Embed Size (px)
Citation preview

1
STABILITY OF BREAKWATER ARMOUR UNITS AGAINST TSUNAMI ATTACK
Miguel Esteban1, Ravindra Jayaratne
2, Takahito Mikami
3, Izumi Morikubo
4, Tomoya
Shibayama5, Nguyen Danh Thao
6, Koichiro Ohira
7, Akira Ohtani
8, Yusuke Mizuno
9, Mizuho
Kinoshita10
and Shunya Matsuba11
Abstract
The design of breakwater armour units against tsunami attacks has received little attention in the
past because of the comparative low frequency of these events and the rarity of structures designed
specifically to withstand them. However, field surveys of recent events, such as the 2011 Great
Eastern Japan Earthquake Tsunami and the 2004 Indian Ocean Tsunami, have shown flaws in the
design of protection structures. During these extreme events, many breakwaters suffered partial or
catastrophic damage. Although it is to be expected that most normal structures fail due to such
high order events, practicing engineers need to possess tools to design certain important
breakwaters that should not fail even during level 2 events. Research into the design of critical
structures that only partially fail (i.e., “resilient” or “tenacious” structures) during a very extreme
level 2 tsunami event should be prioritized in the future, and in this sense the present paper
proposes a formula that allows the estimation of armour unit damage depending on the tsunami
wave height.
Keywords: rubble-mound breakwater; solitary waves; tsunami; Tohoku; stability; Hudson
formula; Van der Meer formula
1 Graduate School of Frontier Sciences, The University of Tokyo,5-1-5 Kashiwanoha, Chiba, 277-8563, Japan.
2 School of Architecture, Computing & Engineering, University of East of London, Docklands Campus, 4-6 University
Way, London E16 2RD, UK. 3 Dept. Civil and Environmental Engineering, Waseda University, 3-4-1 Ookubo, Tokyo, 169-8555, Japan.
4 Nihon Unisys. Ltd., Tokyo, Japan.
5 Dept. Civil and Environmental Engineering, Waseda University, 3-4-1 Ookubo, Tokyo, 169-8555, Japan.
6 Dept. Civil Engineering, Ho Chi Minh City University of Technology, Ho Chi Minh, Vietnam.
7 Chubu Electric Power Company, Japan.
8 Ministry of Land, Infrastructure, Transport and Tourism, Tokyo, Japan.
9 Dept. Civil and Environmental Engineering, Waseda University, 3-4-1 Ookubo, Tokyo, 169-8555, Japan.
10 Dept. Civil and Environmental Engineering, Waseda University, 3-4-1 Ookubo, Tokyo, 169-8555, Japan.
11 Dept. Civil and Environmental Engineering, Waseda University, 3-4-1 Ookubo, Tokyo, 169-8555, Japan.
2 INTRODUCTION
On March 11, 2011, a large earthquake of magnitude 9.0 on the Richter scale occurred offshore the
northeast coast of Japan, generating a major tsunami that devastated large parts of Japan’s north-eastern
coastline. This 2011 Great Eastern Japan Earthquake Tsunami has been described as a one in several
thousand years event, and was one of the worst tsunamis to affect Japan since records began. In its
aftermath, the reliability of the different available tsunami counter-measures is being re-assessed, with
important questions being asked about the ability of hard measures to protect against them. A variety of
failure mechanisms have been reported for different types of structures (Mikami et al., 2012).
Generally speaking, composite breakwaters (those protected by armour units such as tetrapods) were
more resilient than simple caisson breakwaters. Armour units of different sizes and types were
sometimes used in the same breakwater, with lighter units suffering more damage and showcasing how
damage is dependent on the weight of the units (as can be expected from formulas such as that of Van
der Meer, 1987).
To date, research has been carried out on the design of dykes and vertical structures against wind waves
(Goda, 1985, Tanimoto et al., 1996), including assessments of the reliability of these structures
(Esteban et al., 2007). For the case of solitary waves, Tanimoto et al. (1984) performed large-scale
experiments on a vertical breakwater using a sine wave and developed a formula for calculating wave
pressure. Ikeno et al (2001, 2003) conducted model experiments on bore type tsunamis and modified
Tanimoto’s formula by introducing an extra coefficient for wave breaking. Mizutani and Imamura
(2002) also conducted model experiments on a bore overflowing a dike on a level bed and proposed a
set of formulae to calculate the maximum wave pressure behind the dike. Esteban et al. (2008)
calculated the deformation of the rubble mound foundation of a caisson breakwater against different
types of solitary waves. However, all the methods outlined above deal with simple type caisson
structures or dykes, though many composite breakwaters exist (where the caisson is protected by
armour units placed on its seaside part). To this effect, Esteban et al. (2009) calculated the effect that a
partially failed armour layer would have on the forces exerted by a solitary wave on a caisson, allowing
for the determination of the caisson tilt. Subsequently, Esteban et al. (2012a) proposed an initial
formula for the design of armour units against tsunami attack, though this formula was based on the
analysis of only two ports in the Tohoku area, and thus its accuracy is questionable. Formulae that can
3
be used to design armour stones against anticipated current velocities are already given in the Shore
Protection Manual (1977), based on a variety of previous research. More recent researchers (see
Sakakiyama, 2012, Hanzawa et al., 2012, Kato et al., 2012) have also proposed methods to design
armour against tsunami attack, focusing on the current velocity and overtopping effect, though it can be
difficult for a practicing engineer to reliably estimate these parameters in the case of an actual tsunami.
In the present work, the authors have set out to verify the accuracy of the formula of Esteban et al.
(2012a) by expanding the analysis to a number of other ports that were affected by the 2011 Great
Eastern Japan Earthquake and Tsunami and the 2004 Indian Ocean Tsunami. The goal is to obtain a
formula that can be easily applied by a practicing engineer to check whether a certain armour layer (in
either a composite or rubble mound breakwater) is likely to catastrophically fail during a given
tsunami event.
Following the 2011 Great Eastern Japan Earthquake Tsunami the Japanese Coastal Engineering
Community has started to classify tsunami events into two different levels (Shibayama et al., 2012),
according to their level of severity and intensity. Level 1 events have a return period of several decades
to 100+ years and would be relatively low in height, typically with inundation heights of less than 7-10
m. Level 2 events are less frequent events, typically occurring every few hundred to a few thousand
years. The tsunami inundation heights would be expected to be much bigger, typically over 10 m, but
would include events of up to 20-30 m in height.
The way to defend against each tsunami level would thus follow a different philosophy. “Hard
measures”, such as breakwaters or dykes, should be strong enough to protect against loss of life and
property for a level 1 event. However, the construction of such measures against level 2 events is often
seen as unrealistic from a cost-benefit point of view. Thus, during these events it would be accepted
that hard measures would be overcome and the protection of the lives of residents would rely on “soft
measures”, such as evacuation plans and buildings. Nevertheless, hard measures would also have a
secondary role to play in delaying the incoming wave and giving residents more time to escape.
Although many structures in tsunami-prone areas are designed primarily against storm waves, it is
4
desirable that they can survive level 1 tsunami events with little damage to continue to provide some
degree of protection to the communities and infrastructures behind them.
BREAKWATER FAILURES DURING PAST TSUNAMI EVENTS
To derive a formula for the design of breakwater armour units against tsunami attack, the authors used
real-life failures of armour unit layers at several locations along the south-west of the Sri Lankan (for
the 2004 Indian Ocean Tsunami) and northern Japanese (for the 2011 Great Eastern Japan
Earthquake and Tsunami) coastlines. The authors themselves carried out the surveys, relatively
independently from other researchers during the 2004 event (Okayasu et al., 2005, Wijetunge, 2006),
and as members of the larger Tohoku Earthquake Tsunami Joint Survey Group in 2011 (Mori et al.,
2012, Mikami et al., 2012). Also, the authors continued to return to the Tohoku area at regular intervals
during the 18 months that followed the event, compiling further reports of the failure of various
breakwaters along the affected coastline. A summary of each port surveyed is given in the sections
below.
For each breakwater section an armour damage parameter, S, similar to that used in Van der Meer
(1987) was obtained, which was defined as follows:
𝑆 =𝐴𝑒
𝐷𝑛502 (1)
where Ae is the erosion area of the breakwater profile between the still water plus or minus one wave
height and Dn50 is the mean diameter of the armour units. For the case of the Sri Lankan ports this S
value was based on surveys of the average required volumes of material required to restore each
breakwater to its initial condition, while for the case of Japan it was based on the number of armour
units missing from the most severe damaged parts of each breakwater section. S=15 defines
catastrophic damage (Kamphuis, 2000), and thus any damage with S higher than this value (e.g. for the
case of rubble mound breakwaters) was assigned S=15.

5
Damaged ports in Sri Lanka
Sri Lanka was hit by a massive tsunami, triggered by a 9.0 magnitude earthquake, off the coast of
Sumatra, on 26 December 2004. It was the worst natural disaster ever recorded in the history of the
country, causing significant damage to life and coastal infrastructure. A total of 1,100 km of coastline
was affected (particularly along the east, south and west of the country), leaving approximately 39,000
dead and destroying 100,000 homes. Fisheries were badly damaged, including the ports of Hikkaduwa,
Mirissa and Puranawella. A considerable variation in tsunami inundation heights was recorded, ranging
from less than 3.0 m to as high as over 11.0 m, with the height generally showing a decreasing trend
from the south to west coast (Okayasu et al., 2005; Wijetunge, 2006).
Hikkaduwa Fishery Port
Hikkaduwa port is located on the southwest coast of Sri Lanka, approximately 100 km south of
Colombo. It is situated at the northern end of Hikkaduwa town, between Coral Garden Bay and
Hikkaduwa River and by the side of the Colombo-Galle (A002) highway. The region is a major tourist
destination, possessing a submerged coral reef in the near shore area which highlights its ecological
importance as a conservation area. The Hikkaduwa fishery anchorage evolved as a result of structures
that were constructed to prevent sand bar formation across the Hikkaduwa river outlet. The harbour
basin is enclosed by the southern and northern breakwaters, with the outer breakwater taking off from
the southern breakwater to provide the necessary shelter during the SW monsoon. The length of the
southern (main) and outer breakwater is approximately 378 m while the length of the northern
(secondary) breakwater is 291 m.
The seaside and leeside of the main breakwater was covered with 1.0 to 3.0 ton rock armour while the
outer breakwater used 6.0 to 8.0 ton armour. The head of the outer breakwater consisted of 8.0-10.0 ton
armour. The tsunami waves which approached the port were relatively small since they had undergone
diffraction due to the geographical features of the southern coast of Sri Lanka. Figure 1 illustrates the
damage to the primary armour of the outer breakwaters. Water depths in front of the breakwaters at
6
these damaged sections were found to be approximately 0.5 to 4.0 m below MSL at the time of
survey. The measured tsunami wave height at this location was 4.7 m, and as the freeboard was 3.5 m
this would imply that the tsunami would have overtopped the breakwater with an overflow height of
1.2 m. The average S factor for the main section of the outer breakwater was 4.5.
INSERT FIGURE 1
Mirissa Fishery Port
Mirissa fishery port is located in the eastern side of Weligama Bay, which is approximately 27 km east
of Galle. This location is ideal for a fishery port as the eastern headland of the bay provides protection
from the SW monsoon waves. The port consists of a 403 m main breakwater and a 105 m secondary
breakwater. The seaside of the main breakwater was covered with 4 to 6 ton primary rock armour while
the leeside used 3 to 4 ton armour. Figure 2 illustrates the damage observed at the seaward side of the
main breakwater. The water depths at the main breakwater varied from 3.0 to 5.0 m below MSL at the
time of the field survey. The measured tsunami wave height at this location was 5.0 m and thus would
have resulted in an overflow height of 1.5 m (as the freeboard of the breakwater was 3.5m). The
average S factor was 5.3.
INSERT FIGURE 2
Puranawella Fishery Port
Puranawella fishery harbour is located at the southern end of Sri Lanka and consists of two rubble
mound breakwaters: the main breakwater (405 m long) at the southern side and the secondary
breakwater (200 m long) at the northern side of the harbour. The tsunami caused extensive damage to
both breakwaters and other fishing facilities. The primary armour was displaced at several locations
7
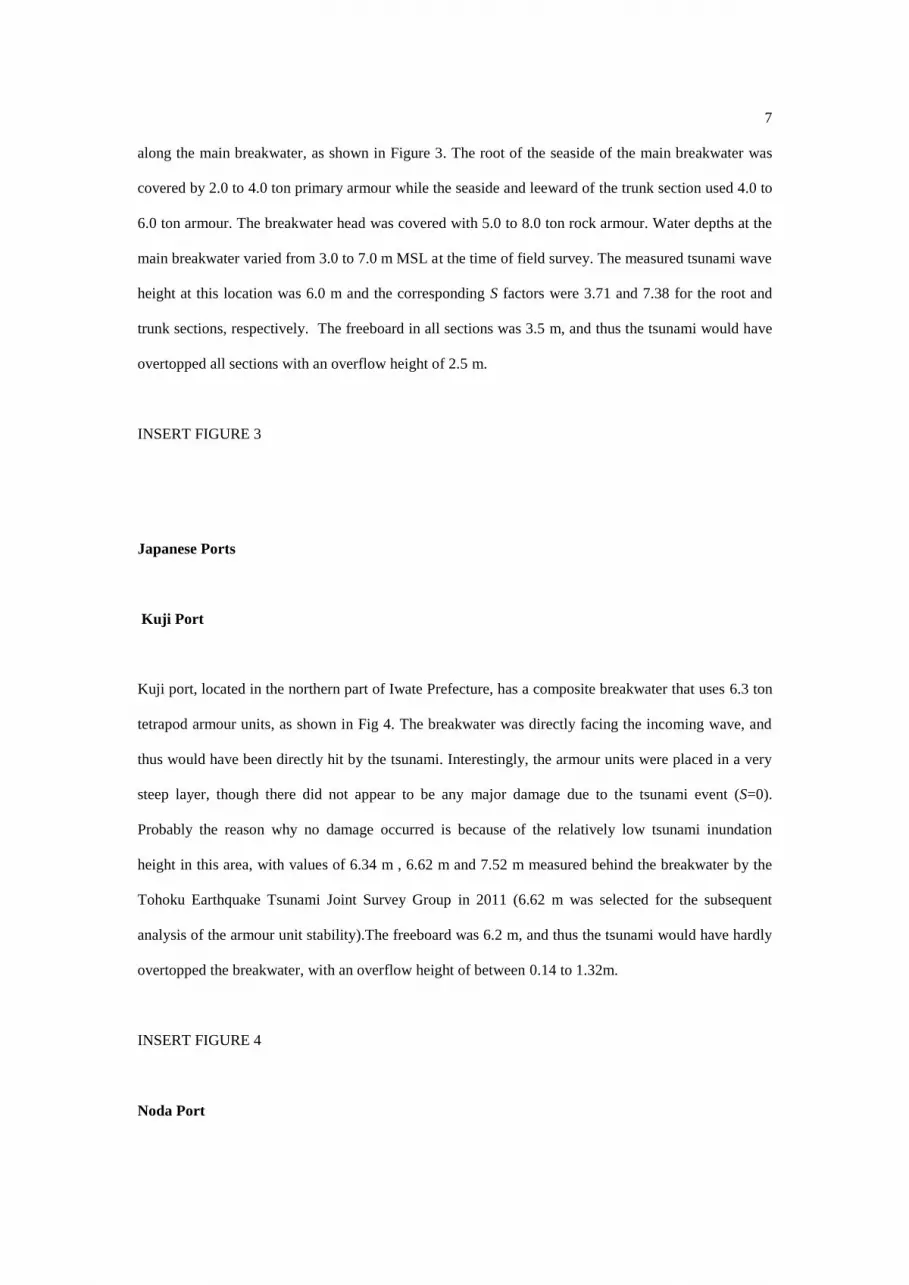
along the main breakwater, as shown in Figure 3. The root of the seaside of the main breakwater was
covered by 2.0 to 4.0 ton primary armour while the seaside and leeward of the trunk section used 4.0 to
6.0 ton armour. The breakwater head was covered with 5.0 to 8.0 ton rock armour. Water depths at the
main breakwater varied from 3.0 to 7.0 m MSL at the time of field survey. The measured tsunami wave
height at this location was 6.0 m and the corresponding S factors were 3.71 and 7.38 for the root and
trunk sections, respectively. The freeboard in all sections was 3.5 m, and thus the tsunami would have
overtopped all sections with an overflow height of 2.5 m.
INSERT FIGURE 3
Japanese Ports
Kuji Port
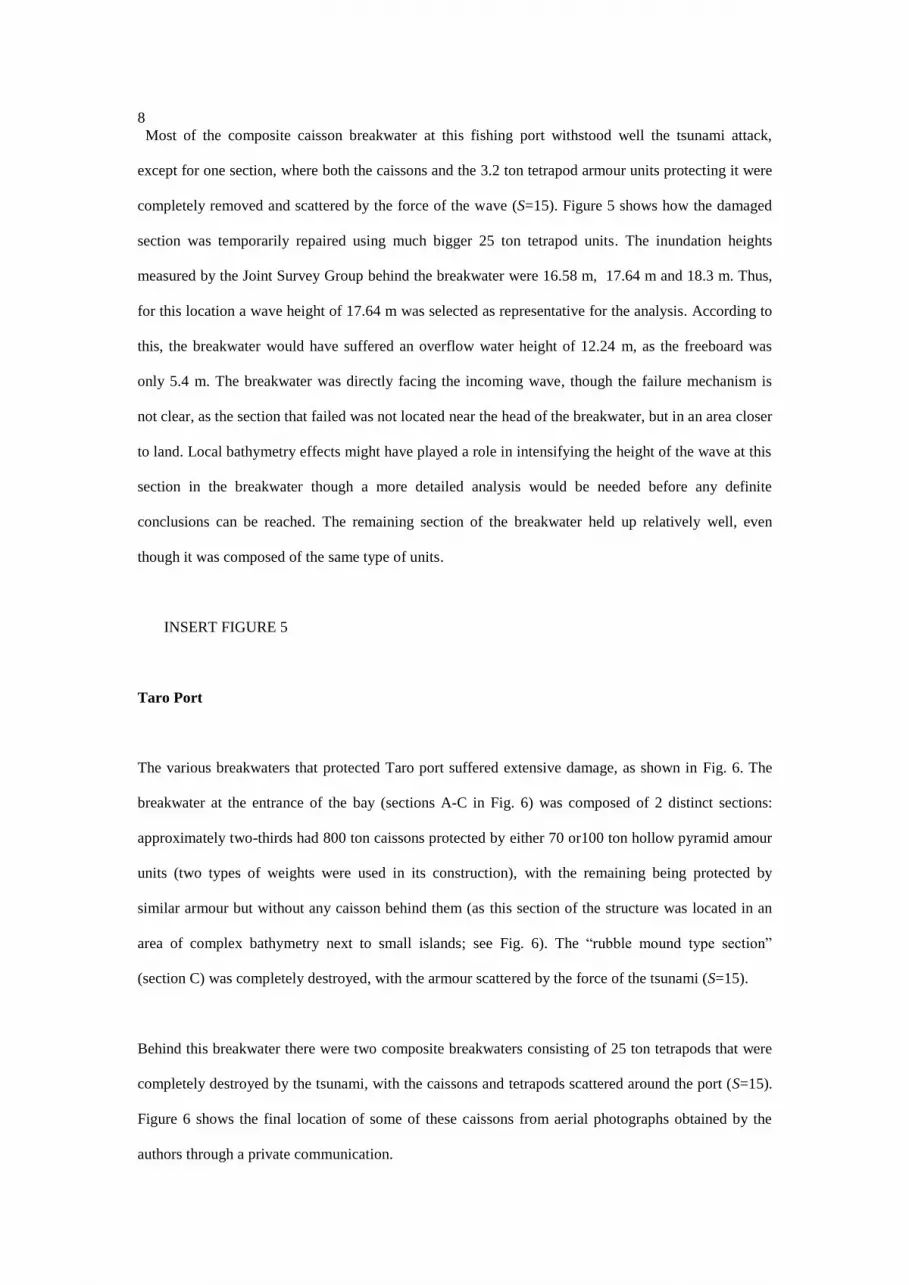
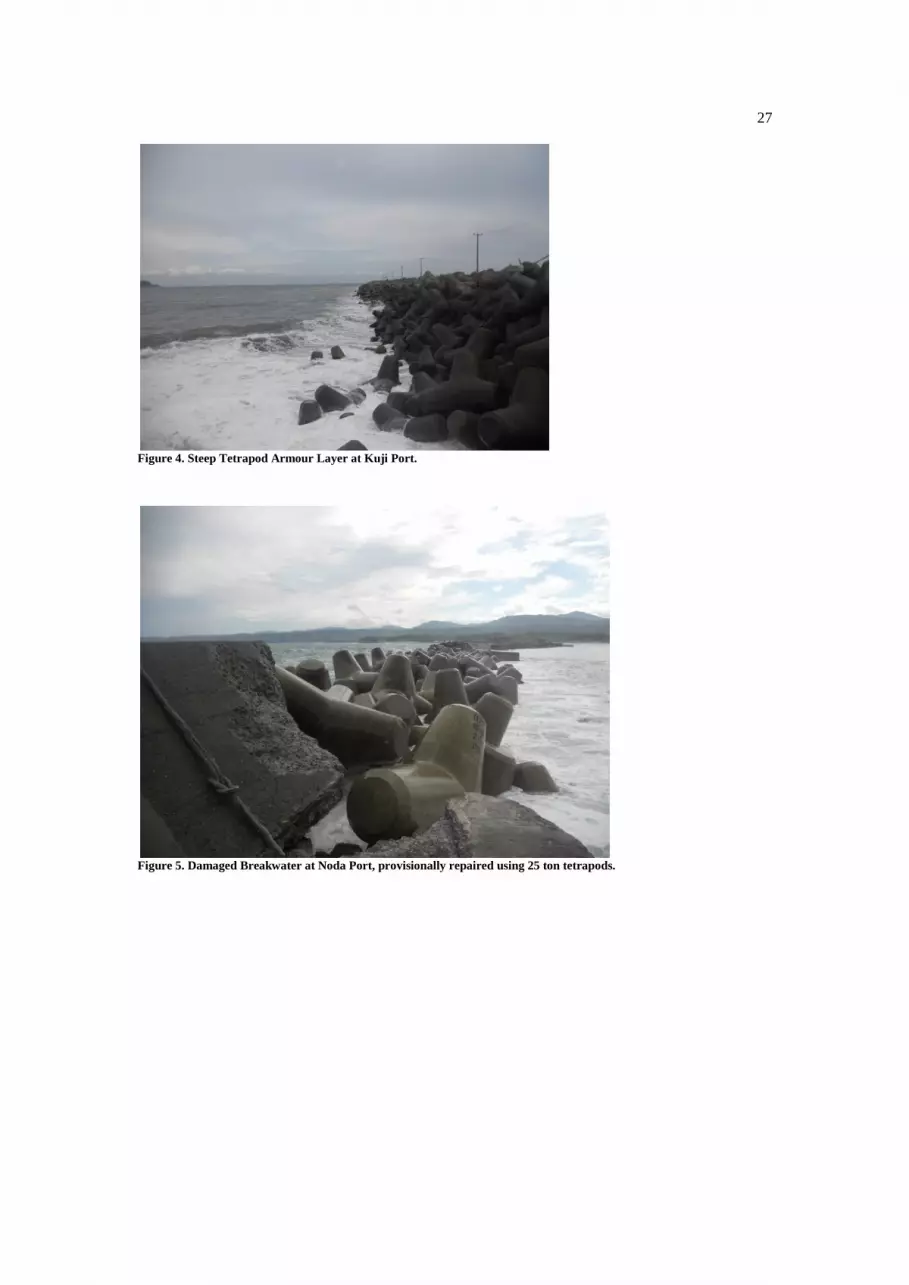
Kuji port, located in the northern part of Iwate Prefecture, has a composite breakwater that uses 6.3 ton
tetrapod armour units, as shown in Fig 4. The breakwater was directly facing the incoming wave, and
thus would have been directly hit by the tsunami. Interestingly, the armour units were placed in a very
steep layer, though there did not appear to be any major damage due to the tsunami event (S=0).
Probably the reason why no damage occurred is because of the relatively low tsunami inundation
height in this area, with values of 6.34 m , 6.62 m and 7.52 m measured behind the breakwater by the
Tohoku Earthquake Tsunami Joint Survey Group in 2011 (6.62 m was selected for the subsequent
analysis of the armour unit stability).The freeboard was 6.2 m, and thus the tsunami would have hardly
overtopped the breakwater, with an overflow height of between 0.14 to 1.32m.
INSERT FIGURE 4
Noda Port
8
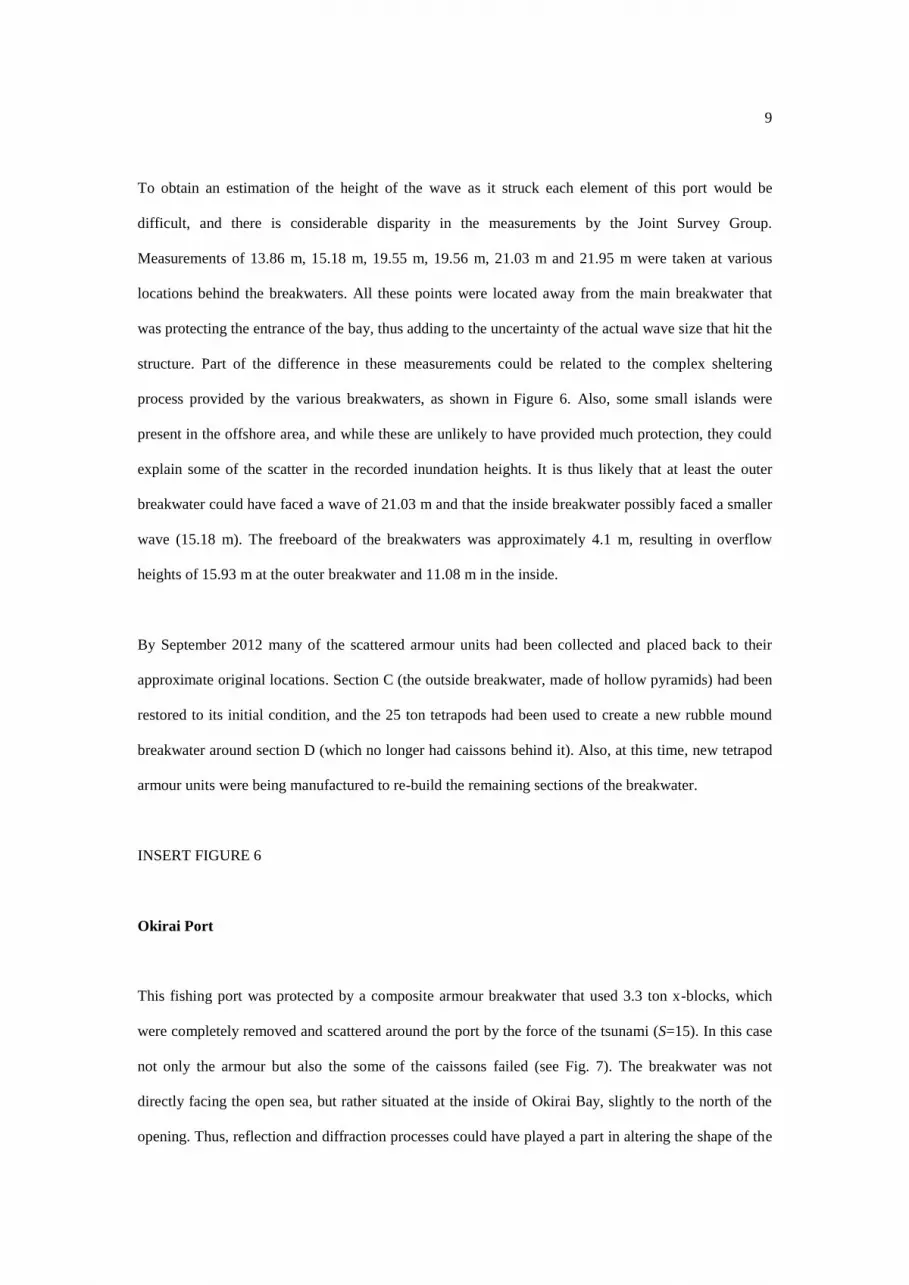
Most of the composite caisson breakwater at this fishing port withstood well the tsunami attack,
except for one section, where both the caissons and the 3.2 ton tetrapod armour units protecting it were
completely removed and scattered by the force of the wave (S=15). Figure 5 shows how the damaged
section was temporarily repaired using much bigger 25 ton tetrapod units. The inundation heights
measured by the Joint Survey Group behind the breakwater were 16.58 m, 17.64 m and 18.3 m. Thus,
for this location a wave height of 17.64 m was selected as representative for the analysis. According to
this, the breakwater would have suffered an overflow water height of 12.24 m, as the freeboard was
only 5.4 m. The breakwater was directly facing the incoming wave, though the failure mechanism is
not clear, as the section that failed was not located near the head of the breakwater, but in an area closer
to land. Local bathymetry effects might have played a role in intensifying the height of the wave at this
section in the breakwater though a more detailed analysis would be needed before any definite
conclusions can be reached. The remaining section of the breakwater held up relatively well, even
though it was composed of the same type of units.
INSERT FIGURE 5
Taro Port
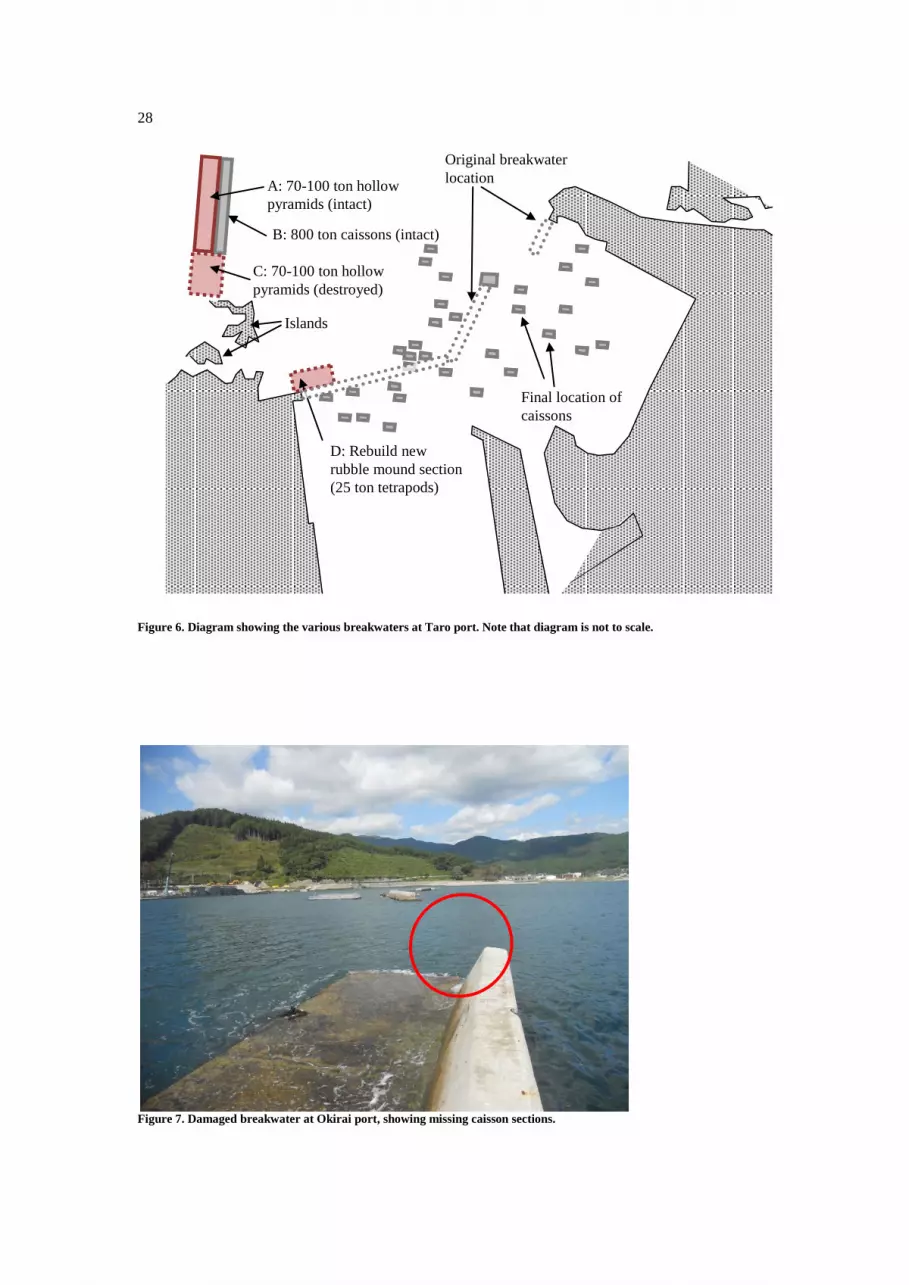
The various breakwaters that protected Taro port suffered extensive damage, as shown in Fig. 6. The
breakwater at the entrance of the bay (sections A-C in Fig. 6) was composed of 2 distinct sections:
approximately two-thirds had 800 ton caissons protected by either 70 or100 ton hollow pyramid amour
units (two types of weights were used in its construction), with the remaining being protected by
similar armour but without any caisson behind them (as this section of the structure was located in an
area of complex bathymetry next to small islands; see Fig. 6). The “rubble mound type section”
(section C) was completely destroyed, with the armour scattered by the force of the tsunami (S=15).
Behind this breakwater there were two composite breakwaters consisting of 25 ton tetrapods that were
completely destroyed by the tsunami, with the caissons and tetrapods scattered around the port (S=15).
Figure 6 shows the final location of some of these caissons from aerial photographs obtained by the
authors through a private communication.
9
To obtain an estimation of the height of the wave as it struck each element of this port would be
difficult, and there is considerable disparity in the measurements by the Joint Survey Group.
Measurements of 13.86 m, 15.18 m, 19.55 m, 19.56 m, 21.03 m and 21.95 m were taken at various
locations behind the breakwaters. All these points were located away from the main breakwater that
was protecting the entrance of the bay, thus adding to the uncertainty of the actual wave size that hit the
structure. Part of the difference in these measurements could be related to the complex sheltering
process provided by the various breakwaters, as shown in Figure 6. Also, some small islands were
present in the offshore area, and while these are unlikely to have provided much protection, they could
explain some of the scatter in the recorded inundation heights. It is thus likely that at least the outer
breakwater could have faced a wave of 21.03 m and that the inside breakwater possibly faced a smaller
wave (15.18 m). The freeboard of the breakwaters was approximately 4.1 m, resulting in overflow
heights of 15.93 m at the outer breakwater and 11.08 m in the inside.
By September 2012 many of the scattered armour units had been collected and placed back to their
approximate original locations. Section C (the outside breakwater, made of hollow pyramids) had been
restored to its initial condition, and the 25 ton tetrapods had been used to create a new rubble mound
breakwater around section D (which no longer had caissons behind it). Also, at this time, new tetrapod
armour units were being manufactured to re-build the remaining sections of the breakwater.
INSERT FIGURE 6
Okirai Port
This fishing port was protected by a composite armour breakwater that used 3.3 ton x-blocks, which
were completely removed and scattered around the port by the force of the tsunami (S=15). In this case
not only the armour but also the some of the caissons failed (see Fig. 7). The breakwater was not
directly facing the open sea, but rather situated at the inside of Okirai Bay, slightly to the north of the
opening. Thus, reflection and diffraction processes could have played a part in altering the shape of the

10
wave. The Joint Survey Group recorded inundation heights of 15.54 m, 15.57 m and 16.17 m behind
the breakwater, and thus a value of 15.57 m was selected as representative for this location, resulting in
an estimated overflow height of 13.57 m (2.0m freeboard)
INSERT FIGURE 7
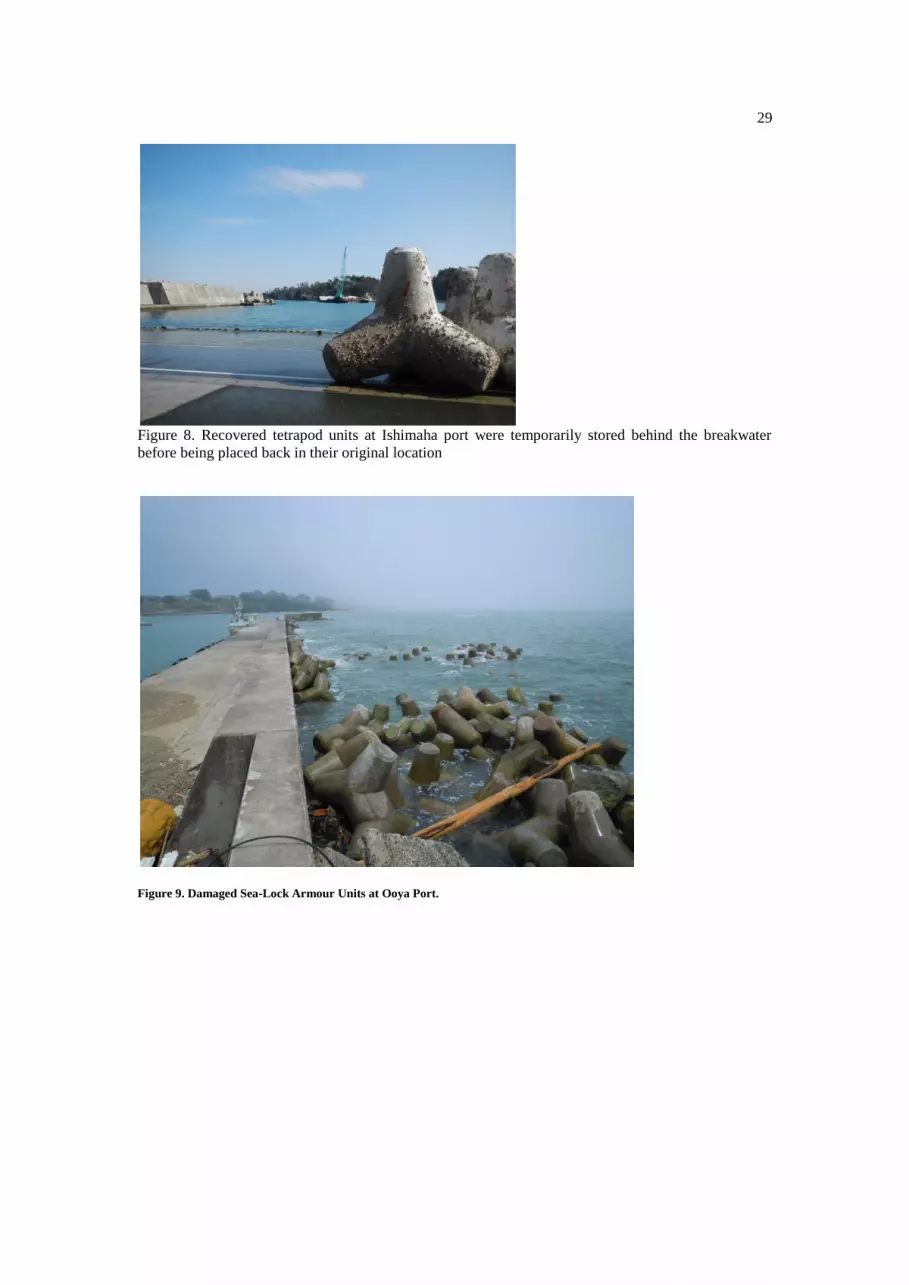
Ishihama Port
This fishing port is located along a relatively straight stretch of the coastline to the east of Kesenuma.
Two composite breakwaters of roughly the same size had been constructed at this location, both of
which used tetrapods. However, the size of the armour units varied throughout both breakwaters. The
north side breakwater had 2 ton armour at the edge with the land, which failed and were just visible
above the water line (S=15). The central part of the breakwater had 8 ton tetrapods, which partially
failed (S=5). Finally, the head of the breakwater was protected by massive tetrapods which did not
appear to have been significantly displaced (one unit had been clearly displaced, and it could have been
possible that more were slightly moved, though it is difficult to ascertain this without knowing the
original position of the units). None of the caisson units in the northern breakwater appeared to have
experienced any displacement.
The southern breakwater was also protected by relatively small 2 ton armour near to its land side,
which failed similarly to those at the northern part (S=15). The central section was protected by what
appeared to be a mixture of armour unit weights, 2 ton, 3.2 ton and 6.3 tons in size. The reason for this
mixture is unclear, and it is possible that some of the lighter units were originally from an adjacent
section and were carried by the wave. Nevertheless, gaps in the armour could be observed in this
section, equivalent to an S=4. The final section of the breakwater was made of much heavier 6.3 ton
units that appeared not to have been displaced. However, the head of the breakwater had not been
protected by armour, resulting in the last caisson tilting into the sea, though still remaining accessible
from the adjacent caisson.
11
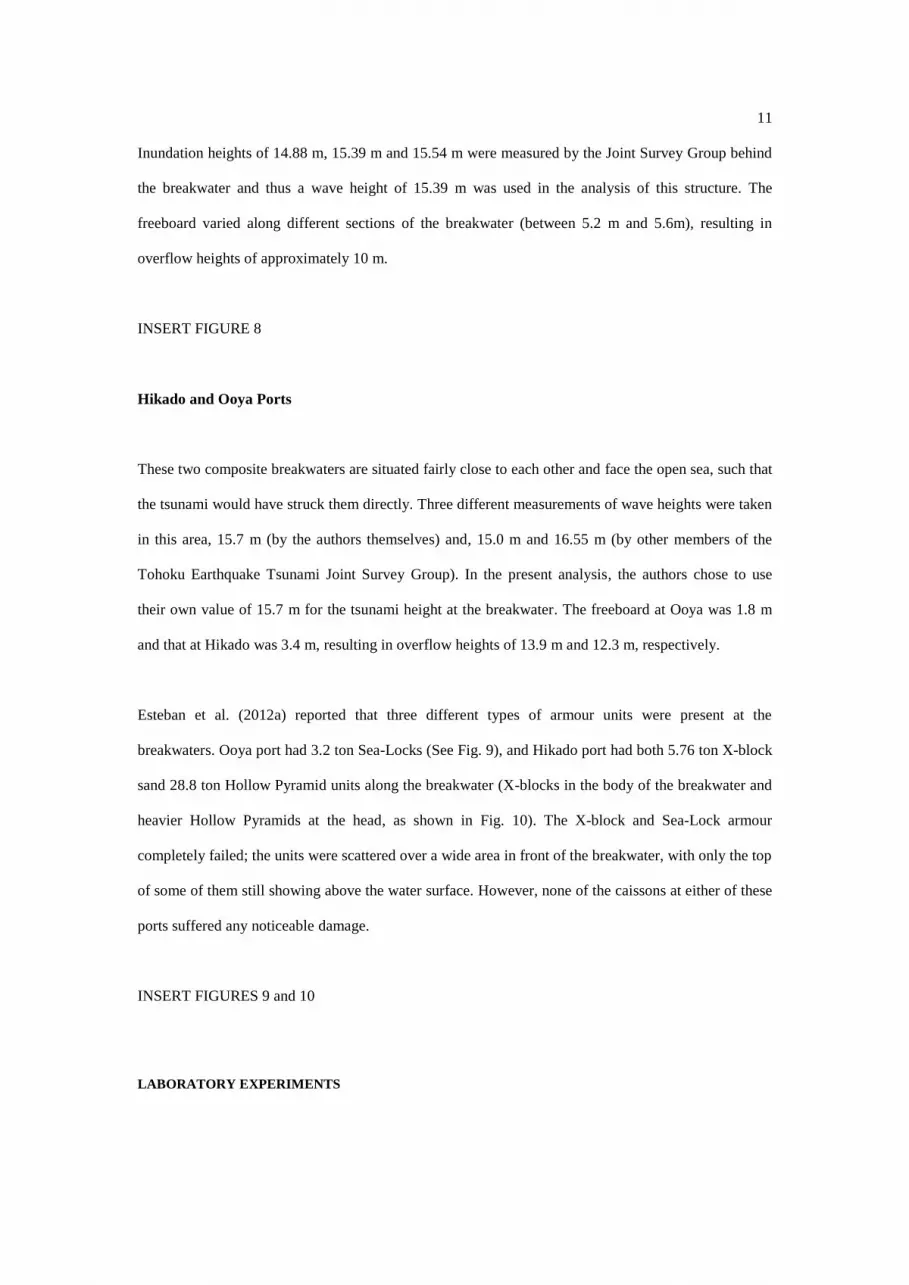
Inundation heights of 14.88 m, 15.39 m and 15.54 m were measured by the Joint Survey Group behind
the breakwater and thus a wave height of 15.39 m was used in the analysis of this structure. The
freeboard varied along different sections of the breakwater (between 5.2 m and 5.6m), resulting in
overflow heights of approximately 10 m.
INSERT FIGURE 8
Hikado and Ooya Ports
These two composite breakwaters are situated fairly close to each other and face the open sea, such that
the tsunami would have struck them directly. Three different measurements of wave heights were taken
in this area, 15.7 m (by the authors themselves) and, 15.0 m and 16.55 m (by other members of the
Tohoku Earthquake Tsunami Joint Survey Group). In the present analysis, the authors chose to use
their own value of 15.7 m for the tsunami height at the breakwater. The freeboard at Ooya was 1.8 m
and that at Hikado was 3.4 m, resulting in overflow heights of 13.9 m and 12.3 m, respectively.
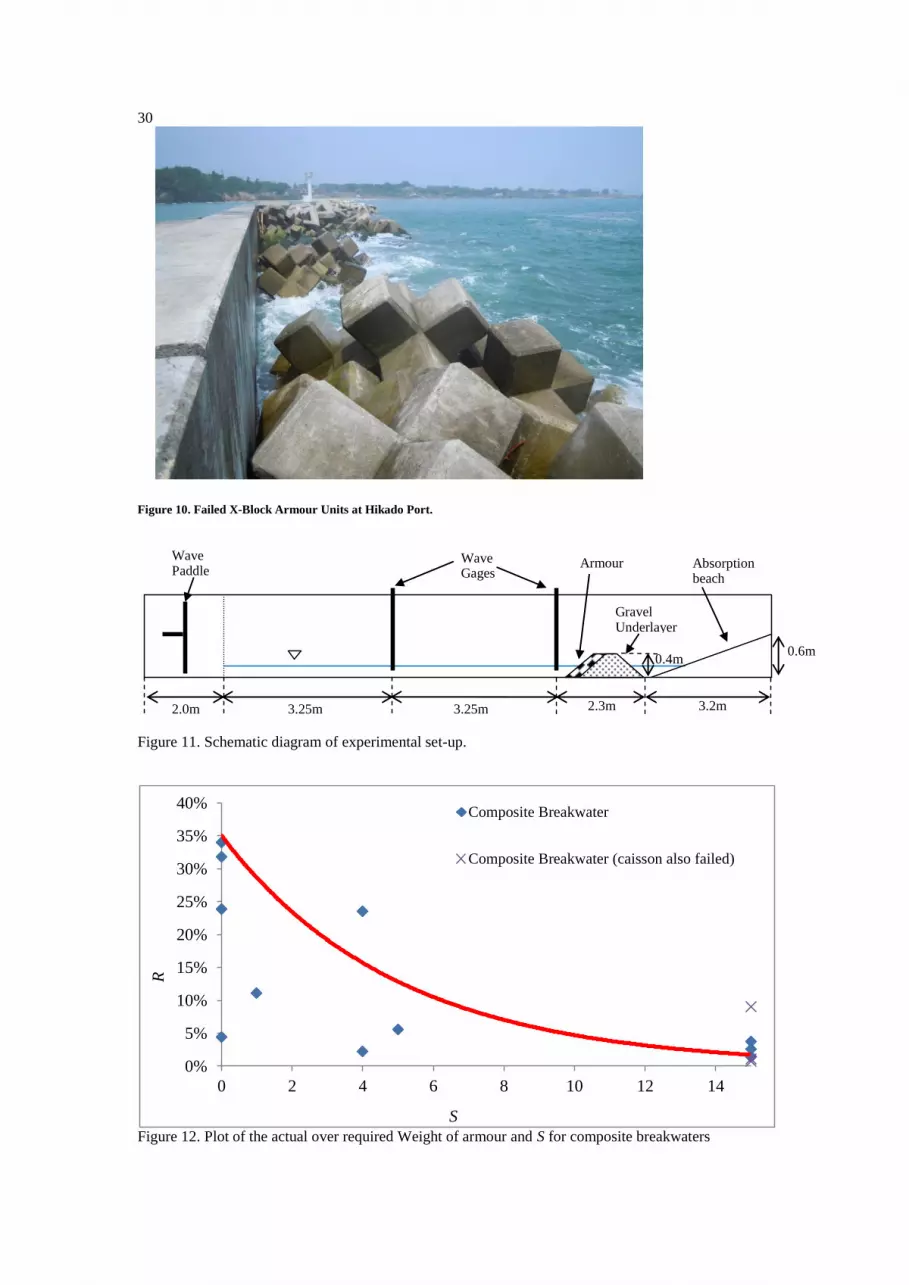
Esteban et al. (2012a) reported that three different types of armour units were present at the
breakwaters. Ooya port had 3.2 ton Sea-Locks (See Fig. 9), and Hikado port had both 5.76 ton X-block
sand 28.8 ton Hollow Pyramid units along the breakwater (X-blocks in the body of the breakwater and
heavier Hollow Pyramids at the head, as shown in Fig. 10). The X-block and Sea-Lock armour
completely failed; the units were scattered over a wide area in front of the breakwater, with only the top
of some of them still showing above the water surface. However, none of the caissons at either of these
ports suffered any noticeable damage.
INSERT FIGURES 9 and 10
LABORATORY EXPERIMENTS
12
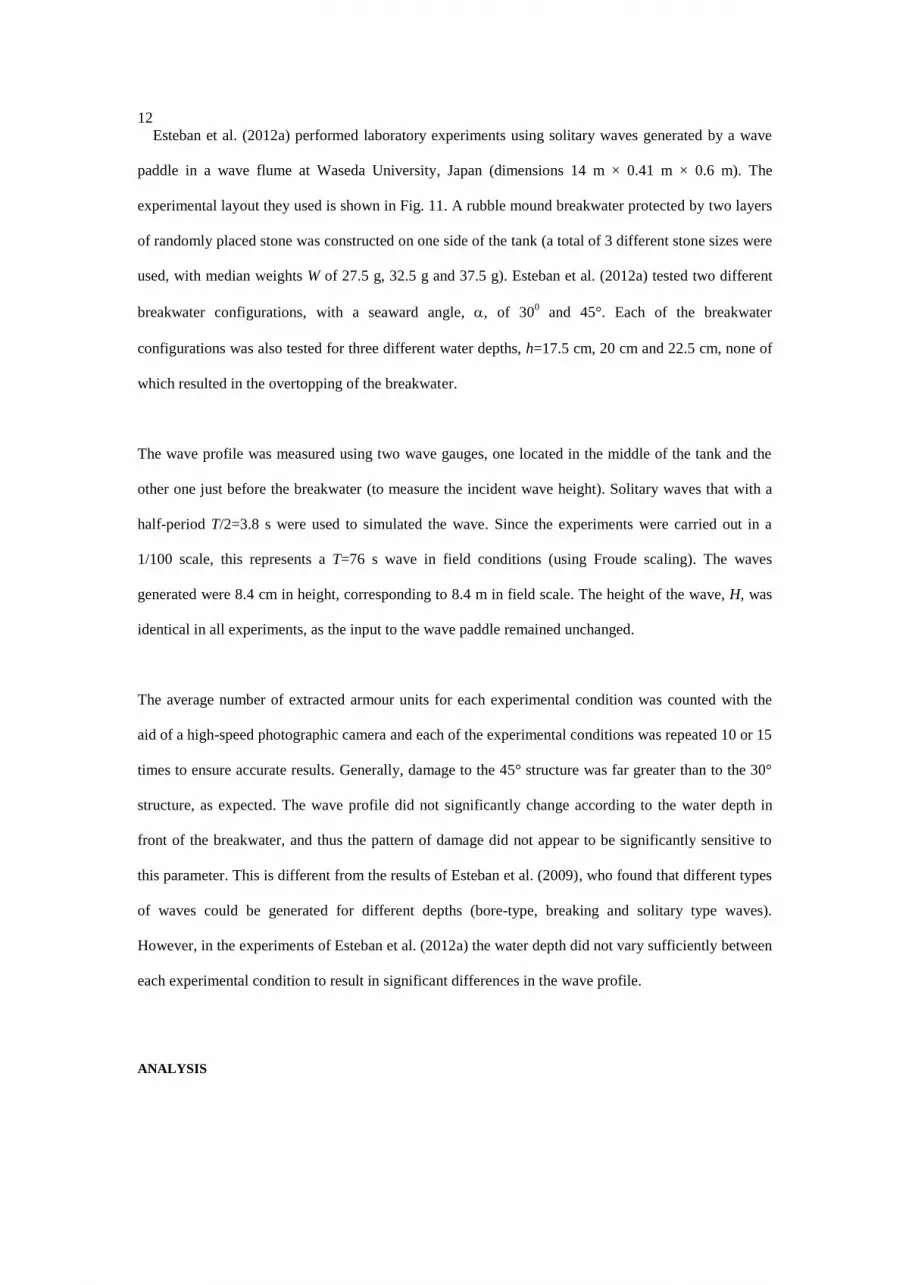
Esteban et al. (2012a) performed laboratory experiments using solitary waves generated by a wave
paddle in a wave flume at Waseda University, Japan (dimensions 14 m × 0.41 m × 0.6 m). The
experimental layout they used is shown in Fig. 11. A rubble mound breakwater protected by two layers
of randomly placed stone was constructed on one side of the tank (a total of 3 different stone sizes were
used, with median weights W of 27.5 g, 32.5 g and 37.5 g). Esteban et al. (2012a) tested two different
breakwater configurations, with a seaward angle, , of 300 and 45°. Each of the breakwater
configurations was also tested for three different water depths, h=17.5 cm, 20 cm and 22.5 cm, none of
which resulted in the overtopping of the breakwater.
The wave profile was measured using two wave gauges, one located in the middle of the tank and the
other one just before the breakwater (to measure the incident wave height). Solitary waves that with a
half-period T/2=3.8 s were used to simulated the wave. Since the experiments were carried out in a
1/100 scale, this represents a T=76 s wave in field conditions (using Froude scaling). The waves
generated were 8.4 cm in height, corresponding to 8.4 m in field scale. The height of the wave, H, was
identical in all experiments, as the input to the wave paddle remained unchanged.
The average number of extracted armour units for each experimental condition was counted with the
aid of a high-speed photographic camera and each of the experimental conditions was repeated 10 or 15
times to ensure accurate results. Generally, damage to the 45° structure was far greater than to the 30°
structure, as expected. The wave profile did not significantly change according to the water depth in
front of the breakwater, and thus the pattern of damage did not appear to be significantly sensitive to
this parameter. This is different from the results of Esteban et al. (2009), who found that different types
of waves could be generated for different depths (bore-type, breaking and solitary type waves).
However, in the experiments of Esteban et al. (2012a) the water depth did not vary sufficiently between
each experimental condition to result in significant differences in the wave profile.
ANALYSIS

13
(2)
The authors used the Hudson formula (CERC, 1984, Kamphuis, 2000) as the starting point for the
analysis. According to this formula, the weight of required armour, W, is proportional to the incident
design wave height, H, as follows:
𝑊 =𝛾
3H
𝐾𝐷(𝑆𝑟 − 1)3𝑐𝑜𝑠𝛼
where is the density of armour (tonnes/m³), Sr is the relative underwater density of armour and KD is
an empirically determined damage coefficient. A summary of the values of KD used for the various
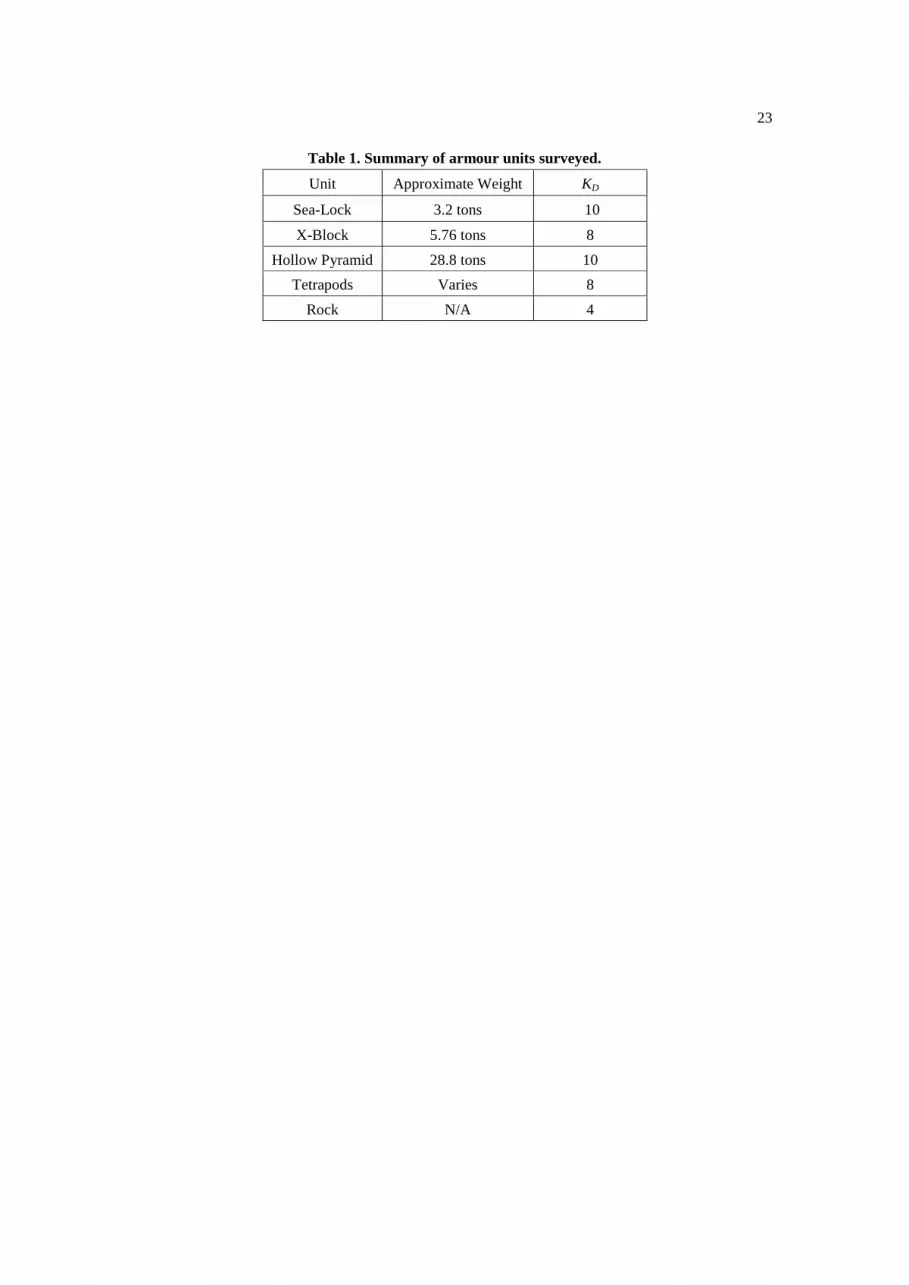
types of armour units analysed in the present research can be found in Table 1 (Kamphuis, 2000). The
use of Hudson KD values is for rubble mound structures exposed to wind waves which are not
overtopped. Hence, the way in which they are being included in the present study is not that for which
they were intended (i.e., for very long period waves overtopping rubble mound structures and
composite breakwaters). Nevertheless, when resisting the tsunami current forces the armour units will
benefit from an interlocking effect, and in the absence of any better measure it is proposed that these
KD values are used.
INSERT TABLE 1
Unlike formulae such as that of Van der Meer’s, the Hudson formula does not provide an indication of
the degree of damage that can be expected for a certain event (although it should be noted that typically
Hudson KD values are considered to indicate 0%-5% damage levels, the Hudson formula cannot predict
higher levels of damage). However, the objective of the present work is to attempt to quantify structure
resilience. Thus the damage to each section of the armour of each breakwater was interpreted using a
damage factor S similar to that used by Van der Meer (1987), as shown in Eq. (1). A ratio R was
defined as the weight of armour, Wrequired, that would be required according to the Hudson formula
using the height of the tsunami (Htsunami) as Hs over the actual weight, Wactual, of the armour at the
breakwaters in the field, given by:
14
(3)
(4)
Where:
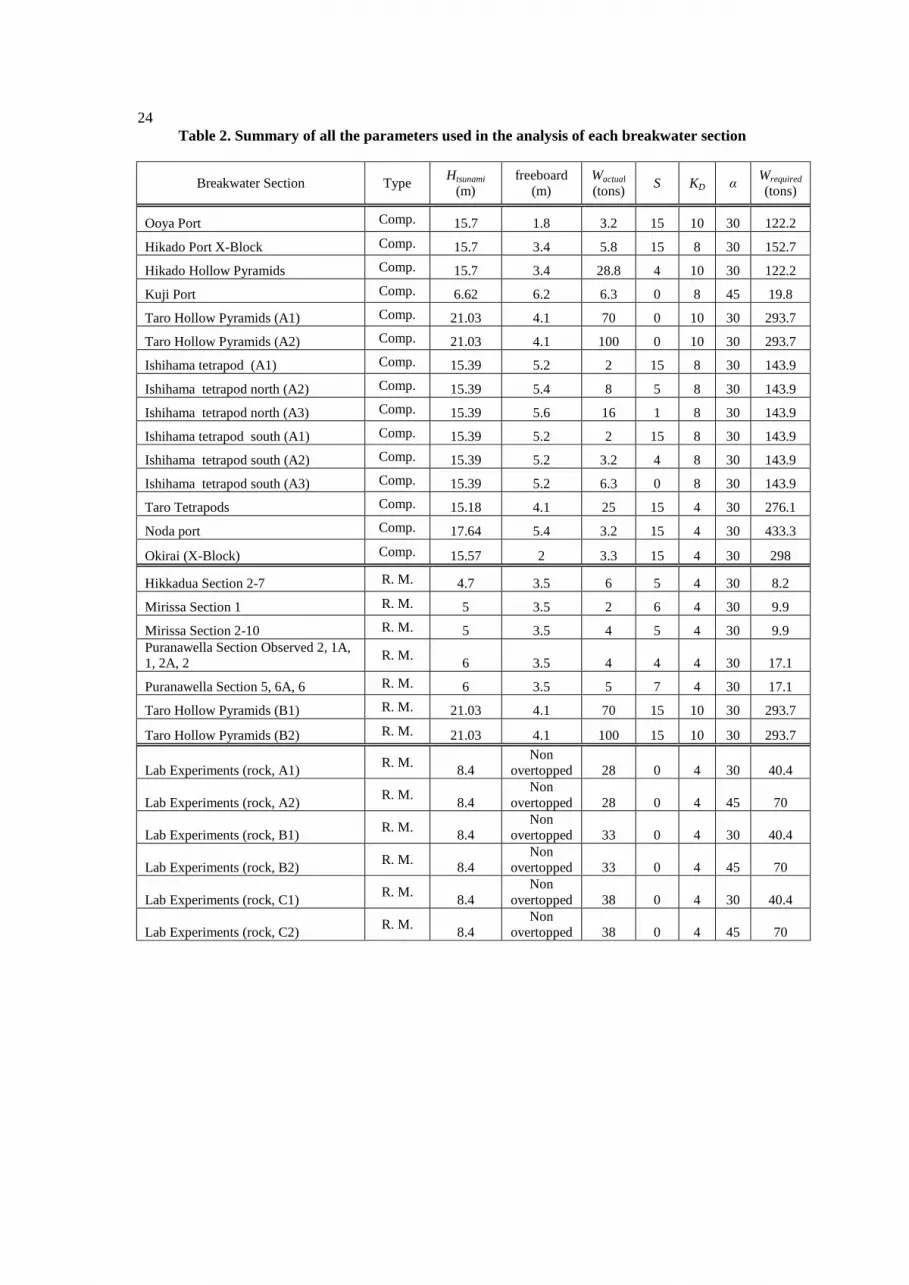
Table 2 shows a summary of the parameters used in each of the breakwater sections that were analysed.
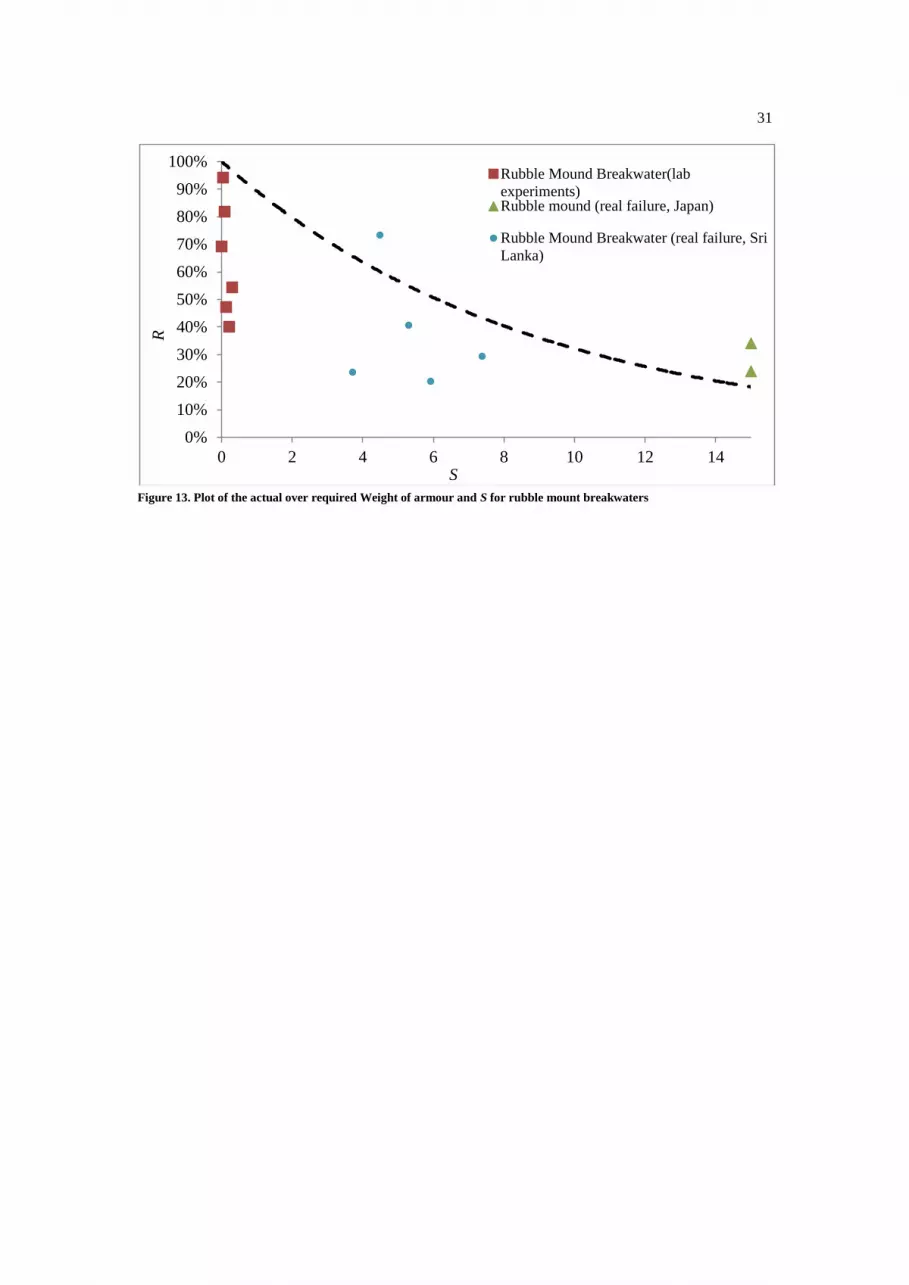
Figures 12 and 13 illustrate the ratio R versus S values for composite and rubble mound breakwaters,
showing how armour units that had lower values of R failed completely (represented by higher S
values) whereas units with higher R only showed partial or no failure. In Figure 13 it the field results
represent breakwaters that were overtopped, whereas those in the laboratory were not, and thus these
two sets of data cannot be interpreted together. The reasons for including the data is only to show that
the laboratory experiments provide some evidence for the shape of the trend line drawn, i.e., to expect a
low S, a large R is required for the case of rubble mound breakwaters.
INSERT TABLE 2
INSERT FIGURES 12 and 13
MODIFICATION TO THE HUDSON FORMULA FOR TSUNAMI EVENTS
According to the results outlined in the previous sections, the authors developed a modification to the
Hudson formula that could be employed for the design of armour units in tsunami prone areas. Thus,
armour units would first be designed using the Van der Meer or Hudson formulae against wind waves
in the area, as usual in the design of any breakwater. However, at the end of the design procedure a
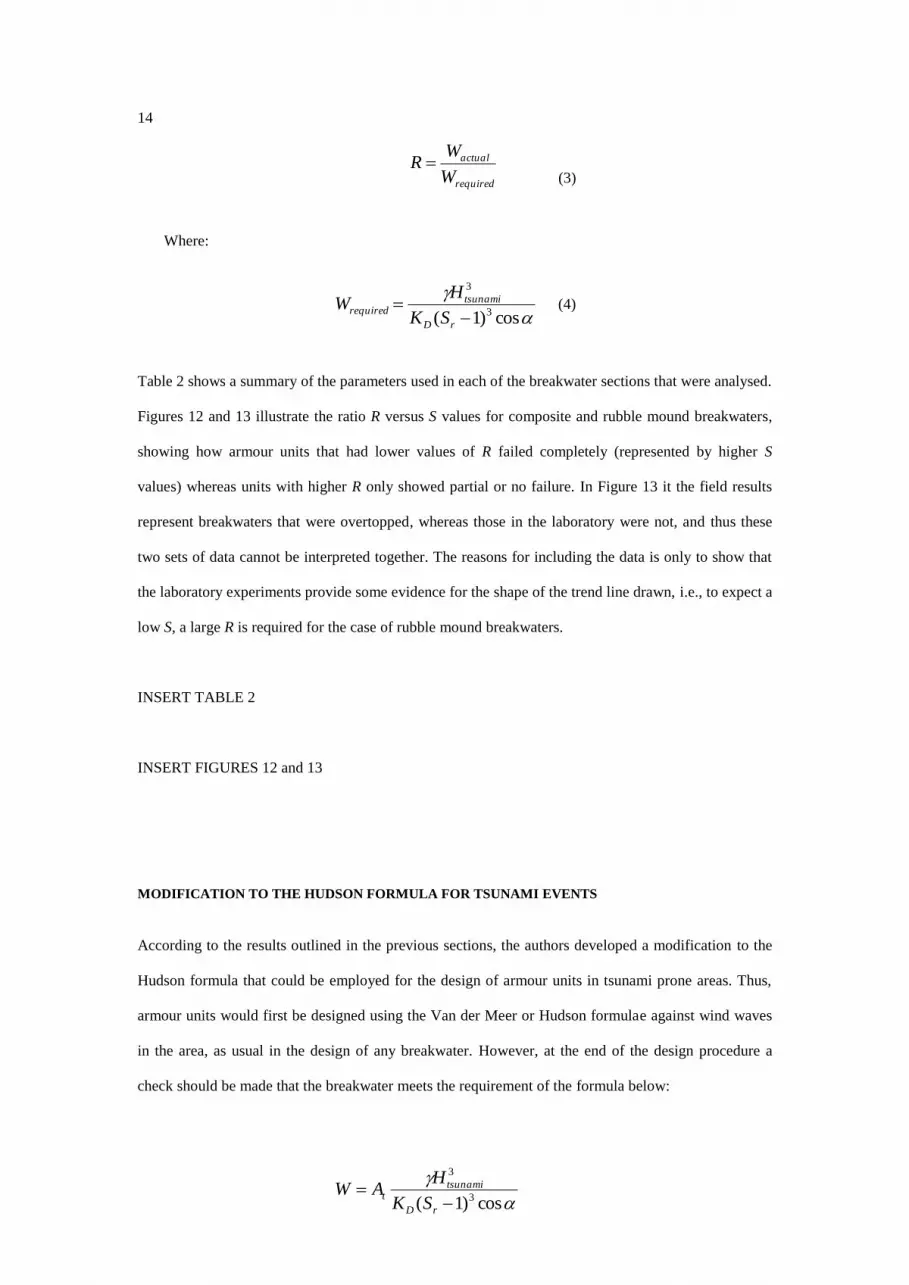
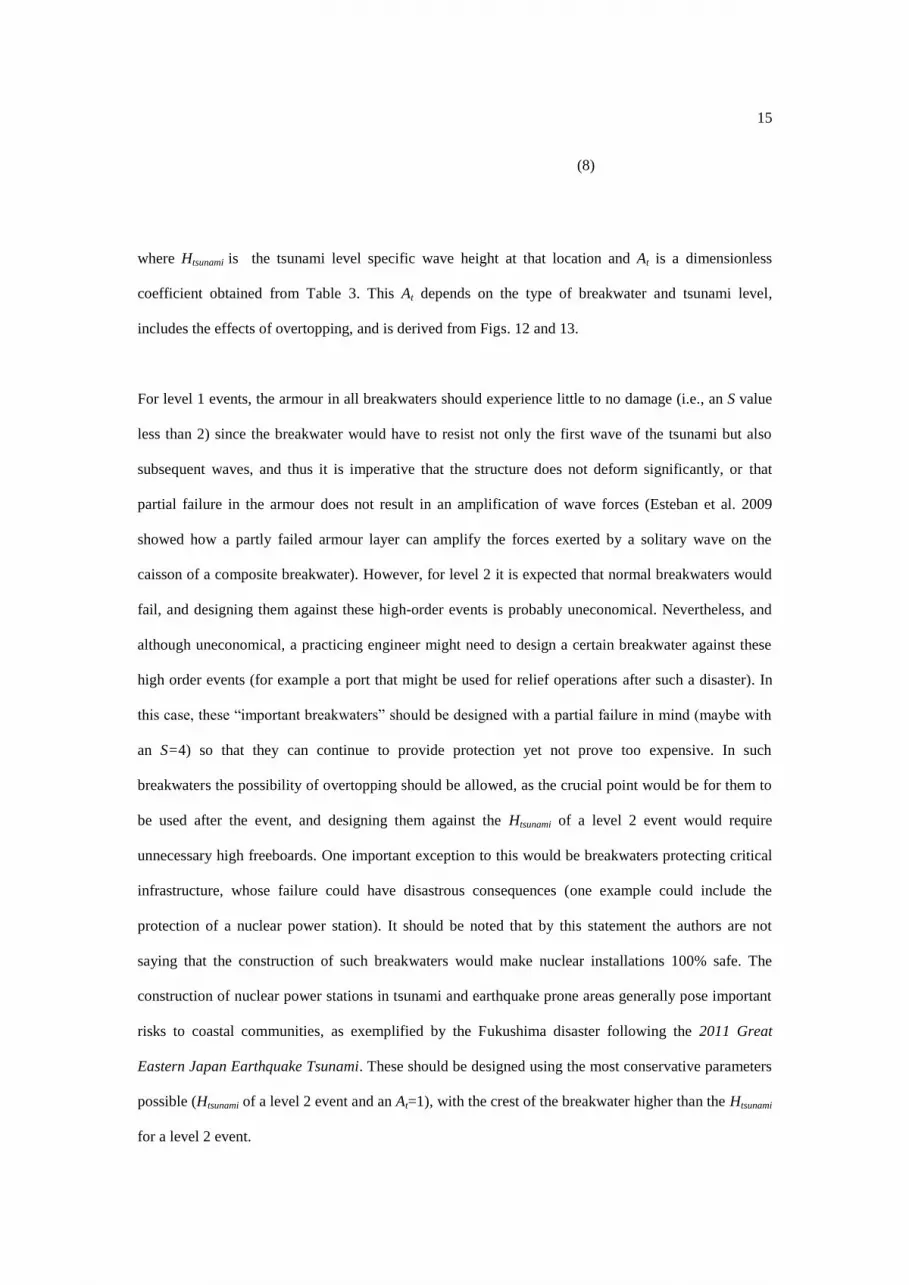
check should be made that the breakwater meets the requirement of the formula below:
required
actual
W
WR
cos)1( 3
3
rD
tsunamit
SK
HAW
cos)1( 3
3
rD
tsunamirequired
SK
HW
15
(8)
where Htsunami is the tsunami level specific wave height at that location and At is a dimensionless
coefficient obtained from Table 3. This At depends on the type of breakwater and tsunami level,
includes the effects of overtopping, and is derived from Figs. 12 and 13.
For level 1 events, the armour in all breakwaters should experience little to no damage (i.e., an S value
less than 2) since the breakwater would have to resist not only the first wave of the tsunami but also
subsequent waves, and thus it is imperative that the structure does not deform significantly, or that
partial failure in the armour does not result in an amplification of wave forces (Esteban et al. 2009
showed how a partly failed armour layer can amplify the forces exerted by a solitary wave on the
caisson of a composite breakwater). However, for level 2 it is expected that normal breakwaters would
fail, and designing them against these high-order events is probably uneconomical. Nevertheless, and
although uneconomical, a practicing engineer might need to design a certain breakwater against these
high order events (for example a port that might be used for relief operations after such a disaster). In
this case, these “important breakwaters” should be designed with a partial failure in mind (maybe with
an S=4) so that they can continue to provide protection yet not prove too expensive. In such
breakwaters the possibility of overtopping should be allowed, as the crucial point would be for them to
be used after the event, and designing them against the Htsunami of a level 2 event would require
unnecessary high freeboards. One important exception to this would be breakwaters protecting critical
infrastructure, whose failure could have disastrous consequences (one example could include the
protection of a nuclear power station). It should be noted that by this statement the authors are not
saying that the construction of such breakwaters would make nuclear installations 100% safe. The
construction of nuclear power stations in tsunami and earthquake prone areas generally pose important
risks to coastal communities, as exemplified by the Fukushima disaster following the 2011 Great
Eastern Japan Earthquake Tsunami. These should be designed using the most conservative parameters
possible (Htsunami of a level 2 event and an At=1), with the crest of the breakwater higher than the Htsunami
for a level 2 event.
16
INSERT TABLE 3
In this type of design, it would be very important to analyse Htsunami correctly, and to do this a certain
wave height should be chosen, corresponding to historical records of tsunamis in the area and to the
perceptions of accepted risk. For the case of Japan, these are framed around the dual tsunami level
classification, where the highest tsunami inundation level that is believed can occur at a given place
(for a return period of several thousand years) should be used for the level 2 Htsunami. Thus, depending
on the area where a breakwater is to be designed and the tsunami risk in the region, the required W of
the armour would be ultimately determined by the wind wave conditions, or by the tsunami risk.
To illustrate this philosophy, Table 4 shows an example of the armour requirements for two of the ports
surveyed by the authors, for different port classifications. In both of the ports shown, it is assumed that
Htsunami=7 m for a level 1 event and Htsunami is equal to that experienced during the 2011 Great Eastern
Japan Earthquake Tsunami for a level 2 event. This shows how, assuming that the armour and
breakwater type stayed the same, both Taro and Ooya currently have armour units of approximately the
size required to withstand a level 1 event (the Sea-Locks at Ooya are slightly smaller than required, 3.2
tons vs. the 3.8 tons required, though this probably would not warrant the reinforcement of the units).
However, if disaster risk managers (for whatever reason) required the outside breakwater of Taro to be
operational after a tsunami event, then 190 ton units would be needed, almost twice the size of the
largest units (100 tons). If a nuclear power station was to be built behind it, this would require units
weighting 290 tons, the crest of the breakwater to be over 21 m high, and a change in the nature of the
breakwater (as a caisson would be required to ensure that the area behind it would not be flooded).
INSERT TABLE 4
17
DISCUSSION
The field trips in Tohoku attempted to establish the extent of damage in the armour by visual inspection,
though this was difficult because the position of the original units were not known. The S values given
in the present study are an estimate of the missing number of armour units in a section, though it was
difficult in many cases to know whether units had moved during the tsunami. In some breakwater
sections, for similar armour weights, some parts showed more damage than others, and the S was
reported for the most damaged sections, not an average. Limitations of using this S parameter were
evident during the field surveys, e.g. the case of breakwaters that had massive armour but were situated
in relatively low water. Thus, an S value of 2 or 3 would probably represent complete failure of the
armour (because of the limited number of units). Although this did not influence the present results (as
these massive units did not fail), this parameter is thus not well suited for small breakwaters protected
by massive armour. Also, the way that the S values were calculated for these composite breakwaters
differed from that used to calculate the rubble mound values (both for the laboratory experiments and
the Sri Lankan ports), which were averages of the breakwater sections evaluated.
Judging from video footage of the 2011 Great Eastern Japan Earthquake Tsunami, these events
comprise complex phenomena, and one of the defining failure modes might be the overtopping effect
of the wave. A prolonged overflowing effect would generate a very intense current, and many
structures along the Tohoku coastline appeared to have failed due to erosion of the landside toe of the
structure. This has led some researchers (Kato et al., 2012, Sakakiyama, 2012, Hanzawa, 2012) to state
that the failure mode is directly related to this overflowing current. Nevertheless, the initial impact of
the wave also has an effect on the breakwater armour, and it would appear logical that once this initial
wave shock has been absorbed, the overflowing current would have no effect on the armour units.
Also, although ultimately the current might be the determining factor in the failure of the armour units,
there is probably relationship between the height of the wave and the magnitude of the current.
Establishing the exact current magnitude for a given tsunami event is far more difficult than
establishing the tsunami wave height (which can easily be measured through field surveys). Thus, the
18
formulae proposed can be used as a proxy for the effect of the current, and thus be easily used by a
practicing engineer in determining the required armour size.
The design of a composite or rubble mound breakwater in a tsunami zone is thus a complex process.
Not only does the stability of the armour have to be checked against wind waves in the area, but also
against tsunamis. The exact failure mechanism for each of the breakwater types is still unclear, and
whether armour units were displaced by the incoming or the outgoing wave could not be easily
established for any of the field failures recorded. In any case, all the breakwaters were overtopped, and
the entire area was completely underwater at one point during the tsunami attack (which would have
also generated large underwater currents around the structures). Importantly, the landside part of the
structure should also be checked for potential scour from the wave as it starts to overtop. It is likely that
most of the landside toe failure occurs during the initial overtopping, since once a large inundation
height is established behind the breakwater the current would probably flow at a higher level, and thus
scour would be less significant. Finally, the effect of the returning wave should also be checked, as this
can result in the inverse process and lead to the destruction of many structures that survived the initial
wave attack, as evidenced in the Tohoku area.
Previously tsunami counter-measures in Japan had been designed to be higher than the expected
tsunami wave height, though they were clearly under-designed for the 2011 Great Eastern Japan
Earthquake Tsunami. Following this event there is a general perception that it is too difficult and
expensive to design tsunami counter-measures against level 2 events. However, it is also clear that
some important structures might have to be designed so that they fail in a non-catastrophic way. These
were described by Kato (2012) as “tenacious structures”, representing a structure that would slowly fail
over the course of the event while retaining some functionality (this idea is similar to what has been
described by other authors as “resilient” structures, which would indicate a structure that would suffer
limited damage even if its design load was greatly exceeded). The difference between “tenacious” and
normal structures is shown by the failure of the breakwaters at Kamaishi (which could be regarded as a
“tenacious structure”, as it suffered great damage but somehow survived the event) and that at Ofunato
(which was completely destroyed).

19
The erection of vertical barriers and dykes can clearly give extra time for residents to evacuate even if
they suffer major damage due to a level 2 event. Much is still not understood about the failure of
protective measures in the event of a tsunami, and their ability to delay the arrival of the flooding water
must be carefully balanced against the extra cost of the armour units. In this respect, significant
research is still needed to ascertain the failure mechanism of armour units, and whether their placement
will increase the forces acting on the caissons behind them, especially if the armour units fail (Esteban
at al., 2012b). Also, the inclusion of crest levels and overtopping depths in an equation to predict
failure should be prioritized in future research.
Unfortunately, ascertaining adequate level 2 tsunami heights is difficult. It requires adequate historical
records, spanning millennia, though most countries’ histories are far shorter, and, even when tsunamis
are recorded in historical documents these do not usually show very detailed information (particularly
for the case of the earlier documents). The field of paleotsunami can thus be very useful, though it often
appears to be difficult to get reliable results as the top levels of the soil in urban areas can be disturbed
by human activities, and these are the areas which are of greatest concern as they concentrate most of
the coastal population (Shibayama et al., 2012).
CONCLUSIONS
Following the 2011 Great Eastern Japan Earthquake Tsunami there is a general perception that much
is still unclear about the failure mechanism of coastal defences. The present research describes the field
surveys of real life breakwater failures in the Tohoku region and South Western of Sri Lanka and
attempts to obtain a design methodology for armour units based on this evidence. This methodology
was inspired by the Hudson formula, but uses the failure definitions given in the Van der Meer
formula. It is recommended that breakwaters in tsunami-prone areas should be designed to withstand
level 1 events, but that only important infrastructure should be designed to remain functional (allowing
partial failure equivalent to an S value of 4) even after being overtopped by the more extreme level 2
tsunami events. Critical infrastructure (such as that protecting nuclear installations) should be designed
to avoid any damage or overtopping to take place even during level 2 events.
20
Establishing the required tsunami inundation heights for level 1 and 2 events is notoriously difficult,
and requires the study of ancient records and tsunami deposits. As most countries do not have records
that span several millennia and these records are often not detailed, the study of tsunami deposits and
seismic faults should be intensified to determine the worst events that can be expected in each region.
ACKNOWLEDGEMENTS
The authors would like to acknowledge the kind financial contribution of the “Disaster Analysis and
Proposal for Rehabilitation Process for the Tohoku Earthquake and Tsunami” Institute for Research on
Reconstruction from the Great East Japan Earthquake/Composed Crisis Research Institute from
Waseda University Research Initiatives. This contribution made possible some of the field visits on
which some of this work rests. The Lanka Hydraulic Institute (LHI) is also acknowledged for providing
breakwater cross-section survey data for three fishery ports in Sri Lanka. The structure and clarity of
the paper was also improved by the helpful comments of two anonymous reviewers, whose
contribution to the paper should also be mentioned.
REFERENCES
CERC. (1984). Shore Protection Manual. Co. Eng. Res. Centre, U.S. Corps of Engineering, Vicksburg.
Esteban, M., Takagi, H. and Shibayama, T. (2007). Improvement in Calculation of Resistance Force on
Caisson Sliding due to Tilting. Coastal Engineering Journal, Vol. 49, No.4, pp. 417-441. Esteban,
M., Danh Thao, N., Takagi H. and Shibayama T. (2008). Laboratory Experiments on the Sliding
Failure of a Caisson Breakwater Subjected to Solitary Wave Attack, PACOMS-ISOPE Conference,
Bangkok, Thailand.
Esteban, M., Danh Thao, N., Takagi, H. and Shibayama, T.
(2009). Pressure Exerted by a Solitary
Wave on the Rubble Mound Foundation of an Armoured Caisson Breakwater, 19th
International
Offshore and Polar Engineering Conference, Osaka.
21
Esteban, M., Morikubo, I., Shibayama, T., Aranguiz Muñoz, R., Mikami, T., Danh Thao, N., Ohira, K.
and Ohtani, A. (2012a). Stability of Rubble Mound Breakwaters against Solitary Waves”, Proc. of
33nd Int. Conf. on Coastal Engineering, Santander, Spain.
Esteban, M., Takagi, H. and Shibayama, T. (2012b). “Modified Goda Formula to Simulate Sliding of
Composite Caisson Breakwater”, Coastal Engineering Journal (accepted).
Goda, Y. (1985).Random Seas and Design of Maritime Structures. University of Tokyo Press.
Hanzawa M, Matsumoto A and Tanaka H (2012) “Stability of Wave-Dissipating Concrete Blocks of
Detached Breakwaters Against Tsunami”. Proc. of the 33rd
Int. Conference on Coastal
Engineering (ICCE), in press
Hudson, R.Y. (1959). Laboratory Investigation of Rubble-Mound Breakwaters, J. Waterways, Harbors
Div., 85, ASCE, pp93-121.
Ikeno, M., Mori, N. and Tanaka, H. (2001). Experimental Study on Tsunami force and Impulsive Force
by a Drifter under Breaking Bore like Tsunamis, Proceedings of Coastal Engineering, JSCE, Vol.
48, pp. 846-850.
Ikeno, M. and Tanaka, H. (2003). Experimental Study on Impulse Force of Drift Body and Tsunami
Running up to Land, Proceedings of Coastal Engineering, JSCE, Vol. 50, pp. 721-725.
Kamphuis, J. W. (2000) Introduction to Coastal Engineering and Management, World Scientific
Kato, F., Suwa, Y., Watanabe, K. and Hatogai, S. (2012). Mechanism of Coastal Dike Failure Induced
by the Great East Japan Earthquake Tsunami. Proc. of 33nd Int. Conf. on Coastal Engineering
Santander, Spain.
Mikami, T., Shibayama, T., Esteban, M. and Matsumaru, R. (2012). Field Survey of the 2011 Tohoku
Earthquake and Tsunami in Miyagi and Fukushima Prefectures, Coastal Engineering Journal, Vol.
54, No. 1, pp. 1-26.
Mizutani, S. and Imamura, F. (2000). Hydraulic Experimental Study on Wave Force of a Bore Acting
on a Structure, Proceedings of Coastal Engineering, JSCE, Vol. 47, pp. 946-950.
Mori, N. and Takahashi T. (2012). The 2011 Tohoku Earthquake Tsunami Joint Survey Group (2012)
Nationwide Survey of the 2011 Tohoku Earthquake Tsunami, Coastal Engineering Journal,
Vol.54, Issue 1, pp.1-27.
22
Okayasu, A. Shibayama, T., Wijayaratna, N. Suzuki, T. Sasaki, A. Jayaratne, R. (2005)
2004 damage survey of southern Sri Lanka 2005 Sumatra earthquake and tsunami, Coastal
Engineering Proceedings, 52 , 1401-1405.
Sakakiyama, T. (2012). Stability of Armour Units of Rubble Mound Breakwater against Tsunamis,
Proc. of 32nd Int. Conf. on Coastal Engineering, Santander, Spain.
Shibayama, T., Esteban, M., Nistor, I., Takagi, H., Danh Thao, N., Matsumaru, R., Mikami, T.,
Arenguiz, R., Jayaratne, R. and Ohira, K. (2012). Classification of Tsunami and Evacuation Areas,
Natural Hazards, Springer Publishers (in preparation).
Tanimoto, L., Tsuruya, K. and Nakano, S. (1984). Tsunami Force of Nihonkai-Chubu Earthquake in
1983 and Cause of Revetment Damage, Proceeding of the 31st Japanese Conference on Coastal
Engineering, JSCE.
Tanimoto, K., K. Furakawa and H. Nakamura (1996). Hydraulic resistant force and sliding distance
model at sliding of a vertical caisson, Proc. Coastal Engineering, JSCE 43:846-850 (in Japanese).
US Army Coastal Engineering Research Center (1977) Shore Protection Manual
Van der Meer, J. W. (1987). Stability of Breakwater Armour Layers, Coastal Engineering, Vol. 11, pp.
219-239.
Wijetunge, J.J. (2006). Tsunami on 26 December 2004: Spatial Distribution of Tsunami Height and the
Extent of Inundation in Sri Lanka, Science of Tsunami Hazards, Vol. 24, No 3, pp. 225-239.
23
Table 1. Summary of armour units surveyed.
Unit Approximate Weight KD
Sea-Lock 3.2 tons 10
X-Block 5.76 tons 8
Hollow Pyramid 28.8 tons 10
Tetrapods Varies 8
Rock N/A 4
24
Table 2. Summary of all the parameters used in the analysis of each breakwater section
Breakwater Section Type Htsunami
(m)
freeboard
(m)
Wactual
(tons) S KD α
Wrequired
(tons)
Ooya Port Comp. 15.7 1.8 3.2 15 10 30 122.2
Hikado Port X-Block Comp. 15.7 3.4 5.8 15 8 30 152.7
Hikado Hollow Pyramids Comp. 15.7 3.4 28.8 4 10 30 122.2
Kuji Port Comp. 6.62 6.2 6.3 0 8 45 19.8
Taro Hollow Pyramids (A1) Comp. 21.03 4.1 70 0 10 30 293.7
Taro Hollow Pyramids (A2) Comp. 21.03 4.1 100 0 10 30 293.7
Ishihama tetrapod (A1) Comp. 15.39 5.2 2 15 8 30 143.9
Ishihama tetrapod north (A2) Comp. 15.39 5.4 8 5 8 30 143.9
Ishihama tetrapod north (A3) Comp. 15.39 5.6 16 1 8 30 143.9
Ishihama tetrapod south (A1) Comp. 15.39 5.2 2 15 8 30 143.9
Ishihama tetrapod south (A2) Comp. 15.39 5.2 3.2 4 8 30 143.9
Ishihama tetrapod south (A3) Comp. 15.39 5.2 6.3 0 8 30 143.9
Taro Tetrapods Comp. 15.18 4.1 25 15 4 30 276.1
Noda port Comp. 17.64 5.4 3.2 15 4 30 433.3
Okirai (X-Block) Comp. 15.57 2 3.3 15 4 30 298
Hikkadua Section 2-7 R. M. 4.7 3.5 6 5 4 30 8.2
Mirissa Section 1 R. M. 5 3.5 2 6 4 30 9.9
Mirissa Section 2-10 R. M. 5 3.5 4 5 4 30 9.9
Puranawella Section Observed 2, 1A,
1, 2A, 2 R. M.
6 3.5 4 4 4 30 17.1
Puranawella Section 5, 6A, 6 R. M. 6 3.5 5 7 4 30 17.1
Taro Hollow Pyramids (B1) R. M. 21.03 4.1 70 15 10 30 293.7
Taro Hollow Pyramids (B2) R. M. 21.03 4.1 100 15 10 30 293.7
Lab Experiments (rock, A1) R. M.
8.4
Non
overtopped 28 0 4 30 40.4
Lab Experiments (rock, A2) R. M.
8.4
Non
overtopped 28 0 4 45 70
Lab Experiments (rock, B1) R. M.
8.4
Non
overtopped 33 0 4 30 40.4
Lab Experiments (rock, B2) R. M.
8.4
Non
overtopped 33 0 4 45 70
Lab Experiments (rock, C1) R. M.
8.4
Non
overtopped 38 0 4 30 40.4
Lab Experiments (rock, C2) R. M.
8.4
Non
overtopped 38 0 4 45 70

25
Table 3. Values of At for different breakwater types and tsunami Levels.
Type of Breakwater
Structure Type and Tsunami Level used for Htsunami
Normal
breakwater (Level
1 tsunami)
Important
breakwater
(Level 2 tsunami)
Critical
breakwater (level
2 tsunami)
Rubble Mound 1.0 0.65 1.0
Composite 0.35 0.15 1.0
Table 4. Example of required armour size for different type of breakwater types
Breakwater and armour
unit Breakwater type Type Htsunami At Wrequired Notes
Taro Hollow Pyramids
Normal R. M. 7 1 10.8 Pre-
tsunami
armour
was 70-
100 tons
Important R. M. 21.03 0.65 190.9
Critical Comp. 21.03 1 293.7
Ooya Port Sea-Lock
Normal Comp. 7 0.35 3.8 Pre-
tsunami
armour
was 3.2
tons
Important Comp. 15.7 0.15 18.3
Critical Comp. 15.7 1 122.2

26
Figure 1. Displaced rock armour at the seaward side of the outer breakwater at Hikkaduwa.
Figure 2.Displaced primary rock armour at the seaward and crest of the main breakwater at Mirissa
Figure 3. Displaced primary rock armour at seaward and crest of the main breakwater at Puranawella
27
Figure 4. Steep Tetrapod Armour Layer at Kuji Port.
Figure 5. Damaged Breakwater at Noda Port, provisionally repaired using 25 ton tetrapods.
28
Figure 6. Diagram showing the various breakwaters at Taro port. Note that diagram is not to scale.
Figure 7. Damaged breakwater at Okirai port, showing missing caisson sections.
A: 70-100 ton hollow
pyramids (intact)
C: 70-100 ton hollow
pyramids (destroyed)
B: 800 ton caissons (intact)
Islands
D: Rebuild new
rubble mound section
(25 ton tetrapods)
Final location of
caissons
Original breakwater
location
29
Figure 8. Recovered tetrapod units at Ishimaha port were temporarily stored behind the breakwater
before being placed back in their original location
Figure 9. Damaged Sea-Lock Armour Units at Ooya Port.
30
Figure 10. Failed X-Block Armour Units at Hikado Port.
Figure 11. Schematic diagram of experimental set-up.
Figure 12. Plot of the actual over required Weight of armour and S for composite breakwaters
0%
5%
10%
15%
20%
25%
30%
35%
40%
0 2 4 6 8 10 12 14
R
S
Composite Breakwater
Composite Breakwater (caisson also failed)
2.0m 3.25m 2.3m 3.2m 3.25m
0.6m
Wave Paddle
Wave Gages
Armour
Gravel Underlayer
Absorption beach
0.4m
31
Figure 13. Plot of the actual over required Weight of armour and S for rubble mount breakwaters
0%
10%
20%
30%
40%
50%
60%
70%
80%
90%
100%
0 2 4 6 8 10 12 14
R
S
Rubble Mound Breakwater(lab
experiments)Rubble mound (real failure, Japan)
Rubble Mound Breakwater (real failure, Sri
Lanka)


