Embed Size (px)
Citation preview

Multi-layer weighted social network model
Yohsuke Murase,1, 2, ∗ Janos Torok,3 Hang-Hyun Jo,4, 5 Kimmo Kaski,4 and Janos Kertesz6, 3, 4
1RIKEN Advanced Institute for Computational Science, 7-1-26,Minatojima-minami-machi, Chuo-ku, Kobe, Hyogo, 650-0047, Japan
2CREST, Japan Science and Technology Agency 4-1-8 Honcho, Kawaguchi, Saitama, 332-0012, Japan3Department of Theoretical Physics, Budapest University of Technology and Economics, H-1111 Budapest, Hungary
4Department of Biomedical Engineering and Computational Science,Aalto University School of Science, P.O. Box 12200, Espoo, Finland
5BK21plus Physics Division and Department of Physics,Pohang University of Science and Technology, Pohang 790-784, Republic of Korea
6Center for Network Science, Central European University, Nador u. 9, H-1051 Budapest, Hungary(Dated: August 7, 2014)
Recent empirical studies using large-scale datasets have validated the Granovetter hypothesis onthe structure of the society in that there are strongly wired communities connected by weak ties.However, as interaction between individuals takes place in diverse contexts, these communities turnout to be overlapping. This implies that the society has a multi-layered structure, where the layersrepresent the different contexts. To model this structure we begin with a single-layer weighted socialnetwork (WSN) model showing the Granovetterian structure. We find that when merging such WSNmodels, sufficient amount of inter-layer correlation is needed to maintain the relationship betweentopology and link weights but these correlations destroy the enhancement in the community overlapdue to multiple layers. To resolve this, we devise a geographic multi-layer WSN model, where theindirect inter-layer correlations due to the geographic constraints of individuals enhance the overlapsbetween the communities and, at the same time, the Granovetterian structure is preserved.
I. INTRODUCTION
The abundance of data due to the rapid developmentof the information and communication technology (ICT)has generated entirely new, multidisciplinary approachesin social sciences[1, 2], in which physics plays a consid-erable role both in terms of data analysis and model-ing. One of the major challenges in this context is theunderstanding of the structure of the society, which iscrucial for many applications ranging from epidemiologyto urban planning. While traditional techniques basedmainly on questionnaires focused on small scale organi-zation of the society [3] the new tools enable to uncoverthe structure on many scales up to the societal level. Abroad range of ICT data has been used to study empiri-cally these questions. Examples include email [4], mobilephone call (MPC) [5–8], short-message communication,social network services (SNS) [9], and scientific collabo-rations [10, 11].
Mobile phone data have a special role in this endeavoras the coverage in the adult population approaches 100%and much of the inter-personal communication runs to-day over mobile phones. Therefore the records of the callscan be used to map out the network of social interactions[5, 6, 12]. In this mobile call network the famous Gra-novetter hypothesis about the ”strength of weak ties” [13]turned out to be correct. According to this hypothesislinks between individuals have different strengths corre-sponding to the intensity of the relationship, the timespent together, mutual confiding etc. and the stronger is
a tie, the larger is the overlap between the further con-tacts of those, who form the tie. This local propertyhas severe consequences on the entire structure: The so-ciety consists of communities, which are strongly wiredand these communities are then connected by weak ties,thus playing an important role to hold society together.The duration or the frequency of calls serve as a natu-ral measure of the strength of ties for mobile phone callsand in this way it was possible to prove the Granovetterhypothesis on this dataset [5, 6].
In order to demonstrate the global consequences a per-colation analysis was carried out. Removing the links oneby one according to their strength sequence and startingfrom the weakest link, i.e. in ascending order, results ina sharp transition at a relatively early stage, indicatingthe fragmentation of the society. In the opposite case,when links were eliminated in the descending order oftheir strength, the percolation threshold set in at a muchhigher portion of removed links because strong links arewithin the communities, where a large number of pathsbetween nodes exist. In this sense, the difference ∆fc be-tween the two percolation thresholds can be consideredas the measure of the Granovetterian character of thenetwork.
After this empirical verification of the Granovetter hy-pothesis, the next step was to understand the mecha-nisms leading to the formation of these structures in a so-cial network by constructing a model, which incorporatesbasic link-formation processes between individuals. Twomain mechanisms were taken into account, namely localand global attachment rules together with tie strengthreinforcement [14, 15]. Here the local and global attach-ment rule correspond to cyclic and focal closure mecha-
arX
iv:1
408.
1190
v1 [
phys
ics.
soc-
ph]
6 A
ug 2
014

2
nisms [4], with the former referring to the link forma-tion with one’s network neighbors, or with friends offriends and the latter to the attribute-related link forma-tion which is independent of the local network topology.The reinforcement step corresponds to the general obser-vation that social ties get strengthened by using them.With these simple processes, the complex Granovetterianweight-topology relation of social networks could be suc-cessfully reproduced as demonstrated for the large valueof ∆fc [14].
The community structure of complex networks is anextensively studied topic [16]. The identification of com-munities or structural modules, i.e., groups of nodes hav-ing more connections among themselves than outside thegroup is a highly non-trivial task and much effort hasbeen devoted to its solution (see, e.g., [17–19].) Most ofthe methods produce a partition of the network, meaningthat a node can belong to only one community. However,as pointed out in [20] this cannot lead to an appropri-ate description of many complex networks, especially ofsocial ones, where there is usually considerable overlapbetween the communities due to the fact that nodes canbelong simultaneously to several of them. A number ofalgorithms have been suggested to uncover overlappingcommunities [20–22].
The community detection method of Ahn et al. [22]was based on the identification of link communities; atthe same time they suggested a remarkable mechanismas the origin of overlapping communities. Using the lan-guage of social networks (what we are interested in here),they propose that a person can be in different types ofrelationships, like kinship, collaboration, friendship, etc.Moreover, people are switching their social contexts andcommunication channels depending on the occasions, andthe social network should strongly dependent on the con-text [23, 24]. To handle these aspects, it is necessary torepresent the social networks as a multi-layer or multi-plex network [25–27], where each layer corresponds to adifferent type of relationship. Since these contexts arehardly distinguishable from the available data, the net-works observed in this way are usually considered as pro-jections or aggregate of multiple layers. Such a projectionof multi-layer networks should be in line with the ob-served stylized facts faithfully with empirical data, suchas Granovetter-type structure. An important aspect ofmulti-layer structure is missing both from the originalGranovetter paper [13] and the above described model[14]. The aim of the present paper is to investigate thepossibilities to model the combination of the multi-layerstructure of the society with the Granovetterian relation-ship between tie strengths and topology. In order todo so, we start from the simple, single layer model byKumpula et al. [14] and introduce the multi-layer struc-ture in different ways.
This paper is organized as follows. In the next section,a naive multi-layer network is investigated and it is shownthat it leads to a break down of the Granovetter-typestructure as correlations are suppressed. We therefore
introduce the copy-and-shuffle model, where a parametertunes the correlations. We find a regime with ∆fc sig-nificantly different from zero, however, there the averagenumber of overlapping communities, a node participatesin, is low. To overcome this difficulty, we formulate amodel in Section 3, where correlations are caused by thedependence on the geographic distance. This model hasa parameter region where both Granovetterian stuctureis preserved and a considerable enhancement of the av-erage overlap is observed. The last section is devoted toa summary and discussion.
II. MULTI-LAYER WEIGHTED SOCIALNETWORK (WSN) MODEL
A. Single-Layer WSN Model[14]
Let us first summarize the original WSN model byKumpula et al. [14]. It considers an undirected weightednetwork of N nodes. The links in the networks are up-dated by the following three rules. The first rule is calledlocal attachment (LA). Node i chooses one of its neigh-bors j with probability proportional to wij , which standsfor the weight of the link between nodes i and j.
Then, node j chooses one of its neighbors except i,say k, randomly with probability proportional to wjk. Ifnode i and k are not connected, they are connected withprobability p∆ with a link of weight w0, but if they arealready connected this link weight and the other two linkweights wij and wjk in a triangle are increased by δ. Thesecond rule is global attachment (GA), where if a node hasno links or otherwise with probability pr, it is connectedto a randomly chosen node with weight w0. Finally, thethird rule node deletion (ND) is introduced to the model,where with probability pd, a node loses all its links. Ateach time step, LA, GA and ND are applied to all nodes.Starting from a network without any links, the networkreaches a statistically stationary state after a sufficientnumber of updates. As a function of the reinforcementparameter δ this model shows a gradual transition from amodule free topology to a Granovetterian structure withstrongly wired communities connected by weak ties.
B. Generalization to the Multi-Layer Case
In order to study multi-layer effects we generalize theSingle-Layer WSN model in the following naive way. Weconsider L layers of the same set of nodes and we assumethat each layer corresponds to a different type of rela-tionship or communication context. For each layer, weindependently construct a network in the same way asin the original Single-Layer WSN model. For simplicity,the same parameters are used for all the layers. After thestationary networks are constructed in each layer, the ag-gregate network is constructed by summing up the edge
weights: wij =∑Lk=1 w
kij , where wkij is the weight of the

3
0
0.2
0.4
0.6
0.8
1
RL
CC
(a) L=1
ascendingdescending
(b) L=2
ascendingdescending
0
40
80
120
160
200
0 0.2 0.4 0.6 0.8 1
Su
sce
ptib
ility
f
0 0.2 0.4 0.6 0.8 1
f
FIG. 1. Percolation analysis for L = 1 (left) and L = 2(right). The upper figures show the relative size of the largestconnected component, RLCC , as a function of the fraction ofthe removed links f . The lower figures show the susceptibilityχ. Links are removed in ascending or descending order of thelink weights. The error bars show standard errors.
link between nodes i and j in the k-th layer. It is this ag-gregate network for which we expect the Granovetterianstructure.
In the following, N = 50000, pr = 0.0005, p∆ = 0.05,pd = 0.001, δ = 1, and w0 = 1 are used. The resultsare obtained after 25× 103 time steps and averaged over50 realizations. To see whether the multi-layer model re-produces a realistic social network of the kind the mobilephone call (MPC) graph is a proxy[5, 6], a percolationanalysis is carried out for the model. We removed frac-tion f of the links from the generated networks in bothascending and descending orders, and measured the rel-ative size RLCC of the largest connected component andthe normalized susceptibility χ =
∑nss
2/N , where ns isthe number of components of size s and the sum is takenover all but the largest component. At the percolationthreshold the order parameter RLCC vanishes and χ di-verges in the thermodynamic limit. For finite systems theformer quantity shows a fast decay and the latter one asharp peak at the threshold value fc. The significant dif-ference ∆fc in the thresholds for the two sequences oflink removal is characteristic by the Granovetter struc-ture; ∆fc = fdc − fac , where the upper index d(a) standsfor descending (ascending) sequences of removed links.
Fig. 1 shows RLCC and χ as a function of f for asingle-layer network (L = 1) and a double-layer network(L = 2). The two plots in each figure show the resultsfor ascending and descending orders. For L = 1 we get∆fc ≈ 0.35, while for L = 2 the figure shows that thetransition point for ascending order fac is not significantlydifferent from that for descending order fdc (i.e., ∆fc ≈0).
The transition points for L = 2 are approximately thesame, fc ≈ 0.95, indicating that the introduction of a
(a) p=0 (b) p=0.01
(c) p=0.1 (d) p=1
FIG. 2. Snapshots of the copy-and-shuffle model with dif-ferent p shuffling parameter values and N = 300. Red (blue)links are in the first (second) layer; green links are in bothlayers.
second layer destroys the Granovetterian structure. Thetransition point agrees well with that of an Erdos-Renyi(ER) random network having the same average degree 〈k〉as the simulated model: fc = 1−1/〈k〉 with the measured〈k〉 = 21.9. (Note that this is twice the average degree ofa single layer.) This observation shows that combiningalready two independent layers from the original one-layer WSN model leads to a high level of randomizationin the aggregate[28]. One may think that the observedeffect is due to the increasing total degree when two layersare merged. However, we carried out simulations, whereglobal degree was controlled by p∆ and found that forL = 2 the thresholds are always very close to each other;∆fc ≈ 0.
C. Copy-and-Shuffle WSN model
Due to fact merging two layers of WSN models de-stroys the Granovetterian structure, we investigated howcorrelation between layers affect the properties of the net-work. We created the second layer by copying the firstlayer and then shuffled the fraction p of the nodes in thesecond layer. Shuffling nodes i and j means that all orig-inal links (i, k) become (j, k) and vice versa. This is justa relabelling of the nodes in that layer, meaning that thetopology remains the same, i.e., both layers correspondto single layer WSN models but with increasing p thecorrelations between them decrease. This is the “copy-
4
0.5
0.6
0.7
0.8
0.9
1
0.0001 0.001 0.01 0.1 1
p
fc
ascendingdescending
fitting
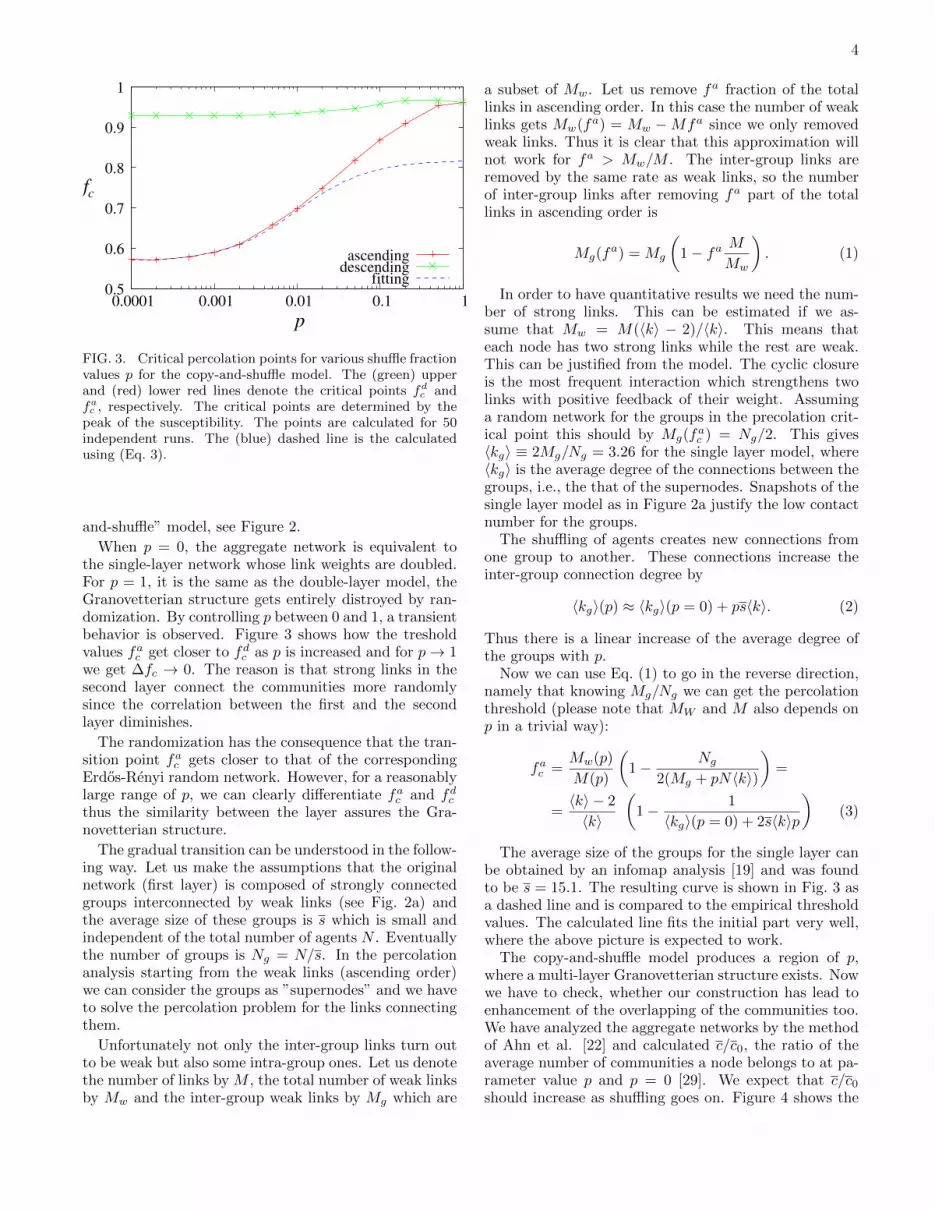
FIG. 3. Critical percolation points for various shuffle fractionvalues p for the copy-and-shuffle model. The (green) upperand (red) lower red lines denote the critical points fd
c andfac , respectively. The critical points are determined by the
peak of the susceptibility. The points are calculated for 50independent runs. The (blue) dashed line is the calculatedusing (Eq. 3).
and-shuffle” model, see Figure 2.
When p = 0, the aggregate network is equivalent tothe single-layer network whose link weights are doubled.For p = 1, it is the same as the double-layer model, theGranovetterian structure gets entirely distroyed by ran-domization. By controlling p between 0 and 1, a transientbehavior is observed. Figure 3 shows how the tresholdvalues fac get closer to fdc as p is increased and for p→ 1we get ∆fc → 0. The reason is that strong links in thesecond layer connect the communities more randomlysince the correlation between the first and the secondlayer diminishes.
The randomization has the consequence that the tran-sition point fac gets closer to that of the correspondingErdos-Renyi random network. However, for a reasonablylarge range of p, we can clearly differentiate fac and fdcthus the similarity between the layer assures the Gra-novetterian structure.
The gradual transition can be understood in the follow-ing way. Let us make the assumptions that the originalnetwork (first layer) is composed of strongly connectedgroups interconnected by weak links (see Fig. 2a) andthe average size of these groups is s which is small andindependent of the total number of agents N . Eventuallythe number of groups is Ng = N/s. In the percolationanalysis starting from the weak links (ascending order)we can consider the groups as ”supernodes” and we haveto solve the percolation problem for the links connectingthem.
Unfortunately not only the inter-group links turn outto be weak but also some intra-group ones. Let us denotethe number of links by M , the total number of weak linksby Mw and the inter-group weak links by Mg which are
a subset of Mw. Let us remove fa fraction of the totallinks in ascending order. In this case the number of weaklinks gets Mw(fa) = Mw −Mfa since we only removedweak links. Thus it is clear that this approximation willnot work for fa > Mw/M . The inter-group links areremoved by the same rate as weak links, so the numberof inter-group links after removing fa part of the totallinks in ascending order is
Mg(fa) = Mg
(1− fa M
Mw
). (1)
In order to have quantitative results we need the num-ber of strong links. This can be estimated if we as-sume that Mw = M(〈k〉 − 2)/〈k〉. This means thateach node has two strong links while the rest are weak.This can be justified from the model. The cyclic closureis the most frequent interaction which strengthens twolinks with positive feedback of their weight. Assuminga random network for the groups in the precolation crit-ical point this should by Mg(f
ac ) = Ng/2. This gives
〈kg〉 ≡ 2Mg/Ng = 3.26 for the single layer model, where〈kg〉 is the average degree of the connections between thegroups, i.e., the that of the supernodes. Snapshots of thesingle layer model as in Figure 2a justify the low contactnumber for the groups.
The shuffling of agents creates new connections fromone group to another. These connections increase theinter-group connection degree by
〈kg〉(p) ≈ 〈kg〉(p = 0) + ps〈k〉. (2)
Thus there is a linear increase of the average degree ofthe groups with p.
Now we can use Eq. (1) to go in the reverse direction,namely that knowing Mg/Ng we can get the percolationthreshold (please note that MW and M also depends onp in a trivial way):
fac =Mw(p)
M(p)
(1− Ng
2(Mg + pN〈k〉)
)=
=〈k〉 − 2
〈k〉
(1− 1
〈kg〉(p = 0) + 2s〈k〉p
)(3)
The average size of the groups for the single layer canbe obtained by an infomap analysis [19] and was foundto be s = 15.1. The resulting curve is shown in Fig. 3 asa dashed line and is compared to the empirical thresholdvalues. The calculated line fits the initial part very well,where the above picture is expected to work.
The copy-and-shuffle model produces a region of p,where a multi-layer Granovetterian structure exists. Nowwe have to check, whether our construction has lead toenhancement of the overlapping of the communities too.We have analyzed the aggregate networks by the methodof Ahn et al. [22] and calculated c/c0, the ratio of theaverage number of communities a node belongs to at pa-rameter value p and p = 0 [29]. We expect that c/c0should increase as shuffling goes on. Figure 4 shows the

5
c/c0
fc
∆
c/c0
fc
∆
0
0.1
0.2
0.3
0.4
0.0001 0.001 0.01 0.1 1 0
1
2
3
p
FIG. 4. Characteristic quantities for the copy-and-shufflemulti-layer WSN model. The difference ∆fc between the per-colation thresholds decreases with the shuffling probability p,while c/c0, the ratio of the average number of communitiesa node belongs to at parameter value p and p = 0 decreases.There is no regime, where ∆fc is significantly larger than zeroand c/c0 ≈ 2.
dependence of this quantity on p. Unfortunately, theoverlap starts to increase only when the Granovetteriancorrelation between link strength and topology is alreadywiped away. In the next section we make another at-tempt to produce a model, where Granovetterian struc-ture and overlapping communities coexist.
III. GEOGRAPHIC MULTI-LAYER WSNMODEL
The above results show that some correlations areneeded between layers in order to have ∆fc significantlydifferent from zero for a multi-layer model. Previousstudies have reported that there are strong geographicconstraints on social network groups even in the era ofthe Internet [30] and this is reflected in the MPC data[12, 31, 32]. For example, inter-city communication in-tensity is inversely proportional to the square of theirEuclidean distance, which is reminiscent of the gravitylaw [12, 31].
Motivated by these observations, we consider nowa model embedded into a two-dimensional geographicspace. At the beginning the simulation nodes are dis-tributed randomly in the unit square with periodicboundary condition. These geographic positions are fixedand shared by all the layers. We assume that the proba-bility for making a new connection in the global attach-ment (GA) step in the WSN model is higher if the twonodes are geographically close. The probability that nodei makes a new connection to node j by GA is proportionalto r−αij , where rij is a distance between nodes i and j, andα is a new parameter controlling the dependence on geo-graphic distance as in [33, 34]. When α = 0, this proba-
0
0.2
0.4
0.6
0.8
1
RL
CC
(a) α=0
ascendingdescending
(b) α=6
ascendingdescending
0
200
400
600
800
0.5 0.6 0.7 0.8 0.9 1
Susceptibili
ty
f
0.5 0.6 0.7 0.8 0.9 1
f
FIG. 5. Percolation analysis for (a) α = 0 and (b) α = 6. Theupper figures show the relative size of the largest connectedcomponent, RLCC , as a function of the fraction of the removedlinks f . The lower figures show the susceptibility χ. Note thatthe scale of the horizontal axis is different from Fig. 1. Linksare removed in ascending or descending orders of the linkweight. The results are obtained by 50 independent samples.The error bars show standard errors.
bility is independent of the geographic distance, thus themodel is equivalent to the uncorrelated multi-layer modelwe presented in the previous section. When α is larger,the nodes tend to be connected with geographically closenodes yielding the correlation between the networks indifferent layers. Since only non-connected pairs are con-sidered, the probability for node i to make connectionwith a node j which is not yet connected to i is given by
pij =r−αij∑k∈Si
r−αik, (4)
where Si is the set of the nodes not connected to the nodei. The other rules such as LA or ND are kept the sameas in the original WSN model.
Figure 5 shows the results for percolation analysis forthe geographic model with α = 0 and 6. Because thenetwork for larger α has a smaller average degree, we useda larger value of pr (0.002) in order to keep the averagedegree comparable to the results for the non-geographicmodel (〈k〉 = 18.0 for α = 6 and 〈k〉 = 27.6 for α = 0).As shown in the figure, the network for α = 6 exhibits aGranovetterian structure as fac and fdc are significantlydifferent with ∆fc ≈ 0.1.
Small (N=300) samples of networks for different al-pha are shown in Fig. 6. While the network for α = 0and 2 look similar to the uncorrelated double-layer non-geographic network in Fig. 2d, The networks for largerα clearly show a nice community structure. About 19percent of the links are shared by two layers for α = 6,while less than 0.1 percent of the total links are shared forα = 0. (Also see inset of Fig. 7.) This already indicates

6
(a) α=0 (b) α=2
(c) α=4 (d) α=6
FIG. 6. Sample of double-layer networks of the geographicmodel forN=300. Links only in the first and the second layersare shown in blue and red, respectively, and links shared byboth the layers are depicted in green.
0.80
0.84
0.88
0.92
0.96
1.00
0 1 2 3 4 5 6
f c
α
ascending
descending
8
10
12
14
0 1 2 3 4 5 6
k / L
α
L=1
L=2
FIG. 7. Transition points fac and fd
c for the geographic modelas a function of α. The transition points are determined asthe point where maximum susceptibility is observed and thenaveraged over 50 independent samples. Inset: Average de-grees divided by L as a function of α for L = 1 and L = 2.The values for L = 2 are smaller than those for L = 1 whenα is sufficiently large because there are links appear in bothtwo layers.
the possibility of overlapping communities.
The dependence of fc on α is shown in Fig. 8, whichsummarizes the main results for the geographic model.∆fc becomes larger with increasing α and seems to getsaturated around 0.15. The ratio c/c0 decreases ratherrapidly and reaches the limit value of 2. This means thatfor sufficiently large α we have both Granovetterian prop-
fc
∆
c/c0
fc
∆ c/c0
0
0.05
0.1
0.15
0 5 10 15 20 1
2
3
4
α
FIG. 8. This figure is a similar plot in Fig. 4 for the ge-ographic multi-layer WSN model. Here ∆fc and c/c0 areshown as a function of α. Note that for this model c0 alsodepends on α. For α ≥ 6 we have ∆fc significantly largerthan 0 and c/c0 close to 2.
erties and the enhancement of the number of overlappingcommunities due to the multilayer structure. We notethat for α > 4 both the average contact number in onelayer 〈k(L = 1)〉 ' 11 and c0(α > 4) ' 3 is the same asin the non-geographic case indicating similar structure.
We note that neither the transition points nor the av-erage degree show significant dependence on α for α < 2.We speculate that this is because the network dimensionbecomes infinite for α < 2 even when it is embedded in atwo-dimensional space [34]. Since the dimensionality ofthe network is finite, the clustering coefficient for the net-work is higher compared to the network with smaller α.(For α = 0, 2 and 6, clustering coefficients are 0.23, 0.24,and 0.55, respectively.) This also explains the change inthe average degree. If a link and its neighboring link areselected by LA, the probability that the third link closingthe triangle is already there will be higher for higher αthus the number of links newly created by LA is smallerleading to the decrease in the average degree.
IV. SUMMARY AND DISCUSSION
Our aim in this paper has been to model two impor-tant properties of the social network: Its Granovetterianstructure and the large amount of overlapping commu-nities due to its multi-layer character. We introducedthe difference ∆fc of the percolation thresholds fdc andfac as a single variable characterising the link-topologyrelationship and c/c0, the ratio of the average numberof communities a node participates in for the multi-layerand the single-layer networks. We expect from a modelsatisfying our goal simultaneously a ∆fc considerably dif-ferent from zero and c/c0 significantly larger than one.
The naive introduction of multiple layers of single-layer WSN models breaks the Granovetter-type weight-

7
topology relation since the communities in one layer getconnected by strong ties in another layer. If we controlthe amount of randomness by the shuffling probabilityp and start from replicas of single-layer models then wearrive at a multi-layer model, which, however, has noregion of the control parameter p, where both requiredproperties can simultaneously be observed.
In order to maintain both requirements, we introducedan extension of the single-layer model such that eachnode has a geographic position and that geographicallyclose nodes have more chance to form a link via GA.The multi-layer model consists then of a combination ofsuch single layers. Controlling the distance dependenceby the exponent α (as defined in eq. (4)) we concludethat for α ≥ 6 we have a multi-layer weighted social net-work, which has both the Granovetterian structure andthe enhanced community overlap.
We note here that previous studies on MPC datahave revealed that inter-city communication density is in-versely proportional to the square of the distance [12, 31].Regarding the geographic model, the relation between αand the exponent characterizing inter-city communica-tion density is not trivial because the links created byLA are not affected by the geographic position. Fur-thermore, we assumed that the position of the nodes areuniformly distributed, which is clearly an idealized as-pect of the model since we know that population usuallyaggregates around city areas.
Our results have several implications. First, they showthat geographic correlations play a key role to changethe picture drastically in a multi-layer weighted networksimilarly to what was observed for inter-dependent net-works [35]. Moreover, although the models we studied arestrong simplifications of the society, we believe that theyhave their role in the investigation of social structures.
In particular, such models enable to study the specialeffects of the Granovetterian and the overlapping com-munity structure on dynamic phenomena like spreading.
Communities organize themselves along common at-tributes like sharing working places, classes at univer-sities, joint interest, e.g., in sport, residental districtsetc.[33]. Geographic proximity is just one of the pos-sibilities and other attributes can play important role inthe formation of network as well. Future work is neededto find out how to treat explicitly these attributes andtheir impact on the formation of the network.
Our models have also implications for further empir-ical studies. Unfortunately, most datasets contain onlyinformation about one channel of communication, whichsubstantially restricts sampling of relationships even inthe case of mobile call networks. An alternative approachis ”reality mining”, where a limited number of volunteers(of the order of hundred) carry devices, which record sev-eral channels of communication, including face to face en-counters [36]. This methodology could pave the way forstudies of the effects of the multi-layer character of hu-man society, especially from the points of view presentedin this paper.
ACKNOWLEDGMENTS
Y. M. appreciates hospitality at Aalto University andH.-H. J. wishes to acknowledge financial supports by theAalto University postdoctoral program. The systematicsimulations in this study were assisted by OACIS [37].J. T. acknowledges the financial support of EuropeanUnion and the European Social Fund through projectFuturICT.hu (grant no.: TAMOP-4.2.2.C-11/1/KONV-2012-0013). J. K. thanks EU grant FP7 317532 (MUL-TIPLEX).
[1] D. Lazer, A. Pentland, L. Adamic, S. Aral, A.-L.Barabasi, D. Brewer, N. Christakis, N. Contractor,J. Fowler, M. Gutmann, T. Jebara, G. King, M. Macy,D. Roy, and M. Van Alstyne, Science 323, 721 (2009).
[2] P. Sen and B. K. Chakrabarti, Sociophysics: an intro-duction (Oxford University Press, 2013).
[3] S. Wasserman and K. Faust, Social Network Analysis:Methods and Applications (Cambridge university press,1994).
[4] G. Kossinets and D. J. Watts, Science 311, 88 (2006).[5] J.-P. Onnela, J. Saramaki, J. Hyvonen, G. Szabo, M. A.
De Menezes, K. Kaski, A.-L. Barabasi, and J. Kertesz,New J. Phys. 9, 179 (2007).
[6] J.-P. Onnela, J. Saramaki, J. Hyvonen, G. Szabo,D. Lazer, K. Kaski, J. Kertesz, and A.-L. Barabasi, Proc.Nat. Acad. Sci. 104, 7332 (2007).
[7] M. C. Gonzalez, C. A. Hidalgo, and A.-L. Barabasi,Nature (London) 453, 779 (2008).
[8] R. K. Pan, M. Kivela, J. Saramaki, K. Kaski, andJ. Kertesz, Phys. Rev. E 83, 046112 (2011).
[9] M. Szell, R. Lambiotte, and S. Thurner, Proc. Nat. Acad.
Sci. 107, 13636 (2010).[10] M. E. Newman, Proc. Nat. Acad. Sci. 98, 404 (2001).[11] G. Menichetti, D. Remondini, P. Panzarasa, R. J. Mon-
dragon, and G. Bianconi, PLOS ONE 9, e97857 (2014).[12] R. Lambiotte, V. D. Blondel, C. de Kerchove, E. Huens,
C. Prieur, Z. Smoreda, and P. Van Dooren, Physica A387, 5317 (2008).
[13] M. S. Granovetter, Am. J. Sociol. 78, 1360 (1973).[14] J. M. Kumpula, J.-P. Onnela, J. Saramaki, K. Kaski,
and J. Kertesz, Phys. Rev. Lett. 99, 228701 (2007).[15] H.-H. Jo, R. K. Pan, and K. Kaski, PLOS ONE 6, e22687
(2011).[16] S. Fortunato, Phys. Rep. 486, 75 (2010).[17] M. E. Newman, Proc. Nat. Acad. Sci. 103, 8577 (2006).[18] V. D. Blondel, J.-L. Guillaume, R. Lambiotte, and
E. Lefebvre, J. Stat. Mech. 2008, P10008 (2008).[19] M. Rosvall and C. T. Bergstrom, Proc. Nat. Acad. Sci.
105, 1118 (2008).[20] G. Palla, A.-L. Barabasi, and T. Vicsek, Nature (Lon-
don) 446, 664 (2007).[21] A. Lancichinetti, S. Fortunato, and J. Kertesz, New J.

8
Phys. 11, 033015 (2009).[22] Y.-Y. Ahn, J. P. Bagrow, and S. Lehmann, Nature (Lon-
don) 466, 761 (2010).[23] H.-H. Jo, M. Karsai, J. Karikoski, and K. Kaski, EPJ
Data Science 1, 1 (2012).[24] H.-H. Jo, R. K. Pan, J. I. Perotti, and K. Kaski, Phys.
Rev. E 87, 062131 (2013).[25] M. Kivela, A. Arenas, M. Barthelemy, J. Gleeson,
Y. Moreno, and M. Porter, J. Complex Networks (2014),doi:10.1093/comnet/cnu016, arXiv:1309.7233.
[26] S. Boccaletti, G. Bianconi, R. Criado, C. del Genio,J. Gomez-Gardenes, M. Romance, I. Sendina-Nadal,Z. Wang, and M. Zanin, Phys. Rep. (2014).
[27] H.-H. Jo, S. Ki Baek, and H.-T. Moon, Physica A 361,534 (2006).
[28] Of course, the resulting network has a topology differentfrom an ER graph as it has high clustering by construc-tion.
[29] We get even for p = 0 a value larger than 1 (c0 = 2.96.This is due to the fact that the method of [22] is a parti-
tion of the link graph producing a large number of singlelinks (diads) as communities, which enhance the overlap.
[30] J.-P. Onnela, S. Arbesman, M. C. Gonzalez, A.-L.Barabasi, and N. A. Christakis, PLOS ONE 6, e16939(2011).
[31] G. Krings, F. Calabrese, C. Ratti, and V. D. Blondel, J.Stat. Mech. 2009, L07003 (2009).
[32] P. Expert, T. S. Evans, V. D. Blondel, and R. Lambiotte,Proc. Nat. Acad. Sci. 108, 7663 (2011).
[33] K. Kosmidis, S. Havlin, and A. Bunde, Europhys. Lett.82, 48005 (2008).
[34] L. Daqing, K. Kosmidis, A. Bunde, and S. Havlin, Na-ture Phys. 7, 481 (2011).
[35] R. Parshani, C. Rozenblat, D. Ietri, C. Ducruet, andS. Havlin, Europhys. Lett. 92, 68002 (2010).
[36] N. Eagle and A. Pentland, Personal and ubiquitous com-puting 10, 255 (2006).
[37] Y. Murase, T. Uchitane, and N. Ito, to ap-pear in proceedings of 27’th CSP workshop (2014),arXiv:1404.3867.


