Embed Size (px)
Citation preview

BioMed CentralBMC Systems Biology
ss
Open AcceMethodology articleIntegrated Weighted Gene Co-expression Network Analysis with an Application to Chronic Fatigue SyndromeAngela P Presson1,2, Eric M Sobel3, Jeanette C Papp3, Charlyn J Suarez3, Toni Whistler4, Mangalathu S Rajeevan4, Suzanne D Vernon4,5 and Steve Horvath*1,3Address: 1Biostatistics, University of California, Los Angeles, CA, USA, 2Pediatrics, University of California, Los Angeles, CA, USA, 3Human Genetics, University of California, Los Angeles, CA, USA, 4Division of Viral and Rickettsial Diseases, National Center for Zoonotic, Vector-Borne and Enteric Diseases, Centers for Disease Control and Prevention, Atlanta, GA, USA and 5Chronic Fatigue and Immune Dysfunction Syndrome (CFIDS), PO Box 220398, Charlotte, NC, USA
Email: Angela P Presson - [email protected]; Eric M Sobel - [email protected]; Jeanette C Papp - [email protected]; Charlyn J Suarez - [email protected]; Toni Whistler - [email protected]; Mangalathu S Rajeevan - [email protected]; Suzanne D Vernon - [email protected]; Steve Horvath* - [email protected]
* Corresponding author
AbstractBackground: Systems biologic approaches such as Weighted Gene Co-expression NetworkAnalysis (WGCNA) can effectively integrate gene expression and trait data to identify pathwaysand candidate biomarkers. Here we show that the additional inclusion of genetic marker dataallows one to characterize network relationships as causal or reactive in a chronic fatigue syndrome(CFS) data set.
Results: We combine WGCNA with genetic marker data to identify a disease-related pathwayand its causal drivers, an analysis which we refer to as "Integrated WGCNA" or IWGCNA.Specifically, we present the following IWGCNA approach: 1) construct a co-expression network,2) identify trait-related modules within the network, 3) use a trait-related genetic marker toprioritize genes within the module, 4) apply an integrated gene screening strategy to identifycandidate genes and 5) carry out causality testing to verify and/or prioritize results. By applying thisstrategy to a CFS data set consisting of microarray, SNP and clinical trait data, we identify a moduleof 299 highly correlated genes that is associated with CFS severity. Our integrated gene screeningstrategy results in 20 candidate genes. We show that our approach yields biologically interestinggenes that function in the same pathway and are causal drivers for their parent module. We use aseparate data set to replicate findings and use Ingenuity Pathways Analysis software to functionallyannotate the candidate gene pathways.
Conclusion: We show how WGCNA can be combined with genetic marker data to identifydisease-related pathways and the causal drivers within them. The systems genetics approachdescribed here can easily be used to generate testable genetic hypotheses in other complex diseasestudies.
Published: 6 November 2008
BMC Systems Biology 2008, 2:95 doi:10.1186/1752-0509-2-95
Received: 13 June 2008Accepted: 6 November 2008
This article is available from: http://www.biomedcentral.com/1752-0509/2/95
© 2008 Presson et al; licensee BioMed Central Ltd. This is an Open Access article distributed under the terms of the Creative Commons Attribution License (http://creativecommons.org/licenses/by/2.0), which permits unrestricted use, distribution, and reproduction in any medium, provided the original work is properly cited.
Page 1 of 21(page number not for citation purposes)
BMC Systems Biology 2008, 2:95 http://www.biomedcentral.com/1752-0509/2/95
BackgroundNetwork approaches provide a means to bridge the gapfrom individual genes to complex traits. Methods forinferring gene interactions from expression data havebeen an active area of systems biology research [1-6].Gene set enrichment analysis (GSEA) determines whetheran a priori defined set of genes shows statistically signifi-cant differences between two biological states [7]. In con-trast, Weighted Gene Co-expression Network Analysis(WGCNA) constructs gene sets (modules) from theobserved gene expression data. These modules are thenrelated to gene ontology information to study their bio-logical plausibility and to eliminate spurious modulesdue to technical artifacts. Although WGCNA shares thephilosophy of GSEA by focusing on gene sets as opposedto individual genes, it does not make use of a prioridefined gene sets [8]. Instead, modules are constructedfrom the expression data by using unsupervised cluster-ing. Although it is advisable to relate the resulting mod-ules to gene ontology information for assessing theirbiological plausibility, it is not required. WGCNA hasbeen successfully applied to identify brain cancer genes[9], to characterize genes related to body weight in mice[10,11], and to study atherosclerosis [12].
WGCNA alleviates the multiple testing problem inherentin microarray data analysis. Instead of relating thousandsof genes to the trait, WGCNA relates only a few modules.Because the modules may correspond to biological path-ways, focusing the analysis on modules amounts to a bio-logically motivated data reduction scheme. If geneticmarker data are available, one can use genetic marker-based causality tests to identify the genetic drivers under-lying the modules of interest. The concept of conductinga causality analysis based on genetic marker data has beenexplored by several authors [13-22]. We refer to aweighted gene co-expression network analysis that usesgenetic markers in causality testing as "Marker IntegratedWGCNA" or simply as "IWGCNA".
IWGCNA relies on correlation measures to relate geneexpression profiles, genetic markers and clinical traits.Using a correlation measure affords a truly unifiedapproach for relating variables from disparate data sets.We demonstrate IWGCNA on a chronic fatigue syndrome(CFS) data set and show that it identifies candidate geneswhose functions are consistent with results from otherCFS studies.
Background on chronic fatigue syndromeChronic fatigue syndrome (CFS) is a major public healthproblem that affects more than one million people in theUS [23]. CFS is defined as debilitating fatigue of at least sixmonths duration accompanied by at least four of the fol-lowing case defining symptoms: post exertional fatigue
lasting longer than 24 hours, unrefreshing sleep, diffcultyconcentrating or remembering, headaches unusual in fre-quency or duration, muscle pain, joint pain, sore throatand tender lymph nodes [24]. CFS has been associatedwith similar debilitating conditions such as fibromyalgia,connective tissue disease and mitochondrial deficiency[25,26]. CFS has been shown to affect the endocrine, mus-cular and immune systems [27-29] and some cases maybe triggered by viruses [30]. While there is no consistentcause, evidence for immune and hypothalamic-pituitary-adrenal (HPA) axis abnormalities have been observed atthe symptom, molecular and genetic level of CFS patients[31].
Several groups have found higher cytotoxic T-cell countsand impaired T-cell function in CFS patients in compari-son to controls [32,33]. There has also been compellingevidence for higher rates of immune cell apoptosis in CFSpatients, specifically neutrophils and peripheral bloodlymphocytes [34,35]. The HPA axis is a feedback systemthat mediates glucocorticoid hormones (cortisol) andserotonin and is closely linked to the immune system. It isthought that a dysfunctional HPA axis might be linked toCFS [31,36]. Subclasses of CFS have been associated withpolymorphisms in genes that function in the HPA axisNR3C1, TPH2 and MAOA [37-39].
While molecular profiles and genetic variants withingenes related to the immune system and the HPA axishave been shown to be associated with CFS [40-42] thereis a need to gain a systems level understanding of the dis-ease. Standard gene mapping techniques are not designedto identify pathways underlying complex traits, whichexhibit genetic heterogeneity involving many small-effectgenes. The quest to determine the genetic etiology of CFSis further obfuscated by diagnostic errors, phenotypic het-erogeneity and in some cases environmental effects.
Recent systems genetic strategies that characterize interac-tions between genotype data and co-expression moduleshave successfully been applied to complex diseases[11,43]. Here we present the IWGCNA approach for inte-grating a weighted gene co-expression network with SNPdata to identify a disease-related module and to develop asystems genetic gene-screening strategy that generates test-able hypotheses. Furthermore, we use the Network EdgeOrienting (NEO) software to show that this screeningstrategy selects genes that are causal for the module [18].Our analysis identifies novel genes associated with CFSseverity that are causal drivers for a severity-related mod-ule. Gene ontology software indicates that IWGCNA iden-tifies clinically relevant biological pathways and genes.
Page 2 of 21(page number not for citation purposes)

BMC Systems Biology 2008, 2:95 http://www.biomedcentral.com/1752-0509/2/95
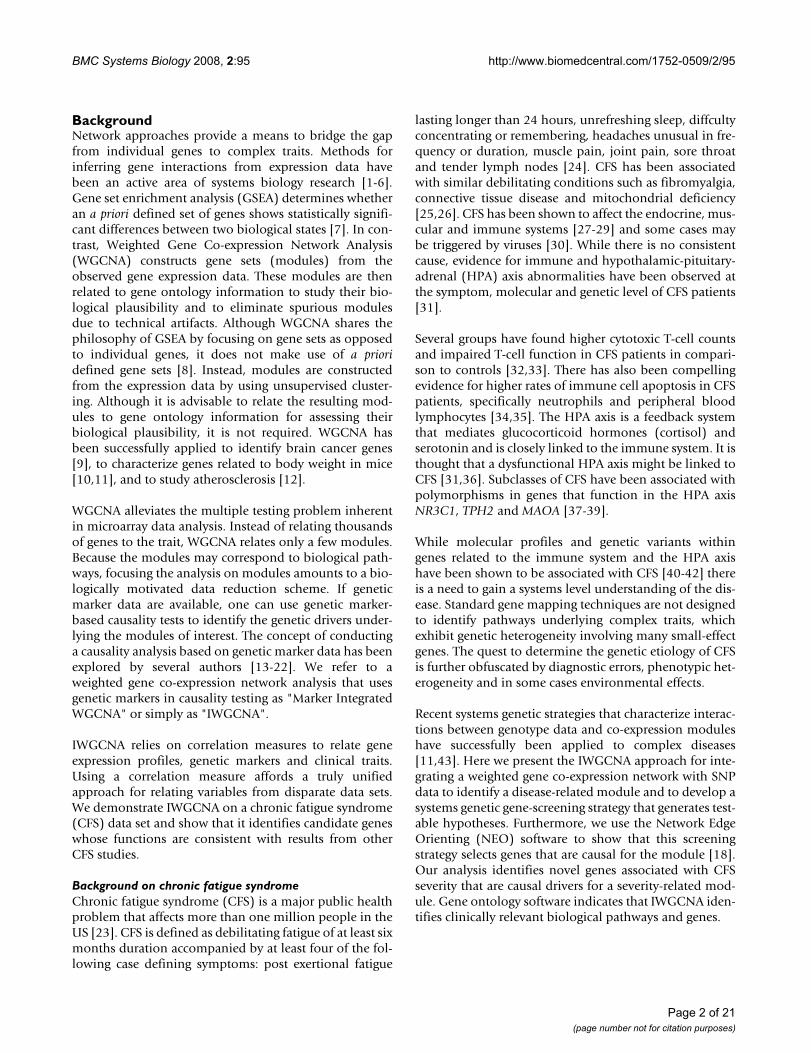
ResultsThe fundamental tenets of IWGCNA are to find geneexpressions that are 1) significantly related to the clinicaltrait, 2) highly connected "hub" genes in a disease relatedco-expression module and 3) significantly associated witha disease-related genetic marker. We apply this approachto a chronic fatigue syndrome (CFS) data set consisting ofmicroarray, SNP, and trait data (CFS severity). As our anal-ysis of this data set consists of several steps working withdifferent subsets of data, we provide a flow chart overviewin Figure 1 and begin with an outline of IWGCNA. Wethen present results from our analysis of the CFS data andcompare them to the results obtained from a standardanalysis approach that ignores the SNP data. Finally, weshow that IWGCNA identifies functionally relevant candi-date genes that are causal drivers for their trait-related par-ent module.
Step 1: Construct a co-expression network and modulesWe define co-expression networks as undirected,weighted gene networks. The nodes of such a network cor-respond to gene expression profiles, and edges betweengenes are determined by the pairwise correlationsbetween gene expressions. Network construction was per-formed using our freely available customized R softwarefunctions [8-10,44]. The absolute value of the Pearsoncorrelation coefficient is calculated for all pair-wise com-parisons of gene-expression values across all microarraysamples. The correlation matrix is then transformed intoa weighted undirected network (i.e., a matrix of connec-tion strengths) by raising the absolute value of each entryto a power β. High values of β emphasize high correla-tions at the expense of low correlations. Unlikeunweighted networks that use a hard threshold to dichot-omize the correlation matrix, the soft thresholding ofweighted gene co-expression networks preserves the con-tinuous nature of the gene co-expression information,leading to highly robust results and allowing for a simplegeometric interpretation of network concepts [8,45,46].
The next step is to organize the genes into clusters or mod-ules. Toward this end we use topological overlap, which isa robust measure of interconnectedness [47-49]. The (i, j)entry in the topological overlap matrix reflects a sharedconnectivity pattern between genes xi and xj. Average link-
age hierarchical clustering is then used to cluster the genesinto modules using the topological overlap dissimilaritymeasure [8,48]. Several centrality measures have beenproposed in the literature [45,50]. Here we focus on cen-trality (connectivity) measures that are useful within theWGCNA context. Whole network connectivity k(i) is thesum of the connection strengths between a particular genexi and all other genes in the network
, where N refers to the set of
network genes. Intramodular connectivity kq(i) is anothermeasure which is more meaningful for our module-basedanalysis. It is computed from the sum of the connectionstrengths between a particular gene and all other genes in
the module , where q refers
to a specific module. Another measure of connectivity is
the module eigengene-based connectivity , which
is computed from the absolute value of a gene expressionxi within the q-th module and its first principal compo-
nent or "q-th module eigengene", MEq. Specifically,
= |Cor(xi, MEq)|, where larger values indicate
greater similarity between a gene xiand the q-th module
eigengene. One can show that the module eigengene-based connectivity measure is highly correlated withintramodular connectivity [45], but a theoretical advan-
tage of is that its definition can be easily extended
to expression profiles outside the module. Another advan-
tage of is that a simple correlation test p-value can
be used to assess the statistical significance of the relation-ship between xi and ME.
Step 2: Find clinical trait-related modulesTo incorporate external information into the co-expres-sion network, we first define a measure of gene significance(GS). Abstractly speaking, the higher the i-th gene's|GS(i)|, the greater its biological significance. For exam-ple, GS(i) could encode pathway membership (e.g., 1 ifthe gene is a known apoptosis gene and 0 otherwise),knockout essentiality, or the correlation with an externalmicroarray sample trait. A gene significance measurecould also be defined by minus log of a p-value. The onlyrequirement is that a gene significance of 0 indicates thatthe gene is not significant with regard to the biologicalquestion of interest.
We define GSseverity(i) as the absolute value of the correla-tion between the CFS severity phenotype and the i-th geneexpression xi: GSseverity(i) = |Cor(xi, severity)|. A correlationtest can be used to assign a statistical significance level (p-value) to GSseverity(i). Note that a β power of gene signifi-cance, |Cor(xi, severity)|β, can be interpreted as the con-nection strength between severity and the i-th geneexpression in a weighted network. To arrive at a measureof module significance, we average the GSseverity values of allgenes within a module. Alternatively, one could define amodule significance measure by correlating the trait withthe module eigengene [45]. Subsequent analyses focus on
k i x xi jj N j i( ) ( , )
,= ∈ ≠∑ Cor
β
k i x xqi jj q j i
( ) ( , ),
= ∈ ≠∑ Corβ
k iMEq ( )
k iMEq ( )
k iMEq ( )
k iMEq ( )
Page 3 of 21(page number not for citation purposes)
BMC Systems Biology 2008, 2:95 http://www.biomedcentral.com/1752-0509/2/95
Page 4 of 21(page number not for citation purposes)
a. Flow chart overview of methods and b. subsets of patients analyzed at each stepFigure 1a. Flow chart overview of methods and b. subsets of patients analyzed at each step. We first constructed a co-expression network based on 127 CFS samples and then identified a CFS severity-related module using a subset of 87 patients with CFS severity scores. We then related the SNPs and connectivities to the module gene expressions in both the males and homogenized female samples separately. We selected candidate genes based on 1) association with a SNP that in turn was associated with severity, 2) connectivity, and 3) association with severity in both sexes. We then repeated analysis steps 1–5 on a second data set.
1. Construct a co-expression network and modules
2. Find clinical trait related modules
3. Prioritize module genes using disease-related SNP
4. Use the integrated model to screen for genes
0.0 0.2 0.4 0.6 0.8
0.0
0.2
0.4
0.6
0.8
Module connectivity M vs. F cor= 0.80, p < 10^{-15}
Module connectivity in females (F)
Mod
ule
conn
ectiv
ity in
mal
es (M
)
blue brown green grey turquoise yellow
Gen
e S
ign
ifica
nce
0.00
0.05
0.10
0.15
0.20
0.25
0.30
Severity (A) , p-value= 5.7e-107
0.5
0.6
0.7
0.8
0.9
1.0
Clustered Gene Expression Values
Colored by Modules
a. IWGCNA steps b. CFS Patients analyzed in IWGCNA steps
1. Full data set: 127 CFS patients
2. Primary data set: 87 patient subset with CFS severity scores
Exclude heterogeneous female samples
3-5. 76 samples with CFS severity scores
Repeat steps 1-5using secondary data
set (33 patients)5. Determine causal drivers of module
BMC Systems Biology 2008, 2:95 http://www.biomedcentral.com/1752-0509/2/95
the module that is most related to the clinical trait of inter-est.
Step 3: Prioritizing gene expressions with a SNP markerThis step requires a SNP marker that is associated withboth the trait and the trait-related module. To measure theassociation between a SNP and the gene expression pro-files we define a SNP-based gene significance measureGSSNP(i) = |Cor(xi, SNP)|. In our application we use a cor-relation test to compute the corresponding p-value forGSSNP(i). GSSNP is similar to a single point LOD score, as itmeasures the extent to which a gene is associated with theSNP.
Step 4: Using network connectivity and genetic information to find candidate genesWhile a standard gene screening approach would draft afinal list of candidate genes based solely on the associa-tion between gene expression and the clinical trait (GSsever-
ity), our integrated screening strategy additionally usesGSSNP, and kME. This approach allows us to select diseaserelated genes that are implicated by the genetic markerand network connectivity information.
Step 5: Network edge orienting analysis to determine causal drivers of moduleWe use the Network Edge Orienting (NEO) software toproduce edge orienting scores which allow us to deter-mine whether a candidate gene is causal or reactive to itsparent module [18]. Since we use a single genetic markeras a causal anchor, we use the LEO.NB.SingleMarker scoreto evaluate the causal edge xi → ME, where xi is the expres-sion profile of the i-th candidate gene and ME is the mod-ule eigengene. Genes with a causal relationship to theirparent module are highly related to many other geneswithin the module and are upstream of the moduleexpressions.
The systems genetic analysis described in steps 1–5 resultsin a biologically motivated gene screening strategy. Path-way analysis and additional data sets can then be used tosupport and/or prioritize the resulting candidate genes.
An IWGCNA of chronic fatigue syndromeIn the following sections, we apply the IWGCNA to achronic fatigue syndrome (CFS) data set consisting ofphenotype, genotype and expression data from the Cent-ers for Disease Control [38,40,51]. The CFS patients stud-ied here were a subset of a 227 patient cohort fromWichita, KS collected between December 2002 and July2003 [52]. Details on the CFS severity measure as well asother diagnostic criteria are included in the Methods sec-tion.
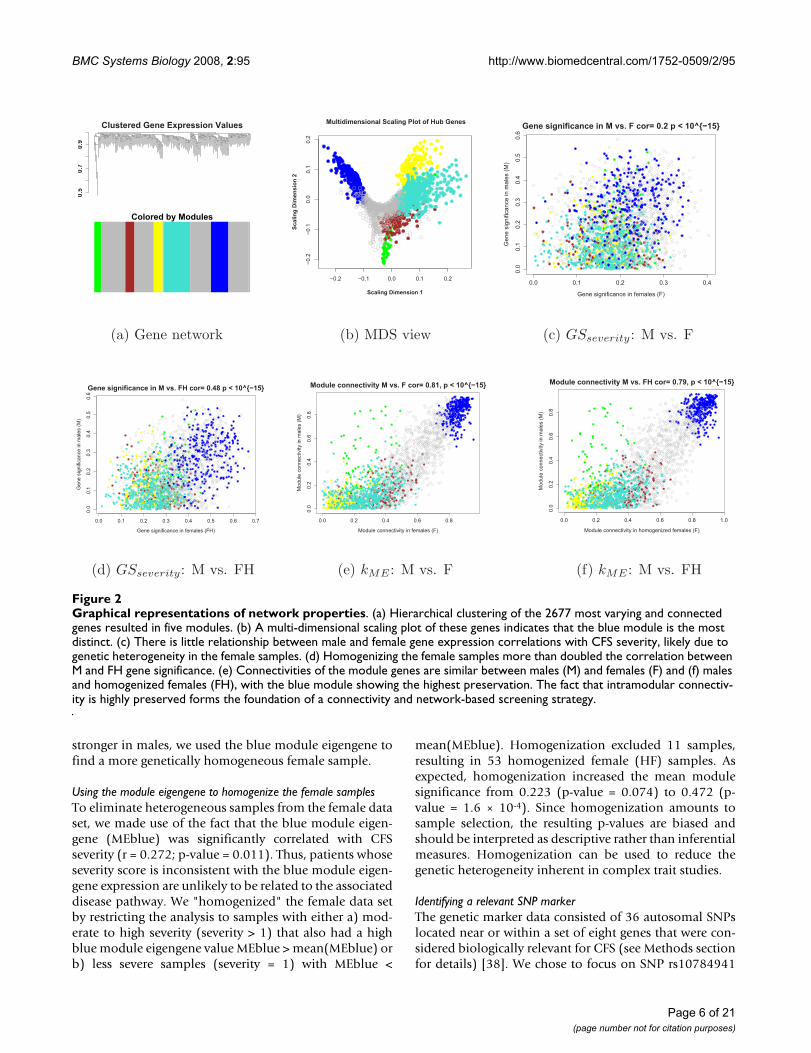
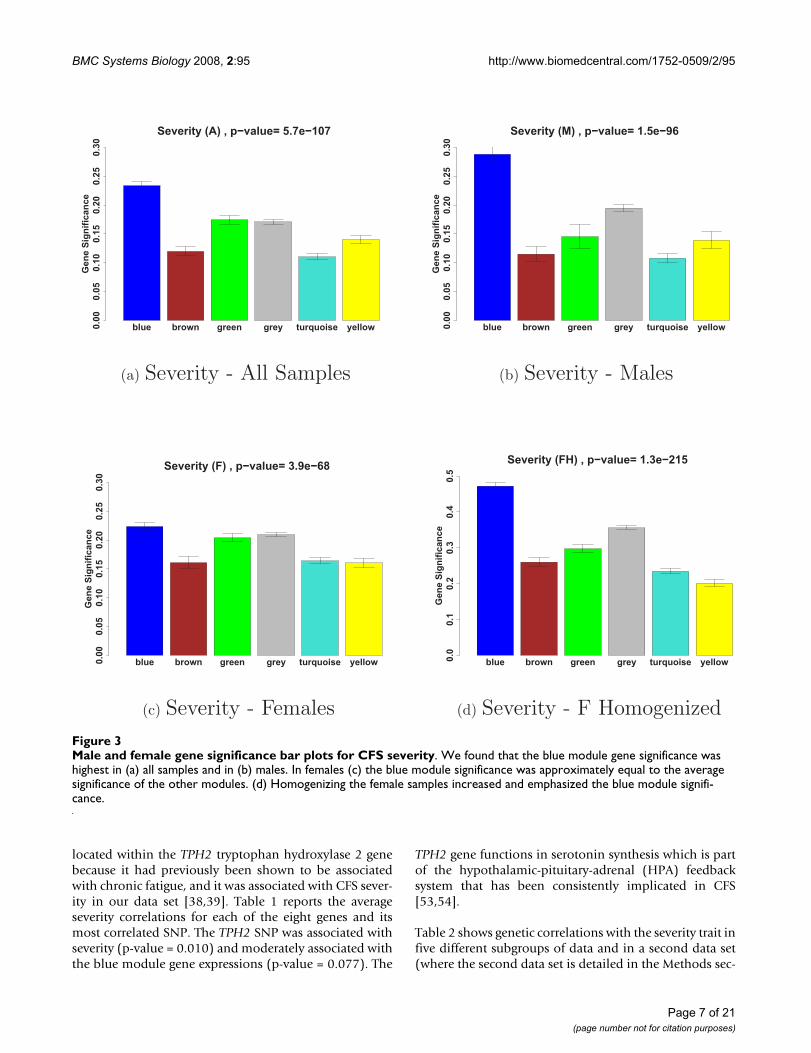
Defining co-expression network modules and relating them to the CFS trait dataStarting with the 8966 most varying genes (where "genes"refers to "probes") described in the Methods section, weselected the 30% most connected (2677) for our networkanalysis. WGCNA identified five modules of co-expressedgenes. Figure 2(a) shows a cluster tree of the gene net-work, where the five color-coded modules correspond tobranches of this tree. The color band underneath the treedepicts the branches (modules), and grey denotes thegenes outside of the modules (background genes). A clas-sical multi-dimensional scaling plot illustrates the relativepositions of the module genes (Figure 2b). Next, werelated our five modules to the severity trait to identify themodule with the strongest association. Figure 3 showsthat the blue module with 299 genes has the highest mod-ule significance in (a) all samples (mean GSseverity = 0.234,corresponding to a p-value of 0.007), (b) males and (c)females. As a result, we focused on this module in the fol-lowing analyses.
Modules facilitate a molecular characterization of gender differencesSince CFS is four times more likely to occur in womenthan in men [51], it is possible that there are genetic dif-ferences between men and women regarding CFS severity.Furthermore, women outnumber men three to one in thisdata set, so without considering gender in our analysis,results could be skewed toward severity related alleles thatare more important in women. To ensure that our analysisproduced gene candidates related to CFS severity in bothsexes, we stratified the analysis by sex.
Before relating the blue module genes to severity and theSNP data, we investigated whether the network model waspreserved when the data was stratified by sex. We com-pared the GSseverity values between males and females (Fig-
ure 2c) and found a weak correlation (r = 0.197).However, the blue module was associated with CFS sever-ity in both men and women independently and in thesamples combined. Furthermore, there was a high correla-
tion (r = 0.81; p-value < 10-16) between the (i) values
of the male and female networks (Figure 2e). The impor-tance of the blue module in both genders and the preser-
vation of the module membership measure (i)
demonstrate the value of using network properties toscreen for genes.
Figure 3(b) shows that the blue module was the onlymodule that was highly related to severity in males,whereas in females the blue module was only slightlymore significant than the other modules 3(c). Because therelationship between gene expression and severity was
kMEblue
kMEblue
Page 5 of 21(page number not for citation purposes)
BMC Systems Biology 2008, 2:95 http://www.biomedcentral.com/1752-0509/2/95
stronger in males, we used the blue module eigengene tofind a more genetically homogeneous female sample.
Using the module eigengene to homogenize the female samplesTo eliminate heterogeneous samples from the female dataset, we made use of the fact that the blue module eigen-gene (MEblue) was significantly correlated with CFSseverity (r = 0.272; p-value = 0.011). Thus, patients whoseseverity score is inconsistent with the blue module eigen-gene expression are unlikely to be related to the associateddisease pathway. We "homogenized" the female data setby restricting the analysis to samples with either a) mod-erate to high severity (severity > 1) that also had a highblue module eigengene value MEblue > mean(MEblue) orb) less severe samples (severity = 1) with MEblue <
mean(MEblue). Homogenization excluded 11 samples,resulting in 53 homogenized female (HF) samples. Asexpected, homogenization increased the mean modulesignificance from 0.223 (p-value = 0.074) to 0.472 (p-value = 1.6 × 10⁻⁴). Since homogenization amounts tosample selection, the resulting p-values are biased andshould be interpreted as descriptive rather than inferentialmeasures. Homogenization can be used to reduce thegenetic heterogeneity inherent in complex trait studies.
Identifying a relevant SNP markerThe genetic marker data consisted of 36 autosomal SNPslocated near or within a set of eight genes that were con-sidered biologically relevant for CFS (see Methods sectionfor details) [38]. We chose to focus on SNP rs10784941
Graphical representations of network propertiesFigure 2Graphical representations of network properties. (a) Hierarchical clustering of the 2677 most varying and connected genes resulted in five modules. (b) A multi-dimensional scaling plot of these genes indicates that the blue module is the most distinct. (c) There is little relationship between male and female gene expression correlations with CFS severity, likely due to genetic heterogeneity in the female samples. (d) Homogenizing the female samples more than doubled the correlation between M and FH gene significance. (e) Connectivities of the module genes are similar between males (M) and females (F) and (f) males and homogenized females (FH), with the blue module showing the highest preservation. The fact that intramodular connectiv-ity is highly preserved forms the foundation of a connectivity and network-based screening strategy.
0.5
0.7
0.9
Clustered Gene Expression Values
Colored by Modules
(a) Gene network
−0.2 −0.1 0.0 0.1 0.2
−0
.2−
0.1
0.0
0.1
0.2
Multidimensional Scaling Plot of Hub Genes
Scaling Dimension 1S
ca
lin
g D
ime
ns
ion
2
(b) MDS view
0.0 0.1 0.2 0.3 0.4
0.0
0.1
0.2
0.3
0.4
0.5
0.6
Gene significance in M vs. F cor= 0.2 p < 10^{−15}
Gene significance in females (F)
Gene s
ignific
ance in m
ale
s (
M)
(c) GSseverity: M vs. F
0.0 0.1 0.2 0.3 0.4 0.5 0.6 0.7
0.0
0.1
0.2
0.3
0.4
0.5
0.6
Gene significance in M vs. FH cor= 0.48 p < 10^{−15}
Gene significance in females (FH)
Gene s
ignific
ance in m
ale
s (
M)
(d) GSseverity: M vs. FH
0.0 0.2 0.4 0.6 0.8
0.0
0.2
0.4
0.6
0.8
Module connectivity M vs. F cor= 0.81, p < 10^{−15}
Module connectivity in females (F)
Module
connectivity in m
ale
s (
M)
(e) kME : M vs. F
0.0 0.2 0.4 0.6 0.8 1.0
0.0
0.2
0.4
0.6
0.8
Module connectivity M vs. FH cor= 0.79, p < 10^{−15}
Module connectivity in homogenized females (F)
Module
connectivity in m
ale
s (
M)
(f) kME : M vs. FH
Page 6 of 21(page number not for citation purposes)
BMC Systems Biology 2008, 2:95 http://www.biomedcentral.com/1752-0509/2/95
located within the TPH2 tryptophan hydroxylase 2 genebecause it had previously been shown to be associatedwith chronic fatigue, and it was associated with CFS sever-ity in our data set [38,39]. Table 1 reports the averageseverity correlations for each of the eight genes and itsmost correlated SNP. The TPH2 SNP was associated withseverity (p-value = 0.010) and moderately associated withthe blue module gene expressions (p-value = 0.077). The
TPH2 gene functions in serotonin synthesis which is partof the hypothalamic-pituitary-adrenal (HPA) feedbacksystem that has been consistently implicated in CFS[53,54].
Table 2 shows genetic correlations with the severity trait infive different subgroups of data and in a second data set(where the second data set is detailed in the Methods sec-
Male and female gene significance bar plots for CFS severityFigure 3Male and female gene significance bar plots for CFS severity. We found that the blue module gene significance was highest in (a) all samples and in (b) males. In females (c) the blue module significance was approximately equal to the average significance of the other modules. (d) Homogenizing the female samples increased and emphasized the blue module signifi-cance.
blue brown green grey turquoise yellow
Gen
e S
ign
ific
an
ce
0.0
00.0
50.1
00.1
50.2
00.2
50.3
0
Severity (A) , p−value= 5.7e−107
(a) Severity - All Samples
blue brown green grey turquoise yellow
Gen
e S
ign
ific
an
ce
0.0
00.0
50.1
00.1
50.2
00.2
50.3
0
Severity (M) , p−value= 1.5e−96
(b) Severity - Males
blue brown green grey turquoise yellow
Gen
e S
ign
ific
an
ce
0.0
00.0
50.1
00.1
50.2
00.2
50.3
0
Severity (F) , p−value= 3.9e−68
(c) Severity - Females
blue brown green grey turquoise yellow
Gen
e S
ign
ific
an
ce
0.0
0.1
0.2
0.3
0.4
0.5
Severity (FH) , p−value= 1.3e−215
(d) Severity - F Homogenized
Page 7 of 21(page number not for citation purposes)

BMC Systems Biology 2008, 2:95 http://www.biomedcentral.com/1752-0509/2/95
tion). Severity was significantly correlated (p-value =0.011) with the blue module eigengene in all samples andhad moderate correlation in females. The severity associa-tion with the TPH2 SNP was very significant for all sam-ples combined (p-value = 0.010), the male samples (p-value = 0.030), and moderately significant in the femalesamples after homogenization (p-value = 0.076). Sincehomogenization strengthened the relationship betweenseverity and the TPH2 SNP in both the female samplesand in the male and homogenized female samples com-bined, we used the homogenized samples in our genescreening procedure.
Systems genetic screening criteria
Because the connectivity can be interpreted as a
measure of membership to the blue module, it can beused to prioritize pathway defining genes. We selectedcandidate genes that met the following criteria in bothmales and homogenized female samples: i) GSTPH2 greater
than 0.2 to select genes that were associated with a CFS-
related SNP, ii) in the top 80% to select genes that
were centrally located within the blue module, and iii)GSseverity and GSTPH2 signs that were consistent in both
sexes. The purpose of this last criterion was to safeguardagainst potentially spurious correlations. We reasoned
kMEblue
kMEblue
Table 1: Average absolute value of severity associations for the SNPs within eight candidate genes.
Gene Name Gene Location Average Correlation (SD) Count of SNPs in candidate gene Most Correlated SNPName Correlation p-value
POMC 2p24 0.14 (NA) 1 rs12473543 0.135 0.216NR3C1 5q34 0.07 (0.06) 7 rs258750 0.198 0.069CRHR2 7p15 0.15 (0.08) 3 hCV15960586 0.225 0.036
TH 11p15 0.07 (0.01) 2 rs4074905 0.080 0.466TPH2 12q21 0.23 (0.04) 7 rs10784941 0.275 0.010
SLC6A4 17q11.1 0.18 (0.17) 3 rs4325622 0.347 0.001CRHR1 17q21 0.03 (0.02) 6 rs242940 0.069 0.531COMT 22q11.1 0.04 (0.02) 7 hCV11804654 0.077 0.479
TPH2 with seven SNPs had the highest average association with CFS severity.
Table 2: Understanding the factors that affect gene significance.
Data Set No. Samples a.) cor(severity, MEblue)1 b.) cor(severity, SNP)2
Samples with severity scores 87 r = 0.27 (p = 0.011) r = 0.28 (p = 0.010)Males & HomFemales 76 r = 0.50 (p = 8 × 10⁻⁶) r = 0.33 (p = 0.003)Males with severity scores 23 r = 0.34 (p = 0.113) r = 0.45 (p = 0.030)Females with severity scores 64 r = 0.26 (p = 0.041) r = 0.17 (p = 0.170)Homogenized Females 53 r = 0.54 (p = 2 × 10⁻⁵) r = 0.25 (p = 0.076)Second data set (DS)3 33 r = 0.09 (p = 0.638) r = 0.03 (p = 0.846)Second DS Homogenized3 30 r = 0.38 (p = 0.040) r = 0.15 (p = 0.415)
Data Set No. Samples c.) cor(severity, FOXN1) d.) cor(SNP, FOXN1)
Samples with severity scores 87 r = 0.21 (p = 0.055) r = 0.18 (p = 0.088)Males & HomFemales 76 r = 0.38 (p = 6 × 10⁻⁴) r = 0.23 (p = 0.045)Males with severity scores 23 r = 0.27 (p = 0.216) r = 0.20 (p = 0.365)Females with severity scores 64 r = 0.21 (p = 0.101) r = 0.19 (p = 0.137)Homogenized Females 53 r = 0.44 (p = 0.001) r = 0.24 (p = 0.082)Second DS3 33 r = 0.28 (p = 0.116) r = 0.18 (p = 0.318)Second DS Homogenized3 30 r = 0.40 (p = 0.030) r = 0.12 (p = 0.515)
The severity, MEblue, TPH2 SNP, and FOXN1 correlations (r) and p-values (p) for five different subsets of the first primary data set and the homogenized samples in the secondary data set. Severity is most significantly related toMEblue, the TPH2 SNP and the candidate FOXN1 gene in the combined male and homogenized female sub set. Homogenizing the second data set (which discarded three samples) also improved the MEblue and FOXN1 associations with severity.
1MEblue refers to the blue module eigengene, or first principal component of the blue module.2SNP refers to the TPH2 SNP rs10784941.3Here empiric replaces severity in cor(severity, FOXN1).
Page 8 of 21(page number not for citation purposes)
BMC Systems Biology 2008, 2:95 http://www.biomedcentral.com/1752-0509/2/95
that genes which are positively correlated with severity inone sex but are negatively correlated in the other are lesscredible than those with strong correlations in the samedirection among both sexes. iv) We also required a mod-erate correlation of 0.2 with the severity trait (GSseverity) in
males and a slightly stronger correlation of 0.35 in thehomogenized females (since homogenization increasedthe GSseverity measure). Out of the 2677 network genes,
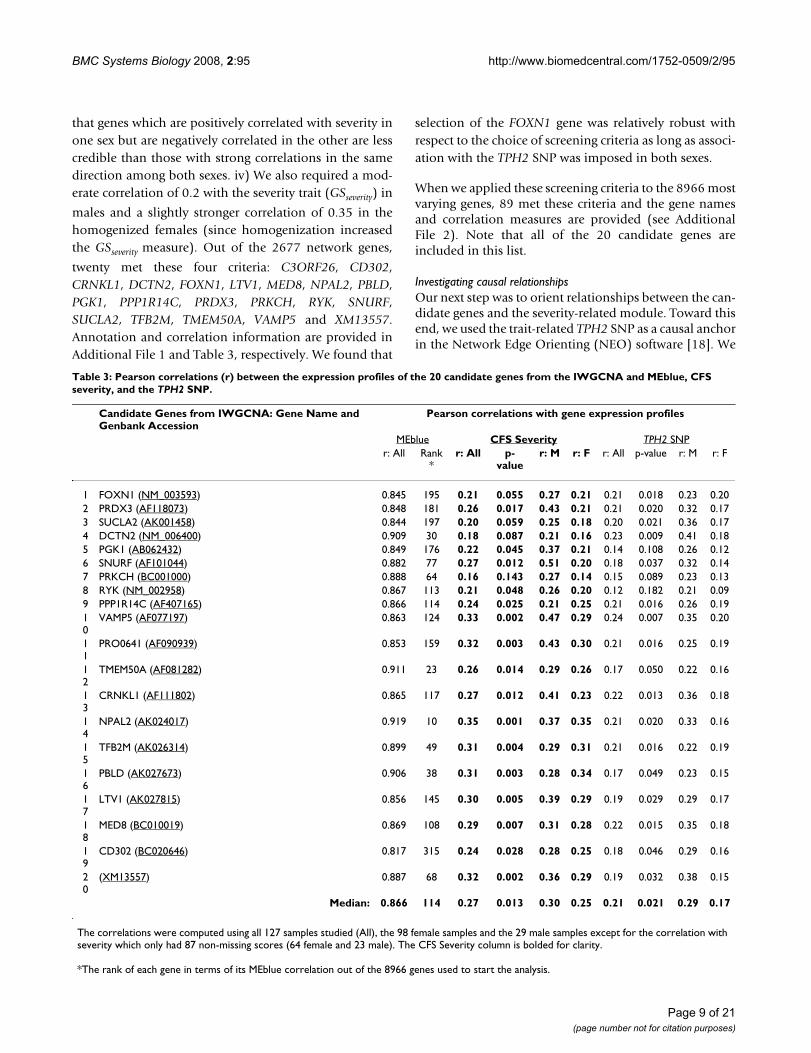
twenty met these four criteria: C3ORF26, CD302,CRNKL1, DCTN2, FOXN1, LTV1, MED8, NPAL2, PBLD,PGK1, PPP1R14C, PRDX3, PRKCH, RYK, SNURF,SUCLA2, TFB2M, TMEM50A, VAMP5 and XM13557.Annotation and correlation information are provided inAdditional File 1 and Table 3, respectively. We found that
selection of the FOXN1 gene was relatively robust withrespect to the choice of screening criteria as long as associ-ation with the TPH2 SNP was imposed in both sexes.
When we applied these screening criteria to the 8966 mostvarying genes, 89 met these criteria and the gene namesand correlation measures are provided (see AdditionalFile 2). Note that all of the 20 candidate genes areincluded in this list.
Investigating causal relationshipsOur next step was to orient relationships between the can-didate genes and the severity-related module. Toward thisend, we used the trait-related TPH2 SNP as a causal anchorin the Network Edge Orienting (NEO) software [18]. We
Table 3: Pearson correlations (r) between the expression profiles of the 20 candidate genes from the IWGCNA and MEblue, CFS severity, and the TPH2 SNP.
Candidate Genes from IWGCNA: Gene Name and Genbank Accession
Pearson correlations with gene expression profiles
MEblue CFS Severity TPH2 SNPr: All Rank
*r: All p-
valuer: M r: F r: All p-value r: M r: F
1 FOXN1 (NM_003593) 0.845 195 0.21 0.055 0.27 0.21 0.21 0.018 0.23 0.202 PRDX3 (AF118073) 0.848 181 0.26 0.017 0.43 0.21 0.21 0.020 0.32 0.173 SUCLA2 (AK001458) 0.844 197 0.20 0.059 0.25 0.18 0.20 0.021 0.36 0.174 DCTN2 (NM_006400) 0.909 30 0.18 0.087 0.21 0.16 0.23 0.009 0.41 0.185 PGK1 (AB062432) 0.849 176 0.22 0.045 0.37 0.21 0.14 0.108 0.26 0.126 SNURF (AF101044) 0.882 77 0.27 0.012 0.51 0.20 0.18 0.037 0.32 0.147 PRKCH (BC001000) 0.888 64 0.16 0.143 0.27 0.14 0.15 0.089 0.23 0.138 RYK (NM_002958) 0.867 113 0.21 0.048 0.26 0.20 0.12 0.182 0.21 0.099 PPP1R14C (AF407165) 0.866 114 0.24 0.025 0.21 0.25 0.21 0.016 0.26 0.1910
VAMP5 (AF077197) 0.863 124 0.33 0.002 0.47 0.29 0.24 0.007 0.35 0.20
11
PRO0641 (AF090939) 0.853 159 0.32 0.003 0.43 0.30 0.21 0.016 0.25 0.19
12
TMEM50A (AF081282) 0.911 23 0.26 0.014 0.29 0.26 0.17 0.050 0.22 0.16
13
CRNKL1 (AF111802) 0.865 117 0.27 0.012 0.41 0.23 0.22 0.013 0.36 0.18
14
NPAL2 (AK024017) 0.919 10 0.35 0.001 0.37 0.35 0.21 0.020 0.33 0.16
15
TFB2M (AK026314) 0.899 49 0.31 0.004 0.29 0.31 0.21 0.016 0.22 0.19
16
PBLD (AK027673) 0.906 38 0.31 0.003 0.28 0.34 0.17 0.049 0.23 0.15
17
LTV1 (AK027815) 0.856 145 0.30 0.005 0.39 0.29 0.19 0.029 0.29 0.17
18
MED8 (BC010019) 0.869 108 0.29 0.007 0.31 0.28 0.22 0.015 0.35 0.18
19
CD302 (BC020646) 0.817 315 0.24 0.028 0.28 0.25 0.18 0.046 0.29 0.16
20
(XM13557) 0.887 68 0.32 0.002 0.36 0.29 0.19 0.032 0.38 0.15
Median: 0.866 114 0.27 0.013 0.30 0.25 0.21 0.021 0.29 0.17
The correlations were computed using all 127 samples studied (All), the 98 female samples and the 29 male samples except for the correlation with severity which only had 87 non-missing scores (64 female and 23 male). The CFS Severity column is bolded for clarity.
*The rank of each gene in terms of its MEblue correlation out of the 8966 genes used to start the analysis.
Page 9 of 21(page number not for citation purposes)
BMC Systems Biology 2008, 2:95 http://www.biomedcentral.com/1752-0509/2/95
defined a gene as being causal for the module if theLEO.NB.SingleMarker score for the causal model was pos-itive and at least twice as probable as the maximum alter-native model's score, i.e. we required a minimumLEO.NB.SingleMarker score of 0.30 ≈ log10(2). While athreshold of log10(10) = 1 was recommended by [18], werelaxed it here due to our small sample size (127 patients).
The LEO.NB.SingleMarker scores for the 20 candidategenes are provided in Additional File 1. There were 66causal genes out of 299 blue module genes. All but threeof our 20 candidate genes were causal for the blue mod-ule, with an average causality score rank of 25. A NEOanalysis of the male and homogenized female data subset(76 samples) indicated that all but two of the 20 candi-date genes were causal, with an average causality rank of39 (not shown). These results indicate that our 5-stepstrategy identifies a trait-related module and its potentialcausal drivers.
Applying our gene screening strategy to a second data set
We applied our gene screening strategy to the 33 patientsamples that were missing severity scores but had a similarmeasure of CFS severity called "empiric severity". Therationale was that replicating the candidate gene findingsin these samples would support the IWGCNA results. Wefirst checked that the module definitions from the firstdata set were preserved in the second data set. Figure 4(a)shows that the blue module was well preserved and Figure4(b) shows that the corresponding module membership
measures were preserved as well. Applying the same
integrated gene screening criteria as described aboveresulted in 61 candidate genes, six of which had beenidentified in the primary data set: FOXN1, DCTN2,PPP1R14C, VAMP5, TFB2M and XM13557.
Pathway annotation of candidate genesAdditional File 1 includes pathway annotations for the 16candidate genes that were eligible for annotation withIngenuity® Systems' Pathways Analysis (IPA, http://www.ingenuity.com) software. Column (a) gives resultsfor an IPA analysis of the candidate genes, and (b) showstheir corresponding annotations when the 299 blue mod-ule genes were analyzed (where 212 of the blue modulegenes were eligible for pathway annotation in August2008). Out of the 16 candidate genes, IPA identified ahighly significant pathway (p-value ≈ 10-32) containing 12of them FOXN1, PRDX3, SUCLA2, TFB2M, MED8,SNURF, DCTN2, PGK1, PRKCH, RYK, VAMP5 and PBLD,and this pathway most likely functioned in Cell Cycle,Cancer, Cell Death, and Hematological Disease (p-valuerange = 1.15 × 10⁻⁵, 1.03 × 10⁻¹). Column (b) shows thatthe 212 blue module analysis suggested functionally rele-
vant pathways for the candidate genes such as i) Endo-crine System Disorders, Infectious Disease, andInflammatory Disease; ii) Connective Tissue Develop-ment and Function and iii) Viral Function. Pathways i-iiiand hematological disease are consistent with results fromprevious CFS research [35,55-58].
We investigated the TPH2 SNP's contribution to our genescreening strategy by repeating the candidate gene IPAwith TPH2 included. Indeed, IPA positioned TPH2 withinthe top hematological disease pathway containing 12 can-didate genes. This finding supports the notion that SNP-associated gene expression profiles are likely to interactwith the SNP-containing gene.
To determine known interactions between the candidategenes within the blue module, we carried out an IPA com-parison between the candidate gene and blue modulegene networks. Figure 5 shows that the main hematologi-cal disease pathway in the candidate gene IPA is directlyconnected to seven pathways within the blue module net-work (where the number of common genes are listedadjacent to the connection edges). This illustrates thevalue of IWGCNA: it identifies a candidate gene pathwaythat is centrally located within the blue module network,i.e. it identifies genes influencing multiple biologicalpathways.
Functional annotation of candidate genesThe IWGCNA of a CFS data set identifies candidate genesthat interact in biologically relevant immune and connec-tive tissue pathways. In this section, we show that in addi-tion to belonging to relevant pathways, our candidategenes have functions that are consistent with findingsfrom other CFS studies. Here we focus on FOXN1, PRDX3,and SUCLA2, but other interesting candidates aredescribed in Additional File 1. FOXN1 is highly expressedin thymus epithelia cells. The thymus gland plays a piv-otal role in the immune system by converting lym-phocytes to T-cells and releasing functional T-cells tocombat infection. A FOXN1 knockout mouse model hasbeen shown to have a deficient immune system due to alack of functional T-cells [59-61]. Similarly, humans withmutations in FOXN1 have an immune system deficiency[62,63]. Under the assumption that a compromisedimmune system can cause chronic fatigue, this knockoutmouse suggests a potential role for FOXN1 in chronicfatigue. Because of its statistical significance and biologi-cal importance, FOXN1 is a candidate for investigating theimmune system's role in CFS severity.
PRDX3 is a clinically interesting candidate because of itsrole in mitochondrial function and apoptosis. Specifi-cally, it regulates the abundance of H2O2 and other reac-tive oxygen compounds that mediate apoptosis [64,65].
kMEblue
Page 10 of 21(page number not for citation purposes)

BMC Systems Biology 2008, 2:95 http://www.biomedcentral.com/1752-0509/2/95
Page 11 of 21(page number not for citation purposes)
Secondary data set resultsFigure 4Secondary data set results. (a) Average linkage hierarchical clustering of the gene expressions from 33 secondary data set samples colored by the original network module definitions shows that the blue module is preserved. (b) Intramodular connec-tivity is preserved between the secondary and primary data set networks.
0.6
0.7
0.8
0.9
1.0
Clustered gene expressions from second data set
Colored by first data set module definitions
(a) Gene network of second data set samples
0.0 0.2 0.4 0.6 0.8
0.0
0.2
0.4
0.6
0.8
Second data set kME vs. First data set kME
First data set kME (female samples)
Seco
nd
data
set
kM
E
(b) Second data set vs. first data set connectivity

BMC Systems Biology 2008, 2:95 http://www.biomedcentral.com/1752-0509/2/95
SUCLA2 is another gene involved in mitochondrial func-tion that could be clinically relevant for chronic fatigue.Mutations in SUCLA2 have previously been associatedwith mitochondrial encephalomyopathy, a disorderwhich causes fatigue and muscle weakness [66,67]. Theseimmune, cell death, and muscular system functions areconsistent with findings from other CFS studies[27,28,34].
A standard analysis of chronic fatigue syndrome that excludes the TPH2 SNP marker and module membershipIWGCNA requires at least one reliable SNP marker that isassociated with the disease. While the relationshipbetween CFS and the TPH2 SNP has been reported in aprevious study, the relatively unimpressive p-value sug-gests that additional data are needed to confirm its valid-ity. Here we present results from a standard analysis of the
Ingenuity Pathway Analysis resultsFigure 5Ingenuity Pathway Analysis results. An IPA comparison analysis indicates that the 20 candidate gene pathway (light blue) is connected with several of the most highly significant blue module pathways (dark blue). Each pathway description was selected from the top three most significant IPA pathway annotations, and the other two are listed below the diagram. The ranks corre-spond to the p-values of the identified networks, where the network with the smallest p-value has rank = 1.
Hematological Disease,
Rank = 1 (20)
Connective Tissue,
Rank = 2
Cell Cycle, Rank = 5
Connective Tissue,
Rank = 7
Endocrine/ Inflammation,
Rank = 6
Cell Function, Rank = 8*
Connective Tissue,
Rank = 8*
Amino Acid Metabolism,
Rank = 1 (299)
Cell Cycle, Rank = 4
Rank 1 (20): Cell Cycle, Cancer, Hematological DiseaseRank 1 (299): Post-Translational Modification, Amino Acid Metabolism, Molecular TransportRank 2: Organ Morphology, Cell Morphology, Connective Tissue Development and FunctionRank 4: Post-Translational Modification, Cell Cycle, Gene ExpressionRank 5: Cell Assembly and Organization, Cell Cycle, DNA Replication/Recombination/RepairRank 6: Endocrine System Disorders, Infectious Disease, Inflammatory DiseaseRank 7: Gene Expression, Cellular Development, Connective Tissue Development and Function Rank 8*: Embryonic Development, Organ Development, Connective Tissue Development and FunctionRank 8*: Cell Fun. and Main., Small Molecule Biochem., Molecular Transport; *Same p-values
Page 12 of 21(page number not for citation purposes)
BMC Systems Biology 2008, 2:95 http://www.biomedcentral.com/1752-0509/2/95
chronic fatigue data that excludes the SNP and modulemembership information.
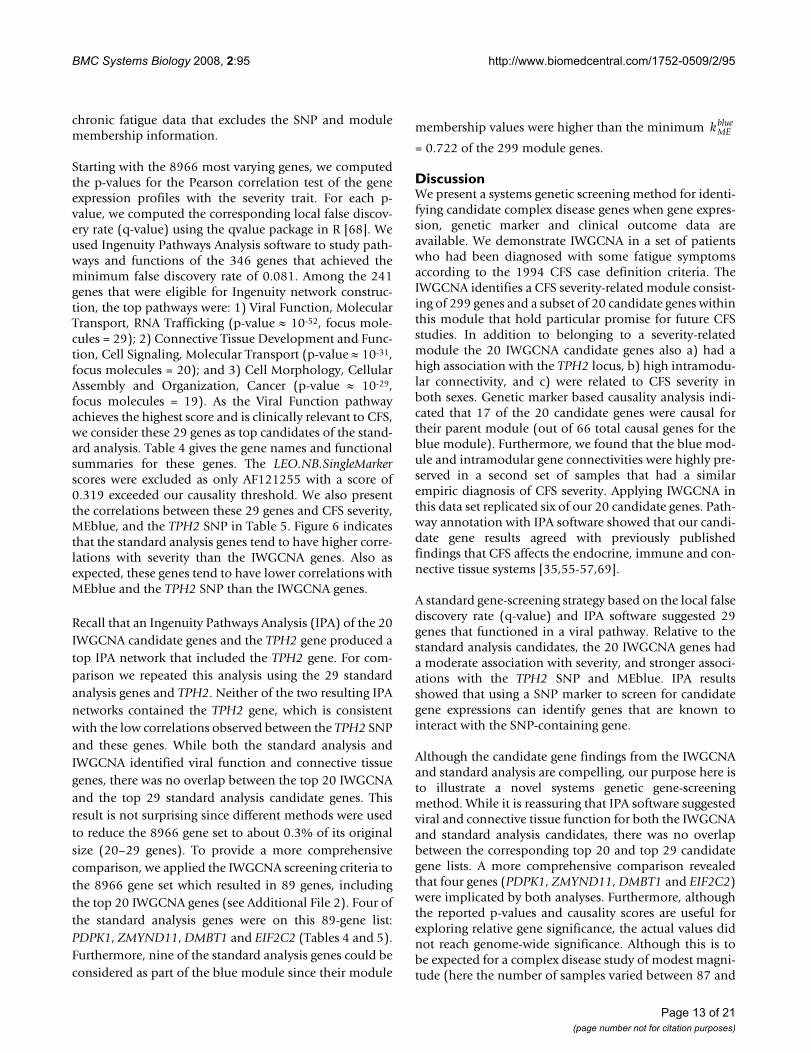
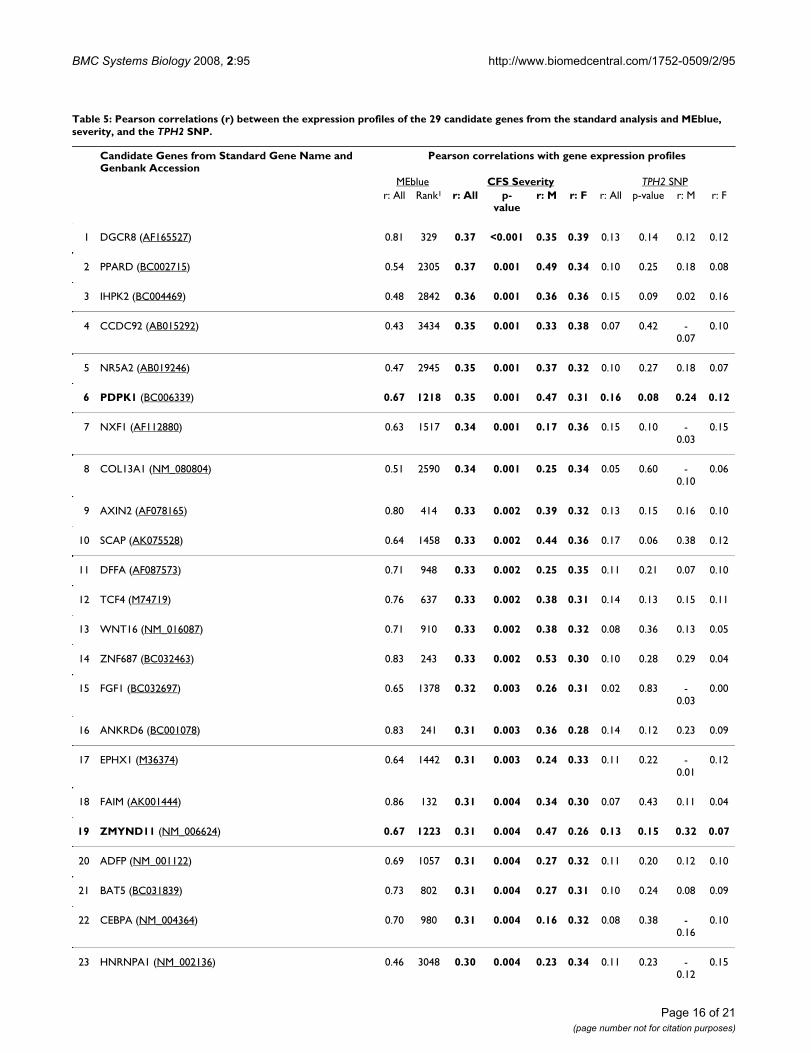
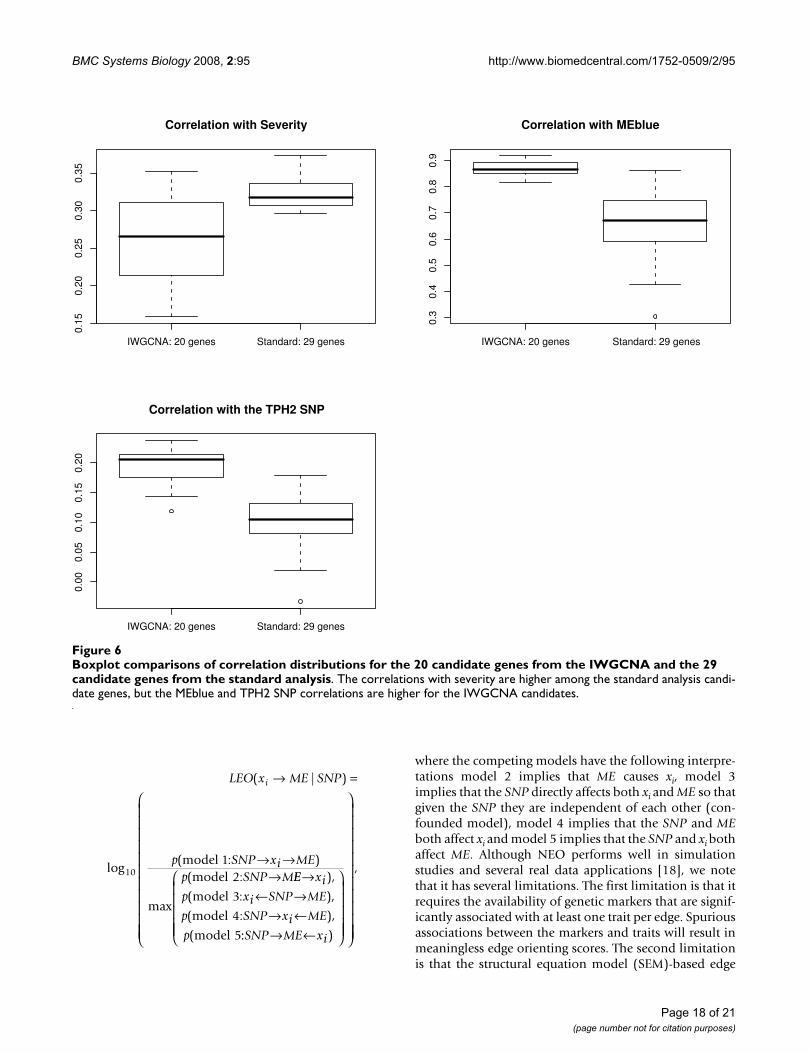
Starting with the 8966 most varying genes, we computedthe p-values for the Pearson correlation test of the geneexpression profiles with the severity trait. For each p-value, we computed the corresponding local false discov-ery rate (q-value) using the qvalue package in R [68]. Weused Ingenuity Pathways Analysis software to study path-ways and functions of the 346 genes that achieved theminimum false discovery rate of 0.081. Among the 241genes that were eligible for Ingenuity network construc-tion, the top pathways were: 1) Viral Function, MolecularTransport, RNA Trafficking (p-value ≈ 10-52, focus mole-cules = 29); 2) Connective Tissue Development and Func-tion, Cell Signaling, Molecular Transport (p-value ≈ 10-31,focus molecules = 20); and 3) Cell Morphology, CellularAssembly and Organization, Cancer (p-value ≈ 10-29,focus molecules = 19). As the Viral Function pathwayachieves the highest score and is clinically relevant to CFS,we consider these 29 genes as top candidates of the stand-ard analysis. Table 4 gives the gene names and functionalsummaries for these genes. The LEO.NB.SingleMarkerscores were excluded as only AF121255 with a score of0.319 exceeded our causality threshold. We also presentthe correlations between these 29 genes and CFS severity,MEblue, and the TPH2 SNP in Table 5. Figure 6 indicatesthat the standard analysis genes tend to have higher corre-lations with severity than the IWGCNA genes. Also asexpected, these genes tend to have lower correlations withMEblue and the TPH2 SNP than the IWGCNA genes.
Recall that an Ingenuity Pathways Analysis (IPA) of the 20IWGCNA candidate genes and the TPH2 gene produced atop IPA network that included the TPH2 gene. For com-parison we repeated this analysis using the 29 standardanalysis genes and TPH2. Neither of the two resulting IPAnetworks contained the TPH2 gene, which is consistentwith the low correlations observed between the TPH2 SNPand these genes. While both the standard analysis andIWGCNA identified viral function and connective tissuegenes, there was no overlap between the top 20 IWGCNAand the top 29 standard analysis candidate genes. Thisresult is not surprising since different methods were usedto reduce the 8966 gene set to about 0.3% of its originalsize (20–29 genes). To provide a more comprehensivecomparison, we applied the IWGCNA screening criteria tothe 8966 gene set which resulted in 89 genes, includingthe top 20 IWGCNA genes (see Additional File 2). Four ofthe standard analysis genes were on this 89-gene list:PDPK1, ZMYND11, DMBT1 and EIF2C2 (Tables 4 and 5).Furthermore, nine of the standard analysis genes could beconsidered as part of the blue module since their module
membership values were higher than the minimum
= 0.722 of the 299 module genes.
DiscussionWe present a systems genetic screening method for identi-fying candidate complex disease genes when gene expres-sion, genetic marker and clinical outcome data areavailable. We demonstrate IWGCNA in a set of patientswho had been diagnosed with some fatigue symptomsaccording to the 1994 CFS case definition criteria. TheIWGCNA identifies a CFS severity-related module consist-ing of 299 genes and a subset of 20 candidate genes withinthis module that hold particular promise for future CFSstudies. In addition to belonging to a severity-relatedmodule the 20 IWGCNA candidate genes also a) had ahigh association with the TPH2 locus, b) high intramodu-lar connectivity, and c) were related to CFS severity inboth sexes. Genetic marker based causality analysis indi-cated that 17 of the 20 candidate genes were causal fortheir parent module (out of 66 total causal genes for theblue module). Furthermore, we found that the blue mod-ule and intramodular gene connectivities were highly pre-served in a second set of samples that had a similarempiric diagnosis of CFS severity. Applying IWGCNA inthis data set replicated six of our 20 candidate genes. Path-way annotation with IPA software showed that our candi-date gene results agreed with previously publishedfindings that CFS affects the endocrine, immune and con-nective tissue systems [35,55-57,69].
A standard gene-screening strategy based on the local falsediscovery rate (q-value) and IPA software suggested 29genes that functioned in a viral pathway. Relative to thestandard analysis candidates, the 20 IWGCNA genes hada moderate association with severity, and stronger associ-ations with the TPH2 SNP and MEblue. IPA resultsshowed that using a SNP marker to screen for candidategene expressions can identify genes that are known tointeract with the SNP-containing gene.
Although the candidate gene findings from the IWGCNAand standard analysis are compelling, our purpose here isto illustrate a novel systems genetic gene-screeningmethod. While it is reassuring that IPA software suggestedviral and connective tissue function for both the IWGCNAand standard analysis candidates, there was no overlapbetween the corresponding top 20 and top 29 candidategene lists. A more comprehensive comparison revealedthat four genes (PDPK1, ZMYND11, DMBT1 and EIF2C2)were implicated by both analyses. Furthermore, althoughthe reported p-values and causality scores are useful forexploring relative gene significance, the actual values didnot reach genome-wide significance. Although this is tobe expected for a complex disease study of modest magni-tude (here the number of samples varied between 87 and
kMEblue
Page 13 of 21(page number not for citation purposes)
BMC Systems Biology 2008, 2:95 http://www.biomedcentral.com/1752-0509/2/95
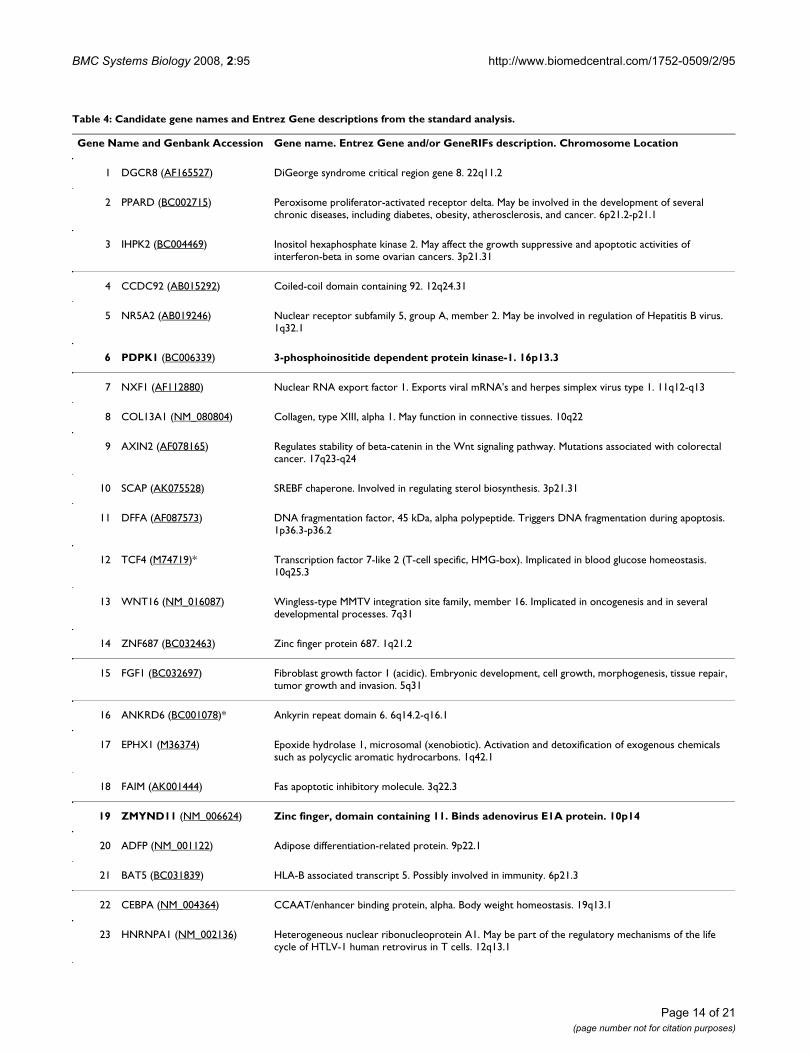
Table 4: Candidate gene names and Entrez Gene descriptions from the standard analysis.
Gene Name and Genbank Accession Gene name. Entrez Gene and/or GeneRIFs description. Chromosome Location
1 DGCR8 (AF165527) DiGeorge syndrome critical region gene 8. 22q11.2
2 PPARD (BC002715) Peroxisome proliferator-activated receptor delta. May be involved in the development of several chronic diseases, including diabetes, obesity, atherosclerosis, and cancer. 6p21.2-p21.1
3 IHPK2 (BC004469) Inositol hexaphosphate kinase 2. May affect the growth suppressive and apoptotic activities of interferon-beta in some ovarian cancers. 3p21.31
4 CCDC92 (AB015292) Coiled-coil domain containing 92. 12q24.31
5 NR5A2 (AB019246) Nuclear receptor subfamily 5, group A, member 2. May be involved in regulation of Hepatitis B virus. 1q32.1
6 PDPK1 (BC006339) 3-phosphoinositide dependent protein kinase-1. 16p13.3
7 NXF1 (AF112880) Nuclear RNA export factor 1. Exports viral mRNA's and herpes simplex virus type 1. 11q12-q13
8 COL13A1 (NM_080804) Collagen, type XIII, alpha 1. May function in connective tissues. 10q22
9 AXIN2 (AF078165) Regulates stability of beta-catenin in the Wnt signaling pathway. Mutations associated with colorectal cancer. 17q23-q24
10 SCAP (AK075528) SREBF chaperone. Involved in regulating sterol biosynthesis. 3p21.31
11 DFFA (AF087573) DNA fragmentation factor, 45 kDa, alpha polypeptide. Triggers DNA fragmentation during apoptosis. 1p36.3-p36.2
12 TCF4 (M74719)* Transcription factor 7-like 2 (T-cell specific, HMG-box). Implicated in blood glucose homeostasis. 10q25.3
13 WNT16 (NM_016087) Wingless-type MMTV integration site family, member 16. Implicated in oncogenesis and in several developmental processes. 7q31
14 ZNF687 (BC032463) Zinc finger protein 687. 1q21.2
15 FGF1 (BC032697) Fibroblast growth factor 1 (acidic). Embryonic development, cell growth, morphogenesis, tissue repair, tumor growth and invasion. 5q31
16 ANKRD6 (BC001078)* Ankyrin repeat domain 6. 6q14.2-q16.1
17 EPHX1 (M36374) Epoxide hydrolase 1, microsomal (xenobiotic). Activation and detoxification of exogenous chemicals such as polycyclic aromatic hydrocarbons. 1q42.1
18 FAIM (AK001444) Fas apoptotic inhibitory molecule. 3q22.3
19 ZMYND11 (NM_006624) Zinc finger, domain containing 11. Binds adenovirus E1A protein. 10p14
20 ADFP (NM_001122) Adipose differentiation-related protein. 9p22.1
21 BAT5 (BC031839) HLA-B associated transcript 5. Possibly involved in immunity. 6p21.3
22 CEBPA (NM_004364) CCAAT/enhancer binding protein, alpha. Body weight homeostasis. 19q13.1
23 HNRNPA1 (NM_002136) Heterogeneous nuclear ribonucleoprotein A1. May be part of the regulatory mechanisms of the life cycle of HTLV-1 human retrovirus in T cells. 12q13.1
Page 14 of 21(page number not for citation purposes)

BMC Systems Biology 2008, 2:95 http://www.biomedcentral.com/1752-0509/2/95
127), it emphasizes a conservative interpretation of theseresults. Finally, the patient sample may not be representa-tive of the typical CFS patient population, as thesepatients were physically able to attend clinic (although toour knowledge this problem is inherent in many CFSstudies). We should also point out that the candidategenes relate to CFS severity among patients with somefatigue symptoms, so these genes may not distinguish CFSpatients from healthy controls. In order to make a clinicalcontribution to CFS etiology, our candidate gene findingsrequire validation in additional studies. The purpose ofthis article is to illustrate a systems genetic gene screeningstrategy that yields testable hypotheses for future investi-gations. IWGCNA is a step towards the development andapplication of systems genetic approaches to complex dis-ease gene mapping.
ConclusionIntegrating gene co-expression networks with allelic asso-ciation studies holds great promise for elucidating thegenetic basis of complex diseases. We describe an intuitiveand simple five-step incarnation of such an approach(IWGCNA) and apply it to a chronic fatigue syndromedata set. Our complete R statistical software code is avail-able at http://www.genetics.ucla.edu/labs/horvath/CoexpressionNetwork/CFS.
MethodsWe analyzed the phenotype, genotype and expressiondata from a four year longitudinal study conducted by theCenters for Disease Control (CDC) [38,40,51,52]. Of the164 patients described in Reeves et al. [52], we focused onthe 127 that were diagnosed with some fatigue accordingto the Intake diagnosis defined below (i.e., we removedthe controls).
CFS phenotypes: severity and empiricThe phenotype data included several variables that meas-ured different aspects of chronic fatigue syndrome.
"Intake diagnosis" was a 5-level classification of CFSbased on the 1994 case definition criteria [24]. In addi-tion to intake diagnosis, the data set included scores fromestablished diagnostic procedures used to evaluate qualityof life in people suffering from cancer and other illnesses:1) Medical Outcomes Survey Short Form (SF-36), 2) Mul-tidimensional Fatigue Inventory (MFI), and 3) CDCSymptom Inventory Case Definition scales [52,70]. TheSF-36 scale assesses eight characteristics: physical func-tion, role physical, bodily pain, general health, vitality,social function, role emotional, and mental health. TheMFI scale assesses five characteristics: general fatigue,physical fatigue, mental fatigue, reduced motivation, andreduced activity. The CDC symptom inventory scaleassesses symptoms accompanying chronic fatigue. Each ofthese 14 characteristics is derived from several scoresdesigned to evaluate the particular characteristic. Reeves etal. (2005) clustered these scores from 118 patients andidentified three clusters of CFS severity: high, moderateand low.
The analyses in this manuscript mostly focus on the CFSseverity trait in a subset of patients who had some fatiguesymptoms according to the intake diagnosis. We also ana-lyzed a second set of patients who did not have severityscores but did have a similar measure of severity based onsome of the scores used to define CFS severity "empiricseverity". The empiric severity diagnosis was highly corre-lated with CFS severity (r = 0.782, p-value = 2.2 × 10⁻¹⁶).
Primary and secondary data set subjectsThe full data set consisted of 127 samples classified as illaccording to the intake diagnosis. The majority werefemale (98), and about 95% were Caucasian. None ofthese CFS patients had an additional medical or pyscho-logical condition that can be considered exclusionary[52,71].
24 DMBT1 (NM_004406) Deleted in malignant brain tumors 1. May play a role in the interaction of tumor cells and the immune system. 10q25.3-q26.1
25 RNASEN (AF116910) Ribonuclease type III, nuclear. Participates in diverse RNA maturation and decay pathways. 5p13.3
26 EDAR (AF130988) Ectodysplasin A receptor. Mutations in this gene result in hypohidrotic ectodermal dysplasia. 2q11-q13
27 F3 (AF540377) Coagulation factor III (thromboplastin, tissue factor). Enables cells to initiate the blood coagulation cascades. 1p22-p21
28 HSPG2 (AL445795) Heparan sulfate proteoglycan 2. 1p36.1-p34
29 EIF2C2 (AF121255) Eukaryotic translation initiation factor 2C, 2. Encodes a member of the Argonaute family of proteins which play a role in RNA interference. 8q24
*Members of the blue module.
Table 4: Candidate gene names and Entrez Gene descriptions from the standard analysis. (Continued)
Page 15 of 21(page number not for citation purposes)
BMC Systems Biology 2008, 2:95 http://www.biomedcentral.com/1752-0509/2/95
Table 5: Pearson correlations (r) between the expression profiles of the 29 candidate genes from the standard analysis and MEblue, severity, and the TPH2 SNP.
Candidate Genes from Standard Gene Name and Genbank Accession
Pearson correlations with gene expression profiles
MEblue CFS Severity TPH2 SNPr: All Rank1 r: All p-
valuer: M r: F r: All p-value r: M r: F
1 DGCR8 (AF165527) 0.81 329 0.37 <0.001 0.35 0.39 0.13 0.14 0.12 0.12
2 PPARD (BC002715) 0.54 2305 0.37 0.001 0.49 0.34 0.10 0.25 0.18 0.08
3 IHPK2 (BC004469) 0.48 2842 0.36 0.001 0.36 0.36 0.15 0.09 0.02 0.16
4 CCDC92 (AB015292) 0.43 3434 0.35 0.001 0.33 0.38 0.07 0.42 -0.07
0.10
5 NR5A2 (AB019246) 0.47 2945 0.35 0.001 0.37 0.32 0.10 0.27 0.18 0.07
6 PDPK1 (BC006339) 0.67 1218 0.35 0.001 0.47 0.31 0.16 0.08 0.24 0.12
7 NXF1 (AF112880) 0.63 1517 0.34 0.001 0.17 0.36 0.15 0.10 -0.03
0.15
8 COL13A1 (NM_080804) 0.51 2590 0.34 0.001 0.25 0.34 0.05 0.60 -0.10
0.06
9 AXIN2 (AF078165) 0.80 414 0.33 0.002 0.39 0.32 0.13 0.15 0.16 0.10
10 SCAP (AK075528) 0.64 1458 0.33 0.002 0.44 0.36 0.17 0.06 0.38 0.12
11 DFFA (AF087573) 0.71 948 0.33 0.002 0.25 0.35 0.11 0.21 0.07 0.10
12 TCF4 (M74719) 0.76 637 0.33 0.002 0.38 0.31 0.14 0.13 0.15 0.11
13 WNT16 (NM_016087) 0.71 910 0.33 0.002 0.38 0.32 0.08 0.36 0.13 0.05
14 ZNF687 (BC032463) 0.83 243 0.33 0.002 0.53 0.30 0.10 0.28 0.29 0.04
15 FGF1 (BC032697) 0.65 1378 0.32 0.003 0.26 0.31 0.02 0.83 -0.03
0.00
16 ANKRD6 (BC001078) 0.83 241 0.31 0.003 0.36 0.28 0.14 0.12 0.23 0.09
17 EPHX1 (M36374) 0.64 1442 0.31 0.003 0.24 0.33 0.11 0.22 -0.01
0.12
18 FAIM (AK001444) 0.86 132 0.31 0.004 0.34 0.30 0.07 0.43 0.11 0.04
19 ZMYND11 (NM_006624) 0.67 1223 0.31 0.004 0.47 0.26 0.13 0.15 0.32 0.07
20 ADFP (NM_001122) 0.69 1057 0.31 0.004 0.27 0.32 0.11 0.20 0.12 0.10
21 BAT5 (BC031839) 0.73 802 0.31 0.004 0.27 0.31 0.10 0.24 0.08 0.09
22 CEBPA (NM_004364) 0.70 980 0.31 0.004 0.16 0.32 0.08 0.38 -0.16
0.10
23 HNRNPA1 (NM_002136) 0.46 3048 0.30 0.004 0.23 0.34 0.11 0.23 -0.12
0.15
Page 16 of 21(page number not for citation purposes)

BMC Systems Biology 2008, 2:95 http://www.biomedcentral.com/1752-0509/2/95
We divided the full data set into two subsets according toa) patients with CFS severity scores available (87 total: 64females and 23 males) and b) patients without severityscores who had empiric severity scores (39 total: 33females and 6 males). The data set with severity measureswas the main data set analyzed in this manuscript and werefer to it as the primary or first data set. The primary dataset had the following CFS severity distribution: high (24),moderate (48), and low (15). We refer to the remainingdata samples as the secondary or second data set and weuse it to support our primary data findings. Since themajority of the second data set samples were female, weavoided sex confounding by analyzing only the femalesubjects in this data set. The resulting secondary data setconsisted of empiric severity, gene expression and SNPdata for 33 female samples.
Gene Expression Microarray DataPeripheral blood mononuclear cells were assayed withapproximately 20,000 probes from glass-slide arrays byMWG Biotech. ArrayVision software read the slides andnormalized the data by subtracting background intensityfrom the spot intensity values. When background inten-sity exceeded spot intensity, ArrayVision set the probeintensity values to zero.
We excluded two outlier arrays based on their high meangene expression levels and then using the remaining 162arrays we filtered for genes whose mean expression was inthe upper 50% and whose variance was in the upper 66%.These filtering criteria resulted in 8966 genes. Our remain-ing analyses focused on the 127 samples that had been
classified as having fatigue symptoms according to theintake diagnosis. Additional gene filtering is described inthe Results section.
Genetic Marker DataWe considered 36 autosomal SNPs that the CDC hadselected from eight candidate CFS genes, TPH2 (SNPsselected from locus 12q21), POMC (2p24), NR3C1(5q34), CRHR2 (7p15), TH (11p15), SLC6A4 (17q11.1),CRHR1 (17q21), COMT (22q11.1) [38]. We additivelycoded the SNPs as 0, 1, or 2, for genotypes AA, AB, and BB,respectively. While this additive coding method may besub-optimal for dominant or recessively acting loci, it hasbeen shown to be effective for many genetic models.
Causality analysis with the Network Edge Orienting softwareWe used a trait-related SNP marker as a causal anchor forthe Network Edge Orienting (NEO) software to character-ize whether each candidate gene expression was causal orreactive to the module eigengene (ME) [18]. We calcu-lated the LEO.NB.SingleMarker (LEO) score, which is a rel-ative fitting index that compares the model fitting p-valueof the causal model for a gene xi causing ME to that of thenext best competing model. For the edge orientation xi →ME, the LEO.NB.SingleMarker score is given by
24 DMBT1 (NM_004406) 0.59 1874 0.30 0.005 0.50 0.24 0.08 0.37 0.20 0.03
25 RNASEN (AF116910) 0.75 680 0.30 0.005 0.29 0.31 0.10 0.26 0.09 0.08
26 EDAR (AF130988) 0.82 288 0.30 0.005 0.20 0.33 0.09 0.32 -0.02
0.09
27 F3 (AF540377) 0.67 1181 0.30 0.005 0.28 0.30 0.10 0.26 0.18 0.06
28 HSPG2 (AL445795) 0.30 4880 0.30 0.005 0.09 0.33 -0.03
0.71 -0.25
-0.02
29 EIF2C2 (AF121255) 0.60 1760 0.30 0.005 0.29 0.27 0.18 0.04 0.27 0.13
Median2: 0.67 1218 0.32 0.003 0.33 0.32 0.10 0.24 0.13 0.09
The correlations were computed using the 127 samples studied (All), the 98 female samples and the 29 male samples except for the correlation with severity which only had 87 non-missing scores (64 female and 23 male). Four of the candidate genes indicated in bold satisfied our IWGCNA screening criteria (excluding blue module membership). The CFS Severity column is bolded forclarity.
1The rank of each gene in terms of its MEblue correlation out of the 8966 genes used to start the analysis.2The median was computed using the absolute value.
Table 5: Pearson correlations (r) between the expression profiles of the 29 candidate genes from the standard analysis and MEblue, severity, and the TPH2 SNP. (Continued)
Page 17 of 21(page number not for citation purposes)
BMC Systems Biology 2008, 2:95 http://www.biomedcentral.com/1752-0509/2/95
where the competing models have the following interpre-tations model 2 implies that ME causes xi, model 3implies that the SNP directly affects both xi and ME so thatgiven the SNP they are independent of each other (con-founded model), model 4 implies that the SNP and MEboth affect xi and model 5 implies that the SNP and xi bothaffect ME. Although NEO performs well in simulationstudies and several real data applications [18], we notethat it has several limitations. The first limitation is that itrequires the availability of genetic markers that are signif-icantly associated with at least one trait per edge. Spuriousassociations between the markers and traits will result inmeaningless edge orienting scores. The second limitationis that the structural equation model (SEM)-based edge
LEO x ME SNP
p SNP xi MEp SNP M
i( | )
log( : )
max
( :
→ =
→ →→10
12
model model EE xi
p xi SNP ME
p SNP xi ME
p
→← →
→ ←
),
( : ),
( : ),
(
model
model
model
3
4
5:: )
,
SNP ME xi→ ←
⎛
⎝
⎜⎜⎜⎜⎜
⎞
⎠
⎟⎟⎟⎟⎟
⎛
⎝
⎜⎜⎜⎜⎜⎜⎜⎜⎜⎜⎜⎜
⎞
⎠
⎟⎟⎟⎟⎟⎟⎟⎟⎟⎟⎟⎟
Boxplot comparisons of correlation distributions for the 20 candidate genes from the IWGCNA and the 29 candidate genes from the standard analysisFigure 6Boxplot comparisons of correlation distributions for the 20 candidate genes from the IWGCNA and the 29 candidate genes from the standard analysis. The correlations with severity are higher among the standard analysis candi-date genes, but the MEblue and TPH2 SNP correlations are higher for the IWGCNA candidates.
IWGCNA: 20 genes Standard: 29 genes
0.15
0.20
0.25
0.30
0.35
Correlation with Severity
IWGCNA: 20 genes Standard: 29 genes
0.3
0.4
0.5
0.6
0.7
0.8
0.9
Correlation with MEblue
IWGCNA: 20 genes Standard: 29 genes
0.00
0.05
0.10
0.15
0.20
Correlation with the TPH2 SNP
Page 18 of 21(page number not for citation purposes)
BMC Systems Biology 2008, 2:95 http://www.biomedcentral.com/1752-0509/2/95
orienting scores assume linear relationships betweentraits and SNP markers. This is mathematically convenientand allows the NEO approach to work in the domain oflinear graphical models since it is based on correlationsand SEMs. The third limitation is that causal inference andstructural equation modeling assume that relevant traitsand causal anchors have been included in the causalmodel. Under-specified causal models, i.e. models thatomit important variables, may mislead the user to detectspurious causal relationships.
Pathway Annotation SoftwareIngenuity Pathways Analysis (IPA) software allowed us tocompare co-expression interactions with interactioninformation that was manually curated from the literatureand to annotate these interactions with the closest match-ing biological functions. The user-input or "focus" genelist was compared to the "Global Molecular Network"(GMN) database consisting of thousands of genes andinteractions. The focus genes were sorted based on highestto lowest connectivities within the GMN, and then net-works of approximately 35 genes were grown starting withthe most connected focus gene. IPA creates networksbased on the principle that highly connected gene net-works are most biologically meaningful. It assigns a p-value for a network of size n and an input focus gene listof size f by calculating the probability of finding f or morefocus genes in a randomly selected set of n genes from theGMN. Since these p-values are generally small, the -log10(p-value) "p-score" is reported. Similarly, a Fisherexact test p-value is calculated for the functional analysis.In this case the four categories include genes associated/not associated with the annotation and focus/non-focusgenes. The IPA p-values were not corrected for multipletesting, and the authors recommend them as rough guidesfor approximating molecular function http://www.ingenuity.com. The IPA interaction database is manuallycurated by scientists and updated quarterly. The resultspresented here were obtained in August 2008.
Data and software availabilityThe complete chronic fatigue syndrome gene expression,genotype and clinical data, and R statistical software codefor the IWGCNA presented here can be found athttp:www.genetics.ucla.edu/labs/horvath/CoexpressionNet work/CFS.
Authors' contributionsAPP and SH developed the methods and wrote the article.APP and CJS analyzed the data. MSR, SDV, EMS, and JCPrevised the manuscript.
The Centers for Disease Control (CDC) collected thechronic fatigue gene expression, SNP marker and clinicaltrait data. At the CDC, TW supervises the genomics and
proteomics laboratory in the Molecular EpidemiologyProgram in the Chronic Viral Diseases Branch; MSR super-vises the genetics laboratory in the Molecular Epidemiol-ogy Program in the Chronic Viral Diseases Branch; SDV isTeam Leader of the Molecular Epidemiology Program inthe Chronic Viral Diseases Branch. All authors haveapproved the manuscript.
Additional material
AcknowledgementsWe thank the Centers for Disease Control and Prevention for making the data available to the Critical Assessment of Microarray Data Analysis con-ference. We also thank Jason Aten, Jun Dong, Ai Li, Jake Lusis, Dan Geschwind, Peter Langfelder, Tova Fuller, Roel Ophoff and Wei Zhao for their helpful discussions.
Funding
This work was supported in part by USPHS grants U19 AI063603 (SH), T32 HG002536 (APP), P50CA092131 (SH), HL28481 (SH) and CA16042 (SH).
References1. Zhou L, Ma X, Sun F: The effects of protein interactions, gene
essentiality and regulatory regions on expression variation.BMC Syst Biol 2008, 2:54.
2. Shieh GS, Chen CM, Yu CY, Huang J, Wang WF, Lo YC: Inferringtranscriptional compensation interactions in yeast via step-wise structure equation modeling. BMC Bioinformatics 2008,9:134.
3. Wei H, Persson S, Mehta T, Srinivasasainagendra V, Chen L, Page GP,Somerville C, Loraine A: Transcriptional coordination of themetabolic network in Arabidopsis. Plant Physiol 2006,142(2):762-74.
4. Stuart JM, Segal E, Koller D, Kim SK: A gene-coexpression net-work for global discovery of conserved genetic modules. Sci-ence 2003, 302(5643):249-55.
5. Emilsson V, Thorleifsson G, Zhang B, Leonardson AS, Zink F, Zhu J,Carlson S, Helgason A, Walters GB, Gunnarsdottir S, Mouy M,Steinthorsdottir V, Eiriksdottir GH, Bjornsdottir G, Reynisdottir I,Gudbjartsson D, Helgadottir A, Jonasdottir A, Styrkarsdottir U, Gre-tarsdottir S, Magnusson KP, Stefansson H, Fossdal R, Kristjansson K,Gislason HG, Stefansson T, Leifsson BG, Thorsteinsdottir U, Lamb JR,Gulcher JR, Reitman ML, Kong A, Schadt EE, Stefansson K: Geneticsof gene expression and its effect on disease. Nature 2008,452(7186):423-8.
6. Oldham MC, Horvath S, Geschwind DH: Conservation and evolu-tion of gene coexpression networks in human and chimpan-zee brains. Proc Natl Acad Sci USA 2006, 103(47):17973-8.
Additional file 1Functional annotation of IWGCNA candidate genes.Click here for file[http://www.biomedcentral.com/content/supplementary/1752-0509-2-95-S1.pdf]
Additional file 2Results for 89 genes that met the IWGCNA criteria out of the 8966 most varying genes.Click here for file[http://www.biomedcentral.com/content/supplementary/1752-0509-2-95-S2.pdf]
Page 19 of 21(page number not for citation purposes)
BMC Systems Biology 2008, 2:95 http://www.biomedcentral.com/1752-0509/2/95
7. Subramanian A, Tamayo P, Mootha VK, Mukherjee S, Ebert BL, Gil-lette MA, Paulovich A, Pomeroy SL, Golub TR, Lander ES, Mesirov JP:Gene set enrichment analysis: a knowledge-based approachfor interpreting genome-wide expression profiles. Proc NatlAcad Sci USA 2005, 102(43):15545-50.
8. Zhang B, Horvath S: A general framework for weighted geneco-expression network analysis. Stat Appl Genet Mol Biol 2005,4:Article17 [http://www.bepress.com/sagmb/vol4/iss1/art17/].
9. Horvath S, Zhang B, Carlson M, Lu KV, Zhu S, Felciano RM, LauranceMF, Zhao W, Qi S, Chen Z, Lee Y, Scheck AC, Liau LM, Wu H,Geschwind DH, Febbo PG, Kornblum HI, Cloughesy TF, Nelson SF,Mischel PS: Analysis of oncogenic signaling networks in gliob-lastoma identifies ASPM as a molecular target. Proc Natl AcadSci USA 2006, 103(46):17402-17407.
10. Ghazalpour A, Doss S, Zhang B, Wang S, Plaisier C, Castellanos R,Brozell A, Schadt EE, Drake TA, Lusis AJ, Horvath S: IntegratingGenetic and Network Analysis to Characterize GenesRelated to Mouse Weight. PLoS Genet 2006, 2(8):.
11. Fuller TF, Ghazalpour A, Aten JE, Drake TA, Lusis AJ, Horvath S:Weighted gene coexpression network analysis strategiesapplied to mouse weight. Mamm Genome 2007, 18(6–7):463-72.
12. Gargalovic PS, Imura M, Zhang B, Gharavi NM, Clark MJ, Pagnon J,Yang WP, He A, Truong A, Patel S, Nelson SF, Horvath S, Berliner JA,Kirchgessner TG, Lusis AJ: Identification of inflammatory genemodules based on variations of human endothelial cellresponses to oxidized lipids. Proc Natl Acad Sci USA 2006,103(34):12741-6.
13. Katan MB: Apolipoprotein E isoforms, serum cholesterol, andcancer. Lancet 1986, 1(8479):507-8.
14. Clayton D, McKeigue PM: Epidemiological methods for studyinggenes and environmental factors in complex diseases. Lancet2001, 358(9290):1356-1360.
15. Smith D, Ebrahim S: Mendelian randomization': can genetic epi-demiology contribute to understanding environmentaldeterminants of disease? Int J Epidemiol 2003, 32:1-22.
16. Little J, Khoury M: Mendelian randomization: a new spin or realprogress? Lancet 2003, 362:930-931.
17. Schadt EE, Lamb J, Yang X, Zhu J, Edwards S, Guhathakurta D, Sie-berts SK, Monks S, Reitman M, Zhang C, Lum PY, Leonardson A,Thieringer R, Metzger JM, Yang L, Castle J, Zhu H, Kash SF, Drake TA,Sachs A, Lusis AJ: An integrative genomics approach to infercausal associations between gene expression and disease.Nat Genet 2005, 37(7):710-717.
18. Aten JE, Fuller TF, Lusis AJ, Horvath S: Using genetic markers toorient the edges in quantitative trait networks: the NEOsoftware. BMC Syst Biol 2008, 2:34.
19. Chaibub Neto E, Ferrara CT, Attie AD, Yandell BS: Inferring causalphenotype networks from segregating populations. Genetics2008, 179(2):1089-100.
20. Opgen-Rhein R, Strimmer K: From correlation to causation net-works: a simple approximate learning algorithm and itsapplication to high-dimensional plant gene expression data.BMC Syst Biol 2007, 1:37.
21. Li R, Tsaih SW, Shockley K, Stylianou IM, Wergedal J, Paigen B,Churchill GA: Structural model analysis of multiple quantita-tive traits. PLoS Genet 2006, 2(7):e114.
22. Chen Y, Zhu J, Lum PY, Yang X, Pinto S, MacNeil DJ, Zhang C, LambJ, Edwards S, Sieberts SK, Leonardson A, Castellini LW, Wang S,Champy MF, Zhang B, Emilsson V, Doss S, Ghazalpour A, Horvath S,Drake TA, Lusis AJ, Schadt EE: Variations in DNA elucidatemolecular networks that cause disease. Nature 2008,452(7186):429-35.
23. Centers for Disease Control and Prevention, ChronicFatigue Syndrome 2006 [http://www.cdc.gov/cfs]
24. Fukuda K, Straus SE, Hickie I, Sharpe MC, Dobbins JG, Komaroff A:The chronic fatigue syndrome: a comprehensive approachto its definition and study. International Chronic FatigueSyndrome Study Group. Ann Intern Med 1994, 121(12):953-9.
25. Bains W: Treating Chronic Fatigue states as a disease of theregulation of energy metabolism. Med Hypotheses 2008,71(4):481-488.
26. Hench PK: Evaluation and differential diagnosis of fibromyal-gia. Approach to diagnosis and management. Rheum Dis ClinNorth Am 1989, 15:19-29.
27. Lloyd AR, Gandevia SC, Hales JP: Muscle performance, voluntaryactivation, twitch properties and perceived effort in normal
subjects and patients with the chronic fatigue syndrome.Brain 1991, 114(Pt 1A):85-98.
28. Torpy DJ, Chrousos GP: The three-way interactions betweenthe hypothalamic-pituitary-adrenal and gonadal axes andthe immune system. Baillieres Clin Rheumatol 1996, 10(2):181-98.
29. Kaushik N, Fear D, Richards SC, McDermott CR, Nuwaysir EF, Kel-lam P, Harrison TJ, Wilkinson RJ, Tyrrell DA, Holgate ST, Kerr JR:Gene expression in peripheral blood mononuclear cells frompatients with chronic fatigue syndrome. J Clin Pathol 2005,58(8):826-32.
30. Holmes GP, Kaplan JE, Stewart JA, Hunt B, Pinsky PF, Schonberger LB:A cluster of patients with a chronic mononucleosis-like syn-drome. Is Epstein-Barr virus the cause? JAMA 1987,257(17):2297-302.
31. Klimas NG, Koneru AO: Chronic fatigue syndrome: inflamma-tion, immune function, and neuroendocrine interactions.Curr Rheumatol Rep 2007, 9(6):482-7.
32. Rasmussen AK, Nielsen H, Andersen V, Barington T, Bendtzen K,Hansen MB, Nielsen L, Pedersen BK, Wiik A: Chronic fatigue syn-drome-a controlled cross sectional study. J Rheumatol 1994,21(8):1527-31.
33. Patarca R: Cytokines and chronic fatigue syndrome. Ann N YAcad Sci 2001, 933:185-200.
34. Vojdani A, Ghoneum M, Choppa PC, Magtoto L, Lapp CW: Elevatedapoptotic cell population in patients with chronic fatiguesyndrome: the pivotal role of protein kinase RNA. J Intern Med1997, 242(6):465-478.
35. Kennedy G, Spence V, Underwood C, Belch JJ: Increased neu-trophil apoptosis in chronic fatigue syndrome. J Clin Pathol2004, 57(8):891-3.
36. Silverman MN, Pearce BD, Biron CA, Miller AH: Immune modula-tion of the hypothalamic-pituitary-adrenal (HPA) axis duringviral infection. Viral Immunol 2005, 18:41-78.
37. Rajeevan MS, Smith AK, Dimulescu I, Unger ER, Vernon SD, Heim C,Reeves WC: Glucocorticoid receptor polymorphisms andhaplotypes associated with chronic fatigue syndrome. GenesBrain Behav 2007, 6(2):167-176.
38. Smith AK, White PD, Aslakson E, Vollmer-Conna U, Rajeevan MS:Polymorphisms in genes regulating the HPA axis associatedwith empirically delineated classes of unexplained chronicfatigue. Pharmacogenomics 2006, 7(3):387-94.
39. Goertzel BN, Pennachin C, de Souza Coelho L, Gurbaxani B, MaloneyEM, Jones JF: Combinations of single nucleotide polymor-phisms in neuroendocrine effector and receptor genes pre-dict chronic fatigue syndrome. Pharmacogenomics 2006,7(3):475-83.
40. Vernon SD, Reeves WC: The challenge of integrating disparatehigh-content data: epidemiological, clinical and laboratorydata collected during an in-hospital study of chronic fatiguesyndrome. Pharmacogenomics 2006, 7(3):345-54.
41. Whistler T, Unger ER, Nisenbaum R, Vernon SD: Integration ofgene expression, clinical, and epidemiologic data to charac-terize Chronic Fatigue Syndrome. J Transl Med 2003, 1:10.
42. Smith AK, Dimulescu I, Falkenberg VR, Narasimhan S, Heim C, Ver-non SD, Rajeevan MS: Genetic evaluation of the serotonergicsystem in chronic fatigue syndrome. Psychoneuroendocrinology2008, 33(2):188-97.
43. Ferrara CT, Wang P, Neto EC, Stevens RD, Bain JR, Wenner BR,Ilkayeva OR, Keller MP, Blasiole DA, Kendziorski C, Yandell BS, New-gard CB, Attie AD: Genetic networks of liver metabolismrevealed by integration of metabolic and transcriptional pro-filing. PLoS Genet 2008, 4(3):e1000034.
44. R Development Core Team: R: A Language and Environmentfor Statistical Computing. 2008 [http://www.R-project.org].
45. Horvath S, Dong J: Geometric interpretation of gene coexpres-sion network analysis. PLoS Comput Biol 2008, 4(8):e1000117.
46. Dong J, Horvath S: Understanding network concepts in mod-ules. BMC Syst Biol 2007, 1:24.
47. Yip AM, Horvath S: Gene network interconnectedness and thegeneralized topological overlap measure. BMC Bioinformatics2007, 8:22.
48. Ravasz E, Somera AL, Mongru DA, Oltvai ZN, Barabasi AL: Hierar-chical organization of modularity in metabolic networks. Sci-ence 2002, 297(5586):1551-5.
Page 20 of 21(page number not for citation purposes)
BMC Systems Biology 2008, 2:95 http://www.biomedcentral.com/1752-0509/2/95
Publish with BioMed Central and every scientist can read your work free of charge
"BioMed Central will be the most significant development for disseminating the results of biomedical research in our lifetime."
Sir Paul Nurse, Cancer Research UK
Your research papers will be:
available free of charge to the entire biomedical community
peer reviewed and published immediately upon acceptance
cited in PubMed and archived on PubMed Central
yours — you keep the copyright
Submit your manuscript here:http://www.biomedcentral.com/info/publishing_adv.asp
BioMedcentral
49. Li A, Horvath S: Network Neighborhood Analysis With TheMulti-Node Topological Overlap Measure. Bioinformatics 2007,23(2):222-231.
50. Freeman L: A Set of Measures of Centrality Based onBetweenness. Sociometry 1977, 40:35-41.
51. Reyes M, Nisenbaum R, Hoaglin DC, Unger ER, Emmons C, RandallB, Stewart JA, Abbey S, Jones JF, Gantz N, Minden S, Reeves WC:Prevalence and incidence of chronic fatigue syndrome inWichita, Kansas. Arch Intern Med 2003, 163(13):1530-6.
52. Reeves WC, Wagner D, Nisenbaum R, Jones JF, Gurbaxani B, Solo-mon L, Papanicolaou DA, Unger ER, Vernon SD, Heim C: Chronicfatigue syndrome-a clinically empirical approach to its defi-nition and study. BMC Med 2005, 3:19.
53. Walther DJ, Peter JU, Bashammakh S, Hortnagl H, Voits M, Fink H,Bader M: Synthesis of serotonin by a second tryptophanhydroxylase isoform. Science 2003, 299(5603):76.
54. Zhang X, Gainetdinov RR, Beaulieu JM, Sotnikova TD, Burch LH, Wil-liams RB, Schwartz DA, Krishnan KR, Caron MG: Loss-of-functionmutation in tryptophan hydroxylase-2 identified in unipolarmajor depression. Neuron 2005, 45:11-6.
55. Lane RJ, Soteriou BA, Zhang H, Archard LC: Enterovirus relatedmetabolic myopathy: a postviral fatigue syndrome. J NeurolNeurosurg Psychiatry 2003, 74(10):1382-1386.
56. Janal MN, Ciccone DS, Natelson BH: Sub-typing CFS patients onthe basis of 'minor' symptoms. Biol Psychol 2006, 73(2):124-131.
57. Lloyd AR, Hickie I, Boughton CR, Spencer O, Wakefield D: Preva-lence of chronic fatigue syndrome in an Australian popula-tion. Med J Aust 1990, 153(9):522-8.
58. Kerr JR, Petty R, Burke B, Gough J, Fear D, Sinclair LI, Mattey DL,Richards SC, Montgomery J, Baldwin DA, Kellam P, Harrison TJ, Grif-fin GE, Main J, Enlander D, Nutt DJ, Holgate ST: Gene expressionsubtypes in patients with chronic fatigue syndrome/myalgicencephalomyelitis. J Infect Dis 2008, 197(8):1171-84.
59. Flanagan SP: 'Nude', a new hairless gene with pleiotropiceffects in the mouse. Genet Res 1966, 8:295-309.
60. Pantelouris EM: Absence of thymus in a mouse mutant. Nature1968, 217(5126):370-371.
61. De Sousa MA, Parrott DM, Pantelouris EM: The lymphoid tissuesin mice with congenital aplasia of the thymus. Clin Exp Immunol1969, 4(6):637-644.
62. Adriani M, Martinez-Mir A, Fusco F, Busiello R, Frank J, Telese S,Matrecano E, Ursini MV, Christiano AM, Pignata C: Ancestralfounder mutation of the nude (FOXN1) gene in congenitalsevere combined immunodeficiency associated with alo-pecia in southern Italy population. Ann Hum Genet 2004, 68(Pt3):265-8.
63. Pignata C, Fiore M, Guzzetta V, Castaldo A, Sebastio G, Porta F, Gua-rino A: Congenital Alopecia and nail dystrophy associatedwith severe functional T-cell immunodeficiency in two sibs.Am J Med Genet 1996, 65(2):167-70.
64. Chang TS, Cho CS, Park S, Yu S, Kang SW, Rhee SG: PeroxiredoxinIII, a mitochondrion-specific peroxidase, regulates apoptoticsignaling by mitochondria. J Biol Chem 2004, 279(40):41975-84.
65. Wonsey DR, Zeller KI, Dang CV: The c-Myc target gene PRDX3is required for mitochondrial homeostasis and neoplastictransformation. Proc Natl Acad Sci USA 2002, 99(10):6649-54.
66. Elpeleg O, Miller C, Hershkovitz E, Bitner-Glindzicz M, Bondi-Rubin-stein G, Rahman S, Pagnamenta A, Eshhar S, Saada A: Deficiency ofthe ADP-forming succinyl-CoA synthase activity is associ-ated with encephalomyopathy and mitochondrial DNAdepletion. Am J Hum Genet 2005, 76(6):1081-1086.
67. Carrozzo R, Dionisi-Vici C, Steuerwald U, Lucioli S, Deodato F, DiGiandomenico S, Bertini E, Franke B, Kluijtmans LA, Meschini MC,Rizzo C, Piemonte F, Rodenburg R, Santer R, Santorelli FM, van RooijA, Vermunt-de Koning D, Morava E, Wevers RA: SUCLA2 muta-tions are associated with mild methylmalonic aciduria,Leigh-like encephalomyopathy, dystonia and deafness. Brain2007, 130(Pt 3):862-874.
68. Storey JD, Tibshirani R: Statistical significance for genomewidestudies. Proc Natl Acad Sci USA 2003, 100(16):9440-5.
69. Kurup RK, Kurup PA: Hypothalamic digoxin, cerebral chemicaldominance and myalgic encephalomyelitis. Int J Neurosci 2003,113(5):683-701.
70. Kaasa S, Knobel H, Loge JH, Hjermstad MJ: Hodgkin's disease:quality of life in future trials. Ann Oncol 1998, 9(Suppl 5):137-45.
71. Reeves WC, Lloyd A, Vernon SD, Klimas N, Jason LA, Bleijenberg G,Evengard B, White PD, Nisenbaum R, Unger ER: Identification ofambiguities in the 1994 chronic fatigue syndrome researchcase definition and recommendations for resolution. BMCHealth Serv Res 2003, 3:25.
Page 21 of 21(page number not for citation purposes)