Embed Size (px)
Citation preview
SOFTWARE Open Access
Construct and Compare Gene CoexpressionNetworks with DAPfinder and DAPviewJeff Skinner1, Yuri Kotliarov2, Sudhir Varma1, Karina L Mine3, Anatoly Yambartsev4, Richard Simon5,Yentram Huyen1* and Andrey Morgun6*
Abstract
Background: DAPfinder and DAPview are novel BRB-ArrayTools plug-ins to construct gene coexpression networksand identify significant differences in pairwise gene-gene coexpression between two phenotypes.
Results: Each significant difference in gene-gene association represents a Differentially Associated Pair (DAP). Ourtools include several choices of filtering methods, gene-gene association metrics, statistical testing methods andmultiple comparison adjustments. Network results are easily displayed in Cytoscape. Analyses of gliomaexperiments and microarray simulations demonstrate the utility of these tools.
Conclusions: DAPfinder is a new friendly-user tool for reconstruction and comparison of biological networks.
BackgroundMicroarray researchers need easy-to-use tools to identifydifferences in the coexpression and coregulation of genesbetween phenotypes that cannot be identified with tradi-tional tools. Often researchers compute Student’s t-tests,analysis of variance (ANOVA), significance analysis ofmicroarrays [1] or empirical Bayes analysis [2] for eachgene on their microarray to identify individual differen-tially expressed genes (DEGs) among two or more phe-notypes [3]. Unfortunately, these approaches ignorecoexpression because they cannot account for the com-plex multivariate relationships among genes. Multivariatestatistical methods like hierarchical clustering and princi-ple components analysis (PCA) are often used for qualitycontrol and exploration of microarray data. However,these multivariate methods do not effectively modelcoexpression nor do they allow for hypothesis tests tocompare phenotypes. Gene-gene association networksbuilt using ARACNe [4], context likelihood relatedness
(CLR) [5], maximum relevancy (MR) [6,7] and othermethods often provide helpful models of coexpressionand coregulation, but the networks are based on datafrom a single phenotype and are not easily comparedusing statistical tests. New methods are needed toaccount for the complex relationships among genes whileproviding hypothesis tests to compare phenotypes.Several research groups have addressed the question of
comparing the coexpression of specific gene-gene pairsor coexpression networks among two or more pheno-types. Two early examples used search algorithms toidentify optimally sized clusters of coexpressed genes andresampling tests to identify significant differences amongthe coexpressed clusters between phenotypes [8,9]. Otherpublished methods used variations on familiar statisticaltechniques like Fisher’s Z tests or modified F-statistics todirectly compare pairwise gene-gene correlationsbetween two phenotypes [10-12]. Some of these meth-ods [10,11,13] are readily available as source scripts ofpackage libraries in R http://www.r-project.org. Someinteresting approaches apply the results from statisticaltests that compare pairwise gene-gene associationsbetween two phenotypes to the construction and inter-pretation of gene coexpression networks [10,14]. Both ofthese methods allow researchers to explore the complexdifferences among gene expression networks using statis-tical tests, but unfortunately neither method has beenimplemented in a user-friendly tool.
* Correspondence: [email protected]; [email protected] and Computational Biosciences Branch (BCBB), Office ofCyber Infrastructure and Computational Biology (OCICB), National Institute ofAllergy and Infectious Disease (NIAID), National Institutes if Health (NIH),Bethesda, Maryland, USA6“Ghost Lab”, T-Cell Tolerance and Memory Section (TCTMS), Laboratory ofCellular and Molecular Immunology (LCMI), National Institute of Allergy andInfectious Disease (NIAID), National Institutes if Health (NIH), Bethesda,Maryland, USAFull list of author information is available at the end of the article
Skinner et al. BMC Bioinformatics 2011, 12:286http://www.biomedcentral.com/1471-2105/12/286
© 2011 Skinner et al; licensee BioMed Central Ltd. This is an Open Access article distributed under the terms of the Creative CommonsAttribution License (http://creativecommons.org/licenses/by/2.0), which permits unrestricted use, distribution, and reproduction inany medium, provided the original work is properly cited.

DAPfinder and DAPview are plug-ins for BRB-Array-Tools http://linus.nci.nih.gov/BRB-ArrayTools.html, whichwill provide researchers with accessible tools to test differ-ences in the coexpression between two phenotypes andexplore those results on gene association networks. BRB-ArrayTools is a comprehensive microarray analysis pack-age that does not require specific skills in programming ordirect script usage. It is available for free to non-commer-cial users and has more than 11,000 users in 65 coun-tries [15]. Our DAPfinder and DAPview tools will identifyand visualize individual significant differences in gene-gene association between the two classes, each of whichwe will call a Differentially Associated Pair (DAP). Outputfrom these tools can be used to construct gene-gene asso-ciation networks and identify the significant differences incoexpression between two groups. Our hope is that thesetools can be used to identify systems-level features in thegene-gene association networks like network growth ordecay, network merging or splitting, and network birth ordeath, reflecting functional changes in biological pathways.
ImplementationDAPfinderDAPfinder is used to compute pair-wise gene-gene asso-ciations (i.e. gene-gene correlations) for two groups ofmicroarray experiments, then compare each specific gene-gene association between the two groups with a statisticaltest (Additional file 1, Figure S1). Gene-gene associationscan be estimated using Pearson correlation coefficients,Spearman rank correlation coefficients, Kendall rank cor-relation coefficients or mutual information. Pearson corre-lations are the most familiar metric and the easiest tocompute, but only the Spearman, Kendall and mutualinformation metrics are appropriate for nonlinear associa-tions between genes. Significant Pearson correlationswithin each class are identified using a one-sample Fisher’sZ-test. Differences in gene-gene correlations (i.e. Pearson,Spearman and Kendall) are automatically tested usingFisher’s Z-test methods, while optional permutation testsare used to compare differences in gene-gene correlationor mutual information. P-values from the Fisher’s Z-testmethods are approximate p-values that assume large sam-ple sizes; permutation tests make no assumption aboutsample size, but they require lengthy computation times.Permutation test calculations can be hastened by choosingfrom one of four gene-gene pair subset selection methods(Additional file 1, Figure S1). Tests can be computed withequal numbers of permutations for each gene-gene pair orwith an adaptive method that identifies the minimumnumber of permutations required for each gene-gene pair.Fisher’s Z-tests of individual Pearson correlations withineach class or differences in correlation between thetwo classes can be corrected for multiple testing usingfalse discovery rate (FDR) methods [16,17], q-value
methods [18-20] or Bonferroni family-wise error rate(FWER) methods using step-up adjusted p-values [21].The same multiple testing adjustments can be applied tothe optional permutation tests. Researchers can pre-filterindividual genes by the coefficient of variation (CV) oftheir gene expression, by a minimum sample size criteria(after outliers and missing data have been removed) orusing the internal methods of BRB-ArrayTools. Research-ers can also upload a specific list of gene-gene pairs fortesting. Outliers among the individual expression valuesfrom each gene can be removed using univariate standarddeviation or interquartile range (IQR) criteria.Output from DAPfinder includes a hyper-text markup
language (HTML) report and comprehensive outputstored as an Excel spreadsheet or tab-delimited text file.The HTML report opens up automatically in a webbrowser to display the current user settings and diagnos-tics from the analyses. Reported user settings includechoices of pre-filtering methods, association metrics andstatistical tests, plus the directory location of the results.Diagnostics include the amount of missing data, thenumber of genes and gene-gene pairs used in the calcula-tions and the computation time required. Optionally, the10 most significant results from the Fisher’s Z-tests andpermutation test can be added to the HTML report. Thecomprehensive output includes the unique IDs andrelated annotations for both genes in each gene-genepair, the individual gene-gene associations for each of thetwo groups with test statistics and p-values reported forthe Pearson correlations in each group, the Fisher’sZ-test statistics and p-values for comparisons betweenthe two groups and finally the differences in associationand permutation p-values between the two groups (ifrequested). These results can be sorted and reorganizedin Excel to identify the most significant gene-gene asso-ciations in a single group, the most significant Fisher’sZ-test results, etc. Results from the comprehensiveoutput file can be directly imported into visualizationsoftware packages like Cytoscape [[22], http://www.cytos-cape.org] to create network graphs using the two col-umns of unique IDs to define nodes and the columns ofcorrelation coefficients or p-values to define edgeweights. Both the HTML report and the comprehensiveoutput are automatically saved to the user’s BRB-Array-Tools project folder.
DAPviewDAPview graphs the expression values for two specificgenes in a XY scatter plot with the differences in coex-pression between two phenotypes displayed in differentcolors and symbols (Figure 1). Typically, a statisticallysignificant difference in gene-gene association would bediscovered using DAPfinder, then the relationship canbe visualized with DAPview. The two groups are
Skinner et al. BMC Bioinformatics 2011, 12:286http://www.biomedcentral.com/1471-2105/12/286
Page 2 of 8

graphed using different colors and symbols with a figurelegend clearly identifying each group. Researchers canchoose to identify, eliminate or ignore the outlierexpression values identified by the same univariate stan-dard deviation or interquartile (IQR) range criteria fromDAPfinder. Identified outliers are plotted in red, whileeliminated outliers are completely removed from thegraph and ignored outliers are plotted in the same col-ors as the legitimate data. Scatter plot graphs are auto-matically opened in portable document file (PDF)format and saved into the user’s BRB-ArrayTools projectfolder.
ResultsEvaluation of DAPfinder with Simulated Microarray DataThe efficacy of the DAPfinder procedures was evaluatedusing simulated microarray data with known gene-genecorrelations to ensure its statistical methods can detectknown differences in gene-gene association with highlevels of statistical power and low levels of false posi-tives. See the supplementary materials (Additional file 1)for details on the generation of simulated microarraydata and other simulation methods. Simulation resultswere used to create receiver-operator characteristic(ROC) curves that explore the relationships between sta-tistical power, sample size and effect strength under sev-eral different simulation conditions. Other simulationsexamined the relationship between approximate p-valuesfrom the Fisher’s Z-tests and exact p-values from thepermutation tests. Simulations were conducted entirely
in R using the same R source code used to buildDAPfinder.Examining changes in Area Under Curve (AUC) for the
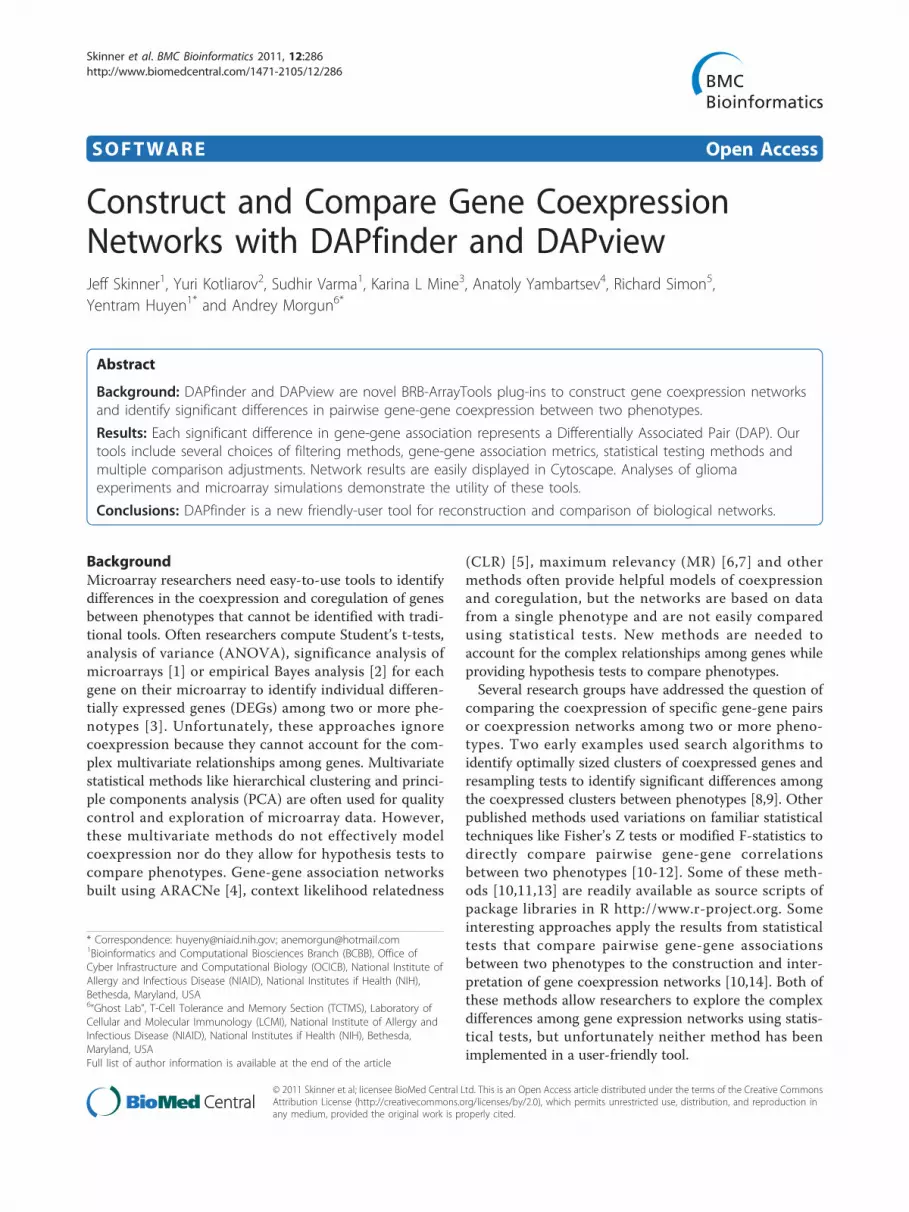
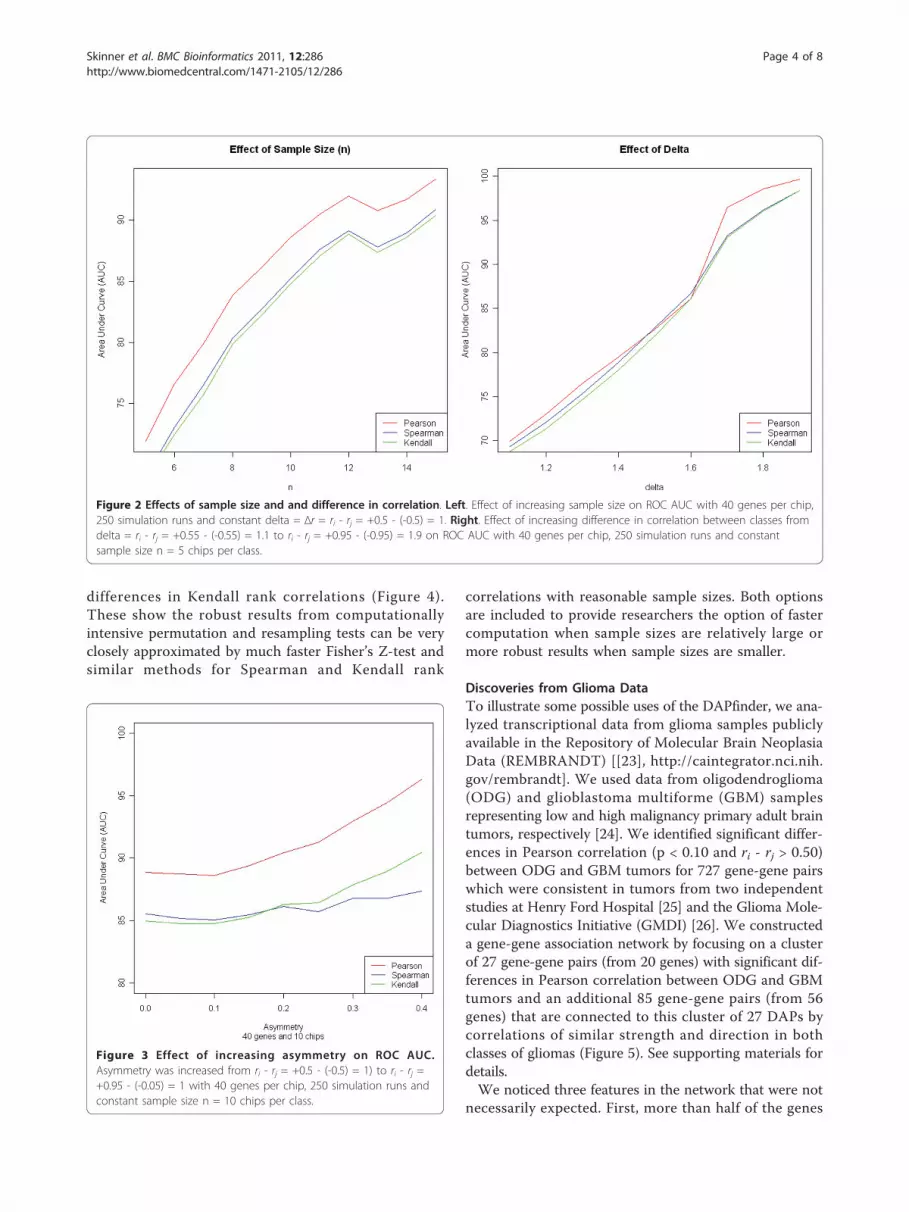
ROC quickly revealed many properties of the analyses inDAPfinder. Not surprisingly, results from the simulationsshow that sensitivity (i.e. statistical power) and specificity(i.e. control over false positives) increase as sample sizes(n) or differences in correlation (delta = Δr = ri - rj)increase (Figure 2) when all other experimental condi-tions are held constant (Additional file 1, supplementaryinformation). These results show the DAPfinder per-forms well even for relatively small sample sizes and dif-ferences in correlation. Increasing as the number ofgenes on each microarray chip did not affect sensitivityor specificity (Additional file 1, Figure S6), supportingour decision to use simulations with a small number ofgenes per chip because they are more efficient (see Addi-tional file 1, supplementary materials, for details). In thereal world, increasing the number of genes per chipwould decrease statistical power due to the more conser-vative FDR- and FWER adjustments for multiple testingand possible due to higher level interactions among largenumbers of genes. However, these simulations computedROC curves using unadjusted p-values and fixed num-bers of interacting genes. It may be surprising that sensi-tivity and specificity did not change as the expressionvariances of individual genes increased (Additional file 1,Figure S7) with all other experimental conditions heldconstant. However, increasing the individual gene expres-sion variance does not affect sensitivity and specificity,because the correlation of two genes is a property of thejoint distribution that is not solely dependent on themagnitude of individual gene expression variances. Per-haps the most important simulation result showed thatsensitivity and specificity increased as correlation coeffi-cients from the two groups changes from perfectly sym-metric with ri - rj = +0.5 - (-0.5) = 1 to increasinglyasymmetric coefficients like ri - rj = +0.95 - (-0.05) = 1 orri - rj = +0.05 - (-0.95) = 1 with all other conditions heldconstant (Figure 3). Asymmetric correlation coefficientshave more statistical power because the nonlinear Fish-er’s Z-transformation used in the Fisher’s Z-test inflatesz-scores for strong correlations and deflates z-scores formoderate correlations (Additional file 1, Figure S8),creating larger differences in Z-scores and more signifi-cant Fisher’s Z-tests.Additional simulations showed approximate p-values
from the Fisher’s Z-test of differences in Pearson corre-lation are strongly correlated to the exact p-values fromthe permutation tests, and the correlation between theapproximate and exact p-values increases with samplesize (Additional file 1, Figure S9). Similar correlationsbetween approximate p-values and exact p-values areseen for differences in Spearman rank correlation and
Figure 1 Negative correlation between MYTL1 gene (probe set216672_at) and SOX5 gene (probe set 207336_at) inoligodendrogliomas (ODG) and no association between SOX5and MYTL1 in glioblastoma multiforme (GBM) illustrated usingthe DAPview.
Skinner et al. BMC Bioinformatics 2011, 12:286http://www.biomedcentral.com/1471-2105/12/286
Page 3 of 8
differences in Kendall rank correlations (Figure 4).These show the robust results from computationallyintensive permutation and resampling tests can be veryclosely approximated by much faster Fisher’s Z-test andsimilar methods for Spearman and Kendall rank
correlations with reasonable sample sizes. Both optionsare included to provide researchers the option of fastercomputation when sample sizes are relatively large ormore robust results when sample sizes are smaller.
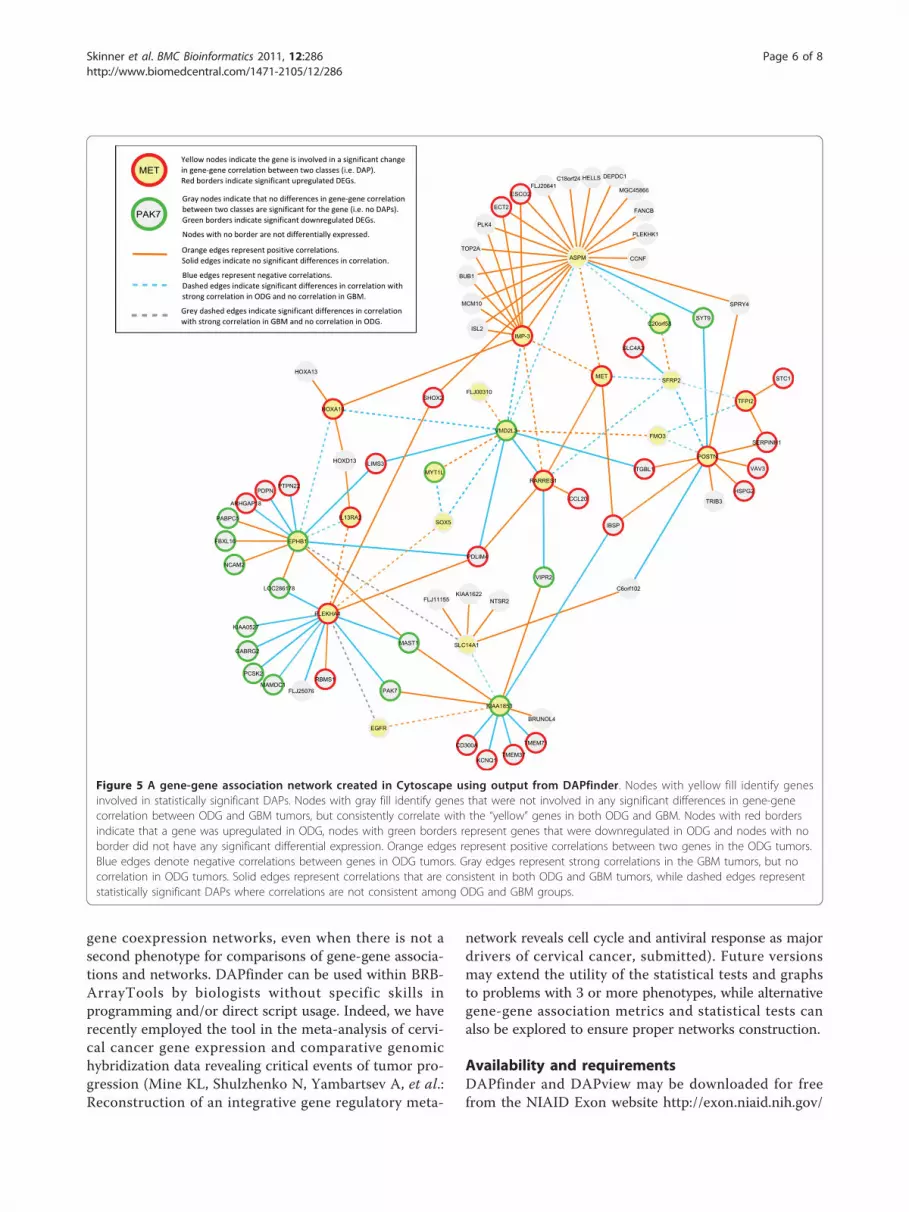
Discoveries from Glioma DataTo illustrate some possible uses of the DAPfinder, we ana-lyzed transcriptional data from glioma samples publiclyavailable in the Repository of Molecular Brain NeoplasiaData (REMBRANDT) [[23], http://caintegrator.nci.nih.gov/rembrandt]. We used data from oligodendroglioma(ODG) and glioblastoma multiforme (GBM) samplesrepresenting low and high malignancy primary adult braintumors, respectively [24]. We identified significant differ-ences in Pearson correlation (p < 0.10 and ri - rj > 0.50)between ODG and GBM tumors for 727 gene-gene pairswhich were consistent in tumors from two independentstudies at Henry Ford Hospital [25] and the Glioma Mole-cular Diagnostics Initiative (GMDI) [26]. We constructeda gene-gene association network by focusing on a clusterof 27 gene-gene pairs (from 20 genes) with significant dif-ferences in Pearson correlation between ODG and GBMtumors and an additional 85 gene-gene pairs (from 56genes) that are connected to this cluster of 27 DAPs bycorrelations of similar strength and direction in bothclasses of gliomas (Figure 5). See supporting materials fordetails.We noticed three features in the network that were not
necessarily expected. First, more than half of the genes
Figure 2 Effects of sample size and and difference in correlation. Left. Effect of increasing sample size on ROC AUC with 40 genes per chip,250 simulation runs and constant delta = Δr = ri - rj = +0.5 - (-0.5) = 1. Right. Effect of increasing difference in correlation between classes fromdelta = ri - rj = +0.55 - (-0.55) = 1.1 to ri - rj = +0.95 - (-0.95) = 1.9 on ROC AUC with 40 genes per chip, 250 simulation runs and constantsample size n = 5 chips per class.
Figure 3 Effect of increasing asymmetry on ROC AUC.Asymmetry was increased from ri - rj = +0.5 - (-0.5) = 1) to ri - rj =+0.95 - (-0.05) = 1 with 40 genes per chip, 250 simulation runs andconstant sample size n = 10 chips per class.
Skinner et al. BMC Bioinformatics 2011, 12:286http://www.biomedcentral.com/1471-2105/12/286
Page 4 of 8

from this network were differentially expressed betweenthe two classes of glioma (46 out 76 genes). This suggeststhere may be a general correlation between differentialexpression and differences in association between pheno-types. Second, the relationship between differentialexpression and direction of correlation from consistentedges may represent potential regulatory relationshipsamong genes. Positive correlations occur whenever bothgenes are up- or down-regulated, while negative correla-tions occur whenever one gene is up-regulated and theother is down-regulated. Note, because the correlationsare estimated within the same type of samples, eitherODG or GBM, the fact that genes are up- or down-regu-lated in GBM relative to ODG should not influence thecorrelation results. This phenomenon is seen in all 48correlations that are consistent between the ODG andGBM tumors. Third, the significant differences in gene-gene association seem to reflect the biological differencesbetween ODG and GBM. Correlations that change direc-tion between glioma types typically show strong positiveor negative correlations consistent with regulation inODG, while having zero correlation in GBM. This sug-gests that evolution of the tumor may lead to the loss ofregulatory relationships in the de-differentiating tissue.The gene-gene association shrinks from 76 genes and110 gene-gene pairs in ODG to 69 genes and 87 gene-gene pairs in GBM, suggesting systems-level networkshrinkage from ODG to GBM resulting in loss of regula-tion functions.Among the significant correlation changes in the net-
work, we find three genes (MYT1L, EGFR, POSTN) knownto have meaningful roles in glioma pathogenesis [27-29].
Myelin transcription factor 1 (MYTL1) is upregulated inthe less malignant ODG tumors and it is a major factornecessary for neuronal differentiation [30]. The significantdifference in Pearson correlation between SOX5 andMYTL1 in ODG and GBM tumors is visualized with DAP-view (Figure 1). Epidermal growth factor receptor (EGFR)is a famous member of the erbB family of receptors thatinvolved in regulation of cell proliferation and differentia-tion. Deregulation of EGFR was shown to have critical rolein gliomas [31] as well as in several other malignan-cies [32-36]. Up-regulation in the protein-coding genePOSTN (periostin) is correlated with metastasis in bothmelanoma and breast cancer [37]. Although this analysisdoes not allow for definitive biological conclusions, it findsboth previously established genes essential for tumorgenesisas wells as points to a new previously unexplored area oftranscriptional regulation of gliomas. These results supportthe idea that estimating not only the structure but alsochanges in the co-expression gene networks can be a usefulapproach for understanding the disease process.
ConclusionsAnalyses of empirical and simulated microarray data haveshown that DAPfinder is a powerful tool to reconstructand compare gene regulatory networks. Its design is notrestricted to gene expression data from single channeland dual channel microarray experiments. The tool canalso be used with expression data from RNA-Seq readsor it can analyze complex quantitative biological data likecomparative genomic hybridization (CGH), metabolome,microbiome and proteome data. DAPfinder can also beused to compute gene-gene associations and construct
Figure 4 Effect of increasing sample size on the relationship between analytical (i.e. approximate) p-values from Fisher’s Z-testprocedures and permutation (i.e. exact) p-values.
Skinner et al. BMC Bioinformatics 2011, 12:286http://www.biomedcentral.com/1471-2105/12/286
Page 5 of 8
gene coexpression networks, even when there is not asecond phenotype for comparisons of gene-gene associa-tions and networks. DAPfinder can be used within BRB-ArrayTools by biologists without specific skills inprogramming and/or direct script usage. Indeed, we haverecently employed the tool in the meta-analysis of cervi-cal cancer gene expression and comparative genomichybridization data revealing critical events of tumor pro-gression (Mine KL, Shulzhenko N, Yambartsev A, et al.:Reconstruction of an integrative gene regulatory meta-
network reveals cell cycle and antiviral response as majordrivers of cervical cancer, submitted). Future versionsmay extend the utility of the statistical tests and graphsto problems with 3 or more phenotypes, while alternativegene-gene association metrics and statistical tests canalso be explored to ensure proper networks construction.
Availability and requirementsDAPfinder and DAPview may be downloaded for freefrom the NIAID Exon website http://exon.niaid.nih.gov/
Figure 5 A gene-gene association network created in Cytoscape using output from DAPfinder. Nodes with yellow fill identify genesinvolved in statistically significant DAPs. Nodes with gray fill identify genes that were not involved in any significant differences in gene-genecorrelation between ODG and GBM tumors, but consistently correlate with the “yellow” genes in both ODG and GBM. Nodes with red bordersindicate that a gene was upregulated in ODG, nodes with green borders represent genes that were downregulated in ODG and nodes with noborder did not have any significant differential expression. Orange edges represent positive correlations between two genes in the ODG tumors.Blue edges denote negative correlations between genes in ODG tumors. Gray edges represent strong correlations in the GBM tumors, but nocorrelation in ODG tumors. Solid edges represent correlations that are consistent in both ODG and GBM tumors, while dashed edges representstatistically significant DAPs where correlations are not consistent among ODG and GBM groups.
Skinner et al. BMC Bioinformatics 2011, 12:286http://www.biomedcentral.com/1471-2105/12/286
Page 6 of 8
dapfinder/index.html. Complete installation instructionsare provided on the website. DAPfinder and DAPviewrequires the installation of BRB-ArrayTools. BRB-Array-Tools currently requires the installation of MicrosoftExcel, Java Virtual Machine, R 2.12.0 or higher and stat-connDCOM on computer using the Microsoft Windowsoperating system. DAPfinder and DAPview are BRB-ArrayTools plug-ins, which mostly utilize open source Rscript files. A complete description of the DAPfinderand DAPview files can be found in our supplementarymaterials (Additional file 1). DAPfinder and DAPvieware also available to download as Additional Files 2and 3.
Additional material
Additional file 1: Additional information and Supplemental figuresnot included in the article. Additional Details About DAPfinderMethods; Development details of DAPfinder and DAPview; Validation ofDAPfinder with Simulated Microarray Data; Discoveries from Glioma Data.
Additional file 2: DAPfinder. DAPfinder plug-in software for BRB-ArrayTools.
Additional file 3: DAPview. DAPview plug-in software for BRB-ArrayTools.
List of abbreviationsANOVA: Analysis of Variance; ARACNe: Algorithm for the Reconstruction ofAccurate Cellular Networks; AUC: Area Under Curve; CGH: ComparativeGenomic Hybridization; CLR: Context Likelihood of Relatedness; CV:Coefficient of Variation; DAP: Differentially Associated Pair; DEG: DifferentiallyExpressed Gene; FDR: False Discovery Rate; FWER: Family-Wise Error Rate;GBM: Glioblastoma multiforme; GMDI: Glioma Molecular DiagnosticsInitiative; HTML: Hyper Text Markup Language; IQR: Interquartile Range; MR:Maximum Relatedness or Minimum Redundancy; ODG: Oligodendroglioma;PCA: Principle Components Analysis; PDF: Portable Document File;REMBRANDT: Repository of Molecular Brain Neoplasia Data; ROC: ReceiverOperator Characteristic.
AcknowledgementsThis work was supported by funding from the Department of IntramuralResearch (DIR) and the Office of the Director (OD) at NIAID, NIH. VivekGopalan, Supriya Menezes and Ming-Chung Li helped with the initial codingof DAPfinder. Vijay Nagarajan and Michael Dolan helped produce and editthe figures. Natalia Shulzenko discussed biological questions motivating ourtool.
Author details1Bioinformatics and Computational Biosciences Branch (BCBB), Office ofCyber Infrastructure and Computational Biology (OCICB), National Institute ofAllergy and Infectious Disease (NIAID), National Institutes if Health (NIH),Bethesda, Maryland, USA. 2Neuro-Oncology Branch (CHIAI), National CancerInstitute (NCI), National Institutes of Neurological Disorder and Stroke(NINDS), National Institutes if Health (NIH), Bethesda, Maryland, USA. 3Setorde Imunogenética, Departamento de Pediatria, Universidade Federal de SãoPaulo (UNIFESP), São Paulo, Brasil. 4Instituto de Matemática e Estatística (IME),Universidade de São Paulo (USP), São Paulo, Brasil. 5Biometric ResearchBranch (BRB), Division of Cancer Treatment and Diagnosis (DCTD), NationalCancer Institute (NCI), National Institutes if Health (NIH), Bethesda, Maryland,USA. 6“Ghost Lab”, T-Cell Tolerance and Memory Section (TCTMS), Laboratoryof Cellular and Molecular Immunology (LCMI), National Institute of Allergyand Infectious Disease (NIAID), National Institutes if Health (NIH), Bethesda,Maryland, USA.
Authors’ contributionsJS was the primary software developer, critically contributed to the overallconcept of the software, performed and analyzed the simulationexperiments, and drafted the manuscript. YK analyzed the glioma data andsimulation results, drafted part of the manuscript related to the glioma dataand provided input on the development of the software. SV assisted withsoftware development, contributed the adaptive permutation test feature tothe software, performed and analyzed simulation experiments. KLM testedthe software and provided input on the development of the software. AYconceived the original idea for the software, provided input on thedevelopment of the software and assisted with the generation of simulatedmicroarray data. RS provided formulas for approximate tests of Kendall andSpearman correlations, contributed the single class correlation selectionprocedure to select gene-gene pairs for permutation tests. YH supervisedthe software development project, provided web distribution of thesoftware and provided input on the development of the software. AMconceived the original idea for the software, provided the originalspecifications for the software, analyzed and interpreted glioma data andsimulation results, drafted parts of the manuscript and provided scientificleadership of the project. All authors reviewed and approved themanuscript.
Authors’ informationNone.
Competing interestsThe authors declare that they have no competing interests.
Received: 7 March 2011 Accepted: 14 July 2011 Published: 14 July 2011
References1. Tusher VG, Tibshirani R, Chu G: Significance analysis of microarrays
applied to the ionizing radiation response. P Natl Acad Sci USA 2001,98:5116-5121.
2. Efron B, Tibshirani R, Storey JD, Tusher V: Empirical Bayes analysis of amicroarray experiment. J Am Stat Assoc 2001, 96:1151-1160.
3. Pan W: A comparative review of statistical methods for discoveringdifferentially expressed genes in replicated microarray experiments.Bioinformatics 2002, 18:546-554.
4. Margolin AA, Nemenman I, Basso K, Wiggins C, Stolovitzky G, DallaFavera R, Califano A: ARACNE: an algorithm for the reconstruction ofgene regulatory networks in a mammalian cellular context. BMCBioinformatics 2006, 7(Suppl 1):S7.
5. Faith JJ, Hayete B, Thaden JT, Mogno I, Wierzbowski J, Cottarel G, Kasif S,Collins JJ, Gardner TS: Large-scale mapping and validation of Escherichiacoli transcriptional regulation from a compendium of expressionprofiles. PLoS Biol 2007, 5:e8.
6. Ding C, Peng H: Minimum redundancy feature selection from microarraygene expression data. J Bioinform Comput Biol 2005, 3:185-205.
7. Peng H, Long F, Ding C: Feature selection based on mutual information:criteria of max-dependency, max-relevance, and min-redundancy. IEEETrans Pattern Anal Mach Intell 2005, 27:1226-1238.
8. Kostka D, Spang R: Finding disease specific alterations in the co-expression of genes. Bioinformatics 2004, 20(Suppl 1):i194-199.
9. Xiao YH, Frisina R, Gordon A, Klebanov L, Yakovlev A: Multivariate searchfor differentially expressed gene combinations. BMC Bioinformatics 2004,5(20).
10. Choi JK, Yu US, Yoo OJ, Kim S: Differential coexpression analysis usingmicroarray data and its application to human cancer. Bioinformatics 2005,21:4348-4355.
11. Dettling M, Gabrielson E, Giovanni P: Searching for differentially expressedgene combinations. Genome Biol 2005, 6(164).
12. Lai Y, Wu B, Chen L, Zhao H: A statistical method for identifyingdifferential gene-gene co-expression patterns. Bioinformatics 2004,20:3146-3155.
13. Watson M: CoXpress: differential co-expression in gene expression data.BMC Bioinformatics 2006, 7(509).
14. Mani KM, Lefebvre C, Wang K, Lim WK, Basso K, Dalla-Favera R, Califano A:A systems biology approach to prediction of oncogenes and molecularperturbation targets in B-cell lymphomas. Mol Syst Biol 2008, 4:169.
Skinner et al. BMC Bioinformatics 2011, 12:286http://www.biomedcentral.com/1471-2105/12/286
Page 7 of 8
15. Simon R, Lam A, Li MC, Ngan M, Menenzes S, Zhao Y: Analysis of GeneExpression Data Using BRB-Array Tools. Cancer Inform 2007, 3:11-17.
16. Benjamini Y, Hochberg Y: Controlling the False Discovery Rate - aPractical and Powerful Approach to Multiple Testing. J Roy Stat Soc B Met1995, 57(1):289-300.
17. Benjamini Y, Yekutieli D: The control of the false discovery rate inmultiple testing under dependency. Ann Stat 2001, 29:1165-1188.
18. Storey JD: A direct approach to false discovery rates. J Roy Stat Soc B2002, 64:479-498.
19. Storey JD: The positive false discovery rate: A Bayesian interpretationand the q-value. Ann Stat 2003, 31:2013-2035.
20. Storey JD, Tibshirani R: Statistical significance for genomewide studies.P Natl Acad Sci USA 2003, 100:9440-9445.
21. Wright SP: Adjusted P-Values for Simultaneous Inference. Biometrics 1992,48:1005-1013.
22. Cline MS, Smoot M, Cerami E, Kuchinsky A, Landys N, Workman C,Christmas R, Avila-Campilo I, Creech M, Gross B, Hanspers K, Isserlin R,Kelley R, Killcoyne S, Lotia S, Maere S, Morris J, Ono K, Pavlovic V, Pico AR,Vailaya A, Wang PL, Adler A, Conklin BR, Hood L, Kuiper M, Sander C,Schmulevich I, Schwikowski B, Warner GJ, Ideker T, Bader GD: Integration ofbiological networks and gene expression data using Cytoscape. NatProtoc 2007, 2:2366-2382.
23. Madhavan S, Zenklusen JC, Kotliarov Y, Sahni H, Fine HA, Buetow K:Rembrandt: helping personalized medicine become a reality throughintegrative translational research. Mol Cancer Res 2009, 7:157-167.
24. Behin A, Hoang-Xuan K, Carpentier AF, Delattre JY: Primary brain tumoursin adults. Lancet 2003, 361:323-331.
25. Sun LX, Hui AM, Su Q, Vortmeyer A, Kotliarov Y, Pastorino S, Passaniti A,Menon J, Walling J, Bailey R, Rosenblum M, Mikkelsen T, Fine HA: Neuronaland glioma-derived stem cell factor induces angiogenesis within thebrain. Cancer Cell 2006, 9:287-300.
26. Li A, Walling J, Ahn S, Kotliarov Y, Su Q, Quezado M, Oberholtzer JC, Park J,Zenklusen JC, Fine HA: Unsupervised analysis of transcriptomic profilesreveals six glioma subtypes. Cancer Res 2009, 69:2091-2099.
27. Ducray F, Idbaih A, de Reynies A, Bieche I, Thillet J, Mokhtari K, Lair S,Marie Y, Paris S, Vidaud M, Hoang-Xuan K, Delattre O, Delattre JY, Sanson M:Anaplastic oligodendrogliomas with 1p19q codeletion have a proneuralgene expression profile. Mol Cancer 2008, 7:41.
28. Mukasa A, Ueki K, Ge X, Ishikawa S, Ide T, Fujimaki T, Nishikawa R, Asai A,Kirino T, Aburatani H: Selective expression of a subset of neuronal genesin oligodendroglioma with chromosome 1p loss. Brain Pathol 2004,14:34-42.
29. Wong AJ, Bigner SH, Bigner DD, Kinzler KW, Hamilton SR, Vogelstein B:Increased Expression of the Epidermal Growth-Factor Receptor Gene inMalignant Gliomas Is Invariably Associated with Gene Amplification. PNatl Acad Sci USA 1987, 84:6899-6903.
30. Vierbuchen T, Ostermeier A, Pang ZP, Kokubu Y, Sudhof TC, Wernig M:Direct conversion of fibroblasts to functional neurons by defined factors.Nature 2010, 463:1035-U1050.
31. Aguirre A, Rubio ME, Gallo V: Notch and EGFR pathway interactionregulates neural stem cell number and self-renewal. Nature 2010,467:323-327.
32. Huang PH, Xu AM, White FM: Oncogenic EGFR signaling networks inglioma. Sci Signal 2009, 2:re6.
33. Libermann TA, Nusbaum HR, Razon N, Kris R, Lax I, Soreq H, Whittle N,Waterfield MD, Ullrich A, Schlessinger J: Amplification, enhancedexpression and possible rearrangement of EGF receptor gene in primaryhuman brain tumours of glial origin. Nature 1985, 313:144-147.
34. Sainsbury JR, Farndon JR, Needham GK, Malcolm AJ, Harris AL: Epidermal-growth-factor receptor status as predictor of early recurrence of anddeath from breast cancer. Lancet 1987, 1:1398-1402.
35. Veale D, Ashcroft T, Marsh C, Gibson GJ, Harris AL: Epidermal growth factorreceptors in non-small cell lung cancer. Br J Cancer 1987, 55:513-516.
36. Yano S, Kondo K, Yamaguchi M, Richmond G, Hutchison M, Wakeling A,Averbuch S, Wadsworth P: Distribution and function of EGFR in humantissue and the effect of EGFR tyrosine kinase inhibition. Anticancer Res2003, 23:3639-3650.
37. Soikkeli J, Podlasz P, Yin M, Nummela P, Jahkola T, Virolainen S, Krogerus L,Heikkila P, von Smitten K, Saksela O, Holtta E: Metastatic outgrowthencompasses COL-I, FN1, and POSTN up-regulation and assembly to
fibrillar networks regulating cell adhesion, migration, and growth. Am JPathol 2010, 177:387-403.
doi:10.1186/1471-2105-12-286Cite this article as: Skinner et al.: Construct and Compare GeneCoexpression Networks with DAPfinder and DAPview. BMC Bioinformatics2011 12:286.
Submit your next manuscript to BioMed Centraland take full advantage of:
• Convenient online submission
• Thorough peer review
• No space constraints or color figure charges
• Immediate publication on acceptance
• Inclusion in PubMed, CAS, Scopus and Google Scholar
• Research which is freely available for redistribution
Submit your manuscript at www.biomedcentral.com/submit
Skinner et al. BMC Bioinformatics 2011, 12:286http://www.biomedcentral.com/1471-2105/12/286
Page 8 of 8


