Embed Size (px)
Citation preview

Measurement of Muscle Fatigue
DEAN P. CURRIER, M.A.
^ The effects of muscle fatigue on the electrical activity of muscle have been studied in five normal subjects with a total of twenty recordings by a quantitative electromyographic method of converting voltage into frequency pulses. The relation between the progressive increase of electrical activity from a sustained static contraction of the anterior deltoid muscle and the time of contraction was found to be linear. It was also found that, in most individuals, electrical activity increases as the anterior deltoid muscle becomes fatigued. The method of electromyography used showed a moderately high correlation coefficient for reliability. ^
ELECTRICAL CHANGES associated with normal muscular activity occur as a series of action potentials produced by motor units firing at certain frequencies. This phenomenon can be demonstrated through the use of electromyographic techniques with oscillographic recording. As the muscle being studied increases its force of contraction, a greater number of motor units are superimposed upon one another until an interference pattern appears on the oscilloscope. This interference pattern of normal muscle contraction can be defined in terms of frequency and duration of excitation.
Qualitative electromyographic techniques
Mr. Currier is Chief, Physical Therapy Department, U.S. Public Health Service Hospital, Baltimore, Maryland 21211.
From the Research Laboratory, Department of Physical Education, University of Maryland, College Park, Maryland.
have been employed for several years as an indicator of gross muscular activity or of individual motor-unit activity. Many investigators, however, have focused their attention on quantitative techniques in order to obtain a numerical equivalent of the electromyographic pattern. Attempts have been made to quantify the electrical changes during muscular activity, and to correlate them with muscle tension, work performed, and fatigue of muscle following prolonged contraction.
REVIEW OF THE LITERATURE
Relationships between the electromyographic interference pattern and tension under specific conditions, that is, between isometric and isotonic contractions and stretch, have been demonstrated.1-4 Using integrated electromyography and a strain-gauge dynamometer, Inman and his associates studied muscle tensions and lengths in patients with amputations having cineplastic muscle procedures.1 They observed that changes in electrical output, as revealed by the integrated electromyographic technique, parallel changes in tension in a muscle during isometric contraction, and that this method can be used as a means of assessing muscle tension in isometric contraction of muscle. They also observed that the amplitude of the electromyo-gram diminished when the muscle was stretched, and that it increased when the muscle was shortened. The electromyogram amplitude was, therefore, believed to be a function of changing muscle length with the same effort.
Lippold found a linear relation between the integrated electromyogram and the tension pro-
724 PHYSICAL THERAPY
Dow
nloaded from https://academ
ic.oup.com/ptj/article/49/7/724/4595863 by guest on 01 Septem
ber 2022

duced by voluntary isometric muscle contraction.2 He believed that this relation was a function of the number of active motor units and the frequency of their discharge. He concluded that the degree of contraction determines the amount of electrical activity and isometric tension which a muscle can exert. The varied degrees of tension which Lippold utilized were found to be proportional to the integrated activity recorded from surface electrodes.
Bigland and Lippold found a linear relation between the velocity of shortening or lengthening and electrical activity.3 They concluded that these variables are interdependent, and that integration of the electrical record provides a composite measure of the number of active fibers and their frequency of excitation.
In 1960 Close and his associates, seeking a better means of quantifying the electromyographic expression of muscular activity, reported a method of counting all the rapidly occurring action potentials found in the electromyographic record of normal muscle contraction.5 These continuous action-potential counts were found to increase in linear fashion as the strength of the isometric and isotonic contractions increased. The authors believed that these counts were directly related to tension as long as the muscle was "loaded." They further concluded that muscle action-potential counts could be conveniently recorded by means of electronic counters.
De Vries reported a method of converting the electromyographic signal to pulses whose frequency of occurrence is determined by the magnitude of the interference pattern.6-9 The method provides a numerical expression of the
absolute voltage of the activity of muscle. This, in turn, eliminates the use of arbitrary electrical units for quantification of collected data employed by the older integrated electromyographic methods. Using this method, de Vries found a high degree of linearity for the relationship between force of contraction and electrical activity of muscle.0, 9
All these studies show that integrated electromyographic techniques may be used as an index of tension in a muscle voluntarily contracted under certain conditions, i.e., isometric and isotonic contractions. Thus, the degree to which a muscle is excited can be recorded either by means of its tension or by the electrical activity it displays in the recordings. The integrated electromyographic techniques, therefore, set the stage for studying the changes in muscular tension during prolonged activity that leads to fatigue of the muscle undergoing study.
Knowlton and his associates, while employing qualitative electromyographic techniques, observed that the amplitude of the muscle action potentials increased as the muscle began to fatigue.10 They thought that the increase in amplitude was a result of recruiting new motor units which overshadowed units which had been recruited earlier in the activity but which had become fatigued. They employed various loads at several work rates to induce subjective fatigue in muscles of the hand. Action potentials were found to be larger during stages of fatigue than those occurring during initial stages of the activity.
Edwards and Lippold, employing five-second periods of isometric contraction at a series of constant, but varied, tensions, found that the
the author
Dean P. Currier, chief of the Physical Therapy Department at the U.S. Public Health Service Hospital in Baltimore, Maryland, earned his B.S. degree in health and physical education from East Stroudsburg State College in Pennsylvania, his M.A. degree in education from New York University, and his certificate in physical therapy from the Medical College of Virginia in Richmond. He is currently clinically affiliated with student training at the University of Pennsylvania and the University of Maryland.
Volume 49 / Number 7 725
Dow
nloaded from https://academ
ic.oup.com/ptj/article/49/7/724/4595863 by guest on 01 Septem
ber 2022
electrical activity progressively increased during the course of continuous contraction of given strength.11 They thought fatigue was caused by a decrease in the contraction strength of the muscle fibers, but found that the fibers became more active as the contraction continued. Thus, they concluded that more electrical activity is associated with the maintenance of tension in the fatigued muscle.
Scherrer and Bourguignon stated that the total electrical activity during initial maximal isometric contraction is less than the activity in the same muscle following a period of muscular work.4 They related this observation to the increase in the number of motor units and their synchronization. Close also considered synchronization as bearing quantitative significance to the action-potential count in muscular activity.12
In the present investigation, it was postulated that de Vries' pulse-counting method 6-9 should provide a linear relation to the submaximal tension developed in the anterior deltoid muscle over a period of time during sustained static contraction, but that the pulse count would increase with the onset of fatigue. Furthermore, it was felt that results obtained from an individual should be consistently reproducible in a statistical sense if the test was repeated on different days under the same conditions. In addition, this study proposed to evaluate the results of others, since little information exists in the literature regarding study of muscle fatigue by means of converting voltage produced by muscle contraction into frequency counts by electronic means. Although differences exist with respect to basic instrumentation and methods of quantification, the results should be consistent.
METHOD
Integrated electrical activity was recorded from the deltoids (anterior portion) of five normal, healthy male subjects without pre-existing neurological deficits. Their ages ranged from twenty-one to thirty-eight, with a mean age of twenty-eight. The deltoids (right and left) were tested on each subject on two occasions a week apart, providing a total of twenty recordings for the study. All the tests were consistently performed between the hours of 3 and 4 P.M. (N=3), and 7 and 8 P.M. (N=2).
Each subject tested was seated on a straight-back wooden chair with his feet resting on the floor and his knees flexed to 90 degrees. A heavy
webbed strap was positioned around the subject's hips and the chair to prevent hyperex-tension of the low back and undesired movements of the hips while fatigue was occurring.
Each subject was asked to flex his shoulder to 90 degrees with slight internal rotation, elbow extended, forearm pronated, and wrist held in neutral position while holding a seven-pound weight in his hand. This position of the extended arm was maintained by sustained static contraction of the deltoid muscle until the subject could no longer maintain the test position because of loss of tension due to fatigue. A mark was placed on an adjacent wall for assistance to the subject in maintaining the 90-degree position of shoulder flexion throughout the test. The shoulder angle was determined by use of a goniometer and by the method described by Moore.13
Muscle action-potential activity was recorded from the anterior portion of the deltoid muscle, bilaterally, of each subject while he was holding the weight in the testing position previously described. A unipolar electrode of the suction-cup type was used to record the muscle activity, since this electrode seems to discriminate changes in activity better than the commonly employed bipolar type.7 This active electrode was placed six centimeters below the acromioclavicular joint where the motor point of the anterior deltoid is located.14 This is the approximate location that contains the greatest concentration of motor end-plates.15 Thus, it is the point where one might expect maximal electrical activity.
The skin covering the selected electrode site was prepared by stroking with a fine-grade sandpaper and by applying conductive electrode jelly. Each electrode application and reappli-cation (marks from previous week's test remained visible) was checked with the ohm-meter which was built into a monitor.* The mean skin resistance was 6,430 ohms. The ground electrode, an electrocardiograph plate, was strapped over the dorsal aspect of the wrist.
The study utilized the method of recording developed by deVries, which converts the electrical activity (voltage) produced by contracting muscle into frequency (Hertz units).6-9 The action potentials of the contracted anterior deltoid were amplified and converted to pulses by
* Integrating Bioelectric Monitor, Model 100, Newport Laboratories, Inc., Newport Beach, California 92663.
726 PHYSICAL THERAPY
Dow
nloaded from https://academ
ic.oup.com/ptj/article/49/7/724/4595863 by guest on 01 Septem
ber 2022
the integrating bioelectric monitor, which is a solid-state amplifier- and voltage-controlled oscillator. The frequency band of the monitor provided a range of 10 to 250 Hertz units, which is in accord with the spectrum suggested by Hayes.16 The recording sensitivity was 1 millivolt full scale. The frequency output from the monitor was counted as pulses by an electronic counter,f which provided a quantitative reading of the direct integral of muscle action potentials over continuous periods of ten seconds each. The readings from the counter were later corrected for calibration change, and for amplifier and thermal noise, and converted to units of microvolts root mean square (fxV RMS). A conversion factor of 1.253 was used to change the corrected counter readings to microvolts root mean square. Calibration of the electronic counter was made before each test session. The electrical activity of the contracting muscle was monitored by means of an audio amplifier contained in the monitor.
RESULTS
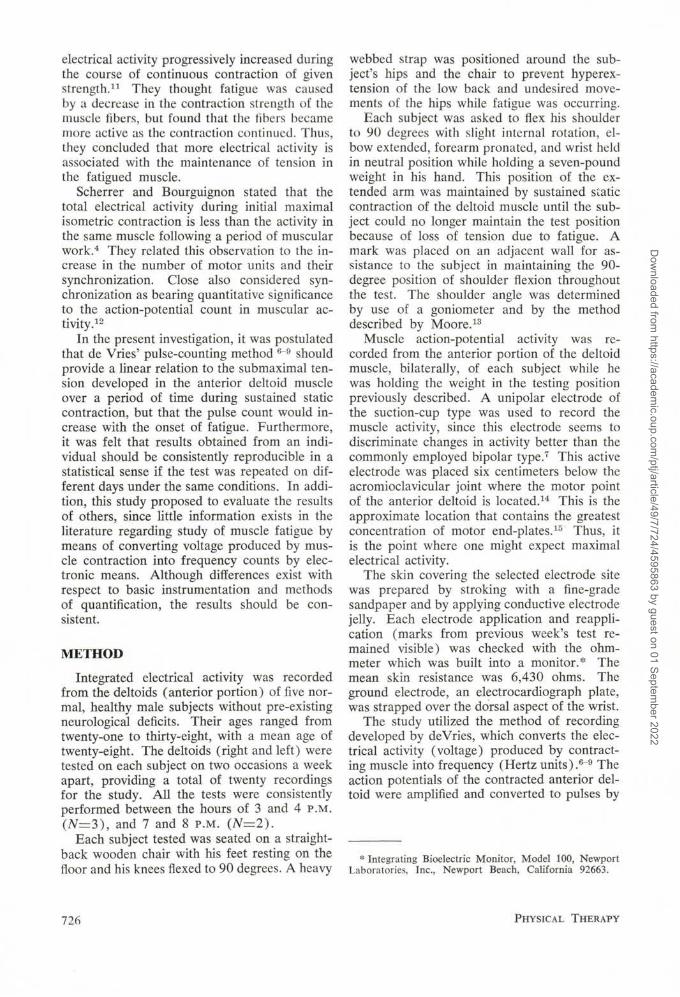
The recordings obtained during the two testing sessions produced comparable results. The initial ten-second recordings provided higher values of electrical activity than did the second and third ten seconds of the recording (Fig 1).
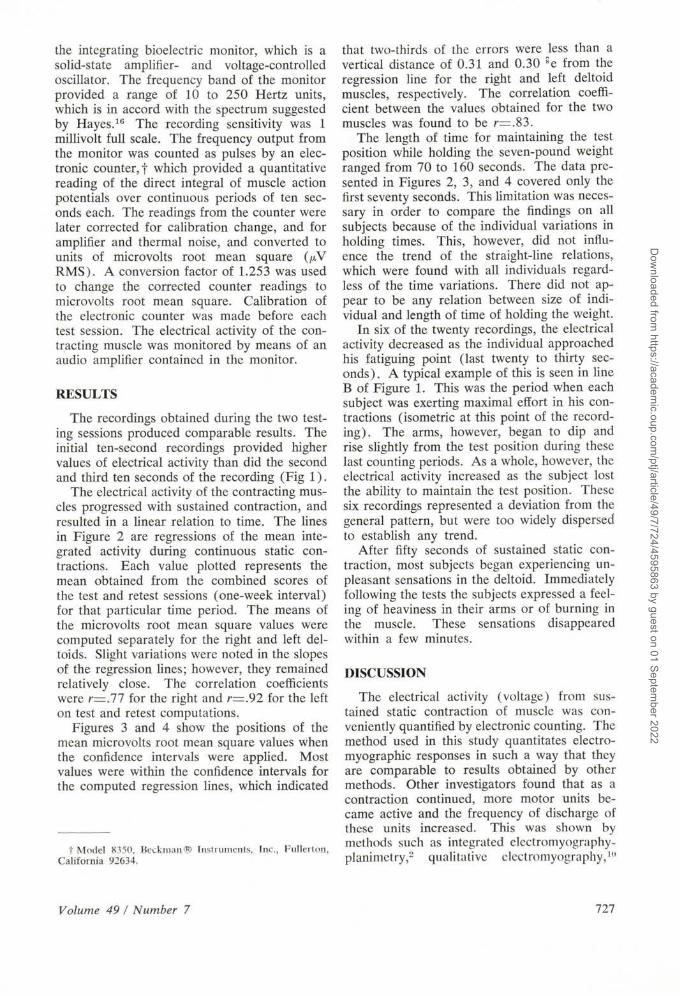
The electrical activity of the contracting muscles progressed with sustained contraction, and resulted in a linear relation to time. The lines in Figure 2 are regressions of the mean integrated activity during continuous static contractions. Each value plotted represents the mean obtained from the combined scores of the test and retest sessions (one-week interval) for that particular time period. The means of the microvolts root mean square values were computed separately for the right and left deltoids. Slight variations were noted in the slopes of the regression lines; however, they remained relatively close. The correlation coefficients were r=.ll for the right and r=.92 for the left on test and retest computations.
Figures 3 and 4 show the positions of the mean microvolts root mean square values when the confidence intervals were applied. Most values were within the confidence intervals for the computed regression lines, which indicated
t Model 8350, Beckmati® Instruments, Inc., Fullerton, California 92634,
that two-thirds of the errors were less than a vertical distance of 0.31 and 0.30 se from the regression line for the right and left deltoid muscles, respectively. The correlation coefficient between the values obtained for the two muscles was found to be r=.83.
The length of time for maintaining the test position while holding the seven-pound weight ranged from 70 to 160 seconds. The data presented in Figures 2, 3, and 4 covered only the first seventy seconds. This limitation was necessary in order to compare the findings on all subjects because of the individual variations in holding times. This, however, did not influence the trend of the straight-line relations, which were found with all individuals regardless of the time variations. There did not appear to be any relation between size of individual and length of time of holding the weight.
In six of the twenty recordings, the electrical activity decreased as the individual approached his fatiguing point (last twenty to thirty seconds). A typical example of this is seen in line B of Figure 1. This was the period when each subject was exerting maximal effort in his contractions (isometric at this point of the recording). The arms, however, began to dip and rise slightly from the test position during these last counting periods. As a whole, however, the electrical activity increased as the subject lost the ability to maintain the test position. These six recordings represented a deviation from the general pattern, but were too widely dispersed to establish any trend.
After fifty seconds of sustained static contraction, most subjects began experiencing unpleasant sensations in the deltoid. Immediately following the tests the subjects expressed a feeling of heaviness in their arms or of burning in the muscle. These sensations disappeared within a few minutes.
DISCUSSION
The electrical activity (voltage) from sustained static contraction of muscle was conveniently quantified by electronic counting. The method used in this study quantitates electromyographic responses in such a way that they are comparable to results obtained by other methods. Other investigators found that as a contraction continued, more motor units became active and the frequency of discharge of these units increased. This was shown by methods such as integrated electromyography-planimetry,2 qualitative electromyography,10
Volume 49 / Number 7 727
Dow
nloaded from https://academ
ic.oup.com/ptj/article/49/7/724/4595863 by guest on 01 Septem
ber 2022

and counting the total number of action potentials.5' 12
The results from this very small sample of twenty recordings indicate that within the circumstances of this experiment, a linear relation exists between the electrical activity and time of sustained contraction. It was shown that, in most individuals, the electrical activity increases as the muscle fatigues. The exceptions noted in this study might be attributed to the decreased
blood supply to the active muscle(s) when maximum static contraction occurs.17 Measurement of this effect was not within the scope of this study; however, Lippold and his colleagues demonstrated that a decreased blood supply to a muscle is associated with reduction in the electrical activity of the muscle.18
It was noted that the initial ten-second recordings provided higher values of electrical activity than did the second and third ten sec-
10 30 50 70 90 110 130 T i m e i n s e c o n d s
Fig. 1. Representation recordings of muscle excitation over a period of time while holding a seven-pound weight. Line A shows an initial decrease of activity followed by a general progressive increase. Line B shows a decrease at beginning and end of sustained static contraction.
9 -
1/5
i 8
7 -
6 -
2 5-UJ R i g h t A n t e r i o r D e l t o i d A
L e f t A n t e r o r D e l t o i d O
2 0 3 0 4 0 5 0 T i m e i n s e c o n d s
60 70 Fig. 2, Voltage of contracting muscle as a function of time.
728 PHYSICAL THERAPY
Dow
nloaded from https://academ
ic.oup.com/ptj/article/49/7/724/4595863 by guest on 01 Septem
ber 2022

onds of recording (Fig. 1). This was true for thirteen of the twenty recordings (65%), and is probably a result of muscle grading between the act of holding the weight of the arm in the 90-degree flexed position, and the adjustment made when the seven-pound weight was suddenly added (overcoming added force to equilibrate the lever). The tested individuals were questioned about this point later. They stated that they found they could apply less holding force, and yet still maintain the test position with the weight, after a few seconds of contracting the deltoid. This technique seemed to work successfully for a period of ten to thirty seconds, after which time greater demands were placed on the muscle to maintain the test position. Following this initial period when the subject appeared to be able to exert some control over tension-relaxation, the electrical activity began to increase progressively. The level of electrical activity increased as the static contraction of the deltoid continued over a period of time.
The small variations in the recorded values during the sustained static contractions (Fig. 1) could be related to the tension produced by synergists, as suggested by Lippold.19 This has also been demonstrated electromyographically in the study by Inman and his associates, where the pectoralis major, and supraspinatus assist in forward flexion at the shoulder joint.1 Increased assistance from the synergistic muscle
might tend to reduce temporarily the activity required of the deltoid to maintain the contraction.
The values obtained for the first ten-second interval recordings were found to be lower for the retest session than for the first test session. Lower initial values were found in eight of the ten recordings of the retest session. This was also found true for the recordings taken during resting phases before the actual weight holding began. The subjects tended to be less tense during the second session; a learning factor from the previous testing session may have contributed to greater relaxation. Relaxation can easily be taught by having an individual listen to the audio response of muscle activity or by having him observe the values displayed on the electronic counter.
While using different methodology, this study confirms the findings of others, i.e., that the electrical activity progressively increases during the course of continuous static muscle contraction. Also, the findings of this study show a linear relation between electrical activity and a sustained static muscle contraction over a period of time.
SUMMARY
The effects of muscle fatigue on the electrical activity of muscle were studied in five normal subjects with a total of twenty recordings by
10 —r~ 30
—I 5 0
"l 70
9-
8 -
7-
6 -
5-
10 30 50
—,
70 Time (seconds)
Figs. 3 and 4 (left and right anterior deltoids). Root mean square as a function of time, showing computed regression line and confidence interval for the line.
Volume 49 / Number 7 729
Dow
nloaded from https://academ
ic.oup.com/ptj/article/49/7/724/4595863 by guest on 01 Septem
ber 2022

a quantitative electromyographic method of converting voltage into frequency pulses. The relation between the progressive increase of electrical activity from a sustained static contraction of the anterior deltoid muscle and the time of contraction was found to be linear.
It was also found that as the anterior deltoid fatigues, the electrical activity increases in most individuals.
The method of electromyography used in this study showed a moderately high correlation for reliability.
REFERENCES
1. Inman, V. T., H. J. Ralston, J. B. deC. M. Saunders, B. Feinstein, and E. W. Wright. Relation of human electromyogram to muscular tension. Electroenceph. Clin. Neurophysiol. 4:187-194, May 1952.
2. Lippold, O. C. J. The relation between integrated action potentials in a human muscle and its isometric tension. J. Physiol. 117:492^99, August 1952.
3. Bigland, B., and O. C. J. Lippold. The relation between force, velocity, and integrated electric activity in human muscles. J. Physiol. 123:214-224, January 1954.
4. Scherrer, J., and A. Bourguignon. Changes in the Electromyogram Produced by Fatigue in Man. In The Utrecht Symposium on the Innervation of Muscle, edited by H. D. Bouman and A. L. Woolf. Baltimore: The Williams and Wilkins Co., 1960, pp. 170-180.
5. Close, J. R., E. D. Nickel, and F. N. Todd. Motor-unit action-potential counts. J. Bone Joint Surg. 42A: 1207-1222, October 1960.
6. de Vries, H. A. Muscle tonus in postural muscles. Amer. J. Phys. Med. 44:275-291, June 1965.
7. de Vries, H. A. Quantitative electromyographic investigation of the spasm theory of muscle pain. Amer. J. Phys. Med. 45:119-134, June 1966.
8. de Vries, H. A. Efficiency of electric activity as a physiological measure of the functional state of muscle tissue. Amer. J. Phys. Med. 47:10-22, January 1968.
9. de Vries, H. A. Physiology of Exercise for Physical Education and Athletics. Dubuque, Iowa: William C. Brown Company, Publishers, 1966.
10. Knowlton, G. C., R. L. Bennett, and R. McClure. Electromyography of fatigue. Arch. Phys. Med. 32: 648-652, October 1951.
11. Edwards, R. G., and O. C. J. Lippold. The relation between force and integrated electric activity in fatigued muscle. J. Physiol. 132:677-681, June 1956.
12. Close, J. R. Motor Function in the Lower Extremity: Analysis by Electronic Instrumentation. Springfield, Illinois: Charles C Thomas, Publisher, 1964.
13. Moore, M. L. The measurement of joint motion. Part II: the technique of goniometry. Phys. Ther. Rev. 29:256-264, January 1949.
14. Harriman, D. Histology of the Motor End-plate (Motor-point Muscle Biopsy). In Electrodiagnosis and Electromyography, edited by S. Licht. New Haven, Connecticut: Elizabeth Licht, Publisher, 1961.
15. Coers, C., and A. L. Woolf. The Innervation of Muscle: A Biopsy Study. Springfield, Illinois: Charles C Thomas, Publisher, 1959.
16. Hayes, K. J. Wave analyses of tissue noise and muscle-action potentials. J. Appl. Physiol. 15:749-752, July 1960.
17. Barcroft, H., and A. C. Dornhurst. The blood flow through the human calf during rhythmic exercise. J. Physiol. 109:402^411, September 15, 1949.
18. Lippold, O. C. J., J. W. T. Redfearn, and J. Vuco. The electromyography of fatigue. Ergonomics 3:121-131, April 1960.
19. Davis, J. F. Manual of Surface Electromyography. WADC Technical Report 59:184. Montreal: McGill University, Allen Memorial Institute of Psychiatry, 1959.
730 PHYSICAL THERAPY
Dow
nloaded from https://academ
ic.oup.com/ptj/article/49/7/724/4595863 by guest on 01 Septem
ber 2022


