Embed Size (px)
Citation preview

EARTH SURFACE PROCESSES AND LANDFORMSEarth Surf. Process. Landforms 36, 97–106 (2011)Copyright © 2010 John Wiley & Sons, Ltd.Published online 5 July 2010 in Wiley Online Library(wileyonlinelibrary.com) DOI: 10.1002/esp.2024
Variability of interrill erosion at low slopesA. Armstrong,1* J. N. Quinton,1 B. C. P. Heng2 and J. H. Chandler1
1 Lancaster Environment Centre, Lancaster University, Lancaster, UK2 Department of Civil and Building Engineering, Loughborough University, Loughborough, UK
Received 15 October 2009; Revised 11 February 2010; Accepted 23 February 2010
*Correspondence to: Alona Armstrong, Lancaster Environment Centre, Lancaster University, Lancaster, LA1 4YQ, UK. E-mail: [email protected]
ABSTRACT: Numerous models and risk assessments have been developed in order to estimate soil erosion from agricultural land, with some including estimates of nutrient and contaminant transfer. Many of these models have a slope term as a control over particle transfer, with increased transfer associated with increased slopes. This is based on data collected over a wide range of slopes and using relatively small soil fl umes and physical principals, i.e. the role of gravity in splash transport and fl ow. This study uses laboratory rainfall simulation on a large soil fl ume to investigate interrill soil erosion of a silt loam under a rainfall intensity of 47 mm h−1 on 3%, 6% and 9% slopes, which are representative of agricultural land in much of northwest Europe. The results show: (1) wide variation in runoff and sediment concentration data from replicate experiments, which indicates the complexities in interrill soil erosion processes; and (2) that at low slopes processes related to surface area connectivity, soil satura-tion, fl ow patterns and water depth may dominant over those related to gravity. Consequently, this questions the use of risk assessments and soil erosion models with a dominant slope term when assessing soil erosion from agricultural land at low slopes. Copyright © 2010 John Wiley & Sons, Ltd.
KEYWORDS: microtopography; water depth; surface connectivity; rainfall simulation; particle size
Introduction
Soil is a key resource and understanding its erosion has become increasingly important given growing food demands, the increasing awareness of the impacts of diffuse pollution downstream and the introduction of legislation such as the European Union Water Framework Directive. One of the dominant sources of soil erosion is agricultural land, which is thought to contribute up to 50% of diffuse pollution to water courses (Defra, 2002). In order to understand, and therefore reduce erosion, much attention has been given to the domi-nant controls on erosion from agricultural land. Variables such as rainfall (Huang, 1995), soil type (Bradford and Foster, 1996; Ben-Hur and Wakindiki, 2004), ground cover (Snelder and Bryan, 1995) and slope (Fox and Bryan, 1999) have all been demonstrated to affect erosion rates. Of these factors slope and rainfall are among the most universal and feature in many models and risk assessment procedures (De Roo et al., 1996; Morgan et al., 1998; Renschler et al., 1999).
Traditionally, soil erosion is thought to increase with slope. This has been demonstrated in the fi eld (Chaplot and Le Bissonnais, 2000) and in the laboratory (Assouline and Ben-Hur, 2006). The process behind increased erosion at higher slopes is attributed to the increased velocities which increase stream power and the preferential movement of splashed par-ticles in the downslope direction (Ghadiri and Payne, 1988). However, there are complexities which can cause exceptions to this accepted relationship including variation in infi ltration
and surface fl ow characteristics, such as (1) the development of fl ow threads, (2) source area connectivity, (3) soil saturation and therefore cohesive strength, and (4) water depth and therefore obstruction of sediment movement and effi ciency of splash detachment and transport. These complexities will alter the slope impact on the detachment and transport of soil by fl ow and rain splash.
Infi ltration affects erosion-slope relationships by controlling the discharge. Infi ltration should be greater on shallower slopes as water depth is greater which increases the pressure head. In addition, higher infi ltration rates on lower slopes have been attributed to greater hydraulic conductivities around stable mounds, more of which are submerged given the greater water depth (Fox et al., 1997). However, these accepted physical relationships between slope and infi ltration are com-plicated by surface sealing, which reduces the infi ltration rate. Surface seals have been observed to develop slower and less extensively on steeper slopes and therefore infi ltration rates are higher (Poesen, 1984), although after suffi cient time surface seals can develop to the same extent on steeper slopes (Luk et al., 1993).
Variation in surface fl ow characteristics will also impact soil erosion. Interrill fl ow is often assumed to be evenly distributed sheet fl ow. However, in practice overland fl ow comprises of a distribution of fl ow velocities with more, narrower and faster fl ow threads found on steeper slopes and less, wider, and slower fl owing fl ow threads on gentler slopes (Fox et al., 1997). Furthermore, Bryan (1979) noted that the hydraulics of

98 A. ARMSTRONG ET AL.
Copyright © 2010 John Wiley & Sons, Ltd. Earth Surf. Process. Landforms, Vol. 36, 97–106 (2011)
overland fl ow varied with slope angle. These differences in fl ow regime impact both the amount and size distribution of sediment transported.
Related to the fl ow pattern, is the connectivity of the soil surface, the degree of saturation and obstruction of sediment movement. Given the broader fl ows associated with lower slopes a greater proportion of the soil surface is likely to be connected compared with steeper slopes. While the greater linkage of source areas with the channel has the potential to allow the transportation of a greater amount of sediment, the fl ow energy will be lower, leading to lower sediment concen-trations and the transport of fi ner sediment. In addition to the extent of the fl ow, slope will impact water depth producing the greatest depths on shallower slopes. While no study has aimed to examine the impact of fl ow depth on obstruction of particle movement, and consequently erosion rates, there is anecdotal evidence in Parsons et al. (1998) which suggests that at low fl ow and rainfall energies, sediment transport dis-tances are greater on shallower slopes. Finally, another com-plexity is that with greater connectivity and deeper fl ows on shallower slopes a higher proportion of the soil will be satu-rated. Given that saturation has been shown to decrease cohe-sive strength and therefore potentially increase erosion (Gao et al., 2003) sediment supply may be increased at lower slopes.
Consequently, although historically slope and soil erosion are considered to be positively related, processes relating to the amount and nature of the runoff, in terms of its extent, depth, and velocity distribution, may cause higher soil erosion rates on lower slopes. Given variation in rainfall, soil type and surface cover it is diffi cult to test such slope-erosion relations in the fi eld. Therefore, several studies examining slope con-trols on erosion have been undertaken using laboratory rain-fall simulation. However, these studies look at a wide range of slope angles (Table I), most of which are far in excess of those typical in agricultural fi elds in northwest Europe. While the conclusions of these studies all state that soil erosion increases with slope some illustrate exceptions at the lowest slopes (Helming et al., 1998; Römkens et al., 2002; Assouline and Ben-Hur, 2006). Furthermore, most of the existing studies used soil fl umes with an area of <2 m2 (Table I). Although, such fl umes have advantages: they are easier to work with and can be used under drip-type simulators, it is possible that processes which dominate in fi eld environments may not occur in these smaller soil boxes, especially those which relate to the distribution and nature of shallow fl ows which, as out-lined earlier, can impact the relationship between slope and soil erosion.
Due to the small fl ume sizes and unrepresentative range of slopes used in existing studies the fundamental underpinning of soil erosion on slope in various models and risk assessments
may be unsound for assessing erosion from arable agricultural land. This study has been designed to address this research gap by testing the slope–erosion relationship on slope angles representative of agricultural land using a larger soil fl ume (3·9 × 1·4 m) to avoid scale issues associated with small soil fl umes. In addition to monitoring runoff volumes and sediment loss the extent of runoff and the particle size distribution of the sediment were monitored to allow insight into processes responsible for relations between slope and soil erosion.
Methods
In order to test the relationship between slope and soil erosion rates a laboratory rainfall simulator and a 3·9 m long by 1·4 m wide soil fl ume were used. The slope was set at 3%, 6% and 9% and the experiments run in triplicate. Along each side of the soil fl ume a 15 cm exclusion zone was created to prevent boundary effects. The fl ume was layered with 20 cm of gravel, a sheet of fi ne mesh, 20 cm of sand and 20 cm of soil. The soil used was a silt loam with 4·6% clay, 49·9% silt and 45·5% sand (primary particle size distribution) and was screened to 10 mm. The soil was fi eld moist, added to the fl ume in known volumes, compacted to a bulk density of 1·3 g cm−3 and pre-pared as a seed bed. At the end of each experiment the top 4 cm of the soil was removed and fresh soil packed to the same density. Between each slope the subsoil was turned over, raked, and reprofi led to assure similar subsurface condi-tions between slope angles. Soil moisture was measured using six Delta-T ML2-x theta probes and recorded using a DL6 data logger. The theta probes were inserted 7 cm below the surface 0·5, 1·5, 2·5 and 3·5 m from the top of the fl ume and 12 cm below the surface 0·5 and 3·5 m from the top of the fl ume. Dry bulk density measurements were made between experi-mental runs using a 5 cm long cylinder with a 6 cm diameter.
The rainfall was generated using a pumped rainfall system. Pressure regulators maintained an even pressure of 0·45 bar to four Fulljet ½ HH 40WSQ nozzles via solenoid valves as described in Strauss et al. (2000). The solenoid valves were controlled by a PC to turn on for two seconds and off for six seconds, generating rainfall with an average intensity of 47 mm h−1 with a standard deviation of 2·5. The spatial vari-ability was reduced by altering nozzle positions and gave a Christensen uniformity coeffi cient of 70% (Christensen, 1942). De-ionized water was used for all runs to ensure no variability in input water quality.
Runoff was collected using a runoff trough with a metal plate lip inserted into the soil. Discharge was monitored at the end of the fl ume every two seconds using weighing scales (Ohaus Defender 3000 Hybrid) with 0·02 kg resolution. The impact of
Table I. Summary of rainfall simulation studies with the rainfall rate, slope angle and soil fl ume size
Reference Rainfall rate (mm h−1) Slope (%) Flume size (m)
Fox and Bryan (1999) 49·1 2·5, 11·5, 20·5, 30, 40 1·0 × 0·4Bradford and Foster (1996) 72 9, 20 1·02 × 1·02Huang (1995) 50, 70, 100 4, 5, 9, 20 1·2 × 1·2Meyer and Harmon (1989) 14, 27, 56, 115 5, 10, 20, 30 0·15, 0·30, 0·45 & 0·60 × 0·30Ben-Hur and Wakindiki (2004) 40 9, 15, 20, 25 0·5 × 0·3Helming et al. (1998) 15, 30, 45, 60 2, 8, 17 3·7 × 0·60Huang (1998) 30, 60, 90 5, 10, 15 5 × 0·6Wan and El-Swaify (1998) 45, 60, 90, 135 4, 9, 18, 27, 36 0·6 × 0·3Assouline and Ben-Hur (2006) 24, 60 5, 9, 15, 20, 25 0·5 × 0·3Römkens et al. (2002) 15, 30, 45, 60 2, 8, 17 3·7 × 0·60
VARIABILITY OF INTERRILL EROSION AT LOW SLOPES 99
Copyright © 2010 John Wiley & Sons, Ltd. Earth Surf. Process. Landforms, Vol. 36, 97–106 (2011)
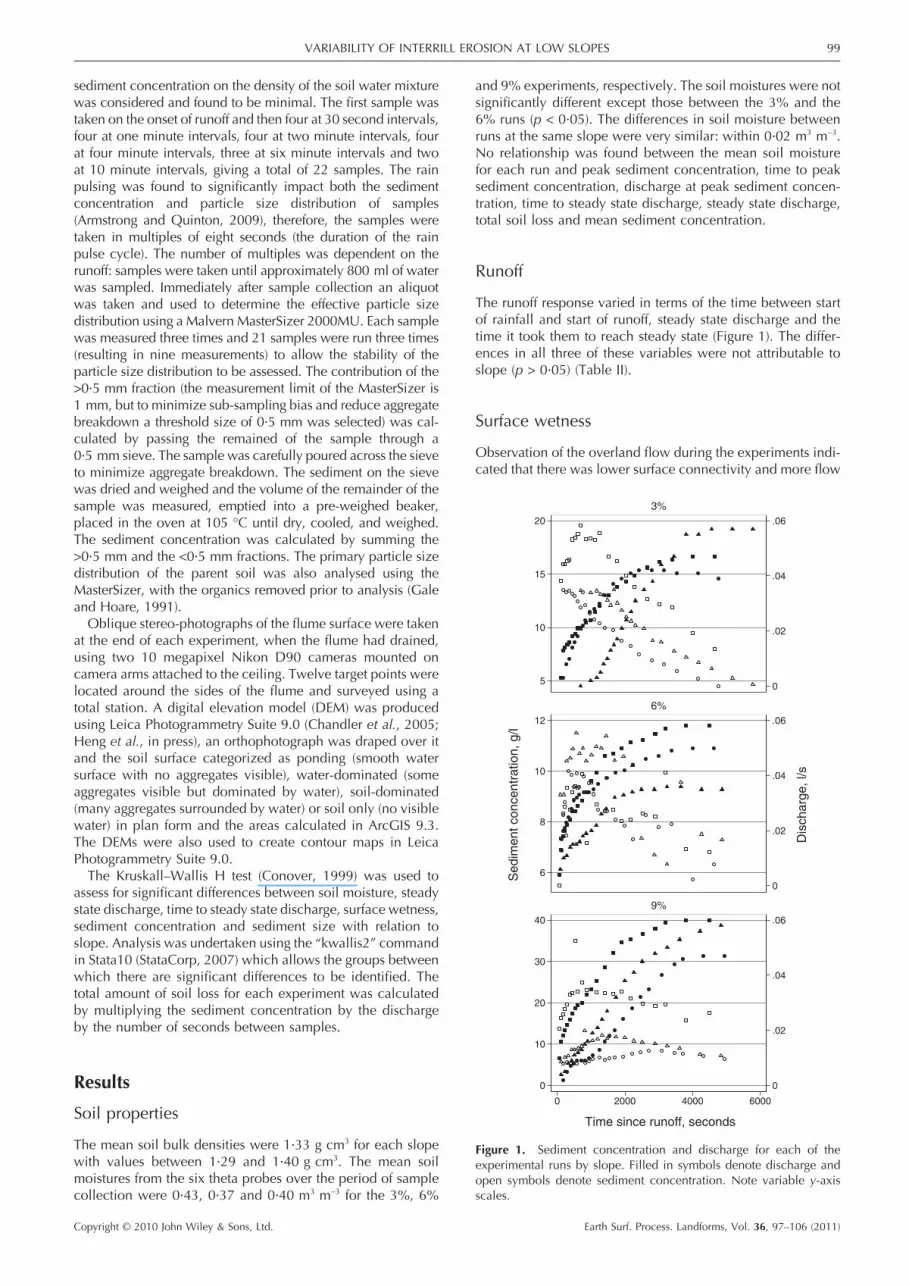
sediment concentration on the density of the soil water mixture was considered and found to be minimal. The fi rst sample was taken on the onset of runoff and then four at 30 second intervals, four at one minute intervals, four at two minute intervals, four at four minute intervals, three at six minute intervals and two at 10 minute intervals, giving a total of 22 samples. The rain pulsing was found to signifi cantly impact both the sediment concentration and particle size distribution of samples (Armstrong and Quinton, 2009), therefore, the samples were taken in multiples of eight seconds (the duration of the rain pulse cycle). The number of multiples was dependent on the runoff: samples were taken until approximately 800 ml of water was sampled. Immediately after sample collection an aliquot was taken and used to determine the effective particle size distribution using a Malvern MasterSizer 2000MU. Each sample was measured three times and 21 samples were run three times (resulting in nine measurements) to allow the stability of the particle size distribution to be assessed. The contribution of the >0·5 mm fraction (the measurement limit of the MasterSizer is 1 mm, but to minimize sub-sampling bias and reduce aggregate breakdown a threshold size of 0·5 mm was selected) was cal-culated by passing the remained of the sample through a 0·5 mm sieve. The sample was carefully poured across the sieve to minimize aggregate breakdown. The sediment on the sieve was dried and weighed and the volume of the remainder of the sample was measured, emptied into a pre-weighed beaker, placed in the oven at 105 °C until dry, cooled, and weighed. The sediment concentration was calculated by summing the >0·5 mm and the <0·5 mm fractions. The primary particle size distribution of the parent soil was also analysed using the MasterSizer, with the organics removed prior to analysis (Gale and Hoare, 1991).
Oblique stereo-photographs of the fl ume surface were taken at the end of each experiment, when the fl ume had drained, using two 10 megapixel Nikon D90 cameras mounted on camera arms attached to the ceiling. Twelve target points were located around the sides of the fl ume and surveyed using a total station. A digital elevation model (DEM) was produced using Leica Photogrammetry Suite 9.0 (Chandler et al., 2005; Heng et al., in press), an orthophotograph was draped over it and the soil surface categorized as ponding (smooth water surface with no aggregates visible), water-dominated (some aggregates visible but dominated by water), soil-dominated (many aggregates surrounded by water) or soil only (no visible water) in plan form and the areas calculated in ArcGIS 9.3. The DEMs were also used to create contour maps in Leica Photogrammetry Suite 9.0.
The Kruskall–Wallis H test (Conover, 1999) was used to assess for signifi cant differences between soil moisture, steady state discharge, time to steady state discharge, surface wetness, sediment concentration and sediment size with relation to slope. Analysis was undertaken using the “kwallis2” command in Stata10 (StataCorp, 2007) which allows the groups between which there are signifi cant differences to be identifi ed. The total amount of soil loss for each experiment was calculated by multiplying the sediment concentration by the discharge by the number of seconds between samples.
Results
Soil properties
The mean soil bulk densities were 1·33 g cm3 for each slope with values between 1·29 and 1·40 g cm3. The mean soil moistures from the six theta probes over the period of sample collection were 0·43, 0·37 and 0·40 m3 m−3 for the 3%, 6%
and 9% experiments, respectively. The soil moistures were not signifi cantly different except those between the 3% and the 6% runs (p < 0·05). The differences in soil moisture between runs at the same slope were very similar: within 0·02 m3 m−3. No relationship was found between the mean soil moisture for each run and peak sediment concentration, time to peak sediment concentration, discharge at peak sediment concen-tration, time to steady state discharge, steady state discharge, total soil loss and mean sediment concentration.
Runoff
The runoff response varied in terms of the time between start of rainfall and start of runoff, steady state discharge and the time it took them to reach steady state (Figure 1). The differ-ences in all three of these variables were not attributable to slope (p > 0·05) (Table II).
Surface wetness
Observation of the overland fl ow during the experiments indi-cated that there was lower surface connectivity and more fl ow
0
.02
.04
.06
0
.02
.04
.06
0
.02
.04
.06
5
10
15
20
6
8
10
12
0
10
20
30
40
0 2000 4000 6000
3%
6%
9%
Dis
ch
arg
e,
l/s
Se
dim
en
t co
nce
ntr
atio
n, g
/l
Time since runoff, seconds
Figure 1. Sediment concentration and discharge for each of the experimental runs by slope. Filled in symbols denote discharge and open symbols denote sediment concentration. Note variable y-axis scales.

100 A. ARMSTRONG ET AL.
Copyright © 2010 John Wiley & Sons, Ltd. Earth Surf. Process. Landforms, Vol. 36, 97–106 (2011)
threads on the steeper slopes, with the difference being far greater between the 3% and 6% slopes compared with the 3% and 9% slopes (Figure 2). Quantifi cation of the propor-tions of the fl ume covered by ponding water, water-domi-nated, soil-dominated and soil only (Table II) indicated that there was a signifi cantly higher (p < 0·05) proportion of ponded water and water-dominated surfaces on the 3% slopes compared with the 6% and 9% slopes. Furthermore, the pro-portion of soil-dominated area was signifi cantly lower (p < 0·05) on the 3% slopes compared with the 6% and 9% slopes and there was no signifi cant difference in the proportion of soil only areas between the slopes.
Sediment concentration
The sediment concentrations were highly variable between and within the slope treatments (Figure 1). However, up to a discharge of 0·02 l s−1, the highest sediment concentrations were mostly on the 3% slope and the lowest on the 9% slopes (Figure 1). After 0·02 l s−1 there was no discernable pattern between concentration and slope (Figure 1). In contrast, when graphed as hysteresis plots with rescaled axis there was a clear pattern in the sediment concentration-discharge form with slope (Figure 3). Generally, the 3% runs were characterized by a peak in sediment concentration at the beginning of the run followed by a gradual decline, the 6% runs by a sharp increase in sediment concentration and an oscillating decline, and the 9% runs by a slower increase in sediment concentra-tion and a gradual smooth decline (Figure 3). The differences in sediment response were evaluated by comparing (1) time,
(2) instantaneous discharge, and (3) cumulative discharge at the point of maximum sediment concentration. This showed that sediment concentrations peak more rapidly at the lower slopes (mean times of 519, 623 and 1717 seconds for the 3%, 6% and 9% slopes, respectively) with statistically signifi cant differences between the 3% and 9% (p < 0·05) and 6% and 9% (p < 0·05) slopes. The instantaneous discharge associated with the peak sediment concentrations was higher on the higher slopes (mean discharges of 0·008, 0·026 and 0·031 l s−1 for the 3%, 6% and 9% slopes, respectively) with signifi cant differences between the 3% and 6% slopes (p < 0·05) and 3% and 9% slopes (p < 0·05). Finally, the cumulative discharge associated with the peak sediment concentrations were also higher on the higher slopes (means of 4·0, 12·8 and 32·5 l for the 3%, 6% and 9% slopes, respectively) with signifi cant dif-ferences between the 3% and 9% slopes (p < 0·05). In order to assess the effect of slope at steady state, or approaching steady state erosion the sediment concentration of the last samples from each run was compared, but no signifi cant dif-ferences were found (Table III).
Sediment size
The sediment size distribution of the eroded sediment is sig-nifi cantly fi ner than that of the parent soil, even though the parent soil distribution was determined after disaggregation (dispersion with sodium hexametaphosphate) and organic matter removal, whereas the eroded sediment was not treated (Figure 4). The <0·5 mm and >0·5 mm fractions were analysed separately to reduce bias given the different determination
Table II. Summary parameters for each experimental run
ExperimentMoisture (m3 m−3)
Time to steady state discharge
(seconds)
Steady state discharge
(l s−1)
Time to runoff
(seconds)Ponding
(%)Water-dominated
(%)Soil-dominated
(%)Soil
only (%)
3% slope, run 1 0·44 1882 0·043 869 14·3 41·0 3·7 41·13% slope, run 2 0·43 3532 0·056 668 16·2 45·5 3·7 34·53% slope, run 3 0·43 2096 0·044 214 12·3 35·9 2·5 49·36% slope, run 1 0·35 2126 0·048 297 1·0 15·5 9·6 73·96% slope, run 2 0·37 2156 0·036 244 2·4 11·1 3·3 83·26% slope, run 3 0·36 2292 0·054 118 0·7 12·6 4·6 82·09% slope, run 1 0·40 3872 0·050 349 0·6 10·5 7·0 81·99% slope, run 2 0·40 3180 0·052 328 0·7 14·1 4·0 81·29% slope, run 3 0·41 2470 0·058 206 1·9 11·2 6·2 80·6
Figure 2. Typical surface area connectivity and fl ow patterns on the (a) 3%, (b) 6%, and (c) 9% slopes. More threaded fl ow was evident on the 6% and 9% slopes compared with the 3% slope. This fi gure is available in colour online at wileyonlinelibrary.com

VARIABILITY OF INTERRILL EROSION AT LOW SLOPES 101
Copyright © 2010 John Wiley & Sons, Ltd. Earth Surf. Process. Landforms, Vol. 36, 97–106 (2011)
methods employed. Examination of the <0·5 mm particle size data, both graphically and numerically, indicates that, the particle size coarsens through time on each run but there are no trends with slope and the variability between repeats is high (Figure 5 and Table IV). During the 9% slopes the median particle size initially fi ned and then coarsened: a trend not apparent on the other slopes (Figure 5). In terms of temporal dynamics of the <0·5 mm fraction examination of the fi rst sample from each run indicates that the sediment transported on the 6% experiments was coarser than those transported on the 3% and 9% experiments (Figure 4a). In contrast, the sedi-ment transported in the last sample of each experiment, when the system was approaching steady state, was notably fi ner for the 3% runs and there was no discernable difference between the 6% and 9% data (Figure 4b). These observations concur with statistical analysis of the last samples from each run: sediment transported on the 3% slopes was consistently sig-nifi cantly fi ner than that transported on the 6% and 9% slopes regardless of size parameter used (Table IV).
The concentrations of the >0·5 mm fraction determined by sieves are also variable between repeat experiments. There is less >0·5 mm fraction transported on the 3% slope compared with the 6% slope (p < 0·05), but more is transported on the 6% slope compared with the 9% slope but the differences are not signifi cant (p > 0·05). At the steeper slopes a positive relationship between discharge and concentration of the >0·5 mm fraction is evident at discharges above 0·35 l s−1 (Figure 5).
Total soil loss
Examination of the total amount of soil loss during each exper-iment indicates there are limited differences between the slopes (Figure 6), with mean loss of 1·6, 1·5 and 2·3 kg for the 3%, 6% and 9% slopes, respectively. If the last run at the 9% slope is discounted (soil loss was far greater than on any of the other runs) then the mean total soil loss is 1·4 kg, thus total soil loss decreases with slope angle, although the differences are not statistically signifi cant.
Discussion
The results of these experiments indicate that at slope angles representative of agricultural land soil erosion does not increase with slope as traditionally assumed and that the runoff and erosion response is very variable. While numerous studies demonstrate the positive relationship between slope and erosion, closer inspection indicate that some corroborate our fi ndings at low slopes. Helming et al. (1998) investigated soil loss from slopes with different surface roughness with each experiment involving subsequent rainstorms with inten-sities decreasing from 60 to 15 mm h−1 on the same soil surface. They found, for a smooth surface, that the soil loss from the 2% slope was greater than from the 8% slope (0·12 compared with 0·07 kg m−2) during the fi rst rainfall event (60 mm h−1). Römkens et al. (2002) used the same experimen-tal set-up and soil as Helming et al. (1998) and started with 15 mm h−1 rainfall and built up to 60 mm h−1. In this case there was no measureable difference in the sediment yield
5
10
15
5
10
15
5
10
15
20
6
7
8
9
10
6
8
10
12
5
10
5
6
7
8
9
6
8
10
12
14
15
20
25
30
35
0 .02 .04 .06 0 .02 .04 .06 0 .02 .04 .06
3%, 1 3%, 2 3%, 3
6%, 1 6%, 2 6%, 3
9%, 1 9%, 2 9%, 3
Sedim
ent concentr
ation, g/l
Discharge, l/s
Figure 3. Plots of sediment concentration as a function of discharge by slope (3%, 6% and 9%) and run (1, 2, and 3). Note variable x and y axis scales.
Table III. Summary of measured variables from the last sample from each run and if there was a signifi cant difference with relation to slope (p < 0·05)
Variable Difference
Time since runoff (seconds) NSSediment concentration (g l−1) NSDischarge (l s−1) NSTotal discharge (l) NSProportion sediment >0·5 mm 3 & 6Mean diameter (volume) (microns) 3 & 6, 3 & 9Mean diameter (surface) (microns) 3 & 6d (0·1) (microns) 3 & 6d (0·5) (microns) 3 & 6d (0·9) (microns) 3 & 6, 3 & 9Percentage clay 3 & 6Percentage silt 3 & 6, 3 & 9Percentage sand 3 & 6, 3 & 9
Note: The slope with the highest value is highlighted in italic typeface· NS = not signifi cant.

102 A. ARMSTRONG ET AL.
Copyright © 2010 John Wiley & Sons, Ltd. Earth Surf. Process. Landforms, Vol. 36, 97–106 (2011)
(a)
0
20
40
60
80
100
Cum
ula
tive m
ass p
erc
enta
ge
1 10 100 1000
Particle size, microns
3%
6%
9%
Parent soil
(b)
0
20
40
60
80
100
Cum
ula
tive m
ass p
erc
enta
ge
1 10 100 1000
Particle size, microns
3%
6%
9%
Parent soil
Figure 4. Particle size distribution for the parent soil and (a) fi rst and (b) last sample in each experimental run.
6
7
8
9
6
8
10
12
6
7
8
9
10
0 5 10 15 20
0 5 10 15 20
0 5 10 15 20
3%
6%
9%
Run 1 Run 2 Run 3
D0
.5,
mic
ron
s
Sample
(a)
0
.2
.4
.6
0
.5
1
1.5
0
.5
1
1.5
2
0 .02 .04 .06
0 .02 .04 .06
0 .02 .04 .06
3%
6%
9%
Run 1 Run 2 Run 3
Concentr
ation o
f sedim
ent >
0.5
mm
, g/l
Discharge, l/s
(b)
Figure 5. Change in the (a) d(0·5) sediment size and (b) contribution of the >0·5 mm size fraction through the runs for each slope.
from the 2% and 8% slopes during the 15 mm h−1 rainfall and for the second event (30 mm h−1) the sediment yield was higher from the 2% slope compared with the 8% slope (0·13 and 0·08 kg m−2, respectively). Finally, Assouline and Ben-Hur (2006) and Bryan (1979) found that there was no perceivable slope control: Assouline and Ben-Hur (2006) found no differ-ence in sediment concentrations from 5% and 9% slopes and
Bryan (1979) found no slope control during a series of experi-ments on dry and saturated soil using eight soils and 10 slope angles (3° to 30°). In addition Parsons et al. (1998) examined transport distances of 3 mm particles along a fi xed bed fl ume (particle diameters between 1 and 2 mm) at slopes of 3·5°, 5·5°, and 10° for a range of rainfall (0·00–0·85 J m−2 s−1) and fl ow energies (0·05–0·50 J m−2 s−1), which were varied inde-

VARIABILITY OF INTERRILL EROSION AT LOW SLOPES 103
Copyright © 2010 John Wiley & Sons, Ltd. Earth Surf. Process. Landforms, Vol. 36, 97–106 (2011)
pendently from slope. Their data showed that particles trav-elled further on the 3·5° slopes than the 5·5° slopes at the lower fl ow energies (<0·30 J m−2 s−1). Furthermore, at a fl ow energy of 0·15 J m−2 s−1 and rainfall energy of up to 0·24 J m−2 s−1 transport distances were greater on the 3·5° slope than on the 10° slope. These experiments used various soil types and therefore suggest that our fi ndings may be applicable to other soil types.
The runoff records from our experiments were highly vari-able in terms of the time for runoff to commence, steady state discharge and the speed at which it was attained and statistical analysis suggested slope was not a dominant control. The inconsistencies in steady state runoff must be due to the vari-ability in: rainfall intensity; infi ltration rates, variable soil prop-erties including surface seal development; varying amounts of
water fl owing in and out of the 15 cm exclusion zone; or a combination these factors. The mean rainfall rate was 47 mm h−1 with a standard deviation of 2·5 and is therefore unlikely to be the dominant cause of the variability in runoff. Variations in soil properties occurred despite careful prepara-tion of the fl ume and a stable bulk density. While there was some variability in soil moisture the differences were no greater than 0·02 m3 m−3 between repeats. The maximum difference in moisture content between slopes was 0·09 m3 m−3, but the only signifi cant difference was between the 3% and 6% runs. Furthermore, examination of the average moisture content of each run did not show any pattern with peak sediment con-centration, time to peak sediment concentration, discharge at peak sediment concentration, time to steady state discharge, steady state discharge, total soil loss or mean
Table IV. Summary of particle size data for every fi fth sample: volume-weighted mean diameter, d(0·1), d(0·5), d(0·9) and fraction <0·5 mm (mean and percentiles are from the <0·5 mm fraction given bias introduced by combining the sieve and MasterSizer data)
Mean (microns) d(0·1) (microns) d(0·5) (microns) d(0·9) (microns) Percentage <0·5 mm
Sample Run 1 Run 2 Run 3 Run 1 Run 2 Run 3 Run 1 Run 2 Run 3 Run 1 Run 2 Run 3 Run 1 Run 2 Run 3
Slope, 3%1 9·2 9·4 10·7 2·4 2·4 2·1 6·3 6·2 5·9 17·0 16·7 19·4 99·8 100·0 99·65 9·6 15·8 8·9 2·6 2·4 2·5 6·9 7·4 6·4 18·6 30·7 17·1 99·7 99·3 99·710 9·6 16·3 11·4 2·3 2·5 2·3 6·7 7·5 6·7 20·1 30·1 21·4 99·3 96·8 99·415 16·1 19·5 16·7 2·4 2·6 2·4 7·4 8·5 7·2 25·3 35·4 29·9 97·7 97·4 98·820 12·9 16·2 27·1 2·5 2·6 2·5 7·3 8·3 8·2 23·0 33·4 45·3 99·4 95·4 98·3
Slope, 6%1 10·8 10·9 9·6 2·4 2·5 2·4 6·9 6·9 6·3 22·2 21·6 18·1 99·4 98·6 98·85 9·8 11·2 10·3 2·3 2·2 2·2 6·8 6·6 6·3 20·7 23·3 20·2 99·4 98·3 97·610 16·6 14·2 11·9 2·5 2·5 2·4 8·1 7·5 7·0 31·4 29·1 23·8 97·7 97·3 97·715 16·7 15·3 17·9 2·6 2·5 2·5 8·7 8·2 8·0 34·6 31·7 36·9 96·0 91·5 89·720 19·9 21·7 18·9 2·8 2·8 2·5 9·9 10·6 8·4 43·3 50·3 41·1 87·8 87·3 95·4
Slope, 9%1 9·9 14·8 9·6 2·1 2·1 2·4 5·9 6·0 6·3 20·1 22·6 18·1 99·6 99·7 99·55 9·8 9·7 10·3 2·0 2·1 2·2 5·6 5·6 6·3 19·4 18·7 20·2 99·2 98·7 99·610 14·2 10·7 11·9 2·2 2·3 2·4 6·4 6·5 7·0 25·8 20·8 23·8 96·0 97·8 99·415 14·4 14·2 17·9 2·4 2·4 2·5 7·6 7·8 8·0 29·1 29·1 36·9 95·8 97·0 98·120 16·8 18·0 18·9 2·6 2·6 2·5 8·9 8·9 8·4 36·7 39·3 41·1 94·8 96·1 95·0
1
2
3
1
2
3
1
2
3
1
2
3
1
2
3
1
2
3
140
160
180
200
220
To
tal flo
w, l
1
2
3
4
5
To
tal so
il lo
ss,
kg
3 6 9
Slope, %
Total soil loss
Total flow
Figure 6. Total soil loss and discharge from each experimental run.

104 A. ARMSTRONG ET AL.
Copyright © 2010 John Wiley & Sons, Ltd. Earth Surf. Process. Landforms, Vol. 36, 97–106 (2011)
sediment concentration. Therefore, while variable soil mois-ture has been shown to impact on soil erosion (Le Bissonnais et al., 1995) we believe the small variability had limited impact in these experiments. We have no direct measurements of surface seal development, however, observations of the soil surface structure suggest that its development across the fl ume was not uniform and that it may, therefore, have played an important role in controlling the variability of the discharge response. DEMs of the fl ume surface after the experiments generated using the digital photogrammetry indicated that some overland fl ow measured at the end of the fl ume origi-nated from the 15 cm exclusion zone (Heng et al., in press). The variability in discharge was greater than that commonly found in fl ume studies (Fox and Bryan, 1999), but such studies generally use smaller fl umes and a wider range of slopes (Table I). Furthermore, at lower slopes variability discharge records from some studies is high: Assouline and Ben-Hur (2006), who used a 0·3 by 0·5 m soil fl ume, report variation between replicates with overlapping standard errors at 5% and 9% slopes. While the variability makes interpretation of the data more complex, it is also more synonymous of results obtained from fi eld environments, see for example Wendt et al. (1986), and it is processes occurring in these environments and their relative importance which we aim to understand.
Despite the variability in runoff records, characterization of the surface ponding on the fl ume surface gave similar results between repeats and different results between slopes. The dif-ferences were far greater between the 3% and 6% slopes, compared with the 6% and 9% slopes. This concurs with the results of Fox et al. (1997) who also documented much more water ponding on lower slopes: 400 cm3 of water storage on 1·5° slopes, 175 cm3 on 6·5° slopes and 150 cm3 on 11·5° slopes. However, the distribution of patches varied between runs due to slight differences in microtopography and, together with development of a surface seal, and varying contributions from the exclusion zones explains why time to steady state discharge varies. In addition to the quantifi cation of surface conditions, observation of the fl ume surface suggested that the fl ow patterns were different: more, thinner, faster fl ow threads occurred on the 6% and 9% experiments compared with the 3% experiments. These differences in surface conditions can be used to explain the sediment results as they control: (1) source area connectivity; (2) saturation; (3) fl ow patterns; and (4) depth of fl ow, and therefore sediment detachment and transport.
Although not statistically signifi cant there was a negative trend between total soil loss and slope (Figure 6). This did not correspond with total discharge, which is often the dominant control on sediment, nutrient or contaminant transfer. While there are limited data points and the differences are not statisti-cally signifi cant these data suggest there may be a dominant slope control, dominated by source area connectivity, fl ow patterns and depth of fl ow rather than discharge. These fi nd-ings are corroborated by Bryan (1979) who also found that discharge was not the principal control over sediment con-centrations and attributed the variability in sediment concen-tration to variation in the soil surface, water depth, drop diameter and interactions between them. However, this is the response from the onset of rainfall to approaching or at steady state and this should be borne in mind if comparing with models as they are generally based on steady state conditions.
A slope impact was clearly evident in the forms of the rela-tionships between sediment concentration and discharge, despite variations in the magnitude of these variables (Figure 3). The difference are less notable between the 6% and 9% slopes. This refl ects the same pattern as found in the
surface wetness analysis and observations of the fl ow network, and thus can also be attributed to surface connectivity, satura-tion, fl ow patterns and water depth. Other potential explana-tions appear less likely: although soil moisture differed signifi cantly between the 3% and 6% slopes the difference in hysteresis loop form was most notable between the 3% and 9% slopes suggesting that soil moisture was not the cause.
Varying fl ow patterns with slope may be a key variable affecting the sediment concentration discharge relationship as it impacts both the surface connectivity and the fl ow veloci-ties. Interill fl ow is often conceptualized as even shallow fl ow but in reality fl ow threads exist (Dunkerley, 2004) and conse-quently there is a distribution of velocities, as opposed to an equal velocity across the soil surface. Dunkerley (2004) inves-tigated this in a fi eld setting and found that actual velocities were signifi cantly different from the mean velocity: fl ow thread speeds were commonly 2·5 times greater than the mean and up to 6–7 times greater. Furthermore, Bryan (1979) found that the turbulence of fl ow altered with slope. Consequently, the fl ow thread pattern will impact the trans-port capability of the fl ow, affecting both the concentration and the size distribution. A difference in fl ow thread pattern was evident during the experiments, with more narrow faster fl ow threads associated with the steeper slopes compared to broader shallower fl ow on the 3% slopes (Figure 2). Consequently, the difference in the form of the sediment con-centration–discharge relations could be partially attributed to the effi ciency of the different velocity distributions associated with each slope and the differences in surface connectivity which results. It was not possible to reliably measure the velocity distributions as intrusive measurement techniques [e.g. salt-gauging (Planchon et al., 2005)] could not be used given their potential impacts on the fl ow and sediment transfer and tracing techniques, such as dyes, need correction factors and can be very inaccurate (Li et al., 1996). However, obser-vation of the fl ume during the experiments indicated that larger particles were transported in the faster fl ow threads, but it was not possible to assess differences in concentrations between the slower fl owing areas and the faster fl ow threads without disturbing the fl ow. These observations are supported by the particle size data which indicates that while the size distribution of the last samples were similar for the 6% and 9% experiments, the distribution was notably fi ner for the 3% experiments, which had broader slower fl ows. However it may also indicate that more coarse material was splashed into the fl ow at the steeper slopes given splash action has been shown to supply coarser sediment at a range of slopes (Wan and El-Swaify, 1998).
Consequently, if the dynamics of the erosion are considered it is possible to explain the high initial sediment concentra-tions followed by a decline on the 3% slope by considering the surface fl ow characteristics. The signifi cantly greater pro-portion of ponded and water-dominated areas resulted in increased connectivity, reduced soils cohesive strength and increased aggregate breakdown by slaking and thus greater sediment transport. Furthermore, the greater water depth on the 3% slope will have also infl uenced sediment transfer by controlling the effi ciency of splash detachment and transfer (Kinnell, 1991) and also the ease with which particles can move through the water column. The effi ciency of splash detachment and the ease with which particles can move through the water column were diffi cult to observe during the experiments, but the change in splash detachment effi ciency and transport is well documented (Moss and Green, 1983; Ferrera and Singer, 1985; Kinnell, 1991). The impact of the depth of the water column and subsequently the ease with which particles can move through the water is less well docu-

VARIABILITY OF INTERRILL EROSION AT LOW SLOPES 105
Copyright © 2010 John Wiley & Sons, Ltd. Earth Surf. Process. Landforms, Vol. 36, 97–106 (2011)
mented. However, Parsons et al. (1998) examined the travel distances of particles using a fi xed-bed fl ume and their data show that at the lower rainfall energies and fl ow energies particles travelled further on the lower slopes. Consequently, the only feasible explanation is that the increased water depths at the lower slopes enabled the particles to travel downslope less hindered than on the steeper slopes with lower water depths.
Analysis of the particle size data give further insight into processes occurring during the experiments. Firstly, the par-ticle size distribution of all eroded sediment was signifi cantly fi ner than that of the parent soil (even though the parent soil was analysed for its primary particle size) and this enrichment of fi nes concurs with the results of many soil erosion studies (Quinton et al., 2001) and will have important implications for the transfer of contaminants and nutrients. The particle size distribution of the eroded sediment may have coarsened through time which we attribute to increase in discharge, exhaustion of the supply of fi nes or the development of a shielding layer (Heilig et al., 2001).
The sediment particle size data can be used to infer the balance between wash and splash processes and changes in sediment regime with regard to slope. The particle size distri-butions of the <0·5 mm fraction of the fi rst samples from dif-ferent slopes were comparable, although the concentrations were signifi cantly higher on the 3% slopes (Figure 4). The results of Wan and El-Swaify (1998), who examined splash and wash erosion of a silty clay at 4–36% slopes and rainfall of 65–135 mm h−1, illustrated that the particle size distribution of splash and wash sediment is signifi cantly different, thus suggesting that the balance of wash and splash erosion was the same for all slopes in our experiments. However, the coarse sediment fraction (>0·5 mm) was signifi cantly lower on the 3% slope compared with the 6% and 9% slopes, indicat-ing different dominant processes may have been operating. This could be due to increased surface ponding at the 3% slopes resulting in sedimentation of the larger particles or the higher saturation causing the breakdown of aggregates pro-ducing a fi ner sediment supply on the 3% slopes. Furthermore, splash transport may have been more dominant at the steeper slopes: larger particles were transported by splash into the narrow fl ow threads, which had faster velocities than fl ow threads on the 3% slope, and were transported to the end of the fl ume. Alternatively, the higher stream powers on the steeper slopes may have increased transportation of larger particles. Another possible mechanism causing this trend is the operating of the third form of particle transport, splash creep, (Asadi et al. 2007), which is expected to be more dominant at higher slopes given the infl uence of gravity. While more coarse sediment was transported on the 6% slope compared with the 3% slope, a greater amount of coarse sedi-ment was transported on the 6% compared with the 9% slope. This change in direction of trend could be explained by a threshold grain size above which slope is a dominant control or may be related to water depth and the ease with which particles can travel unhindered as observed by Parsons et al. (1998). Alternatively, as the median particle size of the <0·5 mm fraction initially declined on the 9% slopes and then increased (Figure 5) there could be greater aggregate break-down on the higher slopes given the increased energy as a result of gravity and shallower water depths.
In order to allow inferences to be made regarding the role of slope on sediment size the last samples from each run were statistically analysed when the system was at or approaching steady state erosion. This highlighted a clear slope impact on the particle size distribution of eroded sediment: the only variables which were signifi cantly different between slopes
were those related to sediment size (Table III). Sediment was consistently fi ner on the 3% slopes. The differences were only signifi cant between the 3% and steeper slopes which is the same pattern as found in the analysis of surface water cover-age suggesting source area connectivity, saturation, fl ow pat-terns and fl ow depth may all have promoted the fi ner particle size through selective removal of fi nes, breakdown of aggre-gates, insuffi cient fl ow energy to transport coarser particles, and sedimentation of larger particles. Wan and El-Swaify (1998) examined the mean diameter of particles transported and found that size did not increase with slope at rainfall intensities <45 mm h−1. The rainfall rate in this study was 47 mm h−1 so, while a slope impact was evident between the 3% and steeper slopes for it to be apparent between the 6% and 9% slopes higher rainfall intensities may be required. Furthermore, as postulated for the results from the fi rst sample of each run, the coarser sediment found on steeper slopes may refl ect the balance of splash and wash processes (Wan and El-Swaify, 1998). One 3% slope run has a discernibly coarser particle size than the other two, although it is still fi ner than the 6% and 9% runs (Figure 4b). This is explained by a depres-sion, identifi ed by the contour maps derived from the DEMs, towards the end of the fl ume for the two runs with the fi ner coarser particle size distribution within which the coarser particles settled out of suspension. This highlights the impor-tance of microtopography on sediment transfer.
Conclusion
These experiments indicated that interrill soil erosion of a silt loam at low slopes is highly variable. Differences in steady state discharge, which showed no relationship with slope, are attributed to variation in topography and infi ltration, as a result of variable surface sealing, soil properties and contribution of water from the exclusion zone. The rate at which steady state discharge was attained also varied independently of slope and is attributed to variation in surface sealing and connectivity controlled by the microtopography. Sediment concentration was also highly variable but there were characteristic hyster-esis loops for each slope, with the largest difference in form between the 3% and steeper slopes. Furthermore, fi ner sedi-ment was generally associated with the 3% slopes and there were limited differences in particle size between the 6% and 9% slopes. These trends concur with the analysis of surface water coverages and therefore the differences in sediment dynamics are attributed to the affects of varying surface con-nectivity, saturation, fl ow thread patterns and fl ow depths, all of which are strongly infl uenced by microtopography. It is not possible to determine the relative dominance of these factors as they are interrelated and could not be controlled indepen-dently in our experiments. As previously mentioned there is evidence of this change in dominant processes at lower slopes in existing research (Helming et al., 1998; Römkens et al., 2002; Assouline and Ben-Hur, 2006) but it is not highlighted.
These fi ndings point to the complexity of sediment transport on slopes representative of arable agricultural land for a silt loam. They indicate that the interaction between surface topography and slope may be critical in controlling the devel-opment of fl ow pathways and the transport of soil particles. This has implications for soil erosion models and risk assess-ments, many of which include slope as a key driver. Furthermore, it will also be of signifi cance for models and quantifi cation of pollutant transport, which is strongly con-trolled by particle size distribution.

106 A. ARMSTRONG ET AL.
Copyright © 2010 John Wiley & Sons, Ltd. Earth Surf. Process. Landforms, Vol. 36, 97–106 (2011)
Acknowledgements—This research was carried out as part of NERC funded project (NE/E007015/1). The authors would like to thank the anonymous reviewers for their helpful comments, Brenda Cookson for her assistance in the laboratory and Graham Sander, Cecil Scott, and Andrew Wheatley for useful discussions.
ReferencesArmstrong A, Quinton JN. 2009. Pumped rainfall simulators: the
impact of rain pulses on sediment concentration and size. Earth Surface Processes and Landforms 34: 1310–1314.
Asadi H, Ghadiri H, Rose CW, Rouhipour H. 2007. Interrill soil erosion processes and their interaction on low slopes. Earth Surface Processes and Landforms 32: 711–724.
Assouline S, Ben-Hur M. 2006. Effects of rainfall intensity and slope gradient on the dynamics of interrill erosion during soil surface sealing. CATENA 66: 211–220.
Ben-Hur M, Wakindiki IIC. 2004. Soil mineralogy and slope effects on infi ltration, interrill erosion, and slope factor. Water Resources Research 40: W03303.
Bradford JM, Foster GR. 1996. Interrill soil erosion and slope steepness factors. Soil Science Society of America Journal 60: 909–915.
Bryan RB. 1979. The infl uence of slope angle on soil entrainment by sheetwash and rainsplash. Earth Surface Processes 4: 43–58.
Chandler JH, Fryer JG, Jack A. 2005. Metric capabilities of low-cost digital cameras for close range surface measurement. The Photo-grammetric Record 20: 12–26.
Chaplot V, Le Bissonnais Y. 2000. Field measurements of interrill erosion under different slopes and plot sizes. Earth Surface Pro-cesses and Landforms 25: 145–153.
Christensen JE. 1942. Irrigation by sprinkling. In University of Califor-nia Agricultural Experiment Station Bulletin, 670. University of Cali-fornia: Berkeley, CA; 124.
Conover WJ. 1999. Practical Nonparametric Statistics. Wiley: New York.
De Roo APJ, Wesseling CG, Ritsema CJ. 1996. LISEM: a single-event physically based hydrological and soil erosion model for drainage basins. I: Theory, input and output. Hydrological Processes 10: 1107–1117.
Department for Environment, Food and Rural Affairs (Defra). 2002. Agriculture and Water: A Diffuse Pollution Review. Defra: London; 115.
Dunkerley D. 2004. Flow threads in surface run-off: implications for the assessment of fl ow properties and friction coeffi cients in soil erosion and hydraulics investigations. Earth Surface Processes and Landforms 29: 1011–1026.
Ferrera AG, Singer MJ. 1985. Energy dissipation for water drop impact into shallow pools. Soil Science Society of America Journal 49: 1537–1542.
Fox DM, Bryan RB. 1999. The relationship of soil loss by interrill erosion to slope gradient. CATENA 38: 211–222.
Fox DM, Bryan RB, Price AG. 1997. The infl uence of slope angle on fi nal infi ltration rate for interrill conditions. Geoderma 80: 181–194.
Gale SJ, Hoare PG. 1991. Quaternary Sediments. Belhaven Press: London.
Gao B, Walter MT, Steenhuis TS, Parlange JY, Nakano K, Rose CW, Hogarth WL. 2003. Investigating ponding depth and soil detach-ability for a mechanistic erosion model using a simple experiment. Journal of Hydrology 277: 116–124.
Ghadiri H, Payne D. 1988. The formation and characteristics of splash following raindrop impact on soil. Journal of Soil Science 39: 563–575.
Heilig A, DeBruyn D, Walter MT, Rose CW, Parlange JY, Steenhuis TS, Sander GC, Hairsine PB, Hogarth WL, Walker LP. 2001. Testing a mechanistic soil erosion model with a simple experiment. Journal of Hydrology 244: 9–16.
Helming K, Romkens MJM, Prasad SN. 1998. Surface roughness related processes of runoff and soil loss: a fl ume study. Soil Science Society of America Journal 62: 243–250.
Heng BCP, Chandler JH, Armstrong A. In press. Applying close range digital photogrammetry in soil erosion studies. Photogrammetric Record.
Huang C.-h. 1995. Empirical analysis of slope and runoff for sediment delivery from interrill areas. Soil Science Society of America Journal 59: 982–990.
Huang C-h. Sediment regimes under different slope and surface hydrologic conditions. Soil Sci Soc Am J 1998; 62: 423–430.
Kinnell PIA. 1991. Effect of fl ow depth on sediment transport induced by raindrops impacting shallow fl ows. Transactions of the American Society of Agricultural Engineers 34: 161–168.
Le Bissonnais Y, Renaux B, Delouche H. 1995. Interactions between soil properties and moisture content in crust formation, runoff and interrill erosion from tilled loess soils. CATENA 25: 33–46.
Li G, Abrahams ADJ, Atkinson JF. 1996. Correction factors in the determination of mean velocity of overland fl ow. Earth Surface Processes and Landforms 21: 509–515.
Luk SH, Cai Q, Wang GP. 1993. Effects of surface crusting and slope gradient on soil and water losses in the hilly loess region, North China. CATENA 24: 29–45.
Meyer LD, Harmon WC. How row-sideslope length and steepness affect sideslope erosion. Transactions of the American Society of Agricultural Engineers 1989; 32: 639–644.
Morgan RPC, Quinton JN, Smith RE, Govers G, Poesen JWA, Auer-swald K, Chisci G, Torri D, Styczen ME. 1998. The European Soil Erosion Model (EUROSEM): a dynamic approach for predicting sediment transport from fi elds and small catchments. Earth Surface Processes and Landforms 23: 527–544.
Moss AJ, Green P. 1983. Movement of solids in air and water by raindrop impact. Effects of drop-size and water-depth variations. Australian Journal of Soil Research 21: 257–269.
Parsons AJ, Stromberg SGL, Greener M. 1998. Sediment-transport competence of rain-impacted interrill overland fl ow. Earth Surface Processes and Landforms 23: 365–375.
Planchon O, Silvera N, Gimenez R, Favis-Mortlock D, Wainwright J, Le Bissonnais Y, Govers G. 2005. An automated salt-tracing gauge for fl ow-velocity measurement. Earth Surface Processes and Land-forms 30: 833–844.
Poesen J. 1984. The infl uence of slope angle on infi ltration rate and Hortonian overland fl ow volume. Zeitschrift für Geomorpholgie 49: 117–131.
Quinton JN, Catt JA, Hess TM. 2001. The selective removal of phos-phorus from soil: is event size important? Journal of Environmental Quality 30: 538–545.
Renschler CS, Mannaerts C, Diekkrüger B. 1999. Evaluating spatial and temporal variability in soil erosion risk – rainfall erosivity and soil loss ratios in Andalusia, Spain. CATENA 34: 209–225.
Römkens MJM, Helming K, Prasad SN. 2002. Soil erosion under dif-ferent rainfall intensities, surface roughness, and soil water regimes. CATENA 46: 103–123.
Snelder DJ, Bryan RB. 1995. The use of rainfall simulation tests to assess the infl uence of vegetation density on soil loss on degraded rangelands in the Baringo District, Kenya. CATENA 25: 105–116.
StataCorp. 2007. Stata Statistical Software: Release 10. Stata Press: College Station, TX.
Strauss P, Pitty J, Pfeffer M, Mentler A. 2000. Rainfall simulation for outdoor experiments. In Current Research Methods to Assess the Environmental Fate of Pesticides, Jamet P, Cornejo J (eds). INRA Editions: Paris; 329–333.
Wan Y, El-Swaify SA. 1998. Characterizing interrill sediment size by partitioning splash and wash processes. Soil Science Society of America Journal 62: 430–437.
Wendt RC, Alberts EE, Hjelmfelt AT. 1986. Variability of runoff and soil loss from fallow experimental plots. Soil Science Society of America Journal 50: 730–736.


