Embed Size (px)
Citation preview
Seediscussions,stats,andauthorprofilesforthispublicationat:https://www.researchgate.net/publication/32116849
EffectivenessofPalmandSimulatedGeotextilesinReducingRun-offandInter-rillErosiononMediumandSteepSlopes
ARTICLEinSOILUSEANDMANAGEMENT·AUGUST2007
ImpactFactor:1.47·DOI:10.1111/j.1475-2743.2007.00098.x·Source:OAI
CITATIONS
36
READS
36
4AUTHORS:
ToonSmets
FlemishInstituteforTechnologicalResearch
19PUBLICATIONS236CITATIONS
SEEPROFILE
J.Poesen
UniversityofLeuven
641PUBLICATIONS19,376CITATIONS
SEEPROFILE
MichaelFullen
UniversityofWolverhampton
184PUBLICATIONS1,575CITATIONS
SEEPROFILE
ColinA.Booth
UniversityoftheWestofEngland,Bristol
125PUBLICATIONS658CITATIONS
SEEPROFILE
Allin-textreferencesunderlinedinbluearelinkedtopublicationsonResearchGate,
lettingyouaccessandreadthemimmediately.
Availablefrom:MichaelFullen
Retrievedon:05February2016
Effectiveness of palm and simulated geotextiles in reducingrun-off and inter-rill erosion on medium and steep slopes
T. Smets1
, J . Poesen1
, M. A. Fullen2
& C. A. Booth3
1Physical and Regional Geography Research Group, K. U. Leuven, Geo-Institute, Celestijnenlaan 200E, B-3001 Heverlee, Belgium,2School of Applied Sciences, The University of Wolverhampton, Wulfruna Street, Wolverhampton WV1 1SB, UK, and 3School of
Engineering and the Built Environment, The University of Wolverhampton, Wulfruna Street, Wolverhampton WV1 1SB, UK
Abstract
Palm-leaf geotextiles could be an effective and cheap soil conservation method with enormous global
potential. However, there are very few data on the effectiveness of palm geotextiles in reducing soil
erosion by water. This study investigates the effectiveness of two types of palm geotextiles and the
effect of geotextile mesh size on infiltration, run-off and inter-rill erosion rate and soil surface rough-
ness on a medium and steep slope. A well-defined protocol was developed to conduct laboratory
experiments. Rainfall was simulated for 90 min with an intensity (I) of 45 and 67 mm h)1 on an inter-
rill erosion plot, filled with an erodible sandy loam and having slope gradients (S) of 15 and 45%.
Two palm-leaf geotextiles (Borassus aethiopum and Brazilian Buriti Palm) and three simulated geo-
textiles (polyethylene tarpaulin) with different mesh sizes (1 · 1, 5 · 5 and 12 · 12 cm) were tested on
a simulated fine tilth. Calculated k values from the Horton infiltration equation ranged from 0.025 to
0.145 and decreased linearly on both slopes with geotextile cover. Geotextiles are more effective in
reducing the run-off coefficient on a medium slope (15%) compared with that on a steep slope (45%),
ranging from 76.4 to 17.9%. Mean b values from the mulch cover equation equalled 0.024 for a 15%
slope and 0.045 for a 45% slope, indicating a higher effectiveness of geotextiles in reducing total inter-
rill soil loss on gentler slopes compared with commonly used mulches. Erosion-induced soil surface
roughness at the end of each experiment increased linearly with geotextile cover percentage and this
increase was not significantly different between the two slope gradients.
Keywords: Geotextiles, infiltration rates, inter-rill erosion, laboratory experiments, simulated rainfall
Introduction
On steep slopes intense rainfall can cause significant soil ero-
sion. The establishment of a vegetative cover, which can pro-
vide long-term protection of slopes, is counteracted by the
erosive forces of rain and run-off. Seeds and seedlings can be
damaged or even washed away, so vegetation growth on
steep erodible slopes is limited. During this period of high
erosion risk, geotextiles or erosion control mats are a poss-
ible temporary replacement for vegetative cover and can
offer immediate soil protection on steep slopes (Hann &
Morgan, 2006). Geotextiles are defined as ‘permeable textiles
used in conjunction with soil, foundation, rock, earth or any
geotechnical engineering-related material, as an integral part
of a man-made project’ (John, 1987). They are currently used
in various applications, including separating two distinct
materials, filtration, drainage, reinforcement of weak soils
and other materials and surface soil erosion control which is
considered in this study. Erosion control geotextiles are made
from natural or synthetic materials, including jute, coir, sisal,
cereal straw, nylon, palm leafs, polypropylene, polyester and
polyethylene (Rickson, 2006). In this study, we focus on
palm geotextiles for erosion control. Preliminary investiga-
tions suggest palm-leaf geotextiles could be an effective and
cheap soil conservation method with enormous global poten-
tial (Booth et al., 2005; Davies et al., 2006). However, there
are few data on the effectiveness of palm geotextiles to
reduce soil erosion by water. In many of the existing field
and laboratory studies as reviewed by Sutherland (1998a,b),
results are difficult to interpret because very few treatment
replications were conducted and often influencing variablesCorrespondence: T. Smets. E-mail: [email protected]
Received January 2007; accepted after revision May 2007
Soil Use and Management, September 2007, 23, 306–316 doi: 10.1111/j.1473-2743.2007.00098.x
306 ª 2007 The Authors. Journal compilation ª 2007 British Society of Soil Science
were not controlled between experiments. Even so, there is
little understanding of how geotextiles interact with the var-
ious hydrological (infiltration and run-off production) and
erosion processes (splash, inter-rill and rill erosion) on a
range of slopes and under different rainfall intensities. This
is mainly attributed to the lack of standardized protocols to
assess the erosion control effectiveness of geotextiles.
The objectives of this study were therefore to: (i) develop a
methodology to assess the effectiveness of different types of
geotextiles in controlling water erosion; (ii) assess the effect-
iveness of two types of palm geotextiles in increasing infiltra-
tion rates and reducing inter-rill run-off and erosion rates on
a medium and steep slope gradient and under two rainfall
intensities; and (iii) investigate the effect of palm geotextile
mesh size on increasing infiltration rates and reducing inter-
rill run-off and erosion rates. The hypothesis tested in this
study is that geotextiles applied to the soil surface act as
mulch elements in increasing infiltration rates and reducing
inter-rill run-off and erosion rates.
Materials and methods
Experimental design
Inter-rill erosion plot. All experiments were conducted using a
rectangular inter-rill erosion plot, 1.25 · 1.78 m2 (Poesen
et al., 1990) (Figure 1). The erosion plot had a central test
area of 0.60 · 0.94 m2, surrounded by a buffer area, identic-
ally treated as the test area to compensate for losses of water
and sediment due to splash from the central test area. The
development of rills was limited because of the limited size
of the test area. On the bottom of the erosion plot, wet
cloths were placed on top of perforated plates. Run-off and
percolated water from the test area were collected at the
downslope end or below the erosion plot. Given that soil
erosion can be severe on medium and steep slopes, experi-
ments were conducted on 15 and 45% slopes.
Soil type. The soil used in the experiments was Tertiary sandy
loam, erodible subsoil, quarried in central Belgium (Bierbeek)
and often found in road cuttings and on construction
sites. The soil has 13% clay (<0.002 mm), 24% silt
(0.002–0.063 mm) and 63% sand (0.063–2 mm) and 0.18%
organic matter. The inter-rill erosion plot was filled in the test
area to a depth of 0.10 m and in the buffer area to 0.05 m, so a
soil volume of 0.14 m3 was needed for each experiment.
Simulated rainfall. Rainfall was simulated for 90 min by a
single-nozzle, continuous-spray system (Poesen et al., 1990;
Poesen & Lavee, 1991). Water pressure in the system could
be adjusted by a pressure regulator. Experiments were con-
ducted with a water pressure of 0.59 and 0.71 bar at the noz-
zle outlet, yielding a mean rainfall intensity over the test area
of 45 and 67 mm h)1, respectively. Because fall-height equal-
led 3.25 m, and using the drop-size distribution and the cal-
culated drop-fall velocity (Laws, 1941), the simulated rainfall
produced a kinetic energy at the soil surface of 15.2 and
15.8 J m)2 mm)1, respectively. This equals to approximately
60% of the energy of natural rainfall with similar intensities
(Salles et al., 2002).
Geotextiles. Experiments were conducted with simulated geo-
textiles and two types of palm geotextiles: the Borassus aethi-
opum geotextile (Davies et al., 2006), manufactured in
Gambia and Brazilian Buriti Palm geotextiles (Guerra et al.,
2005), manufactured in Brazil (Figure 2). To investigate the
effects of geotextile mesh size on increasing infiltration rates
and reducing inter-rill run-off and erosion rates, simulated
geotextiles with three different mesh sizes were constructed
by cutting, weaving and stapling 1.5-cm-wide strips similar
to the Borassus and Buriti geotextiles from reinforced poly-
ethylene sheets using mesh sizes of 0.01 · 0.01, 0.05 · 0.05
RunoffCollecting
system
Buffer area
Test area
0.94 m
0.60 m
Figure 1 Inter-rill erosion plot used in this study.
(a) (b)
Figure 2 Palm-leaf geotextiles (a) Buriti and (b) Borassus geotextiles;
total length of scale bar equals 60 cm.
Effectiveness of erosion control palm geotextiles 307
ª 2007 The Authors. Journal compilation ª 2007 British Society of Soil Science, Soil Use and Management, 23, 306–316
and 0.12 · 0.12 m (Figure 3). The cover percentage, mesh
size and thickness of the Borassus, Buriti and simulated geo-
textiles are given in Table 1.
Preparation of experiments
To assess the effectiveness of geotextiles in increasing infiltra-
tion and reducing inter-rill run-off and erosion, a standard
procedure was applied. Prior to each experiment, the soil
was air dried (room temperature, initial gravimetric moisture
content: 9.0 ± 1.5%) for 4 days and sieved using a sieve
with circular holes of 2.7-cm diameter. The erosion plot was
filled with the sieved soil and the soil surface flattened using
a board, simulating a fine tilth similar to a fine seedbed, with
a bulk density of 1.20 ± 0.04 g cm)3. Next, the soil surface
of the test and buffer area was covered with a geotextile.
Measurement procedure
Before the start of each experiment, soil samples in the test
area were taken to determine the initial gravimetric soil mois-
ture (%) and bulk density (kg m)3). Rainfall intensity
(mm h)1) over the test area was measured before and after
each experiment for 3 min using a rain gauge. Each experi-
ment lasted for 90 min which was sufficient to reach steady-
state conditions. During the experiments, percolation and
run-off samples including sediment were taken for 1 min with
an interval of 2 min. The run-off samples were oven-dried at
105 �C for 24 h. After each experiment, the geotextiles were
removed and the erosion-induced soil surface roughness was
measured using the chain method (Saleh, 1993). A 1-m-long
chain with link lengths of 0.003 m was used. Chain roughness
(CR, %) was calculated using the equation:
CR ¼ 100 1� L2
L1
� �ð1Þ
where L1 is the full length of the chain (m) and L2 is the
horizontal distance between chain ends when placed on the
soil surface (m) (Saleh, 1993).
For each combination of slope gradient and rainfall
intensity, a control experiment (bare soil surface) was
conducted and for each combination of cover, slope
gradient and rainfall intensity, two to three replications
were conducted. In total, 60 rainfall experiments were
conducted (Table 2).
Data processing
Inter-rill soil loss (ISL, kg m)2) was determined by weighing
the oven-dried run-off samples. Run-off volume (mm) was cal-
culated by subtracting the mass of the ISL samples from the
mass of the run-off samples (water density: 1.0 g cm)3). Total
inter-rill soil loss (total ISL, kg m)2) was calculated by integra-
ting the ISL samples over the duration of each experiment.
Next, inter-rill sediment concentration (ISC, kg m)3) was cal-
culated. Because rainfall intensity was kept constant during
the experiments, infiltration rate (mm h)1) was calculated by
subtracting the run-off rate, determined by the run-off volume
and the sampling time, from the rainfall intensity. ANOVA
tests were conducted on the results of the experiments (infiltra-
tion rate, run-off rate and total ISL) using the SAS statistical
program (version 9.1, SAS Institute Inc., 2002).
Table 2 Outline of the inter-rill laboratory experiments
Rainfall intensity (I) 45 and 67 mm h)1
Duration 90 min
Slope gradient (S) 15 and 45%
Soil type (texture) Sandy loam
Cover type Bare, Borassus, Buriti and three
simulated geotextiles
Replications Two to three
Total number of
experiments
60
0.6 m
1 by 1 cm
(C = 84%)
5 by 5 cm
(C = 43%)
12 by 12 cm
(C = 22%)
Figure 3 Simulated geotextiles with different
mesh sizes (C = surface cover, %).
Table 1 Characteristics of Borassus, Buriti and simulated geotextiles
Geotextile Cover (%) Mesh size (m · m) Thickness (m)
Borassus 43 0.05 · 0.05 0.016
Buriti 42 0.04 · 0.04 0.013
Simulated
0.01 · 0.01 m2 84 0.01 · 0.01 0.001
0.05 · 0.05 m2 43 0.05 · 0.05 0.001
0.12 · 0.12 m2 22 0.12 · 0.12 0.001
308 T. Smets et al.
ª 2007 The Authors. Journal compilation ª 2007 British Society of Soil Science, Soil Use and Management, 23, 306–316
Results
Infiltration and run-off
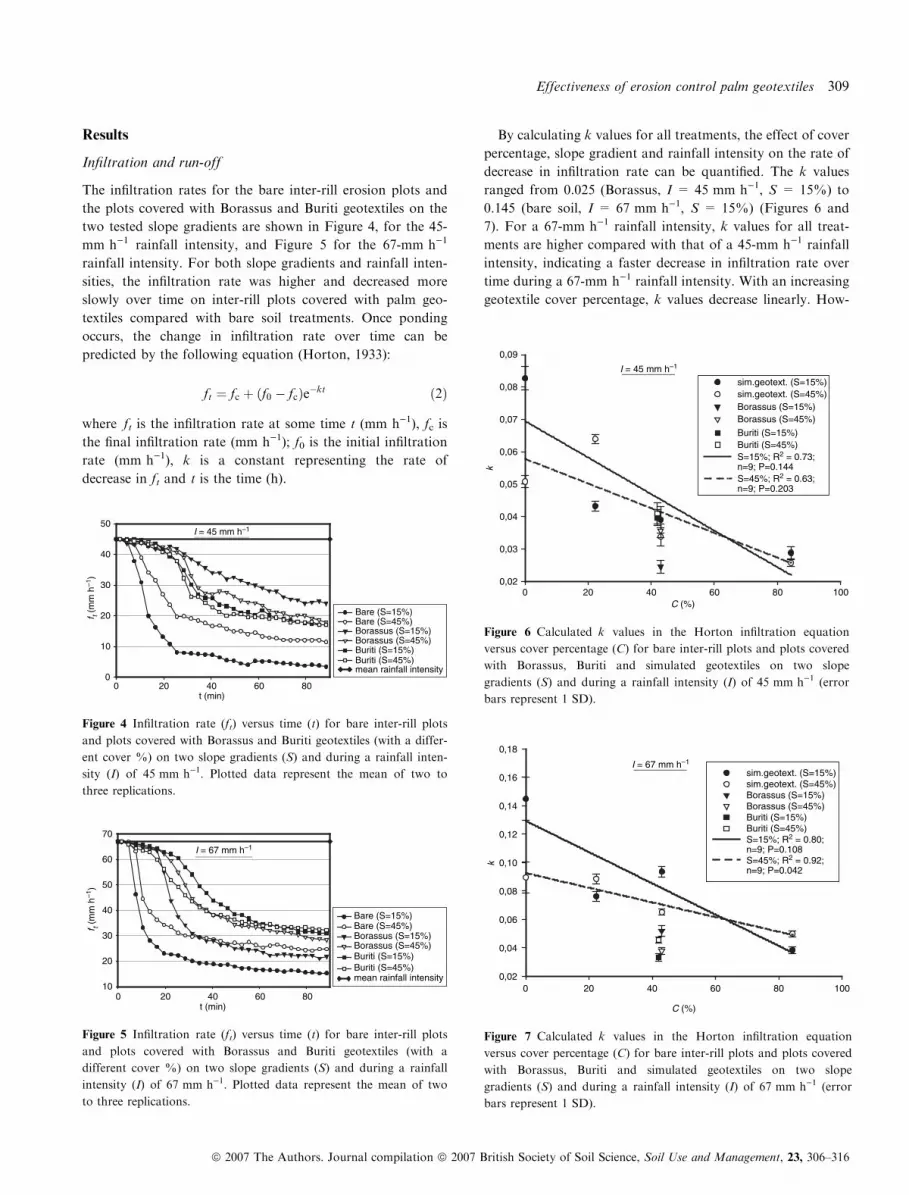
The infiltration rates for the bare inter-rill erosion plots and
the plots covered with Borassus and Buriti geotextiles on the
two tested slope gradients are shown in Figure 4, for the 45-
mm h)1 rainfall intensity, and Figure 5 for the 67-mm h)1
rainfall intensity. For both slope gradients and rainfall inten-
sities, the infiltration rate was higher and decreased more
slowly over time on inter-rill plots covered with palm geo-
textiles compared with bare soil treatments. Once ponding
occurs, the change in infiltration rate over time can be
predicted by the following equation (Horton, 1933):
ft ¼ fc þ ðf0 � fcÞe�kt ð2Þ
where ft is the infiltration rate at some time t (mm h)1), fc is
the final infiltration rate (mm h)1); f0 is the initial infiltration
rate (mm h)1), k is a constant representing the rate of
decrease in ft and t is the time (h).
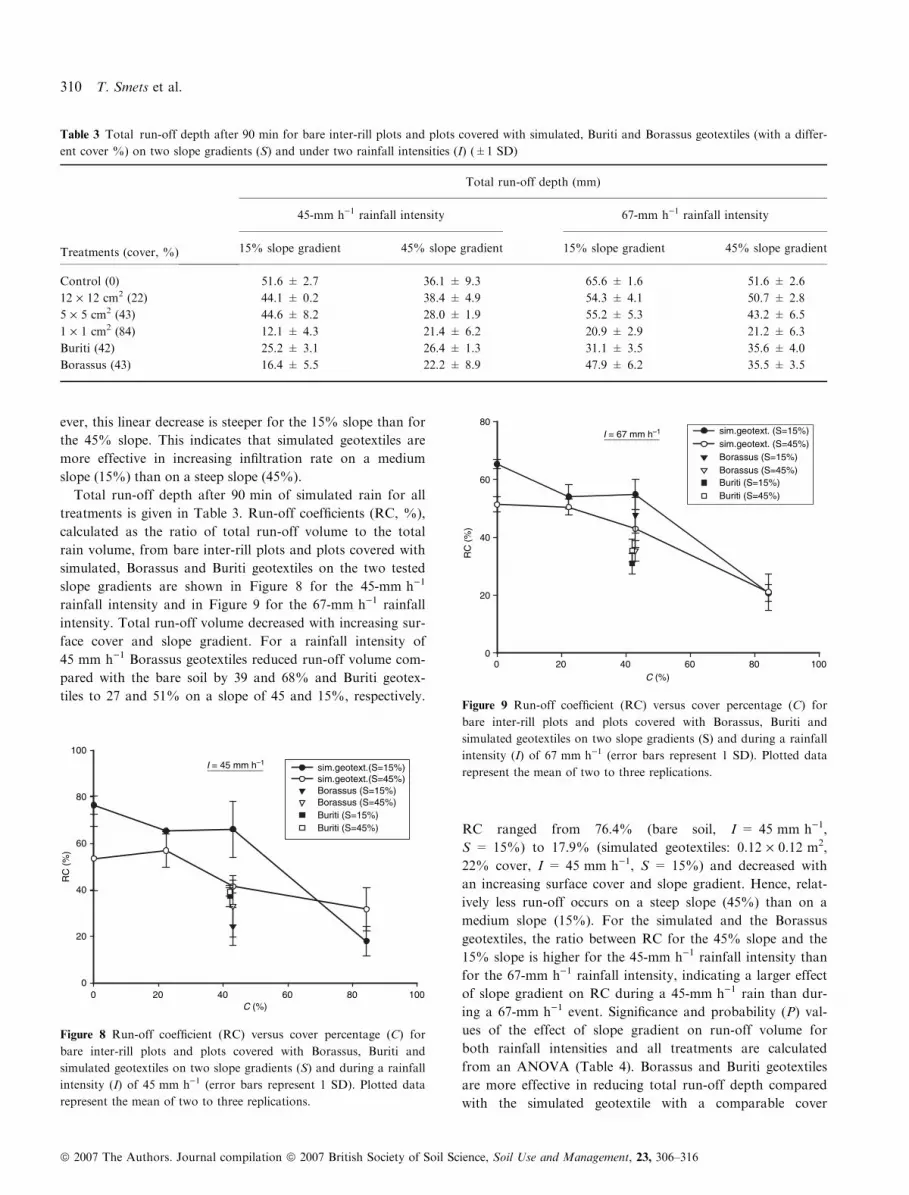
By calculating k values for all treatments, the effect of cover
percentage, slope gradient and rainfall intensity on the rate of
decrease in infiltration rate can be quantified. The k values
ranged from 0.025 (Borassus, I = 45 mm h)1, S = 15%) to
0.145 (bare soil, I = 67 mm h)1, S = 15%) (Figures 6 and
7). For a 67-mm h)1 rainfall intensity, k values for all treat-
ments are higher compared with that of a 45-mm h)1 rainfall
intensity, indicating a faster decrease in infiltration rate over
time during a 67-mm h)1 rainfall intensity. With an increasing
geotextile cover percentage, k values decrease linearly. How-
I = 67 mm h–1
t (min)0 20 40 60 80
10
20
30
40
50
60
70
Bare (S=15%) Bare (S=45%) Borassus (S=15%) Borassus (S=45%) Buriti (S=15%) Buriti (S=45%) mean rainfall intensity
f t (m
m h
–1)
Figure 5 Infiltration rate (ft) versus time (t) for bare inter-rill plots
and plots covered with Borassus and Buriti geotextiles (with a
different cover %) on two slope gradients (S) and during a rainfall
intensity (I) of 67 mm h)1. Plotted data represent the mean of two
to three replications.
I = 67 mm h–1
C (%)
0 20 40 60 80 100
k
0,02
0,04
0,06
0,08
0,10
0,12
0,14
0,16
0,18
sim.geotext. (S=15%)sim.geotext. (S=45%)Borassus (S=15%)Borassus (S=45%)Buriti (S=15%)Buriti (S=45%)S=15%; R2 = 0.80;n=9; P=0.108S=45%; R2 = 0.92;n=9; P=0.042
Figure 7 Calculated k values in the Horton infiltration equation
versus cover percentage (C) for bare inter-rill plots and plots covered
with Borassus, Buriti and simulated geotextiles on two slope
gradients (S) and during a rainfall intensity (I) of 67 mm h)1 (error
bars represent 1 SD).
I = 45 mm h–1
t (min)0 20 40 60 80
f t (m
m h
–1)
0
10
20
30
40
50
Bare (S=15%) Bare (S=45%)Borassus (S=15%)Borassus (S=45%)Buriti (S=15%)Buriti (S=45%)mean rainfall intensity
Figure 4 Infiltration rate (ft) versus time (t) for bare inter-rill plots
and plots covered with Borassus and Buriti geotextiles (with a differ-
ent cover %) on two slope gradients (S) and during a rainfall inten-
sity (I) of 45 mm h)1. Plotted data represent the mean of two to
three replications.
I = 45 mm h–1
C (%)0 20 40 60 80 100
k
0,02
0,03
0,04
0,05
0,06
0,07
0,08
0,09
sim.geotext. (S=15%)sim.geotext. (S=45%)Borassus (S=15%)Borassus (S=45%)
Buriti (S=15%)Buriti (S=45%)S=15%; R2 = 0.73; n=9; P=0.144S=45%; R2 = 0.63; n=9; P=0.203
Figure 6 Calculated k values in the Horton infiltration equation
versus cover percentage (C) for bare inter-rill plots and plots covered
with Borassus, Buriti and simulated geotextiles on two slope
gradients (S) and during a rainfall intensity (I) of 45 mm h)1 (error
bars represent 1 SD).
Effectiveness of erosion control palm geotextiles 309
ª 2007 The Authors. Journal compilation ª 2007 British Society of Soil Science, Soil Use and Management, 23, 306–316
ever, this linear decrease is steeper for the 15% slope than for
the 45% slope. This indicates that simulated geotextiles are
more effective in increasing infiltration rate on a medium
slope (15%) than on a steep slope (45%).
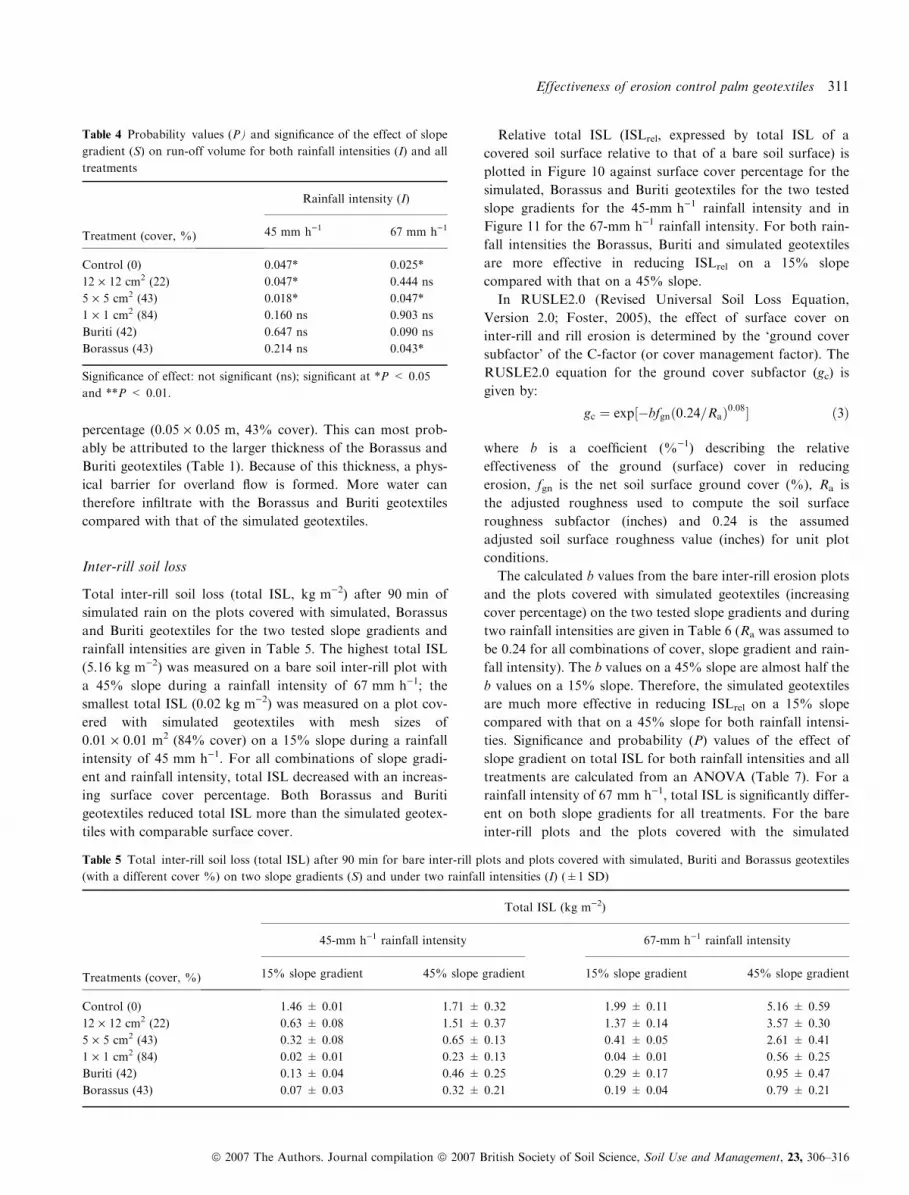
Total run-off depth after 90 min of simulated rain for all
treatments is given in Table 3. Run-off coefficients (RC, %),
calculated as the ratio of total run-off volume to the total
rain volume, from bare inter-rill plots and plots covered with
simulated, Borassus and Buriti geotextiles on the two tested
slope gradients are shown in Figure 8 for the 45-mm h)1
rainfall intensity and in Figure 9 for the 67-mm h)1 rainfall
intensity. Total run-off volume decreased with increasing sur-
face cover and slope gradient. For a rainfall intensity of
45 mm h)1 Borassus geotextiles reduced run-off volume com-
pared with the bare soil by 39 and 68% and Buriti geotex-
tiles to 27 and 51% on a slope of 45 and 15%, respectively.
RC ranged from 76.4% (bare soil, I = 45 mm h)1,
S = 15%) to 17.9% (simulated geotextiles: 0.12 · 0.12 m2,
22% cover, I = 45 mm h)1, S = 15%) and decreased with
an increasing surface cover and slope gradient. Hence, relat-
ively less run-off occurs on a steep slope (45%) than on a
medium slope (15%). For the simulated and the Borassus
geotextiles, the ratio between RC for the 45% slope and the
15% slope is higher for the 45-mm h)1 rainfall intensity than
for the 67-mm h)1 rainfall intensity, indicating a larger effect
of slope gradient on RC during a 45-mm h)1 rain than dur-
ing a 67-mm h)1 event. Significance and probability (P) val-
ues of the effect of slope gradient on run-off volume for
both rainfall intensities and all treatments are calculated
from an ANOVA (Table 4). Borassus and Buriti geotextiles
are more effective in reducing total run-off depth compared
with the simulated geotextile with a comparable cover
Table 3 Total run-off depth after 90 min for bare inter-rill plots and plots covered with simulated, Buriti and Borassus geotextiles (with a differ-
ent cover %) on two slope gradients (S) and under two rainfall intensities (I) (±1 SD)
Treatments (cover, %)
Total run-off depth (mm)
45-mm h)1 rainfall intensity 67-mm h)1 rainfall intensity
15% slope gradient 45% slope gradient 15% slope gradient 45% slope gradient
Control (0) 51.6 ± 2.7 36.1 ± 9.3 65.6 ± 1.6 51.6 ± 2.6
12 · 12 cm2 (22) 44.1 ± 0.2 38.4 ± 4.9 54.3 ± 4.1 50.7 ± 2.8
5 · 5 cm2 (43) 44.6 ± 8.2 28.0 ± 1.9 55.2 ± 5.3 43.2 ± 6.5
1 · 1 cm2 (84) 12.1 ± 4.3 21.4 ± 6.2 20.9 ± 2.9 21.2 ± 6.3
Buriti (42) 25.2 ± 3.1 26.4 ± 1.3 31.1 ± 3.5 35.6 ± 4.0
Borassus (43) 16.4 ± 5.5 22.2 ± 8.9 47.9 ± 6.2 35.5 ± 3.5
C (%)0 20 40 60 80 100
RC
(%
)
0
20
40
60
80sim.geotext. (S=15%)sim.geotext. (S=45%)Borassus (S=15%) Borassus (S=45%) Buriti (S=15%) Buriti (S=45%)
I = 67 mm h–1
Figure 9 Run-off coefficient (RC) versus cover percentage (C) for
bare inter-rill plots and plots covered with Borassus, Buriti and
simulated geotextiles on two slope gradients (S) and during a rainfall
intensity (I) of 67 mm h)1 (error bars represent 1 SD). Plotted data
represent the mean of two to three replications.I = 45 mm h–1
C (%)0 20 40 60 80 100
RC
(%
)
0
20
40
60
80
100
sim.geotext.(S=15%)sim.geotext.(S=45%)Borassus (S=15%) Borassus (S=45%) Buriti (S=15%) Buriti (S=45%)
Figure 8 Run-off coefficient (RC) versus cover percentage (C) for
bare inter-rill plots and plots covered with Borassus, Buriti and
simulated geotextiles on two slope gradients (S) and during a rainfall
intensity (I) of 45 mm h)1 (error bars represent 1 SD). Plotted data
represent the mean of two to three replications.
310 T. Smets et al.
ª 2007 The Authors. Journal compilation ª 2007 British Society of Soil Science, Soil Use and Management, 23, 306–316
percentage (0.05 · 0.05 m, 43% cover). This can most prob-
ably be attributed to the larger thickness of the Borassus and
Buriti geotextiles (Table 1). Because of this thickness, a phys-
ical barrier for overland flow is formed. More water can
therefore infiltrate with the Borassus and Buriti geotextiles
compared with that of the simulated geotextiles.
Inter-rill soil loss
Total inter-rill soil loss (total ISL, kg m)2) after 90 min of
simulated rain on the plots covered with simulated, Borassus
and Buriti geotextiles for the two tested slope gradients and
rainfall intensities are given in Table 5. The highest total ISL
(5.16 kg m)2) was measured on a bare soil inter-rill plot with
a 45% slope during a rainfall intensity of 67 mm h)1; the
smallest total ISL (0.02 kg m)2) was measured on a plot cov-
ered with simulated geotextiles with mesh sizes of
0.01 · 0.01 m2 (84% cover) on a 15% slope during a rainfall
intensity of 45 mm h)1. For all combinations of slope gradi-
ent and rainfall intensity, total ISL decreased with an increas-
ing surface cover percentage. Both Borassus and Buriti
geotextiles reduced total ISL more than the simulated geotex-
tiles with comparable surface cover.
Relative total ISL (ISLrel, expressed by total ISL of a
covered soil surface relative to that of a bare soil surface) is
plotted in Figure 10 against surface cover percentage for the
simulated, Borassus and Buriti geotextiles for the two tested
slope gradients for the 45-mm h)1 rainfall intensity and in
Figure 11 for the 67-mm h)1 rainfall intensity. For both rain-
fall intensities the Borassus, Buriti and simulated geotextiles
are more effective in reducing ISLrel on a 15% slope
compared with that on a 45% slope.
In RUSLE2.0 (Revised Universal Soil Loss Equation,
Version 2.0; Foster, 2005), the effect of surface cover on
inter-rill and rill erosion is determined by the ‘ground cover
subfactor’ of the C-factor (or cover management factor). The
RUSLE2.0 equation for the ground cover subfactor (gc) is
given by:
gc ¼ exp½�bfgnð0:24=RaÞ0:08� ð3Þ
where b is a coefficient (%)1) describing the relative
effectiveness of the ground (surface) cover in reducing
erosion, fgn is the net soil surface ground cover (%), Ra is
the adjusted roughness used to compute the soil surface
roughness subfactor (inches) and 0.24 is the assumed
adjusted soil surface roughness value (inches) for unit plot
conditions.
The calculated b values from the bare inter-rill erosion plots
and the plots covered with simulated geotextiles (increasing
cover percentage) on the two tested slope gradients and during
two rainfall intensities are given in Table 6 (Ra was assumed to
be 0.24 for all combinations of cover, slope gradient and rain-
fall intensity). The b values on a 45% slope are almost half the
b values on a 15% slope. Therefore, the simulated geotextiles
are much more effective in reducing ISLrel on a 15% slope
compared with that on a 45% slope for both rainfall intensi-
ties. Significance and probability (P) values of the effect of
slope gradient on total ISL for both rainfall intensities and all
treatments are calculated from an ANOVA (Table 7). For a
rainfall intensity of 67 mm h)1, total ISL is significantly differ-
ent on both slope gradients for all treatments. For the bare
inter-rill plots and the plots covered with the simulated
Table 5 Total inter-rill soil loss (total ISL) after 90 min for bare inter-rill plots and plots covered with simulated, Buriti and Borassus geotextiles
(with a different cover %) on two slope gradients (S) and under two rainfall intensities (I) (±1 SD)
Treatments (cover, %)
Total ISL (kg m)2)
45-mm h)1 rainfall intensity 67-mm h)1 rainfall intensity
15% slope gradient 45% slope gradient 15% slope gradient 45% slope gradient
Control (0) 1.46 ± 0.01 1.71 ± 0.32 1.99 ± 0.11 5.16 ± 0.59
12 · 12 cm2 (22) 0.63 ± 0.08 1.51 ± 0.37 1.37 ± 0.14 3.57 ± 0.30
5 · 5 cm2 (43) 0.32 ± 0.08 0.65 ± 0.13 0.41 ± 0.05 2.61 ± 0.41
1 · 1 cm2 (84) 0.02 ± 0.01 0.23 ± 0.13 0.04 ± 0.01 0.56 ± 0.25
Buriti (42) 0.13 ± 0.04 0.46 ± 0.25 0.29 ± 0.17 0.95 ± 0.47
Borassus (43) 0.07 ± 0.03 0.32 ± 0.21 0.19 ± 0.04 0.79 ± 0.21
Table 4 Probability values (P) and significance of the effect of slope
gradient (S) on run-off volume for both rainfall intensities (I) and all
treatments
Treatment (cover, %)
Rainfall intensity (I)
45 mm h)1 67 mm h)1
Control (0) 0.047* 0.025*
12 · 12 cm2 (22) 0.047* 0.444 ns
5 · 5 cm2 (43) 0.018* 0.047*
1 · 1 cm2 (84) 0.160 ns 0.903 ns
Buriti (42) 0.647 ns 0.090 ns
Borassus (43) 0.214 ns 0.043*
Significance of effect: not significant (ns); significant at *P < 0.05
and **P < 0.01.
Effectiveness of erosion control palm geotextiles 311
ª 2007 The Authors. Journal compilation ª 2007 British Society of Soil Science, Soil Use and Management, 23, 306–316
geotextiles, the ratio of total ISL for the 45% slope to the 15%
slope is higher for the 67-mm h)1 rainfall intensity than for the
45-mm h)1 rainfall intensity. The ratios of total ISL on the
45% slope to the 15% slope for both Borassus and Buriti
geotextiles are not significantly different for the 67- and
45-mm h)1 rainfall intensities.
Soil surface roughness
Soil surface roughness (SR) is an important parameter influ-
encing water erosion. SR determines the water volume that
can be stored on the surface as depression storage and affects
run-off velocity and erosivity. SR includes depressions where
sediment deposition occurs and soil heights of large and
stable soil aggregates that are resistant to soil detachment.
SR increases infiltration rate and slows run-off rate which
reduces total run-off and erosion (Foster, 2005). Soil surface
cover, slope gradient and rainfall intensity can have a consid-
erable effect on SR. In this study, SR is represented by chain
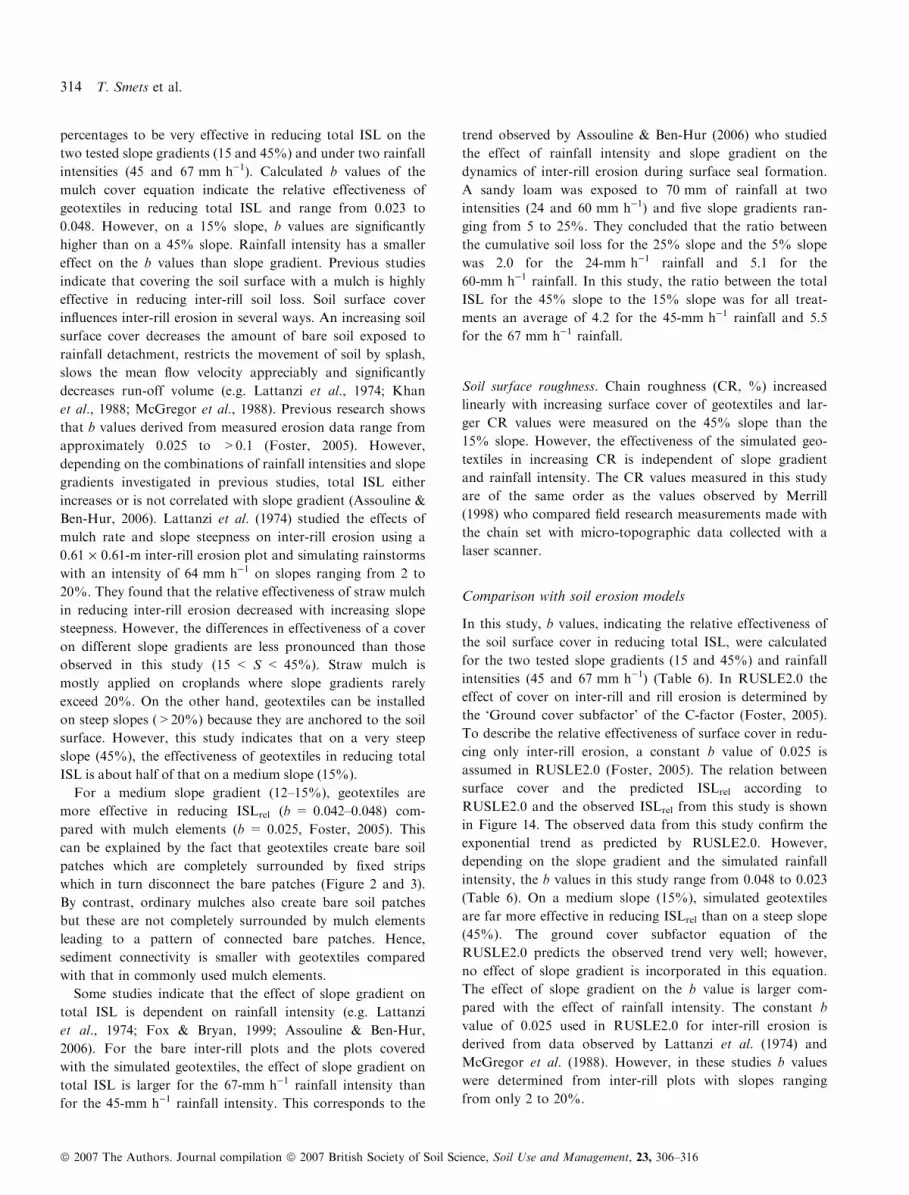
roughness (CR). The effect of slope gradient and geotextile
cover percentage on CR is shown in Figures 12 and 13 for a
rainfall intensity of 45 and 67 mm h)1 respectively. CR ran-
ged from 0.6% (bare soil, I = 67 mm h)1, S = 15%) to
22.7% (simulated geotextile: 0.01 · 0.01 m2, 84% cover,
I = 67 mm h)1, S = 45%). CR increased linearly with
increasing cover percentage of geotextiles and higher CR val-
ues were measured on the 45% slope compared with that on
the 15% slope. However, the linear increase in CR with
cover percentage is not significantly different for both slope
gradients. For all the treatments the ratios between CR for
the 45% slope and the 15% slope gradient are higher for the
67-mm h)1 rainfall intensity than for the 45-mm h)1 rainfall
intensity. During the highest rainfall intensity, slope gradient
C (%)0 20 40 60 80 100
ISL re
l (%
)
0
20
40
60
80
100
120
sim.geotext. (S=15%) sim.geotext. (S=45%) Borassus (S=15%) Borassus (S=45%) Buriti (S=15%) Buriti (S=45%)
I = 67 mm h–1
Figure 11 Relative total inter-rill soil loss (ISLrel) versus cover per-
centage (C) for bare inter-rill plots and plots covered with Borassus,
Buriti and simulated geotextiles on two slope gradients (S) and dur-
ing a rainfall intensity (I) of 67 mm h)1 (error bars represent 1 SD).
Plotted data represent the mean of two to three replications.
C (%)0 20 40 60 80 100
ISL re
l (%
)
0
20
40
60
80
100
120
sim.geotext. (S=15%) sim.geotext. (S=45%) Borassus (S=15%) Borassus (S=45%) Buriti (S=15%) Buriti (S=45%)
I = 45 mm h–1
Figure 10 Relative inter-rill soil loss (ISLrel) versus cover percentage
(C) for bare inter-rill plots and plots covered with Borassus, Buriti
and simulated geotextiles on two slope gradients (S) and during a
rainfall intensity (I) of 45 mm h)1 (error bars represent 1 SD). Plot-
ted data represent the mean of two to three replications.
Table 6 b values in the RUSLE2.0 ground cover equation (Foster,
2005) for inter-rill plots covered with simulated geotextiles (with a
different cover %) on two slope gradients (S) and under two rainfall
intensities (I); n is the number of data points used to calculate b
values
45-mm h)1 rainfall
intensity
67-mm h)1 rainfall
intensity
15% slope
gradient
45% slope
gradient
15% slope
gradient
45% slope
gradient
b value 0.048 0.023 0.042 0.024
r2 0.96 0.94 0.95 0.93
n 9 9 9 9
Table 7 Probability values (P) and significance of the effect of slope
gradient (S) on total inter-rill soil loss (total ISL) for both rainfall
intensities (I) and all treatments
Treatment
(cover, %)
45-mm h)1
rainfall intensity
67-mm h)1
rainfall intensity
Control (0) 0.309 ns 0.013*
12 · 12 cm2 (22) 0.061 ns 0.001**
5 · 5 cm2 (43) 0.095 ns 0.004**
1 · 1 cm2 (84) 0.082 ns 0.046*
Buriti (42) 0.159 ns 0.099 ns
Borassus (43) 0.183 ns 0.043*
Significance of effect: not significant (ns); significant at *P < 0.05
and **P < 0.01.
312 T. Smets et al.
ª 2007 The Authors. Journal compilation ª 2007 British Society of Soil Science, Soil Use and Management, 23, 306–316
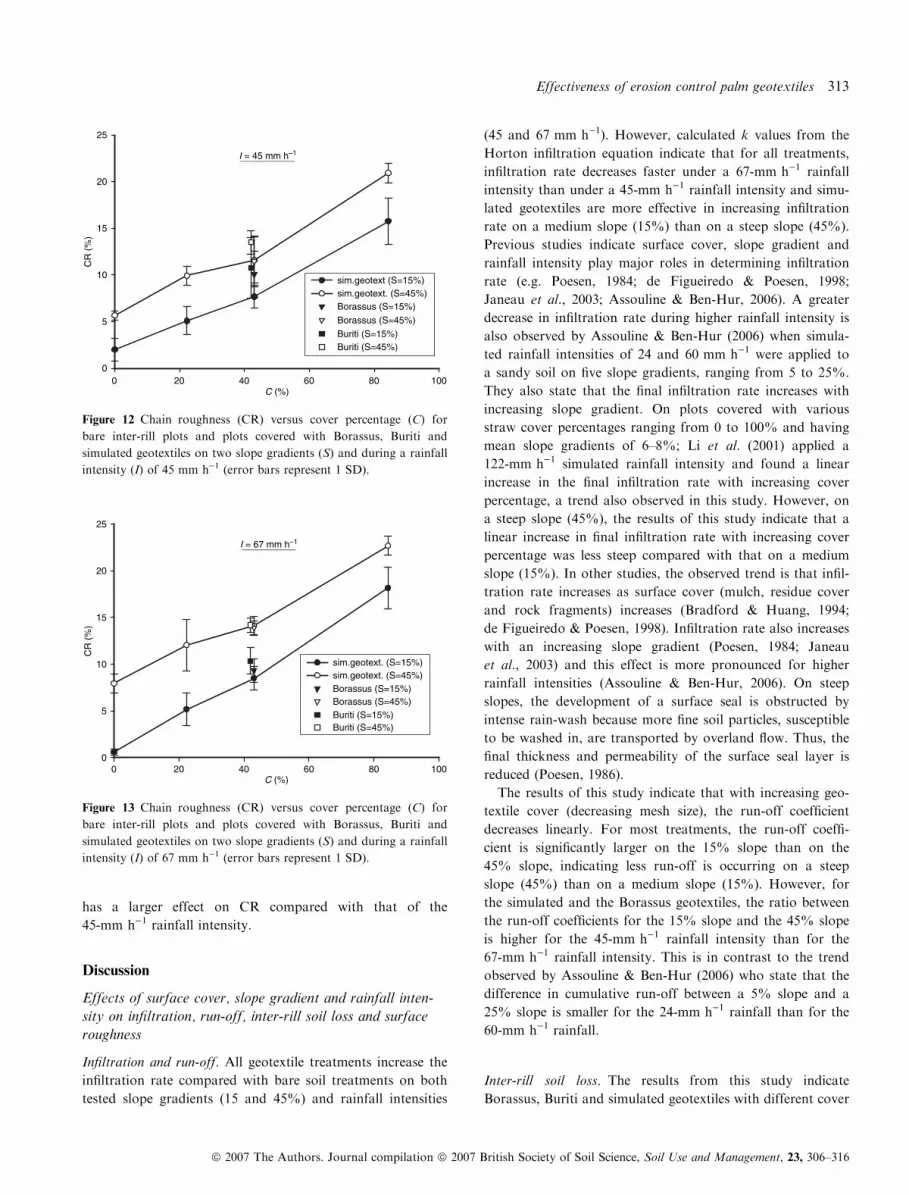
has a larger effect on CR compared with that of the
45-mm h)1 rainfall intensity.
Discussion
Effects of surface cover, slope gradient and rainfall inten-
sity on infiltration, run-off, inter-rill soil loss and surface
roughness
Infiltration and run-off. All geotextile treatments increase the
infiltration rate compared with bare soil treatments on both
tested slope gradients (15 and 45%) and rainfall intensities
(45 and 67 mm h)1). However, calculated k values from the
Horton infiltration equation indicate that for all treatments,
infiltration rate decreases faster under a 67-mm h)1 rainfall
intensity than under a 45-mm h)1 rainfall intensity and simu-
lated geotextiles are more effective in increasing infiltration
rate on a medium slope (15%) than on a steep slope (45%).
Previous studies indicate surface cover, slope gradient and
rainfall intensity play major roles in determining infiltration
rate (e.g. Poesen, 1984; de Figueiredo & Poesen, 1998;
Janeau et al., 2003; Assouline & Ben-Hur, 2006). A greater
decrease in infiltration rate during higher rainfall intensity is
also observed by Assouline & Ben-Hur (2006) when simula-
ted rainfall intensities of 24 and 60 mm h)1 were applied to
a sandy soil on five slope gradients, ranging from 5 to 25%.
They also state that the final infiltration rate increases with
increasing slope gradient. On plots covered with various
straw cover percentages ranging from 0 to 100% and having
mean slope gradients of 6–8%; Li et al. (2001) applied a
122-mm h)1 simulated rainfall intensity and found a linear
increase in the final infiltration rate with increasing cover
percentage, a trend also observed in this study. However, on
a steep slope (45%), the results of this study indicate that a
linear increase in final infiltration rate with increasing cover
percentage was less steep compared with that on a medium
slope (15%). In other studies, the observed trend is that infil-
tration rate increases as surface cover (mulch, residue cover
and rock fragments) increases (Bradford & Huang, 1994;
de Figueiredo & Poesen, 1998). Infiltration rate also increases
with an increasing slope gradient (Poesen, 1984; Janeau
et al., 2003) and this effect is more pronounced for higher
rainfall intensities (Assouline & Ben-Hur, 2006). On steep
slopes, the development of a surface seal is obstructed by
intense rain-wash because more fine soil particles, susceptible
to be washed in, are transported by overland flow. Thus, the
final thickness and permeability of the surface seal layer is
reduced (Poesen, 1986).
The results of this study indicate that with increasing geo-
textile cover (decreasing mesh size), the run-off coefficient
decreases linearly. For most treatments, the run-off coeffi-
cient is significantly larger on the 15% slope than on the
45% slope, indicating less run-off is occurring on a steep
slope (45%) than on a medium slope (15%). However, for
the simulated and the Borassus geotextiles, the ratio between
the run-off coefficients for the 15% slope and the 45% slope
is higher for the 45-mm h)1 rainfall intensity than for the
67-mm h)1 rainfall intensity. This is in contrast to the trend
observed by Assouline & Ben-Hur (2006) who state that the
difference in cumulative run-off between a 5% slope and a
25% slope is smaller for the 24-mm h)1 rainfall than for the
60-mm h)1 rainfall.
Inter-rill soil loss. The results from this study indicate
Borassus, Buriti and simulated geotextiles with different cover
C (%)0 20 40 60 80 100
CR
(%
)
0
5
10
15
20
25
sim.geotext (S=15%) sim.geotext. (S=45%) Borassus (S=15%)
Borassus (S=45%)
Buriti (S=15%) Buriti (S=45%)
I = 45 mm h–1
Figure 12 Chain roughness (CR) versus cover percentage (C) for
bare inter-rill plots and plots covered with Borassus, Buriti and
simulated geotextiles on two slope gradients (S) and during a rainfall
intensity (I) of 45 mm h)1 (error bars represent 1 SD).
C (%)0 20 40 60 80 100
CR
(%
)
0
5
10
15
20
25
sim.geotext. (S=15%) sim.geotext. (S=45%) Borassus (S=15%) Borassus (S=45%) Buriti (S=15%) Buriti (S=45%)
I = 67 mm h–1
Figure 13 Chain roughness (CR) versus cover percentage (C) for
bare inter-rill plots and plots covered with Borassus, Buriti and
simulated geotextiles on two slope gradients (S) and during a rainfall
intensity (I) of 67 mm h)1 (error bars represent 1 SD).
Effectiveness of erosion control palm geotextiles 313
ª 2007 The Authors. Journal compilation ª 2007 British Society of Soil Science, Soil Use and Management, 23, 306–316
percentages to be very effective in reducing total ISL on the
two tested slope gradients (15 and 45%) and under two rainfall
intensities (45 and 67 mm h)1). Calculated b values of the
mulch cover equation indicate the relative effectiveness of
geotextiles in reducing total ISL and range from 0.023 to
0.048. However, on a 15% slope, b values are significantly
higher than on a 45% slope. Rainfall intensity has a smaller
effect on the b values than slope gradient. Previous studies
indicate that covering the soil surface with a mulch is highly
effective in reducing inter-rill soil loss. Soil surface cover
influences inter-rill erosion in several ways. An increasing soil
surface cover decreases the amount of bare soil exposed to
rainfall detachment, restricts the movement of soil by splash,
slows the mean flow velocity appreciably and significantly
decreases run-off volume (e.g. Lattanzi et al., 1974; Khan
et al., 1988; McGregor et al., 1988). Previous research shows
that b values derived from measured erosion data range from
approximately 0.025 to >0.1 (Foster, 2005). However,
depending on the combinations of rainfall intensities and slope
gradients investigated in previous studies, total ISL either
increases or is not correlated with slope gradient (Assouline &
Ben-Hur, 2006). Lattanzi et al. (1974) studied the effects of
mulch rate and slope steepness on inter-rill erosion using a
0.61 · 0.61-m inter-rill erosion plot and simulating rainstorms
with an intensity of 64 mm h)1 on slopes ranging from 2 to
20%. They found that the relative effectiveness of straw mulch
in reducing inter-rill erosion decreased with increasing slope
steepness. However, the differences in effectiveness of a cover
on different slope gradients are less pronounced than those
observed in this study (15 < S < 45%). Straw mulch is
mostly applied on croplands where slope gradients rarely
exceed 20%. On the other hand, geotextiles can be installed
on steep slopes (>20%) because they are anchored to the soil
surface. However, this study indicates that on a very steep
slope (45%), the effectiveness of geotextiles in reducing total
ISL is about half of that on a medium slope (15%).
For a medium slope gradient (12–15%), geotextiles are
more effective in reducing ISLrel (b = 0.042–0.048) com-
pared with mulch elements (b = 0.025, Foster, 2005). This
can be explained by the fact that geotextiles create bare soil
patches which are completely surrounded by fixed strips
which in turn disconnect the bare patches (Figure 2 and 3).
By contrast, ordinary mulches also create bare soil patches
but these are not completely surrounded by mulch elements
leading to a pattern of connected bare patches. Hence,
sediment connectivity is smaller with geotextiles compared
with that in commonly used mulch elements.
Some studies indicate that the effect of slope gradient on
total ISL is dependent on rainfall intensity (e.g. Lattanzi
et al., 1974; Fox & Bryan, 1999; Assouline & Ben-Hur,
2006). For the bare inter-rill plots and the plots covered
with the simulated geotextiles, the effect of slope gradient on
total ISL is larger for the 67-mm h)1 rainfall intensity than
for the 45-mm h)1 rainfall intensity. This corresponds to the
trend observed by Assouline & Ben-Hur (2006) who studied
the effect of rainfall intensity and slope gradient on the
dynamics of inter-rill erosion during surface seal formation.
A sandy loam was exposed to 70 mm of rainfall at two
intensities (24 and 60 mm h)1) and five slope gradients ran-
ging from 5 to 25%. They concluded that the ratio between
the cumulative soil loss for the 25% slope and the 5% slope
was 2.0 for the 24-mm h)1 rainfall and 5.1 for the
60-mm h)1 rainfall. In this study, the ratio between the total
ISL for the 45% slope to the 15% slope was for all treat-
ments an average of 4.2 for the 45-mm h)1 rainfall and 5.5
for the 67 mm h)1 rainfall.
Soil surface roughness. Chain roughness (CR, %) increased
linearly with increasing surface cover of geotextiles and lar-
ger CR values were measured on the 45% slope than the
15% slope. However, the effectiveness of the simulated geo-
textiles in increasing CR is independent of slope gradient
and rainfall intensity. The CR values measured in this study
are of the same order as the values observed by Merrill
(1998) who compared field research measurements made with
the chain set with micro-topographic data collected with a
laser scanner.
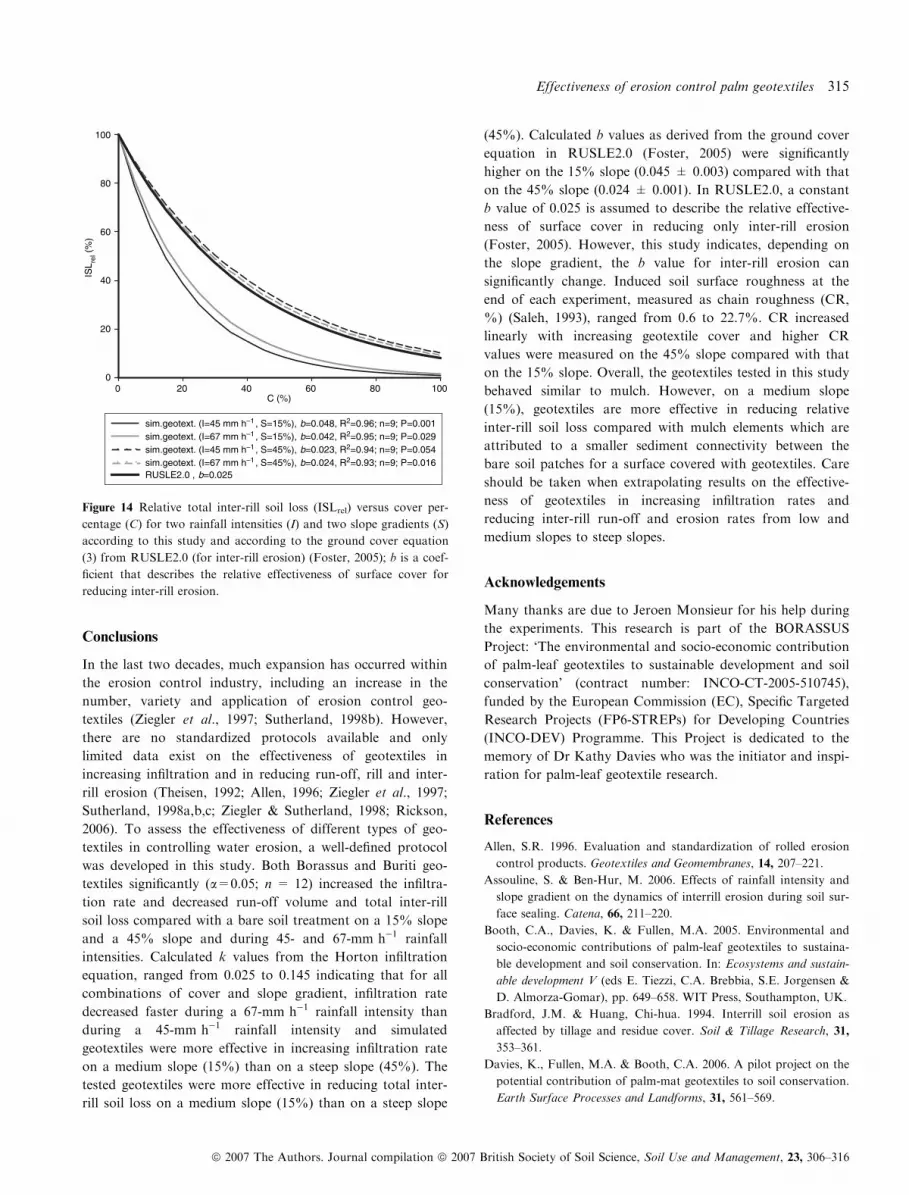
Comparison with soil erosion models
In this study, b values, indicating the relative effectiveness of
the soil surface cover in reducing total ISL, were calculated
for the two tested slope gradients (15 and 45%) and rainfall
intensities (45 and 67 mm h)1) (Table 6). In RUSLE2.0 the
effect of cover on inter-rill and rill erosion is determined by
the ‘Ground cover subfactor’ of the C-factor (Foster, 2005).
To describe the relative effectiveness of surface cover in redu-
cing only inter-rill erosion, a constant b value of 0.025 is
assumed in RUSLE2.0 (Foster, 2005). The relation between
surface cover and the predicted ISLrel according to
RUSLE2.0 and the observed ISLrel from this study is shown
in Figure 14. The observed data from this study confirm the
exponential trend as predicted by RUSLE2.0. However,
depending on the slope gradient and the simulated rainfall
intensity, the b values in this study range from 0.048 to 0.023
(Table 6). On a medium slope (15%), simulated geotextiles
are far more effective in reducing ISLrel than on a steep slope
(45%). The ground cover subfactor equation of the
RUSLE2.0 predicts the observed trend very well; however,
no effect of slope gradient is incorporated in this equation.
The effect of slope gradient on the b value is larger com-
pared with the effect of rainfall intensity. The constant b
value of 0.025 used in RUSLE2.0 for inter-rill erosion is
derived from data observed by Lattanzi et al. (1974) and
McGregor et al. (1988). However, in these studies b values
were determined from inter-rill plots with slopes ranging
from only 2 to 20%.
314 T. Smets et al.
ª 2007 The Authors. Journal compilation ª 2007 British Society of Soil Science, Soil Use and Management, 23, 306–316
Conclusions
In the last two decades, much expansion has occurred within
the erosion control industry, including an increase in the
number, variety and application of erosion control geo-
textiles (Ziegler et al., 1997; Sutherland, 1998b). However,
there are no standardized protocols available and only
limited data exist on the effectiveness of geotextiles in
increasing infiltration and in reducing run-off, rill and inter-
rill erosion (Theisen, 1992; Allen, 1996; Ziegler et al., 1997;
Sutherland, 1998a,b,c; Ziegler & Sutherland, 1998; Rickson,
2006). To assess the effectiveness of different types of geo-
textiles in controlling water erosion, a well-defined protocol
was developed in this study. Both Borassus and Buriti geo-
textiles significantly (a=0.05; n = 12) increased the infiltra-
tion rate and decreased run-off volume and total inter-rill
soil loss compared with a bare soil treatment on a 15% slope
and a 45% slope and during 45- and 67-mm h)1 rainfall
intensities. Calculated k values from the Horton infiltration
equation, ranged from 0.025 to 0.145 indicating that for all
combinations of cover and slope gradient, infiltration rate
decreased faster during a 67-mm h)1 rainfall intensity than
during a 45-mm h)1 rainfall intensity and simulated
geotextiles were more effective in increasing infiltration rate
on a medium slope (15%) than on a steep slope (45%). The
tested geotextiles were more effective in reducing total inter-
rill soil loss on a medium slope (15%) than on a steep slope
(45%). Calculated b values as derived from the ground cover
equation in RUSLE2.0 (Foster, 2005) were significantly
higher on the 15% slope (0.045 ± 0.003) compared with that
on the 45% slope (0.024 ± 0.001). In RUSLE2.0, a constant
b value of 0.025 is assumed to describe the relative effective-
ness of surface cover in reducing only inter-rill erosion
(Foster, 2005). However, this study indicates, depending on
the slope gradient, the b value for inter-rill erosion can
significantly change. Induced soil surface roughness at the
end of each experiment, measured as chain roughness (CR,
%) (Saleh, 1993), ranged from 0.6 to 22.7%. CR increased
linearly with increasing geotextile cover and higher CR
values were measured on the 45% slope compared with that
on the 15% slope. Overall, the geotextiles tested in this study
behaved similar to mulch. However, on a medium slope
(15%), geotextiles are more effective in reducing relative
inter-rill soil loss compared with mulch elements which are
attributed to a smaller sediment connectivity between the
bare soil patches for a surface covered with geotextiles. Care
should be taken when extrapolating results on the effective-
ness of geotextiles in increasing infiltration rates and
reducing inter-rill run-off and erosion rates from low and
medium slopes to steep slopes.
Acknowledgements
Many thanks are due to Jeroen Monsieur for his help during
the experiments. This research is part of the BORASSUS
Project: ‘The environmental and socio-economic contribution
of palm-leaf geotextiles to sustainable development and soil
conservation’ (contract number: INCO-CT-2005-510745),
funded by the European Commission (EC), Specific Targeted
Research Projects (FP6-STREPs) for Developing Countries
(INCO-DEV) Programme. This Project is dedicated to the
memory of Dr Kathy Davies who was the initiator and inspi-
ration for palm-leaf geotextile research.
References
Allen, S.R. 1996. Evaluation and standardization of rolled erosion
control products. Geotextiles and Geomembranes, 14, 207–221.
Assouline, S. & Ben-Hur, M. 2006. Effects of rainfall intensity and
slope gradient on the dynamics of interrill erosion during soil sur-
face sealing. Catena, 66, 211–220.
Booth, C.A., Davies, K. & Fullen, M.A. 2005. Environmental and
socio-economic contributions of palm-leaf geotextiles to sustaina-
ble development and soil conservation. In: Ecosystems and sustain-
able development V (eds E. Tiezzi, C.A. Brebbia, S.E. Jorgensen &
D. Almorza-Gomar), pp. 649–658. WIT Press, Southampton, UK.
Bradford, J.M. & Huang, Chi-hua. 1994. Interrill soil erosion as
affected by tillage and residue cover. Soil & Tillage Research, 31,
353–361.
Davies, K., Fullen, M.A. & Booth, C.A. 2006. A pilot project on the
potential contribution of palm-mat geotextiles to soil conservation.
Earth Surface Processes and Landforms, 31, 561–569.
C (%)0 20 40 60 80 100
ISL re
l (%
)
0
20
40
60
80
100
sim.geotext. (I=45 mm h–1 , S=15%), b=0.048, R2=0.96; n=9; P=0.001sim.geotext. (I=67 mm h–1 , S=15%), b=0.042, R2=0.95; n=9; P=0.029sim.geotext. (I=45 mm h–1 , S=45%), b=0.023, R2=0.94; n=9; P=0.054sim.geotext. (I=67 mm h–1 , S=45%), b=0.024, R2=0.93; n=9; P=0.016RUSLE2.0 , b=0.025
Figure 14 Relative total inter-rill soil loss (ISLrel) versus cover per-
centage (C) for two rainfall intensities (I) and two slope gradients (S)
according to this study and according to the ground cover equation
(3) from RUSLE2.0 (for inter-rill erosion) (Foster, 2005); b is a coef-
ficient that describes the relative effectiveness of surface cover for
reducing inter-rill erosion.
Effectiveness of erosion control palm geotextiles 315
ª 2007 The Authors. Journal compilation ª 2007 British Society of Soil Science, Soil Use and Management, 23, 306–316
de Figueiredo, T. & Poesen, J. 1998. Effects of surface rock fragment
characteristics on interrill runoff and erosion of a silty loam soil.
Soil & Tillage Research, 46, 81–95.
Foster, G.R. 2005. Revised universal soil loss equation, Version 2.0
(RUSLE2.0): science documentation. USDA-Agricultural
Research Service, Washington, DC.
Fox, D.M. & Bryan, R.B. 1999. The relationship of soil loss by
interrill erosion to slope gradient. Catena, 38, 211–222.
Guerra, A., Marcal, M., Polivanov, H., Sathler, R., Mendonca, J.,
Guerra, T., Bezerra, F., Furtado, M., Lima, N., Souza, U.,
Feitosa, A., Davies, K., Fullen, M.A. & Booth, C.A. 2005.
Environmental management and health risks of soil erosion gullies
in Sao Luıs (Brazil) and their potential remediation using palm-
leaf geotextiles, In: Environmental health risk III (eds C. A
Brebbia, V. Popov & D. Fayzieva), pp. 459–467. WIT Press,
Southampton, UK.
Hann, M.J. & Morgan, R.P.C. 2006. Evaluating erosion control
measures for biorestoration between the time of soil reinstatement
and vegetation establishment. Earth Surface Processes and Land-
forms, 31, 589–597.
Horton, R.E. 1933. The role of infiltration in the hydrological cycle.
American Geophysical Union, Transactions, 14, 446–460.
Janeau, J.L., Bricquet, J.P., Planchon, O. & Valentin, C. 2003. Soil
crusting and infiltration on steep slopes in northern Thailand.
European Journal of Soil Science, 54, 1–11.
John, M.W.M. 1987. Geotextiles. Blackie and Son, Glasgow.
Khan, M.J., Monke, E.J. & Foster, G.R. 1988. Mulch cover and
canopy effect on soil loss. Transactions of the American Society of
Agricultural Engineers, 31, 706–711.
Lattanzi, A.R., Meyer, L.D. & Baumgardner, M.F. 1974. Influences
of mulch rate and slope steepness on interrill erosion. Soil Science
Society of America Journal, 38, 946–950.
Laws, J. 1941. Measurements of the fall-velocity of waterdrops and
raindrops. Transactions, Geophysical Union, 22, 709–721.
Li, Y., Tullberg, J.N. & Freebairn, D.M. 2001. Traffic and residue
cover on infiltration. Australian Journal of Soil Research, 39,
239–247.
McGregor, K.C., Bengtson, R.L. & Mutchler, C.K. 1988. Effects of
surface straw on interrill runoff and erosion of Grenada silt loam
soil. Transactions of the American Society of Agricultural Engin-
eers, 31, 111–116.
Merrill, S.D. 1998. Comments on the chain method for measuring
soil surface roughness: use of the chain set. Soil Science Society of
America Journal, 62, 1147–1149.
Poesen, J. 1984. The influence of slope angle on infiltration rate and
Hortonian overland flow. Zeitschrift fur Geomorphologie, Supple-
ment Band, 49, 117–131.
Poesen, J. 1986. Surface sealing as influenced by slope angle and
position of simulated stones in the top layer of loose sediments.
Earth Surface Processes and Landforms, 11, 1–10.
Poesen, J. & Lavee, H. 1991. Effects of size and incorporation of
synthetic mulch on runoff and sediment yield from interrills in a
laboratory study with simulated rainfall. Soil & Tillage Research,
21, 209–223.
Poesen, J., Ingelmo-Sanchez, F. & Mucher, H. 1990. The hydrologi-
cal response of soil surfaces to rainfall as affected by cover and
deposition of rock fragments in the top layer. Earth Surface Pro-
cesses and Landforms, 15, 653–671.
Rickson, R.J. 2006. Controlling sediment at source: an evaluation of
erosion control geotextiles. Earth Surface Processes and Land-
forms, 31, 550–560.
Saleh, A. 1993. Soil roughness measurement: chain method. Journal
of Soil and Water Conservation, 48, 527–529.
Salles, C., Poesen, J. & Sempere-Torres, D. 2002. Kinetic energy of
rain and its functional relationship with intensity. Journal of
Hydrology, 257, 256–270.
SAS Institute Inc. 2002. SAS Version 9.1. SAS Institute Inc., Cary,
NC.
Sutherland, R.A. 1998a. Rolled erosion control systems for hillslope
surface protection: a critical review, synthesis and analysis of
available data. I. Background and formative years. Land Degrada-
tion & Development, 9, 465–486.
Sutherland, R.A. 1998b. Rolled erosion control systems for hillslope
surface protection: a critical review, synthesis and analysis of
available data. II. The post-1990 period. Land Degradation &
Development, 9, 487–511.
Sutherland, R.A. 1998c. A critical assessment of the research con-
ducted at the hydraulics and erosion control laboratory – a focus
on rolled erosion control systems applied to hillslopes. Geotextiles
and Geomembranes, 16, 87–118.
Theisen, M.S. 1992. The role of geosynthetics in erosion and sedi-
ment control: an overview. Geotextiles and Geomembranes, 11,
535–550.
Ziegler, A.D. & Sutherland, R.A. 1998. Reduction in interrill sedi-
ment transport by rolled erosion control systems. Soil & Tillage
Research, 45, 265–278.
Ziegler, A.D., Sutherland, R.A. & Tran, L.T. 1997. Influence of
rolled erosion control systems on temporal rainsplash response – a
laboratory rainfall simulation experiment. Land Degradation &
Development, 8, 139–157.
316 T. Smets et al.
ª 2007 The Authors. Journal compilation ª 2007 British Society of Soil Science, Soil Use and Management, 23, 306–316


