Embed Size (px)
Citation preview

QUARTERLY JOURNAL OF THE ROYAL METEOROLOGICAL SOCIETYQ. J. R. Meteorol. Soc. 134: 801–816 (2008)Published online 27 May 2008 in Wiley InterScience(www.interscience.wiley.com) DOI: 10.1002/qj.259
Observations of cross-ridge flows across steep terrain
H. W. Lewis,a* S. D. Mobbsa and M. Lehningb
a Institute for Atmospheric Science, University of Leeds, UKb Swiss Federal Institute for Snow and Avalanche Research, Davos, Switzerland
ABSTRACT: A field experiment, Gaudex, has been conducted to address the need for quantitative measurements ofturbulence in the vicinity of steep terrain. A dense network of automatic weather stations and turbulence towers wasdeployed along cross-ridge transects over Gaudergrat, a steep triangular cross-section ridge in eastern Switzerland.
A new feature, whereby ridge-normal cross-ridge flows develop at the crest even when the flow in each valley is orientedparallel to the ridge axis, is identified. This occurs independently of whether the flow is thermally or synoptically driven.Pressure measurements across the ridge show that this flow is driven by a cross-ridge pressure gradient. Two mechanismsfor generating cross-ridge flows have been identified from measurements of pressure, wind and temperature. In most casesthe pressure gradient arises from a difference in flow speeds between the two sides of the ridge, caused by different valleygeometries. Less commonly, the cross-ridge flow is explained by linear speed-up of the ridge-normal flow. Copyright 2008 Royal Meteorological Society
KEY WORDS Bernoulli function; Gaudex; microbarograph; orography
Received 26 October 2007; Revised 2 April 2008; Accepted 14 April 2008
1. Introduction
The influence of surface undulations on the motion ofEarth’s atmosphere can lead to a wide variety of phenom-ena on a range of scales. An understanding, quantificationand parametrization of these features has proved to beimportant in improving both local weather forecasts andthe accuracy of operational numerical weather-predictionmodels on a global scale. The influence of smaller-scaleorography on the atmosphere is becoming increasinglysignificant as such models begin to resolve it explicitly.
It is well understood that individual hills mayinduce dynamic features such as crest speed-up, flowblocking, lee waves, slope flows and turbulent wakes(e.g. Carruthers and Hunt, 1990). These processes havea considerable influence on the dynamics of theatmospheric boundary layer above complex terrain. Oneapproach used to predict the flow pattern over anisolated hill is to assume that modifications to theinitial background state are small, so that the governingequations of motion can be linearized (Jackson and Hunt,1975). This method has proved to be highly successful,and has been verified and extended as a result ofmuch subsequent analytical, numerical and observationalresearch (Taylor et al., 1987). However, it is limited byits restriction to shallow topography and its failure todescribe complex flow in the wake region, which maydevelop in the lee of hills and mountains. In reality,most hills are not of sufficiently low slope, and the flowbehaviour can become highly nonlinear.
* Correspondence to: H. W. Lewis, Met Office, Fitzroy Road, Exeter,EX1 3PB, UK. E-mail: [email protected]
Recent work has concentrated on understanding flowswithin more complex environments. The most compre-hensive observational and modelling studies to date wereduring the Mesoscale Alpine Programme. Mayr et al.(2007) have summarized the achievements in under-standing gap flows that resulted from a high-resolutionobservation campaign in the Wipp Valley with associ-ated modelling work. A similar approach in the Riv-iera Valley has yielded new understanding of the inter-action between thermally-driven flows and the near-surface turbulence structure (e.g. Weigel and Rotach,2004).
The Gaudergrat Experiment (Gaudex) was devised tomeet a need for quantitative measurements of the near-surface flow in the vicinity of steep terrain, primarilyfor the verification of numerical simulations of flowin such environments. The main aim was to provide adetailed description of flow separation and turbulencein the lee of steep hills. A variety of measurementswere conducted over Gaudergrat, a steep ridge in easternSwitzerland, during the summer of 2003. In this paper weprovide some background to the Gaudex measurementcampaign, and present new observations of a cross-ridgeflow phenomenon.
The Gaudex measurements are described in Section 2.The meteorology at the time of the campaign is sum-marized in Section 3, and the dominant mean-flow fea-tures are identified in Section 4. Evidence of the cross-ridge flow phenomenon is presented in Section 5. InSection 6, the measurements are used to identify a mech-anism to explain its occurrence. Conclusions are drawnin Section 7.
Copyright 2008 Royal Meteorological Society

802 H. W. LEWIS ET AL.
2. The Gaudex field measurements
A dense instrument network was deployed across Gaud-ergrat, a steep-sided ridge located on the Alpine plateau ineastern Switzerland (46.46 °N, 9.80 °E), for over 100 daysbetween June and October 2003. More limited flow mea-surements have been conducted across the ridge by theSwiss Federal Institute for Snow and Avalanche Research(SLF) for several years (Doorschot et al., 2001): this isbecause it is known that small-scale flow features suchas separation, recirculation and turbulence can result ininhomogeneous snow distributions on mountains, andincrease the risk of avalanches. Terrain-induced flow sep-aration is known to be facilitated by both a steep lee slopeand a sharp ridge crest. Photographs of these features onGaudergrat are shown in Figure 1. A maximum slopeangle in excess of 40° is clearly greater than typical val-ues for the critical lee slope predicted by Wood (1995)for the onset of separation in neutral turbulent flow overhills.
2.1. Field site
A map of the Gaudergrat orography is shown in Figure 2.Gaudergrat is approximately triangular in cross section
(a)
(b)
Figure 1. Photographs of the Gaudergrat field site. (a) Crest and eastslope. (b) Automatic weather station located on the sharp crest.
along its 1.5 km length, running NNE–SSW between twoU-shaped valleys. Cross sections of the ridge-crest andvalley-floor profiles, and of the cross-ridge profile, areshown in Figure 3. The eastern valley is about 150 mdeep and 500 m wide: significantly narrower than thewestern valley, which is about 1.5 km wide. The ridgerises to a peak of 2305 m a.m.s.l. towards its southernend, where it joins the surrounding terrain. At its northernend, the ridge crest falls away to the height of thesurrounding valleys over a distance of about 200 m.The ridge may therefore be considered as quasi-two-dimensional over the majority of its length.
The task of defining typical length scales for theGaudergrat terrain profile is complicated by the fact thatthe west and east valley floors are at different altitudes.In addition, Figure 3 illustrates how the eastern valleydeepens with down-valley distance towards the north.The average of the valley depths h1 and h2 along thecentral transect (Figure 3) gives a representative hillheight h = (h1 + h2)/2 = 130.5 m. The half-width athalf the hill height is estimated to be Lh = 152 m forthis central transect.
2.2. Instrumentation
The instrument network deployed across Gaudergrat dur-ing Gaudex is shown in Figure 2. A total of 27 auto-matic weather stations (AWSs) were distributed alongthree cross-ridge transects and around the northern ridgeend, where three-dimensional mean-flow features wereexpected to be most significant. Site positions along thecrest and in the east and west valleys are also shown inFigure 3.
The AWSs at sites 22–27 are operated by SLF toprovide long-term wind-speed measurements at heightsof 5 m, 3 m and 2 m (within the inner layer) at 1 sand 10 s resolution. These stations were supplementedduring Gaudex with an additional 20 AWSs providedby the University of Leeds, which recorded surfacepressure and wind speed and direction at 2 m height at1 s time resolution. Temperature and relative humiditywere recorded every 4 s. The AWS deployed at site 28was supplied by the University of Innsbruck (IMGI), andprovided 60 s measurements of pressure, temperature,relative humidity, and wind speed and direction, whichserved as reference surface data for the radiosondeslaunched from that location.
The Leeds AWSs have been developed over a num-ber of years, and have been employed in several fieldcampaigns above complex terrain. These include mea-surements of the mean flow associated with BlackCombe, Cumbria (Vosper and Mobbs, 1997), the Isleof Arran (Vosper et al., 2002), the Falkland Islands(Mobbs et al., 2005) and the Wipptal (Mayr et al.,2007). The basic design used during Gaudex is shownin Figure 1(b). Each AWS consisted of a propelleranemometer mounted on a 2 m lattice mast, aspiratedtemperature and relative-humidity sensors housed in aradiation shield, and a sensitive microbarograph. The
Copyright 2008 Royal Meteorological Society Q. J. R. Meteorol. Soc. 134: 801–816 (2008)DOI: 10.1002/qj

OBSERVATIONS OF CROSS-RIDGE FLOWS 803
01
020329
405060708
09
1030
11 12
13
14
15
1617
18
19
20
04
28 34
22
23 242526
27
3132
33
AWS (Leeds) AWS (SLF) 28 AWS (IMGI)
Turbulence tower Sodar Radiosonde
Figure 2. Orographic map showing the location of instrument sites across the Gaudergrat region during the Gaudex campaign. Each grid squareis 1 km × 1 km.
2810
714 15 16 17
18
24
1
2
22
-1600 -1400 -1200 -1000 -800 -600 -400 -200 0 200 400 600 800 1000 1200
Along-ridge distance (m)
2000
2100
2200
2300
Alti
tude
(m
)
-1600 -1400 -1200 -1000 -800 -600 -400 -200 0 200 400 600 800 1000 1200
Across-ridge distance (m)
2000
2100
2200
2300
Alti
tude
(m
)
Crest
AWS
West
EastCrest
EastWest
h1h2
L2L1
hLh
Figure 3. Two-dimensional cross sections of the Gaudergrat ridge. Top: profiles along the ridge crest (bold), and the west (dotted) and east(dashed) valley-floor transects. Bottom: cross-ridge profile across a central transect. Symbols are defined in Figure 2.
data from each sensor were processed by a circuit boardhoused inside the white microbarograph box, and stored,together with the time according to an internal clock, ona PCMCIA flash card for later retrieval. The microbaro-graphs were calibrated against a high-precision barome-ter to account for their temperature dependence (Vosperet al., 2002). The pressure data presented are consideredto have an associated error of 0.24 hPa (Lewis, 2006). In
order to maintain all logger clocks in close synchroniza-tion (essential for making instantaneous comparisons ofmeasurements from instruments in close proximity), eachlogger included a GPS receiver and and was synchronizedto GPS every 12 h.
In addition, turbulence measurements were made usingultrasonic anemometers mounted on towers across theridge crest on the central cross-ridge transect at sites 31,
Copyright 2008 Royal Meteorological Society Q. J. R. Meteorol. Soc. 134: 801–816 (2008)DOI: 10.1002/qj

804 H. W. LEWIS ET AL.
32 and 33. The operational details of these instruments,as well as an analysis of the data, is provided by Lewis(2006). Remote measurements of wind and turbulenceprofiles were gathered with sodars in each valley atsites 29 and 30. These surface-based measurements werecomplemented by daily radiosonde ascents, launchedabout 1 km to the northeast of Gaudergrat from site 34.
3. Meteorological overview
The Gaudex observation period was characterized bygenerally slack synoptic-scale pressure gradients acrossEurope, occasionally interrupted by isolated convectivestorms. During the campaign, 14 days were character-ized by mainly southerly flow and 21 days by mainlynortherly flow, evident at most sites. All other days wereidentified as valley-wind days, since a well-defined diur-nal cycle of wind directions was observed along the eastand west valleys on each day. This cycle correspondsto local thermally-driven flows, up-valley during day-time and down-valley at night (Whiteman, 1990). Thelongest period of successive valley-wind days duringGaudex lasted for over two weeks, between 1 Augustand 16 August 2003.
Measurements show the daytime up-valley flow toaccelerate with distance along the east valley, driven byan up-valley temperature gradient of up to 1.5 K overan along-valley distance of about 700 m (Lewis, 2006).A corresponding pressure difference of about 0.1 hPawas measured over the same distance, with flow towardsthe region of lower pressure. The valley wind speedwas approximately linearly related to the along-valleyflow-induced pressure difference, and daytime up-valleyflow speeds were inversely related to the along-valleytemperature difference. An average daytime wind speedat 2 m of 3.5 ms−1 was measured on valley-wind days atsite 02 on the east valley floor (Figure 2). Flow speedswere generally lower in the west valley than in theeast valley, with an average of 1.5 ms−1 measured atsite 10. This difference may be due to the larger size
of the west valley, reducing the terrain-induced along-valley temperature gradient, and the shallower valley-floor slope, reducing night-time drainage-flow speeds.
In addition to the along-valley temperature gradientsobserved, temperature measurements from AWSs at var-ious positions along each slope show a clear diurnaltemperature variation across Gaudergrat as a result ofits north–south orientation. Figure 4(a) shows profiles ofnear-surface potential temperature θ measured along thewest and east slopes during a typical valley-wind day,8 August 2003. Potential temperatures relative to site 07are plotted every 2 h. An average near-surface tempera-ture gradient ∂θ/∂z on each slope can be estimated foreach time period by performing a linear regression of thetemperature at each AWS along the slope with stationheight. These results are plotted in Figure 4(b).
At night, the valley layer is stably stratified, withtemperatures at the valley-floor sites up to 5 K coolerthan at the ridge crest (∂θ/∂z ≈ 0.015 Km−1). Stabil-ity within each valley tends to increase with time untila peak at about 0300 UTC. The temperature profiles at0600 UTC (see Figure 4(a)) illustrate how the easternprofile warms earlier than the western profile, in responseto the eastern slope becoming sunlit while the westernslope remains shaded behind the ridge. The resultingcross-ridge temperature gradient persists above an alti-tude of about 2280 m (between sites 09 and 05) untilabout 1000 UTC, while the gradient between sites 08and 06 across the ridge crest lasts throughout the morn-ing. On 8 August, the peak temperature difference acrossthe crest of 4.7 K was measured at 0710 UTC. By mid-day, the profiles show approximately neutral behaviour,and θ values that are reasonably constant with height.The afternoon temperature-profile evolution mirrors themorning pattern, with the eastern-slope profile cooling inresponse to local shadowing from about 1500 UTC. Amaximum afternoon cross-ridge horizontal temperaturegradient between sites 08 and 06 of 1.4 K was measuredat 1730 UTC – considerably smaller than the temperaturegradient associated with the morning shadowing effect.
0000 0300 0600 0900 1200 1500 1800 2100 2400
Time of Day (hours, UTC)
2180
2200
2220
2240
2260
2280
2300
2320
2340
2360
Alti
tude
(m
)
0000 0600 1200 1800 2400
Time of Day (hours, UTC)
-0.01
0.00
0.01
0.02
0.03
0.04
dq/d
z (K
m-1
)
(a) (b)
+5-5 ∆q (k)
East valleyWest valley
Figure 4. (a) Evolution of vertical potential-temperature profiles along the east (solid) and west (dashed) slopes during 8 August 2003, asmeasured by AWSs along the central transect (see Figure 3). (b) Average vertical potential-temperature gradient ∂θ/∂z through each profile with
time of day. Symbols show 10 min values on 8 August 2003; solid lines show the average diurnal pattern over all valley-wind days.
Copyright 2008 Royal Meteorological Society Q. J. R. Meteorol. Soc. 134: 801–816 (2008)DOI: 10.1002/qj

OBSERVATIONS OF CROSS-RIDGE FLOWS 805
4. Terrain-induced flow patterns
The dominant near-surface wind patterns measured acrossGaudergrat are illustrated by the wind roses plottedin Figure 5, which show the wind-direction frequencydistributions at each AWS site. The steep terrain has aclear influence on local wind patterns, with systematicdifferences in the flow characteristics within a smallspatial area.
Data at sites located near the ridge end (17, 18, 20,19) display evidence of flow around the ridge end. Thisis illustrated by comparing the flow directions at sites 16and 17, located within 50 m of each other but with site 16located on the ridge crest (Figure 3). While cross-ridgeflows are prevalent at site 16, the mean flow at site 17tends to follow the terrain contours. Southwesterly windsat sites 19 and 20 may be indicative of flow separationfrom the ridge end.
Measurements along the east (01, 02, 03, 21, 22) andwest (10, 27) valleys show ridge-parallel near-surfaceflows. These are associated with the diurnal cycle ofvalley winds, northeasterly up-valley during the daytimeand southwesterly down-valley at night. Even when flowsare driven by larger-scale pressure gradients, the meanflow may still be parallel to the ridge axis because ofchannelling.
Wind roses for locations on the east (05, 06, 11, 12,23) and west (08, 09, 13, 25) ridge slopes in Figure 5show a more even flow distribution than along the valley
floor, with less than 5% of data from any 5° sector. Theprevailing wind directions are oriented across each slopeat an angle to the terrain contours. Flow at these sitesalso tends to follow a diurnal cycle, with measurementson the east slope showing northeasterly flows during thedaytime and southwesterly flow at night, while thoseon the west slope tend to be northwesterly during thedaytime and southeasterly at night. This is consistent withthermally-forced slope flows, upslope during the day anddownslope at night (Whiteman, 1990). The orientation ofthe mean wind direction across the slope is perhaps anindication of an interaction between the valley and slopewind systems. These directions are also consistent withdynamically-induced flow across the ridge and lee-slopeseparation.
The dominant flow patterns observed at sites alongthe ridge crest (24, 14, 15, 07, 16) are strikinglydifferent. While flows in either valley tend to be ridge-parallel, Figure 5 shows a strong tendency for flow atthe ridge-crest sites to be oriented at right angles to theridge axis. For example, 54.4% of all wind directionsmeasured at site 07 on the central cross-ridge transectswere from within a 60° range, between 275° and 335°.On average, a change in flow direction of almost 90°
occurs within a 50 m distance on the eastern side ofGaudergrat crest between sites 07 and 06 (Figure 2). Thisfeature is replicated between sites 24 and 23 on thesouthern transect, where the ridge-normal wind directionis northwesterly.
27
25 24
23
22
28
21
20
19
18
17
16
15
14
13
1211
10
09
08
07
0605 03
02
9060
300
330
300
270
240
210180
150
12001
Figure 5. Wind-rose plots showing the wind-direction frequency and mean wind-speed distributions at each site, calculated from 1 s data duringthe Gaudex campaign. Wind directions are split into 5° sectors. The radial axis of each rose ranges between zero and 5% (frequency) and betweenzero and 5 ms−1 (wind speed). The position of site 28 has been moved for clarity (see Figure 2). Terrain contours are plotted at 25 m intervals.
Copyright 2008 Royal Meteorological Society Q. J. R. Meteorol. Soc. 134: 801–816 (2008)DOI: 10.1002/qj

806 H. W. LEWIS ET AL.
5. Evidence of cross-ridge flows
Figure 5 illustrates the dominant phenomenon observedduring the Gaudex campaign: cross-ridge flows at theridge crest when the flow in each valley is orientedparallel to the main ridge axis. In this section, wewill describe the periods when cross-ridge flows wereobserved. Case studies have been selected from thoseperiods when steady southerly or southwesterly flowswere measured along each slope (i.e. all 10 min meanAWS wind directions within a sector between 158° and248°). Such flows account for 10% of the Gaudex dataset,and are typically associated with thermally-driven night-time flows down both valleys. In Section 6, we willfurther analyse the cross-ridge flow phenomenon usingall measured data.
5.1. Thermally-driven night-time flow
Figure 6 illustrates a typical night-time flow patternmeasured on a valley-wind day during the Gaudexcampaign (8 August 2003). The influence of thermalforcing is clear, with southerly down-valley flow parallelto the ridge axis at sites 01, 02, 03 and 22 in the eastvalley and at sites 10 and 27 on the west-valley floor.These flows are driven by the along-valley temperatureand pressure gradients discussed in Section 3. In contrast,flow vectors at the crest demonstrate westerly flowacross the ridge, while the flow elsewhere is generallyalong-ridge. For example, there is a shift of almost 90°
between wind-direction measurements at site 08 on thewest slope and site 07 on the ridge crest during this time.This feature is apparent at crest sites along the entireridge length, while measurements at the ridge end areconsistent with the southerly down-valley wind direction.
A further example of this situation is shown inFigure 7(a). At this time, measurements at sites along theeast slope show some downslope flow behaviour, drivenby horizontal temperature gradients between the slopeand the surrounding environment (Whiteman, 1990).Cross-ridge profiles of the flow-induced pressure per-turbation p′, the Bernoulli parameter ρ0u2/2 and thepotential-temperature perturbation θ ′ measured along thecentral transect during night-time southerly-flow periodsare plotted in Figure 7(b). Pressure perturbations p′ arecalculated by first reducing the measured pressure at eachAWS to a mean reference height (2284 m a.m.s.l.). Thisremoves the hydrostatic-pressure component, estimatedusing a polytropic atmosphere profile and by fitting linearvertical temperature profiles to the east- and west-valleydata (Figure 4). The background synoptic pressure, esti-mated as the spatially-averaged reduced pressure in eachtime interval, is then subtracted from the reduced pres-sures. The calculation is estimated to have an error in p′of 0.24 hPa (Lewis, 2006). The background atmospheric-temperature gradient is subtracted from temperature mea-surements to give θ ′ estimates.
Figure 7(b) illustrates two features which are consis-tent with the sense of cross-ridge flow and which may
08/08/032330 UTC
5 m/s
09/08/030000 UTC
5 m/s
09/08/030030 UTC
5 m/s
(a)
(b)
(c)
Figure 6. 10 min-average wind vectors at (a) 2330 UTC, (b) 0000 UTCand (c) 0030 UTC on 8–9 August 2003, showing examples of
night-time flow patterns across Gaudergrat.
prove important in determining its origin. One possiblefactor is that the θ ′ profiles show generally higher tem-peratures at east-slope sites than on the west slope. This isperhaps a result of the east valley being more enclosed.Assuming the air on both sides of the ridge to be inhydrostatic balance, a cross-ridge temperature differencewill result in a difference of pressure between the two
Copyright 2008 Royal Meteorological Society Q. J. R. Meteorol. Soc. 134: 801–816 (2008)DOI: 10.1002/qj

OBSERVATIONS OF CROSS-RIDGE FLOWS 807
24/08/032120 UTC
5 m/s
-0.8-0.6-0.4-0.20.00.20.4
(b)
(a)
p’ (
hPa)
0.0
0.1
ru2 /2
(hP
a)
0300-0900 UTC0900-1500 UTC1500-2100 UTC2100-0300 UTC
-400 -200 0 200
Cross-ridge distance (m)
-1.5
-0.5
0.5
1.5
q’ (
K)
Figure 7. Example of night-time southerly flow in the west valley, and westerly ridge-normal cross-ridge flow along the crest. (a) 10 min-mean2 m wind vectors at 2120 UTC on 24 August 2003. (b) Cross-ridge profiles of 10 min-mean flow-induced pressure perturbation p′, Bernoulliparameter ρ0u2/2 and potential-temperature perturbation θ ′ measured at sites along the central transect. Mean values are plotted as a grey line,with error bars showing the standard deviation of each point. The profile measured at 2120 UTC on 24 August is plotted in bold with black
squares.
Copyright 2008 Royal Meteorological Society Q. J. R. Meteorol. Soc. 134: 801–816 (2008)DOI: 10.1002/qj

808 H. W. LEWIS ET AL.
sides of the ridge. Smith (1978) estimated the pressuredifference �p′ halfway up a ridge of height h that wouldresult from a temperature difference �θ ′ as
�p′ ≈ ρg�θ ′
θ
h
2.
For example, the largest difference between averagetemperatures on the two slopes shown in Figure 7(b)is 0.7 K, measured between sites 05 and 08. Such atemperature difference induces a cross-ridge pressuredifference of 0.015 hPa, with the westerly cross-ridgewind being consistent with flow from regions of higherpressure to regions of lower pressure.
The second feature highlighted in Figure 7(b) is thepresence of generally stronger down-valley wind speedsin the east valley than in the west valley. This maybe a result of the steeper valley-floor inclination in theeast valley (Figure 3) and larger along-valley temperaturecontrasts driving faster flow in the east valley. Assumingp′ to vary inversely with ρ0u2/2, the data suggest thatthe east slope is a region of lower pressure than the westslope. The observed westerly cross-ridge flow is consis-tent with flow towards the region of faster-moving, lower-pressure air. Unfortunately, the p′ values in Figure 7(b)are inconclusive in such light-wind conditions, being ofsimilar magnitude to the estimated error associated withthe p′ calculation and an order of magnitude greater thanthe temperature-induced pressure gradient.
5.2. Synoptically-driven flow
The strongest wind speeds measured during the Gaudexfield campaign occurred during periods of synoptically-driven southerly flow (Section 3). Figure 8 shows onesuch case on 28 August 2003, when a 2 m cross-ridgewind speed of 13.0 ms−1 was measured at site 07 onthe crest while steady southerly flows of 6.2 ms−1 and10.2 ms−1 were measured in the west and east valleysrespectively.
The along-valley flow illustrated in Figure 8(a) isclearly not thermally-driven, since the typical flow patternat 1430 UTC would involve northerly daytime up-valleywinds along each valley. The remarkable feature shownin Figure 8(a) is the presence of strong ridge-normal flowmeasured at all sites along the crest. The ridge-crest flowvector at site 07 is aligned perfectly with the centralcross-ridge AWS transect at this time, and deviatesby more than 90° from the wind direction measuredimmediately downstream at site 06. A similar contrastcan be seen over an even shorter distance betweensites 24 and 23 along the south transect. This featurefirst became established at 0800 UTC on this day, andpersisted until 1500 UTC, when it was briefly interruptedby easterly winds across the whole Gaudergrat region.We do not know whether such striking behaviour haspreviously been measured or reported, but it certainlynot a widely known or understood phenomenon of flowsin the vicinity of steep ridges. The flow pattern illustrated
in Figure 8(a) is very reminiscent of that shown inFigure 7(a), where thermally-driven night-time southerlywinds dominate in each valley. It seems likely that thesame forcing mechanism must account for both cases.This idea is developed in Section 6.
The profiles of cross-ridge potential temperature θ ′plotted in Figure 8(b) show generally higher tempera-tures in the east valley during periods of synoptically-driven southerly flows. The θ ′ cross section measuredat 1430 UTC on 28 August 2003 shows an average θ ′value at sites in the west valley of −0.38 K, and atsites in the east valley of 0.21 K. This is in clear con-trast to the typical behaviour at this time on valley-winddays, when solar heating is strongest on the west slope(Figure 4). Following the analysis of Smith (1978), sucha temperature difference would lead to different hydro-static balances on the two sides of the ridge, and resultin a cross-ridge pressure difference of about 0.013 hPa.The westerly cross-ridge flow is therefore consistent withflow towards the region of higher temperature and lowerpressure in the east valley.
Figure 8(b) also shows that the synoptically-drivensoutherly flows tend to be stronger in the east valleythan in the west valley. For example, the average valueof ρ0u2/2 in the east valley for the 28 August caseshown is 0.38 hPa, while that at west-valley sites is0.21 hPa. This trend is replicated in all cases plottedin Figure 8(b). Peak wind speeds are associated withthe cross-ridge flow at the ridge crest, where maximumρ0u2/2 values of up to 0.8 hPa occur. The increasedwind strength observed during these synoptically-drivencases leads to flow-induced pressure perturbations thatcan be resolved beyond the level of error associated withtheir measurement and calculation. Values at west-valleysites show a region of higher pressure, with average p′values of 0.22 hPa for the case in Figure 8(a), whilevalues at east-valley sites show lower pressure, with anaverage of 0.03 hPa. Measurements across the ridge crestitself show that the cross-ridge flow is associated with across-ridge pressure difference between sites 06 and 08of −0.54 hPa. A measurable pressure gradient thereforeexists, driving flow at the crest normal to the ridge axistowards the region of lower pressure.
Comparison of the cross-ridge ρ0u2/2 and p′ profilesin Figure 8(b) shows excellent correspondence betweenthe spatial variations of the two quantities. This is bestillustrated by the maximum p′ values at the ridge crestassociated with minimum ρ0u2/2 values; but increasesor decreases in ρ0u2/2 between adjacent sites can alsobe associated with corresponding decreases or increasesin p′ between those sites. The strength of this correla-tion is highlighted in Figure 9, which shows the variationof �p′ with ρ0�u2/2, where differences are measuredfor sites 08 and 06 relative to ridge-crest values. Linear-regression correlation coefficients of 0.74 and 0.40 can becalculated for the differences between sites 07 and 08 andbetween sites 07 and 06 respectively. The relationshipbetween �p′ and ρ0�u2/2 for the two pairs of mea-surements can be estimated as ρ0�u2/2 = −0.36�p′. No
Copyright 2008 Royal Meteorological Society Q. J. R. Meteorol. Soc. 134: 801–816 (2008)DOI: 10.1002/qj

OBSERVATIONS OF CROSS-RIDGE FLOWS 809
28/08/031430 UTC
5 m/s
-0.8-0.6-0.4-0.20.00.20.4
p’ (
hPa)
0.0
0.2
0.4
0.6
0.8
1.0
ru2 /2
(hP
a)
0300-0900 UTC0900-1500 UTC1500-2100 UTC2100-0300 UTC
-400 -200 0 200Cross-ridge distance (m)
-1.5
-0.5
0.5
1.5
q’ (
K)
(a)
(b)
Figure 8. Example of synoptically-driven southwesterly flow in the west and east valleys and westerly ridge-normal cross-ridge flow alongthe crest. (a) 10 min-mean 2 m wind vectors at 1430 UTC on 28 August 2003. (b) Cross-ridge profiles of 10 min-mean flow-induced pressureperturbation p′, Bernoulli parameter ρ0u2/2 and potential-temperature perturbation θ ′ measured at sites along the central transect. Mean valuesare plotted as a grey line, with error bars showing the standard deviation of each point. The profile measured at 1430 UTC on 28 August is
plotted in bold with black squares.
Copyright 2008 Royal Meteorological Society Q. J. R. Meteorol. Soc. 134: 801–816 (2008)DOI: 10.1002/qj

810 H. W. LEWIS ET AL.
such correlation is found between �p′ and �θ ′, since �θ ′values tend to zero for large �p′. This is in responseto mixing of temperature gradients in the presence ofstrengthened cross-ridge flow.
By Bernoulli’s theorem, the quantity
ρ0u2/2 + p′ + ρgz, (1)
is constant along a streamline. Although the flow mea-surements across Gaudergrat clearly show that sites arenot on the same streamline, there is a strong relationshipbetween the ρ0u2/2 and p′ measurements. Vosper andMobbs (1997) derived an expression for the differencein the quantity (1) along two streamlines that pass over ahill, assuming that the streamlines originate from a regionof horizontally-homogeneous inviscid flow far upstream,where they are separated by a small vertical distance δuz,if δu is a small difference in wind speed between the twolevels. In this case,
1
2
(u2
1 − u22
) + 1
ρ
(p′
1 − p′2
) + δu(1
2u2) = 0.
Assuming that streamlines at sites across the ridgeoriginate from regions of similar wind speed, it canbe expected that differences in wind speed will berelated to differences in flow-induced pressure. The moreseparated the upstream origins of the two streamlines,the weaker the inverse correlation between �p′ andρ0�u2/2. Dissipative processes that may be dominantclose to the surface will also weaken the correlation(Vosper et al., 2002). Figure 9(a) shows that significantinverse correlation remains in this case despite thesefactors.
5.2.1. Easterly cross-ridge winds
Synoptically-driven southerly winds persisted duringmost of 28 August 2003. Figure 10(a) shows the flowpattern at 1840 UTC. While the flow in each valley isapparently very similar to that observed during the after-noon (Figure 8), measurements at the ridge crest showeasterly cross-ridge winds. The flow vector at site 08,
located immediately downwind of the crest at this time,has a significant upslope component, indicative of hill-induced flow separation on the lee slope.
Figure 10(b) shows that the easterly cross-ridge flow isassociated with a cross-ridge pressure difference betweensites 08 and 06 of −0.14 hPa. While this is consistentwith easterly flow from a region of higher pressureto a region of lower pressure, the cross-ridge profilesof ρ0u2/2 and θ ′ are very similar to those shown inFigure 8(b) during westerly cross-ridge flow periods. Forexample, the average value of ρ0u2/2 in the east valleyfor the case shown in 0.56 hPa, while that at west-valley sites is 0.23 hPa. Wind speeds and temperaturesgenerally remain higher in the east than in the west valleyduring southerly-flow periods, apparently independentof the cross-ridge wind direction. The profiles plottedin Figure 10(b) show good correspondence of ρ0u2/2and p′ changes between adjacent sites, although themagnitudes of those changes are less well matched thanin Figure 8(b). For example, the highest p′ values occurin the east valley while the lowest ρ0u2/2 values continueto be measured in the west valley.
Figure 11 shows the correlation between �p′ andρ0�u2/2 for all southerly-flow periods when east-erly cross-ridge winds were observed. The correlationbetween �p′ and ρ0�u2/2 measured between sites 06and 07 is similar to that shown in Figure 9 for the casesof westerly cross-ridge flow. There is no correlationbetween �p′ and ρ0�u2/2 values calculated betweensites 07 and 08, however, suggesting that the easterlycross-ridge winds are independent of conditions down-wind of the ridge crest. The generally reduced �p′ valuesbetween sites 07 and 08 shown in Figure 11 are consis-tent with slackened pressure gradients associated with theoccurrence of flow separation downwind of an obsta-cle. As in Figure 9(b), the variation of �p′ with �θ ′in Figure 11(b) shows the largest �p′ values to be asso-ciated with near-zero values of �θ ′. Most �θ ′ valuesplotted in Figure 11(b) show temperatures at the crest andeast slope to exceed those on the west slope, highlightingthe tendency for most cases of easterly cross-ridge flowto take place during the morning (Figure 4).
Figure 9. Correlation of 1 min-mean differences of pressure perturbation p′ with differences of (a) Bernoulli parameter ρ0u2/2 and(b) potential-temperature perturbation θ ′ measurements, at the crest and above the west (site 08) and east (site 06) slopes during periods of
westerly cross-ridge flows at the ridge crest.
Copyright 2008 Royal Meteorological Society Q. J. R. Meteorol. Soc. 134: 801–816 (2008)DOI: 10.1002/qj

OBSERVATIONS OF CROSS-RIDGE FLOWS 811
28/08/031840 UTC
5 m/s
-0.8-0.6-0.4-0.20.00.20.4
p’ (
hPa)
0.0
0.2
0.4
0.6
0.8
1.0
ru2 /2
(hP
a)
0300-0900 UTC0900-1500 UTC1500-2100 UTC2100-0300 UTC
-400 -200 0 200Cross-ridge distance (m)
-1.5
-0.5
0.5
1.5
q’ (
K)
(b)
(a)
Figure 10. Example of southerly flow in the west and east valleys and easterly ridge-normal cross-ridge flow along the crest. (a) 10 min-mean2 m wind vectors at 1840 UTC on 28 August 2003. (b) Cross-ridge profiles of 10 min-mean flow-induced pressure perturbation p′, Bernoulliparameter ρ0u2/2 and potential-temperature perturbation θ ′ measured at sites along the central transect. The profile measured at 1840 UTC on
28 August is plotted in bold with black squares.
6. Cross-ridge flow mechanism
The results of Section 5 highlight the occurrence ofridge-normal flows at the ridge crest even when the
flow in each valley is oriented along-valley. The Gaudexcampaign provides the first field measurements of sucha feature. The majority of cases involve westerly cross-ridge flow during periods of southerly winds along each
Copyright 2008 Royal Meteorological Society Q. J. R. Meteorol. Soc. 134: 801–816 (2008)DOI: 10.1002/qj

812 H. W. LEWIS ET AL.
Figure 11. Correlation between 1 min-mean differences of pressure perturbation p′ with differences of (a) Bernoulli parameter ρ0u2/2 and(b) potential-temperature perturbation θ ′ measurements, at the crest and above the west (site 08) and east (site 06) slopes during periods of
easterly cross-ridge flows.
valley, independent of whether that flow is driven bylocal thermal forcing or synoptic-scale pressure gradients.This suggests that the same process must account forthis feature in both cases, and analysis of all flow typesis required to determine the factors that influence anddrive this cross-ridge flow. For sufficiently high windspeeds, it is clear that the westerly flows are driven bya cross-ridge pressure gradient. This pressure differenceis well correlated with the cross-ridge difference ofρ0u2/2. Easterly cross-ridge flows were also observedin apparently similar conditions. Characterization andprediction of flows in the vicinity of steep terrain requiresan understanding of the conditions under which easterlyor westerly cross-ridge flows develop.
6.1. Geographic scale
Our first consideration is that the ridge-crest flow pat-tern may reflect a larger-scale wind feature that occursabove the east- and west-valley layers, rather than beingorographically induced, so that, in effect, the valley-winddirection is determined by the terrain rather than by thatat the crest. The validity of this suggestion is difficult toassess from the available network of near-surface AWSs,which are all influenced to some extent by the ridge. Mea-surements away from the Gaudex study region are toofar from the ridge in both the horizontal and the verticaldirections to be assured of relevance to conditions acrossGaudergrat. Figure 12 compares radiosonde (site 34) andsodar (site 30) measurements made at heights of 150 m,500 m and 1000 m above the west valley with the closest10 min-mean crest-wind direction to that measurementtime (site 07). All available values are plotted, indepen-dent of flow conditions and crest-wind direction. Thedistribution of wind-direction measurements by the west-valley sodar shown in Figure 12(b) is very similar tothat measured by the co-located AWS on the west-valleyfloor at site 10. The absence of systematic correlationbetween the AWS data and radiosonde or sodar measure-ments above and below crest height demonstrates that theperpendicular crest flow is restricted to the ridge crest,rather than being part of a larger-scale feature.
6.2. Speed-up
Coppin et al. (1994) measured flow deviations of upto 20° towards ridge-normal for flow within 40° ofperpendicular to the crest of a two-dimensional hill with10° slopes. This was explained as being consistent withlinear theory, which predicts that only the ridge-normalwind-speed component is accelerated as it crosses atwo-dimensional ridge. Figure 13(a) shows the differencebetween wind directions measured at sites 10 and 07on the ridge crest, plotted against wind direction, forall periods with crest-wind directions greater than 180°.This reflects the strong tendency for cross-ridge flows tooccur for all such incident flow directions. Figure 13(b)shows the flow deviation but with the crest-wind directionrecomputed to neglect the ridge-normal component offlow speed-up. The observed deviation for small anglesof incidence (±45°) can be accounted for by neglectingthe ridge-normal component of flow speed-up. This is notthe case for the deviation associated with larger angles ofincidence (Section 5), which involves considerable flowacceleration in the cross-ridge direction and along-ridgedeceleration. The westerly cross-ridge flows are thereforenot simply due to ridge-induced speed-up.
Figure 14 shows similar behaviour between winddirections at the ridge crest with those at site 02 in theeast valley, for those periods when crest-wind directionsare less than 180°. The variation between incident winddirections and the ridge-crest flow deviation is not aswell defined as for westerly flows (Figure 13(a)). Thisis perhaps due to the influence of flow channelling inthe narrower east valley, restricting wind directions atsite 02. Flow speed-up cannot explain the observed 90°
shifts of wind direction. For lower angles of incidenceand southerly along-valley flow directions (relative winddirection greater than 0°), the scatter of flow deviationsis removed by accounting for flow speed-up, and valuestend to zero.
It is interesting to note that all cases of easterlycross-ridge flow described in Section 5.2 involve flowdeviations of only about 45°. In the absence of furtherevidence, it is possible that these flow patterns could beaccounted for by flow speed-up of the cross-ridge wind-speed component. The strong correlation between �p′
Copyright 2008 Royal Meteorological Society Q. J. R. Meteorol. Soc. 134: 801–816 (2008)DOI: 10.1002/qj

OBSERVATIONS OF CROSS-RIDGE FLOWS 813
0.0 90.0 180.0 270.0 360.0
Ridge crest AWS (site 07) wind direction (°)
0.0
45.0
90.0
135.0
180.0
225.0
270.0
315.0
360.0
Rad
ioso
nde
(site
34)
win
d di
rect
ion
(°) 1000 m
500 m150 m
0.0 90.0 180.0 270.0 360.0
Ridge crest AWS (site 07) wind direction (°)
0.0
45.0
90.0
135.0
180.0
225.0
270.0
315.0
360.0
Wes
t val
ley
SOD
AR
(si
te 3
0) w
ind
dire
ctio
n (°
)
(a) (b)
Figure 12. Correlation between ridge-crest wind direction at site 07 and wind-direction measurements at heights of 150 m (white squares), 500 m(stars) and 1000 m (black circles), by (a) radiosondes and (b) west-valley sodar.
-180 -90 0 90 180
Upwind wind direction - Ridge normal (°)
-180.0
-90.0
0.0
90.0
180.0
Cre
st -
Upw
ind
dir.
cha
nge
(°)
-180 -90 0 90 180
Upwind wind direction - Ridge normal (°)
(a) (b)
Figure 13. (a) Difference between wind directions measured at sites 10 and 07 for westerly ridge-crest flow directions during Gaudex, as afunction of incident wind direction (at site 10) relative to ridge-normal. Only periods when u07 > 1 ms−1 are included. (b) As (a), but showing
the difference between incident and crest wind directions after removing the cross-ridge speed-up component.
-180 -90 0 90 180
Upwind wind direction - Ridge normal (°)
-180.0
-90.0
0.0
90.0
180.0
Cre
st -
Upw
ind
dir.
cha
nge
(°)
-180 -90 0 90 180
Upwind wind direction - Ridge normal (°)
(a) (b)
Figure 14. As Figure 13, but for wind directions measured at sites 02 and 07 for easterly ridge-crest flow directions during Gaudex.
and ρ0�u2/2 measured between sites 07 and 06 duringeasterly-flow periods shown in Figures 10(b) and 11 thenhighlights flow acceleration towards the ridge crest drivenby an along-slope pressure gradient. This idea impliesthat flow along the east valley with an easterly upslopecomponent is necessary for easterly cross-ridge flow atthe ridge crest.
6.3. Thermally-driven plain-basin flow
It has been shown (see, for example, Figure 4) that theGaudergrat region is subject to significant thermal gradi-ents over small distances. All the evidence presented inSection 5 showed higher temperatures at sites along theeast slope than along the west slope. It was shown that the
Copyright 2008 Royal Meteorological Society Q. J. R. Meteorol. Soc. 134: 801–816 (2008)DOI: 10.1002/qj

814 H. W. LEWIS ET AL.
resulting difference between the hydrostatic balance onthe two sides of the ridge in such conditions would pro-duce a cross-ridge pressure difference of about 0.015 hPa.The sense of �θ ′ plotted in Figure 9 shows cross-ridgeflow towards the region of higher temperatures and lowerhydrostatic pressure. However, �θ ′ values are not corre-lated with measured pressure differences, and, as shownin Section 5.1, the magnitude of �θ ′ is too small toaccount for the observed p′ values using the analysis ofSmith (1978). This indicates that the observed pressuregradient and resulting cross-ridge flows are not thermallyinduced.
6.4. Dynamically-driven pressure-gradient flow
The correlation between differences of flow speed andpressure perturbation measured at the ridge crest andimmediately upwind and downwind at sites 08 and 06during periods of westerly cross-ridge flow shown inFigure 9 demonstrates an association between ridge-crestand along-valley flow conditions. Figure 15(a) showsthe correlation between 1 min-mean values of the ridge-crest wind speed and the cross-ridge pressure gradientcalculated between sites 08 and 06 for all flow conditionsduring Gaudex.
For westerly cross-ridge flows, Figure 15(a) showsthat the cross-ridge flow speed is correlated with thecross-ridge pressure gradient (R2 = 0.44). The strongest2 m wind speeds, of up to 15 ms−1, are associatedwith �p′ values of 1.5 hPa. Figure 15(b) confirms thatthis pressure difference is related to the wind-speeddifference across Gaudergrat. Cases when ρ0�u2/2 >
0 correspond to cases of hill-induced flow separationdownwind of the crest and reduced wind speeds atsite 06. Significantly fewer positive values of ρ0�u2/2are calculated for cross-ridge wind-speed differencesbetween measurements at sites 10 and 02, where theflows are purely along-valley.
Easterly ridge-crest wind speeds are less well corre-lated with �p′ (R2 = 0.22). This reflects the indepen-dence of �p′ and ρ0�u2/2 between sites 08 and 07shown in Figure 11. Conversely, easterly crest-windspeeds are well correlated with the cross-ridge values ofρ0�u2/2 (R2 = 0.77). These results are consistent withthe suggestion that easterly cross-ridge flows at the crestare associated with speed-up of flow along the east slope(Section 6.2). The easterly crest-wind speed increaseswith upwind flow speed at site 06, while for strong cross-ridge flows, wind speeds downwind at site 08 are reducedas a result of flow separation. Figure 10(a) shows anexample of this process. The lack of correspondencebetween the variation of the ridge-crest wind speed with�p′ and ρ0�u2/2 for easterly and westerly ridge-crestwind directions also suggests that different mechanismsaccount for the two flow conditions.
We therefore propose the following mechanism toaccount for westerly cross-ridge flow across Gaudergrat.A schematic illustration is provided in Figure 16. Along-valley flow past Gaudergrat is driven in the east and west
-20.0 -15.0 -10.0 -5.0 0.0 5.0 10.0 15.0 20.0
uridge-crest (ms-1)
-20.0 -15.0 -10.0 -5.0 0.0 5.0 10.0 15.0 20.0
uridge-crest (ms-1)
-2.0
-1.5
-1.0
-0.5
0.0
0.5
1.0
1.5
2.0
∆p’
(hPa
)
Easterly Westerly
Easterly Westerly
-0.5
-0.4
-0.3
-0.2
-0.1
0.0
0.1
0.2
0.3
0.4
0.5
r∆u
2 /2 (
hPa)
(a)
(b)
Figure 15. Correlation between 1 min-mean ridge-crest 2 m wind speedat site 07 and the cross-ridge difference in (a) flow-induced pressureperturbation p′ and (b) Bernoulli parameter ρ0u2/2, calculated betweensites 08 and 06. For easterly crest winds, ucrest < 0; for westerly crest
winds, ucrest > 0.
valleys by synoptic-scale or thermally-induced pressuregradients, with wind speed in the east valley increasedrelative to that along the west valley (ρ0�u2/2 < 0).This is due to the difference in valley geometries,perhaps because the east valley is considerably narrowerand shallower than the west valley, encouraging flowconvergence and acceleration in the east valley. Thecross-sectional areas of the east and west valleys alongthe central transect shown in Figure 3 are estimated tobe at least 0.046 km2 and 0.17 km2 respectively. Theeffect of this areal difference will be accentuated forsoutherly flows by the steeper valley-surface elevationalong the east valley. The faster-flowing airstream inthe east valley generates low pressure relative to theslower west-valley flow. This pressure difference has
Copyright 2008 Royal Meteorological Society Q. J. R. Meteorol. Soc. 134: 801–816 (2008)DOI: 10.1002/qj
OBSERVATIONS OF CROSS-RIDGE FLOWS 815
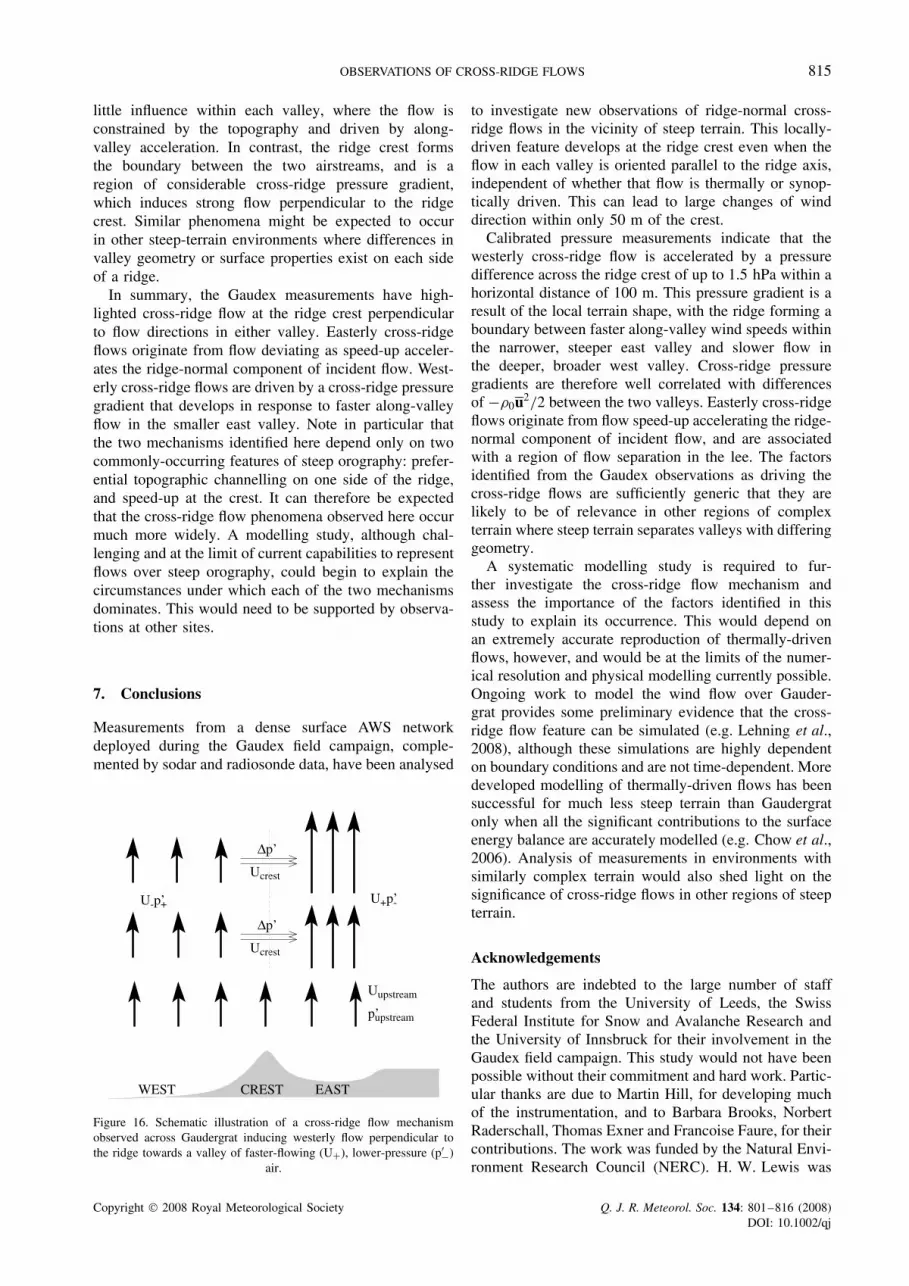
little influence within each valley, where the flow isconstrained by the topography and driven by along-valley acceleration. In contrast, the ridge crest formsthe boundary between the two airstreams, and is aregion of considerable cross-ridge pressure gradient,which induces strong flow perpendicular to the ridgecrest. Similar phenomena might be expected to occurin other steep-terrain environments where differences invalley geometry or surface properties exist on each sideof a ridge.
In summary, the Gaudex measurements have high-lighted cross-ridge flow at the ridge crest perpendicularto flow directions in either valley. Easterly cross-ridgeflows originate from flow deviating as speed-up acceler-ates the ridge-normal component of incident flow. West-erly cross-ridge flows are driven by a cross-ridge pressuregradient that develops in response to faster along-valleyflow in the smaller east valley. Note in particular thatthe two mechanisms identified here depend only on twocommonly-occurring features of steep orography: prefer-ential topographic channelling on one side of the ridge,and speed-up at the crest. It can therefore be expectedthat the cross-ridge flow phenomena observed here occurmuch more widely. A modelling study, although chal-lenging and at the limit of current capabilities to representflows over steep orography, could begin to explain thecircumstances under which each of the two mechanismsdominates. This would need to be supported by observa-tions at other sites.
7. Conclusions
Measurements from a dense surface AWS networkdeployed during the Gaudex field campaign, comple-mented by sodar and radiosonde data, have been analysed
∆p’
∆p’
Ucrest
Ucrest
p’upstream
Uupstream
WEST EAST
U-p’+ U+p’-
CREST
Figure 16. Schematic illustration of a cross-ridge flow mechanismobserved across Gaudergrat inducing westerly flow perpendicular tothe ridge towards a valley of faster-flowing (U+), lower-pressure (p′−)
air.
to investigate new observations of ridge-normal cross-ridge flows in the vicinity of steep terrain. This locally-driven feature develops at the ridge crest even when theflow in each valley is oriented parallel to the ridge axis,independent of whether that flow is thermally or synop-tically driven. This can lead to large changes of winddirection within only 50 m of the crest.
Calibrated pressure measurements indicate that thewesterly cross-ridge flow is accelerated by a pressuredifference across the ridge crest of up to 1.5 hPa within ahorizontal distance of 100 m. This pressure gradient is aresult of the local terrain shape, with the ridge forming aboundary between faster along-valley wind speeds withinthe narrower, steeper east valley and slower flow inthe deeper, broader west valley. Cross-ridge pressuregradients are therefore well correlated with differencesof −ρ0u2/2 between the two valleys. Easterly cross-ridgeflows originate from flow speed-up accelerating the ridge-normal component of incident flow, and are associatedwith a region of flow separation in the lee. The factorsidentified from the Gaudex observations as driving thecross-ridge flows are sufficiently generic that they arelikely to be of relevance in other regions of complexterrain where steep terrain separates valleys with differinggeometry.
A systematic modelling study is required to fur-ther investigate the cross-ridge flow mechanism andassess the importance of the factors identified in thisstudy to explain its occurrence. This would depend onan extremely accurate reproduction of thermally-drivenflows, however, and would be at the limits of the numer-ical resolution and physical modelling currently possible.Ongoing work to model the wind flow over Gauder-grat provides some preliminary evidence that the cross-ridge flow feature can be simulated (e.g. Lehning et al.,2008), although these simulations are highly dependenton boundary conditions and are not time-dependent. Moredeveloped modelling of thermally-driven flows has beensuccessful for much less steep terrain than Gaudergratonly when all the significant contributions to the surfaceenergy balance are accurately modelled (e.g. Chow et al.,2006). Analysis of measurements in environments withsimilarly complex terrain would also shed light on thesignificance of cross-ridge flows in other regions of steepterrain.
Acknowledgements
The authors are indebted to the large number of staffand students from the University of Leeds, the SwissFederal Institute for Snow and Avalanche Research andthe University of Innsbruck for their involvement in theGaudex field campaign. This study would not have beenpossible without their commitment and hard work. Partic-ular thanks are due to Martin Hill, for developing muchof the instrumentation, and to Barbara Brooks, NorbertRaderschall, Thomas Exner and Francoise Faure, for theircontributions. The work was funded by the Natural Envi-ronment Research Council (NERC). H. W. Lewis was
Copyright 2008 Royal Meteorological Society Q. J. R. Meteorol. Soc. 134: 801–816 (2008)DOI: 10.1002/qj

816 H. W. LEWIS ET AL.
supported by an NERC CASE studentship in collabo-ration with the Met Office.
References
Carruthers DJ, Hunt JCR. 1990. ‘Fluid mechanics of airflow over hills:turbulence, fluxes and waves in the boundary layer’. Pp. 83–103in Atmospheric Processes over Complex Terrain, Blumen W (ed).American Meteorological Society.
Chow FK, Weigel AP, Street RL, Rotach MW, Xue M. 2006. High-resolution large-eddy simulations of flow in a steep Alpine valley.Part I: Methodology, verification, and sensitivity experiments. J.Appl. Meteorol. 45: 63–86.
Coppin PA, Bradley EF, Finnigan JJ. 1994. Measurements of flow overan elongated ridge and its thermal stability dependence: the meanfield. Boundary-Layer Meteorol. 69: 173–199.
Doorschot J, Raderschall N, Lehning M. 2001. Measurements and one-dimensional model calculations of snow transport over a mountainridge. Ann. Glaciol. 32: 153–158.
Jackson PS, Hunt JCR. 1975. Turbulent wind flow over a low hill. Q.J. R. Meteorol. Soc. 101: 929–955.
Lehning M, Lowe H, Ryser M, Raderschall N. 2008. Inhomogeneousprecipitation distribution and snow transport in steep terrain. WaterResour. Res. (in press). DOI: 10.1029/2007WR006545.
Lewis HW. 2006. The Dynamics of the Atmospheric Boundary Layerover Steep Terrain. PhD thesis, University of Leeds.
Mayr GJ, Armi L, Gohm A, Zangl G, Durran DR, Flamant C, GabersekS, Mobbs S, Ross A, Weissmann M. 2007. Gap flows: results fromthe Mesoscale Alpine Programme. Q. J. R. Meteorol. Soc. 133:881–896.
Mobbs SD, Vosper SB, Sheridan PF, Cardoso R, Burton RR, ArnoldSJ, Hill MK, Horlacher V, Gadian AM. 2005. Observations ofdownslope winds and rotors in the Falkland Islands. Q. J. R.Meteorol. Soc. 131: 329–351.
Smith RB. 1978. A measurement of mountain drag. J. Atmos. Sci. 35:1644–1654.
Taylor PA, Mason PJ, Bradley EF. 1987. Boundary-layer flow over lowhills. Boundary-Layer Meteorol. 39: 107–132.
Vosper SB, Mobbs SD. 1997. Measurement of the pressure field on amountain. Q. J. R. Meteorol. Soc. 123: 129–144.
Vosper SB, Mobbs SD, Gardiner BA. 2002. Measurements of near-surface flow over a hill. Q. J. R. Meteorol. Soc. 128: 2257–2280.
Weigel AP, Rotach MW. 2004. Flow structure and turbulencecharacteristics of the daytime atmosphere in a steep and narrowAlpine valley. Q. J. R. Meteorol. Soc. 130: 2605–2627.
Whiteman CD. 1990. ‘Observations of thermally developed windsystems in mountainous terrain’. Pp 5–42 in Atmospheric Processesover Complex Terrain, Blumen W (ed). American MeteorologicalSociety.
Wood N. 1995. The onset of separation in neutral, turbulent flow overhills. Boundary-Layer Meteorol. 76: 137–164.
Copyright 2008 Royal Meteorological Society Q. J. R. Meteorol. Soc. 134: 801–816 (2008)DOI: 10.1002/qj