Embed Size (px)
Citation preview
Soil crusting and infiltration on steep slopes in northernThailand
J . L . J ANEAUa , J . P . B R I CQUET
a , O . P LANCHONb & C . V ALENT IN
c
aInstitut de Recherche pour le Developpement, International Water Management Institute, PO Box 1025, Jatujak, Bangkok 10903,
Thailand, bInstitut de Recherche pour le Developpement, BP 1386 Dakar, Senegal, and cInstitut de Recherche pour le Developpement,
National Agriculture and Forest Institute, BP 06 Vientiane, Laos
Summary
Predicting the rate at which rain infiltrates on steep slopes is very uncertain. There is no consistent
information in the literature. We have therefore related infiltrability to slope gradient under field
conditions by experimenting on a gravelly loamy soil occupying the upper half of a cultivated convex
hill in northern Thailand. Fifteen 1m� 1m plots with slope gradients ranging from 16 to 63% were
established, and simulated rain was allowed to fall on them at controlled rates and for fixed times. We
obtained the following results. The surface fell 0.4–7.2mm due to compaction and soil loss. The
proportions of crust (0–40%) and embedded gravel (10–60%), the runoff coefficient (0.05–0.78mm
mm�1), the mean sediment concentrations (0–5.6 g l�1), and soil detachment (10–313 gm�2) were more
pronounced on the gentle slopes than on the steep ones. The steady final infiltration rate (1–107mm
hour�1) increased sharply with increasing slope gradient. Microaggregates tended to behave like sand
and become tightly packed on gentle slopes (packing crust). These results suggest that the vertical
component of kinetic energy, which is greater on gentle slopes, has a dominant role. Nevertheless, the
differences in compaction and in sediment concentration could not be ascribed to the vertical component
of kinetic energy alone. On steep slopes the horizontal component of the kinetic energy is transformed
into shear stress, hampering the development of crusts so that water can still infiltrate. On steeper slopes,
the water film was thinner, thereby limiting the role of splash. We conclude that the relationship between
slope gradient and infiltrability depends on the nature of the soil and must be examined in the light of
surface crusting processes.
Introduction
Most recent models to predict soil erosion from small catch-
ments use data on the spatial variation of soil infiltrability.
These GIS-based models use infiltration attributes for each
main soil unit. This approach may be questioned when it is
applied to very steep slopes because under such conditions a
soil map unit is rarely homogeneous, in terms of soil texture,
stoniness, crustability, and soil depth. Furthermore, the clas-
sical methods of soil physics used to assess hydraulic conductiv-
ity can apply only to horizontal surfaces. Likewise, the
prediction of soil infiltrability from topographic factors alone
is risky since no one has shown an unequivocal relationship
between slope gradient and infiltrability. Some authors have
found no relation between the two (e.g. Singer & Blackard,
1982; Mah et al., 1992). Others have reported a decrease in
infiltration with increasing slope angle due to a decrease in
depth of overland flow and surface storage (e.g. Chaplot & Le
Bissonnais, 2000). Fox et al. (1997) observed decreasing infil-
tration rates with increasing gradient until a critical threshold
was reached; thereafter the infiltration rate was steady and
independent of slope gradient. More surprising is that in
some studies the infiltration rate increased with increasing
gradient. For interrill conditions, these trends have been
ascribed to weaker crusting on steeper slopes because rain-
drops hit the soil at a more acute angle, and thus with less
kinetic energy per unit area of surface (e.g. Poesen, 1986).
Under tropical conditions, crusting hampers infiltration not
only on loamy and clayey soils but also on sandy soils (Valentin,
1991) and gravelly ones (Valentin & Casenave, 1992).
Surface crusts contribute to the redistribution of water and
its concentration in the runon areas (water-harvesting), which
can be essential for the maintenance of vegetation (Greene,
Paper given at the Michel Rieu Memorial Colloquium, 8–10 October
2001, in Paris.
Correspondence: C. Valentin. E-mail: [email protected]
Received 7 November 2001; revised version accepted 12 July 2002
European Journal of Soil Science, September 2003, 54, 543–553
# 2003 Blackwell Publishing Ltd 543

1992; Valentin et al., 1999) and crop productivity (Rockstrom &
Valentin, 1997).
Although agriculture is extending gradually on to steep
lands in many parts of the world, there are few studies on
very steep cultivated slopes. We therefore need better under-
standing of the relations between slope gradient, crusting and
infiltration. We have investigated the effect of slope gradient
on infiltrability, and determined the interactions with surface
features such as crusts, stoniness and soil surface roughness
and compaction, and we report our results below.
Materials and methods
The study site
Field research was carried out in the Mae Yom experimental
catchment, 30 km east of Phrae Township in northern
Thailand (64�690540 0E, 20�160320 0N, 440m above sea level,
Figure 1). The landscape is a typical one of convex hills adjacent
to irrigated valleys. The hills have been cleared illegally and
intensively cultivated since 1982. The average annual rainfall
over the last 26years is 1072mm, with most falling during the
monsoon season between May and September.
The soils are derived from shale and are very gravelly. They
vary from moderately drained to well drained and are mostly
shallow. The convex hilltops, as well as the uniform steep
slopes, have loamy soils, which are very porous with a fine granu-
lar structure and are 0.5–0.7m deep. On the foothills soils
are generally deeper but otherwise similar (Podwojewski, 2001).
Experimental design
Fifteen 1m� 1m plots were established for rainfall simulation
experiments within a rectangular area of approximately
15m� 30m on the upper half of a typical catena. The plots
were bounded by rigid metal frames inserted to a depth of
0.1m (Figure 2). The plots were selected so that they all belonged
to the same soil type (Luvisol) but differed greatly in slope gra-
dient, ranging from 0.16 to 0.63mm�1 (Figure 3). The slope
was accurately measured using a level. The topsoil thickness,
as assessed from pits dug in each plot, varied between 8 and
41 cm with no clear relation to the gradient (Table 1). Particle-
size analysis by the hydrometer method (Gee & Bauder, 1986)
showed that clay contents increased with gradient from 14 to
28% and sand decreased from 60 to 40%, while silt remained
nearly constant (26–30%). The organic matter content deter-
mined by the Walkley–Black method, as described by Nelson &
Sommers (1986), varied little from plot to plot and was
fairly large (3.9–4.7%), despite continuous cultivation (Table 1).
CAMBODIA
GULF OFTHAILAND
Bangkok
MALAYSIA
ANDAMANSEA
MYANMAR
LAOSMYANMAR
Khon Khaen
Chiang Mai
Phrae
THAILANDLAOS
18°15'
18°
17°45'
100°15' 100°30' 100°45'Longitude
Ban Den Chai
Phrae
Ban Mae
SirikitReservoir
Ban Na Noi
Study site
Figure 1 Location map of the experimental site in northern Thailand.
O O O O O O
0.08 m
Outlet (hole line)
Cover for runoff canal
Canal to collectrunoff
1 m
1 m
Figure 2 Metal frame and runoff canal used for each 1-m2 plot
submitted to rainfall simulation.
544 J. L. Janeau et al.
# 2003 Blackwell Publishing Ltd, European Journal of Soil Science, 54, 543–553

Before the rainfall simulation, each of the plots was hoed to
a depth of 0.07–0.10m and rolled, with aggregates crushed to
less than 4mm, to reproduce seedbed conditions (e.g. Fox
et al., 1997). Gravimetric soil moisture was determined before
the tests in five plots along the slope (M3, M6, M8, M12 and
M14) at depths 0–5 cm, 5–15 cm, 15–25 cm, 35–45 cm,
45–55 cm, 55–75 cm and 75–105 cm.
Surface roughness was measured on each plot before and
after rainfall simulation with a laser distance meter (Leica
Disto. Pro, laser class 2–635 nm) as a relief-meter on a 5-cm
grid with elevational resolution of 1mm. The distance meter
was mounted 0.8m above the plots on a frame fixed parallel to
the surface. Random roughness (Rr), as defined by Allmaras
et al. (1966), was assessed as follows (Planchon et al., 2002):
Rr ¼1
N � 1
Xnri¼1
Xncj¼1
zi; j � zi;� � z�; j þ z�;�� �2( )1
2
; ð1Þ
where nr is the number of rows in the grid, nc is the number
of columns, zi;�; z�; j and z�;� are the means, respectively, of row
i, column j, and all the data, and N¼ nr� nc is the total
number of cells.
This equation provides the standard deviation of the eleva-
tion after subtraction of the means, calculated per line and per
column, in order to remove the effects of the slope gradient
and of the tillage-oriented roughness.
We collected from the hoed layer in each plot before and
after rain samples of soil on which to assess aggregate stability
and to determine the mean weight diameter of stable aggre-
gates by the wet-sieving method of Kemper & Roseneau
(1986). We estimated surface conditions visually using the
method of Casenave & Valentin (1992). We included the
recognition of various types of surface features such as crusts
and gravel, either free or embedded in a crust (Valentin &
Casenave, 1992), and we estimated surface gravel visually as
the proportion of surface occupied by gravel. We brushed the
surface gently to distinguish the surface gravel that was
included in the crust and the free gravel that was readily
removed by the brush. The bulk density of the upper 6 cm
was assessed before and after the experiments in a 100-cm3
Figure 3 Topographic surface profile and setting of the experimental plots.
Table 1 Main topographic and soil characteristics of the experimental
plots: mean, standard deviation (SD) and coefficient of determination,
R2, of each variable as regressed on the slope gradient
Slope
gradient Topsoil Sand Silt Clay Organic matter
/m m�1 depth /m /%
Mean 0.388 0.20 49 28 22 4.2
SD 0.179 0.09 6 2 5 0.3
R2 0.14 0.71 0.06 0.68 0.25
Infiltration on steep slopes 545
# 2003 Blackwell Publishing Ltd, European Journal of Soil Science, 54, 543–553
cylinder (height 6 cm, diameter 4.6 cm), with three replications
per plot. These cylinders were also used to assess the percent-
age of gravimetric gravel and gravimetric soil moisture before
the rains in the uppermost 6 cm of soil.
After the rains, undisturbed samples of surface soil were
collected in steel Kubiena boxes from each plot, air-dried
and impregnated with polyester resin. Thin sections, 55mm
by 25mm, were prepared and examined with SEM (Backscat-
tered Electron Scanning Image, BESI mode) at low resolution.
We placed particular emphasis on the arrangement, micro-
structure and porosity. Surface crusts were classified in the
typology proposed by Valentin & Bresson (1992).
The plots were subjected to simulated rain with ORSTOM’s
portable field simulator (Casenave & Valentin, 1992), with
drop size distribution and kinetic energy similar to those of
tropical rain of the same intensity (20 Jmm�1m�2 at 60mm
hour�1, 24 Jmm�1m�2 at 120mm hour�1). The multistage feet
of the simulator’s tower were adjusted to compensate for the
slope differences and simulate vertical rain. We calibrated the
intensity by collecting all of the rain before each test and after
simulation from an impermeable 1-m2 pan placed horizontally
and directly over the plot. For a given intensity, the plots did
not all receive the same quantity of rain because a plot of
length l on a slope of gradient a has a projection of only
l cos a in the horizontal plane. The experiments were con-
ducted from late November to early December 2000. The
first run, on dry soil, lasted for 1 hour at an intensity of
60mmhour�1; the second run, 22 hours later, lasted 30min-
utes at an intensity of 120mmhour�1. These two events cor-
responded to a return period of 2 years in northern Thailand.
Gravimetric soil moisture was monitored on five plots to a
depth of 0.95m, before the rain, and 0.5, 1, 2 hours, 1, 2, 3, 10
and 15 days after the second run.
Time to ponding was measured for each plot and each run.
We determined runoff rates by taking volumetric samples of
the water discharged from a trough placed along the lowest
side of the plot (Figure 2) every minute after runoff had begun.
The infiltration rate was determined as the difference between
the rainfall intensity times cosa and the runoff rate. For each
rain event, the infiltration rate decreased to a constant,
denoted hereafter as the final infiltration rate (FIR). We col-
lected samples of runoff water at intervals ranging from 1 to 3
minutes, depending on the runoff intensity. On each plot we
measured the volume of runoff after the cessation of the rain.
Because of the even surface (little roughness) and the steep
slope gradient, we considered that no puddle could form, and
we neglected the proportion of the running water at the soil
surface that could infiltrate after the end of the rain. Thus, we
estimated the mean depth of overland flow at the end of the
rain (Dr) from the volume of runoff after the end of the rain,
divided by the plot area (1m2).
Results
Initial conditions
The proportion of gravel, whether expressed gravimetrically or
by areal percentage, increased slightly with slope gradient, but
neither bulk density nor the soil moisture of the seedbed varied
with slope (Table 2). No significant difference was found
among the soil moisture profiles before the rain events.
Wet aggregate stability, gravel and surface crusts
Wet aggregate stability decreased somewhat with increasing
gradient before the rain (Table 2), but there was no relation
between the two afterwards. Slope had no influence on mean
weight diameter of stable aggregates (MWD) either before or
after the rain. Rain did not change the mean value of MWD,
0.77mm, calculated for the 15 plots. The condition of the soil
surface after the last rain event varied greatlywith slope (Table 3),
and there was a clear relation between slope and the
percentage of embedded gravel (i.e. included in a surface crust,
Figure 4).
Micromorphological examination showed that the crust was
mostly of the packing type, consisting of skeleton grains or
stable microaggregates tightly packed at the soil surface with
very few macropores (Figure 5).
Hydrological variables
Time to ponding ranged from 6 to 22minutes during the first
run and from 9 to 100 s during the second run. No relation was
found between time to ponding and other variables. In particu-
lar, time to ponding was not influenced by gradient. Runoff was
generated from each plot during the two rain events. Rills did
not occur at any stage of the experiment. The steady final
infiltration rate measured on each plot increased sharply with
Table 2 Main surface conditions before the rainfall experiments: mean, standard deviation (SD) and coefficient of determination, R2, of each
variable as regressed on the slope gradient
Slope gradient /mm�1
Wet aggregate stability
/kg kg�1
Gravimetric gravel
/kg kg�1
Surface gravel
/m2m�2
Bulk density
/g cm�3
Soil moisture
/kg kg�1
Mean 0.388 0.719 0.680 0.490 1.28 0.018
SD 0.179 0.059 0.075 0.156 0.07 0.003
R2 0.31 0.45 0.39 0.02 0.26
546 J. L. Janeau et al.
# 2003 Blackwell Publishing Ltd, European Journal of Soil Science, 54, 543–553

increasing slope gradient for the two rain storms (Figure 6).
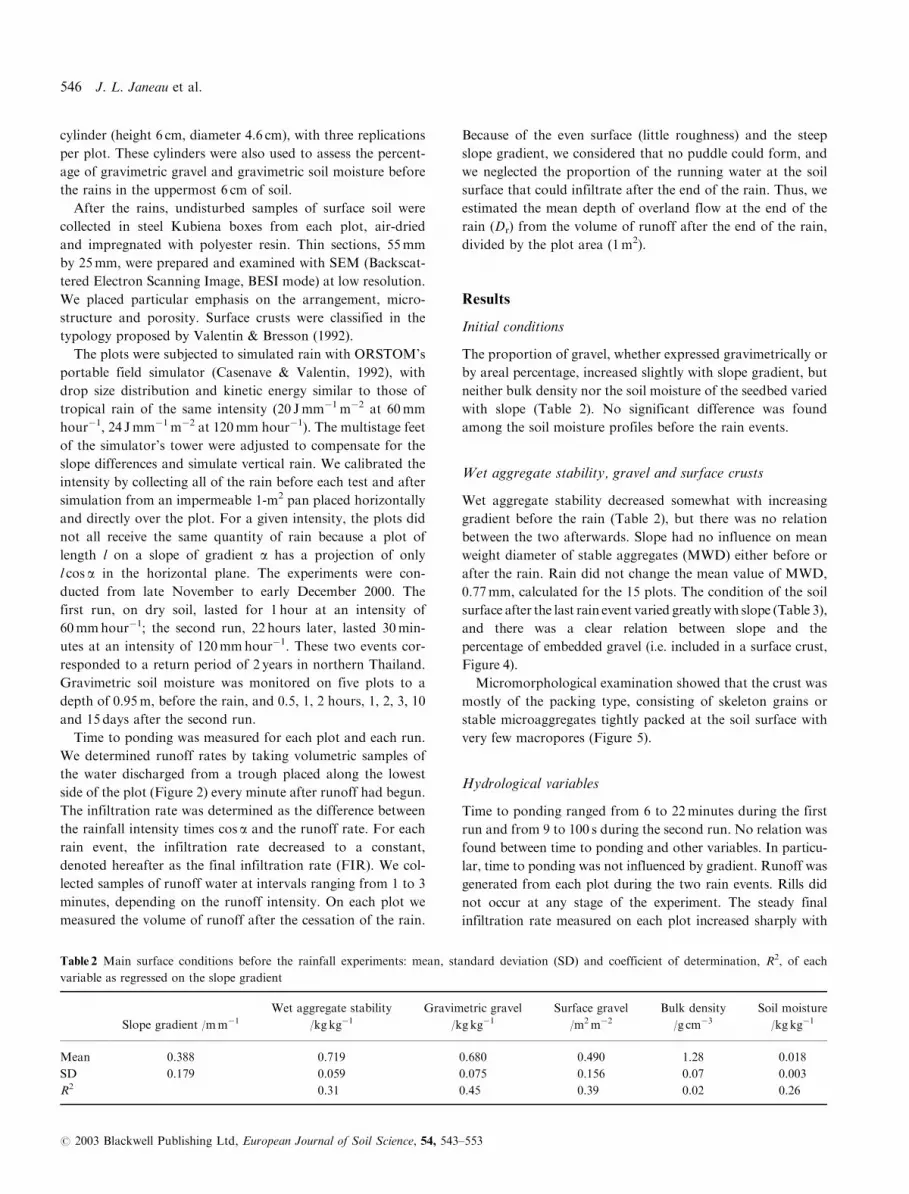
Conversely, the runoff coefficient (Kr, the runoff:rainfall ratio)
calculated for the two runs decreased from 0.78 on gentler
slopes to 0.05 on steeper slopes (Figure 7). The evaluated
mean depth of overland flow (Dr) decreased sharply with
increasing slope for the two rain events (Figure 8).
Sediment concentration, detachment and compaction
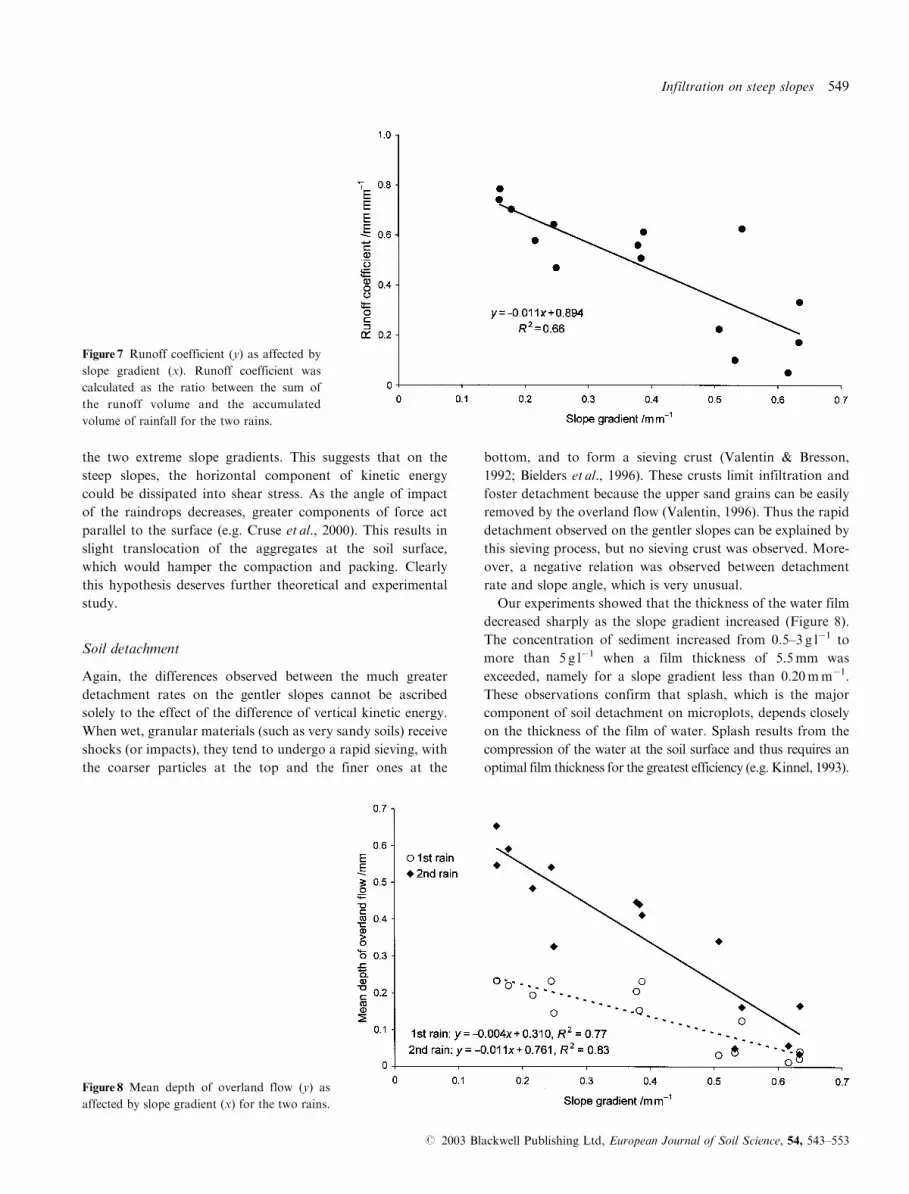
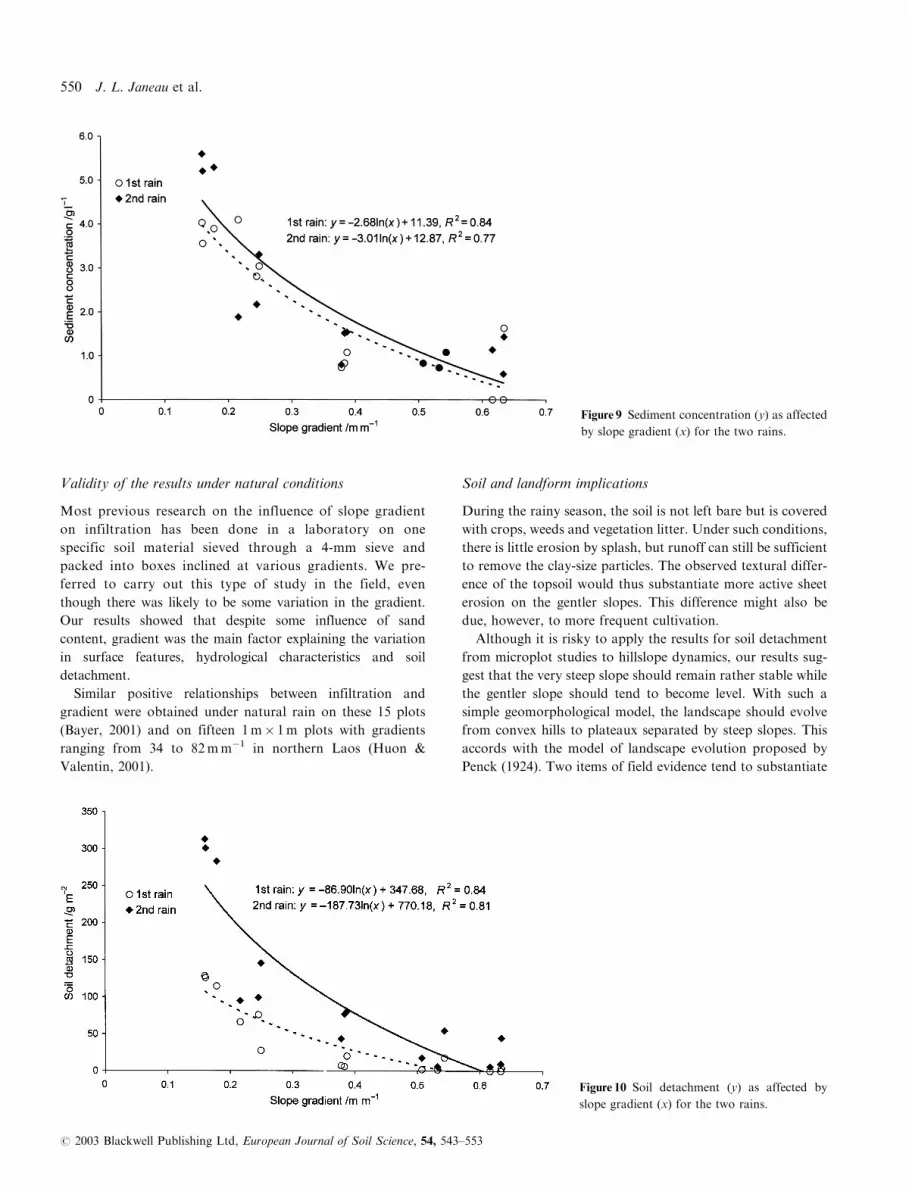
Mean concentration of sediment (Figure 9), as well as soil
detachment (Figure 10), sharply decreased with the slope gra-
dient. The mean random roughness (Rr¼ 3.4mm) of the sur-
face of the plots did not change during the rainfall simulations,
while the standard deviation increased from 0.3 to 0.4mm. In
contrast, the mean distance to the reference plane increased
during the rain events. This lowering of the surface was much
more pronounced for the gentler slopes than for the steeper
ones. Considering that lowering of the surface level was due to
soil detachment plus compaction, compaction appeared to be
the major factor (Figure 11).
Interactions among factors
As shown in Table 4, there were highly significant correlations
among topographic and soil variables (slope gradient and sand
percentage), surface features (free gravel, embedded gravel,
crust percentages and lowering of the surface), hydrological
variables (FIR, Dr of the first and second rains and the mean
Kr) and soil detachment.
Stepwise regression indicated that slope gradient was the
best predictor for compaction, crust, embedded gravel, an
impervious surface (crust plus embedded gravel), hydrological
variables and soil detachment (Table 5).
Discussion
Crusting processes and compaction
According to the classification proposed by Valentin & Bresson
(1992) and for these conditions of soil texture and moisture,
slaking crusts should have formed at the onset of the first
rain. Instead of slaked aggregates, we observed very stable
microaggregates that tended to behave like sand and became
tightly packed. This aggregate stability can be attributed to the
fairly large content of organic matter. Soil containing less
organic matter would have been more likely to slake. As a
result of rapid wetting, slaking crusts would have developed at
the onset of the first rain on every plot, regardless of kinetic
energy. We could not have then established any relationship
between infiltration and slope gradient. This accords with the
observations of Singer & Blackard (1982) and of Mah et al.
Table 3 Main surface conditions after the rainfall experiments: mean, standard deviation (SD) and
coefficient of determination, R2, of each variable as regressed on the slope gradient
Slope
/mm�1
Free aggregates
/m2m�2
Free gravel
/m2m�2
Crust
/m2m�2
Embedded gravel
/m2m�2
Mean 0.388 0.07 0.30 0.22 0.40
SD 0.179 0.14 0.25 0.15 0.16
R2 0.12 0.66 0.56 0.76
Figure 4 Per cent of embedded gravel (y) as
affected by slope gradient (x).
Infiltration on steep slopes 547
# 2003 Blackwell Publishing Ltd, European Journal of Soil Science, 54, 543–553

(1992). With much runoff, rills could have occurred on the
steeper slopes to disrupt crusts and therefore to favour greater
infiltration, as suggested by Poesen (1986). Another possible
cause of limited infiltration on gentler slopes might have been
a greater proportion of depositional crusts that are less perme-
able than structural crusts (Valentin, 1991). But during these
experiments, we observed neither rills nor depositional crusts.
This absence of depositional crust confirms that no puddle
formed during the experiments. The more pronounced devel-
opment of the packing crust and embedded gravel on gentler
slopes supports the hypothesis that the vertical component of
kinetic energy is the principal cause (Poesen, 1986). The depth
of rain received on a slope gradient of 63mm�1 was roughly
86% of that on a 0.16m m�1 slope. In addition, the energy flux
density, normal for the surface, decreased in the same propor-
tion. The kinetic energy was thus decreased by 27% from the
gentlest to the steepest slopes. Although this hypothesis is
supported by the greater compaction on gentler slopes, the
vertical component of kinetic energy is insufficient to explain
the differences in compaction (from 7 to 2mm) recorded on
Figure 5 Micrograph from a thin section from
plotM1. Note the embedded gravel in the packing
crust made of packed microaggregates.
Figure 6 Final infiltration rate (y) as affected by
slope gradient (x) for the two rains.
548 J. L. Janeau et al.
# 2003 Blackwell Publishing Ltd, European Journal of Soil Science, 54, 543–553
the two extreme slope gradients. This suggests that on the
steep slopes, the horizontal component of kinetic energy
could be dissipated into shear stress. As the angle of impact
of the raindrops decreases, greater components of force act
parallel to the surface (e.g. Cruse et al., 2000). This results in
slight translocation of the aggregates at the soil surface,
which would hamper the compaction and packing. Clearly
this hypothesis deserves further theoretical and experimental
study.
Soil detachment
Again, the differences observed between the much greater
detachment rates on the gentler slopes cannot be ascribed
solely to the effect of the difference of vertical kinetic energy.
When wet, granular materials (such as very sandy soils) receive
shocks (or impacts), they tend to undergo a rapid sieving, with
the coarser particles at the top and the finer ones at the
bottom, and to form a sieving crust (Valentin & Bresson,
1992; Bielders et al., 1996). These crusts limit infiltration and
foster detachment because the upper sand grains can be easily
removed by the overland flow (Valentin, 1996). Thus the rapid
detachment observed on the gentler slopes can be explained by
this sieving process, but no sieving crust was observed. More-
over, a negative relation was observed between detachment
rate and slope angle, which is very unusual.
Our experiments showed that the thickness of the water film
decreased sharply as the slope gradient increased (Figure 8).
The concentration of sediment increased from 0.5–3 g l�1 to
more than 5 g l�1 when a film thickness of 5.5mm was
exceeded, namely for a slope gradient less than 0.20mm�1.
These observations confirm that splash, which is the major
component of soil detachment on microplots, depends closely
on the thickness of the film of water. Splash results from the
compression of the water at the soil surface and thus requires an
optimal film thickness for the greatest efficiency (e.g. Kinnel, 1993).
Figure 8 Mean depth of overland flow (y) as
affected by slope gradient (x) for the two rains.
Figure 7 Runoff coefficient (y) as affected by
slope gradient (x). Runoff coefficient was
calculated as the ratio between the sum of
the runoff volume and the accumulated
volume of rainfall for the two rains.
Infiltration on steep slopes 549
# 2003 Blackwell Publishing Ltd, European Journal of Soil Science, 54, 543–553
Validity of the results under natural conditions
Most previous research on the influence of slope gradient
on infiltration has been done in a laboratory on one
specific soil material sieved through a 4-mm sieve and
packed into boxes inclined at various gradients. We pre-
ferred to carry out this type of study in the field, even
though there was likely to be some variation in the gradient.
Our results showed that despite some influence of sand
content, gradient was the main factor explaining the variation
in surface features, hydrological characteristics and soil
detachment.
Similar positive relationships between infiltration and
gradient were obtained under natural rain on these 15 plots
(Bayer, 2001) and on fifteen 1m� 1m plots with gradients
ranging from 34 to 82mm�1 in northern Laos (Huon &
Valentin, 2001).
Soil and landform implications
During the rainy season, the soil is not left bare but is covered
with crops, weeds and vegetation litter. Under such conditions,
there is little erosion by splash, but runoff can still be sufficient
to remove the clay-size particles. The observed textural differ-
ence of the topsoil would thus substantiate more active sheet
erosion on the gentler slopes. This difference might also be
due, however, to more frequent cultivation.
Although it is risky to apply the results for soil detachment
from microplot studies to hillslope dynamics, our results sug-
gest that the very steep slope should remain rather stable while
the gentler slope should tend to become level. With such a
simple geomorphological model, the landscape should evolve
from convex hills to plateaux separated by steep slopes. This
accords with the model of landscape evolution proposed by
Penck (1924). Two items of field evidence tend to substantiate
Figure 9 Sediment concentration (y) as affected
by slope gradient (x) for the two rains.
Figure 10 Soil detachment (y) as affected by
slope gradient (x) for the two rains.
550 J. L. Janeau et al.
# 2003 Blackwell Publishing Ltd, European Journal of Soil Science, 54, 543–553

this idea. First, the gullies that originate from the hilltops
do not broaden and deepen down the hillslopes, suggest-
ing that the steep slopes do not contribute to their forma-
tion and development, and thus confirming great
infiltrability. Secondly, the weathering zone does not con-
form to the topography. Although it is not clear on the 15
plots, a more extensive survey in the region has shown that
the soils tend to be shallower on the hilltops than on the
hillslopes (Podwojewski, 2001). This lack of conformity with
Penck, however, suggests that the landscape is no longer in
equilibrium with the climate that prevailed during the soil
formation. Convex hillslopes that have probably developed
under a more humid environment (e.g. Thomas et al., 1999)
would not remain stable under drier conditions, especially
after forest clearance.
Conclusions
Fifteen 1m� 1m plots were established on slopes ranging in
gradient from 0.16 to 0.63mm�1 in northern Thailand, sub-
mitted to two rainfall simulation tests. We found a clear
positive relationship between infiltration and slope gradient.
Soil detachment decreased sharply with increasing slope.
Slaking crusts did not develop on this loamy soil but a
packing crust, of tightly packed microaggregates, did. This
crust with its embedded gravel was mostly on the gentler
sloping plots. Furthermore, compaction was more pronounced
on the gentler slopes. To some extent the vertical component
of the kinetic energy, which is greater on gentler slopes, was
the cause. However, we think that the lateral component was
dissipated on the steepest slope by shear strain resulting in a
Figure 11 Contribution of soil loss and
compaction (x) to the lowering of the plot
surface (y).
Table 4 Correlations among main variables expressed as the Pearson correlation coefficient, r
Slope gradient Sand Free gravel Crust Embedded gravel Lowering FIR1a,b FIR2 Dr1 Dr2 Kr Detachment
Slope gradient 1.000
Sand �0.844 1.000
Free gravel 0.811 �0.555 1.000
Crust �0.746 0.617 �0.751 1.000
Embedded gravel �0.871 0.740 �0.915 0.769 1.000
Lowering �0.794 0.723 �0.517 0.410 0.649 1.000
FIR1 0.881 �0.775 0.795 �0.929 �0.834 �0.600 1.000
FIR2 0.775 �0.734 0.806 �0.918 �0.882 �0.468 0.902 1.000
Dr1 �0.878 0.785 �0.793 0.868 0.834 0.545 �0.961 �0.878 1.000
Dr2 �0.909 0.859 �0.812 0.744 0.928 0.668 �0.848 �0.848 0.890 1.000
Kr �0.812 0.752 �0.789 0.944 0.858 0.531 �0.970 �0.958 0.935 0.849 1.000
Detachment �0.849 0.754 �0.649 0.714 0.727 0.808 �0.790 �0.668 0.722 0.781 0.771 1.000
aFinal infiltration rate.bThe subscripts 1 and 2 refer to the rain event number.
Infiltration on steep slopes 551
# 2003 Blackwell Publishing Ltd, European Journal of Soil Science, 54, 543–553

slight translocation of microaggregates that hampered the for-
mation of the crust. We attribute the limited concentration of
sediment on the steeper slopes to the thinner film of water on
the surface, which limited detachment by splash. Because simi-
lar results have been obtained under natural rain in northern
Laos, these results appear to be valid for mountain soils with
highly stable microaggregates. Our data should encourage
more research on the physical processes involved in soil ero-
sion on very steep slopes.
Acknowledgements
This research is part of the Management of Soil Erosion
Project coordinated by the International Water Management
Institute involving Thailand, Lao PDR, Vietnam, Indonesia,
the Philippines and Nepal. We thank particularly the Royal
Forest Department and the Land Development Department in
Thailand, and the French Ministry of Foreign Affairs.
References
Allmaras, R.R., Burwell, R.E., Larson, W.E. & Holt, R.F. 1966. Total
porosity and random roughness of the interrow zone as influenced by
tillage. USDA Conservation Research Report 7, US Department of
Agriculture, St Paul, MN.
Bayer, A. 2001. Influence de la pente sur l’infiltration et la perte en terre
dans le nord de la Thaılande. Memoire de fin d’etude, ISTOM,
Cergy-Pontoise, France.
Bielders, C.L., Baveye, P., Wilding, L., Drees, R. & Valentin, C. 1996.
Tillage-induced spatial distribution of surface crusts on a sandy Paleus-
tult from Togo. Soil Science Society of America Journal, 60, 843–855.
Casenave, A. & Valentin, C. 1992. A runoff capability classification
system based on surface features criteria in the arid and semi-arid
areas of West Africa. Journal of Hydrology, 130, 213–249.
Chaplot, V. & Le Bissonnais, Y. 2000. Field measurements of interrill
erosion under different slopes and plot sizes. Earth Surface Pro-
cesses and Landforms, 25, 145–153.
Cruse, R.M., Berghoefer, B.E., Mize, C.W. & Ghaffarzadeh, M. 2000.
Water drop impact angle and soybean protein amendment effects
on soil detachment. Soil Science Society of America Journal, 64,
1474–1478.
Fox, D.M., Bryan, R.B. & Price, A.G. 1997. The influence of slope
angle on final infiltration rate for interrill conditions. Geoderma, 80,
181–194.
Gee, G.W. & Bauder, J.W. 1986. Hydrometer method. Particle-size
analysis. In: Methods of Soil Analysis: Part 1, Physical and Miner-
alogical Methods, 2nd edn (ed. A. Klute), pp. 404–408. American
Society of Agronomy, Madison, WI.
Greene, R.S.B. 1992. Soil physical properties of three geomorphic
zones in a semi-arid mulga woodland. Australian Journal of Soil
Research, 30, 55–69.
Huon, S. & Valentin, C. 2001. Impact de la pratique de defriche-brulis
sur la dynamique de la matiere organique et l’erosion hydrique et
aratoire d’un petit bassin versant au Laos. Rapport 2000, Programme
National Sols et Erosion, Paris.
Kemper, W.D. & Roseneau, R.C. 1986. Wet sieving. Aggregate stabil-
ity and size distribution. In: Methods of Soil Analysis: Part 1,
Physical and Mineralogical Methods, 2nd edn (ed. A. Klute), pp.
435–442. American Society of Agronomy, Madison, WI.
Kinnell, P.I. 1993. Runoff as a factor influencing experimentally determined
interrill erodibilities.Australian Journal of Soil Science, 31, 333–342.
Mah, M.G.C., Douglas, L.A. & Ringrose-Voase, A.J. 1992. Effects of
crust development and surface slope on erosion by rainfall. Soil
Science, 154, 37–43.
Nelson, D.W. & Sommers, L.E. 1986. Organic carbon. In: Methods of
Soil Analysis: Part 2, Chemical and Microbiological Properties, 2nd
edn (ed. A. Klute), pp. 983–1001. American Society of Agronomy,
Madison, WI.
Penck, W. 1924. Morphological Analysis of Land Forms: A Contribu-
tion to Physical Geology. Translated in 1953 from the 1924 version
by H. Czech and K.C. Boswell, reprinted 1972; originally published
in German. Macmillan, London.
Planchon, O., Esteves, M., Silvera, N. & Lapetite, J.-M. 2002. Micro-
relief induced by tillage: measurement and modelling of surface
storage capacity. Catena, 46, 141–157.
Podwojewski, P. 2001. Soil Survey of the Mae-Yom Site. IRD, Bondy,
France.
Poesen, J. 1986. Surface sealing as influenced by slope angle and
position of simulated stones in the top layer of loose sediments.
Earth Surface Processes and Landforms, 11, 1–10.
Rockstrom, M. & Valentin, C. 1997. Hillslope dynamics of on-farm
generation of surface water flows: the case of rainfed cultivation of
pearl millet on sandy soil in the Sahel. Agricultural Water Manage-
ment, 33, 183–210.
Singer, M.J. & Blackard, J. 1982. Slope angle–interrill soil loss rela-
tionships for slopes up to 50%. Soil Science Society of America
Journal, 46, 1270–1273.
Thomas, M., Thorp, M. & McAlister, J. 1999. Equatorial weathering,
landform development and the formation of white sands in north
western Kalimantan, Indonesia. Catena, 36, 205–232.
Valentin, C. 1991. Surface crusting in two alluvial soils of northern
Niger. Geoderma, 48, 201–222.
Table 5 Results of stepwise regressions
Dependent variable Predictor Adjusted R2
Compaction Slope gradient, 0.60
topsoil depth, 0.85
and sand 0.90
Crust Slope gradient 0.52
Embedded gravel Slope gradient, 0.74
and initial surface gravel 0.84
Crust þ embedded gravel Slope gradient 0.72
FIR1a,b Slope gradient 0.76
FIR2 Slope gradient 0.57
Kr Slope gradient 0.63
Dr1 Slope gradient 0.80
Dr2 Slope gradient 0.81
Detachment Slope gradient, 0.70
and initial soil moisture 0.77
aFinal infiltration rate.bThe subscripts 1 and 2 refer to the rain event number.
552 J. L. Janeau et al.
# 2003 Blackwell Publishing Ltd, European Journal of Soil Science, 54, 543–553

Valentin, C. 1996. Soil erosion under global change. In: Global Change
and Terrestrial Ecosystems (eds B.H. Walker & W.L. Steffen),
pp. 317–338. Cambridge University Press, Cambridge.
Valentin, C. &Bresson, L.M. 1992.Morphology, genesis and classification
of soil crusts in loamy and sandy soils.Geoderma, 55, 225–245.
Valentin, C. & Casenave, A. 1992. Infiltration into sealed soils as
influenced by gravel cover. Soil Science Society of America Journal,
56, 1667–1673.
Valentin, C., d’Herbes, J. & Poesen, J. 1999. Soil and water compo-
nents of vegetation patterning. Catena, 37, 1–24.
Infiltration on steep slopes 553
# 2003 Blackwell Publishing Ltd, European Journal of Soil Science, 54, 543–553