Embed Size (px)
Citation preview

Factors Controlling Vegetation Establishment andWater Erosion on Motorway Slopes in Valencia,SpainEsther Bochet1 and Patricio Garcıa-Fayos
Abstract
In semiarid Mediterranean areas, the widespread environ-mental impact caused by the construction of motorways,railways, and pipelines has created an increasing need foreffective restoration. We examined the influence of slopecharacteristics on vegetation and water erosion on 71motorway slopes in a semiarid Mediterranean region. Speci-fically, we studied the effect of slope angle, type (roadfill vs.roadcut) and aspect (north vs. south) on soil properties,vegetation cover, species richness, floristic composition, andwater-caused erosion. Temporal dynamics of soil watercontent was monitored and related to the soil waterpotential in order to explain possible differences invegetation cover between slope types. The main factorsinfluencing vegetation on motorway slopes were the angle,type, and aspect of the slope. Vegetation was almost com-pletely lacking on roadcuts with slopes greater than 45�. Ongentler slopes, vegetation cover was 44�78% on roadfills butdid not reach 10% on roadcuts, regardless of aspect. Themain soil properties affected by the slope type and aspectwere the organic matter content, soil available P, and water
content. Rill erosion, gully erosion, and mass movementwere all significantly higher on roadcuts than roadfills. Atotal of 308 spontaneous colonizers and seeded species wererecorded. The type and aspect of the slope also controlledspecies composition. The short duration of available waterin the soil with respect to soil water potential proved to be alimiting factor to plant colonization on roadcuts and south-facing slopes as well as the low soil fertility in the case ofroadcuts. Our results underscore the difficulty of revegetat-ing slopes with angles greater than 45�, where theprobability of seeds moving downhill is high. Future effortsshould focus on increasing the surface roughness or buildingterraces at regular intervals in order to reduce slope angle toless than 45� and favor seed trapping and germination. Ongentler slopes, adjusting of seed mixes according to domi-nant species associated with each slope type and aspectshould improve considerably the success of roadsiderevegetation.
Key words: erosion, motorway slopes, restoration, soilproperties, soil water availability, vegetation.
Introduction
In the last decades the construction of linear infrastruc-tures such as motorways, railways, and pipelines has beenhighly controversial because of their severe and wideimpact on ecosystems. Apart from their direct effects,linear infrastructures fragment landscapes and may resultin biodiversity loss (Navarro & Ugalde 1995; Whisenant1999; Nicolau & Asensio 2000; Balaguer 2002). One of themain impacts of construction is the creation of bare, steepslopes that are exposed to the direct action of rainfall andhigh rates of water erosion. Thus, the widely accepted roleof the vegetation in controlling soil loss and runoff (i.e.,Elwell & Stocking 1976; Wischmeier & Smith 1978;Snelder & Bryan 1995) is also essential in the stabilizationof motorway slopes (Larrea & Arnaez 1994; Andres &Jorba 2000). Vegetation reduces water-caused erosion byintercepting rainfall (Tromble 1987; Cabezas et al. 1991),
increasing water infiltration on associated ‘‘soil-fertility’’islands (Cerda 1995; Bochet et al. 1999), interceptingrunoff at surface level (Sanchez & Puigdefabregas 1994;Bochet et al. 2000), and stabilizing soil with roots.
In semiarid environments, high rainfall variabilitymakes restoration especially challenging (Aronson et al.1993; Le Houerou 2000). One of the main practices toreclaim motorway slopes is hydroseeding, that is, sprayinga mixture of water, seeds, fertilizers, fixing substances, andmulches. A mixture of herbaceous species (mainly grassesand legumes) that quickly produces a dense cover isusually used. In semiarid Mediterranean Europe, however,long periods of drought and intense rainfall frequentlycause hydroseeding to fail (Bautista et al. 1997; Andres& Jorba 2000). One cause for this is sowing commercialspecies usually used for restoration in central Europe, butwhich are unsuitable in Mediterranean systems. Othercauses of failure in our region include seed removal bywater running over bare and crusted soils, high rates ofplant mortality due to recurrent drought, and an inabilityof some species to expand their populations in dry condi-tions (Mitchley et al. 1996; Cerda & Garcıa-Fayos 1997;
Centro de Investigaciones sobre Desertificacion (CSIC, Universidad Valencia,Generalitat Valenciana), Apdo Oficial, 46470 Albal (Valencia), Spain.1Address correspondence to E. Bochet, email [email protected]
� 2004 Society for Ecological Restoration International
166 Restoration Ecology Vol. 12 No. 2, pp. 166�174 JUNE 2004

Garcıa-Fayos & Cerda 1997). In addition to hydroseeding,rooted shrubs are commonly transplanted for motorwayslope restoration, but the results obtained are also poorbecause of the inability of transplants to capture water andnutrients in soils without organic matter (Paschke et al.2000). Alternative solutions based on bioengineering tech-niques are sometimes adopted to improve the efficiency ofhydroseeding and transplanting, such as the use of syn-thetic grid-like materials to stabilize soil. However, thesemeasures greatly increase the cost of revegetation (Cottset al. 1991; Barker 1996; Paschke et al. 2000). An alter-native to hydroseeded species is to explore the ability ofnative plants to colonize spontaneously the bare slopeswith the final objective of restoring the original habitatand preserving regional biodiversity. Before this becomespossible, information on the factors that influence plantcolonization on motorway slopes is needed.
Our goals were to determine the slope characteristicsthat control vegetation establishment and water erosion onmotorway slopes. We hypothesized that:
(1) Slope angle limits the establishment of the vegetation,in terms of vegetation cover and species richness.
(2) Slope type and aspect influence the amount and com-position of the vegetation as well as the prevalence ofthe different water erosion processes through the con-trol of soil characteristics and soil moisture dynamics.
Methods
Description of the Study Area
The study area is located in the region called ‘‘La Plana deUtiel-Requena’’ of the Valencian Community, Spain(39�290N; 1�060W). The motorway slopes selected for thestudy were at 267�307 km of the A-3 dual carriageway thatlinks Valencia and Madrid.
The geology, climate, and slope age were homogeneousalong the selected road section. The construction of theroad and adjacent slopes on calcareous marls and claysof Tertiary origin (Garcıa 1996) was completed betweenwinter 1992 and summer 1994. All motorway slopes werehydroseeded just after the road was built with a mixtureof legumes and grasses (see Appendix 1). Mean annualprecipitation and temperature at Requena are 418mm and14.2 � C, respectively (Perez 1994). Rainfall distributionbetween and within years is very variable showing two
peaks in May and October. The large temperature rangegives a continental aspect to this area where frost eventsoccur in winter and droughts are associated with the sum-mer period.
The actual vegetation that borders the road results fromhuman activities carried on in this region for centuries.Most of the surrounding areas are currently cultivated(mainly vineyards, but also almond and olive orchards),but there are small patches of shrublands and open forestswhere Pinus halepensis (Pinaceae) is the most abundanttree, Rosmarinus officinalis (Lamiaceae), Thymus vulgaris(Lamiaceae), Genista scorpius (Fabaceae), and Quercuscoccifera (Fagaceae) are the dominant shrubs, and Brachy-podium retusum (Poaceae), Koeleria vallesiana (Poaceae),Stipa offneri (Poaceae), and Helictotrichon filifolium(Poaceae) are the dominant grasses.
Motorway Slope Selection
Study slopes selected were all greater than 20m long, 5mhigh, and 25� steep and had less than 5% cover of rockoutcrops. Sampling accounted for the type, aspect, andangle of slopes. There were two types of motorway slopes,roadcuts resulting from the excavation of high areas androadfills, which were built by accumulating and compact-ing unconsolidated materials from an adjacent area. As theA3-motorway runs east to west, the resulting slopes areoriented north or south.
We sampled 71 motorway slopes in 2000, including 45roadcuts and 26 roadfills, both groups including north- andsouth-oriented slopes. Whereas all the roadfills had slopeangles less than 45�, two main groups of roadcuts wereconsidered according to their inclination: a first group of21 roadcuts with slopes less than 45� situated along theroad and a second group of 24 roadcuts with slopes greaterthan 45� beside exit roundabouts. The effect of slope angleon plant establishment was determined, considering thesetwo homogeneous groups of roadcuts of the same origin(both excavated) that differed only in their inclination.The influence of soil characteristics and other slope factors(slope type and aspect) was determined, taking only intoaccount a more homogeneous set of slopes all under 45 �
(roadcuts and roadfills) (Table 1). Slopes greater than 45 �
were not included in this second analysis, not only becausethey were restricted to exit roundabouts and represented asmall proportion of the area occupied by the road slope
Table 1. Site characteristics of the 47 sampled motorway slopes (,45�) (mean values± SE).
Roadcuts Roadfills
North (n5 10) South (n5 11) North (n5 12) South (n5 14)
Slope angle (�) 36.3 ± 0.8 35.9 ± 0.8 32.2 ± 0.8 31.2 ± 0.5Height (m) 9.4 ± 1.4 9.8 ± 1.2 10.8 ± 0.9 12.8 ± 1.3Area (m2) 1276.3 ± 495.8 1600.1 ± 698.5 1272.7 ± 367.7 1267.8 ± 316.0
Vegetation and Erosion on Motorway Slopes
JUNE 2004 Restoration Ecology 167
network (,10%) but also because the very strong influ-ence of their inclination on plant establishment mightobscure the more subtle effects of soil parameters.
Vegetation Parameters
The success of plant colonization was expressed in terms oftotal vegetation cover, floristic composition, and speciesrichness.Total cover was visually estimated by two observers
20m from the slope. In all cases the two observers werethe same. The sampling area was divided into adjacent5-m-wide vertical strips, and the maximum acceptable dif-ference in cover estimation for any strip between the twoobservers was 10% (otherwise the estimate was repeated).Total cover for the whole sampled area was calculated asthe mean of all strip covers. Floristic composition wasdetermined by two persons who walked the sample areain two lines parallel to the road, one in the upper part andthe other in the lower part of the slope, and noted allspecies found in their respective fields of vision. A firstsurvey was performed at the beginning of the spring and asecond at the beginning of the summer in order to includeas many species with different phenologies as possible.The sampling area was proportional to the size of the road
slopes and ranged from 150 to 8,000m2. Although the size ofthe sampling area was different in all cases and might affectspecies richness, its distribution was homogeneous between allthe sets of slopes considered in the analyses. The similarity ofdistributions of the size of sampled areas was statistically con-firmed between roadcuts less than 45� and greater than 45 �
(UMW5 179.5; p5 0.099), between roadfills and roadcuts lessthan 45� (UMW5 239.5; p5 0.612), and between north- andsouth-facing slopes (UMW5 226.0; p5 0.421). Species richnesswas standardized to a unit area (number of species in 100m2).
Water Erosion Processes
The severity of water erosion on slopes was determined byconsidering rill erosion, gully erosion, and mass movementseparately. Classes from 0 to 3 were defined according tothe percentage cover of rills, gullies, and mass movements,respectively, within the same vertical strips as for the vege-tation cover estimations (0: no erosion, 1: % cover< 1/3, 2:% cover between 1/3 and 2/3, and 3: % cover. 2/3 of thetotal sampling area). The final value of each subprocess fora given slope was calculated as the mean of all partialestimates given by the two observers to the successivestrips. An overall index of water erosion was also assignedto each slope and defined as the sum of the values obtainedfor the three subprocesses (Gonzalez del Tanago 1993;Guerrero 1998).
Soil Characteristics
Two soil samples (10 cm deep) were collected from eachslope. Soil texture (percent sand, silt, and clay content),
stable aggregates, and chemical characteristics (organicmatter, total nitrogen, and available phosphorus) weredetermined. Particle-size distribution (,2mm) was deter-mined by the hydrometer method (Gee & Bauder 1986).Stable aggregates were determined by the wet sievingmethod described by Primo & Carrasco (1973). Analysesof the soil chemical properties were performed using theprocedures of Page et al. (1982): the Walkley�Blackmethod for organic matter, the Kjeldahl method for totalnitrogen, and the Olsen method for available phosphorus.Richard’s standard pressure chamber (Klute 1986) wasused to determine soil moisture content at wilting point(1,500KPa), expressed as the volumetric soil moisturecontent (cm3 water/cm3 soil). We assume that soil moistureavailable for plant functions (germination and develop-ment) was that retained in the soil above the wilting point.
Soil Moisture Dynamics
In order to characterize soil moisture dynamics, soil wassampled (5 cm deep and 5.5 cm diameter) from October2000 to June 2001 in two areas of each slope after anabundant rainfall event. Soil moisture content was meas-ured daily during the first week after the rainfall and thenmore irregularly until the dry summer period. Soil watercontent was determined gravimetrically.
Statistical Analyses
The influence of slope angle on vegetation cover andspecies richness was determined using Mann�Whitney Utests, because data could not be normalized. The effects ofaspect and type of motorway slopes on vegetation cover,species richness, and soil physical and chemical propertieswere determined using two-factor ANOVA, after trans-forming variables to fit the assumptions of normality andhomogeneity of variances. Nonparametric correlationswere used to determine the relationship between erosionprocesses and vegetation parameters.
Correspondence analysis was used to determine thedependence of the floristic composition on the aspectand type of slope. This analysis was performed withcommon species present on more than 10% of the slopes(Causton 1988).
SPSS statistical package version 11.0 was used fortwo-factor ANOVA models and correlations, and theNTSYSpc 2.02 statistical package was run for correspon-dence analyses.
Results
Influence of the Slope Angle on Vegetation Establishment
Plant colonization on roadcuts greater than 45� was almostnonexistent, with mean values of vegetation cover of1.6 ± 0.5% (mean±SE) significantly less than on roadcutsless than 45� (7.4 ± 1.2%) (UMW5 58.5, p, 0.001). Speciesrichness was also significantly lower on roadcuts greater
Vegetation and Erosion on Motorway Slopes
168 Restoration Ecology JUNE 2004

than 45 � (3 species ± 1) than on slopes less than 45 � (10species ± 2; UMW5 132.0, p5 0.006).
Influence of Slope Type and Aspect on Vegetation, Soil, and
Erosion (Only Slopes ,45�)
Vegetation Parameters. The aspect and type of motor-way slopes (,45 �) both had a strong influence on vegeta-tion cover (Fig. 1a). p values for type and aspect were lessthan 0.001 and p5 0.002 for their interaction (F1,43). Road-fills had significantly higher cover than roadcuts(59.4 ± 4.7% and 7.4 ± 1.2%, respectively, averaged acrossslope exposure), and north-facing slopes were significantlymore vegetated than south-facing ones (47.0 ± 7.8% and26.7 ± 4.8%, respectively, averaged across slope type).Furthermore, the influence of slope aspect on cover dif-fered between slope types (see high significance of theinteraction). Whereas the difference in cover betweennorth- and south-oriented roadfills was great, the differ-ences were small between the north- and south-facingslopes of roadcuts (Fig. 1a).
Species richness did not vary significantly with slopetype or aspect (p5 0.478 for type, p5 0.385 for aspect,and p5 0.584 for their interaction) (Fig. 1b).
We found 308 plant species, with 122 species present inmore than 10% of the slopes including 12 hydroseeded and110 naturally establishing species (Appendix 2). The two
first dimensions of the correspondence analysis explainedonly a small portion of the variability of the whole set ofslopes (10.6 and 7.4%, respectively). However, the segre-gation of motorway slopes by these two dimensions sug-gests that the slope type and aspect influence the floristiccomposition of the motorway slopes. Coordinates ondimension 1 are significantly lower for roadfills than forroadcuts (UMW5 61.0, p, 0.001), and coordinates ondimension 2 are significantly lower for north-orientedslopes than for south-oriented ones (UMW5 116.0,p5 0.001) (Fig. 2). In a second step the same analysis wasperformed with the 110 native species excluding the com-mercial hydroseeded species from the list. The resultsobtained were very similar, indicating that the type andaspect of the slope influenced the selection of naturallyestablishing species that colonized the motorway slopesfrom the adjacent areas.
Dominant species were the hydroseeded perennial legumesMedicago sativa and Onobrychis viciifolia, which togethercovered more than 50 and 20% of north- and south-orientedroadfill slopes, respectively, and less than 10 and 5% of north-and south-exposed roadcut slopes, respectively. Among thenaturally establishing species,Avena barbata, Bromus rubens,Hordeum murinum (Poaceae),Diplotaxis erucoides,Alyssumsimplex (Brassicaceae), Anacyclus clavatus, and Sonchusoleraceus (Asteraceae) were the most important species onall slope types and aspects. Other successful annual specieswere associated with a specific slope type or aspect, such asthe abundant Calendula arvensis (Asteraceae) or Medicagominima (Fabaceae) on roadfills, Eryngium campestre (Apia-ceae) on roadcuts, Scorzonera laciniata (Asteraceae) or Silenenocturna (Brassicaceae) on north-facing slopes, or Plantagoalbicans (Plantaginaceae) or Pallenis spinosa (Asteraceae) onsouth-facing slopes.
Water Erosion. The type of slope had a strong influence onmost erosion subprocesses as well as on the overall erosionindex (Fig. 3a). Erosion was significantly greater on roadcuts
0
20
40
60
80
100
Roadfill Roadcut
Veg
etat
ion
cove
r (%
) North South
0
10
20
30
Roadfill Roadcut
Num
ber
of s
peci
es/1
00 m
2
North South
(a)
(b)
Figure 1. Mean vegetation cover (a) and species number/100m2
(b) with their respective SD of north- and south-facing slopes of
roadfills and roadcuts (,45�).
– 1.18
– 0.65
– 0.12
0.41
0.94
– 1.03 – 0.29 0.45 1.19 1.93
Dimension1
Dim
ensi
on 2
Figure 2. Results of correspondence analysis, where 46 motorway
slopes (,45�) have been spatially plotted in accordance with their
floristic composition, including hydroseeded species. ., north roadfill;*, south roadfill; &, north roadcut; &, south roadcut.
Vegetation and Erosion on Motorway Slopes
JUNE 2004 Restoration Ecology 169

than roadfills (UMW(rills)5 60.5, p, 0.001; UMW(gullies)5
162.5, p5 0.017; UMW(mass movement)5 221.5, p5 0.109;UMW(overall erosion)5 75.0, p, 0.001). However, no cleareffect of slope aspect on erosion was observable (Fig. 3b).Vegetation cover was negatively and significantly
correlated with all erosion subprocesses and theoverall erosion index (r(rills)520.736; r(gullies)520.329;r(mass movement)520.315; r(overall erosion)520.675; p, 0.001,n5 47 in all cases). Total erosion was significantly andnegatively correlated with species richness (r520.364,n5 46, p5 0.013).
Soil Characteristics and Soil Moisture Dynamics. Soilorganic matter (F1,45 87.4, p5 0.001) and available phos-phorus (F1,45 10.7, p5 0.031) were significantly higher inroadfills than in roadcuts. The same trend was found fortotal nitrogen, although it was not significant (F1,45 4.9,p5 0.09) (Table 2). No soil variable was influenced byslope aspect or any interaction.Soil moisture at wilting point was lower on roadfills
(0.136± 0.008 cm3 water/cm3 soil, n5 4) than on roadcuts(0.170± 0.004 cm3water/cm3 soil, n5 4; t524.1, df5 6,
p5 0.006), indicating higher water-holding capacity inroadfills than in roadcuts.
After a high rainfall event between 20 October 2000 and25 October 2000, soil moisture content stayed above thewilting point for only 8, 9, and 15 days in the south-facingroadcuts, south-facing roadfills, and north-facing roadcuts,respectively, but until the next summer (June) in the caseof north-oriented roadfills.
Discussion
In general terms, slope angle, type, and aspect all greatlyinfluenced vegetation establishment and composition ofthe motorway slopes.
The very low plant cover characteristic of the steepestroadcuts with slope angles greater than 45� underscoresthe difficulty of revegetating these extreme slopes. Andreset al. (1996) obtained similar results on the slopes of amotorway in Catalonia (Spain), with somewhat highertotal covers on an irregular, soft, and weathered surfacematerial and concluded that hydroseeding was not appro-priate for slope stabilization of roadcuts near or above 45�.The causes of failure include the probability of seeds mov-ing downhill, with or without water (Cerda & Garcıa-Fayos 1997; Garcıa-Fayos & Cerda 1997). Thus, futureefforts should focus on increasing the surface roughnessof the slope, building terraces at regular intervals, or exca-vating to produce slope angles well under 45�.
On gentler slopes (,45�), roadfills were better for plantestablishment than roadcuts. The scarceness of the vegeta-tion on roadcut slopes (,45�) could be an indicator ofenvironmental harshness or of the impossibility of seedsto stay on these bare crusted slopes. The chemical andhydrological status of these slopes indicated a very lowfertility (low phosphorus, nitrogen, and organic mattercontent) as well as a high restriction of available waterfor plants. Differences in vegetation cover between forestmotorway slope types in La Rioja (Spain) were alsodescribed by Larrea and Arnaez (1994) with denser meancovers on roadfills (20�25%) than on roadcuts (1�5%).
The well-known influence of aspect on plant coloniza-tion and recovery was also evident, with north-facingvegetation covers being almost two times denser thansouth-facing ones and differing in the floristic composition.
The severity of water erosion, determined by the slopetype, seemed to be a hindrance to plant establishment andsurvival on motorway slopes less than 45�, especially onroadcuts. According to Andres and Jorba (2000), erosionrates are severe and unacceptable unless vegetation coverexceeds 50% of the motorway slope area. Consequently,the only motorway slopes that could prevent erosion in ourstudy area would be the north-oriented roadfills.
Unlike other studies based on quantitative estimationsof erosion on motorway slopes (i.e., Arnaez & Larrea1995; Andres & Jorba 2000), we found no effect of aspecton the intensity of erosion. This could be a consequence of
0
1
2
3
4
5
6
North South
Sev
erity
of e
rosi
on
0
1
2
3
4
5
6
Roadfill Roadcut
Sev
erity
of e
rosi
on
Rills GulliesMass movement Global erosion
Rills GulliesMass movement Global erosion
(a)
(b)
Figure 3. Intensity of water erosion subprocesses and total erosion
according to the type (a) and aspect (b) of the slopes (,45�). Themean values for each process were all significantly different (except
for mass movement) between roadfills and roadcuts using a Tukey’s
Studentized range test (p5 0.05), whereas no significant differences
were detected between north and south aspects.
Vegetation and Erosion on Motorway Slopes
170 Restoration Ecology JUNE 2004

the semiquantitative methodology used here, which maynot have been precise enough to detect such differences.
The soil fertility as well as the available water usable byplants and its temporal variation after a rainfall eventseemed to be some of the main factors responsible forthe differences in vegetation cover observed between thedifferent motorway slopes (,45�). Soil fertility was lowerin roadcuts than in roadfills as expressed by the organicmatter, available phosphorus, and total nitrogen contents.Moreover, in all south-facing slopes and north-facing road-cuts, the soil dried more quickly than it did on north-facingroadfills, reaching the wilting point more quickly aftera rainfall. North-facing roadfills behaved similarly to asurrounding matorral reference site (typical Mediterraneanshrubland vegetation) where the water remained availablein the soil for the plants till the very warm and dry summerseason (Bochet & Garcıa-Fayos, unpublished data). Theeffect of aspect on the dynamics of water availabilityseemed to be more important than the effect of the soilstructure and texture, because the south-facing slopesreached the wilting point more quickly than the north-oriented slopes. This could be due to the lack of insolationon the north-facing slopes in winter, whereas in the sameperiod, south-facing slopes do receive insolation. Garcıa-Fayos et al. (2000) stated that the main factor limitingplant colonization on badland slopes in southeasternSpain on materials of the same tertiary origin as ourstudy site was the very short duration of available waterin the soil due to the physical and chemical characteristicsof the regolith (high salinity and clay content). Theseauthors concluded that regolith water availability haddetrimental effects on seed germination, as the soil moisturestayed above the wilting point for 1�7 days after the rainfallceased and the time needed for seed germination waslonger. Thus, the dynamics of soil water availability andthe different efficiency in water use between plant speciescould also explain the differences in plant compositionobserved in our study between the slope types and aspects.
In conclusion, hydroseeding is unsuitable for stabilizingsteep (.45�) slopes, because the probability of seeds mov-ing downhill is high. Future efforts should focus on increas-ing the surface roughness or building terraces in order to
reduce the slope angle to less than 45� in order to favorseed trapping and germination. On gentler slopes, north-facing roadfills reach an acceptable vegetation cover, ableto reduce significantly water erosion with the commercialhydroseeded mixtures. On roadcuts (,45�) and south-facing slopes, however, revegetation success by hydro-seeding is still unsatisfactory. The different ecologicalconstraints (i.e., soil fertility, available water content, andtemporal variation) of each slope type and aspect shoulddictate the selection of species to be included in the seedmixes in order to improve revegetation success on theseslopes. Thus, besides the hydroseeded perennial legumesMedicago sativa and Onobrychis viciifolia that aresuccessful on all types of slopes (,45�), other naturallyestablishing species such as Avena barbata, Bromusrubens, Hordeum murinum, Diplotaxis erucoides, Alyssumsimplex, Anacyclus clavatus, and Sonchus oleraceus couldbe included in the seed mixes of all kind of slopes (,45�).More specifically, the inclusion of specific annual colonizerspecies in seed mixes specific to each slope type and aspectcould be an alternative strategy in roadside vegetation(i.e., Calendula arvensis or Medicago minima on roadfills,Eryngium campestre on roadcuts, Scorzonera laciniataor Silene nocturna on north-facing slopes, or Plantagoalbicans or Pallenis spinosa on south-facing slopes).
Acknowledgments
We thank UE-FEDER and the Spanish ‘‘Plan Nacional deI1D1 I del Ministerio de Ciencia y Tecnologıa’’ (projects1FD97-0551 and REN2001-2313) for funding, D. Montesinosfor field assistance, the staff of the laboratories of the CIDEfor soil analyses, the Department ‘‘Demarcacion de Carre-teras del Estado en Valencia del Ministerio de Fomento’’for data on motorway slope building and hydroseedingtreatments, and S. Wilson and two anonymous referees forcomments on the manuscript.
LITERATURE CITED
Andres, P., and M. Jorba. 2000. Mitigation strategies in some motorway
embankments (Catalonia, Spain). Restoration Ecology 8:268�275.
Table 2. Soil characteristics of north- and south-oriented roadfills and roadcuts (,45�).
Roadcuts Roadfills
North South North South
Sand (%) 40.84 ± 11.52 32.06 ± 0.87 35.10 ± 2.67 41.14 ± 7.63Lime (%) 32.66 ± 6.64 35.80 ± 2.53 30.73 ± 2.07 24.23 ± 3.52Clay (%) 26.56 ± 4.94 32.14 ± 1.67 34.18 ± 0.60 37.89 ± 14.31Stable aggregates (%) 22.82 ± 6.69 37.52 ± 3.64 31.23 ± 7.16 30.82 ± 2.07O.M. (%) ,0.8* ,0.8* 1.2 ± 0.0 1.5 ± 0.2Ntotal (%) ,0.070* ,0.070* ,0.070* 0.076 ± 0.002Pavailable (mgP2O5 100 g soil
21) 0.5 ± 0.1 0.5 ± 0.1 1.9 ± 0.9 3.1 ± 1.4
Values are mean ±SE (n5 2 in all cases).*Lower than the level of detection of the method used.
Vegetation and Erosion on Motorway Slopes
JUNE 2004 Restoration Ecology 171

Andres, P., V. Zapater, and M. Pamplona. 1996. Stabilization of motorway
slopes with herbaceus cover, Catalonia, Spain. Restoration Ecology
4:51�60.Arnaez, J., and V. Larrea. 1995. Erosion processes and rates on road-
sides of hill-roads (Iberian System, La Rioja, Spain). Physical,
Chemical and Earth Sciences 20:395�401.Aronson, J., C. Floret, E. Le Floc’h, C. Ovalle, and R. Pontanier. 1993.
Restoration and rehabilitation of degraded ecosystems in arid and
semi-arid lands. I. A view from the south. Restoration Ecology
1:8�17.Balaguer, L. 2002. Las limitaciones de la restauracion de la cubierta
vegetal. Ecosistemas 11:72�82.Barker, D. H. 1996. Bioengineering techniques for erosion control and
slope stabilisation of sloping ground. Pages 29�43 in First European
Conference, and Trade Exposition on Erosion Control, IECA,
Sitges, Barcelona, 29�31 May 1996. Colegi Oficial D’enginyers de
Camins, Canals Y Ports, Barcelona, Spain.
Bautista, S., N. Abad, J. Lloret, C. Blade, A. Ferran, J. M. Ponce, J. A.
Alloza, J. Bellot, and V. R. Vallejo. 1997. Siembra de herbaceas
y aplicacion de mulch para la conservacion de suelos afectados por
incendios forestales. Pages 395�434 in V. R. Vallejo, editor. La
Restauracion de la Cubierta Vegetal de la Comunidad Valenciana.
Fundacion CEAM—Consellerıa de Agricultura Y Medio Ambiente,
Valencia, Spain.
Bochet, E., J. L. Rubio, and J. Poesen. 1999. Modified top soil islands
within a patchy Mediterranean vegetation in SE Spain. Catena
38:23�44.Bochet, E., J. Poesen, and J. L. Rubio. 2000. Mound development as an
interaction of individual plants with soil, water erosion and sedimen-
tation processes on slopes. Earth Surface Processes and Landforms
25:847�867.Cabezas, J., P. Vaquero, and J. C. Escudero. 1991. Valoracion de las
lluvias interceptadas por especies de matorral dotadas de distintas
estrategias estructurales. Ecologıa 5:163�171.Causton, D. R., editor. 1988. An introduction to vegetation analysis.
Unwin-Hyman Ltd, London, United Kingdom.
Cerda, A. 1995. Factores y variaciones espacio-temporales de la infiltra-
cion en los ecosistemas mediterraneos. Monografıas Cientıficas, No.
5, Geoforma Ediciones, Logrono, Spain.
Cerda, A., and P. Garcıa-Fayos. 1997. The influence of slope angle on
sediment, water and seed losses on badland landscapes. Geomor-
phology 18:77�90.Cotts, N. R., E. F. Redente, and R. Schiller. 1991. Restoration methods
for abandoned roads at lower elevations in Grand Teton National
Park, Wyoming. Arid Soil Research and Rehabilitation 5:235�249.Elwell, H. A., and M. A. Stocking. 1976. Vegetal cover to estimate soil
erosion hazard in Rhodesia. Geoderma 15:61�70.Garcıa, E. 1996. Estudio florıstico y fitogeografico de la comarca de la
Plana de Utiel-Requena (Valencia). PhD thesis. Universidad de
Valencia, Spain.
Garcıa-Fayos, P., and A. Cerda. 1997. Seed losses by surface wash in
degraded Mediterranean environments. Catena 29:73�83.Garcıa-Fayos, P., B. Garcıa-Ventoso, and A. Cerda. 2000. Limitations to
plant establishment on eroded slopes in southeastern Spain. Journal
of Vegetation Science 11:77�86.Gee, G. W., and J. W. Bauder. 1986. Particle-size analysis. Pages 383�441
in A. Klute, editor. Methods of soil analysis. Part 1. Physical and
mineralogical methods. 2nd edition. Agronomy Monograph 9.
American Society of Agronomy—Soil Science Society of America,
Madison, Wisconsin.
Gonzalez del Tanago, M. 1993. Erosion real y erosion potencial. Princi-
pales metodos para su estimacion. Montes 34:31�40.Guerrero, J. 1998. Respuestas de la vegetacion y de la morfologıa de las
plantas a la erosion del suelo. Valle del Ebro y Prepirineo aragones,
Serie Investigacion. Consejo de Proteccion de la Naturaleza de
Aragon, Zaragoza, Spain.
Klute, A. 1986. Water retention: laboratory methods. Pages 635�662 in
A. Klute, editor. Methods of soil analysis. Part 1. Physical and
mineralogical methods, 2nd edition. Agronomy Monograph 9.
American Society of Agronomy—Soil Science Society of America,
Madison, Wisconsin.
Larrea, V., and J. Arnaez. 1994. Primeros resultados sobre tasas de erosion
en taludes de pistas forestales: el ejemplo de Santa Marina (Sistema
Iberico, La Rioja, Espana). Pages 69�80 in J. Arnaez-Vadillo,
J. M. Garcıa-Ruiz, and A. G. Villar, editors. Geomorfologıa en
Espana. III. Reunion de Geomorfologıa, Logrono, Spain.
Le Houerou, H. N. 2000. Restoration and rehabilitation of arid and
semiarid Mediterranean ecosystems in North Africa and West
Asia: a review. Arid Soil Research and Rehabilitation 14:3�14.Mitchley, J., G. P. Buckley, and D. R. Helliwell. 1996. Vegetation
establishment on chalk marl spoil: the role of nurse grass species
and fertiliser application. Journal of Vegetation Science 7:543�548.Navarro, J., and M. Ugalde. 1995. La restauracion de la cubierta vegetal
en el entorno de las carreteras. Montes 42:5�10.Nicolau, J. M., and E. Asensio. 2000. Rainfall erosion on opencast coal-
mine lands: ecological perspective. Pages 51�73 in M. J. Haigh, editor.
Reclaimed land—erosion control, soils and ecology. Land reconstruc-
tion and management 1. Balkema, Rotterdam, The Netherlands.
Page, A. L., R. H. Miller, and D. R. Keeney, editors. 1982. Methods of
soil analysis. Part 2. Chemical and microbiological properties. 2nd
edition. Agronomy monograph. American Society of Agronomy—
Soil Science Society of America, Madison, Wisconsin.
Paschke, M. W., C. Deleo, and E. F. Redente. 2000. Revegetation of
roadcut slopes in Mesa Verde National Park, USA. Restoration
Ecology 8:276�282.Perez, A. J., editor. 1994. Atlas Climatic de la Comunitat Valenciana
(1961�1990). Consellerıa d’Obres Publiques, Urbanisme i Trans-
ports, Valencia, Spain.
Primo, E., and J. M. Carrasco, editors. 1973. Quımica agrıcola I: suelos y
fertilizantes. Alhambra, Madrid, Spain.
Sanchez, G., and J. Puigdefabregas. 1994. Interactions between plant
growth and sediment movement in semi-arid slopes. Geomorphology
9:243�260.Snelder, D. J., and R. B. Bryan. 1995. The use of rainfall simulation
tests to assess the influence of vegetation density on soil loss on
degraded rangelands in the Baringo District, Kenya. Catena 25:
105�116.Tromble, J. M. 1987. Water interception by two arid land shrubs. Journal
of Arid Environments 15:65�70.Whisenant, S. G., editor. 1999. Repairing damaged wildlands. A process-
oriented, landscape-scale approach. Biological conservation, restora-
tion, and sustainability 1. Cambridge University Press, Cambridge,
United Kingdom.
Wischmeier, W. H., and D. D. Smith. 1978. Predicting rainfall erosion
losses. A guide to conservation planning. USDA agricultural hand-
book 537. U.S. Department of Agriculture, Washington, D.C.
Vegetation and Erosion on Motorway Slopes
172 Restoration Ecology JUNE 2004

Appendix1. The species composition of seed mixtures used for motorway slope hydroseeding. Seeds (30 g/m2) were hydroseeded in combination
with a mixture of fiber mulch (150 g/m2), fertilizers (100 g/m2 organic fertilizer and 50 g/m2 mineral fertilizer N-P-K), algin-based binding substances
(4 g/m2), and hydrocolloid- and anionic water-soluble polymer-based fix substances (20 g/m2).
Family and species name % of seed mixture
PoaceaeBromus inermis 10Festuca rubra 15Cynodon dactylon 5Lolium multiflorum 10Puccinellia distans 2Festuca arundinaceae 17Eragrostis curvula 5
FabaceaeMedicago sativa 7Vicia villosa 6Trifolium repens 6Onobrychis viciifolia 11Trifolium campestre 6
Appendix2. List of hydroseeded (in bold) and naturally occurring species found by the authors in more than 10% of the motorway slopes studied.
AlliaceaeAllium porrum
ApiaceaeDaucus carotaEryngium campestreFoeniculum vulgare ssp. piperitum
AsphodelaceaeAsphodelus fistulosus
AsteraceaeAnacyclus clavatusAtractylis humilisCalendula arvensisCarduus pycnocephalusCarduus tenuiflorusCarthamus lanatusCatananche caeruleaCentaurea asperaCentaurea melitensisChondrilla junceaCichorium intybusCrepis foetidaCrepis vesicariaFilago pyramidataGalactites duriaeiGalactites tomentosaHedypnois creticaHelichrysum serotinumHelichrysum stoechasInula viscosaLactuca serriolaLaunaea fragilisLaunaea pumilaLeontodon longirrostrisPallenis spinosaPilosella anchusoidesSantolina chamaecyparissus
ssp. squarrosaScolymus hispanicus
Scorzonera angustifoliaScorzonera laciniataSenecio gallicusSenecio vulgarisSilybum marianumSonchus oleraceusSonchus tenerrimusTragopogon dubius
BoraginaceaeAnchusa arvensisEchium vulgare
BrassicaceaeAlyssum simplexCardaria drabaDiplotaxis erucoidesHirschfeldia incanaMatthiola fruticulosaRapistrum rugosumSisymbrium irioSisymbrium orientale
CaryophyllaceaeCerastium pumilumParonychia aretioidesPetrorhagia proliferaSilene colorataSilene nocturnaSilene vulgaris
CistaceaeHelianthemum violaceum
ConvolvulaceaeConvolvulus arvensis
DipsacaceaeScabiosa atropurpureaEuphorbia helioscopiaScabiosa simplex
EuphoriaceaeEuphorbia serrataMercurialis tomentosa
FabaceaeAstragalus hamosusCoronilla scorpioidesGenista scorpiusHippocrepis scorpioidesLotus corniculatusMedicago doliataMedicago littoralisMedicago minimaMedicago sativaMelilotus officinalisMelilotus sulcataOnobrychis viciifoliaOnonis pusillaScorpiurus muricatusTrigonella polyceratiaUlex parviflorusVicia peregrina
GeraniaceaeErodium ciconiumErodium cicutariumErodium malacoides
HyacinthaceaeMuscari neglectum
LamiaceaeMarrubium supinumRosmarinus officinalisSalvia verbenacaThymus vulgaris
MalvaceaeAlthaea hirsutaMalva neglecta
PapaveraceaeGlaucium corniculatumPapaver rhoeas
Vegetation and Erosion on Motorway Slopes
JUNE 2004 Restoration Ecology 173

PlantaginaceaePlantago albicansPlantago coronopusPlantago lanceolataPlantago sempervirens
PoaceaeAegilops geniculataAegilops triuncialisAvenula bromoidesAgropyron pectinatumAvena barbataAvena sterilis
Brachypodium retusumBromus inermisBromus rubensBromus tectorumCynodon dactylonDactylis glomerataElymus repensFestuca valentinaHordeum murinum ssp. leporinumKoeleria vallesianaLolium rigidumPiptatherum miliaceumStipa offneri
PolygonaceaeRumex pulcher ssp. woodsii
ResedaceaeReseda phyteumaReseda undata
RosaceaeSanguisorba minor
RubiaceaeAsperula aristata
ScrophulariaceaeLinaria simplex
Vegetation and Erosion on Motorway Slopes
174 Restoration Ecology JUNE 2004

Vegetation ordination at the southern Chihuahuan Desert (San LuisPotosi, Mexico)
Francisco Martín Huerta-Martínez1,3,*, José Antonio Vázquez-García2,Edmundo García-Moya3, Lauro López-Mata3 and Humberto Vaquera-Huerta4
1Departamento de Ecología. Centro Universitario de Ciencias Biológicas y Agropecuarias. Universidad deGuadalajara. Carretera Guadalajara Nogales, Km. 15.5. Las Agujas, Nextipac, Zapopan, Jalisco, México;2Departamento de Botánica y Zoología. Centro Universitario de Ciencias Biológicas y Agropecuarias.Universidad de Guadalajara. Carretera Guadalajara Nogales, Km. 15.5. Las Agujas, Nextipac, Zapopan,Jalisco, México; 3Programa de Botánica. Colegio de Postgraduados, Carretera México-Texcoco. Km. 35.5.Montecillo, Edo. de México. C. P. 56230 México; 4Programa de Estadística y Cálculo. Colegio dePostgraduados, Carretera México-Texcoco. Km. 35.5. Montecillo, Edo. de México. C. P. 56230 México;*Author for correspondence (E-mail: [email protected])
Received 18 December 2002; accepted in revised form 27 August 2003
Key words: Bray-Curtis Ordination, Southern Chihuahuan Desert, Vegetation-environment relationships
Abstract
Cover data for 93 perennial plant species from fifty 1 ha sites, were used to ordinate desert vegetation in relationto 50 environmental variables at El Huizache Corridor. Cumulative variance recovered in the Bray and Curtisvariance-regression ordination was substantial �80%�. Community structure of desert plant communities at ElHuizache Corridor may be influenced primarily by a combination of landscape and edaphic variables, which inturn may determine the distribution and abundance of moisture and nutrients, and perhaps promote habitat spe-cialization and or competitive exclusion. Secondly, to a lesser extent, climate variables could be influencingcommunity organization at small scale gradients, the longer the gradient the more relevant climatic factors be-come. First axis represented a landscape gradient; it was positively correlated to exposure, geology, slope angle,rocks, stoniness, iron, January mean temperature, and organic matter content; it was negatively correlated withlatitude, longitude, soil depth, and potassium content. The second axis represented mainly a climatic gradient; itwas positively correlated with mean precipitation of January, February, July, August, September, November, De-cember, annual mean precipitation, Lang’s Index, organic matter content, and stoniness. The third axis repre-sented an edaphic gradient; it was positively correlated with electrical conductivity, Mn, Zn and elevation, andnegatively correlated with pH, nitrates, Ca, and disturbance. These findings should guide conservation efforts tomaintain species diversity and endemism at this area.
Introduction
A central goal of plant ecology is to understand thefactors controlling local distribution of plant speciesand thus composition of plant communities �Barton1993�. Plant communities change gradually along en-vironmental gradients �Gleason 1926; Curtis 1959;
Whittaker 1956; Whittaker 1960; ter Braak and Pren-tice 1988; Vazquez and Givnish 1988; Givnish 1999�,so, the individual response of species to environmentand other species presence and/or abundance, lead toassembly rules �Wilson and Gitay 1995; Díaz et al.1999� . The species distribution reflects the effects ofseveral factors at different scales. Climate, topogra-
Plant Ecology 174: 79–87, 2004.© 2004 Kluwer Academic Publishers. Printed in the Netherlands.
79

phy, soil chemistry, and soil texture exert progres-sively finer influences on the geographical distribu-tion of plant species �Ricklefs 1990�. Communitystructure is determined by some environmental fac-tors, for example, species diversity varies within sites�alfa diversity�, between sites in a region �beta diver-sity�, and among regions �gamma diversity� �Mengeand Olson 1990�. Alfa diversity results from nichedifferentiation within species and beta diversity fromthe species responses to a range of habitats �Whittaker1960; Whittaker 1972�. Many authors have found thatlandscape or physiographic factors play an importantrole in community organization �Rzedowski 1956;Whittaker and Niering 1965; Ricklefs 1973; Phillipsand McMahon 1978; Yeaton and Cody 1979; Warrenand Anderson 1985; Brown 1988; Rohde 1992;O’Brien 1993; McAuliffe 1994; Valverde et al. 1996and Hahs et al. 1999; Abd El-Ghani 2000�. Othershave described climatic variables as major determi-nants of community organization �Daubenmire 1979;Klaus and Frankenberg 1979; Miles 1981; Bowmanet al. 1985; Cramer and Hytteborn 1987; Gentry1988; Nobel 1994; González-Medrano 1996; Agua-do-Santacruz and García-Moya 1998�. Some authorshave concluded that soil characteristics are the mostimportant factors in community organization �Rze-dowski 1965; Sharaf El Din and Shaltout 1985; AbdEl-Ghani 1998;. Huerta-Martínez et al. 1999; Abd El-Ghani 2000 and Yoder and Nowak 2000�.
Chihuahuan Desert vegetation, particularly in thenorthern Chihuahuan Desert, has been studied bymany authors �Shreve 1942; MacMahon and Wagner1985; Henrickson and Johnston 1986; Dick-Peddie1993; Brown 1994; Johnson et al. 2000�. However,few studies have been done in the southern Chihua-huan Desert, and few have attempted to establishvegetation-environment relationships �Meyer andGarcía-Moya 1989; Meyer et al. 1992; Valverde et al.1996�. The present study was done at El Huizache,which is one of 155 priority regions for conservationin Mexico identified by the Mexican National Com-mission for the Knowledge and Use of Biodiversity�CONABIO 1994�. The region is considered as a bio-logical corridor because it links several sectors of theChihuahuan Desert. In addition, it is rich in endemicspecies and is a center of origin and diversificationfor cacti. Despite the importance of the region, amanagement strategy is lacking.
In this paper we aim to describe vegetation-envi-ronment relationships, and to generate hypothesesabout species distributions such as: vegetation pat-
terns at El Huizache Corridor are determined by acombination of different kind of factors.
Methods
Study area
El Huizache Corridor covers about 1920 km2, and islocated between 22°36'17� N and 23°14'11� N and100°01'21� W and 100°30'18� W �Figure 1�. The re-gion reaches elevations of up to 2000 m and hassedimentary soils. The climate is semiarid, with meanannual precipitation of 400-600 mm and mean annualtemperature ranging from 18 to 22 °C �García 1990�.The vegetation comprises mainly xerophytic shru-bland dominated by Yucca filifera Chab. and Larreatridentata �DC� Coville. At some sites, the vegetationcomprises gypsophilic grasslands.
Soil and vegetation sampling
In a region of about 1920 km2, we selected fifty 1-hasites, based on their physiognomy, structure anddominant species �Peinado et al. 1995�. At each site,four 300-m2 �30 m�10 m� plots were randomly se-lected to obtain cover values for each of the 93 pe-rennial species. Fifty environmental variables weremeasured for each site. Climatic data were obtainedfrom García �1987� and Comisión Nacional del Agua�unpublished data�. Soil depth was determined in situand a composite soil sample was taken in the centreof the plot. The soil sample was characterized bymeasuring 12 variables: Nitrogen content �usingKjeldahl’s method, modified for including nitrates�Brenmer 1965a; Brenmer 1965b��; pH �using the 1:2soil:H2O ratio�; organic matter �Wakley and Black1934�; electrical conductivity �Richards 1954�; phos-phorus content �Olsen et al. 1954�; the macronutrientspotassium, calcium, and magnesium �Chapman andKelly 1930�, and the micronutrients iron, copper,manganese, and zinc �Lindsay and Norvell 1978�.Vouchers were deposited at IBUG, IIZD and CHAPAHerbaria. Species nomenclature follows the Interna-tional Plant Names Project �1999�.
Unstandardized data were analyzed with Bray-Curtis variance regression ordination, using theSørensen coefficient of similarity as the distancemeasure, in PC-ORD 4.10 �McCune and Mefford1999�. The Bray-Curtis variance regression ordina-tion was used because it is considered an effective
80

technique for revealing ecological gradients �Beals1973; Beals 1984; Emlen 1972; Emlen 1977;Will-Wolf 1975; Causton 1988; Ludwig and Rey-nolds 1988; McCune and Beals 1993; McCune andGrace 2002�. The Bray-Curtis coefficient, also knownas Sørensen’s coefficient, was originally applied topresence-absence data, but it works equally well withquantitative data �McCune and Mefford 1999�. WhenSørensen’s coefficient of similarity is used as the dis-tance measure it causes less distortion than Euclideandistance and analyses of presence-absence or quanti-tative data yield more meaningful results and are lesssensitive to outliers �Beals 1984�. The Bray-Curtisordination technique is one of the most useful tech-niques for community analyses �McCune and Mef-ford 1999; McCune and Grace 2002�. Its use wasquestioned by Austin and Orloci �1966�, but recentauthors consider it to be one of the better ordinationtechniques �McCune and Beals 1993; McCune and
Grace 2002�. In a comparison of three ordinationtechniques �Bray-Curtis, Principal Components Anal-ysis, and Discriminant Function Analysis�, the Bray-Curtis technique gave, in general, the best ordinationresults �Kessell and Whittaker 1976�. Faith et al.�1987� pointed out that Bray-Curtis distance yieldsbetter results with unstandardized data than Chorddistance, Kendall’s coefficient, Chi squared, Manhat-tan distance, or Euclidean distance. The Sørensen co-efficient of similarity was used originally in Bray-Curtis ordination, and is better than the Euclideandistance because it retains sensitivity in more hetero-geneous data sets and gives less weight to outliers�Beals 1984�.
The main matrix consisted of 93 perennial speciescover data from 50 sites; the secondary matrix �envi-ronmental matrix� consisted of 55 environmental var-iables from 50 sites. Two of the environmental werenominal categorical �slope exposure and geology� and
Figure 1. Location of El Huizache Corridor at San Luis Potosi state, Mexico, and sampling sites �•�.
81

the rest were quantitative. After completing Bray-Curtis variance-regression ordination, using all thespecies cover values from all sites, three outliers weredetected. The analysis was then repeated, excludingthe three outliers.
Results
Bray-Curtis ordination of the main matrix showedthat cumulative variance explained by the first threeaxes was 30%, 58% and 69% �Table 1�. After exclud-ing the three outliers, cumulative variance explainedby the first three axes increased substantially to 47%,68%, and 80% �Table 2�. Individual extractedvariance increased for axis one, decreased for axistwo, and remained statistically similar for axis three�Table 1, Table 2�.
A combination of landscape, climatic and edaphicfactors influenced the community structure at thestudy sites. The first axis represented mainly a land-scape gradient, but some other variables such as cli-matic and edaphic were represented too; it waspositively correlated with exposure, geology, slopeangle, rocks, stoniness, iron, January mean tempera-ture and organic matter content; it was negativelycorrelated with latitude, longitude, soil depth and po-tassium content. The second axis represented amainly climatic gradient but two edaphic variableswere represented by this axis too; it was positivelycorrelated with mean precipitation in January, Febru-ary, July, August, September, November, December;annual mean precipitation; Lang’s Index; organicmatter content, and stoniness. The third axis repre-sented an edaphic gradient, but factors related to cli-mate were represented too; it was positively corre-
lated with electrical conductivity, Mn, Zn, Longitudeand elevation, and was negatively correlated with pH,nitrates, calcium, and disturbance �Table 3�.
The ordination diagram �Figure 2� showed disper-sion of sites with respect to the first two axes. On theleft of the diagram, sites 45, 46, 47, 48, 49 and 50�Group IV�, correspond to the gypsum grassland andalluvial desert shrubland �Group III�. The speciescorrelated to this portion of the axis were Larrea tri-dentata, Opuntia kleineae DC, O. imbricata DC,Agave scabra Salm-Dyck, and Yucca filifera �Table4�. On the right, were those sites with shallow soils,steeper slopes and sedimentary substrata �Group I,sites 2, 3, 7, 8, 17, 23, 25, 29, 30, 34, 39, 40 and 42�.These sites correspond to submontane shrubland. Thespecies correlated to this portion of the axis wereNeopringlea integrifolia S. Watson, Karwinskya
Table 1. Bray-Curtis ordination for 93 species and 50 sites at ElHuizache, San Luis Potosi.
Explained variation Axis 1 Axis 2 Axis 3
% Extracted 30.05 27.74 11.56% Cumulative 30.05 57.79 69.35
Table 2. Bray-Curtis ordination results without outliers �93 speciesand 47 sites�.
Explained variation Axis 1 Axis 2 Axis 3
% Extracted 46.75 20.81 12.05% Cumulative 46.75 67.56 79.62
Table 3. Correlation coefficients between environmental variablesand ordination axes without outliers �Bold indicates statistical sig-nificance at p � 0.05, 45 d.f.�.
AXES
VARIABLES 1 2 3
Latitude �0.411 � 0.260 � 0.216Longitude �0.473 0.090 0.434Soil depth �0.608 � 0.055 � 0.064Potassium content �0.654 � 0.267 � 0.236Exposure 0.487 � 0.109 0.199Geology 0.611 0.233 0.243Slope inclination 0.674 0.115 0.156% Rocks 0.395 0.064 � 0.054Iron content 0.365 0.250 0.135January mean temperature 0.435 � 0.222 � 0.010Organic matter 0.614 0.365 � 0.096Stoniness 0.374 0.518 0.106January mean precipitation 0.032 0.415 0.079February mean precipitation 0.251 0.362 0.195July mean precipitation 0.165 0.429 0.112August mean precipitation 0.029 0.422 0.018September mean precipitation � 0.093 0.406 0.104November mean precipitation 0.099 0.426 0.111December mean precipitation 0.196 0.351 0.113Annual mean precipitation 0.093 0.425 0.120Lang’s Index 0.089 0.432 0.088Electrical conductivity � 0.050 0.127 0.392Manganesse 0.197 0.195 0.406Zinc 0.066 0.086 0.414Elevation 0.004 0.248 0.497pH � 0.333 � 0.301 -0.412Nitrates � 0.200 � 0.030 -0.428Calcium � 0.249 � 0.236 -0.618Disturbance � 0.269 � 0.222 -0.430
82

humboldtiana S. Watson, Helietta parvifolia �A.Gray� Benth., and Hechtia glomerata Zucc. �Table 4�.
The second axis represented mainly a climatic gra-dient. The sites located at vthe upper right portion ofdiagram �Group II�, correspond to calcareous desertshrubland, where the annual mean precipitation, andJuly and November mean precipitation, were higher.Also, the substrate at these sites was stonier than atother sites. The species correlated to this portion ofthe axis were Krameria cytisoides Cav., Daleabicolor Humb. and Bonpl., Ageratina sp., Helianthe-mum glomeratum Lag., Penstemon roseus G. Don,Agave striata Zucc., and Gochnatia hypoleuca A.Gray �Table 4�.
The third axis was correlated to some edaphiccharacteristics. The ordination diagram �Figure 3�showed sites 36, 34, 37, 35, and eventually 49 and,47� where calcium content, and pH, were higher thanat other sites. In such condition grow edaphically re-stricted species, such as Helietta parvifolia, Gochna-tia hypoleuca and Thelocactus hexaedrophorus�Lem.� Britton and Rose �Table 4�. Note that H.parvifolia was the dominant species in submontanoshrubland �Figure 4�.
Discussion
Landscape characteristics and soil properties are im-portant determinants of the distribution of vegetationwithin our study site. These findings support thehypothesis that geology has a major influence onplant community composition in San Luis Potosi state�Rzedowski 1956�, and that the processes that limitthe distribution and abundance of plants at short el-evational gradients are directly related to landscape
Figure 2. Bray-Curtis ordination of 47 vegetation plots ���, derivedfor cover values of species and overlays of relevant environmentalvariables �vectors�, at El Huizache corridor �ADS� Alluvial desertshrubland, CDS� Calcareous desert shrubland; GG� Gypsumgrassland; SS� Submontano shrubland�.
Table 4. Correlation coefficients between species and ordinationaxes in a Bray-Curtis ordination without outliers �Bold indicatesstatistical significance *p � 0.05; **p � 0.01; 45 d.f.�.
AXES
SPECIES 1 2 3
Larrea tridentata � 0.830** � 0.203 � 0.183Opuntia kleineae � 0.470* � 0.094 � 0.089Agave striata � 0.527* � 0.061 � 0.206Opuntia imbricata � 0.563* � 0.156 � 0.225Yucca filifera � 0.443* � 0.053 � 0.123Prosopis sp. � 0.393* � 0.381* � 0.189Neopringlea integrifolia 0.493* � 0.026 � 0.246Karwinskya humboldtiana 0.392* 0.293 0.195Helietta parvifolia 0.356* 0.079 � 0.723**Hechtia glomerata 0.526* � 0.674** 0.030Gymnosperma glutinosum 0.013 � 0.406* 0.094Maytenus phylantoides 0.008 � 0.446* 0.085Krameria cytisoides 0.097 0.510* 0.216Dalea bicolor 0.056 0.399* 0.235Ageratina sp. 0.065 0.630** 0.120Helianthemum glomeratum 0.058 0.460* 0.134Penstemon roseus 0.039 0.502** 0.085Agave striata 0.133 0.422* 0.354*Gochnatia hypoleuca 0.170 0.416* � 0.463*Thelocactus hexaedrophorus 0.045 0.098 � 0.450*Salvia ballotaeflora 0.221 0.050 0.415*
Figure 3. Bray-Curtis ordination of 47 vegetation plots ���, derivedfor cover values of species and relevant environmental variables�vectors�, with respect to second and third axes at El Huizache cor-ridor. �ADS� alluvial desert shrubland, CDS� Calcareous desertshrubland; GG� Gypsum grassland; SS� Submontano shrubland�.
83

characteristics �McAuliffe, 1994; Vazquez andGivnish 2000�. For example, age and stability of sub-strata, and soil depth, strongly influence the spatialdistribution, availability, and vertical movement ofwater in the substrata �MacAuliffe 1994�.
The dominance of L. tridentata in soils with allu-vial substrata has been documented by MacAuliffe�1994�, Johnson et al. �2000� and is supported in thisstudy; land form age and stability affect the structureof populations of long-lived Larrea tridentata. Indi-viduals of this shrub species can exhibit clone-likegrowth and increase considerably in diameter overtime spans of many centuries or millennia. Thegrowth and persistence of this long-lived clones insome parts of the landscape apparently contribute tothe exclusion of other species �McAuliffe 1994�. Soilcharacteristics correlated with the first axis suggestthat fertile soils were those where potassium and or-ganic matter are higher. Sites with high values of or-ganic matter content lead to good water retentioncapacity �Sharaf El Din and Shaltout 1985; Abd El-Ghani 1998�. Abd El-Ghani �2000� mentioned thatorganic matter content plays an important role as akey element for the soil fertility in arid ecosystems inEgypt. Variation in the amount and source of organicmatter on the soil creates parallel gradients of acidity,soil moisture, and available nitrogen. Such factors of-ten interact in complex ways to determine the distri-butions of plants �Ricklefs 1990�. Potassium is oftena limiting factor in soils, because it has low mobilityand is frequently unavailable to plants �Molles 1999�.The high levels of Potassium in soils in our study sitecould be related to strong microbiological activity,e.g., by mycorrhizal fungi, which increase the avail-
ability of phosphorus and potassium for plants�Huerta-Martínez et al. 1999�.
Yoder and Nowak �2000�, reported that live anddead roots of L. tridentata, Ambrosia dumosa and Ly-ucium pallidum, were colonized by vesiculo-arbuscu-lar mycorrizhal fungi, which play an important rolein the acquisition of phosphorus by plants. Cross andSchlesinger �1999�, found greater concentrations ofavailable soil nutrients �–NO3-N, total N, organic C,K, Cl and P� under L. tridentata canopy than in openareas. How many species in the study area have my-corrhizal associations? Is Potassium involved in otherinteractions, such as competition or facilitation?These are questions that need to be answered in fu-ture research.
The second axis was related to mean monthly rain-fall. This supports the findings of Aguado-Santacruzand García-Moya �1998�, who pointed out that sum-mer precipitation showed one of the highest correla-tions with the first two species axes at the southern-most part of the North American Graminetum �r �0.77 and r � � 0.39 respectively�. The strong influ-ence of precipitation on species distribution has beendocumented by other authors �Whittaker and Niering1975; Hadley and Szarek 1981; Ehleringer andMooney 1983; Nobel 1994�. and it is well known asthe limitative factor in arid and semiarid ecosystems.However, our results suggest that water �in the rain-fall form� was not the major factor involved in com-munity organization at the El Huizache Corridor, andwas only second in importance after landscape fea-tures because their correlations with second and firstaxes respectively.
The dominance of H. parvifolia in sites covered bysubmontane shrublands was reported by Rzedowski�1956�, and is supported by this study. In many cases,the dominance of one shrub in a plant communitymay be caused by negative interactions such as com-petition or allelopathic effects. For example, Graueand Rovalo �1982� pointed out that the dominance ofH. parvifolia is caused by the liberation of some al-kaloids present in leaves, which dissolved in the rain,inhibits germination and growth of other plantspecies. In this study, we found that high values ofpH could be another factor inhibiting the establish-ment of a great number of plant species. Correlationof Ca and pH with third axe suggest that an edaphiccontrol on species establishment could be happeningin the study area and promote habitat specializationfor some species. In arid and semiarid regions oftenthe main source of calcium is carbonate �CaCO3�
Figure 4. Overlay diagram showing the distribution of Heliettaparvifolia with respect to the second and third axes, biggertriangles indicate higher cover values of the cited species.
84

�Nelson 1982; Haby et al. 1990�, but often are gyp-sum outcrops �CaSO4·2H2O� �Parsons, 1976�, whichexplains the fact that the highest values of calciumwere recorded in gypsum grasslands. Calcium is akey element determining floristic composition, be-cause saturates the cation exchange capacity andmodifies soil pH �to alkaline� �Etherington 1982�. Thefour vegetation types have alkaline soils � � 7.0�, butthe extreme value was recorded in gypsum grassland�8.27�. High concentrations of calcium and alkalinepH affect directly the availability of N, P, K, Mg, Fe,Mn, Zn and Cu �Maldonado et al. 2001�. The speciesgrowing in such soils must have specials adaptationsfor the utilization of calcium, such as the ability oflink calcium ions in their vacuoles through the for-mation of calcium oxalate crystals �Larcher 1975�.
Our results demonstrate that three clear gradientsinfluence the structure of plant communities in ourstudy site; a combination of landscape features, cli-mate, and soil properties explain the organization ofplant communities. To maintain the diversity andstructure of plant communities at El Huizache Corri-dor, conservation efforts should focus on conservingthese landscape features.
Acknowledgements
The principal author thanks CONACyT for a schol-arship-loan to conduct these doctoral studies. Someaspects of this research were supported by CentroUniversitario de Ciencias Biològicas y Agropecuarias�Universidad de Guadalajara� and by Instituto de Re-cursos Naturales, Colegio de Postgraduados. Wethank Miguel Cházaro B. for his valuable help withspecies identification. We also thank AlejandroMuñoz Urias, Dunia González, Juan J. Ramos H.,Marco A. Ramos L. and Luz E. Rocha V. for theirhelp with field work. Special thanks to Don HermiloMartínez and his family and Doña Chabela, fromCharco Blanco, San Luis Potosi, for their hospitalityand help during field trips.
References
Abd El-Ghani M.M. 1998. Environmental correlates of speciesdistribution in arid desert ecosystems of eastern Egypt. Journalof Arid Environments 38: 297–313.
Abd El-Ghani M.M. 2000. Floristics and enviromental relations intwo extreme desert zones of western Egypt. Global Ecology andBiogeography 9: 499-516.
Aguado-Santacruz A. and García-Moya E. 1998. Environmentalfactors and community dynamics at the southern part of theNorth American Graminetum. I. On the contribution of climaticfactors to temporal variation in species composition. Plant Ecol-ogy 135: 13–29.
Austin M.P. and Orloci L. 1966. Geometrical models in ecology.II. An evaluation of some ordination techniques. Journal ofEcology 54: 217–227.
Barton A.M. 1993. Factors controlling plant distributions: drought,competition, and fire in montane pines in Arizona. EcologicalMonographs 63: 367–397.
Beals E.W. 1973. Ordination: Mathematical elegance and ecologi-cal naiveté. Journal of Ecology 61: 23–35.
Beals E.W. 1984. Bray-Curtis ordination: An effective strategy foranalysis of multivariate ecological data. Advances in EcologicalResearch 14: 1–55.
Bowman R.A., Mueller D.M. and McGinnies W.J. 1985. Soil andvegetation relationships in a Central Plains saltgrass meadow.Journal of Range Management 38: 325–328.
Brenmer J.M. 1965a. Inorganic forms of nitrogen. In: Black C.A.�ed.�, Methods of soil analysis Part 2, Agronomy. American So-ciety of Agronomy, Madison, Wisconsin, USA. 9: 1179-1206.
Brenmer J.M. 1965b. Total nitrogen. In: Black C.A. �ed.�, Methodsof soil analysis Part 2, Agronomy. American Society ofAgronomy, Madison, Wisconsin, USA. 9: 1149-1178.
Brown D.E. 1994. Biotic communities. Southwestern United Statesand Northwestern Mexico. University of Utah Press, Salt LakeCity, Utah, USA. 342 p.
Brown J.H. 1988. Species diversity. In: Meyrs A.A. and Giller P.S.�eds�, Analytical biogeography. Chapman and Hall, London, En-gland. pp. 57–89.
Causton D.R. 1988. An introduction to vegetation analysis: Prin-ciples, practice and interpretation. Unwin Hyman, London, UK.
Chapman H.D. and Kelly W.P. 1930. The determination of the re-placeable bases and bases exchange capacity of soils. Soil Sci-ence 30: 391–406.
CONABIO 1994. Taller de Identificación de Regiones Prioritariaspara la Conservación en México. CONABIO/PRONATURA/WWF/FMCN/USAID/TNC/INE. Página de Internet Explorer:http://www.conabio.gob.mx.
Cramer W. and Hytteborn H. 1987. The separation of fluctuationand long-term change in vegetation dynamics of a risingseashore. Vegetatio 69: 157–167.
Cross A.F. and Schlesinger W.H. 1999. Plant regulation of soil nu-trient distribution in the northern Chihuahuan Desert. PlantEcology 145: 11–25.
Curtis J.T. 1959. The vegetation of Wisconsin. An ordination ofplant communities. University of Wisconsin Press, Madison,Wisconsin, USA.
Daubenmire R.F. 1979. Ecología Vegetal. Tratado de autoecologíade plantas. Noriega Limusa, México, D.F. 496 p.
Díaz S., Cabido M. and Casanoves F. 1999. Functional implica-tions of trait-environment linkages in plant communities. In:Weiher E. and Keddy P. �eds�, Ecological Assembly Rules. Per-spectives, advances and retreats. Cambridge University Press.UK. pp. 338–362.
Dick-Peddie W.A. 1993. New Mexico vegetation. Past, present andfuture. University of New Mexico Press, Albuquerque; NewMexico, USA. 244 p.
Ehleringer J.R. and Mooney H.A. 1983. Productivity of desert andMediterranean-climate plants. In: Lange O.L., Nobel P.S.,
85

Osmond C.B. and Zeiger H. �eds�, Physiological plant ecologyIV. �Ency. Plant Physiol. NS Vol. 12D�. Springer-verlag, Berlin-Heidelberg-New York. pp. 205–231.
Emlen J.T. 1972. Size and structure of a wintering avian commu-nity in southern Texas. Ecology 53: 317–329.
Emlen J.T. 1977. Land bird communities of Grand Bahama Island:The structure and dynamics of an avifauna. OrnithologicalMonographs 24: 1–129.
Etherington J.R. 1982. Environment and plant ecology. 2nd Edi-tion. John Wiley and Sons, Chichester, UK. 487 pp.
Faith D.P., Minchin P.R. and Belbin L. 1987. Compositional dis-similarity as a robust measure of ecological distance. Vegetatio69: 57–68.
García E. 1987. Sistema de clasificación climática de Köppen�Modificado para adaptarlo a las condiciones de la RepúblicaMexicana�. México, D.F.
García E. 1990. Climas, IV.4.10. Atlas Nacional de México. Vol.II. Instituto de Geografía, UNAM. México, D.F.
Gentry A.H. 1988. Changes in plant community diversity and flo-ristic composition on environmental and geographical gradients.Annals of the Missouri Botanical Garden 75�1�: 1–34.
Givnish T.J. 1999. On the causes of gradients in tropical tree di-versity. Journal of Ecology 87: 193–210.
Gleason H.A. 1926. The individualistic concept of plant associa-tions. Bulletin of the Torrey Botanical Club 53: 7–26.
González-Medrano F. 1996. Algunos aspectos de la evolución dela vegetación de México. Boletín de la Sociedad Botánica deMéxico 58: 129–136.
Graue-Wiehers B. and Rovalo-Merino M. 1982. Potencialalelopático y microbicida de Helietta parvifolia. BIOTICA 7:405–416.
Haby V.A., Russelle M.P. and Skogley E.O. 1990. Testing soils forPotassium, Calcium and Manganesum. In: Westerman �ed.�, SoilTesting and Plant Analysis. Madison, Wisconsin, USA. SSSABook Series No. 3. 784 pp.
Hadley N.F. and Szarek S.R. 1981. Productivity of desert ecosys-tems. BioScience 31: 747–753.
Hahs A., Enright N.J. and Thomas I. 1999. Plant communities,species richness and their environmental correlates in the sandyheaths of Little Desert National Park, Victoria. Australian Jour-nal of Ecology 24: 249–257.
Henrickson J. and Johnston M.C. 1986. Vegetation and communitytypes of the Chihuahuan Desert. In: Barlow J.C., Powell A.M.and Timmermann B.N. �eds�, Second Simposium on theresources of the Chihuahuan Desert Region. Chihuahuan DesertResearch Institute, Alpine, Texas, USA. pp. 20–39.
Huerta-Martínez F.M., García-Moya E., Flores-Flores J.L. and Pi-mienta-Barrios E. 1999. Ordenación de las poblaciones silves-tres de pitayo y cardón en la Cuenca de Sayula, Jalisco. Boletínde la Sociedad Botánica de México 64: 11–24.
Johnson A.R., Turner S.J., Whitford W.G., de Zoyza A.G. and VanZee J.W. 2000. Multivariate characterization of perennial veg-etation in the northern Chihuahuan Desert. Journal of Arid En-vironments. 44: 305–325.
Kessell S.R. and Whittaker R.H. 1976. Comparisons of three ordi-nation techniques. Vegetatio 32: 21–29.
Klaus D. and Frankenberg P. 1979. Statistical relationships betweenfloristic composition and mean climate conditions in the Sahara.Journal of Biogeography 6: 391–405.
Larcher W. 1975. Physiological plant ecology 3rd ed. Springer-verlag, Berlin, Germany. 252 p.
Lindsay W.L. and Norvell W.A. 1978. Development of DTPA soiltest for zinc iron, manganese and cooper. Soil Science Societyof America Journal 42: 421–428.
Ludwig J.A. and Reynolds J.F. 1988. Statistical Ecology. A primerof methods and computing. John Wiley and Sons, New York,New York, USA.
McAuliffe J.R. 1994. Landscape evolution, soil formation, andecological patterns and processes in Sonoran Desert bajadas.Ecological Monographs 64: 111–148.
MacMahon J.A. and Wagner F.H. 1985. The Mojave, Sonoran andChihuahuan Deserts of North America, pp. 105-202. In: EvanariM., Noy-Meir I. and Goodall D. W. �eds�, Hot deserts and aridshrublands. Ecosystems of the world 12A,. Elsevier, Amsterdam,The Netherlands.
Maldonado T.R., Etchevers B.J.D., Alcantar G.G., Rodríguez A.J.and Colinas L.M.T. 2001. Estado nutrimental del limón mexi-cano en suelos calcimórficos. TERRA 19: 163–174.
McCune B. and Beals E.W. 1993. History of the development ofBray-Curtis Ordination, pp. 67-79. In: Fralish J. S., McIntoshR.P. and Loucks O.L. �eds�, John T. Curtis. Fifty Years of Wis-consin Plant Ecology.
McCune B. and Mefford M.J. 1999. Multivariate Analysis of Eco-logical Data V.4.10. MjM Software, Gleneden Beach, Oregon,USA.
McCune B. and Grace J.B. 2002. Analysis of Ecological Commu-nities. MjM Software Design, Gleneden Beach, Oregon, USA.300 p.
Menge B.A. and Olson A.M. 1990. Role of scale and environmen-tal factors in regulation of community structure. Trends in Ecol-ogy and Evolution 5�2�: 52–57.
Meyer S.E. and García-Moya E. 1989. Plant patterns and soilmoisture regime in gypsum grasslands of north central Mexico.Journal of Arid Environments 16: 147–155.
Meyer S.E., García-Moya E. and Lagunes-Espinoza L.C. 1992.Topographic and soil surface effects on gypsophile plant com-munity patterns in central Mexico. Journal of Vegetation Science3: 429–438.
Miles J. 1981. Problems in heathland and grassland dynamics.Vegetatio 46: 61–74.
Molles M.C.Jr. 1999. Ecology. Concepts and Applications.McGraw Hill, USA. 1st. edn., 509 p.
Nelson R.E. 1982. Carbonate and Gypsum. In: Page A.L., MillerR.H. and Keeney D.R. �eds�, Methods of soil analysis Part 2.-Chemical and microbiological properties-Agronomy Mono-graphs No. 9. 2nd Edition. Madison, Wisconsin, USA. pp. 181–197.
Nobel P.S. 1994. Remarkable agaves and cacti. Oxford UniversityPress, New York, New York, USA. 166 p.
O’Brien E.M. 1993. Climatic gradients in woody plant speciesrichness: towards and explanation based on an analysis of south-ern Africa’s woody flora. Journal of Biogeography 20: 181–198.
Olsen S.R., Cole C.V., Watanabe F.S. and Dean L.A. 1954. Esti-mation of available phosphorus in soil by extraction with sodiumbicarbonate. USDA. Circ. 939. US Gov. Print. Office, Washing-ton, D.C., USA.
Parsons R.E. 1976. Gypsophily in Plants-A Review. The AmericanMidland Naturalist 96: 1–20.
Peinado M., Alcaráz F., Aguirre J.L. and Delgadillo J. 1995. Majorplant communities of warm North American deserts. Journal ofVegetation Science 6: 78–94.
86

Phillips O.L. and MacMahon J.A. 1978. Gradient analysis of a So-noran Desert bajada. Southwestern Naturalist 23: 669–680.
Richards L.A. 1954. Rehabilitation of saline and alkali soils.USDA handbook. No. 60 USDA.
Ricklefs R.E. 1973. Ecology. Chiron Press, Portland, Oregon,USA. 861 p.
Ricklefs R.E. 1990. Ecology, Third edn. W. H. Freeman and Com-pany, New York, New York, USA. 896 p.
Rohde K. 1992. Latitudinal gradients in species diversity: thesearch for the primary cause. OIKOS 65: 514–527.
Rzedowski J. 1956. Notas sobre la flora y vegetación del estado deSan Luis Potosí. III. Vegetación de la región de Guadalcazar.Anales del Instituto de Biología. �UNAM� 27�1�: 169–228.
Rzedowski J. 1965. Vegetación del estado de San Luis Potosí. ActaCientífica Potosina 5: 5–291.
Sharaf El Din A. and Shaltout K.H. 1985. On the phytosociologyof Wadi Araba in the Eastern Sesert of Egypt. Proceedings ofthe Egyptian Botanical Society 4: 1311-1325.
Shreve F. 1942. The desert vegetation of North America. BotanicalReview 8: 195–246.
ter Braak C.J.F. and Prentice I.C. 1988. A theory of GradientAnalysis. Advances in Ecological Research 18: 271–317.
The Plant Names Project 1999. International Plant Names Index.Published at Internet; http://www.ipni.org �consulted on June 5th2001�.
Valverde P.L., Zavala-Hurtado J.A., Montaña C. and Escurra E.1996. Numerical analyses of vegetation based on environmentalrelationships in the southern Chihuahuan Desert. The SouthernNaturalist 41: 424–433.
Vazquez-García J.A. and Givnish T.J. 1998. Altitudinal gradientsin tropical forest composition, structure and diversity in the Si-erra de Manantlán. Journal of Ecology, 86: 999–1020.
Vazquez-García J.A. and Givnish T.J. 2000. Vegetation of the CerroGrande massif: Sierra de Manatlán, Mexico: ordination of a long
altitudinal gradient with high species turnover. Bol. Inst. Bot.Universidad de Guadalajara 6�2-3�: 227–250.
Wakley A. and Black J.A. 1934. An examination of the Degjareffmethod for determining SOM and a proposed modification of theChromic Acid Titration Method. Soil Science 37: 29–38.
Warren P.L. and Anderson L.S. 1985. Gradient analysis of a Sono-ran Desert Wash. Paper presented on the First North AmericanRiparian Conference. University of Arizona, Tucson, Arizona,USA.
Whittaker R.H. 1956. Vegetation of the Great Smoky Mountains.Ecological Monographs 26: 1–80.
Whittaker R.H. 1960. Vegetation of the Siskiyou MountainsOregon and California. Ecological Monographs 30: 279–338.
Whittaker R.H. 1972. Evolution and measurement of species di-versity. Taxon 21: 213–251.
Whittaker R.H. and Niering W.A. 1975. Vegetation of the SantaCatalina Mountains, Arizona. V. Biomass, production and diver-sity along the elevation gradient. Ecology 56: 771–790.
Will-Wolf S. 1975. Multivariate analysis of foraging site selectionby flower-feeding insects in a western South Dakota praire. Ph.D. dissertation. University of Wisconsin, Madison, Wisconsin,USA.
Wilson J.B. and Gitay H. 1995. Community structure and assem-bly rules in a dune slack: Variance in richness, guild proportion-ality, biomass constancy and dominance/diversity relations.Vegetatio 116: 93–106.
Yeaton R.I. and Cody M.L. 1979. The distribution of cacti alongenvironmental gradients in the Sonoran and Mohave deserts.Journal of Ecology 65: 529–541.
Yoder C.K. and Nowak R.S. 2000. Phosphorus acquisition by Bro-mus madritensis ssp. rubens from soils interspaces shared withMojave Desert shrubs. Functional Ecology 14: 685–692.
87

ARTICLE IN PRESS
Journal of AridEnvironments
Journal of Arid Environments 62 (2005) 93–108
0140-1963/$ -
doi:10.1016/j
�CorrespoE-mail ad
www.elsevier.com/locate/jnlabr/yjare
Slope aspect influences plant association patternsin the Mediterranean matorral of central Chile
E.I. Badano�, L.A. Cavieres, M.A. Molina-Montenegro,C.L. Quiroz
ECOBIOSIS, Departamento de Botanica, Facultad de Ciencias Naturales & Oceanograficas,
Universidad de Concepcion, Casilla 160-C, Concepcion, Chile
Received 2 June 2004; received in revised form 1 October 2004; accepted 23 October 2004
Available online 20 January 2005
Abstract
The most important processes shaping communities are likely to leave observable imprints
on their spatial structure. The net outcome of positive and negative interactions among plants
has been proposed to vary inversely with environmental harshness. In the Mediterranean-type
matorral of central Chile, slope aspect strongly influences mesoclimatic conditions: equatorial-
facing slope are xeric and are dominated by spiny shrubs and cacti, while evergreen
sclerophyllous trees dominate polar-facing slopes due to their more mesic conditions. Here we
use spatial pattern analyses to infer on the interactions that shape community structure in this
matorral. We sampled the vegetation on two polar- and equatorial-facing slopes and assessed
the dominant interaction at each slope through: (1) a species co-occurrence index (C-score) for
the entire community; (2) the frequencies of negative and positive associations between species
pairs; and (3) the species richness at each slope. Our results indicated that negative spatial
associations dominated plant assemblages on all slopes, but the importance of negative
associations decreased from mesic (�30%) to xeric slopes (�16%). Species richness was higher
on xeric than on mesic slopes. Although competition seems to be the main biotic force
structuring communities on both mesic and xeric slopes, we suggest that the decrease in
see front matter r 2004 Elsevier Ltd. All rights reserved.
.jaridenv.2004.10.012
nding author. Tel.: +5641 203846; fax: +56 41 246005.
dress: [email protected] (E.I. Badano).

ARTICLE IN PRESS
E.I. Badano et al. / Journal of Arid Environments 62 (2005) 93–10894
importance of negative interactions from mesic to xeric habitats could produce an increase in
diversity.
r 2004 Elsevier Ltd. All rights reserved.
Keywords: Environmental gradients; Community diversity; Mediterranean matorral; Negative
interactions; Positive interactions
1. Introduction
The spatial structure of a plant community is the product of many processes actingin concert including both abiotic and biotic processes such as dispersal, herbivory,disturbance, competition, and distribution of available resources. The mostimportant processes structuring the community are likely to leave strong imprintson the spatial distribution of species, and therefore, it should be possible to usespatial pattern analyses to infer on the processes shaping community structure(Schenk et al., 2003).Competition has been proposed as one of the main forces determining the
structure and diversity of plant communities in highly productive habitats (Grubb,1977; Grime, 1979). These negative interactions are generally thought to decrease theabundance of competitors (Sammul et al., 2000) and generate negative patterns ofspatial associations between species (Keddy, 1990; Pacala and Levin, 1997).However, the importance of competition on community structure decreases instressful environments (Grime, 1974, 1979). On the other hand, it has also beenproposed that this decrease in importance of negative interactions is accompanied byan increase in importance of positive interactions (i.e. facilitation) (Bertness andCallaway, 1994; Brooker and Callaghan, 1998).More specifically, Bertness and Callaway (1994) proposed a conceptual model in
which the relative importance of competition and facilitation vary inversely along stressgradients. The empirical support for this model has come from observations of spatialassociations between species pairs (Valiente-Banuet and Ezcurra, 1991; Haase et al.,1996; Cavieres et al., 2002), as well as from results of the effects of experimentalneighbor removal along stress gradients (Quinos et al., 1998; Pugnaire and Luque, 2001;Callaway et al., 2002). However, few studies have focused on the relative effects ofcompetition and facilitation along stress gradients at the level of the entire community.This is mainly due to the unfeasibility of performing experiments with many specieswithin a community. For this reason, it is common to rely on measures of spatialassociation between species to indirectly infer on the possible effects of interactions oncommunity structure and diversity along environmental gradients (Pugnaire et al., 1996;Tewksbury and Lloyd, 2001). For example, Tewksbury and Lloyd (2001) reportedgreater species richness of annual plants beneath the canopies of Olneya spp. comparedto open areas in xeric habitats of the Sonoran Desert. In contrast, Olneya tree canopieshad little or no impacts on species diversity in mesic habitats. In this study, we use asimilar approach to determine if spatial associations allow us to infer on the importanceof positive and negative in plant communities of the Mediterranean Chilean matorral.

ARTICLE IN PRESS
E.I. Badano et al. / Journal of Arid Environments 62 (2005) 93–108 95
The Chilean matorral consist of sclerophyllous vegetation covering relativelyundisturbed areas in the Mediterranean-type climate zone of central Chile. Plantspecies are distributed in shrub-clumps interspaced among large open spaces(Dallman, 1998). A marked contrast between vegetation occurring on equatorial-and polar-facing slopes has been observed in this area (Armesto and Martınez, 1978;Fuentes et al., 1984). While equatorial-facing slopes bear open scrub vegetation withspiny shrubs and cacti, shade-tolerant evergreen trees and shrubs dominate in polar-facing slopes (Armesto and Martınez, 1978; Dallman, 1998). Although changes inproductivity and species composition between slopes have been attributed to anincrease in water stress on equatorial-facing slopes (Armesto and Martınez, 1978;Armesto et al., 1979; Martınez and Armesto, 1983), experimental results for somespecies of this matorral suggest that variations in the intensity of competition andfacilitation could influence the community structure on polar- and equatorial-facingslopes (Holmgren et al., 2000).In this study, we measured the spatial patterns of association of woody species in
the Chilean matorral to assess the sign of the dominant interaction (i.e. negative orpositive) of entire plant assemblages on mesic polar- and xeric equatorial-facingslopes. We also compare the relative frequencies of positive and negative associationsbetween all species pairs on mesic and xeric slopes to assess changes in the relativefrequencies of both types of associations between both slope exposures. Based on themodel of Bertness and Callaway (1994), we predict a decrease in the relativefrequency of negative associations, and an increase in positive associations, frommesic to xeric slopes. Moreover, since species association frequencies are expected tochange with slope aspect, we hypothesized that relative species richness withinclumps would be lower on mesic polar-facing slopes and higher on xeric equatorial-facing slopes.
2. Methods
2.1. Study sites
This study was carried out at two sites on the Andean foothills of theMediterranean-type climate zone of central Chile: Corral Quemado (331250S,701350W, 1400m elevation) and San Carlos de Apoquindo (331230S, 701310W, 900melevation). At each site, a polar- and an equatorial-facing slope was sampled in orderto analyse the species association patterns within shrub-clumps.Mean annual temperature in the study area is 18 1C, but exceeds 30 1C in summer
and falls below 0 1C during winter (di Castri and Hajek, 1976). Annual rainfallranges from 300 to 500mm and the dry season occurs in summer (op. cit.). In theAndean foothills, patterns of temperature and moisture are primarily a function oftopography. This way, equatorial-facing slopes are dryer than polar-facing onesbecause they receive more solar radiation and have greater evapo-transpiration rates(Rundel, 1981).

ARTICLE IN PRESS
E.I. Badano et al. / Journal of Arid Environments 62 (2005) 93–10896
Most of the dominant species within shrub-clumps on xeric equatorial-facingslopes are drought-tolerant, such as Baccharis spp. (Asteraceae) and Proustia spp.(Asteraceae), and these clumps are inter-spaced by large open areas of bare ground.Clumps on mesic-polar-facing slopes are dominated by shade-tolerant tree species,such as Quillaja saponaria (Rosaceae), Kageneckia spp. (Rosaceae) and Lithraea
caustica (Anacardiaceae). Open spaces on mesic slopes are smaller than on xericslopes, and are covered by small annual grasses, mainly exotics, introduced fromEurasia (Rundel, 1981; Dallman, 1998).
2.2. Vegetation sampling
On each selected slope, five 50m parallel transect lines, spaced 10m apart, wereused to sample the vegetation. All shrub-clumps that intercepted each transect linewere recorded, considering a ‘clump’ as any group of woody species forming adiscrete spatial unit (i.e. separated from similar units by open areas). All woodyplants growing within these clumps were identified and counted, and species wereclassified according to their life-form (tree, shrub or succulent) and functional group(drought tolerant or shade tolerant) using the classifications proposed by Rundel(1981) and Rodrıguez et al. (1983). At each transect, clump cover was measuredusing the percentage intercept method (i.e. the percentage of the line length coveredby clumps). The area of clumps intercepted by lines was also estimated by measuringthe longest diameter of each clump and its orthogonal axis. Thus, the area wascalculated assuming an elliptical shape for clumps. Both cover and area of shrub-clumps were compared between slope aspects (polar- or equatorial-facing) andlocalities (San Carlos de Apoquindo–Corral Quemado) with a nested ANOVA(slope aspect nested within localities).
2.3. Species association analyses
To assess the sign of interactions dominating communities on different slopes weused the C-score index (Stone and Roberts, 1992). This index is the average of allpossible ‘checkerboard units’ (CU) calculated for all the pairs of species that occur atleast once in the clumps. A CU is any sub-matrix with the form:
Sample 1 Sample 2 Sample 1 Sample 2
Species 1 0 1 or Species 1 1 0
Species 2 1 0 Species 2 0 1
The number of CU for each species pair is calculated as CU ¼ (ri�S)(rj�S), whereri and rj are the numbers of samples (clumps) where species i and j were detected, andS is the number of samples containing both species. The observed C-score calculatedfor each slope was contrasted against an expected C-score value generated byrandomizing species occurrences between samples (Gotelli and Entsminger, 2001).Matrix rows corresponded to species and columns to clumps, and the entriesindicated the presence (1) or absence (0) of a given species within a particular clump

ARTICLE IN PRESS
E.I. Badano et al. / Journal of Arid Environments 62 (2005) 93–108 97
(Gotelli and Graves, 1996). Expected C-score values were obtained by averaging theC-scores of 1000 null communities simulated from the respective co-occurrencematrix. Null communities were constructed by placing the species randomly andindependently of each other, but the probability of a particular clump being ‘hit’ by agiven species was a function of its relative area (i.e. the area of the jth sample/thetotal area of the clumps on a that slope) (Gotelli and Entsminger, 2001). C-scorevalues higher than expected by chance suggest competitively structured communities,while C-score values lower than expected by chance suggest that communities aredominated by positive interactions (Stone and Roberts, 1992).To assess the relative frequencies of positive and negative associations between
species pairs on each slope we performed a series of randomization tests. In theseanalyses, for each species pair, the observed occurrence frequency of each species wasrandomized 1000 times to generate an expected frequency of co-occurrence. Theobserved frequency of co-occurrence was compared with this randomly generatedfrequency distribution. We then calculated the probability of the observed co-occurrence frequency being generated by chance (cf. Fortin and Jacquez, 2000).When significant differences were detected, negative or positive associations wereassumed if the observed frequency was lower or higher than that expected by chance,respectively (Kikvidze et al., 2001). Relative frequencies of positive and negativeassociations were computed as the ratio between the number of significant speciesassociations and the total number of species pairs on the respective slope.To compare species richness within clumps on mesic and xeric slopes we estimated
species richness through rarefaction. Since at each study site the area and the numberof individuals within clumps varied with slope aspect, individual-based rarefactionswere used to standardize the number of species (Gotelli and Colwell, 2001). Theslope aspect with fewer individuals defined the sub-sample size (number ofindividuals pooled) used to estimate the species richness through rarefaction onthe opposite slope. Estimated species richness was defined as the average number ofspecies calculated from 1000 random sub-samples of individuals. Thus, the observedspecies richness on the slope aspect with fewer individuals was compared with theestimated species richness on the opposite slope. To assess statistical differencesbetween slopes we calculated the 95% confidence interval for the estimated value ofspecies richness, and significant differences were assumed if the observed value didnot fall within this interval (cf. Gotelli and Entsminger, 2001).
3. Results
3.1. Species, cover and clump areas
The number of sampled shrub-clumps varied among slopes, but it was alwayslower on equatorial-facing than on polar-facing slopes (Table 1). Fifteen species weredetected on the polar-facing slope at Corral Quemado (hereafter CQP), being theassemblage with the highest species richness. Ten species were detected on the polar-facing slope at San Carlos de Apoquindo (hereafter SCP). Observed species richness

ARTIC
LEIN
PRES
S
Table 1
Relative frequencies of occurrence of species (i.e. number of clumps where species i was detected / the total number of clumps on that slope) within clumps on
polar- and equatorial-facing slopes at San Carlos de Apoquindo and Corral Quemado
Species Life-form Functional group San Carlos de Apoquindo Corral Quemado
Polar Equatorial Polar Equatorial
Adesmia confusa Deciduous shrub Drought-tolerant ND ND ND 0.21
Azara dentata Evergreen shrub Shade-tolerant 0.03 ND ND ND
Baccharis paniculata Semi-deciduous shrub Drought-tolerant 0.03 0.95 0.05 1.00
Colliguaja integerrima Semi-deciduous shrub Shade-tolerant ND ND 0.13 0.04
Colliguaja odorifera Semi-deciduous shrub Shade-tolerant 0.37 0.14 0.05 0.04
Echinopsis chiloensis Stem succulent Drought-tolerant ND 0.09 ND 0.33
Gochnatia foliolosa Semi-deciduous shrub Shade-tolerant 0.03 ND 0.63 0.13
Guindilia trinervis Evergreen shrub Shade-tolerant ND ND 0.42 ND
Haplopappaus sp. Semi-deciduous shrub Unknown ND 0.50 ND ND
Haplopappus chrisanthemifolius Semi-deciduous shrub Unknown ND ND 0.03 ND
Kageneckia angustifolia Semi-deciduous tree Shade-tolerant ND ND 0.05 ND
Kageneckia oblonga Semi-deciduous tree Shade-tolerant 0.73 ND 0.87 0.43
Lithraea caustica Evergreen tree Shade-tolerant 0.63 0.18 0.13 0.04
Maytenus boaria Evergreen tree Shade-tolerant ND ND 0.03 ND
Porlieria chilensis Semi-deciduous tree Shade-tolerant ND ND 0.05 ND
Proustia cuneifolia Deciduous shrub Drought-tolerant ND 0.05 ND 0.04
Puya berteroniana Stem succulent Drought-tolerant ND 0.05 ND UN
Quillaja saponaria Evergreen tree Shade-tolerant 0.23 ND 0.11 ND
Schinus montanus Evergreen tree Shade-tolerant 0.03 ND ND ND
Solanum ligustrinum Deciduous shrub Shade-tolerant ND 0.27 0.11 ND
Teucrium bicolor Semi-deciduous shrub Shade-tolerant ND ND 0.18 0.08
Trevoa quinquenervia Deciduous tree Shade-tolerant 0.13 ND ND ND
Trevoa trinervis Deciduous tree Shade-tolerant 0.16 0.07 ND ND
Viviana marifolia Deciduous shrub Shade-tolerant ND ND 0.03 ND
Total species richness 10 9 15 10
Number of sampled clumps 30 22 38 24
Species were classified by life-form and functional group according to Rundel (1981) and Rodriguez et al. (1983). ‘ND’ indicates the species was not detected on
that slope, and ‘Unknown’ indicates that no information is available on the functional classification of the species.
E.I.
Ba
da
no
eta
l./
Jo
urn
al
of
Arid
En
viron
men
ts6
2(
20
05
)9
3–
10
898

ARTICLE IN PRESS
E.I. Badano et al. / Journal of Arid Environments 62 (2005) 93–108 99
in both xeric slopes was lower than on mesic slopes; ten species were detected on theequatorial-facing slope at Corral Quemado (hereafter CQE) and nine species at SanCarlos de Apoquindo (hereafter SCE).The drought-tolerant shrub Baccharis paniculata and the shade-tolerant tree
Kageneckia oblonga were the more frequent species on xeric and mesic slopes,respectively. At both sites, the relative frequencies of occurrence of these dominantspecies were lower on the opposite slopes. In addition to B. paniculata, five drought-tolerant species detected on xeric slopes were not registered within clumps on mesicslopes (Table 1). On the other hand, nine shade-tolerant species were detectedexclusively on the mesic slopes, while another six shade-tolerant species were lessfrequent at xeric than at mesic slopes (Table 1).Shrub-clump cover on mesic slopes was higher than on xeric ones (F ¼ 31:85;
po0:01), with no significant differences being detected between localities (F ¼ 2:34;p ¼ 0:15) (Fig. 1). Sizes (area) of clumps were significantly different between slopes(F ¼ 27:39; po0:01) and localities (F ¼ 20:95; po0:01). Overall, clumps on mesicslopes were larger than on xeric ones. However, differences between localities weredue to clumps at SCP being significantly larger than at CQP, while no differenceswere observed between SCE and CQE (Fig. 1).
3.2. Species association patterns
Observed C-scores were higher than values expected by chance at all slopes(Fig. 2). These results indicated lower species co-occurrence within clumps than whatis expected when species are distributed independently of each other, which suggestcompetitively structured communities on all slopes.
Fig. 1. Average (71 S.E.) cover (solid bars) and area (dashed bars) of shrub-clumps on polar- and
equatorial-facing slopes at San Carlos de Apoquindo and Corral Quemado. Bars with different letters
indicate differences between sampled slopes (a posteriori Tukey test a ¼ 0:05).

ARTICLE IN PRESS
Fig. 2. Observed (solid circles) and expected (empty circles) C-scores (71 S.D.) for polar- and equatorial-
facing slopes at San Carlos de Apoquindo and Corral Quemado. Probability values for statistical
differences between observed (O) and expected (E) C-score values are shown below each plot ða ¼ 0:05Þ:
E.I. Badano et al. / Journal of Arid Environments 62 (2005) 93–108100
Randomization tests between species pairs indicated one positive and six negativeassociations in SCE, one positive and 17 negative associations in SCP, one positiveand eight negative associations in CQE, and two positive and 31 negativeassociations in CQP (see Appendix A). Negative associations proved to be almosttwice as frequent on mesic slopes compared to xeric slopes (Fig. 3). On the otherhand, relative frequencies of positive associations were similar among all slopes, andwere lower than those of negative associations (Fig. 3).
3.3. Comparison of species richness
At San Carlos de Apoquindo, 119 individuals were detected on the equatorial-facing slope, and 301 on the polar-facing slope. At Corral Quemado, 168 individualswere recorded on the equatorial facing slope and 361 on the polar facing one.Therefore, at both sites, the equatorial-facing slopes defined the size of the sub-sample used to estimate the species richness on polar facing slopes throughrarefactions. Considering these differences in the number of individuals, at bothlocalities, observed species richness on the equatorial-facing slope was significantlyhigher than the corresponding estimated species richness on the polar-facing slope.At San Carlos de Apoquindo, observed species richness on the equatorial-facingslope was 9 and estimated species richness (795% confidence interval) on theopposite slope was 7.1 (70.2). At Corral Quemado observed species richness on theequatorial-facing slope was 10, while estimated species richness on the polar-facingslope was 8.8 (70.4).

ARTICLE IN PRESS
Fig. 3. Relative frequencies of significant negative (black bars) and positive associations (dashed bars)
between species pairs on polar- and equatorial-facing slopes at San Carlos de Apoquindo and Corral
Quemado.
E.I. Badano et al. / Journal of Arid Environments 62 (2005) 93–108 101
4. Discussion
Our results concur with those of previous studies (Armesto and Martınez, 1978;Fuentes et al., 1984) in that plant cover and shrub-clump size are significantlyaffected by slope aspect in the matorral of central Chile. However, although wepredicted species assemblages dominated by competitive interactions on mesic sitesand by facilitation on xeric sites, spatial pattern analyses suggested competitivelystructured species assemblages on both slope aspects.The negative patterns of species co-occurrence on mesic polar-facing slopes could
be due to competition for light. In previous studies on polar-facing slopes of theChilean matorral, Segura et al. (1998) and Holmgren et al. (2000) have shown that,despite seed germination of several species being greater beneath the canopy ofshade-tolerant species than in open spaces, no seedling recruitment occurred. Theysuggested, following Armesto and Martınez (1978), that strong asymmetricalcompetition for light prevents recruitment within clumps on these habitats, especiallyfor drought-tolerant species. In contrast, experiments performed on xeric equatorial-facing slopes have shown that seedling survival of several species was greater beneathshrub-clumps than on open areas, indicating a strong nurse effect of the clumps onmost species from this matorral (Fuentes et al., 1984). However, these experimentsonly evaluated ‘first year’ seedling survival without further monitoring of speciesestablishment. It is well known that the outcome of positive and negative effectschanges with plant life-stage, with many examples of positive effects of nurse plantson seedlings of beneficiary species and strong competition as seedlings grow (seeCallaway and Walker, 1997). Thus, while Fuentes et al. (1984) indicated that

ARTICLE IN PRESS
E.I. Badano et al. / Journal of Arid Environments 62 (2005) 93–108102
protection from desiccation and herbivores are the main mechanisms behind thenurse effect of shrub-clumps on seedling recruitment in xeric sites, our results suggestthat an increase in competition when facilitated species increase in size could explainthe competitive patterns obtained on the xeric slopes. The desiccant conditions onequatorial-facing slopes suggest that competition could be related with wateravailability.Water limitation could generate strong belowground competition (Tilman, 1994;
Reynolds, 1999) thereby causing plants to invest more resources in root developmentrather than on above-ground biomass (Holmgren et al., 1997). As far as we areaware, there are no studies on belowground biomass distribution patterns in thistype of environment. However, field experiments carried out in other arid ecosystemshave reported increasing root competition between species from mesic to xerichabitats (Pugnaire and Luque, 2001). Thus, we suggest that drought-tolerant plantsdominating the clumps on xeric slopes could exclude other species by belowgroundcompetition, generating the negative species association patterns observed at thewhole community level.In spite of the competitive patterns obtained for species assemblages on mesic and
xeric slopes, randomization analyses indicated a decrease in the relative frequenciesof negative associations from polar- to equatorial-facing slopes. These results agreewith the prediction of Grime (1974, 1979) that the importance of competitiveinteractions on the structure of plant communities should decrease under harsherconditions. On the other hand, although positive associations had a low relativeimportance on all slopes, they could be an important factor for the recruitment of afew shade-tolerant species on xeric slopes in some years. For instance, seedlingsurvival of some shade-tolerant species (e.g. Lithraea caustica and Kageneckia
oblonga) beneath the nurse shrubs increases during high rainfall ENSO (El Nino)years (Fuentes et al., 1984; Jimenez and Armesto, 1992). Although both competitionand facilitation could be acting on community structure in this ecosystem, speciesassociation patterns suggest that competition seems to be more important.Nevertheless, long-term experiments analysing the effects of competition andfacilitation at different life-stages are urgently needed to assess how speciesinteractions affect community structure.The observed change in the intensity of negative associations could be related with
the observed increase in species richness within shrub-clumps from mesic to xericslopes. Some authors have suggested that the integrated effect of abiotic stress andbiotic interactions is the main force driving community diversity (Callaway, 1995;Bruno et al., 2003). This theoretical framework states a dominance of competitiveinteractions (which reduce diversity) in benign habitats and a dominance offacilitation (that increases diversity) in stressful habitats (Grime, 1979; Bertness andCallaway, 1994). Our results indicate that increases in aridity from mesic to xericslopes cannot eliminate the dominant effects of competition. However, regarding thisapparent dominance of competition, species richness within clumps was higher in thestressful environments (i.e. xeric slopes). This suggests that the greater observedplant diversity within clumps in xeric habitats could have resulted from the decreasein the frequency of competitive interactions on these slopes.

ARTICLE IN PRESS
E.I. Badano et al. / Journal of Arid Environments 62 (2005) 93–108 103
Although we are aware that our approach is correlative and further experimentsare needed, particularly long-term experiments related with the net outcome ofpositive and negative effects with life-stage under different slope exposures, ouranalyses suggest that negative interactions are more intense than positive onesin the Chilean matorral. Notwithstanding, species association patterns alsosuggested that slope aspect could regulate the intensity of negative interactionsand, in consequence, the diversity within shrub-clumps in the sclerophyllousmatorral of central Chile.
Acknowledgments
The authors thank Rosanna Ginocchio for her logistic support during sampling,Maritza Mihoc and Alicia Marticorena for their collaboration with the identificationof species, Glenn Hofmann and Chris Lusk for their valuable suggestions andsoftware supply, and Chris Lortie and Alejandro Munoz for helpful comments onthe manuscript. E.I. Badano holds a Doctoral fellowship from MECESUP grantUCO9906. This paper forms part of the research activities of the Millennium Centerfor Advanced Studies in Ecology and Research on Biodiversity supported by GrantNo. P02-051-F ICM.

ARTIC
LEIN
PRES
S
Appendix A
Results of randomization tests ða ¼ 0:05Þ performed between all species pairs detected within shrub-clumps on polar- andequatorial-facing slopes of San Carlos de Apoquindo and Corral Quemado. Probability values for positive (+) and negative(�) associations are showed
San Carlos de
Apoquindo,
equatorial-
facing slope
Colliguaja
odorifera
Haplopa-
ppaus sp.
Lithraea
caustica
Proustia
cuneifolia
Puya
berte-
roniana
Solanum
ligu-
strinum
Trevoa
trinervis
Echinopsis
chiloensis
Baccharis
paniculata
0.11 0.02(+) 0.18 0.01(�) 0.02(�) 0.16 0.08 0.02(�)
Colliguaja
odorifera
0.15 0.38 0.39 0.43 0.28 0.33 0.04
Haplo-
pappaus sp.
0.02(�) 0.14 0.04(�) 0.06 0.03(�) 0.17
Lithraea
caustica
0.24 0.21 0.32 0.19 0.23
Proustia
cuneifolia
0.58 0.12 0.40 0.55
Puya
berteroniana
0.14 0.40 0.57
Solanum
ligustrinum
0.10 0.13
Trevoa
trinervis
0.42
San Carlos de
Apoquindo,
polar-facing
slope
Bac-
charis
pani-
culata
Colliguaja
odorifera
Goch-
natia
foliolosa
Kage-
neckia
oblonga
Lithraea
caustica
Quillaja
sapo-
naria
Schinus
mon-
tanus
Trevoa
quinque-
nervia
Trevoa
trinervis
Azara
dentata
0.58 0.04(�) 0.58 0.01(�) 0.03(�) 0.34 0.55 0.24 0.41
Baccharis
paniculata
0.04(�) 0.58 0.01(�) 0.01(�) 0.09 0.57 0.22 0.43
E.I.
Ba
da
no
eta
l./
Jo
urn
al
of
Arid
En
viron
men
ts6
2(
20
05
)9
3–
10
8104

ARTIC
LEIN
PRES
S
Colliguaja
odorifera
0.15 0.11 0.10 0.23 0.03(�) 0.01(�) 0.03(�)
Gochnatia
foliolosa
0.01(�) 0.01(�) 0.09 0.58 0.24 0.42
Kage-
neckia
oblonga
0.01(+) 0.01(�) 0.014(�) 0.04(�) 0.01(�)
Lithraea
caustica
0.10 0.01(�) 0.01(�) 0.07
Quillaja
saponaria
0.09 0.18 0.09
Schinus
montanus
0.23 0.41
Trevoa
quinque-
nervia
0.18
Corral
Quemado,
equatorial-
facing
slope
Baccharis
pani-
culata
Colliguaja
integer-
rima
Colli-
guaja odori-
fera
Gochnatia
foliolosa
Kage-
neckia
oblonga
Lithraea
caustica
Proustia
cuneifolia
Teucrium
bicolor
Echi-
nopsis
chilo-
ensis
Adesmia
confusa
0.19 0.17 0.15 0.09 0.09 0.13 0.20 0.14 0.12
Baccharis
paniculata
0.01(�) 0.01(�) 0.08 0.01(+) 0.01(�) 0.01(�) 0.04(�) 0.16
Colliguaja
integerrima
0.54 0.30 0.08 0.54 0.57 0.44 0.08
Colliguaja
odorifera
0.23 0.01(�) 0.55 0.57 0.41 0.08
Gochnatia
foliolosa
0.01(�) 0.43 0.42 0.34 0.22
Kageneckia
oblonga
0.07 0.07 0.04(�) 0.20
Lithraea
caustica
0.57 0.39 0.26
Proustia
cuneifolia
0.39 0.24
E.I.
Ba
da
no
eta
l./
Jo
urn
al
of
Arid
En
viron
men
ts6
2(
20
05
)9
3–
10
8105

ARTIC
LEIN
PRES
S
Teucrium
bicolor
0.07
Corral
Quemado,
polar-
facing
slope
Colliguaja
integer-
rima
Colliguaja
odorifera
Goch-
natia
foliolosa
Guindilia
trinervis
Haplo-
pappus
chrisan-
themi-
folius
Kage-
neckia
angusti-
folia
Kage-
neckia
oblonga
Lithraea
caustica
Maytenus
boaria
Porlieria
chilensis
Quillaja
saponaria
Solanum
ligu-
strinum
Teucrium
bicolor
Viviania
mari-
folia
Baccharis
paniculata
0.23 0.30 0.18 0.20 0.34 0.28 0.04(�) 0.19 0.13 0.10 0.33 0.23 0.13 0.13
Colliguaja
integerrima
0.23 0.04(�) 0.13 0.08 0.04(�) 0.12 0.24 0.25 0.22 0.13 0.15 0.01(�) 0.08
Colliguaja
odorifera
0.01(�) 0.03(�) 0.13 0.09 0.03(�) 0.21 0.14 0.09 0.04(�) 0.04(�) 0.04(�) 0.11
Gochnatia
foliolosa
0.06 0.01(�) 0.02(�) 0.01(+) 0.04(�) 0.01(�) 0.03(�) 0.14 0.13 0.04(�) 0.01(�)
Guindilla
trinervis
0.01(�) 0.03(�) 0.01(+) 0.15 0.01(�) 0.01(�) 0.17 0.02(�) 0.04(�) 0.03(�)
Haplopappus
chrisanthe-
mifolius
0.40 0.01(�) 0.13 0.41 0.44 0.24 0.20 0.09 0.58
Kageneckia
angustifolia
0.04(�) 0.12 0.41 0.31 0.18 0.17 0.26 0.43
Kageneckia
oblonga
0.04(�) 0.01(�) 0.01(�) 0.01(�) 0.01(�) 0.09 0.01(�)
Lithraea
caustica
0.39 0.27 0.25 0.33 0.21 0.20
Maytenus
boaria
0.37 0.43 0.41 0.09 0.56
Porlieria
chilensis
0.41 0.22 0.08 0.41
Quillaja
saponaria
0.27 0.22 0.23
Solanum
ligustrinum
0.04(�) 0.23
Teucrium
bicolor
0.10
E.I.
Ba
da
no
eta
l./
Jo
urn
al
of
Arid
En
viron
men
ts6
2(
20
05
)9
3–
10
8106

ARTICLE IN PRESS
E.I. Badano et al. / Journal of Arid Environments 62 (2005) 93–108 107
References
Armesto, J.J., Martınez, J.A., 1978. Relationships between vegetation structure and slope aspect in the
Mediterranean region of Chile. Journal of Ecology 66, 881–889.
Armesto, J.J., Gutierrez, J.R., Martınez, J.A., 1979. Las comunidades vegetales de la region mediterranea
de Chile: distribucion de especies y formas de vida en un gradiente de aridez. Medio Ambiente 4,
62–70.
Bertness, D., Callaway, R.M., 1994. Positive interactions in communities. Trends in Ecology & Evolution
9, 191–193.
Brooker, R.W., Callaghan, T.V., 1998. The balance between positive and negative interactions and its
relationship to environmental gradient: a model. Oikos 81, 196–207.
Bruno, J.F., Stachowicz, J.J., Bertness, M.D., 2003. Inclusion of facilitation into ecological theory. Trends
in Ecology & Evolution 18, 119–125.
Callaway, R.M., 1995. Positive interactions among plants. Botanical Review 61, 306–349.
Callaway, R.M., Walker, L.R., 1997. Competition and facilitation: a synthetic approach to interactions in
plant communities. Ecology 78, 1958–1965.
Callaway, R.M., Brooker, R.W., Choler, P., Kikvidze, Z., Lortie, C.J., Michalet, R., Paolini, L., Pugnaire,
F.I., Newingham, B., Aschehoug, E.T., Armas, C., Kikodze, D., Cook, B.J., 2002. Positive interactions
among alpine plants increase with stress. Nature 417, 844–848.
Cavieres, L., Arroyo, M.T.K., Penaloza, A., Molina-Montenegro, M., Torres, C., 2002. Nurse effect of
Bolax gummifera cushion plants in the alpine vegetation of the Chilean Patagonian Andes. Journal of
Vegetation Science 13, 547–554.
Dallman, P.R., 1998. Plant Life in the World’s Mediterranean Climates. University of California, Los
Angeles.
di Castri, F., Hajek, E., 1976. Bioclimatologıa de Chile. Ediciones Universidad Catolica de Chile,
Santiago.
Fortin, M., Jacquez, G., 2000. Randomization test and spatially autocorrelated data. Bulletin of
Ecological Society of America 81, 201–205.
Fuentes, E.R., Otaiza, R.D., Alliende, M.C., Hoffmann, A.J., Poiani, A., 1984. Shrub clumps of the
Chilean matorral vegetation: structure and possible maintenance mechanisms. Oecologia 62, 405–411.
Gotelli, N.J., Colwell, R.K., 2001. Quantifying biodiversity: procedures and pitfalls in the measurement
and comparison of species richness. Ecology Letters 4, 379–391.
Gotelli, N.J., Entsminger, G.L., 2001. EcoSim: Null Models Software for Ecology, Version 7.0. Acquired
Intelligence Inc. and Kesey-Bear, Burlington.
Gotelli, N.J., Graves, G.R., 1996. Null Models in Ecology. Smithsonian Press, Washington.
Grime, J.P., 1974. Vegetation classification by reference to strategy. Nature 250, 26–30.
Grime, J.P., 1979. Plant Strategies and Vegetation Processes. Wiley, Chichester.
Grubb, P.J., 1977. The maintenance of species-richness in plant communities: the importance of the
regeneration niche. Biological Reviews 52, 107–145.
Haase, P., Pugnaire, F.I., Clark, S.C., Incoll, L.D., 1996. Spatial patterns in a two-tiered semi-arid
shrubland in southeastern Spain. Journal of Vegetation Science 7, 527–534.
Holmgren, M., Scheffer, M., Huston, M.A., 1997. The interplay of facilitation and competition in plant
communities. Ecology 78, 1966–1975.
Holmgren, M., Segura, A.M., Fuentes, E.R., 2000. Limiting mechanisms in the regeneration of the
Chilean matorral. Plant Ecology 147, 49–57.
Jimenez, H., Armesto, J.J., 1992. Importance of the soil seed bank of disturbed sites in Chilean matorral in
early secondary succession. Journal of Vegetation Science 3, 579–586.
Keddy, P.A., 1990. Competitive hierarchies and centrifugal organization in plant communities. In: Grace,
J.B., Tilman, D. (Eds.), Perspectives on Plant Competition. Academic Press, San Diego, pp. 265–290.
Kikvidze, Z., Khetsuriani, L., Kikodze, D., Callaway, R.M., 2001. Facilitation and interference in sub-
alpine meadows of the central Caucasus, Europe. Journal of Vegetation Science 12, 833–838.
Martınez, J.A., Armesto, J.J., 1983. Ecophysiological plasticity and habitat distribution in three evergreen
sclerophyllous shrubs of the Chilean matorral. Acta Oecologica 4, 211–219.

ARTICLE IN PRESS
E.I. Badano et al. / Journal of Arid Environments 62 (2005) 93–108108
Pacala, S.W., Levin, S.A., 1997. Biologically generated spatial pattern and the coexistence of competing
species. In: Tilman, D., Kareiva, P. (Eds.), Spatial Ecology: The Role of Space in Population Dynamics
and Interspecific Interactions. Princeton University, Princeton, pp. 204–232.
Pugnaire, F.I., Luque, M.T., 2001. Changes in plant interactions along a gradient of environmental stress.
Oikos 93, 42–49.
Pugnaire, F.I., Haase, P., Puigdefabregas, J., Cueto, M., Clark, S.C., Incoll, L.D., 1996. Facilitation and
succession under the canopy of a leguminous shrub, Retama sphaerocarpa, in a semi-arid environment
in south-east Spain. Oikos 76, 455–464.
Quinos, P.M., Insausti, P., Soriano, A., 1998. Facilitative effects of Lotus tenuis on Paspalum dilatatum in
a lowland grassland of Argentina. Oecologia 114, 427–431.
Reynolds, H.L., 1999. Plant interactions: competition. In: Pugnaire, F.I., Valladares, F. (Eds.), Handbook
of Functional Plant Ecology. Marcel Dekker, New York, pp. 649–676.
Rodriguez, R., Matthei, O., Quezada, M., 1983. Flora Arborea de Chile. Universidad de Concepcion,
Concepcion.
Rundel, P.W., 1981. The matorral zone of Central Chile. In: di Castri, F., Goodall, D.W., Spetch, R.L.
(Eds.), Mediterranean Type Shrublands. Elsevier, Amsterdam, pp. 175–201.
Sammul, M., Kull, K., Oksanen, L., Veromann, P., 2000. Competition intensity and its importance: results
of field experiments with Anthtoxanthum odoratum. Oecologia 125, 18–25.
Schenk, H.J., Holzpfel, C., Hamilton, J.G., Mahall, B.E., 2003. Spatial ecology of a small desert shrub on
adjacent geological substrates. Journal of Ecology 91, 383–395.
Segura, A.M., Holmgren, M., Anabalon, J.J., Fuentes, E.R., 1998. The significance of fire intensity in
creating local patchiness in the Chilean matorral. Plant Ecology 139, 259–264.
Stone, L., Roberts, A., 1992. Competitive exclusion, or species aggregation? An aid in deciding. Oecologia
91, 419–424.
Tewksbury, J.J., Lloyd, J.D., 2001. Positive interactions under nurse plants: spatial scale, stress gradient
and benefactor size. Oecologia, 425–434.
Tilman, D., 1994. Competition and diversity in spatially structured habitats. Ecology 78, 81–92.
Valiente-Banuet, A., Ezcurra, E., 1991. Shade as a cause of the association between the cactus
Neobuxbaumia tetezo and the nurse plant Mimosa luisana in the Tehuacan Valley, Mexico. Journal of
Ecology 79, 961–971.

- Seed population dynamics on badland slopes in SE Spain - 691
Journal of Vegetation Science 6: 691-696, 1995© IAVS; Opulus Press Uppsala. Printed in Sweden
with physiography, soil properties and erosion rates(Brown 1971; Butler et al. 1986; Korzhenevskiy &Klyukin 1989; Alexander & Calvo 1990; Guardia &Ninot 1992). However, none of these studies looked atwhy there is almost no vegetation in badland slopes,although they implied that erosion processes are themain reason. In a general model on erosion and plantcompetition, the removal of sediments and litter hasbeen proposed as the mechanism through which erosioninfluences vegetation development, because it affectsplant establishment, growth and survival (Thornes 1985,1990).
We hypothesized that the removal by erosion ofseeds arriving at the soil surface is the main factorexplaining the scarcity or the absence of vegetation onbadland slopes. To test this hypothesis, we quantifiedthe balance between seed inputs and outputs at thecatchment scale in a badland area, and experimentallytested the susceptibility of the seeds to be removed bysoil erosion at the plot scale.
Study site
This study was performed near Petrer, in the prov-ince of Alicante, Spain (38° 30' N, 0° 45' W.) The regionhas a semi-arid Mediterranean climate, characterized bydry summers lasting 4-5 months. Average annual rain-fall is 370 mm, and average annual temperature is ca.16 °C. The badlands occur on both sides of a smallvalley cut into Cretaceous (Senonian) marls (Anon.1978). The general orientation of the valley is E-W, andbadland development and extension differ on north- andsouth-facing slopes. On the south-facing slopes, badlandsextend from the valley floor to the divide. However, onthe north-facing slopes badland extension is limited,covering only the lower section of the slopes (Calvo &Harvey 1989). The slopes are very steep, ranging from25° to 50°, and the regolith surface is characterized by acrack morphology. The dominant erosion processes arerill and interrill overland flow together with local pipingand mass movements. Erosion rates recorded in these
Seed population dynamics on badland slopes in southeastern Spain
García-Fayos, P.1*, Recatalá, T.M.2, Cerdá, A.2 & Calvo, A.1,2
<Centro de Estudios sobre Desertificación (CSIC-UV-GV), Calle Jaime Roig, 11, E-46010 Valencia, Spain;*Tel. +34 3 3690800 ext. 54; Fax +34 3 3930001; 2Departamento de Geografía, Facultad de Geografía,
Universidad de Valencia P.O. Box 22060, E-46080 Valencia, Spain
Abstract. The dynamics of seed population on slope surfaceswere studied to test the hypothesis that the lack of vegetationon badlands is caused by seed removal by erosion. The initialsoil seed bank and two years of seed rain and seed removal byerosion were estimated in two small catchments, and a seedbalance was constructed. In addition, six rainfall simulationexperiments were performed to test the susceptibility of seedsto be removed by overland flow. A variety of soil surfaceconditions, rainfall characteristics and plot sizes were used inthese experiments.
Soil seed bank densities are low, but enough for thedevelopment of plant cover. Seed losses due to erosion afternatural rains were low (< 13 %), and in agreement with seedlosses from simulated rainfall experiments. After two years,seed inputs in the seed rain were greater than seed outputsthrough seed removal, which resulted in a continuous increasein the numbers of seeds in the soil bank. These results point outthat seed removal by erosion is not the key factor explainingthe lack of vegetation on badlands. It is suggested that otherfactors, such as those related to seed germination and seedlingsurvival, may play an important role.
Keywords: Colonization; Erosion; Seed rain; Soil seed bank.
Nomenclature: Tutin et al. (1964-1980).
Introduction
Badlands is a term of current use in earth sciences,especially in geomorphology. The term indicates a dis-tinctive land form that develops in semi-arid regions,characterized by a highly dissected topography, veryhigh drainage rates, rapid erosion rates and a sparse oreven non-existant plant cover (Bryan & Yair 1982).
Important data are available on the geomorphologicalimplications of the erosion processes involved in badlanddevelopment (Bryan & Yair 1982; Calvo & Harvey1989; López-Bermúdez & Romero-Díaz 1989; Harvey& Calvo 1991), but little is known about the implica-tions for vegetation, especially plant colonization. Themain topics in badland-vegetation studies have been thedistribution of species and communities and its relations

692 García-Fayos, P., et al.
badlands are around 2000 g m–2 hr–1, among the highestreported for southeast Spain (Calvo & Harvey 1989;Calvo et al. 1992).
Natural vegetation in this region has been highlyinfluenced by human activity for centuries. The currentvegetation is the result of the degradation of a dense andtall shrubland of the association Rhamno-Quercetumcocciferae. It consists of isolated individuals ofMoricandia arvensis and Lygeum spartum, leaving mostof the soil completely bare. Vegetation of the colluvialsoils on the south slopes and terraces adjacent to thebadlands is a sparse and low scrubland dominated byLygeum spartum, Salsola genistoides, Moricandiaarvensis, Cheirolophus intybaceus, Helichrysumstoechas, Fumana ericoides, Sedum sediforme, andPhagnalon saxatile. Vegetation of the adjacent northfacing slopes is denser, especially on the upper partswhere the colluvial soils are deeper. It is dominated byCoronilla minima, Brachypodium retusum, Cistusalbidus, Bupleurum fruticescens, Erica multiflora,Helictotrichon filifolium and Fumana ericoides.
Methods
Seed population dynamics
A two-year complete seed balance was calculated intwo adjacent small catchments. After estimating theinitial soil seed bank, seed inputs and outputs weremeasured monthly and summarized for the study pe-riod. Measurements started in March 1991 and finishedin April 1993. The areas of the catchments, to be calledC-1 and C-2, were 245 and 335 m2 respectively.
The initial soil seed bank in the catchments wassampled in March 1991, after seed dispersal and germi-nation. At each catchment, 30 soil cores (5.5 cm diam-eter, 6 cm depth) were extracted, following an evendesign from the top to the bottom of the slopes. Thesamples were sieved through a 0.25-mm mesh and ex-amined using a 7× - 40× microscope to determine thepresence and amount of seeds of each species. Damagedand empty seeds were disregarded. The seed densitiesobtained were extrapolated to the catchment area, inorder to estimate total seed numbers. The initial seedpools of the catchments were compared using a non-parametric Mann-Whitney test.
Seed inputs were measured monthly in three 0.34-m2 seed rain traps installed on the upper, medium andlower parts of each catchment. Each trap consisted offour 33-cm diameter funnels kept 50 cm above theground using a metal frame. Each funnel had a 0.25-mmmesh size bag attached to the end. The bag was replacedmonthly, its content examined in the microscope, and
the total number of seeds of each species determined.Damaged and empty seeds were rejected. The seeds ofbird-dispersed species were discarded, because theirpresence was considered a consequence of the attrac-tiveness of the trap for the birds. Seed predation byanimals was not observed at any trap for the duration ofthe study. Total seed rain in each catchment was calcu-lated by extrapolating the sampled densities, and com-pared yearly using a Mann-Whitney test.
Seed outputs were measured in sediment traps in-stalled at the outlets of both catchments. The trapsconsisted of a metal frame holding a 0.25-mm mesh sizebag that intercepted the sediments carried out by therun-off water. After each rainfall which led to run-off,the bags were replaced, their contents weighed andsieved, the sediments examined in the microscope, andthe number of seeds of each species determined. Dam-aged and empty seeds were disregarded. The amountand intensity of the rainfall were measured in two rain-fall gauges located at the higher and lower part of thestudy area.
Simulated rainfall experiments
A total of six rainfall simulation experiments ondyed seeds were performed, covering a variety of siteand rainfall conditions, described in Table 3. Experi-ments SL-01 to SL-03 were carried out in February andMarch 1992, using a sprinkler rainfall simulator (Calvoet al. 1988). Plot size was 0.24 m2, and rainfall intensity55 mm/hr. The plot size used in these experiments wassmall, so new experiments using a larger sprinkler rain-fall simulator were carried out in October and Novem-ber 1992 (SL-04 to SL-06). In these experiments plotsize was 3 m2 and rainfall intensity 45 mm/hr. Rainfallintensities are similar to those of the heavier rainstormsregistered in the area.
Seeds of Cheirolophus inthybaceus, Cistus albidus,Helichrysum stoechas and Moricandia arvensis werecollected from populations living in the study area, air-dried in the laboratory and dyed with blue aniline. Thesespecies were chosen because of their dominance in theseed bank and adjacent vegetation. 24 seeds of eachspecies were used in experiments SL-01 to SL-03 and60 in the experiments SL-04 to SL-06. The seeds wereplaced on the soil surface, in the centre of each plot.During the rain simulation, samples of the overlandflow were collected every minute. Run-off water, sedi-ment content and seed losses were determined at eachsample. The results from this experiment were not sta-tistically analyzed because its objective was to ex-perimentally verify the rates of seed losses obtained inthe seed traps and thus there was no replication.

- Seed population dynamics on badland slopes in SE Spain - 693
Results
Seed population dynamics
Initial soil seed bank density was 280 ± 74 and 266 ±85 seeds/m2 in catchments C-1 and C-2, respectively(see García-Fayos & Recatalá 1992 for additional infor-mation). These values are equivalent, as shown by theMann-Whitney test (U = 4.00, p = 1.000, d.f = 1). Threespecies, Sedum sediforme, Erica multiflora, and Phag-nalon saxatile, account for 75 % of the total seed bank(Table 1), a dominance that may be explained by theseed production of these species, the larger of all speciesin the study area. In addition, Erica multiflora dispersesits seeds in February and March, when sampling wasconducted. However, Sedum sediforme and Phagnalonsaxatile disperse in October and May, respectively.
Seed inputs in catchments C-1 and C-2 were 52 ± 10and 37 ± 7 seeds m–2 yr–1 in the first year, and 53 ± 11 and54 ± 13 seeds m–2 yr–1 in the second year, respectively.These differences between catchments were not statisti-cally significant in either year (Mann-Whitney test: U =7.00, p = 0.2752, d.f. = 1 for the first year, and U = 4.00,p = 0.8273, d.f. = 1 for the second year). Seed inputswere continuous over the year, although some variabil-ity existed. In general, seed rain tended to be lower
Table 1. Initial number of seeds in the soil bank and totalnumber of seeds in two years of seed rain and seed removal byerosion, with indication of their dispersal agent (W=wind,X=others). The data are refered to the total study area (580m2).
Dispersal Seed Seed SeedSpecies agent bank rain removal
Sedum sediforme W 48739 6957 4392Erica multiflora W 38835 4282 3043Phagnalon saxatile W 31582 5651 2578Helichrysum stoechas W 4692 6192 1891Crepis vesicaria W 4692 2348 505Pallenis spinosa X 4692 0 162Lygeum spartum W 4692 0 0Sonchus oleraceus W 3431 2411 683Moricandia (2 spp.) X 3431 326 1046Salsola genistoides W 3431 979 477Dittrichia viscosa W 0 9369 1102Phragmites australis W 0 5675 126Dactylis glomerata X 0 2762 916Stipa parviflora W 0 1218 0Ulmus minor W 0 955 0Bupleurum fruticescens X 0 803 0Senecio linifolius W 0 326 0Piptatherum miliaceum X 0 326 0Stipa tenacissima W 0 239 0Cistus albidus X 0 0 126Thymus (2 spp.) X 0 0 71Globularia alypum W 0 0 66Brachypodium retusum X 0 0 63Foeniculum vulgare X 0 0 63Cheirolophus intybaceus X 0 0 63Teucrium pseudochamaepit. X 0 0 3Asteraceae (7 spp.) W 8123 4044 385Inderminated (6 spp.) X 3431 2436 474
Fig. 1. Seed population dynamics in catchments C-1 and C-2.The initial value corresponds to the soil seed bank. (verticalbars=seed rain and seed removal by erosion; solid line=seedbalance).
during summer and winter. The most abundant speciesin the seed rain, accounting for more than 60 % of thetotal, were Dittrichia viscosa, Sedum sediforme,Helichrysum stoechas, Phragmites australis, Phagnalonsaxatile and Erica multiflora (Table 1).
Seed outputs for the two-year period accounted onlyfor 12.5 % and 5.6 % of the total seed bank in catchmentsC-1 and C-2 respectively, including the two-year seedrain. For the duration of the study, there were only threerainfall events that produced seed losses, on 25 October1991, 18 - 23 February 1992 and 3 - 8 February 1993.Again, Sedum sediforme, Erica multiflora, Phagnalonsaxatile, Helichrysum stoechas and Dittrichia viscosawere the main species in the seed output, accounting forover 65 % of total losses (Table 2).
After two years, in both catchments, seed inputs inthe seed rain were greater than seed outputs through seedremoval, which resulted in a positive balance (Fig. 1).

694 García-Fayos, P., et al.
Simulated rainfall experiments
Seed losses were low in all experiments, less than 13% of the total seeds present, despite the conditions of theexperiment (Table 3). Seed losses increased as slopeangle and rain duration increased, and decreased as totaltransport length increased. This behaviour is similar tothat of sediment particles (Govers 1989; Parsons et al.1993). However, increased run-off caused by high ini-tial soil moisture did not result in an increase in seedlosses, as expected with soil sediment particles (Govers1991).
Each species showed a different susceptibility toremoval (Table 4). While some species, such as Cheiro-lophus inthybaceus, presented high losses in all experi-ments, others, such as Helichrysum stoechas and Mori-candia arvensis presented only least losses in one ex-per iment .
Discussion
Soil seed densities were low, but there were seedsavailable for germination in the soil of the slopes in bothcatchments in 1991, 1992, and 1993, as data from theseed bank and seed balance showed. This result is indisagreement with the hypothesis that removal by ero-sion of the seeds arriving to the soil surface would be themain factor explaining the scarcity or absence of vegeta-tion on badland slopes. Seed densities reported here,about 275 seeds/m2, are comparable to those found inthe Sonora and Mohave deserts and in the semi-arid
Table 2. Rainfall events producing seed losses from March 1991 to April 1993 at catchments C-1 and C-2.
C-1 C-2Total Maximum Seed losses Seed losses
Date precipitation intensity n % n %
25th October 1991 5.6 l/m2 59 mm/h 0 0 3 < 0.118-23th February 1992 97 l/m2 12 mm/h 8577 10.7 4265 43-8th February 1993 66 l/m2 14 mm/h 2712 3.4 2970 2.6
sagebrush steppes of Utah. Soil in these areas contained400, 269 and 92 seeds/m2, respectively (Kemp 1989).The presence of vegetation in these ecosystems suggeststhat the lack of vegetation on the badlands cannot beexplained only by the seed removal hypothesis.
The spatial distribution of the seed bank was highlyheterogeneous. The frequency distribution of the numberof seed in each sample has a skewed pattern; few sam-ples have a large number of seeds but most have a few ornone (Fig. 2). This pattern of highly clumped seeds isfrequent in desert seed banks (Nelson & Chew 1977;Reichman 1984; Kemp 1989).
The seed rain values reported in this study are verylow, compared with values from other environmentswhere similar seed traps and methodology were used.Over a period of two years, average seed rain in Petrerranged from 45 to 52 seeds m–2 yr–1. Reported values inthe literature range from 45 - 175 seeds m–2 yr–1 in theopen ground of a fynbos community in S Africa (Manders1990), to 7677 - 9622 seeds m–2 yr–1 in a recently burntout plantation of Cryptomeria japonica in Japan(Kominami 1988), and to 35 000 seeds m–2 yr–1 in an old-field community in Central New York (USA) (Morris etal. 1986).
Seed losses through natural rainfall over the studyperiod were lower than expected, although the resultsagree with those obtained in the rainfall simulationexperiments. Maximum seed losses observed in thesimulation experiments were 12.5 % of the total after110 minutes of a 55 mm/hr rainfall. The probability of arainfall of higher intensity and duration occurring isvery low, and therefore the probability of complete
Table 3. Site and experimental conditions of the rainfall simulations, and rate of seed losses.
SL-01 SL-02 SL-03 SL-04 SL-05 SL-06
Transport length (cm) 25 25 25 120 120 120Slope (degrees) 25 40 40 40 45 45Rain intensity (mm/h) 55 55 55 45 45 45Rain duration (minutes) 40 40 110 40 40 40Previous soil moisture dry dry dry dry dry wetRun-off average (mm/h) 36.7 47.4 50.3 17.5 24.2 40.6Erosion (gr·l–1·m–2) 1893.6 2505.5 3422.9 3212.0 3855.9 7099.4Seed losses (%) 2.27 8.33 12.50 1.14 0.68 0.69

- Seed population dynamics on badland slopes in SE Spain - 695
this fact, seed inputs were greater than outputs over thestudy period, and the seed balance showed a continuousincrease in the number of seeds in both catchments. Thepositive results of the two-year seed balance may becaused by decreased seed losses due to scarce, lowintensity precipitation during the study period. How-ever, this low precipitation also affected seed produc-tion, thus reducing the amount of seeds available asinputs. Many individuals of Erica multiflora did notbloom in the winter of 1992 and the mortality of matureplants of Fumana ericoides from February 1991 tillFebruary 1992 was as high as 50 % in some stands.
We can conclude that seed removal is not the causeof the lack of vegetation in the slopes of badlands. Thepresence of available seeds in the soil bank, the lowlosses caused by rainfall, and the number of seeds greaterin the inputs than in the outputs support this conclusion.These results are reinforced by the agreement betweenobservational and experimental data from the rain simu-lators. Low seed availability alone cannot explain thelack of vegetation in the badlands, and thus other factorssuch as seed germination and seedling survival shouldbe considered.
Acknowledgements. This research was supported by projectsNAT89-1072-C06-04 and AMB93-0844-C06-04 of theComisión Interministerial de Ciencia y Tecnología. We aregrateful to Mario Payá and his family and I. Tiemessen and N.Bouma for their help in field work at Petrer. Thanks are due toVicente Monleon and two anonymous reviewers for theircomments and suggestions on an earlier version of the manu-script.
References
Anon. 1978. Mapa Geológico de España, 1:50.000: Hoja nº871 (Elda). IGME (Instituto Geológico y Minero deEspaña). Ministerio de Industria, Madrid. (Sheet and ac-companying memoir).
Alexander, R.W. & Calvo, A. 1990. The influence of lichensin slope processes in some spanish badlands. In: Thornes,J.B. (ed.) Vegetation and Erosion. J.Wiley & Sons, Chich-ester.
Brown, R.W. 1971. Distribution of plant communities insouth-eastern Montana badlands. Am. Midl. Nat. 85:458-477.
Bryan, R.B. & Yair, A. (eds.) 1982. Badlands. Geomorphologyand piping. Geo Books. Norwich.
Butler, J., Goetz, H. & Richardson, J.L. 1986. Vegetation andsoil landscape relationships in the North Dakota badlands.Am. Midl. Nat. 116: 378-386.
Calvo, A. & Harvey, A.M. 1989. Morphology and develop-ment of selected badlands in southeast Spain: implicationsof climate change. In: Imeson, A. & De Groot, R.S. (eds.)
Table 4. Percentage of seed losses per species after rainfallsimulations.
Experiment Cheirolophus Cistus Helichrysum Moricandiaintybaceus albidus stoechas arvensis
SL-01 4.17 0.00 4.17 0.00SL-02 25.00 8.33 0.00 0.00SL-03 37.50 8.33 0.00 4.17SL-04 3.33 3.33 0.00 0.00SL-05 1.67 0.00 0.00 0.00SL-06 4.35 0.00 0.00 0.00
Fig. 2. Distribution of the soil seed bank samples that con-tained seeds (n = 90).
depletion of the soil seed bank is remote. The resultsfrom the seed rain data suggest that, even if the soil seedbank is completely removed, the arrival of seeds wouldbe enough to ensure a rapid re-establishment of the seedbank.
The same set of species dominates the soil seed bankand the seed input and output, indicating that the resultsare consistent. However, there was a relative lack ofeffectiveness of the soil seed bank and seed rain sam-pling design, because seeds of some species that ap-peared in the sediment traps were not found in the seedbank or rain (Table 1). This can most likely be attributedto the seed dispersal mechanisms of these species, whichwere either short distance, ballistic dispersion mecha-nisms (Cistus albidus), short pedicels (Teucrium pseudo-chamaepitys, Thymus vulgaris and T. longiflorus) orbarochorous species (Brachypodium retusum, Foenicu-lum vulgare and Cheirolophus inthybaceus). As a con-sequence, total seed input was underestimated. Despite

696 García-Fayos, P., et al.
Landscape-Ecological Impact of Climatic Change on theMediterranean Region, pp. 321-330. University of Utrechtand University of Amsterdam, Amsterdam.
Calvo, A., Gisbert, J., Palau, E. & Romero, M. 1988. Unsimulador de lluvia portátil de fácil construcción. In: Sala,M. & Gallart, F. (eds.) Métodos y técnicas para la mediciónen el campo de procesos geomorfológicos, pp. 6-15. Mono-grafía nº1, Sociedad Española de Geomorfología, Barce-lona.
Calvo, A., Harvey, A.M., Payá, J. & Alexander, R.W. 1992.Response of badland surfaces in southeast Spain to simu-lated rainfall. Cuat. Geomorfol. 5: 3-14
García-Fayos, P. & Recatalá, T.M. 1992. La reserva de semillasen una cuenca de badlands (Petrer, Alicante). Pirineos140: 29-36.
Govers, G. 1989. Grain velocities in overland flow: A labora-tory experiment. Earth Surf. Proces. 14: 481-489.
Govers, G. 1991. Time dependency of run-off velocity anderosion: The effect of the initial soil moisture profile.Earth Surf. Process. 16: 713-729.
Guardia, R. & Ninot, J. 1992. Distribution of plant communi-ties in the badlands of the upper Llobregat basin (South-eastern Pyrenees). Stud. Geobot. 12: 83-103.
Harvey, A.M. & Calvo, A. 1991. Process interactions and rilldevelopment on badlands and gully slopes. Z. Geomorph.N. F. Suppl.-Bd. 83: 175-94.
Kemp, P.R. 1989. Seed bank and vegetation processes indeserts. In: Leck, M.A., Parker, V.T. & Simpson, R.L.(eds.) Ecology of soil seed banks, pp. 257-281. AcademicPress. San Diego, CA.
Kominami, Y. 1988. Seed-fall in the early stage of successionafter a forest fire. Ecol. Rev. 21: 169-176.
Korzhenivskiy, V.V. & Klyukin, A.A. 1989. Vegetation ofCrimean badlands. Sov. J. Ecol. 20: 338-344.
López-Bermúdez, F. & Romero-Díaz, M.A. 1989. Pipingerosion and badland development in SE Spain. In: Yair, A.& Berkowicz, S. (eds.) Arid and semiarid environments:Geomorphological and pedological aspects, pp. 59-73.Catena supplement, 14. Catena, Cremlingen.
Manders, P.T. 1990. Soil seed banks and post-fire seed depo-sition across a forest-fynbos ecotone in the Cape Province.J. Veg. Sci. 1: 491-498.
Morris, W.F., Marks, P.L., Mohler, C.L., Rappaport, N.R.,Wesley, F.R. & Moran, M.A. 1986. Seed dispersal andseedling emergence in an old field community in CentralNew York (USA). Oecologia (Berl.). 70: 92-99.
Nelson, J.F. & Chew, R.M. 1977. Factors affecting seedreserves in the soil of a Mojave desert ecosystem, RockValley, Nye County, Nevada. Am. Midl. Nat. 97: 300-321.
Parsons, A.J., Wainwright, J. & Abrahams, A.D. 1993. Trac-ing sediment movement in interrill overland flow on asemi-arid grassland hillslope using magnetic susceptibil-ity. Earth Surf. Process. 18: 721-732.
Reichman, O.J. 1984. Spatial and temporal variation of seeddistributions in Sonora Desert Soils. J. Biogeogr. 11: 1-11.
Thornes, J.B. 1985. The ecology of erosion. Geography 70:222-235.
Thornes, J.B. 1990. The interaction of erosional andvegetational dynamics in land degradation: Spatial out-
comes. In: Thornes, J.B. (ed.) Vegetation and Erosion.J.Wiley & Sons, London.
Tutin, T.G., Heywood, V.H., Burges, N.A. Valentine, D.H.Walters, S.M. & Webb, D.A. (eds.) 1964-1980. FloraEuropaea. Cambridge University Press, Cambridge.
Received 7 March 1994;Revision received 9 March 1995;
Accepted 25 June 1995.

- Limitations to plant establishment on eroded slopes in SE Spain - 77
Journal of Vegetation Science 11: 77-86, 2000© IAVS; Opulus Press Uppsala. Printed in Sweden
Abstract. The possible causes for the lack of vegetation in fivebadland sites from southeast Spain were experimentally tested.The main factors affecting seed germination and seedlingsurvival considered were seed availability, regolith water dy-namics in relation to rain events, regolith salinity, seedlingpredation by herbivores and seedling removal by erosion.
Four issues are addressed: 1. Both rainfall and the tempo-ral and spatial dynamics of regolith water during the seedlingemergence period were monitored in five different zones atone site (Petrer, Alicante). 2. Effects of salinity and waterpotential on the rate and speed of germination of local seedswere determined. 3. Seed reserve and seedling emergence andmortality were followed throughout one season. 4. Regolithcharacteristics of all five sites were compared and the conse-quences for plant colonization discussed.
The main factor limiting plant colonization in these siteswas the very short duration of available water in the soil, dueto the physical and chemical characteristics of the regolith. Inaddition, high regolith salinity and its effects on seed germina-tion, the aspect of the site and the pattern of rain events, playeda very important role reducing germination and survival.Herbivory and erosion were seldom responsible for seedlingmortality. However, there were no highly erosive rain eventsduring the study period, although several have been measuredduring the past few years.
Keywords: Badland; Germination; Plant colonization; Seed-ling dynamics; Soil salinity; Soil water dynamics.
Introduction
A badland is a distinctive land form that develops inareas of accelerated slope erosion in soft-rock terrain.Badlands are particularly important landscapes in semi-arid regions, but they are also present under other cli-matic regimes (Bryan & Yair 1982; Campbell 1989;Calvo & Harvey 1996).
Seed availability, microsite limitations and predationby herbivores are the main factors potentially limitingrecruitment in plant populations (Crawley 1990; Eriksson& Ehrlén 1992). Although badlands are characterized byvery high rates of erosion, previous studies have shownthat erosion does not affect the seed reserve as much as
Limitations to plant establishment on eroded slopesin southeastern Spain
García-Fayos, Patricio1*, García-Ventoso, Belen2 & Cerdà, Artemi2
1Centro de Investigaciones sobre Desertificación (CSIC-UV-GV), Apartado Oficial, E-46470 Albal, Valencia, Spain;2Departament de Geografia, Universitat de València, Apartado Postal 22060, E-46080 Valencia, Spain;
*Corresponding author; Fax +34 961270967; E-mail [email protected]
expected. Seeds do accumulate in the badland surfaces insufficient quantities to ensure plant recruitment (García-Fayos et al. 1995; Cerdà & García-Fayos 1997; García-Fayos & Cerdà 1997). Thus, if the lack of seeds is not themain cause for the lack of vegetation, then micrositefactors and herbivore predation should be considered.
The regolith is the weathered surface layer of thebadlands. It has very distinctive physical and chemicalproperties that may make it unsuitable for plant growth.First, the regolith usually has very high electrical con-ductivity, mostly because of the high concentration ofsodium chloride and gypsum (Harvey 1982; Gerits et al.1987; Imeson & Verstraten 1988). In addition, its physi-cal structure is such that water may only be available fora short time after a rain event, regardless of the amountof rainfall (Cerdà 1997). Thus, we hypothesize thatsalinity and reduced water availability, through theireffects on seed germination and seedling survival, couldbe the main factors accounting for the lack of vegetationon the badland slopes in southeast Spain.
The objective of this study is to test two possiblecauses for the lack of vegetation in badlands: the highsalinity and reduced water availability of the regolith,and the predation of seedlings by herbivores. Specifi-cally, we present evidence for: (1) the temporal andspatial dynamics of regolith water in relation to rainfallevents during the seedling emergence period; (2) theeffects of both salinity and water potential of the badlandregolith on the rate and speed of germination of the mainspecies of the local flora; (3) the main agents of seedlingmortality; and (4) the trends of soil salinity and moisturedynamics in the regoliths of five representative badlandsin southeastern Spain.
Material and Methods
Study sites
Five badland sites that encompass the main lithologic,climatic and geomorphological gradients across south-east Spain were selected. The sites are Petrer and
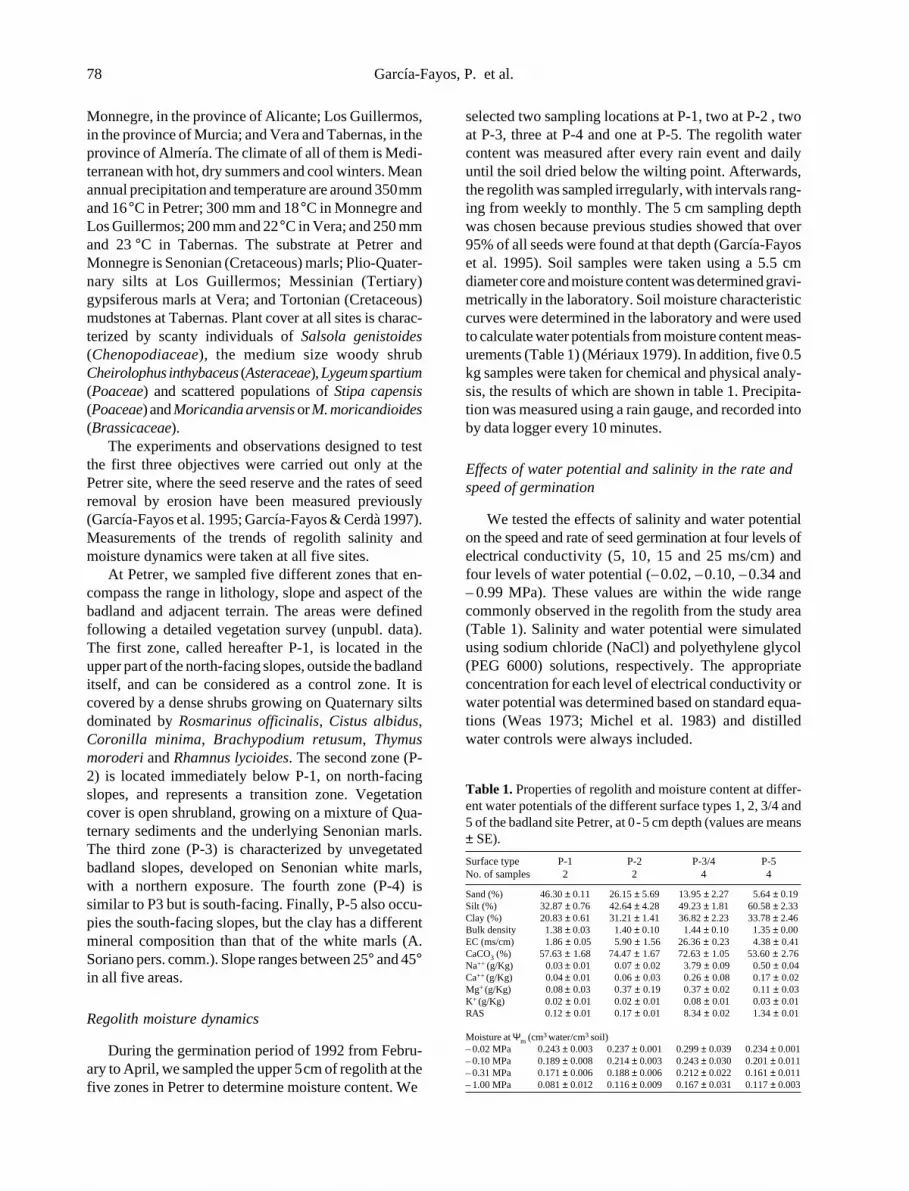
78 García-Fayos, P. et al.
Monnegre, in the province of Alicante; Los Guillermos,in the province of Murcia; and Vera and Tabernas, in theprovince of Almería. The climate of all of them is Medi-terranean with hot, dry summers and cool winters. Meanannual precipitation and temperature are around 350 mmand 16 °C in Petrer; 300 mm and 18 °C in Monnegre andLos Guillermos; 200 mm and 22 °C in Vera; and 250 mmand 23 °C in Tabernas. The substrate at Petrer andMonnegre is Senonian (Cretaceous) marls; Plio-Quater-nary silts at Los Guillermos; Messinian (Tertiary)gypsiferous marls at Vera; and Tortonian (Cretaceous)mudstones at Tabernas. Plant cover at all sites is charac-terized by scanty individuals of Salsola genistoides(Chenopodiaceae), the medium size woody shrubCheirolophus inthybaceus (Asteraceae), Lygeum spartium(Poaceae) and scattered populations of Stipa capensis(Poaceae) and Moricandia arvensis or M. moricandioides(Brassicaceae).
The experiments and observations designed to testthe first three objectives were carried out only at thePetrer site, where the seed reserve and the rates of seedremoval by erosion have been measured previously(García-Fayos et al. 1995; García-Fayos & Cerdà 1997).Measurements of the trends of regolith salinity andmoisture dynamics were taken at all five sites.
At Petrer, we sampled five different zones that en-compass the range in lithology, slope and aspect of thebadland and adjacent terrain. The areas were definedfollowing a detailed vegetation survey (unpubl. data).The first zone, called hereafter P-1, is located in theupper part of the north-facing slopes, outside the badlanditself, and can be considered as a control zone. It iscovered by a dense shrubs growing on Quaternary siltsdominated by Rosmarinus officinalis, Cistus albidus,Coronilla minima, Brachypodium retusum, Thymusmoroderi and Rhamnus lycioides. The second zone (P-2) is located immediately below P-1, on north-facingslopes, and represents a transition zone. Vegetationcover is open shrubland, growing on a mixture of Qua-ternary sediments and the underlying Senonian marls.The third zone (P-3) is characterized by unvegetatedbadland slopes, developed on Senonian white marls,with a northern exposure. The fourth zone (P-4) issimilar to P3 but is south-facing. Finally, P-5 also occu-pies the south-facing slopes, but the clay has a differentmineral composition than that of the white marls (A.Soriano pers. comm.). Slope ranges between 25° and 45°in all five areas.
Regolith moisture dynamics
During the germination period of 1992 from Febru-ary to April, we sampled the upper 5 cm of regolith at thefive zones in Petrer to determine moisture content. We
selected two sampling locations at P-1, two at P-2 , twoat P-3, three at P-4 and one at P-5. The regolith watercontent was measured after every rain event and dailyuntil the soil dried below the wilting point. Afterwards,the regolith was sampled irregularly, with intervals rang-ing from weekly to monthly. The 5 cm sampling depthwas chosen because previous studies showed that over95% of all seeds were found at that depth (García-Fayoset al. 1995). Soil samples were taken using a 5.5 cmdiameter core and moisture content was determined gravi-metrically in the laboratory. Soil moisture characteristiccurves were determined in the laboratory and were usedto calculate water potentials from moisture content meas-urements (Table 1) (Mériaux 1979). In addition, five 0.5kg samples were taken for chemical and physical analy-sis, the results of which are shown in table 1. Precipita-tion was measured using a rain gauge, and recorded intoby data logger every 10 minutes.
Effects of water potential and salinity in the rate andspeed of germination
We tested the effects of salinity and water potentialon the speed and rate of seed germination at four levels ofelectrical conductivity (5, 10, 15 and 25 ms/cm) andfour levels of water potential (– 0.02, – 0.10, – 0.34 and– 0.99 MPa). These values are within the wide rangecommonly observed in the regolith from the study area(Table 1). Salinity and water potential were simulatedusing sodium chloride (NaCl) and polyethylene glycol(PEG 6000) solutions, respectively. The appropriateconcentration for each level of electrical conductivity orwater potential was determined based on standard equa-tions (Weas 1973; Michel et al. 1983) and distilledwater controls were always included.
Table 1. Properties of regolith and moisture content at differ-ent water potentials of the different surface types 1, 2, 3/4 and5 of the badland site Petrer, at 0 - 5 cm depth (values are means± SE).
Surface type P-1 P-2 P-3/4 P-5No. of samples 2 2 4 4
Sand (%) 46.30 ± 0.11 26.15 ± 5.69 13.95 ± 2.27 5.64 ± 0.19Silt (%) 32.87 ± 0.76 42.64 ± 4.28 49.23 ± 1.81 60.58 ± 2.33Clay (%) 20.83 ± 0.61 31.21 ± 1.41 36.82 ± 2.23 33.78 ± 2.46Bulk density 1.38 ± 0.03 1.40 ± 0.10 1.44 ± 0.10 1.35 ± 0.00EC (ms/cm) 1.86 ± 0.05 5.90 ± 1.56 26.36 ± 0.23 4.38 ± 0.41CaCO3 (%) 57.63 ± 1.68 74.47 ± 1.67 72.63 ± 1.05 53.60 ± 2.76Na++ (g/Kg) 0.03 ± 0.01 0.07 ± 0.02 3.79 ± 0.09 0.50 ± 0.04Ca++ (g/Kg) 0.04 ± 0.01 0.06 ± 0.03 0.26 ± 0.08 0.17 ± 0.02Mg+ (g/Kg) 0.08 ± 0.03 0.37 ± 0.19 0.37 ± 0.02 0.11 ± 0.03K+ (g/Kg) 0.02 ± 0.01 0.02 ± 0.01 0.08 ± 0.01 0.03 ± 0.01RAS 0.12 ± 0.01 0.17 ± 0.01 8.34 ± 0.02 1.34 ± 0.01
Moisture at Ψm (cm3 water/cm3 soil)– 0.02 MPa 0.243 ± 0.003 0.237 ± 0.001 0.299 ± 0.039 0.234 ± 0.001– 0.10 MPa 0.189 ± 0.008 0.214 ± 0.003 0.243 ± 0.030 0.201 ± 0.011– 0.31 MPa 0.171 ± 0.006 0.188 ± 0.006 0.212 ± 0.022 0.161 ± 0.011– 1.00 MPa 0.081 ± 0.012 0.116 ± 0.009 0.167 ± 0.031 0.117 ± 0.003

- Limitations to plant establishment on eroded slopes in SE Spain - 79
The effect of salinity and water potential was testedfor the following species:
Asteraceae: Cheirolophus inthybaceus, Helichrysum stoechasPhagnalon saxatile;
Poaceae: Dactylis glomerata ssp. hispanica, Lygeum spartium;Brassicaceae: Moricandia arvensis;Chenopodiaceae:Salsola genistoides;
Crassulaceae: Sedum sediforme.
These species were selected because they were domi-nant in P-1 and P-2 and were also present in the otherfour badlands. Seeds were collected in the study areaduring 1993, air-dried and stored at room temperatureuntil the autumn of 1993, when the germination experi-ments were run. Because seeds may have specializeddispersal structures, which may or may not be lostduring dispersion, they were always used in the formthey keep after the dispersion event.
Each level of electrical conductivity or water poten-tial was replicated four times for each species. A repli-cate consisted of a Petri dish with filter paper moistenedwith 5 ml of the appropriate solution and 50 seeds.However, replicates for L. spartium and S. genistoidesonly had 25 seeds, because of their larger size. The Petridishes were covered with PVC sheets to prevent evapo-ration and placed in a growth chamber with a 12:12 hphotoperiod. Temperature was kept at 25 °C duringdaytime and 15 °C during night-time. These photope-riod length and temperatures correspond to conditionsfound in the field during the germination periods of 1991and 1992. The dishes were checked daily until the firstseed germinated. A seed was considered to have germi-nated when the radicle emerged from the seed coat. Fromthen on the number of seeds that had germinated wascounted 5 times per week, for a total of 28 days. At theend of this period the viability of the seeds that had notgerminated was checked using the Tetrazolium test, andonly viable seeds were considered for calculations. Wecalculated germination rate as the percentage of seedsthat had germinated by day 28, and germination speed asthe number of days until the first germination was de-tected.
The effects of water potential and salinity on thegermination rate for each species were determined usinganalysis of variance. Tukey tests were applied to comparegermination rates among treatment levels. The data werearcsin transformed to fit the assumptions of normality andhomogeneity of variances. The effects of water potentialand salinity on germination speed were analysed usingthe Kruskal-Wallis test, because data cannot be normal-ized. Also ‘a posteriori’ tests were performed to comparegermination speed among treatment levels (Zar 1996).
Seedling emergence and survival
A total of 78 0.5 m × 0.5 m plots were established inthe five zones at Petrer prior to the 1993-1994 germina-tion period. The location of the plots was determinedfollowing a stratified sampling procedure. Three plotswere established in P-1, 15 in P-2, 18 in P-3, 31 in P-4,and 11 in P-5. Seedling emergence, survival and reproduc-tion were monitored in each plot at least every 15 daysfrom 30/09/93 to 01/07/94, and then monthly until 11/10/94. When a seedling was first detected, it was identifiedwith a toothpick, so that each individual could be foundin successive visits. Mortality was classified into fourpossible causes: drought, erosion, herbivory and unde-termined. If a seedling was found desiccated, its deathwas attributed to drought. If the seedling could not befound and signs of regolith erosion were identified, itsdeath was attributed to erosion. If a dead seedling hadcotyledons or leaves partially or totally defoliated, itsdeath was attributed to herbivory. If a seedling haddisappeared, but we were not able to assign its death toany of the preceding causes, the cause of death wasconsidered as undetermined. In addition, precipitationwas registered daily during the same period using raingauges connected to a data-logger.
In order to assess the effects of the soil seed bank onseedling emergence, we estimated the density ofgerminable seeds. In October 1991, before the period ofseedling emergence, five 20 cm × 20 cm plots wererandomly located in each of the P-1, P-2 and P-3 zones,and the top 6 cm of regolith collected. Each sample wasdesegregated and homogeneously distributed on trays.The soil sample was arranged in a 1 cm thick layer overa 5 cm bed of vermiculite. The trays were covered witha plastic mesh to prevent seed and seedling predationand placed outside. They were sprinkled with waterthree times per week. During the following four months,seedlings emergence was counted weekly, and the seed-lings were removed after the species was identified.
Other badlands in southeast Spain
We measured electrical conductivity and obtainedsoil moisture characteristic curves of the regolith in thefive badlands during February 1994. Only the most repre-sentative substrate from each site was sampled. In Petrer,it was the substrate from P-3 and P-4. Five 5 cm deepsubsamples were taken from five different south facingpoints at each badland site. After homogenizing thesubsamples, they were air-dried, sieved through a 2 mmsieve and electrical conductivity and soil moisture charac-teristic curve determined.
To estimate the period of time during which soilwater remained available after a rain event three 0.5 l
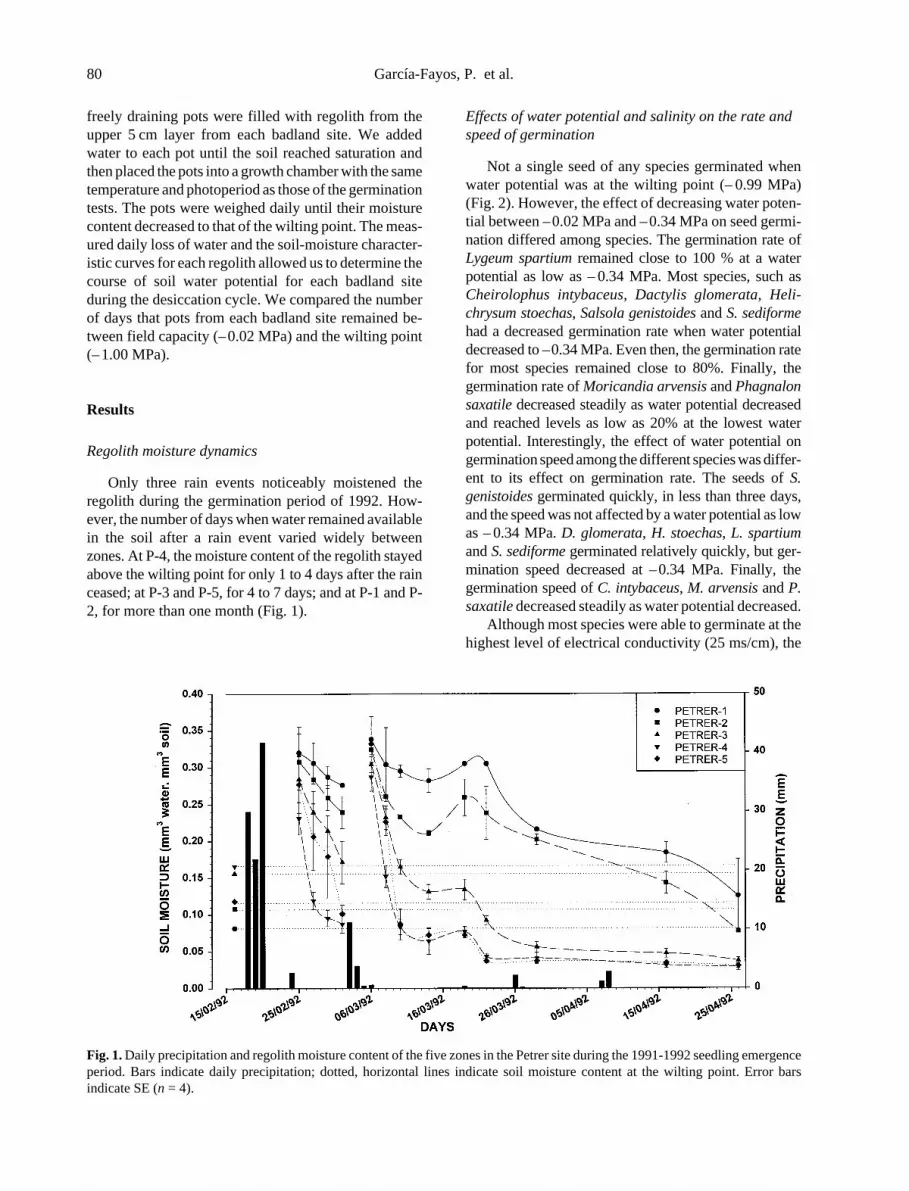
80 García-Fayos, P. et al.
freely draining pots were filled with regolith from theupper 5 cm layer from each badland site. We addedwater to each pot until the soil reached saturation andthen placed the pots into a growth chamber with the sametemperature and photoperiod as those of the germinationtests. The pots were weighed daily until their moisturecontent decreased to that of the wilting point. The meas-ured daily loss of water and the soil-moisture character-istic curves for each regolith allowed us to determine thecourse of soil water potential for each badland siteduring the desiccation cycle. We compared the numberof days that pots from each badland site remained be-tween field capacity (– 0.02 MPa) and the wilting point(– 1.00 MPa).
Results
Regolith moisture dynamics
Only three rain events noticeably moistened theregolith during the germination period of 1992. How-ever, the number of days when water remained availablein the soil after a rain event varied widely betweenzones. At P-4, the moisture content of the regolith stayedabove the wilting point for only 1 to 4 days after the rainceased; at P-3 and P-5, for 4 to 7 days; and at P-1 and P-2, for more than one month (Fig. 1).
Effects of water potential and salinity on the rate andspeed of germination
Not a single seed of any species germinated whenwater potential was at the wilting point (– 0.99 MPa)(Fig. 2). However, the effect of decreasing water poten-tial between – 0.02 MPa and – 0.34 MPa on seed germi-nation differed among species. The germination rate ofLygeum spartium remained close to 100 % at a waterpotential as low as – 0.34 MPa. Most species, such asCheirolophus intybaceus, Dactylis glomerata, Heli-chrysum stoechas, Salsola genistoides and S. sediformehad a decreased germination rate when water potentialdecreased to – 0.34 MPa. Even then, the germination ratefor most species remained close to 80%. Finally, thegermination rate of Moricandia arvensis and Phagnalonsaxatile decreased steadily as water potential decreasedand reached levels as low as 20% at the lowest waterpotential. Interestingly, the effect of water potential ongermination speed among the different species was differ-ent to its effect on germination rate. The seeds of S.genistoides germinated quickly, in less than three days,and the speed was not affected by a water potential as lowas – 0.34 MPa. D. glomerata, H. stoechas, L. spartiumand S. sediforme germinated relatively quickly, but ger-mination speed decreased at –0.34 MPa. Finally, thegermination speed of C. intybaceus, M. arvensis and P.saxatile decreased steadily as water potential decreased.
Although most species were able to germinate at thehighest level of electrical conductivity (25 ms/cm), the
Fig. 1. Daily precipitation and regolith moisture content of the five zones in the Petrer site during the 1991-1992 seedling emergenceperiod. Bars indicate daily precipitation; dotted, horizontal lines indicate soil moisture content at the wilting point. Error barsindicate SE (n = 4).

- Limitations to plant establishment on eroded slopes in SE Spain - 81
effects of salinity on germination were more dramaticthan the effects of reduced water potential (Fig. 3). Withthe exception of L. spartium, the germination rate orspeed of all species was affected at an electrical conduc-tivity greater than 5 ms/cm. At an electrical conductivityof 15 ms/cm or above only L. spartium, S. genistoidesand D. glomerata maintained reasonably high germina-tion rates and speeds.
Seedling emergence and survival
Germinable seed densities in P-2 and P-3 were simi-lar, but they were much lower than the seed density in P-1, the control area outside the badland (Table 2). Fourcohorts of seedlings were detected from September
1993 to June 1994, following four rainy periods. A totalof 643 seedlings emerged. The cohort of November wasthe most numerous, with 67% of the seedlings. Al-though P-4 had the most intensive sampling (31 plots,covering a total of 7.75 m2), not a single seedling wasdetected during the 9 months of study (Table 2). Ingeneral, the number of seedlings and species decreasedfrom the northern to the southern slopes, and fromvegetated to unvegetated areas within the northern slopes.Thus, 273 seedlings/m2 emerged in P-1; 55/m2 in P-2;0.8/m2 in P-3; and none in P-4. Only seedlings from P-1and P-2 had reproduced or survived by the end of thestudy (see App. 1). In P-5 10 seedlings/m2 emerged, allM. arvensis, but none reproduced or survived. Thenumber of species that emerged followed the same
Fig. 2. Effect of water potential on germina-tion rate (black bars), and germination speed(grey bars) for each species. Germinationrate measures the percent of seeds that ger-minated after 28 days, while germinationspeed measures the number of days until thefirst seed germinated. Values are means ±SE. Different letters indicate significant sta-tistical differences between treatment levelsat the 0.05 level. No letters on bars indicatethat the treatment had no significant effect.

82 García-Fayos, P. et al.
Fig. 3. Effect of the salinity ongermination rate (black bars), andgermination speed (grey bars) foreach species. Values are means ±SE. Different letters indicate sig-nificant statistical differences be-tween treatment levels at the 0.05level. No letters on bars indicatethat the treatment had no signifi-cant effect.
Table 2. Germinable seed densities in the regolith in October 1991; seedling emergence, survival and causes of mortality for therecruitment period of 1993-1994 in the Petrer site. Values are means ± SE.
P-1 P-2 P-3 P-4 P-5
Seed bank (seeds/m2) 2335 ± 423.0 365 ± 133.3 315 ± 121.6 * *Emergence (seedlings/m2) 272.8 ± 38.2 54.8 ± 9.2 0.8 ± 0.4 0.0 ± 0.0 9.4 ± 3.2Survival (seedlings/m2) 6.4 ± 4.2 1.2 ± 0.5 0.8 ± 0.4 0.0 ± 0.0 0.0 ± 0.0
Causes of mortality:Drought (%) 76.28 75.09 100.00 – 55.56Erosion (%) 0.00 2.60 0.00 – 3.70Predation (%) 2.10 3.72 0.00 – 0.00Unknown (%) 21.62 18.59 0.00 – 40.74
* These regolith surfaces were not sampled for seed bank, but seed density values might be similar to those in P-3 as inferred from García-Fayos et al. (1995).

- Limitations to plant establishment on eroded slopes in SE Spain - 83
pattern. There were 13 species in total in the three plotsof P-1; 11 species in the 15 plots of P-2; and two speciesin the 18 plots of P-3 (see App. 1). Only one species,M. arvensis, emerged in the 11 plots of P-5. M. arvensiswas the most abundant species in all the zones where itwas present, due to a better germination rate and highreproduction and survival rates. C. inthybaceus and L.spartium were the only species able to emerge at P-3, butnone of them survived (see App. 1).
Drought was the main cause of death (Table 2),accounting for all seedling mortality in P-3, more than75% in P-1 and P-2 and for more than 50% in P-5.Erosion and herbivory were responsible for less than 5% ofthe deaths in all zones. Erosion as a cause of mortality wasonly detected in P-3 and P-5, whereas herbivory was onlydetected in P-1 and in P-2.
Other badlands in southeast Spain
All of the badlands, except Los Guillermos, havemoderate to highly saline regoliths. The Vera and Petrerbadlands have the highest values, up to 51.8 and 36.5ms/cm, respectively (Table 3). The salinity at LosGuillermos is similar to that of the Quaternary sedimentsat the Petrer site (P-1) (Table 1).
The regoliths from all but one of the sites retainedwater above the wilting point for ca. 5 days after the soilhad been saturated. The only exception was the regolithfrom the Vera badlands, which retained available waterfor almost 15 days (Table 3).
Discussion
The dynamics of soil water availability – determinedby physical and chemical characteristics of the regolithsuch as its texture and sodium content – and the high soilelectrical conductivity (Table 1), are the main factorsresponsible for the differences in seed emergence andseedling survival in the five zones in the Petrer badlands.Only the water retained in the regolith between fieldcapacity (– 0.02 MPa) and wilting point (– 1.00 MPa) isusable by plants. In general, water availability in-creases as soil texture changes from sandy to loamy,and decreases again in clayey soils (Brady 1990). Withregard to electrical conductivity, excessive salinity maycause ion toxicity to seeds and plants (Lima et al. 1990).In addition, high solute concentration has an osmoticeffect, decreasing soil water potential and, therefore,seed water imbibition (Mayer & Poljakoff-Mayber 1989).
Neither water availability nor salinity seemed tolimit germination in P-1 or P-2, the control and transi-tion zones, where the highest seedling densities weredetected. Regolith water potential remained close to
field capacity (– 0.02 MPa) for several weeks, a periodof time much longer than the ca. 5 days needed for seedgermination (Figs. 1 and 2). Likewise, electrical conduc-tivity was too low to affect the speed or the rate ofgermination of the species of the local flora (Table 1 andFig. 3). In fact, most of the species present in the areawere able to germinate in these two zones (App. 1). Thefivefold difference in seedling density between the sitesmay be caused by differences in seed availability, thedensity of germinable seeds at P-2 was almost an orderof magnitude lower than that at P-1 (Table 2).
In the pure badland zones, P-3 and P-4, both regolithwater availability and salinity had detrimental effects onseed germination. High clay and sodium content in theregolith resulted in large amounts of water held belowthe wilting point (ca. 0.167 cm3 water per cm3 soil) andsignificantly reduced the ability of the soil to retainavailable water. Thus, the soil dried quickly after a rainevent and reached the wilting point more quickly thanthe soil at other zones. After the rain had ceased, theupper 5 cm of soil at P-3 and P-4 remained above thewilting point for only 1 to 7 days. However, the actualtime available for seed germination was longer, becausethe regolith was also moist while it was raining or if tworain events occurred close enough to each other. Thus,during the germination season of 1992, the number ofconsecutive days when soil water potential remained abovethe wilting point was 8 at P-4 and 22 at P-3 (Fig. 1).Nevertheless, the laboratory experiments showed thatgermination rate and speed were also affected by waterpotentials above the wilting point. So, reduced waterpotential during those days may result in a reduction inthe germination rate and/or an increase in the time neededto initiate germination (Fig. 2).
In addition to the effects of reduced water potential,high soil conductivity also affected seed germinationrate and speed. Soil conductivity in the regolith from P-3 and P-4 was ca. 25 ms/cm (Table 1), a salinity level thatcompletely inhibited germination of Phagnalon saxatileand strongly depressed germination of Helichrysum
Table 3. Chemical and physical properties of the regolith ofthe badland study areas in SE Spain.Values are means ± SE.
Petrer Monnegre Guillermos Vera Tabernas
EC (ms.cm) 36.500 10.700 2.170 51.800 6.530Na+ (meq/100g) 0.590 0.645 0.015 0.687 0.652Ca++ (meq/100g) 0.332 0.235 0.165 0.595 0.410Mg++ (meq/100g) 0.130 0.135 0.074 0.215 0.179K+ (meq/100g) 0.283 0.178 0.018 1.159 0.129RAS 1.228 1.500 0.042 1.079 1.201DAWP* 5.60 4.67 5.72 14.67 6.67
± 0.42 ± 0.22 ± 0.27 ± 0.29 ± 0.17
*Number of days that pots remain above wilting point after artificialwetting.

84 García-Fayos, P. et al.
stoechas, Moricandia arvensis and Salsola sediforme.Even when electrical conductivity was 15 ms/cm, thegermination of Cheirolophus inthybaceus, Dactylisglomerata, H. stoechas and S. sediforme was delayed foreight or more days. This delay would prevent seed germi-nation of all species except Lygeum spartum and S.genistoides at P-4, and could explain the failure to detectany seedling emergence in this zone. However, at P-3water remained available for 22 days and, therefore, someseeds of C. inthybaceus, D. glomerata, M. arvensis, L.spartum and S. genistoides could germinate, even at aconductivity as high as 25 ms/cm.
The characteristics of P-5 were intermediate betweenthe two types described above. Soil conductivity at this sitewas ca. 4 ms/cm, relatively low and similar in magnitude tothat of P-2 (Table 1). However, the duration of availablewater in the soil was between that of P-3 and P-4. Theabundance in this zone of M. arvensis, completely absent inP-3 and P-4, would support this explanation. M. arvensis isa species severely limited by soil salinity but only moder-ately affected by low water potentials.
The density of seedlings that emerged in theunvegetated badland zones (P-3, P-4 and P-5) was muchlower than the 36.8 ± 4.1 seedling/m2 reported for abadland area in the Pyrenees mountain range (Guàrdiaet al. 1996). However, this latter badland was located ata higher altitude, received a much higher precipitation(ca. 1000 mm) and had different parent material. Never-theless, the seedling density at the Pyrenees site is muchlower than that in the vegetated zones at our study site(P-1 and P-2), and certainly much lower than the seedbank of the regolith. Interestingly, the seed content fromthe P-3 zone was similar to that reported by García-Fayos et al. (1995) for March 1991 in the same area (280± 74 seeds/m2), despite methodological and chronologi-cal differences. The disparity between seed reserve andemergence suggests again that seedling emergence is notlimited by seed availability, but by microsite conditions.
In addition to the reduced or inhibited seed germina-tion, seedling survival was a very important factor limitingthe recruitment of plants in the badlands. However, similarrates of mortality have been reported for other semi-aridenvironments outside badlands (Fuentes et al. 1984;Soriano & Sala 1986; Harrington 1991; Milton 1995).Not a single individual survived or reproduced in any ofthe badland areas (P-3, P-4 and P-5) and only 5.3% and2.6% survived in P-1 and P-2, respectively. The maincause of mortality was drought, as expected from thewater retention characteristics of the regolith discussedabove. Seedling removal by erosion occurred infrequentlyand was not a major factor causing seedling mortality.Similar results have been found in other badland areas(Guàrdia et al. 1996), and are also in agreement with thenegligible effects of erosion on seed dynamics (García-
Fayos et al. 1995).The patterns of seed germination and seedling survival
are consistent with the current distribution of adult plants inthe badlands of Petrer (unpubl. data). The presence of adultplants of species of which not a single seedling was de-tected, could be explained by the occurrence of extraordi-narily wet periods in the past. Climatic characteristics, suchas the number of rainy days and the course of precipitationand temperatures throughout the year, influence the waterdynamics of the regolith and, therefore, affect germinationand survival. For instance, during the germination periodof 1993-1994, there were five days of continuous rain, butonly eight rainy periods longer than five days have beenrecorded between 1950 and 1990.
The same limitations to seed germination and seed-ling survival, caused by the interaction between theregolith physical and chemical characteristics and theclimatic conditions, may also apply to other badlandareas from southeastern Spain. The five sites sampledhad similar regolith characteristics and are under a cli-matic regime similar or even drier than that at Petrer. Thetime it took the regolith to reach the wilting point afterbeing saturated with water was equally short in all sitesexcept Vera. However, the electrical conductivity of theregolith at Vera was almost twice that of P-3 and P-4(Tables 1 and 3), which may explain the scarce andscattered vegetation there. Although it is possible thatplant populations from different badlands have devel-oped differences in their germination patterns (Acharyaet al. 1989, 1992; Meyer & Monsen 1991), we do notthink that these differences are so large and generalizedas to invalidate the proposed explanations. For instance,a germination experiment with two levels of electricalconductivity (14.54 and 11.73 ms/cm) showed no differ-ences on either germination rate or speed between seedsof H. stoechas from the Petrer and Monnegre populations(data not shown).
Although salinity and water availability seem toexplain the lack of vegetation on badland areas, erosioncould also occasionally play a mayor role in plant colo-nization. It is well-known that erosion processes inMediterranean climates operate in a catastrophic mode(Wainwright 1994). Several highly erosive rain events,with important geomorphological consequences, haveoccurred in the studied areas during the last few years(Calvo et al. 1991). These events can affect the coloniza-tion processes by completely removing the regolith seedbank, killing already established plants and seedlings,and modifying the properties of the regolith. On theother hand, extreme events such as those reported hereare not exclusive to badlands areas. In other environ-ments such as road cuttings (Mineau & Puech 1987) anddegraded slopes in Mediterranean and semi-arid regions(Francis et al. 1986; Agami 1987; Gutterman & Agami

- Limitations to plant establishment on eroded slopes in SE Spain - 85
1987; Tong 1987, 1989; Dargie 1987; González-Hidalgoet al. 1990), plant colonization is also controlled byerosive, lithologic and topographic factors.
In conclusion, short-lived water availability and highsalinity of the regolith seem to be the key factors limitingcolonization of vegetation on the badland slopes insoutheast Spain. This limitation arises from the effectsof the physical and chemical characteristics of the regolithon the water retention curve, and it is increased by othercharacteristics such as salt toxicity, aspect and climate.Although these factors may be present in other erosiveand degraded environments, it is the degree and presenceof all of them that make the badland environments sounique, and what results in the almost complete lack ofvegetation so characteristic of these landscapes.
Acknowledgements. We thank José Martínez and AmparoSoriano for providing data on soil properties and Adolfo Calvoand Alejandro Pérez-Cueva for providing meteorological data.Adolfo Calvo, Vicente Monleón and Vicente Pons helpedwith field and laboratory work. We are very grateful to VicenteMonleón, Carolina Hooper, Francisco Lloret, Adolfo Calvo,Miguel Verdú and two anonymous reviewers for their con-structive comments on the manuscript. Mario Payá and hisfamily granted permission to access and work on their prop-erty and assisted in the fieldwork. This study was supported bythe Spanish Comisión Interministerial de Ciencia y Tecnología(projects NAT89-1072-C06-04 and AMB93-0844-C06-04).
References
Acharya, S.N., Chu, C.B. & Hermesh, R. 1989. Effects ofpopulation, environment and their interaction on saskatoonberry (Amelanchier alnifolia Nutt.) seed germination. Can.J. Plant Sci. 69: 277-284.
Acharya, S.N., Chu, C.B., Hermesh, R. & Schaalge, G.B.1992. Factors affecting red-osier dogwood germination.Can. J. Bot. 70: 1012-1015.
Agami, M. 1987. The establishment, growth, phenology andlongevity of two species of Helianthemum in the NegevDesert Highlands. Oecologia (Berl.) 71: 486-490.
Brady, N.C. 1990. The nature and properties of soils. 10th ed.Macmillan Publishing Company, New York, NY.
Bryan, R. & Yair, A. (eds.) 1982. Badland: geomorphologyand pipping. Geobooks, Norwich.
Calvo, A. & Harvey, A.M. 1996. Morphology and develop-ment of selected badlands in southeast Spain: Implicationsof climatic change. Earth Surface Proc. Landforms 21:725-735.
Calvo, A., Harvey, A.M. & Payá, J. 1991. Process interactionsand badland development in SE Spain. In: Sala, J.M.,Rubio, J.L. & García-Ruiz, J.M. (eds.) Soil erosion studiesin Spain, pp. 75-90. Geoforma Ed., Logroño.
Campbell, I. 1989. Badlands and badland gullies. In: Thomas,D.S.G. (ed.) Arid zone geomorphology, pp. 159-183.
Bellhaven Press, London.Cerdà, A. 1997. Distribución de la humedad del suelo en las
cárcavas del sur del País Valenciano. Cuad. Geogr. 61: 1-13.Cerdà, A. & García-Fayos, P. 1997. The influence of slope
angle on sediment, water and seed losses on badlandlandscapes. Geomorphology 18: 77-90.
Crawley, M.J. 1990. The population dynamics of plants. Phil.Trans. R. Soc. London Ser. B 330: 125-140.
Dargie, T.C.D. 1987. An ordination analysis of vegetationpatterns on topoclimate gradients in Southeast Spain. J.Biogeogr. 14: 197-211.
Eriksson, O. & Ehrlén, J. 1992. Seed and microsite limitationof recruitment in plant populations. Oecologia (Berl.) 91:360-364.
Francis, C.F., Thornes, J.B., Romero-Díaz, A., López-Bermúdez,F. & Fischer, G.C. 1986. Topographic soil moisture vegeta-tion cover and land degradation in a moisture stressedMediterranean environment. Catena 13: 211-225.
Fuentes, E.R., Otaiza, R.D., Alliende, M.C., Hoffman, A. &Podani, P. 1984. Shrub clumps of the Chilean matorralvegetation: structure and possible maintenance mecha-nisms. Oecologia (Berl.) 62: 405-411.
García-Fayos, P. & Cerdà, A. 1997. Seed losses by surfacewash in degraded Mediterranean environments. Catena29: 73-83.
García-Fayos, P., Recatalá, T.M., Cerdà, A & Calvo, A. 1995.Seed population dynamics on badland slopes in southeast-ern Spain. J. Veg. Sci. 6: 691-696.
Gerits, J.J.P., Imeson, A.C., Verstraten, J.M. & Bryan, R.B.1987. Rill development and badland regolith properties.Catena (Suppl.) 8: 141-160.
González-Hidalgo, J.C., Echeverría, M.T. & Pellicer, F. 1990.Erosion and ecology in the midle of the Ebro Basin. Slopeaspects as a factor of erosional processes, and introductionapproach. In: Sala, M., Rubio, J.L. & García-Ruiz, J.M.(eds.) Soil erosion studies in Spain, pp. 123-136. GeoformaEd., Logroño.
Guàrdia, R., Alcántara, C. & Ninot, J.M. 1996. Seedlingemergence and dynamics in the badland areas of theVallcebre Basin (Alt llobregat). Fol. Bot. Misc. 10: 211-229. (In Catalanian.)
Gutterman, Y. & Agami, M. 1987. A comparative germina-tion study of seeds of Helianthemum vesicarium Boiss.and H. ventosum Boiss., perennial desert shrub speciesinhabiting two different neighboring habitats in the NegevDesert highlands, Israel. J. Arid Environ. 12: 215-221.
Harrington, G.N. 1991. Effects of soil moisture on shrub seed-ling survival in a semiarid grassland. Ecology 72: 1138-1149.
Harvey, A.M. 1982. The role of piping in the development ofbadlands and gully systems in southeast Spain. In: Bryan,R. & Yair, A. (eds.) Badland. Geomorphology and piping,pp. 317-35. Geobooks, Norwich.
Imeson, A.C. & Verstraten, J.M. 1988. Rills on badland slopes:a physicochemical controlled phenomena. Catena (Suppl.)12: 139-150.
Lima, L.A., Grismer, M.E., Nielsen, D.R. 1990. Salinity ef-fects on Yolo loam hydraulic properties. Soil Sci. 150:451-458.

86 García-Fayos, P. et al.
Mayer, A.M. & Poljakoff-Mayber, A. 1989. The germinationof seeds. 4th ed. Pergamon Press, Oxford.
Mériaux, S. 1979. Le sol et l’eau. In: Bonneau, M. & Souchier,B. (eds.) Pédologie 2: Constituants et propriétés du sol,pp. 226-312. Masson, Paris.
Meyer, D.E. & Monsen, S.B. 1991. Habitat-correlated varia-tion in mountain big sagebrush (Artemisia tridentata ssp.vaseyana) seed germination pattern. Ecology 72: 739-742.
Michel, B.E., Wiggins, O.K. & Outlaw, W.H. 1983. A guideto establishing water potential of aqueous two-phase solu-tions (Polyethylene Glycol plus Dextran) by amendmentwith mannitol. Plant Physiol. 72: 60-65.
Milton, S.J. 1995. Spatial and temporal patterns in the emer-gence and survival of seedlings in arid Karoo shrubland. J.Appl. Ecol. 32: 145-156.
Mineau, H. & Puech, S. 1987. Le mode de germination desdiaspores et la résistance des plantes à la sécheresse estivale,chez quelques espèces herbacées colonisatrices de talusroutiers. Ecol. Med. 13: 43-51.
Soriano, A. & Sala, O.E. 1986. Emergence and survival ofBromus setifolius seedlings in different microsites of aPatagonian arid steppe. Isr. J. Bot. 35: 91-100.
Tong, S.T.Y. 1987. The germination responses of Aristidacoerulescens, Helictotrichon filifolium and Helichrysumstoechas to temperature and water stress. Int. J. Ecol.Environ. Sci. 13: 133-147.
Tong, S.T.Y. 1989. Growth analysis of Aristida coerulescensand Helictotrichon filifolium seedlings under simulatedtemperature and nutrient conditions. J. Arid Environ. 19:161-167.
Wainwright, J. 1994. Anthropogenic factors in the degrada-tion of semiarid regions: a prehistoric case study in South-ern France. In: Millington, A.C. & Pye, K. (eds.) Environ-mental change in drylands: Biogeographical and geo-morphological perspectives, pp. 305-320. J. Wiley & Sons,Chichester.
Weas, R.C. (ed.) 1973. Handbook of chemistry and physics.54th ed. CRC Press, Boca Raton, LA.
Zar, J.H. 1996. Biostatistical analysis. 3rd ed. Prentice Hall,Upper Sadle River, NJ.
Received 23 January 1998;Revision received 23 January 1999;
Accepted 10 May 1999.Coordinating Editor: L. Mucina.
App
. 1. N
umbe
r of
see
dlin
gs th
at e
mer
ged,
rep
rodu
ced
and
surv
ived
of
all s
peci
es d
urin
g th
e re
crui
tmen
t per
iod
of 1
993-
1994
on
the
diff
eren
t sur
face
type
s in
the
badl
and
area
of
Petr
er. D
otte
d lin
e in
the
colu
mn
of p
lant
rep
rodu
ctio
n in
dica
tes
spec
ies
that
can
not r
epro
duce
the
firs
t yea
r. (
Val
ues
are
mea
ns ±
SE
.)
PET
RE
R-1
PET
RE
R-2
PE
TR
ER
-3
PET
RE
R-4
PET
RE
R-5
Em
erge
dR
epro
d.Su
rviv
edE
mer
ged
Rep
rod.
Surv
ived
Em
erge
dSu
rviv
edE
mer
ged
Surv
ived
Em
erge
dSu
rviv
ed
Bra
chyp
odiu
m r
etus
um0.
8 ±
0.7
——
—-
0.0
± 0.
00.
0 ±
0.0
——
—-
0.0
± 0.
00.
0 ±
0.0
0.0
± 0.
00.
0 ±
0.0
0.0
± 0.
00.
0 ±
0.0
0.0
± 0.
0C
heir
olop
hus
inth
ybac
eus
6.4
± 2.
4—
——
-0.
8 ±
0.7
3.0
± 0.
9—
——
-0.
0 ±
0.0
0.2
± 0.
20.
0 ±
0.0
0.0
± 0.
00.
0 ±
0.0
0.0
± 0.
00.
0 ±
0.0
Cor
is m
onsp
elie
nsis
4.8
± 3.
5—
——
-0.
0 ±
0.0
0.2
± 0.
2—
——
-0.
0 ±
0.0
0.0
± 0.
00.
0 ±
0.0
0.0
± 0.
00.
0 ±
0.0
0.0
± 0.
00.
0 ±
0.0
Dac
tyli
s gl
omer
ata
32 ±
12.
0—
——
-0.
8 ±
0.7
9.8
± 2.
9—
——
-0.
2 ±
1.9
0.0
± 0.
00.
0 ±
0.0
0.0
± 0.
00.
0 ±
0.0
0.0
± 0.
00.
0 ±
0.0
Eup
horb
ia e
xigu
a0.
8 ±
0.7
0.0
± 0.
00.
0 ±
0.0
0.0
± 0.
00.
0 ±
0.0
0.0
± 0.
00.
0 ±
0.0
0.0
± 0.
00.
0 ±
0.0
0.0
± 0.
00.
0 ±
0.0
0.0
± 0.
0F
uman
a er
icoi
des
8.0
± 3.
8—
——
-0.
0 ±
0.0
0.8
± 0.
4—
——
-0.
0 ±
0.0
0.0
± 0.
00.
0 ±
0.0
0.0
± 0.
00.
0 ±
0.0
0.0
± 0.
00.
0 ±
0.0
Hel
iant
hem
um s
yria
cum
0.8
± 0.
7—
——
-0.
0 ±
0.0
0.0
± 0.
0—
——
-0.
0 ±
0.0
0.0
± 0.
00.
0 ±
0.0
0.0
± 0.
00.
0 ±
0.0
0.0
± 0.
00.
0 ±
0.0
Hel
ichr
ysum
sto
echa
s22
.4 ±
10.
4—
——
-0.
0 ±
0.0
2.4
± 0.
9—
——
-0.
0 ±
0.0
0.0
± 0.
00.
0 ±
0.0
0.0
± 0.
00.
0 ±
0.0
0.0
± 0.
00.
0 ±
0.0
Hip
pocr
epis
gla
uca
0.8
± 0.
70.
0 ±
0.0
0.0
± 0.
00.
0 ±
0.0
0.0
± 0.
00.
0 ±
0.0
0.0
± 0.
00.
0 ±
0.0
0.0
± 0.
00.
0 ±
0.0
0.0
± 0.
00.
0 ±
0.0
Lyg
eum
spa
rtum
0.0
± 0.
0—
——
-0.
0 ±
0.0
1.0
± 0.
5—
——
-0.
2 ±
0.2
0.6
± 0.
30.
0 ±
0.0
0.0
± 0.
00.
0 ±
0.0
0.0
± 0.
00.
0 ±
0.0
Mor
ican
dia
arve
nsis
152.
8 ±
36.8
8.0
± 6.
30.
8 ±
0.7
25.8
± 6
.40.
2 ±
0.2
0.6
± 0.
30.
0 ±
0.0
0.0
± 0.
00.
0 ±
0.0
0.0
± 0.
09.
4 ±
3.2
0.0
± 0.
0P
hagn
alon
sax
atil
e7.
2 ±
3.8
——
—-
0.0
± 0.
03.
8 ±
0.8
0.0±
0.0
0.0
± 0.
00.
0 ±
0.0
0.0
± 0.
00.
0 ±
0.0
0.0
± 0.
00.
0 ±
0.0
0.0
± 0.
0P
lant
ago
albi
cans
9.6
± 7.
7—
——
- 0
.0 ±
0.0
0.2
±0.2
——
—-
0.0
± 0.
00.
0 ±
0.0
0.0
± 0.
00.
0 ±
0.0
0.0
± 0.
00.
0 ±
0.0
0.0
± 0.
0Se
dum
sed
ifor
me
22.4
± 1
3.0
——
—-
4.0±
3.6
6.8
± 1.
8—
——
-0.
2 ±
0.2
0.0
± 0.
00.
0 ±
0.0
0.0
± 0.
00.
0 ±
0.0
0.0
± 0.
00.
0 ±
0.0
Not
Det
erm
ined
4.0
± 1.
6—
——
-0.
0 ±
0.0
1.2
± 0.
5—
——
-0.
0 ±
0.0
0.0
± 0.
00.
0 ±
0.0
0.0
± 0.
00.
0 ±
0.0
0.0
± 0.
00.
0 ±
0.0
TO
TA
L27
2.8
± 85
.48.
8 ±
13.7
6.4
± 4.
254
.8 ±
9.2
0.2
± 0.
21.
2 ±
0.5
0.8
± 0.
40.
0 ±
0.0
0.0
± 0.
00.
0 ±
0.0
9.8
± 3.
20.
0 ±
0.0

CROP SCIENCE SOCIETY OF AMERICA 677 South Segoe Road • Madison WI 53711 • (608) 273-8086 • Fax (608) 273-2021 • www.crops.org
Crop Science Guidelines for Proofreading The next step in the publication process involves reviewing the galley proofs for your article. Please return the galley proofs by air/express mail to the address above within 5 days of receipt. Late return of galley proofs may mean postponement to a later issue. Please make a copy of the corrected proofs before returning them; keep the copy for your records.
This step is entirely the responsibility of the corresponding author. The galley proofs will not be read by editorial staff. Errors that you fail to mark will be published.
Note that you are being asked to correct errors, not to revise the paper. You will not be charged for our editing mistakes or typographical errors, but you will be charged for any alterations from the original text that you make on the galley proofs. Extensive alteration may require Editorial Board approval, possibly delaying publication. Please follow these guidelines when reviewing the galley proofs:
• Mark your corrections, in red ink, directly on the galley proofs. Make sure that your corrections are noticeable and easy to understand.
• Check all type on the galley proofs, including the running heads that appear at the top of each page. Check the title and byline, as well as the abbreviations list and the author–paper documentation paragraph.
• Check the table data against that in your original tables.
• Check any equations against those in your original manuscript. Make sure special characters have not dropped out.
• Check to be sure that figures are entirely legible, including any small-print text. If a figure requires alteration, you must provide a printed copy of the revised figure. If the manuscript has color figures, proof them on your monitor.
• If you find an error, look again at the lines around the error. Mistakes tend to cluster.
? For more information on proofreading and journal style, see the ASA–CSSA–SSSA Publications Handbook and Style Manual (1998), available online at http://www.asa-cssa-sssa.org/style/index.html.
Galley proof corrections will be classified by editorial staff as author alterations (AAs), editor alterations (EAs), or printer errors (PEs). If you would like us to send to you via
email an explanation of the AA charge, please include a request when returning the corrected galley proofs.
revised 6 April 2004

CROP SCIENCE SOCIETY OF AMERICA, INC. 677 South Segoe Road • Madison WI 53711677 South Segoe Road • Madison WI 53711677 South Segoe Road • Madison WI 53711677 South Segoe Road • Madison WI 53711 608 273608 273608 273608 273----8080 • 608 2738080 • 608 2738080 • 608 2738080 • 608 273----2021 (fax)2021 (fax)2021 (fax)2021 (fax)
CROP SCIENCE PUBLICATION CHARGE AND REPRINT ORDER FORM
Jan.–Feb. 2005 (Add manuscript number and title): C___-______(__)
Corresponding author name, address, e-mail (Please add): Membership number: _______________________
Charges: Following are the charges for your Crop Science manuscript or Registration article. An invoice for these charges will be sent to you approximately 6 weeks after publication. Reprints will be shipped at that time. Return corrected proofs 3 business days after receipt to ensure inclusion in this issue. Please fill in this form AS COMPLETELY AS POSSIBLE. • Manuscript publication charges are $350 for members, $600 for nonmembers; for registration articles, $150 for members, $400 for nonmembers. There is no manuscript charge for book reviews. • Illustrations are $10 each, less $15.00 (amount contributed by CSSA). Color illustrations are an additional $1000.00 per page of color. • Author alterations to the galley proofs that represent changes from the original manuscript are $5.00 per line.
Manuscript charge for members $ Manuscript charge for nonmembers $
Figure charge: $ for figures (# fig. × $10.00 − $15.00 = charge). Color figures $ for page of color ($1000/page).
Alteration charge: $ for galley alterations. •Reprints (check one): hard copies only: $ for reprints.
hard copies + PDF: $ for reprints + additional $25.00 for PDF file. or PDF only ($100) $
Cover charge: $ for covers. Shipping charge: $
• Reprint charges are shown in the table below; you may purchase reprint covers that display manuscript title and authors’ names.
Number of reprints (choose quantity and B&W or color) 100 200 300 400 500 1000
Pages B&W color B&W color B&W color B&W color B&W color B&W color 2 $25 – $29 – $32 – $35 – $38 – $27 –
3-4 $46 $80 $53 $133 $59 $179 $64 $224 $69 $269 $127 $527 5-8 $75 $115 $90 $143 $100 $220 $115 $275 $130 $330 $225 $625
9-12 $100 $140 $119 $172 $137 $257 $155 $315 $173 $373 $293 $693 13-16 $120 $160 $140 $193 $160 $280 $180 $340 $210 $410 $341 $741
Cover Prices (Cover sheet with author byline and title) $35 $40 $45 $50 $75 $100
Non-U.S. Shipments:
Express (1–2 wk)
Standard (3–4 wk)
Purchase Order: A formal purchase order for these charges must be sent to our office before the issue is published, unless you are paying with a credit card. Please forward a copy of this form to your purchasing department to initiate the order. Please include manuscript number and issue on the purchase order. Please contact CSSA if the purchase order cannot be prepared with estimates for the author alteration and shipping charges. Credit Card Orders: Please provide the following information. Do not use a card that will expire within the next three months.
G Visa G MasterCard Card number: Expiration date: Print cardholder's name: Fax # for receipt:
Author signature: 25 August 2004
This form must be returned with the galley proofs, even if you do not order reprints

Rep
rodu
ced
from
Cro
p S
cien
ce. P
ublis
hed
by C
rop
Sci
ence
Soc
iety
of A
mer
ica.
All
copy
right
s re
serv
ed.
Species Diversity and Functional Composition of Pastures that Vary inLandscape Position and Grazing Management
John A. Guretzky,* Kenneth J. Moore, E. Charles Brummer, and C. Lee Burras
ABSTRACT ing may be further classified into those that exhibitavoidance or tolerance mechanisms (Briske, 1996). Ef-The productivity of grasslands depends in part on their diversityfect plant functional types are groups of plant speciesof species and functional composition. Our objective was to examine
the effects of three landscape positions (summit, backslope, and toes- that affect ecosystem processes such as productivity, nu-lope) and three stocking systems (continuous, rotational, and non- trient cycling, and trophic transfer similarly (Diaz et al.,grazed) on species diversity and percentage of cover of grass, legume, 2002). In experiments examining the effects of diversityand weed species functional types in southeastern Iowa pastures. Data on productivity of grasslands, functional types includedwere collected in 0.2-m2 plots randomly distributed throughout each of C3 grasses, C4 grasses, legumes, non-N-fixing forbs, andfour replicate pastures in spring and summer 2000 and 2001. Backslope woody plants (Hooper and Vitousek, 1997; Tilman et al.,landscape positions within pastures managed with either continuous or
1997). Effect and response plant functional types mayrotational stocking contained the greatest overall diversity of species.further be classified by life history (annuals, biennials,Across years, overall species richness under grazing averaged 4.8 onand perennials) and growth form. Perennial grasses maybackslopes, 3.5 on summits, and 2.9 on toeslopes. Legume cover wasbe bunch- or sod-forming (Briske, 1996), and legumesgreatest within the rotational stocking system, averaging 21% on back-
slopes, 10% on summits, and 3% on toeslopes across years. Cool- may be clone- or crown-forming (Beuselinck et al., 1994).season grasses dominated summits and toeslopes, consisting of 88 to Patterns of plant species diversity and functional com-94% of the cover. Weed species diversity and cover were greatest on position of pastures have been evaluated in the north-backslopes within the continuous stocking system. Our results showed eastern USA. These pastures generally received littlethat rotational stocking had more desirable effects through greater improvements and grazing management for several de-legume cover and less weed cover on backslopes than continuous stock- cades and were dominated by white clover, Kentuckying. This research suggested that spatial components of pastures should
bluegrass, and dandelion (Tracy and Sanderson, 2000b;be considered to optimize the production and quality of forage forsee Table 1 for taxonomy). Annual and perennial non-grazing livestock.N-fixing forbs consisted of �90% of the species pool(Tracy and Sanderson, 2000b). Annual and perennialforbs also dominated the seedbanks of these pastures,The productivity and stability of aboveground bio-and it was concluded that a manager, seeking to estab-mass in grassland ecosystems depends in part on thelish a diverse, mixed-species pasture consisting of pro-functional composition and diversity of plant species.ductive grasses and legumes, must reseed the desiredRecent experiments showed that species-rich grasslandsspecies (Tracy and Sanderson, 2000a).have greater productivity (Hector et al., 1999; Tilman
Landscape position and grazing management haveet al., 2001) and reduced year-to-year variability of above-been shown to affect legume species diversity and abun-ground biomass (Tilman, 1996). These experiments havedance in southeastern Iowa pastures. Legume biomassbeen controversial in that the effects of species diversityand legume species diversity were greater on backslopewere not evaluated independently from the effects of keypositions than on summit or toeslope positions, andspecies (Aarrsen, 1997; Huston, 1997). Some scientistspastures managed with continuous and rotational stock-have suggested that the productivity and stability of eco-ing produced greater legume biomass than nongrazedsystems do not depend on the number of species butpastures (Harmoney et al., 2001). Spatial patterns of spe-rather the presence of key species and functional typescies richness also existed and varied by grazing treat-(Grime, 1997; Huston, 1997).ment (Barker et al., 2002). Continuously stocked pas-Plant species are commonly classified into either re-tures had a complex structure consisting of species-richsponse or effect plant functional types (Diaz et al., 2002).and species-poor patches with secondary patches occur-Response plant functional types are groups of plant spe-ring within primary patches (Barker et al., 2002). Howcies that respond similarly to the abiotic and biotic envi-landscape position and grazing management affectedronment. Classification of plants as increasers, decreasers,overall species diversity and functional composition ofand invaders in response to grazing (Dyksterhuis, 1949)these pastures was not determined. This information isis an example of grouping plants by their response to theimportant to improving the management of pasturesbiotic environment. Plants that show resistance to graz-for grazing livestock in spatially heterogeneous envi-ronments.
J.A. Guretzky, Ecological Processes Branch, U.S. Army ERDC-CERL, Thus, the objectives of our experiment were to: (i) de-Champaign, IL 61826-9005; K.J. Moore, E.C. Brummer, and C.L. termine the effects of three landscape positions (summit,Burras, Dep. of Agronomy, Iowa State Univ., Ames, IA 50011-1010.
backslope, and toeslope) and three stocking systemsReceived 15 Apr. 2003. *Corresponding author ([email protected]). (continuous, rotational, and nongrazed) on overall spe-
cies, forage grass, forage legume, and weed species di-Published in Crop Sci. 45:�–� (2005). Crop Science Society of America677 S. Segoe Rd., Madison, WI 53711 USA Abbreviations: AUM, animal unit months.
1

Rep
rodu
ced
from
Cro
p S
cien
ce. P
ublis
hed
by C
rop
Sci
ence
Soc
iety
of A
mer
ica.
All
copy
right
s re
serv
ed.
2 CROP SCIENCE, VOL. 45, JANUARY–FEBRUARY 2005
Table 1. Plant species occurring in experimental pastures at Rhodes, IA. Each pasture consisted of three landscape positions (summit,backslope, and toeslope) and three stocking systems (rotational, continuous, and nongrazed). Values represent the mean aerial coverof each species across all pastures. Pastures were sampled during May and July 2000 and 2001.
Functional group Common name Scientific name Growth form Cover
%Forage grasses smooth brome Bromus inermis Leyss. grass 40
reed canarygrass Phalaris arundinacea L. grass 33Kentucky bluegrass Poa pratensis L. grass 8orchardgrass Dactylis glomerata L. grass 4timothy Phleum pratense L. grass 1tall fescue Festuca arundinacea Schreb. grass �1
Forage legumes birdsfoot trefoil Lotus corniculatus L. legume 6red clover Trifolium pratense L. legume 1white clover Trifolium repens L. legume 1alfalfa Medicago sativa L. legume �1sweetclovers Melilotus spp. legume �1cicer milk-vetch Astragalus cicer L. legume �1kura clover Trifolium ambiguum M. Bieb. legume �1
Weed species quackgrass Elytrigia repens (L.) Desv. ex Nevski grass �1sedges Carex and Cyperus spp. grass �1foxtail species Setaria spp. grass �1redtop bent Agrostis stolonifera L. grass �1barnyardgrass Echinochloa crus-galli (L.) P. Beauv. grass �1dandelion Taraxacum officinale F.H. Wigg. aggr. forb 7pale dock Rumex altissimus Alph. Wood forb �1curly dock Rumex crispus L. forb �1common yarrow Achillea millefolium L. forb �1bull thistle Cirsium vulgare (Savi) Ten. forb �1musk thistle Carduus nutans L. forb �1Canada thistle Cirsium arvense (L.) Scop. forb �1tall thistle Cirsium altissimum (L.) Spreng. forb �1daisy fleabane Erigeron strigosus Muhl. ex Willd. forb �1hoary vervain Verbena stricta Vent. forb �1sulfur cinquefoil Potentilla recta L. forb �1Canada goldenrod Solidago canadensis L. forb �1common ragweed Ambrosia artemisiifolia L. forb �1yellow rocket Barbarea vulgaris R. Br. forb �1field pennycress Thlaspi arvense L. forb �1hoary alyssum Berteroa incana (L.) DC. forb �1shepherd’s-purse Capsella bursa-pastoris (L.) Medik. forb �1yellow woodsorrel Oxalis stricta L. forb �1horseweed Conyza canadensis (L.) Cronquist forb �1henbit Lamium amplexicaule L. forb �1blackseed plantain Plantago rugelii Decne. forb �1common lambs-quarters Chenopodium album L. forb �1motherwort Leonurus cardiaca L. forb �1horse-nettle Solanum carolinense L. forb �1redroot pigweed Amaranthus retroflexus L. forb �1stinging nettle Urtica dioica L. forb �1
pastures. The legumes used were alfalfa, biennial yellow sweet-versity, and (ii) examine how these factors affect theclover [Melilotus officinalis (L.) Lam.], biennial white sweet-cover of these functional groups and individual speciesclover (M. albus Medik.), birdsfoot trefoil, white clover, red clo-within pastures. We chose these functional types becausever, kura clover, cicer milk-vetch, berseem clover (Trifolium alex-grasses provide most of the biomass (Harmoney et al.,andrinum L.), striate lespedeza [Kummerowia striata (Thunb.)2001) and competitively displace legumes (Guretzky et al.,Schindler], and annual white sweetclover (M. albus Medik.).2004) in these pastures. Legumes have high forage qual- Because of poor establishment in the first seeding, the legumesity (Van Soest, 1982), fix atmospheric N2 through a sym- were resown in the grass sod in 1996.
biotic relationship with Rhizobium bacteria (Heichel Each pasture replicate contained three landscape positions:et al., 1985), and usually improve productivity of pasture summit, backslope, and toeslope, and was subdivided into pad-mixtures (Sleugh et al., 2000). Weed species contribute to docks that used three different stocking systems: continuous,biomass, but their forage quality is usually less than that rotational, and nongrazed. The paddocks of each pasture wereof grasses and legumes, especially as they mature (Mar- 0.4 ha. Summit and backslope positions consisted of Downs
(fine-silty, mixed, superactive, mesic Mollic Hapludalf) soils,ten and Andersen, 1975; Marten et al., 1987). Discussionand toeslope positions consisted of Colo (fine-silty, mixed, super-of the life history and growth habit of the dominantactive, mesic Cumulic Endoaquoll) and Ackmore (fine-silty,species within the functional types in response to land-mixed, superactive, nonacid, mesic Mollic Fluvaquent) soilsscape position and grazing management was provided.(Oelmann, 1981). Slopes ranged from 0 to 5% on summit andtoeslope positions and 10 to 24% on backslope positions. Pre-
MATERIALS AND METHODS vious research showed that aspect did not affect legume diver-sity or composition of these pastures (Harmoney et al., 2001).We conducted the experiment at the Iowa State UniversityThus, effects of aspect were not examined.Rhodes Research Farm (41�52� N, 93�10� W) in pastures de-
Grazing treatments were initiated in 1996. From 1996 to 1998,scribed by Harmoney et al. (2001). In 1995, a mixture of le-gumes was frost-seeded into four established cool-season grass grazing began at the end of May and continued until early to

Rep
rodu
ced
from
Cro
p S
cien
ce. P
ublis
hed
by C
rop
Sci
ence
Soc
iety
of A
mer
ica.
All
copy
right
s re
serv
ed.
GURETZKY ET AL.: PASTURE SPECIES DIVERSITY AND COMPOSITION 3
mid-August within the continuously stocked plots. Each of the cates. Because unequal numbers of 0.2-m2 samples occurredwithin each treatment combination, the experiment was ana-rotationally stocked plots was grazed for 4 d in mid-May, early
July, and late October. Stocking rates were similar among lyzed as a randomized complete block design with unequalsubclass numbers (Piepho, 1997) using Proc Mixed within thethe rotational and continuous stocking treatments: 9.4 animal
unit months (AUM) ha�1 within the rotational system and Statistical Analysis System software (SAS Institute, Inc., Cary,NC). The Mixed Procedure, however, could not support the10.1 AUM ha�1 within the continuous system. An AUM was
equivalent to the amount of dry forage that a 454-kg cow, dry combined analysis of the 4484 plots sampled across both years.Thus, landscape position and stocking system effects wereor with a calf less than 6 mo old, who eats about 12 kg of dry
matter per day, would consume in 1 mo (Iowa State University analyzed and presented separately for 2000 and 2001. Pairwisecomparisons were made using the DIFF option in Proc Mixed.Extension, 1998). Nongrazed plots were not grazed, but dead
vegetation was mowed in mid-November (Harmoney et al., Significant season effects and interactions of season with land-scape position and stocking system occurred (P � 0.05) and2001).
From 1999 to 2001, pastures managed with continuous stock- are mentioned. However, because these effects generally wereminor, means are presented and discussed as averaged acrossing were grazed by two mature, nonlactating beef cows for 28 d
in May and June, 21 d in July, and 14 d in October. Pastures spring and summer samples. Landscape position, stocking sys-tem, and season were considered fixed and pasture repli-managed with rotational stocking were grazed with eight to
nine cows for 4 d in May, seven to eight cows for 4 d in July, cates random.and six to seven cows for 4 d in October. Initiation of grazingwithin the continuous and rotational stocking treatments oc-
RESULTScurred on the same date. Cows were removed from the contin-uous stocking system when residue height for the majority of Species Diversitythe herbage was �13 cm. Cows were removed from the rota-tional stocking system after the 4-d period of each grazing Overall species richness was greatest on backslopeevent. Stocking density within the rotational stocking system landscape positions within pastures managed with con-was intended to be heavy enough to reduce selective grazing, tinuous or rotational stocking. Overall species richnessremove the majority of forage within a 4-d span, and increase averaged 4.1 on backslopes, 3.1 on summits, and 2.5 onthe period of rest between grazing events relative to the contin- toeslopes in 2000 (Table 2). In 2001, a landscape posi-uous stocking system.
tion, stocking system, and season interaction occurredWe used a percentage cover method (Daubenmire, 1968)(Table 3). Differences among landscape positions wereto visually estimate aerial cover of each plant species through-greater within the continuous and rotational stockingout the stocking systems and landscape positions. Approxi-systems than within the nongrazed pastures and whenmately 100 0.2-m2 sample plots were randomly distributed and
sampled each spring (May) and summer (July) of 2000 and sampled during summer than during spring (data not2001 within each stocking system of each pasture. The land- shown). Overall, species richness was similar amongscape position of each sample was noted. An unequal number rotational and continuous stocking systems regardlessof plots were sampled throughout the landscape positions of of landscape position or year (Table 2).each pasture replicate because the positions of each pasture Backslope landscape positions consisted of a greaterdiffered in area. diversity of forage grass and legume species. In 2000The relative percentage of cover for each species on a 0 to
and 2001, an average of 2.4 grass species occurred among100% scale was calculated for each sample plot because theplots on backslopes, compared with 2.2 and 2.0 grasstotal percentage of aerial cover for all species within a plotspecies on summits and toeslopes, respectively (Table 2).could sum to � or � 100% due to overlapping of species orLandscape position effects on legume species richnessgaps between species. Plant species occurring within the pas-
tures were classified into three functional types: forage grasses, depended on season in 2000 and stocking system andforage legumes, and weed species (Table 1). The forage grasses season in 2001 (Table 3). In 2000, legume species rich-group consisted of perennial cool-season grasses that were ness averaged 0.7 in spring and 1.0 in summer amongdesirable within pastures. The forage legumes group consisted plots on backslopes but was not affected by season onof any of the legume species that persisted following initial summits and toeslopes, averaging 0.4 and 0.1 on theseestablishment in 1995 and 1996. All remaining plant species positions, respectively (data not shown). In 2001, legumefound within the pastures were classified as weed species.
species richness was affected in a similar pattern as over-Species diversity was determined for each 0.2-m2 sampleall species richness in that backslopes within the continu-using two measures: richness and the Shannon-Wiener indexous and rotational stocking system had the greatest le-of diversity (H�). Species richness was calculated by summinggume species richness and differences were greater whenthe number of different species for the forage grass, foragesampling occurred during summer than during springlegume, and weed species functional types found within each
sample. The Shannon-Wiener index of diversity was calculated (Table 2).with the formula: H� � �� pi ln pi, where pi was the proportion Continuous and rotational stocking had similar forageof sample cover by each species. A correlation analysis also grass and legume species diversity. On average, acrosswas conducted across years, pastures, landscape positions, landscape positions and years, 2.3 grass species and 0.6stocking systems, and season (n � 144) to examine how overall legume species were found among plots in continuousspecies diversity (richness and H�) and diversity within func- and rotational stocking systems compared with 2.0 grasstional types related to the percentage cover of each functional
species and 0.4 legume species among plots in the non-type. Means were not presented for H� because of the stronggrazed pastures (Table 2). Weed species diversity wascorrelations with species richness.greatest on summits and backslopes within the continu-The experiment was a randomized complete block design.ous stocking system. Across years, weed species richnessLandscape position and stocking system treatments were ar-
ranged as a split block within each of the four pasture repli- on summits and backslopes ranged from 0.8 to 1.6 within

Rep
rodu
ced
from
Cro
p S
cien
ce. P
ublis
hed
by C
rop
Sci
ence
Soc
iety
of A
mer
ica.
All
copy
right
s re
serv
ed.
4 CROP SCIENCE, VOL. 45, JANUARY–FEBRUARY 2005
Table 2. Species richness of pastures at Rhodes, IA, as affected by landscape position, stocking system, and year. Means for overallspecies richness and richness of forage grass, forage legume, and weed species functional groups were determined among 0.2-m2
subsamples randomly distributed throughout four replicate pastures in 2000 and 2001. Pairwise comparisons were made only forsignificant interactions or main effects. Means without a similar letter within a year differ (P � 0.05).
Landscape position
2000 2001
Functional group Stocking system Summit Backslope Toeslope Mean Summit Backslope Toeslope Mean
Overall continuous 3.5 4.9 2.8 3.7a 3.7c 5.4a 3.2cde 4.1rotational 3.3 4.2 2.8 3.4a 3.3cd 4.8b 2.7def 3.6nongrazed 2.5 3.1 2.0 2.5b 2.7ef 3.4c 2.1f 2.7mean 3.1b 4.1a 2.5b 3.2 4.5 2.6
Forage grasses continuous 2.2 2.7 2.1 2.3a 2.3 2.6 2.1 2.4arotational 2.3 2.5 2.1 2.3a 2.1 2.5 2.0 2.2anongrazed 2.0 2.2 1.7 2.0b 2.1 2.2 1.6 1.9bmean 2.2ab 2.4a 2.0b 2.2ab 2.4a 1.9b
Forage legumes continuous 0.5 0.9 0.1 0.5a 0.5bc 1.1a 0.2d 0.6rotational 0.5 1.0 0.2 0.6a 0.5bc 1.2a 0.1d 0.6nongrazed 0.3 0.5 0.0 0.3b 0.3cd 0.6b 0.1d 0.4mean 0.4b 0.8a 0.1c 0.4 1.0 0.1
Weed species continuous 0.8b 1.3a 0.6bcd 0.9 0.8 1.6 0.8 1.1arotational 0.5bcd 0.7bc 0.5bcd 0.6 0.7 1.1 0.5 0.8abnongrazed 0.2d 0.4bcd 0.3cd 0.3 0.3 0.6 0.4 0.4bmean 0.5 0.8 0.4 0.6b 1.1a 0.6b
Table 3. ANOVA table for species richness and percent cover of forage grasses, forage legumes, weed species, and overall speciesrichness in pastures at Rhodes, IA. Sources of variation included four pastures (P), three stocking systems (G), three landscapepositions (L), and two seasons (S). The P values for main effects and interactions are presented by year.
Forage grass Forage legume Weed species
Richness Cover Richness Cover Richness Cover
Source F test df 2000 2001 2000 2001 2000 2001 2000 2001 2000 2001 2000 2001
Overallspeciesrichness
2000 2001
P 3G MS (G)/MS (P � G) 2 * * * *** * *** ns ** ns ** ns ** *** ***P � G 6L MS (L)/MS (P � L) 2 * * *** *** ** *** ** ** ** *** * ** ** ***P � L 6G � L MS (G � L)/MS (P � G � L) 4 ns ns ns ** ns ** ns * ** ns * ** ns *P � G � L 12S MS (S)/MS (P � G � L � S) 1 ns ns ns ns ns * ns * ns ns ns ns ns nsG � S MS (G � S)/MS (P � G � L � S) 2 ns ns ns ns ns ns ns ns ns ns ns ns ns nsL � S MS (L � S)/MS (P � G � L � S) 2 ns ns ns ns * ns ns ns ns *** ns ns ns **G � L � S MS (G � L � S)/MS (P � G � L � S) 4 ns ns ns ns ns *** ns ns ns * ns ns ns *P � G � L � S 12
* Denotes significance at the 0.05 probability level.** Denotes significance at the 0.01 probability level.*** Denotes significance at the 0.001 probability level.
the continuous stocking system, 0.5 to 1.1 within the ro- the cover on summits, backslopes, and toeslopes, respec-tational stocking system, and 0.2 to 0.6 within the non- tively, and their cover was 8 to 11% greater withingrazed system. Weed species richness was similar among the nongrazed system than within the rotational andstocking systems on toeslopes in 2000 and 2001 (Table 2). continuous stocking systems (Table 5). In 2001, a land-
Landscape position and stocking system effects on scape position and stocking system interaction occurredoverall species diversity and diversity within each func- (Table 3). Forage grass cover was similar among grazedtional type were similar whether measured by richness and nongrazed pastures on summits and toeslopes, butor H� (data not shown). Within each functional type, on backslopes was 16 to 23% less within the rotationalcorrelations of species richness and H� were r � 0.87 and continuous stocking systems, respectively, thanfor legumes, r � 0.59 for grasses, and r � 0.72 for weeds within the nongrazed pastures (Table 5).(Table 4). The diversity measures also showed strong Reed canarygrass consisted of 18, 11, and 69% ofcorrelations within functional types to the percentage the cover on summit, backslope, and toeslope positions,of ground cover consisting of each functional type respectively, across years (P � 0.001). On these same(Table 4). These correlations were positive for legumes positions, Kentucky bluegrass consisted of 10, 11, and 4%and weeds and negative for grasses. Overall species rich- of the cover across years (P � 0.05). Stocking systemness and H� were positively correlated with legume and did not affect either species. Interactions of landscapeweed species cover and negatively correlated with grass position and stocking system affected the percentagespecies cover (Table 4). cover of smooth brome in 2000 and 2001 (P � 0.05
and � 0.05). Compared with nongrazed pastures, rota-Functional Composition tional and continuous stocking reduced the cover of
smooth brome on backslopes by 20 to 30% across yearsForage grasses, as a percentage of cover, were greatest(Table 6). Smooth brome cover remained similar amongon summit and toeslope positions within the nongrazed
pastures. In 2000, they consisted of 86, 76, and 95% of the stocking systems on summit and toeslope positions.

Rep
rodu
ced
from
Cro
p S
cien
ce. P
ublis
hed
by C
rop
Sci
ence
Soc
iety
of A
mer
ica.
All
copy
right
s re
serv
ed.
GURETZKY ET AL.: PASTURE SPECIES DIVERSITY AND COMPOSITION 5
Table 4. Correlations between the percentage cover, species richness, and Shannon’s diversity index (H�), of forage grasses, foragelegumes, and weed species functional groups of pastures at Rhodes, IA. Pearson correlation coefficients (r ) were computed acrossfour pastures, three landscape positions, three stocking methods, 2 yr, and two seasons (P � 0.05; n � 144).
Forage grasses Forage legumes Weed species Overall
Functional group Index % cover richness H� % cover richness H� % cover richness H� richness H�
Forage grasses % cover 1.00 �0.51 �0.38 �0.85 �0.87 �0.79 �0.69 �0.73 �0.54 �0.86 �0.60richness 1.00 0.59 0.54 0.65 0.58 0.22 0.36 0.20 0.80 0.56H� 1.00 0.27 0.36 0.59 0.34 0.36 0.59 0.53 0.94
Forage legumes % cover 1.00 0.89 0.83 0.19 0.35 ns 0.71 0.41richness 1.00 0.87 0.39 0.55 0.27 0.88 0.52H� 1.00 0.33 0.48 0.41 0.77 0.74
Weed species % cover 1.00 0.86 0.81 0.62 0.54richness 1.00 0.72 0.79 0.57H� 1.00 0.50 0.78
Overall richness 1.00 0.67H� 1.00
Table 5. Percentage of cover consisting of forage grasses, forage legumes, and weed species in pastures at Rhodes, IA. Values for eachfunctional group represent main effects of landscape position and stocking system and their interactions by sampling year. Pairwisecomparisons were made only for significant interactions or main effects. Means without a similar letter within a year differ (P � 0.05).
Landscape position
2000 2001
Functional group Stocking system Summit Backslope Toeslope Mean Summit Backslope Toeslope Mean
%Forage grasses continuous 81 68 94 81b 87ab 63d 93ab 81
rotational 84 74 92 84b 87ab 70c 92ab 83nongrazed 92 85 98 92a 93ab 86b 94a 91mean 86b 76c 95a 89 73 93
Forage legumes continuous 9 17 2 9 6cd 16b 2d 8rotational 11 21 3 11 8cd 21a 3d 11nongrazed 7 12 0 6 5cd 10c 2d 6mean 9b 17a 1c 6 16 2
Weed species continuous 10b 15a 5c 10 7bc 21a 6bc 11rotational 5bc 5c 5bc 5 5bc 9b 5bc 6nongrazed 1c 3c 2c 2 2c 4bc 3bc 3mean 5 7 4 5 11 5
Landscape position and stocking system did not affect Dandelion, the dominant weed species of these pastures,consisted of 8 to 14% of the cover on backslopes withinthe percentage of cover consisting of orchardgrass, timo-
thy, and tall fescue (Table 1). the continuously stocking system (Table 6). Weed spe-cies cover was similar among landscape positions withinAcross years, legumes, as a percentage of cover, tended
to be greatest on backslope positions within pastures the rotational and nongrazed pastures both years. Allother weed species comprised � 1% cover throughoutmanaged with rotational stocking. In 2000, legumes were
not affected by stocking system and consisted of 9, 17, the pastures and generally were not affected by land-scape position or stocking system (Table 1).and 1% of the cover on summits, backslopes, and toe-
slopes, respectively (Table 5). In 2001, a landscape posi-tion and stocking system interaction occurred (Table 3). DISCUSSIONLegumes consisted of 21, 16, and 10% cover on back-slopes within rotationally stocked, continuously stocked, Backslope landscape positions consisted of an overall
greater diversity of species than summit or toeslope po-and nongrazed pastures, respectively (Table 5). Legumecover was similar among stocking systems on summits sitions. Species diversity was probably inhibited by com-
petition from grasses, accumulation of litter, and lowand toeslopes.Red clover consisted of 5% cover on backslopes within penetration of light through the canopy. It has been shown
that as aboveground productivity increases in grasslandsthe rotational stocking system, but �1% across the otherpositions and stocking systems in 2000 and 2001 (Table 6; a lower diversity of seedlings germinate and survive
(Tilman, 1993). Competition from grasses inhibited le-P � 0.05 and � 0.05). White clover provided 3 to 4%cover on backslopes within the continuous stocking sys- gume survival on summits (Guretzky et al., 2004), and
would likely on toeslopes, because aboveground bio-tem but �1% across the other positions and stockingsystems in 2000 and 2001 (Table 6; P � 0.05 and � 0.09). mass of grasses decreases from backslopes to summits
to toeslopes (Harmoney et al., 2001).Landscape position and stocking system had negligibleeffects on the percentage cover of birdsfoot trefoil, alfalfa, A diversity of species likely contributes to maintenance
and stability of aboveground biomass both spatially andsweetclover, kura clover, and cicer milk-vetch (Table 1).Landscape position and stocking system interactions temporally in pastures. Experimental manipulations of
plant species richness have shown that increased plantaffected the percentage of weed species cover both years(Table 3). Weed species cover was greatest on backslope diversity causes increased aboveground biomass (Hec-
tor et al., 1999; Tilman et al., 2001) and reduces year-positions within the continuous stocking system (Table 5).

Rep
rodu
ced
from
Cro
p S
cien
ce. P
ublis
hed
by C
rop
Sci
ence
Soc
iety
of A
mer
ica.
All
copy
right
s re
serv
ed.
6 CROP SCIENCE, VOL. 45, JANUARY–FEBRUARY 2005
Table 6. Percentage of cover consisting of smooth brome, red clover, white clover, and dandelion in pastures at Rhodes, IA. Valuesfor each species represent means as affected by landscape position and grazing management interactions. Means without a similarletter within a year differ (P � 0.05).
Landscape position
2000 2001
Species Stocking system Summit Backslope Toeslope Mean Summit Backslope Toeslope Mean
%Smooth brome continuous 50ab 36bcd 13e 33 51bc 30d 13d 31
rotational 54ab 44bc 26cde 41 54abc 42c 20d 39nongrazed 65a 65a 21de 50 61a 61a 23d 49mean 56 48 20 55 44 19
Red clover continuous 0b 2b 0c 1 0c 3b 1bc 1rotational 2b 5a 0c 2 1bc 5a 0c 2nongrazed 0b 0c 0c 0 0c 1c 0c 0mean 1 2 0 0 3 0
White clover continuous 2b 4a 0c 2 1b 3a 0b 1rotational 1bc 0bc 0c 0 1b 0b 0b 1nongrazed 0c 0c 0c 0 0b 1b 0b 0mean 1 1 0 1 1 0
Dandelion continuous 3b 8a 1b 4 3b 14a 3b 7rotational 1b 1b 0b 1 1b 3b 1b 1nongrazed 0b 1b 0b 0 1b 2b 1b 1mean 1 3 1 2 6 1
to-year variability of biomass (Tilman, 1996) in grass- species small in stature and seed size, and N2 fixing plants(Leach and Givnish, 1996). Large grazing animals createlands. Niche complementation is a proposed mechanism
that allows species-rich mixtures to capture and use re- heterogeneity in plant communities through patch-selec-tive defoliation, trampling, and excretion of manure andsources more completely and have greater productivity
than less diverse versions or monocultures of any indi- urine (Steinauer and Collins, 1995).The diet selection process of cattle consists of a hier-vidual species (Hector et al., 1999; Tilman et al., 2001).
The importance of diversity, however, depends on soil archy from the landscape scale down to the individualplant (Stuth, 1991). At the landscape level, distance tofertility (Huston, 1997) and moisture (Mulder et al.,
2001), and diversity effects on productivity are likely to water and steepness of slopes can impede cattle grazingof certain plant communities (Stuth, 1991). In our pas-be greater when and where these factors are limited
(Huston, 1994). tures, slope gradients did not exceed 24%, and paddockswere small, 0.4 ha, and did not restrict cattle from graz-A greater overall diversity of species may be neces-
sary to capture and convert available light to biomass ing away from the water source. We also did not observecattle preferring to graze one landscape position beforeon backslopes because these positions likely have less
fertility and/or moisture than summits and toeslopes. another. Previous studies showed that at a landscapescale, cattle preference for plant communities (WalkerWe did not determine the relationship of landscape po-
sitions with soil properties in these pastures because et al., 1989a) and the quality and botanical compositionof their diets (Walker et al., 1989b) were similar amongprevious attempts have been largely unsuccessful; sum-
mit, backslope, and toeslope positions were similar for rotational and continuous stocking systems.Within plant communities, selection occurs primarilyseveral properties, including soil P, K, pH, organic mat-
ter, and texture (Harmoney, 1999). Summits and toe- at the patch scale (Hodgson et al., 1994). Cattle generallyshow preference for patches with a high abundance ofslopes, however, produced 0.5 and 2.4 Mg ha�1, respec-
tively, more grass biomass than backslopes (Harmoney leaves before stems, live before dead components, and le-gumes before grasses, and generally, avoid patches withet al., 2001). Along rolling landscapes, soil organic mat-
ter and A-horizon thickness tends to be proportional toxic plants, mature seed heads, and plant materials withhigh structural strength (Hodgson et al., 1994). In ourto slope, and soils on steep slopes tend to be thin and
have low organic matter in the A-horizon (Birkeland, pastures, stocking rates were similar among the rota-tional and continuous stocking systems. Continuous stock-1999). Toeslopes also have been shown to have greater
soil moisture and exhibit poorer drainage than other ing, however, allowed less time for plant recovery be-tween defoliations and created patches that varied inlandscape positions (Hanna et al., 1982; Knapp et al.,
1993). degree of utilization. Sward heights were ≈2 to 5 cmwithin heavily-utilized patches and 20 to 30 cm withinGrazing increased overall species diversity in these
pastures. We found that pastures managed with either under-utilized patches. By midsummer, underutilizedpatches appeared to be dominated by mature grasses.continuous or rotational stocking had greater overall
species diversity than nongrazed pastures, particularly Within the rotational stocking system, cattle were stockedat a high density for a short period to minimize patch-on backslope landscape positions. Competitive interac-
tions have been shown to decrease species richness of selective grazing. Sward heights, following each rota-tion, were ≈10 to 20 cm on summits and backslopes andgrasslands when disturbances such as grazing are absent
(Collins et al., 1998). In remnant prairies in Wisconsin, 20 to 30 cm on toeslopes. Despite differences in selectionand time of recovery, overall species diversity was simi-lack of disturbance led to reductions of plant diversity,

Rep
rodu
ced
from
Cro
p S
cien
ce. P
ublis
hed
by C
rop
Sci
ence
Soc
iety
of A
mer
ica.
All
copy
right
s re
serv
ed.
GURETZKY ET AL.: PASTURE SPECIES DIVERSITY AND COMPOSITION 7
lar among the rotational and continuous stocking sys- roots, nodules, and leaf residues decompose, soil N mayincrease (Heichel et al., 1985). Legumes may improvetems. Our results contrasted with Barker et al. (2002),the nutritional value of forage mixtures because of theirwhom found that patches varied more in species richnesshigh crude protein and digestibility (Van Soest, 1982).under continuous stocking than under rotational stock-Our results concurred with Harmoney et al. (2001), whoing. The differences may have been due to differentfound an average of 2.2 legume species on backslopes,sampling techniques as we characterized the vegetation1.3 on summits, and 0.9 on toeslopes among these pas-at a courser scale using plots as opposed to a fine-scaletures. Across landscape positions, stocking systems, andusing transects.pastures, legumes, as a percentage of dry matter, wereSpecies diversity within functional types (Tilman et al.,correlated positively with legume species richness and1997) and the presence of key species or functional groupsspecies dry matter diversity (Harmoney et al., 2001).(Grime, 1997; Huston, 1997) is also known to affect theWe found similar positive correlations between the per-productivity and stability of grasslands. Perennial cool-centage of pasture cover consisting of legumes and le-season grasses dominated summit and toeslope positions,gume species richness and H� (Table 5).particularly in the nongrazed pastures. These grasses were
Weed species diversity was greatest on backslope po-primarily sod-forming, and averaged across years andsitions within the continuous stocking system (Table 2).stocking systems, they accounted for 88% of cover onThe weed species functional type consisted of annualsummits and 94% of cover on toeslopes (Table 5). Reedgrasses, sedges, rushes, and annual, biennial, and peren-canarygrass dominated the toeslopes and smooth bromenial forbs (Table 1). These species, especially annualdominated the summits and backslopes. Kentucky blue-and perennial forbs, have high seed rain and comprisegrass was a subordinate grass species having greater covermost of the species in seed banks of pastures (Tracyon summits and backslopes than toeslopes.and Sanderson, 2000a). Selective grazing and tramplingAs with overall species diversity, we found that graz-by cattle probably favors their recruitment (Tracy anding effects on species composition and diversity withinSanderson, 2000b). Weed species, as a percentage offunctional types were strongest on backslope positions.pasture cover, were positively correlated with overallForage grass species richness and H� were correlated neg-species richness (Table 5) contrasting with the hypothe-atively with the percentage of cover consisting of grassessis that as species richness increases in grasslands, weed(Table 4). Grazing reduced cover of smooth brome byinvasion should decrease (Tilman, 1997). This may have20 to 30% within the rotational and continuous stock-occurred because our study was conducted in temperateing systems relative to the nongrazed pastures (Table 6).pastures where approximately one-third of the speciesSmooth brome, a grass with high forage quality, is sus-within a sample plot were weed species as opposed toceptible to energy depletion when grazing occurs duringungrazed, native grasslands as in Tilman (1997). Tracyjointing and if recovery periods following defoliationand Sanderson (2000b) found that 90% of the speciesare inadequate (Brummer and Moore, 2000). As grazingpool in northeastern U.S. pastures was comprised ofreduced cover of smooth brome, the occurrence of mi-weed species.nor grass species like Kentucky bluegrass, orchardgrass,
In conclusion, our experiment indicated that land-and timothy increased in these pastures (Guretzky et al.,scape positions differ in the diversity and composition2002), thus increasing grass species diversity.of grass, legume, and weed species, and that grazingLegumes provided a greater percentage of cover onwas important to the maintenance of species diversity inbackslope positions, especially within pastures managedpastures. In pastures that vary in landscape positions orwith rotational stocking. Continuous stocking increasedgrazing conditions, a diversity of grass and legume spe-cover of white clover and weed species, particularly dan-cies may be necessary to exploit heterogeneity in re-delion, on backslopes, while rotational stocking increasedsource conditions (Tilman, 1996) and maintain yield andcover of red clover. Taller grazing heights, which occurredquality of forage both spatially and temporally (Harmo-throughout the rotationally stocked system, favor upright-ney et al., 2001; Sleugh et al., 2000). By producing greatergrowing legumes like red clover (Carlassarre and Kar-legume cover and less weed cover on backslope posi-sten, 2002). Shorter heights, which occurred within thetions, rotational stocking had more desirable effects onheavily utilized patches of the continuous stocking sys-the diversity and functional composition of these pas-tem, favor less productive, prostrate-growing speciestures than continuous stocking. Our research suggestedlike white clover and dandelion (Carlassarre and Kar-that forage managers consider spatial components ofsten, 2002). Birdsfoot trefoil, an intermediate-growingpastures to optimize forage productivity and quality forspecies, was the dominant legume but was not favoredgrazing livestock.by any method of stocking. The accumulation of tannins
within birdsfoot trefoil may have enhanced its success ACKNOWLEDGMENTSthroughout these pastures, as grazing animals often avoid
We thank several people who have assisted with carryinglegumes that produce secondary compounds (Hodgsonout this experiment. Keith Harmoney, Todd White, Daveet al., 1994).Barker, and Keith Betteridge provided discussions about pas-Seeding a diverse assemblage of legume species im- ture ecology and management during early stages of this exper-
proves forage production and quality on backslopes and iment. Roger Hintz, Trish Patrick, and the staff at the Iowamay improve its fertility (Harmoney, 1999; Harmoney State University Rhodes Research Farm assisted with manag-et al., 2001). Legumes fix atmospheric N2 through a sym- ing the pastures and organized field crews for data collection.
Alison Tarr, Indi Braden, and several undergraduate studentsbiotic relationship with Rhizobium bacteria, and as their

Rep
rodu
ced
from
Cro
p S
cien
ce. P
ublis
hed
by C
rop
Sci
ence
Soc
iety
of A
mer
ica.
All
copy
right
s re
serv
ed.
8 CROP SCIENCE, VOL. 45, JANUARY–FEBRUARY 2005
Dinitrogen fixation and N and dry matter distribution during 4helped with data collection. We also thank Vance Owens, Daveyear stands of birdsfoot trefoil and red clover. Crop Sci. 25:101–105.Barker, and one anonymous reviewer for editing and re-
Hodgson, J., D.A. Clark, and R.J. Mitchell. 1994. Foraging behaviorviewing this manuscript. This research was conducted in partialin grazing animals and its impact on plant communities. In G.C.fulfillment of the senior author’s dissertation requirements forFahey et al. (ed.) Forage quality, evaluation, and utilization. ASA,a Ph.D. in Crop Production and Physiology at Iowa State CSSA, and SSSA, Madison, WI.
University, Ames. Hooper, D.U., and P.M. Vitousek. 1997. The effects of plant composi-tion and diversity on ecosystem processes. Science (Washington,DC) 277:1302–1305.REFERENCES
Huston, M.A. 1994. Biological diversity. The coexistence of speciesAarrsen, L.W. 1997. High productivity in grassland ecosystems: Ef- on changing landscapes. Cambridge Univ. Press, Cambridge, UK.
fected by species diversity or productive species? Oikos 80:183–184. Huston, M.A. 1997. Hidden treatments in ecological experiments: Re-Barker, D.J., K.J. Moore, and J.A. Guretzky. 2002. Spatial variation evaluating the ecosystem function of biodiversity. Oecologia 110:
in species richness under contrasting topographies and grazing re- 449–460.gimes. Proc. Am. Forage Grassl. Conf. 11:222–225. Iowa State University Extension. 1998. Pasture management guide
Beuselinck, P.R., J.H. Bouton, W.O. Lamp, A.G. Matches, M.H. for livestock producers. Pm-1713. Iowa State Univ. Ext., Ames.McCaslin, C.J. Nelson, L.H. Rhodes, C.C. Sheaffer, and J.J. Vo- Knapp, A.K., J.T. Fahnestock, S.P. Hamburg, L.J. Statland, T.R.lenec. 1994. Improving legume persistence in forage crop systems. Seastedt, and D.S. Schimel. 1993. Landscape patterns in soil-waterJ. Prod. Agric. 7:311–322. relations and primary production in tallgrass prairie. Ecology 74:
Birkeland, P.W. 1999. Soils and geomorphology. 3rd ed. Oxford Univ. 549–560.Press, New York. Leach, M.K., and T.J. Givnish. 1996. Ecological determinants of
Briske, D.D. 1996. Strategies of plant survival in grazed systems: A species loss in remnant prairies. Science (Washington, DC) 273:functional approach. p. 37–67. In J. Hodgson and A.W. Illius (ed.) 1555–1558.The ecology and management of grazing systems. CAB Interna- Marten, G.C., and R.N. Andersen. 1975. Forage nutritive value andtional, Wallingford, UK. palatability of 12 common annual weeds. Crop Sci. 15:821–827.
Brummer, E.C., and K.J. Moore. 2000. Persistence of perennial cool- Marten, G.C., C.C. Sheaffer, and D.L. Wyse. 1987. Forage nutritiveseason grass and legume cultivars under continuous grazing by value and palatability of perennial weeds. Agron. J. 79:980–986.beef cattle. Agron. J. 92:466–471. Mulder, C.P.H., D.D. Uliassi, and D.F. Doak. 2001. Physical stress
Carlassarre, M., and H.D. Karsten. 2002. Species contribution to sea- and diversity-productivity relationships: The role of positive inter-sonal productivity of a mixed pasture under two sward grazing actions. Proc. Natl. Acad. Sci. USA 98:6704–6708.height regimes. Agron. J. 94:840–850. Oelmann, D.B. 1981. Soil survey of Marshall County, Iowa. USDA-
Collins, S.L., A.K. Knapp, J.M. Briggs, J.M. Blair, and E.M. Steinauer. SCS. U.S. Gov. Print. Office, Washington, DC.1998. Modulation of diversity by grazing and mowing in native Piepho, H.-P. 1997. Analysis of a randomized block design with un-tallgrass prairie. Science (Washington, DC) 280:745–747. equal subclass numbers. Agron. J. 89:718–723.
Daubenmire, R.F. 1968. Plant communities: A textbook of plant syn- Sleugh, B., K.J. Moore, J.R. George, and E.C. Brummer. 2000. Binaryecology. Harper & Row, New York. legume-grass mixtures improve forage yield, quality, and seasonal
Diaz, S., D.D. Briske, and S. McIntyre. 2002. Range management distribution. Agron. J. 92:24–29.and plant functional types. p. 81–100. In A.C. Grice and K.C. Steinauer, E.M., and S.L. Collins. 1995. Effects of urine depositionHodgkinson (ed.) Global rangelands: Progress and prospects. CAB on small-scale patch structure in prairie vegetation. Ecology 76:International, Wallingford, UK. 1195–1205.
Dyksterhuis, E.J. 1949. Condition and management of rangelands Stuth, J.W. 1991. Foraging behavior. p. 65–83. In J.W. Stuth (ed.)based on quantitative ecology. J. Range Manage. 2:104–115. Grazing management: An ecological perspective. Timber Press,
Grime, J.P. 1997. Biodiversity and ecosystem function: The debate Portland, OR.deepens. Science (Washington, DC) 277:1260–1261. Tilman, D. 1993. Species richness of experimental productivity gradi-
Guretzky, J.A., K.J. Moore, E.C. Brummer, and M.H. Wiedenhoeft. ents: How important is colonization limitation? Ecology 74:2179–2191.2002. Multi-scale sampling of plant diversity in pastures varying in Tilman, D. 1996. Biodiversity: Population versus ecosystem stability.grazing management and landscape position. Proc. Am. Forage Ecology 77:350–363.Grassl. Conf. 11:80–84. Tilman, D. 1997. Community invasibility, recruitment limitation, and
Guretzky, J.A., K.J. Moore, A.D. Knapp, and E.C. Brummer. 2004. grassland biodiversity. Ecology 78:81–92.Emergence and survival of legumes seeded into pastures varying Tilman, D., J. Knops, D. Wedin, P. Reich, M. Ritchie, and E. Siemann.in landscape position. Crop Sci. 44:227–233. 1997. The influence of functional diversity and composition on
Hanna, A.Y., P.W. Harlan, and D.T. Lewis. 1982. Soil available water ecosystem processes. Science (Washington, DC) 277:1300–1302.as influenced by landscape position and aspect. Agron. J. 74:999–1004. Tilman, D., P. Reich, J. Knops, D. Wedin, T. Mielke, and C. Lehman.
Harmoney, K.R. 1999. Legume establishment and persistence at sites 2001. Diversity and productivity in a long-term grassland experi-varying in landscape position, grazing method, and soil characteris- ment. Science (Washington, DC) 294:843–845.tics. Ph.D. diss. Iowa State Univ., Ames. Tracy, B.J., and M.A. Sanderson. 2000a. Seedbank diversity in grazing
Harmoney, K.R., K.J. Moore, E.C. Brummer, C.L. Burras, and J.R. lands of the northeast United States. J. Range Manage. 53:114–118.George. 2001. Spatial legume composition and diversity across Tracy, B.J., and M.A. Sanderson. 2000b. Patterns of plant speciesseeded landscapes. Agron. J. 93:992–1000. richness in pasture lands of the northeast United States. Plant
Hector, A., B. Schmid, C. Beierkuhnlein, M.C. Caldeira, M. Deimer, Ecol. 149:169–180.P.G. Dimitrakopoulos, J.A. Finn, H. Freitas, P.S. Giller, J. Good, Van Soest, P.J. 1982. Nutritional ecology of the ruminant. O & BR. Harris, P. Hogberg, K. Huss-Danell, J. Joshi, A. Jumpponen, Books, Corvallis, OR.C. Korner, P.W. Leadley, M. Loreau, A. Minns, C.P.H. Mulder, Walker, J.W., R.K. Heitschmidt, and S.L. Dowhower. 1989a. SomeG. O’Donovan, S.J. Otway, J.S. Pereira, A. Prinz, D.J. Read, M. effects of a rotational grazing treatment on cattle preference forScherer-Lorenzen, E.-D. Schulze, A.-S.D. Siamantziouras, E.M. plant communities. J. Range Manage. 42:143–148.Spehn, A.C. Terry, A.Y. Troumbis, F.I. Woodward, S. Yachi, and Walker, J.W., R.K. Heitschmidt, E.A. De Moraes, M.M. Kothmann,J.H. Lawton. 1999. Plant diversity and productivity experiments in and S.L. Dowhower. 1989b. Quality and botanical composition ofEuropean grasslands. Science (Washington, DC) 286:1123–1127. cattle diets under rotational and continuous grazing treatments. J.
Range Manage. 42:239–242.Heichel, G.H., C.P. Vance, D.K. Barnes, and K.I. Henjum. 1985.


