Embed Size (px)
Citation preview
‘AD—A063 b’i3 WINDOM (HERBERT I.) SAVANNAH GA F/S 13/3ABILItY OF SALT MARSHES TO REMOVE NUTRIENTS AND HEAVY METALS FR——Etc(u)DEC fl H L WINDOM DACW2I—76—C—013k
UNCLASSIF IED W ES—T R—D—77— 37 NL
IDG]EID II~IATI~~IIAL mJjo~ oo~~ I~~~J~AI~CIHI IPi~oc1~A~TECHNICAL REPORT D.77-37
ABILITY OF SALT MARSHES TO REMOVENUTRIENTS AND HEAVY METALS FROM
DREDGED MATERIAL DISPOSALAREA EFFLUENTS
~~~~~~~~~~~~~~~~~~~~~~~ ~~ 0 ~ .7
(Herbert L~WindomP. 0. Box 14208 .
‘
Savannah, G;..~~; 31406
D.c.mb.r 1977Fin~I R.port -
Approved For Public Release; Distribution Unlimited]
Prepared for Office, Chief 0f Engineers, U. S. ArmyWashington, D. C. 20314
Under Contract No. DACW2 I -76-C-0 134(DMRP Work Unit No. 6B09)
Monitored by Environmental Effects LaboratoryU. S. Army Engineer Waterways Experiment Station
P O-~~ox 631, Vicksburg, Miss. 39180
__________ ~,
4 . V I
I
Destroy this report when no longer needed. Do not returnit to the originator.
I
It- 4 • fl “P - - 4 -
Q DEPARTMENT OF THE ARMYWATERWAYS EXPERIMENT STATION. CORPS OF ENGINEERS
P. 0. BOX 631V ICKSBUR c3, MISSISSIPPI 39180
IN R EPL Y REFER TO WESYV 3]. July 1978
SUBJECT : Transmittal of Technical Report D— 77—37
TO: All Repor t Recip ients
1. The technical report transmitted herewith represents the results ofone research e f fo r t initiated in Task 6B , Treatment of ContaminatedDredged Material, of the Corps of Engineers ’ Dred ged Material ResearchProgram (DMRP). This task, included as par t of the Disp osal Opera tionsProject of the DMRP , was concerned with evaluating physical , chemical ,and/or biological methods for removing contaminants from dredged mate-rial.
2. In recent years , there has been continued concern about the potentialadverse environmental impac t of dredg ing and disposal opera tions onwater quality and aquatic organisms. Rapid industr ial and popu la tiongrowth in areas adjacent to navigable waterways has continued to con-tribute to the contamination of the water bodies and the sediments thateventually must be dredged . It became apparent during the planningphases of the DMRP that there could arise situations where it might benecessary to treat contaminated dredged material or the effluent dis-charged from containment areas before it could be returned to openwa ter . Therefore , Task 6B was developed to meet this anticipated need .
3. Within the last several years, overland f l ow concep ts hav e bc~ n usedin wastewater treatment systems to decrease the biological oxygen demand ,nutrient , and heavy metal levels in industrial and domestic wastewater .Because natural salt marshes also have an inheren t abili ty to acc umu latenutrients and heavy metals without apparent deleterious effects , thisstudy , entitled “Ability of Salt Marshes to Remove Nutrients and HeavyMetals from Dredged Material Disposal Area Effluents ,” was under taken todetermine the potential use of salt marshes for treating the effluentfrom dredged material containment areas. The results of this studyind icate that nu trients and heav y metals ar e removed f rom e f f l uen t wa terduring flow through salt marshes. Because the majority of the metalsand nutrients are associated with the fine—grained material suspended inthe e f f l u e nt water , this removal is probably caused primarily by sett lingof the solids as well as hydra ted manganese and iron oxides as theef f luen t passes throug h the salt marsh.
TiJ
- I - - ~~~~~~~~~~~~~~~~~~~~~
____ ___ _ -- --- - -- — ——
WESYV 31 July 1978SUBJECT : Transmittal of Technical Report D—77--37
4. The utility of this study in predicting the potential treatmente f fec t iveness of salt marshes is limited by the small scale of theexper imental system , the lack of uptake da ta during the maximum grow ingseason , and various problems encountered in the field . Therefore , theresults from this study, al though probabl y correct from a concep tualstandpoint , must be in terpr eted very qual itatively. In addition , whilevegetative filtering by marshes may be a viable treatment technique , itcannot be universally endorsed at this time due to the ecolog icalimportance of and political sensitivity surrounding wetland environments.
JOHN L. CANNONColonel , Corps of Eng ineersCommander and Direct or
2
I
--- — -~~~~~~ --~~~~-..~~~~~~~~ - . - - - -~~~.-~~~--~~~~
_ _ _ _ ~~~~~~~-= ~~- - - - -
L ~~JI~/..:
Unclassifiedt SECURITY C L A S S I F I C A T I O N OF THIS P AO E (II?.o n Del. Entered)
(77 REPOR [DOCUMENTATION PAGE BEFO c FORMI. REPO’ MBER 2. GOVT ACCESSION NO. ~~~~~~ t I P I E N T 5 C A T A L O G N U M B E R
TechnicaT Repo~~ D~77-~7’~’ -
4 TITLE (m.d &~b1uL.) — - -
~‘ . 5 l ~~W-6P R~ 1’UFT~ & P~~l~i~~D COV~~~~~~~~~
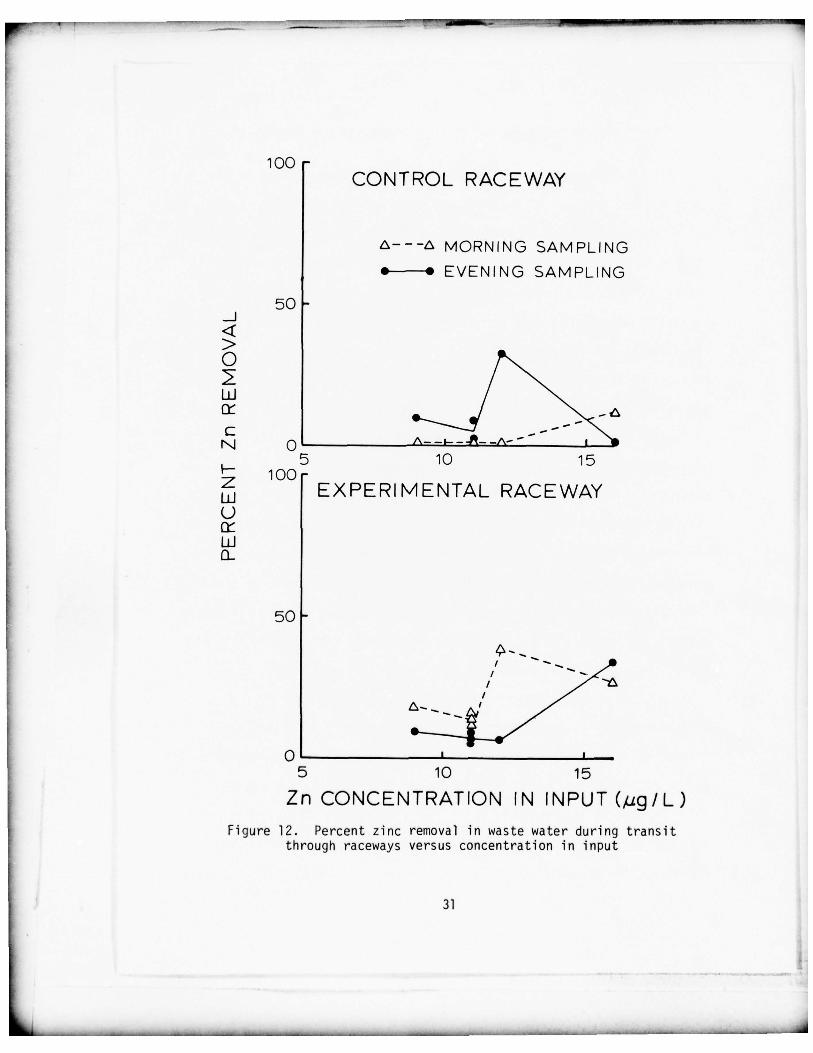
f , A B I L I T Y OF .SALT 1~1ARSHES TO . REMOVE NUTRIENTS AND F i nal rep~~~~‘~
HEAVY METALS FROM DREDGED MATERIAL DISPOSAL AREA- - - - G~
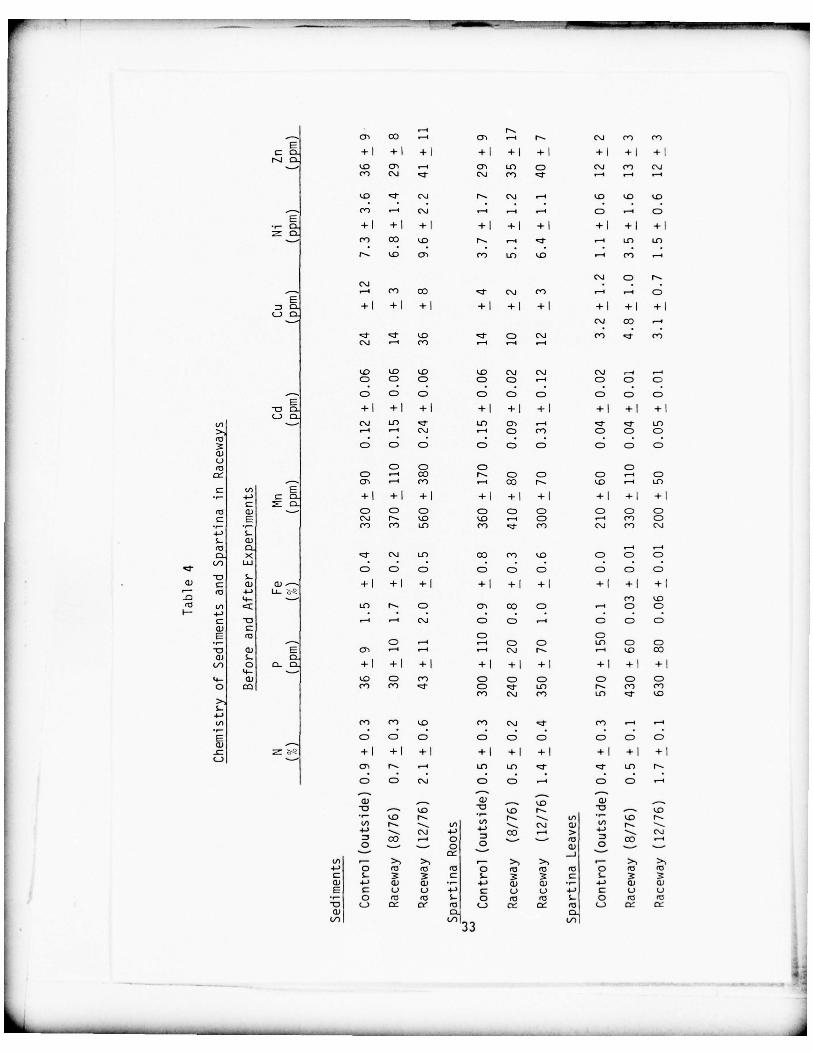
-~~~~RFORMIN~~ PRG. REPORT N U NR ER
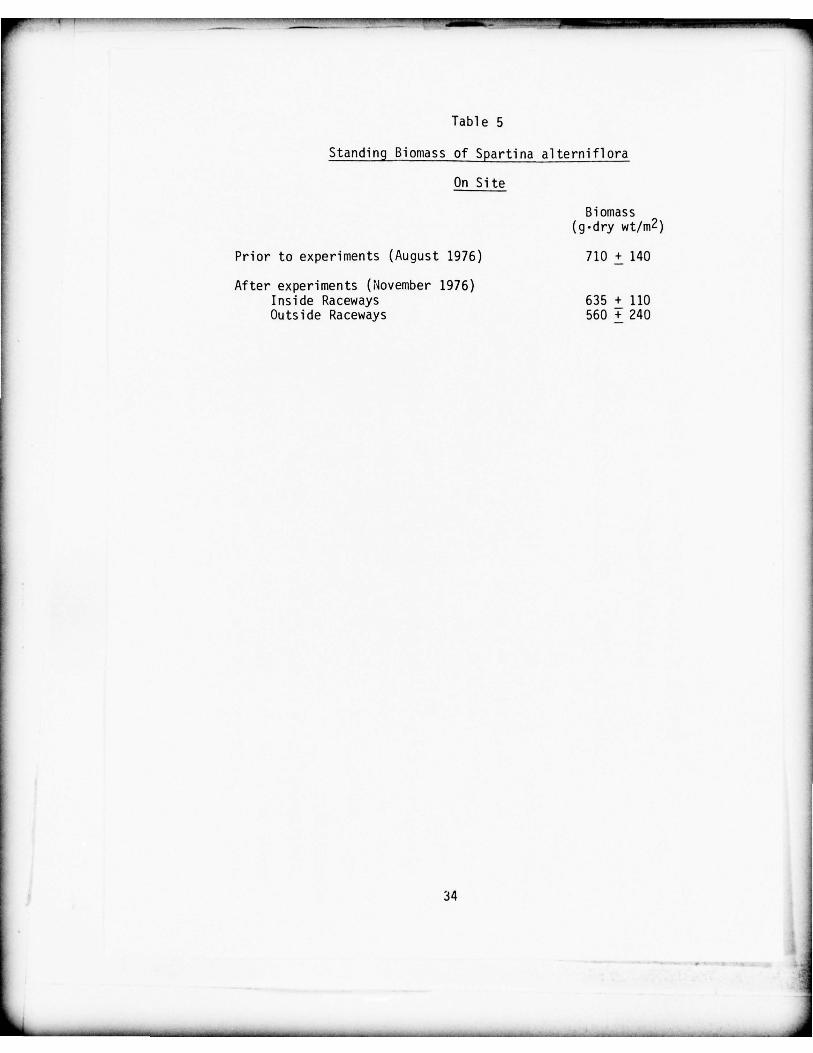
EFFLUENTS , ,.,,. >‘,~
, -— .
— —.— -.. —— - —~- - - - - - — - —————— -‘———————-- - I - I , -
1. AUTI.IOR(.) NTRAC T OR OR AM T NUMBER (.) -————— ~ I —
~~ —-— - -
Herbert L ./Windom / C ract No.I /‘ DACW2 1 76-C~~134~’
9. PERFORMING O R G A N I Z A T I O N NAM E AND P~OOR ESS t O. PROGRA M ELEMEP4 T , PROj ECT , TASI(AREA & WORK UNIT NUMBERS
Herbert L. Windom DMRP Work Un it No. 6B09
Sava nnah , Georgia 31406 ______________________________9 - CONTROLLING OFFICE NAME AND ADDRESS - ‘~2. -~ €peftT OAT&..— - -
Office , Ch i ef of En g i neers , U. S. Army // ( Dec~mb ,~~~JWash in gto n , 0. C. 20314 ‘.-_-~ . - ii. ww~ee*
IA. M ONITORING AGENCY N A M E & ADDRESS (II d if f e r e n t lroe, Controlflna Office) 95. SECURITY CLASS. (of ihie report)
U. S. Army Engineer Waterways Experiment Station UnclassifiedEnvironmental Effects Laboratory _____________________________P. 0. Box 631 , Vicksburg , Miss. 39180 I5~
~AI~~
IEF I C A T ION / O O W N GR A D I N G
16. DISTRIB UTION STATEMENT (of tl. i. Report)
Approved for public release; distr ibution unlimited . .~~~._‘ —~~- ‘ /
- ~j 4
17. DISTRIBUTION S TATEMENT (of the ab.lrect .nI.r. dln Block 20. if different from Report)
99. SUPPLEMENTARY NOTES
7 Appendices A-E - , .. .. _______ a re enclose d ~~~JI— — inside the back cover.
99, KEY WORDS (Contln.I. on ,.reree .ia. if n.c....ly end identity by block ncmber)
Conta i nment areas Heavy metals Waste disposal sitesDi sposal areas Nutr ientsDredged mater ial d i sposal Pol l u tantsE f f l u e n t s Sal t marsh es
20. A BSTRACT (Cen*~~4.. ~~ ,.,., ~~ f~~ if n.ome,y end Identify by block n.neb.r)
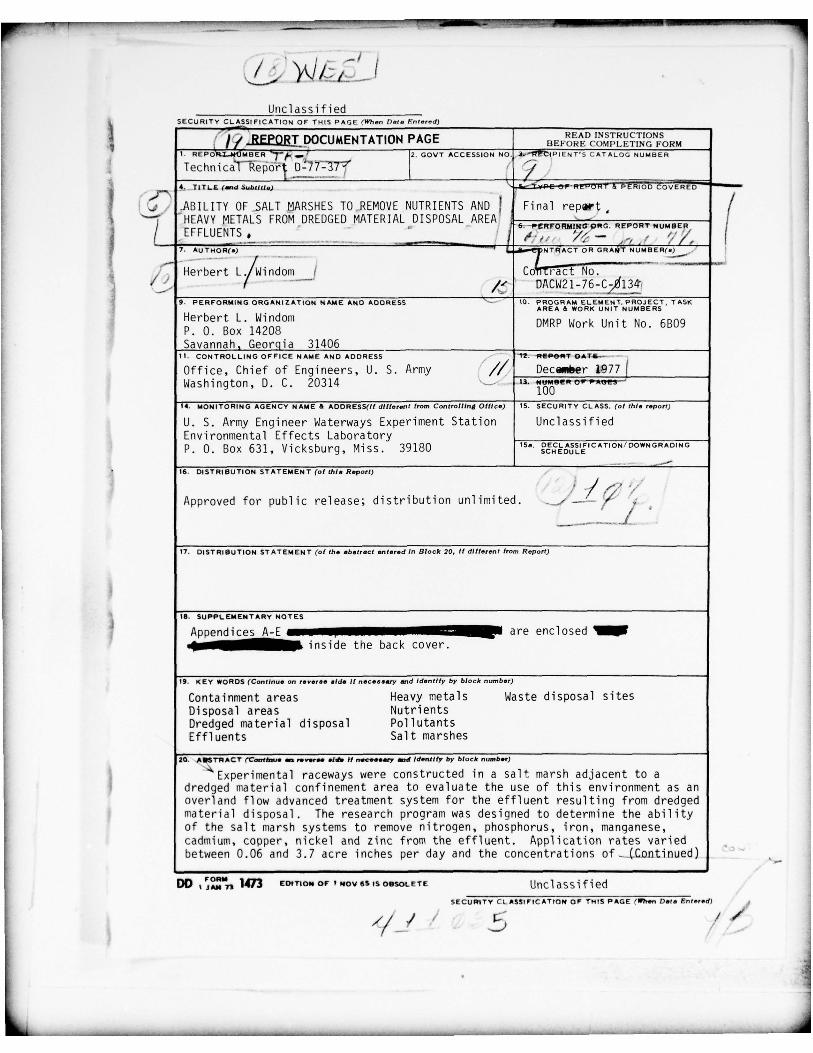
~‘Experimenta l raceways were constructed in a salt marsh adjacent to a
dredged material confinement area to evaluate the use of this environment as anoverland flow advanced treatment system for the effluent resulting from dredgedmaterial disp osal. The research program was designed to determine the abilityof the salt marsh systems to remove nitrogen , phosphorus , iron , manganese ,cadm ium , copper , nickel and zinc from the effluent. Application rates variedbetween 0.06 and 3.7 acre inches per day and the concentrations of _4Continued)
~~~~ ~~~‘J~ ~473
EDIT1ON O F ’V I OV 6SIS OBSOLETE UnclassifiedSECURI TY CLASS IFICATION OF THIS PAGE (WIt.,, Dde Entered)
~~~~ / / /
¶1 ~~~~--~~~~~~~~~~~~~~ — .- -~~~~~- -.~~ -~~-~~~
UnclassifiedSECURITY CLASSIF ICATION OF THIS PAG E(I+~,.n Del. Ent.r.d)
20. ABSTRACT (Continued).
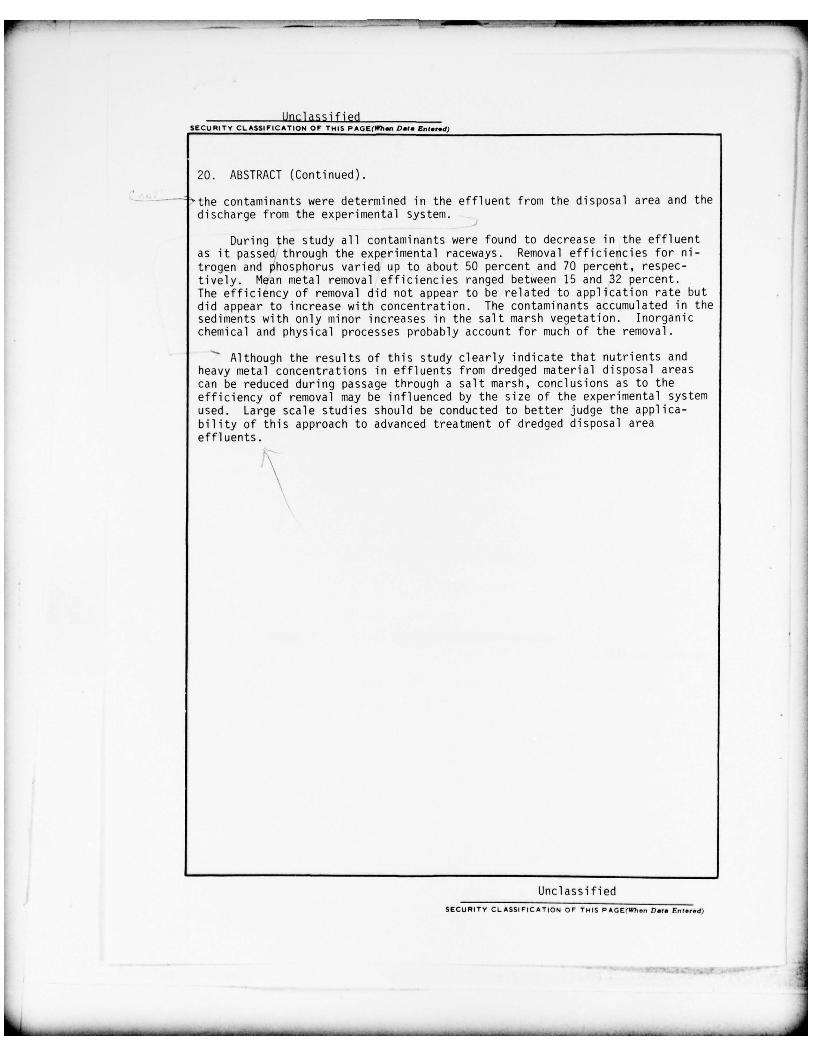
~the contaminants were determined in the effluent from the disposal area and thedischarge from the experimental system .
During the study all contaminants were found to decrease in the effluentas it passed through the experimental raceways . Removal efficiencies for ni-trogen and phosphorus varied up to about 50 percent and 70 percent, respec-tively. Mean metal removal efficiencies ranged between 15 and 32 percent.The efficiency of removal did not appear to be related to application rate butdid appear to increase with concentration. The contaminants accumulated in thesediments with only minor increases in the salt marsh vegetation. Inorganicchemical and physical processes probably account for much of the removal.
Although the results of this study clearly indicate that nutrients andheavy metal concentrations in effluents from dredged material disposal areascan be reduced during passage through a salt marsh , conclus ions as to theeff i c i ency of removal may be i nfl uenced by the s i ze of the ex peri mental syste mused. Large scale studies should be conducted to better judge the applica-bility of this approach to advanced treatment of dredged disposa l areaefflue nts.
\
UnclassifiedSECURITY CL A S S I F I C A T I O N OF THIS FAGE(W hen Del. Ent.red)
.
~~~~~~~~~~~~~~~
. ~~~~~~_~
_ _: J
~ ~~~~~~~_ . .
PREFACE
This project was funded by the U. S. Army Corps of Engineers
Waterways Experiment Station (WES), Dredged Material Research Program
(DMRP), Contract Number DACW21-76-C-0134. The contract for this re-
search was administered by the U. S. Army Corps of Engineers , Savannah
District , for the DMRP Disposal Operations Project (DOP).
The design of the research program discussed in this report was
developed in cooperation with and managed by Dr. Luther Holloway ,
Mr. Thomas Moore, and Dr. William Barnard of the DMRP staff. Techni-
cal and log istical support on the project was prov ided by members of
the Savannah District (Messrs. W. Clarkson , W . Young, and H. Roberts).
The research described in this report was initiated in August 1976
and completed in January 1977.
DOP Manager was Mr. Charles C. Calhoun , Jr. The Commander!
Director of WES was COL J. L. Cannon , CE , and the Technical Director
was Mr. F. R. Brown .
- .•, tIOS
t , ’L~~C’~ 00
y . - -,
‘111
~1
SUMMARY
Experimenta l raceways were constructed in a Spartina alternif lorasalt marsh adjacent to a dredged material confinement area to evaluatethe use of this environment as an overland flow advanced treatment sys-tem for the effl uent resulting from a dredged material disposal site .The research program was designed to determine the abilit y of the saltmarsh systems to remove nitrogen , phosphorus , iron , manganese , cadmi um ,copper , nickel and zinc from the effluent. Appli cation rates variedbetween 0.06 and 3.7 acre inches per day and the concentrations of thecontaminants were determi ned in the effluent from the disposal area andthe discharge from the experimental system .
During the study all contaminants were found to decrease in theeffl uent as it passed through the experimental raceways. Removalefficiencies for nitrogen and phosphorus varied up to about 50 percentand 70 percent , respectively. Mean metal removal efficiencies rangedbetween 15 and 32 percent. The efficiency of removal did not appearto be related to application rate but did appear to increase with nu-trient concentrations. The contaminants accumulated in the sed imentswith only minor increases in the salt marsh vegetation . Inorganicchemical and physical processes probably account for much of theremoval .
Al though the results of this study clearly indicate that nutrientsand heavy metal concentrations in effl uents from dredged materialdisposal areas can be reduced during passage through a salt marsh ,conclusions as to the efficiency of removal may be influenced by thesize of the experi mental system used. Large scale studies should beconducted to better judge the applicability of this approach toadvanced treatment of dredged disposal area effluents .
iv
~~~~~~ ~ -_ . - .- ..- -_- .-.._ -~~~~~~~-- - --—---- --~ - - _ - . . - _ _
— ~~~~~~~~~~~~ ..
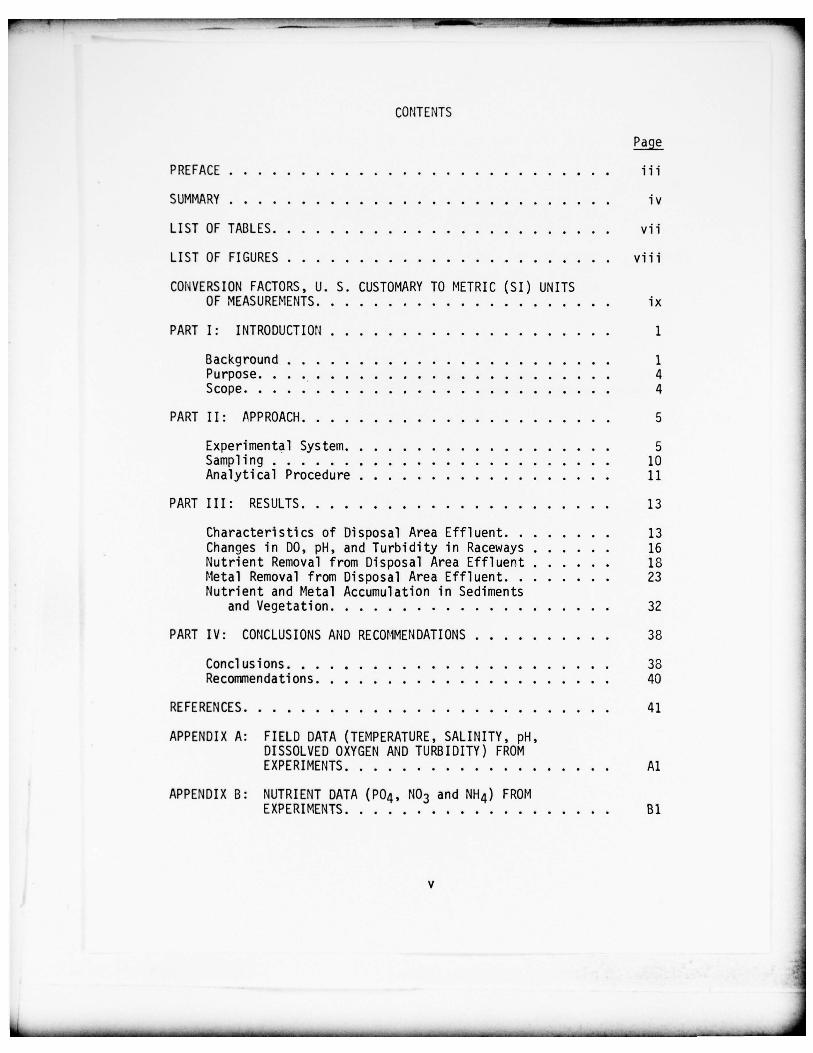
CONTENTS
PREFACE iii
SUMMARY iv
LIST OF TABLES vii
LIST OF FIGURES viii
CONVERSION FACTORS , U. S. CUSTOMARY TO METRIC (SI) UNITSOF MEASUREMENTS ix
PART I: INTRODUCTION 1
Background 1Purpose 4Scope 4
PART II: APPROACH 5
Experimental System 5Sampling 10Analytical Procedure 11
PART III: RESULTS 13
Characteristi cs of Disposal Area Effluent 13Changes in DO, pH , and Turbidity in Raceways 16Nutrient Removal from Disposal Area Effluent 18Metal Removal from Disposal Area Effluent 23Nutrient and Metal Accumulation in Sediments
and Vegetation 32
PART IV: CONCLUSIONS AND RECOMMENDATIONS 38
Concl usions 38Recoimiendations 40
REFERENCES 41
APPENDIX A : FIELD DATA (TEMPERATURE , SALINITY , pH ,DISSOLVED OXY GEN AND TURBIDITY) FROMEXPERI MENTS Al
APPENDIX B : NUTRIENT DATA (P04, NO3 and NH4) FROMEXPERIMENTS Bl
v
r .- . — _ — .. . . —a —-----
~~~~~~~~~~~~~~~~~~~~~~ - —
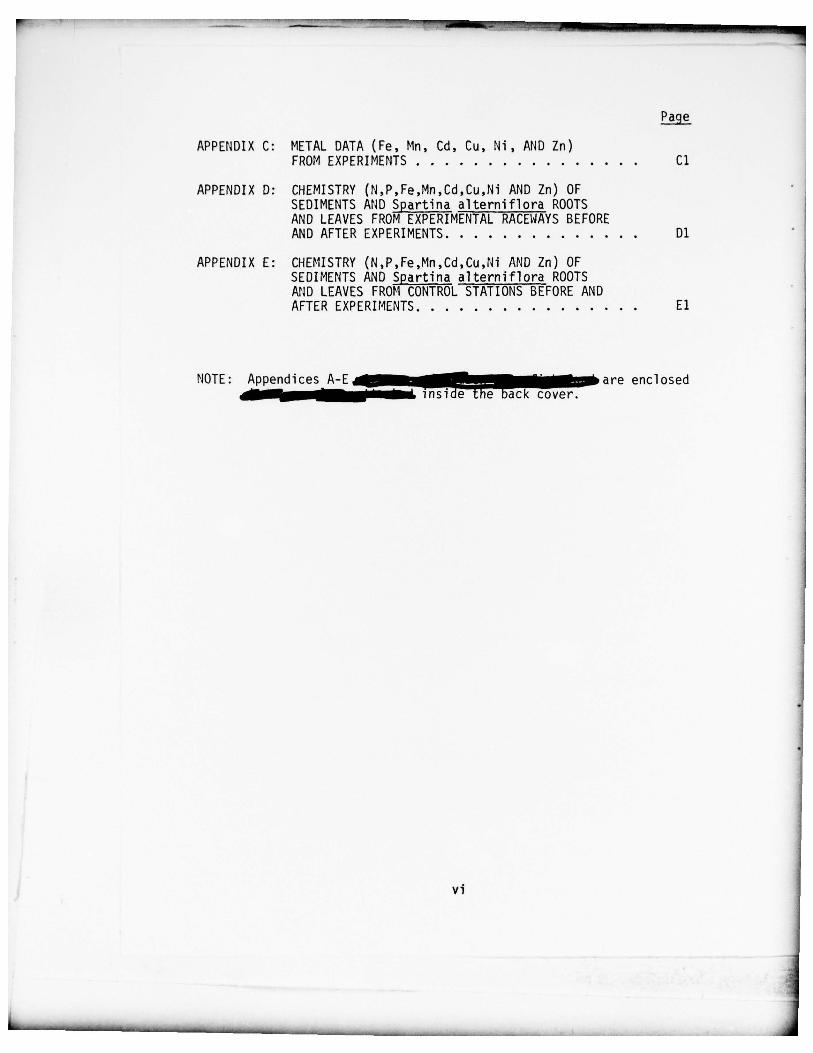
APPENDIX C: METAL DATA (Fe, Mn , Cd , Cu , Ni , AND Zn)FROM EXPERIMENTS Cl
APPENDIX D: CHEMISTRY (N,P,Fe,Mn ,Cd ,Cu,Ni AND Zn) OFSEDIMENTS AND Spartina alterniflora ROOTSAN D LEAVES FROM EXPERIMENTAL RACEWAYS BEFOREAND AFTER EXPERIMENTS Dl
APPENDIX E: CHEMISTRY (N,P,Fe,Mn ,Cd ,Cu ,Ni AND Zn) OFSEDIMENTS AND Spartina alterniflora ROOTSAND LEAVE S FROM CONTROL STATIONS BEFORE ANDAFTER EXPERIMENTS El
NOTE : Appendices A-E __L~.. J ..—I_are enclosedf~s ide e back cover.
vi
- ,--~ . -~~ — —~-~~... -=:--‘-1~ -~~ ~~~~~~‘—‘~~~~.:
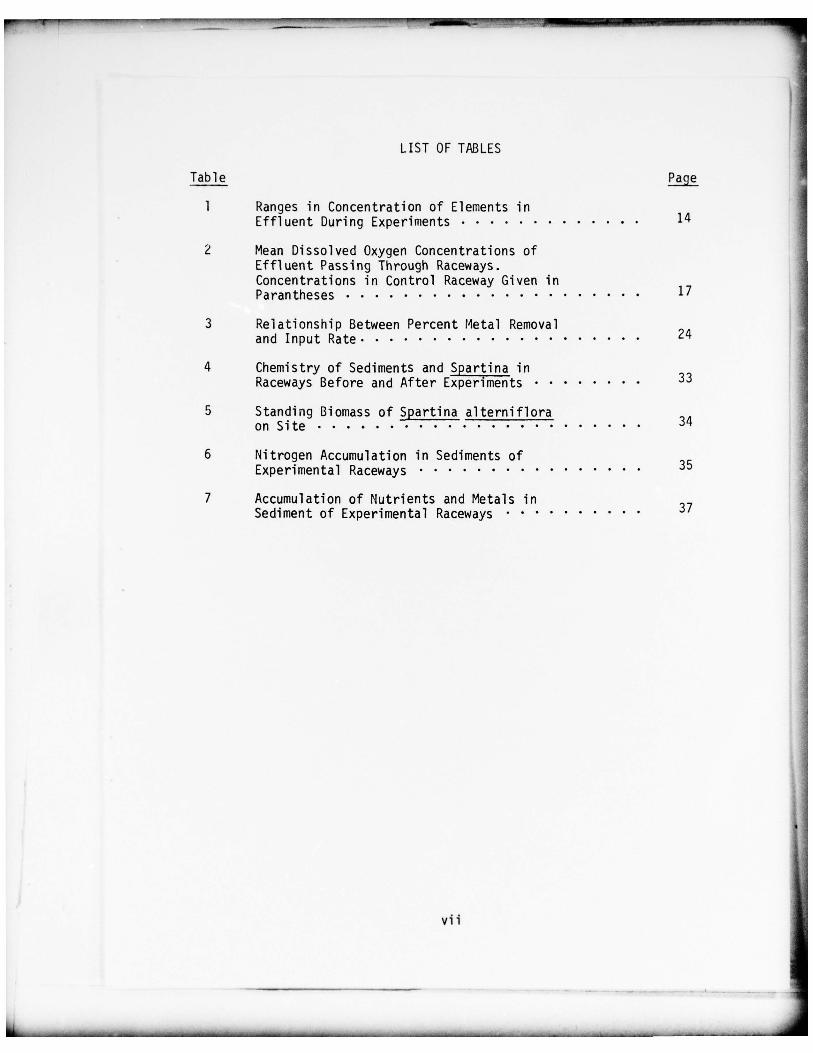
LIST OF TABLES
Table
1 Ranges in Concentration of Elements inEffl uent During Experiments 14
2 Mean Dissolved Oxygen Concentrations ofEffl uent Passing Through Raceways.Concentrations in Control Raceway Given inParantheses 17
3 Relationship Between Percent Metal Remova land Input Rate 24
4 Chemistry of Sediments and Spartina inRaceways Before and After Experiments 33
5 Standing Biomass of Spartina alternifloraon Site
6 Nitrogen Accumulation in Sediments ofExperimental Raceways 35 -
7 Accumula tion of Nutrients and Metals inSediment of Experimental Raceways 37
I
4’
vii
—5---, - — ~~~~~ _.
-- — — .- ‘~~~~~~~~~‘ —
- ~~~~~~b~~~~~~~~~~~~~~ —
~~~~~~
LIST OF FIGURES
Figure Paq~1 Location of experimental site on north side
of Savannah River 6
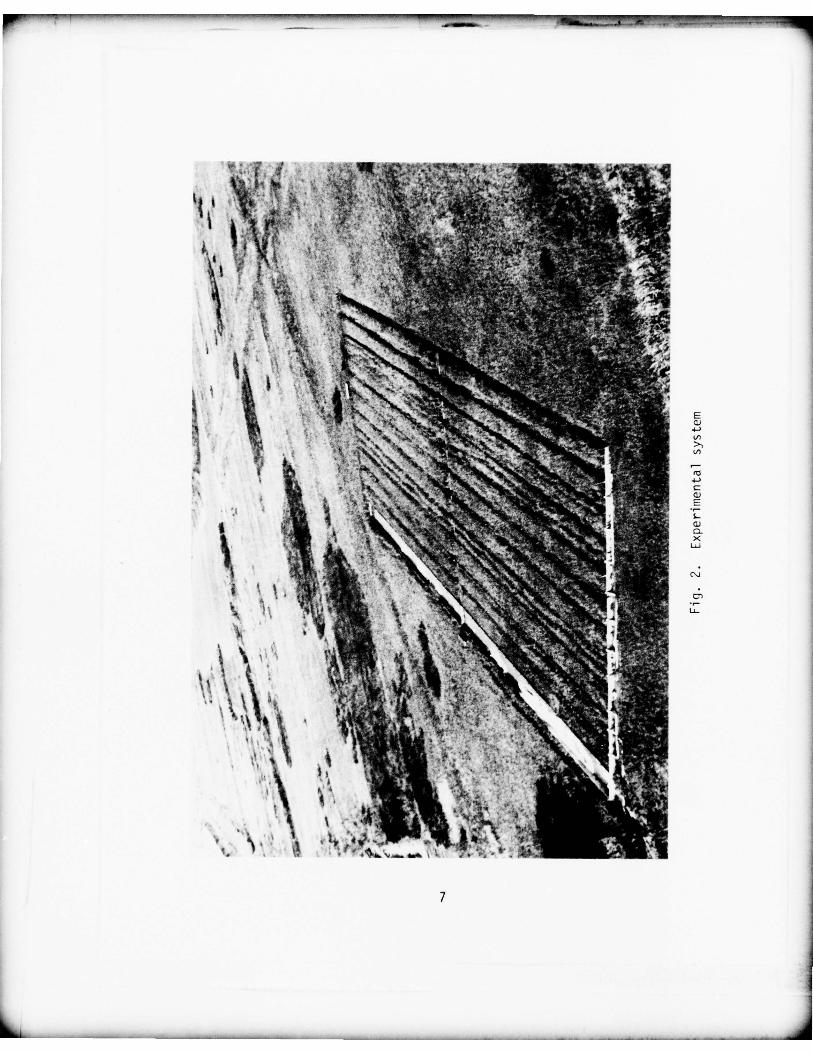
2 Experimental system 7
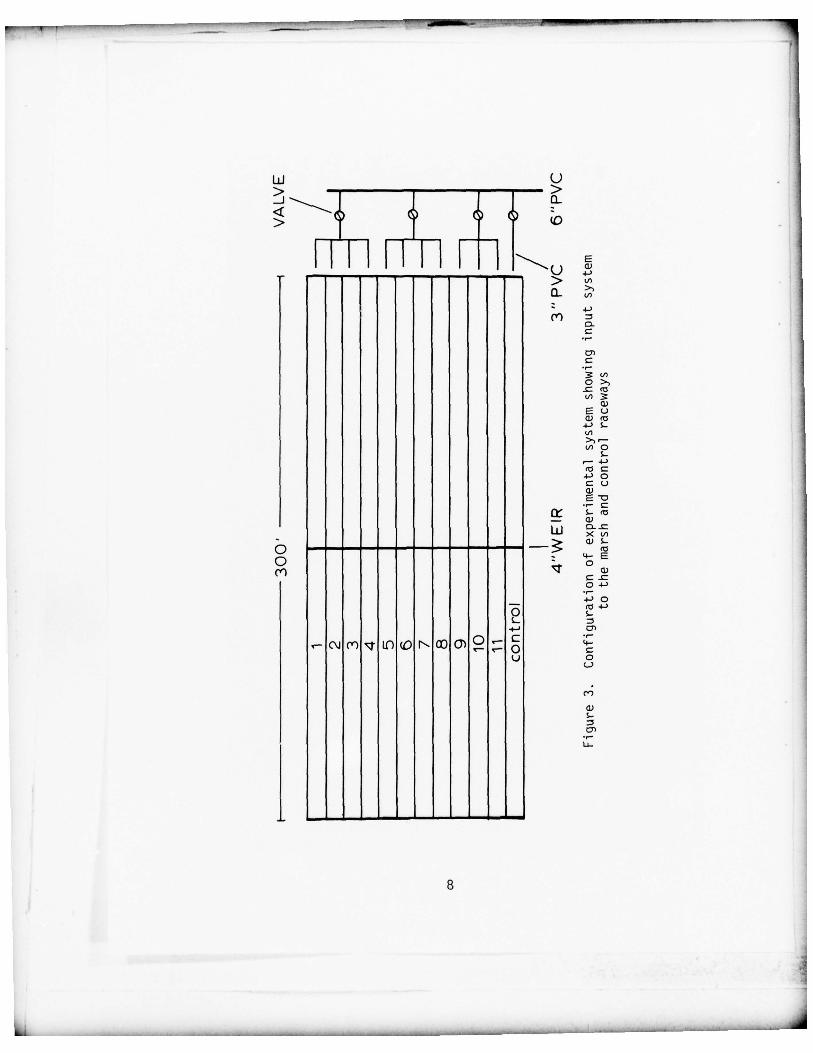
3 Configuration of experimental system showinginput system to the marsh and control raceways . . . . 8
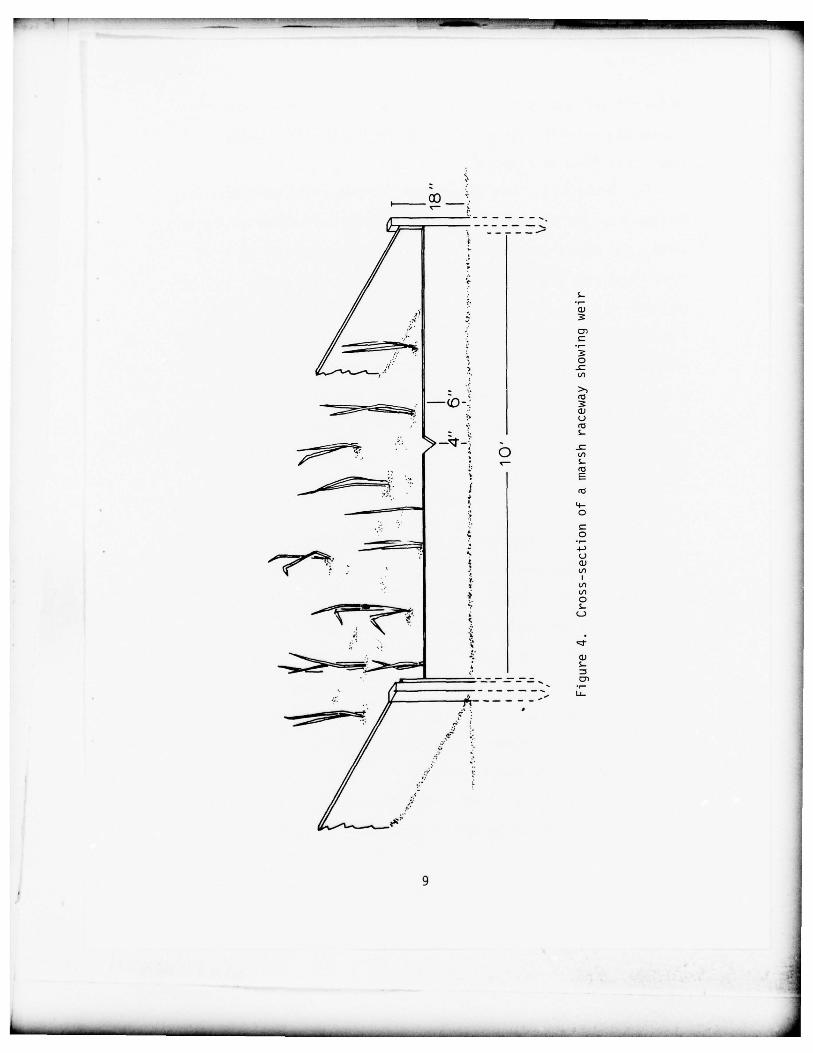
4 Cross-section of a marsh raceway showing weir . . . . 9
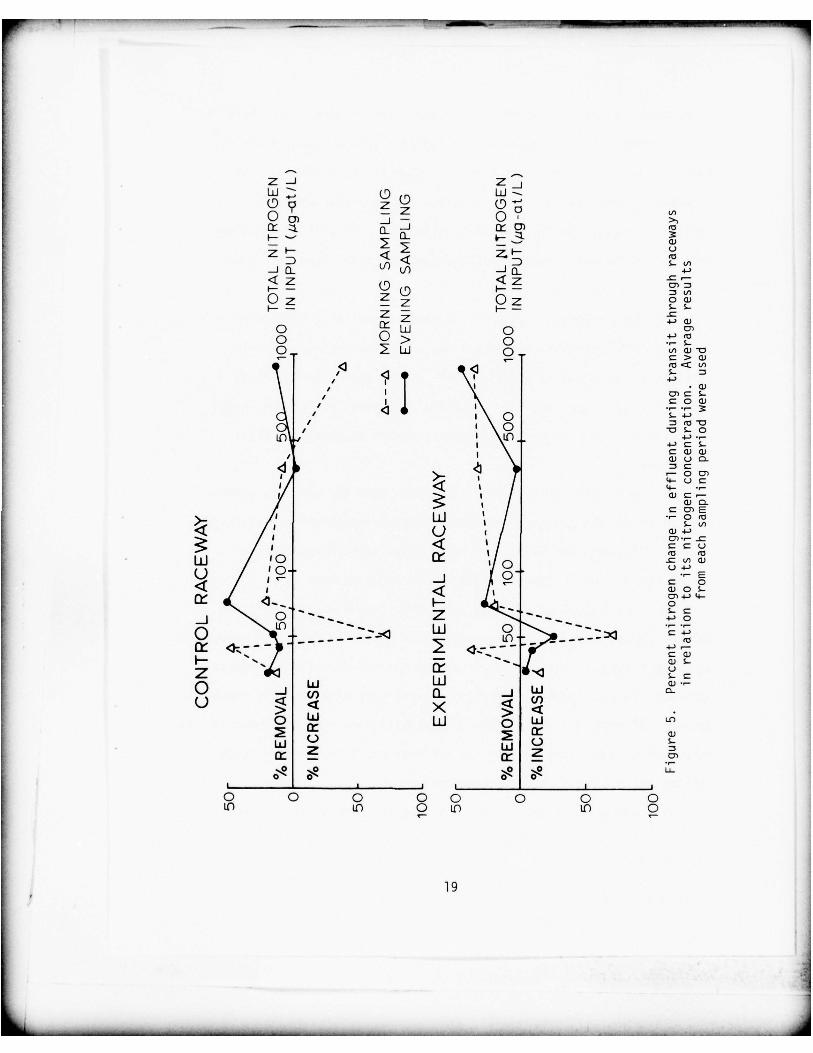
5 Percent nitrogen change in effl uent duringtransit through raceways in relation to itsnitrogen concentration . Average resultsfrom each sampling period were used 19
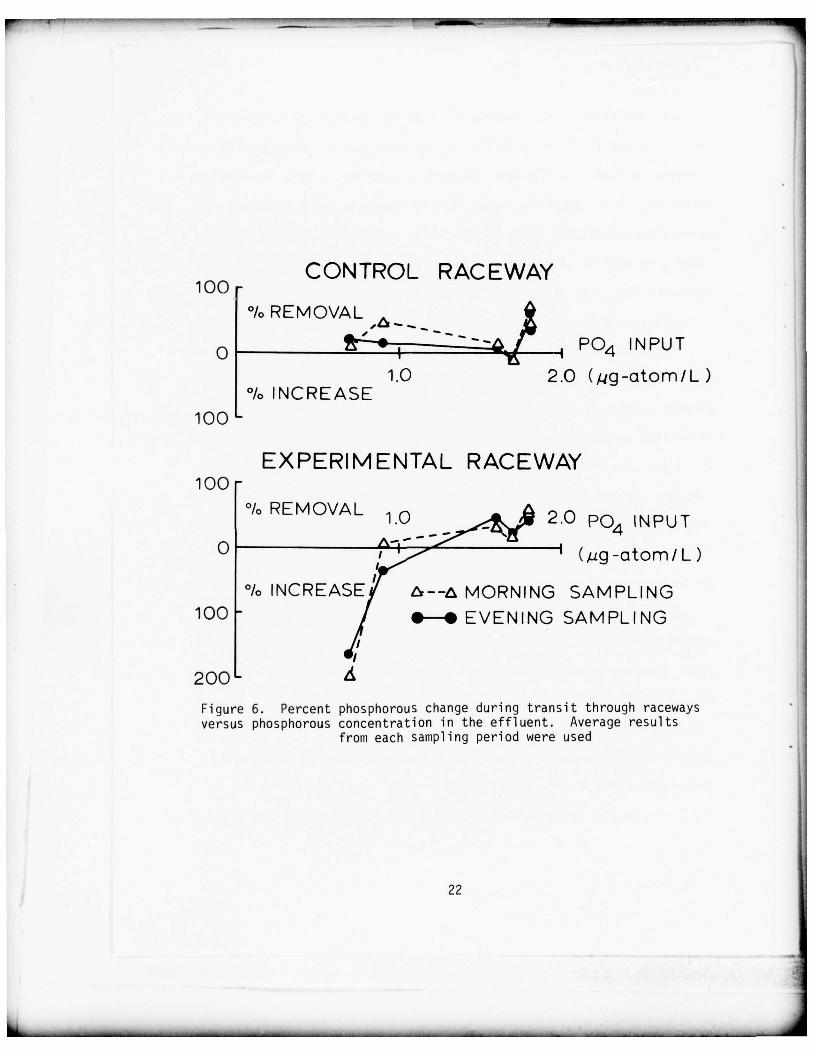
6 Percent phosph orus change during transit throughraceways versus phosphorous concentration in theeffluent. Average results from each samplingperiod were used 22
7 Percent i ron removal in waste water duringtransit through raceways versus concentrationin input 26
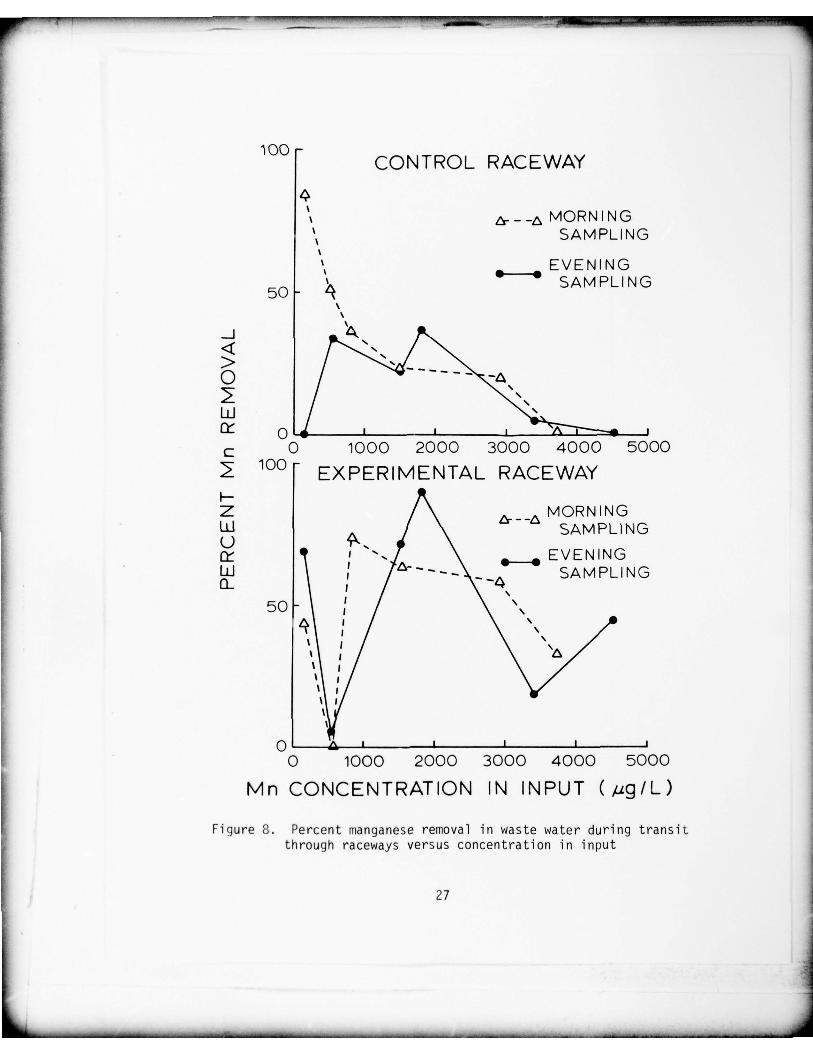
8 Percent manganese removal in waste water duringtransit through raceways versus concentrationin input 27
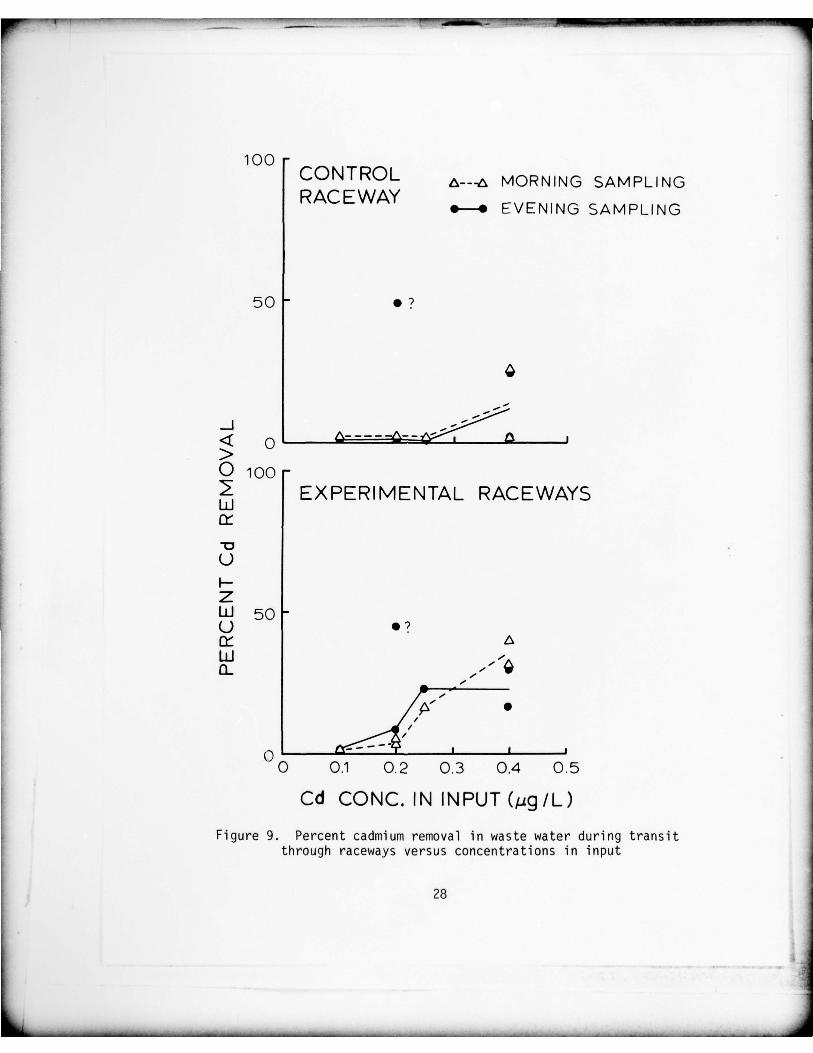
9 Percent cadmi um removal in waste water duringtransit through raceways versus concentrationin input 28
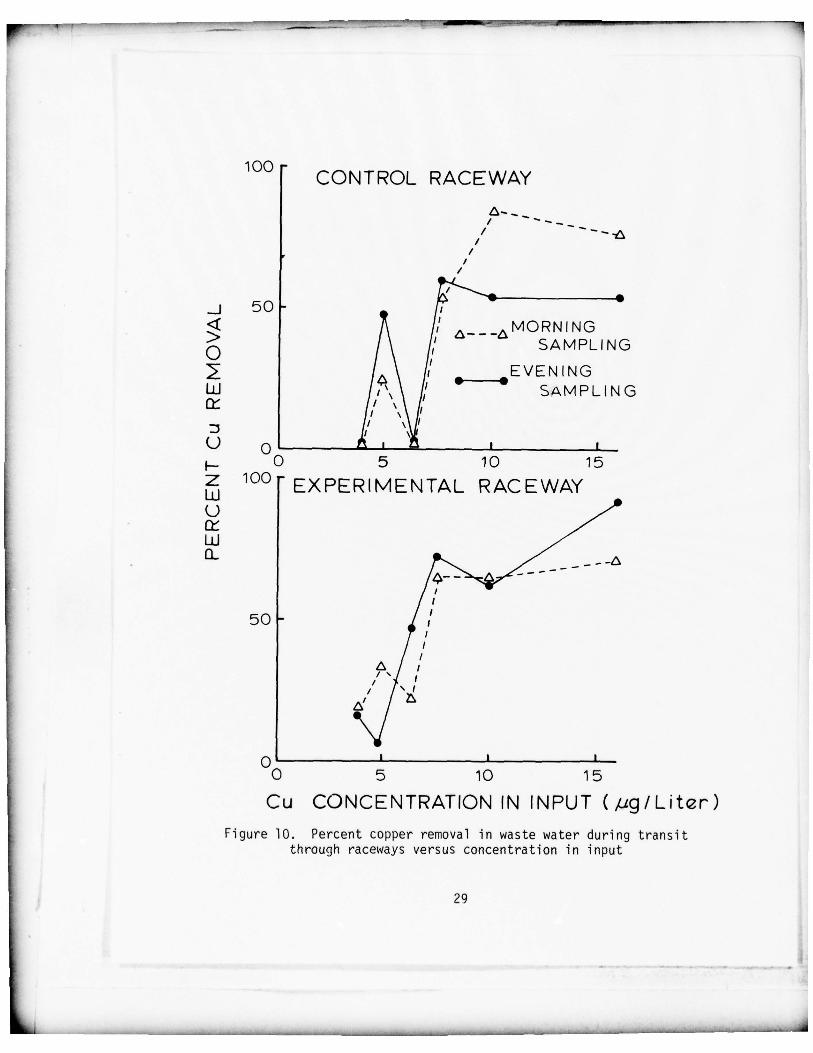
10 Percent copper removal in waste water durin gtransit through raceways versus concentrationin input 29
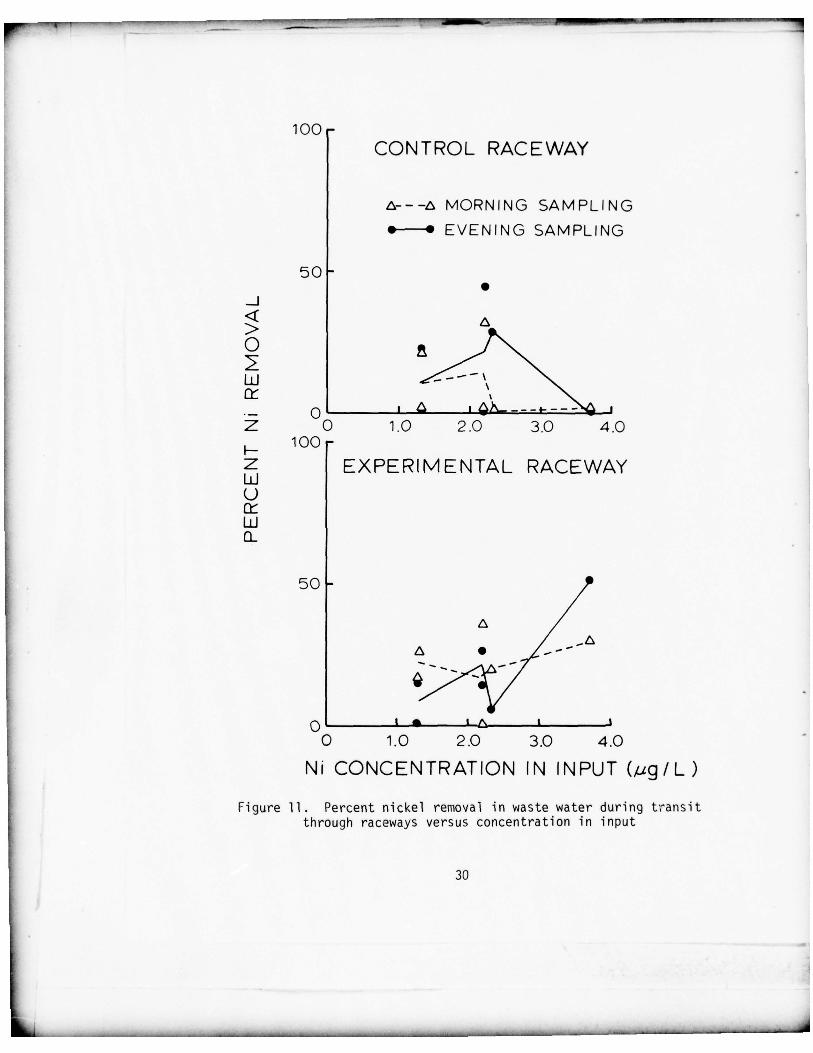
11 Percent nickel removal in waste water duringtransit through raceways versus concentrationin input 30
12 Percent zinc removal in waste water duringtransit through raceways versus concentrationin input 31
viii
~
. ~~~~~~~~~~~~~~~~~~~~~~~ . _ _ _ _ _ _
‘~~~~~~ —‘———-- -- .—- —---—— - -— - ‘- —— - ,~ - . . , . .— .-,..—.-
CONVERSION FACTORS, U. S. CUSTOMARY TO METRIC (SI)UNITS OF MEASUREMENT
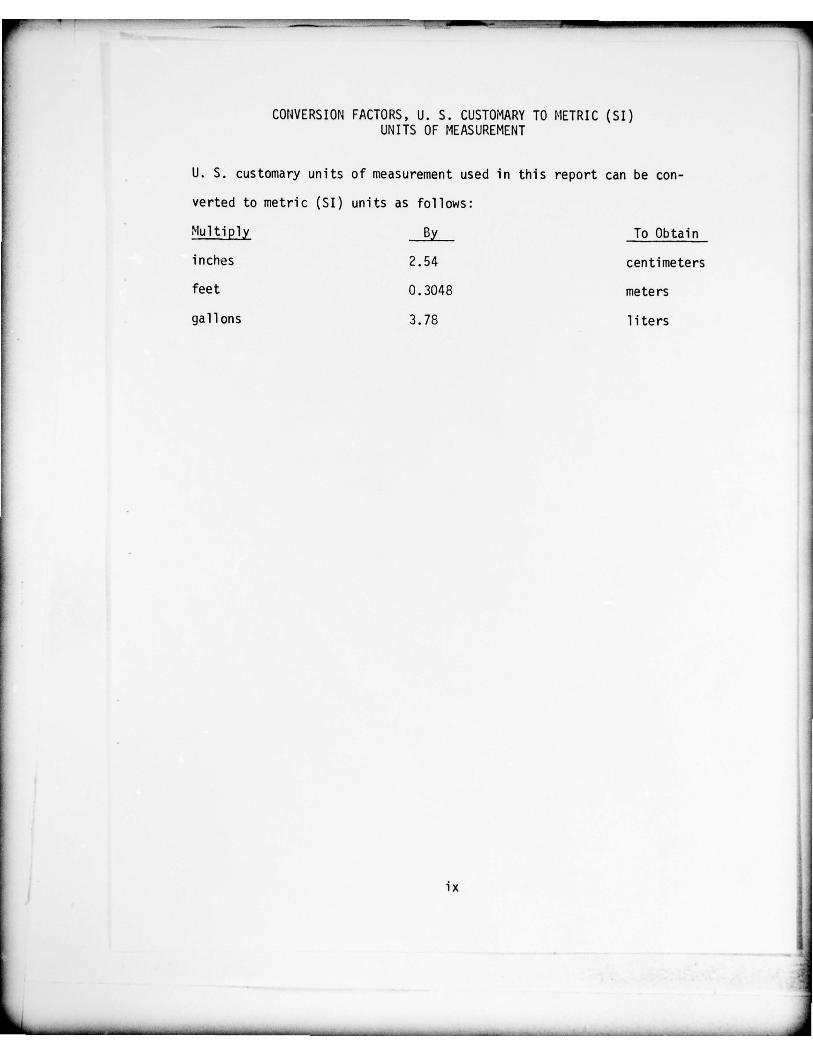
U. S. customary units of measurement used in this report can be con-
verted to metri c (SI) units as follows:
Multiply By To Obtain
inches 2.54 centimeters
feet 0.3048 meters
gallons 3.78 liters
ix
L~ _ _
ABILITY OF SALT MARSHES
TO REMOVE NUTRIENTS AND HEAVY METALS
FROM DREDGED MATERIAL DISPOSAL AREA EFFLUENTS
PART I: INTRODUCTION
Background
1. The ability of wetlands to accumulate and store nutrients and
metals is well established.”2’3’4’5’6’7 The feasibility of using wet-
land environments for overland flow as a method of wastewater treat-
ment has been suggested by a number of researchers8 and has recently
received attention for the treatment of the effluents from dredged
material disposal areas.9
2. Overland flow, like other land treatment systems, is becoming
familiar to environmental engineers as an effective advanced waste10,11,12,13 . .water treatment system. Unlike the infi l tration systems
where waste water is treated by the soil , plants and microorganisms
as it moves through the soi l , overland flow systems depend on treat-
ment of the waste water as it flows over a rel atively impermeable soi l
surface. In this system the surface vegetation and associated
organic mat and microorganism play an important role.11 The applica-
tion of overl and f1ow treatment system has been successful in decreas-
ing BUD, nutrients and heavy metals in industrial and domestic wastes.
3. Overland flow systems are established on sites where soil
permeability is low . A requirement for the satisfactory application
of this system for waste treatment is that the site have a slight
1
- --_ ~~~~~~-.-- _- - - -- - — - - - - . .~~~~~~~~~~~~~~~~~ -~~~~~~~~ -
______ —
slope, general ly less than 8 percent. Wetl ands , such as salt marshes ,
generally have these characteristics .
4. Salt marshes in the Southeastern United States have been
studied to understand their role in the biogeochemistry of nutrients4,6 .and heavy metals. The results of these studies indicate that salt
marsh systems exert considerable infl uence on the transfer of nutrients
and trace elements , including heavy metals , in estuari ne environments .
In these studies it was demonstrated that both the marsh sediments
and the dominant plant (Spartina alterniflora ) and its associated
floral and faunal components play an important role in the overall
cycling of metals and nutri ents. Materials transferred to and through
salt marsh envi ronments may accumulate in the sediments where they may
be inertly bound or be taken up by vegetation . Nutrients and trace
elements taken up by the plants subsequently become incorporated into
the detritus based food chain upon plant death .
5. Some studies have show n that Spartina alterniflora accumu-
lates nutrients and metals from sediments through its root system and
transfers them to the water column by di rect release from the14,15leaves. Some very vol atile elements such as arsenic and mercury
may also be taken up by the root system and released from the leaves to
the atmosphere in vapor form e Rooted marsh plants do not normally
accumul~ L~.. iiutrients or metals directly from the water column . How-
ever, these materials can be removed from the water due to sorption
onto sediments and subsequently taken up by the plants through their
root system.
2
I
w ‘~~~~~~ ‘ ,_ —r . ---- - - . . -_
6. Natura l salt marshes have been shown to accumulate essentially
all the nutri ents supplied to them4 and are apparently able to take up
increased amounts through “luxury consumption .” For example , studies
of nitrogen applications on some salt marsh plants have shown favor-
able growth responses of the vegetation to the increased nutrients .16
7. The ability of the salt marsh vegetation to accumulate high
concentrations of heavy metals without deleterious effects has also
been demonstrated.17 During laboratory studies where plants were
exposed to high levels of heavy metals , littl e effect on growth was
noted. Natural salt marshes that have been exposed to high inputs of
heavy metal pollutants (e.g., mercury) also appear not to be greatly18
altered.
8. In the Southeastern United States the major portion of the
maintenance dredging by the Corps of Engineers arid the pri vate sector
is in channels adjacent to salt marshes. Hydraulic dredges are more
commonly used and the dredged material is often disposed of in impound-
ments designed to improve the quality of the effluent returning to the
waterways .
9. Due to their capacity to accumulate both nutrients and heavy
metals to rel atively high l evels , their fi ltering ability to decrease
turbidity and their proximity to dredging activities , salt marshes
represent a potential overl and advanced treatment system for the
effluents from dredged material disposal areas . This report discusses
results of studies designed to evaluate the feasibility of the use of
salt marshes for this purpose.
3
. ~~~~~~~~~~~~~~~~~~~~~~~~~~~~~~~~~~~~~~~~~~~~~ -- ‘ ..-
Purpose
10. The purpose of this study was to evaluate the ability of a
Spartina alterniflora marsh for advanced treatment of effluent from
dredged material disposal areas. The study was designed to provide
preliminary information on which future, more detailed feasibility
studies could be based.
Scope
11. The primary objective of this project was to make an initial
assessment of the ability of a salt marsh system to remove certain nu-
trients and heavy metals from the effluent of confined dredged material
disposal areas. A detailed investigation of the processes responsible
was not included in this study. Within the time requirements and
facilities available , however , the study was designed to develop an
indication of how changes in conditions such as effluent flow rate,
contaminant concentration , daylight and temperature affect the remova l
efficiency , since these are of fundamental importance in the management
of such a treatment system. Because of the limited nature of the study ,
only certain types of contaminants were studied. They included nitro-
gen , phosphorus , i ron, manganese , cadmi um, copper, nickel , zinc and
turbidity . The study was conducted between August and December 1976.
4
_— - -------_ ._- .-.-- .--__, - - -_ - . -- -_-- --- ---—,-- ~~.- - . --------- ---
PART II: APPROA CH
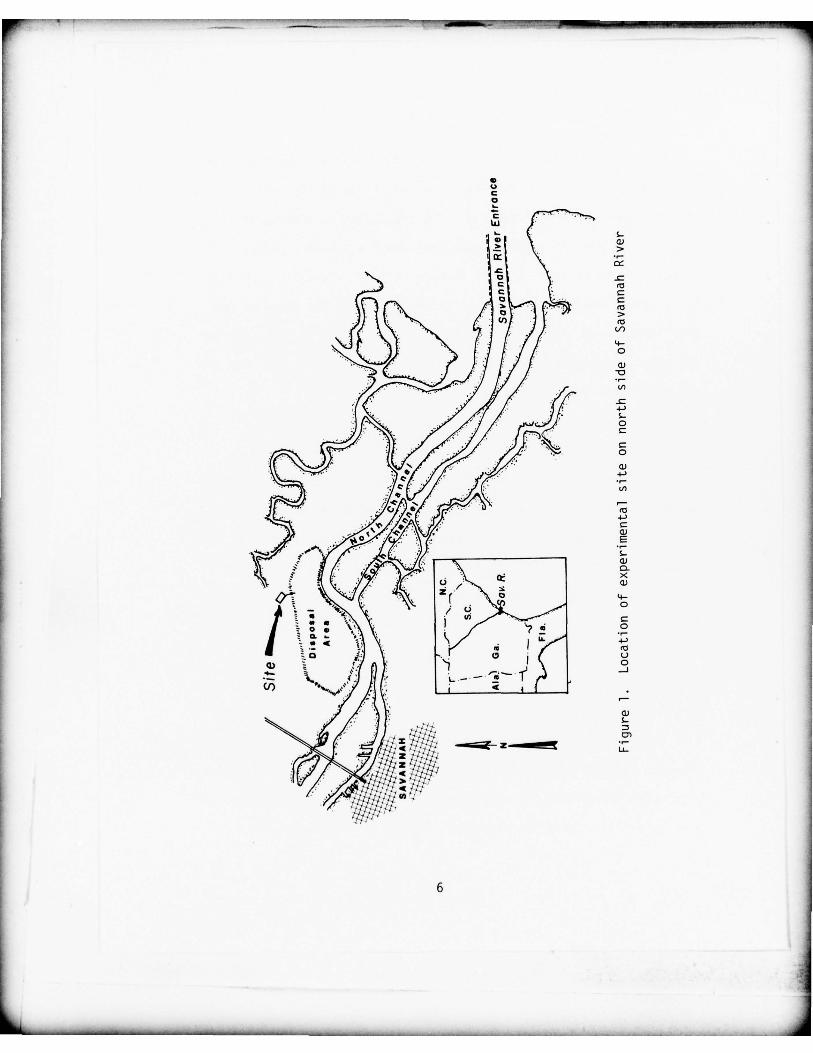
12. The site chosen for this study was a natural marsh adjacent
to a dredged material confinement area which lies on the northern side
of the Savannah Ri ver (Figure 1). The vegetation in this marsh is
composed of short Spartina alternif lora and has a peak standing above-
ground biomass of approximately 700 9/rn2 dry wt. Access to the site
was accomplished along a road maintained on top of the dikes of the
confinement area . The marsh was flooded twice daily by tides and was
adjacent to a natural creek which ultimately drains eastward into the
Savannah River distributary system.
Experimental System
13. The experimental system was located a few hundred feet from
the diked confinement area. It consisted of 12 raceways built in the
marsh and designed to allow effluent from the confi nement area to drain
through them (Figure 2). The raceways were built adjacent to one
another and were 10 ft wide and 300 ft long (Figure 3). The sides of
the raceways were constructed of plywood extending 18 inches above the
surface of the marsh and 6 inches below (Figure 4). These retained the
effluent waters and prevented entry of tidal waters. Weirs were located
at the mid point and end of each raceway to maintain a depth of no
more than 4 inches during the experiments . Effluent from the dredged
material disposal area was del i vered to the raceways through a 6 inch PVC
pipe which penetrated the di ke. Three inch pipes came off the 6 inch
pipe to deliver the effl uent to each raceway . The flow of effluent
S
_____ ~-. ~~~~~~~~~~~~~ ._____~_~~~_ —.—
UCCI-
CW )t
0)
_ _ I
_
I
~1/ IJ~~ ~~~~~~~
1’ -41 ~~ .
~~~~~~~ z —~~~~~~~~~~
~~~~~~~~~~~~~~ ~~~~~~~~
6
- ~— ---:;
~~~~~~~ --‘
~~~~~~~~~~~~~~~~~~~~~~~~
~~~~~
~~~~~~~ c
~~t ,4~~~~~ ~~~~~~~
I ~~-
~~~~~~~~~~~~~~~~~~~~ ~~~~~~~~~~~~~~~~~~~ ~~~~~~~~~~~~~~~~ 14
~~~~~
I
~F ‘~. ~ ~~~~~ -
~ •-~:> :-
~~~ -
‘ I. . . .
- .,CA- .. , -C
• -~- ,~: ~ :-
-. E
~I “ —
- ,
. -
. .
,
. - - ...;
~ ~~~~~~~~~~~~~~~~~~~~
;.~ ~~~~~I
..
.\ ~
- .
.. .
I~~~~ ~~~~~~~~~ ~~~~
I A ~~
- \ ~~~~~~~~~ I
• . .
7
____________ ______ - . — ~~~~~~~~~~~~~~~~~~~~~
w 0>
LLLL!i!!!Jt ~;;:(n~~~~
-~ to
0) 1D4-’ ~-
>1~~~~(noS.-
,— -1-)
4-~ 0
‘a)
C,,
0)5-
r
8
—
~
.- -
- —_-_-----
‘
- —----~~~
I-
/ H - S.-
~i1 ci)
I
i’-
~~1.
~~~
-
~~
I
-
~~~~~~~~~~~~~ - __
to the raceways was controlled by PVC valves. The bottom of one race-
way was covered with plywood and subsequently lined with plastic
sheeting to serve as a control .
14. Using this system the effluent from the confinement area was
delivered to the raceways to evaluate the removal efficiency of the salt
marsh. The control raceway was used to evaluate processes where the
marsh vegetation and sediment were not involved . With the delivery sys-
tern used , flows to any raceway could be controlled from approximately
1 gal/mm to 60 gal/mm . This is equivalent to a range of overland ap-
plications of from about 0.06 to 3.7 acre inches per day and is similar
to the rates used by other workers.1° This range of applications also
represents a range in the residence time of the water in the raceways
of from 20 to 120 hrs .
Sampling
15. Prior to conducting the experiments (August 1976), sediment
and vegetation (Spartina roots and leaves) samples were collected at
three evenly spaced stations wi thin each of the 11 marsh raceways.
Similar samples were collected at eight outside control stations (two
on each side of the experimental system). After the experiments were
completed (December 1976), samples were again collected from these
locations . All of these samples were analyzed for nitrogen , phosphor-
us , i ron, manganese , cadmi um , copper , nickel and zinc. The sediments
were also analyzed for volatile solids .
16. Samples of the effluent input to the raceways were collected
at two-hour intervals during each of the six 24-hour sampling periods
10
-_ ..-
(experiments) conducted during this study. Samples were also collected
at the mid point and end of each raceway in the morning (0630), and in
the afternoon (1430) during each sampling period. Each of these
samples was analyzed in the field for temperature , salinity , pH ,
dissolved oxygen and turbidity . They were subsequently analyzed in the
laboratory for ammonia , nitrate , phosphate , and total i ron manganese ,
cadmium , copper , nickel and zinc.
17. Two of the six sampling peri ods (experiments) were conducted
on 5-6 and 11-12 September. The other four were carried out continu-
ously on 13, 14, 15 and 16 November 1976. The timing of each sampling
period was controlled by dredging activities along the Savannah Ri ver
and by weather conditions which during one occasion resulted in the
destruction of the dike system therefore diminishing the effluent
supply to the raceways.
Analytical Procedure
18. Water samples were analyzed for nutrients on site or frozen
to be transported to the laboratory for subsequent analysis. Ammonia
was determined colorimetrically as indophenol blue which is formed by
the reaction of hyperchlori te with alkaline ammonium solution in the
presence of phenol and nitropruss ide ions.’9 Nitrate was determined
by a cadmium reduction method2° and phosphate was determined by a
molybdenum blue technique. 21 Blanks were determined on quartz dis-
tilled water.
19. Water samples collected for metal analyses were acidified
to a pH of 1 in the field. In the laboratory the pH was adjusted and
11
- ._ ---- - — - -_ — .—.-- -——— - ,-- -~~~~ —~~- _.--—~~~~— --_ _ , _ —. . .~ _ ._ . . _- .—_-.--rn
— --—--- —~~~~~~~~~ ... . .. .
the metals were extracted by an APDC -MIBK technique .22 The solvent
phase (MIBK) was then analyzed for the particular metal by atomi c
absorption spectrophotometry .
20. Field measurements on water samples were conducted using
a refractometer for salinity , pH and dissolved oxygen meters and a
candle turbidimeter for turbidit y . Prior to analysis , samples of
Spartina altern i flora were washed wi th double distilled water to
remove salts. The grass was then cut into pieces (about 2 cm in
length) and thoroughly mi xed in a plastic bag. A portion of this
material (about 10 grams ) was then dried and later homogenized
using a mortar and pestle.
21. Sediment and grass samples were analyzed for total nitro-
gen by the Kjeldahl method using about 1 gram of each. Phosphorus was
determined as phosphate on acid digests of approximately 1 gram
samples of sediment and grass. Total metal concentrations were de-
termined on the grass samples by atomic absorption spectrophotometry
after digestion in concentrated nitric acid. Sediment samples were
leached with nitric acid and analyzed in a similar manner. Total
volatile solids in the sed iment samples were determined by weight
loss after combustion at 600° C for 3 hours .
12
_. _..-
~
-.
~
--,.--.
~~
--—
~~~~~
PART III: RESULTS
22. All the data from field observations and laboratory analyses
are given in appendices at the end of this report. The appendices are
broken into sections dealing with specifi c classes of data and within
each appendix tables are grouped according to sampling period. Input
data and data from raceway samples are given in separate tables within
each appendix. All chemical data on sediment and grass samples are
also listed in separate appendices (Appendices 0 and E).
Characteristics of Disposal Area Effl uent
23. The quality of the effluent from the confi nement area
(referred to as influent in appendices ) varied during the six sampling
periods . Vari ations wi thin a given sampling period were also observed
(Appendix A).
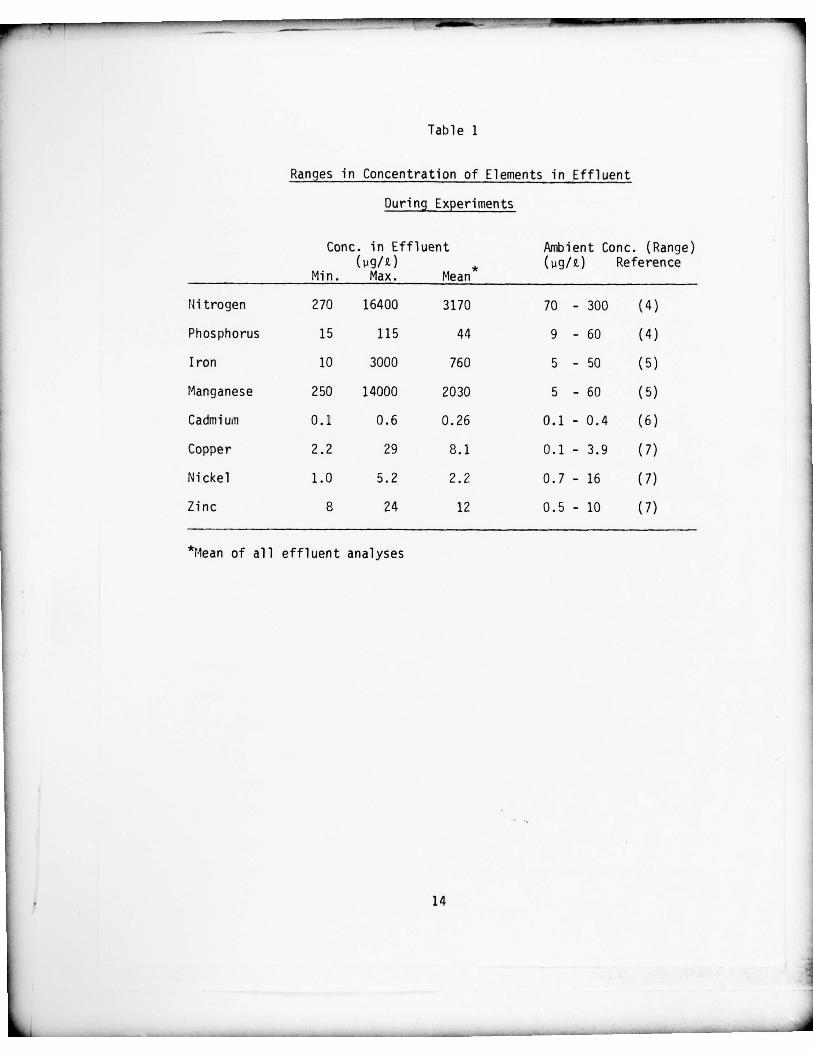
24. The range in concentrations of the eight contaminants investi-
gated during the study are given in Table 1. For comparison local , assumed
ambient concentrations of these elements are also given. Generally,
the concentrations of the eight elements in the effluent ranged from
the high side of the ambient concentration to about an order of magni-
tude greater. During any one sampling period , however , only i ron and
manganese were found to vary signifi cantly in the effluent (Appendix
C, Tables Cl , C3, C5, C7, C9 and Cli).
25. During the study the water temperature varied from about 18
to 31° C during the two September sampling periods down to tempera-
tures of around 5-13° C during the November experiments . Salinit y
ranged between 8 and 14 °/00 throughout the six sampling peri ods .
13
.. .
—~.-=—~- . . w._ - -.-- —_ _--
_ . .~- - w - ~~ - - _ .--,------~
----.-_
Table 1
Ranges in Concentration of Elements in Effluent
During Experiments
Conc. in Effluent Ambient Conc. (Range)(pg/&)
* (~ig/~) Reference
M m . Max . Mean
Nitrogen 270 16400 3170 70 - 300 (4)
Phosphorus 15 115 44 9 — 60 ( 4 )
Iron 10 3000 760 5 - 50 ( 5 )
Manganese 250 14000 2030 5 - 60 (5)
Cadmium 0.1 0.6 0.26 0.1 - 0 . 4 ( 6 )
Copper 2.2 29 8.1 0.1 - 3.9 (7)
Nickel 1.0 5.2 2.2 0.7 — 16 (7)
Zinc 8 24 12 0.5 - 10 (7)
*Flean of all effluent analyses
14
— _ -- --_.-_- - -.~.., ~~~~ —- ----- ---- ------- —-_--- -- - _~~~~~r
26. The dissolved oxygen concentration in the effluent varied
diurnally with concentrations reaching super saturation during day-
light and decreasing to less than 50 percent saturation in some cases
during night time . Supersaturation of oxygen is a feature commonly
observed for discharges from dredged material confinement areas23 and
is apparently due to the increased primary production (due to phyto-
plankton and/or benthic algae) stimulated by nutrient release from the
dredged sediment. This leads to increased photosynthetic oxygen
production .
27. pH also varied diurnally and appears to be related to the
dissolved oxygen concentration . This phenomenon has been previously
oo~erved23 and is apparently due to utilization of CO2 by phytoplank-
ton with simultaneous production of oxygen.
28. Turbidity varied considerably during the study . The values
observed ranged from less than 40 to over 100 JIUs. This variation is
apparently due to variations in the residence time of the water in the
disposal area which is a function of the point in discharge for the
dredge . This varied considerably during the course of the study .
29. The quality of the effluent from the disposal area was not much
l ower than typical estua~-1ne waters47 during the experiments as judged
from the data presented in Table 1. Clearly the effluent from the dis-
posal area is not as contaminated as industrial or municipal wastes to
which overland flow treatment systems have been applied . Mean levels of
contaminants were generally equal to the highest ambient levels (P, Cd ,
and Zn) or as much as 30 times this value (Mn), and , therefore , sufficed
for the purpose of this study .
15
I
~
- _ -- - -- .- ~~~~~~~~~~~~~~~~~~~~~~~~~~~~~~~~~~~~~~~~~~~~~~~~~~~~~~~
— — ._T.— ~~ — , —- .
~~~~~~~~~~ - - _.~ -_
~~..—-—
~~~~~~~~~~~~~~~~~~~ — — .-. - . - — -
Changes in DO, pH, and Turbidity in Raceways
30. During transit of the effluent through the experimental
marsh raceways, dissolved oxygen always decreased (Table 2, Appendix A).
This was more evident in samples collected in the morn ing (0630) indi-
cating the effect of respiration in the marsh system over phytosynthe-
sis. In the control raceways the large decrease in dissol ved oxygen
was not observed during any of the sampling periods . In fact, increased
oxygen concentrations commonly occurred at the mid point and discharge
end as a result of a substantial phytoplankton and epiphyte populations
within this raceway.
31. The change in dissolved oxygen from the input to the dis-
charge side of the raceways did not appear to be influenced by flow
rate. Within each sampling peri od the concentration of dissolved
oxygen in a given raceway varied independently of water flow .
32. As was the case with the disposal area effluent , pH increases
with increasing oxygen concentration . For example , the mean pH increases
from about 7.0 or lower to about 8.0 as dissolved oxygen percent satura-
tion increases from less than 10 to about 100. pH usual ly decreased
from input to discharge in the marsh raceways. In the control raceways
the opposite trend was always observed.
33. In the marsh raceways turbidity of the water always decreased . In
the control raceway this was not the case (see Appendix A). At the mid point
and discharge end of the raceways , turbidity was less than 40 JTU in every
case even though the turbidity of the effluent from the disposal area once
reached a level greater than 100 JTU . In the control raceway, however , the
16
_ _ _ --. - ~~~~---~~~~~~~~~~~~ - . - -~~~
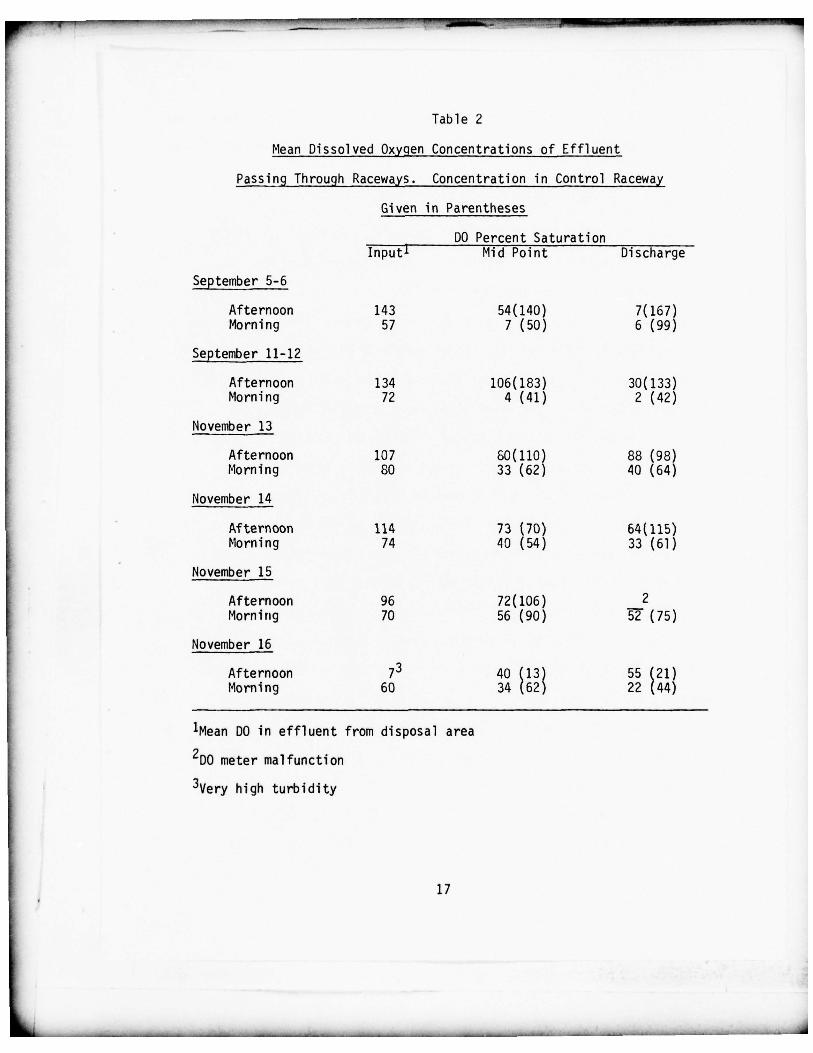
Table 2
Mean Dissol ved Oxygen Concentrations of Effl uent
Passing Through Raceways. Concentration in Control Raceway
Gi ven in Parentheses
DO Percent SaturationInput 1 Mid Point Discharge
September 5-6
Afternoon 143 54(140) 7(167)Morning 57 7 (50) 6 (99)
~~pteniber 11-12
Afternoon 134 106(183) 30(133)Morning 72 4 (41) 2 (42)
November 13
Afternoon 107 60(110) 88 (98)Morning 80 33 (62) 40 (64)
November 14
Afternoon 114 73 (70) 64(115)Morning 74 40 (54) 33 (61)
November 15
Afternoon 96 72(106) 2Morning 70 56 (90) 52 (75)
November 16
Afternoon 73 40 (13) 55 (21)Morning 60 34 (62) 22 (44)
‘Mean DO in effluent from disposal area
2D0 meter malfunction
3Very high turbidity
L ~~~~~~~~~~~~~~~~~~~~~~~~~~~~~~~~~~~~~~~~~~~~~~~~~~~~~~~~~~~~~~~~~~~~~~~ - -
- - . - . ~~~~~~~~~~~ —
~~~~- :~~ ~~~~~~~~~~~~~ L . .- --
~
——-
turbidity did not generally decrease significantly be l ow input levels. The
filtering ability of the marsh vegetation clearly aids in decreasing turbidit y.
Nutrient Removal from Disposal Area Effluent
34. Throughout the experimental and control raceways the distri-
bution of nitrogen between ammonia and nitrate species varied. Gener-
ally, nitrate was higher than ammonia in both the input and the raceway
water samples. The transformation of nitrogen between these two species
followed no detectable pattern . Total inorganic nitrogen (NH 4 + NO3)
concentrations were therefore calculated and this value is used in the
following discussion. The nutrient data are presented in Appendix B.
35. In general , nitrogen removal from the effl uent during transit
through the experimental raceways is not related to input fl ow rate .
It does , however , appear to be related to the concentration of nitrogen
in the effluent. Figure 5 shows the efficiency of nitrogen removal
from the effl uent as a functi on of its nitrogen concentration . Each
point on this plot is based on the mean concentration of nitrogen in
the effl uent and the discharge from the raceways for each sampling
period (one point each for morning and evening samplings). With increas-
ing nitrogen in the effluent , the efficiency of removal (e.g., percent
removal ) appears to increase. For example , during sampling peri od 2
the average total nitrogen concentration in the effluent was 860 itg ~
atoms/t. The average total nitrogen concentrations in the discharge
from the experimental raceways were about 500 and 420 pg~atoms/2~ for
morning and evening samples , respectfully. This represents a 42-52
percent decrease in nitrogen during transit. At l ower total nitrogen
18 .
~~~~~~~ .~~~~~~~~~~~~~~~~~~~~~~~~~~~~~~
_________ 1T~ — _
~
. .,-__.- ______
z~i~(9 UJ— .( 9 9
::~~J 3. - 4-’
4z
/
I
‘I
74 .‘- III 4 I 4- .,-II ~~~ I II I I/ II’ ILl I/ II c__i 0)-I-,
-~~ / I
Si. jw / S Q /
I ~0
04-’y / , .~- —J ~~~~~~
.
-i / g 4
Il 0 ) 0 5 -
~~ ~3- .. F-- -~~
-..‘.--- - -_J ‘N. 0 —~~.- ~~-
‘~~-~ - -- -o ~~~~~~
w -
k - ~~~ G~-:~~~
- - -
I—. •- I — U S -zo j Wo ~~~~~~~~ xo w LiJ o w
ci)w 0 w
u~
__________ I I I
0 0 0 0 0 0 0 0In In 0 in In 0
19
_ _ _ _ _ _ _ _ _ _ _ _ _
— -
concentrations the average removal is l ower and in some cases there is
a net increase. For example , during sampling periods 4 and 5 almost
every raceway showed an increase in nitrogen in its discharge . This
increase is probably due to release from the sediments which is a
continuing process due to mi crobial activity . At low nitrogen concen-
trations in the water column , nitrogen release must exceed nitrogen
uptake in the sediments .
36. In the control raceway, nitrogen removal also appears to
decrease wi th decreasing concentrations. Removal thus is probably
completely controlled by algal uptake . During cold periods , total
nitrogen in the input was low. Decrease in removal efficiency in the
control and marsh raceways may therefore be due to decreased algal
production .
37. For the first two sampling periods when the nitrogen concen-
tration in the input was well above ambient and temperatures were high ,
removal efficiency was also high . Percentage removal ranged from
around zero to over 50 percent with a mean of 30 percent.
33. The removal of nitrogen appears to take place in the first
half o-f the marsh raceway so that decreased concentrati ons are observed
at the mid point. This suggests that the most of the nitrogen remova l
occurs during the initial contact of the effluent with the salt marsh
system. If removal is a function of concentration , then the absolute
amount of nitrogen removed from the effluent would be expected to be
greatest in the first half of the raceway.
39. Removal of nitrogen can be accomplished by adsorption on
20
L _ _ --—--~~~~~~~~~~-.— .-- -~~~~~~~~~~ - . . -- .-.--- - ~~~~~~~~~~~~~~~~~~~ .. ~~~~~~~~~~~~~~~
-- — - — - - - — --..--—--- .- - . — -- - -— --------- .-- ~__ .J___ -- . -- ‘-
.—
sediment particles as they settle out into the marsh after initial
entry of the effl uent as suggested by the decrease in turbidity . As
in other overl and flow systems, an aerobic-anaerobic double l ayer exists
consisting of the overlying water film and the underly ing sediment.
Under these conditions , both nitrification and denitrifi cation occur
leading to removal of nitrogen by volatilization as a gas.10’13 These
processes also control the availability of nitrogen to plants which
ultimately provide another sink for the excess nitrogen.
40. Phosphate removal is similar to that of nitrogen . Here again
the input rate of the effluent appears to have little effect on the
removal efficiency . The removal efficiency , however , does appear to
be related to the concentration of phosphate in the effluent (Figure 6).
As in the case of nitrogen , at low phosphate concentrations during
sampling periods 1 and 2, many of the marsh raceways showed an
increase in phosphate in the discharge water. This suggests a chemi cal
equilibration process similar to that described for the buffering of
phosphate concentrations by salt marsh sediments .24 The chemi cal pro-
cesses wh i ch control this appear to involve ferric oxyhydroxides which
adsorb phosphate .25 Oxidation-reduction conditions of the sediment may
alter the phosphate removal effici ency to a considerable degree at
higher P04 concentrations.
41. Excluding sampling periods 1 and 2, the average removal
efficiency of all of the marsh raceways for phosphate was 38 percent.
During these experiments the effl uent concentrations were between 1.6
and 1.8 ~g~atoms/L or approximately twice those for sampling periods 1
and 2.
21 -
~~~~~~~ . .~~~~~~~--~~~~--- - , . -
~~~-. ---,--~~~~~~~~~~~~~~~~~~~~~~~~~~~~ ~~~~~~~~~~~~~~~ ~~~~~~
--~~~~~~~~~~~~~~
-~~ - . ——
100~ CONTROL RACEWAY
°/0 REMOVAL 4
o P0~ I N PU T1.0 2.0 ( ,qg-atom/L)
0/~ INCREASE100
EX PERIMENTAL RAC EWAY100
0,0 REMOVA L 2.0 po4 tNPUT0
~,j~
-- I (~ g -atom/ L)
0/0 INCREASEf E~--~ MORNING SAMPLING
J
—S EVENING SAMPLING
Figure 6. Percent phosphorous change during transit through racewaysversus phosphorous concentration in the effluent. Avera ge results
from each sam pling period were used
22
, .- - - - - - - - - -- -~~ —~~~ --- -‘~~~ . -~~~~~~~~- - - -- - - . -~~~~
-
~
-=.-- - —-----.--—- 1
42. Similar again to the results observed for nitrogen , phosphate
is removed in the fi rs t hal f of the marsh raceways. In most cases ,
phosphate reduction at the mid point was found to he equal to or greater
than that observed at the discharge.
Metal Removal from Disposal Area Effluent
43. All data on the concentrations of metals in the effl uent
(input to raceways) and in samples collected from the mid point and
discharge of the marsh and control raceways are g iven in Appendix C.
44. The efficiency of metal removal from the effl uent during
transit through the marsh raceways was evaluated by comparing the
concentrations in the discharges with the average concentrations in the
input prior to sampling . All the metal s behaved similarly in the race-
ways showing some removal during transit. In every case the concentra-
tions in the discharge from the raceways were lower than that in the
input or not significantly different (i.e. differences are within the
precision of the analyses which is conservatively estimated at +15%).
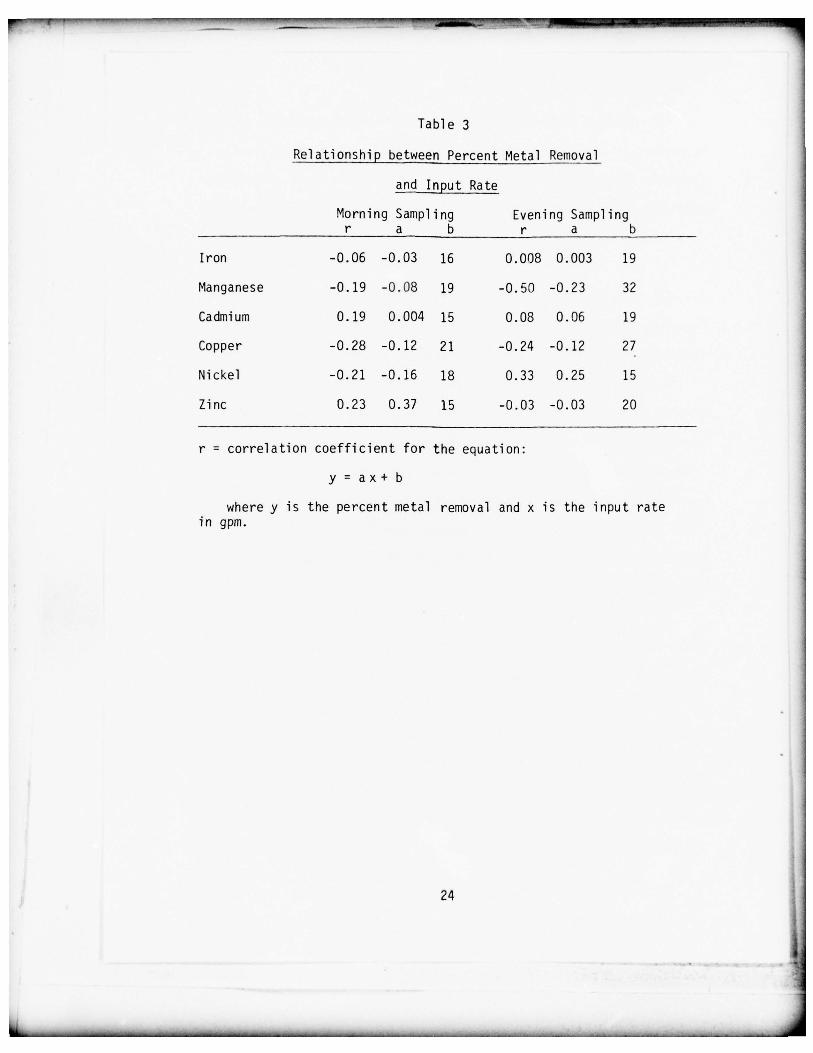
45. The percent of metal removal in the effl uent passing through
the raceways does not appear to be related to the input flow rate.
Results of linear regression analysis of the relation between removal
efficiency and effl uent input rates for all samples collected yield
insignificant correlation coefficients (Table 3). Using the most signi- -
ficant correlati on (manganese percent removal versus flow rate for
samples collected in the evening), a change of from 10 to 50 gpm in the
flow rate only decreases the removal efficiency by about 10 percent.
46. The intercepts for the regression equations (b in Table 3)
23
--- ~~~~~~~~~~~~~ - . . - - --- ---.--~~~~~- - -_- -.- .... .
Tabl e 3
Relationship between Percent Metal Removal
and Input Rate
Morning Sampling Evening Samplingr a b r a b
Iron -0.06 -0.03 16 0.008 0.003 19
Manganese -0.19 -0.08 19 -0.50 -0.23 32
Cadmium 0.19 0.004 15 0.08 0.06 19
Copper -0.28 -0.12 21 -0.24 -0.12 27
Nickel -0.21 -0.16 18 0.33 0.25 15
Zinc 0.23 0.37 15 -0.03 -0.03 20
r = correlation coefficient for the equation :
y = a x + b
where y is the percent metal removal and x is the input ratein gpm .
24
I
— --- - -- -——.- -~~~~~~~ .- —--- - --. -.- -~~ -~~~-~~~~~ -— - - -~~~~~~~--- -
for each metal can be considered as the mean removal efficiency for all
of the raceways and for all of the sampling periods for the experi-
mental system used in this study . Therefore, depending on the metal ,
15 to 32 percent removal efficiencies can be reasonably expected in a
salt ma rsh , overl and flow treatment system , under the conditions obtain S
ed during this study .
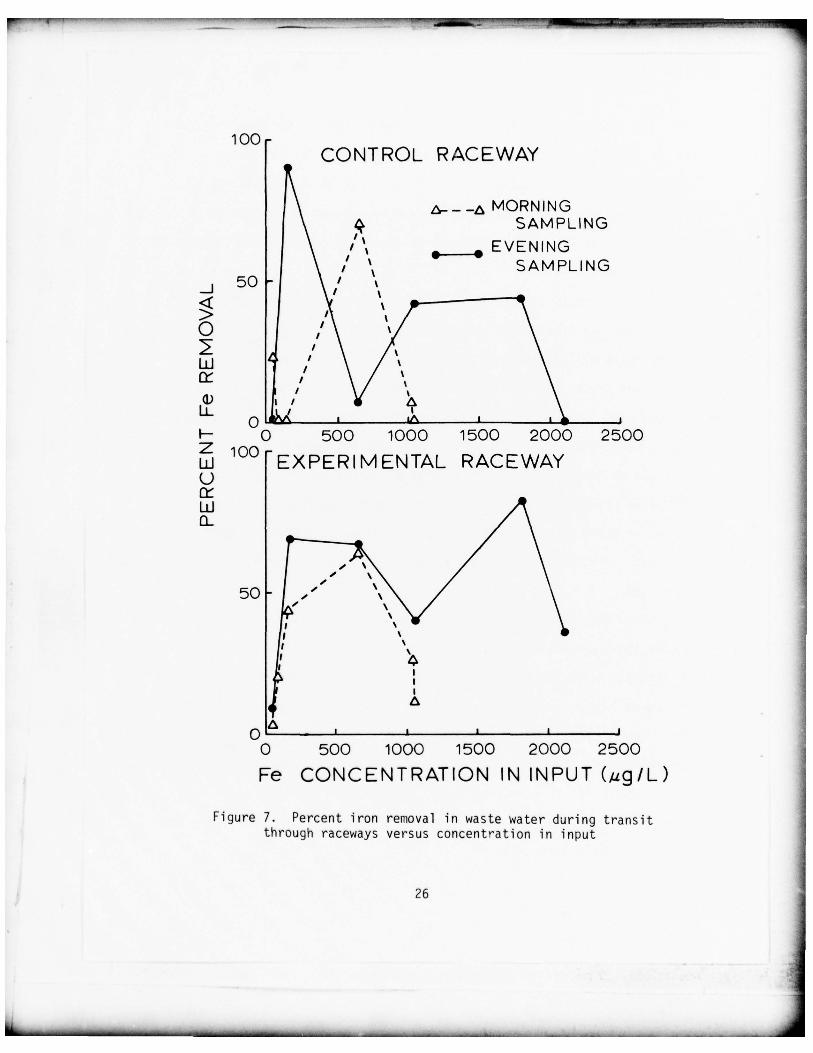
47. The above correlation of the removal efficiency with fl ow
rate takes into consideration conditions of various metal conc’~ntra-
tions in the effluent input. A compari son of the percentage removal of
the metals versus the concentration of the metal in the effluent shows
generally an increase with increasing concentrations (Figs . 7 through
12). The removal also takes place in the control raceway although not
to the same degree (i.e. differences in efficiencies are outside the
precision of analyses and therefore considered significant). In the case
of the i ron and manganese , the removal efficiency may reach a maximum at
an input concentration of around 2 ppm , near the upper limit observed in
this study .
48. Metal removal in the marsh and control raceways is probably
controlled by inorganic chemical reactions and/or adsorptive scavenging
by settling sedi-ients . Because of the high pH and oxygen concentrations
in the effluent , it is likely that hydrated iron and manganese oxide
are formed in the raceway waters. These compounds probably exist in
the effluent as fine colloidal particles which precipitate or adhere to
plants upon entry into the raceways. These precipitates are capable of
scavenging other metals as well , and probably account for their removal
from the water column .
25
_ ----~~~~~~.
r~ —- ---- --—----——--
~
-
— — ~~~~~~~~~~~ - -.:~~~~~~~~ ‘~~~~ ~~~.
100 -
CONTROL RACEWAY
~~~~~~MORNINGSAMPLING
, • EVENING
/ SAMPLING50 ~/
_________
L~ I IA I I p
F- 0 500 1000 1500 2000 2500100 EXPERIMENTAL RAC EWAY
0
LU
, ‘//
~
5 0 - ,‘
/
0 I I I I I
0 500 1000 1500 2000 2500
Fe CONCENTRATION IN INPUT (/ tgIL)
Fi gure 7. Percent i ron removal in waste water durin g transitthrough raceways versus concentration in input
26
_ _ - - -----~~~~~~~~~~~ - - ~~~~~~~~~~~ .-.-- ~~~~ .- -~~~~~~~~~~~~~~~~~~~~~~ -.-- ..-~~~~~-—-—
- —- .-- . -—--- -------.- -~~~~~~~r~L_
100 -
CONTROL RACEWAY4
~~~~MORNIN GSAMPLING
_ _ _ _ EVENING
50 S S SAMPLING
0 1000 2000 3000 4000 5000100 -
EXPERIMENTA L RACEWAYI— AZ \ f r A MORNIN GLU \ SAMPLING0 \
\ • • EVENIN G
11 1
SAMPLING
5 0 - 1 \ ‘~A s \ ft—V \ \ /
/\ ‘A /
‘p g‘p I‘p I‘ I
0 A I I I I I
0 1000 2000 3000 4000 5000
Mn CONCENTRATION IN INPUT (/1g/L)
Fi gure 8. Percent manganese removal in waste water during transi tthrough raceways versus concentration in input
27
I _ _
100 -CONTROL A- S-A MORNING SAMPLINGRAC EWAY
• • EVENING SAMPLING
50
- - - I
O i ~ o~ EXPERIMENTAL RACEWAYS
LU sO-UA
LU —
00 ~~~~. 2 ; ~3 o . 4 0.5
Cd CONC . IN INPUT (pg/L)
Figure 9. Percent cadmi um removal in waste water during transitthrough raceways versus concentrations in input
28
4
_ _ _ _ _ _ _ _ _ _ _ _ _ _ _ _
~ -— . . .. --- - ‘-- —- -j ~~~~~~~~ . -: .. .~ . .
100~~ CONTROL RACEWAYA- -
5 0 ’ NA 7’ ~~~~~~~~~~~~~~~~~~~~~~
00
14V’
E V ENIN P I N G
z 100 EXPERIMENTA L RAC EWAYULU
Cu CONCENTRATION IN INPUT ( ,üg/Lithr)Figure 10. Percent copper removal in waste water durin g transit
through raceways versus concentration in input
29
- —- -— - - -
— ______ ~~~~~~~ —-...._ = --. w,~-’_- -—
~~~~~~~~~~~~~~~~~~~~~~~~~~ ‘.“
~“
~~~~
100 -CONTROL RACEWAY
A - - -A MORNIN G SAMPLIN G.— S EVENING SAMPLING
50 -.
-JA
0 I AZ 0 1.0 2.0 3.0 4 .0I—
EXPERIMENTA L RACEWAYU
LU
0 ~~~~~~~~~~~~~~~~~~
Ni CONCENTRATION IN INPU T (,~.ig/L)
Fi gure 11. Percent nickel removal in waste water during transitthrou gh raceways versus concentration in input
30
_ _ _ __ _ _ _ _ _ - .- -~~~~
- - -
- -—_- __, - --—— ---- •—-—- ----—-——- ______ . ~=1=~
~~=-= ‘~ * _-— .-- .---~~-—-— - .-—— - ~—,-——‘.--~~
100 -CONTROL RAC EWAY
A - - -A MORNING SAMPLING.— • EVENING SAMPLING
5 0 •
0
LU
05 10 15I— 100
EXPERIMENTA L RAC EWAYU
Ui0~
50
Zn CONCENTRATION IN INPUT C ug /L )Figure 12. Percent zinc removal in waste water during transit
through raceways versus concentration in input
31
~
--_
~
-- - .-
ruup___ _—-_---- .- ---‘ --——.-_---- --- - -_--.- _—- -
Nutrient and Metal Accumulation in Sediments and Vegetation
49. To evaluate the accumulation of nutrients and metals in the
marsh system , analyses of sediment and grass samples collected at the
end of the experiments (December 1976) were compared to those on samples
collected prior to the experiments (August 1976). Tabl e 4 gives the
average results of all the analyses of sediment and grass samples from
control stations outside of the raceways (collected in December) and from
the ex per imental racewa ys before and af ter the ex per imen ts were con ducte d.
It i s clear from these resul ts t ha t mean concentra ti ons of both nutr i ents
and metals increase in the sediment as a result of their removal from the
effluent . Ni trogen also appears to have increased i n the roots and leaves
of Spartina in the raceways. No significant enrichment of the other ele-
men ts in the p lants , however , appears to have occurred.
50. Although a significant uptake of nitrogen by the plants in the
experimental raceways apparently occurred , there was no increase i n the
stand ing biomass of the vegetation (Table 5). However a greater number of
flowerin g culms was noted in the ex per imental raceways than in the natura l
marsh. The increase in the nitrogen levels in the plants could account
for an avera ge nitrogen remova l of about 7 g/m2 of salt marsh .
51. The accumulation of the contaminants removed from the
effl uent appears to occur dominantly in the sediments . The accumula-
tion of nitrogen can be calculated by evaluating its absol ute increase
in the sediments during the experiments for each raceway and assuming
this increase is to a depth of 1 cm (Table 6). Using this approach ,
the mean accumulation of nitrogen in the sediments is over 200 g/m2 .
Therefore , the accumulation in the vegetation as compared to this
32
r
- -_.-- -
- -.---_ - .-_ _- —.-_~~~~~~~~~~~~
‘ —
N-_ CO .-i r—. c\J ~~~ c~)
+ + +~ + , + ÷ ;‘ ;I
tO ~~ (\J N- (‘.1 — to tO to
-~~ ) .--I ~~~~~~~~~ ~~~~~~~~~~~~~~~~~~~~~~
+ 1 + 1 + 1 + 1 + 1 + 1 +1 +~ +1(__ ) C N- .—4 ~~ - Lf) In
C’.) C) N-C’~I
-~ — c~ Co ~~- c’.j c’~ .-. .-~ c~E ~~ -
~~~ ~ ‘ :‘ :
~~
~~
‘
S
to ‘.0 to to c ’j c’j C-.) .—. —
-~ C) C) C) CD CD CD C) C) C)
~
I
~
I
~
l
~
I
~
I
~
I ~ I ~ l ~~I
C ) C D C) ~~~~~~ d cci)
C) C) C) C)C) .-I CO N- C) C) C) .-. C)
-i .-I Co N- ‘~O ‘-I In
C C + 1 + 1 +1 ±1 ± 1 ± 1 +1 + 1 + 1
c(ci CI) — C~ C) C) C) C) C) C) C) C)C C C’.) N- tO to .—~ C) —I (‘) C)..- ..- r’) C~) In (() ç() (S.) (S) (5)
÷-‘ S.-.5- ci)(ci —4 —
x ~~ C’.i In Co to C) C) C)cn LU •
C) C) C) C) C) C) C) C) C)
U 0) .—~ + 1 ±~ +1 ±~ + J +1 + 1 + 1 +~~~ (ci 4-~ LJ~~~~
4- C-) tOrci ~~ In N- C) O’ CO C) .-l C) C)
I— ~~~
. . . . . .‘-‘ —‘ (‘-.1 C) CD .-‘ C) C) C)
CI) CC (ci C) C)
C) .-I .-.4 C) C) In C) C)-~~ CI) E O~ —I .-4 —l C’. N- .-4 to CDcii S...L/) 0 Ci~ ±1 +1 +1 +1 +1 +1 ±1 +1 ±1
4-.4- CI) tO C) m C) ~~ C) C) C) C)0 o~ C’) C’) ~~ C) ~~ In N- (o) ( )
C~) C’.) (/) In ~~ tC)
S.-.4-’
.4” C’) C’) tO
• C’) (5) ..
~~ C’) — .-4
C) C) C) C) 0 C) C) C) C)
-~~ +1 ± 1 +1 +1 + 1 + 1 +1 + 1 + 1L)
N- .-I It) It) ~~ ~~ It) N-
C ) C ) C ’ J 0 0—
C]) _
-~~ CI)_ ‘.0 tO N- to
~~ to N- ‘~~ N. —.. (I) ~~~ to N-
IA N- ~~ C/) —. C’) C]) ‘.~ N- —.~ ‘~ (‘-4 4-’ CO ‘—4 > 4-’
~~ C’.)CO ~~~ 0 -..-.— -_- (ci
0 ~ — 0 0 ~~
0cx~ .j
‘I, .— >~ >., .— >., >., ,— >., >-,-~~~ 0 (ci (ci ~ci 0 (ci (ci (ci 0 (ci (ciC 5- 3 3 C 5- 3 3 C 5.. 3 3ci) -I-) C]) C]) 4..) C]) C]) ~- 4~) ci) CI)E C 0 0 4-’ C 0 0 4~) C 0 0
~,- 0 (ci (ci ~.. o ci (ci 5- 0 (ci (ci-o L) O~ ~Y (ci (. ) ~~~ C~~ (ci L) ~~~0) 04 04If) ‘.1) 1 v)I
4 ;
~~~~~~~~~~~~~~~~~~~~ ~~~~~~~ —~ ..---——. -
Table 5
Standing Biomass of Spartina alte rniflora
On Site
Biomass(g.dry wt/m2)
Prior to experiments (August 1976) 710 ÷ 140
After experiments (November 1976)Inside Raceways 635 ÷ 110Outside Raceways 560 + 240
34
- - —
~
- - - - - - .- ~~~~, -—-~~~~~~~ ---~---~~~.-.- - . ---- .- - —. -~---- --- -- - --.S- -- .. .
_ ~~~~~~~~~~~~~~~~~~~~~~~~~~~~~~~~~~~~~~~ -
~~~
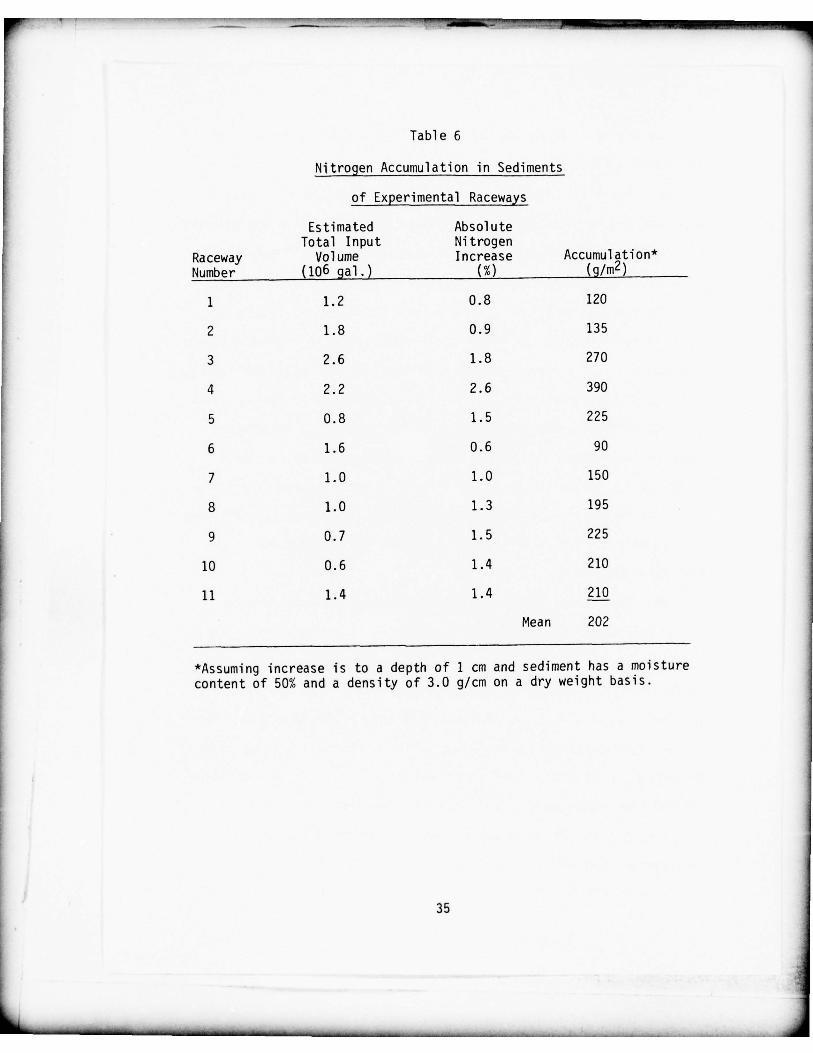
Table 6
Nitrogen Accumulation in Sediments
of Experimental Raceways
Estimated Absol uteTotal Input Nitrogen
Raceway Volume Increase Accumu lation *Number (106 gal.) (%) (g/m2)
1 1.2 0.8 120
2 1.8 0.9 135
3 2.6 1.8 270
4 2.2 2.6 390
5 0.8 1.5 225
6 1.6 0.6 90
7 1.0 1.0 150
8 1.0 1.3 195
9 0.7 1.5 225
10 0.6 1.4 210
11 1.4 1.4 210
Mean 202
*Assuming increase is to a depth of 1 cm and sediment has a moisturecontent of 50% and a density of 3.0 g/cm on a dry weight basis.
_ _1___ __~. . __ _ _ _ _ _._ _ _
- r ——~~~~~ --- - -------- . - ~~~~~~~~~~~~~~~~~~~~~~~~~~~~~~~~~~~~~~~~~~~~~~~~~~~~~~~~~~~~~~~~~~~~~~~~~~~~~~~~~~~~~~~~~~~~~~~~~~~~~~~ —..--
I--—-----
represents only a few percent of the total storage of nitrogen in the
salt marsh system .
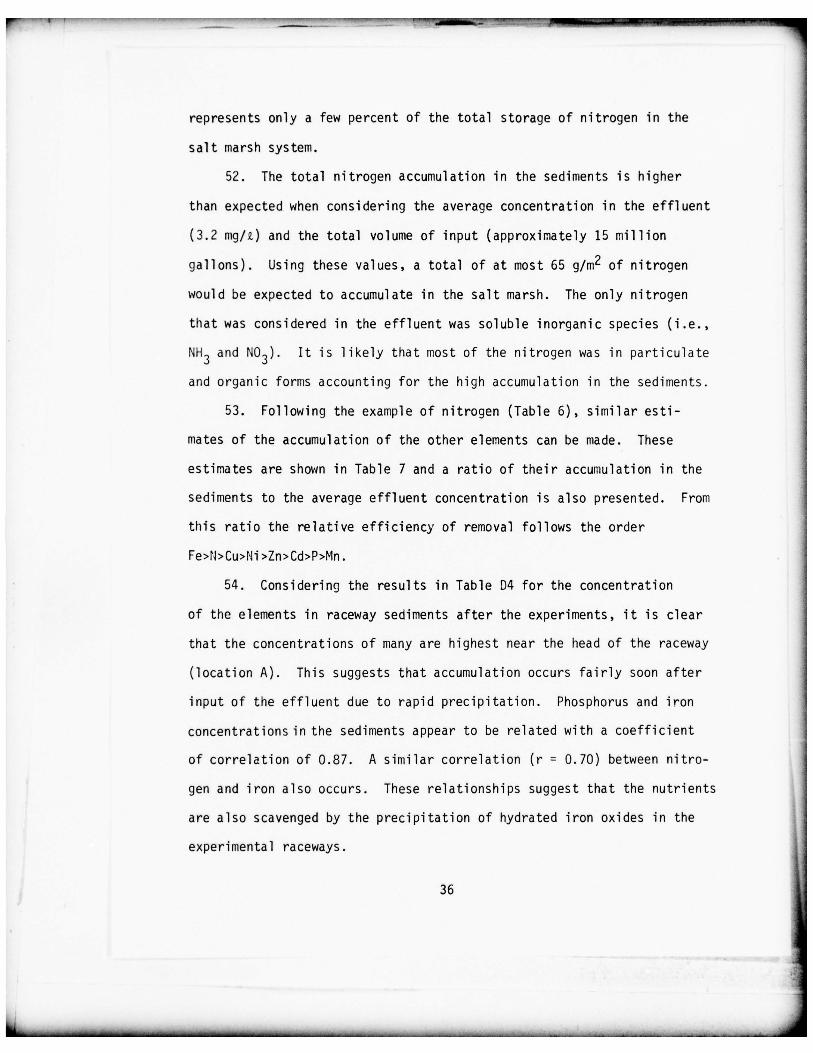
52. The total nitrogen accumulation in the sediments is higher
than expected when considering the average concentration in the effl uent
(3.2 mg/i) and the total vo l ume of input (approximately 15 million
gallons). Using these values , a total of at most 65 g/m2 of nitrogen
woul d be expected to accumul ate in the salt marsh. The only nitrogen
that was considered in the effluent was soluble inorganic species (i.e.,
NH3 and NO3). It is likel y that most of the nitrogen was in particulate
and organic forms accounting for the high accumulation in the sediments .
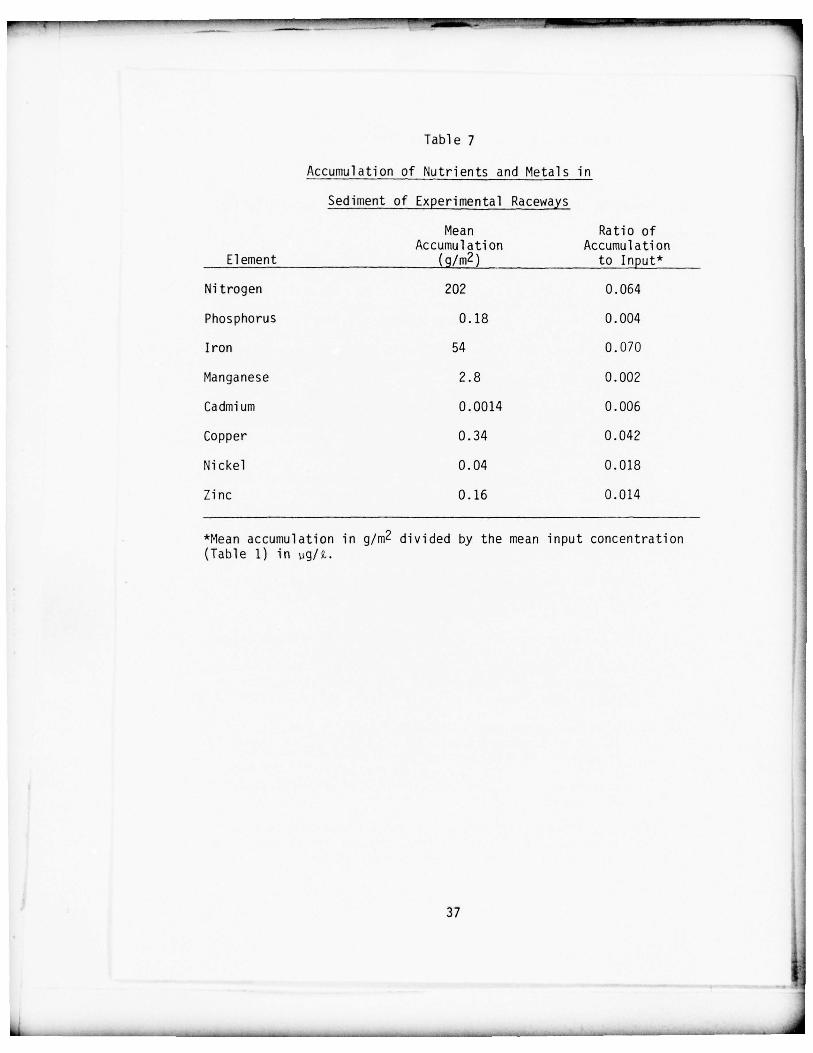
53. Following the example of nitrogen (Table 6), similar esti-
mates of the accumulation of the other elements can be made . These
estimates are shown in Table 7 and a ratio of their accumulation in the
sediments to the average effluent concentration is also presented. From
this ratio the relative efficiency of removal follows the order
Fe>Ti>Cu>Ni >Zn>Cd>P>Mn .
54. Consideri ng the resul ts in Table D4 for the concentration
of the elements in raceway sediments after the experiments , it is clear
that the concentrations of many are highest near the head of the raceway
(location A). This suggests that accumulation occurs fairly soon after
input of the effluent due to rapid precipitation. Phosphorus and iron
concentrations in the sediments appear to be related with a coefficient
of correlation of 0.87. A similar correlation (r = 0.70) between nitro-
gen and i ron also occurs . These relationships suggest that the nutrients
are also scavenged by the precipitation of hydrated i ron oxides in the
experimenta l raceways .
36
-_ - - - -~~~~~~~ -- - . .. -— .
U-.- ~~~~~~~~~~~~~~~~~~~~~~~
-~~~~
-~~~~~~~~~~~~~~~~~~~
--_ - .-~~~~~~~~~~~~~~~~~~
---_- - - -, .--,-- -~~
- - - - - . - —
Ta b le 7
Accumulation of Nutrients and Metals in
Sed iment of Exper imental Raceways
Mean Ratio ofAccumulati on Accumulation
Element (g/m2) -
to Input*
Nitro gen 202 0.064
Phos phorus 0.18 0.004
Iron 54 0.070
Manganese 2.8 0.002
Cadm i um 0.0014 0.006
Copper 0.34 0.042
Nickel 0.04 0.018
Zinc 0.16 0.014
*Mean accumulation in g/m2 divided by the mean input concentration(Table 1) in pg/9~.
37
ii .- -~~~~~ - - -~~~~~~~~~~~~~~~~~~~~~~~~~~~~~~ -----~~
-— -—---- - - —~~~~~~-- — ~~~~~~~~~~~ ~~~~~~~~~~~~~~~~~~~~~~~~~~~~~~~~~~ - ~~~~~~~~~~~~~~~~~~~~~
PART IV : CONCLUSIONS AND RECOMMENDATIONS
Conclusions
55. Based on the results of thi s s tudy, the follow ing conclusions
can be made :
a . Nutrients (nitrogen and phosphorus ) and metals (iron ,manganese , ca dmium , copper , ni ckel , and zinc) are removedfrom effluent dur ing overland flow in salt marshes. Duringthe period of this study the mean metal concentrations ofthe effluent from the ex perimental salt marsh racewa ys werebetween 15 and 32 percent l ower than the mean metal concen-trations of the i nput . Exclu d ing periods when concentra-t i ons were near ambien t, the mean phos phorus and nit rogenremoval efficienc i es were above 30 percen t. These remova lefficienc i es are cons id era bly less than those reportedfor overlan d flow treatment of industrial and domesticwastes .10’11 ’12 In these cases , however , the concentra-tions of contaminants in the effluents to be treated wereconsiderably higher than i n the present study.
b. The most important mech anism of removal appea rs to be dueto i norganic chemical processes which lead to the accumu-lat i on of nutrients and metals on part i cles which are su b-sequently deposited in the salt marsh se di ments , althoughbiological processes are also active and may be more im-portant during more productive seasons.
c. Because of the nature of the processes involved , removaloccurs shortl y after the initial introduction of theeffluent to the salt marsh system.
d. The removal processes may be controlled to a large degreeby the formation of hydrated i ron and manganese ox ideswhich scavenge both nutr ients and metals . Since these com-pounds form more readily at high pH and hig h oxygen con-centrations , removal is more efficient during daylight hours.
e. With the system used i n th i s study and the rates of appli-cation employed (1-60 gal/mm ), removal di d not a ppear tobe strong ly related to flow rate . Generally , overland flowsystems employ very slow application rates. Additionalstudies at l ower flow rates could show different patternsof contaminant removal.
f. The efficiency of removal of most contaminants appears tobe a function of their conc.~ntration in the effluent overthe range of concentratiuns encountered during this study
38
—~~- - - - - - --~~~ —.-—~
- - -‘S —
(approximately an order of m agnitude above ambientlevels).
~~~. The use of salt marshes for overland flow , advanced treat-ment of effluents from disposal areas appears to befeasible. Further larger scale studies , however , arenecessary to clearly define the degree to wh i ch treatmentcan be accomplis hed.
39
-----~~~~---~~~~~~~ .- -
— .—-_----- —----.-- ---— .—-_-. -— - ---S.---
Recommendations
56. The removal mechanisms appear to be the most efficient
shortly after introduction of the waste water to the marsh system. It
is therefore recommended that future designs for the appl i cation of
this method employ a system producing a greater initial interface
between the disposal area effl uent and the salt marsh system. Such a
system might utilize a spraying device to maximize the interface .
57. The smal l scale nature of the experimental system used in
this study could possibly have limited its utility in determining the
removal of contaminant from disposal area effluents by salt marshes.
Future studies should employ larger scale systems and have greater
control on the levels of contaminants studied.
58. During the spring and summer , the maximum growing season ,
increased contaminant removal by salt marshes may occur due to increased
uptake by plants (including epiphytes). Since the present study was con-
ducted during winter it is recommended that some comparative experiments
be carried out during a more favorable growing period .
40
-— --
--- ----
~~
- -
~~~
-— - __________
RE FE RE W CES
1. Boyd , C. E., “Vascular Aqua tic Plants for Mineral Nutrient Removalfrom Polluted Waters ,” Economic Botany, Vol 24, 1970, pp 95-103.
2. Will i ams , R. B. and Murdock , M. B. , “The Potential Importance ofSpartina alterniflora in Conveying Zinc , Manganese and Iron intoEstuarine Food Chains ,” Proceedings, Second Nationa l Symposiumon Radioecology, U. S. Atomic Energy Commission , 1967 , pp 431-439.
3. Bently, E. M. , The Effect of Marshes on Water Quality, Ph. DDissertation , University of Wisconsin , 1969 .
4. Windom , H. L., Dunstan , W. N., and Gardner , W. S., “Ri ver Inputof Inorganic Phosphorus and Nitrogen to the Southeastern Salt-Marsh Estuarine Environment ,” in Mineral Cycling in SoutheasternEcosystems, ERDA Symposium Series , CONF 740513, 1975, pp 309-313.
5. Windom , H. L., “Heavy Metal Fluxes Through Salt—Marsh Estuaries ,”in Estuarine Research (1. E. Cronin , ed.) Vol I , 1975, pp 137-152.
6. Windom , H. L., “Geochemi cal Interactions of Heavy Metal s in South-eastern Salt Marsh Environments ,” EPA Ecolog i cal Research Series ,EPA—600/3—76-023, 1976.
7. Windom , H. L., Unpublished data.
8. U. S. Environmental Protection Agency , Offi ce of Water ProgramOperations , “Evaluation of Land Appl ication Systems ,” EPA Techni-cal Bulletin 430—9-75-001, 1975.
9. Lee, C. R. , Hoeppel , R. E., Hunt , P. G., and Carl son , C. A.,“Feasibility of the Functional Use of Vegetation to Filter ,Dewater , and Remove Contaminants from Dredged Material ,” U. S.Army Corps of Engineers , Dredged Material Research ProgramTechnical Report D-76-4, 1976.
10. Hunt, P. G. and Lee, C. R., “Land Treatment of Wastewater byOverl and Flow for Improved Water Quality ,” in Biological Controlof Water Pollution (J. Toubier and R. W. Pierson , Jr., eds),1976 , pp 151-160.
11. Carlson , C. A. , Hunt, P. G., and Delaney , T. B., Jr., “OverlandFl ow Treatment of Wastewater ,° U. S. Army Engineers WaterwaysExperiment Station , Miscellaneous Paper Y-74-3, 1974, 63 p.
~~~- - ~_ _ ~i_ _ . - -. - -
—-S - --—V — -------::::::: i~i-- - ..-..- ---.-
~~~~~. ‘ . - i 1i - -
~~~~~~~~~~~~~~~~~~~~~~~~~~~~~~~~~~
12. Hoeppel , R. E., Hunt , P. 6. and Delaney , 1. C. Jr. , “W~stewaterTreatment on Soils of Low Permeabil ity ,” U. S. Army EngineersWaterways Experiment Station , F-liscellaneous Paper Y-74-2, 1974,84 p .
13. Hunt , P. G. , Lee , C . R. and Peters , R. E. , “Update : OverlandFlow ,” Water Spectrum , Vol 9, No. 2 , 1977 , pp 23-29.
14. Reimol d , R. J., “The Movement of Phosphorus through the SaltMarsh Cord Grass, Spartina alterniflora ,” Limnology and Oceanog-raphy , Vol 17, 1972, pp 606-611.
15. Rahn , H. R., Jr. , “The Role of Spartina alterniflora in theTransfer of Mercury in a Salt Marsh Environment ,” M. S. Diserta-tion , Georgia Institute of Technology , 1973.
16. Va liela , I. and J. M. Teal , “Nutrient Limi tation in Salt MarshVegetation ,” in Ecology of Halophytes , (R. J. Reimold and W. E.Queen , eds), 1974, pp 547—583.
17. Dunstan , W. M. and Windom , H. L., “The Influence of Environ-mental Changes in Heavy Metal Concentrations on Spartinaalternif lora ,” in Estuarine Research (L. E. Cronin , ed) Vol I ,1975 , pp 393—404.
18. Windom , H., Gardner , H., Stephens , J., and Taylor , F., “The Roleof Methylmercury Production in the Transfer of Mercury in a SaltMarsh Ecosystem ,” Estuarine and Coastal Marine Science, Vol 4,1976, pp 579-593.
19. Koroleff, F., “Direct Determination of Ammonia in Natural Watersas Indophenol Blue ,” Institute of Marine Research , Helsinki ,Finland , personal communication.
20. Strickland , 3. D. H. and Parsons , T. R., A Practi cal Handbook ofSea Water Analysis , Fisheries Research Board of Canada , 1968.
21. Murphy, J. and Ri ley, J. P. , “A Modified Single Solution Methodfor the Determination of Phosphate in Natural Waters ,” Analyti calChemi ca Acta, Vol 27, 1962, pp 31-38.
22. Windom , H. L. and Cutshall, N., “Atomi c Absorption Spectropho-tometry,” in Stratigies for Marine Pollution Monitoring (E. D.Goldberg , ed) , 1976 , pp 161-184.
23. Windom , H. L. , “Environmenta l Aspects of Dredging in the CoastalZone ,” Critical Reviews in Environmental Control, Vol 6 , 1976 ,pp 91-109 .
42
. -— - . - .~~~-~~~~~~~~~~ -. . --- --- --—~~~-- —V —4
- _ ________-S-S~~~~~~~~~~~ S.~~~~~~~~~~~~ SV -VT~~~~ ~~~~~~~~~~~~~~~~~~~~~~~~~ ~~~~~~-~~ -- - - - ——-
24. Pome roy , L. R., Johannes , R. E., Odum , E . P., and Roffnian , B.,“The Phosphorus and Zinc Cycles and Productivity of a SaltMarsh ,” in Proceeding of the Second Nation al Symposium on Radio -ecology (0. J. Nelson and F. C. Evans , eds), 1969, pp 412-419.
25. Patrick , W . H. and Kha lid , R. A., “Phosphate Release and Sorptionby Soils and Sediments: Effects of Aerobic and Anaerobic Condi-tions ” , Science, Vol 186, 1974, pp 53-55.
43
_ _ — — - - - - -.—~~~~ - — — - — — —---~~~-——— ——~~-— —-V -~~~~~~- —-—
- V -V
In accordance wi th letter from DAEN-Rl)C , UAEN-AS 1 dated22 Jul y 1977 , Subject: Facsimile Catalog Cards forLabora tory Technical Publications , a facsimile ca talogcard in Library of Congress MARC format is reproducedbelow .
Windom , Herber t LAbility of salt marshes to remove nutrients and heavy
meta ls from dred ged material disposal area ~ffluent s Iby Herbert L. Windom. Vicksburg , Miss. : I. S. WaterwaysExperiment Station ; Spr ingfield , V a. : available fromNational Technical Informa t ion Service , 1977 .
ix , 43 , g5Oj p. : ill. ; 27 cm. (Technical report —
U . S . Army Engineer Waterways Experiment Station ; D—77—37)Prepared for O f f i ce, Ch ie f of Eng ineers , U . S. Army,
‘Washington , D. C., under Contract No. DACW21—76—C—01 34(DMRP Work Unit No. 6BO9)Append ices &—E on microfiche in pocket.References: p. 41—43.
1. Containment areas. 2. Disposal areas . 3. Dredged materialdisp osal. 4. Effluents. 5. Heavy metals. 6. Nutrients.7. Pollutants. 8. Salt marshes. 9. Waste disposal sites.I. United States . Army. Corps of Engineers. II. Series:Uni ted States. Waterways Experiment Stat ion , Vicksburg,Miss. Technical report ; D—77—37 .TA7.W34__no .D—77—37
_ -- -- - - - - — - V - --- ----- — —~~~~- —-V--—-— . -V.- - - S . .-
- T_. —~—~T ---- . . —--
~~~~~~~~~~~~~~~~~~~~~ -
L. :i~~~~_ ~~~~~~~~~~~~~~~~~~~~~~~~~~~~~~~~ ~~~~~~~~~~~~~~~~~~~~~~~~
--~~~~~~~~
~) ~~~~~~ A ~~~ ~~ 11 ,~~ L
EAI~~~~~H Pi~~~c~u~~iTECHiI CAL REPORT D-.77-37
ABILITY OF SALT MARSHES TO REMOVE NUTRIENTS ~~ HEAVY METALSFROM DREDGED ~~TERIAL DISPOSAL ARE~ E F F L U E N T S
by
Herbert L. Windo!itP. 0. Box 14208
Savannah , Georg ia 31405 . --
December 1977 - .
-~ .
Final Report - ~~~~
{APPRQVEO
_FOR ~~~~~~~~~~~~~~~~~~~~~~~~~~~~~~~ -
-
- - . V
-
~~~~~~~~
•~~~~~~ V~~~~~~
Pre pared for Off ice , Chief of Engineers , U. S. Army - - .~
Washington , D. C. 20314
Under Contract No. DAC~-!21-76-C-O13~(D M RP ~- o . - -k Urv t No. 6B09)
Monitored by Environmental Effects LaboratoryU. S. i-.rry Engineer Water’:,aj~ Experiment StationP. 0. Box 631 . V icksburg , Mj s c . 39180
‘
~~~~~~~~~~~~~ - --- - -- - --- _ _ _
APPENDIX A
FIELD DATA (TEMPERATURE , SALINITYpH , DISSOLVED OXYGEN AND TURBIDITYFROM EXPERI MENTS )
Al
- . —---- - , ..
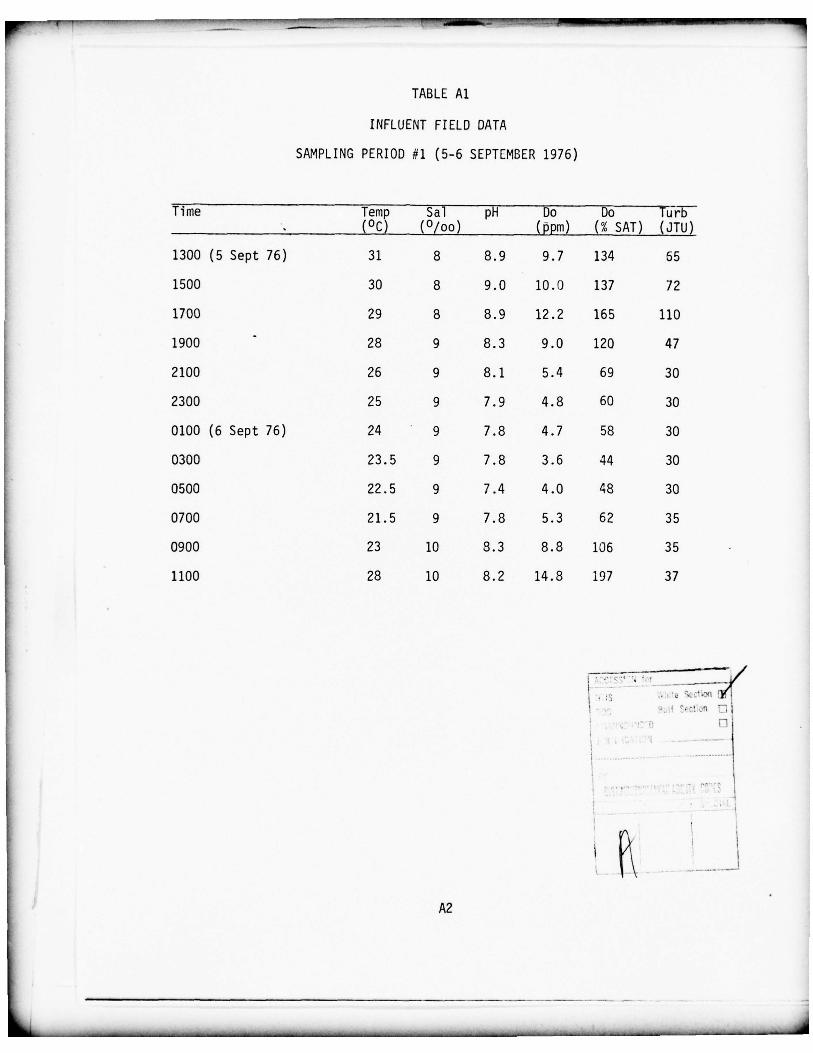
TABLE Al
INFLUENT FIELD DATA
SAMPLING PERIOD #1 (5-6 SEPTEMBER 1976)
Time Temp Sal pH Do Do(°C) (°/oo) (ppm) (% SAT) (JTU)
1300 (5 Sept 76) 31 8 8.9 9.7 134 55
1500 30 8 9.0 10.0 137 72
1700 29 8 8.9 12.2 165 110
1900 28 9 8.3 9.0 120 47
2100 26 9 8.1 5.4 69 30
2300 25 9 7.9 4.8 60 30
0100 (6 Sept 76) 24 - 9 7.8 4 .7 58 30
0300 23.5 9 7.8 3.6 44 30
0500 22 .5 9 7.4 4 .0 48 30
0700 21.5 9 7.8 5.3 62 35
0900 23 10 8.3 8.8 106 35
1100 28 10 8.2 14.8 197 37
—- . - - --V - . - -- - - ---- - - - - - - - S — V - - — - - - — -— . -~~~~~~~~~~~
_ _ _ _ -~~~~ —
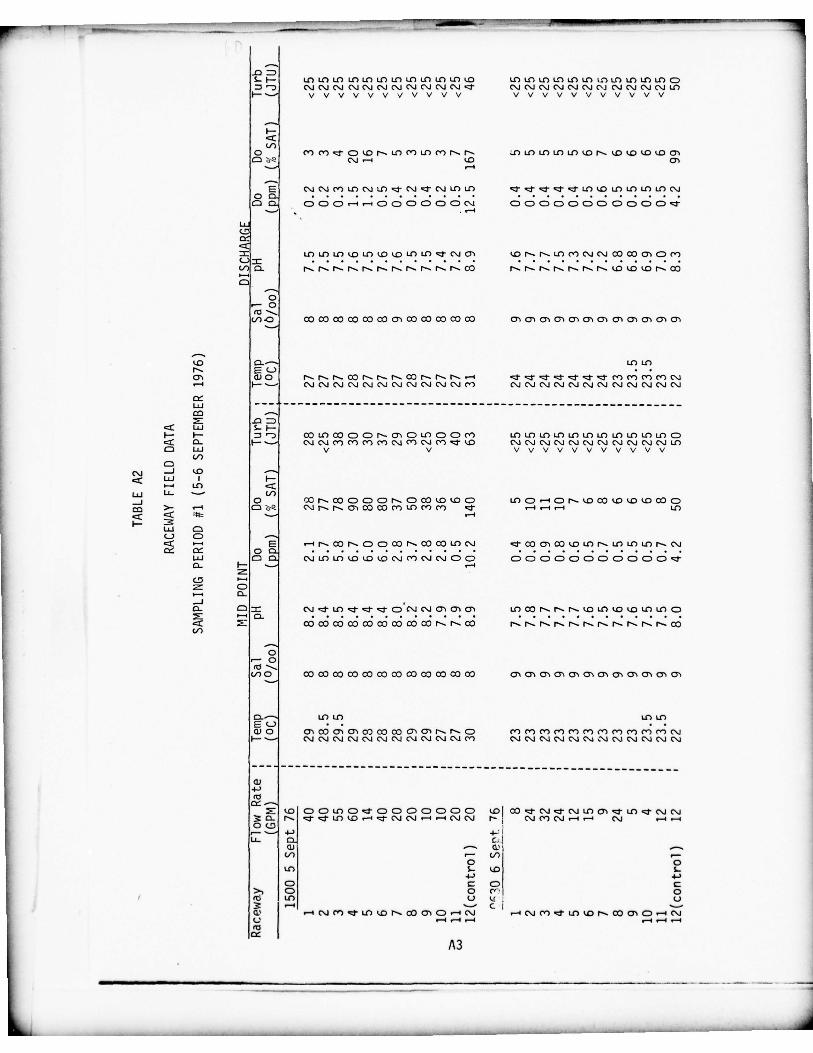
L i— IC) IC) IC) IC) IC) U) U) U) U) U) U) 10 U) U) U) IC) IC) U) U) U) tn U) U) C~ ‘D C.J (V,J (~J (“4 (“4 C”J (‘4 C”J (‘4 (“4 C\J .~j (‘.1 (“4 (“4 (‘4 (‘4 C”.J C”J (‘4 C”.J (‘4 (“4 IC)
I— V V V V V V V V V V V v v v v v v v v v v v
F—
~J)o C~) C”) ~~ C ‘0 N- U) C’) U) C”) N. N’ 4) U) It) U) It) IO N- 10101010 ciC C”4 .-l 10 ci
‘-4
-
~~~ C’~ (‘si C”) U) (‘4 U) ~~~- (‘4 ~~ C~J U) U) ~~~ ~~~-
~~~ ~~~-
~~ U) 10 U) U) U) U) (‘40C C CD C ~ -‘ -‘ C C C C C CD (“4 C C C C C) C C C C C C ~~~
‘- - 4
LC)~~~~(”4 ci I O N-N . C O C OO iQ c”)
0. N. N. N. N- N- N . N- N. N. N. N. CO N. N. N- N- N. N. N- 10 10 10 N- CO-4
0— 0( C ’-55(/) .0 CO CO CO CO CO CO ci CO CO CO CO CO ci ci ci ci ci ci ci ci ci ci ci ci
U) Lt)N- ~~~L) . .ci U 0 N- r-s N. CO N- N. N- CO N- N- N- ~~4 “u- ~~~ ~~~- ~~~- ~~ C’) C”) C’) C’~) (‘4— I— (“4 (“4 (‘4 (‘4 (‘4 (‘Si (‘4 (‘Si (“4 (‘SJ (Si C’) (SJ CsJ (“4 (‘Si (‘Si (‘Si (“4 C’J C’Si e.J (SJ (Si
wCD -~~
~~ LUI— I— D~~~ C O I C) C O CC N .C iC L C) C C C’ ) U) IC)U)C< I— — (‘Si (“4 C”) C’) C’) C’) (‘4 C’) (Si C’) ~~ 10 (‘4C~) (Si (‘4 (‘-4 (‘Vi (‘Si (“4 (‘.4 (Si (Si U)C LU V V v v v v v v v v v v v
U)C
(“4 _J 10LU I I—~~-4 10
LU Li~ -~~-J 0 CO N. CO C C C N. C CO 10100 U) CD .-I C N. 10 CO 101010 CD CCD >~ .4 C ~~ (‘4 N. N. ci CO CO ~‘) U) ~~) C’) .-4 -I .-1 U)
~— ~~~LU CDL) C
E ‘~-4 N- 3D N. C C CO N. 3D CO U) CSJ ~~~
- CO ci 3D ‘-.0 It) N. If) U) It) N. (‘,j0
LU C C”4 U) U) 10 10 10 C’4 C’) (‘4 (“4 C C C C C C CD C C C C C C ~~C- F--4
~~ C‘-‘ 35
C- C~~~ U)~~~~~~~~~~~C C’J C’J Qi Oi ci U) C O N- N . r -.I0U) U)LO C~~~ ~~~~~~~~~ C O c O C O C O C O C O C O C O C O N - N . C O N .N - N .N .N . N- N .N . N . N- N . C OV)
0.— 0(4~ ‘-.(1)0 CO CO CO CO CO CO CO CO CO CO CO CO ci ci ci ci ci Ci ci ci Oi ci ci ci
C). IC) It) U) U)
U 0 ci CO 0’, ci 3D CO CO Ci ci N. N. C C’) C’) C’) C’) C”) C”) C’) C’) C’) C”) C’) (SiI- C’4 (Si C’) ~~~~~~~~~~~~~~~~~~~~~~~~~~ ‘4 C\J (’-4 t’4
U4-’
E I OC C U) C ”~1- C C C CC C C I0I CO~~~~~~~~~~~~.JU) Oi~~~~ U)~~~V C ..J C~4
~~ C- N- ‘~~~ ‘~~~ U) 10 .—I ‘~r C~i (‘4 .-4 .4 (“4 (‘4 N (“4 C’) (Si ,-4 - (‘4
‘— 4-)LI.
U -~~ UU) r- C/)
0 0IC) S.- 10 S.-
4-’ 4-’C ~~ CD C
>., CD 0 C’ 0U) 0 U 0
~ —4 5.— c : i —U —4 (‘4 C’) ‘~~~ U) 10 N. CO ci C ‘-I (‘4 (‘.4 C’) ~~ If) 10 N.. CO Ci CD .-~ (‘SiU ~-4.-4~~-4 4 .-4 .-4(C
A3
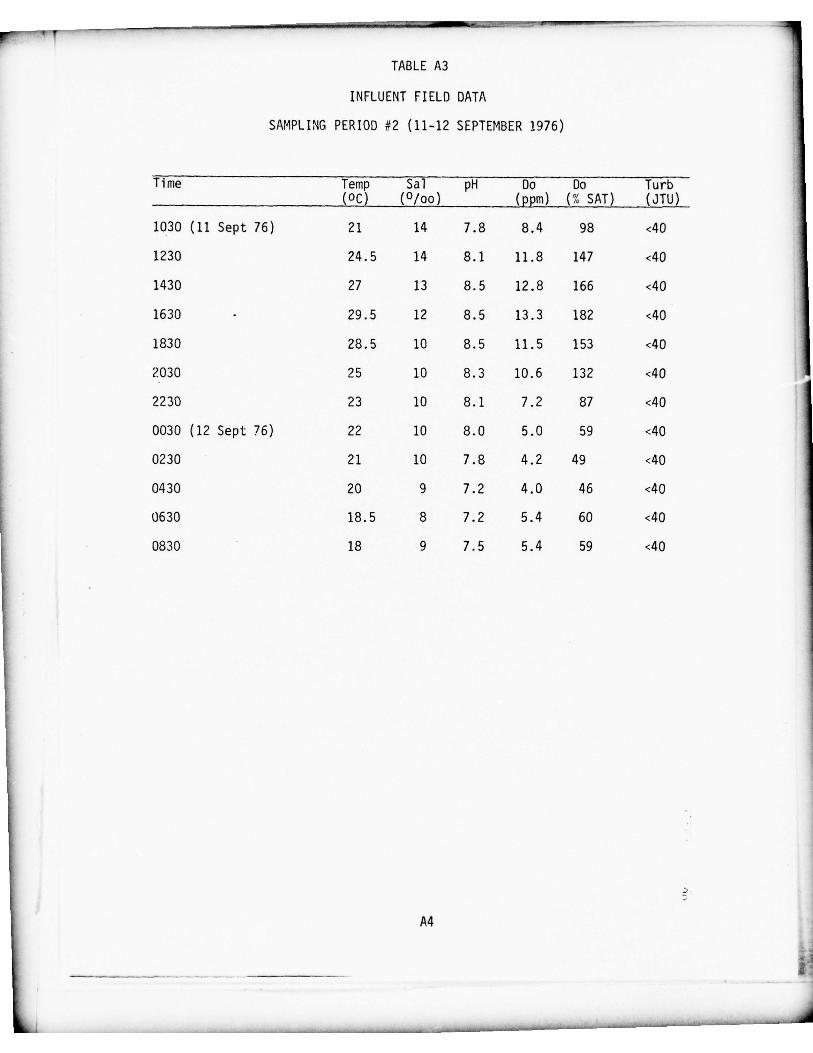
TABLE A3
INFLUENT FIELD DATA
SAMPLING PERIOD #2 (11-12 SEPTEMBER 1976)
Time Temp Sal pH Do —
Do Turb —
(oc) (°/oo) (ppm) (% SAT) (JTU)
1030 (11 Sept 76) 21 14 7.8 8.4 98 <40
1230 24.5 14 8.1 11.8 147 <40
1430 27 13 8.5 12.8 166 <40
1630 - 29.5 12 8.5 13.3 182 <40
1830 28.5 10 8.5 11.5 153 <40
2030 25 10 8.3 10.6 132 <40
2230 23 10 8.1 7.2 87 <40
0030 (12 Sept 76) 22 10 8.0 5.0 59 <40
0230 21 10 7.8 4.2 49 <40
0430 20 9 7.2 4.0 46 <40
0630 18.5 8 7.2 5.4 60 <40
0830 18 9 7.5 5.4 59 <40
_
-- ~~~~~~~~~~~~~~~~~~~~~~~~~~~~~~~~~~~~~~~~~~~~~~~~~~~~~~~~~~~~~ ~~~~~~~~~~~~~~~~~~~~~~~~~~~~~
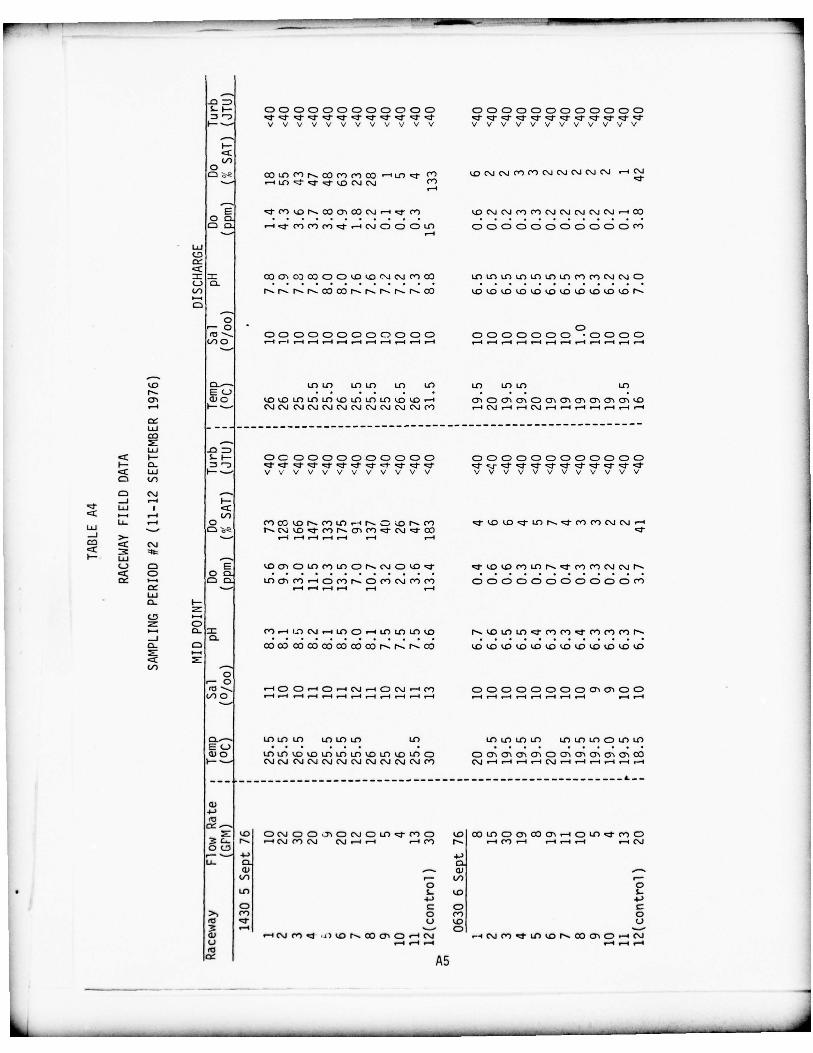
S.. F-- C C C C CD C C C C C) C C C) C C C C C C CD C C C C~~
) ~~. .
~~.
~~~. ,,j.
~~.
~~~.
~~~.
~~~.
~~- .~~ ~~~ .~~- ~~.
~~.
~~~.
~~~. .~~
. ~~. ,~. .,
~. ~1- ~~ ‘4.I— V V V V V V V V V V V V V V V V V V V V V V V V
I—
“I
C~~~ C O U ) C f l N . C OC ’ ) ’ ) C O~~-~~U) .4. C” ) IO~~~~~~~~~~~~~~~~~~~~~~~~~~ (’~I .-
E ‘~~~ c’) 10 N. ~ ) ci 3) (‘4 .-4 ‘4 C’) 10 (‘4 (‘4 C’) C’) (‘4 (“4 (“-4 (Si (“4 _ I 3)
C C’) C’) C’)~~~~~-4 ( S J CC CU ) CD~~~~ cD~~~~~~~ C Q C QC D CC ’ )—4
LU
C)::
CO Ci 0) CO C C~.V O 1 0 (‘4 C’4 C’) 0) 10101010101010 C’) C’) (‘-4 “.i CL)C).U) N.N.N.N - C O C O N- N - N - N - N - a D 1010I01O I0 ¼0 IO104.O 10 IO N.-4C
0—~~0 - C( C ’--.. C C C C C C C) C C D C C C D C CC DC C C C • C C C CU) 0 .-4 _I _I.-I _I _I _I ,-4 .-I .—4 _I _I .-4 .-4 ,-I .-4 .-4 ..-4 4 .-4 .-.4 _I -4 -4
10 0.— U) U) U)IC) IC) U) U) U) U) U)N. E C ~
) . . . . . . . .ci C) 0 1 0 1 0 1 0 1 0 1 0 1 0 U) I0U)IO 10 —1 ci C ci ci C ci ci ci ci Ci ci 10
F-- s.-- (“4 (‘..J (Si (‘4 (‘4 (‘4 (“4 C’.) (‘-4 (Si (Si C’) .-I (‘4 4 .-4 (Si ~~~~~4_I_I~~~4 _I _I
LUCD
LU~~ F-- S.. F-- C C C C C CC C C C C C C CC C C C CC C C C CF-- C- ~~~~)CC 14.4 F-’ v v V v v v v v v v V V V V V V V V V V V V V VC U )
C (‘.4 .—-J _I I-
‘4. w iCC — U)
LI. ~~~4 0 C’)C O 1 0 N- C’ )U) .— 4 N- - C ) ’ 0 N - C’ )LU ~~.- CD N. (‘4 10 ‘4. C” ) N- Ci C’) ‘4 (Si ‘4_J >- 5.— -4 -4 _I -4 -4 -4 _-4
CD ~~< ~~F-- LUL) C E 1 0 c i C U)C’) U )C N. .C’4CI0 ’4~ ‘4 10 10 C’)U)N.’4C’)C’)C’J CSJ N.cZ ci 0~~ CD I f lc iC ’ ) _ ICC ’) N- CC ’)C’.J C’) C’) C C C C C C C C C C C C’ )
c~ ~— .-s .-4 -4LUC- F--
~~ CC- C’) _IIC) (Si — 4100— 110101010 N. 101010 ‘4~ C’) C’) ~~ C’) C’) C”) N-0.
C- C C O C O C O C O C O C O C O C O r .. . N .N .O ) 10101 0 1 0 1 0 1 0 1 0 1 0 1 01 0 1 0 1 0I-,
cCU) —
0‘-0(C ... ~
-~CD C .-4 C ‘-I (Si .-i C (‘4 .-I C’) C C 0 C C C C C ci ci C C)
U) 0 .-I .-l .-4 -4 ~~I .-4 -4 -4 . 1 .1 ~-4 ~-I _I .-4 .-I _I . 1 _I .-4 . 1 _I
101010 101010 U) 10101010 1 0 1 0 1 00 1010~~
L) . . . . . C) 0 U) IC) 101.010 U) 1 0 1 0 1 0 1 0 1 0 C C ci Ci Ci Ci C ci Ci ci ci Ci COI- (SJ (’J 4 C’4 C’.J C’J (’iC’) (S~~~~~~~~~~~~~~~~~~~~~~~ I~~~I_ I l _ I
1..-—
U4-’
~~~~‘0 C (’ .JCC.Y iC cs J CU) ’4 - C’) C 1 0 3 DU ) C c i 3 D C i — l C U)~~~’ C ’ ) C DN- _I (Si C”) (Si ( ‘4 - 4 - 4 _ I C’) N- .-I C’) _I .-I .-4 —4 ,-.I C’J
O (!~— 4.) 4-’LI.
U -— C) -U, ~~
. (1)0 0
IC) IC) S.-4-’ 4’
C C C) C>., C’) 0 C’) 0‘V ‘4’ 0 1.0 0~~ — CC) .—4 C’JC’)~~~~-~ )’0N.COCiCe-ICsJ .-4 C’4 C’)~~~~ 10 ’ 0 N . C Oc iCC”J0 ~-4 -4 --I
AS
—-—---- ~~~~~-- ~~~~~~~~~~~~~~~~~~~~~ ~~~~~~~~~~~~~~~~~~~~~~~~~
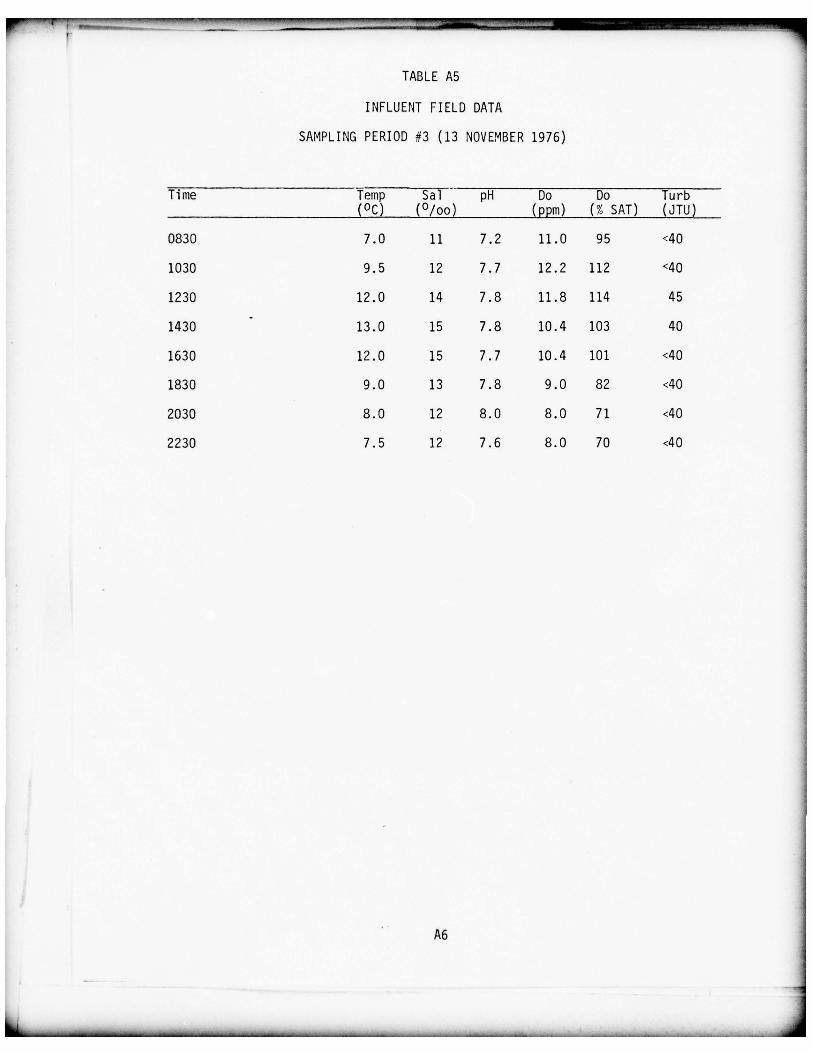
TABLE A5
INFLUENT FIELD DATA
SAMPLING PERIOD #3 (13 NOVEMBER 1976)
Time izemp Sal pH Do Do Tur b(°C) (°/oo) (ppm) (% SAT) (JTU)
0830 7.0 11 7.2 11.0 95 <40
1030 9.5 12 7.7 12.2 112 <40
1230 12.0 14 7.8 11.8 114 45
1430 -
13.0 15 7.8 10.4 103 40
1630 12.0 15 7.7 10.4 101 <40
1830 9.0 13 7.8 9.0 82 <40
2030 8.0 12 8.0 8.0 71 <40
2230 7.5 12 7.6 8.0 70 <40
-
A6
-- --- - --~~~~~ --~~~~~~~~~~~~.- --— -~~~~~~-- . ._ . - ---- ~~~~~~~~~~~~~~~~~~~~~~~~
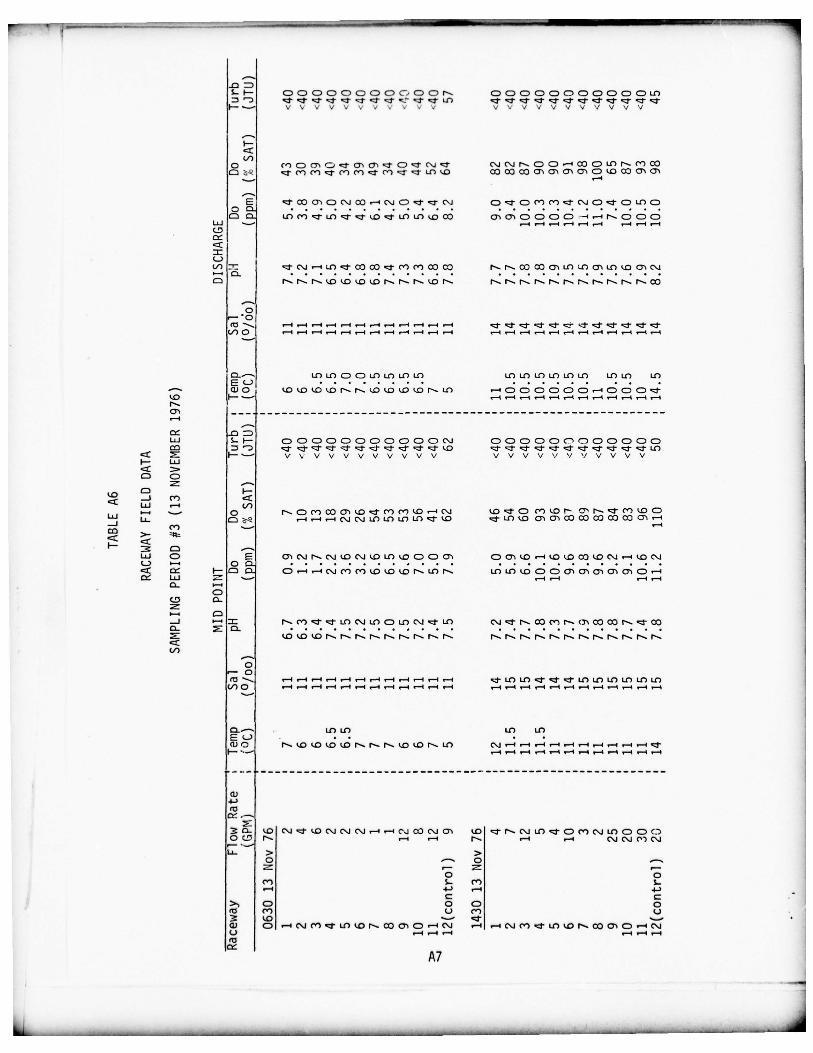
- _~~~~~~~-.- —
S.~ F- C C C C C C C C) C~- C C) N. C C) C C C CD C C C C CU)D ‘) ‘4. ’4. ’4 ‘4 ’ 4 . ‘4 ‘45 ‘4~ U) ‘4. .5~.’4. ‘4- ‘4.’4~ ‘4.~~~~ ‘4. ’4’ ‘4._Si.F-’— V V V V V V - - . . V . V ~ V V V V V V V
I—CC
o c’) ~~ c-i ci ‘4~ ci ci c ~~ ‘ C’.i ~~ “.l C’-.~l N. C C .—~ CO C U) N- C’) COC~~ -~ ~~~~~~~~~~~~~~~~‘iC’~~~~~~C’) ’4- ’4- U)I0 3)ODCOciOiCi ciC 1.0COCici
E ‘4 ’ C O c iC C ’ i 3 )_ I (’ iC~~~~~~~ C’4 C~~~~C~~~~ C’)’4~~C ’ iC ’4 C U)C C IC) C’) ‘4 ’U)’4 ‘4-~,0 ‘4’ It)
U) 1.0 CO ci ci C C C C - _I N. C C CLU -
~ - -4 4 _I _I ,‘ .4 4CD
cC
C.)U) ) ‘4~~C’ i_ IU)~~~~ C O C O ’ 4 ’C’) C ’ ) C O 3 D N .N .C OC Oc i U ) U ) c i U) I Oc iC ’ J
0•0( C”-, —4-4 ~~1— I _ I _ I ~-I -4 -4 -4 -4 ~ -4 ‘4’ _’4. ’4- ~4 -S i~~.4’ -~~
,~j ‘4 ‘4U) 0 ~ 4 _I ~~4 .—1 ~ —1 . 1 ,-I -4 -4 , ‘.“~
, , ‘-‘-4
U) U) C C LOU) It)LC) U) U) U) U) U) U) IOU) U)EL)
- C) 0 10101.01.0 N- N. 10101.01.0 N. U) — C C C C CD C _I C C C ‘4-1.0 F- --- ,., ,.., ,..., _4 ,~~ ~~4 -4 -4 1-4N-ci-4
144 S.. I— C C C C (DCC C CD C C (SI C C C C C Ci C) CD C C C CCD D ‘ D ‘4- ~~-‘4” 4’ ‘4’ Si Si ‘4- .
~f’ ‘4- Si’ ID ‘4. .4. .4- ‘4. -Si. Si~ .4~~.4. .4- ’4. ‘4’U)
cC ~~ l— ’—~ V V V V V V V V V V V V V V V \ ’ V V V V V VLU
CCC CD
—5C F-
CC -i C’) CC
0 N. C C’) CO ci 1.0 ~~ C”) C”) 1.0 _ I (Si 1.0 Si C C’) 1.0 N C’ N. Si C’) 1.0 CLU LI. C~~~ _ I_ I_ I (’4(’SI U)U)U’)U)Si’IO Si- U) 1 . O c i c i C O C O C D C O 3) C i _ I
C”) -
F- ~~ C -—LU C E ci (’ .JN . ( ’.J I OC ’ J 1 0U) I OC CC i Cci1.0_ I’0IOCO1.OC\J .-4 1.0 C’4C.) ‘-‘ 0CC a I-C C - 4_ I C’ J C’ C ’ ) 1 0 1 0 1 0 N . U) N- U)IO 1 . O CCC i c i c ic i c iQ .- l
LU ~~ ~~-‘ -4C-
CCD C-
CD-i 4-’~~~~~ N- C’ ) Si- L O C’4 U ) ( DLO(SJS i-U) N.O)C’)F CY i C O 0) N-~~~~CO
1.0 1.0 1 . 0 N- N .N . N- N . N . N - N -N . N - N - N - N -N - N -N - N - N - N - N -N -
U)
0‘ -0(C 5.___ -4 -4 -1 -4 -4 -1 -4 -4 -4 -4 -4 -4 1010.4 . 4- 4 - U ) U ) U ) U ) U)U)U) 0 -4 —l _I -4 ~-4 _I _I .-I ~ , ~-4 ‘-‘ , ~~~~~~~~~~~~~ ~
0.— 1010 It) InE L ) .Cl) 0 N- 1 0 1 0 1 . 01.0 N. N- N. 1.0 10 N- U) (Si ~ 4 _I ~-4 — _I ~~~I .-4 .-4 _I’4’F- “— r-4 ,-4 _I _I -4 ~~4 .-~
Cl)4-,CC
~ C)- 1.0 C”) Si 1.0 (‘SI (‘4 (‘4 ,—4 —4 (‘-4 CC (‘Si ci 1.0 ‘4’N- (SI Li) ‘4~ C C”) (“.1 IC) C C C)O (5 N- .—I ,—l N- .—‘l .—l (Si C”.) C’) (Si
Li~ >0 - - 0 —
I- I—0 0
C’) S. C’) S.-_I +4 r1C C>., C 0 CD 0
(C C”) 0 C”) 0~~ 1.0 5—U C) ‘-4 C’) (‘)‘4~ 101.0 N- CO ci C —4 (‘.4 r-4 _ I C”) C”) .d’ 101.0 N.. 3D Ci C .-4 C’.)O 4 . 1 ~~4 1-4 . 1(C
A7
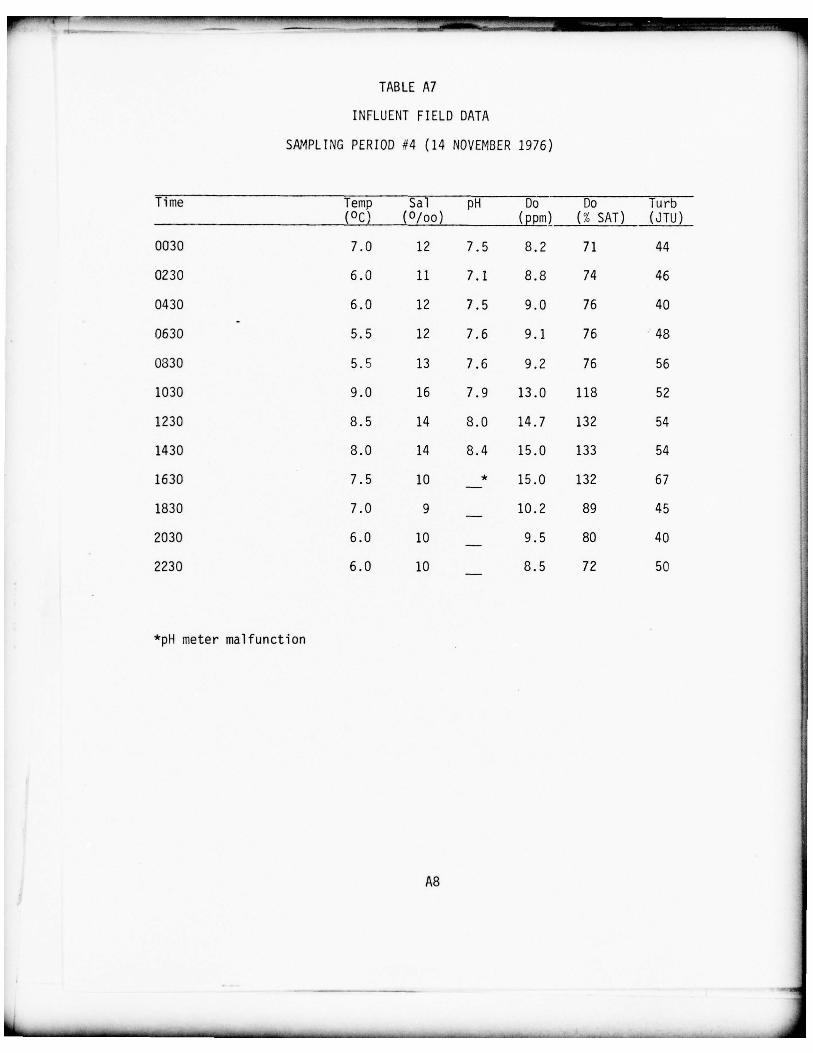
‘ .~~~~~ ~~~~~~~~~~~~~~~~~~~~~~~~~~~~~~~~
TABLE A7INFLUENT FIELD DATA
SA1~1PLING PERIOD #4 ( 14 NO V EMBER 1976)
Time Temp Sal pH Do Do Turb( °c) (°/oo) (ppm) (% SAT) (JTU)
0030 7.0 12 7.5 8.2 71 44
0230 6 .0 11 7 .1 8.8 74 46
0430 6.0 12 7.5 9.0 76 40
0630 5.5 12 7 .6 9.1 76 48
0830 5 .5 13 7 .6 9 .2 76 56
1030 9.0 16 7.9 13.0 118 52
1230 8.5 14 8.0 14.7 132 54
1430 8.0 14 8.4 15.0 133 54
1630 7.5 10 * 15.0 132 67
1830 7.0 9 —
10.2 89 45
2030 6.0 10 9.5 80 40
2230 6.0 10 —
8.5 72 50
*pH meter malfunction
A8
-- - - - - - -~~~~~~~~ -~~~~~~~~~~~~~~~~~~~~~~~~~~~~ -~~~~- ---- ~~~~~ ----- ~~~~~~~~~~~~-— --.~~~ -- ~~----.- -~~~
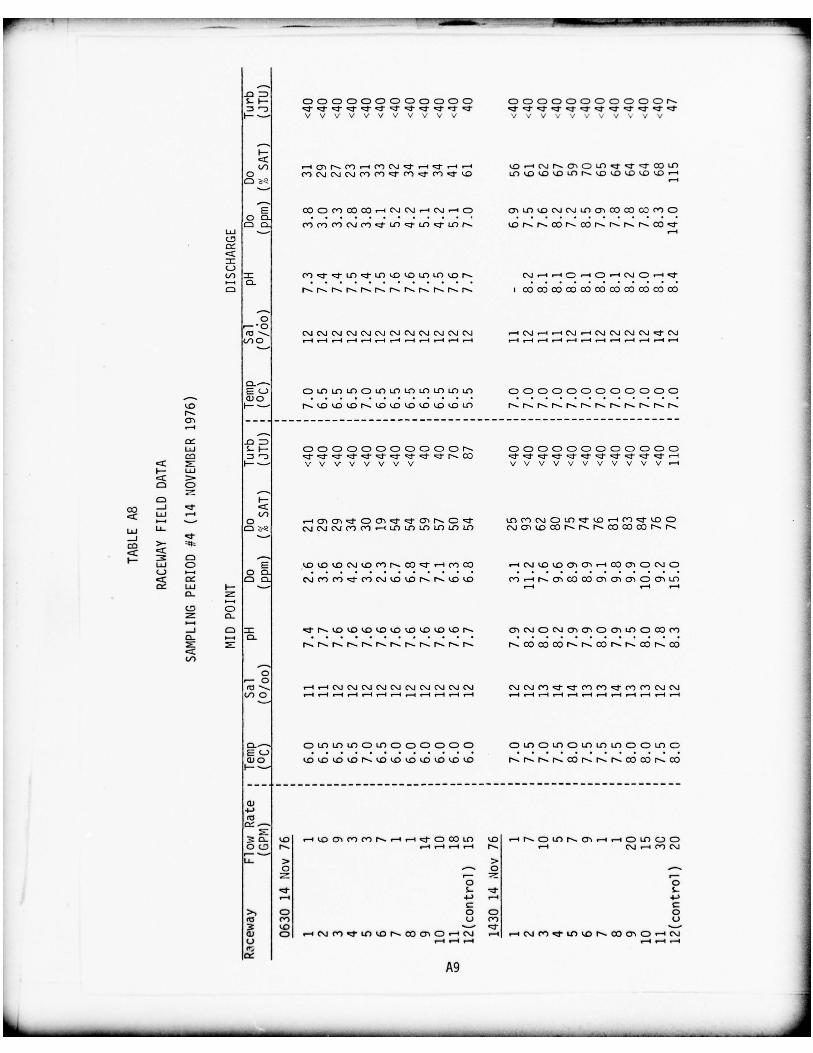
- - - - ~~—~~~~~—-- --~ --- -~~~~~~~~~~~~~~~~ - - - . ~~~—‘~~~~-~~~~ -~~ -
~~~~ - - -~ --~~~~~~~~ ~~~~~~~~~ - - , -~~~ -
S.- F- C C C C C CD C C C C C C C C C C C) C C) CD C C C N.~~
••~) 4- ’4. 4- 4- ,4- 4- .4. 4- 4 - 4 - 4 - ’4 . ‘4, ’4~ ‘4-4- 4- 4- 4- 4-4- ‘4.4- 4-
I—” -—- V V V V V V V V V V V V V V -, — -.
- V V V V
F-CCU) ~~I ci N. C’) -4 C’) ( ‘4 4- _ I 4- .-~ ‘-4 1.0~~~I (Si N. ci C U) 4- 4- 4- 3) U)
0 C’) (‘4 C’) (SI C’) C’) ‘4’ C’) 4- C’) 4- 1.0 10101.01.0 U) C’- 1 0 1 0 1 0 1 0 1 0 ‘-IC~~~Q ‘-I
E CO C C’) CO CO _I (‘4 (Si — (Si —I C ci 101.0 (“4 (‘4 U) ci (0 3) 0) 0) C0 0C C) 4’) C’) C’) (“4 C’) .4’ 10-4 -10 .4’ U) N. (0 N. C”. C O N - (C N. N. N. N. CO Si’
LU — —CD
CC
C.)U) = C ’ ) 4 - 4 -U ) 4 -U ) 1 . 01 . 0 U ) U ) 1 . 0N-
C N - N - N - N - N - N - N - N - N - N - N - N . u C O O D O D C O C X D C 0 C O 0 D C O C O C O
0I—(C~~~~. (‘4 (‘—4 (Si (Si (‘4 (‘-4 (Si (‘4 (‘-4 (Si (‘-4 (‘4 _ I (Si ~~ 1 .-I (Si _I (‘4 (Si (“4 C’) ‘4- (SiU) 0 ~-4 ~I .-4 .—I _I 4 ,-~I .—I .-4 _I ~~ 4 .-l _I .-‘I .-I .-4 _I _I _I .-4 _I _I .-I
C).—E C.) C U) U) U) CD U) 1010 10 U) ‘4) U) C C C C C C C C C C C C(1)0
1.0 F-— N-IC IC I0 N-I0 I0 1.0’.0 10 1.0U) N - N -N - N - N - N - N - N-N- N - N - N -N-ci‘-I
1D Z)LU S.. F- C C C C C C C C C) C C N. C C C C C C C C C C C CCD “i 4- ‘4- 4 - 4 - ‘4- Si’ 4- 4- Si’ Si’ N- 3) ~4- 4- ‘4- 4- 4- ‘4’ ‘4- ‘4- ‘4- ‘4- 4- ‘—4
CC ~~ F-— V V V V V V V V V V V V V V V V V V V . — IF- L~JcC )‘C C
CD F-3D -~~ 4- CC
LU — U)— 0 _I Ci Ci Si’ C ci ‘4- 4- Ci N- CD 4- Ii) C”) (Si C 104- 1.0 _ I C’) 4- ~0 C
LU C ~~ C’) (‘4 (‘4 0) C”) ~-4 L0 1010101010 (“J O) 10 CO N- N- N- CC (COD N- N.‘4. -.--
(‘C >~ ~~~cCF- ~~ C -‘
LU C) 101.01.0 (‘SI lO C’) N- (0 4- —4 C’) 3) —4 (“1 (0 1.0 ci ci _ I O D ci C ‘i CDC.) — 0 0 -
CC C C ) (SJ0)0)4-C’)C ’i l O I O N-N -l OIO C’) , — I N- c iC O C O C ic ic iC c i U )
~~ LU I— “— -I .- .‘ —C- ~~
CD C~~ C--4..J C 4- N- I 0 I0 IO 1.0 tO I0 I0 ¼0 ’- ON- ci C”J C C’Jc i c i CC iL OC C OC ’ )C- . 0 .
N- N- N- N. N- N- N- N- N- N- N- N- N- CO Q D C O N - N- CO N- N- CO N- COU)
0. —0CC ‘--. —I _I (‘4 (Si C’) (Si (Si (‘4 (‘4 (Si (SI (Si (‘Si (Si C’) ’4- 4- C’) C’) .4-0) C”) (‘4 (‘-4U) C) _ I_ I_I_I 4_ I_ I _ I_ I _ I_ II .—I _I ~~~4 _I .- I .-I ,-I _I .—I .—4
0.— C U) U) U) C U) C C C C C C C U) C U) C U) U) U) C C U) CEL)(1)0 10101.01.0 N. 1 0 1 0 1 0 1 0 1 0 1 0 1 0 N. N- N. N. CO N- N. N. (0(0 N- 3DF-—
a)4-,(C
~~~C- 1.0 _ I 1 . 0 c i 0 )C ’ ) N - _ I _ I 4- C C O U) 1.0 .-4 N- C U) N- c i . - - 4,-- ICU)C) CO CD N- -4 .-I -4 -4 N. _I (‘4 .—.I C’) (SJ
LI. >0 — 0 —.-
0 0‘4. 5.. .4. S..-4 4’ -4 4.)
C C>‘, C 0 C 0(3 C”) U 4’) U~ 1.0 ‘4’C) C ,-4 C’J0)4- In1 . 0N .C Oc iC_ I ( SJ _I _ I C’ C ’ )4 - 1 0 1 0N- 3 ) C iC_ I C’JO _I_ I.-44,)
A9
~~~~- -~~~~~~~ -~~~~~~~~~~~~-
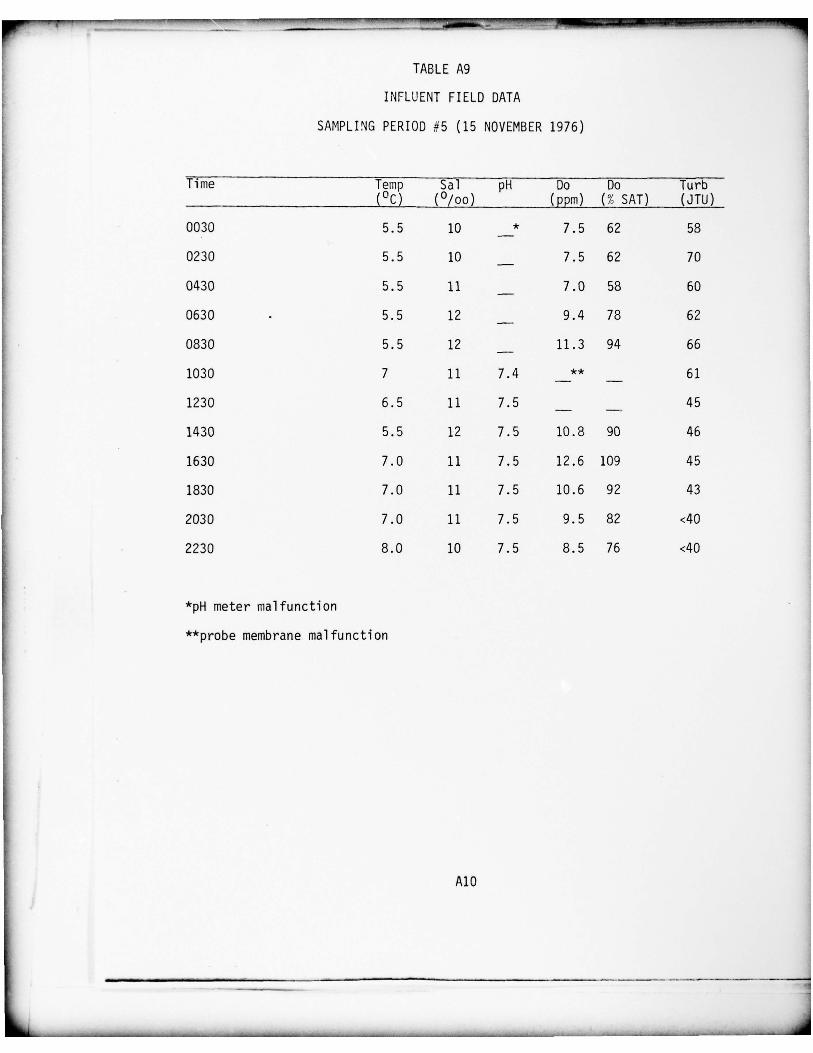
-
~~~~~~~~~~~~~~~~~~~~~~~~~~~~~ —-~-~~~
- -. ~~~~- -~~ ——- — -
~~‘-- --
~~~~~
TABLE A9
INFLUENT F IELD DATA
SAMPLING PERIOD #5 (15 NOVEMBER 1976)
Time Temp Sal pH Do Do Thrb(°c) (°/oo) (ppm) (% SAT) (JTU)
0030 5.5 10 _* 7.5 62 58
0230 5.5 10 —
7.5 62 70
0430 5.5 11 —
7.0 58 60
0630 . 5.5 12 9.4 78 62
0830 5.5 12 —
11.3 94 66
1030 7 11 7 .4 —
61
1230 6.5 11 7.5 — —
45
1430 5.5 12 7.5 10.8 90 46
1630 7.0 11 7.5 12.6 109 45
1830 7 .0 11 7.5 10.6 92 43
2030 7.0 11 7.5 9.5 82 <40
2230 8.0 10 7.5 8.5 76 <40
*pH meter malfunction
**probe membrane malfunction
Al 0
_______
_______ ——-—~~~~- - -~~~~~~~~~~~ -~--~~~—
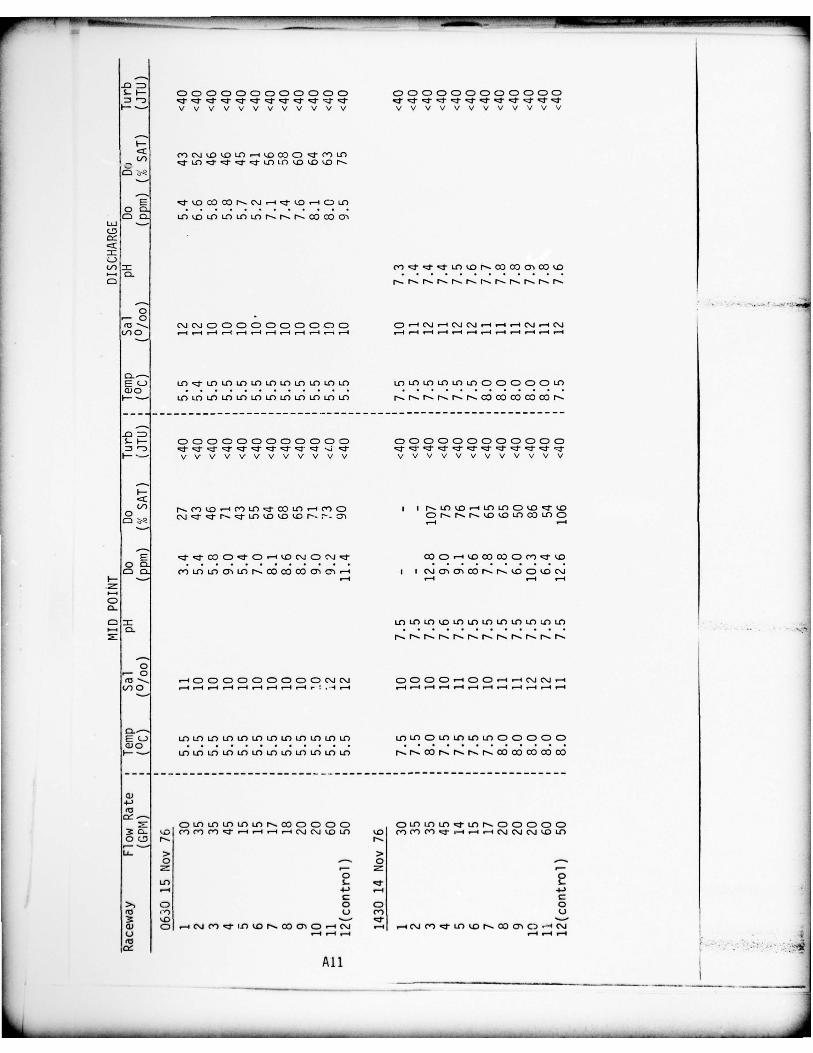
__---
~~~~~~~~~~~ -~~~~ - - ~~~~~~r~~ J w - .. ,- -
S.. F- C C C C C C C C CD C C C C C C C C C C CD C C C C~~
‘_) 4-Si ’ ‘4’ .4, 4 -4 - .4, .4, .4. .4. 4 - 4 - 4- ‘4- 4- ‘4.4-4- 4 - 4 - 4 - 4 - 4 - 4 -F--— V V V V V V V V V V V V V V V V V V V V V V V V
I-’0) (Si IC) ID U) .-4 1.0 3D C Si~ C’) U)
c 4- 4- .4- 1010(0 1.0 1.0 N-
E 4 - I C( C O DN - ( ’ 4—4 4-- 1.0 .-IcD U)O CC C 1 0 1 0 1 0 1 0 1 0 1 0 N- N’ N- CO CO Ci
LUCD
cC
C.)U) C’) 4- 4- 4 -1 0 1 0 N- CX) 0) ci CO 10
C N- N- N- N- N- N- N- N. N- N- N- N-
-;;.
~~~~0( C’ --, (‘)(‘J CD C C C C CC C-C C C — (SI — (‘4 (Si .-I .-4 .-4 C’) — (SiU) 0 .- ~ —4 --I~~~~~~~ -4 .-4 .‘ 4 ~~-I ~~~ ‘-4 .-4 4 .-I ~~ 4 . 4 .‘.4 -4 -4 ._‘4 -4
C)’— .E C.) U) ‘4’ 1 0 1 0 1 0 1 0 U) U) U) U) U) U) U) U) U) U) U) U) C C C C C U)0)0
1010 10 U)U)U)U)L0U) U)U)U) N . N -N . C ’ - .N -N - C O C C C O C OC ON .
5— F- CD C C CD C CD C C C C C ~~ CD C C C C C C C CD C C C~~
.—) 4- .4,4- ‘4- ‘ 4 . 4 - 4 - 4 - 4 - 4 - ‘ - 4 4 ’ ‘4 .4- ‘4- .4-4- . 4, 4 - 4 -4 - 4 - 4 - ‘4-F-’— V V V V V V V V V V V V V V V V V V V V V V V V
F-CC
N- C’) 10 .- ’ C’) U) 4- 3D U) .-4 C”) C I I N- 1010 .-4 U) 10 C 104- 10C\i ‘4- 4- N. Si’ U) ‘-0 10 1 0 N- r’ - Cli C) N- N- N- 10 10 U) 3D U) C
E ‘4,4 - CD C ‘4- CD ‘—1 10 (Si C (‘44- CO C ,-4 10 3) 0) C C’) 4-10O CC C C’) U) U) ci U) N- CO CO CO ci Ci — I I (S-i ci ci CO N- N- 10 C 10 (SI
F- — .-4 ‘-‘ ‘-‘ ‘-4CC-
C = 101010(01010 U) U) IC) U) U) U)‘-. 0.
N- N- N. N- N- N- N- N- N- N- N- N-
0‘ — 0( 3 ’.-.. — C C C C C C C C C (‘-4 (‘4 C C C C — C C — — (“4 (Si —U) 0 ~~ 4 4 ~ 4
._4 -4 -4 ~...4 1-4 .~ ._ 4 ~“4 ~“I ~~ 4 .—4 .‘-I .—4 .—4 ,—4 ,—4 .—4 .—4 .—4 .—4
E C.) U) U) U) U) U) U) 1 0 1 0 1 0 1 0 1 0 U) U) I.C) C 10 U) U) U) C C C C C0)0F -— U)U)U)L0U)U)U) IOU)U)LOU) N .N . O DN . N .N -N .~~0 3 ) C O C O C O
(1)+~(C
~~~ CU) U ) U ) U ) U ) N- C OC C C C C U ) U ) U )4 - U ) N . C C C C C(0 0)C’) C’) 4-~~~~4 .-4 .-4~~~~4 C’4 C’4 I0 U) 10 0)0)0)Si’.-4~~.4 ,-4 C’-J c’JC’iIO U)
0( 5 N- N-
LI. >0 — 0 —
0U) 5.- .4,-4 4-’ ‘-‘4 4’c C
>~, C 0 () 0(C ,_‘) U C’) U
‘.0 ‘.- 4-C) C .—, C’-i 0)4-t I )t,0 N - C O c iC .— 4(’.i .—4 C ’4 0 ) 4 - 1 0 I ON .3 D C i C )~~~4 C’SiU ~“I 1-”(0
All
—- -~~~~ ~~~~~~~~~~~~ --
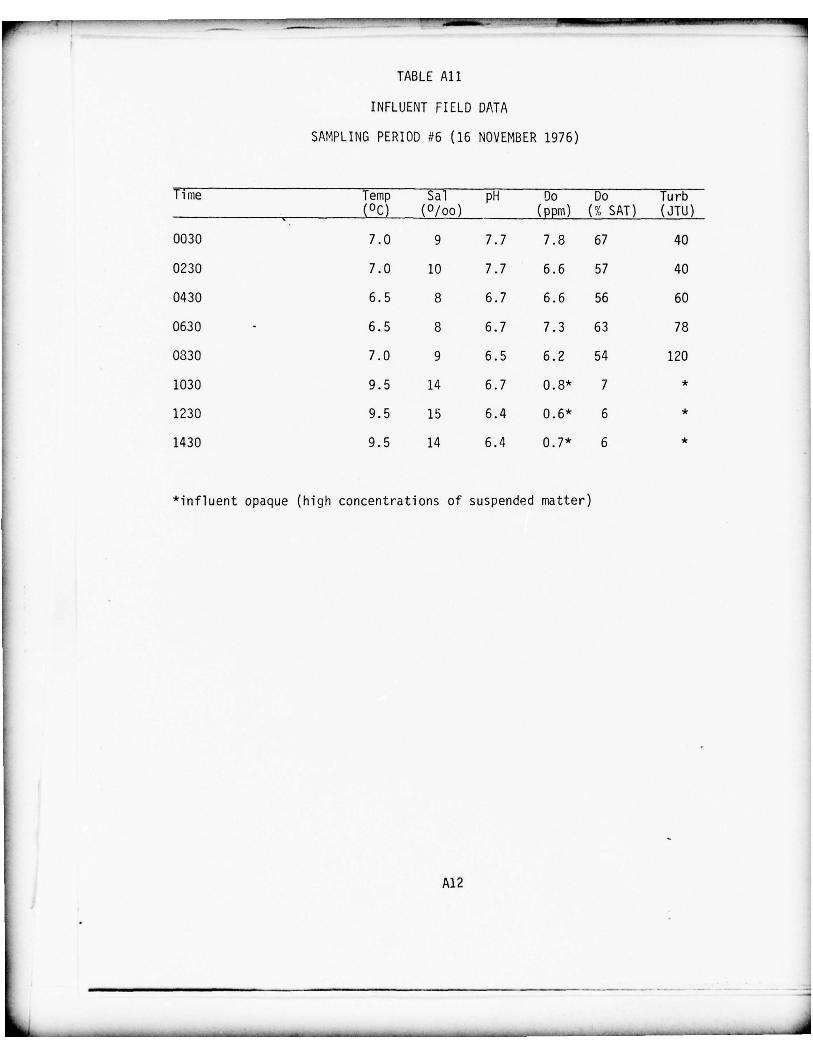
- .~~ — - - - - —~-- - —~~‘--- ~~~~~~~~~~~~~~~~~ -~~~~~~ - -
~~~~~‘ — - ~~~~~~~~~~~~~~~~~~~~~~
——
TABLE All
INFLUENT FIELD DATA
SAMPLING PERIOD #6 (16 NOVEMBER 1976)
Time Temp Sal pH Do Do Tu rb(°C) (°/oo) (ppm ) (% SAT) (JTU)
0030 7.0 9 7.7 7.8 67 40
0230 7.0 10 7.7 6.6 57 40
0430 6 .5 8 6 .7 6 .6 56 60
0630 - 6.5 8 6.7 7.3 63 78
0830 7.0 9 6.5 6.2 54 120
1030 9.5 14 6.7 0.8* 7 *
1230 9.5 15 6.4 0.6* 6 *
1430 9.5 14 6.4 0.7* 6 *
*jnfluent opaque (high concentrations of suspended matter)
Al 2
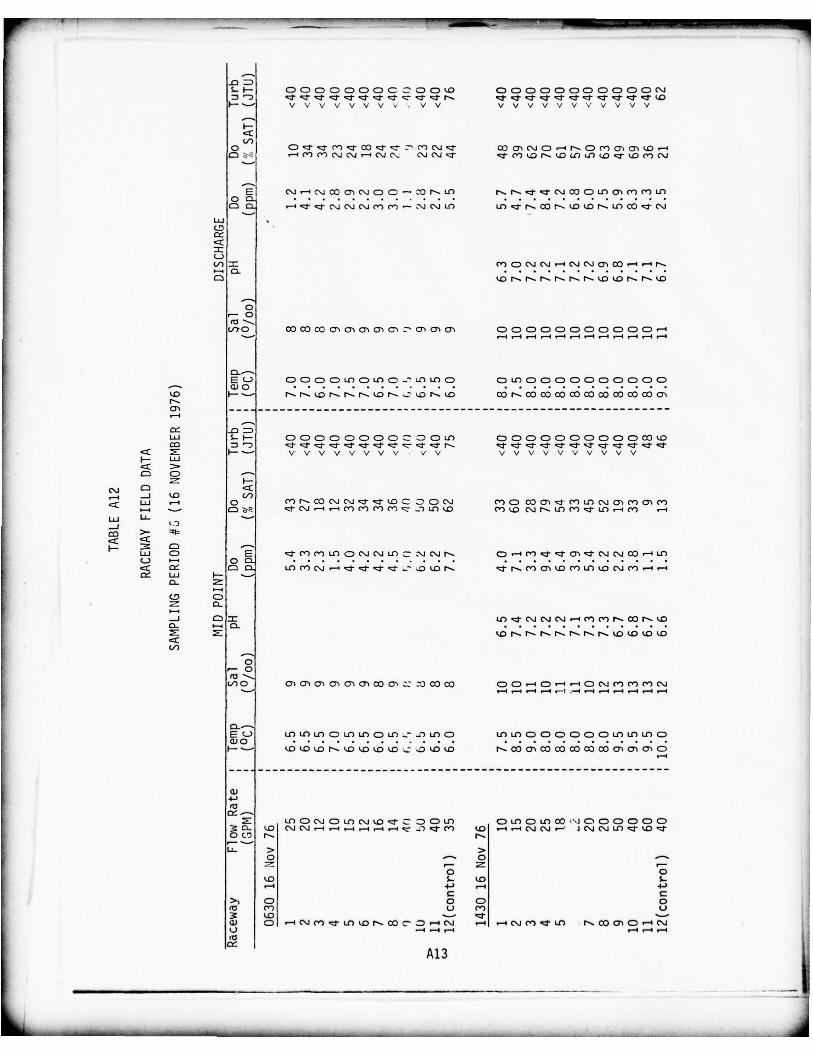
______ - —- ---- - _-— - ; . —- - -_ --- ---- --- - - - - .
— _--~----_‘- __ -- — - — - -
- - — ~~~~----_-- --.- ‘—-X-,-.- ’
S.. F- C C C C C C C C C CD 10 CD C C C C CC C C C C (SID ‘D 4- S i ’4- 4- .4- 4- 4 -S i ’ ‘z 4- 4- N- .4’ ‘4- 4- 4- 4- ‘4- 4’ 4- 4- .4- .4’ 10F-’-.— V V V V V V V V - V V V V V V V V V V V V V
F-CCU)
0 C Si’ 4- C’)’4’ 3) ‘4’ 4- ~~- C’) (‘44- C O O ) (“4 C — N- C C’) ci Ci 1 0’4C ~~ .-4 C”) C”) (‘4 (‘—4 .-‘ (‘-4 (‘S. (‘)(‘4 Si’ 4- C’) 10 N. 101010(04-100) (‘4
E (\i .—4 c’i CO ci (Si C CD — CO N- U) N. N-Si’ 4- (‘4 (CC U) Ci C”) C’) U)0C .“4 Si’ 4- (‘.4 (‘4 (Si C’) C’) .- ~‘) (Si 10 ‘4)4- N- CO N- 10 10 N- 1 0 3)4 - (Si
LU -
CD
cC
C-)(/) C’) C (Si (Si (‘.J C”J ci CO ‘-~ N-
C) 10 N- N- N- N- N- N- 10 10 N- N-IC
0.— 0
v,0 COC0 3D cicicicici c i c i c i C C C C C C C C C C C’ — I55— ,-4 -4 -4 -4 -4 -4 -4 -4 -4 -4 -4 -4
0.—E C-) CD C CD C IC) C U) CD -“ U) “C) CD C U) C C C C C C C C C C
— 04010 F- ‘— N- N- ID N- N- N-ID N- 10 N-IC C O N- CO CO CO CC CX) (0 0)3) CO ciN-ci-4
LU S.~ F- C C C C C C C C C C) C U) C C C C C C C CD C C CD 10CX) a ’ - ) 4- 4- .4- Si’ _4’ S i ’ 4- 4- 4- .4’ N. 4- 4- 4- 4- 4- 4- 4- 4- .4- 4- 4- 4-
cC ~~ F-— V V V V V V V V V V V V V V V V V V V VI— LUCC ~~ ‘C C —
F-~~~
C CC
C’)N-C0C’4C’i-4’Si’C0 C Z)CC’,J 0 )C C Oc i 4 - 0 ) U ) C ’ 4 c i 0 ) c i C ’ )‘-4 ‘,. - -4’ (~“J — . 1 0) C’) C’) C’) C ~~) 1010 C’) 10 (Si N- 100)’4’ U) ‘-I C’) —
LU LI. “-
~~~ >.
~~~~~~~~CC <I’- ~~LU C E Si’ C’) C’) U) CD (SI (‘4 10 ~‘) (Si N- C .-‘ IC’) ‘4- Si’ ci 4- “J C’i CO — U)
C.) — 0CC ~~ C U) C”) (‘—4 — 4- ‘4- Si’ 4- 0 10 N- 4 - N- 0) ci 1 0 0) U) (0 C’) C’) — —I
F ~~ LU F-C- ~~
-4CD CD~~ C--4
1.0 4- (Si (Si (Si .-4 C’) C’) N- CD N- 10C- ~~~~~~~
10 N- N- N- N- N- N- N- 1010 10 10CCU)
0— 0( 3 ”-’U)0 C i c i c i c i c ic iC O c i ) C O ( C C O CC.-I C ---4~~-4 C C’iC’) C”) C’) C’i
1 - 4 4 4 1 - 4 .-I .‘l 4 .-4
E C.) U) 1010 C 1010 C LX) .) U) CD 1 0 1 0 C C C C C C L0 U)IC) C0)0F- — (01010 N- 10101010 ~C 10 10 N. 0) ~i CO CO (03) CO Ci ci ci C
‘-4
51)
(C
~~ U) C (Si C U) (SI 10 ‘4’ C CD C U) C U) C U) 3) “J C C CD C CD C~ C- 10 (SI (‘4 ..—i .
~., ,..4 .-‘l ~ ‘ ,) Si’ C”) ‘.0 .—~ — C’~i (Si .—‘ I (Si (%i IC) ‘4’ 10 4-
O C D N- N-
Li > >0 — 0 —
0 010 5.~ 10 S.-— 4-) _4 4-)
C CCD 0 CD 0
(3 C’) U C’) U
~ 10 55.- 4- —
C) C) ‘-4 (SJ C ’ )4 - U ) ’ . QN .( CC~~~~~~-4 (SJ — ,-4 C’4 0 ) 4 - L C ) N-3DciC.- IC”iU ~ 4 .-I .‘-I .-4 . 4 . ‘4‘C
A13
_ _ __
—
APPENDIX B
NUTRIENT DATA (P04, NO3 AND NH4)FROM EXPERI MENTS
BiIC
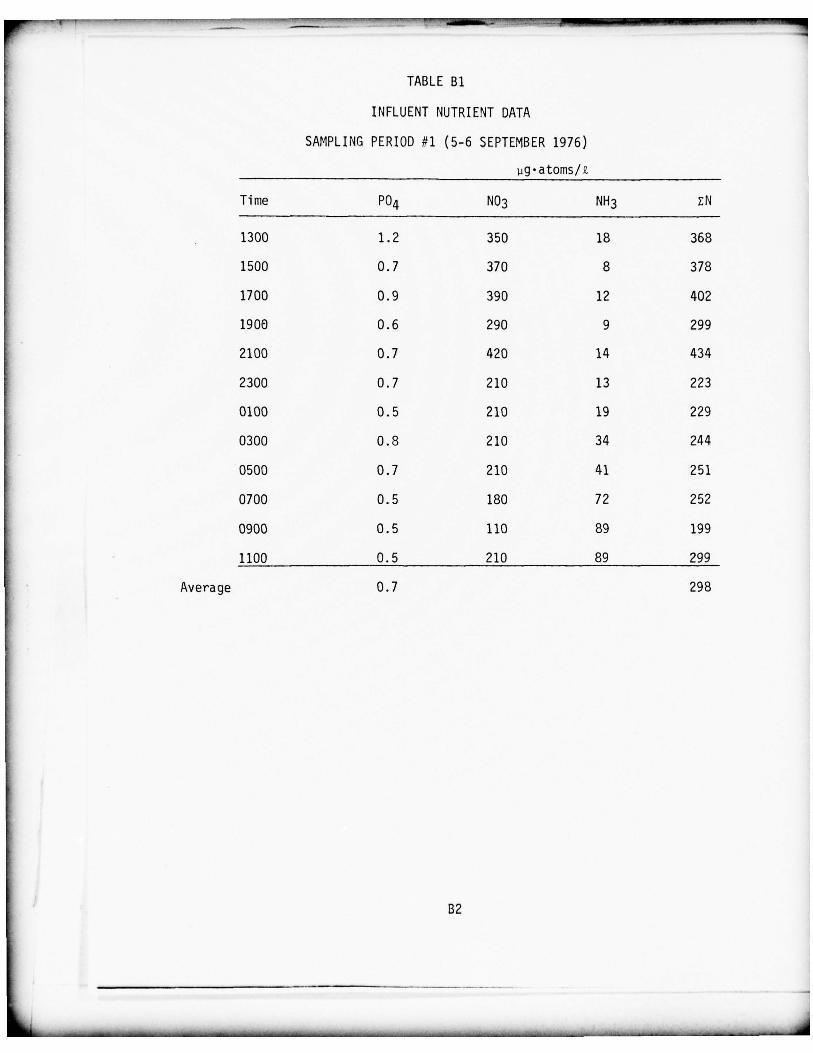
TABLE Bi
IF1FLUENT NUTRIENT DATA
SAMPLING PERIOD # 1 (5-6 SEPTEMBER 1976)pg.atoms/9.
Time P04 NO3 NH3 ZN
1300 1.2 350 18 368
1500 0.7 370 8 378
1700 0.9 390 12 402
1900 0.6 290 9 299
2100 0.7 420 14 434
2300 0.7 210 13 223
0100 0.5 210 19 229
0300 0 .8 210 34 244
0500 0.7 210 41 251
0700 0.5 180 72 252
0900 0.5 110 89 199
1100 0.5 210 89 299
Average 0.7 298
B2
—~~ —- ~~~~_~~~~~~_ , __ __ _ _ m~~~~~ -- -~~~ ~~~~~~~~~~~~~~~~~~~~~~~~~~~~~~~ ——-— - ---—_ -- -‘- -—
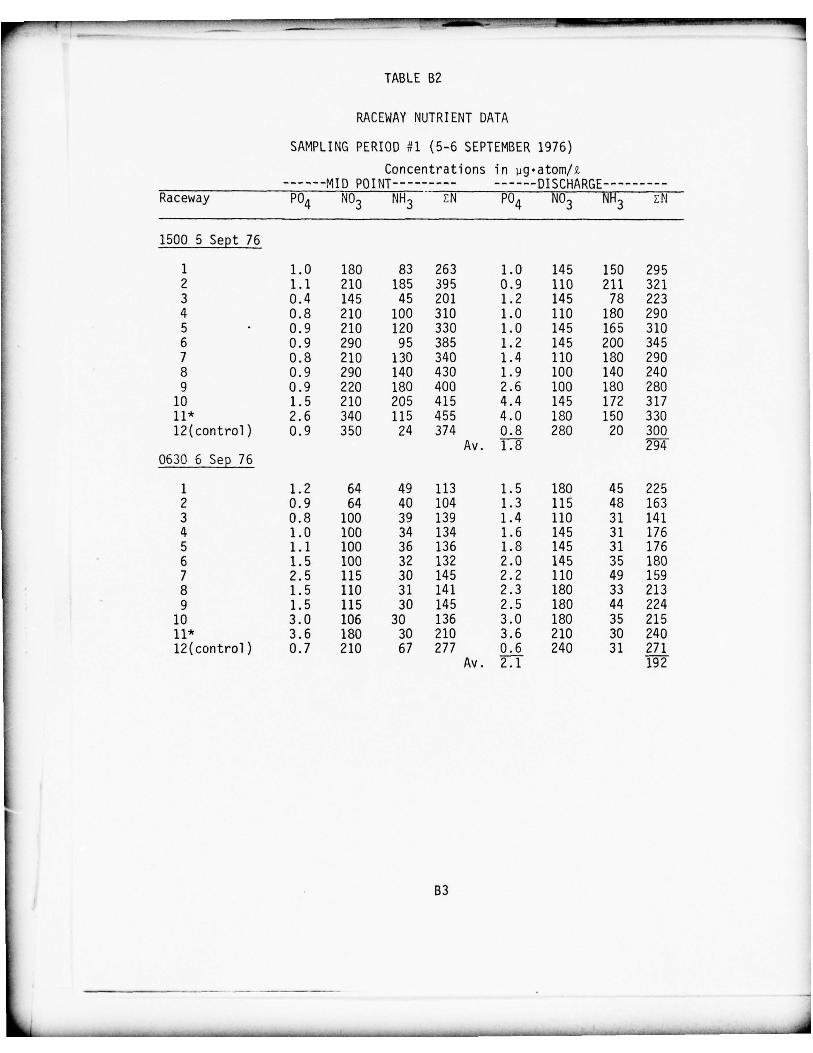
-- ~~~‘ -
~~~~~~~~~~~~~~~~~~~~~ —
~~—
~~~~~~~~ ‘ ‘ - - —
TABLE B2
RACEWAY NUTRIENT DATA
SAMPLING PERIOD # 1 (5-6 SEPTEMBE R 1976)Concentrations in j ig .atom/2~ MID POINT DISCHARGE
Raceway P04 NO 3 NI-I3 -‘
EN P04 NO3 NH3 EM
1500 5 Sept 76
1 1.0 180 83 263 1.0 145 150 2952 1.1 210 185 395 0.9 110 211 3213 0.4 145 45 201 1.2 145 78 2234 0.8 210 100 310 1.0 110 180 2905 0.9 210 120 330 1.0 145 165 3106 0.9 290 95 385 1.2 145 200 3457 0.8 210 130 340 1.4 110 180 2908 0.9 290 140 430 1.9 100 140 2409 0.9 220 180 400 2.6 100 180 280
10 1.5 210 205 415 4.4 145 172 31711* 2.6 340 115 455 4.0 180 150 33012(control ) 0.9 350 24 374 0.8 280 20 300
Av. T’~0630 6 Se p 76
1 1.2 64 49 113 1.5 180 45 2252 0.9 64 40 104 1.3 115 48 1633 0.8 100 39 139 1.4 110 31 1414 1.0 100 34 134 1.6 145 31 1765 1.1 100 36 136 1.8 145 31 1766 1.5 100 32 132 2.0 145 35 1807 2.5 115 30 145 2.2 110 49 1598 1.5 110 31 141 2.3 180 33 2139 1.5 115 30 145 2.5 180 44 224
10 3.0 106 30 136 3.0 180 35 21511* 3.6 180 30 210 3.6 210 30 24012(control ) 0.7 210 67 277 0 .6 240 31 271
Av . 2.1 192
L __ __ _ _ _ _ _ _ _ _ _ _ _ _ _ _
_ _ ~~~~~~~~~~~~~~~~~~~~~~~~~~~~~~~~~~~~~~~~~~~~~~~~~~~~~~~~~~~~~~~~~~~~~~~~~~~~~~~~~~~~~~~~~~~~~~~~~~~
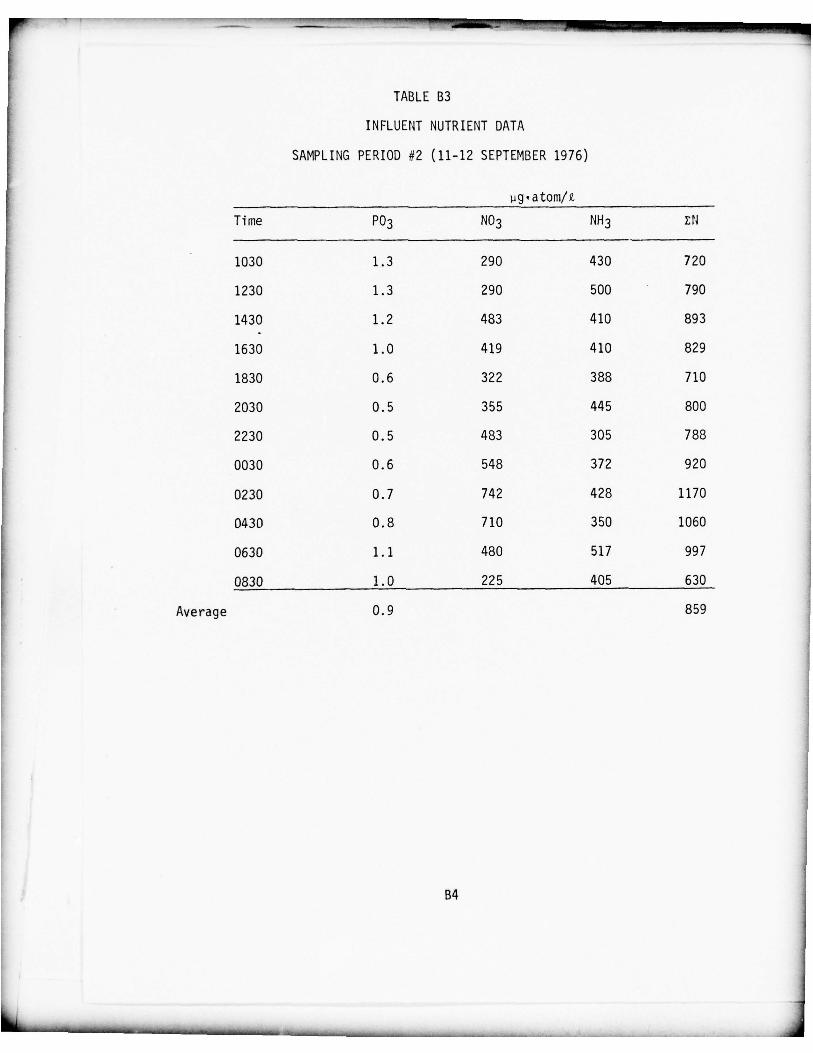
- _ - - -~‘-—‘---- -
~~~~~~ ‘1~jj_~~’~~ _ —.-.w-—~~~
--~
- -v-
TABLE B3
INFLUENT NUTRI ENT DATA
SAMPLING PERIOD #2 (11-12 SEPTEMBER 1976)
j i g ’ atom/i
Time P03 NO3 NH 3 EN
1030 1.3 290 430 720
1230 1.3 290 500 790
1430 1.2 483 410 893
1630 1.0 419 410 829
1830 0.6 322 388 710
2030 0.5 355 445 800
2230 0.5 483 305 788
0030 0.6 548 372 920
0230 0.7 742 428 1170
0430 0.8 710 350 1060
0630 1.1 480 517 997
0830 1.0 225 405 630
Average 0.9 859
84
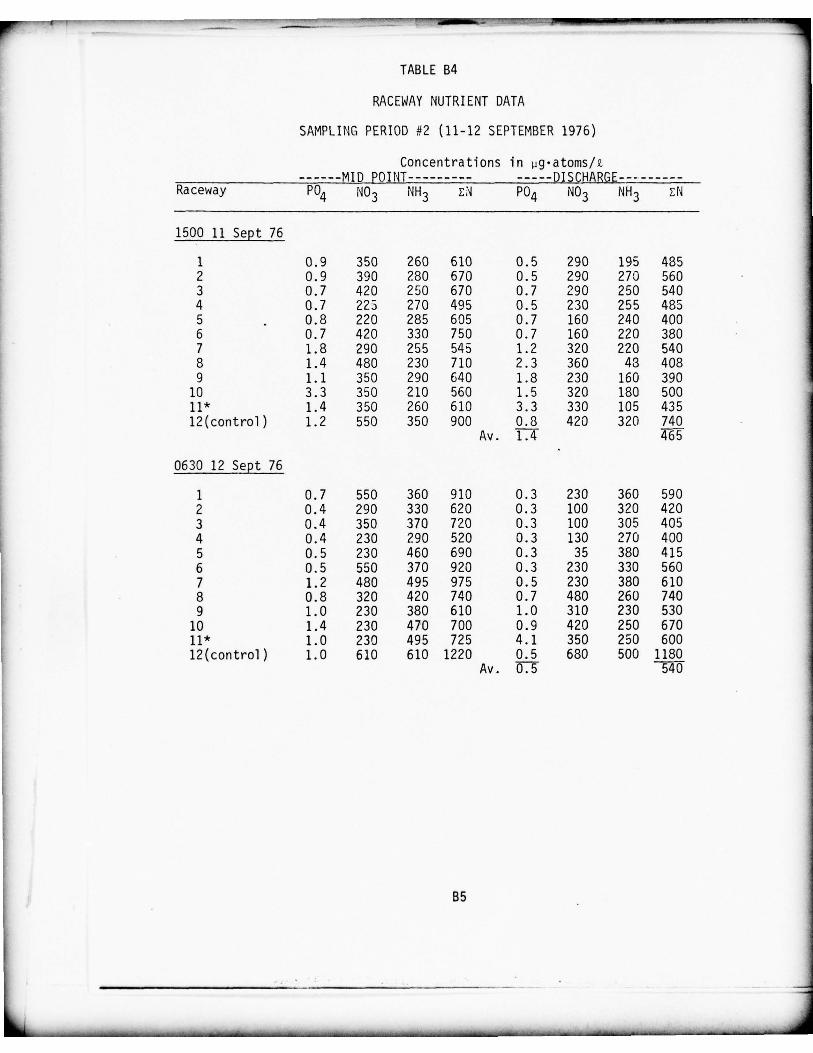
______________________ - - -~_--I_ ---__ ’ -_ --- -- - - - - - -----.------ -- -
TABLE B4
RACEWAY NUTRIENT DATA
SAMPLING PERIOD #2 (11-12 SEPTEMBER 1976)
Concentrat ions in pg•atoms /z MID POINT DISCHARGE
Raceway P04 NO 3 NH 3 ZN P04 NO 3 NH 3 EN
1500 11 Sept 76
1 0.9 350 260 610 0.5 290 195 4852 0.9 390 280 670 0.5 290 270 5603 0.7 420 250 670 0.7 290 250 5404 0.7 223 270 495 0.5 230 255 4855 . 0.8 220 285 605 0.7 160 240 4006 0.7 420 330 750 0.7 160 220 3807 1.8 290 255 545 1.2 320 220 5408 1.4 480 230 710 2.3 360 48 4089 1.1 350 290 640 1.8 230 160 39010 3.3 350 210 560 1.5 320 180 50011* 1.4 350 260 610 3.3 330 105 43512(cont rol ) 1.2 550 350 900 0.8 420 320 740
Av . 1.4 465
0630 12 Sept 76
1 0.7 550 360 910 0.3 230 360 5902 0.4 290 330 620 0.3 100 320 4203 0.4 350 370 720 0.3 100 305 4054 0.4 230 290 520 0.3 130 270 4005 0.5 230 460 690 0.3 35 380 4156 0.5 550 370 920 0.3 230 330 5607 1.2 480 495 975 0.5 230 380 6108 0.8 320 420 740 0.7 480 260 7409 1.0 230 380 610 1.0 310 230 53010 1.4 230 470 700 0.9 420 250 67011* 1.0 230 495 725 4.1 350 250 60012(control ) 1.0 610 610 1220 0.5 680 500 1180
Av . 0 .5 540
B5 -
_ - i1 ._~~~~~~~~~~~~
_~~~~~~~~~~~~
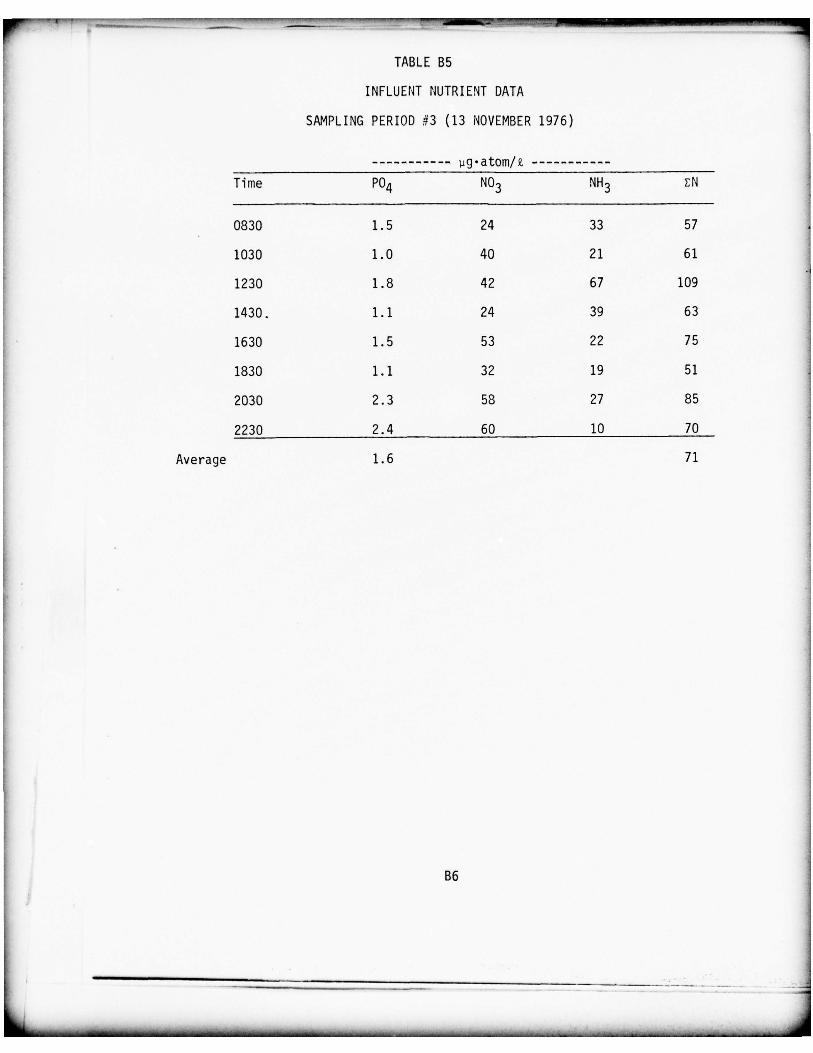
~~~~~~~~~~ - -~ ~~~~~~~~~~~~~~~ _____ ~~~
- -~ - -~~~~~~~-
~~~~~~ - -~~~~~~~~ -_ _
~—
TABLE B5
IN F LUE N T NUTRIENT DATA
SAMPLING PERIOD #3 (13 NOVEMBER 1976)
ug.atom/9
Time P04 NO3 NH 3 EN
0830 1.5 24 33 57
1030 1.0 40 21 61
1230 1.8 42 67 109
1430. 1.1 24 39 63
1630 1.5 53 22 75
1830 1.1 32 19 51
2030 2.3 58 27 85
2230 2.4 60 10 70
Average 1.6 71
86
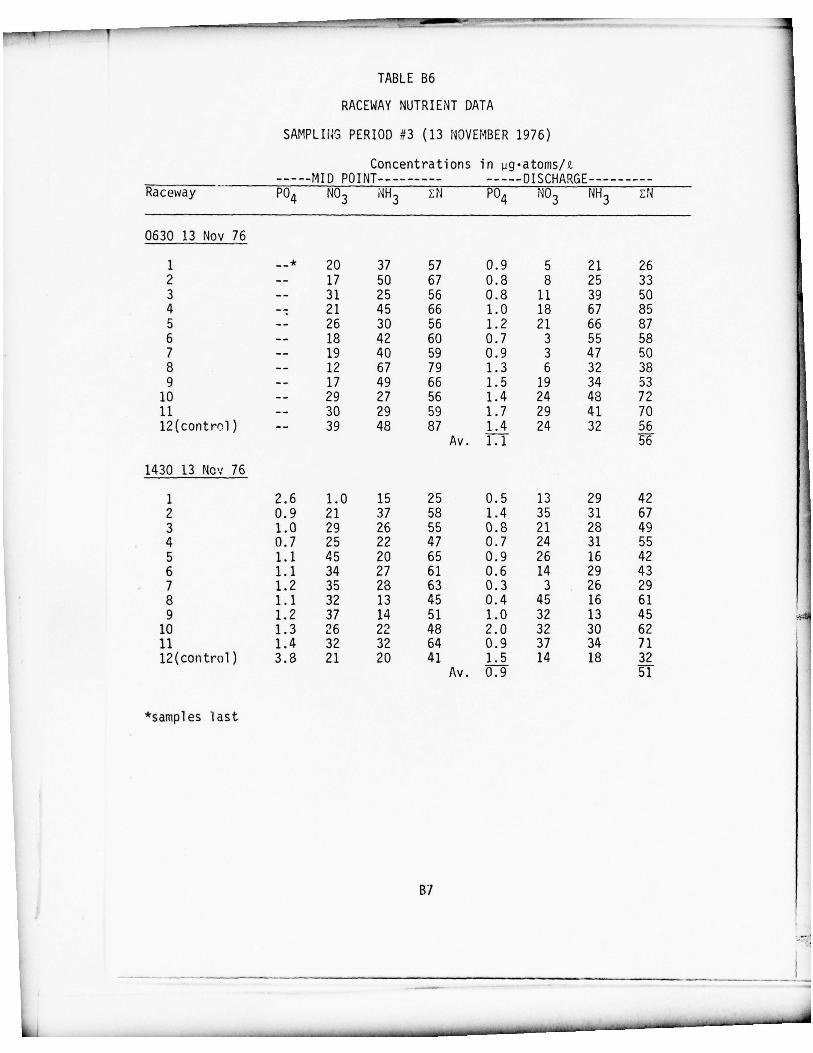
____________________________ - ~~~~~~~~~~ . , -~~~.__ _.,........... “ --.- -- . -
TABLE B6
RACEWAY NUTRIENT DATA
SAMPLII~G PERIOD #3 (13 NOVEMBER 1976)
Concentrations in pg.atoms/9~_________
MID POINT DISCHARGE Raceway P0~ NO3 NH 3 EN P04 NO 3 NH3 EN
0630 13 Nov ~~
1 __ * 20 37 57 0.9 5 21 262 -- 17 50 67 0.8 8 25 333 -- 31 25 56 0.8 11 39 504 -
~~ 21 45 66 1.0 18 67 855 -- 26 30 56 1.2 21 66 876 -- 18 42 60 0.7 3 55 587 -- 19 40 59 0.9 3 47 508 -- 12 67 79 1.3 6 32 389 -- 17 49 66 1.5 19 34 53
10 -- 29 27 56 1.4 24 48 7211 —— 30 29 59 1.7 29 41 7012(control ) - - 39 48 87 1.4 24 32 56
Av . 1.1 56
1430 13 Nov 76
1 2.6 1.0 15 25 0.5 13 29 422 0.9 21 37 58 1.4 35 31 673 1.0 29 26 55 0.8 21 28 494 0.7 25 22 47 0.7 24 31 555 1.1 45 20 65 0. 9 26 16 426 1.1 34 27 61 0 .6 14 29 437 1.2 35 28 63 0.3 3 26 298 1.1 32 13 45 0.4 45 16 619 1.2 37 14 51 1.0 32 13 45
10 1.3 26 22 48 2.0 32 30 6211 1.4 32 32 64 0.9 37 34 7112(control) 3.8 21 20 41 1.5 14 18 32
Av . 0.9 51
*samples last
B7
_ _ _ _ _
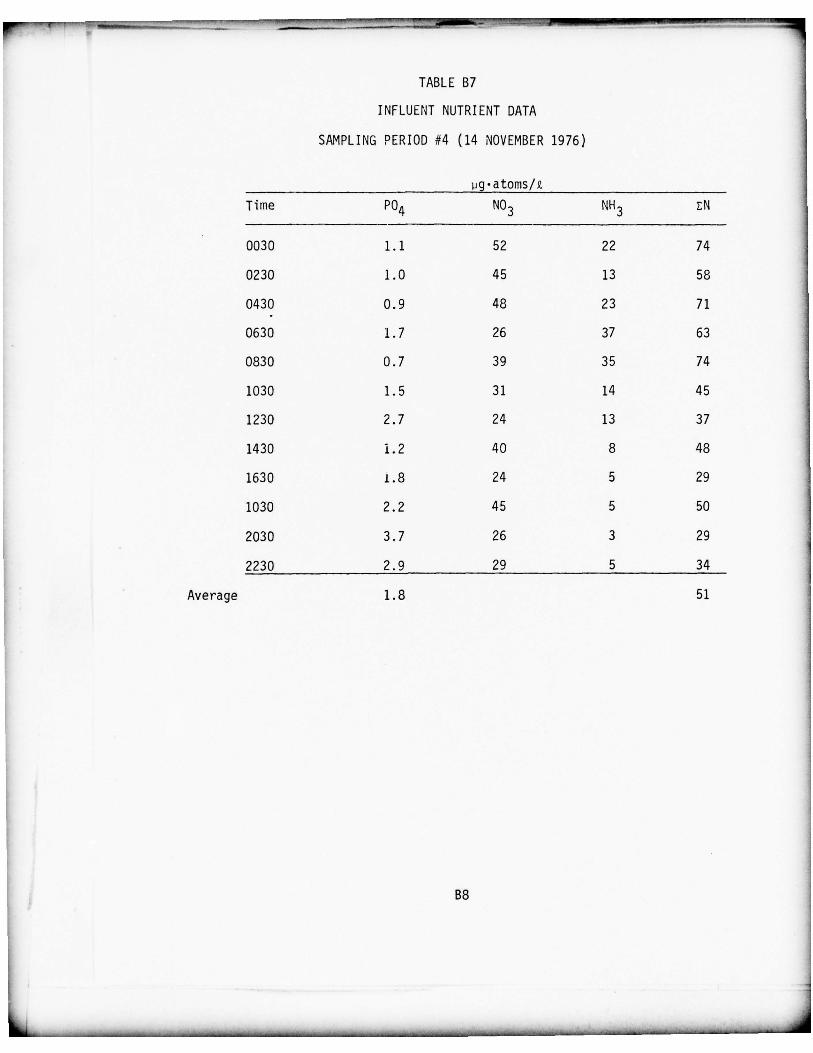
ruPuuUUI,~~P,U uI~~~~~~~~~~~~~~~~~ ____ __________ - - .-
~
-—- -
TABLE 87
INFLUENT NUTRIENT DATA
SAMPLING PERIOD #4 (14 NOVEMBER 1976)
jig.atOm5/9~Time P04 NO 3 NH 3 ZN
0030 1.1 52 22 74
0230 1.0 45 13 58
0430 0.9 48 23 71
0630 1.7 26 37 63
0830 0 .7 39 35 74
1030 1.5 31 14 45
1230 2 .7 24 13 37
1430 1.2 40 8 48
1630 1 .8 24 5 29
1030 2.2 45 5 50
2030 3.7 26 3 29
2230 2.9 29 5 34
Average 1.8 51
B8
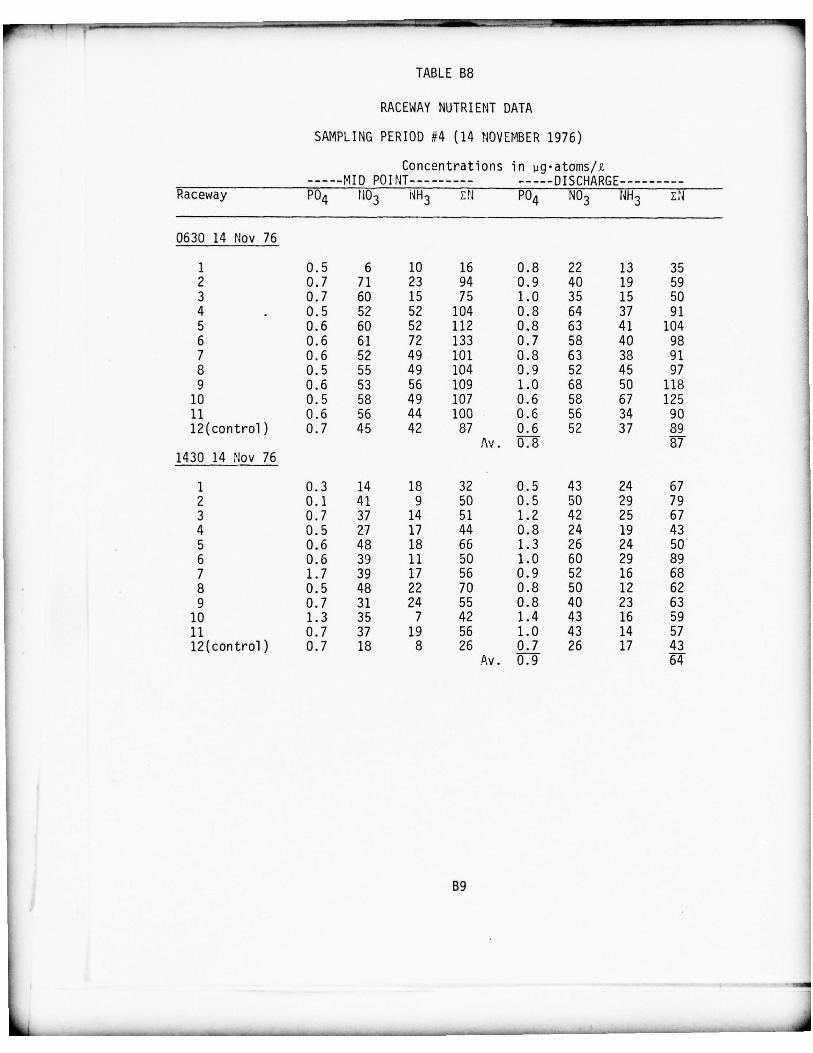
- - ‘ ~~ _ ~~- ~~~~~~~~~~~~~~ ~~~~~~~~~~~~~~~~~~~~ -~---~
-
TABLE B8
RACEWAY NUTRIENT DATA
SAMPLING PERIOD #4 (14 NOVEMBER 1976)
Concentrations in pg.atoms/9~ MID POINT DISCHARGE Racewa y P04 1103 ‘~H3 EN PU4 NO3 NH 3 EN
0630 14 Nov 76
1 0.5 6 10 16 0.8 22 13 352 0.7 71 23 94 0.9 40 19 593 0.7 60 15 75 1.0 35 15 504 . 0.5 52 52 104 0,8 64 37 915 0.6 60 52 112 0.8 63 41 1046 0.6 61 72 133 0.7 58 40 987 0.6 52 49 101 0.8 63 38 918 0.5 55 49 104 0.9 52 45 979 0.6 53 56 109 1.0 68 50 11810 0.5 58 49 107 0.6 58 67 12511 0 .6 56 44 100 0 .6 56 34 9012(control ) 0.7 45 42 87 0.6 52 37 89
Av . 0.8 871430 14 Nov 76
1 0.3 14 18 32 0 .5 43 24 672 0.1 41 9 50 0.5 50 29 793 0.7 37 14 51 1.2 42 25 674 0.5 27 17 44 0.8 24 19 435 0.6 48 18 66 1.3 26 24 50
F 6 0.6 39 11 50 1.0 60 29 897 1.7 39 17 56 0.9 52 16 688 0.5 48 22 70 0 .8 50 12 629 0.7 31 24 55 0.8 40 23 63
10 1.3 35 7 42 1.4 43 16 5911 0.7 37 19 56 1.0 43 14 5712(contro l ) 0.7 18 8 26 0.7 26 17 43
Av . 0.9 64
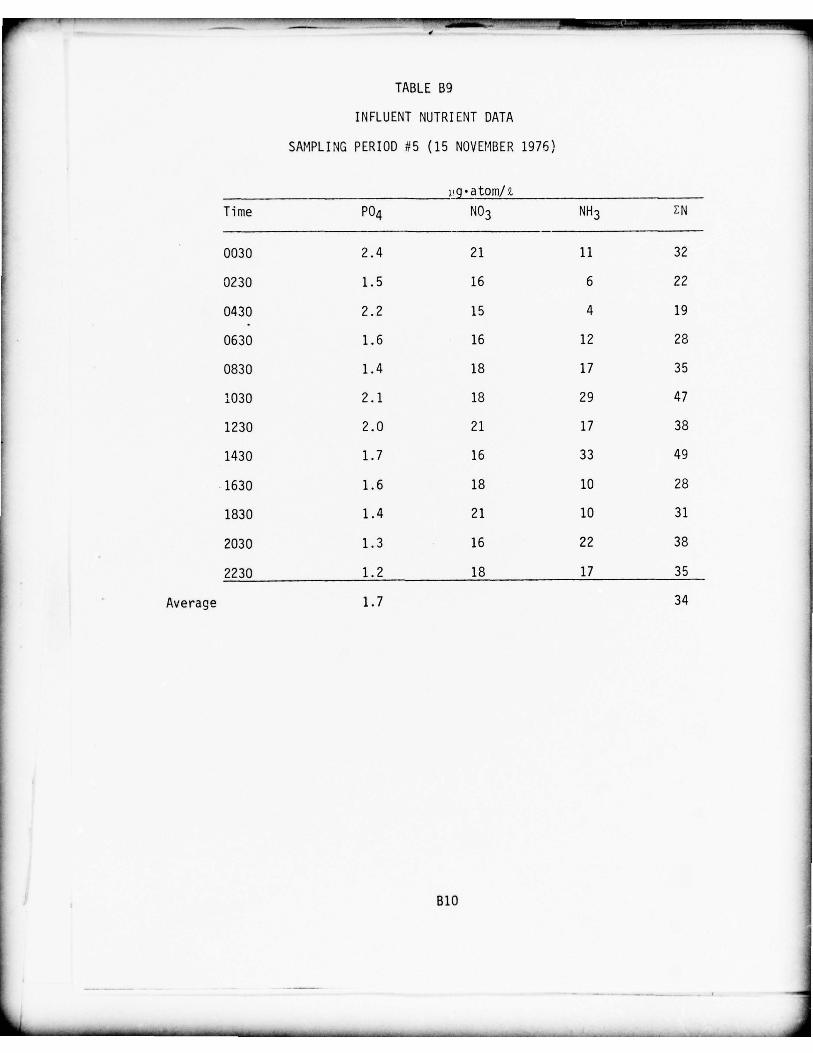
-
TABLE B9
INFLUENT NUTRIENT DATA
SAMPLING PERIOD #5 (15 NOVEMBER 1976)
pg.atom/~Time P04 NO3 NI-I3 EN
0030 2.4 21 11 32
0230 1.5 16 6 22
0430 2 .2 15 4 19
0630 1.6 16 12 28
0830 1.4 18 17 35
1030 2.1 18 29 47
1230 2.0 21 17 38
1430 1.7 16 33 49
1630 1.6 18 10 28
1830 1.4 21 10 31
2030 1.3 16 22 38
2230 1.2 18 17 35
Average 1.7 34
BlO
_ _
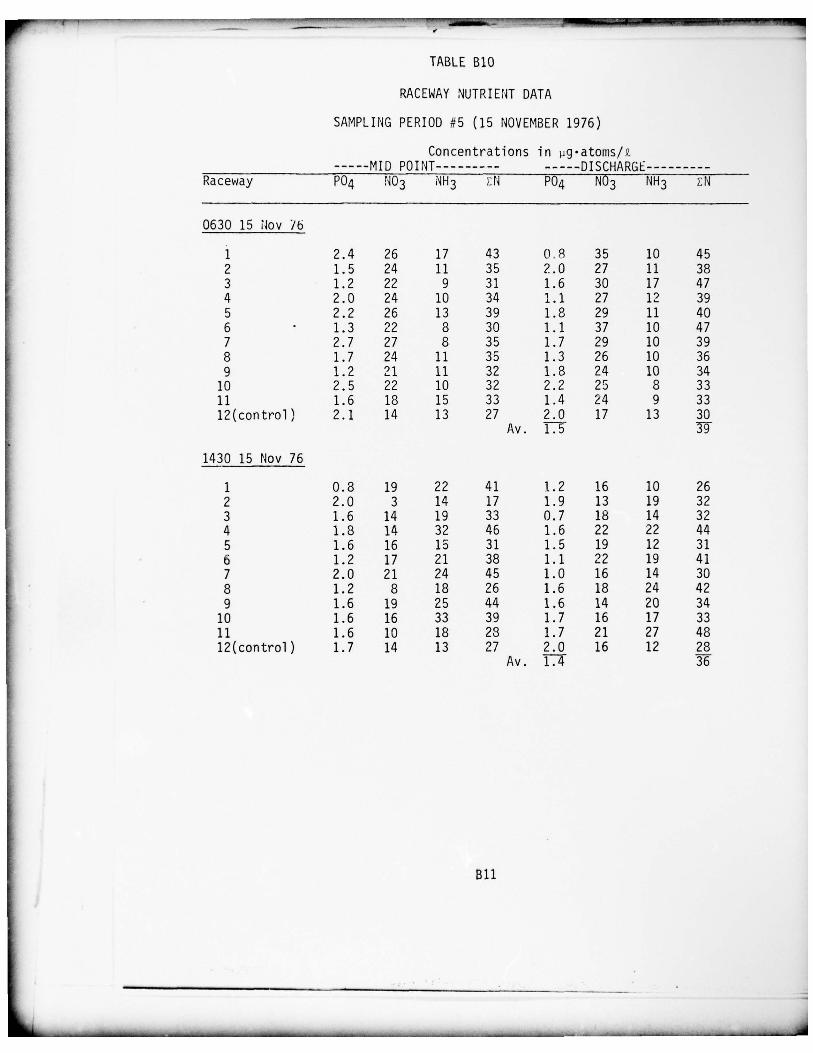
- - -
~~~~~~~~~~~~~~~ -- ~~~~- .,.L L - - .-- __________ --
F TABLE BlO
RACEWAY NUTRIENT DATA
SAMPLING PERIOD #5 (15 NOVEMBER 1976)
Concentrations j~ ~~~~~~~~ MID POINT DISCHARGE Raceway P04 NO 3 NH 3 EN P04 NO3 NH 3 EN
0630 15 Nov ‘/6
1 2.4 26 17 43 0.8 35 10 452 1.5 24 11 35 2.0 27 11 383 1.2 22 9 31 1.6 30 17 474 2.0 24 10 34 1.1 27 12 395 2.2 26 13 39 1.8 29 11 406 - 1.3 22 8 30 1.1 37 10 477 2 .7 27 8 35 1.7 29 10 398 1.7 24 11 35 1.3 26 10 369 1.2 21 11 32 1.8 24 10 3410 2.5 22 10 32 2.2 25 8 3311 1.6 18 15 33 1.4 24 9 3312(control ) 2.1 14 13 27 2.0 17 13 30
Av. 1.5
1430 15 N ov 76
1 0 .8 19 22 41 1.2 16 10 262 2.0 3 14 17 1.9 13 19 323 1.6 14 19 33 0.7 18 14 324 1.8 14 32 46 1 .6 22 22 445 1.6 16 15 31 1.5 19 12 316 1.2 17 21 38 1.1 22 19 417 2.0 21 24 45 1.0 16 14 308 1.2 8 18 26 1.6 18 24 429 1.6 19 25 44 1.6 14 20 34
10 1.6 16 33 39 1.7 16 17 3311 1.6 10 18 28 1.7 21 27 4812(control ) 1.7 14 13 27 2.0 16 12 28
Av. 1.4 36
Bi l
_ _ _ _ _ _ _ _ _ _ _ _ _ _
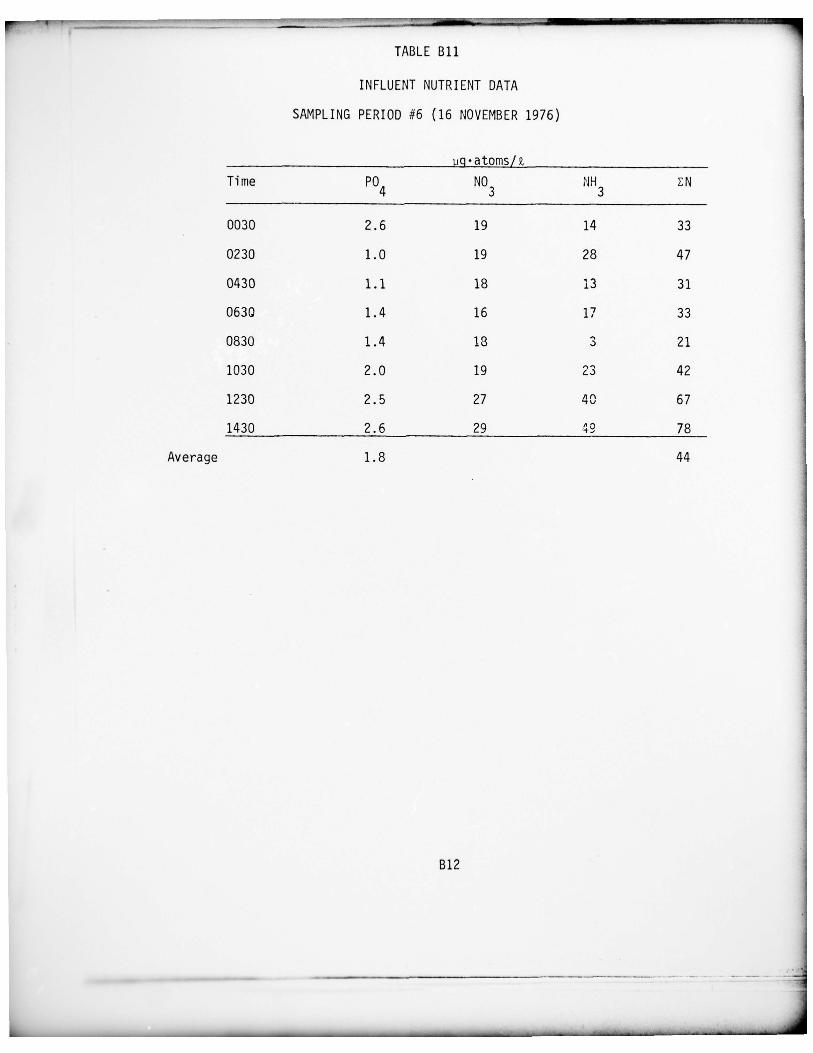
~ ‘~ T: ~~~~~~~~~~ ~~~~~~~~~~ - - •
~~~~~~~~~~~~~~~~~~~~~~~~~~~~~~~~~~~~~~
TABLE 811
I NFLUENT NUTRIENT DATA
SAMPLING PERIOD #6 (16 NOVEMBER 1976)
atoms! 2.Time PU
4 NO3
N H3
EN
0030 2.6 19 14 33
0230 1.0 19 28 47
0430 1.1 18 13 31
0630 1.4 16 17 33
0830 1.4 18 3 21
1030 2.0 19 23 42
1230 2.5 27 40 67
1430 2.6 29 19 78
Average 1.8 44
B 12
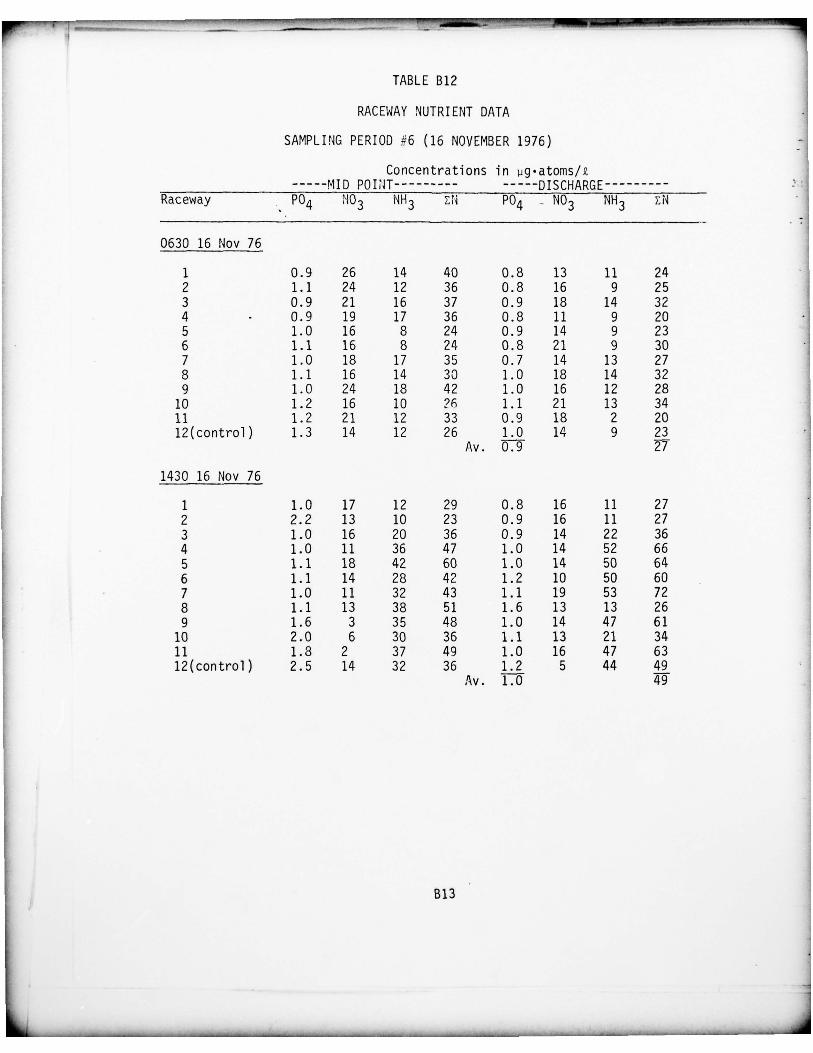
-
~—r-=----
~~~~~~~~~~~~~~~~~ ~~~~~~~~~~~~~~~~~~~~~~~~~~~~~~~~~~~ ~~~~~~~~~~~~~~~~~~ ~~~~~~~~~~~~~~~~~~~~~~ - - - ~~~ —
TABLE 812
RACEW A Y NUT R IENT DAT A
SAMPLING PERIOD #6 (16 NOVEMBER 1976)
Concentrat ions in jig.atoms/9. MID POI N T DISCHARGE
Raceway P04 NO3 NH 3 EN PU 4 - NO3 NH 3 ZN
0630 16 Nov 76
1 0.9 26 14 40 0.8 13 11 242 1.1 24 12 36 0.8 16 9 253 0.9 21 16 37 0.9 18 14 324 - 0.9 19 17 36 0.8 11 9 205 1.0 16 8 24 0.9 14 9 236 1.3. 16 8 24 0.8 21 9 307 1.0 18 17 35 0.7 14 13 278 1.1 16 14 30 1.0 18 14 329 1.0 24 18 42 1.0 16 12 2810 1.2 16 10 26 1.1 21 13 3411 1.2 21 12 33 0.9 18 2 2012(control) 1.3 14 12 26 1.0 14 9 23
Av. 0 .9 27
1430 16 Nov 76
1 1.0 17 12 29 0.8 16 11 272 2.2 13 10 23 0.9 16 11 273 1.0 16 20 36 0.9 14 22 364 1.0 11 36 47 1.0 14 52 665 1.1 18 42 60 1 .0 14 50 646 1.1 14 28 42 1.2 10 50 607 1.0 11 32 43 1.1 19 53 728 1.1 13 38 51 1.6 13 13 269 1.6 3 35 48 1.0 14 47 61
10 2.0 6 30 36 1.1 13 21 3411 1.8 2 37 49 1.0 16 47 6312(cont rol) 2.5 14 32 36 1.2 5 44 49
Av. 1.0 49
B13 -
~~~ -~~~~~~ - ~~~- ---~~~~~~~~ - --~~~~~~~~~~~~~~~~~~~~~~~~ - - -~~- - - - - -
____ -
APPENDIX C
METAL DATA ( Fe , Mn , Cd , Cu , Ni , AND Zn )FROM E X P E R I M E NTS
Cl
-~~~~~~ - - - ~~~~~~~~~~ -- - - - -~~~-~~~~~~~~~~~~~~~~~~ -
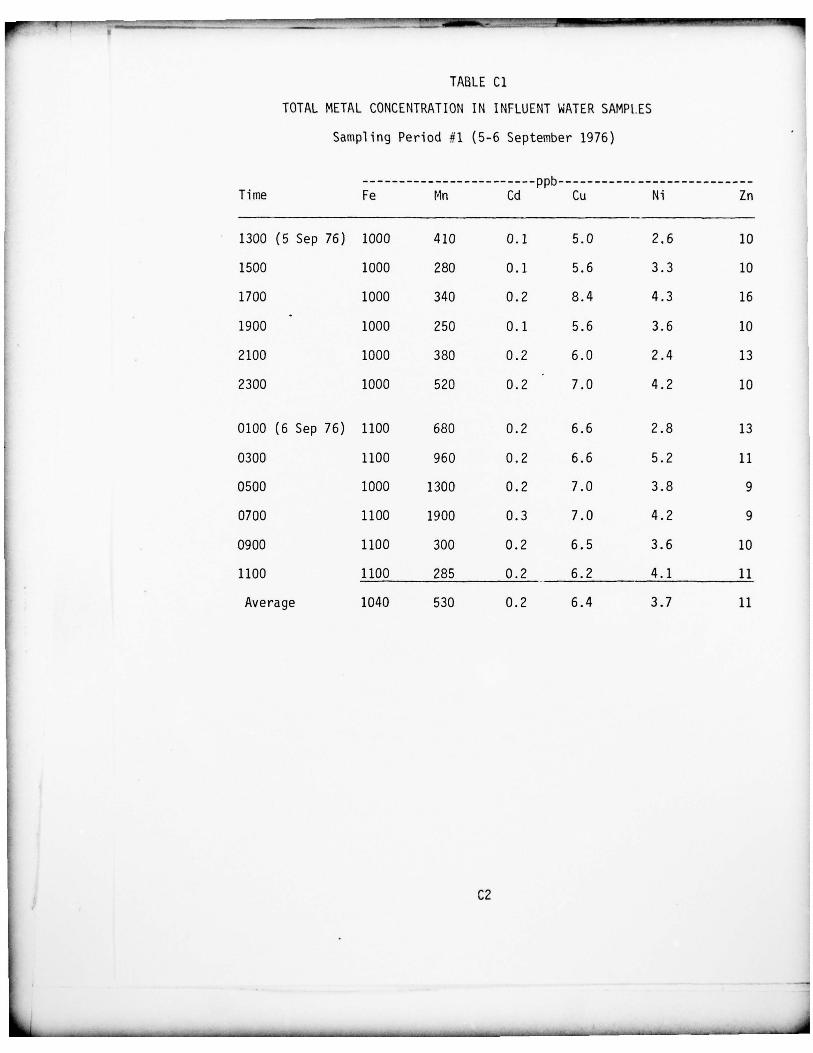
w ~~~~~~~~~~~~~~~~~~~~~~~~~~ _____ ~~~~~~~~~~~~~~~~~~~~~~~ — -- -- -
TABLE Cl
TOTAL METAL CONCENTRATION IN INFL U ENT WATER SAMPL ES
Sampling Period #1 (5-6 September 1976)
ppb Time Fe Mn Cd Cu Ni Zn
1300 (5 Sep 76) 1000 410 0.1 5.0 2.6 10
1500 1000 280 0.1 5.6 3.3 10
1700 1000 340 0.2 8.4 4 .3 16
1900 -
1000 250 0.1 5.6 3.6 10
2100 1000 380 0.2 6.0 2.4 13
2300 1000 520 0.2 -
7.0 4.2 10
0100 (6 Sep 76) 1100 680 0.2 6.6 2.8 13
0300 1100 960 0.2 6 .6 5 .2 11
0500 1000 1300 0.2 7 .0 3.8 9
0700 1100 1900 0.3 7 .0 4 .2 9
0900 1100 300 0.2 6.5 3.6 10
1100 1100 285 0.2 --
6.2 4.1 11
Average 1040 530 0.2 6.4 3.7 11
C2
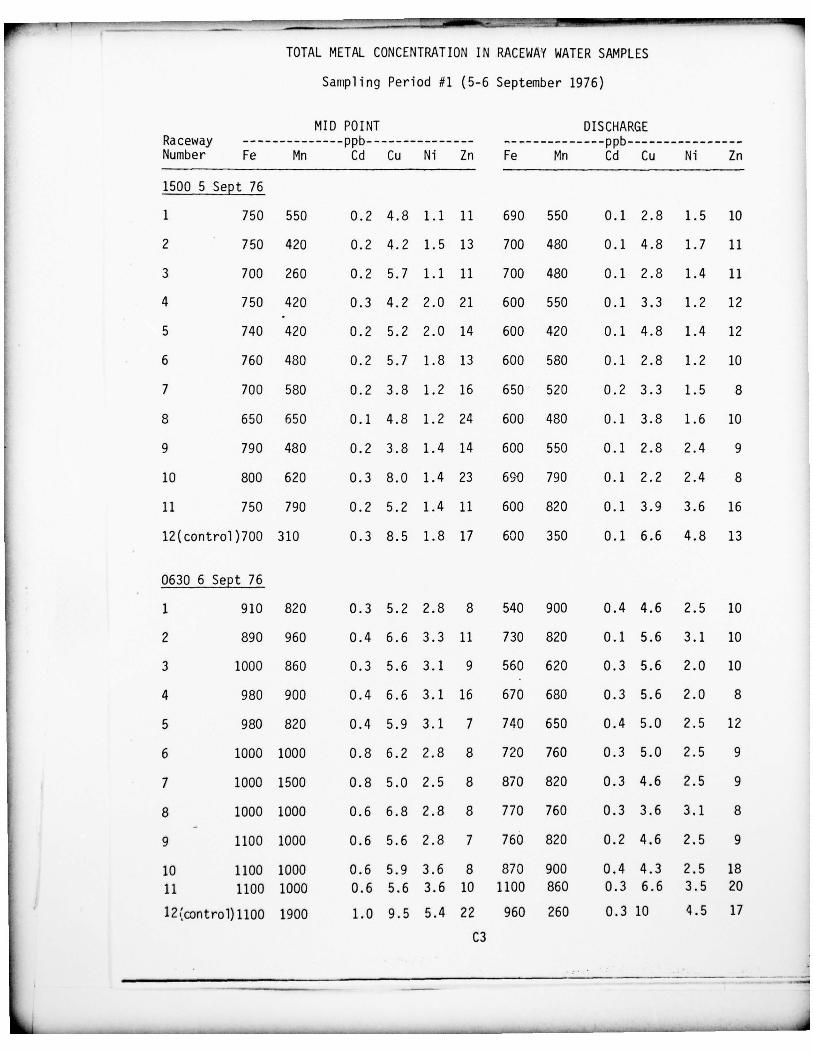
- - - - -~~-~~~~~~ - -— -- -- -- - -
TOTAL METAL CONCENTRATION IN RACEWAY WATER SAMPLES
Samplin g Period #1 (5—6 September 1976)
MID PO INT DIS CH ARGERaceway ppb ppb Num ber Fe Mn Cd Cu Ni Zn Fe Mn Cd Cu Ni Zn
1500 5 Sept 76
1 750 550 0.2 4.8 1.1 11 690 550 0.1 2.8 1.5 10
2 750 420 0.2 4.2 1.5 13 700 480 0.1 4.8 1.7 11
3 700 260 0.2 5.7 1.1 11 700 480 0.1 2.8 1.4 11
4 750 420 0.3 4.2 2.0 21 600 550 0.1 3.3 1.2 12
5 740 420 0.2 5.2 2.0 14 600 420 0.1 4.8 1.4 12
6 760 480 0.2 5.7 1.8 13 600 580 0.1 2.8 1.2 10
7 700 580 0.2 3.8 1.2 16 650 520 0.2 3.3 1.5 8
8 650 650 0.1 4.8 1.2 24 600 480 0.1 3.8 1.6 10
9 790 480 0.2 3.8 1.4 14 600 550 0 .1 2. 8 2 .4 9
10 800 620 0.3 8.0 1.4 23 690 790 0.1 2.2 2.4 8
11 750 790 0 .2 5.2 1.4 11 600 820 0 .1 3.9 3.6 16
12(control)700 310 0.3 8.5 1.8 17 600 350 0.1 6.6 4.8 13
0630 6 Sept 76
3. 910 820 0.3 5.2 2.8 8 540 900 0.4 4.6 2.5 10
2 890 960 0.4 6.6 3.3 11 730 820 0.1 5.6 3.1 10
3 1000 860 0.3 5.6 3.1 9 560 620 0.3 5.6 2.0 10
4 980 900 0 .4 6 .6 3.1 16 670 680 0.3 5.6 2.0 8
5 980 820 0.4 5.9 3.1 7 740 650 0.4 5.0 2.5 12
6 1000 1000 0.8 6.2 2.8 8 720 760 0.3 5.0 2.5 9
7 1000 1500 0.8 5.0 2.5 8 870 820 0.3 4.6 2.5 9
8 1000 1000 0.6 6.8 2.8 8 770 760 0.3 3.6 3.1 8
9 - -
1100 1000 0.6 5.6 2.8 7 760 820 0.2 4.6 2.5 9
10 1100 1000 0.6 5.9 3.6 8 870 900 0.4 4.3 2.5 1811 1100 1000 0.6 5.6 3.6 10 1100 860 0.3 6.6 3.5 20
L
l2(control)1100 1900 1.0 9.5 5.4 22 960 260 0.3 10 4.5 17
C3
—- - -— ~~~~~~~~~~~~~~~~~~~~~~~ -—--~~~~~
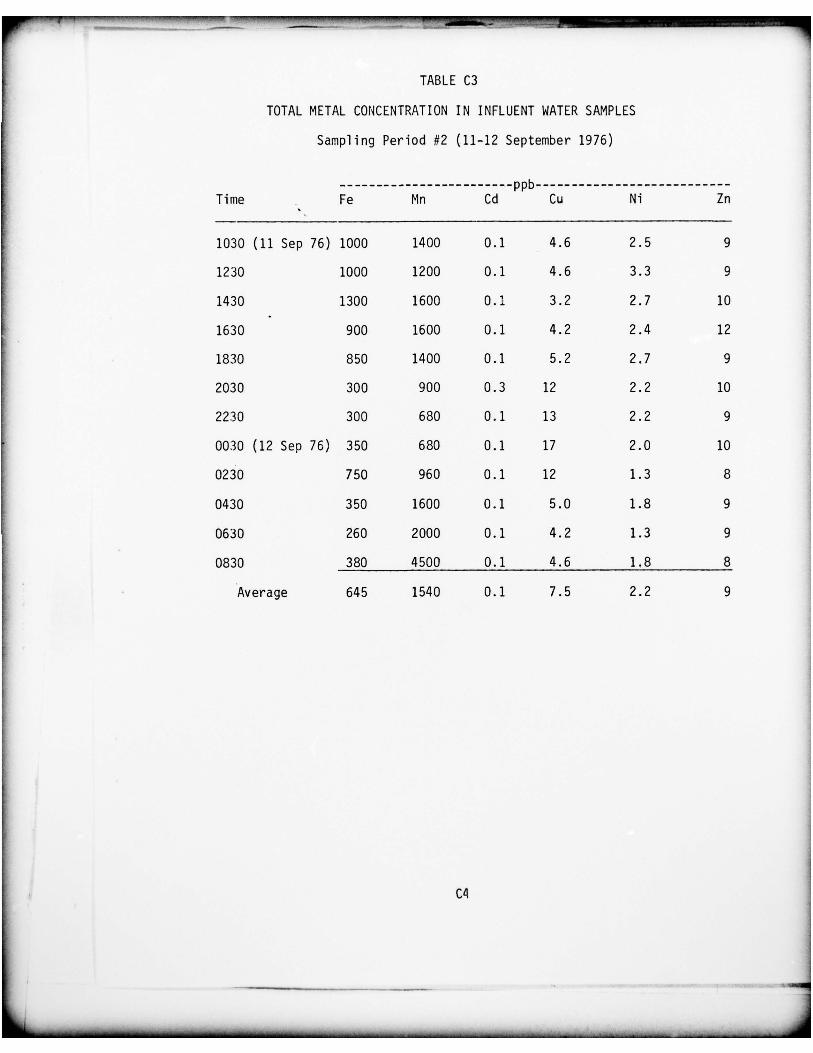
- — - -
~~~~~~~ - —-- - - - - --- ----—-_- - —_ _
~~~~~~~~~~—
~~~~~—_-
-- ~~~~~~~~~~~~~~~~~ ~~~~~~~~~~~~~~~~~~~~~~~~~
TABLE C3
TOTAL METAL CONCENTRATION IN INFLUENT WATER SAMPLES
Sampling Period #2 (11-12 September 1976)
ppb Time
- Fe Mn Cd Cu Ni Zn
1030 (11 Sep 76) 1000 1400 0.1 4.6 2.5 9
1230 1000 1200 0.1 4.6 3.3 9
1430 1300 1600 0.1 3.2 2.7 10
1630 -
900 1600 0.1 4.2 2.4 12
1830 850 1400 0.1 5.2 2.7 9
2030 300 900 0.3 12 2.2 10
2230 300 680 0.1 13 2.2 9
0030 (12 Sep 76) 350 680 0.1 17 2.0 10
0230 750 960 0.1 12 1.3 8
0430 350 1600 0.1 5.0 1.8 9
0630 260 2000 0.1 4.2 1.3 9
0830 380 4500 0. 1 4 .6 1.8 8
Average 645 1540 0.1 7.5 2.2 9
C4
_— - -
~
--
~
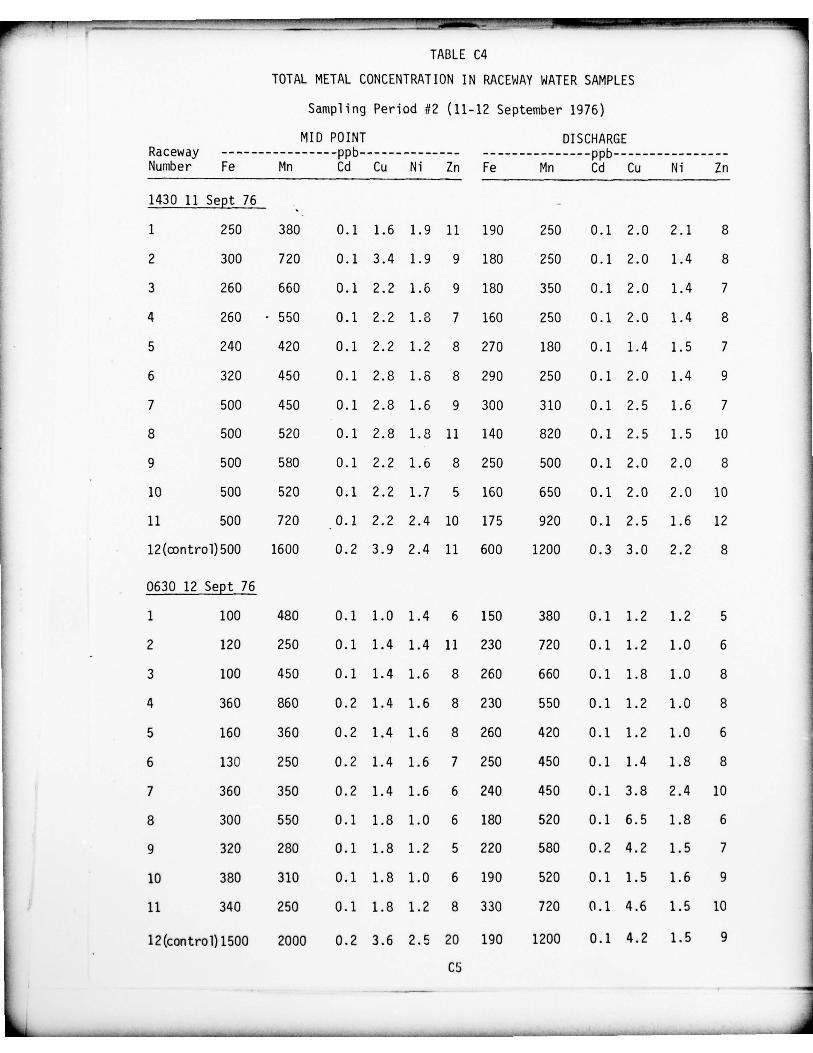
~~~~ - --‘- -----‘-‘------- -- -- ---------- ‘~~~~~~~~~~~~~~~ L ~~~~~~~~~~~~~~~~~~~~~~~ ~~~~~~ -_ -
- - - -
TABLE C4TOTAL METAL CONCENTRATION IN RACEWAY WATER SAMPLES
Sampling Period #2 (11-12 September 1976)
MID POINT DISCHA RGERaceway ppb ppb Number Fe Mn Cd Cu Ni Zn Fe Mn Cd Cu Ni Zn
1430 11 Sept 76 -~
1 250 380 0.1 1.6 1.9 11 190 250 0.1 2.0 2.1 8
2 300 720 0.1 3.4 1.9 9 180 250 0.1 2.0 1.4 8
3 260 660 0.1 2.2 1.6 9 180 350 0.1 2.0 1.4 7
4 260 - 550 0.1 2.2 1.8 7 160 250 0 .1 2.0 1.4 8
5 240 420 0.1 2.2 1.2 8 270 180 0.1 1.4 1.5 7
6 320 450 0.1 2.8 1.8 8 290 250 0.1 2.0 1.4 9
7 500 450 0.1 2.8 1.6 9 300 310 0.1 2.5 1.6 7
8 500 520 0.1 2.8 1.8 11 140 820 0.1 2.5 1.5 10
9 500 580 0.1 2 .2 1.6 8 250 500 0. 1 2.0 2 .0 8
10 500 520 0.1 2.2 1.7 5 160 650 0.1 2.0 2.0 10
11 500 720 0.1 2.2 2.4 10 175 920 0. 1 2 .5 1.6 12
12(control)500 1600 0.2 3.9 2.4 11 600 1200 0.3 3.0 2.2 8
0630 12 Sept 76
1 100 480 0.1 1.0 1.4 6 150 380 0.1 1.2 1.2 5
2 120 250 0.1 1 .4 1.4 11 230 720 0.1 1.2 1.0 6
3 100 450 0.1 1.4 1.6 8 260 660 0.1 1.8 1.0 8
4 360 860 0.2 1.4 1.6 8 230 550 0.1 1.2 1.0 8
5 160 360 0.2 1.4 1 .6 8 260 420 0 .1 1.2 1.0 6
6 130 250 0.2 1.4 1.6 7 250 450 0 .1 1.4 1.8 8
7 360 350 0.2 1.4 1.6 6 240 450 0 .1 3.8 2.4 10
8 300 550 0.1 1.8 1.0 6 180 520 0.1 6.5 1.8 6
9 320 280 0.1 1.8 1.2 5 220 580 0.2 4.2 1.5 7
10 380 310 0.1 1.8 1.0 6 190 520 0.1 1.5 1.6 9
11 340 250 0.1 1.8 1.2 8 330 720 0.1 4.6 1.5 10
l2(control)1500 2000 0.2 3.6 2.5 20 190 1200 0.1 4.2 1.5 9
Cs
~
_--- - - - - - - _ ~~ ---- ----— -~~- _ - - - - - _ - —------~~~ __—--_ - _- ~~~~~~~~~~~~~~~~~~~~~~~~~~~~~~~~~~~~~~~~~~~~~~~~~~~~~~~~~~~~~~~
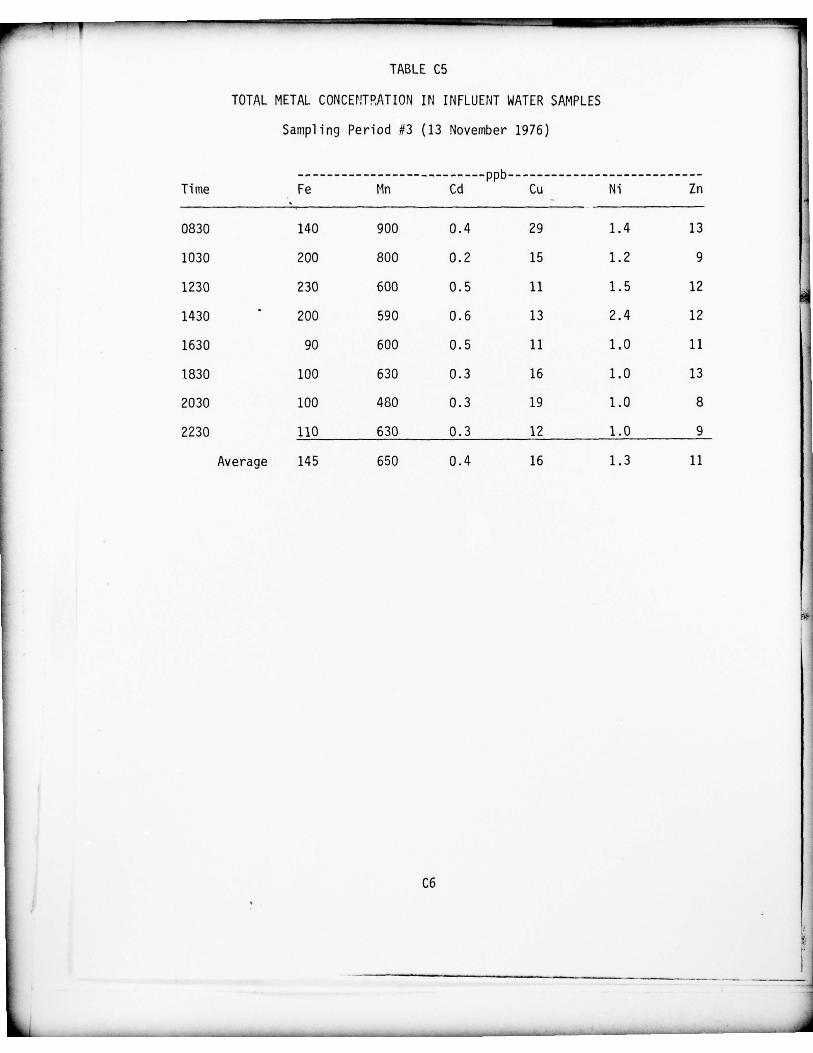
TABLE C5
TOTAL METAL CONCENTRATION IN INFLUENT WATER SAMPLES
Sampling Period #3 (13 November 1976)
ppb Time Fe Mn Cd Cu Ni Zn
0830 140 900 0.4 29 1.4 13
1030 200 800 0.2 15 1.2 9
1230 230 600 0.5 11 1.5 12
1430 200 590 0 .6 13 2 .4 12
1630 90 600 0.5 11 1.0 11
1830 lOU 630 0.3 16 1.0 13
2030 100 480 0.3 19 1,0 8
2230 110 630 0.3 12 1.0 9
Average 145 650 0.4 16 1.3 11
C6
_ _ “~~- -— - -- ~~~~~~~~~~~- ‘_-—---
~~—_
~~~
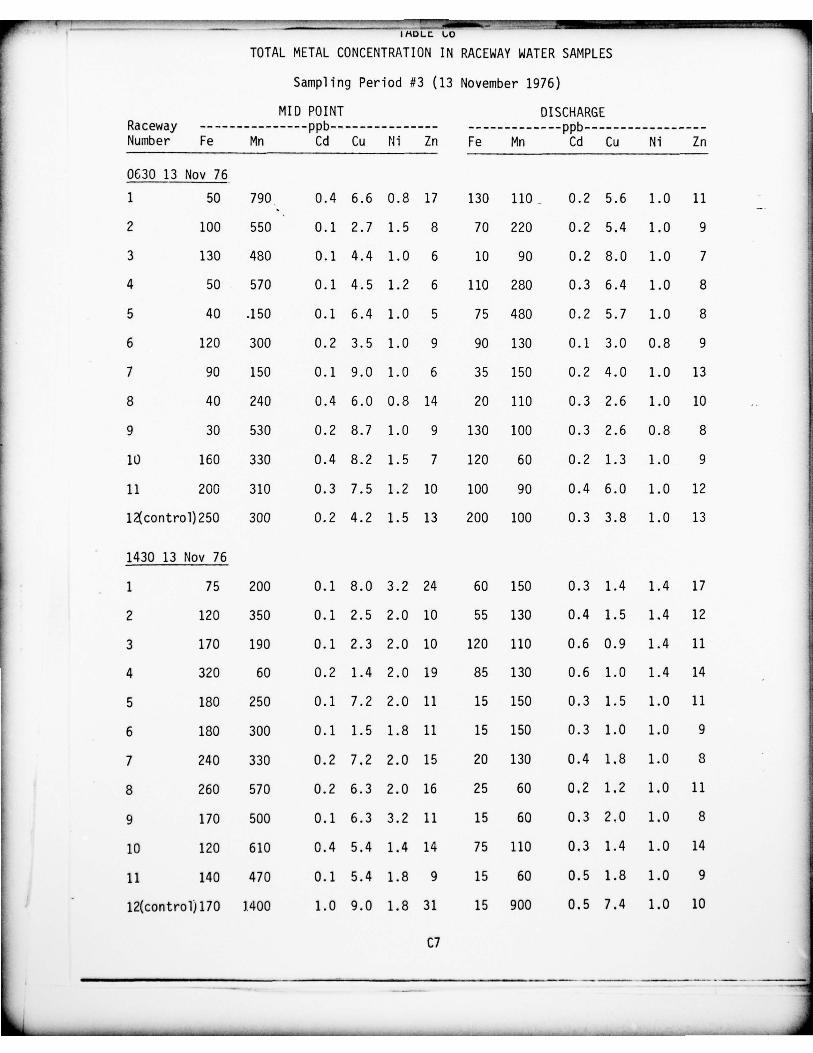
- -
~~
- ---~~~
— __- __~~Th- -
~~~~ ~~~~—
~~~~~ -- ---_ -P. I t~DLC L.O
TOTAL METAL CONCENTRATION IN RACEWAY WATER SAMPLES
Sampling Period #3 (13 November 1976)
MID POINT DISCHARGERaceway ppb ppb Number Fe Mn Cd Cu Iii Zn Fe Mn Cd Cu Ni Zn
0630 13 Nov 761 50 790 , 0 .4 6.6 0.8 17 130 11O 0.2 5.6 1.0 11
2 100 550 -
0.1 2.7 1.5 8 70 220 0.2 5.4 1.0 9
3 130 480 0.1 4 .4 1.0 6 10 90 0.2 8.0 1.0 7
4 50 570 0.1 4 .5 1.2 6 110 280 0.3 6.4 1.0 8
5 40 .150 0.1 6.4 1.0 5 75 480 0.2 5.7 1.0 8
6 120 300 0.2 3.5 1.0 9 90 130 0.1 3.0 0.8 9
7 90 150 0.1 9.0 1.0 6 35 150 0.2 4.0 1.0 13
8 40 240 0.4 6.0 0.8 14 20 110 0.3 2.6 1.0 10
9 30 530 0.2 8.7 1.0 9 130 100 0.3 2.6 0.8 8
10 160 330 0.4 8.2 1.5 7 120 60 0.2 1.3 1.0 9
11 200 310 0.3 7.5 1.2 10 100 90 0.4 6.0 1.0 12
l~ control)25O 300 0.2 4.2 1.5 13 200 100 0.3 3.8 1.0 13
1430 13 Nov 76
1 75 200 0.1 8.0 3.2 24 60 150 0.3 1.4 1.4 17
2 120 350 0.1 2 .5 2 .0 10 55 130 0.4 1.5 1.4 12
3 170 190 0.1 2.3 2.0 10 120 110 0.6 0.9 1.4 11
4 320 60 0.2 1.4 2.0 19 85 130 0.6 1.0 1.4 14
5 180 250 0.1 7 .2 2 .0 11 15 150 0.3 1.5 1.0 11
6 180 300 0.1 1.5 1.8 11 15 150 0 .3 1.0 1.0 9
7 240 330 0.2 7.2 2.0 15 20 130 0.4 1,8 1.0 8
8 260 570 0.2 6.3 2.0 16 25 60 0,2 1,2 1.0 11
9 170 500 0.1 6.3 3.2 11 15 60 0.3 2.0 1.0 8
10 120 610 0.4 5.4 1.4 14 75 110 0.3 1.4 1.0 14
11 140 470 0.1 5.4 1.8 9 15 60 0.5 1.8 1.0 9
12(control)170 1400 1.0 9.0 1.8 31 15 900 0.5 7.4 1.0 10
Cl
- - - -~~~~~~~
- - - - -- - - --- - - - - - - - - _ - - - - - - - - - -- -~~~~~ -~~~~~~~ ~~~~---~~~
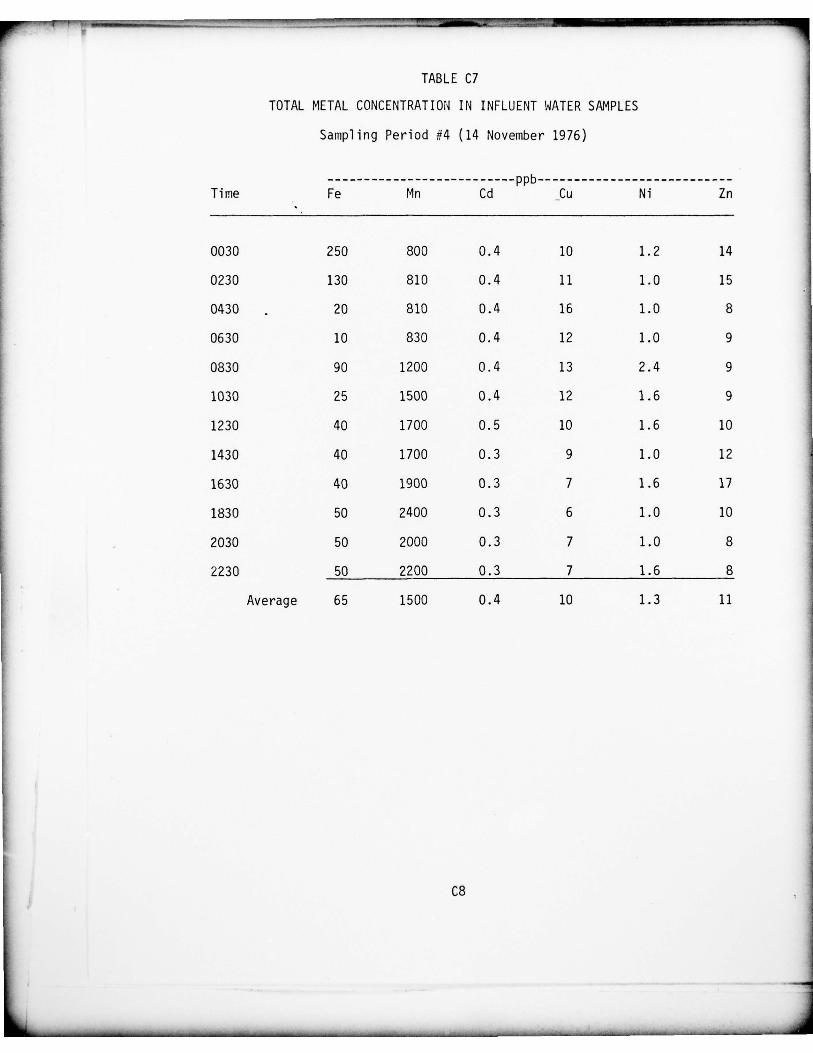
_ _ _ _ _ - ~~~~~~~~~~~~ ~- ---- ~~-- —- -- ~~~~~~~~~~~~~~~~~~~~~~~~~~~~~~~~~~~~~ - - ~~-- - ~~~~~~~~~~~~~ --.
TABLE C7
TOTAL METAL CONCENTRATION IN INFLUENT WATER SAMPLES
Sam pling Period #4 (14 November 1976)
ppb Time Fe Mn Cd Cu Ni Zn
0030 250 800 0.4 10 1.2 14
0230 130 810 0.4 11 1.0 15
0430 . 20 810 0.4 16 1.0 8
0630 10 830 0.4 12 1.0 9
0830 90 1200 0.4 13 2.4 9
1030 25 1500 0.4 12 1.6 9
1230 40 1700 0.5 10 1.6 10
1430 40 1700 0.3 9 1.0 12
1630 40 1900 0 .3 7 1.6 17
1830 50 2400 0. 3 6 1.0 10
2030 50 2000 0.3 7 1.0 8
2230 50 2200 0.3 7 1.6 8
Average 65 1500 0.4 10 1.3 11
C8
_ _ _ _ _ _ _ _ _ _ _ _ _ _ _ - -_~~~- - -~~~~ -~~~~~~~~~~~~~~~~ --‘-- ~~~~~~~ ---- - - -
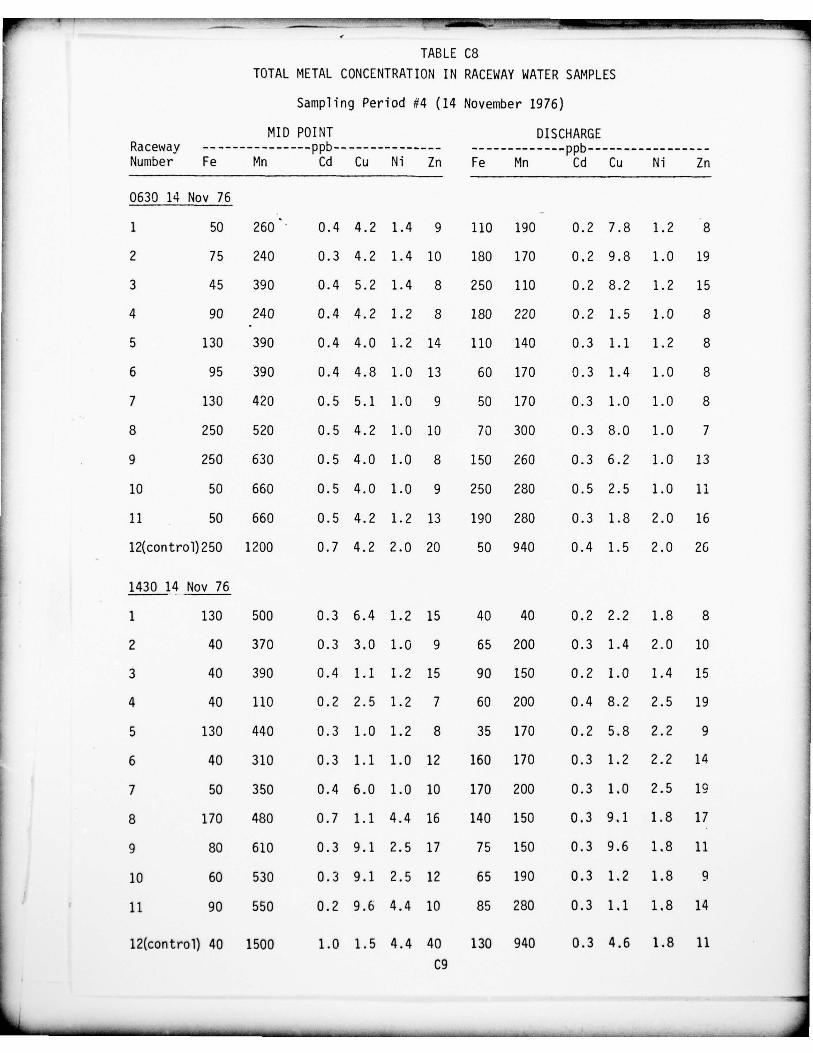
- -- ~~~~ —----‘- ----- ------ -- - -- —---- - -- —~ _~~_ ,~~~~ ~~~~~~ —---.--- ~~~~~~~~~~~~~~ _ —~ -~~-_ —~~---~--~~~-~~~~~~~~~~~~~~~~~~~~~~ ,
TABLE C8TOTAL METAL CONCENTRATION IN RA CEWAY WATER SAMPLES
Sampling Period #4 (14 November 1976)
MID POINT DISCHARGERaceway pp b ppb Number Fe Mn Cd Cu Ni Zn Fe Mn Cd Cu N i Zn
0630 14 Nov 76
1 50 260 ’- 0.4 4.2 1.4 9 110 190 0.2 7.8 1.2 8
2 75 240 0.3 4.2 1.4 10 180 170 0.2 9.8 1.0 19
3 45 390 0.4 5.2 1.4 8 250 110 0.2 8.2 1.2 15
4 90 240 0.4 4.2 1.2 8 180 220 0.2 1.5 1.0 8
5 130 390 0.4 4.0 1.2 14 110 140 0.3 1.1 1,2 8
6 95 390 0.4 4.8 1.0 13 60 170 0.3 1.4 1.0 8
7 130 420 0.5 5.1 1.0 9 50 170 0.3 1.0 1.0 8
8 250 520 0.5 4.2 1.0 10 70 300 0.3 8.0 1.0 7
9 250 630 0.5 4.0 1.0 8 150 260 0.3 6.2 1.0 13
10 50 660 0.5 4.0 1.0 9 250 280 0 .5 2 .5 1.0 11
11 50 660 0.5 4.2 1.2 13 190 280 0.3 1.8 2.0 16
12(control)25O 1200 0.7 4.2 2.0 20 50 940 0.4 1.5 2.0 26
1430 14 Nov 76
1 130 500 0.3 6.4 1.2 15 40 40 0.2 2.2 1.8 8
2 40 370 0.3 3.0 1.0 9 65 200 0.3 1.4 2.0 10
3 40 390 0.4 1.1 1.2 15 90 150 0 .2 1.0 1.4 15
4 40 110 0.2 2.5 1.2 7 60 200 0.4 8.2 2.5 19
5 130 440 0.3 1.0 1.2 8 35 170 0.2 5.8 2.2 9
6 40 310 0 .3 1.1 1.0 12 160 170 0.3 1.2 2 .2 14
7 50 350 0.4 6.0 1.0 10 170 200 0.3 1,0 2.5 19
8 170 480 0.7 1.1 4.4 16 140 150 0.3 9,1 1.8 17
9 80 610 0.3 9.1 2.5 17 75 150 0.3 9.6 1.8 11
10 60 530 0.3 9.1 2.5 12 65 190 0.3 1,2 1.8 9
11 90 550 0.2 9.6 4.4 10 85 280 0.3 1,1 1.8 14
12(control) 40 1500 1.0 1.5 4.4 40 130 940 0.3 4.6 1.8 11C9
- -~~~~~~~~~~~~~~~~ ~~~~~~-—~~~~~~~~~~~~~~~~~~~~~~~ - ‘
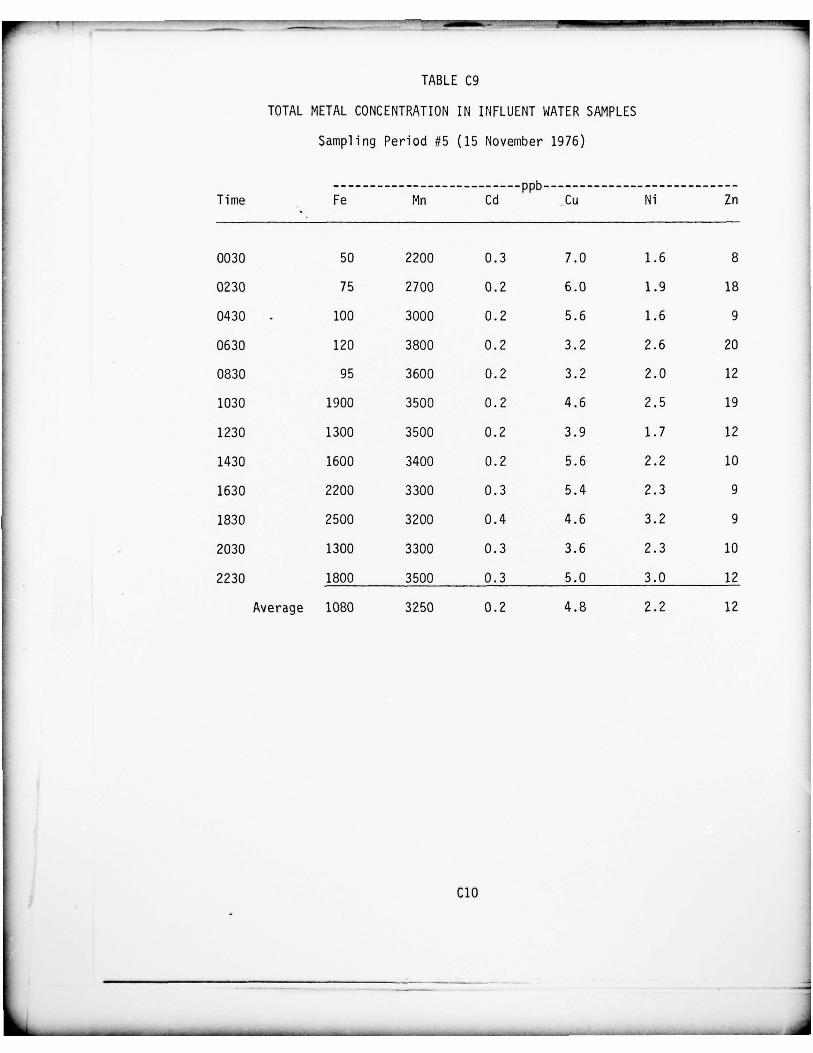
— ~~~~~~~~~~~~~~~~~~~~~~~~~~~~~~~~~~~~~~~~~~~~~~~~~~~~~~ ~~~~~~~~~~~~~~~~~‘ -
~‘~~~- — - - -
TABLE C9
TOTAL METAL CONCENTRAT ION IN INFLUENT WATER SAMPLES
Samp l ing Period #5 (15 November 1976)
ppb Time Fe Mn Cd ~Cu Ni Zn
0030 50 2200 0.3 7,0 1.6 8
0230 75 2700 0.2 6.0 1.9 18
0430 . 100 3000 0.2 5 .6 1.6 9
0630 120 3800 0.2 3.2 2.6 20
0830 95 3600 0.2 3.2 2.0 12
1030 1900 3500 0.2 4.6 2.5 19
1230 1300 3500 0.2 3 .9 1.7 12
1430 1600 3400 0.2 5.6 2.2 10
1630 2200 3300 0.3 5.4 2.3 9
1830 2500 3200 0 .4 4.6 3.2 9
2030 1300 3300 0.3 3.6 2 .3 10
2230 1800 3500 0 .3 5.0 3.0 12
Average 1080 3250 0.2 4.8 2.2 12
ClO
____—- - - -
- — - - -__- ---~~~~ - - -~~~~~~~~~~~~~~~ _ - _ - -~~~~~~--— -~~~~~~~~~~~
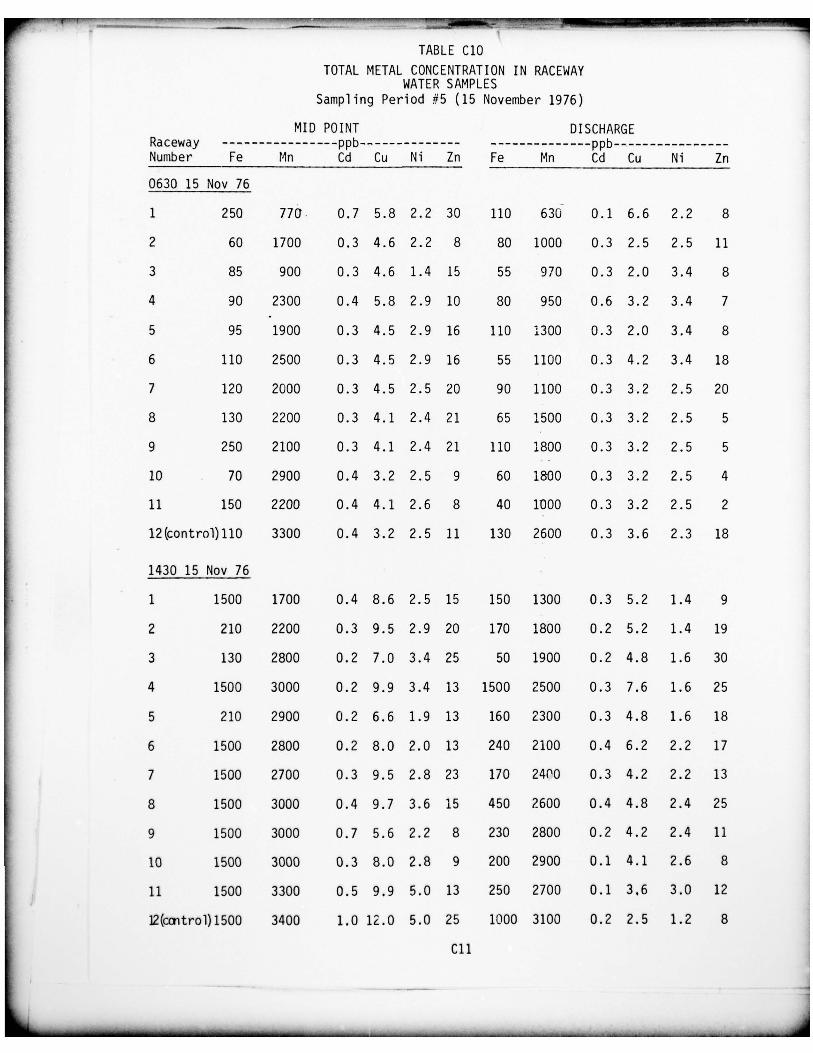
-- -“-“
~- --
~~~~~~~~~~~~~~~~~~~~~~~~~~~~~~~~~~~~~~~~~~~~~~~~~ -
TABLE C1OTOTAL METAL CONCENTRATION IN RACEWAY
WATER SAMPLESSampling Period #5 (15 November 1976)
MID POINT DI SCHARGERaceway ppb ppb Number Fe Mn Cd Cu Ni Zn Fe Mn Cd Cu Ni Zn
0630 15 Nov 76
1 250 770- 0.7 5.8 2.2 30 110 630 0.1 6.6 2.2 8
2 60 1700 0.3 4.6 2.2 8 80 1000 0.3 2.5 2.5 11
3 85 900 0.3 4.6 1.4 15 55 970 0.3 2.0 3.4 8
4 90 2300 0.4 5.8 2.9 10 80 950 0.6 3.2 3.4 7
5 95 1900 0.3 45 2.9 16 110 1300 0.3 2.0 3.4 8
6 110 2500 0.3 4.5 2.9 16 55 1100 0.3 4.2 3.4 18
7 120 2000 0.3 4.5 2.5 20 90 1100 0.3 3.2 2.5 20
8 130 2200 0.3 4.1 2.4 21 65 1500 0.3 3.2 2.5 5
9 250 2100 0.3 4.1 2.4 21 110 1800 0.3 3.2 2.5 5
10 70 2900 0.4 3.2 2 .5 9 60 1800 0 .3 3.2 2 .5 4
11 150 2200 0 .4 4.1 2 .6 8 40 1000 0 .3 3.2 2 .5 2
12(control)11O 3300 0.4 3.2 2.5 11 130 2600 0.3 3.6 2.3 18
1430 15 Nov 76
1 1500 1700 0.4 8.6 2 .5 15 150 1300 0 .3 5.2 1.4 9
2 210 2200 0 .3 9.5 2 .9 20 170 1800 0 .2 5.2 1.4 19
3 130 2800 0.2 7 .0 3.4 25 50 1900 0 .2 4 .8 1.6 30
4 1500 3000 0.2 9.9 3.4 13 1500 2500 0.3 7.6 1.6 25
5 210 2900 0.2 6.6 1.9 13 160 2300 0 .3 4.8 1 .6 18
6 1500 2800 0. 2 8.0 2 .0 13 240 2100 0 .4 6 .2 2.2 17
7 1500 2700 0.3 9.5 2.8 23 170 241’O 0.3 4.2 2.2 13
8 1500 3000 0.4 9.7 3.6 15 450 2600 0.4 4.8 2.4 25
9 1500 3000 0.7 5.6 2.2 8 230 2800 0 .2 4 .2 2.4 11
10 1500 3000 0.3 8.0 2 .8 9 200 2900 0.1 4.1 2.6 8
11 1500 3300 0.5 9,9 5.0 13 250 2700 0.1 3.6 3.0 12
]2(cmtrol)1500 3400 1,0 12.0 5.0 25 1000 3100 0.2 2.5 1.2 8
Cli
- - -— --
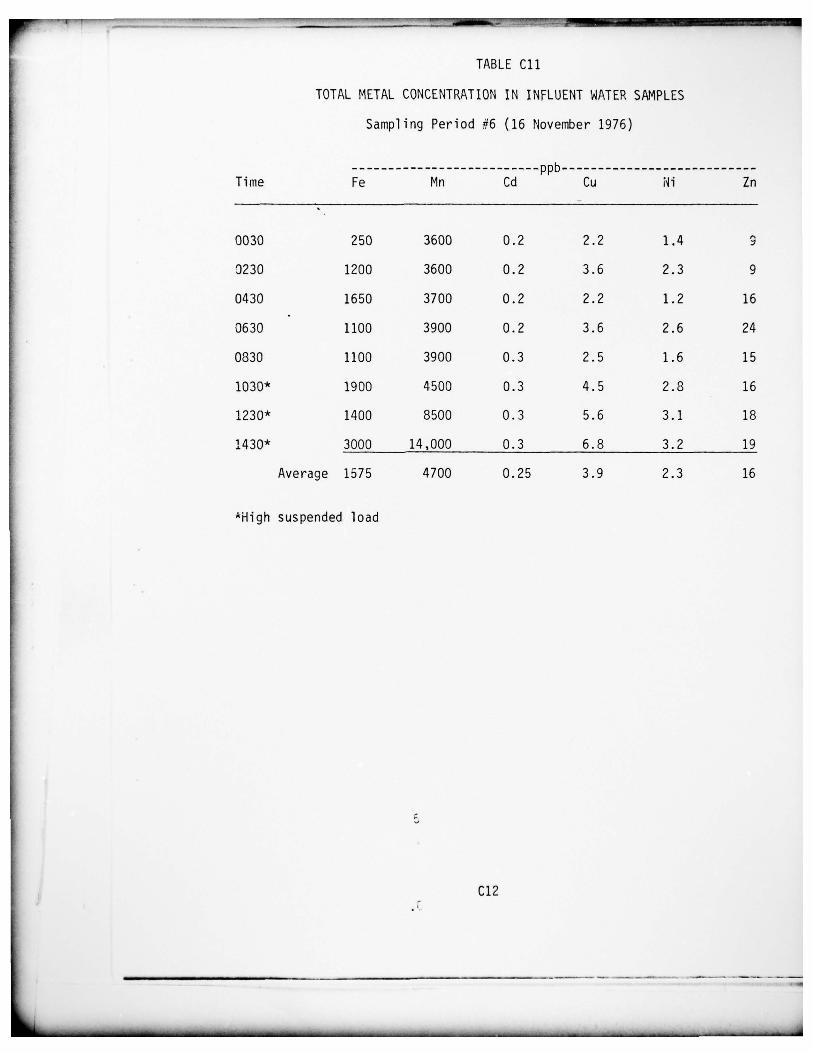
— ~~~ —~ --- - — -fl ---’- ______ ~~~~~~~~~~ —- ,-.-
—--~~~~--~~~~~~~~~~~~~~~~~~~~~~~~
‘-~~~~
- - - - -
TABLE Cil
TOTAL METAL CONCENTRATION IN INFLUENT WATER SAMPLES
Sampl i ng Period #6 (16 November 1976)
ppb Time Fe Mn Cd Cu Ni Zn
0030 250 3600 0.2 2 .2 1.4 9
0230 1200 3600 0.2 3.6 2.3 9
0430 1650 3700 0.2 2.2 1.2 16
0630 -
1100 3900 0.2 3.6 2.6 24
0830 1100 3900 0.3 2.5 1.6 15
1030* 1900 4500 0.3 4.5 2.8 16
1230* 1400 8500 0.3 5.6 3.1 18
1430* 3000 14,000 0.3 6.8 3.2 19
Average 1575 4700 0.25 3.9 2.3 16
~High suspended load
C12
~—
~~—-
~~~-- -,- -
GUS WINDOM (HERBERT U SAVANNA H GA
-
F/B 13/3 IIIJABILITY OF SALT MARSHES TO REMOVE NUTRIENTS AND HEAVY METALS FR—.ETC(U)DEC 77 H L WINDOM DACW 2I—76—C—O1 3’e
UNCLASSIFIED WES —TR—D— 77— 37 NL
.END
b A T F
3- -79~oc
a
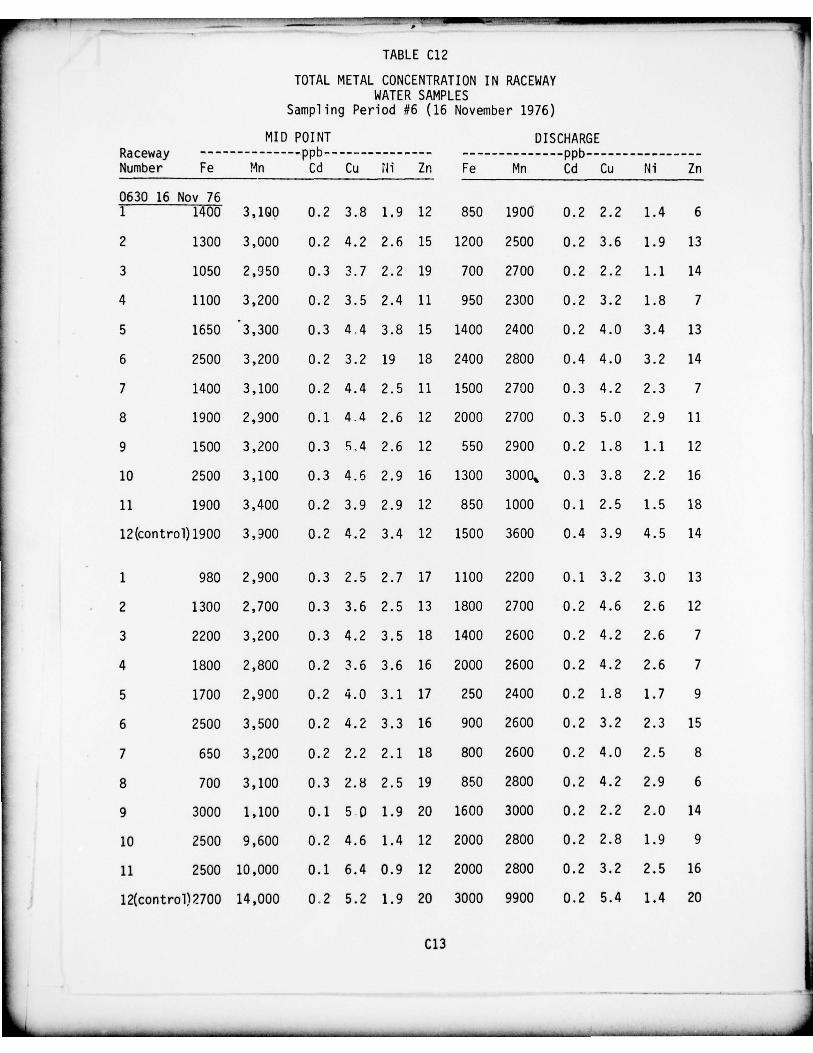
TABLE C12
TOTAL METAL CONCENTRATION IN RACEWAYWATER SAMPLES
Sampling Period #6 (16 November 1976)
MID POINT DISCHARGERaceway ppb ppb Number Fe Mn Cd Cu ~ii Zn Fe Mn Cd Cu Ni Zn
0630 16 Nov 76F 1400 3,100 0.2 3.8 1.9 12 850 19O~ 0.2 2.2 1.4 6
2 1300 3,000 0.2 4.2 2.6 15 1200 2500 0.2 3.6 1.9 13
3 1050 2,950 0.3 3.7 2.2 19 700 2700 0.2 2.2 1.1 14
4 1100 3,200 0.2 3.5 2.4 11 950 2300 0.2 3.2 1.8 7
5 1650 3,300 0.3 4~4 3.8 15 1400 2400 0.2 4.0 3.4 13
6 2500 3 ,200 0.2 3.2 19 18 2400 2800 0.4 4.0 3.2 14
7 1400 3,100 0.2 4.4 2.5 11 1500 2700 0.3 4.2 2.3 7
8 1900 2,900 0.1 4.4 2.6 12 2000 2700 0.3 5.0 2.9 11
9 1500 3,200 0.3 5.4 2.6 12 550 2900 0.2 1.8 1.1 12
10 2500 3 ,100 0.3 4.6 2.9 16 1300 3OO0~ 0.3 3.8 2.2 16
11 1900 3,400 0.2 3.9 2.9 12 850 1000 0.1 2.5 1.5 18
12(control)1900 3,900 0.2 4.2 3.4 12 1500 3600 0.4 3.9 4.5 14
1 980 2 ,900 0.3 2.5 2.7 17 1100 2200 0.1 3.2 3.0 13
2 1300 2 ,700 0.3 3.6 2.5 13 1800 2700 0.2 4.6 2.6 12
3 2200 3,200 0.3 4.2 3.5 18 1400 2600 0.2 4.2 2.6 7
4 1800 2 ,800 0.2 3.6 3.6 16 2000 2600 0.2 4.2 2.6 7
5 1700 2,900 0.2 4.0 3.1 17 250 2400 0.2 1.8 1.7 9
6 2500 3,500 0.2 4.2 3.3 16 900 2600 0.2 3.2 2.3 15
7 650 3,200 0.2 2.2 2.1 18 800 2600 0.2 4.0 2.5 8
8 700 3 ,100 0.3 2.8 2.5 19 850 2800 0.2 4.2 2.9 6
9 3000 1,100 0.1 5 0 1.9 20 1600 3000 0.2 2.2 2.0 14
10 2500 9,600 0.2 4.6 1.4 12 2000 2800 0.2 2.8 1.9 9
11 2500 10,000 0.1 6.4 0.9 12 2000 2800 0.2 3.2 2.5 16
12(control)2700 14,000 0.2 5.2 1.9 20 3000 9900 0.2 5.4 1.4 20
C13
--~~~~~. -~~~~~~~~ -~~~~~~~~~~ -~~~~~~~~~~~~~~_
______________________________________________ - --
~T~TiTI~ —
APPENDIX D
CHEMISTRY (N, P, Fe, Mn , Cd , Cu , Ni AND Zn)OF SEDIMENTS AND ~partina alterniflora ROOTSAND LEAVES FROM EXPERIMENTAL RACEWAYS BEFOREAND AFTER EXPERIMENTS
Iii
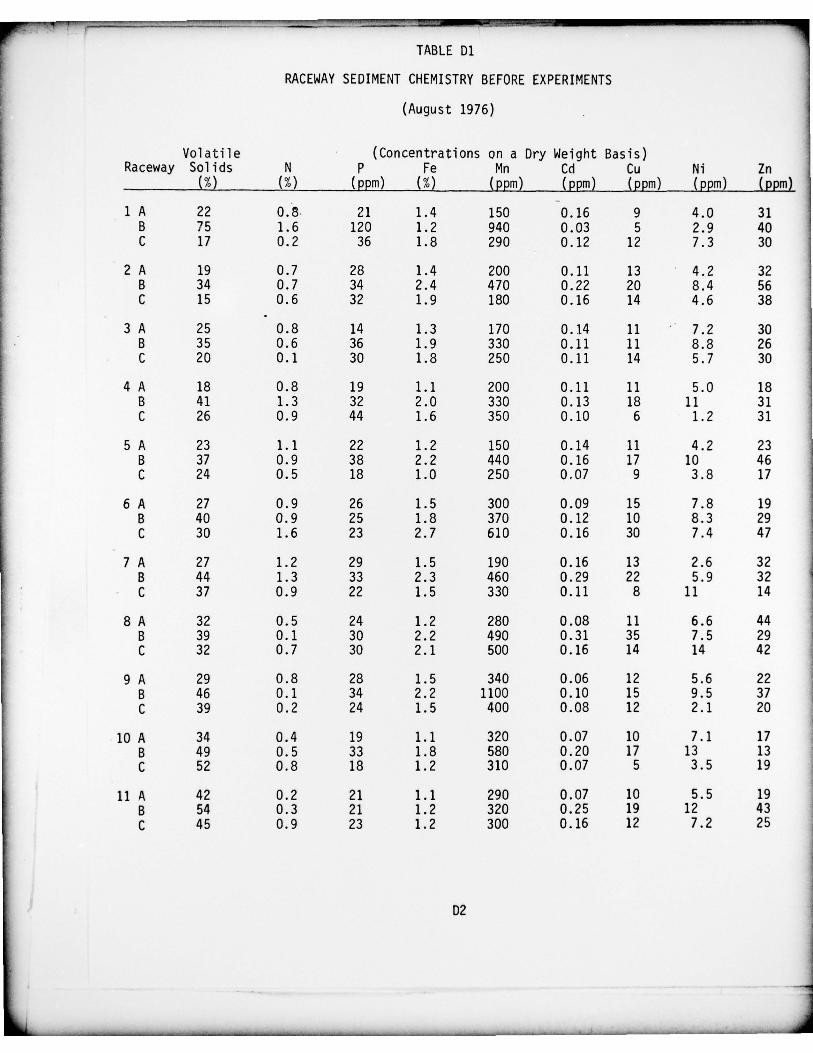
TABLE Dl
RACEWAY SEDIMENT CHEMISTRY BEFORE EXPERIMENTS
(August 1976)
Volatile (Concentrations on a Dry Weight Bas is)Raceway Solids N P Fe Mn Cd Cu Ni Zn
(%) (%) (ppm) (%) (ppm) (ppm) (ppm) (ppm) (ppm)
1 A 22 0.8. 21 1.4 150 0.16 9 4.0 31B 75 1.6 120 1.2 940 0.03 5 2.9 40C 17 0.2 36 1.8 290 0.12 12 7.3 30
2 A 19 0.7 28 1.4 200 0.11 13 4.2 32B 34 0.7 34 2.4 470 0.22 20 8.4 56C 15 0.6 32 1.9 180 0.16 14 4.6 38
3 A 25 0.8 14 1.3 170 0.14 11 7.2 30B 35 0.6 36 1.9 330 0.11 11 8.8 26C 20 0.1 30 1.8 250 0.11 14 5.7 30
4 A 18 0.8 19 1.1 200 0.11 11 5.0 18B 41 1.3 32 2.0 330 0.13 18 11 31C 26 0.9 44 1.6 350 0.10 6 1.2 31
5 A 23 1.1 22 1.2 150 0.14 11 4.2 23B 37 0.9 38 2.2 440 0.16 17 10 46C 24 0.5 18 1.0 250 0.07 9 3.8 17
6 A 27 0.9 26 1.5 300 0.09 15 7.8 19B 40 0.9 25 1.8 370 0.12 10 8.3 29C 30 1.6 23 2.7 610 0.16 30 7.4 47
7 A 27 1.2 29 1.5 190 0.16 13 2.6 32B 44 1.3 33 2.3 460 0.29 22 5.9 32C 37 0.9 22 1.5 330 0.11 8 11 14
8 A 32 0.5 24 1.2 280 0.08 11 6.6 44B 39 0.1 30 2.2 490 0.31 35 7.5 29C 32 0.7 30 2.1 500 0.16 14 14 42
9 A 29 0.8 28 1.5 340 0.06 12 5.6 22B 46 0.1 34 2.2 1100 0.10 15 9.5 37C 39 0.2 24 1.5 400 0.08 12 2.1 20
10 A 34 0.4 19 1.1 320 0.07 10 7.1 17B 49 0.5 33 1.8 580 0.20 17 13 13C 52 0.8 18 1.2 310 0.07 5 3.5 19
11 A 42 0.2 21 1.1 290 0.07 10 5.5 19B 54 0.3 21 1.2 320 0.25 19 12 43C 45 0.9 23 1.2 300 0.16 12 7.2 25
02
L ~~~~~~~~~~~~~~~~~~~~~~~~~~~~~~~~~~~~~~~~~~~~~~~~~~~~~~~~~~~~~~ ~~~~~~~~~~~~~~~~~~~~ ~~~~~~~~~~~~~~~~~~~~~~~~~~~~~~~~~~~~~~~~~~~~~~~~~~~~~~~~~~~~~~~~~~~~~~~~~~~~~ ~~~~~~~~~~~~~~~~~~~~~~~~~
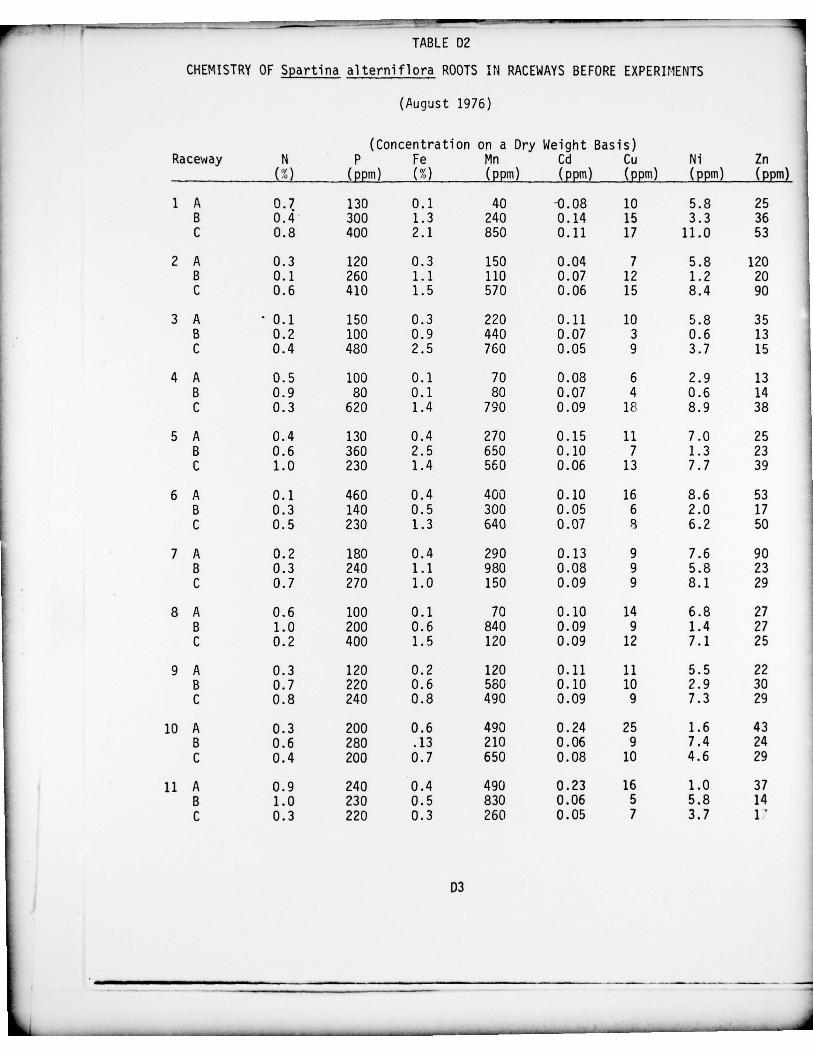
_____• _
~~. .. .
~~~~~~~~~~~~~~~~~~~~~~~~~~
CHEMISTRY OF Spartina alterniflora ROOTS IN RACEWAYS BEFORE EXPERIMENTS
(August 1976)
(Concentration on a Dry Weight Basis)Raceway N P Fe Mn Cd Cu Ni Zn
(%) (ppm) (%) (ppm) (ppm) (ppm) (ppm) (ppm)
1 A 0.7 130 0.1 40 -0.08 10 5.8 25B 0.4 300 1.3 240 0.14 15 3.3 36C 0.8 400 2.1 850 0.11 17 11.0 53
2 A 0.3 120 0.3 150 0.04 7 5.8 120B 0.1 260 1.1 110 0.07 12 1.2 20C 0.6 410 1.5 570 0.06 15 8.4 90
3 A 0.1 150 0.3 220 0.11 10 5.8 35B 0.2 100 0.9 440 0.07 3 0.6 13C 0.4 480 2.5 760 0.05 9 3.7 15
4 A 0.5 100 0.1 70 0.08 6 2.9 13B 0.9 80 0.1 80 0.07 4 0.6 14C 0.3 620 1.4 790 0.09 18 8.9 38
5 A 0.4 130 0.4 270 0.15 11 7.0 25B 0.6 360 2.5 650 0.10 7 1.3 23C 1.0 230 1.4 560 0.06 13 7.7 39
6 A 0.1 460 0.4 400 0.10 16 8.6 53B 0.3 140 0.5 300 0.05 6 2.0 17C 0.5 230 1.3 640 0.07 8 6.2 50
7 A 0.2 180 0.4 290 0.13 9 7.6 90B 0.3 240 1.1 980 0.08 9 5.8 23C 0.7 270 1.0 150 0.09 9 8.1 29
8 A 0.6 100 0.1 70 0.10 14 6.8 27B 1.0 200 0.6 840 0.09 9 1.4 27C 0.2 400 1.5 120 0.09 12 7.1 25
9 A 0.3 120 0.2 120 0.11 11 5.5 22B 0.7 220 0.6 580 0.10 10 2.9 30C 0.8 240 0.8 490 0.09 9 7.3 29
10 A 0.3 200 0.6 490 0.24 25 1 .6 43B 0.6 280 .13 210 0.06 9 7.4 24C 0.4 200 0.7 650 0.08 10 4.6 29
11 A 0.9 240 0.4 490 0.23 16 1.0 37B 1.0 230 0.5 830 0.06 5 5.8 14C 0.3 220 0.3 260 0.05 7 3.7 1.’
D3
L ~~~~~~~~~~~~~~~~~~~~~~~~~~~~~~~~~~~~~~~~~~~~~~~~~~~~~~~~~~~~~~~~~~~~~~~~~~~~~~~~~~~~~~~~~~~~~~~~~~~~~~~~~~~~~~~~ “- • ,.
~~~~~~~~~~~~~~~~~ ~~~~~~~~~~~~~~~~~~~~~~~~~
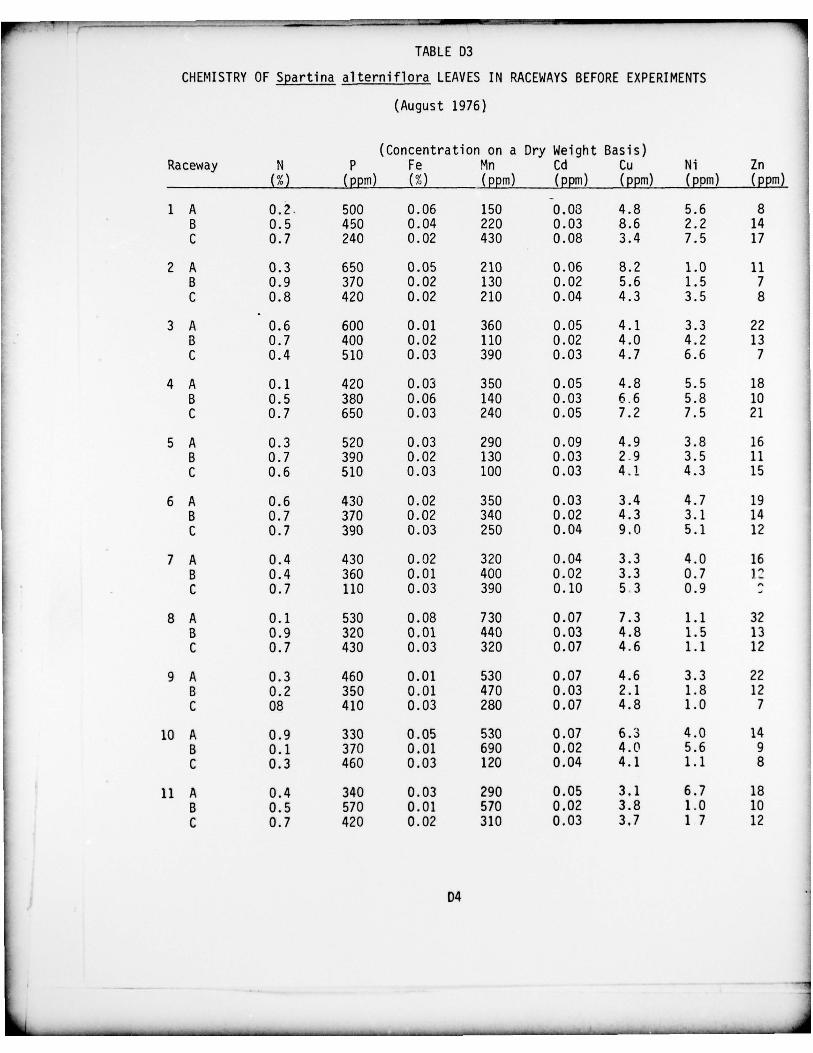
TABLE D3
CHEMISTRY OF Spartina alterniflora LEAVES IN RACEWAYS BEFORE EXPERIMENTS
(August 1976)
(Concentration on a Dry Weight Basis)Raceway N P Fe Mn Cd Cu Ni Zn
(%) (ppm) (%) (ppm) (ppm) (ppm) (ppm) (ppm)
1 A 0.2. 500 0.06 150 0.08 4.8 5.6 8B 0.5 450 0.04 220 0.03 8.6 2.2 14C 0.7 240 0.02 430 0.08 3.4 7.5 17
2 A 0.3 650 0.05 210 0.06 8.2 1.0 11B 0.9 370 0.02 130 0.02 5.6 1.5 7C 0.8 420 0.02 210 0.04 4.3 3.5 8
3 A 0.6 600 0.01 360 0.05 4.1 3.3 22B 0.7 400 0.02 110 0.02 4.0 4.2 13C 0.4 510 0.03 390 0.03 4.7 6.6 7
4 A 0.1 420 0.03 350 0.05 4.8 5.5 18B 0.5 380 0.06 140 0.03 6~6 5.8 10C 0.7 650 0.03 240 0.05 7.2 7.5 21
5 A 0.3 520 0.03 290 0.09 4.9 3.8 16B 0.7 390 0.02 130 0.03 2.9 3.5 11C 0.6 510 0.03 100 0.03 4.1 4.3 15
6 A 0.6 430 0.02 350 0.03 3 .4 4.7 19B 0.7 370 0.02 340 0.02 4.3 3.1 14C 0.7 390 0.03 250 0.04 9.0 5.1 12
7 A 0.4 430 0.02 320 0.04 3.3 4.0 16B 0.4 360 0.01 400 0.02 3.3 0.7 12C 0.7 110 0.03 390 0.10 5.3 0.9 2
8 A 0.1 530 0.08 730 0.07 7.3 1.1 32B 0.9 320 0.01 440 0.03 4.8 1.5 13C 0.7 430 0.03 320 0.07 4.6 1.1 12
9 A 0.3 460 0.01 530 0.07 4.6 3.3 22B 0.2 350 0.01 470 0.03 2.1 1.8 12C 08 410 0.03 280 0.07 4.8 1.0 7
10 A 0.9 330 0.05 530 0.07 6.3 4.0 14B 0.1 370 0.01 690 0.02 4.0 5.6 9C 0.3 460 0.03 120 0.04 4.1 1.1 8
11 A 0.4 340 0.03 290 0.05 3.1 6.7 18B 0.5 570 0.01 570 0.02 3.8 1.0 10C 0.7 420 0.02 310 0.03 3.7 1 7 12
04
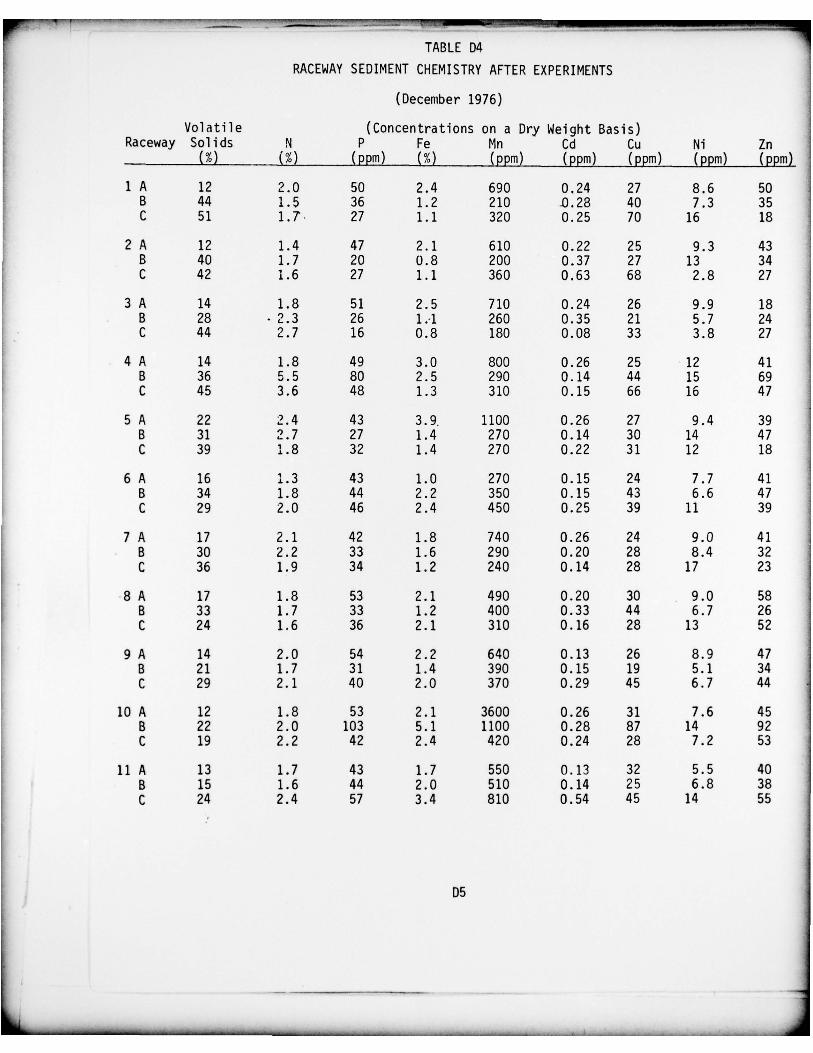
TABLE D4RACEWAY SEDIMENT CHEMISTRY AFTER EXPERIMENTS
(December 1976)
Volat ile (Concentrations on a Dry Weight Basis)Raceway Solids N P Fe Mn Cd Cu Ni Zn(%) (%) (ppm) (%) (ppm) (ppm) (ppm) (ppm) (ppm)
1 A 12 2.0 50 2.4 690 0.24 27 8.6 50B 44 1.5 36 1.2 210 .0.28 40 7.3 35C 51 1.7. 27 1.1 320 0.25 70 16 18
2 A 12 1.4 47 2.1 610 0.22 25 9.3 43B 40 1.7 20 0.8 200 0.37 27 13 34C 42 1.6 27 1.1 360 0.63 68 2.8 27
3 A 14 1.8 51 2.5 710 0.24 26 9.9 18B 28 . 2.3 26 1.~1 260 0.35 21 5.7 24C 44 2.7 16 0.8 180 0.08 33 3.8 27
4 A 14 1.8 49 3.0 800 0.26 25 12 41B 36 5.5 80 2.5 290 0.14 44 15 69C 45 3.6 48 1.3 310 0.15 66 16 47
5 A 22 2.4 43 3.9. 1100 0.26 27 9.4 39B 31 2.7 27 1.4 270 0.14 30 14 47C 39 1.8 32 1.4 270 0.22 31 12 18
6 A 16 1.3 43 1.0 270 0.15 24 7.7 41B 34 1.8 44 2.2 350 0.15 43 6.6 47C 29 2.0 46 2.4 450 0.25 39 11 39
7 A 17 2.1 42 1.8 740 0.26 24 9.0 41B 30 2.2 33 1.6 290 0.20 28 8.4 32C 36 1.9 34 1.2 240 0.14 28 17 23
8 A 17 1.8 53 2.1 490 0.20 30 9.0 58B 33 1.7 33 1.2 400 0.33 44 6.7 26C 24 1.6 36 2.1 310 0.16 28 13 52
9 A 14 2.0 54 2.2 640 0.13 26 8.9 47B 21 1.7 31 1.4 390 0.15 19 5.1 34C 29 2.1 40 2.0 370 0.29 45 6.7 44
10 A 12 1.8 53 2.1 3600 0.26 31 7.6 45B 22 2.0 103 5.1 1100 0.28 87 14 92C 19 2.2 42 2.4 420 0.24 28 7.2 53
11 A 13 1.7 43 1.7 550 0.13 32 5.5 40B 15 1.6 44 2.0 510 0.14 25 6.8 38C 24 2.4 57 3.4 810 0.54 45 14 55
05
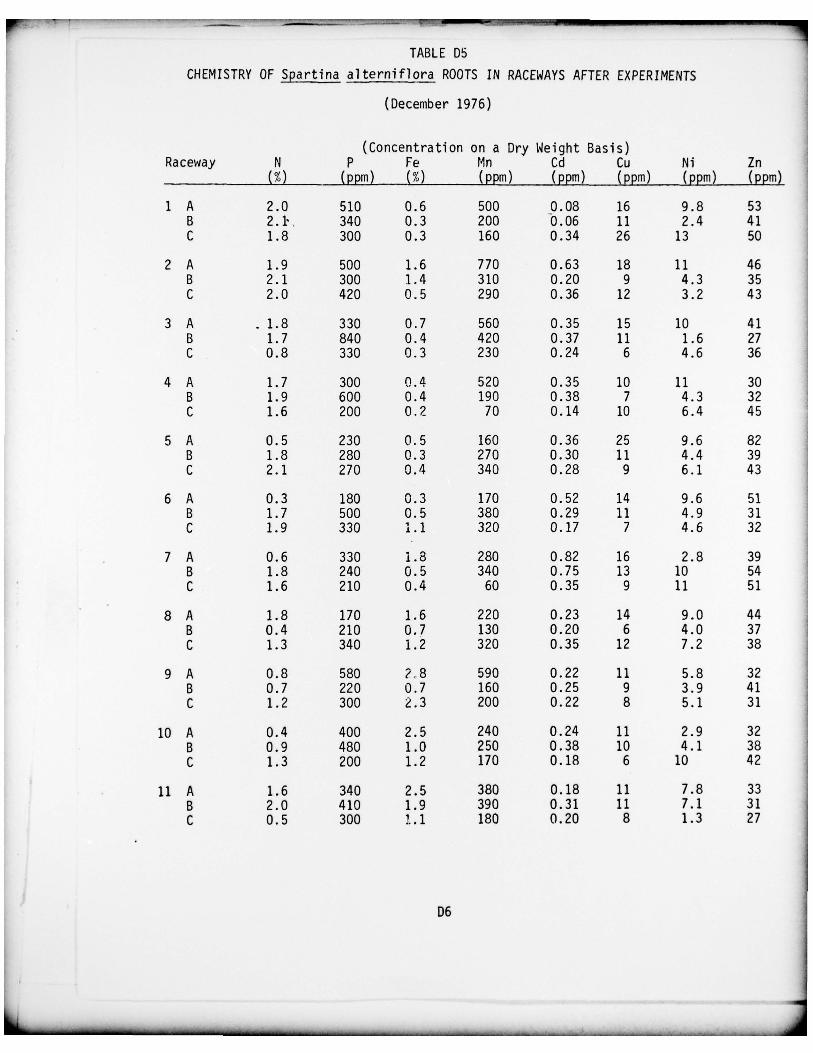
TABLE D5CHEMISTRY OF Spartina alterniflora ROOTS IN RACEWAYS AFTER EXPERIMENTS
(December 1976)
(Concentration on a Dry Weight Basis)Raceway N P Fe Mn Cd Cu Ni Zn
(%) (ppm) (%) (ppm) (ppm) (ppm) (ppm) (ppm)
1 A 2.0 510 0.6 500 0.08 16 9.8 53B 2.1’. 340 0.3 200 0.06 11 2.4 41C 1.8 300 0.3 160 0.34 26 13 50
2 A 1.9 500 1.6 770 0.63 18 11 46B 2.1 300 1.4 310 0.20 9 4.3 35C 2.0 420 0.5 290 0.36 12 3.2 43
3 A . 1.8 330 0.7 560 0.35 15 10 41B 1.7 840 0.4 420 0.37 11 1.6 27C 0.8 330 0.3 230 0.24 6 4.6 36
4 A 1.7 300 0.4 520 0.35 10 11 30B 1.9 600 0.4 190 0.38 7 4.3 32C 1.6 200 0.2 70 0.14 10 6.4 45
5 A 0.5 230 0.5 160 0.36 25 9.6 82B 1.8 280 0.3 270 0.30 11 4.4 39C 2.1 270 0.4 340 0.28 9 6.1 43
6 A 0.3 180 0.3 170 0.52 14 9.6 51B 1.7 500 0.5 380 0.29 11 4.9 31C 1.9 330 1.1 320 0.17 7 4.6 32
7 A 0.6 330 1.8 280 0.82 16 2.8 39B 1.8 240 0.5 340 0.75 13 10 54C 1.6 210 0.4 60 0.35 9 11 51
8 A 1.8 170 1.6 220 0.23 14 9.0 44B 0.4 210 0.7 130 0.20 6 4.0 37C 1.3 340 1.2 320 0.35 12 7.2 38
9 A 0.8 580 ?,8 590 0.22 11 5.8 32B 0.7 220 0.7 160 0.25 9 3.9 41C 1.2 300 2.3 200 0.22 8 5.1 31
10 A 0.4 400 2.5 240 0.24 11 2.9 32B 0.9 480 1.0 250 0.38 10 4.1 38C 1.3 200 1.2 170 0.18 6 10 42
11 A 1.6 340 2.5 380 0.18 11 7.8 33B 2.0 410 1.9 390 0.31 11 7.1 31C 0.5 300 1.1 180 0.20 8 1.3 27
D6
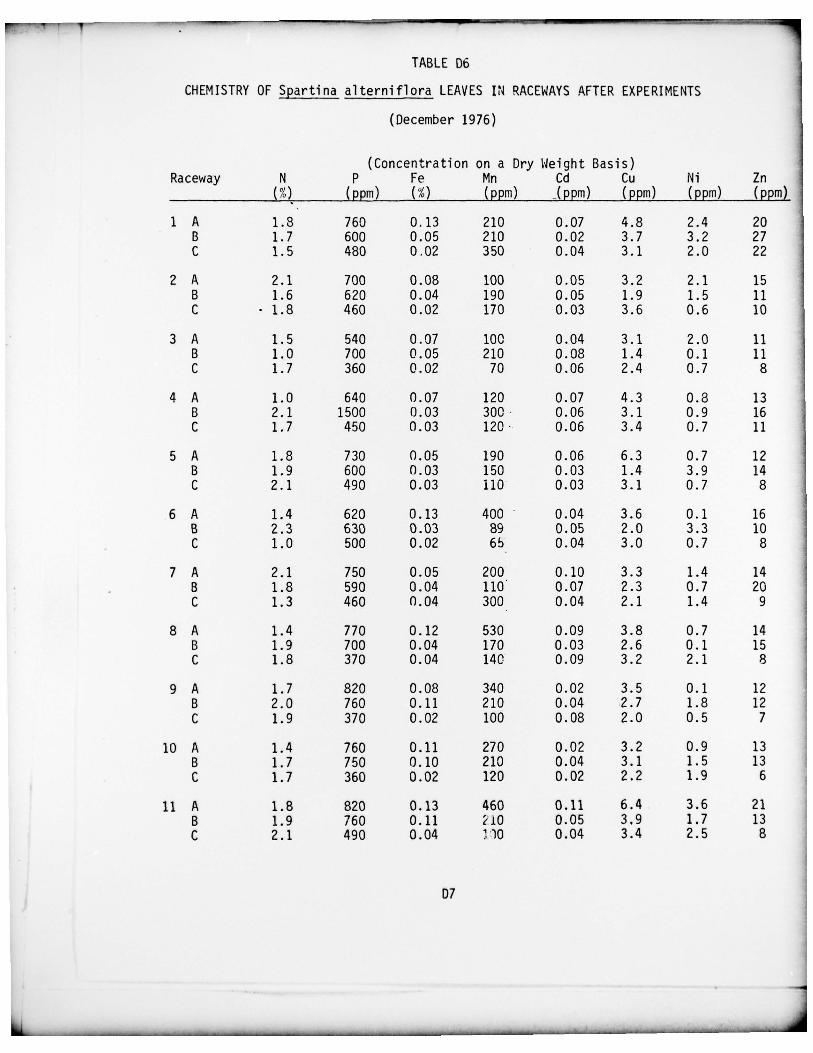
-- -- -- _____
TABLE 06
CHEMISTRY OF Spartina alternif lora LEAVES IN RACEWAYS AFTER EXPERIMENTS
(December 1976)
(Concentration on a Dry Weight Basis)Raceway N P Fe Mn Cd Cu Ni Zn
(%) (ppm) (%) (ppm) (ppm) (ppm) (ppm) (ppm)
1 A 1.8 760 0.13 210 0.07 4.8 2.4 20B 1.7 600 0.05 210 0.02 3.7 3.2 27C 1.5 480 0.02 350 0.04 3.1 2.0 22
2 A 2.1 700 0.08 100 0.05 3.2 2.1 15B 1.6 620 0.04 190 0.05 1.9 1.5 11C • 1.8 460 0.02 170 0.03 3.6 0.6 10
3 A 1.5 540 0.07 100 0.04 3.1 2.0 11B 1.0 700 0.05 210 0.08 1.4 0.1 11C 1.7 360 0.02 70 0.06 2.4 0.7 8
4 A 1.0 640 0.07 120 0.07 4.3 0.8 13B 2.1 1500 0.03 300 0.06 3.1 0.9 16C 1.7 450 0.03 120 0.06 3.4 0.7 11
5 A 1.8 730 0.05 190 0.06 6.3 0.7 12B 1.9 600 0.03 150 0.03 1.4 3.9 14C 2.1 490 0.03 110 0.03 3.1 0.7 8
6 A 1.4 620 0.13 400 0.04 3.6 0.1 16B 2.3 630 0.03 89 0.05 2.0 3.3 10C 1.0 500 0.02 65 0.04 3.0 0.7 8
7 A 2.1 750 0.05 200 0.10 3.3 1.4 14B 1.8 590 0.04 110 0.07 2.3 0.7 20C 1.3 460 0.04 300 0.04 2.1 1.4 9
8 A 1.4 770 0.12 530 0.09 3.8 0.7 14B 1.9 700 0.04 170 0.03 2.6 0.1 15C 1.8 370 0.04 140 0.09 3.2 2.1 8
9 A 1.7 820 0.08 340 0.02 3.5 0.1 12B 2.0 760 0.11 210 0.04 2.7 1.8 12C 1.9 370 0.02 100 0.08 2.0 0.5 7
10 A 1.4 760 0.11 270 0.02 3.2 0.9 13B 1.7 750 0.10 210 0.04 3.1 1.5 13C 1.7 360 0.02 120 0.02 2.2 1.9 6
11 A 1.8 820 0.13 460 0.11 6.4 3.6 21B 1.9 760 0.11 210 0.05 3.9 1.7 13C 2.1 490 0.04 ~~ 0.04 3.4 2.5 8
07
- ~~ . . •
. —.--.-,-—~~~~
. • - •- - -.---- -.----. • —.-------~
. - - -—~~~~~~-• -
~~ ________
APPENDIX E
CHEMISTRY (N, P, Fe, Mn , Cd , Cu , Ni AND Zn)OF SEDIMENTS AND ~partina alterniflora ROOTSAND LEAVES FROM CONTROL STATIONS BEFORE ANDAFTER EXPERIMENTS
El
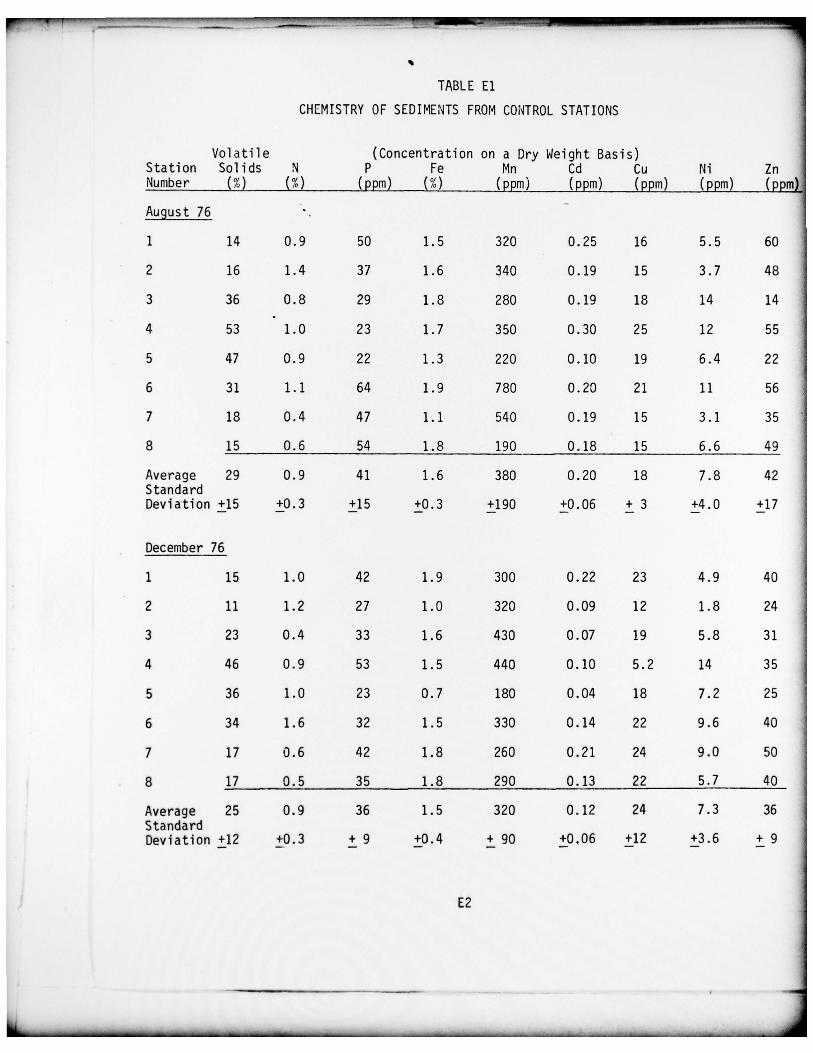
. —.--~~~~---. —- -~---—---— --.. - - - - - - -
— - . • . • , -~~~~~~
TABLE El
CHEMISTRY OF SEDIMENTS FROM CONTROL STATIONS
Volatile (Concentration on a Dry Weight Basis)Station Solids N P Fe Mn Cd Cu Ni ZnNumber (%) (%) (ppm) (%) (ppm) (ppm) (ppm) (ppm) (ppm)
August 76 .,
-
1 14 0.9 50 1.5 320 0.25 16 5.5 60
2 16 1.4 37 1.6 340 0.19 15 3.7 48
3 36 0.8 29 1.8 280 0.19 18 14 14
4 53 1.0 23 1.7 350 0.30 25 12 55
5 47 0.9 22 1.3 220 0.10 19 6.4 22
6 31 1.1 64 1.9 780 0.20 21 11 56
7 18 0.4 47 1.1 540 0.19 15 3.1 35
8 15 0.6 54 1.8 190 0.18 15 6.6 49
Average 29 0.9 41 1.6 380 0.20 18 7.8 42StandardDeviation +15 ±0.3 +15 +0.3 +190 +0.06 + 3 +4.0 +17
December 76
1 15 1.0 42 1.9 300 0.22 23 4.9 40
2 11 1.2 27 1.0 320 0.09 12 1.8 24
3 23 0.4 33 1.6 430 0.07 19 5.8 31
4 46 0.9 53 1.5 440 0.10 5.2 14 35
5 36 1.0 23 0.7 180 0.04 18 7.2 25
6 34 1.6 32 1.5 330 0.14 22 9.6 40
7 17 0.6 42 1.8 260 0.21 24 9.0 50
8 17 0.5 35 1.8 290 0.13 22 5.7 40
Average 25 0.9 36 1.5 320 0.12 24 7.3 36StandardDeviation ±12 ±0.3 ± 9 ±0.4 ± 9O ±0,06 ±12 ±3.6 + g
E2
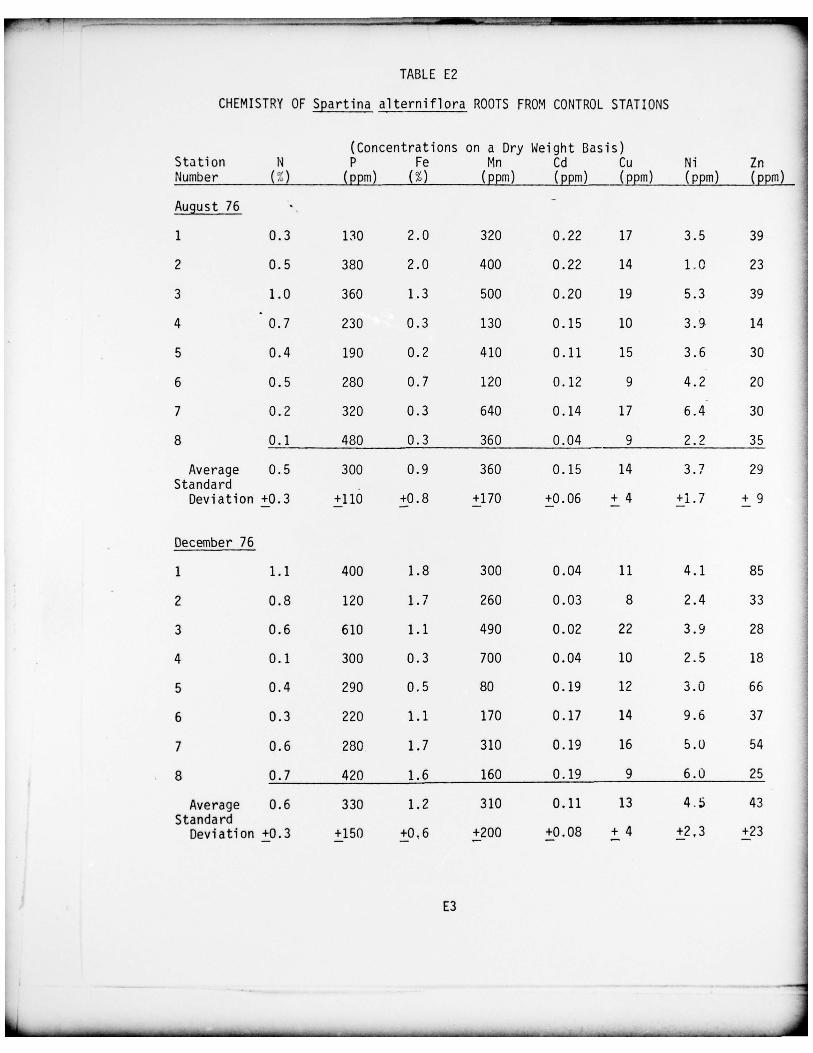
~~~~~~~~~~~~~~~~~~
TABLE E2
CHEMISTRY OF Spartina alternif lora ROOTS FROM CONTROL STATiONS
(Concentrations on a Dry Weight Basis)Station N P Fe Mn Cd Cu Ni ZnNumber (
~ ) (ppm) (%) (ppm) (ppm) (ppm) (ppm) (ppm)
August 76 . -
1 0.3 130 2.0 320 0.22 17 3.5 39
2 0.5 380 2.0 400 0.22 14 1.0 23
3 1.0 360 1.3 500 0.20 19 5.3 39
0.7 230 0.3 130 0.15 10 3.~ 14
5 0.4 190 0.2 410 0.11 15 3.6 30
6 0.5 280 0.7 120 0.12 9 4.2 20
7 0.2 320 0.3 640 0.14 17 6.4 30
8 0.1 480 0.3 360 0.04 9 2.2 35
Average 0.5 300 0.9 360 0.15 14 3.7 29Standard
Deviation ±0.3 ±110 ±0.8 ±170 +0.06 ± 4 tL7 + 9
December 76
1 1.1 400 1.8 300 0.04 11 4.1 85
2 0.8 120 1.7 260 0.03 8 2.4 33
3 0.6 610 1.1 490 0.02 22 3.9 28
4 0.1 300 0.3 700 0.04 10 2.5 18
5 0.4 290 0.5 80 0.19 12 3.0 66
6 0.3 220 1.1 170 0.17 14 9.6 37
7 0.6 280 1.7 310 0.19 16 5.0 54
8 0.7 420 1.6 160 0.19 9 6.0 25
Average 0.6 330 1.2 310 0.11 13 4.~ 43Standard
Deviation ±0.3 ±150 ±0.6 +200 +0.08 ÷ 4 ~2,3 +23
E3
. .~~~~~~~~~~• - .~~~----- -•--~~~~~~~~~~~~~~~~~~~~~ .-~~~~~~~~~~~~-.. --
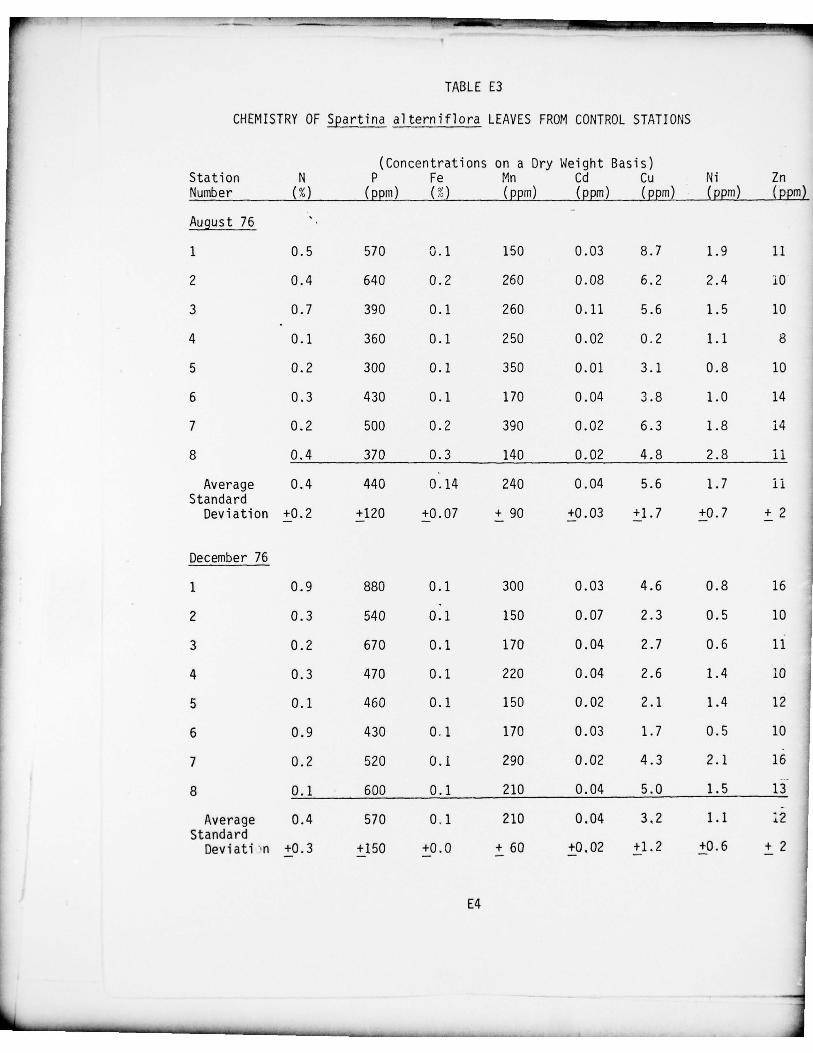
-
TABLE E3
CHEMISTRY OF Spartina alterniflora LEAVES FROM CONTROL STATIONS
(Concentrat ions on a Dry Weight Basis)• Station N P Fe Mn Cd Cu Ni Zn
Number (%) (ppm) ( %) (ppm) (ppm) (ppm) (ppm) (ppm )
Au~ust 76
1 0.5 570 0.1 150 0.03 8.7 1.9 11
2 0.4 640 0.2 260 0.08 6.2 2.4 10
3 0.7 390 0.1 260 0.11 5.6 1.5 10
0.1 360 0.1 250 0.02 0.2 1.1 8
5 0.2 300 0.1 350 0.01 3.1 0.8 10
6 0.3 430 0.1 170 0.04 3.8 1.0 14
7 0.2 500 0.2 390 0.02 6.3 1.8 14
8 0.4 370 0.3 140 0.02 4.8 2.8 ii
Average 0.4 440 0:14 240 0.04 5.6 1.7 iiStandard
Deviation +0.2 ±120 ±0.07 ÷90 +0.03 +1.7 ±0.7 + 2
December 76
1 0.9 880 0.1 300 0.03 4.6 0.8 16
2 0.3 540 0.1 150 0.07 2.3 0.5 10
3 0.2 670 0.1 170 0.04 2.7 0.6 11
4 0.3 470 0.1 220 0.04 2.6 1.4 10
5 0.1 460 0.1 150 0.02 2.1 1.4 12
6 0.9 430 0.1 170 0.03 1.7 0.5 10
7 0.2 520 0.1 290 0.02 4.3 2.1 16
8 0.1 600 0.1 210 0.04 5.0 1.5 13
Average 0.4 570 0.1 210 0.04 3,2 1.1Standard
Deviati n ±0.3 +150 ±0.0 ± 60 ±0.02 ±1.2 ±0.6 ± 2


