Embed Size (px)
Citation preview
The Hongkong and Shanghai Banking Corporation LimitedBanking Disclosure Statement at 30 June 2021 (unaudited)
ContentsPage
Introduction 3
Purpose 3
Basis of preparation 3
The Banking Disclosure Statement 3
Loss-absorbing Capacity Disclosures 3
Structure of the regulatory group 5
Basis of consolidation 5
Balance sheet reconciliation 6
Capital and RWAs 8
Regulatory capital disclosures 8
Countercyclical capital buffer ratio 11
Leverage ratio 12
Overview of RWAs and the minimum capital requirements 13
RWA flow statements 14
Loss-absorbing Capacity 15
Credit risk 17
Credit quality of assets 17
Credit risk under internal ratings-based approach 20
Credit risk under standardised approach 23
Credit risk mitigation 24
Counterparty credit risk exposures 25
Counterparty default risk exposures 25
Counterparty default risk under internal ratings-based approach 27
Counterparty default risk under standardised approach 27
Securitisation 28
Analysis of securitisation exposures 28
Market risk 29
Market risk under standardised approach 29
Analysis of VaR, stressed VaR and incremental risk charge measures 29
Liquidity information 31
Other disclosures 34
Mainland activities 34
International claims 34
Foreign currency positions 35
Other information 36
Abbreviations 36
Banking Disclosure Statement at 30 June 2021
1 The Hongkong and Shanghai Banking Corporation Limited
TablesPage
1 KM1 – Key prudential ratios 4
2 List of subsidiaries outside the regulatory scope of consolidation 5
3 CC2 – Reconciliation of regulatory capital to balance sheet 6
4 CC1 – Composition of regulatory capital 8
5 CCA – Capital instruments 10
6 CCyB1 – Geographical distribution of credit exposures used in countercyclical capital buffer 11
7 LR2 – Leverage ratio 12
8 LR1 – Summary comparison of accounting assets against leverage ratio exposure measure 12
9 OV1 – Overview of RWAs 13
10 CR8 – RWA flow statement of credit risk exposures under IRB approach 14
11 CCR7 – RWA flow statement of default risk exposures under IMM(CCR) approach 14
12 MR2 – RWA flow statement of market risk exposures under IMM approach 14
13 KM2(A) – Key metrics – LAC requirements for material subsidiaries 15
14 TLAC1(A) – TLAC composition 15
15 TLAC2 – The Hongkong and Shanghai Banking Corporation Limited creditor ranking 16
16 CR1 – Credit quality of exposures 17
17 CR2 – Changes in defaulted loans and debt securities 17
18 Credit-impaired exposures and impairment allowances by industry
17
19 Credit-impaired exposures and impairment allowances by geographical location
18
20 Loans and advances to customers by geographical location 18
21 Loans and advances to customers by industry 18
22 Overdue and rescheduled loans and advances to customers 19
23 Off-balance sheet exposures other than derivative transactions 19
24.1 CR6 – Credit risk exposures by portfolio and PD range – for IRB approach (Wholesale) 20
24.2 CR6 – Credit risk exposures by portfolio and PD range – for IRB approach (Retail) 21
24.3 CR6 – Credit risk exposures by portfolio and PD range – for IRB approach (Total) 22
25 CR10 – Specialised Lending under supervisory slotting criteria approach – HVCRE 22
26 CR10 – Specialised Lending under supervisory slotting criteria approach – Other than HVCRE 22
27 CR10 – Equity exposures under the simple risk weight method 22
28 CR5 – Credit risk exposures by asset classes and by risk weights – for STC approach 23
Page
29 CR3 – Overview of recognised credit risk mitigation 24
30 CR7 – Effects on RWAs of recognised credit derivative contracts used as recognised credit risk mitigation – for IRB approach 24
31 CR4 – Credit risk exposures and effects of recognised credit risk mitigation – for STC approach 24
32 CCR1 – Analysis of counterparty default risk exposures (other than those to CCPs) by approaches 25
33 CCR2 – CVA capital charge 25
34 CCR6 – Credit-related derivatives contracts 25
35 CCR5 – Composition of collateral for counterparty default risk exposures (including those for contracts or transactions cleared through CCPs) 26
36 CCR8 – Exposures to CCPs 26
37 CCR4 – Counterparty default risk exposures (other than those to CCPs) by portfolio and PD range – for IRB approach 27
38 CCR3 – Counterparty default risk exposures (other than those to CCPs) by asset classes and by risk weights – for STC approach 27
39 SEC1 – Securitisation exposures in banking book 28
40 SEC2 – Securitisation exposures in trading book 28
41 SEC4 – Securitisation exposures in banking book and associated capital requirements – where AI acts as investor 28
42 MR1 – Market risk under STM approach 29
43 MR3 – IMM approach values for market risk exposures 29
44 MR4 – Comparison of VaR estimates with gains or losses 30
45 LIQ1 – Liquidity coverage ratio – for category 1 institution 31
46 LIQ2 – Net stable funding ratio – for category 1 institution 32
47 Mainland activities 34
48 International claims 34
49 Net structural foreign currency exposures 35
50 Non-structural foreign currency positions 35
Prefixes contained in the table names, where applicable, represent the reference codes of the standard disclosure templates and tables for the Revised Pillar 3 Framework issued by the Hong Kong Monetary Authority (‘HKMA’).
The Hongkong and Shanghai Banking Corporation Limited 2
Introduction
Purpose
The information contained in this document is for The Hongkong and Shanghai Banking Corporation Limited (‘the Bank’) and its subsidiaries (together ‘the group’). It should be read in conjunction with the group's Interim Report 2021. The group's Interim Report 2021, the Banking Disclosure Statement and the Main Features of Regulatory Capital Instruments and Non-capital LAC Debt Instruments document, taken together, comply with both the Banking (Disclosure) Rules (‘BDR’) made under section 60A of the Banking Ordinance and the Financial Institutions (Resolution) (Loss-absorbing Capacity Requirements – Banking Sector) Rules (‘LAC Rules’) made under section 19(1) of the Financial Institutions (Resolution) Ordinance (‘FIRO’).
References to ‘HSBC’, ‘the Group’ or ‘the HSBC Group’ within this document mean HSBC Holdings plc together with its subsidiaries. Within this document the Hong Kong Special Administrative Region of the People’s Republic of China is referred to as ‘Hong Kong’. The abbreviations ‘HK$m’ and ‘HK$bn’ represent millions and billions (thousands of millions) of Hong Kong dollars respectively.
These banking disclosures are governed by the group’s disclosure policy, which has been approved by the Board of Directors. The disclosure policy sets out the governance, control and assurance requirements for publication of the document. While the disclosure statement is not required to be externally audited, the document has been subject to independent review in accordance with the group’s policies on disclosure and its financial reporting and governance processes.
Basis of preparation
Except where indicated otherwise, the financial information contained in this Banking Disclosure Statement has been prepared on a consolidated basis. The basis of consolidation for regulatory purposes is different from that for accounting purposes. Information regarding subsidiaries that are not included in the consolidation for regulatory purposes is set out in the ‘Basis of consolidation’ section in this document.
The information in this document is not audited and does not constitute statutory accounts.
The Banking Disclosure Statement
The group's Banking Disclosure Statement at 30 June 2021 comprises Pillar 3 information required under the framework of the Basel Committee on Banking Supervision (‘BCBS’). The disclosures are made in accordance with the latest BDR and the LAC Rules issued by the HKMA. According to the BDR and the LAC Rules, disclosure of comparative information is not required unless otherwise specified in the standard disclosure templates. Prior period disclosures can be found in the Regulatory Disclosure section of our website, www.hsbc.com.hk.
The Banking Disclosure Statement includes the majority of the information required under the BDR and the LAC Rules. The Main Features of Regulatory Capital Instruments and Non-capital LAC Debt Instruments are published as a standalone document. The remainder of the disclosure requirements are covered in the group’s Interim Report 2021. All the group's banking disclosures can be found in the Regulatory Disclosure section of our website, www.hsbc.com.hk.
Loss-absorbing Capacity Disclosures
The group's loss-absorbing capacity ('LAC') disclosures are included as part of this Banking Disclosure Statement while the LAC disclosures of HSBC Asia Holdings Limited ('HAHO') will be included as part of the HSBC Group's disclosures which can be found in the Investors section of the Group's website, www.hsbc.com. The location of HAHO's LAC disclosure can be found in the following table:
Location of HAHO's LAC disclosures in 2Q21: KM2 – Key metrics of the Asian resolution group
• Table 11.ii of the Group's Pillar 3 Disclosures TLAC1 – TLAC composition
• Table 12 of the Group's Pillar 3 Disclosures TLAC3 – HSBC Asia Holdings Limited Creditor Ranking
• Table 16 of the Group's Pillar 3 DisclosuresCCA(A) – Main Features of Regulatory Capital Instruments and Non-Capital LAC Debt Instruments
• A standalone document which can be found in: www.hsbc.com/investors/fixed-income-investors/regulatory-capital-securities
Banking Disclosure Statement at 30 June 2021
3 The Hongkong and Shanghai Banking Corporation Limited
Key Metrics
Table 1: KM1 – Key prudential ratios
a b c d e
At
30 Jun 31 Mar 31 Dec 30 Sep 30 Jun
Footnotes 2021 2021 2020 2020 2020
Regulatory capital (HK$m) 1
1 Common Equity Tier 1 (‘CET1’) 488,897 496,026 509,452 505,315 491,594
2 Tier 1 535,060 542,161 555,553 551,305 537,507
3 Total capital 595,374 601,024 614,545 610,902 596,815
Risk-weighted assets ('RWAs') (HK$m) 1
4 Total RWAs 3,117,666 3,011,181 2,956,993 3,029,053 2,942,719
Risk-based regulatory capital ratios (as a percentage of RWA) 1
5 CET1 ratio (%) 15.7 16.5 17.2 16.7 16.7
6 Tier 1 ratio (%) 17.2 18.0 18.8 18.2 18.3
7 Total capital ratio (%) 19.1 20.0 20.8 20.2 20.3
Additional CET1 buffer requirements (as a percentage of RWA) 1
8 Capital conservation buffer requirement (%) 2.50 2.50 2.50 2.50 2.50
9 Countercyclical capital buffer ('CCyB') requirement (%) 2 0.52 0.51 0.51 0.53 0.52
10 Higher loss absorbency requirements (%) (applicable only to G-SIBs or D-SIBs) 2.50 2.50 2.50 2.50 2.50
11 Total authorised institution ('AI')-specific CET1 buffer requirements 5.52 5.51 5.51 5.53 5.52
12 CET1 available after meeting the AI’s minimum capital requirements (%) 11.1 12.0 12.7 12.2 12.2
Basel III leverage ratio 3
13 Total leverage ratio (‘LR’) exposure measure (HK$m) 9,068,163 8,895,440 8,705,672 8,659,463 8,474,009
14 LR (%) 5.9 6.1 6.4 6.4 6.3
Liquidity Coverage Ratio (‘LCR’) 4
15 Total high quality liquid assets (‘HQLA’) (HK$m) 1,950,607 2,021,618 1,982,999 1,940,757 1,730,870
16 Total net cash outflows (HK$m) 1,236,236 1,258,857 1,154,822 1,141,000 1,067,926
17 LCR (%) 157.9 160.7 172.1 170.4 162.0
Net Stable Funding Ratio (‘NSFR’) 5
18 Total available stable funding (HK$m) 5,365,697 5,337,445 5,388,197 5,211,670 5,145,116
19 Total required stable funding (HK$m) 3,569,865 3,441,318 3,382,462 3,417,697 3,421,671
20 NSFR (%) 150.3 155.1 159.3 152.5 150.4
1 The regulatory capital, RWAs, risk-based regulatory capital ratios and additional CET1 buffer requirements above are based on or derived from the information as contained in the ‘Capital Adequacy Ratio’ return submitted to the HKMA on a consolidated basis under the requirements of section 3C(1) of the Banking (Capital) Rules (‘BCR’).
2 The jurisdictional CCyB of Hong Kong used in the calculation of the CCyB buffer requirement was 1.0% since 31 March 2020. The JCCyB of other countries used in the calculation of the CCyB requirement ranged from 0% to 1% at 30 June 2021.
3 The Basel III leverage ratios are disclosed in accordance with the information contained in the ‘Leverage Ratio’ return submitted to the HKMA under the requirements specified in Part 1C of the BCR.
4 The Liquidity Coverage Ratios shown are the simple average values of all working days in the reporting periods and are made in accordance with the requirements specified in the ‘Liquidity Position’ return submitted to the HKMA under rule 11(1) of the Banking (Liquidity) Rules (‘BLR’).
5 The Net Stable Funding Ratio disclosures are made in accordance with the information contained in the ‘Stable Funding Position’ return submitted to the HKMA under the requirements specified in rule 11(1) of the BLR.
The Hongkong and Shanghai Banking Corporation Limited 4
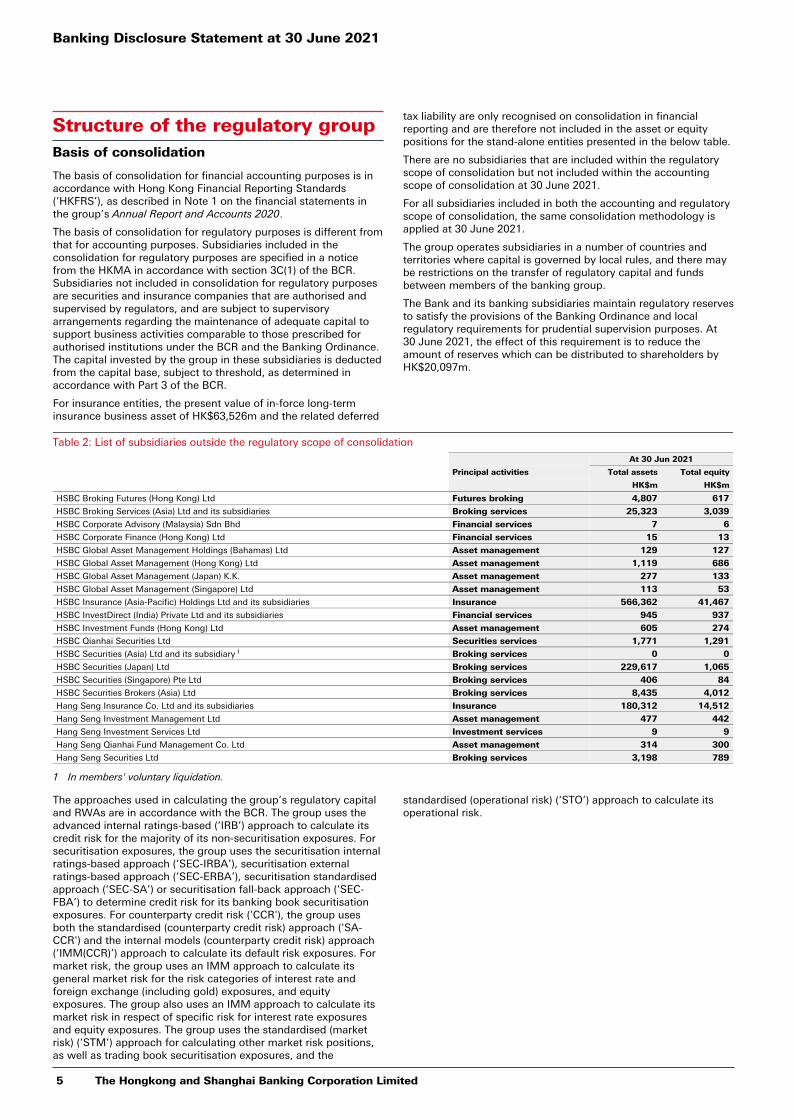
Structure of the regulatory groupBasis of consolidation
The basis of consolidation for financial accounting purposes is in accordance with Hong Kong Financial Reporting Standards (‘HKFRS’), as described in Note 1 on the financial statements in the group’s Annual Report and Accounts 2020.
The basis of consolidation for regulatory purposes is different from that for accounting purposes. Subsidiaries included in the consolidation for regulatory purposes are specified in a notice from the HKMA in accordance with section 3C(1) of the BCR. Subsidiaries not included in consolidation for regulatory purposes are securities and insurance companies that are authorised and supervised by regulators, and are subject to supervisory arrangements regarding the maintenance of adequate capital to support business activities comparable to those prescribed for authorised institutions under the BCR and the Banking Ordinance. The capital invested by the group in these subsidiaries is deducted from the capital base, subject to threshold, as determined in accordance with Part 3 of the BCR.
For insurance entities, the present value of in-force long-term insurance business asset of HK$63,526m and the related deferred
tax liability are only recognised on consolidation in financial reporting and are therefore not included in the asset or equity positions for the stand-alone entities presented in the below table.
There are no subsidiaries that are included within the regulatory scope of consolidation but not included within the accounting scope of consolidation at 30 June 2021.
For all subsidiaries included in both the accounting and regulatory scope of consolidation, the same consolidation methodology is applied at 30 June 2021.
The group operates subsidiaries in a number of countries and territories where capital is governed by local rules, and there may be restrictions on the transfer of regulatory capital and funds between members of the banking group.
The Bank and its banking subsidiaries maintain regulatory reserves to satisfy the provisions of the Banking Ordinance and local regulatory requirements for prudential supervision purposes. At 30 June 2021, the effect of this requirement is to reduce the amount of reserves which can be distributed to shareholders by HK$20,097m.
Table 2: List of subsidiaries outside the regulatory scope of consolidation
At 30 Jun 2021
Principal activities Total assets Total equity
HK$m HK$m
HSBC Broking Futures (Hong Kong) Ltd Futures broking 4,807 617
HSBC Broking Services (Asia) Ltd and its subsidiaries Broking services 25,323 3,039
HSBC Corporate Advisory (Malaysia) Sdn Bhd Financial services 7 6
HSBC Corporate Finance (Hong Kong) Ltd Financial services 15 13
HSBC Global Asset Management Holdings (Bahamas) Ltd Asset management 129 127
HSBC Global Asset Management (Hong Kong) Ltd Asset management 1,119 686
HSBC Global Asset Management (Japan) K.K. Asset management 277 133
HSBC Global Asset Management (Singapore) Ltd Asset management 113 53
HSBC Insurance (Asia-Pacific) Holdings Ltd and its subsidiaries Insurance 566,362 41,467
HSBC InvestDirect (India) Private Ltd and its subsidiaries Financial services 945 937
HSBC Investment Funds (Hong Kong) Ltd Asset management 605 274
HSBC Qianhai Securities Ltd Securities services 1,771 1,291
HSBC Securities (Asia) Ltd and its subsidiary 1 Broking services 0 0
HSBC Securities (Japan) Ltd Broking services 229,617 1,065
HSBC Securities (Singapore) Pte Ltd Broking services 406 84
HSBC Securities Brokers (Asia) Ltd Broking services 8,435 4,012
Hang Seng Insurance Co. Ltd and its subsidiaries Insurance 180,312 14,512
Hang Seng Investment Management Ltd Asset management 477 442
Hang Seng Investment Services Ltd Investment services 9 9
Hang Seng Qianhai Fund Management Co. Ltd Asset management 314 300
Hang Seng Securities Ltd Broking services 3,198 789
1 In members' voluntary liquidation.
The approaches used in calculating the group’s regulatory capital and RWAs are in accordance with the BCR. The group uses the advanced internal ratings-based (‘IRB’) approach to calculate its credit risk for the majority of its non-securitisation exposures. For securitisation exposures, the group uses the securitisation internal ratings-based approach (‘SEC-IRBA’), securitisation external ratings-based approach (‘SEC-ERBA’), securitisation standardised approach (‘SEC-SA’) or securitisation fall-back approach (‘SEC-FBA’) to determine credit risk for its banking book securitisation exposures. For counterparty credit risk ('CCR'), the group uses both the standardised (counterparty credit risk) approach ('SA-CCR') and the internal models (counterparty credit risk) approach (‘IMM(CCR)’) approach to calculate its default risk exposures. For market risk, the group uses an IMM approach to calculate its general market risk for the risk categories of interest rate and foreign exchange (including gold) exposures, and equity exposures. The group also uses an IMM approach to calculate its market risk in respect of specific risk for interest rate exposures and equity exposures. The group uses the standardised (market risk) (‘STM’) approach for calculating other market risk positions, as well as trading book securitisation exposures, and the
standardised (operational risk) (‘STO’) approach to calculate its operational risk.
Banking Disclosure Statement at 30 June 2021
5 The Hongkong and Shanghai Banking Corporation Limited
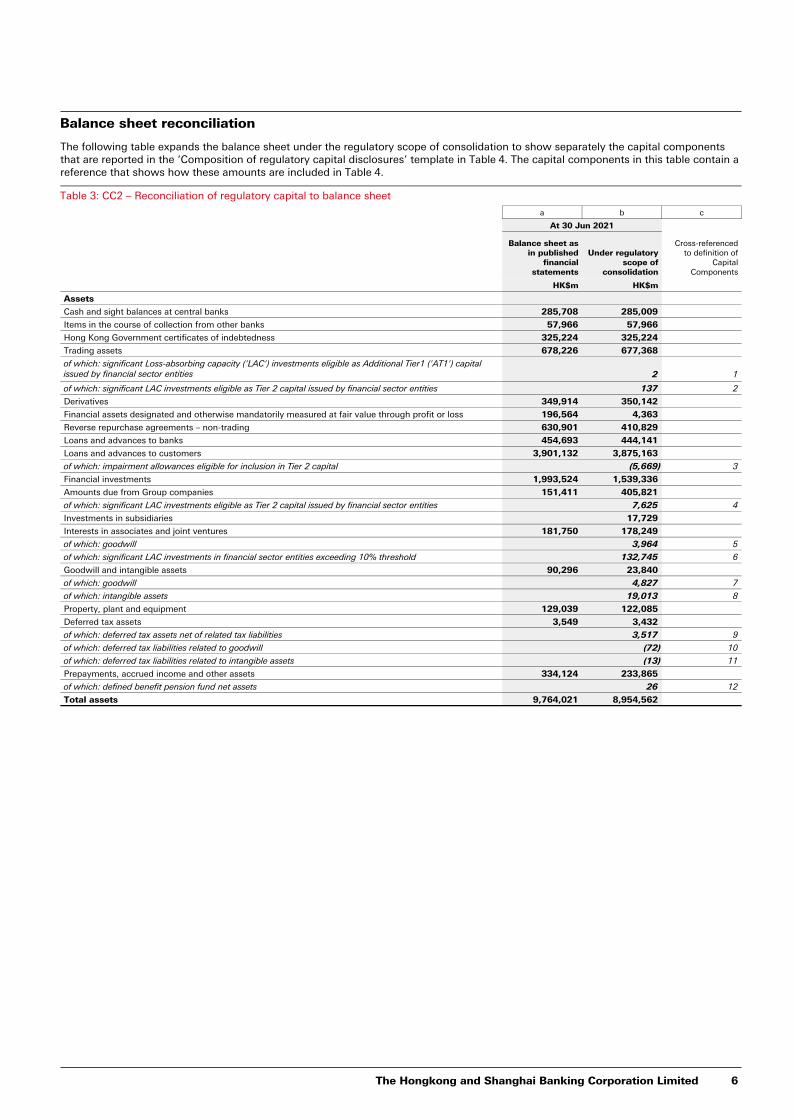
Balance sheet reconciliation
The following table expands the balance sheet under the regulatory scope of consolidation to show separately the capital components that are reported in the ‘Composition of regulatory capital disclosures’ template in Table 4. The capital components in this table contain a reference that shows how these amounts are included in Table 4.
Table 3: CC2 – Reconciliation of regulatory capital to balance sheet
a b c
At 30 Jun 2021
Balance sheet asin published
financialstatements
Under regulatoryscope of
consolidation
Cross-referencedto definition of
CapitalComponents
HK$m HK$m
Assets
Cash and sight balances at central banks 285,708 285,009
Items in the course of collection from other banks 57,966 57,966
Hong Kong Government certificates of indebtedness 325,224 325,224
Trading assets 678,226 677,368
of which: significant Loss-absorbing capacity ('LAC') investments eligible as Additional Tier1 ('AT1') capital issued by financial sector entities 2 1
of which: significant LAC investments eligible as Tier 2 capital issued by financial sector entities 137 2
Derivatives 349,914 350,142
Financial assets designated and otherwise mandatorily measured at fair value through profit or loss 196,564 4,363
Reverse repurchase agreements – non-trading 630,901 410,829
Loans and advances to banks 454,693 444,141
Loans and advances to customers 3,901,132 3,875,163
of which: impairment allowances eligible for inclusion in Tier 2 capital (5,669) 3
Financial investments 1,993,524 1,539,336
Amounts due from Group companies 151,411 405,821
of which: significant LAC investments eligible as Tier 2 capital issued by financial sector entities 7,625 4
Investments in subsidiaries 17,729
Interests in associates and joint ventures 181,750 178,249
of which: goodwill 3,964 5
of which: significant LAC investments in financial sector entities exceeding 10% threshold 132,745 6
Goodwill and intangible assets 90,296 23,840
of which: goodwill 4,827 7
of which: intangible assets 19,013 8
Property, plant and equipment 129,039 122,085
Deferred tax assets 3,549 3,432
of which: deferred tax assets net of related tax liabilities 3,517 9
of which: deferred tax liabilities related to goodwill (72) 10
of which: deferred tax liabilities related to intangible assets (13) 11
Prepayments, accrued income and other assets 334,124 233,865
of which: defined benefit pension fund net assets 26 12
Total assets 9,764,021 8,954,562
The Hongkong and Shanghai Banking Corporation Limited 6
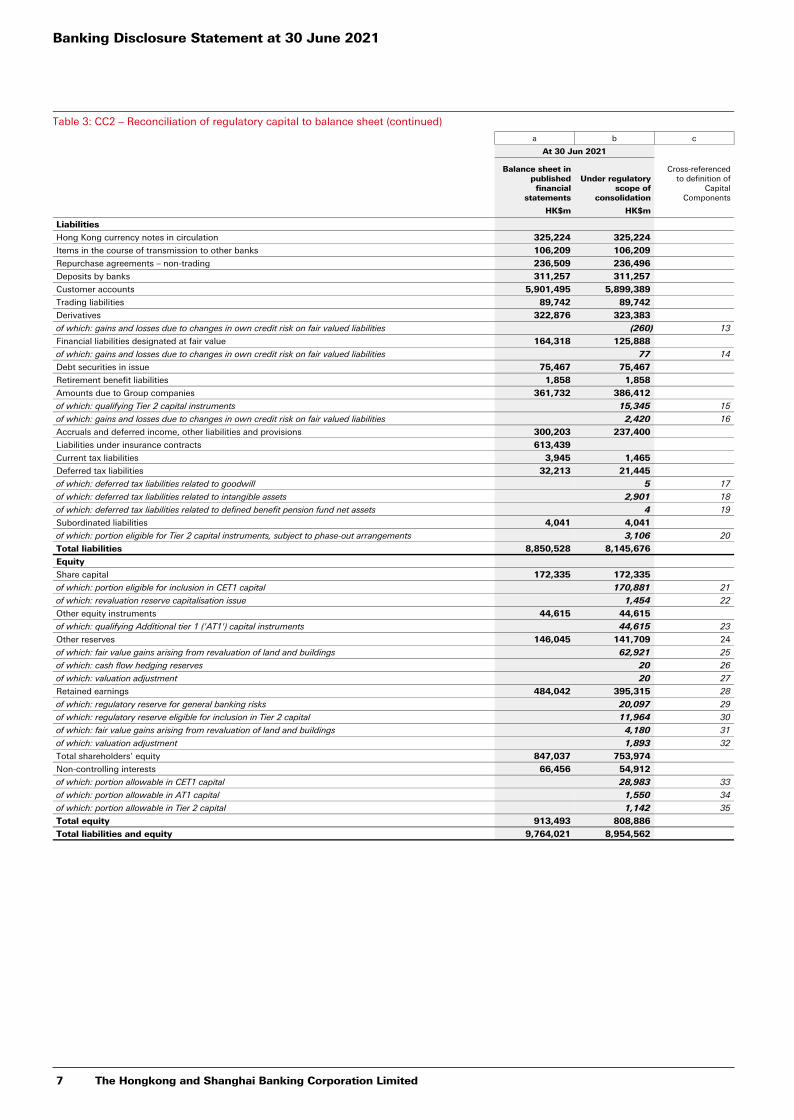
Table 3: CC2 – Reconciliation of regulatory capital to balance sheet (continued)
a b c
At 30 Jun 2021
Balance sheet in published financial
statements
Under regulatory scope of
consolidation
Cross-referenced to definition of
Capital Components
HK$m HK$m
Liabilities
Hong Kong currency notes in circulation 325,224 325,224
Items in the course of transmission to other banks 106,209 106,209
Repurchase agreements – non-trading 236,509 236,496
Deposits by banks 311,257 311,257
Customer accounts 5,901,495 5,899,389
Trading liabilities 89,742 89,742
Derivatives 322,876 323,383
of which: gains and losses due to changes in own credit risk on fair valued liabilities (260) 13
Financial liabilities designated at fair value 164,318 125,888
of which: gains and losses due to changes in own credit risk on fair valued liabilities 77 14
Debt securities in issue 75,467 75,467
Retirement benefit liabilities 1,858 1,858
Amounts due to Group companies 361,732 386,412
of which: qualifying Tier 2 capital instruments 15,345 15
of which: gains and losses due to changes in own credit risk on fair valued liabilities 2,420 16
Accruals and deferred income, other liabilities and provisions 300,203 237,400
Liabilities under insurance contracts 613,439
Current tax liabilities 3,945 1,465
Deferred tax liabilities 32,213 21,445
of which: deferred tax liabilities related to goodwill 5 17
of which: deferred tax liabilities related to intangible assets 2,901 18
of which: deferred tax liabilities related to defined benefit pension fund net assets 4 19
Subordinated liabilities 4,041 4,041
of which: portion eligible for Tier 2 capital instruments, subject to phase-out arrangements 3,106 20
Total liabilities 8,850,528 8,145,676
Equity
Share capital 172,335 172,335
of which: portion eligible for inclusion in CET1 capital 170,881 21
of which: revaluation reserve capitalisation issue 1,454 22
Other equity instruments 44,615 44,615
of which: qualifying Additional tier 1 ('AT1') capital instruments 44,615 23
Other reserves 146,045 141,709 24
of which: fair value gains arising from revaluation of land and buildings 62,921 25
of which: cash flow hedging reserves 20 26
of which: valuation adjustment 20 27
Retained earnings 484,042 395,315 28
of which: regulatory reserve for general banking risks 20,097 29
of which: regulatory reserve eligible for inclusion in Tier 2 capital 11,964 30
of which: fair value gains arising from revaluation of land and buildings 4,180 31
of which: valuation adjustment 1,893 32
Total shareholders’ equity 847,037 753,974
Non-controlling interests 66,456 54,912
of which: portion allowable in CET1 capital 28,983 33
of which: portion allowable in AT1 capital 1,550 34
of which: portion allowable in Tier 2 capital 1,142 35
Total equity 913,493 808,886
Total liabilities and equity 9,764,021 8,954,562
Banking Disclosure Statement at 30 June 2021
7 The Hongkong and Shanghai Banking Corporation Limited
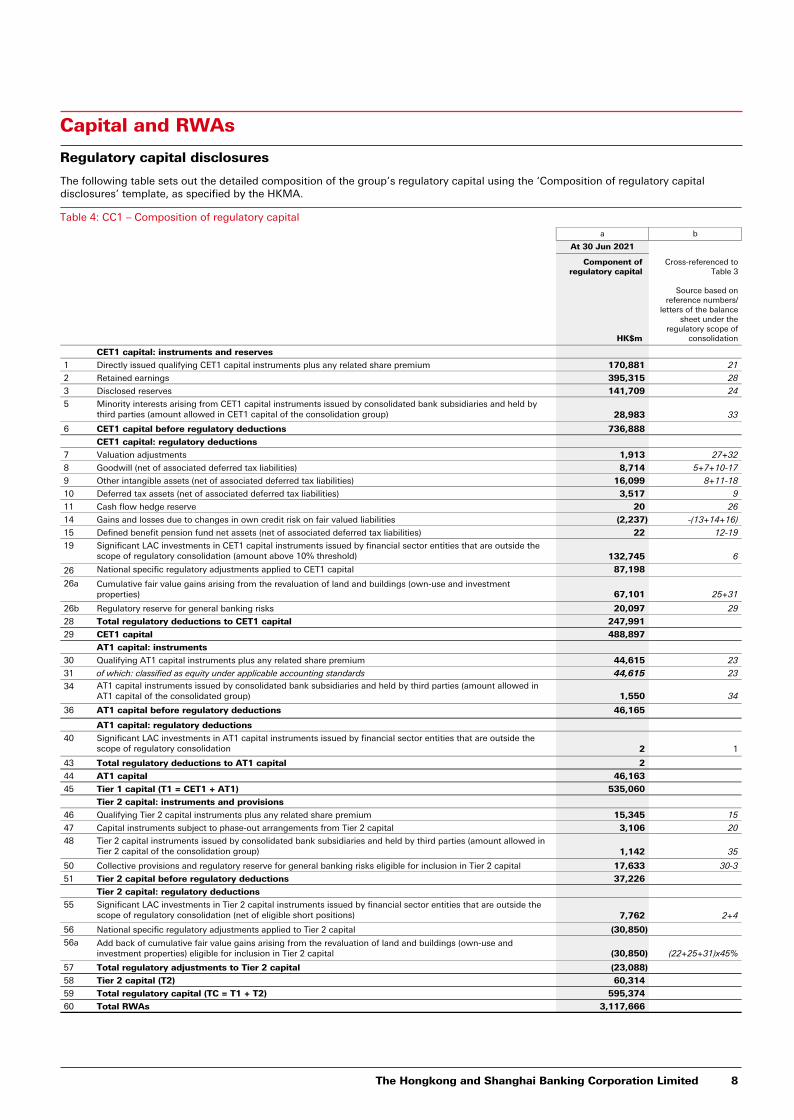
Capital and RWAs
Regulatory capital disclosures
The following table sets out the detailed composition of the group’s regulatory capital using the ‘Composition of regulatory capital disclosures’ template, as specified by the HKMA.
Table 4: CC1 – Composition of regulatory capital
a b
At 30 Jun 2021
Component of regulatory capital
Cross-referenced to Table 3
HK$m
Source based on reference numbers/
letters of the balance sheet under the
regulatory scope of consolidation
CET1 capital: instruments and reserves
1 Directly issued qualifying CET1 capital instruments plus any related share premium 170,881 21
2 Retained earnings 395,315 28
3 Disclosed reserves 141,709 24
5 Minority interests arising from CET1 capital instruments issued by consolidated bank subsidiaries and held by third parties (amount allowed in CET1 capital of the consolidation group) 28,983 33
6 CET1 capital before regulatory deductions 736,888
CET1 capital: regulatory deductions
7 Valuation adjustments 1,913 27+32
8 Goodwill (net of associated deferred tax liabilities) 8,714 5+7+10-17
9 Other intangible assets (net of associated deferred tax liabilities) 16,099 8+11-18
10 Deferred tax assets (net of associated deferred tax liabilities) 3,517 9
11 Cash flow hedge reserve 20 26
14 Gains and losses due to changes in own credit risk on fair valued liabilities (2,237) -(13+14+16)
15 Defined benefit pension fund net assets (net of associated deferred tax liabilities) 22 12-19
19 Significant LAC investments in CET1 capital instruments issued by financial sector entities that are outside the scope of regulatory consolidation (amount above 10% threshold) 132,745 6
26 National specific regulatory adjustments applied to CET1 capital 87,198
26a Cumulative fair value gains arising from the revaluation of land and buildings (own-use and investment properties) 67,101 25+31
26b Regulatory reserve for general banking risks 20,097 29
28 Total regulatory deductions to CET1 capital 247,991
29 CET1 capital 488,897
AT1 capital: instruments
30 Qualifying AT1 capital instruments plus any related share premium 44,615 23
31 of which: classified as equity under applicable accounting standards 44,615 23
34 AT1 capital instruments issued by consolidated bank subsidiaries and held by third parties (amount allowed in AT1 capital of the consolidated group) 1,550 34
36 AT1 capital before regulatory deductions 46,165
AT1 capital: regulatory deductions
40 Significant LAC investments in AT1 capital instruments issued by financial sector entities that are outside the scope of regulatory consolidation 2 1
43 Total regulatory deductions to AT1 capital 2
44 AT1 capital 46,163
45 Tier 1 capital (T1 = CET1 + AT1) 535,060
Tier 2 capital: instruments and provisions
46 Qualifying Tier 2 capital instruments plus any related share premium 15,345 15
47 Capital instruments subject to phase-out arrangements from Tier 2 capital 3,106 20
48 Tier 2 capital instruments issued by consolidated bank subsidiaries and held by third parties (amount allowed in Tier 2 capital of the consolidation group) 1,142 35
50 Collective provisions and regulatory reserve for general banking risks eligible for inclusion in Tier 2 capital 17,633 30-3
51 Tier 2 capital before regulatory deductions 37,226
Tier 2 capital: regulatory deductions
55 Significant LAC investments in Tier 2 capital instruments issued by financial sector entities that are outside the scope of regulatory consolidation (net of eligible short positions) 7,762 2+4
56 National specific regulatory adjustments applied to Tier 2 capital (30,850)
56a Add back of cumulative fair value gains arising from the revaluation of land and buildings (own-use and investment properties) eligible for inclusion in Tier 2 capital (30,850) (22+25+31)x45%
57 Total regulatory adjustments to Tier 2 capital (23,088)
58 Tier 2 capital (T2) 60,314
59 Total regulatory capital (TC = T1 + T2) 595,374
60 Total RWAs 3,117,666
The Hongkong and Shanghai Banking Corporation Limited 8
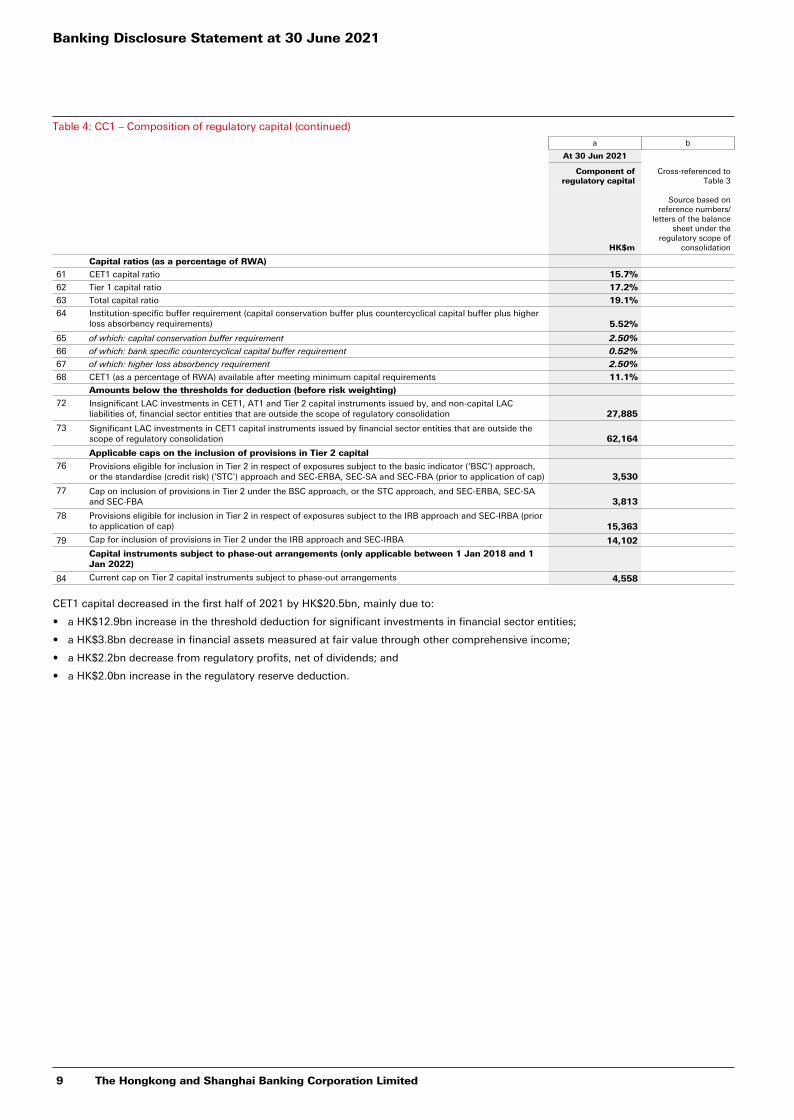
Table 4: CC1 – Composition of regulatory capital (continued)
a b
At 30 Jun 2021
Component of regulatory capital
Cross-referenced to Table 3
HK$m
Source based on reference numbers/
letters of the balance sheet under the
regulatory scope of consolidation
Capital ratios (as a percentage of RWA)
61 CET1 capital ratio 15.7%
62 Tier 1 capital ratio 17.2%
63 Total capital ratio 19.1%
64 Institution-specific buffer requirement (capital conservation buffer plus countercyclical capital buffer plus higher loss absorbency requirements) 5.52%
65 of which: capital conservation buffer requirement 2.50%
66 of which: bank specific countercyclical capital buffer requirement 0.52%
67 of which: higher loss absorbency requirement 2.50%
68 CET1 (as a percentage of RWA) available after meeting minimum capital requirements 11.1%
Amounts below the thresholds for deduction (before risk weighting)
72 Insignificant LAC investments in CET1, AT1 and Tier 2 capital instruments issued by, and non-capital LAC liabilities of, financial sector entities that are outside the scope of regulatory consolidation 27,885
73 Significant LAC investments in CET1 capital instruments issued by financial sector entities that are outside the scope of regulatory consolidation 62,164
Applicable caps on the inclusion of provisions in Tier 2 capital
76 Provisions eligible for inclusion in Tier 2 in respect of exposures subject to the basic indicator ('BSC') approach, or the standardise (credit risk) ('STC') approach and SEC-ERBA, SEC-SA and SEC-FBA (prior to application of cap) 3,530
77 Cap on inclusion of provisions in Tier 2 under the BSC approach, or the STC approach, and SEC-ERBA, SEC-SA and SEC-FBA 3,813
78 Provisions eligible for inclusion in Tier 2 in respect of exposures subject to the IRB approach and SEC-IRBA (prior to application of cap) 15,363
79 Cap for inclusion of provisions in Tier 2 under the IRB approach and SEC-IRBA 14,102
Capital instruments subject to phase-out arrangements (only applicable between 1 Jan 2018 and 1 Jan 2022)
84 Current cap on Tier 2 capital instruments subject to phase-out arrangements 4,558
CET1 capital decreased in the first half of 2021 by HK$20.5bn, mainly due to:
• a HK$12.9bn increase in the threshold deduction for significant investments in financial sector entities;
• a HK$3.8bn decrease in financial assets measured at fair value through other comprehensive income;
• a HK$2.2bn decrease from regulatory profits, net of dividends; and
• a HK$2.0bn increase in the regulatory reserve deduction.
Banking Disclosure Statement at 30 June 2021
9 The Hongkong and Shanghai Banking Corporation Limited
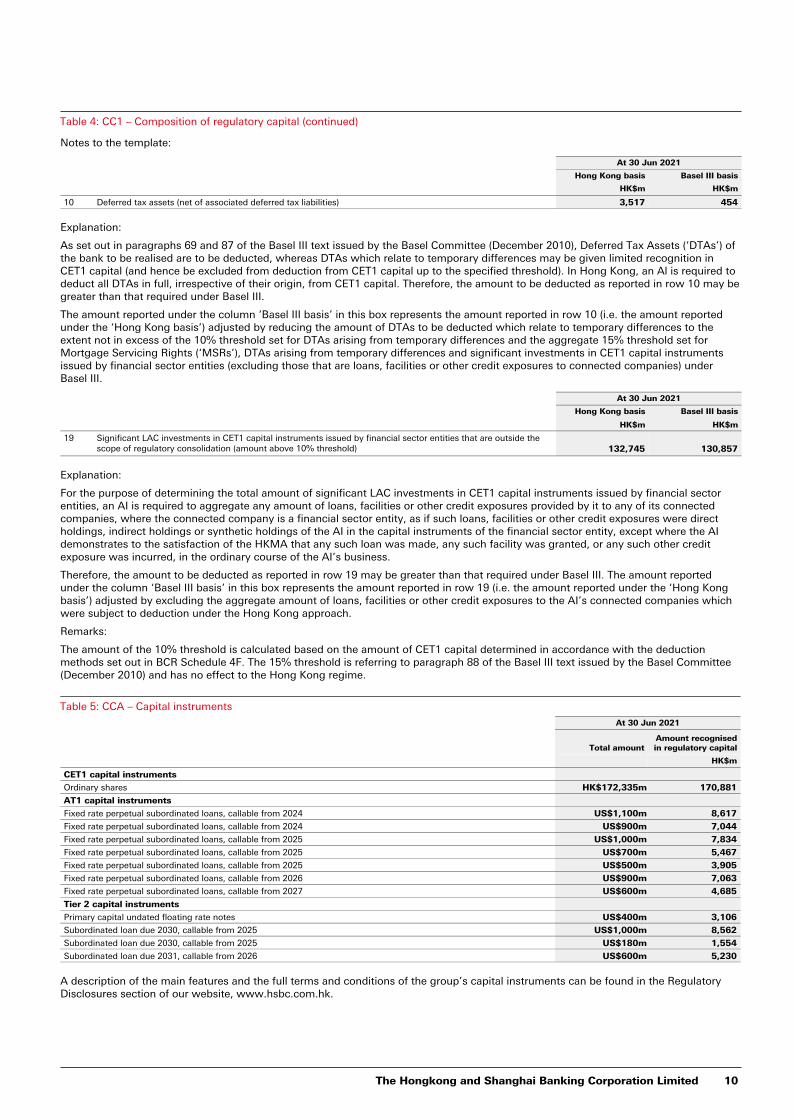
Table 4: CC1 – Composition of regulatory capital (continued)
Notes to the template:
At 30 Jun 2021
Hong Kong basis Basel III basis
HK$m HK$m
10 Deferred tax assets (net of associated deferred tax liabilities) 3,517 454
Explanation:
As set out in paragraphs 69 and 87 of the Basel III text issued by the Basel Committee (December 2010), Deferred Tax Assets (‘DTAs’) of the bank to be realised are to be deducted, whereas DTAs which relate to temporary differences may be given limited recognition in CET1 capital (and hence be excluded from deduction from CET1 capital up to the specified threshold). In Hong Kong, an Al is required to deduct all DTAs in full, irrespective of their origin, from CET1 capital. Therefore, the amount to be deducted as reported in row 10 may be greater than that required under Basel III.
The amount reported under the column ‘Basel III basis’ in this box represents the amount reported in row 10 (i.e. the amount reported under the ‘Hong Kong basis’) adjusted by reducing the amount of DTAs to be deducted which relate to temporary differences to the extent not in excess of the 10% threshold set for DTAs arising from temporary differences and the aggregate 15% threshold set for Mortgage Servicing Rights (‘MSRs’), DTAs arising from temporary differences and significant investments in CET1 capital instruments issued by financial sector entities (excluding those that are loans, facilities or other credit exposures to connected companies) under Basel III.
At 30 Jun 2021
Hong Kong basis Basel III basis
HK$m HK$m
19 Significant LAC investments in CET1 capital instruments issued by financial sector entities that are outside the scope of regulatory consolidation (amount above 10% threshold) 132,745 130,857
Explanation:
For the purpose of determining the total amount of significant LAC investments in CET1 capital instruments issued by financial sector entities, an AI is required to aggregate any amount of loans, facilities or other credit exposures provided by it to any of its connected companies, where the connected company is a financial sector entity, as if such loans, facilities or other credit exposures were direct holdings, indirect holdings or synthetic holdings of the AI in the capital instruments of the financial sector entity, except where the AI demonstrates to the satisfaction of the HKMA that any such loan was made, any such facility was granted, or any such other credit exposure was incurred, in the ordinary course of the AI’s business.
Therefore, the amount to be deducted as reported in row 19 may be greater than that required under Basel III. The amount reported under the column ‘Basel III basis’ in this box represents the amount reported in row 19 (i.e. the amount reported under the ‘Hong Kong basis’) adjusted by excluding the aggregate amount of loans, facilities or other credit exposures to the AI’s connected companies which were subject to deduction under the Hong Kong approach.
Remarks:
The amount of the 10% threshold is calculated based on the amount of CET1 capital determined in accordance with the deduction methods set out in BCR Schedule 4F. The 15% threshold is referring to paragraph 88 of the Basel III text issued by the Basel Committee (December 2010) and has no effect to the Hong Kong regime.
Table 5: CCA – Capital instruments
At 30 Jun 2021
Total amountAmount recognised in regulatory capital
HK$m
CET1 capital instruments
Ordinary shares HK$172,335m 170,881
AT1 capital instruments
Fixed rate perpetual subordinated loans, callable from 2024 US$1,100m 8,617
Fixed rate perpetual subordinated loans, callable from 2024 US$900m 7,044
Fixed rate perpetual subordinated loans, callable from 2025 US$1,000m 7,834
Fixed rate perpetual subordinated loans, callable from 2025 US$700m 5,467
Fixed rate perpetual subordinated loans, callable from 2025 US$500m 3,905
Fixed rate perpetual subordinated loans, callable from 2026 US$900m 7,063
Fixed rate perpetual subordinated loans, callable from 2027 US$600m 4,685
Tier 2 capital instruments
Primary capital undated floating rate notes US$400m 3,106
Subordinated loan due 2030, callable from 2025 US$1,000m 8,562
Subordinated loan due 2030, callable from 2025 US$180m 1,554
Subordinated loan due 2031, callable from 2026 US$600m 5,230
A description of the main features and the full terms and conditions of the group’s capital instruments can be found in the Regulatory Disclosures section of our website, www.hsbc.com.hk.
The Hongkong and Shanghai Banking Corporation Limited 10
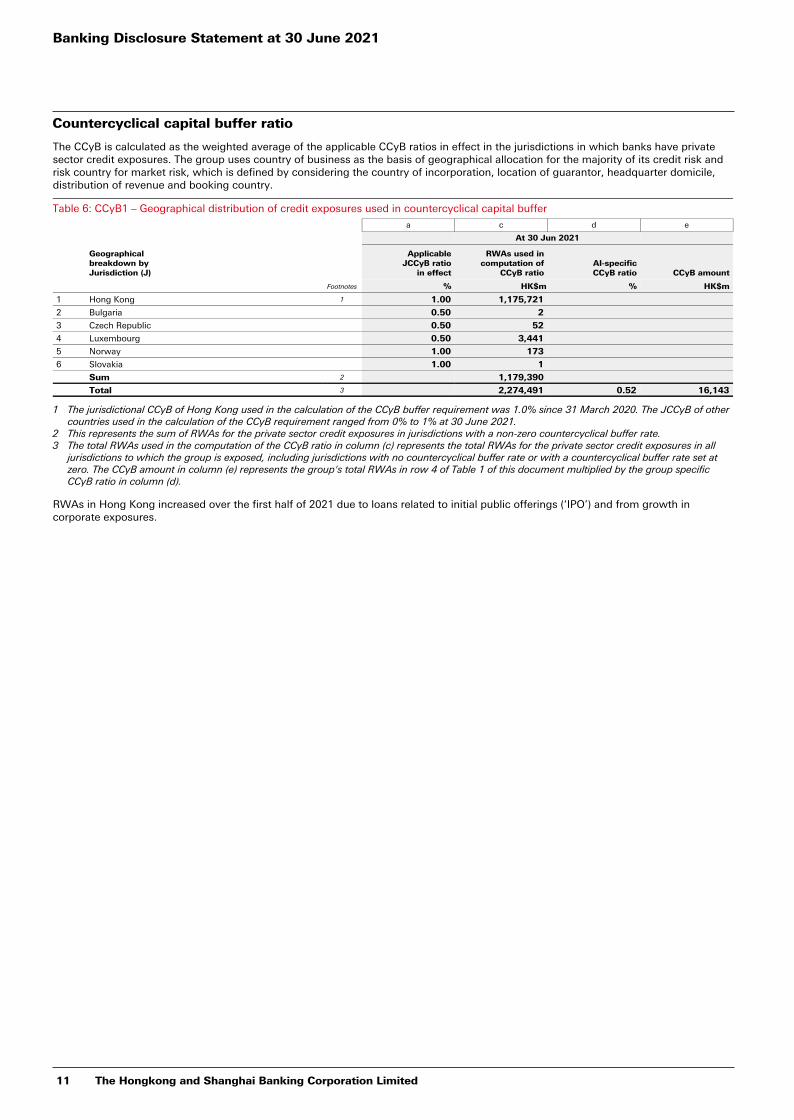
Countercyclical capital buffer ratio
The CCyB is calculated as the weighted average of the applicable CCyB ratios in effect in the jurisdictions in which banks have private sector credit exposures. The group uses country of business as the basis of geographical allocation for the majority of its credit risk and risk country for market risk, which is defined by considering the country of incorporation, location of guarantor, headquarter domicile, distribution of revenue and booking country.
Table 6: CCyB1 – Geographical distribution of credit exposures used in countercyclical capital buffer
a c d e
At 30 Jun 2021
Geographical breakdown by Jurisdiction (J)
ApplicableJCCyB ratio
in effect
RWAs used in computation of
CCyB ratioAI-specificCCyB ratio CCyB amount
Footnotes % HK$m % HK$m
1 Hong Kong 1 1.00 1,175,721
2 Bulgaria 0.50 2
3 Czech Republic 0.50 52
4 Luxembourg 0.50 3,441
5 Norway 1.00 173
6 Slovakia 1.00 1
Sum 2 1,179,390
Total 3 2,274,491 0.52 16,143
1 The jurisdictional CCyB of Hong Kong used in the calculation of the CCyB buffer requirement was 1.0% since 31 March 2020. The JCCyB of other countries used in the calculation of the CCyB requirement ranged from 0% to 1% at 30 June 2021.
2 This represents the sum of RWAs for the private sector credit exposures in jurisdictions with a non-zero countercyclical buffer rate.3 The total RWAs used in the computation of the CCyB ratio in column (c) represents the total RWAs for the private sector credit exposures in all
jurisdictions to which the group is exposed, including jurisdictions with no countercyclical buffer rate or with a countercyclical buffer rate set at zero. The CCyB amount in column (e) represents the group's total RWAs in row 4 of Table 1 of this document multiplied by the group specific CCyB ratio in column (d).
RWAs in Hong Kong increased over the first half of 2021 due to loans related to initial public offerings (‘IPO’) and from growth in corporate exposures.
Banking Disclosure Statement at 30 June 2021
11 The Hongkong and Shanghai Banking Corporation Limited
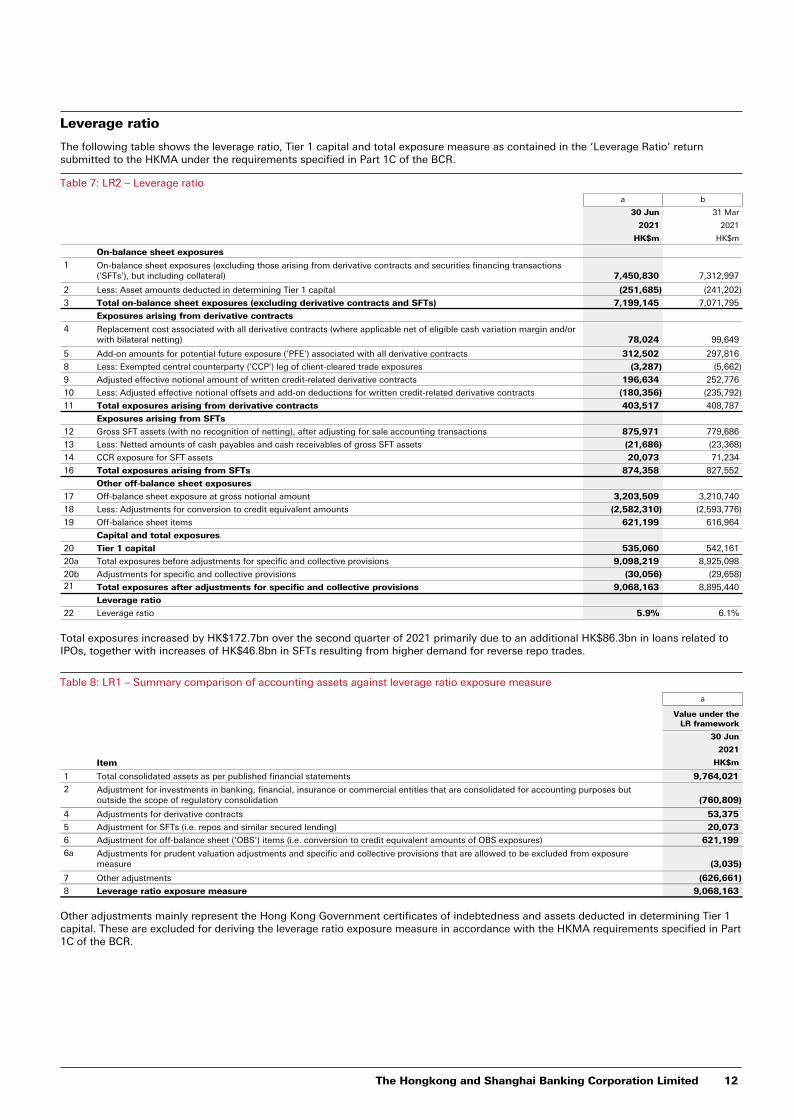
Leverage ratio
The following table shows the leverage ratio, Tier 1 capital and total exposure measure as contained in the ‘Leverage Ratio’ return submitted to the HKMA under the requirements specified in Part 1C of the BCR.
Table 7: LR2 – Leverage ratio
a b
30 Jun 31 Mar
2021 2021
HK$m HK$m
On-balance sheet exposures
1 On-balance sheet exposures (excluding those arising from derivative contracts and securities financing transactions ('SFTs'), but including collateral) 7,450,830 7,312,997
2 Less: Asset amounts deducted in determining Tier 1 capital (251,685) (241,202)
3 Total on-balance sheet exposures (excluding derivative contracts and SFTs) 7,199,145 7,071,795
Exposures arising from derivative contracts
4 Replacement cost associated with all derivative contracts (where applicable net of eligible cash variation margin and/or with bilateral netting) 78,024 99,649
5 Add-on amounts for potential future exposure ('PFE') associated with all derivative contracts 312,502 297,816
8 Less: Exempted central counterparty ('CCP') leg of client-cleared trade exposures (3,287) (5,662)
9 Adjusted effective notional amount of written credit-related derivative contracts 196,634 252,776
10 Less: Adjusted effective notional offsets and add-on deductions for written credit-related derivative contracts (180,356) (235,792)
11 Total exposures arising from derivative contracts 403,517 408,787
Exposures arising from SFTs
12 Gross SFT assets (with no recognition of netting), after adjusting for sale accounting transactions 875,971 779,686
13 Less: Netted amounts of cash payables and cash receivables of gross SFT assets (21,686) (23,368)
14 CCR exposure for SFT assets 20,073 71,234
16 Total exposures arising from SFTs 874,358 827,552
Other off-balance sheet exposures
17 Off-balance sheet exposure at gross notional amount 3,203,509 3,210,740
18 Less: Adjustments for conversion to credit equivalent amounts (2,582,310) (2,593,776)
19 Off-balance sheet items 621,199 616,964
Capital and total exposures
20 Tier 1 capital 535,060 542,161
20a Total exposures before adjustments for specific and collective provisions 9,098,219 8,925,098
20b Adjustments for specific and collective provisions (30,056) (29,658) 21 Total exposures after adjustments for specific and collective provisions 9,068,163 8,895,440
Leverage ratio
22 Leverage ratio 5.9% 6.1%
Total exposures increased by HK$172.7bn over the second quarter of 2021 primarily due to an additional HK$86.3bn in loans related to IPOs, together with increases of HK$46.8bn in SFTs resulting from higher demand for reverse repo trades.
Table 8: LR1 – Summary comparison of accounting assets against leverage ratio exposure measure
a
Value under the LR framework
30 Jun
2021
Item HK$m
1 Total consolidated assets as per published financial statements 9,764,021
2 Adjustment for investments in banking, financial, insurance or commercial entities that are consolidated for accounting purposes but outside the scope of regulatory consolidation (760,809)
4 Adjustments for derivative contracts 53,375
5 Adjustment for SFTs (i.e. repos and similar secured lending) 20,073
6 Adjustment for off-balance sheet (‘OBS’) items (i.e. conversion to credit equivalent amounts of OBS exposures) 621,199
6a Adjustments for prudent valuation adjustments and specific and collective provisions that are allowed to be excluded from exposure measure (3,035)
7 Other adjustments (626,661)
8 Leverage ratio exposure measure 9,068,163
Other adjustments mainly represent the Hong Kong Government certificates of indebtedness and assets deducted in determining Tier 1 capital. These are excluded for deriving the leverage ratio exposure measure in accordance with the HKMA requirements specified in Part 1C of the BCR.
The Hongkong and Shanghai Banking Corporation Limited 12
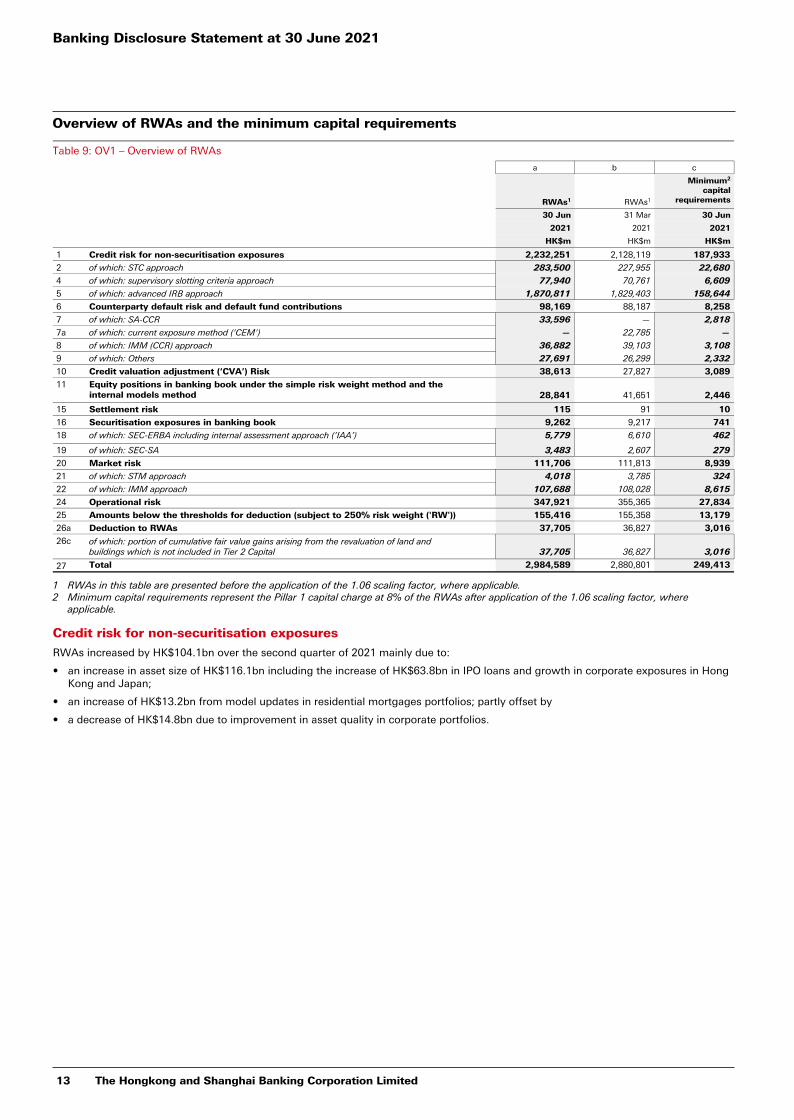
Overview of RWAs and the minimum capital requirements
Table 9: OV1 – Overview of RWAs
a b c
RWAs1 RWAs1
Minimum2
capital requirements
30 Jun 31 Mar 30 Jun
2021 2021 2021
HK$m HK$m HK$m
1 Credit risk for non-securitisation exposures 2,232,251 2,128,119 187,933
2 of which: STC approach 283,500 227,955 22,680
4 of which: supervisory slotting criteria approach 77,940 70,761 6,609
5 of which: advanced IRB approach 1,870,811 1,829,403 158,644
6 Counterparty default risk and default fund contributions 98,169 88,187 8,258
7 of which: SA-CCR 33,596 — 2,818
7a of which: current exposure method ('CEM') — 22,785 —
8 of which: IMM (CCR) approach 36,882 39,103 3,108
9 of which: Others 27,691 26,299 2,332
10 Credit valuation adjustment (‘CVA’) Risk 38,613 27,827 3,089
11 Equity positions in banking book under the simple risk weight method and the internal models method 28,841 41,651 2,446
15 Settlement risk 115 91 10
16 Securitisation exposures in banking book 9,262 9,217 741
18 of which: SEC-ERBA including internal assessment approach (‘IAA’) 5,779 6,610 462
19 of which: SEC-SA 3,483 2,607 279
20 Market risk 111,706 111,813 8,939
21 of which: STM approach 4,018 3,785 324
22 of which: IMM approach 107,688 108,028 8,615
24 Operational risk 347,921 355,365 27,834
25 Amounts below the thresholds for deduction (subject to 250% risk weight ('RW')) 155,416 155,358 13,179
26a Deduction to RWAs 37,705 36,827 3,016
26c of which: portion of cumulative fair value gains arising from the revaluation of land and buildings which is not included in Tier 2 Capital 37,705 36,827 3,016
27 Total 2,984,589 2,880,801 249,413
1 RWAs in this table are presented before the application of the 1.06 scaling factor, where applicable.2 Minimum capital requirements represent the Pillar 1 capital charge at 8% of the RWAs after application of the 1.06 scaling factor, where
applicable.
Credit risk for non-securitisation exposures
RWAs increased by HK$104.1bn over the second quarter of 2021 mainly due to:
• an increase in asset size of HK$116.1bn including the increase of HK$63.8bn in IPO loans and growth in corporate exposures in Hong Kong and Japan;
• an increase of HK$13.2bn from model updates in residential mortgages portfolios; partly offset by
• a decrease of HK$14.8bn due to improvement in asset quality in corporate portfolios.
Banking Disclosure Statement at 30 June 2021
13 The Hongkong and Shanghai Banking Corporation Limited
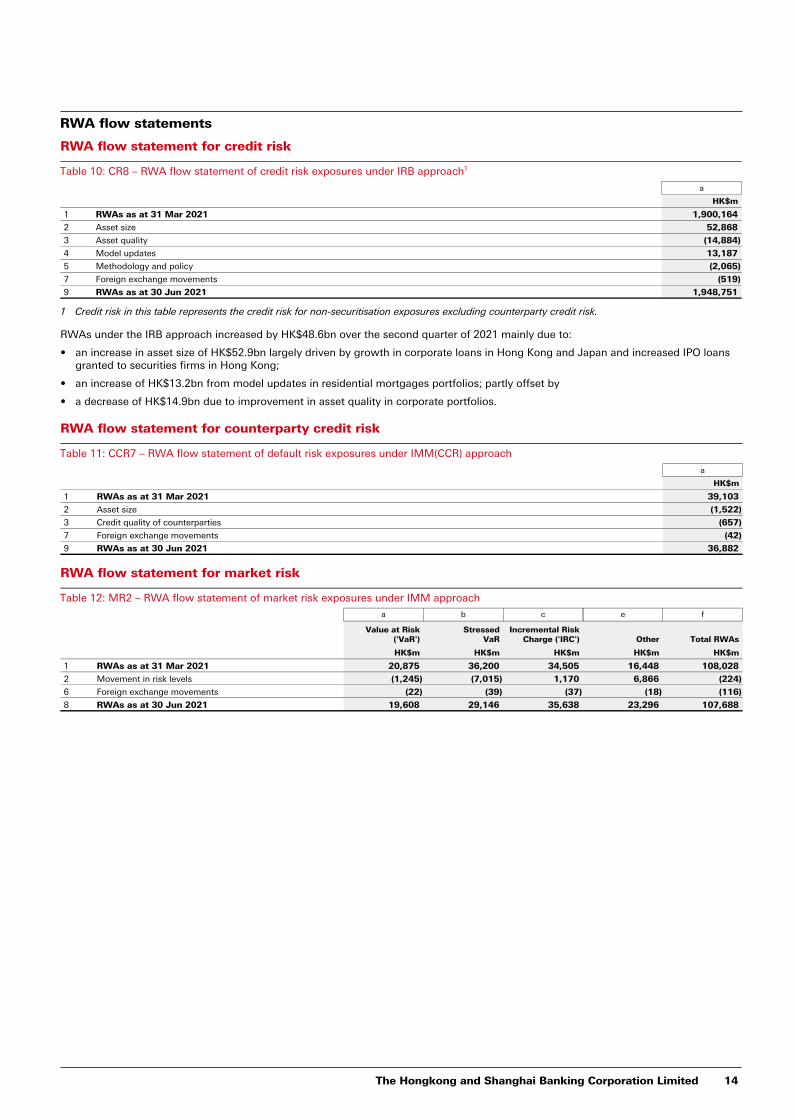
RWA flow statements
RWA flow statement for credit risk
Table 10: CR8 – RWA flow statement of credit risk exposures under IRB approach1
a
HK$m
1 RWAs as at 31 Mar 2021 1,900,164
2 Asset size 52,868
3 Asset quality (14,884)
4 Model updates 13,187
5 Methodology and policy (2,065)
7 Foreign exchange movements (519)
9 RWAs as at 30 Jun 2021 1,948,751
1 Credit risk in this table represents the credit risk for non-securitisation exposures excluding counterparty credit risk.
RWAs under the IRB approach increased by HK$48.6bn over the second quarter of 2021 mainly due to:
• an increase in asset size of HK$52.9bn largely driven by growth in corporate loans in Hong Kong and Japan and increased IPO loans granted to securities firms in Hong Kong;
• an increase of HK$13.2bn from model updates in residential mortgages portfolios; partly offset by
• a decrease of HK$14.9bn due to improvement in asset quality in corporate portfolios.
RWA flow statement for counterparty credit risk
Table 11: CCR7 – RWA flow statement of default risk exposures under IMM(CCR) approach
a
HK$m
1 RWAs as at 31 Mar 2021 39,103
2 Asset size (1,522)
3 Credit quality of counterparties (657)
7 Foreign exchange movements (42)
9 RWAs as at 30 Jun 2021 36,882
RWA flow statement for market risk
Table 12: MR2 – RWA flow statement of market risk exposures under IMM approach
a b c e f
Value at Risk ('VaR')
Stressed VaR
Incremental Risk Charge ('IRC') Other Total RWAs
HK$m HK$m HK$m HK$m HK$m
1 RWAs as at 31 Mar 2021 20,875 36,200 34,505 16,448 108,028
2 Movement in risk levels (1,245) (7,015) 1,170 6,866 (224)
6 Foreign exchange movements (22) (39) (37) (18) (116)
8 RWAs as at 30 Jun 2021 19,608 29,146 35,638 23,296 107,688
The Hongkong and Shanghai Banking Corporation Limited 14
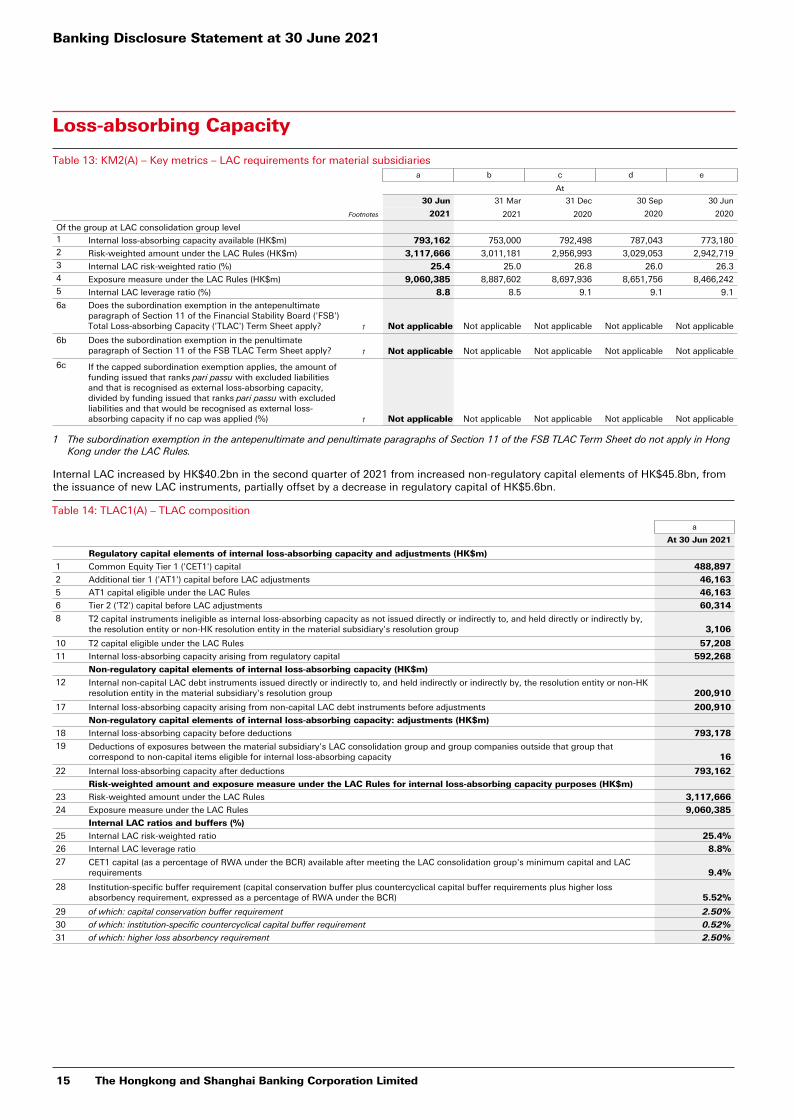
Loss-absorbing Capacity
Table 13: KM2(A) – Key metrics – LAC requirements for material subsidiariesa b c d e
At
30 Jun 31 Mar 31 Dec 30 Sep 30 Jun
Footnotes 2021 2021 2020 2020 2020
Of the group at LAC consolidation group level1 Internal loss-absorbing capacity available (HK$m) 793,162 753,000 792,498 787,043 773,1802 Risk-weighted amount under the LAC Rules (HK$m) 3,117,666 3,011,181 2,956,993 3,029,053 2,942,7193 Internal LAC risk-weighted ratio (%) 25.4 25.0 26.8 26.0 26.34 Exposure measure under the LAC Rules (HK$m) 9,060,385 8,887,602 8,697,936 8,651,756 8,466,2425 Internal LAC leverage ratio (%) 8.8 8.5 9.1 9.1 9.1
6a Does the subordination exemption in the antepenultimate paragraph of Section 11 of the Financial Stability Board ('FSB') Total Loss-absorbing Capacity ('TLAC') Term Sheet apply? 1 Not applicable Not applicable Not applicable Not applicable Not applicable
6b Does the subordination exemption in the penultimate paragraph of Section 11 of the FSB TLAC Term Sheet apply? 1 Not applicable Not applicable Not applicable Not applicable Not applicable
6c If the capped subordination exemption applies, the amount of funding issued that ranks pari passu with excluded liabilities and that is recognised as external loss-absorbing capacity, divided by funding issued that ranks pari passu with excluded liabilities and that would be recognised as external loss-absorbing capacity if no cap was applied (%) 1 Not applicable Not applicable Not applicable Not applicable Not applicable
1 The subordination exemption in the antepenultimate and penultimate paragraphs of Section 11 of the FSB TLAC Term Sheet do not apply in Hong Kong under the LAC Rules.
Internal LAC increased by HK$40.2bn in the second quarter of 2021 from increased non-regulatory capital elements of HK$45.8bn, from the issuance of new LAC instruments, partially offset by a decrease in regulatory capital of HK$5.6bn.
Table 14: TLAC1(A) – TLAC composition
a
At 30 Jun 2021
Regulatory capital elements of internal loss-absorbing capacity and adjustments (HK$m)
1 Common Equity Tier 1 ('CET1') capital 488,897
2 Additional tier 1 ('AT1') capital before LAC adjustments 46,163
5 AT1 capital eligible under the LAC Rules 46,163
6 Tier 2 ('T2') capital before LAC adjustments 60,314
8 T2 capital instruments ineligible as internal loss-absorbing capacity as not issued directly or indirectly to, and held directly or indirectly by, the resolution entity or non-HK resolution entity in the material subsidiary's resolution group 3,106
10 T2 capital eligible under the LAC Rules 57,208
11 Internal loss-absorbing capacity arising from regulatory capital 592,268
Non-regulatory capital elements of internal loss-absorbing capacity (HK$m)
12 Internal non-capital LAC debt instruments issued directly or indirectly to, and held indirectly or indirectly by, the resolution entity or non-HK resolution entity in the material subsidiary's resolution group 200,910
17 Internal loss-absorbing capacity arising from non-capital LAC debt instruments before adjustments 200,910
Non-regulatory capital elements of internal loss-absorbing capacity: adjustments (HK$m)
18 Internal loss-absorbing capacity before deductions 793,178
19 Deductions of exposures between the material subsidiary's LAC consolidation group and group companies outside that group that correspond to non-capital items eligible for internal loss-absorbing capacity 16
22 Internal loss-absorbing capacity after deductions 793,162
Risk-weighted amount and exposure measure under the LAC Rules for internal loss-absorbing capacity purposes (HK$m)
23 Risk-weighted amount under the LAC Rules 3,117,666
24 Exposure measure under the LAC Rules 9,060,385
Internal LAC ratios and buffers (%)
25 Internal LAC risk-weighted ratio 25.4%
26 Internal LAC leverage ratio 8.8%
27 CET1 capital (as a percentage of RWA under the BCR) available after meeting the LAC consolidation group's minimum capital and LAC requirements 9.4%
28 Institution-specific buffer requirement (capital conservation buffer plus countercyclical capital buffer requirements plus higher loss absorbency requirement, expressed as a percentage of RWA under the BCR) 5.52%
29 of which: capital conservation buffer requirement 2.50%
30 of which: institution-specific countercyclical capital buffer requirement 0.52%
31 of which: higher loss absorbency requirement 2.50%
Banking Disclosure Statement at 30 June 2021
15 The Hongkong and Shanghai Banking Corporation Limited
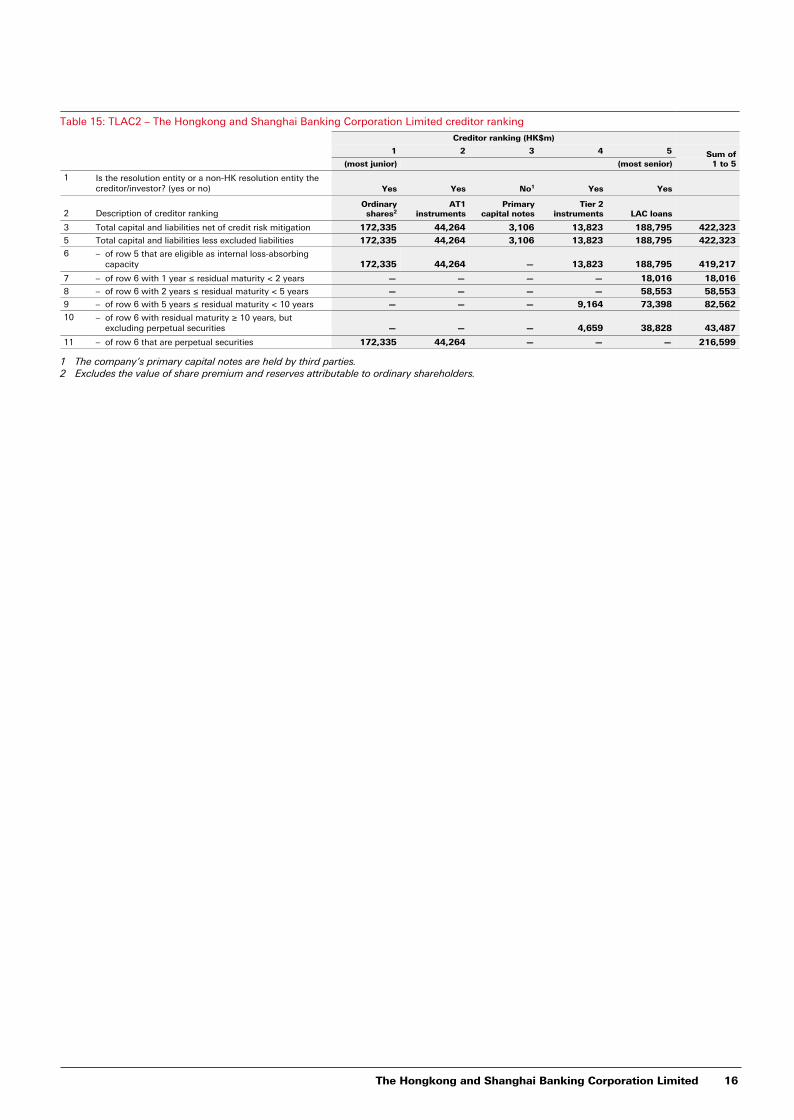
Table 15: TLAC2 – The Hongkong and Shanghai Banking Corporation Limited creditor ranking
Creditor ranking (HK$m)
Sum of 1 to 5
1 2 3 4 5
(most junior) (most senior)
1 Is the resolution entity or a non-HK resolution entity the creditor/investor? (yes or no) Yes Yes No1 Yes Yes
2 Description of creditor rankingOrdinary shares2
AT1 instruments
Primary capital notes
Tier 2 instruments LAC loans
3 Total capital and liabilities net of credit risk mitigation 172,335 44,264 3,106 13,823 188,795 422,323
5 Total capital and liabilities less excluded liabilities 172,335 44,264 3,106 13,823 188,795 422,323
6 – of row 5 that are eligible as internal loss-absorbing capacity 172,335 44,264 — 13,823 188,795 419,217
7 – of row 6 with 1 year ≤ residual maturity < 2 years — — — — 18,016 18,016
8 – of row 6 with 2 years ≤ residual maturity < 5 years — — — — 58,553 58,553
9 – of row 6 with 5 years ≤ residual maturity < 10 years — — — 9,164 73,398 82,562
10 – of row 6 with residual maturity ≥ 10 years, but excluding perpetual securities — — — 4,659 38,828 43,487
11 – of row 6 that are perpetual securities 172,335 44,264 — — — 216,599
1 The company’s primary capital notes are held by third parties.2 Excludes the value of share premium and reserves attributable to ordinary shareholders.
The Hongkong and Shanghai Banking Corporation Limited 16
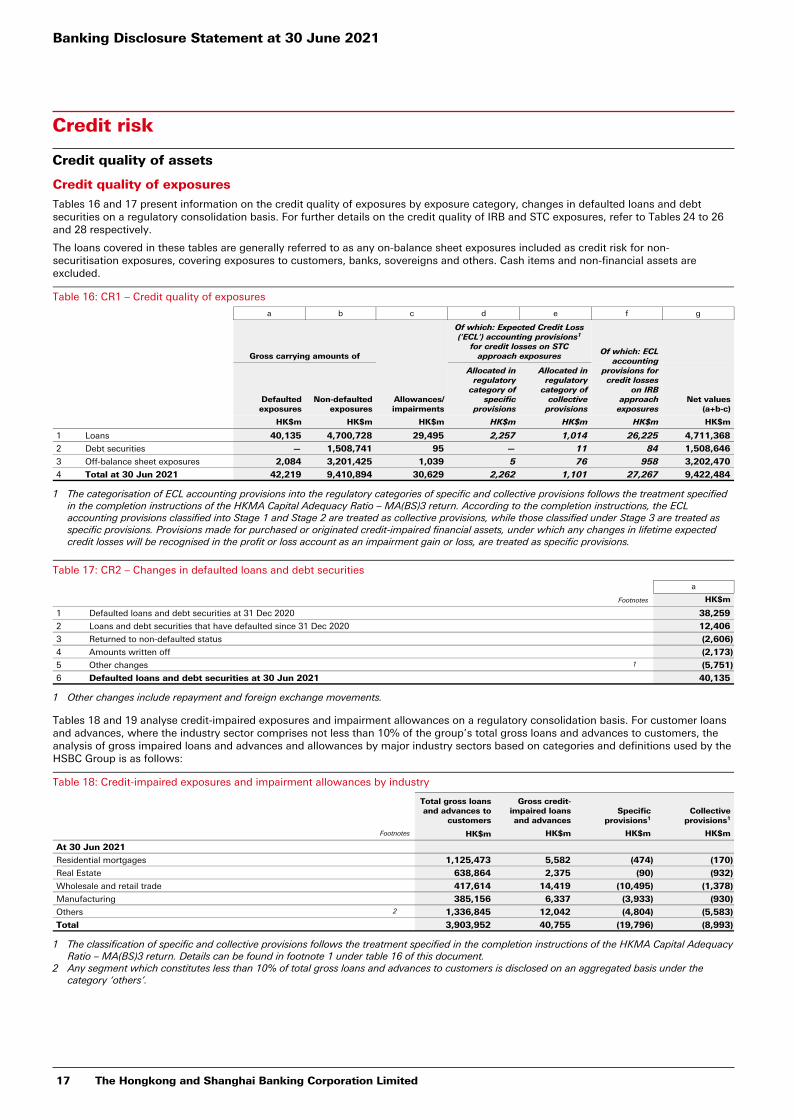
Credit risk
Credit quality of assets
Credit quality of exposures
Tables 16 and 17 present information on the credit quality of exposures by exposure category, changes in defaulted loans and debt securities on a regulatory consolidation basis. For further details on the credit quality of IRB and STC exposures, refer to Tables 24 to 26 and 28 respectively.
The loans covered in these tables are generally referred to as any on-balance sheet exposures included as credit risk for non-securitisation exposures, covering exposures to customers, banks, sovereigns and others. Cash items and non-financial assets are excluded.
Table 16: CR1 – Credit quality of exposures
a b c d e f g
Gross carrying amounts of
Allowances/impairments
Of which: Expected Credit Loss ('ECL') accounting provisions1
for credit losses on STC approach exposures
Of which: ECL
accounting provisions for credit losses
on IRB approach
exposuresNet values
(a+b-c)Defaulted exposures
Non-defaulted exposures
Allocated in regulatory
category of specific
provisions
Allocated in regulatory
category of collective
provisions
HK$m HK$m HK$m HK$m HK$m HK$m HK$m
1 Loans 40,135 4,700,728 29,495 2,257 1,014 26,225 4,711,368
2 Debt securities — 1,508,741 95 — 11 84 1,508,646
3 Off-balance sheet exposures 2,084 3,201,425 1,039 5 76 958 3,202,470
4 Total at 30 Jun 2021 42,219 9,410,894 30,629 2,262 1,101 27,267 9,422,484
1 The categorisation of ECL accounting provisions into the regulatory categories of specific and collective provisions follows the treatment specified in the completion instructions of the HKMA Capital Adequacy Ratio – MA(BS)3 return. According to the completion instructions, the ECL accounting provisions classified into Stage 1 and Stage 2 are treated as collective provisions, while those classified under Stage 3 are treated as specific provisions. Provisions made for purchased or originated credit-impaired financial assets, under which any changes in lifetime expected credit losses will be recognised in the profit or loss account as an impairment gain or loss, are treated as specific provisions.
Table 17: CR2 – Changes in defaulted loans and debt securities
a
Footnotes HK$m
1 Defaulted loans and debt securities at 31 Dec 2020 38,259
2 Loans and debt securities that have defaulted since 31 Dec 2020 12,406
3 Returned to non-defaulted status (2,606)
4 Amounts written off (2,173)
5 Other changes 1 (5,751)
6 Defaulted loans and debt securities at 30 Jun 2021 40,135
1 Other changes include repayment and foreign exchange movements.
Tables 18 and 19 analyse credit-impaired exposures and impairment allowances on a regulatory consolidation basis. For customer loans and advances, where the industry sector comprises not less than 10% of the group’s total gross loans and advances to customers, the analysis of gross impaired loans and advances and allowances by major industry sectors based on categories and definitions used by the HSBC Group is as follows:
Table 18: Credit-impaired exposures and impairment allowances by industry
Total gross loans and advances to
customers
Gross credit-impaired loans and advances
Specific provisions1
Collective provisions1
Footnotes HK$m HK$m HK$m HK$m
At 30 Jun 2021
Residential mortgages 1,125,473 5,582 (474) (170)
Real Estate 638,864 2,375 (90) (932)
Wholesale and retail trade 417,614 14,419 (10,495) (1,378)
Manufacturing 385,156 6,337 (3,933) (930)
Others 2 1,336,845 12,042 (4,804) (5,583)
Total 3,903,952 40,755 (19,796) (8,993)
1 The classification of specific and collective provisions follows the treatment specified in the completion instructions of the HKMA Capital Adequacy Ratio – MA(BS)3 return. Details can be found in footnote 1 under table 16 of this document.
2 Any segment which constitutes less than 10% of total gross loans and advances to customers is disclosed on an aggregated basis under the category ‘others’.
Banking Disclosure Statement at 30 June 2021
17 The Hongkong and Shanghai Banking Corporation Limited
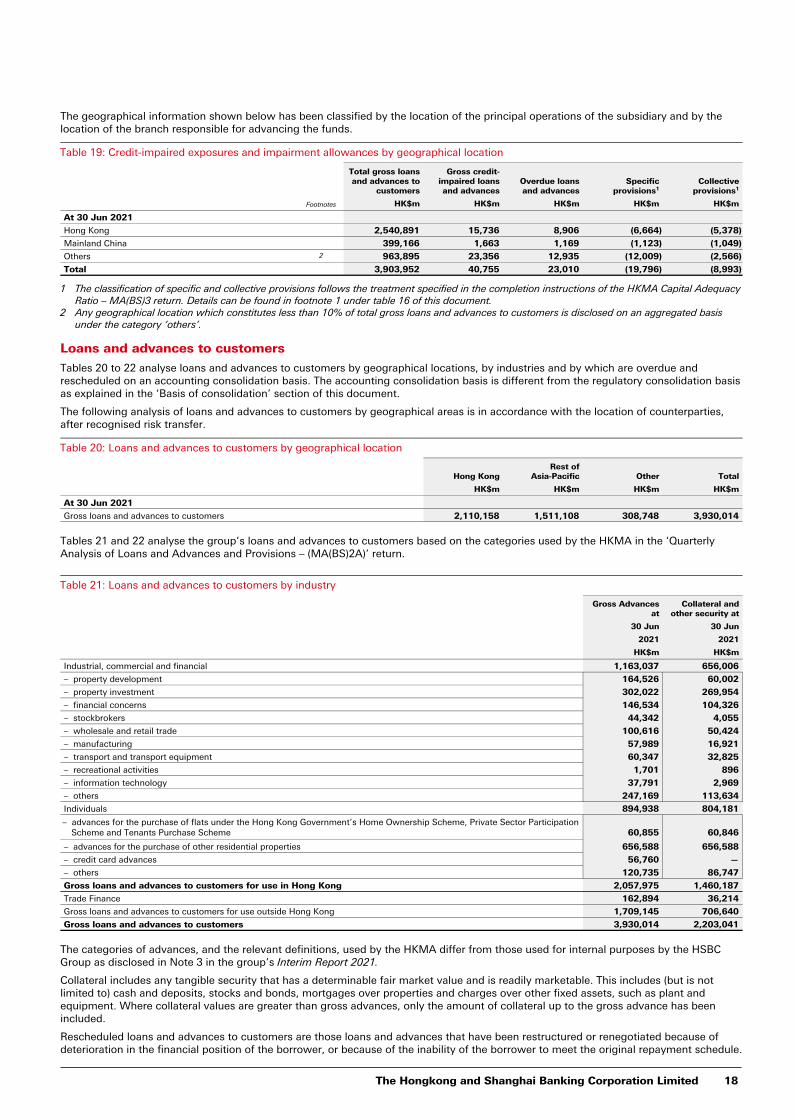
The geographical information shown below has been classified by the location of the principal operations of the subsidiary and by the location of the branch responsible for advancing the funds.
Table 19: Credit-impaired exposures and impairment allowances by geographical location
Total gross loans and advances to
customers
Gross credit-impaired loans and advances
Overdue loans and advances
Specific provisions1
Collective provisions1
Footnotes HK$m HK$m HK$m HK$m HK$m
At 30 Jun 2021
Hong Kong 2,540,891 15,736 8,906 (6,664) (5,378)
Mainland China 399,166 1,663 1,169 (1,123) (1,049)
Others 2 963,895 23,356 12,935 (12,009) (2,566)
Total 3,903,952 40,755 23,010 (19,796) (8,993)
1 The classification of specific and collective provisions follows the treatment specified in the completion instructions of the HKMA Capital Adequacy Ratio – MA(BS)3 return. Details can be found in footnote 1 under table 16 of this document.
2 Any geographical location which constitutes less than 10% of total gross loans and advances to customers is disclosed on an aggregated basis under the category ‘others’.
Loans and advances to customers
Tables 20 to 22 analyse loans and advances to customers by geographical locations, by industries and by which are overdue and rescheduled on an accounting consolidation basis. The accounting consolidation basis is different from the regulatory consolidation basis as explained in the ‘Basis of consolidation’ section of this document.
The following analysis of loans and advances to customers by geographical areas is in accordance with the location of counterparties, after recognised risk transfer.
Table 20: Loans and advances to customers by geographical location
Hong KongRest of
Asia-Pacific Other Total
HK$m HK$m HK$m HK$m
At 30 Jun 2021
Gross loans and advances to customers 2,110,158 1,511,108 308,748 3,930,014
Tables 21 and 22 analyse the group’s loans and advances to customers based on the categories used by the HKMA in the ‘Quarterly Analysis of Loans and Advances and Provisions – (MA(BS)2A)’ return.
Table 21: Loans and advances to customers by industry
Gross Advances at
Collateral and other security at
30 Jun 30 Jun
2021 2021
HK$m HK$m
Industrial, commercial and financial 1,163,037 656,006
– property development 164,526 60,002
– property investment 302,022 269,954
– financial concerns 146,534 104,326
– stockbrokers 44,342 4,055
– wholesale and retail trade 100,616 50,424
– manufacturing 57,989 16,921
– transport and transport equipment 60,347 32,825
– recreational activities 1,701 896
– information technology 37,791 2,969
– others 247,169 113,634
Individuals 894,938 804,181
– advances for the purchase of flats under the Hong Kong Government’s Home Ownership Scheme, Private Sector Participation Scheme and Tenants Purchase Scheme 60,855 60,846
– advances for the purchase of other residential properties 656,588 656,588
– credit card advances 56,760 —
– others 120,735 86,747
Gross loans and advances to customers for use in Hong Kong 2,057,975 1,460,187
Trade Finance 162,894 36,214
Gross loans and advances to customers for use outside Hong Kong 1,709,145 706,640
Gross loans and advances to customers 3,930,014 2,203,041
The categories of advances, and the relevant definitions, used by the HKMA differ from those used for internal purposes by the HSBC Group as disclosed in Note 3 in the group’s Interim Report 2021.
Collateral includes any tangible security that has a determinable fair market value and is readily marketable. This includes (but is not limited to) cash and deposits, stocks and bonds, mortgages over properties and charges over other fixed assets, such as plant and equipment. Where collateral values are greater than gross advances, only the amount of collateral up to the gross advance has been included.
Rescheduled loans and advances to customers are those loans and advances that have been restructured or renegotiated because of deterioration in the financial position of the borrower, or because of the inability of the borrower to meet the original repayment schedule.
The Hongkong and Shanghai Banking Corporation Limited 18
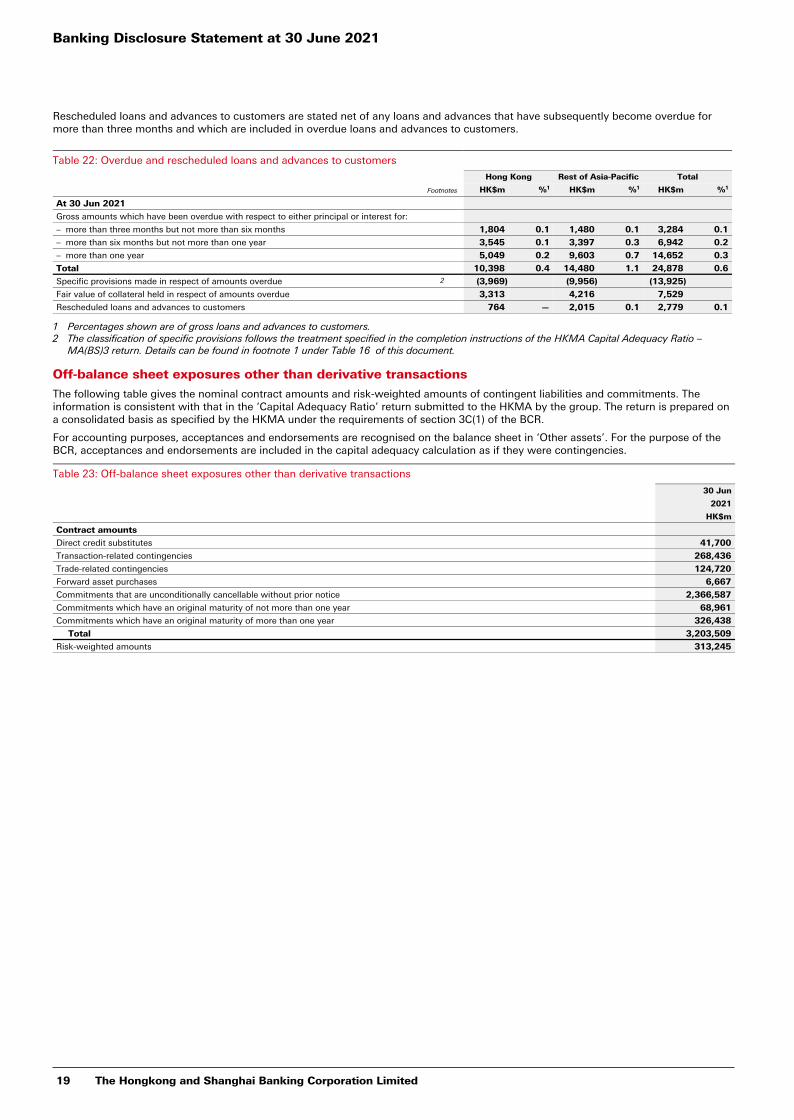
Rescheduled loans and advances to customers are stated net of any loans and advances that have subsequently become overdue for more than three months and which are included in overdue loans and advances to customers.
Table 22: Overdue and rescheduled loans and advances to customers
Hong Kong Rest of Asia-Pacific Total
Footnotes HK$m %1 HK$m %1 HK$m %1
At 30 Jun 2021
Gross amounts which have been overdue with respect to either principal or interest for:
– more than three months but not more than six months 1,804 0.1 1,480 0.1 3,284 0.1
– more than six months but not more than one year 3,545 0.1 3,397 0.3 6,942 0.2
– more than one year 5,049 0.2 9,603 0.7 14,652 0.3
Total 10,398 0.4 14,480 1.1 24,878 0.6
Specific provisions made in respect of amounts overdue 2 (3,969) (9,956) (13,925)
Fair value of collateral held in respect of amounts overdue 3,313 4,216 7,529
Rescheduled loans and advances to customers 764 — 2,015 0.1 2,779 0.1
1 Percentages shown are of gross loans and advances to customers.2 The classification of specific provisions follows the treatment specified in the completion instructions of the HKMA Capital Adequacy Ratio –
MA(BS)3 return. Details can be found in footnote 1 under Table 16 of this document.
Off-balance sheet exposures other than derivative transactions
The following table gives the nominal contract amounts and risk-weighted amounts of contingent liabilities and commitments. The information is consistent with that in the ‘Capital Adequacy Ratio’ return submitted to the HKMA by the group. The return is prepared on a consolidated basis as specified by the HKMA under the requirements of section 3C(1) of the BCR.
For accounting purposes, acceptances and endorsements are recognised on the balance sheet in ‘Other assets’. For the purpose of the BCR, acceptances and endorsements are included in the capital adequacy calculation as if they were contingencies.
Table 23: Off-balance sheet exposures other than derivative transactions
30 Jun
2021
HK$m
Contract amounts
Direct credit substitutes 41,700
Transaction-related contingencies 268,436
Trade-related contingencies 124,720
Forward asset purchases 6,667
Commitments that are unconditionally cancellable without prior notice 2,366,587
Commitments which have an original maturity of not more than one year 68,961
Commitments which have an original maturity of more than one year 326,438
Total 3,203,509
Risk-weighted amounts 313,245
Banking Disclosure Statement at 30 June 2021
19 The Hongkong and Shanghai Banking Corporation Limited
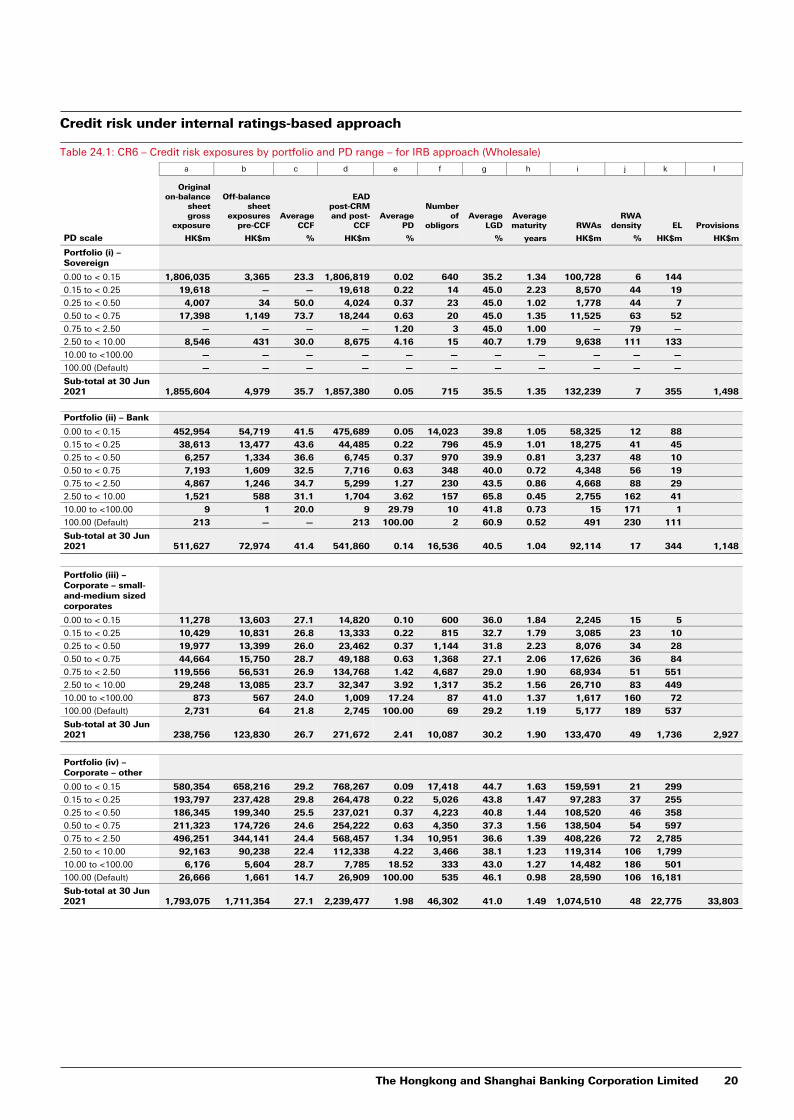
Credit risk under internal ratings-based approach
Table 24.1: CR6 – Credit risk exposures by portfolio and PD range – for IRB approach (Wholesale)
a b c d e f g h i j k l
Originalon-balance
sheet gross
exposure
Off-balance sheet
exposurespre-CCF
AverageCCF
EADpost-CRM and post-
CCFAverage
PD
Numberof
obligorsAverage
LGDAveragematurity RWAs
RWA density EL Provisions
PD scale HK$m HK$m % HK$m % % years HK$m % HK$m HK$m
Portfolio (i) – Sovereign
0.00 to < 0.15 1,806,035 3,365 23.3 1,806,819 0.02 640 35.2 1.34 100,728 6 144
0.15 to < 0.25 19,618 — — 19,618 0.22 14 45.0 2.23 8,570 44 19
0.25 to < 0.50 4,007 34 50.0 4,024 0.37 23 45.0 1.02 1,778 44 7
0.50 to < 0.75 17,398 1,149 73.7 18,244 0.63 20 45.0 1.35 11,525 63 52
0.75 to < 2.50 — — — — 1.20 3 45.0 1.00 — 79 —
2.50 to < 10.00 8,546 431 30.0 8,675 4.16 15 40.7 1.79 9,638 111 133
10.00 to <100.00 — — — — — — — — — — —
100.00 (Default) — — — — — — — — — — —
Sub-total at 30 Jun 2021 1,855,604 4,979 35.7 1,857,380 0.05 715 35.5 1.35 132,239 7 355 1,498
Portfolio (ii) – Bank
0.00 to < 0.15 452,954 54,719 41.5 475,689 0.05 14,023 39.8 1.05 58,325 12 88
0.15 to < 0.25 38,613 13,477 43.6 44,485 0.22 796 45.9 1.01 18,275 41 45
0.25 to < 0.50 6,257 1,334 36.6 6,745 0.37 970 39.9 0.81 3,237 48 10
0.50 to < 0.75 7,193 1,609 32.5 7,716 0.63 348 40.0 0.72 4,348 56 19
0.75 to < 2.50 4,867 1,246 34.7 5,299 1.27 230 43.5 0.86 4,668 88 29
2.50 to < 10.00 1,521 588 31.1 1,704 3.62 157 65.8 0.45 2,755 162 41
10.00 to <100.00 9 1 20.0 9 29.79 10 41.8 0.73 15 171 1
100.00 (Default) 213 — — 213 100.00 2 60.9 0.52 491 230 111
Sub-total at 30 Jun 2021 511,627 72,974 41.4 541,860 0.14 16,536 40.5 1.04 92,114 17 344 1,148
Portfolio (iii) – Corporate – small- and-medium sized corporates
0.00 to < 0.15 11,278 13,603 27.1 14,820 0.10 600 36.0 1.84 2,245 15 5
0.15 to < 0.25 10,429 10,831 26.8 13,333 0.22 815 32.7 1.79 3,085 23 10
0.25 to < 0.50 19,977 13,399 26.0 23,462 0.37 1,144 31.8 2.23 8,076 34 28
0.50 to < 0.75 44,664 15,750 28.7 49,188 0.63 1,368 27.1 2.06 17,626 36 84
0.75 to < 2.50 119,556 56,531 26.9 134,768 1.42 4,687 29.0 1.90 68,934 51 551
2.50 to < 10.00 29,248 13,085 23.7 32,347 3.92 1,317 35.2 1.56 26,710 83 449
10.00 to <100.00 873 567 24.0 1,009 17.24 87 41.0 1.37 1,617 160 72
100.00 (Default) 2,731 64 21.8 2,745 100.00 69 29.2 1.19 5,177 189 537
Sub-total at 30 Jun 2021 238,756 123,830 26.7 271,672 2.41 10,087 30.2 1.90 133,470 49 1,736 2,927
Portfolio (iv) – Corporate – other
0.00 to < 0.15 580,354 658,216 29.2 768,267 0.09 17,418 44.7 1.63 159,591 21 299
0.15 to < 0.25 193,797 237,428 29.8 264,478 0.22 5,026 43.8 1.47 97,283 37 255
0.25 to < 0.50 186,345 199,340 25.5 237,021 0.37 4,223 40.8 1.44 108,520 46 358
0.50 to < 0.75 211,323 174,726 24.6 254,222 0.63 4,350 37.3 1.56 138,504 54 597
0.75 to < 2.50 496,251 344,141 24.4 568,457 1.34 10,951 36.6 1.39 408,226 72 2,785
2.50 to < 10.00 92,163 90,238 22.4 112,338 4.22 3,466 38.1 1.23 119,314 106 1,799
10.00 to <100.00 6,176 5,604 28.7 7,785 18.52 333 43.0 1.27 14,482 186 501
100.00 (Default) 26,666 1,661 14.7 26,909 100.00 535 46.1 0.98 28,590 106 16,181
Sub-total at 30 Jun 2021 1,793,075 1,711,354 27.1 2,239,477 1.98 46,302 41.0 1.49 1,074,510 48 22,775 33,803
The Hongkong and Shanghai Banking Corporation Limited 20
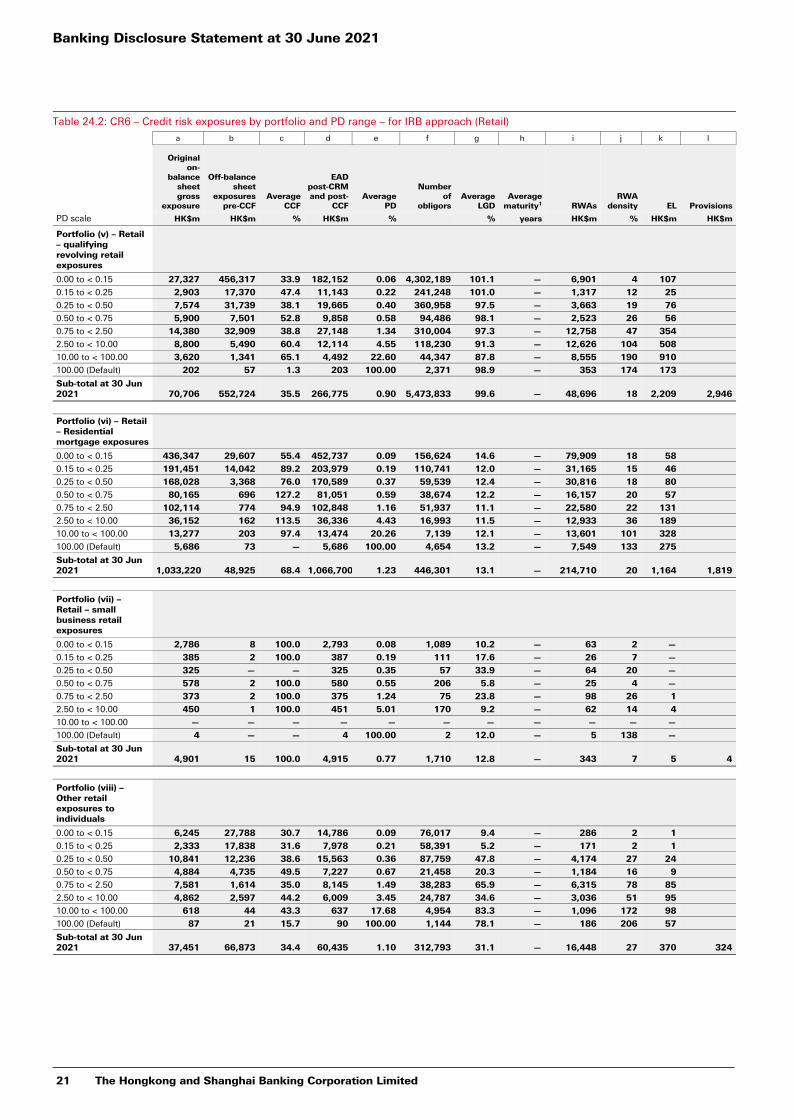
Table 24.2: CR6 – Credit risk exposures by portfolio and PD range – for IRB approach (Retail)
a b c d e f g h i j k l
Originalon-
balancesheet gross
exposure
Off-balance sheet
exposurespre-CCF
AverageCCF
EADpost-CRM and post-
CCFAverage
PD
Numberof
obligorsAverage
LGDAverage
maturity1 RWAsRWA
density EL Provisions
PD scale HK$m HK$m % HK$m % % years HK$m % HK$m HK$m
Portfolio (v) – Retail – qualifying revolving retail exposures
0.00 to < 0.15 27,327 456,317 33.9 182,152 0.06 4,302,189 101.1 — 6,901 4 107
0.15 to < 0.25 2,903 17,370 47.4 11,143 0.22 241,248 101.0 — 1,317 12 25
0.25 to < 0.50 7,574 31,739 38.1 19,665 0.40 360,958 97.5 — 3,663 19 76
0.50 to < 0.75 5,900 7,501 52.8 9,858 0.58 94,486 98.1 — 2,523 26 56
0.75 to < 2.50 14,380 32,909 38.8 27,148 1.34 310,004 97.3 — 12,758 47 354
2.50 to < 10.00 8,800 5,490 60.4 12,114 4.55 118,230 91.3 — 12,626 104 508
10.00 to < 100.00 3,620 1,341 65.1 4,492 22.60 44,347 87.8 — 8,555 190 910
100.00 (Default) 202 57 1.3 203 100.00 2,371 98.9 — 353 174 173
Sub-total at 30 Jun 2021 70,706 552,724 35.5 266,775 0.90 5,473,833 99.6 — 48,696 18 2,209 2,946
Portfolio (vi) – Retail – Residential mortgage exposures
0.00 to < 0.15 436,347 29,607 55.4 452,737 0.09 156,624 14.6 — 79,909 18 58
0.15 to < 0.25 191,451 14,042 89.2 203,979 0.19 110,741 12.0 — 31,165 15 46
0.25 to < 0.50 168,028 3,368 76.0 170,589 0.37 59,539 12.4 — 30,816 18 80
0.50 to < 0.75 80,165 696 127.2 81,051 0.59 38,674 12.2 — 16,157 20 57
0.75 to < 2.50 102,114 774 94.9 102,848 1.16 51,937 11.1 — 22,580 22 131
2.50 to < 10.00 36,152 162 113.5 36,336 4.43 16,993 11.5 — 12,933 36 189
10.00 to < 100.00 13,277 203 97.4 13,474 20.26 7,139 12.1 — 13,601 101 328
100.00 (Default) 5,686 73 — 5,686 100.00 4,654 13.2 — 7,549 133 275
Sub-total at 30 Jun 2021 1,033,220 48,925 68.4 1,066,700 1.23 446,301 13.1 — 214,710 20 1,164 1,819
Portfolio (vii) – Retail – small business retail exposures
0.00 to < 0.15 2,786 8 100.0 2,793 0.08 1,089 10.2 — 63 2 —
0.15 to < 0.25 385 2 100.0 387 0.19 111 17.6 — 26 7 —
0.25 to < 0.50 325 — — 325 0.35 57 33.9 — 64 20 —
0.50 to < 0.75 578 2 100.0 580 0.55 206 5.8 — 25 4 —
0.75 to < 2.50 373 2 100.0 375 1.24 75 23.8 — 98 26 1
2.50 to < 10.00 450 1 100.0 451 5.01 170 9.2 — 62 14 4
10.00 to < 100.00 — — — — — — — — — — —
100.00 (Default) 4 — — 4 100.00 2 12.0 — 5 138 —
Sub-total at 30 Jun 2021 4,901 15 100.0 4,915 0.77 1,710 12.8 — 343 7 5 4
Portfolio (viii) – Other retail exposures to individuals
0.00 to < 0.15 6,245 27,788 30.7 14,786 0.09 76,017 9.4 — 286 2 1
0.15 to < 0.25 2,333 17,838 31.6 7,978 0.21 58,391 5.2 — 171 2 1
0.25 to < 0.50 10,841 12,236 38.6 15,563 0.36 87,759 47.8 — 4,174 27 24
0.50 to < 0.75 4,884 4,735 49.5 7,227 0.67 21,458 20.3 — 1,184 16 9
0.75 to < 2.50 7,581 1,614 35.0 8,145 1.49 38,283 65.9 — 6,315 78 85
2.50 to < 10.00 4,862 2,597 44.2 6,009 3.45 24,787 34.6 — 3,036 51 95
10.00 to < 100.00 618 44 43.3 637 17.68 4,954 83.3 — 1,096 172 98
100.00 (Default) 87 21 15.7 90 100.00 1,144 78.1 — 186 206 57
Sub-total at 30 Jun 2021 37,451 66,873 34.4 60,435 1.10 312,793 31.1 — 16,448 27 370 324
Banking Disclosure Statement at 30 June 2021
21 The Hongkong and Shanghai Banking Corporation Limited
a b c d e f g h i j k l
Originalon-balance
sheet gross
exposure
Off-balance sheet
exposurespre-CCF
AverageCCF
EADpost-CRM and post-
CCFAverage
PD
Numberof
obligorsAverage
LGDAverage1
maturity RWAsRWA
density EL Provisions2
HK$m HK$m % HK$m % % years HK$m % HK$m HK$m
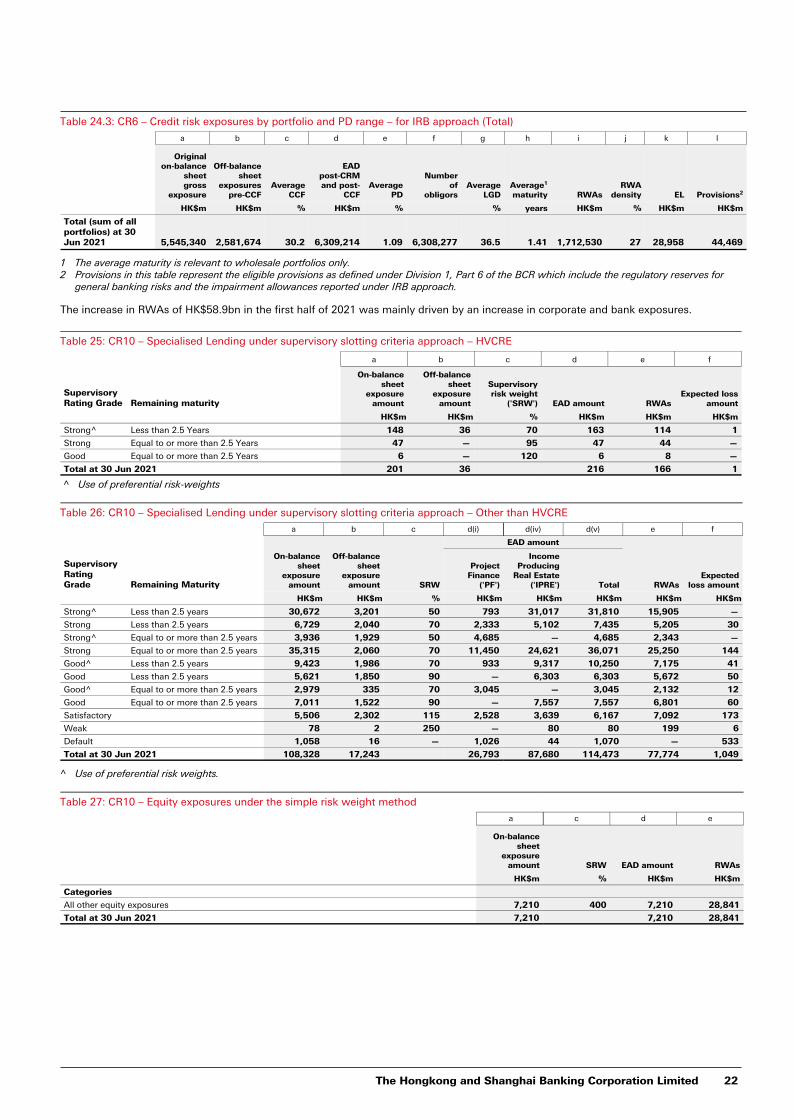
Total (sum of all portfolios) at 30 Jun 2021 5,545,340 2,581,674 30.2 6,309,214 1.09 6,308,277 36.5 1.41 1,712,530 27 28,958 44,469
Table 24.3: CR6 – Credit risk exposures by portfolio and PD range – for IRB approach (Total)
1 The average maturity is relevant to wholesale portfolios only.2 Provisions in this table represent the eligible provisions as defined under Division 1, Part 6 of the BCR which include the regulatory reserves for
general banking risks and the impairment allowances reported under IRB approach.
The increase in RWAs of HK$58.9bn in the first half of 2021 was mainly driven by an increase in corporate and bank exposures.
Table 25: CR10 – Specialised Lending under supervisory slotting criteria approach – HVCRE
a b c d e f
Supervisory Rating Grade Remaining maturity
On-balance sheet
exposure amount
Off-balance sheet
exposure amount
Supervisory risk weight
('SRW') EAD amount RWAsExpected loss
amount
HK$m HK$m % HK$m HK$m HK$m
Strong^ Less than 2.5 Years 148 36 70 163 114 1
Strong Equal to or more than 2.5 Years 47 — 95 47 44 —
Good Equal to or more than 2.5 Years 6 — 120 6 8 —
Total at 30 Jun 2021 201 36 216 166 1
^ Use of preferential risk-weights
Table 26: CR10 – Specialised Lending under supervisory slotting criteria approach – Other than HVCRE
a b c d(i) d(iv) d(v) e f
Supervisory Rating Grade Remaining Maturity
On-balance sheet
exposure amount
Off-balance sheet
exposure amount SRW
EAD amount
RWAsExpected
loss amount
Project Finance
('PF')
Income Producing
Real Estate ('IPRE') Total
HK$m HK$m % HK$m HK$m HK$m HK$m HK$m
Strong^ Less than 2.5 years 30,672 3,201 50 793 31,017 31,810 15,905 —
Strong Less than 2.5 years 6,729 2,040 70 2,333 5,102 7,435 5,205 30
Strong^ Equal to or more than 2.5 years 3,936 1,929 50 4,685 — 4,685 2,343 —
Strong Equal to or more than 2.5 years 35,315 2,060 70 11,450 24,621 36,071 25,250 144
Good^ Less than 2.5 years 9,423 1,986 70 933 9,317 10,250 7,175 41
Good Less than 2.5 years 5,621 1,850 90 — 6,303 6,303 5,672 50
Good^ Equal to or more than 2.5 years 2,979 335 70 3,045 — 3,045 2,132 12
Good Equal to or more than 2.5 years 7,011 1,522 90 — 7,557 7,557 6,801 60
Satisfactory 5,506 2,302 115 2,528 3,639 6,167 7,092 173
Weak 78 2 250 — 80 80 199 6
Default 1,058 16 — 1,026 44 1,070 — 533
Total at 30 Jun 2021 108,328 17,243 26,793 87,680 114,473 77,774 1,049
^ Use of preferential risk weights.
Table 27: CR10 – Equity exposures under the simple risk weight method
a c d e
On-balance sheet
exposure amount SRW EAD amount RWAs
HK$m % HK$m HK$m
Categories
All other equity exposures 7,210 400 7,210 28,841
Total at 30 Jun 2021 7,210 7,210 28,841
The Hongkong and Shanghai Banking Corporation Limited 22
Credit risk under standardised approach
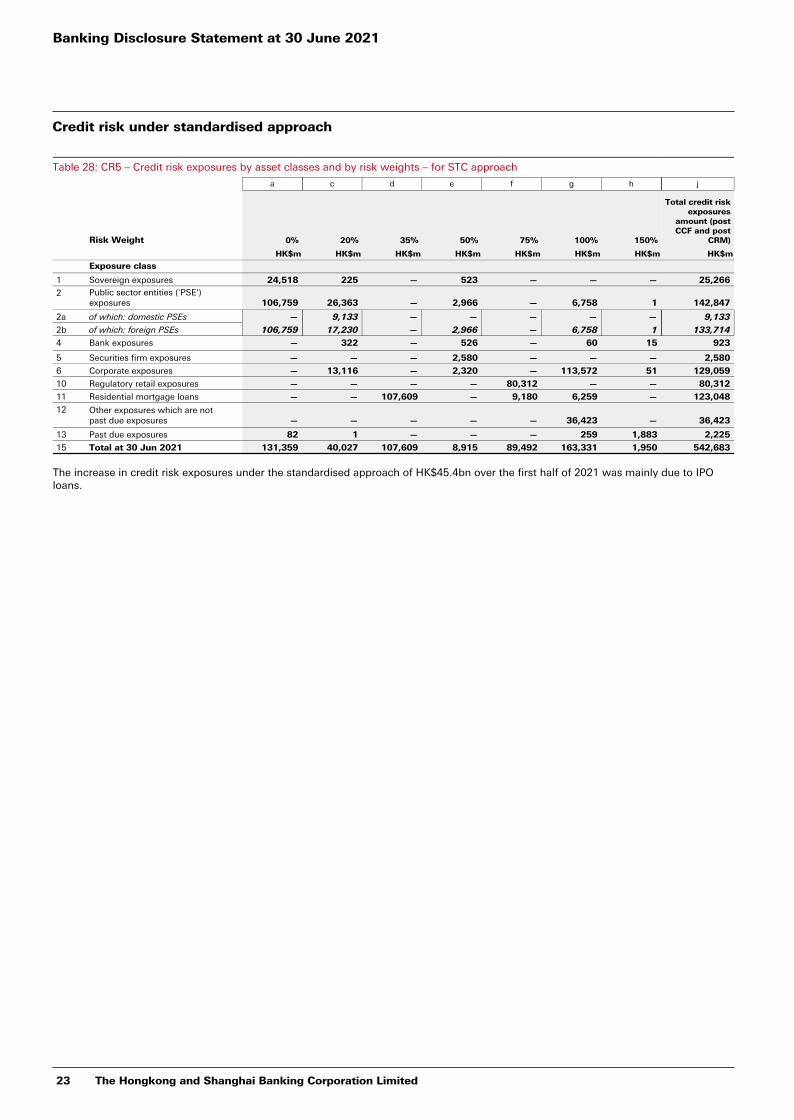
Table 28: CR5 – Credit risk exposures by asset classes and by risk weights – for STC approach
a c d e f g h j
Risk Weight 0% 20% 35% 50% 75% 100% 150%
Total credit risk exposures
amount (post CCF and post
CRM)
HK$m HK$m HK$m HK$m HK$m HK$m HK$m HK$m
Exposure class
1 Sovereign exposures 24,518 225 — 523 — — — 25,266
2 Public sector entities ('PSE') exposures 106,759 26,363 — 2,966 — 6,758 1 142,847
2a of which: domestic PSEs — 9,133 — — — — — 9,133
2b of which: foreign PSEs 106,759 17,230 — 2,966 — 6,758 1 133,714
4 Bank exposures — 322 — 526 — 60 15 923
5 Securities firm exposures — — — 2,580 — — — 2,580
6 Corporate exposures — 13,116 — 2,320 — 113,572 51 129,059
10 Regulatory retail exposures — — — — 80,312 — — 80,312
11 Residential mortgage loans — — 107,609 — 9,180 6,259 — 123,048
12 Other exposures which are notpast due exposures — — — — — 36,423 — 36,423
13 Past due exposures 82 1 — — — 259 1,883 2,225
15 Total at 30 Jun 2021 131,359 40,027 107,609 8,915 89,492 163,331 1,950 542,683
The increase in credit risk exposures under the standardised approach of HK$45.4bn over the first half of 2021 was mainly due to IPO loans.
Banking Disclosure Statement at 30 June 2021
23 The Hongkong and Shanghai Banking Corporation Limited
Credit risk mitigation
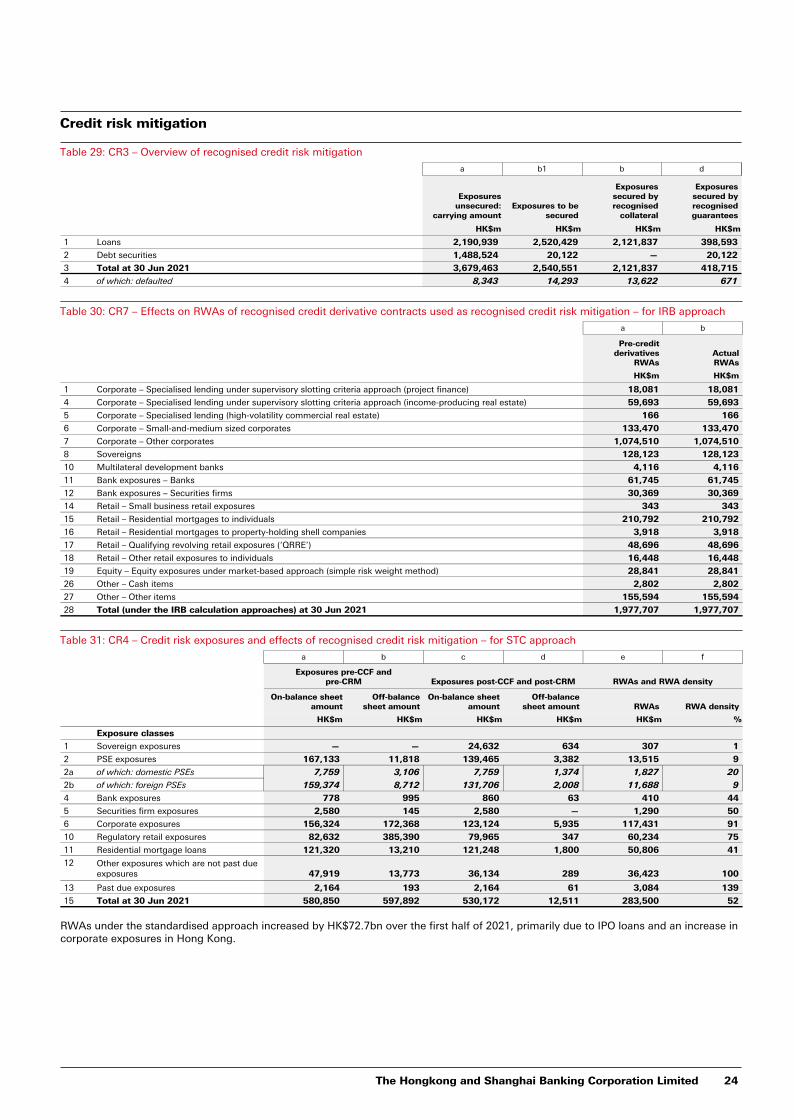
Table 29: CR3 – Overview of recognised credit risk mitigation
a b1 b d
Exposures unsecured:
carrying amountExposures to be
secured
Exposures secured by recognised
collateral
Exposures secured by recognised guarantees
HK$m HK$m HK$m HK$m
1 Loans 2,190,939 2,520,429 2,121,837 398,593
2 Debt securities 1,488,524 20,122 — 20,122
3 Total at 30 Jun 2021 3,679,463 2,540,551 2,121,837 418,715
4 of which: defaulted 8,343 14,293 13,622 671
Table 30: CR7 – Effects on RWAs of recognised credit derivative contracts used as recognised credit risk mitigation – for IRB approach
a b
Pre-credit derivatives
RWAsActualRWAs
HK$m HK$m
1 Corporate – Specialised lending under supervisory slotting criteria approach (project finance) 18,081 18,081
4 Corporate – Specialised lending under supervisory slotting criteria approach (income-producing real estate) 59,693 59,693
5 Corporate – Specialised lending (high-volatility commercial real estate) 166 166
6 Corporate – Small-and-medium sized corporates 133,470 133,470
7 Corporate – Other corporates 1,074,510 1,074,510
8 Sovereigns 128,123 128,123
10 Multilateral development banks 4,116 4,116
11 Bank exposures – Banks 61,745 61,745
12 Bank exposures – Securities firms 30,369 30,369
14 Retail – Small business retail exposures 343 343
15 Retail – Residential mortgages to individuals 210,792 210,792
16 Retail – Residential mortgages to property-holding shell companies 3,918 3,918
17 Retail – Qualifying revolving retail exposures (‘QRRE’) 48,696 48,696
18 Retail – Other retail exposures to individuals 16,448 16,448
19 Equity – Equity exposures under market-based approach (simple risk weight method) 28,841 28,841
26 Other – Cash items 2,802 2,802
27 Other – Other items 155,594 155,594
28 Total (under the IRB calculation approaches) at 30 Jun 2021 1,977,707 1,977,707
Table 31: CR4 – Credit risk exposures and effects of recognised credit risk mitigation – for STC approach
a b c d e f
Exposures pre-CCF andpre-CRM Exposures post-CCF and post-CRM RWAs and RWA density
On-balance sheet amount
Off-balance sheet amount
On-balance sheet amount
Off-balance sheet amount RWAs RWA density
HK$m HK$m HK$m HK$m HK$m %
Exposure classes
1 Sovereign exposures — — 24,632 634 307 1
2 PSE exposures 167,133 11,818 139,465 3,382 13,515 9
2a of which: domestic PSEs 7,759 3,106 7,759 1,374 1,827 20
2b of which: foreign PSEs 159,374 8,712 131,706 2,008 11,688 9
4 Bank exposures 778 995 860 63 410 44
5 Securities firm exposures 2,580 145 2,580 — 1,290 50
6 Corporate exposures 156,324 172,368 123,124 5,935 117,431 91
10 Regulatory retail exposures 82,632 385,390 79,965 347 60,234 75
11 Residential mortgage loans 121,320 13,210 121,248 1,800 50,806 41
12 Other exposures which are not past due exposures 47,919 13,773 36,134 289 36,423 100
13 Past due exposures 2,164 193 2,164 61 3,084 139
15 Total at 30 Jun 2021 580,850 597,892 530,172 12,511 283,500 52
RWAs under the standardised approach increased by HK$72.7bn over the first half of 2021, primarily due to IPO loans and an increase in corporate exposures in Hong Kong.
The Hongkong and Shanghai Banking Corporation Limited 24
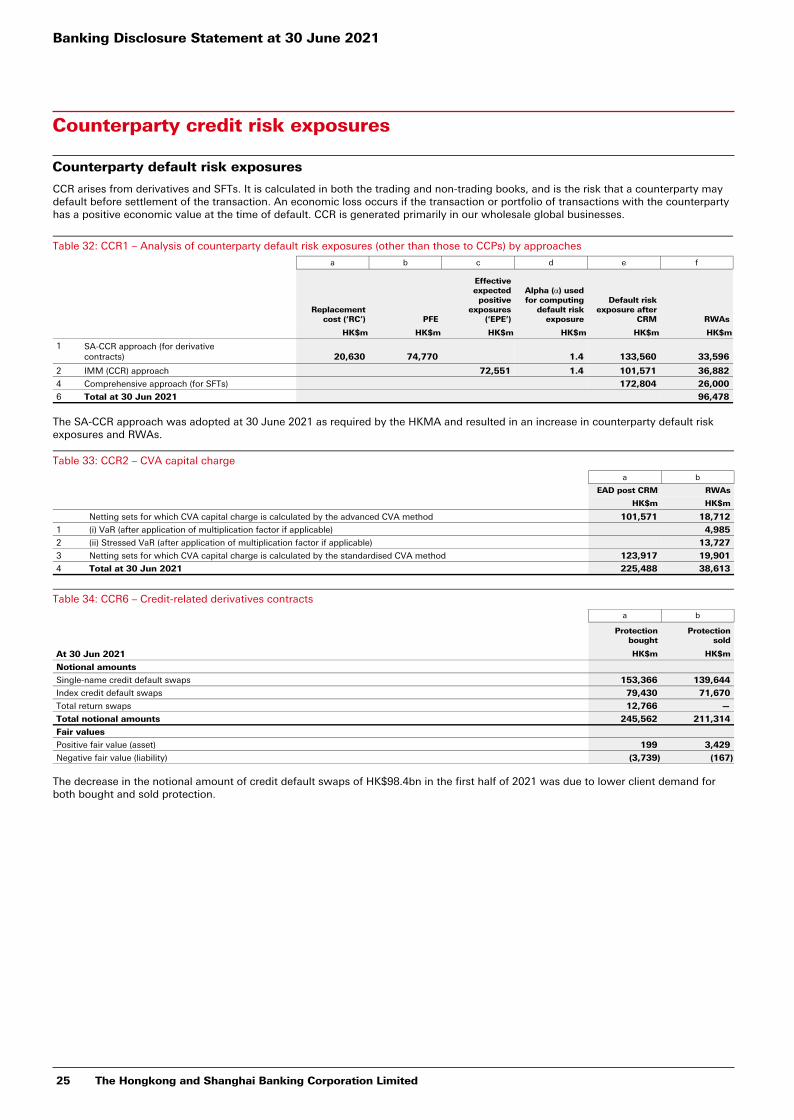
Counterparty credit risk exposures
Counterparty default risk exposures
CCR arises from derivatives and SFTs. It is calculated in both the trading and non-trading books, and is the risk that a counterparty may default before settlement of the transaction. An economic loss occurs if the transaction or portfolio of transactions with the counterparty has a positive economic value at the time of default. CCR is generated primarily in our wholesale global businesses.
Table 32: CCR1 – Analysis of counterparty default risk exposures (other than those to CCPs) by approaches
a b c d e f
Replacement cost (‘RC’) PFE
Effective expected
positive exposures
(‘EPE’)
Alpha (⍺) used for computing
default risk exposure
Default risk exposure after
CRM RWAs
HK$m HK$m HK$m HK$m HK$m HK$m
1 SA-CCR approach (for derivative contracts) 20,630 74,770 1.4 133,560 33,596
2 IMM (CCR) approach 72,551 1.4 101,571 36,882
4 Comprehensive approach (for SFTs) 172,804 26,000
6 Total at 30 Jun 2021 96,478
The SA-CCR approach was adopted at 30 June 2021 as required by the HKMA and resulted in an increase in counterparty default risk exposures and RWAs.
Table 33: CCR2 – CVA capital charge
a b
EAD post CRM RWAs
HK$m HK$m
Netting sets for which CVA capital charge is calculated by the advanced CVA method 101,571 18,712
1 (i) VaR (after application of multiplication factor if applicable) 4,985
2 (ii) Stressed VaR (after application of multiplication factor if applicable) 13,727
3 Netting sets for which CVA capital charge is calculated by the standardised CVA method 123,917 19,901
4 Total at 30 Jun 2021 225,488 38,613
Table 34: CCR6 – Credit-related derivatives contracts
a b
Protectionbought
Protectionsold
At 30 Jun 2021 HK$m HK$m
Notional amounts
Single-name credit default swaps 153,366 139,644
Index credit default swaps 79,430 71,670
Total return swaps 12,766 —
Total notional amounts 245,562 211,314
Fair values
Positive fair value (asset) 199 3,429
Negative fair value (liability) (3,739) (167)
The decrease in the notional amount of credit default swaps of HK$98.4bn in the first half of 2021 was due to lower client demand for both bought and sold protection.
Banking Disclosure Statement at 30 June 2021
25 The Hongkong and Shanghai Banking Corporation Limited
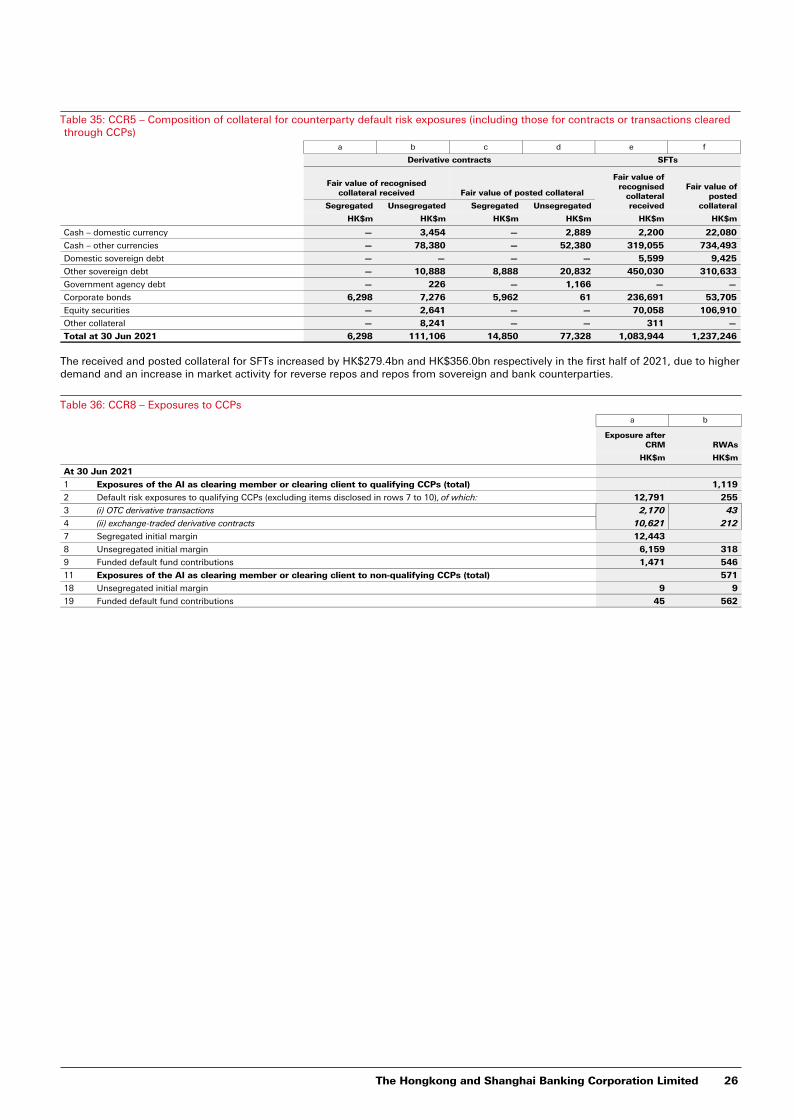
Table 35: CCR5 – Composition of collateral for counterparty default risk exposures (including those for contracts or transactions cleared through CCPs)
a b c d e f
Derivative contracts SFTs
Fair value of recognised collateral received Fair value of posted collateral
Fair value of recognised
collateral received
Fair value of posted
collateralSegregated Unsegregated Segregated Unsegregated
HK$m HK$m HK$m HK$m HK$m HK$m
Cash – domestic currency — 3,454 — 2,889 2,200 22,080
Cash – other currencies — 78,380 — 52,380 319,055 734,493
Domestic sovereign debt — — — — 5,599 9,425
Other sovereign debt — 10,888 8,888 20,832 450,030 310,633
Government agency debt — 226 — 1,166 — —
Corporate bonds 6,298 7,276 5,962 61 236,691 53,705
Equity securities — 2,641 — — 70,058 106,910
Other collateral — 8,241 — — 311 —
Total at 30 Jun 2021 6,298 111,106 14,850 77,328 1,083,944 1,237,246
The received and posted collateral for SFTs increased by HK$279.4bn and HK$356.0bn respectively in the first half of 2021, due to higher demand and an increase in market activity for reverse repos and repos from sovereign and bank counterparties.
Table 36: CCR8 – Exposures to CCPsa b
Exposure after CRM RWAs
HK$m HK$m
At 30 Jun 2021
1 Exposures of the AI as clearing member or clearing client to qualifying CCPs (total) 1,119
2 Default risk exposures to qualifying CCPs (excluding items disclosed in rows 7 to 10), of which: 12,791 255
3 (i) OTC derivative transactions 2,170 43
4 (ii) exchange-traded derivative contracts 10,621 212
7 Segregated initial margin 12,443
8 Unsegregated initial margin 6,159 318
9 Funded default fund contributions 1,471 546
11 Exposures of the AI as clearing member or clearing client to non-qualifying CCPs (total) 571
18 Unsegregated initial margin 9 9
19 Funded default fund contributions 45 562
The Hongkong and Shanghai Banking Corporation Limited 26
Counterparty default risk under internal ratings-based approach
Portfolio (i) – Sovereign
0.00 to < 0.15 91,357 0.07 50 44.5 0.29 8,390 9
0.15 to < 0.25 2,730 0.22 2 45.0 0.01 821 30
0.25 to < 0.50 142 0.37 2 45.0 1.00 72 51
0.50 to < 0.75 87 0.63 1 48.0 1.68 62 72
0.75 to < 2.50 — — — — — — —
2.50 to < 10.00 — 3.05 1 45.0 1.00 — 110
10.00 to < 100.00 — — — — — — —
100.00 (Default) — — — — — — —
Sub-total at 30 Jun 2021 94,316 0.08 56 44.5 0.29 9,345 10
Portfolio (ii) – Bank
0.00 to < 0.15 182,627 0.05 1,547 35.5 1.01 21,909 12
0.15 to < 0.25 18,689 0.22 167 48.5 0.64 7,691 41
0.25 to < 0.50 7,336 0.37 177 48.8 0.59 3,986 54
0.50 to < 0.75 2,626 0.63 43 45.2 1.07 2,010 77
0.75 to < 2.50 382 0.90 29 47.1 0.83 333 87
2.50 to < 10.00 16 3.68 6 49.7 1.08 24 154
10.00 to < 100.00 — — — — — — —
100.00 (Default) — — — — — — —
Sub-total at 30 Jun 2021 211,676 0.09 1,969 37.3 0.96 35,953 17
Portfolio (iii) – Corporate
0.00 to < 0.15 48,685 0.09 1,820 47.4 1.79 13,311 27
0.15 to < 0.25 13,377 0.22 551 50.0 1.06 5,561 42
0.25 to < 0.50 5,084 0.37 431 50.3 1.63 2,768 54
0.50 to < 0.75 6,430 0.63 448 50.5 1.33 4,897 76
0.75 to < 2.50 9,316 1.38 1,069 51.6 1.27 9,344 100
2.50 to < 10.00 2,068 3.70 293 51.0 1.51 3,030 146
10.00 to < 100.00 6 17.54 15 60.1 1.00 14 241
100.00 (Default) 61 100.00 2 53.0 1.00 — —
Sub-total at 30 Jun 2021 85,027 0.47 4,629 48.8 1.57 38,925 46
Total (sum of all portfolios) at 30 Jun 2021 391,019 0.17 6,654 41.5 0.93 84,223 22
Table 37: CCR4 – Counterparty default risk exposures (other than those to CCPs) by portfolio and PD range – for IRB approacha b c d e f g
EAD post-CRM
Average PD
Number of obligors
Average LGD
Average maturity RWAs
RWA density
PD scale HK$m % % years HK$m %
The increase in counterparty default risk exposures and RWAs in the first half of 2021 was driven by the implementation of the SA-CCR approach for derivative contracts. The decrease in average RW% between 31 December 2020 and 30 June 2021 is due to decreases in average PD and average maturity in the counterparty credit risk exposures under corporate and sovereign portfolios.
At 30 June 2021, the percentage of total RWAs covered by IRB models is 96% for sovereign exposures, 98% for bank exposures and 78% for corporate exposures. Details on the scope of models for each of the regulatory portfolios can be found in the ‘Credit risk under internal ratings-based approach’ section from pages 26 to 28 of the Banking Disclosure Statement at 31 December 2020.
Counterparty default risk under standardised approach
Table 38: CCR3 – Counterparty default risk exposures (other than those to CCPs) by asset classes and by risk weights – for STC approach
a c d e f i
0% 20% 50% 75% 100%
Total default risk exposure
after CRM
Risk Weight HK$m HK$m HK$m HK$m HK$m HK$m
Exposure class
1 Sovereign exposures — 1,773 — — — 1,773
2 PSE exposures 1,410 791 823 — — 3,024
2a of which: domestic PSEs — 455 — — — 455
2b of which: foreign PSEs 1,410 336 823 — — 2,569
4 Bank exposures — 302 903 — 13 1,218
5 Securities firm exposures — — 2 — — 2
6 Corporate exposures — 68 — — 10,665 10,733
8 Regulatory retail exposures — — — 165 — 165
12 Total at 30 Jun 2021 1,410 2,934 1,728 165 10,678 16,915
Banking Disclosure Statement at 30 June 2021
27 The Hongkong and Shanghai Banking Corporation Limited
Securitisation
Analysis of securitisation exposures
Table 39: SEC1 – Securitisation exposures in banking book
a b c g h i
Acting as originator (excluding sponsor) Acting as investor
Traditional Synthetic Sub-total Traditional Synthetic Sub-total
HK$m HK$m HK$m HK$m HK$m HK$m
At 30 Jun 2021
1 Retail (total) – of which: 67,630 — 67,630 35,688 — 35,688
2 residential mortgage 67,630 — 67,630 15,754 — 15,754
3 credit card — — — 7,378 — 7,378
4 other retail exposures — — — 12,556 — 12,556
Table 40: SEC2 – Securitisation exposures in trading book
g i
Acting as investor
Traditional Sub-total
HK$m HK$m
At 30 Jun 2021
1 Retail (total) – of which: 6,667 6,667
2 residential mortgage 3,852 3,852
4 other retail exposures 2,815 2,815
Table 41: SEC4 – Securitisation exposures in banking book and associated capital requirements – where AI acts as investor
a b c d g h k l o p
Exposure values (by RW bands)Exposure values (by regulatory approach)
RWAs (by regulatory approach)
Capital charges after cap
≤20% RW>20% to 50% RW
>50% to 100% RW
>100% to <1250%
RW
SEC-ERBA (including
IAA) SEC-SA
SEC-ERBA (including
IAA) SEC-SA
SEC-ERBA (including
IAA) SEC-SA
HK$m HK$m HK$m HK$m HK$m HK$m HK$m HK$m HK$m HK$m
At 30 Jun 2021
1 Total exposures 30,156 1,574 2,596 1,362 23,733 11,955 5,779 3,483 462 279
2 Traditional securitisation 30,156 1,574 2,596 1,362 23,733 11,955 5,779 3,483 462 279
3 of which: securitisation 30,156 1,574 2,596 1,362 23,733 11,955 5,779 3,483 462 279
4 of which: retail 30,156 1,574 2,596 1,362 23,733 11,955 5,779 3,483 462 279
The Hongkong and Shanghai Banking Corporation Limited 28
Market risk
Market risk under standardised approach
Table 42: MR1 – Market risk under STM approach
a
RWAs
HK$m
Outright product exposures
2 Equity exposures (general and specific risk) 3,409
4 Commodity exposures 13
8 Securitisation exposures 596
9 Total at 30 Jun 2021 4,018
Analysis of VaR, stressed VaR and incremental risk charge measures
The following table is prepared in accordance with the basis of preparation used to calculate the group’s market risk capital charge under the IMM approach.
Table 43: MR3 – IMM approach values for market risk exposures
a
Footnotes HK$m
At 30 Jun 2021
VaR (10 day – one-tailed 99% confidence interval) 1
1 Maximum Value 703
2 Average Value 522
3 Minimum Value 335
4 Period End 479
Stressed VaR (10 day – one-tailed 99% confidence interval) 1
5 Maximum Value 1,137
6 Average Value 865
7 Minimum Value 620
8 Period End 731
IRC (99.9% confidence interval)
9 Maximum Value 3,165
10 Average Value 2,805
11 Minimum Value 2,304
12 Period End 2,304
1 The total VaR excludes Risks not in VaR ('RNIV').
Trading VaR at 30 June 2021 was slightly lower than 31 December 2020 due to a reduction in interest rate trading VaR.
The increase in trading Stressed VaR at 30 June 2021 compared to 31 December 2020 was mainly driven by the Stressed VaR period change.
Trading IRC at 30 June 2021 was lower than 31 December 2020 due to a reduction in the credit trading position.
Banking Disclosure Statement at 30 June 2021
29 The Hongkong and Shanghai Banking Corporation Limited
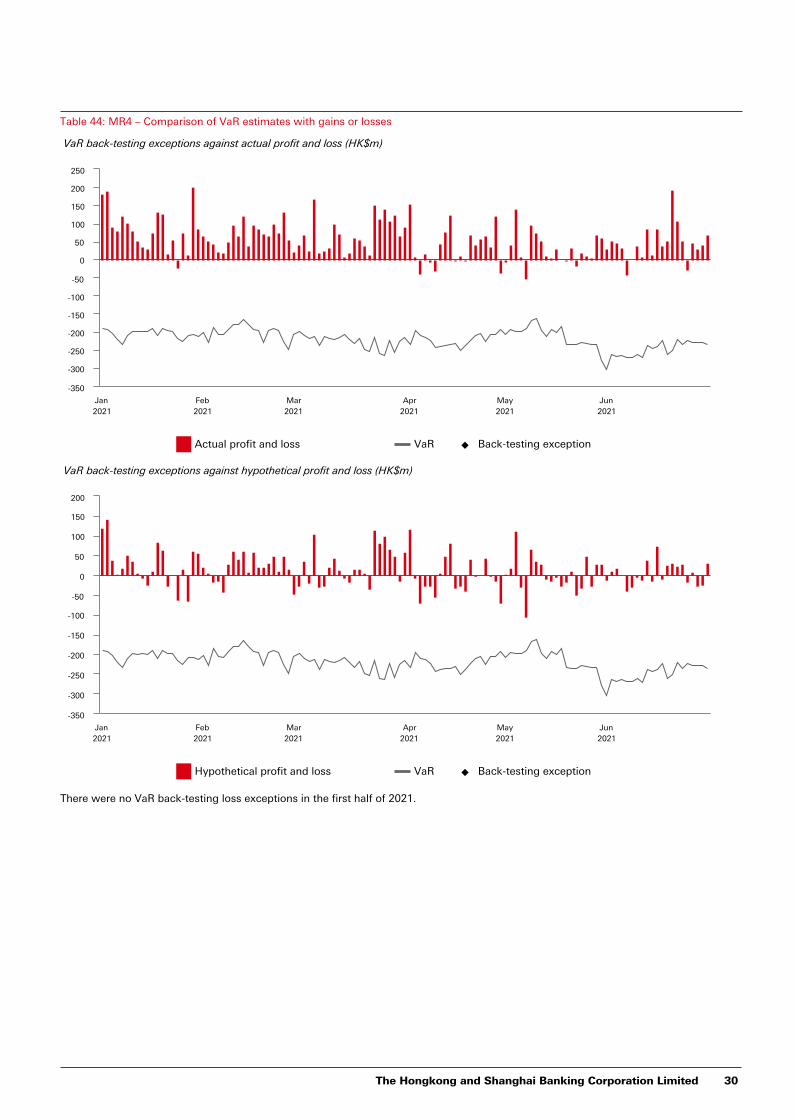
Table 44: MR4 – Comparison of VaR estimates with gains or losses
VaR back-testing exceptions against actual profit and loss (HK$m)
Jan2021
Feb2021
Mar2021
Apr2021
May2021
Jun2021
-350
-300
-250
-200
-150
-100
-50
0
50
100
150
200
250
Actual profit and loss VaR Æ Back-testing exception
VaR back-testing exceptions against hypothetical profit and loss (HK$m)
Jan2021
Feb2021
Mar2021
Apr2021
May2021
Jun2021
-350
-300
-250
-200
-150
-100
-50
0
50
100
150
200
Hypothetical profit and loss VaR Æ Back-testing exception
There were no VaR back-testing loss exceptions in the first half of 2021.
The Hongkong and Shanghai Banking Corporation Limited 30
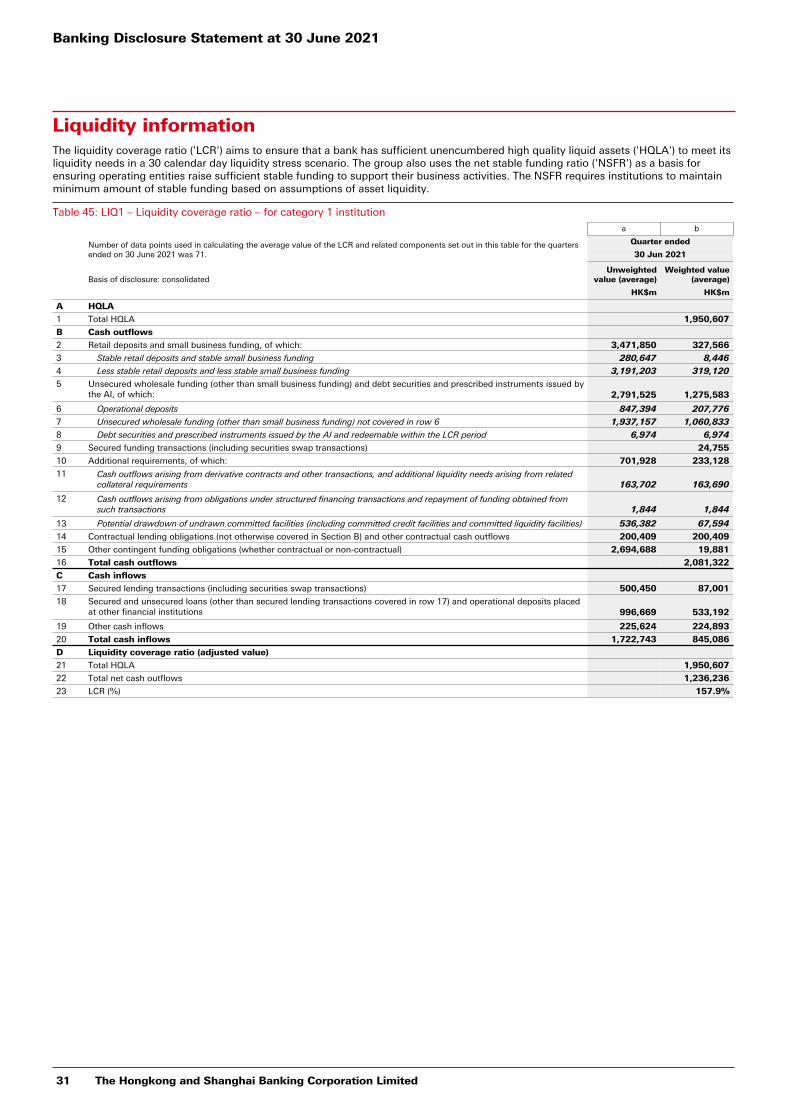
Liquidity informationThe liquidity coverage ratio ('LCR') aims to ensure that a bank has sufficient unencumbered high quality liquid assets ('HQLA') to meet its liquidity needs in a 30 calendar day liquidity stress scenario. The group also uses the net stable funding ratio ('NSFR') as a basis for ensuring operating entities raise sufficient stable funding to support their business activities. The NSFR requires institutions to maintain minimum amount of stable funding based on assumptions of asset liquidity.
Table 45: LIQ1 – Liquidity coverage ratio – for category 1 institution
a b
Number of data points used in calculating the average value of the LCR and related components set out in this table for the quarters ended on 30 June 2021 was 71.
Quarter ended
30 Jun 2021
Basis of disclosure: consolidated Unweighted
value (average) Weighted value
(average)
HK$m HK$m
A HQLA
1 Total HQLA 1,950,607
B Cash outflows
2 Retail deposits and small business funding, of which: 3,471,850 327,566
3 Stable retail deposits and stable small business funding 280,647 8,446
4 Less stable retail deposits and less stable small business funding 3,191,203 319,120
5 Unsecured wholesale funding (other than small business funding) and debt securities and prescribed instruments issued by the AI, of which: 2,791,525 1,275,583
6 Operational deposits 847,394 207,776
7 Unsecured wholesale funding (other than small business funding) not covered in row 6 1,937,157 1,060,833
8 Debt securities and prescribed instruments issued by the AI and redeemable within the LCR period 6,974 6,974
9 Secured funding transactions (including securities swap transactions) 24,755
10 Additional requirements, of which: 701,928 233,128
11 Cash outflows arising from derivative contracts and other transactions, and additional liquidity needs arising from related collateral requirements 163,702 163,690
12 Cash outflows arising from obligations under structured financing transactions and repayment of funding obtained from such transactions 1,844 1,844
13 Potential drawdown of undrawn committed facilities (including committed credit facilities and committed liquidity facilities) 536,382 67,594
14 Contractual lending obligations (not otherwise covered in Section B) and other contractual cash outflows 200,409 200,409
15 Other contingent funding obligations (whether contractual or non-contractual) 2,694,688 19,881
16 Total cash outflows 2,081,322
C Cash inflows
17 Secured lending transactions (including securities swap transactions) 500,450 87,001
18 Secured and unsecured loans (other than secured lending transactions covered in row 17) and operational deposits placed at other financial institutions 996,669 533,192
19 Other cash inflows 225,624 224,893
20 Total cash inflows 1,722,743 845,086
D Liquidity coverage ratio (adjusted value)
21 Total HQLA 1,950,607
22 Total net cash outflows 1,236,236
23 LCR (%) 157.9%
Banking Disclosure Statement at 30 June 2021
31 The Hongkong and Shanghai Banking Corporation Limited
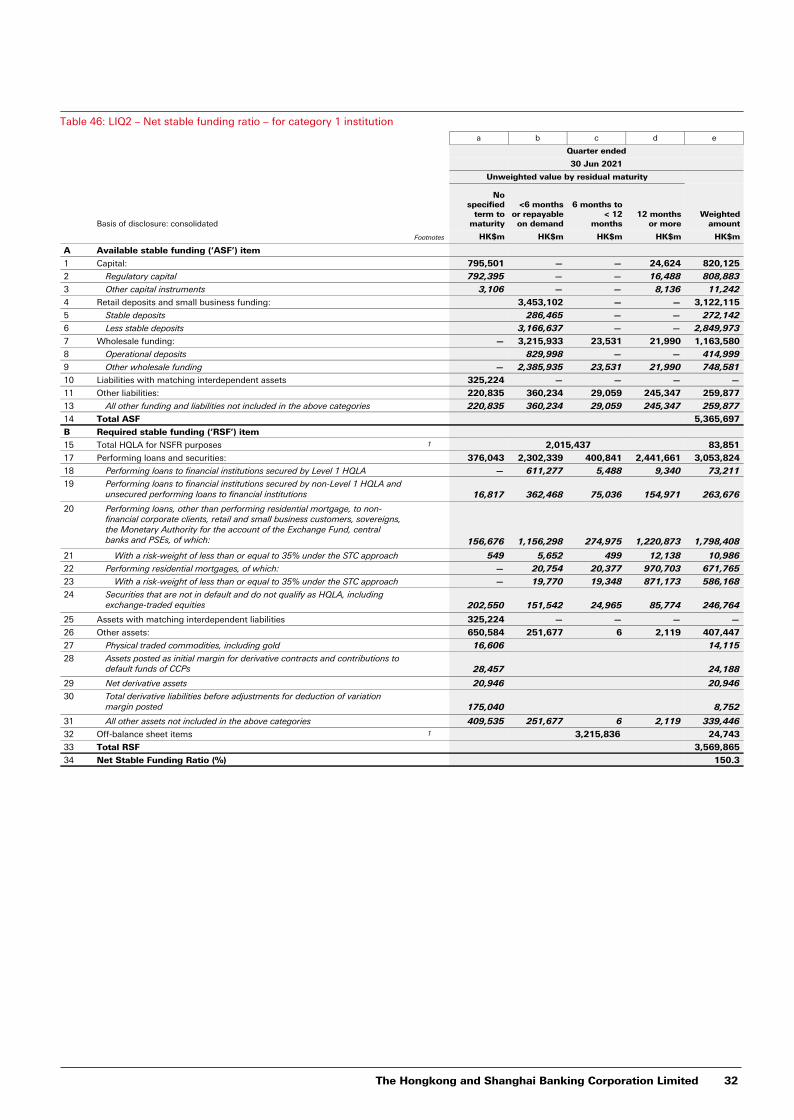
Table 46: LIQ2 – Net stable funding ratio – for category 1 institution
a b c d e
Quarter ended
30 Jun 2021
Unweighted value by residual maturity
Weighted amount Basis of disclosure: consolidated
No specified
term to maturity
<6 months or repayable
on demand
6 months to < 12
months12 months
or more
Footnotes HK$m HK$m HK$m HK$m HK$m
A Available stable funding (‘ASF’) item
1 Capital: 795,501 — — 24,624 820,125
2 Regulatory capital 792,395 — — 16,488 808,883
3 Other capital instruments 3,106 — — 8,136 11,242
4 Retail deposits and small business funding: 3,453,102 — — 3,122,115
5 Stable deposits 286,465 — — 272,142
6 Less stable deposits 3,166,637 — — 2,849,973
7 Wholesale funding: — 3,215,933 23,531 21,990 1,163,580
8 Operational deposits 829,998 — — 414,999
9 Other wholesale funding — 2,385,935 23,531 21,990 748,581
10 Liabilities with matching interdependent assets 325,224 — — — —
11 Other liabilities: 220,835 360,234 29,059 245,347 259,877
13 All other funding and liabilities not included in the above categories 220,835 360,234 29,059 245,347 259,877
14 Total ASF 5,365,697
B Required stable funding (‘RSF’) item
15 Total HQLA for NSFR purposes 1 2,015,437 83,851
17 Performing loans and securities: 376,043 2,302,339 400,841 2,441,661 3,053,824
18 Performing loans to financial institutions secured by Level 1 HQLA — 611,277 5,488 9,340 73,211
19 Performing loans to financial institutions secured by non-Level 1 HQLA and unsecured performing loans to financial institutions 16,817 362,468 75,036 154,971 263,676
20 Performing loans, other than performing residential mortgage, to non-financial corporate clients, retail and small business customers, sovereigns, the Monetary Authority for the account of the Exchange Fund, central banks and PSEs, of which: 156,676 1,156,298 274,975 1,220,873 1,798,408
21 With a risk-weight of less than or equal to 35% under the STC approach 549 5,652 499 12,138 10,986
22 Performing residential mortgages, of which: — 20,754 20,377 970,703 671,765
23 With a risk-weight of less than or equal to 35% under the STC approach — 19,770 19,348 871,173 586,168
24 Securities that are not in default and do not qualify as HQLA, including exchange-traded equities 202,550 151,542 24,965 85,774 246,764
25 Assets with matching interdependent liabilities 325,224 — — — —
26 Other assets: 650,584 251,677 6 2,119 407,447
27 Physical traded commodities, including gold 16,606 14,115
28 Assets posted as initial margin for derivative contracts and contributions to default funds of CCPs 28,457 24,188
29 Net derivative assets 20,946 20,946
30 Total derivative liabilities before adjustments for deduction of variation margin posted 175,040 8,752
31 All other assets not included in the above categories 409,535 251,677 6 2,119 339,446
32 Off-balance sheet items 1 3,215,836 24,743
33 Total RSF 3,569,865
34 Net Stable Funding Ratio (%) 150.3
The Hongkong and Shanghai Banking Corporation Limited 32
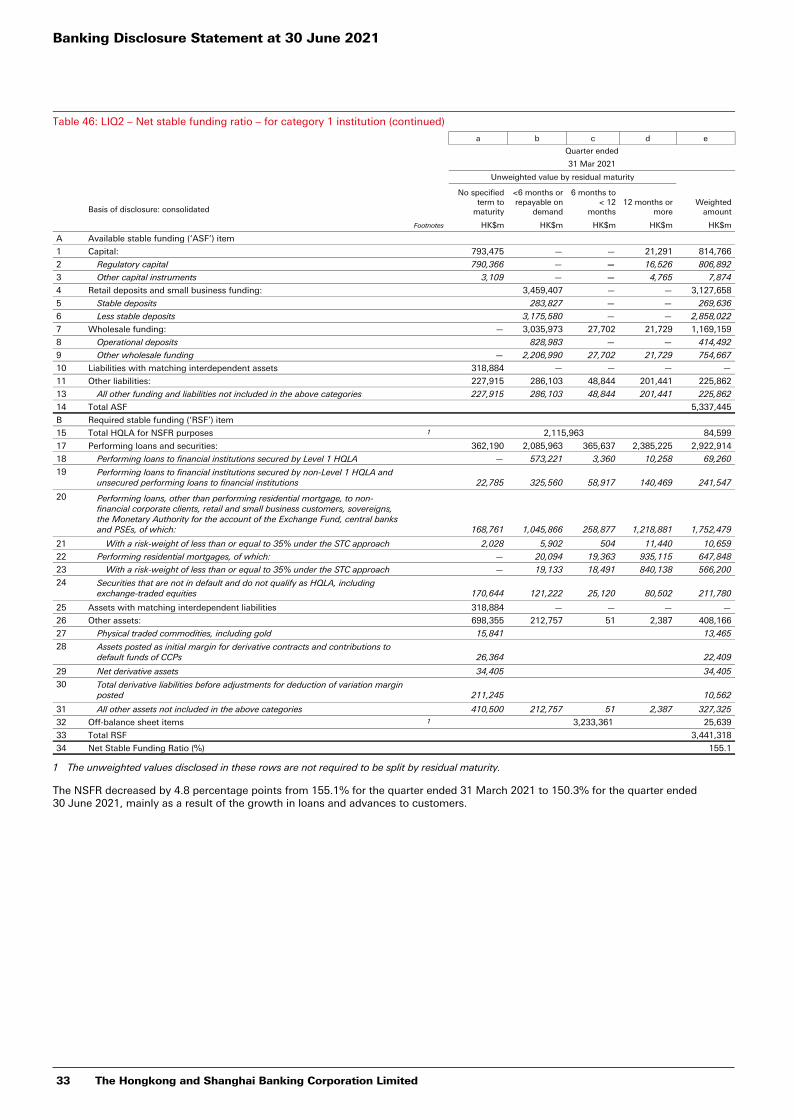
Table 46: LIQ2 – Net stable funding ratio – for category 1 institution (continued)
a b c d e
Quarter ended
31 Mar 2021
Unweighted value by residual maturity
Weighted amount Basis of disclosure: consolidated
No specified term to
maturity
<6 months or repayable on
demand
6 months to < 12
months12 months or
more
Footnotes HK$m HK$m HK$m HK$m HK$m
A Available stable funding (‘ASF’) item
1 Capital: 793,475 — — 21,291 814,766
2 Regulatory capital 790,366 — — 16,526 806,892
3 Other capital instruments 3,109 — — 4,765 7,874
4 Retail deposits and small business funding: 3,459,407 — — 3,127,658
5 Stable deposits 283,827 — — 269,636
6 Less stable deposits 3,175,580 — — 2,858,022
7 Wholesale funding: — 3,035,973 27,702 21,729 1,169,159
8 Operational deposits 828,983 — — 414,492
9 Other wholesale funding — 2,206,990 27,702 21,729 754,667
10 Liabilities with matching interdependent assets 318,884 — — — —
11 Other liabilities: 227,915 286,103 48,844 201,441 225,862
13 All other funding and liabilities not included in the above categories 227,915 286,103 48,844 201,441 225,862
14 Total ASF 5,337,445
B Required stable funding (‘RSF’) item
15 Total HQLA for NSFR purposes 1 2,115,963 84,599
17 Performing loans and securities: 362,190 2,085,963 365,637 2,385,225 2,922,914
18 Performing loans to financial institutions secured by Level 1 HQLA — 573,221 3,360 10,258 69,260
19 Performing loans to financial institutions secured by non-Level 1 HQLA and unsecured performing loans to financial institutions 22,785 325,560 58,917 140,469 241,547
20 Performing loans, other than performing residential mortgage, to non-financial corporate clients, retail and small business customers, sovereigns, the Monetary Authority for the account of the Exchange Fund, central banks and PSEs, of which: 168,761 1,045,866 258,877 1,218,881 1,752,479
21 With a risk-weight of less than or equal to 35% under the STC approach 2,028 5,902 504 11,440 10,659
22 Performing residential mortgages, of which: — 20,094 19,363 935,115 647,848
23 With a risk-weight of less than or equal to 35% under the STC approach — 19,133 18,491 840,138 566,200
24 Securities that are not in default and do not qualify as HQLA, including exchange-traded equities 170,644 121,222 25,120 80,502 211,780
25 Assets with matching interdependent liabilities 318,884 — — — —
26 Other assets: 698,355 212,757 51 2,387 408,166
27 Physical traded commodities, including gold 15,841 13,465
28 Assets posted as initial margin for derivative contracts and contributions to default funds of CCPs 26,364 22,409
29 Net derivative assets 34,405 34,405
30 Total derivative liabilities before adjustments for deduction of variation margin posted 211,245 10,562
31 All other assets not included in the above categories 410,500 212,757 51 2,387 327,325
32 Off-balance sheet items 1 3,233,361 25,639
33 Total RSF 3,441,318
34 Net Stable Funding Ratio (%) 155.1
1 The unweighted values disclosed in these rows are not required to be split by residual maturity.
The NSFR decreased by 4.8 percentage points from 155.1% for the quarter ended 31 March 2021 to 150.3% for the quarter ended 30 June 2021, mainly as a result of the growth in loans and advances to customers.
Banking Disclosure Statement at 30 June 2021
33 The Hongkong and Shanghai Banking Corporation Limited
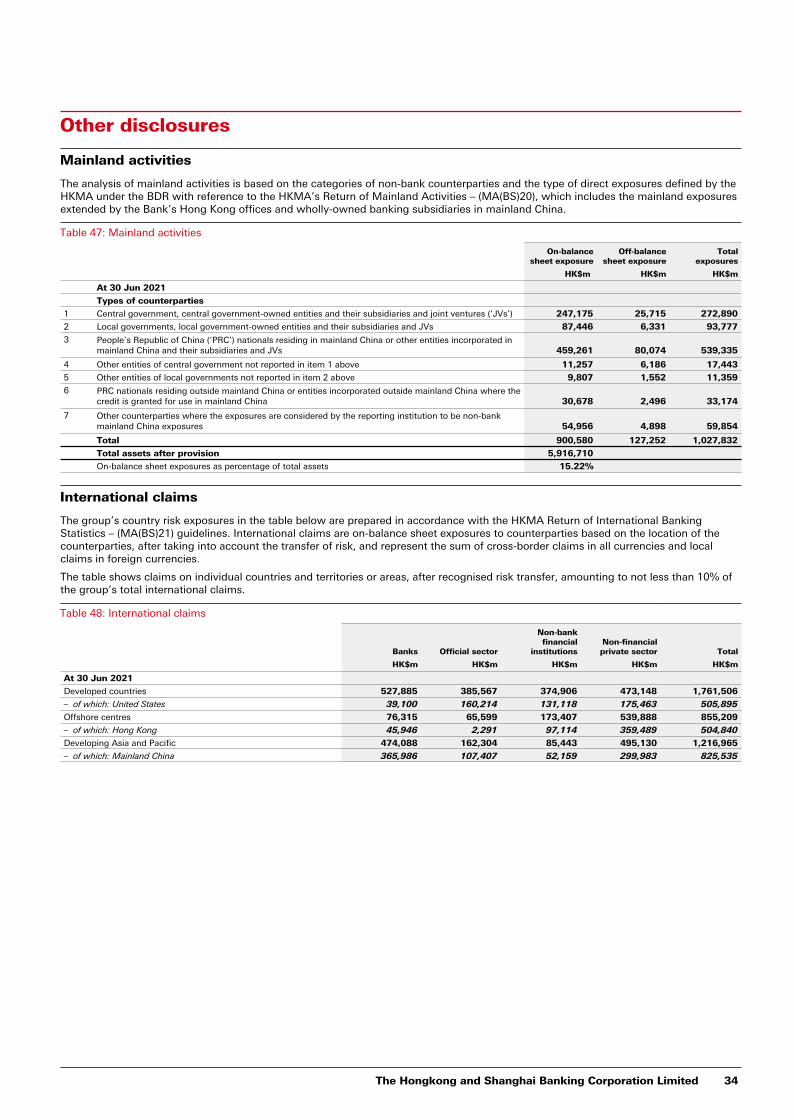
Other disclosures
Mainland activities
The analysis of mainland activities is based on the categories of non-bank counterparties and the type of direct exposures defined by the HKMA under the BDR with reference to the HKMA’s Return of Mainland Activities – (MA(BS)20), which includes the mainland exposures extended by the Bank’s Hong Kong offices and wholly-owned banking subsidiaries in mainland China.
Table 47: Mainland activities
On-balancesheet exposure
Off-balancesheet exposure
Totalexposures
HK$m HK$m HK$m
At 30 Jun 2021
Types of counterparties
1 Central government, central government-owned entities and their subsidiaries and joint ventures (‘JVs’) 247,175 25,715 272,890
2 Local governments, local government-owned entities and their subsidiaries and JVs 87,446 6,331 93,777
3 People’s Republic of China (‘PRC’) nationals residing in mainland China or other entities incorporated in mainland China and their subsidiaries and JVs 459,261 80,074 539,335
4 Other entities of central government not reported in item 1 above 11,257 6,186 17,443
5 Other entities of local governments not reported in item 2 above 9,807 1,552 11,359
6 PRC nationals residing outside mainland China or entities incorporated outside mainland China where the credit is granted for use in mainland China 30,678 2,496 33,174
7 Other counterparties where the exposures are considered by the reporting institution to be non-bank mainland China exposures 54,956 4,898 59,854
Total 900,580 127,252 1,027,832
Total assets after provision 5,916,710
On-balance sheet exposures as percentage of total assets 15.22%
International claims
The group’s country risk exposures in the table below are prepared in accordance with the HKMA Return of International Banking Statistics – (MA(BS)21) guidelines. International claims are on-balance sheet exposures to counterparties based on the location of the counterparties, after taking into account the transfer of risk, and represent the sum of cross-border claims in all currencies and local claims in foreign currencies.
The table shows claims on individual countries and territories or areas, after recognised risk transfer, amounting to not less than 10% of the group’s total international claims.
Table 48: International claims
Banks Official sector
Non-bank financial
institutionsNon-financial private sector Total
HK$m HK$m HK$m HK$m HK$m
At 30 Jun 2021
Developed countries 527,885 385,567 374,906 473,148 1,761,506
– of which: United States 39,100 160,214 131,118 175,463 505,895
Offshore centres 76,315 65,599 173,407 539,888 855,209
– of which: Hong Kong 45,946 2,291 97,114 359,489 504,840
Developing Asia and Pacific 474,088 162,304 85,443 495,130 1,216,965
– of which: Mainland China 365,986 107,407 52,159 299,983 825,535
The Hongkong and Shanghai Banking Corporation Limited 34
Foreign currency positions
The group’s foreign exchange exposures in the tables below are prepared in accordance with the HKMA return ‘Foreign Currency Position Return – (MA(BS)6)’. The group had the following net structural foreign currency exposures that were not less than 10% of total net structural foreign currency positions at 30 June 2021:
Table 49: Net structural foreign currency exposures
Net structural position
LCYm HK$m
At 30 Jun 2021
Renminbi 225,835 271,593
The group had the following non-structural foreign currency positions that were not less than 10% of the net non-structural positions in all foreign currencies at 30 June 2021:
Table 50: Non-structural foreign currency positions
United States Dollars Australian dollars
HK$m equivalent Footnotes HK$m HK$m
At 30 Jun 2021
Spot assets 2,325,072 563,940
Spot liabilities (2,885,768) (484,385)
Forward purchases 10,590,142 1,231,144
Forward sales (10,006,838) (1,308,821)
Net options positions (7,510) 124
Net long (net short) position 1 15,098 2,002
1 The net options positions reported above are calculated using the delta-weighted positions of the options contracts.
Banking Disclosure Statement at 30 June 2021
35 The Hongkong and Shanghai Banking Corporation Limited
Other information
Abbreviations
The following abbreviated terms are used throughout this document.
Currencies
HK$m Millions of Hong Kong dollars
HK$bn Billions (thousands of millions) of Hong Kong dollars
US$m Millions of United States dollars
AAI Authorised institution
ASF Available stable funding
AT1 Additional tier 1
BBCBS Basel Committee on Banking Supervision
BCR Banking (Capital) Rules
BDR Banking (Disclosure) Rules
BLR Banking (Liquidity) Rules
BSC Basic approach
CCCF Credit conversion factor
CCP1 Central counterparty
CCR1 Counterparty credit risk
CCyB1 Countercyclical capital buffer
CEM Current exposure method
CET11 Common equity tier 1
CRM1 Credit risk mitigation/mitigant
CRO Chief Risk Officer
CRR1 Customer risk rating
CSA Credit Support Annex
CVA1 Credit valuation adjustment
DD-SIB Domestic systemically important authorised institution
DTAs Deferred tax assets
EEAD1 Exposure at default
ECL1 Expected credit loss
EL Expected loss
EPE Effective expected positive exposures
FFIRO Financial Institutions (Resolution) Ordinance
FSB Financial Stability Board
GGroup HSBC Holdings together with its subsidiary
undertakings
group The Hongkong and Shanghai Banking Corporation Limited together with its subsidiary undertakings
G-SIB1 Global systemically important authorised institution
HHAHO HSBC Asia Holdings Limited
HKFRS Hong Kong Financial Reporting Standards
HKMA Hong Kong Monetary Authority
Hong Kong The Hong Kong Special Administrative Region of the People’s Republic of China
HQLA High-quality liquid assets
HSBC HSBC Holdings together with its subsidiary undertakings
HVCRE High volatility commercial real estate
IIAA Internal assessment approach
IMM1 Internal Models Method
IMM(CCR) Internal models (counterparty credit risk)
IPO Initial public offering
IPRE Income producing real estate
IRB1 Internal ratings-based approach
IRC Incremental risk charge
JJCCyB Jurisdictional countercyclical capital buffer
JVs Joint ventures
LLAC Loss-absorbing capacity
LAC Rules Financial Institutions (Resolution) (Loss-absorbing Capacity Requirements - Banking Sector) Rules
LCR1 Liquidity Coverage Ratio
LGD1 Loss given default
LR Leverage ratio
MMSRs Mortgage servicing rights
NNSFR1 Net stable funding ratio
NMDs Non-maturity and deposits
OOBS Off-balance sheet
OTC1 Over-the-counter
PPD1 Probability of default
PF Project finance
PFE Potential future exposure
PRC People’s Republic of China
PSE Public sector entities
QQRRE Qualifying revolving retail exposures
RRC Replacement cost
RNIV Risks not in VaR
RSF Required stable funding
RW Risk weight
RWA1 Risk-weighted asset/risk-weighted amount
SSA-CCR Standardised approach for counterparty credit risk
SEC-ERBA Securitisation external ratings-based approach
SEC-FBA Securitisation fall-back approach
SEC-IRBA Securitisation internal ratings-based approach
SEC-SA Securitisation standardised approach
SFT Securities Financing Transactions
SPE1 Special Purpose Entity
SRW Supervisory risk weight
STC Standardised (credit risk) approach
STM Standardised (market risk) approach
STO Standardised (operational risk) approach
TT1 Tier 1
T2 Tier 2
TC Total regulatory capital
TLAC1 Total Loss-absorbing Capacity
VVaR1 Value at risk
1 Full definition included in the Glossary published on HSBC website www.hsbc.com
The Hongkong and Shanghai Banking Corporation Limited 36
The Hongkong and Shanghai Banking Corporation Limited
HSBC Main Building1 Queen's Road Central, Hong KongTelephone: (852) 2822 1111Facsimile: (852) 2810 1112 www.hsbc.com.hk