Embed Size (px)
Citation preview
Scientific paper
Temporal and spatial di#erences of methane fluxat arctic tundra in Alaska
Yoshinobu Harazono+�, Masayoshi Mano,, Akira Miyata,,
Mayumi Yoshimoto,, Rommel C. Zulueta-, George L. Vourlitis-,
Hyojung Kwon- and Walter C. Oechel-
+ International Arctic Research Center, University of Alaska Fairbanks, AK 3311/, U.S.A., Ecosystem Gas Flux Research Team, National Institute for Agro-Environmental
Sciences, Tsukuba -*/-20*.- Global Change Research Group, San Diego State University, San Diego, CA 3,+2,, U.S.A.
�Corresponding author. E-mail: [email protected]
(Received April 0, ,**/; Accepted January +1, ,**0)
Abstract: High latitude ecosystems were thought to enhance CH. emission in
relation to the current arctic warming. However, we have little information about
this potential feedback mechanisms on climate change, thus, model parameterization is
insu$cient and the observational data are required.
We observed CH. flux at several types of tundra in Alaska over the growing seasons
since +33/. From these observed data, we examined current CH. emission and its
controlling factors on Alaskan tundra. Then we discussed about spatial and temporal
di#erences in CH. flux.
Daily trend of half hourly CH. flux had little relation with soil temperature, but
the seasonal trend of daily flux changed with soil or water temperature. Cumulative
CH. fluxes during the growing seasons were 2.+ gCH.m�, on wet sedge tundra at
Happy Valley in +33/, -.- gCH.m�, on non-acidic moist tundra in +330, and -./2�2.,.
gCH.m�, on wet sedge tundra at Barrow between +333�,**-. Non-acidic tundra had
low CH. emission with low CO, accumulation. There was large spatial di#erence in
CH. flux caused by tundra type, and the large temporal di#erence at the wet sedge
tundra reflected yearly weather variability.
key words: Arctic ecosystem, CH. flux, temporal and spatial variability, tundra, warm-
ing climate
+. Introduction
The arctic tundra is an important ecosystem for global climate change because of its
enormous carbon storage in the soil (Post et al., +32,) and the seasonally thawed layer
may have considerable e#ects on atmospheric concentration of greenhouse gases
(GHG) (Oechel et al., +33-). Warming climate is widely observed in the arctic and
sub-arctic (Hinzman et al., ,**/), and many GCMs and climate models have predicted
remarkable warming in the arctic in the near future (Martin et al., +331; Rigor et al.,
,***; Polyakov et al., ,**,). The warming trend in the arctic ecosystems makes the
13
Mem. Natl Inst. Polar Res., Spec. Issue, /3, 13�3/, ,**0� ,**0 National Institute of Polar Research
decomposition rate of organic matter in the permafrost increase, resulting in increase of
GHG such as carbon dioxide (CO,) and methane (CH.) in the atmosphere (Mathews
and Fung, +321; Oechel et al., +33-). Conversely the warm climate shortens the
snow-cover period and prolongs the growing season over the arctic ecosystems, which
may provide greater CO, accumulation and biomass production (Oechel and Vourlitis,
+331; Oechel et al., ,***; Vourlitis et al., ,***). The arctic warming is also making the
upper soil layers dry, which may reduce CH. production but increase CO, emission.
However, we have little information of potential feedback mechanisms of these GHG
budgets on the climate change, especially for CH. budget in the arctic ecosystems.
Considering CH. in terms of its global warming potential (GWP), which is thought
to be at least ,- times (+**-yr horizon) stronger than that of CO, in the atmosphere
(Houghton et al., ,**+). Its major source in nature is anaerobic ecosystem such as
tundra and wetlands; however, some of produced CH. in the rhizosphere are oxidized at
upper soil layer, moss layer and vascular system of plants under aerobic conditions
(Joabsson and Christensen, ,**+; Christensen et al., ,**-). Many models have been
proposed to reveal the potential feedback mechanisms of the CH. exchange between
each ecosystem and atmosphere. However, model parameterization of CH. budget is
insu$cient because observational data available to parameterize are few. There are
several problems in observational data acquisition; one is di$culties of field observation
of CH. in the Arctic by methodological limitation including power supply under severe
weather, another is heterogeneous distribution of wet/mesic/dry types of vegetation
which makes it di$cult to understand each of its contribution of CH. emission and/or
uptake as an average.
We have been applying meteorological flux observation methods to arctic tundra
ecosystems since +33-, in which we applied gradient techniques to determine CH. flux.
These measurement methods have great advantages allowing continuous flux observa-
tions over growing seasons, large-scale flux evaluation as hectare scale (namely, stand
scale), and data acquisition available to analyze relationship between CH. flux and
meteorological conditions.
In this paper, the daily variation and intra-seasonal changes of CH. flux determined
by micrometeorological techniques over several types of tundra in Alaska are shown,
then the current CH. flux levels and spatial di#erence among arctic tundra are discussed.
We also examined temporal di#erences of CH. flux at Alaskan tundra by using five years
of records from field observations at Barrow.
,. Observation sites, vegetation and methods
,.+. Site description and measurement methods
Our meteorological CH. flux observation at Alaskan tundra started at Barrow in
mid-June in +33- and continued until the end of August, then the observations were
carried out at Prudhoe Bay between mid-June and mid-August in +33. and at Happy
Valley between early June and late August in +33/, respectively. These CH. flux
measurements were continued one to two days a week because of the limitation of
applicability of CH. analyzer. Since +330, we used a Non Dispersive type Infra-Red
CH. (NDIR-CH.; Horiba, GA--0*, Japan) analyzer (Harazono et al., +33/) and a
Y. Harazono et al.80
Flame Ionized Detector type CH. analyzer (FID-CH.; Horiba, APHA--0*, Japan) after
spring of ,***. These improvements allowed measuring CH. concentration continu-
ously at the sites. In this paper we show relatively longer recorded results, obtained
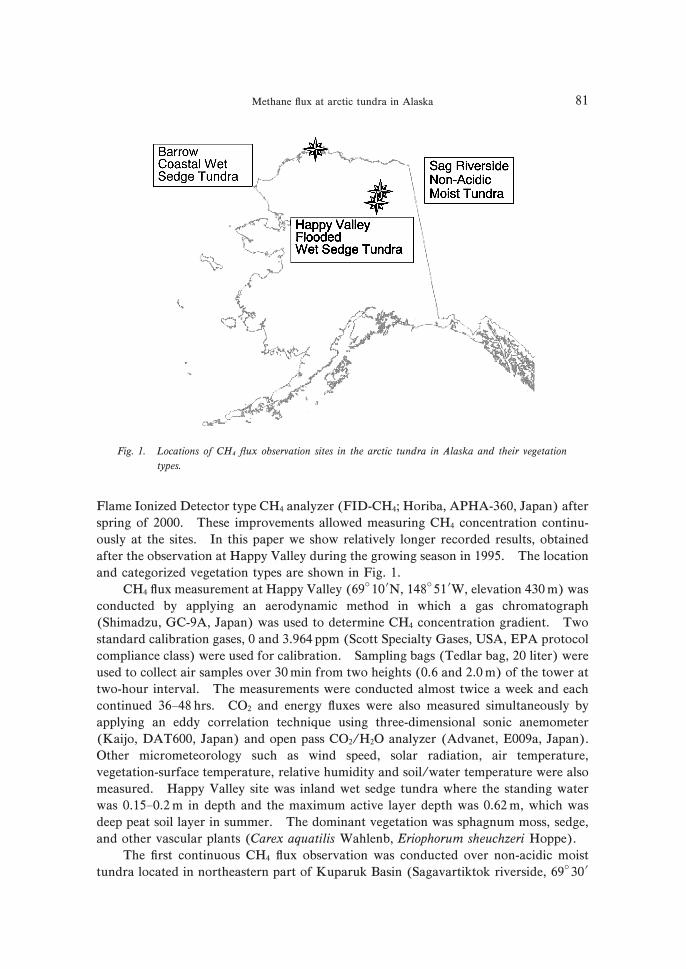
after the observation at Happy Valley during the growing season in +33/. The location
and categorized vegetation types are shown in Fig. +.
CH. flux measurement at Happy Valley (03�+*�N, +.2�/+�W, elevation .-* m) was
conducted by applying an aerodynamic method in which a gas chromatograph
(Shimadzu, GC-3A, Japan) was used to determine CH. concentration gradient. Two
standard calibration gases, * and -.30. ppm (Scott Specialty Gases, USA, EPA protocol
compliance class) were used for calibration. Sampling bags (Tedlar bag, ,* liter) were
used to collect air samples over -* min from two heights (*.0 and ,.* m) of the tower at
two-hour interval. The measurements were conducted almost twice a week and each
continued -0�.2 hrs. CO, and energy fluxes were also measured simultaneously by
applying an eddy correlation technique using three-dimensional sonic anemometer
(Kaijo, DAT0**, Japan) and open pass CO,/H,O analyzer (Advanet, E**3a, Japan).
Other micrometeorology such as wind speed, solar radiation, air temperature,
vegetation-surface temperature, relative humidity and soil/water temperature were also
measured. Happy Valley site was inland wet sedge tundra where the standing water
was *.+/�*., m in depth and the maximum active layer depth was *.0, m, which was
deep peat soil layer in summer. The dominant vegetation was sphagnum moss, sedge,
and other vascular plants (Carex aquatilis Wahlenb, Eriophorum sheuchzeri Hoppe).
The first continuous CH. flux observation was conducted over non-acidic moist
tundra located in northeastern part of Kuparuk Basin (Sagavartiktok riverside, 03�-*�
Fig. +. Locations of CH. flux observation sites in the arctic tundra in Alaska and their vegetation
types.
Methane flux at arctic tundra in Alaska 81
,*�N, +.2�+-�-*�W, elevation +1* m, hereafter we state Sag-river site) from June . to
September +* in +330. Vegetation at the site was mesic tundra, consisted of vascular
plant, moss and a few short shrubs. The density and height of vascular plants were low
compared to the Happy Valley site. The NDIR-CH. analyzer (Horiba, GA-0*, Japan)
was applied to determine CH. concentration (two standard gases +.02 and -.32 ppm
air-balanced by Takachiho Chemical Industry, Japan, were used twice a day at 2 AM and
/ PM for calibration). The analyzer allowed continuous CH. concentration measure-
ments with a +* ppb realizable limit and good reproducibility at fields (Harazono et al.,
+330). The vertical CH. concentration gradient was measured by alternating air
samples from two heights of the tower (*./ and ,./ m) by switching the sampling lines
at three-minute intervals. CH. flux was determined using the improved aerodynamic
method (Harazono et al., +330; Miyata et al., ,***) applying measured friction velocity
(u�) and sensible heat flux (H) by the simultaneous eddy correlation measurement at
the site.
Continuous long-term CH. flux observations have been conducted at Barrow since
+333 spring. Barrow site (1+�+3�+,./�N, +/0�-1�,*.,++�W, elevation + m) was com-
pletely wet tundra located at the northern edge of a dried lagoon called the Central
Marsh in Barrow. Vegetation consists of wet sedges, grasses, moss and lichens, and the
dominant species is Arctophila fulva (Walker and Acevedo, +321; Oechel et al., +33/).
The vegetation was completely flooded after spring thaw (Harazono et al., ,**-; Oechel
and Vourlitis, +331). We applied the NDIR-CH. analyzer and improved aerodynamic
method (Miyata, ,**+) to determine CH. flux the same way as Sag-river site, in which
air sampling heights were di#erent (*.1 and ,.3 m). After ,*** spring, we applied the
FID-CH. analyzer to improve the CH. concentration measurement during cold season.
Two standard gases * and around - ppm (di#erent numbers within five years) were used
at 2 AM for calibration. Supporting micrometeorological data were also measured at
the observation tower (0., m tall). Details of the measurement at the Barrow site are
reported in Harazono et al. (,**-).
,.,. CH. Flux calculation methods
CH. flux was determined by gradient method according to the Monin-Obukhov
similarity; there is a relationship between turbulent transport of a subject and its vertical
profile within boundary layer over a flat canopy. Fortunately, the boundary layer
conditions of our measurement sites were verified to have enough fetch length for
dominant wind direction, we were able to apply improved aerodynamic method.
Details of the method are introduced in Harazono et al. (+330), Harazono and Miyata
(+331), Miyata et al. (,***), and Miyata (,**+), and the outlines were as follows.
From Monin-Obukhov similarity theory, the vertical flux of a gas F is related to the
mean vertical gradient of the mass mixing ratio s (Fowler and Duyzer, +323; Denmead,
+33.):
F��r�aKg�z��s
�z���r�a
�ku �z�d�fg�z�
�s
�z� � (+)
where, Kg (z) is the eddy di#usivity at a height z, and d, u�, ra and k are the zero plane
displacement determined from measured wind profile, the friction velocity, the density
Y. Harazono et al.82
of dry air, and von Karman’s constant (�*..), respectively. The term fg (z) in eq. (+)
is the correction to the eddy di#usivity as a function of the Monin-Obukhov stability
parameter z defined as
z���z�d�u-��
kHq
g
(,)
fh��+�+0 z��+�,� �z�*� (-a)
fh�+�/ z� �z�*� (-b)
where, q, H and g are potential temperature, sensible heat flux, and acceleration of
gravity, respectively.
By using u� and H obtained from the simultaneous eddy flux measurements, the
stability parameter z and therefore fh (z) were determined by eq. (-a) and eq. (-b).
Then, we calculated the CH. flux from the CH. concentration gradient using eq. (+).
Based on the previous studies (Denmead, +33.; Dyer and Hicks, +31*; Webb, +31*) and
the site conditions, we put dimensionless gradients as fg�fh.
-. Results and discussions
-.+. Methane flux at inland wet sedge tundra
The average CH. concentration at Happy Valley was around +.2/ ppm with little
daily variation in June, then the concentration increased to +.30 ppm in July and then
decreased to +.3+ ppm in August. The atmospheric CH. concentration at Barrow
Station, NOAA-CMDL during +33/ summer was less than +.2/ ppm as daily base
(Russell et al., ,**.), so the CH. concentration over the inland wet sedge tundra was
higher than background concentration and also higher than +.2,/ ppm measured at
Alaskan tundra previously (Fan et al., +33,). The amplitude in daily CH. concentra-
tion was very small in June, but fluctuated largely in July and August, especially in
daytime, which did not show a typical diurnal pattern with temperature or solar radiation.
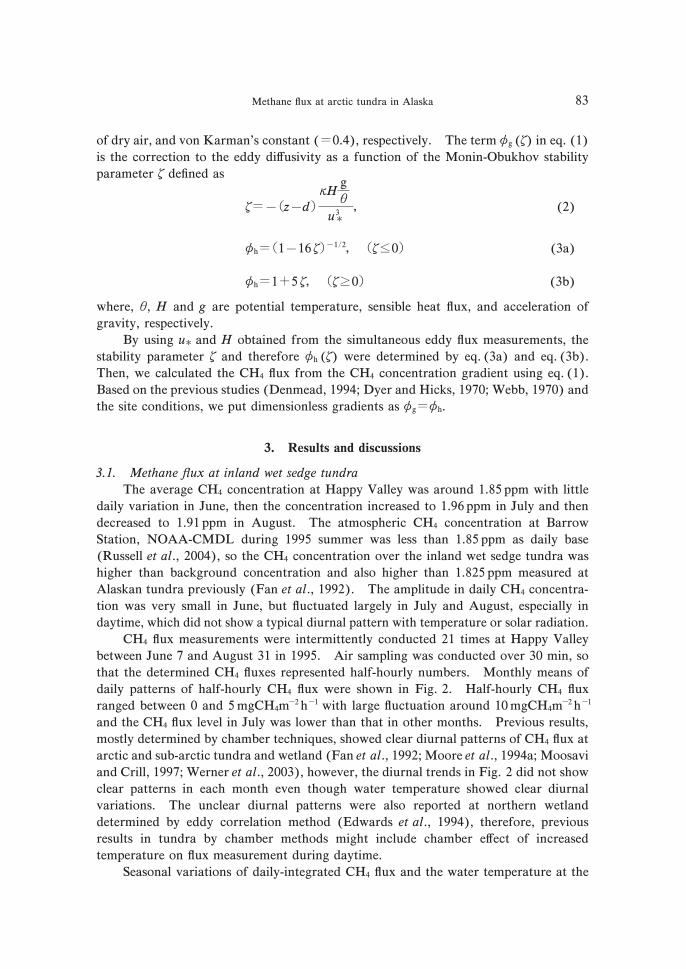
CH. flux measurements were intermittently conducted ,+ times at Happy Valley
between June 1 and August -+ in +33/. Air sampling was conducted over -* min, so
that the determined CH. fluxes represented half-hourly numbers. Monthly means of
daily patterns of half-hourly CH. flux were shown in Fig. ,. Half-hourly CH. flux
ranged between * and / mgCH.m�, h�+ with large fluctuation around +* mgCH.m
�, h�+
and the CH. flux level in July was lower than that in other months. Previous results,
mostly determined by chamber techniques, showed clear diurnal patterns of CH. flux at
arctic and sub-arctic tundra and wetland (Fan et al., +33,; Moore et al., +33.a; Moosavi
and Crill, +331; Werner et al., ,**-), however, the diurnal trends in Fig. , did not show
clear patterns in each month even though water temperature showed clear diurnal
variations. The unclear diurnal patterns were also reported at northern wetland
determined by eddy correlation method (Edwards et al., +33.), therefore, previous
results in tundra by chamber methods might include chamber e#ect of increased
temperature on flux measurement during daytime.
Seasonal variations of daily-integrated CH. flux and the water temperature at the
Methane flux at arctic tundra in Alaska 83
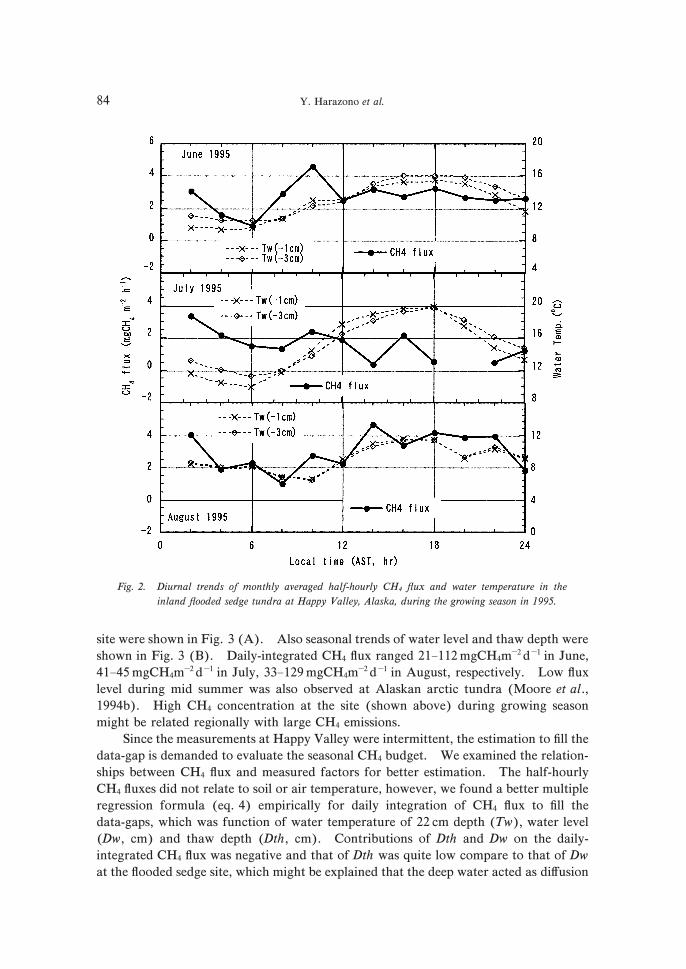
site were shown in Fig. - (A). Also seasonal trends of water level and thaw depth were
shown in Fig. - (B). Daily-integrated CH. flux ranged ,+�++, mgCH.m�, d�+ in June,
.+�./ mgCH.m�, d�+ in July, --�+,3 mgCH.m
�, d�+ in August, respectively. Low flux
level during mid summer was also observed at Alaskan arctic tundra (Moore et al.,
+33.b). High CH. concentration at the site (shown above) during growing season
might be related regionally with large CH. emissions.
Since the measurements at Happy Valley were intermittent, the estimation to fill the
data-gap is demanded to evaluate the seasonal CH. budget. We examined the relation-
ships between CH. flux and measured factors for better estimation. The half-hourly
CH. fluxes did not relate to soil or air temperature, however, we found a better multiple
regression formula (eq. .) empirically for daily integration of CH. flux to fill the
data-gaps, which was function of water temperature of ,, cm depth (Tw), water level
(Dw, cm) and thaw depth (Dth, cm). Contributions of Dth and Dw on the daily-
integrated CH. flux was negative and that of Dth was quite low compare to that of Dw
at the flooded sedge site, which might be explained that the deep water acted as di#usion
Fig. ,. Diurnal trends of monthly averaged half-hourly CH. flux and water temperature in the
inland flooded sedge tundra at Happy Valley, Alaska, during the growing season in +33/.
Y. Harazono et al.84
resistance between soil layer and the atmosphere (Miyata et al., ,***) and accelerator
of CH.-oxidation within water (Yagi, +33.).
CH.flux�+,.2Tw�*...Dth�..,Dw�//.2. (.)
�determination coefficient�*...� n�+/�
The estimation according to eq. (.) with available data in Fig. - provided the
cumulative CH. flux of 2.+ gCH.m�, in the flooded sedge tundra at Happy Valley
between DOY +/+�,/, (+*+ days) in +33/. The total flux was similar to those pre-
viously estimated such as 0.. gCH.m�, during +-* days of growing period (Moore et al.,
+33.b), 2.1 gCH.m�, during +** days at Alaskan wet tundra (Sebacher et al., +320),
+2.1 gCH.m�, during +-* days and +, gCH.m
�, during +,* days at Alaskan wet tundra
(Bartlet et al., +33,).
-.,. Methane flux at non-acidic moist tundra
CH. concentration and CH. flux were measured continuously at Sag-river site
during the growing season in +330. The average CH. concentrations in daytime were
around +.2, ppm from early June to mid-August, and then it increased gradually up to
,.*/ ppm in early September. There was no obvious daily variation in CH. concentra-
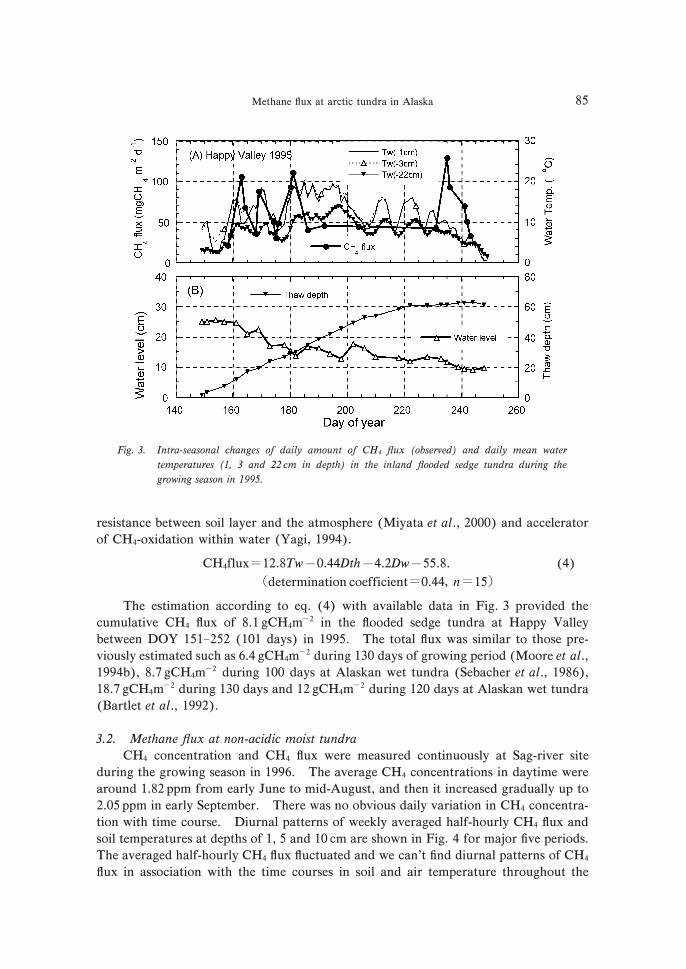
tion with time course. Diurnal patterns of weekly averaged half-hourly CH. flux and
soil temperatures at depths of +, / and +* cm are shown in Fig. . for major five periods.
The averaged half-hourly CH. flux fluctuated and we can’t find diurnal patterns of CH.
flux in association with the time courses in soil and air temperature throughout the
Fig. -. Intra-seasonal changes of daily amount of CH. flux (observed) and daily mean water
temperatures (+, - and ,, cm in depth) in the inland flooded sedge tundra during the
growing season in +33/.
Methane flux at arctic tundra in Alaska 85
observed period. The fluctuations might be the reflection of wind condition and
heterogeneity of the field, where small ponds, submerged plots and dry spots of the
tundra were present. Weak CH. uptakes were measured sometimes as half-hourly base,
which were also observed at other sub-arctic wetland and tundra under drained
conditions (Bartlett et al., +33,; Moore et al., +33.a; Nakano et al., ,**.). The
oxidization at aerobic soil parts within the site might have strong e#ect on the fluctuation
in measured half-hourly CH. fluxes.
The weekly averaged half-hourly fluxes were lower than , mgCH.m�, h�+ by mid-
June (no figure), then increased gradually. In late June, the average flux levels
Fig. .. Diurnal trends of weekly averaged half-hourly CH. flux and soil temperature (+, /, +* cm
in depth) over the non-acidic moist tundra at Sagavartiktok riverside (Sag-river site),
Alaska, during the growing season in +330.
Y. Harazono et al.86
increased to around - mgCH.m�, h�+ in daytime, and then continued almost similar
averages until late July. However the weekly average levels fluctuated and did not
show clear diurnal pattern. After mid-August the weekly averaged CH. flux level
decreased gradually, also we observed high level fluxes after dusk and before dawn when
the midnight sun was gone. The high levels during dusk and dawn might be caused by
the low CH. oxidation in relation to low wind speed during nighttime. In late August,
the weekly average CH. flux decreased to less than + mgCH.m�, h�+.
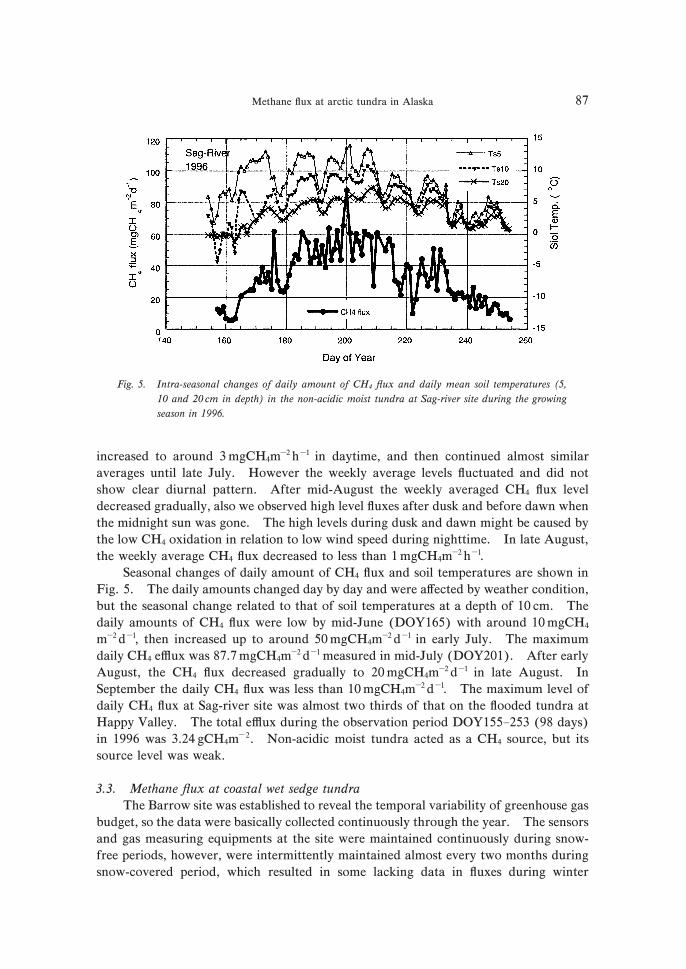
Seasonal changes of daily amount of CH. flux and soil temperatures are shown in
Fig. /. The daily amounts changed day by day and were a#ected by weather condition,
but the seasonal change related to that of soil temperatures at a depth of +* cm. The
daily amounts of CH. flux were low by mid-June (DOY+0/) with around +* mgCH.
m�, d�+, then increased up to around /* mgCH.m�, d�+ in early July. The maximum
daily CH. e%ux was 21.1 mgCH.m�, d�+ measured in mid-July (DOY,*+). After early
August, the CH. flux decreased gradually to ,* mgCH.m�, d�+ in late August. In
September the daily CH. flux was less than +* mgCH.m�, d�+. The maximum level of
daily CH. flux at Sag-river site was almost two thirds of that on the flooded tundra at
Happy Valley. The total e%ux during the observation period DOY+//�,/- (32 days)
in +330 was -.,. gCH.m�,. Non-acidic moist tundra acted as a CH. source, but its
source level was weak.
-.-. Methane flux at coastal wet sedge tundra
The Barrow site was established to reveal the temporal variability of greenhouse gas
budget, so the data were basically collected continuously through the year. The sensors
and gas measuring equipments at the site were maintained continuously during snow-
free periods, however, were intermittently maintained almost every two months during
snow-covered period, which resulted in some lacking data in fluxes during winter
Fig. /. Intra-seasonal changes of daily amount of CH. flux and daily mean soil temperatures (/,
+* and ,* cm in depth) in the non-acidic moist tundra at Sag-river site during the growing
season in +330.
Methane flux at arctic tundra in Alaska 87
through spring. In this section, we show data mainly obtained during vegetation
growing seasons in +333, ,***, and ,**+ to examine the spatial di#erence of CH. flux
compared to other sites above.
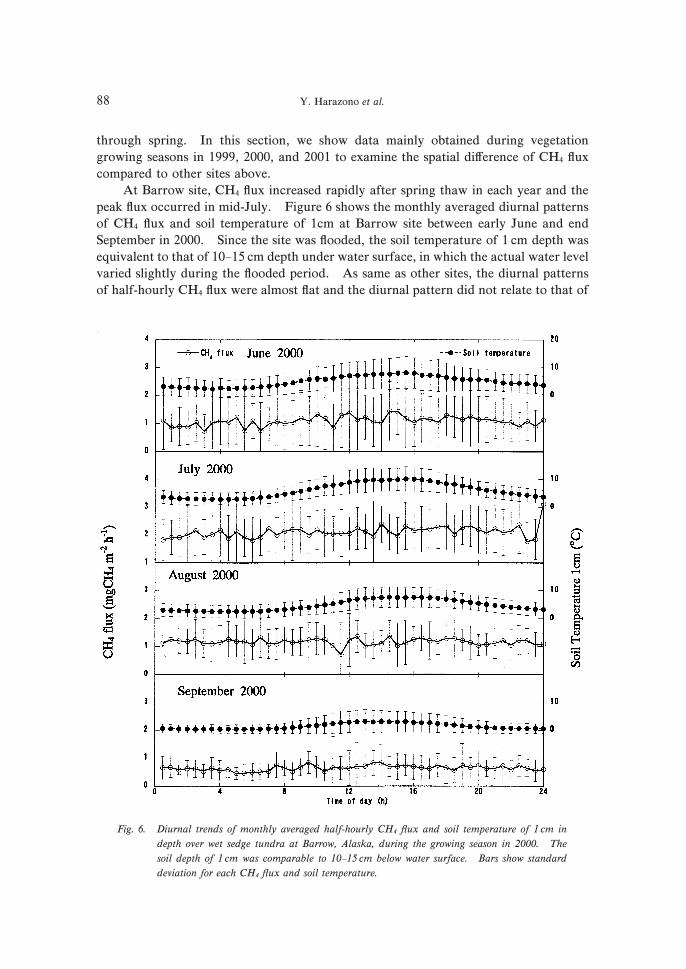
At Barrow site, CH. flux increased rapidly after spring thaw in each year and the
peak flux occurred in mid-July. Figure 0 shows the monthly averaged diurnal patterns
of CH. flux and soil temperature of +cm at Barrow site between early June and end
September in ,***. Since the site was flooded, the soil temperature of + cm depth was
equivalent to that of +*�+/ cm depth under water surface, in which the actual water level
varied slightly during the flooded period. As same as other sites, the diurnal patterns
of half-hourly CH. flux were almost flat and the diurnal pattern did not relate to that of
Fig. 0. Diurnal trends of monthly averaged half-hourly CH. flux and soil temperature of + cm in
depth over wet sedge tundra at Barrow, Alaska, during the growing season in ,***. The
soil depth of + cm was comparable to +*�+/ cm below water surface. Bars show standard
deviation for each CH. flux and soil temperature.
Y. Harazono et al.88
soil temperature. We also found little diurnal patterns in two-weekly averaged CH.
flux and monthly averaged CH. flux for years +333, ,**+ and after.
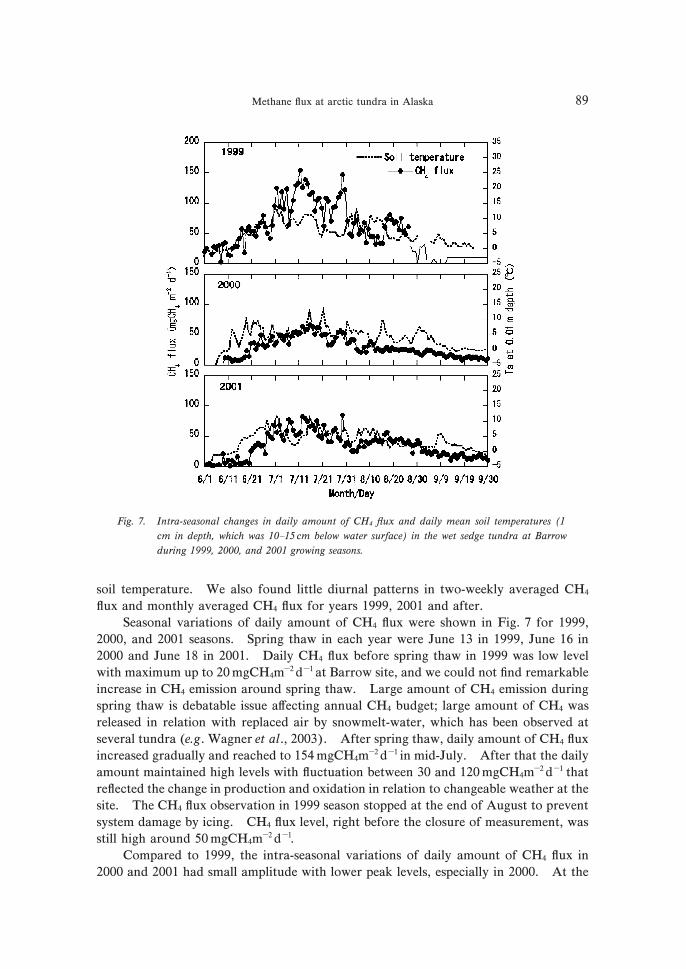
Seasonal variations of daily amount of CH. flux were shown in Fig. 1 for +333,
,***, and ,**+ seasons. Spring thaw in each year were June +- in +333, June +0 in
,*** and June +2 in ,**+. Daily CH. flux before spring thaw in +333 was low level
with maximum up to ,* mgCH.m�, d�+ at Barrow site, and we could not find remarkable
increase in CH. emission around spring thaw. Large amount of CH. emission during
spring thaw is debatable issue a#ecting annual CH. budget; large amount of CH. was
released in relation with replaced air by snowmelt-water, which has been observed at
several tundra (e.g. Wagner et al., ,**-). After spring thaw, daily amount of CH. flux
increased gradually and reached to +/. mgCH.m�, d�+ in mid-July. After that the daily
amount maintained high levels with fluctuation between -* and +,* mgCH.m�, d�+ that
reflected the change in production and oxidation in relation to changeable weather at the
site. The CH. flux observation in +333 season stopped at the end of August to prevent
system damage by icing. CH. flux level, right before the closure of measurement, was
still high around /* mgCH.m�, d�+.
Compared to +333, the intra-seasonal variations of daily amount of CH. flux in
,*** and ,**+ had small amplitude with lower peak levels, especially in ,***. At the
Fig. 1. Intra-seasonal changes in daily amount of CH. flux and daily mean soil temperatures (+cm in depth, which was +*�+/ cm below water surface) in the wet sedge tundra at Barrow
during +333, ,***, and ,**+ growing seasons.
Methane flux at arctic tundra in Alaska 89
beginning of the measurement around spring thaw; the daily CH. flux was less than +*mgCH.m
�, d�+ in ,*** (before June +0) and almost the same level in ,**+ (June +2),
while it was almost doubled in +333 (June +-). Di#erences in environmental factor
among these three years is soil temperature, shown in Fig. 1, which increased above zero
about two weeks earlier than the spring thaw in +333, while that delayed a week in ,***and ,**+. Soil temperature below zero may be a key trigger to know the activity of
methanogen bacteria. Mid-summer peaks of daily CH. flux levels were also lower in
,*** and ,**+ than that in +333, which increased gradually up to 00 mgCH.m�, d�+ in
,*** and to 2/ mgCH.m�, d�+ in ,**+. The inter-annual di#erences are discussed in the
latter section.
The seasonal amount of CH. flux were determined for four months (+,* days)
between June and September, in which data gap were filled by applying Mean Diurnal
Variation method (MDV; Falge et al., ,**+). However, we could not apply the MDV
for after August ,2, +333, so that we applied simple model fitting according to Cao et
al. (+330). The model is consisted by both CH. production and oxidation, in which the
production is functions of soil temperature and water level and the oxidation is function
of gross primary production (GPP) of the vegetation (Mano, ,**-). The seasonal
budgets at wet sedge tundra were 2.,. gCH.m�, in +333, -./2 gCH.m
�, in ,*** and ..+,gCH.m
�, in ,**+, respectively.
As we could not find clear diurnal patterns and the relationship between CH. flux
and soil temperature based on half-hourly data, however CH. flux related to soil
temperature as daily base over growing season. The relationship to temperature was
normally expressed using Q+* value, namely the coe$cient for the exponential relation-
ship between temperature and CH. flux, multiplied by ten. Q+* and the contribution
(R,) in each year were ,.1 (*.++), 0.. (*.,,), and ..* (*.,*) respectively.
-... Spatial and temporal di#erence of CH. flux in the arctic tundra in Alaska
As shown in figures above, we could not find clear diurnal patterns of CH. flux at
several types of Alaskan tundra, in which soil or water temperature had little relation to
CH. flux as hourly base. Also other micrometeorology such as solar radiation, wind
speed, air temperature, and humidity had little influence on hourly CH. flux. However,
the daily variations of CH. flux were observed in other wetland (Fan et al., +33,; Verma
et al., +33,) and in rice paddy (Miyata et al., ,***), which showed higher levels during
daytime.
The depth of thawed layer increased gradually after snow-melt in tundra vegeta-
tion, so the soil temperature at deep layer was close to that of thawed permafrost (nearly
*�C), which resulted in low and almost constant temperature. The methanogen bacte-
ria was active at deep soil layer where it is anaerobic and the temperature range varied
little within a day. While soil temperature changes seasonally thus, the CH. production
might not change in relation to diurnal changes in temperature but related to seasonal
changes. There are many reports on relationship between CH. flux and seasonal soil
temperature for wetlands (Sebacher et al., +320; Morrissey and Livingston, +33,;
Frolking and Crill, +33.; Moosavi et al., +330; Suyker et al., +330), and this relationship
was normally applied to fill the data gap and to extend large-scale estimation (Fung et
al., +33+). However, the reported Q+* ranged widely between +.1 and 1.* (Moore et
Y. Harazono et al.90
al., +33.b; Chapman and Thurlow, +330), which showed heterogeneity of vegetation
types with di#erences in activity of methanogen bacteria and organic supply (Valentini
et al., +33.). Also, Q+* at the Barrow site showed large inter-annual variability among
three years. Our Barrow results suggest that the inter-annual variability in Q+* may be
caused by di#erent weather, thus, we have to consider the importance of micro-
meteorological factors to control CH. flux as the same contribution as those of soil
conditions.
One key factor on CH. flux at the ecosystem level may be amount of CH. oxidation;
CH. is oxidized by the methanotrophic bacteria when the rhizosphere is aerobic, namely
if oxygen exist in the soil layer methane is oxidized. Vascular plants transport oxygen
from atmosphere to rhizosphere through their tissue providing aerobic conditions
especially around their roots. Also decrease of water level and increase of water flow
lead to oxygen rich rhizosphere by its di#usion. As a result, CH. oxidation takes place
at soil surface, in the soil layer, and within plant tissue. Moss is also the aerobic portion
in the tundra ecosystems. The strengths of oxidation by vascular plants showed large
di#erences (*�3*�) among plant species (Joabsson and Christensen, ,**+). Thus, the
CH. sink can be distributed anywhere in the tundra vegetation at the ecosystem level.
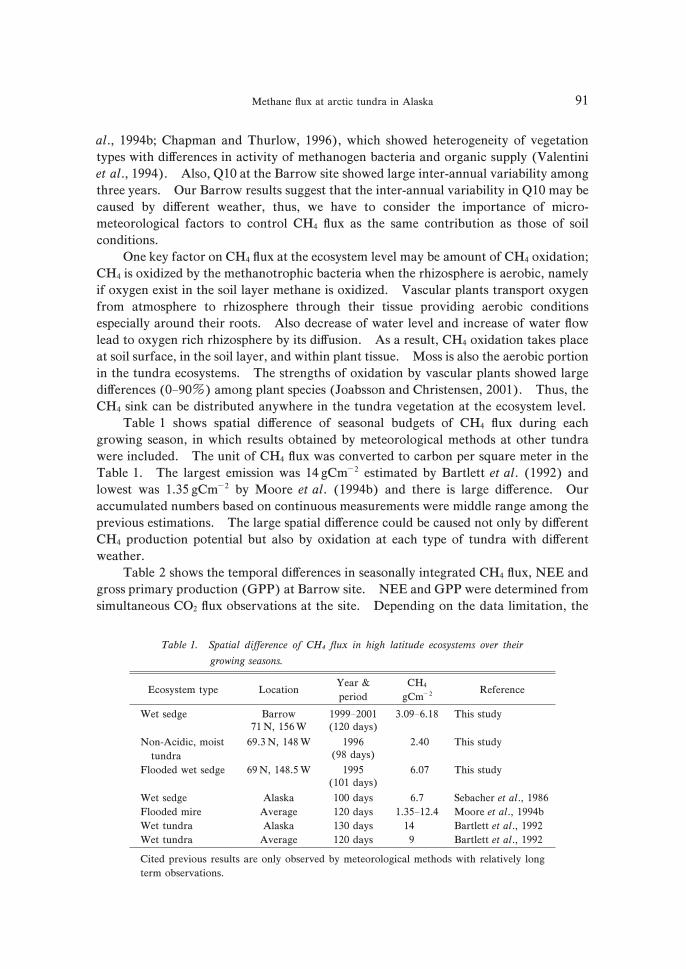
Table + shows spatial di#erence of seasonal budgets of CH. flux during each
growing season, in which results obtained by meteorological methods at other tundra
were included. The unit of CH. flux was converted to carbon per square meter in the
Table +. The largest emission was +. gCm�, estimated by Bartlett et al. (+33,) and
lowest was +.-/ gCm�, by Moore et al. (+33.b) and there is large di#erence. Our
accumulated numbers based on continuous measurements were middle range among the
previous estimations. The large spatial di#erence could be caused not only by di#erent
CH. production potential but also by oxidation at each type of tundra with di#erent
weather.
Table , shows the temporal di#erences in seasonally integrated CH. flux, NEE and
gross primary production (GPP) at Barrow site. NEE and GPP were determined from
simultaneous CO, flux observations at the site. Depending on the data limitation, the
Table +. Spatial di#erence of CH. flux in high latitude ecosystems over their
growing seasons.
Ecosystem type LocationYear &
period
CH.
gCm�, Reference
Wet sedge Barrow
1+ N, +/0 W
+333�,**+(+,* days)
-.*3�0.+2 This study
Non-Acidic, moist
tundra
03.- N, +.2 W +330(32 days)
,..* This study
Flooded wet sedge 03 N, +.2./ W +33/(+*+ days)
0.*1 This study
Wet sedge
Flooded mire
Wet tundra
Wet tundra
Alaska
Average
Alaska
Average
+** days
+,* days
+-* days
+,* days
0.1+.-/�+,..
+.3
Sebacher et al., +320Moore et al., +33.b
Bartlett et al., +33,Bartlett et al., +33,
Cited previous results are only observed by meteorological methods with relatively long
term observations.
Methane flux at arctic tundra in Alaska 91
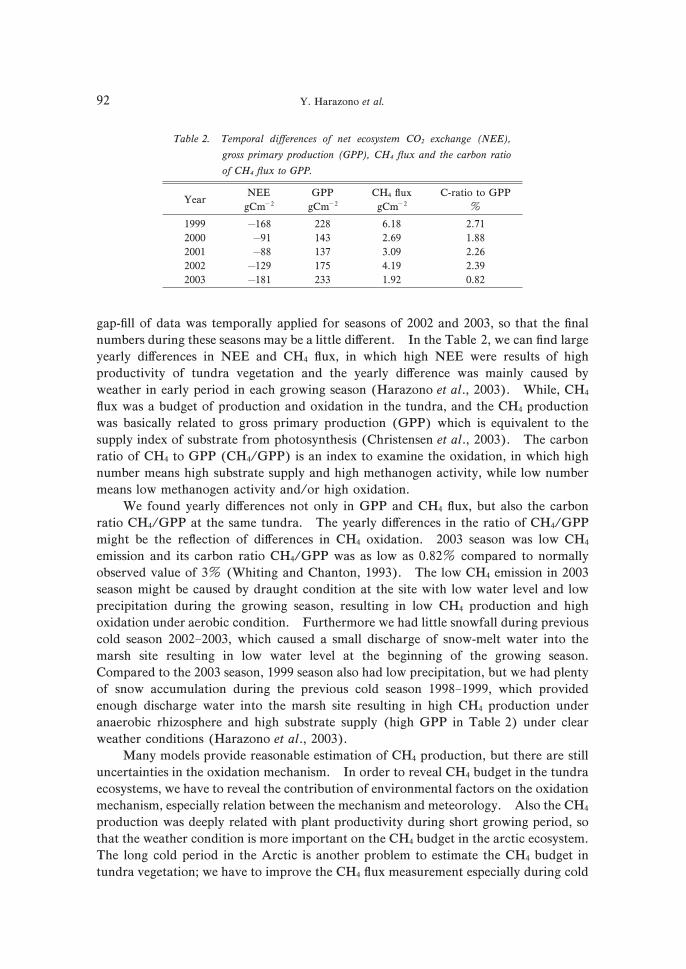
gap-fill of data was temporally applied for seasons of ,**, and ,**-, so that the final
numbers during these seasons may be a little di#erent. In the Table ,, we can find large
yearly di#erences in NEE and CH. flux, in which high NEE were results of high
productivity of tundra vegetation and the yearly di#erence was mainly caused by
weather in early period in each growing season (Harazono et al., ,**-). While, CH.
flux was a budget of production and oxidation in the tundra, and the CH. production
was basically related to gross primary production (GPP) which is equivalent to the
supply index of substrate from photosynthesis (Christensen et al., ,**-). The carbon
ratio of CH. to GPP (CH./GPP) is an index to examine the oxidation, in which high
number means high substrate supply and high methanogen activity, while low number
means low methanogen activity and/or high oxidation.
We found yearly di#erences not only in GPP and CH. flux, but also the carbon
ratio CH./GPP at the same tundra. The yearly di#erences in the ratio of CH./GPP
might be the reflection of di#erences in CH. oxidation. ,**- season was low CH.
emission and its carbon ratio CH./GPP was as low as *.2,� compared to normally
observed value of -� (Whiting and Chanton, +33-). The low CH. emission in ,**-season might be caused by draught condition at the site with low water level and low
precipitation during the growing season, resulting in low CH. production and high
oxidation under aerobic condition. Furthermore we had little snowfall during previous
cold season ,**,�,**-, which caused a small discharge of snow-melt water into the
marsh site resulting in low water level at the beginning of the growing season.
Compared to the ,**- season, +333 season also had low precipitation, but we had plenty
of snow accumulation during the previous cold season +332�+333, which provided
enough discharge water into the marsh site resulting in high CH. production under
anaerobic rhizosphere and high substrate supply (high GPP in Table ,) under clear
weather conditions (Harazono et al., ,**-).
Many models provide reasonable estimation of CH. production, but there are still
uncertainties in the oxidation mechanism. In order to reveal CH. budget in the tundra
ecosystems, we have to reveal the contribution of environmental factors on the oxidation
mechanism, especially relation between the mechanism and meteorology. Also the CH.
production was deeply related with plant productivity during short growing period, so
that the weather condition is more important on the CH. budget in the arctic ecosystem.
The long cold period in the Arctic is another problem to estimate the CH. budget in
tundra vegetation; we have to improve the CH. flux measurement especially during cold
Table ,. Temporal di#erences of net ecosystem CO, exchange (NEE),
gross primary production (GPP), CH. flux and the carbon ratio
of CH. flux to GPP.
YearNEE
gCm�,
GPP
gCm�,
CH. flux
gCm�,
C-ratio to GPP
�+333,***,**+,**,,**-
�+02
�3+
�22
�+,3
�+2+
,,2+.-+-1+1/,--
0.+2,.03-.*3..+3+.3,
,.1++.22,.,0,.-3*.2,
Y. Harazono et al.92
period to overcome the limitation of data availability.
.. Conclusions
Daily trends of half hourly CH. flux have little correlation with soil temperature
nor solar radiation at inland and coastal tundra, thus we state that the hourly CH. flux
in the arctic tundra showed little diurnal pattern. On the other hand, the seasonal
trend of daily-integrated CH. flux changed with soil temperature. Cumulative CH. flux
during vegetation growing season of flooded sedge tundra at Happy Valley was 2.+gCH.m
�, in +33/ (+*+ days) and that at moist tundra (non-acidic) was -.- gCH.m�, in
+330 (32 days). At Barrow site, CH. flux increased rapidly after snowmelt and the
peak flux occurred in mid-July. Peak levels in each year showed large temporal
di#erences with //�,*/ mgCH.m�, d�+ and the cumulative CH. flux varied ,./0�2.,.
gCH.m�, (+.3,�0.+2 gCm�,) among five growing seasons between +333�,**-. The
carbon ratio of emitted CH. to the gross primary production (GPP) of the wet tundra
varied temporally.
Observed CH. fluxes at several types of tundra showed large spatial di#erence, but
were within the range obtained by previous studies. CH. flux in wet sedge tundra at
Barrow showed large inter-annual variability (coe$cient of variance -/�) rather than
that in CO, flux (coe$cient of variance ,.�). In order to improve the understanding
of CH. budget at arctic tundra, the oxidation mechanism has to be investigated more
and further observations during cold period must be promoted.
Acknowledgments
The field studies were funded by the bilateral collaborative study (FY,***-,**+) of
former Japanese Science and Technology Agency (STA) and United State of America
National Science Foundation (NSF 33-31-,+*3). We had field assistances by graduate
students from San Diego State University, Okayama University, and Osaka Prefecture
University, and had logistic supports by BASC at Barrow and by PICO at Happy Valley
and Sagavartiktok riverside, respectively. Authors acknowledge to graduate students,
others with above organizations, and to reviewers of their useful comments.
References
Bartlett, K.B., Crill, P.M, Sass, R.L., Harriss, R.C. and Dise, N.B. (+33,): Methane emissions from tundra
environments in the Yukon-Kushokwin Delta, Alaska. J. Geophys. Res., 31, +00./�+000*.
Cao, M., Marshall, S. and Gregson, K. (+330): Global carbon exchange and methane emissions from natural
wetlands: Application of a process-based model. J. Geophys. Res., +*+, +.--3�+..+..
Chapman, S. J. and Thurlow, M. (+330): The influence of climate on CO, and CH. emissions from organic
soils. Agric. Forest Meteorol., 13, ,*/�,+1.
Christensen, T.R., Panikov, N., Mastepanov, M., Joabsson, A., Stewart, A., Oquist, M., Sommerkorn, M.,
Reynaud, S. and Svensson, B. (,**-): Biotic controls on CO, and CH. exchange in wetlands�a
closed environment study. Biogeochemistry, 0., --1�-/..
Denmead, O.T. (+33.): Measuring fluxes of greenhouse gases between rice fields and the atmosphere. Climate
Change and Rice, ed. by S. Peng et al. Berlin, Springer, +/�,3.
Dyer, A.J. and Hicks, B.B. (+31*): Flux-gradient relationships in the constant flux layer. Q. J. R. Meteorol.
Methane flux at arctic tundra in Alaska 93
Soc., 30, 1+/�1,+.
Edwards, G.C., Neumann, H.H., den Hartog, G., Thurtell, G.W. and Kidd, G. (+33.): Eddy correlation
measurements of methane fluxes using a tunable diode laser at the Kinosheo Lake tower site during
the Northern Wetlands Study (NOWES). J. Geophys. Res., 33, +/++�+/+1.
Falge, E., Baldocchi, D., Olson, R., Anthoni, P., Aubinet, M. and ,3 other authors (,**+): Gap filling
strategies for long term energy flux data sets. Agric. Forest Meteorol., +*1, 1+�11.
Fan, S.M., Wofsy, S.C., Bakwin, P.S., Jacob, D.J., Anderson, S.M., Kebabian, P.L., McManus, J.B., Kolb,
C.E. and Fitzjarralf, D.R. (+33,): Micrometeorological measurements of CH. and CO, exchange
between the atmosphere and subarctic tundra. J. Geophys. Res., 31, +00,1�+00.-.
Fowler, D. and Duyzer, J.H. (+323): Micrometeorological techniques for the measurement of trace gas
exchange. Exchange of Trace Gases between Terrestrial Ecosystems and the Atmosphere, ed. by M.
O. Andreae and D.S. Schimel. Chichester, J. Wiley, +23�,*1.
Frolking, S. and Crill, P. (+33.): Climate controls on temporal variability of methane flux from a poor fen in
southeastern New Hampshire: Measurement and modeling. Global Biogeochem. Cycles, 2, -2/�-31.
Fung, I., John, J., Lerner, J., Mathews, E., Prather, M., Steele, L.P. and Frases, P. J. (+33+): Three-
dimensional model synthesis of the global methane cycle. J. Geophys. Res., 30, +-*--�+-*0/.
Harazono, Y. and Miyata, A. (+331): Evaluation of greenhouse gas fluxes over agricultural and natural
ecosystems by means of micrometeorological methods. J. Agric. Meteorol., /,, .11�.2*.
Harazono, Y., Miyata, A., Yoshimoto, M., Mikasa, H. and Oku, T. (+33/): Development of a movable
NDIR-methane analyzer and its application for micrometeorological measurements of methane flux
over grasslands. J. Agric. Meteorol., /+, ,1�-/ (in Japanese with English abstract).
Harazono, Y., Monji, N., Miyata, A., Kita, K., Hamotani, K., Uchida, Y., Yoshimoto, M., Sano, T., Fujiwara,
M., Isobe, S. and Ogawa, T. (+330): Development of measurements methods for trace gas fluxes in
the surface boundary layer and a basic examination of the flux evaluation. Bull. Natl. Inst. Agro-
Environ. Sci., +-, +00�,,0 (in Japanese with English abstract).
Harazono, Y., Mano, M., Miyata, A., Zulueta, R.C. and Oechel, W.C. (,**-): Inter-annual carbon dioxide
uptake at wet sedge tundra ecosystem in the Arctic. Tellus, //B, ,+-�,,1.
Hinzman, L., Bettez, N.D., Bolton, W.R., Chapin, F.S., Dyurgerov, M.B. and -* other authors (,**/):
Evidence and implications of recent climate change in northern Alaska and other arctic regions.
Climate Change, 1,, ,/+�,32, doi: +*.+**1/s+*/2.-**/-/-/,-,.
Houghton, J.T., Ding, Y., Griggs, D.J., Noguer, M. van den Linden, P. J., Dai, X., Maskell, K. and Johnson,
C.A., ed. (,**+): Climate Change ,**+: The Scientific Basis. Contribution of Working Group + to
the Third Assesment Report of the Intergovernmental Pannel on Climate Change. New York,
Cambridge Univ. Press, 22+ p.
Joabsson, A. and Christensen, R.T. (,**+): Methane emission from wetland and their relationship with
vascular plants: an Arctic example. Global Change Biol., 1, 3+3�3-,.
Mano, M. (,**-): Study of CO, and CH. budget on coastal wet sedge tundra in the Arctic. PhD thesis of
Graduate School of Natural Sciences, Chiba University. March ,**-. +,1 p (in Japanese)
Martin, S., Munoz, E. and Dreucker, R. (+331): Recent observations of a spring-summer warming over the
Arctic Ocean. Gyophys. Res. Lett., ,., +,/3�+,0,.
Matthews, E. and Fung, I. (+321): Methane emission from natural wetlands: Global distribution, area, and
environmental characteristics of sources. Global Biogeochem. Cycles, +, 0+�20.
Miyata, A. (,**+): Observational study on methane exchange between wetland ecosystem and the atmosphere.
Bull. Natl. Inst. Agro-Environ. Sci., +3, 0+�+2-.
Miyata, A., Leuning, R., Denmead, O.T., Kim, J. and Harazono, Y. (,***): Carbon dioxide and methane
fluxes from an intermittently flooded paddy field. Agric. Forest Meteorol., +*,, ,21�-*-.
Moore, K.E., Fitzjarrald, D.R., Wofsy, S.C., Daube, B.C., Munger, J.W., Bakwin, P.S. and Crill, P. (+33.a):
A season of heat, water vapor, total hydrocarbon, and ozone fluxes at a subarctic fen. J. Geophys.
Res., 33, +3-1�+3/,Moore, T.R., Heyes, A. and Roulet, N.T. (+33.b): Methane emissions from wetlands, southern Hudson Bay
lowland. J. Geophys. Res., 33, +.//�+.01Moosavi, S. and Crill, P.M. (+331): Controls on CH. and CO, emissions along two moisture gradients in the
Canadian boreal zone. J. Geophys. Res., +*,, ,3,0+�,3,11.
Y. Harazono et al.94
Moosavi, S.C., Crill, P.M., Pullman, E.R., Funk, D.W. and Peterson, K.M. (+330): Controls on CH. flux
from an Alaskan boreal wetland. Global Biogeochem. Cycles, +*, ,21�,30.
Morrissey, L.A. and Livingston, G.P. (+33,): Methane emission from Alaska Arctic tundra: An assessment
of local spatial variability. J. Geophys. Res., 31, +000+�+001*.
Nakano, T., Inoue, G. and Fukuda, M. (,**.): Methane consumption and soil respiration by a birch forest
soil in west Siberia. Tellus, /0B, ,,-�,,3.
Oechel, W.C. and Vourlitis, G.L. (+331): Climate change in northern latitudes: Alterations in ecosystem
structure and function and e#ects on carbon sequestration. Global Change and Arctic Terrestrial
Ecosystems, Berlin, Springer, -2+�.*+.
Oechel, W.C., Hastings, S. J., Vourlitis, G.L., Jenkins, M., Richers, G. and Grulke, N. (+33-): Recent change
of Arctic tundra ecosystems from a net carbon dioxide sink to source. Nature, -0+, /,*�/,-.
Oechel, W.C., Vourlitis, G.L., Hastings, S. J. and Bochkarev, S.A. (+33/): Change in arctic CO, flux over two
decades: e#ects of climatic at Barrow, Alaska. Ecol. Appl., /, 2.0�2//.
Oechel, W.C., Vourlitis, G.L., Hastings, S. J., Zulueta, R.C., Hinzman, L. and Kane, D. (,***): Acclimation
of ecosystem CO, exchange in the Alaskan arctic in response to decadal climate warming. Nature,
.*0, 312�32+.
Polyakov, I.V., Alekseev, G.V., Bekryaev, R.V., Bhatt, U., Colony, R.L., Johnson, M.A., Karklin, V.P.,
Makshtas, A.P., Walsh, D.Y. and Alexander, V. (,**,): Observationally based assessment of polar
amplification of global warming. Geophys. Res. Lett., ,3, Issue +2, ,/ p., CiteID +212, DOI +*.+*,3/
,**+GL*+++++.
Post, W.M., Emanual, W.R., Zinke, P. J. and Stangenberger, A.G. (+32,): Soil carbon pools and world life
zones. Nature, ,32, +/0�+/2.
Rigor, I.G., Colony, R.L. and Martin, S. (,***): Variations in surface air temperature observations in the
Arctic, +313�31. J. Climate, +-, 230�3+..
Russel, C.S., Buggle, A.M. and Rosson, R.M., ed. (,**.): Climate Monitoring and Diagnostics Laboratory
Summary Report No. ,1, ,**,�,**-. NOAA, Boulder, Colorado, +1. p.
Sebacher, D.I., Harris, R.C., Bartlett, K.B., Sebacher, S.M. and Grice, S.S. (+320): Atmospheric methane
sources: Alaskan tundra bogs, an alpine fen, and a subarctic boreal marsh. Tellus, -2B, +�+*.
Suyker, A.E., Verma, S.B., Clement, R.J. and Billesbach, D.P. (+330): Methane flux in a boreal fen:
Season-long measurement by eddy correlation. J. Geophys. Res., +*+, ,20-1�,20.1.
Valentine, D.W., Holland, E.A. and Schimel, D.S. (+33.): Ecosystem and physiological controls over methane
production in northern wetlands. J. Geophys. Res., 33, +/0-�+/1+.
Verma, S.B., Ullman, F.G., Billesbach, D., Clement, R.J. and Kim, J. (+33,): Eddy correlation measurements
of methane flux in a northern peatland ecosystem. Boundary-Layer Meteorol., /2, ,23�-*..
Vourlitis, G.L., Harazono, Y., Oechel, W.C., Yoshimoto, M. and Mano, M. (,***): Spatial and temporal
variations in hectare-scale net CO, flux, respiration and gross primary production of Arctic tundra
ecosystems. Funct. Ecol., +., ,*-�,+..
Wagner, D., Kobabe, S., Pfei#er, E.M. and Hubberten, H.W. (,**-): Microbial controls on methane fluxes
from a polygonal tundra of the Lena Delta, Siberia. Permafrost Periglacial Processes, +., +1-�+2/.
Walker, D.A. and Acevedo, W. (+321): Vegetation and a Landsat-derived cover map of the Beechey Point
quadrangle arctic coastal plain, Alaska. Cold Reg. Res. Eng. Lab. Rep., 2/�21.
Webb, E.K. (+31*): Profile relationships: The log-linear range, and extension to strong stability. Q. J. R.
Meteorol. Soc., +*0, 2/�+**.
Werner, C., Davis, K., Bakwin, P., Yi, C., Hurst, D. and Lock, L. (,**-): Regional-scale measurements of
CH. exchange from a tall tower over a mixed temperate/boreal lowland and wetland forest. Global
Change Biol., 3, +,/+�+,0+.
Whiting, G.J. and Chanton, J.P. (+33-): Primary production control of methane emission from wetlands.
Nature, -0., 13.�13/.
Yagi, K. (+33.): Methane in Soil and Atmosphere, ed. by K. Minami. Tokyo, Asakura-Shoten, //�2. (in
Japanese).
Methane flux at arctic tundra in Alaska 95


