Embed Size (px)
Citation preview
AKU-T-79-004 C. 3
MARKET STRUCTURE
uf the
ALASKA SEAFOOD PROCESSING INDUSTRY
by
V. L. Orth
3. A. Richardson
S. Mj. Piddle
I! niver~ity of Alack t
gaea ~rant Report 7H - 10
Bee entber 1979

Alaska Sea Grant ProgramUniversity of Alaska
Fairbanks, Alaska 99701
MARKET STRUCTURE
OF THE
ALASKA SEAFOOD PROCESSING INDUSTRY
Volume I
Shellfish
by
Franklin L. Orth
James A. Richardson
Sandra M. Pidde
Sea Grant Report 78-10November 1979
CONTENTS
PAGE
FIGURES vij
TABLES.
ACKNOWLEDGEMENTS. XVi i
CHAPTER I. INTRODUCTION
1 3 5Industry:
7
9
9
13
15
65
Background and Scope of the Study.Data Resources ~ ~ ~ ~ ~ ~ ~ ~ ~ ~ ~ ~ ~ ~ ~ ~
Organization.Structural Elements of the UPS. Seafood Processing
A Literature Summary. ~ ~ ~ ~ ~ ~
Alaska Fishing Industry: Regulatory Environment..Federal
State..
CHAPTER II. ECONOMIC STRUCTURE OF THE ALASKA SEAFOOD PROCESSING
SECTOR AND DETAILED SHELLFISH PROCESSING INDUSTRIES. ~
Introduction.
Structural Parameters of the Alaska Seafood ProcessingS ector.. ~ ~ ~ ~ ~ ~ ~ ~ ~ ~ ~ ~
Geographic Distribution of Production Facilities........Aggregate Concentration..Diversification.
Turnover....
Vertical Integration ~ ~ ~ ~ ~ ~ ~ 4 ~ ~ 0 ~ ~ 4
Other Company-Specific InformationStructural Parameters of Individual Seafood Markets: Shellfish
Market Concentration ~ ~ ~ ~ ~ ~ ~ ~ ~ ~
Plant Size Characteristics............
Summary
CHAPTER III. THE HISTORY OF THE KING AND TANNER CRAB FISHERIESIN ALASKA
Development of the Alaska King Crab FisheryThe Foreign Fishery.The U.S. Fishery ~ ~ ~ ~ ~ ~ ~ ~ ~ ~ ~ ~ ~ ~ ~ ~ ~
Development. of the Alaska Tanner Crab Fishery.Foreign Fishery: Japan.......Foreign Fishery: USSR... . . ~T he U.S. Fishery
16
16
19
31
36
40
41
45
47
52
56
65
65
72
76
76
77
81

CONTENTS
continued!
PAGE
83CHAPTER IV. THE CRAB RESOURCE.
King Crab.World Catch...........
Expansion Potential ofTanner Crab
Catch and Abundance In
World Catch.
Expansion Potential ofDungeness Crab.
83
83
87
88
88
92
92
92
the King Crab Fishery............
Alaska. ~ ~ ~ ~ ~~ ~ ~ ~ ~ ~ ~
the Tanner Crab Fishery.....
121
121
121
124
125
129
132
132
CHAPTER V. FISHING GEAR AND PROCESSING METHODS FOR KING AND
ANNE R CRAB ~ ~ ~ ~ ~ ~ ~ ~ ~ ~ ~ ~ ~ ~ ~ ~ ~ ~ ~ ~ ~ ~ ~ ~ ~ e ~ ~ ~ ~ ~ ~ ~ ~ ~ ~ ~ ~ ~ ~T
Crab Fishing Gear.Vessels
Gear on the Vessel.
Pots' ~ ~ ~
Circulating Seawater Tanks..B uoys........... ~ .... ~ ~ ~
B ait 4 ~ ~ ~ ~ ~ ~ ~ ~ ~ ~ ~ ~ ~ 0 ~ ~ ~ ~ ~ ~ ~ ~ ~ ~ ~ ~ ~ J 4 ~ ~ ~ ~
Fishing the GearHarvesting Capacity..
Processing ~ ~ ~ ~ ~ ~ ~ ~ ~
Processing Methods... ~ ~
Processing of Crab MeatsProcessing of Crab Sections Shell Stock!....New Developments in Crab Processing Methods..Processing Capacity and Capacity Utilization.Southeastern Alaska..
Prince William Sound.
Cook Inlet
Kodiak. ~ ~
Westward.
CHAPTER VI. THE HISTORY OF THE SHRIMP FISHERY IN ALASKA..........
Foreign Shrimp Fishing in Waters off Alaska.Japanese Shrimp FisherySoviet Shrimp Fishery..................
U.S. Shrimp Fishery in Alaska...............
CHAPTER VII ' THE SHRIMP RESOURCE ~ ~ ~ ~ ~ ~ ~ ~ ~ ~ ~ ~ ~ ~ ~ ~ ~ ~ ~ ~ ~ e ~ ~ ~ ~ ~ ~ ~ ~ ~ ~ ~
Pacific Coast Pandalid Shrimp FisheryWorld Supply ~ ~ ~ ~ ~ ~ ~ ~ ~ ~ ~ ~ ~ ~ ~ ~ ~ ~ ~ ~ 0 ~ ~ ~ 4 ~ ~ ~ ~ ~ ~
95
95
98
98
100
100
101
101
101
104
105
105
107
108
108
111
113
113
115
117
CONTENTS
continued!
PAGE
137
ilization........
155
Crab.
183
184
184
185
185
189
192~ ~ ~ 92 ~ ~ ~ ~File and
193
CHAPTER VIII. FISHING GEAR AND PROCESSING METHODS FOR SHRIMP...
Shrimp Fishing Gear......................Vessels
Types of Gear......... ~ .....On-Board Handling......... ~Electronic Gear.
New Technology............ ~ ..........Harvesting Capacity..................
Processing Methods for Shrimp.Frozen Raw-Whole.....................
Frozen Raw-Peeled. ~ .. ~ ....... ~ .......
Frozen Cooked-Blocks/Canned..........Individual Quick Frozen..............Canned.
Shrimp Processing Capacity and Capacity UtSoutheasterne ~ ~ ~ ~ ~ ~ ~ ~ ~ ~ ~ ~ ~ ~ ~ ~ ~ ~ ~ ~ 0 a ~Cook Inlet.
Kodiak ~ ~ ~ ~
Chignik/South Peninsula/Dutch Harbor.
CHAPTER IX. ~TING OF ALASKA SHELLFISH ~ ............. ~ .... ~
Marketing of King Crab..............Marketing of Tanner Crab............Geographic Distribution..Market Channels for King and Tanner
Product for Export.............Product for the Domestic Market
Import and Export Markets.... ~ .D emand. ~ ~ ~ ~ ~ ~ ' ~ ~ ~ ~ ~ ~ ~Prices. ~ ~ ~ 0 ~ ~
Marketing of Shrimp.................Market Channels..... ~ .......
Geographic Distribution..... ~Import and Export MarketsDemand. ~ ~ ~
Pl ices ~ ~ ~ ~ ~ ~ ~
APPENDIX I. REVIE'W OF PROCEDURES FOR DATA FILE REFINEMENTS.....
Part I: Resolution of Problems.......
Classification of Plants..
Fisherman-Direct Sell............
Custom-Packing..Recovery and Conversion Factors..Incomplete Data................Apparent Accuracy of Edited Data
Published Statistics...........
137
137
137
141
141
142
142
146
146
148
148
148
148
149
149
149
151
153
155156
158
160
159159
163
166
172
172
177
177
178
178
179
CONTENTS
continued!
PAGE
201
202
Sectors.........
217
221
222
242
259
283
Part II: Recommendations for Improvements in Alaska'sFisheries Data..........
Catch and Landing Data by Species and Area.........Production Data by Species, Product Form and Area..Price Series Data by Species and Area..............Employment Statistics by Area....
APPENDIX II. STRUCTURE OF UNITED STATES SEAFOOD PROCESSINGINDUSTRY ~ ~ ~ ~ ~ ~ ~ ~ ~ ~ ~ ~ ~ ~ ~ ~
Part I: Conceptual Framework of Industrial Organization
Part II: A Literature Review..........
In't r o due t ion ~ ~ e ~ ~ ~ ~ ~ ~ ~ ~ ~ ~ ~ ~
Economic Structure of Process Form
Overview
Fresh Process Form Sector....
Frozen Process Form Sector...
Canned Process Form Sector...
Cured Process Form Sector
S ummary s ~ ~ ~ ~ ~ i ~ ~ ~ ~ ~ ~ ~ ~ ~ ~ ~ ~ ~ ~ ~
P TT ~art III. Glossarye ~ ~ ~ ~ ~ ~ ~ ~ ~ ~ ~ ~ ~ ~ ~ ~ ~ ~ ~ ~ ~ ~ ~ ~ ~ ~ ~ ~ ~ ~ ~ ~ r ~ ~
APPENDIX III. INDUSTRY SURVEY: SURVEY FORM AND RESPONSES...
Part I: Survey Form...........
Part II: Survey Responses............. ~ ..........
APPENDIX IV. PERIOD 3 �976! STRUCTURAL PAKVKTERS..... ~ ....
FERENCES ~ ~ ~ ~ ~ ~ ~ ~ ~ ~ ~ ~ t s ~ ~ e ~ ~ ~ ~ ~ ~ ~ ~ ~ ~ ~ ~ ~ ~
197
197
197
198
199
206
206
206
206
207
210
213
215
215
FIGURES
PAGE
FIGURE 3
29
30
FIGURE 7
75
FIGURE 8
78
FIGURE 9
79
FIGURE 10
80
106
109
FIGURE 13
110
FIGURE 14
126
FIGURE 15 Shrimp Catch of Domestic Fleets by Area 1964 to 1977. 127
FIGURE 16 Typical Rigging for a Shrimp Otter Trawl............. 140
FIGURE 1
FIGURE 2
FIGURE 4
FIGURE 5
FIGURE 6
FIGURE ll
FIGURE 12
Conceptualization of Market Structure Study..........
Landed Weight, Ex-vessel Value and WholesaleValue of Alaska Fisheries 1975.................... ~ ..
Agencies and Organizations Affecting AlaskaMarine Resources Development.........................
Lorenz Curves for Alaska Seafood Processing Plants...
Lorenz Curves for Alaska Seafood Processing Companies
King Crab Catch by Foreign and Domestic Fleets1953 to 1977.
King Crab Catch for the Kodiak Registration Areaby Fishing Season 1950-51 to 1977-78
Areas and Catch Quotas for 1973 and 1974 Establishedfor Japanese King and Tanner Crab Fishing in theEastern Bering Sea by the U.S.-Japan Agreement ofDecember 1972
Japanese Eastern Bering Sea Crab Quotas and QuotaAreas 1975 and 1976.............................
Tanner Crab Catch by Foreign and Domestic Fleets1 965 'to 1977 o ~ ~ ~ ~ ~ ~ ~ ~ ~ ~ ~ ~ ~ ~ ~ ~ t ~ a ~ ~ ~ ~ ~ ~ ~ ~ ~ ~ ~ ~ ~ ~ ~ s ~ ~ ~ ~ ~
Steps in Processing King and Tanner Crab........... ~ ~
Locations of Alaska's Major Shellfish Processingp lantso ~ ~ ~ ~ t ~ ~ ~ ~ ~ ~ ~ ~ ~ ~ ~ ~ ~ ~ ~ ~ ~ ~ ~ t ~ ~ t ~ ~ ~ ~ ~ ~ ~ ~ ~ ~ ~ ~ ~ ~ ~ ~ ~
Relation Between Alaskan Monthly Tanner Crab, KingCrab and Shrimp Catches, All Areas, 1977.............
Shrimp Catch by Foreign and Domestic Fleets 1960 to1977 ~ ~ ~ ~ ~ ~ ~ ~ ~ ~ ~
FIGURES
continued!
PAGE
140Double-Rigged Shrimp Trawler
147
by Major160
CrabFIGURE 20161
FIGURE 21
162
205FIGURE 2-1 Identification of Firms Utilizing Census Data......
FIGURE 17
FIGURE 18
FIGURE 19
Flow Chart for Shrimp Processing...................
Distribution of Alaskan Shellfish Products
Centers of Distribution..........
Market Channels for Frozen King and TannerProducts ~ ~ ~ ~ ~ ~ ~ ~ ~ ~ ~ ~ ~ ~ ~ 0 ~ ~ ~ ~
Market Channels for Canned Alaskan Shellfish
p loductse ~ ~ a ~ s.a~~os.~.s.o.~.e.os..see.~o...e~ee..
TABLES
PAGE
TABLE 1
TABLE 417
20
22
23
25
TABLE 1126
TABLE 1227
TABLE 13
28
TABLE 14
32
TABLE 15
33
TABLE 2
TABLE 3
TABLE 6
TABLE 7
TABLE 8
TABLE 9
TABLE 10
Seafood Processing Plant Count and Harvests byearl ~ ~ ~ ~ ~ ~ ~ ~ ~ ~ ~ ~ ~ ~ 0 ~ ~ ~ ~ ~ ~ ~ ~ ~ ~ ~ ~ ~ ~ ~7
Continuity of Company Operation by Period..........
Summary of Market Structure Elements of U.S. Sea-food Processing Industry by National and RegionalProcess Form Sectors..
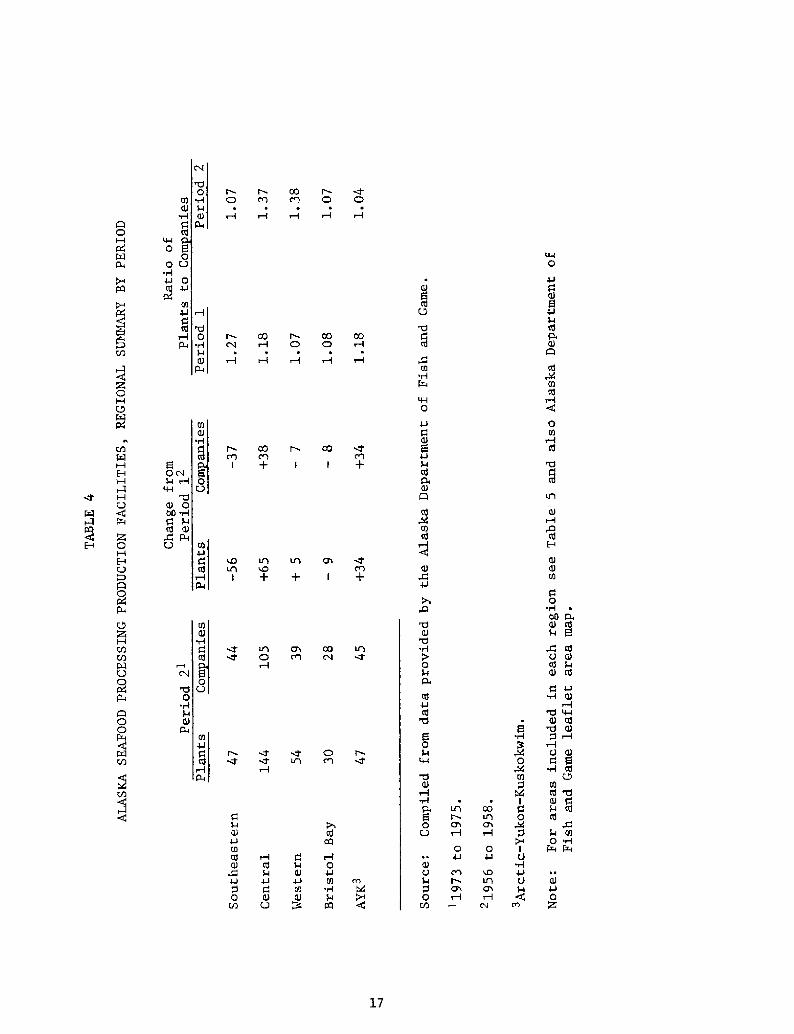
Alaska Seafood Processing Production Facilities,Regional Summary by Period.
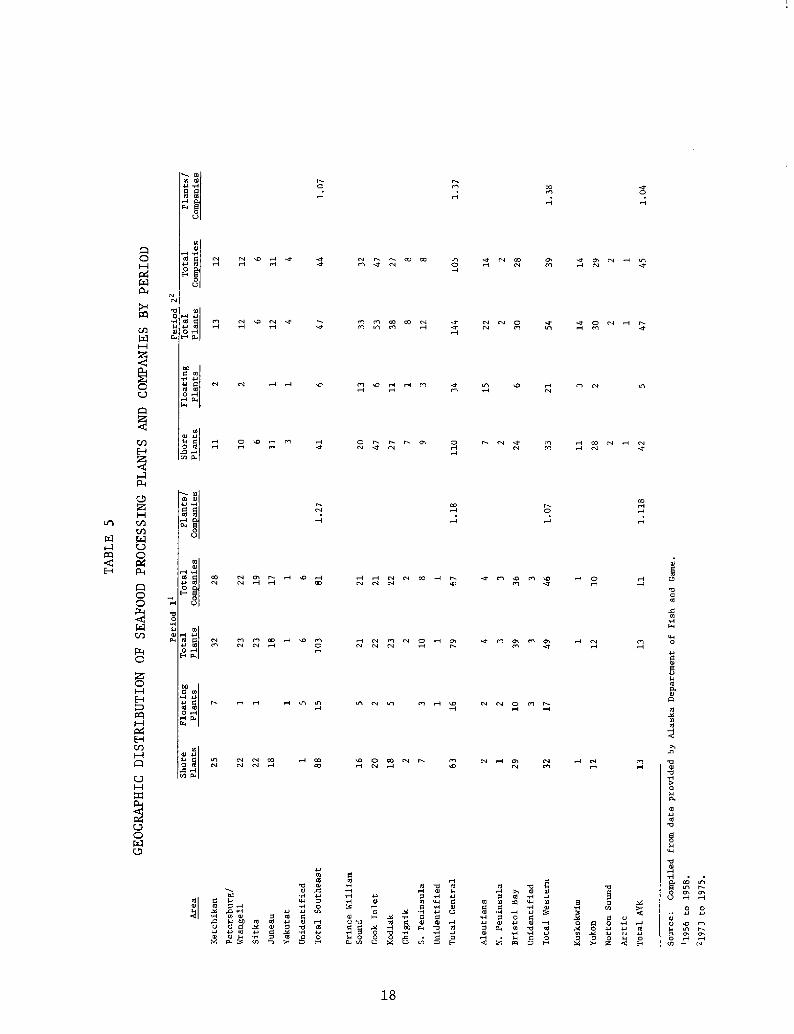
Geographic Distribution of Seafood ProcessingPlants and Companies by Period..
Harvest of Finfish and Shellfish by Region.........
Company Frequency Distribution by Number ofGeneral Regions and Specific Areas by Period.......
Plant Size Distribution by Region and Period.......
Company Size Distribution by Region and Period.....
Number of Alaska Seafood Plants Operated byCompanies by Period
Size Distribution of Alaska Seafood Plants andCompanies by Period.......
Distribution of Production of Alaska SeafoodProcessing Plants by Percent Category and Period...
Distribution of Production of Alaska SeafoodProcessing Companies by Percent Category andPeriod..
Aggregate Concentration in the Alaska SeafoodProcessing Sector by Plants and Companies andby Period........
Diversification of Alaska Seafood ProcessingPlants and Companies as Measured by the Numberof Species Handled and by Period.
TABLES
continued!
PAGE
TABLE 16
34
TABLE 17
35
TABLE 18
37
TABLE 19
38
TABLE 20
39
46
48
TABLE 24
49
TABLE 25
50
TABLE 26
51
TABLE 27
53
TABLE 28
TABLE 29
55
TABLE 21
TABLE 22
TABLE 23
Diversification of Alaska Seafood ProcessingPlants and Companies as Measured by the Numberof Processes and by Period..
Diversification of Alaska Seafood ProcessingPlants and Companies as Measured by the Numberof Products and by Period
Distribution of Companies Producting in BothPeriods Grouped by the Size of the Increase orDecrease in Production...
Size Distribution of Companies Producing in BothPeriods ~ ~ ~ ~ ~ ~ ~ ~ ~ ~ ~
Opposite Period Production by Market Share RankC ategory. ~ ~ ~ ~ ~ ~ ~ ~ ~ ~ ~ + ~ ~ ~ ~ ~ ~ ~ ~ ~
Extent of Vessel Ownership by "Yes" Respondents....
Summary of Level and Trends in Market Concentration
Statewide and Regional Market Concentration forTotal Crab Products by Period, Unadjusted forOwnership Interties
Statewide and Regional Market Concentration forKing Crab Products by Period, Unadjusted forOwnership Interties.
Statewide and Regional Market Concentration forTanner Crab Products by Period, Unadjusted for Owner-ship Interties
Statewide and Regional Market Concentration forDungeness Crab Products by Period, Unadjusted forOwnership Interties. ~ ~ ~ ~ ~ ~ ~ ~ ~ ~ ~ ~ ~ ~ ~ ~ ~ ~
Prince William Sound and Bristol Bay Market Con-centration for Crab Products by Period, Unadjustedfor Ownership Interties........
Statewide and Regional Market Concentration forShrimp Products by Period, Unadjusted for Owner-ship Interties.
Prince William Sound and Bristol Bay Market Con-centration for Shrimp Products by Period, Unad-justed for Ownership Interties
TABLES
continued!
PAGE
TABLE 30
57
TABLE 31
58
TABLE 32
59
TABLE 3360
TABLE 3461
TABLE 3562
TABLE 3666
TABLE 37
67
TABLE 3869
TABLE 3971
73
74
TABLE 4282
TABLE 4384
86
89
TABLE 40
TABLE 41
TABLE 44
TABLE 45
TABLE 46
Size Distribution of Plants by Species Categoryand by Period Based on Primary Species Amounts....
Size Distribution of Plants by Species Categoryand by Period Based on Total Amounts... ~ ......
Number and Average Size of Plants by Region andSpecies. ~ ~ t ~ ~
Size Distribution of Plants by Process Form andby Period Based on Primary Process Amounts........
Size Distribution of Plants by Process Form andby Period Based on Total Amounts Produced.........
Number and Average Size of Plants by Region andProcess Form. ~ ~ ~
Japanese Eastern Bering Sea King Crab FisheryEarly Period 1930 to 1939 ' ......... ~ ..............
Estimated Annual Red and Blue King Crab Catchesin the Eastern Bering Sea by United States, Japanand USSR 1953 to 1977.. ~ ~ ~ ~ ~ ~ ~ ~ ~ ~ ~ ~
Foreign quotas for King and Tanner Crab inEastern Bering Sea ~ ~
Foreign Crab Fishing Restrictions for Japan andthe VSSRe ~ ~ ~ ~ ~ ~ ~ ~ ~ ~ ~ ~ ~ ~ ~ ~ ~ ~
Alaska Catch of King Crab by Region 1941 to 1977..
Foreign and U.S. Catch of Tanner Crab in EasternBering Sea 1965 to 1976.. ~ ~ ~ 4 ~ ~ ~ ~ ~ 4 ~ ~ ~ ~ ~ ~ ~
Percentage of Total Alaska Catch of Tanner Crabby Area 1967 to 1977.....
Estimates of Naximum Sustainable Yield for KingCrab. ~ ~ ~
Alaska Catch of King Crab by Management Area......
World Catches of King Crab by Country.............
Catch of Southern King Crab Lithodes antarcticus!
TABLES
continued!
PAGE
TABLE 47
TABLE 48
89
90
91
93
96
TABLE 52
97
TABLE 53
99
102
103
112
112
TABLE 58
114
TABLE 59
116
TABLE 60
120
TABLE 61
120
TABLE 62
122
TABLE 63
TABLE 64
TABLE 65
130
Xii
TABLE 49
TABLE 50
TABLE 51
TABLE 54
TABLE 55
TABLE 56
TABLE 57
Chionoecetes spp., Depth Location and Distribution
Estimates of Maximum Sustainable Yield MSY!,Optimum Yield OY!, and Allowable Biological Catch ABC! for Tanner Crab....
Catch of Tanner Crab by Area.......................
World Catches of Tanner Crab by Country............
Registered Tanner Crab Vessels for Kodiak andWestward Management Areas 1977-78 Season...........
Registered King Crab Vessels for Kodiak andWestward Management Areas 1977-78 Season...........
Number of Vessels Making Landings by ManagementArea 1969 to 1976............. ~ . ~ ... ~ ~ ~ ~ ~ - ~ ~ ~ ~ ... ~-
King Crab Harvesting Capacity by Area 1976.........
Tanner Crab Harvesting Capacity by Area 1976.......
King and Tanner Crab Catch by Area 1977............
King and Tanner Crab Maximum Daily ProcessingCapacities by Area.........
Capacity Utilization, King and Tanner Crab forSoutheast Alaska....................
Capacity Utilization, King and Tanner Crab forook Inlet........................... ~ .....C
Capacity Utilization, King and Tanner Crab forK odiak ~ ~ ~ ~ ~ ~ ~ ~ ~ ~ ~ ~ ~ ~ ~ ~ ~ ~ ~
Capacity Utilization, King and Tanner Crab forWestward Area
Japanese Central Bering Sea Shrimp FisheryS tatistics.........................
Foreign Catches of Shrimp from the Gulf of Alaskaand the Bering Sea 1961 to 1973.................... 123
Alaska Shrimp Catch by Management Area 1964 to 1977 128
General Characteristics of the Five ImportantSpecies of Alaska Shrimp.......................
TABLES
continued!
PAGE
131
133
135
138
TABLE 72143
145
150
152
TABLE 76152
TABLE 77154
157
164
TABLE 80165
TABLE 81167
TABLE 82167
TABLE 83168
169TABLE 84
TABLE 66
TABLE 67
TABLE 68
TABLE 69
TABLE 70
TABLE 71
TABLE 73
TABLE 74
TABLE 75
TABLE 78
TABLE 79
Guideline Harvest Quotas for Shrimp by Area....... 130
Catch of Shrimp by Management Area
Annual Pandalid Shrimp Landings 1965 to 1977by Region. 4 ~ ~ ~ ~ ~ ~ ~ ~ ~ ~ ~ ~ ~
World Landings of Pandalus Shrimp by Area.........
Fishing Vessels by Management Area 1969 to 1976...
Registered Shrimp Vessels by Fishing Gear 1977-78Season Area J Kodiak and Westward! 138
Shrimp Harvesting Capacity Estimate for theSoutheastern Alaska Area 1976-77 Season...........
Shrimp Harvesting Capacity by Area 1976...........
Shrimp Catch by Area 1977...... ~ ............. ~ ....
Total Alaska Shrimp Processing Capacity 1977 to1978.
1977 Capacity Utilization of Kodiak ShrimpProcessing Plants.......
1977 Capacity Utilization for Chignik/SouthPeninsula/Dutch Harbor
Shellfish Product Weights by Year............. ~ . ~ .
U.S. Exports of Frozen King Crab by Country ofDestination 1968 to 1977...
U.S. Exports of Prepared or Preserved King Crabby Country of Destination 1968 to 1977........ ~ ...
Summary of Imports of Fresh or Frozen Crab intoJapan. ~ ~ ~ ~
U.S. Exports of Frozen Tanner Crab to Japan 1970to 1976 a ~ ~ ~ ~ ~ ~ ~ ~ ~ ~ ~ ~ ~ ~
U.S. Imports of Crabs and Crab Meat Fresh,Chilled, or Frozen........... ~ ~ ~ ~ ~ ~
U.S. Imports of Crab and Processed Crab Meat......
TABLES
continued!
PAGE
TABLE 85
170
TABLE 86
170
TABLE 87
TABLE 88
174
TABLE 89
175
TABLE 90
176
180
181
182
186
Custom-Pack Tally 188
190
194
TABLE 1-5
195
APPENDIX II
TABLE 2-1,
203
TABLE 2 � 2
208
xiv
TABLE 91
TABLE 92
TABLE 93
APPENDIX I
TABLE 1-1
TABLE 1-2
TABLE 1-3
TABLE 1-4
Summary of Japanese Exports of Canned TannerCrab. ~ ~ ~
Canned King and Tanner Crab Imports from Japan1968 to 1976.
Kodiak Ex-Vessel Prices of King and Tanner Crab1970 to 1977. 173
Wholesale Prices for King and Snow Crab Neat,Nonthly 1974 to 1977.. ~ ............
Landings, Landed Values, and Wholesale MarketValue of Alaskan King Crab 1960 to 1977............
Landings, Landed Values, and Wholesale MarketValue of Alaskan Tanner Crab 1960 to 1977..........
Per Capita Consumption of Shrimp 1950 to 1977......
Kodiak Ex-Vessel Prices for Shrimp 1960 to 1978....
Landings, Landed Values, and Wholesale MarketValues of Alaskan Shrimp 1960 to 1977.......
Fisherman-Direct. Sell by General Area..............
Conversion Factors for Canned Production...........
Comparison of ADF&G Reported Landings with Pro-duction from Processors' Annual Reports for KingCrab, Tanner Crab, Dungeness Crab, and Shrimp for1973 to 1975 and 1956 to 1958.
Comparison of ADF&G Reported Landings with Pro-duction from Production Statistics from ADF&G
Statistical Leaflets..........
Model of Industrial Organization Analysis withApplication to the U.S. Seafood Processing Industry
States Included in the National Marine Fisheries
Service Regions............... ~ ~ ~
TABLES
continued!
PAGE
TABLE 2-3
209
TABLE 2-4
212
TABLE 2-5
214
TABLE 2 � 6
216
TABLE 4 � 2
TABLE 4-3
262
TABLE 4 � 4
TABLE 4-5
264
TABLE 4-6
265
TABLE 4-7
265
TABLE 4-8 Size Distribution of PlantsPeriod 3 �976!.
by Species Category266
Size Distribution of Plants
Period 3 �976!...........
TABLE 4-9 by Process Form
267
APPENDIX IV
TABLE 4 � 1
Concentration Ratios for Four, Eight, and TwentyLargest Fresh Seafood Processing Plants, National,New England, and Middle Atlantic Region 1965 to1968, 1970 to 1974 '
Concentration Ratios for Four, Eight, and TwentyLargest Frozen Seafood Processing Plants, National,New England, and Middle Atlantic Region 1965 to1968, 1970 to 1974.
Concentration Ratios for Four, Eight, and TwentyLargest Canned Seafood Processing Plants, Nationaland Pacific Region 1965 to 1968, 1970 to 1974......
Concentration Ratios for Four, Eight, and TwentyLargest Cured Seafood Processing Plants, Nationally1965 to 1968, 1970 to 1974.
Geographic Distribution of Seafood Processing Plantsand Companies Period 3 �976! . . ... ... 260
Company Frequency Distribution by Number of GeneralAreas and Specific Areas Period 3 �976!........ ~ .. 261
Distribution of Production of Alaska Seafood Pro-cessing Plants by Percent Category Period 3 �976!.
Distribution of Production of Alaska Seafood Pro-cessing Companies by Percent Category Period 3 �976! 263
Diversification of Alaska Seafood Processing Plantsand Companies as Measured by the Number of ProductsPeriod 3 �976!.
Diversification of Alaska Seafood Processing Plantsand Companies as Measured by the Number of ProcessesPeriod 3 �976!.... ~ ... ~ ~ ~ ~ ~ ~ ~ ~ ~ ~ ~ ~ ~ ~ ~ ~ ~ ~ ~
Diversification of Alaska Seafood Processing Plantsand Companies as Measured by the Number of SpeciesHandled Period 3 �976!.....
TABLE
continued!
PAGE
268
269
270
TABLE 4-13
271
TABLE 4-14
272
TABLE 4-15
273
TABLE 4 � 16
TABLE 4-17
275
TABLE 4-18
276
TABLE 4-19
277
TABLE 4-20
278
TABLE 4-21
279
TABLE 4-22
280
xvi
TABLE 4-10
TABLE 4-11
TABLE 4-12
Plant Size Distribution Period 3 �976!.....
Company Size Distribution Period 3 �976!...
Statewide and Regional Market Concentrationfor Shrimp Products by Period, Unadjustedfor Ownership Interties Period 3 �976!.....
State~ide and Regional Market Concentrati,onfor Total Crab Products by Period, Unadjustedfor Ownership Interties Period 3 �976!.....
Statewide and Regional Market Concentrationfor King Crab Products by Period, Unadjustedfor Ownership Interties Period 3 �976!.....
Statewide and Regional Market Concentrationfor Tanner Crab Products by Period, Unadjustedfor Ownership Interties Period 3 �976!.....
Statewide and Regional Market Concentrationfor Dungeness Crab Products by Period, Un-adjusted for Ownership Interties Period 3 1 97 6! ~ ~ ~ o ~ ~ ~ ~ ~ ~ ~ ~ ~ ~ ~ ~ ~ ~ ~ ~ ~ t
Prince William Sound and Bristol Bay MarketConcentration for Shrimp Products by Period,Unadjusted for Ownership Interties Period 3 1 976! ~ ~ ~ ~ ~ ~ ~ o ~ ~ ~ ~ ~ ~ ~ ~ ~ ~ ~ ~ ~ ~ ~ ~ ~ ~ ~ ~
Prince William Sound and Bristol Bay MarketConcentration for Crab Products by Period,Unadjusted for Ownership Interties Period 3 1976! ~ ~ ~ ~ ~ ~ ~ ~ ~ ~ ~ ~ ~ ~ ~ ~ ~ a s ~ ~ ~ ~ ~ ~ ~ ~ a ~ ~ e ~ o o ~
Number and Mean Size of Plants by Region andSpecies Based on Primary Species AmountsPeriod. 3 �976!......
Number and Mean Size of Plants by Region andSpecies Based on Total Amounts Period 3 �976!
Number and Mean Size of Plants by Region andProcess Form Based on Primary Process AmountsPeriod 3 �976!..........+..................
Number and Mean Size of Plants by Region andProcess Form Based on Total Amounts Period3 1 97 6! ~ ~ ~ ~ ~ ~ ~ ~ ~ ~ ~ ~ ~ ~ ~ e ~ ~ ~ a ~ ~ ~ ~ ~ s ~ ~ ~ ~
ACKNOWLEDGMENTS
The authors wish to gratefully acknowledge the assistance they havereceived throughout the course of this project from a large number ofindividuals in the seafood processing industry and in various governmentagencies, in obtaining data necessary to this study. While space con-straints make it impossible to list all those who assisted in providinginformation, mention should be made of a number of people who deserverecognition for their contributions. They are: Judy Brakel, AlaskaCommercial Fisheries Entry Commission; Pete Harris, New England FishCompany; Pat Holmes, Alaska Department of Fish and Game ADF&G!, Kodiak;Chuck Jensen, Pacific Pearl Seafoods, Inc.; Dick Johnston, Oregon StateUniversity; Ralph Jones, Alaska-Shell, Inc.; Blake Kinnear, Pan-AlaskaFisheries; Jack Lind, Peter Pan Seafoods, Inc.; Jim Major, East PointSeafood; Carl Rosier, ADF&G; Fred Smith, Oregon State University; WaltYonker, Pacific Seafood Processors Association, and several of the ADF&Gfield biologists. The information provided by these people was invaluableas it is not available in published form in most cases.
In addition, the assistance of Peter Rogers is acknowledged fordeveloping the literature review section and the appendix information onindustrial organisation concepts. Special thanks are due to MichelleKrog and Helen Greschke for the typing of this report.
Any errors or omissions remain the responsibility of the authors.
This report is the result of research sponsored by the Alaska SeaGrant Program, cooperatively supported by NOAA Office of Sea Grant, U.S.Department of Commerce, under Grant 04-8-M01-187, and by the Universityof Alaska with funds appropriated by the State of Alaska.
The University of Alaska provides equal educational and employmentopportunities for all regardless of race, religion, color, national origin,sex, age, physical handicap, or veteran status.
CHAPTER I
INTRODUCTION
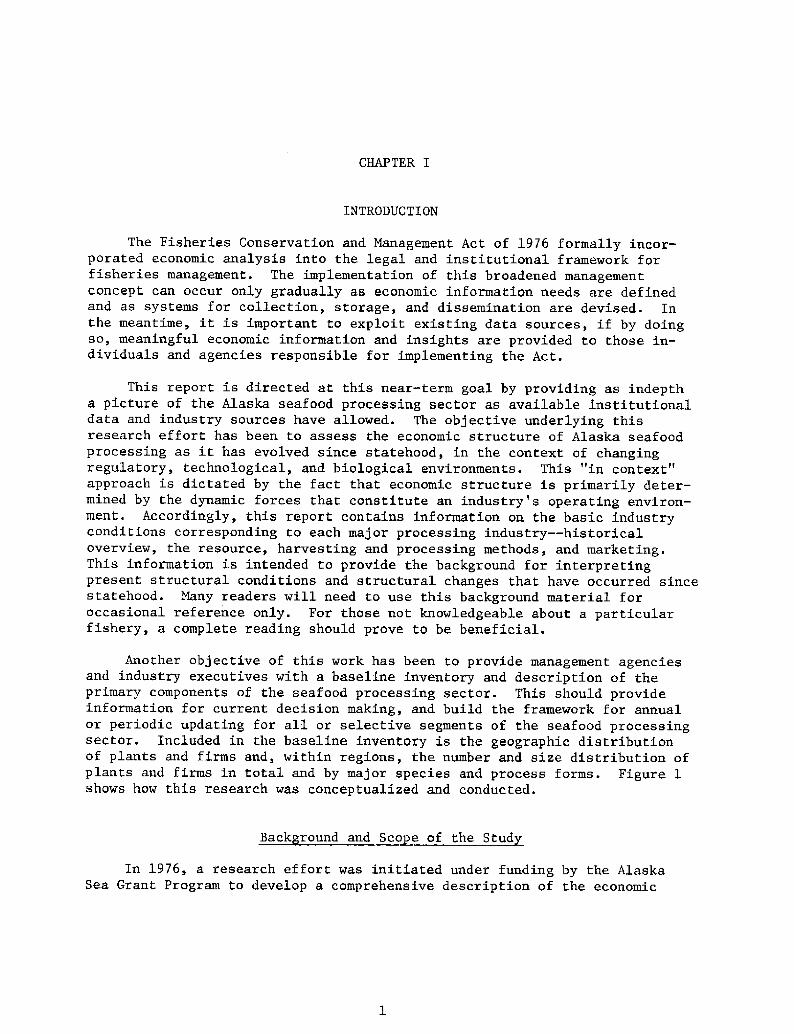
The Fisheries Conservation and Management Act of 1976 formally incor-porated economic analysis into the legal and institutional framework forfisheries management. The implementation of this broadened managementconcept can occur only gradually as economic information needs are definedand as systems for collection, storage, and dissemination are devised. Inthe meantime, it is important to exploit existing data sources, if by doingso, meaningful economic information and insights are provided to those in-dividuals and agencies responsible for implementing the Act.
This report is directed at this near-term goal by providing as indeptha picture of the Alaska seafood processing sector as available institutionaldata and industry sources have allowed. The objective underlying thisresearch effort has been to assess the economic structure of Alaska seafoodprocessing as it has evolved since statehood, in the context of changingregulatory, technological, and biological environments. This "in context"approach is dictated by the fact that economic structure is primarily deter-mined by the dynamic forces that constitute an industry's operating environ-ment. Accordingly, this report contains information on the basic industryconditions corresponding to each major processing industry--historicaloverview, the resource, harvesting and processing methods, and marketing.This information is intended to provide the background for interpretingpresent structural conditions and structural changes that have occurred sincestatehood. Many readers will need to use this background material foroccasional reference only. For those not knowledgeable about a particularfishery, a complete reading should prove to be beneficial.
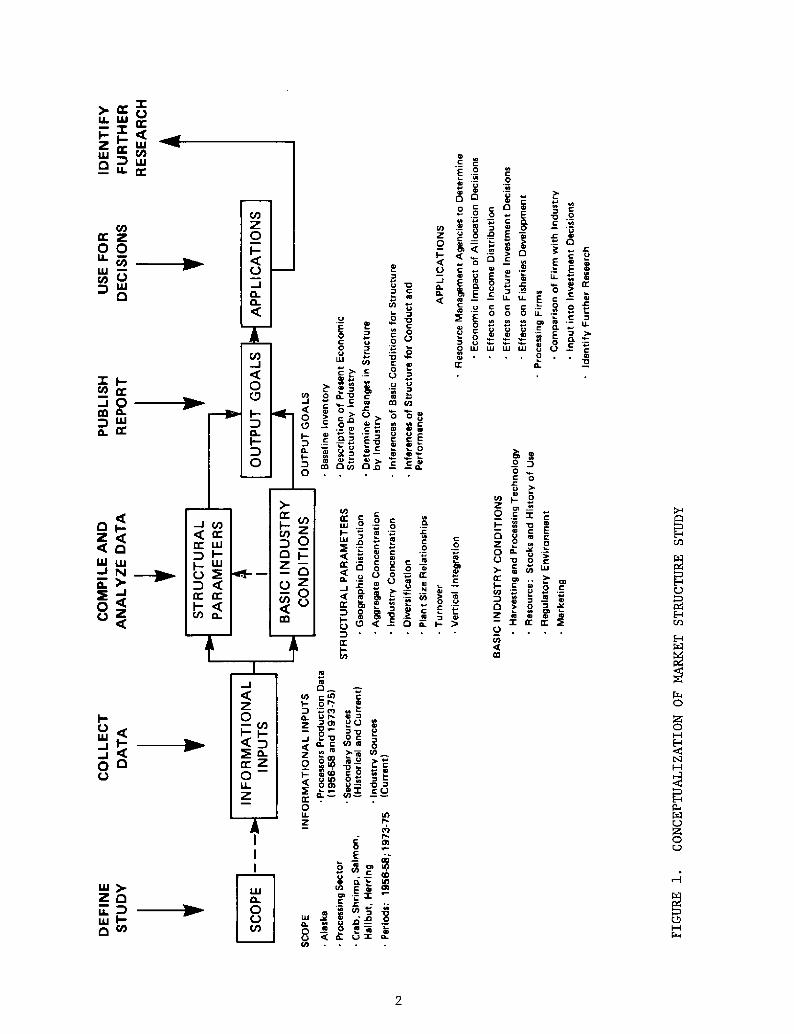
Another objective of this work has been to provide management agenciesand industry executives with a baseline inventory and description of theprimary components of the seafood processing sector. This should provideinformation for current decision making, and build the framework for annualor periodic updating for all or selective segments of the seafood processingsector. Included in the baseline inventory is the geographic distributionof plants and firms and, within regions, the number and size distribution ofplants and firms in total and by major species and process forms. Figure 1shows how this research was conceptualized and conducted.
Back round and Sco e of the Stud
In 1976, a research effort was initiated under funding by the AlaskaSea Grant Program to develop a comprehensive description of the economic
K Z I-CLD
LL
ZUJCI
C6ZI2CO
V IllO
0 crIO
IL C 0 Ug CI
5 0a.
Z CO
IQ
IX:
0 K0 g00c 0V
c2 c ZNS0
Zo~~O a o
Fy coK caC eCrr 'vVl
«oZ ~ ~ I ~K K
Ocaar
c0 co v 0v«m 'v
PC v
o cK'0 c vo O 00
R m
Kca
0 I-Z c CoUJ
N
p 0~ Z
C Cl
E 0cUr
0 CV Va Qa
K 2
0 a h crC
.5v I
I-
g C ~ 0O
8 o 0ca«. VC
IOrrOI
OlIOor
~ OI
UJZ 0g. Dm I-a~
C 0 VIUc +
0 a.'0V
0 c Eo'v E
c 9«
N +vco 0 crr
vIOCICIO Cor evs ls4l«cn UOI<0 0 ca. c err e
ae a
0 v~
cc crr
Epo
o.ID Ec Cvl Crr
UJ ~ IIIse g Cl0 a. Och
a
V V IUrI 0
v 0'v 0O
C ClW IOO ~ 0
crIcl g vcr ~ C
C V'0 c 0
O 0 F V «Lcrr0g CV
04l VIc cra.
E C 0c 0
K cv
0 a.
c C04
oB0v 0
W
I-v 0
O c
a. LEtoClC o
Ecl 0C0V0 UJ
K
c 0
c 0 v
0 EL vv g0 c
E Vc C C0 0V Olv v
vv UJ UJ
V yhlO0
C viiv 0
cCa
U v gv- a K0 Cc0
CW U0E
cO � c4l0
structure of the Alaska seafood processing industry. Two factors pri-marily justified the research, although they by no means exhaust thepossible benefits from increased knowledge. The first was the observationthat Alaska fisheries resource managers could benefit by an improved under-standing of the seafood processing sector. Processing firms make decisionswhich affect the rate and geographic pattern of utilization of stocks undermanagement. Conversely, processors are affected by the decisions of manage-ment agencies. The second justification was that, short of a descriptivestudy of the type reported herein, there were no ready vehicles for providingthe information needed by managers.
The scope of this study is limited in four ways:
First, the study focuses primarily on the processing sector of eachfishery; no indepth treatment of the harvesting and marketing levels wasattempted.
Second, this focus is on Alaska seafood processing to the exclusion ofprocessing activity in Washington, Oregon, California, British Columbia, andthe United States generally. Because these states and regions compete invarying degrees for final-consumption markets, an assessment of economicstructure for only one production region must be interpreted cautiously whenused as data for evaluations of competitive conditions in these markets. Incases where further processing occurs outside Alaska, as is often the case forfroze~ crab sections for example, the assessment of final market-competi.tiveconditi.ons based only on primary-production-area data would be even moretenuous. On the other hand, economic structure in Alaska will be indicativeof competitive conditions on the buying side of the market, that is, in theacquisition of raw fish for processing.
Third, the time periods compared in this study are: �! the three-year periods immediately prior to statehood, and �! the most recent three-year period for which complete data were available. Data were not sufficientto permit coverage of the intervening years.
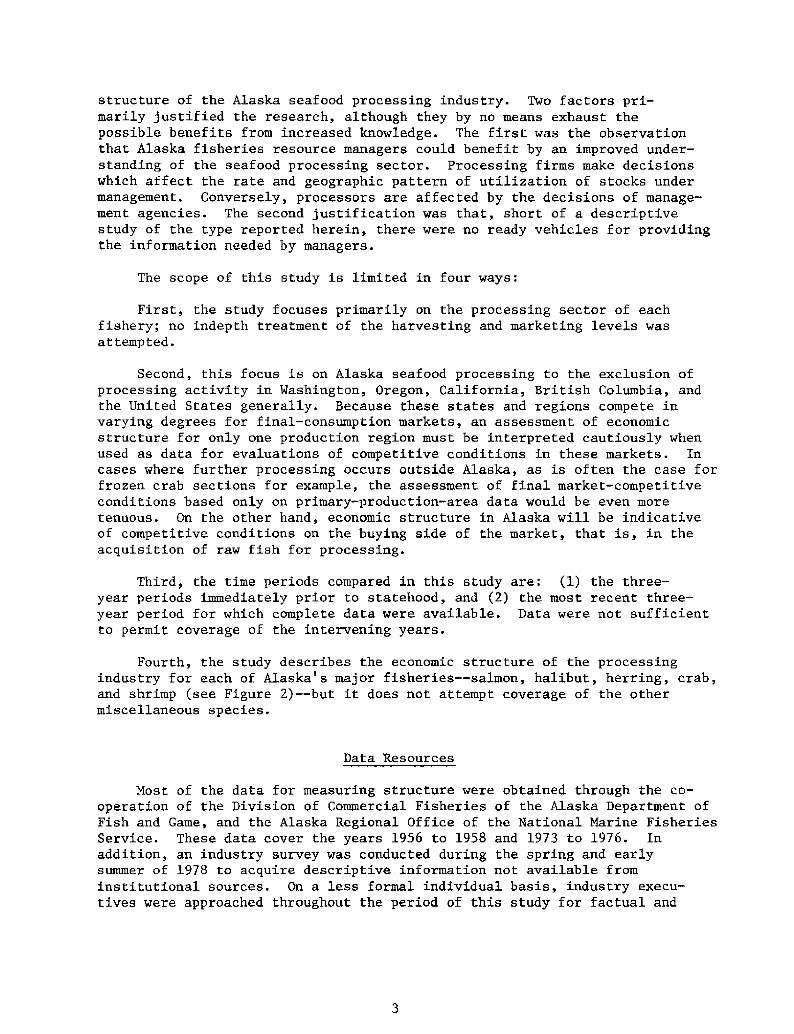
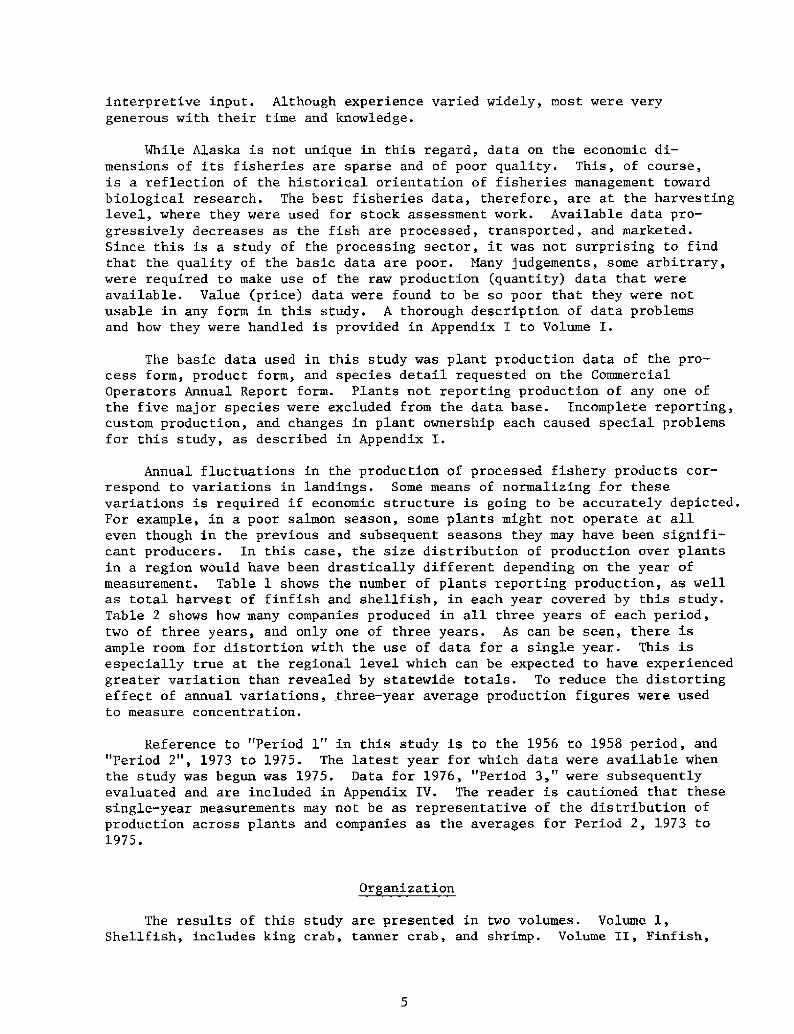
Fourth, the study describes the economic structure of the processingindustry for each of Alaska's major fisheries � salmon, halibut, herring, crab,and shrimp see Figure 2! � but it does not attempt coverage of the othermiscellaneous species.
Data Resources
Nost of the data for measuring structure were obtained through the co-operation of the Division of Commercial Fisheries of the Alaska Department ofFish and Game, and the Alaska Regional Office of the National Marine FisheriesService. These data cover the years 1956 to 1958 and 1973 to 1976. Inaddition, an industry survey was conducted during the spring and earlysummer of 1978 to acquire descriptive information not available frominstitutional sources. On a less formal individual basis, industry execu-tives were approached throughout the period of this study for factual and
OTHER FINFISH .7DUNGE ~ ESS CRABOTHER SHELLF SH 1HA L I 8 LIT 4.0
HERRING 8.3 SALMON 31.1
TANNER CRAB 10.6
KING CRAB 22,1SHRIMP 22 4
LANDED WEIGHT: TOTAL 442,400,373 Ihs.
SALMON 42 7 OTHER FINFISH .7DUNGENESS CRAB 1.3
II OTHER SHELLFISH .5
SHR I MP 6.1
TANNER CRAB 5 4 KING CRAB 29.6
HALIBUT 11.8
HERRING 1.9
LANDED VALUE: FX VESSEL, NOT INCLUDING BONUSESTOTAL 8129,402,150
SALMON 45.8 OTHER FINFISH.4DUNGENESS CRAB .8
! OTHER SHELLFISH .2
HERRING 2.4
HALIBUT 6 5 ~
KING CRAB 28.6TANNE R CRAB 6 6
SHRIMP 8.7 +WHOLESALE VALUE. TOTAL $293,191,989
FIGURE 2. LANDED WEIGHT, EX-VESSEL VALUE, AND WHOLESALE VALUE OF ALASKAFISHERIES 1975. ALL VALUES SHOWN IN PERCENT.
interpretive input. Although experience varied widely, most were verygenerous with their time and knowledge.
While Alaska is not unique in this regard, data on the economic di-mensions of its fisheries are sparse and of poor quality. This, of course,is a reflection of the historical orientation of fisheries management towardbiological research. The best fisheries data, therefore, are at the harvestinglevel, where they were used for stock assessment work. Available data pro-gressively decreases as the fish are processed, transported, and marketed.Since this is a study of the processing sector, it was not surprising to findthat the quality of the basic data are poor. Many judgements, some arbitrary,were required to make use of the raw production quantity! data that wereavailable. Value price! data were found to be so poor that they were notusable in any form in this study. A thorough description of data problemsand how they were handled is provided in Appendix I to Volume I.
The basic data used in this study was plant production data of the pro-cess form, product form, and species detail requested on the CommercialOperators Annual Report form. Plants not reporting production of any one ofthe five major species were excluded from the data base. Incomplete reporting,custom production, and changes in plant ownership each caused special problemsfor this study, as described in Appendix I.
Annual fluctuations in the production of processed fishery products cor-respond to variations in landings. Some means of normalizing for thesevariations is required if economic structure is going to be accurately depicted.For example, in a poor salmon season, some plants might not operate at alleven though in the previous and subsequent seasons they may have been signifi-cant producers. In this case, the size distribution of production over plantsin a region would have been drastically different depending on the year ofmeasurement. Table 1 shows the number of plants reporting production, as wellas total harvest of finfish and shellfish, in each year covered by this study.Table 2 shows how many companies produced in all three years of each period,two of three years, and only one of three years. As can be seen, there isample room for distortion with the use of data for a single year. This isespecially true at the regional level which can be expected to have experiencedgreater variation than revealed by statewide totals. To reduce the distortingeffect of annual variations, three-year average production figures were usedto measure concentration.
Reference to "Period 1" in this study is to the 1956 to 1958 period, and"Period 2", 1973 to 1975. The latest year for which data were available whenthe study was begun was 1975. Data for 1976, "Period 3," were subsequentlyevaluated and are included in Appendix IV. The reader is cautioned that thesesingle-year measurements may not be as representative of the distribution ofproduction across plants and companies as the averages for Period 2, 1973 to1975.
The results of this study are presented in two volumes. Volume 1,Shellfish, includes king crab, tanner crab, and shrimp. Volume II, Finfish,
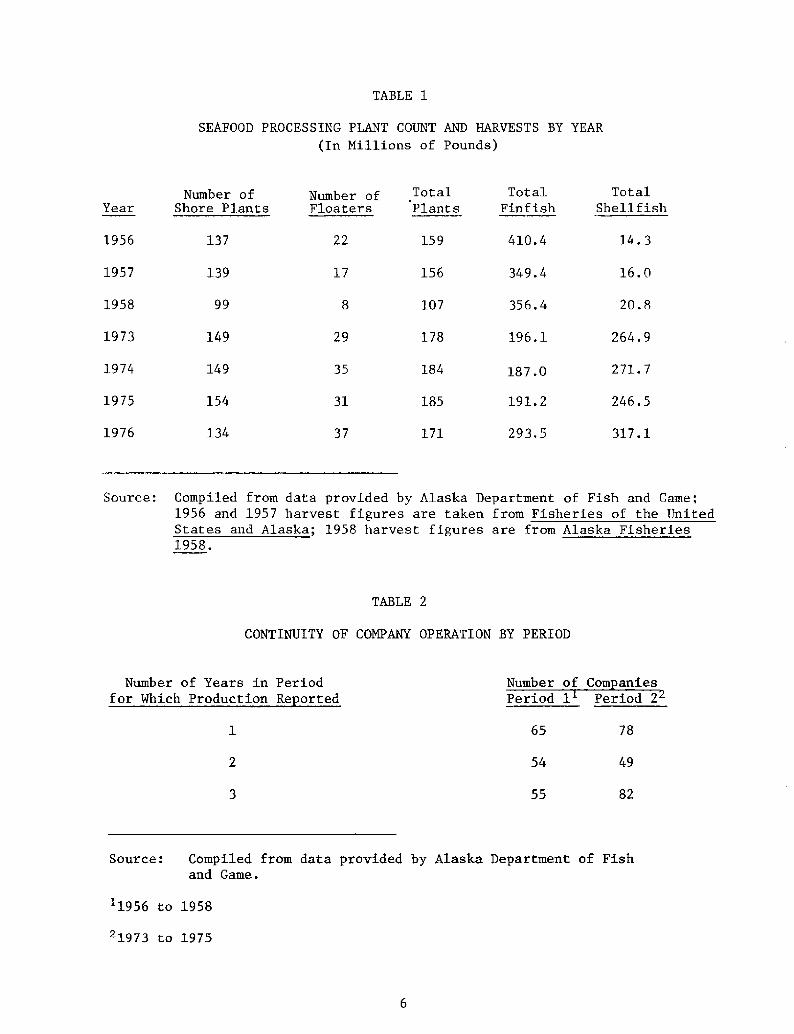
TABLE 1
SEAFOOD PROCESSING PLANT COUNT AND HARVESTS BY YEAR
In Millions of Pounds!
Number of Number of Total Total TotalYear Shore Plants Floaters Plants Finfish Shellfish
1956 14. 3137
1957 139 156 16. 0
20.81958 99 107
1973 149 178 196.1 264.9
1974 149 271. 718435
1975 154 31 246.5185
1976 134 37 171 317.1
Source: Compiled from data provided by Alaska Department of Fish and Game;1956 and 1957 harvest figures are taken from Fisheries of the UnitedStates and Alaska; 1958 harvest figures are from Alaska Fisheries1958.
Number of Years in Period
for Which Production Re orted.
65 78
54
8255
Source: Compiled from data provided by Alaska Department of Fishand Game.
~1956 to 1958
21973 to 1975
410.4
349.4
356. 4
187.0
191.2
293.5
TABLE 2
CONTINUITY OF COMPANY OPERATION BY PERIOD
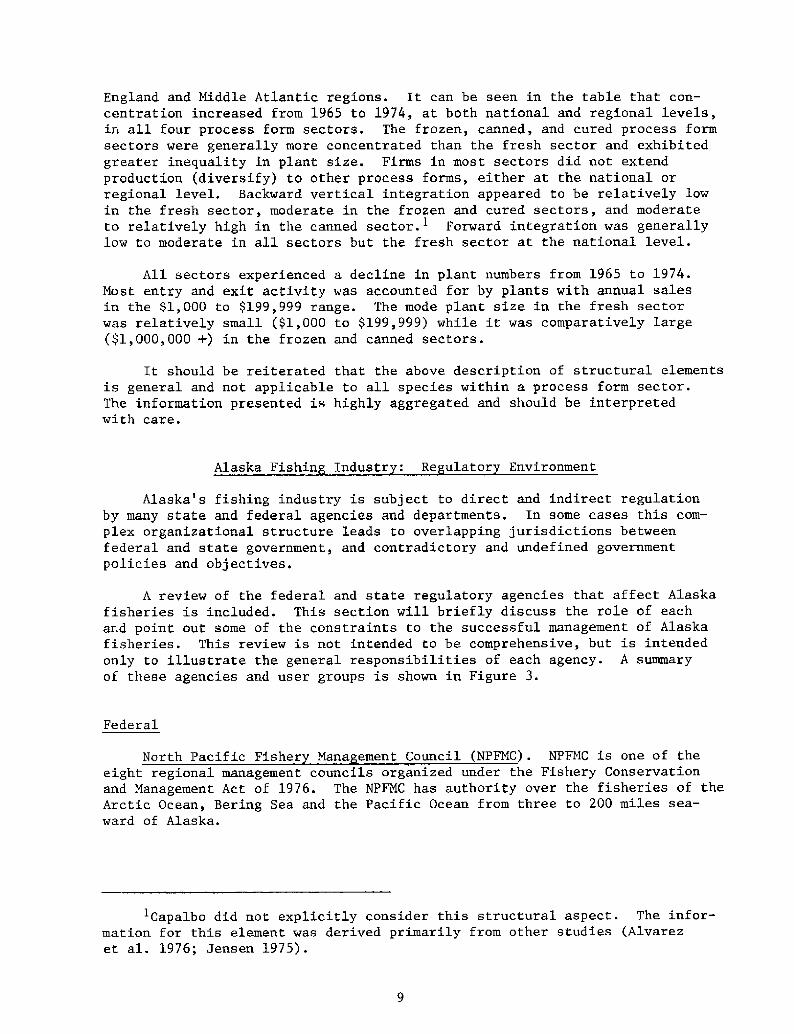
covers halibut, herring, and salmon. Volume I is organized as follows:The remainder of this chapter will provide a brief review of other seafoodprocessing structure studies more detailed treatment of this material isprovided in Appendix II!, and a description of the regulatory environmentfacing the seafood processing sector. The review of other studies isintended to allow the reader to place the results of the present study inbroader perspective.
Chapter II describes the structure of the Alaska seafood processingsector and detailed shellfish processing industries. Chapters III, IV, andV present descriptive information on the basic industry conditions history,the resource, harvesting, and processing methods! of the crab processingindustry. Chapters VI through VIII provide the same categories of informationfor the shrimp processing industry. Chapter IX describes the marketing ofAlaska shellfish.
Appendix I provides detailed information on how data problems were treatedin the course of this research. Appendix II provides a conceptual overviewof economic organization structure! in general, a review of literature onseafood processing structure in the United States, and a glossary of terms.Appendi~ III presents the compiled results of the industry survey. AppendixIV includes statistical tables for Period 3 �976 only! comparable to thoseshown in the main body of this report for Period 1 �956 to 1958! and Period2 �973 to 1975!.
Structural Elements of the UPS. Seafood
Processin Industrv: A Literature Summar
Relatively few studies have been conducted on structural aspects of theU.S. seafood processing industries. Those that presently exist assessstructural components on national and regional bases Capalbo 1976! or byparticular fish and shellfish species Alvarez, Andrews, and Prochaska 1976;Jensen 1975; Kolhonen 1976; Orth et al. 1977! ~ The scope of the Capalbo studyis limited in that it does not evaluate structural elements in all regions andbecause such elements, when assessed, are aggregated by process form sector.The latter feature renders interpretation of structural parameters more diffi-cult as process form sectors rarely conform to the concept of an industry ormarket. The specific-species studies, while being free of the above drawbacks,are simply too limited in number or scope; a few species and/or regions arecovered by these works but not enough to characterize adequately the economicstructure of regional or national markets for these or similar fish products.
In general, the particular species studies are consistent with, and thustend to support, the study of Capalbo �976!. For this reason, a summary ofthe Capalbo study is used to describe structural elements of the U.S. pro-cessing industry. The other studies are discussed in Appendix II.
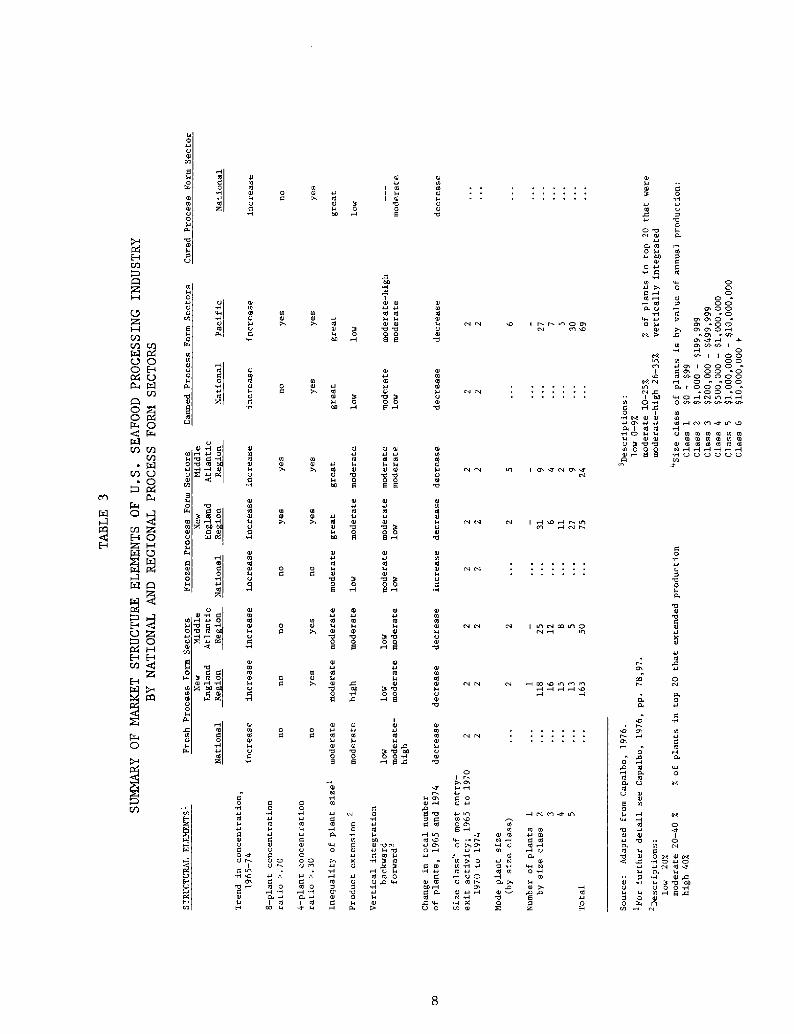
A summary of structural elements is presented in Table 3. Most ofthe structural elements assessed by Capalbo are included in the table; theonly regions for which there was coverage for such elements are the New
0IJ
Ql4J
0e
Ot/6IdQtI 00'0
C 0
Z
0 0
'0 04 0
M IDOlV 06
IJOl
0 ml64 OtJJc4 m0 ODOfC JJ
0 VW 0
Qt
'0 m
4OD
1ol mal of
0 06 6
Ct
0 0 ID0CP
+0 00 00 00 00 00 0
W 0
04 00/04 000mf46. c/7
r r crc 04
mc
IJC 0 00 00 00 00 0 IA
0/4/J OCDI 00
0 m JJIdQl66
64 CO'0 44 00
VJJOj
m ~ Ic6
alldQt0at
attdIU'0 Cl6
JJ6! Ql4al al0 0e 6
Ol0 CD
m m 4Ol
OlOlQI4 IJC
Of44Oj4 IU'006
r t/Ica I
C0
'00 4 0
al
m m UC
OIJJcd
m 0 6C 0 0 0
0 Olrc
Ol
V IC
Ol4JOl
m 0 6
Ol4Jtd4 Ql
60
0 ca 64
IJId~ I4Jtd0'06 0
m IU06
064 640 0IJ
IQl
'Cf 660 6 J-
0 ta0'Cf0
IUIJmm'0 06
ttl4 0IJ
0C M 0 cdCa
0I4JC 0IU 4J4 0cm
6 odCC oj
Oj00JJmCOt tdOD W0 CalW0
0JJal
QtC 0 0V
C 04JttlIJ
C m C 0 0U
C 0IJctlJJ
0 0 0 0V Cl
0JJcdODaf aj4/ 4
rJaj ajV JD
0
4J
W 0
4J
nj0'Cr4
I/IItf 00 06 wr0
WM ! 0I/I fm IJtd JJV 00 It! I0 JJWr6 tU
C
0 QlJJ
m 006
afm~ I Val4/Col at
0 JDm'00Z
IDcdal mVCLQt
4 af6
Cfro 0td4 0
QIO44 td
0 06
ACOl 0C cd
/ICm 00CO 4
0JJ0
a
H
C4O 00 6
O
O
0
CQ O~ 0
C4
0
A
O RD 0C4 HCa mj,'
R
jQ-l
O
4 0
6
0 06 mCJ
QI00 0LI
60
Ural olOl Zal
C alN 0
Ol4 '00 '0
0m Zm 0 064
4
I I
0
0 m CJ 0
4/I 64 CO Mt OCQ 4/I
I
ODrd OC0 IU tUCh 4J JJm al4 '44 0 mU e '00~6'C.
0
00
0,al ol0 Oal IUme rd0W'0Ot QI4 '0
'4J4 IJ0
mV U m0 QI0 tm ID46
ID ID ID Dl M MID ID ID ID I/Im oj m m Q! QjIJ IJ OOOO
England and Middle Atlantic regions. It can be seen in the table that con-centration increased from 1965 to 1974, at both national and regional levels,in all four process form sectors. The frozen, canned, and cured process formsectors were generally more concentrated than the fresh sector and exhibitedgreater inequality in plant size. Firms in most sectors did not extendproduction diversify! to other process forms, either at the national orregional level. Backward vertical integration appeared to be relatively lowin the fresh sector, moderate in the frozen and cured sectors, and moderateto relatively high in the canned sector. Forward integration was generallylow to moderate in all sectors but the fresh sector at the national level.
All sectors experienced a decline in plant numbers from 1965 to 1974.Most entry and exit activity was accounted for by plants with annual salesin the $1,000 to $199,999 range. The mode plant size in the fresh sectorwas relatively small $1,000 to $199,999! while it was comparatively large $1,000,000 +! in the frozen and canned sectors.
It should be reiterated that the above description of structural elementsis general and not applicable to all species within a process form sector.The information presented is highly aggregated and should be interpretedwith care.
Alaska Fishin Industr : Re ulator Environment
Alaska's fishing industry is subject to direct and indirect regulationby many state and federal agencies and departments. In some cases this com-plex organizational structure leads to overlapping jurisdictions betweenfederal and state government, and contradictory and undefined governmentpolicies and objectives.
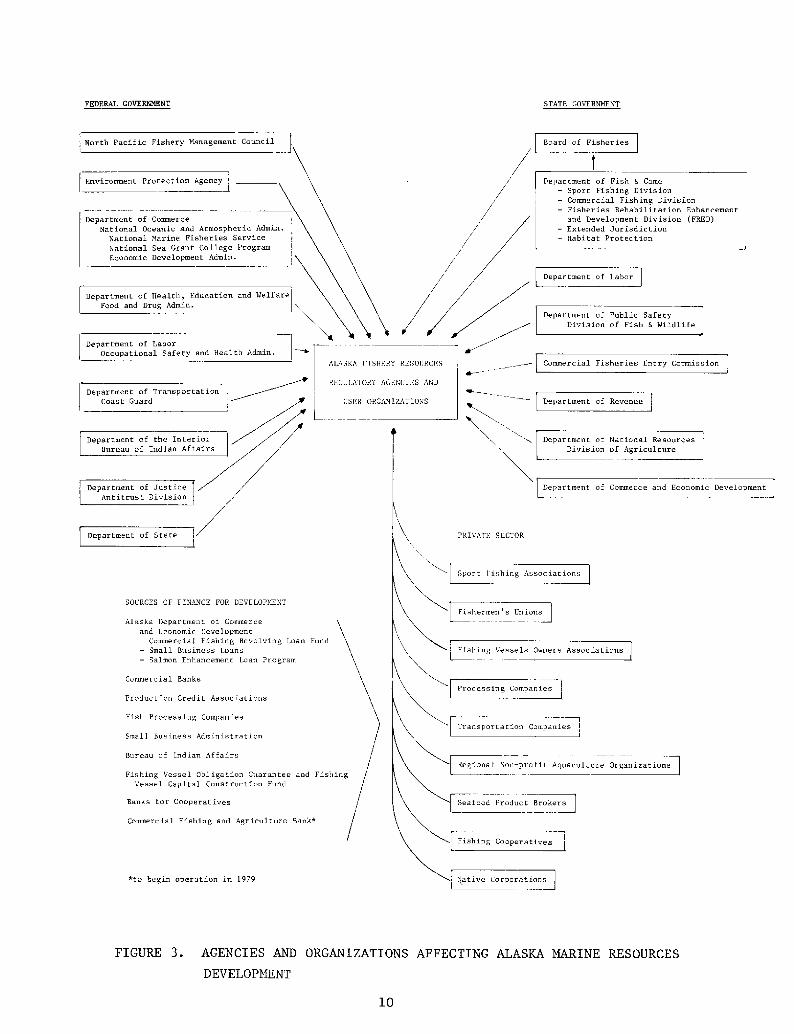
A review of the federal and state regulatory agencies that affect Alaskafisheries is included. This section will briefly discuss the role of eachand point out some of the constraints to the successful management of Alaskafisheries. This review is not intended to be comprehensive, but is intendedonly to illustrate the general responsibilities of each agency. A summaryof these agencies and user groups is shown in Figure 3.
Federal
North Pacific Fisher Mana ement Council NPFMC!. NPFMC is one of theeight regional management councils organized under the Fishery Conservationand Management Act of 1976. The NPFMC has authority over the fisheries of theArctic Ocean, Bering Sea and the Pacific Ocean from three to 200 miles sea-ward of Alaska.
Capalbo did not explicitly consider this structural aspect. The infor-mation for this element was derived primarily from other studies Alvarezet al. 1976; Jensen 1975!.
STATE OVERNHENTFEDERAL GOVERNNENT
Department of LaborOccupational Safety snd Health Admin.
Commercial Fisheries Entry CommissionALASKA I!SHFRY RE!OORCFS
Department of Transportation ces
onomic Development
SOL'RCES OF FINANCE FOR DEVELOPFIENT
Alaska Department. of Commerceand Economic Development
Commercial Fishing Revolving .oan FundSmall Business !.oansSalmon Enhancement Loan Program
Commercial Banks
Production Credit Associations
Fish Processing Companie!
Small Business Administ.ration
Bureau of Indian Affairs
Fishing Vessel Obligation Guarantee and FishiVessel Capital Construction Fund
Banks for Cooperatives
Commercia! Fishing and Agriculture Bank*
*to begin operation in 1979
FIGURE 3. AGENCIES AND ORGANIZATIONS AFFECTING ALASKA MARINE RESOURCES
DEVELOPMENT
10
De artment of Commerce USDC!. The USDC encourages, serves, and pro-motes the nation's economic development and technical advancement. It offersassistance and information to domestic and international businesses; providessocial and economic statistics and analyses for business and governmentplanners; assists in the development and maintenance of the U.S. MerchantMarine, and provides research for and promotes the increased use of scienceand technology in the development of the economy.
National Oceanic and Atmos heric Administration NOAA!. Thepurposes of NOAA are to explore, map, and chart the global oceanand its living resources; to manage and conserve those resources;and to describe, monitor, and predict conditions in the atmosphereand ocean. Among its principal functions, NOAA provides specialservices in support of marine activities. It prepares and issuesnautical charts; predicts tides, currents, and the state of theocean; conducts biological research and surveys the living resourcesof the sea; analyzes economic aspects of fisheries operations withan eye to improving man's ability to use and conserve those re-sources; and protects marine mammals.
National Marine Fisheries Service NMFS!. Fieldorganization of NOAA. It provides research and informationalservices in the areas of resource research, resouce utili-zation, resource management, and international fisheries.
Colle e Pro ram. A federal-state-
which administers and supports research,services in the development of marinein American universities.
National Sea Grant
university partnership,education, and advisoryresource and technology
Economic Develo ment Administration EDA!. The primaryfunction of the EDA is the long-range economic development ofareas with severe unemployment. It aids in the development ofpublic facilities and private enterprise to help create new,permanent jobs.
De artment of State USDS!. The USDS advises the president in theformation and execution of foreign policy. The department determines andanalyzes the facts relating to our overseas interests, makes recommendationson policy and future action, and takes the necessary steps to carry outestablished policy. It is responsible for negotiation or renegotiation oftreaties with other countries which pertain to the fisheries within thefishery canservatation zone.
11
Environmental Protection A enc EPA!. The responsibilities ofthe EPA are to control and abate pollution by research monitoring, standardsetting, and enhancement activities. An example of the regulatory actionof the EPA in Alaska is the regulation enacted in 1973 to stop processingwastes in Kodiak from being dumped into the ocean. Faced with the possibilityof being shut down, the processing companies found a solution by selling orpaying to have taken away! wastes to Bio-Dry, a reduction processing plant.The EPA is presently in the process of enacting a similar regulation at DutchHarbor. As the regulation now stands, the plants there had to have screensinstalled by November 1, 1978, to filter out solid. particles from the wastewater disposal systems.
De artment of Health, Education, and Welfare HEW!. This is thedepartment of the federal government most involved with human concernsand the welfare of the individual. Some programs within HEW which havedirect effects on Alaskan fisheries are described below.
Food and Dru Administration FDA!. The scope of respon-sibility of the FDA includes the protecting of the health ofthe nation against impure and unsafe foods.
Bureau of Biolo ics. The responsibilities of this bureauinclude: regulation of biological products shipped in inter-state and foreign commerce; inspection of manufacturers' facili-ties; establishment of written and physical standards; testing ofproducts submitted for release; approval of licenses for manu-facturers of biological products; conducting research relatedto development, manufacture testing, and manufacture of new andold biological products.
Bureau of Foods. This bureau conducts research and developsstandards on the composition, quality, nutrition, and safety offoods; conducts research designed to improve detecti.on, pre-vention, and control of contamination that may be responsible forillness or injury conveyed by foods; reviews industry petitions.~
De artment of Labor, Occu ational Safet and Health Administration OSHA!.The purpose of OSHA is to develop and promulgate occupational safety andhealth standards; develop and issue regulations; conduct investigations andinspections to determine compliance with safety and health standards; and toissue citations and propose penalties.
Department of Transportation, U.S. Coast. Guard USCG!. The USCG isresponsible for search and rescue life and property! on the high seas and inU.S. waters; law enforcement of laws governing navigation, vessel safety,marine environmental protection, and resource conservation including enforce-ment of safety standards on foreign vessels subject. to U.S. jurisdiction!;investigations, surveillance, operations, and boardings to detect violations.
Department of the Interior, Bureau of Indian Affairs BIA!. The BIAencourages and trains Indian and Alaska Native people to manage their ownaffairs and facilitates full development of their natural resource poten-tials, consistent with principles of resource conservation.
In personal correspondence with a compliance officer of the Food andDrug Administration, Department of Health, Education and Welfare, the followinginformation was obtained in response to questions concerning the Alaskafisheries. "Regulations covering specific industries by geographical areasdo not exist. Specific regulations concerning sanitary practices and con-ditions of fishing vessels do not exist. There are no specific regula-tions with regard to the development of new processing methods or products.The existing statutes and regulations require that all foods shall be freefrom adulteration and shall be appropriately labeled. We HEW! have no setquality control standards and do not specify the frequency of quality checks.It is the responsibility of the manufacturer, distributor, and shipper toensure that foods shipped into interstate commerce are safe and free fromadulteration." A.PE Duzenack 1978, personal communication.!
Department of Justice, Antitrust Division. This organization is re-sponsible for enforcement of federal antitrust laws which involves investi-gation of possible violations, preparing and trying antitrust cases, pro-secuting appeals, etc. It also represents the U.S. in judicial proceedingsto review certain orders of the Interstate Commerce Commission, FederalMaritime Commission, etc.
State
Board of Fisheries. This board is responsible for the establishmentand changes to commercial or sport fishing regulations; holding publicmeetings to allow public participation and input on proposed regulationchanges.
De artment of Fish and Game. This department is responsible for themanagement of Alaska's fishery resources.
De artment of Labor. The workmen's compensation division administersthe fishermen's fund which is comprised of 60 percent of the revenuecollected from commercial fishing licenses. Medical and convalescentbenefits are drawn against the fund through claims filed by fishermen in-jured or sustaining an illness while fishing.
De artment of Public Safet , Division of Fish and Wildlife. Thedivision is responsible for enforcement of harvesting regulations.
Commercial Fisheries Entr Commission. This commission was established
in 1973 for the purpose of stabilizing the number of units of gear in thecommercial fisheries at levels consistent with good fisheries management andfair dollar returns to the fishermen. Permanent entry permits were issuedin 1975 on a point system measuring a fisherman's dependence on fishing; thepermits are transferable.
Crab, canned
Crab, other processes
2 percent of raw value
1 percent of raw value if shore-based processor
4 percent of raw value if floatingprocessor
Shrimp, all processes 1 percent of raw value if shore-based processor
4 percent of raw value if floatingprocessor.
13
De artment of Revenue, Taxation DRT!. DRT is responsible for collectingtax revenue from Alaska fisheries operations. Each processing plant mustcomplete an application for an Alaska fish processor license and pay anannual fee of $25. The state receives "fish tax" revenue from the shellfishindustry through processing companies. The schedule of rates at the timeof the writing of this report are:
Department of Revenue definitions are as follows: "Shore-based fishprocessor means cold storage and processing plants that are permanentlyattached to the land or have remained in the same location from January 1through December 31 of the previous calendar year. Cold storage and fishprocessing plants which are not permanently attached to the land or didnot remain in the same location the previous calendar year are classified as'floating fish processors.'" Floating processors which moor in the samelocation every year except for removal for drydock or repairs are apparentlyeligible for the shore-based rate unless they return to a different locationto process according to the following Alaska statutes. "Removal of vesselsf i . Removal of vessels from the state for drydock repairs does notrequire reclassification under the higher rate of taxation. State vs.Wakefield Fisheries, Inc., Sup. Ct. Op. No. 779 File Nos. 1397, 1398!, 495 p.2d 166 �972!. Removal of vessels for periodic repairs and maintenance shouldnot destroy the continuity of the period during which the vessels are deemedto be at fixed locations for one calendar year. State vs. Wakefield Fisheries,Inc., Sup. Ct. Op. No. 779 File Nos. 1397, 1398!, 495 p. 2d 166 �972!.Processor dis uglified from 'shore-based' status. Where, in addition to theyearly trips to Seattle for maintenance, the processors also sailed amongseveral Alaskan communities to conduct their processing operations, theywere disqualified from 'shore-based' status under this section. State vs.Reefer King Co., Sup. Ct. Op. No. 1344 File Nos. 2605, 2606, 2607!, 559 p.2d 56 �976!."3
Discussions with persons at the Department of Revenue show that thereis no clear definition of the amount of time a processor may remain in dry-dock outside the state each year and still retain shore-based status.
The state also obtains tax revenues from all people involved in anyaspect of the fishing industry in Alaska by state tax on personal income.This is true for year-round or part-year residents.
De artment of Natural Resources, Division of A riculture DNR, DA!.The DNR, DA is the state agency for regulatory control of sanitary conditionsof the seafood harvesting and processing industries.
De artment of Commerce and Economic Develo ment. This department isresponsible for government assistance for fisheries development in Alaska andadministers the fisheries revolving loan fund and. other loan programs forwhich fishermen are eligible. Nost ad hoc programs for fisheries developmentare administered by the department.
Alaska Statutes 543.75.060.

CHAPTER II
ECONOMIC STRUCTURE OF THE ALASKA SEAFOOD PROCESSING SECTORAND DETAILED SHELLFISH PROCESSING INDUSTRIES
Introduction
The collection and interpretation of economic information requires theuse of a systematic and consistent definitional framework. IndustrialOrganization, a branch of the discipline of Economics, provides a conceptualframework that is applicable to seafood processing and all other industriesin the private enterprise economy. The purpose of the framework is to pro-vide a means for sorting and categorizing economic informatin in a mannerwhich is useful for assessing the competitive environment in specific markets.
The economic entities with which economic-structure studies are concernedare plants, firms, industries, and markets. In some instances, the interrela-tionship between or among entities is straightforward; in other cases, they areobscured by vertical integration, ownership interties, diversification, jointventures, and custom-production arrangements. All of these complicatingfactors are common in the Alaska seafood processing sector. Further complicatingany description of economic structure is the difficulty of making precise andpractical delineations among geographic markets and product markets.
It will suffice here to define an industry as the basic competitive entitywhich consists of all sellers firms! who produce a close substitute productand sell to a common group of buyers Bain 1968!. The "close substitute pro-duct" constitutes the "relevant product market," and "the common group of buyers"constitutes the "relevant geographic market." An industry, therefore, is allfirms who compete in a particular geographic and product market. 'For example,the relevant product market might be canned king or tanner crab meat, and therelevant geographic market would be nationwide. The canned crab meat kingand tanner! industry would thus be defined as all firms who produce thesespecies of canned crab meat and sell into the nationwide market system.
As an alternative to a long digression in the body of this report,Appendix II has been developed to provide a conceptual background for theinterpretation of information presented in this report, as well as forassisting the reader who wishes to obtain a general understanding of economicorganization. Appendix II also provides an overview of the results of otherstudies of seafood market structure. This information is intended to allowthe reader to place the results of the present study in broader perspective.Finally, Appendix II contains a glossary of technical terms to assist readersas necessary, although an effort has been made to minimize the use of economicj argon.
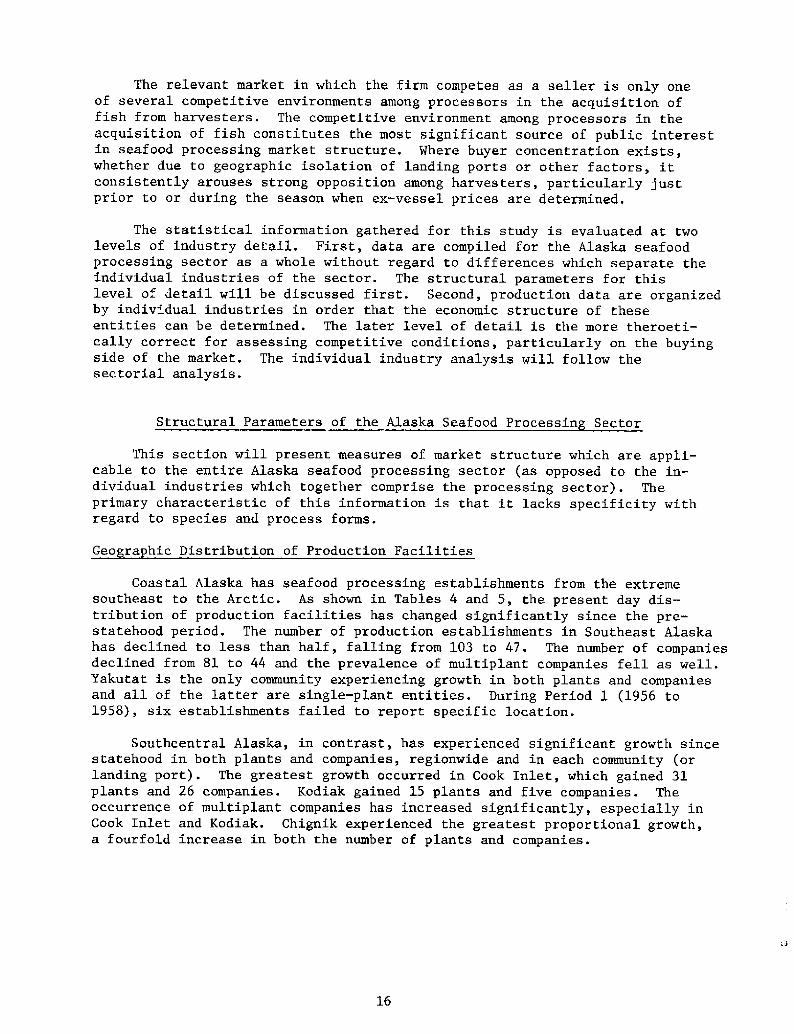
The relevant market in which the firm competes as a seller is only oneof several competitive environments among processors in the acquisition offish from harvesters. The competitive environment among processors in theacquisition of fish constitutes the most si,gnificant source of public interestin seafood processing market structure. Where buyer concentration exists,whether due to geographic isolation of landing ports or other factors, itconsistently arouses strong opposition among harvesters, particularly justprior to or during the season when ex-vessel prices are determined.
The statistical information gathered for this study is evaluated at twolevels of industry detail. First, data are compiled for the Alaska seafoodprocessing sector as a whole without regard to differences which separate theindividual industries of the sector. The structural parameters for thislevel o detail will be discussed first,. Second, production data are organizedby indiv"'dual industries in order that the economic structure of theseentities can be determined. The later level of detail is the more theroeti-cally correct for assessing competitive conditions, particularly on the buyingside of the market. The individual industry analysis will follow thesectorial analysis.
Structural Parameters of the Alaska Seafood Processin Sector
This section will present measures of market structure which are appli-cable to the entire Alaska seafood processing sector as opposed to the in-dividual industries which together comprise the processing sector!. Theprimary characteristic of this information is that it lacks specificity withregard to species and process forms.
Geo ra hic Distribution of Production Facilities
Coastal Alaska has seafood processing establishments from the extremesoutheast to the Arctic. As shown in Tables 4 and 5, the present day dis-tribution of production facilities has changed significantly since the pre-statehood period. The number of production establishments in Southeast Alaskahas declined to less than half, falling from 103 to 47. The number of companiesdeclined from 81 to 44 and the prevalence of multiplant companies fell as well.Yakutat is the only community experiencing growth in both plants and companiesand all of the latter are single-plant entities. During Period 1 �956 to1958!, six establishments failed to report specific location.
Southcentral Alaska, in contrast, has experienced significant growth sincestatehood in both plants and companies, regionwide and in each community orlanding port!. The greatest growth occurred in Cook Inlet, which gained 31plants and 26 companies. Kodiak gained 15 plants and five companies. Theoccurrence of multiplant companies has increased significantly, especially inCook Inlet and Kodiak. Chignik experienced the greatest proportional growth,a fourfold increase in both the number of plants and companies'
COO O
Ql
cdW 0 e
00 ~
A OH
cd
cUA
'0
0 QI CO COO
O HC3 W 0
QI84J
cd
Qla
80 U
W'0
<U 0CO Wgcd cU
+ +
C 0 Cd IQQI cd
gcd
V QIcdQI cd
A O O
~80C3
cU
V 0cfl
~ ~Ql
0
17
~ 92
H O R O H O I-IO H o
p COO
CO M CO
I + I I +
Ch COC>
Ql cd9'-I
cdQl cd $-I 0
QI4J W W cd
C ro0 cU QIm o
8
A' 0A cd
CO0
0 IV
LA
0 WQI cd
QI
~ A cdC3
cUcd
0
M O
cll4J0 Oc
N N
44
0 W44N NN
4! 4J'40 tdClj I4
N CJ
440N
0 M4J
0W 0N N N CON ccjcO
M 444cICCJ
N CON CO c0N N
CA C4J MJ4 0
nj IC$clj
C0 0M4J0
MIJC0
Mj0 M4J0cll td0N C4
MIC MIJ4J g0 44IM
N N
C
A J- 4 Mj0 0 C4J 4J cdCl lll
'0
W44 4J
CIA C
MM4J0
NN N N
0Cj0'0 M
g J!0 0 OC II! CJ
'0cl IJW CM4J CJC0 Ill
Ill
cd 0IJ Cj
0 Clal
W 4J04J MM 04CM
jj
0A5
N W CCIN
cO Nl R c
CO N 6 N
CCj0IJM 44Cj
7I
0 0C!4Jcl'0 CI84W'0
0 CO CCI60 Cj Oc
0 0CjCJCOCI CI0Clj CV
Western Alaska experienced a net decline in companies from 46 to 39,but gained a net of five producing establishments. This resulted in anincrease in the number of multiplant companies. Within this vast region,the Aleutians gained 18 plants �3 of which are floaters! and ten companies.Bristol. Bay, on the other hand, lost nine plants and eight companies.
The Arctic-Yukon � Kuskokwin AYK! region has enjoyed significant growthsince statehood. This region has gained 34 plants and 34 companies, causingmultiplant companies to decrease slightly in relative importance. Both theYukon and Kuskokwim districts are characterized by small pLants and companies.
As might be expected, the distribution of production facilities hasfollowed the geographic distribution of harvestable surpluses in importantstocks see Table 6!. In particular, Southeastern Alaska with the exceptionof Yakutat! and Bristol Bay have lost production facilities, presumably dueto the decline in salmon stocks. Central Alaska and the Aleutians have grownrapidly as a result of exploitation of previously underutili,zed or unutilizedshellfish stocks.
Another relevant aspect of geographic distribution refers to the degreeto which companies specialize geographically and whether this tendency ischanging. As shown in Table 7, geographic specialization is increasing, bothin terms of number of companies producing in multiple regions general areas!and multiple communities specific areas!. The shift in effort to, and thelocation of surplus shellfish stocks in Central and Western Alaska may explainthe increased geographic specializati.on, as these regions are larger andmore remote.
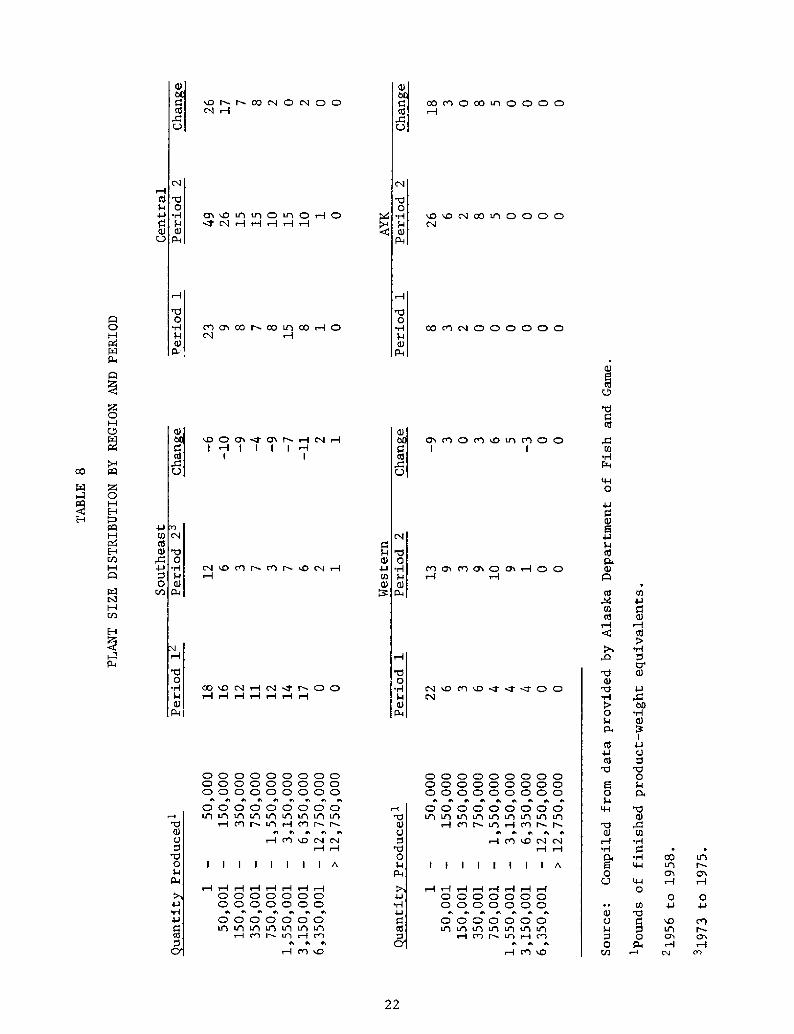
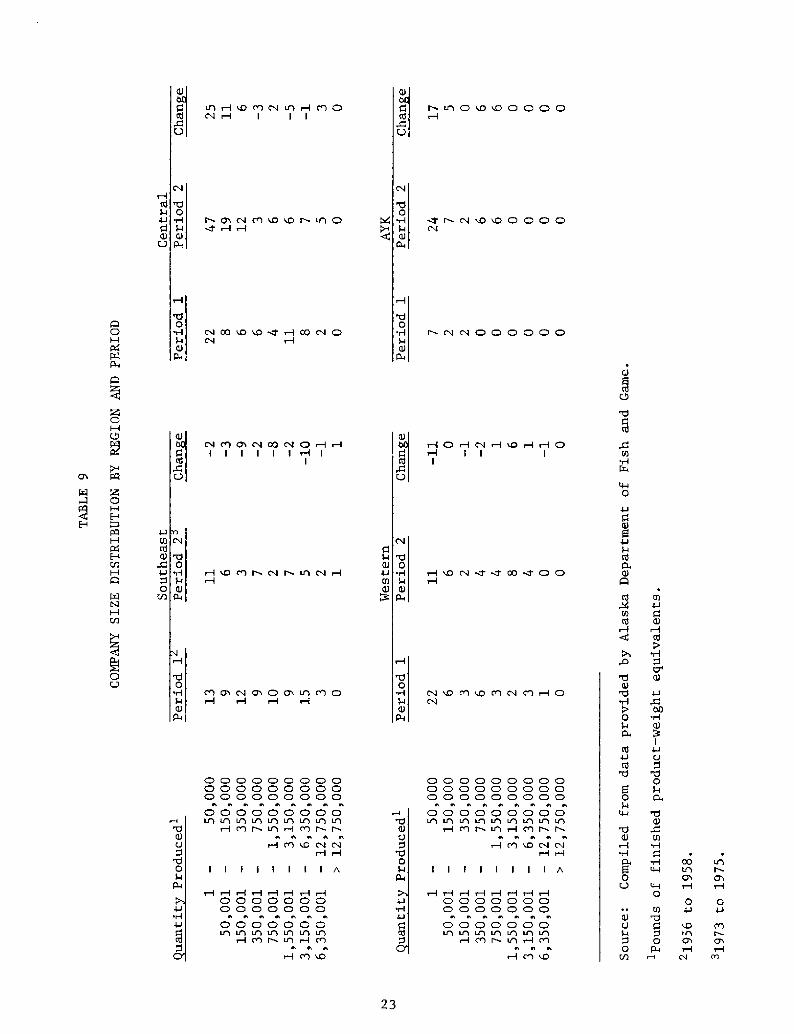
Tables 8 and 9 show the size distribution of plants and companies re-spectively by region and by period. Surprisingly, Southeast Alaska was theonly region gaining plants in the largest size categories though it lostplants overall. Small plants and companies gained in Central and AYK anddeclined in number in Western Alaska.
A re ate Concentration
Aggregate concentration refers to the size distribution of all seafoodproduction among companies or plants!, without regard to species or processform categories. The economic implications of high aggregate concentrationare uncertain. First, high aggregate concentration in the economy or majorsectors thereof does not necessarily imply high concentration in individualindustries for example, canned shrimp, crab sections, etc.!. Second, highaggregate concentration tends to be associated with firms that are large inrelation to the individual markets in which they operate; that is it. tends tobe associated with dominant firms Gort 1962!. The latter, in turn, areoften associated with "price-leadership" pricing behavior by firms in oligo-polistically structured industries. Third, high aggregate concentration ispositively associated with large firm size and diversification, both of whichcan be sources of market power Gort 1962; Orth 1970; Scherer 1970!. Fourth,there is evidence suggesting that large firms tend to be more progressivethan smaller firms, making them more dynamic competitors Scherer 1970!.
19

~ l~ 0
~ l
lP!
Oa
CV
a aCO0
0 CVtl
0 00 00 0
~ I tl'LDCO OCQ 0a a
OH%Ch GOO COB
aCh W O
O'4 Lh 0
a a a&Wr
a ~0 0
FlCO Ch
a a
0
O Ch
0a a
aO <
OOCO0 0 CV H0 0 CO Ha a a aC4 h CO
0a a
0 Ch
GOCh W
Cha ~
< OCQ Yl
a a
Ch NCh
~ I a acV+0
a a a
GOr I cv
~ ~ ~~ ~ ~
GI
Ql
QI lI
CO0 nJ
~ l a t tlOWWCQ
cv 0a a a a
Vlr4WW
l1l CQa a
th 0l1l CV
a aCV COM GO
O~ a
cV GV PCO lA
Ch O~ 92 a
0 OH
GON
tl t
~ aGO
GOCV
O < Cha t ~
P 0 ACh O
CQ~ 92 a tl
QI
0
04J
nJCO
v-I W ~ Wa a tl
~ l aCh CO
fl a0 GQCO WO Ch
a a
O GOCV
OGO
a tlCh M CO
GO
CO
20
GO H Ch ClICOORNA
Ch ad'a ~ a tl a
CO
R O rl N Ot t a tl a
CV WWWC4O Ch R O
M MCO WW U1
QI nnnr ~r I
W 0 c5A 0
QJ 0
0g~ +
d QIVJ
�
0 ~0 W Ct
QI QI
0 QI QI
A
QItd
'CIVJ IdQI
0~ Rbd Gd 0QI
M
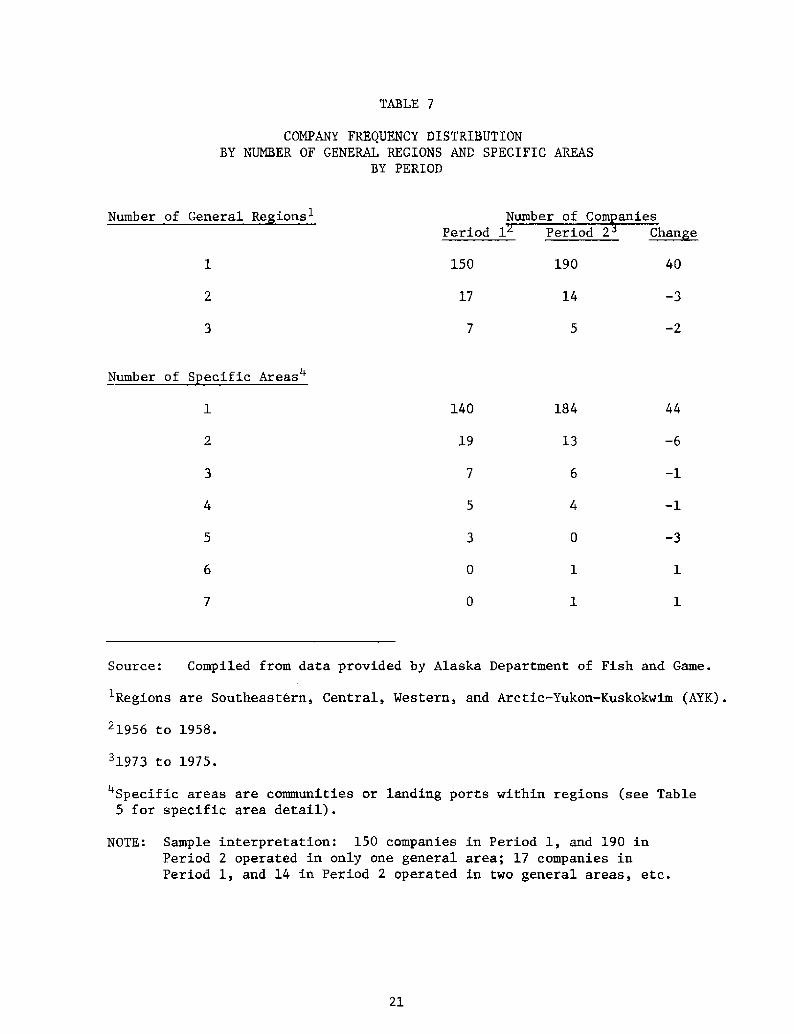
TABLE 7
COMPANY FREQUENCY DISTRIBUTIONBY NUMBER OF GENERAL REGIONS AND SPECIFIC AREAS
BY PERIOD
Number of General Re ions
Period an e
150 190 40
Number of S ecific Areas"
140 184 44
19
4Specific areas are communities or landing ports within regions see Table5 for specific area detail!.
NOTE: Sample interpretation: 150 companies in Period 1, and 190 inPeriod 2 operated in only one general area; 17 companies inPeriod 1, and 14 in Period 2 operated in two general areas, etc.
21
Source: Compiled from data provided by Alaska Department of Fish and Game.
Regions are Southeastern, Central, Western, and Arctic-Yukon-Kuskokwim AYK!.
21956 to 1958.
31973 to 1975.
cd
Cj
A0 H 0 H
'cj0
Ch
dj
och+OO~ -I
000000000000 0 0 0
~ I tl tI t tI00000
lA~ 92
0 00 00 00 0
~ I tlCII
0 00 00 0a0 0
~ I ~
0 0 0000000
0 00 00 0
~ I tI0 0
~ I
0000OOOOOOOO
~ I ~ tlOOOO 000
~ I tI tl
00~ I0
000000~ I tI tl000
LC!p1
0 00 0t S
0 00 0
0 0cr!
A
0 00 0t0 0
~ I tlLQ
0 0 00 00 0
~ tI0 0
0 000 0
tI ~
22
CO
0
9-IH cc
djcrjMA
0ch
Nr r COAOAOQ
00~ e Ch < W R 0 e 0 M 0
dj
0co wco Lrjco IHO
4dj
MQChWChr HCVHI I I I
I I
0VII % A w A w % II
Gj
'00
CO % & H CII N W 0 0
djCk I
I I I I I I I I A
co ctj 0 co v! 0 0 0 0
00~ tI NIIOCII COulOOOO
CVdj
CO ctj hl 0 0 0 0 0 0
O Y! cO A M 0 0I I
W&MNNNOO
I I I I I I I I A
dj8
djC-I
cdAcd
0 C4cd
cd0
80
<U
60U
t ~cdcj
0
dj
V'dj
COdj
ICj
00
'0dj
COW
ChI I
00 0
cC 4J
0 chCct
P!
CV&HWOI I I
cd4J
dI
cd
0 dl'cd
0 <LIC4A O H 0
0
COCdcddl
«OH
0crt
Q 00 00 0
~ I a0 0
H
000000ODD
0 00 00 0A R0 0
A e
0 00 00 0A0 0
A a
r I &
OOOO00000000
~ ~OOOO
00000DOOOO00000
~ I rh tl ~OQOQO
A A R A AY! % CV
000
CO EC!
000000 A000
00 A0
r I0 00 0
0 0
a ~
W r40 0 0DOOA ~ODD
0 00 0A0 0
lAcCI
0
0 00 00 0
A0 0
0 0
23
ncd0~ 6 N Ch CV & cO % W tel O
dl
«0 cO 4 < + CO hl 0
HHCh&OOAOHHI I I I I W I
I
0CV W c«l CV
dlC4
0O Ch R W O
dl
I I I I I I I I A
P WDcOZOOQOc-I
0Cf 6'44>0000
C4
c ACVOOQQQQ
H 0 H CV H cO H R 0I I I
I
HC>cVWN«ONOD
0rl &KWCI WCVPl&0
dl
I I I I I I I A
8 cdC4dlA
A 'cddl
v 0 Occd
cd
8 0 0U
cd
v dIbd
5 I
V 0'cddI
0
The applicability of these generalizations to the Alaska seafood pro-cessing sector is not necessarily straight-forward. For this reason, andbecause a thorough analysis of these issues is beyond the scope of thisstudy, this report will be devoted to a presentation of the factualmaterial gathered. The latter is of interest because it describes theorganization of plants and companies within the sector and how organi-zation has changed since statehood.
During Period 1 �956 to 1958! there were 227 plants and 174 companiesreporting some production. Of these companies, 145 operated only one plant,17 companies operated two plants, six companies had three plants, three hadfour plants, and one each had five, six, and seven plants. As shown inTable 10, the number of one � plant companies in Period 2 was 179. Period 2is otherwise quite comparable to Period 1 except that there are two companieshaving 10 and 11 plants respectively. The mean number of plants in Period1 was 1.305 and in Period 2 it was 1.349.
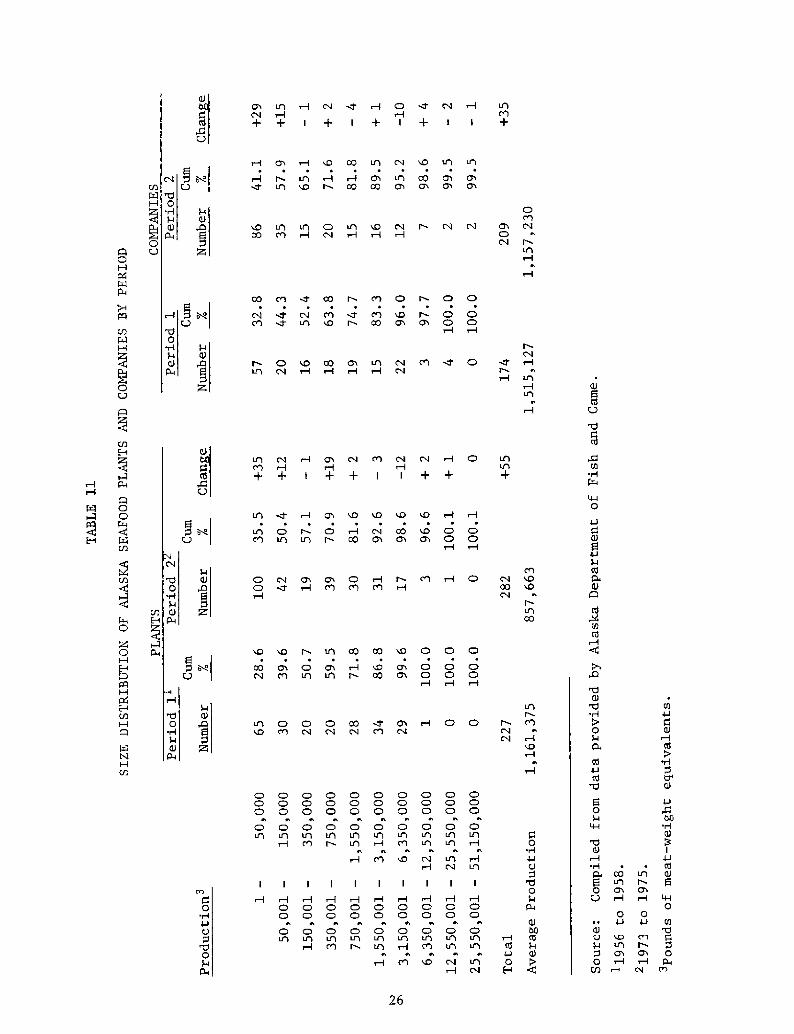
Table ll shows the size distribution of plants and companies for Period 1and Period 2. In Period 1, 28.6 percent of plants produced less than 50,000pounds of product meat weight equivalents! and. 50.7 percent produced lessthan 350,000 pounds. In period 2, 35.5 percent and 57.1 percent of plantsproduced less than 50,000 and 350,000 pounds respectively. In Period 1,28.2 percent of plants produced more than 1.5 million pounds and only 18.4percent of plants produced more than this amount in Period 2. The middlerange, from 350,000 pounds to 1.5 million pounds held 21.1 percent of plantsin Period 1 and 24.5 percent in Period 2. The average production of plantswas approximately 1 ~ 2 million pounds in Period 1 and 0.9 million pounds inPeriod 2.
The distribution of companies by production is similar to that for plants.This is not surprising given that 83 percent of companies in Period 1 and 86percent in Period 2 were single-plant companies. In Period 1, 32.8 percentof companies produced less than 50,000 pounds and 52.4 percent produced lessthan 350,000 pounds. In Period 2, these were 41.1 percent and 65.1 percentrespectively. There were 25.3 percent of all companies producing more than1.5 million pounds in Period 1 and 18.2 percent in Period 2. In Period 1,21.3 percent of the companies produced between 350,000 pounds and 1.5 millionpounds and 16.7 percent fell in this range in Period 2. The average pro-duction of companies was approximately 1.5 and 1.2 million pounds in Periods1 and 2, respectively.
In addition to the number and percent of plants and companies in eachsize category, it is useful to know the cumulative control over productionaccounted for by plants and companies of different sizes. That is, inaddition to knowing the number of companies in a size category, one shouldalso know the percent of total production controlled by those companies.This information is obtained from Tables 12 and 13 and Figures 4 and 5.
Roughly one-half of all plants produced 97 percent of total productionin Period 1 and 98 percent in Period 2. In Period 1, 113 of 227 plantsproduced only three percent of total output, and in Period 2 this fell totwo percent for 141 of 282 plants. The level of aggregate company concentration
24
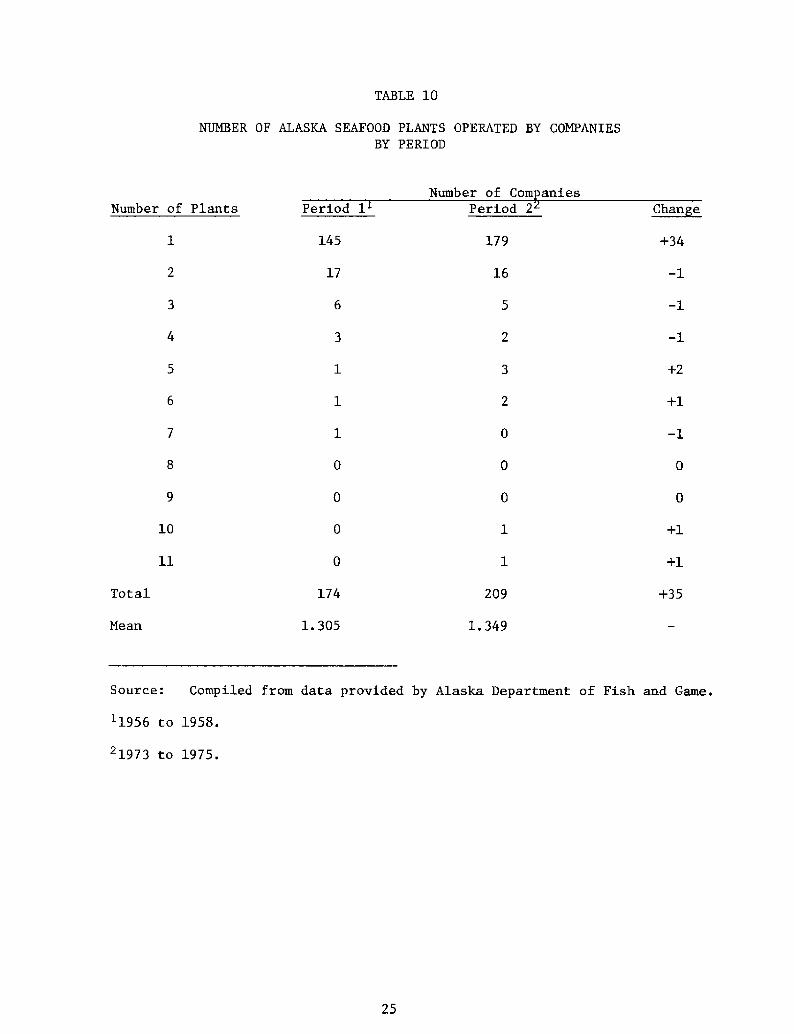
TABLE 10
NUMBER OF ALASKA SEAFOOD PLANTS OPERATED BY COMPANIES
BY PERIOD
Number of Com aniesPeriod 1 Period 2Number of Plants
145 179
17 16
+1
10 +1
174Total 209 +35
l. 305 l. 349Mean
Source: Compiled from data provided by Alaska Department of Fish and Game.
il956 to 1958.
~1973 to 1975 '
QQ ChCh Ch
QO
QO QO
00
0 H H0 0 0O 0 O
~ h
0
CD0
Vl
O 0 00 H hl COP QO Ol Ch
QO
0 0
0 00 0
O
OCh O
QO & CD ChlA A
QQ QO
8 O'8
0 0 0 00 0 0 00 0 0 0
h0 0 0 0
e1 LCI ECI
IVI
0 0 00 0 00 0 0
0 0 0
LCl
H
0 0 00 0 00 0 0
a0 0 0
80
0
'0 0m 0
'Cl0
H0 0 0 00 0 0 0
~ I 4 a a0 0 0 0
LCl~ A a A
F1 W CV
0 0 00 0 0
0 0 0nfl
LCl
0 00 0
0 0
26
a0 0 0 0 H H H
c-I D W NCV+ + I + I + I +
CD W W M PGO
QO W W CO W & 0
CVQO
I O UD CO Ch A CV W < OcV
CVYl H H+ + I + + I I + +
O N a Ol O H > W H OCD QO
O O O QQ < Ch + O OCV K N
I I I I I I I I I I
QCI
5 IQI
W 00
Cl
Ch 0
c4 m
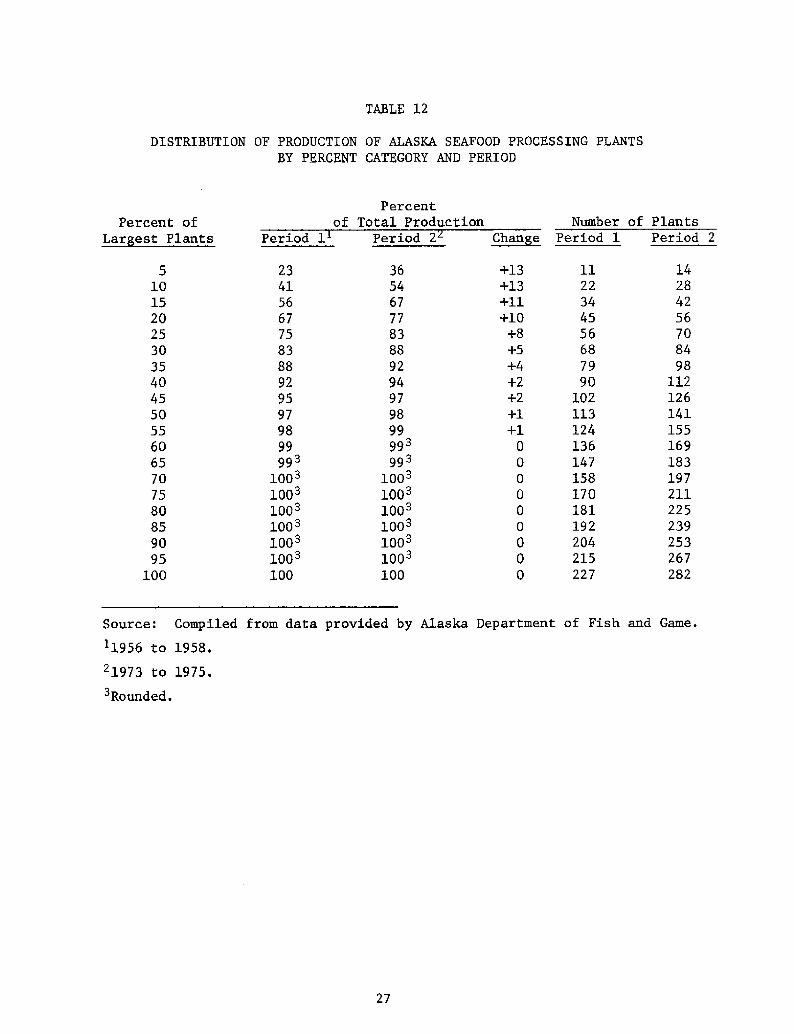
TABLE 12
DISTRIBUTION OF PRODUCTION OF ALASKA SEAFOOD PROCESSING PLANTS
BY PERCENT CATEGORY AND PERIOD
Percent
of Total Production Number of PlantsPercent of
Period 1 ~Chen e Period 2 Period 2Period 2
Source: Compiled from data provided by Alaska Department of Fish and Game.
il956 to 1958.
21973 to 1975.
3Rounded.
27
5
10
15
20
25
30
35
40
45
50
55
60
65
70
75
80
85
90
95
100
23
41
56
67
75
83
88
92
95
97
98
9999~
10031003100~100310031003100
36
54
67
77
83
88
92
94
97
98
99993993
100310031003100310031003100
+13
+13
+11
+10
+8
+5
+4
+2
+2
+1
+1
0 0 0 0 0 00
0 0
ll
22
34
45
56
68
79
90
102
113
124
136
147
158
170
181
192
204
215
227
14
28
42
56
70
84
98
112
126
141
155
169
183
197
211
225
239
253
267
282
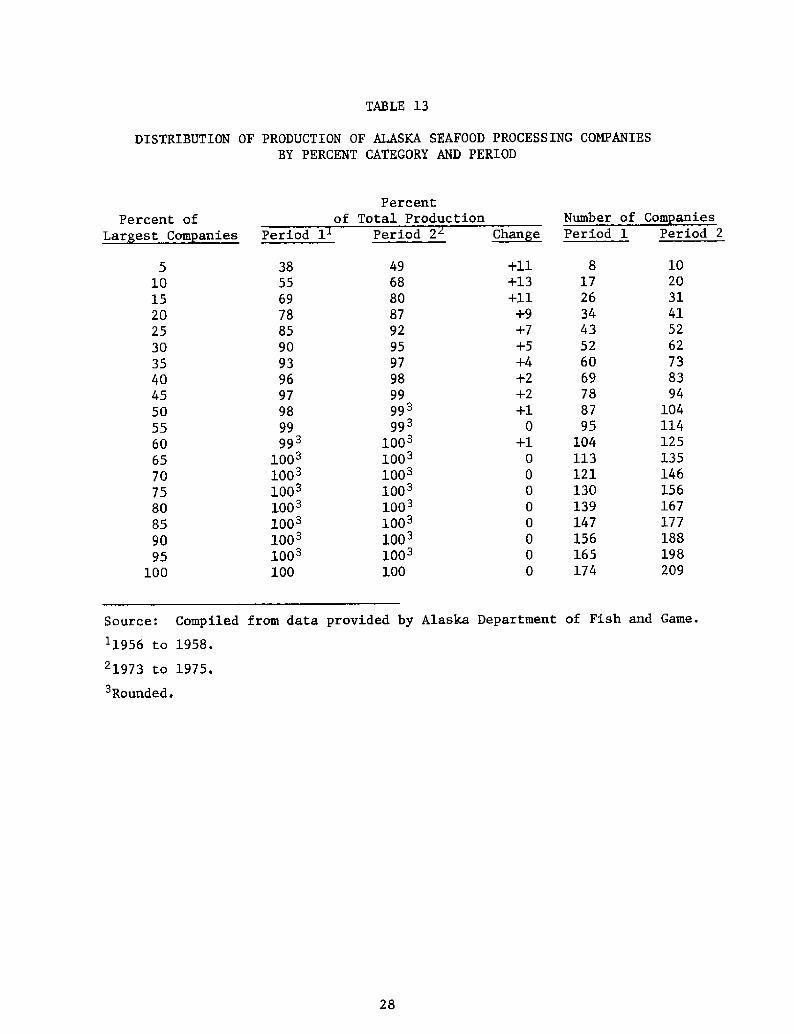
TABLE 13
DISTRIBUTION OF PRODUCTION OF ALASKA SEAFOOD PROCESSING COMPANIESBY PERCENT CATEGORY AND PERIOD
Percent
of Total Production Number of Com aniesPercent of
Lar est Com anies ~Chan a Period 1 Period 2Period 2Period 1
Source: Compiled from data provided by Alaska Department of Fish and Game.
i1956 to 1958.
1973 to 1975,
3Rounded.
28
10
15
20
25
30
35
40
45
50
55
60
65
70
75
80
85
90
95
100
38
55
69
78
85
90
93
96
97
98
9999~
100~100~100~100310031003100~100
49
68
80
87
92
95
97
98
9999399~
1003100310031003100310031003100~100
+11
+13
+11
+9
+7
+5
+4
+2
+2
+1
0
+1
0 0 0 0 0 0 0 0
8
17
26
34
43
52
60
69
78
87
95
104
113
121
130
139
147
156
165
174
10
20
31
41
52
62
73
83
94
104
114
125
135
146
156
167
177
188
198
209

.90
.80
.IO
~ 30
~ 20
.10 ~ 10 .20 .30 .40 .50 .60 .70 .80 .80 1.00PERt;EMTAGE OF TOTAL PROOUCTION
FIGURE 4. LORENZ CURVES FOR ALASKA SEAFOOD PROCESSING PLANTS
*Cumulative from the largest plants
29
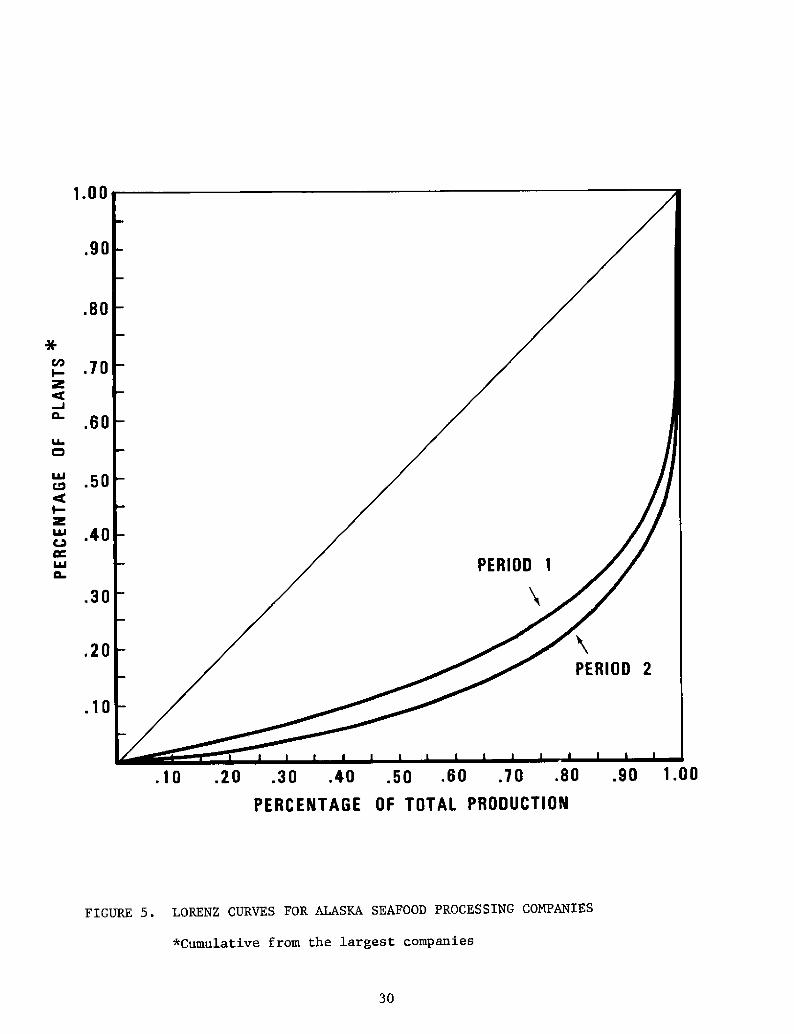
.90
~ 80
co y0
CC
~ 60
U C3
.50cC
m ~ 40
.30
.20
~ 10 .10 .20 .30 .40 .50 .60 .70 .80 .90 1 00PERCENTAGE OF TOTAl PROOUCTION
FIGURE 5. LORENE CURVES FOR ALASKA SEAFOOD PROCESSING COMPANIES
*Cumulative from the largest companies
30

is even higher due to the significance of multiplant companies. There were29 such companies in Period 1 and 30 in Period 2. The top half of companies 87 out of 174! had 98 percent of total seafood production in Period 1 and99 percent �04 out of 209! in Period 2. The largest ten percent �7 and 20companies, respectively! in Period 1 had 55 percent of total product and68 percent in Period 2. The top 25 companies controlled two-thirds andthree-fourths of total production in Period 1 and Period 2 respectively Table 14!. Thus, not only is overall concentration in the Alaska seafoodprocessing sector high, it has increased significantly since statehood.
Diversification
Another structural characteristic of an industry is the degree to whichthe plants and companies are diversified. Diversification refers to theproduction of products by a plant or firm which are sold in more than oneindustry. In principle, being diversified can be thought of as the state ofhaving multiple product lines. In practice, the distinction among productlines their d.ifferences and similarities! is often difficult to determineobjectively. This is partially due to the fact that the degree of differenceis often dependent upon the intended application of a product to a particularend use.~ These complications require decision rules when attempts are madeto specify quantify! the degree of diversification of plants and companies.
For seafood processing plants and companies, the obvious methods formeasuring the degree of diversification are to count the number of speciesprocessed, the number of processing methods canning, curing, freezing, fresh!,or the number of product forms whole, fillets and steaks, sections, claws,etc.!. None of these, of course, are faultless methods. The most appealingcriterion from a technological standpoint is the number of processing methods.However, its use would result in understatement of diversification in that aparticular method for example, freezing! can apply to many species forexample, salmon, crab, shrimp! and product forms for example, whole, fillets,sections! that are not close substitutes.
Tables 15 through 17 show diversification of Alaska seafood processingplants and companies by each of the three measures employed. They areconsistent in showing that diversification of both plants and companies hasincreased since statehood and that, in general, plants are nearly as diversi-fied as companies. This suggests that, in general, company diversification isachieved via plant diversity rather than the acquisition by multiplant com-panies of specialized plants producing in different specialized markets. Inaddition, since among the more diversified plants the number of plants isgreater than the number of diversified companies, one can infer that the morediversified plants are owned by multiplant companies. For the single species or process or product! category, the number of plants also exceeds thenumber of companies. The inference here is that not only do many single-plantcompanies specialize, but a number of multiplant companies hold specializedplants as well, and that their plant holdings overall are targeted towardspecific species.
For example, consumers might view canned crab meat from dungeness,tanner, and king crab species as close substitutes for crab salads but theymight have a distinct species preference for crab cocktail.
31
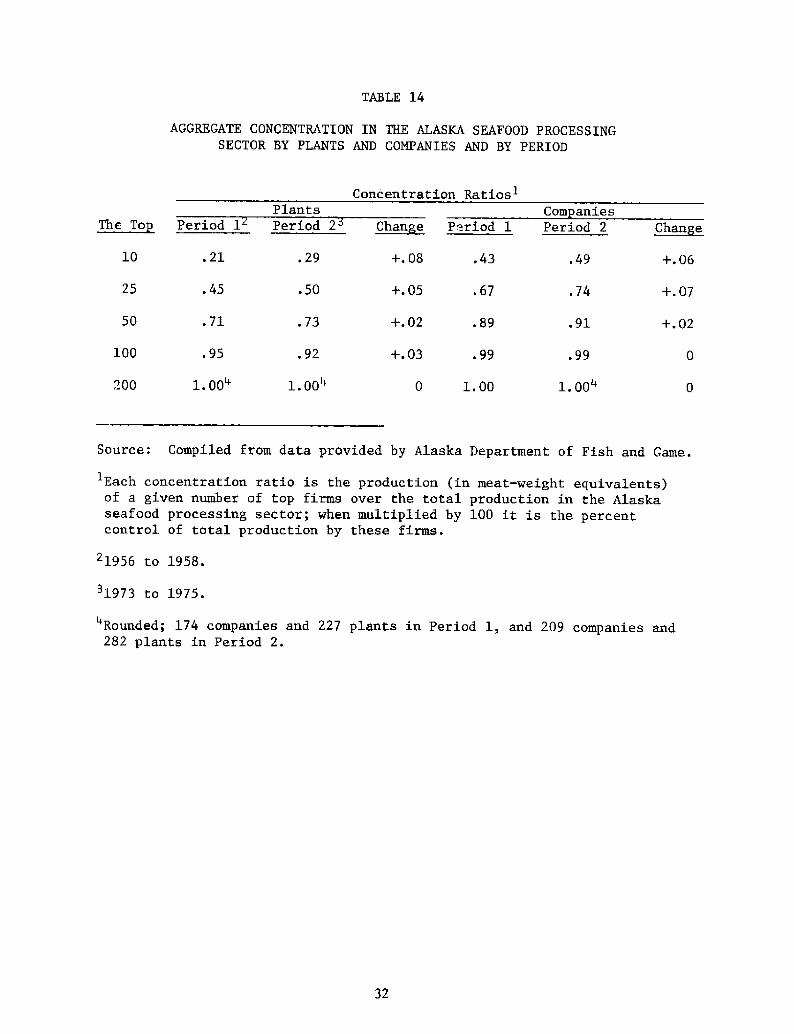
TABLE 14
AGGREGATE CONCENTRATION IN THE ALASKA SEAFOOD PROCESSINGSECTOR BY PLANTS AND COMPANIES AND BY PERIOD
Concentration Ratios
Plants Com aniesPeriod 1 Period 2 ~Chan e P. ried 1 Period 2~The To ~Chan e
+. 08 .43.2110 .29 ~ 49 +.06
.45 .67 .74.50 +. 05 +. 07
.71 +.02 .8950 .73 .91 +.02
100 ~ 95 .92 +.03 .99 .99
1.004 1. 0041.004 1 ~ 00?00
Each concentration ratio is the production in meat-weight equivalents!of a given number of top firms over the total production in the Alaskaseafood processing sector; when multiplied by 100 it is the percentcontrol of total production by these firms.
21956 to 1958.
~1973 to 1975.
Rounded; 174 companies and 227 plants in Period 1, and 209 companies and282 plants in Period 2.
32
Source: Compiled from data provided by Alaska Department of Fish and Game.
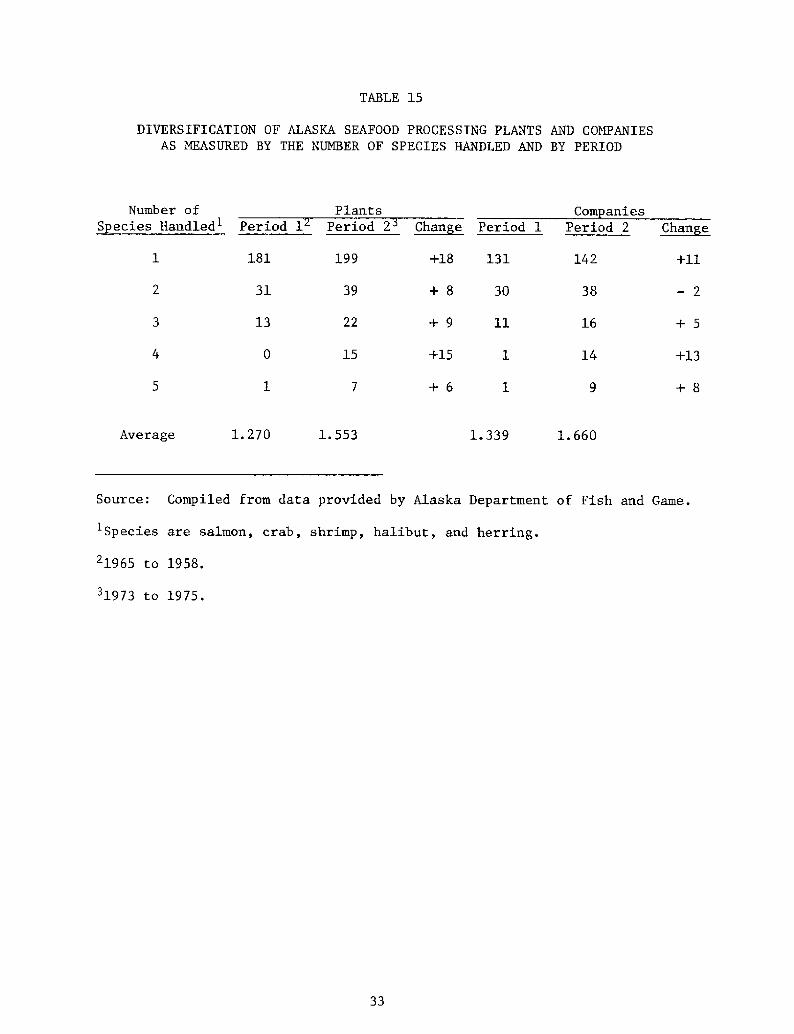
TABLE 15
DIVERSIFICATION OF ALASKA SEAFOOD PROCESSING PLANTS AND COMPANIES
AS MEASURED BY THE NUMBER OF SPECIES HANDLED AND BY PERIOD
Plants Com aniesNumber of
Species Handled Period 1 Period 2 ~Chan e Period 1 Period 2
1 181 199 +18 131 142 +ll
+8 30
+9 11
+15 1
31 39 38
2213 16
14 +13
1. 270 1. 660l. 553 l. 339Average
33
Source: Compiled from data provided by Alaska Department of Fish and Game.
Species are salmon, crab, shrimp, halibut, and herring.
~1965 to 1958.
31973 to 1975.
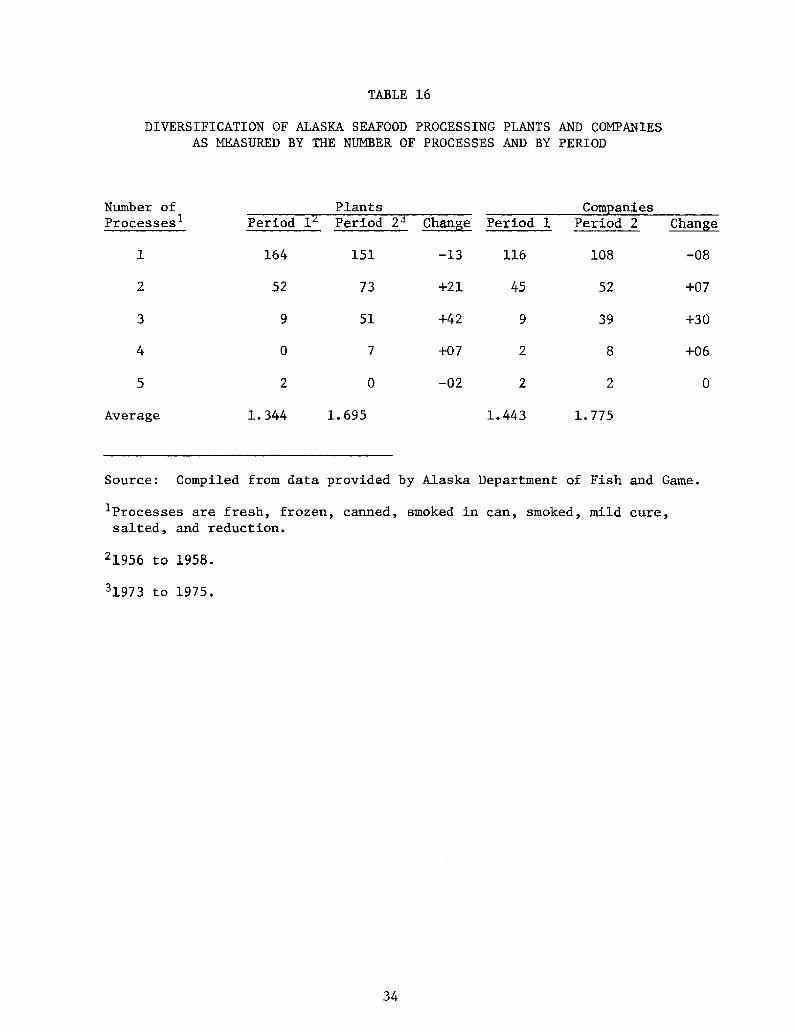
TABLE 16
DIVERSIFICATION OF ALASKA SEAFOOD PROCESSING PLANTS AND COMPANIES
AS MEASURED BY THE NUMBER OF PROCESSES AND BY PERIOD
Number of
Processes
164 -13 116 -08151 108
52 +21 45 52 +07
+4251 +3039
+06
� 02
1.344 1.695 1.443Average l. 775
Source: Compiled from data provided by Alaska Department of Fish and Game.
Processes are fresh, frozen, canned, smoked in can, smoked, mild cure,salted, and reduction.
34
21956 to 1958.
~1973 to 1975.
Plants Com anies
Period i Period 2 ~Chan e Period d, Period 2 ~Chan e
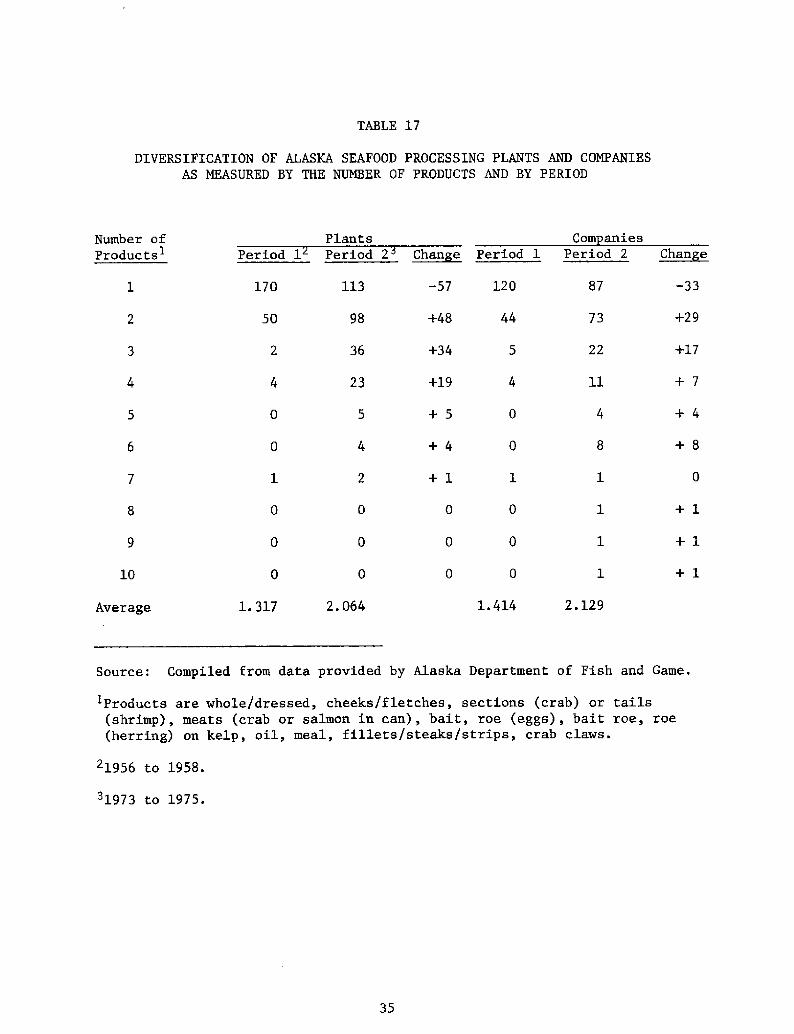
TABlE 17
DIVERSIFICATION OF ALASKA SEAFOOD PROCESSING PLANTS AND COMPANIES
AS MEASURED BY THE NUMBER OF PRODUCTS AND BY PERIOD
Number of
Products
Com aniesPlants
120170 113 -57 87 -33
44 +2998 +48 7350
36 +34 +1722
+1923
+ 8+ 4
+ 1
+ 110
1.4142.064 2. 129l. 317Average
Source: Compiled from data provided by Alaska Department of Pish and Game.
Products are whole/dressed, cheeks/fletches, sections crab! or tails shrimp!, meats crab or salmon in can!, bait, roe eggs!, bait roe, roe herring! on kelp, oil, meal, fillets/steaks/strips, crab claws.
21956 to 1958
31973 to 1975.
Period 1 Period 2 ~chan e Period 1 Period 2 ~Chan e

The apparent trend toward increasing diversity since statehood can probablybe explained by four factors. First, there would appear to be a natural desireby plant owners to increase plant utilization through expansion into areas thatare counter-seasonal to their primary product or species or process!. Second,as traditionally-utilized, high-value resources are depleted, there is economicpressure to expand sales by entering other production activities. Third,technological change and changing marketing conditions have encouraged companiesto expand into new areas. Fourth, foreign investment has stimulated diversityby providing capital for expansion and assured markets.
Turnover
One way to judge the long-run implications of economic concentration in asector of the economy or more narrowly defined individual industry! is toattempt to identify the degree to which companies are entrenched in dominantpositions through time. A high degree of turnover of companies within a sectoror industry suggests that entrenchment is not an important structural char-acteristic.
Turnover is defined as the disappearance from a sector or industryaltogether or from the top echelon of firms in the sector or industry. Con-ducting a test for the presence or absence of turnover is a method ofassessing whether the competitive environment is dynamic or whether it hassettled into a static condition characterized by entrenched positions for thedominant firms.
For this study, company turnover was evaluated both in terms of survivor-ability and change in market share.~ The screening of the data for identifyingcompany turnover is complicated by the inability to follow identity in thosecases where a company has changed its name between Period 1 and Period 2. Tothe extent that this has occurred, the turnover measures will overstateactual turnover to an undetermined degree. In those cases where a firm isdissolved or acquired by another company, it disappears as an ownership entityand is properly treated in the turnover analysis.
Of the 152 companies for which production in Period 1 was greater thanproduction in Period 2, 139 had no production in Period 2. Similarly, of the196 companies having greater production in Period 2 than Period 1, 174 had noproduction in Period 1. There remain, therefore, 35 companies which producedin both periods. Table 18 shows the change in production from Period 1 toPeriod 2 for these 35 companies. The majority of companies producing in bothperiods grew in absolute size, but 13 declined. The size distribution ofthese 35 companies in both periods is shown in Table 19.
Table 20 shows by rank category the number of companies with zero pro-duction in the opposite period. Of the top five companies in Period 1, threewere not in existence in Period 2; of those ranked 6 to 15, seven did not
Market share is defined here as the share of total production of theentire Alaska seafood processing sector.
36
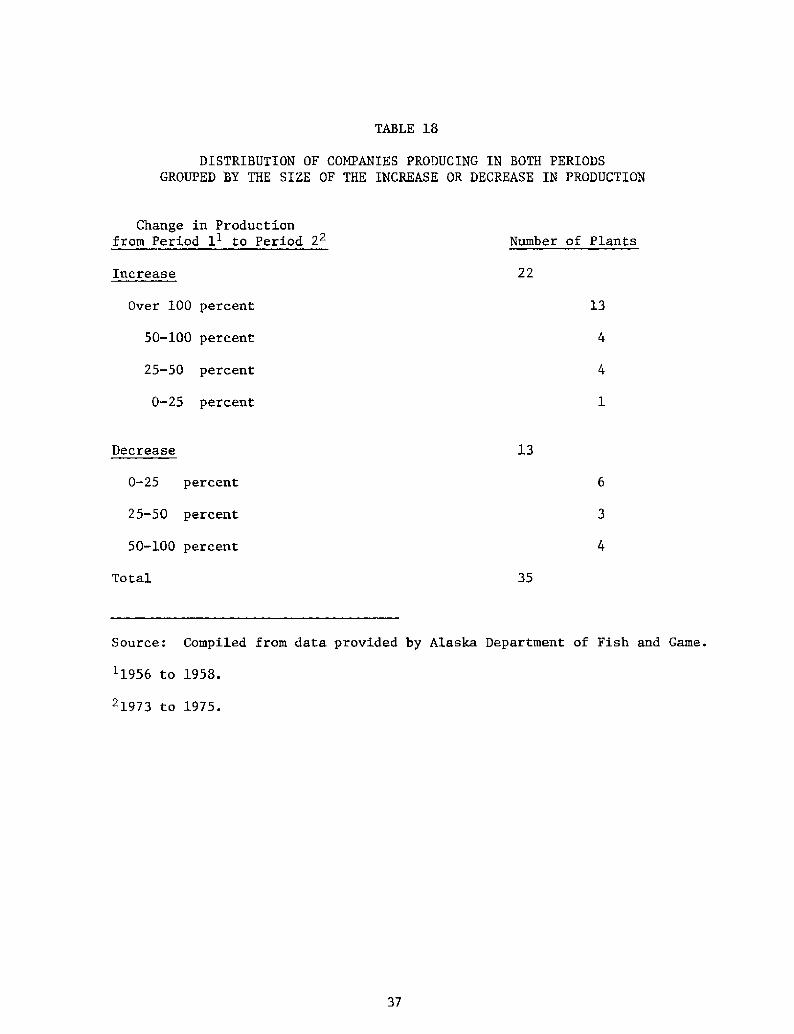
TABLE 18
DISTRIBUTION OF CONPANIES PRODUCING IN BOTH PERIODS
GROUPED BY THE SIZE OF THE INCREASE OR DECREASE IN PRODUCTION
Change in Productionfrom Period 1I to Period 2~ Number of Plants
22Increase
Over 100 percent
50-100 percent
25-50 percent
0-25 percent
Decrease
0-25 percent
25-50 percent
50-100 percent
Total 35
37
Source: Compiled from data provided by Alaska Department of Fish and Game.
i1956 to 1958.
21973 to 1975
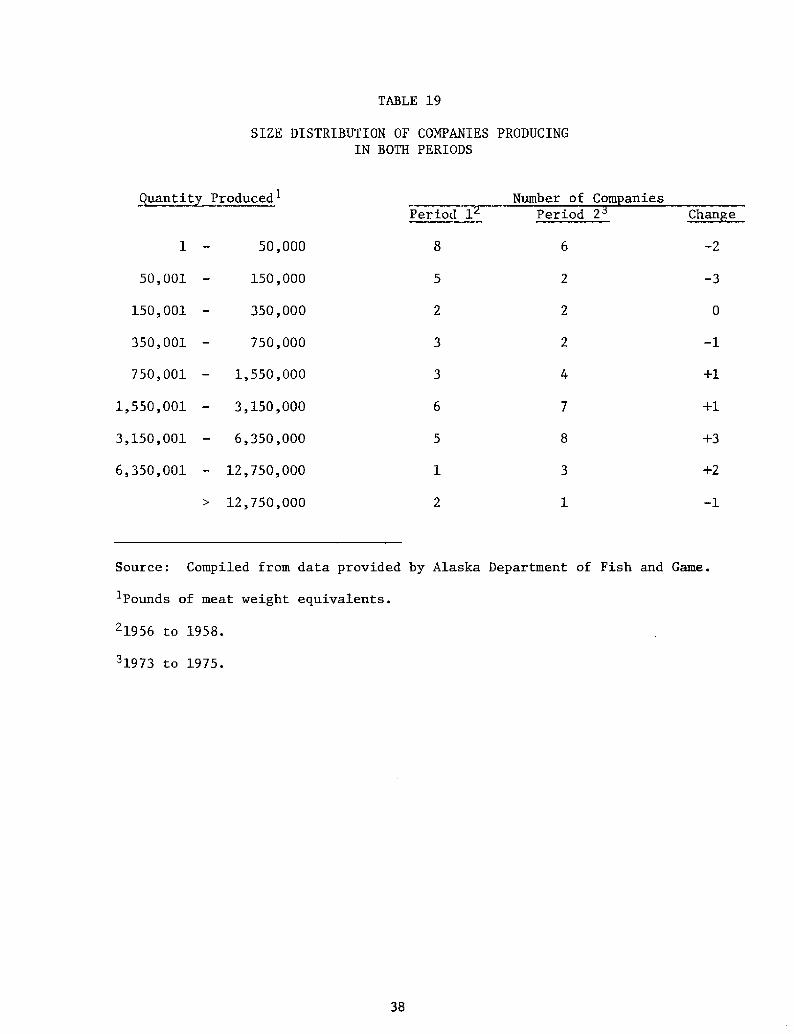
Number of Com anies
Period 2Period 1 ~Chan e
+3
12,750,000
Source: Compiled from data provided by Alaska Department of Fish and Game.
Pounds of meat weight equivalents.
21956 to 1958.
31973 to 1975.
38
50,001
150,001
350,001
750,001
1,550,001
3,150,001
6,350,001
TABLE 19
SIZE DISTRIBUTION OF COMPANIES PRODUCING
IN BOTH PERIODS
50,000
150%000
350,000
750,000
1,550,000
3,150,000
6,350,000
12,750,000
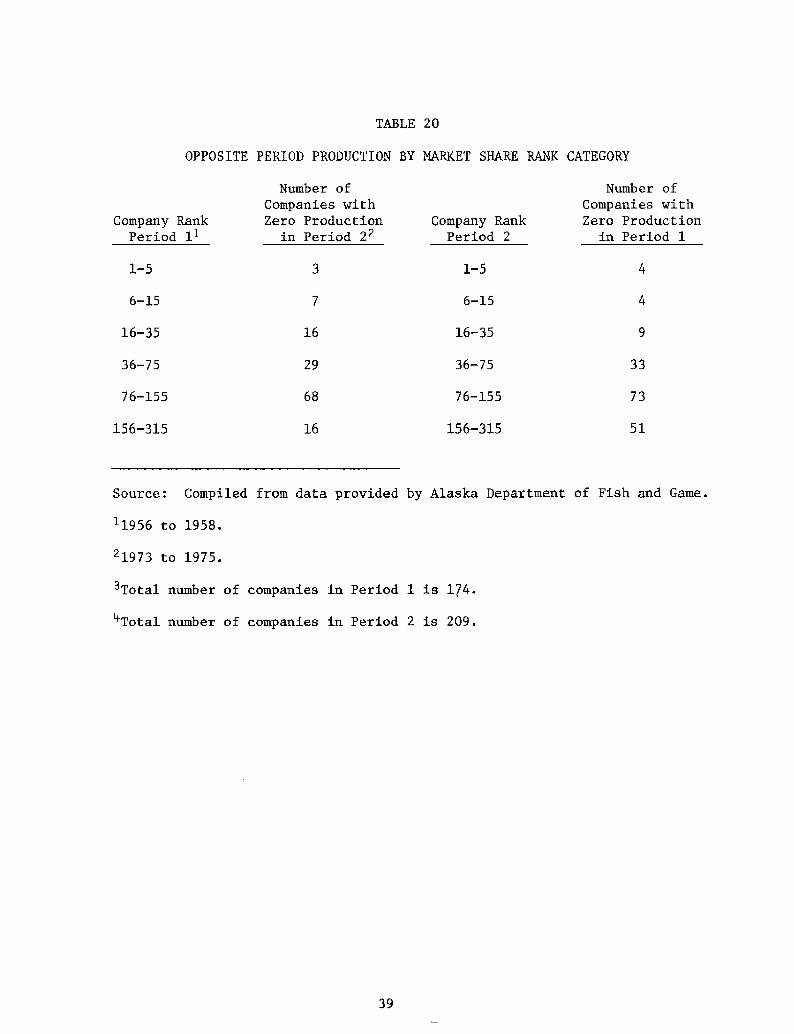
Number of
Companies withZero Production
in Period 2
Number of
Companies withZero Production
in Period 1
Company RankPeriod 1~
Company RankPeriod 2
1-5 1-5
6 � 15 6 � 15
16
3329
68 73
5116
Source: Compiled from data provided by Alaska Department of Fish and Game.
i1956 to 1958.
~1973 to 1975.
~Total number of companies in Period 1 is 174.
~Total number of companies in Period 2 is 209.
39
16-35
36-75
76-155
156-315
TABLE 20
OPPOSITE PERIOD PRODUCTION BY NARKET SHARE RANK CATEGORY
16-35
36-75
76-155
156-315
produce in Period 2. Four of the top five companies in Period 2 did notexist in Period 1; those ranked 6 to 15 in Period 2 contained four whichdid not produce in Period 1. Cumulatively, the very largest firms inPeriod 1 ten of the top 15! did not survive to Period 2 and eight of thetop 15 in Period 2 did not exist in Period l.
To summarize, turnover among Alaska seafood processing firms has beenquite high since statehood. Of the 174 companies operating in Period 1 and209 in Period 2, only 35 operated in both periods under the same companyidentity. Of the industry leaders in Period 1, a significant number did notoperate in Period 2 three of top five and ten of top 15!. Similarly, ofthose holding dominant positions in Period 2, a majority four out of fiveand eight of top 15! did not produce in Period 1.
Due to the inability to consistently trace individual company identitiesover the 20 years covered by this analysis, the data base was taken at facevalue with respect to the identity of reporting plants and companies. Thisloss of detail means that the measures of turnover employed are undoubtedlybiased upward. The overall impression of high turnover is probably soundnonetheless, with the exception of a very few firms that have been able tomaintain high-ranking positions in both periods. Only three companies wereranked among the top 15 companies in both periods. The next largest tencompanies were represented on the list of the top 20 firms in both periodsand each of these was within the largest ten in both periods.
Vertical Inte ration
No direct inferences concerning the extent of vertical integration werepossible from the secondary data resources available to this study. Questionsconcerning vertical integration were included in an industry survey sent toroughly the largest 50 firms in 1976. Of these firms, 19 completed orpartially completed the survey form. An additional ll said they desired torespond but had not done so by August 1, 1978, at which time the survey hadto be closed." Survey results, compiled to avoid disclosure of individual-firm information, are presented in Appendix III.
Two characteristics of the respondents can be mentioned. First, severalof the largest. firms cooperated with the survey including the largest firm!.Second, the firms with the most extensive apparent ownership interties withother seafood processors refused to cooperate with the survey.
41t was unfortunate that the survey was mailed to processors at the be-ginning of their busy season, but this was unavoidable since the researchersexperienced extensive delays in efforts to work with industry executives to-ward a meaningful and mutually acceptable survey format. In addition, a con-siderable amount of confusion was created when the same research team set outto collect processing capacity and marketing data for use by the NorthPacific Fishery Management Council! coincident with initial negotiationsover the survey effort for this study.
40
Backward Vertical Inte ration. Backward integration by a companyrefers to the development of a capability to provide its own sources ofsupply, either through acquisition or construction. In the seafood pro-cessing industry, we are interested in the ownership by processing firmsof vessels or the use of other techniques for example, providing suppliesor credit! to assure supplies of raw fish. Of the 19 survey respondents, nineindicated that they did own vessels; Table 21 shows the number of vesselsowned by each of these respondents and the species fished by these vessels.
Thirteen respondents felt that, in general, the practice of vesselownership had increased over the last ten years; only one believed that thispractice had decreased. Four respondents felt that decreases had occurredin the salmon fisheries; two felt that it had increased in crab.
The practice of advancing money, gear, or supplies is common and may bea tacit form of backward integration. Sixteen respondents indicated thatthey did make advances and nine indicated an interest charge. Mostrespondents believed this practice has not changed over the past decade, whilefive believed it had decreased; only three felt that it had increased.
For those companies who responded to this survey, vertical integrationis an important, but not universal, form of organizational practice. Thispractice appears to be declining in importance, particularly in the salmonfishery where the imposition of limited entry has created greater economicindependence among fishermen. It is uncertain how representative these surveyresults are of the vertical integration practices of the industry as a whole.
Forward Vertical Inte ration. This form of integration exists whencompanies acquire capability in the distribution chain of the goods they pro-duce. Four of the 19 respondents did own an interest in brokerage, whole-sale or retail seafood businesses. Only one respondent believed this practiceof ownership of distributors has decreased, four that it has increased, fivethat it had not changed, and six did not respond. The three remaining re-sponses consisted of narrative to the effect that nearly all large processorshave in-house brokerage or sales departments apparently as opposed toholding an interest in a separate company! and that this structural featureis increasingly evident.
Other Com an -S ecific Information
This section will briefly cover topics which are presented in detail inAppendix III: Industry Survey Form and Responses. These topics are: companyfinancial characteristics, transportation of raw and processed products,domestic sales practices and trends, international business arrangements, andentry and exit decisions of companies.
Com an Financial Characteristics Re: A endix III; I, 1-5 and II!. Allrespondents indicated a high degree of specialization in the seafood business.Fourteen of the 18 companies who responded to this question had 100 percentof their sales in fish products, three others had between 75 and 100 percent,and one between 50 and 75 percent. This specialization in seafood contrastswith the high level and increasing extent of diversification within the sea-food business as shown in an earlier section of this chapter. Five of the
41
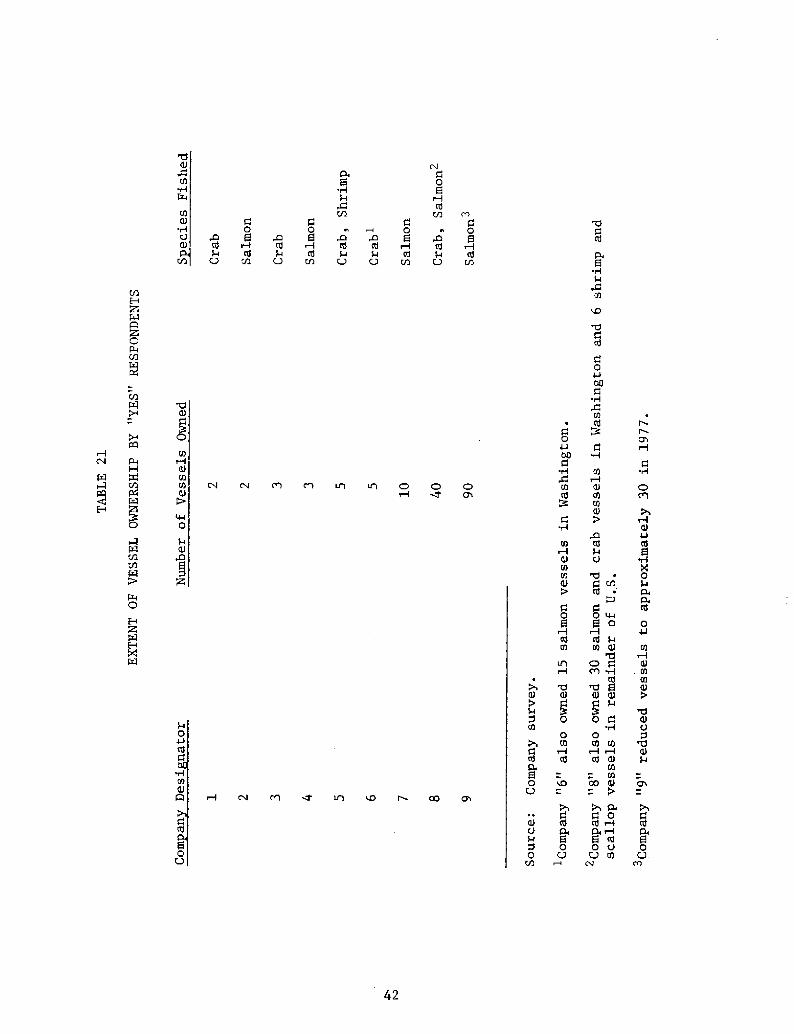
08
a 08
cdcd
0 06 w I
cd W cdcd 4 cd
O etc o O O
A R O C4
CV C4M 8
Mcfc M N A A ch 0 0 0
0cd
N C4g 0
g qj0 V
M1C4
0O
m
'I 0di cdV
00 O
CV & W Ill 4! W QO Ch
0 ddC
cd
Q
di
0 cd
'cddi Ql
M0 M
g cd0 FI0
0
dd
Qi
5
V
g M
C0 W
0
cdM di
O
5 di
0
0
di
MCO 5
co
di
cd8
0 0 0 diQ 08 V'0di
respondent companies indicated that they owned plants in other states, butAlaska is the primary production area for 17 of those responding. Of the17 firms indicating their asset and sales size range, 12 had assets lessmerchandise inventory! of greater than $1 million, eight greater than $5million, and five greater than $10 million; and 16 indicated sales in excessof $1 million, eight had sales in excess of $5 million, and seven had salesof more than $10 million. From this information, it would appear that sea-food processors generally have sales-to-asset ratios greater than one. Eightof the 14 companies providing information on their debt-equity structureshowed equity-to-assets in excess of 50 percent, and seven of these in excessof 75 percent. Four were highly leveraged at ratios of less than 25 percent,two had ratios between 25 and 80 percent. It is uncertain whether the fivenonrespondents were also highly leveraged, as might be assumed. Thirteen ofthe respondents are private, closely-held corporations, only one is publiclytraded, one is a partnership and four are wholly owned subsidiaries of othercompanies. Five of 19 companies indicated some ownership by other seafoodprocessing companies, and five companies indicated that they owned from 50to 100 percent in another seafood processor.
Trans ortation Re: A pendix III; IV, la � lc!. The most common methodfor transporting raw fish to processors is direct delivery by fishing vessels.This is true for all species except salmon when company-owned or charteredtenders are the most frequently reported method. Tendering is also a closesecond in herring and is used occasionally for halibut. There was no reporteduse of tendering in the shellfish fisheries. It is tempting to conclude thataside from depressed stock conditions and the accompanying regulatory con-straints for example, time and area closures! direct delivery is the moreefficient method of transporting raw fish. Such judgments cannot be made, ofcourse, independent of technology and product forms desired by the market for example, frozen versus canned salmon!.
For shipment of processed fishery products, the most popular methods varyby process form as would be expected. The shipment of fresh products isaccomplished by air freight, although some moves south on private or com-mercial vessels. Air freight is also used to a minor extent for the transportof frozen products. The most popular method for frozen products is bycommercial vessels, although buyer-owned or processor-owned vessels are usedto some extent. Canned products are universally shipped by respondents bysurface carriers, and all reported the use of commercial carriers rather thanprivate buyer or processor! vessels. No differences exist, at least amongsample respondents, in the transportation of finfish and shellfish products.Given the past and present structure of transportation rates, process formappears to be the sole determinant of transport. method. Several respondentsreported an increasing shortage of commercial surface capacity in face of ex-panding needs. Processors also appear to be encountering difficulty in theirattempts to charter, lease, or purchase freighting capacity.
Domestic Sales Practices and Trends Re: A endix III; V, 1 � 5; VIIIla � lc!. Processors, as judged by survey responses, sell most of their pro-ducts through brokers, some through wholesalers, and very little throughretailers. The payment terms used most commonly for canned. and fresh/frozen
43
product are normal terms two percent per ten days, net per 30 days!.~ Con-signment is used somewhat more in fresh/frozen than canned! to a muchlesser extent, as is delayed billing. Prepayment appears to be used occasion-ally, although this was only reported by one respondent for the fresh orfrozen process form.
Six of the 19 respondents reported the practice of custom processing forother firms; production advances were reported to not be a part of thesetransactions. Canned salmon, and to a lesser extent frozen salmon, are thetarget product and species for this production arrangement.
It appears that the receipt of sales advances by processors from dis-tribution firms is uncommon, but that when it does occur, interest charges arethe exception. Sales advances or other incentives are most common withcanned salmon, groundfish fillets, and shrimp. This fact supports the pre-sumption that the existence of such incentives would be indicative of a seller' smarket. Eight of 19 respondents indicated that they used incentive to attractbuyers. These include, in descending order of importance, discounts from listprice, advertising assistance, and coupons. Thirteen of 19 companies supportcooperative product promotion through industry associations. Some companiesbelong to as many as five associations, although one or two association member-ships are more common. For the 15 companies engaging in product promotion, theadvertising-to-sales ratio ranged from less than 0.1 percent three companies!to 2.4 percent one company!. Seven of the 15 indicated less than one percent,two companies reported two percent, while three did not respond.
International Business Arran ements Re: A endix III' VI 1 � 5!Japanese ownership in the Alaska seafood processing industry is reported inanother recent research report Gorham and Orth 1978!, and for this reason,questions concerning it were omitted from this survey. No companies reportedownership by companies from countries other than Japan, but one company re-ported that it had an ownership interest in seafood processing companies inCanada, West Germany, and Japan. Production and sales advances from foreignbuyers were reported by five of 17 respondents and four of these indicatedthat interest is charged thereon. All respondents receiving such advancesreport that they are a small percentage of total liabilities less thanten percent!. Long-term purchasing contracts were reported by three of 18respondents. According to the survey, processors do not make advances toforeign buyers.
Entr and Exit Re: Appendix III; VII, la � lc!. Eleven of 19 re-spondents indicated that they planned to enter other fisheries, all of whichare in Alaska, except one which also has expansion plans in Washington. Thetarget species for entry are salmon, groundfish, herring, and mollusks, andthe target areas are Bering Sea and Gulf of Alaska. Recent entry has occurredmostly in crab, shrimp, and herring. Salmon, halibut, scallops, and ground-fish have had some entrants. Herring has had three companies exit; salmonand groundfish have each had one. The most common methods of entry are the
~lf the bill is paid within ten days there is a two percent discountgiven. At 30 days, the full amount is due.
44
purchase of existing plant and equipment and the addition of a new productline. The purchase of subsidiaries is another method which has been utilized,though to a lesser extent than the other methods. Exit occurs most frequentlyby the discontinuance of a product line as opposed to the sale of a sub-sidiary or plant!.
Structural Parameters of Individual Seafood Markets:
Shellfish
Two topics will be addressed in this section. First, individual marketswill be examined with respect to the number and size distribution of producers.This structural characteristic is most commonly referred to as market orindustry concentration. Second, the site distribution of plants within marketsis examined in both periods to determine whether the range of optimum scalecan be identified and whether plant-size characteristics have changed over time.
Market Concentration
This section will present summary information on the level and trend inconcentration for individual seafood markets defined by species and processform!, and detailed information for shellfish markets. The summary infor-mation will be presented first.
Market Concentration Summar . Table 22 shows summary data for all speciesincluded in this study and by process form for salmon and crab. These in-dustries, when viewed from their selling or final market side, are for themost part only moderately concentrated. Given that Alaskan producers competewith those from other states except for king crab and tanner crab, this assess-ment of concentration overstates actual concentration to some degree. WithinAlaska, statewide concentration has declined since statehood except for herringand canned salmon.
When these same industries are viewed from the buying or raw-product-acquisition side, however, market concentration ranges from moderate to veryhigh. In halibut, herring, and crab meats, buyer concentration is especiallyhigh. Geographically, buyer concentration has increased or remained unchangedin all species in Southeast Alaska. In Central Alaska, buyer concentration hasdeclined or remained unchanged in every market except canned salmon. In bothSoutheast and Central the level of concentration ranges from moderate to veryhigh. In Western Alaska, buyer concentration fell or remained the same inall markets, although it was at a high to very high level in the 1973 to 1975period. The Arctic-Yukon-Kuskokwim area, which has only a salmon industry,has experienced high but declining buyer concentration.
Overall, concentration is shown to be inversely related to the size ofthe market, which for these high-valued species is dependent upon stock status.Growth fisheries tend to have high concentration in their incipiency but thelevel tends to decline as expansion occurs. On the other hand, contractingfisheries experience increasing concentration as consolidation occurs and asplants are abandoned or shut down. From the harvester's point of view, buyerconcentration is a local, rather than regional, phenomenon and is usuallyvery high. On the selling side, concentration appears not to be a significantfactor except perhaps for canned salmo~.
45
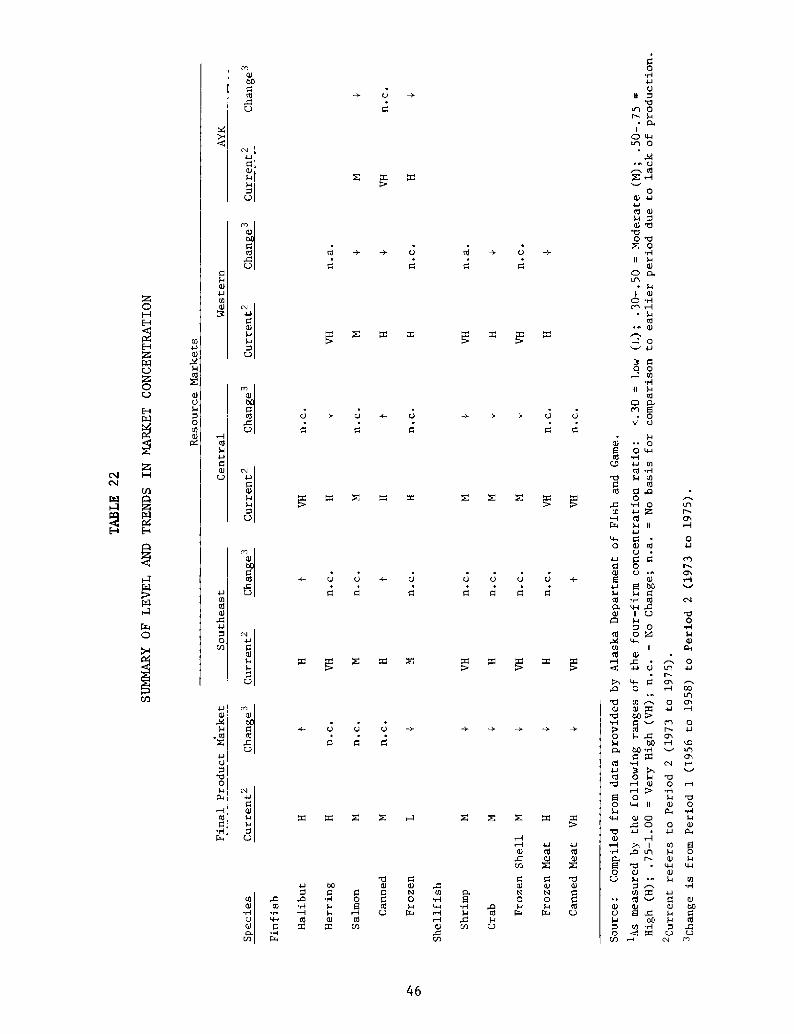
C0
«jII '0«cl 0
IO w
0LIQt
V
k cd
dj
Qtk
0 0«b
cdO 0
8~ 0V «J
«dk
C2Qj
«I «I W «I
cdQl4 JJ0
0
0 QlC QlkO
0LA 4JQc«
od0JJ
Qt
A cdX
M 0
CV r4'«j0
«jQt 0C40 Ql
4J«j'cd0
Qj'k'k
V«b'k 0Ql«HQt
K
C Qtdl bdk C
O OM
0 8cd
«cj o
OH
A'U qlQZV
0«tj
Rc4 H
O
bda ~ 0
«Q k k 8~ HQt cd
C C X «cj
Qt Qt 4N «Q
C 0cdO
Qt«cj
C C C C
Qt Qj ajQt Ql
X
Qj Qj QjN N C0 0 C
cdU
Qj
8 cd
w 0 C Ql84JQjQj
a cdA
'tS
0 C4cdQj
8 0
Qt
8 C 0 Qt0
A~" «j~ Ql
0Qjcd «UkQj '50 «j
0II 'k
QjO p.
kI QlO -r-I
cdQl0
00 w
cdk «Q
qlCa0
0Qj
It
Qj cdC0«I8 bb-k cdw 4I V
00
IQt4J «Iw C0
cdbb
bjtC
0Qt
0wQt O
O
4'0Ql
«tjQjQt8 4
bjt«b
46
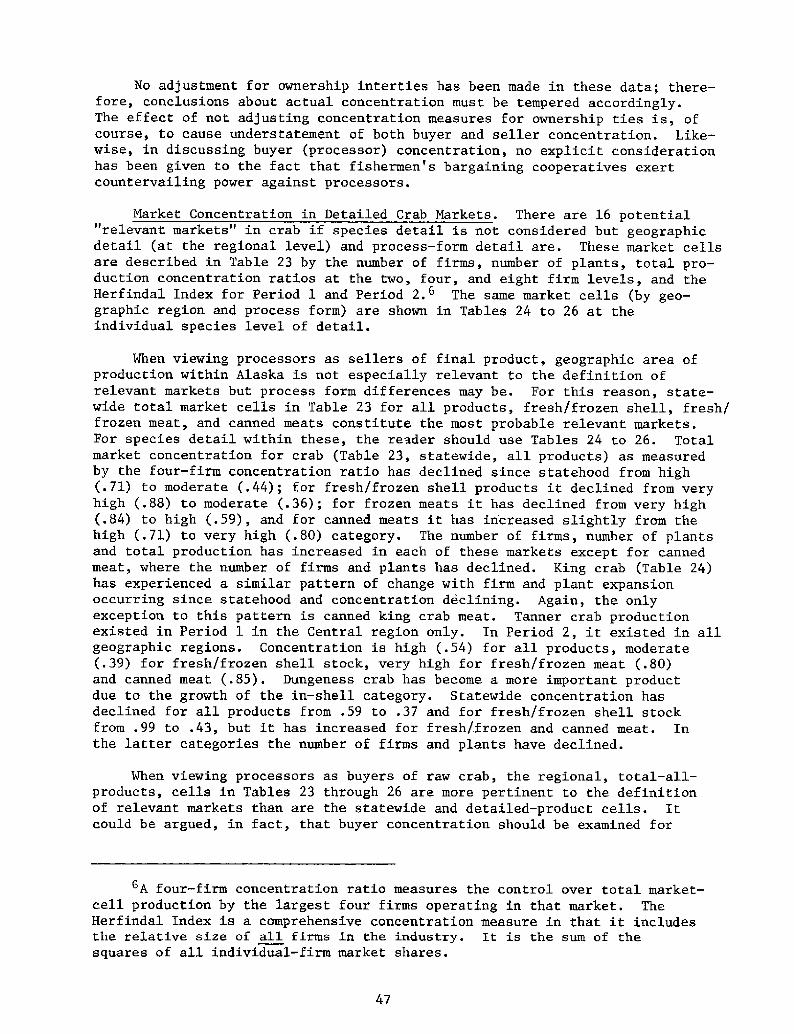
No adjustment for ownership interties has been made in these data; there-fore, conclusions about actual concentration must be tempered accordingly.The effect of not adjusting concentration measures for ownership ties is, ofcourse, to cause understatement of both buyer and seller concentration. Like-wise, in discussing buyer processor! concentration, no explicit considerationhas been given to the fact that fishermen's bargaining cooperatives exertcountervailing power against processors.
Market Concentration in Detailed Crab Narkets. There are 16 potential"relevant markets" in crab if species detail is not considered but geographicdetail at the regional level! and process-form detail are. These market cellsare described in Table 23 by the number of firms, number of plants, total pro-duction concentration ratios at the two, four, and eight firm levels, and theHerfindal Index for Period 1 and Period 2.~ The same market cells by geo-graphic region and process form! are shown in Tables 24 to 26 at theindividual species level of' detail.
When viewing processors as sellers of final product, geographic area ofproduction within Alaska is not especially relevant to the definition ofrelevant markets but process form differences may be. For this reason, state-wide total market cells in Table 23 for all products, fresh/frozen shell, fresh/frozen meat, and canned meats constitute the most probable relevant markets.For species detail within these, the reader should use Tables 24 to 26. Totalmarket concentration for crab Table 23, statewide, all products! as measuredby the four-firm concentration ratio has declined since statehood from high .71! to moderate .44!; for fresh/frozen shell products it declined from veryhigh .88! to moderate .36!; for frozen meats it has declined from very high .84! to high .59!, and for canned meats it has increased slightly from thehigh .71! to very high .80! category. The number of firms, number of plantsand total production has increased in each of these markets except for cannedmeat, where the number of firms and plants has declined. King crab Table 24!has experienced a similar pattern of change with firm and plant expansionoccurring since statehood and concentration declining. Again, the onlyexception to this pattern is canned king crab meat. Tanner crab productionexisted in Period 1 in the Central region only. In Period 2, it existed in allgeographic regions. Concentration is high .54! for all products, moderate .39! for fresh/frozen shell stock, very high for fresh/frozen meat .80!and canned meat .85!. Dungeness crab has become a more important productdue to the growth of the in-shell category. Statewide concentration hasdeclined for all products from .59 to ~ 37 and for fresh/frozen shell stockfrom .99 to .43, but it has increased for fresh/frozen and canned meat. Inthe latter categories the number of firms and plants have declined.
When viewing processors as buyers of raw crab, the regional, total-all-products, cells in Tables 23 through 26 are more pertinent to the definitionof relevant markets than are the statewide and detailed-product cells. Itcould be argued, in fact, that buyer concentration should be examined for
~A four-firm concentration ratio measures the control over total market-cell production by the largest four firms operating in that markets TheHerfindal Index is a comprehensive concentration measure in that it includesthe relative size of all firms in the industry. It is the sum of thesquares of all individual-firm market shares.
47
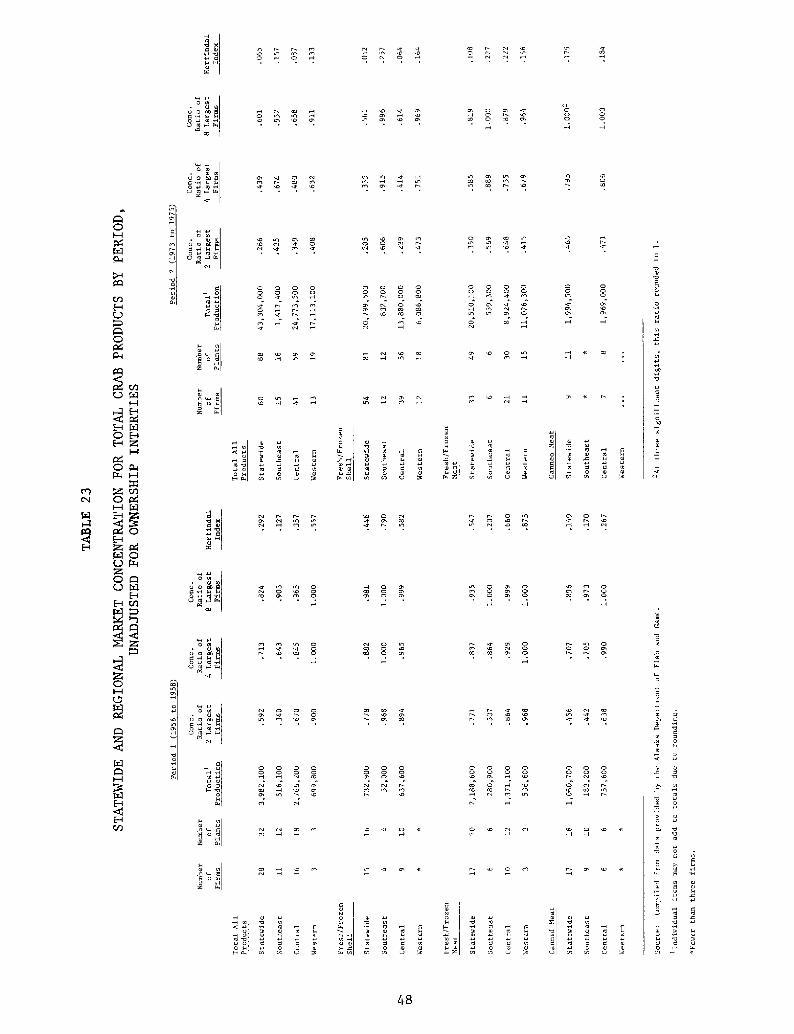
I40 0W 0W
VtO N OrD Vt COO W O
V U0 00 ItlU 0 Cap0
CQ
N COO VC Vlcr ta 0
0 nt
0 IJ QIoVn 'rl Vln a 0 r
0 U CI Nal
W IJ0 0
0 IJ Id~ ICV
o 0 aln
vl Jn oo M rN ID
O OO OOo oO O
0'tl
0 IO CtO OO OO O O Oo on'0caa O
O O O OO O O OI I O CO0Cl ItJ 00F' 0040
0 N CIcr n CD car CQ ca Oo n
O ~V V.
Mr I
rO M
0
0Sl WZ C4
N 0 taca W Vl
J0
0 nd0
Idsw eE D 4I
N 0 Nvl w n
0S IJ
IJCI QQIdtIdUnl 0Vl M
4I Inlnlaltll SU 0tJ
Q I'0 Vltdtll0 SIJ IU 0Ih CQ
0 U'O ca
al 0I/! ta
V 0Cl Ia
at 44 QlJ 4~ ICJ
0U UV~ I IllO 3
al 44 dlIJ IJC nl0 0O 3
0~ I 4I QJ 40 d'4t Ql
«I0
I ~W~ I
0 OO carr r0 CMN W Vl
W 4CDo at oCQ Ch Ol O
o 0ca CI O0 O Ol
4 IJ0 0
0 U QWCJ ld
M or Jl ro OVI O Vlal O anCQ O Ol S nl
14W 0
IQ Iaca e4 4tdD
N O0 MCI O'Cl O 0a ra
'CI
0 0
U CI00 CJldCC
O OO OIQO Oo o O O OO O CIO
O O O OO O O 0Dt OCQ CQ Vl
O O OO O ON D J 0SN NM o M rvnO w r
N
~ Ie
Ctna0
O VDN NM cn .n
E0 I
00QIrdal U 0CQ
at'-I0I
C nl
VlCt
alIJ 00 Ik
Ql VI0 ~ IQt
nlU 0cn v'
4 nlldal «IC0 4I
Qt'a Id Q nl
C0 0
C I4 40 v QlO
0V,V:4 0o
0 4IJQ
0 0I J0I 0
0
C tlt4 0
4 S Qt al4 Srrl
0 0 4 0 ~ I 0I
dl0 4
I VI CJ0 nl~ I
cn I N DO N N CQN
0 o 0 CO CD OCO CD CO 0 O o
Cl Vl Chial CO Oca r r CO
0 vn o I a CDn
~ v rI N
O Oo to r rI N O CQ VI
I O 0 O OM o a o a r o0 O 0 O ca 0 O
I U 0 I OM ca N O O O 0CQ Ca 0 O 0
CO COr o CIr vC CQ a O
IFJInlQt
nl
0'll
! 0 E 0dlCC
0 0 al0
' ~
0 0CJ'0
U 0 4 IQeCl0 0
I 0C
taQI
QI0 4 al
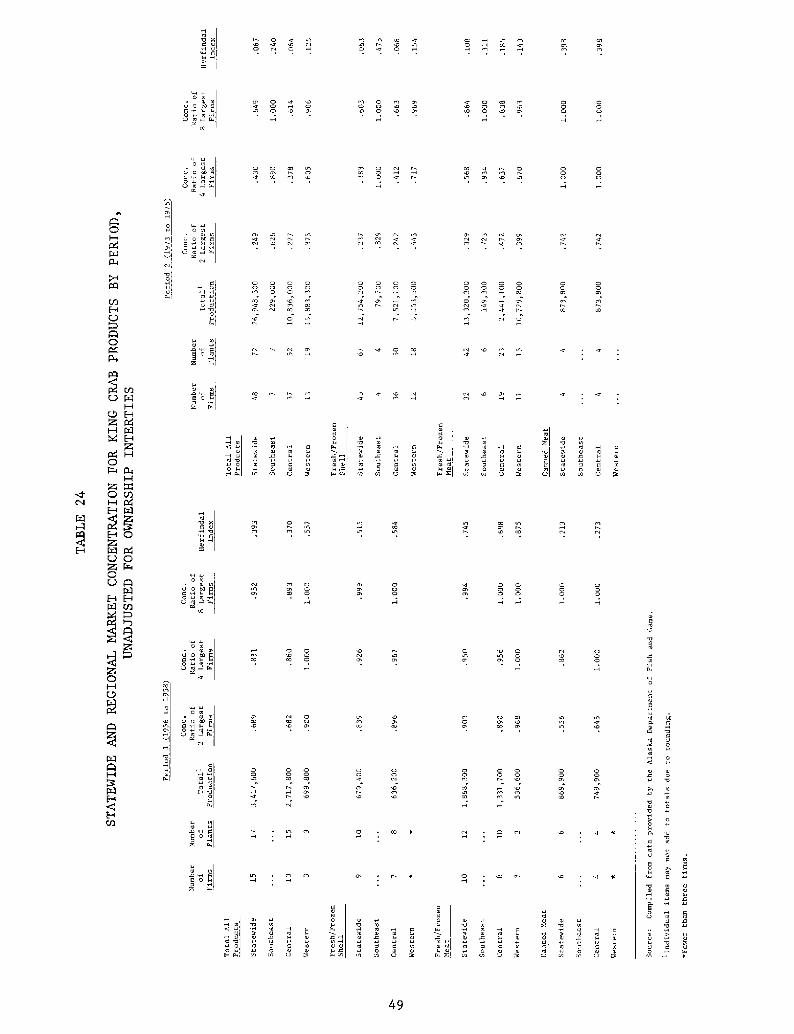
'0 XC tU VtO N O o
4 U0 a4 0 Cue0 I IdCJ CJ
ca
0 c O OO Jf AO MCf O m
U0 u.'tu 0Cl 0 ad ECQ J CJnl 'C
Oca O o m r-
O O caa r Dca
4 Ga 0ua 44
f
0ll r a N utI. I I ~ I dr ut N N I 0M tl 0r 0cu al
ClCa O DO DO MCl O O O OD D DI
O CI O OO D OM M w cao O O
~ 40 MN IQca caCl IUI
0N N 0 . I MrCaO at
IeK
a J4 0G O caN M VI
mw e0 4
0 af~ I
tdtlfXCId4 al ~ IJJ 00 m 0al al ~ Io fu c'
0U CJ
nl '000I 0
IJm IIIdlI ~IJnl
Ura0tlf I 0I U I~ I '0 0 al0 al alVl O
Ct IUIC
JJ 0v. I/I
QU mttl W 0tu nl IQ C I alIJ 0 tnJ 0 0 CII/J t/I tu
0IU 44 alU UC tlt0 tuO
Itl'0 XC 0
dt
Or- v,
W 0 a'
0 I ttlO
1 O0 Oca O O O O
4 0O Otat Oca o0
C 0 IJO ql'W 0
0N OCa D0 O 00 0C0 IJ
'0 0 I0-
C 0Id0I 0
Q
C O O ClO O ClO CQ O O M O OO CQ car a 0 MM
ICIe
IltIW00
Ct
M~ Ie0 4f
Ual tdJ-
0Ct tuO
UCat d I dl4 JC ul0 'U ~ IO
ml qaIJfu CJ40 fd0 I ~ I4 0 cq
alql~ I uJ C~ dtal O
m QC0 tltO
4 0M
C Q JUt
CU a'.a m 0 rdal
I/I
49
C 0 0 al~ I 'lt4 S
0 IU0
0 m Wdl 00
0 dl4 CI
I C u I ~40.
Ca W Vl caca CtI M
-d Ct al O OM O O~ a Ct ca 0 O
ca 0 N D CuP CU CQal ~ CQ ca
Ca Vl I0 I ca N
O OCI O O OO O O CU
0 O N DD 40 CI0 D al O
I eI 0
nl 04
tdJaIJtu 000 J
ILrdIIII 00 mE
4 ttt4 e 4m 00 E 0~ I
0 W Io m 0I'0 4 03C aJ0M W
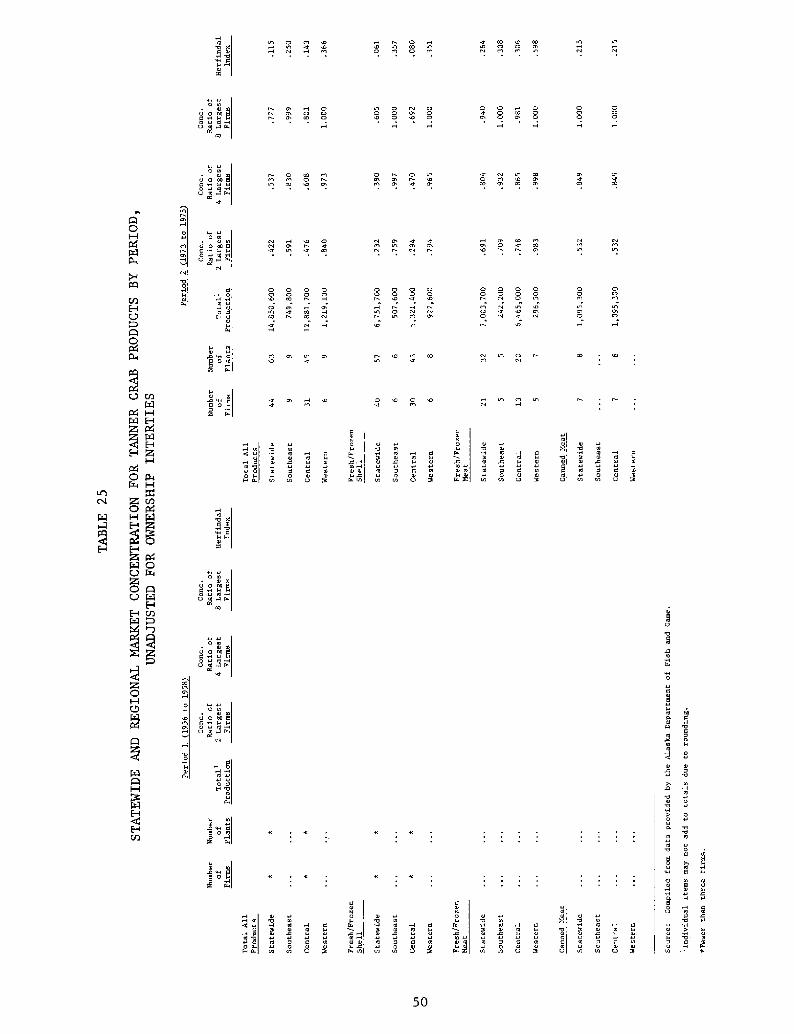
afC al'ldw 0
0CO0 M O Mvt 0 alvl a 4N M Vl
f 0 M 0N h O Dr 0 Cd O0'0oj0 IJ QWCJ�0
Vl 0 N 00 Ct 0 00 ad 0
Wt0 Itv 0 adm4 LI0 4 atwCJ
O r Oa a r ulM a w ar OPl M 0 ICQ 'JI O
AO
W IJ0 00 QcdeC0 Ct IdIJ P A W
0CVN 0 N 0 D 0r N r
'0 0 Il O Cd0 0 0 00 0 0 0I N Qt VlMcd a ar ch0
O O M0 0 0 00 0 0 0r W ra0 Vt M 0
0 00 00 cdD atca r
0 00 0rOtaCQ N
0 0rd III 0
0 40
Vt0 Cd
N
mQ Uf0w CeddZ IU
4 ~ I 0Jaw ee04 D Jf O N
atId~t0U U«IIJ 0Vl
0 I!44t4I Z0Vl Cf
al rltrd~ Idt /JJ IJIlI 0
t4U 0
Il '0It 00 ~I 0
tll IJ'd Q
Id
0~ I tllIJ tJC dlQ tllO
d0IJ0atO
«I I4 alIJC 0Q tlt
cdC QW 'ld0~ UtQ
I U0 0
0 4 td
4 IJO alV 0 IO0 IJ td
w 0
v 0 add0 w 4 I0 J alCJ J 4 IN
0U
0IJ V0I 'ldD
0
Q dtJ 0
tll IJJIW 0e 0 ldZ 4
Z
tlt
0 al ctQ I'D taaldtQIl 0Cff tf
II IJ'd IIItd~ I tdIt U 4I IJtdIJ 0 tltt/I f/I 0
altJ0al '0IJ 00 0
4t'0 0alQatIJ IJalI 0
Q taw tatll~ IU0 0I Q0 Ca
C!4IJ IJC tdtll Q
0l4 44trtC td~ I It0
0I~ Ial4I
Q C 0Cf
I QJ IJC Qal QO
50
0 0 Ia0 40 w0 A0 tdUsIQ Cf
C 0 4 0lo0 al A0 I ~ ZVl
0 al
0 Ia IJ0 IdIllv Z
Jf D o 0I ca
0 0 W 0 0 0O CO O 0 00 O a O 0 0
N Vt CO O OlCt rd 0 0CQ «I CQ O CCI
at co N0 O W rar r 0 Vl ft
Vl 0 CO df
I Vl r ~ r
IJItlalCld 'll4 'd 0U IJ 0C II 0td Id IlCJ Z CJ
I IJ0Q0 '0 C
0
afJQ al'dQ 0 J0IJ4c af'0tll al
td0 D0 at4 alw e at
at 0~ I e al4IIJ0eQ ltl td'd 4
'4I w Q'0C Q0 I-I lCO
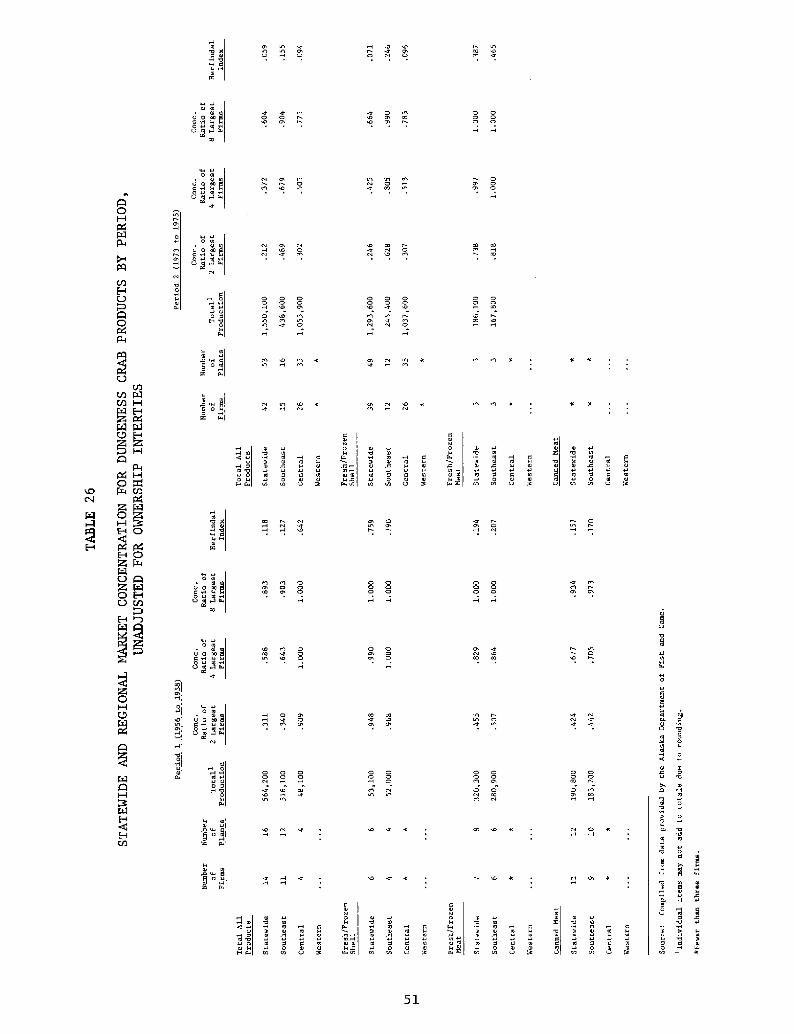
'100Ito
D DD OD O
W0 0 CQO t O01 Da O
W IJ0 ol0cd cara CO
ra
caat
co rra O
D Ct0D DD O
'0 0 tlt0
00ClIJ V0d '00
C
D DD OCOco acO QO
4 mClJC 40 ~ mZ f4
Z fvCa Ut
NI«I Ual Cl
CQ
V U'Id Ctrd0tlt CIJalii QCQ I/I
Q U'0 Illrd0at CUClU 0CQ
0ct 0Ii 00 VI
0 tJClaf~ IQIJ tJalCt 0
~ I at~ ftlt0IJalIJ 0
0al4 tUIJ Clal at
CClV 0I IJ0CI ClCJ
'tlC dt'0W4 W
Orcm D 0 DCC
0 Cl OCca rChO OO OO O
O OO DO D
I OO O01 OCn D
0IJ0 ~ IIJ~ I0D
WCC0'0 00 I
O OCQ 0
040 0
al IJIJ ClDt '00f4
QIJO DD OCO
O C!1 CO
O OO DO raot
O OO D0~ I0cl
O Dra CQCC 0
0 I0Ualtd IJJo 14 g
0 Oca O
0C ot
gIJt4 88 0 'llCl
0 000 al
0 I m U~ I cl'UW R
gIJ
'O 0 to
IU IJ'0 IoalClalU IdU ~CQ I/I
Cl0~ C
Q 0Ctal~tICl 0al CQ
IU'0 olalatIaf 0Ol
td IJItlCIIJal 0U 0CQ Qt
ItlI0 mtm tUO Z
rd atIC clQ Q
rd 4U tC m~ I CtO
0cd ItJ IJOtCt 0CJ
'0 0 C C!CJ
al HCI tUIW IQ
~ 92A O H 4
O 4 g H0 4
C4
Ct gH 0
C3 4
0 B0 M
IK5 H
V 0 CO!D Ii CIO
Ci0V 0 00!0 IJ atWCJ
0 0 CU]5UU mw
QI
0O U D
O D Ia r
ra 0 otI h O
co I DQC D
IQ Oat ct Dca 01 O
ca IQ Oca N Oac O
O 0 OO O O
/I
aO H O
O elO COta ~ r
O D DO D D10IQ Jt r0 0 p1ca N D
cr QI OIQ + ra
0Cl0
Crd 4V 0IJ I Irt 4C 0 Clcl v
Ial0Ct V '0Cl Cl
td III «ICJ 3 IU
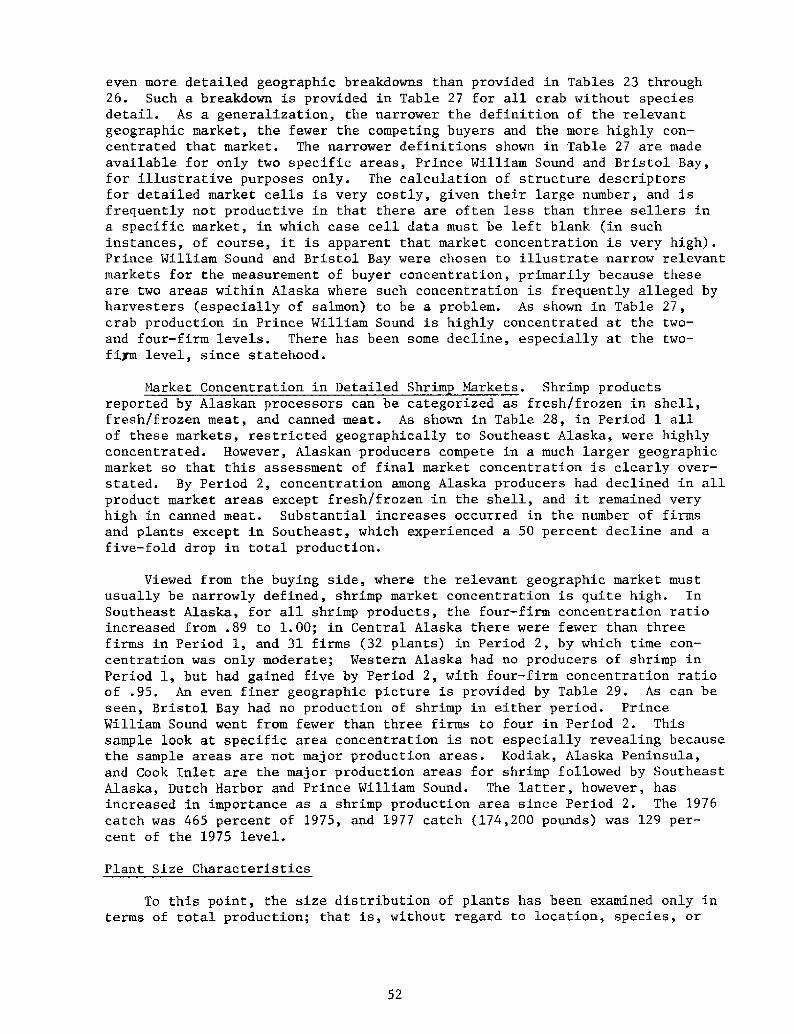
even more detailed geographic breakdowns than provided in Tables 23 through26. Such a breakdown is provided in Table 27 for all crab without speciesdetail. As a generalization, the narrower the definition of the relevantgeographic market, the fewer the competing buyers and the more highly con-centrated that market. The narrower definitions shown in Table 27 are made
available for only two specific areas, Prince William Sound and Bristol Bay,for illustrative purposes only. The calculation of structure descriptorsfor detailed market cells is very costly, given their large number, and isfrequently not productive in that there are often less than three sellers ina specific market, in which case cell data must be left blank in suchinstances, of course, it is apparent that market concentration is very high!.Prince William Sound and Bristol Bay were chosen to illustrate narrow relevantmarkets for the measurement of buyer concentration, primarily because theseare two areas within Alaska where such concentration is frequently alleged byharvesters especially of salmon! to be a problem. As shown in Table 27,crab production in Prince William Sound is highly concentrated at the two-and four-firm levels. There has been some decline, especially at the two-fi~ level, since statehood.
Market Concentration in Detailed Shrim Markets. Shrimp productsreported by Alaskan processors can be categorized as fresh/frozen in shell,fresh/frozen meat, and canned meat. As shown in Table 28, in Period 1 allof these markets, restricted geographically to Southeast. Alaska, were highlyconcentrated. However, Alaskan producers compete in a much larger geographicmarket so that this assessment of final market concentration is clearly over-stated. By Period 2, concentration among Alaska producers had declined in allproduct market areas except fresh/frozen in the shell, and it remained veryhigh in canned meat. Substantial increases occurred in the number of firmsand plants except in Southeast, which experienced a 50 percent decline and afive-fold drop in total production.
Viewed from the buying side, where the relevant geographic market mustusually be narrowly defined, shrimp market concentration is quite high. InSoutheast Alaska, for all shrimp products, the four-firm concentration ratioincreased from .89 to 1.00; in Central Alaska there were fewer than threefirms in Period 1, and 31 firms �2 plants! in Period 2, by which time con-centration was only moderate; Western Alaska had no producers of shrimp inPeriod 1, but had gained five by Period 2, with four-firm concentration ratioof .95. An even finer geographic picture is provided by Table 29. As can beseen, Bristol Bay had no production of shrimp in either period. PrinceWilliam Sound went from fewer than three firms to four in Period 2. This
sample look at. specific area concentration is not especially revealing becausethe sample areas are not major production areas. Kodiak, Alaska Peninsula,and Cook Inlet are the major production areas for shrimp followed by SoutheastAlaska, Dutch Harbor and Prince William Sound. The latter, however, hasincreased in importance as a shrimp production area since Period 2. The 1976catch was 465 percent of 1975, and 1977 catch �74,200 pounds! was 129 per-cent of the 1975 level.
Plant Size Characteristics
To this point, the size distribution of plants has been examined only interms of total production; that is, without regard to location, species, or
52

TABLE 27
PRINCE WILLIAM SOUND AND BRISTOL BAY MARKET CONCENTRATION FOR
CRAB PRODUCTS BY PERIOD, UNADJUSTED FOR OWNERSHIP INTERTIESPERIOD 1 �956 to 1958!
HerfindalIndex
Total All Products
,641,908 1.000 1.00048,100Prince William SoundBristol Bay
Fresh/Frozen � Shell
Prince William SoundBristol Bay
Fresh/Frozen � Mear.
1.000 .926.999 1.00039,400Prince William SoundBristol Bay
Canned Meat
Prince William SoundBristol Bay
Period 2 �973 to 1975!
Total All Products
.243.911 1.0007 2,513,400Prince William SoundBristol Bay
.580
Fresh/Frozen � Shell
.227.913 1.000.5627 1,297,300Prince William SoundBristol Bay
Fresh/Frozen � Neat
.489,987 1.000 1.000810,200Prince William SoundBristol Bay
Canned Meat.
1.000.819 1.000 .369406,000Prince William SoundBristol Bay
Source: Compiled from data provided by the Alaska Department of Pish and Game.
~Individual items may not add to totals due to rounding.
"Fewer than three firms.
53
Numberof
Firms
Numberof Total
Plants Production
Conc.ratio of
2 largestFirms
Conc,ratio of
4 largestFirms
Conc.ratio of
8 largestFirms
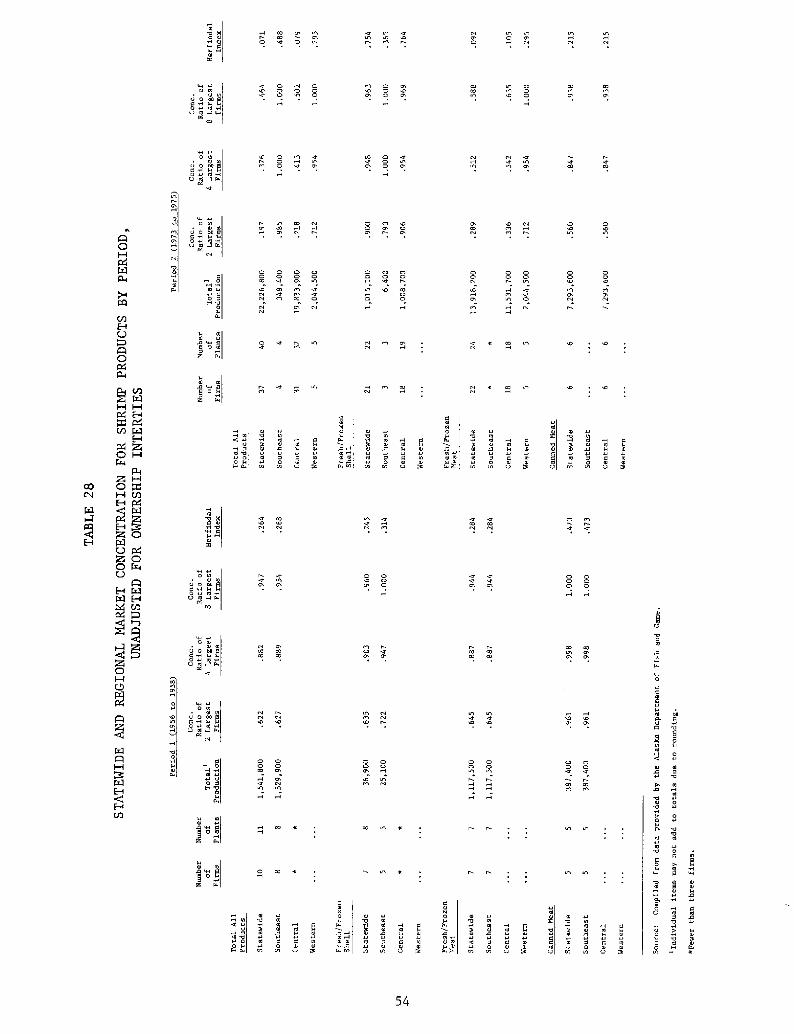
td'0 Xaf4
Ulr Uf r N 010 O 01
0 a0 00 0 000 zad 04I
0 O N 00 0 00 UI 0V 000
W IC OOa D cr0 0
0 0 ad0 I fdOPAW
O 0 D V ~
rUl
CI00 I CI0 td
0 4 0 fk
O CICt 0 0r aUt CU Nca01 N I
CtO
«4
«Ed 0 0 UI
N UJ
0 0 00 0 0'00 4Cl0
0 0 00 0 0 Icdcn0
0CtCn0 00 0 0 0 I 0 CJCU
0
00nl IJI IJ0 7~ nd
0 IC
ca UtUtIU OIU
Iatd IJI C0 III0
Ul CIN
JEW id UtUt Ut CUN
td
0 4 0 04 0I Ul
0 alII
0 nf 4nf
C P.al I 'Cl4 0 0IJ IJC 0 Cdl I ~ al
id IJ'0 00 Ifal UU UnlIJ 0IU IJI
Il I'0 Cltdtdtd CCt Ial 0U CI
tntd
Id '0 UIJ 0 Id0 I UE tk UI
IJInIdCl tdSIJ IJC0IU O
0nf ClU U0 II0 4I
0IIlLIIatlt
tdC 0W ~
IUunNUt UCr
W IJ0 Id 0 00 Da OD 00 00 0dl td
0 4 Itlo atO0
W 0 al4t la0 0 CIH0 4 nfW
pl ID0 ar rcd t0
N0 0
at0
0 e 4IIJ4 nl0 td0
0 at IJ0 dl tav 0 ad0 4 nlO 0CdN
raNr
0 tdU
0 00 0CU 00 N
0 00 000 00 0r r
D O0 0IdIJ 00E 'Cl0
0
UlalU 0'0 '4
'0
0 00IJ4 dl4I IJJn We 0 rd
0 0 IJ0 0 alaledt 4Ie 0
IJ0 tnrl0 4
.0 tn ta4 CUl
C 0 0 Ia UII Ifr X
0al'ld I
dC 4Ikl 04
Ia
al '0IJ 00I 4
~ I IJ'0 taI!IIIJ IItlIJ 0Ih
0 IJ0 nlItlal0 0JInl 0Ut
0U
td tn0 4 0Ih
'0 0 nl0~ IIJC UItd 4IO
aO
cQ
M M
«EJ
R0 e
«0 0H M
'Z 0
0 «faO
0 «Cd
4
~58
aM
CU 01r IU r- 00 W 0 N
Il 4dl0 nl4I A I ClIJ U I IJal 0 C In0 Ilf dlch ca cl
~ I dltd0IJ CI IJnl 0 0 rdIJ 0 4I 0IU Ul CJ
Ul 0 Ul CUO O 0 0
N 0 cd cd
10 Ca 0 0UI r
N I Ul Ul
0'0 Id~ I U 4 nfIJ IJ IJ0 0 0 00 0 III/I Ch CJ
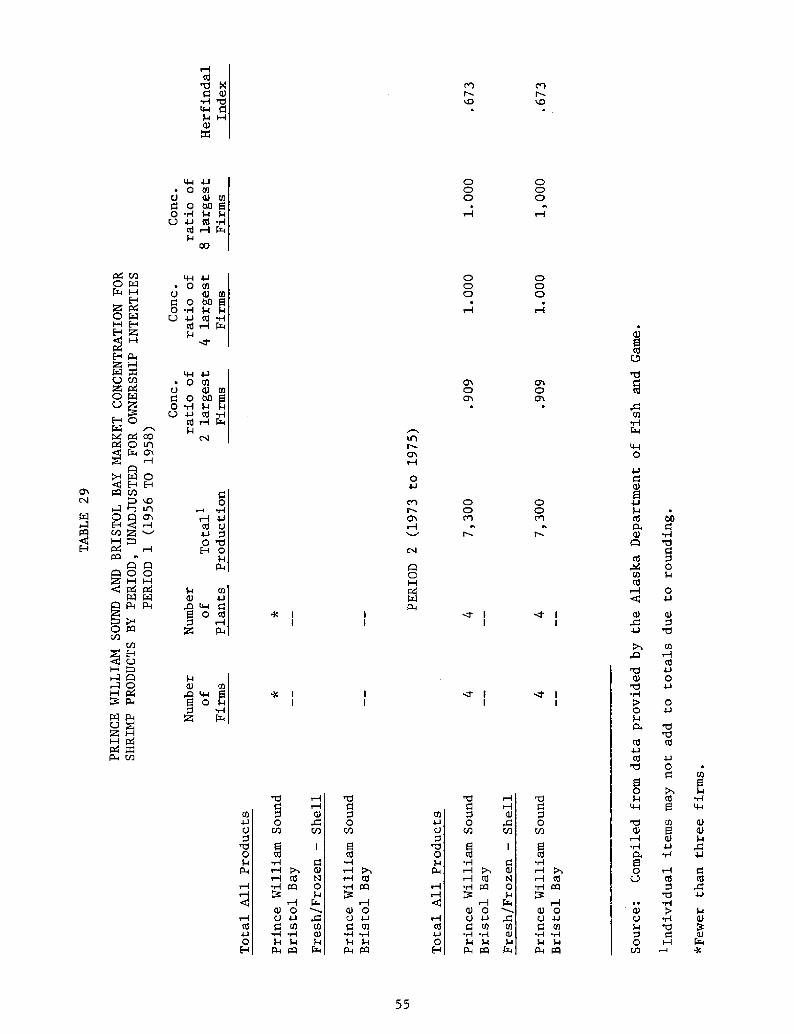
IDIDCl
«DID«D
«DcDCc
~ 0V
00 WO
«D
~ 0V
00 MO
cd
4I cdccd e
cd w
«D
W 0
04J
0 V0 M
0
C4
ClCl
«D«D
00
4 0 0 dlAcDM PCFxhC4
4J
0 cd
S4
0 ecd
cd
dl 0V g 9!
C4 F«l
CQ
00
C4
e cd
cd
dl 0V 4Jg Cd~ 6
cdJJ0
55
CQcD X
H
K c4CI
& R
H F4H
O M
0 F4O g6 «D
X co
HWQ
MC4 a
A ID
«D ««I
4 OH g
O
H
Cv M
4J~ 0 cd
V Ql co0 dde
0O & ccl .8
cd
w ee 0
WR
'cd
80
ecd-r4 g
cdcd N«0 0
cd 0V 4Jg cd cd
4
e Icd
g8
cd~ R ««I 0
cU 0Vg co cd
a 'cd8 0
0 l-4
'cd
e 0 0dI
0 e0
~ ~
V 0
cd
0
0
'cd0cd
0 ~Me
cde wVI 8e dlcd
cd cd
~ B S'0C CIlH
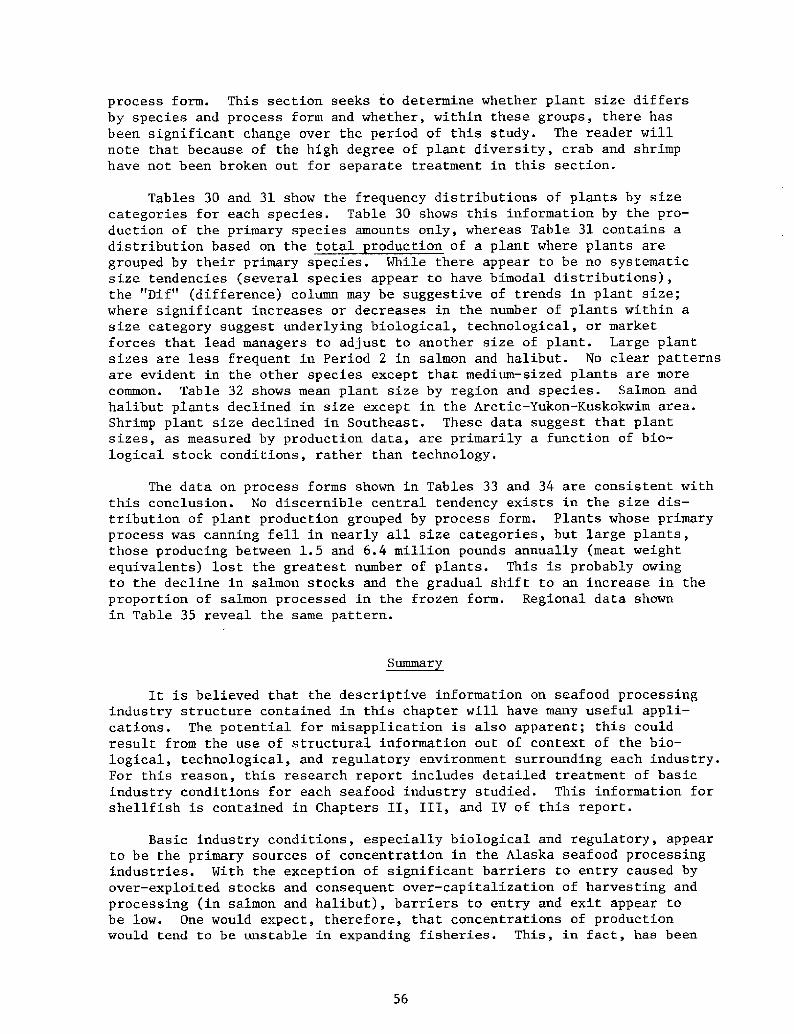
process form. This section seeks to determine whether plant size differsby species and process form and whether, within these groups, there hasbeen significant change over the period of this study. The reader willnote that because of the high degree of plant diversity, crab and shrimphave not been broken out for separate treatment in this section.
Tables 30 and 31 show the frequency distributions of plants by sizecategories for each species. Table 30 shows this information by the pro-duction of the primary species amounts only, whereas Table 31 contains adistribution based on the total roduction of a plant where plants aregrouped by their primary species. While there appear to be no systematicsize tendencies several species appear to have bimodal distributions!,the "Dif" difference! column may be suggestive of trends in plant size;where significant increases or decreases in the number of plants within asize category suggest underlying biological, technological, or marketforces that lead managers to adjust to another size of plant. Large plantsizes are less frequent in Period 2 in salmon and halibut. No clear patternsare evident in the other species except that medium-sized plants are morecommon. Table 32 shows mean plant size by region and species. Salmon andhalibut plants declined in size except in the Arctic-Yukon-Kuskokwim area.Shrimp plant size declined in Southeast. These data suggest that plantsizes, as measured by production data, are primarily a function of bio-logical stock conditions, rather than technology'
The data on process forms shown in Tables 33 and 34 are consistent withthis conclusion. No discernible central tendency exists in the size dis-tribution of plant production grouped by process form. Plants whose primaryprocess was canning fell in nearly all size categories, but large plants,those producing between 1.5 and 6.4 million pounds annually meat weightequivalents! lost the greatest number of plants. This is probably owingto the decline in salmon stocks and the gradual shift to an increase in theproportion of salmon processed in the frozen form. Regional data shownin Table 35 reveal the same pattern.
~Summa r
It is believed that the descriptive information on seafood processingindustry structure contained in this chapter will have many useful appli-cations. The potential for misapplication is also apparent; this couldresult from the use of structural information out of context of the bio-
logical, technological, and regulatory environment surrounding each industry.Por this reason, this research report includes detailed treatment of basicindustry conditions for each seafood industry studied. This information forshellfish is contained in Chapters II, III, and IV of this report.
Basic industry conditions, especially biological and regulatory, appearto be the primary sources of concentration in the Alaska seafood processingindustries. With the exception of significant barriers to entry caused byover-exploited stocks and consequent over � capitalization of harvesting andprocessing in salmon and halibut!, barriers to entry and exit appear tobe low. One would expect, therefore, that concentrations of productionwould tend to be unstable in expanding fisheries. This, in fact, has been
56
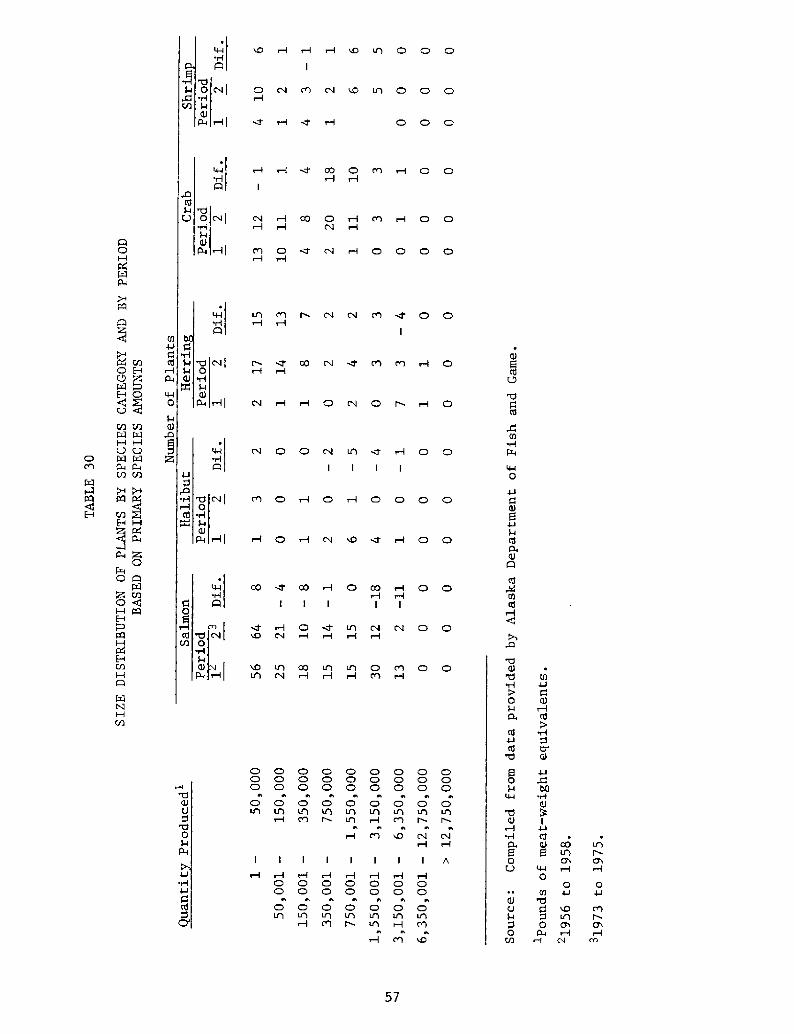
8A
0 0 0
W Ac0
U 0
8C4
W A
WI0
O
A I I I I W 0
c08
c4C40IA
A0
8 c0Wn~M 0
0 CO
I I I
0 0
I I
ON
0 0
0
Q 0 I:4c0a
O 0 0
0 0 00 0 00 0 0
A A Ol0 0 0lPI
0 0 00 0 00 0 0
~ l0 0 0
A
8 00 0 0O O 00 0 0
~ I A A0 0 0
tl aP4
00
0I
I
c0 cog
W 00
V3
0Fu
'a0J
0
cd0'
0 0 00 0 0
A tl0 0 0
~ 92
0 00 0
0 0
0 00 0
~ I a0 01A
57
0M c4Fk
C4 CCI
8 O
M W
0
0 A
CCI0 4W
M
'4 H H H % R O O O
0 B 6 c4 4 0 0 0 0
CO O ch H O O
I
CV 6 CCI 0 H R M O O
O C cV r4 0 0 0 0
N W < 0 O
I
CV M M 0 CV 0 > M 0
cV 0 0 6 4 < 6 0 0
0 H 0 H 0 0 0 0
0 H A 4 < M 0 0
I I I I I I I I A
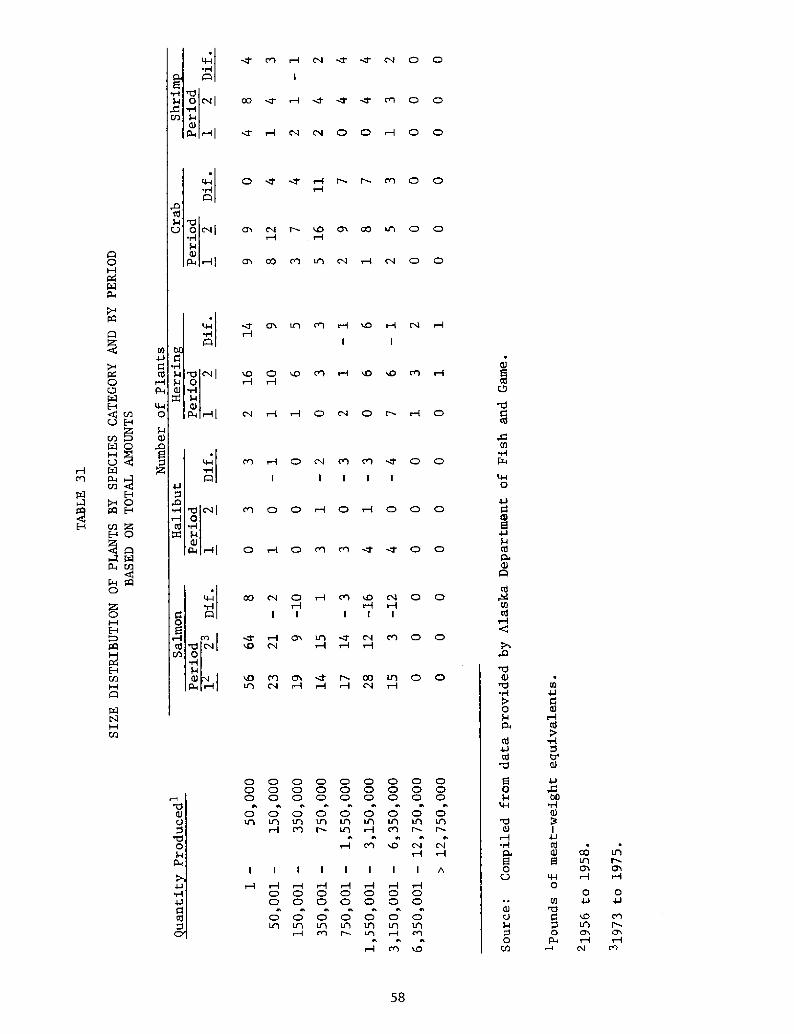
A 0 M PCC4
W A
IL4
0 8W A
W 0
Ol
0 crIQ
A
W 40 8
CA 0
CQ A O
I I I
N O O
Iz 0 M A 0 0
CILcV
CO LQ O OUj
ar
v
cr'8
rrI'0
0W
0 0 00 0 00 0 0
A0 0 0
0 0 00 0 00 0 0
a tl0 0 0
a A
0 00 0
0 00 00 0
A0 0
AN
0 00 0
0 0
0 0 00 0 0
0 0 0LPj
0 00 0
0 0III
V 0
58
0
54 0
E-I 0
0 A
0
W < A cE N N N CV O O
4 I
LICI N M M N N W O 0
cV 0 0 6 0 0
O < < H r r n 0 0'rl4
Ch Q M 0
Ch CO W LQ A H CV O O
Ch
I I
O e O r M O
O cV Y! Fl < O O
I I I I I
0 0 6 0 6 0 0 0
0 H O F1 Pl N N 0 0
I I I I I I I I A
Cbo~ 6rU
I
III Cog cd chW0
0 0rrI'CIgQ Ch Ch
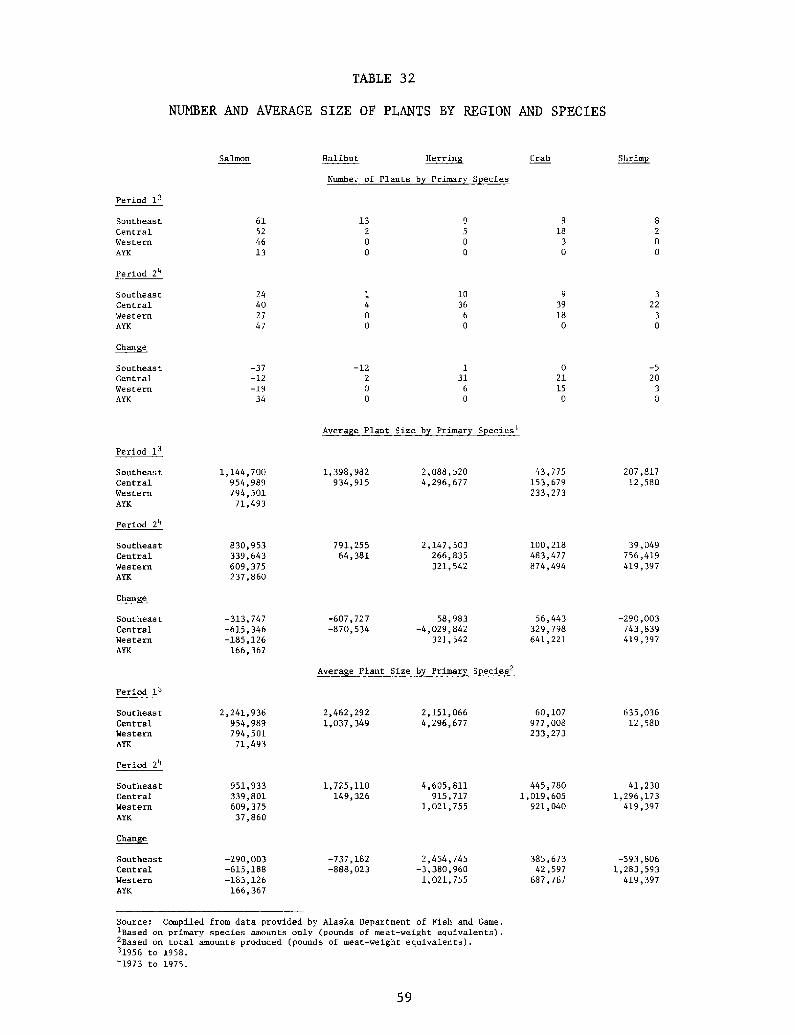
TABLE 32
NUMBER AND AVERAGE SIZE OF PLANTS BY REGION AND SPECIES
Salmon Halibut ~Herr in ~Sh rimCrab
Numbe. of Plants b Primer S ecies
Period 13
Period 24
~Chan e
Ayers e Plant Size b Primer S ecies~
Period ls
1,398,982934,915
2,088,5204,296,677
207,81712,580
Period 24
791,25564,381
~Chan e
-607,727-870,534
~AP> » a
Period 1S
2,462,2921,037,349
2,151,0664,296,677
635,03612,580
Period 24
1,725,110149,326
~Chan e
-737,182-888,023
Source: Compiled from data provided by Alaska Department of Fish and Game.~Based on primary species amounts only pounds of meat-weight equivalents!.Based on total amounts produced pounds of meat-weight equivalents!.
31956 to 1958."1973 to 1975,
59
SoutheastCentralWesternAYK
SoutheastCentralWesternAYK
SoutheastCentralWesternAYK
SoutheastCentralWesternAYK
SoutheastCentralWesternAYK
SoutheastCentralWesternAYX
SoutheastCentralWesternAYK
SoutheastCentralWesternAYK
SoutheastCentralWesternAYK
61524613
24402747
-37-12-1934
1,144,700954,989794,50171,493
830,953339,643609,375237,860
-313,747-615,346-185,126166,367
2,241,936954,989794,50171,493
951,933339,801609,37537,860
-290,003-615,188-185,126166,367
13200
-12200
103660
13160
2,147,503266,835321,54>2
58, 983-4,029,842
321,542
4,605,811915,717
1,021,755
2,454,745-3,380>9601,021,755
91830
939180
021150
43,775153,679233,273
100, 218483,477874,494
56,443329,798641,221
60,107977,008233,273
4>45,7801,019,605
921,040
385,67342>597
687,767
32230
-52030
39,049756,419419,397
-290,003743,839419,397
41,2301,296,173
419,397
-593,8061,283,593
419,397
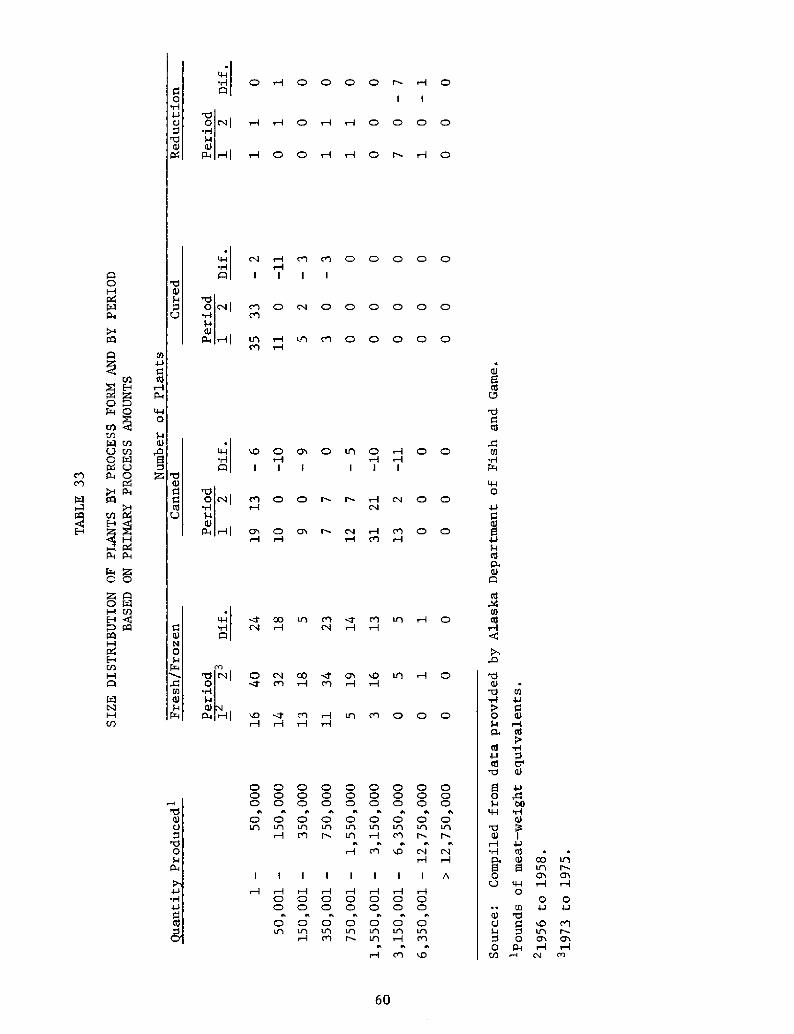
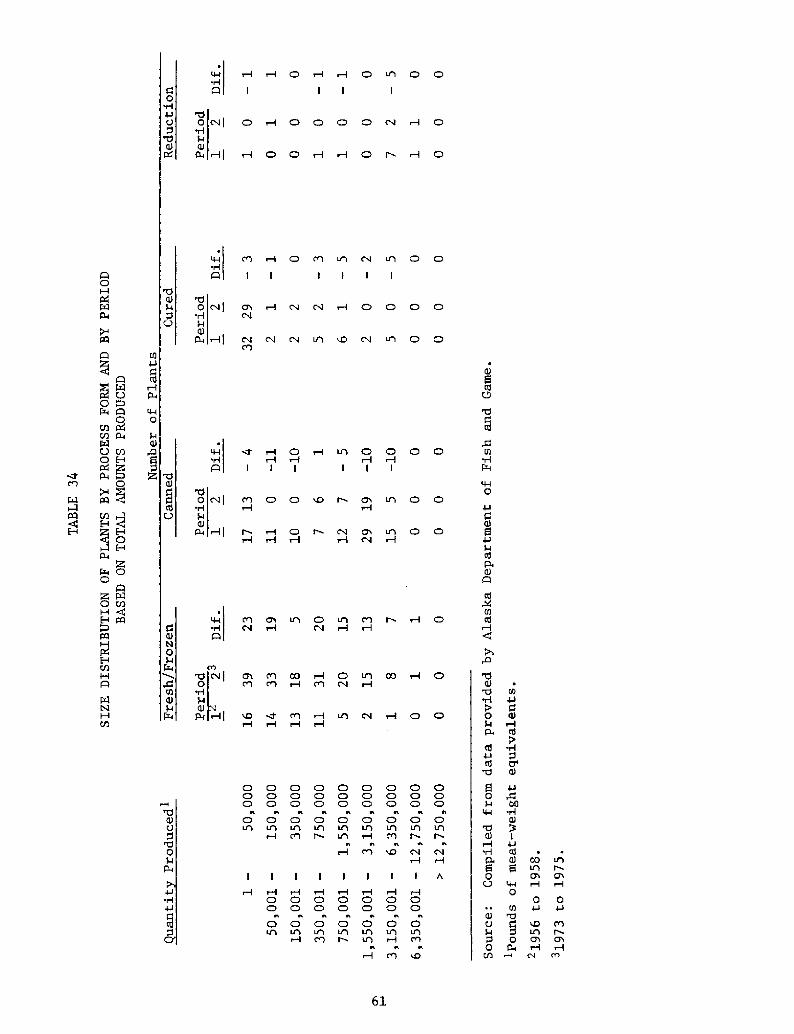
O O
V 0
8 cII
'0 80
OcdC4
0
8
R
W~ r44
0 0O I I 0 0
I I
00 0CT! 0
IcU8
cIIP 8
0 0
4
0
cII
0 4
A cIINl
0co H O
N II
0 v0 9cII
'd
8
0 cUH C40C3
Qlc4
cII
A 00~ 6 IIII
OI8
0
N R O O
0 0 00 0 00 0 0
a a a0 0 0
LAa
0 00 00 0
a a0 0
aCV CV
0 00 00 0
a a0 0
0 00 00 0
a a0 0
l/l~ 92 a
co
0 00 0 a0 0lA LP}
0 0 00 0 0
0 0 0
r I0
a0
0 0 0 0 0
0
QI
U 0M
Ch Ch
40
0 D
0CQ
0 9
g
> 50
4I'40 M
S4
4
O H H O
c' 4 I I I0
0 6 0 0 0 0 A 6 0
0 0 H R O > 6 0
0 Y! P cV 4 0 0
4 I I I I I I
�] ch H A N H O O O O
HJ e4 A 4 4 Z cV ~ 0 0M
I I I I I I I I A
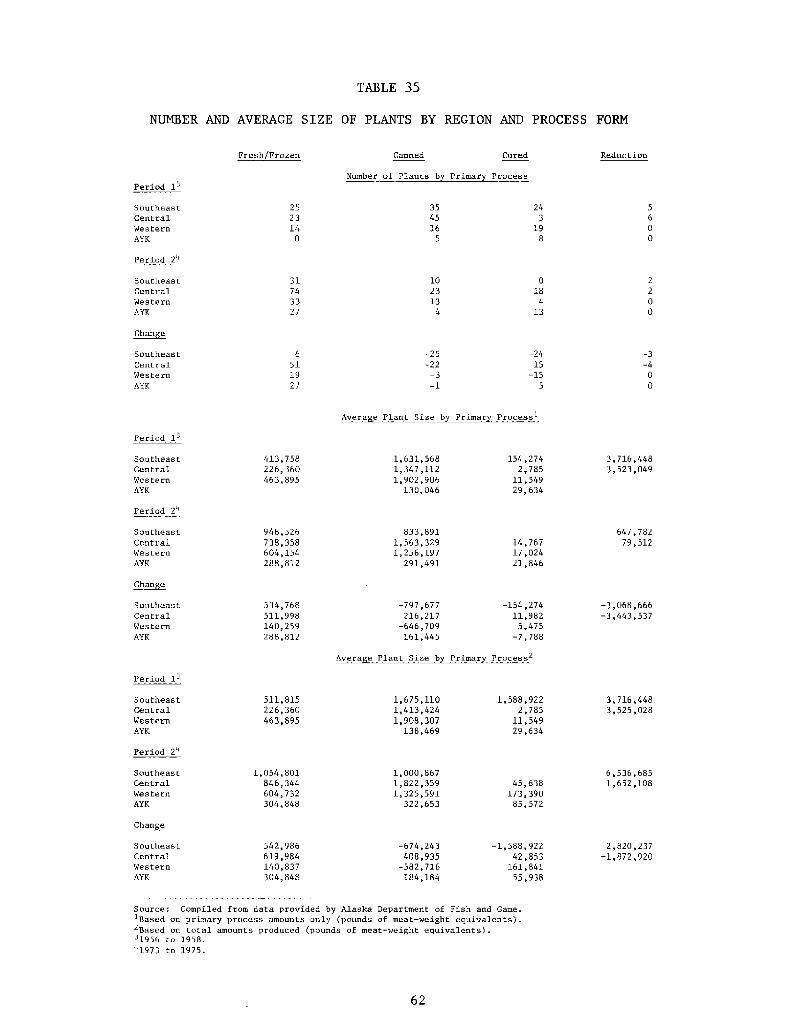
TABLE 35
NUMBER AND AVERAGE SIZE OF PLANTS BY REGION AND PROCESS FORM
Fresh/Frozen ReductionCanned Cured
Number of Plants b Primer ProcessPeriod l.
Period 24
~Chan e
Ayers e Plant Size b Primer Process
Period lt
154,2742,785
11,54929,634
3,716,4483,523,049
Period 24
647,78279,51214,767
17,02421,846
~Chan e
-154,27411,9825,475
-7,788
-3,068,666-3,443,537
~IP1 1' 1 P 4 P
Period 1
1,588,9222,785
11,54929,634
3,716,4483,525,028
Period 24
6,536,6851,652,10845,638
173,39085,572
~Chan e
-1,588,92242,853
161,84155,938
2,820,237-1,872,920
Source: Compiled from data provided by Alaska Department of Fish and Game.tBased on primary process amounts only pounds of meat-weight equivalents!.2Based on total amounts produced pounds of meat-weight equivalents7.s1956 to 1958.41973 to 1975.
62
SoutheastCentralWesternAYK
SoutheastCentralWesternAYK
SoutheastCentralWesternAYK
SoutheastCentralWesternAYK
Southeast.CentralWesternAYK
SoutheastCentralWesternAYK
SoutheastCentralWesternAYK
SoutheastCentralWesternAYK
SoutheastCentralWesternAYK
2523140
31743327
6511927
413,758226,360463,895
948,526738 ' 358604,154288,812
534,768511,998140,259288,812
511,815226 ' 360463,895
1,054,801846,344604,732304,848
542,986619 ' 984140,837304,848
3545165
1023134
-25-22� 3-1
1,631,5681,347,1121,902,906
130,046
833,8911,563,3291,256,197
291,491
-797,677216,217
-646,709161,445
1,675,1101,413,4241,908,307
138,469
1,000,8671,822,3591,325,591
322,653
-674,243408,935
-582,716184,184
243
198
0184
13
� 2415
-155
-3-400
the pattern in Alaska's growth industries. On the other hand, local buyerconcentration will undoubtedly remain high as it is a function of economiesof scale, the geographic distribution of fish stocks and the vast coastaldistances. Changes in harvesting and/or tendering technology are the onlyapparent sources of future instability in local buyer concentration. Im-proved preservation methods on-board vessels for example, heading andgutting/freezing or freezing in the round! would increase the range of op-tions of landing ports, causing the relevant geographic market to expandand buyer concentration to decline. The successful expansion of harvestersinto processing via cooperatives would change the ownership and earningpatterns of processing facilities. This would have little actual impactupon local concentration levels, however, unless the underlying biologicaland marketing forces were expansionary. The main effect of a harvester-ownedprocessing cooperative, if successful, would be to mitigate the tendency ofhigh buyer concentration to depress ex-vessel prices.
63

CHAPTER III
THE HISTORY OF THE KING AND TANNER CRAB FISHERIES IN ALASKA
Develo ment of the Alaska Kin Crab Fisher
The Farci n Fisher
Foreign fishing for king crab in waters off Alaska was limited to theEastern Bering Sea where Japan and the USSR both participated in the kingcrab fishery and dominated the catch until 1971. In that year, the U.S.landed the major part of the area harvest for the first time.
The Japanese involvement in the king crab fishery was split into twoperiods by World War II. The fishery was first initiated by Japan in 1930,and this early development was described in a publication by HerbertShippen �964!. Briefly, from the initial catch of one million pounds withone mothership operating, the fishery reached a peak quickly in 1933 whenjust over two million crabs were landed by two mothership operations. From1933 on, the catch declined steadily to a low of only 250,000 pounds in 1939when the Japanese temporarily abandoned the fishery due to the impending war Table 36!.
During the war years, only very small amounts of king crab from theEastern Bering Sea were landed, however, in 1947, U.S. trawlers began fishingthe area and landed up to half a million crab annually through 1954 Shippen1964!. With the development of the pot fishery south of the AlaskaPeninsula in the late 1950s and the return of the Japanese to the EasternBering Sea in 1953, the U.S. fishing effort and catch declined rapidly through1954 to 1957. After 1958, the U.S. fishing effort in the Eastern Bering Seawas negligible until 1963 when the U.S. started to venture into the areanorth of Unimak Island. with a pot fishery Table 37!.
After their return to the fishery, the Japanese catch of king crab re-mained fairly steady between the years of 1953 to 1959 at just over onemillion crab converted to pounds in Table 37!. During 1959, the USSR enteredthe Eastern Bering Sea king crab fishery in the same area as the Japanese
~With one exception by the Soviet fleet which will be discussed later.
65
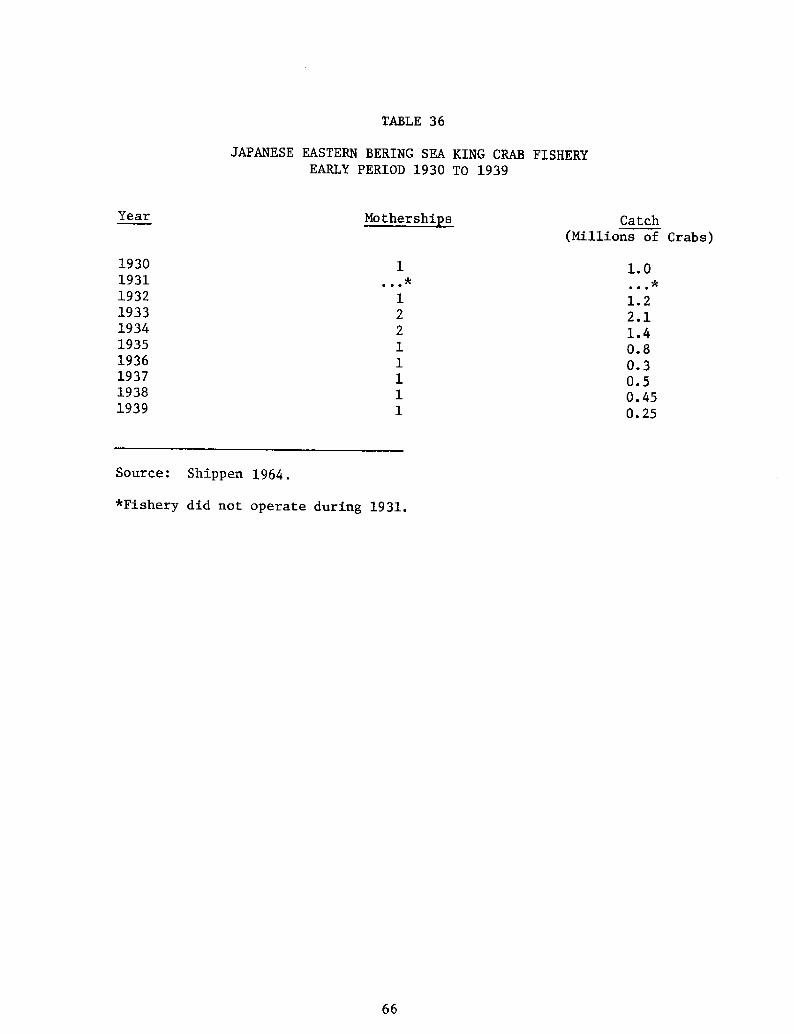
Catch
Nillions of Crabs!
Year
~ ~ ~A
Source: Shippen 1964.
*Fishery did not operate during 1931.
66
1930
1931
1932
1933
1934
1935
1936
1937
1938
1939
TABLE 36
JAPANESE EASTERN BERING SEA KING CRAB FISHERYEARLY PERIOD 1930 TO 1939
1.0~ ~ ~ *
1.2
2 ~ 1
1 ~ 4
0.8
0.3
0.5
0.45
0.25
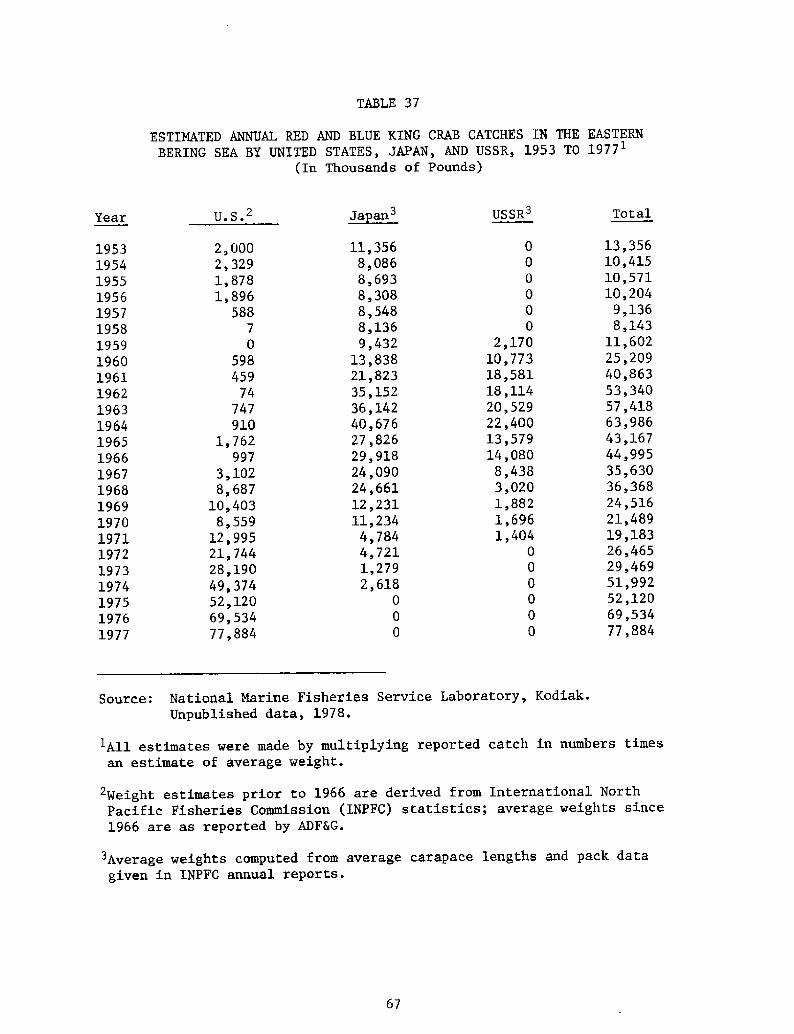
TABLE 37
ESTIMATED ANNUAL RED AND BLUE KING CRAB CATCHES IN THE EASTERNBERING SEA BY UNITED STATES, JAPAN, AND USSR, 1953 TO 1977~
In Thousands of Pounds!
USSR~U ~ S.~ TotalYear
Source: National Marine Fisheries Service Laboratory, Kodiak.Unpublished data, 1978.
All estimates were made by multiplying reported catch in numbers timesan estimate of average weight.
~Weight estimates prior to 1966 are derived from International NorthPacific Fisheries Commission INPFC! statistics; average weights since1966 are as reported by ADFhG.
Average weights computed from average carapace lengths and pack datagiven in INPFC annual reports.
67
1953
1954
1955
1956
1957
1958
1959
1960
1961
1962
1963
1964
1965
1966
1967
1968
1969
1970
1971
1972
1973
1974
1975
1976
1977
2,0002,3291,8781,896
588
7
0
598
459
74
747
910
1,762997
3,1028,687
10,4038,559
12,99521,74428,19049,37452,12069,53477,884
11,3568, 0868,6938,3088,5488,1369,432
13,83821,82335,15236,14240,67627,82629,91824,09024,66112,23111,234
4,7844,7211,2792,618
0 0 0
0 0 0 0 0 02, 170
10,77318,58118,11420,52922,40013,5791I4, 080
8,4383,0201,8821,6961,404
0 0 0 0 0 0
13,35610,41510,57110,204
9,1368,143
11,60225,20940,86353,34057,41863,98643,16744,99535,63036,36824,51621,48919,18326,46529,46951,99252,12069,53477,884

fishery, north of the Alaska Peninsula. From 1959, both the Japanese andUSSR harvests increased rapidly to the peak catches of 5,895,000 crab in1964 for Japan and 3,019,000 crab for the USSR. It was reported by theJapanese that there was severe competition between Russian and Japanesefishing fleets on the fishing grounds, and that the shift of Japanese fishingeffort to the area east of the Pribilof Islands in 1965 to 1966 was to avoid
gear losses due to the conflicts between fishing fleets of the two countries.
The U.S. entered into bilateral agreements with both Japan and the USSRwhich established quotas of 185,000 cases each for 1965 and 1966 Table 38!.These treaties were renegotiated every two years prior to the expiration ofthe then existing treaty. As can be seen from the quota amounts in Table 38,the amount of allowable foreig~ catch was decreased every treaty period twoyears!. As the foreign catch of king crab decreased, the U.S. catch rosesteadily and swiftly as the domestic fishery developed. The catch amountsfor the foreign and U.S. fishing fleets are shown by country in Figure 6for the years 1953 to 1977.
In addition to foreign catch quotas, there were other fishing restrictionsalso negotiated as part of the bilateral treaties. These restrictions,listed in Table 39, were negotiated by the U.S. Secretary of State on behalfof the U.S. government with representatives from the two countries involved,Japan and the USSR.
The first fishing restriction for the foreign fleets which was implementedin November 1964, ended the use of trawl nets to harvest king crab After thisdate, the legal fishing gear allowed consisted of tangle nets or pot fishinggear only. In the same treaty, there were additional restrictions placed onthe foreign fishing fleets. A small area north of Unimak Island, which wasbeing fished by domestic fishermen, was restricted to pot gear only. This
In 1963, two Soviet king crab fleets moved from the Eastern Bering Seainto the Western Gulf of Alaska, southeast of Kodiak Island, and fished forone month. The U.S. protested this intrusion, citing the ratifications ofthe Convention on the Continental Shelf, adopted at Geneva in 1958. Theseratifications included "living organisms belonging to sedentary species,organisms which, at the harvestable stage, either are immobile on or under theseabed or are unable to move except in constant physical contact with the sea-bed or the subsoil," from United Nations Convention on the Law of the Sea,Annex IV; Geneva, 1958! a description which made king crab and some othershellfish! part of the exclusive sovereign natural resources of the Con-tinental Shelf of the U.S. The Soviet fleet withdrew to the Bering Sea aftercatching an estimated 2,200 tons. In 1964, the Soviet fleet again appearedin the Gulf of Alaska and again the U.S. protested this fishing. After threeweeks, the Soviet fishing fleet was withdrawn to the Bering Sea. The firstof the U.S.-USSR bilateral treaties, signed in November, 1964, limitedSoviet king crab fishing to the Eastern Bering Sea and effectively preventedfurther fishing effort in the Gulf of Alaska.
68
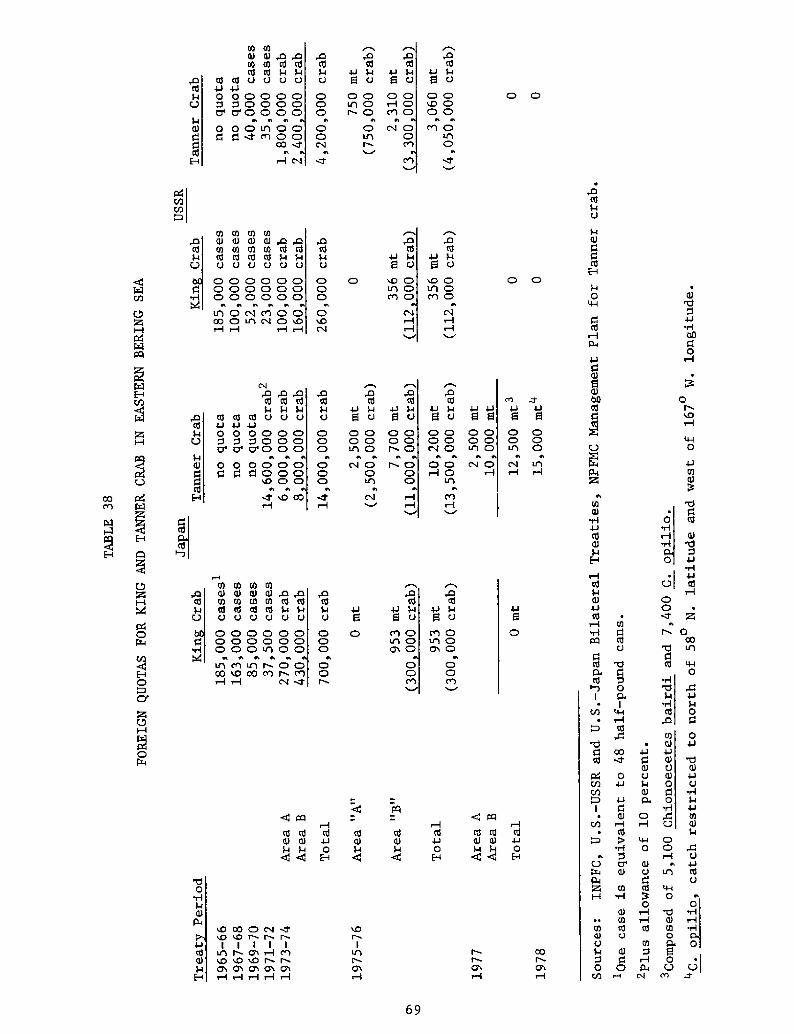
0 00 00 00 0
0 00 0CO
0 0 CDA
C!0
~ l
0 0Z 00 0
Y! 0
0 ~ 1cdC
atd
8 O
0 00 00 0
Ul 0CO O
P4
0 0CD
0 0R 0A OW O !U
JJ
cUIC 0
cd4J8 O
cd cd4O V 8 8
cd4 0 0
0 0O
hl O~ -I
0 00 0
O~ I fl
N
0 00 00 0
~ l0 00 00 0
AW OD
0 00 0c!l O
CV 0C!
A
0 00 0 O
> O 0 0
CICD
~ 920 C!CD
~ I
0 00 0H O
A A0 0R O
C3
0
A
'Cj
clj
0CO
0
v! 0Ul 0Ch 0
0
CDCD
A0 0
0 C0
CU!UOcU
0 0cU
CUC!CD
t
0
cU
0 8 C400
69
cd cd O O4J
0 0000' o'O 0
~ I h0 00 !el
g&M
OOOO0000OOOO
a ~ f ~%WOOc!l W C! M
CV
cd
cd cd OtJ
0 0 0 00 O0' 0' O' C!
A0 0 0 0g 4 0 O
~ I
dj N R cd!U CU cd cU a JDd! ct! cd cd tdcd cd cd cdO O O tJ O O
OOOQQO0000000 0 0 vl 0 0
a A A A a 4O Q
CO W GO
cO CO O cV C
I I I I
Ch M Ch M Ch
4J8 O 8
0 0 0ccl 0 rlc 0
A flO
O C>00
N O
cd
8 o 8
cd
8 80 Y�
ccl Oe O
00
cd cd cdCU
0
cd
CU
CO
tdOLc!j
I
cd
CACO Ico
0 C4
tdcU
V 0
'Cj
0
I
cd
QOg!U
0 O4J
cU
CU O
cdW0
0' djCU O
cd cd
0cUcl!
cd
4
O g4
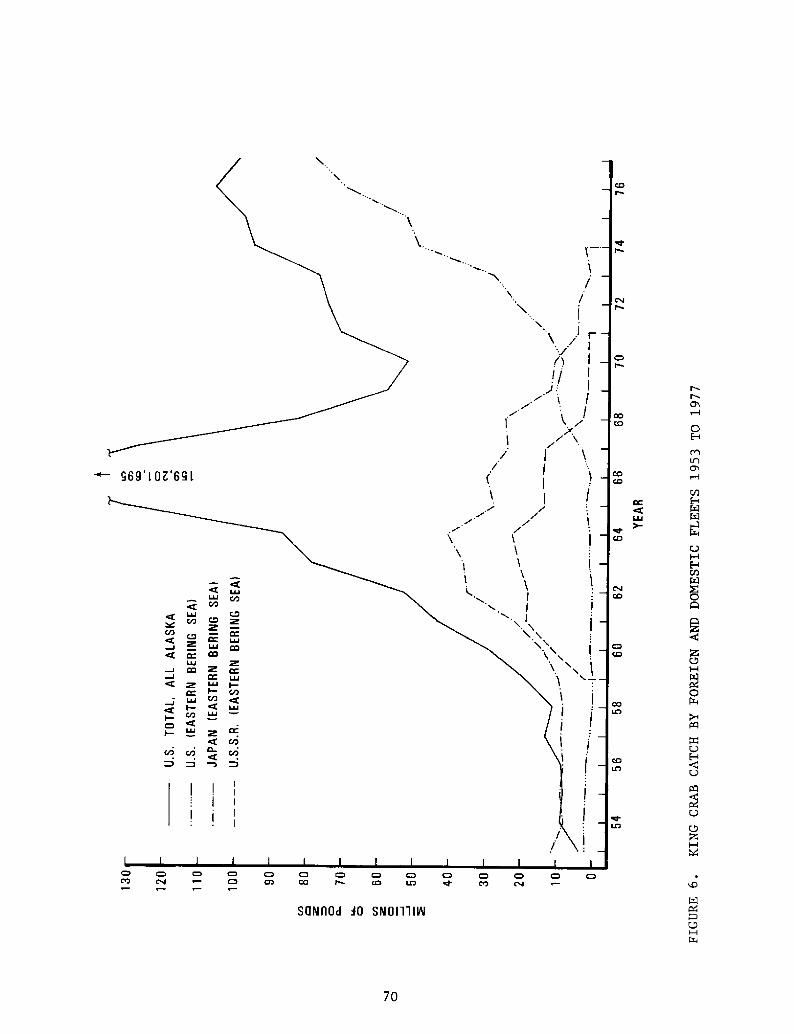
Z O A g RC4O
H
D O O O DD O D D D D O D DCV I D CD CO ~ CLI
SGhlAOd 30 SNOIllllh!
70
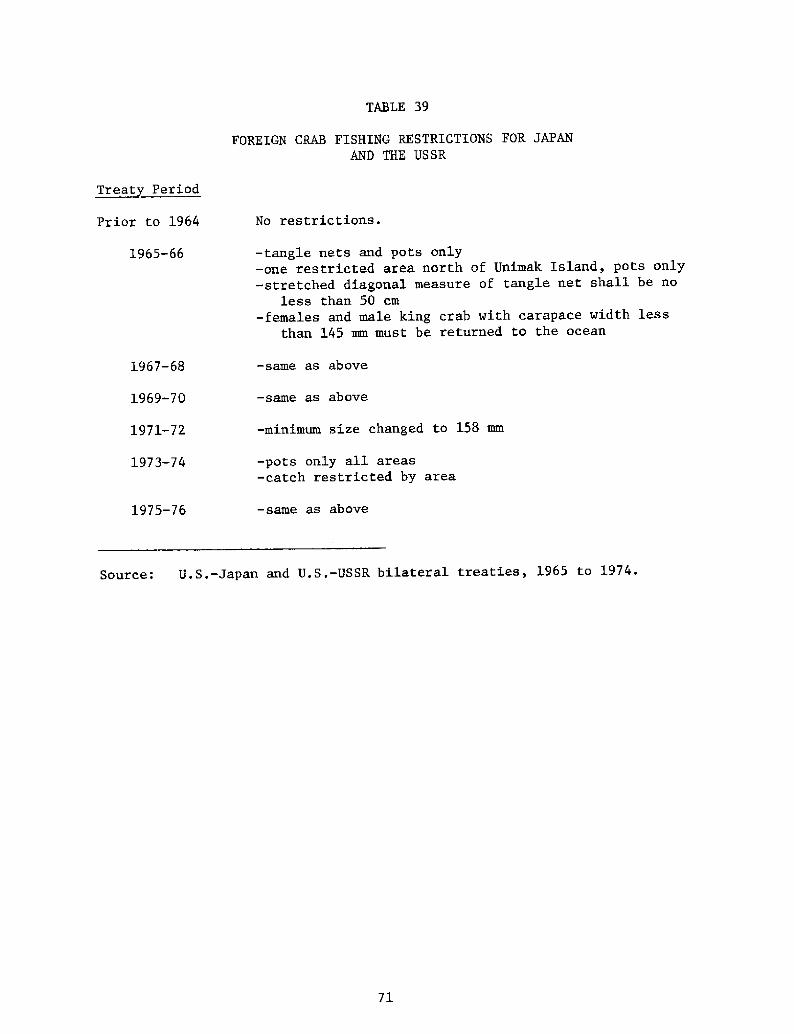
Prior to 1964 No restrictions.
1965-66
-same as above
� same as above
-minimum size changed to 158 mm
-pots only all areas-catch restricted by area
1975-76 � same as above
Source: U.S.-Japan and U.S.-USSR bilateral treaties, 1965 to 1974.
71
1967-68
1969-70
1971-72
1973-74
TABLE 39
FOREIGN CRAB FISHING RESTRICTIONS FOR JAPANAND THE USSR
-tangle nets and pots only-one restricted area north of Unimak Island, pots only-stretched diagonal measure of tangle net shall be no
less than 50 cm-females and male king crab with carapace width less
than 145 mm must be returned to the ocean
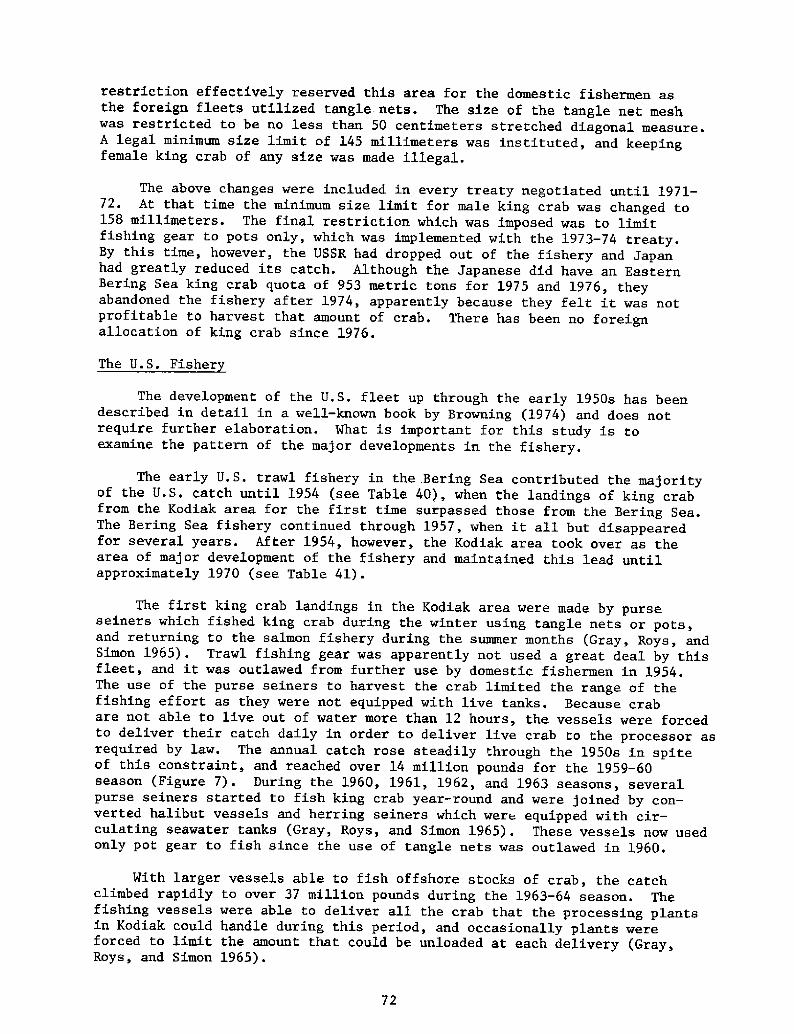
restriction effectively reserved this area for the domestic fishermen asthe foreign fleets utilized tangle nets. The size of the tangle net meshwas restricted to be no less than 50 centimeters stretched diagonal measure.A legal minimum size limit of 145 millimeters was instituted, and keepingfemale king crab of any size was made illegal.
The above changes were included in every treaty negotiated until 1971-72. At that time the minimum size limit for male king crab was changed toL58 millimeters. The final restriction which was imposed was to limitfishing gear to pots only, which was implemented with the 1973-74 treaty.By this time, however, the USSR had dropped out of the fishery and Japanhad greatly reduced its catch. Although the Japanese did have an EasternBering Sea king crab quota of 953 metric tons for 1975 and 1976, theyabandoned the fishery after 1974, apparently because they felt it was notprofitable to harvest that amount of crab. There has been no foreignallocation of king crab since 1976.
The U.S. Fisher
The development of the U.S. fleet up through the early 1950s has beendescribed in detail in a well-known book by Browning �974! and does notrequire further elaboration. What is important for this study is toexamine the pattern of the major developments in the fishery.
The early U.S. trawl fishery in the Bering Sea contributed the majorityof the U.S. catch until 1954 see Table 40!, when the landings of king crabfrom the Kodiak area for the first time surpassed those from the Bering Sea.The Bering Sea fishery continued through 1957, when it all but disappearedfor several years. After 1954, however, the Kodiak area took over as thearea of major development of the fishery and maintained this lead untilapproximately 1970 see Table 41!.
The first, king crab landings in the Kodiak area were made by purseseiners which fished king crab during the winter using tangle nets or pots,and returning to the salmon fishery during the summer months Gray, Roys, andSimon 1965!. Trawl fishing gear was apparently not used a great deal by thisfleet, and it was outlawed from further use by domestic fishermen in 1954.The use of the purse seiners to harvest the crab limited the range of thefishing effort as they were not equipped with live tanks. Because crabare not able to live out of water more than 12 hours, the vessels were forcedto deliver their catch daily in order to deliver live crab to the processor asrequired by law. The annual catch rose steadily through the 1950s in spiteof this constraint, and reached over 14 million pounds for the 1959-60season Figure 7!. During the 1960, 1961, 1962, and 1963 seasons, severalpurse seiners started to fish king crab year-round and were joined by con-verted halibut vessels and herring seiners which were equipped with cir-culating seawater tanks Gray, Roys, and Simon 1965!. These vessels now usedonly pot gear to fish since the use of tangle nets was outlawed in 1960.
With larger vessels able to fish offshore stocks of crab, the catchclimbed rapidly to over 37 million pounds during the 1963-64 season. Thefishing vessels were able to deliver all the crab that the processing plantsin Kodiak could handle during this period, and occasionally plants wereforced to limit the amount that could be unloaded at each delivery Gray,Roys, and Simon 1965!.
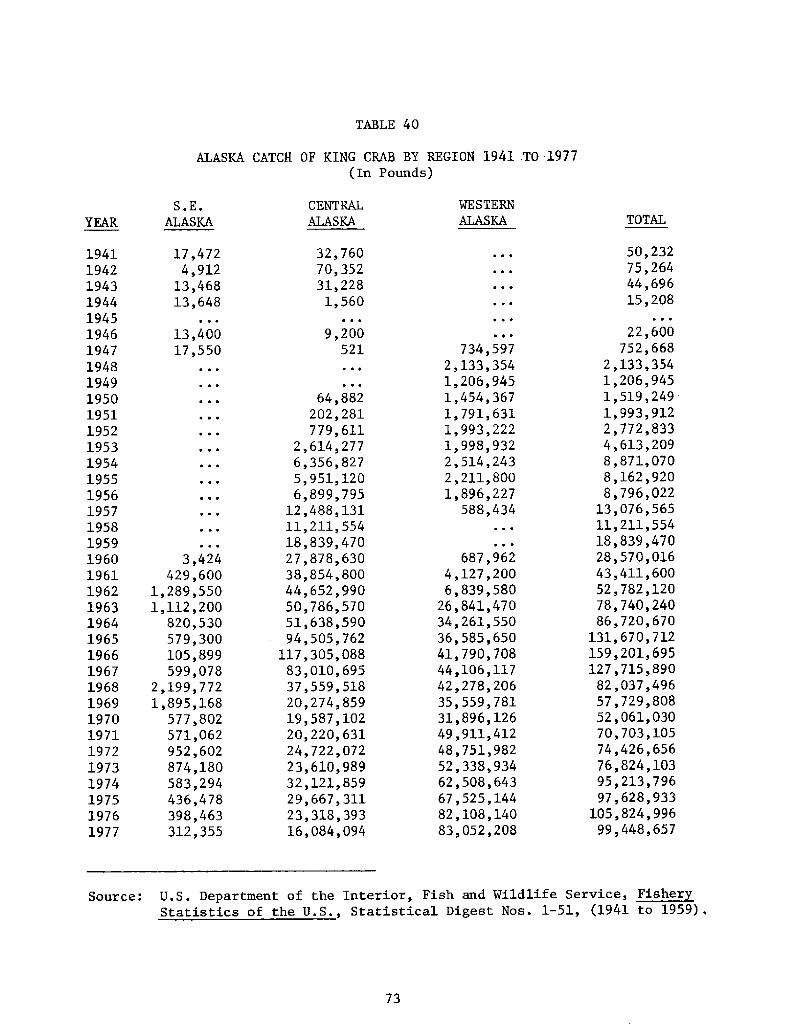
TABLE 40
ALASKA CATCH OF KING CRAB BY REGION 1941,TO 1977 In Pounds!
WESTERN
ALASKACENTRAL
ALASKAS.E.
ALASKA TOTALYEAR
17,4724,912
13,46813,648
32,76070,35231,228
1,560~ ~ ~
9,200521
~ ~ ~
13,40017,550
e ~ ~
734,5972,133,3541,206,9451,454,3671,791,6311,993,2221,998,9322,514,2432,211%8001,896,227
588,434
~ ~ ~
3,424429,600
1,289,5501,112,200
820,530579,300105,899599,078
2,199,7721,895,168
577,802571,0629529602874,180583,294436,478398,463312,355
Source: D.S. Department of the Interior, Fish end Wildlife Service, ~FisherStatistics of the U.S., Statistical Digest Nos. 1-51, �941 to 1959!,
73
1941
1942
1943
1944
1945
1946
1947
1948
1949
1950
1951
1952
1953
1954
1955
1956
1957
1958
1959
1960
1961
1962
1963
1964
1965
1966
1967
1968
1969
1970
1971
1972
1973
1974
1975
1976
1977
~ ~ e
64,882202,281779,611
2,614,2776,356,8275,951,1206,899,795
12,488,13111,211,55418,839,47027,878,63038,854,80044,652,99050,786,57051,638,59094,505,762
117,305,08883,010,69537,559,51820,274,85919,587,10220,220,63124,722,07223,610,98932,121,85929,667,31123,318,39316,084,094
~ ~ ~
687,9624,127,2006,839,580
26,841,47034,261,55036,585,65041,790,70844,106,11742,278,20635,559,78131,896,12649,911,41248,751,98252,338,93462,508,64367,525,14482,108,14083,052,208
50, 23275,26444,69615,208
~ ~ ~
22,600752,668
2,133,3541,206,9451,519,2491,993,9122,772,8334,613,2098,871,0708,162,9208,796,022
13,076,56511,211,55418,839,47028,570,01643,411,60052,782,12078,740,24086,720,670
131,670,712159,201,695127,715,890
82,037,49657,729,80852,061,03070,703,10574,426,65676,824,10395,213,79697,628,933
105,824,99699,448,657
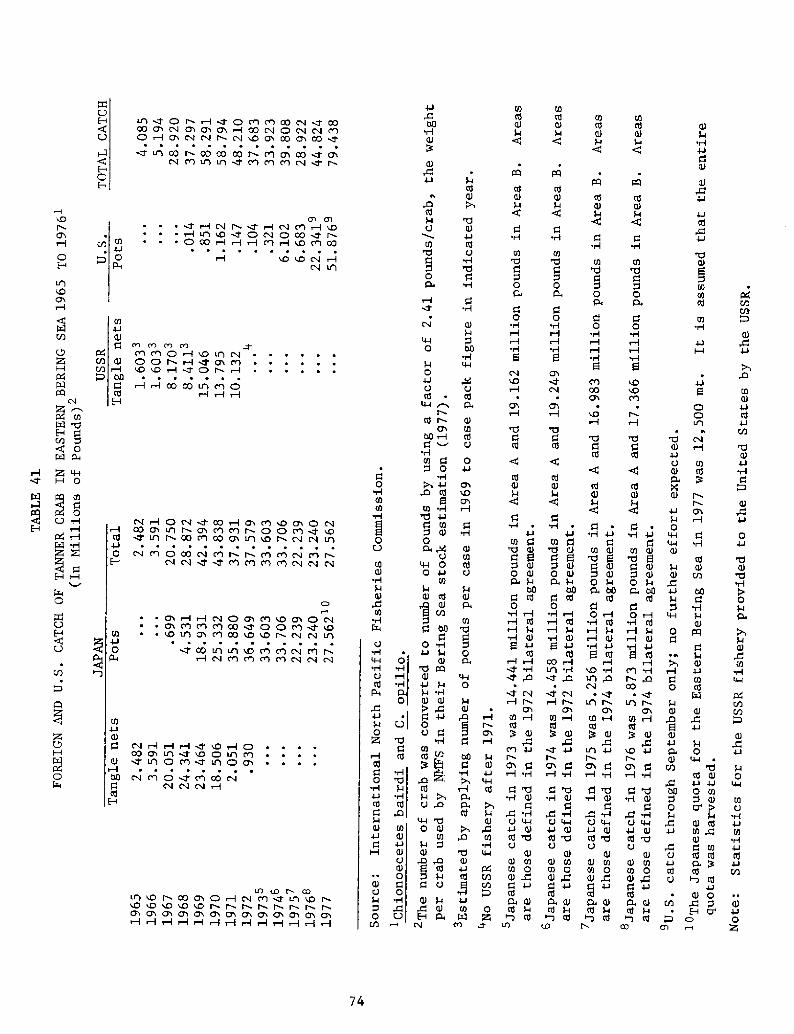
4JUl<OCOO M «h
~ ~CO
D V'cj
0 CJ
4JcdA
~ Ocfl M
'0 0a
C 0
e
C0
e
QJCY>
nWOMOOWM
~ ~ ~ ~CO QO O
R
iV
crJ0
H 0
O h.~ ~
~ ~ ~~ k ~
~ ~~ ~ CV
Ch
Ch
CV
Ch
4JeQO
Ch QJcd4JcrJ
O
ACV
0
0
OCO Ch
h QO~ ~ ~ ~
Pl O QOhl
W GOQO
~ ~
M «h
~ ~
%43 «h O CVOO0lCZ
C4 A ctl
cdQJ
bd
QJco
QJ
QJ44
0
F! '4 Ch OOOY><%'LO ~ 64 CV crl
~ ~ ~ ~
CV
~ ~CO
~ «h M~ Ch~ % crj
~ ~
O ChCOGO
~ 4
QICCI
QJ
QI Qlvj 0 V
M
O
cde
0 0cd
QJ
M
QJ
cd
QJ
cd
0
M
QJC eVMM
GO ChQJ W crl O
~ ~ ~00 e+O
CV
~ ~
'J0 M OO cll Y!
O «h~ ~ ~
QO
~ ~ ~~ ~ ~ 'Cj
QJ4J
0 MQJ
Cr'
QJ cd
05 'CI
QI0
V WQl
cd 0V
QJQJ MM 0QJ J
cdI:4 QJcd
cd
~ c4 QJ
VcU
cd MV
QJQJ MM 0QJ Acd«4 QJcd
g '«jQJ
A
IU
Ql
M 0QIC 4JcdC4 QJcd J4
eV
QI I-I
cU
QJV cU0
0
O
M ~QI
Mcd cdPcd
cd
QI 0
CO
cd
QJ
0R
cUV
0crj
OW«c!CO%<COCh Ch Ch M QO A O A CJCQ M ~ CV W Ch GO Ch CO W
~ ~ ~ ~ ~ ~ ~ ~P QOCO COh Pl «hGO M«h01 A ccl N A 01 & cV
M cV pOcVOCONW
GOMMMQlMMMGO~ ~ ~ ~ ~ ~ ~ ~ ~
W W CV
40 r <0QO «h O M CV W W cJl 4!
mmmmmr r r r r r r rCh Ch Ch Ch «h Ch Ch Ch Ch Ch Ch Ch ChMI M MI M M M M M M M M M M
0
V
W ~
00 M
M0
cde
cd'cd
MQI
0 C4 AV
W 00 4J
QJ cdQl
e v>
g bd
0
~ Q ~
M C"CJ QJc." e
Ql0 QJC4
b0
0
QJe
cd
C cV
M cdQl4J
g
IU
M gQJeQJ
0 IU
bdcd
0
cUe 4J
QjGO MI
M
QJ
g e'rt 4J
M QJeQJQJ
0«4 00
cd
0 M
QJ'e cd
M
QJ
Ch
a
cd
cdQJ
0 e
M QJ'cj eg QJ
QJ0
bdcd
0 M
QJ
e
Mcd
QJ
C 'Cj~ c4 QI
QIcd ~V
QJQJ MM 0Ql J"
C4 QJ
h cd
0
Ql
V QJC4QJ
0
cU
Ql
0 C
0
QJ
eQJ
C4QJCO
bd
0
cdV
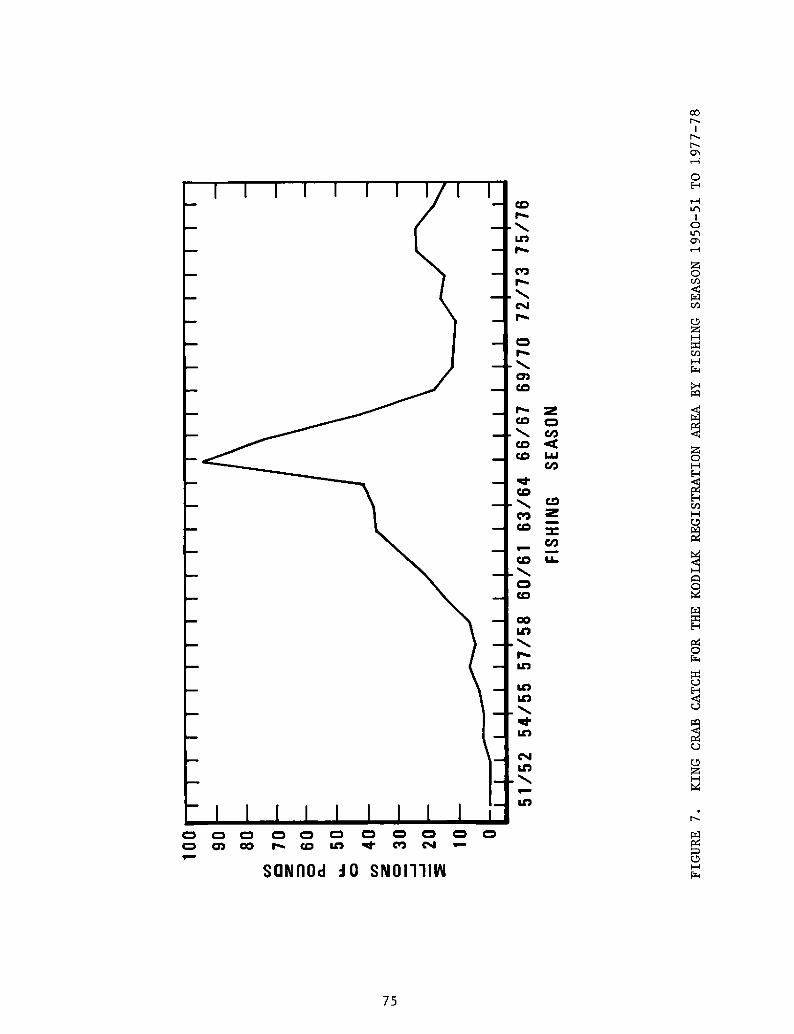
CO
CD
CP
CD
CD
a OOLD
CV
lA
o a n a o a a a n a oO Cn aO r CD n W m CV
SONAOd 30 SNOllllNI
The growing king crab industry received a severe blow in March 1964,when most of the king crab fleet and three of the four canneries weredestroyed or damaged by the tsunami caused by the earthquake. By April1965, however, four new crab processing plants had been completed, greatlyincreasing the processing capacity, and new vessels replaced those lost.The fishing seasons of 1965, 1966, and 1967 proved to be the highest catchesof king crab, both for Kodiak and all of Alaska Figure 6!.
After the peak season during 1965-66, the catch of king crab from theKodiak area declined rapidly. The abundance of large crab apparentlydecreased due to over exploitation of offshore stocks which had not beenfished previously. By 1970, the catch from the Bering Sea had increased toequal the catch from the Kodiak area as more fishing effort was shiftedwestward. As the foreign catch quotas in the Bering Sea were decreased andphased out in two-year increments, the U.S. catch rose rapidly. From 1971to the present, the catch from the Bering Sea has risen to over 78 millionpounds. During this period, the percentage contribution of the Bering Seamanagement area to the total state catch has increased dramatically. In1971, the Bering Sea harvest was 18.5 percent of the state total. By 1977,this had risen to 79.4 percent. The increasing dependence of the statefishery on the Bering Sea resource makes the king crab industry particularlysusceptible to extreme fluctuation if the stocks in the Bering Sea area arenot able to sustain the present rate of harvest. According to current MaximumSustainable Yield MSY! estimates for the Bering Sea, the current catch levelsare well within the estimated MSY. Therefore, while this increasing dependenceof the fishery on the stocks in one area could become a problem in future, itis apparently acceptable at this time.
Develo ment of the Alaska Tanner Crab Fisher
Forei n Fisher : Ja an
The Japanese began experimental fishing for tanner crab in the EasternBering Sea in 1953. The amount of production in 1953 was 170 cases, andremained at experimental levels through 1964 when 3,457 cases were pro-cessed Zahn 1970!. As a result of the implementation of quotas on theforeign king crab catch in 1965, the Japanese mothership crab fleet beganto shift fishing effort to tanner crab. The tanner crab catches in 1965and 1966 were 1.03 and 1.49 million crab, respectively, which were caughtentirely by tangle nets. After 1966, the catch was split between tanglenet and pot gear with pot gear taking an increasing percentage of the totalcatch until 1972, after which tangle nets were restricted from use. From1967 to 1970, the Japanese catch of tanner crab rose rapidly from 8.6 to18.2 million crab as the mothership operation continued to shift effort totanner crab in response to the declining king crab quotas.
A quota for tanner crab catch was included in the U.S.-Japan bilateralagreement for the first time in 1971 see Table 38!. The quota of tannercrab was initially set at 14,600,000 crab, plus an allowable margin of tenpercent, for each year of the first tready period, 1971-72. This quotawas decreased slightly during the next treaty period �973-74! to 14 millionpounds; however, the area of catch was restricted. The areas and allowable
76
catch are shown in Figure 8. During the final �975-76! treaty period,the allowable catch was set at 13,500,000 crab, or 10,200 mt, restrictedto the areas shown in Figure 9.
After 1976, with the establishment of the Fisheries Conservation andNanagement Act, the North Pacific Fishery Management Council NPFNC! tookover management and control of foreign fishing within the U.S. fisherieszone off Alaska. The Japanese quota of tanner crab for the Eastern BeringSea was originally set at 10,200 mt for 1977, with the restriction that only2,500 mt could be caught in Area A with the same boundaries as Figure 9.This catch was further restricted by species so that the catch could be madeup of a maximum of 5,100 mt of Chionocetes bairdi and the remaining 7,400 mtof C. ~oilio. After review by the BPFNC, the 10,200 mt total allowablecatch was increased to 12,500 mt despite some opposition by Alaskan fisher-men and processing companies. The additional allocation of 2.3 mt wasentirely made up of C. ~oilio. The 1970 foreign allocation was set at15,000 mt after much deliberation by the Council. This allocation islimited to C. ~oilio from the area north of BB north latitude and west of0
167 west longitude.0
The amount of foreign allowable catch of C. ~oilio from the Bering geavill continue to be determined by the NPFNC each year as part of the manage-ment plan for tanner crab. The allowable catch will probably remain similarto the 1978 amount for at least a couple of years. At present there is nota great deal of interest by the domestic fishery in the C. ~o ilia resourcein the area the Japanese are presently fishing. It is possible that thesituation could change in the future as the domestic industry developsmarkets for this species. The Japanese allocation of C. ~o ilia, therefore,is subject to decrease, assuming that the domestic industry participation inthis fishery is increased.
A graph of the Japanese catch of tanner crab in waters off Alaska, com-pared with the USSR and U.S. catches, is shown in Figure 10.
Foreign Fisher : USSR
In the same manner as the Japanese, the Soviet mothership crab fleetbegan to shift fishing effort to tanner crab as the quotas were establishedfor king crab. The Soviet catch followed the same pattern as the Japanesecatch, though at a lower total catch Figure 10 and Table 41!. The catchfor the first two years of harvest, 1965 and 1966, was 665,000 crab duringeach year. This amount increased to 3.39 million crab in 1967 and 3.49million crab in 1968. After 1969, tanner crab was included in the U.S.-USSRbilateral treaty Table 38!, with the quota being set at 40,000 cases for theoriginal period, 1969-70. The catch for these two years marked the peakharvest level for the Soviet tanner crab fishery in the Eastern Bering Seaat 6,243,000 and 5,724,000 crab, respectively. The quota was reduced to35,000 cases for 1971 and 1972.3 The catch in 1971 was 4,204,000 crab.
3The drained weight of crab meat in a 48 can case of one-half poundcans is 19.5 pounds. At an average recovery factor of 15 percent, thismeans that each case requires 130 pounds of crab round weight.
77

FIGURE 8. AREAS AND CATCH QUOTAS FOR 1973 AND 1974 ESTABLISHED FOR JAPANESEKING AND TANNER CRAB FISHING IN THE EASTERN BERING SEA BY THEU.S.-JAPAN AGREEMENT OF DECEMBER 1972
78
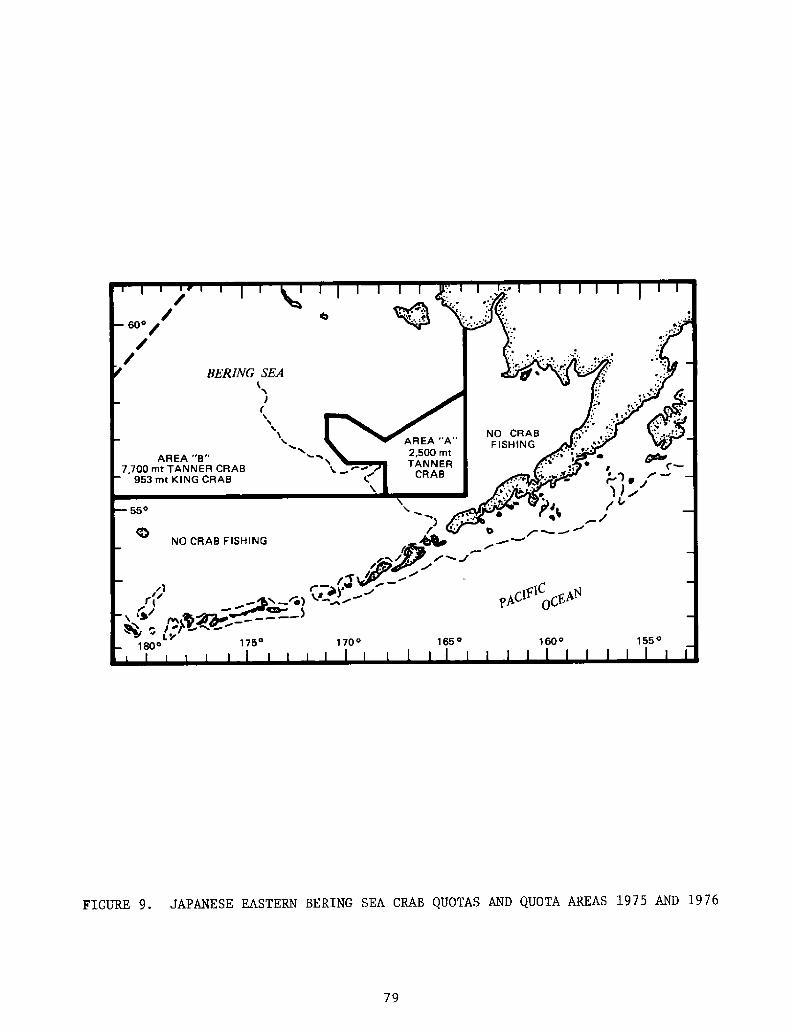
FIGURE 9. JAPANESE EASTERN BERING SEA CRAB QUOTAS AND QUOTA AREAS 1975 AND 1976
79
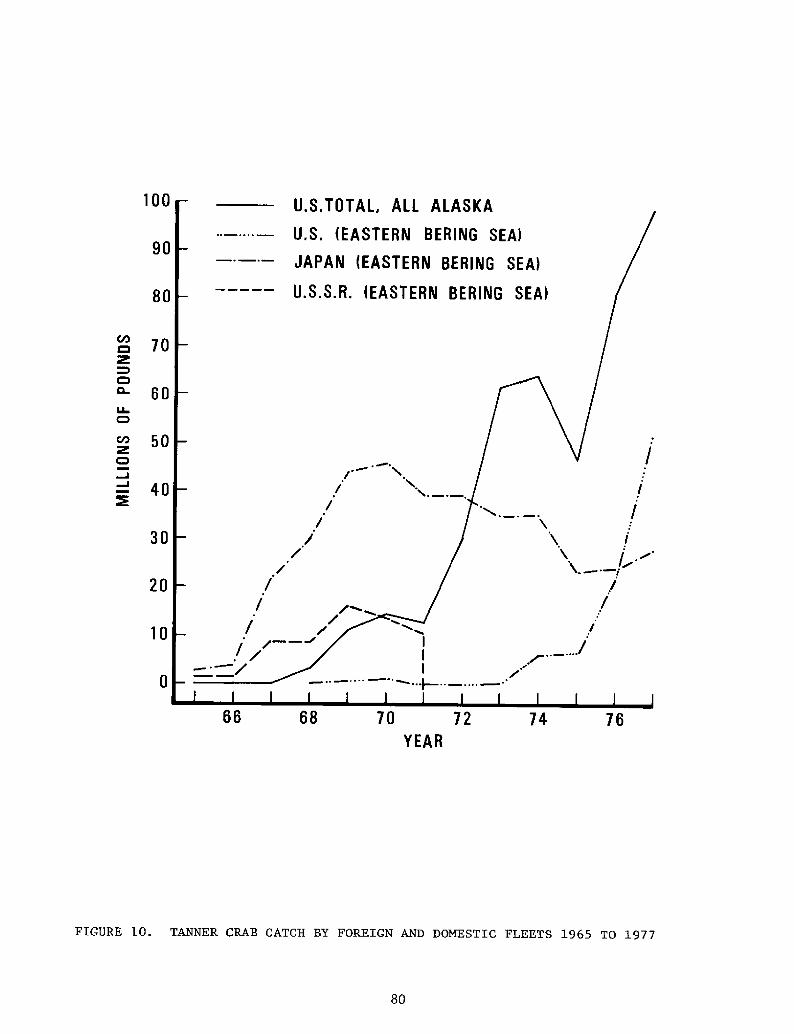
100
90
80
70
C!
60
CD
g 50C!
40
30
20
10
68 70 72 74 76
YEAR
80
FIGURE 10. TANNER CRAB CATCH BY FOREIGN AND DOMESTIC FLEETS 1965 TO 1977
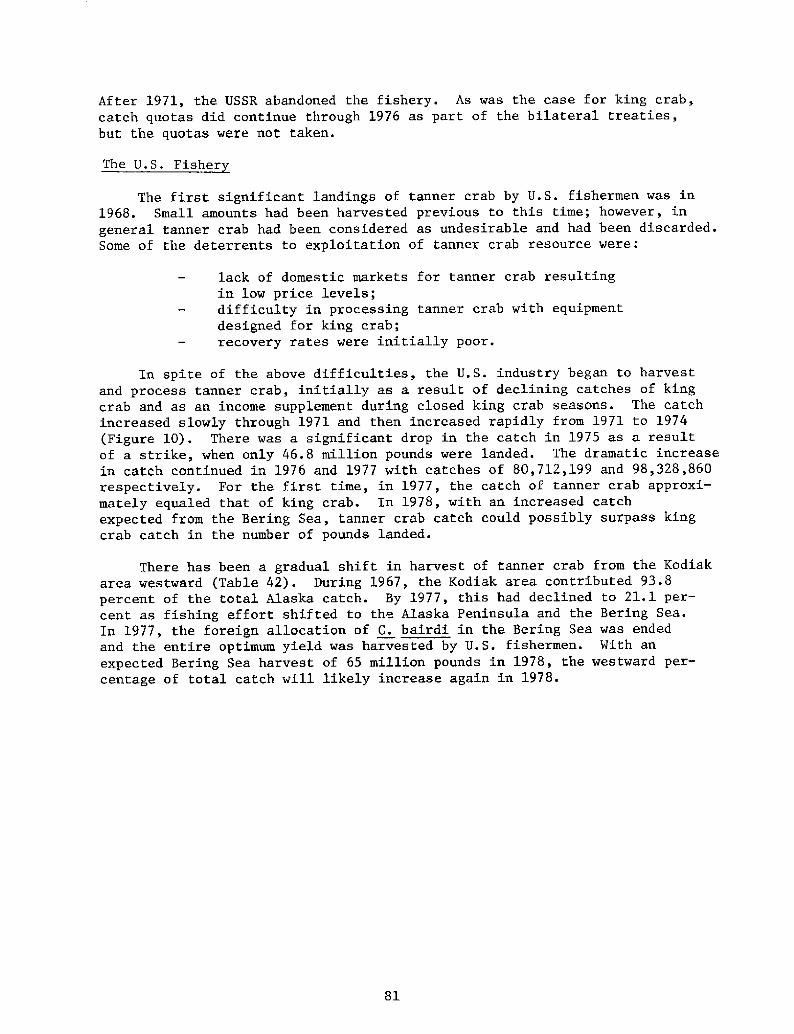
After 1971, the USSR abandoned the fishery. As was the case for king crab,catch quotas did continue through 1976 as part of the bilateral treaties,but the quotas were not taken.
The U.S. Fisher
The first significant landings of tanner crab by U.S. fishermen was in1968. Small amounts had been harvested previous to this time; however, ingeneral tanner crab had been considered as undesirable and had been discarded.Some of the deterrents to exploitation of tanner crab resource were:
lack of domestic markets for tanner crab resultingin low price levels;difficulty in processing tanner crab with equipmentdesigned for king crab;recovery rates were initially poor.
In spite of the above difficulties, the U.S. industry began to harvestand process tanner crab, initially as a result of declining catches of kingcrab and as an income supplement during closed king crab seasons. The catchincreased slowly through 1971 and then increased rapidly from 1971 to 1974 Figure 10!. There was a significant drop in the catch in 1975 as a resultof a strike, when only 46.8 million pounds were landed. The dramatic increasein catch continued in 1976 and 1977 with catches of 80,712,199 and 98,328,860respectively. For the first time, in 1977, the catch of tanner crab approxi-mately equaled that of king crab. In 1978, with an increased catchexpected from the Bering Sea, tanner crab catch could possibly surpass kingcrab catch in the number of pounds landed.
There has been a gradual shift in harvest. of tanner crab from the Kodiakarea westward Table 42!. During 1967, the Kodiak area contributed 93.8percent of the total Alaska catch. By 1977, thi.s had declined to 21. 1 per-cent as fishing effort shifted to the Alaska Peninsula and the Bering Sea.In 1977, the foreign allocation of C. bairdi in the Bering Sea was endedand the entire optimum yield was harvested by U.S. fishermen. With anexpected Bering Sea harvest of 65 million pounds in 1978, the westward per-centage of total catch will likely increase again in 1978.
81
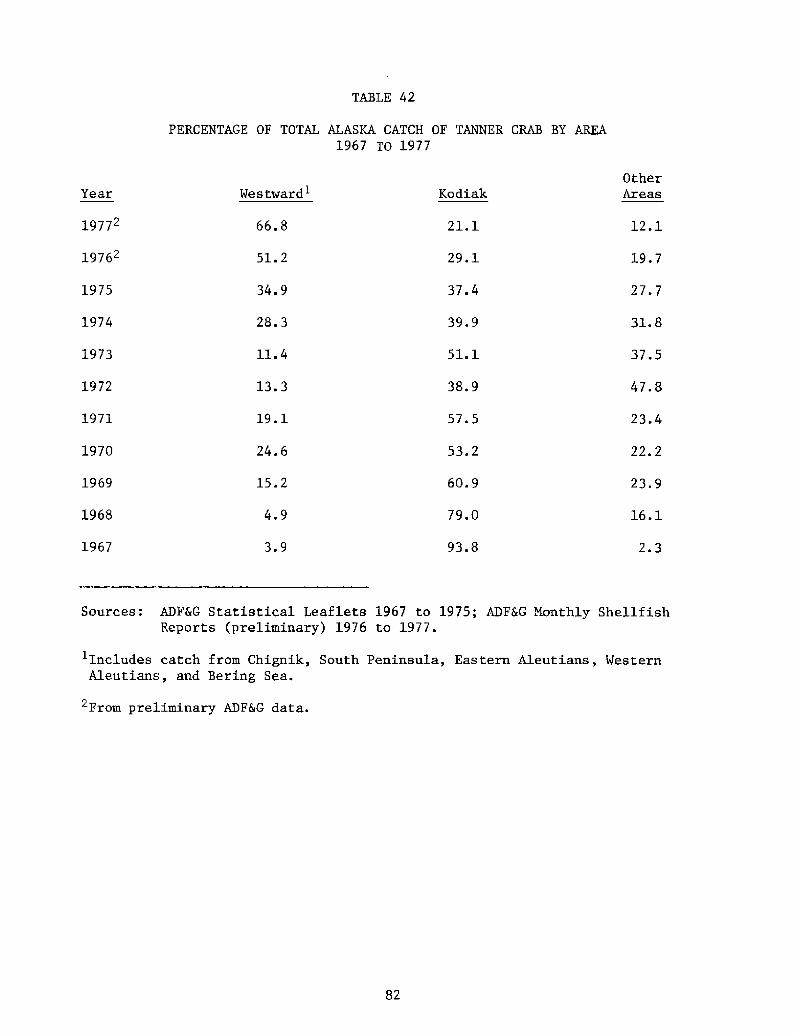
TABLE 42
PERCENTAGE OF TOTAL ALASKA CATCH OF TANNER CRAB BY AREA
1967 TO 1977
Other
AreasWes tward ~ KodiakYear
1977 66.8 21. 1 12. 1
1976~ 51. 2 29. 1 19.7
1975 37.434.9 27. 7
1974 28.3 39.9 31. 8
11. 41973 51. 1 37. 5
1972 13. 3 38. 9 47 ~ 8
1971 19.1 57.5 23.4
1970 24.6 53. 2 22. 2
1969 15.2 60.9 23.9
1968 4.9 79.0 16.1
1967 3.9 93. 8 2.3
Includes catch from Chignik, South Peninsula, Eastern Aleutians, WesternAleutians, and Bering Sea.
From preliminary ADF&G data.
82
Sources: ADF&G Statistical Leaflets 1967 to 1975; ADF&G Nonthly ShellfishReports preliminary! 1976 to 1977.
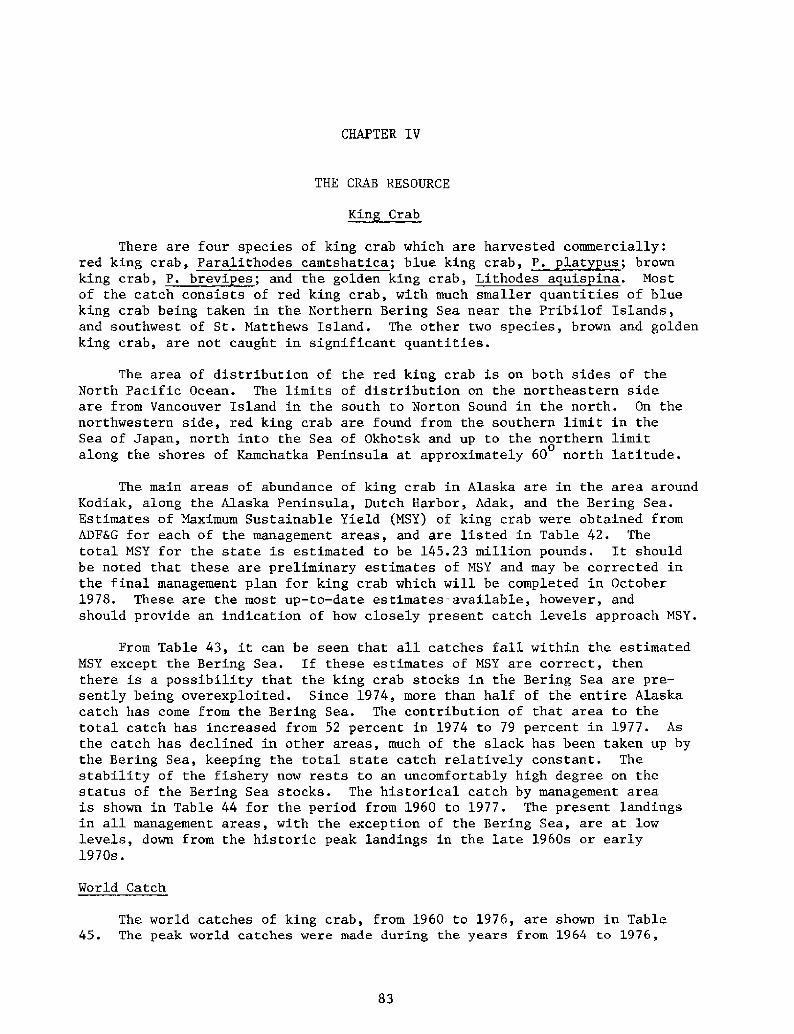
CHAPTER IV
THE CRAB RESOURCE
There are four species of king crab which are harvested commercially:
of the catch consists of red king crab, with much smaller quantities of blueking crab being taken in the Northern Bering Sea near the Pribilof Islands,and southwest of St. Matthews Island. The other two species, brown and goldenking crab, are not caught in significant quantities.
The area of distribution of the red king crab is on both sides of theNorth Pacific Ocean. The limits of distribution on the northeastern side
are from Vancouver Island in the south to Norton Sound in the north. On the
northwestern side, red king crab are found from the southern limit in theSea of Japan, north into the Sea of Okho"sk and up to the northern limit
0along the shores of Kamchatka Peninsula at approximately 60 north latitude.
The main areas of abundance of king crab in Alaska are in the area aroundKodiak, along the Alaska Peninsula, Dutch Harbor, Adak, and the Bering Sea.Estimates of Maximum Sustainable Yield MSY! of king crab were obtained fromADF6G for each of the management areas, and are listed in Table 42. Thetotal MSY for the state is estimated to be 145.23 million pounds. It shouldbe noted that these are preliminary estimates of MSY and may be corrected inthe final management plan for king crab which will be completed in October1978. These are the most up-to-date estimates-available, however, andshould provide an indication of how closely present catch levels approach MSY.
From Table 43, it can be seen that all catches fall within the estimatedMSY except the Bering Sea. If these estimates of MSY are correct, thenthere is a possibility that the king crab stocks in the Bering Sea are pre-sently being overexploited. Since 1974, more than half of the entire Alaskacatch has come from the Bering Sea. The contribution of that area to thetotal catch has increased from 52 percent in 1974 to 79 percent in 1977. Asthe catch has declined in other areas, much of the slack has been taken up bythe Bering Sea, keeping the total state catch relatively constant. Thestability of the fishery now rests to an uncomfortably high degree on thestatus of the Bering Sea stocks. The historical catch by management areais shown in Table 44 for the period from 1960 to 1977. The present landingsin all management areas, with the exception of the Bering Sea, are at. lowlevels, down from the historic peak landings in the late 1960s or early1970s.
World Catch
The world catches of king crab, from 1960 to 1976, are shown in Table45. The peak world catches were made during the years from 1964 to 1976,
83
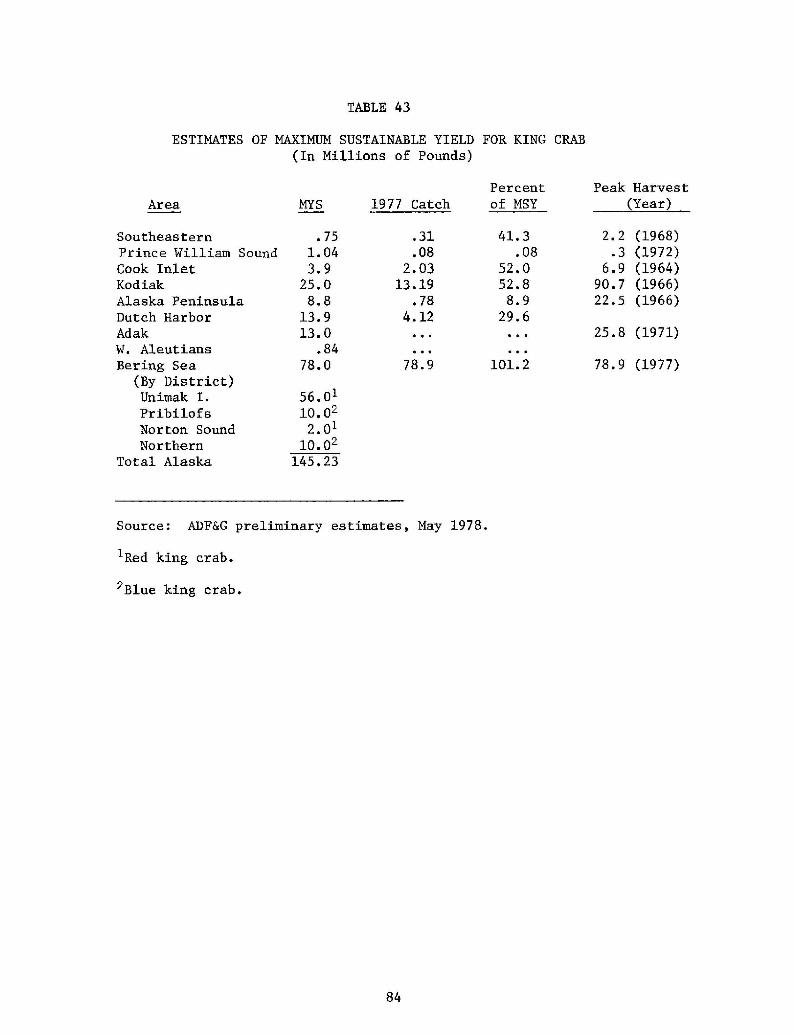
TABLE 43
ESTIMATES OP MAXIMUM SUSTAINABLE YIELD POR KING CRAB
In Millions of Pounds!
Peak Harvest
Year!Percent
of MSY1977 CatchArea MYS
2. 2 �968!.3 �972!
6.9 �964!90.7 �966!22.5 �966!
41. 3
.08
52.0
52.8
8.9
29.6
.31
.08
2. 03
13. 19
~ 78
4. 12
25.8 �971!
78.9 �977!~ ~ ~
101. 2
~ ~ ~
78. 9
56.0i10. 0~
2. Oj10.02
145.23
Source: ADF6G preliminary estimates, May 1978.
~Red king crab.
~Blue king crab.
84
Southeastern
Prince William Sourd
Cook Inlet
Kodiak
Alaska Peninsula
Dutch Harbor
Adak
W. Aleutians
Bering Sea By District!
Unimak I.
Pr ibilo f s
Norton Sound
Northern
Total Alaska
.75
1.04
3.9
25. 0
8.8
13. 9
13 ~ 0.84
78.0
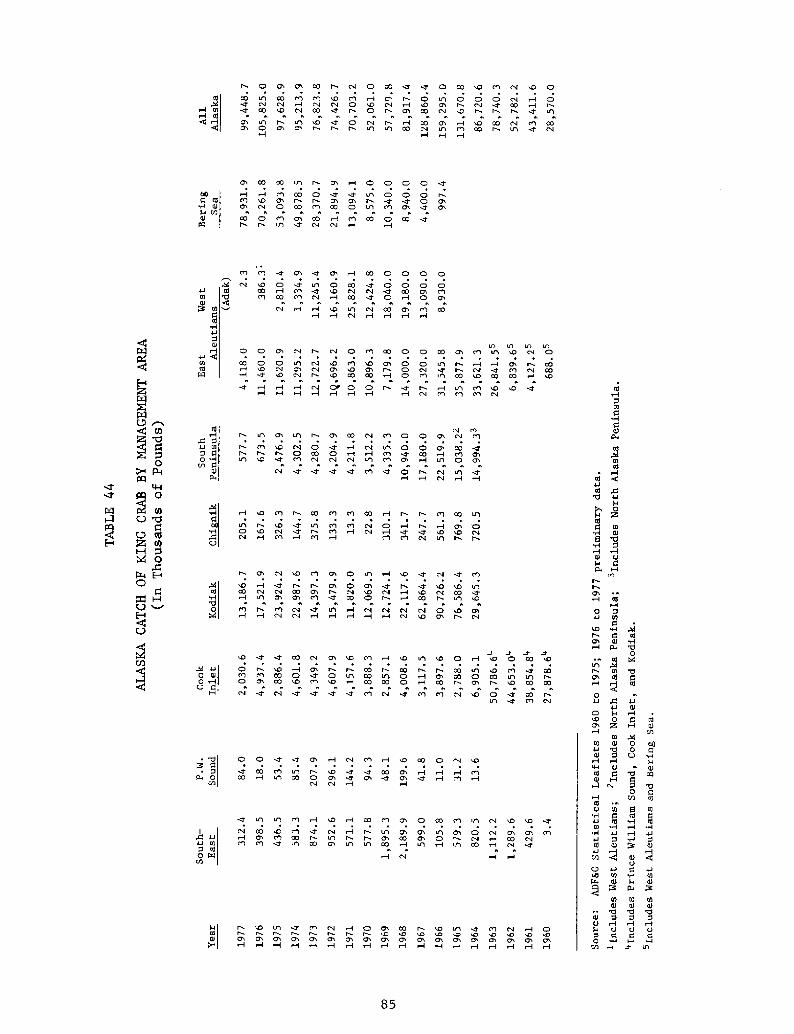
CD I/I CONCO
Ch I/I ICh O
N 0
0
0 r o0 P Ch CO NN r W co crI/1 CO N I/I
NN COI/1Ch
O N 4 OCQ W N
CO N M CQh I/c N N
0 0
CO
cdA IO
Ch CfCQ O
N
c/I O 0 0 N0 ChU1 M Ch W Ch
CO 0 CQ
CQ 0Ch PCh N 0 COIO 0 M Ch cOVl N N
0 MCDI/I 0 COt0 NN H CO
I/IN
0 0 0CO OlO ChCh Pl CO
ON O*N CO
IJdl I/I
IdIJal
u <cd
N 0
CQOa O
CO O 0N Ch 0 00 N0
N
«hCO CO
COCO'0ch ICQO
COlrl
CV0 N M
O
NO N
N0 CO 0 0 «0Ch0
Ql CO Ch0alN
CO N c pN CQ ChCft CII PlNN
0 N COI/I
N0 rN
rCO
N NN IO
CQ
O
O H IO 0 COCO N Ch 10 M H IQ I/I
0LI
0 aldlII-IcdIU
O0 O ChN
CO 0CO CCI I/1
O I/1
COCQcOI CQal O0N
ChCOCQ tllCO OI ChN
COhCO CDCOPl
A IJ0 dr0CJlu
N CO U1 OlCOCON
I/I0 OI/1
N CQNu tatd
0cQ
r IOl ChM NCh O Ch M N
Ch
85
C3 ~ m 0
ra 3wO M
U PoCo CJ
A o
O AM
0 ch ch co I N o co c c o co tQ pl N 4 0
Ch OO CQ t/I r Ch A 0 0 0 0
Ch 4 Ch 6 CO 0 0 0 0
0 0 ch N f N 0 Pl CQ 0 0 cO
r Ill 0 t/I r Ch CO N M 0 0
Pl N CO Pl M CO W h C M CO I/1r c0 N I/1 ch Pl N 0 H h A ch OO 'J3 N C N M H N R C 4 IQ IQ NPl r
Ch N tO M Ch 0 Ifl H tO < N < Pl
O O N < Ch H N M H aD cO O NCO M I/I N tO < < CO Ch H H ca plCO H Ifl CO O Ch < Ch N Ch < H MN N
I/1 I/1 M + IQ H CO M Ch 0 CQ Pl Vl N tQ
JJal
cd
0 8 alr-4
0
r Ch
td
0
A 0 CUIJ0
lu ajal
dr
al
A A 0z hJ
c4
catd
IU
92dCU
arcd
tf
JJCU0
A 0 0
'0 0 8cd
CUcf
tJ
altU
t4
0 CU'0 0 Itl
JJIU
al
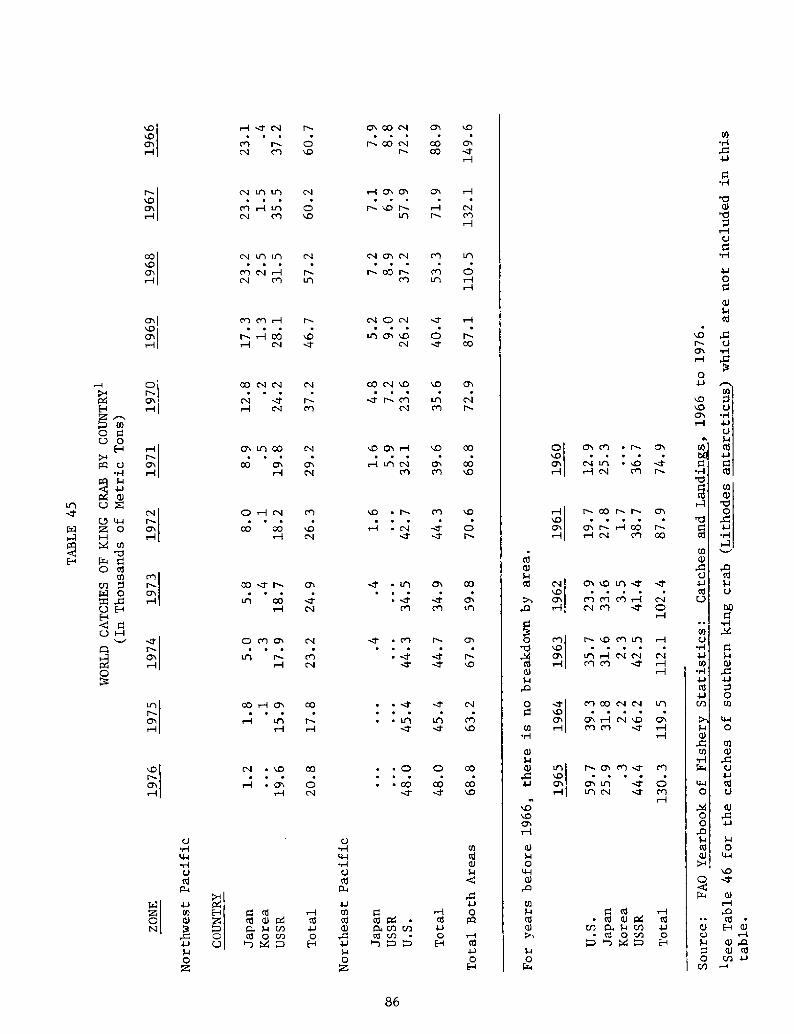
~ ' ~O
GO CV Ch~ ~ 4
GO M GOGO
W Ch Ch
r
CV~ ~
O
c4~ ~
CO O
CV~ ~ ~
CV 0 C
O CQ~ ~ ~
Ch& O~ ~ ~
r WCON
0
Ch
A
GO CV~ ~ ~
ChGO N~ ~ ~
O Ch~ ~
ChH CV
~ ~~ N Ch~ ~
QI
0~ P Ccl~ ~ ~
~ CV O
QI
O cdcdQI
ChCV
cd
O
~ ~ ~CO
~ ~ ~IXl GO
A C 4J0
0CQ
O IG
CO
~ ~CV
~ ~ ~
~ ~
i O~ ~~ GO
~ ~O M
O CO
A 0 00W
QI
0W QI
O QI0CG
0 0cdcd QI
cd 0
cd C4 ~C4 CIJ COcd CG ~
0
86
Ch
O0
O
o 8
W0cd
0CG
CO0
O
I � I
O
CGO QIM
OO
GO CV~ ~
GO Ch Ch
OWN~ ~ ~
CO CON
O WCh~ ~ ~
r I c4
CO W Ch GO~ 0 ~
s-I
CV ~ M CO~ ~
~ Ch O
cdM W Q!V3 0
0z
CO ~ M ChuD ~ ~ ~ ~ ~
Ch M W COCV M GO
M r4Cd e-I Ccl MQI
0 < ccl CO hl CQg ~ ~ ~ ~
�CQ~ 6
QI
QI ~ o
ccl cV
C.'~ cd Q! CC cd
CO 0 I-I CO~ cd 0 M 0
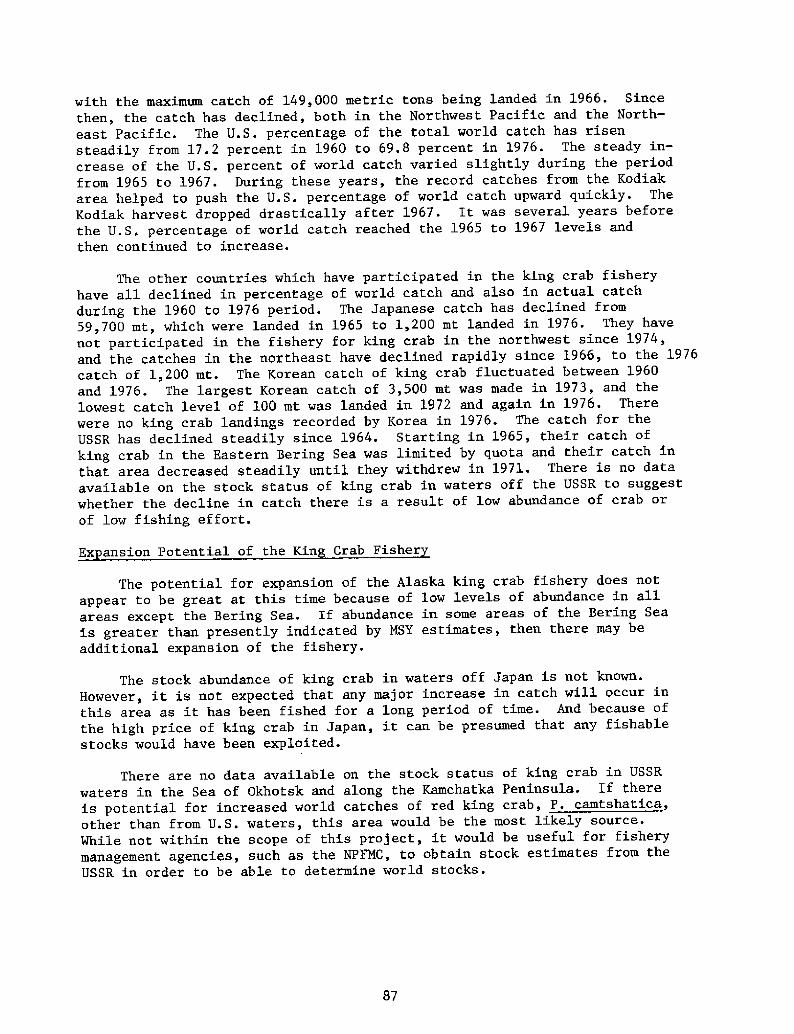
with the maximum catch of 149,000 metric tons being landed in 1966. Sincethen, the catch has declined, both in the Northwest Pacific and the North-east Pacific. The U.S. percentage of the total world catch has risensteadily from 17.2 percent in 1960 to 69.8 percent in 1976. The steady in-crease of the U.S. percent of world catch varied slightly during the periodfrom 1965 to 1967. During these years, the record catches from the Kodiakarea helped to push the U.S. percentage of world catch upward quickly. TheKodiak harvest dropped drastically after 1967. It was several years beforethe U. S. percentage of world catch reached the 1965 to 1967 levels andthen continued to increase.
The other countries which have participated in the king crab fisheryhave all declined in percentage of world catch and also in actual catchduring the 1960 to 1976 period. The Japanese catch has declined from59,700 mt, which were landed in 1965 to 1,200 mt landed in 1976. They havenot participated in the fishery for king crab in the northwest since 1974,and the catches in the northeast have declined rapidly since 1966, to the 1976catch of 1,200 mt. The Korean catch of king crab fluctuated between 1960and 1976. The largest Korean catch of 3,500 mt was made in 1973, and thelowest catch level of 100 mt was landed in 1972 and again in 1976. Therewere no king crab landings recorded by Korea in 1976. The catch for theUSSR has declined steadily since 1964. Starting in 1965, their catch ofking crab in the Eastern Bering Sea was limited by quota and their catch inthat area decreased steadily until they withdrew in 1971. There is no dataavailable on the stock status of king crab in waters off the USSR to suggestwhether the decline in catch there is a result of low abundance of crab orof low fishing effort.
Ex ansion Potential of the Kin Crab Pisher
The potential for expansion of the Alaska king crab fishery does notappear to be great at this time because of low levels of abundance in allareas except the Bering Sea. If abundance in some areas of the Bering Seais greater than presently indicated by NSY estimates, then there may beadditional expansion of the fishery.
The stock abundance of king crab in waters off Japan is not known.However, it is not expected that any major increase in catch will occur inthis area as it has been fished for a long period of time. And because ofthe high price of king crab in Japan, it can be presumed that any fishablestocks would have been exploited.
There are no data available on the stock status of king crab in USSRwaters in the Sea of Okhotsk and along the Kamchatka Peninsula. If thereis potential for increased world catches of red king crab, P. camtshatica,other than from U.S. waters, this area would be the most likely source.While not within the scope of this project, it would be useful for fisherymanagement agencies, such as the NPFMC, to obtain stock estimates from theUSSR in order to be able to determine world stocks.
87
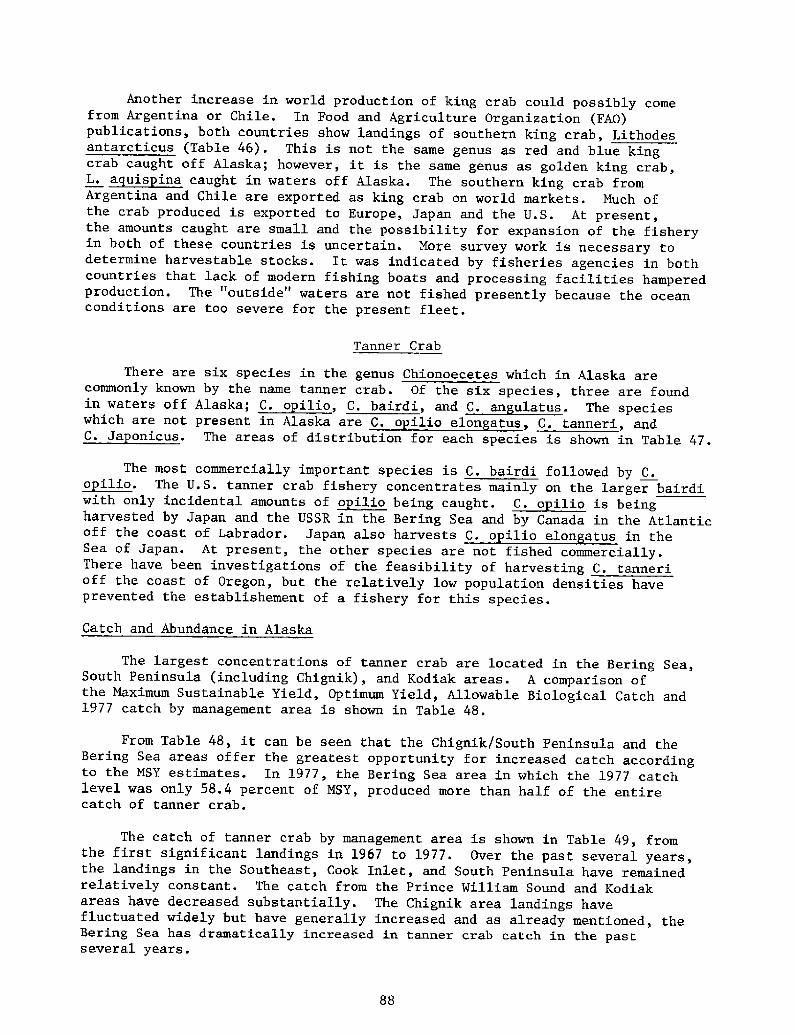
Another increase in world production of king crab could possibly comefrom Argentina or Chile. In Food and Agriculture Organization FAO!publications, both countries show landings of southern king crab, Lithodesantarcticus Table 46!. This is not the same genus as red and blue kingcrab caught off Alaska; however, it is the same genus as golden king crab,L. ~auis ina caught in waters off Alaska. The southern king crab fromArgentina and Chile are exported as king crab on world markets. Much ofthe crab produced is exported to Europe, Japan and the U.S. At present,the amounts caught are small and the possibility for expansion of the fisheryin both of these countries is uncertain. Nore survey work is necessary todetermine harvestable stocks. It was indicated by fisheries agencies in bothcountries that lack of modern fishing boats and processing facilities hamperedproduction. The "outside" waters are not fished presently because the oceanconditions are too severe for the present fleet.
Tanner Crab
There are six species in the genus Chionoecetes which in Alaska arecommonly known by the name tanner crab. Of the six species, three are found
which are not present in Alaska are C. o ilio elon atua, C. tanneri, andC J i . The areas of distribution for each species is shown in Table 47.
The most commercially important species is C. bairdi followed by C.~o ilio. The b.rg. tanner crab fishery concentrates mainly on the larger bairdiwith only incidental amounts of ~o ilio being caught. ~t. o ilio is beingharvested by Japan and the USSR in the Bering Sea and by Canada in the Atlanticoff the coast of Labrador. Japan also harvests C. o ilio elon atus in theSea of Japan. At present, the other species are not fished commercially.There have been investigations of the feasibility of harvesting C. tannerioff the coast of Oregon, but the relatively low population densities haveprevented the establishement of a fishery for this species.
Catch and Abundance in Alaska
The largest concentrations of tanner crab are located in the Bering Sea,South Peninsula including Chignik!, and Kodiak areas' A comparison ofthe Maximum Sustainable Yield, Optimum Yield, Allowable Biological Catch and1977 catch by management area is shown in Table 48.
From Table 48, it can be seen that the Chignik/South Peninsula and theBering Sea areas offer the greatest opportunity for increased catch accordingto the MSY estimates. In 1977, the Bering Sea area in which the 1977 catchlevel was only 58.4 percent of MSY, produced more than half of the entirecatch of tanner crab.
The catch of tanner crab by management area is shown in Table 49, fromthe first significant landings in 1967 to 1977. Over the past several years,the landings in the Southeast, Cook Inlet, and South Peninsula have remainedrelatively constant. The catch from the Prince William Sound and Kodiakareas have decreased substantially. The Chignik area landings havefluctuated widely but have generally increased and as already mentioned, theBering Sea has dramatically increased in tanner crab catch in the pastseveral years.
88
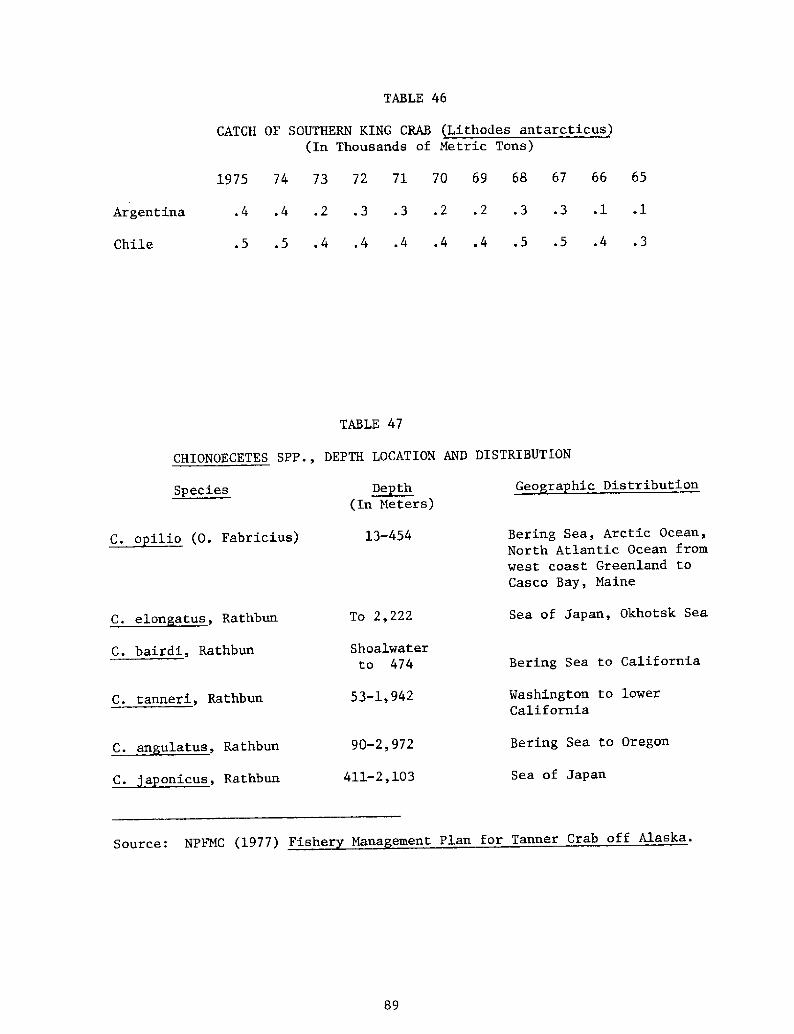
TABLE 46
CATCH OF SOUTHERN KING CRAB Lithodes antarcticus! In Thousands of Metric Tons!
1975 74 73 72 71 70 69 68 67 66 65
.4 .4 .2 .3 .3 .2 .2 .3 .3 .1 .1
.5 .5 .4 .4 .4 .4 .4 .5 .5 .4 .3
TABLE 47
CHIONOECETES SPP., DEPTH LOCATION AND DISTRIBUTION
Geo ra hic DistributionSpecies
~C. o ilia �. Pabricius!
Sea of Japan, Okhotsk SeaTo 2,222Rathbun
C. bairdi, Rathbun Shoalwater
to 474 Bering Sea to California
Washington to lowerCalifornia
53-1, 942C. tanneri, Rathbun
Source: NPFMC �977! Fisher Mana ement Plan for Tanner Crab off Alaska.
89
Argentina
Chile
Rathbun
Rathbun
In Meters!
13-454
90-2, 972
411-2,103
Bering Sea, Arctic Ocean,North Atlantic Ocean fromwest coast Greenland toCasco Bay, Maine
Bering Sea to Oregon
Sea of Japan
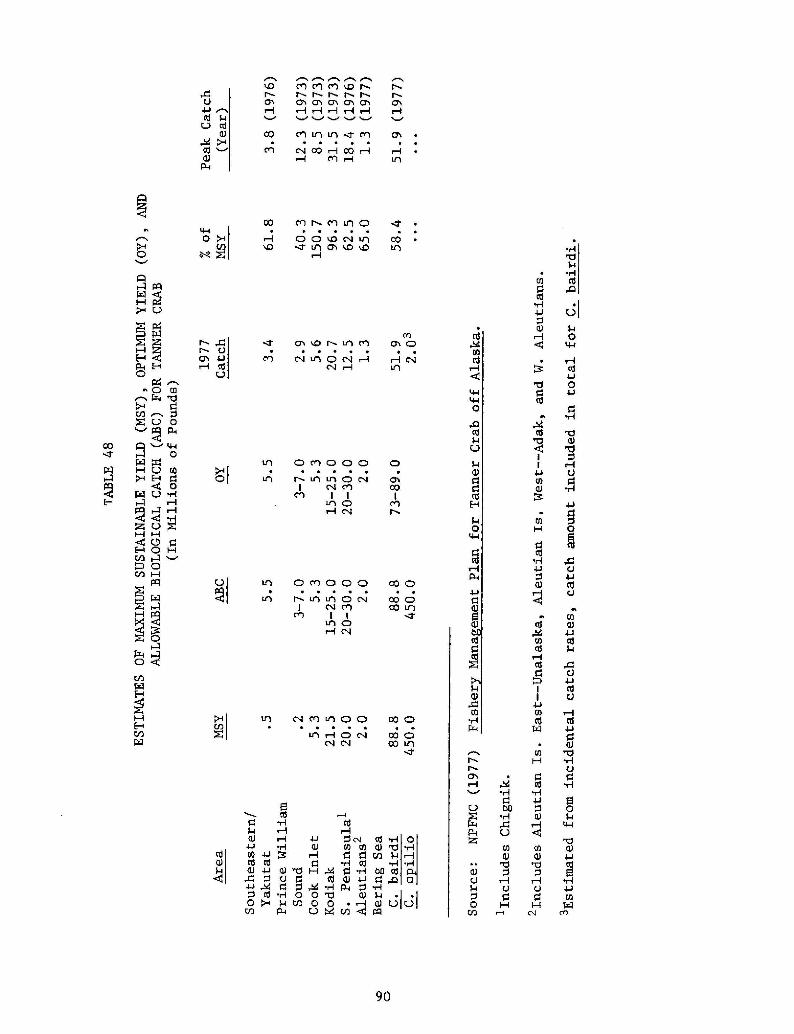
Ch M Chcj
O cddj
cd«jjOr
CQ
P1
F1~ ~ ~ ~
O O «0 hJ~ ~
O
Ch O~ ~CJ
cd'U
~ ~ ~ ~ ~CV ««l O Q
C4O
0 m
ccjg C3 0
A ~&0
MM dj
0
OM W
0 MCQ
OCA M
W L40
cd
O cn O a O~ ~ ~ ~ ~
Ul c«l O
I I««l a
a ChCQ I
04-I
uf n Oc«lOOO~ ~ ~ ~
a
I I««l OM cV
Ia
Q 0
«U
8 0
'a dj
8 cd
m
M cddj
«jj'0
A djj~ 8 dj
M
I«jj W 4J
«jjR
cd g«U W dj'0M&
cd~A 5 5A
c«j 6 0 00 Q 4 ccj 0 0N W a
g r4«jj 4JC4
«Lj
ca 4e ulo
90
Ch ~~ ~ ~ ~ ~ ~ ~
«Q W CO & W ~
AmjAOO cOO«cj ~ ~ ~ ~ ~ 0
RONccjoGQ
cd
dj
A cd'0 I I«IJ
M cd
cd
A «dII
cd
'0 cd
O 0
4J0 0dj
cj
0 g 0 V~ 92
cd
cJ4Jcdcj
cd
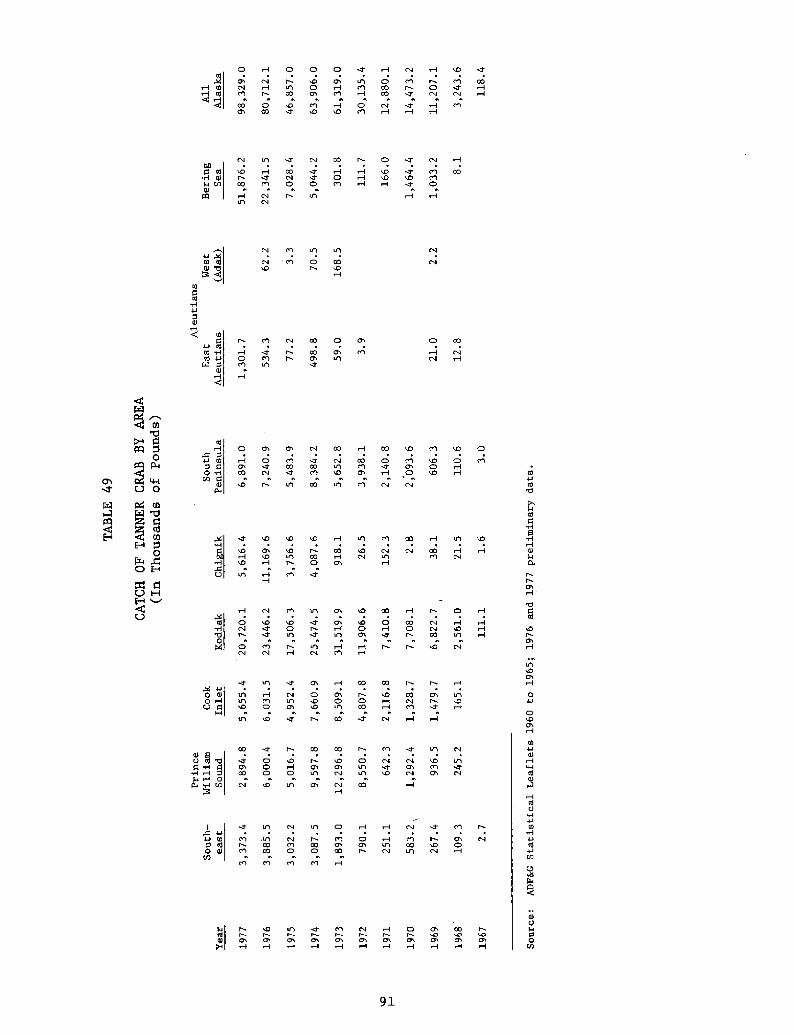
O rW O O OCh N t IO Ch rCIul N rW UI OCC ch r cO chCO 0 IO Ch W 0Ch CO
0 Crl N Crl COCO r 0CO
N IClCNg Cl
CO5CO Vl
P Ch N CO O
O M COCO Nul
NCO ul
CO
CO O CrlCh W OPl
IO O ChO
CC
We4r4 l
I COCD 6 N0 ChN COrrl N
H
NAIO 0 IO uDN «C Oul0 0 Cr!
N
Chr- W OICl Ol
N
0 CO N0 NCO IflI r«rO N
O ClO rW IO ch IrlN
N
ICtuCl
Cl
OIrlN ul
CO
O 0CD 0N
ChO IrlIrl Ch
N IO IClCr1N Ch Ng W 4
4W OM
IC
W CCnl
CuCJ ul ChIC0 ClCG
ICI N ul O.ul NCO CrlCO O
Ch
C«M OCO Ch ChO CCI PChIrl CO rO O
V OCO
rOlNr w rCh
0 Ch CDr Ch
91
tulc rll
IC
«g altuIC WIC 4J
Cl
IC
F40
O 0
PC
A0
Q
CO W W W IO W C«I CD0 r4O O Crl ru + N OIfl
P CD Ch Crl0 Ch I aICI
O Ch Ch N CD W CO rO Ch IO O
I/I 6 N O Ol I«ICI rO 0 0rO 0 Ch IO rCI COIrl Io «C M cD
co N t cD co N Co N uI N

Noxld Catch
The total world catch of tanner crab, for both C. baixdi and C.~oilio is shown in Table 50. The catch is divided into the three majorareas of catch, in the Northwest Pacific, Northeast Pacific, and NorthwestAtlantic. The catch from the Northwest. Pacific made by Japan and the USSRhas declined since 1968 ' Some of the decxease of the Japanese fishery wasmade up by the catches in the Northeast Pacific; however, these have beenreduced by quotas since that time. The major increase in percentage ofworld production has been made by the U.S. As the Japanese tanner crabfishery was reduced in the Bexing Sea, the domestic catch developedquickly. In 1976, the U.S. produced 50s3 percent of the total world supply.The catch of ~C. o ilio made by Canada has remained fairly steady. It isunlikely that Canadian production will experience a major increase in thenear future because processing is done entirely by hand, which is an effectivelimit to increasing supply.
Data on stock abundance for tanner crab for countries other than the
U.S. are not available. It is assumed that catch rates are an indication of
abundance in lieu of stock abundance data.
Ex ansion Potential of the Tanner Crab Fisher
The greatest potential increase for expansion of the tanner cxab fisheryin Alaska is in the Bering Sea. The stocks of C. bairdi from that area areestimated to be capable of withstanding the current or increased level ofharvesting for several years. However, crab from the small year classes inthe mid 1960s wi 11 be entering the fishery in the early 1980s Somexton andLow 1977!. A smaller number of crab available for harvest can be expectedduring this period. The fishery can be expected to shift effort to thesmaller species, ~C. o ilio, to continue production levels. Dp through 1977,there had not been significant interest shown by domestic fishermen andprocessors in ~C. o ilio. In early 1978, however, at least one processingcompany in Dutch Harbor requested deliveries of ~C. o ilio from fishermen andprocessed one million pounds before the end of the season. If the marketingof this product is successful, the domestic fishing effort for ~C. o iliacould increase rapidly during the next several years.
The dungeness crab was not one of the species included in this studybecause of the low landings over the past several years. Most of the crabprocessing companies in the state expressed little interest in processingdungeness crab because of low market prices. In May 1978, however, one ofthe processing companies in Kodiak started taking deliveries of dungeness,paying 60 cents per pound, and expects to process approximately one millionpounds during the year. If market conditions improve for dungeness crab,production again may become more significant in the future.
92
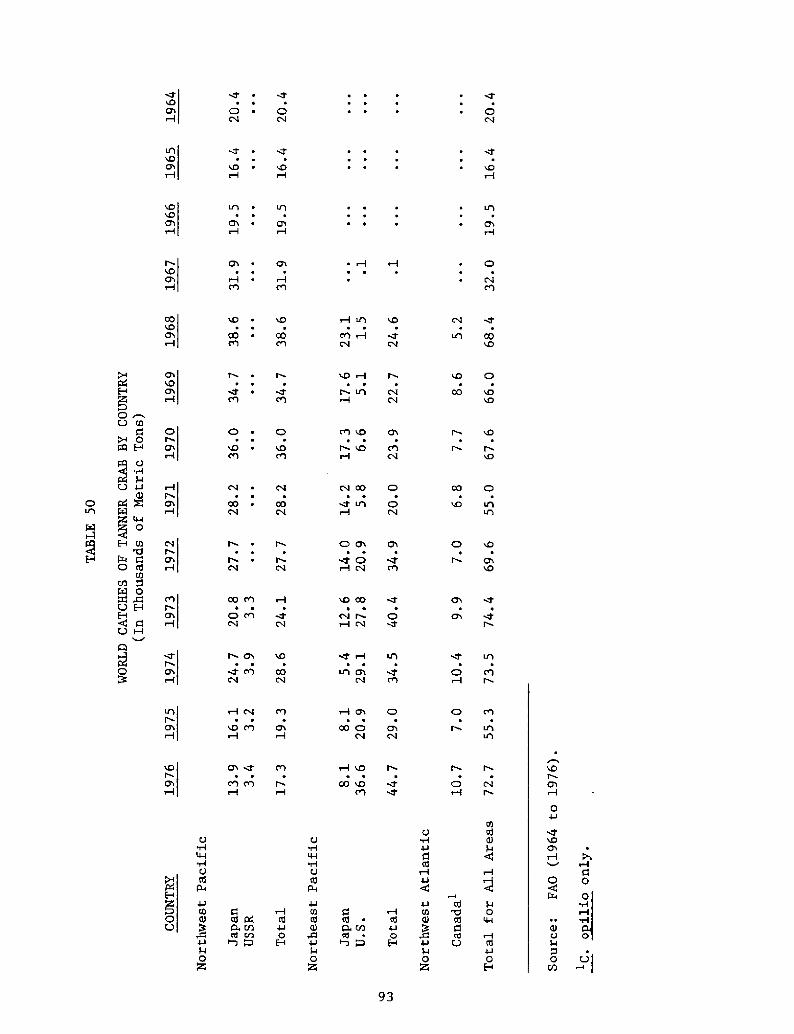
~ ~O ~ O
~ ~~ ~~ ~
92Q ~
~ ~~ ~~ ~
~ ~Ch ~
~ ~~ ~~ ~
O~ ~
M
«h
~ ~
nl
~ ~CO ~ CO
r~ ~
N CV
O CVO
~ ~
O ~~ ~
ccl~ ~
O
N CO O~ ~
O N~ ~
C0 ~ O LClC4
CD
O Ch Ch~ ~
4 O
O
CQ4 ~
O
W CG~ ~
VAN O
~ ~Ch
M Ch
COCV
O
O~ ~
Co ON
~ ~
~ -I
~ ~CO VD
~ ~O
0
ClI4-I
IU
cd
0
~ ~8
0
93
C4
50 ~O Cd
0
O
O Ccl g
cc
cQ cd
M0
X AO
O H
4Jcccd cd ~cd C4 nfl
cd
0
V
4J
cdcd
cd dl cd
0 K cdO
0
cdQl
0 cd0
O 0

CHAPTER V
FISHING GEAR AND PROCESSING METHODS FOR KING AND TANNER CRAB
Crab Fishin Gear
Vessels
The same fishing vessels are used for both king and tanner crab in mostareas. While there are many smaller vessels which fish more protected in-side waters, the weather conditions during the crab seasons in the outsideareas of Kodiak and westward make the use of larger vessels more favorable.The vessels used for crab fishing during the development of the fishery wereconverted gillnetters, herring seiners, or halibut boats. In many casesthese were not satisfactory because of the unique requirements of the crabfishery. The crab fleet has developed through the short history of thefishery to the present status, where a large part of the fleet is made up ofnew steel-hulled vessels in the 80- to 120-foot range, which have beenspecially designed for the fishery. The Bering Sea crab fleet has been des-cribed as the most modern fleet of fishing vessels in the United States,except for the San Diego and San Pedro tuna fleets. There are new vessels,which cost in the range of 1 to 1.5 million dollars, joining the fleet asrapidly as boat yards around the country can turn them out.
Some of the basic requirements for the design of these vessels include:
The ability to maintain stability and maneuverability withheavy loads of seawater in the circulating live tanks.A stable working platform for hauling the pots is required,because much of the present fishery is in outside water duringtimes of the year when heavy seas are normally experienced.Vessels over 80 feet in length are generally preferred for thisreason.A large deck area is required to carry the crab pots as theyare moved from storage to the fishing grounds or from onefishing area to another. With some vessels fishing upwards of300 pots, this capacity becomes essential for operation.A pilothouse which has good visibility of the deck area sothe skipper can observe the deck men handling pots and maneuverthe vessel alongside the buoys.The ability to diversify into other fisheries if necessary.An example of this capability for diversification is shown bymany of the new vessels entering the fishery. They can fishking and tanner crab, tender for salmon, and convert togroundfish gear when that fishery becomes attractive in thefuture.
The numbers of vessels by management area are shown in Tables 51 and52 for king and tanner crab. The vessel numbers are not additive to deter-mine total fleet size because many vessels fish more than one area and bothfisheries.
95
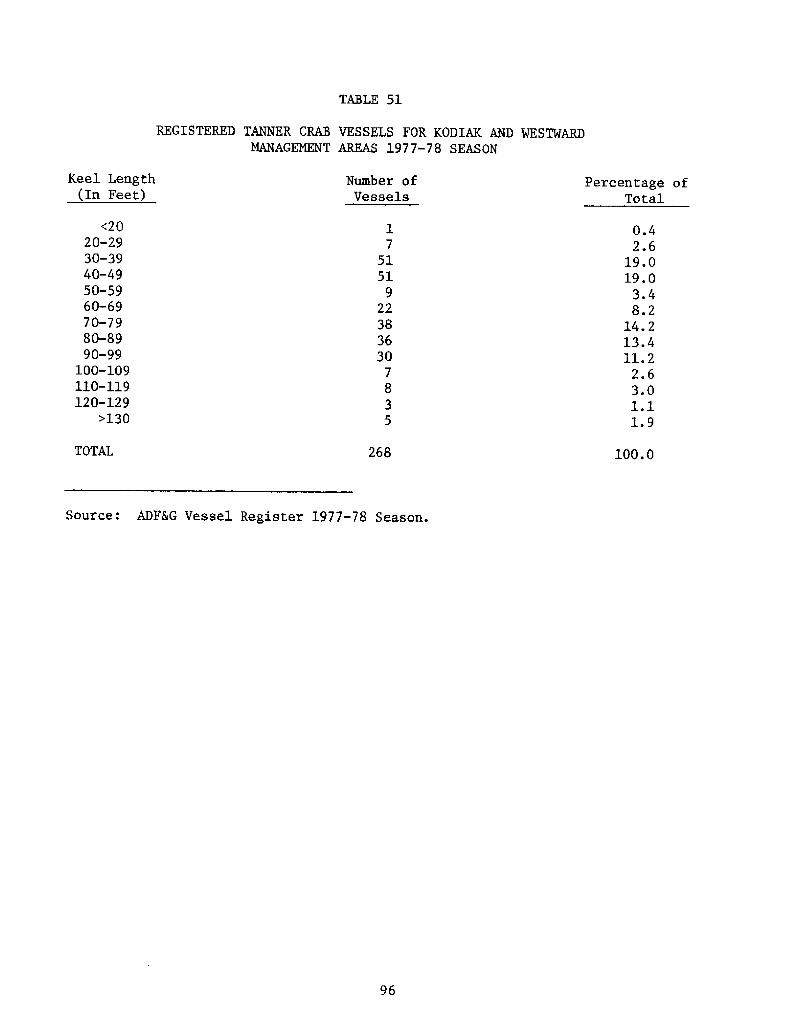
TABLE 51
Keel Length In Feet!
Number of
VesselsPercentage of
Total
268TOTAL 100.0
Source: ADF6G Vessel Register 1977-78 Season.
<20
20-29
30-39
40-49
50-59
60-69
70-79
80-89
90-99
100-109
110-119
120-129
>130
REGISTERED TANNER CRAB VESSELS FOR KODIAK AND WESTWARDNANAGKNENT AREAS 1977-78 SEASON
1 751
51 922
38
36
30 78 35
0.4
2.6
19.0
19.0
3.4
8.2
14. 2
13.4
11. 2
2.6
3.0
1.1
1.9
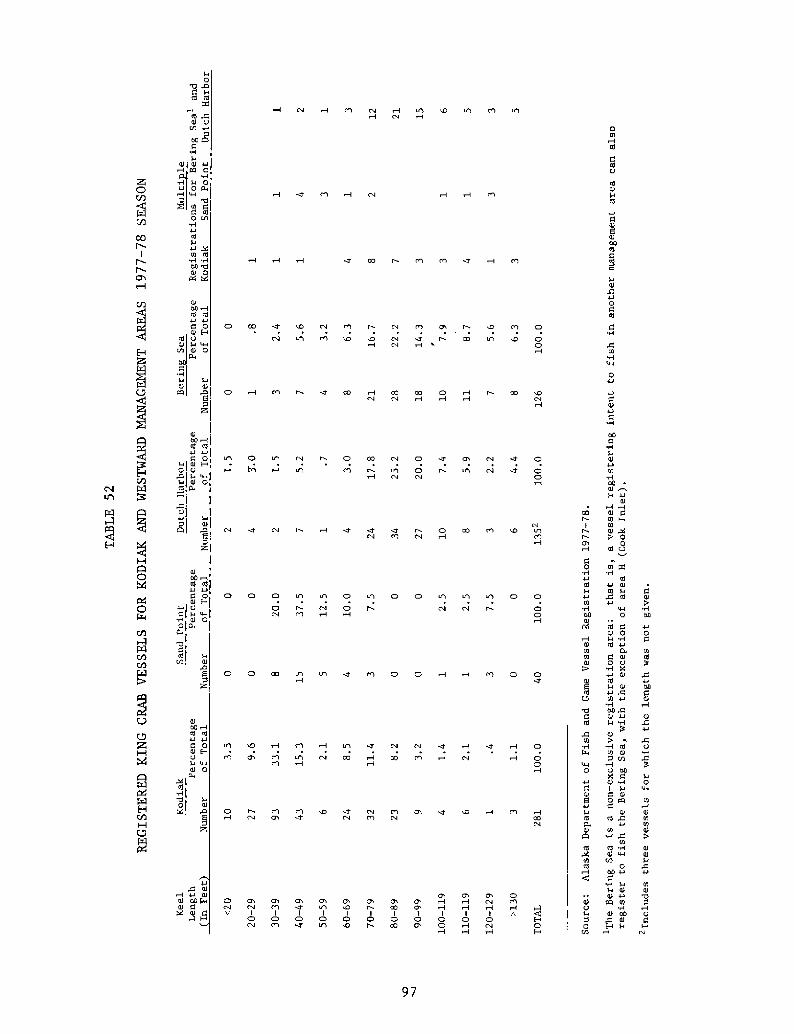
0ra 4cd cd
cd WQlMbd t50
CJ
00
td0 cd0 M
cd
cc cdDD cdQl 0
4
DDcd0CO r
cd
0QlDD WCt
0QlW
tll 0Cb CCt t0 O
N O
Ql0
QlCD Wttj0 0 O4
0GlV CU 0Ctt
O N N N OC0
IX! c1 t0 CC!N
0DD Wcd GjLI0 0Gc
O N O I N OOW 0
O O ccl c1 O O c1 O O
QlDD WGj
0 0V'4 WQl 0
cd
0 Ql8
N < H < H OO O
O K r1N 0c N C1 N C1
CbN
tdGlGl DD 4t
QlQj
0t Ch O
O O N O
0 CttIO O0t O
O 0% OtNv O O I IO O
P bbIO O OI c0
97
N H C1 N c-I cft Z tCt C1 CCtN
O Cb < t0 N C1 t N c1 Ch a c0 C1 O
O H C1 C M CCl H CO Cb O H IN
O Cb N O 4 0t N 4 O
0 0 O CCt tCt O ttc O O CCt CCt tCI O O
CD
0CtGl4LI
DDCDCd
GctbQI
Gc
0 0 td
0
JJ
cdA cd
V 0
bb
Ql
bd ~Ql ~iJ
GcQl 0tbQl
00cd CD
CbcdQlcdctlW0
nl 00
0Ql0 V
Gltd'4 QltbDD Atll Jl
Qltdtb QlM
V bdCQcI0 td0 CCI0 tll
cd C
cdQl W0DD Ct
4 QcQlCb CD
bdGI4
Ql
DD
0 0
Gj
C LIbdCD
td
V 0 tdtdGl
QcQc
CJ
Gc
V
As shown in Table 53, the number of vessels making landings of kingcrab has increased in the areas of Cook Inlet, Kodiak, Dutch Harbor, andthe Bering Sea during 1969 to 1976. The number of vessels fishing kingcrab in Southeast, Prince William Sound, Alaska Peninsula, and the WesternAleutians decreased over the same period. For tanner crab, the areas withthe largest increases in number of vessels fishing were Prince William Sound,Cook Inlet, Alaska Peninsula, and the Bering Sea.
The length distribution for the currently registered king and tannercrab fleets is shown, in Tables 51 and 52 for Kodiak and westward areas.This listing is made by ADFGG regional office in Kodiak and is not availablefor the other management areas in the state.
Data presented in Table 51 indicate that 41 percent of the vessels re-gistered to fish tanner crab are less than 50 feet. Many of these vesselsprobably fish for salmon also as .they are under the Alaska limit for seinevessels. Almost half �7 percent! of the vessels are from 60 to 99 feet,with the remaining 12 percent over 100 feet.
King crab vessels registered are listed by the three exclusive registrationareas: Kodiak, Sand Point, and Dutch Harbor. The Bering Sea is a multipleregistration area which allows vessels to register to fish there in additionto registering in one exclusive area. The exclusive registration areas forthose vessels registered in the Bering Sea are shown in the last three columnsof Table 52. The predominant registration combination is Dutch Harbor and theBering Sea.
Gear on the Vessel
The hydraulic pot lifter is one of the most important pieces of crab gear.Its development has made the recovery of pots in heavy seas easier, and withless gear loss from lines that snapped from the- strain of the pitching of thevessel as the pot is lifted. The hydraulic lifter presently in use is hungfrom a starboard davit and automatically compensates for added stress by payingout line as necessary, thereby maintaining a constant pressure on the linc'
Sophisticated electronic gear is necessary to be able to locate the potstring, especially when visibility is poor. The use of Loran A or C issupposed to be able to guide the skipper to within 1,000 and 100 yards, re-spectively, of the pot string if calibrated correctly. This was confirmedin discussion with fishermen from Kodiak who said that by using Loran C theywere guided consistently to within 100 yards of the pot string.
Pots
Several kinds of pots are used. for king and tanner crab fishing. Themost common type are square, measuring 7 ft x 7 ft x 2 1/2 ft or 6 ft x2 1/2 ft. These pots are constructed of welded steel round bar and mostcommonly use nylon webbing, which is laced to an interior frame to prevent abra-sion from rubbing on the sea bottom or while on the boat. They are strong enoughto withstand stacking and hauling catches, which could weigh up to 2,000pounds. These pots last approximately from three to five years, and thepresent cost has been estimated from $400 to $700 each when rigged ready-to-fish. Other types of pots used include other sizes of square pots from
98
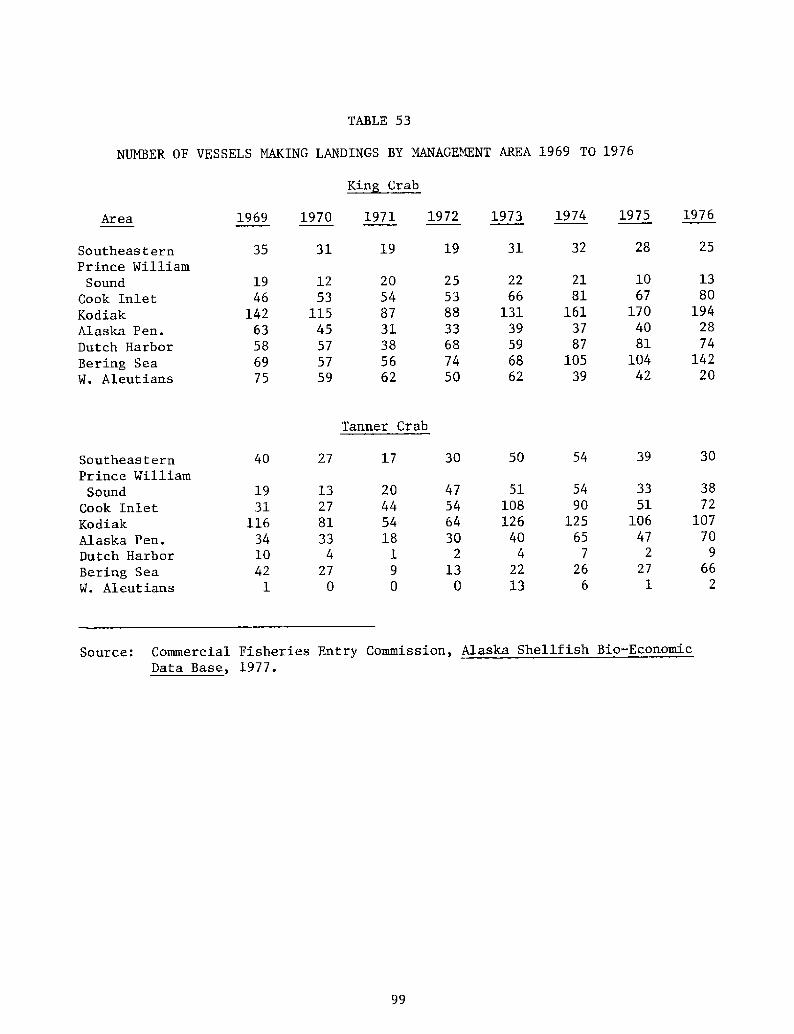
TABLE 53
NUMBER OF VESSELS MAKING LANDINGS BY MANAGEMENT AREA 1969 TO 1976
~Kin Crab
1969 1970 1971 1972 1973 1974 1975 1976Area
28 253219 3131
10 13
67 80
170 194
40 28
81 74
104 142
42 20
Tanner Crab
3927 305040 3017
47 51 5454 108 90
64 126 125
30 40 65
2 4 7
13 22 26
0 13 6
Source: Commercial Fisheries Entry Commission, Alaska Shellfish Bio-EconomicData Base, 1977.
99
Southeastern
Prince William
Sound
Cook Inlet
Kodiak
Alaska Pen.
Dutch Harbor
Bering SeaW. Aleutians
Southeastern
Prince William
Sound
Cook Inlet
Kodiak
A1aska Pen.
Dutch Harbor
Bering SeaW. Aleutians
19
46
142
63
58
69
75
19
31
116
34
10
42
1
12
53
115
45
57
57
59
13
27
81
33
4
27 0
20
54
87
31
38
56
62
20
44
54
18 1 9 0
25
53
88
33
68
74
50
22 21
66 81
131 161
39 37
59 87
68 105
62 39
33
51
106
472
27
1
38
72
107
70
9
66
2
5 ft x 5 ft to 8 ft x 8ft, pyramid style pots, Japanese longline conicalpots, and round pots. The three latter types of pots receive very littleuse. They have top openings which are reportedly less efficient than theside openings of the square pots. The Japanese longline pots have beentried in the Kodiak area but they were not very successful. The strongtidal currents shifted the entire strings along the bottom and they fre-quently became tangled with other gear.
In order to modify the square pots when converting from king crab totanner crab, the tunnel entrance is partially closed, making a smalleropening.
Circulatin Seawater Tanks
The circulating seawater tanks are part of the structure of the vesselitself and are necessary in order to keep landed crab alive until deliveryto the processing plants. The critical determinants for crab survival are:
water replacement within the tank pumping rate! which keepsthe dissolved oxygen level at a tolerable level,salinity,temperature,
extent. of crowding,length of time held,weather encountered which determines the amount of agitationwithin tanks.
2.
3.
4.
5.
6.
Tanner crab are considerably more subject to dead. loss than king crabbecause the shells are relatively thinner and weaker. When stacked in thecirculating seawater tanks the weight of the crab piled above compresses theshell, restricting the movement of water across the gills for those crab inthe bottom layers. This can result in asphyxiation if conditions are severeor prolonged. The problem is accentuated if weather conditions are unfavor-able. The lower layer of crab in the tank can have their shells actuallyworn away from rubbing along the tank if the vessel is rolling heavily.Tanner crab are also extremely sensitive to increases in water temperature.
0 0Increased dead losses can be expected at water temperatures above 5 to 6 C Hartsock 1975!. The salinity of the ocean water which is circulatingthrough the tank is as critical a factor as temperature. The adverse effectson the crab from these different factors are compounded if they occursimultaneously.
The buoys used to locate the crab pots are usually Norwegian inflatablepolyform buoys. Especially when fishing offshore, two buoys are used inorder to provide enough buoyance to remain on the surface in strong tidalcurrents. A third "sea lion" buoy is often used which is made of styrofoam.In case the polyform buoys are punctured by a sea lion, the pot line canstill be located by this third buoy.
100
Bait
For king and tanner crab, frozen herring are usually preferred al-though groundfish are also used. The bait is placed in perforated plasticjars and hung in the pot, usually in pairs. The quality of the bait isimportant to its effectiveness. The freshest bait will catch the most crab.
Fishin the Gear
The crab pots are fished individually in a string, usually set in astraight line to make it easier to locate the pots when they are pulled.The distance that the pots are set apart along the string will vary, dependingupon the fishing area. If the skipper is prospecting a new area where thelocations of crab concentrations are not known, then the string will be widelyspaced in order to cover more area. Once the areas of concentration arelocated, the pots are spaced very close to one another to take advantage ofthe abundance of crab in that area.
Each pot is individually set after being baited and placed on thehydraulic pot launcher. The pot line is adjusted according to the depth ofwater, plus 25 percent to 50 percent if there are strong tidal currents. Thepot is launched over the side and the vessel moves on to make another set.The interval between times the pots are lifted and emptied will vary con-siderably depending upon fishing conditions at the time, which would includeweather, concentrations of crab, proximity to buyer, the size of the vessel,and the number of pots fished.
When approaching the string of pots, the skipper will come up to thebuoys on the leeward side if possible without extra maneuvering. Otherwisethe approach is made in the direction of travel. The bow of the vessel ispointed slightly into the wind to keep the deck men from being engulfed inspray from waves coming against the side of the vessel. The line from thepot to the buoys is caught by a grappling hook and run through the blockson the pot lifter which rapidly raises the pot until the brindle reaches theblocks ~ As the pot is lifted, the line is coiled on deck to be ready toreset the pot. A line from the picking boom is hooked onto the frame of thepot and it is lifted aboard and emptied, rebaited and launched over the sideagain. The vessel then moves to the next. pot in the string. The number ofpots a vessel can lift in one day will again depend on a number of factors,with weather perhaps being most important; however, an estimate for theaverage number of pots which can be lifted in one day is 70 to 80 pots forKodiak vessels and 100 to 150 pots for vessels in the Bering Sea, workingaround the clock.
Harvestin Ca acit
Harvesting capacity estimates have been estimated by management area forking and tanner crab in Tables 54 and 55. Most of the data used to computethese estimates came from the Commercial Fisheries Entry Commission Queiroloet al. 1978!.
The daily and annual harvest capacity estimates were determined by thefollowing method. The number of vessels fishing was determined from thenumber of vessels making landings in each management area in 1976. These
101
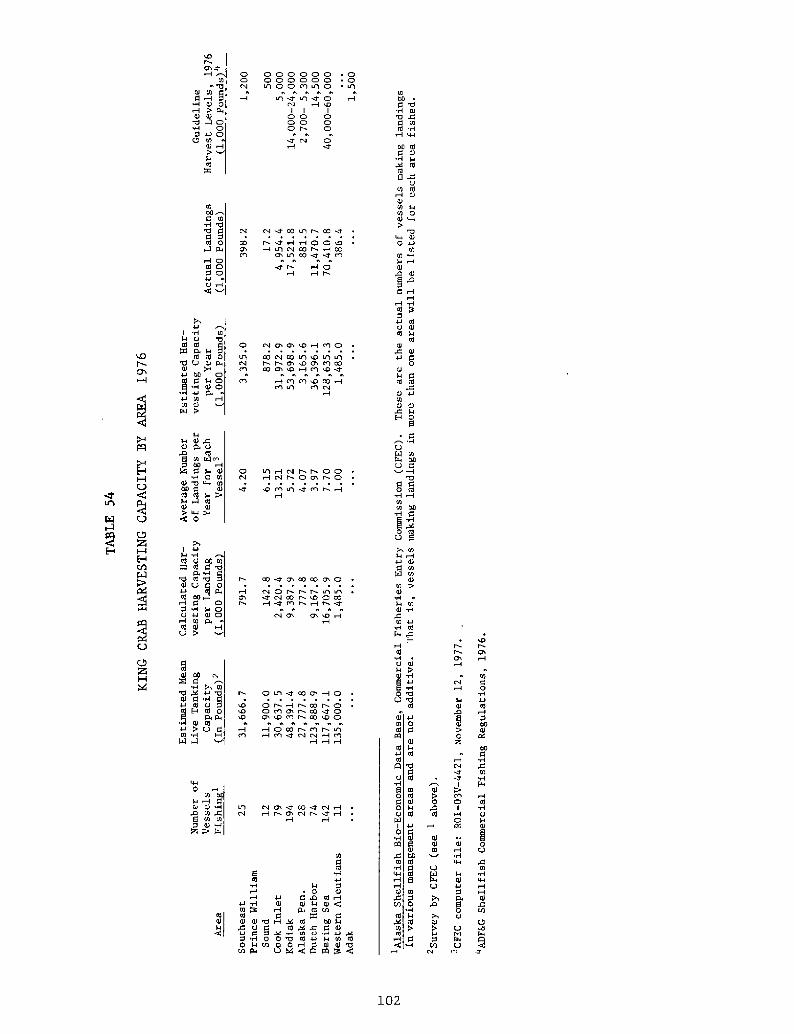
Ccc 4
'0cd M C
0cU MCPIOOOO Vl
CU
cd
CON
OOOOOOtPI O O
lflI
O O
O ~ OO ~ OO Ul
O o O CIO OO Ol/1tA
CI
N
CO ~
W
ad~C M
td 0
Otd OOJJ
V W
'o 0IPtCIOCU O0
O M OCO N COI I 0VO Ch c0
M CPtN M M CO
COM N
00C8 wJJVIM td
MQl CCg MCQ
S Qd00 CQlM! W0
CJcd VQl
QlQI00C
V JJ
Ql0 MtddldlQl
r OOOOc NO
I/1 lPIP cCO COl WC
Ctc
c4cdJJ '0
'V Itd 0tdO H
'0 AIU
O PO P1 ChMO COP1
PCO NOP COHOP CO cCO
P1N VlN Pt
0
tdcda
W 0 tU QlJO Vlg M
8 0 0 0CO
CJIUe
ttl
Icd
0 CUttlMVlCUdlV cd
Ql QOO CO>X
JJ CM dl
'Opt& cdg M A0 0 0 Qlco 0 0
0 tdC
M tdCU 8J C0co 04
NWCOV1CCOO O c0CCI N CO P + CO
CO <P PC O
wc
O V1PC NN
N OCh N N COP
CP
N Oc N CO N NNHPChNC
00 tdC lU
td6 4
MVl 0QI W
W0 JJ
JO cUEj JOC Pt
cdcdV QlcdcdtdQlC0td
Ql CJQl lU
08
td00O C
0 cd
C
oMdl
tdQl4 cd
M cd
PIQl
0 '0O Mcd
P Ch
N 0
Ql M
Ql0
00
NM
Ql0 O nl
Itd PI VO M
Ql tU 0cd W VW
CJ tdQl W
Otd
e0 COV OO kl
AVI OPt m
102
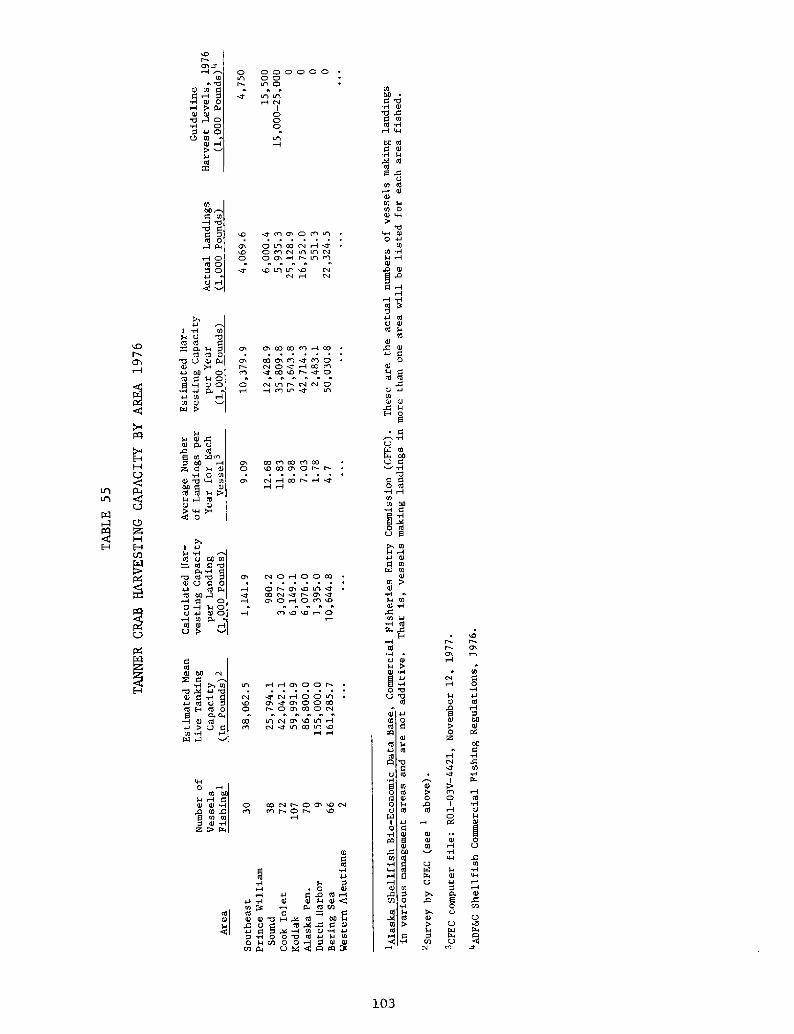
0000000 0tel 0
NC>CI
lcl
Ql tq8 0
Ql 8qd t-I OO00 88
cd
CI cd vl0 ICc CO0 Yl N qj ICI N0 0
ICI tch t0 NN 6 N
+ Otd 05 OIJCJ
CI
LII IJqf ttl
0tdhd O
OO5WJJ
8tq Ql
cd 0*CJ0 O
OCO0N N O
cO ChNO<CON Vl PP1 ttl
th
CI
8Ql 0a
Cl qdODql ql
! W< 0
Itd 0
CC'0tU Octl Cd
IJ8 8O
IJ
80 tqW 8
tU
Ch CO Ch CO Ctl COORCOchOI IN W CO P
8IJ WClICcq
IC !.rl
IQptlat JJ
qljqt P
8
0 '0'0ql
N O H O 0 COICIChO ch
0
OP ChCO N0 ccl
qj
qj AC
8
OO I0 0OOCOcO 0 NN CI
CO
NI OChICI NN N ICI
0
8 0pql
0
8 8P 8 Pg QlZ P
0 0 0jtjI0 8p
0coNCOchcoN0
IUe
cd0 cdIJjdtd
IU
0 IJ IJI 0OI* 0
cd ctfQl 8 8qdhcu 0 0
8
JJ~ 0 Ql0 P 8g
~8O~8cdAp 4 8MVMJJhd td JJ IJ qt0 W 5 Ql QlA C A co W
CC cd8 Cl
8 p
qj 0Ql W
IU
cdql
u 008
gQl IJ
CdO 0
0 IU
* 8N
0JJql
a88 CQ
QI0R OC
N IQ
0 cdI
O Ql
0Op
8 W
O
103
numbers are not additive to determine the total fishing fleet size inAlaska because some vessels deliver to more than one area. The estimatedmean live tanking capacity estimates come from a survey done by CFEC duringthe summer of 1977, and is an average of the vessels included in that survey.These estimated mean tank capacities are given in pounds of crab. Thecalculated daily harvest capacity by area was simply the product of thenumber of vessels fishing and the estimated mean live tanking capacity.
Daily harvest capacity estimates for each area were multiplied by theaverage number of landings made during the year by each vessel fishing inthat management area to give the estimate of annual harvesting capacity. Theestimate for the average number of days on which landings were made for eachvessel were made from the computer files at CFEC which have stored the actualnumber of landings by area.
As seen from the tables, the calculated harvesting capacity is con-siderably larger than the actual landings for 1976. There are severalsuggested reasons for these differences. The estimates generated representwhat would be the maximum possible amount. of catch that could be kept aliveand transported to the processor under ideal conditions. Under actual fishingsituations, these conditions rarely occur. There are a multitude of vari-ables upon which the amount of catch per trip vill depend. These variablesinclude rate of catch, condition of crab, water temperatures, weather con-ditions, and processor rotation schedules. It is significant to note thatthe areas for which the actual landings are the highest percentage ofestimated harvesting capacity are those areas which produce most of the crabcaught. For areas such as Southeast Alaska, which do not have large con-centrations of crab available to harvest, the maximum capacity will notusually be utilized due to low levels of catch. This example helps toreinforce the reservations on harvest capacity estimates reflecting realconditions as stated above.
Most of the early U.S. king crab production ended up as frozen product,partially because of difficulty experienced in canning. The Japanese hadbeen successfully canning king crab for many years before the U.S. startedprocessing, but they were reluctant to divulge many of their processingmethods. Consequently, domestic processors had to learn on their own. Oneof the major obstacles which had to be overcome was the development ofmachinery capable of extracting the meat from the legs, shoulders, and claws.Once this problem was resolved for king crab, the machinery had to be ad-justed to handle the smaller tanner crab when they started to be processedin the late 1960s. Another problem faced was the blueing of the meat inthe can. This was corrected through adjustments in the cooking process.Minor adjustments are still being made in processing methods; however, thebasic steps are similar at all plants. The present processing methodsbeing used are outlined in this section.
104
Processin Methods
There are similar basic methods used in processing king and tanner crab;however, the exact processing sequence and methods vary somewhat at eachplant. The following description attempts to outline an average processingmethod.
Live crab are unloaded by hand from the holds of the fishing vessels.Those crab which have expired are set aside in piles to be discarded or usedfor reduction. If the crab are not going to be processed immediately, theyare put into circulating seawater holding tanks which keep them alive. Ifthe crab are going to be processed immediately, they are loaded into plastictates or crab bags and taken into the processing area. Some plants ice thecrab in the bins if there is some delay anticipated in order to slow themetabolism, thus keeping them alive longer.
The first processing station for the crab after they come out of thevessel or from the live tank is the butcher, where the crab are killed bygrasping the legs on both sides of the body and pushing hard against a dull-bladed fixed knife. This removes the carapace and vicera. The crab aregilled by grinding against a rotating drum. After the crab are gilled, theycan go either to the meat line to be processed into canned or frozen crabmeat,or to the section line to be processed into crab sections.
The decision on which product form the crab will be processed into isbased upon:
the processing equipment available,size and quality of the crab,current market conditions for different product forms,the cost of production of the different product forms.
l.
2.
3.
4.
Processin of Crab Meats
From butchering to the second cook, the process is the same whether crabmeat is destined to be canned or frozen. Usually crab meat processing usesa two-stage cook, partly to help combat the problem of blueing in canned crab.In plants which do not have a canning line, the processing method for frozenmeats uses only a single-stage cook.
Following through the flow diagram, from the first processing stationthe crab goes into a continuous cooker where the leg and body meat is cooked.As soon as possible after the crab comes out of the cooker, the legs andbodies are squeezed in rubber rollers to extract the meat. The shells fromthe legs go through the rollers and the meats which are squeezed out from theshell are moved into a running water trough where shell bits are dropped out.The shoulder and claw meats are removed from the shell by jets of water andgo through a similar water trough to settle impurities.
105
For purposes of clarity, the meats and section processes are discussedseparately below; however, at some processing plants, which have the facilitiesto do so, these are both run concurrently. There is a flow diagram of theprocesses given in Figure 11.
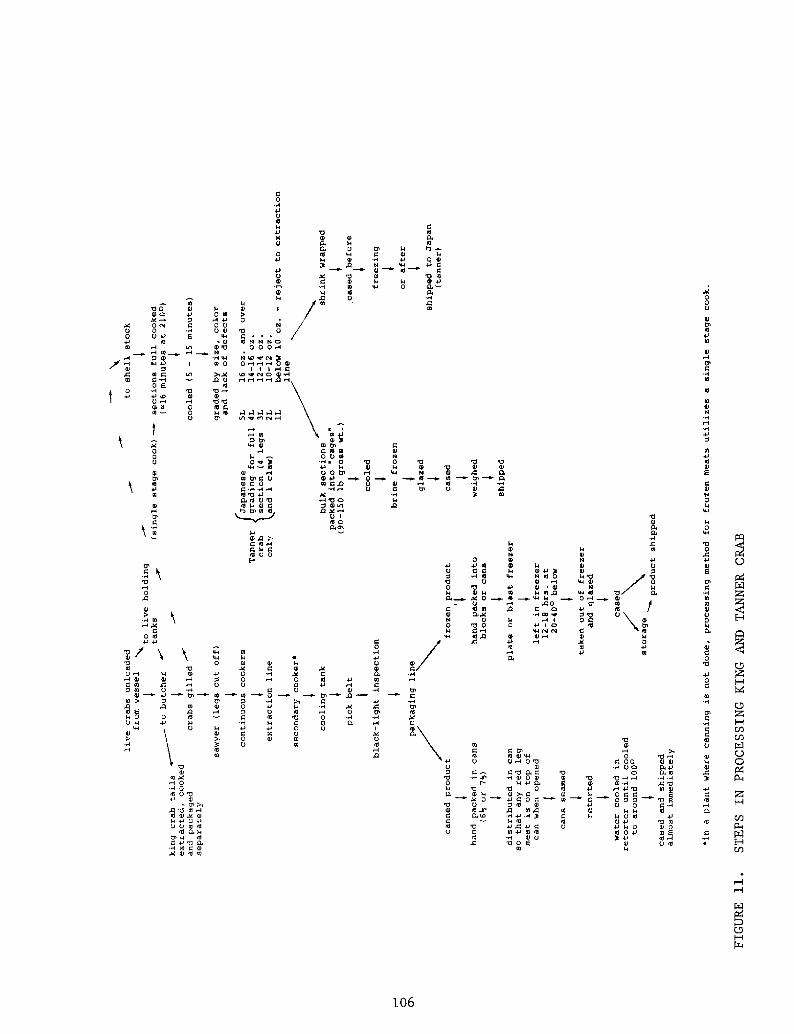
C 0 0ntS Ol
0 nj4 3t
A 4
S 4 0W 4I
A '0 4I4 0
N 4IS '4W
0Jt
A 0 0 UlnCl
0 E'0 0OI OK W0 In0U JPS
M' ~4tWOl C0 -e0 Ent ID0 wSM
0 0
'U 0 0 0
A 0 00
C S 0 4INlU
Cl
Of R0C4 CIO 0 04 4I
S CI4W
CtOlS 4 E OI
V 0 4
4Ol ntN nl 0SCI 'SMRROC O
IOjII.I IO InS w
'0 S Nd0R W 0
0 C0 CtA
0
4IC4 0 Ol
W W 0 CIK 0 0V
Ol0 0
0 4 S'0 C 0 0Ot
A nl4
SAC 0 0 nlS
njA U
Dl
0 0 0 0 0 U4 ID
3 nlnlSwVw 0
SM K00ln 0'0IDRnj nlS K0UU nlnl CD
tn cID nl
C'0 0WS 04'dS C 00 nlR M4 nlJtID nt SCl'OOE
'0 Of
0
4S S OI0 S ul
106
SIOW AC0 S
0 W 4S S0 Ol RIO 0S ~ 4M !RIO E4 0 00
40 ln0 00 ClW~ IItt Cl '0N8 WI M 0
4Ct I!0 N0
nj N N IOCI0 0 0>N IO nt DnOwww 0 4lIID N tn Ct IP tN
0 UlW S
Oe 3W NSM did VIO C 00S'0 nt040'0S 4 4I
ClIDIC S0 0W n0 04l 4N CKM '0S
0Dl0
no 04I 4W0 ~0 Cl0 C4A
C 0
R A
CIO0nl4 tjS 4 0 4IW jjC
0 0 0
'0 '0S SClln ~ U~ 04U S R Ol
00 C Cw S'0 04 A 0VS OlCl OKN 00 '004 CWW S R
IDCnjnt 004 Jf0 I
0 OI4 0'0 0lp ln K'C O.IDnj0 0 nlR
'd OI
0 00V OCt
Dfnt '00CC0 0 0
4S IDS Jt4 0IO 0ntJtS 4
'0 MCl Ct0 ntCD SR '0M 4f
C nl'0 MS 0ID Enl W
0 00 Cl4I
R Cnl
Cn
The crab now goes through the second cook, after which the extractedmeat is cooled in the cooling tank or tube. Either before or after thesecond cook, the meat goes through a pick belt where bits of shell andother extraneous materials are removed. Several plants also use a blacklight as a final inspection in order to be able to see and remove small bitsof shell. Up to this point, the process is the same for meats destined to becanned or packed into frozen packages.
If the product form is to be frozen meats, the meat is now hand packedinto blocks. These blocks are built in three layers with red meats on thebottom layer, shoulder, claw, and leg tip white meat in the middle layer,and merus leg meat! for the top layer. The crab meat is packed into a wax-lined cardboard carton which has been placed inside an aluminum freezing pan.The blocks are formed into lengths that vary in size. One size that is commonis the 15-pound block called a "long fohn." The blocks are frozen in a plateor blast freezer. After freezing, they are cased and then shipped immediatelyor stored for shipping when transportation becomes available.
The meats for canning are packed by hand into the cans. A layer of parch-ment is put into the bottom of the can to prevent the red pigmentation fromleaking onto the plating of the can. Leg portions are cut and fitted for thefirst layer, and then the can is topped with body meat and incidental red meat.The cans are labeled upside down so that the bottom of the can as packed be-comes the top, and when opened by the consumer, the red meat shows first.After filling, the cans are seamed, retorted, and then cooled in water until
0they are around 100 P. At this time they are cased and are ready to ship.King crab tails are not processed along with the other meats but are extracted,cooked, packaged, and frozen separately.
Processin of Crab Sections Shell Stock
5L = 16 oz & over !
!4L = 14 oz � 16 oz !
!3L = 12 oz � 14 oz !
Premium quality
2L = 10 oz � 12 oz
Under 10 oz � re]ect
The individual sections are frozen blast frozen generally! and cased. Theyare then ready for shipment.
are packed into wire "cages" 90 to 150 pound gross weight!.a continuous brine immersion freezer, then cased and shipped.in this manner are destined to be marketed as sections orfurther at plants in Washington or California.
Bulk sections
They are frozen inSections processedcan be reprocessed
107
After the butcher station, crab destined for sections or brine sectionpack go to the cooker. Again this is a continuous cooker and generally crabsection processing uses a single stage cook. The sections are cooled aftercooking to avoid salt absorption, and then are packed into wire cages forfreezing or they can be individually wrapped cryovac shrink wrapping!. Tannercrab sections four legs and one claw! for export to Japan are graded by sizeaccording to the following classifications:
King crab sections for export to Japan do not have the same grades astanner crab. They are frozen in bulk and shipped to Japan in that form.Upon arrival in Japan, they are reprocessed into a canned product.
New Develo ments in Crab Processin Methods
A new processing method which has recently developed for tanner crabsections is to freeze them in a raw green! form without any cooking. Atpresent, sections processed in this manner are destined only for the sectionmarket in Japan. To process, the green sections are dipped in a solutioncontaining chemicals supplied to the processor by Japanese companies. Thepurpose of the solution bath is to prevent blueing of the frozen section.
There have been significant quantities of tanner crab processed by thismethod this year �978!, and sold to the Japanese section market. The ad-vantage to the processor is to reduce processing method steps necessary and,therefore, reduce processing costs per unit of finished product. At present,the chemicals in the bath used to prevent blueing in the sections have notbeen. approved by the FDA for use in this country; however, persons in theindustry indicated that this is because of the amount. of time necessary forthe FDA to approve new chemical processes. When it is presented for approvalfor use for product for domestic market, it was felt that this process willbe approved by the FDA. The process of approval takes several years however,therefore, sections processed raw will not be immediately available to thedomestic market.
The locations of the shellfish processing plants in Alaska are shownin Figure 12 on the following page. Most of the processing plants are con-centrated in two areas: Dutch Harbor/Vnalaska/Akutan and the Kodiak area.
Most processing plants process both king and tanner crab. Since thefishing seasons are at different times of the year for these species, con-flicts for processing facilities of the plants do not occur. There is someoverlap of shrimp processing during the times crab are being processed, butthe equipment used for shrimp is generally different. Unless labor or commonprocessing facilities such as freezing space is a constraint, processing twospecies at one time will not reduce crab processing capacity. The amount ofcatch by month for king crab, tanner crab, and shrimp is shown in Figure 13for the 1977 catch. From this, the time distribution during which the pro-duct will have to be processed can be seen.
Processin Ca acit and Ca acit Utilization
In some areas of the state such as Dutch Harbor, the new processingplants being built and the additions to existing facilities are increasingprocessing capacity rapidly. These processing capacity estimates weredetermined by data which were current at the time of this study. The pointto be made is that the crab processing industry is dynamic, therefore, it isnecessary to update processing capacity figures as increases or decreases!occur.
The processing capacity for king and tanner crab was calculated fromdata collected by surveying individual processing companies in spring and
108
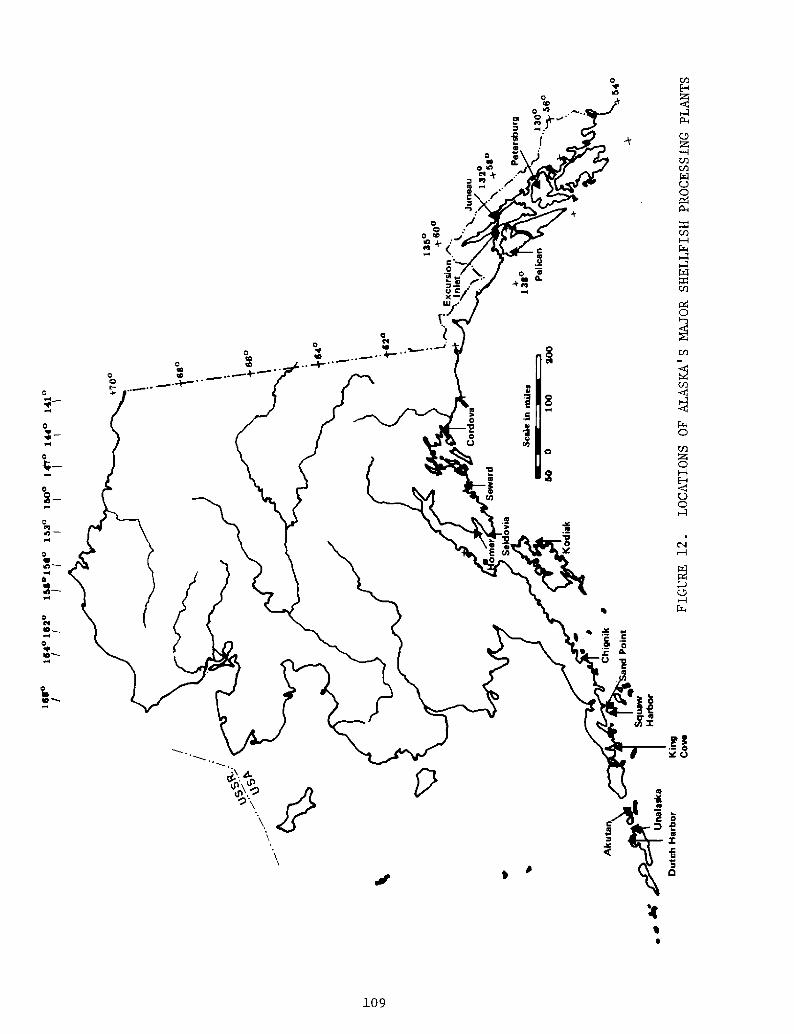
0 IA
0
0 lO
0Id0
0tvCl0
'4
Ow
109
f5<0
0IZ0
6
OH
O
R
C3OS4Cu
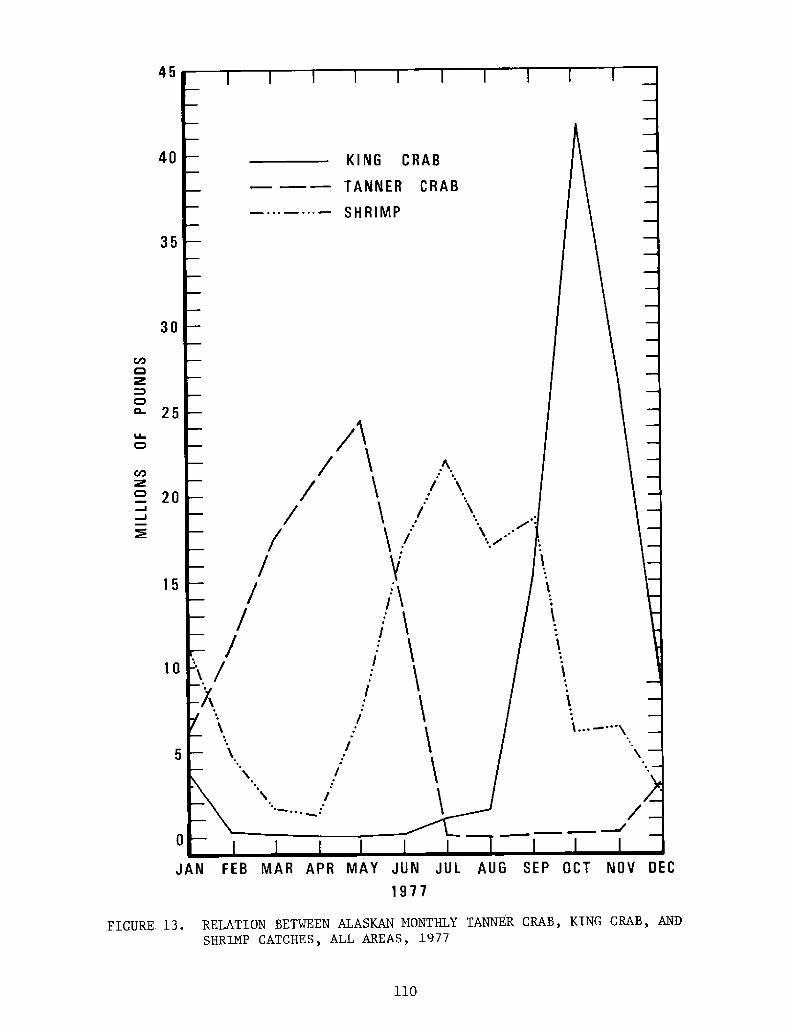
45
35
30
CD
CD25
CIO 20
15
10 JAN FEB MAR APR MAY JUN JUL AUG SEP OCT NOV DEC1977
FIGURE. 13. RELATION BETWEEN ALASKAN MONTHLY TANNER CRAB, KING CRAB, ANDSHRIMP CATCHES, ALL AREAS, 1977
110
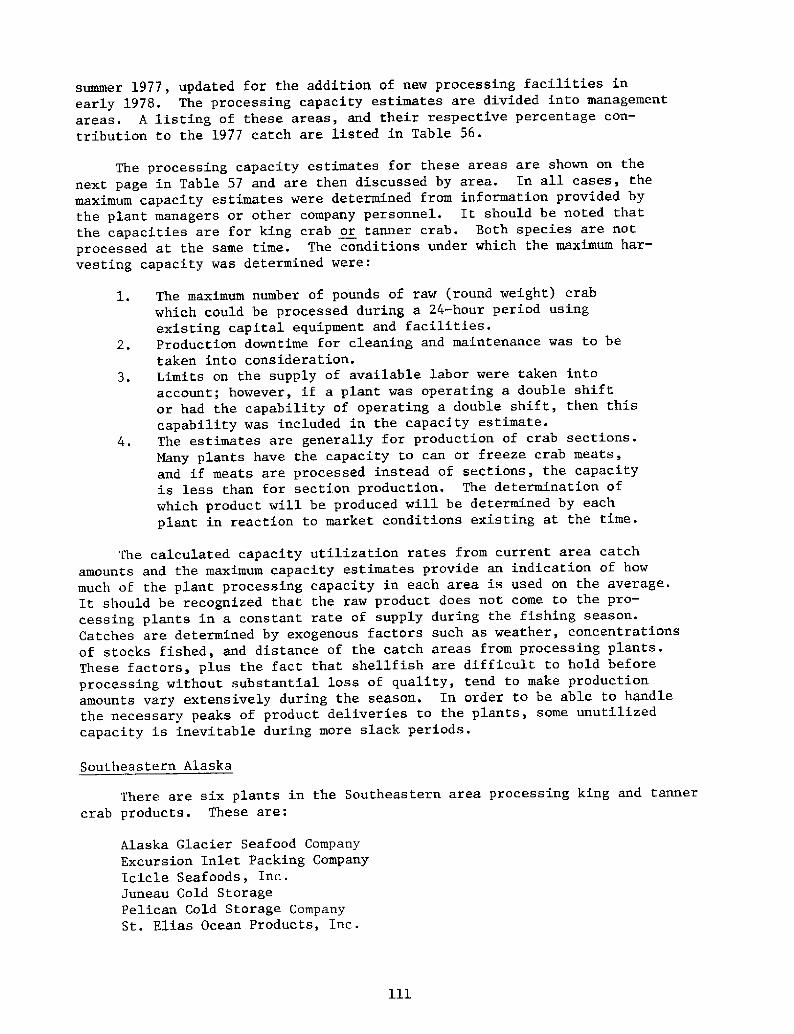
summer 1977, updated for the addition of new processing facilities inearly 1978. The processing capacity estimates are divided into managementareas. A listing of these areas, and their respective percentage con-tribution to the 1977 catch are listed in Table 56.
The processing capacity estimates for these areas are shown on thenext page in Table 57 and are then discussed by area. In all cases, themaximum capacity estimates were determined from information provided bythe plant managers or other company personnel. It should be noted thatthe capacities are for king crab or tanner crab. Both species are notprocessed at the same time. The conditions under which the maximum har-vesting capacity was determined were:
The maximum number of pounds of raw round weight! crabwhich could be processed during a 24-hour period usingexisting capital equipment and facilities.Production downtime for cleaning and maintenance was to betaken into consideration.Limits on the supply of available labor were taken intoaccount; however, if a plant was operating a double shiftor had the capability of operating a double shift, then thiscapability was included in the capacity estimate.The estimates are generally for production of crab sections.Many plants have the capacity to can or freeze crab meats,and if meats are processed instead of sections, the capacityis less than for section production. The determination ofwhich product will be produced will be determined by eachplant in reaction to market conditions existing at the time.
3.
4,
The calculated capacity utilization rates from current area catchamounts and the maximum capacity estimates provide an indication of howmuch of the plant processing capacity in each area is used on the average.It should be recognized that the raw product does not come to the pro-cessing plants in a constant rate of supply during the fishing season.Catches are determined by exogenous factors such as weather, concentrationsof stocks fished, and distance of the catch areas from processing plants.These factors, plus the fact that shellfish are difficult to hold beforeprocessing without substantial loss of quality, tend to make productionamounts vary extensively during the season. In order to be able to handlethe necessary peaks of product deliveries to the plants, some unutilizedcapacity is inevitable during more slack periods.
Southeastern Alaska
Alaska Glacier Seafood CompanyExcursion Inlet Packing CompanyIcicle Seafoods, Inc.Juneau Cold StoragePelican Cold Storage CompanySt. Elias Ocean Products, Inc.
There are six plants in the Southeastern area processing king and tannercrab products' These are:
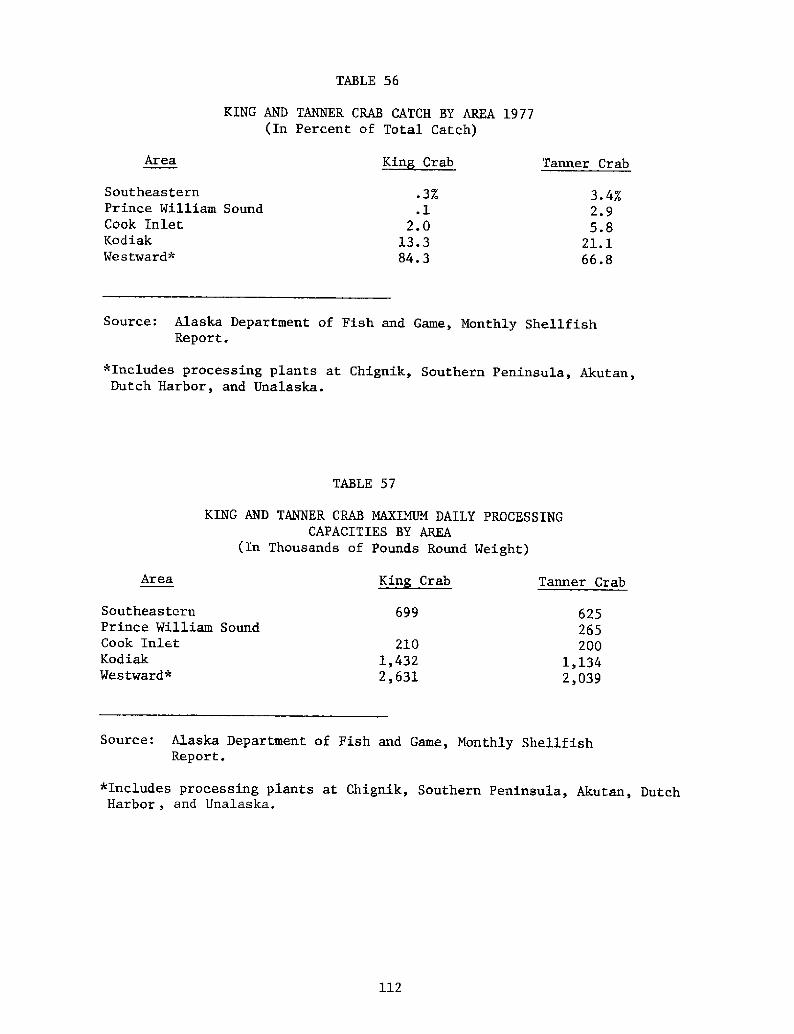
TABLE 56
KING AND TANNER CRAB CATCH BY AREA 1977 In Percent of Total Catch!
Area ~Kin Cr ab Tanner Crab
Source: Alaska Department of Pish and Game, Monthly ShellfishReport.
~Includes processing plants at Chignik, Southern Peninsula, Akutan,Dutch Harbor, and Unalaska.
TABLE 57
KING AND TANNER CRAB MAXIMUM DAILY PROCESSINGCAPACITIES BY AREA
In Thousands of Pounds Round Weight!
~Kin CrabArea Tanner Crab
699 625
265
200
1,1342,039
Source: Alaska Department of Pish and Game, Monthly ShellfishReport.
+Includes processing plants at Chignik, Southern Peninsula, Akutan, DutchHarbor, and Unalaska.
112
Southeastern
Prince William Sound
Cook Inlet
Kodiak
Westward*
Southeastern
Prince William Sound
Cook Inlet
Kodiak
Westward*
.3X
.1
2.0
13. 3
84. 3
210
1,4322,631
3.4X
2.9
5.8
21. 1
66.8
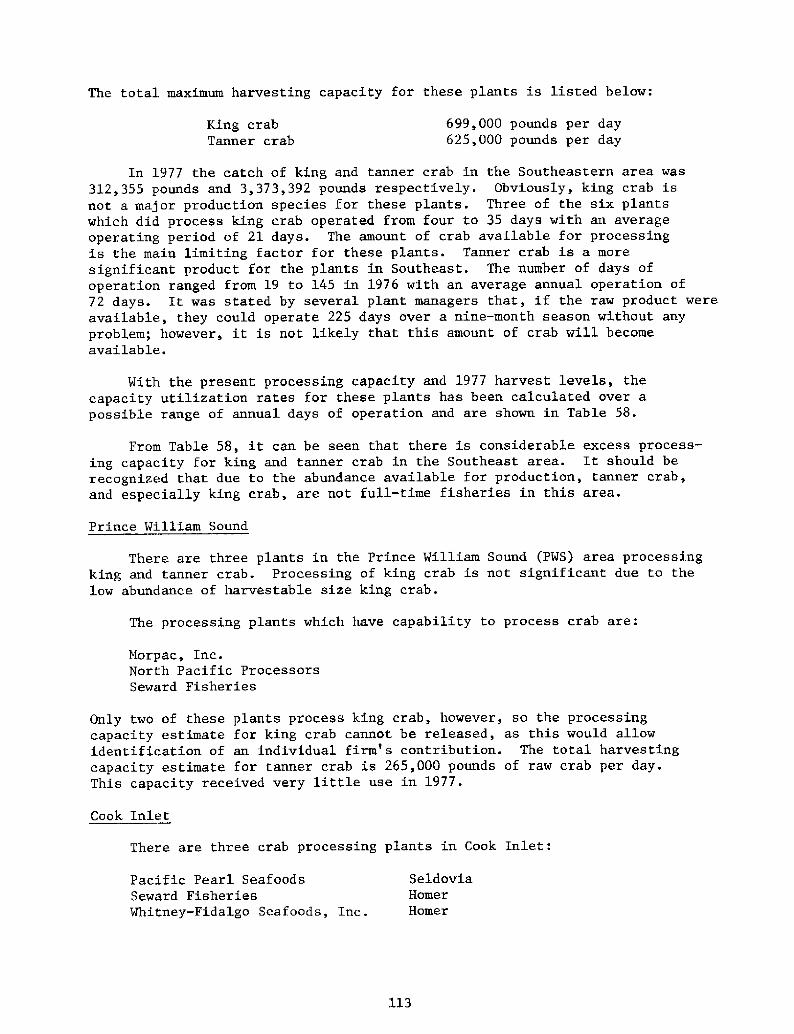
The total maximum harvesting capacity for these plants is listed below:
699,000 pounds per day625,000 pounds per day
King crabTanner crab
With the present processing capacity and 1977 harvest levels, thecapacity utilization rates for these plants has been calculated over apossible range of annual days of operation and are shown in Table 58.
From Table 58, it can be seen that there is considerable excess process-ing capacity for king and tanner crab in the Southeast area. It should berecognized that due to the abundance available for production, tanner crab,and especially king crab, are not full-time fisheries in this area.
Prince William Sound
There are three plants in the Prince William Sound PWS! area processingking and tanner crab. Processing of king crab is not significant due to thelow abundance of harvestable size king crab.
The processing plants which have capability to process crab are:
Norpac, Inc.North Pacific Processors
Seward Fisheries
Only two of these plants process king crab, however, so the processingcapacity estimate for king crab cannot be released, as this would allowidentification of an individual firm's contribution. The total harvestingcapacity estimate for tanner crab is 265,000 pounds of raw crab per day.This capacity received very little use in 1977.
Cook Inlet
There are three crab processing plants in Cook Inlet:
Pacific Pearl Seafoods
Seward Fisheries
Whitney-Fidalgo Seafoods, Inc.
Seldovia
Homer
Homer
113
In 1977 the catch of king and tanner crab in the Southeastern area was312,355 pounds and 3,373,392 pounds respectively. Obviously, king crab isnot a major production species for these plants. Three of the six plantswhich did process king crab operated from four to 35 days with an averageoperating period of 21 days. The amount of crab available for processingis the main limiting factor for these plants. Tanner crab is a moresignificant product for the plants in Southeast. The number of days ofoperation ranged from 19 to 145 in 1976 with an average annual operation of72 days. It was stated by several plant managers that, if the raw product wereavailable, they could operate 225 days over a nine-month season without anyproblem; however, it is not likely that this amount of crab will becomeavailable.
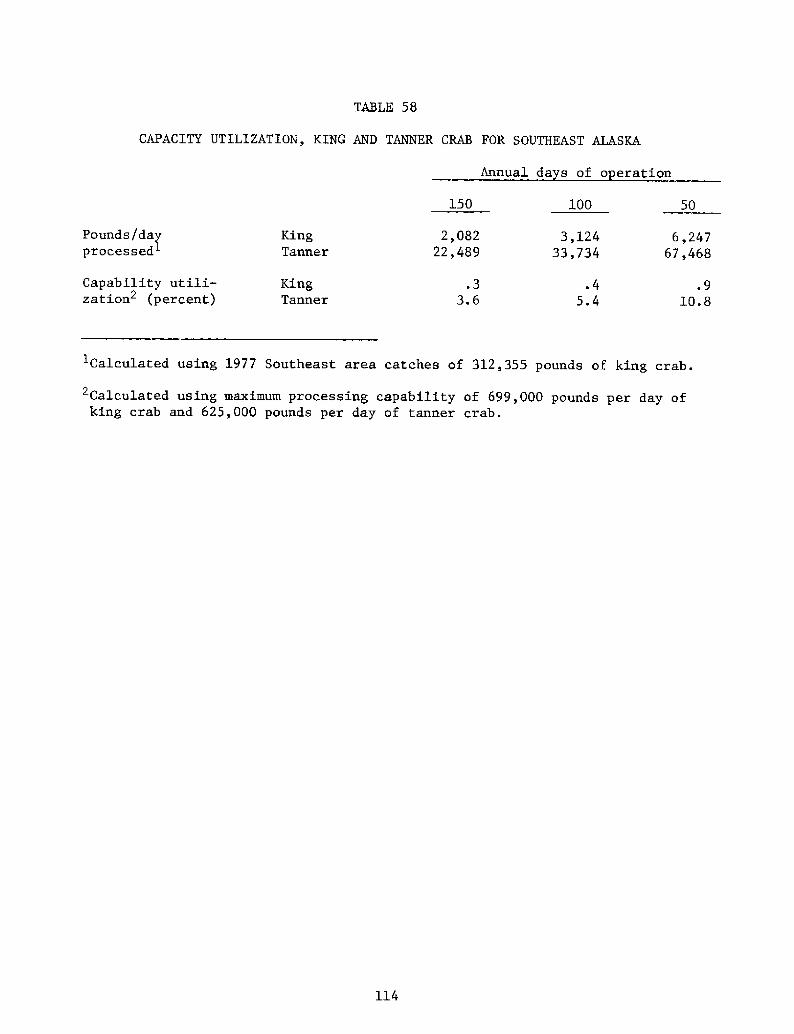
TABLE 58
CAPACITY UTILIZATION, KING AND TANNER CRAB FOR SOUTHEAST ALASKA
Annual da s of o eration
150 100 50
Calculated using 1977 Southeast area catches of 312,355 pounds of king crab.
Calculated using maximum processing capability of 699,000 pounds per day ofking crab and 625,000 pounds per day of tanner crab.
114
Pounds/dayprocessed~
Capability utili-zation percent!
KingTanner
KingTanner
2,08222,489
.3
3.6
3,12433,734
.4
5.4
6,24767,468
.9
10.8
These plants have a total maximum processing capacity of:
210,000 pounds per day200,000 pounds per day.
King crabTanner crab
The annual days of operation in 1976 averaged 47.5 days for king crab and80 days for tanner crab. With the present processing capacity and the 1977harvest levels, the capacity utilization rates for these plants have beencalculated over a possible of annual days of operation and are shown inTable 59.
With a 50-day operating season, which is approximately the length ofoperation in 1976, the king crab capacity utilization is less than 20 per-cent. With the 1976 tanner crab average operating season, the capacityutilization would be 35 percent. Increasing the days of operation wouldreduce the daily capacity utilization rate. If the operating season wereshortened, this would increase the daily capacity utilization rate; however,it appears that this would present no problem as there is excess processingcapacity.
Kodiak
The processing companies surveyed in Kodiak are listed below by companyand by plant where more than one plant is owned by the same company.
Alaska Pacific Seafoods, Inc.Alaska Packers Association, Inc.B & B Fisheries, Inc.East Point Seafood CompanyKodiak King Crab, Inc.New England Fish CompanyNorth Pacific Processors,Pacific Pearl Seafoods � main plant
� Roxanne Division
Pan Alaska Fisheries � Magellan BargeSkookum Chief
Swiftsure Alaska, Inc.Ursin Seafoods, Inc.
Whitney-Fidalgo Seafoods, Inc.
Other plants in Kodiak which were not included in the capacity estimatesbecause they could not be contacted were: Northern Lights Native Groupplant at Port Lyons, the C & C plant at Ouzinkie, and EAC Americo at MiddleBay.
115
The capacity estimates include data from 13 all but one of the aboveplants! which were obtained by individual survey during May 1977. At thattime, the major target for the survey was tanner crab data, therefore,capacity estimates for king crab production were not obtained for all plantssurveyed. Rather than going through the procedure of resurveying the re-maining eight plants for which king crab capacity data was not collected, aratio of king crab to tanner crab processing capacity for Westward was deter-mined from the capacity estimates for that area. The tanner crab processing
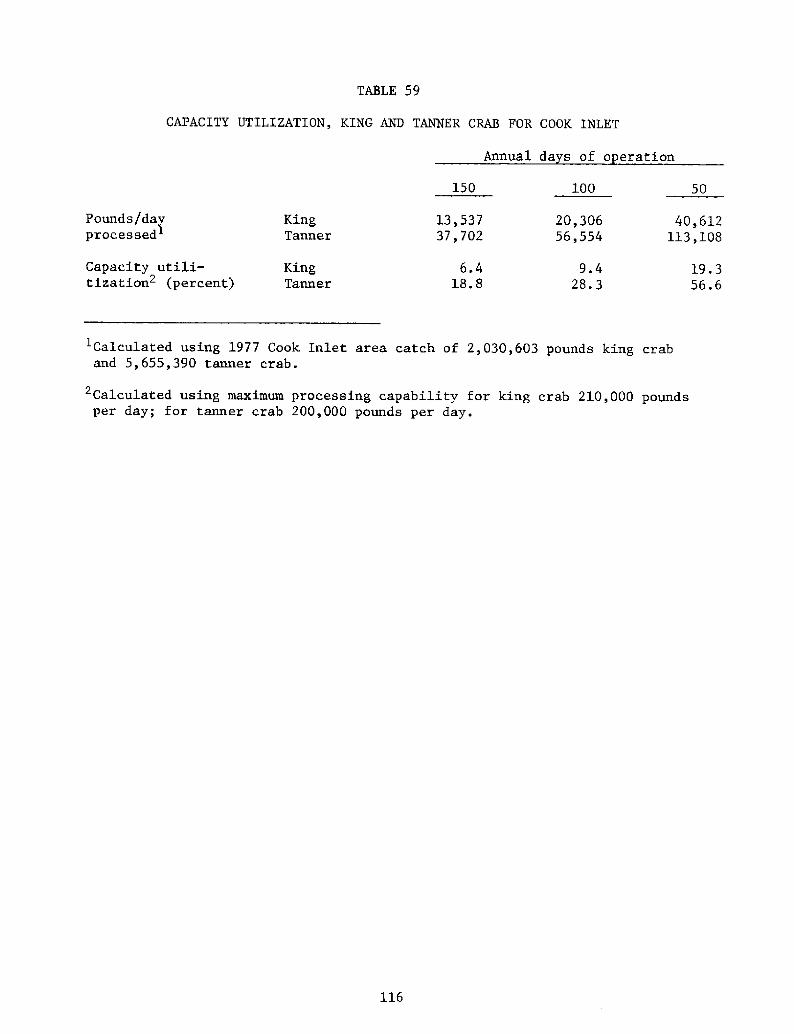
TABLE 59
CAPACITY UTILIZATION, KING AND TANNER CRAB FOR COOK INLET
Annual da s of o eration
100150 50
40,612113,108
Capacity utili-tization percent!
Calculated using 1977 Cook InLet area catch of 2,030,603 pounds king craband 5,655,390 tanner crab.
Calculated using maximum processing capability for king crab 210,000 poundsper day; for tanner crab 200,000 pounds per day.
116
Pounds/dayprocessed~
KingTanner
KingTanner
13,53737,702
6.4
18. 8
20,30656,554
9.4
28. 3
19. 3
56.6
capacity for the missing eight plants was multiplied by this ratio whichwas 1.3!, to determine king crab processing capacity. That is, an in-dividual plant in Kodiak is able to process an average of 1.3 times asmuch raw king crab as tanner crab during a given period. This is due to thelarger size of the king crab with respect to the tanner crab. The crab haveto be handled individually, therefore, a larger per unit weight results inan increased overall capacity. It is recognized that this ratio will changefrom plant to plant; however, on the average, this method should yieldreasonably accurate estimates for king crab processing capacity.
The maximum processing capacity estimates for the Kodiak area are listedbelow. These figures include estimates from all but one of the 14 listedprocessing plants.
King crabTanner crab
1,431,600 pounds per day1,133,700 pounds per day
The number of days of operation can vary from 60 to 120 days operating peryear. During the 1977-78 season, the king crab quota was caught during 122days. The 7-inch season was open from September 15 to November 30, and the8-inch season was open from November 30 to January 15. The tanner crab quotawas caught in 96 days, from January 1 to April 6. Significant amounts of crabfrom other areas such as the South Peninsula and the Bering Sea can bedelivered after the Kodiak season closing date; however, most of the crabprocessing in Kodiak will be done during this period. The capacity utilizationrates for the 1977 Kodiak catch over a range of possible operating days isshown in Table 60. From this table, it can be seen that, with current catchlevels and length of operating season, there is considerable crab processingovercapacity in Kodiak, especially for king crab.
Westward
The Westward area consists of catches from Chignik, South Peninsula,Aleutian Islands East Unalaska!, Aleutian Islands West Adak!, and theBering Sea. There are 25 plants in this area listed below by company andprocessing locations or vessels.
Alaska Packers Association Association, Inc.Chignik Plant
Alaska Shell, Inc.M/V Alaska ShellM/V Northern Shell
All Alaskan Seafood, Inc.M/V All Alaska
Deep Sea, Inc.M/V ~Dee Sea
Dutch Harbor Seafoods, Inc.M/" ~Galaa
New England Fish CompanyM/V Theresa Lee
Pacific Pearl Seafoods
M/V AkutanCaptain's Bay PointSand Point Plant
Dutch Harbor Plant
117
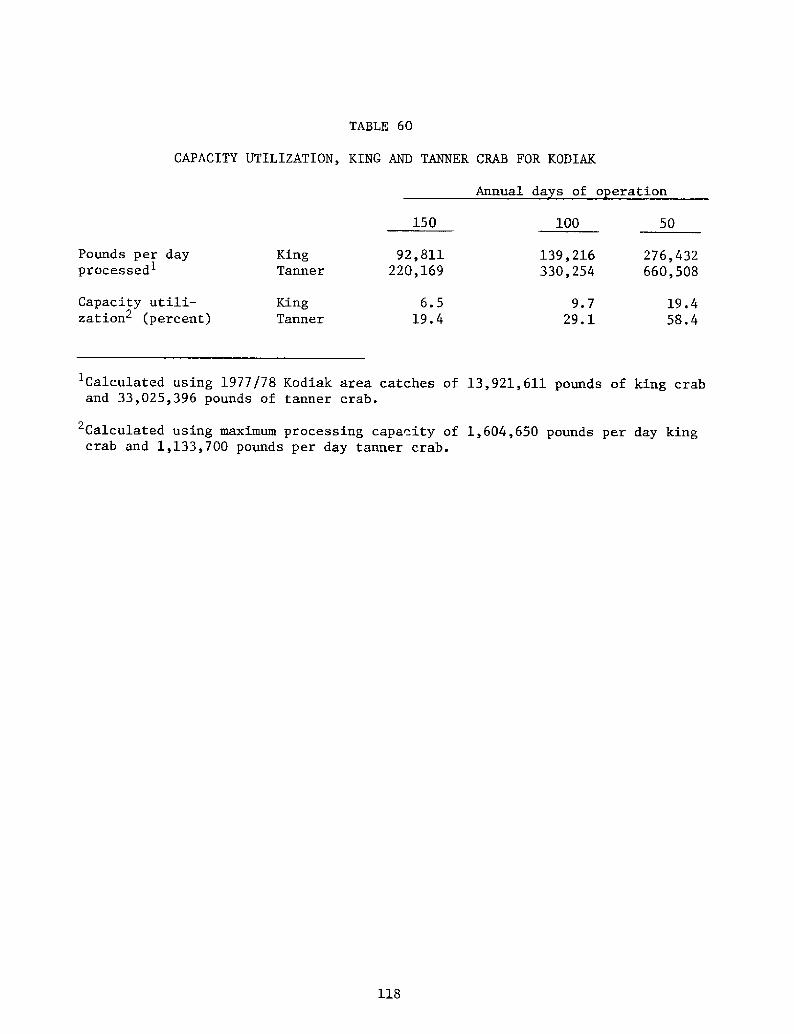
TABLE 60
CAPACITY UTILIZATION, KING AND TANNER CRAB FOR KODIAK
Annual da s of o eration
150 100 50
Calculated using 1977/78 Kodiak area catches of 13,921,611 pounds of king craband 33,025,396 pounds of tanner crab.
Calculated using maximum processing capacity of 1,604,650 pounds per day kingcrab and 1,133,700 pounds per day tanner crab.
118
Pounds per dayprocessed~
Capacity utili-zation~ percent!
KingTanner
KingTanner
92,811220,169
6.5
19. 4
139,216330,254
9.7
29. 1
276,432660,508
19.4
58.4
Pan Alaska Fisheriesi
N/V ~Ro al SeaUnalaska Plant
Pelican Cold Storage CompanyM/V Priscilla Ann
Peter Pan Seafoods, Inc.King Cove
Queen Fisheries, Inc,M/V East Point
Sea Alaska Products
M/V Sea AlaskaM/V Sea Producer
Trident Seafoods CorporationM/V Billican
Universal Seafoods, Ltd.M/V Unisea
Vita Food Products, Ltd.M/V VitaN/V ~Vicero
Whitney-Fidalgo Seafoods, Inc.M/V MokahanaM/V ~Vhicae
This area contributes the major part of the Alaska catch for both king andtanner crab 84.3 percent and 66.8 percent of state catch in 1977, respectively!,and correspondingly has the largest processing capacity. There are severalnew processing plants which have added to the capacity of this area and manyof the other plants have expanded their facilities. The estimates of in-dividual plant capacity for king and tanner crab were updated in January 1978to include these additions. The following total capacity include all but oneof the 25 plants listed.
2,631,000 pounds per day2,033,545 pounds per day
King crabTanner crab
The number of days of operation for these plants varied from 71 to 170days for tanner crab. The king crab operating season is shorter than theoperating season for tanner crab because the king crab quotas are caughtduring a shorter period of time due to the intense fishing pressure.
The capacity utilization for the 1977-78 Westward area catch level overa range of possible operating days is shown in Table 61.
119
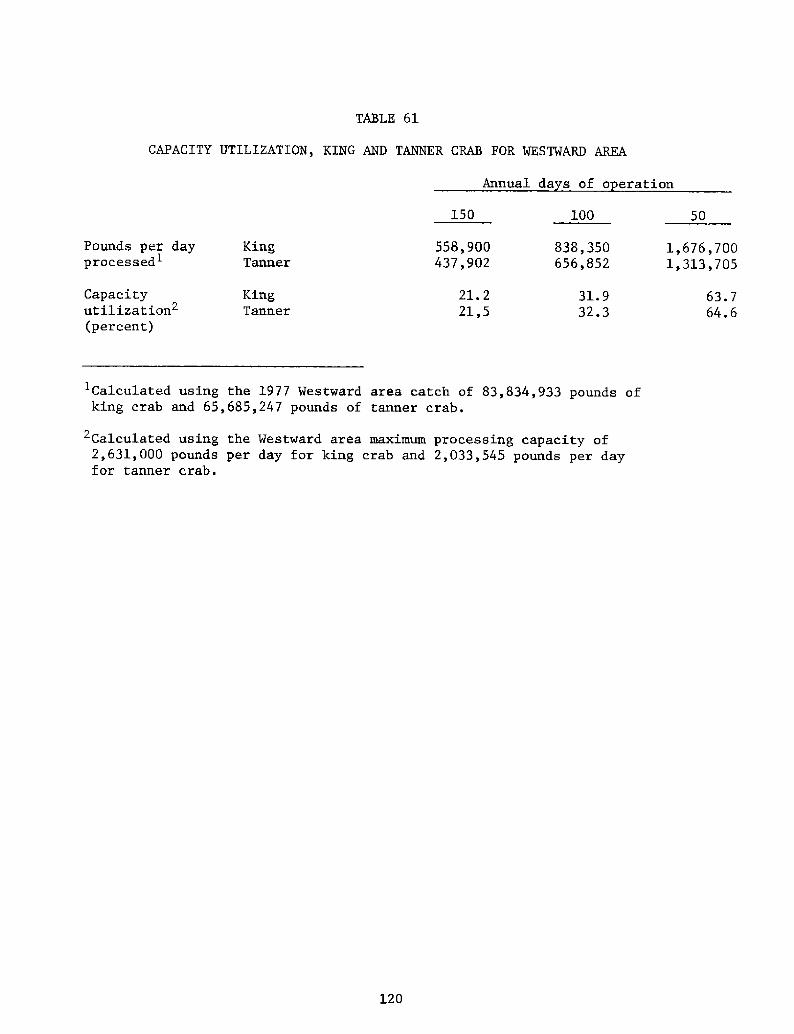
TABLE 61
CAPACITY UTILIZATION, KING AND TANNER CRAB FOR WESTWARD AREA
Annual da s of o eration
150 100 50
Calculated using the 1977 Westward area catch of 83,834,933 pounds ofking crab and 65,685,247 pounds of tanner crab.
Calculated using the Westward area maximum processing capacity of2,631,000 pounds per day for king crab and 2,033,S45 pounds per dayfor tanner crab.
120
Pounds per dayprocessedi
Capacityutilization
percent!
KingTanner
KingTanner
558,900437,902
21. 2
21,5
838, 350656,852
31. 9
32.3
1,676,7001,313,705
63. 7
64.6

CHAPTER VI
THE HISTORY OF THE SHRIMP FISHERY IN ALASKA
Forei n Shrim Fishin in Waters Off Alaska
Shrimp were first harvested in the Eastern Bering Sea and the Gulf ofAlaska by Japanese and USSR fishing fleets. The histories of these fisheriesare described for each country below.
Ja anese Shrim Fisher
Alaskan waters in 1961 north of the Pribilof Islands in the Bering Sea Chitwood 1966!. During the initial year of fishing effort, 16 trawlersdelivering to one factory ship landed over 31 million pounds of shrimp.~
As shown in Table 62, the peak Japanese harvest of shrimp from theEastern Bering Sea was in 1963 when over 60 million pounds were landed. Afterthis year, the catch and effort declined through 1968, when less than onemillion pounds were landed. After 1968, the abundance of shrimp wasapparently not at a sufficiently high level to economically continue to har-vest them. The decline in abundance was apparently due to overfishing andperhaps other factors. After 1968, there was no directed Japanese fisheryfor shrimp in the Eastern Bering Sea, however, catches were made incidentallyto other trawl fisheries. Statistics on the amount of incidental shrimpcatches are not available. NMFS surveillance and law enforcement personnelobserved three Japanese vessels fishing shrimp northwest of the PribilofIslands during July and August of 1976. One vessel was boarded and itscaptain reported that catch rates were in excess of ten metric tons per day.
By agreement after the implementation of the 200-mile limit, the Japanesethrough 1977 and 1978 must return to the ocean all the incidental shrimpcatch from the Eastern Bering Sea. In 1979 the North Pacific Fishery Manage-ment Council will determine if foreign fishing is going to be allowed inthis area and what the quotas will be.~
There is apparently still Japanese interest in fishing the Eastern BeringSea near the Pribilof Islands. In August 1977, NMFS was approached by re-presentatives from the Japan Fishery Agency with a proposal to allow a 600metric ton shrimp catch for exploratory purposes. This proposal wasdeclined by the NPFMC.
Catch figures are taken from Table 63 which do not agree with the catchlisted by Chitwood. Since the data source is the same for both tables INPFC!,it is assumed that the latter table contains revised catch figures and thesehave been used.
~NPFMC, Preliminar Fisher Mana ement Plan for Shrim , December 1976, p. 47.
~M.I ~ Hutton 1978, personal communication.121
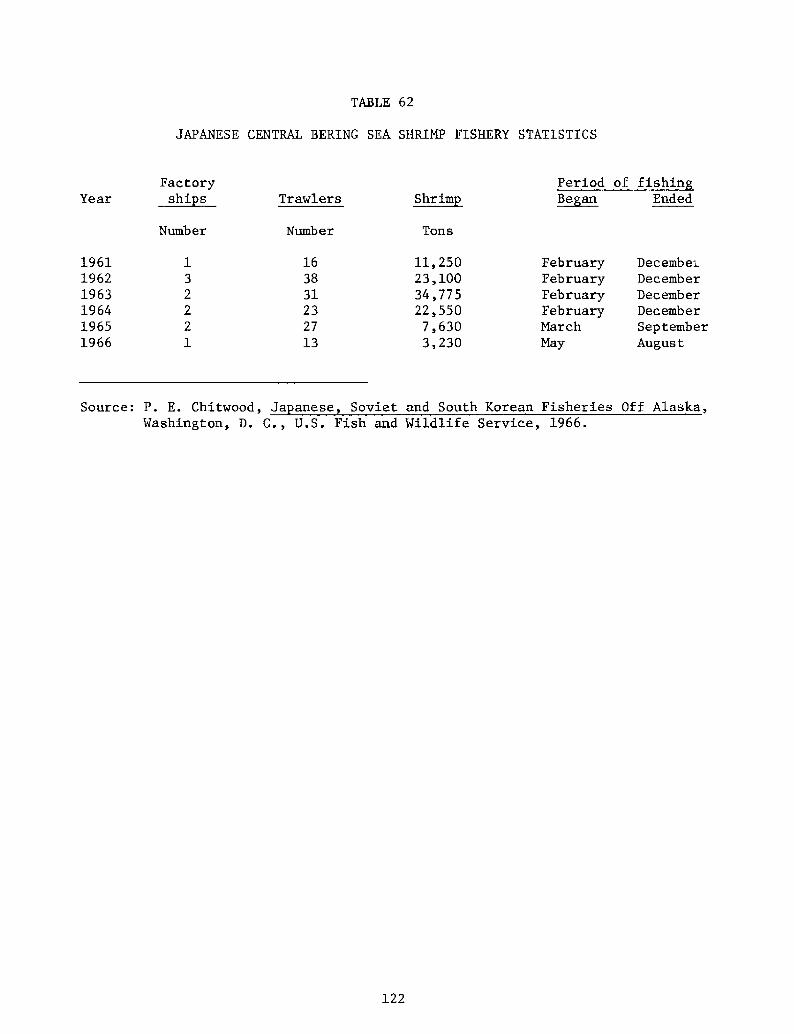
TABLE 62
JAPANESE CENTRAL BERING SEA SHRIMP FISHERY STATISTICS
Period of fishinFactory~shi e ~Shr im
Tons
Trawlers ~Be an EndedYear
Number Number
Source: P. E. Chitwood, Ja anese, Soviet and South Korean Fisheries Off Alaska,Washington, D. C., U.S. Fish and Wildlife Service, 1966.
122
1961
1962
1963
1964
1965
1966
16
38
31
23
27
13
11,25023,10034,77522,550
756303,230
FebruaryFebruaryFebruaryFebruaryMarch
May
Decembe~
December
December
December
SeptemberAugust
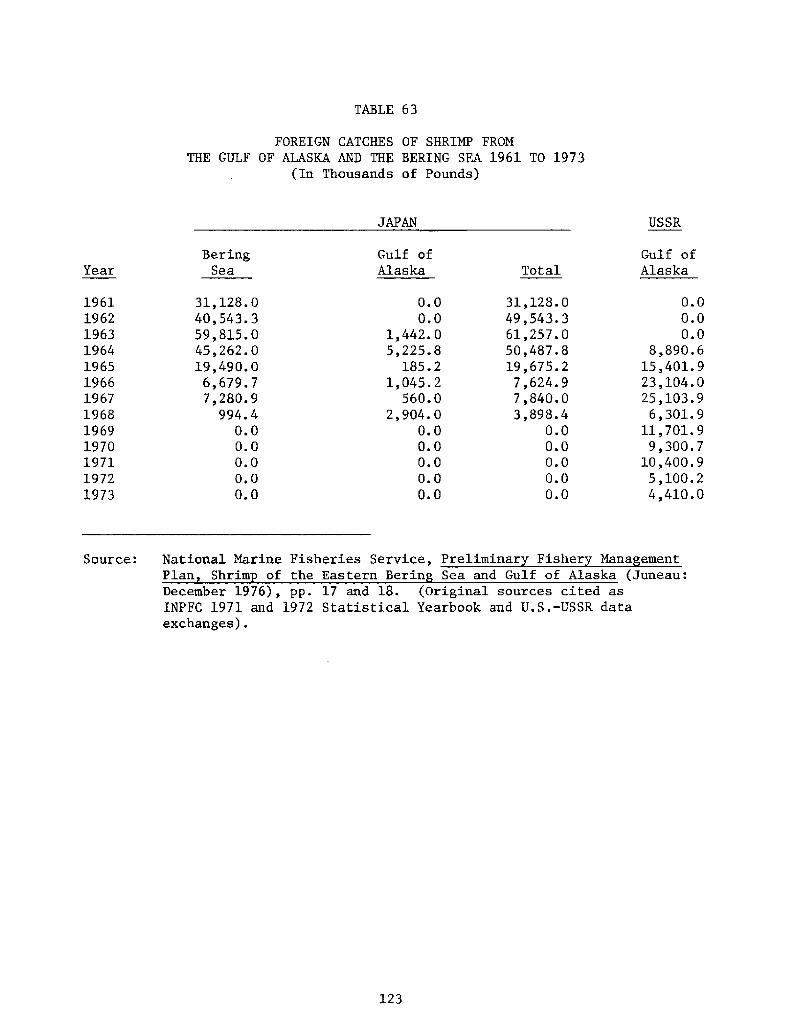
TABLE 63
FOREIGN CATCHES OF SHRIMP FROM
THE GULF OF ALASKA AND THE BERING SEA 1961 TO 1973
In Thousands of Pounds!
USSR
BeringSea
Gulf of
Alaska
Gulf of
AlaskaTotalYear
National Marine Fisheries Service, Preliminar Fisher Mana ementPlan, Shrim of the Eastern Berin Sea and Gulf of Alaska Juneau:December 1976!, pp. 17 and 18. Original sources cited asINPFC 1971 and 1972 Statistical Yearbook and U.S ~ -USSR data
exchanges!.
Source:
123
1961
1962
1963
1964
1965
1966
1967
1968
1969
1970
1971
1972
1973
31,128.040,543.359,815.045,262.019,490.0
6,679.77,280.9
994.4
0.0
0.0
0.0
0.0
0.0
0.0
0.0
1,442.05,225.8
185.2
1,045.2560.0
2,904.00.0
0.0
0.0
0.0
0.0
31,128.049,543.361,257.050,487.819,675.2
7,624.97,840.03,898.4
0.0
0.0
0.0
0.0
0 ~ 0
0.0
0.0
0.0
8,890.615,401.923,104.025,103.9
6,301.911,701.9
9,300.710,400.9
5,100.24,410.0
Gulf of Alaska. The Japanese shrimp catch from the Gulf of Alaska forthe years 1963 to 1968 is shown in Table 63. The fishing took place nearthe Shumagin Islands and offshore from Twoheaded Island.4
Processing of the Japanese shrimp catch was by factory ship operation.Catch from the trawlers was transferred in baskets to the factory ship andshoveled to conveyors which carry the shrimp to the peelers on deck. Thepeeled shrimp then go below deck to be cooked and canned or frozen Chitwood1966! .
Soviet Shrim Fisher
The first known Soviet shrimp fishery in Alaskan waters was during a onemonth period during the spring of 1963, when six large freezer/trawlers fishedjust north of the Pribilof Islands. Previous to this, the Soviet shrimpfishery was restricted by lack of suitable vessels to inshore waters neartheir own coast. During 1962-63, a medium-sized freezer/trawler was developedwhich facilitated the exploitation of more distant fishing areas. In 1964, twoof the new vessels fished the same area in the Eastern Bering Sea from Februaryuntil mid June. Another two vessels fished off the southwest coast of Kodiaknear the Trinity Islands from late October until early December.
After 1964, Soviet shrimp fishing effort was shifted entirely to theShumagin Islands area. In 1965, the ex-vessel fleet which started fishing inFebruary increased to ten by the end of the year with the effort dividedbetween southwest Kodiak Island and the Shumagin Islands. During 1966, theSoviet fishing effort was concentrated mostly in the Shumagin Islands areaand by the end of the year, 18 freezer/trawlers were operating there. Alsoduring 1966, the freezer/trawler fleet was joined by a cannery factor shipwhich allowed complete processing of shrimp on the fishing grounds. Prior tothe arrival of the factory canning ship, the shrimp catch was frozen in theround by the freezer/trawlers and processed when it was delivered to shorefacilities in Soviet ports Chitwood 1966!.
In October 1966, the approval of Public Law 89-658 established afisheries zone contiguous to the territorial sea of the United States. Thisnine-mile contiguous zone carried the same rights as the U.S. territorial seaand so the exclusive fishery zone was effectively extended from three to 12miles. A significant part of the previous Soviet shrimp fishery took placewithin this zone so the act had the effect of restricting Soviet participationin the shrimp fishery off Alaska.
The amount of Soviet shrimp catch in the Gulf of Alaska increased fromless than nine million pounds in 1964 to the peak year of 1967 when over 25million pounds were harvested. It subsequently declined to less than fourand one � half million pounds by 1973 Table 63!.
In March 1967, there were two prosecuted Soviet shrimp fishery violations;one violation of the territorial waters and one violation of the contiguousfishery zone. These violations resulted in fines to the master of $5,000 and
"NPFMC, Preliminar Fisher Mana ement Plan for Shrim , 1976.
124
$10,000 respectively. There were two other contiguous fisheries zoneviolations which were prosecuted in 1971 and 1974. These violationsresulted in fines and civil suits totaling $50,000 and $250,000, re-spectively. There has not been any Soviet shrimp fishing off Alaskasince 1974.
The relationships between the foreign and U.S. shrimp fisheries canbe seen from Figure 14.
U.S. Shrim Fisher in Alaska
The first shrimp processing plant in Alaska was started in 1915 inThomas Bay, north of Petersburg. The catch was initially made entirely bybeam trawl and grew from 164,000 pounds in 1916 to 2.2 million pounds in1921 when there were four shrimp processors in the Petersburg-Wrangellarea processing the catch. The shrimp catch for the Southeast area fluctuatedbetween 1.7 and 5.5 million pounds between 1921 and 1956. During this period,the landed shrimp were cooked, picked by hand, and packed into cans whichwere sealed and kept refrigerated or frozen until they reached the market.Expansion, of the shrimp fishery was limited by the amount of hand labornecessary to pick the shrimp.
In 1957, the mechanical shrimp peeler was introduced in Wrangell.This enabled the processing of the peak catch for the Southeastern area of7.6 million pounds in 1958 ' After that year, the shrimp catch for the South-eastern area declined and has averaged less than one million pounds since 1970.
The introduction of the mechanical peeler precipitated the developmentof the shrimp fishery in the Kodiak area. In 1958 one processing companyinstalled three peeling machines Jackson 1968!, and from this start, Kodiakquickly became the dominant area of the shrimp fishery in Alaska. The catchof shrimp increased rapidly in Kodiak, reaching a peak catch of 82.2 millionpounds in 1971, after which the catch was restricted by quota. Each yearfrom 1965 until 1972, the Kodiak area produced more than 80 percent of theAlaska production of shrimp as shown in Figure 15 and Table 64.
As the shrimp catch in Kodiak declined after 1971, fishing effortincreased in the Chignik-South Peninsula area. The catch for this areahas increased from 5.5 million pounds in 1968 to 74.2 million pounds in 1977,and for the past two years has surpassed the Kodiak catch see Figure 15 andTable 64!. The South Peninsula is now the dominant shrimp producing area inthe state and has the largest concentration of fishing effort. The pro-cessing capacity from this area is growing rapidly in order to handle theincreased catches.
125
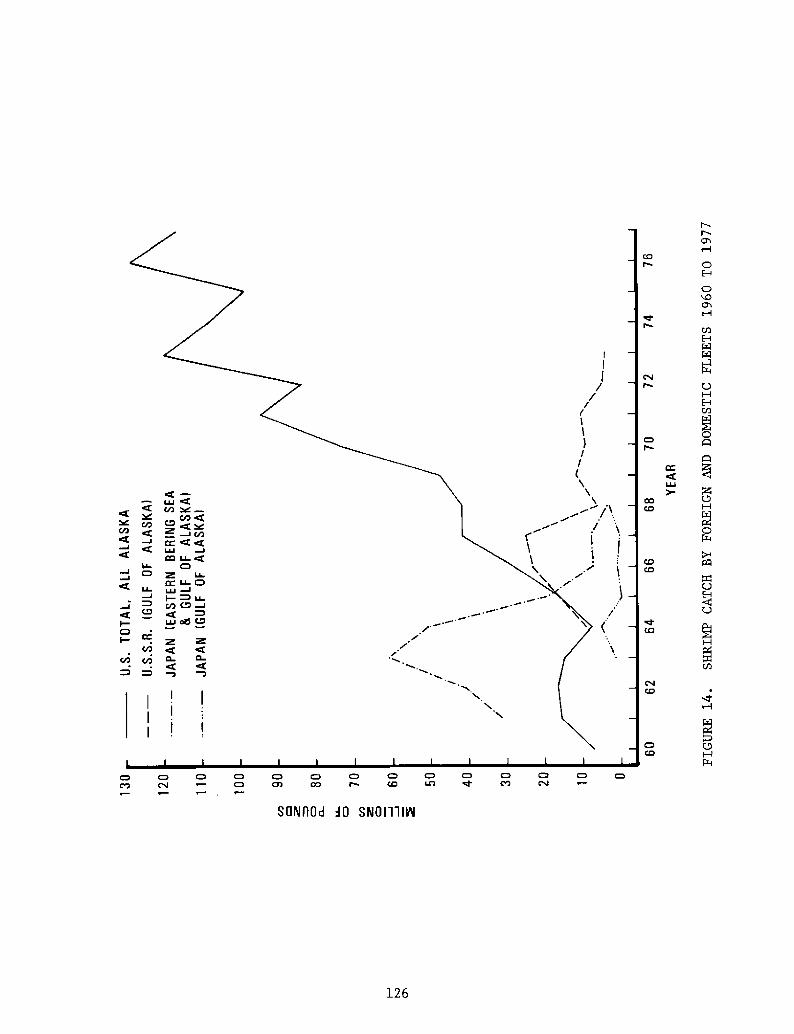
CV
D O O O
SGNAOd 30 SNOlllIIN
126
O O O O O O O O OCV O Cn CO r CO u d
U H 8 H O
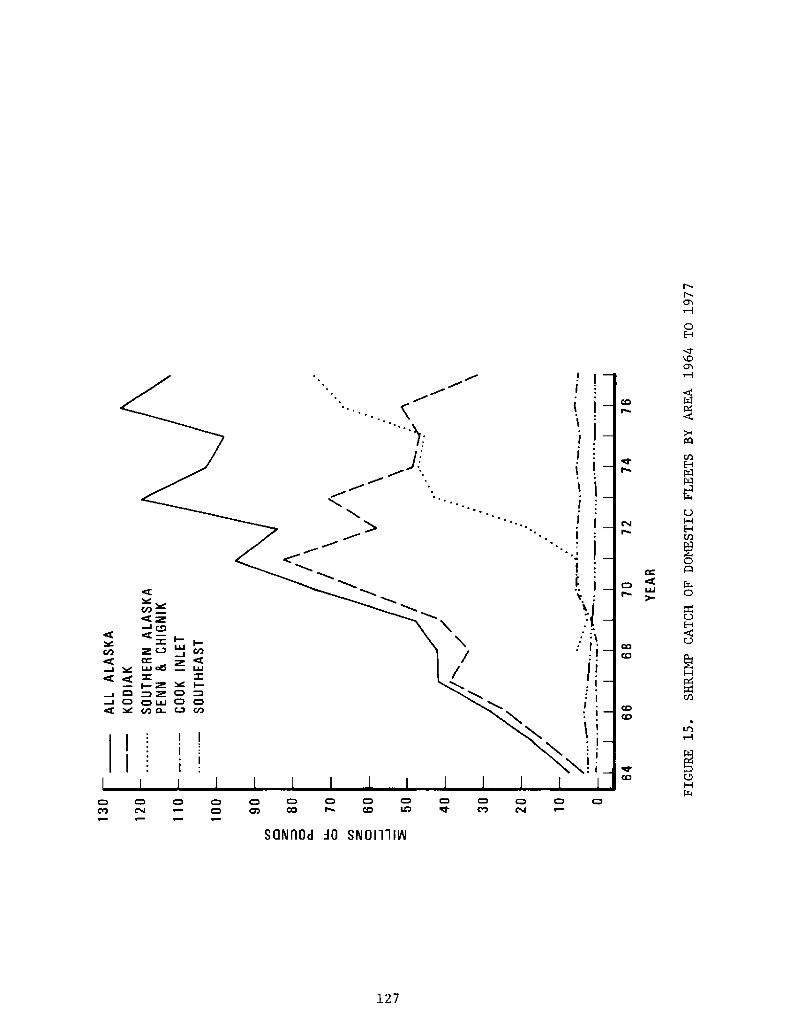
CK
r
o o aCV
SQNflOd 3G SNOlll/W
127
a a o a o a a a a oN ~ a a co ~ cg!
U 8 O CDU

TABLE 64
ALASKA SHRIMP CATCH BY MANAGEMENT AREA 1964 TO 1977
In Pounds!
S. Alaska Pen.~&Chi nik Cook InletYear All Alaska Kodiak Southeastern
Source: ADF&G Statistical Leaflets, 1964 to 1975 'ADF&G Monthl Shellfish Re orts, 1916 to 1977.
128
1964
1965
1966
1967
1968
1969
1970
1971
1972
1973
1974
1975
1976
1977
7,724,63016,819,45028,192,37641,812,60042,019,60047,848,00074,246,40094,884,60083,726,800
119,499,800102,978,200
98,061,600125,168,886112,141,250
4,330,12013,810,17024,097,70038,267,90034,361,60041,243,50062,181,20082,153,70058,352,30070,511,50048,771,10046,759,10051,400,41231,801,573
5,527,6003,076,9005,289,7006,319,900
18,905,90043,380,20047,258,80045,527,30066,588,26674,252,115
601,41064,500
309,676741,400
26,7001,847,2005,817,6005,451,3005,548,6004,897,1005,748,9004,753,1006,201,5285,136,876
2,793,1.002,944,7803,785,0002,803,3002,103,7001,680,400
957,900959,700920,000711,000
1,199,4001,023,100
978,620950,686
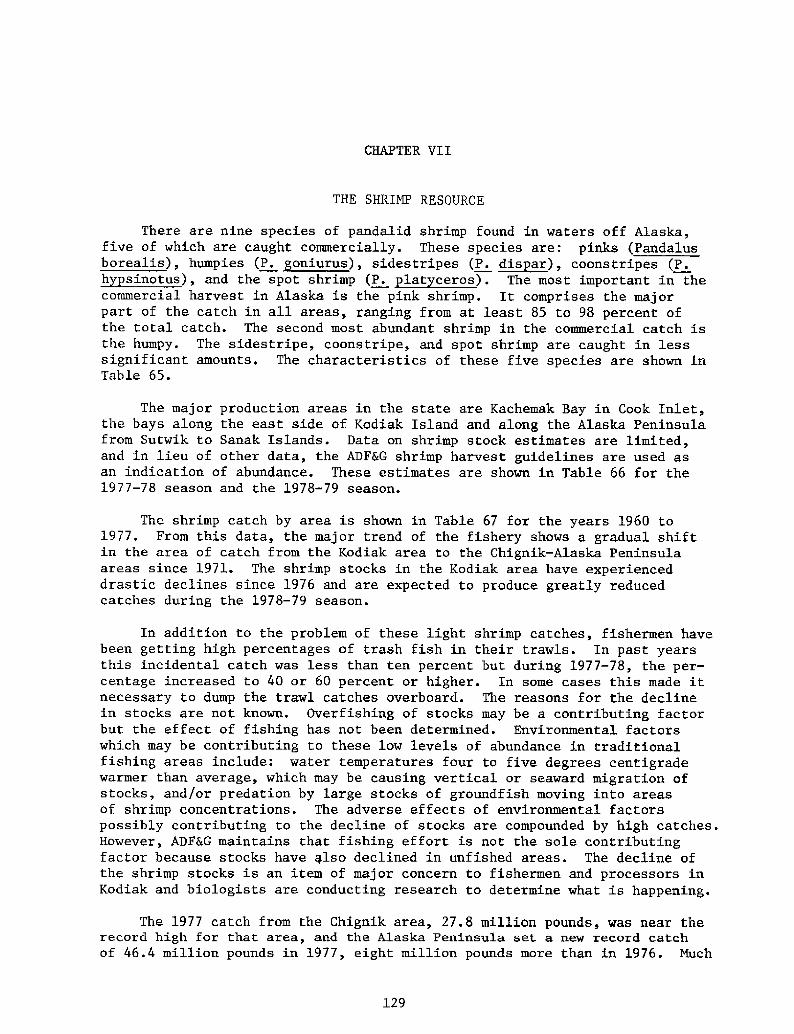
CHAPTER VII
THE SHRIMP RESOURCE
There are nine species of pandalid shrimp found in waters off Alaska,five of which are caught commercially. These species are: pinks {Pandalusborealis!, hunpies p, doniurus!, sidestripes p. ~dis ar!, ooonstripes p.
commercial harvest in Alaska is the pink shrimp. It comprises the majorpart of the catch in all areas, ranging from at least 85 to 98 percent ofthe total catch. The second most abundant shrimp in the commercial catch isthe humpy. The sidestripe, coonstripe, and. spot shrimp are caught in lesssignificant amounts. The characteristics of these five species are shown inTable 65.
The major production areas in the state are Kachemak Bay in Cook Inlet,the bays along the east side of Kodiak Island and along the Alaska Peninsulafrom Sutwik to Sanak Islands. Data on shrimp stock estimates are limited,and in lieu of other data, the ADF6G shrimp harvest guidelines are used asan indication of abundance. These estimates are shown in Table 66 for the
1977-78 season and the 1978-79 season.
The shrimp catch by area is shown in Table 67 for the years 1960 to1977. From this data, the major trend of the fishery shows a gradual shiftin the area of catch from the Kodiak area to the Chignik-Alaska Peninsulaareas since 1971. The shrimp stocks in the Kodiak area have experienceddrastic declines since 1976 and are expected to produce greatly reducedcatches during the 1978-79 season.
In addition to the problem of these light shrimp catches, fishermen havebeen getting high percentages of trash fish in their trawls. In past yearsthis incidental catch was less than ten percent but during 1977-78, the per-centage increased to 40 or 60 percent or higher. In some cases this made itnecessary to dump the trawl catches overboard. The reasons for the declinein stocks are not known. Overfishing of stocks may be a contributing factorbut the effect of fishing has not been determined. Environmental factorswhich may be contributing to these low levels of abundance in traditionalfishing areas include: water temperatures four to five degrees centigradewarmer than average, which may be causing vertical or seaward migration ofstocks, and/or predation by large stocks of groundfish moving into areasof shrimp concentrations. The adverse effects of environmental factorspossibly contributing to the decline of stocks are compounded by high catches.However, ADF6G maintains that fishing effort is not the sole contributingfactor because stocks have also declined in unfished areas. The decline ofthe shrimp stocks is an item of major concern to fishermen and processors inKodiak and biologists are conducting research to determine what is happening.
The 1977 catch from the Chignik area, 27.8 million pounds, was near therecord high for that area, and the Alaska Peninsula set a new record catchof 46.4 million pounds in 1977, eight million pounds more than in 1976. Much
129
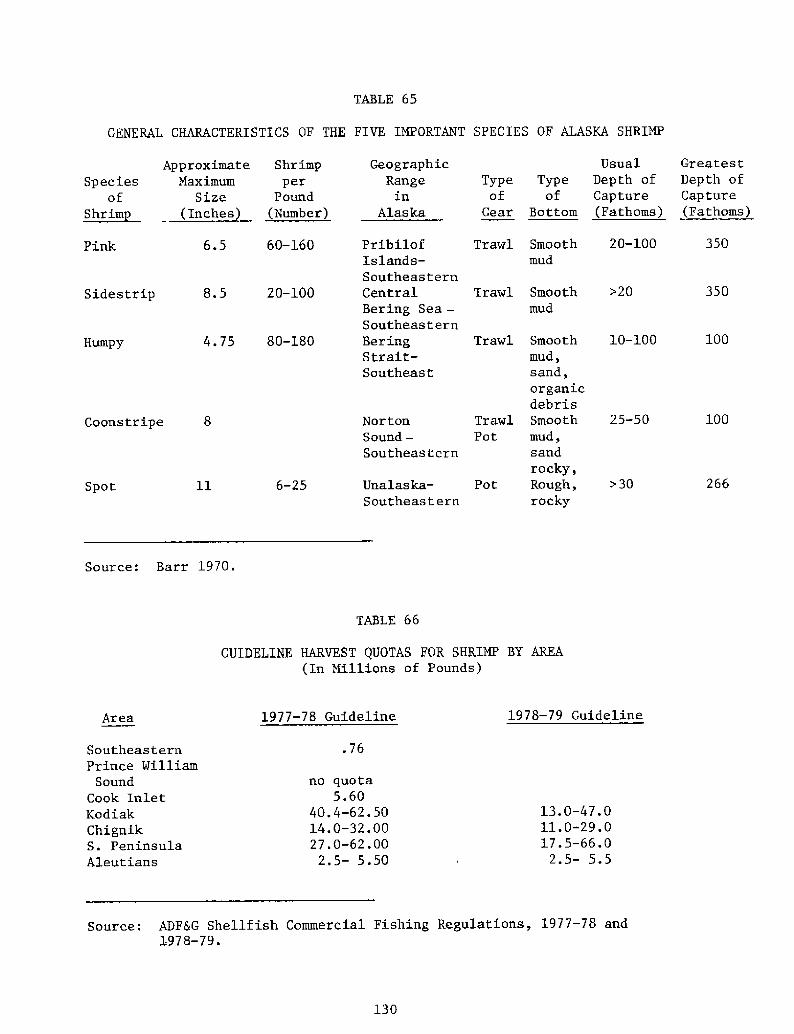
TABLE 65
GENERAL CHARACTERISTICS OF THE FIVE IMPORTANT SPECIES OF ALASKA SHRIMP
GeographicRange
in
Alaska
Usual
Depth ofCapture Fathoms!
Shr impper
Pound
Number!
ApproximateMaximum
Size
Inches!
Greatest
Depth ofCapture Fathoms!
Speciesof
~shr im
Typeof
Gear
Typeof
Bottom
60 � 160 Smooth
mud
20-100 3506.5 TrawlPink
8.5 20-100 Smooth
mud
0 350TrawlSidestrip
10-1004.75 80-180 100TrawlHumpy
25-50Trawl
PotCoonstripe 8 100Norton
Sound-
Southeas t ern
Unalaska-
Southeastern
�0 2666 � 25 PotSpot
Source: Barr 1970.
TABLE 66
GUIDELINE HARVEST QUOTAS FOR SHRIMP BY AREA In Millions of Pounds!
1978-79 Guideline1977-78 GuidelineArea
.76
13.0-47.0
11.0-29.0
17.5-66.0
2.5- 5.5
Source: ADF&G Shellfish Commercial Fishing Regulations, 1977-78 and1978-79.
130
Southeastern
Prince William
Sound
Cook Inlet
Kodiak
ChignikS. Peninsula
Aleutians
Pribilof
Islands-
Southeastern
Central
Bering SeaSoutheastern
BeringStrait-
Southeast
no quota
5.60
40.4-62.50
14.0-32.00
27 ' 0-62.00
2.5- 5.50
Smooth
mud'sand,organicdebris
Smooth
mud,sand
rocky,Rough,rocky
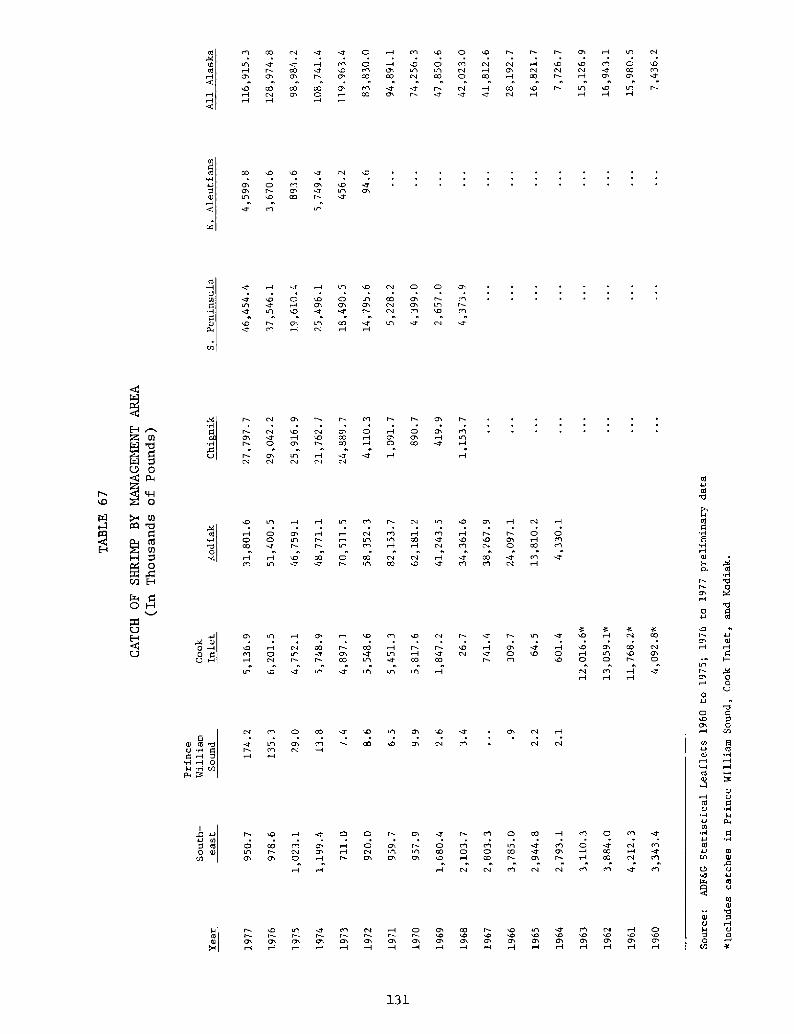
r «OCh Ch Ch0 CO «Xl COUt 0
NCO r W OlO cQ rh
Irc I
M OVl CO CO
CO
«ID 0 M N NN CO O CO
r N H COI M W W N
CrI
O«rt
O O0 «QIrt
I
O IJDCh Cr
cQ
Cl QIOl Irt rM
«rt
R N Qc R I0 H 0Ch0 CO
N «Q N OcCh wt W cQ COCQ
Ch «ItN N N N
aj
8
A cd
R QCh'a
0 cd
rCl W «Q t0 ChN M N 00 0QDrh
NIrtlrl0 Cl NIC« co
CD Ch0 0CO wt I I~ DcID
cJCh td
4HlrtQ0CD
0IJO
0«Q
0 00
CQO 0CO
Ch0ChO «Q 0N
O NIcc
cO I cO«hI cO «rlr«rc CO
ICI trl
J JJIJ tdcd
0 dl
0 OD H M 04 H 4 0 0
Qc Ch O0 CQ r4
CO NCh 6 0Ch R N O CO «D
Ch Ch «QtrlO COCO
NM
N N
NChr- r- Ch
0 H M CI 0 cJD r
N M O CO < '0 IID Ch '0 -Q ~ctc gIJdl
ctfdt
Cl
JJrttdcJ IQ«A dl0 JJ
«J
dt'0dt
«IQ
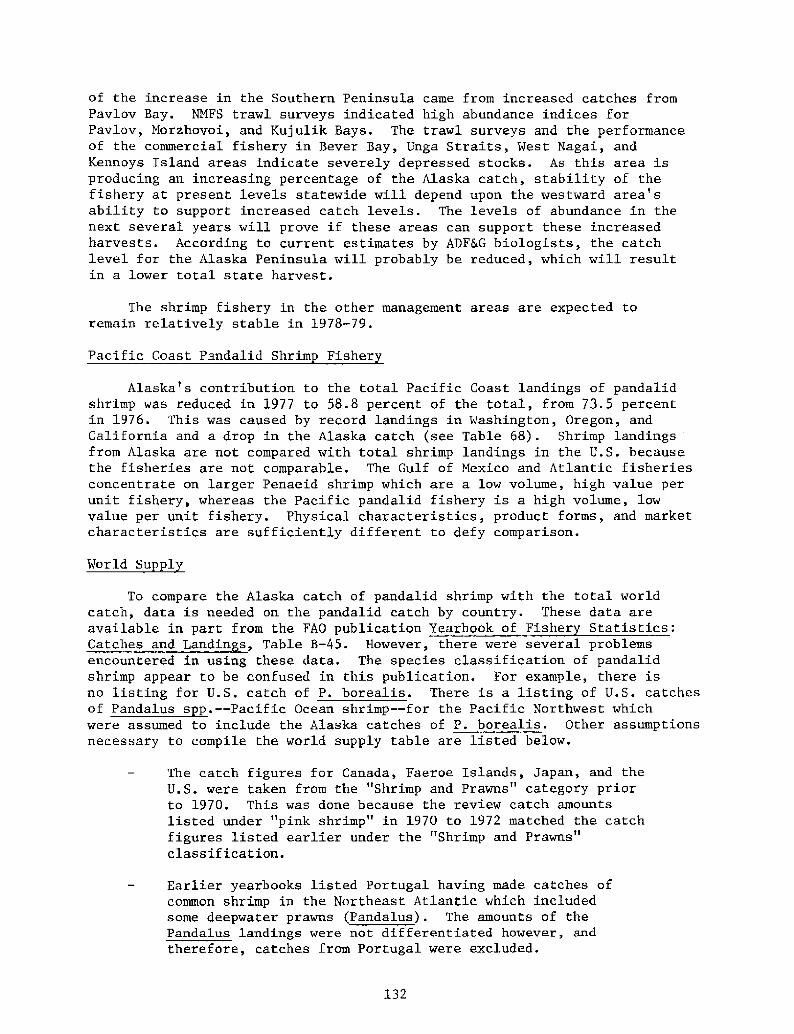
of the increase in the Southern Peninsula came from increased catches from
Pavlov Bay. NNFS trawl surveys indicated high abundance indices forPavlov, Morzhovoi, and Kujulik Bays. The trawl surveys and the performanceof the commercial fishery in Bever Bay, Unga Straits, West Nagai, andKennoys Island areas indicate severely depressed stocks. As this area isproducing an increasing percentage of the Alaska catch, stability of thefishery at present levels statewide will depend upon the westward area'sability to support increased catch levels. The levels of abundance in thenext several years will prove if these areas can support these increasedharvests. According to current estimates by ADF6G biologists, the catchlevel for the Alaska Peninsula will probably be reduced, which will resultin a lower total state harvest.
The shrimp fishery in the other management areas are expected toremain relatively stable in 1978-79.
Pacific Coast Pandalid Shrimp Fisher
Alaska's contribution to the total Pacific Coast landings of pandalidshrimp was reduced in 1977 to 58.8 percent of the total, from 73.5 percentin 1976. This was caused by record landings in Washington, Oregon, andCalifornia and a drop in the Alaska catch see Table 68!. Shrimp landingsfrom Alaska are not compared with total shrimp landings in the U.S. becausethe fisheries are not comparable. The Gulf of Mexico and Atlantic fisheriesconcentrate on larger Penaeid shrimp which are a low volume, high value perunit fishery, whereas the Pacific pandalid fishery is a high volume, lowvalue per unit fishery. Physical characteristics, product forms, and marketcharacteristics are sufficiently different to defy comparison.
To compare the Alaska catch of pandalid shrimp with the total worldcatch, data is needed on the pandalid catch by country. These data areavailable in part from the FAO publication Yearbook of Fisher Statistics:Catches and Landin s, Table B-45. However, there were several problemsencountered in using these data. The species classification of pandalidshrimp appear to be confused in this publication. For example, there isno listing for U.S. catch of P. borealis. There is a listing of U.S. catches
were assumed to include the Alaska catches of P. borealis. Other assumptionsnecessary to compile the world supply table are listed below.
The catch figures for Canada, Faeroe Islands, Japan, and theU.S. were taken from the "Shrimp and Prawns" category pri.orto 1970. This was done because the review catch amounts
listed under "pink shrimp" in 1970 to 1972 matched the catchfigures listed earlier under the "Shrimp and Prawns"classification.
Earlier yearbooks listed Portugal having made catches ofcommon shrimp in the Northeast Atlantic which includedsome deepwater prawns Pandalus!. The amounts of thePandalus landings were not differentiated however, andtherefore, catches from Portugal were excluded.
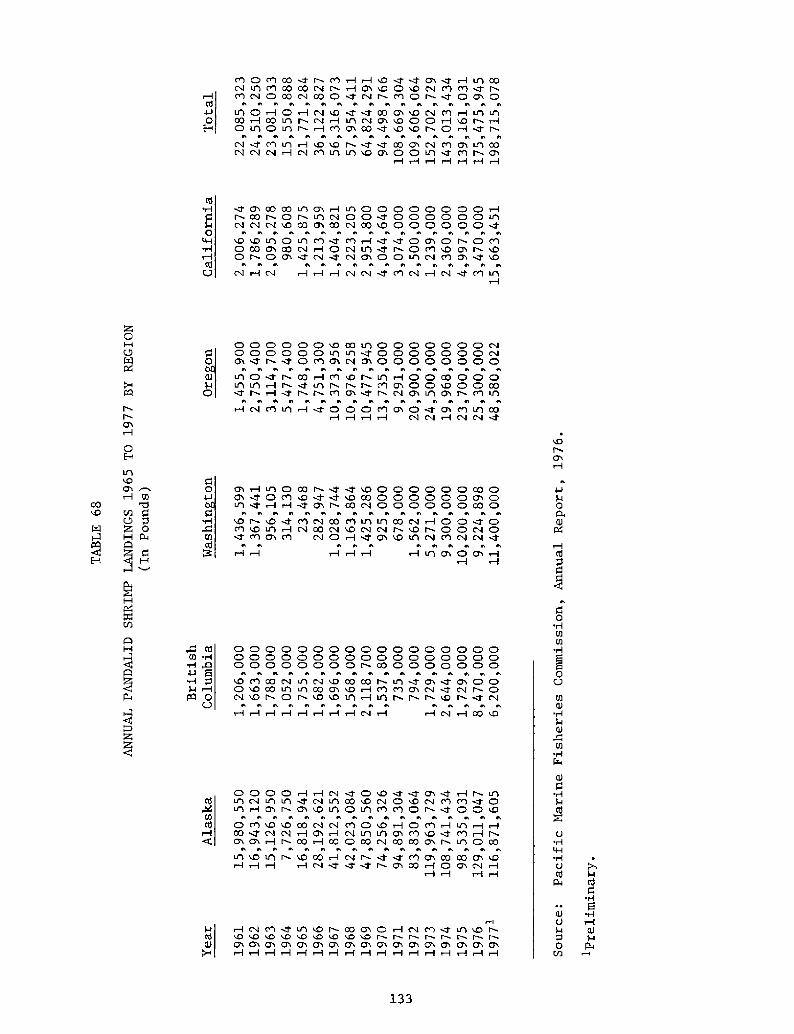
0
C Ch CO CO Ul Ch H A 0 0 0 O O 0 0 0 HrCOrOrUlNOO<OO OOOOcV CV R < CO Ch CO N CO 4 0 0 0 0 0 0 4a h t A A ~ ~ ~ A h A a a tl a A A
OUlWNWANNOChONDOCOChCO~HOCVUl<r OWZChr0 > 0 Ch 4 CV 4 CV Ch 0 0 A CV
A a a ~ I a a tl t tl tl a a tl h ~Cll W W W CV
O O O O O O % CO R 0 0 0 0 0 O 0 CV0 0 0 0 0 0 8 4 < 0 0 0 0 0 0 0 cVCh 4 N C 0 W «h c4 Ch 0 0 0 0 0 0 0 0
~ t h t a ~ ~ h t h ~ h h a h ~ tUl 0 C N CO R W 4 N ul 6 0 0 cO 0 0 0
Ch D 0 W 0 0 COCh le Ch W ltl
h a h h ~ h h A ~ a ~ ~ h h tl t hW Cll M & W W 0 0 0 W Ch 0 M Ch Ctl Ul CO
Cll
0 5Ch+WOCOP 4<%000000cOOCh C O W < C 4 N CO 0 O 0 0 0 O Ch O
> CO A 0 O 0 0 O O CO 0a h h A h A A A h A A ~ A A ~ A
COWMvlGOMWOOWOWZPHC400NQNNl @Dr OOOO
0&WChWlClcVt A A ~ A a tl h a h tl
W n Ch 0 Ch
4 ed
4J g~ II
O-'I 0
0 0 0 0 0 0 0 0 0 0 0 0 0 0 0 0 00 0 0 0 0 0 0 0 0 0 0 0 0 0 0 0 00 0 0 0 0 0 0 0 N CO 0 0 0 0 0 0 0
h A ~ A A t A A tl A A tl A A ~ a ALOWCGCVWCIlMCOCOhhWMChMCh00OWCOA&00Ch'IOAW&ChCV<CIlhhO
O hh M M Ula tl a a a a a A h a A A h A
CO
00 Ch 0eeemeeeemr r r r r r r rCh Ch Ch Ch Ch Ch Ch Ch Ch Ch Ch Ch Ch Ch Ch
133
0 W CO1P! W COCll O QO
A A a tlUl 0 H 0CO W CO0 Ul 0h h ~ A
CV
OOOOCV
a A a aO CO
h a t a
COMr WChWOWCO 0 W V W Cll 0
a tl A t tl h tl aCV M M M 00 Ch 'uD
Vl Cll Ch 4! OCh GO~ a a a h h a ~
t-IMWr WWCOChD 0
HHNNOANWCV 4 CO 4 hl 0 4
Ch A Ul 0 Ul W W 0a ~ a a a h h
00 N CV Yl 0 Z 6 0W Ch H W Vl Vl Ch WCO H QO D CO CV CO CO
h tl h a h h h a00
Ch CO
Ch W W Ul COCll
0 Ch 0h h 'h t h
CV0&&
0a A h t tl
CO
r4cV P P 4 0a<00<
a t a a A
Ch M W 0 COA ~ ~ ~ tCO CO ChOCh&
0 0
V~ I-l
V �
8 0 0
The yearbooks listed catches by Canada in the NortheastPacific for the years 1970 to 1972, but since the lateryearbooks dropped these fi.gures, it was assumed that thiswas a correction and these landings were excluded. Thiswould appear to be an omission in the FAO statisticsbecause Canada does have significant landings of Pandalusshrimp in waters off British Columbia.
The catch figures for Scotland during 1965 to 1969 weretaken from the "Common Shrimp" classification. The "CommonShrimp" catches for Scotland in 1970 to 1972 matched thereview catches of "Pink Shrimp" for 1970 to 1972 in lateryearbooks, and it was assumed that this was a correction ofan earlier misclassification.
Table 69 should provide an indication of the United States' relativeimportance in world Pandalus shrimp catches, the above reservations not-withstanding. The U.S. percentage of world catches varies from 22.0 percentin 1964 to 44 ' 9 percent in 1976, with the highest percentage of world catch,69.4 caught by the U.S. in 1972. As the U.S. had a record catch of pandalidshrimp in 1977, the relative importance in providing the world supply hasprobably increased from the 1976 figure.
134
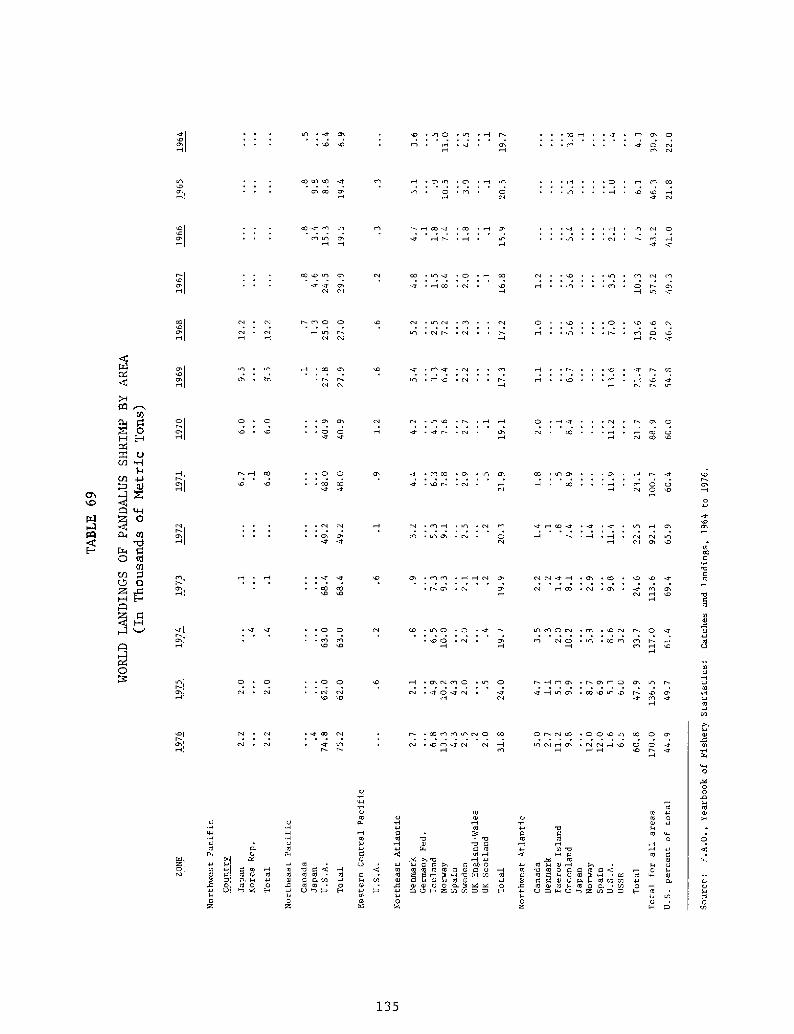
ca w a M ch at
Cl A M aj
N
~ R t/I N 0
r M 0 0rN
N M ' Nul 'NI N' ~N N
N ~ ~ ChN I ~ ca M ~ r v92r rN N
0 0 rI N th0 0
0 0 Ch0 00
0
~ N Nt/I Ch N 0 ~ + N
ntndC'0ItlN N
N ~ al ~
QI0/JCJ
0 0 NN ~ 0 0
a rJIJ
/Jca
0 ~ 0~ N
- 0 0
NN
o 0 � nj ca o chNN Annal 0 r
W 0
0 0 njQttdnf 0Qt LI
cd W0
nf Qt0W Qt0njI/0
t '0cdnj /JQQ 0C 0�
0 td/J
nf
nt na c j
0Z
0
/Q 'CInlQt0 C C0 n!Qt d jt ld0
Ccd
td C t/j0 Qt
'atlf
Qt 00 0Z
Cnj0, /InjO ht D
/Jnf04 0
C Ix acd ca vt l/0 Ch ' I/I 0Z �
0i !I4 Qt td/J 400
135
clt0
0 o~
U
I/t tS
q g
C4 cjj
0 dd
H
Ga t/I 0 al w ca N ca tnt ~ M N Mca N M ~ 0 I Ch
0 ' ' ca 0 ca unVj ~ ~ I M CD uDr
0 ~ a< ~ ~ ~ N ~ r ch 0ca W ~ H ca CDN al '0
I N ca
M W nt ~ N M ta
0 ~ I 0 N R Ca
Ca t/I 0 t/I M O N
0 NM0 t/I O I W M 0t/l atN
I CCMMMNCDC0 0 I NIXfN '� I/l N A Ch

CHAPTER VIII
FISHING GEAR AND PROCESSING METHODS FOR SHRIMP
Shrim Fishin Gear
The vessels and gear used to harvest shrimp throughout Alaska vary fromarea to area due to difierences in species distribution, abundance, and theweather and type of bottom conditions encountered.
Vessels
Southeastern. In 1976 there were 18 vessels fishing for shrimp in theSoutheast area--14 beam-trawlers and four vessels fishing pots. For most ofthe fishermen, shrimp fishing is an off-season employment from the salmon gillnet and seine! and halibut fisheries. The number of vessels partici-pating since 1969 has remained fairly constant Table 70!.
Cook Inlet. There were 42 vessels recording landings in Cook Inletduring 1976. Of these, 34 were fishing with pot gear and eight were trawlers.The ma]ority of the shrimp are landed by the trawlers, although only four ofthem are active in the fishery. The total number of vessels fishing in-creased from 16 in 1969 to 68 in 1973, and has declined since then Table 70!.
Kodiak and Westward. All vessels fishing from Kodiak west are registeredin Area J Table 71!. The vessels registered for the current season arelisted in this table by length and gear type. It should be noted that theseare registered vessels and they have not necessarily all participated in thefishery.
Of the total 90 vessels registered in Area J, six use pot gear, ten usea beam-trawl, 27 use a single otter trawl, and 47 use double otter-trawl gear.The largest component of the fleet and the largest vessels are the doubleotter-trawlers. They are all from 60 to 100 feet in length and many aremodern, steel hulled with a stern ramp for hauling the tzawls.
The numbers of vessels actually fishing for shrimp each year are shownin Table 70. They are shown by management area for the years 1969 to 1976.
From Table 70, it can be seen that the largest increase in numbers offishing vessels has occurred in the Alaska Peninsula. The numbers haveincreased steadily from three to 71. The Southeast participation has remainedfairly constant at around the present 18 vessels. The Prince William Sound,Cook Inlet, and Kodiak numbers of vessels increased and subsequentlydecreased to the 1976 level of two, 42, and 80, respectively. The vesselsfishing in Dutch Harbor increased from two in 1972 to eight in 1976.
es of Gear
Pots. A small percentage .002 percent in 1975! of the annual shrimpcatch is made by pot. They are used to fish selectively for the larger
137
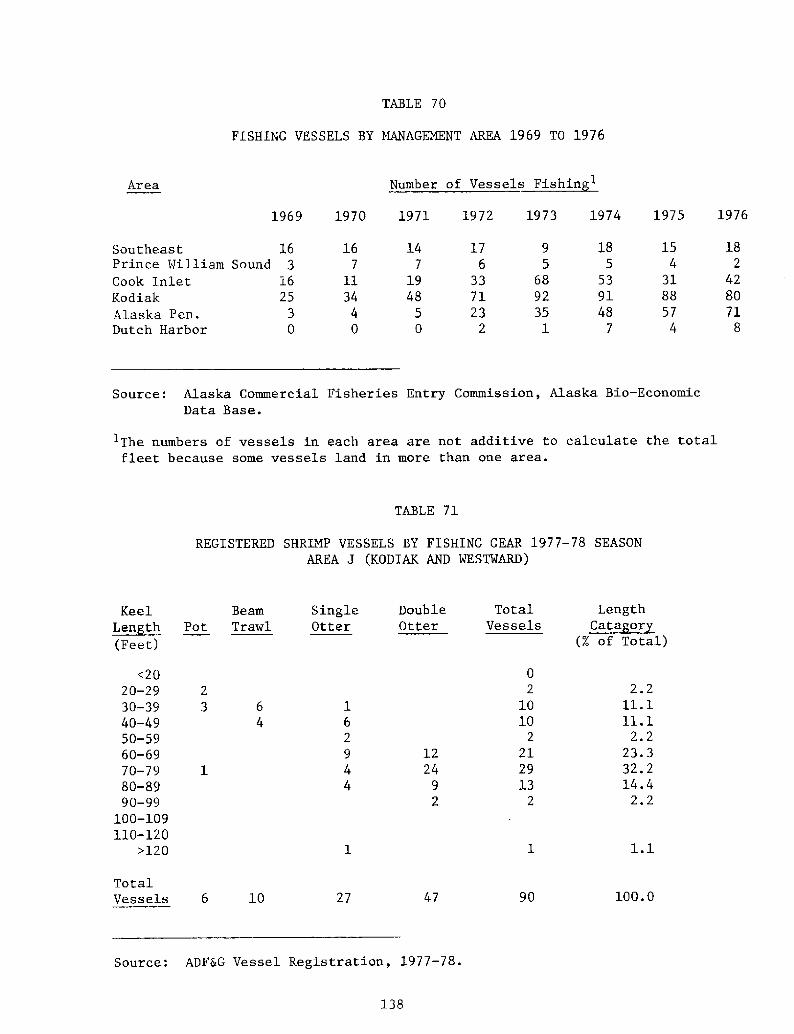
TABLE 70
FISHING VESSELS BY MANAGEMENT AREA 1969 TO 1976
Number of Vessels~FishinArea
1969 1970 1971 1972 1973 1974 1975 1976
18
5
53
91
48
7
18
2
42
80
71
8
16
7
11
34
4
0
14
7
19
48
5
0
Southeast 16Prince William Sound 3
Cook Inlet 16
Kodiak 25
Alaska Pen. 3Dutch Harbor 0
15
4
31
88
57
4
17
6
33
71
23
2
9 568
92
35 1
Source: Alaska Commercial Fisheries Entry Commission, Alaska Bio-EconomicData Base.
The numbers of vessels in each area are not additive to calculate the totalfleet because some vessels land in more than one area.
TABLE 71
REGISTERED SHRIMP VESSELS BY FISHING GEAR 1977-78 SEASON
AREA J KODIAK AND WESTWARD!
Beam Single DoublePot Trawl Otter Otter
Total
Vessels
Length~Cata or
% o f Total!
Keel
~Len th Feet!
12
24
9
2
Total
Vessels 6 10 100.047 9027
Source: ADF6G Vessel Registration, 1977-78.
138
<20
20-29
30-39
40-49
50-59
60-69
70-79
80-89
90-99
100-109
11,0-120
>120
0 210
10 221
29
13 2
2.2
11. 1
ll. 1
2.2
23. 3
32. 2
14. 4
2.2
shrimp, spots and coonstripes, in steep rocky bottom areas where trawls can-not be used. The pots are fished individually in a manner similar tofishing crab pots although on a much smaller size scale.
Beam Trawls. The beam trawl is used to harvest shrimp in SoutheastAlaska and in the Kodiak area. The advantages of the use of a beam trawlover an otter trawl are:
It can be operated easily by one man.
The size and horsepower of a boat are not important; the netis easy to tow.
The gear is relatively inexpensive.
It enables participation in the shrimp fishery in the offseason for any vessel which has a net reel, for example,salmon gillnetters and seiners.
It can be used to fish areas where lack of maneuvering spaceand poor sea bottom conditions make the use of otter trawlsdifficult.
The beam trawls used in the Southeast area are of the conventional sled type.A 40-foot spruce beam keeps the mouth of. the net open and it slides over thesea bed on a steel shoe which also supports the beam. The beam trawls usedin the Kodiak area are of the floating staff type. These trawls use adetachable wood or aluminum staff and do not use a sled but rather are heldoff the bottom by a balance of the weighted ends of the mud rope and thefloats on the headrope.
Otter Trawls. Otter trawls account for almost all of the shrimp landedin Alaska. The two types are the single otter trawl and double-rigged ottertrawl, the latter making up over half the entire fleet for Kodiak andWestward. These trawls are tawed along the ocean bottom at 1 1/2 to 2 knotsand trap shrimp in the cod end.
Sin le Otter Trawls. The single otter trawlers are stern trawlers anduse a drum to wind the net aboard. The shape of the trawl is shown inPigure 16.
The otter doors are set at an angle facing outward and provide the out-ward force to spread the opening of the trawl as they are pulled along theocean bottom. The ground rope is weighted to keep the bottom of the netdown and the head rope is buoyed up by floats. A tickler chain, six toeight feet shorter than the ground rope, drags along the bottom to stir upshrimp and they are trapped by the net and pass back into the cod end. Thenet is attached to the vessel by the towing dandy lines! warps which gofrom the otter doors through the gallows and then through leads to the winch.
To haul the net, the warps are wound in by the winch until the doorsreach the gallows where they are left hanging. The transfer cables areunhooked from the warp line, leaving the mouth and part of the body of the
139

FIGURE 16. TYPICAL RIGGING FOR SHRIMP OTTER TRAWL
FIGURE 17. DOUBLE-RIGGED SHRIMP TRAWLER
Reprinted from Alaska Fish Tales and Game Trails,Alaska Department of Fish and Game, July-August 1977
140
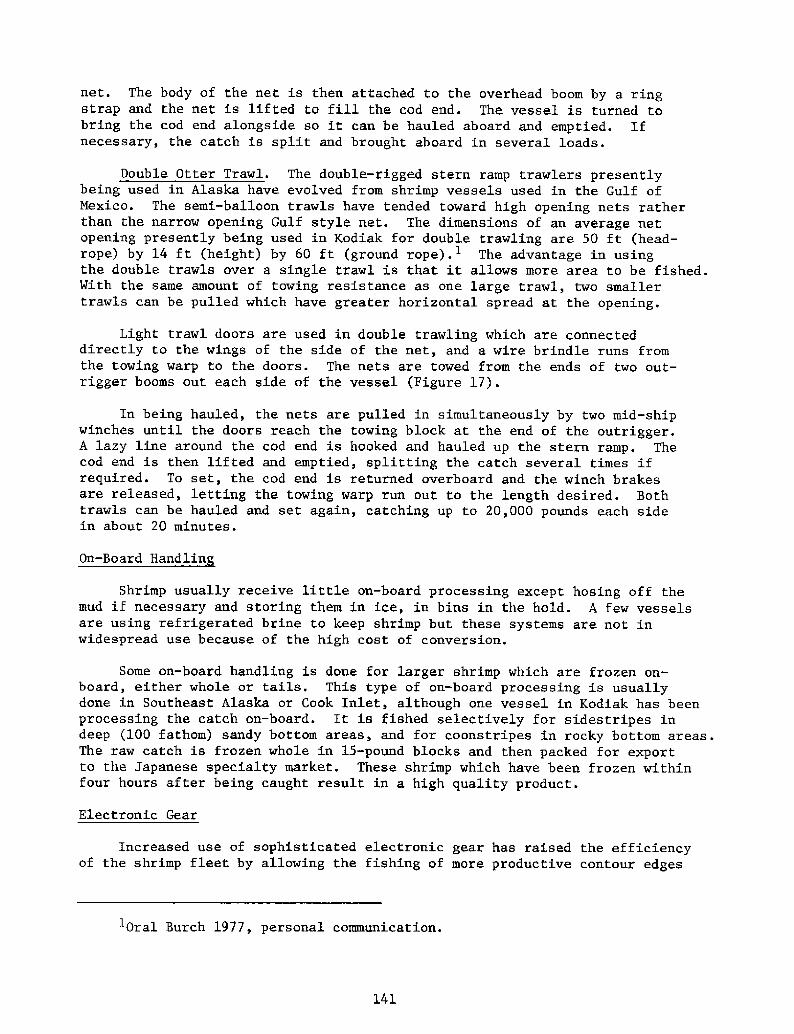
net. The body of the net is then attached to the overhead boom by a ringstrap and the net is lifted to fill the cod end. The vessel is turned tobring the cod end alongside so it can be hauled aboard and emptied. Ifnecessary, the catch is split and brought aboard in several loads.
Double Otter Trawl. The double-rigged stern ramp trawlers presentlybeing used in Alaska have evolved from shrimp vessels used in the Gulf ofMexico. The semi-balloon, trawls have tended toward high opening nets ratherthan the narrow opening Gulf style net. The dimensions of an average netopening presently being used in Kodiak for double trawling are 50 ft head-rope! by 14 ft height! by 60 ft ground rope!. The advantage in usingthe double trawls over a single trawl is that it allows more area to be fished.With the same amount of towing resistance as one large trawl, two smallertrawls can be pulled which have greater horizontal spread at the opening.
Light trawl doors are used in double trawling which are connecteddirectly to the wings of the side of the net, and a wire brindle runs fromthe towing warp to the doors. The nets are towed from the ends of two out-rigger booms out each side of the vessel Figure 17!.
In being hauled, the nets are pulled in simultaneously by two mid-shipwinches until the doors reach the towing block at the end of the outrigger.A lazy line around the cod end is hooked and hauled up the stern ramp. Thecod end is then lifted and emptied, splitting the catch several times ifrequired. To set, the cod end is returned overboard and the winch brakesare released, letting the towing warp run out to the length desired. Bothtrawls can be hauled and set again, catching up to 20,000 pounds each sidein about 20 minutes.
On-Board Handlin
Shrimp usually receive little on-board processing except hosing off themud if necessary and storing them in ice, in bins in the hold. A few vesselsare using refrigerated brine to keep shrimp but these systems are not inwidespread use because of the high cost of conversion.
Some on-board handling is done for larger shrimp which are frozen on-board, either whole or tails. This type of on-board processing is usuallydone in Southeast Alaska or Cook Inlet, although one vessel in Kodiak has beenprocessing the catch on-board. It is fished selectively for sidestripes indeep �00 fathom! sandy bottom areas, and for coonstripes in rocky bottom areas.The raw catch is frozen whole in 15-pound blocks and then packed for exportto the Japanese specialty market. These shrimp which have been frozen withinfour hours after being caught result in a high quality product.
Electronic Gear
Increased use of sophisticated electronic gear has raised the efficiencyof the shrimp fleet by allowing the fishing of more productive contour edges
~Oral Burch 1977, personal communication.
141
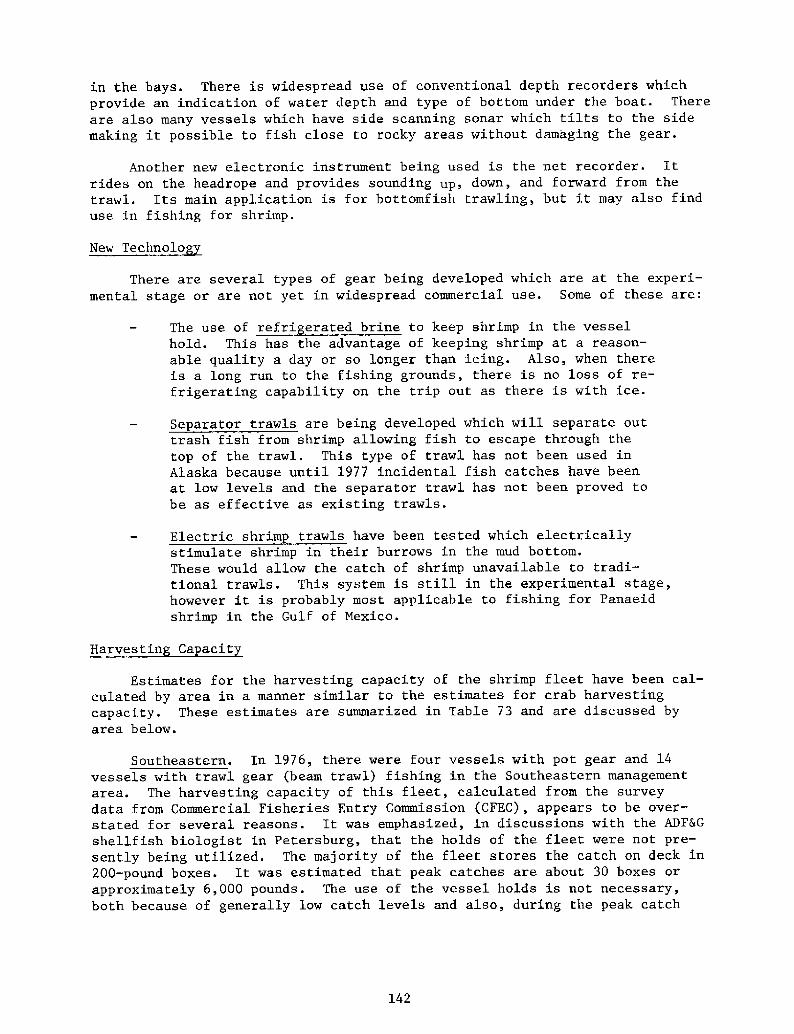
in the bays. There is widespread use of conventional depth recorders whichprovide an indication of water depth and type of bottom under the boat. Thereare also many vessels which have side scanning sonar which tilts to the sidemaking it possible to fish close to rocky areas without damaging the gear.
Another new electronic instrument being used is the net recorder. Itrides on the headrope and provides sounding up, down, and forward from thetrawl. Its main application is for bottomfish trawling, but it may also finduse in fishing for shrimp.
There are several types of gear being developed which are at the experi-mental stage or are not yet in widespread commercial use. Some of these are:
the ose ot ~refzi ersted brine to keep shrimp in the vesselhold. This has the advantage of keeping shrimp at a reason-able quality a day or so longer than icing. Also, when thereis a long run to the fishing grounds, there is no loss of re-frigerating capability on the trip out as there is with ice.
Separator trawls are being developed which will separate outtrash fish from shrimp allowing fish to escape through thetop of the trawl. This type of trawl has not been used inAlaska because until 1977 incidental fish catches have been
at low levels and the separator trawl has not been proved tobe as effective as existing trawls.
Electric shrim trawls have been tested which electricallystimulate shrimp in their burrows in the mud bottom.These would allow the catch of shrimp unavailable to tradi-tional trawls. This system is still in the experimental stage,however it is probably most applicable to fishing for Panaeidshrimp in the Gulf of Mexico.
Harvestin Ca acit
Estimates for the harvesting capacity of the shrimp fleet have been cal-culated by area in a manner similar to the estimates for crab harvestingcapacity. These estimates are summarized in Table 73 and are discussed byarea below.
Southeastern. In 1976, there were four vessels with pot gear and 14vessels with trawl gear beam trawl! fishing in the Southeastern managementarea. The harvesting capacity of this fleet, calculated from the surveydata from Commercial Fisheries Entry Commission CFEC!, appears to be over-stated for several reasons. It was emphasized, in discussions with the ADF&Gshellfish biologist in Petersburg, that the holds of the fleet were not pre-sently being utilized. The majority of the fleet stores the catch on deck in200-pound boxes. It was estimated that peak catches are about 30 boxes orapproximately 6,000 pounds. The use of the vessel holds is not necessary,both because of generally low catch levels and also, during the peak catch
142
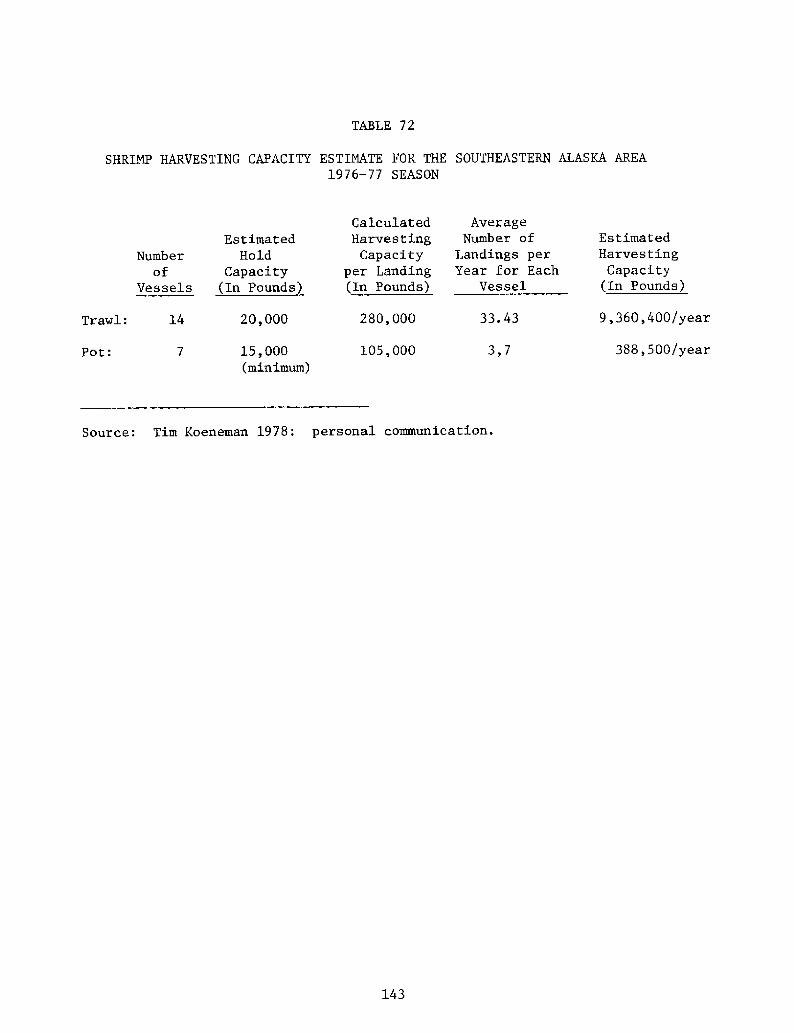
TABLE 72
SHRIMP HARVESTING CAPACITY ESTIMATE FOR THE SOUTHEASTERN ALASKA AREA1976-77 SEASON
33. 4320,00014Trawl:
3,715,000 minimum!
Pot:
Source: Tim Koeneman 1978: personal communication.
143
Number
of
Vessels
Estimated
Hold
Capacity In Pounds!
Calculated
HarvestingCapacity
per Landing In Pounds!
280,000
105,000
AverageNumber of
Landings perYear for Each
Vessel
Estimated
HarvestingCapacity
In Pounds!
9,360,400/year
388,500/year

periods, processors place vessels on landing quotas due to limited processingcapability. A problem also mentioned concerning estimation of harvestingcapacity of the pot fleet was that the fleet size and fishi.ng effort wereinconsistent, making estimation difficult.
As an alternative to the harvesting capacity calculated from the CEFCdata, ADP&G in Petersburg provided their estimate for the 1976-77 season,making the assumptions shown in Table 72.
The estimates shown in Table 72 may be more reflective of harvestingcapability in the Southeastern area than the ones calculated in Table 73oecause they use more current data provided by a person closely involvedwith the fishery. In any case, it would appear that harvesting capacity isnot a constraint to production in this area.
Prince William Sound. No harvesting capacity estimates were calculatedfor the Prince William Sound area because the area historically has notcontributed significant amounts of shrimp catch and there is no residentshrimp fleet. In 1977, the Prince William Sound area set a new catch recordof 168,000 pounds, due mostly to exploratory effort by Kodiak-based vessels.
Cook Inlet. As was the case for the Southeastern area, the estimatesof harvesting capacity for the Cook Inlet area appear to be overstated.Prom the CEAC data, 34 vessels fished shrimp with pot gear and eight vesselsfished with trawl gear. In order to revise the estimate of capacity foundin Table 73, the ADP&G biologist in Homer was contacted for further information.The following information was obtained concerning the trawl fishery. Of theeight vessels registered which made landings, four vessels were active partici-pants in the fishery. These four vessels have an average hold capacity of67,500 pounds, giving a harvesting capacity per landing of 270,000 pounds.During the season, these vessels average approximately 115 deliveries, re-sulting in an annual harvesting capacity of 31 million pounds see Table73, footnote 5!.
Some clarification with regard to this annual harvesting capacity isneeded. The vessels are restricted to landings of around 15,000 pounds ofshrimp per day due to the processing constraint in the area. This is whythe average number of deliveries per vessel is as high as it is. If thevessels delivered as much as they could, the area quota could be filled inabout three weeks. In Cook Inlet, obviously harvesting capacity is not aconstraint to production.
Kodiak Alaska Peninsula, and Dutch Harbor. In these three areas, theharvesting capacity estimates generated seemed to be more reasonable thanfor Southeastern and Cook Inlet. Many of the vessels making landings in allthree areas are from the same fleet out of Kodiak. The number of vessels
fishing in each area and the number of landings made per year in each yearprovide an indication of the amount of harvesting capacity that was avail-able in each area in 1976 ' The actual 1976 catches for these areas represent44 percent, 57 percent, and 32 percent of the total capacity, respectively.Since the capacity estimates are calculated from the actual number of tripsmade, this indicates that total hold capacity is not at present beingutilized. Prom personal discussions with shrimp fishermen during the 1977-78 shrimp season, the unutilized capacity has probably increased due to Lowcatch levels.
144

'0Q4 M CC &Ql 0
Qlad D OO
OVlQl
cd
OD
W ldM Clj D V bbMQl
8cd
cd
0 00' ad JM
bd ~C M
'0 CC d 0
cd0 IJ0
O � OCO 0 D
Ql du Etd'0O Ql
O d OC O
Icj «0N N ONI
O
4
~ C
MVDo C
00
Vl VDC
E
d
4 0 Mdl
t!
M N CfN N
C 0LI
QD D DLI QlVlcdCDVf
VlQl4J d
td0 QI D
0 0CJ '0Ctf
VD ch
C 0ld «4
OQl O0
O IO M MO O
N
0 QfN QlE 0
O NCO«0OICI C
O4J 'ldIJtd 0a «4cd
CI«ON 0 C
CDECD
'0 C 0 C QlE QjQl
cdA V
IQl
O0Q! O
VlCD tll
Ql
ae00Ql
co Opl
E 0 C 0 ClDj0«O
rt
Ql
C 0 ctfE
4J0 ttl cd
4I 0
CQl 4cdQl
Cd0 A
4J
C 0 QlVlctf
440Ccf
A 0 0
0cdcd
QlQDcd
VlM
Qf0
E MCD
Qf '0bd C dQl! W0
al cJ
Ql d bd
C J Vfctl MO v
CdbdK'0Qlcd dE QI4JVl
O O O O OO O OO O
Ict IPI � C M W «0N N Ul
VDC QI4 dVjE J0IDQlIUcdM 0Ql Wv 'CfW dl0 utb
QIQlE JDC
Cdu Q!cdVj D CD
C0dlctf cdQlQl MJ- 0
E
dl VD44CD a4QD
cl8 cdQl00
0Ql VlE VD0 C
'0C td
b CfVD H00 ccl
a!
Qf0
Ql Vf'00 CJ 00
�E O0 O
ODl I
Ql QlM0 Ql
Vl Qf0
0C ctf
A Cl00
0 cdtd0 dQl Qf QlC4
E M OOOM0 O0 Cj
OOtb O /I MP W
0
145
Processin Methods for Shrim
The introduction of the mechanical peeler, which was brought to Alaskain 1957, was perhaps the most important breakthrough in the development ofthe shrimp fishery. Previous to this, all shrimp had to be peeled by hand,making the processing costs prohibitive to large-scale operation. Since themajority of the catch in Alaska is small pink shrimp �0 to 160 to the pound!,the hand labor required per shrimp did not yield a great deal of product forthat effort. The expansion of the fishery beyond the amount produced in thesmall, high quality pack in Southeastern Alaska was limited because of this.Once the methods for economical machine processing of shrimp were available,the fishery was able to develop rapidly.
There were initial problems with quality of product when machine pickedshrimp were first being produced. In order to work efficiently, the shrimphad to be "conditioned" before being peeled. This resulted in shrimp beingheld until they were no longer fresh and the color and flavor of the productsuffered. This problem was solved by the development of peelers which did notneed ripened shrimp to work efficiently.
As was done for king and tanner crab processing, a flow chart describingthe present processing methods for shrimp was developed Figure 18!. Again,because each plant will vary some parts of its processing methods, this willnot describe exactly the processing method used in each plant. It does, how-ever, provide the basic processing steps for the various product forms whichare: frozen raw-whole, frozen raw-peeled, frozen blocks/cans, individualqui,ck frozen IQF!, and canned.
The steps in processing are shown in Figure 18 for the different productforms, from the time the shrimp are unloaded from the vessel hold to when thefinal product is ready to ship. One of the major differences in processingmethods is determined by whether the peeler used is a ~odel A or PCA. Themodel A peels the raw shrimp and the PCA peels cooked shrimp. This dif-ference could become important if the use of refrigerated seawater becomesmore widespread than it is at present because shrimp held this way have to bepeeled raw. This is because the shells of shrimp held in brine for severaldays have already started to break down, and if they are cooked beforepeeling, the recovery is lower than if peeled raw. The first several stepsin the processing method are common for all product forms, however, andthese are described below.
The shrimp are taken from the vessel hold and placed in plastic totes,iced and topped to await processing. The pH of the shrimp in the totes ischecked as a quality control measure to reject poor quality shrimp. Next,the shrimp are run by conveyor to the fish pick where fish and any otherextraneous materials are removed. After this, the shrimp can be run througha grader which separates the shrimp by size, although this operation isfrequently skipped. From this point on, the processing methods vary byproduct form and are treated individually.
Frozen Raw-Whole
This process, when used, is mainly for larger shrimp such as sidestripes,which are put up in a low count-per-pound pack or frozen in blocks. The
L46
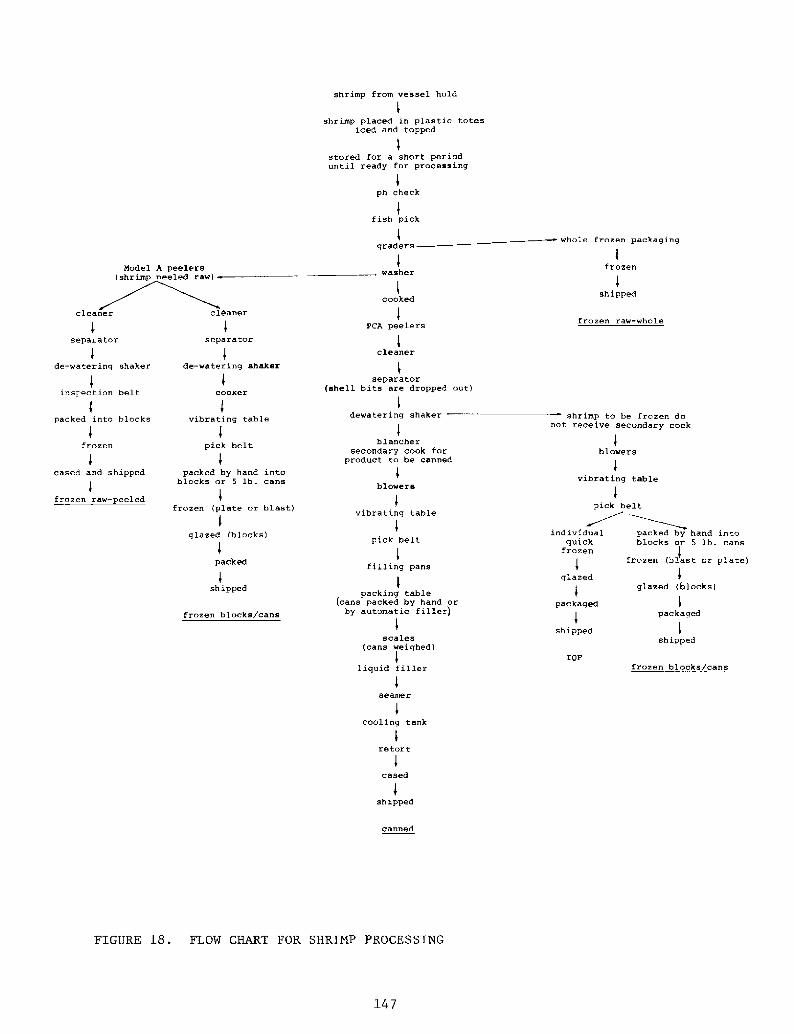
whole frozen packaging
frozen
lshipped
! odel A peelersshrimp neeled raw!
cleaner
separator
de-watering shaker
linspection belt
packed into blocks
lfrozen
cased and shipped
frozen raw- eeled
f ro zen r aw-who le
frozen blocks/cans
IQFfrozen blocks/cans
canned
FIGURE 18. FLOW CHART FOR SHRIMP PROCESSING
147
cleaner
separator
de-watering shaker
cooker
vibrating table
pick belt
packed by hand intoblocks or 5 lb. cans
frozen plate or blast!
glazed blocks!
packed
shipped
shrimp from vessel hold
lshrimp placed in plastic totes
iced and topped
stored for a short perioduntil ready for processing
Jph check
fish pick
graders
washer
cooked
lPCA peelers
cleaner
separator shell bits are dropped out!
ldewatering shaker
lblancher
secondary cook forproduct to be canned
blowers
vibrating table
pick belt
filling pans
lpacking table
cans packed by hand orby automatic filler!
lscales
cans weighed!l
liquid filler
seamer
lcooling tank
retort
lcased
shipped
shrimp to be frozen donot receive secondary cook
blowers
vibrating table
W*individual packed by hand into
quick blocks or 5 lb . cansfrozen
frozen blast or plate!
glazedglazed blocks!
packagedpackaged
shipped lshipped
blocks of shrimp are formed in a manner similar to crab meat blocks. They arehand packed into waxed cardboard cartons which are in an aluminum freezing tray.The shrimp are then frozen in blast or plate freezers, removed from thefreezing pan, and cased.
Frozen Raw-Peeled
After the fish pick, the shrimp go through a washer. and then are peeledby model A peelers ~ They then go through a cleaner and after that. to aseparator where small bits of shell are dropped out. The excess moisture isremoved by a de-watering shaker, the shrimp are inspected for any shell piecesand then are packed into blocks by hand. They are then frozen and glazed andpacked, ready to be shipped.
Frozen Cooked-Blocks/Canned
The shrimp are cooked before or after peeling depending upon which typeof peeler is used. Otherwise, the process is the same for both methods.The shrimp go from the washer and then are cooked and peeled PCA!. Afterthis, the shrimp go through a cleaner, separator, and de-watering shaker. Asthese shrimp are going into a frozen product form, they do not receive asecondary cook, but go next through blowers which blow away shell particles.The shrimp then pass over a vibrating table where broken shrimp are separatedfrom the whole ones and then over a pick belt for final inspection. Theshrimp are packed by hand into blocks or five-pound cans, frozen by blast orplate freezer, glazed blocks!, packaged and are ready for shipping.
Individuall Quick Frozen
Shrimp which are to be individually quick frozen IQF! go through thesame process as the frozen cooked-blocks/canned process described above upto the pick belt. They are then quick frozen individually, glazed, packaged,and are ready to ship.
Canned
The shrimp go through the same process as for frozen product up to thede-watering shaker. The next step is to the blancher where the shrimp peeledby model A receive their first cook and those peeled by PCA receive theirsecond cook. The shrimp then go to first and second stage blowers, throughthe vibrating table and are inspected for shell bits at the pick belt. Theyare graded into whole or broken and put into pans from which the cans arefilled by hand. These gradings will go on the label of the shrimp to in-dicate the relative size and quality of the shrimp. An example of the gradesused are "tiny, broken, and small." There are a couple of plants which usean automatic filler for the cans, although most are filled by hand. The cansare weighed, liquid filled, seamed, and then go to the retort. The times andtemperatures for retorting will vary slightly by plant but will be around240 F for 24 minutes whole shrimp! and 27 to 28 minutes broken!. The canscome out of the retort and are dumped into a water tank which cools the cansand also acts as a cushion to prevent the cans from denting. They are thencased and are ready to ship.
148
The recovery rates from live weight to product weight for shrimp willvary considerably depending on a number of factors such as the uniformity ofthe size of shrimp, condition of the shrimp when peeled, and the competenceof the operator of the peelers. An estimate of average recovery would befrom 16 to 18 percent. However, recovery can vary from less than ten percent,to a maximum of approximately 22 percent.
Shrim Processin Ca acit /Ca acit Utilization
The processing capacity for shrimp in Alaska was calculated from datacollected by ADF&G. For purposes of comparison, the processing capacityhas been divided up into areas of production according to the managementareas delineated by ADFGG. These areas, along with their respective per-centage of the total 1977 Alaska shrimp catch are listed in Table 74.
Southeastern
There are only two plants processing shrimp in the Southeastern area. Be-cause of this, the data on processing capacity cannot be listed as this wouldidentify an individual firm's contribution. This data was collected, however,and comparing the maximum capacity with the average production for both of theseplants, yields a capacity utilization rate of 41.5 percent. This figureindicates that there is excess capacity available. As the catch of shrimpin the Southeastern has remained fairly steady at around one million poundssince 1970, the full capacity of the plants will probably not be utilizedfully in the near future.
There are also several fishermen who process onboard and sell theirshrimp off the docks. These are general1y spot, coonstripe, and sidestripeshrimp which are caught by pots and sold fresh or fresh frozen. The largerspot shrimp are usually sold as tails only, and the sidestripe and coonstripeare sold both as whole and tails. The amount of production per vessel wasestimated to be 300 to 800 pounds per day.
Cook Inlet
As was the case for the Southeastern area, the processing capacity datafor Cook Inlet cannot be released as there is only a single plant in operation.Harvesting capacity is somewhat of a constraint; however, the processingcompany and the three boats fishing shrimp have worked out. a system which seemsto work well. The amount of shrimp each vessel can deliver to the plant eachday is limited to a third of the daily processing capacity. Throughout thefishing season, which runs approximately from July to January, each boat willmake about 130 deliveries until the quota is harvested. When possible, theplant operates at 75 to 80 percent of maximum capacity to ensure a topquality product.
There is also a pot fishery for larger shrimp which are processed onboardor by several small processing operations producing frozen whole shrimp orfrozen tails.
149
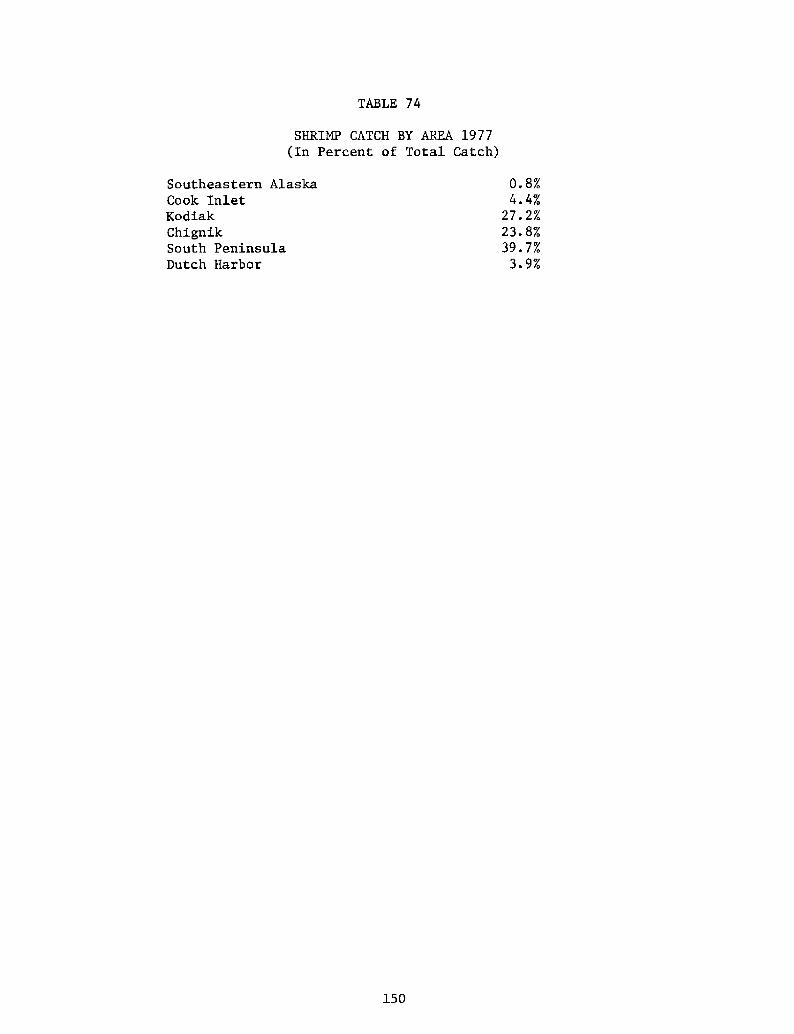
TABLE 74
150
SHRIMP CATCH BY AREA 1977
In Percent of Total Catch!
Southeastern Alaska
Cook Inlet
Kodiak
ChignikSouth Peninsula
Dutch Harbor
0.8X
4.4X
27.2X
23.8X
39.7X
3.9X
Kodiak
For the 1977-78 season, there are eight companies in Kodiak processingshrimp. These companies are:
Alaska Packers Assiciation, Inc.Alaska Pacific Seafoods
B & B Fisheries, Inc.East Point Seafood CompanyKodiak King Crab, Inc.New England Fish CompanyPacific Pearl Seafoods
Pan Alaska Fisheries
The processing capacity of these plants is shown in Table 75.
The eight plants have a total of 80 shrimp peelers and a maximum 24 hr/day operating capacity of 1,210,000 pounds per day round weight!. With thenumber of shifts per day and hours per shift actually run during averageoperation, the capacity is 730,000 pounds per day round weight!. These pro-cessing capacity estimates were collected by ADF&G in Kodiak by contactingeach plant superintendent, and are current as of December 1, 1977.
The number of days which the plants operate in a year is one of themain determinants of capacity utilization. In discussions with the managersat two of the plants in Kodiak, they stated that their plants could processshrimp 250 days per year without conflicting with other production of theplant, for example, crab, and salmon. This length of operation may not bepossible for all plants in Kodiak, but it does provide an estimate of apossible maximum. Table 76 divides the 1977 Kodiak area shrimp catch of31,801,573 pounds by a range of annual operating days to determine the numberof pounds per day which the processing plants in Kodiak would have to processeach day, for annual operating estimates of 250 days per year to 50 days peryear. From the maximum capacity estimate of 1,210,000 pounds per day, thecapacity utilization at each level is calculated.
It is clear from Table 76 that there is excessive shrimp processing inKodiak. In fact, the entire 1977 catch could have been processed in 26.3 days.This comes as no surprise as the amount of shrimp caught in the Kodiak areahas decreased sharply in the past several years, while total processingcapacity has increased. Using only the Kodiak area catch to determine capa-city utilization however, will cause underestimation of the utilization ratebecause Kodiak also processes shrimp caught in other areas such as CookInlet, Chignik, and the South Peninsula. During 1976, the eight plants inKodiak with the exception of one which was under construction! processed65.5 million pounds of shrimp. This was 14.1 million pounds more than theKodiak catch if 51.4 million pounds, the difference coming from other areas'During 1977, there were shrimp coming into Kodiak for processing from as faraway as Pavlov Bay, a 48-hour run for the fishing boats.
Considering that the 1978 Kodiak shrimp catch is expected to be very low,about 15 to 20 million pounds, and also that the processing plants in theSouth Peninsula are increasing capacity to handle more of that area's shrimpcatch, the use of the figure 31.8 million pounds �977 Kodiak area catch! may
151
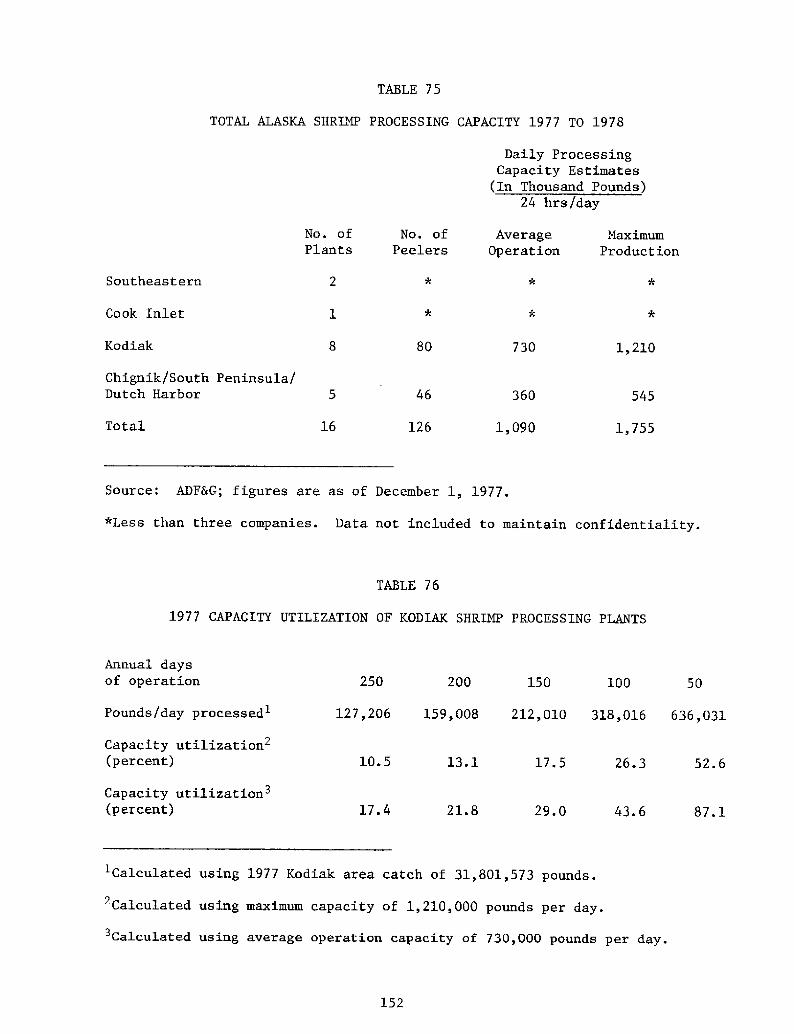
24 hrs/day
Maximum
Production
No. of
PlantsNo. of
PeelersAverage
Operation
Southeastern
80 730 1,210
Chignik/South Peninsula/Dutch Harbor 360 545
126Total 16 1, 090 1, 755
Source: ADF6G; figures are as of December 1, 1977.
*Less than three companies. Data not included to maintain confidentiality.
TABLE 76
1977 CAPACITY UTILIZATION OF KODIAK SHRIMP PROCESSING PLANTS
Annual daysof operation 250 200 150 100 50
Pounds/day processed
Capacity utilization percent! 10.5 26.313.1 17. 5 52.6
Capacity utilization percent! 17.4 29. 021. 8 43. 6 87. 1
Calculated using 1977 Kodiak area catch of 31,801,573 pounds.
~Calculated using maximum capacity of 1,210,000 pounds per day.
~Calculated using average operation capacity of 730,000 pounds per day.
152
Cook Inlet
Kodiak
TABLE 75
TOTAL ALASKA SHRIMP PROCESSING CAPACITY 1977 TO 1978
Daily ProcessingCapacity Estimates
In Thousand Pounds!
127,206 159,008 212,010 318,016 636,031
not be unreasonable. If there is not some kind of encouragement in the shrimpcatches around Kodiak in the next couple of years, some capital equipmentcould be shifted westward where additional processing capacity is needed.
Chi nik/South Peninsula/Dutch Harbor
There are five plants processing shrimp in the Chignik/South Peninsula/Dutch Harbor areas. These are:
Alaska Packers Association, Inc.Peter Pan Seafoods, Inc.Pacific Pearl Seafoods
Whitney-Fidalgo Seafoods, Inc.Vita Food Products, Inc.
Anchorage BaySquaw HarborSand Point
Dutch Harbor
Dutch Harbor
From Table 75 the maximum processing capacity for these plants is 545,000pounds per day round weight. The calculations of capacity utilization overa range of operating days is shown in Table 77.
At the time of this survey December 1977!, one plant was installingfour additional peelers and another was planning to add four peelers. Theseadditions will enable the Westward processing plants to handle a greaterpercentage of the area catch in 1978.
153
Processing the 1977 catch of 78.8 million pounds would have taken 144.7days; however, there were approximately 14 million pounds of this total whichwere processed in Kodiak in 1977. This was probably because 54.7 millionpounds of the total catch was during June, July, and August. Even if all fiveplants had operated at. maximum capacity every day for these three months, theycould not have been able to handle this concentrated production. The capacityutilization, rates calculated using average operating capacities for theseplants, go over 100 percent of capacity for season lengths of 150 and 200days. This is another indication that plants in the Westward area need tooperate as closely as possible to the maximum capacity in order to handleas much of the catch as possible. Operating the plant at the flat-outmaximum may or may not be the most cost efficient level of production forthe individual plants.
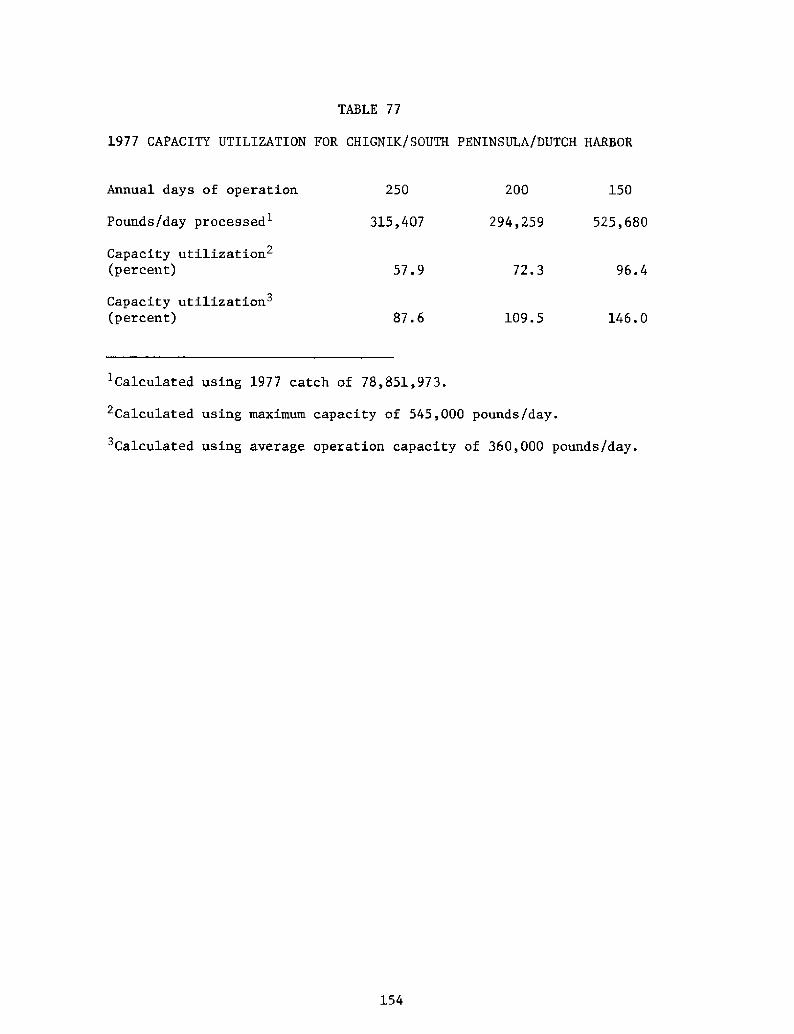
TABLE 77
1977 CAPACITY UTILIZATION FOR CHIGNIK/SOUTH PENINSULA/DUTCH HARBOR
Annual days of operation
Pounds/day processed
250 200 150
315,407 294,259 525,680
Capacity utilization percent! 96.457 ' 9 72.3
Capacity utilization3 percent! 87.6 109.5 146.0
154
Calculated using 1977 catch of 78,851,973.
2Calculated using maximum capacity of 545,000 pounds/day.
Calculated using average operation capacity of 360,000 pounds/day.

CHAPTER IX
MARKETING OF ALASKA SHELLFISH
Marketin of Kin Crab
King crab is the most widely recognized of the three Alaskan crabspecies commercially harvested, and also commands the highest price ofthe three. At the time the U.S. entered the fishery, the Japanese hadalready been fishing king crab for a long period of time and king crabproducts had a strong consumer demand in that country as a result of thislong exposure. The growth of the domestic markets for king crab camelargely as a result of the marketing efforts of the early pioneers in theindustry such as Lowell Wakefield. This early marketing work introducedking crab to consumers in the U.S. and also established European marketsfor U.S. exported products.
King crab is processed and marketed in several different productforms: whole fresh and frozen, frozen sections four legs and one claw!,frozen meats which have been extracted from the shell, canned meats, andthe separate claws. These product forms require varying amounts of pro-cessing and, therefore, vary in the cost. of production.
Whole crab, either fresh or frozen, is generally restricted to smalllocal markets within Alaska. This is because most king crab is shippedout of state, and shipping whole crab would add an additional 45 percentor so to the shipping weight, creating unnecessary additions to theshipping costs.
The predominant king crab product form processed is sections. Pro-duction of sections is less labor intensive than shelled meats, which is animportant consideration because of the high cost of labor in Alaska. Formany processing plants in the Westward region, the physical space con-straints of the processing area and lack of housing available for plantworkers make the production of bulk sections more cost efficient than meatproduction. Almost all of the king crab processed in Alaska is routedthrough the Seattle area and either shipped from there as bulk sections orreprocessed into meats or into smaller packages for distribution to markets.The sections reach the reprocessing plants in brine frozen bulk packagesfrom 75 to 150 pounds gross weight. An example of the smaller packagesize into which these bulk section crates are repackaged is the 20-poundcarton. The legs and claws are glazed, placed in the poly-lined card-board carton in a natural proportion of one claw to four legs.
Production of frozen crab meats is the second most important productform. Extracted meats are generally frozen in 15-pound blocks as des-cribed in the processing section. When the blocks reach the reprocessingplant they are cut into five-pound blocks, glared, placed in a polyethylene
155
cardboard carton and put into a shipping carton. The shipping carton holdssix five-pound blocks total weight 30 pounds!. Some companies also put outsmaller packages of meats destined for the retail trade in eight-ounce, six-ounce, and three-ounce cubes. These small package sizes are necessary to sellthe product at a price low enough so people will buy it; however, many super-market chains have discontinued carrying frozen king crab meats because thereis sucn a high incidence of pilferage.
Canned king crab meats are becoming less popular than they once were.In discussions with marketing people at several processing companies, themain suggested cause of the decrease in the amount of king crab canned wasthat the high cost of raw crab plus increasing costs of canning raise thecost of a can of meats to the point where it is prohibitive to the retailconsumer. One processing company contacted did can a small amount of kingcrab in 1977 and had not been able to sell it. To their knowledge, theywere the only company which canned king crab that year. For a description ofthe shipping methods for canned product, see the shrimp section on distri-bution of canned shrimp.
King crab claws are sometimes packaged by themselves. They go to theinstitutional market or to the retail market as a specialty item.
The product forms processed for 1956 through 1958, and for 1973 through1976, are shown in Table 78. It should be noted that these are the productforms of crab as they are processed in Alaska and not the product forms whichreached the final consumer. The amount of sections which are further re-
processed into meats are certainly significant; however, the quantitativeamounts are not known.
Marketin of Tanner Crab
Tanner crab is marketed under the trade name of snow crab and will be
occasionally referred to by this name in this section. It was originallymarketed under the name "queen crab" in order to imply similarity to kingcrab. The Food and Drug Administration rejected this name as being mis-leading, and the name snow crab has become predominant.
The product forms for tanner crab are mainly frozen sections four legsand one claw � also called shell stock or clusters by the industry! and cannedor frozen extracted meats from the sections' For export to the Japanese market,the sections are graded by size, with the larger sections commanding thehighest price see discussion of specific grades in the processing section!.
The product form for tanner crab processed in Alaska is partly dependentupon current market demand for a specific product form but also more im-portantly, the cost, of production of the different forms. Extraction of themeat from sections, to be either frozen or canned, is relatively more laborintensive than the labor required to produce crab sections. With the highcost of labor in Alaska, it is less costly for processing companies to shipfrozen sections from Alaska south for further reprocessing in Washington orCalifornia than to do complete processing in state.
156
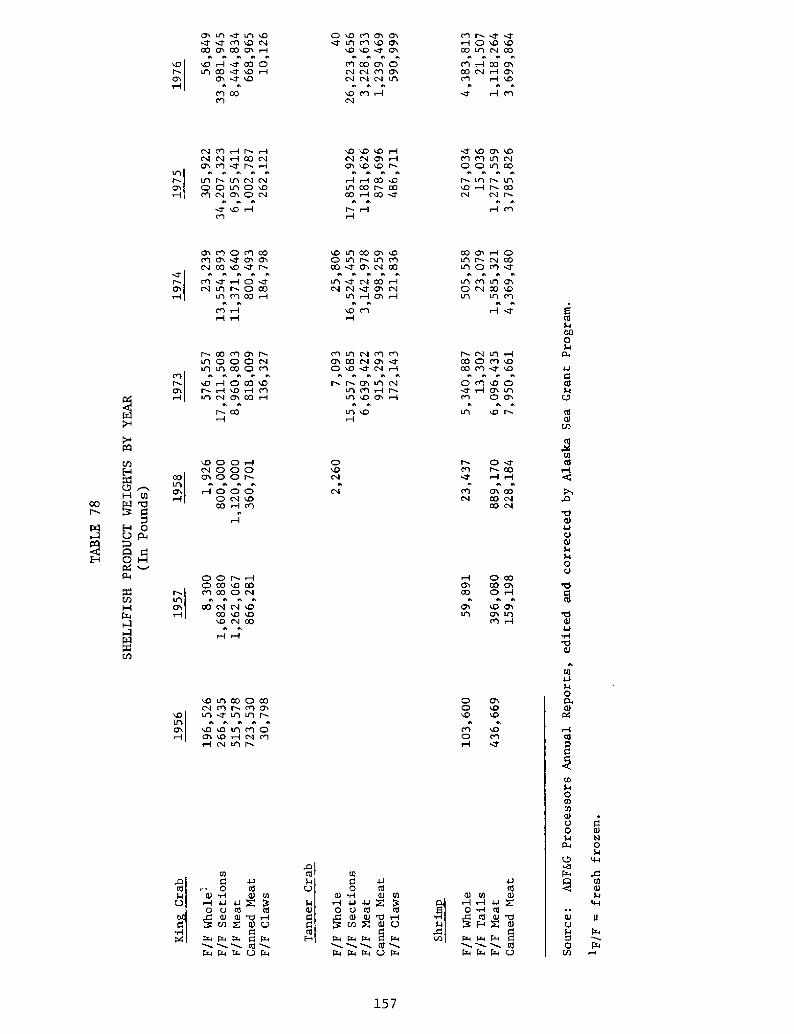
ChCl
CO Ch COA ~ 0
ul CO WChA APl 00
ulCl
ACO 0
ChChChA A
00 Ch OCIl ChN ul~ A
CIlO
CQ
COCIlA
N CQA ACO
A
r I00
A IO 4>0A
A I ~ul h ulO 0
CXlACIl
CO
CCIul
0 W 00
AO C
h. 0 COCIl CQ
COulul 0A
Yl0 ul
00
0 N pCh
0 0 NCO 0O CO 4!
COCQ
N h
Ch W
CO OCO0
A
ul
0O
Ch ul0A A
Ol 000 %~ ~
~ I
u0 ON 0Ch OA A
O 0 CQ
O M0 0O h0 0rl
0NA
000 N~ ~
0 00 00
00h h00
00A
N R00A
0I
0 CI0 Ch
O 0
C rd
157
u~M CQ "~
CO g 'Cd
W & 0O F4
I:I0 M94
M Ch
ul CO 0 00N W&CIlCh
ul W 0Ch
N
O II '6 CI I0
g0 CI Cd Id5'P. eo
d wQ W
0 u0
~ I
N
WWCQ~ul CO W 0000 W 00A ~
ul CO Ch u00 ul I00 < Ch N 00I 1
CQNNNChN
ulCIl
CI VJ4J g
O rJ Cd Id
geng CICd W
0 0 ul 00A ~ul
h COP~ ACIl
0N CQ
ulCO M
PlM
r O <CQ
A ACIl Ch CO
CO NCO N
O COCO Ch
CO OAA ACh M Ch
CJl
4JCI 0I dlOW ldCPz ~
C cdWWWQ
'O CICI
8 4 0 V
0 CCCICI0Cu0
Some of the reprocessing plant locations in the Seattle area includeBellingham, Everett, Rainier, Redmond, and Monroe. Many of the largerprocessing plants have their own reprocessing facilities at these locations.Companies which do not. have these facilities available themselves are ableto have reprocessing done on a custom packing basis. There are severalcustom reprocessing plants in Seattle which use machine processing methods.Tanner crab sections are also shipped frozen by truck to locations inCalifornia where the meats are shaken out by hand. The hand labor resultsin a higher recovery factor than does machine processing. The abundantsupply and relatively less expensive labor in California make hand processingfeasible.
The product forms and amounts processed are shown on a state~ide basisin Table 78 for the years 1956 to 1958 and 1973 to 1976. Due to the largeamount of out-of-state reprocessing, this table is not indicative of theproduct breakdown which reaches the market. It can be seen from this tablethat the predominant form for tanner crab processed in Alaska is in sections.The majority of these are packed in large, 90 to 150 pound bulk packs whichhave been brine frozen. A significant portion of these bulk sections isexported to Japan, generally shipped via Seattle. Product destined for thedomestic market is repackaged or reprocessed, as mentioned above, into smallerpackages. For example, one common package size is 20 pounds. Sections arepacked into a polyethylene-lined cardboard carton. The legs and clos mayhave become separated during processing and shipping, however, a "naturalproportion" of one claw to four legs is maintained in this pack. There isalso a smaller amount of sections which are individually shrink-wrapped cryovac wrapping! for the specialty market in Japan.
Extracted meats are processed into blocks of frozen meats or are canned.Due to the high costs of canning the product, this form is used to a lesserextent by processing companies in Alaska. Blocks of crab meat are usuallyfrozen in a 50-pound block known as a "long john," or similarly sized block.When these blocks reach the reprocessing plants, they are cut into five-pound portions and packed into a polyethylene-lined cardboard carton. Sixof these five-pound portions go into a shipping carton for distribution tomarkets.
Geo ra hic Distribution
Data for the distribution of crab are known only to the extent of thelocations of some of the major centers of distribution. One of thedifficulties in obtaining quantitative estimates of the amount of productgoing to the different areas of the country is that these data are not avail-able on an industry-wide basis. The sales and marketing organization withinone company will know where the product that their company sells is dis-tributed. They will also have a reasonable understanding of where productfrom some of the other processing companies is marketed, but the totalquantities going to different distribution centers will not be known.
In order to determine accurately the quantity of geographic distributionfor crab products, it would be necessary to complete an industry-wide survey
158
of the processing companies. This was originally planned as part of thisstudy; however, due to lack of enthusiasm from the processing industry inbeing subjected to another questionnaire, this part of the study was dropped.
The main centers of distribution which were mentioned by several pro-cessing companies are shown in Figure 19.
Market Channels for Kin and Tanner Crab
The market channels for king and tanner crab are basically the same.From the processing companies in Alaska, the product will go to the domesticmarket or for export. These are discussed separately below and a1.so shownin the flow charts in Figures 20 and 21.
Product for Ex ort
Product for export is shipped from the processing plant to the importingcompany, either directly or via Seattle. In general, export sales do notgo through a broker. They are handled by company sales personnel who dealdirectly with the importer. For example, a processing company in Alaska willsell tanner crab sections directly to a trading company in Japan the largestexport market for both king and tanner crab!. The product is shipped F.O.B.Alaska and may go directly to Japan, or more commonly go through Seattle as atransshipment point.
From discussions with sales personnel at various processing companies,it was estimated that approximately 50 percent of the tanner crab produced isexported to Japan. It was emphasized that their exports were almost entirelysections. Most of the sections are exported in bulk, brine frozen crates,and a small percentage are exported. as single shrink-w apped sections.
A study of the market channels for tanner crab in Japan was not includedwithin the scope of this project. This subject is covered in Alaska SeaGrant Report No. 78-12 Gorham and Orth 1978! whi.ch should be referred to bythose desiring additional information on that area.
From information obtained from processing companies which ship king crabto Japan, the demand there is for bulk sections which are further reprocessedinto canned or frozen meats.
Product for the Domestic Market
Frozen Kin and Tanner Crab. From Alaskan processing companies, frozenking and tanner crab products are put into cold storage facilities near theSeattle area. The project generally is reprocessed and/or repackaged atthese locati.ons. Distribution to the northwestern area is made directlyfrom these cold storage facilities. Sales are made through brokers or by pro-cessing company sales personnel. Brokers act as independent sales agentsrepresenting the processing company, receiving a commission usually 2 1/2percent! on all sales made. They have authority from the processing companyto release product from storage to be shipped to the buyers.
159
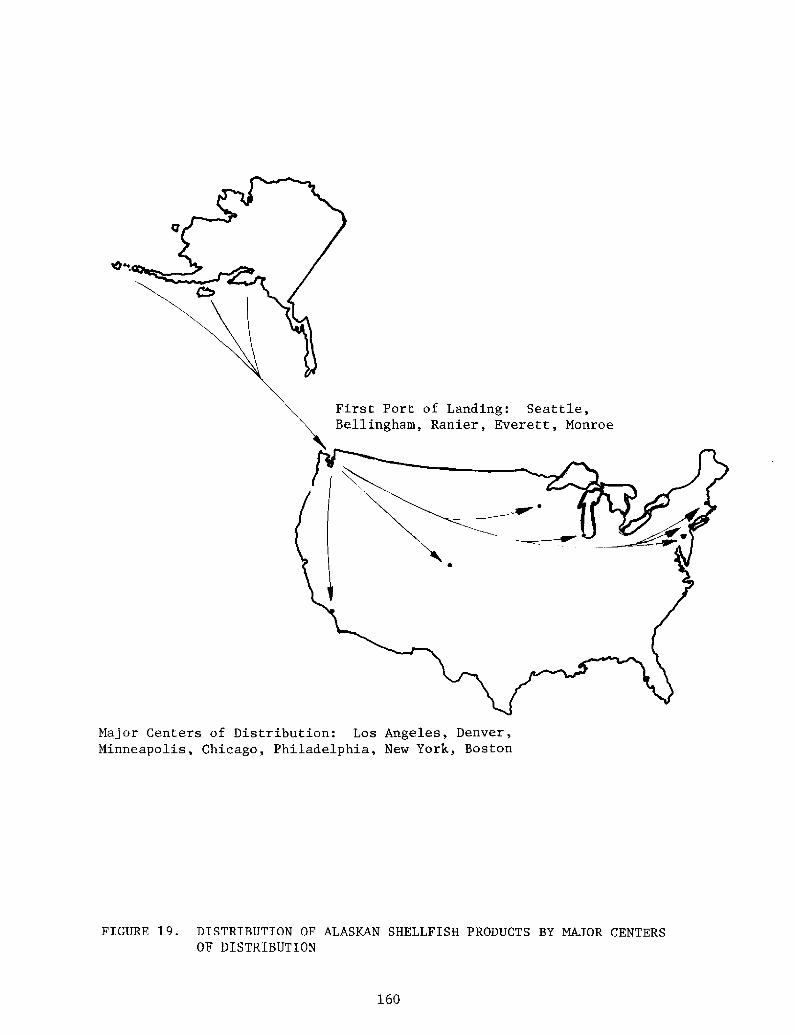
Major Centers of Distribution: Los Angeles, Denver,Minneapolis, Chicago, Philadelphia, New York, Boston
FIGURE 19. DISTRIBUTION OF ALASKAN SHELLFISH PRODUCTS BY MAJOR CENTERS
OF DISTRIBUTION
160

Fishermen
Alaskan Processing Companies shipped direct
Export Markets � sales made by company sales
or via organization!Seattle
Cold Storagecompany owned or leased
Company ownedreprocessing plant
Through field brokers
FIGURE 20. MARKET CHANNELS FOR FROZEN KING AND TANNER CRAB PRODUCTS
161
Seattle Areaport of landing
Custom reprocessingplant
Cold storage facilityat major centers
of distribution
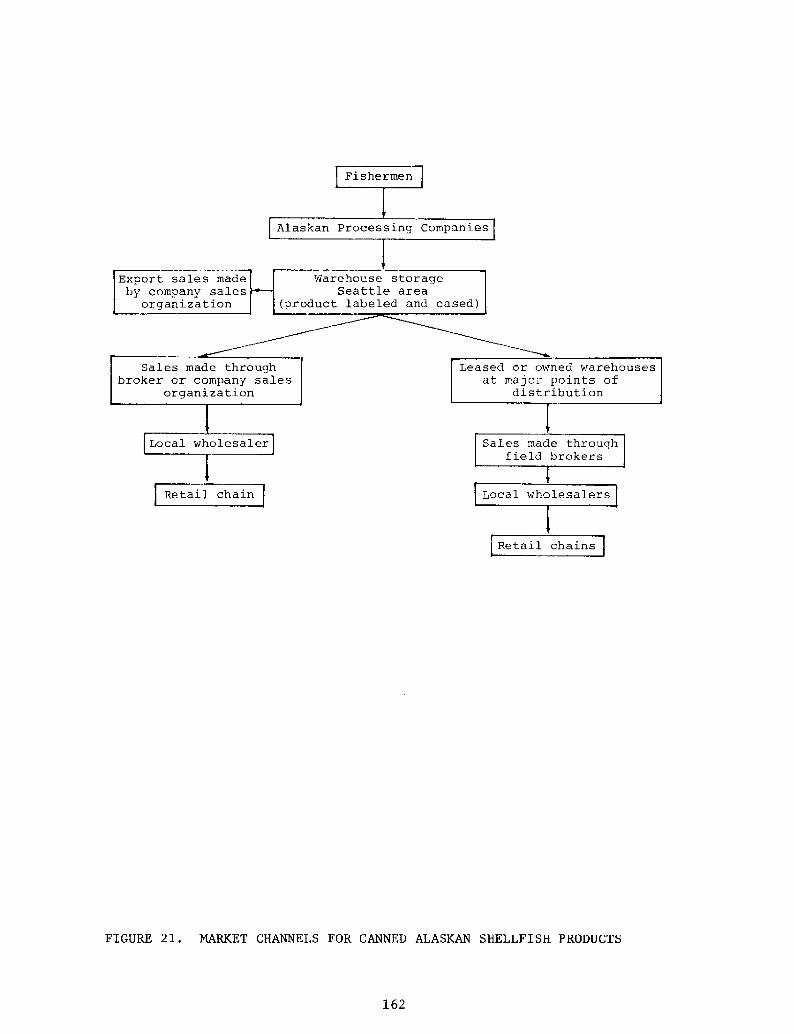
FIGURE 21. MARKET CHANNELS FOR CANNED ALASKAN SHELLFISH PRODUCTS
162
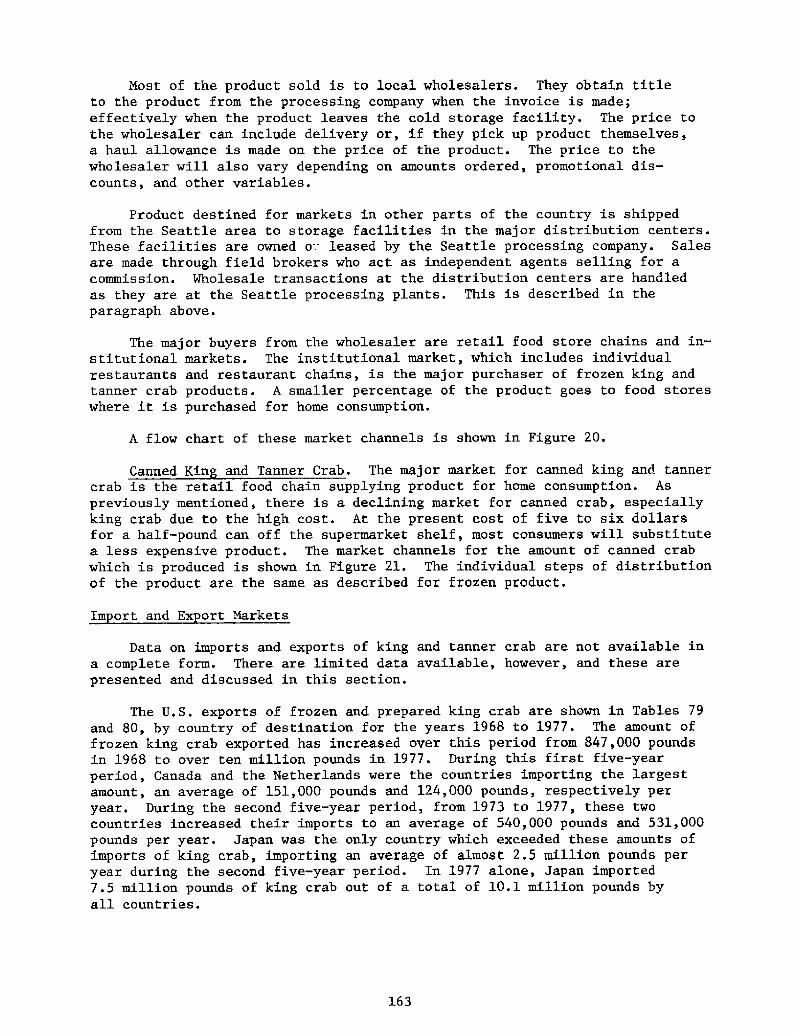
Most of the product sold is to local wholesalers. They obtain titleto the product from the processing company when the invoice is made;effectively when the product leaves the cold storage facility. The price tothe wholesaler can include delivery or, if they pick up product themselves,a haul allowance is made on the price of the product. The price to thewholesaler will also vary depending on amounts ordered, promotional dis-counts, and other variables.
Product destined for markets in other parts of the country is shippedfrom the Seattle area to storage facilities in the major distribution centers.These facilities are owned o" leased by the Seattle processing company. Salesare made through field brokers who act as independent agents selling for acommission. Wholesale transactions at the distribution centers are handled
as they are at the Seattle processing plants. This is described. in theparagraph above.
The major buyers from the wholesaler are retail food store chains and in-stitutional markets. The institutional market, which includes individualrestaurants and restaurant chains, is the major purchaser of frozen king andtanner crab products. A smaller percentage of the product goes to food storeswhere it is purchased for home consumption.
A flow chart of these market channels is shown in Figure 20.
Canned Kin and Tanner Crab. The major market for canned king and tannercrab is the retail food chain supplying product for home consumption. Aspreviously mentioned, there is a declining market for canned crab, especiallyking crab due to the high cost. At the present cost of five to six dollarsfor a half-pound can off the supermarket shelf, most consumers will substitutea less expensive product. The market channels for the amount of canned crabwhich is produced is shown in Figure 21 ' The individual steps of distributionof the product are the same as described for frozen product.
Im ort and Ex ort Narkets
Data on imports and exports of king and tanner crab are not available ina complete form. There are limited data available, however, and these arepresented and discussed in this section.
The U.S. exports of frozen and prepared king crab are shown in Tables 79and 80, by country of destination for the years 1968 to 1977. The amount offrozen king crab exported has increased over this period from 847,000 poundsin 1968 to over ten million pounds in 1977. During this first five-yearperiod, Canada and the Netherlands were the countries importing the largestamount, an average of 151,000 pounds and 124,000 pounds, respectively peryear. During the second five-year period, from 1973 to 1977, these twocountries increased their imports to an average of 540,000 pounds and 531,000pounds per year. Japan was the only country which exceeded these amounts ofimports of king crab, importing an average of almost 2.5 million pounds peryear during the second five-year period. In 1977 alone, Japan imported7.5 million pounds of king crab out of a total of 10.1 million pounds byall countries.
l63

TABLE 79
UPS. EXPORTS OF FROZEN KING CRAB BY COUNTRY OF DESTINATION 1968 TO 1977
In Pounds!
5 � year1968 1969 1970 1971 1972~Countr
40,4055,913
15,585166,432
99563
129,85277,68516,68775,653
153%224290,290
32,294191,815
16,32423,630
82,32613,85042,00630,36773,172
91,77111,544
266,50674,35138,53254,809
185,16422,66996,919
Total 847,308 496,165 479,619 522,779 1,326,939
Imports forlater export: 14,020 14,052 6,535 7,906
5-year~Auere e~Countr 1973 1974 1975 1976 1977
Australia
BelgiumBermuda
Canada
Denmark
France
Japan 1,970,991Netherlands 848,033Sweden 188,190United Kingdom 185,853West GermanyOther 195,225
109,973945,359101,446184,806
477,506327,693
33,102277,407
148,025256,049
43,347657,724
175,926410,297
209,617495,155
78,720764,552459,750
88,813
56,614158,368
4,729,876 2,532,417 2,711,962 4,098,508 10,182,261Total
Imports forlater export: 1,000 2,260 1,060 36,697 5,170
Source: U.S. Bureau of Census, FT 140, Schedule B. Commodity by Country,1968 to 1977.
Australia
BelgiumBermuda
Canada
Denmark
France
JapanNetherlands
Sweden
United KingdomWest GermanyOther
55,35775,32546,429
239,70715,93915,38821,889
115,99323,605
100721514,043
123,418
64,93120,78421,08084,95635,63612,88021,81665,46045,96251,37815,35555,927
84,564401,659370,7003287223
65,40545,660
120,498
630, 05185,18069,959
1,729,650577,074105,140
84,49488,158
142,579
951,09099,903
131,3867,498,861
401,40670,88048,94941,797
233 217
88,75493,99926,415
151,71315,49210,380
8,741124,411
33,86246,42627,449
224,209486,911
35,579540,216
37,01772,926
2,473,143531,393156,249
76,94046,446
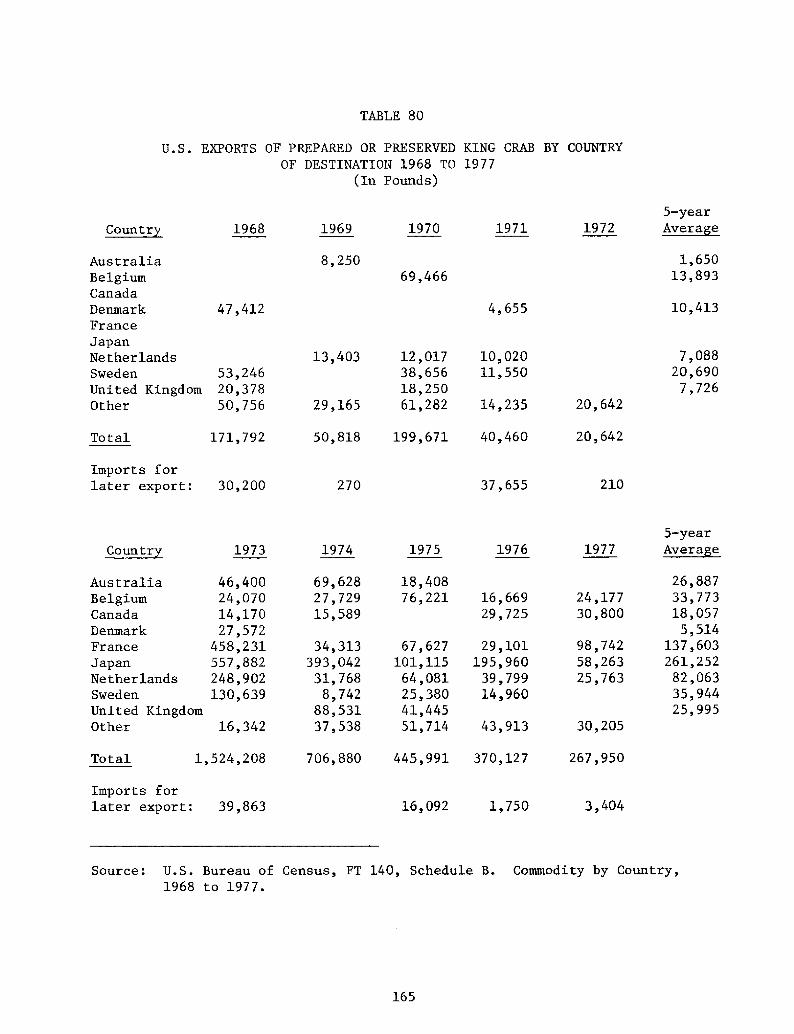
TABLE 80
U.S. EXPORTS OF PREPARED OR PRESERVED KING CRAB BY COUNTRY
OF DESTINATION 1968 TO 1977
In Pounds!
5-year~Avera e1968 19721970 19711969~Count r
Australia
BelgiumCanada
Denmark
France
JapanNetherlands
Sweden 53,246United Kingdom 20,378Other 50,756
1,65013,893
8,25069,466
10,4134965547,412
7,08820,690
7,726
12,01738,65618,25061,282
10,02011,550
13,403
20,642
20,642
14,23529,165
50,818 199,671 40,460171,792Total
Imports forlater export: 30,200 21037,655270
5-year~avera e1976 19771974 19751973~Countr
69, 62827,72915,589
18,40876,221 24, 177
30,80016,66929,725
98,74258,26325,763
299101195,960
39,79914,960
43,91316,342 30,205
267,950706,880 445,991 370,127Total 1,524,208
Imports forlater export: 39,863 16,092 3,4041,750
Source: U.S. Bureau of Census, FT 140, Schedule B. Commodity by Country,1968 to 1977.
165
Australia
BelgiumCanada
Denmark
France
JapanNetherlands
Sweden
United KingdomOther
46,40024,07014,17027,572
458,231557,882248,902130,639
34,313393,042
31,7688,742
88,53137,538
67,627101,115
64,08125,38041,44551,714
26,88733,77318,057
5,514137%603261,252
82,06335,94425,995
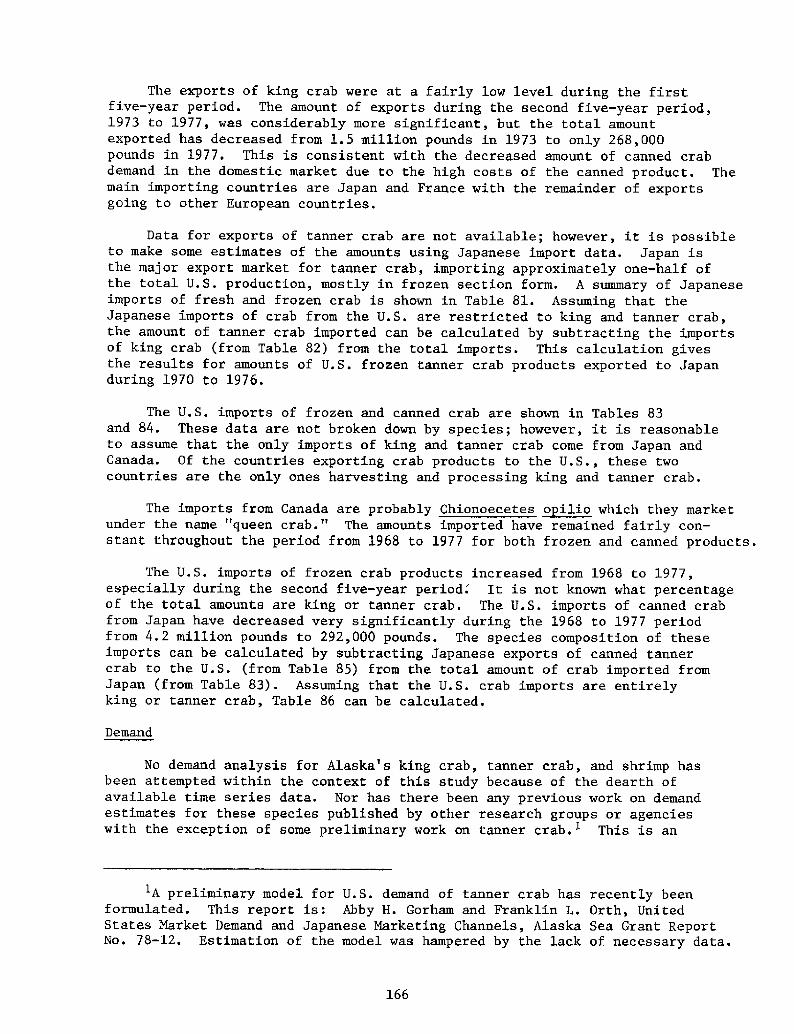
The exports of king crab were at a fairly low level during the firstfive-year period. The amount of exports during the second five-year period,1973 to 1977, was considerably more significant, but the total amountexported has decreased from 1.5 million pounds in 1973 to only 268,000pounds in 1977. This is consistent with the decreased amount of canned crabdemand in the domestic market due to the high costs of the canned product. Themain importing countries are Japan and France with the remainder of exportsgoing to other European countries.
Data for exports of tanner crab are not available; however, it is possibleto make some estimates of the amounts using Japanese import data. Japan isthe major export market for tanner crab, importing approximately one-half ofthe total U.S. production, mostly in frozen section form. A summary of Japaneseimports of fresh and frozen crab is shown in Table 81. Assuming that theJapanese imports of crab from the U.S. are restricted to king and tanner crab,the amount of tanner crab imported can be calculated by subtracting the importsof king crab from Table 82! from the total imports. This calculation givesthe results for amounts of U.S. frozen tanner crab products exported to Japanduring 1970 to 1976.
The U.S. imports of frozen and canned crab are shown in Tables 83and 84. These data are not broken down by species; however, it is reasonableto assume that the only imports of king and tanner crab come from Japan andCanada. Of the countries exporting crab products to the U.S., these twocountries are the only ones harvesting and processing king and tanner crab.
The U.S. imports of frozen crab products increased from 1968 to 1977,especially during the second five-year period: It is not known what percentageof the total amounts are king or tanner crabs The U.S. imports of canned crabfrom Japan have decreased very significantly during the 1968 to 1977 periodfrom 4.2 million pounds to 292,000 pounds. The species composition of theseimports can be calculated by subtracting Japanese exports of canned tannercrab to the U.S. from Table 85! from the total amount of crab imported fromJapan from Table 83!. Assuming that the U.S. crab imports are entirelyking or tanner crab, Table 86 can be calculated.
Demand
No demand analysis for Alaska's king crab, tanner crab, and shrimp hasbeen attempted within the context of this study because of the dearth ofavailable time series data. Nor has there been any previous work on demandestimates for these species published by other research groups or agencieswith the exception of some preliminary work on tanner crab.~ This is an
A preliminary model for U.S. demand of tanner crab hasformulated. This report is: Abby H. Gorham and Franklin L.States Market Demand and Japanese Marketing Channels, AlaskaNo. 78-12. Estimation of the model was hampered by the lack
recently beenOrth, UnitedSea Grant Reportof necessary data.
166
the imports from Canada are probably Chionoecetes ~o ilia which they marketunder the name "queen crab." The amounts imported have remained fairly con-stant throughout the period from 1968 to 1977 for both frozen and canned products.
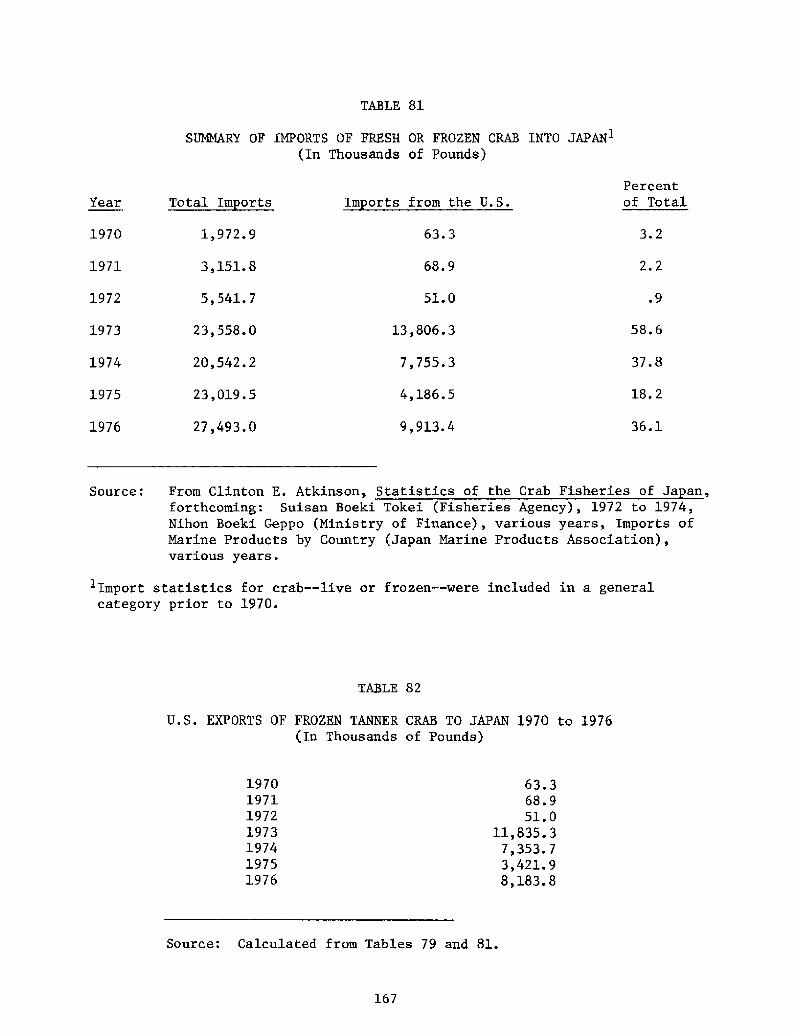
TABLE 81
SUMMARY OF IMPORTS OF FRESH OR FROZEN CRAB INTO JAPAN~ In Thousands of Pounds!
Percent
of TotalIm orts from the U.S.Year
63.3 3.21970
2.268. 91971
51.0 .91972
58.61973
37. 81974
18. 21975
36.11976
From Clinton E. Atkinson, Statistics of the Crab Fisheries of Ja an,forthcoming: Suisan Boeki Tokei Fisheries Agency!, 1972 to 1974,Nihon Boeki Geppo Ministry of Finance!, various years, Imports ofMarine Products by Country Japan Marine Products Association!,various years.
Source:
Ilmport statistics for crab � live or frozen � were included in a generalcategory prior to 1970.
TABLE 82
U.S. EXPORTS OF FROZEN TANNER CRAB TO JAPAN 1970 to 1976
In Thousands of Pounds!
Source: Calculated from Tables 79 and 81.
167
1,972.9
3,151.8
5,541.7
23,558.0
20,542.2
23,019.5
27,493.0
1970
1971
1972
1973
1974
1975
1976
13,806.3
7,755.3
4,186.5
9,913.4
63. 3
68.9
51.0
11,835.37,353.73,421.98,183.8
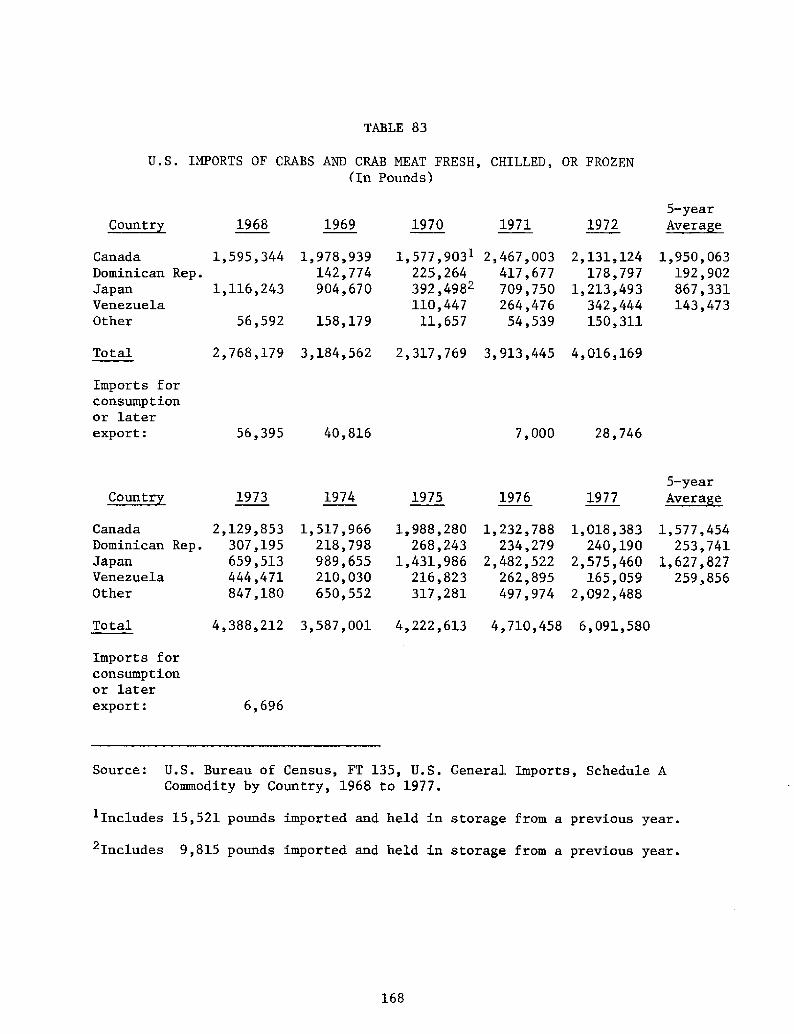
TABLE 83
U.S. IMPORTS OF CRABS AND CRAB MEAT FRESH, CHILLED, OR FROZEN In Pounds' !
5-year1968 1969 1970 1971 1972
Canada
Dominican Rep.JapanVenezuela
Other 56,592 158,179
2,768,179 3,184,562 2,317,769 3,913,445 4,016,169To tal
Imports forconsumptionor later
export: 56,395 40,816 7,000 28,746
5-year1974 1975 1976 19771973~Cauntr
2,129,853Rep. 307,195
659,513444,471847,180
4,388,212 3,587,001 4,222,613 4,710,458 6,091,580Total
Imports forconsumptionor later
export: 6,696
Source: U.S. Bureau of Census, FT 135, U.S. General Imports, Schedule ACommodity by Country, 1968 to 1977.
Includes 15,521 pounds imported and held in storage from a previous year.
Includes 9,815 pounds imported and held in storage from a previous year.
168
Canada
Dominican
JapanVenezuela
Other
1,595,344
1,116,243
1,978,939142,774904,670
1,517,966218,798989,655210,030650,552
1 577 903
225,264392,4982110,447
11,657
1,988,280268,243
1,431,986216,823317%281
2,467,003417,677709,750264,476
54,539
1,232,788234,279
2,482,522262,895497,974
2,131,124 1,950,063178,797 192,902
1,213,493 867,331342,444 143,473150,311
1,018,383 1,577,454240,190 253,741
2,575,460 1,627,827165,059 259,856
2,092,488
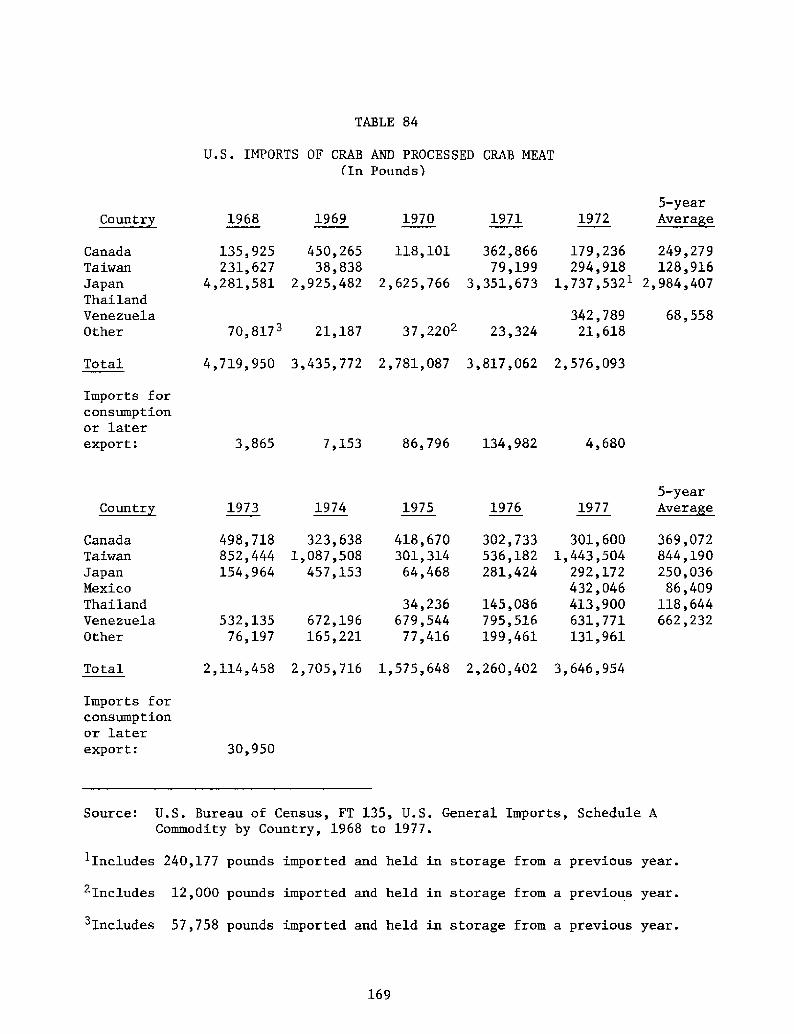
TABLE 84
5-year~Avera e1968 1969 1971 19721970
450,26538,838
2,925,482
118,101
2,625,766
362,86679,199
3,351,673
179,236 249,279294,918 128,916
1,737,532 2,984,407
135,925231,627
4,281,581
342, 78921,618
68,55870,8173 21,187 37,220~ 23,324
4,719,950 3,435,772 2,781,087 3,817,062 2,576,093Total
7,153 86,796 134,982 4,6803,865
5-year~Avera e1974 19761973 1975 1977~Cauatr
498,718 323,638852,444 1,087,508154,964 457,153
418,670301,314
64,468
302,733536,182281,424
34,236679,544
77,416
145,086795,516199,461
532.13576,197
672,196165,221
2,114,458 2,705,716 1,575,648 2,260,402 3,646,954Total
30,950
Source: U.S. Bureau of Census, FT 135, U.S. General Imports, Schedule ACommodity by Country, 1968 to 1977.
Includes 240,177 pounds imported and held in storage from a previous year.
Includes 12,000 pounds imported and held in storage from a previous year.
Includes 57,758 pounds imported and held in storage from a previous year.
169
Canada
Taiwan
JapanThailand
Venezuela
Other
Imports forconsumptionor later
export:
Canada
Taiwan
JapanMexico
Thailand
Venezuela
Other
Imports forconsumptionor later
export:
U.S. IMPORTS OF CRAB AND PROCESSED CRAB MEAT
In Pounds' !
301,6001,443,504
292,172432,046413,900631,771131,961
369,072844,190250,036
86,409118,644662,232
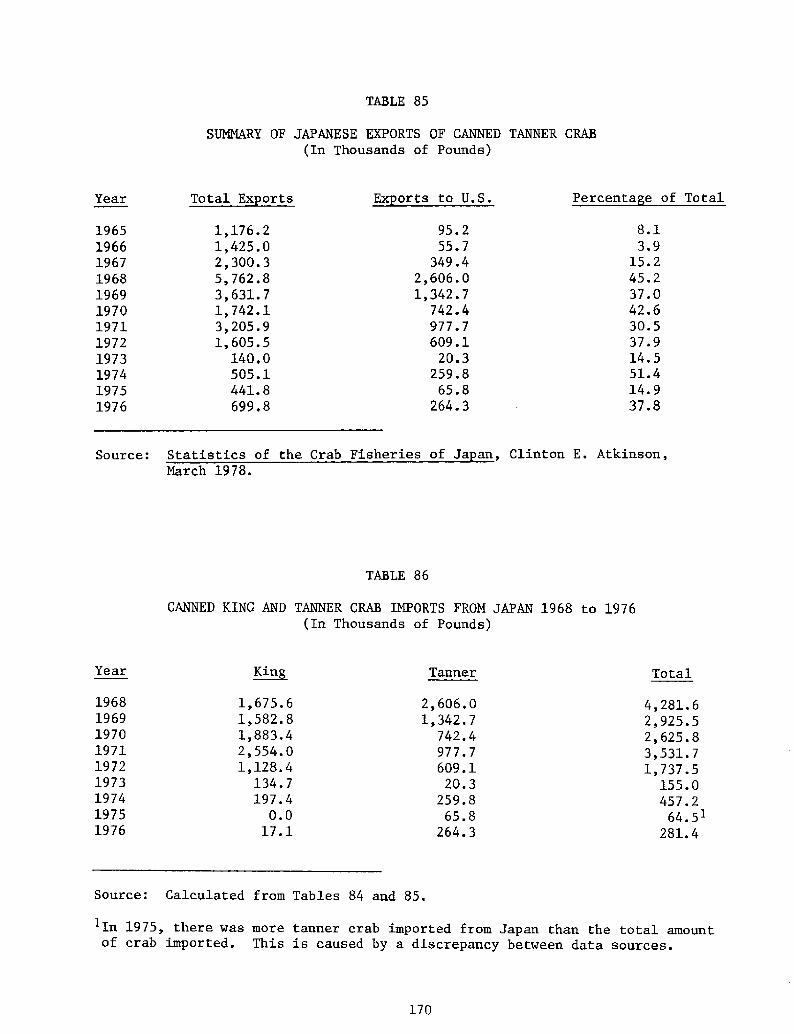
TABLE 85
SUMMARY OF JAPANESE EXPORTS OF CANNED TANNER CRAB
In Thousands of Pounds!
Percenta e of TotalE orts to U.S.Year
8.1
3.9
15.2
45.2
37.0
42.6
30.5
37.9
14.5
51.4
14. 9
37 ' 8
Source: Statistics of the Crab Fisheries of Ja an, Clinton E. Atkinson,March 1978.
TABLE 86
CANNED KING AND TANNER CRAB IMPORTS FROM JAPAN 1968 to 1976 In Thousands of Pounds!
Year ~Kin Tanner Total
Source: Calculated from Tables 84 and 85.
1 In 1975, there was more tanner crab imported from Japan than the total amountof crab imported. This is caused by a discrepancy between data sources.
170
1965
1966
1967
1968
1969
1970
1971
1972
1973
1974
1975
1976
1968
1969
1970
1971
1972
1973
1974
1975
1976
1,176.21,425.02,300.35,762.83,631.71,742.13,205.91,605.5
140.0
505.1
441. 8
699.8
1,675.61,582.81,883.42,554.01,128.4
134.7
197.4
0.0
17. 1
95. 2
55. 7
349.4
2,606.01,342.7
742.4
977.7
609.1
20.3
259.8
65.8
264.3
2,606. 01,342.7
742.4
977.7
609.1
20.3
259.8
65.8
264.3
4,281.62,925.52,625.83,531.71,737.5
155.0
457.2
281. 4
area which should be regarded as a priority item for future research, assumingthat some way can be found to overcome data limitations. This work would beuseful for both the domestic demand and for foreign. demand for Alaskanshellfish products.
During the course of the study, some general information on factors in-fluencing demand were suggested. by persons within the processing industry.These are listed below by species to try to present some overview of the currentconsumer demand.
~gin Crab. The domestic market for king crab is almost entirely institn-tional food service industry!. Through the 1960s, there were significantamounts of the production of canned king crab sold through retail supermarkets;however, this amount has since declined to almost nothing. The cause ofthis change in consumption patterns was suggested to be the price of a canof king crab having risen to the point where it is prohibitive to the retailconsumer. For the same reason, retail sales of frozen meats have also beenslowly phased out. In order to keep the package price low enough so thatconsumers will purchase the product, package sizes have been decreased toas small as six-ounce and three-ounce packages. This has resulted inretailing problems with shoplifting, and many chain stores are removingit from their stores.
All Japanese imports of king crab are frozen sections. After arrivalin Japan, they are reprocessed into a canned or frozen meat product form.In addition to the demand in the food service industry, reference was madeto the fact that retail consumer demand for canned king crab is somewhatseasonal. At certain times of the year, such as the New Year, it is popularto give canned king crab as gifts which contributes to a seasonal demandincrease.
In a paper, Additional Ja anese Comments on the Tanner Crab Issue, pre-sented to the NPFMC in December 1976 as part of the Japanese review of theDraft Management Plan for Tanner Crab, the following comments concerningJapanese crab marketing were made:
"Crab is a luxury food item for the Japanese people. Therefore,demand for tanner crab fluctuates with the general economicsituation. In the long run, there is certainly a good possibilityfor an expanded crab market. However, we would like to stress thatonly through the marketing efforts of Japanese fishing companiesselling the product which they themselves catch will the generalexpansion of the market for both domestic and imported tanner crabbe feasible. For example, in the case of king crab, after Japanhad been phased out of the fishery by the United States and theSoviet Union, the Japanese domestic market for king crab shrank.Contrary to expectations, imports decreased rather than increased.Therefore, the continuation of the Japanese tanner crab fisheryis necessary for the maintenance and expansion of the Japanesedomestic market."
171
This quote indicates that Japanese imports of king crab have decreased as aresult of the Japanese exclusion from the fishery. As the Japanese domesticfishery for king crab was phased out, marketing activity within the countryalso ceased. It is stated that without this marketing activity, demand willdecrease in Japan for U.S. imports of king crab. From Table 82 it can beseen that this has not been the case. In fact, imports of frozen king crabhave increased markedly. This could be caused by a multitude of factors:a relatively price inelastic demand for king crab in Japan; an expansion ofthe distribution and marketing system making king crab available in newmarkets--a result partially caused by the devaluation of the dollar relativeto the yen making the imports less expensive; or other factors.
Tanner Crab. Tanner crab was originally marketed in the U.S. as a lowerpriced substitute for king crab. It has since emerged wi,th a separate productidentity ~ with consumer recognition and popularity.
In the d.istribution of tanner crab products, approximately 50 percentis exported to Japan. Of the remaining 50 percent, approximately 15 percentgoes to retail markets and the rest to the institutional markets. The RedLobster chain purchased an estimated six million pounds of tanner crab in1977. Restaurant. chains like the Red Lobster comprise the largest market.
As is the case for king crab, demand for canned tanner crab has declinedas the price has increased. The production of frozen product is less laborintensive and, therefore, relatively less costly than canning.
The Japanese demand for tanner crab is entirely for sections, mostlybrine frozen and a small amount shrink wrapped. Several marketing personswith Alaskan processing companies stated that at present there is no Japanesemarket for tanner crab meats. They can apparently produce enough from theBering Sea allocation of C. ~cilia to meet the domestic demands.
Prices
The data in Tables 87 through 90 on king and tanner crab prices are in-cluded only to give sn indication of the trend of ex-vessel and wholesaleprices. Price series data sufficiently complete for demand analysis are notavailable. Tables 88 and 89 were compiled from ADF&G published statisticsin order to deflate ex-vessel and wholesale values for king and tanner crabby the consumer price index. This was done to compare the increases invalues with the increases in amount of catch. These data should be taken onlyas indicative due to lack of reliability in the quality of the data used.
Marketin of Shrim
The majority of the Alaskan shrimp processed are small pink or humpyshrimp. These shrimp are marketed primarily as cocktail or salad shrimp.It is important to recognize that they are a separate product from the largershrimp and prawns from the Gulf of Mexico and imported from other countries.The fact that they are a different product makes obtaining necessary datadifficult since most of the available data is for these larger shrimp.
~The Berin Sea Tanner Crab Resource: U.S. Production Ca acit andN~arketin , Appendix D, Snos Crab market Survey � California Region, AlaskaSea Grant Report 77-5, May 1977.
172

O
0 0 0
C GjC GrjC
00 0CV CV
O OGC GG CV
Q O
0 0CV N
cjGrj
0 0 EV 0 O 0 0 0
rjc
cfj
0
0 0 GG 0 NGG GG
N N
0 0c4
0 0 0
z
Gj
V crjcj8
0 0 0
0
GGC
Ccrj8
ccjCLGja
cfr LGr GGcV
rrjcj
04J0Z
173
rjlC
Grj
C rrjr
Grj
Gj
crj
GG
C crjC crl
GG
rrj
Grj
Ccl crrC D c-r 4 W C H GG C c-r 0 cj
cG 0 Z Q
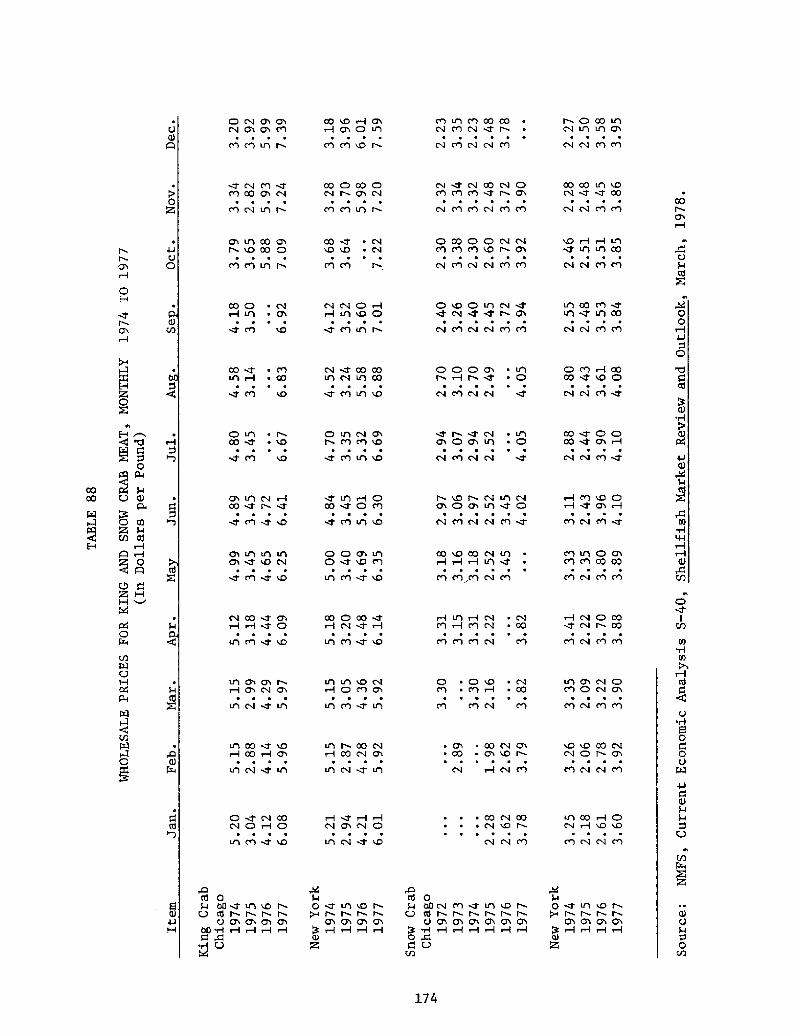
QOrl«hO
~ ~ ~O A Ch ChCV Ch
~ ~ 92 ~
QO QO ccl MP4 W W QO
~ ~ ~ ~NCACOCVD
~ ~ ~ ~ ~ ~CO O CO O
Che ~ ~
W CV00 Ch CV
~ ~ 92 ~
W cCl cCl CO~ ~ ~ ~
CV Cc!
CO + ~~ ~ ~ 4
O CODD~ ~ ~ ~ ~ ~
Ch Lcl COW W CO D
~ ~ ~4JVO
A 00
O
CO O ~ C4ccl ~
~ ~ ~ ~Q0 MW
QO~ ~ ~
CV
O 4! O ccl H <~ ~ ~ ~ ~ ~
C4
ccl 4! D~ 4 ~ ~
D & + QO00<4!O
~ ~ ~ ~CV W CclM
O O O Ch ~ cCl~ 0
~ ~ ~ ~ ' ~QO W ~
~ Q0~ ~ ~ ~
CV N CO COQO
~ ~ ~ ~
CO N O OQO W
~ ~ ~ ~O ccl CV
8 4~ ~ ~ ~
D ccl ~ r00 W ~ W
~ ~ ~ ~CV ~
ch O ch ccl ~ O~ ~ ~ ~ ~ ' ~
Ccl CV
W'43 DCh M
~ ~ ~CV
ch ccl cvtX>MMW
4 ~ ~ ~P W&64cclcVCh O «h cCl < O
~ ~ ~ ~ ~ ~C4 Ccl C4
N ccl H O00 N O
~ ~ ~ ~
ChCO CO
~ ~ ~ ~N YlM
O O Ch cclO&wrn
~ 4 ~ ~CO % CO CV A ~
~ ~ ~ ~ 4 ~Ch cclCh W 4> N
~ ~ ~ ~
O
I«Q
N D COw Q0
~ ~ ~ ~CV
Ill R CV~ QO
~ ~ ~ ~Pl W CV
CO~ ~ ~ ~
QO O QO~ ~ ~ ~
CI
0 0
D~ ~ ~ ~
D ~ O 4 ~~ Ql H ~ CO
~ ~ ~ ' ~ ~ ~N
cfl cclD
~ ~ ~ ~Ch Ch«h
~ ~ ~ ~
QOO W Ch
~ ~ ~ ~N CV
ccl ~ CO00 A Ch
~ ~ ~CV
ccl CO M MW QO W Ch
~ 4 I ~CO CV
~ Ch4 ~ ~ ~
CV
~ CO~ ~
CV
cV O~ ~ ~ ~
ccl CO H DCV
~ ~ ~CV
O C B QQNOCTO
~ ~ ~ ~~ CO R CO~ ~ 0 ~
~ ~~ ~
A
OCh Ch Ch Ch
cd Ob«I M ccl W rcdr r r r
QO W W W I-IA
~ rl O
l74
A
<Q
0 cd
A H
0 A
U C4O V H
cd
QI
W ccl & CO CO ~ D QON Y! N C h ~
~ ~ ~ ~ ~ 0 ~ ~ ~ ~CV CV
acd 0
QQ MO cd
V Ch Ch Ch Ch «h Ch
0
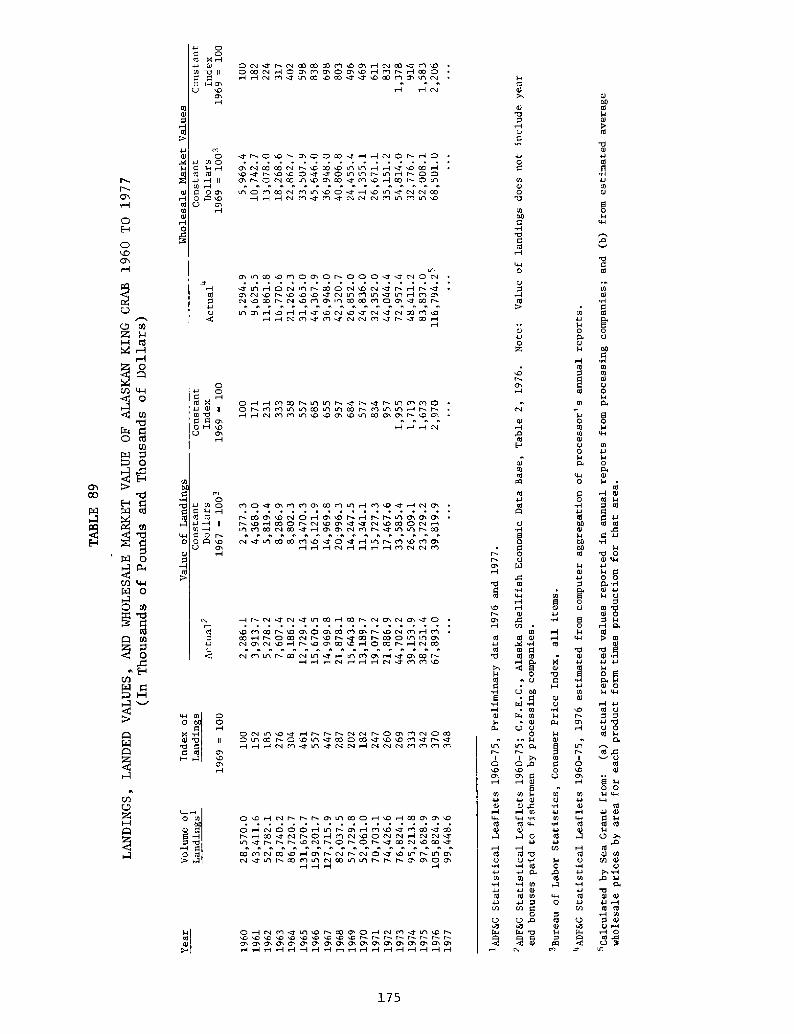
oocl Qla 11
0 00 I-I Ch
Ql4Jtdjj
IQ o44 rtcj4J
C 0Ch0 A 4O
4 0aCh N CO CQ
ch r o N canO M ca N
Id0
0
td neoChN 4 PN4 COP Nn ch
04J0z
o oC rl
dQj 'aaach0 PJO Ch
N
'0
W 0 QlotdalJrldtd M
0 r-OA 4
'e
0 0jtj
W
QI
td QIIQ 0cd QjCc
jd0Vcda dj
C4
CJ COItj
~ QIV0
o JQCP 0Ql
QlQl JIQWtd WCj 04J
td0
QIQI dlIJI 0
A QIPI
oo
ooCh
W 0
n o 4 Ch
0
jd
0!
nCQN
tljV
A
175
M dj
$ ICM W
0
IO
Cjj
CQ W0
C* p
a
A
ONNPNQQCOmM4at+NCOOcONr4ochMchOch4 +MrSeboN M N n co 4 m w w 4 co M ch n N
P O 4 N Ch O O CO < 6 6 N O I 6 Op4m4nnwww4coOwwOnnr nor oon4chmaM4 +mr OnMn4O4&4n&NNmMN MANN NMnMn
a nca4Moa or oooo<NONcOON4N<r+r44M NIPIMn4IPIWMCh4 M Ch trl ca ca M O CII N ca
CQ M 4M+NNMMI %co
o & w M co N n n N w N w M n M M OorMMnnmnnm>Mnn+cr ca ChchN4N
M O 4' ch M M ch ca M nr coa 4NOaat4r ep-r na a acOOI N4chNNN4mon M m N m e e cr cr PJ M r < n n N caNwncocoM4wowwnp N
I NNNNnca+CQNNchNCh<OM ca N 4 ch O ch ca M ch I 4 N M
mar OmNr 4r <mr mOnnaN Ch N 4 t I P 4I Ch m 4 r I O m r H N CONMnNmNnWWnMChWWChcQIN &WAN
Nn4<rlh>NNNPO04MNOmnmro4n4cOOc0444MWPNM<n<NNHNNNMMM
o 4 + N r p w at n m o + 4 + m ch chOOO+nrch+M44Mc04cO
CO 4 N N O 8 M N 4 O N N r4 N Ner r p 4Nr Or Or <coN4coecQ 4 H 04 I N N N O 4 4 n P n
wnr mMnNmnnr r r a a oa
o+NM<n4pcocho+NM<n4444444444 r r r t r r r rch «p a ch at ch cr ch ch ch ch ch ch ch ch ch ch crt
djdlLI
cd
0PJ
V Qljj
00CJ
4JtdLJtrj
0JQQj
W 0 tljQl
LI00cdLt
0td
0td
V 0 0I0
tdbdLICQCQttf
Qj
0 ti80W
cd4J
dlQI
Io ChUl4JQlWQI
QjV
4Jtlj
C3
80
CQ
H0W
0Q4
tdQltd LItdg 4J
LI
0Ql W40 09td 4J
V'000clj djQlg04J IJ
td V00Ql
cdQldj LI0 0
cd4J QIcdC3tdcd CQaj Qj
JQCLtd
tdtdV 0
Otd 4
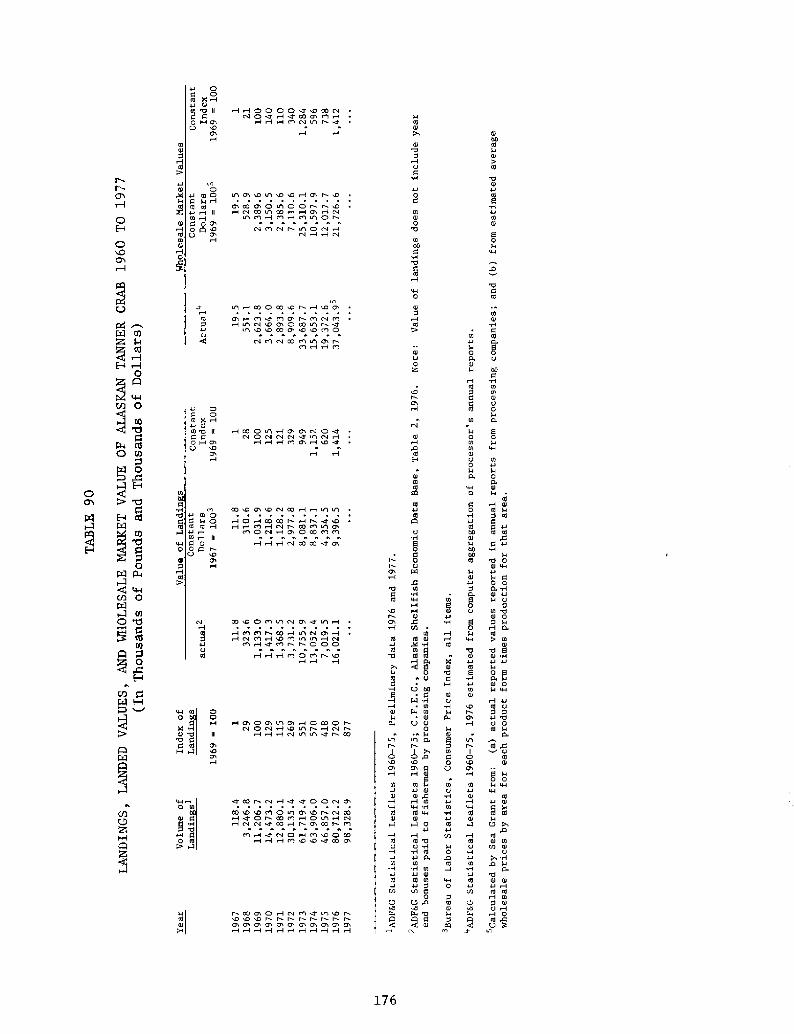
I-I 0g 0JJca0 MChO '0
0 044ajCDIJ mOg 4cd cd44 Malg Oah0 gt JDOl
IJmA 4 0 g
tgCh MN0 I0
8 0
IU
aj0
Ol M alcfc N ccltN cfl N
Ch I0 CO Ift POl to tofl0 al
0 0 U 4CO hl Ifl Ch I
mLI0
4J Og Ocd jd MClm aj0 I-I ChO
m 0 alalV 0
tNE 0
W 0
g 0 cdCCalCCcd
4J Ia QOtd at4Jdo0O Ch
QMCOFlPl O NCO P
0P W toComlft 0D CO
N cd4Jctl
Cfc Pl 4 CON cflM'0 fl tfIN Ch Mcfl tll M NNOQQ0
4JId V4 '0V 0ctlCaj J
alm
0 0
gM
jj0 O4 WW cdIJ dla! Id
ajJDm tcIft m
JD0'0m mal m
0al A
0 CO MM N
CDI tclO 4 COtN m' co MCh lo f tN COWocadr fl
aDQ COCOm'N o
176
gW 0 0
M M O 0 0 0 < aD co NNCDm Mm.cocnflMfl N Vl I
ChcodhQCDDDN IO Ift CO
N Pl N N tfl
Ifl M CO 0 COI 4
M CO 0 tcl M Ot Ch NNQNNNm'tfcN
CD co D fl Ift tN Ch m' Ul M
M Ch O Ch Ifc 0 M O CO 00 N M co Ifl h M N Itfl EA ht M Ccl
m'COI NM-CROON Ch
I COChOMNFlQtftaalI NP I NPCh Ch Ch Ch Ch Ch Ch Ol Oc Oc Ch
g
IdJJ
td
8
m 4
0 dlJJtdI4 IdtU
IJ
alJJ
0 gl
jj0g0IJj
It4I
0
Id Clmal IdCajj0* Vo aa
g
almV0
0 S!Ol g
mm AIaWtd Wal 04JId '0
Id4J
LIaj m4JOt0CD JD
gt gal
m5
jd5'0 0
M V g 0 IJLI
af
0 attI I
0 IdCj
e0
I
'0 Cltd
E ta
Ch
Ch
ICJJ0WajCI
V4JalIJLI
A
'40td
alItl Idg LJcd
4J
'0 0IU W4J0 00td LJIJal 0al 0
0! ICm~ eal4J 4J
W
The product forms into which Alaskan shrimp are processed include:frozen whole, frozen peeled, and frozen tails for the larger shrimp. Thepackages for these products are: 15-pound blocks, frozen IQF packaged intoa "pillow pack," frozen vacuum-canned, frozen in five-pound cans, and cannedconventionally.
As is the case for Alaskan crab products, much of the Alaskan productionis repackaged after it reaches the Seattle area. The 15-pound blocks are cutinto three five-pound sections and are packaged in individual waxed card-board cartons and packed six to a shipping carton. The bulk IQF packagesare also packaged into smaller packages, as small as eight ounces forretail sale.
Canned shrimp and other canned products! are shipped from Alaska in"bright stack." These are unlabeled cans stacked on a shipping pallet andwrapped with plastic, colored for ownership and product identification.When canned shrimp reach Seattle or another point of landing, they are movedinto company owned warehouses for labeling and repackaging into 24-or 48-can cases!, or they can be custom warehoused for labeling and repackaging.The cans are labeled by grades according to instructions from the processingcompany and cased. An example of the different grades used for Alaskanshrimp are tiny, small, and broken. The labels which are put on the sameproduct may differ according to the purchaser. Many processing companieshave their own brand names under which they sell product. They may also sellproduct to chain stores which label with their own private brand label. Afterlabeling and casing, the shrimp are ready for shipment.
Another type of marketed product, which has had limited production todate, is the larger Alaskan shrimp--coonstripes and sidestripes. One Kodiakvessel has been producing a high quality pack of these shrimp for thepast several years and exported it to the Japanese specialty market. Theseshrimp have been frozen raw onboard the vessel within four hours of landing.This provides a high quality shrimp product for which there is a strong demandin Japan. The company involved has been unsuccessful to date in selling anyof their product in the U.S. They are unable to compete with Gulf of Mexicoprawns on a basis of price or consumer appeal.
Market Channels
The market channels for shrimp are basically the same as for crab products.Exports are made mostly through processing company sales personnel directly tothe foreign buyer, domestic sales organization, or through brokers who act asindependent agents selling for a commission. For the Pacific Northwest, theproduct is shipped from warehouse storage around Seattle. For sales to otherareas, the product is shipped to storage warehouses in major sales areas, andsold through field brokers to retail and institutional buyers. Flow chartsshowing the market channels for frozen and canned products is shown inFigures 20 and 21.
Geo ra hic Distribution
No quantitative data are available or were collected to establish thegeographic distribution of Alaskan shrimp products. For discussion withmarketing organizations at processing compani.es, however, some estimates of
177
the product distribution were obtained. It is hoped these will provide someinsight as to where Alaskan shrimp are marketed.
A significant percentage of shrimp go for export. The main countriesimporting Alaskan shrimp were the Scandinavian countries, England, andCanada. Export statistics from the Bureau of Census include only a generalshrimp category, therefore, it is not possible to defferentiate betweenpandalid shrimp and all others in order to quantify the volumes exported.
Within the country only gross estimates of distribution of product wereavailable from marketing information sources. It was estimated for cannedshrimp, for example, that 30 percent of the total U.S. consumption was bythe western states of Washington, Oregon, and California. The midwest areaaround Chicago receives about 30 percent, and the New York area also accountsfor 30 percent. The remaining 10 percent of the total domestic distributiongoes to diverse locations around the country. Similar estimates forfrozen shrimp, even on such a simple level were not available. It wassuggested that the markets for frozen shrimp are diverse and spread allover the country, making estimations of percentage distribution by areadifficult.
Im ort and Ex ort Markets
As mentioned above, import and export data are not available forpandalid shrimp differentiated from the total U.S. shrimp production. Itis known that European markets provide a significant market for Alaskanprocessed shrimp. Without data on the amount of pandalid shrimp exportsto those countries, however, the importance of the markets cannot bedetermined.
Demand
As was the case for king and tanner crab, no detailed analysis wasattempted because of lack of available time series data. There are demandanalyses that have been published for shrimp from the Gulf of Mexico. Someinformation on demand for Alaska shrimp was obtained through discussionwith marketing people at some of the processing companies and these commentsare listed below.
Alaska shrimp compete for markets with shrimp harvested andprocessed in Washington and Oregon. Alaska is the major pro-ducer of pandalid shrimp; however, the landings of Washington,Oregon, and California are increasing.
The export markets for the Scandinavian countries depend uponthe shrimp catch levels within those countries. When they havelow production years there is a market for Alaskan shrimp. Duringnormal or high production years these markets are not available.Scandinavian shrimp is cooked and frozen onboard ship, resulting
178
in a consistently high quality product. Alaskan shrimp is seenby Scandinavians as an inferior product and so, when it is avail-able, domestically processed shrimp is preferred.
The suggestion was made that Alaskan processed canned shrimp wasbeing priced out of some of its traditional export markets forexample, United Kingdom!. Without data on exports of shrimp pro-duct to the United Kingdom, this cannot be confirmed; however,persons dealing on a day-to-day basis with the export marketsshould have more current information than export statistics wouldprovide.
An indication of the domestic demand for shrimp in general is shown bythe increase in per capita consumption of shrimp, listed in Table 91. Percapita consumption of shrimp has increased from 0.75 pounds per year in 1950to 1.59 pounds per year in 1977.
Again, this data is for all shrimp and may or may not apply to Alaskanprocessed pandalid shrimp.
Prices
There are limited price data for Alaskan processed shrimp. Kx-vesselprice series are available only for the Kodiak area, and are listed inTable 92.
Up until 1972, the price remained stationary at four cents per pound.Since then, it has climbed rapidly to the present price of 16.5 cents perpound.
An indication of the relative increases of ex-vessel and wholesale valueincreases, deflated by the general consumer price index, is shown in Table93. While this will give some indication of the comparative increases, thereis some question of the accuracy of the ex-vessel and wholesale value data see Appendix I, Part II for a discussion of the inconsistencies in the data!.
179
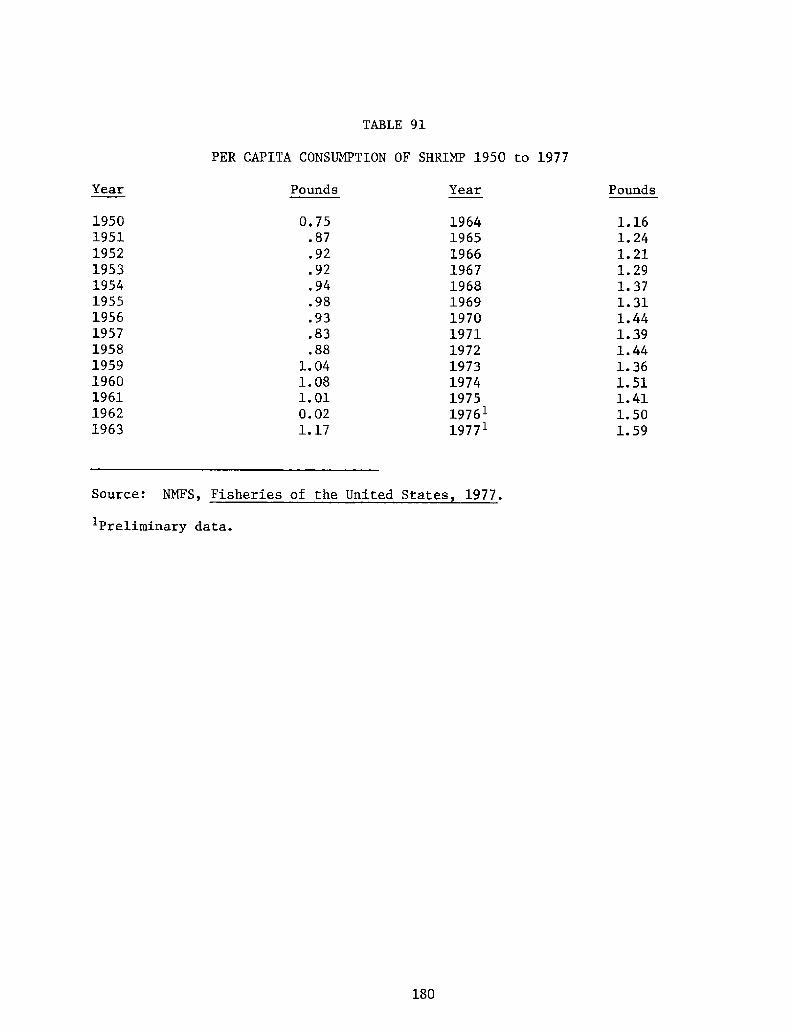
TABLE 91
PER CAPITA CONSUNPTION OF SHRDIP 1950 to 1977
Pounds PoundsYear Year
Source: NNFS, Fisheries of the United States 1977.
Preliminary data.
180
1950
1951
1952
1953
1954
1955
1956
1957
1958
1959
1960
1961
1962
1963
0. 75
.87
.92
.92
.94
.98
.93
.83
.88
1. 04
1. 08
l. 01
0. 02
1. 17
1964
1965
1966
1967
1968
1969
1970
1971
1972
1973
1974
19751976 '1977'
l. 16
l. 24
1. 21
1. 29
1. 37
1. 31
1. 44
1.39
1.44
1.36
1.51
1.41
1.50
1.59
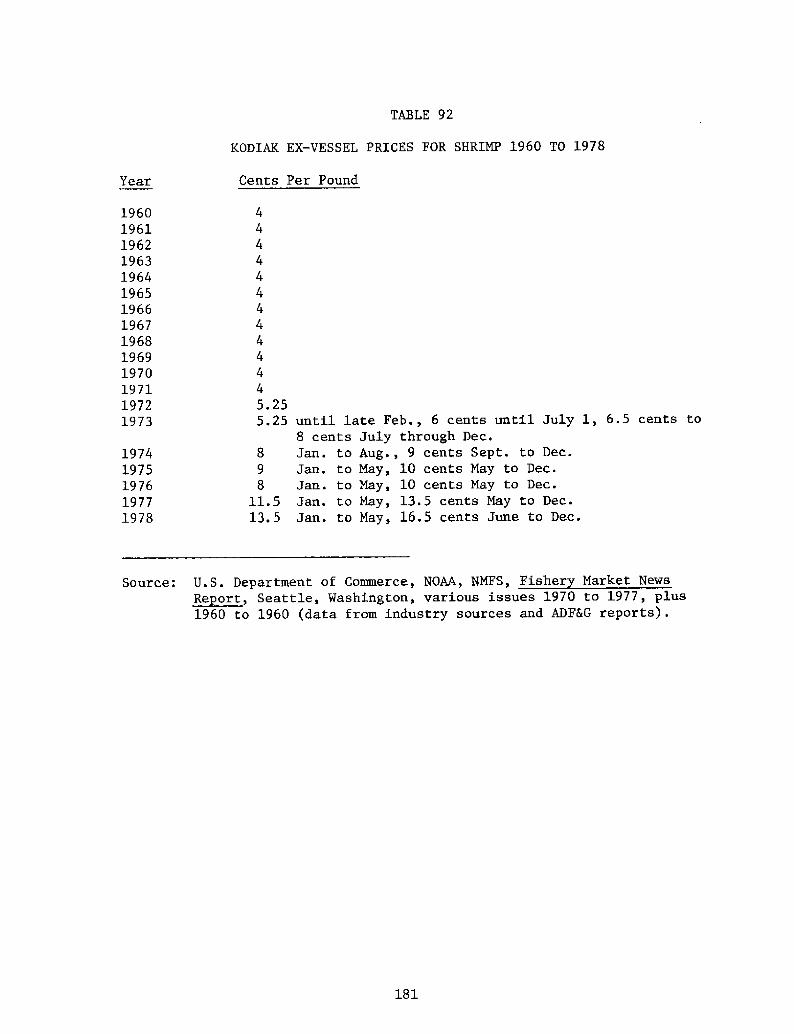
TABLE 92
KODIAK EX-VESSEL PRICES FOR SHRIMP 1960 TO 1978
Cents Per PoundYear
8 9 811.5
13. 5
1974
1975
1976
1977
1978
Source: U.S. Department of Commerce, NOAA, NMFS, Fisher Market News~Re ort, Seattle, RashinRton, various issues 1970 to 1977, plus1960 to 1960 data from industry sources and ADF&G reports!.
181
1960
1961
1962
1963
1964
1965
1966
1967
1968
1969
1970
1971
1972
1973
4 4 4 4 4 4 4 5.255 ' 25 until late Feb., 6 cents until July 1, 6.5 cents to
8 cents July through Dec.Jan. to Aug., 9 cents Sept. to Dec.Jan. to May, 10 cents May to Dec.Jan. to May, 10 cents May to Dec.Jan. to May, 13.5 cents May to Dec.Jan. to May, 16.5 cents June to Dec.
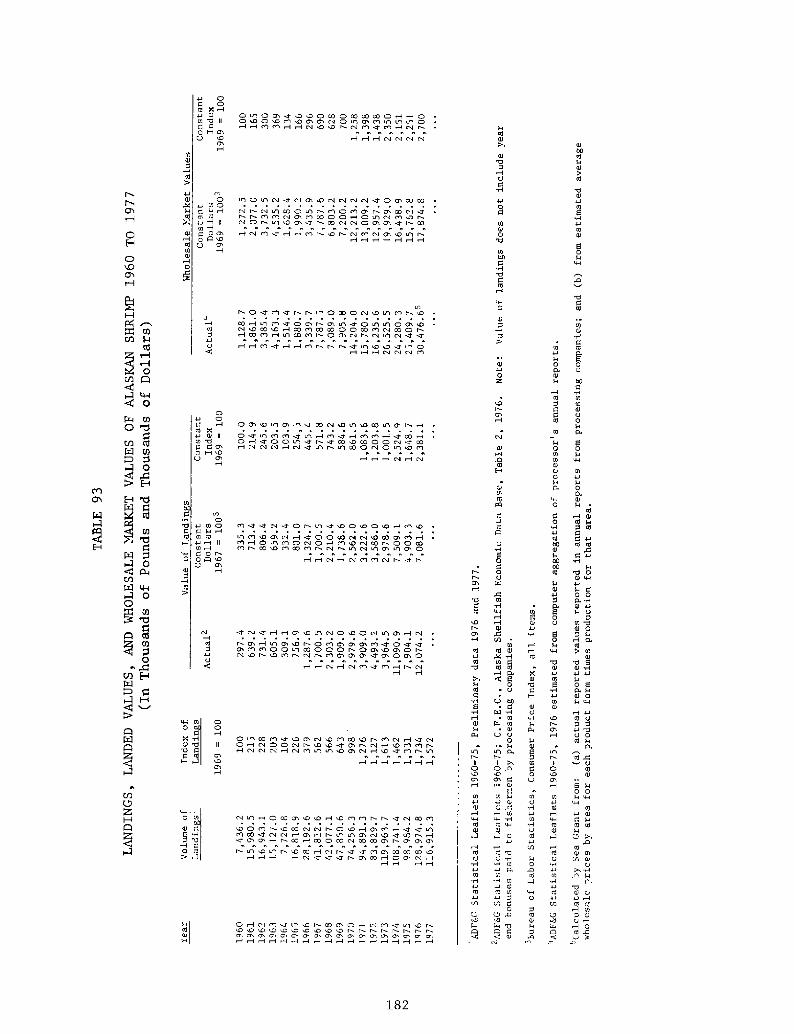
JJ QC QjC MOl� '0C0 MCh'D
M
QlA CIJJ nj QC ttjtd Ct ChCl DO
4J0C
DI NOON hD AI6
W
CJJJcJ
� M I/92tct CO nd M COCO fn M IA CO0 r 0 O CO Q QQ h
Q tA tA QOO CA N co Q IN IA NQN N N Cft
Ol U
�60 rJ0
00
Qj0 0 CLCIQC
Qt� C Ch0 MO Ot
IO
0 OJOlQJ0 0 4CL
NcACA M M CO Ct CO Q Q N C COtD Q N Q A D Pj 60
00
cdtUnj njCC 4JcdC Lt
0IU WC0 00QlO
Qt 0
td �
4
W 0
C
'� 0
04JtdCOtU0000nj
QJJ OJ Q04J Mrft M00 Ct �C Cf
cdCON<Qr Ifl<4DQ
N N '0 CO Cft'DNCOrQ Q cOQ
cl
JJ0
4J0 0
4 JQt
Q A COQMNN
60 0WW tdOlC td
Ql IO
JO00Ql OJJJ�00 0cd
h
zH
' H 0
Q PjCOMth ChJA
W u1cO r hCO CON
182
H
c0
0c6
O 4
M cd
0
cd
0
W0
C>
%4A <4
6j
0a P
CD
g
A
A
Q A Q Ch 0 � tD Q CO Q CO CO CO Q M M Q D CI OO nn � ch Ch N CI Ifl Ch cA I/I I/1OJ40rNYI<CAMNrN N N N
Q IA N < N Ch cD N N N N 4 Q 0 CO COI N A CO Ct IA M A Ct f1 Ch M Cf COr cA fj N ch nn CO Q Q M Q JA N cA tD rNQr IA40 hct CONNQOtthdl CO
Q N cA < r h A Q OO Q N � IA Yl
Q0D trl htA&tDN DQ m W fj m ~ ~ M ~ WQ M hf Q Q IA < r < CONMNQ AI tfl
IA C1 'D Cf N M N Q Q IDQ A Crt Q N QI OO D pj D CA I
M M th � IA N Q tD Q N A ch M NP hMI/1 h OI QcAO4Ch04 tj&Q A Q Q IA CO Q Q Q M Q Ch � 0 QN r nn Ch th 0 < h Q 01 Q
N M N cA W fn M r
0 N cA NQQNt D D<0 r NM Orrtrrtr A � Ch N M D M fn N IA
If!MQCO hect�M40f1 AI I UNCOrwcoNNI Q DI A Ift 0 N 0co M co Q co N cO co ch c
f D OMNI MM AO4CON N N hf f th CO M Q
QMN Pl< A D I COOtOMN AMIA� D I0 D D Dnnoj ct o DI I I I p-I r rcI ch ch cr tf cr a th ch ch cl c th th o cr cr ~
'tjC
cdnj0
cd
6
IU
I
Q tdQl
njrJ4JIO4JrtlJJ
60C00
rftIH
QI
td60000
fnjtd~ tU J0
JA4Q JO
Ql0 rdWQlJ 0
tj .rtnjp.
QlldC0CO Jj
C
6IULI
'0CM Qt0
6 C0 Clnt
0 nj
W 0 tdQl4
4 0LI
60
60IW'0tljIJnj64JtU
Ch
I
Q QtW td
td0
�
fj
APPENDIX I
REVIEW OF PROCEDURES FOR DATA PILE REFINEMENT
PART I: Resolution of Problems
PART II: Recommendations for Improvementsin Alaska's Fisheries Data
183
PART I
Resolution of Problems
Alaska fisheries production data, from the processors' annual reportsfiled with Alaska Department of Fish and Game ADF&G!, required correctingand editing before they could be used for the purposes of this study. Thisreport is completed by each seafood processing plant in Alaska, detailingthe year's production by species and product form processed. Some of thespecific problems encountered were missing reports, multiple reports filedby the same plant, or statistics for two or more plants combined on onereport, incomplete reports, incorrect product form, double counting ofcustom-packed seafood, and changes in format through time.
The problems encountered were handled in several ways. In areas havinga more significant impact on the study, the processors were contacted forclarification of information reported on forms for Period 2 �973 to 1975!of this study. Less significant cases and those cases for which no responsewas received or available! were solved either by making educated decisionsand applying those decisions consistently or by leaving out the material inquestion and coding it as missing.
Classification of Plants
One coding decision involved the type of operation--whether it was ashore plant, floater, or fisherman "direct sell." A shore plant is a shore-based operation including moored floaters!, floaters are floating processors for example, floating canneries and freezer ships!, and fishermen direct sellare those who sell their catch directly to consumser.~
The type of operation was unclear in many cases because either the typewas not checked on the forms, or, with limited choices, inappropriate boxeswere checked. In some cases it was not clear if floating processors weremoored or moving, or if a "floating processor" was actually just a fishingvessel. When the buyer box was checked, it could mean buying from a pro-cessor or buying from a fisherman for tendering, direct sell, or processing.This definitional problem was also apparent when some retail stores have sub-mitted processing reports, listing the number of employees in the store as thenumber engaged in processing. Unless they are processing or acting as anintermediary, these companies should not complete a return. When there wasa question as to the type, decisions were made based on information suppliedby ADF6G from Intent to Operate forms. No entries were made for buyers such asintermediaries and those who bought fish that were already processed.
Fishermen-direct sell includes buyers such as stores and restaurantswho buy directly from fishermen and sell fresh. The catch is not processedby fisherman or buyer!. Buyers were not included if it appeared by the pricethey reported that the fish had already been processed. Note: In a coupleof cases there were fishermen who sold their catch retail but processed it insome way and so were coded as "shore plant" or "floater," depending on wherethe processing took place.
184
Twenty-one reports were not entered because there was some questionabout the type of operation they were running. This excluded companieswhich were obviously buyers or recipients of custom-pack who did no pro-duction of their own, but involved tenders, intermediaries, a few Japanesecompanies which filed reports for roe production at other plants, and caseswhere even minimal information was not supplied. These deletions were madebecause of information received from ADFSG's Intent to Operate forms andfrom clues on the Annual Reports themselves. These exclusions were a verysmall percentage of production.
Fisherrmn-Direct Sell
The fisherman-direct sell category appeared in Periods 2 �973 to 1975!and 3 �976! only and was composed of just a small percentage of the totals,that is, 0.3 percent of Period 2 and 0.4 percent of Period 3. By generalarea, fisherman-direct sell was distributed as shown in Table 1-1.
Since fisherman-direct sell is not involved in the. processing sectorbut hits the local market only, the amounts were excluded from most cal-culations of this study. This omission has a minimal impact because of thesmall percentages it involves.
Another major problem area was custom-packing production of one company'sfish by another company. The predicament was knowing whether the custom-pack which was received or produced by a company was included in that company'sother production. If the itemized custom-pack had been included in thegeneral totals of the producing company, then to include that itemization inthe data base of the study would result in a double entry. Conversely, if itwas assumed that an itemized custom-pack had been included in the generaltotals of the producing company, and therefore was not included in the database of the study, there would be no entry at all for that custom-pack if inreality it had been excluded from the general totals of the producer. Custom-packs were entered in the data base as production of the producing company,so that if the recipient of a custom-pack also included that pack in his pro-duction totals, then there would be another double entry.
The problem arises because of the ambiguous commercial operator reportingforms. In the more recent forms, there were 39 cases which needed clarifi-cation. A questionnaire was sent to those firms in May 1977. In August 197725 reminders were sent to companies who had still not returned the question-naires. There was about a 50 percent return.
According to ADF6G, the processors had been instructed that custom-packing they produced should be included in their totals, but custom-packingthey received should not. To reduce the chance of double entries or noentry at all for custom-packs, the reports were cross-checked against eachother, when possible, to confirm the figures. But in some cases, it wasstill necessary to make the following assumptions:
185
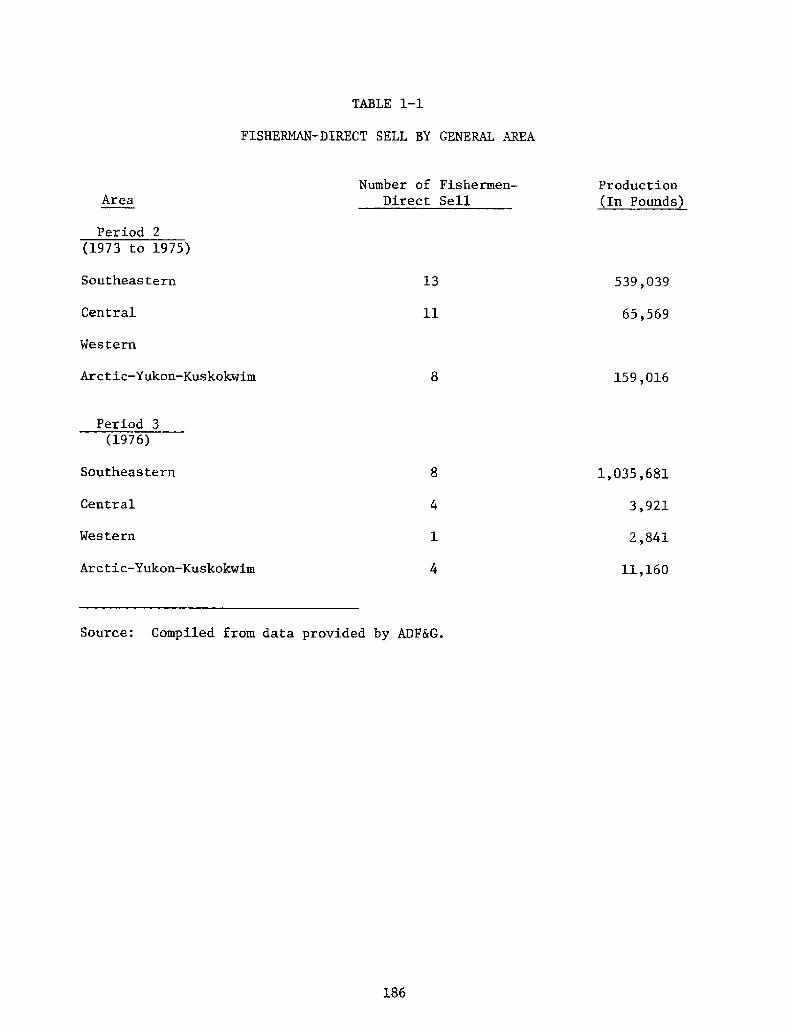
Number of Fishermen-
Direct Sell
Production
In Pounds!Area
Period 2
13 539,039
65,569
Western
Arctic-Yukon-Kuskokwim 159,016
Period 3
Western
Arctic-Yukon-Kuskokwim
Source: Compiled from data provided by ADF6G.
186
�973 to 1975!
Southeastern
Central
�976!
Southeastern
Central
TABLE 1 � 1
FISHERMAN-DIRECT SELL BY GENERAL AREA
1,035,681
3,921
2,841
11,160
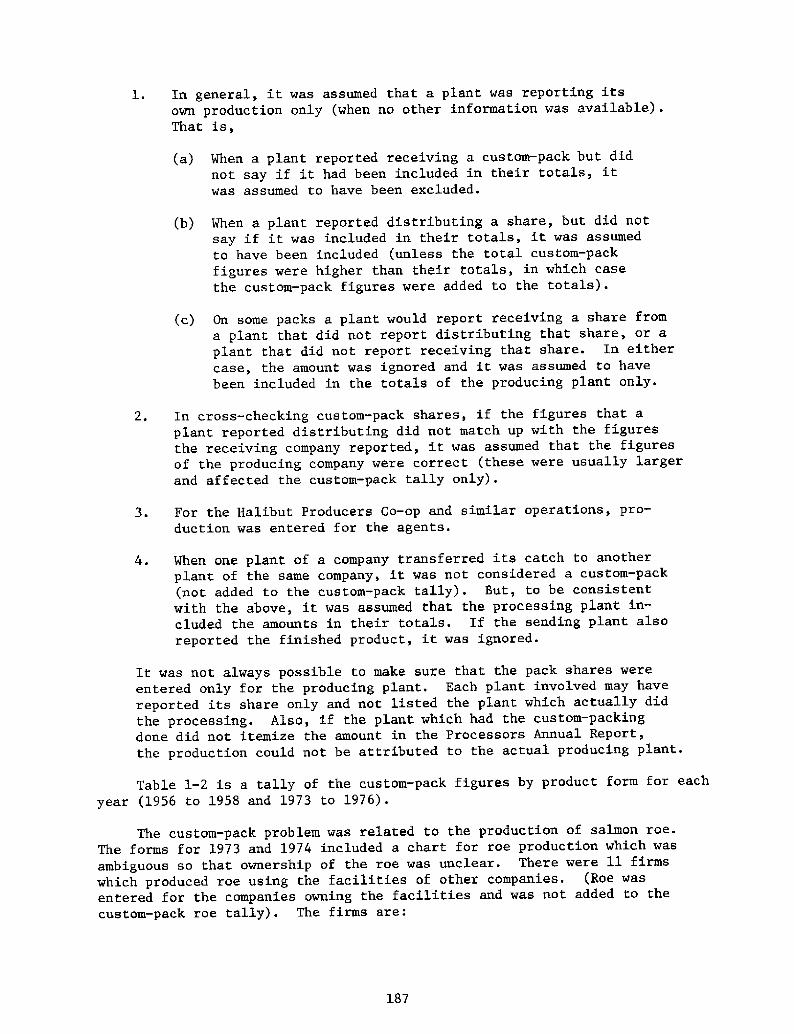
l. In general, it was assumed that a plant was reporting itsown production only when no other information was available!.That is,
a! When a plant reported receiving a custom-pack but didnot say if it had been included in their totals, itwas assumed to have been excluded.
b! When a plant reported distributing a share, but did notsay if it was included in their totals, it was assumedto have been included unless the total custom-packfigures were higher than their totals, in which casethe custom-pack figures were added to the totals!.
c! On some packs a plant would report receiving a share froma plant that did not report distributing that share, or aplant that did not report receiving that share. In eithercase, the amount was ignored, and it was assumed to havebeen included in the totals of the producing plant only.
2. In cross-checking custom-pack shares, if the figures that aplant reported distributing did not match up with the figuresthe receiving company reported, it was assumed that the figuresof the producing company were correct these were usually largerand affected the custom-pack tally only!.
3. For the Halibut Producers Co-op and similar operations, pro-duction was entered for the agents.
4. When one plant of a company transferred its catch to anotherplant of the same company, it was not considered a custom-pack not added to the custom-pack tally!. But, to be consistentwith the above, it was assumed that the processing plant in-cluded the amounts in their totals. If the sending plant alsoreported the finished product, it was ignored.
It was not always possible to make sure that the pack shares wereentered only for the producing plant. Each plant involved may havereported its share only and not listed the plant which actually didthe processing. Also, if the plant which had the custom � packingdone did not itemize the amount in the Processors Annual Report,the production could not be attributed to the actual producing plant.
Table 1-2 is a tally of the custom-pack figures by product form for eachyear �956 to 1958 and 1973 to 1976!.
The custom-pack problem was related to the production of salmon roe.The forms for 1973 and 1974 included a chart for roe production which wasambiguous so that ownership of the roe was unclear. There were 11 firmswhich produced roe using the facilities of other companies' Roe wasentered for the companies owning the facilities and was not added to thecustom-pack roe tally!. The firms are:
187
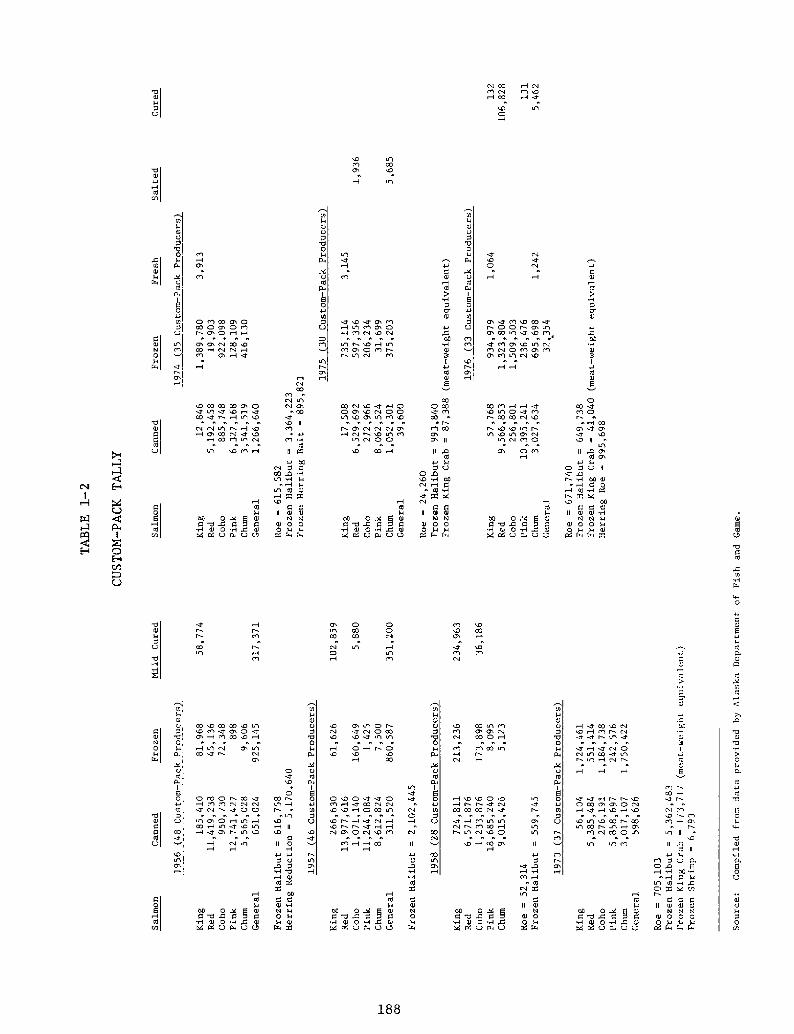
NCOW CQ
voCt
0tU
C
4 0 a0 4
QlcJ'0 0
co NN
C CJ
! 0'IU
CtUCJ
! 0'5
A IJQJOE0IJVl
Jd0 IQ
E0IJvlCJ ocI 0 OOc CO
WN 0tfl
OlONtIlI
cclI Oc tfcPlulON cO
tfl rrtFl Nul r coc7t 0I tfl N
IJDD
IIJCJ
DQD8
CON IftN 0CO
rrtM IQ
0 CICoW Ol
D OlQl O0
CQ0 CQcrcco* r
CO
0N 0 0
N N Ot0 0CO
CO MIfl OCO CO
Ul cotfloc
rft
rOc N00 M
0 CO NO OtVlOtrtfl N
QDN 0 CCo D
tft tU ttt
CJJ Qc 8QJ 0 00
O D
QJ 00Cd
C4 0C 0
QDCQJ 440 Qt
A $ IUD IUO
4A 6 5D QtO o 0
QD 0C '0 D4t 0CJ
QD 0ttf 0Ud cd O
0
CQtEJJ
0Ct
I p COIU COOcco
0'00O
IJDD
5 E
Co CoClW IO0
tfl ONOCO
r OQQ
CQN
N
CO lftOl OcCOO+CQ UlI
COI
tfl Cor
tcl
tetN Ot
I N
N 0I
'0 0
E0
CJ
0QJ
60JJID0 0N CO
A QJOE0JJ
to
D tU
ECQ t4
$ CA
tfcICII
CO OI
Ot 0tft
I CoN-4 0
JDtfttft
Ct co O
QJ rr rN 0 0
<<OCO N NO Co IflN
N co MCo
CQ
N
r rCA 0 N0 O CO
ttltent Co Ipl N
E0t4QJ r oJtft W CrCO O
OE0
CoD Ol < D
CQIUNCQlIQQJ O
0
0 D
tflO
C IVtU 00Cd
4tQJ0 0C Qt
0
C CQt QJIJ CQ0 0
DD 0C ro AQt 0QD 0
IU 0Cd O
188
4 $
'0 0 4vl J4QJ
CJCQc4 0
O
I
0
0CCU 00
CttIE0
'0QJ00 «0
o w co crl 0COOOOICT' N COCO H NM
Co Qo CO Cllco W I W Ifl
N tfl IOc OJco pl trtIfl 'O
rl Ql 0 4 DCd O CJ O
DD 0 A ECMP~ 2 0 ~ DO
Ct
0COtfl
04 40M '0QJ Cd
CQC CQlIQ0 4I92I
Pl COtrtrl
Oc 0 0tft QQ 0CQ CON tfc0 tft
D QJ4
0 D QDN IU
C CQl 4JQt 0 00 4Cd
to 'O CtI I N NCO CQW tft tftr fl cotft N JD 0
CO
tU04DCJ Ot 0
Ataka American, Inc.Co � op Trade Japan, Ltd.Kyoko USA, Inc.Marubeni Iida American Corp.Nitsui & Co.
Nitsubishi Intl. Corp.Nissho Luai American Corp.Sumitoma Shoji AmericaBunsen & Davis CompanyPuget Sound Salmon Egg Co. Seattle!Schenk Seafoods Sales, Inc. Bellingham!
Also, in general, more roe production was reported in 1973, 1974, and1976 probably because there was a special section for reporting roe pro-2
ducts on the 1973, 1974, and 1976 reports only. And except for the 1973and 1974 forms, bait roe was not distinguished from caviar. All "salmonegg" production was coded as roe-caviar.
Another inconsistency in the roe information was the process given.Roe production is a combination of salting and chilling. On most formsthe process was stated as "salted." So when the process was not given, itwas assumed to be salted. But on the 1976 reports, there is one line re-served for roe production in the fresh or frozen category so that most roewas reported as frozen. For the purposes of this study, this was irrelevantsince all processes of roe were grouped together in the market characteristicsfiles.
Herring roe, on the other hand, was a problem on the 1976 reports. Theforms had two categories for herring roe: "Herring Sac Roe" and "Sac RoeAlone," but no space for whole frozen herring. The values of "Herring SacRoe" were running about one � tenth those of "Sac Roe Alone." Apparently pro-cessors were filling in whole herring under "Herring Sac Roe" since it wasshipped whole for the roe to be extracted later. It was coded as whole.
Recover and Conversion Factors
Recovery and conversion factors were another major area of concern.Since all figures were given in product weights, it was necessary to convertproduction to meat equivalent weight so that production would be comparableacross product forms. For canned production of salmon and crab, the con-version tables furnished by ADF&G were used see Appendix Table 1-3!. Theconversion factors did not take into account density variation of species orarea of catch. Another problem was that processors sometimes reported cansize as the actual weight of the can and other times as the drained meatweight. For canned shrimp, a few processors were contacted and it was foundthat, besides the old-style canned shrimp of one-pound can size, there areonly two other can sizes.
~About five million pounds was reported in 1973 and 1974, and almostsix million pounds in 1976 compared to a little over three million poundsin 1975 and about 750,000; 400,000; and 220,000 in 1956, 1957, and 1958respectively.
1S9
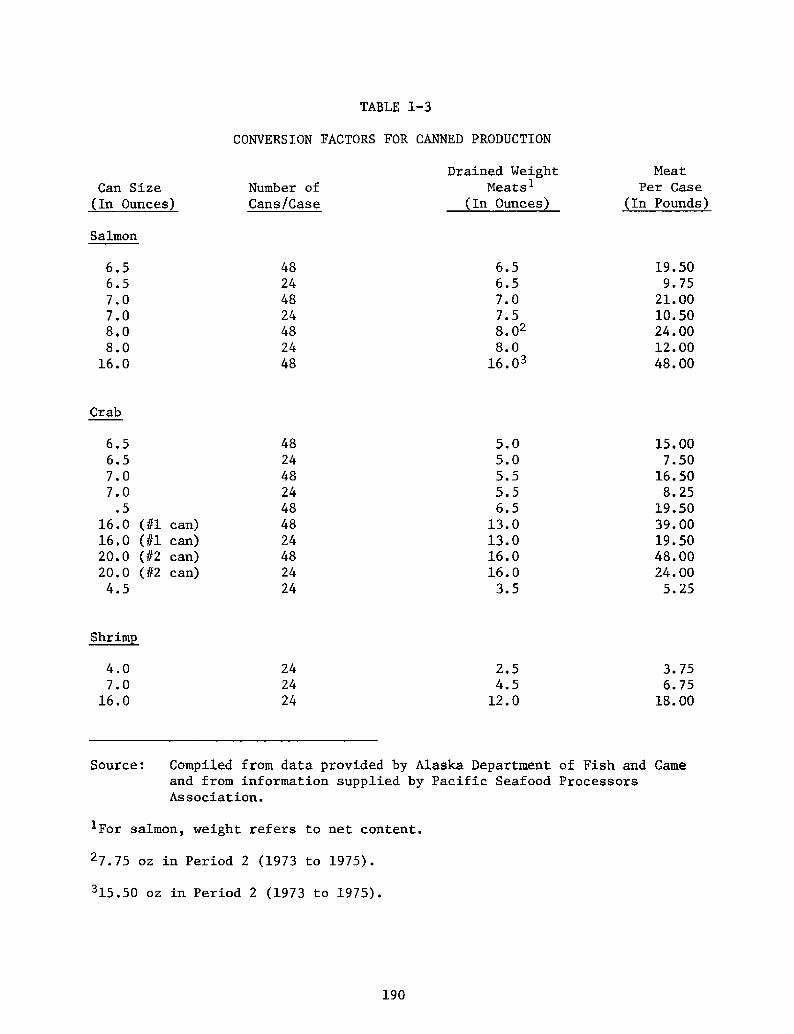
TABLE 1-3
CONVERSION FACTORS FOR CANNED PRODUCTION
Drained WeightMeats
In Ounces!
Meat
Per Case
In Pounds!Number of
Cans/CaseCan Size
In Ounces!
Salmon
Crab
4.0
7.0
16. 0
24
24
24
2.5
4.5
12. 0
3. 75
6. 75
18. 00
Source: Compiled from data provided by Alaska Department of Fish and Gameand from information supplied by Pacific Seafood ProcessorsAssociation.
~For salmon, weight refers to net content.
7.75 oz in Period 2 �973 to 1975!.
315.50 oz in Period 2 �973 to 1975!.
190
6.5
6.5
7.0
7.0
8.0
8.0
16.0
6.5
6.5
7.0
7.0
.5
16.0 I/I can!16.0 /11 can!20.0 82 can!20. 0 82 can!
4.5
48
24
48
24
48
24
48
48
24
48
24
48
48
24
48
24
24
6.5
6.5
7.0
7.58. 028. 0
16. 03
5.0
5.0
5.5
5.5
6.5
13. 0
13. 0
16.0
16.0
3.5
19. 50
9. 75
21. 00
10. 50
24. 00
12. 00
48. 00
15. 00
7. 50
16. 50
8. 25
19.50
39.00
19.50
48.00
24.00
5.25
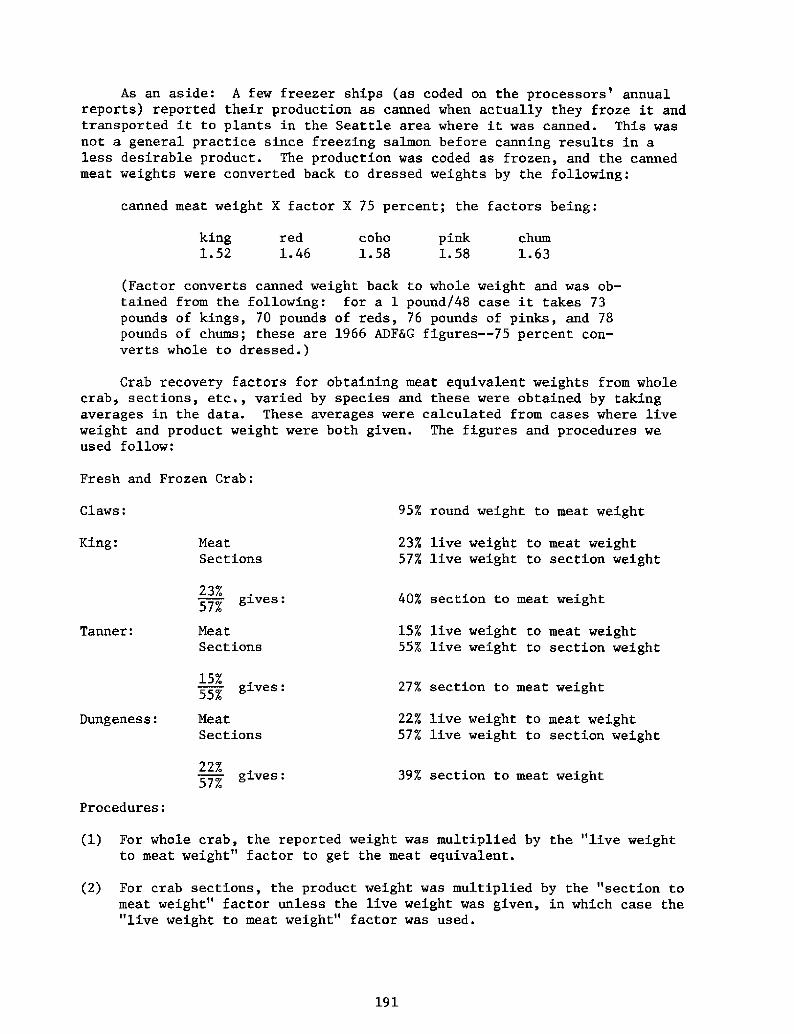
canned meat weight X factor X 75 percent; the factors being:
king1.52
pinkl. 58
red
l. 46
coho
1.58
chum
1.63
Factor converts canned weight back to whole weight and was ob-tained from the following: for a 1 pound/48 case it takes 73pounds of kings, 70 pounds of reds, 76 pounds of pinks, and 78pounds of chums; these are 1966 ADF&G figures--75 percent con-verts whole to dressed.!
Crab recovery factors for obtaining meat equivalent weights from wholecrab, sections, etc., varied by species and these were obtained by takingaverages in the data. These averages were calculated from cases where liveweight and product weight were both given. The figures and procedures weused follow:
Fresh and Frozen Crab:
95X round weight to meat weightClaws:
23/ live weight to meat weight57/ live weight to section weight
King: Meat
Sections
23Xgives: 40X section to meat weight
15/ live weight to meat weight55X live weight to section weight
Meat
SectionsTanner:
15Xgives: 27X section to meat weight
22/ live weight to meat weight57/ live weight to section weight
Meat
Sections
Dungeness:
22Xgives: 39X section to meat weight
Procedures:
�! For whole crab, the reported weight was multiplied by the "live weightto meat weight" factor to get the meat equivalent.
�! For crab sections, the product weight was multiplied by the "section tomeat weight" factor unless the live weight was given, in which case the"live ~eight to meat weight" factor was used.
191
As an aside: A few freezer ships as coded on the processors' annualreports! reported their production as canned when actually they froze it andtransported it to plants in the Seattle area where it was canned. This wasnot a general practice since freezing salmon before canning results in aless desirable product. The production was coded as frozen, and the cannedmeat weights were converted back to dressed weights by the following:
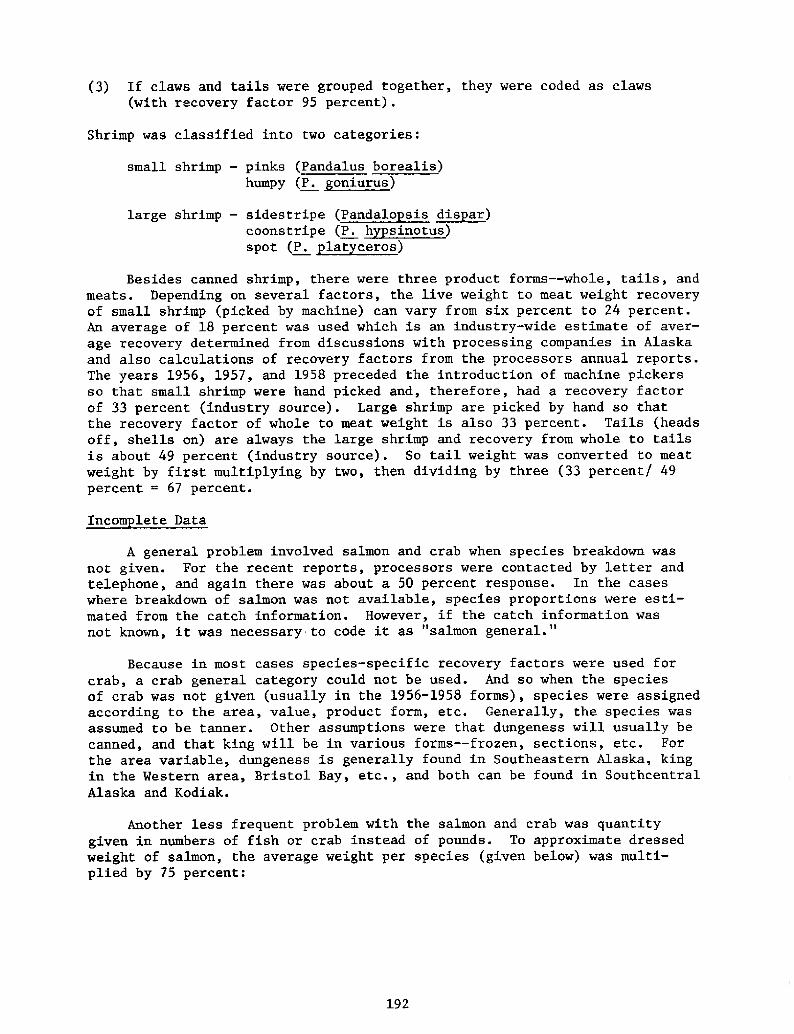
�! If claws and tails were grouped together, they were coded as claws with recovery factor 95 percent!.
Shrimp was classified into two categories:
small shrimp � pinks Pandalus borealis!humpy p. ~oniurue!
Besides canned shrimp, there were three product forms � whole, tails, andmeats. Depending on several factors, the live weight to meat weight recoveryof small shrimp picked by machine! can vary from six percent to 24 percent.An average of 18 percent was used which is an industry-wide estimate of aver-age recovery determined from discussions with processing companies in Alaskaand also calculations of recovery factors from the processors annual reports.The years 1956, 1957, and 1958 preceded the introduction of machine pickersso that small shrimp were hand picked and, therefore, had a recovery factorof 33 percent industry source!. Large shrimp are picked by hand so thatthe recovery factor of whole to meat weight is also 33 percent. Tails headsoff, shells on! are always the large shrimp and recovery from whole to tailsis about 49 percent industry source!. So tail weight was converted to meatweight by first multiplying by two, then dividing by three �3 percent/ 49percent = 67 percent.
Incom lete Data
A general problem involved salmon and crab when species breakdown wasnot given. For the recent reports, processors were contacted by letter andtelephone, and again there was about a 50 percent response. In the caseswhere breakdown of salmon was not available, species proportions were esti-mated from the catch information. However, if the catch information wasnot known, it was necessary to code it as "salmon general."
Because in most cases species-specific recovery factors were used forcrab, a crab general category could not be used. And so when the speciesof crab was not given usually in the 1956-1958 forms!, species were assignedaccording to the area, value, product form, etc. Generally, the species wasassumed to be tanner. Other assumptions were that dungeness will usually becanned, and that king will be in various forms--frozen, sections, etc. Forthe area variable, dungeness is generally found in Southeastern Alaska, kingin the Western area, Bristol Bay, etc., and both can be found in SouthcentralAlaska and Kodiak.
Another less frequent problem with the salmon and crab was quantitygiven in numbers of fish or crab instead of pounds. To approximate dressedweight of salmon, the average weight per species given below! was multi-plied by 75 percent:
192
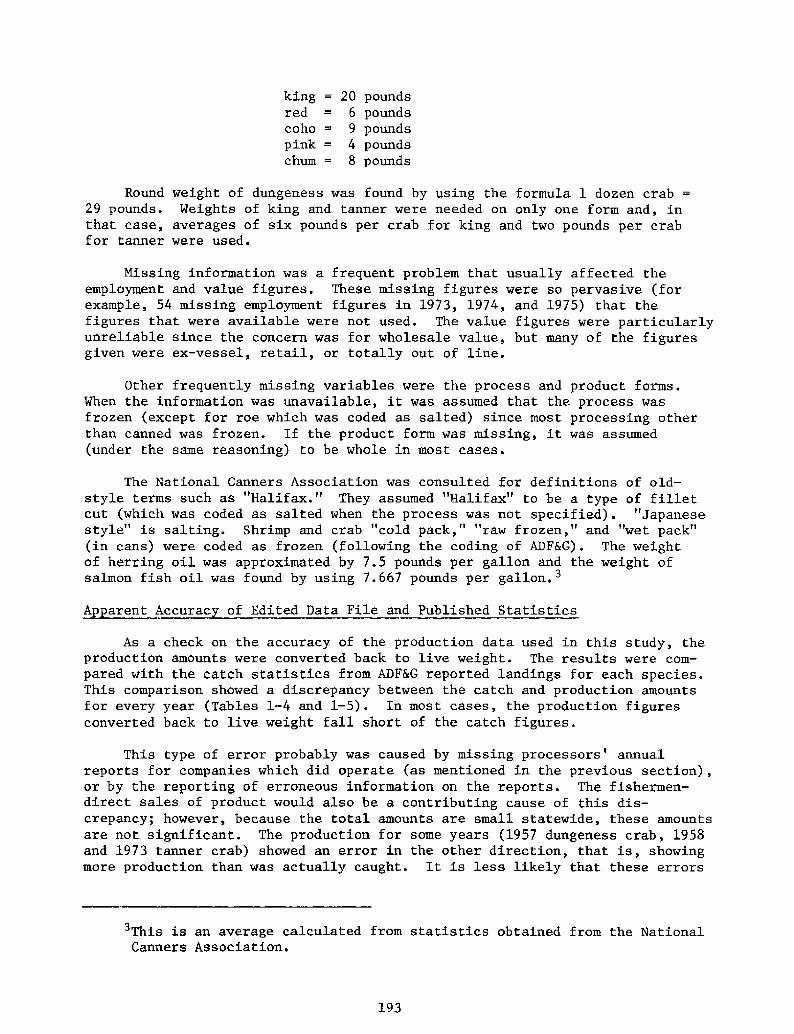
Round weight of dungeness was found by using the formula 1 dozen crab =29 pounds. Weights of king and tanner were needed on only one form and, inthat case, averages of six pounds per crab for king and two pounds per crabfor tanner were used.
Missing information was a frequent problem that usually affected theemployment and value figures. These missing figures were so pervasive forexample, 54 missing employment figures in 1973, 1974, and 1975! that thefigures that were available were not used. The value figures were particularlyunreliable since the concern was for wholesale value, but many of the figuresgiven were ex-vessel, retail, or totally out of line.
Other frequently missing variables were the process and product. forms.When the information was unavaiLable, it was assumed that the process wasfrozen except for roe which was coded as salted! since most processing otherthan canned was frozen. If the product form was missing, it was assumed under the same reasoning! to be whole in most cases.
The National Canners Association was consulted for definitions of old-
style terms such as "Halifax." They assumed "Halifax" to be a type of filletcut which was coded as salted when the process was not specified!. "Japanesestyle" is salting. Shrimp and crab "cold pack," "raw frozen," and "wet pack" in cans! were coded as frozen following the coding of ADF&G!. The weightof herring oil was approximated by 7.5 pounds per gallon and the weight ofsalmon fish oil was found by using 7.667 pounds per gallon.~
A arent Accurac of Edited Data File and Published Statistics
As a check on the accuracy of the production data used in this study, theproduction amounts were converted back to live weight. The results were com-pared with the catch statistics from ADF&G reported landings for each species.This comparison showed a discrepancy between the catch and production amountsfor every year Tables 1-4 and 1-5!. In most cases, the production figuresconverted back to live weight fall short of the catch figures.
This type of error probably was caused by missing processors' annualreports for companies which did operate as mentioned in the previous section!,or by the reporting of erroneous information on the reports. The fishermen-direct sales of product wouLd also be a contributing cause of this dis-crepancy; however, because the total amounts are small statewide, these amountsare not significant. The production for some years �957 dungeness crab, 1958and 1973 tanner crab! showed an error in the other direction, that is, showingmore production than was actually caught. It is less likely that these errors
~This is an average calculated from statistics obtained from the NationalCanners Association.
193
kingred
coho
pinkchum
20 pounds6 pounds9 pounds4 pounds8 pounds
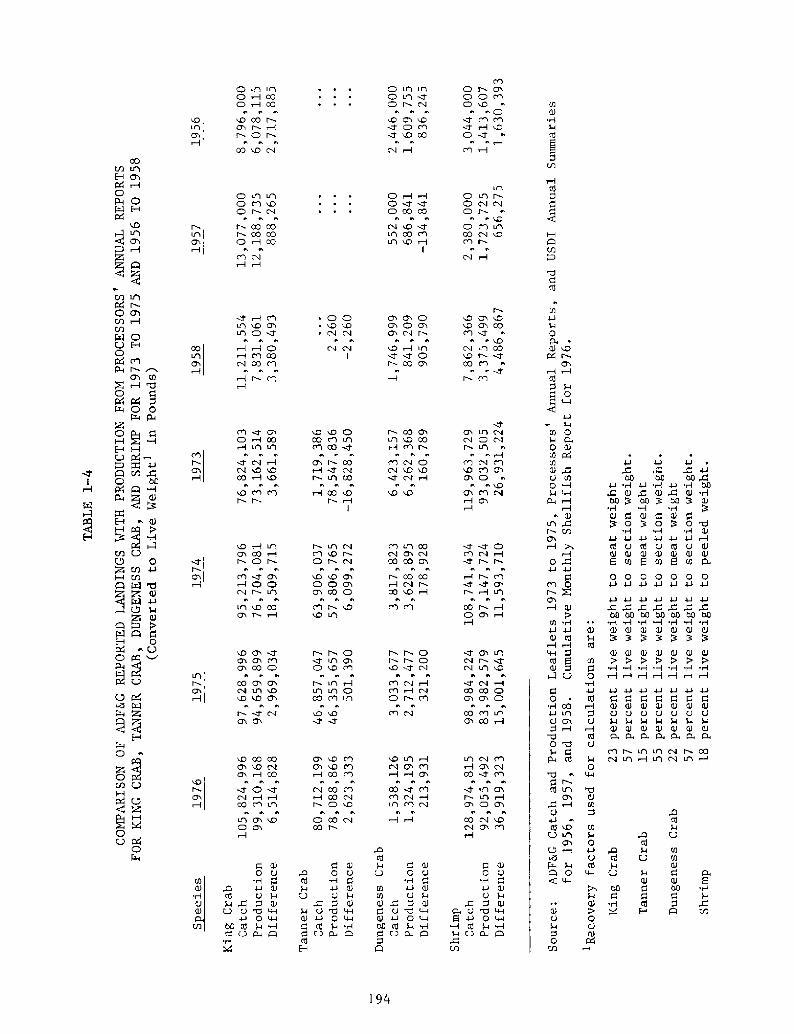
O0 0O
~ t Q
O
0 farlO H CQO H CQ
h ~COO
CO c0 N
OOO p~ t
OCOA
O 0 O hA t
0CQ
OO0 CQ COh
Lrl cOccl M W
I
OO MO hth CO CQh CQ COO H CO~ h
COAA ~
COCO
ChOA ~
0CO
CO MA
Ch OCh 0ChN pA
N<OCO
0 0N A
N Op CCr ~
Q hA
M
0 6 CQ~ ~ ~
NCO W c0~ t t
I-
0cQ M crl
COA
P COLcl COA ~ hCQ
l
CO Chcrl cO CQ
PA0
NA A bd A
bbdl rt
3
0
V dl8 5cb C4
dlbd g bQdl
0 V cdd! dl
8CC8
dlbd
dl0
IJ JJCd Udl cr!g
CQO
t A tCh
O Ot A A
crl ~ CQ
O
P r4
COO Ch
NLO P
O h Nt t
O OCO O
A ~ t
M crl CQCh N
CO COA A ~
CQ CQN
CO M Wh A
bQ bd~ +
dl dl dl'tc
dl dlcc
0JJcd
dl $V V
U A 4cdl Ql
cd C4 C4U
0
QQ Oh hCQN
Ch~ ~
Ch Ch
OCh
O
ccl ccl 0CQ
Or r 0
t ~N
0 p
t ~N
CO CQ 00
~ A ACO
CO
0CO
V Ch
Cl0
cU dl dlU U Udl dl dlC4 C4 C4
dlV Vdl dlC4 C4
CQ COCh cOCh W COA A
O
A ACh
O
CQA
CQCQO N
~ tO COCO
N Ch M~ h A
CQN
Nr4CO
~ A A
crlO Ch
hCQ N LDN Ch
h
Cd
V
0
a 0W
cd
cdo cc
dlCl
dl dlbd
cda
0 U cdW 0
crl
U 0
194
0Pr 0
g A
Cct0 Ol
0
0Cct0 0
0 Q C'H
A crl A0 bQ
dl
P -dl
i]iCD 0
MH CQ
cUav >
CD Ccd
0
CO
00 CCI
0
C dl0 U
CtGl
cd Udl
0 V'00 W
bb cdO C4
dl0 U
dlU
CJW
dl 4r 0 w0 cd
O
dl0 0 V
CtCb c-r dlcb Ud! A 5 cr
Vdl 4r 0 Wbd cdc. 'o c4 a
a
Cd d!0 V
rdl
Vdl
C4 U 0g c-r 0uoc4a
0dlC4
cd
0
0C4
0 dlccl
0
dlul
0 A4J
0
dl
dl cd
cd gS
0 0 0 0 0 0 04J
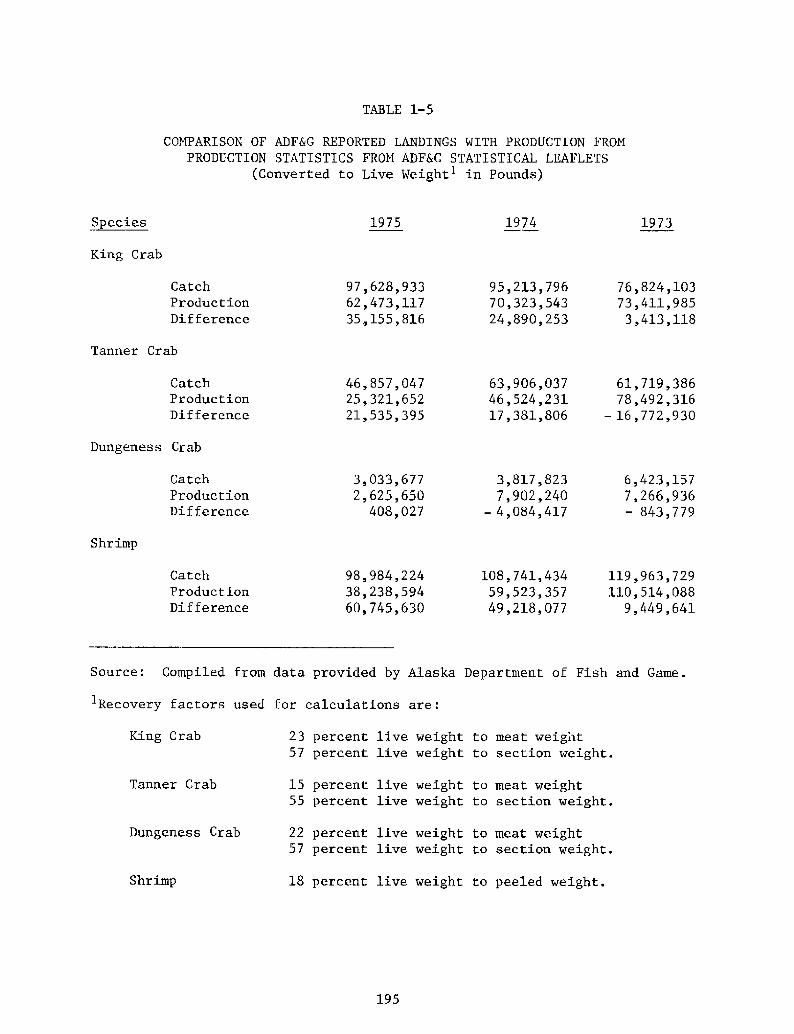
TABLE 1-5
COMPARISON OF ADF&G REPORTED LANDINGS WITH PRODUCTION FROM
PRODUCTION STATISTICS FROM ADF&G STATISTICAL LEAFLETS
Converted to Live Weight in Pounds!
1974~Seeies 1975 1973
King Crab
Tanner Crab
61, 719, 38678,492,316
� 16,772,930
Dungenes s Crab
Shrimp
119,963,729110,514,088
9,449,641
Source: Compiled from data provided by Alaska Department of Fish and Game.
Recovery factors used for calculations are:
King Crab 23 percent live weight to meat weight57 percent live weight to section weight.
15 percent live weight to meat weight55 percent live weight to section weight.
Tanner Crab
Dungeness Crab 22 percent live weight to meat weight57 percent live weight to section weight.
Shrimp 18 percent live weight to peeled weight.
195
Catch
Production
Difference
Catch
Production
Difference
Catch
Production
Difference
Catch
Production
Difference
97,628,93362,473,11735,155,816
46,857,04725,321,65221,535,395
3,033,6772,625,650
408,027
98,984,22438,238,59460,745,630
95,213,79670,323,54324,890,253
63,906,03746,524,23117,381,806
3,817,8237,902,240
� 4,084,417
108,741,43459,523,35749,218,077
76,824,10373,411,985
3,413,118
6,423,1577,266,936� 843,779

were caused by the processing data and may indicate errors in the catchstatistics for those years. Most of the errors in reported production for example, missing reports! tended to understate production amounts.
The production data accuracy, as indicated by these tables, isadmittedly less than ideal. These data were checked as thoroughly aspossible, however, even to the extent of checking back with the individualprocessing companies in some cases, and so represent as accurate a form ofthese data as possible given the problems with the processors' annualreports.
A similar comparison of production figures from ADF&G Statistical Leaf-let series converted back to live weight! against the catch statistics wasalso completed. These data, which are compiled by ADF&G, come from the pri-mary data source as was used in the study the processors' annual reports!.Thi,s comparison sho~ed much greater discrepancies than the data which wereedited and corrected for use in this study. The probable reasons for theseinconsistencies are outlined in the previous section.
196
PART II
Recommendations for Im rovements in Alaska's Fisheries Data
From the experience gained in working with the available Alaska fisheriesdata during the course of this study, several deficient areas can be identifiedwhere necessary data are non-existent, inaccurate, not consistent through time,or not available in a timely manner. The Alaska Department of Fish and Gamehas the responsibility for providing state fisheries data. However, theirmajor emphasis to date has been on the data necessary for biological stockmanagement such as catch data by area and catch per unit of effort. Therehas been much less emphasis by ADF&G placed on providing data required foreconomic management of the fisheries resources. This shortcoming is demon-strated by the fact that the statistical leaflet, which is the ADF&G fisheriesdata publication, is not yet available for 1976 or 1977, and the 1975 leaflethas only been issued. in a preliminary form which is subject to revision. Asrapidly as the fisheries in the state are developing, it is not sufficient toprovide management agencies such as the North Pacific Fishery Management Councilwith preliminary 1975 data to be used in making decisions in mid 1978 on fisheriesresource use. Necessary decisions will be made using the best informationavailable at the time. The use of inaccurate or out-of-date information makes
these decisions more difficult and subject to error.
There are several basic data requirements for fisheries economic data.Most of these data are presently collected in some form. As pointed out inthe previous section, however, there are problems with the accuracy, com-pleteness, and timeliness of these data. These basic requirements are listedbelow.
Catch and Landin Data b S ecies and Area
These data are included in the ADF&G statistical leaflet which is avail-
able at this time up to 1975. Data for 1976 to the present, are available inpreliminary form from the ADF&G monthly catch reports for salmon and shellfish.
Production Data b S ecies, Product Form, and Area
These data are presently collected and compiled from the ADF&G CommercialOperators Annual Report, required by law to be completed by all seafood pro-cessors in Alaska. As pointed out previously, there are several problem areasthat require correction. The entire responsibility for collection, compiling,editing, correcting, and publishing of these data has rested with one positionat ADF&G in Juneau. The lack of manpower available for this task has resultedin the present delay in publication. Also, review and corrective follow-up,where necessary, of the data submitted by processing companies has not beenpossible, even where obviously incorrect forms have been submitted. There arecases where processing companies which did operate during the year did not evensubmit an annual report to ADF&G, and their production has gone unrecorded.This type of error is not caught by ADF&G because there has not been time forthe one person involved to follow-up and correct omissions. In addition toinsufficient manpower, there has also been a problem with staff turnover inthe position responsible for these data. With this situation, continuity of
197
effort has not been possible. In order to upgrade the quality and timelinessof these data, more emphasis by ADF6G in this area is required in the future.
Price Series Data b S ecies and Area
�! Ex-vessel Prices. Price series data at the ex-vessel level are pre-sentl.y available from two sources for Alaska. One is the spot price seriesfor Kodiak which appears in the NMFS Fisher Narket News Re ort. This re-port is a good price data source for some species in Kodiak but this is theonly area for which price data are available. For purposes of statisticalanalysis, it is necessary to be able to match price series data with landingsover the equivalent period. For the Kodiak and Westward areas, monthlycatches by area are published by the monthly shellfish report by ADF&G inKodiak. These data are necessary for the other areas of the state. It ispossible to calculate annual average ex-vessel price from the table, "Valueto Fishermen by Region," which appears in the ADF6G Statistical Leaflet; how-ever, an annual price series is not sufficient for purposes of analysis. Thereis a space on the ADF&G fish ticket for the price paid to the fishermen, whichcould be filled in and compiled to provide ex-vessel price data, but it iseither left blank or not used if it is filled in. Reportedly, the reasonthat this section of the fish ticket is left blank is that ADF&G feels that
processing companies are sensitive to releasing price data, and that it isbetter not to force the issue and possibly jeopardize the quality of otherdata which are filled in on the tickets.
In discussions with managers of processing companies in Alaska,reservations were expressed about releasing the current prices they were payingfor fish or shellfish. If these prices are not released for a couple of weekshowever, they are deemed to be old business and are no longer held as con-fidential. It is felt that some method could be found to collect price databy area from the fish ticket which would not compromise the processing companies'wishes for maintaining confidentiality of current prices paid to fishermen.
One other problem is that recorded ex-vessel prices do not reflect anyconsideration of bonus payments paid to fishermen. These payments may bein many forms such as year-end cash bonuses, interest-free loans, gifts ofseafood products, or others, but all are a component of the price paid forraw product. These data are necessary for agencies such as the CommercialFisheries Entry Commission, in order to determine accurate earnings estimatesfor Alaskan fishermen. Information of bonus payments is held very con-fidentially, though, and no method to include them in determination of ex-vessel price has been reached.
�! Wholesale Prices. Wholesale value for Alaskan processed seafood isavailable on an annual basis, by area, from the ADF6G Statistical Leaflet.This data, however, is not an accurate indication of wholesale value due toincompleteness or errors. Some spot wholesale prices are avail. able from NMFS"pink sheets" and weekly summary sheets, and an annual summary is availablefrom Fisheries Statistics of the United States for selected areas. Nultiplyingthese prices by the Alaska seafood production amounts, however, results ina very marginal estimation of the value of the production of Alaskan seafood.
198
To obtain an accurate indication of the contribution of Alaskan fisheries tothe state, more complete and detailed wholesale prices or wholesale valuedata are required.
Em lo ent Statistics b Area
ADF&G does collect employment statistics on the processors' annual reports.The report only provides peak annual employment for each plant and is left blankin many cases. More thorough employment statistics are collected by the Depart-ment of Labor for the processing sector, and unless there are fewer than threeprocessing companies in an area, they can provide these data. It would be use-ful to have employment data by specific fishery, but these data are not available.
To identify and try to arrive at recommendations to correct some of thedeficiencies in Alaska fisheries data, two meetings of fisheries data userswere held in 1977. The first of these was an ad hoc Fisheries InformationExchange, held in conjunction with the Alaska Science Conference. The purposeof this meeting was to review fisheries management data needs and to initiatesome type of action toward meeting these needs. The participants of thismeeting included representatives from:
Alaska Commercial Fisheries Entry CommissionAlaska Department of Fish and GameWashington Department of FisheriesNational Marine Fisheries Service
Alaska Department of Commerce,Division of Economic Enterprise
Alaska Sea Grant Program, University of AlaskaInstitute of Social and Economic Research,
University of AlaskaNORFISH, University of WashingtonAssociation of Pacific Fisheries
At this meeting, the concept of a "clearinghouse" for fisheries data wasdiscussed as a possible solution to prevent duplication of effort in datacollection by different groups working in the same research areas. Functionsof the clearinghouse would include a referral service to deal with requestsfor socio-economic fisheries data, a library and publication depository forpublications and data, and serve as "bulletin board" for those involved infisheries research by publishing a newsletter describing all current fisheriesresearch projects in Alaska.
As a result of this first meeting, a second meeting was held for furtherdiscussion of the clearinghouse concept and of specific problems with fisheriesdata and to formulate suggested plans to eliminate these problems. These sugges-tions were presented to the advisor to the Governor in charge of a committee tomake recommendations for structural changes within ADF&G, who had called themeeting. At the conclusion of this meeting, it was resolved that the advisorwould pursue correction of the specific data problems mentioned, and the ArcticEnvironmental Information and Data Center would explore the possibility of actingas "clearinghouse" for Alaska Fisheries Data. Neither one of these proposed
199

actions has yielded any apparent results and the issue seems to be dormant again.The fisheries data problems still exist, so the same sort of exercise will un-doubtedly be run through again in the near future. It is hoped that therequirements for fisheries data by groups such as the NPFNC will exert enoughpressure to make changes happen.
200

APPENDIX II
STRUCTURE OF UNITED STATES SEAFOOD PROCESSING INDUSTRY
PART I: Conceptual Framework of In-dustrial Organization
PART II: Literature Review
PART III: Glossary
201

PART I
Conce tual Framework of Industrial Or anization
Private business firms play a major role in determining the natureand direction of economic activity. These relatively autonomous entities,in aggregate, provide most goods and services, employment, and other elementsof interest to society. Since the performance of the economy depends inlarge part upon the independent actions of business firms, it is in theinterest of society to be certain that firms behave in a manner consistentwith the enhancement of social welfare' Analysis of the performance ofbusiness firms, operating under different sets of constraints is one usefulmethod of studying business performance and social welfare. The followingis a brief overview of contempora"y methods for analyzing industrialorganization.
Business firms perform as buyers in the markets for basic factors ofproduction, as coordinators of productive facilities, and as buyers andsellers in the markets for goods and services they produce or use. In thelatter activity, product designs, prices, outputs, and the like, are deter-mined in response to changing conditions in commodity markets; the per-formance of firms as buyers and/or sellers in these markets is generallythe focus of most studies of market performance of business firms.
Organization or structure of industries, and market conduct of firmswithin industries, exert strong influences on the performance of the economy.Organizational elements include buyer and seller concentration, barriersto entry and vertical integration, while price and non-price competitionand advertising, comprise market conduct see Table 2-1!. Since associationsbetween structure, conduct, and performance are usually not apparent, it isnecessary to assess the relative influence of structure and conduct onperformance in actual markets for goods and services. Identification,description, and classification of structural and conduct elements of groupsof firms participating in such markets an industry! is one method of deter-mining the relationships of structure, conduct, and performance.
A market is a relevant entity to analyze for structural aspects,since it is a focal point for buyers and sellers of similar products. Eluci-dating relationships between sellers and buyers, and between establishedsellers and potential entrants is facilitated because the number of partici-pants is limited and can be clearly defined.
Ideally, the researcher would like to be able to assess market structure,conduct, and performance by examining a group of firms which interact in acommon geographic and product market. Frequently, however, available datadoes not allow the researcher this luxury; most often the researcher mustuse data available from the Bureau of Census and other sources. In suchcases, firms which participate in the relevant market must be identifiedand described using data that usually do not facilitate identification. Asan example of this problem, consider the following:
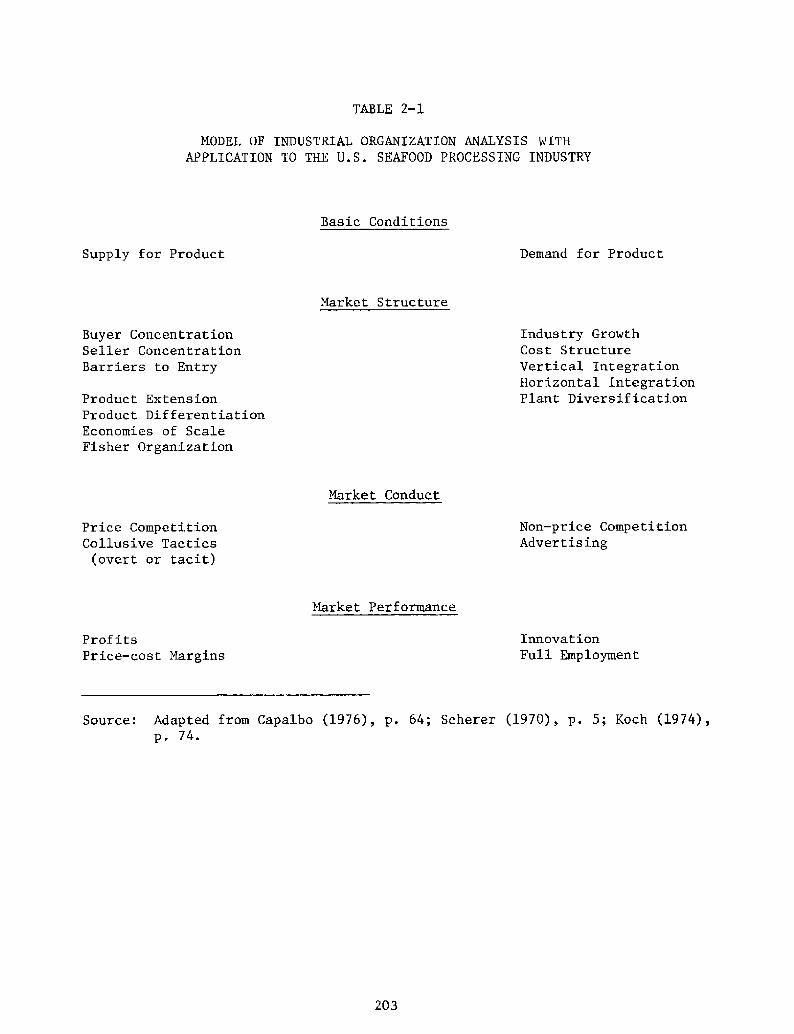
TABLE 2-1
MODEL OF INDUSTRIAL ORGANIZATION ANALYSIS WITH
APPLICATION TO THE U.S. SEAFOOD PROCESSING INDUSTRY
Basic Conditions
Supply for Product Demand for Product
Market Structure
Market Conduct
Non-price CompetitionAdvertising
Market Performance
Innovation
Full EmploymentProfits
Price-cost Margins
Source: Adapted from Capalbo �976!, p. 64; Scherer �970!, p. 5; Koch �974!,p. 74.
203
Buyer ConcentrationSeller Concentration
Barriers to Entry
Product E~tension
Product Differentiation
Economies of Scale
Fisher Organization
Price CompetitionCollusive Tactics
overt or tacit!
Industry GrowthCost Structure
Vertical IntegrationHorizontal IntegrationPlant Diversification
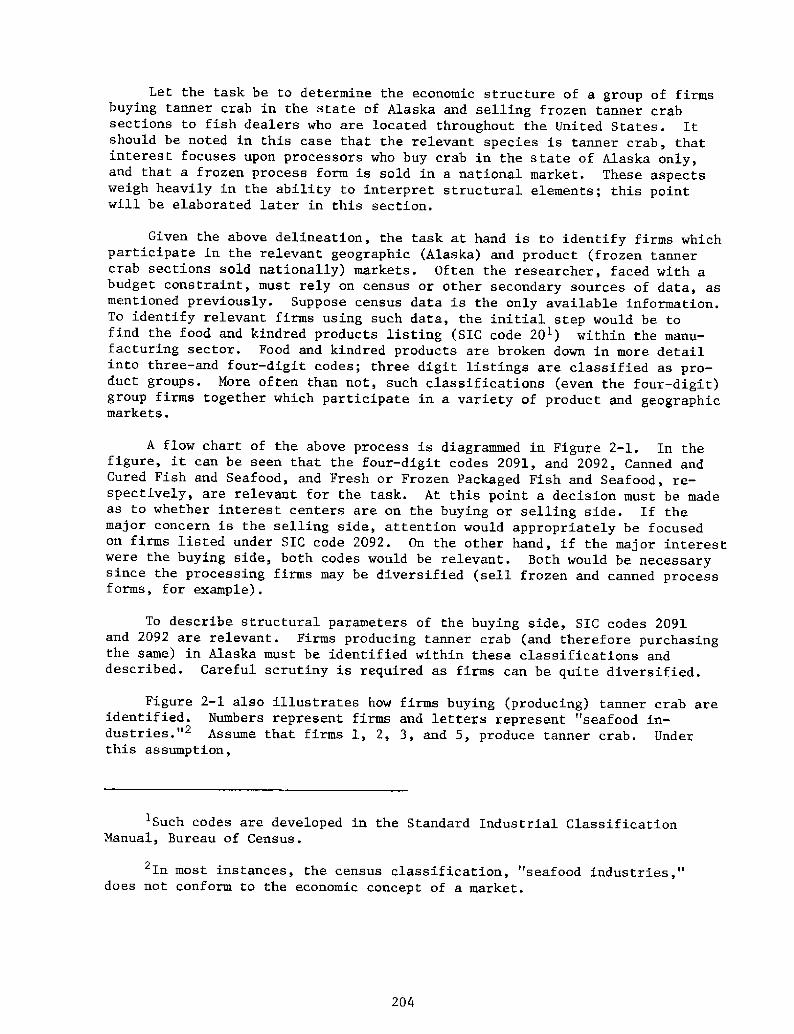
Let the task be to determine the economic structure of a group of firmsbuying tanner crab in the state of Alaska and selling frozen tanner crabsections to fish dealers who are located throughout the United States. Itshould be noted in this case that the relevant species is tanner crab, thatinterest focuses upon processors who buy crab in the state of Alaska only,and that a frozen process form is sold in a national market. These aspectsweigh heavily in the ability to interpret structural elements; this pointwill be elaborated later in this section.
Given the above delineation, the task at hand is to identify firms whichparticipate in the relevant geographic Alaska! and product frozen tannercrab sections sold nationally! markets. Often the researcher, faced with abudget constraint, must rely on census or other secondary sources of data, asmentioned previously. Suppose census data is the only available information.To identify relevant firms using such data, the initial step would be tofind the food and kindred products listing SIC code 20 ! within the manu-facturing sector. Food and kindred products are broken down in more detailinto three-and four-digit codes; three digit listings are classified as pro-duct groups. More often than not, such classifications even the four-digit!group firms together which participate in a variety of product and geographicmarkets.
A flow chart of the above process is diagrammed in Figure 2-1. In thefigure, it can be seen that. the four-digit codes 2091, and 2092, Canned andCured Fish and Seafood, and Fresh or Frozen Packaged Fish and Seafood, re-spectively, are relevant for the task. At this point a decision must be madeas to whether interest centers are on the buying or selling side. If themajor concern is the selling side, attention would appropriately be focusedon firms listed under SIC code 2092. On the other hand, if the major interestwere the buying side, both codes would be relevant. Both would be necessarysince the processing firms may be diversified sell frozen and canned processforms, for example!.
To describe structural parameters of the buying side, SIC codes 2091and 2092 are relevant. Firms producing tanner crab and therefore purchasingthe same! in Alaska must be identified within these classifications anddescribed. Careful scrutiny is required as firms can be quite diversified.
Figure 2-1 also illustrates how firms buying producing! tanner crab areidentified. Numbers represent firms and letters represent "seafood in-dustries." Assume that firms 1, 2, 3, and 5, produce tanner crab. Underthis assumption,
Such codes are developed in the Standard Industrial ClassificationManual, Bureau of Census.
~ln most instances, the census classification, "seafood industries,"does not conform to the economic concept of a market.
204
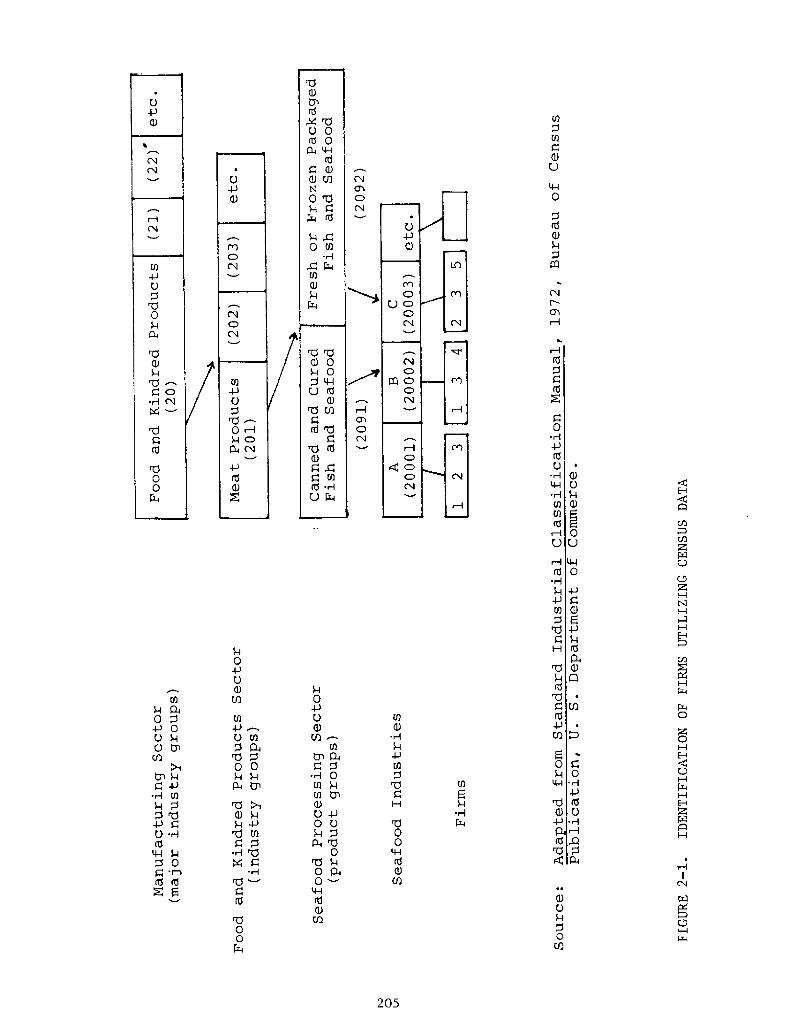
W 0
H M
0 0 8
Q M U M R a H0 tg0
C4
'0 0 0W 8
~ ' ~
8 0 0CfJ
'6 0 0
C40
006
tn 4
9 "d
0�W
0g .nc5
0 MC4
'cl0 0
A '60
C 0
85 K
0 "0
'U '0<D 0
0Q W
5'U M
rd ~
n$8
M
U X
4 0 0 8M ~
K C4
0Ul
M 8 0 N0 0
W '00
'0 40 A
Q 8
205
0 0
W C3
it is apparent that most tanner crab processing firms are diversified be-long to more than one "seafood industry"!. If any one "seafood industry" wereused as the sole source of firms producing tanner crab, over or under-inclusion of firms may result. Thorough investigation of available data istherefore a prerequisite to proper structural analysis.
In sum, to characterize the competitive environment within which firmsexist, it is important to identify and describe a group of firms whichoperate in the geographic and product market of interest. This process isfundamental to the interpretation and validity of the empirical analysis.
PART II
A Literature Review
Introduction
The economic structure of the UPS. seafood processing sector is char-acterized in its literature primarily by the degree of seller concentration,verticle integration, and barriers to entry. Some studies provide informationon other structural elements such as diversification, trends in concentration,inequality in plant size, etc. The literature review which follows focusesprimarily on the work of Capalbo �976!. Thi,s study is augmented and supple-mented by other studies, primarily regional in nature and often directed to-ward a particular species. Primary emphasis is placed upon describing sellerconcentration, vertical integration, barriers to entry, and diversificationin the fresh, frozen, canned, and cured process form sectors. Other elementsof economic organization are included when available and where appropriate.Occasionally, description of elements is specific to a species of fish orshellfish within a process form sector.
Economic Structure of Process Form Sectors
Overview
In 1976, there were 1,668 seafood processing plants in the United States;average seasonal and yearly employment were 77,951 and 60,397 persons, re-spectively Fisheries Statistics of the United States, 1977!. The number andaverage size of seafood processing firms~ was quite small when compared withnon-seafood food! processing firms. Even large seafood processing firms annual sales greater than $10 million! were quite small when compared withlarge non-seafood food! processing firms. Fewer than 44 seafood processingfirms had annual sales in excess of $10 million U.S. Fishing Industry 1976!.
3Some publications used the firm as the unit for analysis while othersused the plant; occasionally both are used in the same publication. Sincemost of the review is derived from Capalbo �976!, the plant is the pre-dominant analytical unit. In spite of the plant's prevalence herein, thefirm is used occasionally. The reader should be aware of such usages asthe two are not interchangeable.
206
Fresh Process Form Sector
1. Ph sical Attributes. Capalbo �976! reported that approximatelyhalf of the largest 20 plants producing the fresh process form are locatedin the New England region. ~ The other half of the 20 largest plants arefairly evenly distributed among the Middle Atlantic, South Atlantic, Gulf,and Pacific regions. Although half of the 20 largest plants are located inNew England, the Chesapeake region specializes in the production of the freshprocess form; this process form is the volume and value leader for the region.
Available data constrain ownership patterns of firms to be reported to-gether with the frozen sector. Capalbo �976! found that single unit oneplant! firms were more common than multi-unit firms in the combined sectors.Multi-unit firms, however, tended to dominate value of production. Corpor-ations were the major type of ownership in both single and multi-unit firmsin 1972.
Plants are typically small, family-run operations employing 15 to 20people per production line, a total of 30 to 40 workers, with an average oftwo production lines per plant.. Space devoted to both processing and storagefacilities averages 10,000 square feet Marcus 1974!.
2. Structural Elements.
a! Seller concentration � Capalbo �976! found that concentration inthe fresh process form sector increased from 1965 to 1974, but at no timeduring this period was the sector considered concentrated Table 2-3!.Capalbo �976! conducted a similar analysis for the New England and MiddleAtlantic regions and reached conclusions identical to the above see alsoTable 2-2!.
A study by Kolhonen �976! of concentration among firms producing freshand frozen fillets~ indicated that there were low levels of concentration inthis product market. Ratios were 27 percent and 39 percent at the four- andeight-firm levels, respectively.
b! Vertical integration � Backward integration into harvesting activitiesexists to some extent as some corporate processing firms own vessels or con-trol their activity through various arrangements. Documentation of thesepractices is, however, generally not available for this sector.
Capalbo �976! Found forward integration to be prevalent at both thenational and regional levels. On a national basis in 1974, 30 percent of thelargest 20 plants were integrated while from 60 to 100 percent of the 20
"States included in regions are listed in Table 2 � 2.
5An industry is considered concentrated if at the four-plant level, theconcentration level is greater than 30 percent, or if at the eight-plantlevel it is greater than 70 percent.
Fresh and frozen fillets include cod, cusk, flounders, haddock, hake,ocean perch, and pollock.
207
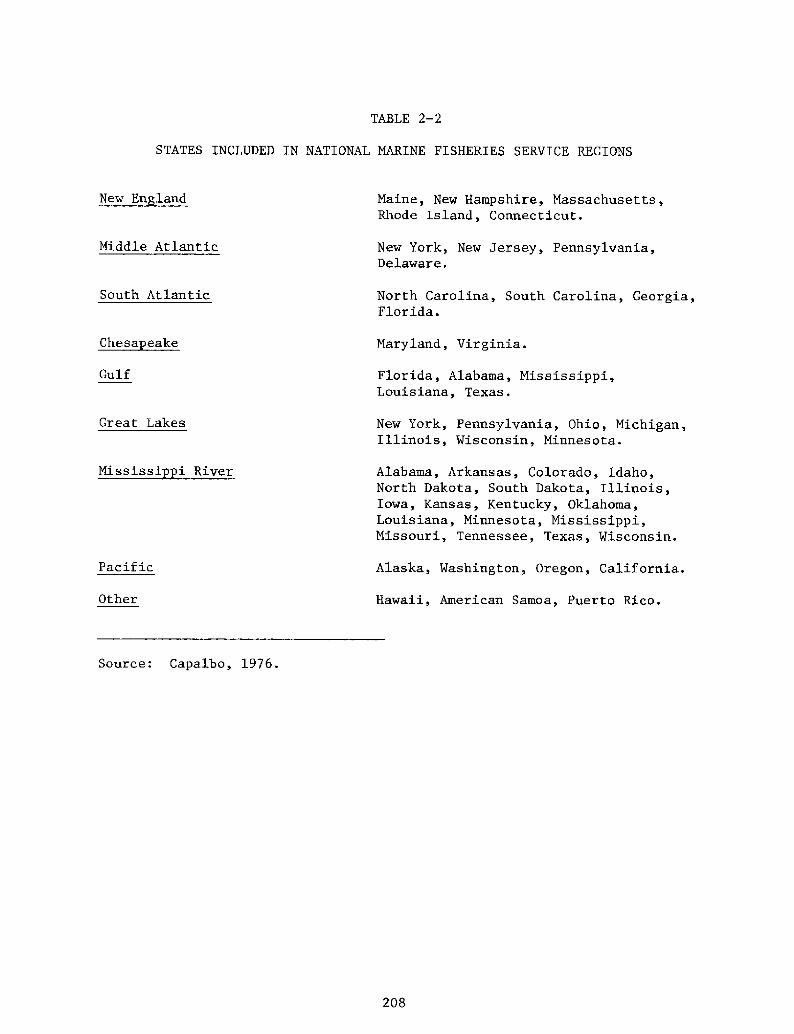
Maine, New Hampshire, Massachusetts,Rhode Island, Connecticut.
Middle Atlantic New York, New Jersey, Pennsylvania,Delaware.
South Atlantic North Carolina, South Carolina, Georgia,Florida.
Maryland, Virginia.
Florida, Alabama, Mississippi,Louisiana, Texas.
Gulf
New York, Pennsylvania, Ohio, Michigan,Illinois, Wisconsin, Minnesota.
Great Lakes
Mississi i River Alabama, Arkansas, Colorado, Idaho,North Dakota, South Dakota, Illinois,Iowa, Kansas, Kentucky, Oklahoma,Louisiana, Minnesota, Mississippi,Missouri, Tennessee, Texas, Wisconsin.
Alaska, Washington, Oregon, California.
Hawaii, American Samoa, Puerto Rico.
Pacific
Other
Source: Capalbo, 1976.
208
TABLE 2-2
STATES INCLUDED IN NATIONAL MARINE FISHERIES SERVICE REGIONS
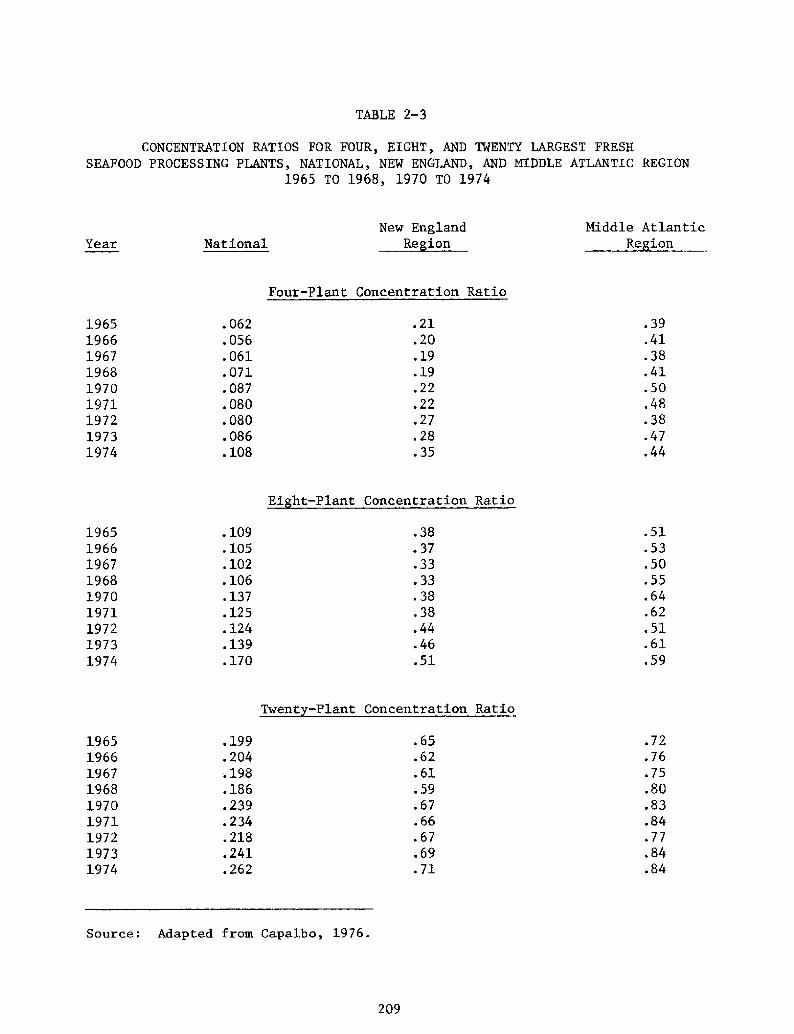
TABLE 2-3
CONCENTRATION RATIOS FOR FOUR, EIGHT, AND TWENTY LARGEST FRESHSEAFOOD PROCESSING PLANTS, NATIONAL, NEW ENGLAND, AND MIDDLE ATLANTIC REGION
1965 TO 1968, 1970 TO 1974
Middle Atlantic
Re ion
New EnglandRNationalYear
Four-Plant Concentration Ratio
Ei ht-Plant Concentration Ratio
Twent -Plant Concentration Ratio
Capalbo, 1976.fromSource: Adapted
209
1965
1966
1967
1968
1970
1971
1972
1973
1974
1965
1966
1967
1968
1970
1971
1972
1973
1974
1965
1966
1967
1968
1970
1971
1972
1973
1974
. 062
. 056
. 061
. 071
. 087
. 080
. 080
.086
.108
. 109
. 105
. 102
. 106
. 137
. 125
.124
.139
.170
. 199
.204
.198
.186
.239
.234
.218
.241
.262
.21
.20
.19
.19
.22
.22
.27
.28
.35
.38
.37
.33
.33
.38
.38
.44
.46
.51
.65
.62
.61
.59
.67
.66
.67
.69
.71
.39
.41
.38
.41
.50
.48
.38
.47
.44
.51
.53
.50
.55
.64
.62
.51
.61
.59
.72
.76
.75
.80
.83
.84
.77
.84
.84
largest plants exhibited such integration in the South Atlantic, NorthCentral, and Pacific regions. Integration at the 20 plant level in otherregions was similar or somewhat less than the national level of 30 percent.
c! Barriers to entry � Concentration levels may be determined, inpart, by barriers to entry. Generally when barriers are low, a sectorexhibits rather low concentration indices and it is said to be "competitive."In the fresh process form sector, this appears to be the case; concentrationlevels are the lowest of all sectors and barriers appear low to moderate.
From 1965 to 1974, the total number of fresh seafood processing plantsin the U.S. decreased slightly Capalbo 1976!. The largest decreases were inthe Middle Atlantic region. Capalbo also found that most entry and exitoccurred in smaller firms where the annual value of production was from$1,000 to $199,000. It appears as though larger plants or firms in the sectorwere "better established" than smaller plants or firms and were better ableto cope with changing conditions. Although reasons for the persistence oflarger firms were not explicitly forwarded in the studies, it appears thatbarriers in this sector include, to some extent, cost advantages associatedwith larger plant size and geographic location advantages.
d! Other structural elements � Capalbo �976! found that seven plants inthe top 20, nationally, produced process forms other than fresh. Comparisonwith other process form sectors revealed that on a national basis the top20 plants in the fresh sector were more diversified than the top 20 plantsin other process form sectors.
On a regional basis, Capalbo found plants in the top 20 to be morediversified in the New England region than in the Middle Atlantic' Generally,more than half of the New England region plants were diversified during 1965to 1974.
Inequality in plant size in the New England and Middle Atlantic regionswas low to moderate. Most plants had annual sales in the $1,000 to $199,999range, a few had sales in the $200,000 to $499,999 range, and very few hadsales greater than $500,000.
Frozen Process Form Sector
1. Ph sical Attributes. Capalbo �976! found that in 1974 the 20largest frozen processing plants were fairly evenly distributed among theregions. All regions except for the Chesapeake and Pacific specialized interms of volume and value! in the production of the frozen process form.
The average plant in this sector employs 30 workers per production lineand typically contains up to eight such production lines per plant Marcus1974!. Frozen fish processing plants are more capital intensive, more auto-mated, and employ fewer workers per pound of fish product than fresh fishplants Capalbo 1976!.
210
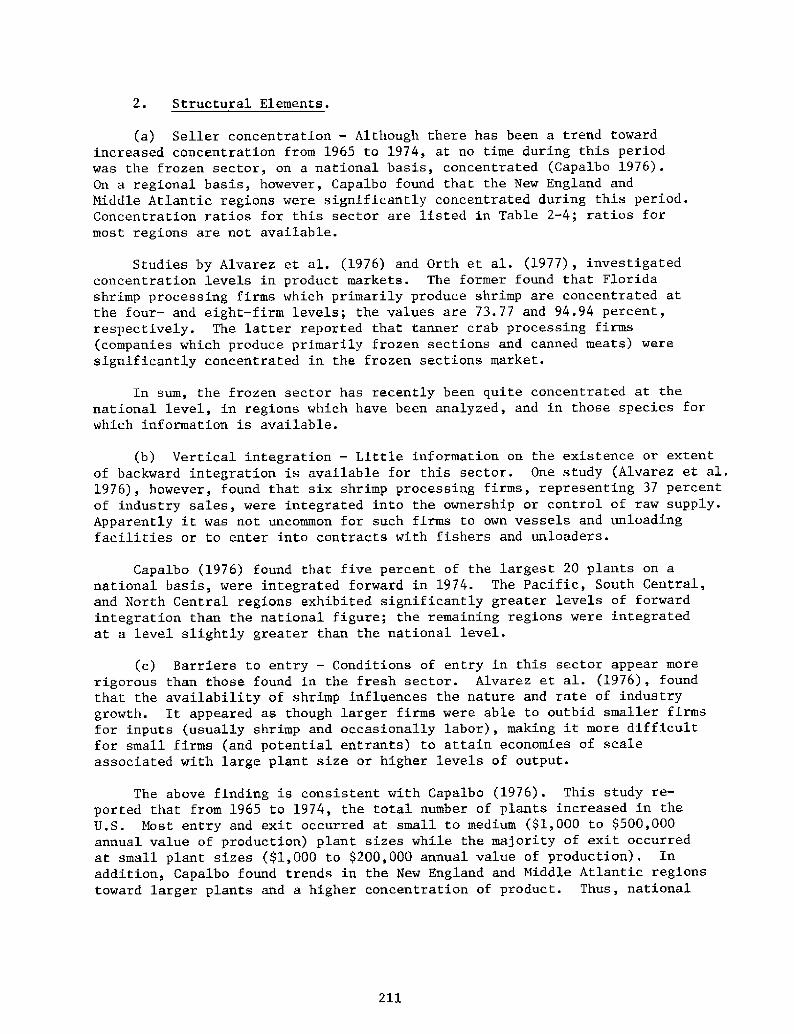
2. Structural Elements.
a! Seller concentration � Although there has been a trend towardincreased concentration from 1965 to 1974, at no time during this periodwas the frozen sector, on a national basis, concentrated Capalbo 1976!.On a regional basis, however, Capalbo found that the New England andMiddle Atlantic regions were significantly concentrated during this period.Concentration ratios for this sector are listed in Table 2-4; ratios formost regions are not available.
Studies by Alvarez et al. �976! and Orth et al. �977!, investigatedconcentration levels in product markets. The former found that Floridashrimp processing firms vhich primarily produce shrimp are concentrated atthe four- and eight-firm levels; the values are 73.77 and 94.94 percent,respectively. The latter reported that tanner crab processing firms companies which produce primarily frozen sections and canned meats! weresignificantly concentrated in the frozen sections market.
In sum, the frozen sector has recently been quite concentrated at thenational level, in regions vhich have been analyzed, and in those species forwhich information is available.
b! Vertical integration � Little information on the existence or extentof backward integration is available for this sector. One study Alvarez et al.1976!, however, found that six shrimp processing firms, representing 37 percentof industry sales, were integrated into the ownership or control of raw supply.Apparently it was not uncommon for such firms to own vessels and unloadingfacilities or to enter into contracts with fishers and unloaders.
Capalbo �976! found that five percent of the largest 20 plants on anational basis, were integrated forward in 1974. The Pacific, South Central,and North Central regions exhibited significantly greater levels of forwardintegration than the national figure; the remaining regions were integratedat a level slightly greater than the national level.
c! Barriers to entry � Conditions of entry in this sector appear morerigorous than those found in the fresh sector. Alvarez et al. �976!, foundthat the availability of shrimp influences the nature and rate of industrygrowth. It appeared as though larger firms were able to outbid smaller firmsfor inputs usually shrimp and occasionally labor!, making it. more difficultfor small firms and potential entrants! to attain economies of scaleassociated with large plant size or higher levels of output.
The above finding is consistent with Capalbo �976!. This study re-ported that from 1965 to 1974, the total number of plants increased in theU.S. Most entry and exit occurred at small to medium $1,000 to $500,000annual value of production! plant sizes while the majority of exit occurredat small plant sizes $1,000 to $200,000 annual value of production!. Inaddition, Capalbo found trends in the New England and Middle Atlantic regionstoward larger plants and a higher concentration of product. Thus, national
211
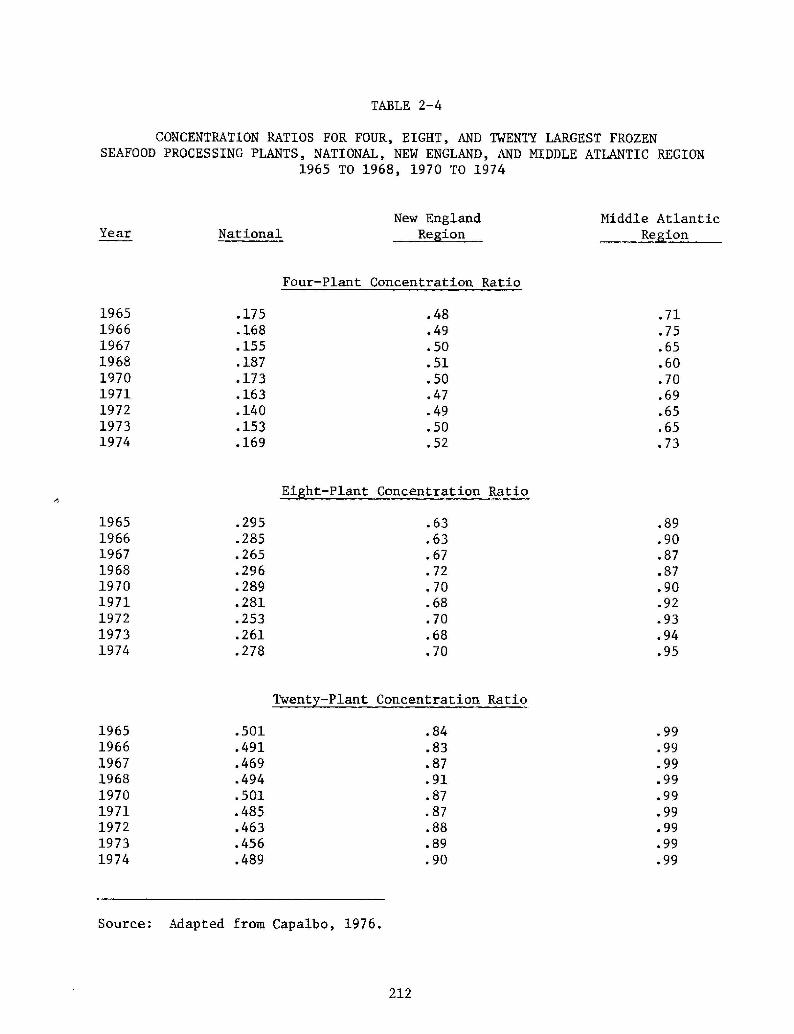
TABLE 2 � 4
CONCENTRATION RATIOS FOR FOUR, EIGHT, AND TWENTY LARGEST FROZENSEAFOOD PROCESSING PLANTS, NATIONAL, NEW ENGLAND, AND MIDDLE ATLANTIC REGION
1965 TO 1968, 1970 TO 1974
Middle Atlantic
Re ion
New EnglandNationalYear
Four-Plant. Concentration Ratio
Ei ht-Plant Concentration Ratio
Twent -Plant Concentration Ratio
Capalbo, 1976.fromSource: Adapted
212
1965
1966
1967
1968
1970
1971
1972
1973
1974
1965
1966
1967
1968
1970
1971
1972
1973
1974
1965
1966
1967
1968
1970
1971
1972
1973
1974
. 175
. 168
. 155
. 187
. 173
. 163
. 140
. 153
. 169
. 295
.285
.265
.296
.289
.281
.253
.261
.278
. 501
.491
.469
.494
.501
.485
.463
.456
.489
.48
.49
.50
.51
.50
.47
.49
.50
.52
.63
.63
.67
.72
.70
.68
.70
.68
.70
.84
.83
.87
.91
.87
.87
.88
.89
.90
.71
.75
.65
.60
.70
.69
.65
.65
.73
.89
.90
.87
.87
.90
.92
.93
.94
.95
.99
.99
.99
~ 99
.99
.99
.99
.99
.99
and regional trends seem to indicate that there may be economies of scaleassociated with larger plant size.
Excess productive capacity, in addition to the above, could explain theexit of smaller firms Alvarez et al. 1976!. Excess productive capacitycould also have a negative influence on the viability of potential entrants.
In sum, the differential ability to procure raw supply, economies ofscale associated with larger plant size, and excess productive capacityappear to pose obstacles to entry in this sector.
d! Other structural elements � Diversification in this sector was notcommon among the 20 largest plants on a national basis in 1974 Capalbo 1976!.Only two of the top plants extended production to other process forms in 1974.On a regional basis a greater number of plants in the top 20 were diversified;six plants in the New England region and eight plants in the Middle Atlanticregion of the top 20 in each region! extended production to other process forms.
Canned Process Form Sector
1. Ph sical Attributes. The Pacific region contains most of the 20largest plants in the U.S. and specializes in the production of the cannedprocess form by volume and weight!. Most canning plants, in number, aresingle unit firms; 82.5 percent of the value of production in 1972 was, how-ever, produced by multi-unit firms Capalbo 1976!. Corporations were thedominant ownership type for both single and multi-unit firms.
2. Structural Elements.
a! Seller concentration � At the national level and in the Pacificregion the canned process form sector is highly concentrated and has becomemore concentrated during the period 1965 through 1974 see Table 2-5!. Jensen�975! stated that substantial concentration in the Pacific salmon processingindustry resulted primarily from consolidation and merger of established firms.Jensen also found that the top ten firms in this region have maintained theirrelative posi.tion over the last ten to 15 years.
The canned shrimp and canned tuna markets also appear to be quite con-centrated. Kolhonen �976! reported that the four- and eight-firm concentrationratios for shrimp were 47.9 and 66.7, respectively, while those for tuna were80.5 and 97.7 percent, respectively.
Finally, Orth et al. �977!, found that Alaskan firms producing cannedtanner crab meat were highly concentrated at the four-firm level in 1976 there were only five firms!.
b! Vertical integration � Little documentation concerning the levelof backward integration exists at the present time. A study by Jensen �975!suggests that many of the large firms in the Washington State salmon pro-cessing industry exert control over raw supply through the extension ofcredit to fisheries. Other means include free boat moorage, repair facilities,etc. Further study of backward integration in the canned process form sectoris necessary to better characterize the extent of such in this sector.
213
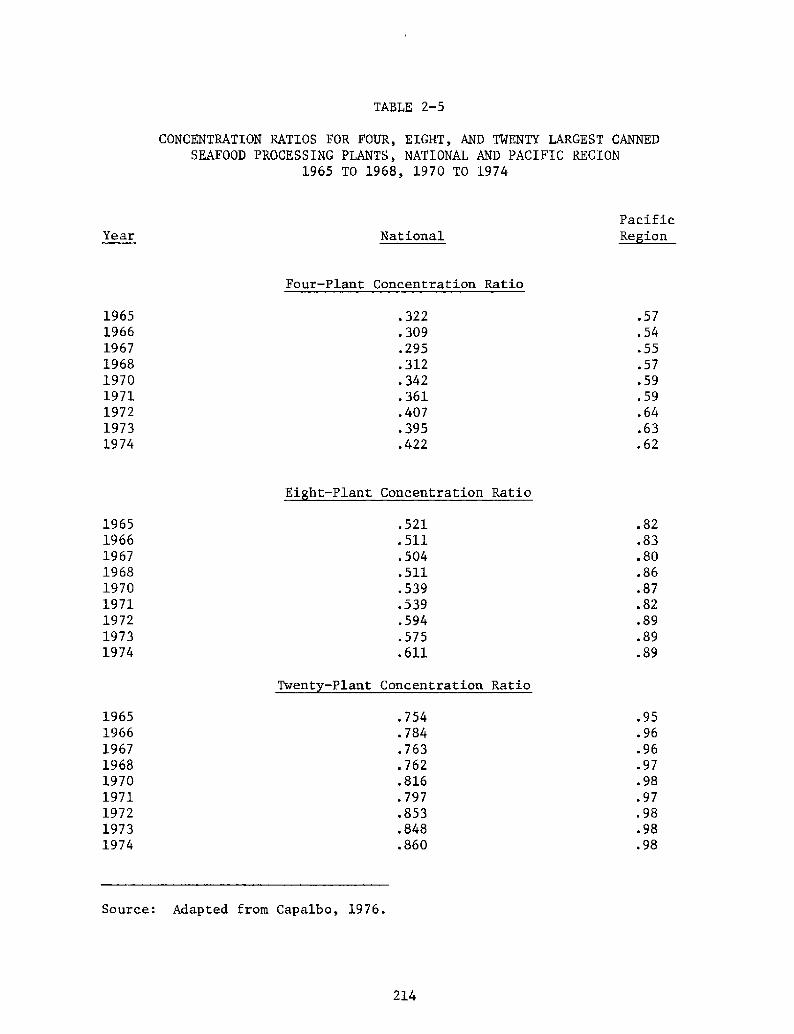
TABLE 2-5
CONCENTRATION RATIOS FOR FOUR, EIGHT, AND TWENTY LARGEST CANNEDSEAFOOD PROCESSING PLANTS, NATIONAL AND PACIFIC REGION
1965 TO 1968, 1970 TO 1974
Pacific
NationalYear
Four-Plant Concentration Ratio
Ei ht-Plant Concentration Ratio
Twent -Plant Concentration Ratio
Source: Adapted from Capalbo, 1976.
214
1965
1966
1967
1968
1970
1971
1972
1973
1974
1965
1966
1967
1968
1970
1971
1972
1973
1974
1965
1966
1967
1968
1970
1971
1972
1973
1974
~ 322
. 309
.295
.312
. 342
. 361
. 407
. 395
.422
.521
.511
~ 504
.511
.539
.539
.594
.575
.611
.754
.784
.763
.762
.816
. 797
.853
.848
.860
.57
~ 54
.55
.57
.59
~ 59
.64
.63
.62
.82
.83
.80
.86
.87
.82
.89
.89
.89
.95
.96
.96
.97
.98
.97
~ 98
.98
.98

Capalbo �976! found that none of the 20 largest plants were integratedforward on a national basis in 1974. On a regional basis, however, theSouth Atlantic, North Central, and Pacific regions exhibited significantlevels of integration.
c! Barriers to entry � Barriers in this sector appear to be excesscapacity, differential ability to procure raw supply, geographic locationand the differential price temporarily! of venture capital. Kolhonen �976!found that plant capacities in the canned shrimp and tuna industries weregeared to take peak landings. Because the availability of raw supplyfluctuated, there was usually excess capacity in these industries. Jensen�975! cited similar reasons for excess capacity in the salmon processingindustry. Faced with high fixed costs and large capacities, established firmsprobably had incentives to outbid smaller firms and potential entrants! forfactor inputs.
Jensen �975! found that entrants into the salmon processing industryusually must secure raw supply through primarily non-price means. Examplesof non-price competition included locating processing facilities in more con-venient locations and enticing fishers with free boat moorage, repair facilities,and generous credit. Since smaller firms or potential entrants were not asstrong financially as larger firms, they were at a relative disadvantage inthis instance.
Jensen �975! also found that established firms began with and, in manycases, continue to enjoy generous lease and credit terms. Potential entrants,faced with less generous terms, would incur increased average costs per unitover the entire production range.
In sum, barriers to entry appear to be rather formidable in some cannedspecies sectors, notably salmon, and perhaps shrimp and tuna. Barriers inthe canned sector are most likely higher than in the other sectors.
d! Other structural elements � Diversification in the canned sector isquite limited as only three of the top 20 plants, nationally and in thePacific region, extended production to other process forms Capalbo 1976!.
Cured Process Form Sector
1. Ph sical Attributes. Most of the 20 largest plants in this sectorare located in the Middle Atlantic and Pacific regions Capalbo 1976!. TheMiddle Atlantic region specializes to the greatest extent in cured processform production; 17.7 percent of its total production was cured in 1974 Capalbo 1976!.
2. Structural Elements.
a! Seller concentration � Concentration ratios at the four- and eight-plant level, on a national basis, increased from 1965 to 1974 and were wellin excess of the critical values in 1974 Table 2-6!. Concentration levelson a regional basis are not available.
215
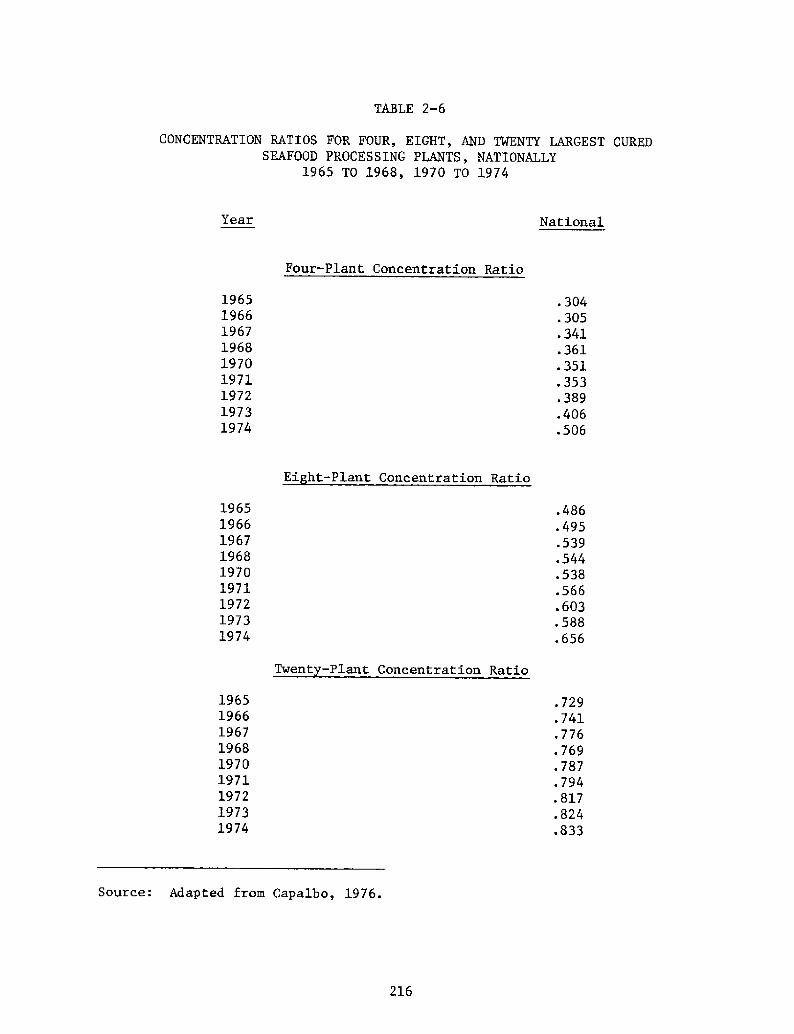
TABLE 2-6
CONCENTRATION RATIOS FOR FOUR, EIGHT, AND TWENTY LARGEST CUREDSEAFOOD PROCESSING PLANTS, NATIONALLY
1965 TO 1968, 1970 TO 1974
NationalYear
Four-Plant Concentration Ratio
Source: Adapted from Capalbo, 1976.
216
1965
1966
1967
1968
1970
1971
1972
1973
1974
1965
1966
1967
1968
1970
1971
1972
1973
1974
1965
1966
1967
1968
1970
1971
1972
1973
1974
Ei ht-Plant Concentration Ratio
Twent -Plant Concentration Ratio
. 304
- 305
. 341
. 361
. 351
. 353
.389
.406
.506
.486
.495
.539
.544
.538
.566
.603
.588
.656
.729
.741
.776
.769
.787
.794
.817
.824
.833
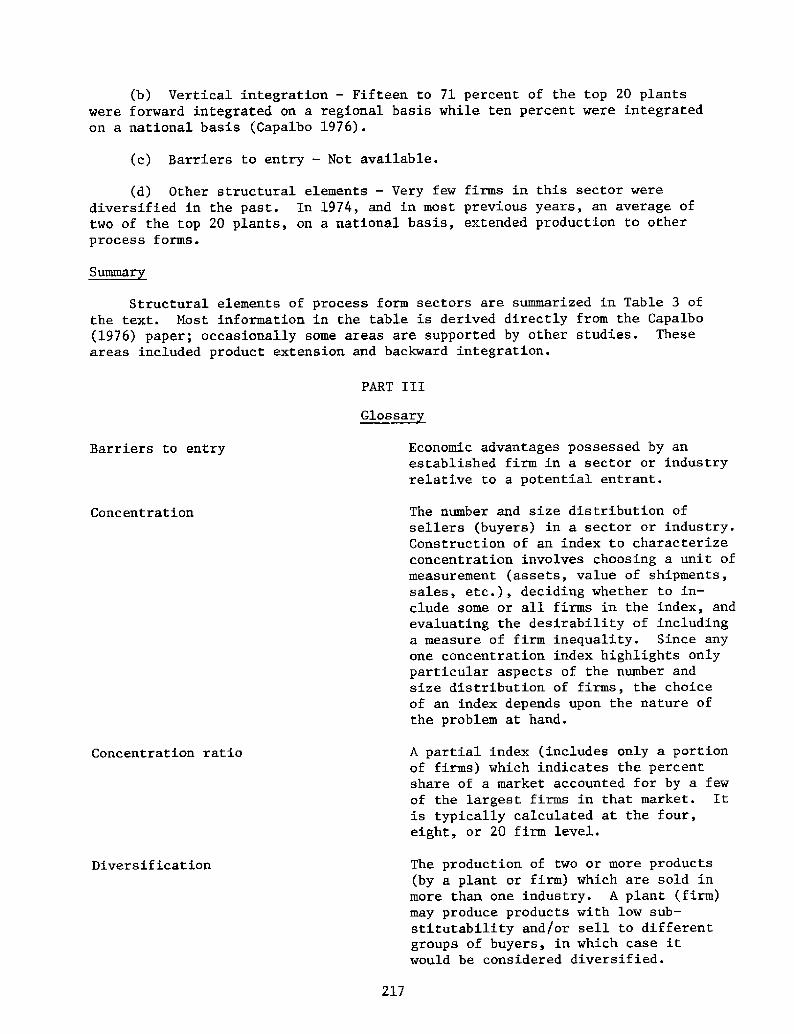
c! Barriers to entry � Not available.
d! Other structural elements � Very few firms in this sector werediversified in the past. In 1974, and in most previous years, an average oftwo of the top 20 plants, on a national basis, extended production to otherprocess forms.
Structural elements of process form sectors are summarized in Table 3 ofthe text. Most information in the table is derived directly from the Capalbo�976! paper; occasionally some areas are supported by other studies. Theseareas included product extension and backward integration.
PART III
Economic advantages possessed by anestablished firm in a sector or industryrelative to a potential entrant.
Barriers to entry
The number and size distribution of
sellers buyers! in a sector or industry.Construction of an index to characterize
concentration involves choosing a unit ofmeasurement assets, value of shipments,sales, etc.!, deciding whether to in-clude some or all firms in the index, andevaluating the desirability of includinga measure of firm inequality. Since anyone concentration index highlights onlyparticular aspects of the number andsize distribution of firms, the choiceof an index depends upon the nature ofthe problem at hand.
Concentration
A partial index includes only a portionof firms! which indicates the percentshare of a market accounted for by a fewof the largest firms in that market. Itis typically calculated at the four,eight, or 20 firm level.
Concentration ratio
The production of two or more products by a plant or firm! which are sold inmore than one industry. A plant firm!may produce products with low sub-stitutability and/or sell to differentgroups of buyers, in which case itwould be considered diversified.
Diversification
217
b! Vertical integration � Fifteen to 71 percent of the top 20 plantswere forward integrated on a regional basis while ten percent were integratedon a national basis Capalbo 1976!.
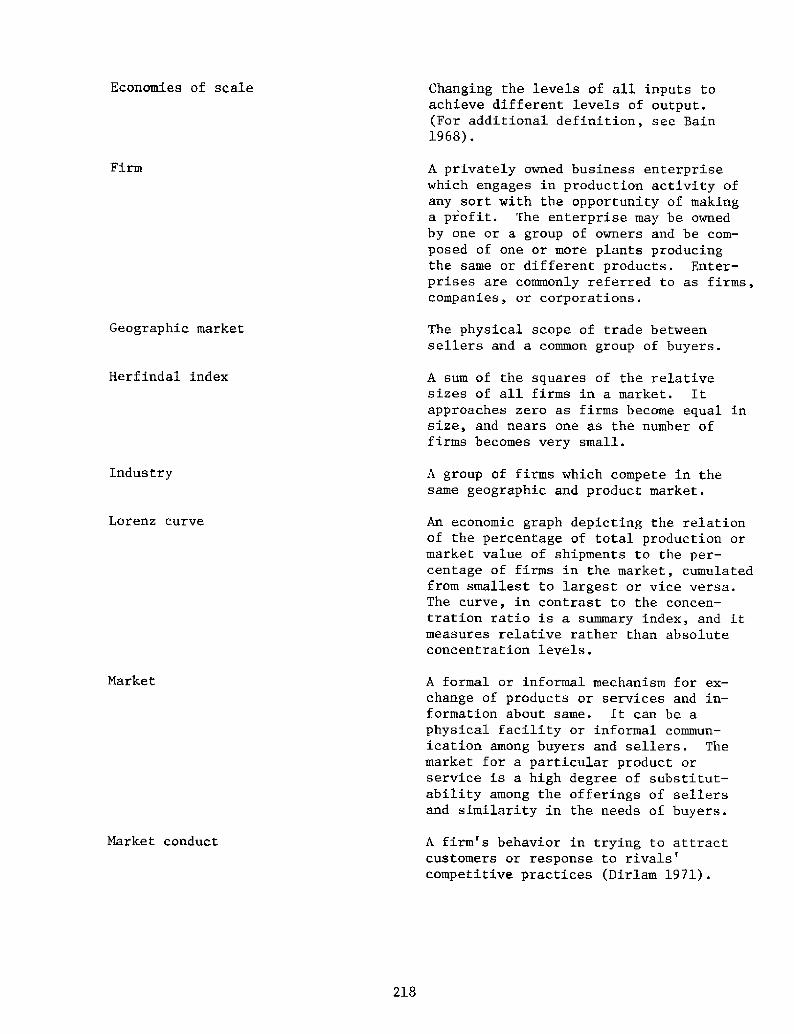
Changing the levels of all inputs toachieve different levels of output. Por additional definition, see Bain1968!.
Economies of scale
A privately owned business enterprisewhich engages in production activity ofany sort with the opportunity of makinga profit. The enterprise may be ownedby one or a group of owners and be com-posed of one or more plants producingthe same or different products. Enter-prises are commonly referred to as firms,companies, or corporations.
Geographic market The physical scope of trade betweensellers and a common group of buyers.
Herfindal index A sum of the squares of the relativesizes of all firms in a market. It
approaches zero as firms become equal insize, and nears one as the number offirms becomes very small.
Industry A group of firms which compete in thesame geographic and product markets
Lorenz curve
Market A formal or informal mechanism for ex-
change of products or services and in-formation about same. It can be a
physical facility or informal commun-ication among buyers and sellers. Themarket for a particular product orservice is a high degree of substitut-ability among the offerings of selLersand similarity in the needs of buyers.
A firm's behavior in trying to attractcustomers or response to rivals'competitive practices Dirlam 1971!.
Market conduct
218
An economic graph depicting the relationof the percentage of total production ormarket value of shipments to the per-centage of firms in the market, cumulatedfrom smallest to largest or vice versa.The curve, in contrast to the concen-tration ratio is a summary index, and itmeasures relative rather than absolute
concentration levels.
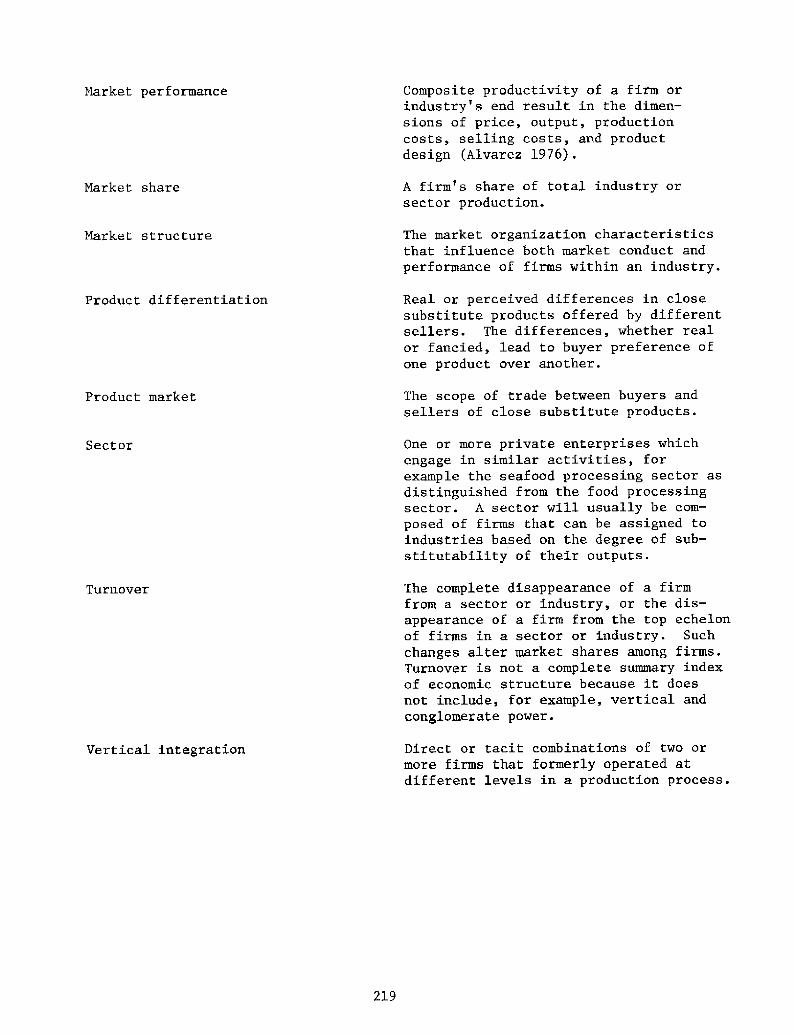
Market performance
Market share
Market structure
Product market
Sector
Turnover
Verti cal integration
219
Product differentiation
Composite productivity of a firm orindustry's end result in the dimen-sions of price, output, productioncosts, selling costs, and productdesign Alvarez 1976!.
A firm's share of total industry orsector production.
The market organization characteristicsthat influence both market conduct and
performance of firms within an industry.
Real or perceived differences in closesubstitute products offered by differentsellers. The differences, whether realor fancied, lead to buyer preference ofone product over another.
The scope of trade between buyers andsellers of close substitute products'
One or more private enterprises whichengage in similar activities, forexample the seafood processing sector asdistinguished from the food processingsector. A sector will usually be com-posed of firms that can be assigned toindustries based on the degree of sub-stitutability of their outputs.
The complete disappearance of a firmfrom a sector or industry, or the dis-appearance of a firm from the top echelonof firms in a sector or industry. Suchchanges alter market shares among firms.Turnover is not a complete summary indexof economic structure because it does
not include, for example, vertical andconglomerate power.
Direct or tacit combinations of two or
more firms that formerly operated atdifferent levels in a production process.


APPENDIX III
INDUSTRY SURVEY: SURVEY FORN AND RESPONSES
22l

PART I
222
University of AlaskaStatewide System of Higher Education
ALASKA SEA GRANT PROGRAM
Fairbanks, Alaska 99701April 14, 1978
Attention:
Gentlemen:
The Alaska Sea Grant Program is in the final year of a major study ofthe Alaska seafood processing industry. This research is intended toprovide baseline economic information to management agencies and toindividual companies who desire to compare their own company againstindustry norms. This study has been coordinated with industry associations,North Pacific Fisheries Management Counci'1, National Marine FisheriesService, Alaska Department of Fish and Game, and other Sea Grant institutionsin the Pacific Northwest.
The universal concern about such a study among industry executives hasbeen the maintenance of confidentiality. This concern is shared equallyby the Alaska Sea Grant Program which has established the followingsafeguards: I! a locked file system to which only authorized researchershave access; 2! the return of information, without copying, to itsoriginal source after recording needed information in an anonymous form;3! industry review and assistance in developing the enclosed survey and;4! industry review of a typed draft of the report before publication toinsure the maintenance of confidentiality.
Several of the questions in the enclosed survey form involve ownershippatterns of the industry. The responses to these sensitive questions,as well as the responses to all other questions, will be consolidated toavowed disclosure. Where consolidation is not possible, the informationwill not be reported in any manner. The questions are intended toprovide a description of industrywide patterns built up in the only waypossible from individual firm responses.
It is our hope that your company will take the enclosed survey seriouslyand that you will view each question as your company's input intoconsolidated industrywide statistics. Each decision not to respond to aparticular question will detract from the overall contribution made by the
223
Apri 1 14, 1978Page two
other respondents. If your company does decide that it cannot respondto particular questions, please complete the remainder of the questionsto which you have no objections.
The procedure we propose is as follows: 1! Please complete the en-closed, self-addressed postcard within ten days of receipt of thisletter, indicating whether your company will respond to the survey and,if you will, what time during the month of Hay would be the most conven-ient for me or my representative to visi t wi th the respondent s ! withinyour company. The purpose of the personal contact is to insure uniform-ity of interpretation of each question so that in fact the responses canbe meaningfully consol~dated. 2! When the survey forms are complete,they should be mailed to the Alaska Sea Grant Program in the returnenvelope provided. They should be returned no later than May 31, 1978.3! The information will be extracted from the survey form and placed ona data sheet where individual firm identi ty will be removed. 4! Thesurvey form will be returned within three weeks, without copying, byregistered mail. 5! The report, of which the consolidated surveyresponses will be a part,- will be reviewed by an industry committeebefore publication as a final safeguard against the disclosure of confi-dential information. The shellfish crab and shrimp! report should beavailable for review by August 1, and the finfish salmon, halibut,herring! report by October 1.
The report will, of course, recognize the contribution of the companiescooperating with this survey and/or other parts of the Alaska seafoodprocessing industry study.
If I may be of any assistance in reaching a decision with respect tothis survey, please call me at �06! 232-3991.
Thank you.
Sincerely,
Franklin L. OrthSenior Economist
FLO:mk
Enclosures
224
~wr~r~ cHarold E. Lokken, ChairmanJim H. Branson, Executive Director
Mailing Address: P.O. Box 3136DTAnchorage, Alaska 99510
Suite 32, 333 West 4th AvenuePost Office Mall Building
Telephone: 907! 274-4563F TS 265-5435
Dear Alaskan Seafood Processor:
The enclosed questionnaire has been developed by Dr. Frank Orth inconsultation with Walt Yonkers and other members of the seafood industryto solicit needed information for the University of Alaska's Sea Grantstudy of Alaska seafood processing. The study, which will be completedthis fall, should give us some basic data on the industry that is badlyneeded for the development of fishery management plans by the NorthPacific Fishery Nanagement Council. While this project is not funded bythe North Pacific Council, the results will be available to it and areexpected to be used in virtually all of the management plans currentlyunder development.
While the study is being done by the Alaska Sea Grant Program, it shouldbe noted that Dr. Orth is now employed as the Senior Economist for EarlR. Combs, Inc., but will continue his association with the University ofAlaska under contract until October 31st of this year. Dr. Orth hasworked closely with the industry in developing this questionnaire and itappears that most of the problems relating to confidentiality and theelimination of questions with no direct bearing to the study in questionhave been resolved.
On behalf of the North Pacific Council, I urge you to cooperate with Dr.Orth in this Sea Grant study. I appreciate the time required to completethis questionnaire and the misgivings many of you have about releasingsome of the requested information, but this basic economic data issorely needed if we are to comply with the provisions of the FisheryConservation and Management Act of 1976. The Council itself has nointerest in anything but the completed study. I will do my utmost toinsure that data from individual companies will be treated in thestrictest confidentiality. It is not expected that Council members orstaff will need or will have access to any individual data.
Thank you for your cooperation.
225
ASSCCIATION OF PACIFIC FISHERIESI600 SO, JACKSON ST.
SEATTLE, WASHINGTON 98 I 44
�06! 323-3540 April 7, 1978
All MembersTO
Walt YonkerF ROM:
cessing IndustryAlaska Sea Gran
Studies
RE'
Dr. Frank Orth, Senior Economist for Earl R. Combs, Inc. and formerlywith the Alaska Sea Grant Program, has a contract from the AlaskaSea Grant Program to complete an economic study of the Alaska seafoodprocessing industry. This study was endorsed by the North PacificFisheries Management Council to develop required economic informationso that the Council can manage the fishery resources under its juris-diction.
Dr. Orth requested that the Pacific Seafood Processors Associationact as an industry contact for coordinating this study with itsmembers.
The original questionnaire as proposed by Dr. Orth was not acceptableto the PSPA members so a small committee composed of Dave Forbush,Bumble Bee; Dexter Lail, Peter Pan; Roy Hendrickson, Whitney-Fidalgoand Ray Lewis, Alaska Packers, worked with me to bring this studyinto a format which might be answered by industry.
This committee's work has now been completed and a number of industrysuggest'.'.ons for additions, deletions and changes have been incorporatedin the final questionnaire which is enclosed. with this letter. Anumber of the questions about which the committee expressed concernshave been modified but. not withdrawn because Dr. Orth held the viewthat they were necessary to provide the North Pacific FisheriesManagement Council with the information which it requested.
Both the committee and Dr. Orth have made a sincere effort to take
into account each other's view on the matter and the questionnaireis being presented to you for your individual corporate decisionson a response.
NVY/kwEnclosure
226

INSTRUCTIONS AND DEFINITIONS FOR COMPLETING SURVEY FORM
1. All figures on financial items dollar value of sales, assets, equity, etc.!should be taken from December 31, 1976, or nearest fiscal year end, finan-cial statements.
2. This survey is directed to firms that operate one or more seafood pr'ocessingestablishments in Alaska under a generally recognized company identity. Ifyour company is a wholly owned subsidiary or a separate division of anothercompany but still retains a generally recognized and separately identifiablecompany identity, your responses should correspond only to your own opera-tions unless otherwise specified as in question III. 3.a.!. If your companyis a parent company, your responses should exclude only that informationwhich corresponds to subsidiaries or division which are themselves generallyrecogni zed and identified as separate.
If you have any questions about the appropriate company entity to which youranswers should correspond, p'lease contact Frank Orth �06! 232-3991 or JimRichardson 907! 479-7961, prior to completion of this survey form.
3. Definition of terms used in survey.
a. Advance: Providing money, gear, supplies or other items of valueprior in time to a requirement of direct repayment or the pro-vision of some other form of consideration.
b. 4lholesaler: For purposes of this survey, DISC corporations are inc]udedwith wholesalers.
c. Promotional Allowances: These include price discounts from listprice, coupons, advertising assistance and other similar promotionaldevices.
d. 1976: All ref'erences to 1976 refer to December 31, 1976, or nearestfiscal year end.
e. Integration: The existence or formation of an economic relationshipwith another fish processor horizontal integration! or with fishermenor distributors vertical integration!.
227
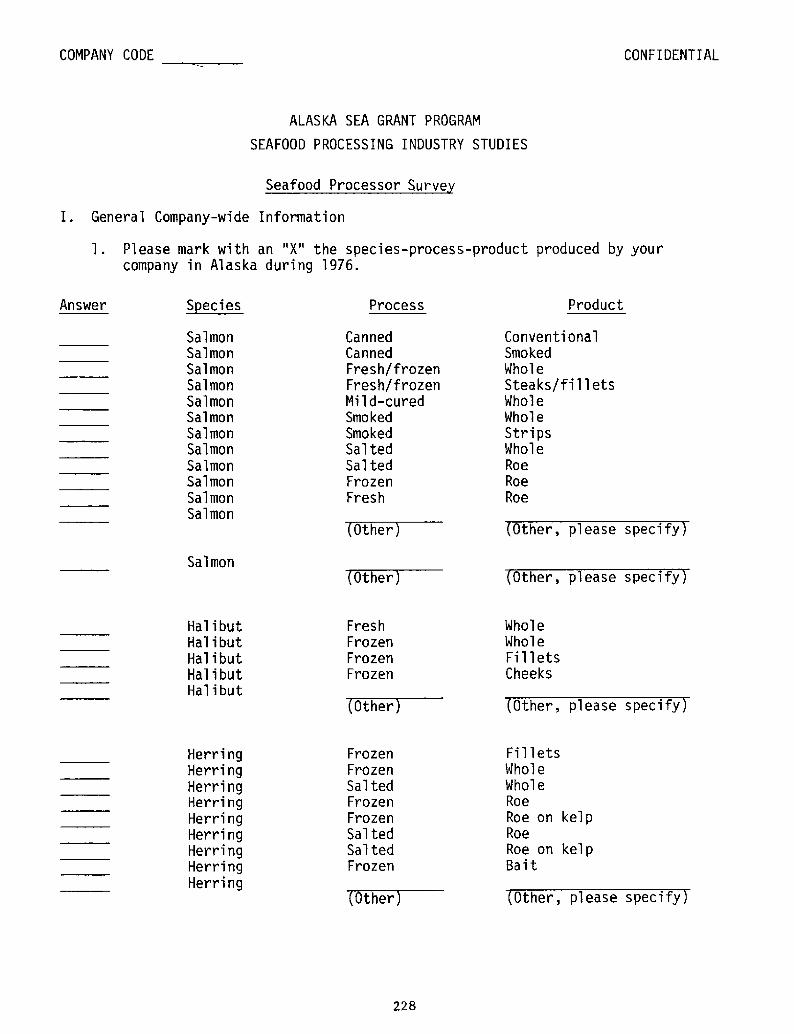
COMPANY CODE CONFIDENTIAL
ALASKA SEA GRANT PROGRAM
SEAFOOD PROCESSING INDUSTRY STUDIES
Seafood Processor Surve
I. General Company-wide Information
Please mark with an "X" the species-process-product produced by yourcompany in Alaska during 1976.
~Secies ProductAnswer Process
Other, please specify
SalmonOther, please specify
Whol eWhol eFi 1 1 etsCheeks
FreshFrozenFrozen
Frozen
HalibutHalibutHalibutHalibut
HalibutOther, please specify
Other, please specify
228
SalmonSalmonSalmonSalmonSalmonSalmonSalmonSalmonSalmonSalmonSalmonSalmon
HerringHerringHerringHerringHerringHerringHerringHerringHerring
CannedCannedFresh/frozenFresh/frozenMild-curedSmokedSmokedSaltedSaltedFrozenFresh
Frozen
Frozen
SaltedFrozen
Frozen
SaltedSaltedFrozen
ConventionalSmokedWhoteSteaks/filletsWholeWholeStripsWholeRoe
RoeRoe
Fillets
WholeWholeRoe
Roe on kelpRoe
Roe on kelpBait
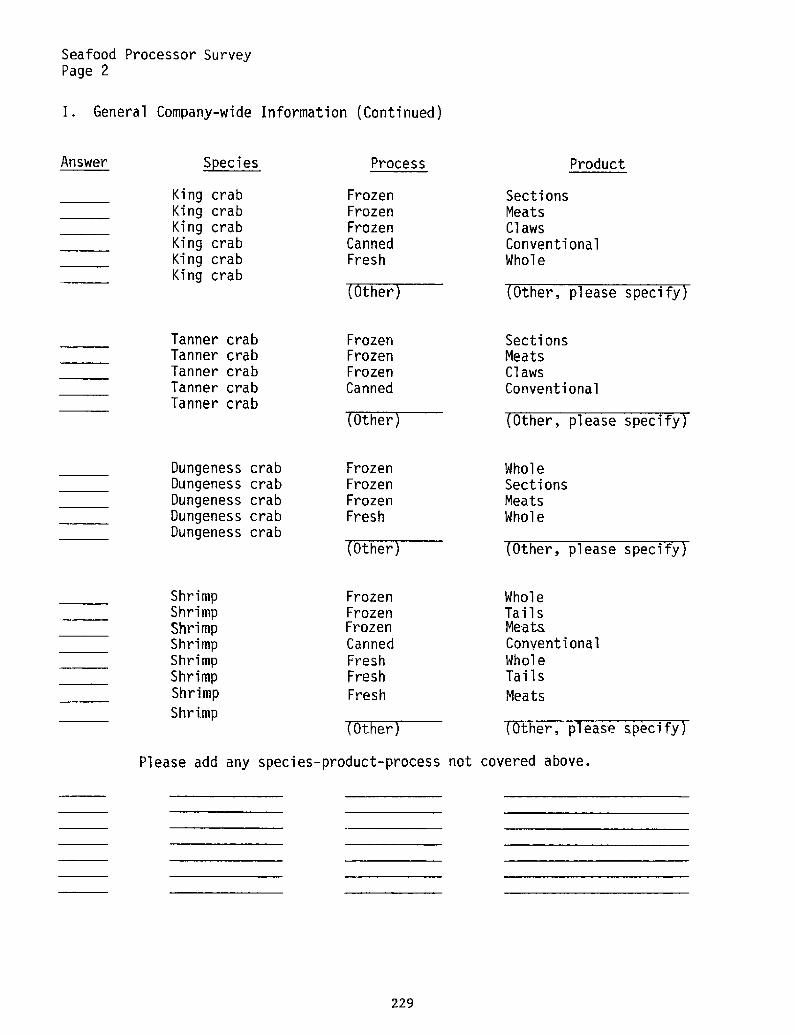
Seafood Processor SurveyPage 2
I. General Company-wide Information Continued!
~Sec i esAnswer Process Product
Other, please specify
SectionsMeatsClaws
Conventional
FrozenFrozenFrozen
Canned
Other, please specify
WholeSectionsMeats
Whole
Frozen
FrozenFrozenFresh
Other, please specify
ther, p ease specify
Please add any species-product-process not covered above.
229
King crabKing crabKing crabKing crabKing crabKing crab
Tanner crabTanner crabTanner crab
Tanner crabTanner crab
Dungeness crabDungeness crabDungeness crabDungeness crabDungeness crab
ShrimpShrimpShrimpShrimpShrimpShrimpShrimpShrimp
FrozenFr ozen
Fr ozenCannedFresh
FrozenFrozenFrozenCannedFreshFresh
Fresh
SectionsMeatsClawsConventionalWhole
Whol eTail sMeatsConventionalWholeTails
Meats
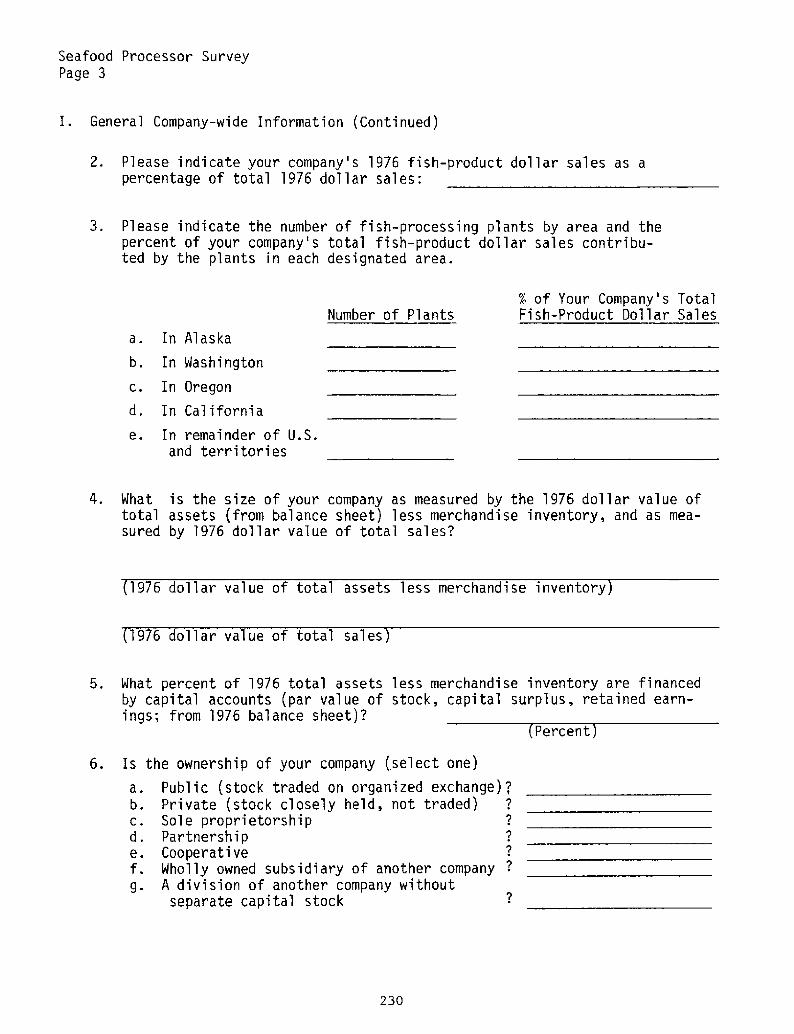
Seafood Processor SurveyPage 3
I. General Company-wide Information Continued!
2. Please indicate your company's 1976 fish-product dollar sales as apercentage of total 1976 dollar sales:
3. Please indicate the number of fish-processing plants by area and thepercent of your company's total fish-product dollar sa'tes contribu-ted by the plants in each designated area.
l of Your Company's TotalFish-Product Dollar Sa'lesNumber of Plants
a. In Alaska
In Washington
In Oregon
In Cal~forn~a
b.
C.
d.
e. In remainder of U.S.and territories
What is the size of your company as measured by the 1976 dollar value oftotal assets from balance sheet! less merchandise inventory, and as mea-sured by 1976 dollar value of total sales?
1976 dollar value of total assets less merchandise inventory
1976 dollar value of total sales
6. Is the ownership of your company select one!
a. Public stock traded on organized exchange! ?b. Private stock closely held, not traded! ?c. Sole proprietorshipd. Partnership ?e. Cooperati vef. Wholly owned subsidiary of another company ?g. A division of another company without
separate capital stock
230
5. What percent of 1976 total assets less merchandise inventory are financedby capital accounts par value of stock, capital surplus, retained earn-ings; from 1976 balance sheet!?
Percent
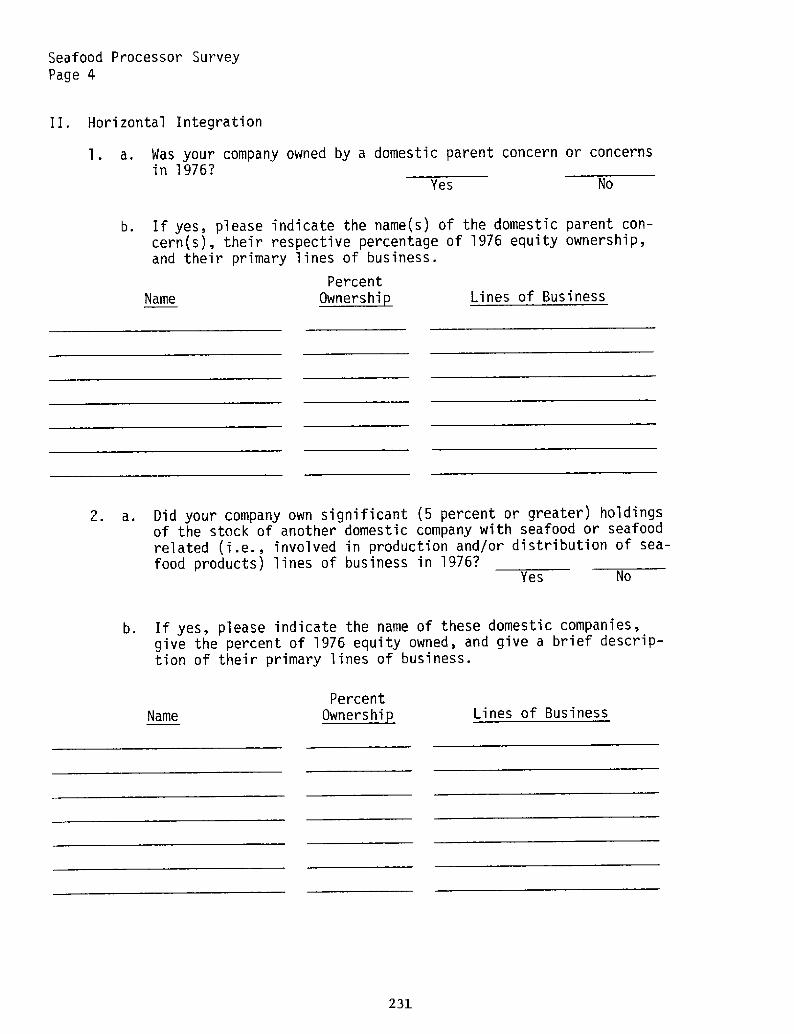
Seafood Processor SurveyPage 4
II. Horizontal Integration
b. If yes, please indicate the name s! of the domestic parent con-cern s!, their respective percentage of 1976 equity ownership,and their primary lines of business.
Percent
~0wnershi Lines of BusinessName
a. Did your company own significant � percent or greater! ho1dingsof the stock of another domestic company with seafood or seafoodrelated i.e., involved in production and/or distribution of sea-food products! fines of business in 1976?
NoYes
b. If yes, please indicate the name of these domestic companies,give the percent of 1976 equity owned, and give a brief descrip-tion of their primary lines of business.
Percent
~Owners hi Lines of BusinessName
231
1. a. Was your company owned by a domestic parent concern or concernsin 1976?
Yes

Seafood Processor SurveyPage 5
III. Vertical Integration
b. If yes, please list the number owned by the primary area andspecies fished.
Number ~SeciesAl aska
washington
Oregon
California
Remainder of U. S. and territories
Is it your observation that, over the past ten years, the practiceof processors owning fishing vessels has generally increased, de-creased, or remained unchanged in importance in the Alaska sea-food processing industry? Is there any particularAlaska fishery in which a trend in processor fishing-vessel owner-ship is especially evident?
C.
Yes No
If yes, name the fishery and indicate whether the trend is towardincreasing or decreasing ownership.
Indicate Increasing orDecreasin Ownershi~Fi sher
2. a. Does your company, parent company, or subsidiary company advancemoney, gear, or supplies to independent fishing vessels?
Yes No
b. If yes, is interest typically charged on such advances?
Yes No
232
l. a. Did your company, parent company, or subsidiary company own fish-ing vessels in 1976?
Yes No

Seafood Processor Sur veyPage 6
III. Yer tica'1 Integration Continued!
c. Is it your observation that, over the last ten years, the practiceof advancing money, gear, or supplies has increased, decreased orremained unchanged in frequency in the Alaska seafood processingindustry?
2.
increased decreased unchanged
Please note any specific trends that you consider important.
b. If yes, please specify the type of operation or operations brok-erage, wholesale, retail! for each such company not necessary toname company! in which there is an ownership interest.
Company A
Company 8
Company C
Company D
Company E
Has the practice of seafood processors owning interests in broker-age, wholesale or retail seafood businesses increased, decreasedor remained unchanged in importance over the past ten years in thePacific Northwest seafood industry?
C.
Yes
Please note any specific trends that you consider important.
233
3. a. Does your company, parent company, or subsidiary company have anownership interest in brokerage, wholesale or retail seafoodbusinesses' ?
Yes No
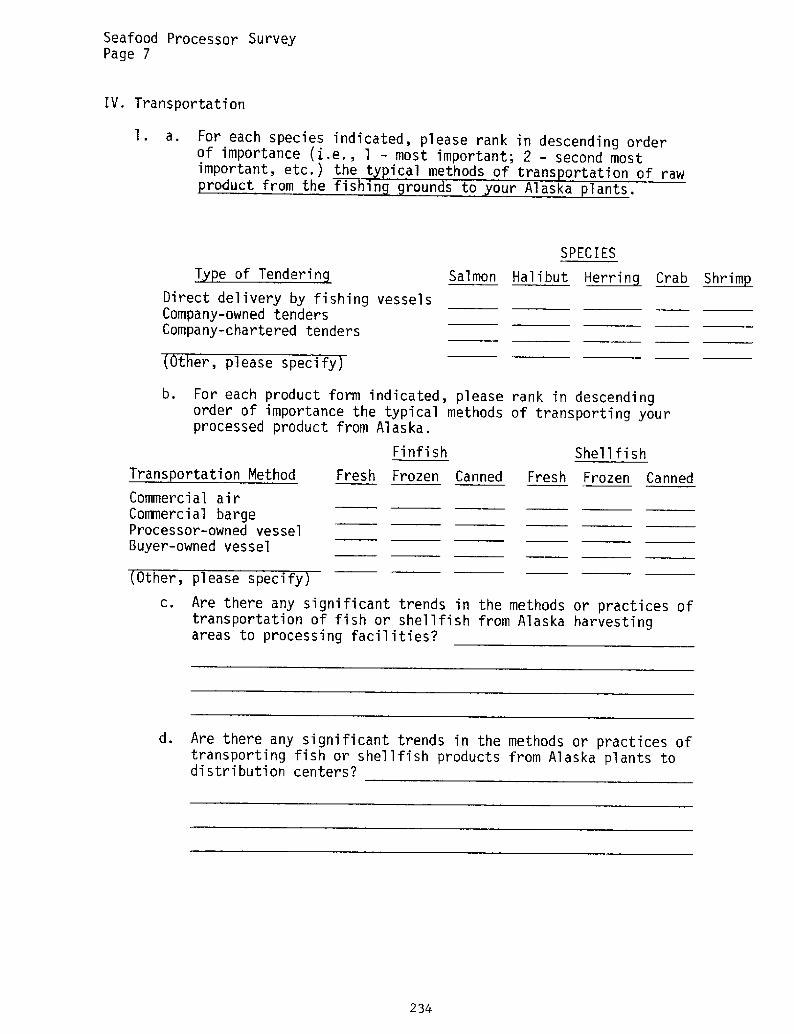
Seafood Processor SurveyPage 7
IV. Transportation
1. a. For each species indicated, please rank in descending orderof importance i.e., 1 - most important; 2 � second mostimportant, etc.! the t ical methods of trans ortation of rawroduct from the fishin roun s to our A aska lants.
SPECIES
Direct delivery by fishing vesselsCompany-owned tendersCompany-chartered tenders
be For each product form indicated, please rank in descendingorder of importance the typical methods of transporting yourprocessed product from Alaska.
Finfish
Trans ortation Method Fresh Frozen Canned Fresh Frozen Canned
Other, please specify
c. Are there any significant trends in the methods or practices oftransportation of fish or shellfish from Alaska harvestingareas to processing facilities?
d. Are there any significant trends in the methods or practices oftransporting fish or shellfish products from Alaska plants todistribution centers?
234
Commercial airCommercial bargeProcessor-owned vesselBuyer-owned vessel
Salmon Halibut Herri~rr Crab ~Sbrim
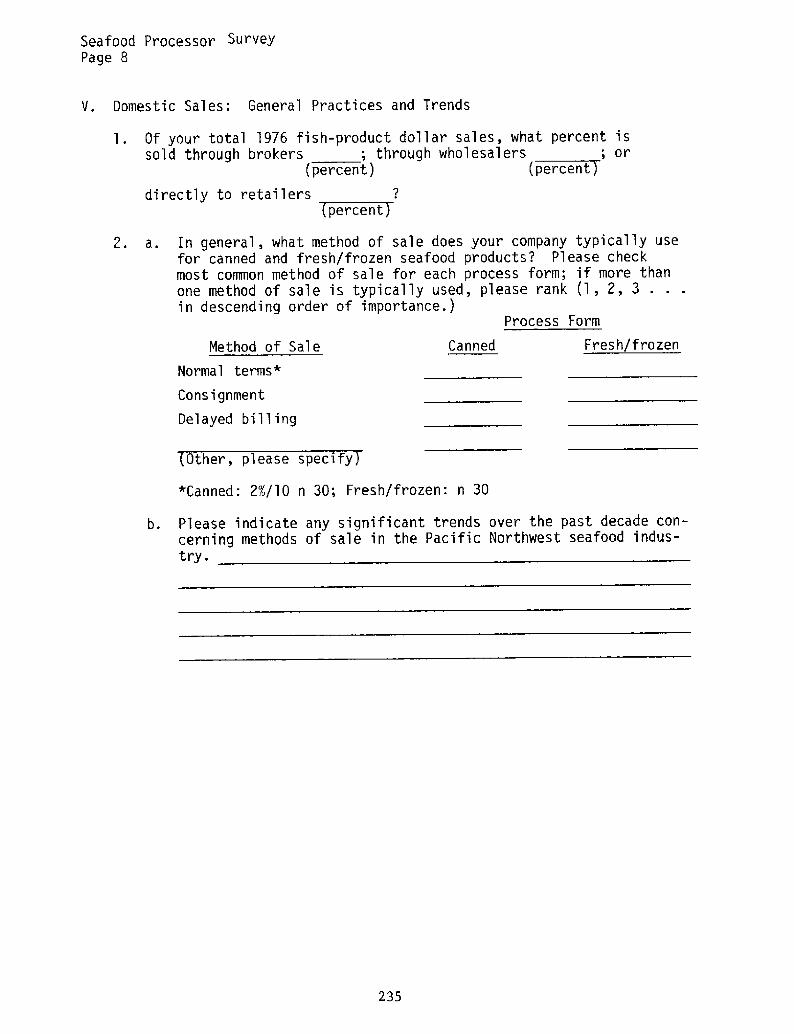
Seafood ProcessorPage 8
V. Domestic Sales: General Practices and Trends
Of your total 1976 tish-product dollar sales, what percent issold through brokers ; through wholesalers ; or
percent! ~percentdirectly to retailers ?
~percent
Fresh/frozenCannedMethod of Sale
Normal terms*
Consignment
Delayed billing
Other, please specify
*Canned: 2X/10 n 30; Fresh/frozen: n 30
b. Please indicate any significant trends over the past decade con-cerning methods of sale in the Pacific Northwest seafood indus-try.
235
2. a. In general, what method of sale does your company typically usefor canned and fresh/frozen seafood products? Please checkmost common method of sale for each process form; if more thanone method of sale is typically used, please rank �, 2, 3 .in descending order of importance.!
Process Form
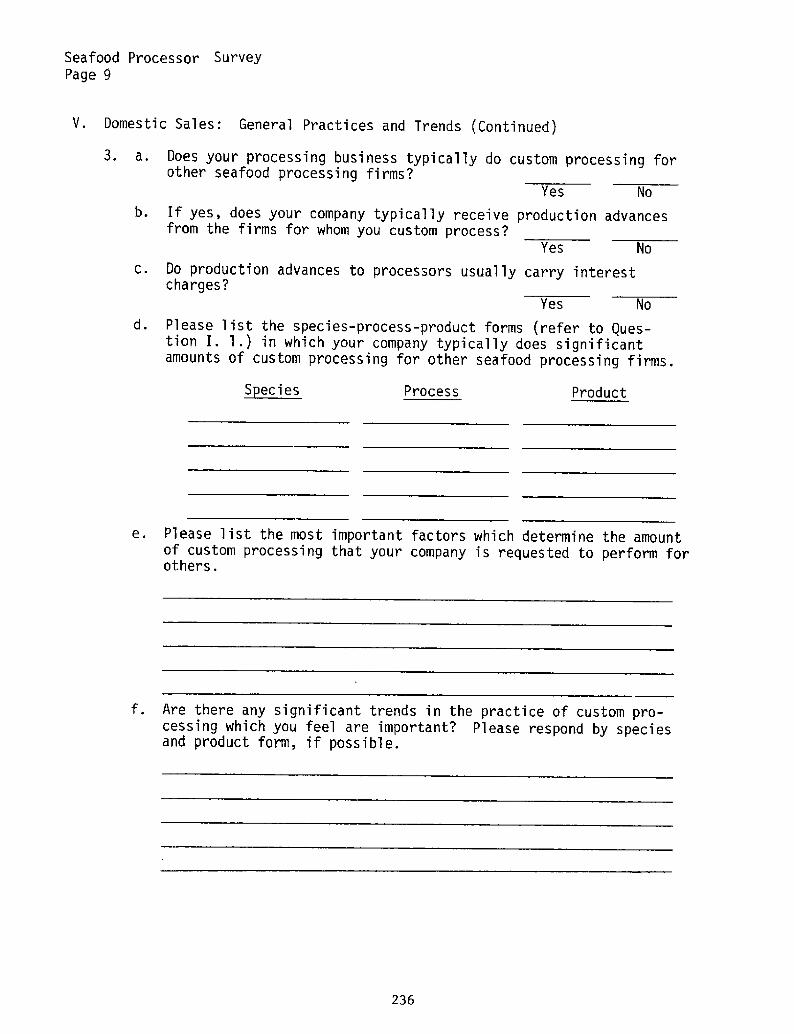
Seafood Processor SurveyPage 9
'lt. Domestic Sales: General Practices and Trends Continued!
b. If yes, does your company typically receive production advancesfrom the firms for whom you custom process?
Yes No
c. Do product~on advances to processors usually carry interestcharges?
Yes No
d. Please list the species-process-product forms refer to Ques-tion I. l.! in which your company typically does significantamounts of custom processing for other seafood processing firms.
~Sec i es Process Product
e. Please list the most important factors which determine the amountof custom processing that your company is requested to perform forothers.
f. Are there any significant trends in the practice of custom pro-cessing which you feel are important? Please respond by speciesand product form, if possible.
236
3. a. Does your processing business typically do custom processing forother seafood processing firms?
Yes No
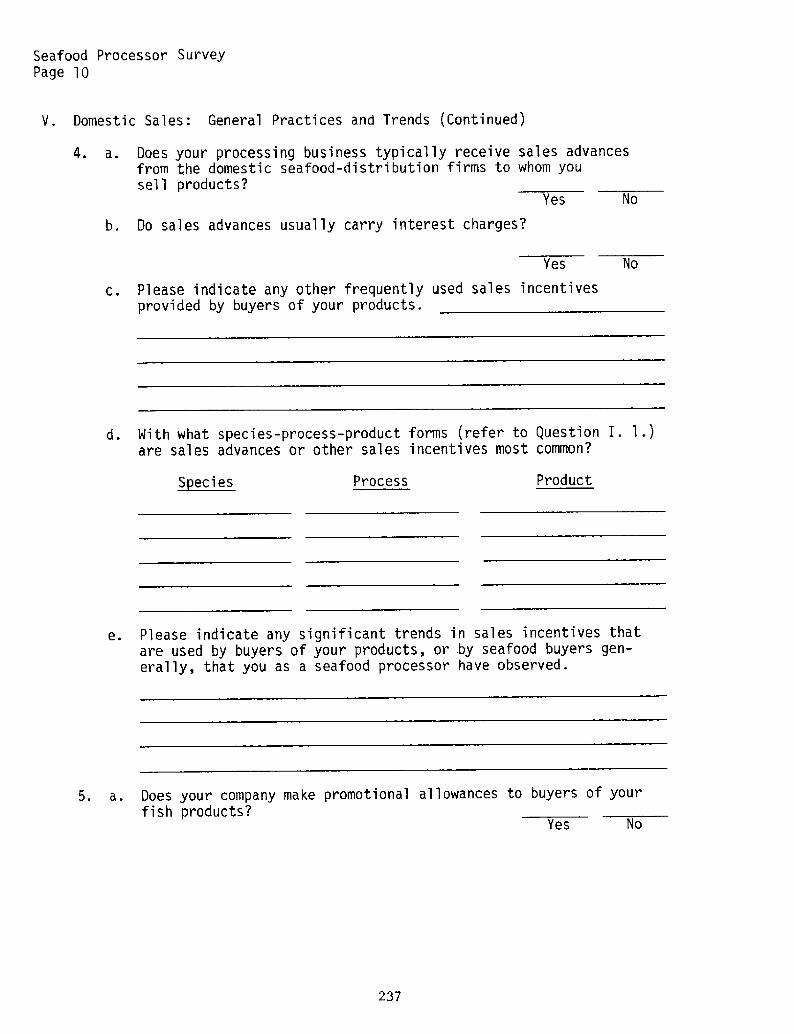
Seafood Processor SurveyPage 10
'lt. Domestic Sales: General Practices and Trends Continued!
4. a. Does your processing business typically receive sales advancesfrom the domestic seafood-distribution firms to whom yousell products?
Yes N
b. Do sales advances usually carry interest charges'?
NoYes
c. Please indicate any other frequently used sales incentivesprovided by buyers of your products.
d. With what species-process-product forms refer to question I. 1.!are sales advances or other sales incentives most common?
Product~Secies Process
e. Please indicate any s~gn~ficant trends in sales incentives thatare used by buyers of your products, or by seafood buyers gen-erally, that you as a seafood processor have observed.
237
5. a. Does your company make promotional allowances to buyers of yourfish products?
Yes No
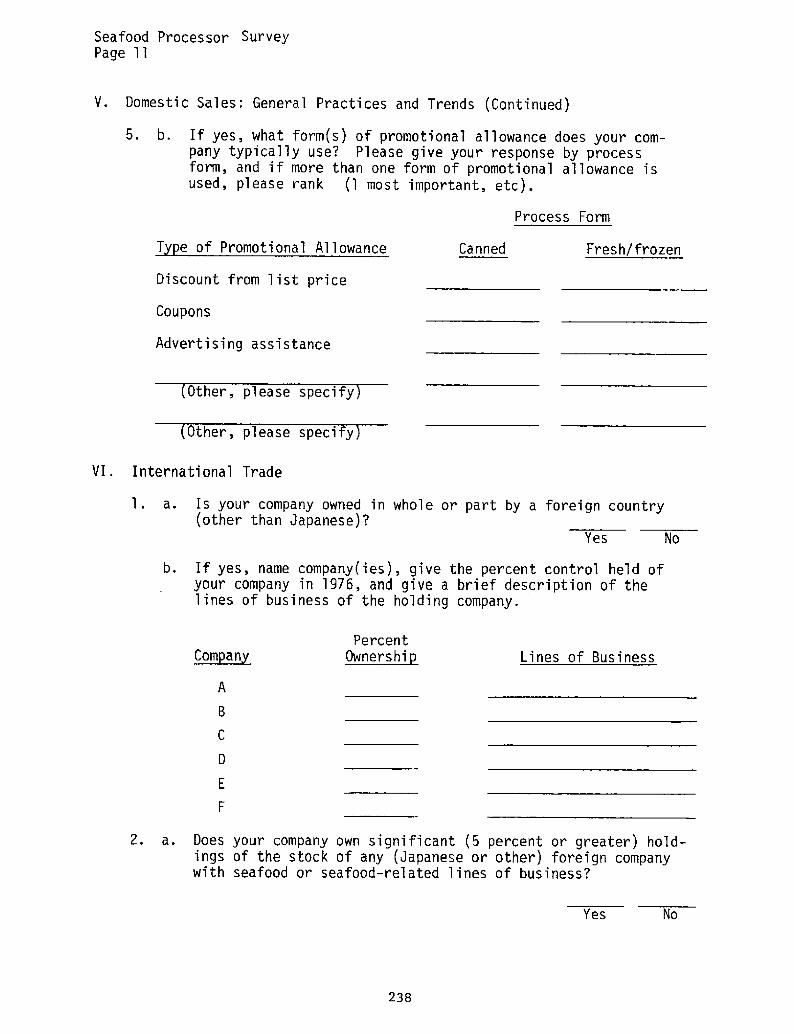
Seafood Processor SurveyPage 11
V. Domestic Sales: General Practices and Trends Continued!
5. b. If yes, what form s! of' promotional allowance does your com-pany typically use? Please give your response by processform, and if more than one form of promotional allowance isused, please rank � most important, etc!.
Process Form
T e of Promotional Allowance Canned Fresh/frozen
Discount from list price
Coupons
Advertising assistance
Other, please specify
Other, please specify
VI. International Trade
l. a. Is your company owned in whole or part by a foreign country other than Japanese!?
Yes No
b. If yes, name company ies!, give the percent control held ofyour company in 1976, and give a brief description of thelines of business of the ho'Iding company.
Percent
~0wnershi Lines of Business
NoYes
238
2. a. Does your company own significant � percent or greater! hold-ings of the stock of any Japanese or other} foreign companywith seafood or seafood-related lines of business?
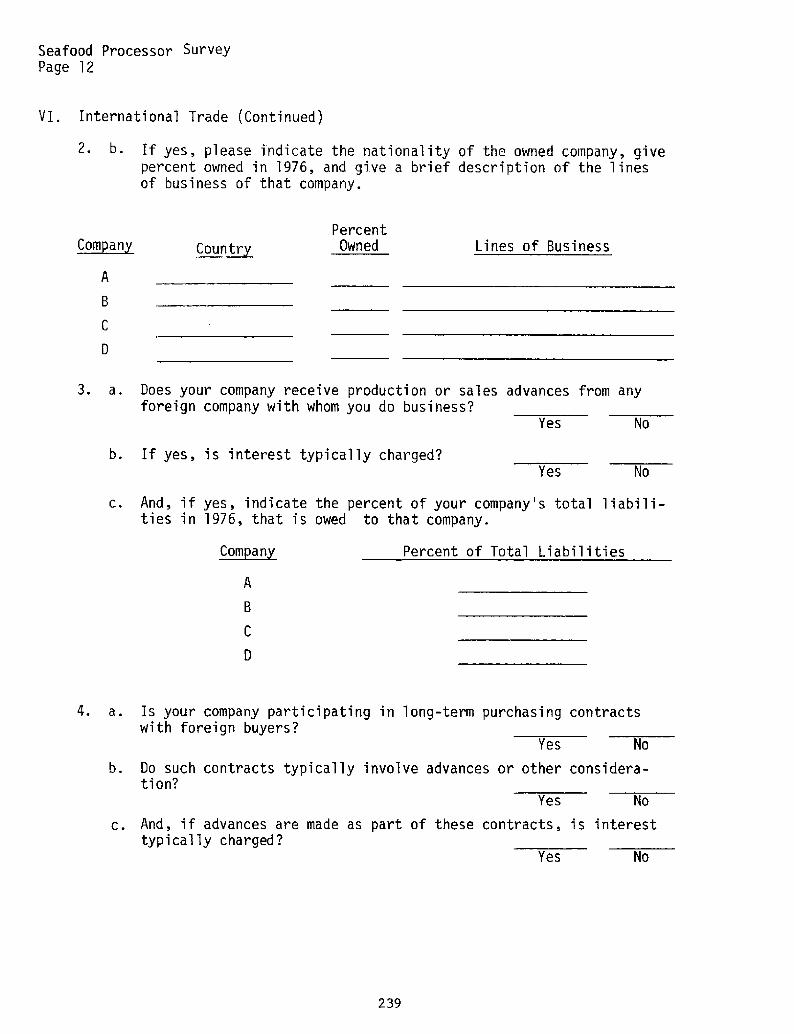
VI. International Trade Continued!
If yes, please indicate the nationality of the owned company, givepercent owned in 1976, and give a brief description of the linesof business of that company.
~Cotn an Lines of Business~Coontr
3. a. Does your company receive production or sales advances trom anyforeign company with whom you do business?
Yes No
b. If yes, is interest typically charged?Yes No
c. And, if yes, indicate the percent of your company's total liabili-ties in 1976, that is owed to that company.
Percent of Total Liabilities
4. a. Is your company participating in long-term purchasingwith foreign buyers?
Yes
contracts
No
b. Do such contracts typically involve advances or othertion?
Yes
considera-
No
c. And, if advances are made as part of these contracts,typically charged?
Yes
is interest
No
239
Seafood Processor SurveyPage 12
PercentOwned
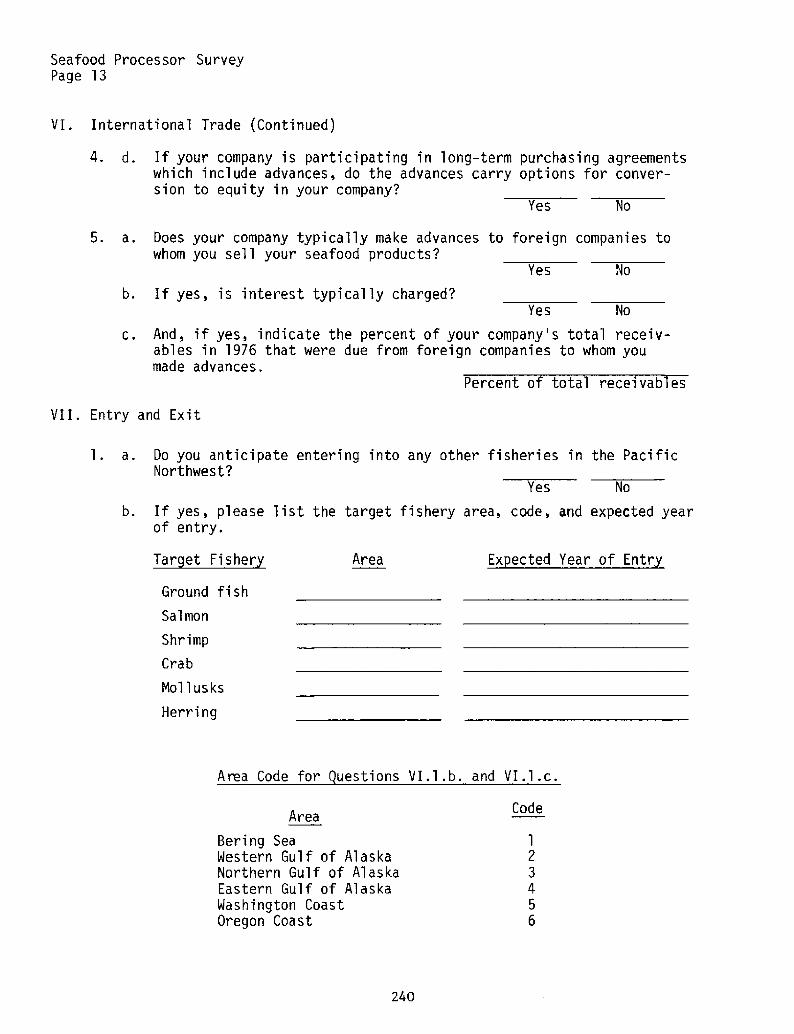
Seafood Processor SurveyPage 13
VI. International Trade Continued}
5. a. Does your company typically make advances to foreign companies towhom you sell your seafood products?
NoYes
b. If yes, is interest typically charged?Yes No
c. And, if yes, indicate the percent of your company's total receiv-ables in 1976 that were due from foreign companies to whom youmade advances.
Percent of total receivab es
VII. Entry and Exit
l. a. Do you anticipate entering into any other fisheries in the PacificNorthwest?
Yes No
b. If yes, please list the target fishery area, code, and expected yearof entry.
Area Ex ected Year of Entr
Ground fish
Salmon
Shrimp
Crab
Nollusks
Herring
Area Code for uestions VI.l.b. and VI.l.c.
CodeArea
Bering SeaWestern Gulf of AlaskaNorthern Gulf of AlaskaEastern Gulf of AlaskaWashington CoastOregon Coast
240
4. d. If your company is participating in long-term purchasing agreementswhich include advances, do the advances carry options for conver-sion to equity in your company?
Yes No
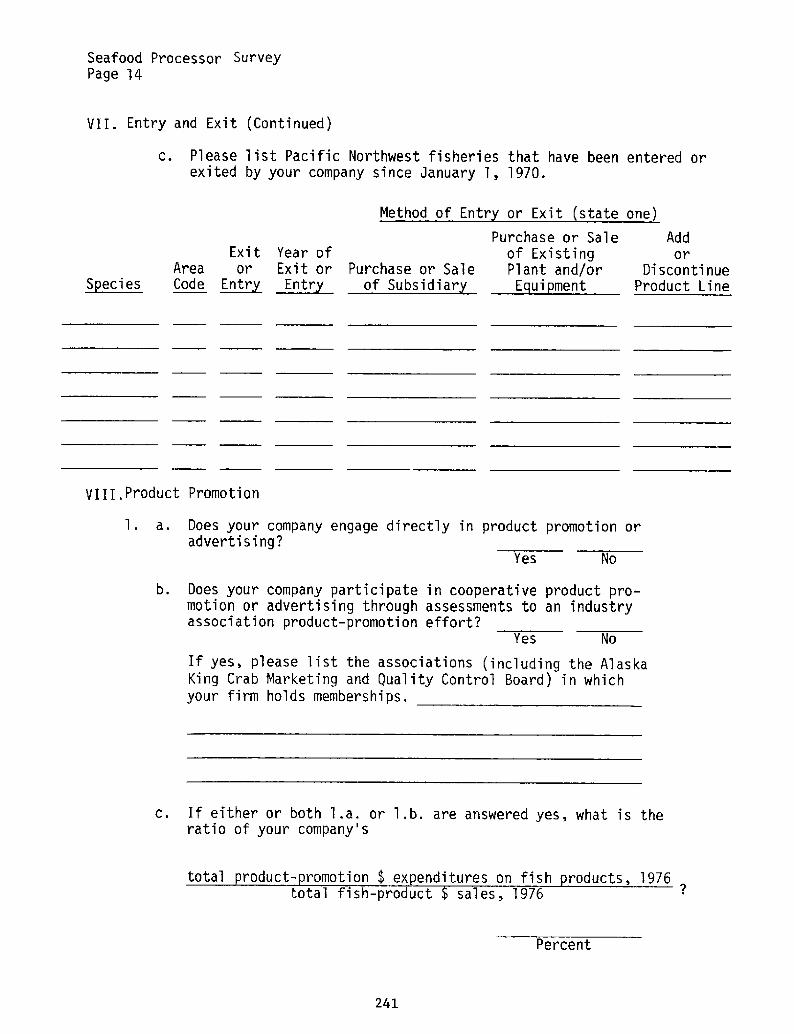
Seafood Processor SurveyPage 14
yII. Entry and Exit Continued!
c. Please list Pacific Northwest fisheries that have been entered orexited by your company since January 1, 1970.
Method of Entr or Exit state one
yIII,Product Promotion
Does your company engage directly in product promotion oradvertising?
Yes No
1. a.
Does your company participate in cooperative product pro-motion or advertising through assessments to an industryassociation product-promotion effort?
Yes No
b.
If yes, please list the associations including the AlaskaKing Crab Marketing and equality Control Board! in whichyour firm holds memberships.
c. If either or both 'l.a. or l,b. are answered yes, what is theratio of your company's
total roduct- romotion 5 ex enditures on fish roducts, 1976total fish-product sales, 'I976
Percent
241
Purchase or Sale AddExit Year of of Existing or
Area or Exit or Pur chase or Sale Plant and/or Discontinue~Secies Code ~Entr ~Entr of S bs'd'e E t Product Line

PART II
Surve Responses
242
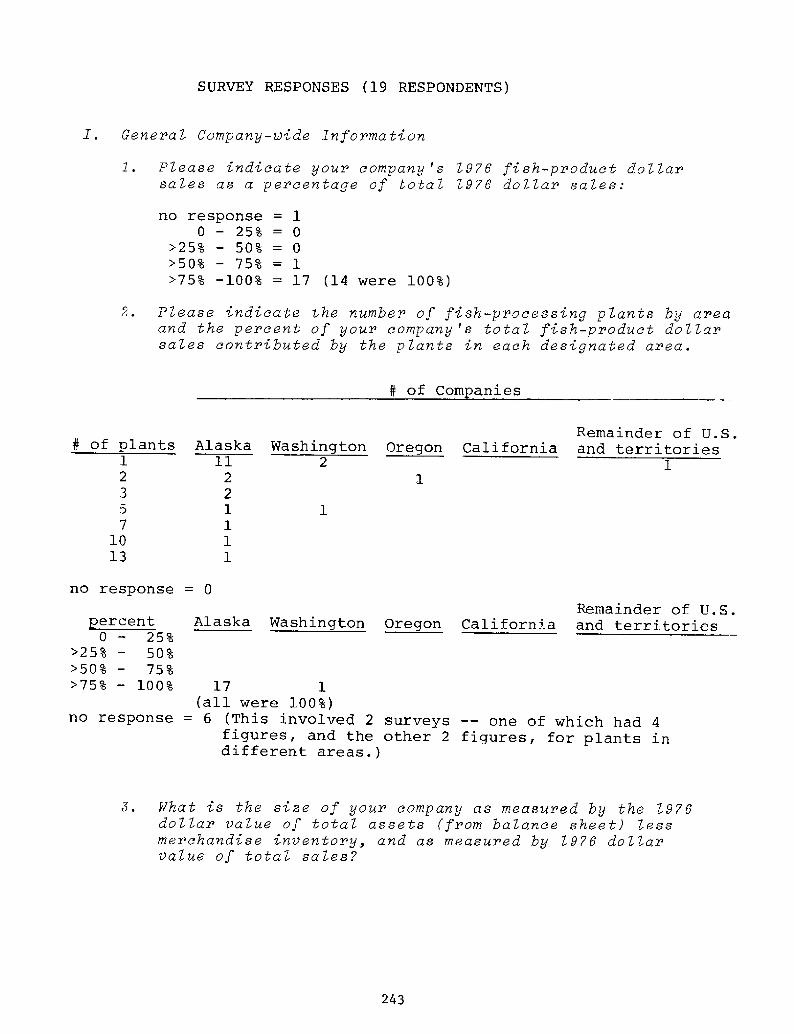
SURVEY RESPONSES �9 RESPONDENTS!
2. Gener a l Company-vide In formation
2. Please indicate pour' company 's l976 fish-product dollarsaLes as a percentage of total l976 aollar saLes:
1
0
0
1
17 �4 were 100%!
no response0 � 25%
>25% � 50%
>50% � 75%
>75% -100%
Please indicate the number' o f fi sh-pr ocessing plants bp ar eaand the percent of your company 's totaL fish-product dol larsales contributed bp the plants in each designated ar ea.
I of Companies
of plants Alaska Washingtonll 2
2
2
1 1
1
1
1
no response = 0
Remainder of U.S.California and territoriesAlaska Washington Oregonpercent
0 � 25%
>25% � 50%>50% � 75%>75% � 100% 17 1
all were 100%!6 This involved 2 surveYs
figures, and the other 2different areas.!
one of which had 4
figures, for plants inno response
Vhat is the size of your company as measurea by the L976dollar value of total assets from balance sheet! lessmer chandi se inventor'y, and as measur ed bp l976 dol larvalue of total sales?
243
1
2 35 7
10
13
Remainder of U.S.Oregon California and territories
11
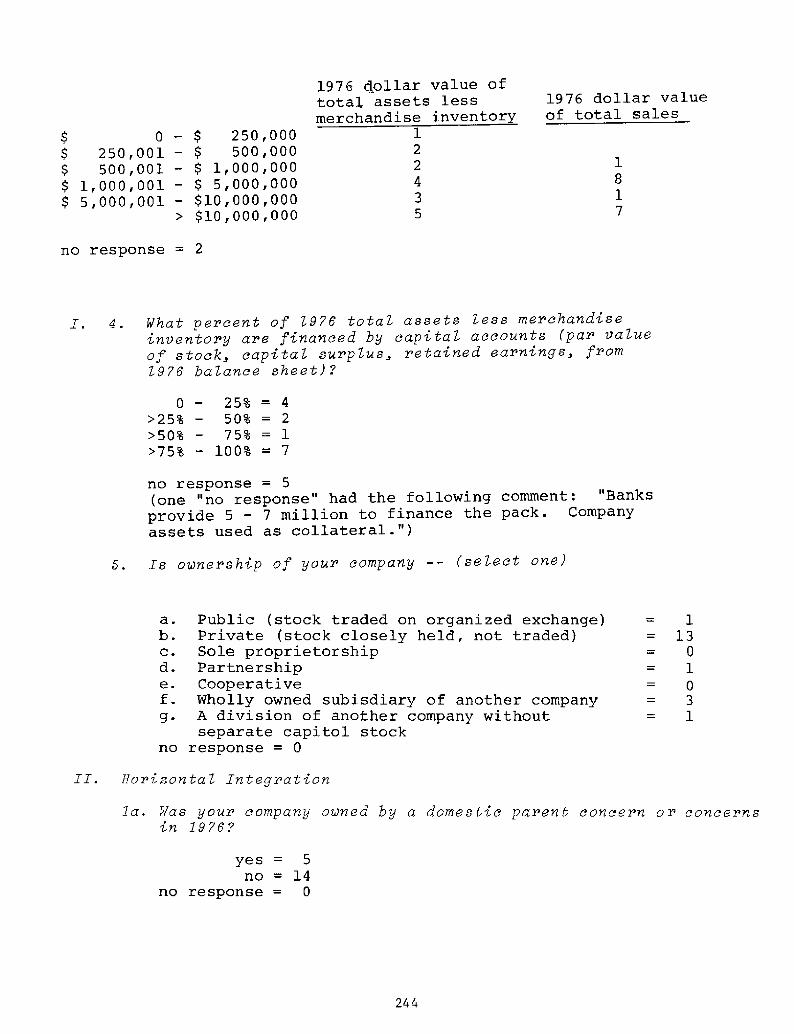
1976 dollar value oftotal assets lessmerchandise inventory
1976 dollar valueof total sales
no response
4. Vhat percent of l976 total assets less merchandiseinventory are financed by capital accounts par valueof stock, capital sur p Lus, r etained earnings, fr oml 976 balance sheet!?
0 � 25% = 4>25% � 50% = 2>50% � 75% = 1>75%, � 100% = 7
no response = 5 one "no response" had the following comment: "Banksprovide 5 � 7 million to finance the pack. Companyassets used as collateral."!
2s ownership of your company � � select one!
Public stock traded on organized exchange!Private stock closely held, not. traded!
c. Sole proprietorshipd. Partnershipe. Cooperativef. Wholly owned subisdiary of another companyg. A division of another company without
separate capitol stockno response = 0
1
13
0
a.
b.
0 3
77. Hori frontal integration
2a. Has your company ouned by a aomestic parent concern or concernsin 1976?
yes = 5no = 14
no response = 0
244
0
250,001$ 500,001
1,000,001$ 5,000,001
250,000500,000
$ 1,000,000$ 5,000,000$10,000,000$10,000,000

Did your company own signi ficant b%%u0 or gr eater! ho2di ngsof the stock of another domestic company vith seafoodor seafood related i. e. invo2ved in pr'oduction and/ordistribution of seafood products! linea of business in2976?
II. 2.
yes=5no = 14
no response = 0
I'I2. Ver ti ca2 Integration
2a. Did your company, parent company, or' subsidiary companyown fishing vease2s in 2976
yes = 9no= 9
no response = 1
2b. I'f yes, p2ease 2ist the number' ovned by the primary areaand speci es fished.
Each "yes" response listed separately!
vessels for salmon
salmon, king crab, tanner
Alaska
Alaska
Alaska
crab
king crab, tanner, shrimpsalmon
�! 3 8! 5 9! 2
2c. Is it your observation that, over the past ten year a, thepractice of processors owning fishing vessels has general lyincr eased deer eased, or r emainea unchanged in impor'tancein the A.laska seafood pr ocessing industry?
increased = 1decreased =13
unchanged = 1no response = 4
Is ther e any par ti cular' A 2aska fisher y in which a tr'endin processor fishing-vessel ownership is especial lyevident?
yes = 6no= 8
no response = 5
245
�! 3�! 40
30
6
�! 10�! 2�! 5
15
�! 90-100
in Alaska fishingAlaska
Wash.
rem U.S.
Alaska
Alaska
AlaskaWash. 1I
Alaska
shrimp, scallopssalmon
crab
crab
salmon
salmon reduced to 30-40during '77!
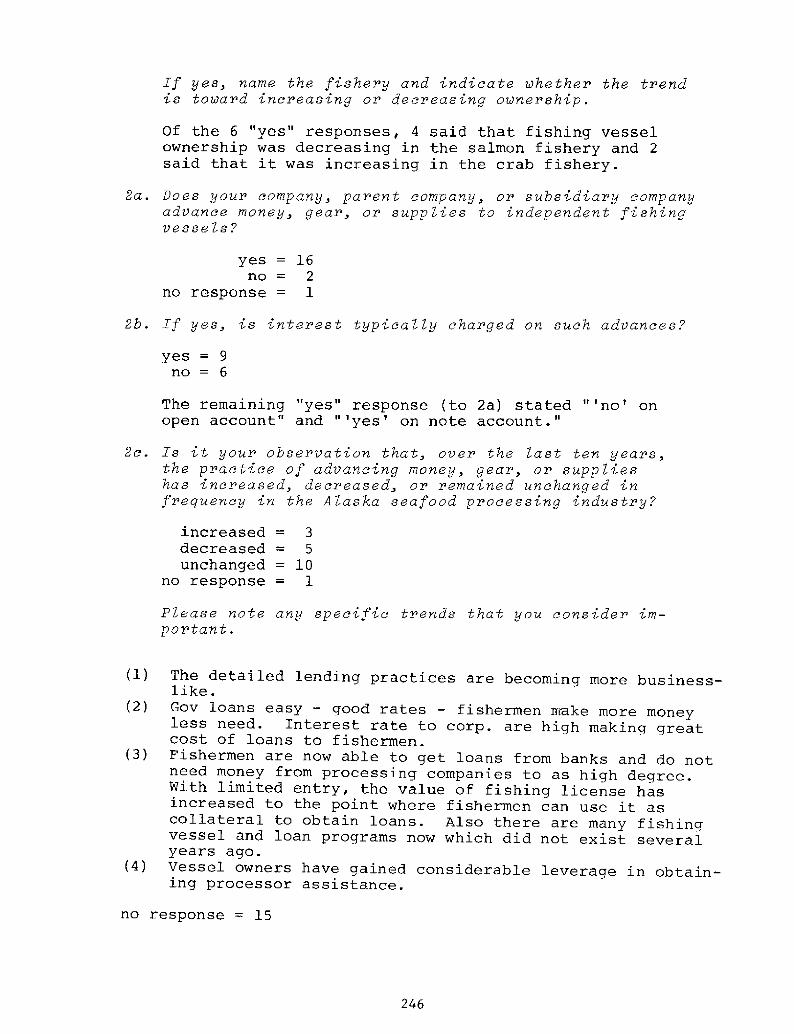
Z'f yes, name the fishery and indicate whether the trendis toward increasing or decreasing ownership.
Of the 6 "yes" responses, 4 said that fishing vesselownership was decreasing in the salmon fishery and 2said that it was increasing in the crab fishery.
Does your company, parent company, or subsidiary companyadvance money, gear, or supplies to independent fishingvessels?
yes = 16no = 2
no response = 1
Zf yes, is interest typically charged on such advances?
yes = 9no= 6
The remaining "yes" response to 2a! stated " 'no' onopen account" and "'yes' on note account."
2s i t your' obser vati on that, over the last ten year s,the pr acti ce of advancing money, gear, or' supplieshas increased, decreased, or remained unchanged infr eouency in the A vaska sea food pr ocessing inaustr y?
Zc,
increaseddecreased
unchangedno response
5
10
1
Please note any specific trends that you consider im-portantt.
�!
�!
no response = 15
246
The detailed lending practices are becoming more business-like.
Gov loans easy � good rates � fishermen rr~ake more moneyless need. Interest rate to corp. are high making greatcost of loans to fishermen.Fishermen are now able to get loans from banks and do notneed money from processing companies to as high degree.With limited entry, the value of fishing license hasincreased to the point where fishermen can use it ascollateral to obtain loans. Also there are many fishingvessel and loan programs now which did not exist severalyears ago.
Vessel owners have gained considerable leverage in obtain-ing processor assistance.
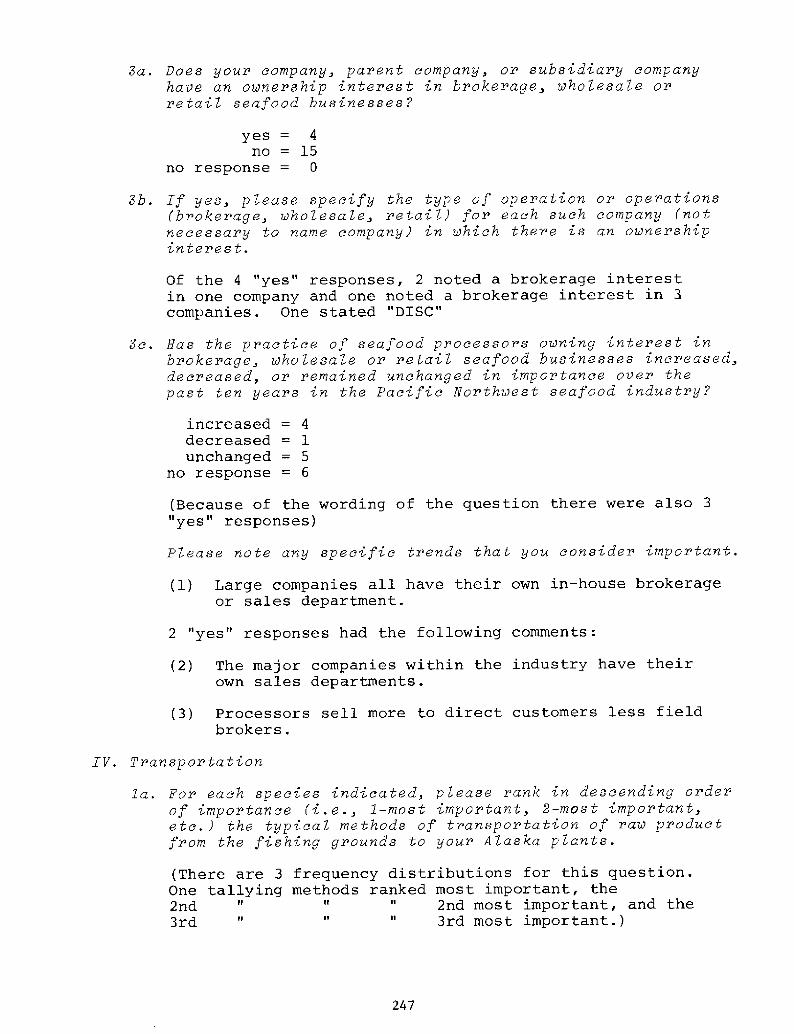
8a. Does your company, par ent company, or' subsi di ar y companyhave an ownership interest in brokerage, vholesaZe orr'etai2 seafood businesses?
yes = 4no = l5
no response = 0
3b. Zf yes, please speci fp the tppe of operation or operations brokerage, vhoZesaZe, retai2! for each such company notnecessar'y to name company! in which ther e i s an orner shipinter est.
Of the 4 "yes" responses, 2 noted a brokerage interestin one company and one noted a brokerage interest in 3companies. One stated "DISC"
3c. Has the practice of seafood processors owning interest inbrokerage, vholesaZe or r etaiZ seafooa businesses increasea,deer eased, or' r emainea unchanged in impor tance over thepast ten pears in the Pacific Aorthvest seafood industry'
increased = 4
decreased = 1
unchanged = 5no response = 6
Because of the wording of the question there were also 3"yes" responses!
Please note any speci fic tr'ends that pou consider impor tant.
�! Large companies all have their own in-house brokerageor sales department.
2 "yes" responses had the following comments:
�! The major companies within the industry have theirown sales departments.
�! Processors sell more to direct customers less fieldbrokers.
7V. 2'ranspor tation
2a. For each species indicated, please rank in aescending orderof importance i. e., 2-most important, 2-most impor'tant,etc. ! the tppica2 methods of transpor tation of r av pr oductfr om the fishing grounds to pour A2aska plants.
There are 3 frequency distributions for this question.One tallying methods ranked most important, the2nd 2nd most important, and the3rd 3rd most important.!
247
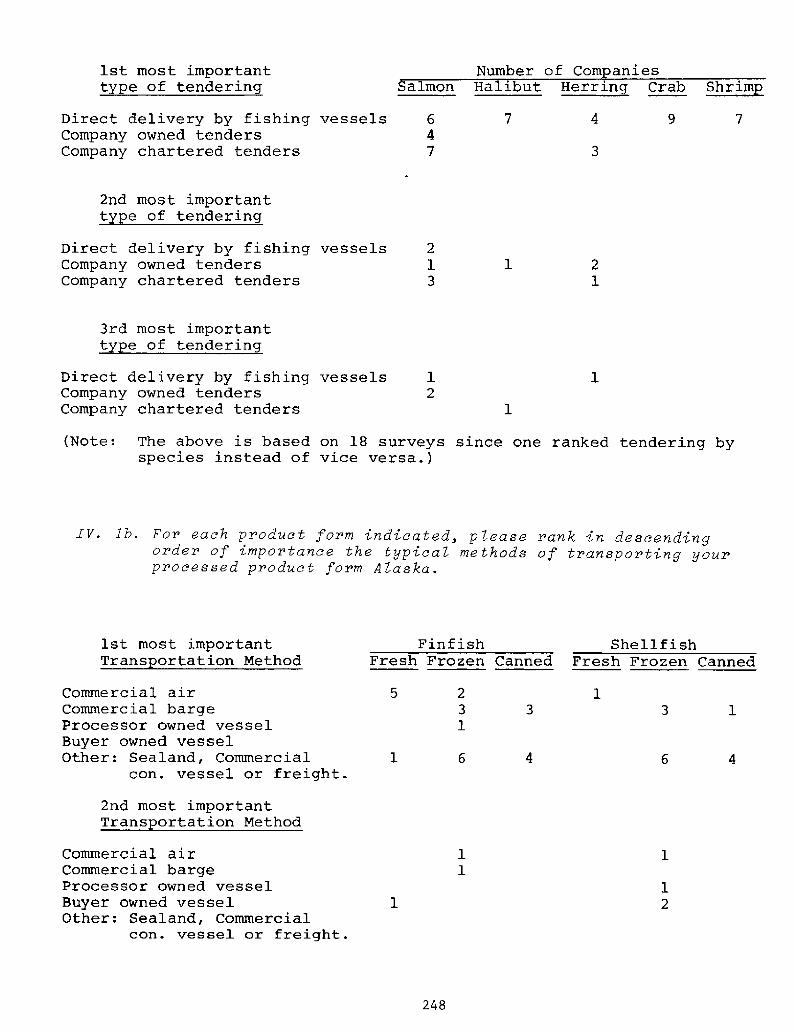
Number of Com anies1st most importanttype of tendering
Direct delivery by fishing vesselsCompany owned tendersCompany chartered tenders
6 7 4 9
4
7 3
2nd most importantt e of tendering
Direct delivery by fishing vessels 2Company owned tenders 1Company chartered tenders 3
3rd most importantt e of tendering
Direct delivery by fishing vessels 1Company owned tenders 2Company chartered tenders
Note: The above is based on 18 surveys since one ranked tendering byspecies instead of vice versa.!
1 V. 2b. For each product form indicatea, please r ank in descendinaorder of impor tance the typical methods of transpor ting yourpr ocessed pr oduct form Alaska.
Finf ish1st most importantTrans ortation Method
Shellfish
2nd most importantTrans ortation Method
248
Comme rcial air
Commercial bargeProcessor owned vessel
Buyer owned vesselOther: Sealand, Commercial
con. vessel or freight.
Commercial air
Commercial bargeProcessor owned vessel
Buyer owned vesselOther: Sealand, Commercial
con. vessel or freight.
almon Halibut Herring Crab ~Shrim
Fresh Frozen Canned Fresh Frozen Canned

ShellfishFinf ish3rd most importantTrans ortation Method Fresh Frozen Canned Fresh Frozen Canned
Commercial airCommercial bargeProcessor owned vesselBuyer owned vesselOther: Sealand, Commercial
con. vessel or freight.
4th most importantTransportation Method
Commercial airCommercial bargeProcessor Owned vesselBuyer owned vesselOther: Sealand, Commercial
con. vessel or freight.
IV. 7c. Awe ther e any signi ficant trends in the methods or pxacti cesof tr anspor tation of fish or she'L'cfish from Alaska harvest-ing a2'eas to processing faci 7i ties?
More using air transport.Catcher boats installing brine and making directdeliveries.Airlift -- we are no longer involved with this, however,Salmon tenders are becoming larger and faster and havebetter refrigeration systems. They are travelinggreater distances.Since we are only concerned with crab, they have beenand probably will continue to be delivered live by thecatcher vessel direct to the processor.It appears that a larger quantity of fish is shippedfresh to Seattle by air for freezing than in the 1960's.We would like to freeze fish in Togiak, but we lack thelong-term capital to install a freezer plant.Nore air from Bristol Bay.In salmon, more brine-called vessels.Nore money being invested in brine refrigeration. Thereis a tremendous amount of processor's money being directedinto this area.
By individual boat.
�!�!
�!
�! 8! 9!
�0!
249
Note: The above is based on 17 surveys because one ranked transportationby product instead of vice-versa and there was one "no response".
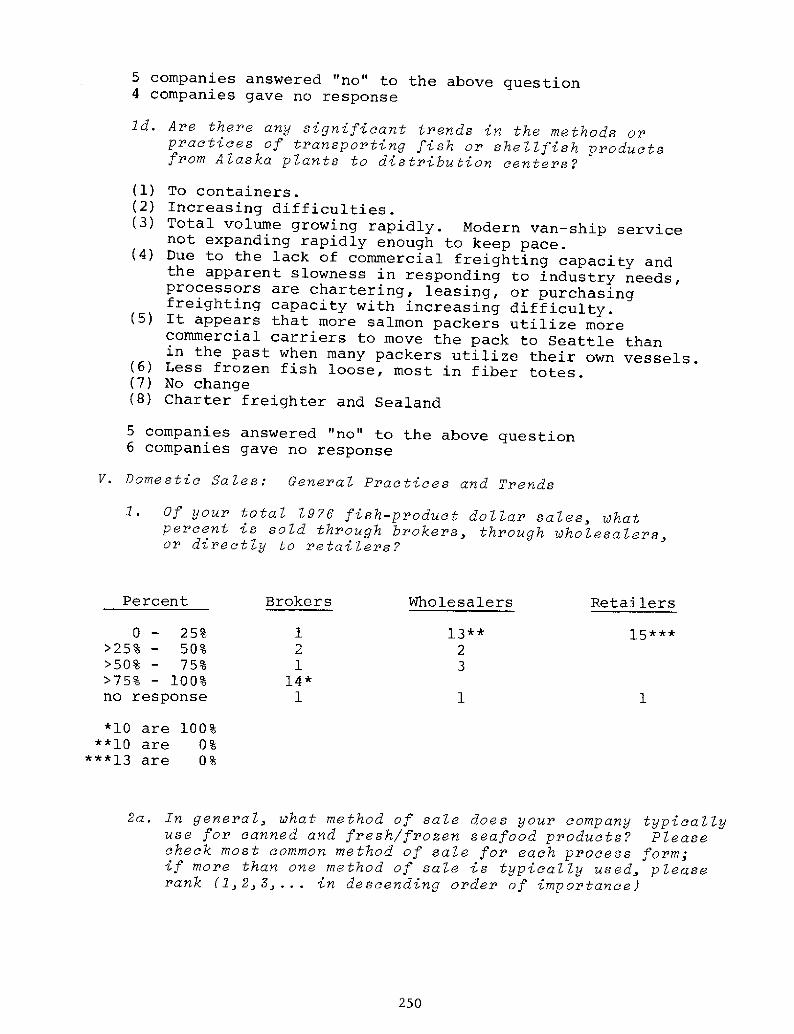
5 companies answered "no" to the above question4 companies gave no response
2d. Ar e ther'e anp signi fi cant tr ends in the methods or'practices of transporting fish or shellfish productsfr'om A laska plants to di stribution center's?
�! To containers.�! Increasing difficulties.�! Total volume growing rapidly. Modern van-ship service
not expanding rapidly enough to keep pace.�! Due to the lack of commercial freighting capacity and
the apparent, slowness in responding to industry needs,processors are chartering, leasing, or purchasingfreighting capacity with increasing difficulty.
�! It appears that more salmon packers utilize morecommercial carriers to move the pack to Seattle thanin the past when many packers utilize their own vessels.
�! Less frozen fish loose, most in fiber totes.�! No change 8! Charter freighter and Sealand
5 companies answered "no" to the above question6 companies gave no response
V. Domestic Sales: 5'eneral Practices and Tr'ends
2. Of pour to ta l 7976' fi sh-pr oduct do Liar sa l es, vhatpercent is sold through br oker's, through wholesalers,or dir ect Lp to retailer s?
RetailersWholesalersBrokersPercent
j 5***13**
2 31
2
114*
1
0 � 25%
>25% � 50%
>50% � 75%
>75% � 100%
no response
*10 are 100%
**10 are 0%
***13 are 0%
250
2a. Zn general, vhat method of sale does pour companp tppicallpuse for canned and fresh/frozen seafooa pr oducts? Pleasecheck most common method of sale for each process form;i f mor'e than one method o f sal e is tppi ca Z l p used, p leaser ank �, 8, 8,... in descending or der o f impor tance!

1st most importantMethod of Sale
Process Form
Canned Fr e sh/Frozen
2nd most importantMethod of Sale
3rd most importantMethod of Sale
2b. Please indicate any signi ficant tr enas over the past decadeconcerning methoas of sale in the Paci fic Nor thvest sea foodindustry.
�! All sales through sister company�! Unknown, but we believe that normal terms are still the
prevalent method of sale.�! less letter of credit on export�! Consignment being used to a lesser extent.�! Retail 2%/10 � N 30 Food Service 30 Net
V. 8a. Does pour pr'ocessi ng business typical lg do custom pr'ocessi ngfor other sea food pr ocessi ng firms?
yes = 6 one of these "yes" responses later statesno = 13 -- in V 8f. -- that they are not involved
no response = 0 in custom processing!
Bb. I f yes, does pour company typical Ey r ecei ve pr'oducti on advancesfrom the firms for whom you custom pr ocess?
yes = 0no= 6
no response = 0
251
Normal terms
ConsignmentDelayed BillingOther telex!cash before ship.
Normal terms
ConsignmentDelayed BillingOther telex!cash before ship.
Normal terms
ConsignmentDelayed BillingOther telex!cash before ship.
no response = 14 � of which said "none"!
13
1
1
1
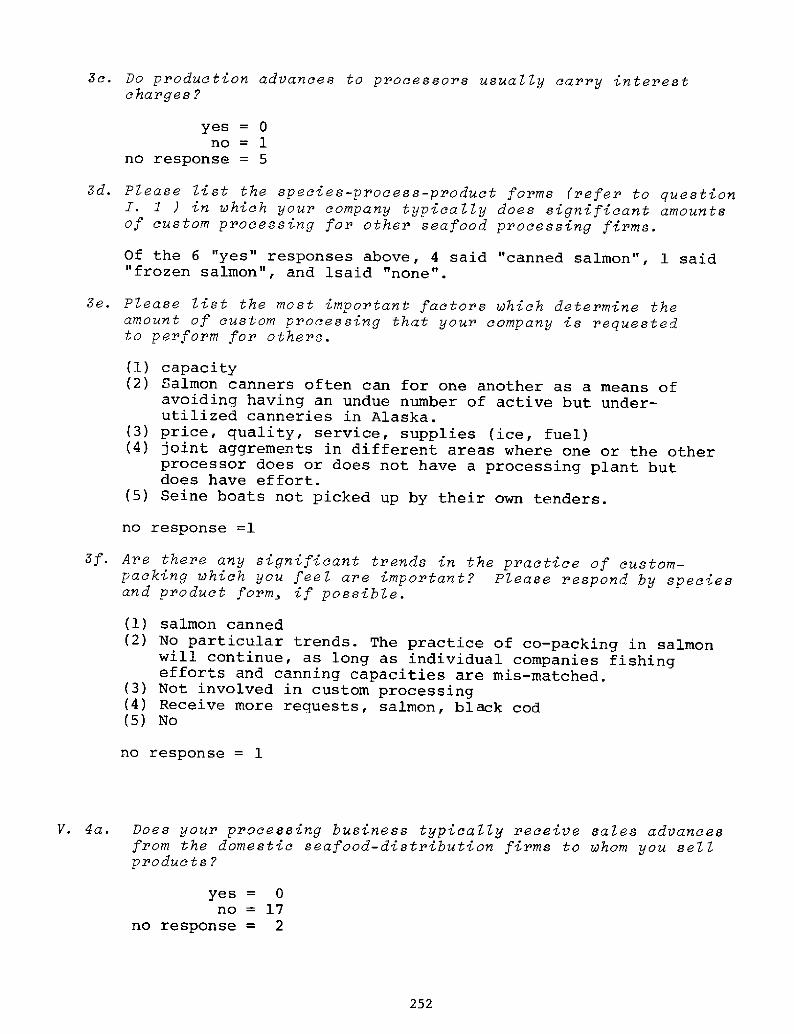
8c. Do pr oduction advances to pz ocesaor's usual ly caz'z y i ntez eatc haz'ges?
yes = 0no= i
no response = 5
8d. PLease li st the species-pr'oceas-product forms refer' to question1. 2 ! in which your company typica Lly does siqni ficant amountsof custom processing for other seafood processing firma.
Of the 6 "yes" responses above, 4 said "canned salmon", l said"frozen salmon", and lsaid "none".
8e. Please list the most impor tant factor'a which determine theamount of custom pz'ocessing that youz company is zequestedto per form foz others.
�! capacity�! Salmon canners often can for one another as a means of
avoiding having an undue number of active but under-utilized canneries in Alaska.
�! price, quality, service, supplies ice, fuel!�! joint aggrements in different areas where one or the other
processor does or does not have a processing plant butdoes have effort.
�! Seine boats not picked up by their own tenders.
no response =1
3 f. Az'e thez e any significant trends i n the pr acti ce of cus tom-pac king which you f e e l ar'e impoz'tant? Pl ease z'eapond by speciesand product form i f possible.
�! salmon canned�! No particular trends. The practice of co-packing in salmon
will continue, as long as individual companies fishingefforts and canning capacities are mis-matched.
�! Not involved in custom processing�! Receive more requests, salmon, black cod�! No
no response = 1
V. 4a. Does your processing business typically receiue sales advancesfrom the domestic seafooa-distribution firma to shorn you sell.pz o due t s?
yes = 0no = 17
no response = 2
252
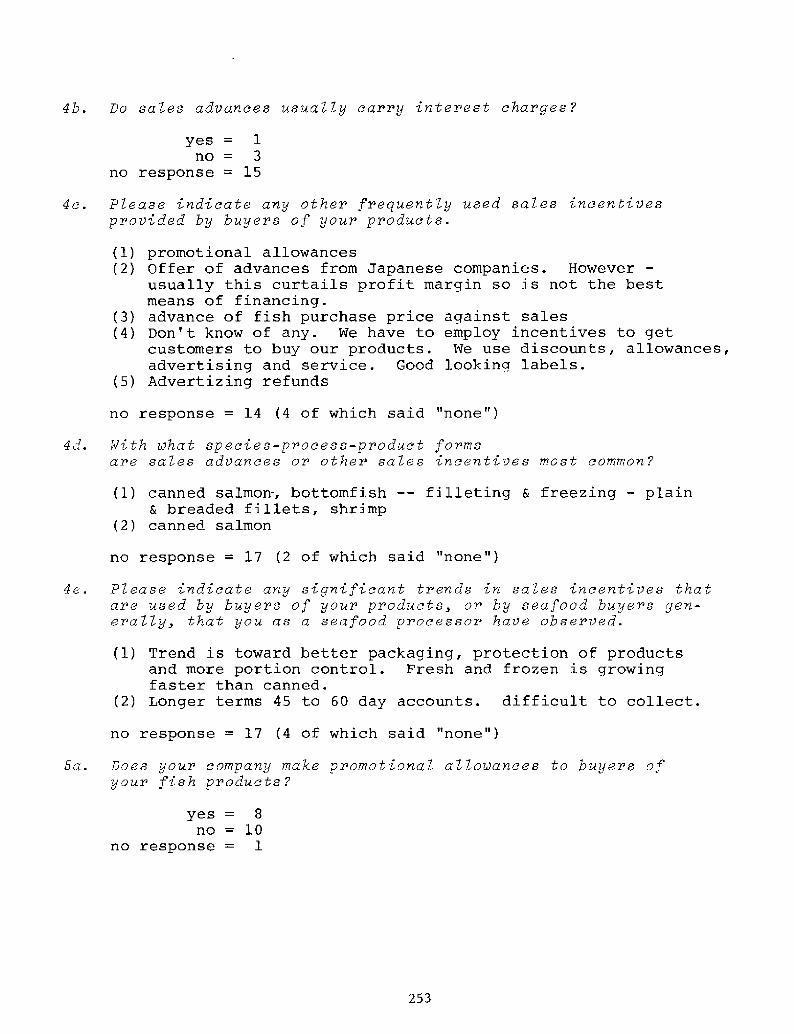
4b. Do sales advances usual ly car r y interest charges?
yes = 1no = 3
no response = 15
4c. Please indicate any other fr equently usea sales incentivespr ovi ded by buyer s of your pr oducts.
�! promotional allowances�! Offer of advances from Japanese companies. However
usually this curtails profit margin so is not the bestmeans of financing.
�! advance of fish purchase price against sales�! Don't know of any. We have to employ incentives to get
customers to buy our products. Ne use discounts, allowances,advertising and service. Good looking labels.
�! Advertizing refunds
no response = 14 � of which said "none"!
Pith vhat species-process-product f'ormsar e sales advances or other' sales incentives most common?
�! canned salmon-, bottomfish -- filleting & freezing � plain& breaded fillets, shrimp
�! canned salmon
no response = 17 � of which said "none"!
4e. Please indicate any signi ficant tr'ends in sales incentives thatare used by buyers of your products, or by seafooa buyers gen-erally, that you as a seafood processor have observed.
�! Trend is toward better packaging, protection of productsand more portion control. Fresh and frozen is growingfaster than canned.
�! Longer terms 45 to 60 day accounts. difficult to collect.
no response = 17 � of which said "none"!
Sa. Does your' company make pr'omotional allowances to buyer's ofyour fi sh pr oducts?
yes = 8no = l0
no response = 1
253
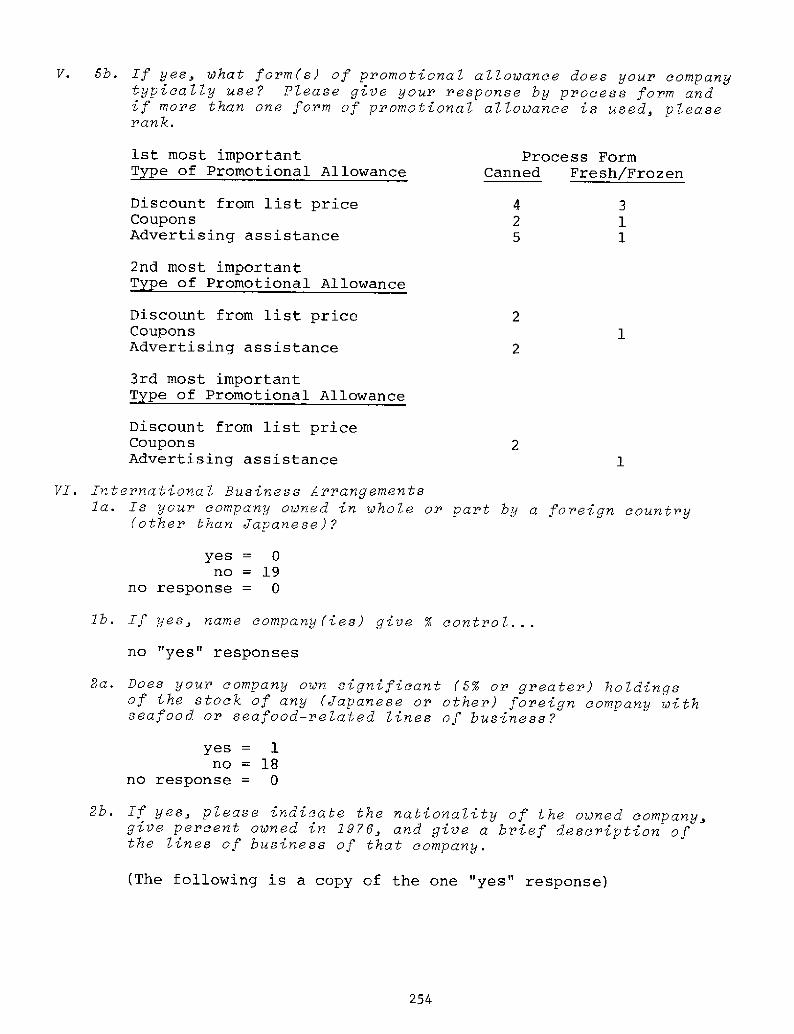
1st most importantT pe of Promotional Allowance
Process Form
Canned Fresh/Frozen
Discount from list priceCouponsAdvertising assistance
2nd most importantT e of Promotional Allowance
Discount from list priceCouponsAdvertising assistance
3rd most importantTy e of Promotional Allowance
Discount from list priceCouponsAdvertising assistance
VZ. Znter national Business Ar'r angementsla. Zs your company ovned in @hole or part by a for'ei gn country
other' than Japanese!?
yes = 0no = 19
no response = 0
2b. Zf yes, name company i es! gi ve %%u contr ol.
no "yes" responses
Ba. Does your company own significant 8% or gr eater ! holdingsof the stock of any Japanese or other! foreign company xithsea food or sea food-r elated lines o f busi ness?
yes = 1no = 18
no response = 0
2b. Zf yes, please indicate the nationality of the ovned company,give per cent ourned in 2976', and give a brief description ofthe lines of business of that company.
The following is a copy of the one "yes" response!
254
V. 8b. Zf yes, vhat for'm s! of promotional allowance does your companytypi ca l ly use? Please gi ve you»esponse by pr ocess form andi f more than one form of promotional allowance is used, pleaser ank.
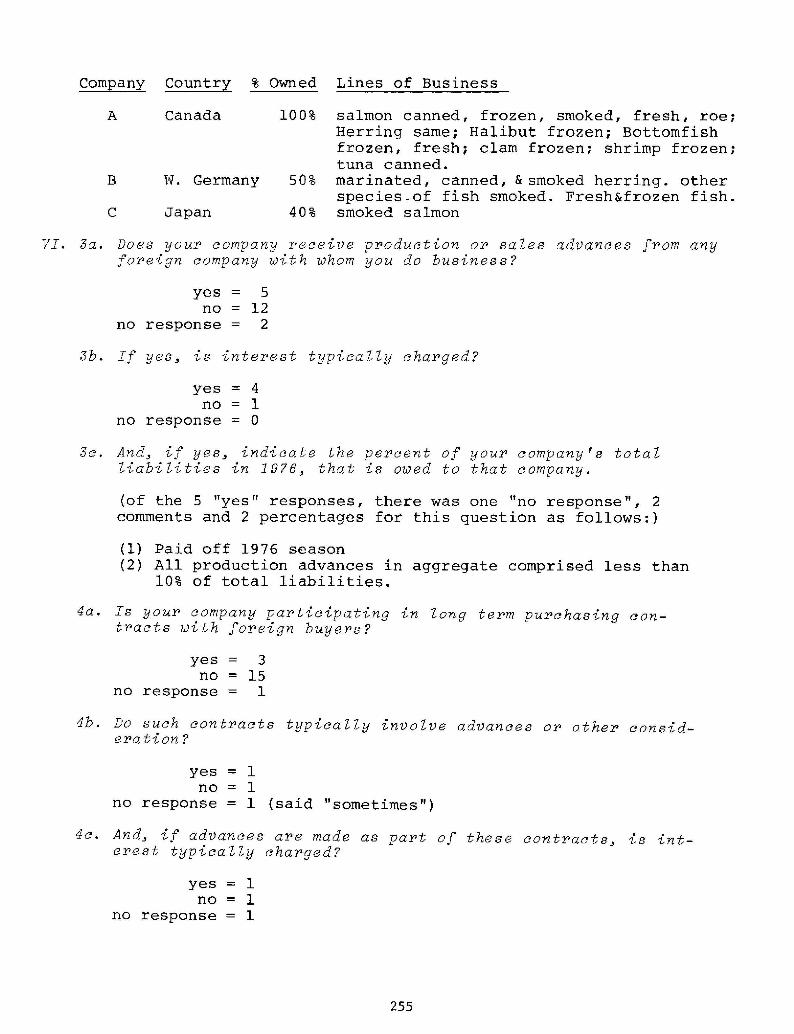
~Com any ~Countr % Owned Lines ot Business
100% salmon canned, frozen, smoked, fresh, roe;Herring same; Halibut frozen; Bottomfishfrozen, fresh; clam frozen; shrimp frozen;tuna canned.
50% marinated, canned, 6 smoked herring. otherspecies� of fish smoked. Fresh&frozen fish.
40% smoked salmon
Canada
N. Germany
Japan
yes = 5no = 12
no response = 2
Vb. Zf yes, is interest typically charged?
yes = 4no = 1
no response = 0
And, i f pes, indicate the percent of your company 's total.liabilities in 2876', that is oned to that company.
of the 5 "yes" responses, there was one "no response", 2comments and 2 percentages for this question as follows: !
�! Paid off 1976 season�! All production advances in aggregate comprised less than
10% of total liabilities.
4a. Is pour company par ticipating in long term pur chasing con-tr acts vi th foreign buyer's?
yes = 3no = 15
no response = 1
4b. Do such cont~acts tppica22p involve advances or other consid-er ation?
yes = 1no= 1
no response = 1 said "sometimes"!
Ana, i f advances are made as part o f these contr'acts, is int-er est typical, ly char ged?
yes = 1no= 1
no response = 1
255
VZ'. Ba. Does your company receive production or sales advances from anpfor eign company vith whom you do business?
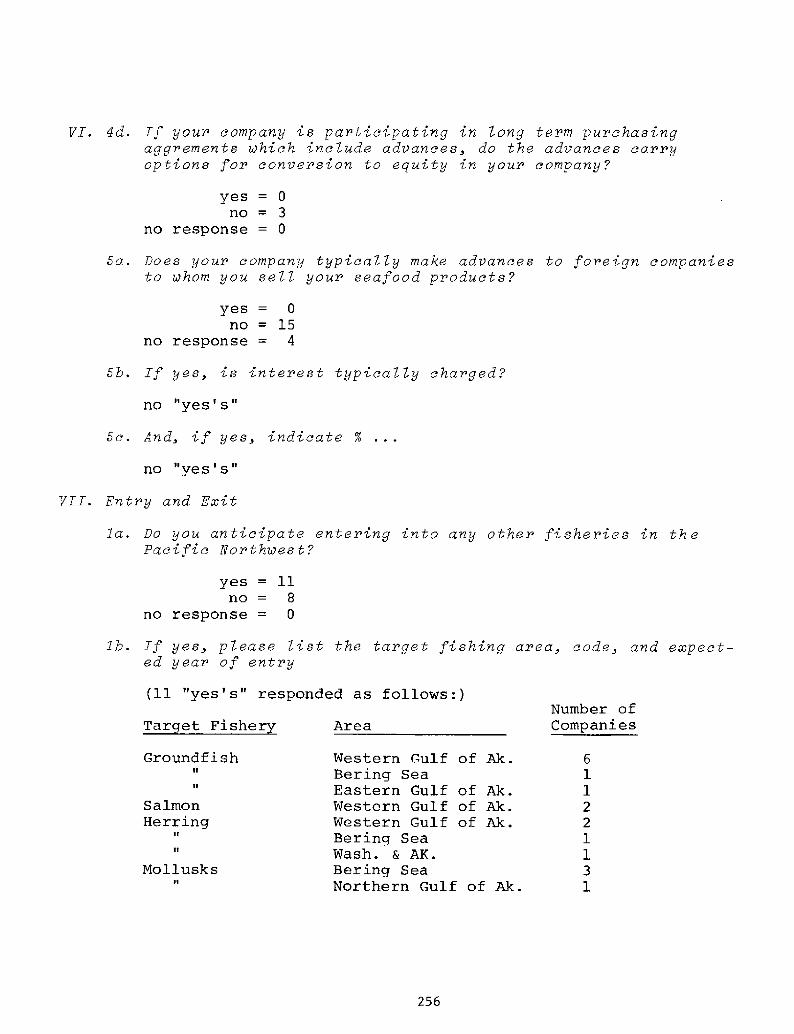
V1. 4d. If your companp is par ticipatinq in long term purchasingaggrements which include advances, do the advances carryoptions for conversion to equity in your company?
yes = 0no = 3
no response = 0
Ga. Does pour companp typical lp make advances to foreiqn companiesto whom you sel,l your' seafood products?
yes = 0no = 15
no response = 4
no "yes's"
5c. And, i f pes, indicate %%u
no "yes ' s"
VII . Entry and Zxi t
1a. Do you anticipate entering into any other fisheries in thePaci fic Nor thvest?
ll
8
0
yesno
no response
2b. If pes, please list the target fishinq area, code, and expect-ed pear of entry
Number of
Companies
Groundfish
Salmon
Herring
Mollusks
256
If pes, is interest typically charged?
ll "yes's" responded as follows: !
Target. Fisher Area
Western Gulf of Ak.
Bering SeaEastern Gulf of Ak.
Western Gulf of Ak.
Western Gulf of Ak.
Bering SeaWash. K AK.
Bering SeaNorthern Gulf of Ak.
6 1
1 2 2 11 31
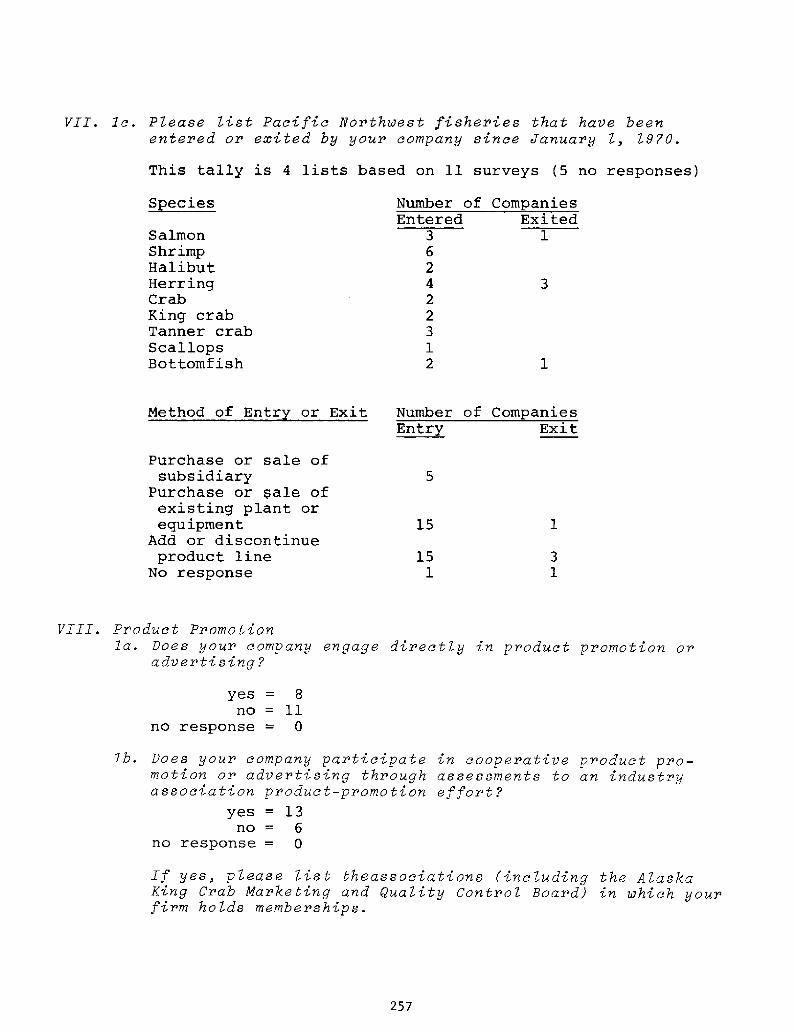
VI2. 2c. Please li st Paci fic Northwest fi sher'i es that have Seenenter ed oz' exited by your' company since January '5, L970.
This tally is 4 lists based on ll surveys � no responses!
Number of CompaniesExitedEntered
Salmon
ShrimpHalibutHerringCrab
King crabTanner crab
ScallopsBottomfish
Method of Entr or Exit Number of CompaniesEntry Exit
Purchase or sale of
subsidiaryPurchase or sale of
existing plant orequipment
Add or discontinue
product lineNo response
15
1
yes = 8no = 11
no response = 0
Zb. Does your company participate in cooperative product pro-motion or adver ti sing through assessments to an industryassociation product-pr omotion ef fort?
yes = 13no= 6
no response = 0
If yes, please list theassociations inc Luding 0he AlaskaEing Crab Marketing and Quality Contr ol Boar d! in which your'firm holds member ships.
257
UIII. Pr oduct Pr'omo ti on
2a. Does your company engage directly in product promotion ora dv er ti si ng?
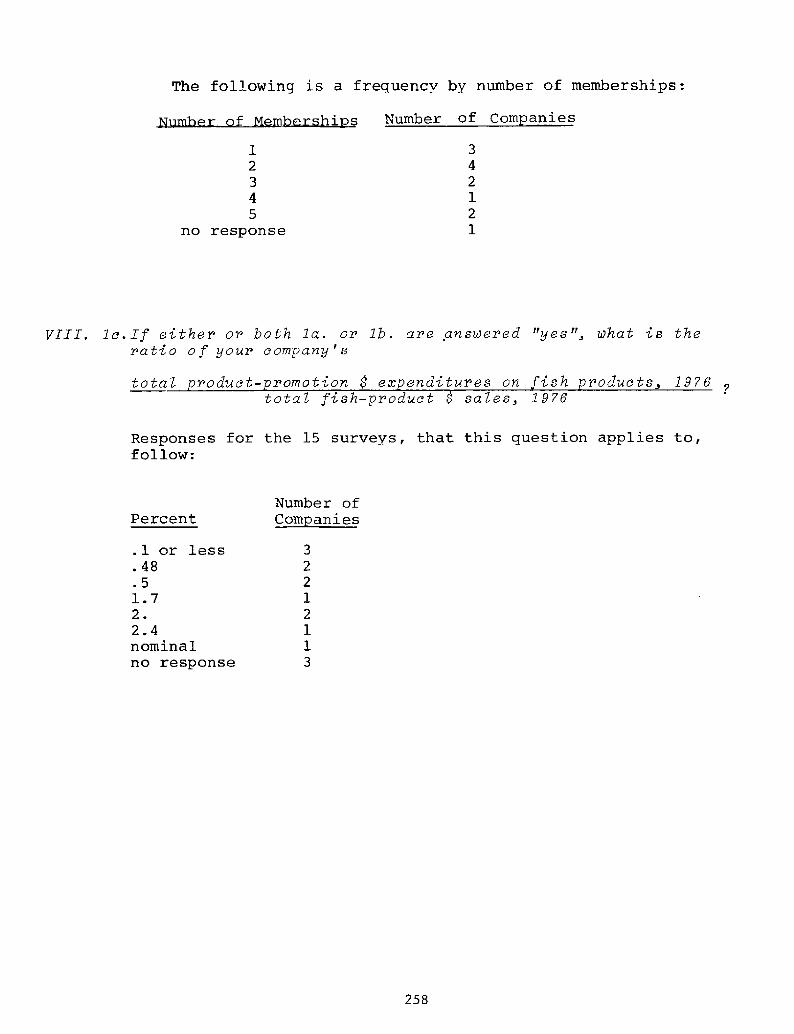
The following is a frequency by number of memberships:
Number of Com anies
1
2
3
4
5
no response
V2'22'. 2e.Zf either or both 2a. or 2b. are answered "yes", vhat is theratio o f your company 's
tota2 r oduct- r omoti on 4 ez enditur es on ish r oduets, 2976total fish-pr oduet sales, 2876'
Responses for the 15 surveys, that this question applies to,follow:
Number of
Percent
.1 or less
.48
.5
1.7
2.
2.4
nominal
no response
258

APPENDIX IV
PERIOD 3 �976! STRUCTURAL PARAMATERS
259
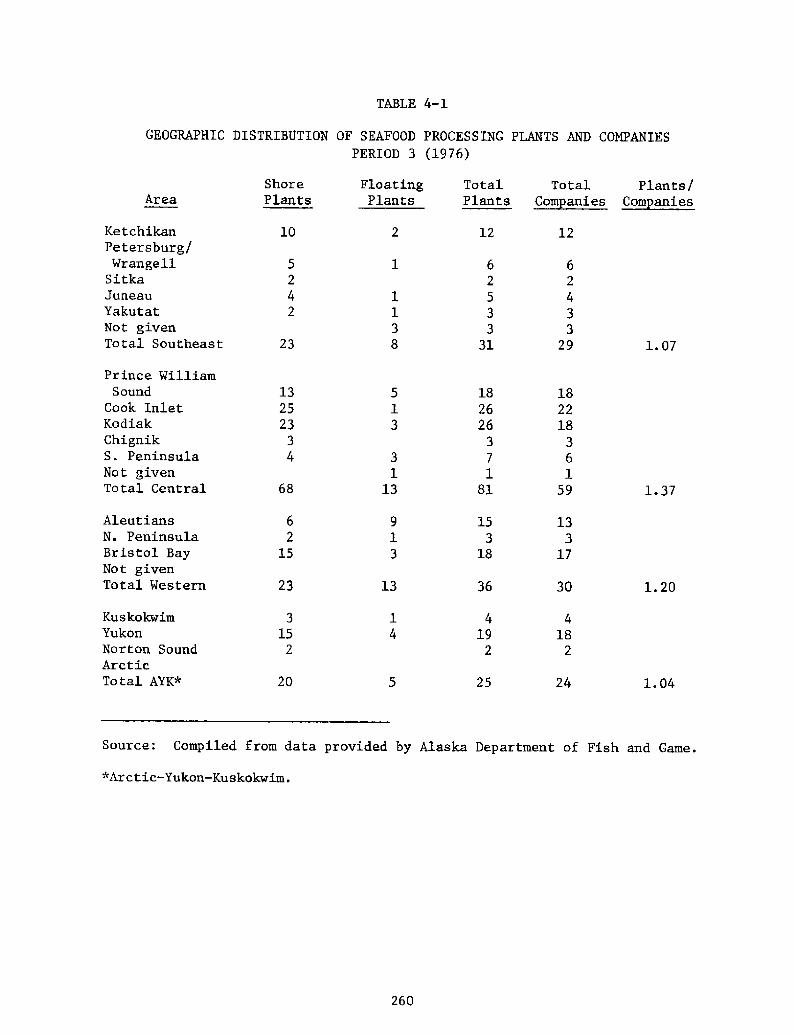
TABLE 4-1
GEOGRAPHIC DISTRIBUTION OF SEAFOOD PROCESSING PLANTS AND COMPANIES
PERIOD 3 �976!
Total Plants/~Com aoiee ~Com aniee
Total
Plants
FloatingPlants
Shore
PlantsArea
10 1212
23 l. 07
3
1
1368 1.37
6
2
15
15
3
18
13
3
17
36 30 1.2013
4
19
2
3
15
2
4
18
2
20 24 1.0425
Source: Compiled from data provided by Alaska Department of Pish and Game.
*Arctic-Yukon-Kuskokvim.
260
Ketchikan
Petersburg/Wrangell
Sitka
Juneau
Yakutat
Not givenTotal Southeast
Prince William
Sound
Cook Inlet
Kodiak
ChignikS. Peninsula
Not givenTotal Central
Aleutians
N. Peninsula
Bristol BayNot givenTotal Western
Ku s kokwim
Yukon
Norton Sound
Arctic
Total AYK*
13
25
23 34
6 2 53 3
31
18
26
26 3 71
81
6
2 4 3 329
18
22
18 36
1
59
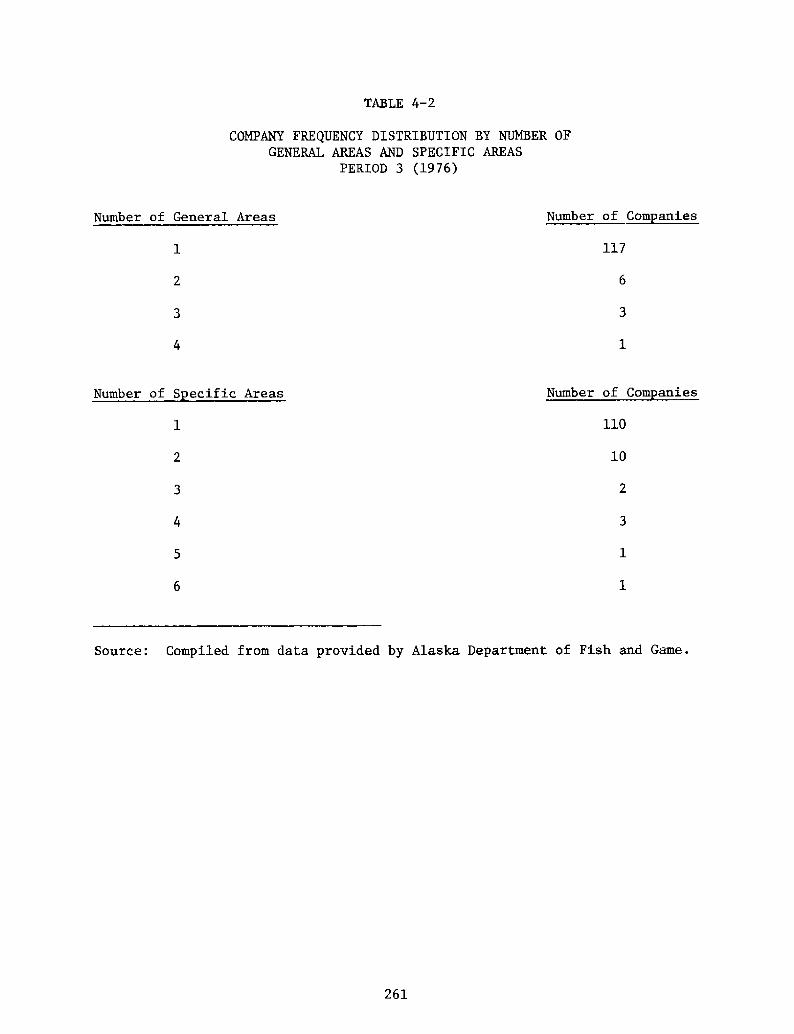
TABLE 4-2
COMPANY FREQUENCY DISTRIBUTION BY NUMBER OFGENERAL AREAS AND SPECIFIC AREAS
PERIOD 3 �976!
Number of General Areas Number of Com anies
117
Number of S ecific Areas Number of Com anies
110
10
Source: Compiled from data provided by Alaska Department of Fish and Game.
261
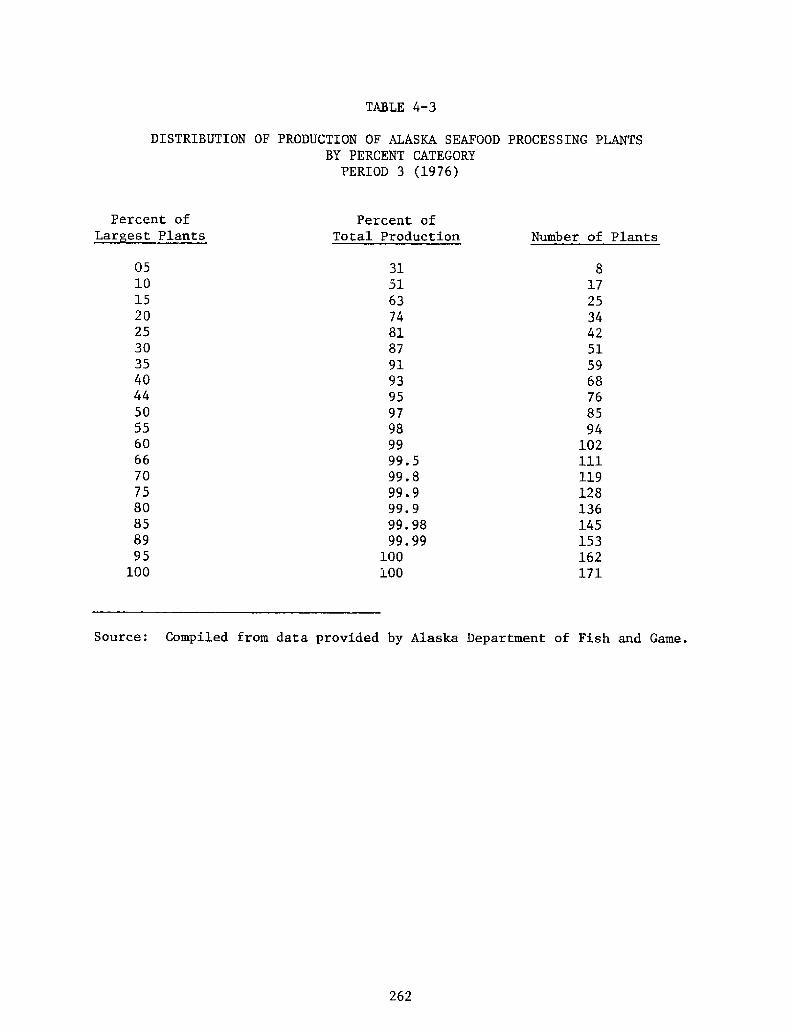
TABLE 4-3
DISTRIBUTION OF PRODUCTION OF ALASKA SEAFOOD PROCESSING PLANTS
BY PERCENT CATEGORY
PERIOD 3 �976!
Percent of Percent of
Total Production Number of Plants
Source: Compiled from data provided by Alaska Department of Fish and Game.
262
05
10
15
20
25
30
35
40
44
50
55
60
66
70
75
80
85
89
95
100
31
51
63
74
81
87
91
93
95
97
98
99
99.5
99.8
99.9
99. 9
99.98
99.99
100
100
8
17
25
34
42
51
59
68
76
85
94
102
ill
119
128
136
145
153
162
171
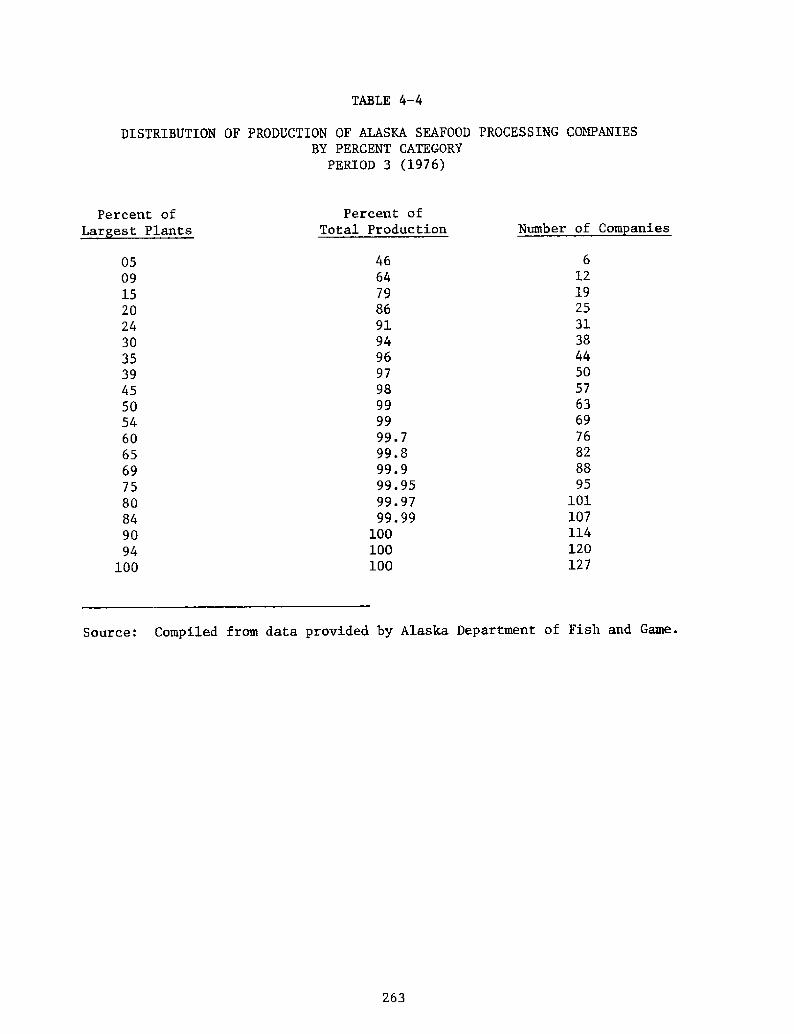
TABLE 4-4
DISTRIBUTION OF PRODUCTION OF ALASKA SEAFOOD PROCESSING COMPANIESBY PERCENT CATEGORY
PERIOD 3 �976!
Percent of
Total ProductionPercent of
Number of Com anies
Source: Compiled from data provided by Alaska Department of Fish and Game.
263
05
09
15
20
24
30
35
39
45
50
54
60
65
69
75
80
84
90
94
100
46
64
79
86
91
94
96
97
98
99
99
99.7
99.8
99.9
99.95
99.97
99.99
100
100
100
6
12
19
25
31
38
44
50
57
63
69
76
82
88
95
101
107
114
120
127
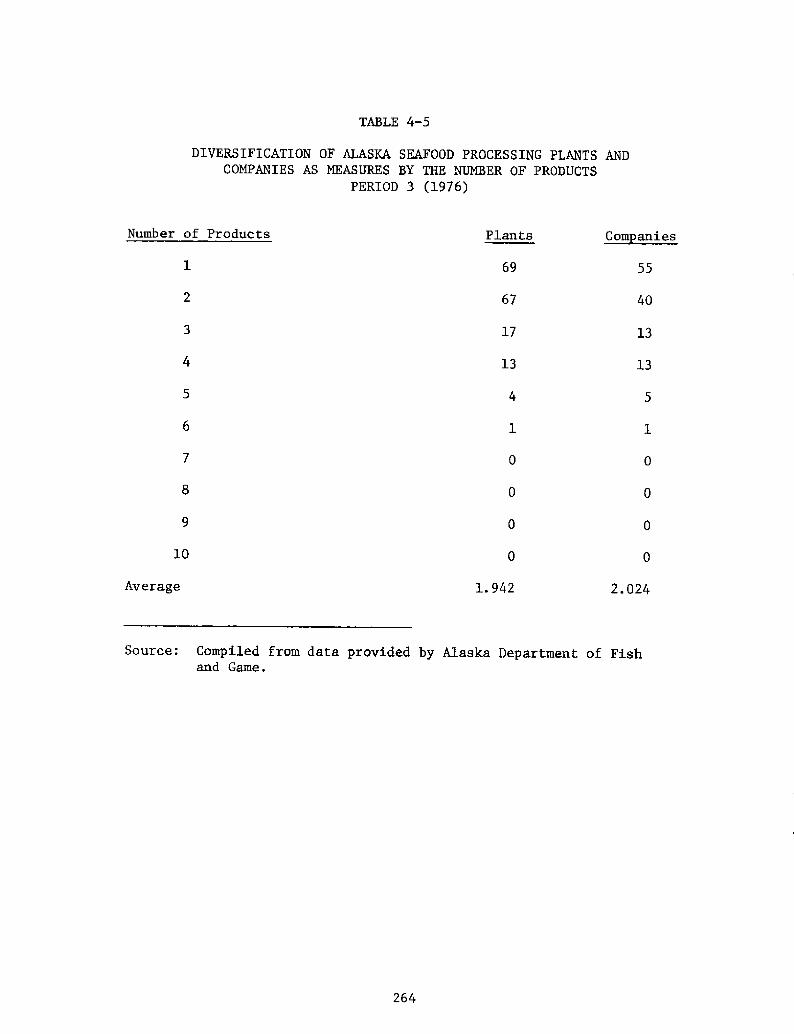
TABLE 4-5
DIVERSIFICATION OF ALASKA SEAFOOD PROCESSING PLANTS ANDCOMPANIES AS MEASURES BY THE NUMBER OF PRODUCTS
PERIOD 3 �976!
~Com aniesPlantsNumber of Products
69 55
67 40
17 13
13 13
10
l. 942 2. 024Average
264
Source: Compiled from data provided by Alaska Department of Fishand Game.
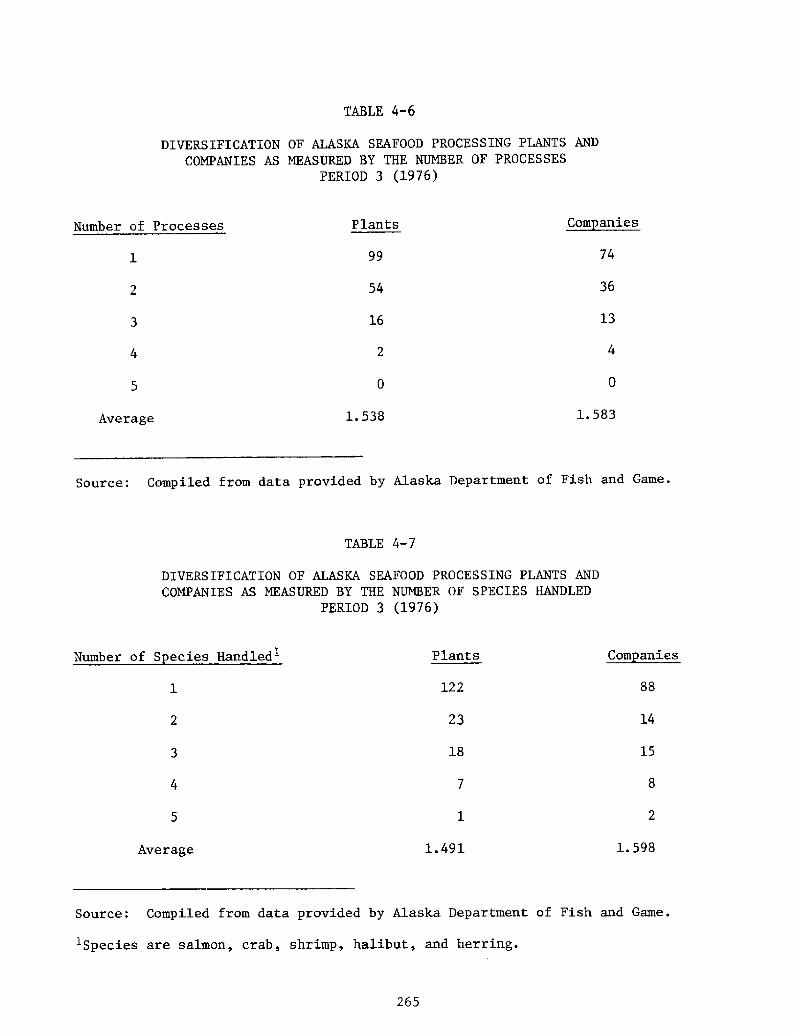
TABLE 4-6
DIVERSIFICATION OF ALASKA SEAFOOD PROCESSING PLANTS ANDCOMPANIES AS MEASURED BY THE NUMBER OF PROCESSES
PERIOD 3 �976!
~Cpm aniesPlantsNumber of Processes
99
3654
13
l. 5831. 538Average
TABLE 4-7
DIVERSIFICATION OF ALASKA SEAFOOD PROCESSING PLANTS AND
COMPANIES AS MEASURED BY THE NUMBER OF SPECIES HANDLED
PERIOD 3 �976!
Number of S ecies Handled~ Plants
122 88
23 14
1518
1. 491 l. 598Average
Source: Compiled from data provided by Alaska Department of Fish and Game.
Species are salmon, crab, shrimp, halibut, and herring.
265
Source: Compiled from data provided by Alaska Department of Fish and Game.
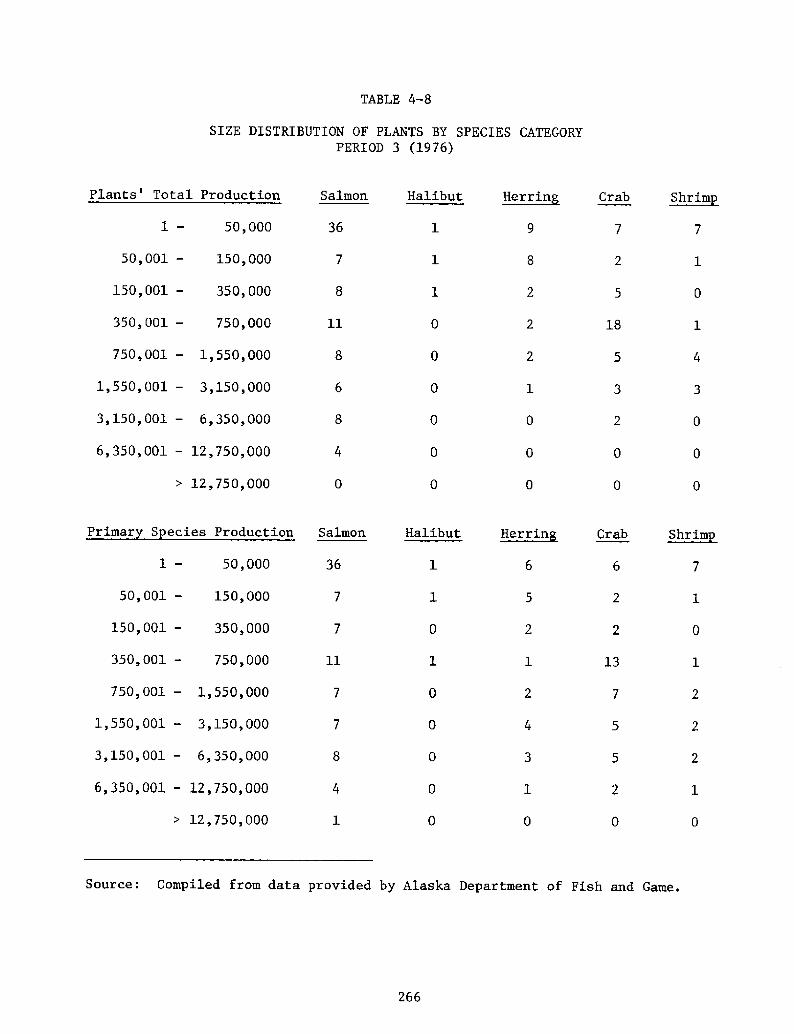
TABLE 4-8
Plants' Total Production Halibut.Salmon ~Barrie Crab
36 1 9
18
> 12,750,000
Primar S ecies Production Salmon Halibut ~Herria Crab
36 1 6
12,750,000
Source: Compiled from data provided by Alaska Department of Fish and Game.
266
50%001
150,001
350,001
750,001
1,550,001
3,150,001
6,350,001
50,001
150,001
350,001
750,001
1,550,001
3,150,001
6,350,001
SIZE DISTRIBUTION OF PLANTS BY SPECIES CATEGORYPERIOD 3 �976!
50,000
j.509000
350, 000
750,000
1,550,000
3,150,000
6,350,000
12,750,000
50,000
150,000
350,000
750,000
1,550,000
3,150,000
6,350,000
12,750,000

TABLE 4-9
Plants' Total Production Fresh/Frozen CuredCanned Reduction
1330
10
24
750,001 � 1,550,000
1,550,001 � 3,150,000
3,150,001 � 6,350,000
6.350 001 12i750.000
! 12,750,000
12
Primar S ecies Production Fresh/Frozen ReductionCanned Cured
1330
24
750,001 � 1,550,000
1,550,001 � 3,150,000
3,150,001 � 6,350,000
6,350,001 � 12,750,000
12,750,000
10
Source: Compiled from data provided by Alaska Department of Fish and Game.
267
50, 001�
150,001�
350,001�
50, 001�
150,001�
350,001�
SIZE DISTRIBUTION OF PLANTS BY PROCESS FORM
PERIOD 3 �976!
50,000
150,000
350,000
750,000
50,000
150,000
350,000
750,000
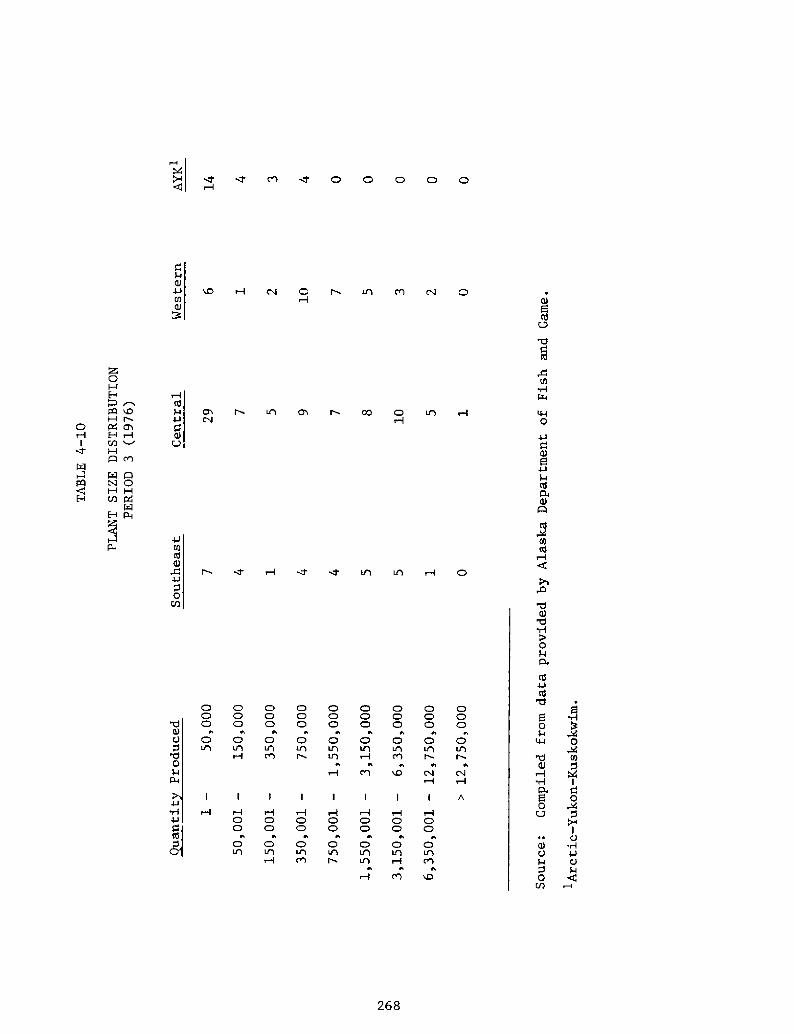
0
I4 AN 0
M
ed
Q 0
0 0 00 0 00 0 0
8 A0 0 0r
0 0 00 0 00 0 0
~ 920 0 0
0 0 00 0 00 O O
~ I ~ l P0 0 0
A
I I I I I I I A
0 00 0
0 0
0 0 00 0 0t A0 0 0lPl
A
0 00 0
A ~ I0 0
A
268
RO
cd
M0 4 n gr4 E4 W dII M
M
0 0 O O 0
0 W ul W & 0
4Jcd
8O4-I
'aQI
8 Q 0O
~ ~dI
V 0

O 0 0 0 O
cV Lc! W QO Pl N O
~ -IR cd0
dIU
c0CV
0
0 00 00 0
A A0 0
I I I I I I I I A
0 0 0 LP!
269
CQ
aPx1
MH 0
C dIdI
cddI4J
0
0 0 0 00 0 0 00 0 0 0
~ I A ~ L0 0 0 0
lA~ I ~ I
0 0 0 00 0 0 0
~ I ~ l0 0 0 0
A
0 0 00 0 00 0 0
0 0 0
A ~ ICVr I
0 00 0
A A0 0
MA A
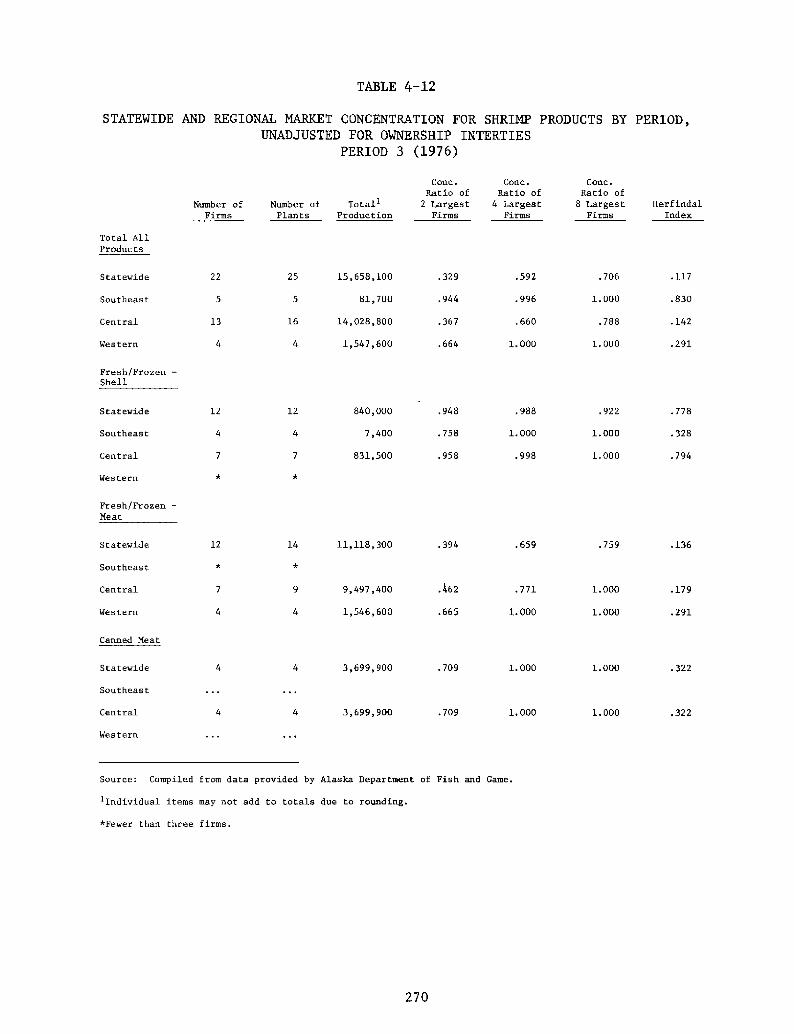
TABLE 4 � 12
STATEWIDE AND REGIONAL ACKET CONCENTRATION FOR SHRIMP PRODUCTS BY PERIOD,UNADJUSTED FOR OWNERSHIP INTERTIES
PERIOD 3 �976!
TotalProduction
HerfindalIndex
Number ofPlants
Number ofFirms
Total AllProducts
22 25 .706 .117. 329 . 592Statewide
.996 1,000 ,830Southeast
16Central 13 . 367 . 660 .788 .142
,664 l. 0001, 000 .291Western
Fresh/FrozenShell
,948 .988Statewide 12 12 . 922 , 778
Southeast .758 1.000 1.000 .328
Central .958 .998 1.000
Western
Fresh/FrozenMeat
12 14Statewide 11,118,300 .394 .659 .759 .136
Southeast
.42Central 9,497,400
1,546,600
.771 1.000 .179
.665 1.000 1,000Western ,291
Canned Meat
Statewide 3,699,900 .709 1.000 1.000 .322
Southeast
Central 3,699,900 .709 1.000 1.000 .322
Western
Source: Compiled from data provided by Alaska Department of Fish and Game.
iindividual items may not add to totals due to rounding.
sFewer than three firms.
270
15,658,100
81,700
14,028,800
1,547,600
840,000
7,400
831,500
Cone.Ratio of
2 LargestFirms
Conc..Ratio of
4 LargestFirms
Cone.Ratio of
8 LargestFirms
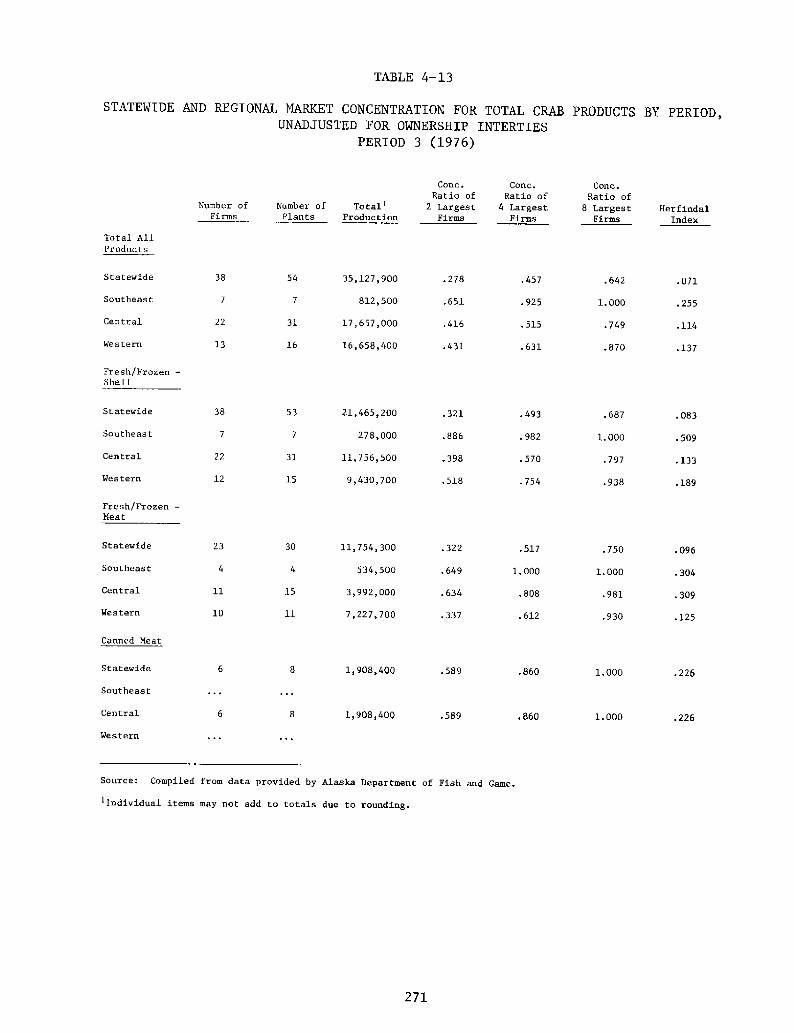
TABLE 4-13
STATEWIDE AND REGIONAL MARKET CONCENTRATION FOR TOTAL CRAB PRODUCTS BY PERIOD,UNADJUSTED FOR OWNERSHIP INTERTIES
PERIOD 3 �976!
TotaliProduction
RerfindalIndex
Number ofPlants
Number ofFirms
Total AllProducts
. 278 , 457 . 64238 .071Statewide
.651 .925 1,000Southeast .255
31 .416 .515 .749 . 114Central 22
.431 .631 .87013 16 .137Western
Fresh/Frozen�Shell
,68/38 53 . 321 .493Statewide .083
,886 . 982Southeast 1.000 .509
22 31 .398 ,570 .797Central .133
12 15 . 754 .938 ,189Western ~ 518
Fresh/FrozenMeat
30Statewide 23 . 322 ~ 517 .750 .096
.649 1.000Southeast
Central
I. 000 .304
.634 .808 .981 ,309
.61210 ,337 .930Western .125
Canned Meat
S t at ewide li908,400 .589 .860 1,000 .226
Southeast
1,908i400Central .589 .860 l. 000 .226
Western
Source: Compiled from data provided by Alaska Department of Fish and Game.
~individual items may not add to totals due to rounding.
271
35,127,900
812,500
17,657,000
16,658,400
21,465,200
278,000
11,756,500
9,430,700
11,754,300
534,500
3,992,000
7,227,700
Conc.Ratio of
2 LargestFirms
Conc,Ratio of
4 LargestFirms
Conc.Ratio of
8 LargestFirms
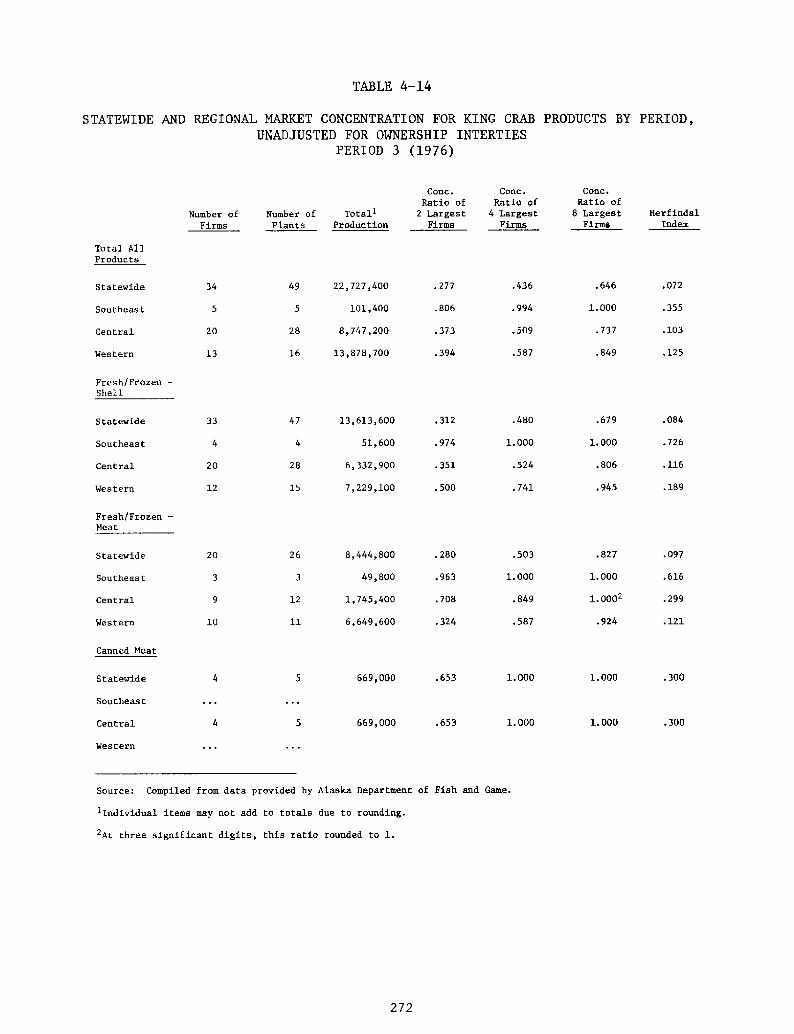
TABLE 4 � 14
STATEWIDE AND REGIONAL LARIAT CONCENTRATION FOR KING CRAB PRODUCTS BY PERIOD,UNADJUSTED FOR OWNERSHIP INTERTIES
PERIOD 3 �976!
TotalIProduction
HerfindalIndex
Number ofFirms
Number ofPlants
Total AllProducts
.43634 .646 .072. 277Statewide
.994 l. 000.806 .355Southeast
.50920 .737 .103.373Central
.849 .125.587.39413Western
Fresh/FrozenShe11
47 13,613,600 . 480. 312 .679Statewide 33 .084
.974 l. 000 .7261.000Southeast
28 .52420 . 351 .806Central . 116
.945.500 .74112 .18915Western
Fresh/Frozen�Meat
. 280 ,50320 26 .827 .097Statewide
1.0001.000 .616.963Southeast
Central 1.000212 .849.708 .299
.324 .587 .92410Western .121
Canned Meat
669,000Statewide 1. 000 .300.653 l. 000
Southeast
Central 669,000 l. 000.653 l. 000 . 300
Western
Source: Compiled from data provi.ded by Alaska Department of Pish and Game.
Individual items may not add to totals due to rounding,
2At three significant digits, this ratio rounded to 1.
272
49 22,727,400
5 101,400
28 8,74>7,200
16 13>878,700
51,600
6,332,900
7>229,100
8,444,800
49,800
1,745>4>00
6,649,600
Conc.Ratio of
2 LargestFirms
Conc.Ratio of
4 LargestFirms
Conc.Ratio of
8 LargestFirms
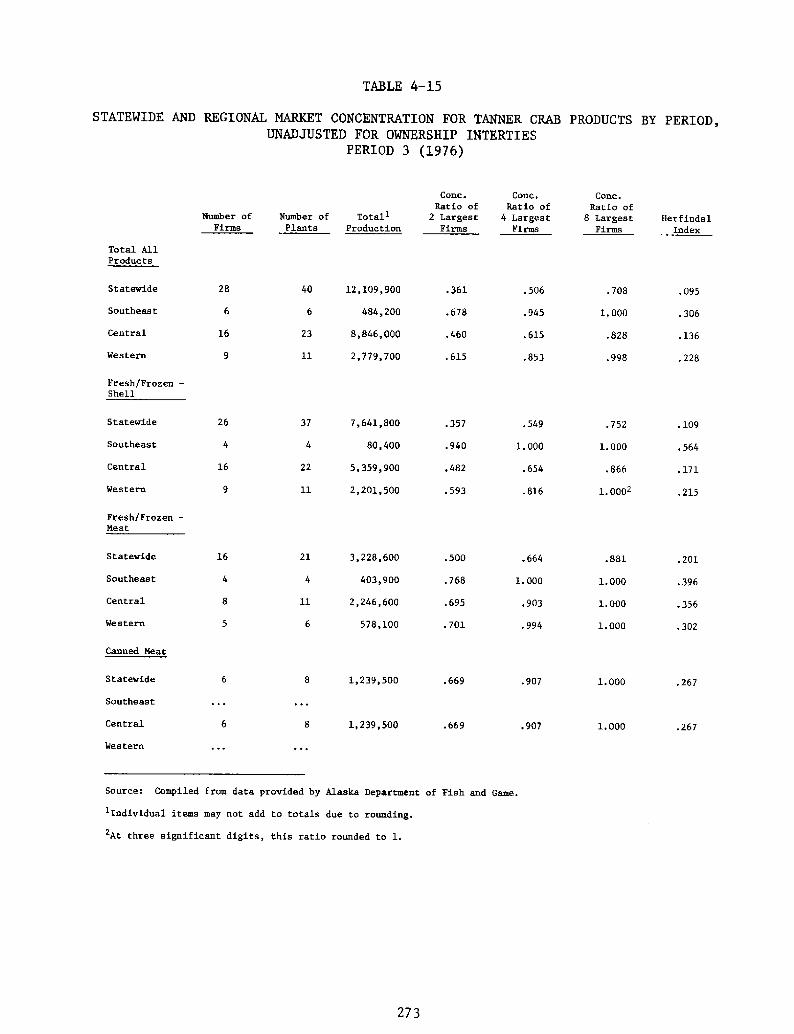
TABLE 4-15
STATEWIDE AND REGIONAL MARKET CONCENTRATION FOR TANNER CRAB PRODUCTS BY PERIOD,UNADJUSTED FOR OWNERSHIP INTERTIES
PERIOD 3 �976!
Total~production
Number ofPlants
Number ofFirms
BerfindalIndex
Total AllProducts
.50628 40 12,109,900 . 361 . 708 , 095
.678 .945 1.000 .306
16 .460 .615 ,82823 .136
,853. 615 . 998 .228Western
Fresh/Frozen�Shell
26 .549 .75237 . 357 . 109
. 940 1. 000 1.000 .564
16 22 .482 .654 .866 .171
1.0002.816Western .593 ,215
Fresh/FrozenMeat
.66416 .500 .881 .201
.768 1. 000 1. 000 .396
. 695 . 903 l. 000 . 356
,994Western . 701 1.000 ,302
Canned Meat
8 1,239,500 .669 .907 1. 000 .267
8 1,239,500 . 669 ,907 1.000 ,267
Western
Source: Compiled fram data provided by Alaska Department of Fish and Game.
tIndividual items may not add to totals due to rounding.
At three significant digits, this ratio rounded to l.
273
Statewide
Southeast
Central
Statewide
Southeast
Central
Statewide
Southeast
Central
Statewide
Southeast
Central
484,200
8,846,000
2,779,700
71641,800
80 ' 400
5,359,900
2,201,500
21 3,228,600
4 403,900
11 2,246,600
6 578,100
Conc.Ratio of
2 LargestFirms
Conc.Ratio of
4 LargestFirms
Conc.Ratio of
8 LargestFirms
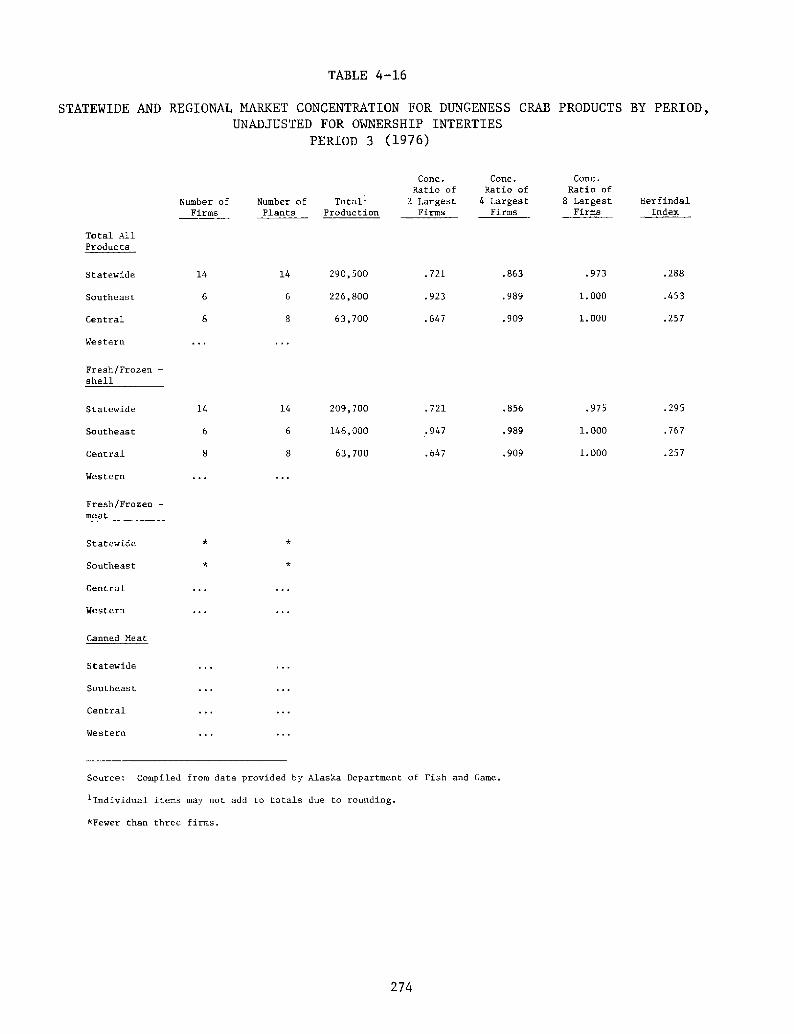
TABLE 4-16
STATEWIDE AND REGIONAL MARKET CONCENTRATION FOR DUNGENESS CRAB PRODUCTS BY PERIOD,UNADJUSTED FOR OWNERSHIP INTERTIES
PERIOD 3 �976!
Total'Production
HerfindalIndex
Number ofFirms
Number ofPlants
Total AllProducts
.973.86314 .288.72114Statewide
1,000.989 .453.923Southeast
.909 l. 000.647 .257Central
Western
Fresh/Frozenshell
,975 . 29514 . 721 ,856Statewide
1.000.947 .989 .767Southeast
,647 1. 000,909 . 257Central
Western
Fresh/Frozenmeat
Statewide
Southeast
Central
Western
Canned Meat
Statewide
Southeast
Central
Western
Source: Compiled from data provided by Alaska Department of Fish ard Came.
Individual items may not add to totals due co rounding,
*Fewer than three. firms.
274
290,500
226,800
63,700
209,700
146,000
63,700
Conc.Ratio of
2 LargestFirms
Conc,Ratio of
4 LargestFirms
Conc.Ratio of
8 LargestFirms
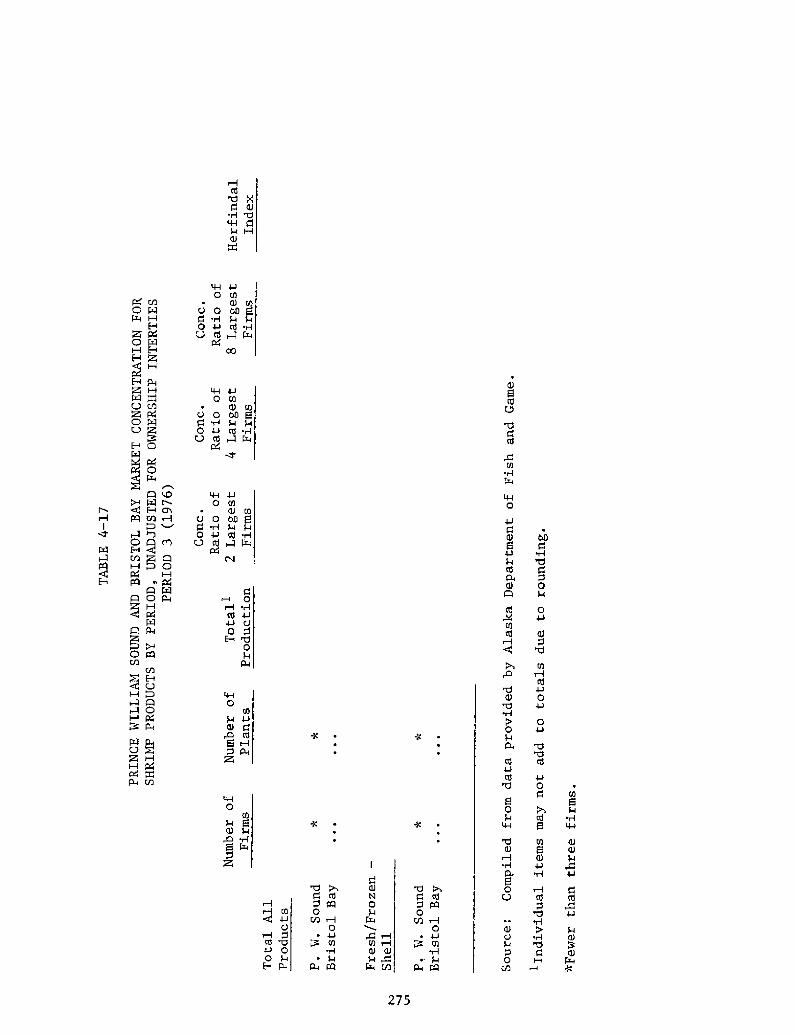
CU
WM
cJ0 c0
IU0 00V 0
O
00
'0 00
cd4J0 0 IU
'CI
0
0 cde
eIU
cd
'Cj
C
0
IU C:cd
eelR
c0e
dICU
IU
cU
0 CU IU"0
cd
0CQ
0C0
C4 O-'I
0cd
0CfI W
0c0
C0
V 00H I-'v
275
Cd MO
M
O
R R
MCd
O
g
0 paCQ
H
4AOW
H
AI
4 44 O
CdcdC4 CG
W 0 c0~ 0I
v000e
0 W cd
W 0<U
V 0 00
0
CV
cUCI
0
na
e0
W 0cU
e0
O cUV 0
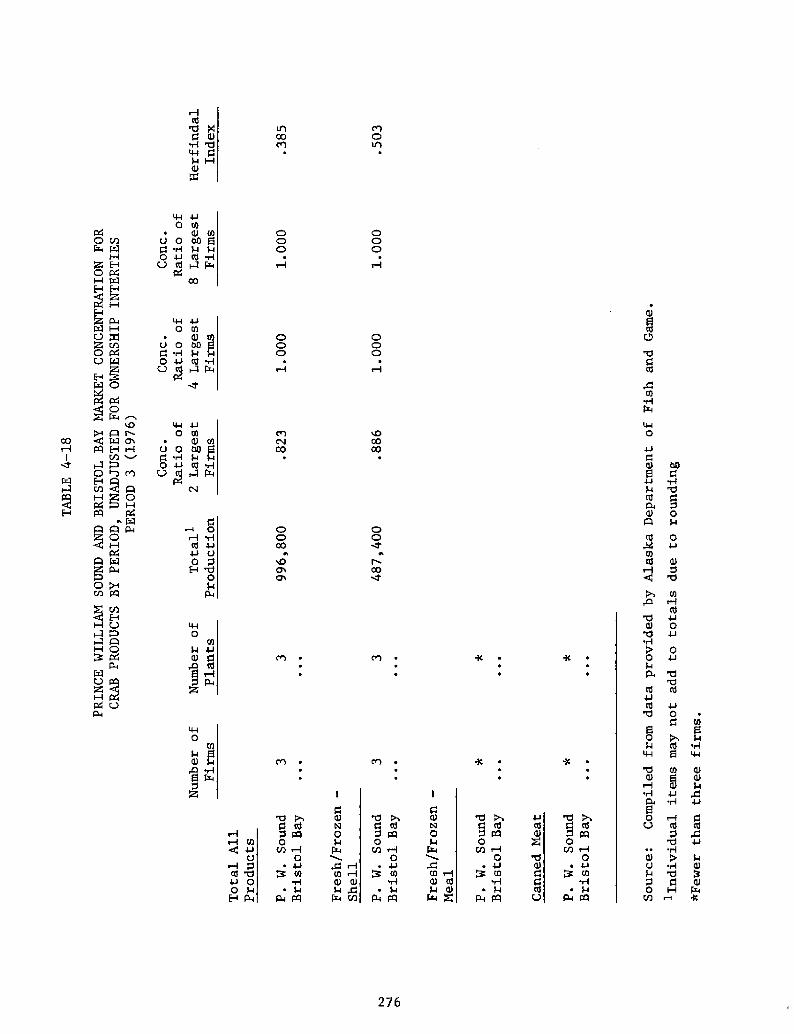
'0g cLl
gH
QO Q
W 00 0g 0
d! M00 f5cd
ClQ Q Q H
QQ Q Q Q Q
W 0
044
Q Q00
~ 92
Ch
~ I
<X!
cd
0
0
««la cd0 H
M ~ '4« ~
lc ~
I
8
0 M I cd44 4
M
S 0 Mdl cd
cd
cdi«4
0V! H
0~ 44
M
C4
0«h H
0
M
M
cd 'cd0
0
0ch H
0 MF4 c«4
276
Q z
Q g
O«I4
Q CC
QN+
M Q 4H!Q
a ga a~g Q
g WQ
H Q
W 440 M
0 44 cd '6
0 M~ dj M
v 0 044
0
'0cd cd
d40«14 H
0~ 44 «d
M gg
~ 4 cd4 Ccl 0
844
C4
A
a '0dl
0 Cccd
cd'0
0 8
8 0 dl0
«cO
g0 0 0 0 0 0 8I cdH
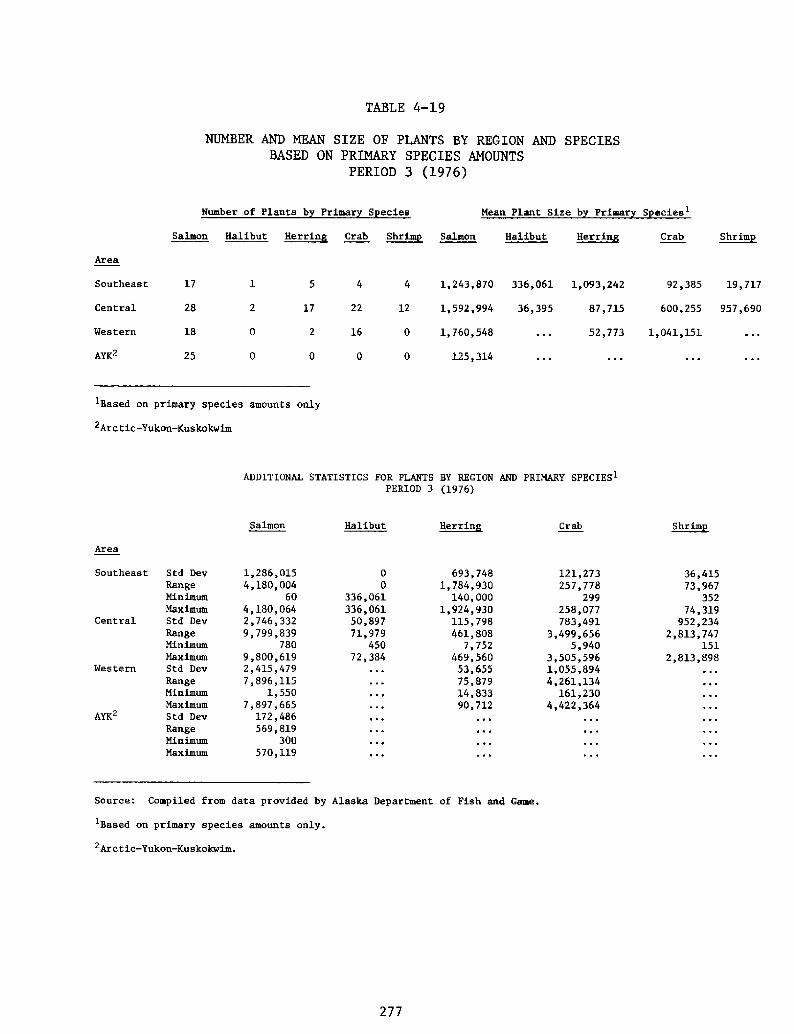
TABLE 4-19
NUMBER AND MEAN SIZE OP PLANTS BY REGION AND SPECIESBASED ON PRIMARY SPECIES AMOUNTS
PERIOD 3 �976!
Mean Plant Size b Prima S eciesNumber of Plants b Primer S ecies
H lib t H~tt Crab ~Shrim> l H lib t. ~nl t b ~>h i >alnan
Area
5 4 4 1,243,870 336,061 1,093,242 92,385 19,71717Southeast
Central 17 22 12 1,592,994 36,395 87,715 600.255 957>690
2 16 0 1,760,548 ... 52,773 1,041,151
0 0 0 125,314
18Western
AYK2 25
Based on primary species amounts only
2Arctic-Yukon-Kuskokwim
ADDITIONAL STATISTICS FOR PLANTS BY REGION AND PRIMARY SPECIES1PERIOD 3 �976!
Salmon ~ShrimHalibut Crab
Area
Southeast 36>4]-573,967
35274,319
952,2342,813,747
1512,813,898
0 0336,061336,06150,89771,979
45072,384
Central
Western
AYERS
Source: Compiled from data provided by Alaska Department of Fish and Game.
Based on primary species amounts only.
Arctic-Yukon-Kuskokwim.
277
Std DevRangeMinimumMaximumStd DevRangeMinimumMaximumStd DevRangeMinimumMaximumStd DevRangeMinimumMaximum
1,286,0154,180,004
604,180,0642>746,3329,799,839
7809,800,6192,415,4797,896,115
1,5507,897,665
172,486569,819
300570,119
693,7481,784,930
140,0001,924,930
115,798461,808
7, 752469,560
53,65575,87914,83390,712
121,273257>778
299258,077783,491
3,499,6565,940
3,505>5961,055,8944,261>134
161,2304,422,364
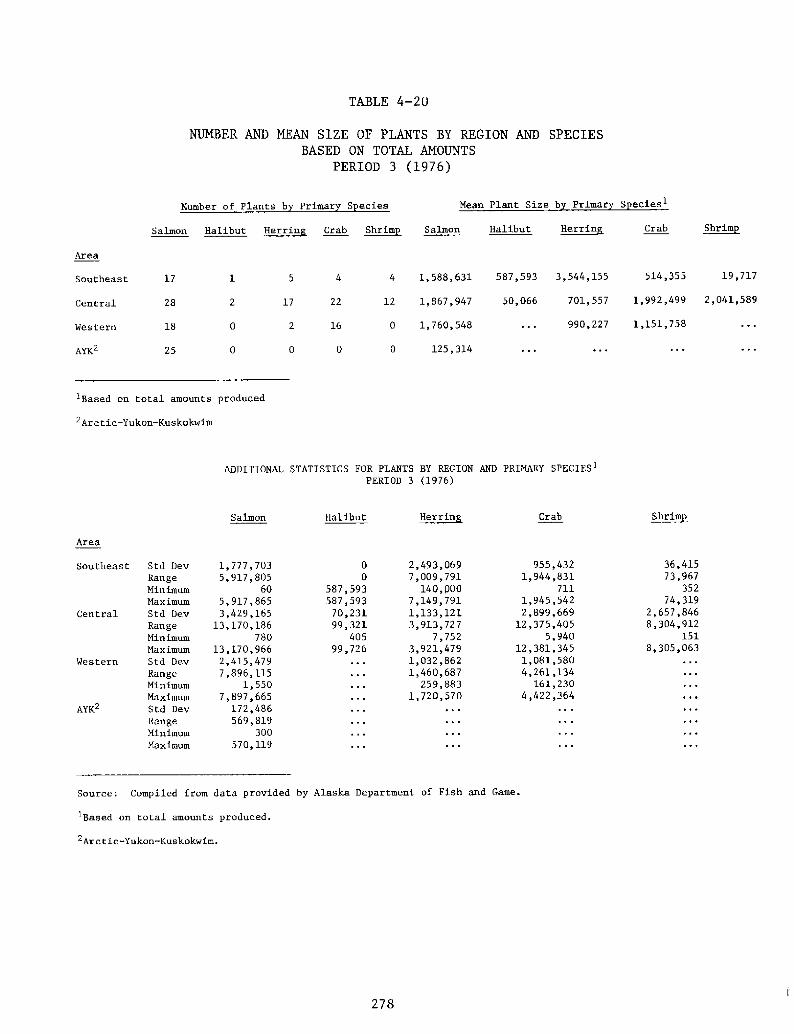
TABLE 4-20
NUMBER AND MEAN SIZE OF PLANTS BY REGION AND SPECIES
BASED ON TOTAL AMOUNTS
PERIOD 3 �976!
Mean Plant Size b Primer S eciesNumber of Plants b Primer S ecies
Crab ~ShrimS 1 Hl'b t ~H1Sl H ltbt ~H' b*b ~bht
Area
4 1,588,631 587,593 3,544,155 514>355 19,71717Southeast
701,557 1,992,499 2,041,589
990,227 1,151,758
12 1,867,947 50,066
0 1>760,548
0 125,314
221728Central
1618Western
AYK 25
Based on total amounts produced
2Arctic-Yukon-Kuskokwim
ADDITIONAL STATISTICS FOR PLANTS BY REGION AND PRIMARY SPECIESfPERIOD 3 �976!
Salmon Halibut Crab ~Shrim
Area
36,41573,967
35274,319
2,657,8468,304,912
1518,305,063
0 0587,593587,59370,23199,321
40599,726
Southeast
Central
Western
Source: Compiled from data provided by Alaska Department of Fish and Game.
Based on total amounts produced.
2 Arctic-Yukon-Kuskokwim.
278
Std DevRangeMinimumMaximumStd DevRangeMinimumMaximumStd DevRangeMinimumMaximumStd DevRangeMinimumMaximum
1,777,7035,917>805
605,917,8653,429,165
13,170,186780
13,170,9662,415,4797,896,115
1,5507,897,665
172,486569,819
300570,119
2,493,0697,009,791
140, I3007,149,7911,133,1213,913,727
7,7523,921,4791,032,8621,460,687
259,8831,720,570
955,4321,944,831
7111,945,5422,899,669
12,375,4055,940
12,381,3451,081,5804,261,134
161,2304,422,364
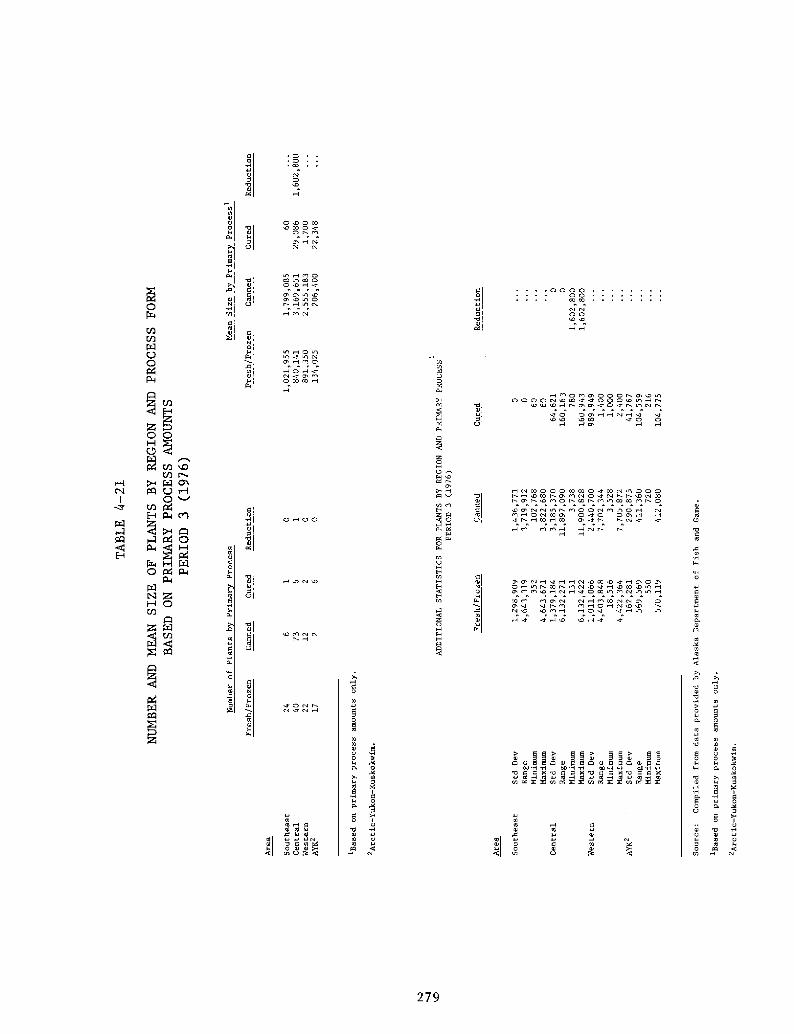
O 0COO
0 0IJ0'0 ~ I«4
alalal0 0 40
OCO0 «0D <'00 I 0CJ
CO
O 0 O ID«0 0
004 U'00Ca
~ 00 0 00 0CO CO0 0CI
0O
fflal 0taN0I
0I
tflI/I UCtON NO CO
Otrl NO t/JLO0O 0
M OCt 0 N Nt al0 0 '0 M IO
OrO 100 rN
0 00 0U' Ocr o a1M Mrrl N0 CI
0 00 00 COM 0
0
f 0«0 N 0 I 000COO'0tlt
0 0$ 00
'0
NNMI M0 ca co 01M CO M CO0 0OO
N
N PlOIO0OMOO
M M0S LtCJ
4 tlt0
01 O1O O1COO1N
I/l I CO I atM CO M NM 0 NU f«O M M
N «ON ONMO
co Ja~10 COCO IflO 0M
OM«ONN0
O M M0 00a!
0 M N N
0'0 0'a 00! IJ04O. 06al alal atal06 V0 0 3W 0
al~ I ~fa0 M 0~ 00 0
00 U0 '0v al 4al Vrf!0fa N
0 0~ I0
IJ
0 0 6 0ca NOI
al 6V04 ACL 0A0al
00 A0 0al Ltca clal 4
Ee3 6
3:P.mls.
0 alaa0JJ 6Vt CC
IE Oal 6aa M0 00cta M0 0 X
Ltrflal alLtLt IJ0 tllca CJ
0Lt N
279
0
O0!3J
ra
0 0
M
Plf 0M
0
N R0
AM
Q gQ
CO 0 O O CO CO O < CO rtaa«OI 0 MNONN«0 rl O I CO I rlM CO CO
JJal0ta 6CO Lt rJat4 0 alVl CJ
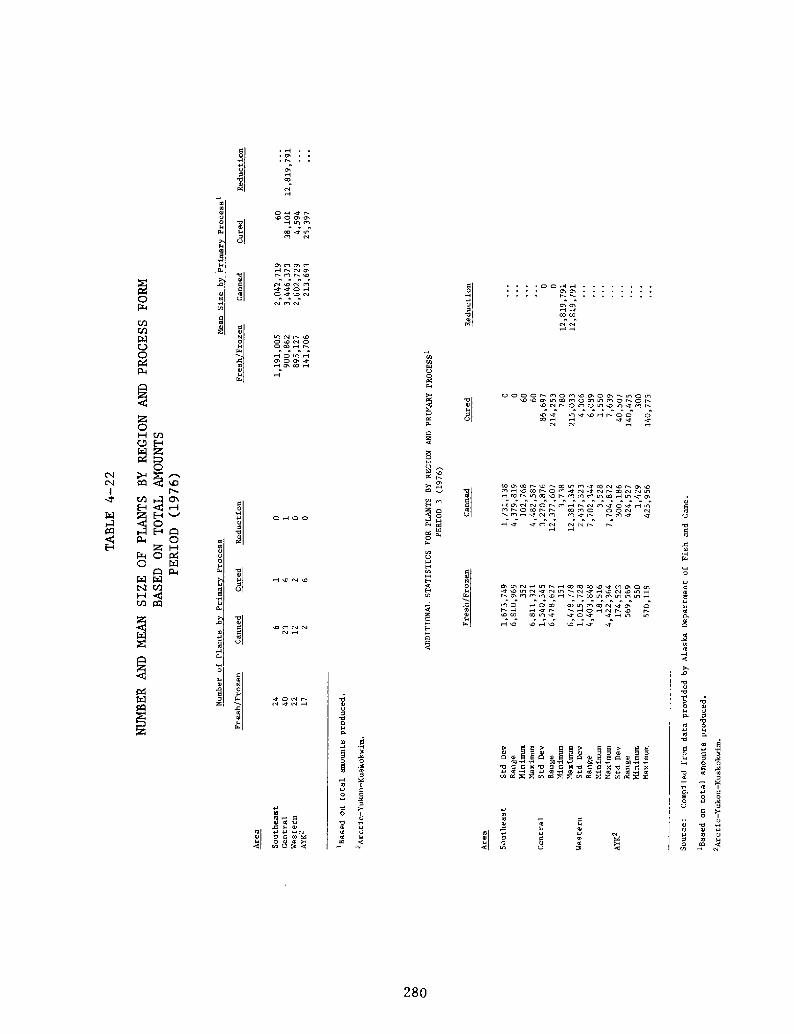
OtOt40
0 0 0omar'0 O 04 OcI/I
CO M I/IN
r1 0 mN tltr m r cofc ClN N CtO N 0N mN
Cl0 0Cl 0
IJ0Cltd
O OOl O01 crCQ CQN
C3
C4Q
C4
Ift NOO COO0 O0
N O
OCO0 ClQlct
O rCI
Ol
OOO'0 /1 OI/1 CON Im dcm OO m
O MO
Otc0 t0 N 40I cQI/c cd
r 0N N hf1 M 0NMO NNOmr ocorI0 0 V
CQN
O CI Or r mr r
O MOO
tdCIV00
O
E O M M O0 8 N 0
8 ClI
44tl44al0
0 0 NO I/II 0m OI40 CO
w m 04 cl ocmm m V1M
o co cQ tfc m al N c 0' oI I MOMNI 40 tIO tfl N M O < C M I/1 m
C tlCCJ
mNNN04J8 tc
CH0
0 tllN 0 14J
'0 tll'0 !0 tt
O N PN C N
A Cl 8'0 C CIJ ItlUl CC X
e 0 0000 500' 05~ l 88CCI 88AV 8 8MM M CQM M CQMC C IC td C 0 8 CQ 0 I'CCXpdtlf gg,cd Idge
tl MCI 8C N4400 Cttft O
0ctCtIQ0
0 V
0
Lt440 ~ IO
280
OH KC3 &
R O
A C4
Ã
0ClIJ'O 0 00 eC
0ldCI I00 044 NC 0
V8 Ntcl VIC lt
I/I 0 CQc 40 / cd 1/Icdl om&NM CQ I Ifl CQ CQ
ch O 0 I Jc o mCO trc m o r o rO Jc JcmMmlJQMI OO O
0
0 8IJ
4J C0 0IJC0 V'0tll
cC

REFERENCES
281
REFERENCES
Alaska Department of Fish and Game. Alaska Catch and Production, CommercialFisheries Statistics. Juneau: 1960 to 1975 Statistical leafletsnos 1-28!, 1976 and 1977 preliminary data.
Alaska Department of Fish and Game. Alaska Fisheries. Annual summary.Washington. DE C.: U.S. Bureau of Commercial Fisheries, 1958.
Alaska Department of Fish and Game. Monthl Shellfish Catch Re ort.Juneau' .1976 and 1977 preliminary data!.
Alaska Department of Fish and Game. Shellfish Commercial Fishin
Alaska Department. of Fish and Game. Vessel registration 1977-78. Juneau.Alvarez, Jose, Chris 0. Andrew, and Fred J. Prochaska. Economic Structure
of the Florida Shrim Processin Industr . Sea Grant Program, StateUniversity System of Florida, Report no 9, 1976.
Atkinson, Clinton E. Statistics of the Crab Fisheries of Ja an. Seattle,Washington: Alaska Sea Grant Program, Project no 78-4692-0173,Fairbanks: forthcoming.
Bain, J. S. Industrial Or anization. New York: John Wiley and Sons, 1968.Barr, Louis. Alaska's Fisher Resources � The Shrim s. United States
Department of the Interior Fishery Leaflet 631, January 1970.Berin Sea Tanner Crab Resource: U.S. Production, Ca acit , and Marketin
Report 77-5, Fairbanks; Alaska Sea Grant Program, May 1977.Browning, Robert J. Fisheries of the North Pacific. Anchorage: Northwest
Publishing Company, 1974.Capalbo, Susan M. "An Analysis of the Market Structure of the Food Fish
Processing Sector of the United States Fishing Industry." Master ofScience Thesis, University of Rhode Island, 1976.
Chitwood, Philip E. Ja anese Soviet and South Korean Fisheries offAlaska. Washington, D. C.: U.S. Department of the Interior, Fish andWildlife Service, Bureau of Commercial Fisheries. Circular no 310.January 1966.
Commercial Fisheries Entry Commission. Alaska Shellfish Bio-Economic DataBase. Juneau: 1978.
Dirlam, Joel. "Food Distribution. " Reprinted in The Structure of American~Industr . Edited by Walter Adams, Mew York: Macmillan Company, 1971.
Food and Agricultural Organization. Yearbook of Fisheries Statistics Catch
Gorham, Abby and F. L. Orth. United States Market Demand and Ja aneseMarketin Channels for Tanner Crab. Report no 78-12. Alaska SeaGrant Program, 1978.
Gort, Michael. Diversification and Inte ration in American IndustrNational Bureau of Economic Research, Princeton University Press, 1962.
Gray, G. W., R. S. Roys, and R. J Simone Develo ment of The Kin CrabFisher off Kodiak Island. Juneau: Alaska Department of Fish andGame Informational Leaflet no 52, 1965.
Hartsock, F. B. "Live-Tanking of Snow Crab." Alaska Seas and Coasts, vol 3no 5 December 1975!.
International North Pacific Fisheries Commission. Annual Reports.Vancouver, British Columbia: 1953 to 1976.
282
Jackson, P. B. Develo ment and Growth of the Kodiak Island Shrim FisherAlaska Department of Fish and Game. April 1968.
Jensen, W. S. "A Market Structure Analysis of the Salmon Processing In-dustry." Ph.D. Dissertation, Oregon State University, 1975.
Koch, J ~ V. Industrial Or anization and Prices. Englewood Cliffs, NewJersey: Prentice-Hall, 1974.
Kolhonen, J. A. Market Structure and Performance of Ma'or U.S. Fish
Industry and Consumer Service Division, 1976.
tives to Aid the New En land Industr . Report no MITSG75-7,Cambridge: Massachusetts Institute of Technology, 1974.
National Marine Fisheries Service. Unpublished data. U.S. Department ofCommerce, Washington, D. C.
National Marine Fisheries Service. As ects of the Structure and MarketBehavior of the Tanner Crab Industries of the United States and Ja an.Prepared by Economic and Marketing Research Division, NMFS, Washington,D. C.: 1976.
National Marine Fisheries Service. Fisheries of the United States.Washington, D. C.: U.S. Government Printing Office, 1977.
National Marine Fisheries Service. Preliminary Fishery Management Plan,Shrim of the Eastern Berin Sea and Gulf of Alaska. Juneau:
December 1976.North Pacific Fishery Management Council. Preliminar Fisher Mana ement
Plan for Shrim . Anchorage: 1976.National Marine Fisheries Service. Fisher Market News Re ort. Seattle:
NMFS Regional Market News Office.North Pacific Fishery Management Council. Fisher Mana ement Plan for
Tanner off Alaska. Anchorage: July 1977.Orth, F. L. et al. The Berin Sea Tanner Crab Resource: U.S. Production
Capacit and Marketin . Fairbanks: Alaska Sea Grant Program, May 1977.Orth, F. L. "An Empirical Analysis of the Relationship Between Diversifi-
cation and Profitability in the 1,000 Largest U.ST Industrial Corpora-tions, 1965." Ph.D. Dissertation, University of Tennessee, Knoxville,1970.
Pacific Marine Fisheries Commission. Annual Report. Portland, 1976.Queirolo et al. Alaska Shellfish Bio-Economic Data Base. Juneau: Alaska
Commercial Fisheries Limited. Entry, 1978.Rubenstein, M. E. "The History of Concentration in the Canned Salmon
Industry of the U.S.A." B.A. Thesis, Harvard University, 1966.Sainsbury, J. C. Commercial Fishin Methods. London: Fishing News Books!
Ltd., 1971.Scherer, F. M. Industrial Market Structure and Economic Performance.
Chicago: Rand McNally, 1970.Shippen., Herbert. The Eastern Berin Sea Kin Crab Fisher . Seattle:
U. S. Department of the Interior, Bureau of Commercial Fish, SeattleBiological Laboratory, 1964.
Somerton, D. and L. L. Low. Determination of Minimum Size and YieldLimitations for Tanner Crab in the Eastern Berin Sea. NorthwestFisheries Center Processer Report no 59, March 1977.
U.S. Department of Commerce, Census Data, Census of Manufacturin , Bureau ofCensus, Washington, D. C.: U.S. Government Printing Office, 1968 to 1977.
283
U.S. Department of Commerce, Bureau of Census Publication, StandardIndustrial Classification Manual. Bureau of Census, Washington,D. C.: U.S. Government Printing Office, 1972 '
U.S. Department of Commerce, National Oceanic and Atmospheric Administration,National Marine Fisher'es Service. Fisher Statistics of the UnitedStates. Washington, D. C.: 1960-1977.
U.S. Department of the Interior. Alaska Fisheries. Annual summary.Washington, D. C.: U.S. Bureau of Commercial Fisheries, 1958.
S. S. Deportment of the Interior, Fish end Mildlife Service. ~FisherStatistics of the U.S. Statistical Digest nos 1-51, 1941-1959.
U.S. Office of Comptroller General. "The U.S. Fishing Industry � -PresentCondition and Future of Marine Fisheries, 1976." A report to Congress.
Zahn, M. C. "Japanese Tanner Crab Fishery in the Eastern Bering Sea."Commercial Fisheries Review, vol 32 no 2 February 1970.
284


