Embed Size (px)
Citation preview

Alaska Physician Workforce Study
Alaska Center for Rural Health
and
Institute for Circumpolar Health Studies
University of Alaska Anchorage3211 Providence Drive
Anchorage, Alaska 99508
May 2000
PROJECT TEAM
Alaska Center for Rural Health
Denny DeGross, Director
Institute for Circumpolar Health Studies Evaluation Team
Kate Heitkamp, BSStacy Smith, MFA
Jennifer Louden, MPABeth Landon, MBA, MHA
Alaska Medical Association
Jim Jordan, Executive DirectorKevin Tomera, M.D., Past President
Rod Wilson, M.D.
Division of Occupational Licensing
Leslie Abel, Executive Administrator, State Medical BoardNancy Ferguson,Licensing Examiner
This is a collaborative project of the Alaska Center for Rural Health,the Institute for Circumpolar Health Studies, the Alaska State Medical Association,
and the Alaska Division of Occupational Licensing.

i
EXECUTIVE SUMMARY
Alaska’s health workforce, with the exception of nurses, community health aides and otherparaprofessionals, received their professional education outside of Alaska. Consequently, thecosts associated with recruiting and retaining adequate levels of health professionals in Alaskaare, by all accounts of the institutions and agencies who employ them, extremely high.
Past attempts to describe the “condition” of Alaska’s health work force were accomplished byperforming surveys of hospitals and government agencies for their current and projectedvacancies and hires. While those surveys were useful in providing a “snapshot” of the healthworkforce at a moment in time, resources have not been available to repeat those measures.Thus, no trends in vacancy or employment patterns were established that would have advisedpotential employers of health workers, or that would have predicted where educationalinstitutions should have been planning greater or less efforts in the preparation of health careworkers.
The present study takes a different approach. This is a study of the demographiccharacteristics and the professional behavior of a single profession, Alaska’s physicians.What can be discovered about physicians that will be useful to the profession, to the agenciesand institutions that employ them, and to the educational institutions that prepare them for theirjobs?
Methodology
This study is a collaboration between the Alaska Center for Rural Health, the Institute forCircumpolar Health Studies, the Alaska State Medical Association, and the Alaska Division ofOccupational Licensing. The Division of Occupational licensing distributed 2,020 surveysalong with license application materials sent to currently licensed physicians and to individualswho had requested licensure during the “off” year (Alaska re-licenses physicians every twoyears). Of those, 960 surveys were returned, for a rate of 44.7%. Approximately 1,220physicians were licensed by Alaska to practice for the “licensed” years (1999 – 2000).
Findings
The average age of the respondents was 49 years. Nearly 43% were over the age of 50. Themean age across “urban,” “rural,” and “remote” was consistent, at about 47. The mean agewas slightly higher for “outside,” which may reflect those who are semi-retired, performinglocum tenens, or doing other “fill-in” work.
The gender breakdown for Alaska was close to the National breakdown, with 76% malephysicians and 23% female physicians. Far fewer women (14%) are practicing in Alaska’snon-Native rural, southeast island communities, or in the non-Native “rail-belt” communities onAlaska’s small road system. This is significantly lower than the proportion of women to menstatewide (23% female to 76% male). Women exceed the statewide rate in the “remote”areas, where Indian Health Service and Alaska Native tribal systems have been delivering thecare for many years.
The ethnic breakdown shows that minorities make up less than 10% of the respondents.While Alaska Natives make up approximately 17% of Alaska’s population, they only make up1.4% of the physician respondents. This improved only marginally in the “remote” parts ofAlaska where the primary employers of physicians are tribally operated systems.
ii
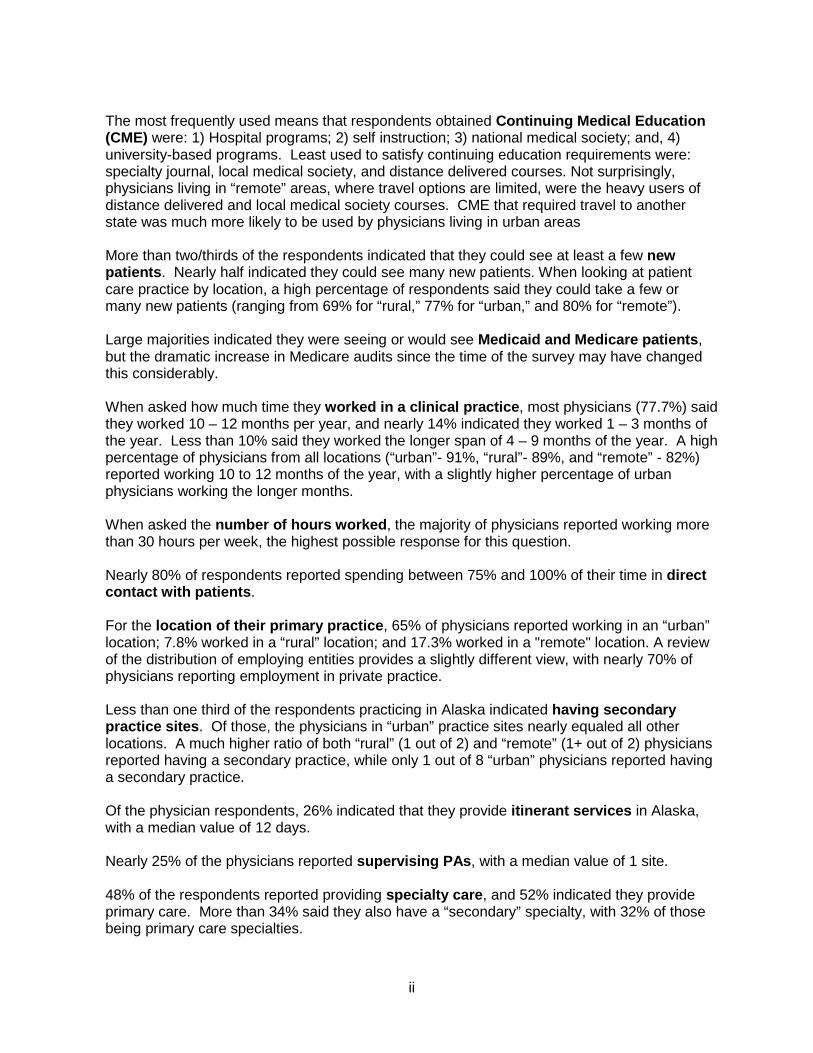
The most frequently used means that respondents obtained Continuing Medical Education(CME) were: 1) Hospital programs; 2) self instruction; 3) national medical society; and, 4)university-based programs. Least used to satisfy continuing education requirements were:specialty journal, local medical society, and distance delivered courses. Not surprisingly,physicians living in “remote” areas, where travel options are limited, were the heavy users ofdistance delivered and local medical society courses. CME that required travel to anotherstate was much more likely to be used by physicians living in urban areas
More than two/thirds of the respondents indicated that they could see at least a few newpatients. Nearly half indicated they could see many new patients. When looking at patientcare practice by location, a high percentage of respondents said they could take a few ormany new patients (ranging from 69% for “rural,” 77% for “urban,” and 80% for “remote”).
Large majorities indicated they were seeing or would see Medicaid and Medicare patients,but the dramatic increase in Medicare audits since the time of the survey may have changedthis considerably.
When asked how much time they worked in a clinical practice, most physicians (77.7%) saidthey worked 10 – 12 months per year, and nearly 14% indicated they worked 1 – 3 months ofthe year. Less than 10% said they worked the longer span of 4 – 9 months of the year. A highpercentage of physicians from all locations (“urban”- 91%, “rural”- 89%, and “remote” - 82%)reported working 10 to 12 months of the year, with a slightly higher percentage of urbanphysicians working the longer months.
When asked the number of hours worked, the majority of physicians reported working morethan 30 hours per week, the highest possible response for this question.
Nearly 80% of respondents reported spending between 75% and 100% of their time in directcontact with patients.
For the location of their primary practice, 65% of physicians reported working in an “urban”location; 7.8% worked in a “rural” location; and 17.3% worked in a "remote" location. A reviewof the distribution of employing entities provides a slightly different view, with nearly 70% ofphysicians reporting employment in private practice.
Less than one third of the respondents practicing in Alaska indicated having secondarypractice sites. Of those, the physicians in “urban” practice sites nearly equaled all otherlocations. A much higher ratio of both “rural” (1 out of 2) and “remote” (1+ out of 2) physiciansreported having a secondary practice, while only 1 out of 8 “urban” physicians reported havinga secondary practice.
Of the physician respondents, 26% indicated that they provide itinerant services in Alaska,with a median value of 12 days.
Nearly 25% of the physicians reported supervising PAs, with a median value of 1 site.
48% of the respondents reported providing specialty care, and 52% indicated they provideprimary care. More than 34% said they also have a “secondary” specialty, with 32% of thosebeing primary care specialties.
iii
Respondents were significantly more likely to have residency training in their primaryspecialty than in their secondary specialty.
The data suggest that a very high proportion of Alaska physicians have ABMS certification intheir specialty. However, the data may be suspect because the survey failed to inquire aboutpossible certification in the American Osteopathic Board (AOB), which is the only othercertifying entity recognized by governments, licensing bodies, and the AMA.
More than half the respondents worked in private health care. However, it should be notedthat physicians working in federal systems may or may not be licensed in Alaska. As expected,“urban” physicians reported a higher proportion of specialties than did “rural” or “remote”physicians.
Interestingly, the ratio of primary care providers to specialty care providers changes forphysicians over age 50. Below age 50, a greater proportion in each age group worked in oneof the primary care fields. After age 50, the balance shifted, showing a greater proportion inspecialty fields.
iv
Table of Contents
EXECUTIVE SUMMARY ...........................................................................................................i
Table of Contents .................................................................................................................... iv
I. Introduction......................................................................................................................... 1A. Purpose of the Assessment ........................................................................................ 1B. Current Information About Alaska's Health Workforce................................................. 1
1. Professional and Other Organizations................................................................... 1C. The Need For More Complete Health Workforce Information...................................... 2D. Methodology ............................................................................................................... 2
II. Survey Response Statistics ............................................................................................... 4A. Demographics & Background...................................................................................... 4
1. Age ....................................................................................................................... 4a. Age of Respondents........................................................................................ 4b. Age by Region................................................................................................. 4
2. Gender.................................................................................................................. 5a. Gender of Respondents .................................................................................. 5b. Gender by Region ........................................................................................... 5
3. Ethnicity ................................................................................................................ 6a. Ethnicity of Respondents................................................................................. 6b. Ethnicity by Region.......................................................................................... 6
4. Continuing Medical Education (CME) Sources...................................................... 7B. Patient Care Information ............................................................................................. 8
1. Patient Care Practice ............................................................................................ 8a. Patient Care Practice Status of Respondents.................................................. 8b. Patient Care Practice Status by Region........................................................... 8
2. Medicaid and Medicare Patients ........................................................................... 9a. Medicaid and Medicare Patients Accepted by Physicians ............................... 9b. Medicaid and Medicare Patients Accepted by Physicians by Region............... 9
3. Physician Work Time .......................................................................................... 10a. Physician Work Time in Clinical Practice........................................................10b. Physician Work Time in Clinical Practice by Location.....................................10
4. Regular Medicine-Related Work Hours ............................................................... 11C. Medical Practice Information..................................................................................... 12
1. Primary Practice Location ................................................................................... 122. Distribution of Physicians in the Health Care System.......................................... 133. Secondary Practice Locations............................................................................. 144. Itinerant Practice in Remote Alaska .................................................................... 145. Supervision of Physician Assistants.................................................................... 15
D. Practice Specialties and Settings.............................................................................. 161. Primary Care and Specialty Care........................................................................ 162. Residency Training in Primary & Secondary Specialties ..................................... 17
a. Primary & Secondary Specialties ...................................................................17b. American Board of Medical Specialties Certification.......................................17c. Primary Care versus Specialty Care by Location............................................18d. Primary Care versus Specialty Care by Age...................................................18

v
Appendices
Appendix A: Physician Survey Instrument
Appendix B: Data Limitations

1
I. Introduction
A. Purpose of the Assessment
Alaska has chronically lacked resources with which to measure and describe the condition ofits health workforce. As a consequence, there have been few opportunities to anticipate shortor long-term shifts in the health careers job market with a degree of precision that could guidehealth career course offerings in educational institutions, or provider investment in long termrecruitment and retention efforts.
In response, the Alaska Center for Rural Health (ACRH) elected to look at one segment of thehealth workforce: physicians. Working in collaboration with the Institute for Circumpolar HealthStudies, the Alaska State Medical Association, and the Alaska Division of OccupationalLicensing, ACRH has reviewed several variables of interest to planning agencies andemployers of Alaska’s workforce.
Some information about Alaska’s health workforce has been gathered on a regular basis.Other knowledge of the workforce has been produced on a sporadic and non-recurring basis.However, it is fair to say that agencies in Alaska lack the resources necessary to performlongitudinal assessments of the health workforce in ways that would be of most use to manyagencies who have that interest.
B. Current Information About Alaska's Health Workforce
Alaska Department of Labor: The ADL web page (http://www.labor.state.ak.us/) is a goodplace to start for general information about Alaska’s health workforce. The Departmentprojects that Alaska’s occupations will be characterized by intense concentration in growth,with ten out of the more than 450 detailed occupations projected to account for 25% of totalemployment growth over the 1996-2006 period. Of those 10 fastest-growing occupations, fiveare associated with health services, and three with computer technology. ADL has been ableto predict with reasonable accuracy large occupational trends based on information gleanedfrom random-sampled surveys of employers (including follow-up phone contact whenrequired), and from information provided by professional organizations. However, no detailedanalysis of specific health professions needs or characteristics are made from informationgathered by ADL.
1. Professional and Other Organizations
Alaska State Medical Association: ASMA publishes an annual directory of the approximately1250 physicians who are licensed to practice in Alaska and who are, for the most part, notemployed by state or federal agencies. (The Division of Occupational Licensing indicatesapproximately 1700 – 1800 physicians licensed in Alaska). The listing is alphabetical, withspecialty self-reported by physicians. ASMA employs a fulltime staff person to keep thedirectory current. ASMA staff has a high level of confidence that physician’s addressesrepresent the location of the practice. Not described are: level of activity; out-of-stateresidency, with sporadic and/or periodic practice in Alaska; split or divided practice locations;and board certification for specialties. The directory contains a useful "Physician Distribution"grid at the back of the book, which shows physicians by community in four categories: PrivatePractice; Public Health; Military; and Municipal, State and Federal.
2
Alaska Dental Society: ADS publishes an annual directory of the approximately 350 Alaskadentists who are tripartite members of the American Dental Association, the Alaska DentalSociety, and a local dental society. That number represents 76% of the dentists who arelicensed to practice dentistry in Alaska.
Alaska Colleagues in Caring: ACIC is a statewide consortium of individuals, agencies, andorganizations formed in 1996 in response to a Robert Wood Johnson Foundation initiative.ACIC is housed in the School of Nursing at the University of Alaska Anchorage. ACIC hascompleted four survey studies: 1) Alaska Registered Nurses, 2) Alaska Licensed PracticalNurses, 3) Federal Nurses in Alaska, and 4) Intention of Employers to Hire Nursing Personnel.The first three studies examined demographic features of the Alaska nurse population,including age, race, and gender. Also examined were: place of origin, the kinds of jobs actuallyperformed, compensation, levels of education, and the kinds of nursing practices engaged inby Alaska nurses. The Employer Study tried to determine whether a nursing "shortage" existsin Alaska, what kinds of vacancy rates are being experienced by provider agencies, and whatcategories of nursing have been the most difficult to fill.
Alaska Center for Rural Health: ACRH completed limited studies of the health workforce needsfor 37 health care occupations within selected Alaska agencies in 1988, and again in 1992.The 1992 study examined vacancy and hiring patterns in all hospitals, nursing facilities, andselected state and Anchorage municipal agencies. The study did not examine the privatesector health workforce needs or professional organizations.
C. The Need For More Complete Health Workforce Information
Examination of Alaska’s health workforce has been sporadic and inconsistent. Limited, shortterm sampling has occurred, but no agency has been able to mount assessments employingrepeated measures that would yield well marked trends. The economic volatility of Alaska’shealth system is such that neither over supply or scarcity in the workforce has ever been evenmarginally predictable.
A wide variety of institutions and organizations would benefit from better information about theevolving condition of Alaska’s health workforce. School districts, universities, and Nativecorporations engaged in career guidance and academic counseling for students interested inhealth careers might craft better career trajectories for students. Employment and recruitmentservices (public as well as private) seeking jobs for clients might better anticipate both shortand long term hiring needs. Most in need of improved understanding of health career hiringpatterns are health institutions (hospitals, clinics, and public health agencies) who expendenormous resources to recruit and retain a health workforce that is characterized by extremelyhigh turnover.
D. Methodology
When assessing the "condition" of Alaska’s health workforce, there are two possibleapproaches. One may look at the major institutional employers for the persistent patterns ofvacancy and hire. The second may examine individual professions (one by one) in order todiscern patterns that might affect their immediate and long term viability. For example, if, inexploring the demographic patterns of a profession, one discovers that an inordinatepercentage of members are approaching retirement age, the system that relies upon thatprofession might wish to take heed. Of course, neither of these two approaches is sufficient toprovide a complete picture of the health workforce "condition." A combination of both would be
3
more ideal. But, unlike many other states, no agency in Alaska to date has been able tosecure the resources required to engage in such a two-pronged comprehensive systemassessment. The Alaska Center for Rural Health, having executed two health facilitiesworkforce assessments in the past (1988 and 1992 - see above), resolved, for purposes ofdemonstrating the difference, to assess a major health profession – hence, this study ofAlaska’s physician population.
A mail out survey of New York State’s physician population provided the model for thisassessment. In the New York study, a survey instrument was mailed out with licenseapplication materials that were sent by the state to all licensed physicians. The response rateand quality of responses were sufficient to justify a similar approach in Alaska. Four agencies–the Alaska Center for Rural Health (ACRH), the Institute for Circumpolar Health Studies(ICHS), the Alaska State Medical Association (ASMA), and the Alaska Division ofOccupational Licensing--took part. ACRH and ICHS developed the survey instrument withassistance from a work committee of ASMA. The instrument was tested with 15 physicians inthe Anchorage area, resulting in a modification of specific items on the survey before finalprinting and dissemination.
A total of 2,020 surveys were delivered to the Alaska Division of Occupational Licensing in thefall of 1998. They were enclosed with license materials sent out to all currently licensedphysicians, as well as to those who had applied for licenses in "off" years. See Appendix A forthe full survey instrument.
A total of 2,020 packets with surveys enclosed were sent out to physicians. Of the 960surveys returned, 7 were discarded for containing no or nearly no data. The return rate was44.7%. This is a good response for a mail survey. ICHS entered the data into Cardiff, anautomated scanning software. Approximately 1,220 physicians were licensed by the state topractice for the next two years (1999 – 2000).

4
Age of respondents who practiced medicine in Alaska in 1998
(n=653)
13.7%
9.2%
19.1% 19.9%
7.7%
4.9%
17.0%
6.6%2.1%
0%
5%
10%
15%
20%
25%
up to35
36-40 41-45 46-50 51-55 56-60 61-65 66-70 70+
Age
Pe
rce
nt
of
Re
sp
on
de
nts
II. Survey Response Statistics
A. Demographics & Background
1. Age
a. Age of Respondents
The average age of thesurvey respondents wasapproximately 49 years,with a standarddeviation of 9.8. Nearly43% of respondentswere over the age of 50,which is a majorconcern for the AlaskaState MedicalAssociation and otheragencies involved in thereplacement of retirees.
Figure 1
b. Age by Region
Figure 2 shows no marked difference in the mean age of physicians across regions. With theexception of respondents in the “rural” region, the mean age of the physicians varies less than5% per region. It is possible that the higher mean age of physicians “outside” Alaska is areflection of those who are semi-retired, or performing locum tenens or other fill-in work.
Figure 2
Mean age of respondents by region
48.3 46.951.5
47.1
0
10
20
30
40
50
60
Urban Rural Remote Outside
Region
Year
s
5
2. Gender
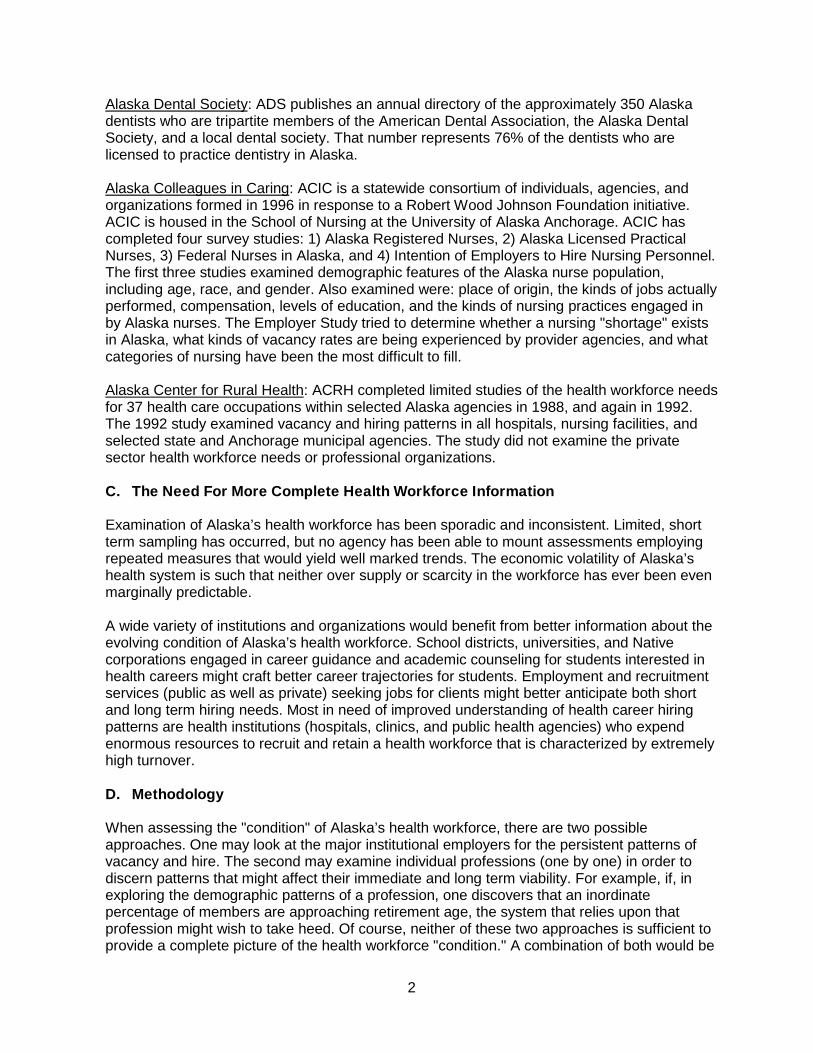
a. Gender of Respondents
The gender breakdown of therespondents is 76% male and 23%female. Due to "rounding," thesepercentages do not total 100%. Thisnumber corresponds with figures fromthe Alaska State Medical Association,which shows 25.2% of Alaska’sphysicians are female. United Statesnumbers for urban areas show 76% ofthe physician population are male and24% are female, and in rural areas85% are male and 15% are female(using the USDA Urban InfluenceCodes).
Figure 3
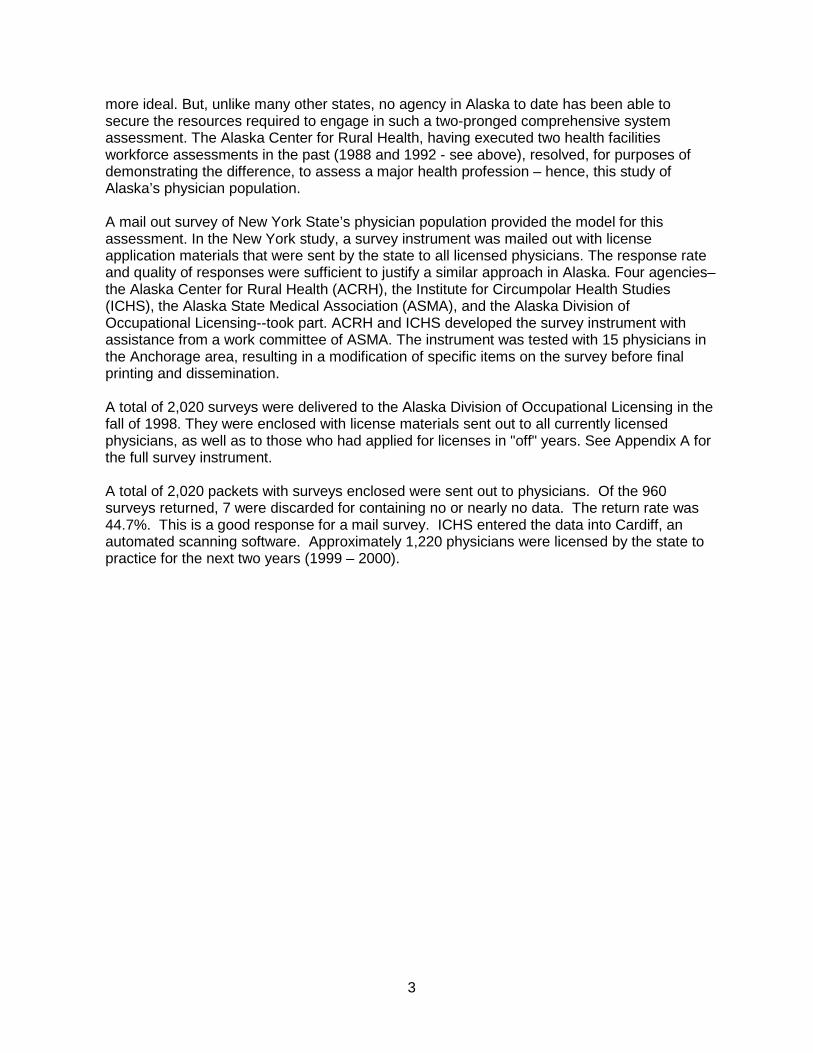
b. Gender by Region
Male physicians significantly outnumbered female physicians. Female physicians are under-represented in this state and do not correlate with the gender proportion of the populationsbeing served. Further, medical schools are now graduating students in a more balanced male/female ratio. Fewer women are practicing in Alaska’s rural non-Native Southeast islandcommunities or in road-system rail-belt communities.
Figure 4
Gender of respondents who practiced medicine in Alaska during the past year
(n=667)
76%
23%
0%
20%
40%
60%
80%
100%
Female MaleGender
Pe
rce
nt
of
Re
sp
on
de
nts
Gender of respondents by region
75.6%85.7% 82.5%
17.5%
72.2%
24.4%14.3%
27.8%
0%
20%
40%
60%
80%
100%
Urban Rural Remote Outside
Region
Pe
rce
nt
of
Re
sp
on
de
nts
%Male %Female
6
3. Ethnicity
a. Ethnicity of Respondents
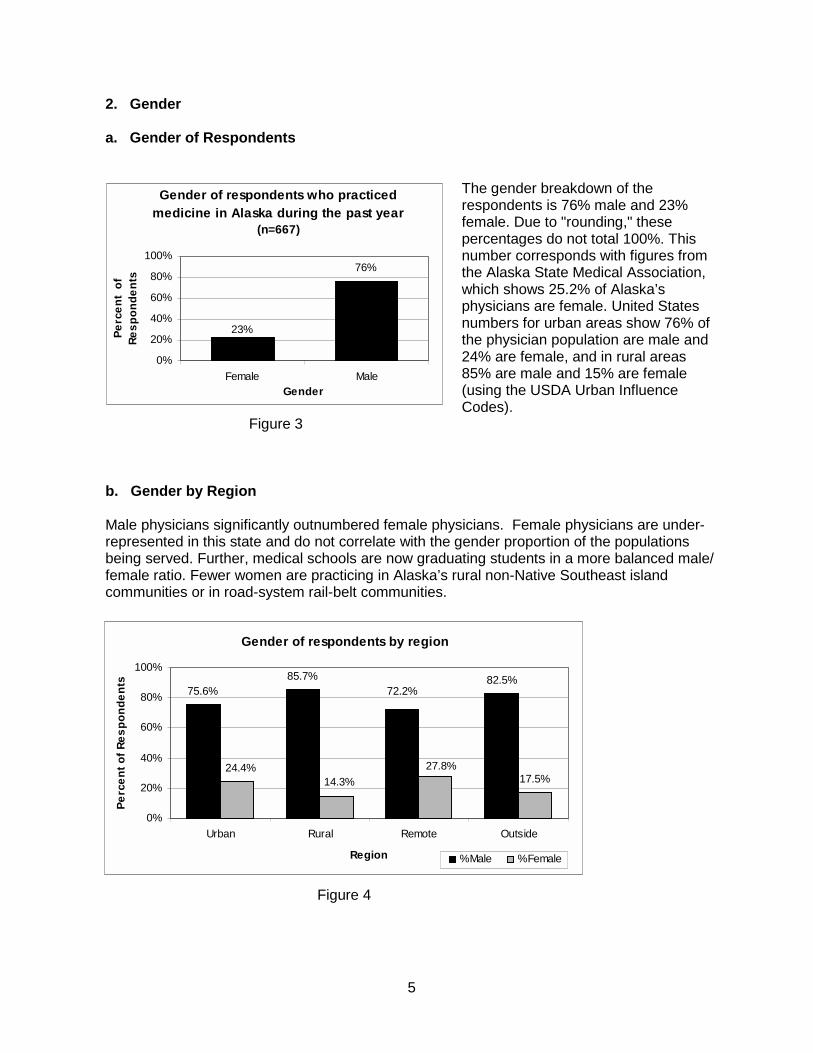
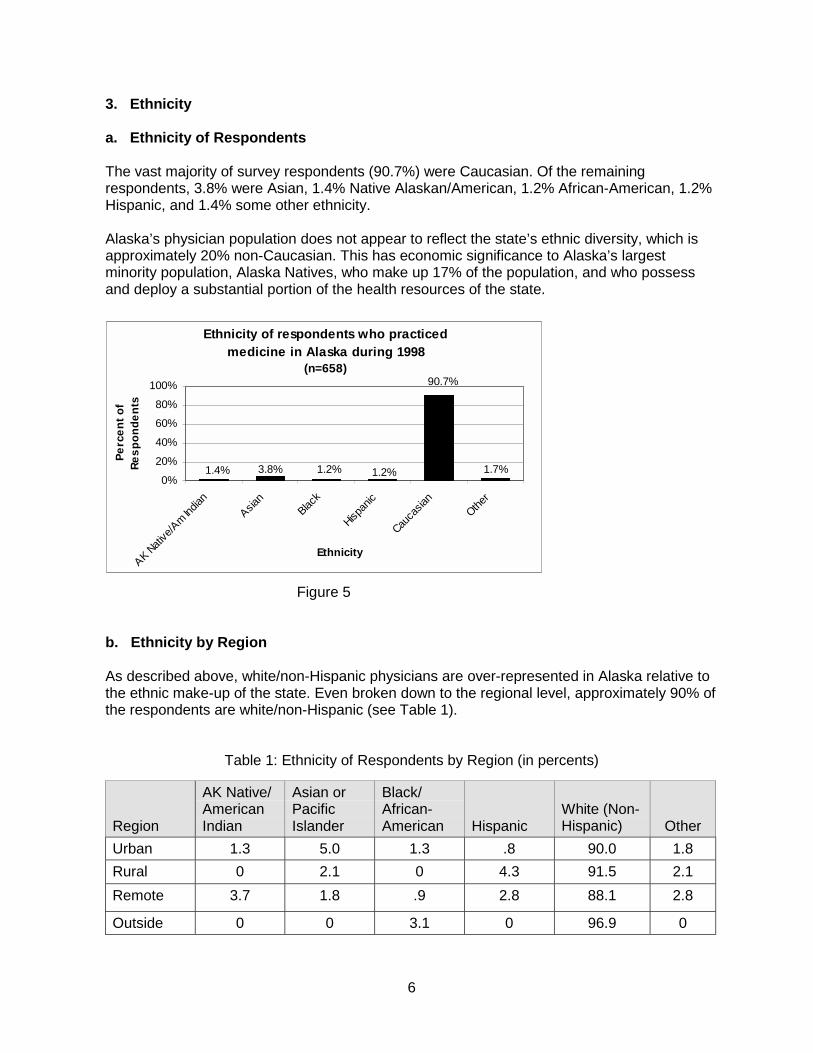
The vast majority of survey respondents (90.7%) were Caucasian. Of the remainingrespondents, 3.8% were Asian, 1.4% Native Alaskan/American, 1.2% African-American, 1.2%Hispanic, and 1.4% some other ethnicity.
Alaska’s physician population does not appear to reflect the state’s ethnic diversity, which isapproximately 20% non-Caucasian. This has economic significance to Alaska’s largestminority population, Alaska Natives, who make up 17% of the population, and who possessand deploy a substantial portion of the health resources of the state.
Figure 5
b. Ethnicity by Region
As described above, white/non-Hispanic physicians are over-represented in Alaska relative tothe ethnic make-up of the state. Even broken down to the regional level, approximately 90% ofthe respondents are white/non-Hispanic (see Table 1).
Table 1: Ethnicity of Respondents by Region (in percents)
Region
AK Native/AmericanIndian
Asian orPacificIslander
Black/African-American Hispanic
White (Non-Hispanic) Other
Urban 1.3 5.0 1.3 .8 90.0 1.8
Rural 0 2.1 0 4.3 91.5 2.1
Remote 3.7 1.8 .9 2.8 88.1 2.8
Outside 0 0 3.1 0 96.9 0
Ethnicity of respondents who practiced medicine in Alaska during 1998
(n=658)90.7%
1.4% 3.8% 1.2% 1.2% 1.7%0%
20%
40%
60%
80%
100%
AK Nat
ive/A
m India
n
Asian
Black
Hispan
ic
Cauca
sian
Other
Ethnicity
Pe
rce
nt
of
Re
sp
on
de
nts
7
4. Continuing Medical Education (CME) Sources
a. CME Sources of Respondents
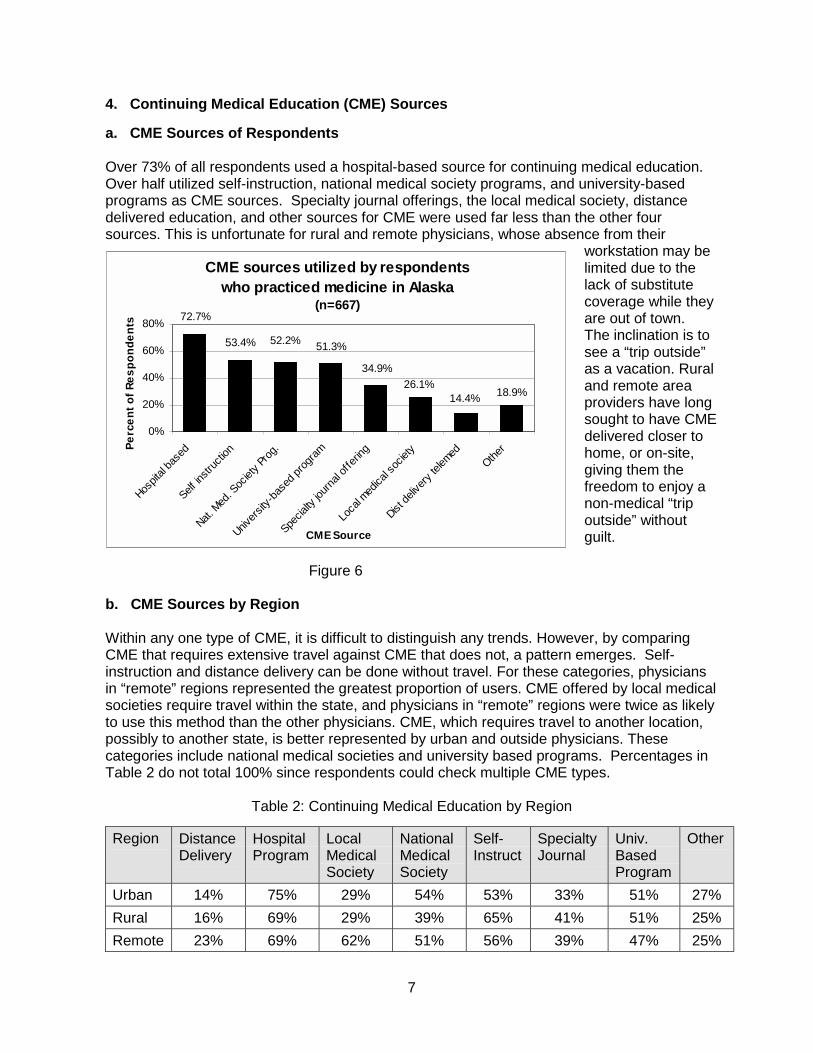
Over 73% of all respondents used a hospital-based source for continuing medical education.Over half utilized self-instruction, national medical society programs, and university-basedprograms as CME sources. Specialty journal offerings, the local medical society, distancedelivered education, and other sources for CME were used far less than the other foursources. This is unfortunate for rural and remote physicians, whose absence from their
workstation may belimited due to thelack of substitutecoverage while theyare out of town.The inclination is tosee a “trip outside”as a vacation. Ruraland remote areaproviders have longsought to have CMEdelivered closer tohome, or on-site,giving them thefreedom to enjoy anon-medical “tripoutside” withoutguilt.
Figure 6
b. CME Sources by Region
Within any one type of CME, it is difficult to distinguish any trends. However, by comparingCME that requires extensive travel against CME that does not, a pattern emerges. Self-instruction and distance delivery can be done without travel. For these categories, physiciansin “remote” regions represented the greatest proportion of users. CME offered by local medicalsocieties require travel within the state, and physicians in “remote” regions were twice as likelyto use this method than the other physicians. CME, which requires travel to another location,possibly to another state, is better represented by urban and outside physicians. Thesecategories include national medical societies and university based programs. Percentages inTable 2 do not total 100% since respondents could check multiple CME types.
Table 2: Continuing Medical Education by Region
Region DistanceDelivery
HospitalProgram
LocalMedicalSociety
NationalMedicalSociety
Self-Instruct
SpecialtyJournal
Univ.BasedProgram
Other
Urban 14% 75% 29% 54% 53% 33% 51% 27%
Rural 16% 69% 29% 39% 65% 41% 51% 25%
Remote 23% 69% 62% 51% 56% 39% 47% 25%
CME sources utilized by respondents who practiced medicine in Alaska
(n=667)
18.9%26.1%
51.3%
72.7%
53.4% 52.2%
34.9%
14.4%
0%
20%
40%
60%
80%
Hospit
al ba
sed
Self in
struc
tion
Nat. M
ed. S
ociet
y Pro
g.
Univer
sity-
base
d pro
gram
Specia
lty jo
urna
l offe
ring
Loca
l med
ical s
ociet
y
Dist de
liver
y tel
emed
Other
CME Source
Pe
rce
nt
of
Re
sp
on
de
nts
8
Patient care practice status of survey respondents who practiced medicine in Alaska during 1998
(n=667)
46.8%
24.7%24.4%
3.0%0%
10%
20%
30%
40%
50%
60%
Can take a fewnew patients
Can take manynew patients
Not taking newpatients
Not Applicable
Patient Care Practice Status
Pe
rce
nt
of
Re
sp
on
de
nts
B. Patient Care Information
1. Patient Care Practice
a. Patient Care Practice Status of Respondents
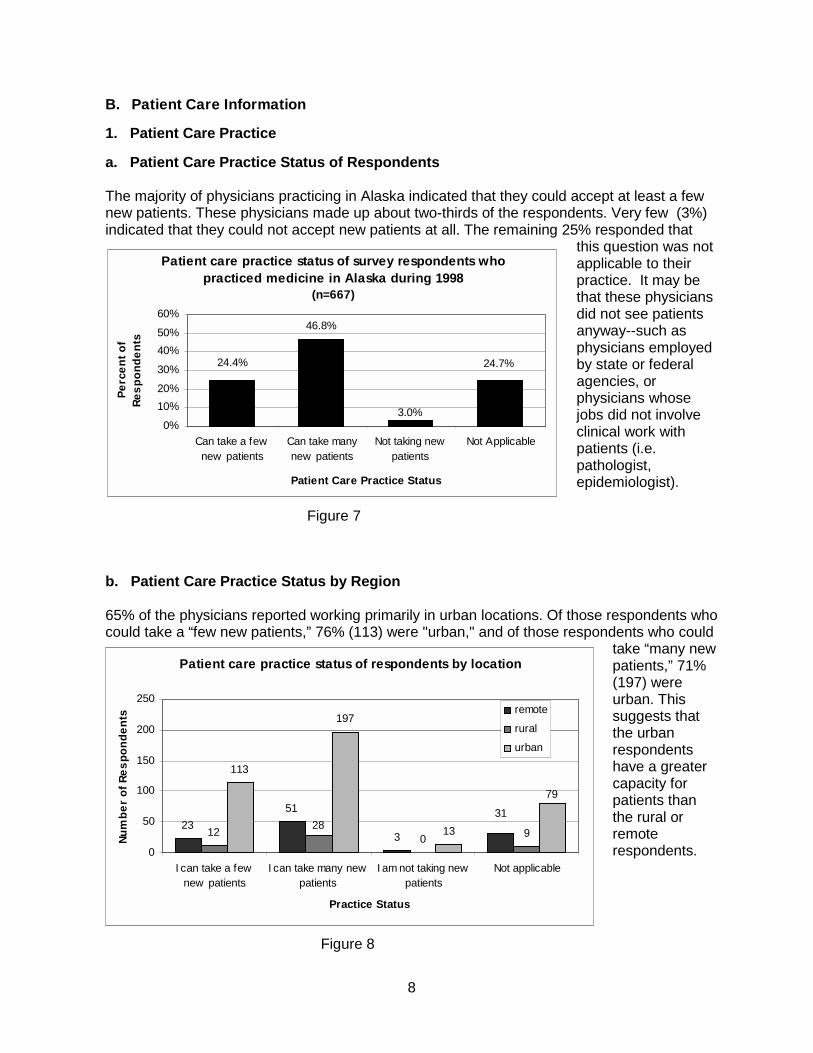
The majority of physicians practicing in Alaska indicated that they could accept at least a fewnew patients. These physicians made up about two-thirds of the respondents. Very few (3%)indicated that they could not accept new patients at all. The remaining 25% responded that
this question was notapplicable to theirpractice. It may bethat these physiciansdid not see patientsanyway--such asphysicians employedby state or federalagencies, orphysicians whosejobs did not involveclinical work withpatients (i.e.pathologist,epidemiologist).
Figure 7
b. Patient Care Practice Status by Region
65% of the physicians reported working primarily in urban locations. Of those respondents whocould take a “few new patients,” 76% (113) were "urban," and of those respondents who could
take “many newpatients,” 71%(197) wereurban. Thissuggests thatthe urbanrespondentshave a greatercapacity forpatients thanthe rural orremoterespondents.
Figure 8
Patient care practice status of respondents by location
23
51
3120 9
113
197
13
3128
79
0
50
100
150
200
250
I can take a fewnew patients
I can take many newpatients
I am not taking newpatients
Not applicable
Practice Status
Nu
mb
er
of
Re
sp
on
de
nts
remote
rural
urban

9
2. Medicaid and Medicare Patients
a. Medicaid and Medicare Patients Accepted by Physicians
A large majority of the physicians reported that they accept and serve both Medicaid andMedicare patients in their practices. The proportion of physicians who accept and serveMedicaid patients was slightly higher (7-8%) than those who accept and serve Medicare
patients. (Note: thisinformation wascollected prior to theMedicaid andMedicare Audits. It ispossible that thesefindings are nowinvalid. Jim Jordan ofthe Alaska StateMedical Associationsuspects that thefigures in 2000 wouldnot show so stronglythat Medicaid andMedicare patients arebeing seen.
Figure 9
b. Medicaid and Medicare Patients Accepted by Physicians by Region
Table 3: Physician Policy for Accepting orTreating Public-pay Patients by Region
RegionAccepts New
MedicaidPatients
Accepts NewMedicarePatients
ServesMedicaidPatients
ServesMedicarePatients
Urban 79% 69% 88% 81%
Rural 92% 86% 98% 92%
Remote 89% 86% 95% 92%
Outside 75% 65% 83% 69%
Physician policy for accepting or treating public-pay patients in Alaska
(n=667)
70.8%78.7%80.2%
87.3%
0%
20%
40%
60%
80%
100%
Serve Medicaid Serve Medicare Accept NewMedicaid
Accept NewMedicare
Medicaid/Medicare Patient Action
Pe
rce
nt
of
Re
sp
on
de
nts
Caution: since this survey was completed, events have occurred which may have invalidatedresults concerning physicians providing services under Medicaid and Medicare, and theirwillingness to take new patients. In fiscal year 1998, Alaska initiated audits on approximately70 physicians providing services to Medicaid patients. This, coupled with physicianperceptions of a federal “witch-hunt” for fraudulent billing for Medicare patients, may havehad a significant “chilling” effect – that is, it might be expected that these high percentages ofparticipation in those services might not be repeated if this study were performed today.
Table 3 demonstrates thaturban respondents are theleast likely to accept newMedicaid and Medicarepatients, second only tophysicians practicingoutside of Alaska. Further,a greater percent of ruraland remote respondentsreported serving Medicaidand Medicare patients.
10
3. Physician Work Time
a. Physician Work Time in Clinical Practice
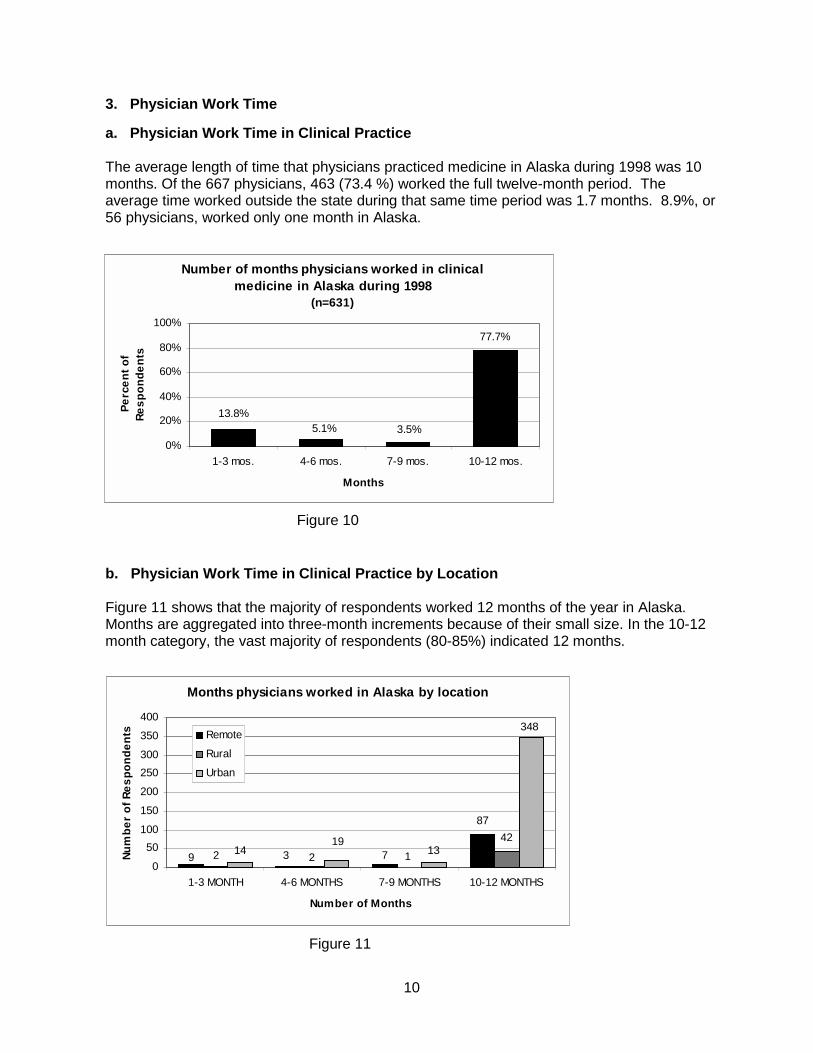
The average length of time that physicians practiced medicine in Alaska during 1998 was 10months. Of the 667 physicians, 463 (73.4 %) worked the full twelve-month period. Theaverage time worked outside the state during that same time period was 1.7 months. 8.9%, or56 physicians, worked only one month in Alaska.
Figure 10
b. Physician Work Time in Clinical Practice by Location
Figure 11 shows that the majority of respondents worked 12 months of the year in Alaska.Months are aggregated into three-month increments because of their small size. In the 10-12month category, the vast majority of respondents (80-85%) indicated 12 months.
Figure 11
Number of months physicians worked in clinical medicine in Alaska during 1998
(n=631)
13.8%5.1% 3.5%
77.7%
0%
20%
40%
60%
80%
100%
1-3 mos. 4-6 mos. 7-9 mos. 10-12 mos.
Months
Pe
rce
nt
of
Re
sp
on
de
nts
Months physicians worked in Alaska by location
87
42
9 732 2 11419
13
348
0
50
100
150
200
250
300
350
400
1-3 MONTH 4-6 MONTHS 7-9 MONTHS 10-12 MONTHS
Number of Months
Nu
mb
er
of
Re
sp
on
de
nts Remote
Rural
Urban
11
4. Regular Medicine-Related Work Hours
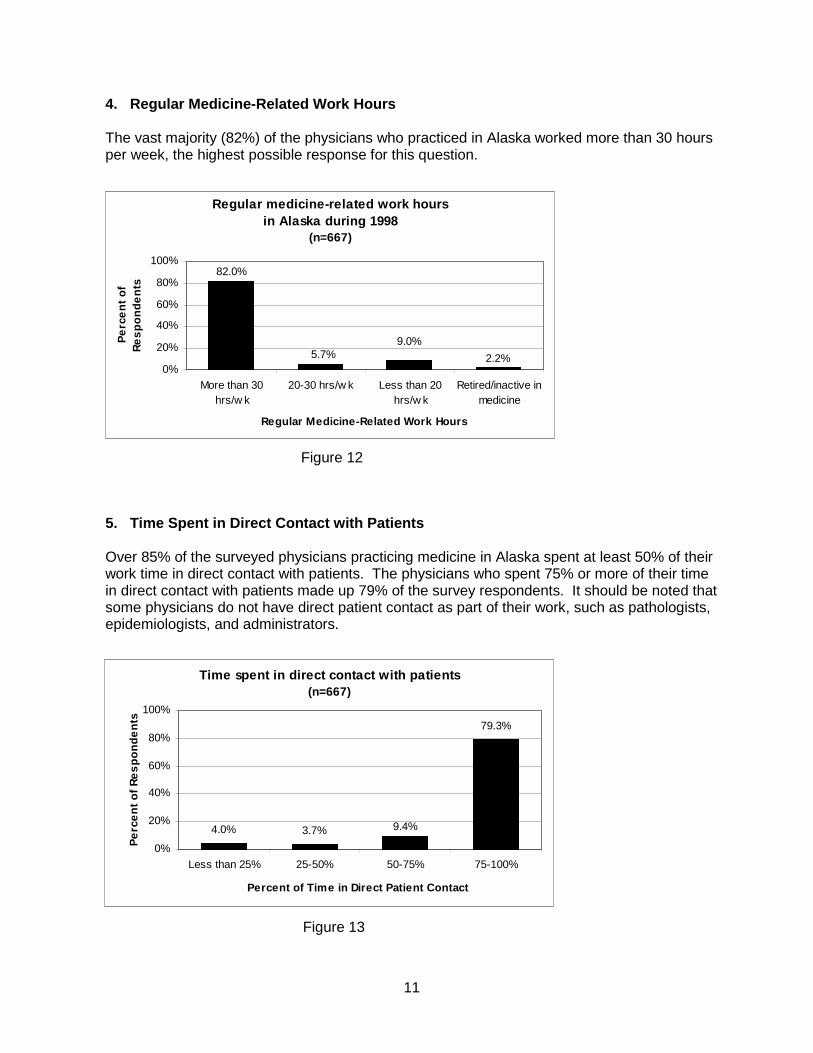
The vast majority (82%) of the physicians who practiced in Alaska worked more than 30 hoursper week, the highest possible response for this question.
Figure 12
5. Time Spent in Direct Contact with Patients
Over 85% of the surveyed physicians practicing medicine in Alaska spent at least 50% of theirwork time in direct contact with patients. The physicians who spent 75% or more of their timein direct contact with patients made up 79% of the survey respondents. It should be noted thatsome physicians do not have direct patient contact as part of their work, such as pathologists,epidemiologists, and administrators.
Figure 13
Regular medicine-related work hours in Alaska during 1998
(n=667)
2.2%5.7%9.0%
82.0%
0%
20%
40%
60%
80%
100%
More than 30hrs/w k
20-30 hrs/w k Less than 20hrs/w k
Retired/inactive inmedicine
Regular Medicine-Related Work Hours
Pe
rce
nt
of
Re
sp
on
de
nts
Time spent in direct contact with patients (n=667)
4.0% 3.7%
79.3%
9.4%
0%
20%
40%
60%
80%
100%
Less than 25% 25-50% 50-75% 75-100%
Percent of Time in Direct Patient Contact
Pe
rce
nt
of
Re
sp
on
de
nts
12
C. Medical Practice Information
1. Primary Practice Location
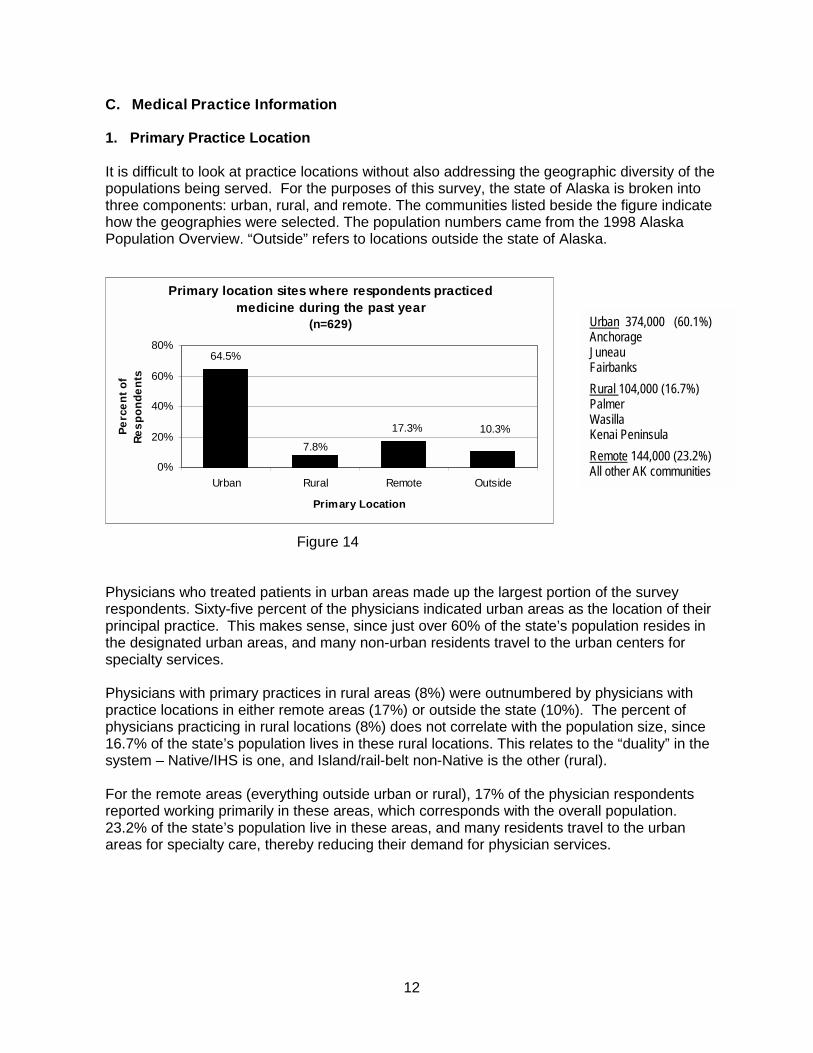
It is difficult to look at practice locations without also addressing the geographic diversity of thepopulations being served. For the purposes of this survey, the state of Alaska is broken intothree components: urban, rural, and remote. The communities listed beside the figure indicatehow the geographies were selected. The population numbers came from the 1998 AlaskaPopulation Overview. “Outside” refers to locations outside the state of Alaska.
Figure 14
Physicians who treated patients in urban areas made up the largest portion of the surveyrespondents. Sixty-five percent of the physicians indicated urban areas as the location of theirprincipal practice. This makes sense, since just over 60% of the state’s population resides inthe designated urban areas, and many non-urban residents travel to the urban centers forspecialty services.
Physicians with primary practices in rural areas (8%) were outnumbered by physicians withpractice locations in either remote areas (17%) or outside the state (10%). The percent ofphysicians practicing in rural locations (8%) does not correlate with the population size, since16.7% of the state’s population lives in these rural locations. This relates to the “duality” in thesystem – Native/IHS is one, and Island/rail-belt non-Native is the other (rural).
For the remote areas (everything outside urban or rural), 17% of the physician respondentsreported working primarily in these areas, which corresponds with the overall population.23.2% of the state’s population live in these areas, and many residents travel to the urbanareas for specialty care, thereby reducing their demand for physician services.
Urban 374,000 (60.1%)AnchorageJuneauFairbanksRural 104,000 (16.7%)PalmerWasillaKenai PeninsulaRemote 144,000 (23.2%)All other AK communities
Primary location sites where respondents practiced medicine during the past year
(n=629)
10.3%
64.5%
7.8%
17.3%
0%
20%
40%
60%
80%
Urban Rural Remote Outside
Primary Location
Pe
rce
nt
of
Re
sp
on
de
nts
13
2. Distribution of Physicians in the Health Care System
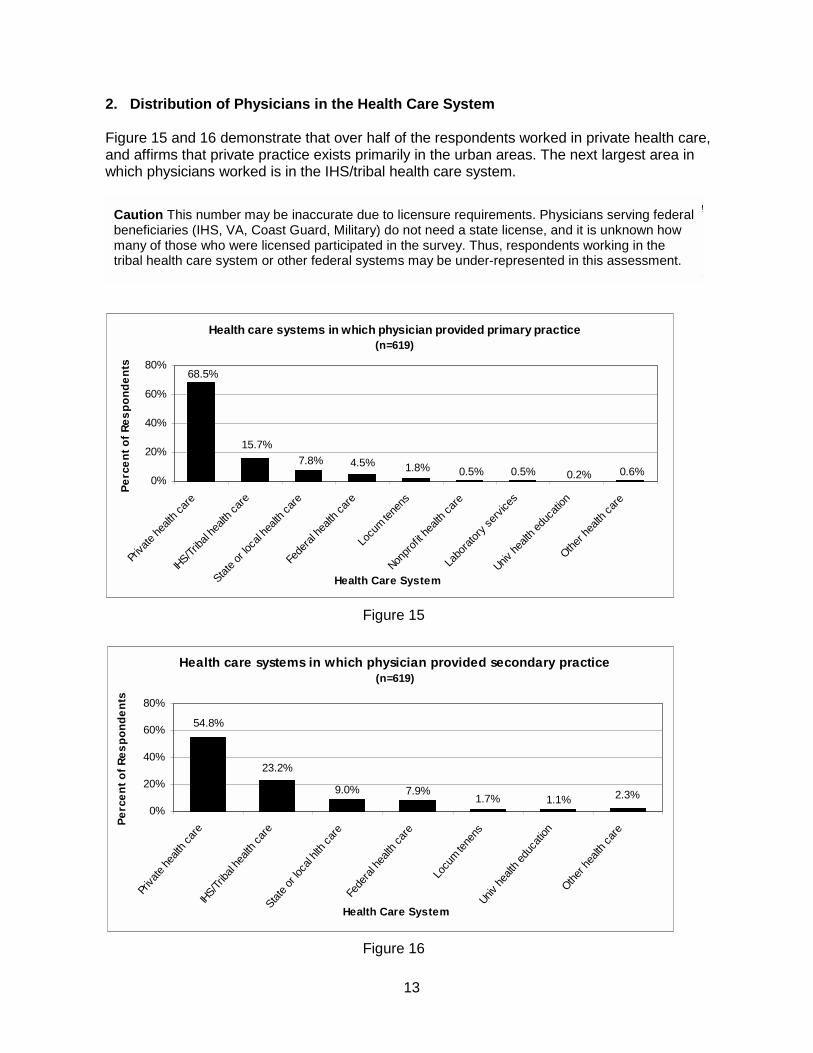
Figure 15 and 16 demonstrate that over half of the respondents worked in private health care,and affirms that private practice exists primarily in the urban areas. The next largest area inwhich physicians worked is in the IHS/tribal health care system.
Figure 15
Figure 16
Caution This number may be inaccurate due to licensure requirements. Physicians serving federalbeneficiaries (IHS, VA, Coast Guard, Military) do not need a state license, and it is unknown howmany of those who were licensed participated in the survey. Thus, respondents working in thetribal health care system or other federal systems may be under-represented in this assessment.
Health care systems in which physician provided secondary practice(n=619)
2.3%1.1%1.7%7.9%
23.2%
54.8%
9.0%
0%
20%
40%
60%
80%
Priva
te h
ealth
car
eIH
S/Trib
al he
alth
care
State
or l
ocal
hlth
care
Fede
ral h
ealth
car
e
Locu
m tene
nsUniv
hea
lth e
duca
tion
Other
hea
lth c
are
Health Care System
Pe
rce
nt
of
Re
sp
on
de
nts
Health care systems in which physician provided primary practice(n=619)
0.6%0.2%0.5%0.5%1.8%4.5%7.8%
68.5%
15.7%
0%
20%
40%
60%
80%
Priva
te he
alth c
are
IHS/Triba
l hea
lth ca
re
State o
r loc
al he
alth c
are
Fede
ral h
ealth
care
Locu
m tene
ns
Nonpr
ofit h
ealth
care
Labo
rato
ry se
rvice
s
Univ he
alth e
duca
tion
Other h
ealth
care
Health Care System
Pe
rce
nt
of
Re
sp
on
de
nts

14
3. Secondary Practice Locations
Less than one third of the physicians surveyed in Alaska indicated having secondary practicesites. Again, urban practice sites outnumbered all other site types, and rural sites had thesmallest proportion of practicing physicians in the survey. Sixteen percent of physiciansreported a rural secondary practice location, and 24% of the physicians reported a remotesecondary practice location. This correlates closely with 16.7% of the rural population and23.2% of the remote population.
Figure 17
4. Itinerant Practice in Remote Alaska
Of the survey respondents, 26% indicated that they provide itinerant services in Alaska, with amedian value of 12 days. A median is the most central or middle value. In this response, it wasmore appropriate to take the median than the average (22 days) because of the high standarddeviation of 28.3 days. The minimum itinerant time period was zero days and the maximum
time was 240 days.The high amount ofitinerant services couldbe accounted for by 1)IHS/Tribal docs, 2)private docs assistingtheir peers, or 3)private physicians inurban areas who donot have a “complete”practice and arelooking for more work.
Figure 18
Secondary location sites where respondents practiced medicine during the past year
(n=164)
13.4%
23.8%
15.9%
47.0%
0%
10%
20%
30%
40%
50%
Urban Rural Remote Outside
Secondary Location
Pe
rce
nt
of
Re
sp
on
de
nts
Physicians who provide itinerant services in Alaska (n=667)
18.1%
25.9%
55.9%
0%
10%
20%
30%
40%
50%
60%
No Yes Did not answ er
Survey Response
Pe
rce
nt
of
Re
sp
on
de
nts
15
5. Supervision of Physician Assistants
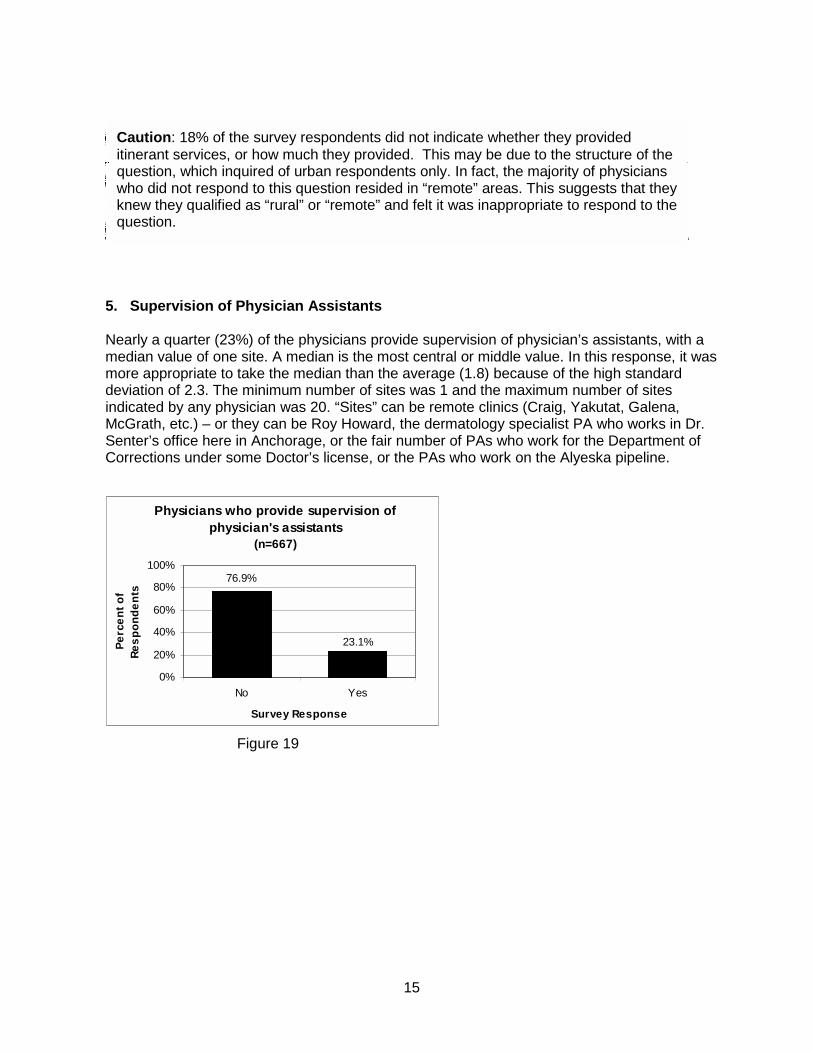
Nearly a quarter (23%) of the physicians provide supervision of physician’s assistants, with amedian value of one site. A median is the most central or middle value. In this response, it wasmore appropriate to take the median than the average (1.8) because of the high standarddeviation of 2.3. The minimum number of sites was 1 and the maximum number of sitesindicated by any physician was 20. “Sites” can be remote clinics (Craig, Yakutat, Galena,McGrath, etc.) – or they can be Roy Howard, the dermatology specialist PA who works in Dr.Senter’s office here in Anchorage, or the fair number of PAs who work for the Department ofCorrections under some Doctor’s license, or the PAs who work on the Alyeska pipeline.
Figure 19
Caution: 18% of the survey respondents did not indicate whether they provideditinerant services, or how much they provided. This may be due to the structure of thequestion, which inquired of urban respondents only. In fact, the majority of physicianswho did not respond to this question resided in “remote” areas. This suggests that theyknew they qualified as “rural” or “remote” and felt it was inappropriate to respond to thequestion.
Physicians who provide supervision of physician's assistants
(n=667)
76.9%
23.1%
0%
20%
40%
60%
80%
100%
No Yes
Survey Response
Pe
rce
nt
of
Re
sp
on
de
nts
16
D. Practice Specialties and Settings
1. Primary Care and Specialty Care
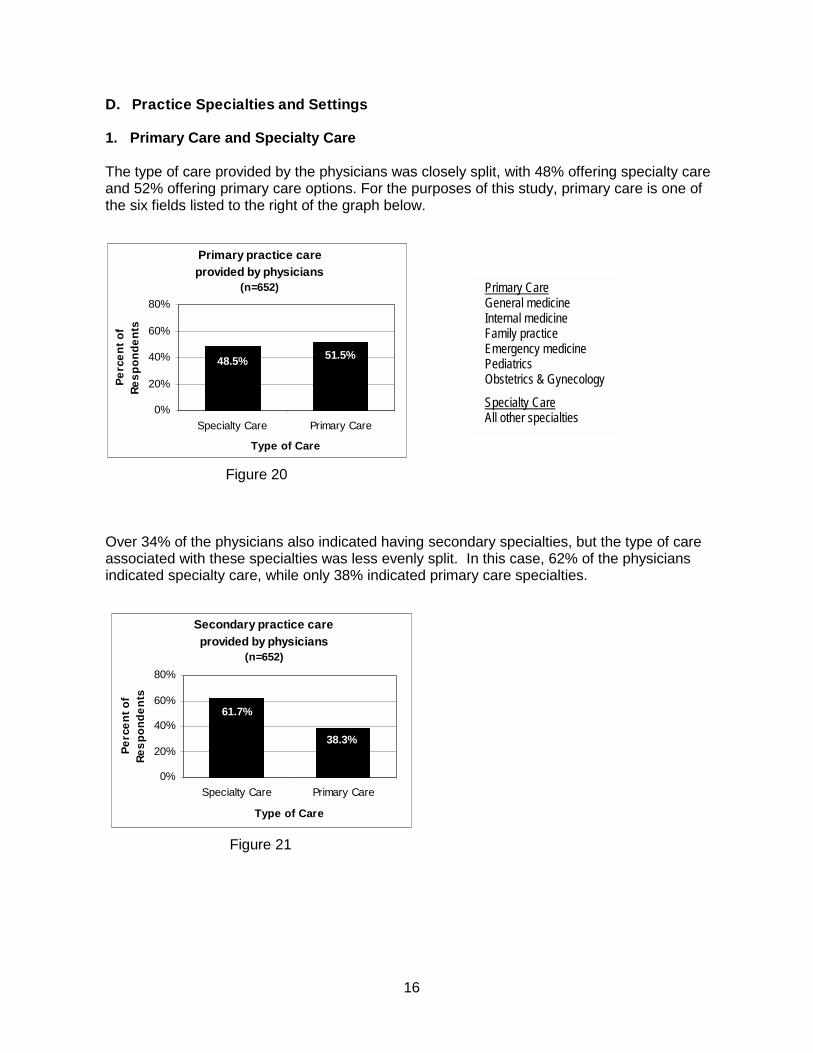
The type of care provided by the physicians was closely split, with 48% offering specialty careand 52% offering primary care options. For the purposes of this study, primary care is one ofthe six fields listed to the right of the graph below.
Figure 20
Over 34% of the physicians also indicated having secondary specialties, but the type of careassociated with these specialties was less evenly split. In this case, 62% of the physiciansindicated specialty care, while only 38% indicated primary care specialties.
Figure 21
Primary Care General medicine Internal medicine Family practice Emergency medicine Pediatrics Obstetrics & Gynecology
Specialty Care All other specialties
Primary practice care provided by physicians
(n=652)
51.5%48.5%
0%
20%
40%
60%
80%
Specialty Care Primary Care
Type of Care
Pe
rce
nt
of
Re
sp
on
de
nts
Secondary practice care provided by physicians
(n=652)
61.7%
38.3%
0%
20%
40%
60%
80%
Specialty Care Primary Care
Type of Care
Pe
rce
nt
of
Re
sp
on
de
nts

17
2. Residency Training in Primary & Secondary Specialties
a. Primary & Secondary Specialties
As the graphs below demonstrate, respondents are significantly more likely to have residencytraining in their primary specialty than in their secondary specialty.
Figure 22 Figure 23
b. American Board of Medical Specialties Certification
These data suggest a very high percentage of respondents are ABMS certified, much higherthan the nation as a whole. However, these results should be viewed with caution for tworeasons. First, this is “self reported,” without any clarification on the integrity of the “board” thatprovided the license. Also, the survey neglected the American Osteopathic Board (AOB),which is the only other certifying entity recognized by governments, licensing bodies, and theAMA.
Figure 24 Figure 25
Physicians with ABMS or other certification in their primary specialty
(n=667)
13.2%
83.4%
0%
20%
40%
60%
80%
100%
No Yes
Survey Response
Pe
rce
nt
of
Re
sp
on
de
nts
Proportion of physicians with residency training in their primary specialties
(n=667)
13.3%
83.5%
0%
20%
40%
60%
80%
100%
No Yes
Survey Response
Pe
rce
nt
of
Re
sp
on
de
nts
Proportion of physicians with residency training in their secondary specialties
(n=667)
14.5% 16.6%
0%
20%
40%
60%
80%
100%
No Yes
Survey ResponseP
erc
en
t o
f R
es
po
nd
en
ts
Physicians with ABMS or other certification in their secondary specialty
(n=667)
13.0% 18.6%
0%
20%
40%
60%
80%
100%
No Yes
Survey Response
Pe
rce
nt
of
Re
sp
on
de
nts
18
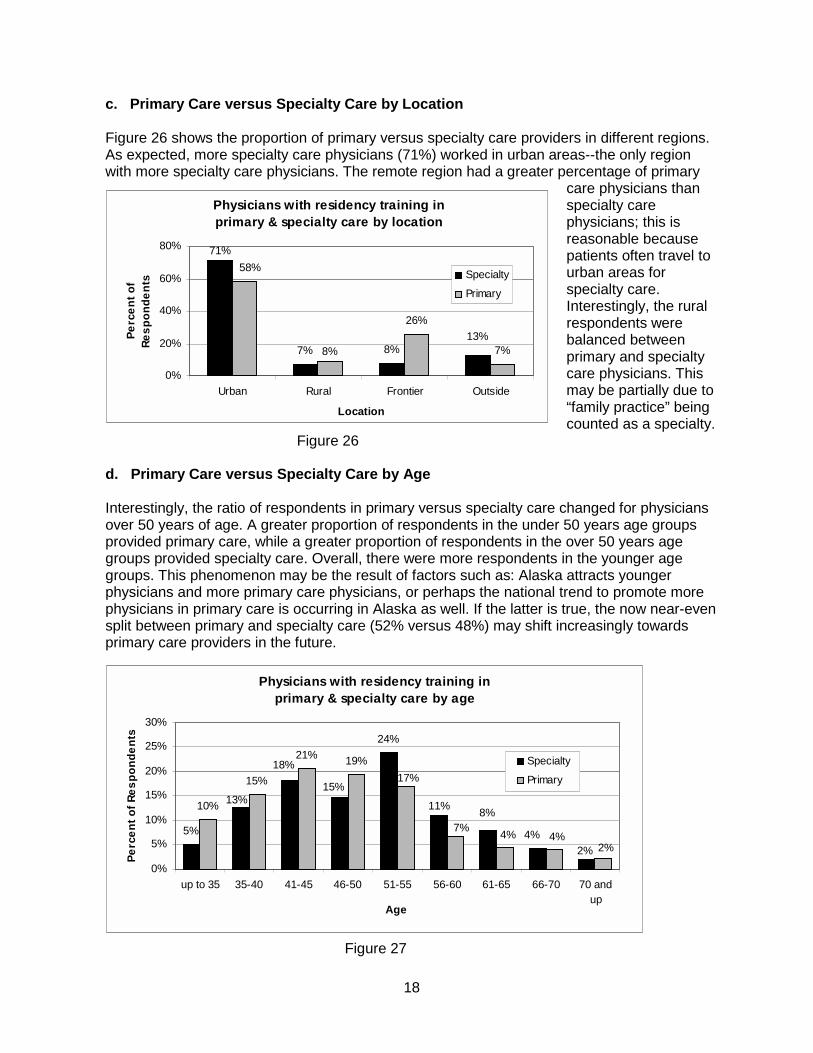
c. Primary Care versus Specialty Care by Location
Figure 26 shows the proportion of primary versus specialty care providers in different regions.As expected, more specialty care physicians (71%) worked in urban areas--the only regionwith more specialty care physicians. The remote region had a greater percentage of primary
care physicians thanspecialty carephysicians; this isreasonable becausepatients often travel tourban areas forspecialty care.Interestingly, the ruralrespondents werebalanced betweenprimary and specialtycare physicians. Thismay be partially due to“family practice” beingcounted as a specialty.
Figure 26
d. Primary Care versus Specialty Care by Age
Interestingly, the ratio of respondents in primary versus specialty care changed for physiciansover 50 years of age. A greater proportion of respondents in the under 50 years age groupsprovided primary care, while a greater proportion of respondents in the over 50 years agegroups provided specialty care. Overall, there were more respondents in the younger agegroups. This phenomenon may be the result of factors such as: Alaska attracts youngerphysicians and more primary care physicians, or perhaps the national trend to promote morephysicians in primary care is occurring in Alaska as well. If the latter is true, the now near-evensplit between primary and specialty care (52% versus 48%) may shift increasingly towardsprimary care providers in the future.
Figure 27
Physicians with residency training in primary & specialty care by location
7% 8%
26%
7%13%
71%
8%
58%
0%
20%
40%
60%
80%
Urban Rural Frontier Outside
Location
Pe
rce
nt
of
Re
sp
on
de
nts
Specialty
Primary
Physicians with residency training in primary & specialty care by age
5%
24%
10%
15%
21% 19%
11%
18%
8%
15%13%
4%
2%
7%
2%4%4%
17%
0%
5%
10%
15%
20%
25%
30%
up to 35 35-40 41-45 46-50 51-55 56-60 61-65 66-70 70 andup
Age
Pe
rce
nt
of
Re
sp
on
de
nts
Specialty
Primary

Appendix A
Physician Survey Instrument
Available at ICHS

Appendix B
Data Limitations
Question #9
Respondents who marked the “retired or inactive in medicine” box often went on to completethe survey, although the survey advised against proceeding. It is unclear if people answeredthe remaining questions from their perspective or former employment or a new career. Toavoid any misinterpretation of the data, all subsequent responses were deleted from this sub-population’s surveys.
Question #12a
The language in this question created unnecessary subjectivity. In the manner written, only“rural” respondents would answer, but it is not clear who is or is not “rural.” Further, it wouldhave been better phrased to include any respondent who provided itinerant services,independent of their community of origin. Fully 18% of the respondents left this question blank.The majority of these were from clearly urban areas. Nevertheless, the data should be viewedwith appropriate caution.
Question #12b
Because of problems in 12a, these data are questionable.
Question #14
Data here are fine. However, based on hand-written insertions, two additional categoriesshould have been included: internal medicine and ophthalmology.
Question #17
The primary and secondary data seem representative of the respondent population. However,written comments under “specify” are problematic and should not be included in the analysis.


