Embed Size (px)
Citation preview
2021Physician CompensationReportFifth Annual Study
December 2021
2021 PHYSICIAN COMPENSATION REPORT | 2
Table of Contents
Introduction
Metro Areas
Compensation by Metro Area
Cost of Living by Metro Area
Compensation Growth by Metro Area
Specialty & Practice Setting
Compensation by Specialty
Compensation Growth by Specialty
Compensation by Employment Setting
Gender Pay Gap
Physician Gender Pay Gap
Women Physicians’ Compensation by Metro Area
Gender Pay Gap by Specialty
NP and PA Gender Pay Gap
COVID-Related Retirement
COVID Impact on Physician Retirement
COVID Impact on Physician Career Plans
COVID Impact on Women Physicians
Methodology
Sources
About Doximity
2021 Physician Compensation Report
3
4
7
10
14
17
19
20
2021 PHYSICIAN COMPENSATION REPORT | 3
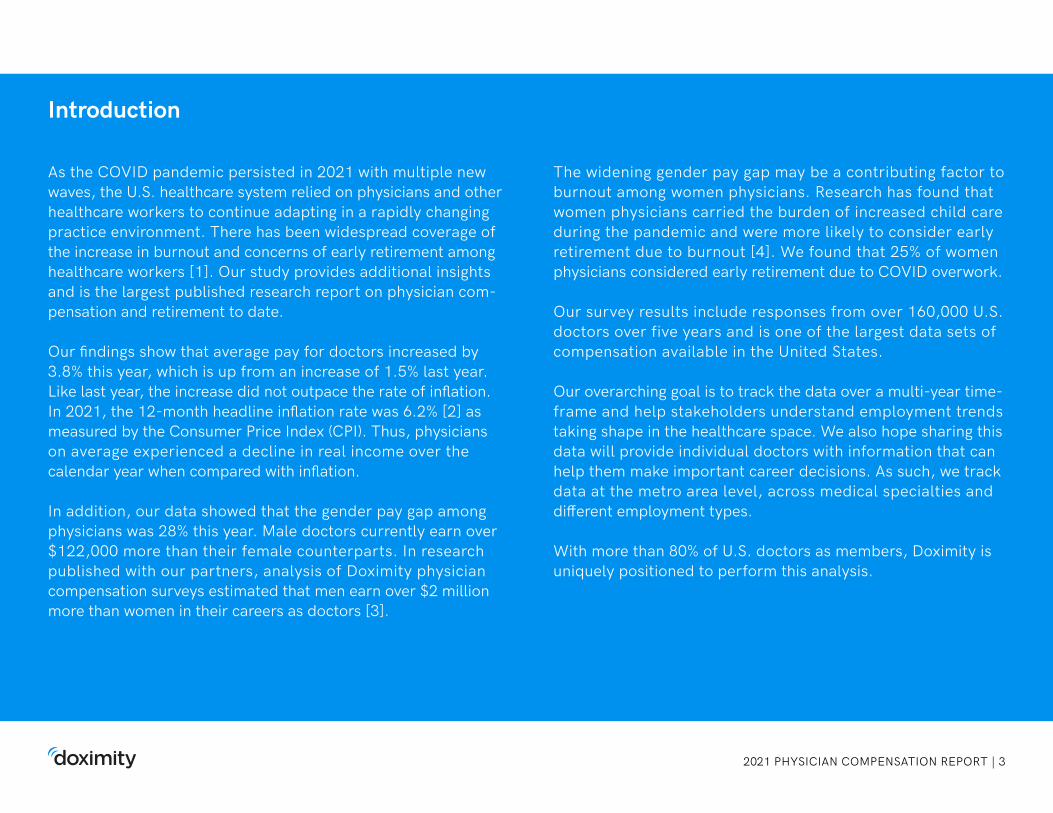
Introduction
As the COVID pandemic persisted in 2021 with multiple new waves, the U.S. healthcare system relied on physicians and other healthcare workers to continue adapting in a rapidly changing practice environment. There has been widespread coverage of the increase in burnout and concerns of early retirement among healthcare workers [1]. Our study provides additional insights and is the largest published research report on physician com- pensation and retirement to date.
Our findings show that average pay for doctors increased by 3.8% this year, which is up from an increase of 1.5% last year. Like last year, the increase did not outpace the rate of inflation. In 2021, the 12-month headline inflation rate was 6.2% [2] as measured by the Consumer Price Index (CPI). Thus, physicians on average experienced a decline in real income over the calendar year when compared with inflation.
In addition, our data showed that the gender pay gap among physicians was 28% this year. Male doctors currently earn over $122,000 more than their female counterparts. In research published with our partners, analysis of Doximity physician compensation surveys estimated that men earn over $2 million more than women in their careers as doctors [3].
The widening gender pay gap may be a contributing factor to burnout among women physicians. Research has found that women physicians carried the burden of increased child care during the pandemic and were more likely to consider early retirement due to burnout [4]. We found that 25% of women physicians considered early retirement due to COVID overwork.
Our survey results include responses from over 160,000 U.S. doctors over five years and is one of the largest data sets of compensation available in the United States.
Our overarching goal is to track the data over a multi-year time- frame and help stakeholders understand employment trends taking shape in the healthcare space. We also hope sharing this data will provide individual doctors with information that can help them make important career decisions. As such, we track data at the metro area level, across medical specialties and different employment types.
With more than 80% of U.S. doctors as members, Doximity is uniquely positioned to perform this analysis.
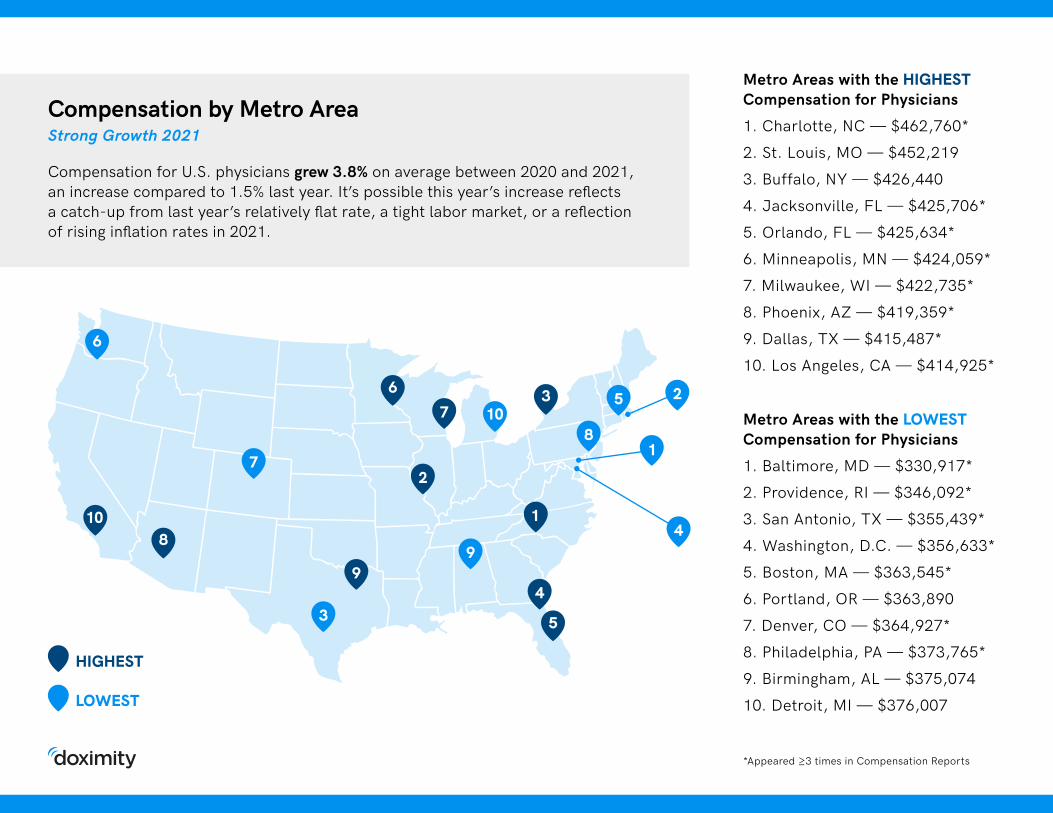
Compensation for U.S. physicians grew 3.8% on average between 2020 and 2021, an increase compared to 1.5% last year. It’s possible this year’s increase reflects a catch-up from last year’s relatively flat rate, a tight labor market, or a reflection of rising inflation rates in 2021.
Metro Areas with the HIGHEST Compensation for Physicians
1. Charlotte, NC — $462,760*2. St. Louis, MO — $452,2193. Buffalo, NY — $426,4404. Jacksonville, FL — $425,706*5. Orlando, FL — $425,634*6. Minneapolis, MN — $424,059*7. Milwaukee, WI — $422,735*8. Phoenix, AZ — $419,359*9. Dallas, TX — $415,487*10. Los Angeles, CA — $414,925*
Metro Areas with the LOWEST Compensation for Physicians 1. Baltimore, MD — $330,917*2. Providence, RI — $346,092*3. San Antonio, TX — $355,439*4. Washington, D.C. — $356,633*5. Boston, MA — $363,545*6. Portland, OR — $363,8907. Denver, CO — $364,927*8. Philadelphia, PA — $373,765*9. Birmingham, AL — $375,07410. Detroit, MI — $376,007
1
2
3
4
5
67
8
9
10
1
4
5
6
78
9
10
3
2
HIGHEST
LOWEST
Compensation by Metro AreaStrong Growth 2021
*Appeared ≥3 times in Compensation Reports
Cost of Living by Metro AreaAdjusted Compensation
HIGHEST
LOWEST
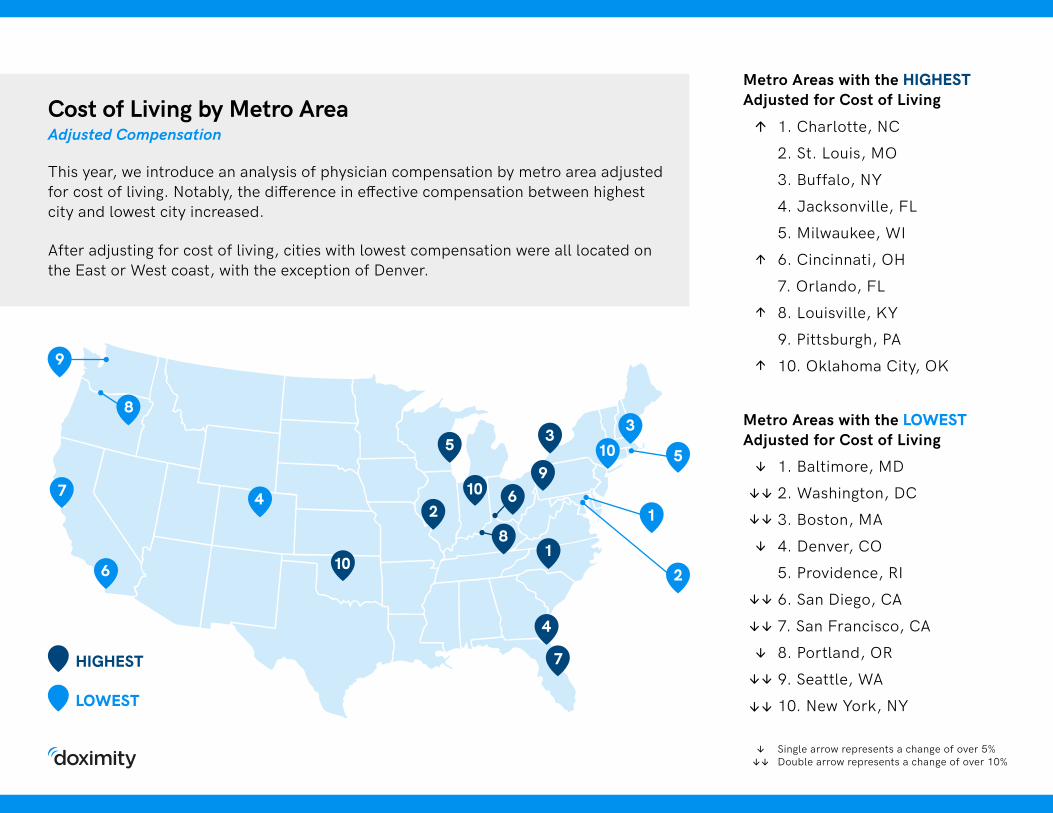
1. Charlotte, NC2. St. Louis, MO3. Buffalo, NY4. Jacksonville, FL5. Milwaukee, WI6. Cincinnati, OH7. Orlando, FL8. Louisville, KY9. Pittsburgh, PA10. Oklahoma City, OK
1. Baltimore, MD2. Washington, DC3. Boston, MA4. Denver, CO5. Providence, RI6. San Diego, CA7. San Francisco, CA8. Portland, OR9. Seattle, WA10. New York, NY
Metro Areas with the HIGHEST Adjusted for Cost of Living
Metro Areas with the LOWESTAdjusted for Cost of Living
2
7
1
35
4
10
7
38
9
10
6
49
6
8
10
5
1
2
This year, we introduce an analysis of physician compensation by metro area adjusted for cost of living. Notably, the difference in effective compensation between highest city and lowest city increased.
After adjusting for cost of living, cities with lowest compensation were all located on the East or West coast, with the exception of Denver.
Single arrow represents a change of over 5%Double arrow represents a change of over 10%
2021 PHYSICIAN COMPENSATION REPORT | 6
Charlotte, NC
Virginia Beach, VA
St. Louis, MO
Tampa, FL
Hartford, CT
Buffalo, NY
Sacramento, CA
Orlando, FL
Nashville, TN
Boston, MA
Compensation Growth by Metro Area
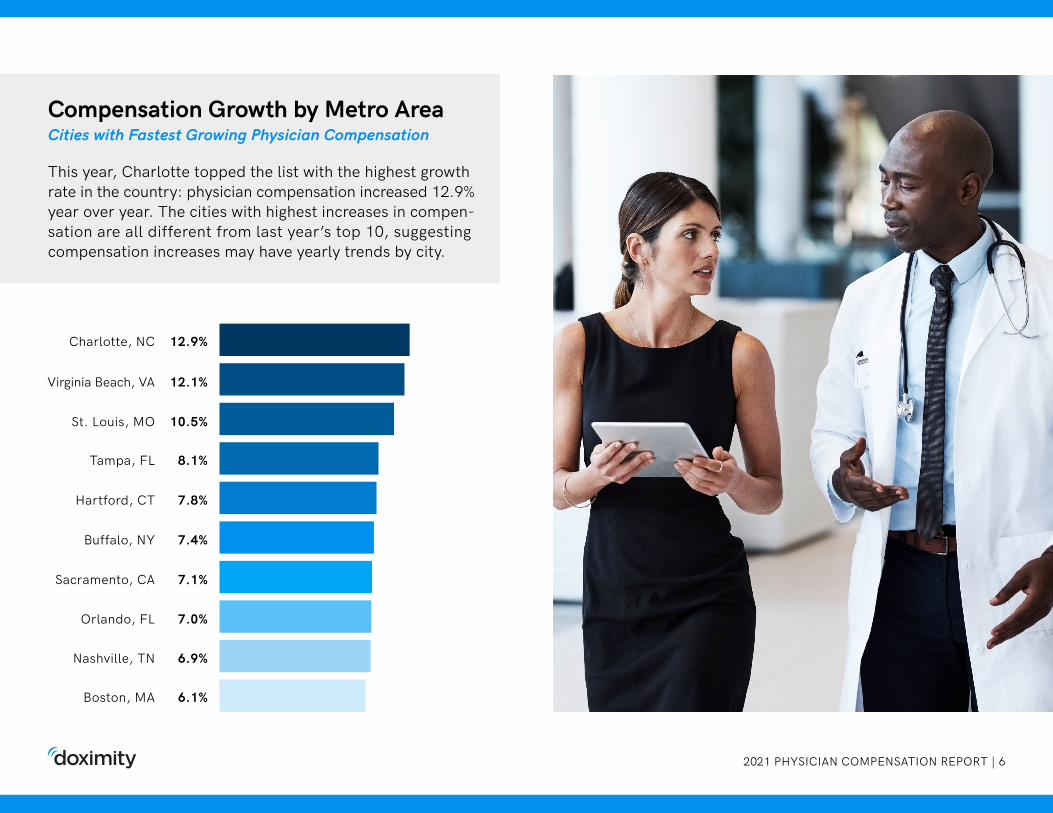
This year, Charlotte topped the list with the highest growth rate in the country: physician compensation increased 12.9% year over year. The cities with highest increases in compen- sation are all different from last year’s top 10, suggesting compensation increases may have yearly trends by city.
12.9%
12.1%
10.5%
8.1%
7.8%
7.4%
7.1%
7.0%
6.9%
6.1%
Cities with Fastest Growing Physician Compensation
2021 PHYSICIAN COMPENSATION REPORT | 7
Average Annual Compensation by Specialty
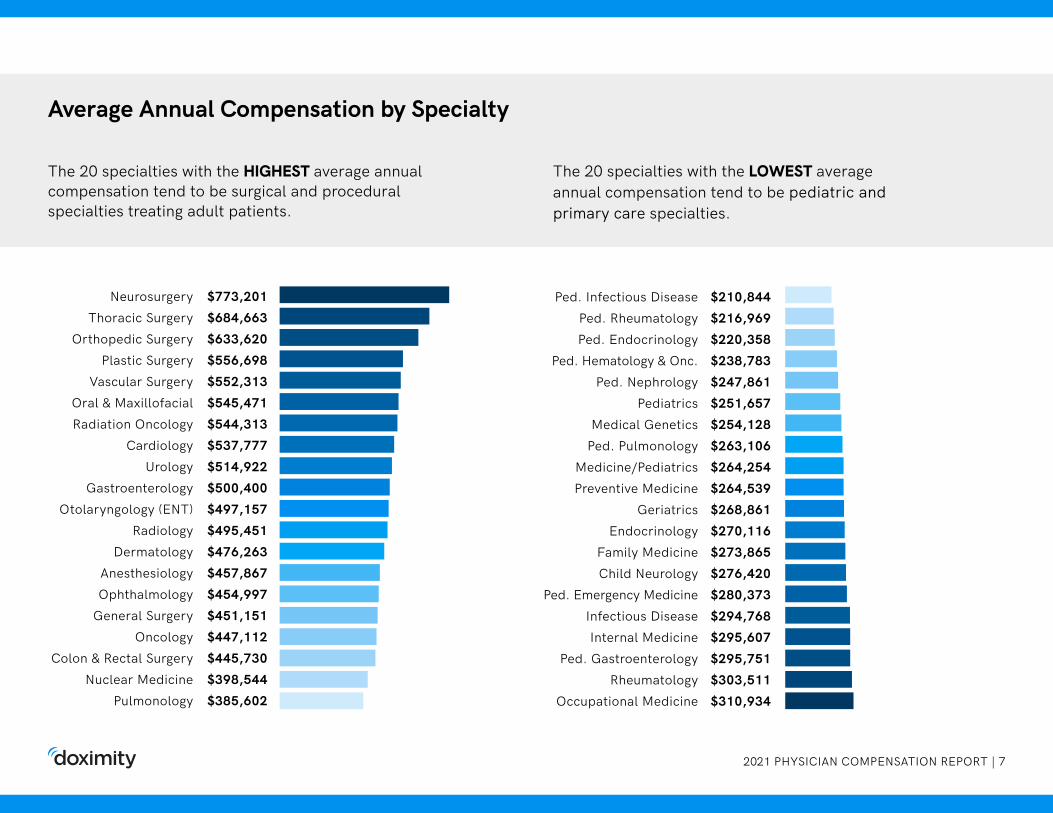
$773,201$684,663$633,620$556,698$552,313$545,471$544,313$537,777$514,922$500,400$497,157$495,451$476,263$457,867$454,997$451,151$447,112$445,730$398,544$385,602
NeurosurgeryThoracic Surgery
Orthopedic SurgeryPlastic Surgery
Vascular SurgeryOral & MaxillofacialRadiation Oncology
CardiologyUrology
GastroenterologyOtolaryngology (ENT)
RadiologyDermatology
AnesthesiologyOphthalmology
General SurgeryOncology
Colon & Rectal SurgeryNuclear Medicine
Pulmonology
$210,844$216,969$220,358$238,783$247,861$251,657$254,128$263,106$264,254$264,539$268,861$270,116$273,865$276,420$280,373$294,768$295,607$295,751$303,511$310,934
Ped. Infectious DiseasePed. RheumatologyPed. Endocrinology
Ped. Hematology & Onc.Ped. Nephrology
PediatricsMedical Genetics
Ped. PulmonologyMedicine/PediatricsPreventive Medicine
GeriatricsEndocrinology
Family MedicineChild Neurology
Ped. Emergency MedicineInfectious DiseaseInternal Medicine
Ped. GastroenterologyRheumatology
Occupational Medicine
The 20 specialties with the HIGHEST average annual compensation tend to be surgical and procedural specialties treating adult patients.
The 20 specialties with the LOWEST average annual compensation tend to be pediatric and primary care specialties.
2021 PHYSICIAN COMPENSATION REPORT | 8
Preventative Medicine
Hematology
Nuclear Medicine
Pediatric Nephrology
Occupational Medicine
Oral & Maxillofacial Surgery
Otolaryngology (ENT)
Pediatric Gastroenterology
Allergy & Immunology
Radiation Oncology
Specialty Compensation Growth
2021 Average Compensation
12.6%
12.2%
10.4%
9.5%
8.4%
7.1%
5.6%
5.4%
5.3%
5.0%
$264,539
$357,292
$398,544
$247,861
$310,934
$545,472
$497,157
$295,751
$329,880
$544,314
Compensation Growth by Specialty
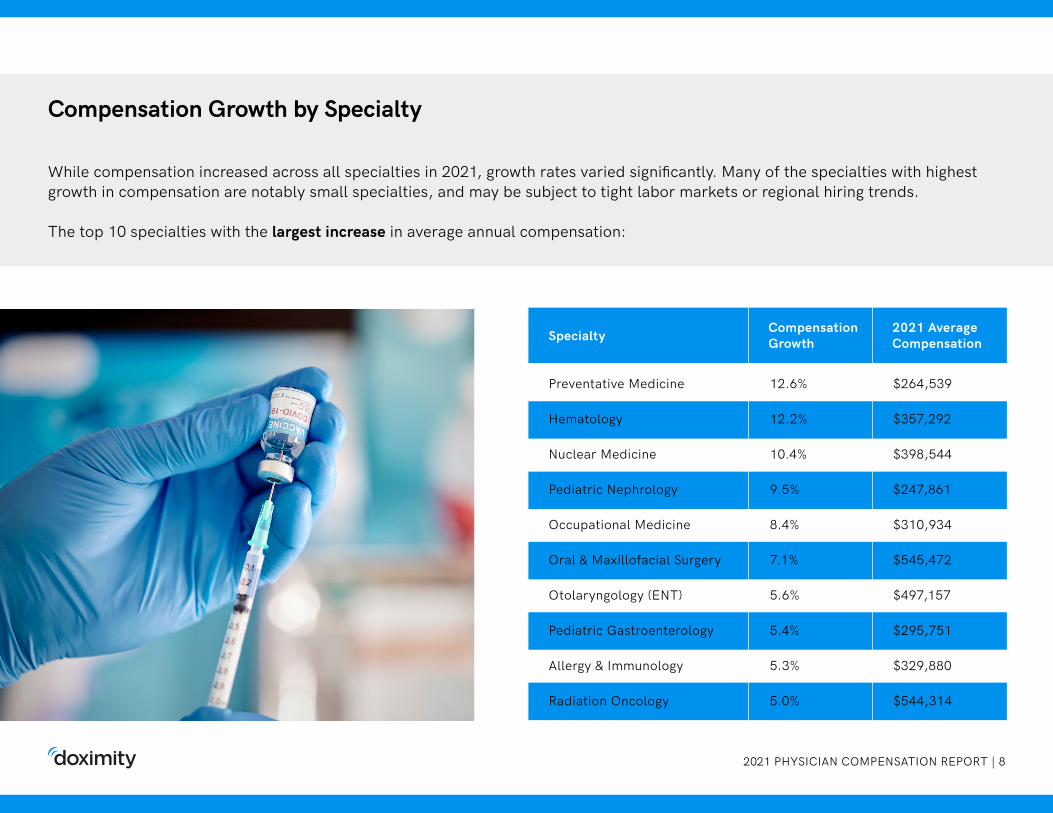
While compensation increased across all specialties in 2021, growth rates varied significantly. Many of the specialties with highest growth in compensation are notably small specialties, and may be subject to tight labor markets or regional hiring trends.
The top 10 specialties with the largest increase in average annual compensation:
2021 PHYSICIAN COMPENSATION REPORT | 9
Single Specialty Group
Multi-specialty Group
Solo Practice
Hospital
Industry / Pharmaceutical
Health System / IDN / ACO
Health Maintenance Organization
Academic
Urgent Care Center / Chain
Government
Employment Setting 2021 Average Compensation
$442,024
$424,312
$415,678
$399,282
$395,560
$394,538
$374,571
$350,232
$267,516
$264,546
Compensation by Employment Setting
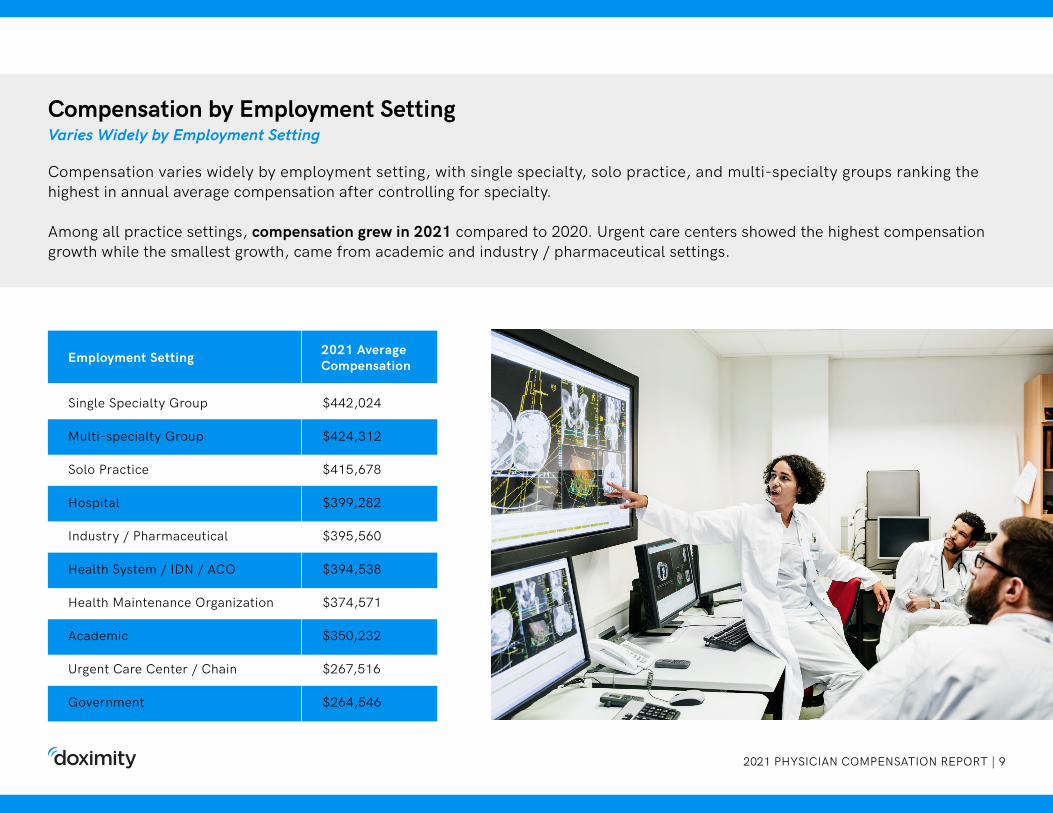
Compensation varies widely by employment setting, with single specialty, solo practice, and multi-specialty groups ranking the highest in annual average compensation after controlling for specialty.
Among all practice settings, compensation grew in 2021 compared to 2020. Urgent care centers showed the highest compensation growth while the smallest growth, came from academic and industry / pharmaceutical settings.
Varies Widely by Employment Setting
2021 PHYSICIAN COMPENSATION REPORT | 10
Physician Gender Pay Gap
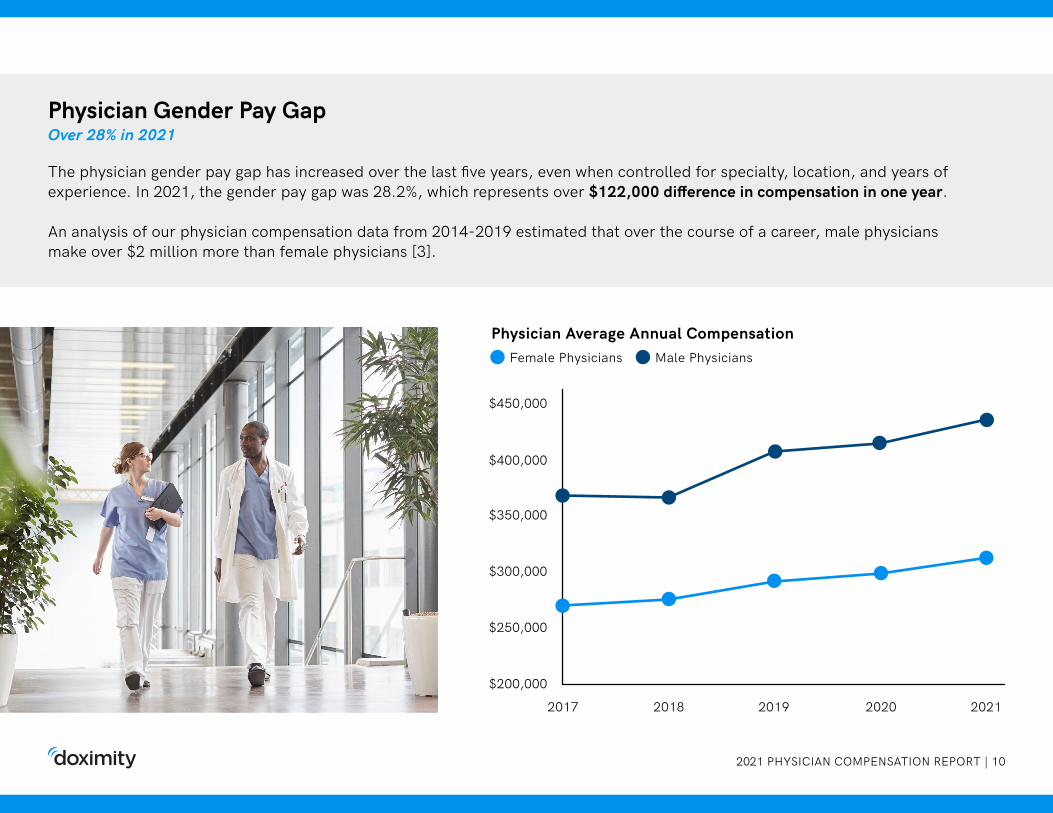
The physician gender pay gap has increased over the last five years, even when controlled for specialty, location, and years of experience. In 2021, the gender pay gap was 28.2%, which represents over $122,000 difference in compensation in one year. An analysis of our physician compensation data from 2014-2019 estimated that over the course of a career, male physicians make over $2 million more than female physicians [3].
Over 28% in 2021
Female Physicians Male Physicians
$200,000
$250,000
$300,000
$350,000
$400,000
$450,000
2017 2018 2019 2020 2021
Physician Average Annual Compensation
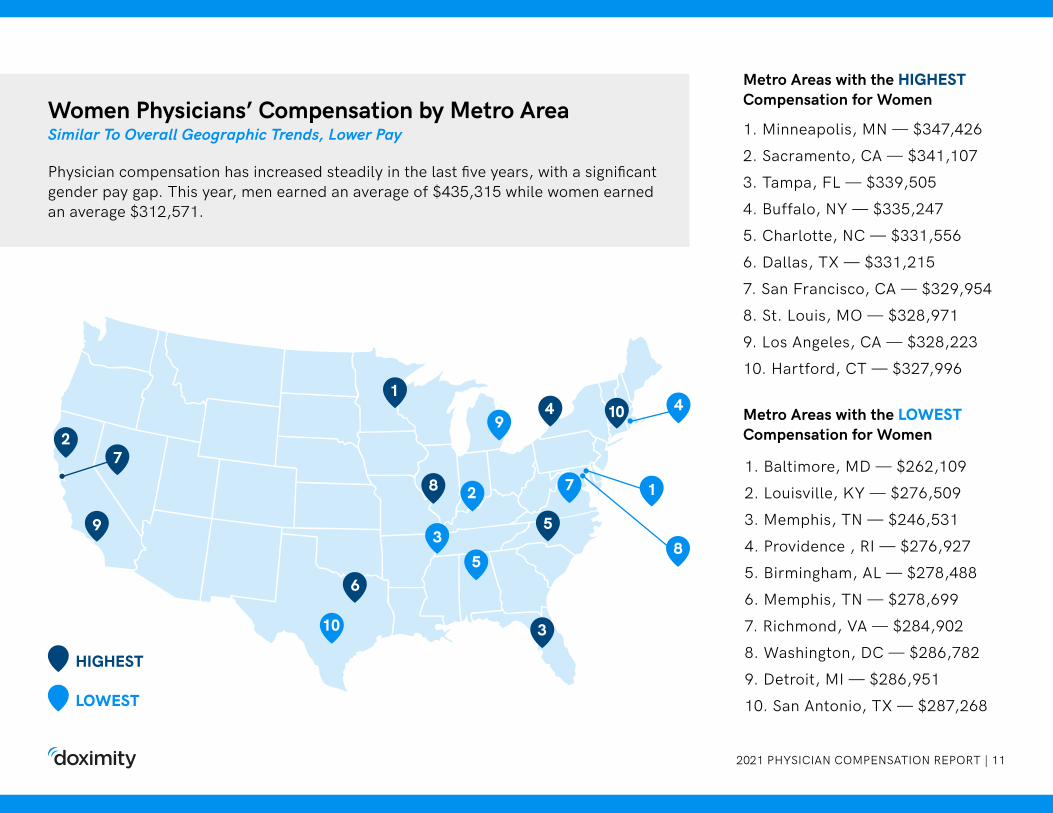
Women Physicians’ Compensation by Metro AreaSimilar To Overall Geographic Trends, Lower Pay
2021 PHYSICIAN COMPENSATION REPORT | 11
HIGHEST
LOWEST
1. Minneapolis, MN — $347,4262. Sacramento, CA — $341,1073. Tampa, FL — $339,5054. Buffalo, NY — $335,2475. Charlotte, NC — $331,5566. Dallas, TX — $331,2157. San Francisco, CA — $329,9548. St. Louis, MO — $328,9719. Los Angeles, CA — $328,22310. Hartford, CT — $327,996
1. Baltimore, MD — $262,1092. Louisville, KY — $276,5093. Memphis, TN — $246,5314. Providence , RI — $276,9275. Birmingham, AL — $278,4886. Memphis, TN — $278,6997. Richmond, VA — $284,9028. Washington, DC — $286,782 9. Detroit, MI — $286,95110. San Antonio, TX — $287,268
Metro Areas with the HIGHESTCompensation for Women
Metro Areas with the LOWESTCompensation for Women
1
2
3
4
5
6
7
2
10
5
7
94
8
9
10
3
1
8
Physician compensation has increased steadily in the last five years, with a significant gender pay gap. This year, men earned an average of $435,315 while women earned an average $312,571.
2021 PHYSICIAN COMPENSATION REPORT | 12
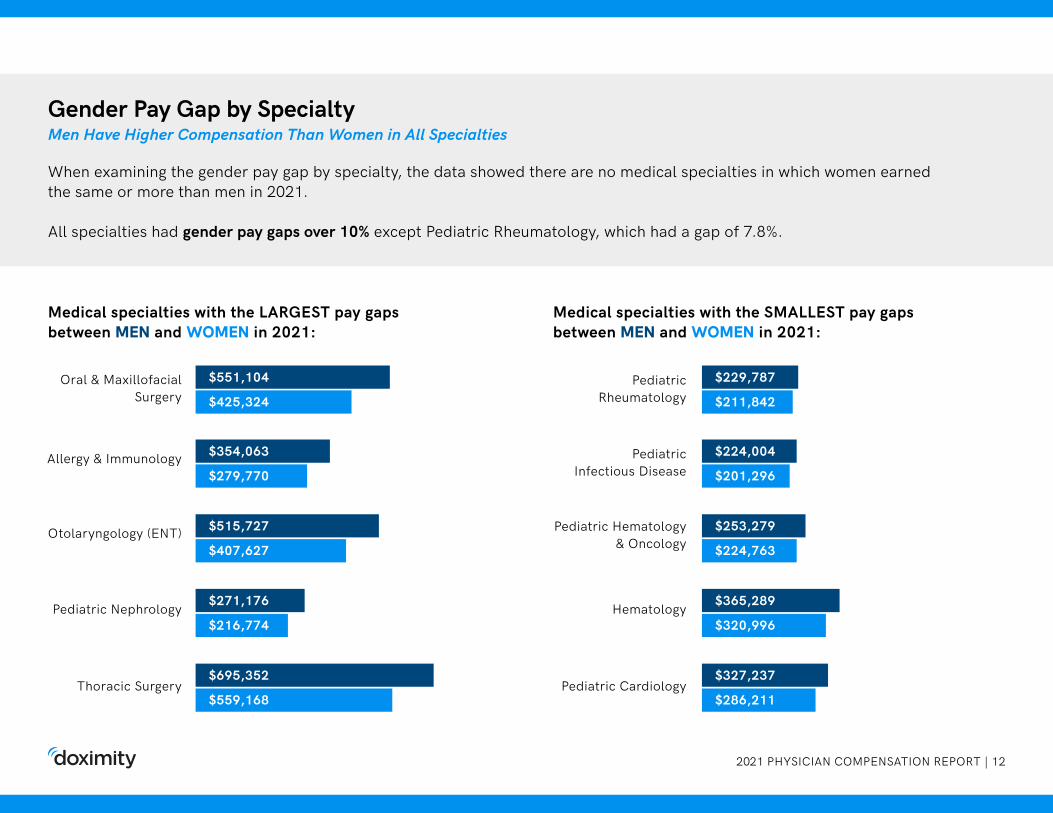
Medical specialties with the LARGEST pay gaps between MEN and WOMEN in 2021:
Medical specialties with the SMALLEST pay gaps between MEN and WOMEN in 2021:
Pediatric Infectious Disease
Allergy & Immunology
Pediatric Hematology & Oncology
Otolaryngology (ENT)
Pediatric Nephrology Hematology
Thoracic Surgery Pediatric Cardiology
Oral & Maxillofacial Surgery
Pediatric Rheumatology
$551,104
$425,324
$354,063
$279,770
$515,727
$407,627
$271,176
$216,774
$695,352
$559,168
$229,787
$211,842
$224,004
$201,296
$253,279
$224,763
$365,289
$320,996
$327,237
$286,211
Gender Pay Gap by Specialty
When examining the gender pay gap by specialty, the data showed there are no medical specialties in which women earned the same or more than men in 2021.
All specialties had gender pay gaps over 10% except Pediatric Rheumatology, which had a gap of 7.8%.
Men Have Higher Compensation Than Women in All Specialties
2021 PHYSICIAN COMPENSATION REPORT | 13
NP and PA Gender Pay Gap
NP Average Annual Compensation (2017-2021) PA Average Annual Compensation (2017-2021)
$140,000
Female NP Female PAMale NP Male PA
$140,000
$130,000 $130,000
$120,000 $120,000
$110,000 $110,000
$100,000 $100,0002017 20172018 20182019 20192020 20202021 2021
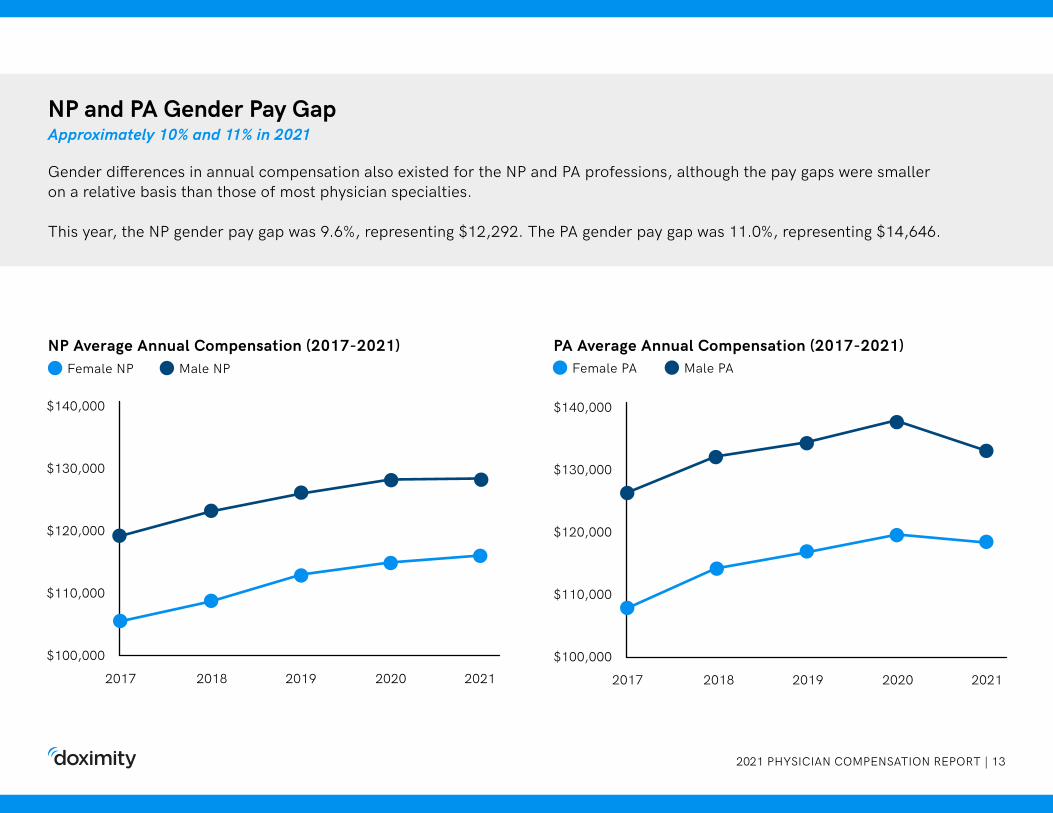
Gender differences in annual compensation also existed for the NP and PA professions, although the pay gaps were smaller on a relative basis than those of most physician specialties.
This year, the NP gender pay gap was 9.6%, representing $12,292. The PA gender pay gap was 11.0%, representing $14,646.
Approximately 10% and 11% in 2021
COVID Impact on Physician Retirement
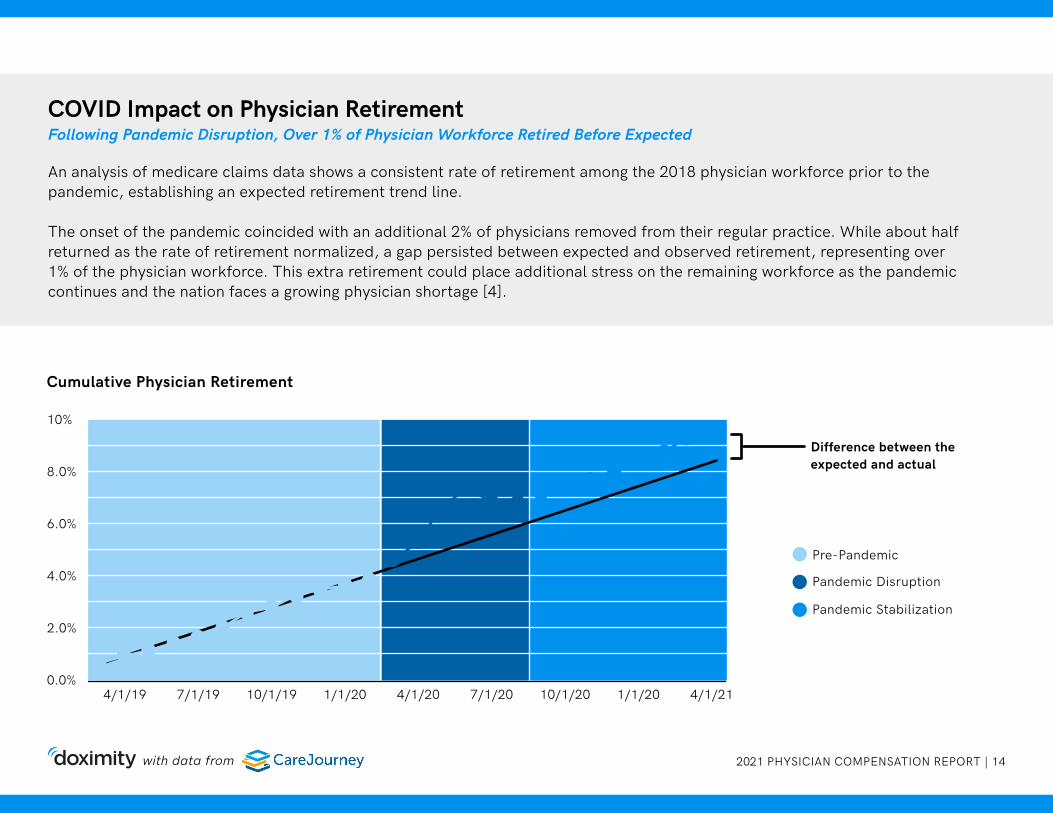
An analysis of medicare claims data shows a consistent rate of retirement among the 2018 physician workforce prior to the pandemic, establishing an expected retirement trend line.
The onset of the pandemic coincided with an additional 2% of physicians removed from their regular practice. While about half returned as the rate of retirement normalized, a gap persisted between expected and observed retirement, representing over 1% of the physician workforce. This extra retirement could place additional stress on the remaining workforce as the pandemic continues and the nation faces a growing physician shortage [4].
Pre-Pandemic
Difference between theexpected and actual
Pandemic Disruption
Pandemic Stabilization
Cumulative Physician Retirement
4/1/19 7/1/19 10/1/19 1/1/20 4/1/20 7/1/20 10/1/20 1/1/20 4/1/210.0%
2.0%
4.0%
6.0%
8.0%
10%
Following Pandemic Disruption, Over 1% of Physician Workforce Retired Before Expected
with data from 2021 PHYSICIAN COMPENSATION REPORT | 14
2021 PHYSICIAN COMPENSATION REPORT | 15
COVID Impact On Physician Career Plans
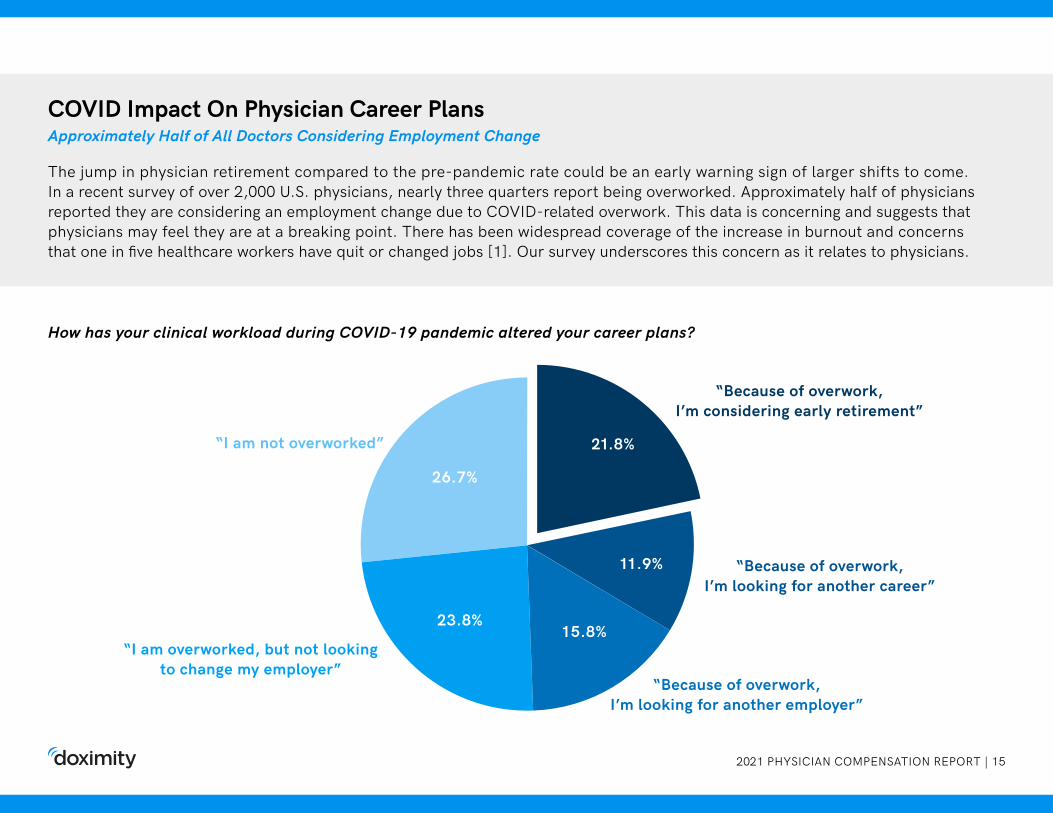
How has your clinical workload during COVID-19 pandemic altered your career plans?
“I am not overworked”
“I am overworked, but not looking to change my employer”
“Because of overwork, I’m considering early retirement”
“Because of overwork, I’m looking for another career”
“Because of overwork, I’m looking for another employer”
The jump in physician retirement compared to the pre-pandemic rate could be an early warning sign of larger shifts to come. In a recent survey of over 2,000 U.S. physicians, nearly three quarters report being overworked. Approximately half of physicians reported they are considering an employment change due to COVID-related overwork. This data is concerning and suggests that physicians may feel they are at a breaking point. There has been widespread coverage of the increase in burnout and concerns that one in five healthcare workers have quit or changed jobs [1]. Our survey underscores this concern as it relates to physicians.
Approximately Half of All Doctors Considering Employment Change
26.7%
23.8%15.8%
11.9%
21.8%
2021 PHYSICIAN COMPENSATION REPORT | 16
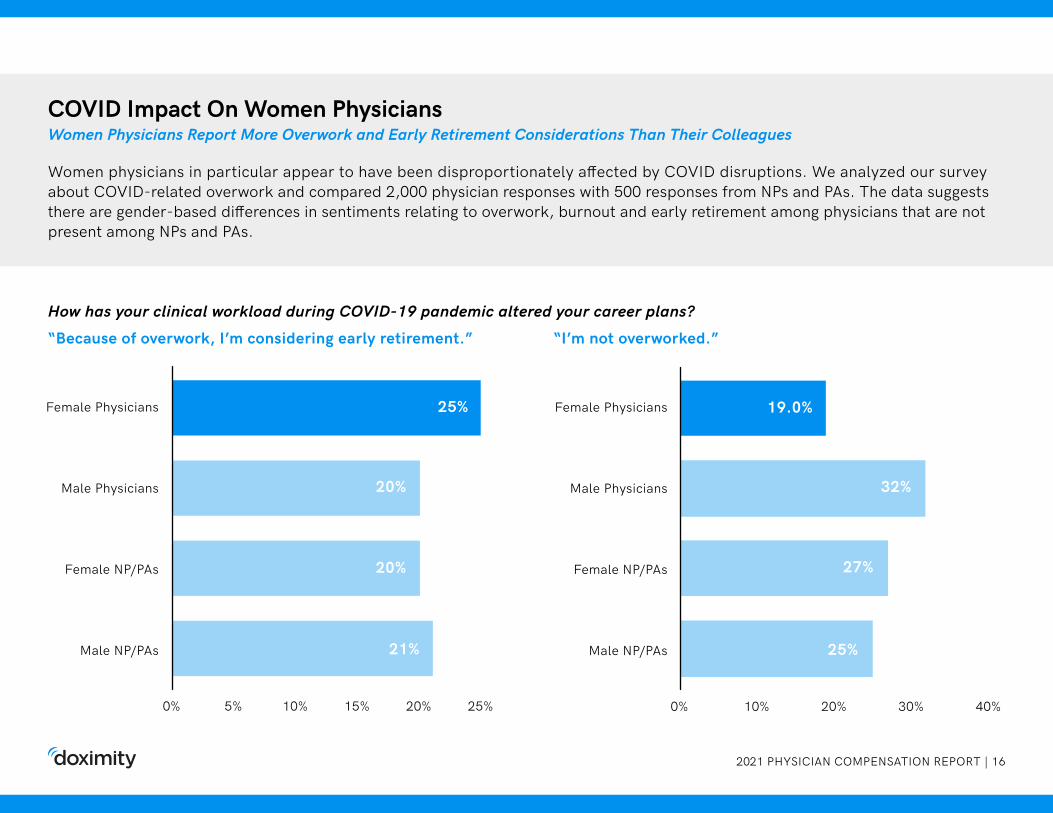
COVID Impact On Women Physicians
How has your clinical workload during COVID-19 pandemic altered your career plans?“Because of overwork, I’m considering early retirement.” “I’m not overworked.”
0% 0%5% 10%10% 20%15% 20% 30%25% 40%
Female Physicians
Male Physicians
Female NP/PAs
Male NP/PAs
Female Physicians
Male Physicians
Female NP/PAs
Male NP/PAs
Women physicians in particular appear to have been disproportionately affected by COVID disruptions. We analyzed our survey about COVID-related overwork and compared 2,000 physician responses with 500 responses from NPs and PAs. The data suggests there are gender-based differences in sentiments relating to overwork, burnout and early retirement among physicians that are not present among NPs and PAs.
Women Physicians Report More Overwork and Early Retirement Considerations Than Their Colleagues
25% 19.0%
32%
27%
25%
20%
20%
21%
2021 PHYSICIAN COMPENSATION REPORT | 17
Methodology
Physician Compensation
This study by Doximity was drawn from over 40,000 self-reported compensation surveys completed in 2021, with data from over 160,000 compensation surveys since 2017. Each survey was completed by full-time, U.S. physicianswho practice at least 40 hours per week.
Responses were mapped across metropolitan statistical areas, and the top 50 MSAs were ranked by the number of respon- dents in the data. To control for differences in specialty, geo- graphy, and other provider-specific factors, we estimated a multivariate regression with controls for provider specialty, metro area, and gender. We also controlled for how long each provider has practiced medicine and their self-reported ave- rage hours worked per week.
Cost of Living Adjustment
This analysis used the 2020 regional price parities of metro state areas published by the Bureau of Economic Analysis. The price parties are publicly available in the Dec. 14, 2021 release on the BEA website.
2021 PHYSICIAN COMPENSATION REPORT | 18
NP/PA Compensation
Doximity’s study was drawn from self-reported compensation surveys completed between 2017 and 2021 among over 15,000 U.S. NPs and over 10,000 U.S. PAs. Compensation was calculated as the mean compensation reported by each sub-group.
COVID Overwork Poll
Doximity’s study was drawn from a poll run in the Doximity Newsfeed over the course of two weeks in May, 2021. Over 2,000 U.S. physicians and over 500 U.S. NPs and PAs responded. The poll asked the following question: “How has your clinical workload during COVID pandemic altered your career plans?”
The poll offered the following five answer options: • “Because of overwork, I’m looking for another employer.” • “Because of overwork, I’m looking at another career.” • “Because of overwork, I’m considering early retirement.” • “I am overworked, but not looking to change my employer.” • “I am not overworked.”
COVID Impact on Physician Retirement
Doximity partnered with CareJourney, a health analytics organization, to measure the impact of the pandemic on accelerated retirement. A baseline population was established of approximately 365,000 U.S. physicians who billed for more than ten Medicare Part B patients in every month of 2018. Over the January 2019 to April 2021 period, physicians who did not treat at least ten Medicare patients per month for three consecutive months were considered “retired.” Monthly retirement was measured over a pre- pandemic baseline period of March 2019 to February 2020 to establish a cumulative retirement trend, which was used to compare actual retirement against expected retirement during the COVID pandemic.
2021 PHYSICIAN COMPENSATION REPORT | 19
Sources
[1] Morning Consult, Nearly 1 in 5 Health Care Workers Have Quit Their Jobs During the Pandemic. Oct 4, 2021. https://morningconsult.com/2021/10/04/health-care-workers-series-part-2-workforce/
[2] U.S. Bureau of Labor Statistics, Consumer Price Index: Consumer prices increase 6.2 percent for the year ended October 2021. Nov 19, 2021. https://www.mercurynews.com/2020/04/27/coronavirus-14000-stanford-health-care-workers-hit-with-furloughs-pay-cuts/
[3] Health Affairs, Female physicians earn an estimated $2 million less than male physicians over a simulated 40-year career. Nov 12, 2021. https://www.healthaffairs.org/doi/10.1377/hlthaff.2021.00461
[4] AAMC, AAMC Report Reinforces Mounting Physician Shortage. June 11, 2021. https://www.aamc.org/news-insights/press-releases/aamc-report-reinforces-mounting-physician-shortage

About Doximity
Founded in 2010, Doximity is the leading digital platform for medical professionals. The company’s network members include over 80% of U.S. physicians across all specialties and practice areas. Doximity provides its verified clinical membership with digital tools built for medicine, enabling them to collaborate with colleagues, stay up to date with the latest medical news and research, manage their careers, and conduct virtual patient visits. Doximity’s mission is to help doctors be more productive so they can provide better care for their patients.
To learn more, visit www.doximity.com.