Embed Size (px)
Citation preview

Emissions of carbon dioxide and methane from a headwater streamnetwork of interior Alaska
John T. Crawford,1,2 Robert G. Striegl,2 Kimberly P. Wickland,2
Mark M. Dornblaser,2 and Emily H. Stanley1
Received 7 June 2012; revised 21 January 2013; accepted 26 January 2013.
[1] Boreal ecosystems store significant quantities of organic carbon (C) that may bevulnerable to degradation as a result of a warming climate. Despite their limited coverageon the landscape, streams play a significant role in the processing, gaseous emission, anddownstream export of C, and small streams are thought to be particularly importantbecause of their close connection with the surrounding landscape. However, ecosystemcarbon studies do not commonly incorporate the role of the aquatic conduit. We measuredcarbon dioxide (CO2) and methane (CH4) concentrations and emissions in a headwaterstream network of interior Alaska underlain by permafrost to assess the potential role ofstream gas emissions in the regional carbon balance. First-order streams exhibited thegreatest variability in fluxes of CO2 and CH4, and the greatest mean pCO2. High-resolutiontime series of stream pCO2 and discharge at two locations on one first-order stream showedopposing pCO2 responses to storm events, indicating the importance of hydrologicflowpaths connecting CO2-rich soils with surface waters. Repeated longitudinal surveys onthe stream showed consistent areas of elevated pCO2 and pCH4, indicative of discretehydrologic flowpaths delivering soil water and groundwater having varying chemistry.Up-scaled basin estimates of stream gas emissions suggest that streams may contributesignificantly to catchment-wide CH4 emissions. Overall, our results indicate that whilestream-specific gas emission rates are disproportionately high relative to the terrestriallandscape, both stream surface area and catchment normalized emission rates were lowerthan those documented for the Yukon River Basin as a whole. This may be due tolimitations of C sources and/or C transport to surface waters.
Citation: Crawford, J. T., R. G. Striegl, K. P. Wickland, M. M. Dornblaser, and E. H. Stanley (2013), Emissions of
carbon dioxide and methane from a headwater stream network of interior Alaska, J. Geophys. Res. Biogeosci, 118,doi:10.1002/jgrg.20034.
1. Introduction
[2] Streams integrate the signals of terrestrial and aquaticcarbon cycling in their catchments, and changes in theirexports likely indicate ecosystem change. Multiple studiessuggest that despite their limited coverage on the landscape,streams can play a significant role in the downstream deliveryof carbon and the emission of trace carbon gases (methane(CH4) and carbon dioxide (CO2)) to the atmosphere[Humborg et al., 2010; Aufdenkampe et al., 2011; Butmanand Raymond, 2011]. While some products of catchment Cprocesses (i.e., bicarbonate, HCO3
�, and dissolved organic
carbon, DOC) are transported downstream, others such asCO2 and CH4 typically experience short residence times andare not transported to the network outlet [Öquist et al.,2009]. Therefore, downstream sampling in larger riversmisses the carbon (C) emissions in headwater streams.Because the boreal biome stores more than 40% of the planet’ssoil organic C and nearly 13% of the planet’s C biomass[Gorham 1991], streams in this region may be particularlyimportant components of the global C cycle if they arestrongly connected to these large C pools. The current roleof aquatic systems in the watershed C balance of this region,however, is poorly known.[3] Shifts in the terrestrial C balance across permafrost
regions due to atmospheric warming, as observed in thetundra [Schuur et al., 2009], will likely modify the role ofstream C cycling particularly in the northern extent of theboreal zone where discontinuous permafrost is common.The hydrology and biogeochemistry of the Yukon RiverBasin (YRB) is already experiencing change. For example,discharge-normalized DOC export from the Yukon Riverduring the growing season has decreased in recent decadesdue to changes in hydrologic flowpaths, water residence
1Center for Limnology, University of Wisconsin-Madison, 680 N. ParkSt. Madison, Wisconsin, USA.
2U.S. Geological Survey, National Research Program, 3215 Marine St.Boulder, Colorado, USA.
Corresponding author: J. T. Crawford, Center for Limnology, Universityof Wisconsin-Madison, 680 N. Park St. Madison, WI 53706, USA.([email protected])
©2013 American Geophysical Union. All Rights Reserved.2169-8953/13/10.1002/jgrg.20034
1
JOURNAL OF GEOPHYSICAL RESEARCH: BIOGEOSCIENCES, VOL. 118, 1–13, doi:10.1002/jgrg.20034, 2013

times, and microbial metabolism of DOC [Striegl et al.,2005]. There has been a significant increase in the ground-water contribution to the total discharge in the Yukon Riverand its tributaries due to the thawing of permafrost, whichhas likely altered C transport to rivers [Walvoord andStriegl, 2007]. Similarly, increased groundwater contribu-tions to total flow are expected for the Yukon Flats Basindue to permafrost degradation [Walvoord et al., 2012].Similar changes to hydrologic flowpaths and C cyclingwithin headwater networks could impact the delivery ofterrestrial C by routing water through environments withsubstantially different C gas concentrations or biogeochemi-cal conditions. Alterations in the delivery and processing ofC in headwaters could also lead to changes in the magnitudeof CO2 and CH4 emissions from surface waters.[4] Headwater streams are abundant and may therefore
play a large role in the landscape C cycle. Although smallon an individual basis, nearly half of the length of anystream network is made up of first-order streams [Knighton,1998]; for the conterminous U.S., first-order streams accountfor at least 20% of the total lotic surface area [Butman andRaymond, 2011]. The distribution of pCO2 from other borealstream networks indicates that small streams tend to have thehighest emission rates relative to larger streams and rivers[Teodoru et al., 2009; Humborg et al., 2010; Jonsson et al.,2007]. Considerably less is known about CH4 emissionsfrom boreal aquatic networks. While CH4 emissions fromstreams are often less than CO2 emissions with respect toC, CH4 is a more potent greenhouse gas, has much lowersolubility in water (relative to CO2), and may be an importantcomponent of the climate system [Bastviken et al., 2011;Guérin et al., 2006]. Given the large proportion of surfacearea and the previously reported high rates of gas loss,headwater streams may be an important component of theC balance that are not incorporated in downstream orterrestrial investigations in permafrost regions.[5] High C gas emissions in small streams have been
attributed to a strong hydrologic connection with the terres-trial landscape (mainly via groundwater) and drainage ofCO2-rich soil waters [Butman and Raymond, 2011]. Becauseof their high turbulence and constant mixing, streams removebarriers to gas exchange imposed by the terrestrial surface. Inmany instances, increased stream discharge corresponds toa decrease in stream pCO2, which may be attributed to in-creased CO2 loss due to greater stream turbulence (increasedatmospheric gas exchange) and/or dilution with CO2-poorwater [Teodoru et al., 2009; Dyson et al., 2010; Dinsmoreet al., 2011]. Therefore, both the magnitude and timing ofhigh discharge events and the hydrologic setting are likelyimportant controls on stream C gas concentrations and emis-sions [Johnson et al., 2007]. Stream geomorphology and theproportion of aquatic surface area in a basin impose otherconstraints on the overall magnitude of stream emissions.[6] Here we address two questions regarding C gas emis-
sions in a headwater network of interior Alaska: (1) Whatare the spatiotemporal patterns of C gas concentrations instreams? (2) What are the magnitudes of stream CO2 andCH4 emissions? Answers to these questions will establish abaseline for understanding current and future roles of head-water streams in the C balance of the Yukon River Basinand other boreal river networks, particularly those drainingcatchments underlain by permafrost. We hypothesize that
the rapid outgassing of CO2 in a headwater network ofthe YRB could represent an important component of thelandscape C cycle whereas CH4 fluxes would be of a lowermagnitude. We used a combination of flux chamber mea-surements, automated sensors, water chemistry sampling,and hydrologic measurements to assess aquatic gas emis-sions for the 2011 open-water season at 10 sites varyingfrom small first-order streams to an intermediate fourth-order stream (Strahler classification system [Strahler,1952]) in a headwater network of the YRB.
2. Methods
2.1. Study Area
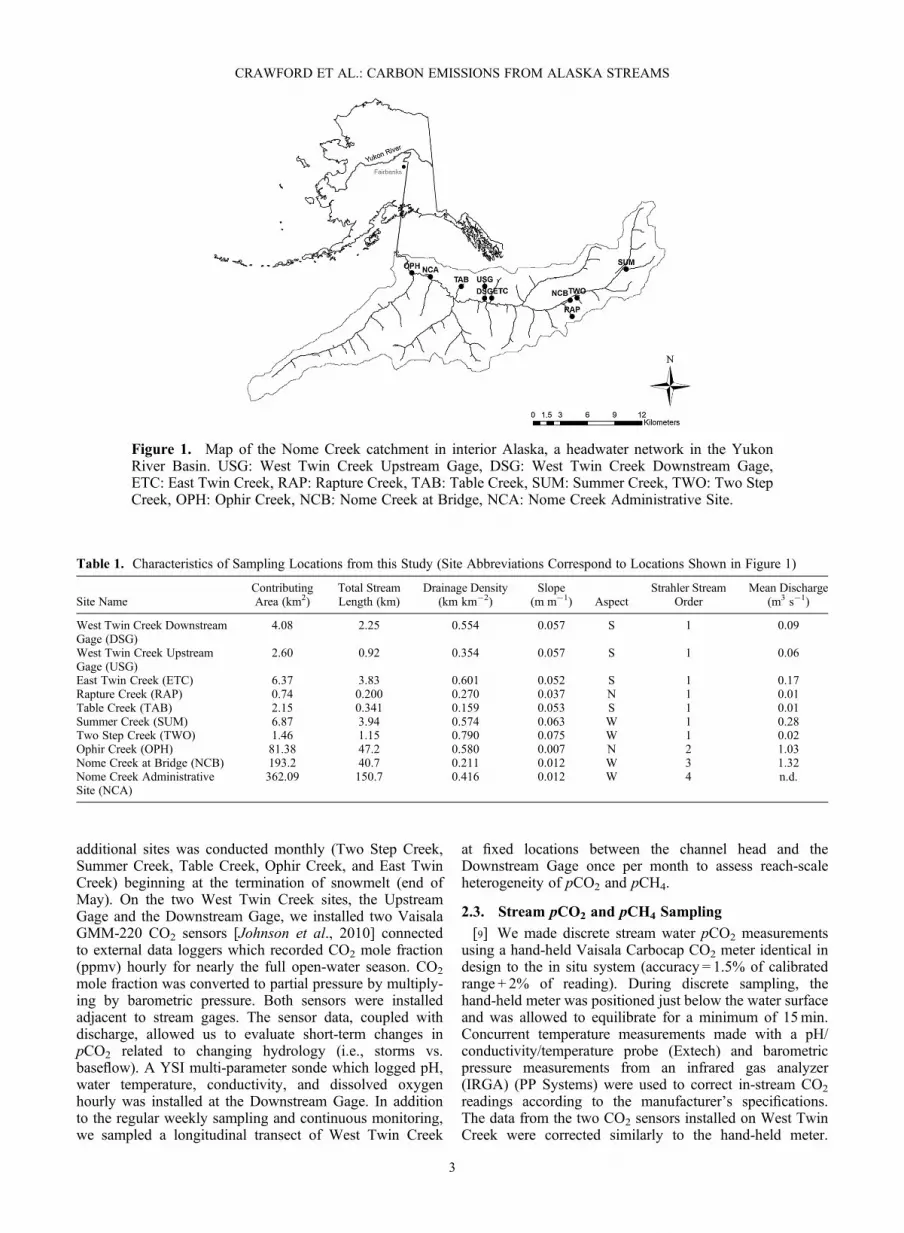
[7] The study area is an upland headwater catchment inAlaska’s interior located approximately 100 km fromFairbanks (65.34045�N, �146.713�W) (Figure 1). The areais road-accessible during the summer and is maintained as aNational Recreation Area by the Bureau of Land Manage-ment (data available at http://www.blm.gov/ak/st/en/prog/nlcs/white_mtns/summer_recreation/nome_creek_valley.html).The stream network is in the zone of discontinuouspermafrost. Permafrost is present in the upper 0.5�1m ofhillslope areas [Kelsey et al., 2012]. The main stream, NomeCreek, is a tributary to Beaver Creek in the YRB. Thecatchment is underlain by relatively homogeneous geologywhich consists of schist (known as the Yukon-Tanana schist[Coney and Jones, 1985]) and thin deposits of loess. Vegeta-tion is typical of the boreal region, dominated by black spruce(Picea mariana), intermixed with white spruce (Picea glauca)near river banks, and associated groundcover (Sphagnum spp.,Salix spp., Betula nana, Cladonia spp., and Cladina spp.).Some portions of the catchment are above treeline(~1525MASL) and drain alpine tundra with relatively thinorganic soils (~10 cm), while much of the catchment drainsthicker organic soils (27–48 cm [Kelsey et al., 2012]). Theonset of snowmelt typically occurs at the end of April withprogressive thaw exposing the ice-filled stream channels nearthe end of May. The open-water season generally ends aroundmid-October when groundwater discharge freezes, resulting inanchored channel ice [McNamara and Kane, 2009]. Riparianareas are typically ~10m wide and have high soil moisture.Along the riparian zone of West Twin Creek (WTC; labeledas upstream gage, USG, and downstream gage, DSG, inFigure 1), one of the focal streams of this study, there arediscrete groundwater seepage areas and thermokarst features.We used a nested catchment study design with a focus onsmall first-order streams (7 of 10 sites are first-order streams).The sites were chosen to represent the landscape variabilitywithin the catchment and included sites draining alpinetundra, forested drainages, and a range of slopes and aspects.Streams drained <1 to >360 km2, had moderate to steepslopes (0.007 to 0.075mm�1), and spanned a large range ofdischarge (Table 1).
2.2. Sampling Design
[8] Sampling was performed weekly at five sites (two sitesalong West Twin Creek: Upstream Gage and DownstreamGage; Rapture Creek, Nome Creek at Bridge, and NomeCreek Administrative Site; see Table 1 for site descriptions)beginning mid-way through snowmelt (May) until August,and one sampling at the end of September. Sampling at five
CRAWFORD ET AL.: CARBON EMISSIONS FROM ALASKA STREAMS
2
additional sites was conducted monthly (Two Step Creek,Summer Creek, Table Creek, Ophir Creek, and East TwinCreek) beginning at the termination of snowmelt (end ofMay). On the two West Twin Creek sites, the UpstreamGage and the Downstream Gage, we installed two VaisalaGMM-220 CO2 sensors [Johnson et al., 2010] connectedto external data loggers which recorded CO2 mole fraction(ppmv) hourly for nearly the full open-water season. CO2
mole fraction was converted to partial pressure by multiply-ing by barometric pressure. Both sensors were installedadjacent to stream gages. The sensor data, coupled withdischarge, allowed us to evaluate short-term changes inpCO2 related to changing hydrology (i.e., storms vs.baseflow). A YSI multi-parameter sonde which logged pH,water temperature, conductivity, and dissolved oxygenhourly was installed at the Downstream Gage. In additionto the regular weekly sampling and continuous monitoring,we sampled a longitudinal transect of West Twin Creek
at fixed locations between the channel head and theDownstream Gage once per month to assess reach-scaleheterogeneity of pCO2 and pCH4.
2.3. Stream pCO2 and pCH4 Sampling
[9] We made discrete stream water pCO2 measurementsusing a hand-held Vaisala Carbocap CO2 meter identical indesign to the in situ system (accuracy = 1.5% of calibratedrange + 2% of reading). During discrete sampling, thehand-held meter was positioned just below the water surfaceand was allowed to equilibrate for a minimum of 15min.Concurrent temperature measurements made with a pH/conductivity/temperature probe (Extech) and barometricpressure measurements from an infrared gas analyzer(IRGA) (PP Systems) were used to correct in-stream CO2
readings according to the manufacturer’s specifications.The data from the two CO2 sensors installed on West TwinCreek were corrected similarly to the hand-held meter.
Table 1. Characteristics of Sampling Locations from this Study (Site Abbreviations Correspond to Locations Shown in Figure 1)
Site NameContributingArea (km2)
Total StreamLength (km)
Drainage Density(km km�2)
Slope(m m�1) Aspect
Strahler StreamOrder
Mean Discharge(m3 s�1)
West Twin Creek DownstreamGage (DSG)
4.08 2.25 0.554 0.057 S 1 0.09
West Twin Creek UpstreamGage (USG)
2.60 0.92 0.354 0.057 S 1 0.06
East Twin Creek (ETC) 6.37 3.83 0.601 0.052 S 1 0.17Rapture Creek (RAP) 0.74 0.200 0.270 0.037 N 1 0.01Table Creek (TAB) 2.15 0.341 0.159 0.053 S 1 0.01Summer Creek (SUM) 6.87 3.94 0.574 0.063 W 1 0.28Two Step Creek (TWO) 1.46 1.15 0.790 0.075 W 1 0.02Ophir Creek (OPH) 81.38 47.2 0.580 0.007 N 2 1.03Nome Creek at Bridge (NCB) 193.2 40.7 0.211 0.012 W 3 1.32Nome Creek AdministrativeSite (NCA)
362.09 150.7 0.416 0.012 W 4 n.d.
Figure 1. Map of the Nome Creek catchment in interior Alaska, a headwater network in the YukonRiver Basin. USG: West Twin Creek Upstream Gage, DSG: West Twin Creek Downstream Gage,ETC: East Twin Creek, RAP: Rapture Creek, TAB: Table Creek, SUM: Summer Creek, TWO: Two StepCreek, OPH: Ophir Creek, NCB: Nome Creek at Bridge, NCA: Nome Creek Administrative Site.
CRAWFORD ET AL.: CARBON EMISSIONS FROM ALASKA STREAMS
3

Pressure and temperature data from stream pressuretransducers (described below) were used to correct thecontinuous pCO2 record. Surface waters were sampled at~10 cm below the surface for pCH4 using a polypropylenesyringe fitted with a three-way stopcock. Fifteen mL of waterwas passed through a 0.45 mm Whatman GMF filter and aneedle into a sealed 37mL serum bottle with N2 headspace.Serum bottles were pre-treated with 2 g KCl to inhibitmicrobial activity [Striegl et al., 2001]. Methane wasanalyzed from the serum headspace on a gas chromatograph(details provided below).
2.4. Gas Fluxes
[10] We measured fluxes of C gases directly from thestream surfaces using clear polycarbonate chambers thatwere lowered 2 cm into the water column and oriented inline with the stream flow direction using a portable crane.We used chambers with straight sides that were 0.25m inheight with streamlined ends (similar to a canoe) in orderto limit disruptions to near-surface turbulence [McMahonand Dennehy, 1999]. Chambers had two ports that wereconnected to an IRGA (instrument error: < 1% of span con-centration over calibrated range) using 4m lengths of Bev-a-line tubing, so that the chamber air was circulated to theIRGA and then returned to the chamber (internal pumprate = 0.3 L min�1). CO2 concentration of the chamber airwas recorded every 15 s for 5min. CO2 fluxes (JCO2) weremeasured in triplicate at each site and were calculated basedon the concentration change within the sealed chamber overtime (equation (1)), typically over 5min.
JCO2 ¼ dc=dt h (1)
where dc/dt is the CO2 concentration change in the chamberair (mol CO2 m
�3 air) during the deployment time (min) andh is the total chamber height (minus the submerged portion)(m). We report fluxes in units of mole CO2 m
�2 s�1.[11] We evaluated the chamber technique by comparing
gas transfer velocity data from the literature with valuesfrom our chamber deployments. Gas transfer velocities(KCO2) were calculated by combining equation (1) with themeasured CO2 gradient between the stream and the atmo-sphere during the chamber deployment. The gas transfervelocity can be empirically derived as
KCO2 ¼ JCO2= Cw � Cað Þ; (2)
where KCO2 is the gas transfer velocity (m d�1), Cw is theCO2 concentration of stream water (mol m�3), and Ca isthe CO2 concentration of water in equilibrium with theatmosphere corrected for changes in solubility according toHenry’s law (mol m�3). Atmospheric pCO2 was assumedto be constant at 368 matm, based on the mean of 102atmospheric measurements made in the Nome Creekcatchment. This assumption likely only applies during thedaytime when the atmosphere is well mixed. The formationof nocturnal boundary layers could alter the partial pressuregradient due to buildup of CO2 from respiration. However,we do not have good knowledge regarding these processesin the catchment, and we suggest that monitoring of Ca
over diel time periods would improve estimates of CO2 flux.[12] Methane fluxes were measured by collecting four
discrete chamber air samples (one every 5min) from the
return line of the IRGA using a 50mL polypropylenesyringe having a three-way stopcock. Air samples wereinjected into pre-evacuated sealed 10mL serum bottles andover-pressurized with 20mL of sample gas. The first CH4
sample was taken with the chamber retracted from thewater surface. We assumed that the CH4 concentration inthe interior of the chamber at the first time point was reflec-tive of the regional atmosphere and these values were usedto calculate mean atmospheric pCH4. Serum bottles usedfor CH4 analyses were pre-evacuated in the laboratory ona vacuum line to approximately 50mTorr to prevent back-ground contamination from the atmosphere. Methane con-centrations were measured using a Hewlett Packard model5890 II gas chromatograph equipped with a flame ionizationdetector having a minimum detection limit of 50 ppbv.
2.5. Discharge and Stream Surface Area
[13] We used hydraulic geometry relationships developedin the catchment (form: width = aQb, Crawford and Stanley,unpublished data (2011)) to estimate the width of streamsacross a range of discharge (Q). Discharge was measuredusing a USGS model 6205 pygmy current meter and thevelocity-area method [Buchanan and Somers, 1969]. Wecreated a model of mean discharge for all streams in theNome Creek catchment based on watershed area of measuredstreams and combined the hydraulic geometry model topredict stream widths. We then combined modeled streamwidths and stream lengths determined from geographic infor-mation system (GIS) to estimate the total aquatic surface areain the basin. Stream lengths were calculated in GIS by delin-eating watersheds and individual stream reaches from theUSGS National Hydrography dataset. Continuous (15min)Q was monitored at two locations on West Twin Creek(Upstream Gage and Downstream Gage) by converting stagemeasurements from non-vented pressure transducers (In Situ,typical error = 0.1%) (corrected for atmospheric pressurevariations) to Q with a rating curve developed from repeatedQ measurements at the two locations.
2.6. Flux Up-scaling and Uncertainty Analysis
[14] We used a simple up-scaling technique to estimate thecontribution of stream CO2 and CH4 emissions to the totalwatershed C balance. For each stream order, we multipliedthe stream surface area (derived from GIS and two regres-sion models) by the daily flux rate and summed across theopen-water season (assumed to be 180 days). To constrainthe estimate and the total uncertainty, we used Monte Carlosimulations and resampling techniques for three of the fourcomponents of the estimation procedure. All simulationsand resampling procedures were repeated 1000 times each.Simulations were used for the model of stream dischargeand the model of stream width (which accepts the outputof the discharge model), and resampling was used to esti-mate CO2 and CH4 fluxes for each stream order. Estimatesof stream lengths derived from GIS were assumed to beconstant and error from this step was not propagated throughto the up-scaled estimate. For the two model steps, wecreated a normal distribution (n = 1000) of model parameters(intercept and slope) centered on the mean and distributedbased on the standard deviation of parameter estimates fromthe regression analysis. Combining stream lengths from GISwith the estimates of the mean width from the two models
CRAWFORD ET AL.: CARBON EMISSIONS FROM ALASKA STREAMS
4

gave a distribution of aquatic surface area, sorted by streamorder. We then simulated daily CO2 and CH4 fluxes bymultiplying randomly sampled flux values (according tostream order) by randomly selected estimates of the streamsurface area (also according to stream order). Because therewere only three flux observations for stream order 2, wecombined CO2 and CH4 flux values from stream orders 2and 3 for the simulations. We note that this combinationleads to some bias in the final accounting. Summarystatistics including the median and 95% confidence intervals(95% CI) were calculated from the final distribution offlux estimates.
3. Results
3.1. Stream pCO2
[15] All streams in the study catchment were constantsources of CO2 to the atmosphere for the entire open-waterseason as they were always supersaturated with respect to theatmosphere (n = 94, mean pCO2=1417matm, s.d. = 528.9,based on hand-held sensor measurements). First-order streamshad the highest mean pCO2 at 1643matm and pCO2 was highlyvariable (Figure 2, left). There was a consistent decrease inpCO2 with increasing stream order as well as a generaldecrease in variability.[16] Environmental variables were correlated with stream
pCO2. Stream pCO2 across the catchment over the courseof the study was negatively correlated with Q (p< 0.05).However, a different pCO2-Q relation was observed fromlongitudinal transect samples taken along West Twin Creekwhere pCO2 decreased between the Upstream and Down-stream Gages (discharge doubles between the two sites) but
was elevated at intermediate sampling sites (Figure 3,top). The observed pattern across the West Twin Creektransect was similar for all sampling periods (May–August).Stream pCO2 was negatively correlated with pH and watertemperature (p< 0.05), positively correlated with air tempera-ture (p< 0.01), and uncorrelated with specific conductance(p> 0.05).[17] Continuous monitoring of pCO2 revealed patterns
that were not discernible with discrete sampling alone. ThepCO2 response to changes in the stream discharge at thetwo instrumented sites along West Twin Creek showedopposite patterns (Figure 4). For example, pCO2 at theUpstream Gage decreased with increasing discharge,whereas pCO2 at the Downstream Gage increased withincreasing discharge. Discharge patterns and responses tostorms were also different at the two sites (Figure 5). Forexample, storm peaks at the Downstream Gage did notalways correspond to distinct peaks in the hydrograph ofthe upstream gage. The discharge response of the Down-stream Gage was flashier compared to the Upstream Gage.Stream pCO2 was always higher at the Upstream Gage.The spring melt was associated with the lowest pCO2 ofthe study period as seen at Upstream Gage. We do not haveaccurate data for snowmelt at Downstream Gage because thestream did not occupy a distinct channel until downcuttingof anchor ice was completed on approximately May 28.The seasonal pCO2 pattern also differed between the twoinstrumented sites on West Twin Creek. At the DownstreamGage mean pCO2 was relatively constant outside of stormevents. In contrast, mean pCO2 at Upstream Gage increasedthroughout snowmelt and was then reduced during a period ofextensive precipitation in June (Julian dates 151–182; Figure 4).
Figure 2. Boxplots of (left) partial pressure of carbondioxide by stream order and (right) carbon dioxide emissionrates by stream order, showing the median (thick black line),first and third quartiles (box edges), 1.5x IQR (whiskers),and outliers which fall outside of 1.5x IQR (open circles);horizontal dashed line denotes atmospheric pCO2.
Figure 3. Longitudinal transect samples taken at WestTwin Creek illustrating the change in pCO2 and pCH4 aswater flows downstream from the head of the catchment(0m) towards the outlet (~500m beyond the last sample);(top) Upstream Gage (USG) and Downstream Gage (DSG)locations are shown; horizontal dashed lines denoteatmospheric (top) pCO2 and (bottom) pCH4.
CRAWFORD ET AL.: CARBON EMISSIONS FROM ALASKA STREAMS
5

[18] Both Upstream and Downstream gages showedstrong diurnal pCO2 trends. The pCO2 was always highestat night even on the summer solstice when there was onlya short period of twilight rather than full darkness. The dielpCO2 amplitude was constant at the Downstream Gageduring the period of record. However, the diurnal pCO2
amplitude at the Upstream Gage increased over the courseof the open-water season and was generally much larger(mean Δ= 534 matm, s.d. Δ = 225 matm) compared with the
Downstream Gage (mean Δ= 195 matm, s.d. Δ= 88 matm.The storm event on day 207 (Figures 5 and 6) is also evidentin the combined response of pH, dissolved oxygen, temper-ature, and specific conductance at the Downstream Gage(Figure 6).
3.2. Stream pCH4
[19] In contrast to pCO2, there was no strong pattern forstream pCH4 across stream orders (Figure 7). Similar to
Figure 4. Time series of pCO2 (thick black line is the trend extracted using the “decompose” function inR [R Core Team, 2012]) and Q (gray line) for the (top) Upstream Gage (USG) and (bottom) DownstreamGage (DSG) locations on West Twin Creek; dashed line denotes atmospheric pCO2; stream pCO2
response to storm events and persistent elevated discharge are strongly opposing between the two sites.
Figure 5. Time series of pCO2 (black lines) and Q (gray lines) across a 10-day period at the (top)upstream gage (USG) and (bottom) downstream gage (DSG) which included a large runoff event beginningon day 207; Q response to rainfall was only witnessed in the downstream gage; dashed lines denoteatmospheric pCO2.
CRAWFORD ET AL.: CARBON EMISSIONS FROM ALASKA STREAMS
6

pCO2, pCH4 appeared to be most variable in first-orderstreams. The mean pCH4 of all samples was 4.03 matm,which was higher than the mean atmospheric concentration(1.81 matm, based on 59 atmospheric samples taken withinthe catchment). Nearly all sampled sites at all dates weresupersaturated with respect to the atmosphere. The longitu-dinal pCH4 pattern along West Twin Creek was relativelyconsistent over the course of the growing season (Figure 3,bottom). Stream pCH4 was ~3 matm for the first 1500m ofthe transect but increased to ~6 matm between 1500 and1800m downstream. However, the June and July transectsindicated an area of decreased pCH4 before the 1500msampling site, which was below atmospheric concentrationin June.
3.3. Carbon Dioxide Emissions
[20] The average measured flux of CO2 from streamsurfaces across the catchment during the study period was5.10 mmol CO2 m
�2 s�1 (n = 94, 3.94 mmol CO2 m�2 s�1).
Emission rates generally decreased with increasing streamorder (Figure 2) although the pattern was not as clear
compared with pCO2. Emission rates among study sitesillustrated different patterns over the course of the open-water season (Figure 8). Some sites showed a slight increasein emissions over time (Upstream Gage, Nome Creek atBridge) whereas others showed a decrease (Nome CreekAdministrative Site) or no strong trend partially due to alimited sample size for some locations. A general trend ofdecreasing flux with distance was observed along individualstreams. For example, between the Upstream and Down-stream Gage, at a distance of less than 2 km, the averageseasonal flux decreased by 0.748 mmol CO2 m�2 s�1. Thesame pattern was also apparent for the main stem of NomeCreek. Moving downstream from Nome Creek at Bridge toNome Creek Administrative Site resulted in an averagedecrease of 0.245 mmol CO2 m
�2 s�1.
3.4. Methane Emissions
[21] Only some streams were constant sources of CH4
to the atmosphere during the open-water season. Therewas no consistent seasonal pattern of CH4 emissions.Most first-order streams showed similar low emissionrates (Figures 7 and 9), with the exception of East TwinCreek and at Downstream Gage which had average fluxesof 58.2 and 9.90 nmol CH4 m�2 s�1, respectively. Othersites with consistent CH4 emission were the UpstreamGage, Nome Creek Administrative Site, and Ophir. Theremaining sites (Rapture, Table, Two Step, and SummerCreeks and Nome Creek at Bridge) showed consistentlylower or undetectable CH4 emissions. Net CH4 uptakewas only detected during one sampling at Table Creeksite in September.
Figure 6. Snapshot time series of stream chemicalparameters at the downstream gage; timing coincides withthe storm pulse on day 207 as also shown in Figure 5.
Figure 7. Boxplots of (left) stream pCH4 and (right)instantaneous CH4 emission rates by stream order showingthe median (thick black line), first and third quartiles (boxedges), 1.5� IQR (whiskers), and outliers which fall outsideof 1.5� IQR (open circles); horizontal dashed line denotesatmospheric pCH4
CRAWFORD ET AL.: CARBON EMISSIONS FROM ALASKA STREAMS
7

3.5. Discharge and Surface Area
[22] The mean stream discharge in the Nome Creek Basinwas highly correlated with the catchment area (equation (3);p< 0.05, r2 = 0.94).
Q ¼ 0:258 ln drainage areað Þ � 1:33 (3)
where Q is discharge (m3 s�1) and drainage area is inha. Applying the YRB empirical relationship amongdischarge, catchment area, and precipitation given by Parksand Madison [1985] to our discharge data and mean annualprecipitation (retrieved from NRCS Snotel site number1090) resulted in a good overall fit (r2 = 0.88), implying thatNome Creek runoff follows a similar pattern to that of thelarger YRB. Combining equation (3) with the model of streamwidths from the hydraulic geometry relationship and streamlengths from GIS gave an estimated water surface area of52.5 ha. Overall, streams comprised<0.2% of the total NomeCreek catchment surface area. Drainage density in the basinwas estimated to be 0.416 km km�2. The low drainagedensity is illustrated in Figure 1, which shows the NomeCreek catchment as dissected by a pinnate stream network.
4. Discussion
4.1. Controls on CO2 and CH4 Delivery to Streams
[23] We attribute the pCO2 patterns in the NomeCreek watershed to the differences in the magnitude of
the land-water connection and hydrologic variationfollowing storms. First-order streams, which consistentlyhad the highest pCO2, are closely connected to theirsurrounding catchments via shallow water flow, whereashigher-order streams receive progressively larger proportionsof water from upstream surface flow. It appears that duringstorms, water is routed through shallow and potentiallyCO2-rich flowpaths, but the stream pCO2 response can vary(Figure 4). Maximum active layer depth in the catchment is~ 0.5m [Kelsey et al., 2012] and the near-surface permafrostlikely constrains supra-permafrost flow to shallow depths.This was confirmed during numerous storm events whenwe observed overland flow in low spots on hillslopes as wellas areas of pipe flow in organic soil horizons. Both runoffprocesses are thought to be common in subarctic catchments[Carey and Woo, 2001] and a nearby headwater catchment[Koch et al., 2012]. The storm pCO2 response is likely aresult of a hydrologic variability such as flowpath lengthand organic soil depth.[24] The diel pCO2 patterns observed at two locations
on West Twin Creek suggest in-stream controls overpCO2 such as primary production (decreased pCO2),sediment respiration (increased pCO2), or changes ingas solubility as a result of temperature changes. Previouswork has documented diel soil pCO2 patterns [Osozawaand Hasegawa, 1995], but we do not have any diel recordsof soil pCO2 in the Nome Creek catchment. In-stream
Figure 8. Plots of the time series of carbon dioxide emissionrates for the ten study sites over the course of the open-waterseason.
Figure 9. Plots of the time series of methane emissionsover the course of the open-water season; note that EastTwin Creek has a different scale.
CRAWFORD ET AL.: CARBON EMISSIONS FROM ALASKA STREAMS
8

metabolism should result in an equal change in concentrationsof both CO2 and O2 (1mol increase in CO2 = 1mol decreasein O2), and indeed, oxygen time series show a similarpattern to CO2 (Figure 6). Although synchronous gasconcentrations were observed at the downstream gage,pCO2 remained far above atmospheric equilibrium(~3000 matm) indicating a non-water column source ofCO2. We contend that the stream simply modifies the CO2
load through metabolism. We do not have good estimatesof the metabolism from this catchment because complexgroundwater exchange patterns (and multiple failed tracerexperiments) precluded the use of the one or two-stationmetabolism techniques. Instead, we can use previouslyreported values from an adjacent watershed to illustratethe potential for in-stream contributions to CO2 flux.Betts and Jones [2009] measured whole ecosystem metabo-lism in a number of watersheds having various degrees ofpermafrost, and in watersheds that had experienced fire.Based on their reported values of maximum respirationand minimum gross primary production, the maximumpotential contribution of in-stream metabolism wouldbe<3 g CO2-C m�2 d�1, approximately half of the meanflux reported here (see section 4.2). Previous studies alsoconclude that most stream CO2 is of terrestrial origin[Dinsmore and Billett, 2008; Hope et al., 2004]. There isalso evidence that the hyporheic zone can account forstream CO2 and CH4, as was shown in a low gradient, northtemperate stream system [Schindler and Krabbenhoft,1998]. The role of the hyporheic zone and gas productionin sediments requires more investigation. Longitudinaltransect samples from West Twin Creek add weight to theconclusion that most CO2 originates from terrestrialsources. The downstream pCO2 pattern is remarkablyconsistent over the study period (Figure 3) and highlightslocations of increased pCO2 consistent with CO2-richgroundwater or soil water inflows, a pattern which has pre-viously been shown in Vermont, U.S. streams [Doctor et al.,2008]. It is unlikely that in-stream metabolism of C exhibitsenough spatial heterogeneity to result in a doubling ofstream pCO2 across such short distances, although thiswarrants further investigation.[25] Environmental variables such as discharge, pH,
water temperature and air temperature were all correlatedwith stream pCO2. These relationships likely result fromchanges in gas solubility and variations in the equilibriumdistribution of the carbonate system. The negative rela-tionship between pCO2 and water discharge could beinterpreted as a dilution effect from increased runoff or itmay result from increased evasion under turbulent flowconditions. However, we contend that this relationship ismerely a result of spatial correlations, with first-orderstreams (lowest discharges) having the highest pCO2
due to close contact with terrestrial C sources. A negativerelationship between pCO2 and pH is expected as dissolvedCO2 acts as an acid in water [Stumm and Morgan, 1996],and in poorly buffered systems, CO2 can be a strong controlon the stream pH [Neal et al., 1998; Waldron et al., 2007].The negative correlation between pCO2 and water temperaturecould be due to decreased gas solubility. However, thecorrelation between water temperature, although statisticallysignificant (p< 0.05), was very weak (r2 = 0.04) and diurnaltemperature variability was very low (Δ ~ 2�C) which
indicates that temperature was not a major control onpCO2 or CO2 flux.[26] Stream pCH4 appears to be controlled by hydrologic
patterns within the catchment. Longitudinal transectsamples along West Twin Creek revealed areas of consistentCH4-saturated water indicative of discrete inflows (Figure 3).The downstream pCH4 pattern was different than pCO2,likely due to localized differences in water chemistry and/or oxidation states. Increases in stream pCH4 at approxi-mately 1800m downstream corresponded with an area ofcomplex wetland hydrology consisting of at least twogroundwater seeps (as witnessed by concentrated ironinflows), artesian silt bubbling from soil pipes (describedin another permafrost stream [Koch et al., 2012]), as wellas a pond which contained dead tilting “drunken trees”which are common signals of thermokarst. We infer thatreducing conditions in these near-stream wetlands andgroundwater likely leads to elevated pCH4. Thermokarstareas have previously been shown to dramatically increaseCH4 fluxes in a black spruce lowland of interior Alaska[Wickland et al., 2006]. It is difficult to extend our conclusionof thermokarst CH4 sources to the other streams in the basinbecause of the challenge in sample collection and theheterogeneity of wetland cover in the basin. Future workwould benefit from a more extensive characterization ofwetland and thermokarst connectivity with surface watersto elucidate the patterns of CH4 delivery and emissions fromheadwater streams.
4.2. Variability in Gas Fluxes
[27] All streams in the study basin were significantsources of CO2 to the atmosphere whereas only some wereconsistent sources of CH4. First-order streams had lowmean CH4 flux relative to the second and fourth-orderstream sites, but they also had the highest individualmeasurements of CH4 flux. First-order streams were alsothe most dynamic streams in the basin with respect to CO2
emissions. The distribution of fluxes among stream orderswas comparable to previous studies which have shown thatsmall headwater streams tend to have the highest CO2 fluxeswithin a network [Wallin et al., 2010; Teodoru et al., 2009].Carbon dioxide fluxes from stream surfaces in this study fellwithin the range of previous studies in boreal, temperate,and peatland systems (Table 2). In general, our discretemeasurements of CO2 fluxes accurately portrayed themagnitude of emissions for these sites over the season.However, discrete measurements did not elucidate the fulldynamics of C emissions.[28] Based on the negative correlation between Q and
pCO2 we might infer that increased flow from storm eventswould lead to decreased stream pCO2 (dilution), but thiswas not the case for at least one sampling location. On thecontrary, in a forested reach of West Twin Creek havingthicker organic soils (Downstream Gage), storm eventsincreased both stream discharge and pCO2 (Figure 4).Changes in stream pCO2 both during storms and over dailycycles can impact the flux in multiple ways. Similarly,changes in discharge alter both stream surface area and thegas transfer velocity concurrently with changes in gasconcentrations. Therefore, routine measurements of gas fluxeswith chambers will tend to underestimate the magnitudeof emissions during storm events, a period which can
CRAWFORD ET AL.: CARBON EMISSIONS FROM ALASKA STREAMS
9

account for the majority of stream emissions in somesystems [Dinsmore and Billett, 2008].[29] This is one of the first studies to incorporate
stream CH4 emissions at a large basin scale in a permafrostregion. As predicted, CH4 emissions were an order ofmagnitude lower compared to CO2. However, stream CH4
fluxes were significantly higher than what might beexpected in oxygen-saturated turbulent streams during thegrowing season. Evasion rates at one first-order stream(East Twin Creek mean = 58.2 nmol CH4 m
�2 s�1) were atleast an order of magnitude lower than values reported forboreal wetlands but were similar to values for a temperatestream in the conterminous United States (Table 3). Streamswere nearly always saturated with CH4 with respect to theatmosphere, and we only measured slight net uptake onone occasion at the Table Creek site in September. Giventhat CH4 is a more potent greenhouse gas compared withCO2, the observed fluxes could represent an importantfeedback to the climate system (discussed further below).
4.3. Evaluation of the Chamber Technique
[30] Our chamber and crane design was easily deployedand transported within the semi-remote catchment and likelydid not seriously alter gas transfer. The average gas transfervelocity (KCO2) calculated from 94 chamber measurementsusing equation (2) was 6.47m day�1 (maximum of14.65m day�1). Values derived from the chamber measure-ments were similar to KCO2 values previously measured inthe catchment (mean = 9.06m day�1, range = 5.03–14.3mday�1) [Crawford, 2012] using the volatile gas tracertechnique [Marzolf et al., 1998]. Mean KCO2 of the smallstreams in this headwater basin was greater than meanvalues calculated for all tributaries (5.2m day�1) and themain stem of the Yukon River (3.1m day�1) [Striegl etal., 2012], which is consistent with the hypothesis of
decreasing KCO2 with increasing stream order [Butmanand Raymond, 2011]. The mean value of KCO2 from thechamber measurements in the Nome Creek catchment alsofell within the range of values for another boreal streamnetwork in Northern Sweden determined by volatile gasinjections [Wallin et al., 2011]. We suggest that thechamber design and portable crane system used in thisstudy be considered for other stream emission studies.
4.4. Up-scaled Basin Estimates of CO2 and CH4
[31] The up-scaling of mean fluxes based on chambermeasurements and surface areas derived from GIS, estimateddischarges, and hydraulic geometry relationships provides anestimate of the contribution of stream CO2 emissions at thecatchment scale. Although lakes can also be important sourcesof C gases, none were present in our study catchment, there-fore this estimate accounts for all aquatic emissions. Assuming180 days of open-water, water surface emissions were esti-mated to be 2.12� 107–3.21� 108 g CO2-C yr�1 (95% CI)(median = 1.16� 108 g CO2-C yr�1). Normalized to the entirecatchment area, streams emitted 0.08–1.22 g CO2-C m�2 yr�1
(95% CI) (median = 0.44 g CO2-C m�2 yr�1) which is quitesmall relative to the YRB as a whole [9.0 g CO2-C m�2 yr�1;Striegl et al., 2012]. Emissions were dominated by streamorders 1 and 2, which both accounted for 42% of the total,whereas orders 3 and 4 only contributed 9% and 7%, respec-tively. Although soil respiration has been measured in partsof the study area [Kelsey et al., 2012], there is insufficientknowledge of the terrestrial C budget for the Nome Creekcatchment to reliably estimate the contribution of streamgas emissions to the basin C budget. However, the magni-tude of gas loss from these permafrost streams is likelysubstantial and represents an important term in the basin Cbudget.
Table 3. CH4 Evasion Rates for Some Boreal and Temperate Water Bodies
Water Type (Location) Mean Daily CH4 Flux (nmol CH4 m�2 s�1) Reference
Boreal streams (interior Alaska) 7.3 This studyAlpine Fen (Alaska) 210 Sebacher et al. [1986]Boreal marsh (Alaska) 77 Sebacher et al. [1986]Boreal poor fens (interior Alaska) 130 Wickland et al. [2006]Boreal rich fen (control treatment, interior Alaska) 71 Turetsky et al. [2008]Boreal reservoir (Finland) 25 Huttunen et al., [2003]Temperate and boreal reservoirs 22 St. Louis et al. [2000]Beaver pond (Manitoba, Canada) 78 Roulet et al. [1997]Temperate peatland stream (Scotland) 170 Hope et al. [2001]Temperate streams (Ontario, Canada) 130 Baulch et al. [2011]Temperate stream (Tennessee, U.S.A.) 9.5 Jones and Mulholland [1998]
Table 2. Representative CO2 Evasion Rates from Northern Streams and the Conterminous U.S.; Normalized to 365 Days
Location pCO2 (matm) CO2 flux (mmol CO2 m-2 s-1) Reference
Small boreal streams (Alaska, U.S.A.) 570–2600 5.21 This studySmall boreal streams (Ontario, Canada) – 1.04 Koprivnjak et al. [2010]Boreal streams (Northern, Sweden) – 7.41 Jonsson et al. [2007]Small boreal streams (Quebec, Canada) 2243 3.01 Teodoru et al. [2009]First-order streams (Sweden) 1445 7.99 Humborg et al. [2010]Headwater Streams (conterminous U.S.) 3120 27.4 Butman and Raymond [2011]Boreal streams 1300 10.6 Aufdenkampe et al. [2011]
CRAWFORD ET AL.: CARBON EMISSIONS FROM ALASKA STREAMS
10

[32] At the basin scale, high rates of areal C gas emissionswere countered by low aquatic surface area (<0.2% of thetotal area). The difference in stream coverage between thisheadwater basin and the Yukon River basin as a whole(1.2% of total area; Striegl et al., 2012) was surprising. Ifwe multiply our areal flux density (0.44 g CO2-C m�2 yr�1)by 6 to reach equivalent aquatic coverage, the resulting fluxof 2.64 g CO2-C m�2 yr�1 is still much smaller comparedto the 9.0 g CO2-C m�2 yr�1 that was estimated for the entireYukon River basin [Striegl et al., 2012]. This disparity raisesinteresting new questions regarding C processes at thesetwo scales. Are there a lack of C sources in the headwaters?Is C transport from terrestrial to aquatic systems limited inthe more arid regions of the interior? Our up-scaling onlyconsidered surface areas at mean discharge. Stream lengths,in addition to widths, may increase significantly duringstorms. For example, we observed that the channel head onWest Twin Creek migrated ~400m closer to the divide dur-ing one storm and became at least 10% longer. Incorporatinglengthening stream reaches could increase estimates of gasemissions. Fluxes may be underestimated for many portionsof the catchment if surface area increased during higherflows, especially for locations where pCO2 responds posi-tively to increased discharge. However, many parts of thecatchment are positioned above treeline and may showpatterns of CO2 dilution during runoff events. Importantquestions remain as to how these catchments will respondto changing hydrology.[33] Up-scaled estimates of CO2 evasion from this perma-
frost stream network could be underestimated because wedid not quantify ebullitive (bubble mediated) fluxes, andbecause CO2 emissions were always measured during theday when pCO2 is lowest. While ebullition has been shownto be a large component of stream CH4 emissions (10�80%)in a north temperate ecosystem [Baulch et al., 2011], there isvery little information regarding ebullitive fluxes from streamselsewhere. We never observed non-linearity during thechamber deployments for either dCO2/dt or dCH4/dt (156 totalobservations spanning 39 h), which would have indicatedebullition. Given that our study streams had high channelvelocities and steep slopes, both of which should precludebubble formation, we suspect that ebullition is uncommon inthis system. We never observed bubbles emerge from streamsediments, even when agitated by walking in the streamchannel. In regards to diurnal variability, mean pCO2 in WestTwin Creek measured using the continuous sensors was 15%and 16% higher than weekly discrete measurements at thedownstream and upstream gages, respectively. Since fluxesscale linearly with the changes in pCO2 (see equation (2)),our up-scaled estimate is probably at least 15% low. Wepredict that other previous studies have also underestimatedemissions by sampling only during the day.[34] Up-scaled stream CH4 emissions reveal a second
important role of the aquatic C cycle in this permafrostnetwork. Boreal black spruce forest soils typically have verylow net CH4 emissions under poorly drained conditions, andthey are often small net consumers of CH4. Mean seasonalCH4 emissions of 4.32–14.4mg CH4-C m�2 d�1 [Bubieret al., 1995] and 4.61�8.64mg CH4-C m�2 d�1 [Wicklandet al., 2006] have been reported for poorly drained blackspruce forests in boreal Canada and interior Alaska,respectively. Additionally, mean net CH4 consumption rates
of �0.02 to �0.09mg CH4-C m�2 d�1 have been measuredin black spruce forest sites of boreal Canada [Savage et al.,1997; Liblik et al., 1997]. To put our measured CH4 fluxesfrom streams into the catchment context, we can apply theseranges in CH4 exchange of black spruce forest soils to theterrestrial portion of the landscape (~262.5 km2). Much ofthe Nome Creek catchment is covered by black spruceforest, ranging in soil moisture content from <0.1m m�3
to 0.3m m�3 in the upper 10 cm [Kelsey et al., 2012], andthe water table is typically >30 cm depth. These soilconditions are conducive to both very low net CH4 emissionand net CH4 consumption [Bubier et al., 1995; Wicklandet al., 1999; Wickland et al., 2006]. Therefore, if we assumethat on average the terrestrial landscape is a small netCH4 source of 4.0mg CH4-C m�2 d�1, the daily emissionis 1050 kg CH4-C d�1. Using the same approach usedfor CO2, CH4 fluxes from streams were estimated tobe 6.05� 104–1.89� 107 g CH4-C m�2 yr�1 (95% CI)(median = 6.15� 105 g CH4-C m�2 yr�1), or 0.03–10.0%(95% CI) of the terrestrial CH4 emission. However, if muchof the time these forest soils are small net CH4 consumers, oreven have zero net CH4 exchange with the atmosphere, thenthe stream emissions can account for most of the catchmentCH4 emission. Although our estimate of stream CH4
emissions was at most an order of magnitude lower thanCO2 emissions with respect to C, 1 kg of CH4 has 25 timesthe global warming potential on a 100 year timescale(GWP100) relative to 1 kg of CO2 [Forster et al., 2007]which results in CH4 emissions of 2.0� 106–6.3� 108 gCO2 equivalents yr�1. This result demonstrates that streamCH4 emissions likely have a significant impact on thegreenhouse gas balance of this permafrost ecosystem.[35] Changes in the hydrologic regime and fluvial compo-
sition will likely modify the importance of stream emissionsin the future. Low drainage density and the narrow, deepchannels in the Nome Creek catchment set an upper limitof the stream surface area during non-flood periods and thustotal emissions. The stream coverage is likely to respond tochanges in annual precipitation and hydrologic alterationsdue to permafrost thaw. However, predicting the directionof change is difficult as fluvial patterns such as the drainagedensity depend on both the initial system state and the direc-tion in which precipitation is changing [Moglen et al., 1998].Permafrost complicates the matter, as most geomorphologictheory was developed in non-permafrost alluvial systems.Geometric patterns of permafrost streams can be strikinglydifferent compared with temperate systems [McNamaraand Kane, 2009]. In larger Arctic streams, permafrost hasbeen shown to retard scour and bank erosion [Scott, 1978]and modeling studies indicate that networks contract duringnon-permafrost conditions and expand when permafrost ispresent [Bogaart et al., 2003]. These findings complicatepredictions of network change in permafrost-dominatedcatchments. Hydrologic alterations that follow with perma-frost thaw and channel adjustments are also likely toimpact the C cycle and stream gas emissions. For example,decreased runoff variability in headwater permafrostcatchments [Jones and Rinehart, 2010] may affect proces-sing of terrestrial C and delivery of CO2 and CH4. Increasedresidence time and altered flowpaths have already changedthe C cycle at the scale of the YRB [Striegl et al., 2005;Walvoord and Striegl, 2007].
CRAWFORD ET AL.: CARBON EMISSIONS FROM ALASKA STREAMS
11

4.5. Conclusion
[36] Stream emissions of both CO2 and CH4 represent apersistent C loss pathway which is traditionally unaccountedfor in ecosystem budgets. Depending on the CH4 conditionsin forest soils, streams may push the system to a net CH4
source and could contribute significantly to the greenhousegas balance of the catchment. The YRB is already experienc-ing changes in response to climate warming. Continuedthawing of permafrost and changes in hydrology will likelyalter the role of stream C emissions through changes in hydro-logic connections and changes in aquatic surface area. Sincestreams integrate catchment processes, continued monitoringof stream C cycling, including gas emissions, will be animportant research topic given the potential for significantecosystem changes to permafrost-dominated landscapes.
[37] Acknowledgments. We thank Doug Halm for assistance with allaspects of the field work and planning, Alex Johnson, Seth Spawn, DebRepert, Paul Schuster, Josh Koch, and Ted Stets for field assistance andDave Harring for technical assistance with the portable crane system usedfor chamber measurements. We also thank Dick Smith and two anonymousreviewers for constructive comments on the manuscript. This research wassupported by the U.S. Geological Survey National Research Program.Additional support was provided through the Dr. and Mrs. Carl A. Bundefund to J.T.C. from the UW-Madison Department of Zoology and the AnnaGrant Birge Memorial Award to J.T.C. Any use of trade or product names isfor descriptive purposes only and does not imply endorsement by the U.S.Government.
ReferencesAufdenkampe, A. F., E. Mayorga, P. A. Raymond, J. M. Melack,S. C. Doney, S. R. Alin, R. E. Aalto, and K. Yoo (2011), Riverinecoupling of biogeochemical cycles between land, oceans, and atmosphere,Front. Ecol. Environ., 9(1), 53–60.
Bastviken, D., L. J. Tranvik, J. A. Downing, P. M. Crill, and A. Enrich-Prast(2011), Freshwater methane emissions offset the continental carbon sink,Science, 331, 50.
Baulch, H. M., P. J. Dillon, R. Maranger, and S. L. Schiff (2011), Diffusiveand ebullitive transport of methane and nitrous oxide from streams: Arebubble-mediated fluxes important? J. Geophys. Res., 116, doi:10.1029/2011JG001656.
Betts, E. F., and J. B. Jones (2009), Impact of wildfire on stream nutrientchemistry and ecosystem metabolism in boreal forest catchments of inte-rior Alaska, Arctic, Antarctic, and Alpine Res., 41(4), 407–417.
Bogaart, P. W., G. E. Tucker, and J. J. de Vries (2003), Channel networkmorphology and sediment dynamics under alternating periglacialand temperate regimes: a numerical simulation study, Geomorphology,54(3–4), 257–277, doi:10.1016/S0169-555X(02)00360-4.
Bubier, J. L., T. R. Moore, L. Bellisario, N. T. Comer, and P. M. Crill(1995), Ecological controls on methane emissions from a northernpeatland complex in the zone of discontinuous permafrost, Manitoba,Canada, Global Biogeochem. Cycles, 9(4), 455–470.
Buchanan, T. J., and W. P. Somers (1969), Discharge measurements atgaging stations, U.S. Geological Survey Techniques of Water-ResourcesInvestigations.
Butman, D., and P. A. Raymond (2011), Significant efflux of carbondioxide from streams and rivers in the United States, Nat. Geosci., 4(10),1–4. doi:10.1038/ngeo1294.
Carey, S. K., and M.-ko. Woo (2001), Slope runoff processes and flowgeneration in a subarctic, subalpine catchment, J. Hydrol., 253(1–4),110–129, doi:10.1016/S0022-1694(01)00478-4.
Coney, P. J., and D. L. Jones (1985), Accretion tectonics and crustalstructure in Alaska, Tectonophysics, 119, 265–283.
Crawford, J. T. (2012), Hydrologic and geomorphologic controls on carbondioxide and methane emissions from a headwater network of interiorAlaska. M.S. thesis, University of Wisconsin, Madison.
Dinsmore, K. J., and Billett M.F. (2008), Continuous measurement andmodeling of CO2 losses from a peatland stream during stormflow events,Water Resour. Res., 44, doi:10.1029/2008WR007284.
Dinsmore, K. J., R. P. Smart, M. F. Billett, J. Holden, A. J. Baird, andP. J. Chapman (2011), Greenhouse gas losses from peatland pipes: Amajor pathway for loss to the atmosphere?, J. Geophys. Res., 116(G3),1–12, doi:10.1029/2011JG001646.
Doctor, D. H., C. Kendall, S. D. Sebestyen, J. B. Shanley, N. Ohte, andE. W. Boyer (2008), Carbon isotope fractionation of dissolved inorganiccarbon (DIC) due to outgassing of carbon dioxide from a headwaterstream, Hydrological Processes, 22, doi:10.1002/hyp.6833.
Dyson, K. E., M. F. Billett, K. J. Dinsmore, F. Harvey, A. M. Thomson,S. Piirainen, and P. Kortelainen (2010), Release of aquatic carbon fromtwo peatland catchments in E. Finland during the spring snowmelt period,Biogeochemistry, 103(1–3), 125–142, doi:10.1007/s10533-010-9452-3.
Forster, P., et al. (2007), Changes in atmospheric constituents and inradiative forcing, in Climate Change 2007: The Physical Science Basis.Contribution of Working Group I to the Fourth Assessment Report ofthe Intergovernmental Panel on Climate Change, edited by S. Soloman,et al., pp. 129–234, Cambridge Univ. Press, Cambridge, U. K.
Gorham, E. (1991), Northern peatlands: Role in the carbon cycle andprobable responses to climatic warming, Ecol. Appl., 1(2), 182,doi:10.2307/1941811.
Guérin, F., G. Abril, S. Richard, B. Burban, C. Reynouard, P. Seyler, andR. Delmas (2006), Methane and carbon dioxide emissions from tropicalreservoirs: Significance of downstream rivers, Geophys. Res. Lett., 33,doi:10.1029/2006GL027929.
Hope, D., S. M. Palmer, M. F. Billett, and J. J. C. Dawson (2001), Carbondioxide and methane evasion from a temperate peatland stream, Limnol.Oceanogr., 46(4), 847–857.
Hope, D., S. M. Palmer, M. F. Billett, and J. J. C. Dawson (2004),Variations in dissolved CO2 and CH4 in a first order stream catchment:An investigation of soil-stream linkages, Limnol. Oceanogr., 46, 847–857.
Humborg, C., C.-M.Mörth, M. Sundbom, H. Borg, T. Blenckner, R. Giesler,and V. Ittekkot (2010), CO2 supersaturation along the aquatic conduitin Swedish watersheds as constrained by terrestrial respiration, aquaticrespiration and weathering, Glob. Chang. Biol., 16(7), 1966–1978,doi:10.1111/j.1365-2486.2009.02092.x.
Huttunen, J. T., J. Alm, A. Liikanen, S. Juutinen, T. Larmola, T. Hammar,J. Silvola, P. J. Martikainen (2003), Fluxes of methane, carbon dioxideand nitrous oxide in boreal lakes and potential anthropogenic effects onthe aquatic greenhouse gas emissions, Chemosphere, 52(3), 609–21,doi:10.1016/S0045-6535(03)00243-1.
Johnson,M. S.,Weiler,M., Cuarto, E. G., Riha, S. J., and J. Lehmann (2007),Storm pulses of dissolved CO2 in a forested headwater Amazonianstream explored using hydrograph separation, Water Resour. Res., 43,doi:10.1029/2007WR006359.
Johnson, M. S., M. F. Billett, K. J. Dinsmore, M. Wallin, K. E. Dyson, andR. S. Jassal (2010), Direct and continuous measurement of dissolvedcarbon dioxide in freshwater aquatic systems—method and applications,Ecohydrology, 3(1), 68–78, doi:10.1002/eco.
Jones, J. B., and P. J. Mulholland (1998), Methane input and evasion in ahardwood forest stream: Effects of subsurface flow from shallow anddeep pathways, Limnol. Oceanogr., 43, 1243–1250.
Jones, J. B., and A. J. Rinehart (2010), The long-term response of streamflow to climatic warming in headwater streams of interior Alaska,Canadian J. Forest Res., 40, 1210–1218, doi:10.1139/X10-047.
Jonsson, A., G. Algesten, A.-K. Bergström, K. Bishop, S. Sobek, L. J. Tranvik,and M. Jansson (2007), Integrating aquatic carbon fluxes in a borealcatchment carbon budget, J. Hydrol., 334(1–2), 141–150, doi:10.1016/j.jhydrol.2006.10.003.
Kelsey, K. C., K. P. Wickland, R. G. Striegl, and J. C. Neff (2012),Variation in soil carbon dioxide efflux at two spatial scales in atopographically complex boreal forest, Arctic, Antarctic and AlpineRes., 44(4), 457–468, doi: http://dx.doi.org/10.1657/1938-4246-44.4.457.
Knighton, A. D. (1998), Fluvial Forms and Processes: A New Perspective,Arnold, London.
Koch, J. C., S. A. Ewing, R. G. Striegl, D. M. McKnight (2012), Rapidrunoff via shallow throughflow and deeper pipe flow in a borealcatchment underlain by frozen silt, Hydrogeology, doi:10.1007/s10040-012-0934-3.
Koprivnjak, J.-F., P. J. Dillon, and L. A. Molot (2010), Importance ofCO2 evasion from small boreal streams, Global Biogeochem. Cycles, 24(4),1–9, doi:10.1029/2009GB003723.
Liblik, L. K., T. R. Moore, J. L. Bubier, and S. D. Robinson (1997),Methane emissions from wetlands in the zone of discontinuouspermafrost: Fort Simpson, Northwest Territories, Canada, GlobalBiogeochem. Cycles, 11(4), 485–494.
Marzolf, E. R., P. J. Mulholland, and A. D. Steinman (1998), Improvementsto the diurnal upstream-downstream dissolved oxygen change techniquefor determining whole-stream metabolism in small streams, Can. J. Fish.Aquat. Sci., 55(7), 1786–1787, doi:10.1139/cjfas-55-7-1786.
McMahon, P. B., and K. F. Dennehy (1999), N2O emissions from anitrogen-enriched river, Environ. Sci. Technol., 33, 21–25.
McNamara, J. P., and D. L. Kane (2009), The impact of a shrinkingcryosphere on the form of arctic alluvial channels, HydrologicalProcesses, 23, 159–168, doi:10.1002/hyp.7199.
CRAWFORD ET AL.: CARBON EMISSIONS FROM ALASKA STREAMS
12

Moglen, G. E., E. A. B. Eltahir, and R. L. Bras (1998), On the sensitivity ofdrainage density to climate change, Water Resour. Res., 34(4), 855–862,doi:10.1029/97WR02709.
Neal, C., W. A. House, H. P. Jarvie, and A. Eartherall (1998), The significanceof dissolved carbon dioxide in major lowland rivers entering the North Sea,Sci. Total Environ., 210, doi:10.1016/S0048-9697(98)00012-6.
Osozawa, S., and S. Hasegawa (1995), Diel and seasonal changes in carbondioxide concentrations and flux in an andisol, Soil Sci., 160(2), 117–124,doi:10.1097/00010694-199516020-00005.
Öquist, M. G., M. Wallin, J. Seibert, K. Bishop, and H. Laudon (2009),Dissolved inorganic carbon export across the soil/stream interface andits fate in a boreal headwater stream, Environ. Sci. Technol., 43(19),7364–9, doi:10.1021/es900416h.
Parks B., Madison R. J. (1985), Estimation of selected flow and water-qualitycharacteristics of Alaskan rivers, in US Geological Survey Water-ResourcesInvestigations Report 84–4247.
R Core Team (2012), R: A Language and Environment for StatisticalComputing. R Foundation for Statistical Computing, Vienna, Austria.
Roulet, N., P. Crill, N. Comer, and A. Dove (1997), CO2 and CH4 fluxbetween a boreal beaver pond and the atmosphere, J. Geophys. Res.,102(D24), 313–29, doi:10.1029/97JD01237.
Savage, K., T. R. Moore, and P. M. Crill (1997), Methane and carbondioxide exchanges between the atmosphere and northern boreal forestsoils, J. Geophys. Res., 102, doi:10.1029/97JD02233.
Schindler, J. E., D. P. Krabbenhoft (1998), The hyporheic zone as a sourceof dissolved organic carbon and carbon gases to a temperate forestedstream, Biogeochemisry, 43, 157–174.
Schuur, E. A. G., J. G. Vogel, K. G. Crummer, H. Lee, J. O. Sickman, andT. E. Osterkamp (2009), The effect of permafrost thaw on old carbon re-lease and net carbon exchange from tundra, Nature, 459(7246), 556–9,doi:10.1038/nature08031.
Scott, K. M. (1978), Effects of permafrost on stream channel behavior inArctic Alaska, in Geological Survey Professional Paper 1068, U.S.Geological Survey, Washington D.C.
Sebacher, D. I., R. C. Harriss, K. B. Bartlett, S. M. Sebacher, and S. S. Grice(1986), Atmospheric methane sources: Alaskan tundra bogs, an alpinefen, and a subarctic boreal marsh, Tellus B, 38B(1), 1–10, doi:10.1111/j.1600-0889.1986.tb00083.x.
St. Louis, V., C. Kelly, Duchemin, and J. Rudd (2000), Reservoir surfacesas sources of greenhouse gases to the atmosphere: A global estimate,Bioscience, 50(9), 766–775.
Strahler, A. N. (1952), Hypsometric (Area Altitude) Analysis of ErosionalTopology, Geological Soc. Am. Bull., 63(11), 1117–1142, doi:10.1130/0016-7606(1952)63[1117:HAAOET]2.0.CO;2
Striegl, R. G., P. Kortelainen, J. P. Chanton, K. P. Wickland, G. C. Bugna,and M. Rantakari (2001), Carbon dioxide partial pressure and 13C content
of north temperate and boreal lakes at spring ice melt, Limnol. Oceanogr.,46, 941–945.
Striegl, R. G., G. R. Aiken, M. M. Dornblaser, P. A. Raymond, andK. P. Wickland (2005), A decrease in discharge-normalized DOC exportby the Yukon River during summer through autumn, Geophys. Res. Lett.,32(L21413), doi:10.1029/2005GL024413
Striegl, R. G., M. M. Dornblaser, C. P. McDonald, J. R. Rover, andE. G. Stets (2012), Carbon dioxide and methane emissions from the YukonRiver system, Global Biogeochem. Cycles, 26, GB0E05, doi:10.1029/2012GB004306.
Stumm, W., and J. J. Morgan (1996), Aquatic Chemistry, ChemicalEquilibria and Rates in Natural Waters, 3rd ed. John Wiley & Sons,Inc., New York.
Teodoru, C. R., P. A. del Giorgio, Y. T. Prairie, and M. Camire (2009),Patterns in pCO2 in boreal streams and rivers of northern Quebec,Canada, Global Biogeochem. Cycles, 23(2), 1–11, doi:10.1029/2008GB003404.
Turetsky, M. R., C. C. Treat, M. Waldrop, J. M. Waddington, J. W. Harden,A. D. McGuire (2008), Short-term response of methane fluxes andmethanogen activity to water table and soil warming manipulations inan Alaskan peatland, J. Geophys. Res., 113, doi:10.1029/2007JG00496.
Waldron, S., E. M. Scott, and C. Soulsby (2007), Stable isotope analysisreveals lower-order river dissolved inorganic carbon pools are highlydynamic, Environ. Sci. Technol., 41, doi:10.1021/es0706089.
Wallin, M., I. Buffam, M. G. Öquist, H. Laudon, K. Bishop (2010),Temporal and spatial variability of dissolved inorganic carbon in a borealstream network: Concentrations and downstream fluxes, J. Geophys. Res.,115(G02014), doi:10.1029/2009JG001100
Wallin, M. B., M. G. Öquist, I. Buffam, M. F. Billett, J. Nisell, and K. H.Bishop (2011), Spatiotemporal variability of the gas transfer coefficient(KCO2) in boreal streams: Implications for large scale estimates of CO2evasion, Global Biogeochem. Cycles, 25, doi:10.1029/2010GB003975.
Walvoord, M. A., and R. G. Striegl (2007), Increased groundwater to streamdischarge from permafrost thawing in the Yukon River basin: Potentialimpacts on lateral export of carbon and nitrogen, Geophys. Res. Lett.,34(12), doi:10.1029/2007GL030216.
Walvoord, M. A., C. I. Voss, and T. P. Wellman (2012), Influence ofpermafrost distribution on groundwater flow in the context of climate-driven permafrost thaw: Example from Yukon Flats Basin, Alaska,United States, Water Resour. Res., 48, doi:10.1029/2011WR015595.
Wickland, K. P., R. G. Striegl, J. C. Neff, and T. Sachs (2006), Effects ofpermafrost melting on CO2 and CH4 exchange of a poorly drained blackspruce lowland, J. Geophys. Res., 111, doi:10.12029/2005JG000099.
Wickland, K. P., R. G. Striegl, S. K. Schmidt, and M. A. Mast (1999),Methane flux in subalpine wetland and unsaturated soils in the southernRocky Mountains, Global Biogeochem. Cycles, 13(1), 101–113.
CRAWFORD ET AL.: CARBON EMISSIONS FROM ALASKA STREAMS
13


