Embed Size (px)
Citation preview
8 March 2007
TARGET2-SECURITIES – ECONOMIC FEASIBILITY
INTRODUCTION
TARGET2-Securities (T2S) will thoroughly change the nature of securities settlement in Europe if it is implemented. Its economic feasibility depends on the benefits it can provide the market as a whole. However, of these benefits are difficult to evaluate, as they are primarily based on estimates. Moreover, the current lack of transparency on settlement costs in the central securities depositories (CSDs) constitutes an additional difficulty, in that finding comparable figures is problematic1.
This document presents the outcome of the analysis conducted by the Eurosystem on the economic feasibility of T2S. It has two main objectives:
1) to estimate the average cost per transaction, in order to check whether T2S will be able to recover costs at a fee lower than, or equal to, the current CSD fees for domestic and cross-border settlement;
2) to produce an impact analysis, in order to check whether the project is beneficial for the various stakeholders of the post-trade securities market, as well as for the economy as a whole.
This document offers a series of assumptions that are purely designed to establish the feasibility and the usefulness of T2S and do not in any way anticipate the future decisions of the Governing Council or those of other actors. Moreover, whenever several options could be envisaged, the most conservative ones have been used, unless specifically mentioned otherwise. On many accounts, it is expected that the actual figures will be much more favourable. The assumptions have been explicitly stated as the Eurosystem wishes to be fully transparent to market participants and public authorities alike.
1 The recent adoption of the Code of Conduct issued by the European Commission (EC) will address this issue for the future.
Page 2 of 30
1. ESTIMATION OF THE AVERAGE COST PER TRANSACTION
1.1 General assumptions
Project duration
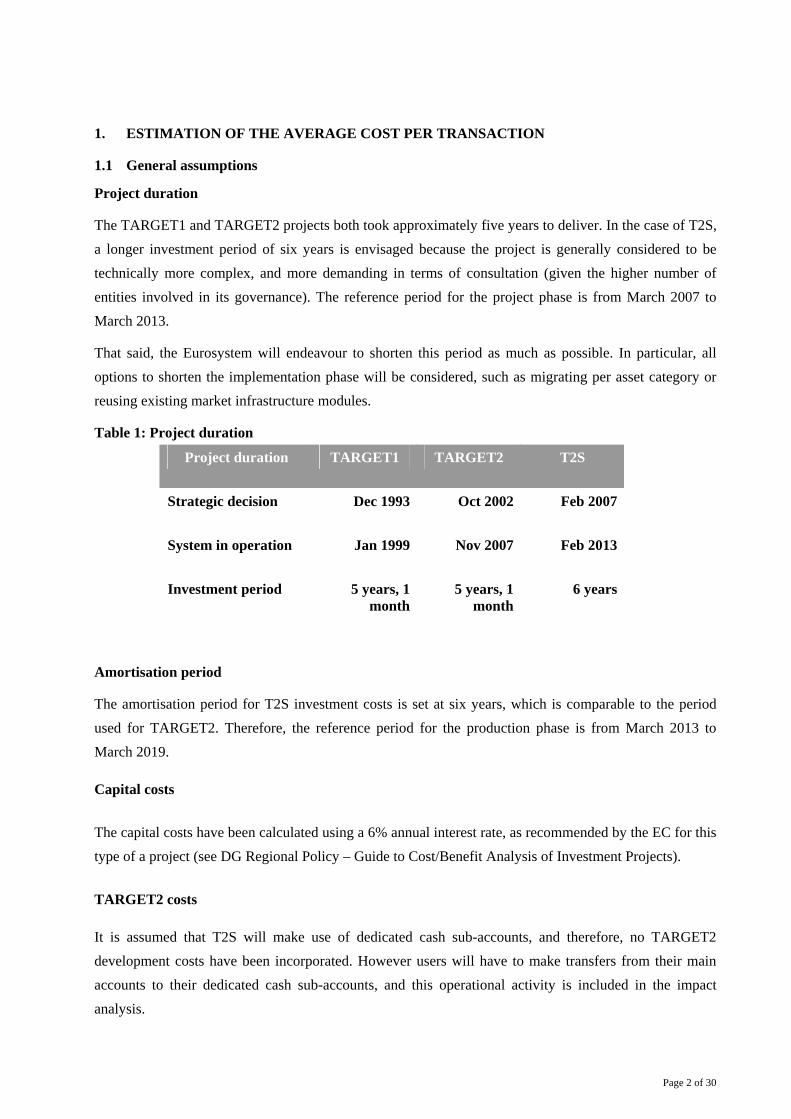
The TARGET1 and TARGET2 projects both took approximately five years to deliver. In the case of T2S, a longer investment period of six years is envisaged because the project is generally considered to be technically more complex, and more demanding in terms of consultation (given the higher number of entities involved in its governance). The reference period for the project phase is from March 2007 to March 2013.
That said, the Eurosystem will endeavour to shorten this period as much as possible. In particular, all options to shorten the implementation phase will be considered, such as migrating per asset category or reusing existing market infrastructure modules.
Table 1: Project duration
Project duration TARGET1 TARGET2 T2S
Strategic decision Dec 1993 Oct 2002 Feb 2007
System in operation Jan 1999 Nov 2007 Feb 2013
Investment period 5 years, 1 month
5 years, 1 month
6 years
Amortisation period
The amortisation period for T2S investment costs is set at six years, which is comparable to the period used for TARGET2. Therefore, the reference period for the production phase is from March 2013 to March 2019.
Capital costs
The capital costs have been calculated using a 6% annual interest rate, as recommended by the EC for this type of a project (see DG Regional Policy – Guide to Cost/Benefit Analysis of Investment Projects).
TARGET2 costs
It is assumed that T2S will make use of dedicated cash sub-accounts, and therefore, no TARGET2 development costs have been incorporated. However users will have to make transfers from their main accounts to their dedicated cash sub-accounts, and this operational activity is included in the impact analysis.
Page 3 of 30
1.2 Investment and running costs
Investment and running costs can be broken down into three areas:
• infrastructure costs: these represent hardware and software investments, including all costs necessary for the backup and recovery functions;
• application costs: these comprise the project costs for defining, developing and implementing the application; and
• running costs: these include yearly recurrent costs, as well as support costs.
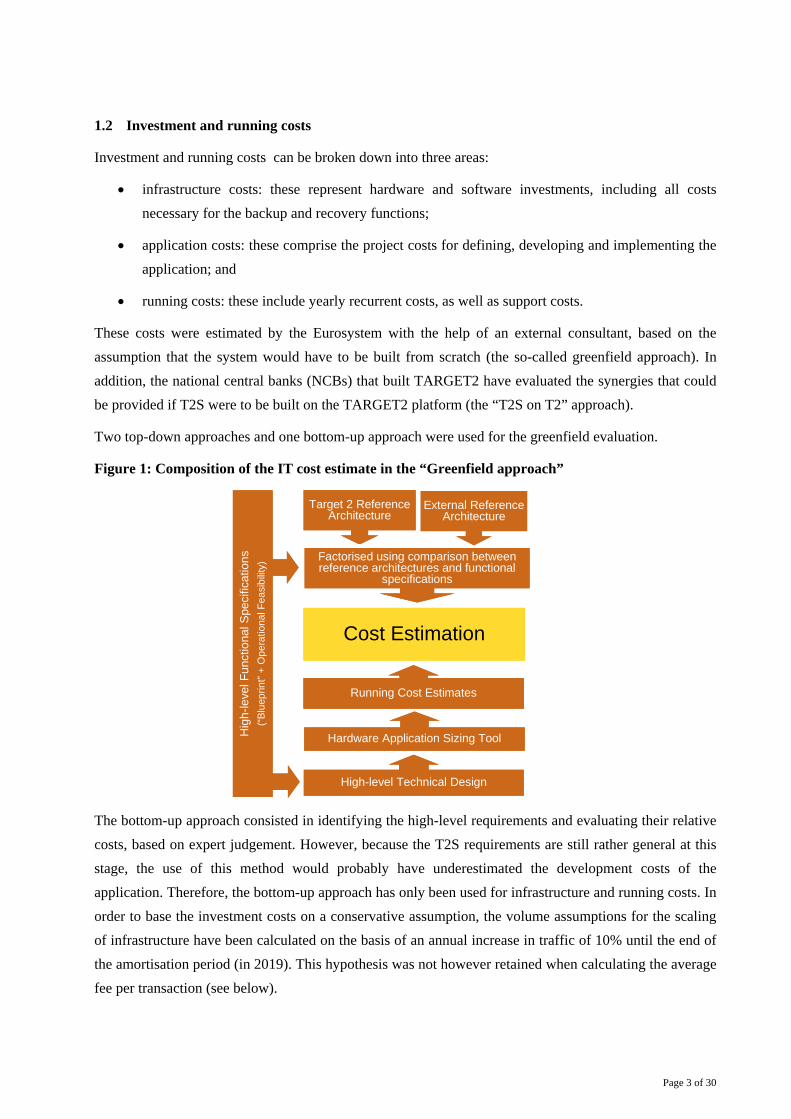
These costs were estimated by the Eurosystem with the help of an external consultant, based on the assumption that the system would have to be built from scratch (the so-called greenfield approach). In addition, the national central banks (NCBs) that built TARGET2 have evaluated the synergies that could be provided if T2S were to be built on the TARGET2 platform (the “T2S on T2” approach).
Two top-down approaches and one bottom-up approach were used for the greenfield evaluation.
Figure 1: Composition of the IT cost estimate in the “Greenfield approach”
The bottom-up approach consisted in identifying the high-level requirements and evaluating their relative costs, based on expert judgement. However, because the T2S requirements are still rather general at this stage, the use of this method would probably have underestimated the development costs of the application. Therefore, the bottom-up approach has only been used for infrastructure and running costs. In order to base the investment costs on a conservative assumption, the volume assumptions for the scaling of infrastructure have been calculated on the basis of an annual increase in traffic of 10% until the end of the amortisation period (in 2019). This hypothesis was not however retained when calculating the average fee per transaction (see below).
Cost Estimation
External Reference Architecture
Target 2 Reference Architecture
Hig
h-le
vel F
unct
iona
l Spe
cific
atio
ns(“B
luep
rint”
+ O
pera
tiona
l Fea
sibi
lity)
Factorised using comparison between reference architectures and functional
specifications
High-level Technical Design
Hardware Application Sizing Tool
Running Cost Estimates
Page 4 of 30
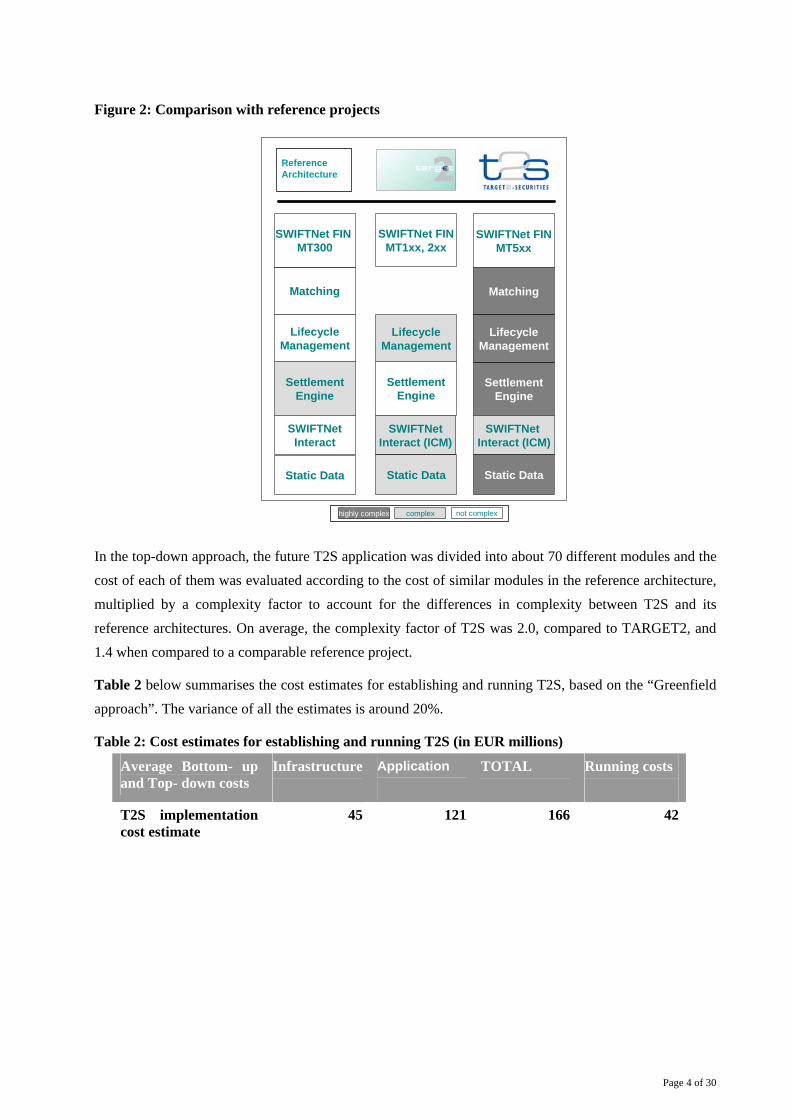
Figure 2: Comparison with reference projects
In the top-down approach, the future T2S application was divided into about 70 different modules and the cost of each of them was evaluated according to the cost of similar modules in the reference architecture, multiplied by a complexity factor to account for the differences in complexity between T2S and its reference architectures. On average, the complexity factor of T2S was 2.0, compared to TARGET2, and 1.4 when compared to a comparable reference project.
Table 2 below summarises the cost estimates for establishing and running T2S, based on the “Greenfield approach”. The variance of all the estimates is around 20%.
Table 2: Cost estimates for establishing and running T2S (in EUR millions)
Average Bottom- up and Top- down costs
Infrastructure
Application
TOTAL
Running costs
T2S implementation cost estimate
45 121 166 42
Matching
SettlementEngine
SettlementEngine
Matching
SettlementEngine
SWIFTNetInteract (ICM)
SWIFTNetInteract
SWIFTNetInteract (ICM)
LifecycleManagement
SWIFTNet FIN MT300
SWIFTNet FINMT1xx, 2xx
SWIFTNet FINMT5xx
Static Data Static Data
LifecycleManagement
highly complex complex not complex
Static Data
LifecycleManagement
ReferenceArchitecture
Page 5 of 30
Synergies with TARGET2:
In addition, the 3CB (the Banque de France, Banca d’Italia and Bundesbank) which built TARGET2, together with Banco de España (3CBplus), have evaluated how much could be saved by building T2S on the TARGET2 platform2 (the “T2S on T2” approach). Their evaluation has identified significant benefits that could stem from the use of this platform as the basis for T2S development and operation. As mentioned in the Operational and Technical Feasibility Studies, synergies with TARGET2 could be highly beneficial, mainly in the domains of the technical architecture, daily operation and support, and project management.
Synergies with TARGET2 were found in the following domains in particular:
Optimal use of IT resources
The workloads for the processing of T2S and for TARGET2 are complementary, in particular in term of distribution of time between the day and the night. To maximise efficiency, additional capacity will be available for T2S during the night, while specific IT resources will be allocated during the day to each system.
In addition, the TARGET2 architecture (2 regions and 2 sites), which ensures a very high level of business continuity, could be used by both systems, potentially optimising the use of idle capacity in terms of IT resources.
Reuse of existing communication technology
For participants’ communication with TARGET2, specific communication tools have been developed, such as the Information and Control Module (ICM), and these could be reused for T2S. This will minimise the adaptation costs of many participants which already have such an interface in place for TARGET2 and will reduce the level of investment needed to build such a system for T2S.
Reuse of existing operational and support organisation:
Finally, a state-of-the-art operations and support organisation will be put in place for TARGET2. In particular, this will make it possible to have operational experts in two different geographic sites who would operate and support both services with a high level of availability. This would ensure a high-level service with costs split between the two systems.
Overall, the 3CBplus have estimated the costs for building and operating “T2S on T2”, based on their concrete experience derived from building and operating TARGET2. An initial estimation predicts synergies that lead to cost reductions of up to 20%, compared with the greenfield approach.
2 TARGET2 has been developed and is operated on the Single Shared Platform (SSP). T2 and T2S can be operated on the SSP as
two different applications supported by the same technical infrastructure.
Page 6 of 30
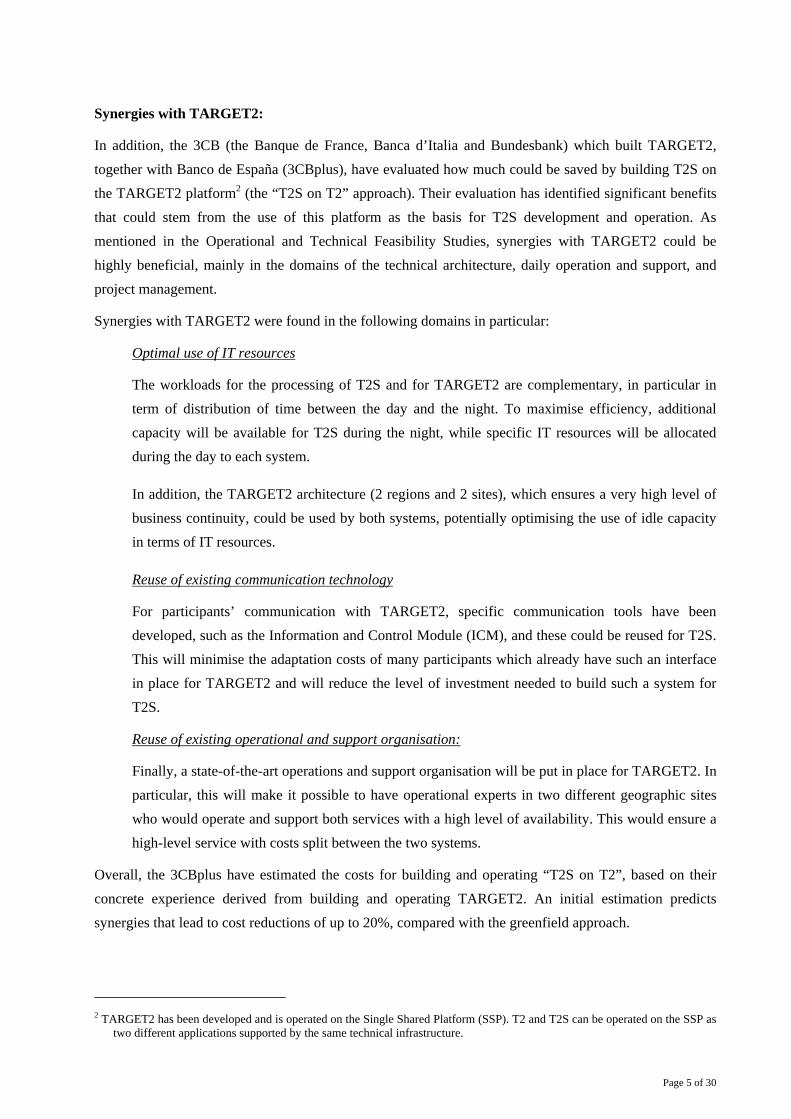
1.3 Telecommunication costs
The envisaged T2S business model will generate additional communication traffic compared with the current situation, as Figure 3 below shows.
Figure 3: Communication messaging in T2S
CSDs and T2S will need to communicate with regard to single transactions and account-related reporting and queries. Such communication could take place either on a one-to-one basis (per transaction or per query), or could be grouped into file transmissions.
Given the high number of messages that need to be transmitted between CSDs and T2S, the use of dedicated lines between T2S and the 18 euro area CSDs could be the cheapest solution, although it is difficult to estimate the actual costs at this stage. The Eurosystem considers that an initial investment of 12 million euro and a yearly cost of 29 million euro would be on the high side.
1.4 Estimated volume of settlement operations
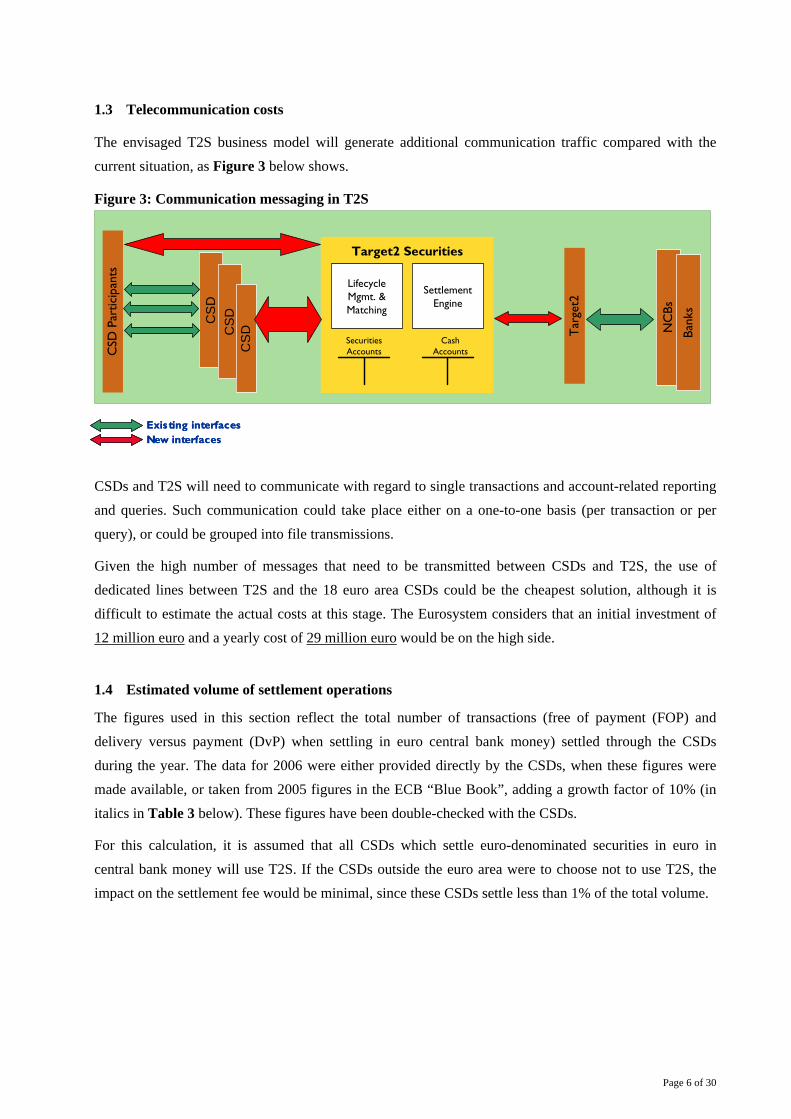
The figures used in this section reflect the total number of transactions (free of payment (FOP) and delivery versus payment (DvP) when settling in euro central bank money) settled through the CSDs during the year. The data for 2006 were either provided directly by the CSDs, when these figures were made available, or taken from 2005 figures in the ECB “Blue Book”, adding a growth factor of 10% (in italics in Table 3 below). These figures have been double-checked with the CSDs.
For this calculation, it is assumed that all CSDs which settle euro-denominated securities in euro in central bank money will use T2S. If the CSDs outside the euro area were to choose not to use T2S, the impact on the settlement fee would be minimal, since these CSDs settle less than 1% of the total volume.
Existing interfacesNew interfacesExisting interfacesNew interfaces
CS
D
CSD
Par
ticip
ants
Tar
get2
CS
DC
SD
Target2 Securities
LifecycleMgmt. & Matching
SettlementEngine
SecuritiesAccounts
Cash Accounts
NC
Bs
Bank
s
CS
D
CSD
Par
ticip
ants
Tar
get2
CS
DC
SD
Target2 Securities
LifecycleMgmt. & Matching
SettlementEngine
SecuritiesAccounts
Cash Accounts
NC
Bs
Bank
s
Page 7 of 30
Table 3: Settlement volumes in some European CSDs.
In the recent years, settlement volumes in securities settled in euro have increased by about 10 % every year. In order to size the technical equipment, this trend has been assumed to continue during the investment and the production periods, i.e. until 2019. However, using such a result to calculate the average costs per transaction could be challenged because there is no guarantee that the present trend will continue for the next 12 years.
As a result, the baseline scenario assumes that volume will only grow by 6% per year in the future.
The evolution of the securities settlement traffic over the next 12 years is difficult to predict, and could be affected by the following factors:
• On the positive side:
- demand curve effects (an increase in the number of transactions in line with the reduction of the settlement fees);
- the benefits of the European harmonisation of the post-trading processes.
• On the negative side:
- a possible increase in the use of commercial bank money or internalisation of settlement in the books of custodian banks;
160,773,700140,159,254TOTAL
Not availableNot availableVPS
1,000493VPC
1,623,6001,476,000Euroclear CREST
6,6006,000VP
1,2901,000Siteme
880,000800,000OeKB
1,3001,253NTMA
420,000400,000NBB
29,136,80026,488,000Monte Titoli
472,458429,508KDD
645,700587,000Interbolsa
13,133,00011,674,000Iberclear
6,873,9006,249,000Euroclear Netherlands
33,300,00032,877,000Euroclear France
2,500,0001,035,000Euroclear Belgium (CIK)
50,358,00041,800,000Clearstream Banking Frankfurt
368,000400,000BOGS
9,645,0006,610,000APK
11,402,7009,325,000ASE
20062005CSD
Page 8 of 30
- a possible increase in central counterparty (CCP) netting.
However, it is important to note that the negative factors are independent of T2S and would equally effect the present infrastructure. As a result, the fee comparison later in this note remains valid despite these uncertainties.
1.5 T2S cost per transaction
Traditionally, in the securities market the settlement fee is charged to both the sender and the receiver of
settlement instructions. Therefore, the estimations of the cost per transaction are presented as a charge on each side in order to facilitate comparison with current settlement solutions.
The T2S cost per transaction is calculated so as to achieve a zero net present value of the cash flows
during the period 2007-2018, in order to comply with the cost-recovery principle. To ensure a conservative approach, the cost figures of the greenfield approach were used for the calculation. Up to 20% of the savings on the average costs presented below can be expected owing to the synergies deriving from the construction of T2S on the TARGET2 platform.
The following additional assumptions have been made:
- running costs increase by 3% per year;
- telecommunication costs do not increase.
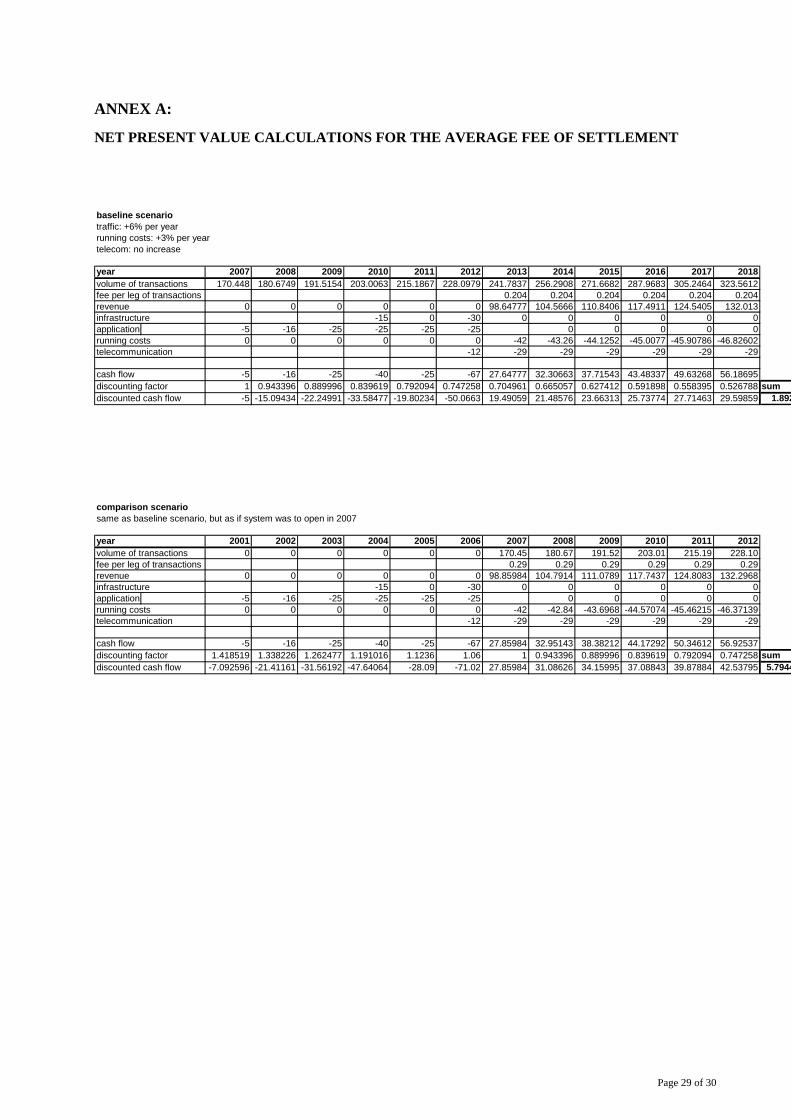
The detailed calculations are presented in Annex A. The main outcome is that the estimated average T2S cost (and therefore the estimated average T2S fee) will be 20 cents per transaction for the baseline scenario between 2013 and 2018. However, this result is not directly comparable with current fees,charged by CSDs because it can be expected that CSD fees will also decrease in the future if the growth assumptions made for calculating T2S fees materialise.
Therefore, the T2S cost (and fee) also has to be calculated as if T2S were to start operating in 2007, i.e.
with 2007 traffic conditions. In this case, T2S would charge on average 29 cents per transaction.
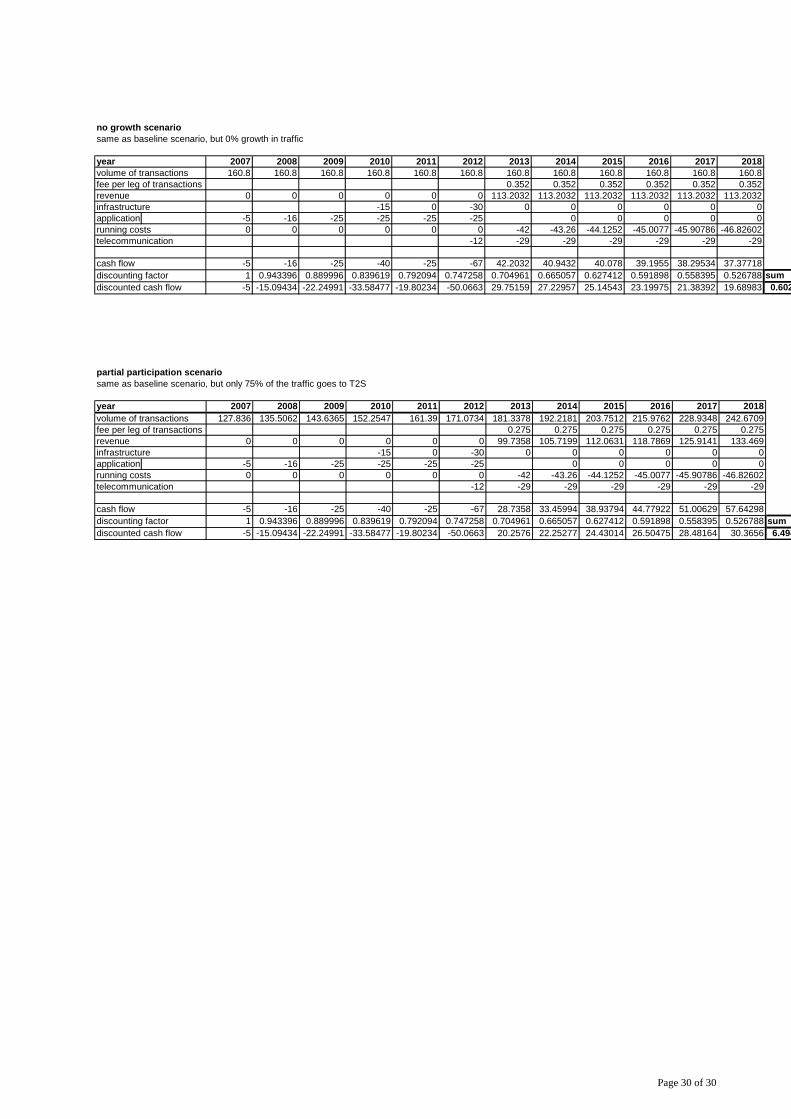
In the case of zero future growth, T2S would charge on average 35 cents. In case only 75% of the CSD traffic goes to TARGET, the average fee would increase in the baseline scenario to 27.5 cents (see Annex A).
It is possible that the future T2S fee schedule may offer discounts to high-volume market participants, as is the case with TARGET2.
Page 9 of 30
1.6 Comparison with current CSD prices
Although CSDs are currently making efforts to simplify their pricing schedules as part of the recently
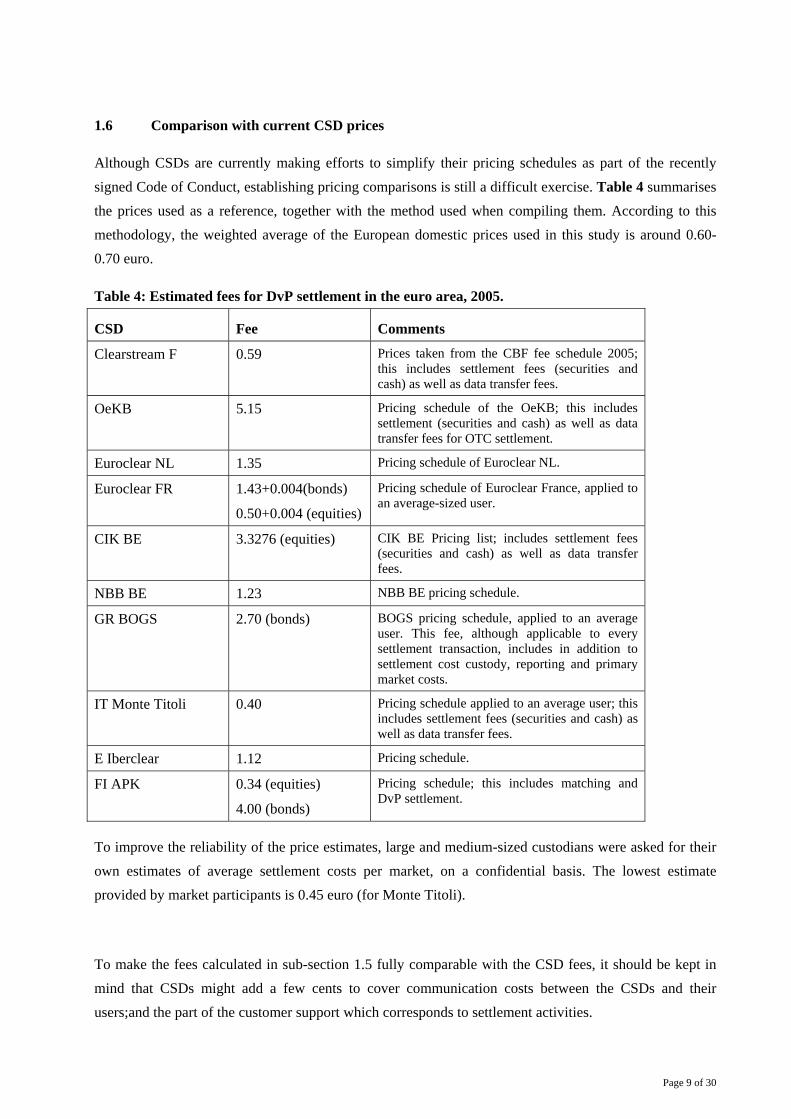
signed Code of Conduct, establishing pricing comparisons is still a difficult exercise. Table 4 summarises the prices used as a reference, together with the method used when compiling them. According to this methodology, the weighted average of the European domestic prices used in this study is around 0.60-0.70 euro.
Table 4: Estimated fees for DvP settlement in the euro area, 2005.
CSD Fee Comments
Clearstream F 0.59 Prices taken from the CBF fee schedule 2005; this includes settlement fees (securities and cash) as well as data transfer fees.
OeKB 5.15 Pricing schedule of the OeKB; this includes settlement (securities and cash) as well as data transfer fees for OTC settlement.
Euroclear NL 1.35 Pricing schedule of Euroclear NL.
Euroclear FR 1.43+0.004(bonds)
0.50+0.004 (equities)
Pricing schedule of Euroclear France, applied to an average-sized user.
CIK BE 3.3276 (equities) CIK BE Pricing list; includes settlement fees (securities and cash) as well as data transfer fees.
NBB BE 1.23 NBB BE pricing schedule.
GR BOGS 2.70 (bonds) BOGS pricing schedule, applied to an average user. This fee, although applicable to every settlement transaction, includes in addition to settlement cost custody, reporting and primary market costs.
IT Monte Titoli 0.40 Pricing schedule applied to an average user; this includes settlement fees (securities and cash) as well as data transfer fees.
E Iberclear 1.12 Pricing schedule.
FI APK 0.34 (equities)
4.00 (bonds)
Pricing schedule; this includes matching and DvP settlement.
To improve the reliability of the price estimates, large and medium-sized custodians were asked for their
own estimates of average settlement costs per market, on a confidential basis. The lowest estimate provided by market participants is 0.45 euro (for Monte Titoli).
To make the fees calculated in sub-section 1.5 fully comparable with the CSD fees, it should be kept in mind that CSDs might add a few cents to cover communication costs between the CSDs and their users;and the part of the customer support which corresponds to settlement activities.
Page 10 of 30
The level of these fees should in any case remain reasonable, particularly as it will be subject to competition.
Another point of comparison is the price of settlement in the USA. The Depository Trust & Clearing
Corporation (DTCC) publishes a settlement price of USD 0.184, whereas Fedwire Securities reports a price of USD 0.32 per transaction. As volumes grow in the dynamic euro securities market which T2S will help to secure, delivering the low prices seen in the USA should become a reality through economies of scale. T2S will both help make this possible and offers the best way of capitalising on them.
Conclusion: As long as a critical mass of CSDs outsource their traffic to T2S, the latter will be able
to deliver a fee per transaction lower than the lowest CSD fee today. Building T2S on TARGET2 platform will bring significant synergies that decrease the costs of the project further.
Page 11 of 30
2. IMPACT ANALYSIS
The European Commission (EC 2006) estimated that the complete integration of the European post-
trading market infrastructure could amount to a potential yearly cost reduction of 2-5 billion euro, and to a yearly increase in GDP of 0.2-0.6% in subsequent years. T2S is a step towards complete integration; the interesting question is therefore how much it could contribute to this total.
The key arguments in favour of T2S can be summarised as follows:
• the existing infrastructure is expensive because it is fragmented and lacks competition;
• T2S will be able to realise economies of scale that are not available at a national level;
• T2S will provide a common backbone, which will create new opportunities for cost savings, disintermediation and system consolidation, and for new entrants;
• these developments will reduce costs over time for the end-users of the securities markets, issuers and investors.
T2S will have an impact on the economy via two main channels: lower CSD infrastructure costs and
custodian back-office costs thanks to the reduced number of interfaces. The latter channel in particular offers a real opportunity for the end-users to become remote members of multiple CSDs using a single direct interface.
The following sub-sections include an initial analysis of the impact of T2S on market participants. The
aim behind this is to stimulate intermediaries to prepare for the next phases, including encouraging them to conduct their own analysis of gains and losses as input for their future business planning. As far as possible, the above-mentioned aspects, together with estimated costs, are made more concrete and attributed to participants across the economy. Due to time constraints, the focus is on the Eurosystem, the CSDs, and intermediaries. For CSDs and intermediaries, additional expenses include project, IT development and migration costs. Benefits taken into account include the decreased complexity of cross-border settlement and lower funding costs for intermediaries, among others. The analysis ends with an overall assessment of the impact of T2S on the European financial market.
Page 12 of 30
2.1 Impact on the Eurosystem
As the Eurosystem will operate T2S on a cost-recovery basis, the direct effect for the Eurosystem should be neutral. There are, however, a number of indirect benefits. These include:
• an increase in back-office efficiency, as the management of Eurosystem credit operations collateral will be facilitated by simpler interactions with the market infrastructure (e.g. a single settlement interface);
• greater accessibility to cross-border collateral;
• reduced systemic risk owing to extended use of real-time gross settlement (RTGS) for DvP transactions.
These aspects have not been quantitatively considered in this study, but would in any case increase the desirability of the project.
However, on the negative side, this project does involve some risks for the Eurosystem, primarily financial and reputational, which are not quantified either. These include the financial risk that the Eurosystem is taking in committing to cost recovery, and the potential risk to reputation that e.g. a substantial delay of the project could pose.
2.2 Impact on CSDs
2.2.1 Investment costs
For the CSDs, the investment costs represent the (transitional) cost of moving from their current systems to T2S. It particular, they consist of project costs, IT development costs and migration costs. Each of these items will be explained in detail in the sub-sections below. Typically, any type of settlement platform must be substantially upgraded or rewritten at least every 10 to 15 years. Consequently, the estimation of the various elements has been based on existing information on comparable projects over the last ten years.
Long-term planning is important for any service provider, so that it can adjust its investment programme early enough. This is why the Eurosystem wants to involve the CSDs in the development of T2S at this early stage. As it will take around six years before T2S starts its operations, the loss in terms of redundant investments is estimated to be small.
Page 13 of 30
Project costs
CSDs will need to adjust to the new operating environment. To start with, they will need to analyse the new market features and adapt their operating plans. The main deliverable of this project phase will be the production of high-level functional specifications.
The project phase corresponds to the first phase presented in Section 5 of the Blueprint, which has a duration of approximately two years. In terms of resources in the project phase, CSDs will need to dedicate a team of specialists per business stream, which could be split as follows:
- static data definition and architecture;
- communication links with T2S;
- settlement module adjustments/decommissioning;
- custody module adjustments;
- accounting interface;
- other areas (when applicable), e.g. new issues, lending and borrowing, registration, etc.
In addition, CSDs will need to appoint a T2S Point of Contact, as well as a Market Coordinator for the largest markets.
The project effort will differ between CSDs according to the following criteria:
1- Their size;
2- Their degree of involvement, i.e. whether theycontribute to building the system (pioneers), or are followers once the system has been built;
3- The complexity of their service needs, for example for direct-holding CSDs or CSDs with complex registration processes.
In total, the project phase is estimated to cost the CSDs 17 million euro. Table 5 presents a detailed breakdown of this estimate.
CSD Category 1 is defined as comprising the largest CSDs, which will need to dedicate at least one Full-time Equivalent (FTE) per business stream, in addition to at least two Coordinators (the T2S Point of Contact and the Market Coordinator). Therefore, the project team should comprise on average 11 FTEs3.
CSD Category 2 is defined as containing mid-size CSDs, which may also have complex market features to be accommodated (direct-holding countries for example). On average, it is estimated that six FTEs will be able to cover the full range of analysis required.
3 The estimation only considers numbers of full-time resources necessary for the analysis phase. The team itself is expected to
be much larger within each CSD to cater for the need for specialist advice (although this is expected in most cases to be on a part-time basis).
Page 14 of 30
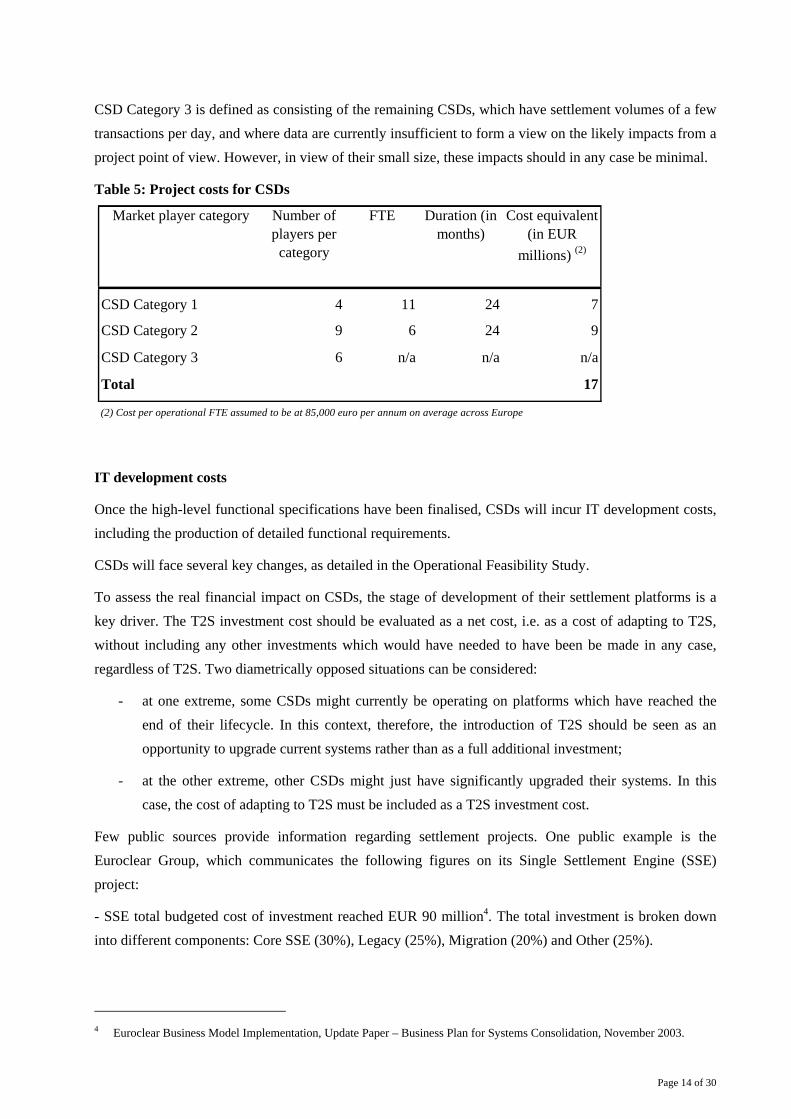
CSD Category 3 is defined as consisting of the remaining CSDs, which have settlement volumes of a few transactions per day, and where data are currently insufficient to form a view on the likely impacts from a project point of view. However, in view of their small size, these impacts should in any case be minimal.
Table 5: Project costs for CSDs
Market player category Number of players per
category
FTE Duration (in months)
Cost equivalent (in EUR
millions) (2)
CSD Category 1 4 11 24 7
CSD Category 2 9 6 24 9
CSD Category 3 6 n/a n/a n/a
Total 17
(2) Cost per operational FTE assumed to be at 85,000 euro per annum on average across Europe
IT development costs
Once the high-level functional specifications have been finalised, CSDs will incur IT development costs, including the production of detailed functional requirements.
CSDs will face several key changes, as detailed in the Operational Feasibility Study.
To assess the real financial impact on CSDs, the stage of development of their settlement platforms is a key driver. The T2S investment cost should be evaluated as a net cost, i.e. as a cost of adapting to T2S, without including any other investments which would have needed to have been be made in any case, regardless of T2S. Two diametrically opposed situations can be considered:
- at one extreme, some CSDs might currently be operating on platforms which have reached the end of their lifecycle. In this context, therefore, the introduction of T2S should be seen as an opportunity to upgrade current systems rather than as a full additional investment;
- at the other extreme, other CSDs might just have significantly upgraded their systems. In this case, the cost of adapting to T2S must be included as a T2S investment cost.
Few public sources provide information regarding settlement projects. One public example is the Euroclear Group, which communicates the following figures on its Single Settlement Engine (SSE) project:
- SSE total budgeted cost of investment reached EUR 90 million4. The total investment is broken down into different components: Core SSE (30%), Legacy (25%), Migration (20%) and Other (25%).
4 Euroclear Business Model Implementation, Update Paper – Business Plan for Systems Consolidation, November 2003.
Page 15 of 30
It is particularly interesting to note that the legacy component (defined as the cost of analysing, designing, building and testing the changes of the legacy platforms to the new platform) is slightly less than the core cost components (defined as the cost of analysis, design, building and testing the new platform).
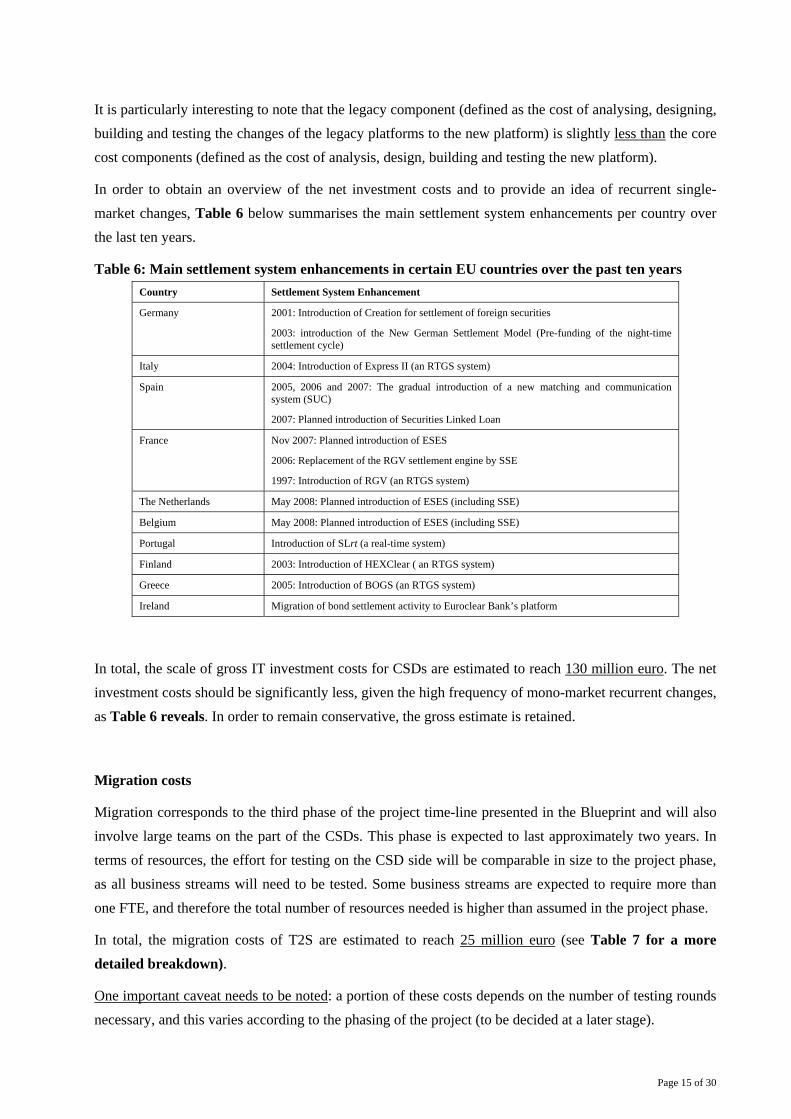
In order to obtain an overview of the net investment costs and to provide an idea of recurrent single-market changes, Table 6 below summarises the main settlement system enhancements per country over the last ten years.
Table 6: Main settlement system enhancements in certain EU countries over the past ten years Country Settlement System Enhancement
Germany 2001: Introduction of Creation for settlement of foreign securities
2003: introduction of the New German Settlement Model (Pre-funding of the night-time settlement cycle)
Italy 2004: Introduction of Express II (an RTGS system)
Spain 2005, 2006 and 2007: The gradual introduction of a new matching and communication system (SUC)
2007: Planned introduction of Securities Linked Loan
France Nov 2007: Planned introduction of ESES
2006: Replacement of the RGV settlement engine by SSE
1997: Introduction of RGV (an RTGS system)
The Netherlands May 2008: Planned introduction of ESES (including SSE)
Belgium May 2008: Planned introduction of ESES (including SSE)
Portugal Introduction of SLrt (a real-time system)
Finland 2003: Introduction of HEXClear ( an RTGS system)
Greece 2005: Introduction of BOGS (an RTGS system)
Ireland Migration of bond settlement activity to Euroclear Bank’s platform
In total, the scale of gross IT investment costs for CSDs are estimated to reach 130 million euro. The net investment costs should be significantly less, given the high frequency of mono-market recurrent changes, as Table 6 reveals. In order to remain conservative, the gross estimate is retained.
Migration costs
Migration corresponds to the third phase of the project time-line presented in the Blueprint and will also involve large teams on the part of the CSDs. This phase is expected to last approximately two years. In terms of resources, the effort for testing on the CSD side will be comparable in size to the project phase, as all business streams will need to be tested. Some business streams are expected to require more than one FTE, and therefore the total number of resources needed is higher than assumed in the project phase.
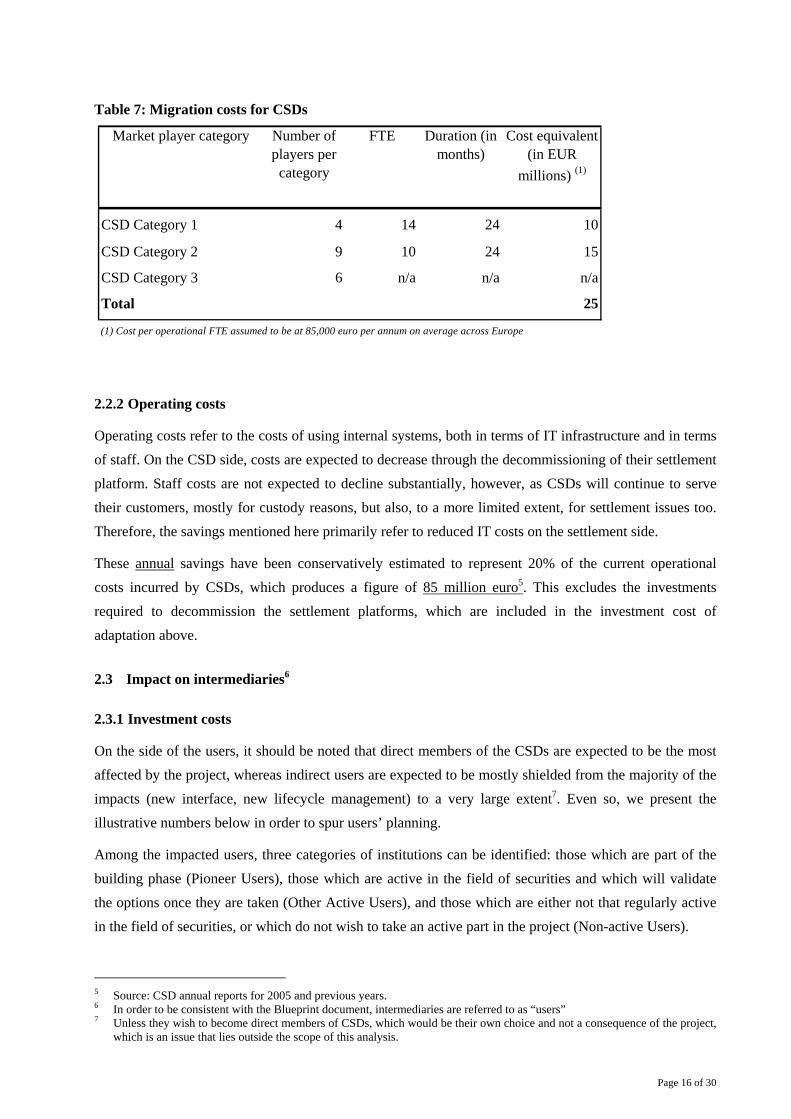
In total, the migration costs of T2S are estimated to reach 25 million euro (see Table 7 for a more detailed breakdown).
One important caveat needs to be noted: a portion of these costs depends on the number of testing rounds necessary, and this varies according to the phasing of the project (to be decided at a later stage).
Page 16 of 30
Table 7: Migration costs for CSDs
Market player category Number of players per
category
FTE Duration (in months)
Cost equivalent (in EUR
millions) (1)
CSD Category 1 4 14 24 10
CSD Category 2 9 10 24 15
CSD Category 3 6 n/a n/a n/a
Total 25
(1) Cost per operational FTE assumed to be at 85,000 euro per annum on average across Europe
2.2.2 Operating costs
Operating costs refer to the costs of using internal systems, both in terms of IT infrastructure and in terms of staff. On the CSD side, costs are expected to decrease through the decommissioning of their settlement platform. Staff costs are not expected to decline substantially, however, as CSDs will continue to serve their customers, mostly for custody reasons, but also, to a more limited extent, for settlement issues too. Therefore, the savings mentioned here primarily refer to reduced IT costs on the settlement side.
These annual savings have been conservatively estimated to represent 20% of the current operational costs incurred by CSDs, which produces a figure of 85 million euro5. This excludes the investments required to decommission the settlement platforms, which are included in the investment cost of adaptation above.
2.3 Impact on intermediaries6
2.3.1 Investment costs
On the side of the users, it should be noted that direct members of the CSDs are expected to be the most affected by the project, whereas indirect users are expected to be mostly shielded from the majority of the impacts (new interface, new lifecycle management) to a very large extent7. Even so, we present the illustrative numbers below in order to spur users’ planning.
Among the impacted users, three categories of institutions can be identified: those which are part of the building phase (Pioneer Users), those which are active in the field of securities and which will validate the options once they are taken (Other Active Users), and those which are either not that regularly active in the field of securities, or which do not wish to take an active part in the project (Non-active Users).
5 Source: CSD annual reports for 2005 and previous years. 6 In order to be consistent with the Blueprint document, intermediaries are referred to as “users” 7 Unless they wish to become direct members of CSDs, which would be their own choice and not a consequence of the project,
which is an issue that lies outside the scope of this analysis.
Page 17 of 30
The first category of users will need to dedicate approximately two FTEs. For the project to be manageable, the number of Pioneer Users should be limited to seven or eight. For the second category, a period of three months will be sufficient for two resource persons (one functional, one IT) to validate the high-level functional specifications. The testing effort will be more significant for the Pioneer Users, as they will need to test each business area as well (including non-regression testing). They might also be involved to a certain degree in CSD non-regression testing (to be determined).
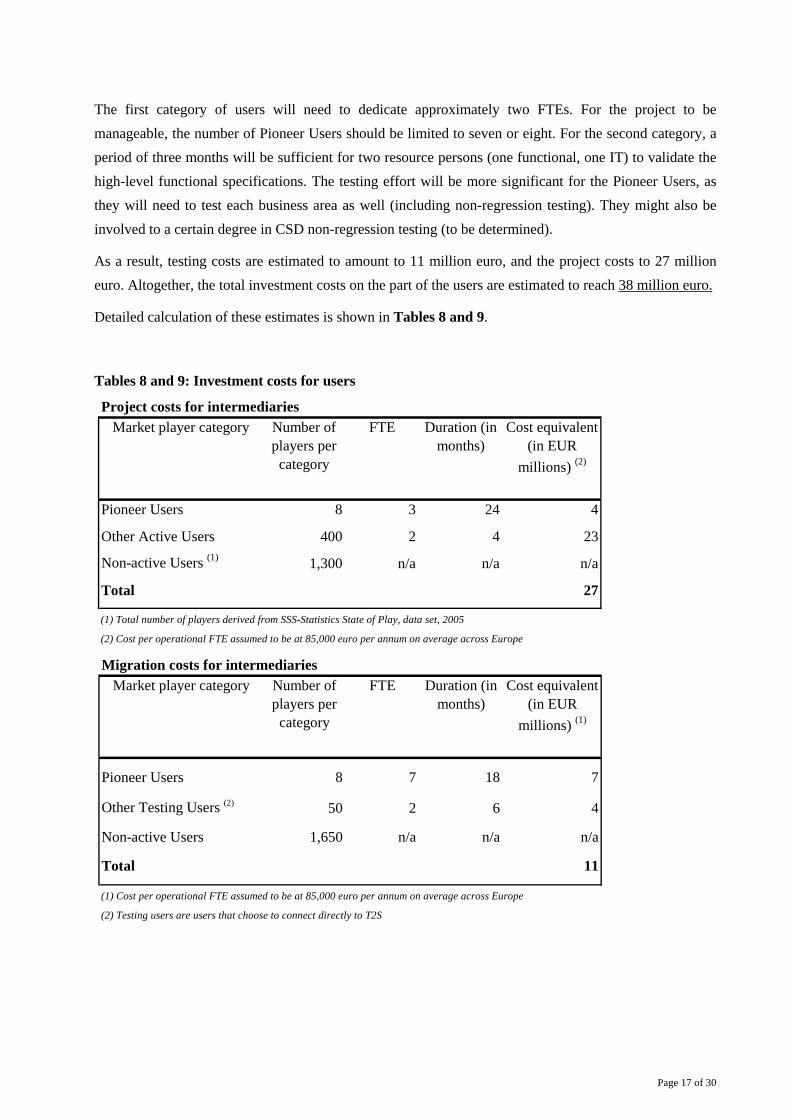
As a result, testing costs are estimated to amount to 11 million euro, and the project costs to 27 million euro. Altogether, the total investment costs on the part of the users are estimated to reach 38 million euro.
Detailed calculation of these estimates is shown in Tables 8 and 9.
Tables 8 and 9: Investment costs for users
Project costs for intermediariesMarket player category Number of
players per category
FTE Duration (in months)
Cost equivalent (in EUR
millions) (2)
Pioneer Users 8 3 24 4
Other Active Users 400 2 4 23
Non-active Users (1) 1,300 n/a n/a n/a
Total 27
(1) Total number of players derived from SSS-Statistics State of Play, data set, 2005
(2) Cost per operational FTE assumed to be at 85,000 euro per annum on average across Europe
Migration costs for intermediariesMarket player category Number of
players per category
FTE Duration (in months)
Cost equivalent (in EUR
millions) (1)
Pioneer Users 8 7 18 7
Other Testing Users (2) 50 2 6 4
Non-active Users 1,650 n/a n/a n/a
Total 11
(1) Cost per operational FTE assumed to be at 85,000 euro per annum on average across Europe
(2) Testing users are users that choose to connect directly to T2S
Page 18 of 30
2.3.2 Benefits from reduced cross-border settlement complexity and collateral costs
For the users, T2S reduces the complexity of cross-border settlement to the level of domestic settlement. The EC (2006) has summarised what the existing studies state regarding the benefits of reduced transaction costs in European cross-border settlement. These studies conclude that a reasonable range for the excess cost of post-trading for investors lies between 2 and 5 billion euro a year. This figure includes far more elements than are currently in the scope of T2S, but represents a useful “top-down” benchmark against which the impact of T2S can be measured.
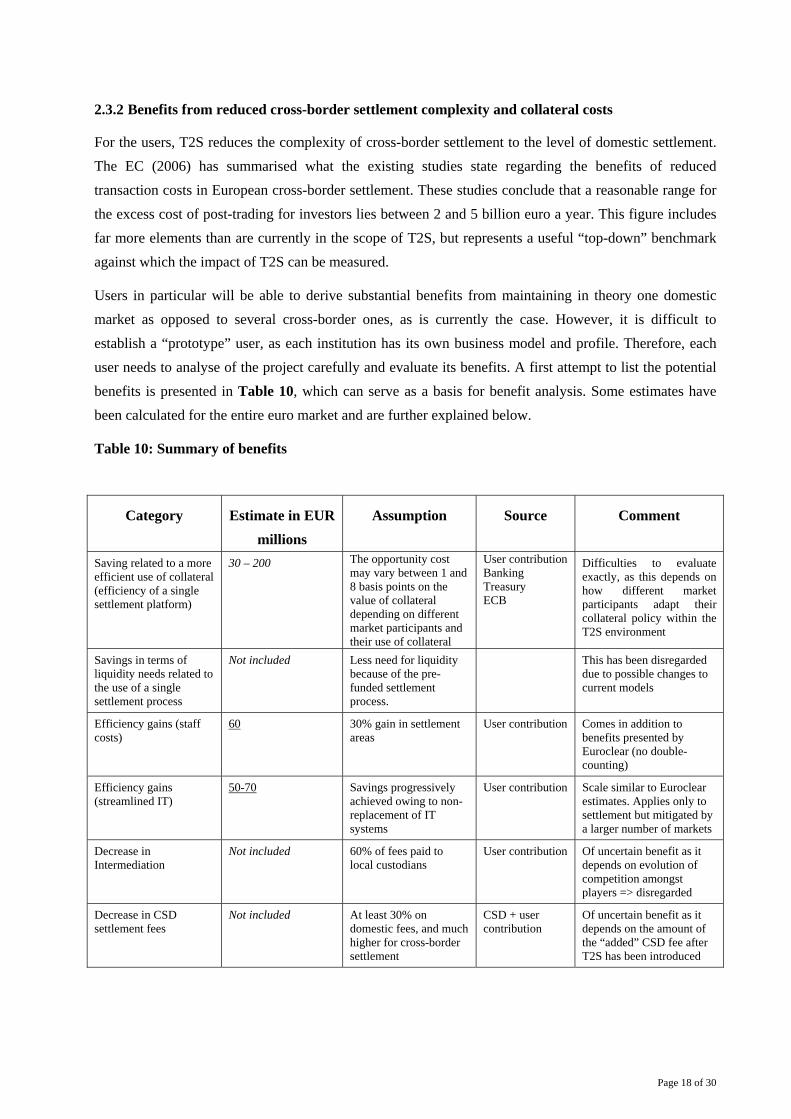
Users in particular will be able to derive substantial benefits from maintaining in theory one domestic market as opposed to several cross-border ones, as is currently the case. However, it is difficult to establish a “prototype” user, as each institution has its own business model and profile. Therefore, each user needs to analyse of the project carefully and evaluate its benefits. A first attempt to list the potential benefits is presented in Table 10, which can serve as a basis for benefit analysis. Some estimates have been calculated for the entire euro market and are further explained below.
Table 10: Summary of benefits
Category Estimate in EUR millions
Assumption Source Comment
Saving related to a more efficient use of collateral (efficiency of a single settlement platform)
30 – 200 The opportunity cost may vary between 1 and 8 basis points on the value of collateral depending on different market participants and their use of collateral
User contribution Banking Treasury ECB
Difficulties to evaluate exactly, as this depends on how different market participants adapt their collateral policy within the T2S environment
Savings in terms of liquidity needs related to the use of a single settlement process
Not included Less need for liquidity because of the pre-funded settlement process.
This has been disregarded due to possible changes to current models
Efficiency gains (staff costs)
60 30% gain in settlement areas
User contribution Comes in addition to benefits presented by Euroclear (no double-counting)
Efficiency gains (streamlined IT)
50-70 Savings progressively achieved owing to non-replacement of IT systems
User contribution Scale similar to Euroclear estimates. Applies only to settlement but mitigated by a larger number of markets
Decrease in Intermediation
Not included 60% of fees paid to local custodians
User contribution Of uncertain benefit as it depends on evolution of competition amongst players => disregarded
Decrease in CSD settlement fees
Not included At least 30% on domestic fees, and much higher for cross-border settlement
CSD + user contribution
Of uncertain benefit as it depends on the amount of the “added” CSD fee after T2S has been introduced
Page 19 of 30
Benefits from reduced funding costs
Reduced funding costs offer the following benefits: positive netting effects across multiple markets in the securities world as well as in the cash world through the wider use of the integrated model; and decreased pre-funding needs via the introduction of harmonised and sophisticated self-collateralisation mechanisms across all instruments.
By pooling several markets, the different single market cash positions will net each other, reducing overall the level of funding requirements. In addition, users will be able to use cash to secure settlements and vice versa on a real-time basis.
This benefit will differ in scale among users depending on their business profile. Some users will greatly benefit from this netting effect, up to 90% on some days, whereas others will not directly derive any real benefits owing to their market presence and collateral resources.
Several attempts have been made to estimate the economic benefits that can be derived from collateral savings as a result of the introduction of T2S. However, as it was very difficult to agree on a non-controversial method, these savings were finally not included in the benefit calculations. An alternative estimation was conducted at a macro level, resulting in savings of 200 million euro (based on input received from some market participants); however, these figures were not retained in order to keep the study as conservative as possible. However, market participants can expect substantial savings related to collateral usage in the euro financial market once settlement has been integrated.
Benefits from reduced IT costs
In the current European landscape, major users are effectively “multi-market” players that are active in several European markets. By contrast, some other users are more “mono-market” players and concentrate the vast majority of their activities on their domestic market. Nevertheless, even these still suffer from the additional complexity and cost of managing their current “foreign” European activities both for them and for their customers.
The global and European multi-market players currently need to build their IT platforms with up to 19 different CSD interfaces for the euro area. Only a few users are connected directly to all 19 CSDs, as most users today connect to foreign markets via agent banks. Additionally, many are connected to one or two CSDs besides their “home” CSD.
In presenting the benefits of its Single Platform project, the Euroclear Group study (2003) provided an interesting indication of the level of benefits to be expected from consolidating IT interfaces. It showed in particular that “consolidation of the current separate interfaces to the CSDs and ICSD8 of the group into one interface” would result “in direct savings of approximately 40 million euro”.
8 The four CSDs are: Crest, Euroclear France, Euroclear Netherlands and CIK, while the one ICSD is Euroclear Banque,
meaning a reduction from five interfaces down to one.
Page 20 of 30
A straight extrapolation from the Single Platform to T2S should however be avoided, in particular as the 19 CSDs are not all comparable with the Euroclear Group CSDs in terms of size.
However, while the Euroclear improvements, in terms of connectivity, have served (or will serve) banks which are purely active in the four Euroclear CSDs, T2S improvements would serve many more banks which are active in more than two CSDs in the euro area.
There is also a significant difference between the two projects in terms of scope: the Single Platform includes the processing of asset-servicing functions and ancillary activities, whereas T2S is limited to settlement functions. For most users however, the interfaces for each functional block are either completely separate or, alternatively, the same “core” interface links to separate internal processing modules.
Therefore, although the limited scope of T2S compared to the Single Platform appears to offer less benefits to its users, in reality most of the benefits will be similar on the users’ side.
In conclusion, a conservative assumption based on information obtained from some users on a confidential basis is that between 50 and 70 million euro a year could be saved by having in place streamlined IT interfaces, in addition to those which the Euroclear Group has already achieved or planned.
Benefits from reduced staff costs
With the introduction of T2S, users will primarily benefit from efficiency gains in the field of settlement. As the current cumbersome and resource-intensive cross-border settlement effectively turns into domestic settlement,, productivity levels of the settlement teams should increase as a scale effect, to an estimated to reach 30%9 of the staff costs. Benefits should also be expected to affect Treasury areas as well as reconciliation teams, though to a lesser extent.
In total, the gross benefits10 derived from redeploying settlement staff are estimated to approximate 60 million euro per annum.
2.4 Impact on issuers
In terms of qualitative analysis, the primary benefit of T2S for issuers will be the enlarged market. Today’s domestic issuances will become euro area issuances at no additional cost, while still remaining under local legal and tax regimes.
For pan-European issues, the settlement of the primary market will be greatly facilitated and will become domestic in T2S.
9 As contributed by users (continental European and UK investment banks) 10 Given that the investments needed to derive such benefits have a short-term payback period (18 months), the gross benefits
represent the recurrent annual amount to be considered in the analysis.
Page 21 of 30
T2S will increase the attractiveness of local debt instruments, as more investors will be able to easily access them easily at a reduced cost. In particular, the general collateral operations could create larger pools similar to government debt instruments in the euro area.
At a longer horizon, this could mean a reduction in the current valuation gap between US dollar securities and the euro market.
2.5 Impact on investors
The benefits of T2S will differ in scale among the categories of investors. For retail investors, T2S will primarily mean easier access to non-local securities, a market segment which is underdeveloped for them today because of the prohibitive cost and high complexity of transfers. However, the impact from domestic settlement might be minimal, as settlement infrastructure costs are a marginal component of retail transaction costs.
For institutional investors, T2S represents significant benefits both for domestic and for non-local securities. Indeed, given the high degree of competition among custody service providers, there is little doubt that savings achieved at the infrastructure level will be passed on to the final investor.
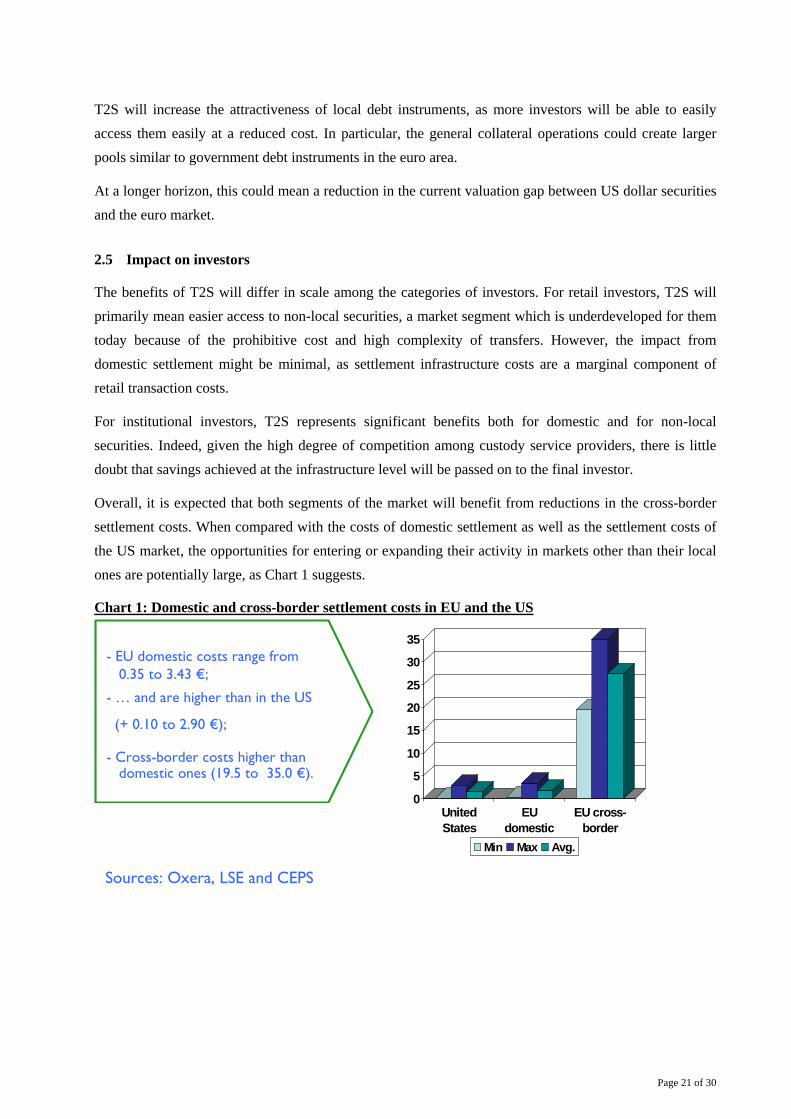
Overall, it is expected that both segments of the market will benefit from reductions in the cross-border settlement costs. When compared with the costs of domestic settlement as well as the settlement costs of the US market, the opportunities for entering or expanding their activity in markets other than their local ones are potentially large, as Chart 1 suggests.
Chart 1: Domestic and cross-border settlement costs in EU and the US
0
5
10
15
20
25
30
35
UnitedStates
EUdomestic
EU cross-border
Min Max Avg.
- EU domestic costs range from0.35 to 3.43 €;
- … and are higher than in the US
(+ 0.10 to 2.90 €);
- Cross-border costs higher thandomestic ones (19.5 to 35.0 €).
Sources: Oxera, LSE and CEPS
Page 22 of 30
2.6 General impact on the market
Overall, T2S means greater opportunities for investors to diversify their portfolios and to consider Europe as a homogeneous geographical zone of investment.
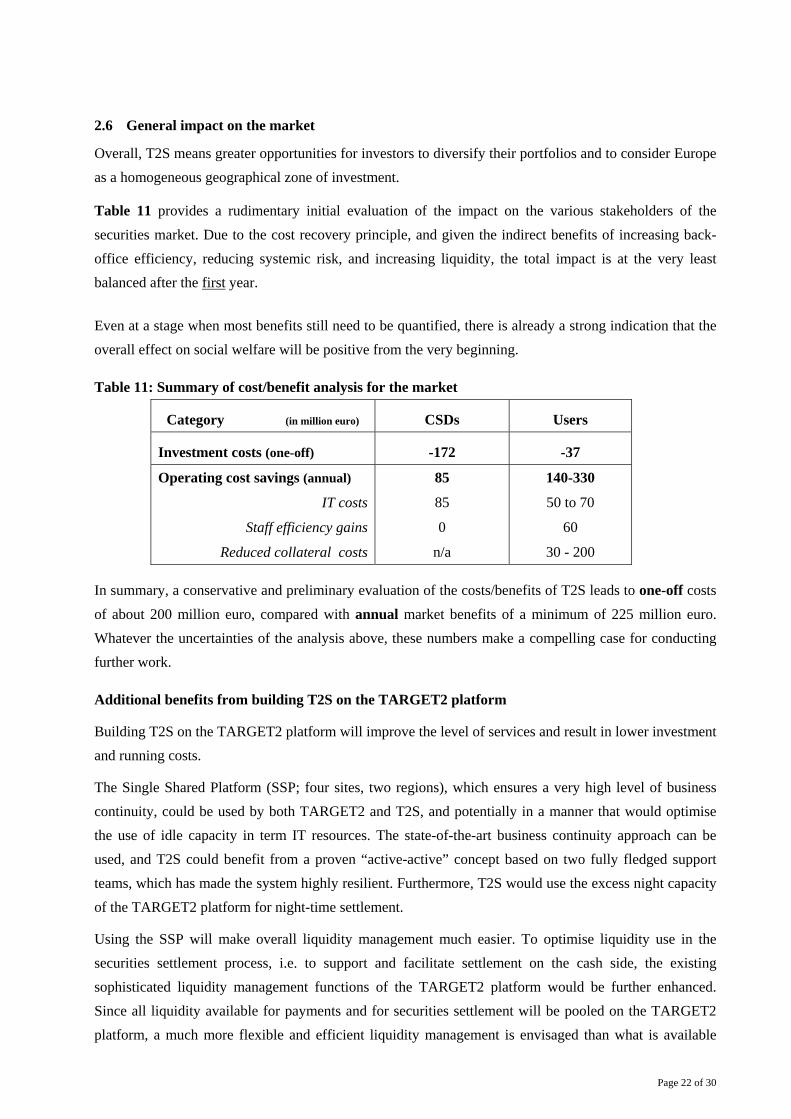
Table 11 provides a rudimentary initial evaluation of the impact on the various stakeholders of the securities market. Due to the cost recovery principle, and given the indirect benefits of increasing back-office efficiency, reducing systemic risk, and increasing liquidity, the total impact is at the very least balanced after the first year.
Even at a stage when most benefits still need to be quantified, there is already a strong indication that the overall effect on social welfare will be positive from the very beginning.
Table 11: Summary of cost/benefit analysis for the market
Category (in million euro) CSDs Users
Investment costs (one-off) -172 -37
Operating cost savings (annual)
IT costs
Staff efficiency gains
Reduced collateral costs
85
85
0
n/a
140-330
50 to 70
60
30 - 200
In summary, a conservative and preliminary evaluation of the costs/benefits of T2S leads to one-off costs of about 200 million euro, compared with annual market benefits of a minimum of 225 million euro. Whatever the uncertainties of the analysis above, these numbers make a compelling case for conducting further work.
Additional benefits from building T2S on the TARGET2 platform
Building T2S on the TARGET2 platform will improve the level of services and result in lower investment and running costs.
The Single Shared Platform (SSP; four sites, two regions), which ensures a very high level of business continuity, could be used by both TARGET2 and T2S, and potentially in a manner that would optimise the use of idle capacity in term IT resources. The state-of-the-art business continuity approach can be used, and T2S could benefit from a proven “active-active” concept based on two fully fledged support teams, which has made the system highly resilient. Furthermore, T2S would use the excess night capacity of the TARGET2 platform for night-time settlement.
Using the SSP will make overall liquidity management much easier. To optimise liquidity use in the securities settlement process, i.e. to support and facilitate settlement on the cash side, the existing sophisticated liquidity management functions of the TARGET2 platform would be further enhanced. Since all liquidity available for payments and for securities settlement will be pooled on the TARGET2 platform, a much more flexible and efficient liquidity management is envisaged than what is available
Page 23 of 30
today. Improved collateral management is also expected, in terms of providing securities as collateral, but as well in combination with an interface to a centralised collateral management tool.
The following functions are foreseen:
• the use of static procedures (automatic cash transfer with user-defined thresholds, time-triggered actions and event-triggered actions);
• the use of dynamic procedures, such as automatic cash transfers based on cash forecasts resulting from the T2S settlement function and initiated according to user-defined parameters (e.g. threshold or a certain add-on percentage as a security margin).
The efficiency of such procedures depends on the implementation of T2S on the TARGET2 platform.
Self-collateralisation and enhanced liquidity management will mutually facilitate each other, when implemented on the TARGET2 platform. On the one hand, less liquidity is needed owing to self-collateralisation; while on the other, the need for self-collateralisation will decrease since the liquidity on the main RTGS-account could be transferred to cover securities settlement transactions in the case of lack of liquidity in the dedicated sub-account, and sufficient liquidity in the main RTGS-account.. Participants with a high need for intraday monitoring on their cash and collateral positions will be those that profit the most within this new schema.
The technical interface of banks for the settlement of pure payments (TARGET2-Cash) and of securities (TARGET2-Securities) would be simplified into a single interface. Users, i.e. banks, would be able to monitor their positions in both securities and cash, and would have a complete overview of their liquidity status (both in cash and securities, which could also be used as collateral for further cash liquidity) at any given point in time.
Moreover, in going forward, T2S would also facilitate the creation of single shared service for collateral management within the Eurosystem.
Page 24 of 30
2.7 Additional benefits for the various stakeholders This section outlines the main benefits of settlement consolidation. It begins with a short elaboration on how the economies of scale are the driving factor in the industry as well as the main social benefit of the T2S project. The final sub-sections conclude with an examination of competition factors and opportunity costs respectively.
2.7.1 Economies of scale and network externalities
Due to high fixed costs11, securities settlement industry shows significant economies of scale. Particularly in Europe, there seems to be further room for consolidation that could decrease the unit costs of settlement. Schmiedel et al. (2002), for example, estimate that doubling the volume of settlement in a typical European CSD would increase costs by two-thirds, i.e. there would be a cost-saving possibility of a third. In a more recent study, Van Cayseele and Wuyts (2005) estimate that these savings would be higher, at about a half. Finally, London Stock Exchange / Oxera (2002) estimate as much as two-thirds cost savings could be achieved if a single system is adopted in Europe. Similarly, the importance of economies of scale in the T2S project is also confirmed by the financial analysis in sub-section 1.3 of this study.
Additional advantages arise from the network externalities inherent in the concentration of settlement activity. The more participants there are in a network, the more it benefits all of its participants. A typical network effect in the context of securities settlement is the gain in liquidity associated with an increase of settlers in a single platform.
2.7.2 Competition factors
A growing number of studies and regulatory initiatives have concluded that the coexistence of economies of scale and network externalities would argue for concentration of securities settlement activities, if there was not the fear that, one way or another, a profit-maximising monopoly could emerge12. T2S, by contrast, will be provided by a public entity and will therefore purely act on a cost-recovery basis, realising the benefits linked to large-scale provision, but avoiding the main concern related to concentration.
Another question is whether the benefits will reach the market, or whether the CSDs could use their possibly dominant position as the interface between T2S and the users to capture these savings by unduly marking up T2S prices. T2S will undoubtedly reshape the European securities industry, not only affecting settlement activity, but to a large extent the provision of custody services as well. CSDs are today largely national and, due to the barriers to cross-border trading, may exhibit monopolistic behaviours. In the context of T2S, CSDs will be given the opportunity to expand their businesses across the markets connected by T2S; equally, the users will be able to obtain the same settlement service via T2S from
11 Software, security, etc. 12 See for example Malkamaki and Topi (1999), Kauko (2003 and 2004), Van Cayseele (2004), Koeppl and Monnet (2004), and
Rochet (2004) for some interesting aspects of the trade-off between competition and economies of scale or network effects in the field of securities settlement.
Page 25 of 30
different CSDs, independent of whether the securities originate from the home market of that particular CSD or not13. Such competition should lead to a degree of price reduction and, to a certain extent, may lead to consolidation as well. Thus, it seems likely that the main bulk of the advantages of T2S will indeed reach the users.
2.7.3 Opportunity costs
A full economic analysis should in theory take into account the best available alternative, i.e. the opportunity costs of the project. However, this is not feasible at this stage of the project, given the great complexity of the issue. Nevertheless, some factors can be stressed.
A logical alternative is to do nothing, i.e. to maintain the present situation. In this option, the investment figures would have to be modified to take into account the alternative investments made in modernisation and keeping up the possibly less automated and standardised systems that the CSDs would have to undertake in the absence of T2S.
Other alternative scenarios could equally be envisaged, for example the creation of a private European CSD. However, this would not be an optimal solution. Apart from the question of who would orchestrate such a CSD, this option could also mean a separation of custody and settlement activities, unless the current CSDs were forced to give up their function. Such a firm would also be unlikely to operate on a cost-recovery basis, making the monopoly problem once again a potential issue.
13 This will also resolve the problem of locked primary markets as outlined in Kauko (2003).
Page 26 of 30
3. CONCLUSION
The assumptions made so far are fairly conservative, and the project is expected to turn out to be more beneficial than estimated in this report. The downside risks for T2S, although significant, are not very material in terms of the overall context of its impact. The following points can be highlighted:
• The estimated cost per settlement transaction in T2S compares positively to international levels and stands below current prices charged by European CSDs. Synergies with TARGET2 will reduce these costs even further.
• The first social welfare estimate shows a positive business case for the economy as a whole.
It can therefore be concluded that the TARGET2-Securities project is sufficiently economically viable to proceed to the next phase.
This positive result comes as no surprise, given the fragmentation of the existing infrastructure, the economies of scale that T2S can achieve, and the elimination of costs related to cross-border settlement. Furthermore, the dynamic effects of reduced costs for the end users, issuers and investors are expected to reinforce this result over the years, once the system enters into use.
Page 27 of 30
REFERENCES
Bourse Consult (2005), “The Future of Clearing and Settlement in Europe”, City Research Series, No 7 (December), Corporation of London.
BME Bolsas y Mercadores Españoles (2004), Annual Report.
BME Bolsas y Mercadores Españoles (2005), Annual Report.
BME Bolsas y Mercadores Españoles (2006), “Business Evolution Interim Report January-September 2006”.
Clearstream International (2002), “Cross-border Equity Trading, Clearing & Settlement in Europe”, White Paper.
Deutsche Börse Group (various), annual reports for 2000, 2001, 2002, 2003, 2004 and 2005.
Deutsche Börse Group (2005), “The European Post-Trade Market”, White Paper.
Euroclear Belgium (2005), Rapport de gestion 2005.
Euroclear Group (various), annual reports for 2000, 2001, 2002, 2003, 2004 and 2005.
Euroclear Group (2003), “Euroclear Business Model Implementation, Update Paper – Business Plan for Systems Consolidation”.
European Central Bank (2005), Payment and Securities Settlement Systems in the European Union (the Blue Book), August, updated March 2006 and December 2006.
European Central Bank (2006), “Payments and Market Infrastructures”, statistics available at www.ecb.int.
European Commission (EC) (2006), draft working document on post-trading, aAvailable at http://ec.europa.eu/internal_market/financial-markets/index_en.htm.
Hellenic Exchanges Holding S.A. (2004), Annual Report.
Hellenic Exchanges Holding S.A. (2005), Annual Report.
Interbolsa (various), Relatório Annual e Contas for 2003, 2004 and 2005.
Kauko, K. (2003), “Interlinking Securities Systems: A Strategic Commitment?, Bank of Finland Discussion Papers, 26/2003.
Kauko, K. (2004), “Links between Securities Settlement Systems: An Oligopoly Theory Approach, International Review of Financial Analysis, 13, pp. 585-600.
Koeppl, T. and C. Monnet (2004), “Guess What: It’s the Settlements!”, ECB Working Paper Series, July.
Malkamaki, M. and J. Topi (1999), “Strategic Challenges for Exchanges and Securities Settlement”, Bank of Finland Discussion Papers, 21/1999.
Page 28 of 30
Mercer Oliver Wyman and Morgan Stanley (2003), “Structural Shifts in Securities Trading: Outlook for European Exchanges”.
Monte Titoli, Gruppo Borsa Italiana (various), Report and Financial Statements as at 31 December 2001, 2002, 2003, 2004 and 2005.
Oesterreichische Kontrollbank AG (various), annual reports for 2003, 2004 and 2005.
Rochet, J.-C. (2004), “The Welfare Effects of Vertical Integration in the Securities Clearing and Settlement Industry”, IDEI, Toulouse University, mimeo.
SCL Servicio de Compensación y Liquidación de Valores, SA (various), annual reports for 2000, 2001 and 2002.
Schmiedel, H., M. Malkamaki and J. Tarkka (2002), “Economies of Scale and Technological Development in Securities Depository and Settlement Systems”, Bank of Finland Discussion Papers, 26/2002.
Securities Industry Association (2005), “Background Note on the Organisation in the US Market for Clearing and Settlement”, note prepared by the Cross-Border Subcommittee of the Securities Industry Association for the European Commission.
Van Cayseele, P. (2004), “Competition and the Organisation of the Clearing and Settlement Industry”, C.E.S., KU Leuven Discussion Paper.
Van Cayseele, P. and C. Wuyts (2005), “Cost Efficiency in the European Securities Settlement and Safekeeping Industry, KU Leuven Discussion Paper.
VPC AB (2005), Annual Report
Page 29 of 30
ANNEX A:
NET PRESENT VALUE CALCULATIONS FOR THE AVERAGE FEE OF SETTLEMENT
baseline scenariotraffic: +6% per yearrunning costs: +3% per yeartelecom: no increase
2007 2008 2009 2010 2011 2012 2013 2014 2015 2016 2017 2018volume of transactions 170.448 180.6749 191.5154 203.0063 215.1867 228.0979 241.7837 256.2908 271.6682 287.9683 305.2464 323.5612fee per leg of transactions 0.204 0.204 0.204 0.204 0.204 0.204
0 0 0 0 0 0 98.64777 104.5666 110.8406 117.4911 124.5405 132.013infrastructure -15 0 -30 0 0 0 0 0 0application -5 -16 -25 -25 -25 -25 0 0 0 0 0running costs 0 0 0 0 0 0 -42 -43.26 -44.1252 -45.0077 -45.90786 -46.82602telecommunication -12 -29 -29 -29 -29 -29 -29
-5 -16 -25 -40 -25 -67 27.64777 32.30663 37.71543 43.48337 49.63268 56.18695discounting factor 1 0.943396 0.889996 0.839619 0.792094 0.747258 0.704961 0.665057 0.627412 0.591898 0.558395 0.526788 sumdiscounted cash flow -5 -15.09434 -22.24991 -33.58477 -19.80234 -50.0663 19.49059 21.48576 23.66313 25.73774 27.71463 29.59859 1.892
year
revenue
cash flow
comparison scenariosame as baseline scenario, but as if system was to open in 2007
2001 2002 2003 2004 2005 2006 2007 2008 2009 2010 2011 2012volume of transactions 0 0 0 0 0 0 170.45 180.67 191.52 203.01 215.19 228.10fee per leg of transactions 0.29 0.29 0.29 0.29 0.29 0.29
0 0 0 0 0 0 98.85984 104.7914 111.0789 117.7437 124.8083 132.2968infrastructure -15 0 -30 0 0 0 0 0 0application -5 -16 -25 -25 -25 -25 0 0 0 0 0running costs 0 0 0 0 0 0 -42 -42.84 -43.6968 -44.57074 -45.46215 -46.37139telecommunication -12 -29 -29 -29 -29 -29 -29
-5 -16 -25 -40 -25 -67 27.85984 32.95143 38.38212 44.17292 50.34612 56.92537discounting factor 1.418519 1.338226 1.262477 1.191016 1.1236 1.06 1 0.943396 0.889996 0.839619 0.792094 0.747258 sumdiscounted cash flow -7.092596 -21.41161 -31.56192 -47.64064 -28.09 -71.02 27.85984 31.08626 34.15995 37.08843 39.87884 42.53795 5.7944
year
revenue
cash flow
Page 30 of 30
no growth scenariosame as baseline scenario, but 0% growth in traffic
2007 2008 2009 2010 2011 2012 2013 2014 2015 2016 2017 2018volume of transactions 160.8 160.8 160.8 160.8 160.8 160.8 160.8 160.8 160.8 160.8 160.8 160.8fee per leg of transactions 0.352 0.352 0.352 0.352 0.352 0.352
0 0 0 0 0 0 113.2032 113.2032 113.2032 113.2032 113.2032 113.2032infrastructure -15 0 -30 0 0 0 0 0 0application -5 -16 -25 -25 -25 -25 0 0 0 0 0running costs 0 0 0 0 0 0 -42 -43.26 -44.1252 -45.0077 -45.90786 -46.82602telecommunication -12 -29 -29 -29 -29 -29 -29
-5 -16 -25 -40 -25 -67 42.2032 40.9432 40.078 39.1955 38.29534 37.37718discounting factor 1 0.943396 0.889996 0.839619 0.792094 0.747258 0.704961 0.665057 0.627412 0.591898 0.558395 0.526788 sumdiscounted cash flow -5 -15.09434 -22.24991 -33.58477 -19.80234 -50.0663 29.75159 27.22957 25.14543 23.19975 21.38392 19.68983 0.602
year
revenue
cash flow
partial participation scenario same as baseline scenario, but only 75% of the traffic goes to T2S
2007 2008 2009 2010 2011 2012 2013 2014 2015 2016 2017 2018volume of transactions 127.836 135.5062 143.6365 152.2547 161.39 171.0734 181.3378 192.2181 203.7512 215.9762 228.9348 242.6709fee per leg of transactions 0.275 0.275 0.275 0.275 0.275 0.275
0 0 0 0 0 0 99.7358 105.7199 112.0631 118.7869 125.9141 133.469infrastructure -15 0 -30 0 0 0 0 0 0application -5 -16 -25 -25 -25 -25 0 0 0 0 0running costs 0 0 0 0 0 0 -42 -43.26 -44.1252 -45.0077 -45.90786 -46.82602telecommunication -12 -29 -29 -29 -29 -29 -29
-5 -16 -25 -40 -25 -67 28.7358 33.45994 38.93794 44.77922 51.00629 57.64298discounting factor 1 0.943396 0.889996 0.839619 0.792094 0.747258 0.704961 0.665057 0.627412 0.591898 0.558395 0.526788 sumdiscounted cash flow -5 -15.09434 -22.24991 -33.58477 -19.80234 -50.0663 20.2576 22.25277 24.43014 26.50475 28.48164 30.3656 6.494
year
revenue
cash flow