Embed Size (px)
Citation preview

The University of Melbourne
Faculty of Architecture, Building & Planning
ABPL 90026 Property Development
Assignment 2
Lecturer: Dr Georgia Warren-Myers
Tutor: Kusal Kusal Nanayakkara
Semestre 1, 2016
Team: X Investments Property Group
Miguel Angel Garcia Escobar (733188)
Daniel Acheampong (723452)
Chen Zhe (812286)
XiXi Zhou (794728)

THIS PAGE IS INTENTIONALLY LEFT BLANK

ABPL 90026 Property Development Garcia, Acheampong, Zhe, Zhou
I
Table of Contents
Assignment 2 ........................................................................................................................................ 1
1 Executive Summary ....................................................................................................................... 1
2 Project Overview ............................................................................................................................ 2
3 Feasibility Assessment. Residual land value analysis .................................................................. 5
4 Comparative analysis .................................................................................................................. 16
5 Feasibility Assessment - Profit analysis ...................................................................................... 18
6 Scenario analysis ......................................................................................................................... 20
6 SWOT analysis ............................................................................................................................. 28
7 RISK ANALYSIS ........................................................................................................................... 30
8 Conclusions & recommendation ................................................................................................. 32
9 Bibliography ................................................................................................................................. 33
Appendix ......................................................................................................................................... 34
Appendix a - Sales in Carlton ......................................................................................................... 35
Appendix B - Sensitivity of assumptions ........................................................................................ 38
Appendix C - Sensitivity of costs .................................................................................................... 40
Appendix D - Case Scenario: Sustainability ................................................................................... 42
Appendix E - Case Scenario: Affordable Housing ......................................................................... 47
Appendix F - Case Scenario: Government Intervention ................................................................. 56

ABPL 90026 Property Development Garcia, Acheampong, Zhe, Zhou
II
THIS PAGE IS INTENTIONALLY LEFT BLANK

ABPL 90026 Property Development Garcia, Acheampong, Zhe, Zhou
1
Assignment 2
1 Executive Summary
This report is a financial analysis and a development proposal for the property at the site of
227-229 and 231 Queensberry Street, Carlton VIC. We propose the development for 12
floors within 2 floors of parking spaces. The land is 442m². There are five types of
apartments. The size of each type is from 35m² to 70m² and the sales price is from 6500$/m²
to 9200/m².
A residual land value was undertaken by reviewing the different costs associated with these
development. Comparable properties were analyzed to review this RLV, and then a profit
analysis was made using this new information.
The following table shows the expected values for the development
Land residual value $3,873,181
Net land value from comparable $2,500,000
Gross Revenue $27,651,000
Net Realization Value $26,268,450
Construction Cost $16,277,939
Total Cost $19,303.641
Developer’s Profit $6,964,809
Profit Margin 27%
Floors 12 stories
Parking Space 2 underground parking levels
No. of Apartments 67
Sellable Square Metres 3865 m²
Gross Building Area 4547m²
Building Efficiency 85%
Gearing 80%
Image 1. Financial Summary.
A sensitivity analysis was made were we have found that the profit margin of our
development is highly sensitive to the building efficiency, the construction and sales price.
Three additional scenarios were studied, where sustainable features were added, affordable
housing was in place and government intervention reduces our building size. This scenarios
were analyzed separately, and financially evaluated. We’ve found that they not have a
hazardous impact, and can be addressed strategically.
After this analysis we recommend to proceed with these development given the
recommendations stated in the body of this report.

ABPL 90026 Property Development Garcia, Acheampong, Zhe, Zhou
2
2 Project Overview
Introduction
The project proposal explores planning opportunities, market demand for possible uses,
and the highest and best use options for Apartment units, Student Accommodation, Office
and a mixed -use development. The site includes an obsolete structure which is currently
ripe for redevelopment. The property is located at 227-229 and 231 Queensberry St. with an
area of 442 square meters. The property currently has a subsisting commercial lease but it
is on the market. Subjecting to the Capital City Zone, the project site is allowed for office
use, residential, and retail; but are subject to design, heritage and parking overlays.
Project Name
The Youth Union
Limitations
There are limited restrictions on size of the site as well as car parking space, both issues
would influence the use of property. The height of each floor and the whole building also
limit the future development options.
Design Considerations
Special care should be taken for the proposal of a building that protects the importance of
the façade of 227-229 Queensberry St which subject to Heritage Overlay (HO).
Market Evaluation
Residential market has made a significant contribution to property growth over the past year,
but in the long term, the residential market would face fierce competition and policy
restriction in the coming year, which may to some extent influence the development and
selling process in the future. According to the ANZ-PCA survey reveals the increasing
mortgage rate and expected tighter debt finance would happen in the coming year.
Meanwhile, the foreign buyers continue to play a key role in Australia’s real estate market
and the proportion of overseas investors remains higher in NSW and Victoria, even though
the restriction of FRIB and mortgage limitation revealed, the highly demand for foreign
buyers would not falling dramatically.
In respect to the market in project site, Carlton, which is likely to be an ideal place for both
independent people and students since it is located near the inner city and close to
universities, parks and medical systems. There are 44% residential apartment and about
62% occupied private dwellings rented which mean the apartment is the main market here,
and the demand of renting an apartment is high, which with a slight increasing price from
last year at 2.54%.
However, the commercial property experiences relatively lower rise and higher vacancy rate
(office market in Australia is at 10.5%).
While, through trough investigation abound the project site, the retail market there is facing
a highly vacant situation, except for a coffee bar around the corner and several motor repair
shops. Lack of footfall is the main problem there for retail.

ABPL 90026 Property Development Garcia, Acheampong, Zhe, Zhou
3
Target Market
Users
Students nearby who study at the universities, and young professionals who work in Carlton
but not live here, most of them do not have a high weekly income.
Buyers
Investors (especially those international investors from China and Singapore), and First
Home Occupiers (currently renting) who work nearby but still living in a leasing room.
Marketing Strategy
Target the price of apartments to achieve Median Market Price, using a strategy for “young
generations”, in order to give the idea that these homes are better than the existing stock,
but not as luxurious as the other upcoming apartments.
Highest and best use analysis
The following chart is the summary of the analysis of four potential options of the project
site.
Image 2. Highest and best use analysis summary
Based on this information, and doing a comparison of the benefits and complications of all
the options. We have synthesized our decision ranked each of the options on a scale that
goes from the best option (4 stars) to the least good option (1star) for every part of the
feasibility study (physical, legal & financial). Among all of the options, the mid-rise apartment
shares all the convenient and positive conditions of the site without a restrict demand for
car parking spaces and construction request on the physically possible; also with a legally
permission of residential use; and the financial possibility is higher than others due to a
steady increase of population and international students in Carlton, which will induce a rise
of demand for apartments.

ABPL 90026 Property Development Garcia, Acheampong, Zhe, Zhou
4
Development strategy
According to the market analysis and HBU, the X property development limited decided to
redevelop the current properties to cost-effectively mid-rise apartment units for sale with few
retail space at the ground floor in line with the perceived market demand and demographic
features of Carlton, through which we could get the highest return with mixed applicable
options of each floor.
Opportunities: the steadily increasing demand on cost- effectively apartments for leasing or
purchasing, through selling off the plan, there is demand and available financing options.

ABPL 90026 Property Development Garcia, Acheampong, Zhe, Zhou
5
3 Feasibility Assessment. Residual land value analysis
A residual land value financial is been made for our property in order to get the residual land
value at the minimum accepted rate of return.
Residual land value calculation summary
Image 3. Land Residual Value. According to the assumptions made in the body of this report.
The project is yielding $A 26.2 million of Net Realisation Value. Subtracting the cost of
construction at $16.2 million and a developer's profit and risk margin of $5.2 million gives
us a gross residual land value of $ 4.71 million, which includes land finance and purchasing
cost. Calculating land finance at 16% of the total net land value and purchasing costs at 5%
we get a Net Land Value of $3.87 million.
The following is a set of explanations of where this costs were drawn to arrive to this
numbers:
Sales
In order to arrive at the sales, the first step is to calculate the maximum number of sellable
square metres per floor.
Assuming if that both sites are fully used, that we have a building efficiency of 85%, and that
the floor to floor height of the building will be 4m for the ground level and 3.4m for all levels
above, the following schedule can be made.

ABPL 90026 Property Development Garcia, Acheampong, Zhe, Zhou
6
Image 4. List of maximum sellable area per floor.
Sellable floor area of each level from ground floor to level 6 will be at a maximum of 359 m²
and 63 m² of common space. After level 7 (passing the 24 m threshold) a setback of 6
metres is required. With a frontage of 14.5m the required setback will lessen our total floor
area by 87m², at which point we will have 285 m² of sellable area and 50 of common area.
This set of areas are based on the assumptions (land use, building efficiency) and will be
subject to change according to the design proposal. But this will gave us the base for the
tenant mix in every floor.
Apartment size and price
In order to get the current market price of the project, the selling price of different properties
have been assessed. The following is a summary of the property listings of Appendix A. In
which we obtain a sell rate per square metre of the different types of properties that will be
used for our site.
Image 5. Summary of the properties analyzed to get the selling rates. Refer to Appendix A.
From this information above the following rates have been assumed for our project.

ABPL 90026 Property Development Garcia, Acheampong, Zhe, Zhou
7
Image X. Summary of the assumptions for property selling rates based on the comparable properties
in Appendix A.
The assumption is that this properties will not have balconies and any benefit that arises
from the architect’s design will give us a better indication of the value added by the design.
It will be up to the architects’ design to achieve maximum benefit possible within the
constraints of the project.
Gross realisation value
Based on the maximum sellable area per floor, the current rates, and the size proposed for
this apartments the following tenant mix was assumed.
Image 6. Detail figure of gross realisation values used in feasibility studies.
It is worth noting that although there were other options that would yield higher gross sales,
some of this options didn't aligned with our market strategy and we chose the mix that we
believe will have the best gross realisation and will not increase the difficulty of sales. i.e.
We’ve found that only using 1 bedroom+1 bathroom apartments will yield the most gross
profit based on our assumptions, however this will give us a building with nearly a hundred
apartments, which increases the problems in the buildings for the residents and also
increases the time and difficulty of sale. Also, all of the cost in included in the report are GST
exclusive.
Developers profit and risks
For the purpose of the Residual Land Value model the risk and profit margin required for
this project was set at 25%. This is considering that the project characteristics, some of
them include the land size, the heritage and planning risks, have some particular issues that
will increase the risk premium component of this margin, compared to similar projects. This
characteristics are described in detail in the risk management section of this report.

ABPL 90026 Property Development Garcia, Acheampong, Zhe, Zhou
8
Construction costs
Construction costs for this part is divided in 3 major areas: demolition, main building and
underground parking.
PART 1 DEMOLITIONS
Image 7. Estimate of demolition costs.
The demolition costs for this site will add up to around $A 100,000. For the purposes of this
model this prices will not considering the additional costs that may arise from trying to
preserve the facade of the building in order to comply with the design of the building that
will help the heritage overlay. It is advised that an estimate of this costs will be addressed
with a chartered quantity surveyor once the design phase is finished in order to adjust
accordingly. ,

ABPL 90026 Property Development Garcia, Acheampong, Zhe, Zhou
9
PART 2 MAIN BUILDING.
Image 8. Estimate of main building costs.
The building price for this project will cost. A$ 11.3 million. This includes a contingency cost
of $A 283K. The type of materials included in this project will include the mid-range finishes,
as the project is not aimed to be luxury apartments.

ABPL 90026 Property Development Garcia, Acheampong, Zhe, Zhou
10
PART 3 UNDERGROUND PARKING
Image 9 Estimate of car parking construction costs
Summary of construction costs
Although the underground parking is part of the main building, it is separated in order to
consider removing it in the financial options, as the price of the apartments stated above
does not include any parking space but is still consider on the cost. This is an important
assumption because the base case we are modelling is a relatively conservative
approach. Statutory costs are set at 1% of the total construction costs, this will include cost
of applying for permits related to the development.

ABPL 90026 Property Development Garcia, Acheampong, Zhe, Zhou
11
Image 10. Summary of construction costs.
Construction finance
The assumed interest of the project was 5.59%, which is slightly above of the land finance
due to the lack of security for the loan. The project will be debt financed by 80%. For this
financial model we have used an estimated schedule of payments for the project. Where
the loan borrowings are made quarterly. After month 36 of this where practical completion
of the project is achieved, the income from pre sales will be available. However, in order for
the firm not to run out of cash, after practical completion it is recommended to make
payments of 50% of the loan balance per month until all units have been sold.
Image 11. Schedule of financing of construction. Where the amount is borrowed every 3 months.

ABPL 90026 Property Development Garcia, Acheampong, Zhe, Zhou
12
Image 12. Graph that shows the loan balance (y axis) at the end of the month (x axis).
Land finance
Explanation: The following is the schedule of payments for finance on the land. A value of
one dollar has been used in order to get the % of real interest payed in relation to the original
loan amount. So that, we can get the total percentage over the land costs using this
schedule.

ABPL 90026 Property Development Garcia, Acheampong, Zhe, Zhou
13
Image 13. Schedule of financing of construction for $1, in order to obtain the percentage of interest
paid over the balance required.
With this percentage we can get the interest from the gross realisation value. (GRV/(1+real
interest on land). The actual amount of Gross Land Value without finance is placed in the
same schedule and calculated in order to corroborate this information.

ABPL 90026 Property Development Garcia, Acheampong, Zhe, Zhou
14
Image 14. Schedule of financing of construction using the calculated values.
Other assumptions
The schedule presented below is the set of inputs and assumptions made in the financial
model that lead to the results stated above. The interest rate of land is assumed at 5%
based on the costs at different banks at current times. Cost for financing construction is
considered riskier and therefore has a slightly higher rate.

ABPL 90026 Property Development Garcia, Acheampong, Zhe, Zhou
15
Image 15. Schedule of assumptions made for the proposal
Building efficiency is currently estimated at 85% however this may be subject to change
depending on the different design proposals made by the architects. We believe a more
efficient design can be achieved.
Selling costs is currently at 2.5% for agents, however an additional 2.5% is considered due
to the additional marketing material that might be required (advertisements, brochures,
design models, website, etc.) Similarly and as a reference CBRE considers 5% average
selling costs.
The equity put in the project is assumed to be at 20%. We consider that the property being
in such a favourable site allows the project to be slightly leveraged.

ABPL 90026 Property Development Garcia, Acheampong, Zhe, Zhou
16
4 Comparative analysis
This analysis is based on development sites that have recently exchanged hands in Carlton and around the fringes of the Melbourne city centre. In essence, we focused on similar properties which has been sold recently, and using the evidence of those transactions to access the value of our development site. The sales data was obtained from various Estate Agency and internet sources (Refer to Reference list).
Trend of values in Carlton and environs: evidence of comparable
1. 202 - 204 Drummond street, Carlton VIC 3053 ; a terrace dwelling which is ripe for
redevelopment, was sold through private treaty for an estimated price of $2,200,000.00 in
February,2016.It has similar features to the subject property and the land area is 536 m² .
2. 128 - 130 Lygon Street, Carlton VIC 3053 is also a retail property which has a
redevelopment potentials. The property was auctioned for $ 1,870,000.00 subject to a 5
years lease which commenced in November, 2012. The Land area is 230 m² and the
property was sold in June, 2015.
3. 140-142 Station Street, Carlton VIC 3053 is a residential premises which was auctioned in
May 2016 for an estimated price of $ 1,800,000.00. The property has a Land area of 352
m².
4. 12 / 121 Cardigan Street, Carlton VIC 3053 is an office property with an existing long term
lease which will expire in 2021. The property has a land area of 214 m² and it was auctioned
for an estimated price of $1,200, 000.00 in September, 2015. The comparable has a
redevelopment potentials.
5. 605 - 609 King Street, West Melbourne is a residential property which has a redevelopment
potential. It was sold through a private treaty for a price of $ 1,800,000.00 in February, 2016.
The property has a Land area of 781 m².
Assumptions essential for effective comparison
Adjustments on the units of comparison are made relative to the development site (227-
229,231 Queensberry St., Carlton VIC 3053); that is the comparable data are adjusted as
though we want to make the comparable development sites identical to the subject. Factors
that are considered for adjustments are similarities and dissimilarities in regards to:
Location; accessibility
Physical features; land area, existing use and facilities.
Time of transaction; changes in market indicators.
Conditions of sale; private treaty or auction.
Development potentials.
Positive features that the comparable possess relative to the subject are negatively adjusted
and negative features are given positive adjustments. Rates for adjustments are subjective
and based on the level of similarity.

ABPL 90026 Property Development Garcia, Acheampong, Zhe, Zhou
17
Comparable data analysis
Item Subject
Property
Comparable Properties
1 2 3 4 5
Location Carlton Carlton Carlton Carlton Carlton West
Melbourne
Date of sale February
2016
June 2015 May 2016 September
2015
February
2016
Existing use Commercial Residential Retail Residential Mixed Residential
Land area (m²) 442 536 230 352 214 781
Price $ 2,200,000 1,870,000 1,800,000 1,200,000 1,800,000
Adjustments
Sales date 2% 6% +5% +2%
Size 2% 5% 2% +4% 8%
Accessibility 2% -1%
Condition of sale +5% +5% +5%
Interest rates/
Market condition
+1% +4% +4% +1%
Existing Lease +2% +4%
Net +1% +20% +7% +22% -6%
Adjusted Price $ 2,222,000 2,244,000 1,926,000 1,464,000 1,692,000
Image 16.Table of comparable properties.
Average of Adjusted prices = $1,909,600
Opinion of value
It is our considered opinion that the Value of the subject is $1,909,600. But comparing this
value with the value obtained using the Residual approach, we will be prepared to pay
$2,500,000.00 for the proposed development site.

ABPL 90026 Property Development Garcia, Acheampong, Zhe, Zhou
18
5 Feasibility Assessment - Profit analysis
Image 17.Graph using the developers’ equation for the base proposal. (Percentages are based on Gross Sales.)
Based on the information from the comparative Analysis, we have determine a value for the
land, then we use this information using the same information in our Residual Model to
calculate our profit analysis. And get more accurate information of the profit margin of the
development.

ABPL 90026 Property Development Garcia, Acheampong, Zhe, Zhou
19
Image 18. Summary of profit analysis.
From the summary above the total profit of the development will be $6.9 million AUD. That
means that the profit margin is 27% as a percentage of the net realisation value. Based on
the expectations of profit margin, the proposal will exceed slightly the expected profit
margin.

ABPL 90026 Property Development Garcia, Acheampong, Zhe, Zhou
20
6 Scenario analysis
Sensitivity analysis
In order to assess the impact of the assumptions made in the base case scenario a
sensitivity analysis was made. The information is detailed in appendix B and C. This
appendix show in detail the sensitivity of the assumptions made and the costs and revenues
calculated in the base case respectively.
Sensitivity of the assumptions
Assuming a 10% change positively and negatively in the input value of the assumptions
made on the base model we can recalculate the model in order to get the new profit margin.
The following graph shows in the y axis, the new profit margin if the assumption is changed
(in the x axis). The most sensitive assumption, using this method, is the Building Efficiency,
which was calculated at 85%. As in the appendix B, a change in 10% of the building
efficiency (93.5% efficiency) would give us a Profit Margin of 31.8%.
The change in the levels of parking (which implicates an impact in the building costs) is the
next sensitive assumption, followed by consultant fees and selling costs.
Image 19.Sensitivity analysis of the assumptions made in the model. For more detail refer to Appendix B & C

ABPL 90026 Property Development Garcia, Acheampong, Zhe, Zhou
21
Sensitivity of the costs (revenues)
The same methodology was used to assess the sensitivity of the costs in the project, where
the input values were modified by an increase and a decrease in 10% ceteris paribus, to
assess the impact that any possible variations would have on the Profit Margin.
Image 20. Table of sensitivity analysis of the costs made by the project. For more detail refer to Appendix B & C
As expected, the most sensitive elements where the Sales Revenue and the cost of construction of construction. A 10% increase in the sales revenue of the project, ceteris paribus, leads to an increase in profit margin up to 33. %.

ABPL 90026 Property Development Garcia, Acheampong, Zhe, Zhou
22
Sustainability scenario
Sustainability has become more and more important for the modern society to think the
environment that we live around. However, it is a challenge to promote a sustainable
building and increase its market value as well. In general, sustainable construction is more
practical than other action. As the buyers’ awareness of sustainability has been improved
significantly in recent years, people may know that sustainability would have the positive
impact on the health, productivity and efficiency. These features would lead to a monetary
savings in the operation of the building. As a result, the property value would be improved
in that case. According to the Moran (2010), the market demand for sustainable buildings
has increased to 40% in 2008 in America. For the property value, decreased operating costs
is one of the most significant value to the use of the green building. Even the property price
for the green building may be a little higher for the potential buyer, they will save the money
as a long-time view, because they may spend less on operating costs. Basically, green
building can reduce 30% utility bills than conventional one. Based on this we are assumed
that added features in sustainability can increase our sales price by 6%.
However, this features will increase the cost of construction and the time required for the
proposal. Studies has shown that an increase due to sustainability components in the
building can increase the price of the construction by 10 up to 20%.
Image 21. Summary of profit analysis using a sustainable scenario. 6% increase in revenue. 10% increase in cost.
And 2 additional months which are reflected in the interest costs.
Although time vary from project to project, we have factored sustainability in our
development timelines and strategy. In the static model that is been presented it will not
have a high impact as time will only affect the interest costs. We have basically considered
an allowance for any construction or design variations as well as overheads.

ABPL 90026 Property Development Garcia, Acheampong, Zhe, Zhou
23
Affordable housing scenario
Image 22. Table of total apartments in the building, including an allowance of 29.37% of the building, via 25
apartments in the “Social Housing” table. Which is equivalent to 7.4 million dollars.
Some city councils in the Melbourne metropolitan area have considered government polices
where affordable housing is contained in this project. Recently, the council of Melbourne
aim to create about 1700 new affordable homes in the inner-city by 2021. How to well
managed and cost effective with the ability to meet low-income community need, without
adding an excessive burden on the taxpayer could be a problem the policy maker should
to tackle with. We are to consider a scenario where the government require us to give 30%
of the project as affordable housing.
Under this scenario, the new apartments valued almost 7.4 million will be taken by
government or social housing communities, which will be rented or brought by low-income
residents. As a compensation, the government or communities may pay the cost prices of
these 25 apartments to the developer. As a result, the profit of this scenario will be negative
(-2%) and rarely developer will undertake that project.

ABPL 90026 Property Development Garcia, Acheampong, Zhe, Zhou
24
Image 23.Summary of the project using a full allowance of 30% of the building, ceteris paribus. Losses would be
500K.
Alternatively, the newest document issued by Victorian Public Tenants Association on
February 2016 stipulated a possible strategy for a development site includes a certain
percentage of affordable housing, which will be more acceptable by developers,
government is offering land to developer free of charge and the developer affords the
completed apartments as same value as the provided land to the government or housing
associations.
We are to assume this strategy for our project.
Under this circumstance, the government pays the land cost about $2,500,000 to acquire
this parcel in Carlton, after the completion of this apartment tower, 13 apartments of one
bedroom & one bathroom and 1 apartment with one bedroom & one studio & one bathroom
which valued $3,225,000 in the market then could be taken by government. X still make 29%
profit as well. This will be the win-win scenario for council and the developer, also benefiting
the low-income residents. This can also give us a reputation and improves our social
citizenship and responsibility image.
Image 23. Table using the new strategy. Where the governments buys the land (equivalent to $2.5 million) and 13
apartments are given in exchange, with an equivalent value of $3.2 million. A win-win situation. The government
receives more than what is paying, and our project saves Purchasing costs and land finance in exchange.

ABPL 90026 Property Development Garcia, Acheampong, Zhe, Zhou
25
Image 24. Summary of the profit analysis. Where the governments buys the land (equivalent to $2.5 million) and 13
apartments are given in exchange, with an equivalent value of $3.2 million. A win-win situation. The government
receives more than what is paying, and our project saves Purchasing costs and land finance in exchange.

ABPL 90026 Property Development Garcia, Acheampong, Zhe, Zhou
26
Government intervention scenario
Image 25. Table of total apartments using a discount in size of 20% in size. 3 storeys were reduced in the building.
During the real development process, stage of getting planning permit might be a dominant
consideration by any developer. While several specific regulations or limitations might occur
within that stage. Related to this project located in Carlton, the city of Melbourne discounted
20% of net leasable area of project site. Under this scenario, 3 floors area would be took off
and the NLA reduced from 3865m² to 2995m², which may saving 4 months construction
period for the whole project, lowering construction costs and financial costs. Given this
circumstance, we loss 16 apartments for selling, reducing sales revenue and project profit
to 22%.
Image 26. Summary of profit analysis, using a reduction in size of the project of 20%. For more detail, refer to the
appendix.

ABPL 90026 Property Development Garcia, Acheampong, Zhe, Zhou
27
Scenario comparison
Image 27. Synthesis of the different case scenarios. A percentage change is set to the right of each with respect to
the base case.
The information presented above is a synthesis of the different scenarios. Adding
sustainability features will not decrease our profits by much, assuming that the 6% increase
in sales is achieved. This also has the benefit of improving our branding.
Affordable housing strategies can be a win-win scenario depending on the negotiations with
the council, as providing them with affordable houses while still making the highest profits
in the scenarios. We highly recommend considering this option.
Government intervention will have an impact in our project, as the overall sales, construction
and time will be reduced. However this reduction is bearable and we believe that the risk of
this event happening can be reduced by a good brief with the design team in order to
respect the planning policies.

ABPL 90026 Property Development Garcia, Acheampong, Zhe, Zhou
28
6 SWOT analysis
A careful consideration of all the possible scenario show that our project is viable, although
we will be faced with some surmountable minor challenges (see SWOT below). The team
have thoroughly considered and examined the negative possible situations and made
provisions for them.
This analysis depicts the possible strengths, challenges, and opportunities associated with
the proposed development project is presented below.
STRENGTHS (what is good about our project)
WEAKNESSES (what is bad about our project)
Market opportunity
Good location.
CBD Fringe
Cost effectively
Small land area
Sensitive for sales, construction and land value
Planning issues such as height limit
OPPORTUNITIES (what can happened that makes our project better)
THREATS (what can happen that makes our project worse)
Increase in number of students will increase demand for units; that is low vacancy rate.
Constant steady economic growth in Australia
Increased immigrations to Melbourne
Overseas investigation limitation
Unstable Australian dollars
Strengths
The commercial and residential building still have a fierce demand in Melbourne. Apart from
that, good location and CBD Fringe attract international students and young professional to
be the potential buyers. Also, cost effective dwelling benefits for first home buyer and young
generations.
Weaknesses
Small land areas limit the further property development. The project schedule would be over
4 years. It is unclear about how is the market and land value trend during this period. The
property would be sensitive for sales, construction and land value. From the other
perspective, there are also several planning issues. For example, height limit and heritage
overlay would limit the development options in the property development process.
Opportunities
Melbourne is one of the most attractive education places for international students and
Melbourne is top 5 best immigration cities in the world. The property demand for
international students in Carlton is still strong in the next few years, especially for Chinese

ABPL 90026 Property Development Garcia, Acheampong, Zhe, Zhou
29
students and other Asian students. Moreover, the constant economic growth in Australia
creates a healthful demand and supply environment for the real estate. We can design the
development project to create a green community in the middle levels which will attract high
demand and enhance our ability to sell -off-the plan, since the bottom line of the
development is closing a deal to meet our expectations.
Threats
According to the Economist (2016), the housing market in Australia is 40% overvalued,
which measured by price to income measures. The Australian banks such as ANZ,
Commonwealth have already ceased to offer loans for overseas’ buyers since April 2016.
Moreover, Australian dollars has experienced depreciation since the second quarter and
the depreciated trend is still going on. Thus, the real purchasing power of local buyers has
plummeted.

ABPL 90026 Property Development Garcia, Acheampong, Zhe, Zhou
30
7 RISK ANALYSIS
As a business activity, property development is filled with risks, the greater risk always along
with a bigger project. As a developer, the risks should be taken into consideration not only
the commencement and progress risks like planning risk, land holding cost, construction
risks, market risk, financial risk, etc., but also think about the settlement risks at the end of
the project building progress. While, there are a number of ways to evade or reduce the
risks in whole development program.
Planning risks
Planning risk which will be happened during the planning application period, such as the
repeatedly amended design plan which would bring out the delay of planning permit. So
before commence the subject site project, due diligence of the background and relative
regulations are key roles to smooth the process after. This site belongs to Council, medical,
consultant and education systems as supplement infrastructures to Carlton are preferred.
Meanwhile, the particular consideration about heritage façade may produces different
requests on building design. What’s more, the restriction of car parking space and building
height need more time to plan and get permit. More time and repeat applies for planning
permit would put off the following developing scheme.
Before the proposed period, the thorough due diligence should be taken and the specified
requests and regulations had been figure out. Secondly, the schedule of planning approval
need includes at least 15 days as reserved time for modifications and changes would
happen. This stage usually takes up between 6 and 12 months before achieve development
approval.
Landholding risks
A downturn in the property market, the interest rates rising, and unexpected delay during
the development may leading to increased holding costs until the project is sold. As our site
contains two tenant contracts there, that means before start the actual construction process,
the rent received offsets the holding costs partially during the planning stage.
At the same time, the condition of this site like land contamination would induce a high risk
of developing, not just increase the building time but the cost of investing and solving the
pollution. The soil condition research could not be neglected.
Market demand risks
Once is the development process started, it is fixed in time and location, and the design
aims at a very narrow target market which within an uncertain economic climate. The
demand for residential units in Carlton is expected to rise steadily since the sustaining
increase population and students here. An accurate orientation of target market as the
“young generation” which preferred cost-effective dwellings, which with well-designed
apartment (less space with sufficient and changeable function), well-quality construction
and high-standard marketing effort would dramatically reduce the market risk for our site.
Financial risks
As before mentioned in the report, the potential risk of interest rate rises during the life of
the project over the future 41 months, and any reduction of project life time would lower this
risk.
Lowering the loan-to-value ratio (LVR) on the developer or buyers which means the lender
need to pay more the purchase the land or property and lend less than before, which may
significant impact on the settlement activity, since the site may be using the sell-off-plan
marketing strategy, means during the settlement period, the lowering LVR may increase the

ABPL 90026 Property Development Garcia, Acheampong, Zhe, Zhou
31
cost of buyers. Usually, the settlement dispute may be triggered under this circumstance,
which directly influenced on the profit return of this project. Therefore, unlike other agencies
make a promises to buyers they can get a debt as 90%, and only need to pay 10% deposit
at first, our marketing team should inform purchasers of the loan risk in the future, they may
experience 10-15% decrease of the loan proportion, to some extent, mitigate the settlement
risk and financial risk then.
Site risks
Our site is the combined two subject properties 227-229 and 231 Queensberry St, and the
construction area is designed to use the whole area of both parcels, which with 15% area
as the common space and 85% as the net saleable area. There is a building risk if the
construction design utilize more space as the common area, the efficiency may decrease.
In effect, reducing our expected returns.
Construction risks
In respect to the pricing, design, quality and possible delays would lead to variation of
construction cost. Like increasing costs in materials and labors recent years led to higher
construction costs. Or the contractors or builders’ changes during the half way of the
development project. These situations could be relieved by drawn up contracts with a fixed
price carefully as well as the quality and criteria of materials and process. There are a variety
of on-site construction work. On-site work can be highly influenced by the materials overdue,
the workers’ experiences and skills and even weather. Also, occupational health and safety
is another part which have high risk in the construction industry. Any accident on the
construction would stop the whole project. For traditional construction process, poor
communication always exists between design and construction. The construction overdue
would happen in this situation because of several reasons such as wrong documentation
and redesign.

ABPL 90026 Property Development Garcia, Acheampong, Zhe, Zhou
32
8 Conclusions & recommendation
This studies have informed our decision to develop a Mid-rise residential development for
sale, after a thorough survey and investigation into what is the best option for the site as
well as the viability of the proposed development project. The market, highest and best use
analysis as well as the feasibility analysis, prove that our intended project will be viable. Meanwhile, we have made provisions for any design, construction, cost and market
variations and these are inherent in our cost estimates, feasibility studies as well as
development strategy. The team examined various scenarios, assessed inherent risks, as
well as predict an unforeseeable market eventualities that may ignite any considerable
variations to our expectations and timelines. In this event, the team have outlined the following recommendations:
1. The team should equip the project manager with management tools and technique
to ensure smooth delivery of the project and work within scope especially financial
(overheads) and timelines.
2. The team should strengthen the marketing base of the project so as to enhance
the presales, a prerequisite for residential development project financing.
3. The planning applications should be facilitated so as to avoid delays and obtain
permits within the timelines scheduled for the entire development process.
4. Through the analysis of three scenarios about sustainability, affordable housing
and government issues, the following outcomes should be considered:
o Sustainability scenario does not affect the project much;
o Government requests about reducing storeys will impact on our project
mildly;
o The affordable housing scenario might be a win-win recommendation if the
government in accordance with our strategy, which will benefit triple-sides:
low-income residents, developer and council (City of Melbourne)
5. We highly recommend negotiations with the council to provide for affordable
housing strategies. To maximize our profits and reputation. From the report we have
confirmed that is a viable option.
6. Sustainability improvements will not have a high impact in cost, but can have a
good impact in reputation. We recommend detailed studies about what
improvements can be design and build, as well as assessing detailed costs
depending on the design.
7. Maximizing the building efficiency will have a great impact in our financial returns,
we recommend to try to achieve a high efficiency by addressing this issue with the
architecture team. Keeping in mind not to sacrifice potential value (loss of
amenities) due to this efficiency objective. A balance is to be achieved.
8. Sell price of the apartments is highly sensitive. In the static model that we
presented, it is not including price escalations, trying to achieve a higher price on
the project as soon as practical completion is achieved is a sound strategy to
maximize our returns.

ABPL 90026 Property Development Garcia, Acheampong, Zhe, Zhou
33
9 Bibliography
Australia, C. H. (n.d.). Current funding framework. Retrieved from http://www.chfv.org.au/current-
funding-framework/
City of Port Phillip. (n.d.). Affordable Housing Development Models. Melborune: Commonwealth of
Australia .
Office, S. R. (2016). Metropolitan Planning Levy. Retrieved from State Goverment Victoria:
http://www.sro.vic.gov.au/mpl
Real Estate.com.au. (n.d.). 12/121 Cardigan Street Carlton Vic 3053. Retrieved from Real
Estate.com.au: https://www.realestate.com.au/property/12-121-cardigan-st-carlton-vic-
3053
Real Estate.com.au. (2016, Feb). 202-204 Drummond Street, Carlton, Vic 3053. Retrieved from
Realestate.com.au: http://www.realcommercial.com.au/property-land+development-vic-
carlton-501767386
Realestate.com.au. (2016, June). 128-130 lygon St, Carlton, Vic 3053. Retrieved from
http://www.realcommercial.com.au/property-retail-vic-carlton-501160299
The Age Victoria. (2014, November 14). Melbourne has given away bargaining power to developers
. The Age Victoria.
Victoria Public Tenants Association. (Ferbruary of 2016). A blueprint for Affordable Housing in Victoria.
Melbourne.

ABPL 90026 Property Development Garcia, Acheampong, Zhe, Zhou
34
Appendix

ABPL 90026 Property Development Garcia, Acheampong, Zhe, Zhou
35
Appendix A - Sales in Carlton
No Picture AddressSize(m2
)Bedroom Bathroom
Car
parking
Bed/Study
roomBalcony Sold Price Sold time Agent Category Floor plan
1
3/26 Little
Cardigan Street
Carlton Vic 3053
1 1 1 1 1 $455,000 16-Apr-16 Hockingstuart Full packaged
2
S1812/570
Lygon Street
Carlton Vic 3053
2 1 1 $255,000 03-May-16EJ Love Real
Estatebasic furnitured
3
301/475
Cardigan Street
Carlton Vic 3053
2 2 1 1 $629,000 16-Apr-16
Nelson
Alexander Real
Estate
Full packaged
4
2005/28
Bouverie Street
Carlton Vic 3053
62 2 2 $555,000 08-Apr-16Royaland Real
EstateFull packaged
5
720/800
Swanston Street
Carlton Vic 3053
1 1 $195,000 21-May-16Lucas Real
Estatebasic furnitured
6
206/101 Grattan
Street Carlton
Vic 3053
2 1 1 1 $545,000 19-May-16Woodards
NorthernFull packaged
7
702/95 Berkeley
Street Carlton
Vic 3053
1 1 1 1 $399,000 04-Apr-16
Nelson
Alexander Real
Estate
Furnitured
http://www.realestate.co
m.au/property-apartment-
vic-carlton-121993902
http://www.realestate.co
m.au/property-apartment-
vic-carlton-121366026
http://www.realestate.co
m.au/property-apartment-
vic-carlton-121502370
http://www.realestate.co
m.au/property-apartment-
vic-carlton-122233578
Website
http://www.realestate.co
m.au/property-apartment-
vic-carlton-120796781
http://www.realestate.co
m.au/property-apartment-
vic-carlton-122205346
http://www.realestate.co
m.au/property-apartment-
vic-carlton-121658386

ABPL 90026 Property Development Garcia, Acheampong, Zhe, Zhou
36
8
417/528
Swanston Street
Carlton Vic 3053
1 1 $219,500 30-May-16 Dingle Partners basic furnitured
9
303/70
Queensberry
Street Carlton
Vic 3053
1 1 $159,000 17-May-16
Nelson
Alexander Real
Estate
basic furnitured
10
28/36
Drummond
Street Carlton
Vic 3053
2 1 1 1 $610,000 27-Feb-16Stockdale &
Leggo Full packaged
11
1515/570 Lygon
Street Carlton
Vic 3053
53.7 2 1 1 $275,000 24-Feb-16UniLodge
Australia Pty Ltdbasic furnitured
12
873/488
Swanston Street
Carlton Vic 3053
2 1 2 $260,000 16-Feb-16Brady
Residentialbasic furnitured
13
110/151 Princes
Street Carlton
Vic 3053
2 2 1 1 $478,000 16-Feb-16Stockdale &
Leggo basic furnitured
14
501/488
Swanston Street
Carlton Vic 3053
32(land
size)2 1 1 $225,000 26-Jan-16 Dingle Partners basic furnitured
15
7/264
Drummond
Street Carlton
Vic 3053
2 2 1 1 $630,000 19-Dec-15
Scott Banks
Real Estate
Group
Full packaged
http://www.realestate.co
m.au/property-apartment-
vic-carlton-122199738
http://www.realestate.co
m.au/property-apartment-
vic-carlton-121655326
http://www.realestate.co
m.au/property-apartment-
vic-carlton-121775894
http://www.realestate.co
m.au/property-apartment-
vic-carlton-120407977
http://www.realestate.co
m.au/property-apartment-
vic-carlton-121602710
http://www.realestate.co
m.au/property-apartment-
vic-carlton-118499991
http://www.realestate.co
m.au/property-apartment-
vic-carlton-121669398
http://www.realestate.co
m.au/property-apartment-
vic-carlton-121412190

ABPL 90026 Property Development Garcia, Acheampong, Zhe, Zhou
37
16
600B/640
Swanston Street
Carlton Vic 3053
84 2 2 1 1 $670,000 10-Dec-15Golden Hills
Property Groupbasic furnitured
http://www.realestate.co
m.au/property-apartment-
vic-carlton-120033985

ABPL 90026 Property Development Garcia, Acheampong, Zhe, Zhou
38
Appendix B - Sensitivity of assumptions

ABPL 90026 Property Development Garcia, Acheampong, Zhe, Zhou
39

ABPL 90026 Property Development Garcia, Acheampong, Zhe, Zhou
40
Appendix C - Sensitivity of costs

ABPL 90026 Property Development Garcia, Acheampong, Zhe, Zhou
41

ABPL 90026 Property Development Garcia, Acheampong, Zhe, Zhou
42
Appendix D - Case Scenario: Sustainability
Profit Analysis Sustainability Scenario Description: $
REVENUE
Sales 27,651,000
Increase due to sustainability 1,659,060
Less Selling costs 1,382,550
NET REALISATION VALUE 27,927,510
.
Construction cost
Construction Cost * 13,957,265 50%
Consultant Fees * 1,395,727 10%
Construction Finance 908,449 7%
Statutory Costs * 139,573
Developers' Contribution 18,144
16,419,157
Add. Sutainability 1,641,916
Total Construction Costs 18,061,073.03
Land Cost
Net Land Value * 2,500,000
Purchasing costs * 125,000 5%
Land finance 422,936
3,047,936
TOTAL COST 21,109,009
PROFIT & RISK
Developer's Profit 6,818,501
Profit Margin (profit / net realisation) 24%
(*) used for IRR calculation * debt service ratio
Static IRR calculation:
Total equity required (pv) 3,598,513
Profit (fv) 6,818,501
months required (n) 41
Monthly Interest rate (i) 1.571%
Annual interest rate ( i * 12) 18.85%
ABPL 90026 Property Development Garcia, Acheampong, Zhe, Zhou
43
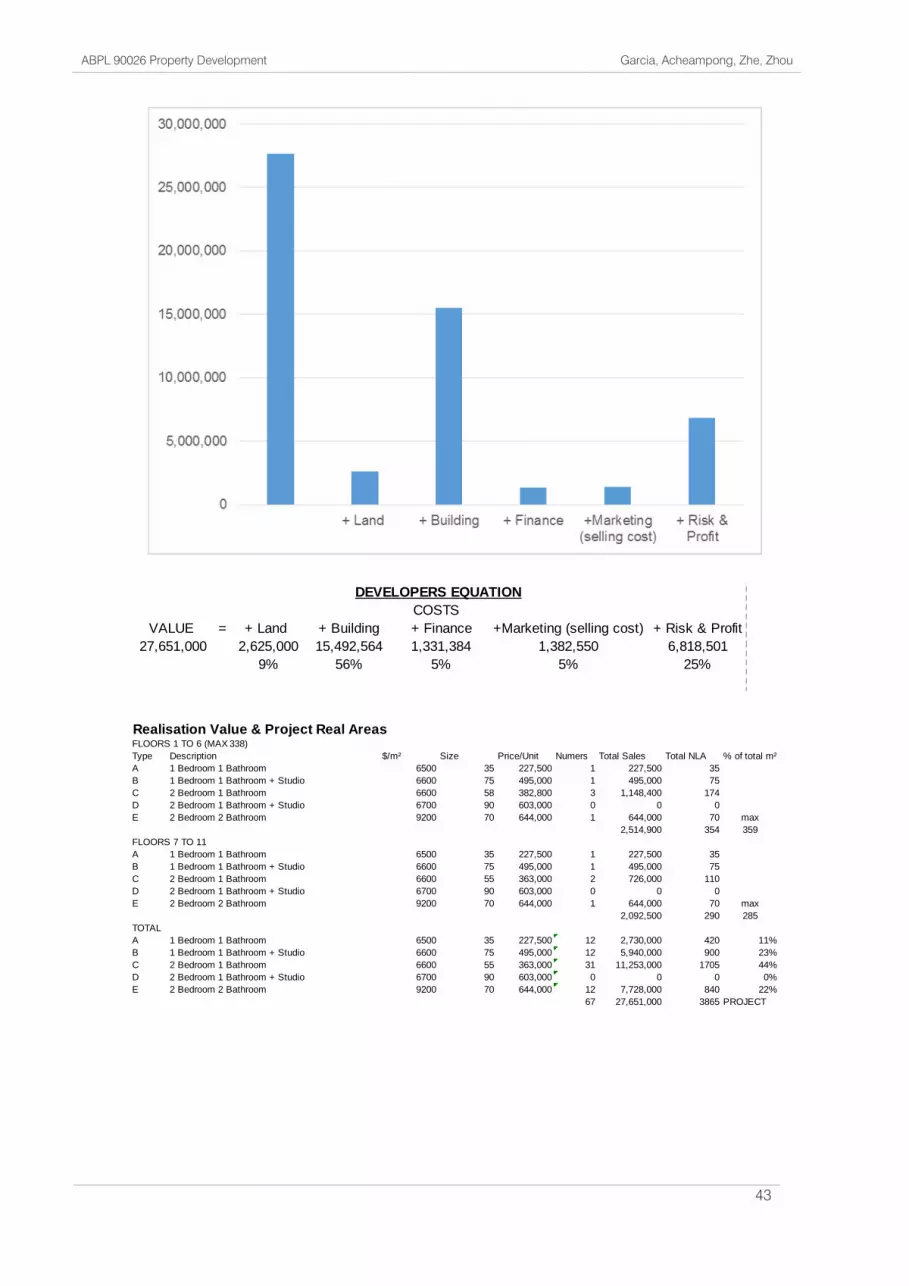
VALUE = + Land + Building + Finance +Marketing (selling cost) + Risk & Profit
27,651,000 2,625,000 15,492,564 1,331,384 1,382,550 6,818,501
9% 56% 5% 5% 25%
DEVELOPERS EQUATION
COSTS
Realisation Value & Project Real AreasFLOORS 1 TO 6 (MAX 338)
Type Description $/m² Size Price/Unit Numers Total Sales Total NLA % of total m²
A 1 Bedroom 1 Bathroom 6500 35 227,500 1 227,500 35
B 1 Bedroom 1 Bathroom + Studio 6600 75 495,000 1 495,000 75
C 2 Bedroom 1 Bathroom 6600 58 382,800 3 1,148,400 174
D 2 Bedroom 1 Bathroom + Studio 6700 90 603,000 0 0 0
E 2 Bedroom 2 Bathroom 9200 70 644,000 1 644,000 70 max
2,514,900 354 359
FLOORS 7 TO 11
A 1 Bedroom 1 Bathroom 6500 35 227,500 1 227,500 35
B 1 Bedroom 1 Bathroom + Studio 6600 75 495,000 1 495,000 75
C 2 Bedroom 1 Bathroom 6600 55 363,000 2 726,000 110
D 2 Bedroom 1 Bathroom + Studio 6700 90 603,000 0 0 0
E 2 Bedroom 2 Bathroom 9200 70 644,000 1 644,000 70 max
2,092,500 290 285
TOTAL
A 1 Bedroom 1 Bathroom 6500 35 227,500 12 2,730,000 420 11%
B 1 Bedroom 1 Bathroom + Studio 6600 75 495,000 12 5,940,000 900 23%
C 2 Bedroom 1 Bathroom 6600 55 363,000 31 11,253,000 1705 44%
D 2 Bedroom 1 Bathroom + Studio 6700 90 603,000 0 0 0 0%
E 2 Bedroom 2 Bathroom 9200 70 644,000 12 7,728,000 840 22%
67 27,651,000 3865 PROJECT

ABPL 90026 Property Development Garcia, Acheampong, Zhe, Zhou
44
Table 4. Construction Costs
SUMMARY
Construction Cost
Demoltion 102,770.00
Apartment B. 12,458,941.18
Parking 1,395,554.00
Total Construction Cost 13,957,265.18
Consultant Fees 1,395,727
Statutory Costs 139,573
Total capital required for construction 15,492,564.35
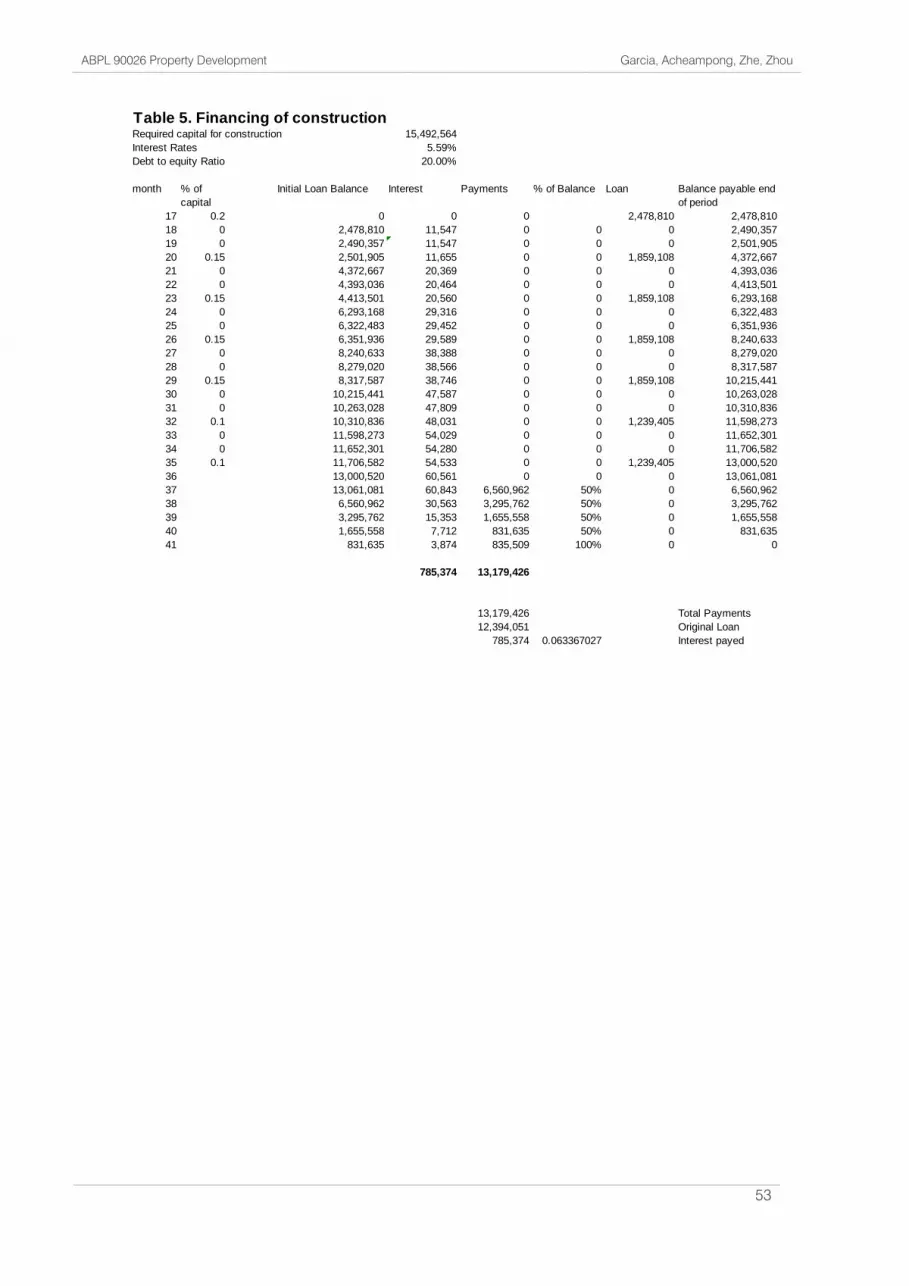
Table 5. Financing of construction Required capital for construction 15,492,564
Interest Rates 5.59%
Debt to equity Ratio 20.00%
month % of
capital
Initial Loan Balance Interest Payments % of Balance Loan Balance payable end
of period
17 0.2 0 0 0 2,478,810 2,478,810
18 0 2,478,810 11,547 0 0 0 2,490,357
19 0 2,490,357 11,547 0 0 0 2,501,905
20 0.15 2,501,905 11,655 0 0 1,859,108 4,372,667
21 0 4,372,667 20,369 0 0 0 4,393,036
22 0 4,393,036 20,464 0 0 0 4,413,501
23 0.15 4,413,501 20,560 0 0 1,859,108 6,293,168
24 0 6,293,168 29,316 0 0 0 6,322,483
25 0 6,322,483 29,452 0 0 0 6,351,936
26 0.15 6,351,936 29,589 0 0 1,859,108 8,240,633
27 0 8,240,633 38,388 0 0 0 8,279,020
28 0 8,279,020 38,566 0 0 0 8,317,587
29 0.15 8,317,587 38,746 0 0 1,859,108 10,215,441
30 0 10,215,441 47,587 0 0 0 10,263,028
31 0 10,263,028 47,809 0 0 0 10,310,836
32 0.1 10,310,836 48,031 0 0 1,239,405 11,598,273
33 0 11,598,273 54,029 0 0 0 11,652,301
34 0 11,652,301 54,280 0 0 0 11,706,582
35 0.1 11,706,582 54,533 0 0 1,239,405 13,000,520
36 0 13,000,520 60,561 0 0 0 13,061,081
37 0 13,061,081 60,843 0 0 0 13,121,924
38 13,121,924 61,126 0 0 0 13,183,050
39 13,183,050 61,411 6,622,230 50% 0 6,622,230
40 6,622,230 30,849 3,326,540 50% 0 3,326,540
41 3,326,540 15,496 1,671,018 50% 0 1,671,018
42 1,671,018 7,784 839,401 50% 0 839,401
43 839,401 3,910 843,311 100% 0 0
908,449 13,302,500
13,302,500 Total Payments
12,394,051 Original Loan
908,449 0.073297138 Interest payed

ABPL 90026 Property Development Garcia, Acheampong, Zhe, Zhou
45
Table 6. Land Finance of $1 dollar
Interest Rates 4.59%
Monthly Interest Rate 0.38%
Periods 41
Effective interest rate 16.94%
Required money for land 1
Debt to equity Ratio 20.00%
month
Initial Loan Balance Interest Balance payable end
of period
Payments
% of Balance payed
0 0.80 0.003 0.803 0.000 0
1 0.80 0.003 0.806 0.000 0
2 0.81 0.003 0.809 0.000 0
3 0.81 0.003 0.812 0.000 0
4 0.81 0.003 0.815 0.000 0
5 0.82 0.003 0.819 0.000 0
6 0.82 0.003 0.822 0.000 0
7 0.82 0.003 0.825 0.000 0
8 0.82 0.003 0.828 0.000 0
9 0.83 0.003 0.831 0.000 0
10 0.83 0.003 0.834 0.000 0
11 0.83 0.003 0.838 0.000 0
12 0.84 0.003 0.841 0.000 0
13 0.84 0.003 0.844 0.000 0
14 0.84 0.003 0.847 0.000 0
15 0.85 0.003 0.850 0.000 0
16 0.85 0.003 0.854 0.000 0
17 0.85 0.003 0.857 0.000 0
18 0.86 0.003 0.860 0.000 0
19 0.86 0.003 0.863 0.000 0
20 0.86 0.003 0.867 0.000 0
21 0.87 0.003 0.870 0.000 0
22 0.87 0.003 0.873 0.000 0
23 0.87 0.003 0.877 0.000 0
24 0.88 0.003 0.880 0.000 0
25 0.88 0.003 0.883 0.000 0
26 0.88 0.003 0.887 0.000 0
27 0.89 0.003 0.890 0.000 0
28 0.89 0.003 0.894 0.000 0
29 0.89 0.003 0.897 0.000 0
30 0.90 0.003 0.901 0.000 0
31 0.90 0.003 0.904 0.000 0
32 0.90 0.003 0.907 0.000 0
33 0.91 0.003 0.911 0.000 0
34 0.91 0.003 0.914 0.000 0
35 0.91 0.003 0.918 0.000 0
36 0.92 0.004 0.921 0.000 0
37 0.92 0.004 0.925 0.000 0
38 0.92 0.004 0.928 0.000 0
39 0.93 0.004 0.932 0.466 50%
40 0.47 0.002 0.468 0.234 50%
41 0.23 0.001 0.235 0.117 50%
42 0.12 0.000 0.118 0.059 50%
43 0.06 0.000 0.059 0.059 100%
0 0.935
Total Payments 0.935
Original Loan 0.800
Interest payed 0.135 16.9174%
Explanation: The following is the schedule of payments for finance on the land. A value of one dollar has
been used in order to get the % of real interest payed in relation to the original loan ammount. So that,
instead of using the 50% rule, the payment schedule is used.

ABPL 90026 Property Development Garcia, Acheampong, Zhe, Zhou
46
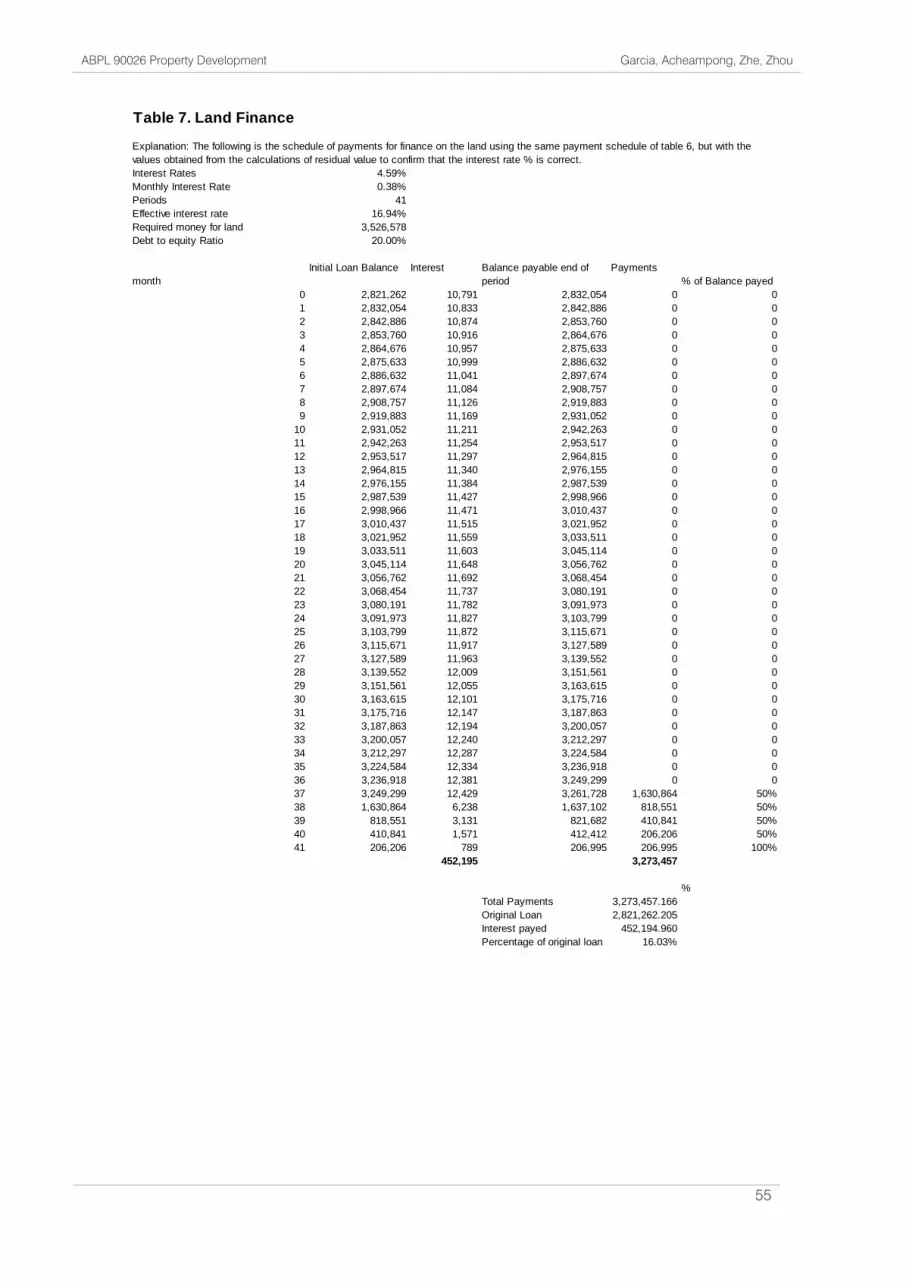
Table 7. Land Finance
Interest Rates 4.59%
Monthly Interest Rate 0.38%
Periods 41
Effective interest rate 16.94%
Required money for land3,946,159
Debt to equity Ratio 20.00%
month
Initial Loan Balance Interest Balance payable end of
period
Payments
% of Balance payed
0 3,156,927 12,075 3,169,002 0 0
1 3,169,002 12,121 3,181,124 0 0
2 3,181,124 12,168 3,193,292 0 0
3 3,193,292 12,214 3,205,506 0 0
4 3,205,506 12,261 3,217,767 0 0
5 3,217,767 12,308 3,230,075 0 0
6 3,230,075 12,355 3,242,430 0 0
7 3,242,430 12,402 3,254,832 0 0
8 3,254,832 12,450 3,267,282 0 0
9 3,267,282 12,497 3,279,779 0 0
10 3,279,779 12,545 3,292,324 0 0
11 3,292,324 12,593 3,304,918 0 0
12 3,304,918 12,641 3,317,559 0 0
13 3,317,559 12,690 3,330,249 0 0
14 3,330,249 12,738 3,342,987 0 0
15 3,342,987 12,787 3,355,774 0 0
16 3,355,774 12,836 3,368,610 0 0
17 3,368,610 12,885 3,381,494 0 0
18 3,381,494 12,934 3,394,429 0 0
19 3,394,429 12,984 3,407,412 0 0
20 3,407,412 13,033 3,420,446 0 0
21 3,420,446 13,083 3,433,529 0 0
22 3,433,529 13,133 3,446,662 0 0
23 3,446,662 13,183 3,459,846 0 0
24 3,459,846 13,234 3,473,080 0 0
25 3,473,080 13,285 3,486,364 0 0
26 3,486,364 13,335 3,499,699 0 0
27 3,499,699 13,386 3,513,086 0 0
28 3,513,086 13,438 3,526,523 0 0
29 3,526,523 13,489 3,540,012 0 0
30 3,540,012 13,541 3,553,553 0 0
31 3,553,553 13,592 3,567,145 0 0
32 3,567,145 13,644 3,580,790 0 0
33 3,580,790 13,697 3,594,486 0 0
34 3,594,486 13,749 3,608,235 0 0
35 3,608,235 13,801 3,622,036 0 0
36 3,622,036 13,854 3,635,891 0 0
37 3,635,891 13,907 3,649,798 0 0
38 3,649,798 13,960 3,663,759 0 0
39 3,663,759 14,014 3,677,772 1,838,886 50%
40 1,838,886 7,034 1,845,920 922,960 50%
41 922,960 3,530 926,490 463,245 50%
42 463,245 1,772 465,017 232,509 50%
43 232,509 889 233,398 233,398 100%
534,071 3,690,998
%
Total Payments 3,690,997.717
Original Loan 3,156,927.078
Interest payed 534,070.640
Percentage of original loan 16.92%
Explanation: The following is the schedule of payments for finance on the land using the same payment
schedule of table 6, but with the values obtained from the calculations of residual value to confirm that the
interest rate % is correct.

ABPL 90026 Property Development Garcia, Acheampong, Zhe, Zhou
47
Appendix E - Case Scenario: Affordable Housing
Residual Land Value Calculation. Option Social Housing From: Description: $
VALUE
Table 3 Sales 27,651,000
Table 1 Less Selling costs 1,382,550
NRV withouth allowances 26,268,450
- Social Housing Allowance -3,225,000 .
Net Realization Value 29,493,450
PROFIT & RISK
Table 1 Developer's Profit 5,898,690 28.96%
DEVELOPING COSTS 16,277,939
Table 4 Construction Cost 13,957,265 53%
Table 1 Consultant Fees 1,395,727 10%
Table 5 Construction Finance 785,374 6%
Table 1 Statutory Costs 139,573
Gross Landing Value 4,091,821
LAND COSTS 4,091,821
Table 7 Land finance 565,244
Table 1 Purchasing costs 167,932 5%
Net Land Value 3,358,645
Site m² 422
$/m² 7,959
Static IRR calculation:
Total equity required (pv) 3,803,828
Profit (fv) 5,898,690
months required (n) 41
Monthly Interest rate (i) 1.076%
Annual interest rate ( i * 12) 12.91%

ABPL 90026 Property Development Garcia, Acheampong, Zhe, Zhou
48
VALUE = + Land + Building + Finance +Marketing (selling cost) + Risk & Profit
27,651,000 0 15,492,564 785,374 1,382,550 6,747,367
0% 56% 3% 5% 24%
DEVELOPERS EQUATION
COSTS

ABPL 90026 Property Development Garcia, Acheampong, Zhe, Zhou
49
Inputs or assumptions
Item From:
A Data Land size 1 242
B Data Land Size 2 180
C = A + B Total Land size 422
D Data GBA of current premises 1195
E Table 3 NLA 3,865
F = D / E GBA 4,547
G = E - F Common Areas 682
H Table 8 Land Value 2,500,000
I Table 6 Interest payed for Land 16.03%
J Input Building Efficiency 85%
K Input Selling Cost 5%
L Input Developers Profit 25%
M Input Consultant Fees 10%
N Input Construction Loan interest Rate 6%
O Input Land Interest Rate 5%
P Input Loan to cost ratio 20%
Q Input Purchasing Costs 5%
R Input Statutory costs 1%
S Input Levels of parking 2.00
T Input Developers' Contribution 0.13%
Table 3 . Realisation Value & Project Real AreasFLOORS GF TO LEVEL 6 (MAX 338)
Type Description $/m² Size Price/Unit Numers Total Sales Total NLA
A 1 Bedroom 1 Bathroom 6500 35 227,500 1 227,500 35
B 1 Bedroom 1 Bathroom + Studio 6600 75 495,000 1 495,000 75
C 2 Bedroom 1 Bathroom 6600 58 382,800 3 1,148,400 174
D 2 Bedroom 1 Bathroom + Studio 6700 90 603,000 0 0 0
E 2 Bedroom 2 Bathroom 9200 70 644,000 1 644,000 70
2,514,900 354
FLOORS 7 TO 11
A 1 Bedroom 1 Bathroom 6500 35 227,500 1 227,500 35
B 1 Bedroom 1 Bathroom + Studio 6600 75 495,000 1 495,000 75
C 2 Bedroom 1 Bathroom 6600 55 363,000 2 726,000 110
D 2 Bedroom 1 Bathroom + Studio 6700 90 603,000 0 0 0
E 2 Bedroom 2 Bathroom 9200 70 644,000 1 644,000 70
2,092,500 290
TOTAL
A 1 Bedroom 1 Bathroom 6500 35 227,500 12 2,730,000 420
B 1 Bedroom 1 Bathroom + Studio 6600 75 495,000 12 5,940,000 900
C 2 Bedroom 1 Bathroom 6600 55 363,000 31 11,253,000 1705
D 2 Bedroom 1 Bathroom + Studio 6700 90 603,000 0 0 0
E 2 Bedroom 2 Bathroom 9200 70 644,000 12 7,728,000 840
67 27,651,000 3865
SOCIAL HOUSING : GOV PAYS LAND STRATEGY
A 1 Bedroom 1 Bathroom 6500 35 227,500 12 2,730,000 420
B 1 Bedroom 1 Bathroom + Studio 6600 75 495,000 1 495,000 75
C 2 Bedroom 1 Bathroom 6600 55 363,000 0 0 0
D 2 Bedroom 1 Bathroom + Studio 6700 90 603,000 0 0 0
E 2 Bedroom 2 Bathroom 9200 70 644,000 0 0 0
13 3,225,000 495
12.81%

ABPL 90026 Property Development Garcia, Acheampong, Zhe, Zhou
50
Table 4. Construction Costs
SUMMARY
Construction Cost
Demoltion 102,770.00
Apartment B. 12,458,941.18
Parking 1,395,554.00
Total Construction Cost 13,957,265.18
Consultant Fees 1,395,727
Statutory Costs 139,573
Total capital required for construction 15,492,564.35
PART 1 - DEMOLITIONS
Total square metres for parking
(from table 1) 1,195.00
Phase $/m² % $ total price
Demolitions: Retail premises, two
storrey ditto with reinforced concrete
slab
86
102,770.00
Total 102,770.00

ABPL 90026 Property Development Garcia, Acheampong, Zhe, Zhou
51
PART 2 - APARTMENT BUILDING
Apartment type Size Number Total m²
A 35 12 420
B 75 12 900
C 55 31 1705
D 90 0 0
E 70 12 840
Net lettable area 3865
Building Efficiency 85%
Gross building Area 4,547
Phase $/m² % $ total price
PRELIMINARIES 392.25 14.32% 1,783,584
SUBSTRUCTURE 37.00 1.35% 168,241
SUPERSTRUCTURE
Columns 50.25 1.83% 228,490
Upper floors 260.75 9.52% 1,185,646
Staircase 33.00 1.20% 150,053
Roof 36.50 1.33% 165,968
External Walls & Windows 317.75 11.60% 1,444,828
External doors 29.75 1.09% 135,275
Internal Walls 100.75 3.68% 458,116
Internal Screens 10.25 0.37% 46,607
Internal Doors 36.25 1.32% 164,831
FINISHES
Walls 76.00 2.77% 345,576
Floor 88.50 3.23% 402,415
Cielings 49.75 1.82% 226,216
FITTINGS
Firments 166.25 6.07% 755,949
Special 0.00 0.00% -
SERVICES
Plumbing 326.25 11.91% 1,483,478
Mechanical 328.25 11.98% 1,492,572
Fire 48.75 1.78% 221,669
Electrical 112.25 4.10% 510,407
Transportation 146.50 5.35% 666,144
Special 23.50 0.86% 106,856
EXTERNAL SERVICES 1.00 0.04% 4,547
CONTINGENCY 68.50 2.50% 311,474
TOTAL 2,740.00 100.00% 12,458,941

ABPL 90026 Property Development Garcia, Acheampong, Zhe, Zhou
52
PART 3 - UNDER GROUND PARKING
Total square metres for parking
(from table 1) 844.00
Phase $/m² % $ total price
PRELIMINARIES 294.25 10.74% 248,347.00
SUBSTRUCTURE 317.00 11.57% 267,548.00
SUPERSTRUCTURE
Columns 68.25 2.49% 57,603.00
Upper floors 151.00 5.51% 127,444.00
Staircase 16.75 0.61% 14,137.00
Roof 226.00 8.25% 190,744.00
External Walls & Windows 152.25 5.56% 128,499.00
External doors 17.50 0.64% 14,770.00
Internal Walls 36.50 1.33% 30,806.00
Internal Screens 0.00 0.00% -
Internal Doors 9.25 0.34% 7,807.00
FINISHES
Walls 16.75 0.61% 14,137.00
Floor 15.00 0.55% 12,660.00
Cielings 15.00 0.55% 12,660.00
FITTINGS
Firments 1.25 0.05% 1,055.00
Special 0.00 0.00% -
SERVICES
Plumbing 39.75 1.45% 33,549.00
Mechanical 104.75 3.82% 88,409.00
Fire 109.00 3.98% 91,996.00
Electrical 61.00 2.23% 51,484.00
Transportation 0.00 0.00% -
Special 0.00 0.00% -
EXTERNAL SERVICES 1.00 0.04% 844.00
CONTINGENCY 1.25 0.05% 1,055.00
TOTAL 1,653.50 60.35% 1,395,554.00
ABPL 90026 Property Development Garcia, Acheampong, Zhe, Zhou
53
Table 5. Financing of construction Required capital for construction 15,492,564
Interest Rates 5.59%
Debt to equity Ratio 20.00%
month % of
capital
Initial Loan Balance Interest Payments % of Balance Loan Balance payable end
of period
17 0.2 0 0 0 2,478,810 2,478,810
18 0 2,478,810 11,547 0 0 0 2,490,357
19 0 2,490,357 11,547 0 0 0 2,501,905
20 0.15 2,501,905 11,655 0 0 1,859,108 4,372,667
21 0 4,372,667 20,369 0 0 0 4,393,036
22 0 4,393,036 20,464 0 0 0 4,413,501
23 0.15 4,413,501 20,560 0 0 1,859,108 6,293,168
24 0 6,293,168 29,316 0 0 0 6,322,483
25 0 6,322,483 29,452 0 0 0 6,351,936
26 0.15 6,351,936 29,589 0 0 1,859,108 8,240,633
27 0 8,240,633 38,388 0 0 0 8,279,020
28 0 8,279,020 38,566 0 0 0 8,317,587
29 0.15 8,317,587 38,746 0 0 1,859,108 10,215,441
30 0 10,215,441 47,587 0 0 0 10,263,028
31 0 10,263,028 47,809 0 0 0 10,310,836
32 0.1 10,310,836 48,031 0 0 1,239,405 11,598,273
33 0 11,598,273 54,029 0 0 0 11,652,301
34 0 11,652,301 54,280 0 0 0 11,706,582
35 0.1 11,706,582 54,533 0 0 1,239,405 13,000,520
36 13,000,520 60,561 0 0 0 13,061,081
37 13,061,081 60,843 6,560,962 50% 0 6,560,962
38 6,560,962 30,563 3,295,762 50% 0 3,295,762
39 3,295,762 15,353 1,655,558 50% 0 1,655,558
40 1,655,558 7,712 831,635 50% 0 831,635
41 831,635 3,874 835,509 100% 0 0
785,374 13,179,426
13,179,426 Total Payments
12,394,051 Original Loan
785,374 0.063367027 Interest payed

ABPL 90026 Property Development Garcia, Acheampong, Zhe, Zhou
54
Table 6. Land Finance of $1 dollar
Interest Rates 4.59%
Monthly Interest Rate 0.38%
Periods 41
Effective interest rate 16.94%
Required money for land 1
Debt to equity Ratio 20.00%
month
Initial Loan Balance Interest Balance payable end
of period
Payments
% of Balance payed
0 0.80 0.003 0.803 0.000 0
1 0.80 0.003 0.806 0.000 0
2 0.81 0.003 0.809 0.000 0
3 0.81 0.003 0.812 0.000 0
4 0.81 0.003 0.815 0.000 0
5 0.82 0.003 0.819 0.000 0
6 0.82 0.003 0.822 0.000 0
7 0.82 0.003 0.825 0.000 0
8 0.82 0.003 0.828 0.000 0
9 0.83 0.003 0.831 0.000 0
10 0.83 0.003 0.834 0.000 0
11 0.83 0.003 0.838 0.000 0
12 0.84 0.003 0.841 0.000 0
13 0.84 0.003 0.844 0.000 0
14 0.84 0.003 0.847 0.000 0
15 0.85 0.003 0.850 0.000 0
16 0.85 0.003 0.854 0.000 0
17 0.85 0.003 0.857 0.000 0
18 0.86 0.003 0.860 0.000 0
19 0.86 0.003 0.863 0.000 0
20 0.86 0.003 0.867 0.000 0
21 0.87 0.003 0.870 0.000 0
22 0.87 0.003 0.873 0.000 0
23 0.87 0.003 0.877 0.000 0
24 0.88 0.003 0.880 0.000 0
25 0.88 0.003 0.883 0.000 0
26 0.88 0.003 0.887 0.000 0
27 0.89 0.003 0.890 0.000 0
28 0.89 0.003 0.894 0.000 0
29 0.89 0.003 0.897 0.000 0
30 0.90 0.003 0.901 0.000 0
31 0.90 0.003 0.904 0.000 0
32 0.90 0.003 0.907 0.000 0
33 0.91 0.003 0.911 0.000 0
34 0.91 0.003 0.914 0.000 0
35 0.91 0.003 0.918 0.000 0
36 0.92 0.004 0.921 0.000 0
37 0.92 0.004 0.925 0.462 50%
38 0.46 0.002 0.464 0.232 50%
39 0.23 0.001 0.233 0.116 50%
40 0.12 0.000 0.117 0.058 50%
41 0.06 0.000 0.059 0.059 100%
0 1
Total Payments 0.928
Original Loan 0.800
Interest payed 0.128 16.0281%
Explanation: The following is the schedule of payments for finance on the land. A value of one dollar has
been used in order to get the % of real interest payed in relation to the original loan ammount. So that,
instead of using the 50% rule, the payment schedule is used.
ABPL 90026 Property Development Garcia, Acheampong, Zhe, Zhou
55
Table 7. Land Finance
Interest Rates 4.59%
Monthly Interest Rate 0.38%
Periods 41
Effective interest rate 16.94%
Required money for land 3,526,578
Debt to equity Ratio 20.00%
month
Initial Loan Balance Interest Balance payable end of
period
Payments
% of Balance payed
0 2,821,262 10,791 2,832,054 0 0
1 2,832,054 10,833 2,842,886 0 0
2 2,842,886 10,874 2,853,760 0 0
3 2,853,760 10,916 2,864,676 0 0
4 2,864,676 10,957 2,875,633 0 0
5 2,875,633 10,999 2,886,632 0 0
6 2,886,632 11,041 2,897,674 0 0
7 2,897,674 11,084 2,908,757 0 0
8 2,908,757 11,126 2,919,883 0 0
9 2,919,883 11,169 2,931,052 0 0
10 2,931,052 11,211 2,942,263 0 0
11 2,942,263 11,254 2,953,517 0 0
12 2,953,517 11,297 2,964,815 0 0
13 2,964,815 11,340 2,976,155 0 0
14 2,976,155 11,384 2,987,539 0 0
15 2,987,539 11,427 2,998,966 0 0
16 2,998,966 11,471 3,010,437 0 0
17 3,010,437 11,515 3,021,952 0 0
18 3,021,952 11,559 3,033,511 0 0
19 3,033,511 11,603 3,045,114 0 0
20 3,045,114 11,648 3,056,762 0 0
21 3,056,762 11,692 3,068,454 0 0
22 3,068,454 11,737 3,080,191 0 0
23 3,080,191 11,782 3,091,973 0 0
24 3,091,973 11,827 3,103,799 0 0
25 3,103,799 11,872 3,115,671 0 0
26 3,115,671 11,917 3,127,589 0 0
27 3,127,589 11,963 3,139,552 0 0
28 3,139,552 12,009 3,151,561 0 0
29 3,151,561 12,055 3,163,615 0 0
30 3,163,615 12,101 3,175,716 0 0
31 3,175,716 12,147 3,187,863 0 0
32 3,187,863 12,194 3,200,057 0 0
33 3,200,057 12,240 3,212,297 0 0
34 3,212,297 12,287 3,224,584 0 0
35 3,224,584 12,334 3,236,918 0 0
36 3,236,918 12,381 3,249,299 0 0
37 3,249,299 12,429 3,261,728 1,630,864 50%
38 1,630,864 6,238 1,637,102 818,551 50%
39 818,551 3,131 821,682 410,841 50%
40 410,841 1,571 412,412 206,206 50%
41 206,206 789 206,995 206,995 100%
452,195 3,273,457
%
Total Payments 3,273,457.166
Original Loan 2,821,262.205
Interest payed 452,194.960
Percentage of original loan 16.03%
Explanation: The following is the schedule of payments for finance on the land using the same payment schedule of table 6, but with the
values obtained from the calculations of residual value to confirm that the interest rate % is correct.

ABPL 90026 Property Development Garcia, Acheampong, Zhe, Zhou
56
Appendix F - Case Scenario: Government Intervention
Residual Land Value Calculation. Government Intervention
From: Description: $
REVENUE
Sales 21,291,500
Less Selling costs 1,064,575
NET REALISATION VALUE 20,226,925
.
Construction cost
Construction Cost * 11,023,853 55%
Consultant Fees * 1,102,385 10%
Construction Finance 491,686 4%
Statutory Costs * 110,239
Developers' Contribution 14,331
12,742,494
Land Cost
Net Land Value * 2,500,000
Purchasing costs * 125,000 5%
Land finance 356,743
2,981,743
TOTAL COST 15,724,238
PROFIT & RISK
Developer's Profit 4,502,687
Profit Margin (profit / net realisation) 22%
(*) used for IRR calculation * debt service ratio
Static IRR calculation:
Total equity required (pv) 2,947,295
Profit (fv) 4,502,687
months required (n) 41
Monthly Interest rate (i) 1.039%
Annual interest rate ( i * 12) 12.47%

ABPL 90026 Property Development Garcia, Acheampong, Zhe, Zhou
57
VALUE = + Land + Building + Finance +Marketing (selling cost) + Risk & Profit
21,291,500 2,625,000 12,236,477 848,429 1,064,575 4,502,687
12% 57% 4% 5% 21%
DEVELOPERS EQUATION
COSTS
Inputs or assumptions
Item From:
A Data Land size 1 242
B Data Land Size 2 180
C = A + B Total Land size 422
D Data GBA of current premises 1195
E Table 3 NLA 2,955
F = D / E GBA 3,476
G = E - F Common Areas 521
H Table 8 Land Value 2,500,000
I Table 6 Interest payed for Land 14.27%
J Input Building Efficiency 85%
K Input Selling Cost 5%
L Input Developers Profit 25%
M Input Consultant Fees 10%
N Input Construction Loan interest Rate 6%
O Input Land Interest Rate 5%
P Input Loan to cost ratio 20%
Q Input Purchasing Costs 5%
R Input Statutory costs 1%
S Input Levels of parking 2.00

ABPL 90026 Property Development Garcia, Acheampong, Zhe, Zhou
58
Table 3 . Realisation Value & Project Real AreasFLOORS 1 TO 6 (MAX 338)
Type Description $/m² Size Price/Unit Numers Total Sales Total NLA % of total m²
A 1 Bedroom 1 Bathroom 6500 35 227,500 1 227,500 35
B 1 Bedroom 1 Bathroom + Studio 6600 75 495,000 1 495,000 75
C 2 Bedroom 1 Bathroom 6600 58 382,800 3 1,148,400 174
D 2 Bedroom 1 Bathroom + Studio 6700 90 603,000 0 0 0
E 2 Bedroom 2 Bathroom 9200 70 644,000 1 644,000 70 max
2,514,900 354 359
FLOORS 7 TO 11
A 1 Bedroom 1 Bathroom 6500 35 227,500 1 227,500 35
B 1 Bedroom 1 Bathroom + Studio 6600 75 495,000 1 495,000 75
C 2 Bedroom 1 Bathroom 6600 55 363,000 2 726,000 110
D 2 Bedroom 1 Bathroom + Studio 6700 90 603,000 0 0 0
E 2 Bedroom 2 Bathroom 9200 70 644,000 1 644,000 70 max
2,092,500 290 285
TOTAL
A 1 Bedroom 1 Bathroom 6500 35 227,500 9 2,047,500 315 11%
B 1 Bedroom 1 Bathroom + Studio 6600 75 495,000 9 4,455,000 675 23%
C 2 Bedroom 1 Bathroom 6600 55 363,000 23 8,349,000 1265 43%
D 2 Bedroom 1 Bathroom + Studio 6700 90 603,000 0 0 0 0%
E 2 Bedroom 2 Bathroom 9200 70 644,000 10 6,440,000 700 24%
51 21,291,500 2955 PROJECT
3 LEVELS MODIFICATION, 2 OF THE REGULAR ONE AND 1 OF THE BIGGER ONES
Table 4. Construction Costs
SUMMARY
Construction Cost
Demoltion 102,770.00
Apartment B. 9,525,529.41
Parking 1,395,554.00
Total Construction Cost 11,023,853.41
Consultant Fees 1,102,385
Statutory Costs 110,239
Total capital required for construction 12,236,477.29
PART 1 - DEMOLITIONS
Total square metres for parking
(from table 1) 1,195.00
Phase $/m² % $ total price
Demolitions: Retail premises, two
storrey ditto with reinforced concrete
slab
86
102,770.00
Total 102,770.00

ABPL 90026 Property Development Garcia, Acheampong, Zhe, Zhou
59
PART 2 - APARTMENT BUILDING
Apartment type Size Number Total m²
A 35 9 315
B 75 9 675
C 55 23 1265
D 90 0 0
E 70 10 700
Net lettable area 2955
Building Efficiency 85%
Gross building Area 3,476
Phase $/m² % $ total price
PRELIMINARIES 392.25 14.32% 1,363,646
SUBSTRUCTURE 37.00 1.35% 128,629
SUPERSTRUCTURE
Columns 50.25 1.83% 174,693
Upper floors 260.75 9.52% 906,490
Staircase 33.00 1.20% 114,724
Roof 36.50 1.33% 126,891
External Walls & Windows 317.75 11.60% 1,104,649
External doors 29.75 1.09% 103,425
Internal Walls 100.75 3.68% 350,254
Internal Screens 10.25 0.37% 35,634
Internal Doors 36.25 1.32% 126,022
FINISHES
Walls 76.00 2.77% 264,212
Floor 88.50 3.23% 307,668
Cielings 49.75 1.82% 172,954
FITTINGS
Firments 166.25 6.07% 577,963
Special 0.00 0.00% -
SERVICES
Plumbing 326.25 11.91% 1,134,199
Mechanical 328.25 11.98% 1,141,151
Fire 48.75 1.78% 169,478
Electrical 112.25 4.10% 390,234
Transportation 146.50 5.35% 509,303
Special 23.50 0.86% 81,697
EXTERNAL SERVICES 1.00 0.04% 3,476
CONTINGENCY 68.50 2.50% 238,138
TOTAL 2,740.00 100.00% 9,525,529

ABPL 90026 Property Development Garcia, Acheampong, Zhe, Zhou
60
PART 3 - UNDER GROUND PARKING
Total square metres for parking
(from table 1) 844.00
Phase $/m² % $ total price
PRELIMINARIES 294.25 10.74% 248,347.00
SUBSTRUCTURE 317.00 11.57% 267,548.00
SUPERSTRUCTURE
Columns 68.25 2.49% 57,603.00
Upper floors 151.00 5.51% 127,444.00
Staircase 16.75 0.61% 14,137.00
Roof 226.00 8.25% 190,744.00
External Walls & Windows 152.25 5.56% 128,499.00
External doors 17.50 0.64% 14,770.00
Internal Walls 36.50 1.33% 30,806.00
Internal Screens 0.00 0.00% -
Internal Doors 9.25 0.34% 7,807.00
FINISHES
Walls 16.75 0.61% 14,137.00
Floor 15.00 0.55% 12,660.00
Cielings 15.00 0.55% 12,660.00
FITTINGS
Firments 1.25 0.05% 1,055.00
Special 0.00 0.00% -
SERVICES
Plumbing 39.75 1.45% 33,549.00
Mechanical 104.75 3.82% 88,409.00
Fire 109.00 3.98% 91,996.00
Electrical 61.00 2.23% 51,484.00
Transportation 0.00 0.00% -
Special 0.00 0.00% -
EXTERNAL SERVICES 1.00 0.04% 844.00
CONTINGENCY 1.25 0.05% 1,055.00
TOTAL 1,653.50 60.35% 1,395,554.00

ABPL 90026 Property Development Garcia, Acheampong, Zhe, Zhou
61
Table 5. Financing of construction Required capital for construction 12,236,477
Interest Rates 5.59%
Debt to equity Ratio 20.00%
month % of
capital
Initial Loan Balance Interest Payments % of Balance Loan Balance payable end
of period
17 0.2 0 0 0 1,957,836 1,957,836
18 0 1,957,836 9,120 0 0 0 1,966,957
19 0 1,966,957 9,120 0 0 0 1,976,077
20 0.2 1,976,077 9,205 0 0 1,957,836 3,943,118
21 0 3,943,118 18,368 0 0 0 3,961,487
22 0 3,961,487 18,454 0 0 0 3,979,941
23 0.2 3,979,941 18,540 0 0 1,957,836 5,956,317
24 0 5,956,317 27,747 0 0 0 5,984,064
25 0 5,984,064 27,876 0 0 0 6,011,939
26 0.15 6,011,939 28,006 0 0 1,468,377 7,508,322
27 0 7,508,322 34,976 0 0 0 7,543,298
28 0 7,543,298 35,139 0 0 0 7,578,438
29 0.15 7,578,438 35,303 0 0 1,468,377 9,082,118
30 0 9,082,118 42,308 0 0 0 9,124,425
31 0 9,124,425 42,505 0 0 0 9,166,930
32 0.1 9,166,930 42,703 0 0 978,918 10,188,551
33 0 10,188,551 47,462 5,118,006 1 0 5,118,006
34 0 5,118,006 23,841 2,570,924 1 0 2,570,924
35 0 2,570,924 11,976 1,291,450 1 0 1,291,450
36 1,291,450 6,016 648,733 1 0 648,733
37 648,733 3,022 651,755 100% 0 0
38 0 0 0 0% 0 0
39 0 0 0 0% 0 0
40 0 0 0 0% 0 0
41 0 0 0 0% 0 0
491,686 10,280,868
10,280,868 Total Payments
9,789,182 Original Loan
491,686 0.050227507 Interest payed

ABPL 90026 Property Development Garcia, Acheampong, Zhe, Zhou
62
Table 6. Land Finance of $1 dollar
Interest Rates 4.59%
Monthly Interest Rate 0.38%
Periods 41
Effective interest rate 16.94%
Required money for land 1
Debt to equity Ratio 20.00%
month
Initial Loan Balance Interest Balance payable end
of period
Payments
% of Balance payed
0 0.80 0.003 0.803 0.000 0
1 0.80 0.003 0.806 0.000 0
2 0.81 0.003 0.809 0.000 0
3 0.81 0.003 0.812 0.000 0
4 0.81 0.003 0.815 0.000 0
5 0.82 0.003 0.819 0.000 0
6 0.82 0.003 0.822 0.000 0
7 0.82 0.003 0.825 0.000 0
8 0.82 0.003 0.828 0.000 0
9 0.83 0.003 0.831 0.000 0
10 0.83 0.003 0.834 0.000 0
11 0.83 0.003 0.838 0.000 0
12 0.84 0.003 0.841 0.000 0
13 0.84 0.003 0.844 0.000 0
14 0.84 0.003 0.847 0.000 0
15 0.85 0.003 0.850 0.000 0
16 0.85 0.003 0.854 0.000 0
17 0.85 0.003 0.857 0.000 0
18 0.86 0.003 0.860 0.000 0
19 0.86 0.003 0.863 0.000 0
20 0.86 0.003 0.867 0.000 0
21 0.87 0.003 0.870 0.000 0
22 0.87 0.003 0.873 0.000 0
23 0.87 0.003 0.877 0.000 0
24 0.88 0.003 0.880 0.000 0
25 0.88 0.003 0.883 0.000 0
26 0.88 0.003 0.887 0.000 0
27 0.89 0.003 0.890 0.000 0
28 0.89 0.003 0.894 0.000 0
29 0.89 0.003 0.897 0.000 0
30 0.90 0.003 0.901 0.000 0
31 0.90 0.003 0.904 0.000 0
32 0.90 0.003 0.907 0.000 0
33 0.91 0.003 0.911 0.455 50%
34 0.46 0.002 0.457 0.229 50%
35 0.23 0.001 0.229 0.115 50%
36 0.11 0.000 0.115 0.058 50%
37 0.06 0.000 0.058 0.058 100%
38 0.00 0.000 0.000 0.000 0%
39 0.00 0.000 0.000 0.000 0%
40 0.00 0.000 0.000 0.000 0%
41 0.00 0.000 0.000 0.000 0%
0 1
Total Payments 0.914
Original Loan 0.800
Interest payed 0.114 14.2697%
Explanation: The following is the schedule of payments for finance on the land. A value of one dollar has
been used in order to get the % of real interest payed in relation to the original loan ammount. So that,
instead of using the 50% rule, the payment schedule is used.

ABPL 90026 Property Development Garcia, Acheampong, Zhe, Zhou
63
Table 7. Land Finance
Interest Rates 4.59%
Monthly Interest Rate 0.38%
Periods 41
Effective interest rate 16.94%
Required money for land 3,022,127
Debt to equity Ratio 20.00%
month
Initial Loan Balance Interest Balance payable end of
period
Payments
% of Balance payed
0 2,417,702 9,248 2,426,950 0 0
1 2,426,950 9,283 2,436,233 0 0
2 2,436,233 9,319 2,445,551 0 0
3 2,445,551 9,354 2,454,905 0 0
4 2,454,905 9,390 2,464,295 0 0
5 2,464,295 9,426 2,473,721 0 0
6 2,473,721 9,462 2,483,183 0 0
7 2,483,183 9,498 2,492,682 0 0
8 2,492,682 9,535 2,502,216 0 0
9 2,502,216 9,571 2,511,787 0 0
10 2,511,787 9,608 2,521,395 0 0
11 2,521,395 9,644 2,531,039 0 0
12 2,531,039 9,681 2,540,720 0 0
13 2,540,720 9,718 2,550,438 0 0
14 2,550,438 9,755 2,560,194 0 0
15 2,560,194 9,793 2,569,987 0 0
16 2,569,987 9,830 2,579,817 0 0
17 2,579,817 9,868 2,589,685 0 0
18 2,589,685 9,906 2,599,590 0 0
19 2,599,590 9,943 2,609,534 0 0
20 2,609,534 9,981 2,619,515 0 0
21 2,619,515 10,020 2,629,535 0 0
22 2,629,535 10,058 2,639,593 0 0
23 2,639,593 10,096 2,649,689 0 0
24 2,649,689 10,135 2,659,824 0 0
25 2,659,824 10,174 2,669,998 0 0
26 2,669,998 10,213 2,680,211 0 0
27 2,680,211 10,252 2,690,463 0 0
28 2,690,463 10,291 2,700,754 0 0
29 2,700,754 10,330 2,711,084 0 0
30 2,711,084 10,370 2,721,454 0 0
31 2,721,454 10,410 2,731,863 0 0
32 2,731,863 10,449 2,742,313 0 0
33 2,742,313 10,489 2,752,802 1,376,401 50%
34 1,376,401 5,265 1,381,666 690,833 50%
35 690,833 2,642 693,475 346,738 50%
36 346,738 1,326 348,064 174,032 50%
37 174,032 666 174,698 174,698 100%
38 0 0 0 0
39 0 0 0 0
40 0 0 0 0
41 0 0 0 0
344,999 2,762,701
%
Total Payments 2,762,701.210
Original Loan 2,417,701.814
Interest payed 344,999.396
Percentage of original loan 14.27%
Explanation: The following is the schedule of payments for finance on the land using the same payment schedule of table 6, but with the
values obtained from the calculations of residual value to confirm that the interest rate % is correct.


