Embed Size (px)
Citation preview
Feasibility Study on Water Resources Development inRural Area in the
Kingdom of MoroccoFinal Report
Volume II Main Report
Part II Feasibility Study
7-1
PART II FEASIBILITY STUDY
CHAPTER 7 NATURAL AND SOCIAL CONDITIONS OF THE PRIORITYPROJECTS
7.1 Natural Conditions
7.1.1 Physiography and Geology
(1) No.5 N’Fifikh
N’Fifikh Dam Site is located almost at the border between the tablelands on theAtlantic Ocean side and the mountainous land. Altitude of riverbed at the dam site is212 m, and the highest peak of the river basin is a little higher than 800 m. Thecatchment area topographically features a lot of dense gullies and stream courseshaving round hill peaks of 500 to 700 m in height of elevation due to long timeerosion of old rocks.
Unconsolidated deposits distributing in the area are Alluvial deposits, Colluvialdeposits, and Terrace deposits. Alluvial deposits consist of River deposits, AlluvialCone deposits, and Alluvial Terrace deposits. Their composition is mainly gravelsand silts. Colluvial deposits consist of the mixture of fine soil and angular rockfragments, while Terrace deposits is of mainly silty to clayey layers with somerounded gravelly layers. Bedrock consists mainly of the alternation of Sandstone andPelitic Stone, intercalated with some Quartzite boudin and Limestone mass.Sandstone has various types such as Quartzitic, Arkosic, ore mineralized, and partlyschistose. The type of Pelitic Stone also ranges widely such as Argillite, Slate,Phyllite, or partly Pelitic to Green Schist. Structurally, the area can be divided mainlyinto Sandstone dominant area and Pelitic Stone dominant area, both of which belongto Devonian to Carboniferous. Overfolds and faults (thrusts) develop very much inthe area, and zones of Pelitic Stone layers are sometimes sheared, phyllitizate, andschistose. Furthermore, very hard rocks such as Quartzite separate into some blocksforming boudin. Depth to sound rock at dam foundation is relatively deep. Surfacezone is commonly developing many fissures. Due to this condition,it is dfficult toconstruct a concrete type of dam on the foundation. Geological profile of N’Fifikh isshown in Figure 7.1.1.
(2) No.9 Taskourt
Taskourt Dam Site is located on the northern slope of Haute Atlas Occidental.Altitude of riverbed at the dam site is 943 m, and the river basin has peaks rangingover 3000 m. The highest one is Jbel Igdet (3615 m). River Assif el Ma has perennialflow provided by snow-melting water from those mountains, and pours itself intoHauz plain around Marrakech.
7-2
Unconsolidated deposits in the area are Alluvial deposits, Colluvial or Talus deposits,and Terrace deposits. Alluvial deposits and Terrace deposits consist of very hardgravels, cobbles and boulders, while Colluvial or Talus deposits is of many brittlerock fragments and rock blocks in matrixes of silty soil. Bedrock around reservoirarea can be divided into 6 zones that are mainly orienting from north to south. Theyare the following from western to eastern side.
i- Quartzite, Quartzitic Schist, Quartz-Chlorite Schist, and Chlorite Schist(Lower Cambrian)
ii- Pelitic or Biotite Schist intercalated with Psammitic Schist(Cambro- Ordovician)
iii- Phyllitize Rocks, Graphite Schist, and Meta-Quartzite layer (boudin)with many Quartz vein, Calcite vein, and Igneous material intrusion(Silurian)
iv- Alteration zone (Brittle Graphite Schist altered by sulphate, gypsum, andother igneous material)
v- Pelitic Schist, Psammitic Schist, or Biotite or Black Schist (partlyphyllitize)(Cambro-Ordovician)
vi- Psammitic Schist or Quartz-Biotite Schist (black and hard, partly Peliticor Biotite Schist)(Ordovician)
The foundation at dam site consists of the rocks of zone (vi) above mentioned. Thoseare slightly folded and their schistosity and bedding are usually dipping todownstream. Faults may exist along riverbed and in the right abutment directing theirstrike mainly parallel to river course and dipping to both riverside and mountainside.Foundation at dam site may probably be hard and massive but some faults may existand covered with thick alluvial deposits along riverbed and talus deposit in the rightabutment. Geological Profile of Taskourt dam axis is shown on Figure 7.1.2
(3) No.10 Timkit
Timkit Dam Site is located on the southern border of Haute Atlas Central limited bythe cliff formed by the so called South Atlasic Faults. Altitude of riverbed at the damsite is 1211 m, and the highest peak of river basin is 2921 m of Ylalla Rejdet situatedNE of the dam site. River basin is prolonged to ENE to WSW due to mountainranging direction. Mountains in this area range usually ENE to WSW having cliffs inthe southern side and sloping sometimes gentle and sometimes steep to the northwardforming like Questa.
7-3
Unconsolidated deposits in the area are Alluvial deposits, Flood deposits, Talusdeposits, and Travertine. Alluvial and Flood deposits is mainly composed of sandsand gravels. Bedrock around reservoir area consists of Limestone, Dolomite, andMarl of Jurassic and Cretaceous. Foundation at dam site consists of the rocks as thefollowings from upstream side to downstream side. Those are all Liassic formations.
i- Limestone and Dolomite
ii- Black to brown ore (iron-manganese) mineralized Dolomite
iii- Alternation of (ii) strata intercalated with marl and (vi) strata
iv- White to bluish gray thinly layered (or laminating) stromatolitic orcherty strata.
Every stratum is dipping 20° to 30° to upstream side. Partial anticlinal folding can beobserved in the downstream side. Stratum (i) in the upstream develops many karstsso that it may be loose, porous, and highly permeable. Stratum (ii) also developslarge karst and many cavities exist inside. In case of strata (iii), they are interbeddedwith slightly cataclastic and nodular layers so that partly develops small karstsbetween these layers and limestone. On the other hand, strata (vi) have no karsts,well-layered, well contact each other, and relatively hard. Foundation rocks areusually relatively hard, but strata (i) and (ii) have a lot of leakage. Strata (iii) also hassome leakage. To prevent leakage, strata (vi) should be utilized effectively.Geological profile of the dam axis is shown on Figure 7.1.3
(4) No.17 Azghar
Azghar Dam Site is located western side of Moyen Atlas whose peak altitude is morethan 3000 m. Altitude of riverbed at the dam site is 821 m, and the highest peak ofriver basin is around 2100 m. Both banks around dam site and the followingwatershed consist of continuous hills, however the central area around reservoir andthe land situating in the rear consist of relatively gentle sloping area. Unconsolidateddeposits in the area are Colluvial deposits, Alluvial deposits, Terrace deposits,Travertine, and Residual soils with some wind transported soil and sheet erosiondeposits. Bedrock in the area consists of two formations, namely:
i- Rhythmical alternation of laminated and fissile Marl and blackLimestone.
ii- Laminated and fissile black Marl or Shale.
Both of them are Lower Liassic, and continuing from lower (ii) formation to upper (i)formation conformably. Large regionally, they form gently undulating Anticline andSyncline with axes NNE-SSW plunging to south. However, small regionally, they aremonoclinic structure dipping 10° to 20° to downstream side at dam site with theirstrike almost parallel to dam axes.
7-4
Formation (ii) extends in relatively flat or gently sloping reservoir area, andFormation (i) forms hilly area around the dam site. Foundation at dam site isgenerally massive and strong enough as a foundation except weathered portion ofsurface layer. Strength of dam foundation may be enough even for concrete type ofdam. Thickness of surface weathered layer is ranging from 3 to 5 m.
Up to 7~8 m depth in right abutment, 1~2 m at valley bottom, and around 20 m inleft abutment from the rock surface, Lugeon value is rather high, usually more than10. Deeper than above-mentioned depth, bedrock is commonly watertight. Bedrock iscovered by colluvial material and travertine with around 10m in thickness at the footin the right abutment, and by terrace deposits (sand and gravel with boulder) and finecolluvial material with 4 to 5 m in thickness at valley bottom. Left abutment usuallyhas no overburden. Geological profile of the dam axis is shown on Figure 7.1.4.
7.1.2 Construction Materials
(1) No. 5 N’Fifikh
N’Fifikh dam and its appurtenant structures proposed by this study will require thefollowing embankment volumes of each construction material:
- Impervious soil zone; 140,000 m3
- Filter and semi-pervious sand and gravel zone; 60,000+300,000=360,000 m3
- Pervious rock zone ; 160,000 m3
- Rip rap ; 20,000 m3
- Concrete aggregate; 60,000 m3
Test pitting, sampling and laboratory testing were carried out for soil material andsand & gravel materials. Also, sub-surface exploration was performed for rock andrip rap materials without laboratory test.
(2) No. 9 Taskourt
Taskourt dam is proposed to be a concrete gravity type. According to JICA StudyTeam recommendation, the concrete volume is estimated as 415,000 m3. Test pitting,sampling and laboratory tests were carried out for concrete aggregates asconstruction material. There is a large amount of river sand and gravel depositobservations in the proposed reservoir area. Also sand and gravel deposits areobserved in the riverbed near downstream of the dam site. Prospecting volumes ofdeposits are estimated as 2,250,000 m3 for the reservoir area and 150,000 m3 fordownstream dam site. Their boulder size content is not high. Silt contents are low,less than 3%. Gravel has excellent quality with 0.7 % of water absorption, 2.68 ofspecific gravity, 27% loss of abrasion test and non-reaction of alkali reaction.
7-5
Therefore, these materials are judged to be suitable for concrete aggregate. However,it should be noted that gravels have flat shape that will be causing less consistency ofmixing concrete and will sometimes require increment of cement content. To obtain aproper condition of mixing, various kinds of concrete mixing tests are necessary.
(3) No. 10 Timkit
Timkit dam is proposed to be a concrete gravity type with concrete volume estimatedas 230,000 m3. There are sand and gravel deposits observed on the riverbed aroundupstream and downstream of the dam site. Prospecting volumes of deposits areestimated as 450,000 m3. In the alluvium plain of downstream of Ifegh village, anenormous volume of sand and gravel are also observed.
Although no laboratory test on sand and gravel as construction material wasperformed, those materials are considered to have hard and of high durability to besuitable from their appearance. Natural sand and gravel have wide range of gradation,depending on the deposit condition and the depth.
Using sand and gravel with the natural gradation as concrete aggregate may affect theconcrete qualities, for example, showing uneven concrete strength.
It is important to clarify the tendency or relation between the gradation of materialand concrete qualities such as strength, workability, etc., through the survey andconcrete mixing test in the next stage.
(4) No. 17 Azghar
Azghar dam and its appurtenant structures proposed by this study will require thefollowing embankment volumes of each construction material:
- Impervious soil zone; 130,900 m3
- Filter and pervious sand and gravel zone; 61,500+531,100=592,600 m3
- Pervious rock zone; 23,200 m3
- Rip rap; 23,100 m3
- Concrete aggregate; 30,000 m3
Test pitting, sampling and laboratory testing were carried out for soil material andsand & gravel materials. Also, sub-surface exploration was performed for rock andrip rap materials without laboratory test.
The results and the detailed assessments and construction materials are described inthe Supporting Report X.
7-6
7.1.3 Hydrology and Groundwater
(1) River Basin
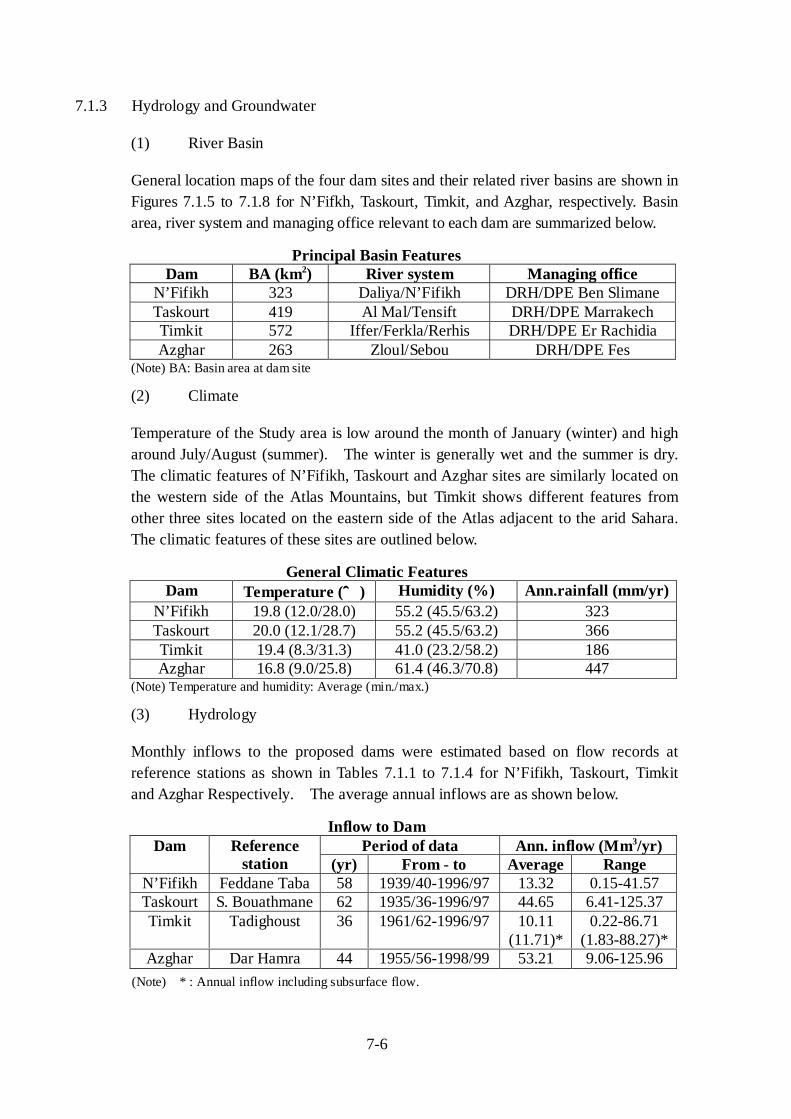
General location maps of the four dam sites and their related river basins are shown inFigures 7.1.5 to 7.1.8 for N’Fifkh, Taskourt, Timkit, and Azghar, respectively. Basinarea, river system and managing office relevant to each dam are summarized below.
Principal Basin FeaturesDam BA (km2) River system Managing office
N’Fifikh 323 Daliya/N’Fifikh DRH/DPE Ben SlimaneTaskourt 419 Al Mal/Tensift DRH/DPE MarrakechTimkit 572 Iffer/Ferkla/Rerhis DRH/DPE Er RachidiaAzghar 263 Zloul/Sebou DRH/DPE Fes
(Note) BA: Basin area at dam site
(2) Climate
Temperature of the Study area is low around the month of January (winter) and higharound July/August (summer). The winter is generally wet and the summer is dry.The climatic features of N’Fifikh, Taskourt and Azghar sites are similarly located onthe western side of the Atlas Mountains, but Timkit shows different features fromother three sites located on the eastern side of the Atlas adjacent to the arid Sahara.The climatic features of these sites are outlined below.
General Climatic FeaturesDam Temperature (℃℃℃℃) Humidity (%) Ann.rainfall (mm/yr)
N’Fifikh 19.8 (12.0/28.0) 55.2 (45.5/63.2) 323Taskourt 20.0 (12.1/28.7) 55.2 (45.5/63.2) 366Timkit 19.4 (8.3/31.3) 41.0 (23.2/58.2) 186Azghar 16.8 (9.0/25.8) 61.4 (46.3/70.8) 447
(Note) Temperature and humidity: Average (min./max.)
(3) Hydrology
Monthly inflows to the proposed dams were estimated based on flow records atreference stations as shown in Tables 7.1.1 to 7.1.4 for N’Fifikh, Taskourt, Timkitand Azghar Respectively. The average annual inflows are as shown below.
Inflow to DamPeriod of data Ann. inflow (Mm3/yr)Dam Reference
station (yr) From - to Average RangeN’Fifikh Feddane Taba 58 1939/40-1996/97 13.32 0.15-41.57Taskourt S. Bouathmane 62 1935/36-1996/97 44.65 6.41-125.37Timkit Tadighoust 36 1961/62-1996/97 10.11
(11.71)*0.22-86.71
(1.83-88.27)*Azghar Dar Hamra 44 1955/56-1998/99 53.21 9.06-125.96
(Note) *: Annual inflow including subsurface flow.
7-7
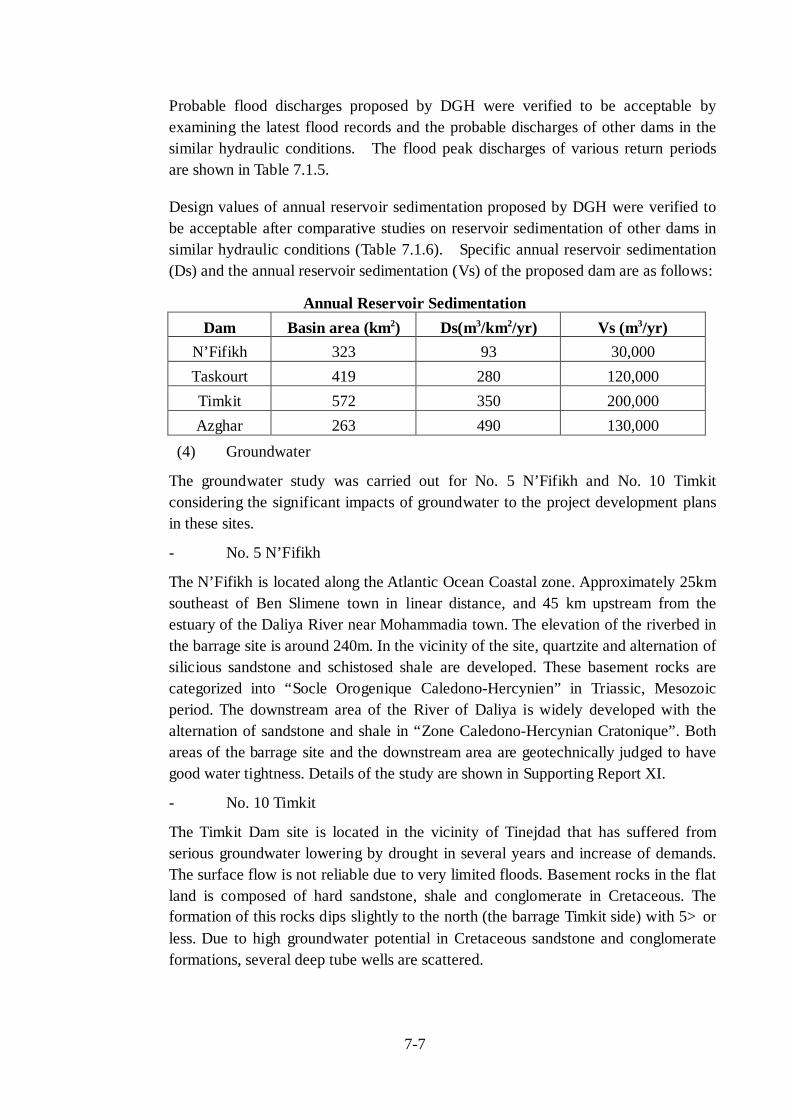
Probable flood discharges proposed by DGH were verified to be acceptable byexamining the latest flood records and the probable discharges of other dams in thesimilar hydraulic conditions. The flood peak discharges of various return periodsare shown in Table 7.1.5.
Design values of annual reservoir sedimentation proposed by DGH were verified tobe acceptable after comparative studies on reservoir sedimentation of other dams insimilar hydraulic conditions (Table 7.1.6). Specific annual reservoir sedimentation(Ds) and the annual reservoir sedimentation (Vs) of the proposed dam are as follows:
Annual Reservoir SedimentationDam Basin area (km2) Ds(m3/km2/yr) Vs (m3/yr)
N’Fifikh 323 93 30,000Taskourt 419 280 120,000Timkit 572 350 200,000Azghar 263 490 130,000
(4) Groundwater
The groundwater study was carried out for No. 5 N’Fifikh and No. 10 Timkitconsidering the significant impacts of groundwater to the project development plansin these sites.
- No. 5 N’Fifikh
The N’Fifikh is located along the Atlantic Ocean Coastal zone. Approximately 25kmsoutheast of Ben Slimene town in linear distance, and 45 km upstream from theestuary of the Daliya River near Mohammadia town. The elevation of the riverbed inthe barrage site is around 240m. In the vicinity of the site, quartzite and alternation ofsilicious sandstone and schistosed shale are developed. These basement rocks arecategorized into “Socle Orogenique Caledono-Hercynien” in Triassic, Mesozoicperiod. The downstream area of the River of Daliya is widely developed with thealternation of sandstone and shale in “Zone Caledono-Hercynian Cratonique”. Bothareas of the barrage site and the downstream area are geotechnically judged to havegood water tightness. Details of the study are shown in Supporting Report XI.
- No. 10 Timkit
The Timkit Dam site is located in the vicinity of Tinejdad that has suffered fromserious groundwater lowering by drought in several years and increase of demands.The surface flow is not reliable due to very limited floods. Basement rocks in the flatland is composed of hard sandstone, shale and conglomerate in Cretaceous. Theformation of this rocks dips slightly to the north (the barrage Timkit side) with 5°orless. Due to high groundwater potential in Cretaceous sandstone and conglomerateformations, several deep tube wells are scattered.
7-8
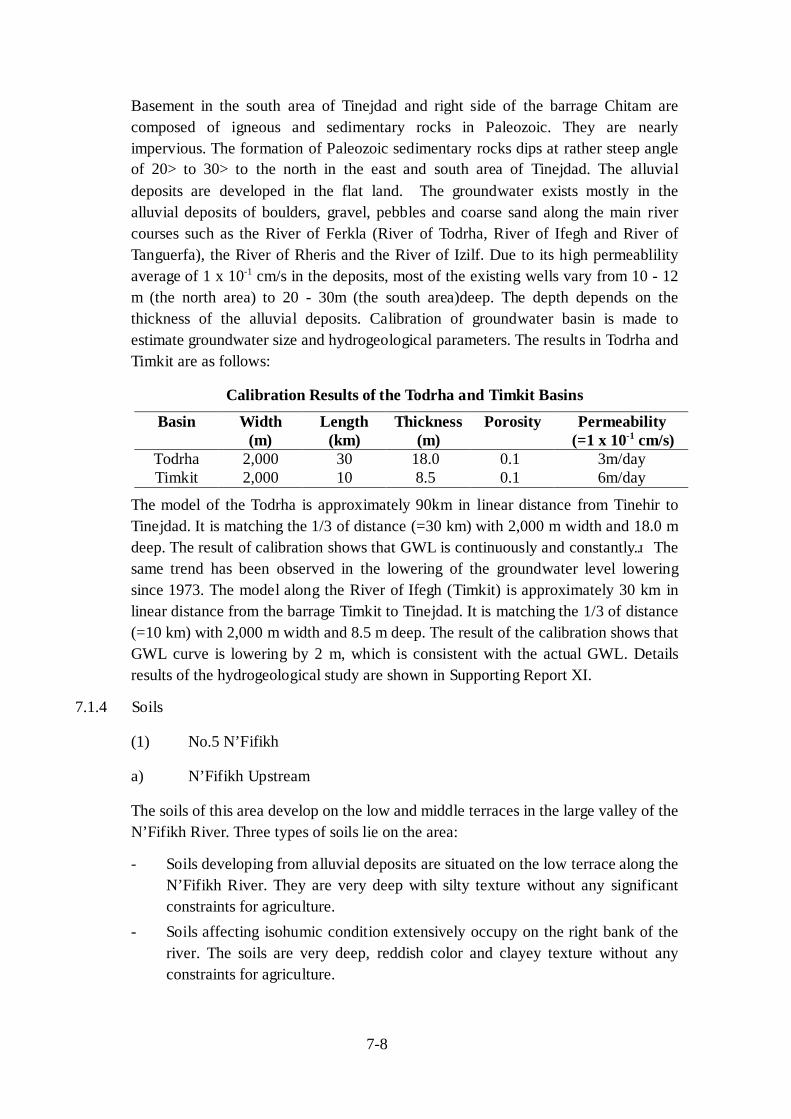
Basement in the south area of Tinejdad and right side of the barrage Chitam arecomposed of igneous and sedimentary rocks in Paleozoic. They are nearlyimpervious. The formation of Paleozoic sedimentary rocks dips at rather steep angleof 20°to 30°to the north in the east and south area of Tinejdad. The alluvialdeposits are developed in the flat land. The groundwater exists mostly in thealluvial deposits of boulders, gravel, pebbles and coarse sand along the main rivercourses such as the River of Ferkla (River of Todrha, River of Ifegh and River ofTanguerfa), the River of Rheris and the River of Izilf. Due to its high permeablilityaverage of 1 x 10⁻¹ cm/s in the deposits, most of the existing wells vary from 10 - 12m (the north area) to 20 - 30m (the south area)deep. The depth depends on thethickness of the alluvial deposits. Calibration of groundwater basin is made toestimate groundwater size and hydrogeological parameters. The results in Todrha andTimkit are as follows:
Calibration Results of the Todrha and Timkit Basins
Basin Width(m)
Length(km)
Thickness(m)
Porosity Permeability(=1 x 10⁻¹ cm/s)
Todrha 2,000 30 18.0 3m/dayTimkit 2,000 10 8.5
0.10.1 6m/day
The model of the Todrha is approximately 90km in linear distance from Tinehir toTinejdad. It is matching the 1/3 of distance (=30 km) with 2,000 m width and 18.0 mdeep. The result of calibration shows that GWL is continuously and constantly. Thesame trend has been observed in the lowering of the groundwater level loweringsince 1973. The model along the River of Ifegh (Timkit) is approximately 30 km inlinear distance from the barrage Timkit to Tinejdad. It is matching the 1/3 of distance(=10 km) with 2,000 m width and 8.5 m deep. The result of the calibration shows thatGWL curve is lowering by 2 m, which is consistent with the actual GWL. Detailsresults of the hydrogeological study are shown in Supporting Report XI.
7.1.4 Soils
(1) No.5 N’Fifikh
a) N’Fifikh Upstream
The soils of this area develop on the low and middle terraces in the large valley of theN’Fifikh River. Three types of soils lie on the area:
- Soils developing from alluvial deposits are situated on the low terrace along theN’Fifikh River. They are very deep with silty texture without any significantconstraints for agriculture.
- Soils affecting isohumic condition extensively occupy on the right bank of theriver. The soils are very deep, reddish color and clayey texture without anyconstraints for agriculture.
7-9
- Soils formed from Vertisols occupy large extent on the left bank of the river.These soils are characterized by very deep, clayey texture and low permeability.Locally, the soils present a stony load in middle surface. The area coveringfrom these soils have a constraint on the slope.
b) N’Fifikh Downstream
The soils of this area develop on the low trays of the coastal plains as follows:
- Hydromorphic soils are dominant in this area. These soils are formed from olddeposits of the Quaternary. They are characterized by a discontinuity of veryclear textures. The surface soils from 30 to 50 cm in depth are coarse texturewith high content in ferruginous concretions. The horizon lies on the accuratetransition and subsurface soils are very clayey and compact horizon ofimpervious layer. These soils present major constraints of texture, discontinuitytexture and internal drainage.
- Red soils lie on the east borders of the area. The soils are deep (from 80 to 120cm) and locally fairly deep (40 to 60 cm). Their textures are slightly sandy insurface and become clayey in depth. These soils are generally good foragriculture, but there are constraints in topographical conditions.
(2) No.9 Taskourt
The Taskourt area has the following types of soils:
- Alluvial soils are situated on the low terraces of the Asif El Mal River anddownstream area. They are very deep with silty textures. These soils are apt toinundate in the low terraces locally. They are capable in any kind of cultivation.
- Brown calcareous soils as well occupy large extent in strand on the left bank ofthe river. These soils are characterized by their shallow layer that are rarely 40cm of surface soil and stony in surface.
- Fersialitic soils occupy large surface in the area and are concentratedcompletely on the left bank of the river. They are characterized by their redcolor and fine texture. The soils generally have constraints in the slope. Theshallow soil depth and stony on surface are recognized partly.
(3) No.10 Timkit
a) Ifegh Area
The area is just located downstream the proposed Timkit dam site situated on thesouth of the High Atlas Mountains. Soils contain plenty of stones and gravels insurface and in depth. Terracing farmlands, which were graded and leveled by farmers,have been artificially developed in this area. In parts of the area dominated by theseguia, soil becomes very shallow and farmers brought earth there to enablecultivation. The soils of this area are characterized the stony and shallow soil.
7-10
b) Tinejdad Area
The area occupies a low alluvial terrace of the Todrha River. Soils are homogeneous.They are very deep alluvial soils with silty texture. The soils of this area do notpresent any considerable constraints for intensification of irrigation.
c) Chitam Area
The area was occupied by many farmlands but it was affected strongly by sandshifting that has invaded more than half of farmlands. Soils in this area are relativelysandy. It is difficult to irrigate part of the area.
(4) No.17 Azghar
This area is occuppies a large terrace of the Zloul River shaped in the tender schistosemarls of the Jurrassique in the north edges of the Middle Atlas. Dominant soils are:- Isohumic red soils occupy terraces where the slope ranges between 2 and 4%.
They are very deep, clayey texture, and locally stony. The soils have highfertility with wide cultivation.
- The soils facing erosion situate in the area relatively steep slope of 4 to 8%. Thesoils are little deep (less than 40 cm). The area has topographic constraint.
(5) Land Suitability of the Each Project Areas
The classification of Land Suitability in Morocco basically follows the Frenchsystem, which is for the operation of large scale in irrigation scheme. However, theirrigation plan has been proposed in consideration of small-scale network in thisproject, which is applicable to the high slope area. Therefore, the application of theclassification of this land suitability will be considered based on the irrigationscheme proposed in the Project.
7.1.5 Natural Environment
Present status of fauna (terrestrial and aquatic) and flora (terrestrial) around the fourdam literature was also reviewed. Field investigation was focused mainly on thesubmerging areas upstream, but ecosystems downstream reaches were also surveyed.Two endangered mammal species, Felis caracal and Ammotragus levia weredistributed around some of the dam sites. Felis caracal was found in N’Fifikh andAzghar, and Ammotragus levia was also found around Taskourt, Timkit and Azgharsites. However, mobility of those species (cat and ungulate) is quite high so that thepopulation size is unlikely seriously reduced unless there is a significant loss of theirhabitats. However, critical habitats of those species in the study areas have not beenidentified and that the impact is unlikely to be significant.
7-11
For to the status of fauna, any endangered or rare species of plant species have notbeen found with the field investigations during the course of the Study. Distributionof the plants is generally limited due to low precipitation.
Present status of natural environment is shown in XVI 3.1 of Supporting Report XVI.
7.2 Social Conditions
7.2.1 Socio-economic Conditions (downstream areas)
(1) Administrative Conditions
The beneficial areas of the four projects cover two municipalities, 13 rural and urbancommunes consist of more than 180 villages (Douars). Administrative conditions ofthe beneficial areas of each Project site are as shown in Table 7.2.1. More than120,000 people will be directly or indirectly benefited from the Projects.
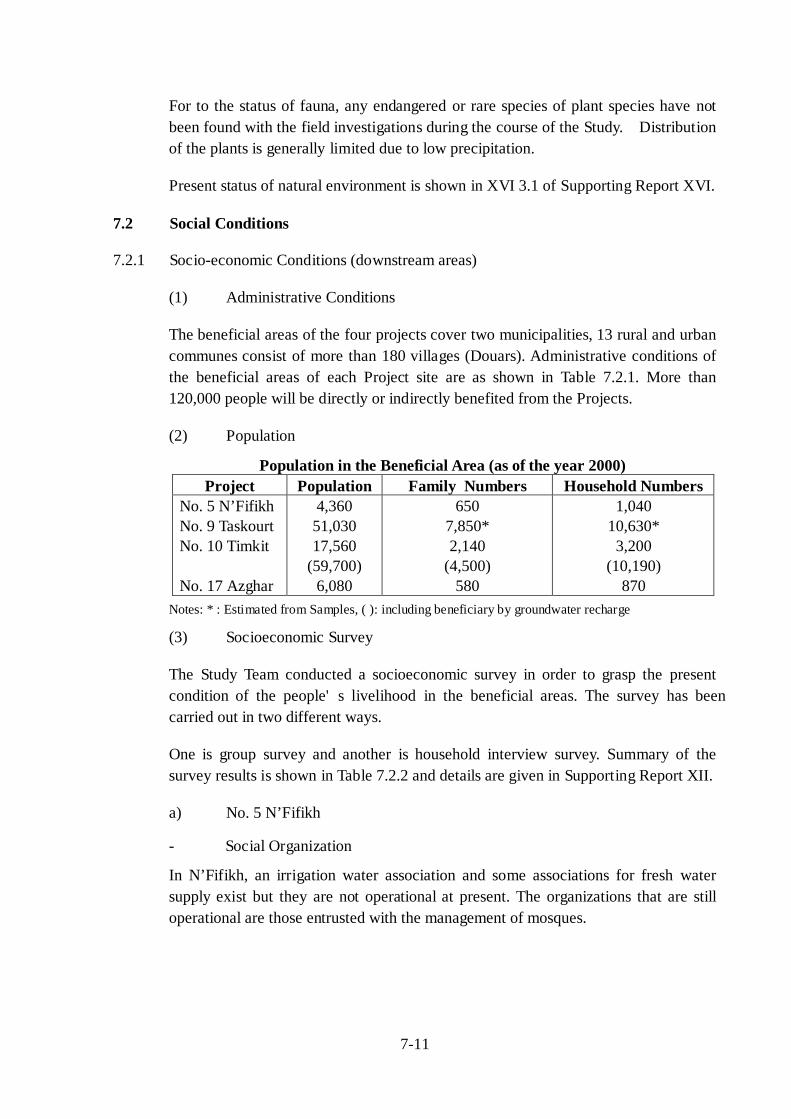
(2) Population
Population in the Beneficial Area (as of the year 2000)Project Population Family Numbers Household Numbers
No. 5 N’FifikhNo. 9 TaskourtNo. 10 Timkit
No. 17 Azghar
4,36051,03017,560
(59,700)6,080
6507,850*2,140
(4,500)580
1,04010,630*3,200
(10,190)870
Notes: *: Estimated from Samples, ( ): including beneficiary by groundwater recharge
(3) Socioeconomic Survey
The Study Team conducted a socioeconomic survey in order to grasp the presentcondition of the people's livelihood in the beneficial areas. The survey has beencarried out in two different ways.
One is group survey and another is household interview survey. Summary of thesurvey results is shown in Table 7.2.2 and details are given in Supporting Report XII.
a) No. 5 N’Fifikh
- Social Organization
In N’Fifikh, an irrigation water association and some associations for fresh watersupply exist but they are not operational at present. The organizations that are stilloperational are those entrusted with the management of mosques.
7-12
- Education
The school attendance rates are relatively high both among boys and girls. They are96% for boys and 89% for girls. This is due to the proximity of large urban centers,availability of school and junior high school within reasonable distance from thevillages. The literacy rates are low at 55% for men and 24% for women. Of thevillages, 2/3 have a school in their villages and the remaining 1/3 are located 0.1 to 3km away from schools.
b) No. 9 Taskourt
- Social Organization
The rural society at the downstream area of Taskourt is very well structured. Thelocal population manages all the collective goods. The management of koranicschools and mosques, collective lands and irrigation water are revealing indicators ofhow well people are informally organized. These informal organizations havecredibility among people. The most important formal (institutional) organizations atthe downstream areas are the six milk cooperatives. Four of them are located in therural communes of Guemmassa and Assif El Mal (two in each commune rural) andtwo are located in the rural communes of Mejjat and Mzouda (one in each).
- Migratory Movement
The migratory movements concern mainly the men’s temporarily emigration. Ofactive men’s population, 50% is concerned with emigration. They go to big citieswhere they stay and work for two to three months. They work in bakeries, cafes,public bathrooms (hammam), etc. Only 4 % of women are concerned by emigration.They go to big cities to work as housekeepers, employees in restaurants or cafes.The main reason of people’s emigration is the lack of employment in villagesaccentuated by the severe drought of the last few years.
- Education
The school attendance rates are relatively high in the studied villages. They are of78% for boys and 65% for girls. This situation could be partially explained by theschools’ availability, which is located at an average distance of 0.4 km. On the otherhand, the literacy rates are very low at 21% for men and 3% for women. Out of theeight sample villages, except in Aazib, primary schools exist in all other villages.
c) No. 10 Timkit
- Social Organization
In this site, social organization is still very active although it has reduced some of itsfunctions. The most significant example is the irrigation community. Every unit hasits Jmaa and does not avoid the implications of hierarchy and social stratification.
7-13
- Education
The schooling rate is also high among boys and girls. On average, it reaches 81% forboys and 76% for girls. In fact, all the villages have a school. The literacy rate isalmost average for males (47%) and low for females (10%). All the douars have aprimary school in their village. Two or three neighboring qsours commonly use oneschool. Junior- senior high schools are located in Tinejdad.
d) No. 17 Azghar
- Social Organization
Organizations that still exist are those entrusted with the mosque management.
- Education
The schooling attendance rate is high both for boys (88%) and girls (78%). This isdue to the proximity of schools to the villages. The literacy rate is low at 44% formen and very low at 9% for women. Of the villages, 86% are less than 2 km awayfrom school.
(4) Results of Household Interview Survey
The household interview survey was conducted in the beneficial areas. Number ofhouseholds surveyed for each site is 63 for N'Fifikh, 75 for Taskourt, 77 for Timkitand 44 for Azghar. Results of the survey are summarized below:
a) Family Structure
In many houses in the Project areas, more than one household live in the same house.Average family size in the Project areas is 8.9 persons and this is larger than averagefamily size in rural area of Morocco, 6.6 persons. The average family sizes atN’Fifikh, Taskourt, Timkit, and Azghar are 8.4, 7.6,11.4, and 7.4, respectively.
b) Economic Activities
Almost all the households are engaged in agriculture, but many of them are alsoinvolved in other businesses. Especially in Timkit, the households engaged inagriculture and other economic activities make up account for 77 percent of the totalhouseholds. Likewise, the farm families involved in other businesses are large at 48percent for N'Fifikh, 63 percent for Taskourt, and 57 percent for Azghar. Probablythis occurred due to drought in recent years and the need for cash income.
Family budget of the households in the Project areas is largely depending onremittance from migrant workers. Approximately 40 percent of the family income iscoveted by remittance from migrant workers on average as shown below:
7-14
Average family income and expenditure (DH/house/year)N’Fifikh Taskourt Timkit Azghar Total
Excl. migrant workers remittanceIncl. migrant workers remittance
32,80047,900
20,80027,000
12,60032,400
16,50023,700
20,55133,129
Family expenditure 15,600 17,100 16,100 16,300 16,300
According to many respondents, actual income and expenditure are almost balancedso they cannot afford to save money.
c) Influence of Flood and Erosion
In Timkit, a serious flood occurred in 1979. About 73% of the sample householdsanswered that they have suffered from flood inundation in their farmlands. Thedamaged crops were dates, alfalfa, and wheat.
In N'Fifikh, a serious flood occurred in 1996. About 41% of the sample householdssuffered from flood damage in their farmland. Wheat, beans, and vegetables weredamaged.
In Taskourt, a serious flood occurred in 1999. The ratios of suffered households arerelatively small at 24%, but they are concentrated in Assif El mal commune. In thecommune, 55% of households suffered from flood damage. The major damagedcrops were barley, olive, and alfalfa.
In Azghar, flood inundation is not significant. The ratios of suffered households aresmall at seven percent.
7.2.2 Agriculture
(1) Present Agricultural Conditions
(a) No. 5 N’Fifikh
The Project area is separated into two, upstream area and downstream area. TheUpstream area is located at the northwest of Ben slimane City and the downstreamarea is located at the west of Mohamedia City.
- N’Fifikh Upstream
The area of N’Fifikh upstream is typically single cultivated area of cereals underrain-fed condition. Main cereals are soft wheat and hard wheat. Vegetables arecultivated in the irrigated areas situated near the N’Fifikh River for self-consumptionand cash income. Irrigation water is collected from groundwater by traditionalmethods, but irrigated areas are very limited.
Legumes (broad bean and green bean), forages (barley and oat) and tree crops (grape andolive) are cultivated in small areas. Present land occupancy of crops in the N’Fifikhupstream area is as follows (fallow or open Land = 9% and irrigated ratio = 3%):
7-15
Crops Cereals Legumes Vegetable Fodder Fruits(%) 85-90 5± 2± 5± 5±
There are no large-scale agricultural processing facilities. Agricultural machinery iswidely utilized for cereal cultivation, and also cultivation by means of animals andmanpower are also widely practiced. Fertilizers and chemicals are utilized but theseamounts are small. Drip irrigation systems are used to cultivate grapes and potato.
- N’Fifikh Downstream
Single cultivation of cereals under rain-fed condition is also predominant in the areaof N’Fifikh downstream. Main cereals are soft wheat and barley. Grapes are famousin this are, though their cultivated areas are not so large.
SBarley and oat are cultivated as fodder production. Vegetables and legumes arecultivated in very limited areas for self-consumption and cash income.
Fallow land in the downstream area occupies larger area compared with the upstreamarea. Farmers in this area have good knowledge and technique of cultivation methods.In the N’Fifikh downstream area, it is difficult to collect irrigation water. Irrigationwater is only available as groundwater and natural ponds in the rainy season. Presentland occupancy of crops in the N’Fifikh downstream area is as follows (fallow oropen land = 22% and irrigated ratio = 5%):
Crops Cereals Legumes Vegetable Fodder Fruits(%) 80-85 1± 2-5 4-8 7±
There are some large-scale agricultural processing facilities. Agricultural machineryis widely utilized for cereal cultivation. Fertilizers and chemicals are utilized butthese amounts are small. Both the upstream and downstream areas in N’Fifikh arelocated near Rabat and Casablanca. These areas have, therefore, high potential forfuture development in view of marketing condition.
(b) No. 9 Taskourt
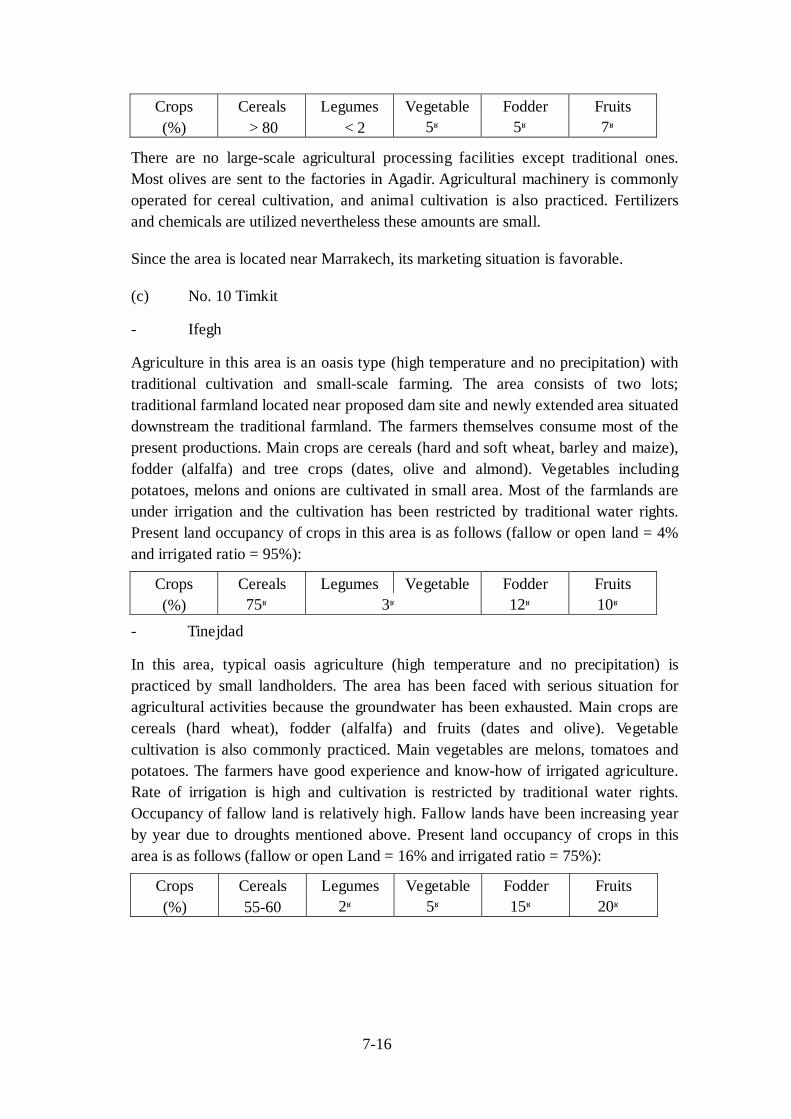
The Taskourt area is located at the typical agricultural zone in the southeast Moroccanclimate, which is relatively warm and has low precipitation. There are some constraintsin farming due to the steep topographical condition and gravely soils.Main cerealsconsist of barley and soft wheat. Fodder cultivation (alfalfa) is practiced along theAssif El Mar River. Fruits including olive and almond are commonly cultivated.Olives are grown in flat lands and almonds relatively in sloppy areas.
Main vegetables are potato and melons. Present land occupancy of crops in this areais as follows (fallow or open land = 4% and irrigated ratio = 32% with permanent,seasonal and flood irrigation)
7-16
Crops Cereals Legumes Vegetable Fodder Fruits(%) >80 <2 5± 5± 7±
There are no large-scale agricultural processing facilities except traditional ones.Most olives are sent to the factories in Agadir. Agricultural machinery is commonlyoperated for cereal cultivation, and animal cultivation is also practiced. Fertilizersand chemicals are utilized nevertheless these amounts are small.
Since the area is located near Marrakech, its marketing situation is favorable.
(c) No. 10 Timkit
- Ifegh
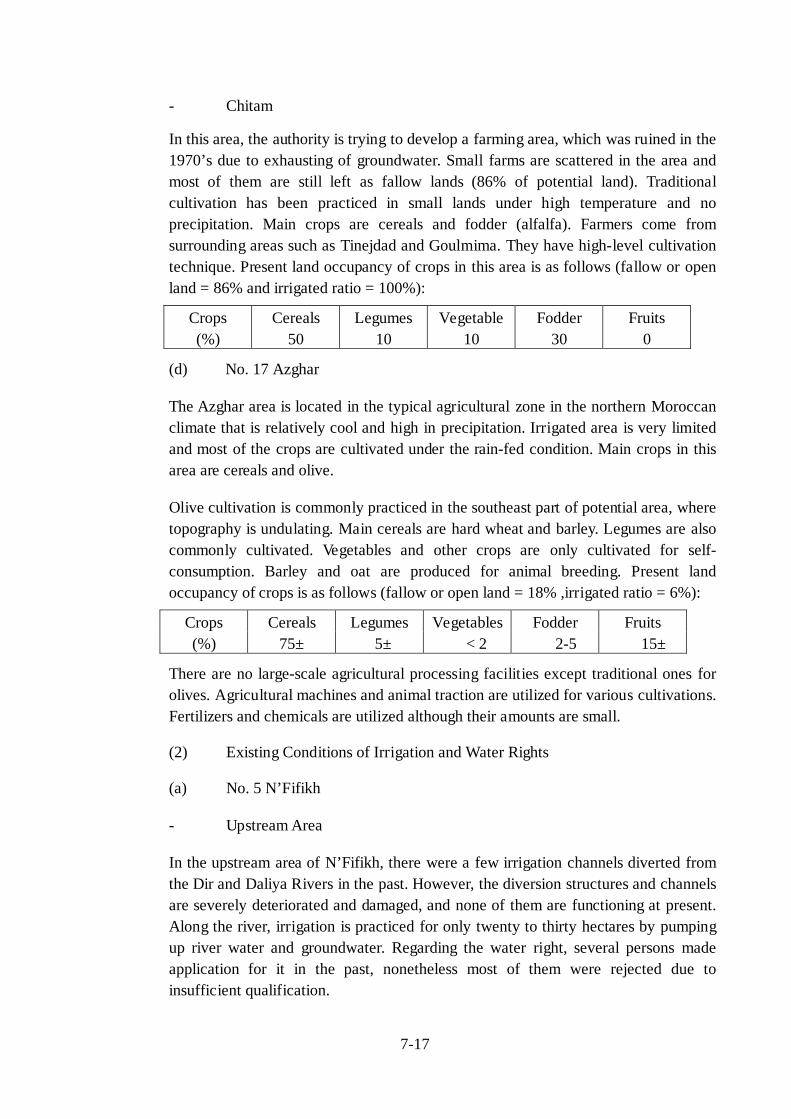
Agriculture in this area is an oasis type (high temperature and no precipitation) withtraditional cultivation and small-scale farming. The area consists of two lots;traditional farmland located near proposed dam site and newly extended area situateddownstream the traditional farmland. The farmers themselves consume most of thepresent productions. Main crops are cereals (hard and soft wheat, barley and maize),fodder (alfalfa) and tree crops (dates, olive and almond). Vegetables includingpotatoes, melons and onions are cultivated in small area. Most of the farmlands areunder irrigation and the cultivation has been restricted by traditional water rights.Present land occupancy of crops in this area is as follows (fallow or open land = 4%and irrigated ratio = 95%):
Crops Cereals Legumes Vegetable Fodder Fruits(%) 75± 3± 12± 10±
- Tinejdad
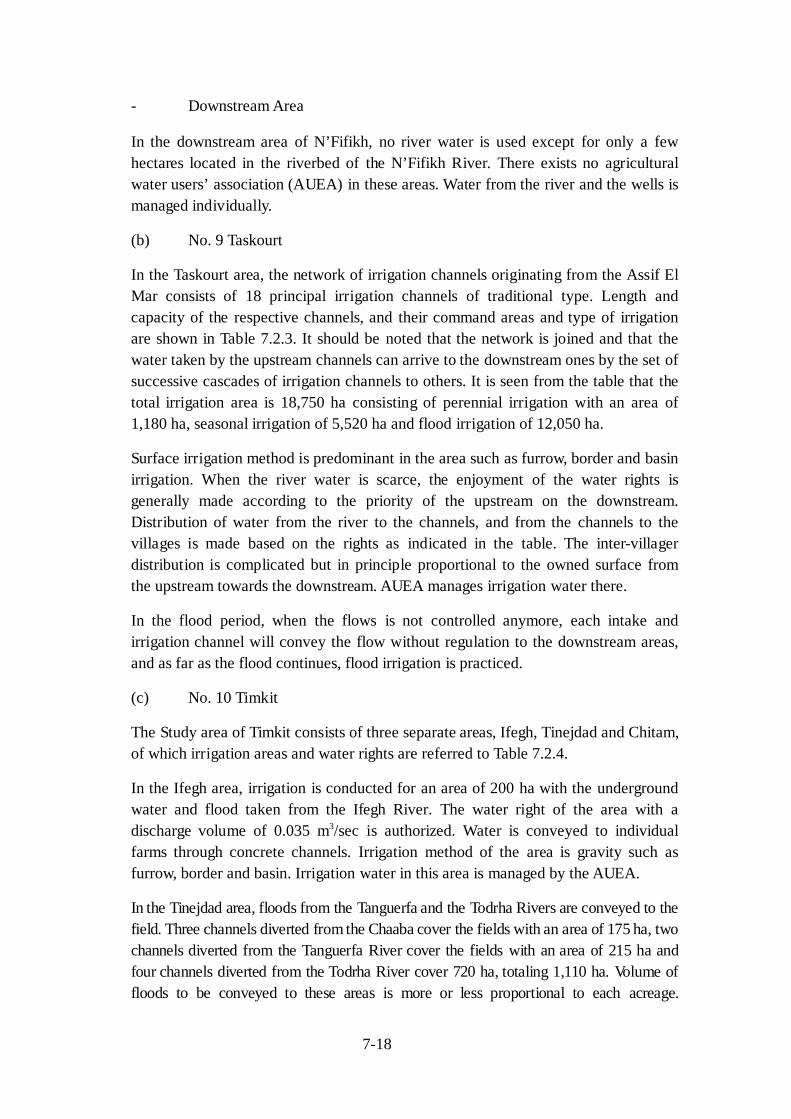
In this area, typical oasis agriculture (high temperature and no precipitation) ispracticed by small landholders. The area has been faced with serious situation foragricultural activities because the groundwater has been exhausted. Main crops arecereals (hard wheat), fodder (alfalfa) and fruits (dates and olive). Vegetablecultivation is also commonly practiced. Main vegetables are melons, tomatoes andpotatoes. The farmers have good experience and know-how of irrigated agriculture.Rate of irrigation is high and cultivation is restricted by traditional water rights.Occupancy of fallow land is relatively high. Fallow lands have been increasing yearby year due to droughts mentioned above. Present land occupancy of crops in thisarea is as follows (fallow or open Land = 16% and irrigated ratio = 75%):
Crops Cereals Legumes Vegetable Fodder Fruits(%) 55-60 2± 5± 15± 20±
7-17
- Chitam
In this area, the authority is trying to develop a farming area, which was ruined in the1970’s due to exhausting of groundwater. Small farms are scattered in the area andmost of them are still left as fallow lands (86% of potential land). Traditionalcultivation has been practiced in small lands under high temperature and noprecipitation. Main crops are cereals and fodder (alfalfa). Farmers come fromsurrounding areas such as Tinejdad and Goulmima. They have high-level cultivationtechnique. Present land occupancy of crops in this area is as follows (fallow or openland = 86% and irrigated ratio = 100%):
Crops Cereals Legumes Vegetable Fodder Fruits(%) 50 10 10 30 0
(d) No. 17 Azghar
The Azghar area is located in the typical agricultural zone in the northern Moroccanclimate that is relatively cool and high in precipitation. Irrigated area is very limitedand most of the crops are cultivated under the rain-fed condition. Main crops in thisarea are cereals and olive.
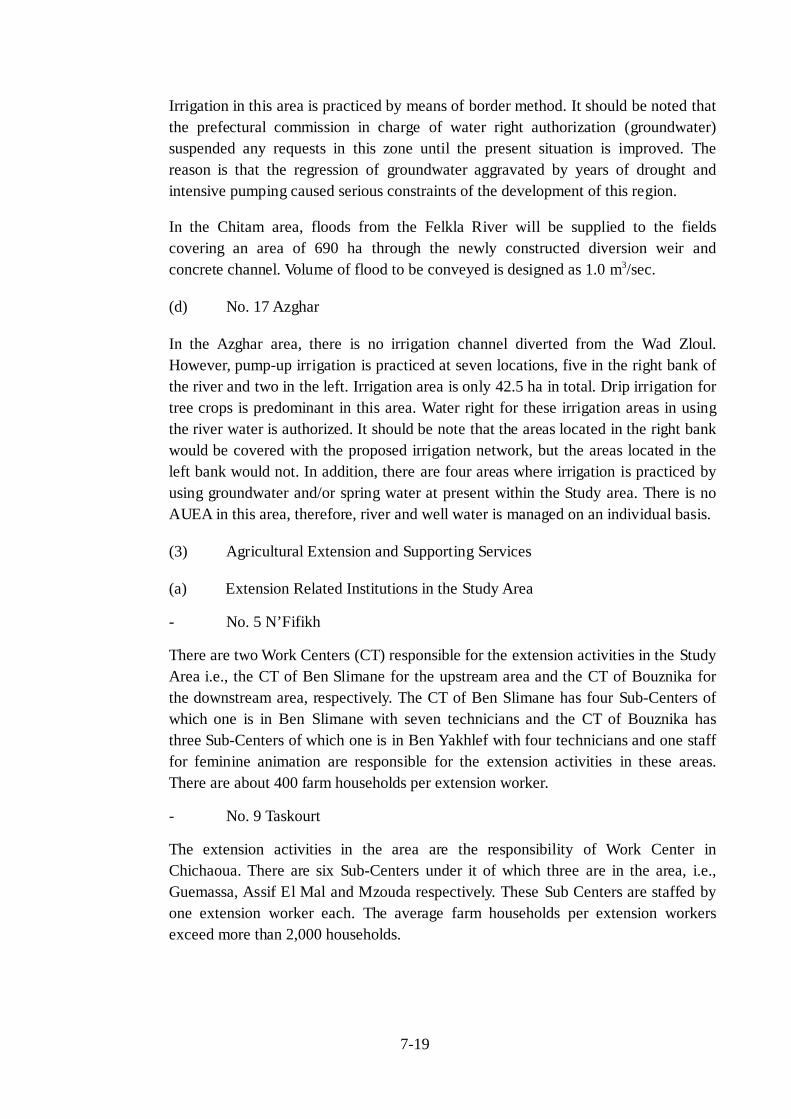
Olive cultivation is commonly practiced in the southeast part of potential area, wheretopography is undulating. Main cereals are hard wheat and barley. Legumes are alsocommonly cultivated. Vegetables and other crops are only cultivated for self-consumption. Barley and oat are produced for animal breeding. Present landoccupancy of crops is as follows (fallow or open land = 18% ,irrigated ratio = 6%):
Crops Cereals Legumes Vegetables Fodder Fruits(%) 75± 5± <2 2-5 15±
There are no large-scale agricultural processing facilities except traditional ones forolives. Agricultural machines and animal traction are utilized for various cultivations.Fertilizers and chemicals are utilized although their amounts are small.
(2) Existing Conditions of Irrigation and Water Rights
(a) No. 5 N’Fifikh
- Upstream Area
In the upstream area of N’Fifikh, there were a few irrigation channels diverted fromthe Dir and Daliya Rivers in the past. However, the diversion structures and channelsare severely deteriorated and damaged, and none of them are functioning at present.Along the river, irrigation is practiced for only twenty to thirty hectares by pumpingup river water and groundwater. Regarding the water right, several persons madeapplication for it in the past, nonetheless most of them were rejected due toinsufficient qualification.
7-18
- Downstream Area
In the downstream area of N’Fifikh, no river water is used except for only a fewhectares located in the riverbed of the N’Fifikh River. There exists no agriculturalwater users’ association (AUEA) in these areas. Water from the river and the wells ismanaged individually.
(b) No. 9 Taskourt
In the Taskourt area, the network of irrigation channels originating from the Assif ElMar consists of 18 principal irrigation channels of traditional type. Length andcapacity of the respective channels, and their command areas and type of irrigationare shown in Table 7.2.3. It should be noted that the network is joined and that thewater taken by the upstream channels can arrive to the downstream ones by the set ofsuccessive cascades of irrigation channels to others. It is seen from the table that thetotal irrigation area is 18,750 ha consisting of perennial irrigation with an area of1,180 ha, seasonal irrigation of 5,520 ha and flood irrigation of 12,050 ha.
Surface irrigation method is predominant in the area such as furrow, border and basinirrigation. When the river water is scarce, the enjoyment of the water rights isgenerally made according to the priority of the upstream on the downstream.Distribution of water from the river to the channels, and from the channels to thevillages is made based on the rights as indicated in the table. The inter-villagerdistribution is complicated but in principle proportional to the owned surface fromthe upstream towards the downstream. AUEA manages irrigation water there.
In the flood period, when the flows is not controlled anymore, each intake andirrigation channel will convey the flow without regulation to the downstream areas,and as far as the flood continues, flood irrigation is practiced.
(c) No. 10 Timkit
The Study area of Timkit consists of three separate areas, Ifegh, Tinejdad and Chitam,of which irrigation areas and water rights are referred to Table 7.2.4.
In the Ifegh area, irrigation is conducted for an area of 200 ha with the undergroundwater and flood taken from the Ifegh River. The water right of the area with adischarge volume of 0.035 m3/sec is authorized. Water is conveyed to individualfarms through concrete channels. Irrigation method of the area is gravity such asfurrow, border and basin. Irrigation water in this area is managed by the AUEA.
In the Tinejdad area, floods from the Tanguerfa and the Todrha Rivers are conveyed to thefield. Three channels diverted from the Chaaba cover the fields with an area of 175 ha, twochannels diverted from the Tanguerfa River cover the fields with an area of 215 ha andfour channels diverted from the Todrha River cover 720 ha, totaling 1,110 ha. Volume offloods to be conveyed to these areas is more or less proportional to each acreage.
7-19
Irrigation in this area is practiced by means of border method. It should be noted thatthe prefectural commission in charge of water right authorization (groundwater)suspended any requests in this zone until the present situation is improved. Thereason is that the regression of groundwater aggravated by years of drought andintensive pumping caused serious constraints of the development of this region.
In the Chitam area, floods from the Felkla River will be supplied to the fieldscovering an area of 690 ha through the newly constructed diversion weir andconcrete channel. Volume of flood to be conveyed is designed as 1.0 m3/sec.
(d) No. 17 Azghar
In the Azghar area, there is no irrigation channel diverted from the Wad Zloul.However, pump-up irrigation is practiced at seven locations, five in the right bank ofthe river and two in the left. Irrigation area is only 42.5 ha in total. Drip irrigation fortree crops is predominant in this area. Water right for these irrigation areas in usingthe river water is authorized. It should be note that the areas located in the right bankwould be covered with the proposed irrigation network, but the areas located in theleft bank would not. In addition, there are four areas where irrigation is practiced byusing groundwater and/or spring water at present within the Study area. There is noAUEA in this area, therefore, river and well water is managed on an individual basis.
(3) Agricultural Extension and Supporting Services
(a) Extension Related Institutions in the Study Area
- No. 5 N’Fifikh
There are two Work Centers (CT) responsible for the extension activities in the StudyArea i.e., the CT of Ben Slimane for the upstream area and the CT of Bouznika forthe downstream area, respectively. The CT of Ben Slimane has four Sub-Centers ofwhich one is in Ben Slimane with seven technicians and the CT of Bouznika hasthree Sub-Centers of which one is in Ben Yakhlef with four technicians and one stafffor feminine animation are responsible for the extension activities in these areas.There are about 400 farm households per extension worker.
- No. 9 Taskourt
The extension activities in the area are the responsibility of Work Center inChichaoua. There are six Sub-Centers under it of which three are in the area, i.e.,Guemassa, Assif El Mal and Mzouda respectively. These Sub Centers are staffed byone extension worker each. The average farm households per extension workersexceed more than 2,000 households.
7-20
- No. 10 Timkit
Two CMV, one in Tinejdad and the other in Aghbalou under ORMVA/TF areresponsible for the extension activities in the area. ORMVA/TF has one Sub-Divisionin Goulmima that supervises the activities of the above CMV. There are altogetherfive Sub-Divisions and 21 CMVs under ORMVA/TF.
In the CMV of Tinejdad there are two extension workers for general agriculture andone for livestock production. In Aghbalou there is only one extension workerspecialized in livestock.
- No. 17 Azghar
There are four Work Centers (CT) in the province of Sefrou. The Work Center (CT)located at Ribot Al khayr is responsible for the extension activities in the area. Thereare six technicians for extension activities and one is in charge of agriculturalmaterials. There are about 500 farm households per extension worker.
(b) Agricultural Marketing
- No. 5 N’Fifkh
Owing to the good excess to the big cities as Casablanca, Mohammedia and Rabat, itis estimated that about 95% of the farmers buy agricultural inputs from privatetraders rather than from the sales points of CT. It is estimated that the prices of inputsin private shops are cheaper by 10% on average. Farmers in the area sale theirproducts either to the wholesalers from the big markets from Casablanca,Mohammedia, Rabat etc. or sale in the local markets called Souks. There are fiveSouks used by the farmers namely, Tlet Zaida, Arba Ben Slimane, Jemaa Fedalette,Khemisse Bouznika and Ahade de Beni Yakhlef.
- No. 9 Taskourt
Farmers of the area procure agricultural inputs from the sales point of CT inChichaoua. Chemical fertilizers and traditional seeds are also available in weeklymarkets (Souks) or private shops, but certified seeds are only available in the salespoint of CT. There are four Souks Had M’jjate, Arba Frougma (Guemassa), SebtMzouda (Mzouda) Arba Assif El Mal in the area. Agricultural products, livestock,daily use commodities etc. are sold in these weekly markets. Traders from other areasor big markets from Marrakech, usually used those Souks for the procurement ofagricultural and livestock products.
- No. 10 Timkit
Farmers of the area buy agricultural inputs from the sales point of CMV or fromprivate shops. SONACOS has a sales point and FERTIMA has four sales points inErrachida of which one is in Goulmima. Prices are rather low at private shops, so theshare of agricultural input supply of private traders is an increasing trend.
7-21
Two Souks, Had Tinejdad and Tlet Goulmima were the main Souks used by thefarmers.
- No. 17 Azghar
Agricultural inputs, such as seeds, fertilizers, pesticides, etc., are available at thesales point of CT at Ribat Al Khayr, which is about 4 km from the area. Fertilizersand seeds of traditional varieties are also available in the weekly market at Al RibatAl Khayr or in private shops. The major destination of the agricultural products in theStudy Area is the Souk of Tinin Ribat Al Khayr.
(c) Cooperatives and Farmers’ Organizations
- No. 5 N’Fifikh
There are several cooperatives in and around the area and most of them are milkcollection and marketing cooperatives. There are three farmers’ associations, N’fifikhRiver Water Users’ Association (Association des Usagers d’eau d’Oued N’fifikh),Red Meat Producers’ Association (Association des Producteurs de Viande Rouge)and Young Farmers’ Provincial Association (Association Provinciale des JeunesAgriculteurs ; APJA).- No. 9 Taskourt
In this area, there are four Water Users’ Associations, two in Assif El Mal one inGuemassa and one in M’jjate respectively. Those associations were established after1996 and have altogether 650 households as members. Thee are eight cooperatives inthe area, three in the commune of M’jjet, three in Assif El Mal, one each inGuemassa and Mzouda respectively. All but two cooperatives are milk collection andmarketing cooperatives.- No. 10 Timkit
In the Study Area there are six cooperatives of which five are in the Commune ofTinejdad and one in Aghbalou. Four cooperatives are active in sheep breeding andone in apiculture.- No. 17 Azghar
There are no cooperatives and farmers’ organizations in this area, however somefarmers are the members of provincial comparatively large cooperative andassociation called ASSAS (Association ds Arboriculture de Sefrou) and Red Metproducers’ Association.
(d) Household Economy
- No. 5 N’Fifikh
According to the household interview survey, 52% households were engaged only inagriculture and livestock keeping, whereas the other 48% were engaged inagriculture and other activities as labor, small business etc.
7-22
Owing to the proximity to the big cities, like Casablanca, Mohammedia, Rabat etc.,there were more opportunities for employment. The total average annual familyincome was estimated at 47,900 Dh. The annual family expenditure was 15,600 Dh(Table 7.2.5).
- No. 9 Taskourt
The major economic activities were agriculture, livestock rearing, small business,seasonal labor, etc., that generated annual average family income of 27,000 Dh.According to the household interview survey, 50% of the active men labor forcefound employment in big towns like Marrakech, Agadhir etc., for two to threemonths during a year. The annual family expenditure was 17,100 Dh (Table 7.2.5).
- No. 10 Timkit
In the area of Timkit, 47% of the respondent households were engaged in agriculturecum labor, whereas 19% were engaged only in agriculture and livestock rearing.Because of the drought during recent years, majority of the households were forcedto get some source of alternative income. According to the household interviewsurvey, nearly two third of the young labor force goes to the cities for seasonalemployment. The average annual family income was 32,400 Dh and the annualaverage family expenditure was 16,100 Dh (Table 7.2.5).
- No. 17 Azghar
In the Study Area, the important source of income is agriculture and animalhusbandry. According to the household interview survey 43% households wereengaged only in agriculture and animal husbandry whereas another 57% wereengaged in agriculture/animal husbandry cum other activities like small business,labor etc. The annual average family income in Azghar was estimated at 23,700 Dhand the average annual expenditure was 16,300 Dh (Table 7.2.5).
7.2.3 Rural Water Supply
Existing water supply systems at downstream reach of the dams are controlled andmanaged by the ONEP, communes, villager’s associations or individuals.
(1) No.5 N’Fifikh
The beneficiary irrigation area of the N’Fifikh dam (upstream) extends within thecommunes of Ziaida, Mellila, Moualine El Ghaba, Oulad Yahya Louta, in BenSlimane province. The local population in and around the irrigation area exists indispersed condition, and mainly depends on wells or springs for drinking watersupply. Major springs are located in Lakdamra village in Ziaida commune (SidiAmar) and Ouled Tarfaya village in Moualine El Ghaba commune (Ain Marsid).
7-23
Public wells are located in Ouled Jialili village in Ziaida commune and Ouled Chaouivillage in Mellila commune.
Private wells are constructed not only beside the river, but also on side of hills at bothbanks. For the latter, however, high salinity and/or scarcity of water quantity duringdrought seasons are observed in some locations. There is no plan for intervention bythe ONEP in this area at this moment. According to site survey, daily domestic waterconsumption (drinking, cooking, washing, bathing and etc.) per capita is 8 to 12liter/capita/day (9.4 in average). Meanwhile, willingness to pay by local habitants forwater supply service varies between 20 and 70 DH per month per one household.
In Mellila center, which is located around 9km westward of the dam site, thecommune manages a water supply network that serves some 200 recipienthouseholds. Water source is a spring (Ain Oum Laknabech) of which discharge is 2liter/sec, and there exists three storage tanks (120m3, 30m3 and 27m3). High salinityis observed. The ONEP is planning to intervene in this center by extendingdistribution pipe from Fedalate center to which the water is supplied from the SidiMohamed Ben Abdallah (SMBA) dam.
(2) No.9 Taskourt
The beneficiary irrigation area of the Taskourt dam extends within the communes ofAssif El Mal, Majjat and Mzouda in Chichaoua province. The local populationdepends on wells, springs or “Mattfias” (storage tank) for drinking water. As a rule,springs are major sources of water for villages in the mountainous area such asTaskourt, Anebdour, Zilawt, Sidi Bou Otmane, etc. in Assif El Mal commune.Quality of water taken from such springs is comparatively better and accepted by thelocal population. Meanwhile “Mattfias” is widely used at many villages in flat area,such as Dar Akimakh, Dar Al Jorf, etc. in Assif El Mal commune and TiguemiOumrhar, Tamatoust, etc. in Mzouda commune, to store surface water in the rivertaken through “Seguia” (canal). Quality of water from “Mattfias” is regarded as oneof the causes for water-borne disease occurrence. Quantity of water in these villagesbecomes insufficient notably during dry seasons. There is no plan for intervention bythe ONEP in this area at this moment.
Daily domestic water consumption per capita is 14.8 to 16.2 liter/capita/day (15.7 inaverage). Meanwhile, willingness to pay by local habitants for water supply servicevaries between 10 and 30 DH per month per household. Monthly expenditure forwater transportation is 5 to 50 DH (21 in average) per month per household. InMajjat center (Souq Al Had Majjat), which is also located within the irrigation area,the commune manages a water supply network that serves some 200 recipienthouseholds and 10 standpipes. There exists two wells equipped with two storagetanks (100m3 and 25m3), and its daily production is about 120 m3/day. There is apossibility that the ONEP will intervene with this system in the future.
7-24
(3) No.10 Timkit
The beneficiary irrigation area of the Timkit dam extends within the communes ofAghbalou-N’kerdous, Ferkla El Oulia and Ferkla Es Soufla in Errachidia province.At the immediate downstream of the dam (Ifegh village), there exists a water supplysystem that serves some 400 recipient households under management by a villager’sassociation. There is one drilled well (168m deep, water surface at some 40m deep)equipped with a pump (21m3/h) and a storage tank (72m3). Monthly production isabout 2,500 to 3,000 m3.
Tinejdad, the municipality that is located downstream of the dam, is served by theONEP’s water supply system (Goulmima-Tinejdad) of which main source are threedrilled wells. Existing water supply capacity is 96 liter/sec. Several villages aroundTinejdad such as Ait Labzem, Ait Assem, Ait Hamou, etc. in Ferkla El Ouliacommune are already connected with the Goumima-Tinejdad system. The remainingvillages in Ferkla El Oulia and Ferkla Es Soufla communes currently depend on“Khettara” (traditional water supply system) or private wells. However, extensionprograms of conduits of the Goulmima-Tinejdad system to cover such villages arealready committed by the ONEP.
(4) No.17 Azghar
The beneficiary irrigation area of the Azghar dam extends within the communes ofIghzrane and Oulad Mkoudou in Sefrou province. Ribat El Kheir, the nearestmunicipality from the dam, is served by the ONEP’s water supply system of whichsource are two wells (Ain Ajri and Ifrah). Existing water supply capacity is 25 l/sec.
Several villages around Ribat El Kheir such as Ikharouane, Tsaout Ou Araar, TaghzaLamrouj, etc., in Ighazrane commune are already connected with the above Ribat ElKheir system. The remaining villages in the irrigation area currently depend on springsand wells. At the most downstream irrigation area (Mghila village in Ouled Mkoudoucommune), there exists a water supply system that is managed by the commune.
This system is in severely poor condition due to scarcity of water quantity at itssource (Ain Jorf spring).
Extension programs of conduits to cover villages in and around the irrigation areas,including Mghila village, are already committed by the ONEP.
7.2.4 Rural Electrification
Among the Projects, the Taskourt and Azghar dams are selected for the study ofpower generation, because of rather ample water resources with respect to annualinflow, storage volume and/or dam height, compared to the other two dams, that is,the N’Fifikh and Timkit dams.
7-25
A survey found that there are concrete programs for rural electrification by theNational Office of Electricity (ONE) to extend its 22 kV distribution lines around thesites of the Taskourt and Azghar dams in the framework of Global RuralElectrification Program (PERG), as shown in Table 7.2.6.
(1) No.9 Taskourt
Villages downstream of the dam such as Imin Ouassif, Zilawt, Sidi Bou Otmane andDar Akimakh in Assif El Mal commune, and upstream of the reservoir such asAdassil, Mejdid, Quiadat in Adassil commune are already connected to the grid.ONE is implementing PERG2 (2000-2002) to electrify major villages in irrigationareas such as Taloutint, Tigourar, Dar N’mes etc., in Assif El Mal commune. Villagesimmediate downstream of the dam such as Taskourt, Anebdour, in Assif El Malcommune and in reservoir area such as Zawyat Hemti, Talat Nemti, Imin Eikha,Kerni, Talborjt, Tiliwa, Assais, etc., in Adassil commune are also to be electrified inPERG 3 (2002-2004).
(2) No. 17 Azghar
Villages located around Ribat Al Khayr such as Ifrah and Sidi Bonaza are alreadyelectrified. ONE is implementing PERG2 (2000-2002) to electrify villages inirrigation area such as Tsaout Ou Araar, Tichout Tamalalet, Nass Said Jbel, TaghzaLamrouj, Ekarbousse. Villages upstream of the reservoir or outside of the irrigationarea are also programmed to be electrified in PERG4 and 5.
7.2.5 Social Environmental Conditions (upstream areas)
- Population
The population data in the downstream beneficial areas of the priority dam sites wasevaluated as shown in Section 7.2.1. In order to evaluate the resettlement plans of theupstream dam sites, the Study Team investigated the actual population andhouseholds for upstream of the four priority dams. The population survey was madebased on the social maps. According to the demographic data obtained at the foursites, the number of households, families and population were as follows:
Population at the Priority Dam SitesSite Household Numbers Family Numbers PopulationAzghar 6 10 42N’Fifikh 31 38 178Timkit 39 64 342Taskourt 301 410 2,306
7-26
Azghar has the lowest population and Taskourt is the most populated site. Numbersof destitute, disabled (entirely or partially) families were 22, 2, and 2 in Taskourt,Timkit, and N’Fifikh, respectively. It should be noted that many young couples(families) live currently with their parents in the same house.
- Socio-demographic:
The education level in the four sites is low for both men and women. Literacy of themen is low and almost all the women are illiterate. This low literacy rate is notconducive to empowering the populations quickly to take care of themselves duringthe resettlement process. Access to health services is possible only in emergencycases. Family planning and birth control exist in very rare cases. Even in the absenceof the husbands, the women are not recognized to head the households.
In all sites except Azghar, more than 60 % of men leave their homes to other regionsof Morocco or foreign counties in search for temporary work. With absence of men,the numbers of women heads households were found as 31, 3 and 1 in Taskourt,Timkit and N’Fifikh respectively.
- Social organization:
Timkit has the most organized population where the traditional association (e.g,Jamaa Soulalia: inherited group) exists. The group settles the conflicts among peopleand seeks to develop relations with other communities. It also directs collective workin the community, such as irrigation and water rights, and manageirrigation/agriculture schedule such harvesting dates. Also, the community grantsbuilding plots for extending the dwellings of applicants. One of the other tasks,which the Jmaa has, is to appoint “community employees”, such as waterman(aiguadier), islamic teachers (Fakih) and guard to monitor farm plots. In Taskourtsome individuals (as assaîs Fakih) possess the moral power amongst the populationand therefore can organize people. These types of social cohesion can be supportiveto facilitate population resettlement. In the N’Fifikh and Azghar there are no socialorganizations.
- Women conditions:
The women participate in all the activities without any decisional role. Their practicalconditions are very unfavorable and do not insure comfort. They don’t take anyadvantage of the strategic conditions of Moroccan women.
This situation is the result of the isolation of the sites, the general illiteracy of women,the willingness of men and resignation of women to maintain their position,respecting customs and traditions. Only the elder women are allowed to go tomarkets (souks). Woman cannot check the family budget and they rarely have theirown income. Many women are ignorant in accounting money.
7-27
To cope with this, monitoring is necessary during the resettlement so that women canhave all their rights. Besides, a lot of conflicts happen between people especiallybetween man and women from the same family.
- Infrastructure and Equipment:
The four sites have a very low social infrastructure with no economic infrastructure.Tourist, cultural and archaeological sites do not exist. All the equipment andinfrastructures whatever their status (public, collective or private) is counted andtheir prices are estimated.
- Land Ownership:
There are different types of landowners in the dam sites. Private farms (Melk)represented by ownership with or without certificate by a notary or court justifying,Islamic properties (Habous) and public lands. The rate of each status wasapproximately evaluated.
Outside the dam sites and near the river, the structure and the nature of soil are poorand the yield is very low. The water right exists only in Timkit. This right wasestablished more than century of years ago. The population wants to recover itdownstream. The forest area is the most important source of animals grazing in treesites (except Timkit). The population is developing livestock breeding of smallanimals (ovines and caprines).
- Economical activities and Revenues:
People income is estimated by PRA and by household questionnaire. The source ofincome mainly comes from migrant workers remittances, livestock breeding, farming.The participation rates of each activity revenues are share (%) in the annual averageincome was estimated. It is understood that in all the sites, the livelihood gained byactivities outside are more important than that obtained by the activities performedwithin the sites. For example, in Azghar the incomes from outside constitute 72%from the global annual revenue to the family. This rate is 58%, 54% and 60% inN’Fifikh, Timkit and Taskourt. This shows how the dam construction can have anincidence upon population’s income.
- Perception of populations:
The population of the four sites agrees to the dam implementation and construction.They participated in counting of their goods, which were estimated beneficiariesresidents or non-residents illegible. Global average income of 20% is added toentitled beneficiaries residents to be compensated for the 1st year of the resettlement.
Detail results of social environmental survey are given in Supporting Report XVI.
8-1
CHAPTER 8 DEVELOPMENT PLAN OF THE PRIORITY PROJECTS
8.1 Agriculture and Irrigation
8.1.1 General
Irrigation area has increased to approximately 1.0 million ha as of 1999. It isclassified into three categories in terms of irrigated conditions. 1) Perennial irrigationwith an equipped area of approximately 670,000 ha of the large-scale irrigationsystem (GH) and 330,000 ha of the small-scale irrigation system (PMH). In addition,2) seasonal irrigation, and 3) flooding irrigation cover a total area of 300,000 ha.
PMH represents a potential of 510,000 ha of perennial irrigation and 300,000 ha ofseasonal irrigation. Increasing attention has been given since the mid-1980s toimproving PMH through rehabilitation and betterment, some 330,000 ha have beendeveloped, and hence approximately 180,000 ha are to be developed.
According to the action plan concerning the rural development and irrigation in theFive Year National Development Plan, new irrigation development of 27,000 ha areproposed to be conducted under PMH, and an integrated rehabilitation programinvolving an area of 134,000 ha of PMH is scheduled to be implemented.
8.1.2 The Scope of PMH
PMH has a great potential for perennial irrigation as discussed above. They arescattered all over the country and developed by mobilizing water resources. Asignificant interest has been taken in PMH owing to the following reasons:
- It accounts for 38% of perennial irrigation potential and mobilizes 35 to40% of water resources of the country;
- From the viewpoint of social equity in terms of its investment anddistribution, PMH irrigation can take advantage of consented investmentsby the Government;
- The sector is promising because of its diversity of favorable ecologicalconditions to practice a variety of farming such as arboriculture, cereal,vegetable, etc.;
- It is possible to enhance water value difficult to regularize and improvewater use efficiency;
- The immediate return of investment is expected due to the experiences oftraditional irrigated farming;
- Social and economic effects will create job opportunity during and after theimplementation and management of the system;
8-2
- It incurs limited intervention costs;
- There will be no serious negative impacts on environment; and
- The new system can be operated and maintained in many cases by theexisting water users’ association.
The Administration has set up a participatory approach with the beneficiaries fromthe design to the achievement of the project to successfully implement the projectand to continue its investment. In addition to these efforts, it encourages thebeneficiaries grouped with the framework of the agricultural water users’ association(AUEA) to take responsibilities for the management of the perimeters.
8.1.3 Alternative Studies for each Project
In order to examine the irrigation extent and economic feasibility of the respectiveprojects, alternative studies were conducted for the following 14 cases. The croppingpatterns, water demands, irrigation areas, costs incurred, benefits derived, results ofeconomic analyses are detailed in the Supporting Report.
(a) No.5 N’Fifikh
i- Upstream
1) Gravity irrigation for the cropping pattern proposed by the JICA Study Teamthat seems to be most appropriate in view of farming practices (AlternativeNU1);
2) Gravity irrigation for the present cropping pattern to estimate the utmost extentof irrigation area (Alternative NU2);
3) Gravity irrigation for the cropping pattern proposed by the DPA Ben Slimanethat seems to be most profitable in view of cash income, though it is risky due tolarge share of vegetables, with which most of the farmers are not familiar withtheir farming practices (Alternative NU3);
4) Mechanical irrigation (50%) together with gravity irrigation (50%) for thecropping pattern proposed 1) above for the examination of the feasibility of theintroduction of the irrigation methods, such as sprinkler, drip, etc. (AlternativeNU4); and
5) Gravity irrigation for the highland areas located at the left bank of the N’Fifikhriver to evaluate economic efficiency (Alternative NU5).
ii- Downstream
6) Mechanical irrigation for the cropping pattern proposed by the JICA Study Teamby lifting water from the N’Fifikh river for the examination of the irrigationextent and economic feasibility (Alternative ND1); and
8-3
7) Mechanical irrigation for the cropping pattern proposed 1) above by liftingwater from a dam/reservoir to be constructed at N’Fifikh river near Rahal for theexamination of the effect of the dam on irrigation area and economic feasibility(Alternative ND2).
(b) No.9 Taskourt
8) Gravity irrigation for the cropping pattern proposed by the JICA Study Teamthrough the dam with a capacity of 34 Mm3, which seems to be most appropriatein view of the scale of the reservoir (Alternative TA1);
9) Mechanical irrigation (50%) and gravity irrigation (50%) for the croppingpattern proposed 1) above through the dam with a capacity of 34 Mm3 toexamine economic feasibility of mechanical irrigation (Alternative TA2);
10) Gravity irrigation for the cropping pattern proposed 1) above through the damwith a capacity of 24 Mm3,which seems to reduce economic and financial costs(Alternative TA3); and
11) Mechanical irrigation (50%) and gravity irrigation (50%) for the croppingpattern proposed 1) above through the dam with a capacity of 24 Mm3 toexamine economic feasibility of mechanical irrigation (Alternative TA4).
(c) No.10 Timkit
12) Gravity irrigation by means of surface water from the Timkit dam andsubsurface water recharged with floods through pump wells except the Ifegharea where is irrigated by surface water (Alternative TI1); and
13) Gravity irrigation by means of subsurface water recharged with floods throughpump wells except the Ifegh area, which is irrigated by surface water(Alternative TI2).
(d) No.17 Azghar
14) Gravity irrigation for the cropping pattern proposed by the JICA Study Team thatseems to be most appropriate in view of farming practices (Alternative AZ1).
8.1.4 Agricultural Development Plan
(1) Basic Consideration
The agricultural development plan was formulated in consideration of the presentland use, actual farming practices, intentions of local authorities and farmers, and thestrategies of the Moroccan Government. The development plan has to contribute tothe improvement of farmers’ living condition and be appropriate and sustainable. Forthe formulation of the agricultural development plan (Target Year 2020), thefollowing basic strategies have been adopted as the general methodologies.
8-4
a) Consideration of present land occupancy and farming practices
- To introduce crops that farmers have sufficient experience and farmingtechniques
- To formulate a plan based on the present cropping occupancy
- To promote cereal cultivation that is most important for increasing stableincome of farmers
- To introduce crops in due consideration of marketing condition
- To apply the most suitable crop rotation for annual cultivation
- To formulate a land use plan with full assistance of the related authorities inview of technical support and marketing arrangement
b) Consideration of agro-climatic condition and soil condition
- To introduce crops that farmers have good experience in cultivation andformulation of a land use plan based on the agro-climatic condition
- To formulate a land use plan to adopt soil conditions in sites
c) Consideration of high value income under appropriate development
- To introduce improved seeds of cereals
- To introduce transplantation for some vegetable cultivation
- To formulate a plan based on the most appropriate managements ofirrigation, fertilization and chemical control
- To introduce the crops those are considered sustainable for increasingfarmers’ income
- To formulate a plan with fodders that are able to increase income fromanimal breeding
d) Consideration of the national food security and governmental policy strategy
- To formulate cropping pattern aiming at production of staple food,especially cereals for national food security, which is one of the mostimportant strategies of the Moroccan Government
- To target small and medium scale farmers as beneficiaries
- To alleviate poverty, to mitigate rural differentials, and particularly to createjob opportunities in the outskirts of main cities
- To harmonize with other development sectors
- To formulate land use plans from the economic and financial viewpoints ofthe project.
8-5
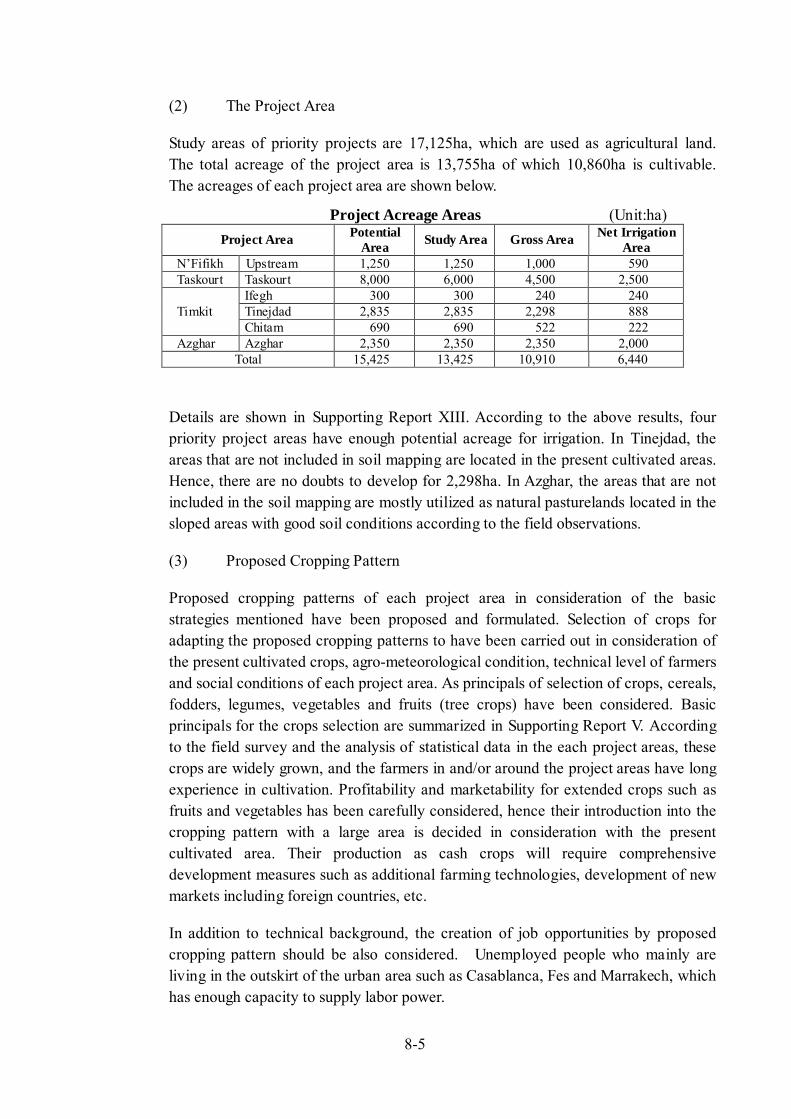
(2) The Project Area
Study areas of priority projects are 17,125ha, which are used as agricultural land.The total acreage of the project area is 13,755ha of which 10,860ha is cultivable.The acreages of each project area are shown below.
Project Acreage Areas (Unit:ha)Project Area Potential
Area Study Area Gross Area Net IrrigationArea
N’Fifikh Upstream 1,250 1,250 1,000 590Taskourt Taskourt 8,000 6,000 4,500 2,500
Ifegh 300 300 240 240Tinejdad 2,835 2,835 2,298 888TimkitChitam 690 690 522 222
Azghar Azghar 2,350 2,350 2,350 2,000Total 15,425 13,425 10,910 6,440
Details are shown in Supporting Report XIII. According to the above results, fourpriority project areas have enough potential acreage for irrigation. In Tinejdad, theareas that are not included in soil mapping are located in the present cultivated areas.Hence, there are no doubts to develop for 2,298ha. In Azghar, the areas that are notincluded in the soil mapping are mostly utilized as natural pasturelands located in thesloped areas with good soil conditions according to the field observations.
(3) Proposed Cropping Pattern
Proposed cropping patterns of each project area in consideration of the basicstrategies mentioned have been proposed and formulated. Selection of crops foradapting the proposed cropping patterns to have been carried out in consideration ofthe present cultivated crops, agro-meteorological condition, technical level of farmersand social conditions of each project area. As principals of selection of crops, cereals,fodders, legumes, vegetables and fruits (tree crops) have been considered. Basicprincipals for the crops selection are summarized in Supporting Report V. Accordingto the field survey and the analysis of statistical data in the each project areas, thesecrops are widely grown, and the farmers in and/or around the project areas have longexperience in cultivation. Profitability and marketability for extended crops such asfruits and vegetables has been carefully considered, hence their introduction into thecropping pattern with a large area is decided in consideration with the presentcultivated area. Their production as cash crops will require comprehensivedevelopment measures such as additional farming technologies, development of newmarkets including foreign countries, etc.
In addition to technical background, the creation of job opportunities by proposedcropping pattern should be also considered. Unemployed people who mainly areliving in the outskirt of the urban area such as Casablanca, Fes and Marrakech, whichhas enough capacity to supply labor power.
8-6
To achieve optimum development, the technical support of the related authorities andtheir managing support for marketing should carefully conducted.
8.1.5 Irrigation Water Demand
(1) Basic Considerations
Estimate of the water demand with project is based on the meteorologicalinformation of five stations of Fes (for Zone I), Marrakech and data on temperaturerecorded at the Sidi Jaber Station (for Zone II), Marrakech (for Zone III), Ouarzazate(for Zone IV) and Errachidia (for Zone V). Reference crop evapotranspiration (ET0)was worked out by the modified Penman method.
The effect of the crop characteristics on crop water requirement is given by the cropcoefficient (kc) which represents the relationship between reference cropevapotranspiration (ET0) and crop evapotranspiration (ETcrop) or ETcrop = kc・ET0.
The effective rainfall (Pe) was calculated by analyzing rainfall records and rainfallprobabilities.
In the Study, the effective rainfall was estimated by the evapotranspiration/precipitationratio method (FAO Irrigation and Drainage Paper No. 25, Effective Rainfall, 1975) atdependable rainfall of 4 out of 5 years. The net irrigation requirement (In) wascalculated using the field water balance. The variables include cropevapotranspiration (ETcrop), rainfall (Pe), groundwater contribution (Ge) and storedsoil water (Wb), or In = ETcrop – (Pe + Ge + Wb). In the Study, Ge and Wb weredisregarded, and hence, In = ETcrop – Pe.
The calculation of the project water requirement (V) required for a given croppingpattern and intensity includes the net irrigation requirement (In) and other waterneeds including conveyance, distribution and application efficiencies of the system.These are calculated on a monthly basis. Using average supply, the total projectacreage can then be determined from the available water resources.
(2) Project Water Requirements
a) N’Fifikh Upstream
(Gravity Irrigation of the Upstream Area, Alternative NU3)
The project water requirements for the proposed cropping pattern by means ofgravity irrigation for the N’Fifikh upstream area are calculated to examine theirrigation extent as well as economic feasibility (to be discussed in Chapter 10) asshown in Tables 8.1.1. Data and information used and procedures are as follows:
8-7
- The reference crop evapotranspiration (ET0) is estimated by themeteorological data observed at the Marrakech Station and modified byusing temperature recorded at the Sidi Jaber Station;
- The crop coefficient (kc) references the standard figures given in theIrrigation and Drainage Paper No. 56. The monthly average kc wascalculated based on the cropping pattern proposed by the ADP Ben Slimanefor the N’Fifikh upstream area, which is shown in Figure 8.1.1.
- The dependable rainfall 4 out of 5 years or 80% probability was estimatedusing the rainfall data observed at the Feddan Taba Station;
- The project water requirement (V) for the upstream area was estimated onthe assumption that the overall irrigation efficiency is 52% (conveyanceefficiency, water released to the river – concrete lined canal – feeder canal:80%, and distribution and application efficiencies of furrow, border andbasin irrigation: 65%);
- Studies on water balance and/or optimization of dam scale indicate that netirrigation area of 590 and 740 ha have 80 and 20% probability, respectively.
b) No.9 Taskourt
(Gravity Irrigation through the Dam with a Capacity of 34 Mm3, Alternative TA1)
The project water requirements for the proposed cropping pattern by means ofgravity irrigation for the Taskourt area were calculated to examine the irrigationextent as well as economic feasibility as shown in Tables 8.1.2. In this calculation,data and information used and procedures are as follows:
- The monthly average kc was calculated based on the cropping patternproposed by the Study Team for the Taskourt area, which is shown in Figure8.1.2;
- The dependable rainfall 4 out of 5 years or 80% probability was estimatedusing the rainfall data observed at the Amezmiz Station;
- The project water requirement (V) was estimated on the assumption that theoverall irrigation efficiency is 52% (conveyance efficiency, water releasedto the river - main canal – feeder canal: 80%, and distribution andapplication efficiencies of furrow, border and basin irrigation: 65%); and
- Studies on water balance and/or optimization of dam scale indicate that thenet irrigation area is 3,530 ha with 80% probability, and 4,500 ha with 20%probability.
c) No.10 Timkit
(Gravity Irrigation by means of Surface Water from the Timkit Dam and SubsurfaceWater Recharged with Floods, Alternative TI1)
8-8
The project water requirements for the proposed cropping pattern by means ofgravity irrigation using surface water from Timkit Dam and subsurface waterrecharged with floods were calculated.
This is to examine the irrigation extent as well as economic feasibility as shown inTables 8.1.3, 8.1.4, and 8.1.5 for Ifegh, Tinejdada and Chitam areas, respectively.Data, procedures and information used are as follows:
- The reference crop evapotranspiration (ET0) was estimated by themeteorological data observed at the Errachidia Station;
- The monthly average kc was calculated based on the cropping patternproposed for the Timkit area, which is shown in Figure 8.1.3 for the Ifegh,Tinejdad, and Chitam areas.
- The dependable rainfall 4 out of 5 years or 80% probability was estimatedusing the rainfall data observed at the Errachidia Station;
- The project water requirement (V) for the Ifegh area was estimated on theassumption that the overall irrigation efficiency is 58% (conveyanceefficiency of concrete lining canal: 90%, and distribution and applicationefficiencies of basin irrigation: 65%)
- The project water requirements (V) for the Tinejdad and Chtam areas bymeans of subsurface water were estimated on the assumption that the overallirrigation efficiency is 60% (conveyance efficiency: 90%, and applicationefficiency: 65%).
- The project water requirements (V) for the Tinejdad and Chtam areas bymeans of surface water from the Timkit Dam were estimated on theassumption that the overall irrigation efficiency is 46% (conveyanceefficiency along the river and canal: 72%, and application efficiency: 65%).
- Studies on water balance and/or optimization of dam scale indicate that thenet irrigation area is 1,110 ha plus 240 ha for the Ifegh area.
d) No.17 Azghar
(Gravity Irrigation, Alternative AZ1)
The project water requirements by means of gravity for the Azghar area werecalculated as shown in Table 8.1.6. In this calculation, data and information used andprocedures are as follows:
- The reference crop evapotranspiration, (ET0) was estimated by themeteorological data observed at the Fes-Sais Station;
- The monthly average kc was calculated based on the cropping patternproposed for the Azghar area, which is shown in Figure 8.1.4;
8-9
- The dependable rainfall 4 out of 5 years or 80% probability was estimatedusing the rainfall data observed at the Ribat Al Kheir Station;
- The project water requirement (V) was estimated on the assumption that theoverall irrigation efficiency is 52% (conveyance efficiency of concretelining canal: 80%, and distribution and application efficiencies of furrow,border and basin irrigation: 65%).
- Studies on water balance and/or optimization of dam scale indicate that thenet irrigation area is 2,000 ha with 80% probability of rainfall.
(3) Net and Gross Irrigation Areas
The area that is determined by the water balance study made between the availablewater resources and the project water requirements estimated based on thedependable rainfall of 80% probability is defined as the net irrigation area which iscommonly used for economic evaluation. However, it is preferable to increase thecultivation area as large as possible in a dry region such is the case in this countrywhere the available water resources are much less to meet the land toresources, as thefarmers intend to utilize the land to the maximum extent. To cope with this, anotherproject water requirement is calculated on the basis of the dependable rainfall of 20%probability as shown in the lower part of Tables 8.1.1, 8.1.2, 8.15 and 8.1.6 forN’Fifkh, Taskourt, Timkit (Ifegh), and Azghar respectively. It is proposed todetermine the project area adopting the latter water requirements instead of theformer. It is expected that incremental benefits may be gained when the rainfallexceeds that of of 80% probability.
The water demand worked out on the basis of the dependable rainfall of 20%probability is lower than that calculated on the basis of the 80% dependability by20% to 35%. In other words, the irrigation area estimated by the former will be largerthan that estimated by the latter by 20% to 35% except for Timkit area, where therainfall is too little to be effective.
It is necessary to determine the area required for infrastructures i.e., canals, ditches,roads, etc, as well as buildings for storage, farming, accommodation, etc. It is acommon practice to add 10 to 15% to the net irrigation area for such structures.
So the gross area should be as large as 1.5 to 1.6 times the net irrigation area withsome allowance. In the future the irrigation area will be increased by adopting watersaving mechanical irrigation method such as sprinkler, drip, etc. The increased area,which was estimated at approximately 30%, can be accommodated in the gross areathus determined. Thus, the irrigation facilities and structures alignment was proposedto cover the entire gross areas.
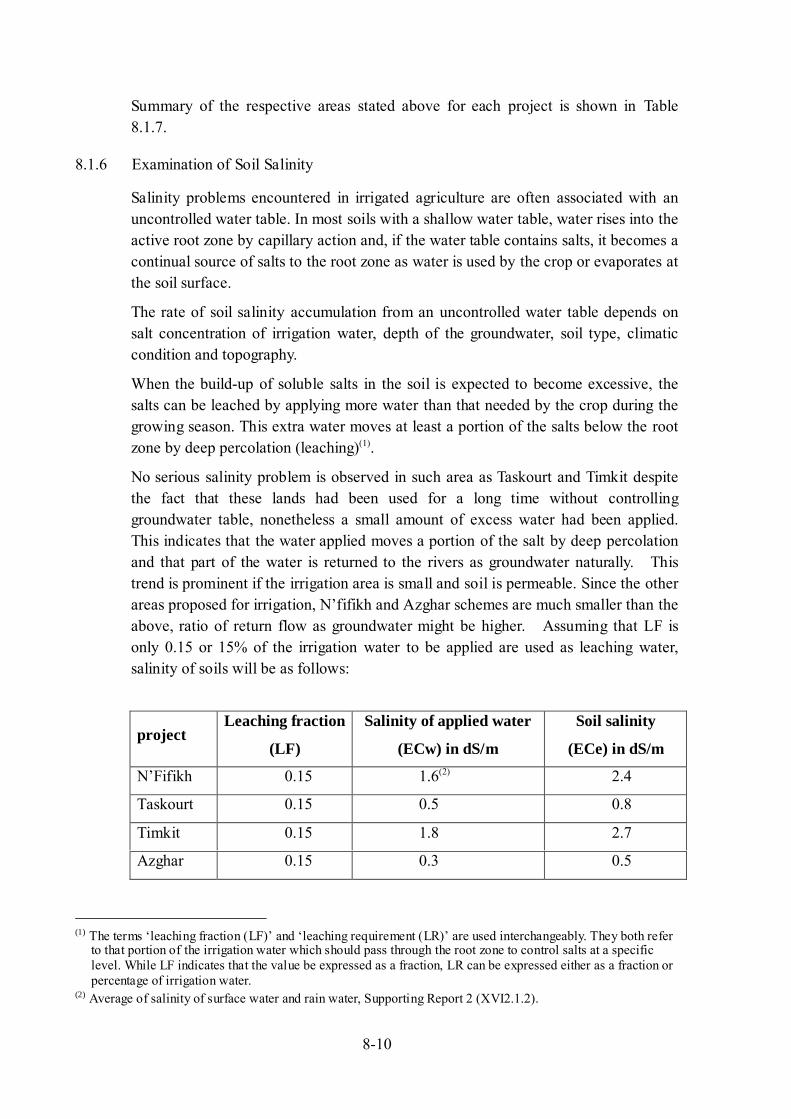
8-10
Summary of the respective areas stated above for each project is shown in Table8.1.7.
8.1.6 Examination of Soil Salinity
Salinity problems encountered in irrigated agriculture are often associated with anuncontrolled water table. In most soils with a shallow water table, water rises into theactive root zone by capillary action and, if the water table contains salts, it becomes acontinual source of salts to the root zone as water is used by the crop or evaporates atthe soil surface.
The rate of soil salinity accumulation from an uncontrolled water table depends onsalt concentration of irrigation water, depth of the groundwater, soil type, climaticcondition and topography.
When the build-up of soluble salts in the soil is expected to become excessive, thesalts can be leached by applying more water than that needed by the crop during thegrowing season. This extra water moves at least a portion of the salts below the rootzone by deep percolation (leaching)(1).
No serious salinity problem is observed in such area as Taskourt and Timkit despitethe fact that these lands had been used for a long time without controllinggroundwater table, nonetheless a small amount of excess water had been applied.This indicates that the water applied moves a portion of the salt by deep percolationand that part of the water is returned to the rivers as groundwater naturally. Thistrend is prominent if the irrigation area is small and soil is permeable. Since the otherareas proposed for irrigation, N’fifikh and Azghar schemes are much smaller than theabove, ratio of return flow as groundwater might be higher. Assuming that LF isonly 0.15 or 15% of the irrigation water to be applied are used as leaching water,salinity of soils will be as follows:
projectLeaching fraction
(LF)
Salinity of applied water
(ECw) in dS/m
Soil salinity
(ECe) in dS/m
N’Fifikh 0.15 1.6(2) 2.4
Taskourt 0.15 0.5 0.8
Timkit 0.15 1.8 2.7
Azghar 0.15 0.3 0.5
(1) The terms ‘leaching fraction (LF)’ and ‘leaching requirement (LR)’ are used interchangeably. They both refer
to that portion of the irrigation water which should pass through the root zone to control salts at a specificlevel. While LF indicates that the value be expressed as a fraction, LR can be expressed either as a fraction orpercentage of irrigation water.
(2) Average of salinity of surface water and rain water, Supporting Report 2 (XVI2.1.2).
8-11
This table suggests that there is no serious salinity hazard for the moderately salinitytolerant crops such as wheat, barley, date palm, olive, pomegranate, and fig.,however, there may be a slight hazard for such salinity sensitive crops as vegetables,alfalfa, etc., for the areas of N’Fifikh and Timkit.
8.1.7 Irrigation Development Plan
(1) No. 5 N’Fifikh
In this area, only a few irrigation channels had been diverted from the Daliya Riverin the past. However, the diversion structures and channels are severely damaged anddeteriorated, and none of them are functioning at present. While several persons hadapplied for water right in the past, most of them were rejected due to insufficientqualification.
To cope with this, a storage dam is proposed to be located in the hilly area, 25 kmsouthwest from Ben Slimane. The dam site was selected at just upstream side of thenarrow valley on the Daliya River.
The irrigation area is divided into two, upstream and downstream areas. For theupstream area, water will be released from the intake structure installed at the dam,and conveyed to the field through two feeder canals for both right and left banks. Forthe downstream area, water released to the river will be taken at an intake weirlocated 16 km downstream of the dam. The irrigation water will be diverted from theintake structure to the fields situated on both banks of the river. All the irrigationfacilities, consisting of feeder canals, intake weir, main canals, branch canals, supplycanals and related structures as well as terminal systems, will be newly constructedas no existing structures are functioning.
An agricultural water users’ association (AUEA) will need to be organized forappropriate management of the river water since it is currently managed individually.
(2) No. 9 Taskourt
In this area, there is a network of 18 principal irrigation channels of traditional typeoriginating from the Assif El Mar. The network is joined and the water taken by theupstream channels is conveyed the downstream ones by the set of successivecascades of irrigation channels to others.
The enjoyment of water rights is generally made according to the priority of theupstream on the downstream. Distributions of water from the river to the channels,and from the channels to the villages are made based on the water rights indicated asperennial, seasonal, and flood irrigation.
8-12
The dam site is proposed to be located on the Assif El Mar flowing down from theHigh Atlas Mountains, about 25 km upstream of Had Mejjat town. An intakestructure to supply irrigation water will be placed on the upstream face of the rightside of the dam body.
A diversion weir is proposed to be constructed immediately upstream of the existingTaslimant channel (the uppermost of the existing 18 channels) in order to maintainthe present water rights.
Main canal route is laid out in the left bank along the seguias, which currentlyconvey the water from the existing diversion weirs to its commanded farmlands.Branch canal is separated from the main canal 5.5 km downstream of the intake weirso as to divert water into farmlands in the right bank. The existing seguias will beused as secondary and terminal systems by rehabilitating their sections, wherevernecessary.
Although the agricultural water users’ association (AUEA) has been organized tooperate and maintain the existing traditional irrigation system, it is suggested toreorganize it for the new system.
(3) No. 10 Timkit
Study area of Timkit consists of three separate areas, Ifegh, Tinejdad and Chitam. Inthe Ifegh area, irrigation is practiced for an area of 200 ha with the subterranean riverwater and flood taken from the Ifegh River. The water right of the area with adischarge of 0.035 m3/sec is authorized. In the Tinejdad area, floods from theTanguerfa and the Todrha Rivers are conveyed to the fields. Three channels divertwater from the Chaaba River to cover the fields with an area of 175 ha, two channelsdivert water from the Tanguerfa River to cover the fields with an area of 215 ha andfour channels divert water from the Todrha River cover 720 ha, totaling 1,110 ha. Inthe Chitam area, irrigation is practiced in a very limited area using the water from theFelkla River.
The proposed dam site is located on the Ifegh River in the mountain range, 25 kmnorthwest from Tinejdad.
An intake structure to supply irrigation water for the Ifegh area will be placed on theupstream face of the right side of the dam. Water will be led through pipes installedin the dam body, and released to the downstream river through a jet- flow gate.
For the Tinejdad and Chitam areas, the stored water will be released to the chute ofspillway through an outlet gate and taken at the existing diversion weirs. The waterwill be conveyed from the intake weirs to farmlands according to the prevailingtraditional water rights. It should be noted that the principal diversion weirs and maincanals have been already constructed on the basis of their design concept.
8-13
The existing seguias will be used as secondary and terminal systems by rehabilitatingtheir sections, wherever necessary.
Although the agricultural water users’ association (AUEA) has been organized tooperate and maintain the existing traditional irrigation system, it is suggested toreorganize it for the new system.
(4) No. 17 Azghar
In the Azghar area, there is no irrigation channel to divert water from the Wad ZloulRiver. However pumping irrigation is practiced at seven locations, five in the rightbank of the river and two in the left. Irrigation area is only 42.5 ha in total. There isno AUEA in this area, and river water is managed on an individual basis.
The dam site is located on the Zloul River in the hilly area, 7 km east from Ribat AlKhayre. An intake structure with type of inclined conduit at the left bank will beplaced on the slope of the left abutment to supply irrigation water.
The layout of irrigation facilities such as main canal, branch canals and relatedstructures is conducted on the basis of the topography, the existing water rights, andthe land suitability as well as the expected land consolidation in the near feature.
All the irrigation facilities consisting of main canals, branch canals, supply canalsand related structures as well as terminal systems will be newly constructed as noexisting structures are available.
Because the river water is managed individually, it is necessary to organize anagricultural water users’ association (AUEA) for appropriate management of theriver water.
8.1.8 Agricultural Water Users’ Association (AUEA)
(1) Law no 02-84, Concerning Agricultural Water Users’ Association
For a long time, the farmers in small and medium scale irrigation areas (PMHperimeters) were engaged in implementing irrigation facilities depending on theirown experiences and know-how.
Likewise, the idea of the water users’ association is not recent in the PMH perimeters.Such traditional association was changed to Association of Jury by the promulgatedlaw no 02-84 (May 13th, 1992). This organization allows a wide partnership coveringpotentially all fields of creation and management of the perimeters.
This decision aimed at setting up a strategic policy for irrigation. Consequently, theoption of a participatory management was adopted in order to:
8-14
- Allow the involvement and responsibility of the farmers in the management,operation and maintenance of equipment and facilities;
- Promote a dialogue and a concerted action between the administration andthe farmers;
- Establish rational water use;
- Practice appropriate management of equipment and reliant facilities for thebest water service;
- Optimize the management expenses;
- Promote agricultural development; and
- Preserve and warrant the equipment durability.
(2) Establishment of AUEA
The government authorities are proceeding to the development of fully modernizedequipment facilities including dam/reservoir for the utilization of agricultural water.In this regard, it is necessary to re-organize the existing AUEA for the two proposedprojects of Taskourt and Timkit and to newly establish AUEA for the projects ofN’Fifikh and Azghar in accordance with the First Article of Law no 02-84.
In the four perimeters, the responsibilities for (1) investment for the implementationof equipment facilities, (2) technical management of water service, and (3) financialmanagement of each perimeter are to be shared between the government and thewater users.
The government has to take major responsibilities for (1) above. However, a part ofthe works is to be shared by the AUEA through the contract negotiations between thetwo parties.
It is proposed that the AUEA be responsible for (2) above consisting of schedulingand organization of irrigators, distribution of water, scheduling of maintenance, etc.The government and the private sector should assist and monitor these activities infavor of AUEA.
It is suggested that the AUEA be responsible for (3) above, which include operationof budget, staff recruitment and payment, invoicing to users, purchase of supplies, etc.It is also proposed that the government and the private sector assist and monitor theseactivities especially in the initial phase.
As a result of the discussions made above, the formation program of the AUEA andmanagement cycle of the AUEA are illustrated in Figure below:
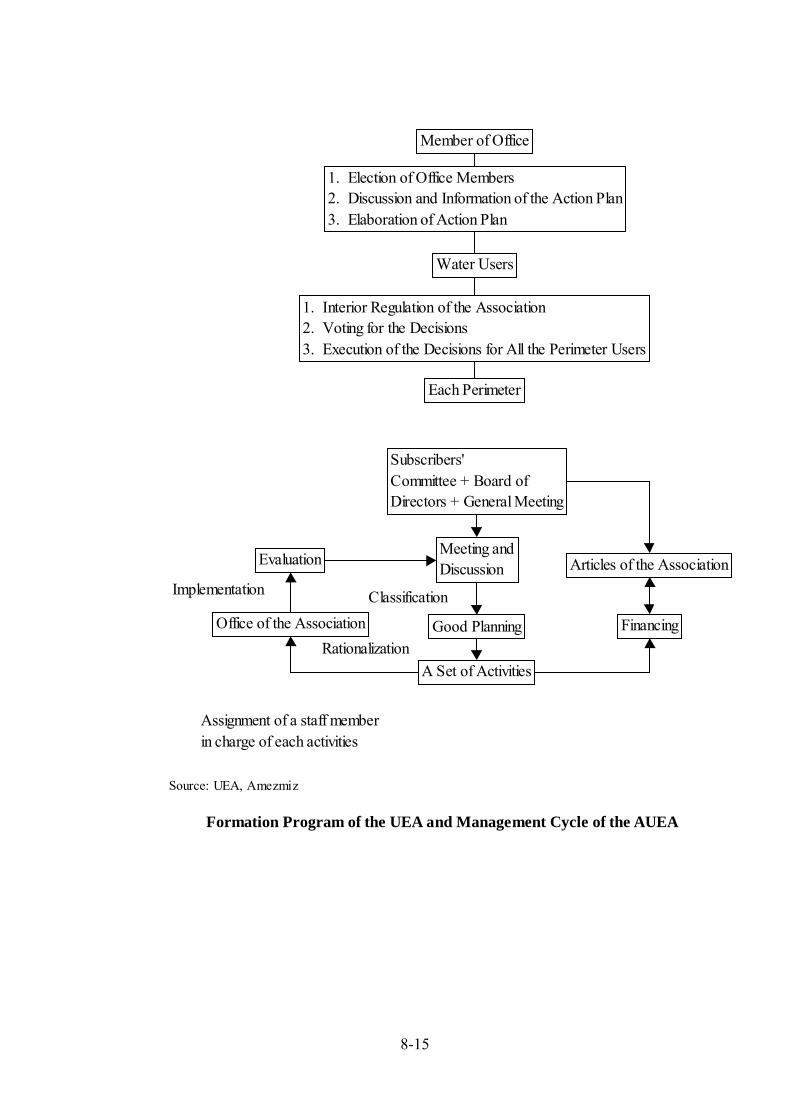
8-15
Member of Office
1. Election of Office Members2. Discussion and Information of the Action Plan3. Elaboration of Action Plan
Water Users
1. Interior Regulation of the Association2. Voting for the Decisions3. Execution of the Decisions for All the Perimeter Users
Each Perimeter
Subscribers'Committee + Board ofDirectors + General Meeting
Meeting andDiscussion Articles of the Association
Financing
A Set of Activities
Evaluation
Office of the Association Good Planning
Implementation Classification
Rationalization
Assignment of a staff memberin charge of each activities
Source: UEA, Amezmiz
Formation Program of the UEA and Management Cycle of the AUEA
8-16
The AUEA takes care of all the management problems, planning, allocation ofirrigation water, maintenance of facilities, etc. In the management cycle, there issubscribers’ committee or general meeting that discusses various problems and setsactivities and plans. Formation program of the AUEA is to establish (1) Member ofOffice, and (2) Water Users’ Association. Major activities of (1) are a) Election of theoffice members, b) Discussion and information of the action plan, and c) Elaborationof the action plan. Meanwhile, the action plan will be executed by the water users, ofwhich main activities are a) Preparation of the interior regulation of the association,b) Voting for any important decision, and c) Execution of the decision for all theperimeter users. At present, the quantity of irrigation water is determined differentlyfrom one irrigation channel to another, from one village to another, from one tribe toanother according to the existing water rights. Also, enjoyment of water right is madestill according to the priority of the upstream over downstream users.
As the river water is regularized with the project, the management of the perimetersis comparative to the large scale ones (GH) in which irrigation water is distributedequally to all the perimeters in terms of area and time as far as the existing waterrights are reserved. Typical organization chart of operation and maintenancesubdivision for a large-scale irrigation project (OMRVA Gharb) is illustrated below.
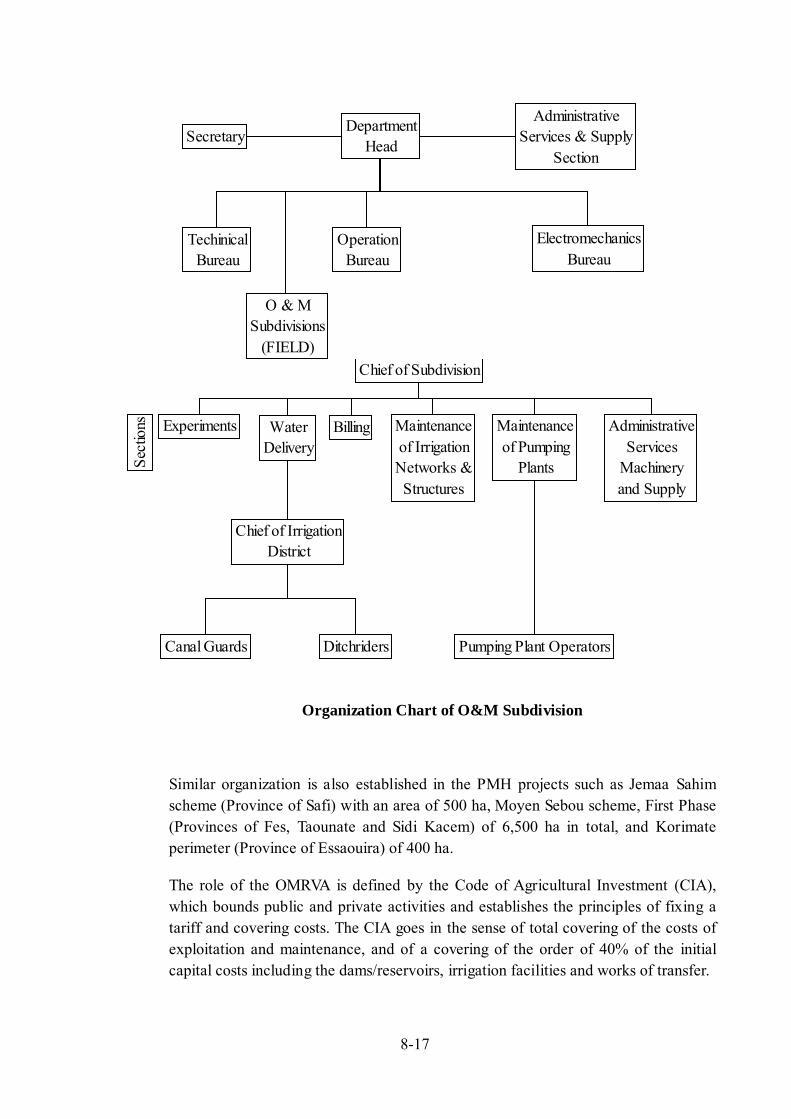
8-17
Organization Chart of O&M Subdivision
Similar organization is also established in the PMH projects such as Jemaa Sahimscheme (Province of Safi) with an area of 500 ha, Moyen Sebou scheme, First Phase(Provinces of Fes, Taounate and Sidi Kacem) of 6,500 ha in total, and Korimateperimeter (Province of Essaouira) of 400 ha.
The role of the OMRVA is defined by the Code of Agricultural Investment (CIA),which bounds public and private activities and establishes the principles of fixing atariff and covering costs. The CIA goes in the sense of total covering of the costs ofexploitation and maintenance, and of a covering of the order of 40% of the initialcapital costs including the dams/reservoirs, irrigation facilities and works of transfer.
SecretaryDepartment
Head
AdministrativeServices & Supply
Section
TechinicalBureau
OperationBureau
ElectromechanicsBureau
O & MSubdivisions
(FIELD)Chief of Subdivision
Sect
ions Experiments Water
DeliveryBilling Maintenance
of IrrigationNetworks &Structures
Maintenanceof Pumping
Plants
AdministrativeServices
Machineryand Supply
Chief of IrrigationDistrict
Canal Guards Ditchriders Pumping Plant Operators
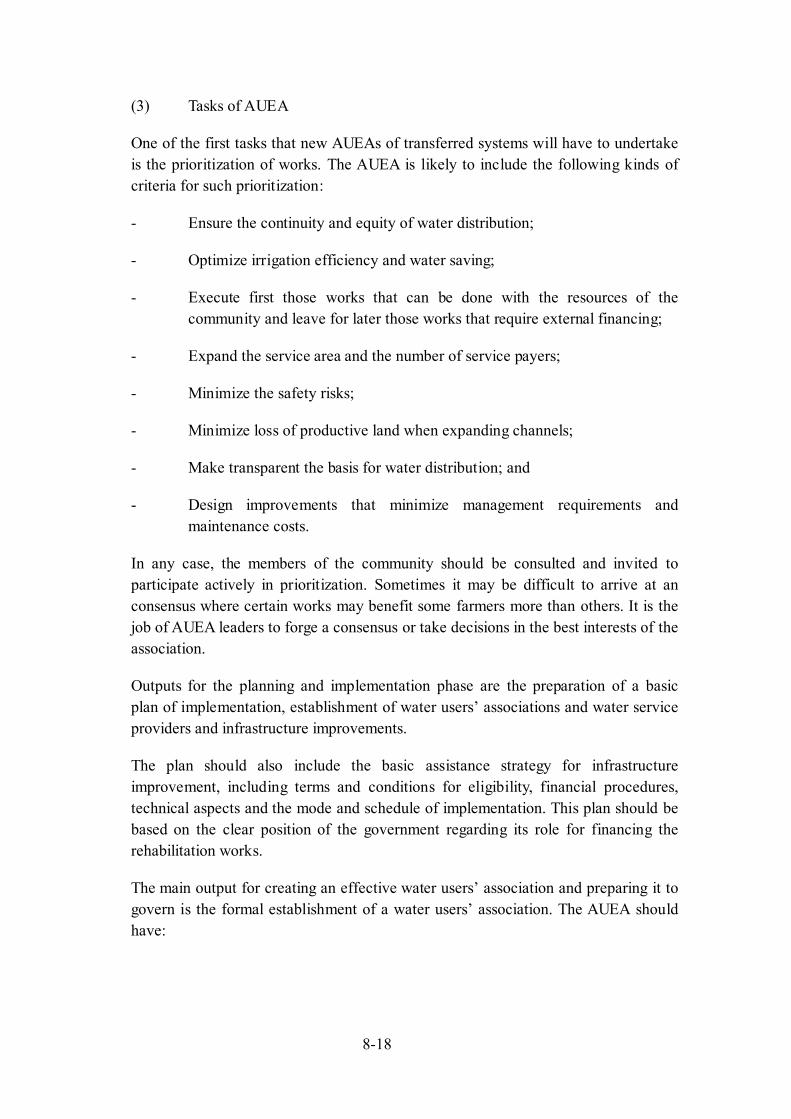
8-18
(3) Tasks of AUEA
One of the first tasks that new AUEAs of transferred systems will have to undertakeis the prioritization of works. The AUEA is likely to include the following kinds ofcriteria for such prioritization:
- Ensure the continuity and equity of water distribution;
- Optimize irrigation efficiency and water saving;
- Execute first those works that can be done with the resources of thecommunity and leave for later those works that require external financing;
- Expand the service area and the number of service payers;
- Minimize the safety risks;
- Minimize loss of productive land when expanding channels;
- Make transparent the basis for water distribution; and
- Design improvements that minimize management requirements andmaintenance costs.
In any case, the members of the community should be consulted and invited toparticipate actively in prioritization. Sometimes it may be difficult to arrive at anconsensus where certain works may benefit some farmers more than others. It is thejob of AUEA leaders to forge a consensus or take decisions in the best interests of theassociation.
Outputs for the planning and implementation phase are the preparation of a basicplan of implementation, establishment of water users’ associations and water serviceproviders and infrastructure improvements.
The plan should also include the basic assistance strategy for infrastructureimprovement, including terms and conditions for eligibility, financial procedures,technical aspects and the mode and schedule of implementation. This plan should bebased on the clear position of the government regarding its role for financing therehabilitation works.
The main output for creating an effective water users’ association and preparing it togovern is the formal establishment of a water users’ association. The AUEA shouldhave:
8-19
- Agreed and legally-recognized article of association and by-laws;
- An agreed definition of the service to be provided;
- A set of officers duly selected and trained; and
- A general sense of commitment to the organization among its members.
(4) Further steps to be taken
Taking into account the rapid change of the participatory process, it is necessary toset up supplementary measures. At the same time, it is necessary to establish atraining program, especially for the following staff:
- Association members; and
- Trainers and water users’ supervisors.
- The training program should include the following contents:
- Administrative management of AUEA;
- Distribution management of water;
- Network operation and maintenance;
- Plot irrigation techniques; and
- Participatory approach and communication method.
(5) Organization proposed for the respective projects
Organization of the Technical Division for AUEA and proposed number of technicalstaff for the respective project of N'Fifikh, Taskourt, Timkit and Azghar areillustrated in the figure below:
Section of Operationof Pump Station
Section of Operationof Irrigation System
Section of Maintenanceof Irrigation System
Section ofAccounting
AUEA (Technical Division)Director of Engineering
(Dam and Canals) (Pump Station) (Dam, Canals and PumpStation)
8-20
– Proposed Number of Technical Staff –
(1)N'Fifikh 4 - 2 2(2)Taskourt 8 - 4 4(3)Timkit 6 4 4 4(4)Azghar 4 - 2 2
8.1.9 For Detailed Design of Irrigation Facilities
Feasibility study for agricultural development has been conducted using photo-mapson a scale of 1:5,000 together with general information on needs of local people,existing water rights, landholdings, etc., collected from the Ministry of Agricultureand its related agencies. In the detailed design stage, it is necessary to study irrigationmethod and area in detail based on accurate information.
For this, the following information should be taken into consideration:
- Existing water rights and water distribution system. Present condition of existingwater rights and water distribution system should be investigated in detail, andthey should be incorporated in the design of irrigation network, and size of canalsand structures. As such investigation is a key to successfully accomplishing theproject, it is necessary to coordinate with the agricultural water users association,which operate and maintain the irrigation network.
- Investigation for land consolidation. For such areas as N’Fifikh and Azgharwhich are planned to newly develop agricultural land, it is necessary to carry outdetailed investigation for land consolidation. Alternative plans for landconsolidation should be established for elaborating detailed water distributionmethod based on the evaluation result of the structure and status of real estate.
- Investigation for optimization of the irrigation system. Investigation foroptimization of the irrigation system is required for minimization of constructioncosts, flexibility of irrigation networks, saving water, relaxation of the restrictionrelated to land consolidation, etc.
- It is necessary to examine the feasibility of low-pressured pipeline networks forthe development of undulating lands of N’Fifikh and Azghar.
8-21
8.2 Groundwater Recharging
8.2.1 Water Intake at Weirs in Timkit Downstream
For the Timkit dam, there are three weirs, that is, Ait Labzem, Bour and Chitam.Their maximum intake capacities are 16, 13.5 and 11 m3/s respectively.
These weirs take floodwater from the Tanguerfa and Todrha rivers. Volume of waterintake and spill-out, excluding due to discharge from the Timkit dam, at each weir isestimated in the following method:
- Based on the monthly, daily and peak discharge data at the Merroutchagauging station, a dimensionless hydrograph on a monthly basis isestablished.
- Inflows to each weir are estimated on a monthly basis based on the flowrecords at Tadighoust gauging station using catchment area ratio.
- Based on the established dimensionless hydrograph, water volume thatexceeds the maximum intake capacity (spill-out) is calculated at each weir.Monthly intake volume is obtained as the difference between the monthlyinflow volume and the monthly spill-out volume.
The above calculation was carried out first to the Chitam weir location with totalintake capacity of the three weirs in order to estimate total intake volume.Subsequently, intake volumes at the Ait Labzem and Bour weirs are calculatedrespectively. Intake volume at the Chitam weir is obtained as difference between thetotal intake volume, and intake volumes at the Ait Labzem and Bour weirs.
Consequently, annual mean intake volumes at the Ait Labzem, Bour and Chitamweirs are estimated as 3.75, 7.87, and 3.75Mm3, respectively. Accordingly, annualmean volume of 15.37Mm3 in total is adopted as inflow to the command area of theproject. This amount does not include the released volume from the Timkit dam.
8.2.2 Simulation of Groundwater Recharge and Pumping
Based on the hydrogeological parameters and findings obtained by the calibrationsresults (described in Section 7.1.3) the recharge and pumping method is simulated bythe manner to catch floods, to transport it through canals to the command area, and toinfiltrate to the underground at the irrigation fields. The simulation is made with thefollowing conditions:
- Groundwater recharge by flood water in the Tanguerfa and Todrha Riversare considered, but released water from the Timkit dam is not counted.
- 37.5% of water intake at the Ait Labzem weir is assumed to discharge intothe Timkit basin, meanwhile remaining water intake at the Ait Labzem,Bour and Chitam weirs is assumed to discharge into the Todrah basin.
8-22
- Groundwater level in the outside of the irrigation area is set at 8.5 and 17.6m the Timkit and Todrah basins respectively at the year of projectcompletion based on the past actual average.
- The 3 scenarios for fluctuation of the groundwater level in the outside of theirrigation area are analysed with condition of; 1) the groundwater levelbased on the 1973-2000 records, 2) 50% reduction of the groundwaterexploitation as of the year 2000, and 3) 100% cut of the groundwaterexploitation. For each scenario above, several pumping plan in the irrigationarea are studied so as to prevent excessive lowering of the groundwater levelin the irrigation area.
Simulation results for each scenario/case are as shown in Supporting Report XV.
For the Timkit basin, it is recommended that 1.12 Mm3 (80% of annual mean inflowto the basin) is to be exploited annually in the irrigation area by 7 wells of 30 liter/seccapacity with 4 hours operation a day on average. Water exploitation at current levelsoutside of the irrigation area can be maintained.
However, for the Todrah basin, it is recommended to restrict groundwaterexploitation outside of the irrigation area to 50% of the year 2000 level. In theirrigation area, 11.17 Mm3 (80% of annual mean inflow to the basin) is to beexploited annually by 30 wells of 30 liter/sec capacity with 9 hours operation per dayon average. In case of drought with 5-year probability, however, the water intakefrom the wells in the irrigation areas is to be reduced to 5.58 Mm3 (50% of 11.17Mm3).
8.3 Rural Water Supply
8.3.1 Small-scale Water Supply System
Small-scale water supply system is planned, utilizing water from dam conveyedthrough irrigation canal or river as its source. Results of water quality test are shownin Table 8.3.1. To secure its quality for drinking purpose, water purification by slowsand filter with settling tank and primary filtration (coarse filtration) will be adopted(refer to Figure 8.3.1). Serious problem in water quality or quantity is recognizedfor the existing water source. Selection of villages is conducted based on thefollowing conditions:
- The village is located within or in the vicinity of the irrigation area.
- There is no existing or programmed water supply system committed by theONEP or commune.
8-23
(1) No.5 N’Fifikh
It is planned to apply the system to Tlet Ziaida village in Ziaida commune, because:1) it is relatively close to the river (irrigation canal), and 2) existence of publicfacilities such as market, school, mosque and hospital.
(2) No. 9 Taskourt
It is planned to apply the system to some of villages in the irrigation area that utilizes“Mattfia”, such as Dar Akimakh in Assif El Mal commune, and Tamatoust andTiguemi Oumrhar villages in M’zouda commune, because of:1) high dependence on“Mattfia” and 2) rather large population.
(3) No. 10 Timkit
No recommendation is done for providing the small-scale water supply system,because the villages in and around the irrigation area are already equipped byadequate water supply facilities or scheduled to cover by ONEP conduit extension.
(4) No. 17 Azghar
No recommendation is done for providing the small-scale water supply systembecause the villages in and around the irrigation area are scheduled to be covered byONEP conduit extension.
The project features of the proposed water supply systems are outlined in Table 8.3.2.Demand in target year of 2020 is obtained by multiplying unit water demand of 20liter/man/day with projected population with 0.7% annual increase rate assumed.
Annual economic benefit of the small-scale water supply systems in the N’Fifikh andTaskourt projects are estimated at 0.16 and 0.28 million DH, based on the averagewillingness to pay of 16.7 DH/m3. Meanwhile, financial construction cost of thesystems is estimated at 1.8 and 3.0 million DH (local currency portion only),respectively, referring to the past record of the PAGER. Procurement is assumedthrough local bidding.
The economic analysis is shown in clause 10.1.4 of this report.
8.3.2 Water Intake for ONEP
As a result of reviewing current situation of water supply in urban centers around theProjects, which the ONEP is responsible for, it might be said that the existing waterresources other than the Projects would cover the immediate water demand.Therefore, this study does not consider provision of ONEP facilities such as watertreatment plant and water conveyance system.
However, in Morocco, it is a common practice to provide a discharge pipe in case ofpossible future use for potable water supply in accordance with request by the ONEP.
8-24
For the Projects, the ONEP suggested to provide water intake of 100, 70, 240 and100 liter/sec for N’Fifikh, Taskourt, Timkit and Azghar, respectively.
According to the suggestion, it is planned to provide independent pipe and valveseparately from water conduit for irrigation equipped in the dam. Inlet for such pipeand valve will be provided also, so as to enable independent water taking.
8.4 Rural Electrification
Mini-hydro power generation utilizing irrigation water is planned on the basis of theso-called subordinate water use for power generation utilizing the unused headwithout causing any trouble to irrigation. The water for irrigation use is dischargedfrom the dam directly into the river in case of the Taskourt dam, or into the irrigationcanal in case of the Azghar dam. In both cases, power generation is obtained byconnecting a power station to a branch pipe provided on the water outlet pipe forirrigation that is equipped downstream of the dam.
The vicinities of both sites of the Taskourt and Azghar dams are to be electrified byextension of 22kV grid by the ONE in the immediate future. Therefore, paralleloperation by connecting the power stations to nearby 22kV distribution lines of theONE is assumed. Accordingly, hybrid power generation combined with photovoltaicthat is ordinarily applied in case of independent operation is not considered in thisstudy. The power station is planned to provide a greater annual power generation, butnot to satisfy the maximum demand. As a result of scale optimization so as tominimize direct construction cost per kWh, plant discharges of 1.5m3/s and 1.0m3/sare adopted for the Taskourt (NWL 995m) and Azghar power stations, respectively.Relevant outputs are 460kW and 50kW.
Annual mean energy produced by the Taskourt (NWL 995m) and Azghar powerstations are calculated at 1.22 GWh and 0.09 GWh, respectively.
Assuming of kWh value of 0.6 DH/kWh, annual economic benefit are estimated at0.73 and 0.05 million DH. Meanwhile, financial construction cost of the powerstations is estimated at 10.3 and 2.5 million DH (50% in local currency portion and50% in foreign currency portion), referring to the past record of the ONE.Procurement is assumed through international bidding.
The project features of the optimal scale are outlined in Table 8.4.1. Calculated unitconstruction cost per kWh suggests that power generation utilizing irrigation water atthe Taskourt and Azghar dams are rather less feasible economically; therefore theplans are discarded.
8-25
8.5 Water Balance Study
Reservoir operation calculation on a monthly basis by computer simulation modelwas carried out to estimate the annual regulated volume from each dam, based on thefollowing equation:
∆V=VE-VS-ENxS
where,
∆V : Increase of stored water volume in the reservoirVE : Inflow volume to the reservoirVS : Outflow volume from the reservoir (water use and spill-out)EN : Net evaporation (evaporation - rainfall) per reservoir areaS : Reservoir area
Hydrology Data such as inflow discharge, sedimentation and precipitation are asdescribed in Chapter 7.1.2 and listed in the Data Book. For evaporation fromreservoir, pan data collected at the nearest and most similarly situated existing damswere adopted and adjusted with coefficient of 0.8. Correlation curves betweenelevation and reservoir area/volume are as shown on Figure 8.5.1.
Water demand is considered for the irrigation purpose only, of which details aredescribed in Chapter 8.1.5. Requirement based on drought rainfall with 5-yearprobability is adopted. Water demand for the small-scale water supply systems isnegligibly small; therefore it is seemed to be included in the irrigation water demand.Water demand for mini-hydro power generation is not considered becausesubordinate water use to the irrigation is assumed.
Duration of simultaneous calculation is taken as long as possible, in so far as themonthly inflow data is available. 50-year sedimentation volume is taken as deadstorage volume for the N’Fifikh, Taskourt and Azghar dams.
Meanwhile, 20-year sedimentation volume is applied for the Timkit dam to avoidwater loss due to excessive evaporation from reservoir surface. Criteria for supplyguarantee for irrigation are set as follows, according to the common practice inMorocco:
- Deficit year is defined as years of which annual deficit overpass 15%.
- Admissible frequency for occurrence of the deficit year is 20%.
- Admissible maximum annual deficit is 50%.
For operation of the reservoir, the following are assumed:
8-26
- 100% of water requirement is taken in case that the reservoir water level isbetween the normal water level and the minimum operation water level-1.
- 68% of water requirement is taken in case that the reservoir water level isbetween the minimum operation water level-1 and -2.
- 50% of water requirement is taken in case that the reservoir water level isbetween the minimum operation water level-2 and the minimum water level(same as the dead storage water level).
- No water is taken in case that the reservoir water level is below theminimum water level.
No maintenance flow to downstream reach is considered. Basic data and criteria forthe calculation are summarized on Table 8.5.1. As a result of the calculation,regulated volumes at respective dam sites are obtained as shown on Table 8.5.2.
8.6 Determination of Project Scale
8.6.1 Applied Criteria
In order to decide development scale for dam and irrigation area, following criteriawas applied without consideration of other project components such as rural watersupply.
a) For each alternative dam scale, direct construction cost of dam and irrigationfacilities per unit-regulated volume were calculated; then optimum scale forproject development was sought. The corresponding scale of the dam wasdetermined as the final development scale of the dam.
b) Development scale of the net irrigation facility area was determined as follows:
- For the N’Fifikh and Taskourt dams, final scale of irrigation facility areawas set at 126 % of irrigation area that corresponds to water requirementbased on drought rainfall with 5-year probability.
- For the Timkit dam, the MOA (ORMVA) has already committed to developthe net irrigation area of 3,060 ha (3,825 ha in gross area). Therefore, thiswhole area was considered as the development scale.
- For the Azghar dam, the development scale of the irrigation facility area wasset considering that the irrigable area is limited to 2,000 ha in net area(2,350 ha in gross area) at maximum due to its topographic condition.
8-27
c) For benefit calculation, annual average irrigable area was calculated as below:
- For the N’Fifikh and Taskourt dams, actual irrigation water requirement foreach year was assumed using annual rainfall for each year. Then, actualpossible irrigation area for each year was estimated as the annual regulatedvolume by dam with the final development scale being divided by the actualirrigation water requirement for each year. Annual average of such actualpossible irrigation area was used for benefit calculation of the project.
- For the Timkit dam, irrigable area for benefit calculation was obtained bywater requirement based on drought rainfall with 5-year probability, becausedifference between drought and abundant rainfalls is negligibly small.
- For the Azghar dam, irrigable area for benefit calculation was setconsidering that the irrigable area is limited to 2,000 ha at maximum.
8.6.2 Determination of the Project Scale
Based on the above criteria, development scale for dam and irrigation area weredetermined for each project as below:
(1) No.5 N’Fifikh
a) Upstream
For the N’Fifikh (upstream), correlation between the normal water level in thereservoir and the direct construction cost of dam and irrigation facilities, and theregulated volume are shown on Figure 8.6.1. The direct construction cost per unitregulated volume touches its bottom in case that the normal water level is around EL.240 to 245m. Therefore, the normal water level is set at EL. 245m as the finaldevelopment scale of the dam. Annual regulated volume corresponding to this damscale is 6.4 Mm3. Net irrigation area that corresponds to the water requirement(Alternative NU1) based on drought rainfall with 5-year probability is 780 ha.Accordingly, development scale of the irrigation facility area is set at 1,000 ha. Withthe same dam scale, four alternative schemes on cropping pattern or irrigationmethod are studied as follows:
- Cropping pattern is made as the identical with the existing condition(Alternative NU2).
- Cropping pattern that enhancing vegetable cultivation (Alternative NU3).
- Mechanical irrigation is introduced with the same cropping pattern for NU1(Alternative NU4).
- Irrigation area is located on the high hills of the left bank (Alternative NU5).
Development scale of irrigation facility area and annual average irrigable area forN’Fifikh upstream area are as follows:
8-28
Alternative Schemes for N’Fifikh (upstream)Alternative Net Irrigation
Area with 80%Probability (ha)
Annual AverageIrrigation Area
(ha)
Net IrrigationFacility Area (ha)
NU1 780 853 1,000NU2 810 886 1,030NU3 590 645 1,000NU4 900 984 1,170NU5 780 853 1,000
According to the economic evaluation, Alternative NU3 brings the highest economicinternal rate of return, accordingly suggested as the definitive plan. With croppingpattern that enhances vegetable cultivation, net irrigation area was calculated at 590ha, and annual average irrigable area is 645 ha. Development scale of the irrigationfacility is set as the same as the Alternative NU1.
b) Downstream
For the N’Fifikh (downstream), two alternative options are conceivable; that is, 1)with intake weir that has no regulating capacity (Alternative ND1), and 2) with smalldam that provides regulated volume (Alternative ND2).
The former option exploits base flow of drought discharge with 5-year probabilityand groundwater. For the latter, correlations between the normal water level in thereservoir and the direct construction cost of dam and irrigation facilities, and theregulated volume are shown on Figure 8.6.2. The normal water level in the reservoiris set at El. 15 m as the most economical option. Annual regulated volumecorresponding to this dam scale is 2.7 Mm3.
Development scale of irrigation facility area and annual average irrigable area for theabove options are as follows:
Alternative Schemes for N’Fifikh (downstream) (Unit:ha)Alternative Net Irrigation Area
with 80% ProbabilityAnnual AverageIrrigation Area
Net IrrigationFacility Area
ND1 210 228 260ND2 470 510 590
According to economic evaluation, Alternative ND1 brings the higher economicinternal rate of return. Nevertheless, as there is still uncertainty in available water atsite due to uncounted water consumption in the intermediate basin, both alternativesare not suggested as the definitive plan.
(2) No.9 Taskourt
Correlations between the normal water level in the reservoir and the directconstruction cost of dam and irrigation facilities, and the regulated volume are shownon Figure 8.6.3.
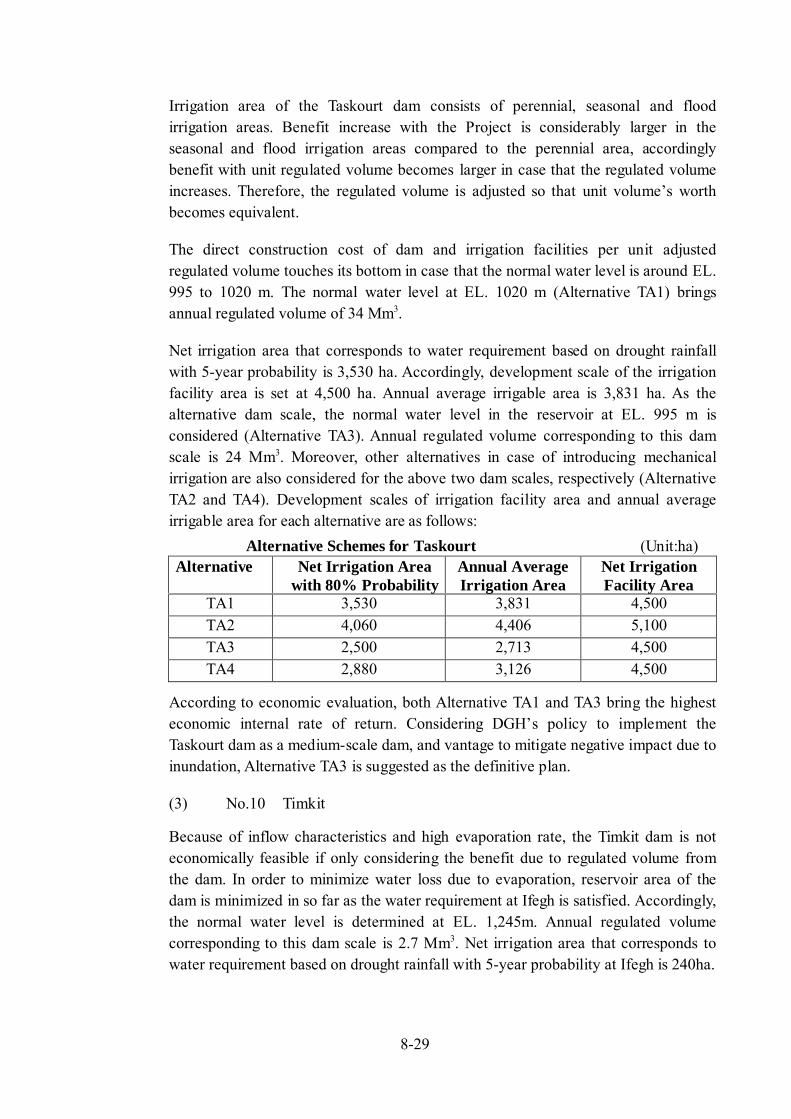
8-29
Irrigation area of the Taskourt dam consists of perennial, seasonal and floodirrigation areas. Benefit increase with the Project is considerably larger in theseasonal and flood irrigation areas compared to the perennial area, accordinglybenefit with unit regulated volume becomes larger in case that the regulated volumeincreases. Therefore, the regulated volume is adjusted so that unit volume’s worthbecomes equivalent.
The direct construction cost of dam and irrigation facilities per unit adjustedregulated volume touches its bottom in case that the normal water level is around EL.995 to 1020 m. The normal water level at EL. 1020 m (Alternative TA1) bringsannual regulated volume of 34 Mm3.
Net irrigation area that corresponds to water requirement based on drought rainfallwith 5-year probability is 3,530 ha. Accordingly, development scale of the irrigationfacility area is set at 4,500 ha. Annual average irrigable area is 3,831 ha. As thealternative dam scale, the normal water level in the reservoir at EL. 995 m isconsidered (Alternative TA3). Annual regulated volume corresponding to this damscale is 24 Mm3. Moreover, other alternatives in case of introducing mechanicalirrigation are also considered for the above two dam scales, respectively (AlternativeTA2 and TA4). Development scales of irrigation facility area and annual averageirrigable area for each alternative are as follows:
Alternative Schemes for Taskourt (Unit:ha)Alternative Net Irrigation Area
with 80% ProbabilityAnnual AverageIrrigation Area
Net IrrigationFacility Area
TA1 3,530 3,831 4,500TA2 4,060 4,406 5,100TA3 2,500 2,713 4,500TA4 2,880 3,126 4,500
According to economic evaluation, both Alternative TA1 and TA3 bring the highesteconomic internal rate of return. Considering DGH’s policy to implement theTaskourt dam as a medium-scale dam, and vantage to mitigate negative impact due toinundation, Alternative TA3 is suggested as the definitive plan.
(3) No.10 Timkit
Because of inflow characteristics and high evaporation rate, the Timkit dam is noteconomically feasible if only considering the benefit due to regulated volume fromthe dam. In order to minimize water loss due to evaporation, reservoir area of thedam is minimized in so far as the water requirement at Ifegh is satisfied. Accordingly,the normal water level is determined at EL. 1,245m. Annual regulated volumecorresponding to this dam scale is 2.7 Mm3. Net irrigation area that corresponds towater requirement based on drought rainfall with 5-year probability at Ifegh is 240ha.
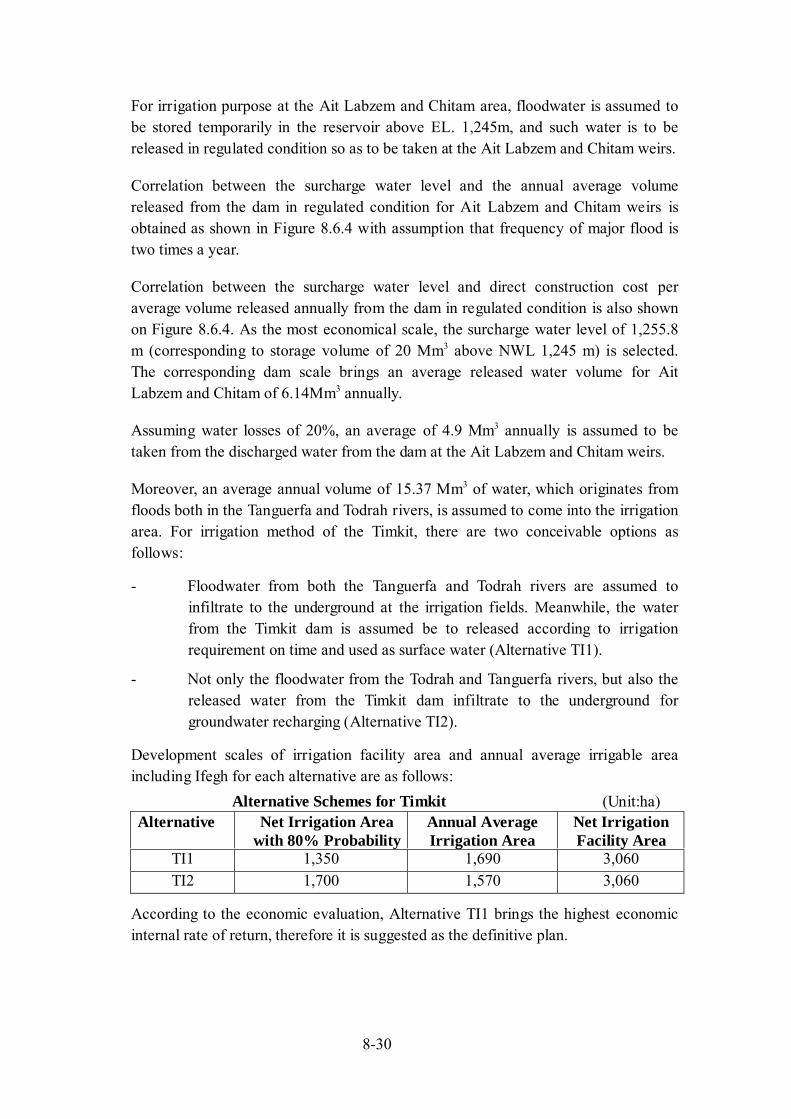
8-30
For irrigation purpose at the Ait Labzem and Chitam area, floodwater is assumed tobe stored temporarily in the reservoir above EL. 1,245m, and such water is to bereleased in regulated condition so as to be taken at the Ait Labzem and Chitam weirs.
Correlation between the surcharge water level and the annual average volumereleased from the dam in regulated condition for Ait Labzem and Chitam weirs isobtained as shown in Figure 8.6.4 with assumption that frequency of major flood istwo times a year.
Correlation between the surcharge water level and direct construction cost peraverage volume released annually from the dam in regulated condition is also shownon Figure 8.6.4. As the most economical scale, the surcharge water level of 1,255.8m (corresponding to storage volume of 20 Mm3 above NWL 1,245 m) is selected.The corresponding dam scale brings an average released water volume for AitLabzem and Chitam of 6.14Mm3 annually.
Assuming water losses of 20%, an average of 4.9 Mm3 annually is assumed to betaken from the discharged water from the dam at the Ait Labzem and Chitam weirs.
Moreover, an average annual volume of 15.37 Mm3 of water, which originates fromfloods both in the Tanguerfa and Todrah rivers, is assumed to come into the irrigationarea. For irrigation method of the Timkit, there are two conceivable options asfollows:
- Floodwater from both the Tanguerfa and Todrah rivers are assumed toinfiltrate to the underground at the irrigation fields. Meanwhile, the waterfrom the Timkit dam is assumed be to released according to irrigationrequirement on time and used as surface water (Alternative TI1).
- Not only the floodwater from the Todrah and Tanguerfa rivers, but also thereleased water from the Timkit dam infiltrate to the underground forgroundwater recharging (Alternative TI2).
Development scales of irrigation facility area and annual average irrigable areaincluding Ifegh for each alternative are as follows:
Alternative Schemes for Timkit (Unit:ha)Alternative Net Irrigation Area
with 80% ProbabilityAnnual AverageIrrigation Area
Net IrrigationFacility Area
TI1 1,350 1,690 3,060TI2 1,700 1,570 3,060
According to the economic evaluation, Alternative TI1 brings the highest economicinternal rate of return, therefore it is suggested as the definitive plan.
8-31
(4) No.17 Azghar
Correlations between the normal water level in the reservoir and the directconstruction cost of dam and irrigation facilities, and the regulated volume are shownon Figure 8.6.5.
Development scale of the irrigation facility area is set at 2,000 ha, that is themaximum limit from the topographic condition. Required regulated volume thatcorresponds to this irrigation area is calculated at 14.6 Mm3, with water requirementbased on drought rainfall of 5-year probability. The normal water level in thereservoir is set at EL. 854 m so as to bring this regulated volume.
According to the economic evaluation, this project scale brings high economicviability even if the negative impact on existing dams in downstream is alsoconsidered. Therefore, this scale is suggested as the definitive plan.
Detail results are shown in Section 10.1.3 of this Report.
8.7 Environmental Impact and Resettlement Plans
8.7.1 Natural Environment
(1) Basic Approach of EIA
Based on the results of the IEE that was conducted in the First Phase of the Study, amore detailed environmental survey was conducted in the Second Phase. TheMinistry of Environment, Morocco has proposed to establish an official EIAprocedure, but the Government has not authorized the proposal yet. So there is nolegal status on the EIA procedure in Morocco at present time. Therefore, JICAguidelines were used in this study, but draft law of Morocco was also respected andfully applied in this study. Environmental laws, rules, regulations and guidelines thatwere used as a basis of this environmental study are primarily as follows:
- The protection of environment (draft EIA law) in Morocco (Ministry ofEnvironment, Morocco)
- SIBE (Sites of Biological and Ecological Interests)
- Guidelines for Environmental Considerations on Rivers and Protection ofErosion (JICA)
- Guidelines for Environmental Considerations on Dam Construction (JICA)
(2) Environmental Factors
According to the results of the environmental screening during the First Phase, waterquality was found to be one of the most important environmental factors to beanalyzed. Therefore, the following aspects were carefully addressed and applied forthe Environmental Management Plan (EMP).
8-32
- Upstream: Eutrophication
- Immediate Downstream: Level of groundwater
- Downstream: Changes in water quality with irrigation
(3) Potential Environmental Impacts
Water turnover ratio (α) of the dam reservoirs was calculated to examine thepossibility of eutrophication. The turnover ratio was found to be quite low at all thereservoirs so that eutrophication is likely to occur.
It is also predicted that a level of groundwater may be lowered. Undergroundaquifer will be stored in the reservoirs with the dams so that underground waterdownstream of the dam sites is likely to be diminished. There will be irrigation areasdownstream of all the dam sites. It is likely that agricultural chemicals will beapplied in the field, which may contain detrimental chemicals to the surroundingenvironment. As a result, water quality of the rivers downstream of the dam siteswill likely to be deteriorated.
(4) Mitigation during the Construction Stage
The following mitigation measures should be taken in the construction stage:
- Upgrading existing roads that are to be used as access roads to the dam sitesinstead of establishing new access roads so that impacts on naturalenvironment can be minimized.
- Avoiding vegetative patches for the establishment of river diversion tunnelat Azghar site.
- Quarry sites and borrow pits will be located in the submerging areas
- Most of the construction materials will be collected from the riverbed usinga bed material sampler so that a baching plant crushing rocks will not used.
- Increasing alkalinity of the water by using cement (concrete and grout) willbe minimized with chemical treatment.
- Turbidity of water will be minimized with the settling basins establishment.
(5) Environmental Management Plan (EMP)
Establishment of Environmental Management Plan (EMP) is the most importantpractice as a long-term mitigation of the environmental impacts. Practicalinstitutional organization for environmental monitoring and management,environmental parameters and sampling locations for water quality have beendetermined and proposed. The following recommendations are made on the EMP:
8-33
- Environmental Management Unit (EMU) should be established, and theDGH be responsible for the implementation of the EMP.
- Development of tree planting program as a counter measure for erosionproblem particularly at Taskourt site is important. This should be included asone of the main components of the EMP.
- Ministry of Forestry should be fully involved into the tree planting program(the Ministry be involved as a regular member of the Steering Committee sothat appropriate counterpart be appointed).
Detail results of natural environmental study are shown in Supporting Report XVI.
8.7.2 Social Environment and Resettlement Plans
(1) Introduction
The social environmental impacts of dam constructions were tentatively studied inthe first Phase (Basic Study) for the proposed 25 dam sites. The Study wasintensified on the second Phase (Feasibility Study) for the priority four dam siteswith special investigations to identify proper resettlement plans for the damimplementations. These plans were evaluated based on site investigations for bothupstream and downstream, people hearing, people land and water rights, existingMoroccan Laws for compensation programs and socio-economic factors. Results ofthe survey include identification of negative impacts of dam construction forupstream and downstream areas, recommended resettlement plans as well asresettlement costs. These results are summarized in the following paragraphs andtheir details are presented in the Supporting Report XVI.
(2) Potential Social Impacts in Upstream
The following negative impacts may occur with the dam implementation in theupstream areas:
a) In all dam sites (except Azghar), some people are supported by the communitiesregarding their land and water ownerships. However, people without properties,represented by young couples, poor families, and women heading householdswill have lower or none compensation offer by the Moroccan Government ifprojects implemented. Therefore, a strong measure is necessary to maintainfamilial and social balance to preserve the present solidarity.
b) In all dam sites (except Azghar), schools are located in or near the submergedareas. This will requires scheduled resettlement to be conducted with thebeginning or end of the school year. Also, looking for better schools locations inthe resettlement sites are essential. Without the above measures, schoolmovement will be difficult.
8-34
c) Women will be potentially impacted with the dam implementations in severalways that may be summarized as follows:
- Only about 6% of the women population who heads the households willbenefit from the compensation if the compensation is paid directly to theheads of families. They can be profitable if involved equitably.
- In case of land compensation, women involvement in land distribution willbe minimal due to their weak mobility and low contact with the externalworld.
- Resettlement of women in new areas will create additional working hours,as modernized agricultural techniques will be applied.
- Currently, men involvement in social decisions is extreme and unequal towomen. This involvement will be strengthening with the resettlement, asmen will gain more decisional power.
d) Recommended measures to reduce these impacts can be considered with specificactions on gender development as well as linking the resettlement plans withimpact on women.
e) In Timkit, farmers’ water rights involve their ownership of springs and khettaralocated in the upstream. However, farmers are willing to re-own similar rights ifthey move to the downstream areas with the proposed resettlement plansdescribed in section 8.7.2 (4).
f) In Taskourt, initial resettlement plans were suggested to resettle the population innearby regions, the upstream called l’aâzib. However, in the this stage, detailinvestigation of it was recommended to avoid resettlement of all the populationin this area to avoid the negative natural impact in l’aâzib the over populationwith the existing people. It is recommended that only a portion of the populationwith entitled beneficiaries can be resettled to l’aâzib and the remaining shouldfollow the proposed resettlement plans.
(3) Potential Social Impacts in Downstream:
The following negative impacts may occurred with the dam implementation in thedownstream areas:
a) A general limitation to the resettlement plans is the land availability in thedownstream. It is especially foreseeable in Taskourt and Timkit sites. Besides,the existing collective lands (Mahroum) in Taskourt site will develop ambitionregarding farms from inside and outside of the area. It is therefore urgent toinvolve local and provincial authorities such as Ministry of Interior into theresettlement plans so they can protect and control these lands.
8-35
b) Women will potentially be impacted with the dam implementations in severalways that may be summarized as follows:
- In Taskourt and Timkit, women are excluded from the collective landsownership. Therefore, future distributions of those lands would not benefitto women. To negotiate, with responsible communities (Jmaa Soulalia),there is a need the change of the traditional rights (Ourf) concerning thisaspect like the rural commune (CR) of Ferquela Haut district. This CR wasimplemented to change the Ourf since 1982.
- Currently, men involvement in social decisions is extreme and unequal towomen. This involvement will be strengthening with the resettlement, asmen will gain more decisional power.
(4) Recommended Resettlement Plans
In all the proposed dam sites, social incomes are very limited by the existingagricultural and breeding activities. These incomes are not viable enough for thelocal people in the sites under the existing natural and social conditions. In order toidentity the new resettlement areas, the Study Team evaluated the assets and numberof families in the existing dam sites having investment outside the dam sites.
The results of these assets and the family numbers are presented in the SupportingReport XVI. The Study Team investigated in the field all the new resettlement areasbased on the following two major points:
- The people’s perception regarding resettlement locations outside the damsites. These locations are generally influenced by their existing properties indifferent areas.
- The Study Team’s perception based on social data analysis and potentialimpacts.
The findings of the study are presented and summarized as follows:
i. No. 5 N’Fifikh
Submerged Area: 31 houses, 38 families, 187 persons
Resettlement Scenarios:
a) Option A: SODEA lands, located downstream of proposed dam(Landsowned by public agricultural company and existing in proposed irrigationarea)
b) Option B: Land purchasing from large scale vegetable farm locateddownstream of proposed dam (Private land can be bought usingcompensation money)
Expected Resettlement Cost: about 4,109 x 103 MDH
8-36
Resettlement Identification:
The survey shows that population having outside properties is as follows:
• 48% of the families own agricultural land areas ranging from 0.14 to 20 ha
• 36% of the families own houses
People willing to the dam construction and resettlement plans is as follows:
• 75% of the people wish to expand their current agricultural and livestockactivates in new areas at downstream.
• 17% of the people wish to invest in small marketing and business outside
As 48% of the families own land properties, 37% who wish to expand activates willrequire additional resettlement lands. Resettlement options (A or B) can be adoptedas high successful measure. However, according to the president of the ruralcommune of Melila, option B is more favorable but requires involving andnegotiating with the downstream beneficiaries before starting any dam constructionworks.
ii. No. 9 Taskourt
Following is in case of N.W.L being 995.00m and estimated based on one in caseN.W.L being 1,020.00m shown in XVI 10.2 of Volume V Supporting Report (2.B).During the detailed design stage, these will be reviewed.
Submerged Area: 154 houses, 205 families, 1,014 persons
Resettlement Scenarios:
a) Group A: 74 families (36%); people applying to their own resettlement plans
b) Group B: 62 families (30%); people having lands in l’Aazib area and to besettled there.
c) Group C: 69 families (34%); people having no lands property and to besettled in new lands
Expected Resettlement Cost: about 35,700 x 103 MDH
Resettlement Identification:
8-37
According to the hearing survey, if proper compensation would be made, people inthe submerged area would cooperate with recommended resettlement plans. Thesummary of the recommended resettlement plans is as follows:
Group A: about 49 families are comparatively wealthy people having rather highincome by different investment trade. These families have their own resettlementplans by purchasing agricultural land of few hectares in the downstream area.However, providing these people by agricultural extension services with moderntechniques will be necessary. Remaining 25 families are relatively less wealthy butthey share the Group resettlement plans. Their financial deficit could be compensatedthrough the expected compensation cost.
However, careful monitoring and training of the compensation money utilization andresettlement plans of these families is necessary.
Group B: about 62 families having houses and agricultural lands (2ha in average) inl’Aazib district located on left bank of the proposed dam. They are willing to expandtheir current agricultural and livestock activates in the l’Aazib area. For theirresettlement, construction of new social infrastructure facilities such as road, waterand electricity supply, school, hospital, … etc. are highly necessary. Existingarcheological sites such as religion monuments (Zaouia), should be transfered to thel’Aazib area. Agricultural extension services to this group regarding planting fruittrees and natural resources utilization are also necessary.
Group C: This group has 69 families and is comparatively poor people currentlymaking small-scale agricultural activities in the submerged area. They can beresettled to Mahroum land (public land) in the downstream irrigation area. The newMahroum land does not have agricultural activities at present but the soil is suitablefor future agricultural practicing. On average, agricultural land of 5 hectares isrequired for each family.
Approximately two villages (cooperatives) equipped by social infrastructure facilitiessuch as schools, roads, mosques, …etc. should be newly created. Careful monitoringand training of resettlement plans of these families is necessary. Among this group,there are 11 families who are considered to be the poorest people among all thegroups. These families are without properties represented by young couples, poorfamilies and women heading households and making small-scale agriculturalactivities in the submerged area. Strong measure is necessary to maintain familial andsocial balance to preserve the present solidarity. A special counter-measure such asmoving to old people’s homes should be given to them with careful monitoringduring the resettlement.
iii. No. 10 Timkit
Submerged Area: 39 houses, 64 families, 342 persons
8-38
Resettlement Scenarios:
a) Group A: 60 families (93%) with lands in Ifegh will be settled there
b) Group B: 4 families (7%) with lands in Ifegh area will be settled outside
Expected Resettlement Cost: about 7,992 x 10 3 MDH
Resettlement Identification:
According to the hearing survey, if proper compensation would be made, people inthe submerged area would cooperate with recommended resettlement plans. Thesummary of the recommended resettlement plans is as follows:
Group A: The main resettlement plans affect this group. The people located in thesubmerged area originated from Ifegh command area located just downstream of theproposed dam with houses, lands and water rights. However, more agricultural landsand water rights would be required if they asked to resettle in Ifegh. These additionalrights could be smoothly obtained subject to senior persons who administrategenerally the water rights in Ifegh agreement.
Group B: about 7 % of the total population has their own source of incomes indifferent regions and they are looking forward to continue and develop their projectsin the regions.
iv. No. 17 Azghar
Submerged Area: 6 houses, 10 families, 42 persons
Resettlement Scenarios:
Government compensation in compliance with Moroccan legal standards.
Expected Resettlement Cost: about 6,351 x 10 3 DH
Resettlement Identification:
All the families originate from Bni Souhane’s area. 34% of the families have landdownstream and 66% own homes. Resettlement does not produce any problembecause the dam site is an appropriate location for the families from social, economicor culture aspects. Simple government compensation in compliance with Moroccanlegal standards will be satisfactory.
9-1
CHAPTER 9 PRELIMINARY DESIGN AND COST ESTIMATES
9.1 Preliminary Design
9.1.1 No. 5 N’Fifikh
(1) Dam Site and Type
The dam site is located in a hilly area, 25 km southwest from Ben Slimene. Thesite was selected at just upstream side of the narrow valley on the Daliya Riverwhere both abutments become closer. Many out-crops of quartzite (hard rocks) areobserved at both abutments running across the site with narrow width. Howeverboth upstream and downstream sides of the quartzite are deteriorated by faults.Therefor, the dam body, especially impervious embankment zone, could not beplaced on the quartzite layer. This will cause harmful un-uniform settlement of theembankment due to difference of settlement characteristics of hard foundation andweak foundation. In order to avoid this, the dam axis was slightly shifted toupstream side where impervious embankment may not be placed on the quartzitelayer. In this case the foundation of the dam body is rather soft rock of weatheredsandstone and pelite stone.
This foundation rock may belong to CL of rock classification, which will not havesufficient bearing capacity for concrete gravity type dam. Accordingly, a fill typedam that can be applied to this soft foundation is selected at this site.
(2) Dam Design
The dam foundation is weathered rock, and is seemingly semi-pervious rock thatprobably requires grouting against leakage. General layout and typical crosssections of the dam are shown in Figures 9.1.1 and 9.1.2.
In the right abutment, pervious quartzite may stretch to the foundation of spillwayinlet portion and higher parts of the dam foundation. So limb grouting will be alsonecessary. Considering the availability of the embankment materials and necessityof grouting, a center-cored fill dam is recommended. The dam was designed forthe following conditions:
- Sediment volume that would be accumulated over 50 years will be storedby the dam. This amounts to 1.5 MCM. Total sediment volume will bestored in the reservoir without other storage measures such as Sabo dam,which were judged to be less economic by an alternative study. Therefore,minimum water level of reservoir to store this total sediment volume isEl 222.5 m.
9-2
- The dam crest elevation was estimated as follows:
Crest Elevation= El 248.36m (FWL)+1.21m (Free Board)+1.35m (damtype allowance) + 0.3m (Core Protection) = El 251.5m
- Dam crest will not provide for the use of public road. Width of dam crestis selected as 6m,
- Stability analysis of sliding by slip circle method is performed to ensurethe safety of dam body. Safety factors satisfy minimum allowance of theMoroccan standard that is almost same as that of the Japanese standard.In this analysis, intensity of seismic acceleration is estimated to be 0.1gas a zone of low frequency based on the analysis of seismic intensity andfrequency. Parameters of shear strength are also estimated for soilembankment and rock embankment densities that are not less than D95%and Dr (relative density) 80%, respectively.
(3) Dam Foundation Design
Weak layers, such as organic soil, clayey soil, alluvium deposit containing silt andclay, etc. should be removed beneath the whole of the dam body. Thicknessremoved will be 0.5 to 1.0 m at both abutments and about 1.0 m at the riverbed.Excavation of the core trench for the dam will be done down to a depth of about10m in the foundation of both abutments and the riverbed to expected rock wheregrouting could effectively improve perviousness of shallow foundation.
Grouting is planned to avoid a leakage through the dam foundation and its limbfoundation targeting pervious rock more than 3 to 5 Lugeon. The maximum depthand the minimum depth of the grouting are planned to be 15 m at the riverbed and10 m at the abutments.
(4) Diversion Design
Box culvert will be used as river diversion facility and will be placed in the soundrock foundation of left abutment slope along the riverbed. A tunnel type iscommon for medium to large-scale fill dam as diversion facility but it is moreexpensive than culvert type. The culvert location was selected to avoid the damageby the dam embankment contact due to un-uniform deformation of large loadfrom the dam embankment. As the dam height above the culvert is only 30 m andthe culvert is not designed to be set into the dam embankment to disperse the damembankment load, a culvert type is judged to be possible for the dam site. Theculvert size was designed as 5 x 5 x 300 m (height x width x length).
9-3
Principal designing conditions was based on flood characteristics in which designdischarge of diversion facility is based on a flood return period of 20 years (236m3/s). To ensure the safety against a leading flood with a discharge of a 50 yearsreturn period (271 m3/s) in the culvert, hydraulic condition is also checked.
(5) Spillway Design
A spillway facility will be placed on the right abutment. Hard foundation rock ofquartzite is suitable for the base of concrete structure. Quartzite on the rightabutment spreads more widely than on the left abutment. Also, the total lengthof spillway channel on the right abutment can be shorter than on the left abutment.The spillway was designed based on the following conditions:
- The spillway is non-gated weir type, which costs less to construct and iseasy to operate and maintain.
- As the dam is a fill type, the spillway was designed based on a floodreturn period of 10,000 years (1,800 m3/s inflow and 1,668 m3/s outflow).
- The weir length is 120 m and maximum height of overflow on thespillway weir is calculated as 3.64 m.
- The transition channel, chute way, and stilling basin are 25 m long, themost effective length based on the hydraulic study.
- Stilling basin was considered as energy dissipater after chute waychannel considering topography and geology of the foundation.
(6) Intake Facility Design
An inclined conduit type intake facility, at the left bank, will be placed on theslope of the left abutment to supply irrigation and potable water for downstreamlocal villages. Water from the reservoir will be led through pipes installed insidethe box culvert of the river diversion. Steel pipes of 1,000 mm diameter forirrigation and steel pipes of 300 mm for potable water are planned. Irrigationwater will be released to the downstream river through a jet-flow gate.
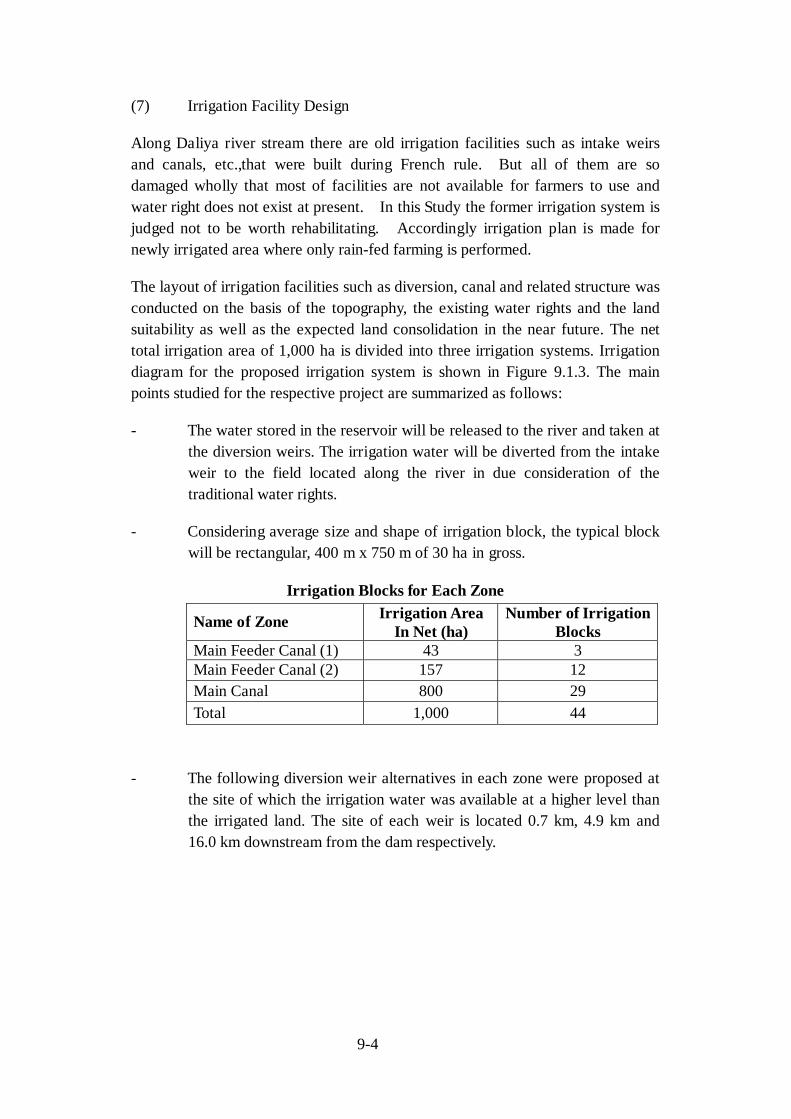
9-4
(7) Irrigation Facility Design
Along Daliya river stream there are old irrigation facilities such as intake weirsand canals, etc.,that were built during French rule. But all of them are sodamaged wholly that most of facilities are not available for farmers to use andwater right does not exist at present. In this Study the former irrigation system isjudged not to be worth rehabilitating. Accordingly irrigation plan is made fornewly irrigated area where only rain-fed farming is performed.
The layout of irrigation facilities such as diversion, canal and related structure wasconducted on the basis of the topography, the existing water rights and the landsuitability as well as the expected land consolidation in the near future. The nettotal irrigation area of 1,000 ha is divided into three irrigation systems. Irrigationdiagram for the proposed irrigation system is shown in Figure 9.1.3. The mainpoints studied for the respective project are summarized as follows:
- The water stored in the reservoir will be released to the river and taken atthe diversion weirs. The irrigation water will be diverted from the intakeweir to the field located along the river in due consideration of thetraditional water rights.
- Considering average size and shape of irrigation block, the typical blockwill be rectangular, 400 m x 750 m of 30 ha in gross.
Irrigation Blocks for Each Zone
Name of Zone Irrigation AreaIn Net (ha)
Number of IrrigationBlocks
Main Feeder Canal (1) 43 3Main Feeder Canal (2) 157 12Main Canal 800 29Total 1,000 44
- The following diversion weir alternatives in each zone were proposed atthe site of which the irrigation water was available at a higher level thanthe irrigated land. The site of each weir is located 0.7 km, 4.9 km and16.0 km downstream from the dam respectively.
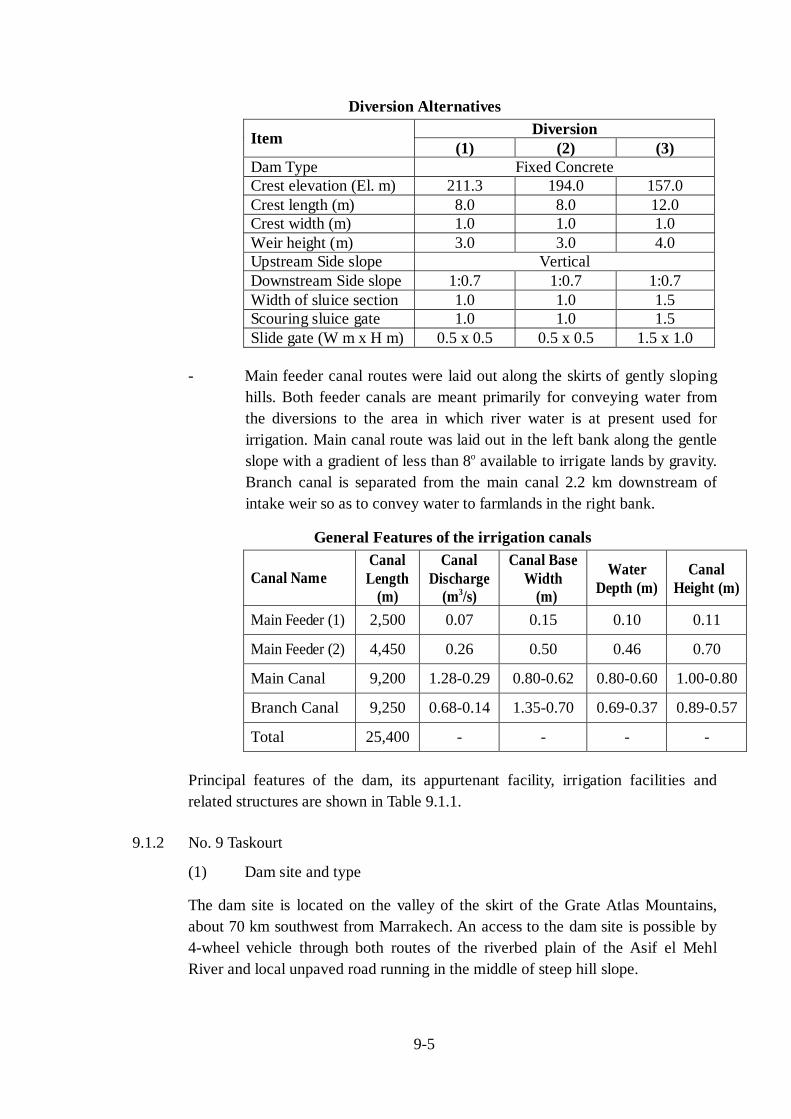
9-5
Diversion AlternativesDiversionItem (1) (2) (3)
Dam Type Fixed ConcreteCrest elevation (El. m) 211.3 194.0 157.0Crest length (m) 8.0 8.0 12.0Crest width (m) 1.0 1.0 1.0Weir height (m) 3.0 3.0 4.0Upstream Side slope VerticalDownstream Side slope 1:0.7 1:0.7 1:0.7Width of sluice section 1.0 1.0 1.5Scouring sluice gate 1.0 1.0 1.5Slide gate (W m x H m) 0.5 x 0.5 0.5 x 0.5 1.5 x 1.0
- Main feeder canal routes were laid out along the skirts of gently slopinghills. Both feeder canals are meant primarily for conveying water fromthe diversions to the area in which river water is at present used forirrigation. Main canal route was laid out in the left bank along the gentleslope with a gradient of less than 8o available to irrigate lands by gravity.Branch canal is separated from the main canal 2.2 km downstream ofintake weir so as to convey water to farmlands in the right bank.
General Features of the irrigation canals
Canal NameCanalLength
(m)
CanalDischarge
(m3/s)
Canal BaseWidth (m)
WaterDepth (m)
CanalHeight (m)
Main Feeder (1) 2,500 0.07 0.15 0.10 0.11
Main Feeder (2) 4,450 0.26 0.50 0.46 0.70
Main Canal 9,200 1.28-0.29 0.80-0.62 0.80-0.60 1.00-0.80
Branch Canal 9,250 0.68-0.14 1.35-0.70 0.69-0.37 0.89-0.57
Total 25,400 - - - -
Principal features of the dam, its appurtenant facility, irrigation facilities andrelated structures are shown in Table 9.1.1.
9.1.2 No. 9 Taskourt
(1) Dam site and type
The dam site is located on the valley of the skirt of the Grate Atlas Mountains,about 70 km southwest from Marrakech. An access to the dam site is possible by4-wheel vehicle through both routes of the riverbed plain of the Asif el MehlRiver and local unpaved road running in the middle of steep hill slope.
9-6
The Asif el Mehl River has open mouth of valley at the upstream of TaskourtVillage. The dam site is selected just downstream, where an efficient reservoir canbe planned. Both the right and left abutments have rather steep slopes and theriverbed is narrow. The foot of the left abutment has a high upright slope wheremass of foundation rock is exposed widely. On the contrary right abutment hasless exposure of rocks. It is mostly covered with shallow talus deposits. Depth toreach foundation rock is shallow on both abutments. And the planned height of thedam is around 80 m. Judging from these geological condition, topography andscale of dam, it is clearly recommended that the dam should be a concrete gravitytype. According to the exploration of subsurface geology and drilling survey it isrecognized that the left abutment is very good condition with massive and hardsandy schist exposures. However, it is anticipated that the right abutment ispossibly covered with thickly fractured and weathered rocks beneath the talusdeposits because of faults running across the right abutment. Excavation of theright abutment thus becomes somewhat large. But the dam site is still in a narrowvalley.
There is a possibility that a alternative dam site about 100m upstream fromproposed present site is also suitable for gravity dam if the geology of the site is asgood as its appearance of surface rock of hard sandy schist. Further detailedsurvey is expected for the next stage.
(2) Dam Designing
As mentioned above, a large amount of suitable sand and gravel materials aredeposited around the dam site. The dam is planned to be a type of rollercompacted cement dam (RCC) with natural sand and gravel, which is verycommon in Morocco recently. General layout and typical cross sections of thedam is shown in Figures 9.1.4 and 9.1.5, respectively. RCC with maximum gravelsize of 80mm will be placed as inner concrete to support dam body stability and tomake an economic embankment. Normal concrete with maximum gravel size of80 mm will be placed as outer concrete to make a dam impervious and to obtainhigh resistance against deterioration of appearance.
Inspection gallery tunnel will be planned to set drainpipes for releasing waterpressure acting on the bottom of the dam. The dam was designed for the followingconditions:
- Sediment volume accumulated over 50 years is to be stored by the dam.Total sediment volume will be stored in the reservoir without otherstorage measures such as Sabo dam, which are judged to be lesseconomical by the alternative study. Total sediment volume is planned as6 MCM. So the dead water level of reservoir that is equivalent elevationto store this total sediment volume is planned to be EL 973 m.
9-7
- Height and dam type allowance were estimated from the normal waterlevel and the flood water level of the reservoir. Then dam crest is decidedas follows:
a) Dam crest; El 998.95m(as FWL)+1.24m(as wave height due towind)+0.31m(dam type allowance)=El 1,000.5m
b) This is almost equivalent as water level at the exceptional flood of10,000 year return period. (Max WL=El 999.85m)
c) Dam crest will not provid for the use of public road. Width of damcrest is selected as 5m,
- Stability analyses of overturning and shear sliding are performed toensure the safety of dam body. Safety factors satisfy minimum allowanceof Moroccan standard that is almost same as that of Japanese standard. Inthis analysis intensity of seismic acceleration is selected to be 0.12gconcerning concrete dam as a zone of high frequency based on theanalysis of seismic intensity and frequency. Parameters of shear strengthof rock foundation are also estimated considering that rocks beneath dambody will be mainly sound sandy schist.
(3) Dam Foundation Designing
All of deposit materials and highly weathered rock should be removed under thedam body. Especially the foundation at riverbed will demands sound rock.Thickness removed from dam foundation will be about 15 m at the left abutmentand riverbed, and about 10 m at the left abutment. Consolidation grouting withlength of 5m into rock will be planned to make a firm and even foundation of damthat might suffer loosening of surface rock by excavation work. This grout will becarried out on the spread of dam concrete after finishing some layers that isexpected the effect of concrete capping.
Grouting is also planned from the upstream taper filet of the dam to avoid afoundation leakage that will cause as lifting pressure, targeting pervious rock morethan 2 Lugeon. The maximum depth and the minimum depth of the grouting areplanned to be 45 m at the riverbed and 20 m at the left abutment respectively.
9-8
(4) Diversion Facilities
The river flow at the dam site is perennial. Discharge of flood in rainy season isvery large. As the construction of the dam can not be completed within a singledry season, Diversion Facilities are necessary. It is recommended to place a boxculvert on the rock foundation in the riverbed. The culvert will be constructed byhalf closing river method during dry season. Other Diversion Facilities such astunnel in the abutment is conceivable. This is, however, very expensive comparedwith the culvert type. Namely, the culvert type diversion is selected as it is cheapand is possibly constructed in the site. Principal points of diversion design are asfollows:
- Design discharge of Diversion Facilities is basically that of return periodof 10 years, as the dam is a rigid concrete gravity type. To ensure the safeleading of flood flow, a discharge of 20 year return period is checked topass without overflowing the culvert wall.
- Discharges of both return periods are 340 m3/s for 10 years and 474 m3/sfor 20 years considering the storage effect of the flood in the reservoir. Sothe size of culvert is planned to be 7.2m high and 7.2m wide with a totallength of 270m.
The culvert will be used as room for conduit of intake facility for irrigation andothers afterward.
(5) Spillway
A spillway facility will be formed on the center of the dam body. Principal pointsof spillway design are as follows:
- The spillway weir for the dam is non-gated type, which is moreeconomical to construct and is easy to operate and maintain.
- The return period of design flood is set at 1,000 years, as the dam is aconcrete type. Estimation for discharge of design flood considers storageeffect in reservoir. So the design discharge is Qout=1,569 m3/s as outletflow against Qin=1,700 m3/s of in-flow of reservoir for the selected caseof weir length of 100 m. Maximum height of overflow on the spillwayweir is calculated as 3.95 m.
- Spillway is also checked against a flood with a return period of 10,000years.
- The width of chute way is 100 m at the top beginning and 80 m at thebottom ending, and a width of stilling basin to dissipate energy fromchute flow is selected to be 80 m considering the geometry of riverbed.
9-9
(6) Intake Facility Designing
An intake facility to supply irrigation water for around 4,500 ha and potable waterfor downstream local village will be placed on the upstream face of the right sidedam body. Water from the reservoir will be led through pipes installed inside thebox culvert of the river diversion. Steel pipe of 2,000 mm diameter for irrigationand steel pipes of 300 mm for potable water are planned. Irrigation water will bereleased to the downstream river through a jet-flow gate.
(7) Irrigation Facility Designing
There are the existing irrigation facilities in the project area. These irrigationfacilities were, therefore, incorporated as much as possible in proposed plan forthe whole irrigation system. Irrigation diagram for the proposed irrigation systemsis shown in Figure 9.1.6. The layout of irrigation facilities such as diversion,canals and related structures was conducted on the basis of the topography, thepresent water rights and the land suitability. The study points are summarized asfollows:
- The total irrigation area of 4,500 ha is divided into 18 irrigation zones inthe same manner as the existing irrigation systems.
- A diversion weir was proposed at the near site of existing diversion ofTaslimant in order to maintain the present water rights. The followingdiversion will be constructed with the intake design discharge of 6.75m3/s based on the irrigation water requirement.
Item Unit DimensionDam type - Fixed Concrete TypeCrest length m 70Crest width m 2.0Weir height m 5.0Side slope (upstream) - VerticalSide slope (downstream) - 1: 0.7Width of sluice section m 2.0Slide gate (W x H x nos.) m x m x nos. 2.0 x 2.0 x 2
Main canal route was laid out in the left bank along the seguias, which currentlyconvey the water from existing diversion weirs to its commanded farmlands.Branch canal was separated from the main canal at 5.45 km downstream of theintake weir so as to divide water into farmlands in the right bank. Irrigation canalswere, in principle, designed as masonry with concrete filled or concrete flume,considering the rapid flow caused by steep slope of canal bed, water loss andmaintenance of canals. General features of the irrigation canals are as follows:
9-10
General Features of the irrigation canals
Name of CanalCanalLength
(m)
CanalDischarge
(m3/s)
Canal BaseWidth
(m)
WaterDepth
(m)
CanalHeight
(m)Main Canal 21,600 6.75-1.26 1.60-1.20 1.59-0.62 2.10-0.90
Branch Canal 15,280 1.67-1.02 1.35-1.10 1.30-0.52 1.50-0.80
Total 36,880 - - - -
Principal features of the dam, its appurtenant structures, irrigation facilities andrelated structures are shown in Table 9.1.2.
9.1.3 No. 10 Timkit
(1) Dam site and type
The dam site is located on the Ifegh River in the mountain range 25 km northwestfrom Tinejdad, which is about 70km southwest of Er-Rachidia. It takes about onehour from Tinejdad by 4-wheel drive vehicle to reach the dam site via a road onthe riverbed plain and a rough unpaved road, passing close to Ifegh village.Around one km upstream from Ifegh village, the river forms a series of gorges.After passing the gorge there is a confluence of two rivers, where the riverbedwould create a very efficient reservoir.
The dam site is selected in the downstream end of this series of gorges with verysteep slope in the left abutment and moderately steep slope in the right abutment.
The geology of this area mainly consists of limestone, which normally possessesmany cavities and open cracks being highly pervious. However, there are clayeylimestone layers that make wide impervious planes in the foundation of the dam.Strike of the planes is parallel with the dam axis, dipping 20 to 30 degrees toupstream. The dam axis should be properly selected so that the dam body can beconnected with the impervious planes by grouting work.
The base of dam body mostly sits on pervious limestone layer. As limestone itselfis hard rock foundation, it could bear the load from both a concrete gravity dam ora fill dam. However, there remains a little anxiety that some cavities and opencracks of limestone beneath the dam base could be left unplugged even if enoughcontact grouting were carried out. If this happens with a fill type dam, erosion andpiping in the embankment, which may lead to fatal damage of the dam, isanticipated. Accordingly a concrete gravity dam that is highly resistible againstsuch erosion is selected for this dam site.
9-11
(2) Dam Design
As mentioned above, there are large suitable sand and gravel deposits around thedam site. The dam is planned to be a type of roller compacted cement dam (RCC)with natural sand and gravel, that is very common in Morocco recently. Generallayout and typical cross sections of the dam is shown in Figures 9.1.7 and 9.1.8,respectively. RCC with maximum gravel size of 80mm will be placed as innerconcrete to support dam body stability and to make an economical embankment.Normal concrete with maximum gravel size of 80 mm will be placed as outerconcrete to make an impervious dam and to obtain high resistance againstdeterioration of appearance. Inspection gallery tunnel is planned to set drainpipesfor releasing water pressure acting on the bottom of the dam. The dam wasdesigned for the following conditions:
- For planning a reservoir to store the sediment volume, alternativemeasures were studied. One is to store total sediment volume in thereservoir as dead water storage. Other is to share a part of the sedimentload on a Sabo dam, which would be located nearby upstream of maindam reservoir to stop only sediment. Sharing on Sabo dam varies from30-year sediment as maximum sharing to 0 years sediment (0%)asminimum sharing. Comparison study on main dam and Sabo dam wascarried out. Study shows that Sabo dam to share the storage ofsedimentation is slightly less economical. If total sedimentation isplanned to rest in the main dam’s reservoir, water storage for irrigationshould be kept on the storage volume of sedimentation. This implies alarger surface area of the reservoir for irrigation. On the other hand, asthe dam site is located in semi-arid dry area, there will be a significantloss of storage water by evaporation.
Accordingly 30 years sediment on Sabo dam, that is maximum sharing, isrecommended for storage. So the sediment volume in the reservoir of themain dam is 4,000,000m3 of 20 years sedimentation. The dead waterlevel of reservoir that is equivalent to elevation to store the total sedimentvolume is 1,240.3 m.
- To decide the dam crest elevation, free board against/for wave rush-upheight and dam type allowance were estimated from the normal waterlevel and the flood water level of the reservoir. So dam crest is decided asfollows:
a) Dam crest; El 1,258.12m(as FWL)+1.17m(as wave height due towind)+0.21m(dam type allowance)=EL 1,259.5m
9-12
b) Dam crest will not provide for the use of public road. Width ofdam crest is selected as 5m,
- Stability analyses of overturning and shear sliding are performed toensure the safety of dam body. Safety factors satisfy minimum allowanceof the Moroccan standard that is almost the same as that of the Japanesestandard. In this analysis, intensity of seismic acceleration is selected tobe 0.10g concerning concrete dam as a zone of high frequency based onthe analysis of seismic intensity and frequency. Parameters of shearstrength of rock foundation are also estimated as rocks beneath dam bodywill be mainly hard limestone.
(3) Dam Foundation Design
All deposit materials and highly weathered rock should be removed under the dambody. Especially, the foundation at riverbed will demand sound rock. Thicknessremoved from dam foundation will be about 15 m at the left abutment andriverbed, and about 10 m at the left abutment.
Most of dam bottom is on limestone foundation that has open cracks and cavitiesand is excessively pervious. On the other hand, there is an impervious plane ofsedimentation rock layer that forms under dam foundation. To avoid leakage offoundation, grouting is required that makes a continuous water-stop curtainconnecting impervious plane and dam body, which is in addition to commonconsolidation grouting.
Grouting at riverbed will be performed from the upstream taper filet of dam. Andgrouting position will gradually move toward downstream of dam site frommiddle of both abutments to make grouting depth as shallow as possible. Themaximum depth of the grouting is planned to be about 15 m at riverbed. Themaximum depth of the grouting at abutments is about 60 m, which is much deeperthan that of riverbed because of geometry of impervious rock plane in thelimestone.
(4) Diversion Facilities
The river of the dam site is non-perennial, but it has subsurface flow in theriverbed throughout the year. Floods also occur two or three times a year, but theirtiming is unpredictable. So the diversion is necessary during the dam construction.A box culvert for diversion will be placed on the foundation of the riverbed. Theculvert should be constructed by closing half the river for some months, whenflood is not likely to occur statistically. Principal points of diversion design are asfollows:
9-13
- Design discharge of Diversion Facilities is basically that of return periodof 10 years, as the dam is a concrete gravity type. To ensure the safeleading of flood flow, a discharge of 20-year return period is checked topass without overflowing the culvert wall.
- Discharges of both return periods are 300 m3/s for 10 years and 348 m3/sfor 20 years considering the storage effect of the flood in the reservoir.Thus, the size of culvert is planned to be 6m high and 6m wide with totala length of 200m.
The box culvert will be used as room for conduit of intake facility for the use ofreservoir water.
(5) Spillway
A spillway facility will be formed on the center of dam body. Principal points ofspillway design are as follows:
- The spillway weir for the dam is non-gated type, which is moreeconomical and easy to operate and maintain.
- The return period of design flood is applied to be 1,000 years, as the damis a concrete type. Estimation for discharge of design flood considersstorage effect above the normal water level (EL 1,255.8m) in reservoir.Room for flood control between the surcharge water level (EL 1,255.8m)and the normal water level is counted in the calculation of storage effect.Thus, the design discharge is Qout=426 m3/s as outlet flow againstQin=2,000 m3/s of in-flow of reservoir for the selected case of weirlength of 60 m. Maximum height of overflow on the spillway weir iscalculated as 2.32 m.
- The width of chute way and stilling basin is selected to be 60 mconsidering the riverbed geometry.
- The energy dissipater after chute way channel selected to be a stillingbasin type considering condition of topography and geology of thefoundation
(6) Intake Facility Design
An intake facility to supply irrigation water for Ifegh and potable water fordownstream local village will be placed on the upstream face of the right side ofthe dam. Outlet gate to supply irrigation water for Tinejdad and Chitam will beplaced on the dam body.
Water from the reservoir will be led through pipes installed in the dam body. Steelpipe of 600 mm diameter for irrigation and steel pipes of 400 mm diameter forpotable water are planned. Ifegh irrigation water will be released to thedownstream river through a jet-flow gate.
9-14
Floodwater from 4m x 4m outlet gate will be released on the chute of the spillway.This water will finally contribute to the irrigation of farmlands around 30 kmdownstream of Tinejdad and Chitam.
(7) Irrigation Facility Design
There are the existing irrigation facilities in the project area. These irrigationfacilities are, therefore, incorporated as much as possible in the proposed plan forthe whole irrigation system. Irrigation diagram for the proposed irrigation systemsis shown in Figure 9.1.9.
The water stored in the reservoir will be released to the river and taken at theexisting diversion weirs. The irrigation water will be conveyed from the intakeweir to farmlands according to the prevailing traditional water rights. In theTinejdad and Chtam areas, the principal diversion weirs and main canals havealready been constructed on the basis of their design concept. The main pointsconsidered for the rehabilitation of irrigation facilities are summarized as follows:
- The total irrigation area of 3,825 ha in gross is divided into three areasIfegh, Tinjidad and Chtam areas;
- All of the traditional diversion weirs located along the rivers and thoserelated seguias are required of the rehabilitation works;
- The canal bases, which are shallow owing to erosion of inside slopes andto sedimentation on the basis of the canal route survey results, will needto be excavated and the destroyed inside slopes will need to be re-embanked by masonry;
- The diversion of 12 weirs will be rehabilitated to convey the water offlood to entire fields with the empirical design intake discharges of 15liters/sec/ha. General features of the irrigation canals are as follows:
Features of the Irrigation Canals
Type of CanalCanalLength
(m)
CanalDischarge
(m3/s)
Canal BaseWidth
(m)
WaterDepth
(m)
CanalHeight
(m)Concrete flume 3,600 0.45 0.50 0.61 0.85
Masonry 34,900 3.50-1.00 1.23-0.71 0.71-1.23 1.53-0.91
Total 38,500 - - - -
Principal features of the irrigation facilities and related structures are shown inTable 9.1.3.
9-15
9.1.4 No. 17 Azghar
(1) Dam site and type
The dam site is located on the Zloul river in a hilly area, 7 km east from Ribat AlKhayre, around 50 km eastward from Sefrou. Access by paved road is possible upto around one(1) km downstream from the dam site. Further access to the dam siteis only possible by 4 wheel drive vehicle.
From hilly point in Ribat el Kheir, future irrigation service area could be nicelyobserved. The Zloul river runs along the south edge of the irrigation service area.A mountain range closes the upstream end of the irrigation service area. Thevalley in the mountain range created by the Zloul River is the dam site.
Geology of the dam site is blackish marl. Hard foundation rocks of the marlexpose on the riverbed and on the slopes of both abutments. Lots of beddingstratification is observed in the marl, but their contacts are firm. So the foundationallows for both a gravity dam and fill dam. Construction materials for both damscould be obtained near the dam site. In order to select the dam type, fill type damwith center-core and concrete gravity type dam, to be constructed by RCC (BCRin French) were compared.
The comparison study found the construction cost of the center-cored fill dam ischeaper by about 30 % than BCC as shown in Supporting Report XVII, so a filltype dam for this site is recommended.
(2) Dam Designing
The foundation rock of dam site has scarce cracks and it is mostly impervious. Butsome parts of foundation near surface are semi-pervious rocks that requiregrouting against leakage. General layout and typical cross sections of the dam isshown in Figures 9.1.10 and 9.1.11, respectively.
Considering the availability of the embankment material and necessity of grouting,a center-cored fill dam is recommended.
The impervious core-zone requires residual or colluvial deposit materials fromreservoir area. Zones of filters and drain are river deposit material, and the mainembankment of upstream-side and downstream-side dam are river depositmaterials and excavation material from spillway. Upstream-side slope of the damwill be protected by riprap of quarry site material. These arrangements ofmaterials for each zone will make dam cost economical. The dam was designedfor the following conditions and considerations:
9-16
- Sediment volume accumulated over 50 yeas is to be stored by the dam.Total sediment volume will be stored in the reservoir without otherstorage measures such as Sabo dam, which were judged to be lesseconomical by the alternative study. Total sediment volume is 6.5 MCM.So the dead water level of reservoir that is equivalent elevation to storethe total sediment volume is 848.5 m.
- To decide the dam crest elevation free board against/for wave rush-upheight and dam type allowance were estimated from the normal waterlevel and the flood water level of the reservoir. The crest of imperviouscore is decided as follows:
a) Core crest; El 856.89m(as FWL)+1.16m(as wave height due towind)+1.15m (dam type allowance)= El 859.20m
b) Dam crest is El 859.5m by adding 0.3m thickness of core protection.
- Dam crest will not provide for the use of public road. Width of dam crestis selected as 6m,
- Stability analysis of sliding by slip circle method is performed to ensurethe safety of dam body. Safety factors satisfy minimum allowance of theMoroccan standard that is almost same as that of the Japanese standard.In this analysis, intensity of seismic acceleration is estimated to be 0.12gas a zone of high frequency based on the analysis of seismic intensity andfrequency. Parameters of shear strength are also estimated,consideringsoil embankment and rock embankment densities that are not less thanD95% and Dr (relative density) 80%, respectively.
(3) Dam Foundation Designing
Weak layers, such as organic soil, clayey soil, alluvium deposit containing silt andclay, etc. should be removed beneath the whole of the dam body. Thicknessremoved will be less than 0.5m at left abutment where many rock exposures areobserved. And it is about 1.0 m at the right abutment and riverbed.
Excavation of the core trench for the dam will be done down to a depth of about10m in the foundation of the abutments and the riverbed to expect the sound rockwhere grouting could effectively improve perviousness of shallow foundation.
Grouting is planned to avoid a leakage through the dam foundation and its limbfoundation targeting pervious rock more than 3 to 5 Lugeon. The maximum depthand the minimum depth of the grouting are planned to be 20 m at riverbed and 25m at the abutments.
9-17
(4) Diversion Designing
River diversion facilities may be proposed to be box culvert type in the gentleslope of the right abutment. Although the tunnel type diversion likely to beproposed in the left abutment will be also studied, it is much more expensive.Principal points of diversion design are as follows:
- Design discharge of diversion facilities is basically that of return periodof 20 years, as the dam is fill type. To ensure the safe leading of floodflow, a discharge of 50-year return period is checked to pass withoutoverflowing the culvert wall.
- Discharges of above both return periods are 213 m3/s for 20 years and222 m3/s for 50 years after considering the storage of flood in thereservoir. So the size of culvert is planned to be 5x5m with total a lengthof 240m.
(5) Spillway Designing
A spillway facility will be planned on the moderate slope of the right abutment,where the spillway channel can be placed on the hard rock with small amount ofexcavation works. On the other hand, spillway on the left abutment, of whichlength will be the same as on the right abutment, is easily recognized to producemuch volume of rock excavation because of steep slope. Principal points ofspillway design are as follows:
- The spillway weir for the dam is non-gated type, which is moreeconomical to construct and is easy to operate and maintain.
- The return period of design flood is applied to be 10,000 years, as thedam is fill type. Ddischarge of design flood was estimated consideringstorage effect in reservoir. The design discharge is Qout=592 m3/s asoutlet flow against Qin=700 m3/s of in-flow of reservoir for the selectedcase of weir length of 60 m. Maximum height of overflow on thespillway weir is calculated as 2.89 m.
- The width of transition channel, chute way and stilling basin is selectedto be 15 m as the most effective cross-section determined by thehydraulic study.
- The energy dissipater after chute way channel is selected to be a stillingbasin type considering condition of topography and geology of thefoundation.
9-18
(6) Intake Facility Designing
An intake facility with type of inclined conduit at the left bank will be placed onthe slope of the left abutment to supply irrigation water for around 2,000 ha andpotable water for downstream local villages. Maximum total design discharge isabout 2.6m3/sec. Water from the reservoir will be led through pipes installedinside the tunnel of the river diversion. Steel pipe of 1,000 mm diameter forirrigation and steel pipes of 300 mm for potable water are planned. Irrigationwater will be supplied to the downstream water tank that will control water headto supply water to farmland.
(7) Irrigation Facility Designing
At present most farmlands are rain-fed. A block of private fruit farmland facesthe Zloul river where drip-by-drip with pumping water is operated. And a fewsmall farmlands are temporary irrigated with water pumped from the river.Several legally entitled water rights exist in the project area, however, thosequantities of water available to the irrigation are not enough for the lands at all.
The layout of irrigation facilities such as main canal, branch canals and relatedstructures was conducted on the basis of the topography, the existing water rightsand the land suitability as well as the expected land consolidation in the near future.
The total irrigation area of 2,000 ha in net will be obtained by maintaining the waterlevel of canal as high as possible for maximizing the irrigation area. Irrigationdiagram for the proposed irrigation system is shown in Figure 9.1.12. The mainconsiderations for the alignment of irrigation facilities are summarized as follows:
- Considering average size and shape of irrigation block, the typical blockwill be rectangular, 400 m x 750 m, of 30 ha in gross. The total numberof irrigation blocks is determined to be 77 blocks of which average areain net was about 26 ha as shown below.
Irrigation Blocks for Each Zone
Name of Canal Irrigation Area In Net(ha)
Number ofIrrigation Blocks
Main Canal 967 37Branch Canal 1) 319 15Branch Canal 2) 541 17Branch Canal 3) 173 8Total 2,000 77

9-19
- Main canal route was laid out in the right bank along the gentle slopewith a gradient of less than 8 degrees available to irrigate lands bygravity. Branch canal 1) was directly connected to the end of main canal.Branch canal 2) was separated from the main canal at 3.72 kmdownstream of the stilling basin so as to convey water to farmlandslocated along or near the river. Branch canal 3) route was laid out alongthe skirts of gently sloping hills in the left bank.
- Irrigation canals were, in principle, designed as stone with concrete filledor concrete flume in consideration of water loss and canal maintenance.
- The canal section was designed taking into account the effective waterflow and the canal slope stability.
General Features of the irrigation canalsCanalLength
(m)
CanalDischarge
(m3/s)
Canal BaseWidth
(m)
WaterDepth
(m)
CanalHeight
(m)Main Canal 13,545 2.38-0.63 1.60-0.60 1.01-0.58 1.25-0.80Branch Canal (1) 2,580 0.25-0.14 0.50-0.40 0.45-0.35 0.60-0.50Branch Canal (2) 5,515 0.71-0.29 1.00-0.60 0.57-0.40 1.00-0.70Branch Canal (3) 2,670 0.23 0.80 0.40 0.60Total 24,310 - - - -
Principal features of the irrigation facilities and related structures are shown inTable 9.1.4.
9.2 Construction Plan and Cost Estimates
9.2.1 Construction Plan
(1) Basic Assumption
- Monthly Workable Days
The number of monthly workable days for construction works of excavation,embankment and concrete are estimated based on the rainfall data at each projectarea from 1991 to 2000. The results are shown in the table below
Monthly Workable Days Work N’Fifikh Taskourt Timkit Azghar
Excavation 25 25 27 23Embankment 25 26 28 24
Concrete 25 26 28 24
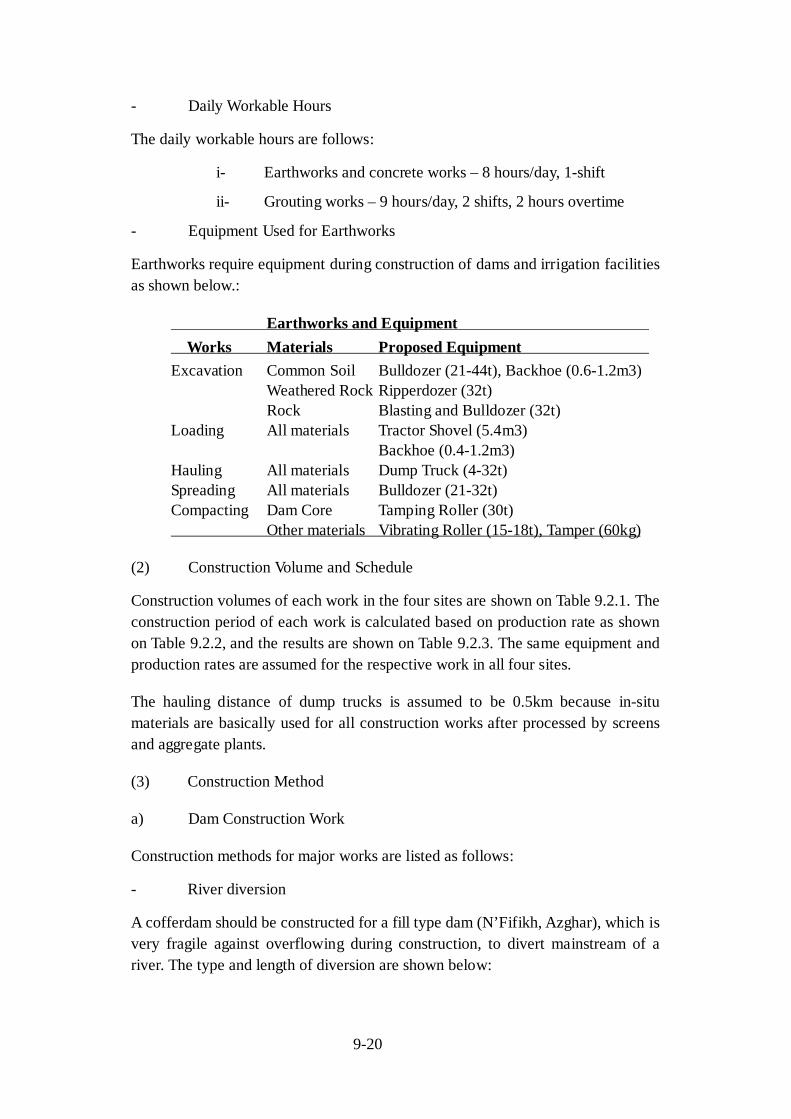
9-20
- Daily Workable Hours
The daily workable hours are follows:
i- Earthworks and concrete works – 8 hours/day, 1-shift
ii- Grouting works – 9 hours/day, 2 shifts, 2 hours overtime
- Equipment Used for Earthworks
Earthworks require equipment during construction of dams and irrigation facilitiesas shown below.:
Earthworks and Equipment Works Materials Proposed Equipment Excavation Common Soil Bulldozer (21-44t), Backhoe (0.6-1.2m3)
Weathered Rock Ripperdozer (32t)Rock Blasting and Bulldozer (32t)
Loading All materials Tractor Shovel (5.4m3)Backhoe (0.4-1.2m3)
Hauling All materials Dump Truck (4-32t)Spreading All materials Bulldozer (21-32t)Compacting Dam Core Tamping Roller (30t) Other materials Vibrating Roller (15-18t), Tamper (60kg)
(2) Construction Volume and Schedule
Construction volumes of each work in the four sites are shown on Table 9.2.1. Theconstruction period of each work is calculated based on production rate as shownon Table 9.2.2, and the results are shown on Table 9.2.3. The same equipment andproduction rates are assumed for the respective work in all four sites.
The hauling distance of dump trucks is assumed to be 0.5km because in-situmaterials are basically used for all construction works after processed by screensand aggregate plants.
(3) Construction Method
a) Dam Construction Work
Construction methods for major works are listed as follows:
- River diversion
A cofferdam should be constructed for a fill type dam (N’Fifikh, Azghar), which isvery fragile against overflowing during construction, to divert mainstream of ariver. The type and length of diversion are shown below:
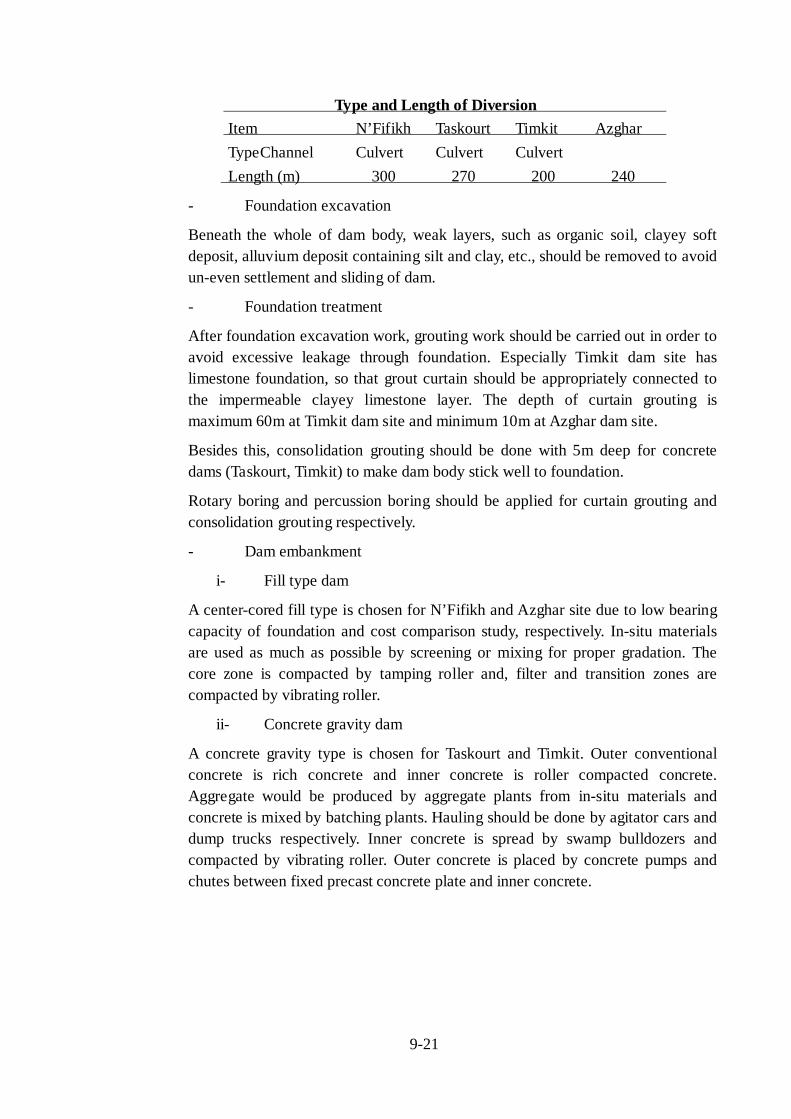
9-21
Type and Length of Diversion Item N’Fifikh Taskourt Timkit Azghar TypeChannel Culvert Culvert Culvert
Length (m) 300 270 200 240
- Foundation excavation
Beneath the whole of dam body, weak layers, such as organic soil, clayey softdeposit, alluvium deposit containing silt and clay, etc., should be removed to avoidun-even settlement and sliding of dam.
- Foundation treatment
After foundation excavation work, grouting work should be carried out in order toavoid excessive leakage through foundation. Especially Timkit dam site haslimestone foundation, so that grout curtain should be appropriately connected tothe impermeable clayey limestone layer. The depth of curtain grouting ismaximum 60m at Timkit dam site and minimum 10m at Azghar dam site.
Besides this, consolidation grouting should be done with 5m deep for concretedams (Taskourt, Timkit) to make dam body stick well to foundation.
Rotary boring and percussion boring should be applied for curtain grouting andconsolidation grouting respectively.
- Dam embankment
i- Fill type dam
A center-cored fill type is chosen for N’Fifikh and Azghar site due to low bearingcapacity of foundation and cost comparison study, respectively. In-situ materialsare used as much as possible by screening or mixing for proper gradation. Thecore zone is compacted by tamping roller and, filter and transition zones arecompacted by vibrating roller.
ii- Concrete gravity dam
A concrete gravity type is chosen for Taskourt and Timkit. Outer conventionalconcrete is rich concrete and inner concrete is roller compacted concrete.Aggregate would be produced by aggregate plants from in-situ materials andconcrete is mixed by batching plants. Hauling should be done by agitator cars anddump trucks respectively. Inner concrete is spread by swamp bulldozers andcompacted by vibrating roller. Outer concrete is placed by concrete pumps andchutes between fixed precast concrete plate and inner concrete.
9-22
- Spillway
A fill type dam requires an independent spillway constructed on the stablefoundation. The spillways are constructed on the right bank in both N’Fifikh andAzghar sites. The size of the spillway in N’Fifikh is quite big due to the big designflood. Both are made of reinforced concrete.
Guide wall and downstream slab are counted as the volume of spillway inTaskourt and Timkit, as a flood overflows the dam crest on the concrete dam.
- Outlet
The outlet facility is constructed to control discharge, connecting the intakefacility to outlet structure. Its pipeline is constructed in the diversion channel/tunnel of N’Fifikh and Azghar, and in the dam body of Taskourt and Timkit.Besides slide gates, jet flow gates and flow meters are installed.
- Sabo dam
A sabo dam is constructed in Timkit to store 6.0 million m3 of sediment,equivalent to 30 years of sediment volume accumulated at the main dam site. Thesite of sabo dam is located approximately 20km upstream from the main dam andit has 60% of basin area of the main one. Rubble masonry is applied for sabo dambody.
b) Irrigation Facility Construction Work
- Main Canal
The structures of main canals, named Main, Branch and Main Feeder canal, aremasonry lining, masonry flume, and reinforced concrete flume, depending on thedischarge and geological condition. Backhoes are used for excavation work andmasonry work would be implemented manually.
- Structures
Structures of irrigation facility are head works, siphons, drops, offtakes, spillways,checks, aqueducts, cross drains, bridges, box culverts and on-farm facilities. Wellsand river channel shaping are also planned in Timkit.
9.3 Cost Estimate
9.3.1 Basic Assumptions and Conditions
Financial construction costs for the dam and irrigation facilities in all four sites areestimated based on the following conditions.
9-23
- The costs are estimated at the price level of April 2000.
- The exchange rate used in the estimate is shown as below:
US$1.00 = DH10.68, JYen100 = DH9.90 DH; Dirhams
- Both local and foreign currency portions are estimated in Dirhams.
- Physical contingency is fixed at 10%.
- Price escalation rate is estimated at 3% per annum for both local andforeign currency portions.
- The estimation includes the following rates of value added tax.· Construction works: 14%· Resettlement: 14%· Engineering services: 20%
- International competitive bidding (ICB) is applied for the construction ofdams and local competitive bidding (LCB) is applied for the constructionof irrigation and small-scale water supply facilities.
- The rate of local and foreign currency portion is 0.35 : 0.65 for the damconstruction cost and 0.50 : 0.50 for the irrigation facility constructioncost. The construction of a dam has higher dependence to foreignresources. Those values are referred from statistical data.
- Earth materials will be obtained in and around the construction sites, andaggregates will be produced with such materials.
9.3.2 Unit Cost
The construction costs are estimated on the unit cost basis. They are calculatedbased on basic costs collected through a survey. Each unit cost is cautiously fixedconsidering the prices used in actual bidding. Tables 9.3.1 to 9.3.3 show basiccosts of major laborers, materials and equipment.
9.3.3 Constitution of Construction Cost
The construction cost consists of the following items.
1) Direct Construction Cost comprises the cost for actual civil works, andoverhead and profit of contractor, the percentage of which varies13 to16% in fill dams, 15 to 22% in concrete dams, and 7% in irrigation works.
2) Physical Contingency is fixed at 10% of 1) for all construction works.
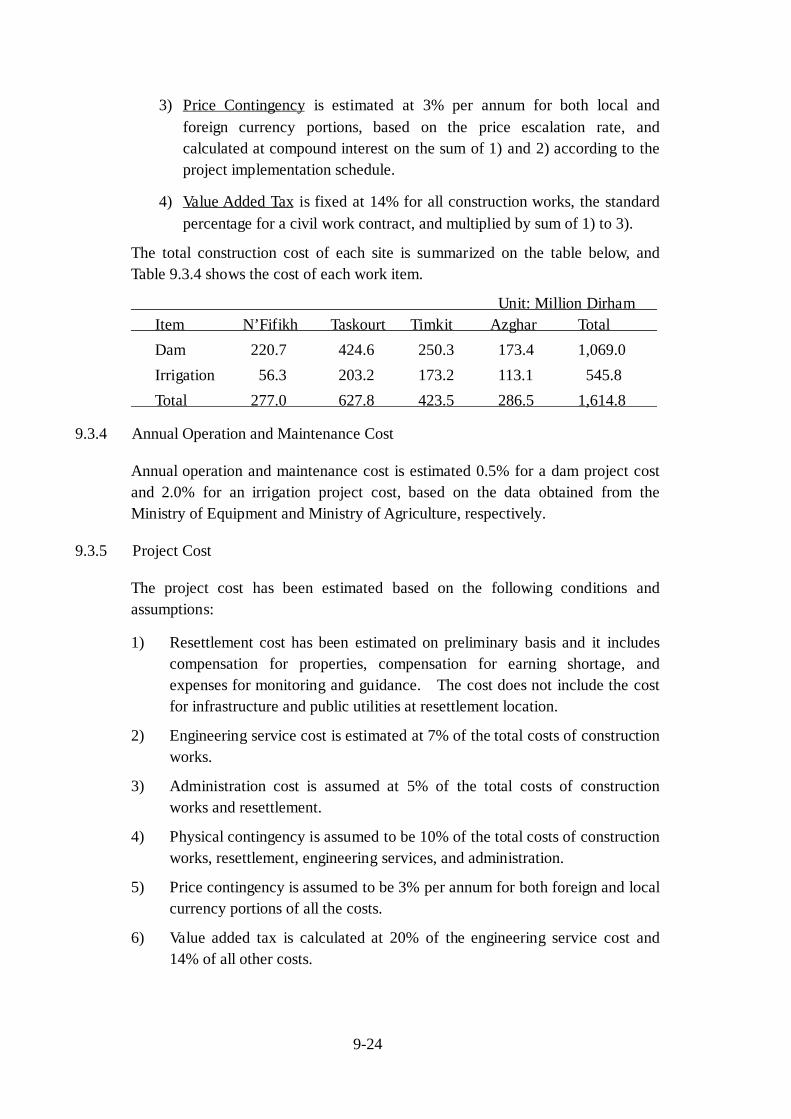
9-24
3) Price Contingency is estimated at 3% per annum for both local andforeign currency portions, based on the price escalation rate, andcalculated at compound interest on the sum of 1) and 2) according to theproject implementation schedule.
4) Value Added Tax is fixed at 14% for all construction works, the standardpercentage for a civil work contract, and multiplied by sum of 1) to 3).
The total construction cost of each site is summarized on the table below, andTable 9.3.4 shows the cost of each work item.
Unit: Million Dirham Item N’Fifikh Taskourt Timkit Azghar Total
Dam 220.7 424.6 250.3 173.4 1,069.0Irrigation 56.3 203.2 173.2 113.1 545.8
Total 277.0 627.8 423.5 286.5 1,614.8
9.3.4 Annual Operation and Maintenance Cost
Annual operation and maintenance cost is estimated 0.5% for a dam project costand 2.0% for an irrigation project cost, based on the data obtained from theMinistry of Equipment and Ministry of Agriculture, respectively.
9.3.5 Project Cost
The project cost has been estimated based on the following conditions andassumptions:
1) Resettlement cost has been estimated on preliminary basis and it includescompensation for properties, compensation for earning shortage, andexpenses for monitoring and guidance. The cost does not include the costfor infrastructure and public utilities at resettlement location.
2) Engineering service cost is estimated at 7% of the total costs of constructionworks.
3) Administration cost is assumed at 5% of the total costs of constructionworks and resettlement.
4) Physical contingency is assumed to be 10% of the total costs of constructionworks, resettlement, engineering services, and administration.
5) Price contingency is assumed to be 3% per annum for both foreign and localcurrency portions of all the costs.
6) Value added tax is calculated at 20% of the engineering service cost and14% of all other costs.
9-25
Estimated costs are presented in Table 10.1.4 and summarized below:Unit: Million DH
Cost Item N'Fifikh Taskourt Timkit Azghar Total1. Construction cost 181.0 409.5 274.6 185.8 1,050.92. Resettlement cost 3.3 28.5 6.4 5.1 43.33. Engineering service cost 12.7 28.7 19.2 13.0 73.64. Administration cost 9.2 21.9 14.0 9.5 54.65. Physical contingency 20.7 48.9 31.4 21.3 122.3
Sub-total (1.-5.) 226.9 537.5 345.6 234.7 1,344.76. Price contingency 44.3 101.0 77.5 46.3 269.1
Sub-total (1.-6.) 271.2 638.5 423.1 281.0 1,613.87. Value added tax 38.9 91.6 60.8 40.4 231.7
Total (1.-7.) 310.1 730.1 483.9 321.4 1,845.5
10-1
CHAPTER 10 ECONOMIC AND FINANCIAL EVALUATION
10.1 Economic Analysis
10.1.1 General
The methodology applied for the economic evaluation of the projects is basicallythe same as that applied for the evaluation of the projects in Phase I (Basic Study).Some parameters for evaluation have been changed based on new findings inPhase II (Feasibility Study).
(1) Price Level and Exchange Rate
The analyses are made at the price level of April 2000 and applied foreignexchange rate is one U.S. dollar equivalent to 10.68 Dirhams and 100 JapaneseYen equivalent to 9.90 Dirhams.
(2) Project Life
The project life depends on the insurability of the facilities. The project life of 50years after construction of dams is assumed for the economic evaluation.Average lifetime of the metal and mechanical facilities related to the projects isassumed to be 25 years after installation. The replacement cost covers the cost forreplacement of such facilities after their lifetime during project life.
(3) Discount Rate
A discount rate of 8% has been applied to reflect the opportunity cost of capital inMorocco. Discount rates of 6, 10 and 12% are also tested for calculation of NPVfor reference.
(4) Price Index
Since the prices of crop and agricultural inputs fluctuate largely year-by-year, theaverage prices for the last 3 to 5 years have been applied. Price indexes were usedfor converting the past values into the present values. For converting the valueof domestic price, domestic price index was used and for internationalcommodities, “World Bank Commodity Price Indices for Low and Middle IncomeCountry” was applied.
10-2
10.1.2 Economic Prices
(1) Standard Conversion Factor (SCF)
The same standard conversion factor (SCF) as estimated in the Phase I study hasbeen applied to the price of non-traded goods and services in order to estimate theeconomic values of them. SCF in this study is 0.86.
(2) Transfer Payment
From the viewpoint of national economy, the transfer payment such as taxes, duty,subsidy and interest is merely a domestic monetary movement without directproductivity. Therefore, it is excluded in the economic prices of goods andservices.
(3) Economic Prices of Agricultural Inputs and Outputs
The economic prices of agricultural inputs and outputs were estimated for bothwith and without project conditions on the assumption that the quality of theinputs and the outputs would be different between the two conditions.
- Without Project Condition
The actual farm gate prices of crops except wheat and barley were converted intoeconomic value by applying SCF on the assumption that the crops would not besufficient for external trade due to their quality and the most of crops would beconsumed domestically. As for wheat and barley, the import parity value at farmgate has been applied since the production of wheat and barley are importsubstitute. The actual farm gate prices of seeds were also converted into economicvalue by applying SCF since the most of the seeds are local species.
For estimation of economic value of fertilizers, the import parity value at farm gatehas been applied. As for agricultural chemicals, an average conversion factor offertilizer has been applied for estimation of economic value of them.
- With Project Condition
Under “with project” condition, it is assumed that more crops than ever would beof better quality and sufficient for external trade on account of appropriate waterand inputs. It is assumed 30% of tomato, 5% of potato, 1% of grape, some 20% ofolive, and half of dates would be sufficient quality for external trade based astatistical data on production and external trade of agricultural crops. The ratiosare slightly higher than present situation but they may be feasible with appropriatewater use and inputs. The economic value of these crops is estimated by
10-3
proportional distribution of domestic farm gate price and import/export parityvalue at farm gate.
For wheat and barley, the import parity value at farm gate has been applied. As forother crops, SCF has been applied on assumption that most of the crops would beconsumed domestically.
The economic prices of seeds/seedlings are estimated from import/export parityvalue if they are actually imported or exported. If most of them are procureddomestically like seeds of watermelon, seedling of grape and dates, the economicprices of seeds/seedlings are estimated by applying SCF.
Supporting Report XVIII shows the calculation of the economic price ofagricultural crops and inputs under "without and with project" conditions.
(4) Economic Prices for Farm Labor, Mechanization, and Animal Traction
In each project site, cropping pattern must be almost same among farmers due toits climate, availability of water, and sometimes by instructions of associations.Hence, many farmers need the labor force at the same timing. Thus, we mayassume that the peak season labor market is a relatively competitive one, thatlabor is in relatively short supply at this period, and that the daily wage at thisperiod may be a good estimate of the daily marginal value product of the laborengaged. On this assumption, the actual daily labor cost obtained by interview isapplied by multiplying SCF as the economic value of the farm labor. Similarly, thedemand of agricultural equipment and animals increases at the same timing.Their market may also be relatively competitive during the peak period.Therefore, the actual costs of mechanization and animal traction are applied bymultiplying SCF as the economic value of them.
(5) Economic Project Cost
The economic project cost has been estimated from the financial project costbased on the following assumptions:
a) Value added tax is deducted from the project cost as the transferpayment.
The following rates are assumed as the value added tax:
- Construction works: 14%
- Resettlement: 14%
- Engineering services: 20%
b) Construction cost has been estimated dividing into two categories:
- Traded goods and services: Foreign currency portion (F.C.)
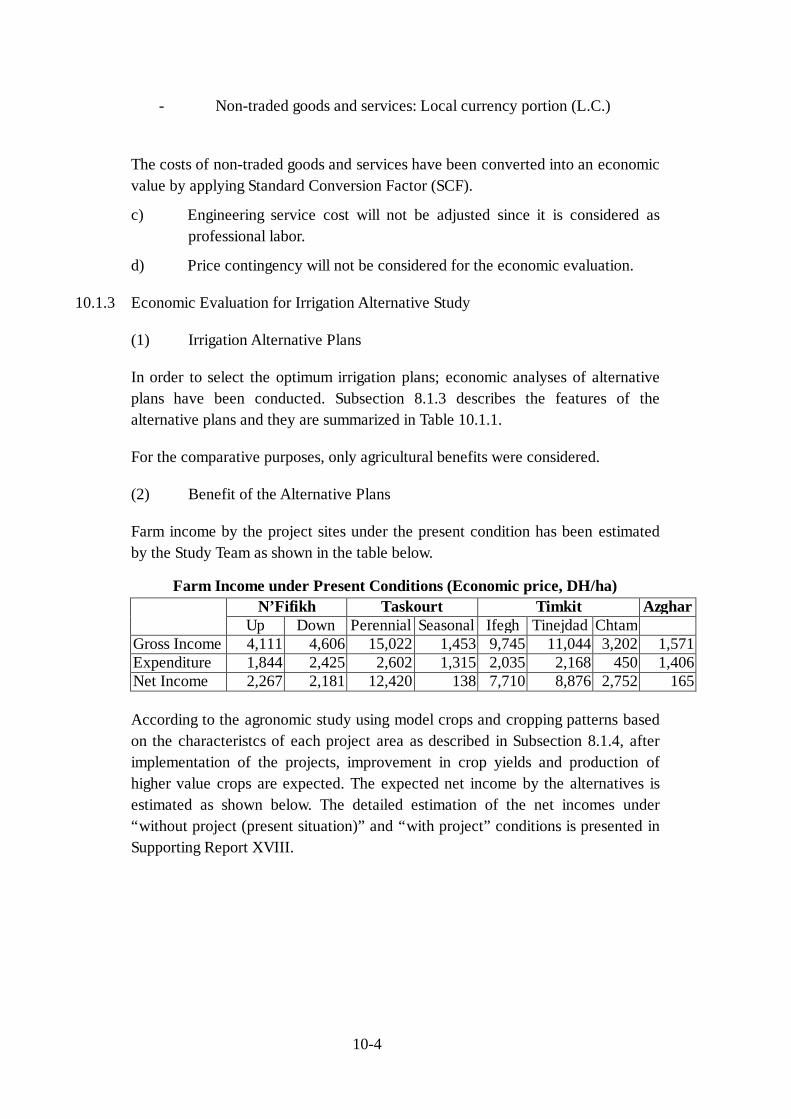
10-4
- Non-traded goods and services: Local currency portion (L.C.)
The costs of non-traded goods and services have been converted into an economicvalue by applying Standard Conversion Factor (SCF).
c) Engineering service cost will not be adjusted since it is considered asprofessional labor.
d) Price contingency will not be considered for the economic evaluation.
10.1.3 Economic Evaluation for Irrigation Alternative Study
(1) Irrigation Alternative Plans
In order to select the optimum irrigation plans; economic analyses of alternativeplans have been conducted. Subsection 8.1.3 describes the features of thealternative plans and they are summarized in Table 10.1.1.
For the comparative purposes, only agricultural benefits were considered.
(2) Benefit of the Alternative Plans
Farm income by the project sites under the present condition has been estimatedby the Study Team as shown in the table below.
Farm Income under Present Conditions (Economic price, DH/ha)N’Fifikh Taskourt Timkit Azghar
Up Down Perennial Seasonal Ifegh Tinejdad ChtamGross Income 4,111 4,606 15,022 1,453 9,745 11,044 3,202 1,571Expenditure 1,844 2,425 2,602 1,315 2,035 2,168 450 1,406Net Income 2,267 2,181 12,420 138 7,710 8,876 2,752 165
According to the agronomic study using model crops and cropping patterns basedon the characteristcs of each project area as described in Subsection 8.1.4, afterimplementation of the projects, improvement in crop yields and production ofhigher value crops are expected. The expected net income by the alternatives isestimated as shown below. The detailed estimation of the net incomes under“without project (present situation)” and “with project” conditions is presented inSupporting Report XVIII.
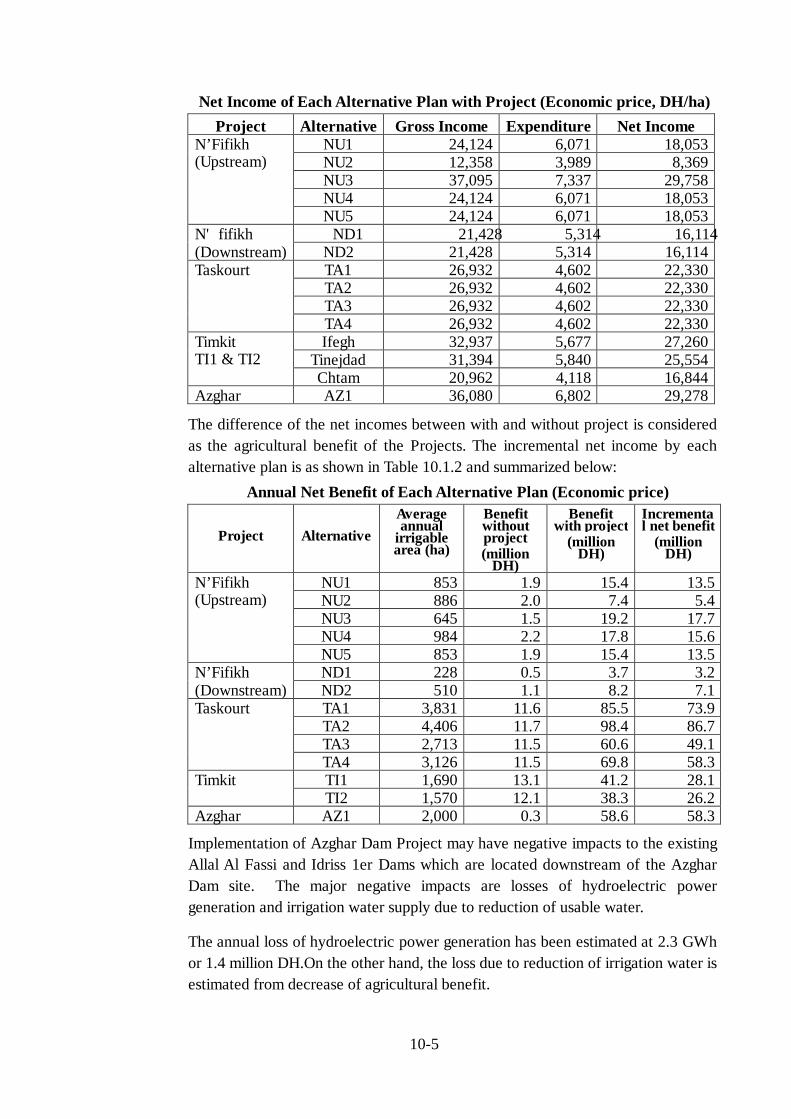
10-5
Net Income of Each Alternative Plan with Project (Economic price, DH/ha)Project Alternative Gross Income Expenditure Net Income
NU1 24,124 6,071 18,053NU2 12,358 3,989 8,369NU3 37,095 7,337 29,758NU4 24,124 6,071 18,053
N’Fifikh(Upstream)
NU5 24,124 6,071 18,053N'fifikh ND1 21,428 5,314 16,114(Downstream) ND2 21,428 5,314 16,114
TA1 26,932 4,602 22,330TA2 26,932 4,602 22,330TA3 26,932 4,602 22,330
Taskourt
TA4 26,932 4,602 22,330Ifegh 32,937 5,677 27,260
Tinejdad 31,394 5,840 25,554TimkitTI1 & TI2
Chtam 20,962 4,118 16,844Azghar AZ1 36,080 6,802 29,278
The difference of the net incomes between with and without project is consideredas the agricultural benefit of the Projects. The incremental net income by eachalternative plan is as shown in Table 10.1.2 and summarized below:
Annual Net Benefit of Each Alternative Plan (Economic price)
Project AlternativeAverageannual
irrigablearea (ha)
Benefitwithoutproject(million
DH)
Benefitwith project
(millionDH)
Incremental net benefit
(millionDH)
NU1 853 1.9 15.4 13.5NU2 886 2.0 7.4 5.4NU3 645 1.5 19.2 17.7NU4 984 2.2 17.8 15.6
N’Fifikh(Upstream)
NU5 853 1.9 15.4 13.5N’Fifikh ND1 228 0.5 3.7 3.2(Downstream) ND2 510 1.1 8.2 7.1
TA1 3,831 11.6 85.5 73.9TA2 4,406 11.7 98.4 86.7TA3 2,713 11.5 60.6 49.1
Taskourt
TA4 3,126 11.5 69.8 58.3TI1 1,690 13.1 41.2 28.1TimkitTI2 1,570 12.1 38.3 26.2
Azghar AZ1 2,000 0.3 58.6 58.3
Implementation of Azghar Dam Project may have negative impacts to the existingAllal Al Fassi and Idriss 1er Dams which are located downstream of the AzgharDam site. The major negative impacts are losses of hydroelectric powergeneration and irrigation water supply due to reduction of usable water.
The annual loss of hydroelectric power generation has been estimated at 2.3 GWhor 1.4 million DH.On the other hand, the loss due to reduction of irrigation water isestimated from decrease of agricultural benefit.
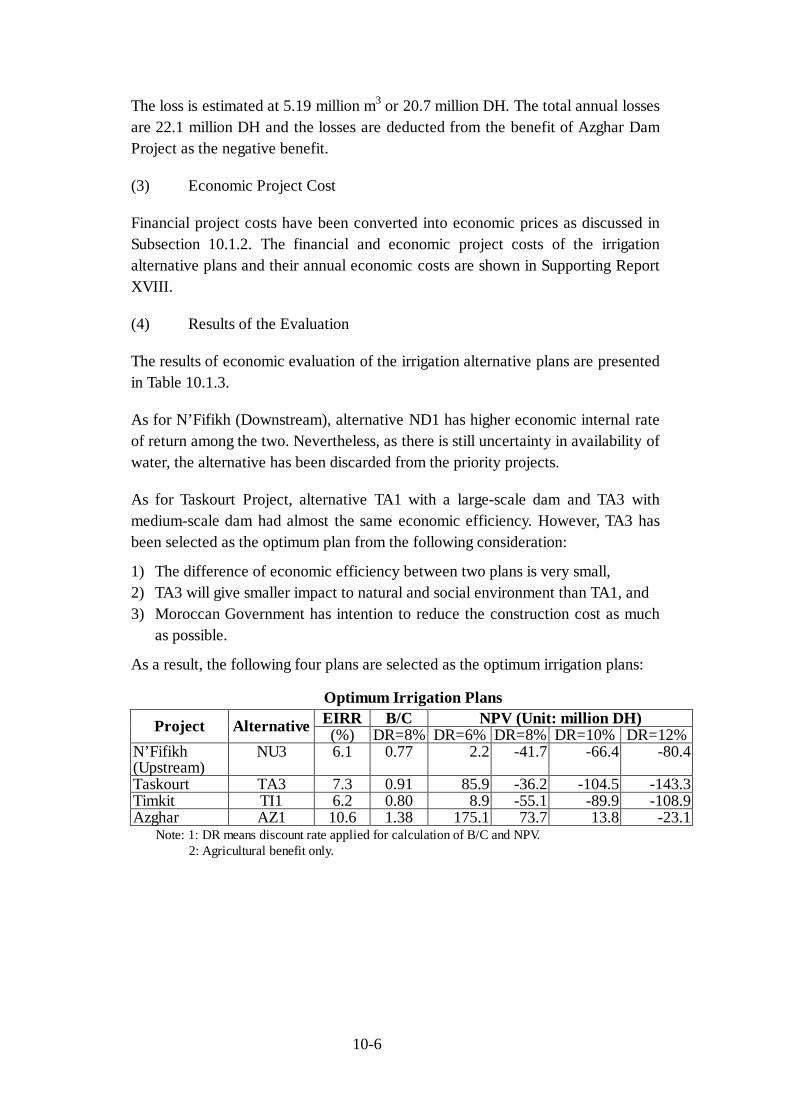
10-6
The loss is estimated at 5.19 million m3 or 20.7 million DH. The total annual lossesare 22.1 million DH and the losses are deducted from the benefit of Azghar DamProject as the negative benefit.
(3) Economic Project Cost
Financial project costs have been converted into economic prices as discussed inSubsection 10.1.2. The financial and economic project costs of the irrigationalternative plans and their annual economic costs are shown in Supporting ReportXVIII.
(4) Results of the Evaluation
The results of economic evaluation of the irrigation alternative plans are presentedin Table 10.1.3.
As for N’Fifikh (Downstream), alternative ND1 has higher economic internal rateof return among the two. Nevertheless, as there is still uncertainty in availability ofwater, the alternative has been discarded from the priority projects.
As for Taskourt Project, alternative TA1 with a large-scale dam and TA3 withmedium-scale dam had almost the same economic efficiency. However, TA3 hasbeen selected as the optimum plan from the following consideration:
1) The difference of economic efficiency between two plans is very small,2) TA3 will give smaller impact to natural and social environment than TA1, and3) Moroccan Government has intention to reduce the construction cost as much
as possible.
As a result, the following four plans are selected as the optimum irrigation plans:
Optimum Irrigation PlansEIRR B/C NPV (Unit: million DH)Project Alternative (%) DR=8% DR=6% DR=8% DR=10% DR=12%
N’Fifikh(Upstream)
NU3 6.1 0.77 2.2 -41.7 -66.4 -80.4
Taskourt TA3 7.3 0.91 85.9 -36.2 -104.5 -143.3Timkit TI1 6.2 0.80 8.9 -55.1 -89.9 -108.9Azghar AZ1 10.6 1.38 175.1 73.7 13.8 -23.1
Note: 1: DR means discount rate applied for calculation of B/C and NPV. 2: Agricultural benefit only.
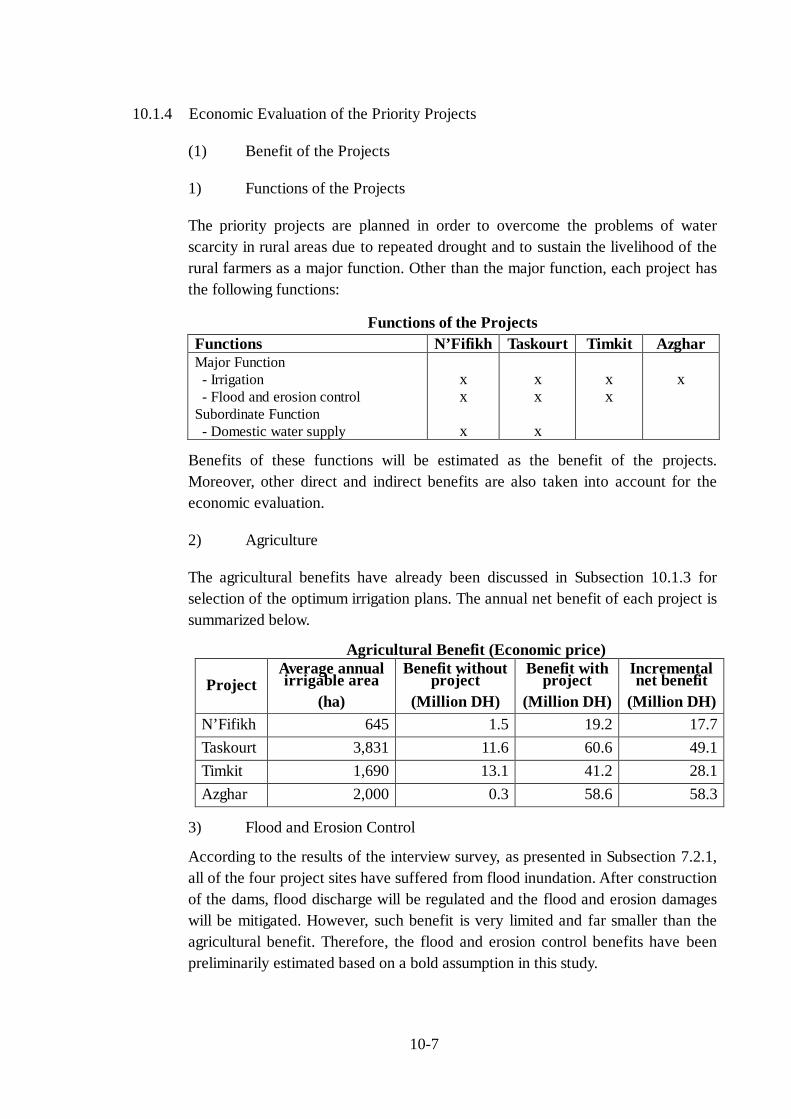
10-7
10.1.4 Economic Evaluation of the Priority Projects
(1) Benefit of the Projects
1) Functions of the Projects
The priority projects are planned in order to overcome the problems of waterscarcity in rural areas due to repeated drought and to sustain the livelihood of therural farmers as a major function. Other than the major function, each project hasthe following functions:
Functions of the ProjectsFunctions N’Fifikh Taskourt Timkit AzgharMajor Function- Irrigation- Flood and erosion control
Subordinate Function- Domestic water supply
xx
x
xx
x
xx
x
Benefits of these functions will be estimated as the benefit of the projects.Moreover, other direct and indirect benefits are also taken into account for theeconomic evaluation.
2) Agriculture
The agricultural benefits have already been discussed in Subsection 10.1.3 forselection of the optimum irrigation plans. The annual net benefit of each project issummarized below.
Agricultural Benefit (Economic price)
ProjectAverage annualirrigable area
(ha)
Benefit withoutproject
(Million DH)
Benefit withproject
(Million DH)
Incrementalnet benefit
(Million DH)N’Fifikh 645 1.5 19.2 17.7Taskourt 3,831 11.6 60.6 49.1Timkit 1,690 13.1 41.2 28.1Azghar 2,000 0.3 58.6 58.3
3) Flood and Erosion Control
According to the results of the interview survey, as presented in Subsection 7.2.1,all of the four project sites have suffered from flood inundation. After constructionof the dams, flood discharge will be regulated and the flood and erosion damageswill be mitigated. However, such benefit is very limited and far smaller than theagricultural benefit. Therefore, the flood and erosion control benefits have beenpreliminarily estimated based on a bold assumption in this study.
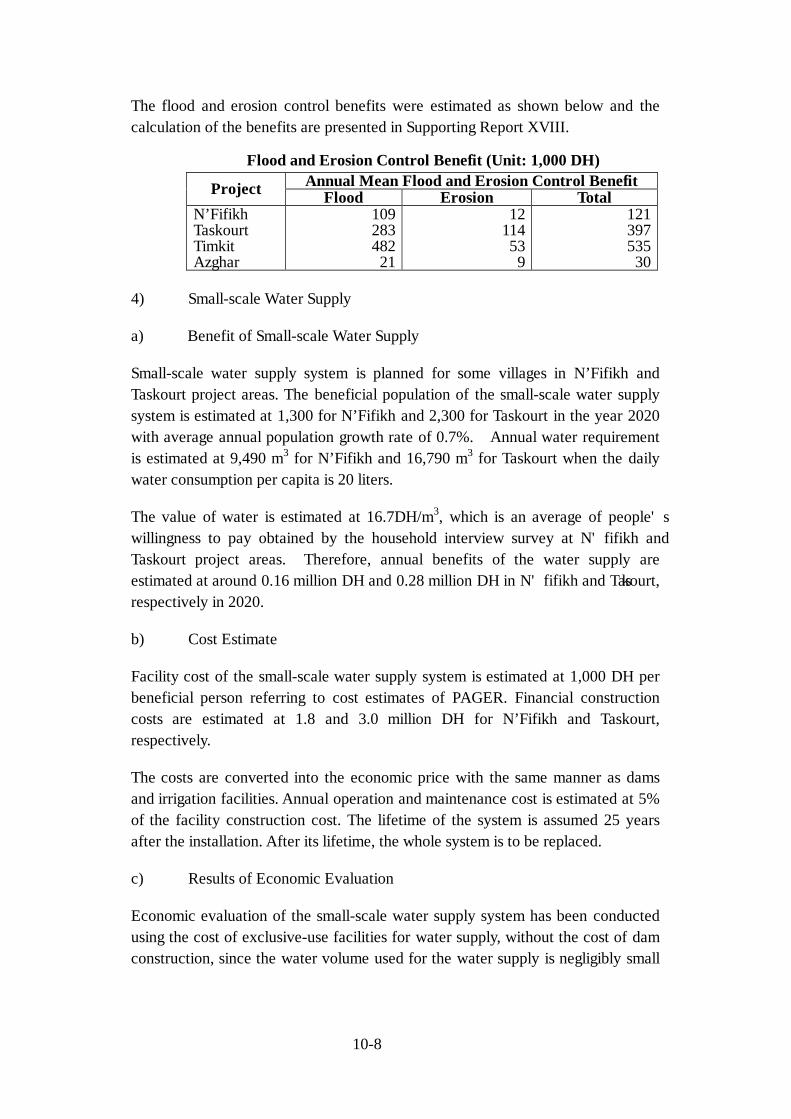
10-8
The flood and erosion control benefits were estimated as shown below and thecalculation of the benefits are presented in Supporting Report XVIII.
Flood and Erosion Control Benefit (Unit: 1,000 DH)Annual Mean Flood and Erosion Control BenefitProject Flood Erosion Total
N’FifikhTaskourtTimkitAzghar
10928348221
12114539
12139753530
4) Small-scale Water Supply
a) Benefit of Small-scale Water Supply
Small-scale water supply system is planned for some villages in N’Fifikh andTaskourt project areas. The beneficial population of the small-scale water supplysystem is estimated at 1,300 for N’Fifikh and 2,300 for Taskourt in the year 2020with average annual population growth rate of 0.7%. Annual water requirementis estimated at 9,490 m3 for N’Fifikh and 16,790 m3 for Taskourt when the dailywater consumption per capita is 20 liters.
The value of water is estimated at 16.7DH/m3, which is an average of people'swillingness to pay obtained by the household interview survey at N'fifikh andTaskourt project areas. Therefore, annual benefits of the water supply areestimated at around 0.16 million DH and 0.28 million DH in N'fifikh and Taskourt,respectively in 2020.
b) Cost Estimate
Facility cost of the small-scale water supply system is estimated at 1,000 DH perbeneficial person referring to cost estimates of PAGER. Financial constructioncosts are estimated at 1.8 and 3.0 million DH for N’Fifikh and Taskourt,respectively.
The costs are converted into the economic price with the same manner as damsand irrigation facilities. Annual operation and maintenance cost is estimated at 5%of the facility construction cost. The lifetime of the system is assumed 25 yearsafter the installation. After its lifetime, the whole system is to be replaced.
c) Results of Economic Evaluation
Economic evaluation of the small-scale water supply system has been conductedusing the cost of exclusive-use facilities for water supply, without the cost of damconstruction, since the water volume used for the water supply is negligibly small
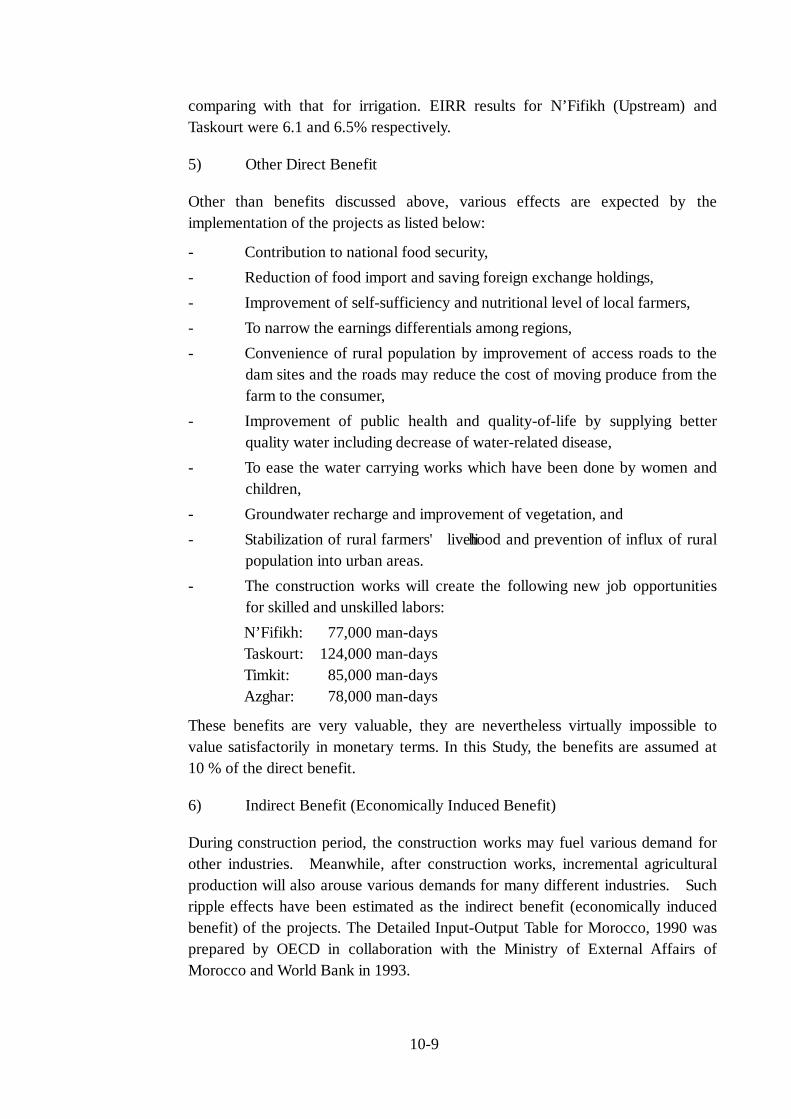
10-9
comparing with that for irrigation. EIRR results for N’Fifikh (Upstream) andTaskourt were 6.1 and 6.5% respectively.
5) Other Direct Benefit
Other than benefits discussed above, various effects are expected by theimplementation of the projects as listed below:
- Contribution to national food security,- Reduction of food import and saving foreign exchange holdings,- Improvement of self-sufficiency and nutritional level of local farmers,- To narrow the earnings differentials among regions,- Convenience of rural population by improvement of access roads to the
dam sites and the roads may reduce the cost of moving produce from thefarm to the consumer,
- Improvement of public health and quality-of-life by supplying betterquality water including decrease of water-related disease,
- To ease the water carrying works which have been done by women andchildren,
- Groundwater recharge and improvement of vegetation, and- Stabilization of rural farmers' livelihood and prevention of influx of rural
population into urban areas.- The construction works will create the following new job opportunities
for skilled and unskilled labors:N’Fifikh: 77,000 man-daysTaskourt: 124,000 man-daysTimkit: 85,000 man-daysAzghar: 78,000 man-days
These benefits are very valuable, they are nevertheless virtually impossible tovalue satisfactorily in monetary terms. In this Study, the benefits are assumed at10 % of the direct benefit.
6) Indirect Benefit (Economically Induced Benefit)
During construction period, the construction works may fuel various demand forother industries. Meanwhile, after construction works, incremental agriculturalproduction will also arouse various demands for many different industries. Suchripple effects have been estimated as the indirect benefit (economically inducedbenefit) of the projects. The Detailed Input-Output Table for Morocco, 1990 wasprepared by OECD in collaboration with the Ministry of External Affairs ofMorocco and World Bank in 1993.
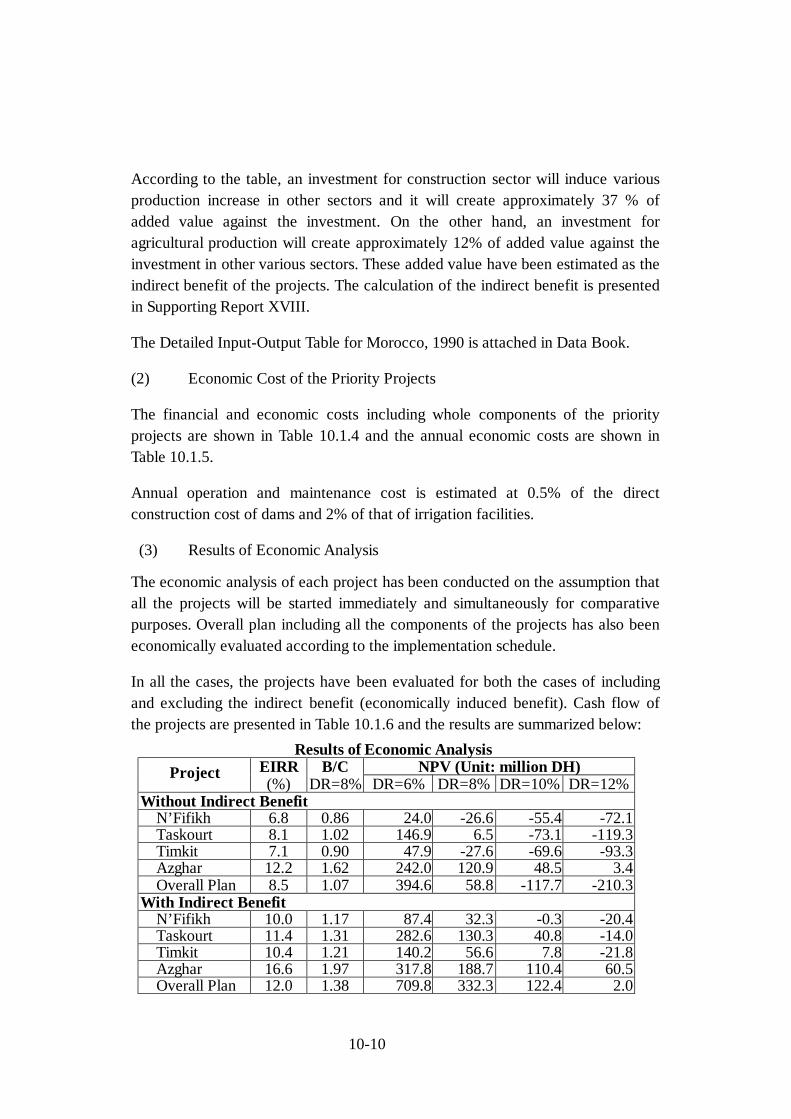
10-10
According to the table, an investment for construction sector will induce variousproduction increase in other sectors and it will create approximately 37 % ofadded value against the investment. On the other hand, an investment foragricultural production will create approximately 12% of added value against theinvestment in other various sectors. These added value have been estimated as theindirect benefit of the projects. The calculation of the indirect benefit is presentedin Supporting Report XVIII.
The Detailed Input-Output Table for Morocco, 1990 is attached in Data Book.
(2) Economic Cost of the Priority Projects
The financial and economic costs including whole components of the priorityprojects are shown in Table 10.1.4 and the annual economic costs are shown inTable 10.1.5.
Annual operation and maintenance cost is estimated at 0.5% of the directconstruction cost of dams and 2% of that of irrigation facilities.
(3) Results of Economic Analysis
The economic analysis of each project has been conducted on the assumption thatall the projects will be started immediately and simultaneously for comparativepurposes. Overall plan including all the components of the projects has also beeneconomically evaluated according to the implementation schedule.
In all the cases, the projects have been evaluated for both the cases of includingand excluding the indirect benefit (economically induced benefit). Cash flow ofthe projects are presented in Table 10.1.6 and the results are summarized below:
Results of Economic AnalysisEIRR B/C NPV (Unit: million DH)Project(%) DR=8% DR=6% DR=8% DR=10% DR=12%
Without Indirect BenefitN’Fifikh 6.8 0.86 24.0 -26.6 -55.4 -72.1Taskourt 8.1 1.02 146.9 6.5 -73.1 -119.3Timkit 7.1 0.90 47.9 -27.6 -69.6 -93.3Azghar 12.2 1.62 242.0 120.9 48.5 3.4Overall Plan 8.5 1.07 394.6 58.8 -117.7 -210.3
With Indirect BenefitN’Fifikh 10.0 1.17 87.4 32.3 -0.3 -20.4Taskourt 11.4 1.31 282.6 130.3 40.8 -14.0Timkit 10.4 1.21 140.2 56.6 7.8 -21.8Azghar 16.6 1.97 317.8 188.7 110.4 60.5Overall Plan 12.0 1.38 709.8 332.3 122.4 2.0
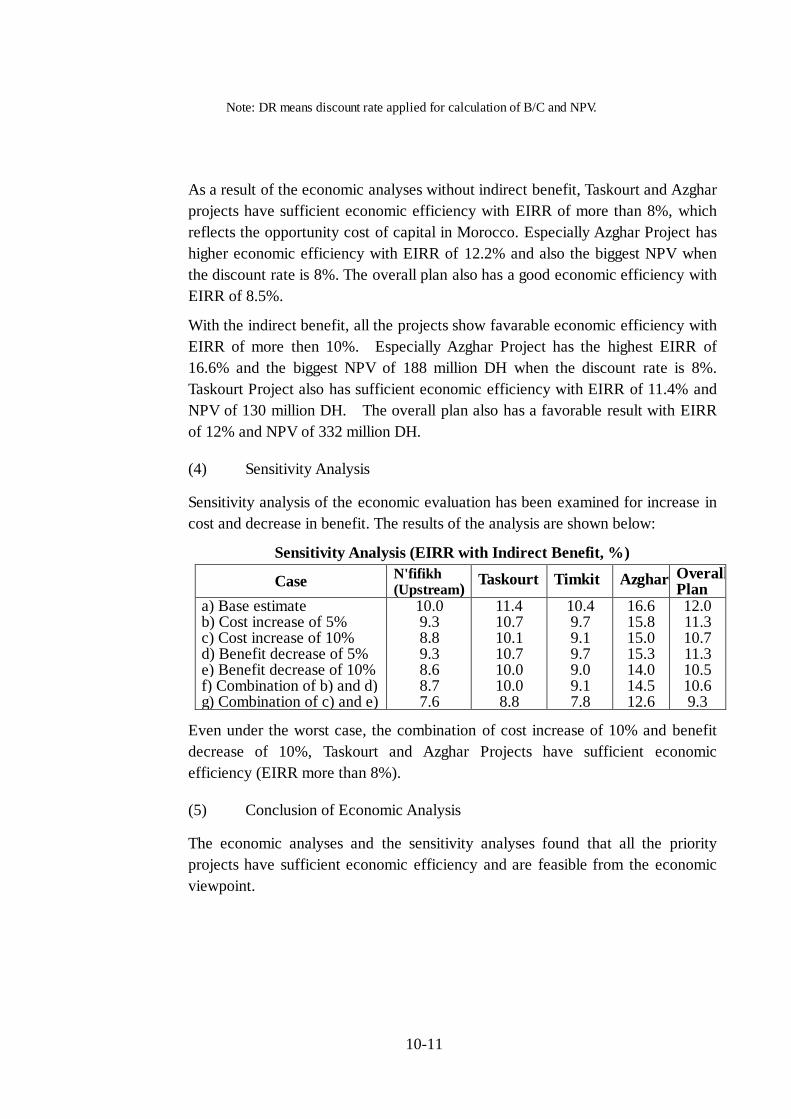
10-11
Note: DR means discount rate applied for calculation of B/C and NPV.
As a result of the economic analyses without indirect benefit, Taskourt and Azgharprojects have sufficient economic efficiency with EIRR of more than 8%, whichreflects the opportunity cost of capital in Morocco. Especially Azghar Project hashigher economic efficiency with EIRR of 12.2% and also the biggest NPV whenthe discount rate is 8%. The overall plan also has a good economic efficiency withEIRR of 8.5%.
With the indirect benefit, all the projects show favarable economic efficiency withEIRR of more then 10%. Especially Azghar Project has the highest EIRR of16.6% and the biggest NPV of 188 million DH when the discount rate is 8%.Taskourt Project also has sufficient economic efficiency with EIRR of 11.4% andNPV of 130 million DH. The overall plan also has a favorable result with EIRRof 12% and NPV of 332 million DH.
(4) Sensitivity Analysis
Sensitivity analysis of the economic evaluation has been examined for increase incost and decrease in benefit. The results of the analysis are shown below:
Sensitivity Analysis (EIRR with Indirect Benefit, %)
Case N'fifikh(Upstream) Taskourt Timkit Azghar Overall
Plana) Base estimateb) Cost increase of 5%c) Cost increase of 10%d) Benefit decrease of 5%e) Benefit decrease of 10%f) Combination of b) and d)g) Combination of c) and e)
10.09.38.89.38.68.77.6
11.410.710.110.710.010.08.8
10.49.79.19.79.09.17.8
16.615.815.015.314.014.512.6
12.011.310.711.310.510.69.3
Even under the worst case, the combination of cost increase of 10% and benefitdecrease of 10%, Taskourt and Azghar Projects have sufficient economicefficiency (EIRR more than 8%).
(5) Conclusion of Economic Analysis
The economic analyses and the sensitivity analyses found that all the priorityprojects have sufficient economic efficiency and are feasible from the economicviewpoint.
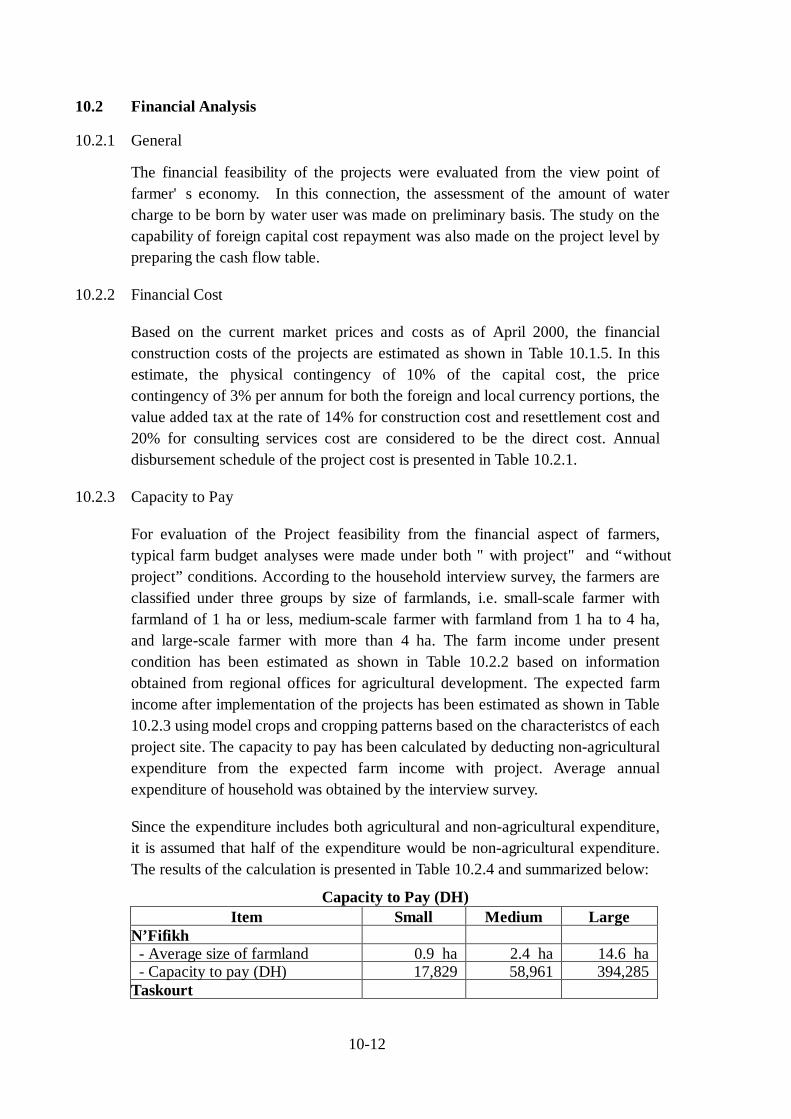
10-12
10.2 Financial Analysis
10.2.1 General
The financial feasibility of the projects were evaluated from the view point offarmer's economy. In this connection, the assessment of the amount of watercharge to be born by water user was made on preliminary basis. The study on thecapability of foreign capital cost repayment was also made on the project level bypreparing the cash flow table.
10.2.2 Financial Cost
Based on the current market prices and costs as of April 2000, the financialconstruction costs of the projects are estimated as shown in Table 10.1.5. In thisestimate, the physical contingency of 10% of the capital cost, the pricecontingency of 3% per annum for both the foreign and local currency portions, thevalue added tax at the rate of 14% for construction cost and resettlement cost and20% for consulting services cost are considered to be the direct cost. Annualdisbursement schedule of the project cost is presented in Table 10.2.1.
10.2.3 Capacity to Pay
For evaluation of the Project feasibility from the financial aspect of farmers,typical farm budget analyses were made under both "with project" and “withoutproject” conditions. According to the household interview survey, the farmers areclassified under three groups by size of farmlands, i.e. small-scale farmer withfarmland of 1 ha or less, medium-scale farmer with farmland from 1 ha to 4 ha,and large-scale farmer with more than 4 ha. The farm income under presentcondition has been estimated as shown in Table 10.2.2 based on informationobtained from regional offices for agricultural development. The expected farmincome after implementation of the projects has been estimated as shown in Table10.2.3 using model crops and cropping patterns based on the characteristcs of eachproject site. The capacity to pay has been calculated by deducting non-agriculturalexpenditure from the expected farm income with project. Average annualexpenditure of household was obtained by the interview survey.
Since the expenditure includes both agricultural and non-agricultural expenditure,it is assumed that half of the expenditure would be non-agricultural expenditure.The results of the calculation is presented in Table 10.2.4 and summarized below:
Capacity to Pay (DH)Item Small Medium Large
N’Fifikh - Average size of farmland 0.9 ha 2.4 ha 14.6 ha - Capacity to pay (DH) 17,829 58,961 394,285 Taskourt
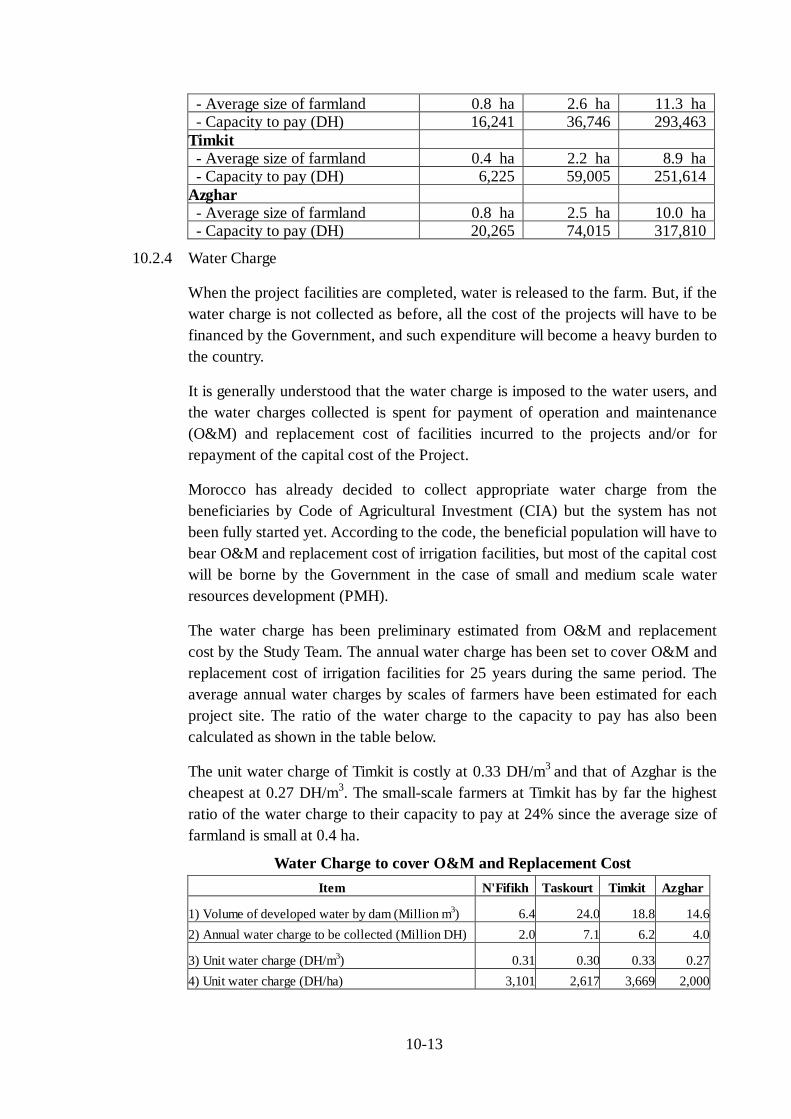
10-13
- Average size of farmland 0.8 ha 2.6 ha 11.3 ha - Capacity to pay (DH) 16,241 36,746 293,463 Timkit - Average size of farmland 0.4 ha 2.2 ha 8.9 ha - Capacity to pay (DH) 6,225 59,005 251,614 Azghar - Average size of farmland 0.8 ha 2.5 ha 10.0 ha - Capacity to pay (DH) 20,265 74,015 317,810
10.2.4 Water Charge
When the project facilities are completed, water is released to the farm. But, if thewater charge is not collected as before, all the cost of the projects will have to befinanced by the Government, and such expenditure will become a heavy burden tothe country.
It is generally understood that the water charge is imposed to the water users, andthe water charges collected is spent for payment of operation and maintenance(O&M) and replacement cost of facilities incurred to the projects and/or forrepayment of the capital cost of the Project.
Morocco has already decided to collect appropriate water charge from thebeneficiaries by Code of Agricultural Investment (CIA) but the system has notbeen fully started yet. According to the code, the beneficial population will have tobear O&M and replacement cost of irrigation facilities, but most of the capital costwill be borne by the Government in the case of small and medium scale waterresources development (PMH).
The water charge has been preliminary estimated from O&M and replacementcost by the Study Team. The annual water charge has been set to cover O&M andreplacement cost of irrigation facilities for 25 years during the same period. Theaverage annual water charges by scales of farmers have been estimated for eachproject site. The ratio of the water charge to the capacity to pay has also beencalculated as shown in the table below.
The unit water charge of Timkit is costly at 0.33 DH/m3 and that of Azghar is thecheapest at 0.27 DH/m3. The small-scale farmers at Timkit has by far the highestratio of the water charge to their capacity to pay at 24% since the average size offarmland is small at 0.4 ha.
Water Charge to cover O&M and Replacement CostItem N'Fifikh Taskourt Timkit Azghar
1) Volume of developed water by dam (Million m3) 6.4 24.0 18.8 14.62) Annual water charge to be collected (Million DH) 2.0 7.1 6.2 4.0
3) Unit water charge (DH/m3) 0.31 0.30 0.33 0.274) Unit water charge (DH/ha) 3,101 2,617 3,669 2,000
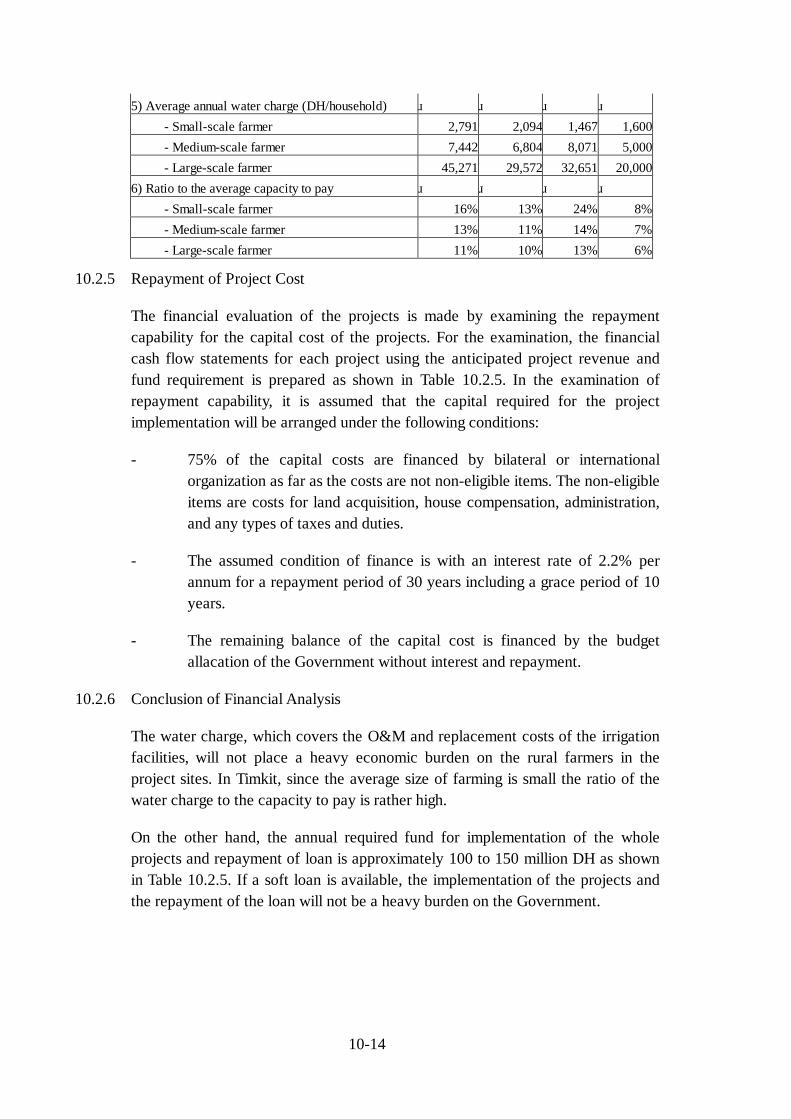
10-14
5) Average annual water charge (DH/household)
- Small-scale farmer 2,791 2,094 1,467 1,600 - Medium-scale farmer 7,442 6,804 8,071 5,000 - Large-scale farmer 45,271 29,572 32,651 20,0006) Ratio to the average capacity to pay
- Small-scale farmer 16% 13% 24% 8% - Medium-scale farmer 13% 11% 14% 7% - Large-scale farmer 11% 10% 13% 6%
10.2.5 Repayment of Project Cost
The financial evaluation of the projects is made by examining the repaymentcapability for the capital cost of the projects. For the examination, the financialcash flow statements for each project using the anticipated project revenue andfund requirement is prepared as shown in Table 10.2.5. In the examination ofrepayment capability, it is assumed that the capital required for the projectimplementation will be arranged under the following conditions:
- 75% of the capital costs are financed by bilateral or internationalorganization as far as the costs are not non-eligible items. The non-eligibleitems are costs for land acquisition, house compensation, administration,and any types of taxes and duties.
- The assumed condition of finance is with an interest rate of 2.2% perannum for a repayment period of 30 years including a grace period of 10years.
- The remaining balance of the capital cost is financed by the budgetallacation of the Government without interest and repayment.
10.2.6 Conclusion of Financial Analysis
The water charge, which covers the O&M and replacement costs of the irrigationfacilities, will not place a heavy economic burden on the rural farmers in theproject sites. In Timkit, since the average size of farming is small the ratio of thewater charge to the capacity to pay is rather high.
On the other hand, the annual required fund for implementation of the wholeprojects and repayment of loan is approximately 100 to 150 million DH as shownin Table 10.2.5. If a soft loan is available, the implementation of the projects andthe repayment of the loan will not be a heavy burden on the Government.
11-1
CHAPTER 11 CONCLUSIONS AND RECOMMENDATIONS
11.1 Conclusions
(1) Part I Basic Study
A large part of the rural areas is suffering from severe drought, where both surfaceand subsurface water resources are insufficient. People living in such areas are notblessed with the public services. Compounding this, some of the areas are subjectto inundation due to floods. As a result, the gap in living standards between urbanand rural areas is getting wider. Lack of job in the rural area has caused people toflow into the cities, especially in the drought years.
In order to decrease this inequity, a program for constructions of medium-scaledams was launched. In 1994, MOE formulated a national plan of medium-scaledam, in association with MOA and MOI.
To establish long-term strategy for sustainable water resources, MOE nominated53 medium-scale dam sites in the framework of the national program. Out of them,high priority 25 sites were selected for this Study.
The 25 proposed dam projects for the Study were evaluated from the standpoint ofsocial aspects, technical feasibility, natural environmental impact, socialenvironmental impact and economical viability as discussed in Section 6.1.
Prioritization of these dams has been made from three different levels of a) ZoneLevel, b) River Basin Level and c) Dam Site Level, and dams were groupedaccording to their priority into four groups namely, A, B, C and D.
Group A: Highest priority projects for immediate feasibility study andimplementation;
Group B: Higher priority projects to be implemented at the next stage;Group C: Priority projects to be implemented at the next stage, andGroup D: Alternative development plan is to be elaborated.
Finally, the following four dams of group A were selected for further FeasibilityStudy:
1) No. 5 N’Fifikh
2) No. 9 Taskourt
3) No. 10 Timkit
4) No. 17 Azghar
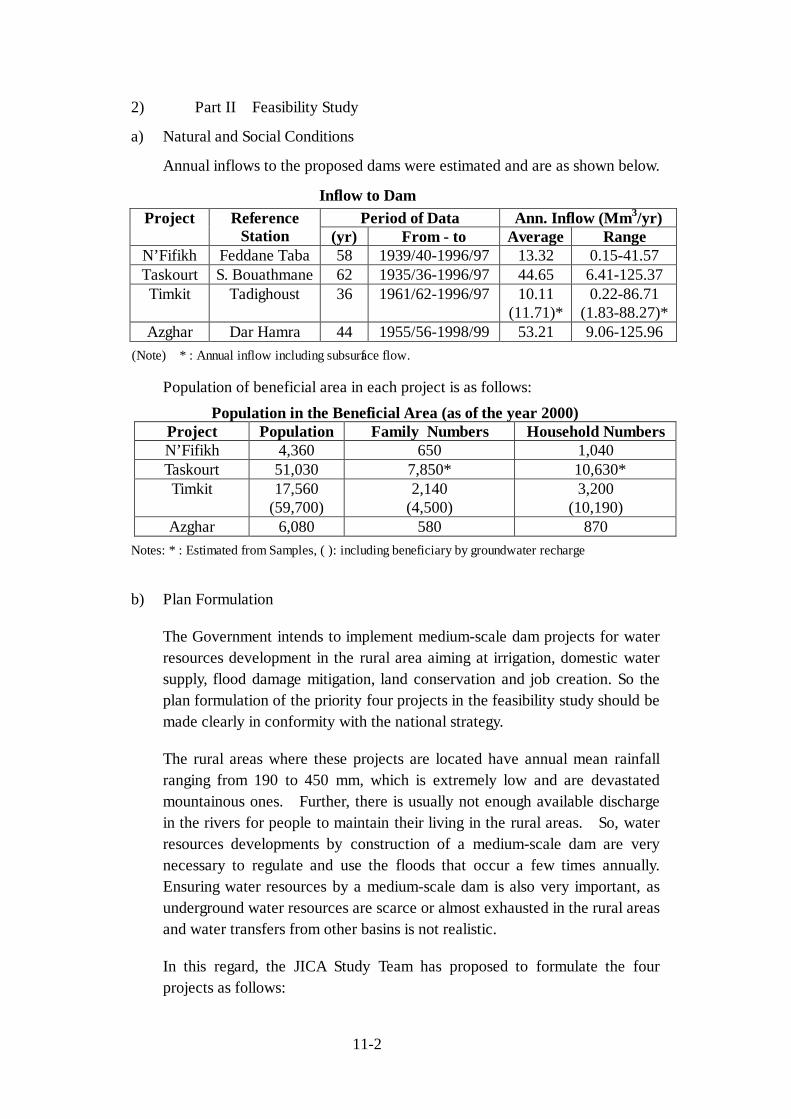
11-2
2) Part II Feasibility Study
a) Natural and Social Conditions
Annual inflows to the proposed dams were estimated and are as shown below.
Inflow to DamPeriod of Data Ann. Inflow (Mm3/yr)Project Reference
Station (yr) From - to Average RangeN’Fifikh Feddane Taba 58 1939/40-1996/97 13.32 0.15-41.57Taskourt S. Bouathmane 62 1935/36-1996/97 44.65 6.41-125.37Timkit Tadighoust 36 1961/62-1996/97 10.11
(11.71)*0.22-86.71
(1.83-88.27)*Azghar Dar Hamra 44 1955/56-1998/99 53.21 9.06-125.96
(Note) *: Annual inflow including subsurface flow.
Population of beneficial area in each project is as follows:Population in the Beneficial Area (as of the year 2000)
Project Population Family Numbers Household NumbersN’Fifikh 4,360 650 1,040Taskourt 51,030 7,850* 10,630*Timkit 17,560
(59,700)2,140
(4,500)3,200
(10,190)Azghar 6,080 580 870
Notes: *: Estimated from Samples, ( ): including beneficiary by groundwater recharge
b) Plan Formulation
The Government intends to implement medium-scale dam projects for waterresources development in the rural area aiming at irrigation, domestic watersupply, flood damage mitigation, land conservation and job creation. So theplan formulation of the priority four projects in the feasibility study should bemade clearly in conformity with the national strategy.
The rural areas where these projects are located have annual mean rainfallranging from 190 to 450 mm, which is extremely low and are devastatedmountainous ones. Further, there is usually not enough available dischargein the rivers for people to maintain their living in the rural areas. So, waterresources developments by construction of a medium-scale dam are verynecessary to regulate and use the floods that occur a few times annually.Ensuring water resources by a medium-scale dam is also very important, asunderground water resources are scarce or almost exhausted in the rural areasand water transfers from other basins is not realistic.
In this regard, the JICA Study Team has proposed to formulate the fourprojects as follows:
11-3
- No.5 N’Fifikh
This project should be implemented mainly so cultivation can resume of thedevastated vegetable fields located at the suburbs of big cities such asCasablanca and Rabat. The main components to be constructed are damfacilities, irrigation facilities, and domestic water supply systems, as shown inTables 8.3.2, 9.1.1, and Figures 9.1.1 to 9.1.3.
An agricultural water users’ association (AUEA) will need to be organized forappropriate management of the river water since it is currently managedindividually.
- No.9 Taskourt
The main purpose of this project is to develop large-scale irrigation to theexisting farmlands located at about 30km downstream the proposed damconsidering possibility of the improvement of the social environment forabout 1,000 inhabitants living in the proposed reservoir area by providingsettlement into a new living area. The main components to be constructed area dam, rehabilitation of existing irrigation facilities, domestic water supplysystems, and social infrastructures in new settlement areas for the inhabitantsin the reservoir, as shown in Tables 8.3.2, 9.1.2, and Figures 9.1.4 to 9.1.6.
Although the AUEA has been organized to operate and maintain the existingtraditional irrigation system, it is suggested to reorganize it for the newsystem.
- No.10 Timkit
The main purpose of this dam is to provide irrigation to the three existingoases. The beneficiary areas of this project are the area immediatelydownstream, and areas about 30km and 40km downstream of the proposeddams, which will help stop the Sahara desert expand to the north. The maincomponents to be constructed are dam facilities, and rehabilitation of existingirrigation facilities, as shown in Table 9.1.3, and Figures 9.1.7 to 9.1.9.
Although the AUEA has been organized to operate and maintain the existingtraditional irrigation system, it is suggested to reorganize it for the newsystem.
11-4
- No.17 Azghar
This project should be implemented mainly to develop medium-scaleirrigation to the existing farmland, just downstream the proposed dam. Themain components to be constructed are dam facilities and irrigation facilitiesas shown in Table 9.1.4, and Figures 9.1.10 to 9.1.12.
It is necessary to organize an AUEA for appropriate management of the riverwater.
c) Environmental Impact
Based on the results of the Initial Environmental Examination (IEE) that wasconducted in the First Phase of the Study, a more detailed environmentalsurvey was conducted in the Second Phase. The Ministry of Environment,Morocco has proposed to establish an official EIA procedure, but theGovernment has not authorized the proposal yet. So there is no legal status onthe EIA procedure in Morocco at present time. Therefore, JICA guidelineswere used in this study, but draft law of Morocco was also respected and fullyapplied in this study.
Environmental laws, rules, regulations and guidelines that were used as abasis of this environmental study are primarily as follows:
- The protection of environment (draft EIA law) in Morocco (Ministry ofEnvironment, Morocco)
- SIBE (Sites of Biological and Ecological Interests)- Guidelines for Environmental Considerations on Rivers and Protection of
Erosion (JICA)- Guidelines for Environmental Considerations on Dam Construction
(JICA)
It can be said that negative impact on natural environment due toimplementation of these four projects are not so serious because these damsare medium-scale and if appropriate countermeasure are made, there will notbe any problem in the implementation. Further, river maintenance flow arevery few in the rivers where these four projects are located, then if ensuringwater resources to be used stably and effectively are made, improvement ofnatural environment in the downstream of the dams such as restoration ofgreen, etc. can be rather expected.
11-5
To evaluate social environmental impacts of dam constructions, the study wasintensified for the priority four dam sites with special investigations toidentify proper resettlement plans for the dam implementations. These planswere evaluated based on site investigations for both upstream anddownstream, people hearing, people land and water rights, existing MoroccanLaws for compensation programs and socio-economic factors. Results of thesurvey include identification of negative impacts of dam construction forupstream and downstream areas, recommended resettlement plans as well asresettlement costs.
In the case of Taskourt, although about 1,000 inhabitants are forced to beresettled for the dam construction, according to a hearing by the JICA StudyTeam, they will cooperate with dam construction if they receive propermonetary compensation. Inhabitants living in the proposed reservoir areahave been maintaining a nomadic life until now and do not seem to have agreat attachment to their ancestral lands. This situation is the same for theother three projects.
d) Priority for the Implementation of the Four Prioritized Projects
In order to judge the priority for the implementation of these four priorityprojects, the following considerations should be taken into account:
- Irrigation systems of No. 9 Taskourt and No.10 Timkit are existing andthese projects shall construct new dam as well as rehabilitation of theirrigation facilities, while No.5 N’Fifikh and No. 17 Azghar shall constructnewly both dam and irrigation facilities. As in Morocco the priority isgiven to rehabilitation projects, No.9 Taskourt and No. 10 Timkit arejudged to have higher priority than the other two projects.
- As mentioned in sub-section 8.6.2 of Main Report of this Study, there aretwo possible method for usage of stored water in the reservoir forirrigation in No.10 Timkit ; 1) directly distributing the usable water to theirrigation field and 2) infiltrating the usable water into undergroundbeneath irrigation field before irrigation usage. Even if whichever methodis applied actually, there exists some uncertainty in No.10 Timkitcompared to No.9 Taskourt. Then the priority of No.10 Timkit is judgedlower than No.9 Taskourt.
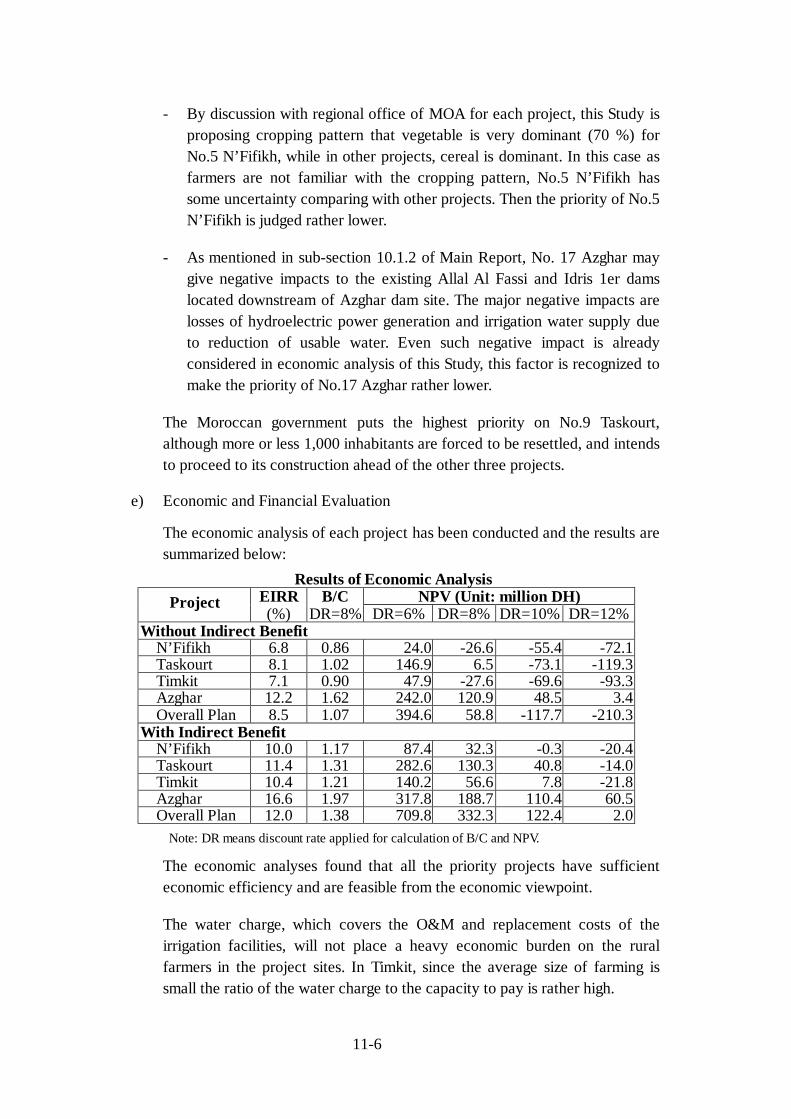
11-6
- By discussion with regional office of MOA for each project, this Study isproposing cropping pattern that vegetable is very dominant (70 %) forNo.5 N’Fifikh, while in other projects, cereal is dominant. In this case asfarmers are not familiar with the cropping pattern, No.5 N’Fifikh hassome uncertainty comparing with other projects. Then the priority of No.5N’Fifikh is judged rather lower.
- As mentioned in sub-section 10.1.2 of Main Report, No. 17 Azghar maygive negative impacts to the existing Allal Al Fassi and Idris 1er damslocated downstream of Azghar dam site. The major negative impacts arelosses of hydroelectric power generation and irrigation water supply dueto reduction of usable water. Even such negative impact is alreadyconsidered in economic analysis of this Study, this factor is recognized tomake the priority of No.17 Azghar rather lower.
The Moroccan government puts the highest priority on No.9 Taskourt,although more or less 1,000 inhabitants are forced to be resettled, and intendsto proceed to its construction ahead of the other three projects.
e) Economic and Financial Evaluation
The economic analysis of each project has been conducted and the results aresummarized below:
Results of Economic AnalysisEIRR B/C NPV (Unit: million DH)Project(%) DR=8% DR=6% DR=8% DR=10% DR=12%
Without Indirect BenefitN’Fifikh 6.8 0.86 24.0 -26.6 -55.4 -72.1Taskourt 8.1 1.02 146.9 6.5 -73.1 -119.3Timkit 7.1 0.90 47.9 -27.6 -69.6 -93.3Azghar 12.2 1.62 242.0 120.9 48.5 3.4Overall Plan 8.5 1.07 394.6 58.8 -117.7 -210.3
With Indirect BenefitN’Fifikh 10.0 1.17 87.4 32.3 -0.3 -20.4Taskourt 11.4 1.31 282.6 130.3 40.8 -14.0Timkit 10.4 1.21 140.2 56.6 7.8 -21.8Azghar 16.6 1.97 317.8 188.7 110.4 60.5Overall Plan 12.0 1.38 709.8 332.3 122.4 2.0
Note: DR means discount rate applied for calculation of B/C and NPV.
The economic analyses found that all the priority projects have sufficienteconomic efficiency and are feasible from the economic viewpoint.
The water charge, which covers the O&M and replacement costs of theirrigation facilities, will not place a heavy economic burden on the ruralfarmers in the project sites. In Timkit, since the average size of farming issmall the ratio of the water charge to the capacity to pay is rather high.
11-7
On the other hand, the annual required fund for implementation of the wholeprojects and repayment of loan is approximately 100 to 150 million DH asshown in Table 10.2.5. If a soft loan is available, the implementation of theprojects and the repayment of the loan will not be a heavy burden on theGovernment.
11.2 Recommendations
(1) Considering the above conclusions, that four priority projects are justifiedfrom the aspects of necessities of projects, technical assessment, natural andsocial environment assessment, and economic and financial evaluation,implementation of them are strongly recommended.
Overall implementation schedule of priority projects and other medium-scaledam projects to be newly identified by Moroccan Government under the longterm water resources development plan until the target year 2020 is proposedas stated below.
a) First Step (Implementation of Group A Projects)
Feasibility study for the Group A projects should be finished by themiddle of July 2001.
According to the implementation schedule of DGH, implementationagency of medium-scale dams, dam construction of Taskourt is to startwithin the current five year national development plan (January 2000to December 2004) and construction of the other three priority dams isto start in the beginning of the next five year national development plan(January 2005 to December 2009). This has been decided consideringcurrent social aspects in Morocco.
Further, DGH has already started land acquisition activities forTaskourt since June 2001 and is expected to complete by May 2004.This step should be hurried up so that the detailed design andconstruction will be completed by November 2008.
b) Second Step (Master Plan for Group B and C Projects)
Review of planning and design for Group C projects and other projectsto be newly identified should be made and a prioritization studytogether with the Group B projects should be made (Master PlanStudy). Then based on this master plan study, the highest priorityprojects (about four in number) will be selected for the next stageimplementation by July 2004.
11-8
c) Third Step (Implementation for the Priority Projects selected fromGroup B and C Projects)
Feasibility study for these priority projects in the second step should becarried out, and then their detailed design and construction also shouldbe made by November 2012.
d) Further Steps
The above second and third steps are to be repeated.
The overall implementation schedule is shown in Figure 11.1.1.
(2) Project cost for the four priority projects and the annual disbursementschedules are shown in Tables 10.1.4 and 10.2.1.
The Government will implement the medium-scale dam projects for the waterresource development in the rural areas by the target year of 2020 as thelong-term water resources development plan. Meanwhile, as described inSection 10.1, economic viability by the direct benefit for the medium-scaledam projects are generally not so high, so the financial plan for each projectis rather difficult to establish. It is, however, possible to justify the projectsconsidering their indirect benefit such as economical induced benefit or inview of the social aspects, which are above all the most serious matters in thiscountry. Considering this, the main points to be noted for the financial planare as follows:
Sources of fund
The following sources of funding for the medium-scale dam projects areconceivable:
- Moroccan Government revenue from various taxes and/or bondsissuance,
- Domestic loan
- Foreign soft loan by Official Development Assistance (ODA) such asJBIC
- Foreign grant by ODA
Combination of the above should be applied to funding for the projects. TheCentral Government is fully responsible for repayment of foreign soft loan byODA. Also, the foreign grant by ODA, besides the Moroccan governmentrevenue, should be eagerly applied to the projects with low economic
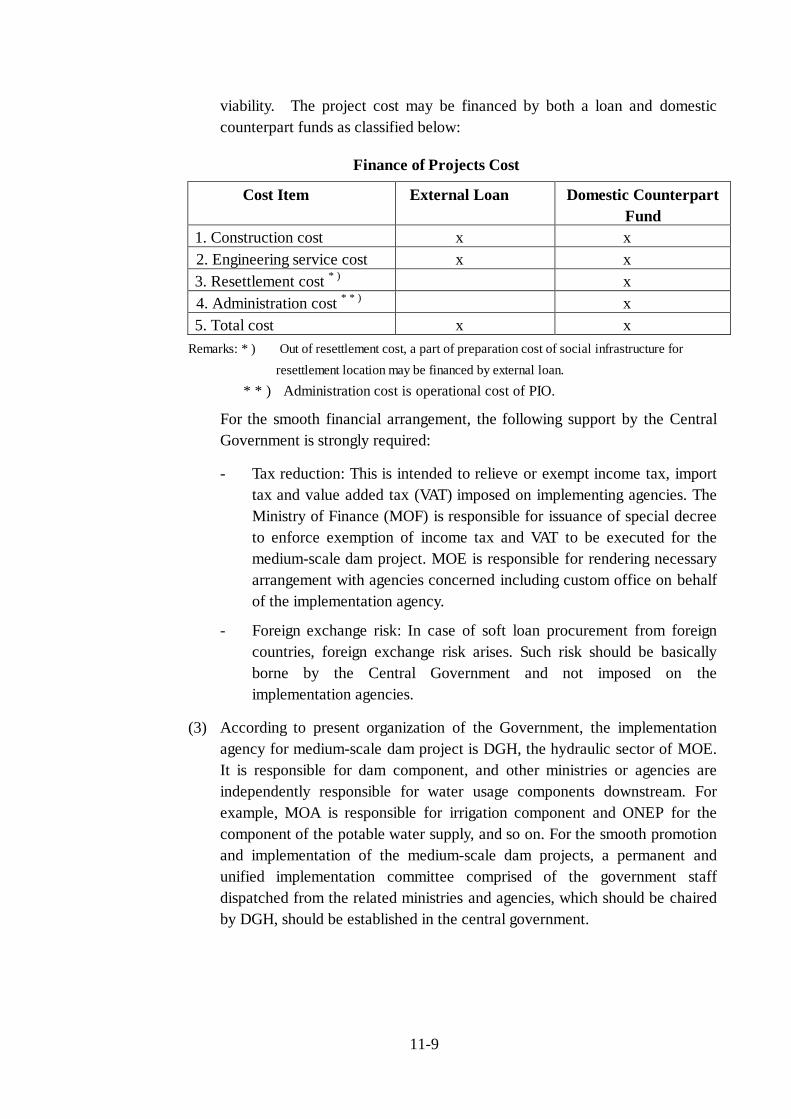
11-9
viability. The project cost may be financed by both a loan and domesticcounterpart funds as classified below:
Finance of Projects Cost
Cost Item External Loan Domestic CounterpartFund
1. Construction cost x x2. Engineering service cost x x3. Resettlement cost *) x4. Administration cost **) x5. Total cost x x
Remarks: *) Out of resettlement cost, a part of preparation cost of social infrastructure forresettlement location may be financed by external loan.
**) Administration cost is operational cost of PIO.
For the smooth financial arrangement, the following support by the CentralGovernment is strongly required:
- Tax reduction: This is intended to relieve or exempt income tax, importtax and value added tax (VAT) imposed on implementing agencies. TheMinistry of Finance (MOF) is responsible for issuance of special decreeto enforce exemption of income tax and VAT to be executed for themedium-scale dam project. MOE is responsible for rendering necessaryarrangement with agencies concerned including custom office on behalfof the implementation agency.
- Foreign exchange risk: In case of soft loan procurement from foreigncountries, foreign exchange risk arises. Such risk should be basicallyborne by the Central Government and not imposed on theimplementation agencies.
(3) According to present organization of the Government, the implementationagency for medium-scale dam project is DGH, the hydraulic sector of MOE.It is responsible for dam component, and other ministries or agencies areindependently responsible for water usage components downstream. Forexample, MOA is responsible for irrigation component and ONEP for thecomponent of the potable water supply, and so on. For the smooth promotionand implementation of the medium-scale dam projects, a permanent andunified implementation committee comprised of the government staffdispatched from the related ministries and agencies, which should be chairedby DGH, should be established in the central government.

11-10
Further, the Government now contemplates that an administrative agency foroperation and maintenance, and implementation of the existing and proposedlarge dams including medium-scale dams is to be established for eachhydraulic region. The proposed permanent and unified committee shouldprovide support in various aspects to the administrative agency for eachhydraulic region. The administrative agency thus operating in cooperationwith the central committee should be fully responsible for construction of themedium-scale dam projects.
The Projects consist of the following components:
Major Components
- Dam
- Irrigation facilities
- Flood damage mitigation
- Watershed management (forestation, check dam)
- Resettlement
Subordinate Components
- Domestic water supply
For the smooth implementation of the Projects, the Government shouldestablish a Project Implementation Office (PIO) consisting of theGovernment Agencies concerned under the above administrative agency foreach hydraulic region. The following government agencies will participatein PIO.
- General Directorate of Hydraulics (DGH), Ministry of Equipment (MOE)
- Ministry of Agriculture, Rural Development, and Maritime Fishery(MOA)
- Ministry of Environment (CSES)
- Direction of Forest and Water (MOA)
- National Office of Potable Water (ONEP)
- Local Administration
Out of the agencies listed above, General Directorate of Hydraulics, Ministryof Equipment would be the secretary of PIO and take overall responsibilityfor the implementation of the Projects. The proposed organization chart ofPIO is shown in Figure 11.3.1.
11-11
(4) Environmental Management Plan (EMP) for natural environment andresettlement plan proposed by the JICA Study Team are as follows:
According to the results of the environmental screening during the First Phase,water quality was found to be one of the most important environmentalfactors to be analyzed. Therefore, the following aspects were carefullyaddressed and applied for the Environmental Management Plan (EMP).
- Upstream: Eutrophication
- Immediate Downstream: Level of groundwater
- Downstream: Changes in water quality with irrigation
Establishment of Environmental Management Plan (EMP) is the mostimportant practice as a long-term mitigation of the environmental impacts.Practical institutional organization for environmental monitoring andmanagement, environmental parameters and sampling locations for waterquality have been determined and proposed. The following recommendationsare made on the EMP:
- Environmental Management Unit (EMU) should be established, and theDGH be responsible for the implementation of the EMP.
- Development of tree planting program as a counter measure for erosionproblem particularly at Taskourt site is important. This should be includedas one of the main components of the EMP.
- Ministry of Forestry should be fully involved into the tree plantingprogram (the Ministry be involved as a regular member of the SteeringCommittee so that appropriate counterpart be appointed).
The issue of resettlement due to dam construction frequently is a majorconcern at the moment in not only Japan but also other countries. So theMoroccan government is strongly requested to make proper action on landacquisition including resettlement issues for these four priority projects byboth monetary compensation under the current law for land acquisition inMorocco and compensation of new resettlement area using collective lands.
Recommended Resettlement Plans by the JICA Study Team for the fourpriority projects are as follows:
11-12
- No. 5 N’Fifikh
Submerged Area: 31 houses, 38 families, 187 persons
Resettlement Scenarios:
a) Option A: SODEA lands, located downstream of proposed dam(Theland is owned by public agricultural company and existing in proposedirrigation area.)
b) Option B: Land purchasing from large-scale vegetable farm locateddownstream of proposed dam (Private land can be bought usingcompensation money, but requires negotiating with downstreambeneficiaries before starting construction.)
- No. 9 Taskourt
Submerged Area: 154 houses, 205 families, 1,014 persons
Resettlement Scenarios:
a) Group A: 74 families (36%) applying to their own resettlement plans
b) Group B: 62 families (30%) having lands in l’Aazib area and to besettled there (Construction of new social infrastructure facilities arenecessary.)
c) Group C: 69 families (34%) having no lands property and to be settled innew lands at downstream irrigation area (Approximately two villagesequipped with social infrastructure facilities should be newlyconstructed.)
- No. 10 Timkit
Submerged Area: 39 houses, 64 families, 342 persons
Resettlement Scenarios:
a) Group A: 60 families (93%) to be settled in Ifegh
b) Group B: 4 families (7%) having own source of income in differentregion and to be settled there
- No. 17 Azghar
Submerged Area: 6 houses, 10 families, 42 persons
Resettlement Scenarios:
Government compensation in compliance with Moroccan legal standards
11-13
(5) Terms of References (TOR) for the details design covering four projects ofNo.5 N’Fifikh, No.9 Taskourt, No.10 Timkit and No.17 Azghar are proposedto be as follows:
(5.1) Additional / Further study5.1.1) Review of regulated water volume for all the projects.
Regulated water volume by each dam and available water volume ateach intake weir, located downstream of each dam should be reviewedbased on floods recorded in the past.
5.1.2) Optimization study for water management for irrigation for all theprojects. Cropping pattern, and duty flow to the downstream should befinally decided considering existing water rights and existing irrigationsystems.
5.1.3) Recharging effects into underground of not only regulated water byTimkit dam but also surface water of Tanguerfa and Todra river forirrigation in No.10 Timkit should be assessed in detail.
5.1.4) Execution method of land consolidation for all projects should beproposed.
5.1.5) Examination of soil salinity for irrigation areas should be made.5.1.6) Overall marketing study for agricultural inputs and products in
Morocco should be carried out.
(5.2) Additional field investigation5.2.1) Topographic survey for irrigation intake weir, and profile and cross
section survey for irrigation canals (Main only) should be made.5.2.2) Additional core boring and permeability tests should be made if
necessary.5.2.3) Additional construction material survey and laboratory tests should be
made if necessary.5.2.4) Concrete mixing tests for concrete dam constructed by RCC should be
made.
(5.3) Detailed designThe following should be prepared:
5.3.1) Design criteria.5.3.2) Basic design.5.3.3) Tender design.5.3.4) Detailed Design.

11-14
(5.4) ReportsFollowing reports should be prepared:
5.4.1) Inception report5.4.2) Further study report including supporting reports and data books.5.4.3) Basic design report and the drawings.5.4.4) Tender documents.5.4.5) Detailed design report and the drawings.5.4.6) Completion reports.
(5.5) Schedule (Tentative)5.5.1) Additional / Further study; January to December, 2002 (12 months)5.5.2) Additional field investigation and detailed design; June, 2002 to
December 2004 (30 months)
Commencement of these works of 5.5.2) in the above will be subject to theresults of the additional further study, and approval of JICA (Tentative) andthe Government of Morocco.

Feasibility Study on Water Resources Development inRural Area in the
Kingdom of MoroccoFinal Report
Volume II Main Report
Tables

No Name Function Position1 Mr.Adachi Leader/Water Resources Development JICA2 Mr.Niwa - ditto - - ditto -3 Mr.Shioya Flood Control
4 Mr.Itaya - ditto - - ditto -5 Mr.Nakajima Agricultural Development
6 Mr.Karashima Project Implementation Plan JBIC7 Mr.Kimura - ditto - - ditto -
No Name Position1 Mr.Matsushima Deputy Director, JICA Tokyo2 Mr.Nakamoto Staff, JICA Tokyo3 Mr.Kageta Staff, JICA Tokyo4 Mr. Yoshizawa Deputy General Manager5 Miss Nonoyama Staff, JICA Morocco6 Mr.Shibata Staff, JICA Morocco
No Name Position1 Mr. Mahfoud General Directorate of Hydraulics2 Mr. El Gomari General Directorate of Hydraulics3 Mrs. Ouarrak General Directorate of Hydraulics4 Mr. Nassouh General Directorate of Hydraulics5 Mr. Belghiti
6 Mrs. Idder National Office of Water Suppy7 Mr. Essaouabi National Office of Water Suppy
Table 1.1.1: List of JICA Advisory Committee and Persons in Charges in JICA,and Steering Committee in Moroccan Government
Ministry of Land, Infrastructureand Transportation
Japan Institute of Irrigation andDrainage
Ministry of Agriculture, RuralDevelopment and Maritime Fisheries
Steering Committee
Advisory committee
Persons in Charge in JICA
T-1
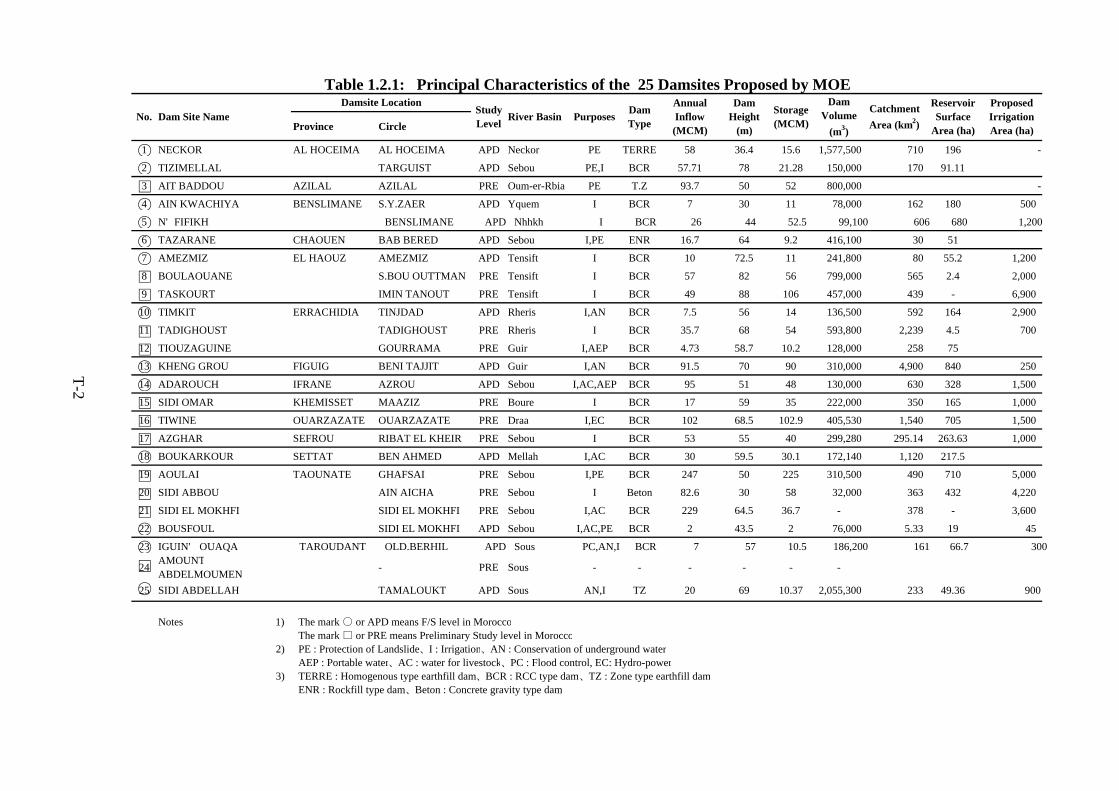
Province Circle
1 NECKOR AL HOCEIMA AL HOCEIMA APD Neckor PE TERRE 58 36.4 15.6 1,577,500 710 196 -
2 TIZIMELLAL TARGUIST APD Sebou PE,I BCR 57.71 78 21.28 150,000 170 91.11
3 AIT BADDOU AZILAL AZILAL PRE Oum-er-Rbia PE T.Z 93.7 50 52 800,000 -
4 AIN KWACHIYA BENSLIMANE S.Y.ZAER APD Yquem I BCR 7 30 11 78,000 162 180 500
5 N'FIFIKH BENSLIMANE APD Nhhkh I BCR 26 44 52.5 99,100 606 680 1,200
6 TAZARANE CHAOUEN BAB BERED APD Sebou I,PE ENR 16.7 64 9.2 416,100 30 51
7 AMEZMIZ EL HAOUZ AMEZMIZ APD Tensift I BCR 10 72.5 11 241,800 80 55.2 1,200
8 BOULAOUANE S.BOU OUTTMAN PRE Tensift I BCR 57 82 56 799,000 565 2.4 2,000
9 TASKOURT IMIN TANOUT PRE Tensift I BCR 49 88 106 457,000 439 - 6,900
10 TIMKIT ERRACHIDIA TINJDAD APD Rheris I,AN BCR 7.5 56 14 136,500 592 164 2,900
11 TADIGHOUST TADIGHOUST PRE Rheris I BCR 35.7 68 54 593,800 2,239 4.5 700
12 TIOUZAGUINE GOURRAMA PRE Guir I,AEP BCR 4.73 58.7 10.2 128,000 258 75
13 KHENG GROU FIGUIG BENI TAJJIT APD Guir I,AN BCR 91.5 70 90 310,000 4,900 840 250
14 ADAROUCH IFRANE AZROU APD Sebou I,AC,AEP BCR 95 51 48 130,000 630 328 1,500
15 SIDI OMAR KHEMISSET MAAZIZ PRE Boure I BCR 17 59 35 222,000 350 165 1,000
16 TIWINE OUARZAZATE OUARZAZATE PRE Draa I,EC BCR 102 68.5 102.9 405,530 1,540 705 1,500
17 AZGHAR SEFROU RIBAT EL KHEIR PRE Sebou I BCR 53 55 40 299,280 295.14 263.63 1,000
18 BOUKARKOUR SETTAT BEN AHMED APD Mellah I,AC BCR 30 59.5 30.1 172,140 1,120 217.5
19 AOULAI TAOUNATE GHAFSAI PRE Sebou I,PE BCR 247 50 225 310,500 490 710 5,000
20 SIDI ABBOU AIN AICHA PRE Sebou I Beton 82.6 30 58 32,000 363 432 4,220
21 SIDI EL MOKHFI SIDI EL MOKHFI PRE Sebou I,AC BCR 229 64.5 36.7 - 378 - 3,600
22 BOUSFOUL SIDI EL MOKHFI APD Sebou I,AC,PE BCR 2 43.5 2 76,000 5.33 19 45
23 IGUIN' OUAQA TAROUDANT OLD.BERHIL APD Sous PC,AN,I BCR 7 57 10.5 186,200 161 66.7 300
24 AMOUNTABDELMOUMEN - PRE Sous - - - - - -
25 SIDI ABDELLAH TAMALOUKT APD Sous AN,I TZ 20 69 10.37 2,055,300 233 49.36 900
Notes 1) The mark ○ or APD means F/S level in Morocco The mark □ or PRE means Preliminary Study level in Morocco
2) PE : Protection of Landslide、 I : Irrigation、 AN : Conservation of underground water AEP : Portable water、 AC : water for livestock、 PC : Flood control, EC: Hydro-power
3) TERRE : Homogenous type earthfill dam、 BCR : RCC type dam、 TZ : Zone type earthfill dam ENR : Rockfill type dam、 Beton : Concrete gravity type dam
ReservoirSurface
Area (ha)
ProposedIrrigationArea (ha)
Damsite LocationStudyLevel
DamHeight
(m)
Table 1.2.1: Principal Characteristics of the 25 Damsites Proposed by MOEStorage(MCM)River Basin Purposes Dam
Type
AnnualInflow(MCM)
Dam Site NameNo.Dam
Volume(m3)
CatchmentArea (km2)
○○
○○○○
○
○○
○
○○
○
□
□□
□□
□□□
□□□
□
T-2
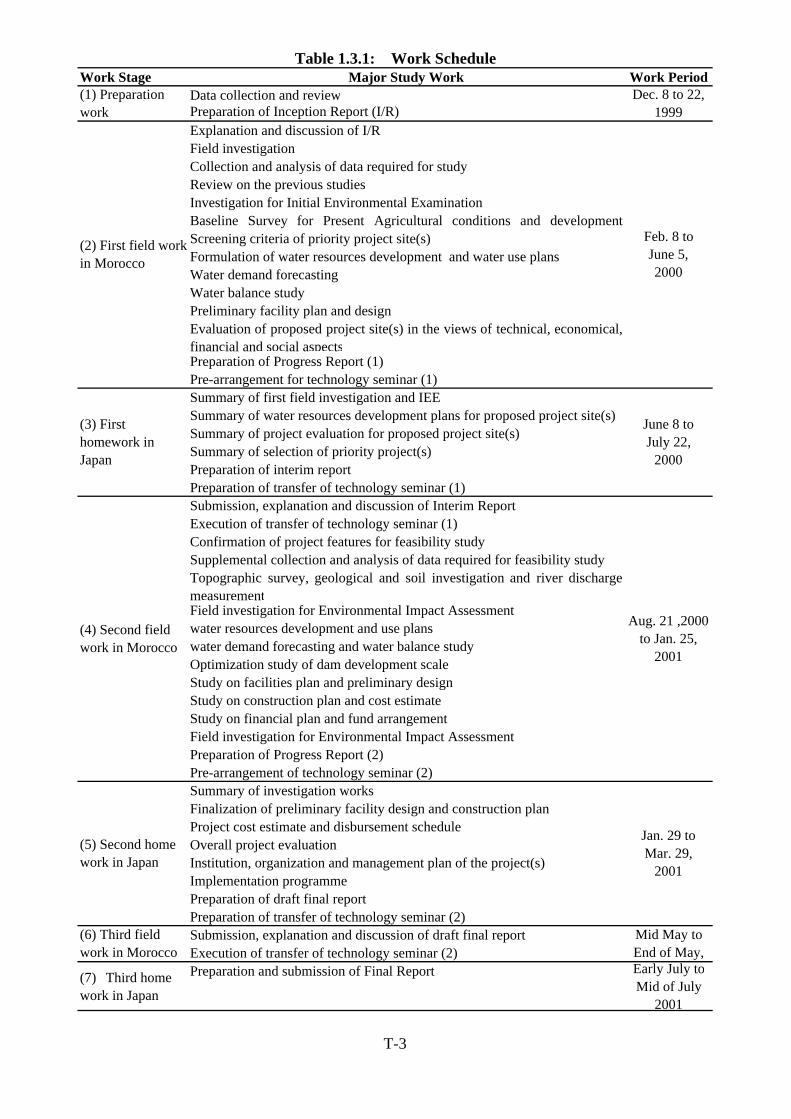
Work Stage Major Study Work Work PeriodData collection and reviewPreparation of Inception Report (I/R)Explanation and discussion of I/RField investigationCollection and analysis of data required for studyReview on the previous studiesInvestigation for Initial Environmental ExaminationBaseline Survey for Present Agricultural conditions and developmentScreening criteria of priority project site(s)Formulation of water resources development and water use plansWater demand forecastingWater balance studyPreliminary facility plan and designEvaluation of proposed project site(s) in the views of technical, economical,financial and social aspectsPreparation of Progress Report (1)Pre-arrangement for technology seminar (1)Summary of first field investigation and IEESummary of water resources development plans for proposed project site(s)Summary of project evaluation for proposed project site(s)Summary of selection of priority project(s)Preparation of interim reportPreparation of transfer of technology seminar (1)Submission, explanation and discussion of Interim ReportExecution of transfer of technology seminar (1)Confirmation of project features for feasibility studySupplemental collection and analysis of data required for feasibility studyTopographic survey, geological and soil investigation and river dischargemeasurementField investigation for Environmental Impact Assessmentwater resources development and use planswater demand forecasting and water balance studyOptimization study of dam development scaleStudy on facilities plan and preliminary designStudy on construction plan and cost estimateStudy on financial plan and fund arrangementField investigation for Environmental Impact AssessmentPreparation of Progress Report (2)Pre-arrangement of technology seminar (2)Summary of investigation worksFinalization of preliminary facility design and construction planProject cost estimate and disbursement scheduleOverall project evaluationInstitution, organization and management plan of the project(s)Implementation programmePreparation of draft final reportPreparation of transfer of technology seminar (2)Submission, explanation and discussion of draft final reportExecution of transfer of technology seminar (2)
(7) Third homework in Japan
Preparation and submission of Final Report Early July toMid of July
2001
Table 1.3.1: Work Schedule
(1) Preparationwork
Dec. 8 to 22,1999
(2) First field workin Morocco
Feb. 8 toJune 5,2000
(3) Firsthomework inJapan
June 8 toJuly 22,
2000
(4) Second fieldwork in Morocco
Aug. 21 ,2000to Jan. 25,
2001
(5) Second homework in Japan
Jan. 29 toMar. 29,
2001
(6) Third fieldwork in Morocco
Mid May toEnd of May,
T-3
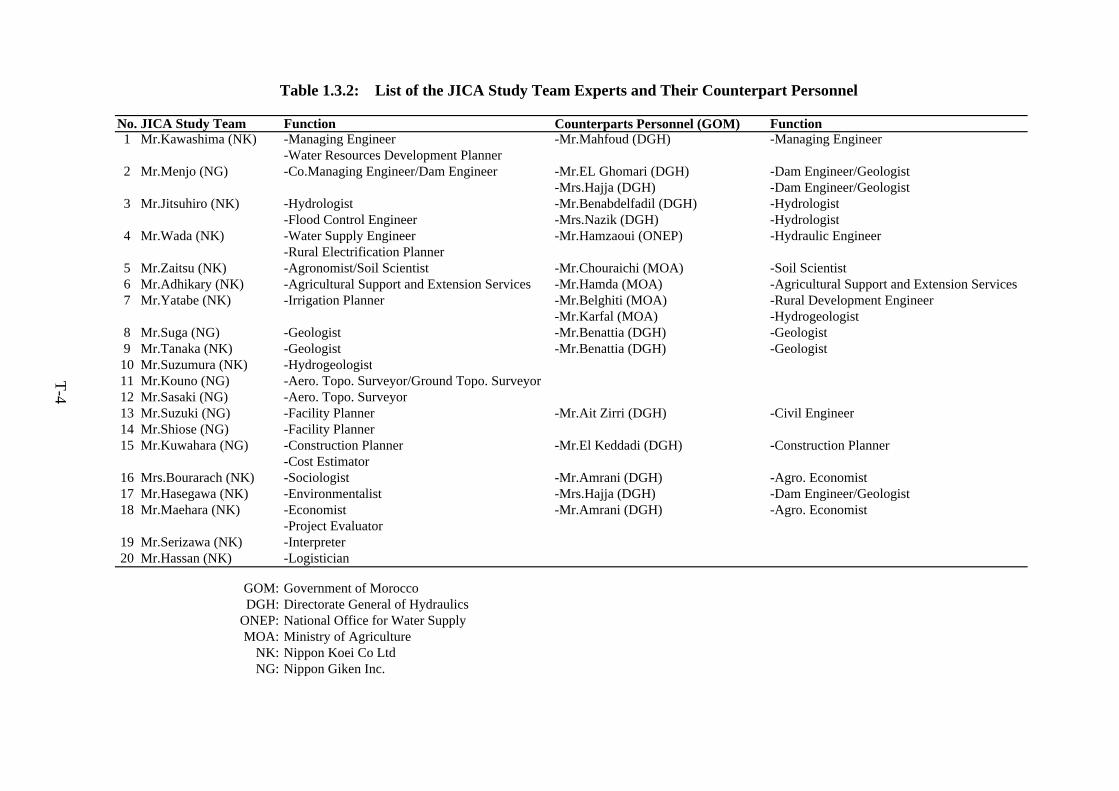
1 Mr.Kawashima (NK) -Managing Engineer -Mr.Mahfoud (DGH) -Managing Engineer-Water Resources Development Planner
2 Mr.Menjo (NG) -Co.Managing Engineer/Dam Engineer -Mr.EL Ghomari (DGH) -Dam Engineer/Geologist-Mrs.Hajja (DGH) -Dam Engineer/Geologist
3 Mr.Jitsuhiro (NK) -Hydrologist -Mr.Benabdelfadil (DGH) -Hydrologist-Flood Control Engineer -Mrs.Nazik (DGH) -Hydrologist
4 Mr.Wada (NK) -Water Supply Engineer -Mr.Hamzaoui (ONEP) -Hydraulic Engineer-Rural Electrification Planner
5 Mr.Zaitsu (NK) -Agronomist/Soil Scientist -Mr.Chouraichi (MOA) -Soil Scientist6 Mr.Adhikary (NK) -Agricultural Support and Extension Services -Mr.Hamda (MOA) -Agricultural Support and Extension Services7 Mr.Yatabe (NK) -Irrigation Planner -Mr.Belghiti (MOA) -Rural Development Engineer
-Mr.Karfal (MOA) -Hydrogeologist8 Mr.Suga (NG) -Geologist -Mr.Benattia (DGH) -Geologist9 Mr.Tanaka (NK) -Geologist -Mr.Benattia (DGH) -Geologist10 Mr.Suzumura (NK) -Hydrogeologist11 Mr.Kouno (NG) -Aero. Topo. Surveyor/Ground Topo. Surveyor12 Mr.Sasaki (NG) -Aero. Topo. Surveyor13 Mr.Suzuki (NG) -Facility Planner -Mr.Ait Zirri (DGH) -Civil Engineer14 Mr.Shiose (NG) -Facility Planner15 Mr.Kuwahara (NG) -Construction Planner -Mr.El Keddadi (DGH) -Construction Planner
-Cost Estimator16 Mrs.Bourarach (NK) -Sociologist -Mr.Amrani (DGH) -Agro. Economist17 Mr.Hasegawa (NK) -Environmentalist -Mrs.Hajja (DGH) -Dam Engineer/Geologist18 Mr.Maehara (NK) -Economist -Mr.Amrani (DGH) -Agro. Economist
-Project Evaluator 19 Mr.Serizawa (NK) -Interpreter20 Mr.Hassan (NK) -Logistician
GOM: Government of MoroccoDGH: Directorate General of Hydraulics
ONEP: National Office for Water SupplyMOA: Ministry of Agriculture
NK: Nippon Koei Co LtdNG: Nippon Giken Inc.
Table 1.3.2: List of the JICA Study Team Experts and Their Counterpart Personnel
No. JICA Study Team Function FunctionCounterparts Personnel (GOM)
T-4
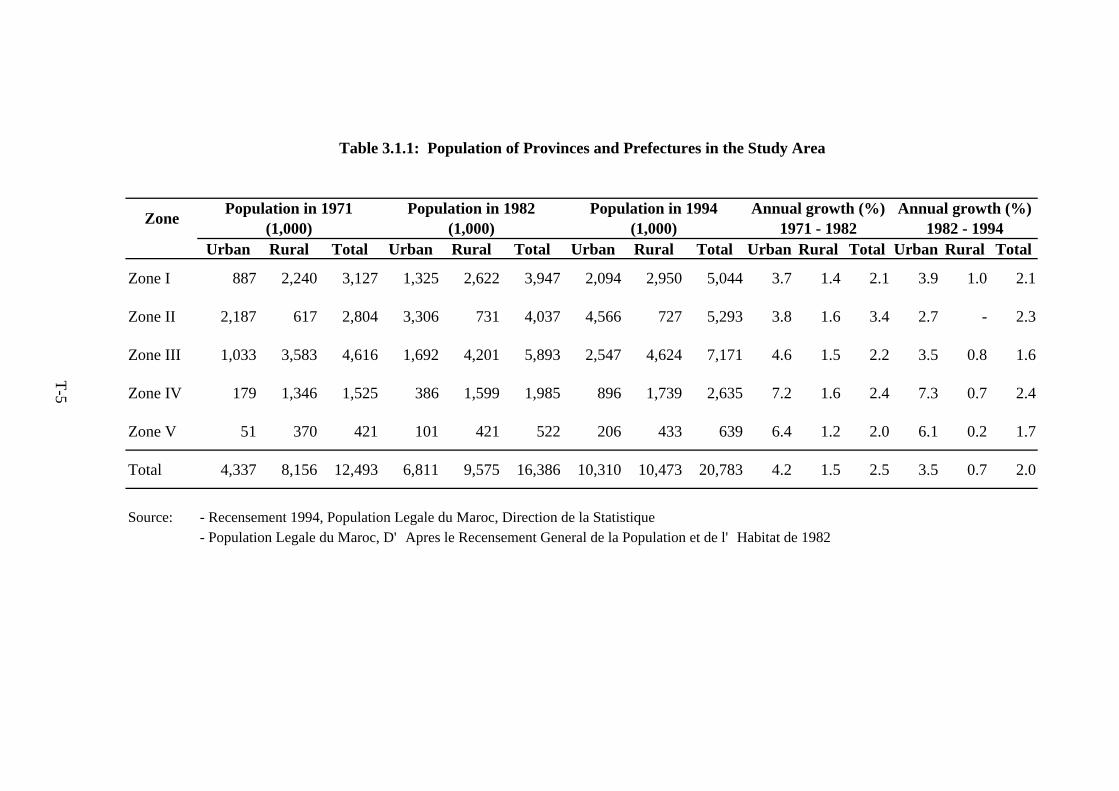
Table 3.1.1: Population of Provinces and Prefectures in the Study Area
Urban Rural Total Urban Rural Total Urban Rural Total Urban Rural Total Urban Rural Total
Zone I 887 2,240 3,127 1,325 2,622 3,947 2,094 2,950 5,044 3.7 1.4 2.1 3.9 1.0 2.1
Zone II 2,187 617 2,804 3,306 731 4,037 4,566 727 5,293 3.8 1.6 3.4 2.7 - 2.3
Zone III 1,033 3,583 4,616 1,692 4,201 5,893 2,547 4,624 7,171 4.6 1.5 2.2 3.5 0.8 1.6
Zone IV 179 1,346 1,525 386 1,599 1,985 896 1,739 2,635 7.2 1.6 2.4 7.3 0.7 2.4
Zone V 51 370 421 101 421 522 206 433 639 6.4 1.2 2.0 6.1 0.2 1.7
Total 4,337 8,156 12,493 6,811 9,575 16,386 10,310 10,473 20,783 4.2 1.5 2.5 3.5 0.7 2.0
Source: - Recensement 1994, Population Legale du Maroc, Direction de la Statistique- Population Legale du Maroc, D'Apres le Recensement General de la Population et de l'Habitat de 1982
Annual growth (%)1971 - 1982
Annual growth (%)1982 - 1994Zone Population in 1971
(1,000)Population in 1982
(1,000)Population in 1994
(1,000)
T-5
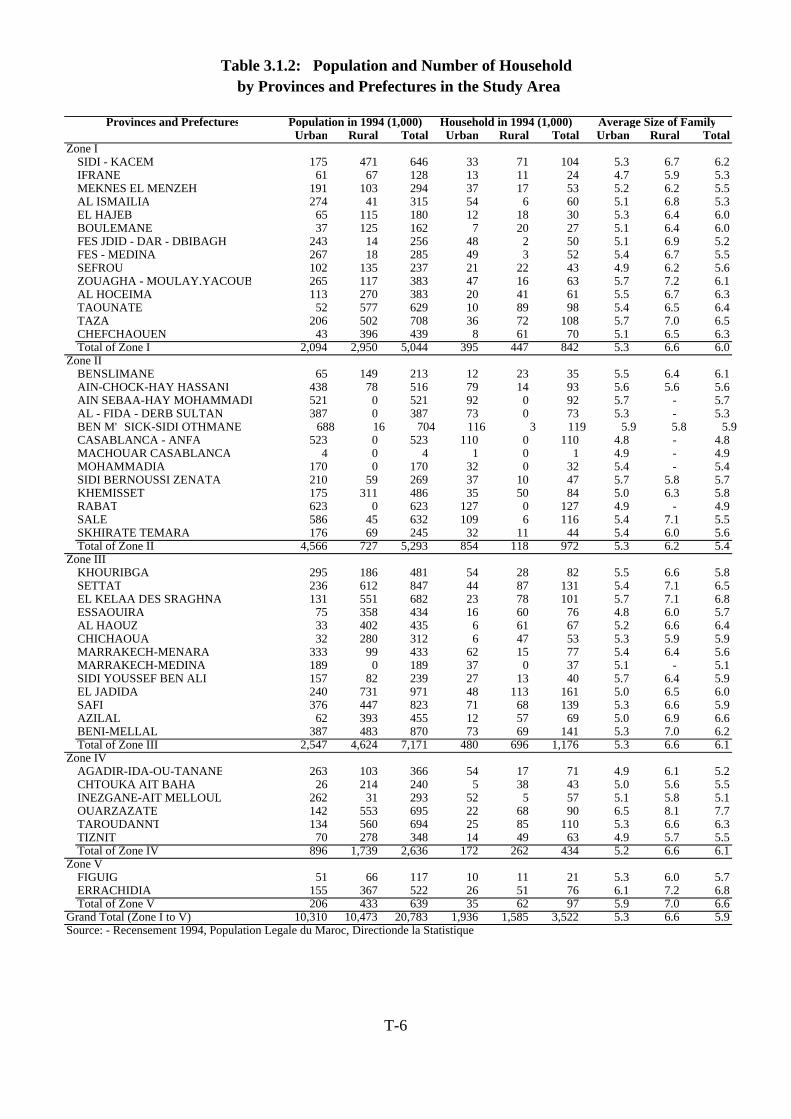
Provinces and Prefectures Population in 1994 (1,000) Household in 1994 (1,000) Average Size of FamilyUrban Rural Total Urban Rural Total Urban Rural Total
Zone ISIDI - KACEM 175 471 646 33 71 104 5.3 6.7 6.2IFRANE 61 67 128 13 11 24 4.7 5.9 5.3MEKNES EL MENZEH 191 103 294 37 17 53 5.2 6.2 5.5AL ISMAILIA 274 41 315 54 6 60 5.1 6.8 5.3EL HAJEB 65 115 180 12 18 30 5.3 6.4 6.0BOULEMANE 37 125 162 7 20 27 5.1 6.4 6.0FES JDID - DAR - DBIBAGH 243 14 256 48 2 50 5.1 6.9 5.2FES - MEDINA 267 18 285 49 3 52 5.4 6.7 5.5SEFROU 102 135 237 21 22 43 4.9 6.2 5.6ZOUAGHA - MOULAY.YACOUB 265 117 383 47 16 63 5.7 7.2 6.1AL HOCEIMA 113 270 383 20 41 61 5.5 6.7 6.3TAOUNATE 52 577 629 10 89 98 5.4 6.5 6.4TAZA 206 502 708 36 72 108 5.7 7.0 6.5CHEFCHAOUEN 43 396 439 8 61 70 5.1 6.5 6.3Total of Zone I 2,094 2,950 5,044 395 447 842 5.3 6.6 6.0
Zone IIBENSLIMANE 65 149 213 12 23 35 5.5 6.4 6.1AIN-CHOCK-HAY HASSANI 438 78 516 79 14 93 5.6 5.6 5.6AIN SEBAA-HAY MOHAMMADI 521 0 521 92 0 92 5.7 - 5.7AL - FIDA - DERB SULTAN 387 0 387 73 0 73 5.3 - 5.3BEN M'SICK-SIDI OTHMANE 688 16 704 116 3 119 5.9 5.8 5.9CASABLANCA - ANFA 523 0 523 110 0 110 4.8 - 4.8MACHOUAR CASABLANCA 4 0 4 1 0 1 4.9 - 4.9MOHAMMADIA 170 0 170 32 0 32 5.4 - 5.4SIDI BERNOUSSI ZENATA 210 59 269 37 10 47 5.7 5.8 5.7KHEMISSET 175 311 486 35 50 84 5.0 6.3 5.8RABAT 623 0 623 127 0 127 4.9 - 4.9SALE 586 45 632 109 6 116 5.4 7.1 5.5SKHIRATE TEMARA 176 69 245 32 11 44 5.4 6.0 5.6Total of Zone II 4,566 727 5,293 854 118 972 5.3 6.2 5.4
Zone IIIKHOURIBGA 295 186 481 54 28 82 5.5 6.6 5.8SETTAT 236 612 847 44 87 131 5.4 7.1 6.5EL KELAA DES SRAGHNA 131 551 682 23 78 101 5.7 7.1 6.8ESSAOUIRA 75 358 434 16 60 76 4.8 6.0 5.7AL HAOUZ 33 402 435 6 61 67 5.2 6.6 6.4CHICHAOUA 32 280 312 6 47 53 5.3 5.9 5.9MARRAKECH-MENARA 333 99 433 62 15 77 5.4 6.4 5.6MARRAKECH-MEDINA 189 0 189 37 0 37 5.1 - 5.1SIDI YOUSSEF BEN ALI 157 82 239 27 13 40 5.7 6.4 5.9EL JADIDA 240 731 971 48 113 161 5.0 6.5 6.0SAFI 376 447 823 71 68 139 5.3 6.6 5.9AZILAL 62 393 455 12 57 69 5.0 6.9 6.6BENI-MELLAL 387 483 870 73 69 141 5.3 7.0 6.2Total of Zone III 2,547 4,624 7,171 480 696 1,176 5.3 6.6 6.1
Zone IVAGADIR-IDA-OU-TANANE 263 103 366 54 17 71 4.9 6.1 5.2CHTOUKA AIT BAHA 26 214 240 5 38 43 5.0 5.6 5.5INEZGANE-AIT MELLOUL 262 31 293 52 5 57 5.1 5.8 5.1OUARZAZATE 142 553 695 22 68 90 6.5 8.1 7.7TAROUDANNT 134 560 694 25 85 110 5.3 6.6 6.3TIZNIT 70 278 348 14 49 63 4.9 5.7 5.5Total of Zone IV 896 1,739 2,636 172 262 434 5.2 6.6 6.1
Zone VFIGUIG 51 66 117 10 11 21 5.3 6.0 5.7ERRACHIDIA 155 367 522 26 51 76 6.1 7.2 6.8Total of Zone V 206 433 639 35 62 97 5.9 7.0 6.6
Grand Total (Zone I to V) 10,310 10,473 20,783 1,936 1,585 3,522 5.3 6.6 5.9Source: - Recensement 1994, Population Legale du Maroc, Directionde la Statistique
Table 3.1.2: Population and Number of Household by Provinces and Prefectures in the Study Area
T-6
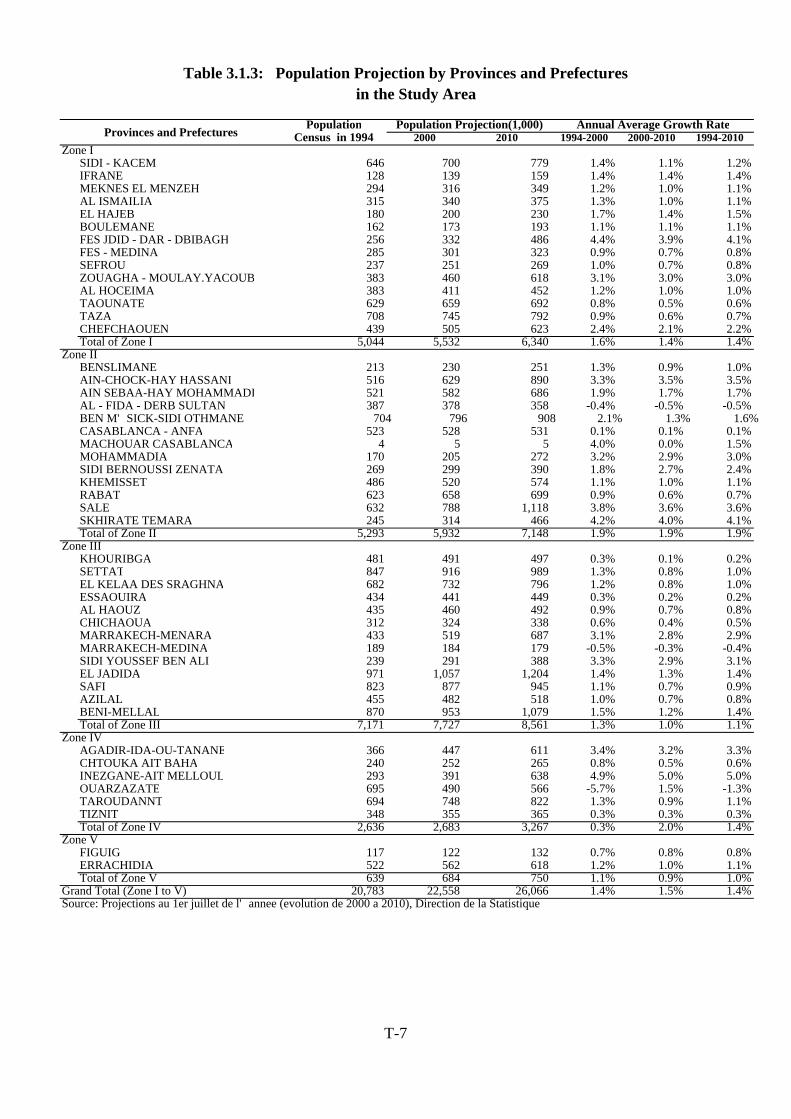
Table 3.1.3: Population Projection by Provinces and Prefectures in the Study Area
Population Population Projection(1,000) Annual Average Growth RateCensus in 1994 2000 2010 1994-2000 2000-2010 1994-2010
Zone ISIDI - KACEM 646 700 779 1.4% 1.1% 1.2%IFRANE 128 139 159 1.4% 1.4% 1.4%MEKNES EL MENZEH 294 316 349 1.2% 1.0% 1.1%AL ISMAILIA 315 340 375 1.3% 1.0% 1.1%EL HAJEB 180 200 230 1.7% 1.4% 1.5%BOULEMANE 162 173 193 1.1% 1.1% 1.1%FES JDID - DAR - DBIBAGH 256 332 486 4.4% 3.9% 4.1%FES - MEDINA 285 301 323 0.9% 0.7% 0.8%SEFROU 237 251 269 1.0% 0.7% 0.8%ZOUAGHA - MOULAY.YACOUB 383 460 618 3.1% 3.0% 3.0%AL HOCEIMA 383 411 452 1.2% 1.0% 1.0%TAOUNATE 629 659 692 0.8% 0.5% 0.6%TAZA 708 745 792 0.9% 0.6% 0.7%CHEFCHAOUEN 439 505 623 2.4% 2.1% 2.2%Total of Zone I 5,044 5,532 6,340 1.6% 1.4% 1.4%
Zone IIBENSLIMANE 213 230 251 1.3% 0.9% 1.0%AIN-CHOCK-HAY HASSANI 516 629 890 3.3% 3.5% 3.5%AIN SEBAA-HAY MOHAMMADI 521 582 686 1.9% 1.7% 1.7%AL - FIDA - DERB SULTAN 387 378 358 -0.4% -0.5% -0.5%BEN M'SICK-SIDI OTHMANE 704 796 908 2.1% 1.3% 1.6%CASABLANCA - ANFA 523 528 531 0.1% 0.1% 0.1%MACHOUAR CASABLANCA 4 5 5 4.0% 0.0% 1.5%MOHAMMADIA 170 205 272 3.2% 2.9% 3.0%SIDI BERNOUSSI ZENATA 269 299 390 1.8% 2.7% 2.4%KHEMISSET 486 520 574 1.1% 1.0% 1.1%RABAT 623 658 699 0.9% 0.6% 0.7%SALE 632 788 1,118 3.8% 3.6% 3.6%SKHIRATE TEMARA 245 314 466 4.2% 4.0% 4.1%Total of Zone II 5,293 5,932 7,148 1.9% 1.9% 1.9%
Zone IIIKHOURIBGA 481 491 497 0.3% 0.1% 0.2%SETTAT 847 916 989 1.3% 0.8% 1.0%EL KELAA DES SRAGHNA 682 732 796 1.2% 0.8% 1.0%ESSAOUIRA 434 441 449 0.3% 0.2% 0.2%AL HAOUZ 435 460 492 0.9% 0.7% 0.8%CHICHAOUA 312 324 338 0.6% 0.4% 0.5%MARRAKECH-MENARA 433 519 687 3.1% 2.8% 2.9%MARRAKECH-MEDINA 189 184 179 -0.5% -0.3% -0.4%SIDI YOUSSEF BEN ALI 239 291 388 3.3% 2.9% 3.1%EL JADIDA 971 1,057 1,204 1.4% 1.3% 1.4%SAFI 823 877 945 1.1% 0.7% 0.9%AZILAL 455 482 518 1.0% 0.7% 0.8%BENI-MELLAL 870 953 1,079 1.5% 1.2% 1.4%Total of Zone III 7,171 7,727 8,561 1.3% 1.0% 1.1%
Zone IVAGADIR-IDA-OU-TANANE 366 447 611 3.4% 3.2% 3.3%CHTOUKA AIT BAHA 240 252 265 0.8% 0.5% 0.6%INEZGANE-AIT MELLOUL 293 391 638 4.9% 5.0% 5.0%OUARZAZATE 695 490 566 -5.7% 1.5% -1.3%TAROUDANNT 694 748 822 1.3% 0.9% 1.1%TIZNIT 348 355 365 0.3% 0.3% 0.3%Total of Zone IV 2,636 2,683 3,267 0.3% 2.0% 1.4%
Zone VFIGUIG 117 122 132 0.7% 0.8% 0.8%ERRACHIDIA 522 562 618 1.2% 1.0% 1.1%Total of Zone V 639 684 750 1.1% 0.9% 1.0%
Grand Total (Zone I to V) 20,783 22,558 26,066 1.4% 1.5% 1.4%Source: Projections au 1er juillet de l'annee (evolution de 2000 a 2010), Direction de la Statistique
Provinces and Prefectures
T-7
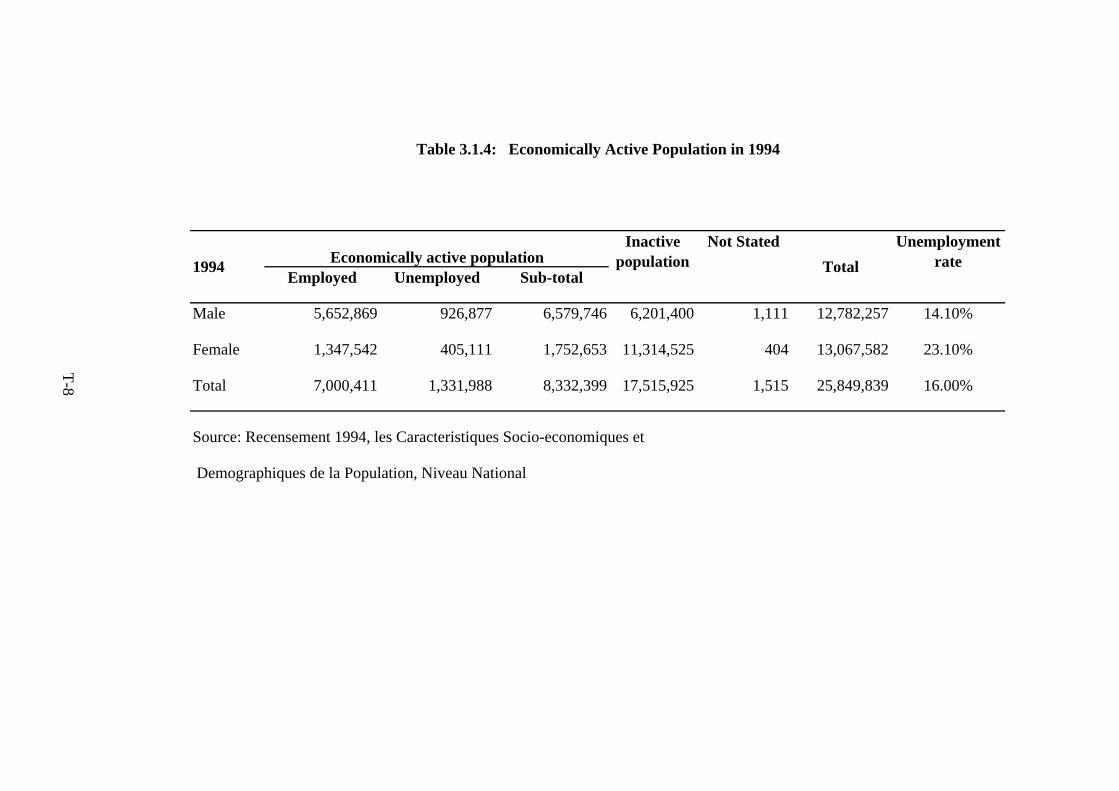
Employed Unemployed Sub-total
Male 5,652,869 926,877 6,579,746 6,201,400 1,111 12,782,257 14.10%
Female 1,347,542 405,111 1,752,653 11,314,525 404 13,067,582 23.10%
Total 7,000,411 1,331,988 8,332,399 17,515,925 1,515 25,849,839 16.00%
Source: Recensement 1994, les Caracteristiques Socio-economiques et
Demographiques de la Population, Niveau National
Table 3.1.4: Economically Active Population in 1994
Unemploymentrate1994 TotalEconomically active population
Inactivepopulation
Not Stated
T-8
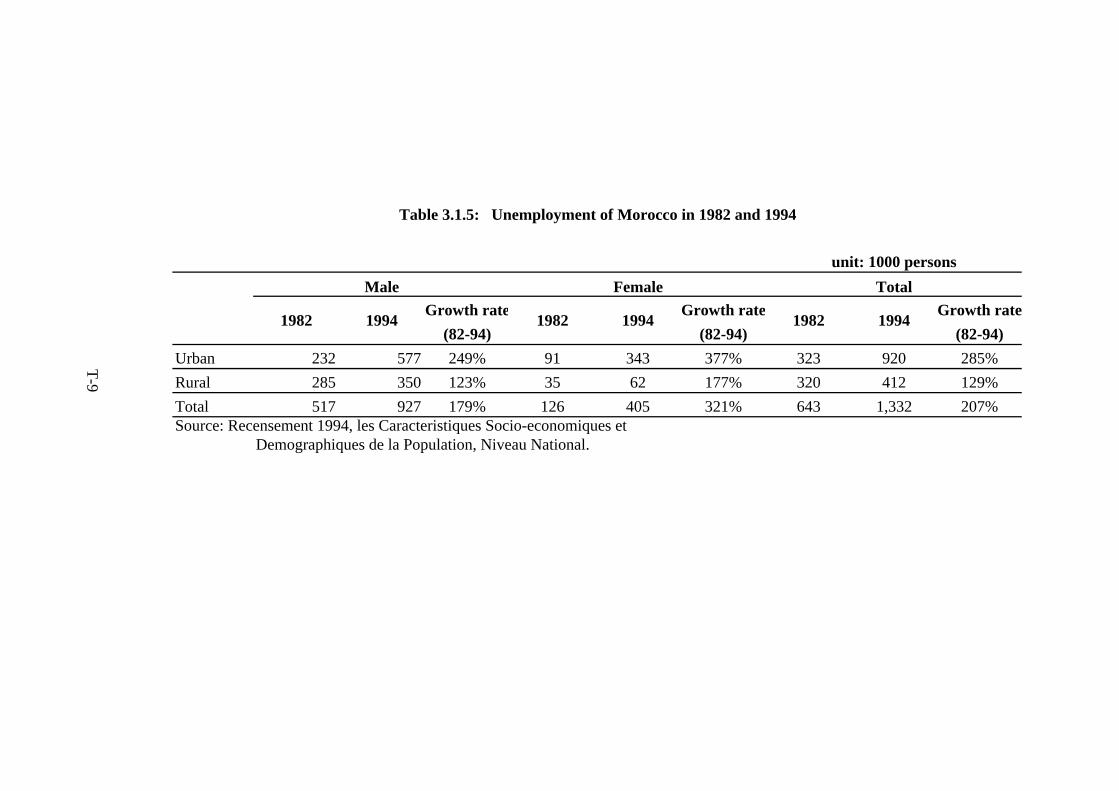
unit: 1000 persons
Growth rate Growth rate Growth rate(82-94) (82-94) (82-94)
Urban 232 577 249% 91 343 377% 323 920 285%Rural 285 350 123% 35 62 177% 320 412 129%Total 517 927 179% 126 405 321% 643 1,332 207%Source: Recensement 1994, les Caracteristiques Socio-economiques et
Demographiques de la Population, Niveau National.
1982 1994 1982
Table 3.1.5: Unemployment of Morocco in 1982 and 1994
Female TotalMale
1994 1982 1994
T-9
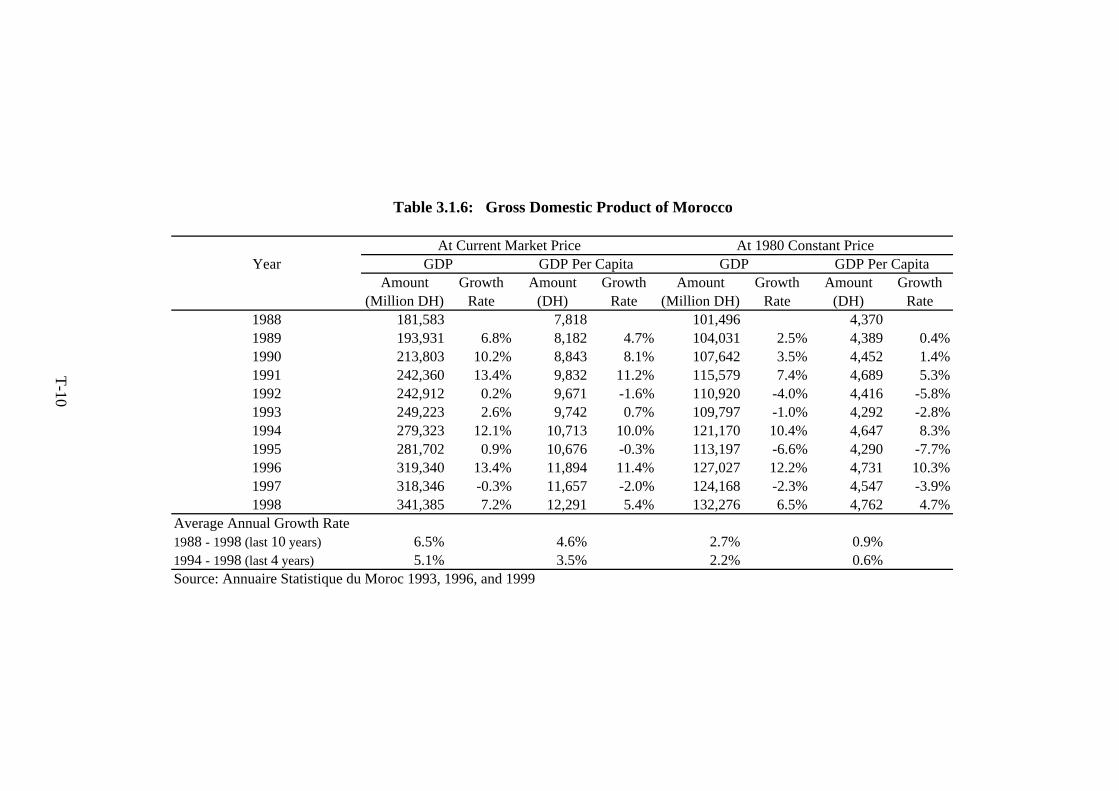
Table 3.1.6: Gross Domestic Product of Morocco
At Current Market Price At 1980 Constant PriceYear GDP GDP Per Capita GDP GDP Per Capita
Amount Growth Amount Growth Amount Growth Amount Growth(Million DH) Rate (DH) Rate (Million DH) Rate (DH) Rate
1988 181,583 7,818 101,496 4,3701989 193,931 6.8% 8,182 4.7% 104,031 2.5% 4,389 0.4%1990 213,803 10.2% 8,843 8.1% 107,642 3.5% 4,452 1.4%1991 242,360 13.4% 9,832 11.2% 115,579 7.4% 4,689 5.3%1992 242,912 0.2% 9,671 -1.6% 110,920 -4.0% 4,416 -5.8%1993 249,223 2.6% 9,742 0.7% 109,797 -1.0% 4,292 -2.8%1994 279,323 12.1% 10,713 10.0% 121,170 10.4% 4,647 8.3%1995 281,702 0.9% 10,676 -0.3% 113,197 -6.6% 4,290 -7.7%1996 319,340 13.4% 11,894 11.4% 127,027 12.2% 4,731 10.3%1997 318,346 -0.3% 11,657 -2.0% 124,168 -2.3% 4,547 -3.9%1998 341,385 7.2% 12,291 5.4% 132,276 6.5% 4,762 4.7%
Average Annual Growth Rate1988 - 1998 (last 10 years) 6.5% 4.6% 2.7% 0.9%1994 - 1998 (last 4 years) 5.1% 3.5% 2.2% 0.6%Source: Annuaire Statistique du Moroc 1993, 1996, and 1999
T-10
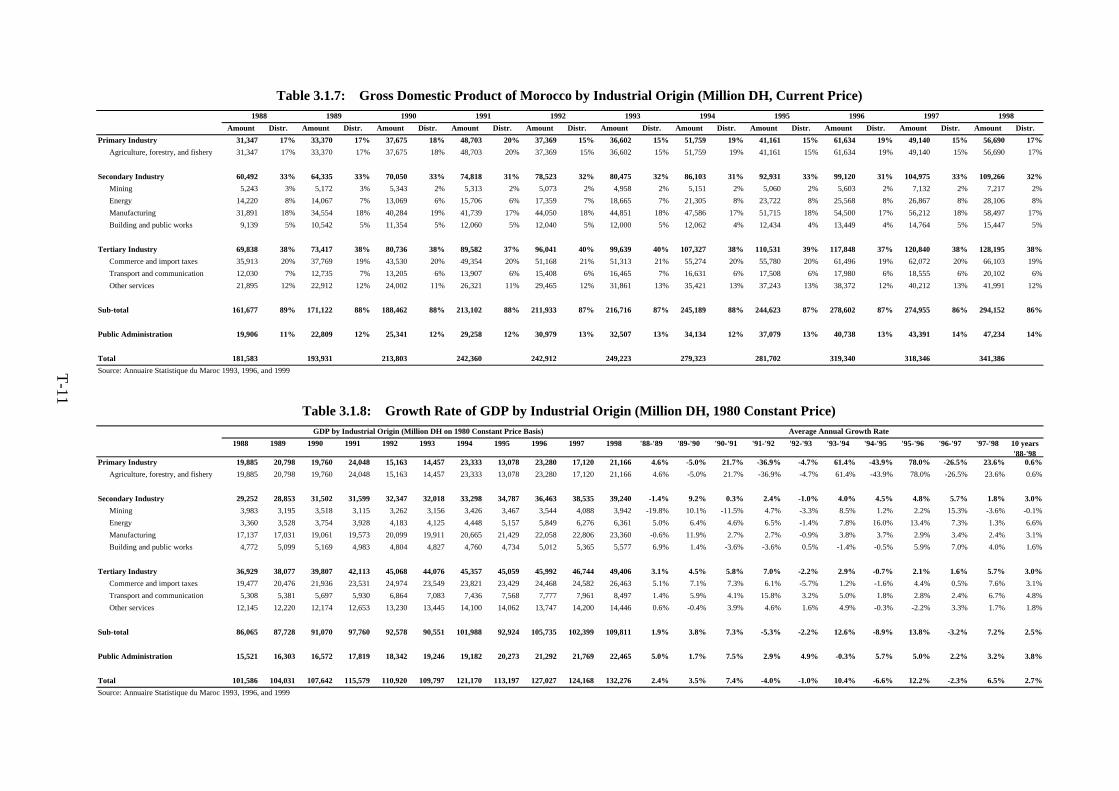
Amount Distr. Amount Distr. Amount Distr. Amount Distr. Amount Distr. Amount Distr. Amount Distr. Amount Distr. Amount Distr. Amount Distr. Amount Distr.31,347 17% 33,370 17% 37,675 18% 48,703 20% 37,369 15% 36,602 15% 51,759 19% 41,161 15% 61,634 19% 49,140 15% 56,690 17%
Agriculture, forestry, and fishery 31,347 17% 33,370 17% 37,675 18% 48,703 20% 37,369 15% 36,602 15% 51,759 19% 41,161 15% 61,634 19% 49,140 15% 56,690 17%
60,492 33% 64,335 33% 70,050 33% 74,818 31% 78,523 32% 80,475 32% 86,103 31% 92,931 33% 99,120 31% 104,975 33% 109,266 32%Mining 5,243 3% 5,172 3% 5,343 2% 5,313 2% 5,073 2% 4,958 2% 5,151 2% 5,060 2% 5,603 2% 7,132 2% 7,217 2%Energy 14,220 8% 14,067 7% 13,069 6% 15,706 6% 17,359 7% 18,665 7% 21,305 8% 23,722 8% 25,568 8% 26,867 8% 28,106 8%Manufacturing 31,891 18% 34,554 18% 40,284 19% 41,739 17% 44,050 18% 44,851 18% 47,586 17% 51,715 18% 54,500 17% 56,212 18% 58,497 17%Building and public works 9,139 5% 10,542 5% 11,354 5% 12,060 5% 12,040 5% 12,000 5% 12,062 4% 12,434 4% 13,449 4% 14,764 5% 15,447 5%
69,838 38% 73,417 38% 80,736 38% 89,582 37% 96,041 40% 99,639 40% 107,327 38% 110,531 39% 117,848 37% 120,840 38% 128,195 38%Commerce and import taxes 35,913 20% 37,769 19% 43,530 20% 49,354 20% 51,168 21% 51,313 21% 55,274 20% 55,780 20% 61,496 19% 62,072 20% 66,103 19%Transport and communication 12,030 7% 12,735 7% 13,205 6% 13,907 6% 15,408 6% 16,465 7% 16,631 6% 17,508 6% 17,980 6% 18,555 6% 20,102 6%Other services 21,895 12% 22,912 12% 24,002 11% 26,321 11% 29,465 12% 31,861 13% 35,421 13% 37,243 13% 38,372 12% 40,212 13% 41,991 12%
161,677 89% 171,122 88% 188,462 88% 213,102 88% 211,933 87% 216,716 87% 245,189 88% 244,623 87% 278,602 87% 274,955 86% 294,152 86%
19,906 11% 22,809 12% 25,341 12% 29,258 12% 30,979 13% 32,507 13% 34,134 12% 37,079 13% 40,738 13% 43,391 14% 47,234 14%
181,583 193,931 213,803 242,360 242,912 249,223 279,323 281,702 319,340 318,346 341,386
GDP by Industrial Origin (Million DH on 1980 Constant Price Basis) Average Annual Growth Rate1988 1989 1990 1991 1992 1993 1994 1995 1996 1997 1998 '88-'89 '89-'90 '90-'91 '91-'92 '92-'93 '93-'94 '94-'95 '95-'96 '96-'97 '97-'98 10 years
'88-'9819,885 20,798 19,760 24,048 15,163 14,457 23,333 13,078 23,280 17,120 21,166 4.6% -5.0% 21.7% -36.9% -4.7% 61.4% -43.9% 78.0% -26.5% 23.6% 0.6%
Agriculture, forestry, and fishery 19,885 20,798 19,760 24,048 15,163 14,457 23,333 13,078 23,280 17,120 21,166 4.6% -5.0% 21.7% -36.9% -4.7% 61.4% -43.9% 78.0% -26.5% 23.6% 0.6%
29,252 28,853 31,502 31,599 32,347 32,018 33,298 34,787 36,463 38,535 39,240 -1.4% 9.2% 0.3% 2.4% -1.0% 4.0% 4.5% 4.8% 5.7% 1.8% 3.0%Mining 3,983 3,195 3,518 3,115 3,262 3,156 3,426 3,467 3,544 4,088 3,942 -19.8% 10.1% -11.5% 4.7% -3.3% 8.5% 1.2% 2.2% 15.3% -3.6% -0.1%Energy 3,360 3,528 3,754 3,928 4,183 4,125 4,448 5,157 5,849 6,276 6,361 5.0% 6.4% 4.6% 6.5% -1.4% 7.8% 16.0% 13.4% 7.3% 1.3% 6.6%Manufacturing 17,137 17,031 19,061 19,573 20,099 19,911 20,665 21,429 22,058 22,806 23,360 -0.6% 11.9% 2.7% 2.7% -0.9% 3.8% 3.7% 2.9% 3.4% 2.4% 3.1%Building and public works 4,772 5,099 5,169 4,983 4,804 4,827 4,760 4,734 5,012 5,365 5,577 6.9% 1.4% -3.6% -3.6% 0.5% -1.4% -0.5% 5.9% 7.0% 4.0% 1.6%
36,929 38,077 39,807 42,113 45,068 44,076 45,357 45,059 45,992 46,744 49,406 3.1% 4.5% 5.8% 7.0% -2.2% 2.9% -0.7% 2.1% 1.6% 5.7% 3.0%Commerce and import taxes 19,477 20,476 21,936 23,531 24,974 23,549 23,821 23,429 24,468 24,582 26,463 5.1% 7.1% 7.3% 6.1% -5.7% 1.2% -1.6% 4.4% 0.5% 7.6% 3.1%Transport and communication 5,308 5,381 5,697 5,930 6,864 7,083 7,436 7,568 7,777 7,961 8,497 1.4% 5.9% 4.1% 15.8% 3.2% 5.0% 1.8% 2.8% 2.4% 6.7% 4.8%Other services 12,145 12,220 12,174 12,653 13,230 13,445 14,100 14,062 13,747 14,200 14,446 0.6% -0.4% 3.9% 4.6% 1.6% 4.9% -0.3% -2.2% 3.3% 1.7% 1.8%
86,065 87,728 91,070 97,760 92,578 90,551 101,988 92,924 105,735 102,399 109,811 1.9% 3.8% 7.3% -5.3% -2.2% 12.6% -8.9% 13.8% -3.2% 7.2% 2.5%
15,521 16,303 16,572 17,819 18,342 19,246 19,182 20,273 21,292 21,769 22,465 5.0% 1.7% 7.5% 2.9% 4.9% -0.3% 5.7% 5.0% 2.2% 3.2% 3.8%
101,586 104,031 107,642 115,579 110,920 109,797 121,170 113,197 127,027 124,168 132,276 2.4% 3.5% 7.4% -4.0% -1.0% 10.4% -6.6% 12.2% -2.3% 6.5% 2.7%Source: Annuaire Statistique du Maroc 1993, 1996, and 1999
Table 3.1.7: Gross Domestic Product of Morocco by Industrial Origin (Million DH, Current Price)1994 1995 1996 1997 19981989 1990 1991 1992 19931988
Primary Industry
Table 3.1.8: Growth Rate of GDP by Industrial Origin (Million DH, 1980 Constant Price)
Secondary Industry
Tertiary Industry
Sub-total
Public Administration
TotalSource: Annuaire Statistique du Maroc 1993, 1996, and 1999
Public Administration
Total
Primary Industry
Secondary Industry
Tertiary Industry
Sub-total
T-11
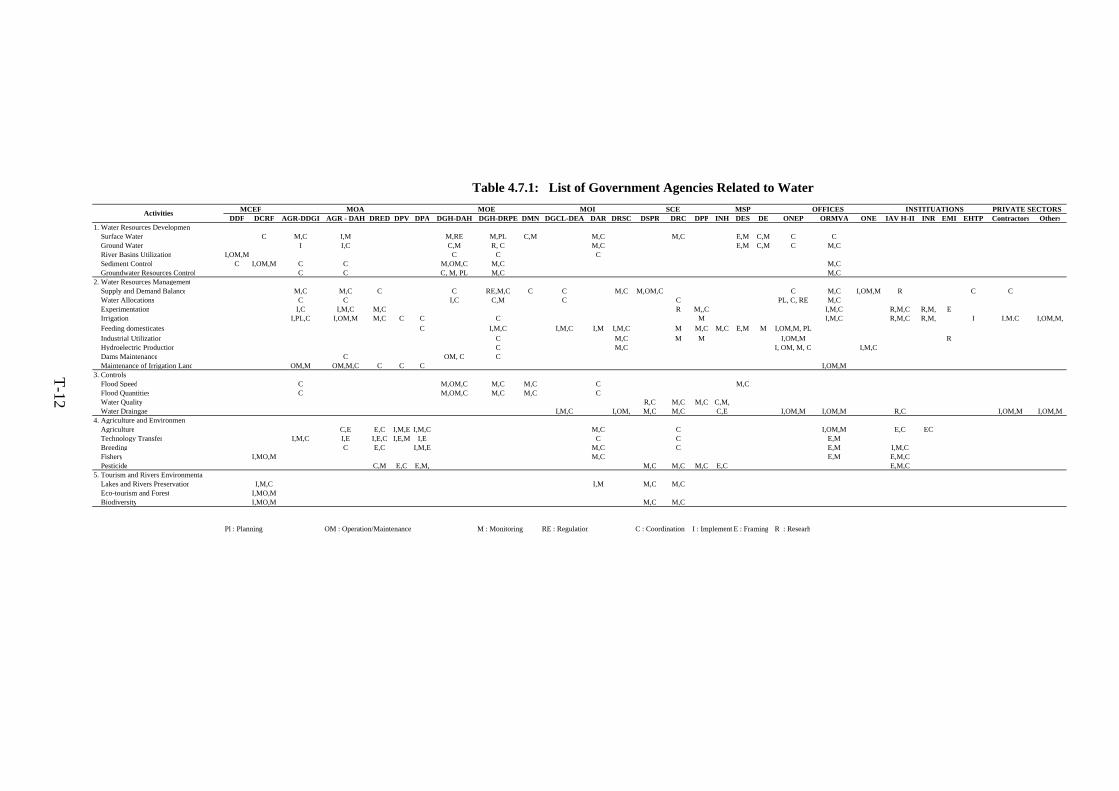
DDF DCRF AGR-DDGI AGR - DAH DRED DPV DPA DGH-DAH DGH-DRPE DMN DGCL-DEA DAR DRSC DSPR DRC DPP INH DES DE ONEP ORMVA ONE IAV H-II INR EMI EHTP Contractors Others1. Water Resources Development Surface Water C M,C I,M M,RE M,PL C,M M,C M,C E,M C,M C C Ground Water I I,C C,M R, C M,C E,M C,M C M,C River Basins Utilization I,OM,M C C C Sediment Control C I,OM,M C C M,OM,C M,C M,C Groundwater Resources Control C C C, M, PL M,C M,C2. Water Resources Management Supply and Demand Balance M,C M,C C C RE,M,C C C M,C M,OM,C C M,C I,OM,M R C C Water Allocations C C I,C C,M C C PL, C, RE M,C Experimentation I,C I,M,C M,C R M,,C I,M,C R,M,C R,M, E Irrigation I,PL,C I,OM,M M,C C C C M I,M,C R,M,C R,M, I I.M.C I,OM,M, Feeding domesticates C I,M,C I,M,C I,M I,M,C M M,C M,C E,M M I,OM,M, PL Industrial Utilization C M,C M M I,OM,M R Hydroelectric Production C M,C I, OM, M, C I,M,C Dams Maintenance C OM, C C Maintenance of Irrigation Land OM,M OM,M,C C C C I,OM,M3. Controls Flood Speed C M,OM,C M,C M,C C M,C Flood Quantities C M,OM,C M,C M,C C Water Quality R,C M,C M,C C,M, Water Draingae I,M,C I,OM, M,C M,C C,E I,OM,M I,OM,M R,C I,OM,M I,OM,M4. Agriculture and Environment Agriculture C,E E,C I,M,E I,M,C M,C C I,OM,M E,C EC Technology Transfer I,M,C I,E I,E,C I,E,M I,E C C E,M Breeding C E,C I,M,E M,C C E,M I,M,C Fishery I,MO,M M,C E,M E,M,C Pesticide C,M E,C E,M, M,C M,C M,C E,C E,M,C5. Tourism and Rivers Environmental Lakes and Rivers Preservation I,M,C I,M M,C M,C Eco-tourism and Forest I,MO,M Biodiversity I,MO,M M,C M,C
Pl : Planning OM : Operation/Maintenance M : Monitoring RE : Regulation C : Coordination I : Implement E : Framing R : Researh
OFFICES INSTITUATIONS PRIVATE SECTORS
Table 4.7.1: List of Government Agencies Related to Water
Activities MCEF MOA MOE MOI SCE MSP
T-12

AbbreviationsMCEF Ministère Chargé des Eaux et Forêts Ministry in Charge of Water and ForestsDDF Direction de Développement Forestier Directorate of Forest DevelopmentDCRF Direction de la Conservation des Directorate of Forest Resources
Ressources Forestières ConservationMOA Ministère de l’Agriculture, du Ministry of Agriculture, Rural
Développement Rural, et des Pêches Development and Maritime FisheriesMaritimes
AGR Administration de Genie Rurale Civil Rural AdministrationDDGI Direction du Développement et de Directorate of Development and
Gestion de l’Irrigation Irrigation ManagementDAH Direction des Aménagements Directorate of Hydraulic Development
HydrauliquesDERD Direction de l’Enseignement, de la Directorate of Development, Research,
Recherche, et de Développement and EducationDPV Direction de la Production Végétale Directorate of Vegetable ProductionDPA Direction de la Production Animale Directorate of Animal ProductionMOE Ministère de l’Equipement Ministry of EquipmentDGH Direction Générale de l’Hydraulique General Directorate of HydraulicDAH Direction des Aménagements Hydrauliques Directorate of Hydraulic DevelopmentDRPE Direction de Recherche et de Planification Directorate of Water Research and
en Eau. PlanningDMN Direction de Météorologie Nationale Directorate of National MeteorologyMOI Ministère de l’intérieur Ministry of InteriorDGCL Direction Générale des Collectivités Locales General Directorate of Local CollectivesDEA Division des Eaux et d’Assainissement Division of Water and SanitationDAR Direction des Affaires Rurales Directorate of Rural AffairsDRSC Direction des Régies et des Services Directorate of Regis and Concedes
Concédés ServiceSECE Secrétariat d’Etat Chargé de l’Environnement Ministry in Charge of EnvironmentDSPR Direction de Surveillance et de la Prévision Directorate of Follow up and Risk
des Risques. PreventationDRC Direction de Régulation et de Contrôle Directorate of Control and RegulationDPP Direction de Planning et de Protection Directorate of Protection and PlanningMSP Ministère de la santé publique Ministry of Public HealthINH Institut National d’Hygiène National Institute of HygieneDES Direction d’Education Sanitaire Directorate of Sanitation EducationDEI Direction d’Epidémiologie et Lutte Contre Directorate of Epidemology and Disease
les Maladies ProtectionofficesONEP Office National de l’Eau Potable National Office of Water SupplyORMVA Office Régional de la Mise en Valeur Regional Office of Agriculture
Agricole DevelopmentONE Office National d’Electricité National Office of ElectricityIRF Instituts De Recherche Et De Formation. Institute of Research and EducationinstitutesIAV H II Institut Agronomique et Vétérinaire Institution of Agronomy and Veterinary
Hassan II Hassan IIINRA Institut National de la Recherche National Institute of Agronomic Research
AgronomiqueEMI Ecole Mohammedia des Ingénieurs Engineering School of MohammediaEHTP Ecole Hassania des Travaux Publics Public Works School of Hassania
EnglishTable 4.7.2: List of Government Agencies Abbreviations
French
T-13
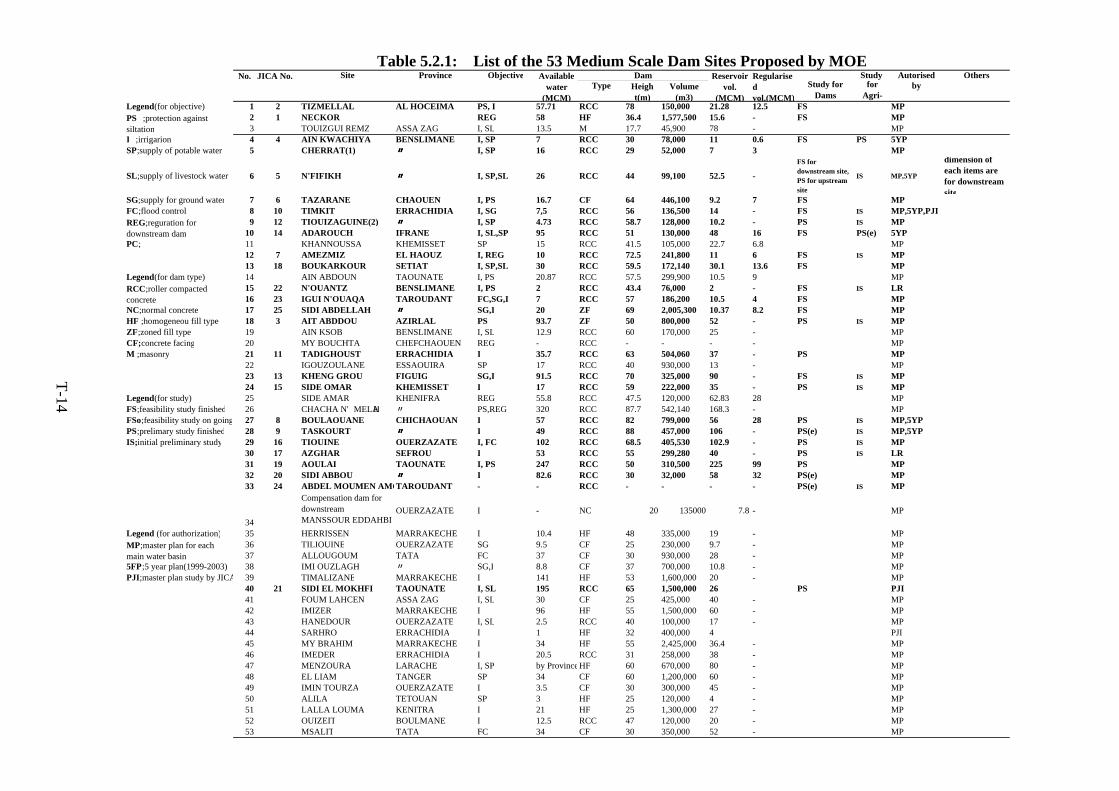
No. Site Province Objective Study Autorised OthersType by
Legend(for objective) 1 2 TIZMELLAL AL HOCEIMA PS, I 57.71 RCC 78 150,000 21.28 12.5 FS MP2 1 NECKOR REG 58 HF 36.4 1,577,500 15.6 - FS MP3 TOUIZGUI REMZ ASSA ZAG I, SL 13.5 M 17.7 45,900 78 - MP
I ;irrigarion 4 4 AIN KWACHIYA BENSLIMANE I, SP 7 RCC 30 78,000 11 0.6 FS PS 5YPSP;supply of potable water 5 CHERRAT(1) 〃〃〃〃 I, SP 16 RCC 29 52,000 7 3 MP
SL;supply of livestock water 6 5 N'FIFIKH 〃〃〃〃 I, SP,SL 26 RCC 44 99,100 52.5 -
FS fordownstream site,PS for upstreamsite
IS MP,5YP
dimension ofeach items arefor downstreamsite
SG;supply for ground water 7 6 TAZARANE CHAOUEN I, PS 16.7 CF 64 446,100 9.2 7 FS MPFC;flood control 8 10 TIMKIT ERRACHIDIA I, SG 7,5 RCC 56 136,500 14 - FS IS MP,5YP,PJI
9 12 TIOUIZAGUINE(2) 〃〃〃〃 I, SP 4.73 RCC 58.7 128,000 10.2 - PS IS MP10 14 ADAROUCH IFRANE I, SL,SP 95 RCC 51 130,000 48 16 FS PS(e) 5YP
PC; 11 KHANNOUSSA KHEMISSET SP 15 RCC 41.5 105,000 22.7 6.8 MP12 7 AMEZMIZ EL HAOUZ I, REG 10 RCC 72.5 241,800 11 6 FS IS MP13 18 BOUKARKOUR SETIAT I, SP,SL 30 RCC 59.5 172,140 30.1 13.6 FS MP
Legend(for dam type) 14 AIN ABDOUN TAOUNATE I, PS 20.87 RCC 57.5 299,900 10.5 9 MP15 22 N'OUANTZ BENSLIMANE I, PS 2 RCC 43.4 76,000 2 - FS IS LR16 23 IGUI N'OUAQA TAROUDANT FC,SG,I 7 RCC 57 186,200 10.5 4 FS MP
NC;normal concrete 17 25 SIDI ABDELLAH 〃〃〃〃 SG,I 20 ZF 69 2,005,300 10.37 8.2 FS MPHF ;homogeneou fill type 18 3 AIT ABDDOU AZIRLAL PS 93.7 ZF 50 800,000 52 - PS IS MPZF;zoned fill type 19 AIN KSOB BENSLIMANE I, SL 12.9 RCC 60 170,000 25 - MPCF;concrete facing 20 MY BOUCHTA CHEFCHAOUEN REG - RCC - - - - MPM ;masonry 21 11 TADIGHOUST ERRACHIDIA I 35.7 RCC 63 504,060 37 - PS MP
22 IGOUZOULANE ESSAOUIRA SP 17 RCC 40 930,000 13 - MP23 13 KHENG GROU FIGUIG SG,I 91.5 RCC 70 325,000 90 - FS IS MP24 15 SIDE OMAR KHEMISSET I 17 RCC 59 222,000 35 - PS IS MP
Legend(for study) 25 SIDE AMAR KHENIFRA REG 55.8 RCC 47.5 120,000 62.83 28 MPFS;feasibility study finished 26 CHACHA N'MELAH 〃 PS,REG 320 RCC 87.7 542,140 168.3 - MPFSo;feasibility study on going 27 8 BOULAOUANE CHICHAOUAN I 57 RCC 82 799,000 56 28 PS IS MP,5YPPS;prelimary study finished 28 9 TASKOURT 〃〃〃〃 I 49 RCC 88 457,000 106 - PS(e) IS MP,5YPIS;initial preliminary study 29 16 TIOUINE OUERZAZATE I, FC 102 RCC 68.5 405,530 102.9 - PS IS MP
30 17 AZGHAR SEFROU I 53 RCC 55 299,280 40 - PS IS LR31 19 AOULAI TAOUNATE I, PS 247 RCC 50 310,500 225 99 PS MP32 20 SIDI ABBOU 〃〃〃〃 I 82.6 RCC 30 32,000 58 32 PS(e) MP33 24 ABDEL MOUMEN AMOTAROUDANT - - RCC - - - - PS(e) IS MP
34
Compensation dam fordownstreamMANSSOUR EDDAHBID
OUERZAZATE I - NC 20 135000 7.8 - MP
Legend (for authorization) 35 HERRISSEN MARRAKECHE I 10.4 HF 48 335,000 19 - MP36 TILIOUINE OUERZAZATE SG 9.5 CF 25 230,000 9.7 - MP37 ALLOUGOUM TATA FC 37 CF 30 930,000 28 - MP
5FP;5 year plan(1999-2003) 38 IMI OUZLAGH 〃 SG,I 8.8 CF 37 700,000 10.8 - MPPJI;master plan study by JICA 39 TIMALIZANE MARRAKECHE I 141 HF 53 1,600,000 20 - MP
40 21 SIDI EL MOKHFI TAOUNATE I, SL 195 RCC 65 1,500,000 26 PS PJI41 FOUM LAHCEN ASSA ZAG I, SL 30 CF 25 425,000 40 - MP42 IMIZER MARRAKECHE I 96 HF 55 1,500,000 60 - MP43 HANEDOUR OUERZAZATE I, SL 2.5 RCC 40 100,000 17 - MP44 SARHRO ERRACHIDIA I 1 HF 32 400,000 4 PJI45 MY BRAHIM MARRAKECHE I 34 HF 55 2,425,000 36.4 - MP46 IMEDER ERRACHIDIA I 20.5 RCC 31 258,000 38 - MP47 MENZOURA LARACHE I, SP by ProvinceHF 60 670,000 80 - MP48 EL LIAM TANGER SP 34 CF 60 1,200,000 60 - MP49 IMIN TOURZA OUERZAZATE I 3.5 CF 30 300,000 45 - MP50 ALILA TETOUAN SP 3 HF 25 120,000 4 - MP51 LALLA LOUMA KENITRA I 21 HF 25 1,300,000 27 - MP52 OUIZEIT BOULMANE I 12.5 RCC 47 120,000 20 - MP53 MSALIT TATA FC 34 CF 30 350,000 52 - MP
Table 5.2.1: List of the 53 Medium Scale Dam Sites Proposed by MOERegularisedvol.(MCM)
PS ;protection againstsiltation
REG;reguration fordownstream dam
forAgri-
Study forDams
MP;master plan for eachmain water basin
RCC;roller compactedconcrete
Availablewater
(MCM)
Reservoirvol.
(MCM)
JICA No.Height(m)
Volume(m3)
Dam
T-14
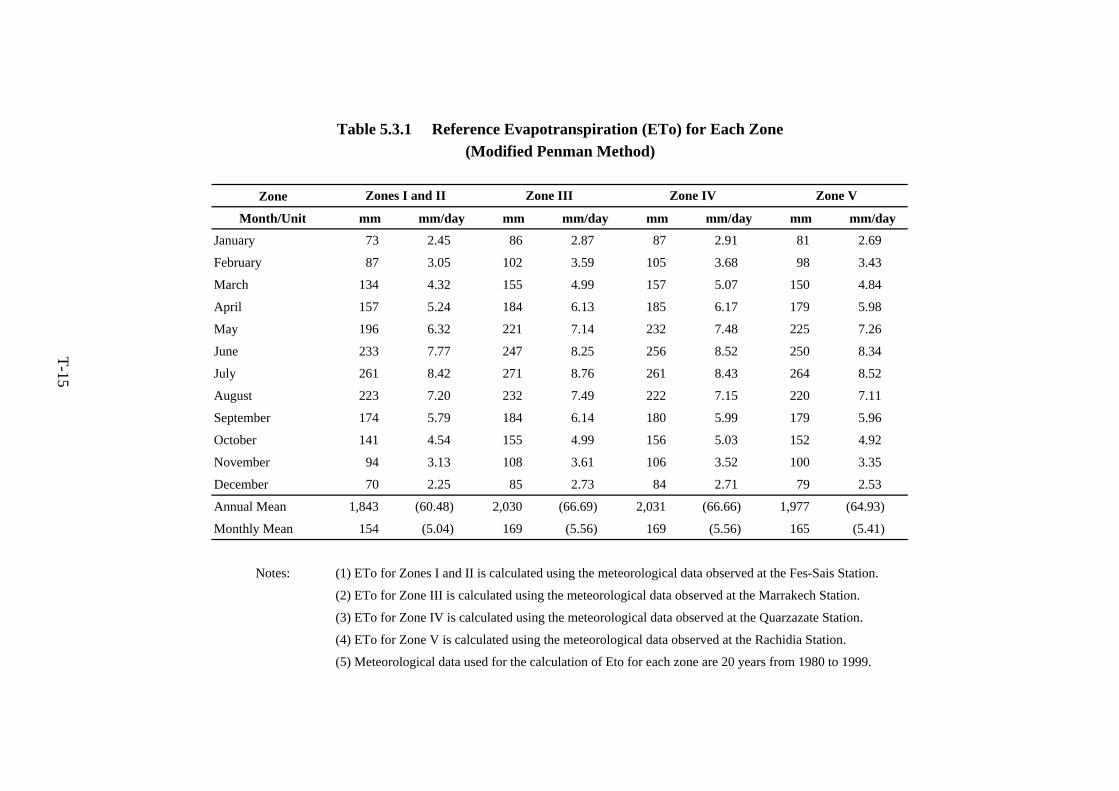
Zone
Month/Unit mm mm/day mm mm/day mm mm/day mm mm/dayJanuary 73 2.45 86 2.87 87 2.91 81 2.69
February 87 3.05 102 3.59 105 3.68 98 3.43
March 134 4.32 155 4.99 157 5.07 150 4.84
April 157 5.24 184 6.13 185 6.17 179 5.98
May 196 6.32 221 7.14 232 7.48 225 7.26
June 233 7.77 247 8.25 256 8.52 250 8.34
July 261 8.42 271 8.76 261 8.43 264 8.52
August 223 7.20 232 7.49 222 7.15 220 7.11
September 174 5.79 184 6.14 180 5.99 179 5.96
October 141 4.54 155 4.99 156 5.03 152 4.92
November 94 3.13 108 3.61 106 3.52 100 3.35
December 70 2.25 85 2.73 84 2.71 79 2.53
Annual Mean 1,843 (60.48) 2,030 (66.69) 2,031 (66.66) 1,977 (64.93)
Monthly Mean 154 (5.04) 169 (5.56) 169 (5.56) 165 (5.41)
Notes: (1) ETo for Zones I and II is calculated using the meteorological data observed at the Fes-Sais Station.
(2) ETo for Zone III is calculated using the meteorological data observed at the Marrakech Station.
(3) ETo for Zone IV is calculated using the meteorological data observed at the Quarzazate Station.
(4) ETo for Zone V is calculated using the meteorological data observed at the Rachidia Station.
(5) Meteorological data used for the calculation of Eto for each zone are 20 years from 1980 to 1999.
Zone V
Table 5.3.1 Reference Evapotranspiration (ETo) for Each Zone(Modified Penman Method)
Zones I and II Zone III Zone IV
T-15
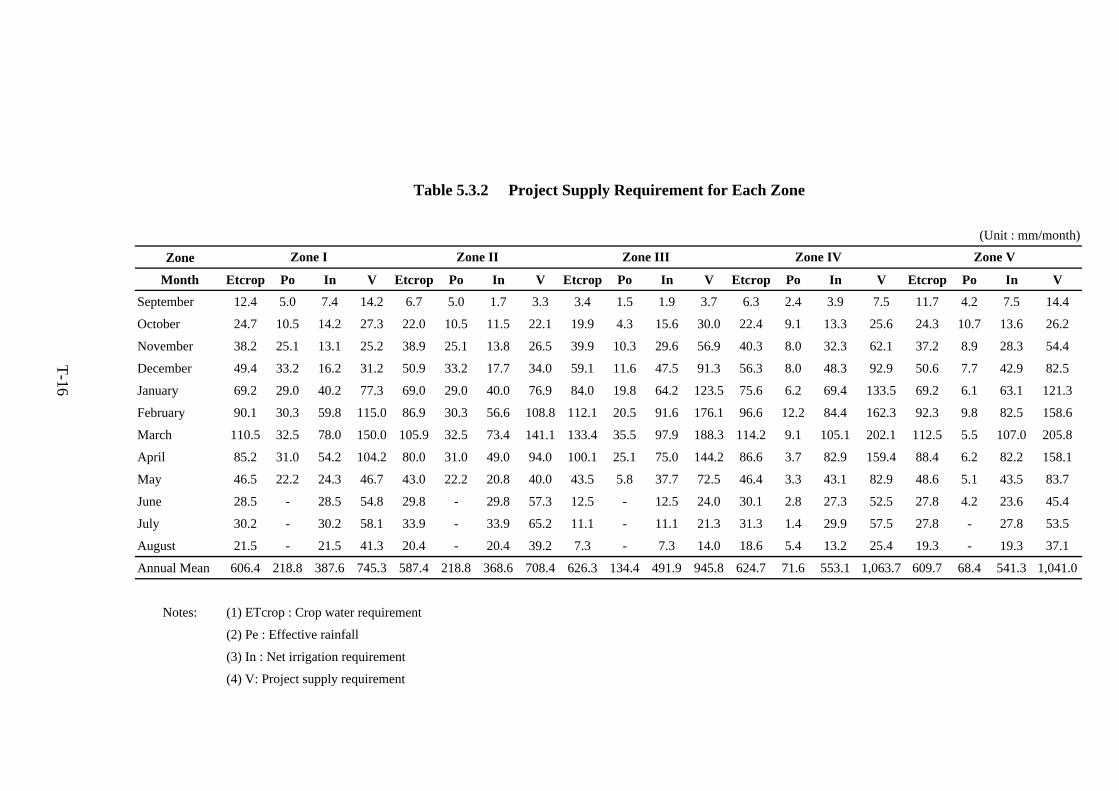
(Unit : mm/month)
Zone
Month Etcrop Po In V Etcrop Po In V Etcrop Po In V Etcrop Po In V Etcrop Po In VSeptember 12.4 5.0 7.4 14.2 6.7 5.0 1.7 3.3 3.4 1.5 1.9 3.7 6.3 2.4 3.9 7.5 11.7 4.2 7.5 14.4
October 24.7 10.5 14.2 27.3 22.0 10.5 11.5 22.1 19.9 4.3 15.6 30.0 22.4 9.1 13.3 25.6 24.3 10.7 13.6 26.2
November 38.2 25.1 13.1 25.2 38.9 25.1 13.8 26.5 39.9 10.3 29.6 56.9 40.3 8.0 32.3 62.1 37.2 8.9 28.3 54.4
December 49.4 33.2 16.2 31.2 50.9 33.2 17.7 34.0 59.1 11.6 47.5 91.3 56.3 8.0 48.3 92.9 50.6 7.7 42.9 82.5
January 69.2 29.0 40.2 77.3 69.0 29.0 40.0 76.9 84.0 19.8 64.2 123.5 75.6 6.2 69.4 133.5 69.2 6.1 63.1 121.3
February 90.1 30.3 59.8 115.0 86.9 30.3 56.6 108.8 112.1 20.5 91.6 176.1 96.6 12.2 84.4 162.3 92.3 9.8 82.5 158.6
March 110.5 32.5 78.0 150.0 105.9 32.5 73.4 141.1 133.4 35.5 97.9 188.3 114.2 9.1 105.1 202.1 112.5 5.5 107.0 205.8
April 85.2 31.0 54.2 104.2 80.0 31.0 49.0 94.0 100.1 25.1 75.0 144.2 86.6 3.7 82.9 159.4 88.4 6.2 82.2 158.1
May 46.5 22.2 24.3 46.7 43.0 22.2 20.8 40.0 43.5 5.8 37.7 72.5 46.4 3.3 43.1 82.9 48.6 5.1 43.5 83.7
June 28.5 - 28.5 54.8 29.8 - 29.8 57.3 12.5 - 12.5 24.0 30.1 2.8 27.3 52.5 27.8 4.2 23.6 45.4
July 30.2 - 30.2 58.1 33.9 - 33.9 65.2 11.1 - 11.1 21.3 31.3 1.4 29.9 57.5 27.8 - 27.8 53.5
August 21.5 - 21.5 41.3 20.4 - 20.4 39.2 7.3 - 7.3 14.0 18.6 5.4 13.2 25.4 19.3 - 19.3 37.1
Annual Mean 606.4 218.8 387.6 745.3 587.4 218.8 368.6 708.4 626.3 134.4 491.9 945.8 624.7 71.6 553.1 1,063.7 609.7 68.4 541.3 1,041.0
Notes: (1) ETcrop : Crop water requirement
(2) Pe : Effective rainfall
(3) In : Net irrigation requirement
(4) V: Project supply requirement
Zone V
Table 5.3.2 Project Supply Requirement for Each Zone
Zone I Zone II Zone III Zone IV
T-16
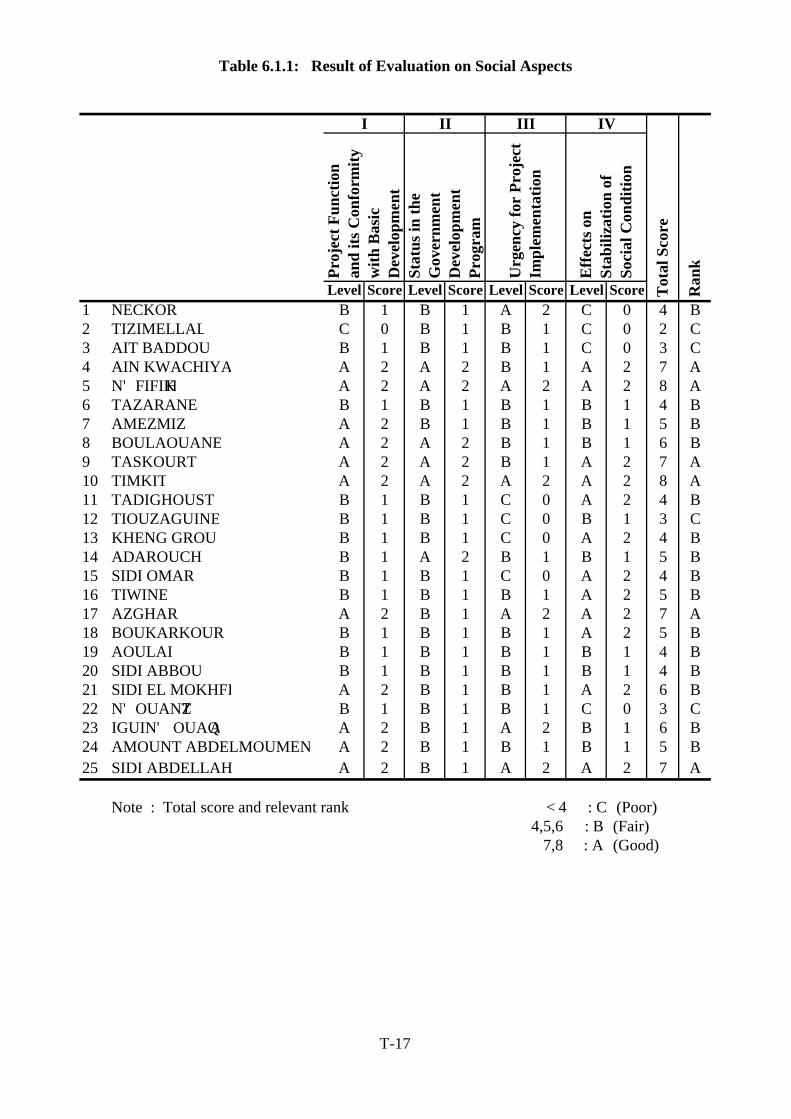
Level Score Level Score Level Score Level Score1 NECKOR B 1 B 1 A 2 C 0 4 B2 TIZIMELLAL C 0 B 1 B 1 C 0 2 C3 AIT BADDOU B 1 B 1 B 1 C 0 3 C4 AIN KWACHIYA A 2 A 2 B 1 A 2 7 A5 N'FIFIKH A 2 A 2 A 2 A 2 8 A6 TAZARANE B 1 B 1 B 1 B 1 4 B7 AMEZMIZ A 2 B 1 B 1 B 1 5 B8 BOULAOUANE A 2 A 2 B 1 B 1 6 B9 TASKOURT A 2 A 2 B 1 A 2 7 A10 TIMKIT A 2 A 2 A 2 A 2 8 A11 TADIGHOUST B 1 B 1 C 0 A 2 4 B12 TIOUZAGUINE B 1 B 1 C 0 B 1 3 C13 KHENG GROU B 1 B 1 C 0 A 2 4 B14 ADAROUCH B 1 A 2 B 1 B 1 5 B15 SIDI OMAR B 1 B 1 C 0 A 2 4 B16 TIWINE B 1 B 1 B 1 A 2 5 B17 AZGHAR A 2 B 1 A 2 A 2 7 A18 BOUKARKOUR B 1 B 1 B 1 A 2 5 B19 AOULAI B 1 B 1 B 1 B 1 4 B20 SIDI ABBOU B 1 B 1 B 1 B 1 4 B21 SIDI EL MOKHFI A 2 B 1 B 1 A 2 6 B22 N'OUANTZ B 1 B 1 B 1 C 0 3 C23 IGUIN' OUAQA A 2 B 1 A 2 B 1 6 B24 AMOUNT ABDELMOUMEN A 2 B 1 B 1 B 1 5 B25 SIDI ABDELLAH A 2 B 1 A 2 A 2 7 A
Note : Total score and relevant rank <4 : C (Poor)4,5,6 : B (Fair)
7,8 : A (Good)
Stat
us in
the
Gov
ernm
ent
Dev
elop
men
tPr
ogra
m
Urg
ency
for
Proj
ect
Impl
emen
tatio
n
Effe
cts o
nSt
abili
zatio
n of
Soci
al C
ondi
tion
Table 6.1.1: Result of Evaluation on Social Aspects
Proj
ect F
unct
ion
and
its C
onfo
rmity
with
Bas
icD
evel
opm
ent
I II III
Ran
k
Tot
al S
core
IV
T-17
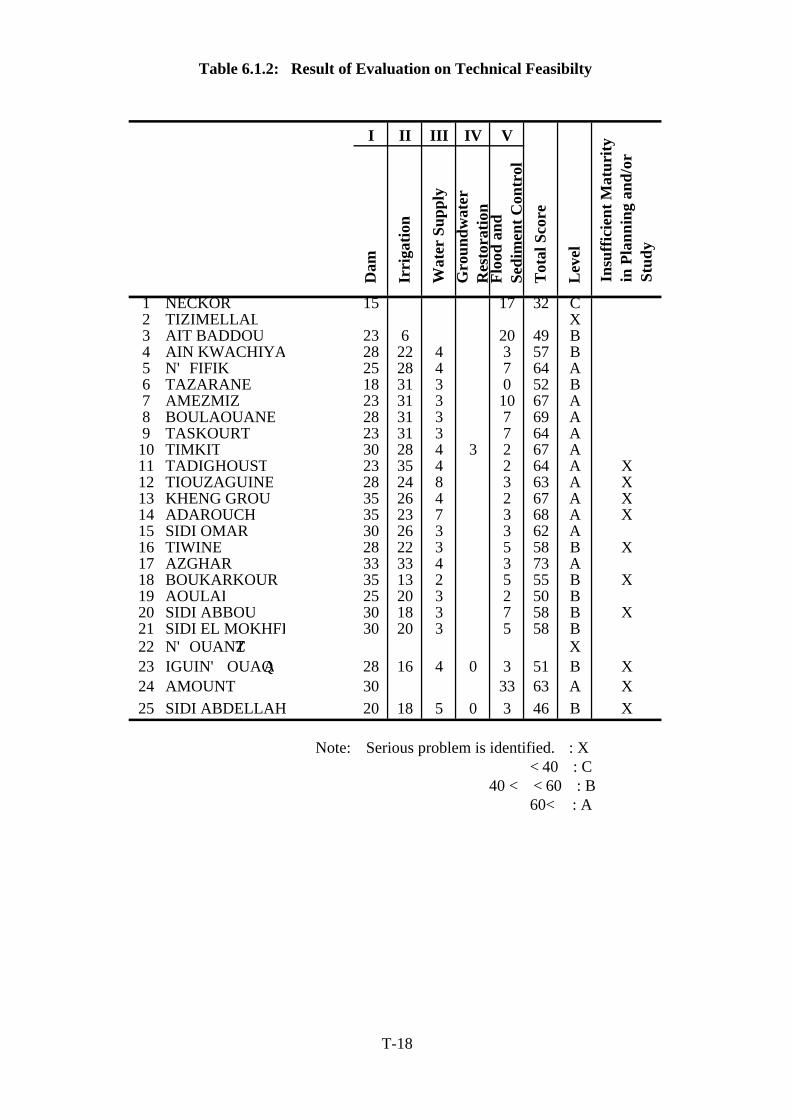
I II III IV V
Dam
Irri
gatio
n
Wat
er S
uppl
yG
roun
dwat
erR
esto
ratio
nFl
ood
and
Sedi
men
t Con
trol
Tot
al S
core
Leve
l
1 NECKOR 15 17 32 C2 TIZIMELLAL X3 AIT BADDOU 23 6 20 49 B4 AIN KWACHIYA 28 22 4 3 57 B5 N'FIFIKH 25 28 4 7 64 A6 TAZARANE 18 31 3 0 52 B7 AMEZMIZ 23 31 3 10 67 A8 BOULAOUANE 28 31 3 7 69 A9 TASKOURT 23 31 3 7 64 A10 TIMKIT 30 28 4 3 2 67 A11 TADIGHOUST 23 35 4 2 64 A X12 TIOUZAGUINE 28 24 8 3 63 A X13 KHENG GROU 35 26 4 2 67 A X14 ADAROUCH 35 23 7 3 68 A X15 SIDI OMAR 30 26 3 3 62 A16 TIWINE 28 22 3 5 58 B X17 AZGHAR 33 33 4 3 73 A18 BOUKARKOUR 35 13 2 5 55 B X19 AOULAI 25 20 3 2 50 B20 SIDI ABBOU 30 18 3 7 58 B X21 SIDI EL MOKHFI 30 20 3 5 58 B22 N'OUANTZ X23 IGUIN' OUAQA 28 16 4 0 3 51 B X24 AMOUNT 30 33 63 A X25 SIDI ABDELLAH 20 18 5 0 3 46 B X
Note: Serious problem is identified. : X<40 : C
40 < <60 : B60< : A
Insu
ffici
ent M
atur
ityin
Pla
nnin
g an
d/or
Stud
y
Table 6.1.2: Result of Evaluation on Technical Feasibilty
T-18
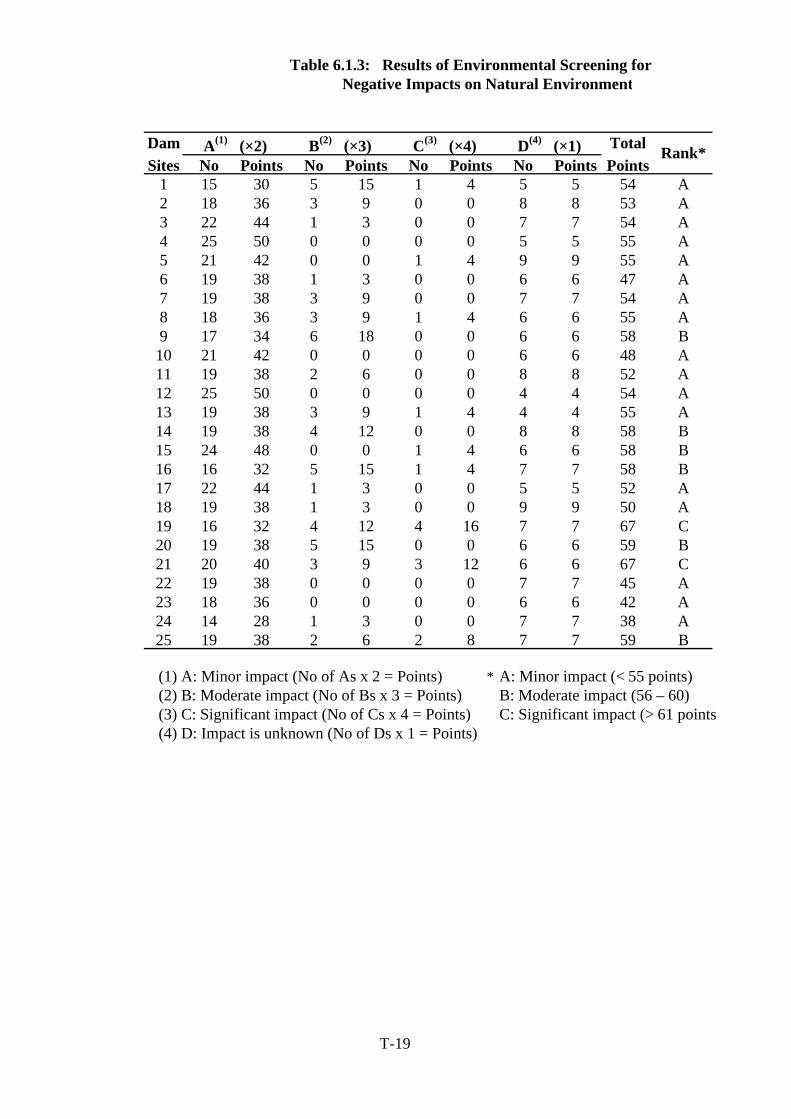
Table 6.1.3: Results of Environmental Screening for Negative Impacts on Natural Environment
Dam TotalSites No Points No Points No Points No Points Points
1 15 30 5 15 1 4 5 5 54 A2 18 36 3 9 0 0 8 8 53 A3 22 44 1 3 0 0 7 7 54 A4 25 50 0 0 0 0 5 5 55 A5 21 42 0 0 1 4 9 9 55 A6 19 38 1 3 0 0 6 6 47 A7 19 38 3 9 0 0 7 7 54 A8 18 36 3 9 1 4 6 6 55 A9 17 34 6 18 0 0 6 6 58 B10 21 42 0 0 0 0 6 6 48 A11 19 38 2 6 0 0 8 8 52 A12 25 50 0 0 0 0 4 4 54 A13 19 38 3 9 1 4 4 4 55 A14 19 38 4 12 0 0 8 8 58 B15 24 48 0 0 1 4 6 6 58 B16 16 32 5 15 1 4 7 7 58 B17 22 44 1 3 0 0 5 5 52 A18 19 38 1 3 0 0 9 9 50 A19 16 32 4 12 4 16 7 7 67 C20 19 38 5 15 0 0 6 6 59 B21 20 40 3 9 3 12 6 6 67 C22 19 38 0 0 0 0 7 7 45 A23 18 36 0 0 0 0 6 6 42 A24 14 28 1 3 0 0 7 7 38 A25 19 38 2 6 2 8 7 7 59 B
(1) A: Minor impact (No of As x 2 = Points) *A: Minor impact (<55 points) (2) B: Moderate impact (No of Bs x 3 = Points) B: Moderate impact (56 – 60) (3) C: Significant impact (No of Cs x 4 = Points) C: Significant impact (>61 points (4) D: Impact is unknown (No of Ds x 1 = Points)
Rank*A(1) (×2) B(2) (×3) C(3) (×4) D(4) (×1)
T-19
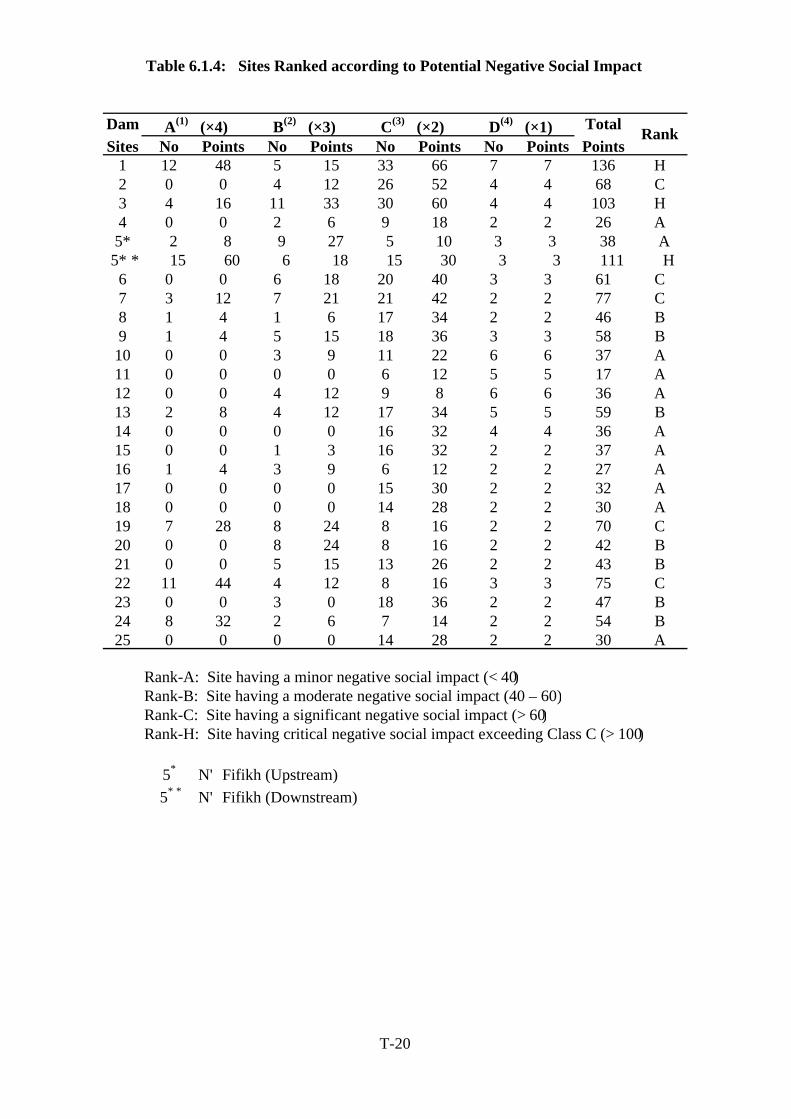
Dam TotalSites No Points No Points No Points No Points Points
1 12 48 5 15 33 66 7 7 136 H2 0 0 4 12 26 52 4 4 68 C3 4 16 11 33 30 60 4 4 103 H4 0 0 2 6 9 18 2 2 26 A5* 2 8 9 27 5 10 3 3 38 A5** 15 60 6 18 15 30 3 3 111 H6 0 0 6 18 20 40 3 3 61 C7 3 12 7 21 21 42 2 2 77 C8 1 4 1 6 17 34 2 2 46 B9 1 4 5 15 18 36 3 3 58 B10 0 0 3 9 11 22 6 6 37 A11 0 0 0 0 6 12 5 5 17 A12 0 0 4 12 9 8 6 6 36 A13 2 8 4 12 17 34 5 5 59 B14 0 0 0 0 16 32 4 4 36 A15 0 0 1 3 16 32 2 2 37 A16 1 4 3 9 6 12 2 2 27 A17 0 0 0 0 15 30 2 2 32 A18 0 0 0 0 14 28 2 2 30 A19 7 28 8 24 8 16 2 2 70 C20 0 0 8 24 8 16 2 2 42 B21 0 0 5 15 13 26 2 2 43 B22 11 44 4 12 8 16 3 3 75 C23 0 0 3 0 18 36 2 2 47 B24 8 32 2 6 7 14 2 2 54 B25 0 0 0 0 14 28 2 2 30 A
5* N'Fifikh (Upstream)5** N'Fifikh (Downstream)
Table 6.1.4: Sites Ranked according to Potential Negative Social Impact
A(1) (×4) B(2) (×3) C(3) (×2) D(4) (×1) Rank
Rank-A: Site having a minor negative social impact (<40)Rank-B: Site having a moderate negative social impact (40 – 60)Rank-C: Site having a significant negative social impact (>60)Rank-H: Site having critical negative social impact exceeding Class C (>100)
T-20
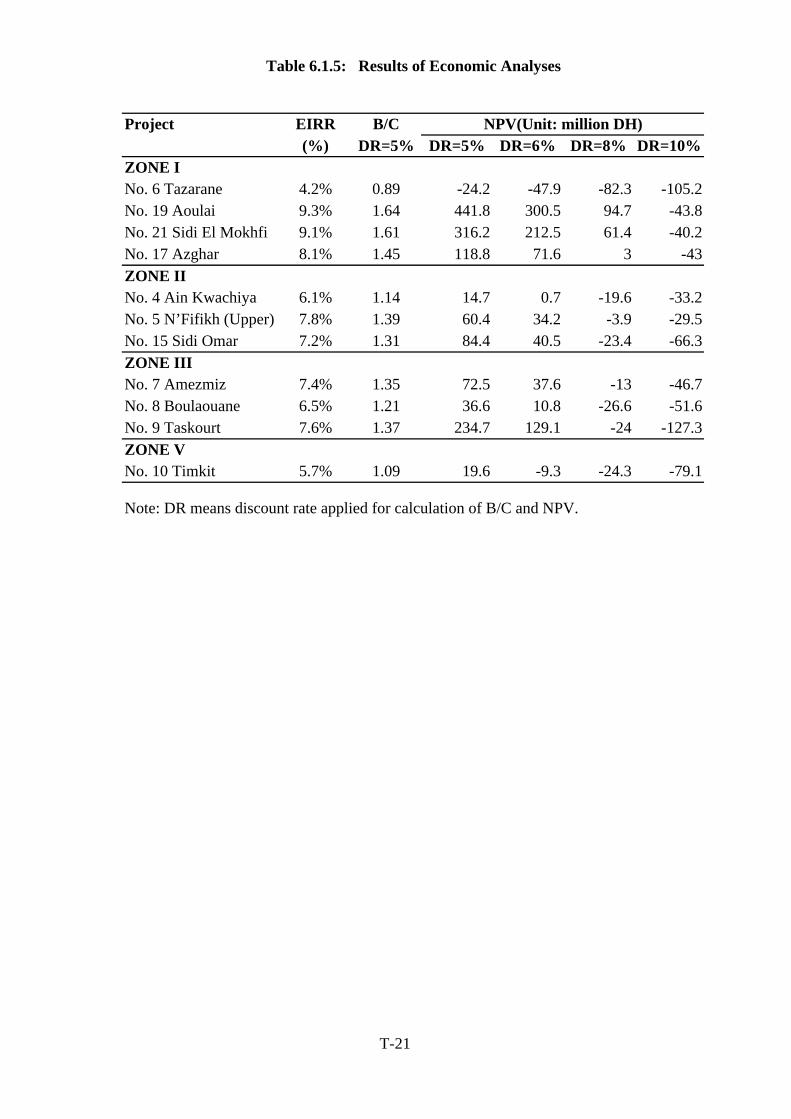
EIRR B/C(%) DR=5% DR=5% DR=6% DR=8% DR=10%
No. 6 Tazarane 4.2% 0.89 -24.2 -47.9 -82.3 -105.2No. 19 Aoulai 9.3% 1.64 441.8 300.5 94.7 -43.8No. 21 Sidi El Mokhfi 9.1% 1.61 316.2 212.5 61.4 -40.2No. 17 Azghar 8.1% 1.45 118.8 71.6 3 -43
No. 4 Ain Kwachiya 6.1% 1.14 14.7 0.7 -19.6 -33.2No. 5 N’Fifikh (Upper) 7.8% 1.39 60.4 34.2 -3.9 -29.5No. 15 Sidi Omar 7.2% 1.31 84.4 40.5 -23.4 -66.3
No. 7 Amezmiz 7.4% 1.35 72.5 37.6 -13 -46.7No. 8 Boulaouane 6.5% 1.21 36.6 10.8 -26.6 -51.6No. 9 Taskourt 7.6% 1.37 234.7 129.1 -24 -127.3
No. 10 Timkit 5.7% 1.09 19.6 -9.3 -24.3 -79.1
Note: DR means discount rate applied for calculation of B/C and NPV.
Table 6.1.5: Results of Economic Analyses
ZONE II
ZONE III
ZONE V
Project NPV(Unit: million DH)
ZONE I
T-21
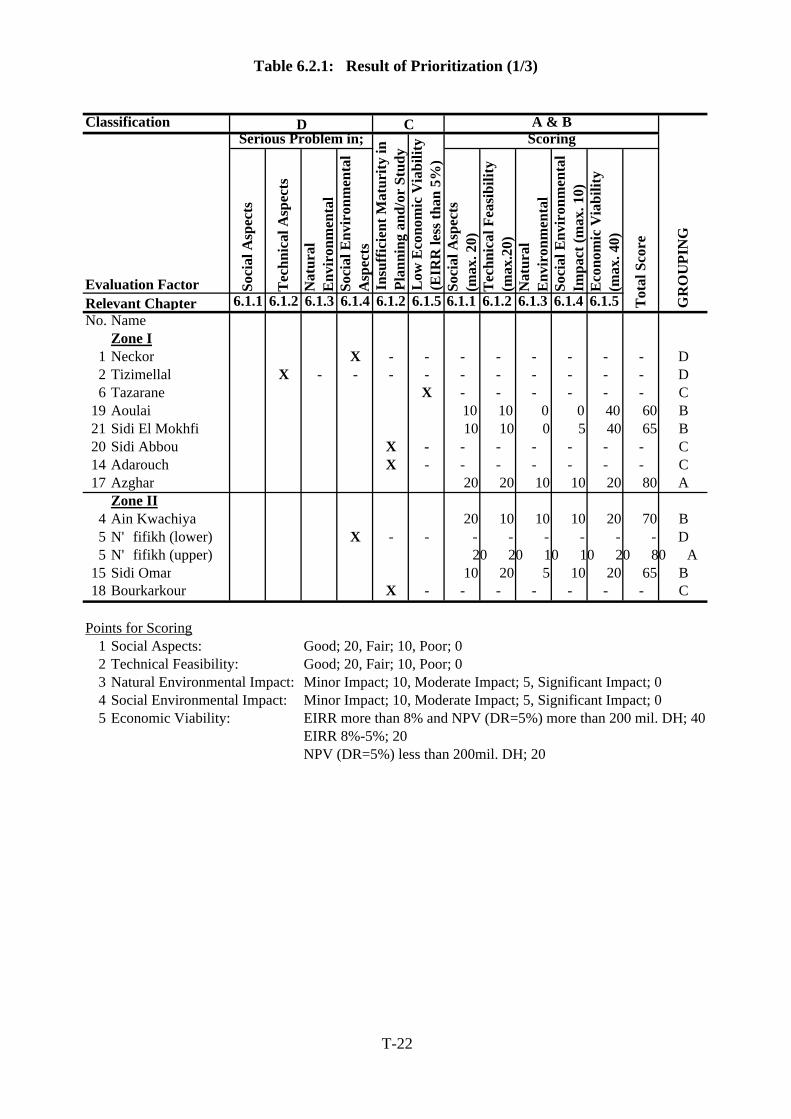
Classification
Soci
al A
spec
ts
Tech
nica
l Asp
ects
Nat
ural
Envi
ronm
enta
lSo
cial
Env
iron
men
tal
Asp
ects
Soci
al A
spec
ts(m
ax. 2
0)Te
chni
cal F
easi
bilit
y(m
ax.2
0)N
atur
alEn
viro
nmen
tal
Soci
al E
nvir
onm
enta
lIm
pact
(max
. 10)
Econ
omic
Via
bilit
y(m
ax. 4
0)
6.1.1 6.1.2 6.1.3 6.1.4 6.1.2 6.1.5 6.1.1 6.1.2 6.1.3 6.1.4 6.1.5No. Name
Zone I1 Neckor X - - - - - - - - D2 Tizimellal X - - - - - - - - - - D6 Tazarane X - - - - - - C
19 Aoulai 10 10 0 0 40 60 B21 Sidi El Mokhfi 10 10 0 5 40 65 B20 Sidi Abbou X - - - - - - - C14 Adarouch X - - - - - - - C17 Azghar 20 20 10 10 20 80 A
Zone II4 Ain Kwachiya 20 10 10 10 20 70 B5 N'fifikh (lower) X - - - - - - - - D5 N'fifikh (upper) 20 20 10 10 20 80 A
15 Sidi Omar 10 20 5 10 20 65 B18 Bourkarkour X - - - - - - - C
Points for Scoring1 Social Aspects: Good; 20, Fair; 10, Poor; 02 Technical Feasibility: Good; 20, Fair; 10, Poor; 03 Natural Environmental Impact: Minor Impact; 10, Moderate Impact; 5, Significant Impact; 04 Social Environmental Impact: Minor Impact; 10, Moderate Impact; 5, Significant Impact; 05 Economic Viability: EIRR more than 8% and NPV (DR=5%) more than 200 mil. DH; 40
EIRR 8%-5%; 20NPV (DR=5%) less than 200mil. DH; 20
D
Evaluation Factor
Serious Problem in;
Insu
ffic
ient
Mat
urity
inPl
anni
ng a
nd/o
r St
udy
Relevant Chapter
Table 6.2.1: Result of Prioritization (1/3)
A & BC
GR
OU
PIN
G
Scoring
Tot
al S
core
Low
Eco
nom
ic V
iabi
lity
(EIR
R le
ss th
an 5
%)
T-22
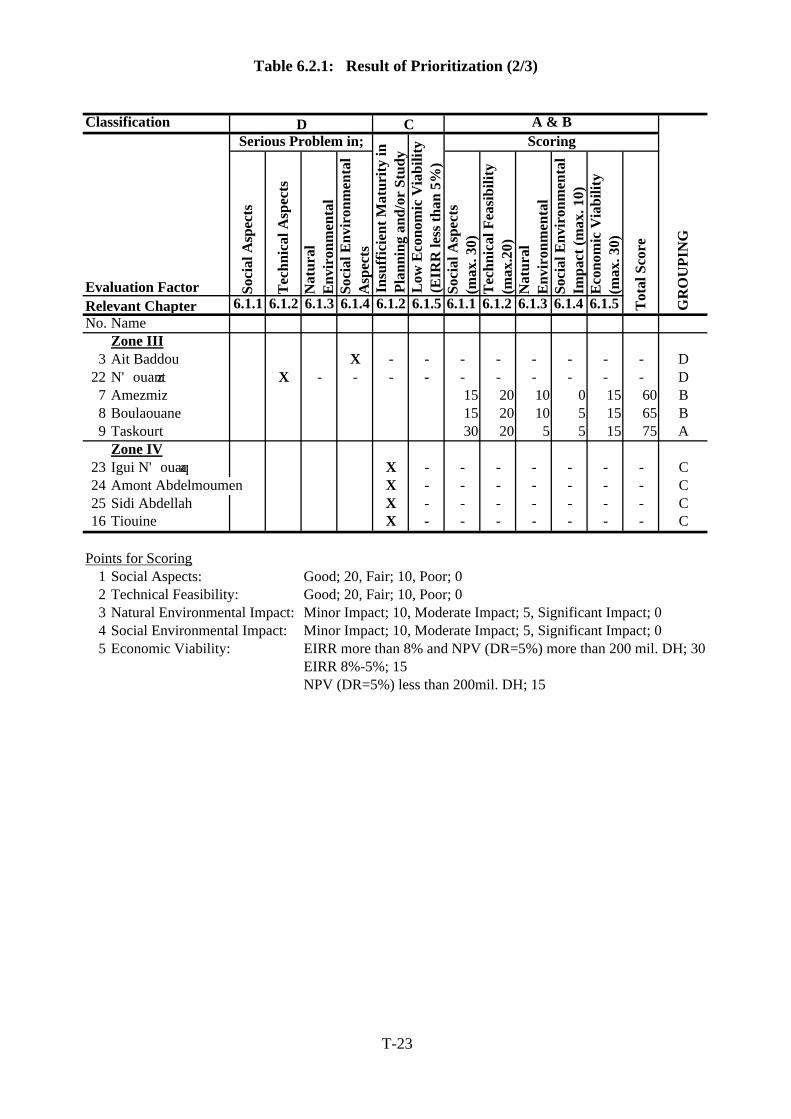
Classification
Soci
al A
spec
ts
Tech
nica
l Asp
ects
Nat
ural
Envi
ronm
enta
lSo
cial
Env
iron
men
tal
Asp
ects
Soci
al A
spec
ts(m
ax. 3
0)Te
chni
cal F
easi
bilit
y(m
ax.2
0)N
atur
alEn
viro
nmen
tal
Soci
al E
nvir
onm
enta
lIm
pact
(max
. 10)
Econ
omic
Via
bilit
y(m
ax. 3
0)
6.1.1 6.1.2 6.1.3 6.1.4 6.1.2 6.1.5 6.1.1 6.1.2 6.1.3 6.1.4 6.1.5No. Name
Zone III3 Ait Baddou X - - - - - - - - D
22 N'ouantz X - - - - - - - - - - D7 Amezmiz 15 20 10 0 15 60 B8 Boulaouane 15 20 10 5 15 65 B9 Taskourt 30 20 5 5 15 75 A
Zone IV23 Igui N'ouaqa X - - - - - - - C24 Amont Abdelmoumen X - - - - - - - C25 Sidi Abdellah X - - - - - - - C16 Tiouine X - - - - - - - C
Points for Scoring1 Social Aspects: Good; 20, Fair; 10, Poor; 02 Technical Feasibility: Good; 20, Fair; 10, Poor; 03 Natural Environmental Impact: Minor Impact; 10, Moderate Impact; 5, Significant Impact; 04 Social Environmental Impact: Minor Impact; 10, Moderate Impact; 5, Significant Impact; 05 Economic Viability: EIRR more than 8% and NPV (DR=5%) more than 200 mil. DH; 30
EIRR 8%-5%; 15NPV (DR=5%) less than 200mil. DH; 15
C A & B
GR
OU
PIN
G
Evaluation Factor Low
Eco
nom
ic V
iabi
lity
(EIR
R le
ss th
an 5
%)
Scoring
Table 6.2.1: Result of Prioritization (2/3)
Tot
al S
core
Serious Problem in;
Insu
ffic
ient
Mat
urity
inPl
anni
ng a
nd/o
r St
udy
D
Relevant Chapter
T-23
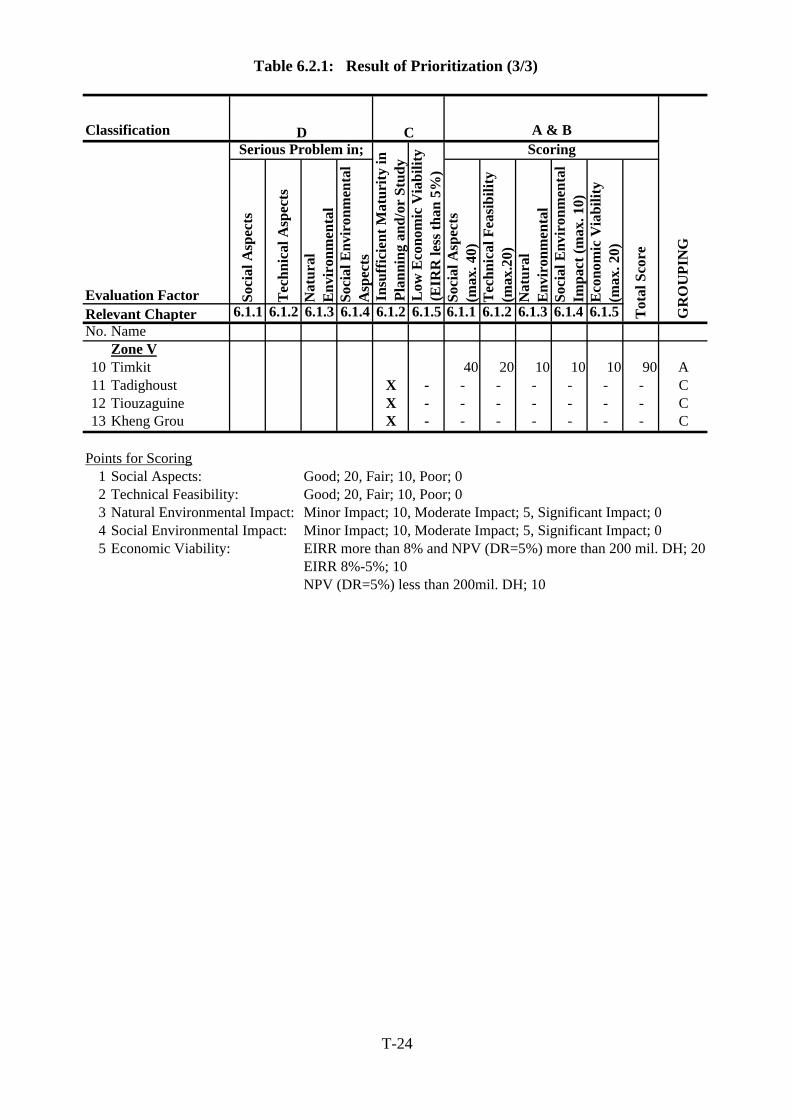
Classification
Soci
al A
spec
ts
Tech
nica
l Asp
ects
Nat
ural
Envi
ronm
enta
lSo
cial
Env
iron
men
tal
Asp
ects
Soci
al A
spec
ts(m
ax. 4
0)Te
chni
cal F
easi
bilit
y(m
ax.2
0)N
atur
alEn
viro
nmen
tal
Soci
al E
nvir
onm
enta
lIm
pact
(max
. 10)
Econ
omic
Via
bilit
y(m
ax. 2
0)
6.1.1 6.1.2 6.1.3 6.1.4 6.1.2 6.1.5 6.1.1 6.1.2 6.1.3 6.1.4 6.1.5No. Name
Zone V10 Timkit 40 20 10 10 10 90 A11 Tadighoust X - - - - - - - C12 Tiouzaguine X - - - - - - - C13 Kheng Grou X - - - - - - - C
Points for Scoring1 Social Aspects: Good; 20, Fair; 10, Poor; 02 Technical Feasibility: Good; 20, Fair; 10, Poor; 03 Natural Environmental Impact: Minor Impact; 10, Moderate Impact; 5, Significant Impact; 04 Social Environmental Impact: Minor Impact; 10, Moderate Impact; 5, Significant Impact; 05 Economic Viability: EIRR more than 8% and NPV (DR=5%) more than 200 mil. DH; 20
EIRR 8%-5%; 10NPV (DR=5%) less than 200mil. DH; 10
Scoring
Relevant Chapter
Table 6.2.1: Result of Prioritization (3/3)
C A & B
Evaluation Factor
Serious Problem in;
Low
Eco
nom
ic V
iabi
lity
(EIR
R le
ss th
an 5
%)
Insu
ffic
ient
Mat
urity
inPl
anni
ng a
nd/o
r St
udy
D
GR
OU
PIN
G
Tot
al S
core
T-24
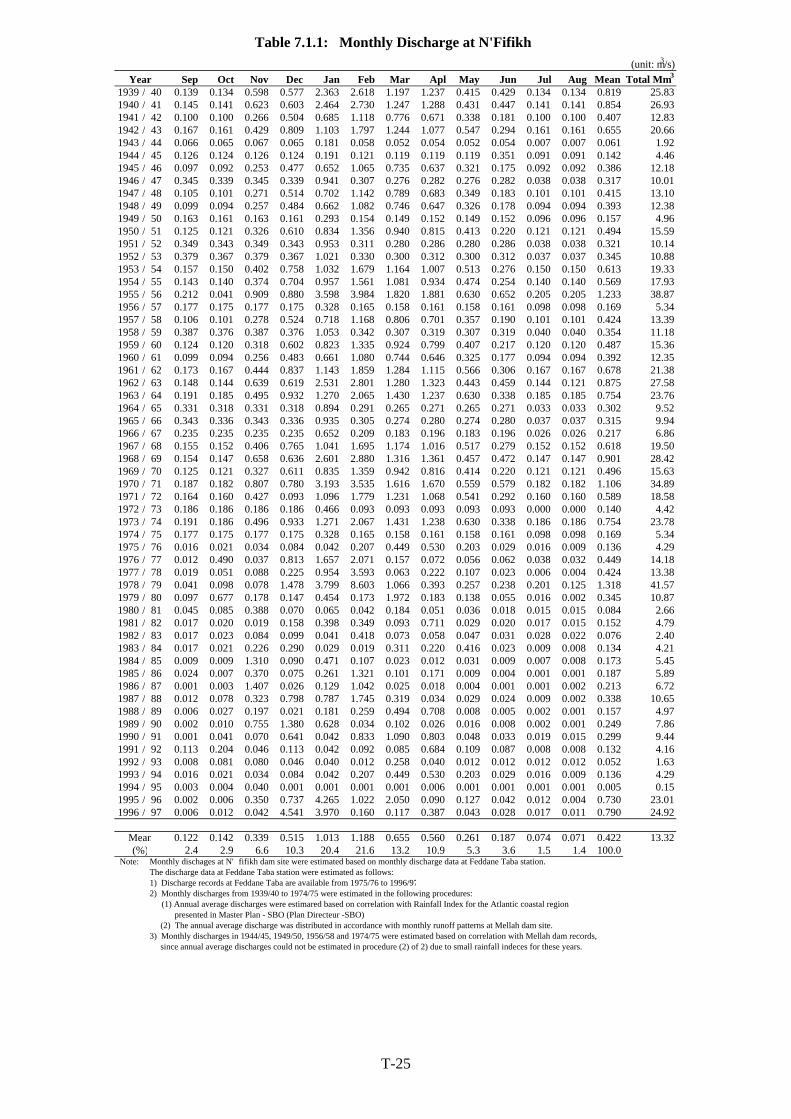
(unit: m3/s)Year Sep Oct Nov Dec Jan Feb Mar Apl May Jun Jul Aug Mean Total Mm3
1939 / 40 0.139 0.134 0.598 0.577 2.363 2.618 1.197 1.237 0.415 0.429 0.134 0.134 0.819 25.831940 / 41 0.145 0.141 0.623 0.603 2.464 2.730 1.247 1.288 0.431 0.447 0.141 0.141 0.854 26.931941 / 42 0.100 0.100 0.266 0.504 0.685 1.118 0.776 0.671 0.338 0.181 0.100 0.100 0.407 12.831942 / 43 0.167 0.161 0.429 0.809 1.103 1.797 1.244 1.077 0.547 0.294 0.161 0.161 0.655 20.661943 / 44 0.066 0.065 0.067 0.065 0.181 0.058 0.052 0.054 0.052 0.054 0.007 0.007 0.061 1.921944 / 45 0.126 0.124 0.126 0.124 0.191 0.121 0.119 0.119 0.119 0.351 0.091 0.091 0.142 4.461945 / 46 0.097 0.092 0.253 0.477 0.652 1.065 0.735 0.637 0.321 0.175 0.092 0.092 0.386 12.181946 / 47 0.345 0.339 0.345 0.339 0.941 0.307 0.276 0.282 0.276 0.282 0.038 0.038 0.317 10.011947 / 48 0.105 0.101 0.271 0.514 0.702 1.142 0.789 0.683 0.349 0.183 0.101 0.101 0.415 13.101948 / 49 0.099 0.094 0.257 0.484 0.662 1.082 0.746 0.647 0.326 0.178 0.094 0.094 0.393 12.381949 / 50 0.163 0.161 0.163 0.161 0.293 0.154 0.149 0.152 0.149 0.152 0.096 0.096 0.157 4.961950 / 51 0.125 0.121 0.326 0.610 0.834 1.356 0.940 0.815 0.413 0.220 0.121 0.121 0.494 15.591951 / 52 0.349 0.343 0.349 0.343 0.953 0.311 0.280 0.286 0.280 0.286 0.038 0.038 0.321 10.141952 / 53 0.379 0.367 0.379 0.367 1.021 0.330 0.300 0.312 0.300 0.312 0.037 0.037 0.345 10.881953 / 54 0.157 0.150 0.402 0.758 1.032 1.679 1.164 1.007 0.513 0.276 0.150 0.150 0.613 19.331954 / 55 0.143 0.140 0.374 0.704 0.957 1.561 1.081 0.934 0.474 0.254 0.140 0.140 0.569 17.931955 / 56 0.212 0.041 0.909 0.880 3.598 3.984 1.820 1.881 0.630 0.652 0.205 0.205 1.233 38.871956 / 57 0.177 0.175 0.177 0.175 0.328 0.165 0.158 0.161 0.158 0.161 0.098 0.098 0.169 5.341957 / 58 0.106 0.101 0.278 0.524 0.718 1.168 0.806 0.701 0.357 0.190 0.101 0.101 0.424 13.391958 / 59 0.387 0.376 0.387 0.376 1.053 0.342 0.307 0.319 0.307 0.319 0.040 0.040 0.354 11.181959 / 60 0.124 0.120 0.318 0.602 0.823 1.335 0.924 0.799 0.407 0.217 0.120 0.120 0.487 15.361960 / 61 0.099 0.094 0.256 0.483 0.661 1.080 0.744 0.646 0.325 0.177 0.094 0.094 0.392 12.351961 / 62 0.173 0.167 0.444 0.837 1.143 1.859 1.284 1.115 0.566 0.306 0.167 0.167 0.678 21.381962 / 63 0.148 0.144 0.639 0.619 2.531 2.801 1.280 1.323 0.443 0.459 0.144 0.121 0.875 27.581963 / 64 0.191 0.185 0.495 0.932 1.270 2.065 1.430 1.237 0.630 0.338 0.185 0.185 0.754 23.761964 / 65 0.331 0.318 0.331 0.318 0.894 0.291 0.265 0.271 0.265 0.271 0.033 0.033 0.302 9.521965 / 66 0.343 0.336 0.343 0.336 0.935 0.305 0.274 0.280 0.274 0.280 0.037 0.037 0.315 9.941966 / 67 0.235 0.235 0.235 0.235 0.652 0.209 0.183 0.196 0.183 0.196 0.026 0.026 0.217 6.861967 / 68 0.155 0.152 0.406 0.765 1.041 1.695 1.174 1.016 0.517 0.279 0.152 0.152 0.618 19.501968 / 69 0.154 0.147 0.658 0.636 2.601 2.880 1.316 1.361 0.457 0.472 0.147 0.147 0.901 28.421969 / 70 0.125 0.121 0.327 0.611 0.835 1.359 0.942 0.816 0.414 0.220 0.121 0.121 0.496 15.631970 / 71 0.187 0.182 0.807 0.780 3.193 3.535 1.616 1.670 0.559 0.579 0.182 0.182 1.106 34.891971 / 72 0.164 0.160 0.427 0.093 1.096 1.779 1.231 1.068 0.541 0.292 0.160 0.160 0.589 18.581972 / 73 0.186 0.186 0.186 0.186 0.466 0.093 0.093 0.093 0.093 0.093 0.000 0.000 0.140 4.421973 / 74 0.191 0.186 0.496 0.933 1.271 2.067 1.431 1.238 0.630 0.338 0.186 0.186 0.754 23.781974 / 75 0.177 0.175 0.177 0.175 0.328 0.165 0.158 0.161 0.158 0.161 0.098 0.098 0.169 5.341975 / 76 0.016 0.021 0.034 0.084 0.042 0.207 0.449 0.530 0.203 0.029 0.016 0.009 0.136 4.291976 / 77 0.012 0.490 0.037 0.813 1.657 2.071 0.157 0.072 0.056 0.062 0.038 0.032 0.449 14.181977 / 78 0.019 0.051 0.088 0.225 0.954 3.593 0.063 0.222 0.107 0.023 0.006 0.004 0.424 13.381978 / 79 0.041 0.098 0.078 1.478 3.799 8.603 1.066 0.393 0.257 0.238 0.201 0.125 1.318 41.571979 / 80 0.097 0.677 0.178 0.147 0.454 0.173 1.972 0.183 0.138 0.055 0.016 0.002 0.345 10.871980 / 81 0.045 0.085 0.388 0.070 0.065 0.042 0.184 0.051 0.036 0.018 0.015 0.015 0.084 2.661981 / 82 0.017 0.020 0.019 0.158 0.398 0.349 0.093 0.711 0.029 0.020 0.017 0.015 0.152 4.791982 / 83 0.017 0.023 0.084 0.099 0.041 0.418 0.073 0.058 0.047 0.031 0.028 0.022 0.076 2.401983 / 84 0.017 0.021 0.226 0.290 0.029 0.019 0.311 0.220 0.416 0.023 0.009 0.008 0.134 4.211984 / 85 0.009 0.009 1.310 0.090 0.471 0.107 0.023 0.012 0.031 0.009 0.007 0.008 0.173 5.451985 / 86 0.024 0.007 0.370 0.075 0.261 1.321 0.101 0.171 0.009 0.004 0.001 0.001 0.187 5.891986 / 87 0.001 0.003 1.407 0.026 0.129 1.042 0.025 0.018 0.004 0.001 0.001 0.002 0.213 6.721987 / 88 0.012 0.078 0.323 0.798 0.787 1.745 0.319 0.034 0.029 0.024 0.009 0.002 0.338 10.651988 / 89 0.006 0.027 0.197 0.021 0.181 0.259 0.494 0.708 0.008 0.005 0.002 0.001 0.157 4.971989 / 90 0.002 0.010 0.755 1.380 0.628 0.034 0.102 0.026 0.016 0.008 0.002 0.001 0.249 7.861990 / 91 0.001 0.041 0.070 0.641 0.042 0.833 1.090 0.803 0.048 0.033 0.019 0.015 0.299 9.441991 / 92 0.113 0.204 0.046 0.113 0.042 0.092 0.085 0.684 0.109 0.087 0.008 0.008 0.132 4.161992 / 93 0.008 0.081 0.080 0.046 0.040 0.012 0.258 0.040 0.012 0.012 0.012 0.012 0.052 1.631993 / 94 0.016 0.021 0.034 0.084 0.042 0.207 0.449 0.530 0.203 0.029 0.016 0.009 0.136 4.291994 / 95 0.003 0.004 0.040 0.001 0.001 0.001 0.001 0.006 0.001 0.001 0.001 0.001 0.005 0.151995 / 96 0.002 0.006 0.350 0.737 4.265 1.022 2.050 0.090 0.127 0.042 0.012 0.004 0.730 23.011996 / 97 0.006 0.012 0.042 4.541 3.970 0.160 0.117 0.387 0.043 0.028 0.017 0.011 0.790 24.92
Mean 0.122 0.142 0.339 0.515 1.013 1.188 0.655 0.560 0.261 0.187 0.074 0.071 0.422 13.32(%) 2.4 2.9 6.6 10.3 20.4 21.6 13.2 10.9 5.3 3.6 1.5 1.4 100.0
Note: Monthly dischages at N'fifikh dam site were estimated based on monthly discharge data at Feddane Taba station.The discharge data at Feddane Taba station were estimated as follows:1) Discharge records at Feddane Taba are available from 1975/76 to 1996/972) Monthly discharges from 1939/40 to 1974/75 were estimated in the following procedures: (1) Annual average discharges were estimared based on correlation with Rainfall Index for the Atlantic coastal region presented in Master Plan - SBO (Plan Directeur -SBO) (2) The annual average discharge was distributed in accordance with monthly runoff patterns at Mellah dam site.3) Monthly discharges in 1944/45, 1949/50, 1956/58 and 1974/75 were estimated based on correlation with Mellah dam records, since annual average discharges could not be estimated in procedure (2) of 2) due to small rainfall indeces for these years.
Table 7.1.1: Monthly Discharge at N'Fifikh
T-25
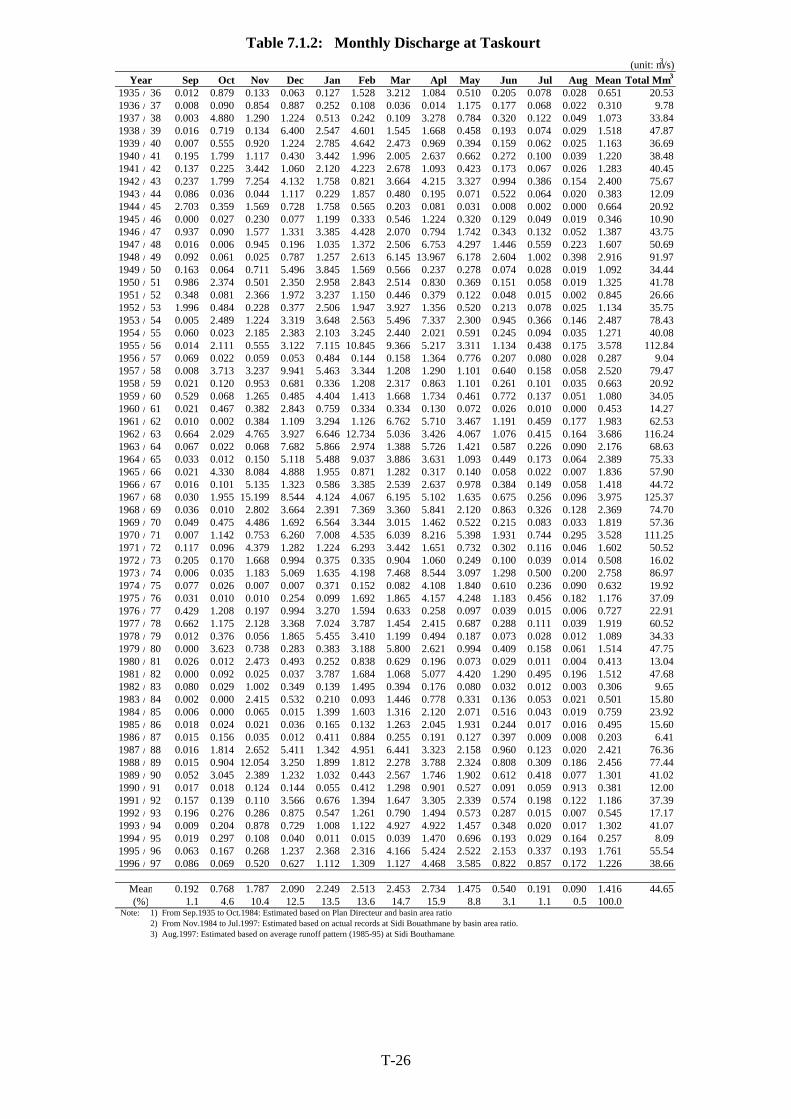
(unit: m3/s)Year Sep Oct Nov Dec Jan Feb Mar Apl May Jun Jul Aug Mean Total Mm3
1935 / 36 0.012 0.879 0.133 0.063 0.127 1.528 3.212 1.084 0.510 0.205 0.078 0.028 0.651 20.531936 / 37 0.008 0.090 0.854 0.887 0.252 0.108 0.036 0.014 1.175 0.177 0.068 0.022 0.310 9.781937 / 38 0.003 4.880 1.290 1.224 0.513 0.242 0.109 3.278 0.784 0.320 0.122 0.049 1.073 33.841938 / 39 0.016 0.719 0.134 6.400 2.547 4.601 1.545 1.668 0.458 0.193 0.074 0.029 1.518 47.871939 / 40 0.007 0.555 0.920 1.224 2.785 4.642 2.473 0.969 0.394 0.159 0.062 0.025 1.163 36.691940 / 41 0.195 1.799 1.117 0.430 3.442 1.996 2.005 2.637 0.662 0.272 0.100 0.039 1.220 38.481941 / 42 0.137 0.225 3.442 1.060 2.120 4.223 2.678 1.093 0.423 0.173 0.067 0.026 1.283 40.451942 / 43 0.237 1.799 7.254 4.132 1.758 0.821 3.664 4.215 3.327 0.994 0.386 0.154 2.400 75.671943 / 44 0.086 0.036 0.044 1.117 0.229 1.857 0.480 0.195 0.071 0.522 0.064 0.020 0.383 12.091944 / 45 2.703 0.359 1.569 0.728 1.758 0.565 0.203 0.081 0.031 0.008 0.002 0.000 0.664 20.921945 / 46 0.000 0.027 0.230 0.077 1.199 0.333 0.546 1.224 0.320 0.129 0.049 0.019 0.346 10.901946 / 47 0.937 0.090 1.577 1.331 3.385 4.428 2.070 0.794 1.742 0.343 0.132 0.052 1.387 43.751947 / 48 0.016 0.006 0.945 0.196 1.035 1.372 2.506 6.753 4.297 1.446 0.559 0.223 1.607 50.691948 / 49 0.092 0.061 0.025 0.787 1.257 2.613 6.145 13.967 6.178 2.604 1.002 0.398 2.916 91.971949 / 50 0.163 0.064 0.711 5.496 3.845 1.569 0.566 0.237 0.278 0.074 0.028 0.019 1.092 34.441950 / 51 0.986 2.374 0.501 2.350 2.958 2.843 2.514 0.830 0.369 0.151 0.058 0.019 1.325 41.781951 / 52 0.348 0.081 2.366 1.972 3.237 1.150 0.446 0.379 0.122 0.048 0.015 0.002 0.845 26.661952 / 53 1.996 0.484 0.228 0.377 2.506 1.947 3.927 1.356 0.520 0.213 0.078 0.025 1.134 35.751953 / 54 0.005 2.489 1.224 3.319 3.648 2.563 5.496 7.337 2.300 0.945 0.366 0.146 2.487 78.431954 / 55 0.060 0.023 2.185 2.383 2.103 3.245 2.440 2.021 0.591 0.245 0.094 0.035 1.271 40.081955 / 56 0.014 2.111 0.555 3.122 7.115 10.845 9.366 5.217 3.311 1.134 0.438 0.175 3.578 112.841956 / 57 0.069 0.022 0.059 0.053 0.484 0.144 0.158 1.364 0.776 0.207 0.080 0.028 0.287 9.041957 / 58 0.008 3.713 3.237 9.941 5.463 3.344 1.208 1.290 1.101 0.640 0.158 0.058 2.520 79.471958 / 59 0.021 0.120 0.953 0.681 0.336 1.208 2.317 0.863 1.101 0.261 0.101 0.035 0.663 20.921959 / 60 0.529 0.068 1.265 0.485 4.404 1.413 1.668 1.734 0.461 0.772 0.137 0.051 1.080 34.051960 / 61 0.021 0.467 0.382 2.843 0.759 0.334 0.334 0.130 0.072 0.026 0.010 0.000 0.453 14.271961 / 62 0.010 0.002 0.384 1.109 3.294 1.126 6.762 5.710 3.467 1.191 0.459 0.177 1.983 62.531962 / 63 0.664 2.029 4.765 3.927 6.646 12.734 5.036 3.426 4.067 1.076 0.415 0.164 3.686 116.241963 / 64 0.067 0.022 0.068 7.682 5.866 2.974 1.388 5.726 1.421 0.587 0.226 0.090 2.176 68.631964 / 65 0.033 0.012 0.150 5.118 5.488 9.037 3.886 3.631 1.093 0.449 0.173 0.064 2.389 75.331965 / 66 0.021 4.330 8.084 4.888 1.955 0.871 1.282 0.317 0.140 0.058 0.022 0.007 1.836 57.901966 / 67 0.016 0.101 5.135 1.323 0.586 3.385 2.539 2.637 0.978 0.384 0.149 0.058 1.418 44.721967 / 68 0.030 1.955 15.199 8.544 4.124 4.067 6.195 5.102 1.635 0.675 0.256 0.096 3.975 125.371968 / 69 0.036 0.010 2.802 3.664 2.391 7.369 3.360 5.841 2.120 0.863 0.326 0.128 2.369 74.701969 / 70 0.049 0.475 4.486 1.692 6.564 3.344 3.015 1.462 0.522 0.215 0.083 0.033 1.819 57.361970 / 71 0.007 1.142 0.753 6.260 7.008 4.535 6.039 8.216 5.398 1.931 0.744 0.295 3.528 111.251971 / 72 0.117 0.096 4.379 1.282 1.224 6.293 3.442 1.651 0.732 0.302 0.116 0.046 1.602 50.521972 / 73 0.205 0.170 1.668 0.994 0.375 0.335 0.904 1.060 0.249 0.100 0.039 0.014 0.508 16.021973 / 74 0.006 0.035 1.183 5.069 1.635 4.198 7.468 8.544 3.097 1.298 0.500 0.200 2.758 86.971974 / 75 0.077 0.026 0.007 0.007 0.371 0.152 0.082 4.108 1.840 0.610 0.236 0.090 0.632 19.921975 / 76 0.031 0.010 0.010 0.254 0.099 1.692 1.865 4.157 4.248 1.183 0.456 0.182 1.176 37.091976 / 77 0.429 1.208 0.197 0.994 3.270 1.594 0.633 0.258 0.097 0.039 0.015 0.006 0.727 22.911977 / 78 0.662 1.175 2.128 3.368 7.024 3.787 1.454 2.415 0.687 0.288 0.111 0.039 1.919 60.521978 / 79 0.012 0.376 0.056 1.865 5.455 3.410 1.199 0.494 0.187 0.073 0.028 0.012 1.089 34.331979 / 80 0.000 3.623 0.738 0.283 0.383 3.188 5.800 2.621 0.994 0.409 0.158 0.061 1.514 47.751980 / 81 0.026 0.012 2.473 0.493 0.252 0.838 0.629 0.196 0.073 0.029 0.011 0.004 0.413 13.041981 / 82 0.000 0.092 0.025 0.037 3.787 1.684 1.068 5.077 4.420 1.290 0.495 0.196 1.512 47.681982 / 83 0.080 0.029 1.002 0.349 0.139 1.495 0.394 0.176 0.080 0.032 0.012 0.003 0.306 9.651983 / 84 0.002 0.000 2.415 0.532 0.210 0.093 1.446 0.778 0.331 0.136 0.053 0.021 0.501 15.801984 / 85 0.006 0.000 0.065 0.015 1.399 1.603 1.316 2.120 2.071 0.516 0.043 0.019 0.759 23.921985 / 86 0.018 0.024 0.021 0.036 0.165 0.132 1.263 2.045 1.931 0.244 0.017 0.016 0.495 15.601986 / 87 0.015 0.156 0.035 0.012 0.411 0.884 0.255 0.191 0.127 0.397 0.009 0.008 0.203 6.411987 / 88 0.016 1.814 2.652 5.411 1.342 4.951 6.441 3.323 2.158 0.960 0.123 0.020 2.421 76.361988 / 89 0.015 0.904 12.054 3.250 1.899 1.812 2.278 3.788 2.324 0.808 0.309 0.186 2.456 77.441989 / 90 0.052 3.045 2.389 1.232 1.032 0.443 2.567 1.746 1.902 0.612 0.418 0.077 1.301 41.021990 / 91 0.017 0.018 0.124 0.144 0.055 0.412 1.298 0.901 0.527 0.091 0.059 0.913 0.381 12.001991 / 92 0.157 0.139 0.110 3.566 0.676 1.394 1.647 3.305 2.339 0.574 0.198 0.122 1.186 37.391992 / 93 0.196 0.276 0.286 0.875 0.547 1.261 0.790 1.494 0.573 0.287 0.015 0.007 0.545 17.171993 / 94 0.009 0.204 0.878 0.729 1.008 1.122 4.927 4.922 1.457 0.348 0.020 0.017 1.302 41.071994 / 95 0.019 0.297 0.108 0.040 0.011 0.015 0.039 1.470 0.696 0.193 0.029 0.164 0.257 8.091995 / 96 0.063 0.167 0.268 1.237 2.368 2.316 4.166 5.424 2.522 2.153 0.337 0.193 1.761 55.541996 / 97 0.086 0.069 0.520 0.627 1.112 1.309 1.127 4.468 3.585 0.822 0.857 0.172 1.226 38.66
Mean 0.192 0.768 1.787 2.090 2.249 2.513 2.453 2.734 1.475 0.540 0.191 0.090 1.416 44.65(%) 1.1 4.6 10.4 12.5 13.5 13.6 14.7 15.9 8.8 3.1 1.1 0.5 100.0
Note: 1) From Sep.1935 to Oct.1984: Estimated based on Plan Directeur and basin area ratio2) From Nov.1984 to Jul.1997: Estimated based on actual records at Sidi Bouathmane by basin area ratio.3) Aug.1997: Estimated based on average runoff pattern (1985-95) at Sidi Bouthamane.
Table 7.1.2: Monthly Discharge at Taskourt
T-26
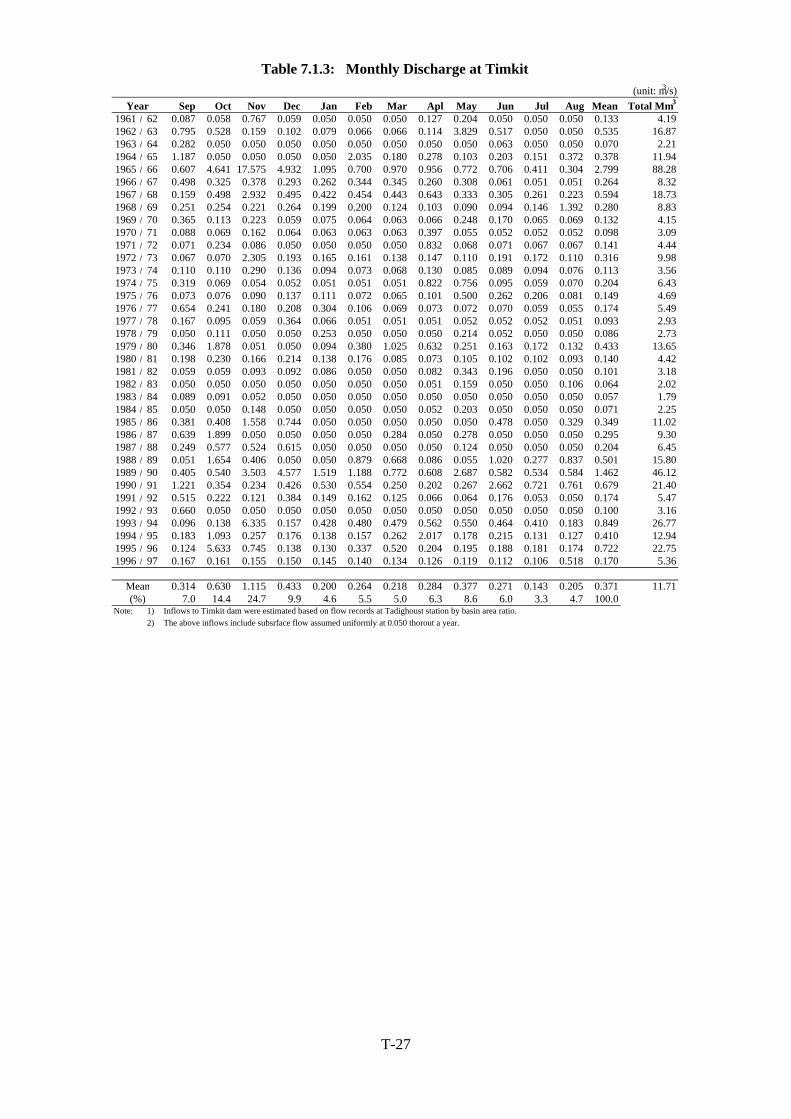
(unit: m3/s)Year Sep Oct Nov Dec Jan Feb Mar Apl May Jun Jul Aug Mean Total Mm3
1961 / 62 0.087 0.058 0.767 0.059 0.050 0.050 0.050 0.127 0.204 0.050 0.050 0.050 0.133 4.191962 / 63 0.795 0.528 0.159 0.102 0.079 0.066 0.066 0.114 3.829 0.517 0.050 0.050 0.535 16.871963 / 64 0.282 0.050 0.050 0.050 0.050 0.050 0.050 0.050 0.050 0.063 0.050 0.050 0.070 2.211964 / 65 1.187 0.050 0.050 0.050 0.050 2.035 0.180 0.278 0.103 0.203 0.151 0.372 0.378 11.941965 / 66 0.607 4.641 17.575 4.932 1.095 0.700 0.970 0.956 0.772 0.706 0.411 0.304 2.799 88.281966 / 67 0.498 0.325 0.378 0.293 0.262 0.344 0.345 0.260 0.308 0.061 0.051 0.051 0.264 8.321967 / 68 0.159 0.498 2.932 0.495 0.422 0.454 0.443 0.643 0.333 0.305 0.261 0.223 0.594 18.731968 / 69 0.251 0.254 0.221 0.264 0.199 0.200 0.124 0.103 0.090 0.094 0.146 1.392 0.280 8.831969 / 70 0.365 0.113 0.223 0.059 0.075 0.064 0.063 0.066 0.248 0.170 0.065 0.069 0.132 4.151970 / 71 0.088 0.069 0.162 0.064 0.063 0.063 0.063 0.397 0.055 0.052 0.052 0.052 0.098 3.091971 / 72 0.071 0.234 0.086 0.050 0.050 0.050 0.050 0.832 0.068 0.071 0.067 0.067 0.141 4.441972 / 73 0.067 0.070 2.305 0.193 0.165 0.161 0.138 0.147 0.110 0.191 0.172 0.110 0.316 9.981973 / 74 0.110 0.110 0.290 0.136 0.094 0.073 0.068 0.130 0.085 0.089 0.094 0.076 0.113 3.561974 / 75 0.319 0.069 0.054 0.052 0.051 0.051 0.051 0.822 0.756 0.095 0.059 0.070 0.204 6.431975 / 76 0.073 0.076 0.090 0.137 0.111 0.072 0.065 0.101 0.500 0.262 0.206 0.081 0.149 4.691976 / 77 0.654 0.241 0.180 0.208 0.304 0.106 0.069 0.073 0.072 0.070 0.059 0.055 0.174 5.491977 / 78 0.167 0.095 0.059 0.364 0.066 0.051 0.051 0.051 0.052 0.052 0.052 0.051 0.093 2.931978 / 79 0.050 0.111 0.050 0.050 0.253 0.050 0.050 0.050 0.214 0.052 0.050 0.050 0.086 2.731979 / 80 0.346 1.878 0.051 0.050 0.094 0.380 1.025 0.632 0.251 0.163 0.172 0.132 0.433 13.651980 / 81 0.198 0.230 0.166 0.214 0.138 0.176 0.085 0.073 0.105 0.102 0.102 0.093 0.140 4.421981 / 82 0.059 0.059 0.093 0.092 0.086 0.050 0.050 0.082 0.343 0.196 0.050 0.050 0.101 3.181982 / 83 0.050 0.050 0.050 0.050 0.050 0.050 0.050 0.051 0.159 0.050 0.050 0.106 0.064 2.021983 / 84 0.089 0.091 0.052 0.050 0.050 0.050 0.050 0.050 0.050 0.050 0.050 0.050 0.057 1.791984 / 85 0.050 0.050 0.148 0.050 0.050 0.050 0.050 0.052 0.203 0.050 0.050 0.050 0.071 2.251985 / 86 0.381 0.408 1.558 0.744 0.050 0.050 0.050 0.050 0.050 0.478 0.050 0.329 0.349 11.021986 / 87 0.639 1.899 0.050 0.050 0.050 0.050 0.284 0.050 0.278 0.050 0.050 0.050 0.295 9.301987 / 88 0.249 0.577 0.524 0.615 0.050 0.050 0.050 0.050 0.124 0.050 0.050 0.050 0.204 6.451988 / 89 0.051 1.654 0.406 0.050 0.050 0.879 0.668 0.086 0.055 1.020 0.277 0.837 0.501 15.801989 / 90 0.405 0.540 3.503 4.577 1.519 1.188 0.772 0.608 2.687 0.582 0.534 0.584 1.462 46.121990 / 91 1.221 0.354 0.234 0.426 0.530 0.554 0.250 0.202 0.267 2.662 0.721 0.761 0.679 21.401991 / 92 0.515 0.222 0.121 0.384 0.149 0.162 0.125 0.066 0.064 0.176 0.053 0.050 0.174 5.471992 / 93 0.660 0.050 0.050 0.050 0.050 0.050 0.050 0.050 0.050 0.050 0.050 0.050 0.100 3.161993 / 94 0.096 0.138 6.335 0.157 0.428 0.480 0.479 0.562 0.550 0.464 0.410 0.183 0.849 26.771994 / 95 0.183 1.093 0.257 0.176 0.138 0.157 0.262 2.017 0.178 0.215 0.131 0.127 0.410 12.941995 / 96 0.124 5.633 0.745 0.138 0.130 0.337 0.520 0.204 0.195 0.188 0.181 0.174 0.722 22.751996 / 97 0.167 0.161 0.155 0.150 0.145 0.140 0.134 0.126 0.119 0.112 0.106 0.518 0.170 5.36
Mean 0.314 0.630 1.115 0.433 0.200 0.264 0.218 0.284 0.377 0.271 0.143 0.205 0.371 11.71(%) 7.0 14.4 24.7 9.9 4.6 5.5 5.0 6.3 8.6 6.0 3.3 4.7 100.0
Note: 1) Inflows to Timkit dam were estimated based on flow records at Tadighoust station by basin area ratio.2) The above inflows include subsrface flow assumed uniformly at 0.050 thorout a year.
Table 7.1.3: Monthly Discharge at Timkit
T-27
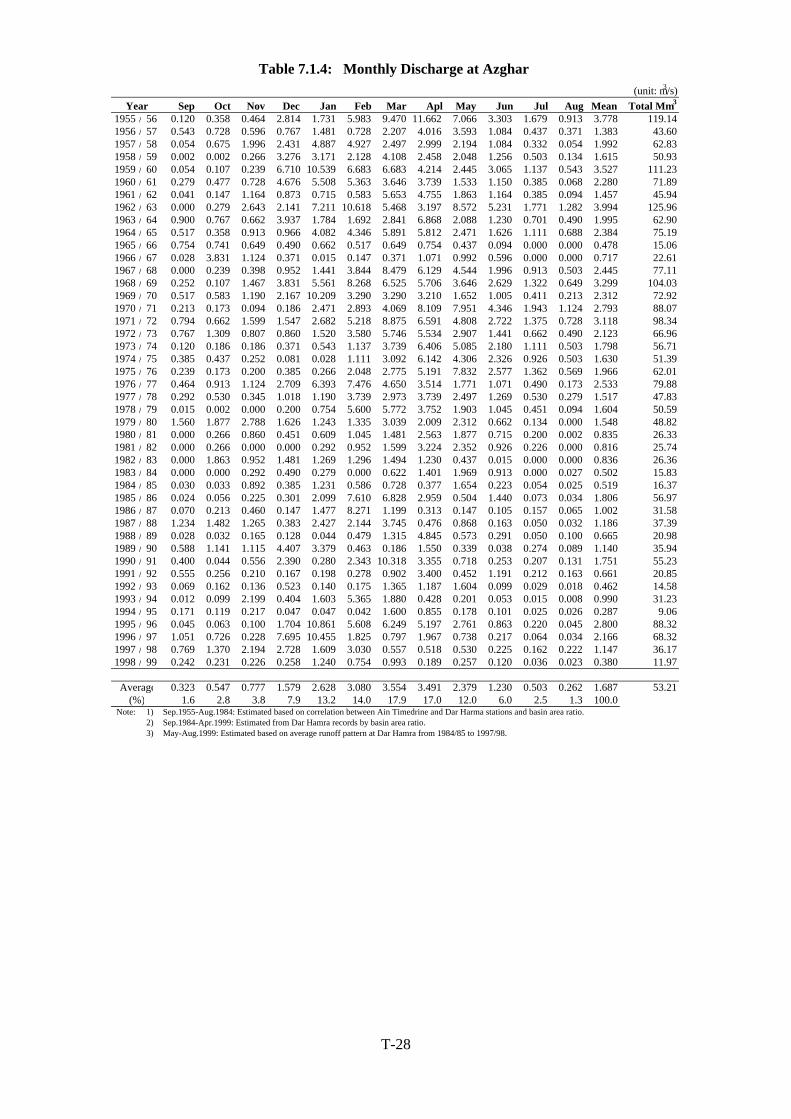
(unit: m3/s)Year Sep Oct Nov Dec Jan Feb Mar Apl May Jun Jul Aug Mean Total Mm3
1955 / 56 0.120 0.358 0.464 2.814 1.731 5.983 9.470 11.662 7.066 3.303 1.679 0.913 3.778 119.141956 / 57 0.543 0.728 0.596 0.767 1.481 0.728 2.207 4.016 3.593 1.084 0.437 0.371 1.383 43.601957 / 58 0.054 0.675 1.996 2.431 4.887 4.927 2.497 2.999 2.194 1.084 0.332 0.054 1.992 62.831958 / 59 0.002 0.002 0.266 3.276 3.171 2.128 4.108 2.458 2.048 1.256 0.503 0.134 1.615 50.931959 / 60 0.054 0.107 0.239 6.710 10.539 6.683 6.683 4.214 2.445 3.065 1.137 0.543 3.527 111.231960 / 61 0.279 0.477 0.728 4.676 5.508 5.363 3.646 3.739 1.533 1.150 0.385 0.068 2.280 71.891961 / 62 0.041 0.147 1.164 0.873 0.715 0.583 5.653 4.755 1.863 1.164 0.385 0.094 1.457 45.941962 / 63 0.000 0.279 2.643 2.141 7.211 10.618 5.468 3.197 8.572 5.231 1.771 1.282 3.994 125.961963 / 64 0.900 0.767 0.662 3.937 1.784 1.692 2.841 6.868 2.088 1.230 0.701 0.490 1.995 62.901964 / 65 0.517 0.358 0.913 0.966 4.082 4.346 5.891 5.812 2.471 1.626 1.111 0.688 2.384 75.191965 / 66 0.754 0.741 0.649 0.490 0.662 0.517 0.649 0.754 0.437 0.094 0.000 0.000 0.478 15.061966 / 67 0.028 3.831 1.124 0.371 0.015 0.147 0.371 1.071 0.992 0.596 0.000 0.000 0.717 22.611967 / 68 0.000 0.239 0.398 0.952 1.441 3.844 8.479 6.129 4.544 1.996 0.913 0.503 2.445 77.111968 / 69 0.252 0.107 1.467 3.831 5.561 8.268 6.525 5.706 3.646 2.629 1.322 0.649 3.299 104.031969 / 70 0.517 0.583 1.190 2.167 10.209 3.290 3.290 3.210 1.652 1.005 0.411 0.213 2.312 72.921970 / 71 0.213 0.173 0.094 0.186 2.471 2.893 4.069 8.109 7.951 4.346 1.943 1.124 2.793 88.071971 / 72 0.794 0.662 1.599 1.547 2.682 5.218 8.875 6.591 4.808 2.722 1.375 0.728 3.118 98.341972 / 73 0.767 1.309 0.807 0.860 1.520 3.580 5.746 5.534 2.907 1.441 0.662 0.490 2.123 66.961973 / 74 0.120 0.186 0.186 0.371 0.543 1.137 3.739 6.406 5.085 2.180 1.111 0.503 1.798 56.711974 / 75 0.385 0.437 0.252 0.081 0.028 1.111 3.092 6.142 4.306 2.326 0.926 0.503 1.630 51.391975 / 76 0.239 0.173 0.200 0.385 0.266 2.048 2.775 5.191 7.832 2.577 1.362 0.569 1.966 62.011976 / 77 0.464 0.913 1.124 2.709 6.393 7.476 4.650 3.514 1.771 1.071 0.490 0.173 2.533 79.881977 / 78 0.292 0.530 0.345 1.018 1.190 3.739 2.973 3.739 2.497 1.269 0.530 0.279 1.517 47.831978 / 79 0.015 0.002 0.000 0.200 0.754 5.600 5.772 3.752 1.903 1.045 0.451 0.094 1.604 50.591979 / 80 1.560 1.877 2.788 1.626 1.243 1.335 3.039 2.009 2.312 0.662 0.134 0.000 1.548 48.821980 / 81 0.000 0.266 0.860 0.451 0.609 1.045 1.481 2.563 1.877 0.715 0.200 0.002 0.835 26.331981 / 82 0.000 0.266 0.000 0.000 0.292 0.952 1.599 3.224 2.352 0.926 0.226 0.000 0.816 25.741982 / 83 0.000 1.863 0.952 1.481 1.269 1.296 1.494 1.230 0.437 0.015 0.000 0.000 0.836 26.361983 / 84 0.000 0.000 0.292 0.490 0.279 0.000 0.622 1.401 1.969 0.913 0.000 0.027 0.502 15.831984 / 85 0.030 0.033 0.892 0.385 1.231 0.586 0.728 0.377 1.654 0.223 0.054 0.025 0.519 16.371985 / 86 0.024 0.056 0.225 0.301 2.099 7.610 6.828 2.959 0.504 1.440 0.073 0.034 1.806 56.971986 / 87 0.070 0.213 0.460 0.147 1.477 8.271 1.199 0.313 0.147 0.105 0.157 0.065 1.002 31.581987 / 88 1.234 1.482 1.265 0.383 2.427 2.144 3.745 0.476 0.868 0.163 0.050 0.032 1.186 37.391988 / 89 0.028 0.032 0.165 0.128 0.044 0.479 1.315 4.845 0.573 0.291 0.050 0.100 0.665 20.981989 / 90 0.588 1.141 1.115 4.407 3.379 0.463 0.186 1.550 0.339 0.038 0.274 0.089 1.140 35.941990 / 91 0.400 0.044 0.556 2.390 0.280 2.343 10.318 3.355 0.718 0.253 0.207 0.131 1.751 55.231991 / 92 0.555 0.256 0.210 0.167 0.198 0.278 0.902 3.400 0.452 1.191 0.212 0.163 0.661 20.851992 / 93 0.069 0.162 0.136 0.523 0.140 0.175 1.365 1.187 1.604 0.099 0.029 0.018 0.462 14.581993 / 94 0.012 0.099 2.199 0.404 1.603 5.365 1.880 0.428 0.201 0.053 0.015 0.008 0.990 31.231994 / 95 0.171 0.119 0.217 0.047 0.047 0.042 1.600 0.855 0.178 0.101 0.025 0.026 0.287 9.061995 / 96 0.045 0.063 0.100 1.704 10.861 5.608 6.249 5.197 2.761 0.863 0.220 0.045 2.800 88.321996 / 97 1.051 0.726 0.228 7.695 10.455 1.825 0.797 1.967 0.738 0.217 0.064 0.034 2.166 68.321997 / 98 0.769 1.370 2.194 2.728 1.609 3.030 0.557 0.518 0.530 0.225 0.162 0.222 1.147 36.171998 / 99 0.242 0.231 0.226 0.258 1.240 0.754 0.993 0.189 0.257 0.120 0.036 0.023 0.380 11.97
Average 0.323 0.547 0.777 1.579 2.628 3.080 3.554 3.491 2.379 1.230 0.503 0.262 1.687 53.21(%) 1.6 2.8 3.8 7.9 13.2 14.0 17.9 17.0 12.0 6.0 2.5 1.3 100.0
Note: 1) Sep.1955-Aug.1984: Estimated based on correlation between Ain Timedrine and Dar Harma stations and basin area ratio.2) Sep.1984-Apr.1999: Estimated from Dar Hamra records by basin area ratio.3) May-Aug.1999: Estimated based on average runoff pattern at Dar Hamra from 1984/85 to 1997/98.
Table 7.1.4: Monthly Discharge at Azghar
T-28
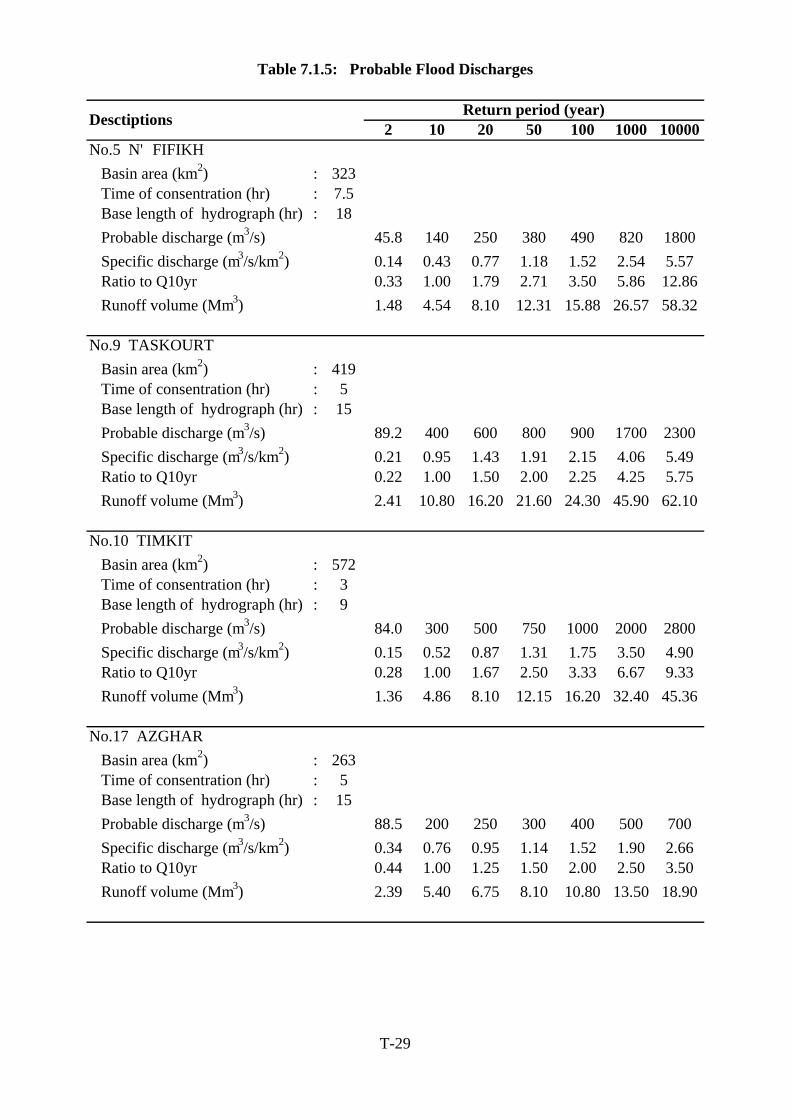
Table 7.1.5: Probable Flood Discharges
Return period (year)2 10 20 50 100 1000 10000
No.5 N'FIFIKH Basin area (km2) : 323 Time of consentration (hr) : 7.5 Base length of hydrograph (hr) : 18 Probable discharge (m3/s) 45.8 140 250 380 490 820 1800 Specific discharge (m3/s/km2) 0.14 0.43 0.77 1.18 1.52 2.54 5.57 Ratio to Q10yr 0.33 1.00 1.79 2.71 3.50 5.86 12.86 Runoff volume (Mm3) 1.48 4.54 8.10 12.31 15.88 26.57 58.32
No.9 TASKOURT Basin area (km2) : 419 Time of consentration (hr) : 5 Base length of hydrograph (hr) : 15 Probable discharge (m3/s) 89.2 400 600 800 900 1700 2300 Specific discharge (m3/s/km2) 0.21 0.95 1.43 1.91 2.15 4.06 5.49 Ratio to Q10yr 0.22 1.00 1.50 2.00 2.25 4.25 5.75 Runoff volume (Mm3) 2.41 10.80 16.20 21.60 24.30 45.90 62.10
No.10 TIMKIT Basin area (km2) : 572 Time of consentration (hr) : 3 Base length of hydrograph (hr) : 9 Probable discharge (m3/s) 84.0 300 500 750 1000 2000 2800 Specific discharge (m3/s/km2) 0.15 0.52 0.87 1.31 1.75 3.50 4.90 Ratio to Q10yr 0.28 1.00 1.67 2.50 3.33 6.67 9.33 Runoff volume (Mm3) 1.36 4.86 8.10 12.15 16.20 32.40 45.36
No.17 AZGHAR Basin area (km2) : 263 Time of consentration (hr) : 5 Base length of hydrograph (hr) : 15 Probable discharge (m3/s) 88.5 200 250 300 400 500 700 Specific discharge (m3/s/km2) 0.34 0.76 0.95 1.14 1.52 1.90 2.66 Ratio to Q10yr 0.44 1.00 1.25 1.50 2.00 2.50 3.50 Runoff volume (Mm3) 2.39 5.40 6.75 8.10 10.80 13.50 18.90
Desctiptions
T-29
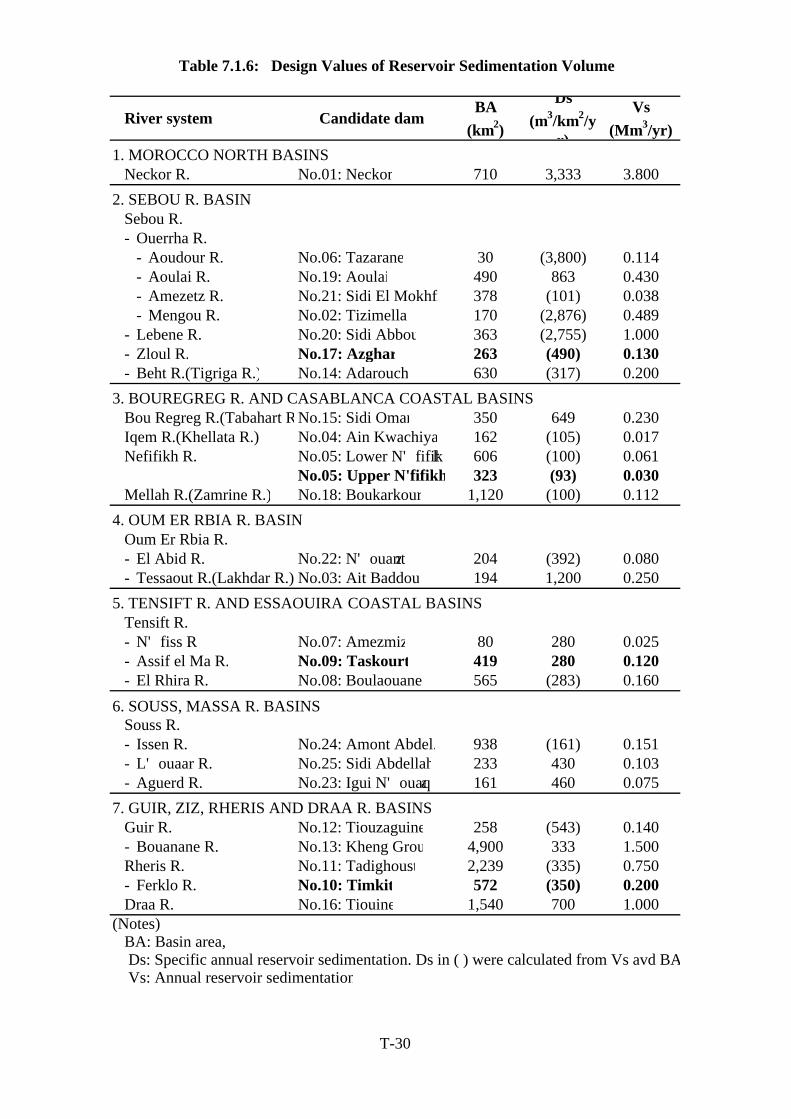
Table 7.1.6: Design Values of Reservoir Sedimentation Volume
River system Candidate damBA
(km2)
Ds(m3/km2/y
r)
Vs(Mm3/yr)
1. MOROCCO NORTH BASINSNeckor R. No.01: Neckor 710 3,333 3.800
2. SEBOU R. BASINSebou R. - Ouerrha R.
- Aoudour R. No.06: Tazarane 30 (3,800) 0.114- Aoulai R. No.19: Aoulai 490 863 0.430- Amezetz R. No.21: Sidi El Mokhfi 378 (101) 0.038- Mengou R. No.02: Tizimellal 170 (2,876) 0.489
- Lebene R. No.20: Sidi Abbou 363 (2,755) 1.000- Zloul R. No.17: Azghar 263 (490) 0.130- Beht R.(Tigriga R.) No.14: Adarouch 630 (317) 0.200
3. BOUREGREG R. AND CASABLANCA COASTAL BASINSBou Regreg R.(Tabahart RNo.15: Sidi Omar 350 649 0.230Iqem R.(Khellata R.) No.04: Ain Kwachiya 162 (105) 0.017Nefifikh R. No.05: Lower N'fifikh 606 (100) 0.061
No.05: Upper N'fifikh 323 (93) 0.030Mellah R.(Zamrine R.) No.18: Boukarkour 1,120 (100) 0.112
4. OUM ER RBIA R. BASINOum Er Rbia R.- El Abid R. No.22: N'ouantz 204 (392) 0.080- Tessaout R.(Lakhdar R.) No.03: Ait Baddou 194 1,200 0.250
5. TENSIFT R. AND ESSAOUIRA COASTAL BASINSTensift R.- N'fiss R. No.07: Amezmiz 80 280 0.025- Assif el Ma R. No.09: Taskourt 419 280 0.120- El Rhira R. No.08: Boulaouane 565 (283) 0.160
Souss R.- Issen R. No.24: Amont Abdel. 938 (161) 0.151- L'ouaar R. No.25: Sidi Abdellah 233 430 0.103- Aguerd R. No.23: Igui N'ouaqa 161 460 0.075
7. GUIR, ZIZ, RHERIS AND DRAA R. BASINSGuir R. No.12: Tiouzaguine 258 (543) 0.140- Bouanane R. No.13: Kheng Grou 4,900 333 1.500Rheris R. No.11: Tadighoust 2,239 (335) 0.750- Ferklo R. No.10: Timkit 572 (350) 0.200Draa R. No.16: Tiouine 1,540 700 1.000
(Notes) BA: Basin area, Ds: Specific annual reservoir sedimentation. Ds in ( ) were calculated from Vs avd BA Vs: Annual reservoir sedimentation
6. SOUSS, MASSA R. BASINS
T-30
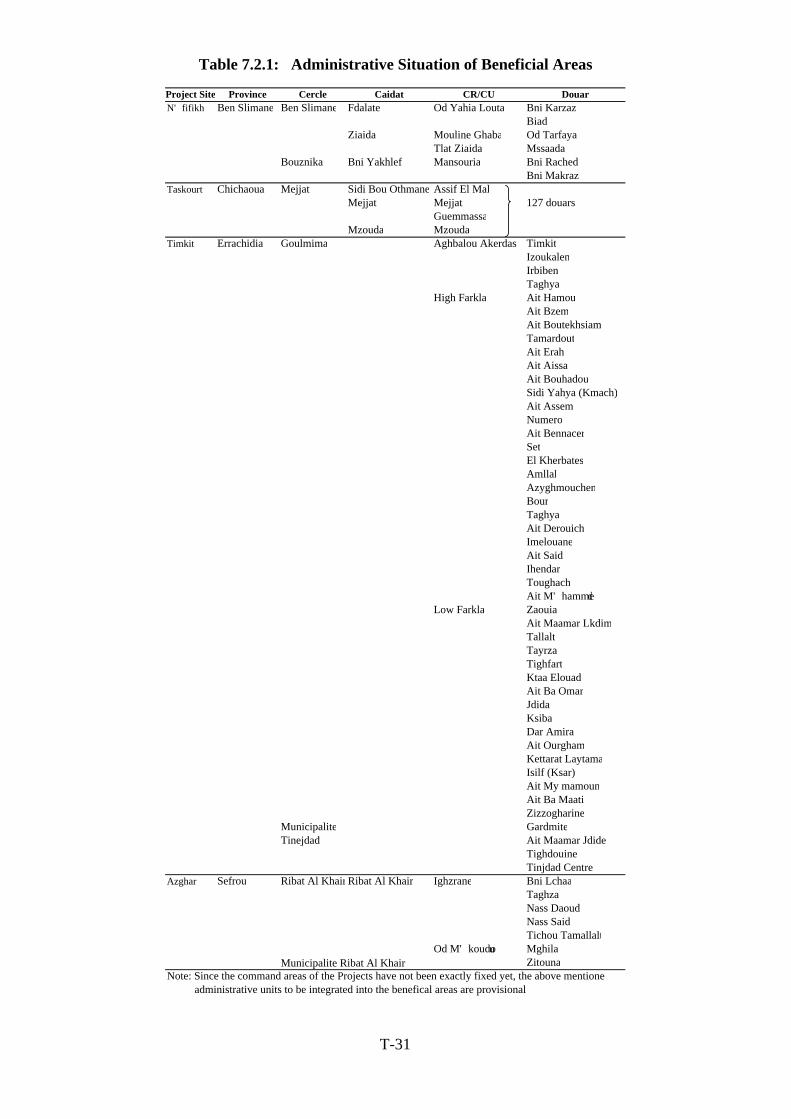
Table 7.2.1: Administrative Situation of Beneficial Areas
Project Site Province Cercle Caidat CR/CU DouarN'fifikh Ben Slimane Ben Slimane Fdalate Od Yahia Louta Bni Karzaz
BiadZiaida Mouline Ghaba Od Tarfaya
Tlat Ziaida MssaadaBouznika Bni Yakhlef Mansouria Bni Rached
Bni MakrazTaskourt Chichaoua Mejjat Sidi Bou Othmane Assif El Mal
Mejjat Mejjat 127 douarsGuemmassa
Mzouda MzoudaTimkit Errachidia Goulmima Aghbalou Akerdas Timkit
IzoukalenIrbibenTaghya
High Farkla Ait HamouAit BzemAit BoutekhsiamTamardoutAit ErahAit AissaAit BouhadouSidi Yahya (Kmach)Ait AssemNumeroAit BennacerSetEl KherbatesAmllalAzyghmouchenBourTaghyaAit DerouichImelouaneAit SaidIhendarToughachAit M'hammed
Low Farkla ZaouiaAit Maamar LkdimTallaltTayrzaTighfartKtaa ElouadAit Ba OmarJdidaKsibaDar AmiraAit OurghamKettarat LaytamaIsilf (Ksar)Ait My mamounAit Ba MaatiZizzogharine
Municipalite GardmiteTinejdad Ait Maamar Jdide
TighdouineTinjdad Centre
Azghar Sefrou Ribat Al Khair Ribat Al Khair Ighzrane Bni LchaaTaghzaNass DaoudNass SaidTichou Tamallalt
Od M'koudou MghilaZitouna
Note: Since the command areas of the Projects have not been exactly fixed yet, the above mentioned administrative units to be integrated into the benefical areas are provisional
Municipalite Ribat Al Khair
T-31
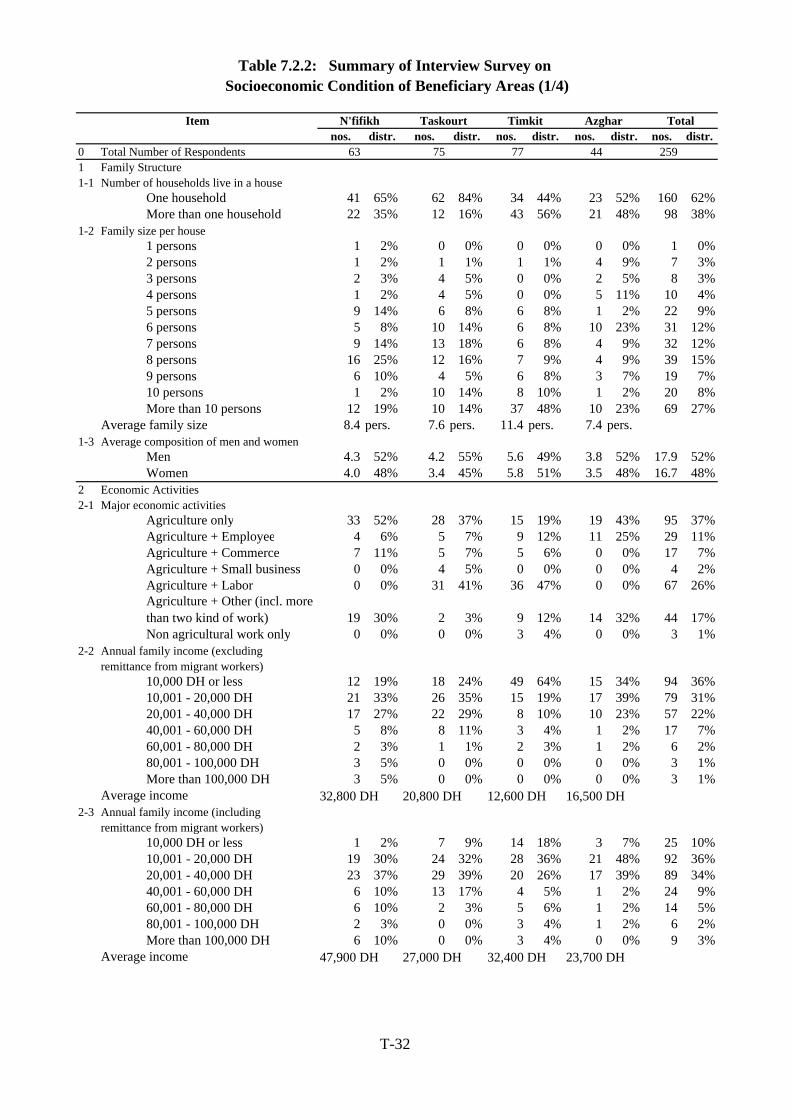
Table 7.2.2: Summary of Interview Survey on Socioeconomic Condition of Beneficiary Areas (1/4)
Item N'fifikh Taskourt Timkit Azghar Totalnos. distr. nos. distr. nos. distr. nos. distr. nos. distr.
0 Total Number of Respondents 63 75 77 44 2591 Family Structure1-1 Number of households live in a house
One household 41 65% 62 84% 34 44% 23 52% 160 62%More than one household 22 35% 12 16% 43 56% 21 48% 98 38%
1-2 Family size per house1 persons 1 2% 0 0% 0 0% 0 0% 1 0%2 persons 1 2% 1 1% 1 1% 4 9% 7 3%3 persons 2 3% 4 5% 0 0% 2 5% 8 3%4 persons 1 2% 4 5% 0 0% 5 11% 10 4%5 persons 9 14% 6 8% 6 8% 1 2% 22 9%6 persons 5 8% 10 14% 6 8% 10 23% 31 12%7 persons 9 14% 13 18% 6 8% 4 9% 32 12%8 persons 16 25% 12 16% 7 9% 4 9% 39 15%9 persons 6 10% 4 5% 6 8% 3 7% 19 7%10 persons 1 2% 10 14% 8 10% 1 2% 20 8%More than 10 persons 12 19% 10 14% 37 48% 10 23% 69 27%
Average family size 8.4 pers. 7.6 pers. 11.4 pers. 7.4 pers.1-3 Average composition of men and women
Men 4.3 52% 4.2 55% 5.6 49% 3.8 52% 17.9 52%Women 4.0 48% 3.4 45% 5.8 51% 3.5 48% 16.7 48%
2 Economic Activities2-1 Major economic activities
Agriculture only 33 52% 28 37% 15 19% 19 43% 95 37%Agriculture + Employee 4 6% 5 7% 9 12% 11 25% 29 11%Agriculture + Commerce 7 11% 5 7% 5 6% 0 0% 17 7%Agriculture + Small business 0 0% 4 5% 0 0% 0 0% 4 2%Agriculture + Labor 0 0% 31 41% 36 47% 0 0% 67 26%Agriculture + Other (incl. morethan two kind of work) 19 30% 2 3% 9 12% 14 32% 44 17%Non agricultural work only 0 0% 0 0% 3 4% 0 0% 3 1%
2-2 Annual family income (excludingremittance from migrant workers)
10,000 DH or less 12 19% 18 24% 49 64% 15 34% 94 36%10,001 - 20,000 DH 21 33% 26 35% 15 19% 17 39% 79 31%20,001 - 40,000 DH 17 27% 22 29% 8 10% 10 23% 57 22%40,001 - 60,000 DH 5 8% 8 11% 3 4% 1 2% 17 7%60,001 - 80,000 DH 2 3% 1 1% 2 3% 1 2% 6 2%80,001 - 100,000 DH 3 5% 0 0% 0 0% 0 0% 3 1%More than 100,000 DH 3 5% 0 0% 0 0% 0 0% 3 1%
Average income2-3 Annual family income (including
remittance from migrant workers)10,000 DH or less 1 2% 7 9% 14 18% 3 7% 25 10%10,001 - 20,000 DH 19 30% 24 32% 28 36% 21 48% 92 36%20,001 - 40,000 DH 23 37% 29 39% 20 26% 17 39% 89 34%40,001 - 60,000 DH 6 10% 13 17% 4 5% 1 2% 24 9%60,001 - 80,000 DH 6 10% 2 3% 5 6% 1 2% 14 5%80,001 - 100,000 DH 2 3% 0 0% 3 4% 1 2% 6 2%More than 100,000 DH 6 10% 0 0% 3 4% 0 0% 9 3%
Average income
32,800 DH 20,800 DH 12,600 DH 16,500 DH
47,900 DH 27,000 DH 32,400 DH 23,700 DH
T-32
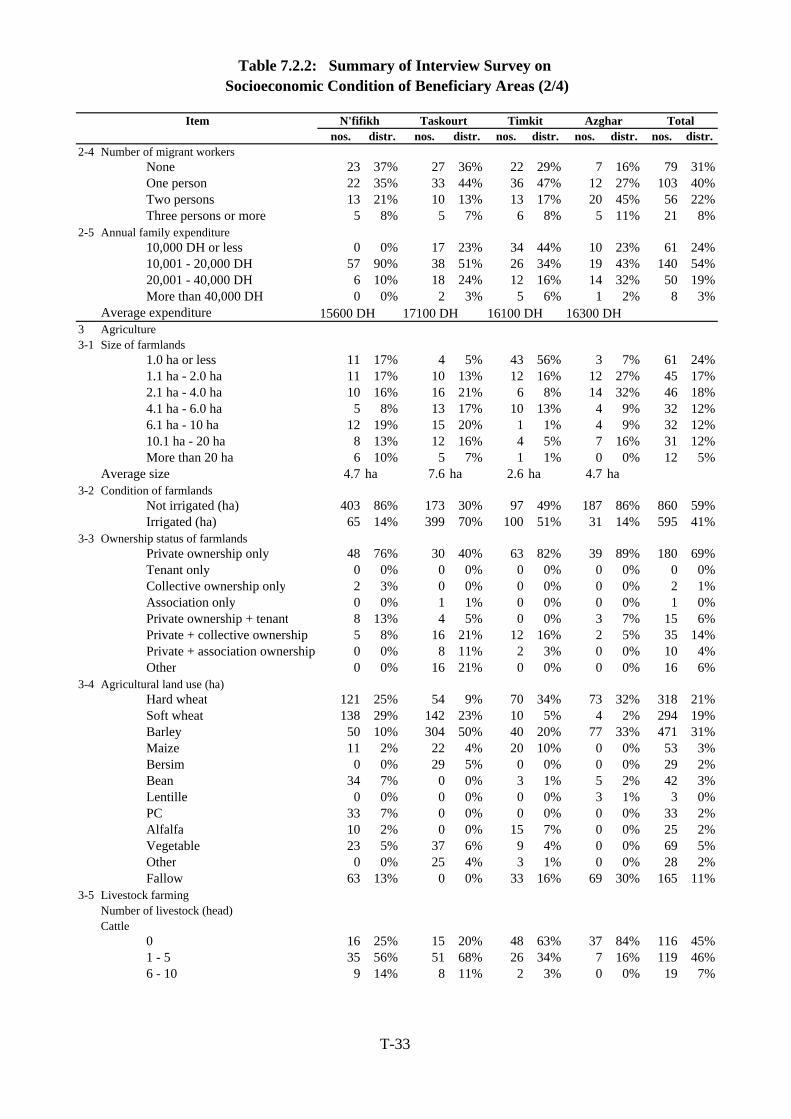
Table 7.2.2: Summary of Interview Survey on Socioeconomic Condition of Beneficiary Areas (2/4)
Item N'fifikh Taskourt Timkit Azghar Totalnos. distr. nos. distr. nos. distr. nos. distr. nos. distr.
2-4 Number of migrant workersNone 23 37% 27 36% 22 29% 7 16% 79 31%One person 22 35% 33 44% 36 47% 12 27% 103 40%Two persons 13 21% 10 13% 13 17% 20 45% 56 22%Three persons or more 5 8% 5 7% 6 8% 5 11% 21 8%
2-5 Annual family expenditure10,000 DH or less 0 0% 17 23% 34 44% 10 23% 61 24%10,001 - 20,000 DH 57 90% 38 51% 26 34% 19 43% 140 54%20,001 - 40,000 DH 6 10% 18 24% 12 16% 14 32% 50 19%More than 40,000 DH 0 0% 2 3% 5 6% 1 2% 8 3%
Average expenditure3 Agriculture3-1 Size of farmlands
1.0 ha or less 11 17% 4 5% 43 56% 3 7% 61 24%1.1 ha - 2.0 ha 11 17% 10 13% 12 16% 12 27% 45 17%2.1 ha - 4.0 ha 10 16% 16 21% 6 8% 14 32% 46 18%4.1 ha - 6.0 ha 5 8% 13 17% 10 13% 4 9% 32 12%6.1 ha - 10 ha 12 19% 15 20% 1 1% 4 9% 32 12%10.1 ha - 20 ha 8 13% 12 16% 4 5% 7 16% 31 12%More than 20 ha 6 10% 5 7% 1 1% 0 0% 12 5%
Average size 4.7 ha 7.6 ha 2.6 ha 4.7 ha3-2 Condition of farmlands
Not irrigated (ha) 403 86% 173 30% 97 49% 187 86% 860 59%Irrigated (ha) 65 14% 399 70% 100 51% 31 14% 595 41%
3-3 Ownership status of farmlandsPrivate ownership only 48 76% 30 40% 63 82% 39 89% 180 69%Tenant only 0 0% 0 0% 0 0% 0 0% 0 0%Collective ownership only 2 3% 0 0% 0 0% 0 0% 2 1%Association only 0 0% 1 1% 0 0% 0 0% 1 0%Private ownership + tenant 8 13% 4 5% 0 0% 3 7% 15 6%Private + collective ownership 5 8% 16 21% 12 16% 2 5% 35 14%Private + association ownership 0 0% 8 11% 2 3% 0 0% 10 4%Other 0 0% 16 21% 0 0% 0 0% 16 6%
3-4 Agricultural land use (ha)Hard wheat 121 25% 54 9% 70 34% 73 32% 318 21%Soft wheat 138 29% 142 23% 10 5% 4 2% 294 19%Barley 50 10% 304 50% 40 20% 77 33% 471 31%Maize 11 2% 22 4% 20 10% 0 0% 53 3%Bersim 0 0% 29 5% 0 0% 0 0% 29 2%Bean 34 7% 0 0% 3 1% 5 2% 42 3%Lentille 0 0% 0 0% 0 0% 3 1% 3 0%PC 33 7% 0 0% 0 0% 0 0% 33 2%Alfalfa 10 2% 0 0% 15 7% 0 0% 25 2%Vegetable 23 5% 37 6% 9 4% 0 0% 69 5%Other 0 0% 25 4% 3 1% 0 0% 28 2%Fallow 63 13% 0 0% 33 16% 69 30% 165 11%
3-5 Livestock farmingNumber of livestock (head)Cattle
0 16 25% 15 20% 48 63% 37 84% 116 45%1 - 5 35 56% 51 68% 26 34% 7 16% 119 46%6 - 10 9 14% 8 11% 2 3% 0 0% 19 7%
15600 DH 17100 DH 16100 DH 16300 DH
T-33
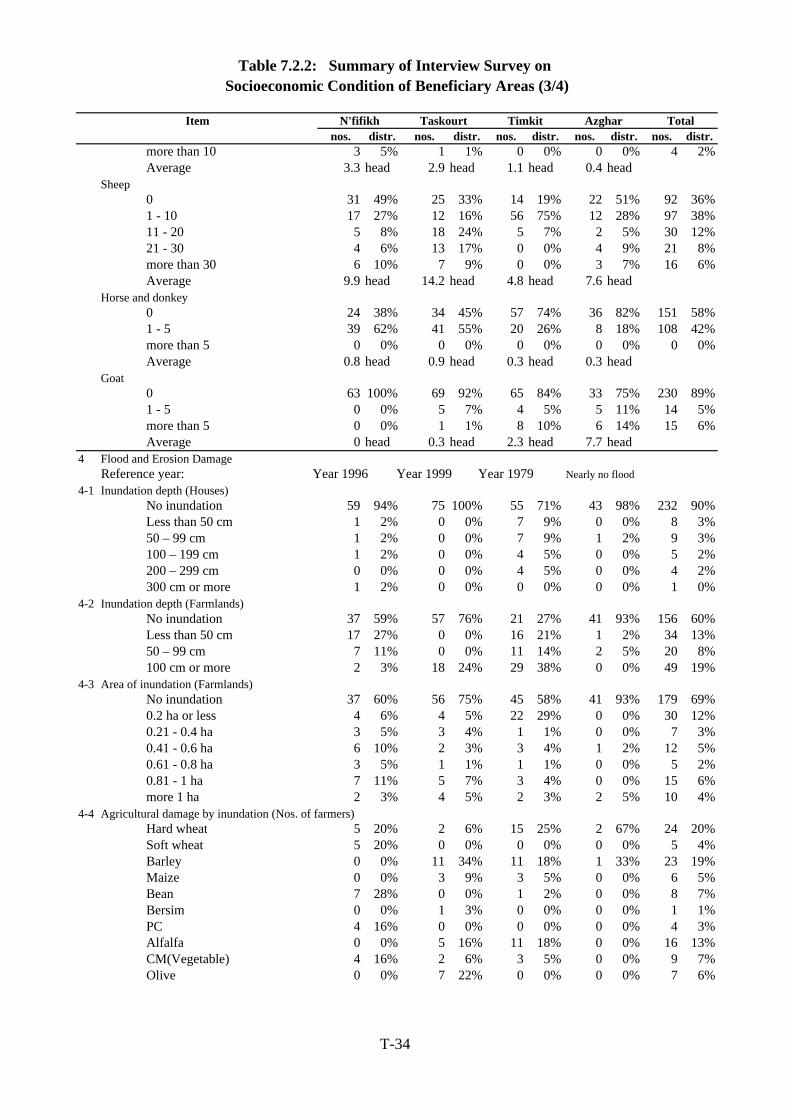
Table 7.2.2: Summary of Interview Survey on Socioeconomic Condition of Beneficiary Areas (3/4)
Item N'fifikh Taskourt Timkit Azghar Totalnos. distr. nos. distr. nos. distr. nos. distr. nos. distr.
more than 10 3 5% 1 1% 0 0% 0 0% 4 2%Average 3.3 head 2.9 head 1.1 head 0.4 head
Sheep0 31 49% 25 33% 14 19% 22 51% 92 36%1 - 10 17 27% 12 16% 56 75% 12 28% 97 38%11 - 20 5 8% 18 24% 5 7% 2 5% 30 12%21 - 30 4 6% 13 17% 0 0% 4 9% 21 8%more than 30 6 10% 7 9% 0 0% 3 7% 16 6%Average 9.9 head 14.2 head 4.8 head 7.6 head
Horse and donkey0 24 38% 34 45% 57 74% 36 82% 151 58%1 - 5 39 62% 41 55% 20 26% 8 18% 108 42%more than 5 0 0% 0 0% 0 0% 0 0% 0 0%Average 0.8 head 0.9 head 0.3 head 0.3 head
Goat0 63 100% 69 92% 65 84% 33 75% 230 89%1 - 5 0 0% 5 7% 4 5% 5 11% 14 5%more than 5 0 0% 1 1% 8 10% 6 14% 15 6%Average 0 head 0.3 head 2.3 head 7.7 head
4 Flood and Erosion DamageReference year: Year 1996 Year 1999 Year 1979 Nearly no flood
4-1 Inundation depth (Houses)No inundation 59 94% 75 100% 55 71% 43 98% 232 90%Less than 50 cm 1 2% 0 0% 7 9% 0 0% 8 3%50 – 99 cm 1 2% 0 0% 7 9% 1 2% 9 3%100 – 199 cm 1 2% 0 0% 4 5% 0 0% 5 2%200 – 299 cm 0 0% 0 0% 4 5% 0 0% 4 2%300 cm or more 1 2% 0 0% 0 0% 0 0% 1 0%
4-2 Inundation depth (Farmlands)No inundation 37 59% 57 76% 21 27% 41 93% 156 60%Less than 50 cm 17 27% 0 0% 16 21% 1 2% 34 13%50 – 99 cm 7 11% 0 0% 11 14% 2 5% 20 8%100 cm or more 2 3% 18 24% 29 38% 0 0% 49 19%
4-3 Area of inundation (Farmlands)No inundation 37 60% 56 75% 45 58% 41 93% 179 69%0.2 ha or less 4 6% 4 5% 22 29% 0 0% 30 12%0.21 - 0.4 ha 3 5% 3 4% 1 1% 0 0% 7 3%0.41 - 0.6 ha 6 10% 2 3% 3 4% 1 2% 12 5%0.61 - 0.8 ha 3 5% 1 1% 1 1% 0 0% 5 2%0.81 - 1 ha 7 11% 5 7% 3 4% 0 0% 15 6%more 1 ha 2 3% 4 5% 2 3% 2 5% 10 4%
4-4 Agricultural damage by inundation (Nos. of farmers)Hard wheat 5 20% 2 6% 15 25% 2 67% 24 20%Soft wheat 5 20% 0 0% 0 0% 0 0% 5 4%Barley 0 0% 11 34% 11 18% 1 33% 23 19%Maize 0 0% 3 9% 3 5% 0 0% 6 5%Bean 7 28% 0 0% 1 2% 0 0% 8 7%Bersim 0 0% 1 3% 0 0% 0 0% 1 1%PC 4 16% 0 0% 0 0% 0 0% 4 3%Alfalfa 0 0% 5 16% 11 18% 0 0% 16 13%CM(Vegetable) 4 16% 2 6% 3 5% 0 0% 9 7%Olive 0 0% 7 22% 0 0% 0 0% 7 6%
T-34
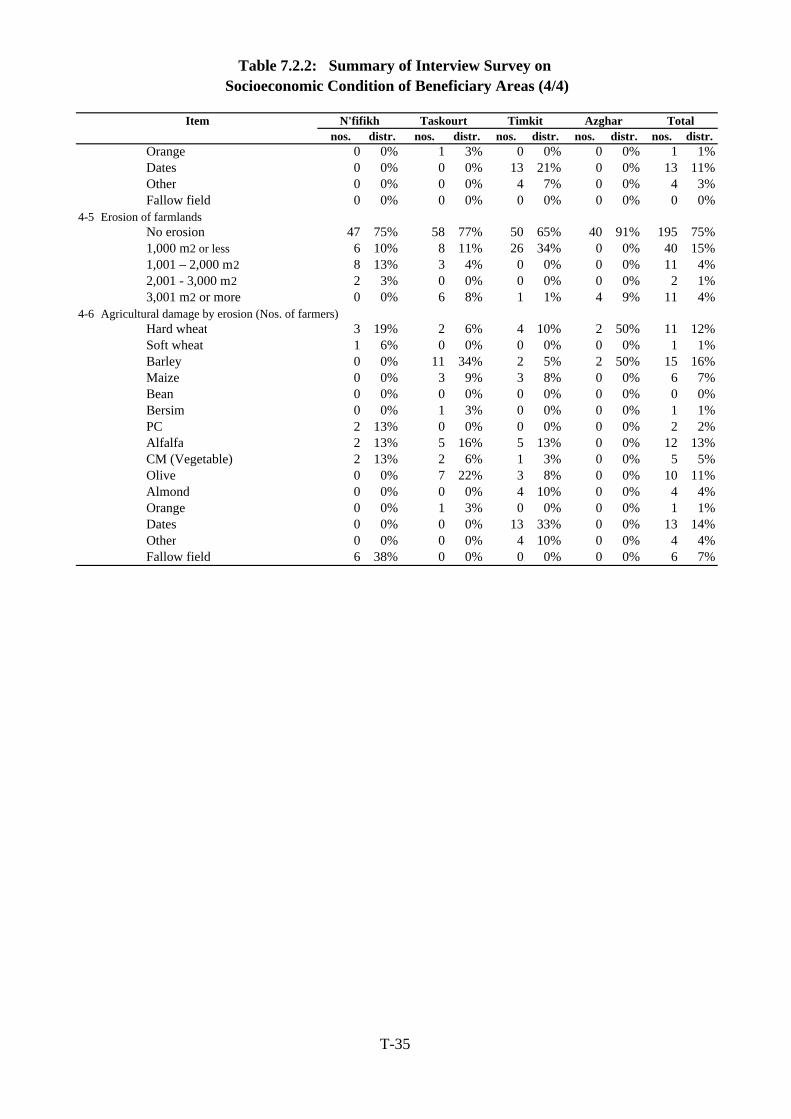
Table 7.2.2: Summary of Interview Survey on Socioeconomic Condition of Beneficiary Areas (4/4)
Item N'fifikh Taskourt Timkit Azghar Totalnos. distr. nos. distr. nos. distr. nos. distr. nos. distr.
Orange 0 0% 1 3% 0 0% 0 0% 1 1%Dates 0 0% 0 0% 13 21% 0 0% 13 11%Other 0 0% 0 0% 4 7% 0 0% 4 3%Fallow field 0 0% 0 0% 0 0% 0 0% 0 0%
4-5 Erosion of farmlandsNo erosion 47 75% 58 77% 50 65% 40 91% 195 75%1,000 m2 or less 6 10% 8 11% 26 34% 0 0% 40 15%1,001 – 2,000 m2 8 13% 3 4% 0 0% 0 0% 11 4%2,001 - 3,000 m2 2 3% 0 0% 0 0% 0 0% 2 1%3,001 m2 or more 0 0% 6 8% 1 1% 4 9% 11 4%
4-6 Agricultural damage by erosion (Nos. of farmers)Hard wheat 3 19% 2 6% 4 10% 2 50% 11 12%Soft wheat 1 6% 0 0% 0 0% 0 0% 1 1%Barley 0 0% 11 34% 2 5% 2 50% 15 16%Maize 0 0% 3 9% 3 8% 0 0% 6 7%Bean 0 0% 0 0% 0 0% 0 0% 0 0%Bersim 0 0% 1 3% 0 0% 0 0% 1 1%PC 2 13% 0 0% 0 0% 0 0% 2 2%Alfalfa 2 13% 5 16% 5 13% 0 0% 12 13%CM (Vegetable) 2 13% 2 6% 1 3% 0 0% 5 5%Olive 0 0% 7 22% 3 8% 0 0% 10 11%Almond 0 0% 0 0% 4 10% 0 0% 4 4%Orange 0 0% 1 3% 0 0% 0 0% 1 1%Dates 0 0% 0 0% 13 33% 0 0% 13 14%Other 0 0% 0 0% 4 10% 0 0% 4 4%Fallow field 6 38% 0 0% 0 0% 0 0% 6 7%
T-35
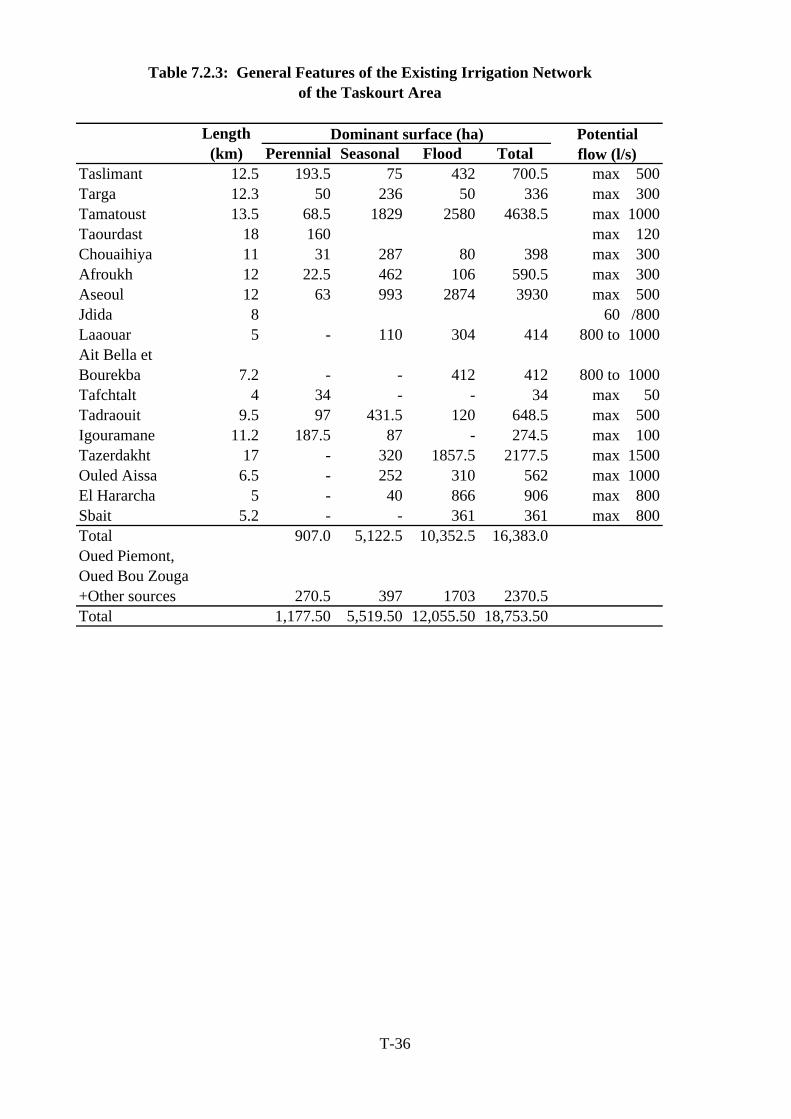
Length(km) Perennial Seasonal Flood Total
Taslimant 12.5 193.5 75 432 700.5 max 500Targa 12.3 50 236 50 336 max 300Tamatoust 13.5 68.5 1829 2580 4638.5 max 1000Taourdast 18 160 max 120Chouaihiya 11 31 287 80 398 max 300Afroukh 12 22.5 462 106 590.5 max 300Aseoul 12 63 993 2874 3930 max 500Jdida 8 60 /800Laaouar 5 - 110 304 414 800 to 1000Ait Bella etBourekba 7.2 - - 412 412 800 to 1000Tafchtalt 4 34 - - 34 max 50Tadraouit 9.5 97 431.5 120 648.5 max 500Igouramane 11.2 187.5 87 - 274.5 max 100Tazerdakht 17 - 320 1857.5 2177.5 max 1500Ouled Aissa 6.5 - 252 310 562 max 1000El Hararcha 5 - 40 866 906 max 800Sbait 5.2 - - 361 361 max 800Total 907.0 5,122.5 10,352.5 16,383.0Oued Piemont,Oued Bou Zouga+Other sources 270.5 397 1703 2370.5Total 1,177.50 5,519.50 12,055.50 18,753.50
Table 7.2.3: General Features of the Existing Irrigation Networkof the Taskourt Area
Potentialflow (l/s)
Dominant surface (ha)
T-36
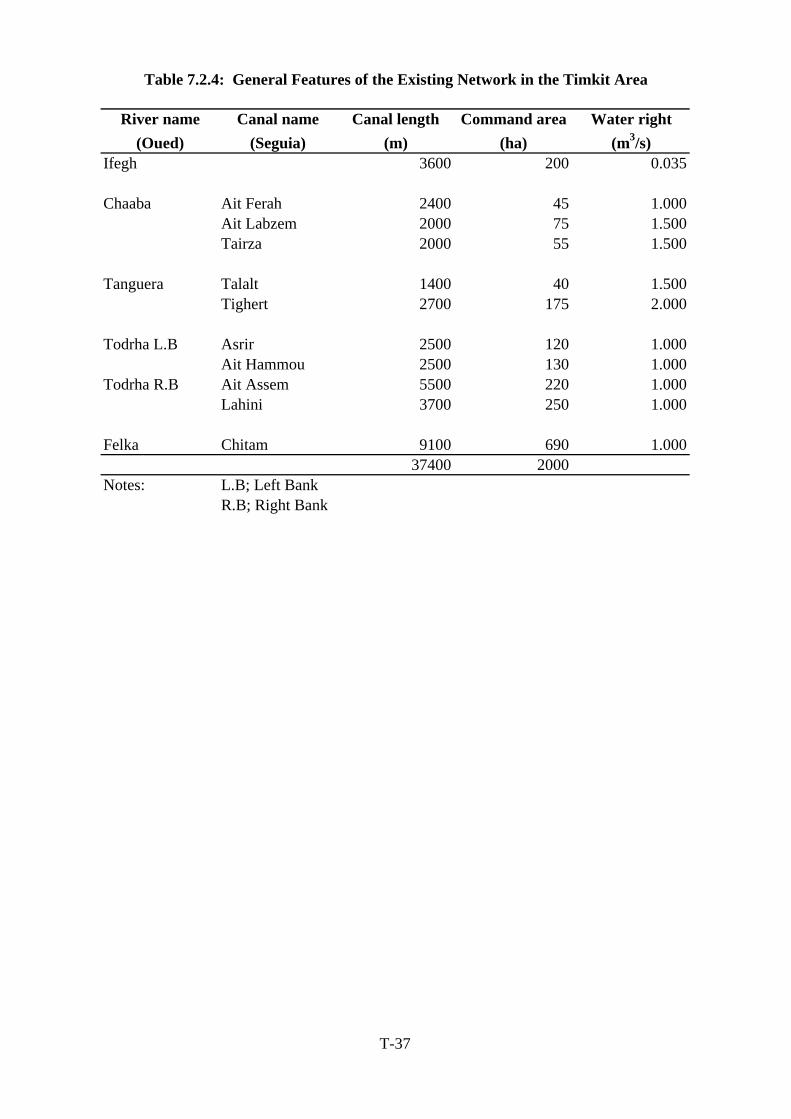
River name Canal name Canal length Command area Water right(Oued) (Seguia) (m) (ha) (m3/s)
Ifegh 3600 200 0.035
Chaaba Ait Ferah 2400 45 1.000Ait Labzem 2000 75 1.500Tairza 2000 55 1.500
Tanguera Talalt 1400 40 1.500Tighert 2700 175 2.000
Todrha L.B Asrir 2500 120 1.000Ait Hammou 2500 130 1.000
Todrha R.B Ait Assem 5500 220 1.000Lahini 3700 250 1.000
Felka Chitam 9100 690 1.00037400 2000
Notes: L.B; Left BankR.B; Right Bank
Table 7.2.4: General Features of the Existing Network in the Timkit Area
T-37
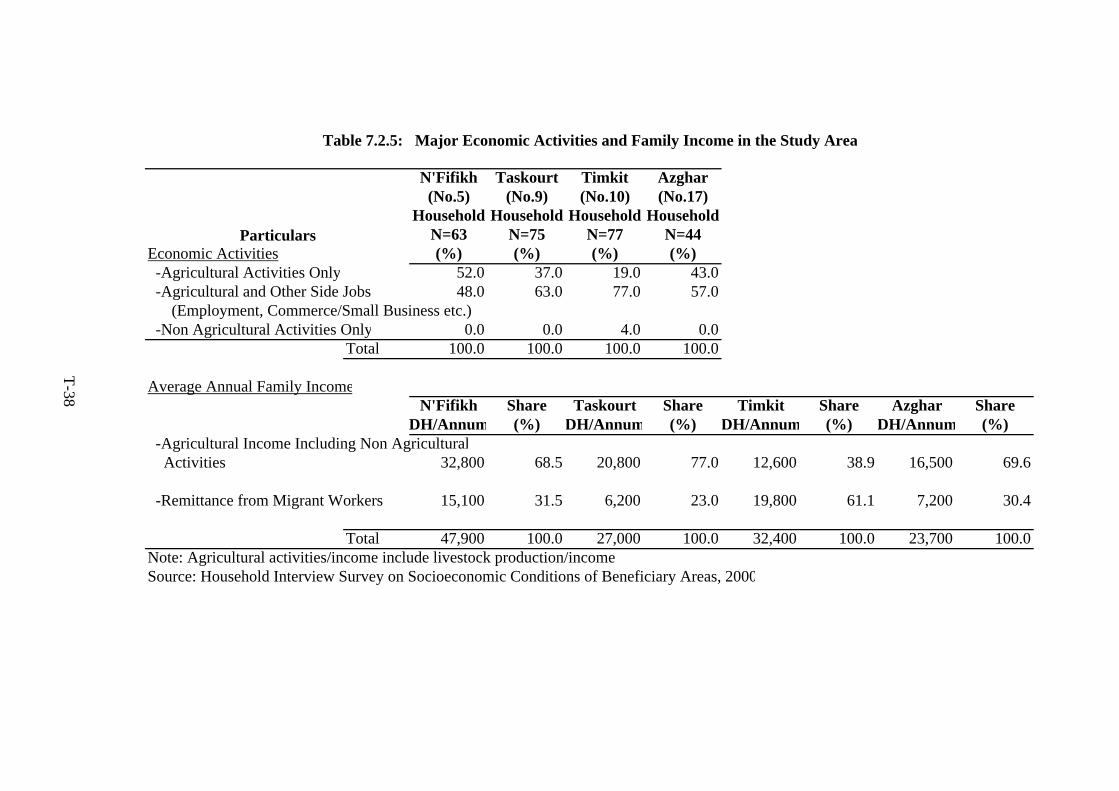
N'Fifikh Taskourt Timkit Azghar(No.5) (No.9) (No.10) (No.17)
Household Household Household HouseholdN=63 N=75 N=77 N=44
Economic Activities (%) (%) (%) (%) -Agricultural Activities Only 52.0 37.0 19.0 43.0 -Agricultural and Other Side Jobs 48.0 63.0 77.0 57.0 (Employment, Commerce/Small Business etc.) -Non Agricultural Activities Only 0.0 0.0 4.0 0.0
Total 100.0 100.0 100.0 100.0
Average Annual Family IncomeN'Fifikh Share Taskourt Share Timkit Share Azghar Share
DH/Annum (%) DH/Annum (%) DH/Annum (%) DH/Annum (%) -Agricultural Income Including Non Agricultural Activities 32,800 68.5 20,800 77.0 12,600 38.9 16,500 69.6
-Remittance from Migrant Workers 15,100 31.5 6,200 23.0 19,800 61.1 7,200 30.4
Total 47,900 100.0 27,000 100.0 32,400 100.0 23,700 100.0Note: Agricultural activities/income include livestock production/incomeSource: Household Interview Survey on Socioeconomic Conditions of Beneficiary Areas, 2000
Particulars
Table 7.2.5: Major Economic Activities and Family Income in the Study Area
T-38
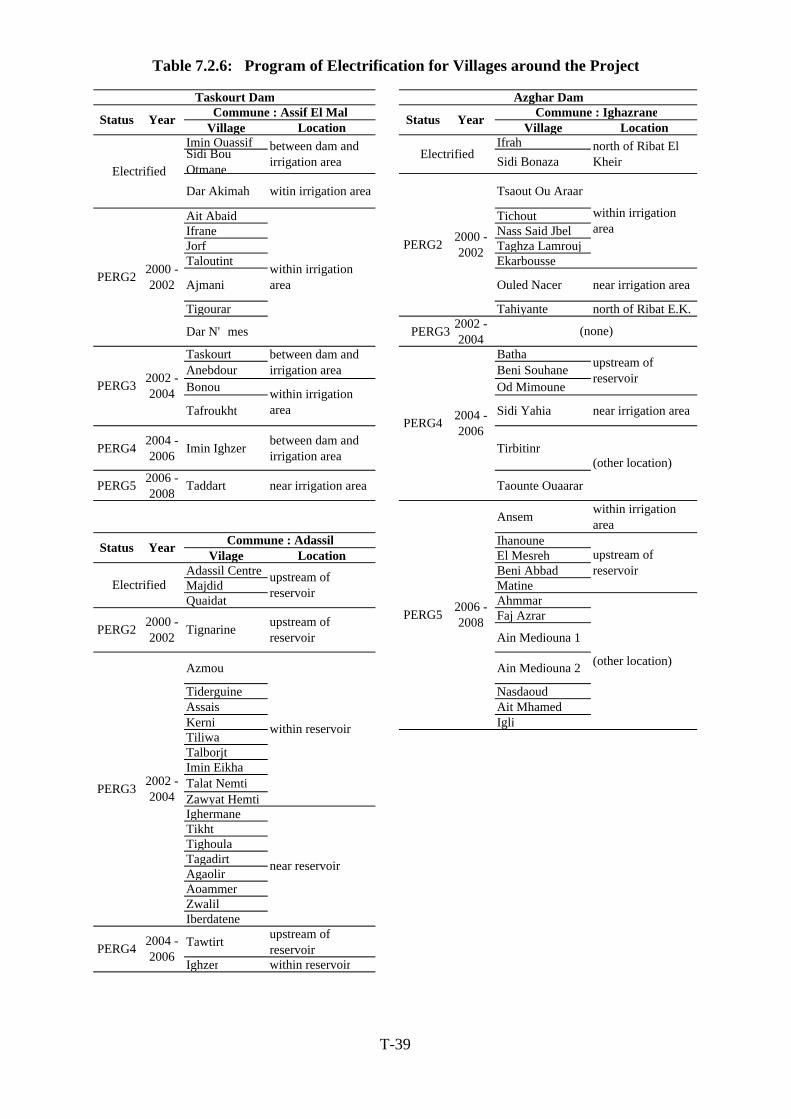
Village Location Village LocationImin Ouassif IfrahSidi BouOtmane Sidi Bonaza
Dar Akimah witin irrigation area Tsaout Ou Araar
Ait Abaid TichoutIfrane Nass Said JbelJorf Taghza LamroujTaloutint Ekarbousse
Ajmani Ouled Nacer near irrigation area
Tigourar Tahiyante north of Ribat E.K.
Dar N'mes PERG3 2002 -2004
Taskourt BathaAnebdour Beni SouhaneBonou Od Mimoune
Tafroukht Sidi Yahia near irrigation area
PERG4 2004 -2006 Imin Ighzer between dam and
irrigation area Tirbitinr
PERG5 2006 -2008 Taddart near irrigation area Taounte Ouaarar
Ansem within irrigationarea
IhanouneVilage Location El Mesreh
Adassil Centre Beni AbbadMajdid MatineQuaidat Ahmmar
Faj Azrar
Ain Mediouna 1
Azmou Ain Mediouna 2
Tiderguine NasdaoudAssais Ait MhamedKerni IgliTiliwaTalborjtImin EikhaTalat NemtiZawyat HemtiIghermaneTikhtTighoulaTagadirtAgaolirAoammerZwalilIberdatene
Tawtirt upstream ofreservoir
Ighzer within reservoir
Table 7.2.6: Program of Electrification for Villages around the Project
Taskourt Dam Azghar Dam
upstream ofreservoir
Electrified upstream ofreservoir
(other location)
2000 -2002
PERG5 2006 -2008
near reservoir
PERG3 2002 -2004
PERG4 2004 -2006
Status Year Commune : Adassil
within reservoir
PERG2 Tignarine upstream ofreservoir
(none)
PERG3 2002 -2004
between dam andirrigation area
PERG4 2004 -2006
upstream ofreservoir
within irrigationarea
(other location)
PERG2 2000 -2002
within irrigationarea
Year Commune : Ighazrane
Electrified
between dam andirrigation area Electrified north of Ribat El
Kheir
PERG2 2000 -2002
within irrigationarea
Status Year Commune : Assif El Mal Status
T-39
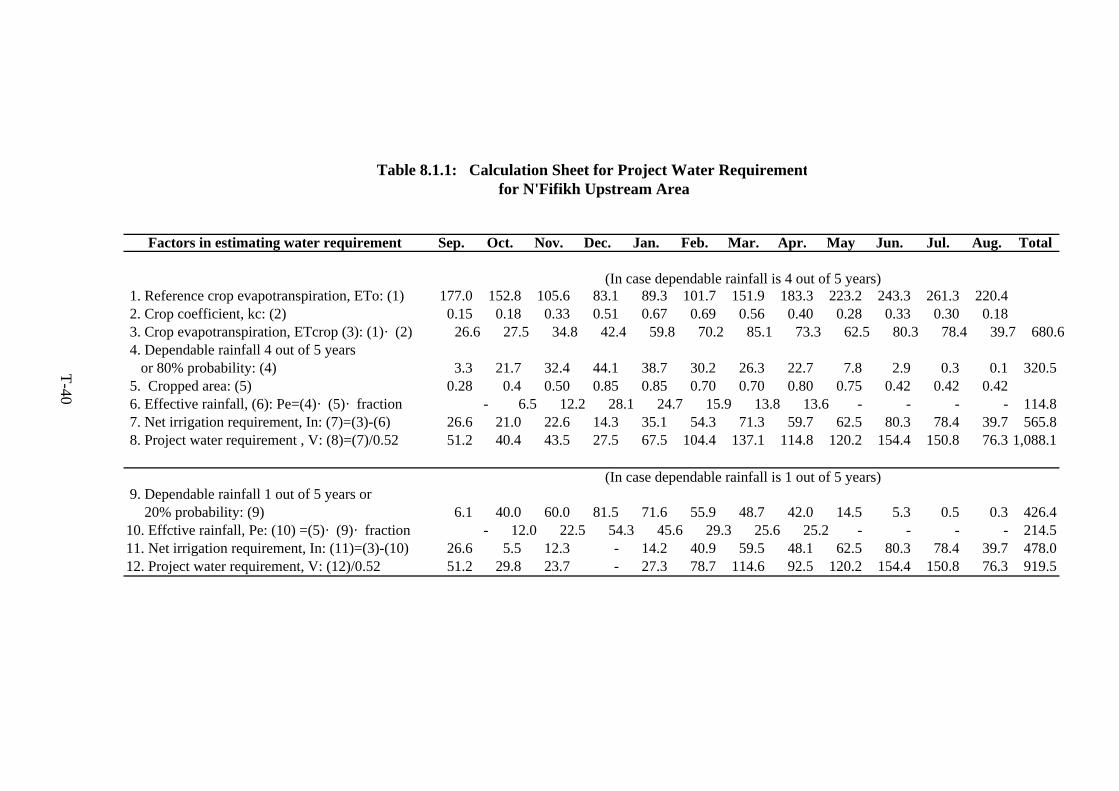
Factors in estimating water requirement Sep. Oct. Nov. Dec. Jan. Feb. Mar. Apr. May Jun. Jul. Aug. Total
1. Reference crop evapotranspiration, ETo: (1) 177.0 152.8 105.6 83.1 89.3 101.7 151.9 183.3 223.2 243.3 261.3 220.4 2. Crop coefficient, kc: (2) 0.15 0.18 0.33 0.51 0.67 0.69 0.56 0.40 0.28 0.33 0.30 0.18 3. Crop evapotranspiration, ETcrop (3): (1)·(2) 26.6 27.5 34.8 42.4 59.8 70.2 85.1 73.3 62.5 80.3 78.4 39.7 680.6 4. Dependable rainfall 4 out of 5 years or 80% probability: (4) 3.3 21.7 32.4 44.1 38.7 30.2 26.3 22.7 7.8 2.9 0.3 0.1 320.5 5. Cropped area: (5) 0.28 0.4 0.50 0.85 0.85 0.70 0.70 0.80 0.75 0.42 0.42 0.42 6. Effective rainfall, (6): Pe=(4)·(5)·fraction - 6.5 12.2 28.1 24.7 15.9 13.8 13.6 - - - - 114.8 7. Net irrigation requirement, In: (7)=(3)-(6) 26.6 21.0 22.6 14.3 35.1 54.3 71.3 59.7 62.5 80.3 78.4 39.7 565.8 8. Project water requirement , V: (8)=(7)/0.52 51.2 40.4 43.5 27.5 67.5 104.4 137.1 114.8 120.2 154.4 150.8 76.3 1,088.1
9. Dependable rainfall 1 out of 5 years or 20% probability: (9) 6.1 40.0 60.0 81.5 71.6 55.9 48.7 42.0 14.5 5.3 0.5 0.3 426.410. Effctive rainfall, Pe: (10) =(5)·(9)·fraction - 12.0 22.5 54.3 45.6 29.3 25.6 25.2 - - - - 214.511. Net irrigation requirement, In: (11)=(3)-(10) 26.6 5.5 12.3 - 14.2 40.9 59.5 48.1 62.5 80.3 78.4 39.7 478.012. Project water requirement, V: (12)/0.52 51.2 29.8 23.7 - 27.3 78.7 114.6 92.5 120.2 154.4 150.8 76.3 919.5
(In case dependable rainfall is 4 out of 5 years)
(In case dependable rainfall is 1 out of 5 years)
Table 8.1.1: Calculation Sheet for Project Water Requirementfor N'Fifikh Upstream Area
T-40
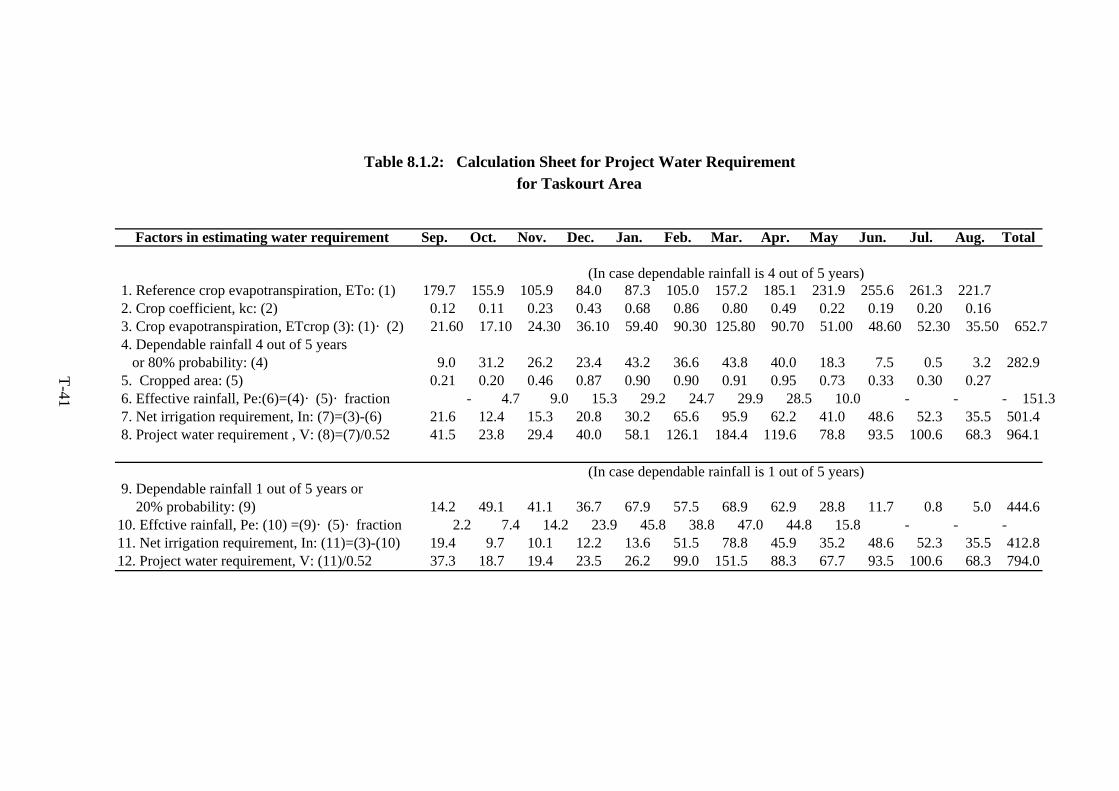
Factors in estimating water requirement Sep. Oct. Nov. Dec. Jan. Feb. Mar. Apr. May Jun. Jul. Aug. Total
1. Reference crop evapotranspiration, ETo: (1) 179.7 155.9 105.9 84.0 87.3 105.0 157.2 185.1 231.9 255.6 261.3 221.7 2. Crop coefficient, kc: (2) 0.12 0.11 0.23 0.43 0.68 0.86 0.80 0.49 0.22 0.19 0.20 0.16 3. Crop evapotranspiration, ETcrop (3): (1)·(2) 21.60 17.10 24.30 36.10 59.40 90.30 125.80 90.70 51.00 48.60 52.30 35.50 652.7 4. Dependable rainfall 4 out of 5 years or 80% probability: (4) 9.0 31.2 26.2 23.4 43.2 36.6 43.8 40.0 18.3 7.5 0.5 3.2 282.9 5. Cropped area: (5) 0.21 0.20 0.46 0.87 0.90 0.90 0.91 0.95 0.73 0.33 0.30 0.27 6. Effective rainfall, Pe:(6)=(4)·(5)·fraction - 4.7 9.0 15.3 29.2 24.7 29.9 28.5 10.0 - - - 151.3 7. Net irrigation requirement, In: (7)=(3)-(6) 21.6 12.4 15.3 20.8 30.2 65.6 95.9 62.2 41.0 48.6 52.3 35.5 501.4 8. Project water requirement , V: (8)=(7)/0.52 41.5 23.8 29.4 40.0 58.1 126.1 184.4 119.6 78.8 93.5 100.6 68.3 964.1
9. Dependable rainfall 1 out of 5 years or 20% probability: (9) 14.2 49.1 41.1 36.7 67.9 57.5 68.9 62.9 28.8 11.7 0.8 5.0 444.610. Effctive rainfall, Pe: (10) =(9)·(5)·fraction 2.2 7.4 14.2 23.9 45.8 38.8 47.0 44.8 15.8 - - -11. Net irrigation requirement, In: (11)=(3)-(10) 19.4 9.7 10.1 12.2 13.6 51.5 78.8 45.9 35.2 48.6 52.3 35.5 412.812. Project water requirement, V: (11)/0.52 37.3 18.7 19.4 23.5 26.2 99.0 151.5 88.3 67.7 93.5 100.6 68.3 794.0
(In case dependable rainfall is 4 out of 5 years)
(In case dependable rainfall is 1 out of 5 years)
Table 8.1.2: Calculation Sheet for Project Water Requirementfor Taskourt Area
T-41
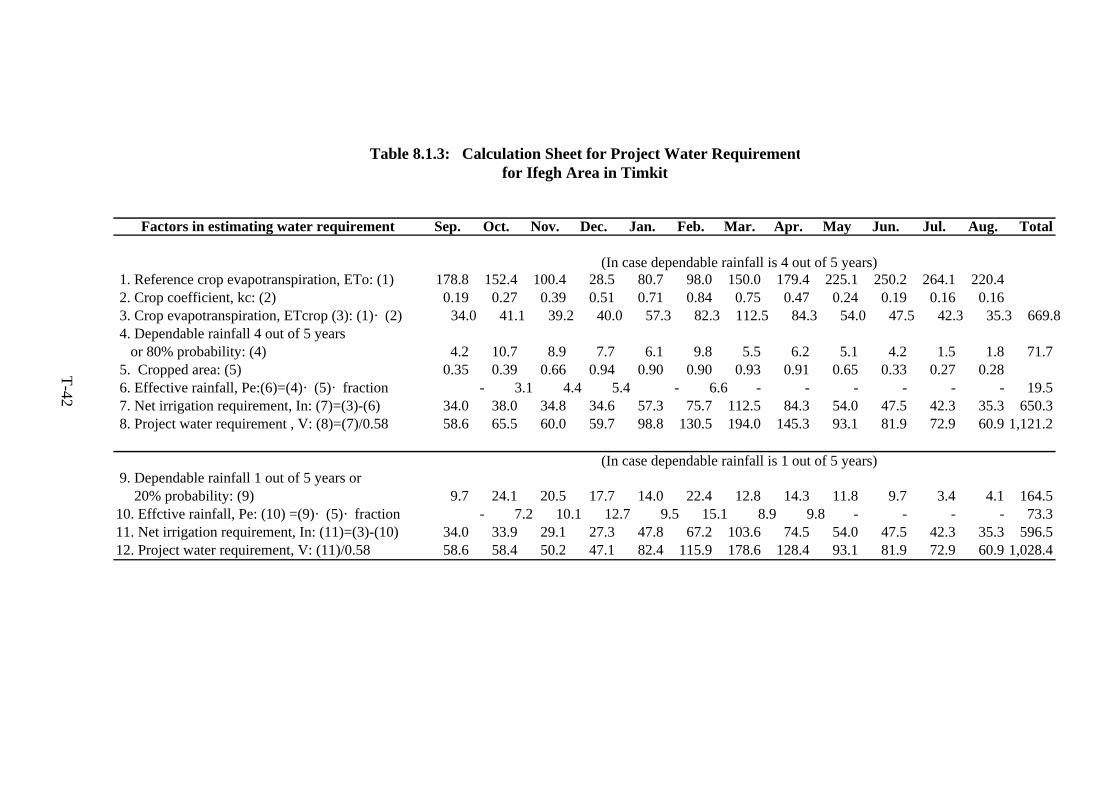
Factors in estimating water requirement Sep. Oct. Nov. Dec. Jan. Feb. Mar. Apr. May Jun. Jul. Aug. Total
1. Reference crop evapotranspiration, ETo: (1) 178.8 152.4 100.4 28.5 80.7 98.0 150.0 179.4 225.1 250.2 264.1 220.4 2. Crop coefficient, kc: (2) 0.19 0.27 0.39 0.51 0.71 0.84 0.75 0.47 0.24 0.19 0.16 0.16 3. Crop evapotranspiration, ETcrop (3): (1)·(2) 34.0 41.1 39.2 40.0 57.3 82.3 112.5 84.3 54.0 47.5 42.3 35.3 669.8 4. Dependable rainfall 4 out of 5 years or 80% probability: (4) 4.2 10.7 8.9 7.7 6.1 9.8 5.5 6.2 5.1 4.2 1.5 1.8 71.7 5. Cropped area: (5) 0.35 0.39 0.66 0.94 0.90 0.90 0.93 0.91 0.65 0.33 0.27 0.28 6. Effective rainfall, Pe:(6)=(4)·(5)·fraction - 3.1 4.4 5.4 - 6.6 - - - - - - 19.5 7. Net irrigation requirement, In: (7)=(3)-(6) 34.0 38.0 34.8 34.6 57.3 75.7 112.5 84.3 54.0 47.5 42.3 35.3 650.3 8. Project water requirement , V: (8)=(7)/0.58 58.6 65.5 60.0 59.7 98.8 130.5 194.0 145.3 93.1 81.9 72.9 60.9 1,121.2
9. Dependable rainfall 1 out of 5 years or 20% probability: (9) 9.7 24.1 20.5 17.7 14.0 22.4 12.8 14.3 11.8 9.7 3.4 4.1 164.510. Effctive rainfall, Pe: (10) =(9)·(5)·fraction - 7.2 10.1 12.7 9.5 15.1 8.9 9.8 - - - - 73.311. Net irrigation requirement, In: (11)=(3)-(10) 34.0 33.9 29.1 27.3 47.8 67.2 103.6 74.5 54.0 47.5 42.3 35.3 596.512. Project water requirement, V: (11)/0.58 58.6 58.4 50.2 47.1 82.4 115.9 178.6 128.4 93.1 81.9 72.9 60.9 1,028.4
(In case dependable rainfall is 4 out of 5 years)
(In case dependable rainfall is 1 out of 5 years)
Table 8.1.3: Calculation Sheet for Project Water Requirementfor Ifegh Area in Timkit
T-42
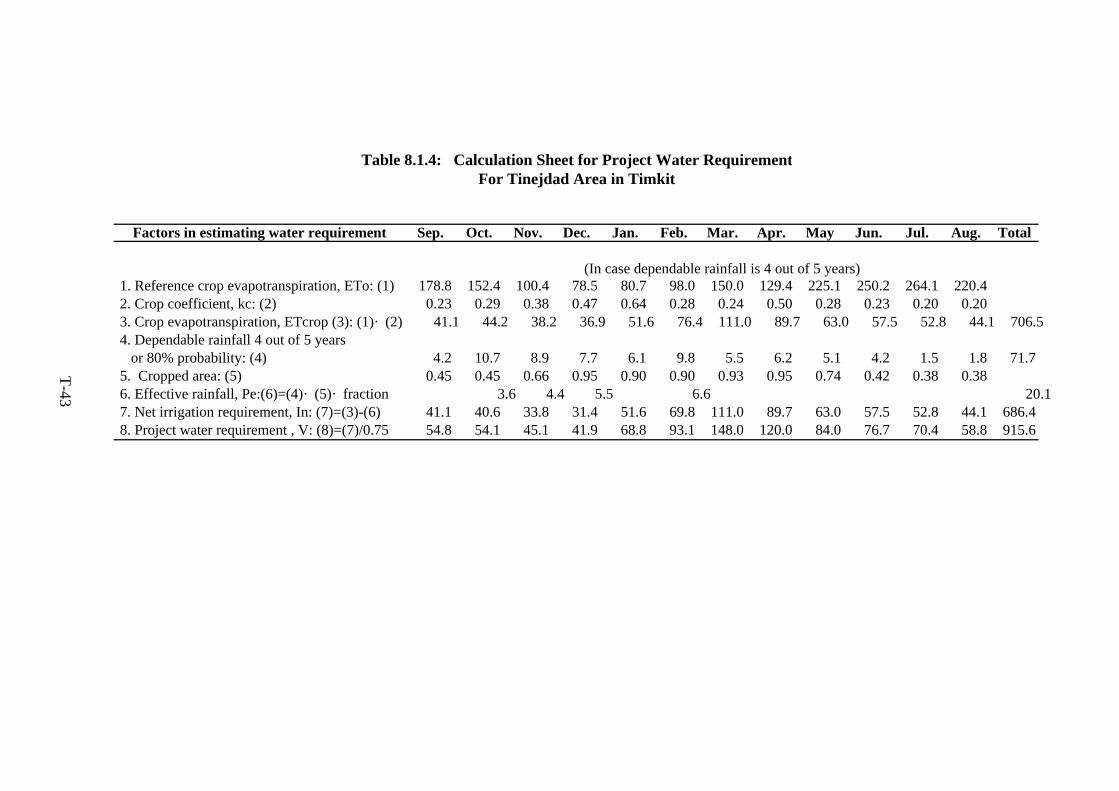
Factors in estimating water requirement Sep. Oct. Nov. Dec. Jan. Feb. Mar. Apr. May Jun. Jul. Aug. Total
1. Reference crop evapotranspiration, ETo: (1) 178.8 152.4 100.4 78.5 80.7 98.0 150.0 129.4 225.1 250.2 264.1 220.4 2. Crop coefficient, kc: (2) 0.23 0.29 0.38 0.47 0.64 0.28 0.24 0.50 0.28 0.23 0.20 0.20 3. Crop evapotranspiration, ETcrop (3): (1)·(2) 41.1 44.2 38.2 36.9 51.6 76.4 111.0 89.7 63.0 57.5 52.8 44.1 706.5 4. Dependable rainfall 4 out of 5 years or 80% probability: (4) 4.2 10.7 8.9 7.7 6.1 9.8 5.5 6.2 5.1 4.2 1.5 1.8 71.7 5. Cropped area: (5) 0.45 0.45 0.66 0.95 0.90 0.90 0.93 0.95 0.74 0.42 0.38 0.38 6. Effective rainfall, Pe:(6)=(4)·(5)·fraction 3.6 4.4 5.5 6.6 20.1 7. Net irrigation requirement, In: (7)=(3)-(6) 41.1 40.6 33.8 31.4 51.6 69.8 111.0 89.7 63.0 57.5 52.8 44.1 686.4 8. Project water requirement , V: (8)=(7)/0.75 54.8 54.1 45.1 41.9 68.8 93.1 148.0 120.0 84.0 76.7 70.4 58.8 915.6
(In case dependable rainfall is 4 out of 5 years)
Table 8.1.4: Calculation Sheet for Project Water RequirementFor Tinejdad Area in Timkit
T-43

Factors in estimating water requirement Sep. Oct. Nov. Dec. Jan. Feb. Mar. Apr. May Jun. Jul. Aug. Total
1. Reference crop evapotranspiration, ETo: (1) 178.8 152.4 100.4 78.5 80.7 98.0 150.0 129.4 225.1 250.2 264.1 220.40 2. Crop coefficient, kc: (2) 0.11 0.11 0.23 0.45 0.72 0.91 0.86 0.52 0.21 0.15 0.12 0.11 3. Crop evapotranspiration, ETcrop (3): (1)·(2) 19.7 16.8 23.1 35.3 58.1 89.2 129.0 93.3 47.3 37.5 31.7 24.2 605.2 4. Dependable rainfall 4 out of 5 years or 80% probability: (4) 4.2 10.7 8.9 7.7 6.1 9.8 5.5 6.2 5.1 4.2 1.5 1.8 5. Cropped area: (5) 0.20 0.20 0.48 0.92 0.95 0.95 0.98 1.00 0.74 0.28 0.23 0.20 6. Effective rainfall, Pe:(6)=(4)·(5)·fraction - 1.6 3.2 5.3 - 7.0 - - - - - - 17.1 7. Net irrigation requirement, In: (7)=(3)-(6) 19.7 15.2 19.9 30.0 58.1 82.2 129.0 93.3 47.3 37.5 31.7 24.2 588.1 8. Project water requirement , V: (8)=(7)/0.75 26.3 20.3 26.5 40.0 77.4 109.6 172.0 124.4 63.1 50.0 42.3 32.3 784.1
(In case dependable rainfall is 4 out of 5 years)
Table 8.1.5: Calculation Sheet for Project Water Requirementfor Chitam Area in Timkit
T-44
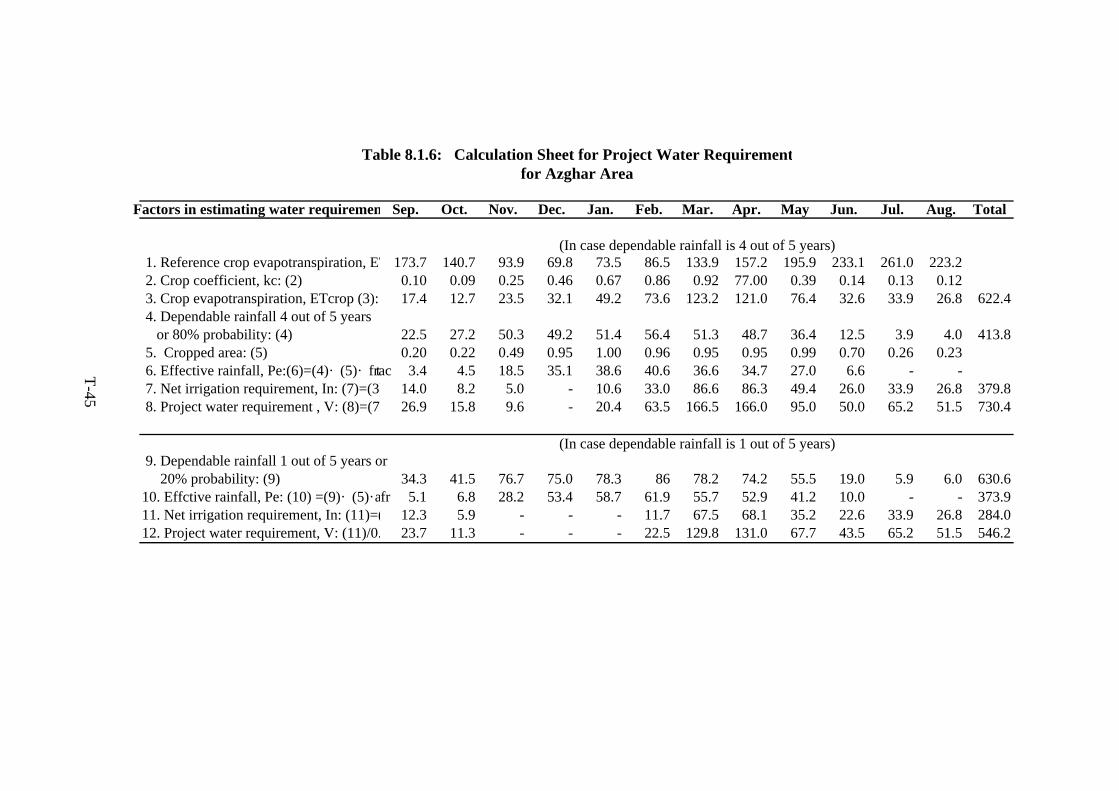
Factors in estimating water requiremen Sep. Oct. Nov. Dec. Jan. Feb. Mar. Apr. May Jun. Jul. Aug. Total
1. Reference crop evapotranspiration, ET 173.7 140.7 93.9 69.8 73.5 86.5 133.9 157.2 195.9 233.1 261.0 223.2 2. Crop coefficient, kc: (2) 0.10 0.09 0.25 0.46 0.67 0.86 0.92 77.00 0.39 0.14 0.13 0.12 3. Crop evapotranspiration, ETcrop (3): 17.4 12.7 23.5 32.1 49.2 73.6 123.2 121.0 76.4 32.6 33.9 26.8 622.4 4. Dependable rainfall 4 out of 5 years or 80% probability: (4) 22.5 27.2 50.3 49.2 51.4 56.4 51.3 48.7 36.4 12.5 3.9 4.0 413.8 5. Cropped area: (5) 0.20 0.22 0.49 0.95 1.00 0.96 0.95 0.95 0.99 0.70 0.26 0.23 6. Effective rainfall, Pe:(6)=(4)·(5)·fract 3.4 4.5 18.5 35.1 38.6 40.6 36.6 34.7 27.0 6.6 - - 7. Net irrigation requirement, In: (7)=(3) 14.0 8.2 5.0 - 10.6 33.0 86.6 86.3 49.4 26.0 33.9 26.8 379.8 8. Project water requirement , V: (8)=(7 26.9 15.8 9.6 - 20.4 63.5 166.5 166.0 95.0 50.0 65.2 51.5 730.4
9. Dependable rainfall 1 out of 5 years or 20% probability: (9) 34.3 41.5 76.7 75.0 78.3 86 78.2 74.2 55.5 19.0 5.9 6.0 630.610. Effctive rainfall, Pe: (10) =(9)·(5)·fra 5.1 6.8 28.2 53.4 58.7 61.9 55.7 52.9 41.2 10.0 - - 373.911. Net irrigation requirement, In: (11)=( 12.3 5.9 - - - 11.7 67.5 68.1 35.2 22.6 33.9 26.8 284.012. Project water requirement, V: (11)/0. 23.7 11.3 - - - 22.5 129.8 131.0 67.7 43.5 65.2 51.5 546.2
(In case dependable rainfall is 4 out of 5 years)
(In case dependable rainfall is 1 out of 5 years)
Table 8.1.6: Calculation Sheet for Project Water Requirementfor Azghar Area
T-45
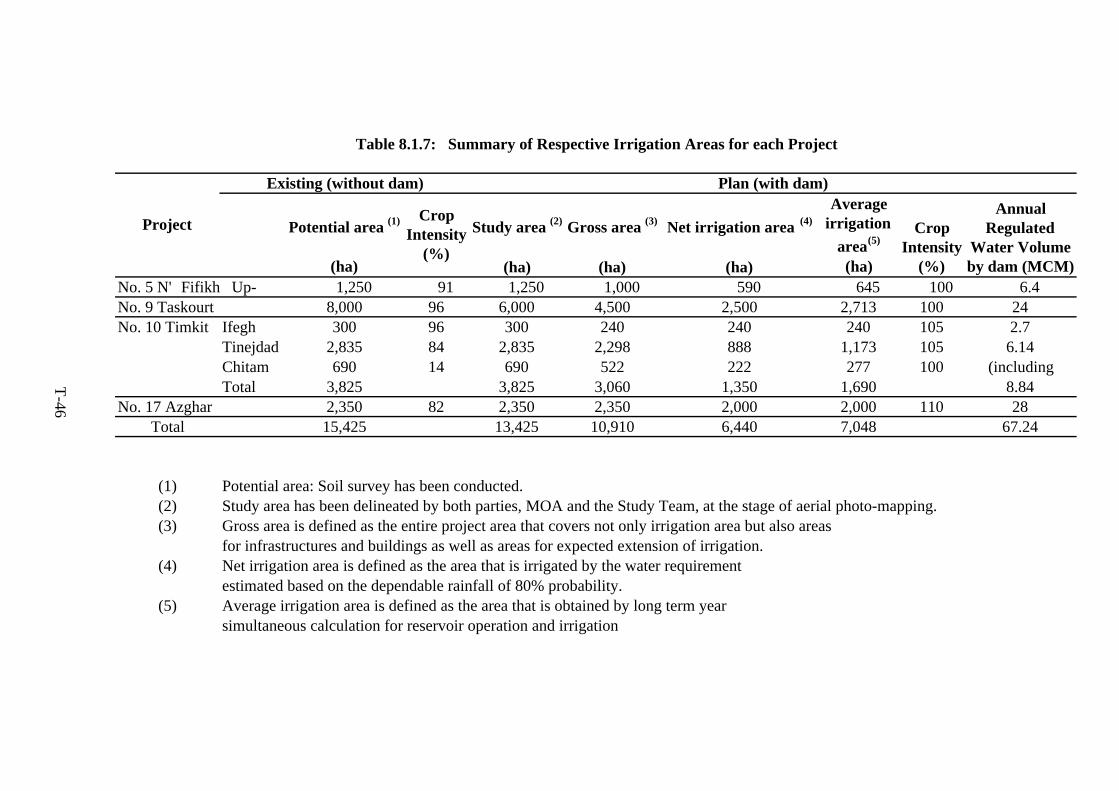
Potential area (1) Study area (2) Gross area (3) Net irrigation area (4)Average
irrigationarea(5)
(ha) (ha) (ha) (ha) (ha)No. 5 N'Fifikh Up- 1,250 91 1,250 1,000 590 645 100 6.4No. 9 Taskourt 8,000 96 6,000 4,500 2,500 2,713 100 24No. 10 Timkit Ifegh 300 96 300 240 240 240 105 2.7
Tinejdad 2,835 84 2,835 2,298 888 1,173 105 6.14Chitam 690 14 690 522 222 277 100 (includingTotal 3,825 3,825 3,060 1,350 1,690 8.84
No. 17 Azghar 2,350 82 2,350 2,350 2,000 2,000 110 28Total 15,425 13,425 10,910 6,440 7,048 67.24
(1) Potential area: Soil survey has been conducted.(2) Study area has been delineated by both parties, MOA and the Study Team, at the stage of aerial photo-mapping.(3) Gross area is defined as the entire project area that covers not only irrigation area but also areas
for infrastructures and buildings as well as areas for expected extension of irrigation.(4) Net irrigation area is defined as the area that is irrigated by the water requirement
estimated based on the dependable rainfall of 80% probability.(5) Average irrigation area is defined as the area that is obtained by long term year
simultaneous calculation for reservoir operation and irrigation
Table 8.1.7: Summary of Respective Irrigation Areas for each Project
Project
Existing (without dam) Plan (with dam)
CropIntensity
(%)Crop
Intensity(%)
AnnualRegulated
Water Volumeby dam (MCM)
T-46
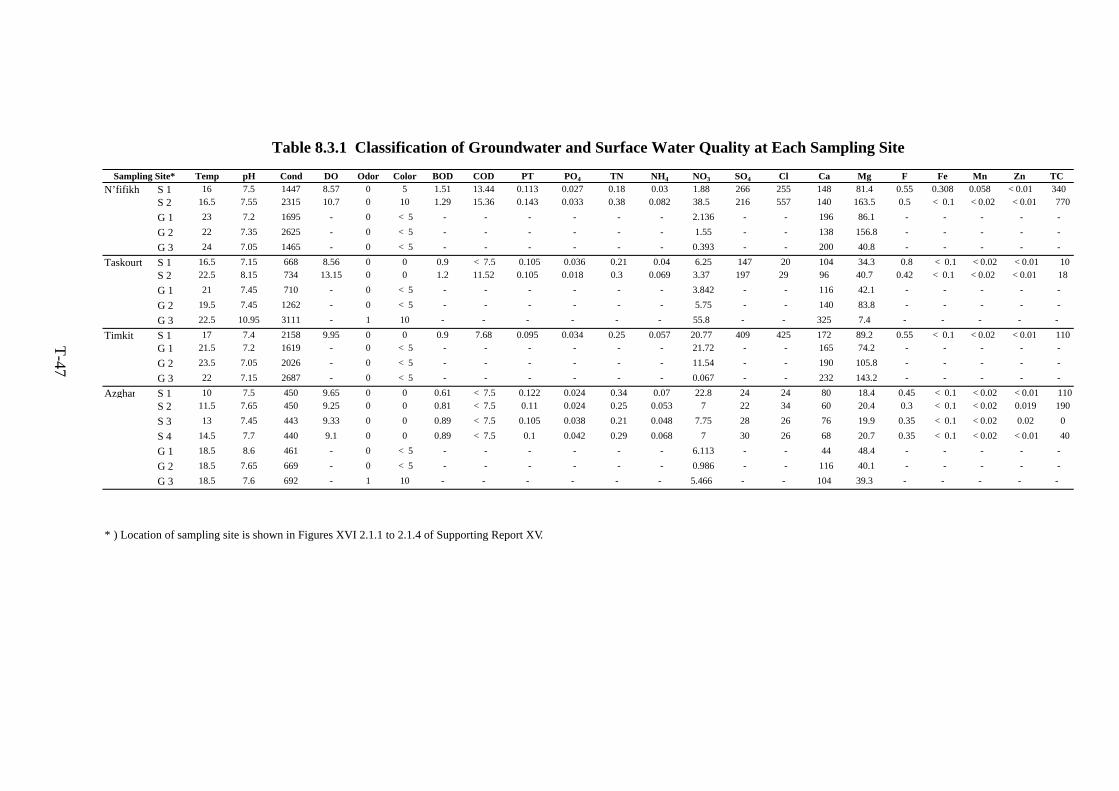
Temp pH Cond DO Odor Color BOD COD PT PO4 TN NH4 NO3 SO4 Cl Ca Mg F Fe Mn Zn TCN’fifikh S 1 16 7.5 1447 8.57 0 5 1.51 13.44 0.113 0.027 0.18 0.03 1.88 266 255 148 81.4 0.55 0.308 0.058 <0.01 340
S 2 16.5 7.55 2315 10.7 0 10 1.29 15.36 0.143 0.033 0.38 0.082 38.5 216 557 140 163.5 0.5 < 0.1 <0.02 <0.01 770
G 1 23 7.2 1695 - 0 < 5 - - - - - - 2.136 - - 196 86.1 - - - - -
G 2 22 7.35 2625 - 0 < 5 - - - - - - 1.55 - - 138 156.8 - - - - -
G 3 24 7.05 1465 - 0 < 5 - - - - - - 0.393 - - 200 40.8 - - - - -
Taskourt S 1 16.5 7.15 668 8.56 0 0 0.9 < 7.5 0.105 0.036 0.21 0.04 6.25 147 20 104 34.3 0.8 < 0.1 <0.02 <0.01 10S 2 22.5 8.15 734 13.15 0 0 1.2 11.52 0.105 0.018 0.3 0.069 3.37 197 29 96 40.7 0.42 < 0.1 <0.02 <0.01 18
G 1 21 7.45 710 - 0 < 5 - - - - - - 3.842 - - 116 42.1 - - - - -
G 2 19.5 7.45 1262 - 0 < 5 - - - - - - 5.75 - - 140 83.8 - - - - -
G 3 22.5 10.95 3111 - 1 10 - - - - - - 55.8 - - 325 7.4 - - - - -
Timkit S 1 17 7.4 2158 9.95 0 0 0.9 7.68 0.095 0.034 0.25 0.057 20.77 409 425 172 89.2 0.55 < 0.1 <0.02 <0.01 110G 1 21.5 7.2 1619 - 0 < 5 - - - - - - 21.72 - - 165 74.2 - - - - -
G 2 23.5 7.05 2026 - 0 < 5 - - - - - - 11.54 - - 190 105.8 - - - - -
G 3 22 7.15 2687 - 0 < 5 - - - - - - 0.067 - - 232 143.2 - - - - -
Azghar S 1 10 7.5 450 9.65 0 0 0.61 < 7.5 0.122 0.024 0.34 0.07 22.8 24 24 80 18.4 0.45 < 0.1 <0.02 <0.01 110S 2 11.5 7.65 450 9.25 0 0 0.81 < 7.5 0.11 0.024 0.25 0.053 7 22 34 60 20.4 0.3 < 0.1 <0.02 0.019 190
S 3 13 7.45 443 9.33 0 0 0.89 < 7.5 0.105 0.038 0.21 0.048 7.75 28 26 76 19.9 0.35 < 0.1 <0.02 0.02 0
S 4 14.5 7.7 440 9.1 0 0 0.89 < 7.5 0.1 0.042 0.29 0.068 7 30 26 68 20.7 0.35 < 0.1 <0.02 <0.01 40
G 1 18.5 8.6 461 - 0 < 5 - - - - - - 6.113 - - 44 48.4 - - - - -
G 2 18.5 7.65 669 - 0 < 5 - - - - - - 0.986 - - 116 40.1 - - - - -
G 3 18.5 7.6 692 - 1 10 - - - - - - 5.466 - - 104 39.3 - - - - -
*) Location of sampling site is shown in Figures XVI 2.1.1 to 2.1.4 of Supporting Report XVI.
Sampling Site*
Table 8.3.1 Classification of Groundwater and Surface Water Quality at Each Sampling Site
T-47
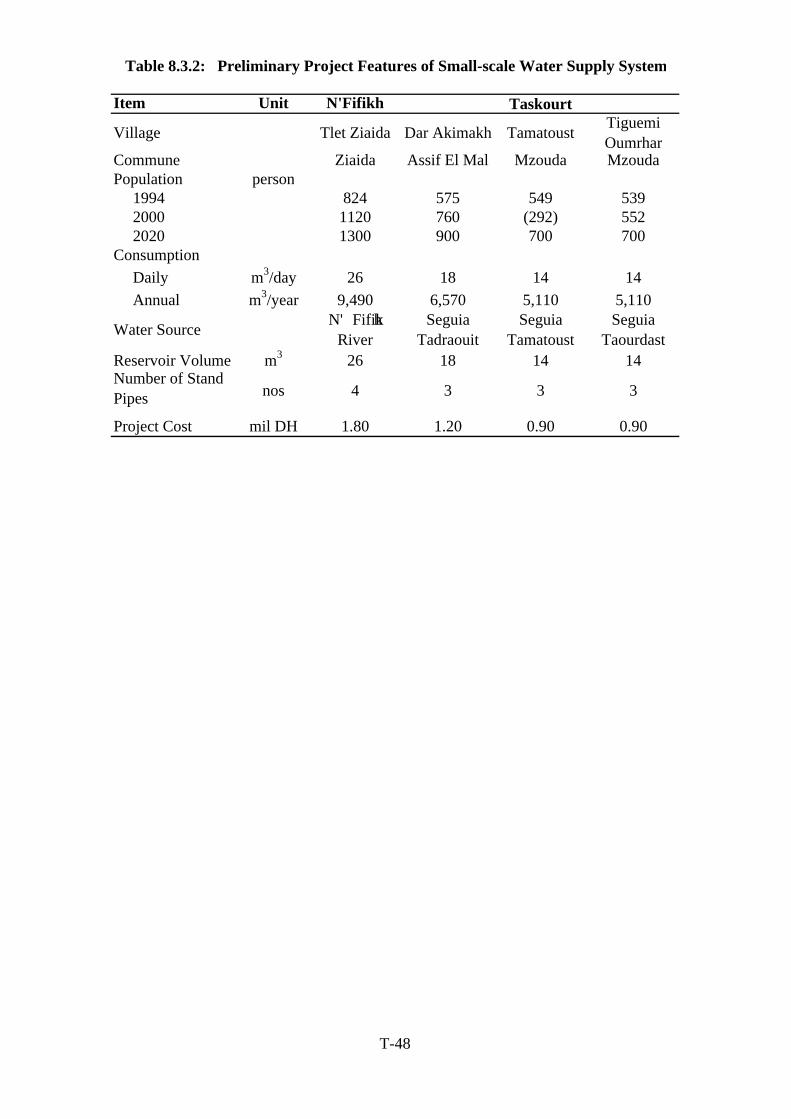
Item Unit N'Fifikh
Village Tlet Ziaida Dar Akimakh Tamatoust TiguemiOumrhar
Commune Ziaida Assif El Mal Mzouda MzoudaPopulation person
1994 824 575 549 5392000 1120 760 (292) 5522020 1300 900 700 700
ConsumptionDaily m3/day 26 18 14 14Annual m3/year 9,490 6,570 5,110 5,110
Water Source N'FifikhRiver
SeguiaTadraouit
SeguiaTamatoust
SeguiaTaourdast
Reservoir Volume m3 26 18 14 14
nos 4 3 3 3
Project Cost mil DH 1.80 1.20 0.90 0.90
Taskourt
Number of StandPipes
Table 8.3.2: Preliminary Project Features of Small-scale Water Supply System
T-48
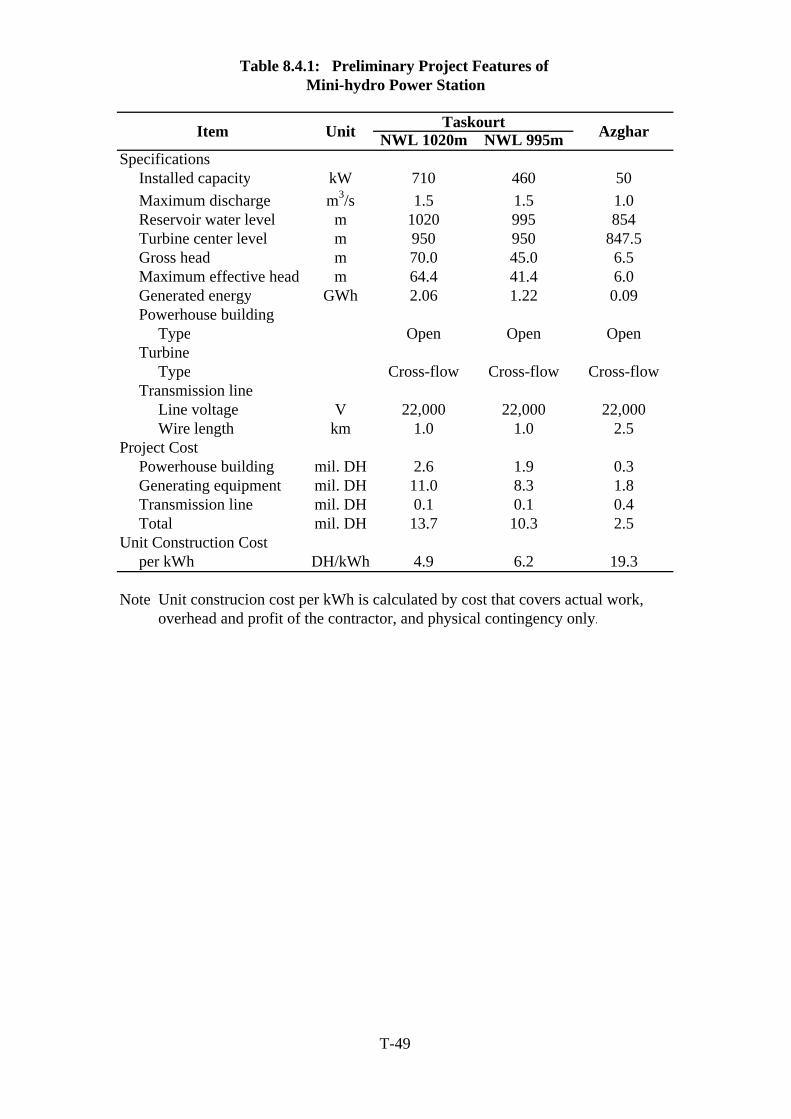
NWL 1020m NWL 995mSpecifications
Installed capacity kW 710 460 50Maximum discharge m3/s 1.5 1.5 1.0Reservoir water level m 1020 995 854Turbine center level m 950 950 847.5Gross head m 70.0 45.0 6.5Maximum effective head m 64.4 41.4 6.0Generated energy GWh 2.06 1.22 0.09Powerhouse building
Type Open Open OpenTurbine
Type Cross-flow Cross-flow Cross-flowTransmission line
Line voltage V 22,000 22,000 22,000Wire length km 1.0 1.0 2.5
Project CostPowerhouse building mil. DH 2.6 1.9 0.3Generating equipment mil. DH 11.0 8.3 1.8Transmission line mil. DH 0.1 0.1 0.4Total mil. DH 13.7 10.3 2.5
Unit Construction Costper kWh DH/kWh 4.9 6.2 19.3
Note Unit construcion cost per kWh is calculated by cost that covers actual work, overhead and profit of the contractor, and physical contingency only.
Mini-hydro Power StationTable 8.4.1: Preliminary Project Features of
Item Taskourt AzgharUnit
T-49
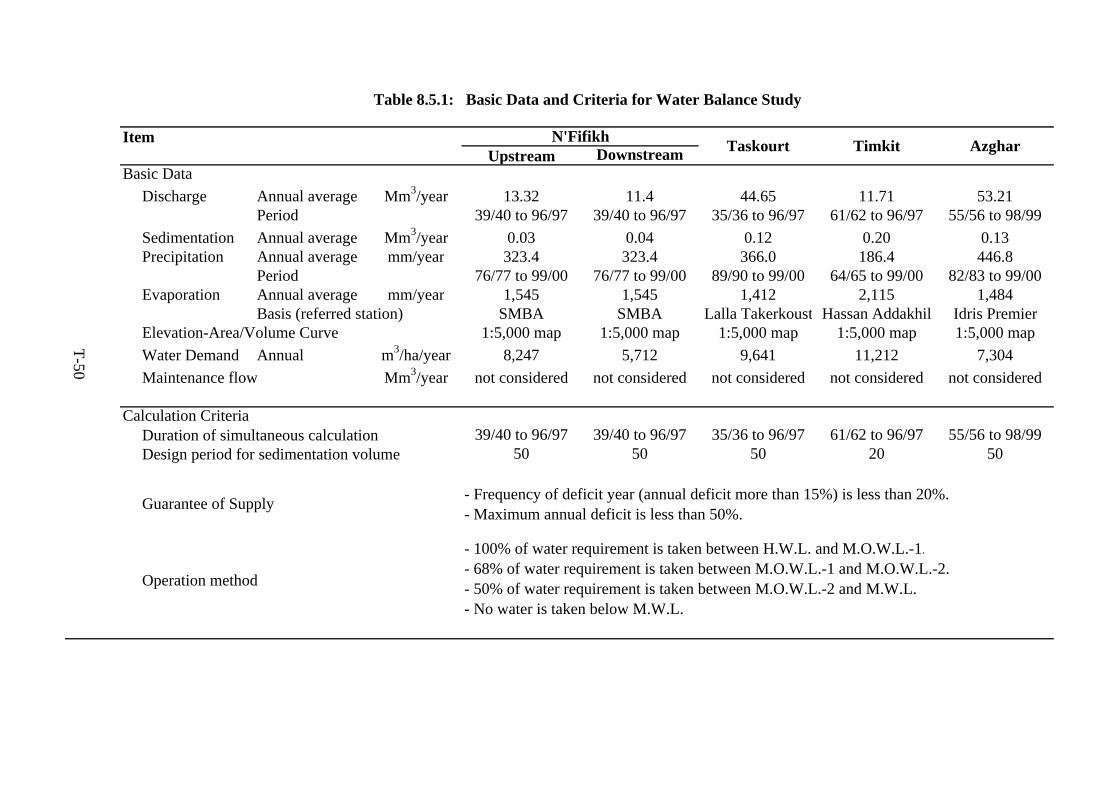
ItemUpstream Downstream
Basic DataDischarge Annual average Mm3/year 13.32 11.4 44.65 11.71 53.21
Period 39/40 to 96/97 39/40 to 96/97 35/36 to 96/97 61/62 to 96/97 55/56 to 98/99Sedimentation Annual average Mm3/year 0.03 0.04 0.12 0.20 0.13Precipitation Annual average mm/year 323.4 323.4 366.0 186.4 446.8
Period 76/77 to 99/00 76/77 to 99/00 89/90 to 99/00 64/65 to 99/00 82/83 to 99/00Evaporation Annual average mm/year 1,545 1,545 1,412 2,115 1,484
Basis (referred station) SMBA SMBA Lalla Takerkoust Hassan Addakhil Idris PremierElevation-Area/Volume Curve 1:5,000 map 1:5,000 map 1:5,000 map 1:5,000 map 1:5,000 mapWater Demand Annual m3/ha/year 8,247 5,712 9,641 11,212 7,304Maintenance flow Mm3/year not considered not considered not considered not considered not considered
Calculation Criteria39/40 to 96/97 39/40 to 96/97 35/36 to 96/97 61/62 to 96/97 55/56 to 98/99
50 50 50 20 50
Table 8.5.1: Basic Data and Criteria for Water Balance Study
Azghar
Duration of simultaneous calculation
N'Fifikh Taskourt
- Frequency of deficit year (annual deficit more than 15%) is less than 20%.- Maximum annual deficit is less than 50%.
Timkit
- 100% of water requirement is taken between H.W.L. and M.O.W.L.-1.- 68% of water requirement is taken between M.O.W.L.-1 and M.O.W.L.-2.- 50% of water requirement is taken between M.O.W.L.-2 and M.W.L.- No water is taken below M.W.L.
Operation method
Guarantee of Supply
Design period for sedimentation volume
T-50
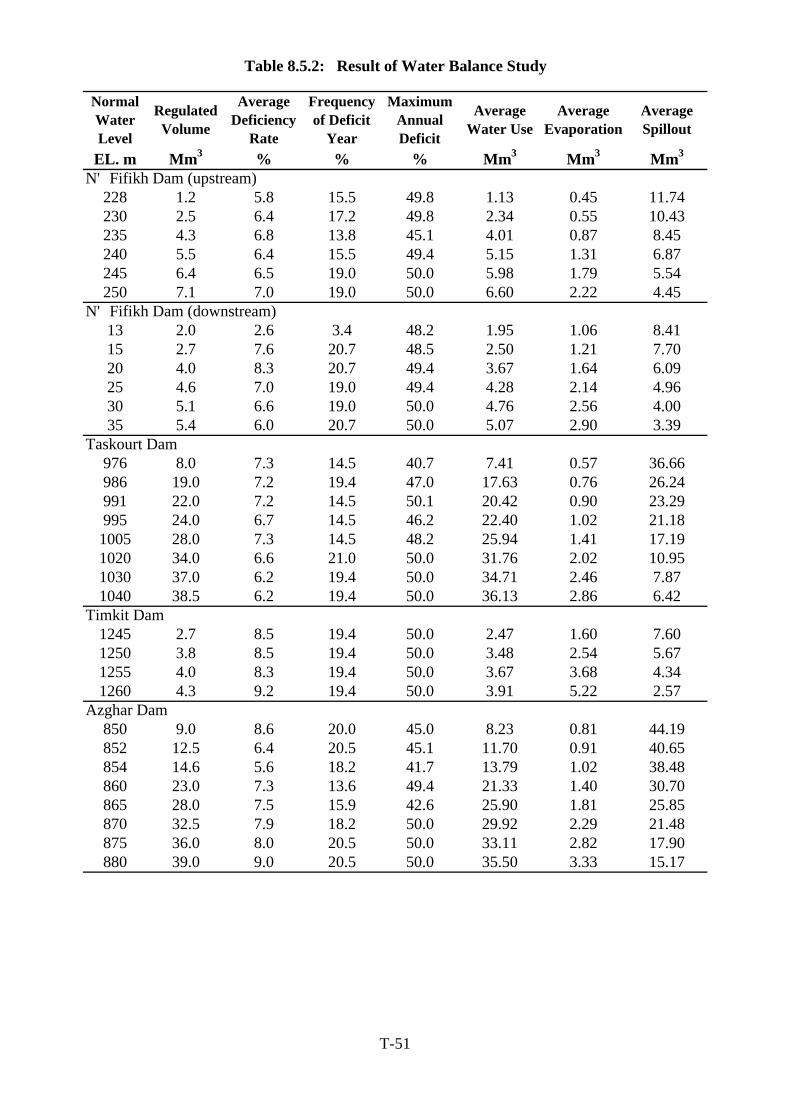
NormalWaterLevel
RegulatedVolume
AverageDeficiency
Rate
Frequencyof Deficit
Year
MaximumAnnualDeficit
AverageWater Use
AverageEvaporation
AverageSpillout
EL. m Mm3 % % % Mm3 Mm3 Mm3
N'Fifikh Dam (upstream)228 1.2 5.8 15.5 49.8 1.13 0.45 11.74230 2.5 6.4 17.2 49.8 2.34 0.55 10.43235 4.3 6.8 13.8 45.1 4.01 0.87 8.45240 5.5 6.4 15.5 49.4 5.15 1.31 6.87245 6.4 6.5 19.0 50.0 5.98 1.79 5.54250 7.1 7.0 19.0 50.0 6.60 2.22 4.45
N'Fifikh Dam (downstream)13 2.0 2.6 3.4 48.2 1.95 1.06 8.4115 2.7 7.6 20.7 48.5 2.50 1.21 7.7020 4.0 8.3 20.7 49.4 3.67 1.64 6.0925 4.6 7.0 19.0 49.4 4.28 2.14 4.9630 5.1 6.6 19.0 50.0 4.76 2.56 4.0035 5.4 6.0 20.7 50.0 5.07 2.90 3.39
Taskourt Dam976 8.0 7.3 14.5 40.7 7.41 0.57 36.66986 19.0 7.2 19.4 47.0 17.63 0.76 26.24991 22.0 7.2 14.5 50.1 20.42 0.90 23.29995 24.0 6.7 14.5 46.2 22.40 1.02 21.181005 28.0 7.3 14.5 48.2 25.94 1.41 17.191020 34.0 6.6 21.0 50.0 31.76 2.02 10.951030 37.0 6.2 19.4 50.0 34.71 2.46 7.871040 38.5 6.2 19.4 50.0 36.13 2.86 6.42
Timkit Dam1245 2.7 8.5 19.4 50.0 2.47 1.60 7.601250 3.8 8.5 19.4 50.0 3.48 2.54 5.671255 4.0 8.3 19.4 50.0 3.67 3.68 4.341260 4.3 9.2 19.4 50.0 3.91 5.22 2.57
Azghar Dam850 9.0 8.6 20.0 45.0 8.23 0.81 44.19852 12.5 6.4 20.5 45.1 11.70 0.91 40.65854 14.6 5.6 18.2 41.7 13.79 1.02 38.48860 23.0 7.3 13.6 49.4 21.33 1.40 30.70865 28.0 7.5 15.9 42.6 25.90 1.81 25.85870 32.5 7.9 18.2 50.0 29.92 2.29 21.48875 36.0 8.0 20.5 50.0 33.11 2.82 17.90880 39.0 9.0 20.5 50.0 35.50 3.33 15.17
Table 8.5.2: Result of Water Balance Study
T-51
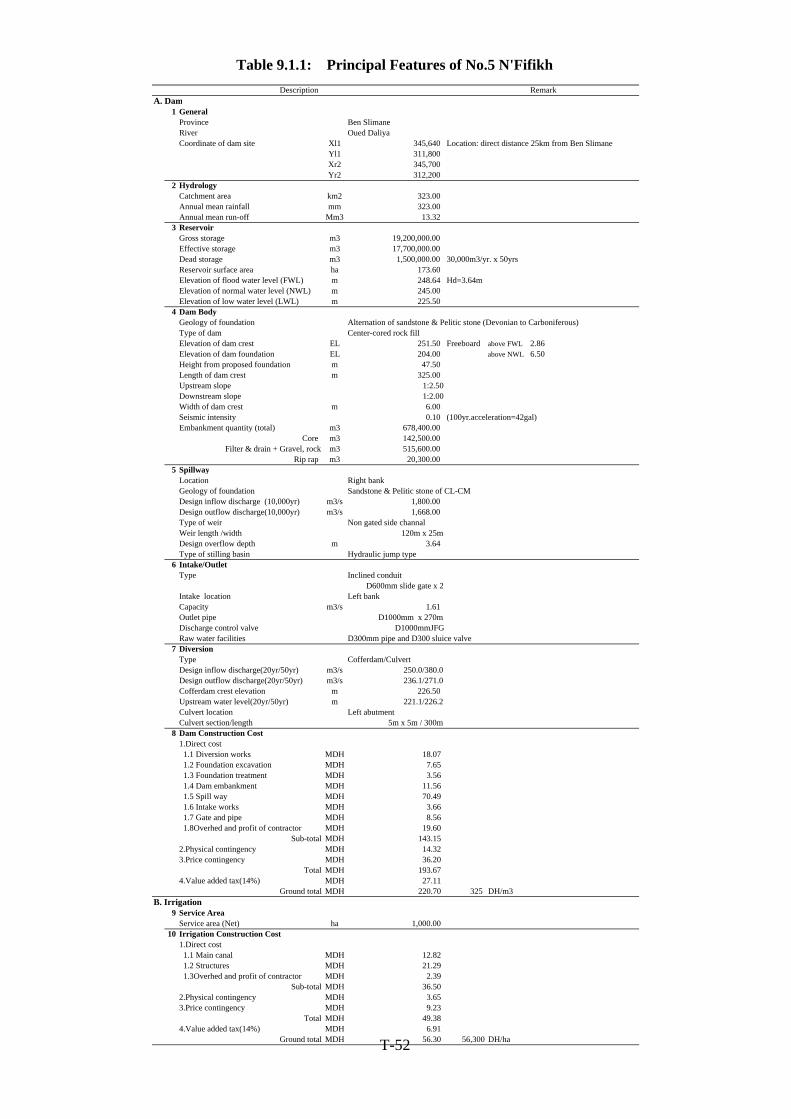
Table 9.1.1: Principal Features of No.5 N'FifikhDescription Remark
A. Dam1 General
Province Ben SlimaneRiver Oued DaliyaCoordinate of dam site Xl1 345,640 Location: direct distance 25km from Ben Slimane
Yl1 311,800Xr2 345,700Yr2 312,200
2 HydrologyCatchment area km2 323.00Annual mean rainfall mm 323.00Annual mean run-off Mm3 13.32
3 ReservoirGross storage m3 19,200,000.00Effective storage m3 17,700,000.00Dead storage m3 1,500,000.00 30,000m3/yr. x 50yrsReservoir surface area ha 173.60Elevation of flood water level (FWL) m 248.64 Hd=3.64mElevation of normal water level (NWL) m 245.00Elevation of low water level (LWL) m 225.50
4 Dam BodyGeology of foundation Alternation of sandstone & Pelitic stone (Devonian to Carboniferous)Type of dam Center-cored rock fill Elevation of dam crest EL 251.50 Freeboard above FWL 2.86Elevation of dam foundation EL 204.00 above NWL 6.50Height from proposed foundation m 47.50Length of dam crest m 325.00Upstream slope 1:2.50Downstream slope 1:2.00Width of dam crest m 6.00Seismic intensity 0.10 (100yr.acceleration=42gal) Embankment quantity (total) m3 678,400.00
Core m3 142,500.00 Filter & drain + Gravel, rock m3 515,600.00
Rip rap m3 20,300.005 Spillway
Location Right bankGeology of foundation Sandstone & Pelitic stone of CL-CMDesign inflow discharge (10,000yr) m3/s 1,800.00Design outflow discharge(10,000yr) m3/s 1,668.00Type of weir Non gated side channalWeir length /width 120m x 25mDesign overflow depth m 3.64Type of stilling basin Hydraulic jump type
6 Intake/OutletType Inclined conduit
D600mm slide gate x 2Intake location Left bankCapacity m3/s 1.61Outlet pipe D1000mm x 270mDischarge control valve D1000mmJFGRaw water facilities D300mm pipe and D300 sluice valve
7 Diversion Type Cofferdam/CulvertDesign inflow discharge(20yr/50yr) m3/s 250.0/380.0Design outflow discharge(20yr/50yr) m3/s 236.1/271.0Cofferdam crest elevation m 226.50Upstream water level(20yr/50yr) m 221.1/226.2Culvert location Left abutmentCulvert section/length 5m x 5m / 300m
8 Dam Construction Cost1.Direct cost 1.1 Diversion works MDH 18.07 1.2 Foundation excavation MDH 7.65 1.3 Foundation treatment MDH 3.56 1.4 Dam embankment MDH 11.56 1.5 Spill way MDH 70.49 1.6 Intake works MDH 3.66 1.7 Gate and pipe MDH 8.56 1.8Overhed and profit of contractor MDH 19.60
Sub-total MDH 143.152.Physical contingency MDH 14.323.Price contingency MDH 36.20
Total MDH 193.674.Value added tax(14%) MDH 27.11
Ground total MDH 220.70 325 DH/m3B. Irrigation
9 Service AreaService area (Net) ha 1,000.00
10 Irrigation Construction Cost1.Direct cost 1.1 Main canal MDH 12.82 1.2 Structures MDH 21.29 1.3Overhed and profit of contractor MDH 2.39
Sub-total MDH 36.502.Physical contingency MDH 3.653.Price contingency MDH 9.23
Total MDH 49.384.Value added tax(14%) MDH 6.91
Ground total MDH 56.30 56,300 DH/haT-52
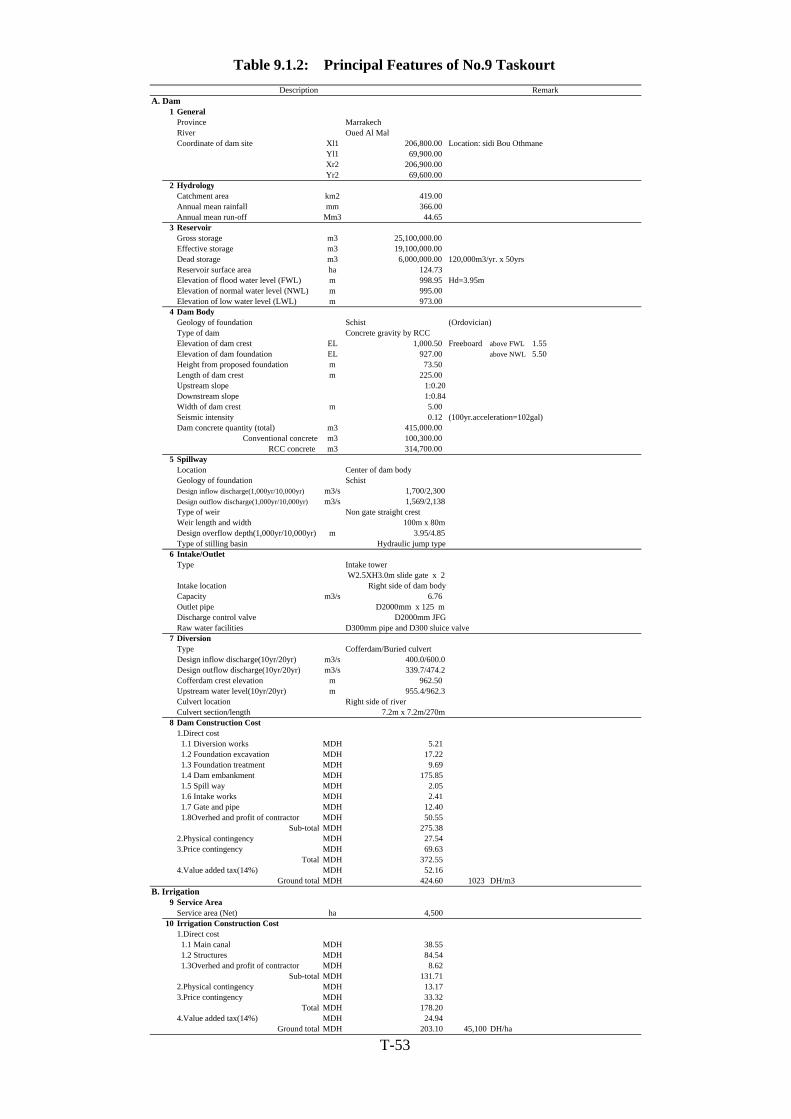
Table 9.1.2: Principal Features of No.9 TaskourtDescription Remark
A. Dam1 General
Province MarrakechRiver Oued Al MalCoordinate of dam site Xl1 206,800.00 Location: sidi Bou Othmane
Yl1 69,900.00Xr2 206,900.00Yr2 69,600.00
2 HydrologyCatchment area km2 419.00Annual mean rainfall mm 366.00Annual mean run-off Mm3 44.65
3 ReservoirGross storage m3 25,100,000.00Effective storage m3 19,100,000.00Dead storage m3 6,000,000.00 120,000m3/yr. x 50yrsReservoir surface area ha 124.73Elevation of flood water level (FWL) m 998.95 Hd=3.95mElevation of normal water level (NWL) m 995.00Elevation of low water level (LWL) m 973.00
4 Dam BodyGeology of foundation Schist (Ordovician)Type of dam Concrete gravity by RCCElevation of dam crest EL 1,000.50 Freeboard above FWL 1.55Elevation of dam foundation EL 927.00 above NWL 5.50Height from proposed foundation m 73.50Length of dam crest m 225.00Upstream slope 1:0.20Downstream slope 1:0.84Width of dam crest m 5.00Seismic intensity 0.12 (100yr.acceleration=102gal) Dam concrete quantity (total) m3 415,000.00
Conventional concrete m3 100,300.00 RCC concrete m3 314,700.00
5 SpillwayLocation Center of dam bodyGeology of foundation SchistDesign inflow discharge(1,000yr/10,000yr) m3/s 1,700/2,300Design outflow discharge(1,000yr/10,000yr) m3/s 1,569/2,138Type of weir Non gate straight crestWeir length and width 100m x 80mDesign overflow depth(1,000yr/10,000yr) m 3.95/4.85Type of stilling basin Hydraulic jump type
6 Intake/OutletType Intake tower
W2.5XH3.0m slide gate x 2Intake location Right side of dam bodyCapacity m3/s 6.76Outlet pipe D2000mm x 125 mDischarge control valve D2000mm JFGRaw water facilities D300mm pipe and D300 sluice valve
7 Diversion Type Cofferdam/Buried culvertDesign inflow discharge(10yr/20yr) m3/s 400.0/600.0Design outflow discharge(10yr/20yr) m3/s 339.7/474.2Cofferdam crest elevation m 962.50Upstream water level(10yr/20yr) m 955.4/962.3Culvert location Right side of riverCulvert section/length 7.2m x 7.2m/270m
8 Dam Construction Cost1.Direct cost 1.1 Diversion works MDH 5.21 1.2 Foundation excavation MDH 17.22 1.3 Foundation treatment MDH 9.69 1.4 Dam embankment MDH 175.85 1.5 Spill way MDH 2.05 1.6 Intake works MDH 2.41 1.7 Gate and pipe MDH 12.40 1.8Overhed and profit of contractor MDH 50.55
Sub-total MDH 275.382.Physical contingency MDH 27.543.Price contingency MDH 69.63
Total MDH 372.554.Value added tax(14%) MDH 52.16
Ground total MDH 424.60 1023 DH/m3B. Irrigation
9 Service AreaService area (Net) ha 4,500
10 Irrigation Construction Cost1.Direct cost 1.1 Main canal MDH 38.55 1.2 Structures MDH 84.54 1.3Overhed and profit of contractor MDH 8.62
Sub-total MDH 131.712.Physical contingency MDH 13.173.Price contingency MDH 33.32
Total MDH 178.204.Value added tax(14%) MDH 24.94
Ground total MDH 203.10 45,100 DH/ha
T-53
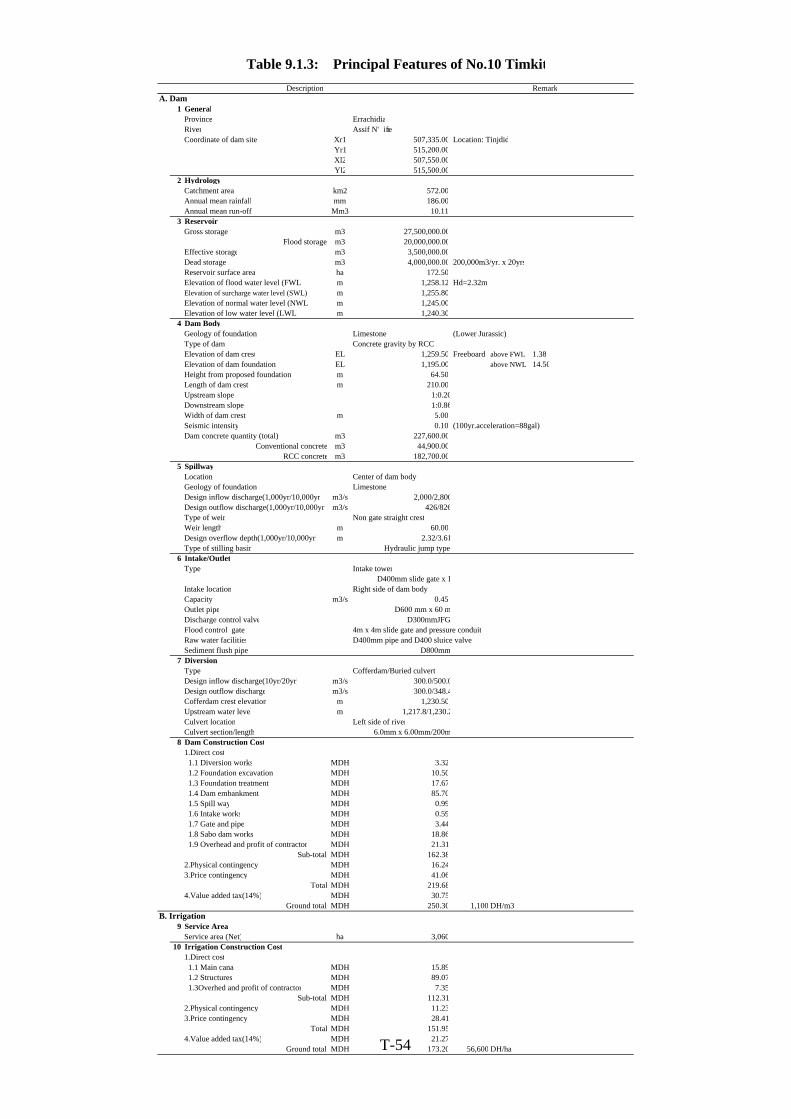
Table 9.1.3: Principal Features of No.10 TimkitDescription Remark
A. Dam1 General
Province ErrachidiaRiver Assif N'iferCoordinate of dam site Xr1 507,335.00 Location: Tinjdid
Yr1 515,200.00Xl2 507,550.00Yl2 515,500.00
2 HydrologyCatchment area km2 572.00Annual mean rainfall mm 186.00Annual mean run-off Mm3 10.11
3 ReservoirGross storage m3 27,500,000.00
Flood storage m3 20,000,000.00Effective storage m3 3,500,000.00Dead storage m3 4,000,000.00 200,000m3/yr. x 20yrsReservoir surface area ha 172.50Elevation of flood water level (FWL) m 1,258.12 Hd=2.32mElevation of surcharge water level (SWL) m 1,255.80Elevation of normal water level (NWL) m 1,245.00Elevation of low water level (LWL) m 1,240.30
4 Dam BodyGeology of foundation Limestone (Lower Jurassic)Type of dam Concrete gravity by RCCElevation of dam crest EL 1,259.50 Freeboard above FWL 1.38Elevation of dam foundation EL 1,195.00 above NWL 14.50Height from proposed foundation m 64.50Length of dam crest m 210.00Upstream slope 1:0.20Downstream slope 1:0.86Width of dam crest m 5.00Seismic intensity 0.10 (100yr.acceleration=88gal) Dam concrete quantity (total) m3 227,600.00
Conventional concrete m3 44,900.00 RCC concrete m3 182,700.00
5 SpillwayLocation Center of dam bodyGeology of foundation LimestoneDesign inflow discharge(1,000yr/10,000yr m3/s 2,000/2,800Design outflow discharge(1,000yr/10,000yr) m3/s 426/826Type of weir Non gate straight crestWeir length m 60.00Design overflow depth(1,000yr/10,000yr) m 2.32/3.61Type of stilling basin Hydraulic jump type
6 Intake/OutletType Intake tower
D400mm slide gate x 1Intake location Right side of dam bodyCapacity m3/s 0.45Outlet pipe D600 mm x 60 mDischarge control valve D300mmJFGFlood control gate 4m x 4m slide gate and pressure conduitRaw water facilities D400mm pipe and D400 sluice valve Sediment flush pipe D800mm
7 Diversion Type Cofferdam/Buried culvertDesign inflow discharge(10yr/20yr) m3/s 300.0/500.0Design outflow discharge m3/s 300.0/348.4Cofferdam crest elevation m 1,230.50Upstream water level m 1,217.8/1,230.2Culvert location Left side of riverCulvert section/length 6.0mm x 6.00mm/200m
8 Dam Construction Cost1.Direct cost 1.1 Diversion works MDH 3.32 1.2 Foundation excavation MDH 10.50 1.3 Foundation treatment MDH 17.67 1.4 Dam embankment MDH 85.70 1.5 Spill way MDH 0.99 1.6 Intake works MDH 0.59 1.7 Gate and pipe MDH 3.44 1.8 Sabo dam works MDH 18.86 1.9 Overhead and profit of contractor MDH 21.31
Sub-total MDH 162.382.Physical contingency MDH 16.243.Price contingency MDH 41.06
Total MDH 219.684.Value added tax(14%) MDH 30.75
Ground total MDH 250.30 1,100 DH/m3B. Irrigation
9 Service AreaService area (Net) ha 3,060
10 Irrigation Construction Cost1.Direct cost 1.1 Main canal MDH 15.89 1.2 Structures MDH 89.07 1.3Overhed and profit of contractor MDH 7.35
Sub-total MDH 112.312.Physical contingency MDH 11.233.Price contingency MDH 28.41
Total MDH 151.954.Value added tax(14%) MDH 21.27
Ground total MDH 173.20 56,600 DH/haT-54
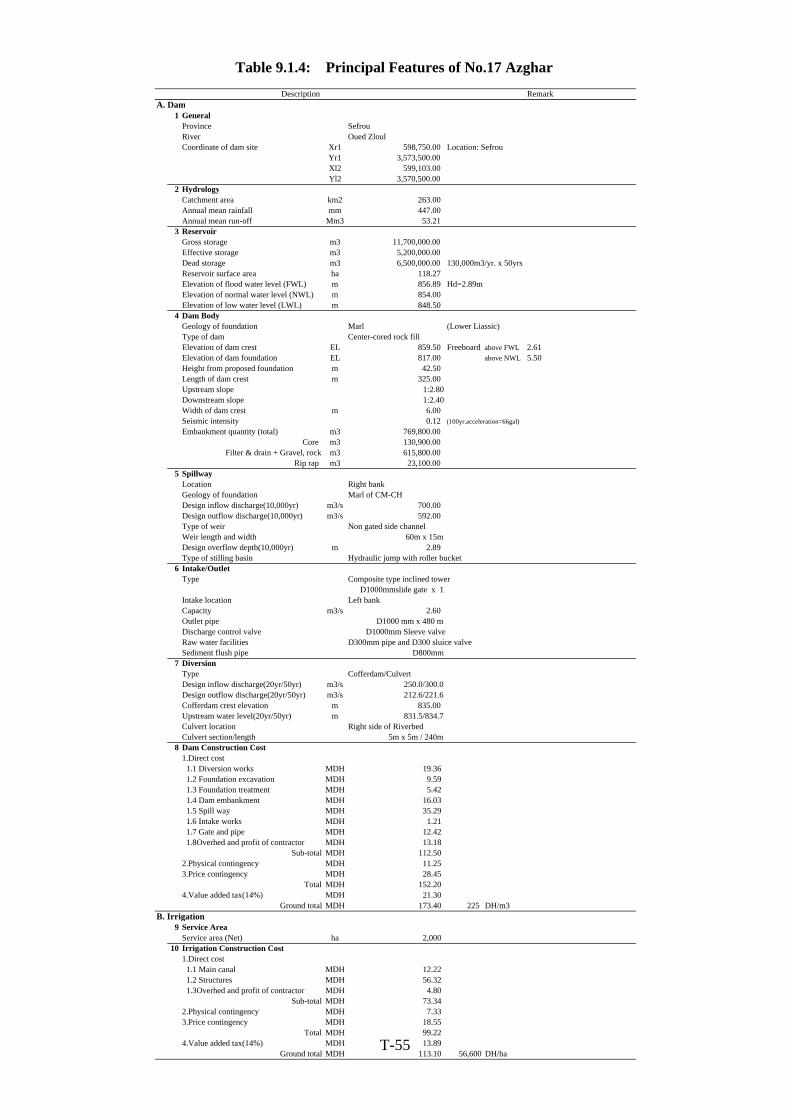
Table 9.1.4: Principal Features of No.17 AzgharDescription Remark
A. Dam1 General
Province SefrouRiver Oued ZloulCoordinate of dam site Xr1 598,750.00 Location: Sefrou
Yr1 3,573,500.00Xl2 599,103.00Yl2 3,570,500.00
2 HydrologyCatchment area km2 263.00 Annual mean rainfall mm 447.00Annual mean run-off Mm3 53.21
3 ReservoirGross storage m3 11,700,000.00Effective storage m3 5,200,000.00Dead storage m3 6,500,000.00 130,000m3/yr. x 50yrsReservoir surface area ha 118.27Elevation of flood water level (FWL) m 856.89 Hd=2.89mElevation of normal water level (NWL) m 854.00Elevation of low water level (LWL) m 848.50
4 Dam BodyGeology of foundation Marl (Lower Liassic)Type of dam Center-cored rock fill Elevation of dam crest EL 859.50 Freeboard above FWL 2.61Elevation of dam foundation EL 817.00 above NWL 5.50Height from proposed foundation m 42.50Length of dam crest m 325.00Upstream slope 1:2.80Downstream slope 1:2.40Width of dam crest m 6.00Seismic intensity 0.12 (100yr.acceleration=66gal) Embankment quantity (total) m3 769,800.00
Core m3 130,900.00 Filter & drain + Gravel, rock m3 615,800.00
Rip rap m3 23,100.005 Spillway
Location Right bankGeology of foundation Marl of CM-CHDesign inflow discharge(10,000yr) m3/s 700.00Design outflow discharge(10,000yr) m3/s 592.00Type of weir Non gated side channelWeir length and width 60m x 15mDesign overflow depth(10,000yr) m 2.89Type of stilling basin Hydraulic jump with roller bucket
6 Intake/OutletType Composite type inclined tower
D1000mmslide gate x 1Intake location Left bankCapacity m3/s 2.60Outlet pipe D1000 mm x 480 mDischarge control valve D1000mm Sleeve valveRaw water facilities D300mm pipe and D300 sluice valve Sediment flush pipe D800mm
7 Diversion Type Cofferdam/CulvertDesign inflow discharge(20yr/50yr) m3/s 250.0/300.0Design outflow discharge(20yr/50yr) m3/s 212.6/221.6Cofferdam crest elevation m 835.00Upstream water level(20yr/50yr) m 831.5/834.7Culvert location Right side of RiverbedCulvert section/length 5m x 5m / 240m
8 Dam Construction Cost1.Direct cost 1.1 Diversion works MDH 19.36 1.2 Foundation excavation MDH 9.59 1.3 Foundation treatment MDH 5.42 1.4 Dam embankment MDH 16.03 1.5 Spill way MDH 35.29 1.6 Intake works MDH 1.21 1.7 Gate and pipe MDH 12.42 1.8Overhed and profit of contractor MDH 13.18
Sub-total MDH 112.502.Physical contingency MDH 11.253.Price contingency MDH 28.45
Total MDH 152.204.Value added tax(14%) MDH 21.30
Ground total MDH 173.40 225 DH/m3B. Irrigation
9 Service AreaService area (Net) ha 2,000
10 Irrigation Construction Cost1.Direct cost 1.1 Main canal MDH 12.22 1.2 Structures MDH 56.32 1.3Overhed and profit of contractor MDH 4.80
Sub-total MDH 73.342.Physical contingency MDH 7.333.Price contingency MDH 18.55
Total MDH 99.224.Value added tax(14%) MDH 13.89
Ground total MDH 113.10 56,600 DH/haT-55
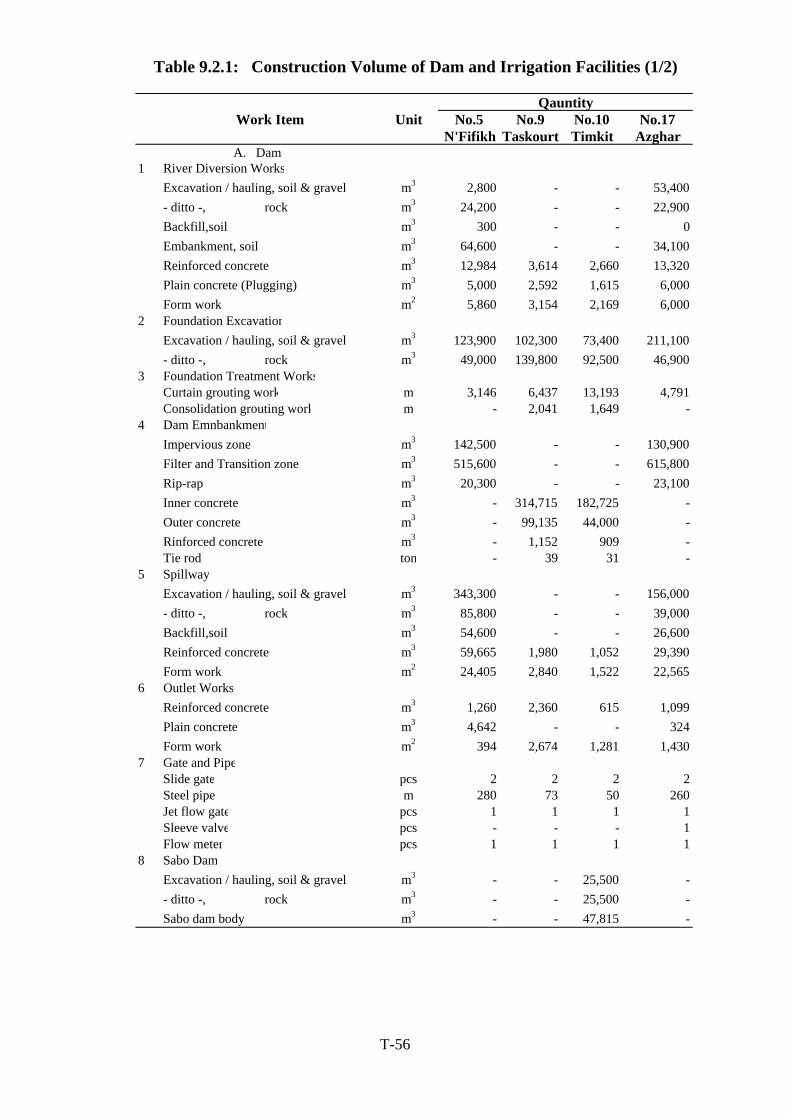
QauntityWork Item Unit No.5 No.9 No.10 No.17
N'Fifikh Taskourt Timkit Azghar
1 River Diversion WorksExcavation / hauling, soil & gravel m3 2,800 - - 53,400- ditto -, rock m3 24,200 - - 22,900Backfill,soil m3 300 - - 0Embankment, soil m3 64,600 - - 34,100Reinforced concrete m3 12,984 3,614 2,660 13,320Plain concrete (Plugging) m3 5,000 2,592 1,615 6,000Form work m2 5,860 3,154 2,169 6,000
2 Foundation ExcavationExcavation / hauling, soil & gravel m3 123,900 102,300 73,400 211,100- ditto -, rock m3 49,000 139,800 92,500 46,900
3 Foundation Treatment WorksCurtain grouting work m 3,146 6,437 13,193 4,791Consolidation grouting work m - 2,041 1,649 -
4 Dam EmnbankmentImpervious zone m3 142,500 - - 130,900Filter and Transition zone m3 515,600 - - 615,800Rip-rap m3 20,300 - - 23,100Inner concrete m3 - 314,715 182,725 -Outer concrete m3 - 99,135 44,000 -Rinforced concrete m3 - 1,152 909 -Tie rod ton - 39 31 -
5 Spillway Excavation / hauling, soil & gravel m3 343,300 - - 156,000- ditto -, rock m3 85,800 - - 39,000Backfill,soil m3 54,600 - - 26,600Reinforced concrete m3 59,665 1,980 1,052 29,390Form work m2 24,405 2,840 1,522 22,565
6 Outlet WorksReinforced concrete m3 1,260 2,360 615 1,099Plain concrete m3 4,642 - - 324Form work m2 394 2,674 1,281 1,430
7 Gate and PipeSlide gate pcs 2 2 2 2Steel pipe m 280 73 50 260Jet flow gate pcs 1 1 1 1Sleeve valve pcs - - - 1Flow meter pcs 1 1 1 1
8 Sabo DamExcavation / hauling, soil & gravel m3 - - 25,500 -- ditto -, rock m3 - - 25,500 -Sabo dam body m3 - - 47,815 -
A. Dam
Table 9.2.1: Construction Volume of Dam and Irrigation Facilities (1/2)
T-56
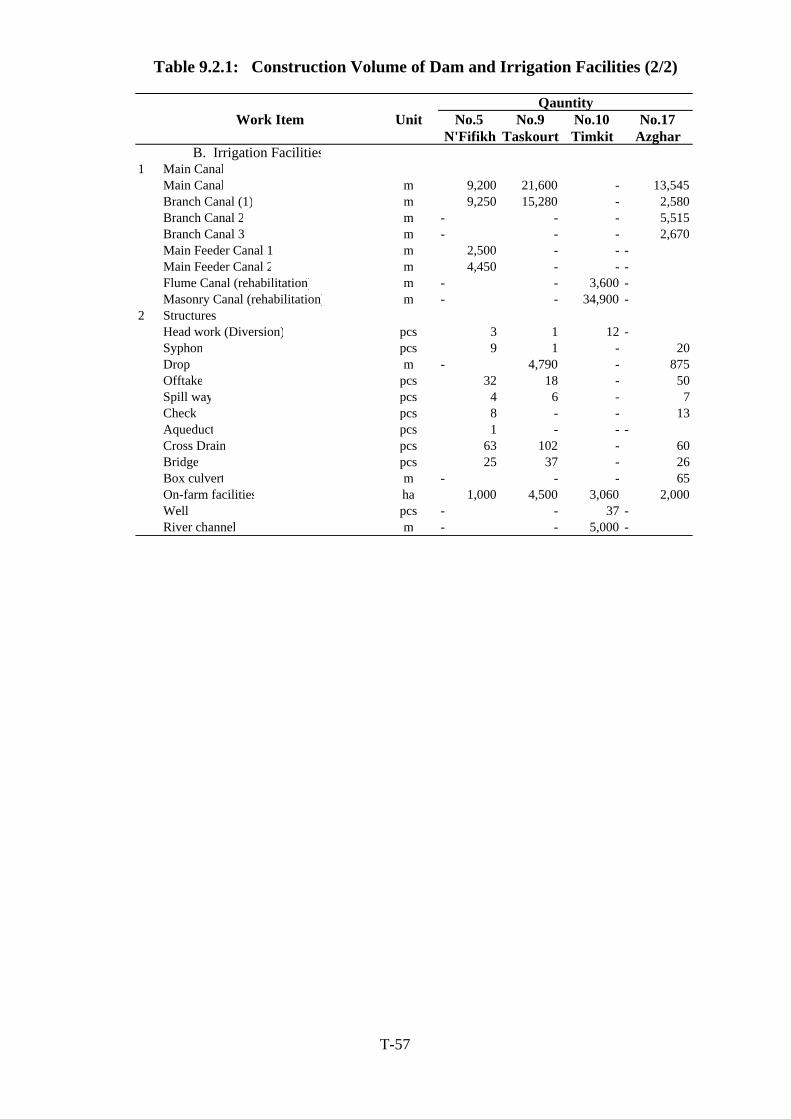
QauntityWork Item Unit No.5 No.9 No.10 No.17
N'Fifikh Taskourt Timkit Azghar
1 Main CanalMain Canal m 9,200 21,600 - 13,545Branch Canal (1) m 9,250 15,280 - 2,580Branch Canal 2 m - - - 5,515Branch Canal 3 m - - - 2,670Main Feeder Canal 1 m 2,500 - - -Main Feeder Canal 2 m 4,450 - - -Flume Canal (rehabilitation) m - - 3,600 -Masonry Canal (rehabilitation) m - - 34,900 -
2 StructuresHead work (Diversion) pcs 3 1 12 -Syphon pcs 9 1 - 20Drop m - 4,790 - 875Offtake pcs 32 18 - 50Spill way pcs 4 6 - 7Check pcs 8 - - 13Aqueduct pcs 1 - - -Cross Drain pcs 63 102 - 60Bridge pcs 25 37 - 26Box culvert m - - - 65On-farm facilities ha 1,000 4,500 3,060 2,000Well pcs - - 37 -River channel m - - 5,000 -
B. Irrigation Facilities
Table 9.2.1: Construction Volume of Dam and Irrigation Facilities (2/2)
T-57
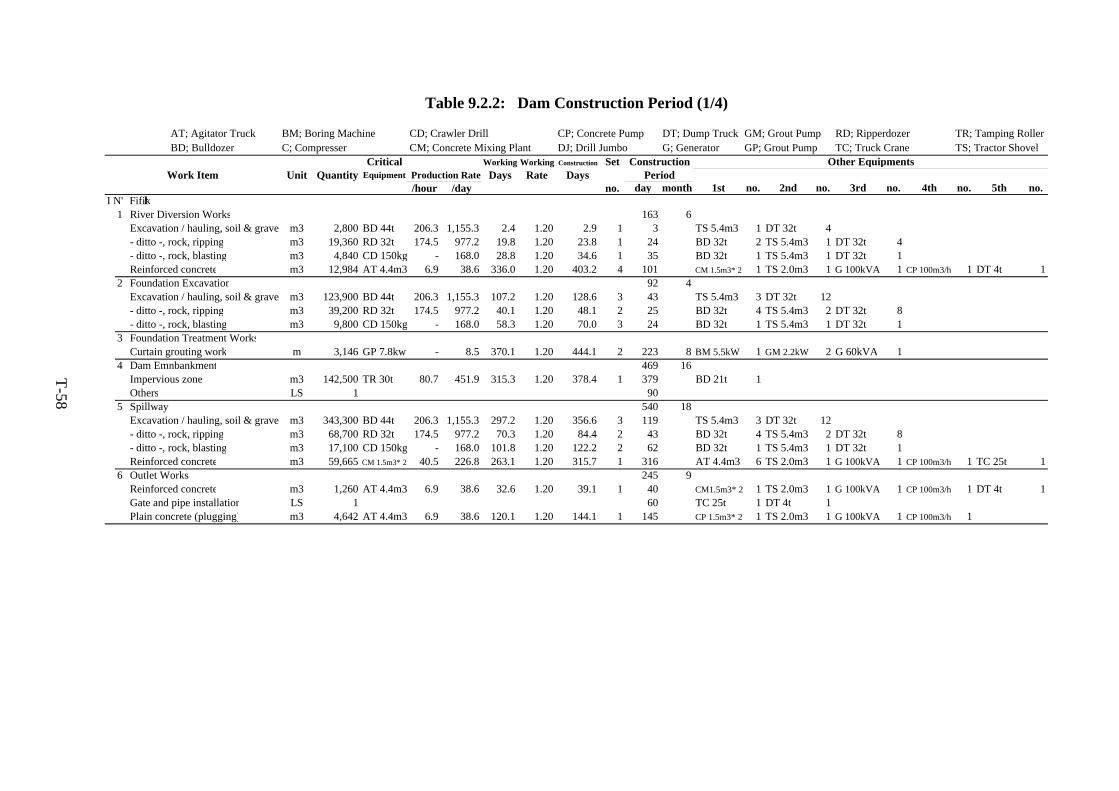
AT; Agitator Truck BM; Boring Machine CD; Crawler Drill CP; Concrete Pump DT; Dump Truck GM; Grout Pump RD; Ripperdozer TR; Tamping Roller BD; Bulldozer C; Compresser CM; Concrete Mixing Plant DJ; Drill Jumbo G; Generator GP; Grout Pump TC; Truck Crane TS; Tractor Shovel
Critical Working Working Construction Set Construction Other EquipmentsWork Item Unit Quantity Equipment Production Rate Days Rate Days Period
/hour /day no. day month 1st no. 2nd no. 3rd no. 4th no. 5th no.I N'Fifikh
1 River Diversion Works 163 6Excavation / hauling, soil & gravel m3 2,800 BD 44t 206.3 1,155.3 2.4 1.20 2.9 1 3 TS 5.4m3 1 DT 32t 4- ditto -, rock, ripping m3 19,360 RD 32t 174.5 977.2 19.8 1.20 23.8 1 24 BD 32t 2 TS 5.4m3 1 DT 32t 4- ditto -, rock, blasting m3 4,840 CD 150kg - 168.0 28.8 1.20 34.6 1 35 BD 32t 1 TS 5.4m3 1 DT 32t 1Reinforced concrete m3 12,984 AT 4.4m3 6.9 38.6 336.0 1.20 403.2 4 101 CM 1.5m3*2 1 TS 2.0m3 1 G 100kVA 1 CP 100m3/h 1 DT 4t 1
2 Foundation Excavation 92 4Excavation / hauling, soil & gravel m3 123,900 BD 44t 206.3 1,155.3 107.2 1.20 128.6 3 43 TS 5.4m3 3 DT 32t 12- ditto -, rock, ripping m3 39,200 RD 32t 174.5 977.2 40.1 1.20 48.1 2 25 BD 32t 4 TS 5.4m3 2 DT 32t 8- ditto -, rock, blasting m3 9,800 CD 150kg - 168.0 58.3 1.20 70.0 3 24 BD 32t 1 TS 5.4m3 1 DT 32t 1
3 Foundation Treatment WorksCurtain grouting work m 3,146 GP 7.8kw - 8.5 370.1 1.20 444.1 2 223 8 BM 5.5kW 1 GM 2.2kW 2 G 60kVA 1
4 Dam Emnbankment 469 16Impervious zone m3 142,500 TR 30t 80.7 451.9 315.3 1.20 378.4 1 379 BD 21t 1Others LS 1 90
5 Spillway 540 18Excavation / hauling, soil & gravel m3 343,300 BD 44t 206.3 1,155.3 297.2 1.20 356.6 3 119 TS 5.4m3 3 DT 32t 12- ditto -, rock, ripping m3 68,700 RD 32t 174.5 977.2 70.3 1.20 84.4 2 43 BD 32t 4 TS 5.4m3 2 DT 32t 8- ditto -, rock, blasting m3 17,100 CD 150kg - 168.0 101.8 1.20 122.2 2 62 BD 32t 1 TS 5.4m3 1 DT 32t 1Reinforced concrete m3 59,665 CM 1.5m3*2 40.5 226.8 263.1 1.20 315.7 1 316 AT 4.4m3 6 TS 2.0m3 1 G 100kVA 1 CP 100m3/h 1 TC 25t 1
6 Outlet Works 245 9Reinforced concrete m3 1,260 AT 4.4m3 6.9 38.6 32.6 1.20 39.1 1 40 CM1.5m3*2 1 TS 2.0m3 1 G 100kVA 1 CP 100m3/h 1 DT 4t 1Gate and pipe installation LS 1 60 TC 25t 1 DT 4t 1Plain concrete (plugging) m3 4,642 AT 4.4m3 6.9 38.6 120.1 1.20 144.1 1 145 CP 1.5m3*2 1 TS 2.0m3 1 G 100kVA 1 CP 100m3/h 1
Table 9.2.2: Dam Construction Period (1/4)
T-58
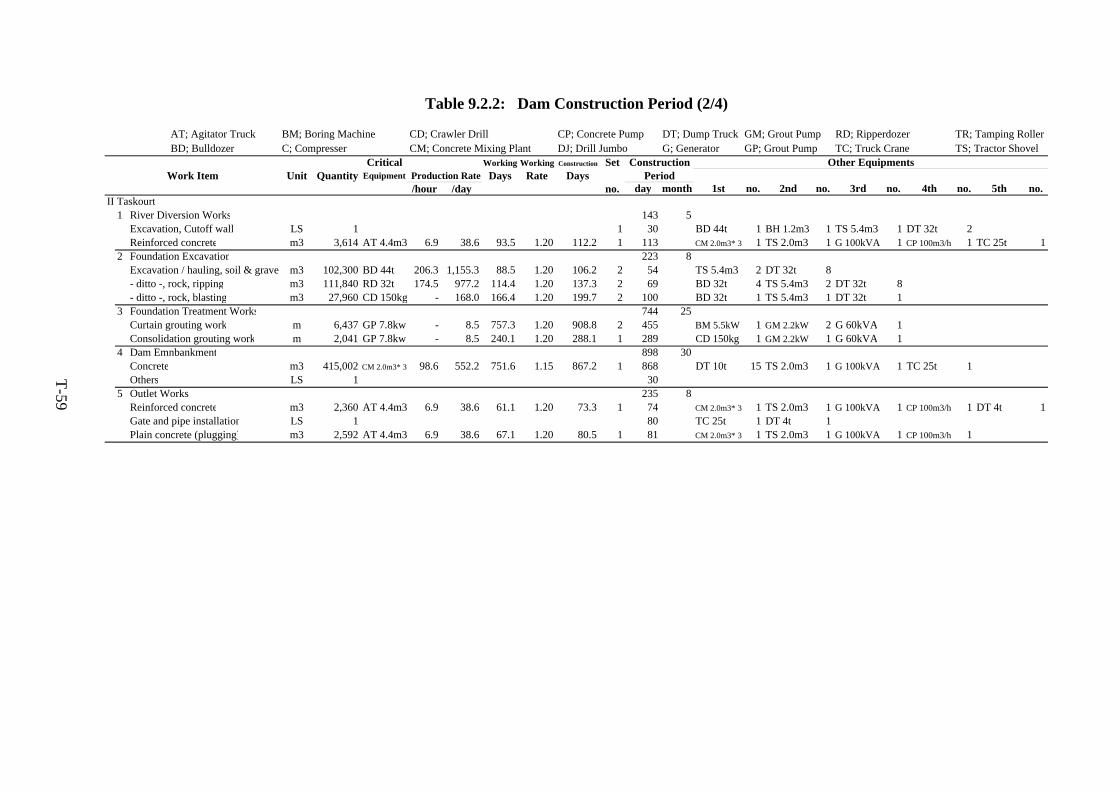
AT; Agitator Truck BM; Boring Machine CD; Crawler Drill CP; Concrete Pump DT; Dump Truck GM; Grout Pump RD; Ripperdozer TR; Tamping Roller BD; Bulldozer C; Compresser CM; Concrete Mixing Plant DJ; Drill Jumbo G; Generator GP; Grout Pump TC; Truck Crane TS; Tractor Shovel
Critical Working Working Construction Set Construction Other EquipmentsWork Item Unit Quantity Equipment Production Rate Days Rate Days Period
/hour /day no. day month 1st no. 2nd no. 3rd no. 4th no. 5th no.II Taskourt
1 River Diversion Works 143 5Excavation, Cutoff wall LS 1 1 30 BD 44t 1 BH 1.2m3 1 TS 5.4m3 1 DT 32t 2Reinforced concrete m3 3,614 AT 4.4m3 6.9 38.6 93.5 1.20 112.2 1 113 CM 2.0m3*3 1 TS 2.0m3 1 G 100kVA 1 CP 100m3/h 1 TC 25t 1
2 Foundation Excavation 223 8Excavation / hauling, soil & gravel m3 102,300 BD 44t 206.3 1,155.3 88.5 1.20 106.2 2 54 TS 5.4m3 2 DT 32t 8- ditto -, rock, ripping m3 111,840 RD 32t 174.5 977.2 114.4 1.20 137.3 2 69 BD 32t 4 TS 5.4m3 2 DT 32t 8- ditto -, rock, blasting m3 27,960 CD 150kg - 168.0 166.4 1.20 199.7 2 100 BD 32t 1 TS 5.4m3 1 DT 32t 1
3 Foundation Treatment Works 744 25Curtain grouting work m 6,437 GP 7.8kw - 8.5 757.3 1.20 908.8 2 455 BM 5.5kW 1 GM 2.2kW 2 G 60kVA 1Consolidation grouting work m 2,041 GP 7.8kw - 8.5 240.1 1.20 288.1 1 289 CD 150kg 1 GM 2.2kW 1 G 60kVA 1
4 Dam Emnbankment 898 30Concrete m3 415,002 CM 2.0m3*3 98.6 552.2 751.6 1.15 867.2 1 868 DT 10t 15 TS 2.0m3 1 G 100kVA 1 TC 25t 1Others LS 1 30
5 Outlet Works 235 8Reinforced concrete m3 2,360 AT 4.4m3 6.9 38.6 61.1 1.20 73.3 1 74 CM 2.0m3*3 1 TS 2.0m3 1 G 100kVA 1 CP 100m3/h 1 DT 4t 1Gate and pipe installation LS 1 80 TC 25t 1 DT 4t 1Plain concrete (plugging) m3 2,592 AT 4.4m3 6.9 38.6 67.1 1.20 80.5 1 81 CM 2.0m3*3 1 TS 2.0m3 1 G 100kVA 1 CP 100m3/h 1
Table 9.2.2: Dam Construction Period (2/4)
T-59
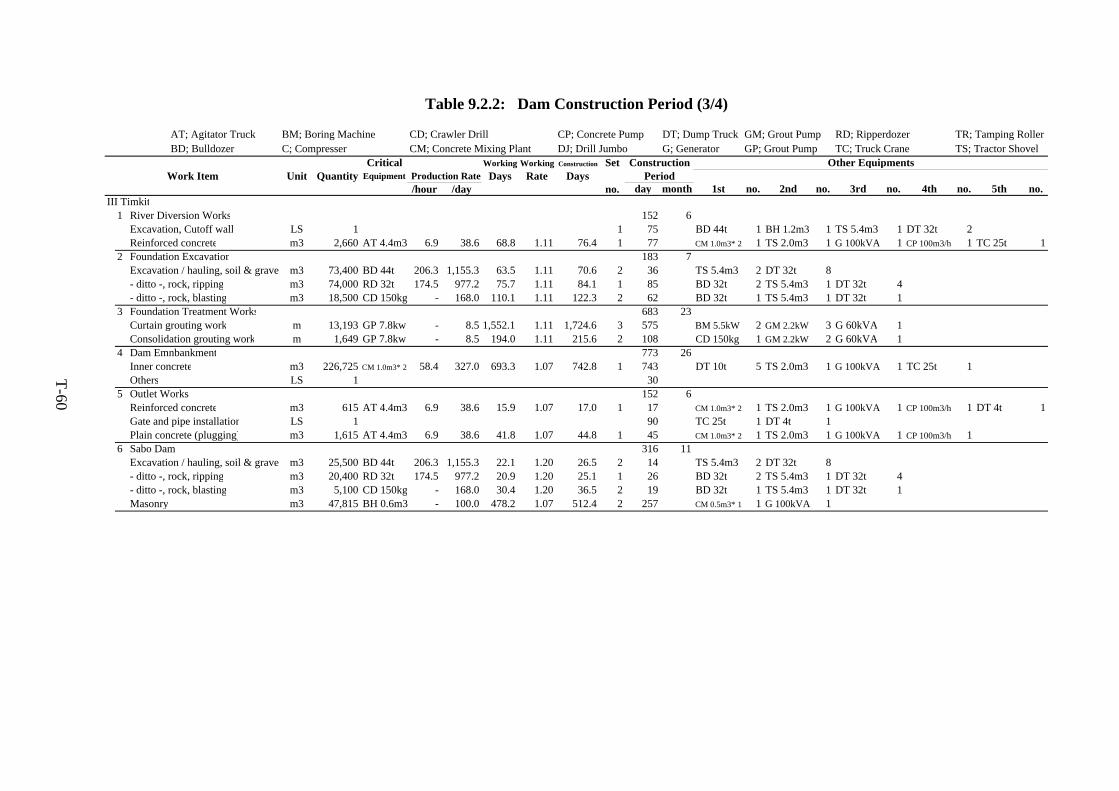
AT; Agitator Truck BM; Boring Machine CD; Crawler Drill CP; Concrete Pump DT; Dump Truck GM; Grout Pump RD; Ripperdozer TR; Tamping Roller BD; Bulldozer C; Compresser CM; Concrete Mixing Plant DJ; Drill Jumbo G; Generator GP; Grout Pump TC; Truck Crane TS; Tractor Shovel
Critical Working Working Construction Set Construction Other EquipmentsWork Item Unit Quantity Equipment Production Rate Days Rate Days Period
/hour /day no. day month 1st no. 2nd no. 3rd no. 4th no. 5th no.III Timkit
1 River Diversion Works 152 6Excavation, Cutoff wall LS 1 1 75 BD 44t 1 BH 1.2m3 1 TS 5.4m3 1 DT 32t 2Reinforced concrete m3 2,660 AT 4.4m3 6.9 38.6 68.8 1.11 76.4 1 77 CM 1.0m3*2 1 TS 2.0m3 1 G 100kVA 1 CP 100m3/h 1 TC 25t 1
2 Foundation Excavation 183 7Excavation / hauling, soil & gravel m3 73,400 BD 44t 206.3 1,155.3 63.5 1.11 70.6 2 36 TS 5.4m3 2 DT 32t 8- ditto -, rock, ripping m3 74,000 RD 32t 174.5 977.2 75.7 1.11 84.1 1 85 BD 32t 2 TS 5.4m3 1 DT 32t 4- ditto -, rock, blasting m3 18,500 CD 150kg - 168.0 110.1 1.11 122.3 2 62 BD 32t 1 TS 5.4m3 1 DT 32t 1
3 Foundation Treatment Works 683 23Curtain grouting work m 13,193 GP 7.8kw - 8.5 1,552.1 1.11 1,724.6 3 575 BM 5.5kW 2 GM 2.2kW 3 G 60kVA 1Consolidation grouting work m 1,649 GP 7.8kw - 8.5 194.0 1.11 215.6 2 108 CD 150kg 1 GM 2.2kW 2 G 60kVA 1
4 Dam Emnbankment 773 26Inner concrete m3 226,725 CM 1.0m3*2 58.4 327.0 693.3 1.07 742.8 1 743 DT 10t 5 TS 2.0m3 1 G 100kVA 1 TC 25t 1Others LS 1 30
5 Outlet Works 152 6Reinforced concrete m3 615 AT 4.4m3 6.9 38.6 15.9 1.07 17.0 1 17 CM 1.0m3*2 1 TS 2.0m3 1 G 100kVA 1 CP 100m3/h 1 DT 4t 1Gate and pipe installation LS 1 90 TC 25t 1 DT 4t 1Plain concrete (plugging) m3 1,615 AT 4.4m3 6.9 38.6 41.8 1.07 44.8 1 45 CM 1.0m3*2 1 TS 2.0m3 1 G 100kVA 1 CP 100m3/h 1
6 Sabo Dam 316 11Excavation / hauling, soil & gravel m3 25,500 BD 44t 206.3 1,155.3 22.1 1.20 26.5 2 14 TS 5.4m3 2 DT 32t 8- ditto -, rock, ripping m3 20,400 RD 32t 174.5 977.2 20.9 1.20 25.1 1 26 BD 32t 2 TS 5.4m3 1 DT 32t 4- ditto -, rock, blasting m3 5,100 CD 150kg - 168.0 30.4 1.20 36.5 2 19 BD 32t 1 TS 5.4m3 1 DT 32t 1Masonry m3 47,815 BH 0.6m3 - 100.0 478.2 1.07 512.4 2 257 CM 0.5m3*1 1 G 100kVA 1
Table 9.2.2: Dam Construction Period (3/4)
T-60
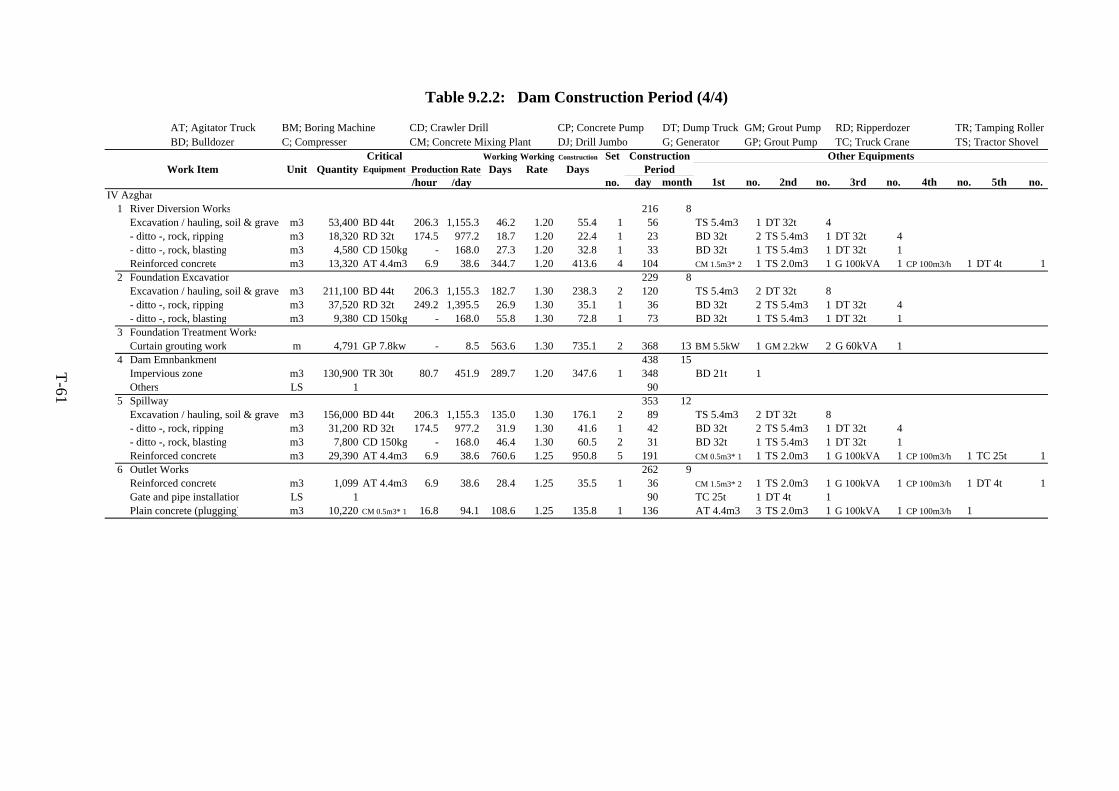
AT; Agitator Truck BM; Boring Machine CD; Crawler Drill CP; Concrete Pump DT; Dump Truck GM; Grout Pump RD; Ripperdozer TR; Tamping Roller BD; Bulldozer C; Compresser CM; Concrete Mixing Plant DJ; Drill Jumbo G; Generator GP; Grout Pump TC; Truck Crane TS; Tractor Shovel
Critical Working Working Construction Set Construction Other EquipmentsWork Item Unit Quantity Equipment Production Rate Days Rate Days Period
/hour /day no. day month 1st no. 2nd no. 3rd no. 4th no. 5th no.IV Azghar
1 River Diversion Works 216 8Excavation / hauling, soil & gravel m3 53,400 BD 44t 206.3 1,155.3 46.2 1.20 55.4 1 56 TS 5.4m3 1 DT 32t 4- ditto -, rock, ripping m3 18,320 RD 32t 174.5 977.2 18.7 1.20 22.4 1 23 BD 32t 2 TS 5.4m3 1 DT 32t 4- ditto -, rock, blasting m3 4,580 CD 150kg - 168.0 27.3 1.20 32.8 1 33 BD 32t 1 TS 5.4m3 1 DT 32t 1Reinforced concrete m3 13,320 AT 4.4m3 6.9 38.6 344.7 1.20 413.6 4 104 CM 1.5m3*2 1 TS 2.0m3 1 G 100kVA 1 CP 100m3/h 1 DT 4t 1
2 Foundation Excavation 229 8Excavation / hauling, soil & gravel m3 211,100 BD 44t 206.3 1,155.3 182.7 1.30 238.3 2 120 TS 5.4m3 2 DT 32t 8- ditto -, rock, ripping m3 37,520 RD 32t 249.2 1,395.5 26.9 1.30 35.1 1 36 BD 32t 2 TS 5.4m3 1 DT 32t 4- ditto -, rock, blasting m3 9,380 CD 150kg - 168.0 55.8 1.30 72.8 1 73 BD 32t 1 TS 5.4m3 1 DT 32t 1
3 Foundation Treatment WorksCurtain grouting work m 4,791 GP 7.8kw - 8.5 563.6 1.30 735.1 2 368 13 BM 5.5kW 1 GM 2.2kW 2 G 60kVA 1
4 Dam Emnbankment 438 15Impervious zone m3 130,900 TR 30t 80.7 451.9 289.7 1.20 347.6 1 348 BD 21t 1Others LS 1 90
5 Spillway 353 12Excavation / hauling, soil & gravel m3 156,000 BD 44t 206.3 1,155.3 135.0 1.30 176.1 2 89 TS 5.4m3 2 DT 32t 8- ditto -, rock, ripping m3 31,200 RD 32t 174.5 977.2 31.9 1.30 41.6 1 42 BD 32t 2 TS 5.4m3 1 DT 32t 4- ditto -, rock, blasting m3 7,800 CD 150kg - 168.0 46.4 1.30 60.5 2 31 BD 32t 1 TS 5.4m3 1 DT 32t 1Reinforced concrete m3 29,390 AT 4.4m3 6.9 38.6 760.6 1.25 950.8 5 191 CM 0.5m3*1 1 TS 2.0m3 1 G 100kVA 1 CP 100m3/h 1 TC 25t 1
6 Outlet Works 262 9Reinforced concrete m3 1,099 AT 4.4m3 6.9 38.6 28.4 1.25 35.5 1 36 CM 1.5m3*2 1 TS 2.0m3 1 G 100kVA 1 CP 100m3/h 1 DT 4t 1Gate and pipe installation LS 1 90 TC 25t 1 DT 4t 1Plain concrete (plugging) m3 10,220 CM 0.5m3*1 16.8 94.1 108.6 1.25 135.8 1 136 AT 4.4m3 3 TS 2.0m3 1 G 100kVA 1 CP 100m3/h 1
Table 9.2.2: Dam Construction Period (4/4)
T-61
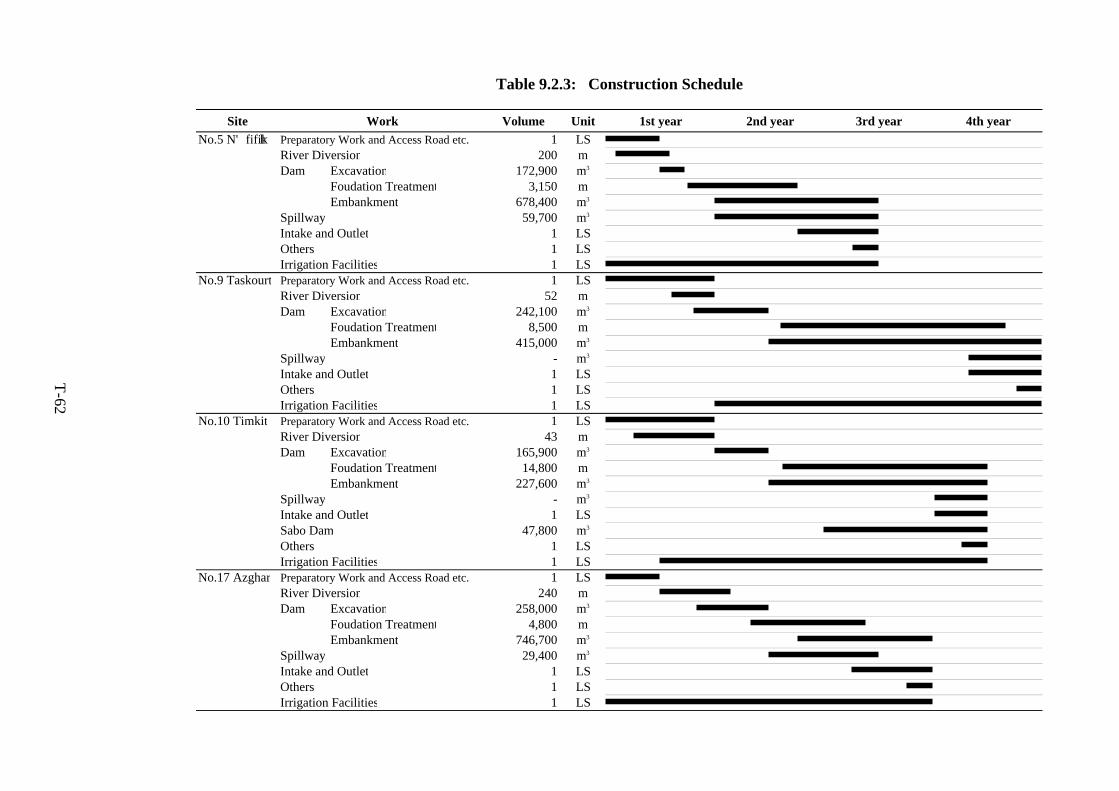
Table 9.2.3: Construction Schedule
Site Work Volume Unit 1st year 2nd year 3rd year 4th yearNo.5 N'fifikh Preparatory Work and Access Road etc. 1 LS
River Diversion 200 mDam Excavation 172,900 m3
Foudation Treatment 3,150 mEmbankment 678,400 m3
Spillway 59,700 m3
Intake and Outlet 1 LSOthers 1 LSIrrigation Facilities 1 LS
No.9 Taskourt Preparatory Work and Access Road etc. 1 LSRiver Diversion 52 mDam Excavation 242,100 m3
Foudation Treatment 8,500 mEmbankment 415,000 m3
Spillway - m3
Intake and Outlet 1 LSOthers 1 LSIrrigation Facilities 1 LS
No.10 Timkit Preparatory Work and Access Road etc. 1 LSRiver Diversion 43 mDam Excavation 165,900 m3
Foudation Treatment 14,800 mEmbankment 227,600 m3
Spillway - m3
Intake and Outlet 1 LSSabo Dam 47,800 m3
Others 1 LSIrrigation Facilities 1 LS
No.17 Azghar Preparatory Work and Access Road etc. 1 LSRiver Diversion 240 mDam Excavation 258,000 m3
Foudation Treatment 4,800 mEmbankment 746,700 m3
Spillway 29,400 m3
Intake and Outlet 1 LSOthers 1 LSIrrigation Facilities 1 LS
T-62
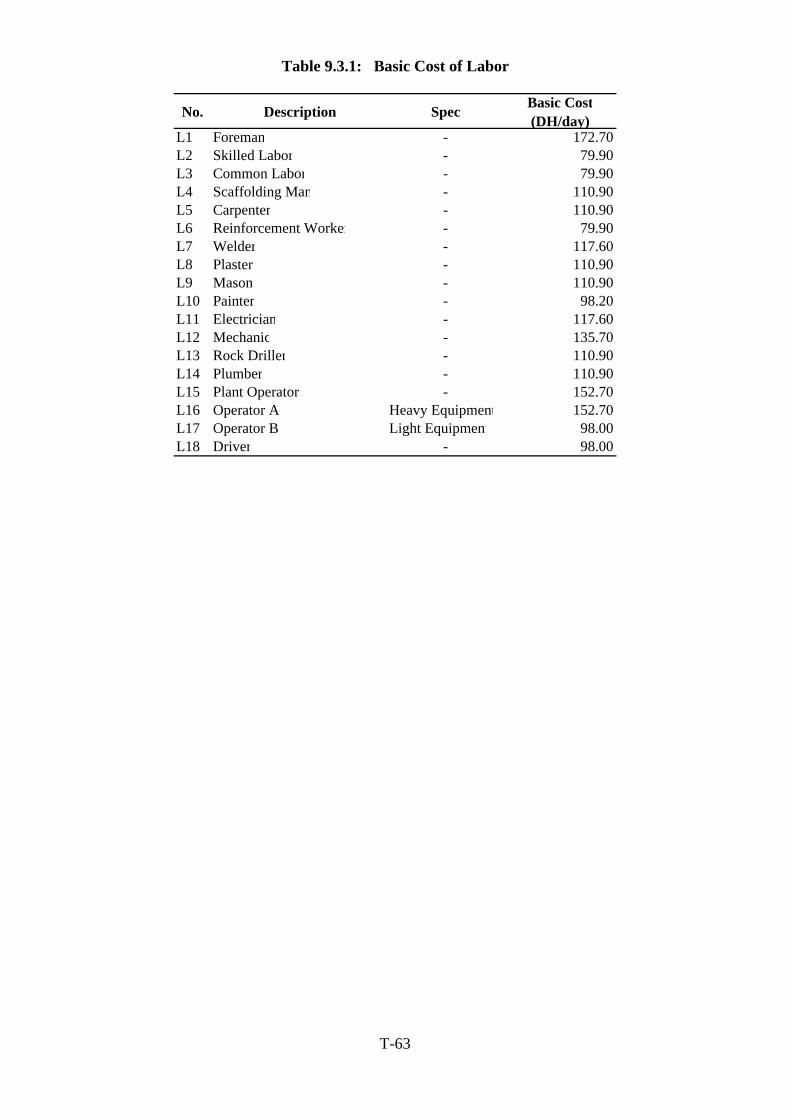
No. Description Spec Basic Cost(DH/day)
L1 Foreman - 172.70L2 Skilled Labor - 79.90L3 Common Labor - 79.90L4 Scaffolding Man - 110.90L5 Carpenter - 110.90L6 Reinforcement Worker - 79.90L7 Welder - 117.60L8 Plaster - 110.90L9 Mason - 110.90L10 Painter - 98.20L11 Electrician - 117.60L12 Mechanic - 135.70L13 Rock Driller - 110.90L14 Plumber - 110.90L15 Plant Operator - 152.70L16 Operator A Heavy Equipment 152.70L17 Operator B Light Equipment 98.00L18 Driver - 98.00
Table 9.3.1: Basic Cost of Labor
T-63
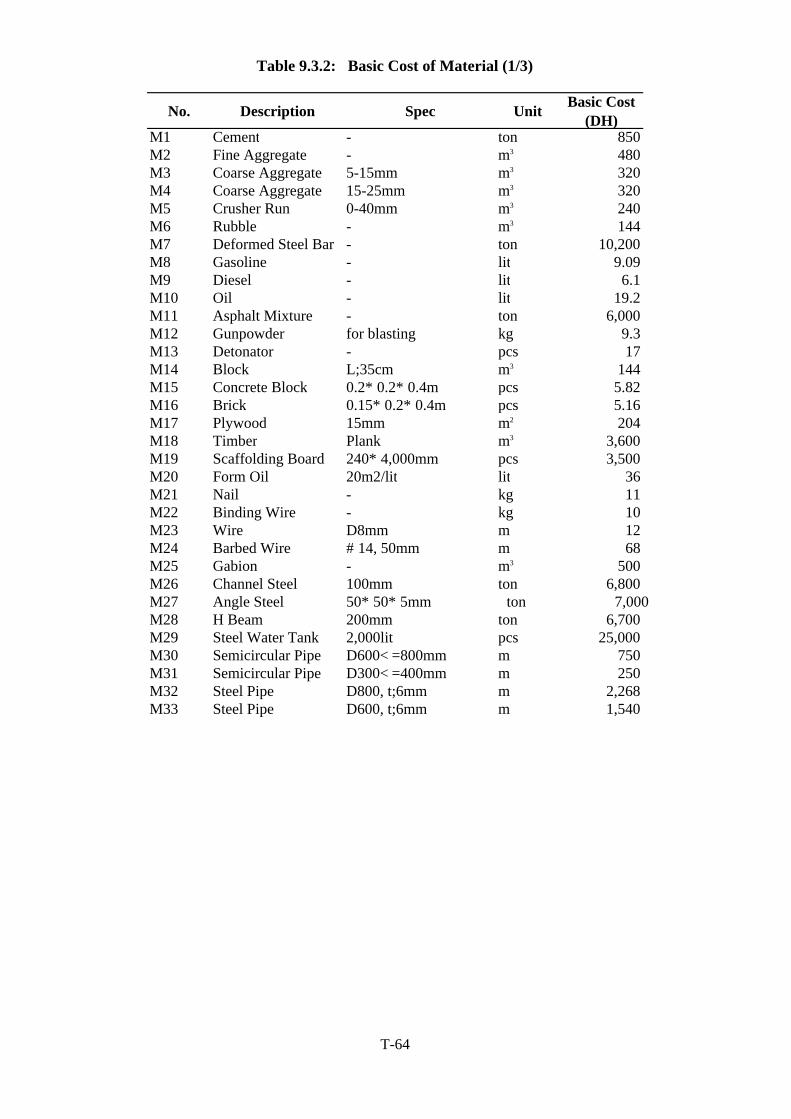
No. Description Spec Unit Basic Cost(DH)
M1 Cement - ton 850M2 Fine Aggregate - m3 480M3 Coarse Aggregate 5-15mm m3 320M4 Coarse Aggregate 15-25mm m3 320M5 Crusher Run 0-40mm m3 240M6 Rubble - m3 144M7 Deformed Steel Bar - ton 10,200M8 Gasoline - lit 9.09M9 Diesel - lit 6.1M10 Oil - lit 19.2M11 Asphalt Mixture - ton 6,000M12 Gunpowder for blasting kg 9.3M13 Detonator - pcs 17M14 Block L;35cm m3 144M15 Concrete Block 0.2*0.2*0.4m pcs 5.82M16 Brick 0.15*0.2*0.4m pcs 5.16M17 Plywood 15mm m2 204M18 Timber Plank m3 3,600M19 Scaffolding Board 240*4,000mm pcs 3,500M20 Form Oil 20m2/lit lit 36M21 Nail - kg 11M22 Binding Wire - kg 10M23 Wire D8mm m 12M24 Barbed Wire #14, 50mm m 68M25 Gabion - m3 500M26 Channel Steel 100mm ton 6,800M27 Angle Steel 50*50*5mm ton 7,000M28 H Beam 200mm ton 6,700M29 Steel Water Tank 2,000lit pcs 25,000M30 Semicircular Pipe D600<=800mm m 750M31 Semicircular Pipe D300<=400mm m 250M32 Steel Pipe D800, t;6mm m 2,268M33 Steel Pipe D600, t;6mm m 1,540
Table 9.3.2: Basic Cost of Material (1/3)
T-64
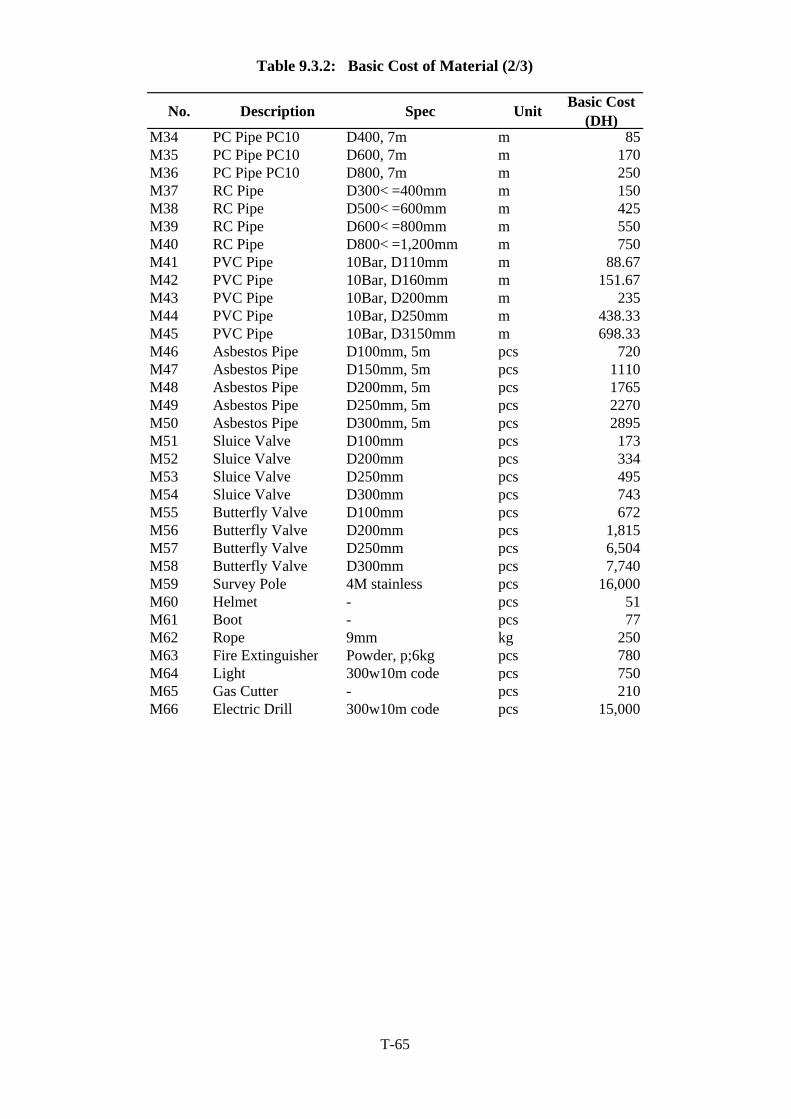
No. Description Spec Unit Basic Cost(DH)
M34 PC Pipe PC10 D400, 7m m 85M35 PC Pipe PC10 D600, 7m m 170M36 PC Pipe PC10 D800, 7m m 250M37 RC Pipe D300<=400mm m 150M38 RC Pipe D500<=600mm m 425M39 RC Pipe D600<=800mm m 550M40 RC Pipe D800<=1,200mm m 750M41 PVC Pipe 10Bar, D110mm m 88.67M42 PVC Pipe 10Bar, D160mm m 151.67M43 PVC Pipe 10Bar, D200mm m 235M44 PVC Pipe 10Bar, D250mm m 438.33M45 PVC Pipe 10Bar, D3150mm m 698.33M46 Asbestos Pipe D100mm, 5m pcs 720M47 Asbestos Pipe D150mm, 5m pcs 1110M48 Asbestos Pipe D200mm, 5m pcs 1765M49 Asbestos Pipe D250mm, 5m pcs 2270M50 Asbestos Pipe D300mm, 5m pcs 2895M51 Sluice Valve D100mm pcs 173M52 Sluice Valve D200mm pcs 334M53 Sluice Valve D250mm pcs 495M54 Sluice Valve D300mm pcs 743M55 Butterfly Valve D100mm pcs 672M56 Butterfly Valve D200mm pcs 1,815M57 Butterfly Valve D250mm pcs 6,504M58 Butterfly Valve D300mm pcs 7,740M59 Survey Pole 4M stainless pcs 16,000M60 Helmet - pcs 51M61 Boot - pcs 77M62 Rope 9mm kg 250M63 Fire Extinguisher Powder, p;6kg pcs 780M64 Light 300w10m code pcs 750M65 Gas Cutter - pcs 210M66 Electric Drill 300w10m code pcs 15,000
Table 9.3.2: Basic Cost of Material (2/3)
T-65
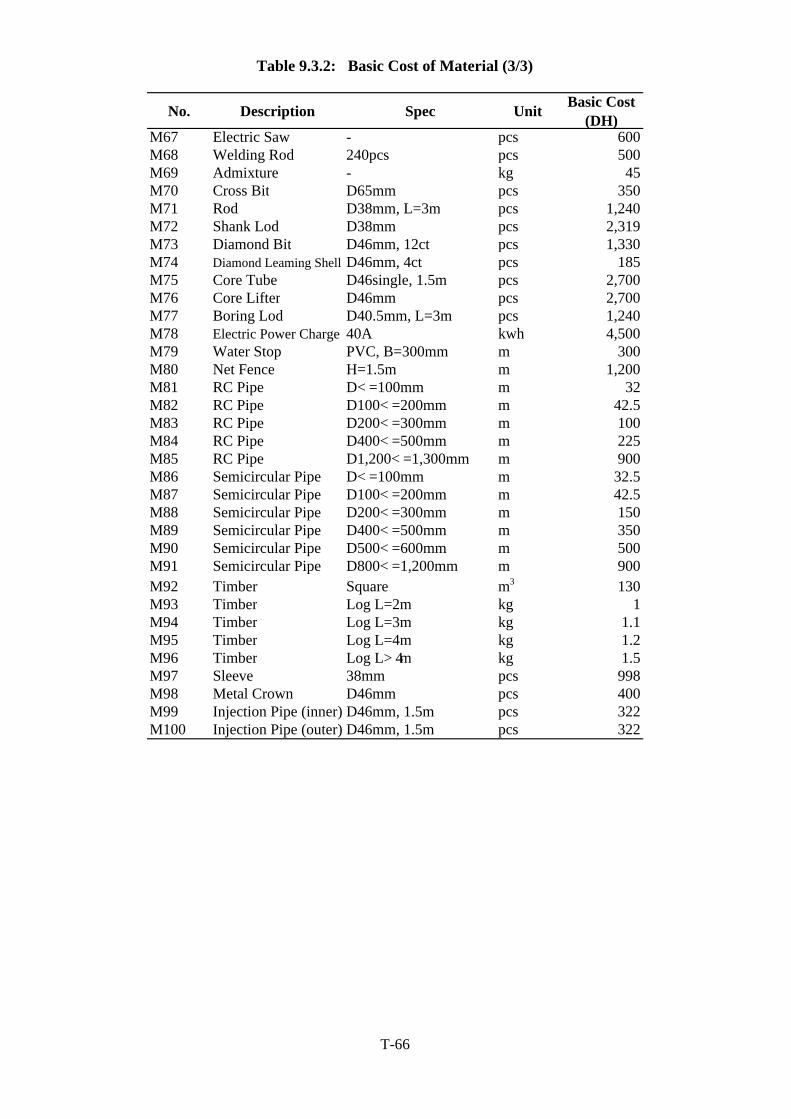
No. Description Spec Unit Basic Cost(DH)
M67 Electric Saw - pcs 600M68 Welding Rod 240pcs pcs 500M69 Admixture - kg 45M70 Cross Bit D65mm pcs 350M71 Rod D38mm, L=3m pcs 1,240M72 Shank Lod D38mm pcs 2,319M73 Diamond Bit D46mm, 12ct pcs 1,330M74 Diamond Leaming Shell D46mm, 4ct pcs 185M75 Core Tube D46single, 1.5m pcs 2,700M76 Core Lifter D46mm pcs 2,700M77 Boring Lod D40.5mm, L=3m pcs 1,240M78 Electric Power Charge 40A kwh 4,500M79 Water Stop PVC, B=300mm m 300M80 Net Fence H=1.5m m 1,200M81 RC Pipe D<=100mm m 32M82 RC Pipe D100<=200mm m 42.5M83 RC Pipe D200<=300mm m 100M84 RC Pipe D400<=500mm m 225M85 RC Pipe D1,200<=1,300mm m 900M86 Semicircular Pipe D<=100mm m 32.5M87 Semicircular Pipe D100<=200mm m 42.5M88 Semicircular Pipe D200<=300mm m 150M89 Semicircular Pipe D400<=500mm m 350M90 Semicircular Pipe D500<=600mm m 500M91 Semicircular Pipe D800<=1,200mm m 900M92 Timber Square m3 130M93 Timber Log L=2m kg 1M94 Timber Log L=3m kg 1.1M95 Timber Log L=4m kg 1.2M96 Timber Log L>4m kg 1.5M97 Sleeve 38mm pcs 998M98 Metal Crown D46mm pcs 400M99 Injection Pipe (inner) D46mm, 1.5m pcs 322M100 Injection Pipe (outer) D46mm, 1.5m pcs 322
Table 9.3.2: Basic Cost of Material (3/3)
T-66
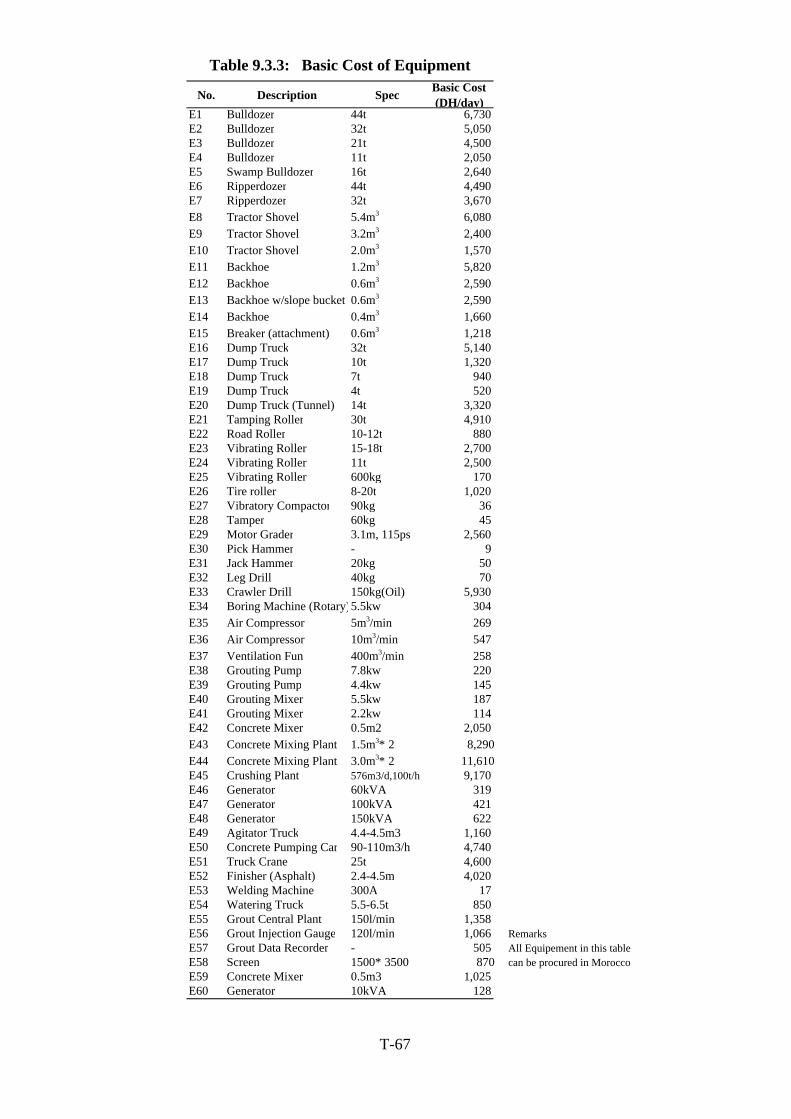
No. Description Spec Basic Cost(DH/day)
E1 Bulldozer 44t 6,730E2 Bulldozer 32t 5,050E3 Bulldozer 21t 4,500E4 Bulldozer 11t 2,050E5 Swamp Bulldozer 16t 2,640E6 Ripperdozer 44t 4,490E7 Ripperdozer 32t 3,670E8 Tractor Shovel 5.4m3 6,080E9 Tractor Shovel 3.2m3 2,400E10 Tractor Shovel 2.0m3 1,570E11 Backhoe 1.2m3 5,820E12 Backhoe 0.6m3 2,590E13 Backhoe w/slope bucket 0.6m3 2,590E14 Backhoe 0.4m3 1,660E15 Breaker (attachment) 0.6m3 1,218E16 Dump Truck 32t 5,140E17 Dump Truck 10t 1,320E18 Dump Truck 7t 940E19 Dump Truck 4t 520E20 Dump Truck (Tunnel) 14t 3,320E21 Tamping Roller 30t 4,910E22 Road Roller 10-12t 880E23 Vibrating Roller 15-18t 2,700E24 Vibrating Roller 11t 2,500E25 Vibrating Roller 600kg 170E26 Tire roller 8-20t 1,020E27 Vibratory Compactor 90kg 36E28 Tamper 60kg 45E29 Motor Grader 3.1m, 115ps 2,560E30 Pick Hammer - 9E31 Jack Hammer 20kg 50E32 Leg Drill 40kg 70E33 Crawler Drill 150kg(Oil) 5,930E34 Boring Machine (Rotary)5.5kw 304E35 Air Compressor 5m3/min 269E36 Air Compressor 10m3/min 547E37 Ventilation Fun 400m3/min 258E38 Grouting Pump 7.8kw 220E39 Grouting Pump 4.4kw 145E40 Grouting Mixer 5.5kw 187E41 Grouting Mixer 2.2kw 114E42 Concrete Mixer 0.5m2 2,050E43 Concrete Mixing Plant 1.5m3*2 8,290E44 Concrete Mixing Plant 3.0m3*2 11,610E45 Crushing Plant 576m3/d,100t/h 9,170E46 Generator 60kVA 319E47 Generator 100kVA 421E48 Generator 150kVA 622E49 Agitator Truck 4.4-4.5m3 1,160E50 Concrete Pumping Car 90-110m3/h 4,740E51 Truck Crane 25t 4,600E52 Finisher (Asphalt) 2.4-4.5m 4,020E53 Welding Machine 300A 17E54 Watering Truck 5.5-6.5t 850E55 Grout Central Plant 150l/min 1,358E56 Grout Injection Gauge 120l/min 1,066 RemarksE57 Grout Data Recorder - 505 All Equipement in this tableE58 Screen 1500*3500 870 can be procured in MoroccoE59 Concrete Mixer 0.5m3 1,025E60 Generator 10kVA 128
Table 9.3.3: Basic Cost of Equipment
T-67
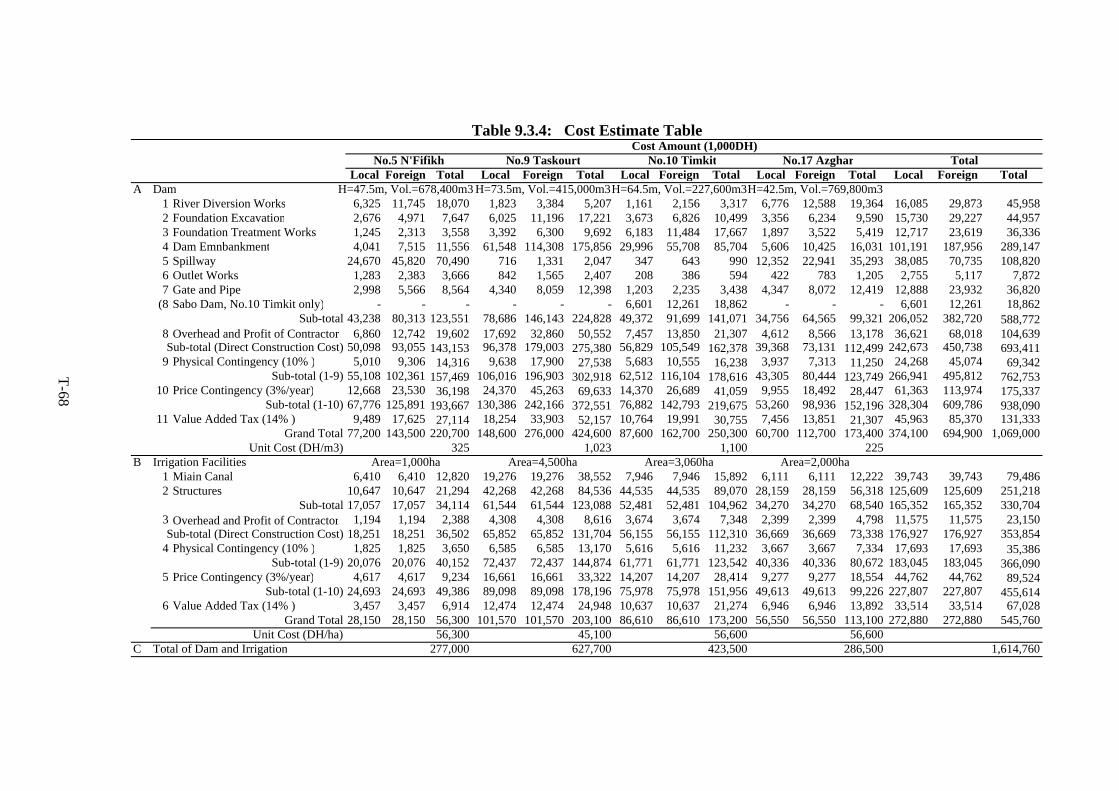
Cost Amount (1,000DH)No.5 N'Fifikh No.9 Taskourt No.10 Timkit No.17 Azghar Total
Local Foreign Total Local Foreign Total Local Foreign Total Local Foreign Total Local Foreign TotalA Dam H=47.5m, Vol.=678,400m3 H=73.5m, Vol.=415,000m3H=64.5m, Vol.=227,600m3H=42.5m, Vol.=769,800m3
1 River Diversion Works 6,325 11,745 18,070 1,823 3,384 5,207 1,161 2,156 3,317 6,776 12,588 19,364 16,085 29,873 45,9582 Foundation Excavation 2,676 4,971 7,647 6,025 11,196 17,221 3,673 6,826 10,499 3,356 6,234 9,590 15,730 29,227 44,9573 Foundation Treatment Works 1,245 2,313 3,558 3,392 6,300 9,692 6,183 11,484 17,667 1,897 3,522 5,419 12,717 23,619 36,3364 Dam Emnbankment 4,041 7,515 11,556 61,548 114,308 175,856 29,996 55,708 85,704 5,606 10,425 16,031 101,191 187,956 289,1475 Spillway 24,670 45,820 70,490 716 1,331 2,047 347 643 990 12,352 22,941 35,293 38,085 70,735 108,8206 Outlet Works 1,283 2,383 3,666 842 1,565 2,407 208 386 594 422 783 1,205 2,755 5,117 7,8727 Gate and Pipe 2,998 5,566 8,564 4,340 8,059 12,398 1,203 2,235 3,438 4,347 8,072 12,419 12,888 23,932 36,820
(8 Sabo Dam, No.10 Timkit only) - - - - - - 6,601 12,261 18,862 - - - 6,601 12,261 18,862Sub-total 43,238 80,313 123,551 78,686 146,143 224,828 49,372 91,699 141,071 34,756 64,565 99,321 206,052 382,720 588,772
8 Overhead and Profit of Contractor 6,860 12,742 19,602 17,692 32,860 50,552 7,457 13,850 21,307 4,612 8,566 13,178 36,621 68,018 104,639Sub-total (Direct Construction Cost) 50,098 93,055 143,153 96,378 179,003 275,380 56,829 105,549 162,378 39,368 73,131 112,499 242,673 450,738 693,411
9 Physical Contingency (10% ) 5,010 9,306 14,316 9,638 17,900 27,538 5,683 10,555 16,238 3,937 7,313 11,250 24,268 45,074 69,342Sub-total (1-9) 55,108 102,361 157,469 106,016 196,903 302,918 62,512 116,104 178,616 43,305 80,444 123,749 266,941 495,812 762,753
10 Price Contingency (3%/year) 12,668 23,530 36,198 24,370 45,263 69,633 14,370 26,689 41,059 9,955 18,492 28,447 61,363 113,974 175,337Sub-total (1-10) 67,776 125,891 193,667 130,386 242,166 372,551 76,882 142,793 219,675 53,260 98,936 152,196 328,304 609,786 938,090
11 Value Added Tax (14% ) 9,489 17,625 27,114 18,254 33,903 52,157 10,764 19,991 30,755 7,456 13,851 21,307 45,963 85,370 131,333Grand Total 77,200 143,500 220,700 148,600 276,000 424,600 87,600 162,700 250,300 60,700 112,700 173,400 374,100 694,900 1,069,000
Unit Cost (DH/m3) 325 1,023 1,100 225B Irrigation Facilities Area=1,000ha Area=4,500ha Area=3,060ha Area=2,000ha
1 Miain Canal 6,410 6,410 12,820 19,276 19,276 38,552 7,946 7,946 15,892 6,111 6,111 12,222 39,743 39,743 79,4862 Structures 10,647 10,647 21,294 42,268 42,268 84,536 44,535 44,535 89,070 28,159 28,159 56,318 125,609 125,609 251,218
Sub-total 17,057 17,057 34,114 61,544 61,544 123,088 52,481 52,481 104,962 34,270 34,270 68,540 165,352 165,352 330,7043 Overhead and Profit of Contractor 1,194 1,194 2,388 4,308 4,308 8,616 3,674 3,674 7,348 2,399 2,399 4,798 11,575 11,575 23,150Sub-total (Direct Construction Cost) 18,251 18,251 36,502 65,852 65,852 131,704 56,155 56,155 112,310 36,669 36,669 73,338 176,927 176,927 353,854
4 Physical Contingency (10% ) 1,825 1,825 3,650 6,585 6,585 13,170 5,616 5,616 11,232 3,667 3,667 7,334 17,693 17,693 35,386Sub-total (1-9) 20,076 20,076 40,152 72,437 72,437 144,874 61,771 61,771 123,542 40,336 40,336 80,672 183,045 183,045 366,090
5 Price Contingency (3%/year) 4,617 4,617 9,234 16,661 16,661 33,322 14,207 14,207 28,414 9,277 9,277 18,554 44,762 44,762 89,524Sub-total (1-10) 24,693 24,693 49,386 89,098 89,098 178,196 75,978 75,978 151,956 49,613 49,613 99,226 227,807 227,807 455,614
6 Value Added Tax (14% ) 3,457 3,457 6,914 12,474 12,474 24,948 10,637 10,637 21,274 6,946 6,946 13,892 33,514 33,514 67,028Grand Total 28,150 28,150 56,300 101,570 101,570 203,100 86,610 86,610 173,200 56,550 56,550 113,100 272,880 272,880 545,760
Unit Cost (DH/ha) 56,300 45,100 56,600 56,600C Total of Dam and Irrigation 277,000 627,700 423,500 286,500 1,614,760
Table 9.3.4: Cost Estimate Table
T-68
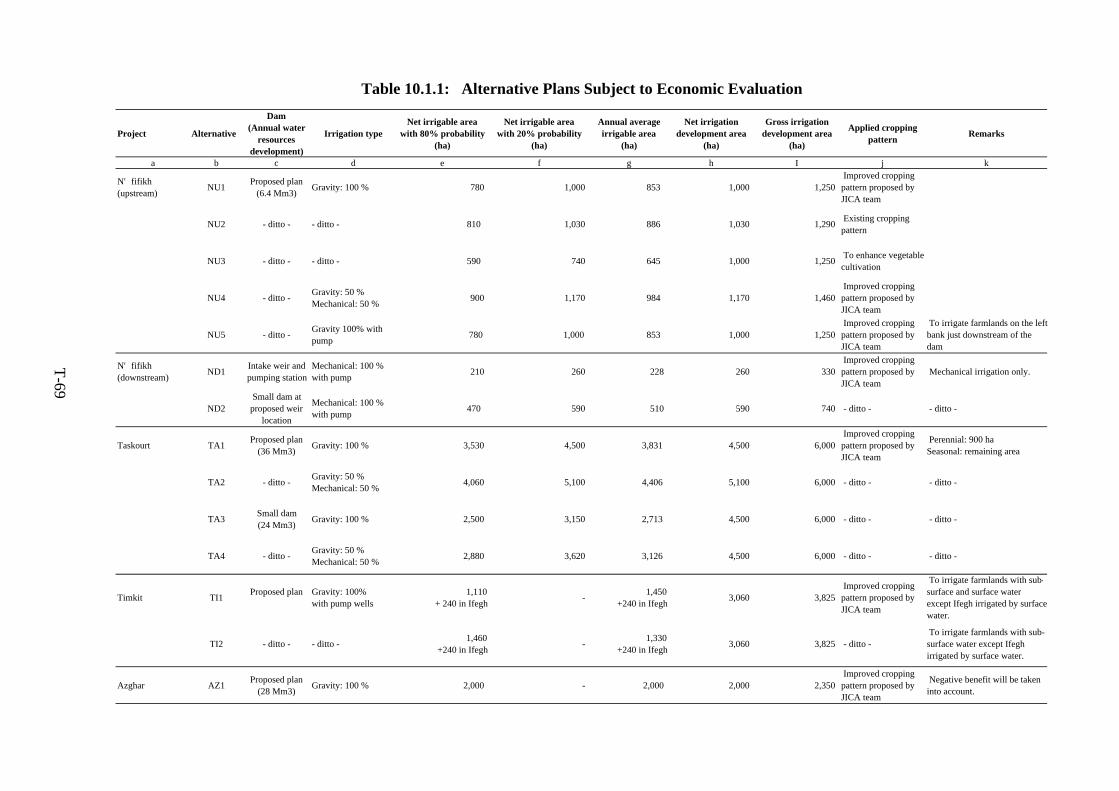
Project Alternative
Dam(Annual water
resourcesdevelopment)
Irrigation typeNet irrigable area
with 80% probability(ha)
Net irrigable areawith 20% probability
(ha)
Annual averageirrigable area
(ha)
Net irrigationdevelopment area
(ha)
Gross irrigationdevelopment area
(ha)
Applied croppingpattern Remarks
a b c d e f g h I j k
N'fifikh(upstream) NU1 Proposed plan
(6.4 Mm3) Gravity: 100 % 780 1,000 853 1,000 1,250 Improved croppingpattern proposed byJICA team
NU2 - ditto - - ditto - 810 1,030 886 1,030 1,290 Existing croppingpattern
NU3 - ditto - - ditto - 590 740 645 1,000 1,250 To enhance vegetablecultivation
NU4 - ditto - Gravity: 50 %Mechanical: 50 % 900 1,170 984 1,170 1,460
Improved croppingpattern proposed byJICA team
NU5 - ditto - Gravity 100% withpump 780 1,000 853 1,000 1,250
Improved croppingpattern proposed byJICA team
To irrigate farmlands on the leftbank just downstream of thedam
N'fifikh(downstream) ND1 Intake weir and
pumping stationMechanical: 100 %with pump 210 260 228 260 330
Improved croppingpattern proposed byJICA team
Mechanical irrigation only.
ND2Small dam at
proposed weirlocation
Mechanical: 100 %with pump 470 590 510 590 740 - ditto - - ditto -
Taskourt TA1 Proposed plan(36 Mm3) Gravity: 100 % 3,530 4,500 3,831 4,500 6,000
Improved croppingpattern proposed byJICA team
Perennial: 900 haSeasonal: remaining area
TA2 - ditto - Gravity: 50 %Mechanical: 50 % 4,060 5,100 4,406 5,100 6,000 - ditto - - ditto -
TA3 Small dam(24 Mm3) Gravity: 100 % 2,500 3,150 2,713 4,500 6,000 - ditto - - ditto -
TA4 - ditto - Gravity: 50 %Mechanical: 50 % 2,880 3,620 3,126 4,500 6,000 - ditto - - ditto -
Timkit TI1 Proposed plan Gravity: 100%with pump wells
1,110+ 240 in Ifegh - 1,450
+240 in Ifegh 3,060 3,825 Improved croppingpattern proposed byJICA team
To irrigate farmlands with sub-surface and surface waterexcept Ifegh irrigated by surfacewater.
TI2 - ditto - - ditto - 1,460+240 in Ifegh - 1,330
+240 in Ifegh 3,060 3,825 - ditto - To irrigate farmlands with sub-surface water except Ifeghirrigated by surface water.
Azghar AZ1 Proposed plan(28 Mm3) Gravity: 100 % 2,000 - 2,000 2,000 2,350
Improved croppingpattern proposed byJICA team
Negative benefit will be takeninto account.
Table 10.1.1: Alternative Plans Subject to Economic Evaluation
T-69
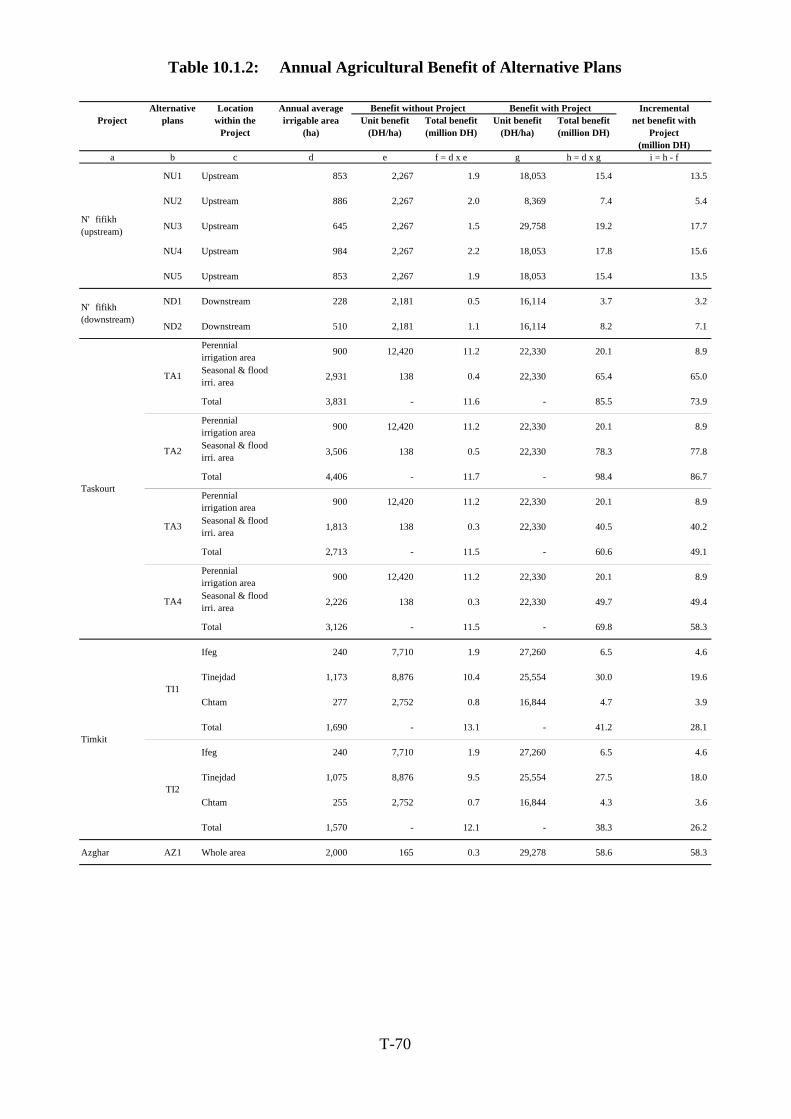
Table 10.1.2: Annual Agricultural Benefit of Alternative Plans
Alternative Location Annual average Benefit without Project Benefit with Project IncrementalProject plans within the
Projectirrigable area
(ha)Unit benefit
(DH/ha)Total benefit(million DH)
Unit benefit(DH/ha)
Total benefit(million DH)
net benefit withProject
(million DH)a b c d e f = d x e g h = d x g i = h - f
NU1 Upstream 853 2,267 1.9 18,053 15.4 13.5
NU2 Upstream 886 2,267 2.0 8,369 7.4 5.4
NU3 Upstream 645 2,267 1.5 29,758 19.2 17.7
NU4 Upstream 984 2,267 2.2 18,053 17.8 15.6
NU5 Upstream 853 2,267 1.9 18,053 15.4 13.5
ND1 Downstream 228 2,181 0.5 16,114 3.7 3.2
ND2 Downstream 510 2,181 1.1 16,114 8.2 7.1
Perennialirrigation area 900 12,420 11.2 22,330 20.1 8.9
Seasonal & floodirri. area 2,931 138 0.4 22,330 65.4 65.0
Total 3,831 - 11.6 - 85.5 73.9
Perennialirrigation area 900 12,420 11.2 22,330 20.1 8.9
Seasonal & floodirri. area 3,506 138 0.5 22,330 78.3 77.8
Total 4,406 - 11.7 - 98.4 86.7
Perennialirrigation area 900 12,420 11.2 22,330 20.1 8.9
Seasonal & floodirri. area 1,813 138 0.3 22,330 40.5 40.2
Total 2,713 - 11.5 - 60.6 49.1
Perennialirrigation area 900 12,420 11.2 22,330 20.1 8.9
Seasonal & floodirri. area 2,226 138 0.3 22,330 49.7 49.4
Total 3,126 - 11.5 - 69.8 58.3
Ifeg 240 7,710 1.9 27,260 6.5 4.6
Tinejdad 1,173 8,876 10.4 25,554 30.0 19.6
Chtam 277 2,752 0.8 16,844 4.7 3.9
Total 1,690 - 13.1 - 41.2 28.1
Ifeg 240 7,710 1.9 27,260 6.5 4.6
Tinejdad 1,075 8,876 9.5 25,554 27.5 18.0
Chtam 255 2,752 0.7 16,844 4.3 3.6
Total 1,570 - 12.1 - 38.3 26.2
Azghar AZ1 Whole area 2,000 165 0.3 29,278 58.6 58.3
TI2
TI1
TA1
TA2
TA3
TA4
N'fifikh(upstream)
N'fifikh(downstream)
Taskourt
Timkit
T-70
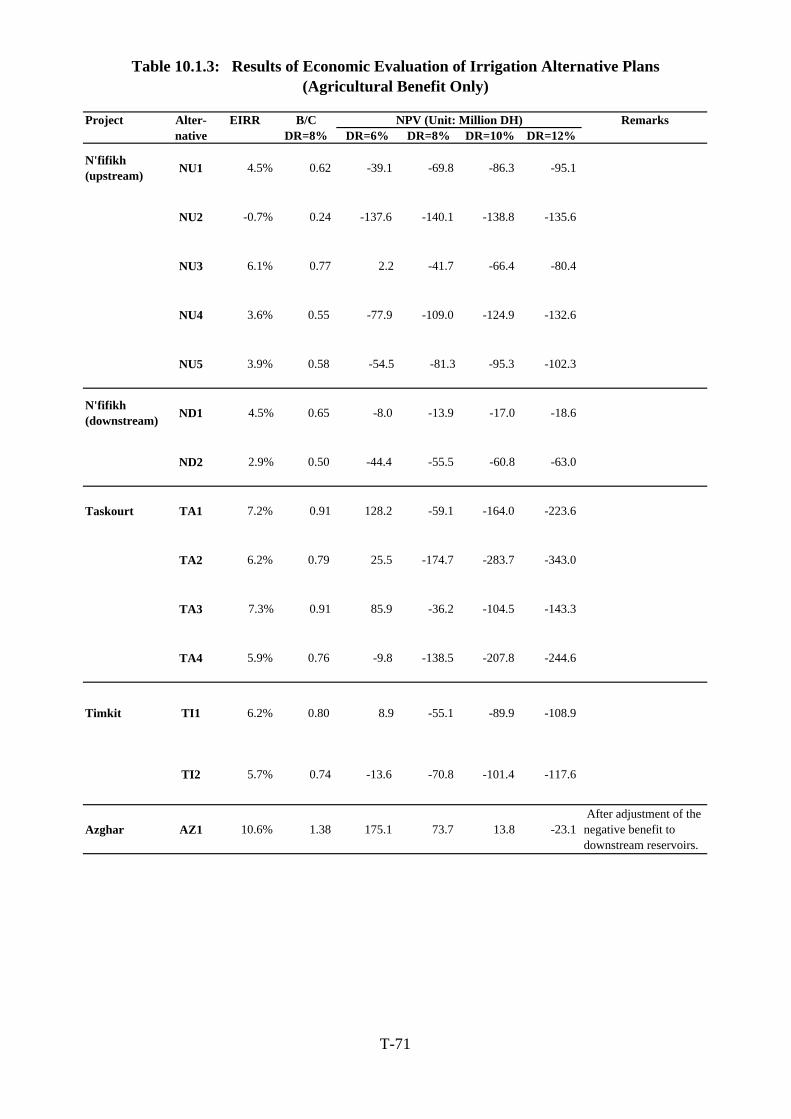
Table 10.1.3: Results of Economic Evaluation of Irrigation Alternative Plans(Agricultural Benefit Only)
Project Alter- EIRR B/C NPV (Unit: Million DH) Remarksnative DR=8% DR=6% DR=8% DR=10% DR=12%
N'fifikh(upstream) NU1 4.5% 0.62 -39.1 -69.8 -86.3 -95.1
NU2 -0.7% 0.24 -137.6 -140.1 -138.8 -135.6
NU3 6.1% 0.77 2.2 -41.7 -66.4 -80.4
NU4 3.6% 0.55 -77.9 -109.0 -124.9 -132.6
NU5 3.9% 0.58 -54.5 -81.3 -95.3 -102.3
N'fifikh(downstream) ND1 4.5% 0.65 -8.0 -13.9 -17.0 -18.6
ND2 2.9% 0.50 -44.4 -55.5 -60.8 -63.0
Taskourt TA1 7.2% 0.91 128.2 -59.1 -164.0 -223.6
TA2 6.2% 0.79 25.5 -174.7 -283.7 -343.0
TA3 7.3% 0.91 85.9 -36.2 -104.5 -143.3
TA4 5.9% 0.76 -9.8 -138.5 -207.8 -244.6
Timkit TI1 6.2% 0.80 8.9 -55.1 -89.9 -108.9
TI2 5.7% 0.74 -13.6 -70.8 -101.4 -117.6
Azghar AZ1 10.6% 1.38 175.1 73.7 13.8 -23.1 After adjustment of thenegative benefit todownstream reservoirs.
T-71
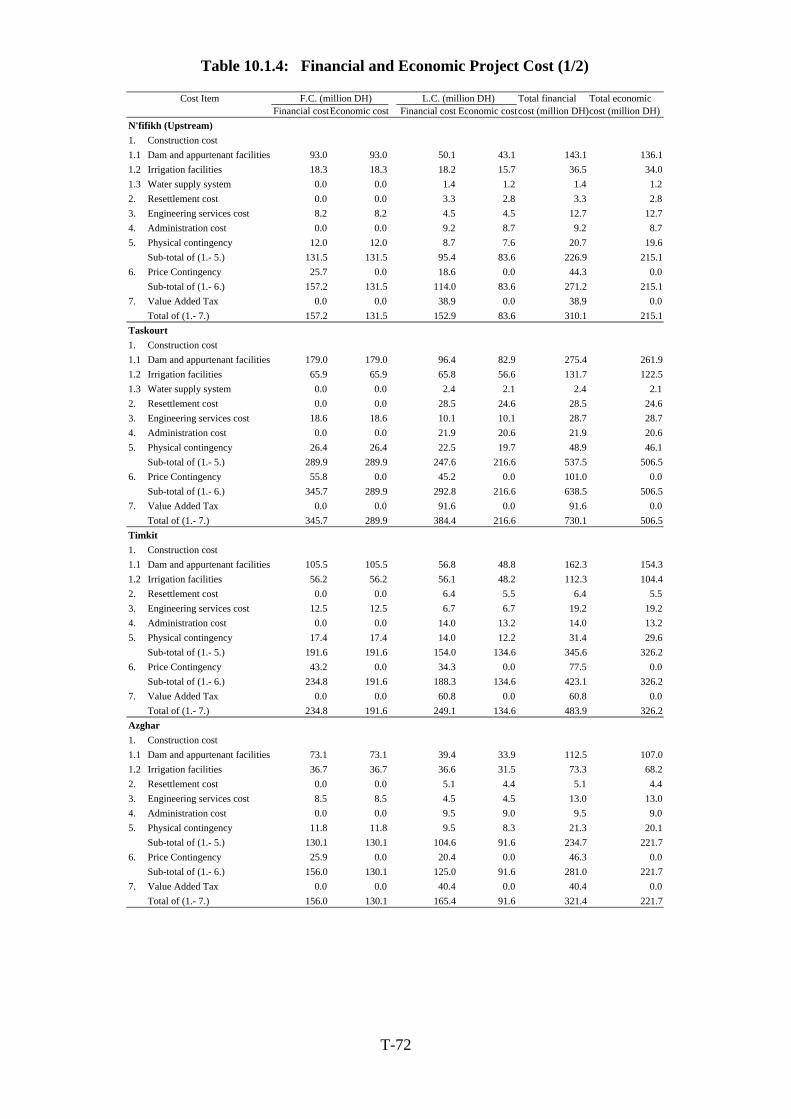
Table 10.1.4: Financial and Economic Project Cost (1/2)
Cost Item F.C. (million DH) L.C. (million DH) Total financial Total economicFinancial costEconomic cost Financial cost Economic costcost (million DH)cost (million DH)
N'fifikh (Upstream)1. Construction cost1.1 Dam and appurtenant facilities 93.0 93.0 50.1 43.1 143.1 136.11.2 Irrigation facilities 18.3 18.3 18.2 15.7 36.5 34.01.3 Water supply system 0.0 0.0 1.4 1.2 1.4 1.22. Resettlement cost 0.0 0.0 3.3 2.8 3.3 2.83. Engineering services cost 8.2 8.2 4.5 4.5 12.7 12.74. Administration cost 0.0 0.0 9.2 8.7 9.2 8.75. Physical contingency 12.0 12.0 8.7 7.6 20.7 19.6
Sub-total of (1.- 5.) 131.5 131.5 95.4 83.6 226.9 215.16. Price Contingency 25.7 0.0 18.6 0.0 44.3 0.0
Sub-total of (1.- 6.) 157.2 131.5 114.0 83.6 271.2 215.17. Value Added Tax 0.0 0.0 38.9 0.0 38.9 0.0
Total of (1.- 7.) 157.2 131.5 152.9 83.6 310.1 215.1Taskourt1. Construction cost1.1 Dam and appurtenant facilities 179.0 179.0 96.4 82.9 275.4 261.91.2 Irrigation facilities 65.9 65.9 65.8 56.6 131.7 122.51.3 Water supply system 0.0 0.0 2.4 2.1 2.4 2.12. Resettlement cost 0.0 0.0 28.5 24.6 28.5 24.63. Engineering services cost 18.6 18.6 10.1 10.1 28.7 28.74. Administration cost 0.0 0.0 21.9 20.6 21.9 20.65. Physical contingency 26.4 26.4 22.5 19.7 48.9 46.1
Sub-total of (1.- 5.) 289.9 289.9 247.6 216.6 537.5 506.56. Price Contingency 55.8 0.0 45.2 0.0 101.0 0.0
Sub-total of (1.- 6.) 345.7 289.9 292.8 216.6 638.5 506.57. Value Added Tax 0.0 0.0 91.6 0.0 91.6 0.0
Total of (1.- 7.) 345.7 289.9 384.4 216.6 730.1 506.5Timkit1. Construction cost1.1 Dam and appurtenant facilities 105.5 105.5 56.8 48.8 162.3 154.31.2 Irrigation facilities 56.2 56.2 56.1 48.2 112.3 104.42. Resettlement cost 0.0 0.0 6.4 5.5 6.4 5.53. Engineering services cost 12.5 12.5 6.7 6.7 19.2 19.24. Administration cost 0.0 0.0 14.0 13.2 14.0 13.25. Physical contingency 17.4 17.4 14.0 12.2 31.4 29.6
Sub-total of (1.- 5.) 191.6 191.6 154.0 134.6 345.6 326.26. Price Contingency 43.2 0.0 34.3 0.0 77.5 0.0
Sub-total of (1.- 6.) 234.8 191.6 188.3 134.6 423.1 326.27. Value Added Tax 0.0 0.0 60.8 0.0 60.8 0.0
Total of (1.- 7.) 234.8 191.6 249.1 134.6 483.9 326.2Azghar1. Construction cost1.1 Dam and appurtenant facilities 73.1 73.1 39.4 33.9 112.5 107.01.2 Irrigation facilities 36.7 36.7 36.6 31.5 73.3 68.22. Resettlement cost 0.0 0.0 5.1 4.4 5.1 4.43. Engineering services cost 8.5 8.5 4.5 4.5 13.0 13.04. Administration cost 0.0 0.0 9.5 9.0 9.5 9.05. Physical contingency 11.8 11.8 9.5 8.3 21.3 20.1
Sub-total of (1.- 5.) 130.1 130.1 104.6 91.6 234.7 221.76. Price Contingency 25.9 0.0 20.4 0.0 46.3 0.0
Sub-total of (1.- 6.) 156.0 130.1 125.0 91.6 281.0 221.77. Value Added Tax 0.0 0.0 40.4 0.0 40.4 0.0
Total of (1.- 7.) 156.0 130.1 165.4 91.6 321.4 221.7
T-72
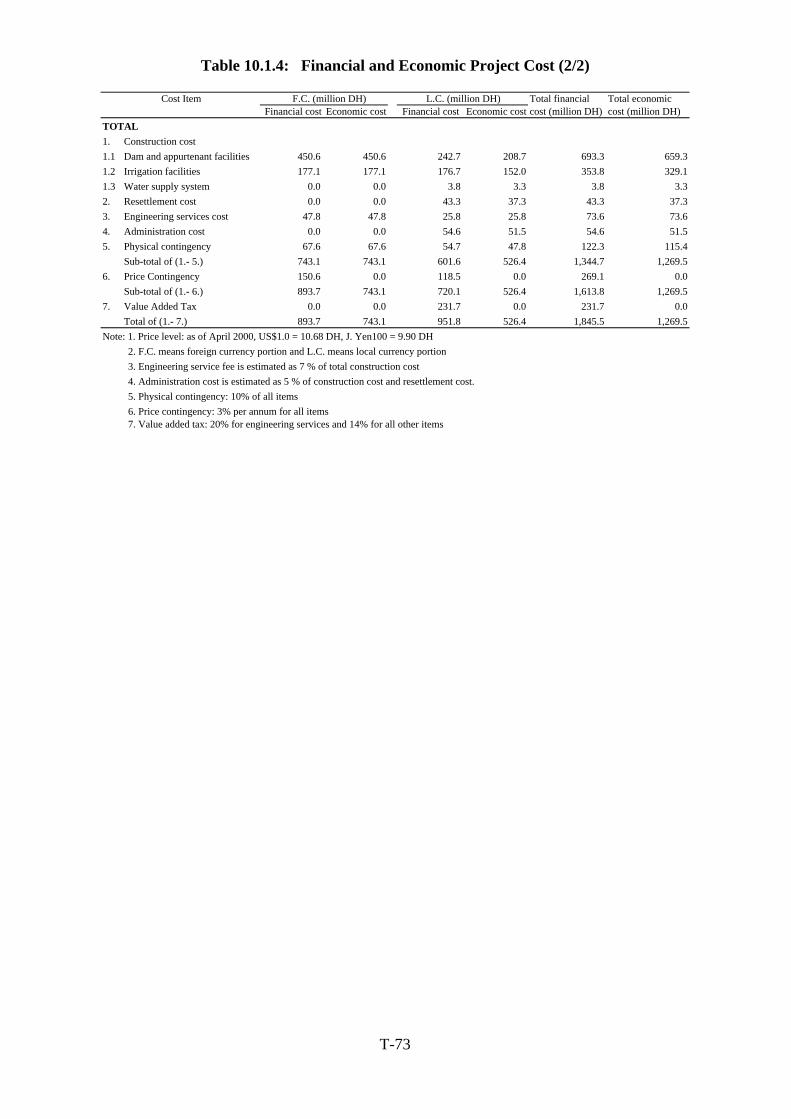
Table 10.1.4: Financial and Economic Project Cost (2/2)
Cost Item F.C. (million DH) L.C. (million DH) Total financial Total economicFinancial cost Economic cost Financial cost Economic cost cost (million DH) cost (million DH)
TOTAL1. Construction cost1.1 Dam and appurtenant facilities 450.6 450.6 242.7 208.7 693.3 659.31.2 Irrigation facilities 177.1 177.1 176.7 152.0 353.8 329.11.3 Water supply system 0.0 0.0 3.8 3.3 3.8 3.32. Resettlement cost 0.0 0.0 43.3 37.3 43.3 37.33. Engineering services cost 47.8 47.8 25.8 25.8 73.6 73.64. Administration cost 0.0 0.0 54.6 51.5 54.6 51.55. Physical contingency 67.6 67.6 54.7 47.8 122.3 115.4
Sub-total of (1.- 5.) 743.1 743.1 601.6 526.4 1,344.7 1,269.56. Price Contingency 150.6 0.0 118.5 0.0 269.1 0.0
Sub-total of (1.- 6.) 893.7 743.1 720.1 526.4 1,613.8 1,269.57. Value Added Tax 0.0 0.0 231.7 0.0 231.7 0.0
Total of (1.- 7.) 893.7 743.1 951.8 526.4 1,845.5 1,269.5Note: 1. Price level: as of April 2000, US$1.0 = 10.68 DH, J. Yen100 = 9.90 DH 2. F.C. means foreign currency portion and L.C. means local currency portion 3. Engineering service fee is estimated as 7 % of total construction cost 4. Administration cost is estimated as 5 % of construction cost and resettlement cost. 5. Physical contingency: 10% of all items 6. Price contingency: 3% per annum for all items 7. Value added tax: 20% for engineering services and 14% for all other items
T-73
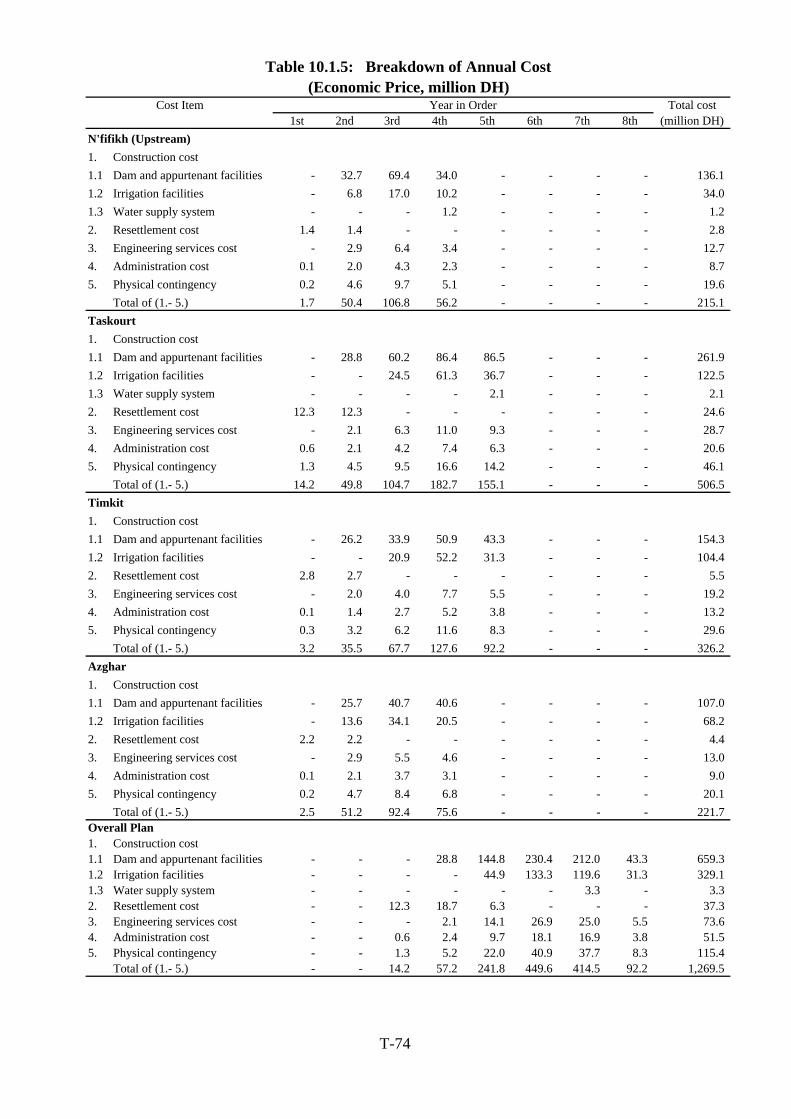
Table 10.1.5: Breakdown of Annual Cost(Economic Price, million DH)
Cost Item Year in Order Total cost1st 2nd 3rd 4th 5th 6th 7th 8th (million DH)
N'fifikh (Upstream)1. Construction cost1.1 Dam and appurtenant facilities - 32.7 69.4 34.0 - - - - 136.1 1.2 Irrigation facilities - 6.8 17.0 10.2 - - - - 34.0 1.3 Water supply system - - - 1.2 - - - - 1.2 2. Resettlement cost 1.4 1.4 - - - - - - 2.8 3. Engineering services cost - 2.9 6.4 3.4 - - - - 12.7 4. Administration cost 0.1 2.0 4.3 2.3 - - - - 8.7 5. Physical contingency 0.2 4.6 9.7 5.1 - - - - 19.6
Total of (1.- 5.) 1.7 50.4 106.8 56.2 - - - - 215.1 Taskourt1. Construction cost1.1 Dam and appurtenant facilities - 28.8 60.2 86.4 86.5 - - - 261.9 1.2 Irrigation facilities - - 24.5 61.3 36.7 - - - 122.5 1.3 Water supply system - - - - 2.1 - - - 2.1 2. Resettlement cost 12.3 12.3 - - - - - - 24.6 3. Engineering services cost - 2.1 6.3 11.0 9.3 - - - 28.7 4. Administration cost 0.6 2.1 4.2 7.4 6.3 - - - 20.6 5. Physical contingency 1.3 4.5 9.5 16.6 14.2 - - - 46.1
Total of (1.- 5.) 14.2 49.8 104.7 182.7 155.1 - - - 506.5 Timkit1. Construction cost1.1 Dam and appurtenant facilities - 26.2 33.9 50.9 43.3 - - - 154.3 1.2 Irrigation facilities - - 20.9 52.2 31.3 - - - 104.4 2. Resettlement cost 2.8 2.7 - - - - - - 5.5 3. Engineering services cost - 2.0 4.0 7.7 5.5 - - - 19.2 4. Administration cost 0.1 1.4 2.7 5.2 3.8 - - - 13.2 5. Physical contingency 0.3 3.2 6.2 11.6 8.3 - - - 29.6
Total of (1.- 5.) 3.2 35.5 67.7 127.6 92.2 - - - 326.2 Azghar1. Construction cost1.1 Dam and appurtenant facilities - 25.7 40.7 40.6 - - - - 107.0 1.2 Irrigation facilities - 13.6 34.1 20.5 - - - - 68.2 2. Resettlement cost 2.2 2.2 - - - - - - 4.4 3. Engineering services cost - 2.9 5.5 4.6 - - - - 13.0 4. Administration cost 0.1 2.1 3.7 3.1 - - - - 9.0 5. Physical contingency 0.2 4.7 8.4 6.8 - - - - 20.1
Total of (1.- 5.) 2.5 51.2 92.4 75.6 - - - - 221.7 Overall Plan1. Construction cost1.1 Dam and appurtenant facilities - - - 28.8 144.8 230.4 212.0 43.3 659.3 1.2 Irrigation facilities - - - - 44.9 133.3 119.6 31.3 329.1 1.3 Water supply system - - - - - - 3.3 - 3.3 2. Resettlement cost - - 12.3 18.7 6.3 - - - 37.3 3. Engineering services cost - - - 2.1 14.1 26.9 25.0 5.5 73.6 4. Administration cost - - 0.6 2.4 9.7 18.1 16.9 3.8 51.5 5. Physical contingency - - 1.3 5.2 22.0 40.9 37.7 8.3 115.4
Total of (1.- 5.) - - 14.2 57.2 241.8 449.6 414.5 92.2 1,269.5
T-74
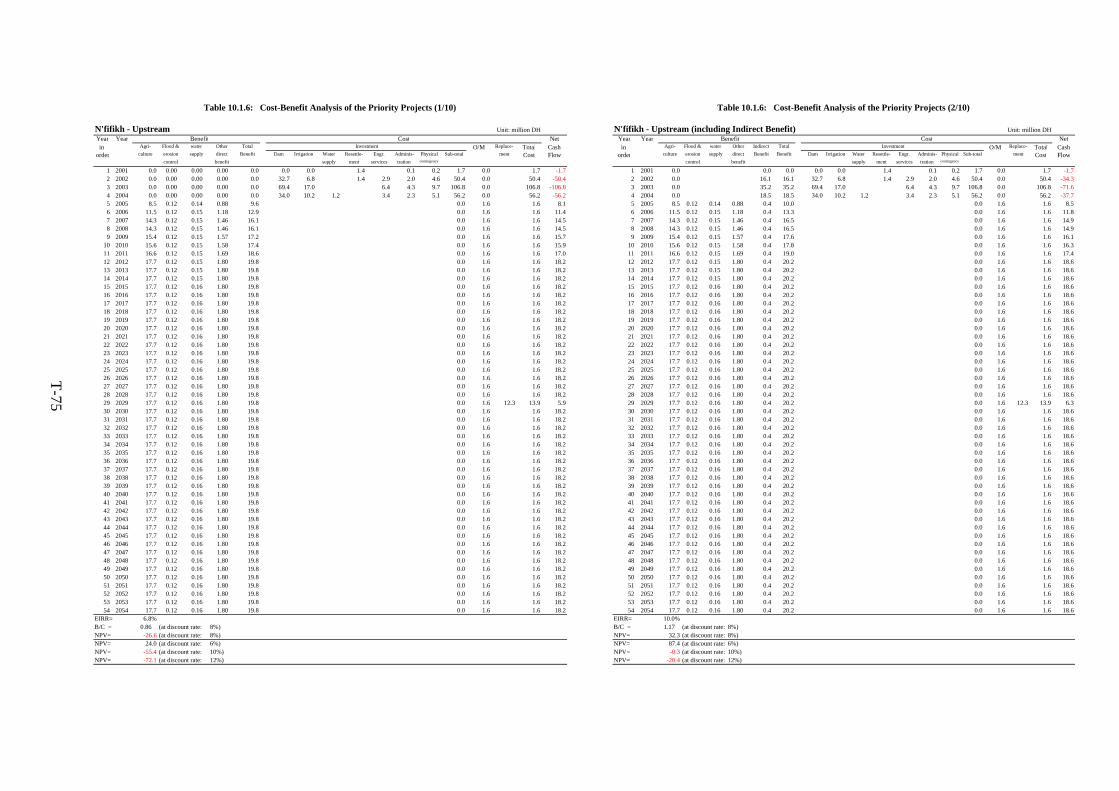
Table 10.1.6: Cost-Benefit Analysis of the Priority Projects (1/10) Table 10.1.6: Cost-Benefit Analysis of the Priority Projects (2/10)
N'fifikh - Upstream Unit: million DH N'fifikh - Upstream (including Indirect Benefit) Unit: million DHYear Year Benefit Cost Net Year Year Benefit Cost Netin Agri- Flood & water Other Total Investment O/M Replace- Total Cash in Agri- Flood & water Other Indirect Total Investment O/M Replace- Total Cash
order culture erosion supply direct Benefit Dam Irrigation Water Resettle- Engr. Adminis- Physical Sub-total ment Cost Flow order culture erosion supply direct Benefit Benefit Dam Irrigation Water Resettle- Engr. Adminis- Physical Sub-total ment Cost Flowcontrol benefit supply ment services tration contingency control benefit supply ment services tration contingency
1 2001 0.0 0.00 0.00 0.00 0.0 0.0 0.0 1.4 0.1 0.2 1.7 0.0 1.7 -1.7 1 2001 0.0 0.0 0.0 0.0 0.0 1.4 0.1 0.2 1.7 0.0 1.7 -1.72 2002 0.0 0.00 0.00 0.00 0.0 32.7 6.8 1.4 2.9 2.0 4.6 50.4 0.0 50.4 -50.4 2 2002 0.0 16.1 16.1 32.7 6.8 1.4 2.9 2.0 4.6 50.4 0.0 50.4 -34.33 2003 0.0 0.00 0.00 0.00 0.0 69.4 17.0 6.4 4.3 9.7 106.8 0.0 106.8 -106.8 3 2003 0.0 35.2 35.2 69.4 17.0 6.4 4.3 9.7 106.8 0.0 106.8 -71.64 2004 0.0 0.00 0.00 0.00 0.0 34.0 10.2 1.2 3.4 2.3 5.1 56.2 0.0 56.2 -56.2 4 2004 0.0 18.5 18.5 34.0 10.2 1.2 3.4 2.3 5.1 56.2 0.0 56.2 -37.75 2005 8.5 0.12 0.14 0.88 9.6 0.0 1.6 1.6 8.1 5 2005 8.5 0.12 0.14 0.88 0.4 10.0 0.0 1.6 1.6 8.56 2006 11.5 0.12 0.15 1.18 12.9 0.0 1.6 1.6 11.4 6 2006 11.5 0.12 0.15 1.18 0.4 13.3 0.0 1.6 1.6 11.87 2007 14.3 0.12 0.15 1.46 16.1 0.0 1.6 1.6 14.5 7 2007 14.3 0.12 0.15 1.46 0.4 16.5 0.0 1.6 1.6 14.98 2008 14.3 0.12 0.15 1.46 16.1 0.0 1.6 1.6 14.5 8 2008 14.3 0.12 0.15 1.46 0.4 16.5 0.0 1.6 1.6 14.99 2009 15.4 0.12 0.15 1.57 17.2 0.0 1.6 1.6 15.7 9 2009 15.4 0.12 0.15 1.57 0.4 17.6 0.0 1.6 1.6 16.1
10 2010 15.6 0.12 0.15 1.58 17.4 0.0 1.6 1.6 15.9 10 2010 15.6 0.12 0.15 1.58 0.4 17.8 0.0 1.6 1.6 16.311 2011 16.6 0.12 0.15 1.69 18.6 0.0 1.6 1.6 17.0 11 2011 16.6 0.12 0.15 1.69 0.4 19.0 0.0 1.6 1.6 17.412 2012 17.7 0.12 0.15 1.80 19.8 0.0 1.6 1.6 18.2 12 2012 17.7 0.12 0.15 1.80 0.4 20.2 0.0 1.6 1.6 18.613 2013 17.7 0.12 0.15 1.80 19.8 0.0 1.6 1.6 18.2 13 2013 17.7 0.12 0.15 1.80 0.4 20.2 0.0 1.6 1.6 18.614 2014 17.7 0.12 0.15 1.80 19.8 0.0 1.6 1.6 18.2 14 2014 17.7 0.12 0.15 1.80 0.4 20.2 0.0 1.6 1.6 18.615 2015 17.7 0.12 0.16 1.80 19.8 0.0 1.6 1.6 18.2 15 2015 17.7 0.12 0.16 1.80 0.4 20.2 0.0 1.6 1.6 18.616 2016 17.7 0.12 0.16 1.80 19.8 0.0 1.6 1.6 18.2 16 2016 17.7 0.12 0.16 1.80 0.4 20.2 0.0 1.6 1.6 18.617 2017 17.7 0.12 0.16 1.80 19.8 0.0 1.6 1.6 18.2 17 2017 17.7 0.12 0.16 1.80 0.4 20.2 0.0 1.6 1.6 18.618 2018 17.7 0.12 0.16 1.80 19.8 0.0 1.6 1.6 18.2 18 2018 17.7 0.12 0.16 1.80 0.4 20.2 0.0 1.6 1.6 18.619 2019 17.7 0.12 0.16 1.80 19.8 0.0 1.6 1.6 18.2 19 2019 17.7 0.12 0.16 1.80 0.4 20.2 0.0 1.6 1.6 18.620 2020 17.7 0.12 0.16 1.80 19.8 0.0 1.6 1.6 18.2 20 2020 17.7 0.12 0.16 1.80 0.4 20.2 0.0 1.6 1.6 18.621 2021 17.7 0.12 0.16 1.80 19.8 0.0 1.6 1.6 18.2 21 2021 17.7 0.12 0.16 1.80 0.4 20.2 0.0 1.6 1.6 18.622 2022 17.7 0.12 0.16 1.80 19.8 0.0 1.6 1.6 18.2 22 2022 17.7 0.12 0.16 1.80 0.4 20.2 0.0 1.6 1.6 18.623 2023 17.7 0.12 0.16 1.80 19.8 0.0 1.6 1.6 18.2 23 2023 17.7 0.12 0.16 1.80 0.4 20.2 0.0 1.6 1.6 18.624 2024 17.7 0.12 0.16 1.80 19.8 0.0 1.6 1.6 18.2 24 2024 17.7 0.12 0.16 1.80 0.4 20.2 0.0 1.6 1.6 18.625 2025 17.7 0.12 0.16 1.80 19.8 0.0 1.6 1.6 18.2 25 2025 17.7 0.12 0.16 1.80 0.4 20.2 0.0 1.6 1.6 18.626 2026 17.7 0.12 0.16 1.80 19.8 0.0 1.6 1.6 18.2 26 2026 17.7 0.12 0.16 1.80 0.4 20.2 0.0 1.6 1.6 18.627 2027 17.7 0.12 0.16 1.80 19.8 0.0 1.6 1.6 18.2 27 2027 17.7 0.12 0.16 1.80 0.4 20.2 0.0 1.6 1.6 18.628 2028 17.7 0.12 0.16 1.80 19.8 0.0 1.6 1.6 18.2 28 2028 17.7 0.12 0.16 1.80 0.4 20.2 0.0 1.6 1.6 18.629 2029 17.7 0.12 0.16 1.80 19.8 0.0 1.6 12.3 13.9 5.9 29 2029 17.7 0.12 0.16 1.80 0.4 20.2 0.0 1.6 12.3 13.9 6.330 2030 17.7 0.12 0.16 1.80 19.8 0.0 1.6 1.6 18.2 30 2030 17.7 0.12 0.16 1.80 0.4 20.2 0.0 1.6 1.6 18.631 2031 17.7 0.12 0.16 1.80 19.8 0.0 1.6 1.6 18.2 31 2031 17.7 0.12 0.16 1.80 0.4 20.2 0.0 1.6 1.6 18.632 2032 17.7 0.12 0.16 1.80 19.8 0.0 1.6 1.6 18.2 32 2032 17.7 0.12 0.16 1.80 0.4 20.2 0.0 1.6 1.6 18.633 2033 17.7 0.12 0.16 1.80 19.8 0.0 1.6 1.6 18.2 33 2033 17.7 0.12 0.16 1.80 0.4 20.2 0.0 1.6 1.6 18.634 2034 17.7 0.12 0.16 1.80 19.8 0.0 1.6 1.6 18.2 34 2034 17.7 0.12 0.16 1.80 0.4 20.2 0.0 1.6 1.6 18.635 2035 17.7 0.12 0.16 1.80 19.8 0.0 1.6 1.6 18.2 35 2035 17.7 0.12 0.16 1.80 0.4 20.2 0.0 1.6 1.6 18.636 2036 17.7 0.12 0.16 1.80 19.8 0.0 1.6 1.6 18.2 36 2036 17.7 0.12 0.16 1.80 0.4 20.2 0.0 1.6 1.6 18.637 2037 17.7 0.12 0.16 1.80 19.8 0.0 1.6 1.6 18.2 37 2037 17.7 0.12 0.16 1.80 0.4 20.2 0.0 1.6 1.6 18.638 2038 17.7 0.12 0.16 1.80 19.8 0.0 1.6 1.6 18.2 38 2038 17.7 0.12 0.16 1.80 0.4 20.2 0.0 1.6 1.6 18.639 2039 17.7 0.12 0.16 1.80 19.8 0.0 1.6 1.6 18.2 39 2039 17.7 0.12 0.16 1.80 0.4 20.2 0.0 1.6 1.6 18.640 2040 17.7 0.12 0.16 1.80 19.8 0.0 1.6 1.6 18.2 40 2040 17.7 0.12 0.16 1.80 0.4 20.2 0.0 1.6 1.6 18.641 2041 17.7 0.12 0.16 1.80 19.8 0.0 1.6 1.6 18.2 41 2041 17.7 0.12 0.16 1.80 0.4 20.2 0.0 1.6 1.6 18.642 2042 17.7 0.12 0.16 1.80 19.8 0.0 1.6 1.6 18.2 42 2042 17.7 0.12 0.16 1.80 0.4 20.2 0.0 1.6 1.6 18.643 2043 17.7 0.12 0.16 1.80 19.8 0.0 1.6 1.6 18.2 43 2043 17.7 0.12 0.16 1.80 0.4 20.2 0.0 1.6 1.6 18.644 2044 17.7 0.12 0.16 1.80 19.8 0.0 1.6 1.6 18.2 44 2044 17.7 0.12 0.16 1.80 0.4 20.2 0.0 1.6 1.6 18.645 2045 17.7 0.12 0.16 1.80 19.8 0.0 1.6 1.6 18.2 45 2045 17.7 0.12 0.16 1.80 0.4 20.2 0.0 1.6 1.6 18.646 2046 17.7 0.12 0.16 1.80 19.8 0.0 1.6 1.6 18.2 46 2046 17.7 0.12 0.16 1.80 0.4 20.2 0.0 1.6 1.6 18.647 2047 17.7 0.12 0.16 1.80 19.8 0.0 1.6 1.6 18.2 47 2047 17.7 0.12 0.16 1.80 0.4 20.2 0.0 1.6 1.6 18.648 2048 17.7 0.12 0.16 1.80 19.8 0.0 1.6 1.6 18.2 48 2048 17.7 0.12 0.16 1.80 0.4 20.2 0.0 1.6 1.6 18.649 2049 17.7 0.12 0.16 1.80 19.8 0.0 1.6 1.6 18.2 49 2049 17.7 0.12 0.16 1.80 0.4 20.2 0.0 1.6 1.6 18.650 2050 17.7 0.12 0.16 1.80 19.8 0.0 1.6 1.6 18.2 50 2050 17.7 0.12 0.16 1.80 0.4 20.2 0.0 1.6 1.6 18.651 2051 17.7 0.12 0.16 1.80 19.8 0.0 1.6 1.6 18.2 51 2051 17.7 0.12 0.16 1.80 0.4 20.2 0.0 1.6 1.6 18.652 2052 17.7 0.12 0.16 1.80 19.8 0.0 1.6 1.6 18.2 52 2052 17.7 0.12 0.16 1.80 0.4 20.2 0.0 1.6 1.6 18.653 2053 17.7 0.12 0.16 1.80 19.8 0.0 1.6 1.6 18.2 53 2053 17.7 0.12 0.16 1.80 0.4 20.2 0.0 1.6 1.6 18.654 2054 17.7 0.12 0.16 1.80 19.8 0.0 1.6 1.6 18.2 54 2054 17.7 0.12 0.16 1.80 0.4 20.2 0.0 1.6 1.6 18.6
EIRR= 6.8% EIRR= 10.0%B/C = 0.86 (at discount rate: 8%) B/C = 1.17 (at discount rate: 8%)NPV= -26.6 (at discount rate: 8%) NPV= 32.3 (at discount rate: 8%)NPV= 24.0 (at discount rate: 6%) NPV= 87.4 (at discount rate: 6%)NPV= -55.4 (at discount rate: 10%) NPV= -0.3 (at discount rate: 10%)NPV= -72.1 (at discount rate: 12%) NPV= -20.4 (at discount rate: 12%)
T-75
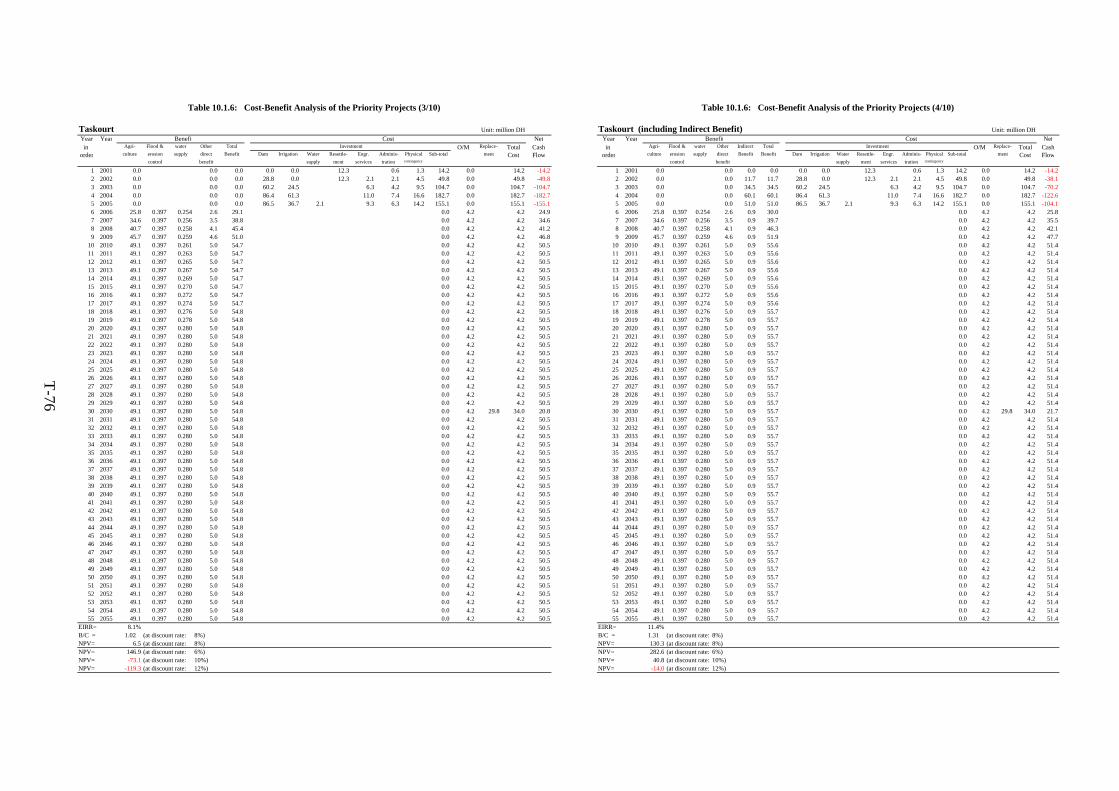
Table 10.1.6: Cost-Benefit Analysis of the Priority Projects (3/10) Table 10.1.6: Cost-Benefit Analysis of the Priority Projects (4/10)
Taskourt Unit: million DH Taskourt (including Indirect Benefit) Unit: million DHYear Year Benefit Cost Net Year Year Benefit Cost Netin Agri- Flood & water Other Total Investment O/M Replace- Total Cash in Agri- Flood & water Other Indirect Total Investment O/M Replace- Total Cash
order culture erosion supply direct Benefit Dam Irrigation Water Resettle- Engr. Adminis- Physical Sub-total ment Cost Flow order culture erosion supply direct Benefit Benefit Dam Irrigation Water Resettle- Engr. Adminis- Physical Sub-total ment Cost Flowcontrol benefit supply ment services tration contingency control benefit supply ment services tration contingency
1 2001 0.0 0.0 0.0 0.0 0.0 12.3 0.6 1.3 14.2 0.0 14.2 -14.2 1 2001 0.0 0.0 0.0 0.0 0.0 0.0 12.3 0.6 1.3 14.2 0.0 14.2 -14.22 2002 0.0 0.0 0.0 28.8 0.0 12.3 2.1 2.1 4.5 49.8 0.0 49.8 -49.8 2 2002 0.0 0.0 11.7 11.7 28.8 0.0 12.3 2.1 2.1 4.5 49.8 0.0 49.8 -38.13 2003 0.0 0.0 0.0 60.2 24.5 6.3 4.2 9.5 104.7 0.0 104.7 -104.7 3 2003 0.0 0.0 34.5 34.5 60.2 24.5 6.3 4.2 9.5 104.7 0.0 104.7 -70.24 2004 0.0 0.0 0.0 86.4 61.3 11.0 7.4 16.6 182.7 0.0 182.7 -182.7 4 2004 0.0 0.0 60.1 60.1 86.4 61.3 11.0 7.4 16.6 182.7 0.0 182.7 -122.65 2005 0.0 0.0 0.0 86.5 36.7 2.1 9.3 6.3 14.2 155.1 0.0 155.1 -155.1 5 2005 0.0 0.0 51.0 51.0 86.5 36.7 2.1 9.3 6.3 14.2 155.1 0.0 155.1 -104.16 2006 25.8 0.397 0.254 2.6 29.1 0.0 4.2 4.2 24.9 6 2006 25.8 0.397 0.254 2.6 0.9 30.0 0.0 4.2 4.2 25.87 2007 34.6 0.397 0.256 3.5 38.8 0.0 4.2 4.2 34.6 7 2007 34.6 0.397 0.256 3.5 0.9 39.7 0.0 4.2 4.2 35.58 2008 40.7 0.397 0.258 4.1 45.4 0.0 4.2 4.2 41.2 8 2008 40.7 0.397 0.258 4.1 0.9 46.3 0.0 4.2 4.2 42.19 2009 45.7 0.397 0.259 4.6 51.0 0.0 4.2 4.2 46.8 9 2009 45.7 0.397 0.259 4.6 0.9 51.9 0.0 4.2 4.2 47.7
10 2010 49.1 0.397 0.261 5.0 54.7 0.0 4.2 4.2 50.5 10 2010 49.1 0.397 0.261 5.0 0.9 55.6 0.0 4.2 4.2 51.411 2011 49.1 0.397 0.263 5.0 54.7 0.0 4.2 4.2 50.5 11 2011 49.1 0.397 0.263 5.0 0.9 55.6 0.0 4.2 4.2 51.412 2012 49.1 0.397 0.265 5.0 54.7 0.0 4.2 4.2 50.5 12 2012 49.1 0.397 0.265 5.0 0.9 55.6 0.0 4.2 4.2 51.413 2013 49.1 0.397 0.267 5.0 54.7 0.0 4.2 4.2 50.5 13 2013 49.1 0.397 0.267 5.0 0.9 55.6 0.0 4.2 4.2 51.414 2014 49.1 0.397 0.269 5.0 54.7 0.0 4.2 4.2 50.5 14 2014 49.1 0.397 0.269 5.0 0.9 55.6 0.0 4.2 4.2 51.415 2015 49.1 0.397 0.270 5.0 54.7 0.0 4.2 4.2 50.5 15 2015 49.1 0.397 0.270 5.0 0.9 55.6 0.0 4.2 4.2 51.416 2016 49.1 0.397 0.272 5.0 54.7 0.0 4.2 4.2 50.5 16 2016 49.1 0.397 0.272 5.0 0.9 55.6 0.0 4.2 4.2 51.417 2017 49.1 0.397 0.274 5.0 54.7 0.0 4.2 4.2 50.5 17 2017 49.1 0.397 0.274 5.0 0.9 55.6 0.0 4.2 4.2 51.418 2018 49.1 0.397 0.276 5.0 54.8 0.0 4.2 4.2 50.5 18 2018 49.1 0.397 0.276 5.0 0.9 55.7 0.0 4.2 4.2 51.419 2019 49.1 0.397 0.278 5.0 54.8 0.0 4.2 4.2 50.5 19 2019 49.1 0.397 0.278 5.0 0.9 55.7 0.0 4.2 4.2 51.420 2020 49.1 0.397 0.280 5.0 54.8 0.0 4.2 4.2 50.5 20 2020 49.1 0.397 0.280 5.0 0.9 55.7 0.0 4.2 4.2 51.421 2021 49.1 0.397 0.280 5.0 54.8 0.0 4.2 4.2 50.5 21 2021 49.1 0.397 0.280 5.0 0.9 55.7 0.0 4.2 4.2 51.422 2022 49.1 0.397 0.280 5.0 54.8 0.0 4.2 4.2 50.5 22 2022 49.1 0.397 0.280 5.0 0.9 55.7 0.0 4.2 4.2 51.423 2023 49.1 0.397 0.280 5.0 54.8 0.0 4.2 4.2 50.5 23 2023 49.1 0.397 0.280 5.0 0.9 55.7 0.0 4.2 4.2 51.424 2024 49.1 0.397 0.280 5.0 54.8 0.0 4.2 4.2 50.5 24 2024 49.1 0.397 0.280 5.0 0.9 55.7 0.0 4.2 4.2 51.425 2025 49.1 0.397 0.280 5.0 54.8 0.0 4.2 4.2 50.5 25 2025 49.1 0.397 0.280 5.0 0.9 55.7 0.0 4.2 4.2 51.426 2026 49.1 0.397 0.280 5.0 54.8 0.0 4.2 4.2 50.5 26 2026 49.1 0.397 0.280 5.0 0.9 55.7 0.0 4.2 4.2 51.427 2027 49.1 0.397 0.280 5.0 54.8 0.0 4.2 4.2 50.5 27 2027 49.1 0.397 0.280 5.0 0.9 55.7 0.0 4.2 4.2 51.428 2028 49.1 0.397 0.280 5.0 54.8 0.0 4.2 4.2 50.5 28 2028 49.1 0.397 0.280 5.0 0.9 55.7 0.0 4.2 4.2 51.429 2029 49.1 0.397 0.280 5.0 54.8 0.0 4.2 4.2 50.5 29 2029 49.1 0.397 0.280 5.0 0.9 55.7 0.0 4.2 4.2 51.430 2030 49.1 0.397 0.280 5.0 54.8 0.0 4.2 29.8 34.0 20.8 30 2030 49.1 0.397 0.280 5.0 0.9 55.7 0.0 4.2 29.8 34.0 21.731 2031 49.1 0.397 0.280 5.0 54.8 0.0 4.2 4.2 50.5 31 2031 49.1 0.397 0.280 5.0 0.9 55.7 0.0 4.2 4.2 51.432 2032 49.1 0.397 0.280 5.0 54.8 0.0 4.2 4.2 50.5 32 2032 49.1 0.397 0.280 5.0 0.9 55.7 0.0 4.2 4.2 51.433 2033 49.1 0.397 0.280 5.0 54.8 0.0 4.2 4.2 50.5 33 2033 49.1 0.397 0.280 5.0 0.9 55.7 0.0 4.2 4.2 51.434 2034 49.1 0.397 0.280 5.0 54.8 0.0 4.2 4.2 50.5 34 2034 49.1 0.397 0.280 5.0 0.9 55.7 0.0 4.2 4.2 51.435 2035 49.1 0.397 0.280 5.0 54.8 0.0 4.2 4.2 50.5 35 2035 49.1 0.397 0.280 5.0 0.9 55.7 0.0 4.2 4.2 51.436 2036 49.1 0.397 0.280 5.0 54.8 0.0 4.2 4.2 50.5 36 2036 49.1 0.397 0.280 5.0 0.9 55.7 0.0 4.2 4.2 51.437 2037 49.1 0.397 0.280 5.0 54.8 0.0 4.2 4.2 50.5 37 2037 49.1 0.397 0.280 5.0 0.9 55.7 0.0 4.2 4.2 51.438 2038 49.1 0.397 0.280 5.0 54.8 0.0 4.2 4.2 50.5 38 2038 49.1 0.397 0.280 5.0 0.9 55.7 0.0 4.2 4.2 51.439 2039 49.1 0.397 0.280 5.0 54.8 0.0 4.2 4.2 50.5 39 2039 49.1 0.397 0.280 5.0 0.9 55.7 0.0 4.2 4.2 51.440 2040 49.1 0.397 0.280 5.0 54.8 0.0 4.2 4.2 50.5 40 2040 49.1 0.397 0.280 5.0 0.9 55.7 0.0 4.2 4.2 51.441 2041 49.1 0.397 0.280 5.0 54.8 0.0 4.2 4.2 50.5 41 2041 49.1 0.397 0.280 5.0 0.9 55.7 0.0 4.2 4.2 51.442 2042 49.1 0.397 0.280 5.0 54.8 0.0 4.2 4.2 50.5 42 2042 49.1 0.397 0.280 5.0 0.9 55.7 0.0 4.2 4.2 51.443 2043 49.1 0.397 0.280 5.0 54.8 0.0 4.2 4.2 50.5 43 2043 49.1 0.397 0.280 5.0 0.9 55.7 0.0 4.2 4.2 51.444 2044 49.1 0.397 0.280 5.0 54.8 0.0 4.2 4.2 50.5 44 2044 49.1 0.397 0.280 5.0 0.9 55.7 0.0 4.2 4.2 51.445 2045 49.1 0.397 0.280 5.0 54.8 0.0 4.2 4.2 50.5 45 2045 49.1 0.397 0.280 5.0 0.9 55.7 0.0 4.2 4.2 51.446 2046 49.1 0.397 0.280 5.0 54.8 0.0 4.2 4.2 50.5 46 2046 49.1 0.397 0.280 5.0 0.9 55.7 0.0 4.2 4.2 51.447 2047 49.1 0.397 0.280 5.0 54.8 0.0 4.2 4.2 50.5 47 2047 49.1 0.397 0.280 5.0 0.9 55.7 0.0 4.2 4.2 51.448 2048 49.1 0.397 0.280 5.0 54.8 0.0 4.2 4.2 50.5 48 2048 49.1 0.397 0.280 5.0 0.9 55.7 0.0 4.2 4.2 51.449 2049 49.1 0.397 0.280 5.0 54.8 0.0 4.2 4.2 50.5 49 2049 49.1 0.397 0.280 5.0 0.9 55.7 0.0 4.2 4.2 51.450 2050 49.1 0.397 0.280 5.0 54.8 0.0 4.2 4.2 50.5 50 2050 49.1 0.397 0.280 5.0 0.9 55.7 0.0 4.2 4.2 51.451 2051 49.1 0.397 0.280 5.0 54.8 0.0 4.2 4.2 50.5 51 2051 49.1 0.397 0.280 5.0 0.9 55.7 0.0 4.2 4.2 51.452 2052 49.1 0.397 0.280 5.0 54.8 0.0 4.2 4.2 50.5 52 2052 49.1 0.397 0.280 5.0 0.9 55.7 0.0 4.2 4.2 51.453 2053 49.1 0.397 0.280 5.0 54.8 0.0 4.2 4.2 50.5 53 2053 49.1 0.397 0.280 5.0 0.9 55.7 0.0 4.2 4.2 51.454 2054 49.1 0.397 0.280 5.0 54.8 0.0 4.2 4.2 50.5 54 2054 49.1 0.397 0.280 5.0 0.9 55.7 0.0 4.2 4.2 51.455 2055 49.1 0.397 0.280 5.0 54.8 0.0 4.2 4.2 50.5 55 2055 49.1 0.397 0.280 5.0 0.9 55.7 0.0 4.2 4.2 51.4
EIRR= 8.1% EIRR= 11.4%B/C = 1.02 (at discount rate: 8%) B/C = 1.31 (at discount rate: 8%)NPV= 6.5 (at discount rate: 8%) NPV= 130.3 (at discount rate: 8%)NPV= 146.9 (at discount rate: 6%) NPV= 282.6 (at discount rate: 6%)NPV= -73.1 (at discount rate: 10%) NPV= 40.8 (at discount rate: 10%)NPV= -119.3 (at discount rate: 12%) NPV= -14.0 (at discount rate: 12%)
T-76
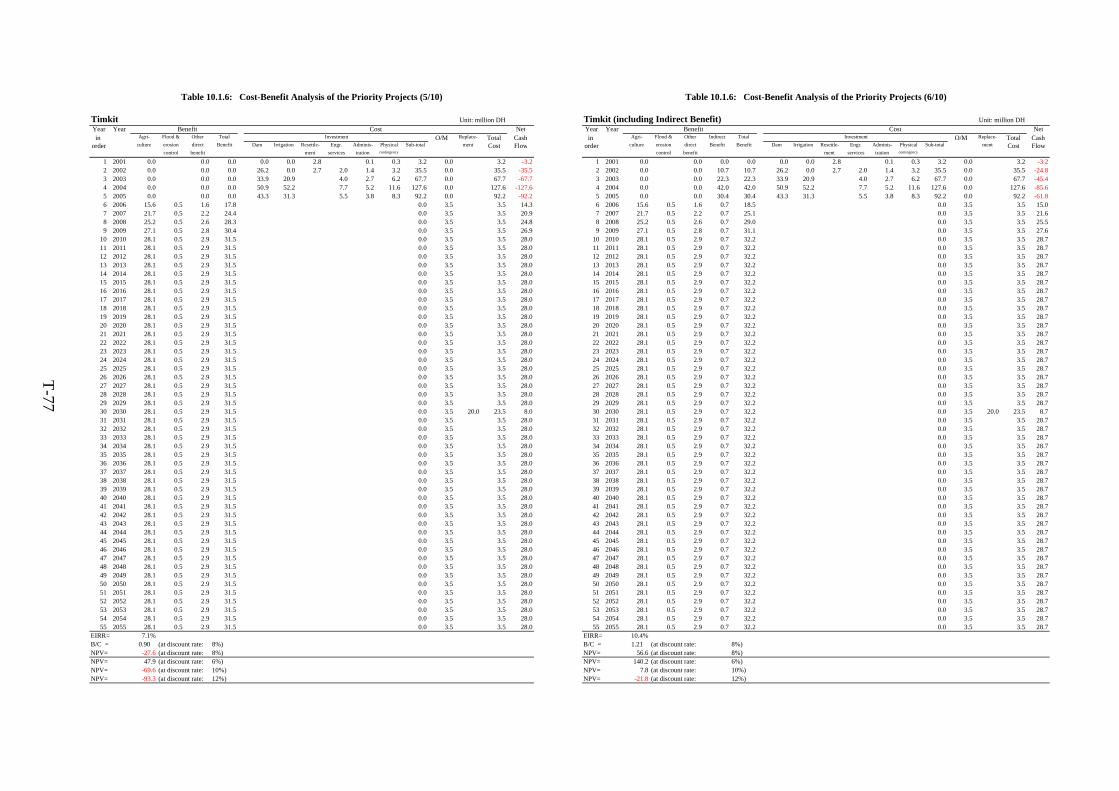
Table 10.1.6: Cost-Benefit Analysis of the Priority Projects (5/10) Table 10.1.6: Cost-Benefit Analysis of the Priority Projects (6/10)
Timkit Unit: million DH Timkit (including Indirect Benefit) Unit: million DHYear Year Benefit Cost Net Year Year Benefit Cost Netin Agri- Flood & Other Total Investment O/M Replace- Total Cash in Agri- Flood & Other Indirect Total Investment O/M Replace- Total Cash
order culture erosion direct Benefit Dam Irrigation Resettle- Engr. Adminis- Physical Sub-total ment Cost Flow order culture erosion direct Benefit Benefit Dam Irrigation Resettle- Engr. Adminis- Physical Sub-total ment Cost Flowcontrol benefit ment services tration contingency control benefit ment services tration contingency
1 2001 0.0 0.0 0.0 0.0 0.0 2.8 0.1 0.3 3.2 0.0 3.2 -3.2 1 2001 0.0 0.0 0.0 0.0 0.0 0.0 2.8 0.1 0.3 3.2 0.0 3.2 -3.22 2002 0.0 0.0 0.0 26.2 0.0 2.7 2.0 1.4 3.2 35.5 0.0 35.5 -35.5 2 2002 0.0 0.0 10.7 10.7 26.2 0.0 2.7 2.0 1.4 3.2 35.5 0.0 35.5 -24.83 2003 0.0 0.0 0.0 33.9 20.9 4.0 2.7 6.2 67.7 0.0 67.7 -67.7 3 2003 0.0 0.0 22.3 22.3 33.9 20.9 4.0 2.7 6.2 67.7 0.0 67.7 -45.44 2004 0.0 0.0 0.0 50.9 52.2 7.7 5.2 11.6 127.6 0.0 127.6 -127.6 4 2004 0.0 0.0 42.0 42.0 50.9 52.2 7.7 5.2 11.6 127.6 0.0 127.6 -85.65 2005 0.0 0.0 0.0 43.3 31.3 5.5 3.8 8.3 92.2 0.0 92.2 -92.2 5 2005 0.0 0.0 30.4 30.4 43.3 31.3 5.5 3.8 8.3 92.2 0.0 92.2 -61.86 2006 15.6 0.5 1.6 17.8 0.0 3.5 3.5 14.3 6 2006 15.6 0.5 1.6 0.7 18.5 0.0 3.5 3.5 15.07 2007 21.7 0.5 2.2 24.4 0.0 3.5 3.5 20.9 7 2007 21.7 0.5 2.2 0.7 25.1 0.0 3.5 3.5 21.68 2008 25.2 0.5 2.6 28.3 0.0 3.5 3.5 24.8 8 2008 25.2 0.5 2.6 0.7 29.0 0.0 3.5 3.5 25.59 2009 27.1 0.5 2.8 30.4 0.0 3.5 3.5 26.9 9 2009 27.1 0.5 2.8 0.7 31.1 0.0 3.5 3.5 27.6
10 2010 28.1 0.5 2.9 31.5 0.0 3.5 3.5 28.0 10 2010 28.1 0.5 2.9 0.7 32.2 0.0 3.5 3.5 28.711 2011 28.1 0.5 2.9 31.5 0.0 3.5 3.5 28.0 11 2011 28.1 0.5 2.9 0.7 32.2 0.0 3.5 3.5 28.712 2012 28.1 0.5 2.9 31.5 0.0 3.5 3.5 28.0 12 2012 28.1 0.5 2.9 0.7 32.2 0.0 3.5 3.5 28.713 2013 28.1 0.5 2.9 31.5 0.0 3.5 3.5 28.0 13 2013 28.1 0.5 2.9 0.7 32.2 0.0 3.5 3.5 28.714 2014 28.1 0.5 2.9 31.5 0.0 3.5 3.5 28.0 14 2014 28.1 0.5 2.9 0.7 32.2 0.0 3.5 3.5 28.715 2015 28.1 0.5 2.9 31.5 0.0 3.5 3.5 28.0 15 2015 28.1 0.5 2.9 0.7 32.2 0.0 3.5 3.5 28.716 2016 28.1 0.5 2.9 31.5 0.0 3.5 3.5 28.0 16 2016 28.1 0.5 2.9 0.7 32.2 0.0 3.5 3.5 28.717 2017 28.1 0.5 2.9 31.5 0.0 3.5 3.5 28.0 17 2017 28.1 0.5 2.9 0.7 32.2 0.0 3.5 3.5 28.718 2018 28.1 0.5 2.9 31.5 0.0 3.5 3.5 28.0 18 2018 28.1 0.5 2.9 0.7 32.2 0.0 3.5 3.5 28.719 2019 28.1 0.5 2.9 31.5 0.0 3.5 3.5 28.0 19 2019 28.1 0.5 2.9 0.7 32.2 0.0 3.5 3.5 28.720 2020 28.1 0.5 2.9 31.5 0.0 3.5 3.5 28.0 20 2020 28.1 0.5 2.9 0.7 32.2 0.0 3.5 3.5 28.721 2021 28.1 0.5 2.9 31.5 0.0 3.5 3.5 28.0 21 2021 28.1 0.5 2.9 0.7 32.2 0.0 3.5 3.5 28.722 2022 28.1 0.5 2.9 31.5 0.0 3.5 3.5 28.0 22 2022 28.1 0.5 2.9 0.7 32.2 0.0 3.5 3.5 28.723 2023 28.1 0.5 2.9 31.5 0.0 3.5 3.5 28.0 23 2023 28.1 0.5 2.9 0.7 32.2 0.0 3.5 3.5 28.724 2024 28.1 0.5 2.9 31.5 0.0 3.5 3.5 28.0 24 2024 28.1 0.5 2.9 0.7 32.2 0.0 3.5 3.5 28.725 2025 28.1 0.5 2.9 31.5 0.0 3.5 3.5 28.0 25 2025 28.1 0.5 2.9 0.7 32.2 0.0 3.5 3.5 28.726 2026 28.1 0.5 2.9 31.5 0.0 3.5 3.5 28.0 26 2026 28.1 0.5 2.9 0.7 32.2 0.0 3.5 3.5 28.727 2027 28.1 0.5 2.9 31.5 0.0 3.5 3.5 28.0 27 2027 28.1 0.5 2.9 0.7 32.2 0.0 3.5 3.5 28.728 2028 28.1 0.5 2.9 31.5 0.0 3.5 3.5 28.0 28 2028 28.1 0.5 2.9 0.7 32.2 0.0 3.5 3.5 28.729 2029 28.1 0.5 2.9 31.5 0.0 3.5 3.5 28.0 29 2029 28.1 0.5 2.9 0.7 32.2 0.0 3.5 3.5 28.730 2030 28.1 0.5 2.9 31.5 0.0 3.5 20.0 23.5 8.0 30 2030 28.1 0.5 2.9 0.7 32.2 0.0 3.5 20.0 23.5 8.731 2031 28.1 0.5 2.9 31.5 0.0 3.5 3.5 28.0 31 2031 28.1 0.5 2.9 0.7 32.2 0.0 3.5 3.5 28.732 2032 28.1 0.5 2.9 31.5 0.0 3.5 3.5 28.0 32 2032 28.1 0.5 2.9 0.7 32.2 0.0 3.5 3.5 28.733 2033 28.1 0.5 2.9 31.5 0.0 3.5 3.5 28.0 33 2033 28.1 0.5 2.9 0.7 32.2 0.0 3.5 3.5 28.734 2034 28.1 0.5 2.9 31.5 0.0 3.5 3.5 28.0 34 2034 28.1 0.5 2.9 0.7 32.2 0.0 3.5 3.5 28.735 2035 28.1 0.5 2.9 31.5 0.0 3.5 3.5 28.0 35 2035 28.1 0.5 2.9 0.7 32.2 0.0 3.5 3.5 28.736 2036 28.1 0.5 2.9 31.5 0.0 3.5 3.5 28.0 36 2036 28.1 0.5 2.9 0.7 32.2 0.0 3.5 3.5 28.737 2037 28.1 0.5 2.9 31.5 0.0 3.5 3.5 28.0 37 2037 28.1 0.5 2.9 0.7 32.2 0.0 3.5 3.5 28.738 2038 28.1 0.5 2.9 31.5 0.0 3.5 3.5 28.0 38 2038 28.1 0.5 2.9 0.7 32.2 0.0 3.5 3.5 28.739 2039 28.1 0.5 2.9 31.5 0.0 3.5 3.5 28.0 39 2039 28.1 0.5 2.9 0.7 32.2 0.0 3.5 3.5 28.740 2040 28.1 0.5 2.9 31.5 0.0 3.5 3.5 28.0 40 2040 28.1 0.5 2.9 0.7 32.2 0.0 3.5 3.5 28.741 2041 28.1 0.5 2.9 31.5 0.0 3.5 3.5 28.0 41 2041 28.1 0.5 2.9 0.7 32.2 0.0 3.5 3.5 28.742 2042 28.1 0.5 2.9 31.5 0.0 3.5 3.5 28.0 42 2042 28.1 0.5 2.9 0.7 32.2 0.0 3.5 3.5 28.743 2043 28.1 0.5 2.9 31.5 0.0 3.5 3.5 28.0 43 2043 28.1 0.5 2.9 0.7 32.2 0.0 3.5 3.5 28.744 2044 28.1 0.5 2.9 31.5 0.0 3.5 3.5 28.0 44 2044 28.1 0.5 2.9 0.7 32.2 0.0 3.5 3.5 28.745 2045 28.1 0.5 2.9 31.5 0.0 3.5 3.5 28.0 45 2045 28.1 0.5 2.9 0.7 32.2 0.0 3.5 3.5 28.746 2046 28.1 0.5 2.9 31.5 0.0 3.5 3.5 28.0 46 2046 28.1 0.5 2.9 0.7 32.2 0.0 3.5 3.5 28.747 2047 28.1 0.5 2.9 31.5 0.0 3.5 3.5 28.0 47 2047 28.1 0.5 2.9 0.7 32.2 0.0 3.5 3.5 28.748 2048 28.1 0.5 2.9 31.5 0.0 3.5 3.5 28.0 48 2048 28.1 0.5 2.9 0.7 32.2 0.0 3.5 3.5 28.749 2049 28.1 0.5 2.9 31.5 0.0 3.5 3.5 28.0 49 2049 28.1 0.5 2.9 0.7 32.2 0.0 3.5 3.5 28.750 2050 28.1 0.5 2.9 31.5 0.0 3.5 3.5 28.0 50 2050 28.1 0.5 2.9 0.7 32.2 0.0 3.5 3.5 28.751 2051 28.1 0.5 2.9 31.5 0.0 3.5 3.5 28.0 51 2051 28.1 0.5 2.9 0.7 32.2 0.0 3.5 3.5 28.752 2052 28.1 0.5 2.9 31.5 0.0 3.5 3.5 28.0 52 2052 28.1 0.5 2.9 0.7 32.2 0.0 3.5 3.5 28.753 2053 28.1 0.5 2.9 31.5 0.0 3.5 3.5 28.0 53 2053 28.1 0.5 2.9 0.7 32.2 0.0 3.5 3.5 28.754 2054 28.1 0.5 2.9 31.5 0.0 3.5 3.5 28.0 54 2054 28.1 0.5 2.9 0.7 32.2 0.0 3.5 3.5 28.755 2055 28.1 0.5 2.9 31.5 0.0 3.5 3.5 28.0 55 2055 28.1 0.5 2.9 0.7 32.2 0.0 3.5 3.5 28.7
EIRR= 7.1% EIRR= 10.4%B/C = 0.90 (at discount rate: 8%) B/C = 1.21 (at discount rate: 8%)NPV= -27.6 (at discount rate: 8%) NPV= 56.6 (at discount rate: 8%)NPV= 47.9 (at discount rate: 6%) NPV= 140.2 (at discount rate: 6%)NPV= -69.6 (at discount rate: 10%) NPV= 7.8 (at discount rate: 10%)NPV= -93.3 (at discount rate: 12%) NPV= -21.8 (at discount rate: 12%)
T-77
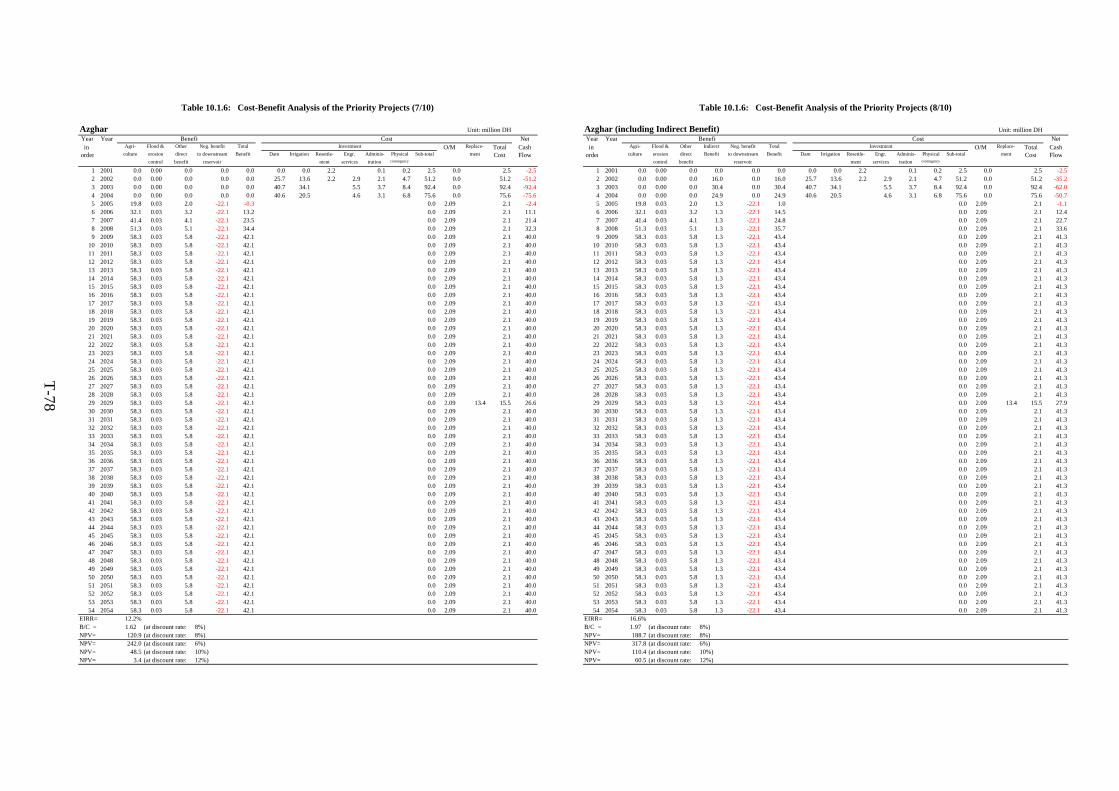
Table 10.1.6: Cost-Benefit Analysis of the Priority Projects (7/10) Table 10.1.6: Cost-Benefit Analysis of the Priority Projects (8/10)
Azghar Unit: million DH Azghar (including Indirect Benefit) Unit: million DHYear Year Benefit Cost Net Year Year Benefit Cost Netin Agri- Flood & Other Neg. benefit Total Investment O/M Replace- Total Cash in Agri- Flood & Other Indirect Neg. benefit Total Investment O/M Replace- Total Cash
order culture erosion direct to downstream Benefit Dam Irrigation Resettle- Engr. Adminis- Physical Sub-total ment Cost Flow order culture erosion direct Benefit to downstream Benefit Dam Irrigation Resettle- Engr. Adminis- Physical Sub-total ment Cost Flowcontrol benefit reservoir ment services tration contingency control benefit reservoir ment services tration contingency
1 2001 0.0 0.00 0.0 0.0 0.0 0.0 0.0 2.2 0.1 0.2 2.5 0.0 2.5 -2.5 1 2001 0.0 0.00 0.0 0.0 0.0 0.0 0.0 0.0 2.2 0.1 0.2 2.5 0.0 2.5 -2.52 2002 0.0 0.00 0.0 0.0 0.0 25.7 13.6 2.2 2.9 2.1 4.7 51.2 0.0 51.2 -51.2 2 2002 0.0 0.00 0.0 16.0 0.0 16.0 25.7 13.6 2.2 2.9 2.1 4.7 51.2 0.0 51.2 -35.23 2003 0.0 0.00 0.0 0.0 0.0 40.7 34.1 5.5 3.7 8.4 92.4 0.0 92.4 -92.4 3 2003 0.0 0.00 0.0 30.4 0.0 30.4 40.7 34.1 5.5 3.7 8.4 92.4 0.0 92.4 -62.04 2004 0.0 0.00 0.0 0.0 0.0 40.6 20.5 4.6 3.1 6.8 75.6 0.0 75.6 -75.6 4 2004 0.0 0.00 0.0 24.9 0.0 24.9 40.6 20.5 4.6 3.1 6.8 75.6 0.0 75.6 -50.75 2005 19.8 0.03 2.0 -22.1 -0.3 0.0 2.09 2.1 -2.4 5 2005 19.8 0.03 2.0 1.3 -22.1 1.0 0.0 2.09 2.1 -1.16 2006 32.1 0.03 3.2 -22.1 13.2 0.0 2.09 2.1 11.1 6 2006 32.1 0.03 3.2 1.3 -22.1 14.5 0.0 2.09 2.1 12.47 2007 41.4 0.03 4.1 -22.1 23.5 0.0 2.09 2.1 21.4 7 2007 41.4 0.03 4.1 1.3 -22.1 24.8 0.0 2.09 2.1 22.78 2008 51.3 0.03 5.1 -22.1 34.4 0.0 2.09 2.1 32.3 8 2008 51.3 0.03 5.1 1.3 -22.1 35.7 0.0 2.09 2.1 33.69 2009 58.3 0.03 5.8 -22.1 42.1 0.0 2.09 2.1 40.0 9 2009 58.3 0.03 5.8 1.3 -22.1 43.4 0.0 2.09 2.1 41.3
10 2010 58.3 0.03 5.8 -22.1 42.1 0.0 2.09 2.1 40.0 10 2010 58.3 0.03 5.8 1.3 -22.1 43.4 0.0 2.09 2.1 41.311 2011 58.3 0.03 5.8 -22.1 42.1 0.0 2.09 2.1 40.0 11 2011 58.3 0.03 5.8 1.3 -22.1 43.4 0.0 2.09 2.1 41.312 2012 58.3 0.03 5.8 -22.1 42.1 0.0 2.09 2.1 40.0 12 2012 58.3 0.03 5.8 1.3 -22.1 43.4 0.0 2.09 2.1 41.313 2013 58.3 0.03 5.8 -22.1 42.1 0.0 2.09 2.1 40.0 13 2013 58.3 0.03 5.8 1.3 -22.1 43.4 0.0 2.09 2.1 41.314 2014 58.3 0.03 5.8 -22.1 42.1 0.0 2.09 2.1 40.0 14 2014 58.3 0.03 5.8 1.3 -22.1 43.4 0.0 2.09 2.1 41.315 2015 58.3 0.03 5.8 -22.1 42.1 0.0 2.09 2.1 40.0 15 2015 58.3 0.03 5.8 1.3 -22.1 43.4 0.0 2.09 2.1 41.316 2016 58.3 0.03 5.8 -22.1 42.1 0.0 2.09 2.1 40.0 16 2016 58.3 0.03 5.8 1.3 -22.1 43.4 0.0 2.09 2.1 41.317 2017 58.3 0.03 5.8 -22.1 42.1 0.0 2.09 2.1 40.0 17 2017 58.3 0.03 5.8 1.3 -22.1 43.4 0.0 2.09 2.1 41.318 2018 58.3 0.03 5.8 -22.1 42.1 0.0 2.09 2.1 40.0 18 2018 58.3 0.03 5.8 1.3 -22.1 43.4 0.0 2.09 2.1 41.319 2019 58.3 0.03 5.8 -22.1 42.1 0.0 2.09 2.1 40.0 19 2019 58.3 0.03 5.8 1.3 -22.1 43.4 0.0 2.09 2.1 41.320 2020 58.3 0.03 5.8 -22.1 42.1 0.0 2.09 2.1 40.0 20 2020 58.3 0.03 5.8 1.3 -22.1 43.4 0.0 2.09 2.1 41.321 2021 58.3 0.03 5.8 -22.1 42.1 0.0 2.09 2.1 40.0 21 2021 58.3 0.03 5.8 1.3 -22.1 43.4 0.0 2.09 2.1 41.322 2022 58.3 0.03 5.8 -22.1 42.1 0.0 2.09 2.1 40.0 22 2022 58.3 0.03 5.8 1.3 -22.1 43.4 0.0 2.09 2.1 41.323 2023 58.3 0.03 5.8 -22.1 42.1 0.0 2.09 2.1 40.0 23 2023 58.3 0.03 5.8 1.3 -22.1 43.4 0.0 2.09 2.1 41.324 2024 58.3 0.03 5.8 -22.1 42.1 0.0 2.09 2.1 40.0 24 2024 58.3 0.03 5.8 1.3 -22.1 43.4 0.0 2.09 2.1 41.325 2025 58.3 0.03 5.8 -22.1 42.1 0.0 2.09 2.1 40.0 25 2025 58.3 0.03 5.8 1.3 -22.1 43.4 0.0 2.09 2.1 41.326 2026 58.3 0.03 5.8 -22.1 42.1 0.0 2.09 2.1 40.0 26 2026 58.3 0.03 5.8 1.3 -22.1 43.4 0.0 2.09 2.1 41.327 2027 58.3 0.03 5.8 -22.1 42.1 0.0 2.09 2.1 40.0 27 2027 58.3 0.03 5.8 1.3 -22.1 43.4 0.0 2.09 2.1 41.328 2028 58.3 0.03 5.8 -22.1 42.1 0.0 2.09 2.1 40.0 28 2028 58.3 0.03 5.8 1.3 -22.1 43.4 0.0 2.09 2.1 41.329 2029 58.3 0.03 5.8 -22.1 42.1 0.0 2.09 13.4 15.5 26.6 29 2029 58.3 0.03 5.8 1.3 -22.1 43.4 0.0 2.09 13.4 15.5 27.930 2030 58.3 0.03 5.8 -22.1 42.1 0.0 2.09 2.1 40.0 30 2030 58.3 0.03 5.8 1.3 -22.1 43.4 0.0 2.09 2.1 41.331 2031 58.3 0.03 5.8 -22.1 42.1 0.0 2.09 2.1 40.0 31 2031 58.3 0.03 5.8 1.3 -22.1 43.4 0.0 2.09 2.1 41.332 2032 58.3 0.03 5.8 -22.1 42.1 0.0 2.09 2.1 40.0 32 2032 58.3 0.03 5.8 1.3 -22.1 43.4 0.0 2.09 2.1 41.333 2033 58.3 0.03 5.8 -22.1 42.1 0.0 2.09 2.1 40.0 33 2033 58.3 0.03 5.8 1.3 -22.1 43.4 0.0 2.09 2.1 41.334 2034 58.3 0.03 5.8 -22.1 42.1 0.0 2.09 2.1 40.0 34 2034 58.3 0.03 5.8 1.3 -22.1 43.4 0.0 2.09 2.1 41.335 2035 58.3 0.03 5.8 -22.1 42.1 0.0 2.09 2.1 40.0 35 2035 58.3 0.03 5.8 1.3 -22.1 43.4 0.0 2.09 2.1 41.336 2036 58.3 0.03 5.8 -22.1 42.1 0.0 2.09 2.1 40.0 36 2036 58.3 0.03 5.8 1.3 -22.1 43.4 0.0 2.09 2.1 41.337 2037 58.3 0.03 5.8 -22.1 42.1 0.0 2.09 2.1 40.0 37 2037 58.3 0.03 5.8 1.3 -22.1 43.4 0.0 2.09 2.1 41.338 2038 58.3 0.03 5.8 -22.1 42.1 0.0 2.09 2.1 40.0 38 2038 58.3 0.03 5.8 1.3 -22.1 43.4 0.0 2.09 2.1 41.339 2039 58.3 0.03 5.8 -22.1 42.1 0.0 2.09 2.1 40.0 39 2039 58.3 0.03 5.8 1.3 -22.1 43.4 0.0 2.09 2.1 41.340 2040 58.3 0.03 5.8 -22.1 42.1 0.0 2.09 2.1 40.0 40 2040 58.3 0.03 5.8 1.3 -22.1 43.4 0.0 2.09 2.1 41.341 2041 58.3 0.03 5.8 -22.1 42.1 0.0 2.09 2.1 40.0 41 2041 58.3 0.03 5.8 1.3 -22.1 43.4 0.0 2.09 2.1 41.342 2042 58.3 0.03 5.8 -22.1 42.1 0.0 2.09 2.1 40.0 42 2042 58.3 0.03 5.8 1.3 -22.1 43.4 0.0 2.09 2.1 41.343 2043 58.3 0.03 5.8 -22.1 42.1 0.0 2.09 2.1 40.0 43 2043 58.3 0.03 5.8 1.3 -22.1 43.4 0.0 2.09 2.1 41.344 2044 58.3 0.03 5.8 -22.1 42.1 0.0 2.09 2.1 40.0 44 2044 58.3 0.03 5.8 1.3 -22.1 43.4 0.0 2.09 2.1 41.345 2045 58.3 0.03 5.8 -22.1 42.1 0.0 2.09 2.1 40.0 45 2045 58.3 0.03 5.8 1.3 -22.1 43.4 0.0 2.09 2.1 41.346 2046 58.3 0.03 5.8 -22.1 42.1 0.0 2.09 2.1 40.0 46 2046 58.3 0.03 5.8 1.3 -22.1 43.4 0.0 2.09 2.1 41.347 2047 58.3 0.03 5.8 -22.1 42.1 0.0 2.09 2.1 40.0 47 2047 58.3 0.03 5.8 1.3 -22.1 43.4 0.0 2.09 2.1 41.348 2048 58.3 0.03 5.8 -22.1 42.1 0.0 2.09 2.1 40.0 48 2048 58.3 0.03 5.8 1.3 -22.1 43.4 0.0 2.09 2.1 41.349 2049 58.3 0.03 5.8 -22.1 42.1 0.0 2.09 2.1 40.0 49 2049 58.3 0.03 5.8 1.3 -22.1 43.4 0.0 2.09 2.1 41.350 2050 58.3 0.03 5.8 -22.1 42.1 0.0 2.09 2.1 40.0 50 2050 58.3 0.03 5.8 1.3 -22.1 43.4 0.0 2.09 2.1 41.351 2051 58.3 0.03 5.8 -22.1 42.1 0.0 2.09 2.1 40.0 51 2051 58.3 0.03 5.8 1.3 -22.1 43.4 0.0 2.09 2.1 41.352 2052 58.3 0.03 5.8 -22.1 42.1 0.0 2.09 2.1 40.0 52 2052 58.3 0.03 5.8 1.3 -22.1 43.4 0.0 2.09 2.1 41.353 2053 58.3 0.03 5.8 -22.1 42.1 0.0 2.09 2.1 40.0 53 2053 58.3 0.03 5.8 1.3 -22.1 43.4 0.0 2.09 2.1 41.354 2054 58.3 0.03 5.8 -22.1 42.1 0.0 2.09 2.1 40.0 54 2054 58.3 0.03 5.8 1.3 -22.1 43.4 0.0 2.09 2.1 41.3
EIRR= 12.2% EIRR= 16.6%B/C = 1.62 (at discount rate: 8%) B/C = 1.97 (at discount rate: 8%)NPV= 120.9 (at discount rate: 8%) NPV= 188.7 (at discount rate: 8%)NPV= 242.0 (at discount rate: 6%) NPV= 317.8 (at discount rate: 6%)NPV= 48.5 (at discount rate: 10%) NPV= 110.4 (at discount rate: 10%)NPV= 3.4 (at discount rate: 12%) NPV= 60.5 (at discount rate: 12%)
T-78
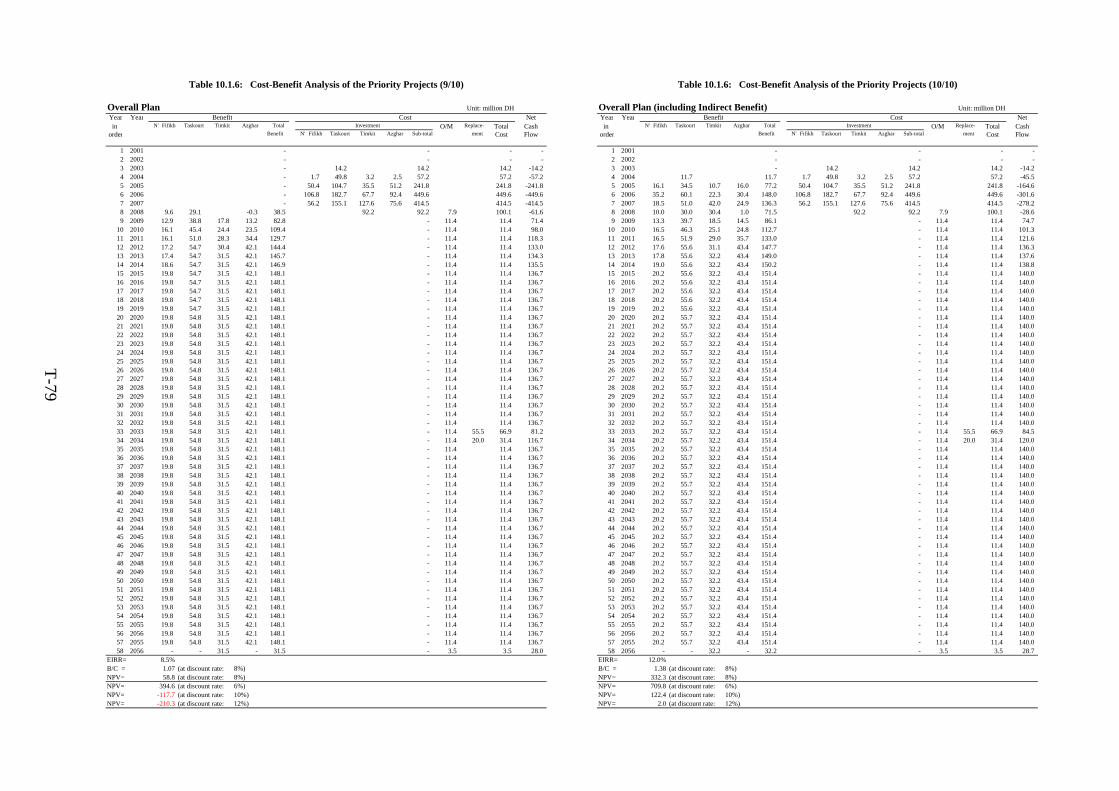
Table 10.1.6: Cost-Benefit Analysis of the Priority Projects (9/10) Table 10.1.6: Cost-Benefit Analysis of the Priority Projects (10/10)
Overall Plan Unit: million DH Overall Plan (including Indirect Benefit) Unit: million DHYear Year Benefit Cost Net Year Year Benefit Cost Netin N'Fifikh Taskourt Timkit Azghar Total Investment O/M Replace- Total Cash in N'Fifikh Taskourt Timkit Azghar Total Investment O/M Replace- Total Cash
order Benefit N'Fifikh Taskourt Timkit Azghar Sub-total ment Cost Flow order Benefit N'Fifikh Taskourt Timkit Azghar Sub-total ment Cost Flow
1 2001 - - - - 1 2001 - - - - 2 2002 - - - - 2 2002 - - - - 3 2003 - 14.2 14.2 14.2 -14.2 3 2003 - 14.2 14.2 14.2 -14.2 4 2004 - 1.7 49.8 3.2 2.5 57.2 57.2 -57.2 4 2004 11.7 11.7 1.7 49.8 3.2 2.5 57.2 57.2 -45.5 5 2005 - 50.4 104.7 35.5 51.2 241.8 241.8 -241.8 5 2005 16.1 34.5 10.7 16.0 77.2 50.4 104.7 35.5 51.2 241.8 241.8 -164.6 6 2006 - 106.8 182.7 67.7 92.4 449.6 449.6 -449.6 6 2006 35.2 60.1 22.3 30.4 148.0 106.8 182.7 67.7 92.4 449.6 449.6 -301.6 7 2007 - 56.2 155.1 127.6 75.6 414.5 414.5 -414.5 7 2007 18.5 51.0 42.0 24.9 136.3 56.2 155.1 127.6 75.6 414.5 414.5 -278.2 8 2008 9.6 29.1 -0.3 38.5 92.2 92.2 7.9 100.1 -61.6 8 2008 10.0 30.0 30.4 1.0 71.5 92.2 92.2 7.9 100.1 -28.6 9 2009 12.9 38.8 17.8 13.2 82.8 - 11.4 11.4 71.4 9 2009 13.3 39.7 18.5 14.5 86.1 - 11.4 11.4 74.7
10 2010 16.1 45.4 24.4 23.5 109.4 - 11.4 11.4 98.0 10 2010 16.5 46.3 25.1 24.8 112.7 - 11.4 11.4 101.3 11 2011 16.1 51.0 28.3 34.4 129.7 - 11.4 11.4 118.3 11 2011 16.5 51.9 29.0 35.7 133.0 - 11.4 11.4 121.6 12 2012 17.2 54.7 30.4 42.1 144.4 - 11.4 11.4 133.0 12 2012 17.6 55.6 31.1 43.4 147.7 - 11.4 11.4 136.3 13 2013 17.4 54.7 31.5 42.1 145.7 - 11.4 11.4 134.3 13 2013 17.8 55.6 32.2 43.4 149.0 - 11.4 11.4 137.6 14 2014 18.6 54.7 31.5 42.1 146.9 - 11.4 11.4 135.5 14 2014 19.0 55.6 32.2 43.4 150.2 - 11.4 11.4 138.8 15 2015 19.8 54.7 31.5 42.1 148.1 - 11.4 11.4 136.7 15 2015 20.2 55.6 32.2 43.4 151.4 - 11.4 11.4 140.0 16 2016 19.8 54.7 31.5 42.1 148.1 - 11.4 11.4 136.7 16 2016 20.2 55.6 32.2 43.4 151.4 - 11.4 11.4 140.0 17 2017 19.8 54.7 31.5 42.1 148.1 - 11.4 11.4 136.7 17 2017 20.2 55.6 32.2 43.4 151.4 - 11.4 11.4 140.0 18 2018 19.8 54.7 31.5 42.1 148.1 - 11.4 11.4 136.7 18 2018 20.2 55.6 32.2 43.4 151.4 - 11.4 11.4 140.0 19 2019 19.8 54.7 31.5 42.1 148.1 - 11.4 11.4 136.7 19 2019 20.2 55.6 32.2 43.4 151.4 - 11.4 11.4 140.0 20 2020 19.8 54.8 31.5 42.1 148.1 - 11.4 11.4 136.7 20 2020 20.2 55.7 32.2 43.4 151.4 - 11.4 11.4 140.0 21 2021 19.8 54.8 31.5 42.1 148.1 - 11.4 11.4 136.7 21 2021 20.2 55.7 32.2 43.4 151.4 - 11.4 11.4 140.0 22 2022 19.8 54.8 31.5 42.1 148.1 - 11.4 11.4 136.7 22 2022 20.2 55.7 32.2 43.4 151.4 - 11.4 11.4 140.0 23 2023 19.8 54.8 31.5 42.1 148.1 - 11.4 11.4 136.7 23 2023 20.2 55.7 32.2 43.4 151.4 - 11.4 11.4 140.0 24 2024 19.8 54.8 31.5 42.1 148.1 - 11.4 11.4 136.7 24 2024 20.2 55.7 32.2 43.4 151.4 - 11.4 11.4 140.0 25 2025 19.8 54.8 31.5 42.1 148.1 - 11.4 11.4 136.7 25 2025 20.2 55.7 32.2 43.4 151.4 - 11.4 11.4 140.0 26 2026 19.8 54.8 31.5 42.1 148.1 - 11.4 11.4 136.7 26 2026 20.2 55.7 32.2 43.4 151.4 - 11.4 11.4 140.0 27 2027 19.8 54.8 31.5 42.1 148.1 - 11.4 11.4 136.7 27 2027 20.2 55.7 32.2 43.4 151.4 - 11.4 11.4 140.0 28 2028 19.8 54.8 31.5 42.1 148.1 - 11.4 11.4 136.7 28 2028 20.2 55.7 32.2 43.4 151.4 - 11.4 11.4 140.0 29 2029 19.8 54.8 31.5 42.1 148.1 - 11.4 11.4 136.7 29 2029 20.2 55.7 32.2 43.4 151.4 - 11.4 11.4 140.0 30 2030 19.8 54.8 31.5 42.1 148.1 - 11.4 11.4 136.7 30 2030 20.2 55.7 32.2 43.4 151.4 - 11.4 11.4 140.0 31 2031 19.8 54.8 31.5 42.1 148.1 - 11.4 11.4 136.7 31 2031 20.2 55.7 32.2 43.4 151.4 - 11.4 11.4 140.0 32 2032 19.8 54.8 31.5 42.1 148.1 - 11.4 11.4 136.7 32 2032 20.2 55.7 32.2 43.4 151.4 - 11.4 11.4 140.0 33 2033 19.8 54.8 31.5 42.1 148.1 - 11.4 55.5 66.9 81.2 33 2033 20.2 55.7 32.2 43.4 151.4 - 11.4 55.5 66.9 84.5 34 2034 19.8 54.8 31.5 42.1 148.1 - 11.4 20.0 31.4 116.7 34 2034 20.2 55.7 32.2 43.4 151.4 - 11.4 20.0 31.4 120.0 35 2035 19.8 54.8 31.5 42.1 148.1 - 11.4 11.4 136.7 35 2035 20.2 55.7 32.2 43.4 151.4 - 11.4 11.4 140.0 36 2036 19.8 54.8 31.5 42.1 148.1 - 11.4 11.4 136.7 36 2036 20.2 55.7 32.2 43.4 151.4 - 11.4 11.4 140.0 37 2037 19.8 54.8 31.5 42.1 148.1 - 11.4 11.4 136.7 37 2037 20.2 55.7 32.2 43.4 151.4 - 11.4 11.4 140.0 38 2038 19.8 54.8 31.5 42.1 148.1 - 11.4 11.4 136.7 38 2038 20.2 55.7 32.2 43.4 151.4 - 11.4 11.4 140.0 39 2039 19.8 54.8 31.5 42.1 148.1 - 11.4 11.4 136.7 39 2039 20.2 55.7 32.2 43.4 151.4 - 11.4 11.4 140.0 40 2040 19.8 54.8 31.5 42.1 148.1 - 11.4 11.4 136.7 40 2040 20.2 55.7 32.2 43.4 151.4 - 11.4 11.4 140.0 41 2041 19.8 54.8 31.5 42.1 148.1 - 11.4 11.4 136.7 41 2041 20.2 55.7 32.2 43.4 151.4 - 11.4 11.4 140.0 42 2042 19.8 54.8 31.5 42.1 148.1 - 11.4 11.4 136.7 42 2042 20.2 55.7 32.2 43.4 151.4 - 11.4 11.4 140.0 43 2043 19.8 54.8 31.5 42.1 148.1 - 11.4 11.4 136.7 43 2043 20.2 55.7 32.2 43.4 151.4 - 11.4 11.4 140.0 44 2044 19.8 54.8 31.5 42.1 148.1 - 11.4 11.4 136.7 44 2044 20.2 55.7 32.2 43.4 151.4 - 11.4 11.4 140.0 45 2045 19.8 54.8 31.5 42.1 148.1 - 11.4 11.4 136.7 45 2045 20.2 55.7 32.2 43.4 151.4 - 11.4 11.4 140.0 46 2046 19.8 54.8 31.5 42.1 148.1 - 11.4 11.4 136.7 46 2046 20.2 55.7 32.2 43.4 151.4 - 11.4 11.4 140.0 47 2047 19.8 54.8 31.5 42.1 148.1 - 11.4 11.4 136.7 47 2047 20.2 55.7 32.2 43.4 151.4 - 11.4 11.4 140.0 48 2048 19.8 54.8 31.5 42.1 148.1 - 11.4 11.4 136.7 48 2048 20.2 55.7 32.2 43.4 151.4 - 11.4 11.4 140.0 49 2049 19.8 54.8 31.5 42.1 148.1 - 11.4 11.4 136.7 49 2049 20.2 55.7 32.2 43.4 151.4 - 11.4 11.4 140.0 50 2050 19.8 54.8 31.5 42.1 148.1 - 11.4 11.4 136.7 50 2050 20.2 55.7 32.2 43.4 151.4 - 11.4 11.4 140.0 51 2051 19.8 54.8 31.5 42.1 148.1 - 11.4 11.4 136.7 51 2051 20.2 55.7 32.2 43.4 151.4 - 11.4 11.4 140.0 52 2052 19.8 54.8 31.5 42.1 148.1 - 11.4 11.4 136.7 52 2052 20.2 55.7 32.2 43.4 151.4 - 11.4 11.4 140.0 53 2053 19.8 54.8 31.5 42.1 148.1 - 11.4 11.4 136.7 53 2053 20.2 55.7 32.2 43.4 151.4 - 11.4 11.4 140.0 54 2054 19.8 54.8 31.5 42.1 148.1 - 11.4 11.4 136.7 54 2054 20.2 55.7 32.2 43.4 151.4 - 11.4 11.4 140.0 55 2055 19.8 54.8 31.5 42.1 148.1 - 11.4 11.4 136.7 55 2055 20.2 55.7 32.2 43.4 151.4 - 11.4 11.4 140.0 56 2056 19.8 54.8 31.5 42.1 148.1 - 11.4 11.4 136.7 56 2056 20.2 55.7 32.2 43.4 151.4 - 11.4 11.4 140.0 57 2055 19.8 54.8 31.5 42.1 148.1 - 11.4 11.4 136.7 57 2055 20.2 55.7 32.2 43.4 151.4 - 11.4 11.4 140.0 58 2056 - - 31.5 - 31.5 - 3.5 3.5 28.0 58 2056 - - 32.2 - 32.2 - 3.5 3.5 28.7
EIRR= 8.5% EIRR= 12.0%B/C = 1.07 (at discount rate: 8%) B/C = 1.38 (at discount rate: 8%)NPV= 58.8 (at discount rate: 8%) NPV= 332.3 (at discount rate: 8%)NPV= 394.6 (at discount rate: 6%) NPV= 709.8 (at discount rate: 6%)NPV= -117.7 (at discount rate: 10%) NPV= 122.4 (at discount rate: 10%)NPV= -210.3 (at discount rate: 12%) NPV= 2.0 (at discount rate: 12%)
T-79
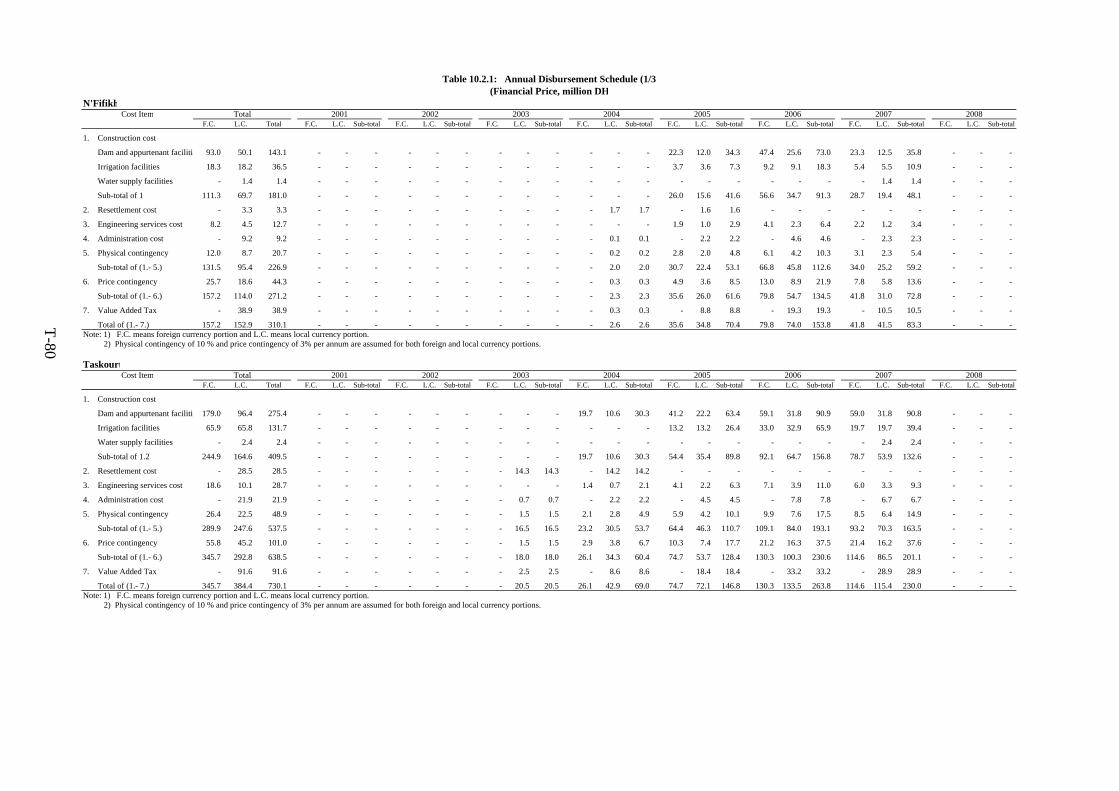
Table 10.2.1: Annual Disbursement Schedule (1/3(Financial Price, million DH
N'Fifikh
F.C. L.C. Total F.C. L.C. Sub-total F.C. L.C. Sub-total F.C. L.C. Sub-total F.C. L.C. Sub-total F.C. L.C. Sub-total F.C. L.C. Sub-total F.C. L.C. Sub-total F.C. L.C. Sub-total
1. Construction cost
Dam and appurtenant faciliti 93.0 50.1 143.1 - - - - - - - - - - - - 22.3 12.0 34.3 47.4 25.6 73.0 23.3 12.5 35.8 - - -
Irrigation facilities 18.3 18.2 36.5 - - - - - - - - - - - - 3.7 3.6 7.3 9.2 9.1 18.3 5.4 5.5 10.9 - - -
Water supply facilities - 1.4 1.4 - - - - - - - - - - - - - - - - - - - 1.4 1.4 - - -
Sub-total of 1 111.3 69.7 181.0 - - - - - - - - - - - - 26.0 15.6 41.6 56.6 34.7 91.3 28.7 19.4 48.1 - - -
2. Resettlement cost - 3.3 3.3 - - - - - - - - - - 1.7 1.7 - 1.6 1.6 - - - - - - - - -
3. Engineering services cost 8.2 4.5 12.7 - - - - - - - - - - - - 1.9 1.0 2.9 4.1 2.3 6.4 2.2 1.2 3.4 - - -
4. Administration cost - 9.2 9.2 - - - - - - - - - - 0.1 0.1 - 2.2 2.2 - 4.6 4.6 - 2.3 2.3 - - -
5. Physical contingency 12.0 8.7 20.7 - - - - - - - - - - 0.2 0.2 2.8 2.0 4.8 6.1 4.2 10.3 3.1 2.3 5.4 - - -
Sub-total of (1.- 5.) 131.5 95.4 226.9 - - - - - - - - - - 2.0 2.0 30.7 22.4 53.1 66.8 45.8 112.6 34.0 25.2 59.2 - - -
6. Price contingency 25.7 18.6 44.3 - - - - - - - - - - 0.3 0.3 4.9 3.6 8.5 13.0 8.9 21.9 7.8 5.8 13.6 - - -
Sub-total of (1.- 6.) 157.2 114.0 271.2 - - - - - - - - - - 2.3 2.3 35.6 26.0 61.6 79.8 54.7 134.5 41.8 31.0 72.8 - - -
7. Value Added Tax - 38.9 38.9 - - - - - - - - - - 0.3 0.3 - 8.8 8.8 - 19.3 19.3 - 10.5 10.5 - - -
Total of (1.- 7.) 157.2 152.9 310.1 - - - - - - - - - - 2.6 2.6 35.6 34.8 70.4 79.8 74.0 153.8 41.8 41.5 83.3 - - - Note: 1) F.C. means foreign currency portion and L.C. means local currency portion. 2) Physical contingency of 10 % and price contingency of 3% per annum are assumed for both foreign and local currency portions.
Taskourt
F.C. L.C. Total F.C. L.C. Sub-total F.C. L.C. Sub-total F.C. L.C. Sub-total F.C. L.C. Sub-total F.C. L.C. Sub-total F.C. L.C. Sub-total F.C. L.C. Sub-total F.C. L.C. Sub-total
1. Construction cost
Dam and appurtenant faciliti 179.0 96.4 275.4 - - - - - - - - - 19.7 10.6 30.3 41.2 22.2 63.4 59.1 31.8 90.9 59.0 31.8 90.8 - - -
Irrigation facilities 65.9 65.8 131.7 - - - - - - - - - - - - 13.2 13.2 26.4 33.0 32.9 65.9 19.7 19.7 39.4 - - -
Water supply facilities - 2.4 2.4 - - - - - - - - - - - - - - - - - - - 2.4 2.4 - - -
Sub-total of 1.2 244.9 164.6 409.5 - - - - - - - - - 19.7 10.6 30.3 54.4 35.4 89.8 92.1 64.7 156.8 78.7 53.9 132.6 - - -
2. Resettlement cost - 28.5 28.5 - - - - - - - 14.3 14.3 - 14.2 14.2 - - - - - - - - - - - -
3. Engineering services cost 18.6 10.1 28.7 - - - - - - - - - 1.4 0.7 2.1 4.1 2.2 6.3 7.1 3.9 11.0 6.0 3.3 9.3 - - -
4. Administration cost - 21.9 21.9 - - - - - - - 0.7 0.7 - 2.2 2.2 - 4.5 4.5 - 7.8 7.8 - 6.7 6.7 - - -
5. Physical contingency 26.4 22.5 48.9 - - - - - - - 1.5 1.5 2.1 2.8 4.9 5.9 4.2 10.1 9.9 7.6 17.5 8.5 6.4 14.9 - - -
Sub-total of (1.- 5.) 289.9 247.6 537.5 - - - - - - - 16.5 16.5 23.2 30.5 53.7 64.4 46.3 110.7 109.1 84.0 193.1 93.2 70.3 163.5 - - -
6. Price contingency 55.8 45.2 101.0 - - - - - - - 1.5 1.5 2.9 3.8 6.7 10.3 7.4 17.7 21.2 16.3 37.5 21.4 16.2 37.6 - - -
Sub-total of (1.- 6.) 345.7 292.8 638.5 - - - - - - - 18.0 18.0 26.1 34.3 60.4 74.7 53.7 128.4 130.3 100.3 230.6 114.6 86.5 201.1 - - -
7. Value Added Tax - 91.6 91.6 - - - - - - - 2.5 2.5 - 8.6 8.6 - 18.4 18.4 - 33.2 33.2 - 28.9 28.9 - - -
Total of (1.- 7.) 345.7 384.4 730.1 - - - - - - - 20.5 20.5 26.1 42.9 69.0 74.7 72.1 146.8 130.3 133.5 263.8 114.6 115.4 230.0 - - - Note: 1) F.C. means foreign currency portion and L.C. means local currency portion. 2) Physical contingency of 10 % and price contingency of 3% per annum are assumed for both foreign and local currency portions.
Cost Item Total 2008200720062005200420032001 2002
Cost Item Total 2001 2002 2003 2004 2005 2006 2007 2008
T-80
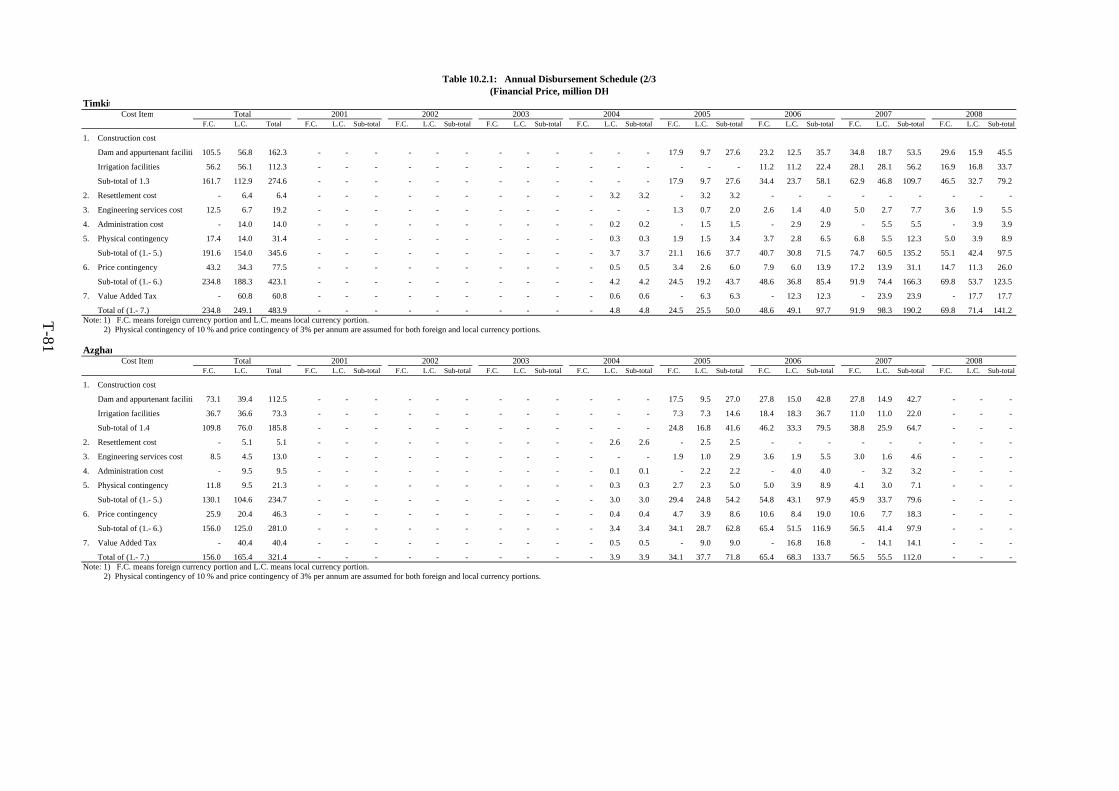
Table 10.2.1: Annual Disbursement Schedule (2/3(Financial Price, million DH
Timkit
F.C. L.C. Total F.C. L.C. Sub-total F.C. L.C. Sub-total F.C. L.C. Sub-total F.C. L.C. Sub-total F.C. L.C. Sub-total F.C. L.C. Sub-total F.C. L.C. Sub-total F.C. L.C. Sub-total
1. Construction cost
Dam and appurtenant faciliti 105.5 56.8 162.3 - - - - - - - - - - - - 17.9 9.7 27.6 23.2 12.5 35.7 34.8 18.7 53.5 29.6 15.9 45.5
Irrigation facilities 56.2 56.1 112.3 - - - - - - - - - - - - - - - 11.2 11.2 22.4 28.1 28.1 56.2 16.9 16.8 33.7
Sub-total of 1.3 161.7 112.9 274.6 - - - - - - - - - - - - 17.9 9.7 27.6 34.4 23.7 58.1 62.9 46.8 109.7 46.5 32.7 79.2
2. Resettlement cost - 6.4 6.4 - - - - - - - - - - 3.2 3.2 - 3.2 3.2 - - - - - - - - -
3. Engineering services cost 12.5 6.7 19.2 - - - - - - - - - - - - 1.3 0.7 2.0 2.6 1.4 4.0 5.0 2.7 7.7 3.6 1.9 5.5
4. Administration cost - 14.0 14.0 - - - - - - - - - - 0.2 0.2 - 1.5 1.5 - 2.9 2.9 - 5.5 5.5 - 3.9 3.9
5. Physical contingency 17.4 14.0 31.4 - - - - - - - - - - 0.3 0.3 1.9 1.5 3.4 3.7 2.8 6.5 6.8 5.5 12.3 5.0 3.9 8.9
Sub-total of (1.- 5.) 191.6 154.0 345.6 - - - - - - - - - - 3.7 3.7 21.1 16.6 37.7 40.7 30.8 71.5 74.7 60.5 135.2 55.1 42.4 97.5
6. Price contingency 43.2 34.3 77.5 - - - - - - - - - - 0.5 0.5 3.4 2.6 6.0 7.9 6.0 13.9 17.2 13.9 31.1 14.7 11.3 26.0
Sub-total of (1.- 6.) 234.8 188.3 423.1 - - - - - - - - - - 4.2 4.2 24.5 19.2 43.7 48.6 36.8 85.4 91.9 74.4 166.3 69.8 53.7 123.5
7. Value Added Tax - 60.8 60.8 - - - - - - - - - - 0.6 0.6 - 6.3 6.3 - 12.3 12.3 - 23.9 23.9 - 17.7 17.7
Total of (1.- 7.) 234.8 249.1 483.9 - - - - - - - - - - 4.8 4.8 24.5 25.5 50.0 48.6 49.1 97.7 91.9 98.3 190.2 69.8 71.4 141.2 Note: 1) F.C. means foreign currency portion and L.C. means local currency portion. 2) Physical contingency of 10 % and price contingency of 3% per annum are assumed for both foreign and local currency portions.
Azghar
F.C. L.C. Total F.C. L.C. Sub-total F.C. L.C. Sub-total F.C. L.C. Sub-total F.C. L.C. Sub-total F.C. L.C. Sub-total F.C. L.C. Sub-total F.C. L.C. Sub-total F.C. L.C. Sub-total
1. Construction cost
Dam and appurtenant faciliti 73.1 39.4 112.5 - - - - - - - - - - - - 17.5 9.5 27.0 27.8 15.0 42.8 27.8 14.9 42.7 - - -
Irrigation facilities 36.7 36.6 73.3 - - - - - - - - - - - - 7.3 7.3 14.6 18.4 18.3 36.7 11.0 11.0 22.0 - - -
Sub-total of 1.4 109.8 76.0 185.8 - - - - - - - - - - - - 24.8 16.8 41.6 46.2 33.3 79.5 38.8 25.9 64.7 - - -
2. Resettlement cost - 5.1 5.1 - - - - - - - - - - 2.6 2.6 - 2.5 2.5 - - - - - - - - -
3. Engineering services cost 8.5 4.5 13.0 - - - - - - - - - - - - 1.9 1.0 2.9 3.6 1.9 5.5 3.0 1.6 4.6 - - -
4. Administration cost - 9.5 9.5 - - - - - - - - - - 0.1 0.1 - 2.2 2.2 - 4.0 4.0 - 3.2 3.2 - - -
5. Physical contingency 11.8 9.5 21.3 - - - - - - - - - - 0.3 0.3 2.7 2.3 5.0 5.0 3.9 8.9 4.1 3.0 7.1 - - -
Sub-total of (1.- 5.) 130.1 104.6 234.7 - - - - - - - - - - 3.0 3.0 29.4 24.8 54.2 54.8 43.1 97.9 45.9 33.7 79.6 - - -
6. Price contingency 25.9 20.4 46.3 - - - - - - - - - - 0.4 0.4 4.7 3.9 8.6 10.6 8.4 19.0 10.6 7.7 18.3 - - -
Sub-total of (1.- 6.) 156.0 125.0 281.0 - - - - - - - - - - 3.4 3.4 34.1 28.7 62.8 65.4 51.5 116.9 56.5 41.4 97.9 - - -
7. Value Added Tax - 40.4 40.4 - - - - - - - - - - 0.5 0.5 - 9.0 9.0 - 16.8 16.8 - 14.1 14.1 - - -
Total of (1.- 7.) 156.0 165.4 321.4 - - - - - - - - - - 3.9 3.9 34.1 37.7 71.8 65.4 68.3 133.7 56.5 55.5 112.0 - - - Note: 1) F.C. means foreign currency portion and L.C. means local currency portion. 2) Physical contingency of 10 % and price contingency of 3% per annum are assumed for both foreign and local currency portions.
Cost Item Total 2001 2002 2003 2004 2005 2006
2003 2004 2005 2006Cost Item Total 2001 2002 2007 2008
2007 2008
T-81
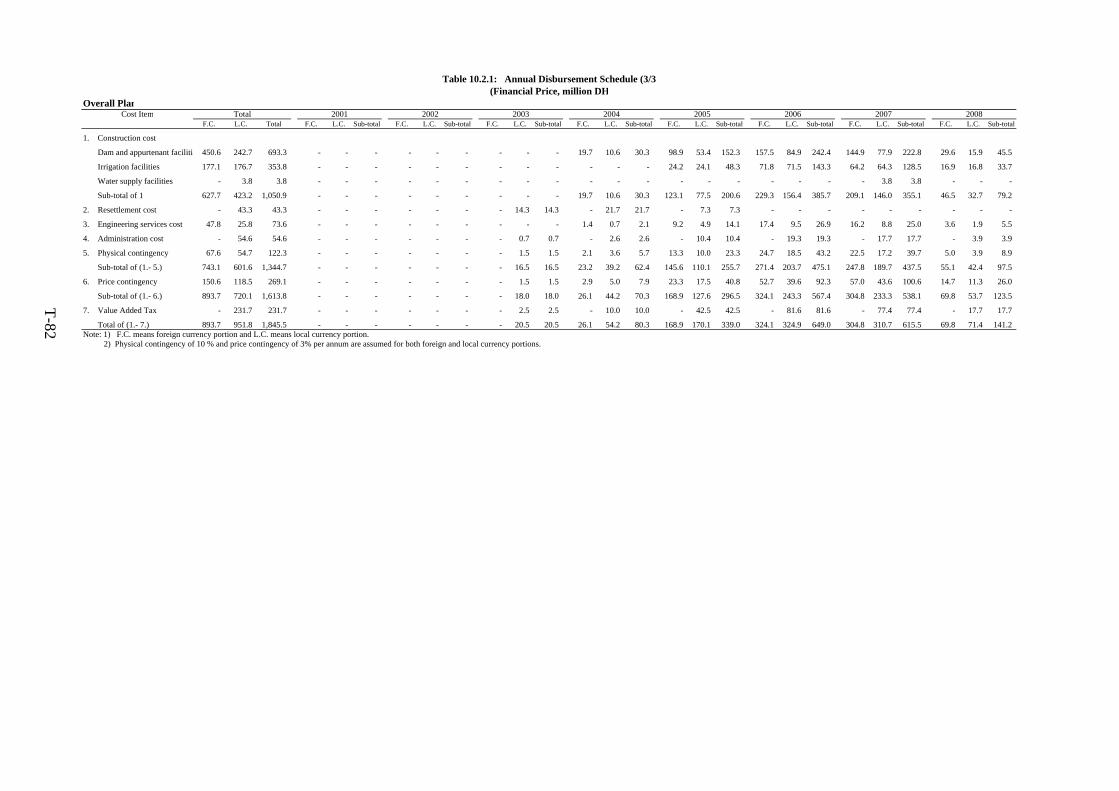
Table 10.2.1: Annual Disbursement Schedule (3/3(Financial Price, million DH
Overall Plan
F.C. L.C. Total F.C. L.C. Sub-total F.C. L.C. Sub-total F.C. L.C. Sub-total F.C. L.C. Sub-total F.C. L.C. Sub-total F.C. L.C. Sub-total F.C. L.C. Sub-total F.C. L.C. Sub-total
1. Construction cost
Dam and appurtenant faciliti 450.6 242.7 693.3 - - - - - - - - - 19.7 10.6 30.3 98.9 53.4 152.3 157.5 84.9 242.4 144.9 77.9 222.8 29.6 15.9 45.5
Irrigation facilities 177.1 176.7 353.8 - - - - - - - - - - - - 24.2 24.1 48.3 71.8 71.5 143.3 64.2 64.3 128.5 16.9 16.8 33.7
Water supply facilities - 3.8 3.8 - - - - - - - - - - - - - - - - - - - 3.8 3.8 - - -
Sub-total of 1 627.7 423.2 1,050.9 - - - - - - - - - 19.7 10.6 30.3 123.1 77.5 200.6 229.3 156.4 385.7 209.1 146.0 355.1 46.5 32.7 79.2
2. Resettlement cost - 43.3 43.3 - - - - - - - 14.3 14.3 - 21.7 21.7 - 7.3 7.3 - - - - - - - - -
3. Engineering services cost 47.8 25.8 73.6 - - - - - - - - - 1.4 0.7 2.1 9.2 4.9 14.1 17.4 9.5 26.9 16.2 8.8 25.0 3.6 1.9 5.5
4. Administration cost - 54.6 54.6 - - - - - - - 0.7 0.7 - 2.6 2.6 - 10.4 10.4 - 19.3 19.3 - 17.7 17.7 - 3.9 3.9
5. Physical contingency 67.6 54.7 122.3 - - - - - - - 1.5 1.5 2.1 3.6 5.7 13.3 10.0 23.3 24.7 18.5 43.2 22.5 17.2 39.7 5.0 3.9 8.9
Sub-total of (1.- 5.) 743.1 601.6 1,344.7 - - - - - - - 16.5 16.5 23.2 39.2 62.4 145.6 110.1 255.7 271.4 203.7 475.1 247.8 189.7 437.5 55.1 42.4 97.5
6. Price contingency 150.6 118.5 269.1 - - - - - - - 1.5 1.5 2.9 5.0 7.9 23.3 17.5 40.8 52.7 39.6 92.3 57.0 43.6 100.6 14.7 11.3 26.0
Sub-total of (1.- 6.) 893.7 720.1 1,613.8 - - - - - - - 18.0 18.0 26.1 44.2 70.3 168.9 127.6 296.5 324.1 243.3 567.4 304.8 233.3 538.1 69.8 53.7 123.5
7. Value Added Tax - 231.7 231.7 - - - - - - - 2.5 2.5 - 10.0 10.0 - 42.5 42.5 - 81.6 81.6 - 77.4 77.4 - 17.7 17.7
Total of (1.- 7.) 893.7 951.8 1,845.5 - - - - - - - 20.5 20.5 26.1 54.2 80.3 168.9 170.1 339.0 324.1 324.9 649.0 304.8 310.7 615.5 69.8 71.4 141.2 Note: 1) F.C. means foreign currency portion and L.C. means local currency portion. 2) Physical contingency of 10 % and price contingency of 3% per annum are assumed for both foreign and local currency portions.
Cost Item Total 2001 2002 2007 20082003 2004 2005 2006
T-82
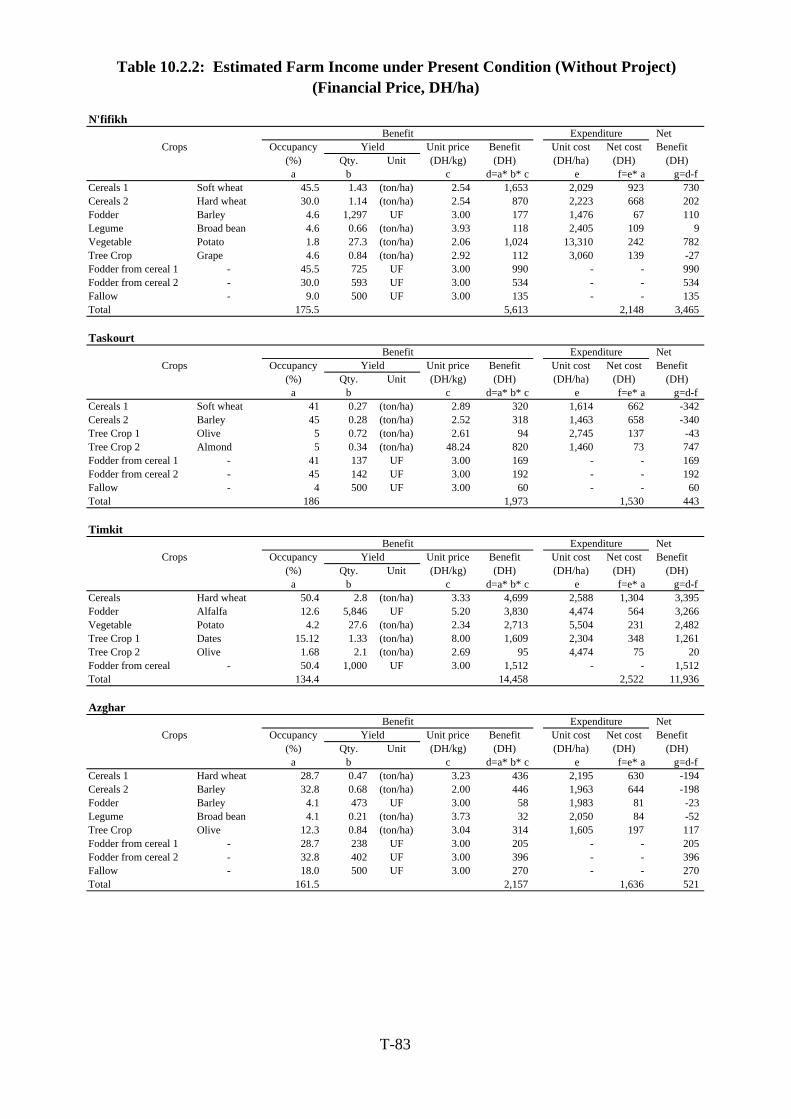
Table 10.2.2: Estimated Farm Income under Present Condition (Without Project)(Financial Price, DH/ha)
N'fifikhBenefit Expenditure Net
Crops Occupancy Yield Unit price Benefit Unit cost Net cost Benefit(%) Qty. Unit (DH/kg) (DH) (DH/ha) (DH) (DH)
a b c d=a*b*c e f=e*a g=d-fCereals 1 Soft wheat 45.5 1.43 (ton/ha) 2.54 1,653 2,029 923 730 Cereals 2 Hard wheat 30.0 1.14 (ton/ha) 2.54 870 2,223 668 202 Fodder Barley 4.6 1,297 UF 3.00 177 1,476 67 110 Legume Broad bean 4.6 0.66 (ton/ha) 3.93 118 2,405 109 9 Vegetable Potato 1.8 27.3 (ton/ha) 2.06 1,024 13,310 242 782 Tree Crop Grape 4.6 0.84 (ton/ha) 2.92 112 3,060 139 -27 Fodder from cereal 1 - 45.5 725 UF 3.00 990 - - 990 Fodder from cereal 2 - 30.0 593 UF 3.00 534 - - 534 Fallow - 9.0 500 UF 3.00 135 - - 135 Total 175.5 5,613 2,148 3,465
TaskourtBenefit Expenditure Net
Crops Occupancy Yield Unit price Benefit Unit cost Net cost Benefit(%) Qty. Unit (DH/kg) (DH) (DH/ha) (DH) (DH)
a b c d=a*b*c e f=e*a g=d-fCereals 1 Soft wheat 41 0.27 (ton/ha) 2.89 320 1,614 662 -342 Cereals 2 Barley 45 0.28 (ton/ha) 2.52 318 1,463 658 -340 Tree Crop 1 Olive 5 0.72 (ton/ha) 2.61 94 2,745 137 -43 Tree Crop 2 Almond 5 0.34 (ton/ha) 48.24 820 1,460 73 747 Fodder from cereal 1 - 41 137 UF 3.00 169 - - 169 Fodder from cereal 2 - 45 142 UF 3.00 192 - - 192 Fallow - 4 500 UF 3.00 60 - - 60 Total 186 1,973 1,530 443
TimkitBenefit Expenditure Net
Crops Occupancy Yield Unit price Benefit Unit cost Net cost Benefit(%) Qty. Unit (DH/kg) (DH) (DH/ha) (DH) (DH)
a b c d=a*b*c e f=e*a g=d-fCereals Hard wheat 50.4 2.8 (ton/ha) 3.33 4,699 2,588 1,304 3,395 Fodder Alfalfa 12.6 5,846 UF 5.20 3,830 4,474 564 3,266 Vegetable Potato 4.2 27.6 (ton/ha) 2.34 2,713 5,504 231 2,482 Tree Crop 1 Dates 15.12 1.33 (ton/ha) 8.00 1,609 2,304 348 1,261 Tree Crop 2 Olive 1.68 2.1 (ton/ha) 2.69 95 4,474 75 20 Fodder from cereal - 50.4 1,000 UF 3.00 1,512 - - 1,512 Total 134.4 14,458 2,522 11,936
AzgharBenefit Expenditure Net
Crops Occupancy Yield Unit price Benefit Unit cost Net cost Benefit(%) Qty. Unit (DH/kg) (DH) (DH/ha) (DH) (DH)
a b c d=a*b*c e f=e*a g=d-fCereals 1 Hard wheat 28.7 0.47 (ton/ha) 3.23 436 2,195 630 -194 Cereals 2 Barley 32.8 0.68 (ton/ha) 2.00 446 1,963 644 -198 Fodder Barley 4.1 473 UF 3.00 58 1,983 81 -23 Legume Broad bean 4.1 0.21 (ton/ha) 3.73 32 2,050 84 -52 Tree Crop Olive 12.3 0.84 (ton/ha) 3.04 314 1,605 197 117 Fodder from cereal 1 - 28.7 238 UF 3.00 205 - - 205 Fodder from cereal 2 - 32.8 402 UF 3.00 396 - - 396 Fallow - 18.0 500 UF 3.00 270 - - 270 Total 161.5 2,157 1,636 521
T-83
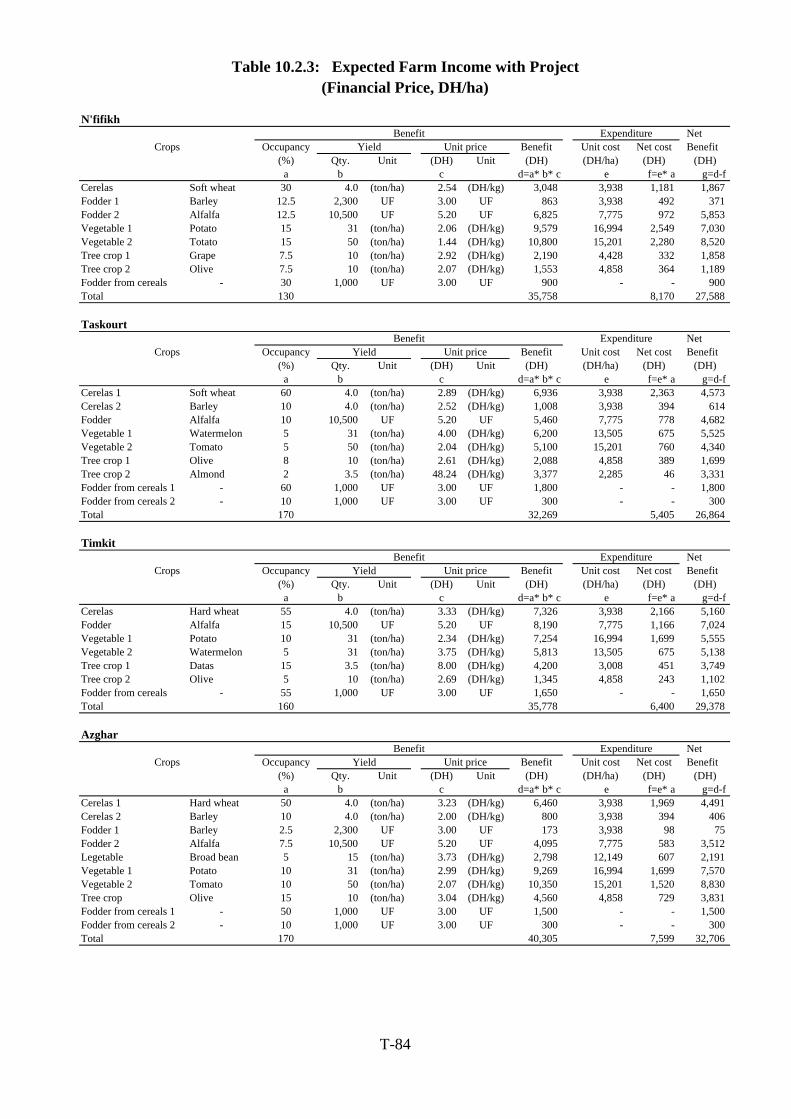
Table 10.2.3: Expected Farm Income with Project(Financial Price, DH/ha)
N'fifikhBenefit Expenditure Net
Crops Occupancy Yield Unit price Benefit Unit cost Net cost Benefit(%) Qty. Unit (DH) Unit (DH) (DH/ha) (DH) (DH)
a b c d=a*b*c e f=e*a g=d-fCerelas Soft wheat 30 4.0 (ton/ha) 2.54 (DH/kg) 3,048 3,938 1,181 1,867 Fodder 1 Barley 12.5 2,300 UF 3.00 UF 863 3,938 492 371 Fodder 2 Alfalfa 12.5 10,500 UF 5.20 UF 6,825 7,775 972 5,853 Vegetable 1 Potato 15 31 (ton/ha) 2.06 (DH/kg) 9,579 16,994 2,549 7,030 Vegetable 2 Totato 15 50 (ton/ha) 1.44 (DH/kg) 10,800 15,201 2,280 8,520 Tree crop 1 Grape 7.5 10 (ton/ha) 2.92 (DH/kg) 2,190 4,428 332 1,858 Tree crop 2 Olive 7.5 10 (ton/ha) 2.07 (DH/kg) 1,553 4,858 364 1,189 Fodder from cereals - 30 1,000 UF 3.00 UF 900 - - 900 Total 130 35,758 8,170 27,588
TaskourtBenefit Expenditure Net
Crops Occupancy Unit price Benefit Unit cost Net cost Benefit(%) Qty. Unit (DH) Unit (DH) (DH/ha) (DH) (DH)
a b c d=a*b*c e f=e*a g=d-fCerelas 1 Soft wheat 60 4.0 (ton/ha) 2.89 (DH/kg) 6,936 3,938 2,363 4,573 Cerelas 2 Barley 10 4.0 (ton/ha) 2.52 (DH/kg) 1,008 3,938 394 614 Fodder Alfalfa 10 10,500 UF 5.20 UF 5,460 7,775 778 4,682 Vegetable 1 Watermelon 5 31 (ton/ha) 4.00 (DH/kg) 6,200 13,505 675 5,525 Vegetable 2 Tomato 5 50 (ton/ha) 2.04 (DH/kg) 5,100 15,201 760 4,340 Tree crop 1 Olive 8 10 (ton/ha) 2.61 (DH/kg) 2,088 4,858 389 1,699 Tree crop 2 Almond 2 3.5 (ton/ha) 48.24 (DH/kg) 3,377 2,285 46 3,331 Fodder from cereals 1 - 60 1,000 UF 3.00 UF 1,800 - - 1,800 Fodder from cereals 2 - 10 1,000 UF 3.00 UF 300 - - 300 Total 170 32,269 5,405 26,864
TimkitBenefit Expenditure Net
Crops Occupancy Unit price Benefit Unit cost Net cost Benefit(%) Qty. Unit (DH) Unit (DH) (DH/ha) (DH) (DH)
a b c d=a*b*c e f=e*a g=d-fCerelas Hard wheat 55 4.0 (ton/ha) 3.33 (DH/kg) 7,326 3,938 2,166 5,160 Fodder Alfalfa 15 10,500 UF 5.20 UF 8,190 7,775 1,166 7,024 Vegetable 1 Potato 10 31 (ton/ha) 2.34 (DH/kg) 7,254 16,994 1,699 5,555 Vegetable 2 Watermelon 5 31 (ton/ha) 3.75 (DH/kg) 5,813 13,505 675 5,138 Tree crop 1 Datas 15 3.5 (ton/ha) 8.00 (DH/kg) 4,200 3,008 451 3,749 Tree crop 2 Olive 5 10 (ton/ha) 2.69 (DH/kg) 1,345 4,858 243 1,102 Fodder from cereals - 55 1,000 UF 3.00 UF 1,650 - - 1,650 Total 160 35,778 6,400 29,378
AzgharBenefit Expenditure Net
Crops Occupancy Unit price Benefit Unit cost Net cost Benefit(%) Qty. Unit (DH) Unit (DH) (DH/ha) (DH) (DH)
a b c d=a*b*c e f=e*a g=d-fCerelas 1 Hard wheat 50 4.0 (ton/ha) 3.23 (DH/kg) 6,460 3,938 1,969 4,491 Cerelas 2 Barley 10 4.0 (ton/ha) 2.00 (DH/kg) 800 3,938 394 406 Fodder 1 Barley 2.5 2,300 UF 3.00 UF 173 3,938 98 75 Fodder 2 Alfalfa 7.5 10,500 UF 5.20 UF 4,095 7,775 583 3,512 Legetable Broad bean 5 15 (ton/ha) 3.73 (DH/kg) 2,798 12,149 607 2,191 Vegetable 1 Potato 10 31 (ton/ha) 2.99 (DH/kg) 9,269 16,994 1,699 7,570 Vegetable 2 Tomato 10 50 (ton/ha) 2.07 (DH/kg) 10,350 15,201 1,520 8,830 Tree crop Olive 15 10 (ton/ha) 3.04 (DH/kg) 4,560 4,858 729 3,831 Fodder from cereals 1 - 50 1,000 UF 3.00 UF 1,500 - - 1,500 Fodder from cereals 2 - 10 1,000 UF 3.00 UF 300 - - 300 Total 170 40,305 7,599 32,706
Yield
Yield
Yield
T-84
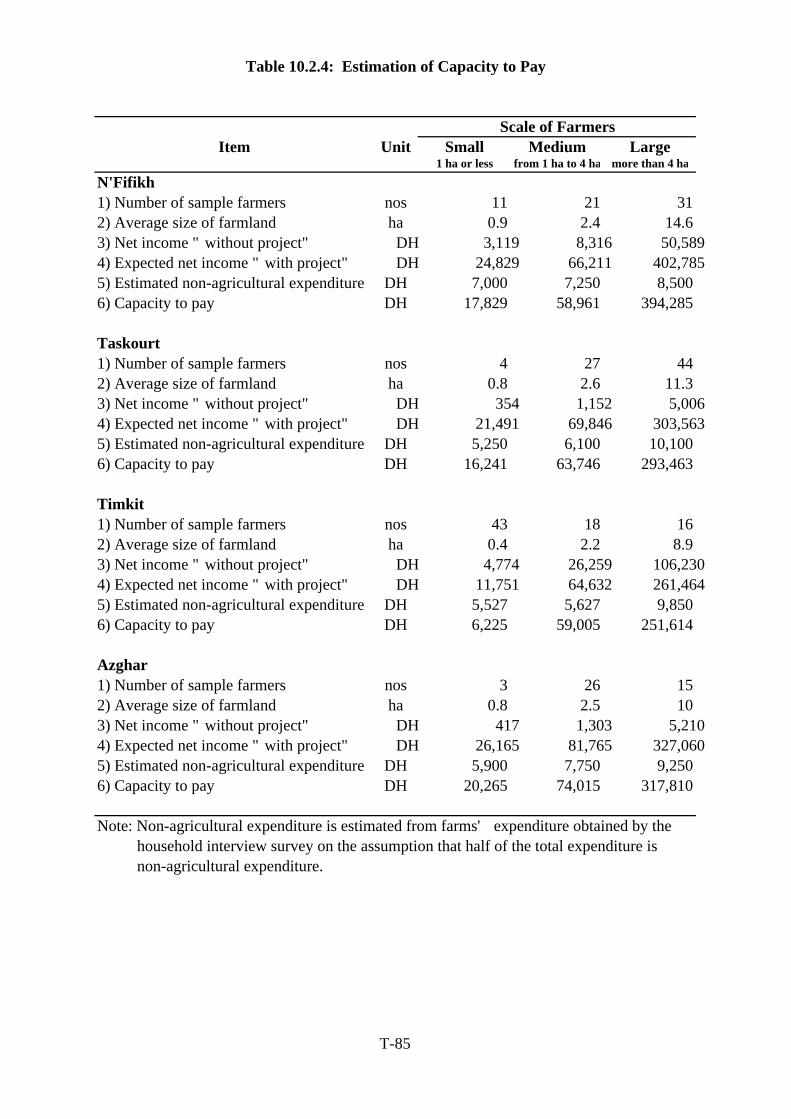
Table 10.2.4: Estimation of Capacity to Pay
Scale of FarmersItem Unit Small Medium Large
1 ha or less from 1 ha to 4 ha more than 4 ha
N'Fifikh1) Number of sample farmers nos 11 21 312) Average size of farmland ha 0.9 2.4 14.63) Net income "without project" DH 3,119 8,316 50,5894) Expected net income "with project" DH 24,829 66,211 402,7855) Estimated non-agricultural expenditure DH 7,000 7,250 8,5006) Capacity to pay DH 17,829 58,961 394,285
Taskourt1) Number of sample farmers nos 4 27 442) Average size of farmland ha 0.8 2.6 11.33) Net income "without project" DH 354 1,152 5,0064) Expected net income "with project" DH 21,491 69,846 303,5635) Estimated non-agricultural expenditure DH 5,250 6,100 10,1006) Capacity to pay DH 16,241 63,746 293,463
Timkit1) Number of sample farmers nos 43 18 162) Average size of farmland ha 0.4 2.2 8.93) Net income "without project" DH 4,774 26,259 106,2304) Expected net income "with project" DH 11,751 64,632 261,4645) Estimated non-agricultural expenditure DH 5,527 5,627 9,8506) Capacity to pay DH 6,225 59,005 251,614
Azghar1) Number of sample farmers nos 3 26 152) Average size of farmland ha 0.8 2.5 103) Net income "without project" DH 417 1,303 5,2104) Expected net income "with project" DH 26,165 81,765 327,0605) Estimated non-agricultural expenditure DH 5,900 7,750 9,2506) Capacity to pay DH 20,265 74,015 317,810
Note: Non-agricultural expenditure is estimated from farms' expenditure obtained by the household interview survey on the assumption that half of the total expenditure is non-agricultural expenditure.
T-85
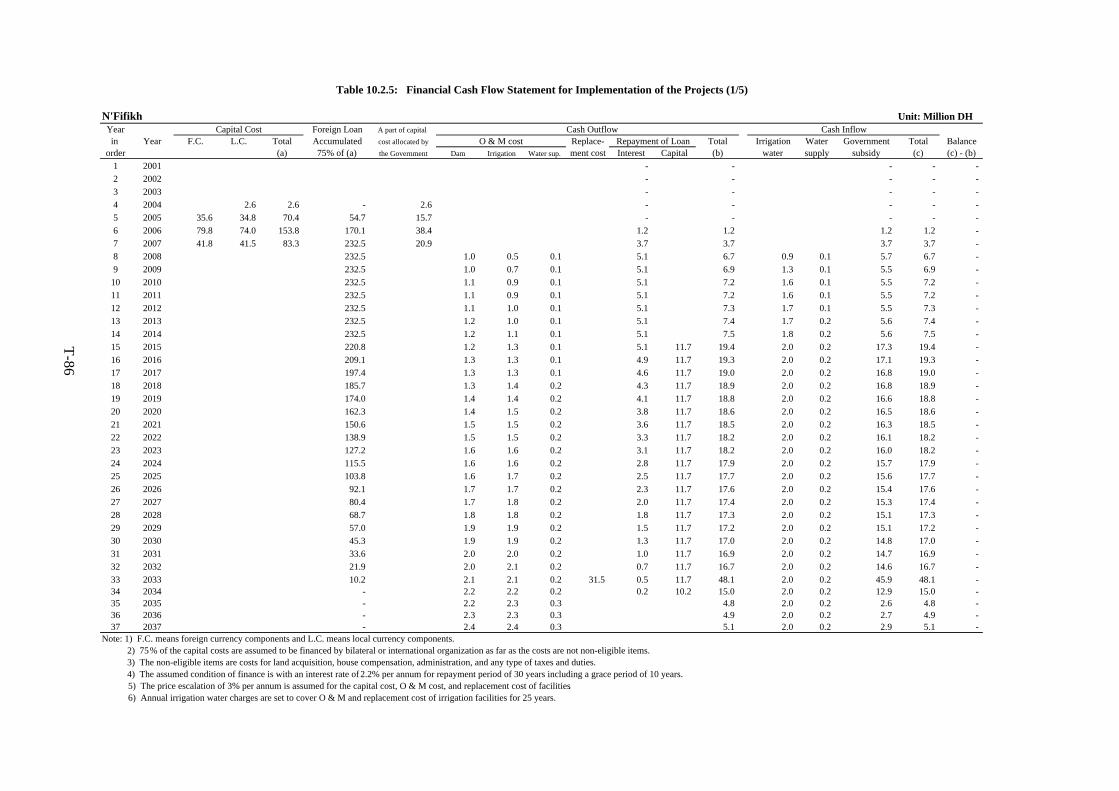
Table 10.2.5: Financial Cash Flow Statement for Implementation of the Projects (1/5)
N'Fifikh Unit: Million DHYear Capital Cost Foreign Loan A part of capital Cash Outflow Cash Inflowin Year F.C. L.C. Total Accumulated cost allocated by O & M cost Replace- Repayment of Loan Total Irrigation Water Government Total Balance
order (a) 75% of (a) the Government Dam Irrigation Water sup. ment cost Interest Capital (b) water supply subsidy (c) (c) - (b)1 2001 - - - - - 2 2002 - - - - - 3 2003 - - - - - 4 2004 2.6 2.6 - 2.6 - - - - - 5 2005 35.6 34.8 70.4 54.7 15.7 - - - - - 6 2006 79.8 74.0 153.8 170.1 38.4 1.2 1.2 1.2 1.2 - 7 2007 41.8 41.5 83.3 232.5 20.9 3.7 3.7 3.7 3.7 - 8 2008 232.5 1.0 0.5 0.1 5.1 6.7 0.9 0.1 5.7 6.7 - 9 2009 232.5 1.0 0.7 0.1 5.1 6.9 1.3 0.1 5.5 6.9 -
10 2010 232.5 1.1 0.9 0.1 5.1 7.2 1.6 0.1 5.5 7.2 - 11 2011 232.5 1.1 0.9 0.1 5.1 7.2 1.6 0.1 5.5 7.2 - 12 2012 232.5 1.1 1.0 0.1 5.1 7.3 1.7 0.1 5.5 7.3 - 13 2013 232.5 1.2 1.0 0.1 5.1 7.4 1.7 0.2 5.6 7.4 - 14 2014 232.5 1.2 1.1 0.1 5.1 7.5 1.8 0.2 5.6 7.5 - 15 2015 220.8 1.2 1.3 0.1 5.1 11.7 19.4 2.0 0.2 17.3 19.4 - 16 2016 209.1 1.3 1.3 0.1 4.9 11.7 19.3 2.0 0.2 17.1 19.3 - 17 2017 197.4 1.3 1.3 0.1 4.6 11.7 19.0 2.0 0.2 16.8 19.0 - 18 2018 185.7 1.3 1.4 0.2 4.3 11.7 18.9 2.0 0.2 16.8 18.9 - 19 2019 174.0 1.4 1.4 0.2 4.1 11.7 18.8 2.0 0.2 16.6 18.8 - 20 2020 162.3 1.4 1.5 0.2 3.8 11.7 18.6 2.0 0.2 16.5 18.6 - 21 2021 150.6 1.5 1.5 0.2 3.6 11.7 18.5 2.0 0.2 16.3 18.5 - 22 2022 138.9 1.5 1.5 0.2 3.3 11.7 18.2 2.0 0.2 16.1 18.2 - 23 2023 127.2 1.6 1.6 0.2 3.1 11.7 18.2 2.0 0.2 16.0 18.2 - 24 2024 115.5 1.6 1.6 0.2 2.8 11.7 17.9 2.0 0.2 15.7 17.9 - 25 2025 103.8 1.6 1.7 0.2 2.5 11.7 17.7 2.0 0.2 15.6 17.7 - 26 2026 92.1 1.7 1.7 0.2 2.3 11.7 17.6 2.0 0.2 15.4 17.6 - 27 2027 80.4 1.7 1.8 0.2 2.0 11.7 17.4 2.0 0.2 15.3 17.4 - 28 2028 68.7 1.8 1.8 0.2 1.8 11.7 17.3 2.0 0.2 15.1 17.3 - 29 2029 57.0 1.9 1.9 0.2 1.5 11.7 17.2 2.0 0.2 15.1 17.2 - 30 2030 45.3 1.9 1.9 0.2 1.3 11.7 17.0 2.0 0.2 14.8 17.0 - 31 2031 33.6 2.0 2.0 0.2 1.0 11.7 16.9 2.0 0.2 14.7 16.9 - 32 2032 21.9 2.0 2.1 0.2 0.7 11.7 16.7 2.0 0.2 14.6 16.7 - 33 2033 10.2 2.1 2.1 0.2 31.5 0.5 11.7 48.1 2.0 0.2 45.9 48.1 - 34 2034 - 2.2 2.2 0.2 0.2 10.2 15.0 2.0 0.2 12.9 15.0 - 35 2035 - 2.2 2.3 0.3 4.8 2.0 0.2 2.6 4.8 - 36 2036 - 2.3 2.3 0.3 4.9 2.0 0.2 2.7 4.9 - 37 2037 - 2.4 2.4 0.3 5.1 2.0 0.2 2.9 5.1 -
Note: 1) F.C. means foreign currency components and L.C. means local currency components. 2) 75% of the capital costs are assumed to be financed by bilateral or international organization as far as the costs are not non-eligible items. 3) The non-eligible items are costs for land acquisition, house compensation, administration, and any type of taxes and duties. 4) The assumed condition of finance is with an interest rate of 2.2% per annum for repayment period of 30 years including a grace period of 10 years. 5) The price escalation of 3% per annum is assumed for the capital cost, O & M cost, and replacement cost of facilities. 6) Annual irrigation water charges are set to cover O & M and replacement cost of irrigation facilities for 25 years.
T-86
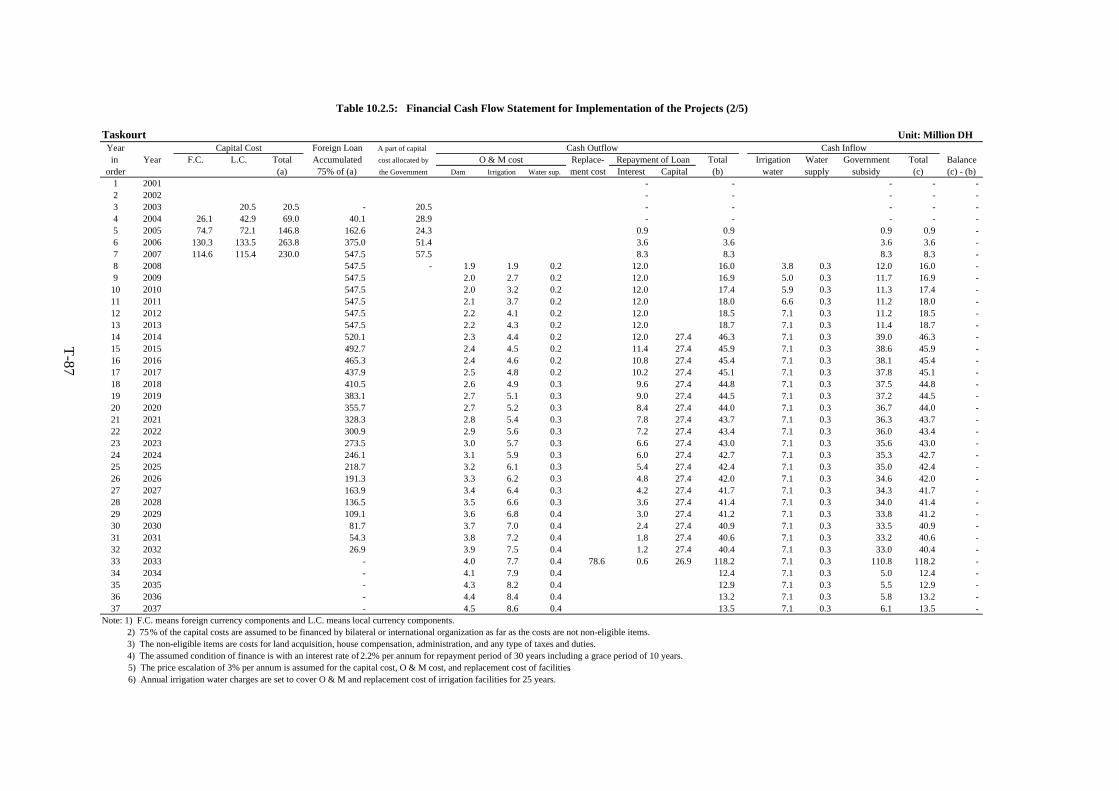
Table 10.2.5: Financial Cash Flow Statement for Implementation of the Projects (2/5)
Taskourt Unit: Million DHYear Capital Cost Foreign Loan A part of capital Cash Outflow Cash Inflowin Year F.C. L.C. Total Accumulated cost allocated by O & M cost Replace- Repayment of Loan Total Irrigation Water Government Total Balance
order (a) 75% of (a) the Government Dam Irrigation Water sup. ment cost Interest Capital (b) water supply subsidy (c) (c) - (b)1 2001 - - - - - 2 2002 - - - - - 3 2003 20.5 20.5 - 20.5 - - - - - 4 2004 26.1 42.9 69.0 40.1 28.9 - - - - - 5 2005 74.7 72.1 146.8 162.6 24.3 0.9 0.9 0.9 0.9 - 6 2006 130.3 133.5 263.8 375.0 51.4 3.6 3.6 3.6 3.6 - 7 2007 114.6 115.4 230.0 547.5 57.5 8.3 8.3 8.3 8.3 - 8 2008 547.5 - 1.9 1.9 0.2 12.0 16.0 3.8 0.3 12.0 16.0 - 9 2009 547.5 2.0 2.7 0.2 12.0 16.9 5.0 0.3 11.7 16.9 -
10 2010 547.5 2.0 3.2 0.2 12.0 17.4 5.9 0.3 11.3 17.4 - 11 2011 547.5 2.1 3.7 0.2 12.0 18.0 6.6 0.3 11.2 18.0 - 12 2012 547.5 2.2 4.1 0.2 12.0 18.5 7.1 0.3 11.2 18.5 - 13 2013 547.5 2.2 4.3 0.2 12.0 18.7 7.1 0.3 11.4 18.7 - 14 2014 520.1 2.3 4.4 0.2 12.0 27.4 46.3 7.1 0.3 39.0 46.3 - 15 2015 492.7 2.4 4.5 0.2 11.4 27.4 45.9 7.1 0.3 38.6 45.9 - 16 2016 465.3 2.4 4.6 0.2 10.8 27.4 45.4 7.1 0.3 38.1 45.4 - 17 2017 437.9 2.5 4.8 0.2 10.2 27.4 45.1 7.1 0.3 37.8 45.1 - 18 2018 410.5 2.6 4.9 0.3 9.6 27.4 44.8 7.1 0.3 37.5 44.8 - 19 2019 383.1 2.7 5.1 0.3 9.0 27.4 44.5 7.1 0.3 37.2 44.5 - 20 2020 355.7 2.7 5.2 0.3 8.4 27.4 44.0 7.1 0.3 36.7 44.0 - 21 2021 328.3 2.8 5.4 0.3 7.8 27.4 43.7 7.1 0.3 36.3 43.7 - 22 2022 300.9 2.9 5.6 0.3 7.2 27.4 43.4 7.1 0.3 36.0 43.4 - 23 2023 273.5 3.0 5.7 0.3 6.6 27.4 43.0 7.1 0.3 35.6 43.0 - 24 2024 246.1 3.1 5.9 0.3 6.0 27.4 42.7 7.1 0.3 35.3 42.7 - 25 2025 218.7 3.2 6.1 0.3 5.4 27.4 42.4 7.1 0.3 35.0 42.4 - 26 2026 191.3 3.3 6.2 0.3 4.8 27.4 42.0 7.1 0.3 34.6 42.0 - 27 2027 163.9 3.4 6.4 0.3 4.2 27.4 41.7 7.1 0.3 34.3 41.7 - 28 2028 136.5 3.5 6.6 0.3 3.6 27.4 41.4 7.1 0.3 34.0 41.4 - 29 2029 109.1 3.6 6.8 0.4 3.0 27.4 41.2 7.1 0.3 33.8 41.2 - 30 2030 81.7 3.7 7.0 0.4 2.4 27.4 40.9 7.1 0.3 33.5 40.9 - 31 2031 54.3 3.8 7.2 0.4 1.8 27.4 40.6 7.1 0.3 33.2 40.6 - 32 2032 26.9 3.9 7.5 0.4 1.2 27.4 40.4 7.1 0.3 33.0 40.4 - 33 2033 - 4.0 7.7 0.4 78.6 0.6 26.9 118.2 7.1 0.3 110.8 118.2 - 34 2034 - 4.1 7.9 0.4 12.4 7.1 0.3 5.0 12.4 - 35 2035 - 4.3 8.2 0.4 12.9 7.1 0.3 5.5 12.9 - 36 2036 - 4.4 8.4 0.4 13.2 7.1 0.3 5.8 13.2 - 37 2037 - 4.5 8.6 0.4 13.5 7.1 0.3 6.1 13.5 -
Note: 1) F.C. means foreign currency components and L.C. means local currency components. 2) 75% of the capital costs are assumed to be financed by bilateral or international organization as far as the costs are not non-eligible items. 3) The non-eligible items are costs for land acquisition, house compensation, administration, and any type of taxes and duties. 4) The assumed condition of finance is with an interest rate of 2.2% per annum for repayment period of 30 years including a grace period of 10 years. 5) The price escalation of 3% per annum is assumed for the capital cost, O & M cost, and replacement cost of facilities. 6) Annual irrigation water charges are set to cover O & M and replacement cost of irrigation facilities for 25 years.
T-87
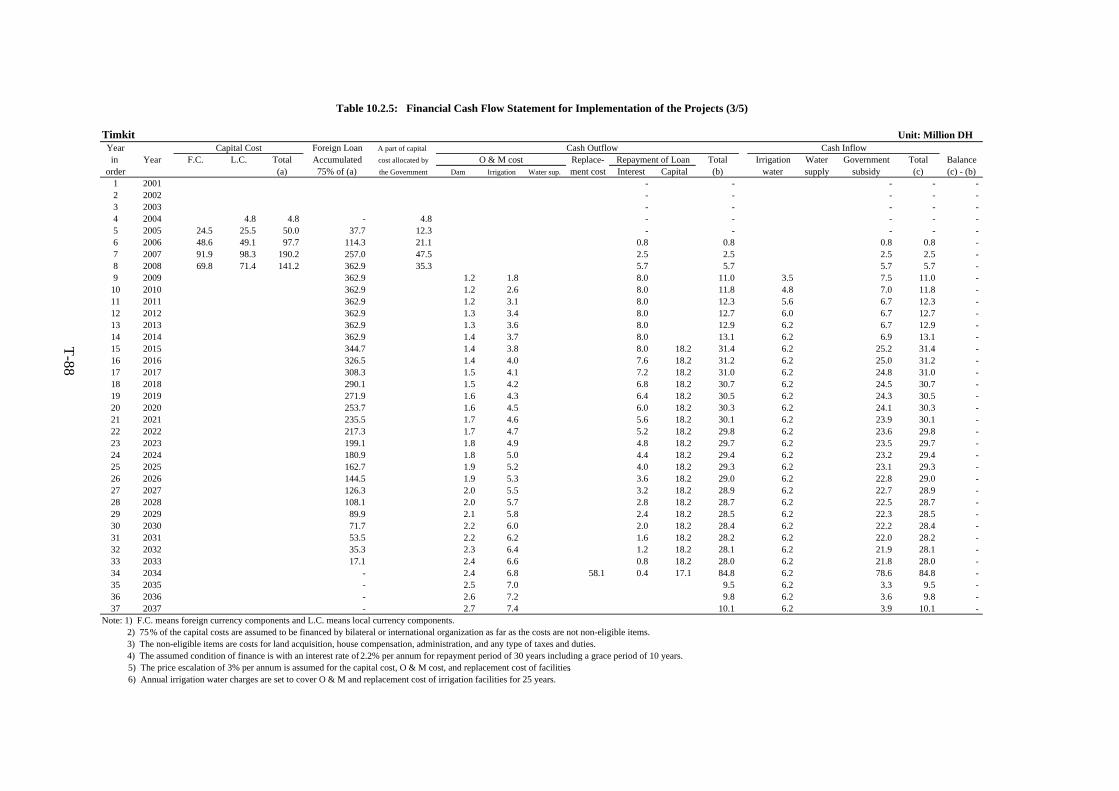
Table 10.2.5: Financial Cash Flow Statement for Implementation of the Projects (3/5)
Timkit Unit: Million DHYear Capital Cost Foreign Loan A part of capital Cash Outflow Cash Inflowin Year F.C. L.C. Total Accumulated cost allocated by O & M cost Replace- Repayment of Loan Total Irrigation Water Government Total Balance
order (a) 75% of (a) the Government Dam Irrigation Water sup. ment cost Interest Capital (b) water supply subsidy (c) (c) - (b)1 2001 - - - - - 2 2002 - - - - - 3 2003 - - - - - 4 2004 4.8 4.8 - 4.8 - - - - - 5 2005 24.5 25.5 50.0 37.7 12.3 - - - - - 6 2006 48.6 49.1 97.7 114.3 21.1 0.8 0.8 0.8 0.8 - 7 2007 91.9 98.3 190.2 257.0 47.5 2.5 2.5 2.5 2.5 - 8 2008 69.8 71.4 141.2 362.9 35.3 5.7 5.7 5.7 5.7 - 9 2009 362.9 1.2 1.8 8.0 11.0 3.5 7.5 11.0 -
10 2010 362.9 1.2 2.6 8.0 11.8 4.8 7.0 11.8 - 11 2011 362.9 1.2 3.1 8.0 12.3 5.6 6.7 12.3 - 12 2012 362.9 1.3 3.4 8.0 12.7 6.0 6.7 12.7 - 13 2013 362.9 1.3 3.6 8.0 12.9 6.2 6.7 12.9 - 14 2014 362.9 1.4 3.7 8.0 13.1 6.2 6.9 13.1 - 15 2015 344.7 1.4 3.8 8.0 18.2 31.4 6.2 25.2 31.4 - 16 2016 326.5 1.4 4.0 7.6 18.2 31.2 6.2 25.0 31.2 - 17 2017 308.3 1.5 4.1 7.2 18.2 31.0 6.2 24.8 31.0 - 18 2018 290.1 1.5 4.2 6.8 18.2 30.7 6.2 24.5 30.7 - 19 2019 271.9 1.6 4.3 6.4 18.2 30.5 6.2 24.3 30.5 - 20 2020 253.7 1.6 4.5 6.0 18.2 30.3 6.2 24.1 30.3 - 21 2021 235.5 1.7 4.6 5.6 18.2 30.1 6.2 23.9 30.1 - 22 2022 217.3 1.7 4.7 5.2 18.2 29.8 6.2 23.6 29.8 - 23 2023 199.1 1.8 4.9 4.8 18.2 29.7 6.2 23.5 29.7 - 24 2024 180.9 1.8 5.0 4.4 18.2 29.4 6.2 23.2 29.4 - 25 2025 162.7 1.9 5.2 4.0 18.2 29.3 6.2 23.1 29.3 - 26 2026 144.5 1.9 5.3 3.6 18.2 29.0 6.2 22.8 29.0 - 27 2027 126.3 2.0 5.5 3.2 18.2 28.9 6.2 22.7 28.9 - 28 2028 108.1 2.0 5.7 2.8 18.2 28.7 6.2 22.5 28.7 - 29 2029 89.9 2.1 5.8 2.4 18.2 28.5 6.2 22.3 28.5 - 30 2030 71.7 2.2 6.0 2.0 18.2 28.4 6.2 22.2 28.4 - 31 2031 53.5 2.2 6.2 1.6 18.2 28.2 6.2 22.0 28.2 - 32 2032 35.3 2.3 6.4 1.2 18.2 28.1 6.2 21.9 28.1 - 33 2033 17.1 2.4 6.6 0.8 18.2 28.0 6.2 21.8 28.0 - 34 2034 - 2.4 6.8 58.1 0.4 17.1 84.8 6.2 78.6 84.8 - 35 2035 - 2.5 7.0 9.5 6.2 3.3 9.5 - 36 2036 - 2.6 7.2 9.8 6.2 3.6 9.8 - 37 2037 - 2.7 7.4 10.1 6.2 3.9 10.1 -
Note: 1) F.C. means foreign currency components and L.C. means local currency components. 2) 75% of the capital costs are assumed to be financed by bilateral or international organization as far as the costs are not non-eligible items. 3) The non-eligible items are costs for land acquisition, house compensation, administration, and any type of taxes and duties. 4) The assumed condition of finance is with an interest rate of 2.2% per annum for repayment period of 30 years including a grace period of 10 years. 5) The price escalation of 3% per annum is assumed for the capital cost, O & M cost, and replacement cost of facilities. 6) Annual irrigation water charges are set to cover O & M and replacement cost of irrigation facilities for 25 years.
T-88
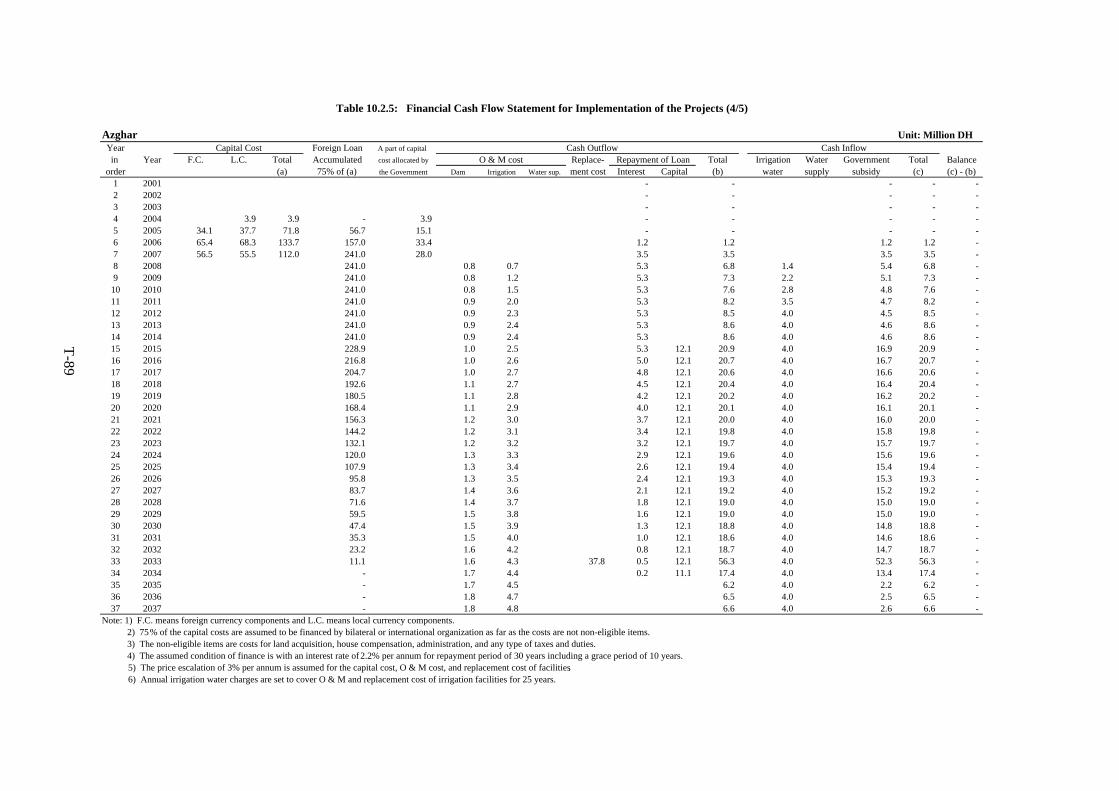
Table 10.2.5: Financial Cash Flow Statement for Implementation of the Projects (4/5)
Azghar Unit: Million DHYear Capital Cost Foreign Loan A part of capital Cash Outflow Cash Inflowin Year F.C. L.C. Total Accumulated cost allocated by O & M cost Replace- Repayment of Loan Total Irrigation Water Government Total Balance
order (a) 75% of (a) the Government Dam Irrigation Water sup. ment cost Interest Capital (b) water supply subsidy (c) (c) - (b)1 2001 - - - - - 2 2002 - - - - - 3 2003 - - - - - 4 2004 3.9 3.9 - 3.9 - - - - - 5 2005 34.1 37.7 71.8 56.7 15.1 - - - - - 6 2006 65.4 68.3 133.7 157.0 33.4 1.2 1.2 1.2 1.2 - 7 2007 56.5 55.5 112.0 241.0 28.0 3.5 3.5 3.5 3.5 - 8 2008 241.0 0.8 0.7 5.3 6.8 1.4 5.4 6.8 - 9 2009 241.0 0.8 1.2 5.3 7.3 2.2 5.1 7.3 -
10 2010 241.0 0.8 1.5 5.3 7.6 2.8 4.8 7.6 - 11 2011 241.0 0.9 2.0 5.3 8.2 3.5 4.7 8.2 - 12 2012 241.0 0.9 2.3 5.3 8.5 4.0 4.5 8.5 - 13 2013 241.0 0.9 2.4 5.3 8.6 4.0 4.6 8.6 - 14 2014 241.0 0.9 2.4 5.3 8.6 4.0 4.6 8.6 - 15 2015 228.9 1.0 2.5 5.3 12.1 20.9 4.0 16.9 20.9 - 16 2016 216.8 1.0 2.6 5.0 12.1 20.7 4.0 16.7 20.7 - 17 2017 204.7 1.0 2.7 4.8 12.1 20.6 4.0 16.6 20.6 - 18 2018 192.6 1.1 2.7 4.5 12.1 20.4 4.0 16.4 20.4 - 19 2019 180.5 1.1 2.8 4.2 12.1 20.2 4.0 16.2 20.2 - 20 2020 168.4 1.1 2.9 4.0 12.1 20.1 4.0 16.1 20.1 - 21 2021 156.3 1.2 3.0 3.7 12.1 20.0 4.0 16.0 20.0 - 22 2022 144.2 1.2 3.1 3.4 12.1 19.8 4.0 15.8 19.8 - 23 2023 132.1 1.2 3.2 3.2 12.1 19.7 4.0 15.7 19.7 - 24 2024 120.0 1.3 3.3 2.9 12.1 19.6 4.0 15.6 19.6 - 25 2025 107.9 1.3 3.4 2.6 12.1 19.4 4.0 15.4 19.4 - 26 2026 95.8 1.3 3.5 2.4 12.1 19.3 4.0 15.3 19.3 - 27 2027 83.7 1.4 3.6 2.1 12.1 19.2 4.0 15.2 19.2 - 28 2028 71.6 1.4 3.7 1.8 12.1 19.0 4.0 15.0 19.0 - 29 2029 59.5 1.5 3.8 1.6 12.1 19.0 4.0 15.0 19.0 - 30 2030 47.4 1.5 3.9 1.3 12.1 18.8 4.0 14.8 18.8 - 31 2031 35.3 1.5 4.0 1.0 12.1 18.6 4.0 14.6 18.6 - 32 2032 23.2 1.6 4.2 0.8 12.1 18.7 4.0 14.7 18.7 - 33 2033 11.1 1.6 4.3 37.8 0.5 12.1 56.3 4.0 52.3 56.3 - 34 2034 - 1.7 4.4 0.2 11.1 17.4 4.0 13.4 17.4 - 35 2035 - 1.7 4.5 6.2 4.0 2.2 6.2 - 36 2036 - 1.8 4.7 6.5 4.0 2.5 6.5 - 37 2037 - 1.8 4.8 6.6 4.0 2.6 6.6 -
Note: 1) F.C. means foreign currency components and L.C. means local currency components. 2) 75% of the capital costs are assumed to be financed by bilateral or international organization as far as the costs are not non-eligible items. 3) The non-eligible items are costs for land acquisition, house compensation, administration, and any type of taxes and duties. 4) The assumed condition of finance is with an interest rate of 2.2% per annum for repayment period of 30 years including a grace period of 10 years. 5) The price escalation of 3% per annum is assumed for the capital cost, O & M cost, and replacement cost of facilities. 6) Annual irrigation water charges are set to cover O & M and replacement cost of irrigation facilities for 25 years.
T-89
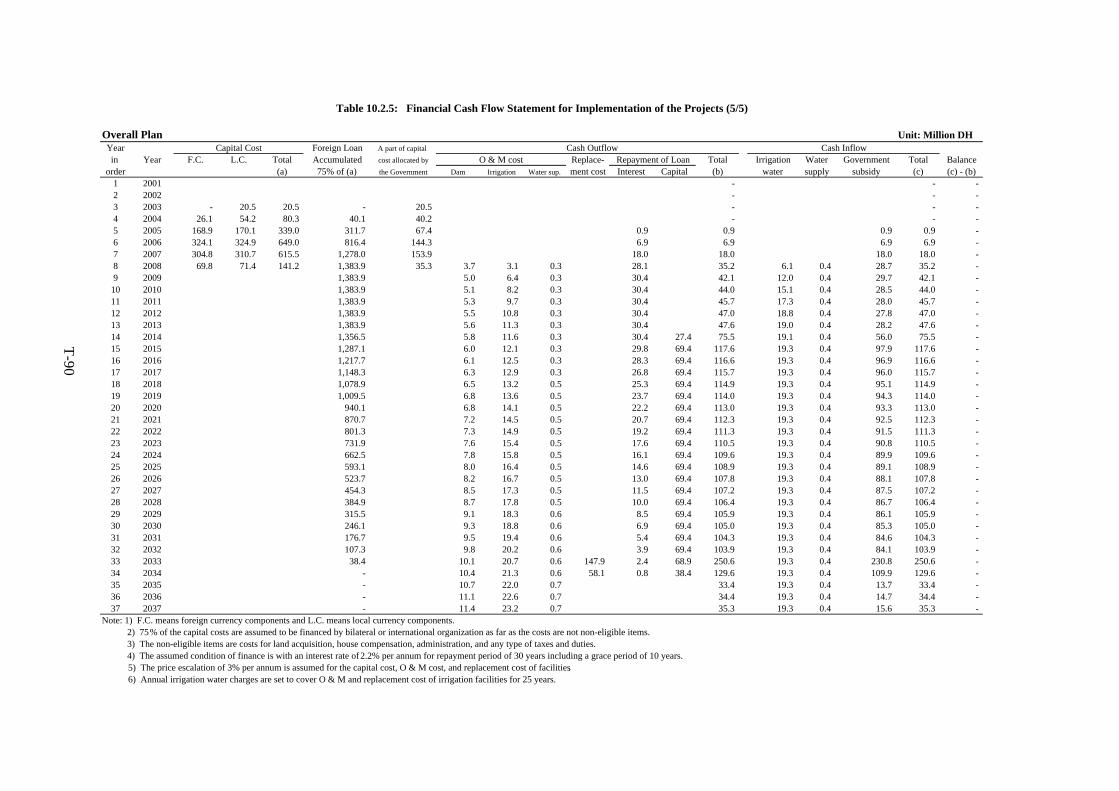
Table 10.2.5: Financial Cash Flow Statement for Implementation of the Projects (5/5)
Overall Plan Unit: Million DHYear Capital Cost Foreign Loan A part of capital Cash Outflow Cash Inflowin Year F.C. L.C. Total Accumulated cost allocated by O & M cost Replace- Repayment of Loan Total Irrigation Water Government Total Balance
order (a) 75% of (a) the Government Dam Irrigation Water sup. ment cost Interest Capital (b) water supply subsidy (c) (c) - (b)1 2001 - - - 2 2002 - - - 3 2003 - 20.5 20.5 - 20.5 - - - 4 2004 26.1 54.2 80.3 40.1 40.2 - - - 5 2005 168.9 170.1 339.0 311.7 67.4 0.9 0.9 0.9 0.9 - 6 2006 324.1 324.9 649.0 816.4 144.3 6.9 6.9 6.9 6.9 - 7 2007 304.8 310.7 615.5 1,278.0 153.9 18.0 18.0 18.0 18.0 - 8 2008 69.8 71.4 141.2 1,383.9 35.3 3.7 3.1 0.3 28.1 35.2 6.1 0.4 28.7 35.2 - 9 2009 1,383.9 5.0 6.4 0.3 30.4 42.1 12.0 0.4 29.7 42.1 -
10 2010 1,383.9 5.1 8.2 0.3 30.4 44.0 15.1 0.4 28.5 44.0 - 11 2011 1,383.9 5.3 9.7 0.3 30.4 45.7 17.3 0.4 28.0 45.7 - 12 2012 1,383.9 5.5 10.8 0.3 30.4 47.0 18.8 0.4 27.8 47.0 - 13 2013 1,383.9 5.6 11.3 0.3 30.4 47.6 19.0 0.4 28.2 47.6 - 14 2014 1,356.5 5.8 11.6 0.3 30.4 27.4 75.5 19.1 0.4 56.0 75.5 - 15 2015 1,287.1 6.0 12.1 0.3 29.8 69.4 117.6 19.3 0.4 97.9 117.6 - 16 2016 1,217.7 6.1 12.5 0.3 28.3 69.4 116.6 19.3 0.4 96.9 116.6 - 17 2017 1,148.3 6.3 12.9 0.3 26.8 69.4 115.7 19.3 0.4 96.0 115.7 - 18 2018 1,078.9 6.5 13.2 0.5 25.3 69.4 114.9 19.3 0.4 95.1 114.9 - 19 2019 1,009.5 6.8 13.6 0.5 23.7 69.4 114.0 19.3 0.4 94.3 114.0 - 20 2020 940.1 6.8 14.1 0.5 22.2 69.4 113.0 19.3 0.4 93.3 113.0 - 21 2021 870.7 7.2 14.5 0.5 20.7 69.4 112.3 19.3 0.4 92.5 112.3 - 22 2022 801.3 7.3 14.9 0.5 19.2 69.4 111.3 19.3 0.4 91.5 111.3 - 23 2023 731.9 7.6 15.4 0.5 17.6 69.4 110.5 19.3 0.4 90.8 110.5 - 24 2024 662.5 7.8 15.8 0.5 16.1 69.4 109.6 19.3 0.4 89.9 109.6 - 25 2025 593.1 8.0 16.4 0.5 14.6 69.4 108.9 19.3 0.4 89.1 108.9 - 26 2026 523.7 8.2 16.7 0.5 13.0 69.4 107.8 19.3 0.4 88.1 107.8 - 27 2027 454.3 8.5 17.3 0.5 11.5 69.4 107.2 19.3 0.4 87.5 107.2 - 28 2028 384.9 8.7 17.8 0.5 10.0 69.4 106.4 19.3 0.4 86.7 106.4 - 29 2029 315.5 9.1 18.3 0.6 8.5 69.4 105.9 19.3 0.4 86.1 105.9 - 30 2030 246.1 9.3 18.8 0.6 6.9 69.4 105.0 19.3 0.4 85.3 105.0 - 31 2031 176.7 9.5 19.4 0.6 5.4 69.4 104.3 19.3 0.4 84.6 104.3 - 32 2032 107.3 9.8 20.2 0.6 3.9 69.4 103.9 19.3 0.4 84.1 103.9 - 33 2033 38.4 10.1 20.7 0.6 147.9 2.4 68.9 250.6 19.3 0.4 230.8 250.6 - 34 2034 - 10.4 21.3 0.6 58.1 0.8 38.4 129.6 19.3 0.4 109.9 129.6 - 35 2035 - 10.7 22.0 0.7 33.4 19.3 0.4 13.7 33.4 - 36 2036 - 11.1 22.6 0.7 34.4 19.3 0.4 14.7 34.4 - 37 2037 - 11.4 23.2 0.7 35.3 19.3 0.4 15.6 35.3 -
Note: 1) F.C. means foreign currency components and L.C. means local currency components. 2) 75% of the capital costs are assumed to be financed by bilateral or international organization as far as the costs are not non-eligible items. 3) The non-eligible items are costs for land acquisition, house compensation, administration, and any type of taxes and duties. 4) The assumed condition of finance is with an interest rate of 2.2% per annum for repayment period of 30 years including a grace period of 10 years. 5) The price escalation of 3% per annum is assumed for the capital cost, O & M cost, and replacement cost of facilities. 6) Annual irrigation water charges are set to cover O & M and replacement cost of irrigation facilities for 25 years.
T-90


