Embed Size (px)
Citation preview
Journal of Hydrology (2006) 329, 186–195
ava i lab le at www.sc iencedi rec t . com
journal homepage: www.elsevier .com/ locate / jhydro l
Soil gas radon emanometry: A tool for delineationof fractures for groundwater in granitic terrains
D.V. Reddy a,*, B.S. Sukhija a, P. Nagabhushanam a, G.K. Reddy a,Devender Kumar a, P. Lachassagne b
a National Geophysical Research Institute (NGRI), Tritium Lab, Uppal Road, Hyderabad, Andhra Pradesh 500007, Indiab BRGM/Water Division/Resource Evaluation, Discontinuous Aquifers Unit-1039, rue de Pinville, 34000 Montpellier, France
Received 12 April 2005; received in revised form 7 February 2006; accepted 10 February 2006
Summary In several arid and semi-arid hard rock areas of the world, overexploitation ofgroundwater has caused de-saturation of the phreatic weathered zone. Attempts are nowunderway to draw supplies from deeper fracture zones. But random drilling often fails toencounter such productive zones. Further, currently available hydrogeological and geophysicalmethods are of limited applicability. Alternative geochemical methods, employing soil gas222radon (Rn) and helium (4He) have been explored but not investigated sufficiently.This paper reports the results of a systematic survey of 222Rn concentration in soil gas (at a
depth of 60 and 160 cm) in a watershed located in a semi-arid granitic area in India. We wereable to demarcate three high 222Rn anomalies, which were supplemented by 4He measure-ments. Drilling was carried out on the sites of these high 222Rn anomalies as well as on low222Rn anomalies. The bore wells drilled at the site of high 222Rn concentration were found tobe quite productive and those drilled on low 222Rn concentration sites were dry; those sitesof the intermediate 222Rn concentrations had intermediate yields. These preliminary resultssuggest that 222Rn emanometry method may turn out to be useful. The method still needs tobe investigated in detail and its usefulness in various settings still needs to be established ona statistical basis. We have made an attempt to understand the process that may cause such222Rn anomalies. Our observations of 222Rn concentration in the soil gas and of 222Rn emanationrates from the soil and uranium concentrations in the soil indicate that fracturing of the rock,rather than advection of 222Rn from deeper strata may be responsible for such 222Rn anomalies.
�c 2006 Elsevier B.V. All rights reserved.
KEYWORDSRadon;Helium;Soil gas;Groundwater;Hard rock;Fracture delineation
0d
022-1694/$ - see front matter �c 2006 Elsevier B.V. All rights reserved.oi:10.1016/j.jhydrol.2006.02.033* Corresponding author. Tel.: +91 40 23434602; fax: +91 40 23434651.E-mail address: [email protected] (D.V. Reddy).

Soil gas radon emanometry: A tool for delineation of fractures for groundwater in granitic terrains 187
Introduction
The granitic terrains in semi-arid regions are generally char-acterized by low primary porosity. It is only the weatheredzone at the top, generally very shallow, that can store sig-nificant quantities of water. The storage is quite small indeeper fractures, but they can act as good conduits fordrawing water from distant weathered zones to which theymay be connected (Sukhija et al., 2003). Due to over exploi-tation of the shallow groundwater, the weathered zone inarid and semi-arid areas has become de-saturated. The nat-ural recharge from rainfall is insufficient to refill it (Sukhijaet al., 1996). Hence, further search for groundwater restson drilling to deeper levels with the hope of encounteringwater-saturated fractures. It is not unusual that a boredrilled at one site may meet a productive fracture while an-other drilled a short distance away misses it. As their stor-age is low, even small withdrawals cause a large drop inwater level. In some pockets, the situation is already alarm-ing. Nevertheless, the search for deeper fractures contin-ues. It is therefore considered worthwhile to investigatewhether soil gas radon emanometry can help in locatingpotentially productive fracture zones (Pointet, 1989; Gasco-yne et al., 1993; Lachassagne et al., 2001). Here, we de-scribe our attempt in this direction.
Radon-222 (222Rn), is radioactive and arises as a by-prod-uct of the radioactive decay of two natural radioactive ele-ments, uranium and thorium. Out of many short-livedisotopes, 222Rn can be used in hydrology, as its half-life is3.82 days (for convenience, it is written as Rn in the restof the text). Rn has been widely measured in soil gas, inthe air of caves, tunnels and other underground cavities,in order to detect zones of enhanced permeability inducedby fractures or faults (Gascoyne et al., 1993; King et al.,1996; Monin and Seidel, 1997). In addition to Rn, we alsostudied Helium in the soil gas. Helium has two isotopes,3He and 4He. The ratio of 3He/4He in the air is�1.2 · 10�6. Mostly 3He is primordial, where as 4He is gen-erated from the decay of U, Th and their daughter products.Here we consider only 4He. The 4He values are given in ppbover and above its atmospheric air concentration of5240 ppb.
Banwell and Parizek (1988) attempted to study the asso-ciation between known fractures in unexposed granitic rockand 4He and 222Rn concentration in groundwater and soilgas. They concluded that the groundwater 4He signaturesdid not indicate the fracture zone precisely; rather it re-vealed presence of lineament related structural features.In their study, 222Rn in the groundwater as well as in soilgas also did not indicate the presence of a fracture zone.In contrast, Pointet (1989) found a good correlation be-tween radon highs and productive bore wells, in a 5 km tra-verse in West Africa at Burkina-Faso. Similar observationswere made in a granitic area in Canada (Gascoyne et al.,1993). However, a study conducted by Reddy et al. (1996)around many existing bore wells in a granitic area in India,did not indicate any positive correlation between well yieldsand Rn concentration in soil gas. The wells were selectedrandomly and radon concentrations were measured in thesoil gas samples collected near the wells at about 60 cmdepth. Lachassagne et al. (2001) reported that the radonemanometry could reveal fractured zones in hard rock since
there may be an upward flux of deep origin gases (CO2,4He,
etc.) from the fracture zone. However, our present studyhas revealed no such occurrence. We found that the Rndepth profile in the soil was invariably diffusive and no sig-nificant presence of advection was seen. In this paper, wepresent our observations at three sites, where relativelyhigh Rn and He values were associated with high productiv-ity zones. We hypothesize that the association may resultfrom the possibility that fracturing itself is accompaniedby a permanent increase of Rn emanation rate from the rock(and soil derived from it).
Study area
An experimental site was selected within Maheshwaram wa-tershed, situated about 35 km south of Hyderabad, India(Fig. 1) to determine if radon emanometry could be usedto locate productive fracture zones. The site is situated ingranite – gneisses overlain by about a 10–20 m-weatheredzone. The top soil consists of clayey loam, loam and sandyloam with pebbles. Normally, groundwater occurs underphreatic conditions in the weathered zone but over-exploitation has de-saturated the phreatic aquifer, andnow the groundwater occurs mostly in the deeper fracturezones. Average annual rainfall in Maheshwaram is about700 mm and average maximum and minimum temperaturesare 40 and 22 �C, respectively. Soil gas Rn was measuredat three sites (viz. K.B. Tanda, Mohabatnagar andSigilipuram, Fig. 1) and 4He was measured at the first twosites.
Methodology and sampling
At K.B. Tanda (Fig. 1), soil gas radon measurements weremade quite extensively. Initially, Rn was measured in soilgas at 60 cm depth on a 50 m grid interval, encompassingan area of �800 · 900 m2 covered by different types of soils.The soil gas samples were obtained by driving a hollowstainless steel (SS) tube of diameter 8 mm (Reimer and Bow-les, 1979), up to depth of 60 cm into the soil. The bottomend of the SS tube is tapered and closed to facilitate easypassage in to the soil. On the tapered part of the SS tube,small holes are provided through which soil gas enters thetube. A 60 cc plastic syringe was used to purge the gases3–4 times from the tube and then inject undiluted soil gasesinto evacuated scintillation chambers (stainless steel cham-bers coated inside with activated zinc sulfide) for radonmeasurement and evacuated brass cylinders for He mea-surement. Rn and He were measured on the same day usingalpha counters for Rn and AlcatelTM He leak detector for Hemeasurement. 4He is measured with respect to air as a ref-erence (5240 ppb He). The data indicated high radon anom-alies at three locations. In order to locate these anomaliesmore precisely, a close interval grid (40 · 140 m2, Fig. 2)is made in the NS direction within the 800 · 900 m2 areacovering the two Rn anomalies. The sampling interval is10 m within the traverse and traverses are separated by20 m intervals (a total of three traverses A–A 0, B–B 0 andC–C 0, Fig. 2). Soil gas samples for these traverses weredrawn from 160 cm depth. For this purpose, a hole wasdrilled to a depth of 160 cm using a power-drilling unit; a

Figure 2 Closely spaced (10 m interval) Rn and He measurements at 160 cm depth along the traverses A–A 0, B–B 0 and C–C 0
(separated each by 20 m) with in the survey area (50 m grid interval) of K.B. Tanda covering Rn anomaly II and III.
Figure 1 Maheshwaram watershed in semi-arid hard rocks with radon survey sites indicated in red. (For interpretation of thereferences to colour in this figure legend, the reader is referred to the web version of this article.)
188 D.V. Reddy et al.
narrow plastic tube (1.5 mm ID) was then inserted to thebottom of the hole and the hole filled back tightly withthe same soil. Gas samples were collected using a syringeat the top end of the plastic tubing as described above.
For the measurement of Rn emanation rate of soil, sam-ples were collected from the bottom of the pit dug 40–50 cm deep at the point where the soil gas samples werecollected. About 100 g of soil sample was sealed in a knownvolume airtight container, which has the facility to draw airfrom the container. The Rn emanating from the soil was col-lected in the container for a week or more and the gas in the
container was then transferred to an evacuated scintillationcell and its Rn content measured.
At one of the anomaly points at K.B. Tanda (Fig. 1), wedeployed a unit which measured Rn continuously. The unit(Fig. 3) was installed in an augered hole fitted with a�6 cm diameter PVC tube (monitoring unit diameter 5 cm,Lachassagne et al., 2001). The bottom portion of the tubewas kept open and bottom soil was loosened for properplacement of the Rn unit as well as for free air circulation.After installation of the unit in the hole, the top 20 cm wasfilled with the soil after closing the hole with a wire mesh

Figure 3 Experimental set up for continuous recording of soilgas radon using radon probe.
Soil gas radon emanometry: A tool for delineation of fractures for groundwater in granitic terrains 189
and a cloth. This provides enough thermal insulation to theRn unit from the atmosphere so as to eliminate problems ofvariable condensation of moisture on the detector in thenight and its evaporation in the daytime, while the flow ofgas to (and from) the atmosphere is not impeded (Fig. 3).The unit records Rn activity at set intervals and has thefacility to record ambient temperature and pressure also.
Figure 4 Detailed radon survey around K.B. Tanada Village. One b(MW-2 and MW-3) drilled on off-anomaly areas for validating the assobservation wells (OB-1, OB-2 and OB-3) were drilled around MW-1
The unit was set to record hourly readings at three depths,0.7 m, 1.0 m and 1.4 m at different times.
At Mohabatnagar (Fig. 1), the aerial photographs re-vealed a lineament adjacent to the village, which turnedout to be a stream course. Under an Indo-French Program,several geophysical investigations have been carried outacross this lineament. Geophysical studies (Descloitres andRobin, 2000) confirmed the existence of a shear zone in thisarea. A Rn traverse was also made covering about 300 macross the lineament at 10 m intervals. Soil gas sampleswere drawn initially from 60 cm depth and later from160 cm depth. Helium was also measured in the lattersamples.
Radon measurements were also made at the Sigilipuramvillage (Fig. 1), situated on a slightly topographically ele-vated area, covered with a few granite outcrops and sandyloam type soil. Rn was measured in soil gas samples at thissite from 60 cm depth, at an interval of 25 m in a grid cov-ering an area of 125 · 125 m2.
Results
Rn measurements carried out at shallow depths in threeareas: (i) K.B. Tanda, (ii) Mohabatnagar and (iii) Sigilipuramin the Maheshwaram watershed (Fig. 1), showed a few highRn anomalies. Details are given below:
(i) K.B. Tanda
About 180 soil gas samples were collected from a depth of60 cm covering an area of 800 m · 900 m, radon concentra-tions ranged from few hundred to 446 kBq/l (Fig. 4). Some
ore well (MW-1) drilled on the radon anomaly III and two wellsociation of high radon signature site with successful well. Three.

190 D.V. Reddy et al.
suspected anomalous values were rechecked. Non-repro-ducible spurious data (mostly very low values) perhapscaused by improper sampling at times, were rejected. Anaverage radon concentration for this site is about 90 kBq/lwith a standard deviation of 70 kBq/l. The large standarddeviation indicates a fairly large variation in the radonconcentration.
Most of the eastern part of the grid area (Fig. 4) is topo-graphically low and flat area covered by clayey loam soils,and radon concentration here is generally less than 42kBq/l. Relatively topographically elevated parts located inthe northwest of the grid area are covered by sandy loamsoil with quartz pebbles/boulders and with granite out-crops, this area has higher radon concentration (80–167kBq/l). The Southwest part of grid area is covered by sandyloam with mixed red soils having a radon concentrationbetween 85 and 125 kBq/l. Within this sandy loam area inthe west central part, two small areas show more than170 kBq/l of radon concentration. The northwestern regioncovered by granite boulders has a radon concentration >400kBq/l. Out of the two anomalies in the NW region, one is lo-cated within the boulders (anomaly I) and another one atthe periphery of the boulders (anomaly II). The southern-most anomaly is labeled as anomaly III. Incidentally, thethree high radon concentration anomalies found at this sitefall on a line striking NNW-SSE (Fig. 4). Orientation of these
Figure 5 Soil gas samples collected from 1.6 m depth with closerthe traverses, also confirmed the existence of high radon anomalie
Figure 6 Plot of helium measurements in soil gas at depth ofK.B. Tanda sites.
anomalies is approximately perpendicular to the streamflowing towards the east, passing between the anomaliesII and III. Though the three high radon anomalies align in aline, there is no topographic feature such as the trace of afault or fracture, which could be related to theseanomalies.
We investigated the area between two anomalies (II andIII) in detail, with 10 m intervals in the traverse and 20 mintervals each between three traverses (Fig. 2; samplingdepth was 160 cm). The area around Rn anomaly I couldnot be investigated in detail, since it is covered by boulders.Rn measurements were carried out in the soil gas at 160 cmdepth for three traverses A–A 0, B–B 0 and C–C 0 (Fig. 2). Rnconcentrations show variation from 20 to 340 kBq/l(Fig. 5). This figure shows the persistence of Rn anomaliesII and III even at 160 cm depth. However, the lateral extentof the deeper anomaly (160 cm depth) appears to be some-what enlarged. Surprisingly, the radon concentration at60 cm and 160 cm depths were similar. The two sets of mea-surements were done in different seasons, during November1999 (post-monsoon) at 60 cm depth, and in April 2001 (dryseason) at 160 cm depth. Helium measurements carried outat 160 cm depth, on the locations of the three traversesindicate higher concentrations of 200 ppb He, correspondingto the Rn anomaly II, however, relatively low He concentra-tion (90 ppb) is observed at Rn anomaly III (Fig. 6).
interval (10 m interval in north-south and 20 m interval betweens observed at 60 cm depth soil gas sampling.
160 cm (same hole is used for both Rn and He samplings) at

Figure 7 Continuous soil gas radon measurement with one-hour interval measured at K.B. Tanda radon anomaly III site,and at 0.70, 1.0 and 1.4 m depths. High radon signal observedat 1.0 m depth on 17-4-2002 was related to a micro-earthquakediscussed elsewhere (after Reddy et al., 2004).
Figure 8 Radon and helium concentration measured in atraverse at Mohabatnagar. Rn is measured at two depths (60 cmand 160 cm) and helium is measured at the same point as thatof Rn from 160 cm depth. Radon and helium are very high attwo depths in the traverse between 160 and 180 m.
Soil gas radon emanometry: A tool for delineation of fractures for groundwater in granitic terrains 191
At anomaly III site, we carried out continuous radon mon-itoring for 40 days. The monitoring unit was placed at threedifferent depths, for two to three weeks at each depth. Theaverage radon concentration at 70 cm depth was 65 kBq/m3
with standard deviation of 7.5 kBq/m3, that at 100 cm was120 ± 12 kBq/m3, while at 140 cm it was 155 ± 10 kBq/m3
(Fig. 7) as expected from the hypothesis of vertical trans-port being governed entirely by molecular diffusion. Thisis discussed later. The sudden increase of radon at 1 mdepth during 16th to 22nd April 2002 was attributed to a mi-cro-earthquake and discussed in detail in a separate paper(Reddy et al., 2004).
(ii) Mohabatnagar
A Rn traverse across the lineament at Mohabatnagar, showsthe radon concentration to be between 17 and 135 kBq/l(Fig. 8). Low radon concentration was observed in the topo-graphically elevated ground (i.e. banks of the stream) andhigher concentration in the valley portion of the traverse.Rn measurements were also carried out at 160 cm depth.The radon concentration at 160 cm depth was higher (2–2.5 times) than the concentration at 60 cm depth but thelateral extent of anomalies at the two depths was similar.The average Rn concentration for 60 cm depth was 43kBq/l and at 160 cm, 83 kBq/l.
A He survey was carried out at 160 cm depth along thesame traverse as radon (Fig. 8). The maximum He concen-tration was 470 ppb, which was much higher than what weobserved at K.B. Tanda. As expected, similar to Rn concen-trations, higher He values were observed in the valley por-tion and low values at the banks. Further there wasgeneral agreement between high Rn and He but there wasno one to one correlation between them.
(iii) Sigilipuram
An area of 100 m · 120 m at Sigilipuram was surveyed at agrid interval of 25 m, at a depth of 60 cm. Radon concentra-tion at this site varied from 20 to 187 kBq/l, with an aver-age concentration of 67 kBq/l and standard deviation of33 kBq/l. An anomaly (187.5 kBq/l) was observed in thewestern part of the grid (Fig. 9). The studied area was also
slightly topographically elevated, and the Rn anomaly waslocated close to the outcrop. Repeat sampling and measure-ments after two years still confirmed the Rn anomaly.
Discussion
We discuss the results in two parts: (i) validation of thehypothesis that productive bore wells may be sited at radonhigh anomalies and (ii) conjecture on how high radon anom-alies may be associated with hidden fracture zones.
During the present study at K.B. Tanda area (800 m ·900 m) radon anomalies are identified on the basis of highradon concentration (236–446 kBq/l), which is almost an or-der of magnitude more than the background Rn concentra-tion (25–42 kBq/l) of the grid area (Fig. 4). Further wenote that high radon concentration anomaly is also evi-denced at a depth of 160 cm (Fig. 5). High radon and heliumanomaly location, as discussed later, represent vents forsoil gas rich in radon and 4He, which emanate from deepfracture system and connect through the network of smallerfractures to the top horizon where soil gas is sampled. It isargued that such emanation could be an indicator of ‘‘frac-tures’’ which are in turn a potential source of groundwater(Pointet, 1989; Gascoyne et al., 1993; Lachassagne et al.,2001). In order to validate this hypothesis, we drilled wellson the high radon anomaly as well as off anomaly sites.Though the resistivity sounding conducted at radon anomalysite III had not indicated any favorable zone to drill a borewell, the well (MW-1) to a depth of 90 m drilled at anomalyIII was quite successful and had a drilling discharge of 4.5 lps(liters per second) of groundwater. The litho log of the well(MW-1, Fig. 10) shows that the top 13 m is covered with aweathered zone followed by semi-weathered/fractured

Figure 9 Radon survey at Sigilipuram village. MW-4 is drilled at the anomaly point.
192 D.V. Reddy et al.
rock up to a depth of 25 m. Below 25 m, it is solid granitewith minor fractures at different depths.
To further test the hypothesis that the low radon anom-alies are not potential zones of groundwater, one well wasdrilled up to 80 m in the off-anomaly zone (MW-2) where ra-don concentration was 42 kBq/l (Fig. 4). The site MW-2,though located in a streambed was considered convention-ally highly favorable for locating a productive bore well be-cause of its location and existence of a thick weatheredzone, but the drilling yield was only 0.5 lps. Another well(MW-3, Fig. 4) in the off-anomaly zone (radon concentration42 kBq/l) completely failed. The litho log of off-anomaly
Figure 10 Lithologs of different wells drilled at Maheshwa-ram watershed based on radon data.
site well (MW-3, Fig. 10) indicated a few unproductive thinfracture zones within 18 m of weathered/semi-weatheredzone. Below 18 m depth it encountered solid granite withvery few minor unproductive fractures. No water except afew wet zones was found during drilling. At Rn anomaly II,which was also supported by a He anomaly (Fig. 6), we couldnot drill a hole since the site was under cultivation. How-ever, we observed that a well drilled about a year backand about 35 m NE of anomaly II turned out to be a success-ful well (yield �10 lps).
Further we attempted to test whether intermediate val-ues of radon were associated with sites for intermediateyields. Near the successful well at anomaly III, we drilled3 wells OB-1, OB-2, OB-3 to a depth of 45 m at a distanceof 20 m in different directions (Fig. 4). The well (OB-1)was located on a radon concentration 83 kBq/l drilled20 m north of the main well (MW-1) and was partially suc-cessful (drilling discharge 1.0 lps) and the other two wells(OB-2 and OB-3) located on radon concentration of 42k–50 kBq/l, drilled towards southwest and south, respectively,did not yield any water (Table 1). Thus, the well sited on arelatively high radon concentration of 233 kBq/l at K.B.Tanda (Table 1) yielded 4.5 lps, the well sited on 83 kBq/lyielded 1.0 lps, and those sited on lower radon concentra-tion (42–50 kBq/l) yielded no water.
At the Sigilipuram site, the anomaly (183 kBq/l) is com-parable to that of radon anomaly III at K.B. Tanda. The area
Table 1 Bore wells drilled based on the radon survey
Village Radonconcentration(kBq/l)
WellNo.
Welldepth(m)
Dischargeduring drilling(lps)
K.B. Tanda 233 MW-1 91.5 4.583 OB1-1 45.75 1.050 OB1-2 45.75 No water42 OB1-3 45.75 No water42 MW-2 64.0 0.542 MW-3 55.0 No water
Sigilipuram 183 MW-4 91.5 0.5
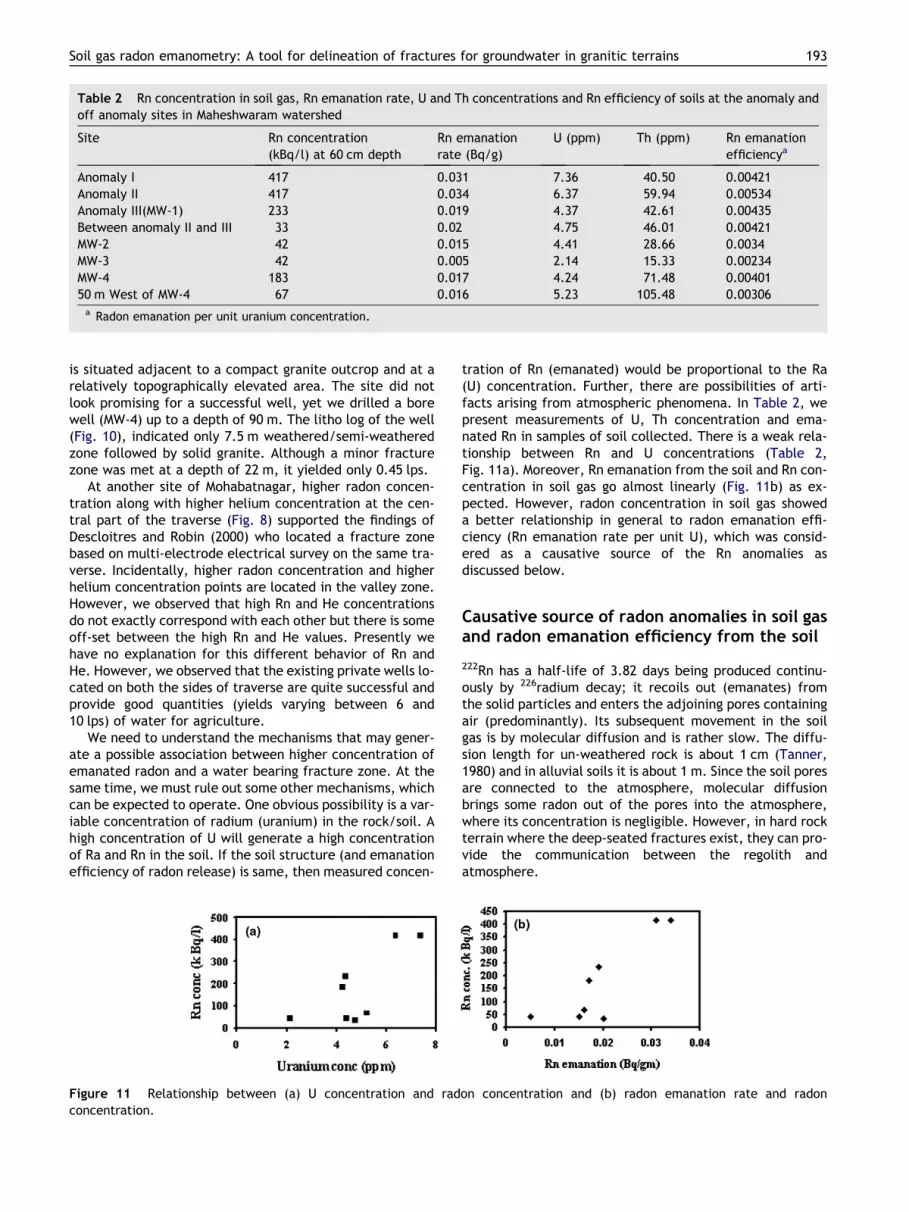
Table 2 Rn concentration in soil gas, Rn emanation rate, U and Th concentrations and Rn efficiency of soils at the anomaly andoff anomaly sites in Maheshwaram watershed
Site Rn concentration(kBq/l) at 60 cm depth
Rn emanationrate (Bq/g)
U (ppm) Th (ppm) Rn emanationefficiencya
Anomaly I 417 0.031 7.36 40.50 0.00421Anomaly II 417 0.034 6.37 59.94 0.00534Anomaly III(MW-1) 233 0.019 4.37 42.61 0.00435Between anomaly II and III 33 0.02 4.75 46.01 0.00421MW-2 42 0.015 4.41 28.66 0.0034MW-3 42 0.005 2.14 15.33 0.00234MW-4 183 0.017 4.24 71.48 0.0040150 m West of MW-4 67 0.016 5.23 105.48 0.00306a Radon emanation per unit uranium concentration.
Soil gas radon emanometry: A tool for delineation of fractures for groundwater in granitic terrains 193
is situated adjacent to a compact granite outcrop and at arelatively topographically elevated area. The site did notlook promising for a successful well, yet we drilled a borewell (MW-4) up to a depth of 90 m. The litho log of the well(Fig. 10), indicated only 7.5 m weathered/semi-weatheredzone followed by solid granite. Although a minor fracturezone was met at a depth of 22 m, it yielded only 0.45 lps.
At another site of Mohabatnagar, higher radon concen-tration along with higher helium concentration at the cen-tral part of the traverse (Fig. 8) supported the findings ofDescloitres and Robin (2000) who located a fracture zonebased on multi-electrode electrical survey on the same tra-verse. Incidentally, higher radon concentration and higherhelium concentration points are located in the valley zone.However, we observed that high Rn and He concentrationsdo not exactly correspond with each other but there is someoff-set between the high Rn and He values. Presently wehave no explanation for this different behavior of Rn andHe. However, we observed that the existing private wells lo-cated on both the sides of traverse are quite successful andprovide good quantities (yields varying between 6 and10 lps) of water for agriculture.
We need to understand the mechanisms that may gener-ate a possible association between higher concentration ofemanated radon and a water bearing fracture zone. At thesame time, we must rule out some other mechanisms, whichcan be expected to operate. One obvious possibility is a var-iable concentration of radium (uranium) in the rock/soil. Ahigh concentration of U will generate a high concentrationof Ra and Rn in the soil. If the soil structure (and emanationefficiency of radon release) is same, then measured concen-
Figure 11 Relationship between (a) U concentration and radconcentration.
tration of Rn (emanated) would be proportional to the Ra(U) concentration. Further, there are possibilities of arti-facts arising from atmospheric phenomena. In Table 2, wepresent measurements of U, Th concentration and ema-nated Rn in samples of soil collected. There is a weak rela-tionship between Rn and U concentrations (Table 2,Fig. 11a). Moreover, Rn emanation from the soil and Rn con-centration in soil gas go almost linearly (Fig. 11b) as ex-pected. However, radon concentration in soil gas showeda better relationship in general to radon emanation effi-ciency (Rn emanation rate per unit U), which was consid-ered as a causative source of the Rn anomalies asdiscussed below.
Causative source of radon anomalies in soil gasand radon emanation efficiency from the soil
222Rn has a half-life of 3.82 days being produced continu-ously by 226radium decay; it recoils out (emanates) fromthe solid particles and enters the adjoining pores containingair (predominantly). Its subsequent movement in the soilgas is by molecular diffusion and is rather slow. The diffu-sion length for un-weathered rock is about 1 cm (Tanner,1980) and in alluvial soils it is about 1 m. Since the soil poresare connected to the atmosphere, molecular diffusionbrings some radon out of the pores into the atmosphere,where its concentration is negligible. However, in hard rockterrain where the deep-seated fractures exist, they can pro-vide the communication between the regolith andatmosphere.
on concentration and (b) radon emanation rate and radon

194 D.V. Reddy et al.
From Table 2, we see that high radon concentration insoil at Maheshwaram is not solely related to higher U orTh concentrations, but more clearly related to radon ema-nation (Bq/g) of soil and radon emanation efficacy (Rn ema-nation rate per unit Ra or U).
Our data on depth variation of Rn concentration in soilgas (measured at three depths at K.B. Tanda) essentiallyshows that the radon profile is governed by bulk moleculardiffusion and provides no evidence for significant advection.
To verify the molecular diffusion process for our ob-served radon concentration, the molecular diffusion equa-tion C = C0(1 � e�z/
p(Ds)) is used, where C is the Rn
concentration at a given depth (z), C0 is the maximum Rnconcentration deep in the profile say >2 m and (Ds) is thediffusion length defined as the average length of the soilcolumn (an atom can move through dry soil before it decaysafter being produced through decay of uranium/thoriumatoms, Wilkening, 1990). To compute Rn activities at vari-ous depths, we have assumed diffusion length (Ds) to be1 m and the maximum measured Rn activity to be 200kBq/m3. The computed Rn activity is compared with mea-sured Rn activity at 0.4, 0.7, 1.0 and 1.4 m depths (Fig. 12).
The comparison shows that at depths >0.7 m, the mea-sured radon concentration is in agreement with the com-puted Rn concentration from the diffusion equation. Whilethe soil gas at a depth of <1 m has a Rn activity somewhatlower than the computed ones, the lower Rn activity couldhave resulted because of dilution of the soil gas at thisdepth (<1 m) caused by the atmospheric air containing neg-
Figure 12 Figure shows the calculated Rn concentrationusing the molecular diffusion equation and measured Rn atdifferent depths.
Figure 13 Relation between the Rn emanation efficiency ofsoil and Rn concentration in soil gas.
ligible Rn concentration. Thus, the decreasing Rn activityfrom deeper depths to shallow depths as depicted aboveshows that the Rn migration from deeper depths to surfacefollows a molecular diffusion process through the soil ma-trix. However, it is clear that there is no advection as theshallow depth (<1 m) soil gas samples are depleted in Rnconcentration rather than enhanced which can be expectedin case of advection.
Further we observe that spatial variations in radon con-centrations are caused not by U–Ra concentration alone,but also by variation in the microstructure of soil (Fig. 13)indicated by the Rn emanation efficiency, which in turncould be caused by stressful processes (including tectonicforces), which create fractures. Our earlier laboratoryexperiments (Reddy et al., 1996) demonstrated that whensolid granite plugs were subjected to high pressure the ema-nation rate increased by a factor 3–4, presumably by crea-tion of micro-fractures in the plug. We further observedthat the increase in Rn concentration due to this processis permanent.
Conclusion
The preliminary Rn emanometry results (supplemented byHe measurements) show promise of a potential tool in sitingsuccessful wells encountering water-bearing fractures in agranitic area. This finding is validated through drilling car-ried out on relatively high, intermediate and low Rn concen-tration sites in the studied area. Drilling on sites with highRn and He concentration resulted in successful wells thathad fractures at depths, and the low and intermediate Rnconcentration sites indicated an absence of water bearingfractures and thus failure of wells. It is argued that highRn concentration in soil gas is intrinsically linked to thepresence of a network of fractures, which have high Rnemanation efficiency (rather than to U and Th concentrationalone in soil), thus providing the basis for using the Rn meth-od for exploring fractures in granitic areas.
Acknowledgements
We are grateful to Dr. V.P. Dimri, Director, NGRI, for per-mission to publish the paper. Critical discussions and valu-able scientific inputs from Prof. Rama are gratefullyacknowledged. Sh. V.Y. Giri helped in measurements andmaintenance of radon units. We thank the anonymous re-viewer for helping in improving the manuscript. Radon mea-surements were done within the framework of Indo-FrenchProject, at NGRI, Hyderabad, and exploratory wells on ra-don anomaly sites were drilled under CSIR Network Projecton Groundwater (COR-0005). BSS thanks CSIR for awardingemeritus scientist scheme.
References
Banwell, G.M., Parizek, R.R., 1988. Helium-4 and radon-222concentrations in groundwater and soil gas as indicators ofzones of fracture concentration in unexposed rock. J. Geophys.Res. 93 (B1), 355–366.

Soil gas radon emanometry: A tool for delineation of fractures for groundwater in granitic terrains 195
Descloitres, M., Robin, H., 2000. Multi-electrode electrical and timedomain electromagnetism survey at Maheshwaram catchmentfrom November 9th to 28th 1999. Indo-French Project Report on‘‘Optimal development and management of groundwater inweathered-fractured aquifer’’, NGRI, Hyderabad.
Gascoyne, M., Wuschke, D.M., Durrance, E.M., 1993. Fracturedetection and groundwater flow characterization using He andRn in soil gases, Manitoba, Canada. Appl. Geochem. 8, 223–233.
King, C.-Y., King, B.-S., Evans, W.C., Zhang, W., 1996. Spatial radonanomalies on active faults in California. Appl. Geochem. 11,497–510.
Lachassagne, P., Pinault, J.L., Laporte, P., 2001. Radon 222emanometry: a relevant methodology for water well siting inhard rock aquifers. Water Resour. Res. 37, 3131–3146.
Monin, M.M., Seidel, J.L., 1997. Physical models related to radonemission in connection with dynamic manifestations in the upperterrestrial crust: a review. Radiat. Meas. 28, 703–712.
Pointet, Th., 1989. Exploration of fractured zones by radondetermination in the soilInternational Workshop on AppropriateMethodologies for Development and Management of Groundwa-ter Resources in Developing Countries, vol. 3. NGRI, Hyderabad,pp. 37–47.
Reddy, D.V., Sukhija, B.S., Rama, 1996. Search for correlationbetween radon and high-yield bore wells in granitic terrain. J.Appl. Geophys. 34, 221–228.
Reddy, D.V., Sukhija, B.S., Nagabhushanam, P., Kumar, D., 2004. Aclear case of radon anomaly associated with a micro-earthquakeevent in a Stable Continental Region. Geophys. Res. Lett. 31,L10609. doi:10.1029/2004GL019971.
Reimer, G.M., Bowles, C.G., 1979. Soil gas helium concentrations inthe vicinity of uranium deposit, Red Desert, Wyoming. USGeological Survey Open File Report, 79-975, 9 pp.
Sukhija, B.S., Nagabhushanam, P., Reddy, D.V., 1996. Groundwaterrecharge in semi-arid regions of India: an overview of resultsobtained using tracers. Hydrogeol. J. 4 (3), 50–71.
Sukhija, B.S., Reddy, D.V., Nagabhushanam, P., Hussain, S., 2003.Recharge processes: piston flow vs. preferential flow in semi-arid aquifers of India. Hydrogeol. J. 11 (3), 387–395.
Tanner, A.B., 1980. Radon migration in the ground: a supplementaryreview. In: The Natural Radiation Environment 111, SymposiumProceedingsHoustonTexas, 23–28April 1978,Rep.CONF-780422,US Department of Energy, Washington, DC, 1980, pp. 5–56.
Wilkening, M., 1990. Radon in the Environment. Studies in Environ-mental Science, vol. 40. Elsevier, Amsterdam.