Embed Size (px)
Citation preview

Mass movements in tropical volcanic terrains:
the case of Teziutlan (Mexico)
L. Capraa,*, J. Lugo-Hubpa, L. Borsellib
a Instituto de Geografıa, Universidad Nacional Autonoma de Mexico, Coyoacan 04510, D.F. Mexicob Istituto per lo Studio degli Ecosistemi (CNR-ISE), Florence, Italy
Received 29 January 2002; accepted 14 January 2003
Abstract
During the last decade, soil degradation coupled with global climate changes has increased hydrogeological hazards in
Mexico. In tropical volcanic terrains, alteration processes have enhanced the formation of clay minerals that promote water
retention and result in soil/rock weakness. Intense seasonal rainfall can trigger the liquefaction and remobilization of these low-
resistance terrains. During the first week of October 1999, heavy rains affected eastern Mexico, including Puebla State. As a
consequence, approximately 3000 mass movements, consisting of rock and soil slides and slips, debris flows and avalanches
were generated in this area. In the town of Teziutlan (Puebla), which is located on volcanic deposits, a single mass-movement
event caused approximately 150 deaths. In the present work we identified two types of mass movements in the Teziutlan area—
Type 1: superficial erosion of an unwelded ignimbritic sequence forming small detrital fans, and Type 2: thin soil slide/debris
flow from the remobilization of a volcanic sequence composed of clay-rich paleosols interbedded with ashfall horizons. The
clay-rich volcanic paleosols favored the formation of perched water tables on a hydraulic aquiclude. Positive pore-water
pressures triggered the failure. Based on these results, the principal human settlement in the Teziutlan area may be threatened by
future debris flows, which could cause serious harm to the dense population and severe damage to its infrastructure. It is
necessary to prevent future deaths and damage by installation of mitigative measures based on detailed studies. Without any
further study, it will not be possible to prevent and mitigate a natural disaster with the same magnitude as the 1999 catastrophic
hydrogeological phenomena.
D 2003 Elsevier Science B.V. All rights reserved.
Keywords: Mass movement; Soil slide; Debris flow; Tropical volcanic terrain; Mexico
1. Introduction
During the last decade, soil degradation coupled
with global climate changes (responsible for extraor-
dinary rainy seasons) has caused an increase in hydro-
geological hazards in Mexico. These phenomena have
occurred previously in recent geological history, but
today’s population and anthropic activity increase the
increment of susceptibility for such events.
The instability in Mexican tropical volcanic ter-
rains is caused by (1) low physical shear strength of
volcaniclastic deposits, (2) conspicuous rainfall sea-
sons, and (3) weathering and hydrothermal alteration
0013-7952/03/$ - see front matter D 2003 Elsevier Science B.V. All rights reserved.
doi:10.1016/S0013-7952(03)00071-1
* Corresponding author. Tel.: +52-55-6224335; fax: +52-55-
5502486.
E-mail address: [email protected] (L. Capra).
www.elsevier.com/locate/enggeo
Engineering Geology 69 (2003) 359–379

of incoherent volcaniclastic deposits. In tropical areas,
the alteration processes determine the soil/rock weak-
ness by the formation of clay minerals that promote
water retention (Pla Sentıs, 1997; Terlien, 1997). The
increase of pore-water pressure can trigger the lique-
faction and remobilization of these unstable terrains.
These failures can result in several types of mass
movements, ranging from slides to debris flows and
mud flows (i.e., Iverson et al., 1997).
During the first week of October 1999, heavy
rains associated with the Tropical Depression Num-
ber 11 affected eastern Mexico, including Puebla
Fig. 1. (a) Sketch map of the study area showing its location in respect to the Trans-Mexican Volcanic Belt. Triangles refer to principal Mexican
active volcanoes. Abbreviations are: CVC: Colima Volcanic Complex. Pa: Paricutin. NT: Nevado de Toluca. Jo: Jocotitlan. Iz: Iztaccıhuatl. Po:
Popocatepetl. Pdo: Pico de Orizaba. (b) Map of Puebla State showing the location of the town of Teziutlan and the area affected by intense
rainfall during October 4–5, 1999 (modified from Lugo-Hubp et al., 2001). Dashed border in (b) indicates the limits of the Sierra Norte.
L. Capra et al. / Engineering Geology 69 (2003) 359–379360

State (Fig. 1). As a consequence, approximately 3000
mass movements (landslides), ranging from soil
slides to debris flows and avalanches, occurred. On
October 5, in the town of Teziutlan (Puebla State) a
single landslide caused approximately 150 deaths. All
of the area of Teziutlan and some portion of the
northern sierra were affected by several mass move-
ments, differing in magnitude and flow type (Lugo-
Hubp et al., 2001).
In volcanic terrains, such processes are very com-
mon during exceptional rainfall seasons. On May 5,
1998, after 30 h of continuous rainfall, a large area of
tephra-rich colluvial cover, 15 km east of Vesuvius
volcano (Italy) failed, generating a series of debris
flows that killed more than 150 people (Pareschi et
al., 2000). On October 30, 1998, Hurricane Mitch
caused abnormal rainfall that triggered a flank col-
lapse of Casita volcano, Nicaragua, causing the
deaths of 1550 people (Sheridan et al., 1999; Scott
et al., 2003). The case of Teziutlan presented here is
another example of these events and represents the
first detailed study in Mexico, where, during the last
decade, mass movements have been responsible for
thousands of deaths.
Fig. 2. Daily precipitation records of (a) normal rainfall for the month of October (example from October 1997; Quintas, 2000), (b) October 1–
10, 1999 (from Vazquez-Conde et al., 2001), the rainfall peak of October 4 and 5 corresponded with the initiation of mass movements.
L. Capra et al. / Engineering Geology 69 (2003) 359–379 361

This work presents a detailed study of the textural
and sedimentological characteristics of the paleosols
and volcanic sediments involved in this phenomenon
in the Teziutlan area. The main purpose of this study
is to define the relationships between the soil/rock
characteristics, the types of flows derived from the
mass movement, and the hazards related. In addition,
a qualitative estimation of the triggering mechanism is
proposed, despite the fact that no direct geotechnical
parameters are available for this area. Thus, the
proposed model is based only upon indirect evalua-
tion of the geotechnical/geohydraulic properties of the
soils.
2. Meteorological data
The heavy rainfall that was observed during the
first week of October 1999 originated in different
atmospheric systems (Vazquez-Conde et al., 2001).
Tropical Depression Number 11, which was created in
the Gulf of Mexico, was responsible for the abnormal
rainfall of October 4 and 5. At the same time, flows of
humid air from both the Pacific Ocean and the Gulf of
Mexico increased the amount of water vapor in the
atmosphere, which resulted in heavy rain in the states
of Veracruz, Puebla, and Hidalgo. Finally, Tropical
Wave Number 35 also had an effect on October 4.
According to published data (Vazquez-Conde et al.,
2001), during the first 10 days of October 1999,
precipitation reached 1200 mm, approximately five
times higher than the precipitation registered for the
entire month of October (e.g., 243 mm in 1997);
however, approximately 800 mm of this amount was
concentrated between October 4 and 5 (Fig. 2a and b).
Even though approximately 200 mm of rain had fallen
on the area between September 30 and October 4,
likely saturating the terrain, the sudden rainfall
increase of October 4–5 undoubtedly triggered the
mass failures.
3. Morphological features of the Teziutlan region
From the Landsat image of Fig. 3 and the slope
map of Fig. 4, it is possible to make some observa-
tions of the morphological characteristics of the
studied area.
The town of Teziutlan is located on top of a plateau
at an elevation of 1700 m a.s.l. surrounded by relief
that reaches up to 2800 m a.s.l. The main drainage is
oriented N-S, and NE-SW, probably controlled by
tectonic lineaments (Fig. 3). Erosion has produced
deep (as much as 100 m) parallel ravines at distances
of 50–100 m from each other, generally symmetrical
and rectilinear. The bases of these canyons are narrow
(less than 50 m). From the slope map (Fig. 4), the
steepest gradient characterizes the northern sierra,
with slopes >40j, while the principal inhabited areas
are settled on flat zones that normally are limited by
deep and unstable ravines.
During the past 30 years, rapid human develop-
ment has modified the relief. Disorganized urban
growth coupled with deforestation has led to complete
vulnerability of the Teziutlan area to slope mass
movements.
4. Geology of the area
The town of Teziutlan is located in the Sierra
Norte of Puebla State, the geology of which consists
of thick Cretaceous sequences of folded limestones
and terrigenous sedimentary rocks. The peculiarity of
the Teziutlan region is that the basement rocks are
covered by thick (more than 50 m) volcanic deposits
erupted from the Los Humeros caldera, located 40
km to the south (Fig. 3). This caldera activated
approximately 250,000 years ago with the emplace-
ment of thick sequences of ignimbrite deposits
(welded and unwelded pumice-flow deposits) and
ashfall horizons (Ferriz and Mahood, 1984; Ferriz,
1985). Two main caldera collapses were recognized
by these authors (resulting in Xaltipan and Zaragoza
ignimbrites), separated by the extrusion of volumi-
nous basaltic lava flows associated with cinder
cones, and rhyolitic domes along caldera-rim frac-
tures. Fig. 5 presents a simplified geological map of
the study area, representing only the distribution of
pyroclastic deposits. Teziutlan and its neighboring
towns are positioned on top of this volcanic
sequence. In particular, the flat areas that morpho-
logically correspond to basaltic lava flows are cap-
ped by a sequence up to 5 m thick consisting of
clay-rich paleosols (paleo-andosoils, developed in
ash flow deposits) interbedded with several scoria/
L. Capra et al. / Engineering Geology 69 (2003) 359–379362

pumice fall deposits. This sequence is rare in the
northern portion of the area, where it appears as
small patches in flat areas. All the ashfall units are
massive and grain-supported, varying in thickness
from 30 cm to 1.5 m, and mostly consisting of
pumice or scoria and accidental lithics. The paleosols
that separate the ashfall horizons vary in color from
light to dark brown, with thicknesses ranging from
20 cm to 1.7 m, and contain some dispersed frag-
ments of scoria or pumice (Fig. 6, sections TZ14 and
TZ22).
In contrast, the steeper slopes and deep canyons,
which dominate the northern region, are covered by a
thick (up to 50 m) volcanic sequence constituted at
the base by a 30-m-thick, massive, unwelded pumice-
flow deposit (Xaltipan ignimbrite) (Ferriz and
Mahood, 1984), crowned by a 1.5-m grain-supported
pumice-fall horizon directly associated with a 4-m-
thick pumice-flow layer, which shows lenses of
pumice accumulation (section TZ06, Fig. 6). The
thicker sections are observable along the main can-
yons, whereas on the southern portion its maximum
observable thickness is 4 m, where it is always
capped by the scoria/pumice fall sequence. Fig. 6
shows selected stratigraphic columns of the volcanic
sequence.
5. Type of mass movement and areal distribution
Integrating the field work performed during 2000–
2001, and the aerial photos taken just after the October
5, 1999, catastrophic episode, we determined the
distribution of the different mass-movement events,
Fig. 3. Landsat image (bands 3, 4 and 7) showing the location of Teziutlan with respect to the Los Humeros Caldera. Note the NE-SW drainage
orientation that dominates the Teziutlan area.
L. Capra et al. / Engineering Geology 69 (2003) 359–379 363

their characteristics and extents. These data, where
reported on a digital-elevation model of the area (Fig.
5) and all other information (area, slope, type of scarp
and flow; see Table 1) were compiled on different
maps using a GIS instrument (ILWIS, 2.1). Due to the
small magnitudes of individual events, we traced on
Fig. 5 the overall areas affected by mass movement,
without tracing each single scarp or flow trace. Two
principal types of mass movements were recognized.
� Type 1: Shallow landslides with vertical walls that
form the deepest canyons in the northern region
(Figs. 5 and 7).
This phenomenon affected mostly slopes steeper
than 40j, constituted by the unwelded ignimbrite
deposit (Table 1). The removal of this incoherent
material resulted in only small remaining talus
deposits (Fig. 7). The total area affected by this
Fig. 4. Simplified slope map of the study area and location of the principal sites affected by mass movements, which mostly fall in a zone with
slopes between 20j and 40j. Contour interval: 20 m.
L. Capra et al. / Engineering Geology 69 (2003) 359–379364
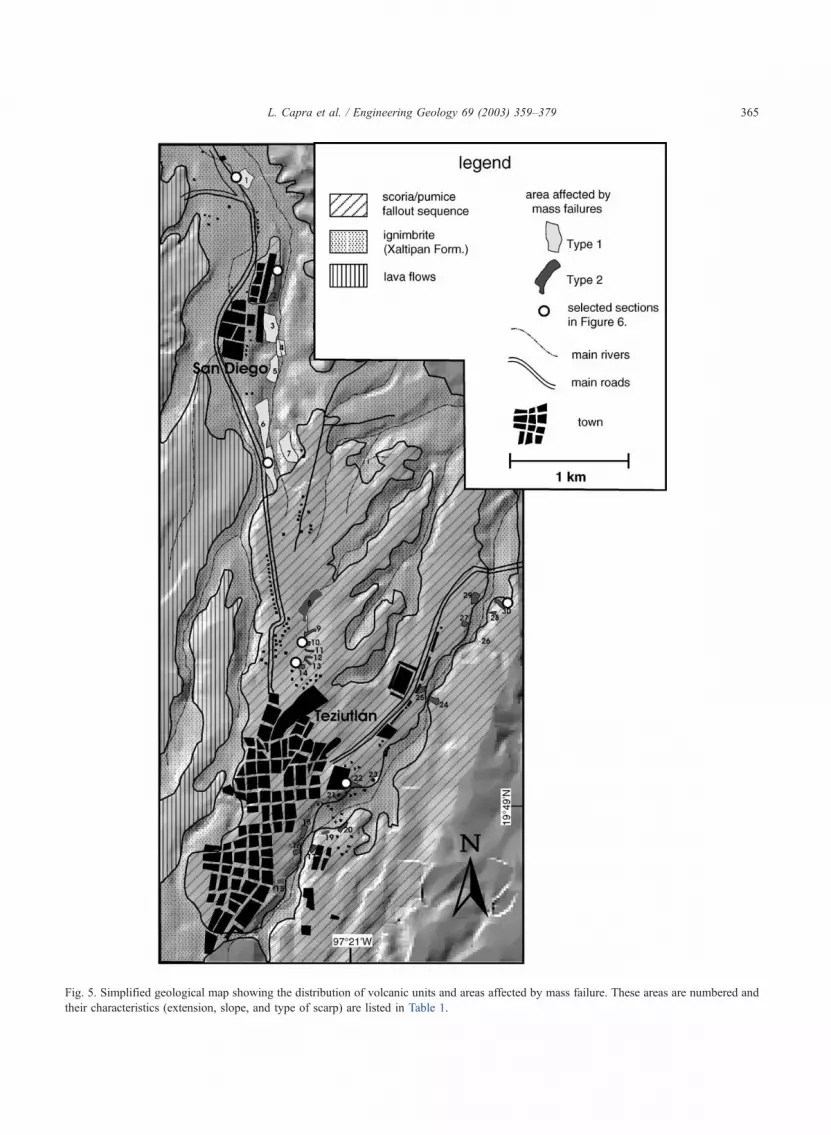
Fig. 5. Simplified geological map showing the distribution of volcanic units and areas affected by mass failure. These areas are numbered and
their characteristics (extension, slope, and type of scarp) are listed in Table 1.
L. Capra et al. / Engineering Geology 69 (2003) 359–379 365

process is about 0.15 km2. Well-defined scarps are
not observable and, for this reason, a total volume
estimation of the removed mass was not calcu-
lated.
� Type 2: Soil slides/debris flows (debris flows
developed from slides of the soil mantle; terminol-
ogy after Campbell, 1975) (Figs. 5 and 8).
These landslides occurred mainly on slopes
between 28j and 40j where they formed well-
defined scarps (Table 1). This slope range coincides
with the most common slope interval reported for
soil slides ranging from 25j to 45j (Campbell,
1975). This type of movement affected only the
sequence composed of the clay-rich paleosols inter-
bedded with the pumice/scoria ashfall, which char-
acterizes the southern portion of the study area,
including the urban zone of Teziutlan. In fact, this
process affected densely populated areas, as well as
agricultural slopes. The thickness of the material
involved in such events ranged from a minimum of
40 cm up to 1.5 m. In particular, the sliding surface
corresponded with the transition to the lower, clay-
rich paleosol layer, which separated the pumice/
scoria ashfall sequence from the basal ignimbrite.
The total area affected by Type 2 events has been
0.07 km2, lower than the Type 1 events, but with the
striking difference that, in the Type 2 cases, the soil
slides transformed into very mobile debris flows that
caused the deaths of hundreds of people. In fact, the
failure at Taxcala Hill (number 21, Figs. 5 and 9),
the summit of which is occupied by a cemetery,
mobilized a soil mass of approximately 5000 m3 that
was transformed into a debris flow that killed 150
people.
The volume of each soil slide of Type 2 can
easily be obtained by multiplying the areas reported
in Table 1 by the effective thickness of the removed
layered sequences of 1–2 m (see model below). This
Fig. 6. Selected stratigraphic columns showing relation between fall units and paleosols. Section numbers correspond to those used to indicate
the areas affected by mass failure on Fig. 5.
L. Capra et al. / Engineering Geology 69 (2003) 359–379366

estimation does not consider a possible volume
increase due to the bulking process caused by water
and by rock or soil fragments picked up as the mass
moves downslope.
6. Physical properties of volcanic deposits and
associated soils
6.1. Sedimentology
Sedimentological analyses were carried out for the
volcanic horizons, as well as for the soils/paleosols
found in the stratigraphic record. The global sedimen-
tological spectrum of the deposit (from � 5/ to 10/)was obtained by dry-sieve analyses (� 5/ (4 mm) to
4/ (0.0625 mm)), and by a laser sedimentograph (5/(0.031 mm) to 10/ (0.001 mm)). The results are
reported in Table 2.
The ignimbritic sequence in the Northern Sierra is
constituted by a basal pumice flow deposit (sample
TZ01 and TZ06d) with up to 84% in sand, and barren
of the clay fraction. The paleosol that lies between the
ignimbrite and the pumice-fall deposit (TZ06c) is silt
loam with up to 16% in clay fraction. The upper
pumice-fall deposit (TZ06b) consists only of gravel
and sand fractions (57% and 43%, respectively). The
upper laminated pumice-flow deposit (TZ06a) is rich
in sand (up to 72%) with low amounts of gravel and
silt, and is barren of clay.
The scoria/pumice-fall sequence, where the towns
of Teziutlan and San Diego are located, shows differ-
ent sedimentological characteristics. All of the scoria/
pumice-fall layers that have been recognized are made
up mainly of gravel and sand, with practically no silt
or clay fractions (Table 2). All of these layers are
interbedded with clay-rich paleosols. The analyzed
paleosols are mainly silty (varying from silt, silt loam,
to loam sand; USDA soil textural classification; Table
2) and with an important content in the clay fraction,
varying from a minimum of 4% to a maximum of
24% (Table 2). For example, section TZ30 (Fig. 6)
shows, from bottom to top, a 40-cm-thick dark silt
loam paleosol (up to 21% in clay fraction), a 60-cm-
thick brown silt loam paleosol (up to 4.5% clay), and
a 75-cm-thick pumice-fall deposit, consisting of
gravel and sand (56% and 44%, respectively), and
without silty or clay fractions. The modern soil caps
the section. Section TZ02 shows a similar stratigraphy
(Fig. 6, Table 2). It is worth mentioning that in all the
analyzed sections the clay content in the paleosols
increases downward, and that the lowest soil layer,
which separates the upper fallout sequence from the
older ignimbritic deposits, shows the highest clay
content. A triangular graph (Fig. 10) shows the later
trend, where the clay content, from top to bottom,
migrates toward the clay vertex (see, for example,
samples TZ02b-c-d and TZ22a-c-e).
6.2. Permeability
The saturated permeability (Ks) for the analyzed
paleosols and sediments has been calculated from
theoretical pedotransfer models available in the liter-
Table 1
Type of mass movement, scarp, slope, and areal extent for each
recognized event
Location Type Area
(m2)
Slope
(j)Scarp type
1 1 16,100 40 not defined
2 2 17,800 38 well defined
3 1 24,500 40 well defined
4 1 9400 40 well defined
5 1 16,200 39 slightly defined
6 1 53,500 41 slightly defined
7 1 21,500 41 slightly defined
8 2 22,500 17 not defined
9 2 2200 28 not defined
10 2 1600 35 not defined
11 2 900 35 well defined
12 2 600 35 well defined
13 2 1000 35 well defined
14 2 2100 35 well defined
15 2 3400 46 well defined
16 2 2100 28 well defined
17 2 2300 28 well defined
18 2 4300 30 well defined
19 2 2200 38 well defined
20 2 2600 25 well defined
21 2 2200 21 slightly defined
22 2 3900 39 not defined
23 1 600 17 slightly defined
24 2 4000 28 slightly defined
25 2 3900 18 slightly defined
26 2 200 28 slightly defined
27 2 1800 28 slightly defined
28 2 1100 33 not defined
29 2 5000 28 slightly defined
30 2 3900 30 well defined
See Fig. 5 for point location.
L. Capra et al. / Engineering Geology 69 (2003) 359–379 367

Fig. 7. Panoramic view of the Sierra Norte showing the Type 1 mass movement. Notice the small detrital fan (black arrow), which originated at
the base of the canyon wall.
Fig. 8. Aerial view of points 10–14 (see Fig. 5 for locations) showing an example of Type 2 mass movement.
L. Capra et al. / Engineering Geology 69 (2003) 359–379368

ature (Lalibert et al., 1968; Brakensiek et al., 1984),
and implemented in the web applet PEDON-SEI 1.1
(CNR-IGES, 2001). As observed by Wosten et al.
(2001), these functions often prove to be satisfactory
predictors for missing soil hydraulics characteristics,
as is the case of Teziutlan, where geohydraulic and
geotechnical parameters are not available. Table 3
shows all the values obtained for the soils and
pyroclastic layers discussed in the text. Based on
these results, it is evident that the scoria/pumice-fall
sequence shows important differences in terms of
permeability (Fig. 11). In fact, the ashfall horizons,
due to their grain-supported texture, lack fine sedi-
ments (total absence of silt and clay fraction), which,
in turn, results in a highly porous and permeable soil,
with average values of Ks up to 500 mm/h (Table 3).
In contrast, the soils that separate the fallout horizons
are clay-rich and relatively impermeable with values
that range from 5 to 9 mm/h, approximately two
orders of magnitude lower than the ashfall units. As
deduced from the sedimentological analysis, the clay
content increases downward; so, the permeability
Fig. 9. Aerial view of the soil slide/debris flow at Taxcala Hill. This debris flow caused the deaths of 150 people. Dashed line indicates the limits
of the debris flow.
L. Capra et al. / Engineering Geology 69 (2003) 359–379 369

decreases in the same direction. These variations in
permeability represent important discontinuities in
ground-water infiltration that correspondingly pro-
mote the formation of perched water tables. In the
next section, we present a triggering model for Type
2 movement based on the infiltration process in the
multi-layer succession (pyroclastic deposits/paleo-
sols). In contrast, the ignimbritic sequence is quite
homogeneous. Its permeability is lower as compared
to the ashfall layers (Ks of 400 mm/h, Table 3),
because the fine-grained material fills all the cavities
between the clasts and boulders, but its permeability
is still higher in respect to the clay-rich paleosol
horizons.
7. Mass movement triggering mechanisms
7.1. Type 1
The Type 1 mass movements have been recog-
nized as affecting only the ignimbritic unit that
characterizes the northern region where it constitutes
vertical walls of deep canyons. This phenomenon
involved only the erosion of external portions of the
exposures, which are very unweathered (fresh) due
to the high erosion rate. In fact, Yokota and Iwa-
matsu (1999) demonstrated that a slope with such
characteristics becomes gradually unstable as the
weathering of rocks proceeds inward from its sur-
Table 2
Textural and sedimentological characteristics of analyzed deposits and paleosols
Sample Type Gravel
(>2 mm)
Sand
(2 mm–62 Am)
Silt
(62–2 Am)
Clay
( < 2 Am)
Mud
(silt + clay)
TZ01 ig 0.00 71.54 24.93 3.53 28.46
TZ06a ig 14.95 71.17 13.88 0.00 13.88
TZ06b pf 57.38 42.62 0.00 0.00 0.00
TZ06c SIL pls 13.17 22.01 58.34 6.48 64.82
TZ06d ig 8.46 83.74 7.80 0.00 7.80
TZ10 SIL sl 15.01 24.79 58.21 1.72 59.93
TZ02a pf 38.68 59.75 1.57 0.00 1.57
TZ02b SI pls 0.00 1.96 97.74 0.31 98.05
TZ02c SI pls 0.00 1.57 94.11 4.32 98.43
TZ02d SIL pls 0.00 0.35 75.16 24.50 99.66
TZ30a pf 56.17 43.83 0.00 0.00 0.00
TZ30b SIL pls 6.67 36.82 52.03 4.49 56.52
TZ30c SIL pls 0.00 0.00 78.39 21.61 100.00
TZ22a LS pls 17.38 73.13 9.32 0.16 9.48
TZ22b pf 67.50 32.50 0.00 0.00 0.00
TZ22c SI pls 0.00 3.44 91.56 5.00 96.56
TZ22d pf 88.33 11.67 0.00 0.00 0.00
TZ22e SI pls 0.00 13.72 76.22 9.86 86.08
TZ23a ig 24.19 65.71 10.10 0.00 10.10
TZ23b pf 72.48 27.52 0.00 0.00 0.00
TZ23c SI pls 0.00 0.87 99.12 0.00 99.12
TZ14a SIL pls 0.00 25.29 68.44 6.21 74.65
TZ14b pf 72.18 27.82 0.00 0.00 0.00
TZ14c SI pls 0.00 14.86 70.68 14.46 85.14
TZ14d sf 85.02 14.98 0.00 0.00 0.00
TZ14e SI pls 0.00 13.78 76.34 9.89 86.23
Abbreviation for U.S. Dept. of Agriculture (USDA) soil textural classification: LS, loam sand; SIL: silt loam; SI: silt. Other abbreviations: ig:
ignimbrite; pf: pumice fall; sf: scoria fall; pls: paleosol; sl: soil.
L. Capra et al. / Engineering Geology 69 (2003) 359–379370

face, typically failing during heavy rainfall. Frequent
failures along steep slopes composed of soft, degrad-
able pyroclastic rocks are believed to be mainly
attributable to rock weathering because individual
failures are very shallow and they tend to repeat with
time (Shimokawa et al., 1989). The weathering of
volcanic rocks is due to a geochemical reaction in
which the volcanic glass degrades to clay minerals
such as allophane and halloysite (Pettapiece and
Pawluck, 1972; Neall, 1975; Parfitt and Wilson,
1985). These chemical changes accelerate the phys-
ical and mechanical deterioration. In this sense, rock
porosity increases and both dry density and strength
decrease with time. It is likely that this process is
occurring in the study area where Type 1 movements
were recognized. In fact, a sample taken from the
ignimbrite deposit (TZ01, Table 2) indicated the
presence of a very low percentage of clay fraction,
for which X-ray analysis yielded a halloysitic com-
position. Yokota and Iwamatsu (1999) found that the
estimated rate of weathering ranges from 10� 2 to
100 cm year� 1 in this type of rock. The October 4–
5 meteorological event probably accelerated this
process, resulting in massive superficial erosion with
the formation of detrital fans at the base of the
canyon walls (Fig. 7). The direct consequence of
this phenomenon was the erosion of the surface of
roads that in some places drastically reduced their
usable widths.
7.2. Type 2
Rainfall triggering of debris flows in steep terrains
has been the object of intensive study (e.g., Varnes,
1978; Johnson, 1984; Reid et al., 1988; Iverson et al.,
1997; Phillips and Davies, 1991; Reddi and Wu,
1991; Cruden and Varnes, 1996; Terlien, 1997). The
key hydrologic requisites for debris-flow mobilization
are sufficient water to saturate (or nearly saturate) the
soil and sufficient pore-water pressure and/or weight
to satisfy the Coulomb criterion of failure (Iverson et
al., 1997). In fact, most studies indicate that debris
flows result from development of positive pore
pressures that accompany saturation. Saturation and
positive pore pressures commonly develop when
infiltrating water encounters soil with low perme-
ability, and transient perching of the water table
occurs (Campbell, 1975; Reid et al., 1988). In this
sense, based on Darcy’s law, if the rainfall intensity
rate (mm/h) is greater than the hydraulic conductivity
Ks of the soil, a saturated zone will develop.
It is important to note that slope failure can occur
even though a significant fraction of the soil is not
fully saturated. In fact, when positive pressure at
Fig. 10. Sand–silt –clay triangular diagram showing sedimentological variation between the analyzed horizons. Observe the increment on the
clay fraction toward the lower paleosols.
L. Capra et al. / Engineering Geology 69 (2003) 359–379 371

depth triggers failure, the water content in the unsa-
turated zone can rise to saturated or near-saturated
levels as a consequence of soil contraction that
originates at the sliding surface but that spreads to
adjacent portions by conduction of granular temper-
ature (Iverson, 1997; Iverson et al., 1997; Van Asch et
al., 1999).
This process seems to be most probably respon-
sible for the slope failure at the Teziutlan area that
caused the mobilization of a debris flow (Type 2
event). In fact, the particular intercalation of paleosols
and ashfall units with different hydraulic conductiv-
ities caused the formation of perched water tables. In
this scenario, during an intense rainfall a saturated
zone formed in correspondence of those low-perme-
ability soils and propagated upwards. When the pos-
itive pore pressure raised up to the limit of the soil
strength and cohesion forces, the failure occurred and,
for soil contraction, positive pore pressure increased
also in the non-saturated part of the soil liquefying the
mass completely to form the debris flow.
Figs. 12 and 13 present an infiltration model for
two typical sections observed in the Teziutlan area,
referring to the simplest case of single layer (TZ22)
and the more complicated of multi-layers (TZ02).
The model used is based on the Green–Ampt alge-
braic solution (Green and Ampt, 1911) modified by
Mein and Larson (1973) for a constant rainfall rate.
In this model, water is assumed to infiltrate into the
soil as piston flow resulting in a sharply defined
Table 3
USDA soil texture Green–Ampt infiltration parameters
Sample Type Ks
(mm/h)
Sf(mm)
/(m3/m3)
hi(m3/m3)
TZ06a ig 300 50 2 –
TZ06b pf 500 20 2 –
TZ06c SIL pls 26.58 220 0.566 0.055
TZ06d ig 300 50 2 –
TZ10 SIL sl 35 180 0.621 0.05
TZ02a pf 500 20 2 –
TZ02b SI pls 10.18 330 0.441 0.051
TZ02c SI pls 8.93 350 0.453 0.03
TZ02d SIL pls 4.89 500 0.411 0.023
TZ30a pf 500 20 2 –
TZ30b SIL pls 55 180 0.51 0.037
TZ30c SIL pls 5.9 500 0.415 0.024
TZ22a LS pls 370 50 2 –
TZ22b pf 500 20 2 –
TZ22c SI pls 9.6 350 0.434 0.032
TZ22d pf 500 20 2 –
TZ22e SI pls 9.75 330 0.509 0.042
TZ23a ig 300 50 2 –
TZ23b pf 500 20 2 –
TZ23c SI pls 9.75 360 0.441 0.039
TZ14a SIL pls 27 220 0.566 0.052
TZ14b pf 500 20 2 –
TZ14c SI pls 13 350 0.509 0.051
TZ14d sf 500 20 2 –
TZ14e SI pls 18 330 0.517 0.0441
Abbreviation for USDA soil textural classification: LS, loam sand;
SIL: silt loam; SI: silt.
Other abbreviations: ig: ignimbrite, pf: pumice fall, sf: scoria fall,
pls: paleosol, sl: soil, Ks: saturated hydraulic conductivity; Sf:
effective suction at the wetting front; /: soil porosity; hi: initialwater content.
Fig. 11. Typical stratigraphic relationship between the pumice-fall
layer (PF) and paleosols (Pls). Section TV21. Scale: 60 cm.
L. Capra et al. / Engineering Geology 69 (2003) 359–379372

wetting front, which separates the wet and unwet
zones. The integrated form that describes the infiltra-
tion rate is:
Ksðt � tp � tpVÞ ¼ F � Sf ð/ � hiÞln 1þ F
Sf ð/ � hiÞ
� �
ð1Þ
tp ¼Fp
Rð2Þ
Fp ¼Sf ð/ � hiÞ
RKs
� 1ð3Þ
where, Ks [L/T] is the saturated hydraulic conductiv-
ity; Sf [L] is the effective suction at the wetting front;
/ [L3/L3] is the soil porosity; hi [L3/L3] is the initial
water content; F [L] is the accumulated infiltration;
Fp [L] is the cumulative infiltration at time of
ponding; tp [T] is the time to surface pounding; tpV[T] is the time to infiltrate volume Fp; R [L] is the
rainfall rate.
Immediately prior to surface ponding, the infiltra-
tion rate is equal to the rainfall rate, and after finding
tp, Eq. (1) can be applied to determine the infiltration
rate (t). For layered soils, where the hydraulic con-
ductivity of the successive layer decreases with depth,
as the studied case (i.e., section TZ02), when the
wetting front enters the successive layer, Ks is set as
the harmonic mean Kh=(Ks1�Ks2)1/2 and the effective
suction at the wetting front is set equal to Sf of the
second layer.
As stated before, Ks to solve this problem is
obtained from pedo-transfer functions, and the other
infiltration parameters needed to apply Eqs. (1)–(3)
are deduced from theoretical tables (Rawls et al.,
1992). Table 4 lists the values used for each layer.
We used a constant rainfall rate of 40 mm/h, twice
the average of the total rainfall measured during
October 4 and 5, 1999. We applied this value
because the rainfall rates available are averages
computed over 24 h, whereas the abnormal rainfalls
accumulated during only a few hours. It is worth
mentioning that the rain started on September 30, and
Fig. 12. (a) Infiltration rate through section TZ22. (b) Stratigraphic sections showing the migration of the wetting front and the location of the
perched water table at different time intervals.
L. Capra et al. / Engineering Geology 69 (2003) 359–379 373

the layers were probably already partially saturated
on October 4. This implies that the calculated infil-
tration times are probably lower with respect to
reality. Despite this approximation, the model dem-
onstrates that the lowest, clay-rich paleosol that
separates the pumice/scoria-fall sequence from the
ignimbrite deposit corresponds to the hydraulic dis-
continuity where a water table begins to grow
upward, saturating the upper layers where positive
water pressure initiates.
Fig. 13. (a) Infiltration rate through section TZ02. (b) Stratigraphic sections showing the migration of the wetting front and the location of the
perched water table at different time intervals.
Table 4
Geotechnical parameters used to determine the Fs for sections TZ02 and TZ22
TZ22 TZ02b and c TZ02d TZ02d (multi-layer)
Min Max Min Max Min Max Min Max
cV(kPa) 0 0 0 0 0 0 0 0
/V(j) 35 40 35 40 35 40 35 40
ru 0.3 0.47 0.07 0.164 0.385 0.474 0.35 0.395
b (j) 28 40 28 40 28 40 28 40
cp (kN/m3) 10.7 13.7 9 13 9 13 11.86 14.36
z (m) 0.8 0.9 0.2 0.3 0.2 0.3 0.9 1
%Fs < 1 100 62 100 100
%Fs>1.3 0 1.23 0 0
Abbreviations: cV: cohesion; /: friction angle; ru: coefficient of interstitial pressure; b: slope angle; cp: pondered soil unit weight; z: sliding
surface depth.
L. Capra et al. / Engineering Geology 69 (2003) 359–379374

The infiltration model for section TZ22 (Fig. 12a
and b) shows that as soon as the wetting front reaches
the base of the paleosol TZ22c, the upper ashfall
horizon and the modern soil are already saturated
and positive pore pressure can trigger the slide.
According to the model, because the saturated
hydraulic conductivity of layers a and b are higher
than the rainfall rate, after only 24 h the wetting front
is on the limit between layers b and c. Here, after an
initial time of ponding of 1.11 h the wetting front
begins to move downward, reaching the base of layer
c after approximately 62 h.
Section TZ02 shows a different scenario, because
the ashfall layer rests on top of a multi-layer sequence
of paleosols, where the saturated hydraulic conduc-
tivity decreases downward. Based on the model (Fig.
13a and b), after 39 h the wetting front is at the base of
layer d with a rainfall excess of 609 mm, which means
that the upper sequence is almost completely saturated
and a slide can be triggered. According to the model,
after 7.5 h the wetting front is at the limit between
layer a and b (Ks of layer a is higher than the rainfall
rate; so, the rainfall rate is equal to the percolation
rate) and after a ponding time of 1.10 h it starts to
enter layer b. From the diagram of Fig. 13a, it is
possible to observe an important change of the infil-
tration rate migrating from layer c to layer d (corre-
sponding to a decrease from 23 to 16 mm/h) that
promotes the formation of a perched water table from
layer c and upward.
In the next section, we present a slope stability
analysis to determine whether or not under the
hydraulic conditions determined by this hydrological
model the slopes are in equilibrium.
8. Infinite slope-stability analysis
The hydrological model evidences that the clay-
rich paleosols constitute an important hydraulic
discontinuity over which a perched water table
forms. In this section we present infinite slope-
stability analyses for sections TZ22 and TZ02.
Because this method considers a homogenous layer
that slides over a failure surface parallel to the
slope, we consider that the ashfall cover slides on
the paleosol horizons, as observed in some of the
analyzed cases.
The geotechnical parameters such as friction angle
and unit weight of soil will be taken from previous
studies in which volcanic materials similar to those of
the Teziutlan area were tested. The authors fully
understand that these geotechnical parameters are
difficult to determine and that their accuracy under
particular pore-pressure and saturation conditions is
difficult to estimate. For example, it has been proved
that the inter- and intra-particle voids in pumice soils
determine their response to rainfall/ground water
conditions and that the usual in situ material phases
must be modified, as must the unit weight of the
materials, which will increase as the water penetrates
into them (Esposito and Guadagno, 1998). In addi-
tion, triaxial stress tests simulating rainfall infiltration
in volcanic slopes have evidenced an atypical volu-
metric behavior (Charles and Chiu, 2001). For the
present study, we used the values proposed by Amanti
et al. (2000) for the slope movement, which in 1999
affected the circum-Vesuvian areas of Italy, because
they fit to our model.
For the slope stability analysis we used a routine
based on the Monte-Carlo Method applied to the
general model of infinite slope (Eq. (4); Selby, 1993):
Fs ¼cVcz þ ðcos2b � ruÞtan/V
� �sinb cosb
ð4Þ
where, Fs is the factor of safety; b is the slope angle
(j); /Vis the friction angle (j); cVis the cohesion (kPa);c is the soil unit weight (kN/m3); z is the sliding
surface depth (m); and ru is the coefficient of inter-
stitial pressure where
ru ¼cwZiwXn
i¼1
ciZi þ cwZiw
ð5Þ
with 0.0 < ru < 0.5 for slopes not completely saturated;
Z =Si = 1n Zi is the total thickness of sliding layers; Ziw
is the saturated thickness of each single layer.
A computer program calculates approximately
6000 values of Fs, after the generation of random
values for each variable, using a uniform distribution
defined by lower and upper bounds. A frequency
analysis for the obtained sample of Fs, finally, gave
the percentage of cases for which the Fs is < 1.0 and
L. Capra et al. / Engineering Geology 69 (2003) 359–379 375

Fig. 14. Diagrams showing the frequency of the Fs value (PDF) and its cumulative frequency (CDF) for sections TZ22 (a) and TZ02 (b–d).
L. Capra et al. / Engineering Geology 69 (2003) 359–379376

>1.3 (where the limiting conditions for stability were
defined by Fs = 1.0 and, acceptable condition for
stability of natural slope was Fs>1.3). The range of
parameters used in the analysis is shown in Table 4.
Cohesion will be considered equal to zero because the
ashfall layers do not have clay fractions. Fig. 14
shows the results obtained from the simulation for
TZ22 and TZ02b sections.
Section TZ22 represents the simplest case observed
in the Teziutlan area, where an ashfall layer slides
directly on top of a paleosol. For this case, we
considered an interval of time between 48 and 62 h
that, based on the geohydrological model, corre-
sponds to a piezometric level ranging from 586 to
928 mm. Table 4 shows the parameters used, from
which we concluded that the Fs is always less than
unity (f 0.5) (Fig. 14a).
For section TZ02 we provided three different
scenarios. The first (Fig. 14b) is a slope stability
analysis in which the wetting front moves from layer
b through c, during a span of time from 12 to 21 h.
Here we considered that the sliding surface lies
between layers a and b (situation similar to section
TZ22). Under these conditions, the Fs is for the 62%
under unity (f 0.9) and higher than Fs = 1.3 for the
1.2% only (Fig. 14b). However, when the wetting
front reaches the base of layer d (second scenario),
after approximately 40 h, the ashfall layer is almost
completely saturated and the Fs is 100% less than
unity (f 0.4) (Fig. 14c).
In the third scenario (Fig. 14d), we approximated a
multi-layer situation with a sliding surface deeper than
the previous cases, at 1 m, where an ashfall layer
could be present. The results are interesting because
even in this case the Fs is always below unity
(f 0.5). This last example demonstrates the high
susceptibly of sliding even for deeper volcanic layers,
a really common situation in the studied area.
9. Hazard assessment
Two different types of mass-movement processes
were identified in the Teziutlan area. The Type 1 mass
movement produced on the ignimbrite deposit does not
result in debris flows, but only forms small detritus fans
at the base of the canyon walls, without reaching
human development. The only damage derived from
Type 1 flows is to roads that, because of their proximity
to the ravines, suffered from erosion, resulting in the
reduction of their width. In contrast, the debris flows
that originated from Type 2 mass movements were
responsible for deaths and destruction during the Octo-
ber 5, 1999, event. In fact, soil slides transformed into
highly mobile debris flows that buried human settle-
ments. Under this scenario, the area with the highest
susceptibility for formation of debris flows corre-
sponds to the distribution of the ashfall lithological
units, as delimited in Fig. 5. In particular, as resulted
from the slope-stability analysis, in areas with slopes
between 28j and 40j, where the ashfall layer lies on topof the clay-rich paleosols, the probability that the Fs is
below one unity (f 0.5) is almost always 100% for
rainfalls condition similar to those that occurred in
1999. From Fig. 5, one can deduce that important
human settlements can be threatened by debris flows
that, even if they are small in volume, can inflict serious
damage on a dense population and its infrastructures.
10. Conclusions
This work shows the importance of the study and
hazard assessment of mass movements in tropical
volcanic terrains, such as those of Mexico. The
1999 event on eastern Mexico demonstrated the high
susceptibility of these terrains to failure during intense
rainfall. The Teziutlan case is only a small example of
such phenomena that during 1999 affected several
Mexican states. Damage from landslides accounted
for 384 deaths; 66 people are missing; 212 municipal-
ities incurred damages; 39 rivers overflowed their
banks; and approximately 198,000 people and
48,000 houses were adversely affected to varying
degrees. Economic losses were massive; in the State
of Puebla alone, it is estimated that more than US$200
million will be needed for restoration of damaged
infrastructures (Vazquez-Conde et al., 2001).
The present study utilizes a simple model to
explain mass failure on incoherent volcanic terrains
but, at the same time, indicates that more quantitative
work is needed. Without understanding this type of
phenomenon it is impossible to prevent and mitigate a
catastrophe like the 1999 event, wherein as observed
here, after a period of 12–48 h of heavy rainfall, a soil
slide can occur.
L. Capra et al. / Engineering Geology 69 (2003) 359–379 377

Acknowledgements
This work was supported by the Instituto de
Geografıa, Universidad Nacional Autonima de Mex-
ico (UNAM), CONACYT-CNR project, and Civil
Protection of Puebla State, with special thanks to Prof.
G. Melgarejo. Dr. M. Abrams from the Jet Propulsion
Laboratory (California Institute of Technology) pro-
vided Landsat imagery. Dr. Renato Castro from
UNAM provided technical support during field work.
We appreciated the constructive revisions of Th. Van
Ash and R.L. Schuster, which substantially improved
this manuscript, and the valuable suggestions of K.M.
Scott and G.F. Wieczorek of the U.S. Geological
Survey for the final version.
References
Amanti, M., Chiessi, V., Conte, G., Pantaleone, A., Motteran, G.,
Pantaloni, M., Ventura, R., 2000. Rapporto preliminare relativo
agli eventi idrogeologici che hanno colpito nei giorni 15 e 16
Dicembre del 1999, i comuni di Cervinara e S. Martino in Valle
Caudina in provincia di Avellino. Servizio Geologico d’Italia
(http://www.dstn.it/sgn/u_geoapp/cervinara.htm). 15 pp.
Brakensiek, D.L., Rawls, W.J., Stephenson, G.R., 1984. Modifying
SCS hydrologic soil groups and curve numbers for rangeland
soils. American Society of Agricultural Engineers (Paper No.
PNR-84-203, St. Joseph, Michigan).
Campbell, R.H., 1975. Soil slips, debris flows, and rainstorms in the
Santa Monica Mountains and vicinity, southern California. U.S.
Geological Survey Professional Paper 851, 51.
Charles, W.W., Chiu, A.C.F., 2001. Behaviour of a loosely com-
pacted unsaturated volcanic soil. Journal of Geotechnical and
Geoenvironmental Engineering 127, 1027–1036.
CNR-IGES, 2001. PEDON-SEI: Pedotransfer Functions for Esti-
mating Hydraulic Soil Parameters. http://www.area.fi.cnr.it/iges/
software.htm.
Cruden, D.M., Varnes, D.J., 1996. Landslide types and processes.
In: Turner, A.K., Schuster, R.L. (Eds.), Landslides—Investiga-
tion and Mitigation. Special Report - U.S. National Research
Council, Transportation Research Board, vol. 247, pp. 36–75.
Washington, D.C.
Esposito, L., Guadagno, F.M., 1998. Some special geotechnical
properties of pumice deposits. Bulletin of Engineering Geology
and the Environment 57, 41–50.
Ferriz, H., 1985. Zoneamiento composicional y minarologico en los
productos eruptivos del centro volcanico de Los Humeros, Pue-
bla, Mexico. Geofısica Internacional 25 (1), 97–158.
Ferriz, H., Mahood, G.A., 1984. Eruption rates and compositional
trends at Los Humeros volcanic center, Puebla, Mexico. Journal
of Geophysical Research B89, 8511–8524.
Green, W.H., Ampt, G.A., 1911. Studies on soil physics: 1. The
flow of air and water throughout soils. Journal of Agricultural
Science 4, 1–12.
Iverson, R.M., 1997. The physics of debris flows. Reviews of Geo-
physics 35 (3), 245–296.
Iverson, R.M., Reid, M.E., LaHusen, R.G., 1997. Debris-flow mo-
bilization from landslides. Annual Reviews in Earth and Plane-
tary Sciences 25, 85–138.
Johnson, A.M., 1984. Debris flow. In: Brunsden, D., Prior, D.B.
(Eds.), Slope Instability. Wiley, Chichester, pp. 257–361.
Lalibert, G.E., Brooks, R.H., Corey, A.T., 1968. Permeability cal-
culated from the saturation data. Journal of the Irrigation and
Drainage Division, Proc. ASCE 94, 57–69.
Lugo-Hubp, J., Vazquez-Conde, M.T., Melgarejo-Palafox, G.,
Garcıa-Jimenez, F., Matias-Ramirez, G., 2001. Procesos grav-
itacionales en las montagnas e Puebla. Ciencias y Desarrollo
27, 24–33.
Mein, R.G., Larson, C.L., 1973. Modeling infiltration during steady
rain. Water Resources Research 9 (2), 384–394.
Neall, V.E., 1975. Climate-controlled tephra redeposition on Poua-
kai ring plain, Taranaki, New Zealand. New Zealand Journal of
Geology and Geophysics 18 (2), 317–326.
Pareschi, M.T., Favalli, M., Giannini, F., Sulpizio, R., Zanchetta,
G., Santacroce, R., 2000. May 5, 1998, debris flows in circum-
Vesuvian areas (southern Italy): insights for hazard assessment.
Geology 28 (7), 639–642.
Parfitt, R.L., Wilson, A.D., 1985. Estimation of allophane and hal-
loysite in three sequences of volcanic soils, New Zealand. In:
Fernandez Caldas, E., Yaalon Dan, H. (Eds.), Volcanic Soils.
Catena Supplement, pp. 1–8.
Pettapiece, W.W., Pawluck, S., 1972. Clay mineralogy of soils
developed partially from volcanic ash. Soil Science Society of
America Journal 36, 515–519.
Phillips, C.J., Davies, T.R.H., 1991. Determining rheological pa-
rameters of debris flow material. Geomorphology 4, 101–110.
Pla Sentıs, I., 1997. A soil water balance model for monitoring soil
erosion processes and effects on steep lands in the tropics. Soil
Technology 11, 17–30.
Quintas, L., 2000. EricII, documentacion de la base de datos
climatologica y del programa extractos. Instituto Mexicano
de Tecnologıa del Agua, Mexico. 23 pp. and CD-ROM. ISBN
968-7417404.
Rawls, W.J., Ahuja, L.R., Brakensiek, D.L., Shirmohammadi, A.,
1992. Infiltration and soil water movement. In: Maidment, D.R.
(Ed.), Handbook of Hydrology. McGraw-Hill, New York, pp.
5.1–5.51.
Reddi, L.N., Wu, T.H., 1991. Probabilistic analysis of ground-water
levels in hillside slopes. Journal of Geotechnical Engineering
117, 872–890.
Reid, M.E., Nielsen, H.P., Dreiss, S.J., 1988. Hydrologic factors
triggering a shallow hillslope failure. Bulletin of the Association
of Engineering Geologists 25, 349–361.
Scott, K.M., Kerle, N., Macias, J.L., Strauch, W., Devoli, G., 2003.
Catastrophic precipitation-triggered lahars at Casita Volcano, Ni-
caragua—flow transformations, flow bulking, and future mitiga-
tion strategies. Geological Society of America Bulletin (in press).
Selby, M.J., 1993. Hillslope Materials and Processes, 2nd ed. Ox-
ford Univ. Press, Oxford. 451 pp.
L. Capra et al. / Engineering Geology 69 (2003) 359–379378

Sheridan, M.F., Bonnard, C., Carreno, C., Siebe, C., Strauch, W.,
Navarro, M., Calero, J.C., Trujilo, N.B., 1999. Report on the 30
October 1998 rock fall/avalanche and breakout blow of Casita
Volcano, Nicaragua, triggered by Hurricane Mitch. Landslide
News 12, 2–4.
Shimokawa, E., Jitozono, T., Takano, S., 1989. Periodicity of shal-
low landslide on Shirasu steep slopes and prediction of potential
landslide sites. Transactions of the Japanese Geomorphological
Union 10, 267–284.
Terlien, M.T.J., 1997. Hydrological landslide triggering in ash-cov-
ered slopes of Manizales (Colombia). Geomorphology 20,
165–175.
Van Asch, T.W.J., Buma, J., Van Beek, L.P.H., 1999. A view on
some hydrological triggering systems in landslides. Geomor-
phology 30, 25–32.
Varnes, D.J., 1978. Slope movement types and processes. In:
Schuster, R.L., Krizek, R.J. (Eds.), Landslides—Analysis and
Control. Special Report - U.S. National Research Council,
Transportation Research Board, vol. 176, pp. 11–33.
Vazquez-Conde, M.T., Lugo, J., Matıas, L.G., 2001. Heavy rainfall
effects in Mexico during early October 1999. In: Gruntfest, E.,
Handmer, J. (Eds.), Coping with Flash Floods. Kluwer Academic
Publishers, Netherlands, pp. 289–299.
Wosten, J.H.M., Paschepsky, Y.A., Rawls, W.J., 2001. Pedotransfer
functions: bridging the gap between available basic soil data and
missing soil hydraulic characteristics. Journal of Hydrology 251,
123–150.
Yokota, S., Iwamatsu, A., 1999. Weathering distribution in a steep
slope of soft pyroclastic rocks as an indicator of slope instability.
Engineering Geology 55, 57–68.
L. Capra et al. / Engineering Geology 69 (2003) 359–379 379


