Embed Size (px)
Citation preview
SENSOR PLATFORM OPTIMIZATION AND SIMULATION FOR SURVEILLANCE OF LARGE SCALE TERRAINS
Cagatay Undeger
Modeling and Simulation Section Defense Technologies Engineering Inc.
Ankara, Turkey
Murat Balci, Sertan Girgin, Volkan Koc, Faruk Polat
Modeling and Simulation Center Middle East Technical University
Ankara, Turkey
Sukru Bilir, Ziya Ipekkan Scientific Decision Support Center
Turkish General Staff, HQ 06100 Ankara, Turkey
ABSTRACT
Surveillance of large terrains using limited sensor capabilities is a challenging task in many military applications. In this paper, we present a new method to determine the number, type and location of sensor platform systems to effectively cover a large terrain, which is composed of areas of varying importance. A sensor platform system is an integrated system that consists of a platform (human, jeep, aircraft, etc.) and one or more sensors (day-tv, infra-red, radar, etc.) integrated to that platform. The objective in the optimization is twofold: first, determine locations of a given set of sensor platform systems in order to effectively cover areas in accordance with importance. Second, determine the number, type and locations of sensor platform systems to effectively cover the terrain. We developed a genetic algorithm to solve this optimization problem. In the optimization, user may specify a budget and the tool may be run to determine the number, type and locations of the sensor platform systems within this budget to maximize effective coverage as much as possible. Alternatively the tool may be run to guarantee a predefined effectiveness measure concerning coverage, minimizing total cost of sensor platform systems. In order to simulate optical sensors and radars, we developed a generic probabilistic sensor model, which is based on line-of sight and ray tracing. This stochastic modeling allows us to simulate detection, recognition and identification capabilities of different types of sensors on high-resolution terrains. The next part of that study is a distributed human in the loop simulation, which is developed to demonstrate the usage of the sensor platforms under the control of a tactical level control center. To perform the simulation, a tactical command center, an HLA compliant physical radar simulator, a number of sensor platform consoles and semi-automated agents are developed.
ABOUT THE AUTHORS
Cagatay Undeger received his B.Sc. degree from Kocaeli University, Turkey in 1998 and went to the Department of Computer Engineering, Middle East Technical University, where he has worked as a research assistant and obtained his M.S. degree in 2001. He is currently doing his Ph.D. in the same university and studying on Modeling and Simulation within Defense Technologies Engineering Inc.
Faruk Polat is an associate professor in the Department of Computer Engineering of Middle East Technical University, Ankara, Turkey. He received his B.Sc. in computer engineering from the Middle East Technical University, Ankara, in 1987 and his M.S. and Ph.D. degrees in computer engineering and information science from Bilkent University, Ankara, in 1989 and 1993 respectively. He conducted research as a visiting NATO science scholar at Computer Science Department of University of Minnesota, Minneapolis in 1992-93. His research interests include artificial intelligence, multi-agent systems and object oriented data models.
Lt.Col.Ziya Ipekkan is currently the Force Structure Analyses Team Leader in Scientific Decision Support Center of Turkish General Staff, Ankara, The Republic of Turkey. He received his B.Sc. in electronic engineering from War College, Ankara, in 1981 and his M.Sc. degree in operations research from Naval PostGraduate School, Monterey, CA, USA in 1989.
SENSOR PLATFORM OPTIMIZdATION AND SIMULATION FOR SURVEILLANCE OF LARGE SCALE TERRAINS
Cagatay Undeger
Modeling and Simulation Section Defense Technologies Engineering Inc.
Ankara, Turkey
Murat Balci, Sertan Girgin, Volkan Koc, Faruk Polat
Modeling and Simulation Center Middle East Technical University
Ankara, Turkey
Sukru Bilir, Ziya Ipekkan Scientific Decision Support Center
Turkish General Staff, HQ 06100 Ankara, Turkey
INTRODUCTION
In recent years, genetic algorithms (see Goldberg, 1989, Allenson, 1992, Beasley, Bull & Martin, 1993, Ahuja, Orlin & Tiwari, 1995) have been successfully applied to many different domains such as radio frequency planning, path planning, mission planning, scheduling, electronic circuit designing, time-tabling, etc. The great attention on genetic algorithms is because of its applicability to many different domains, weak algorithmic dependence to the problem parameters, robustness and successful results gained on many applied problems so far.
The genetic algorithm is chosen for the optimization due to the advantages mentioned above. At first the factors affecting the problem are determined. Later on, the representation for the terrain, atmosphere, sensors, platforms and integrated sensor platform systems are designed. An efficient terrain coverage analysis algorithm, which is a derivation of viewshed algorithms (see Franklin & Ray, 1994a, Franklin, Ray & Mehta, 1994b) is developed and implemented in order to compute the effectiveness of a given state (a set of integrated sensor platforms and their locations). And finally two optimization algorithms; location optimization and cost/effectiveness optimization, are developed on top of the virtual environment designed.
The location optimization module gets 4 main inputs; the virtual environment, available sensor platform system types and their parameters, location constraints and a set of sensor platform systems whose locations are going to be optimized. At the end of optimization, best locations of the given sensor platform systems are found.
The cost/effectiveness optimization module gets 5 main inputs; the virtual environment, available sensor platform system types and their parameters, location constraints, the optimization objective and budget or effectiveness limit (depending on the objective). There are two optimization objectives, which are effectiveness optimization and cost optimization. In the effectiveness optimization mode, we have a fixed budget, and we want to maximize the effectiveness of the sensor
platform systems within that budget. In the cost optimization mode, we need the effectiveness about a given amount, and we want to minimize the cost while getting the desired effectiveness. At the end, the number of sensor platforms needed from each type and their best locations are found.
RELATED WORK
Although sensor location optimization over large terrains is a crucial need for the military domains, it is a hard problem and there is not much work published in the literature.
Franklin et al (1994b) studied on optimal placing of observers, and worked on 1-D or 2-D terrains where heights are given at the vertices of regular grids. His objective was to find the minimum number of the observers and their locations such that each point of the terrain is visible from at least one observer. He proposed a greedy algorithm to solve the mentioned problem, which is a special case of the well-known set-covering problem (NP-complete). Although the problem is similar to the one we have focused on, the major difference is that we do not need to cover all the terrain, because the terrain is very mountainous and the cost of covering all the terrain is unacceptably high. Also a straightforward greedy algorithm does not work well on such a mountainous terrain having many local optimums.
In 1998, Kewley and Embrechts developed a fuzzy-genetic algorithm to position military combat units for optimum performance. Their objective was not to maximally cover the terrain, but to successfully complete a tactical mission in a battle, so a simulation model to evaluate solutions, and a fuzzy logic module to map simulation outputs to a single fitness value is developed to work with GA. In the study, they used random selection, steady-state replacement (50% replacement with poorest half of the old population), and a bit-flip mutation with a mutation rate of 0.02. The reason of using the above form of genetic algorithm was to make the GA less sensitive to the fluctuations in fitness, which is computed stochastically. They stated
that the developed fuzzy-genetic system outperformed a human expert during a simulated battle.
In 1998, Rabinkin proposed a two-step sound source location optimization algorithm for optimum sensor placement on microphone arrays. In the first step, time delay of arrival (TDOA) estimates for selecting microphone pairs are determined using a modified version of the Omologo-Svaizer cross-power spectrum phase expression. In the second step, the TDOA estimates are used in a least-mean-squares gradient descent search algorithm to obtain location estimates. Also robotics and computer vision communities are studying a similar problem called sensor planning to locate the sensors on a robot to enhance its navigation capabilities in a closed environment (see Briggs & Donald, 1996, Stamos & Allen, 1998). These researches mostly focus on small, closed environments such as offices, houses, laboratories, and the objective of the optimization is to collect as much information as possible about the surrounding environment.
A similar problem, the antenna-positioning for radio network planning, was studied by Michel Vasquez and Jin-Kao Hao, in 2000. They developed a tabu search algorithm to find a set of good sites for antennas from a set of pre-defined candidate sites, and for each selected site, to determine the number and types of antennas, as well as the associated values for each of the antenna parameters. Their proposed approach was composed of three phases: a constraint-based pre-processing phase to filter out bad configurations, an optimization phase using tabu search, and a post-optimization phase to improve solutions given by tabu search. To validate the approach, the computational results were presented using large and realistic data sets.
In 2001, Kim and Clarke studied new spatial optimization techniques to carry out a visibility analysis on topological surfaces in GIS, which searches for the best viewpoint or site locations. Their paper was aiming on comparison of four developed algorithms: an extensive iterative search technique; a Tornqvist based
search algorithm as conventional spatial solution algorithms; genetic algorithms; and simulated annealing techniques as newer spatial search techniques. The performance of the four solution techniques was compared using a visibility site selection problem. As a result of the experiments, they observed that the genetic algorithm always outperforms the other methods, the simulated annealing algorithm shows its algorithmic consistency over the two conventional methods by the standard deviation values, and even if there is a poor starting configuration for the genetic algorithm or simulated annealing they can generate good solutions.
In 2000, Can proposed a meta-heuristics based on genetic algorithms. The algorithm was focusing on optimizing the locations of a given set of sensor platform systems on large terrains. A part of our paper improves the work of Can. In addition, the developed genetic algorithm also supports selecting the optimum number of sensor platform systems and their locations according to the given constraints such as budget, effectiveness.
ENVIRONMENT REPRESENTATION
To perform the optimization in the right manner, the real world must be represented in a computer-generated world (virtual environment) as realistically as possible. So the virtual environment is defined using terrain elevations, satellite images, surface slopes, surface materials and atmospheric conditions.
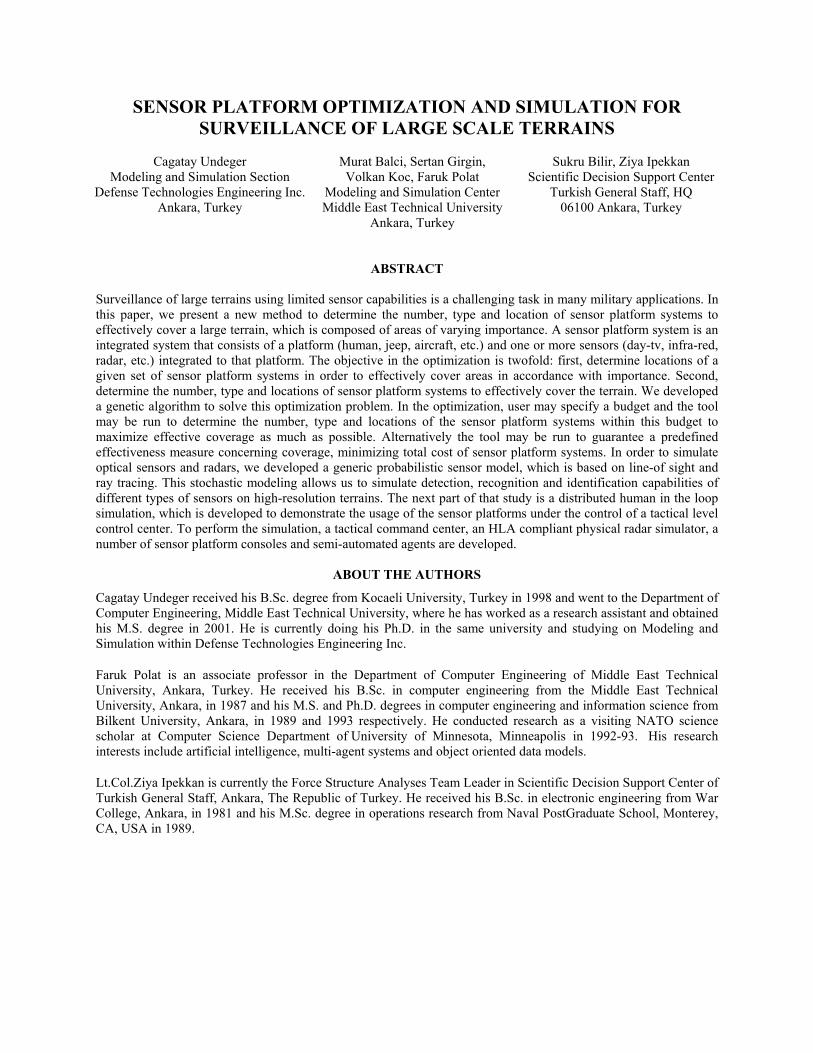
The 3D model of the terrain is loaded from high resolution DEM (Digital Elevation Model) or DTED (Digital Terrain Elevation Data) files (see USGS National Mapping Information, 1998, National Imagery and Mapping Agency, 1999), and stored in a 2D matrix (height fields) that contains elevations (elevations from sea level) of equally distanced samples on the terrain. After loading the height fields, the slope magnitudes and directions are computed for each rectangular surface. A surface is defined by the elevations of its four corners (see Figure 1).
Figure 1. Height fields (left) and slope information of a surface (right)
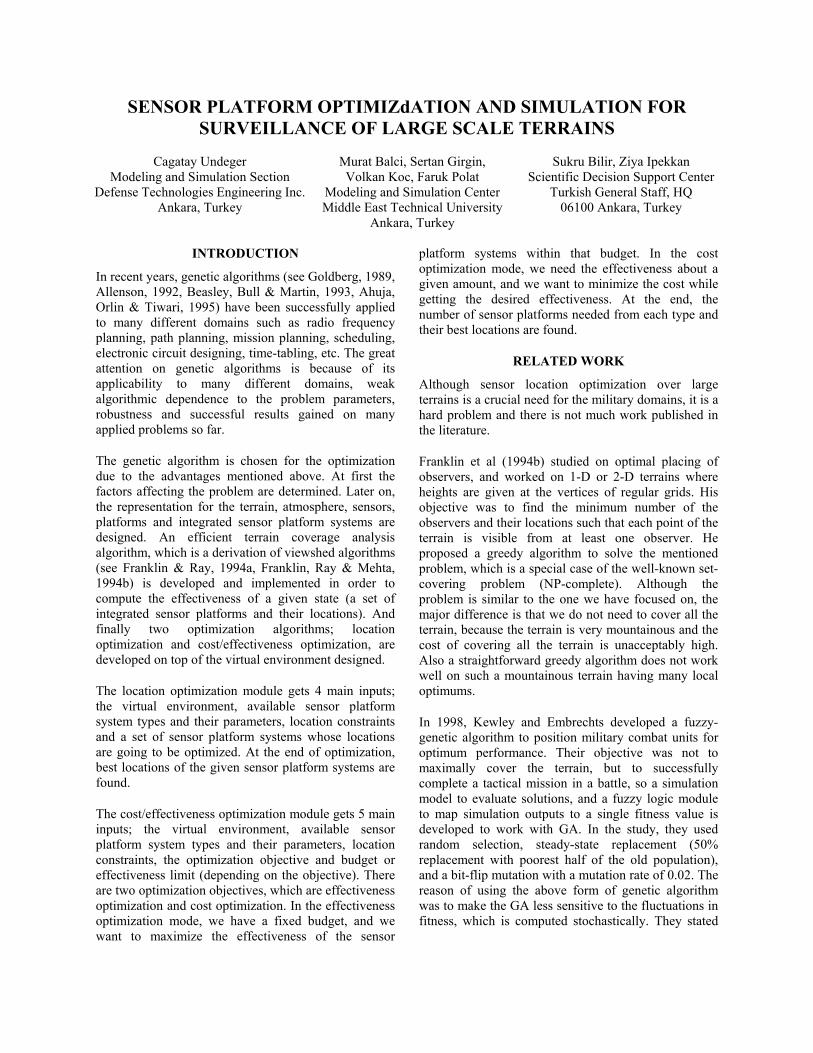
After loading the 3D model, high-resolution satellite images are mapped on the terrain, and by analyzing these images; materials such as water, soil, rock etc. are assigned to the surfaces of the terrain. Finally the atmospheric conditions are defined in detail using statistics of recent years. The visualization of slope magnitudes, slope directions and surface materials are shown in Figure 2.
Figure 2. Visualization of slope magnitudes, slope directions and surface materials
Location Constraints
Location constraints are very important for simulating real world, because sensor platform systems cannot be located at every coordinate on the terrain. For instance,
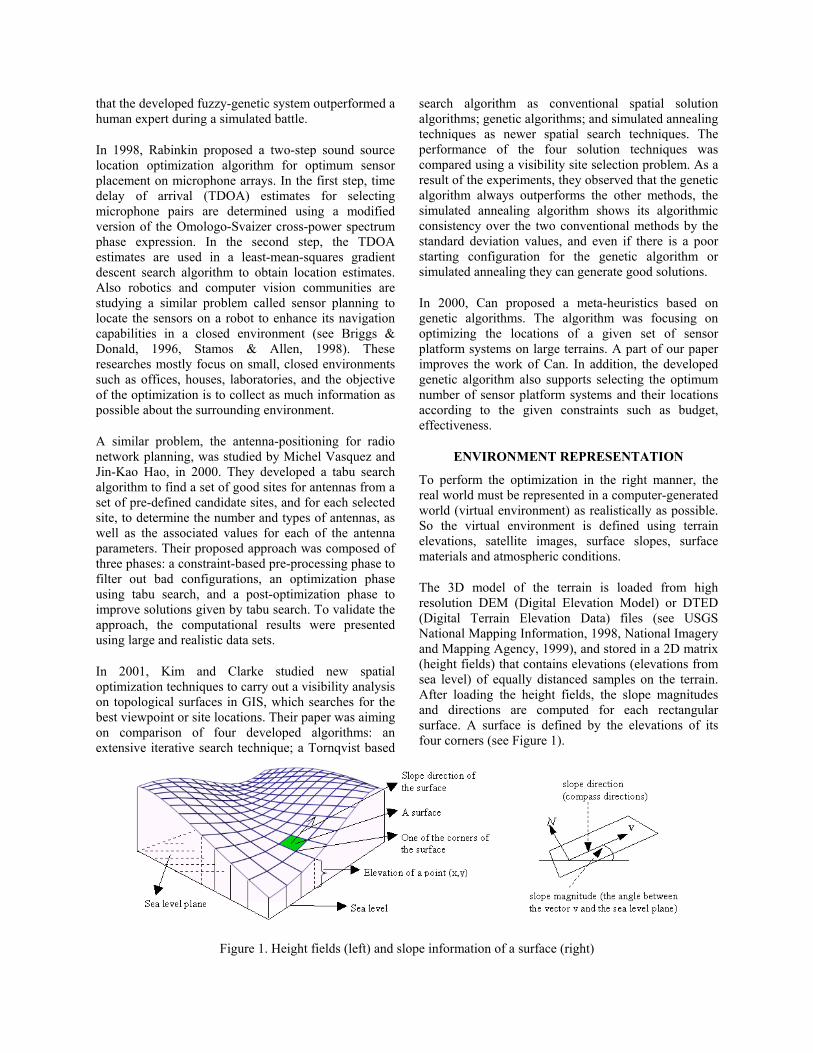
it is not feasible to locate a land platform on a river, on a cliff or outside of the country boundary. To prevent locating platforms at infeasible locations, special set of constraints such as slope, elevation limits, is defined for each sensor platform system type. Although these parameters determine the performance differences among the sensor platform system types, they are not enough to describe conceptual differences such as area of responsibility, being inside of the country boundary etc. So a matrix having same size as the height field matrix is generated to define the global location constraints, which are entered manually by the user or by a set of analysis functions (analysis of point, line, area, features, ridges, cliffs, boundaries etc.). This matrix is called location availability matrix and illustrated in Figure 3.
Figure 3. Location availability matrix
Region Importance
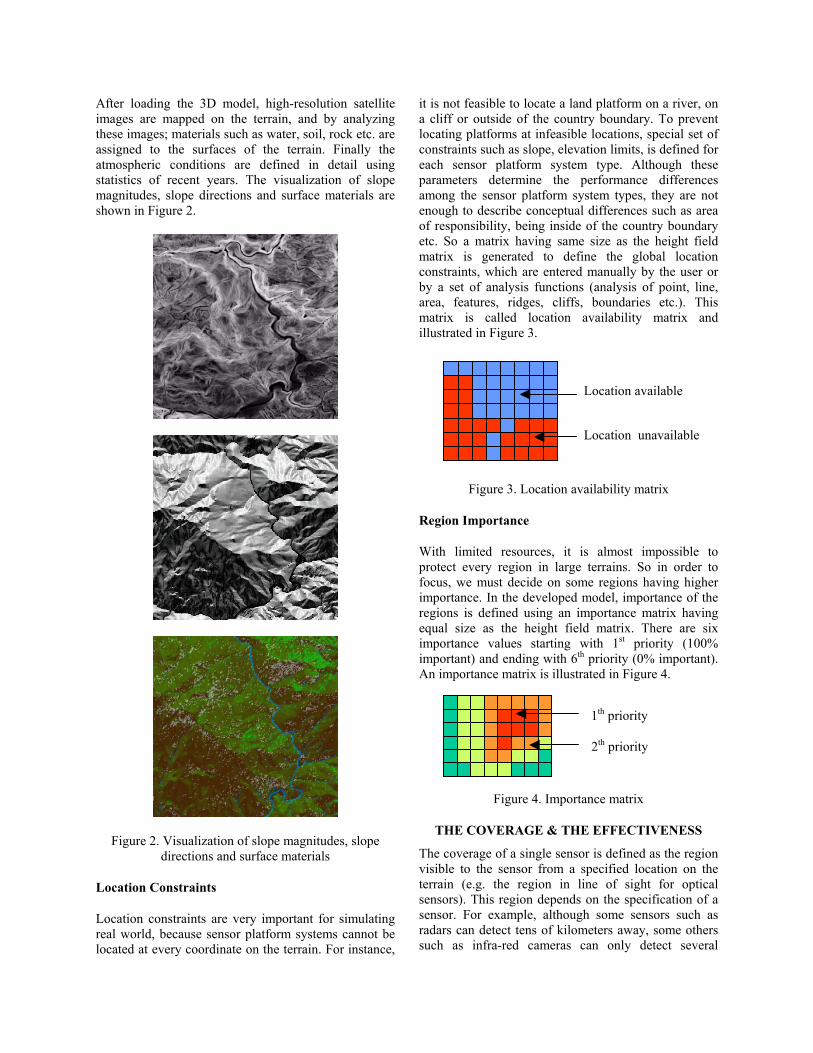
With limited resources, it is almost impossible to protect every region in large terrains. So in order to focus, we must decide on some regions having higher importance. In the developed model, importance of the regions is defined using an importance matrix having equal size as the height field matrix. There are six importance values starting with 1st priority (100% important) and ending with 6th priority (0% important). An importance matrix is illustrated in Figure 4.
Figure 4. Importance matrix
THE COVERAGE & THE EFFECTIVENESS
The coverage of a single sensor is defined as the region visible to the sensor from a specified location on the terrain (e.g. the region in line of sight for optical sensors). This region depends on the specification of a sensor. For example, although some sensors such as radars can detect tens of kilometers away, some others such as infra-red cameras can only detect several
Location available
Location unavailable
1th priority
2th priority
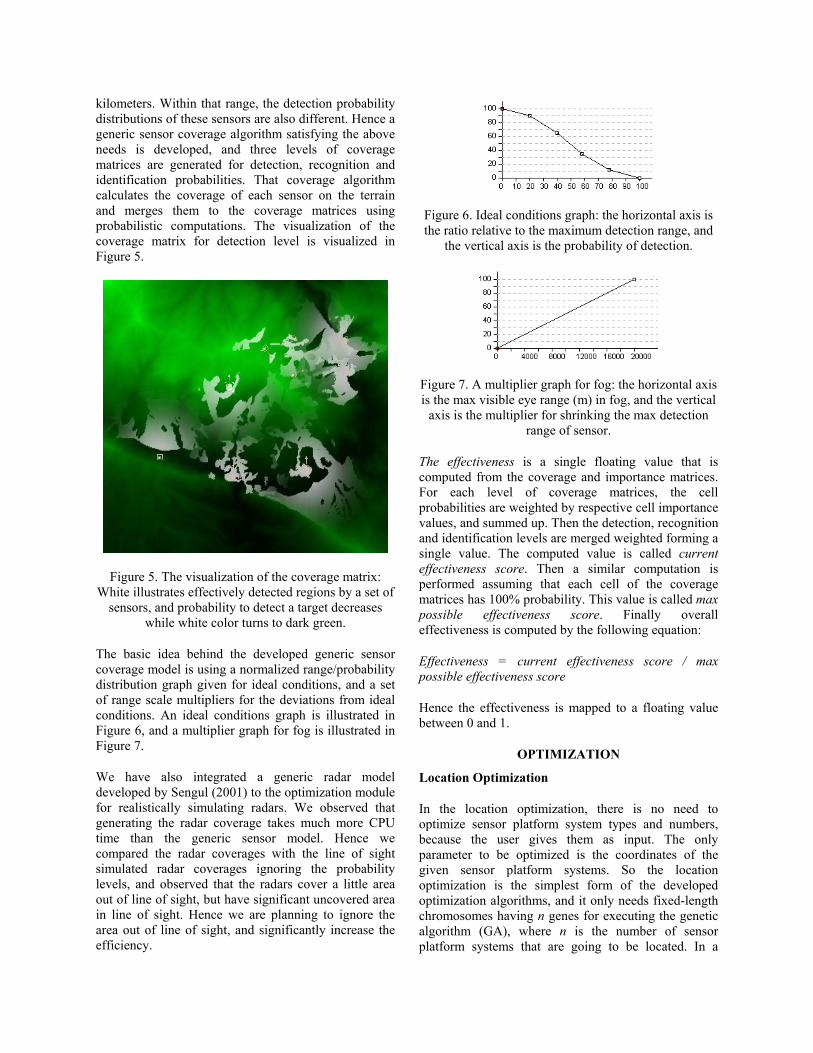
kilometers. Within that range, the detection probability distributions of these sensors are also different. Hence a generic sensor coverage algorithm satisfying the above needs is developed, and three levels of coverage matrices are generated for detection, recognition and identification probabilities. That coverage algorithm calculates the coverage of each sensor on the terrain and merges them to the coverage matrices using probabilistic computations. The visualization of the coverage matrix for detection level is visualized in Figure 5.
Figure 5. The visualization of the coverage matrix: White illustrates effectively detected regions by a set of
sensors, and probability to detect a target decreases while white color turns to dark green.
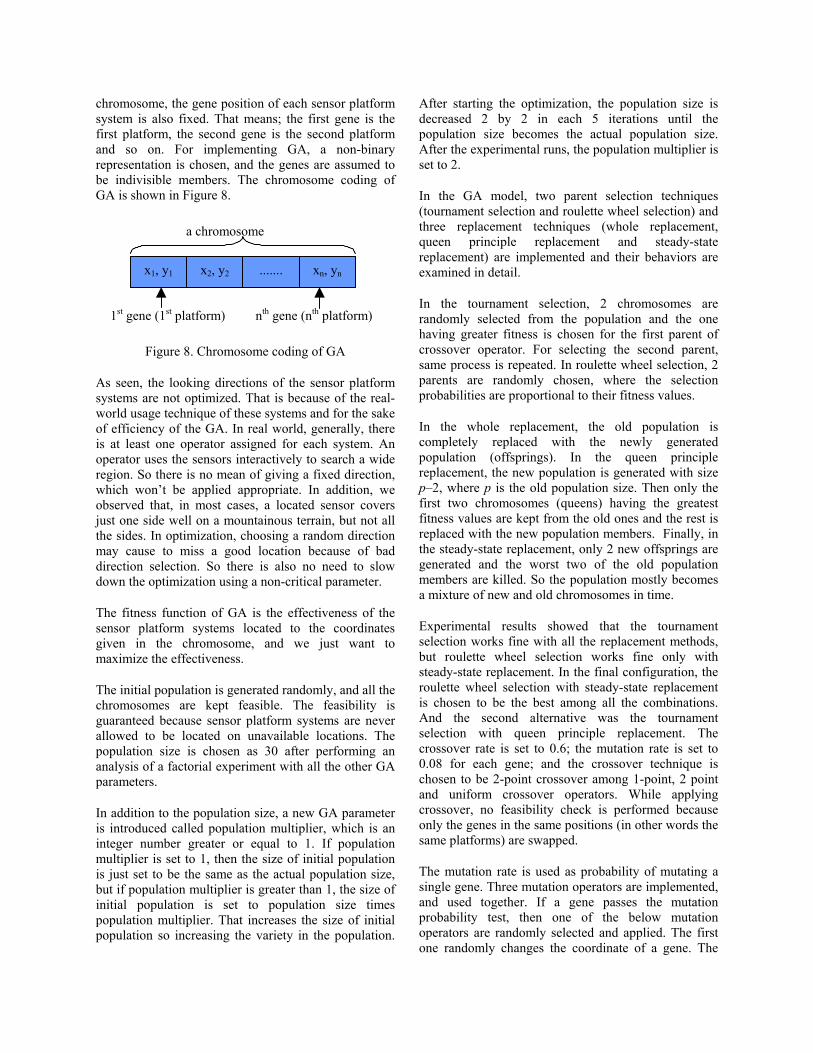
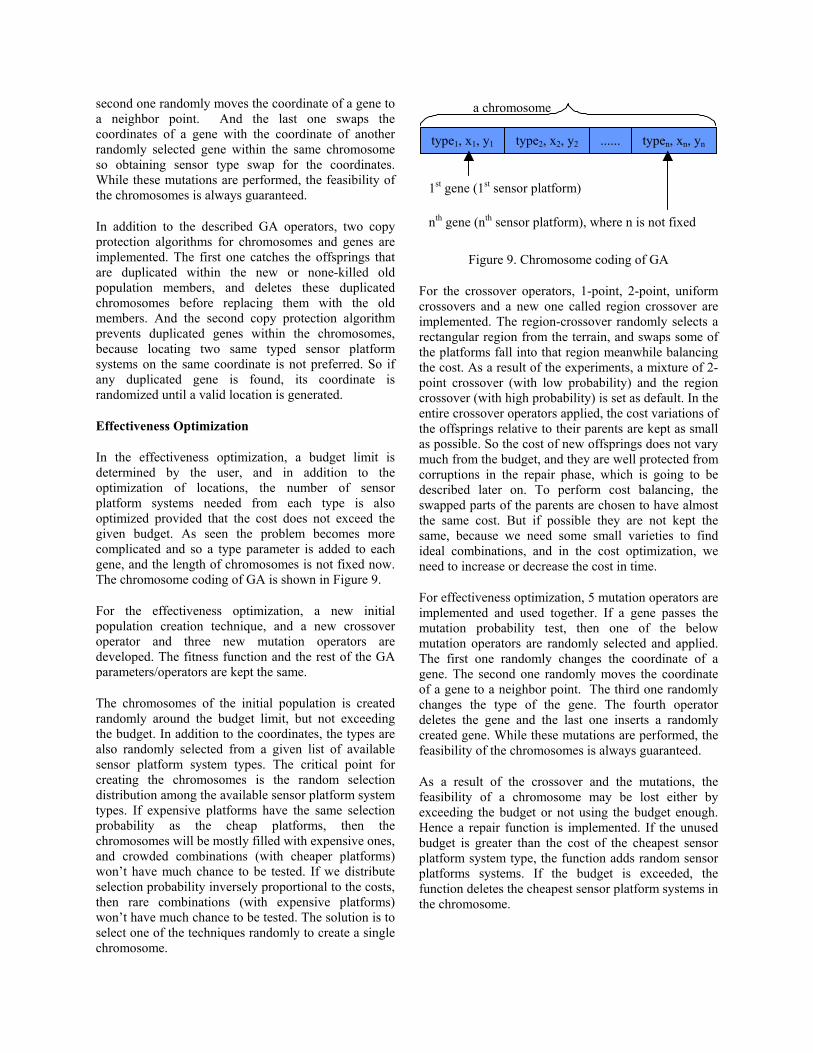
The basic idea behind the developed generic sensor coverage model is using a normalized range/probability distribution graph given for ideal conditions, and a set of range scale multipliers for the deviations from ideal conditions. An ideal conditions graph is illustrated in Figure 6, and a multiplier graph for fog is illustrated in Figure 7.
We have also integrated a generic radar model developed by Sengul (2001) to the optimization module for realistically simulating radars. We observed that generating the radar coverage takes much more CPU time than the generic sensor model. Hence we compared the radar coverages with the line of sight simulated radar coverages ignoring the probability levels, and observed that the radars cover a little area out of line of sight, but have significant uncovered area in line of sight. Hence we are planning to ignore the area out of line of sight, and significantly increase the efficiency.
Figure 6. Ideal conditions graph: the horizontal axis is the ratio relative to the maximum detection range, and
the vertical axis is the probability of detection.
Figure 7. A multiplier graph for fog: the horizontal axis is the max visible eye range (m) in fog, and the vertical
axis is the multiplier for shrinking the max detection range of sensor.
The effectiveness is a single floating value that is computed from the coverage and importance matrices. For each level of coverage matrices, the cell probabilities are weighted by respective cell importance values, and summed up. Then the detection, recognition and identification levels are merged weighted forming a single value. The computed value is called current effectiveness score. Then a similar computation is performed assuming that each cell of the coverage matrices has 100% probability. This value is called max possible effectiveness score. Finally overall effectiveness is computed by the following equation:
Effectiveness = current effectiveness score / max possible effectiveness score
Hence the effectiveness is mapped to a floating value between 0 and 1.
OPTIMIZATION
Location Optimization
In the location optimization, there is no need to optimize sensor platform system types and numbers, because the user gives them as input. The only parameter to be optimized is the coordinates of the given sensor platform systems. So the location optimization is the simplest form of the developed optimization algorithms, and it only needs fixed-length chromosomes having n genes for executing the genetic algorithm (GA), where n is the number of sensor platform systems that are going to be located. In a
chromosome, the gene position of each sensor platform system is also fixed. That means; the first gene is the first platform, the second gene is the second platform and so on. For implementing GA, a non-binary representation is chosen, and the genes are assumed to be indivisible members. The chromosome coding of GA is shown in Figure 8.
Figure 8. Chromosome coding of GA
As seen, the looking directions of the sensor platform systems are not optimized. That is because of the real-world usage technique of these systems and for the sake of efficiency of the GA. In real world, generally, there is at least one operator assigned for each system. An operator uses the sensors interactively to search a wide region. So there is no mean of giving a fixed direction, which won’t be applied appropriate. In addition, we observed that, in most cases, a located sensor covers just one side well on a mountainous terrain, but not all the sides. In optimization, choosing a random direction may cause to miss a good location because of bad direction selection. So there is also no need to slow down the optimization using a non-critical parameter.
The fitness function of GA is the effectiveness of the sensor platform systems located to the coordinates given in the chromosome, and we just want to maximize the effectiveness.
The initial population is generated randomly, and all the chromosomes are kept feasible. The feasibility is guaranteed because sensor platform systems are never allowed to be located on unavailable locations. The population size is chosen as 30 after performing an analysis of a factorial experiment with all the other GA parameters.
In addition to the population size, a new GA parameter is introduced called population multiplier, which is an integer number greater or equal to 1. If population multiplier is set to 1, then the size of initial population is just set to be the same as the actual population size, but if population multiplier is greater than 1, the size of initial population is set to population size times population multiplier. That increases the size of initial population so increasing the variety in the population.
After starting the optimization, the population size is decreased 2 by 2 in each 5 iterations until the population size becomes the actual population size. After the experimental runs, the population multiplier is set to 2.
In the GA model, two parent selection techniques (tournament selection and roulette wheel selection) and three replacement techniques (whole replacement, queen principle replacement and steady-state replacement) are implemented and their behaviors are examined in detail.
In the tournament selection, 2 chromosomes are randomly selected from the population and the one having greater fitness is chosen for the first parent of crossover operator. For selecting the second parent, same process is repeated. In roulette wheel selection, 2 parents are randomly chosen, where the selection probabilities are proportional to their fitness values.
In the whole replacement, the old population is completely replaced with the newly generated population (offsprings). In the queen principle replacement, the new population is generated with size p–2, where p is the old population size. Then only the first two chromosomes (queens) having the greatest fitness values are kept from the old ones and the rest is replaced with the new population members. Finally, in the steady-state replacement, only 2 new offsprings are generated and the worst two of the old population members are killed. So the population mostly becomes a mixture of new and old chromosomes in time.
Experimental results showed that the tournament selection works fine with all the replacement methods, but roulette wheel selection works fine only with steady-state replacement. In the final configuration, the roulette wheel selection with steady-state replacement is chosen to be the best among all the combinations. And the second alternative was the tournament selection with queen principle replacement. The crossover rate is set to 0.6; the mutation rate is set to 0.08 for each gene; and the crossover technique is chosen to be 2-point crossover among 1-point, 2 point and uniform crossover operators. While applying crossover, no feasibility check is performed because only the genes in the same positions (in other words the same platforms) are swapped.
The mutation rate is used as probability of mutating a single gene. Three mutation operators are implemented, and used together. If a gene passes the mutation probability test, then one of the below mutation operators are randomly selected and applied. The first one randomly changes the coordinate of a gene. The
x1, y1 x2, y2 ....... xn, yn
1st gene (1st platform)
a chromosome
nth gene (nth platform)
second one randomly moves the coordinate of a gene to a neighbor point. And the last one swaps the coordinates of a gene with the coordinate of another randomly selected gene within the same chromosome so obtaining sensor type swap for the coordinates. While these mutations are performed, the feasibility of the chromosomes is always guaranteed.
In addition to the described GA operators, two copy protection algorithms for chromosomes and genes are implemented. The first one catches the offsprings that are duplicated within the new or none-killed old population members, and deletes these duplicated chromosomes before replacing them with the old members. And the second copy protection algorithm prevents duplicated genes within the chromosomes, because locating two same typed sensor platform systems on the same coordinate is not preferred. So if any duplicated gene is found, its coordinate is randomized until a valid location is generated.
Effectiveness Optimization
In the effectiveness optimization, a budget limit is determined by the user, and in addition to the optimization of locations, the number of sensor platform systems needed from each type is also optimized provided that the cost does not exceed the given budget. As seen the problem becomes more complicated and so a type parameter is added to each gene, and the length of chromosomes is not fixed now. The chromosome coding of GA is shown in Figure 9.
For the effectiveness optimization, a new initial population creation technique, and a new crossover operator and three new mutation operators are developed. The fitness function and the rest of the GA parameters/operators are kept the same.
The chromosomes of the initial population is created randomly around the budget limit, but not exceeding the budget. In addition to the coordinates, the types are also randomly selected from a given list of available sensor platform system types. The critical point for creating the chromosomes is the random selection distribution among the available sensor platform system types. If expensive platforms have the same selection probability as the cheap platforms, then the chromosomes will be mostly filled with expensive ones, and crowded combinations (with cheaper platforms) won’t have much chance to be tested. If we distribute selection probability inversely proportional to the costs, then rare combinations (with expensive platforms) won’t have much chance to be tested. The solution is to select one of the techniques randomly to create a single chromosome.
Figure 9. Chromosome coding of GA
For the crossover operators, 1-point, 2-point, uniform crossovers and a new one called region crossover are implemented. The region-crossover randomly selects a rectangular region from the terrain, and swaps some of the platforms fall into that region meanwhile balancing the cost. As a result of the experiments, a mixture of 2-point crossover (with low probability) and the region crossover (with high probability) is set as default. In the entire crossover operators applied, the cost variations of the offsprings relative to their parents are kept as small as possible. So the cost of new offsprings does not vary much from the budget, and they are well protected from corruptions in the repair phase, which is going to be described later on. To perform cost balancing, the swapped parts of the parents are chosen to have almost the same cost. But if possible they are not kept the same, because we need some small varieties to find ideal combinations, and in the cost optimization, we need to increase or decrease the cost in time.
For effectiveness optimization, 5 mutation operators are implemented and used together. If a gene passes the mutation probability test, then one of the below mutation operators are randomly selected and applied. The first one randomly changes the coordinate of a gene. The second one randomly moves the coordinate of a gene to a neighbor point. The third one randomly changes the type of the gene. The fourth operator deletes the gene and the last one inserts a randomly created gene. While these mutations are performed, the feasibility of the chromosomes is always guaranteed.
As a result of the crossover and the mutations, the feasibility of a chromosome may be lost either by exceeding the budget or not using the budget enough. Hence a repair function is implemented. If the unused budget is greater than the cost of the cheapest sensor platform system type, the function adds random sensor platforms systems. If the budget is exceeded, the function deletes the cheapest sensor platform systems in the chromosome.
type1, x1, y1 type2, x2, y2 ...... typen, xn, yn
1st gene (1st sensor platform)
a chromosome
nth gene (nth sensor platform), where n is not fixed
Cost Optimization
In the cost optimization, the user wants to get a specified effectiveness level with minimum cost, so the number of sensor platform systems from each type and their locations are optimized in order to obtain this objective. Now the problem is much more complicated, because we don’t know the cost of getting the desired effectiveness and we don’t have a clue for creating the initial population. So we need to estimate the budget to create an initial population, and while optimizing the types, numbers and locations, we also need to search for the minimum cost. For the optimization, 2 fitness functions and a new initial population creation technique is developed.
First a cost estimation is needed to create the initial population. So a preprocess is done as follows: Random sensor platform systems are created and added to a list while effectiveness is less than 50 percent of the desired effectiveness limit. This process is repeated 3 times with random seeds, and the average cost is used to create the initial population.
As mentioned, 2 fitness functions are developed, where the first one is relaxed and the second one is more restricted. The first fitness function is computed as the effectiveness multiplied by the variable called mult, where mult is a floating value between 0 and 1. Computing the fitness function and choosing the value of the variable mult is shown below:
Fitness = Effectiveness x Mult
Mult = 1 if the cost of the chromosome < Estimated Cost
Normal distribution otherwise (a penalty is given)
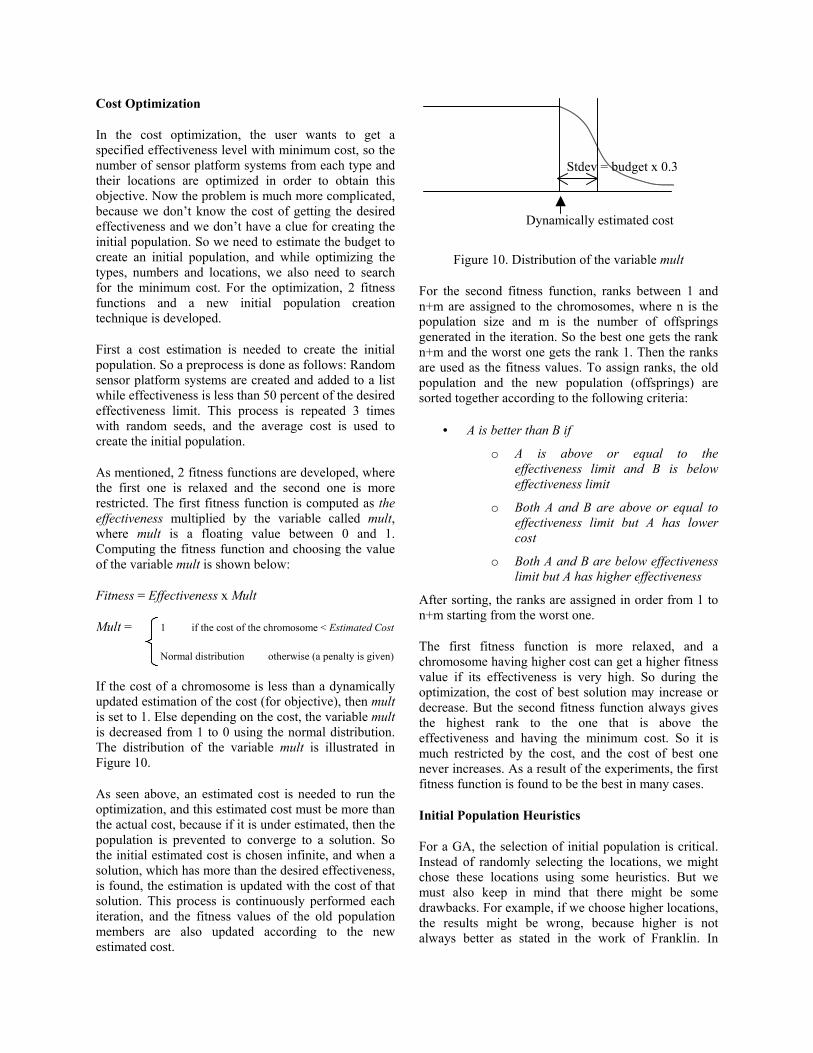
If the cost of a chromosome is less than a dynamically updated estimation of the cost (for objective), then mult is set to 1. Else depending on the cost, the variable mult is decreased from 1 to 0 using the normal distribution. The distribution of the variable mult is illustrated in Figure 10.
As seen above, an estimated cost is needed to run the optimization, and this estimated cost must be more than the actual cost, because if it is under estimated, then the population is prevented to converge to a solution. So the initial estimated cost is chosen infinite, and when a solution, which has more than the desired effectiveness, is found, the estimation is updated with the cost of that solution. This process is continuously performed each iteration, and the fitness values of the old population members are also updated according to the new estimated cost.
Figure 10. Distribution of the variable mult
For the second fitness function, ranks between 1 and n+m are assigned to the chromosomes, where n is the population size and m is the number of offsprings generated in the iteration. So the best one gets the rank n+m and the worst one gets the rank 1. Then the ranks are used as the fitness values. To assign ranks, the old population and the new population (offsprings) are sorted together according to the following criteria:
• A is better than B if
o A is above or equal to the effectiveness limit and B is below effectiveness limit
o Both A and B are above or equal to effectiveness limit but A has lower cost
o Both A and B are below effectiveness limit but A has higher effectiveness
After sorting, the ranks are assigned in order from 1 to n+m starting from the worst one.
The first fitness function is more relaxed, and a chromosome having higher cost can get a higher fitness value if its effectiveness is very high. So during the optimization, the cost of best solution may increase or decrease. But the second fitness function always gives the highest rank to the one that is above the effectiveness and having the minimum cost. So it is much restricted by the cost, and the cost of best one never increases. As a result of the experiments, the first fitness function is found to be the best in many cases.
Initial Population Heuristics
For a GA, the selection of initial population is critical. Instead of randomly selecting the locations, we might chose these locations using some heuristics. But we must also keep in mind that there might be some drawbacks. For example, if we choose higher locations, the results might be wrong, because higher is not always better as stated in the work of Franklin. In
Dynamically estimated cost
Stdev = budget x 0.3
general, the visibility index maps (see Franklin & Ray, 1994a) seems to be the best heurist among all. A visibility index map is a 2D matrix showing how much of the map is seen from each cell. The map can be generated as a pre-process, which takes a high CPU time, and used as a selection heuristic. If we need to locate just a single sensor, the cell with the highest value is optimum, but if we need to locate n sensors, selecting first n highest valued cells is not optimum.
DISTRIBUTED SENSOR SIMULATION
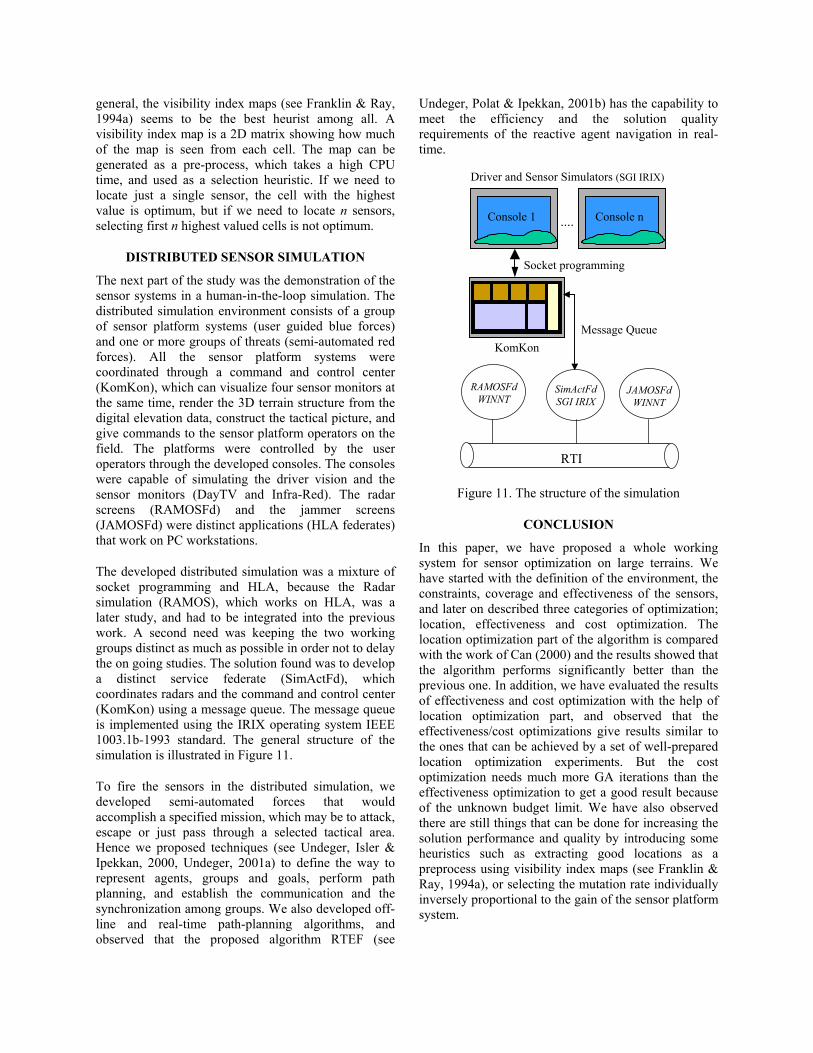
The next part of the study was the demonstration of the sensor systems in a human-in-the-loop simulation. The distributed simulation environment consists of a group of sensor platform systems (user guided blue forces) and one or more groups of threats (semi-automated red forces). All the sensor platform systems were coordinated through a command and control center (KomKon), which can visualize four sensor monitors at the same time, render the 3D terrain structure from the digital elevation data, construct the tactical picture, and give commands to the sensor platform operators on the field. The platforms were controlled by the user operators through the developed consoles. The consoles were capable of simulating the driver vision and the sensor monitors (DayTV and Infra-Red). The radar screens (RAMOSFd) and the jammer screens (JAMOSFd) were distinct applications (HLA federates) that work on PC workstations.
The developed distributed simulation was a mixture of socket programming and HLA, because the Radar simulation (RAMOS), which works on HLA, was a later study, and had to be integrated into the previous work. A second need was keeping the two working groups distinct as much as possible in order not to delay the on going studies. The solution found was to develop a distinct service federate (SimActFd), which coordinates radars and the command and control center (KomKon) using a message queue. The message queue is implemented using the IRIX operating system IEEE 1003.1b-1993 standard. The general structure of the simulation is illustrated in Figure 11.
To fire the sensors in the distributed simulation, we developed semi-automated forces that would accomplish a specified mission, which may be to attack, escape or just pass through a selected tactical area. Hence we proposed techniques (see Undeger, Isler & Ipekkan, 2000, Undeger, 2001a) to define the way to represent agents, groups and goals, perform path planning, and establish the communication and the synchronization among groups. We also developed off-line and real-time path-planning algorithms, and observed that the proposed algorithm RTEF (see
Undeger, Polat & Ipekkan, 2001b) has the capability to meet the efficiency and the solution quality requirements of the reactive agent navigation in real-time.
Figure 11. The structure of the simulation
CONCLUSION
In this paper, we have proposed a whole working system for sensor optimization on large terrains. We have started with the definition of the environment, the constraints, coverage and effectiveness of the sensors, and later on described three categories of optimization; location, effectiveness and cost optimization. The location optimization part of the algorithm is compared with the work of Can (2000) and the results showed that the algorithm performs significantly better than the previous one. In addition, we have evaluated the results of effectiveness and cost optimization with the help of location optimization part, and observed that the effectiveness/cost optimizations give results similar to the ones that can be achieved by a set of well-prepared location optimization experiments. But the cost optimization needs much more GA iterations than the effectiveness optimization to get a good result because of the unknown budget limit. We have also observed there are still things that can be done for increasing the solution performance and quality by introducing some heuristics such as extracting good locations as a preprocess using visibility index maps (see Franklin & Ray, 1994a), or selecting the mutation rate individually inversely proportional to the gain of the sensor platform system.
....
Console 1
Socket programming
Console n
Driver and Sensor Simulators (SGI IRIX)
KomKon Message Queue
RTI
RAMOSFd WINNT
SimActFd SGI IRIX
JAMOSFd WINNT
REFERENCES
Ahuja, R.K., Orlin, J.B. & Tiwari, A. (1995). A Greedy Genetic Algorithm for the Quadratic Assignment Problem. Working paper, Sloan School of Management, WP\#3826-95.
Allenson, R. (1992). Genetic Algorithms with Gender for Multi-function Optimisation. Technical Report EPCC-SS92-01, Edinburgh Parallel Computing Centre, Edinburgh, Scotland.
Beasley, D., Bull, D.R. & Martin, R.R. (1993). An Overview of Genetic Algorithms: Part 1, Fundamentals, and Part 2, Research Topics. University Computing, 15(2) 58-59 and 15(4) 170-181.
Briggs, A. & Donald, B. (1996). Robust Geometric Algorithms for Sensor Planning. The proceedings of the 2nd International Workshop on Algorithmic Foundation of Robotic, Toulouse, France.
Can, T., Isler, V. & Ipekkan, Z. (2000). Sensor Optimization in a Virtual Environment. In proceedings of the 9th Conference on Computer Generated Forces and Behavioral Representation, pp. 421-426, Orlando, Florida.
Franklin, W.R. & Ray, C.K. (1994a). Higher isn't necessarily better: visibility algorithms and experiments. In proceedings of the 6th International Symposium on Spatial Data Handling, pp 751 – 770, Edinburgh, UK.
Franklin W.R., Ray, C.K. & Mehta, S. (1994b). Geometric Algorithms for Siting of Air Defense Missile Batteries. Research Proj. for Battelle, Contract Number DAAL-86-D-0001, Electrical, Computer and Systems Engineering Department, Rensselaer Polytechnic Institute.
Goldberg, D.E. (1989). Genetic Algorithms in Search Optimisation & Machine Learning. Addison Wesley Logman, Inc.
Kewley, R.H. & Embrechts, M.J. (1998). Fuzzy-Genetic Decision Optimization for Positioning of Military Combat Units. The proceedings of SMC’98, IEEE International Conference on Systems, Man, and Cybernetics, pp. 3658 – 3664, La Jolla, California.
Kim, Y.H. & Clarke, G. (2001). Exploring Optimal Visibility Site Selection Using Spatial Optimisation Techniques: The Potential of Geographical Information Science. In proceedings of GISRUK’ 2001.
National Imagery and Mapping Agency. (1999). Digital Terrain Elevation Data (DTED). Standards and Specifications Publications: MIL-PRF-89020A Amendment-1, 27.
Rabinkin, D.V. (1998). Optimum Sensor Placement For Microphone Arrays. Ph.D. thesis, Electrical and Computer Engineering Department, The State University of New Jersey.
Sengul, O. (2001). Low Altitude Radar Simulation Program Radcal. M.S. thesis, Electric and Electronic Engineering Department of Middle East Technical University, Ankara, Turkey.
Stamos, L. & Allen, P.K. (1998). Interactive Sensor Planning. The proceedings of 17th Conference on Computer Vision and Pattern Recognation, IEEE, pp. 489-494.
Undeger, C., Isler, V. & Ipekkan, Z. (2000). An Intelligent Action Algorithm for Virtual Human Agents. In Proceedings of the 9th Conference on Computer Generated Forces and Behavioral Representation, pp. 25-33, Orlando, Florida.
Undeger, C. (2001a). Real-Time Mission Planning For Virtual Human Agents. M.S. thesis, Computer Engineering Department of Middle East Technical University, Ankara, Turkey.
Undeger, C., Polat, F. & Ipekkan, Z. (2001b). Real-Time Edge Follow: A New Paradigm To Real-Time Path Search. The Proceedings of GAME-ON 2001, London, England.
USGS National Mapping Information. (1998). Digital Elevation Models. Technical Instructions for Digital Elevation Model Standards.
Vasquez, M. & Hao, J.K. (2000). A Heuristic Approach for Antenna Positioning in Cellular Networks. Journal of Heuristics.


![[Health Surveillance: Chagas disease, Health Surveillance]](https://img.dokumen.tips/doc/110x75/635408ff94e36fdd7609b2d5/health-surveillance-chagas-disease-health-surveillance.jpg)