Embed Size (px)
Citation preview

Conference Series No. 25
AuerbachBailyBlackBlades-SturmBlinder
BradfordDenisonEisnerFielekeJump
PennerSolowTobin
WachtelWallich
Sponsored bythe Federal Reserve Bank
of Boston

SAVING AND
GOVERNMENT POLICY
Proceedings of a Conference
Held at
Melvin Village, New Hampshire
October, 1982
Sponsored byThe Federal Reserve Bank of Boston

THE FEDERAL RESERVE BANK OF BOSTONCONFERENCE SERIES
No. 1
No. 2
No. 3
No. 4
No. 5
No. 6
No. 7
No. 8
No. 9
No. 10
No. 11
No. 12
No. 13
No. 14
No. 15
No. 16
No. 17
No. 18
No. 19
No. 20
No. 21
No. 22
No. 23
No. 24
Controlling Monetary Aggregates
The International Adjustment Mechanism
Financing State and Local Governmentsin the Seventies
Housing and Monetary Policy
Consumer Spending and MonetaryPolicy: The Linkages
Canadian-United States FinancialRelationships
Financing Public Schools
Policies for a More Competitive Financial System
Controlling Monetary Aggregates II:The Implementation
Issues in Federal Debt Management
Credit Allocati0h Techniques andMonetary Policy
International Aspects of Stabilization Policies
The Economics of a National Electronic FundsTransfer System
New Mortgage Designs for an InflationaryEnvironment
New England and the Energy Crisis
Funding Pensions: Issues and Implications forFinancial Markets
Minority Business Development
Key Issues in International Banking
After the Phillips Curve: Persistence of HighInflation and High Unemployment
Managed Exchange-Rate Flexibility:The Recent Experience
The Regulation of FinancialInstitutions
The Decline in Productivity Growth
Controlling Monetary Aggregates IIIThe Future of the Thrift Industry
June 1969October 1969
June 1970
October 1970
June 1971
September1971
January1972
January1972
September 1972
June 1973
September 1973
June 1974
October 1974
January 1975
October 1975
October 1976
November 1976October 1977
June 1978
October 1978
October 1979June 1980
October 1980
October 1981
CONTENTS
The Concept and Measurement of Savings: The United Statesand Other Industrialized Countries
DEREK W. BLADESand
PETER H. STURM
Discussion
PAUL A. WACHTEL
EDWARD F. DENISON
Tax Incentives to Promote Personal Saving: Recent CanadianExperience
GREGORY V. JUMP
Discussion
ALAN S. BLINDER
DAVID E BRADFORD
Issues in the Measurement and Encouragement of BusinessSaving
ALAN~AUERBACH
Discussion
MARTIN N. BAILY
ROBERT EISNER
Macroeconomic Policy and Domestic Saving
RUDOLPH G. PENNER
Discussion
JAMES TOBIN
31
39
46
65
73
79
101
104
110
126

National Saving and International Investment
NORMAN S. FIELEKE
Discussion
STANLEY W. BLACK
Reflections on Saving Behavior
ROBERT M. SOLOW
Discussion
HENRY C. WALLICH
138
158
162
175
The Concept and Measurement of Savings:The United States and Other industrialized
Countries
Derek W. Blades and Peter H. Sturm*
Introduction
1. It has long been recognized that conventionally measured saving ra-tios differ widely between countries, and that among the 24 member coun-tries of the OECD the U.S. economy is the one with the lowest national sav-ing ratio. It is also true--though probably less well publicized-- that any’definition of saving is to some extent arbitrary, and that given a specificdefinition, institutional differences between countries may result in differ-ences in saving ratios between economies which otherwise display identicalcharacteristics and behavior. The present paper analyzes the question ofhow important institutional differences are in explaining observed differ-ences in official saving ratios between the United States and other industri-alized countries, and how sensitive this difference is to alternative defini-tions of saving and income. This analysis will be carried out for both theaggregate national saving ratio and the household saving ratio. A separatetreatment of the household sector seems justified, given the dominatingshare this sector contributes to total national savings in most countries, andthe focus on household behavior in theoretical discussions of savingsdeterminants.
2. The various possible modifications of the official definition of sav-ings discussed here result in a large number of alternative savings concepts.Which of these alternatives is the "correct" one will of course depend onthe question analyzed. Special attention will be given in this paper to thesavings concept most relevant for the analysis of economic growth.
3. Part I of the paper discusses basic definitions and briefly presentsthe actual data on official national and household saving ratios, concentra-ting on long-term averages rather than year-to-year fluctuations in thesevariables. Part II explores how intercountry differences in (long-term aver-age) saving ratios are affected by institutional differences between coun-tries, both for the household sector and the nation as a whole, given a stan-dardized definition of savings. In Part III, plausible alternatives to thestandard definition of savings (and--where appropriate--income) are dis-cussed, and their effect on intercountry differences in household and na-tional saving ratios is explored quantitatively. A discussion of likely effectsof further possible modifications to the standard definition of saving, which
*Derek W. Blades is head of the National Accounts Section and Peter H. Sturm is a prin-cipal administrator in the Growth Studies Division, both at the Organisation for EconomicCooperation and Development in Paris.
SAV1NG AND GOVERNMENT POLICY
could not be carried out quantitatively in the present study due to data lim-itations, is presented in Part IV. The final section--Part V--attempts toanswer the question of which savings concept is the most relevant in theanalysis of economic growth and its determinants.
I. Definitions and Actual Data
4. The savings data in this paper have been compiled according to theSystem of National Accounts (SNA)l--the international system used byboth the OECD and the United Nations for reporting comparable nationalaccounts data. In the SNA, saving is the residual item in the income andoutlay accounts where it is obtained by subtracting current disbursementsfrom current receipts. Table 1 lists the transactions that enter into the SNAincome and outlay accounts for the nation as a whole and for each sector ofthe economy.
5. In the United States National Income and Product Accounts (NIPA)saving is similarly defined as the balance between current receipts and dis-bursements. However, there is some disagreement between the SNA andthe NIPA as to what constitutes current (as opposed to’capital) transac-tions, and as a result the two systems generate somewhat different measuresof saving. As regards household (or personal) saving the only differenceconcerns the treatment of estate and gift taxes, which are regarded as cur-rent outlays in the NIPA whereas the SNA treats them as capital outlayswhich are financed by running down assets. As a result, household savingaccording to the SNA is higher than on a NIPA basis by the value of suchtaxes.
6. As regards national savings there are a number of differences be-tween the NIPA and SNA definitions, the most important of which is thatin the NIPA all government purchases are treated as current consumption,whereas the SNA takes the more conventional view that government con-struction and purchases of equipment (excluding military hardware) con-stitute investment. As a result, national saving in the NIPA is substantiallylower than according to the SNA. The resulting U.S. saving ratios compiledaccording to the NIPA and SNA rules are depicted in the top two lines inTable 2.
7. In the SNA, entrepreneurial incomes of unincorporated enterprisesand operating surpluses of corporate enterprises are always calculated afterdeducting consumption of fixed capital. Consequently, saving is also shownnet of capital consumption. The drawback of this approach is that calcu-lating the consumption of fixed capital creates both practical and theoreti-cal difficulties, which are particularly severe in periods of inflation. Sincethe procedures to compute capital consumption are not standardizedacross countries, net saving is usually considered a less reliable statistic ininternational comparison than gross saving, and so this latter concept is
~United Nations, A System of National Accounts, Series F, No. 2, Rev. 3 (New York:United Nation, 1968).
SAVINGS MEASUREMENT BLADES AND STURM
used throughout this paper. When reference is made below to saving anddisposable income "on an SNA basis," it should be understood to meangross rather than net saving as strictly required in the SNA.
8. Table 2 shows the extent to which national and household saving ra-tios differ internationally even after all country figures have been standard-ized to conform to the SNA definitions. Average net national saving ratiosduring the period 1970 to 1980 ranged from a high of 33 percent forLuxembourg to a low of 8 percent for the United States with an unweightedarea mean of 16 percent and a coefficient of variation for the country aver-ages of 32 percent. On a gross basis Luxembourg and the United Statesagain represent the extremes--40~ percent and 184 percent, respectively.The OECD average rises to 24 percent and the relative dispersion is re-duced to 21 percent, although the coefficient of variation may exaggeratethe resulting convergence,z As regards the household sector the UnitedStates has again a relatively low ratio on a net basis--8 percent comparedto an average of 13 percent for the 18 countries covered. When capital con-sumption is added, the U.S. ratio increases to 124 percent--the fourthlowest of the 11 countries included in Table 2.
9. National saving ratios are sometimes calculated with Gross Domes-tic Product at market prices (GDP) or Gross National Product (GNP) asthe denominator. Here the economically more meaningful approach of us-ing Gross National Disposable Income is preferred; this is the sum of grosssaving plus private and government final consumption expenditure. It ex-ceeds GNP by net receipts of current transfers from abroad (a relativelysmall negative number in most OECD countries), and exceeds GDP bythese same transfers plus net receipts of property income and compensa-tion of employees from abroad (again a relatively small number for mostOECD countries). For household saving ratios the denominator used is grossdisposable income, which in the SNA is defined as gross saving plus con-sumption expenditure.
2The coefficient of variation is the standard deviation of the saving ratios expressed as apercentage of their mean, and thus shows the intercountry variation of saving ratios relative totheir average level. An adjustment (e.g., the transition from net to gross ratios) may result ingreater absolute differences between the ratios while still reducing the relative standard devia-tion as measured by the coefficient of variation.

XXNation
XNonfinancial enterprises
XFinancial institutions
XGeneral government
XPrivate nonprofit institutions
XHouseholds (including unincorporated enterprises)
o©
_g
oo
N"
Nation
Nonfinancial enterprises
Financial institutions
General government
Private nonprofit institutions
Households (including unincorporated enterprises)
X;DIqOd ~LN~IAIN~lVJAOD (INV DNIAVS

©©7
3~.o
oo
D;_~
~"
0
0
gI/g~ID£S (1NV S~t(I V’7~[±N~AI~IFISVE[IAi SDNIAVS
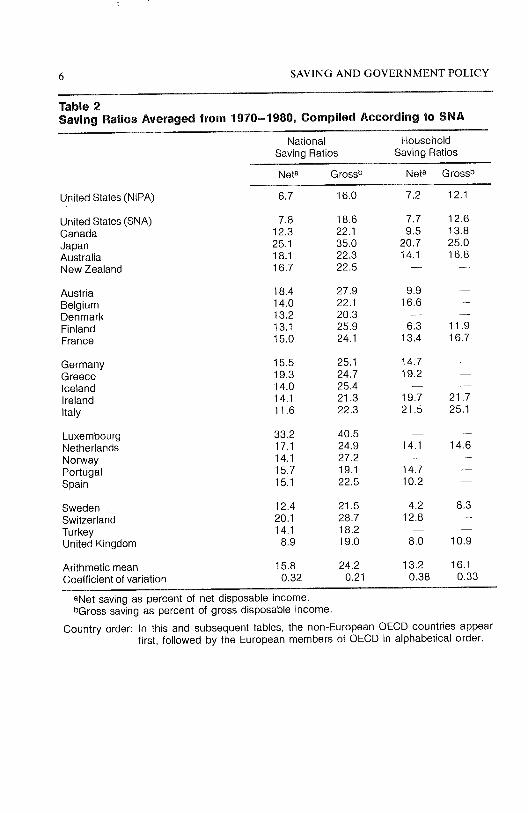
6 SAVING AND GOVERN MENT POLICY
Table 2Saving Ratios Averaged from 1970-1980, Compiled According to SNA
National HouseholdSaving Ratios Saving Ratios
Neta Grossb Neta Grossb
United States (NtPA) 6.7 16.0 7.2 12.1
United States (SNA) 7.8 18.6 7.7 12.6Canada 12.3 22.1 9.5 13.8Japan 25.1 35.0 20.7 25.0Australia 18.1 22.3 14.1 16.8New Zealand 16.7 22.5 -- --
Austria 18.4 27.9 9.9 --Belgium 14.0 22.1 16.6 --Denmark t3.2 20.3 -- --Finland 13.1 25.9 6.3 11.9France 15.0 24.1 13.4 16.7
Germany 15.5 25.1 14.7 --Greece 19.3 24.7 19.2 --Iceland 14.0 25.4 -- --Ireland 14.1 21.3 19.7 21.7Italy 11.6 22.3 21.5 25.1
Luxembourg 33.2 40.5 -- --Netherlands 17.1 24.9 14.1 14.6Norway 14.1 27.2 -- --Portugal 15.7 19.1 14.7 --Spain 15.1 22.5 10.2 --
Sweden 12.4 21.5 4.2 8.3Switzerland 20.1 28.7 12.8 --Turkey 14.1 18.2 -- --United Kingdom 8.9 19.0 8.0 10.9
Arithmetic mean 15.8 24.2 13.2 16.1Coefficient of variation 0.32 0.21 0.38 0.33
aNet saving as percent of net disposable income.bGross saving as percent of gross disposable income.
Country order: In this and subsequent tables, the non-European OECD countries appearfirst, followed by the European members of OECD in alphabetical order.

SAVINGS MEASUREMENT BLADES AND STURM 7
IL Intercountry Differences in Saving Ratios Due to InstitutionalDifferences
10. Saving ratios may differ between countries for three main reasons:(i) because different definitions have been used for income and
saving;(ii) because of differences in institutional arrangements; and(iii) because social, economic, historical and cultural factors have
combined to produce different underlying propensities to save.As already noted the savings data used here have been compiled accordingto standard definitions so that the first possible cause of intercountry dif-ferences has been eliminated. It is attempted here to identify institutionaldifferences between countries that may affect saving ratios and provide ad-justed saving ratios that are institutionally neutral. Remaining intercountrydifferences in these adjusted ratios must then be due to differences in theunderlying savings propensities with respect to the common definition ofsavings adopted.
11. The institutional factors considered in this section are:(i) the relative size of the unincorporated enterprise (small busi-
ness) sector;(ii) the relative importance of social security pensions versus pri-
vate pension and life insurance schemes;(iii) the relative importance of health and education services pro-
vided by government; and(iv) the relative importance of taxes on consumption expenditure
as compared with taxes on income.12. All four of these institutional factors may affect househoM saving
ratios which are therefore considered first; only the last one has any impacton national saving ratios. The analysis to follow includes saving ratios forthe United States, Canada, Japan, Australia, Finland, France, Italy, Swe-den, and the United Kingdom. While the choice of countries was limited bydata availability, the economies included in the analysis are believed toconstitute a representative sample of the more industrialized OECDcountries.
(a) Household Saving Ratios
Relative size of unincorporated business
13. In the SNA the household sector as defined for the income andoutlay accounts contains some unincorporated enterprises in addition tohouseholds. The enterprises concerned are those for which the owners donot keep a complete set of accounts, covering financial and capital transac-tions in addition to production operations. The reason why such companiesare grouped together with households is that the lack of a complete set ofbusiness accounts indicates that the owners will usually be unable to distin-guish between receipts and outlays arising from business operations andfrom household transactions. Unincorporated enterprises that keep corn-
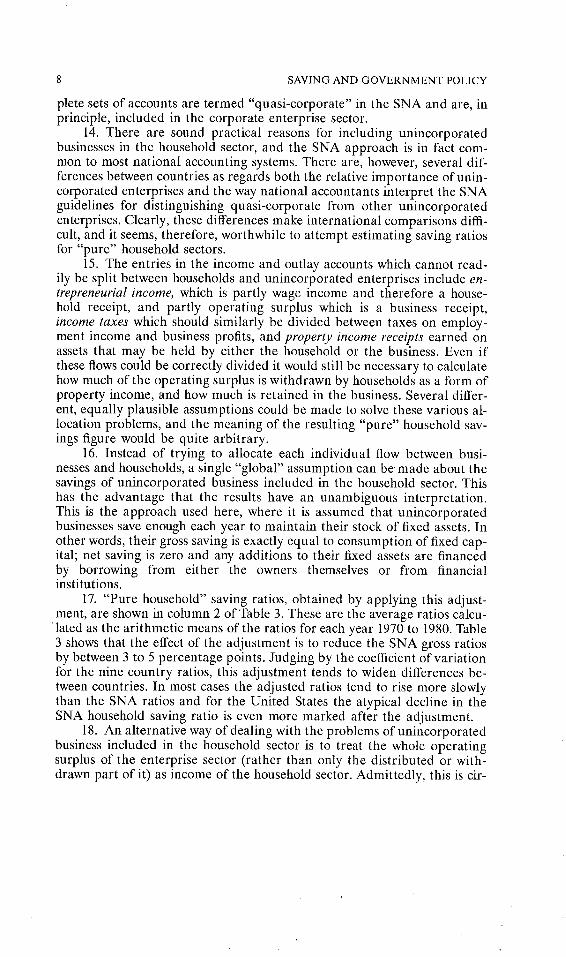
SAVING AND GOVERNMENT POLICY
plete sets of accounts are termed "quasi-corporate" in the SNA and are, inprinciple, included in the corporate enterprise sector.
14. There are sound practical reasons for including unincorporatedbusinesses in the household sector, and the SNA approach is in fact com-mon to most national accounting systems. There are, however, several dif-ferences between countries as regards both the relative importance of unin-corporated enterprises and the way national accountants interpret the SNAguidelines for distinguishing quasi-corporate from other unincorporatedenterprises. Clearly, these differences make international comparisons diffi-cult, and it seems, therefore, worthwhile to attempt estimating saving ratiosfor "pure" household sectors.
15. The entries in the income and outlay accounts which cannot read-ily be split between households and unincorporated enterprises include en-trepreneurial income, which is partly wage income and therefore a house-hold receipt, and partly operating surplus which is a business receipt,income taxes which should similarly be divided between taxes on employ-ment income and business profits, and property income receipts earned onassets that may be held by either the household or the business. Even ifthese flows could be correctly divided it would still be necessary to calculatehow much of the operating surplus is withdrawn by households as a form ofproperty income, and how much is retained in the business. Several differ-ent, equally plausible assumptions could be made to solve these various al-location problems, and the meaning of the resulting "pure" household sav-ings figure would be quite arbitrary.
16. Instead of trying to allocate each individual flow between busi-nesses and households, a single "global" assumption can be" made about thesavings of unincorporated business included in the household sector. Thishas the advantage that the results have an unambiguous interpretation.This is the approach used here, where it is assumed that unincorporatedbusinesses save enough each year to maintain their stock of fixed assets. Inother words, their gross saving is exactly equal to consumption of fixed cap-ital; net saving is zero and any additions to their fixed assets are financedby borrowing from either the owners themselves or from financialinstitutions.
17. "Pure household" saving ratios, obtained by applying this adjust-ment, are shown in column 2 of Table 3. These are the average ratios calcu-
’tated as the arithmetic means of the ratios for each year 1970 to 1980. Table3 shows that the effect of the adjustment is to reduce the SNA gross ratiosby between 3 to 5 percentage points. Judging by the coefficient of variationfor the nine country ratios, this adjustment tends to widen differences be-tween countries. In most cases the adjusted ratios tend to rise more slowlythan the SNA ratios and for the United States the atypical decline in theSNA household saving ratio is even more marked after the adjustment.
18. An alternative way of dealing with the problems of unincorporatedbusiness included in the household sector is to treat the whole operatingsurplus of the enterprise sector (rather than only the distributed or with-drawn part of it) as income of the household sector. Admittedly, this is cir-
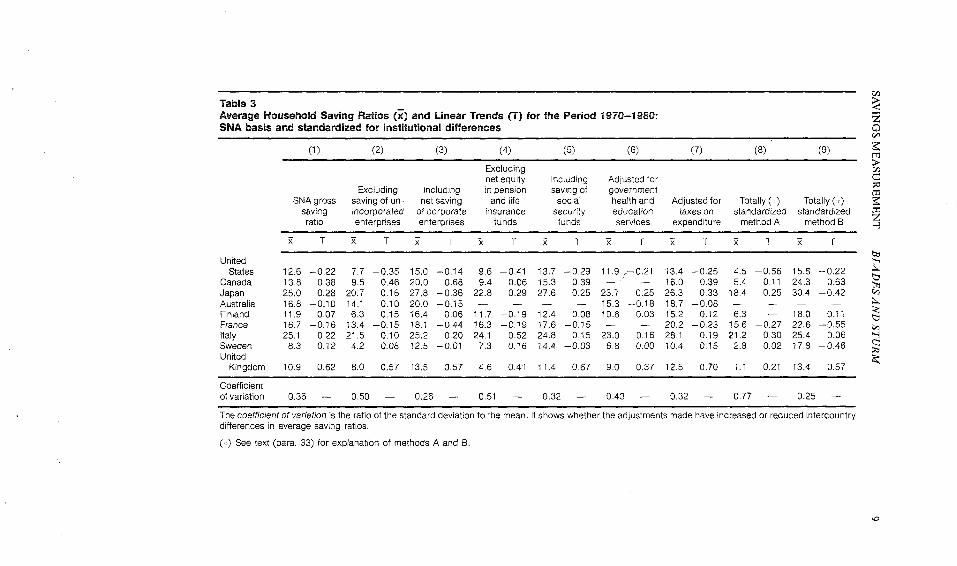
Table 3Average Household Saving Ratios (~’) and Linear Trends (T) for the Period 1970-1980:SNA basis and standardized for insfifufiona~ differences
(1) (2) (3) (4) (5) (6) (7) (8) (9)
UnitedStates
CanadaJapanAustraliaFinlandFranceItalySwedenUnited
Excludingnet equity Including
Excluding Including in pension saving ofSNA gross saving of un- net saving and life social
saving incorporated of corporate insurance securityratio enterprises enterprises funds funds
Adjusted forgovernmenthealth and Adjusted for Totally (,,) Totally (,~=)education taxes on standardized standardizedservices expenditure method A method B
2 T 2 T ~ T 2 T 2 T 2 T 2 T 2 T 2 T
12.6 -0.22 7.7 --0.35 15.0 --0.14 9.6 -0.41 13.7 -0.29 11.9 ,--0.21 13.4 --0.25 4.5 --0.56 15.8 -0.2213.8 0.38 9.5 0.46 20,0 0.68 9.4 0.06 15.3 0.39 -- -- 16.0 0.39 5.4 0.11 24.3 0.6325,0 0.28 20.7 0.16 27,8 --0.36 22.8 0.29 27.6 0.25 23.7 0.25 26.3 0.33 18.4 0.25 30.4 --0.4216.8 --0.10 14.1 0.10 20,0 --0.15 .... 15.3 -0.18 18.7 --0.08 ....11.9 0.07 6.3 0.15 16.4 0.06 11.7 --0.19 12.4 0.08 10.6 0.03 15.2 0.12 6.3 -- 18.0 0.1116.7 -0.16 13.4 --0.15 18.1 -0.44 16.3 -0.19 17.6 -0.15 -- -- 20.2 --0.23 15.6 --0.27 22.6 --0.5525.1 0.22 21.5 0.10 25.2 0.20 24.1 0.52 24.8 0.15 23.0 0.16 28.1 0.19 21.2 0.30 25.4 0.068.3 0.12 4.2 0.08 12.5 -0.01 7.3 0.16 14.4 --0.03 6.8 0.00 10.4 0.15 2.8 0.02 17.8 -0.46
Kingdom 10.g 0.62 8.0 0.57 13.5 0.57 4,6 0.41 11.4 0.67 9.0 0,37 12.5 0.70 1.1 0.21 13.4 0.57
Coefficientof variation 0.36 -- 0.50 -- 0,26 -- 0.51 -- 0.32 -- 0.43 -- 0.32 -- 0.77 -- 0.25 --
The coefficient of variation is the ratio of the standard deviation to the mean. It shows whether the adjustments made have increased or reduced intercountrydifferences in average saving ratios.
See text (par& 33) for explanation of methods A and B.

10 SAVING AND GOVERNMENT POLICY
cumventing rather than solving the disaggregation problems, but as it is ar-guable that the level of household saving is not independent of the wealthformation in the enterprise sector, this. approach can certainly be justified?
19. Because it seems unlikely that households’ spending behavior willbe affected by the level of consumption of fixed capital in the corporate sec-tor, the adjusted saving ratios in column 3 of Table 3 include only the netoperating surplus of (financial and nonfinancial) corporate enterprises. Asis to be expected, the combined sector saving ratios are generally signifi-cantly higher than those for the household sector alone, except for Italywhere during the 1970s the corporate sector recorded on average net oper-ating deficits. Otherwise, the average increase varies between 1.4 percent-age points for France and 6.2 points for Canada w!~h the coefficient of var-iation dropping from 36 to 26 percent. For the United States thisadjustment results in an increase of 2.4 percentage points in the averagesaving ratio--after Italy and France the lowest increase among the coun-tries included in the sample.
20. The marked reduction in intercountry variability when saving ra-tios are adjusted in this way could be interpreted as supporting the hypoth-esis that, in making their decisions about savings, households take accountof earnings retained by companies in which they have an equity holding.An alternative explanation for the sharp reduction in intercountry varia-bility is that households may have a higher propensity to save dividend in-come than other current receipts. If so, in countries where a high propor-tion of profits are distributed, household saving ratios will tend to be highand enterprise savings low; the reverse would be true where most profitsare retained within the enterprise sector. Combining the two sectors willobviously produce more equal saving ratios across countries.
Relative importance of social security pensions
21. Households may provide for pensions and other retirement bene-fits either by contributing to a government social security system, or by par-ticipating in a private pension or life insurance scheme. While both kindsof schemes serve the same purpose from the household’s point of view, theSNA (and most national systems of accounts) considers that transactionsbetween households and social security schemes are current in nature, whilethose with private schemes are mainly capital transactions. This impliesmajor differences in the way these transactions are treated in the incomeand outlay account of households, and hence their impact on household sav-ing. As a result SNA data are difficult to use for comparisons between coun-tries that differ in the relative importance of social security versus privateschemes.
3Several theoretical and empirical studies argue indeed that household and business sav-ings are close substitutes, cf. Paul A. David and John Scadding, "Private Savings: Ultra-ration-ality, Aggregation and ’Denison’s Law’," Journal of Political Economy, 82 (March/April 1974),225-49 and several empirical studies quoted therein.
SAVINGS MEASUREMENT BLA DES AND STURM 11
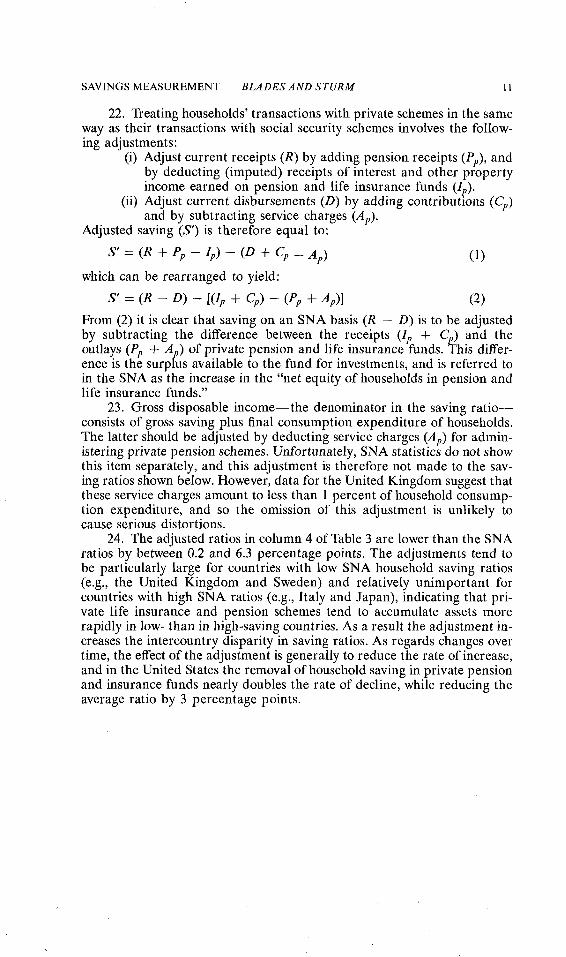
22. Treating households’ transactions with private schemes in the sameway as their transactions with social security schemes involves the follow-ing adjustments:
(i) Adjust current receipts (R) by adding pension receipts (Pp), andby deducting (imputed) receipts of interest and other propertyincome earned on pension and life insurance funds (Ie).
(ii) Adjust current disbursements (D) by adding contributmns (Cp)and by subtracting service charges (Ap).
Adjusted saving (S’) is therefore equal to:
s’ = (R + _ ~rp) - + cp _ Ap)which can be rearranged to yield:
(1)
S’ = (R - D) - [(I/~ + Cp) -- (P/~ + A~)]
From (2) it is clear that saving on an SNA basis (R - D) is to be adjustedby subtracting the difference between the receipts (Ip + Cp) and theoutlays (Pp + Ap) of private pension and life insurance funds. This differ-ence is the surplus available to the fund for investments, and is referred toin the SNA as the increase in the "net equity of households in pension andlife insurance funds."
23. Gross disposable income--the denominator in the saving ratio--consists of gross saving plus final consumption expenditure of households.The latter should be adjusted by deducting service charges (Ap) for admin-istering private pension schemes. Unfortunately, SNA statistics do not showthis item separately, and this adjustment is therefore not made to the sav-ing ratios shown below. However, data for the United Kingdom suggest thatthese service charges amount to less than 1 percent of household consump-tion expenditure, and so the omission of this adjustment is unlikely tocause serious distortions.
24. The adjusted ratios in column 4 of Table 3 are lower than the SNAratios by between 0.2 and 6.3 percentage points. The adjustments tend tobe particularly large for countries with low SNA household saving ratios(e.g., the United Kingdom and Sweden) and relatively unimportant forcountries with high SNA ratios (e.g., Italy and Japan), indicating that pri-vate life insurance and pension schemes tend to accumulate assets morerapidly in low- than in high-saving countries. As a result the adjustment in-creases the intercountry disparity in saving ratios. As regards changes overtime, the effect of the adjustment is generally to reduce the rate of increase,and in the United States the removal of household saving in private pensionand insurance funds nearly doubles the rate of decline, while reducing theaverage ratio by 3 percentage points.
12 SAVING AND GOVERNMENT POLICY
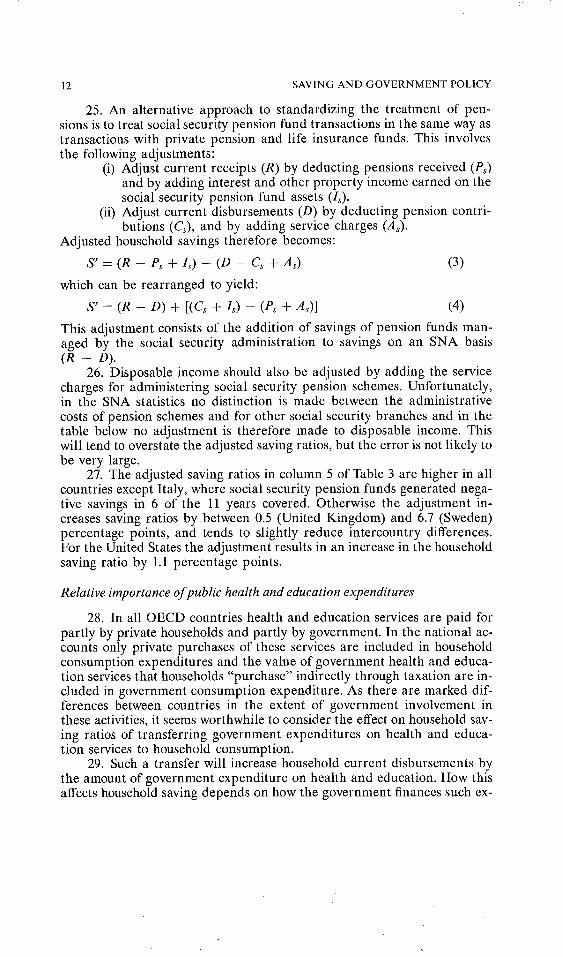
25. An alternative approach to standardizing the treatment of pen-sions is to treat social security pension fund transactions in the same way astransactions with private pension and life insurance funds. This involvesthe following adjustments:
(i) Adjust current receipts (R) by deducting pensions received (P~)and by adding interest and other property income earned on thesocial security pension fund assets (Is).
(ii) Adjust current disbursements (D) by deducting pension contri-butions (Cs), and by adding service charges (As).
Adjusted household savings therefore becomes:
S’ = (R -- Ps + Is) -- (D - Cs + As) (3)which can be rearranged to yield:
S’ = (R - D) + [(Cs + Is) - (Ps + As)] (4)
This adjustment consists of the addition of savings of pension funds man-aged by the social security administration to savings on an SNA basis(R -- D).
26. Disposable income should also be adjusted by adding the servicecharges for administering social security pension schemes. Unfortunately,in the SNA statistics no distinction is made between the administrativecosts of pension schemes and for other social security branches and in thetable below no adjustment is therefore made to disposable income. Thiswill tend to overstate the adjusted saving ratios, but the error is not likely tobe very large.
27. The adjusted saving ratios in column 5 of Table 3 are higher in allcountries except Italy, where social security pension funds generated nega-tive savings in 6 of the 11 years covered. Otherwise the adjustment in-creases saving ratios by between 0.5 (United Kingdom) and 6.7 (Sweden)percentage points, and tends to slightly reduce intercountry differences.For the United States the adjustment results in an increase in the householdsaving ratio by 1.1 percentage points.
Relative importance of public health and education expenditures
28. In all OECD countries health and education services are paid forpartly by private households and partly by government. In the national ac-counts only private purchases of these services are included in householdconsumption expenditures and the value of government health and educa-tion services that households "purchase" indirectly through taxation are in-cluded in government consumption expenditure. As there are marked dif-ferences between countries in the extent of government involvement inthese activities, it seems worthwhile to consider the effect on household sav-ing ratios of transferring government expenditures on health and educa-tion services to household consumption.
29. Such a transfer will increase household current disbursements bythe amount of government expenditure on health and education. How thisaffects household saving depends on how the government finances such ex-
SAVINGS MEASUREMENT BLADES AND STURM 13
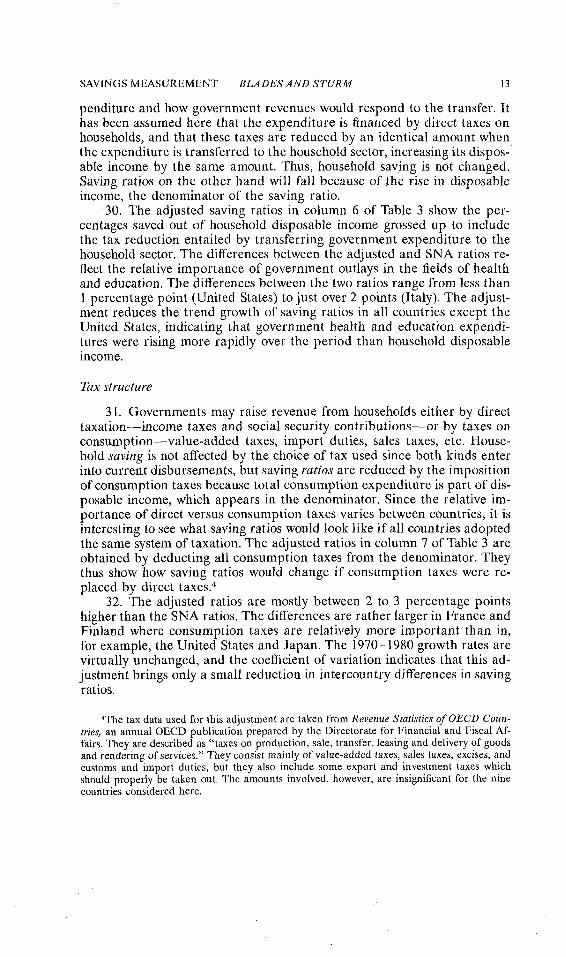
penditure and how government revenues would respond to the transfer. Ithas been assumed here that the expenditure is financed by direct taxes onhouseholds, and that these taxes are reduced by an identical amount whenthe expenditure is transferred to the household sector, increasing its dispos-able income by the same amount. Thus, household saving is not changed.Saving ratios on the other hand will fall because of the rise in disposableincome, the denominator of the saving ratio.
30. The adjusted saving ratios in column 6 of Table 3 show the per-centages saved out of household disposable income grossed up to includethe tax reduction entailed by transferring government expenditure to thehousehold sector. The differences between the adjusted and SNA ratios re-flect the relative importance of government outlays in the fields of healthand education. The differences between the two ratios range from less than1 percentage point (United States) to just over 2 points (Italy). The adjust-ment reduces the trend growth of saving ratios in all countries except theUnited States, indicating that government health and education expendi-tures were rising more rapidly over the period than household disposableincome.
Tax structure
31. Governments may raise revenue from households either by directtaxation--income taxes and social security contributions--or by taxes onconsumption--value-added taxes, import duties, sales taxes, etc. House-hold saving is not affected by the choice of tax used since both kinds enterinto current disbursements, but saving ratios are reduced by the impositionof consumption taxes because total consumption expenditure is part of dis-posable income, which appears in the denominator. Since the relative im-portance of direct versus consumption taxes varies between countries, it isinteresting to see what saving ratios would look like if all countries adoptedthe same system of taxation. The adjusted ratios in column 7 of Table 3 areobtained by deducting all consumption taxes from the denominator. Theythus show how saving ratios would change if consumption taxes were re-placed by direct taxes.4
32. The adjusted ratios are mostly between 2 to 3 percentage pointshigher than the SNA ratios. The differences are rather larger in France andFinland where consumption taxes are relatively more important than in,for example, the United States and Japan. The 1970-1980 growth rates arevirtually unchanged, and the coefficient of variation indicates that this ad-justment brings only a small reduction in intercountry differences in savingratios.
4The tax data used for this adjustment are taken from Revenue Statistics of OECD Coun-tries, an annual OECD publication prepared by the Directorate for Financial and Fiscal Af-fairs. They are described as "taxes on production, sale, transfer, leasing and delivery of goodsand rendering of services." They consist mainly of value-added taxes, sales taxes, excises, andcustoms and import duties, but they also include some export and investment taxes whichshould properly be taken out. The amounts involved, however, are insignificant for the ninecountries considered here.
14 SAVING AND GOVERNMENT POLICY
Combined adjustments
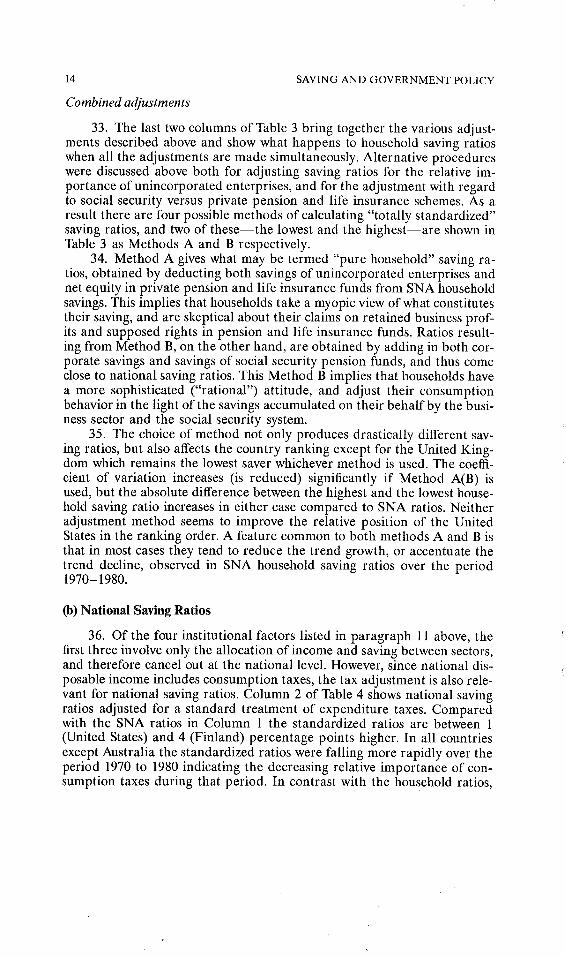
33. The last two columns of Table 3 bring together the various adjust-ments described above and show what happens to household saving ratioswhen all the adjustments are made simultaneously. Alternative procedureswere discussed above both for adjusting saving ratios for the relative im-portance of unincorporated enterprises, and for the adjustment with regardto social security versus private pension and life insurance schemes. As aresult there are four possible methods of calculating "totally standardized"saving ratios, and two of these--the lowest and the highest--are shown inTable 3 as Methods A and B respectively.
34. Method A gives what may be termed "pure household" saving ra-tios, obtained by deducting both savings of unincorporated enterprises andnet equity in private pension and life insurance funds from SNA householdsavings. This implies that households take a myopic view of what constitutestheir saving, and are skeptical about their claims on retained business prof-its and supposed rights in pension and life insurance funds. Ratios result-ing from Method B, on the other hand, are obtained by adding in both cor-porate savings and savings of social security pension funds, and thus comeclose to national saving ratios. This Method B implies that households havea more sophisticated ("rational") attitude, and adjust their consumptionbehavior in the light of the savings accumulated on their behalf by the busi-ness sector and the social security system.
35. The choice of method not only produces drastically different sav-ing ratios, but also affects the country ranking except for the United King-dom which remains the lowest saver whichever method is used. The coeffi-cient of variation increases (is reduced) significantly if Method A(B) isused, but the absolute difference between the highest and the lowest house-hold saving ratio increases in either case compared to SNA ratios. Neitheradjustment method seems to improve the relative position of the UnitedStates in the ranking order. A feature common to both methods A and B isthat in most cases they tend to reduce the trend growth, or accentuate thetrend decline, observed in SNA household saving ratios over the period1970-1980.
(b) National Saving Ratios
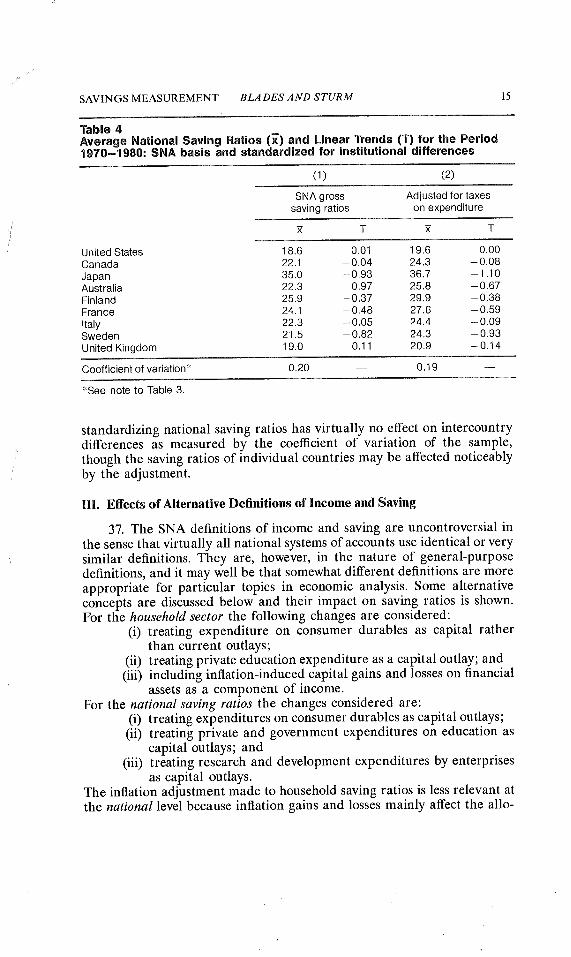
36. Of the four institutional factors listed in paragraph 11 above, thefirst three involve only the allocation of income and saving between sectors,and therefore cancel out at the national level. However, since national dis-posable income includes consumption taxes, the tax adjustment is also rele-vant for national saving ratios. Column 2 of Table 4 shows national savingratios adjusted for a standard treatment of expenditure taxes. Comparedwith the SNA ratios in Column 1 the standardized ratios are between 1(United States) and 4 (Finland) percentage points higher. In all countriesexcept Australia the standardized ratios were falling more rapidly over theperiod 1970 to 1980 indicating the decreasing relative importance of con-sumption taxes during that period. In contrast with the household ratios,
SAVINGS MEASUREMENT BLADES AND STURM 15
Table 4Average National Saving Ratios (~’) and Linear Trends (T) for the Period1970=1980: SNA basis and standardized for institutional differences
(1) (2)
SNA gross Adjusted for taxessaving ratios on expenditure
~ T ~ T
United States 18.6 0.01 19.6 0.00Canada 22.1 - 0.04 24.3 - 0,08Japan 35.0 -0.93 36.7 - 1.10Australia 22.3 - 0.97 25.8 - 0.67Finland 25.9 - 0.37 29.9 - 0.38France 24.1 - 0.48 27.6 - 0.59Italy 22.3 - 0.05 24.4 - 0.09Sweden 21.5 - 0,82 24.3 - 0.93United Kingdom 19.0 -0.11 20.9 -0.14
Coefficient of variation* 0.20 -- 0.19 --
’:’See note to Table 3.
standardizing national saving ratios has virtually no effect on intercountrydifferences as measured by the coefficient of variation of the sample,though the saving ratios of individual countries may be affected noticeablyby the adjustment.
IlL Effects of Alternative Definitions of Incoxne and Saving
37. The SNA definitions of income and saving are uncontroversial inthe sense that virtually all national systems of accounts use identical or verysimilar definitions. They are, however, in the nature of general-purposedefinitions, and it may well be that somewhat different definitions are moreappropriate for particular topics in economic analysis. Some alternativeconcepts are discussed below and their impact on saving ratios is shown.For the household sector the following changes are considered:
(i) treating expenditure on consumer durables as capital ratherthan current outlays;
(ii) treating private education expenditure as a capital outlay; and(iii) including inflation-induced capital gains and losses on financial
assets as a component of income.For the national saving ratios the changes considered are:
(i) treating expenditures on consumer durables as capital outlays;(ii) treating private and government expenditures on education as
capital outlays; and(iii) treating research and development expenditures by enterprises
as capital outlays.The inflation adjustment made to household saving ratios is less relevant atthe national level because inflation gains and losses mainly affect the allo-
16 SAVING AND GOVERNMENT POLICY
cation of saving between sectors and largely cancel out with respect to na-tional savings.
(a) Household Saving Ratios
Classifying consumer durables as capital
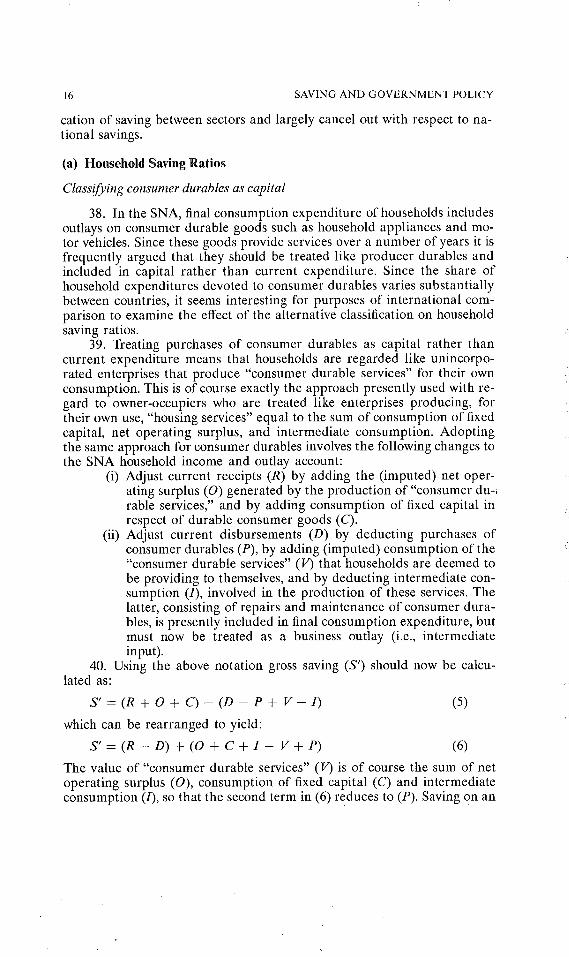
38. In the SNA, final consumption expenditure of households includesoutlays on consumer durable goods such as household appliances and mo-tor vehicles. Since these goods provide services over a number of years it isfrequently argued that they should be treated like producer durables andincluded in capital rather than current expenditure. Since the share ofhousehold expenditures devoted to consumer durables varies substantiallybetween countries, it seems interesting for purposes of international com-parison to examine the effect of the alternative classification on householdsaving ratios.
39. Treating purchases of consumer durables as capital rather thancurrent expenditure means that households are regarded like unincorpo-rated enterprises that produce "consumer durable services" for their ownconsumption. This is of course exactly the approach presently used with re-gard to owner-occupiers who are treated like enterprises producing, fortheir own use, "housing services" equal to the sum of consumption of fixedcapital, net operating surplus, and intermediate consumption. Adoptingthe same approach for consumer durables involves the following changes tothe SNA household income and outlay account:
(i) Adjust current receipts (R) by adding the (imputed) net oper-ating surplus (O) generated by the production of"consumer du-~rable services," and by adding consumption of fixed capital inrespect of durable consumer goods (C).
(ii) Adjust current disbursements (D) by deducting purchases ofconsumer durables (P), by adding (imputed) consumption of the"consumer durable services" (V) that households are deemed tobe providing to themselves, and by deducting intermediate con-sumption (/), involved in the production of these services. Thelatter, consisting of repairs and maintenance of consumer dura-bles, is presently included in final consumption expenditure, butmust now be treated as a business outlay (i.e., intermediateinput).
40. Using the above notation gross saving (S’) should now be calcu-lated as:
s’ = (R + o + c)- (D - P + V-/) (5)which can be rearranged to yield:
S’= (R--D) + (O + C+I- V+P) (6)
The value of "consumer durable services" (V) is of course the sum of netoperating surplus (O), consumption of fixed capital (C) and intermediateconsumption (/), so that the second term in (6) reduces to (P). Saving on an
SAVINGS MEASUREMENT BLADES AND STURM 17
SNA basis is therefore to be increased by thevalue of purchases of con-sumer durables.
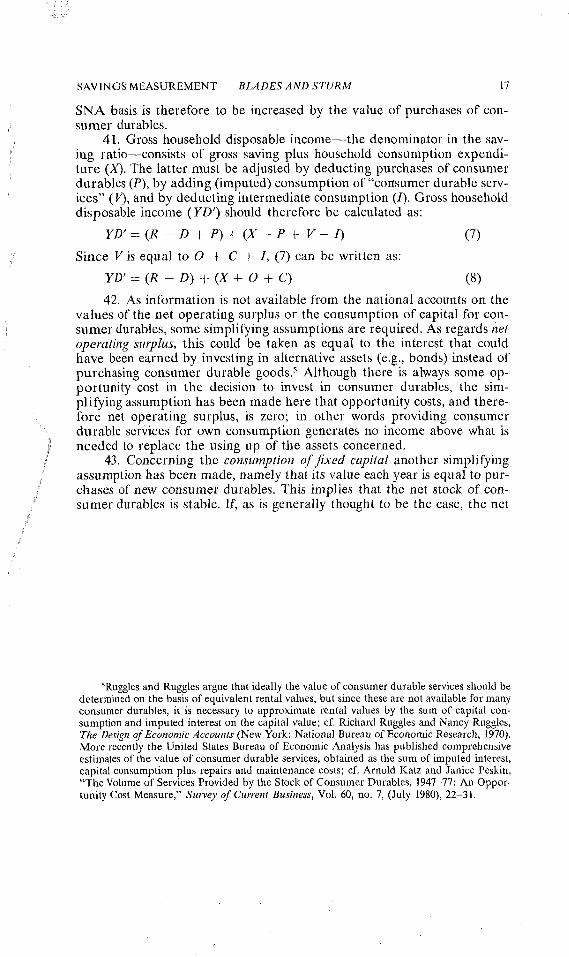
41. Gross household disposable income--the denominator in the sav-ing ratio--consists of gross saving plus household consumption expendi-ture (X). The latter must be adjusted by deducting purchases of consumerdurables (P), by adding (imputed) consumption of "consumer durable serv-ices" (V), and by deducting intermediate consumption (/). Gross householddisposable income (YD’) should therefore be calculated as:
YD’ = (R -- D + P) + (X- P + V-I)
Since V is equal to O + C + I, (7) can be written as:
YD’ = (R -- D) + (X + 0 + C)
(7)
(8)42. As information is not available from the national accounts on the
values of the net operating surplus or the consumption of capital for con-sumer durables, some simplifying assumptions are required. As regards netoperating surplus, this could be taken as equal to the interest that couldhave been earned by investing in alternative assets (e.g., bonds) instead ofpurchasing consumer durable goods,s Although there is always some op-portunity cost in the decision to invest in consumer durables, the sim-plifying assumption has been made here that opportunity costs, and there-fore net operating surplus, is zero; in other words providing consumerdurable services for own consumption generates no income above what isneeded to replace the using up of the assets concerned.
43. Concerning the consumption of fixed capital another simplifyingassumption has been made, namely that its value each year is equal to pur-chases of new consumer durables. This implies that the net stock of con-sumer durables is stable. If, as is generally thought to be the case, the net
5Ruggles and Ruggles argue that ideally the value of consumer durable services should bedetermined on the basis of equivalent rental values, but since these are not available for manyconsumer durables, it is necessary to approximate rental values by the sum of capital con-sumption and imputed interest on the capital value; cf. Richard Ruggles and Nancy Ruggles,The Design of Economic Accounts (New York: National Bureau of Economic Research, 1970).More recently the United States Bureau of Economic Analysis has published comprehensiveestimates of the value of consumer durable services, obtained as the sum of imputed interest,capital consumption plus repairs and maintenance costs; cf. Arnold Katz and Janice Peskin,"The Volume of Services Provided by the Stock of Consumer Durables, 1947-77: An Oppor-tunity Cost Measure," Survey of Current Business, Vol. 60, no. 7, (July 1980), 22-31.
18 SAVING AND GOVERNMENT POLICY
stock is actually growing, the adjustment ratios given in column 2 of Table5 are too low because the denominators are overstated. Data for the UnitedStates suggests, however, that the errors involved are not very large.6
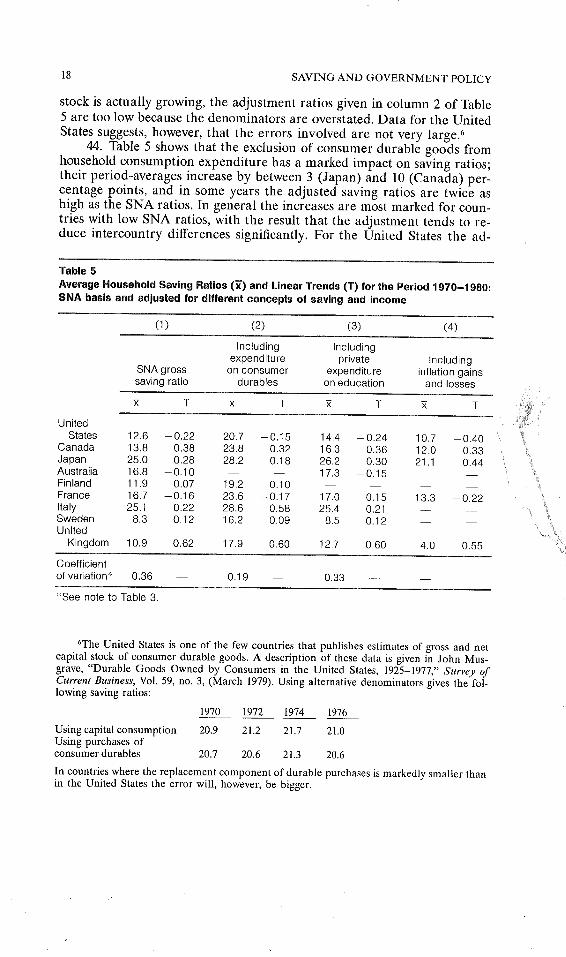
44. Table 5 shows that the exclusion of consumer durable goods fromhousehold consumption expenditure has a marked impact on saving ratios;their period-averages increase by between 3 (Japan) and 10 (Canada) per-centage points, and in some years the adjusted saving ratios are twice ashigh as the SNA ratios. In general the increases are most marked for coun-tries with low SNA ratios, with the result that the adjustment tends to re-duce intercountry differences significantly. For the United States the ad-
Table 5Average Household Saving Ratios (~’) and Linear Trends (T) for the Period 1970-1980:SNA basis and adjusted for different concepts of saving and income
(1) (2) (3) (4)
Including Includingexpenditure private Including
SNA gross on consumer expenditure inflation gainssaving ratio durables on education and losses
~ T ~ T ~ T ~ TUnited
States 12.6 -0.22 20.7 -0.15 14.4 -0.24 10.7 -0.40Canada 13.8 0.38 23.8 0.32 16.3 0.36 12.0 0.33Japan 25.0 0.28 28.2 0.18 26.2 0.30 21.1 0.44Australia 16.8 -0.10 -- -- 17.3 -0.15 -- --Finland 11.9 0.07 19.2 0.10 ....France 16.7 -0.16 23.6 -0.17 17.0 -0.15 13.3 -0.22Italy 25.1 0.22 28.6 0.58 25,4 0.21 -- --Sweden 8.3 0.12 16.2 0.09 8,5 0.12 --United
Kingdom 10.9 0.62 17.9 0.60 12.7 0.60 4.0 0.55Coefficientof variation~ 0.36 -- 0.19 -- 0.33 -- --
"’See note to Table 3.
6The United States is one of the few countries that publishes estimates of gross and netcapital stock of consumer durable goods. A description of these data is given in John Mus-grave, "Durable Goods Owned by Consumers in the United States, 1925-1977," Survey ofCurrent Business, Vol. 59, no. 3, (March 1979). Using alternative denominators gives the fol-lowing saving ratios:
1970 1972 1974 1976
Using capital consumption 20.9 21.2 21.7 21.0Using purchases ofconsumer durables 20.7 20.6 21.3 20.6In countries where the replacement component of durable purchases is markedly smaller thanin the United States the error will, however, be bigger.

SAVINGS MEASUREMENT BLADES AND STURM 19
justment considerably dampens the decline in the household saving ratiorecorded between 1975 and 1978, suggesting a switch from financial savingsto purchases of consumer durables during this period.
Classifying education expenditures as capital outlays
45. While education expenditures do not create physical assets theyresult in "major alterations" to an existing asset--the "stock of human cap-ital"--which g~eatly enhance its productivity. Alterations of this kind aretreated in the SNA as investments when they are made to physical capitalgoods, and here the effect on household saving ratios is examined if thistreatment were extended to human capital.
46. Treating household expenditure on education as a capital outlayrequires a similar kind of adjustment to the accounts as was made earliert~or consumer durable goods. Households are treated as though they wereunincorporated enterprises that purchase an intangible capital asset--edu-cation-which is then used to produce "human capital services." There is,however, an important difference between consumer durable and humancapital services, in that the latter are not primarily for own consumption,but are sold to other households, enterprises, or government. This greatlysimplifies matters since household disposable income already includes, aspart of wages and entrepreneurial income, the gross operating surplus(O + C) generated by "human capital services," while such income had tobe separately imputed in the case of consumer durable services. As a resultthe only adjustment required is the addition of education expenditures tothe numerator of the saving ratio.7
47. Column 3 of Table 5 shows that the adjustment raises householdsaving ratios by between 0.2 (Sweden) and 2.5 (Canada) percentage points.The increase for the United States amounts to 1.8 percentage points, re-flecting the above-average importance of households’ educational expendi-ture in this country. There is a small reduction in intercountry differencesas measured by the coefficient of variation.
Inflation gains and losses
48. In the SNA, gains and losses on liabilities and assets are shown inthe balance sheet accounts where they appear as a reconciliation item be-tween the opening and closing stocks. Some of these gains and losses arisefrom exceptional events such as physical destruction of assets (i.e., naturaldisasters or business failures) but gains and losses arising from holding fi-nancial assets and liabilities during periods of persistent inflation are regu-lar and predictable and there is a prima facie case for treating these par-ticular gains and losses as current flows and including them in income andsavings.
7By ignoring the opportunity cost of forgone earnings by students, this may considerablyunderestimate the actual investment in human capital taking place.
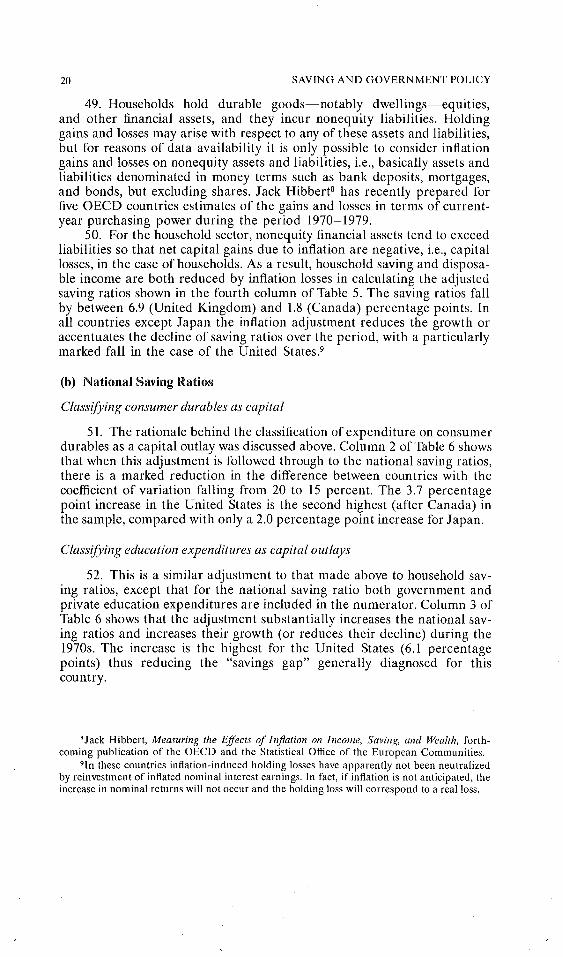
20 SAVING AND GOVERNMENT POLICY
49. Households hold durable goods--notably dwellings--equities,and other financial assets, and they incur nonequity liabilities. Holdinggains and losses may arise with respect to any of these assets and liabilities,but for reasons of data availability it is only possible to consider inflationgains and losses on nonequity assets and liabilities, i.e., basically assets andliabilities denominated in money terms such as bank deposits, mortgages,and bonds, but excluding shares. Jack Hibbert8 has recently prepared forfive OECD countries estimates of the gains and losses in terms of current-year purchasing power during the period 1970-1979.
50. For the household sector, nonequity financial assets tend to exceedliabilities so that net capital gains due to inflation are negative, i.e., capitallosses, in the case of households. As a result, household saving and disposa-ble income are both reduced by inflation losses in calculating the adjustedsaving ratios shown in the fourth column of Table 5. The saving ratios fallby between 6.9 (United Kingdom) and 1.8 (Canada) percentage points. Inall countries except Japan the inflation adjustment reduces the growth oraccentuates the decline of saving ratios over the period, with a particularlymarked fall in the case of the United States?
(b) National Saving Ratios
Classifying consumer durables as capital
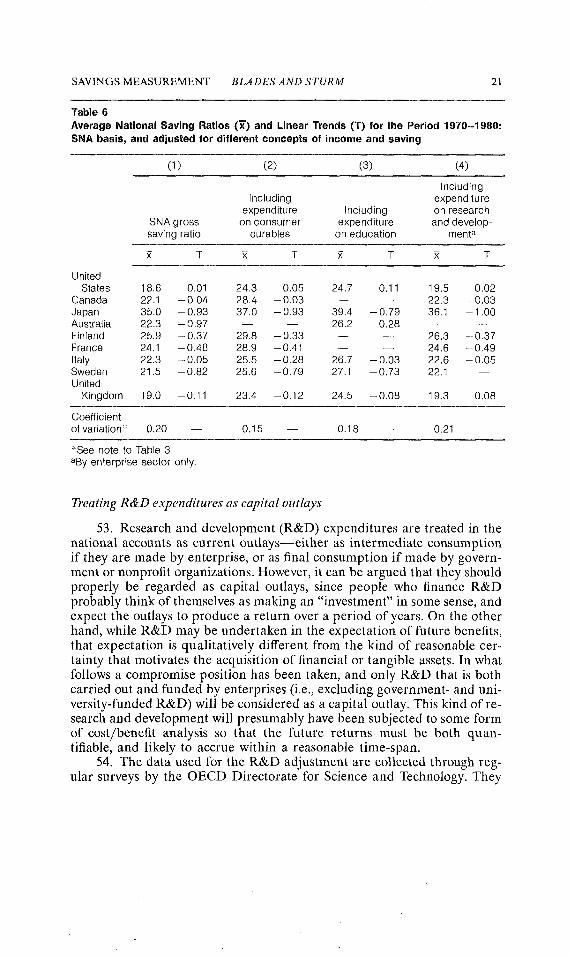
51. The rationale behind the classification of expenditure on consumerdurables as a capital outlay was discussed above. Column 2 of Table 6 showsthat when this adjustment is followed through to the national saving ratios,there is a marked reduction in the difference between countries with thecoefficient of variation falling from 20 to 15 percent. The 3.7 percentagepoint increase in the United States is the second highest (after Canada) inthe sample, compared with only a 2.0 percentage point increase for Japan.
Classifying education expenditures as capital outlays
52. This is a similar adjustment to that made above to household sav-ing ratios, except that for the national saving ratio both government andprivate education expenditures are included in the numerator. Column 3 ofTable 6 shows that the adjustment substantially increases the national sav-ing ratios and increases their growth (or reduces their decline) during the1970s. The increase is the highest for the United States (6.1 percentagepoints) thus reducing the "savings gap" generally diagnosed for thiscountry.
8Jack Hibbert, Measuring the Effects of Inflation on Income, Saving, and Wealth, forth-coming publication of the OECD and the Statistical Office of the European Communities.
9In these countries inflation-induced holding losses have apparently not been neutralizedby reinvestment of inflated nominal interest earnings. In fact, if inflation is not anticipated, theincrease in nominal returns will not occur and the holding loss will correspond to a real loss.
SAVINGS MEASUREMENT BLADES AND STURM 21
Table 6Average National Saving Ratios (~’) and Linear Trends (T) for the Period 1970-1980:SNA basis, and adjusted tot different concepts ot income and saving
(1) (2) (3) (4)
IncludingIncluding expenditure
expenditure Including on researchSNA gross on consumer expenditure and develop-saving ratio durables on education menta
~ T ~ T ~ T ~ T
UnitedStates 18.6 0.01 24.3 0.05 24.7 0,11 19.5 0.02
Canada 22.1 -0.04 28.4 -0.03 -- -- 22.3 -0,03Japan 35.0 -0.93 37.0 -0.93 39,4 -0.79 36.1 -1.00Australia 22.3 - 0.97 -- I 26.2 0,28 -- --Finland 25.9 -0.37 29.8 -0.33 -- -- 26.3 -0.37France 24.1 --0.48 28,9 -0.41 -- -- 24.6 -0.49Italy 22.3 --0.05 25,5 -0.28 26.7 -0.03 22,6 -0,05Sweden 21,5 -0.82 25.6 -0.79 27.1 -0.73 22.1United
Kingdom 19.0 -0.11 23.4 -0.12 24.5 -0.08 19.3 0.08
Coefficientof variation* 0.20 -- 0.15 0.18 -- 0.21
’:’See note to Table 3.aBy enterprise sector only.
Treating R&D expenditures as capital outlays
53. Research and development (R&D) expenditures are treated in thenational accounts as current outlays--either as intermediate consumptionif they are made by enterprise, or as final consumption if made by govern-ment or nonprofit organizations. However, it can be argued that they shouldproperly be regarded as capital outlays, since people who finance R&Dprobably think of themselves as making an "investment" in some sense, andexpect the outlays to produce a return over a period of years. On the otherhand, while R&D may be undertaken in the expectation of future benefits,that expectation is qualitatively different from the kind of reasonable cer-tainty that motivates the acquisition of financial or tangible assets. In whatfollows a compromise position has been taken, and only R&D that is bothcarried out and funded by enterprises (i.e., excluding government- and uni-versity-funded R&D) will be considered as a capital outlay. This kind of re-search and development will presumably have been subjected to some formof cost/benefit analysis so that the future returns nmst be both quan-tifiable, and likely to accrue within a reasonable time-span.
54. The data used for the R&D adjustment are collected through reg-ular surveys by the OECD Directorate for Science and Technology. They
22 SAVING AND GOVERNMENT POLICY
are compiled according to the definitions and classifications of the "Fras-cati Manual" 10 and, at the aggregation level used here, they are both rea-sonably consistent over time and comparable between countries. The mainproblem for present purposes is that they exclude outlays on mineral pros-pecting; these are obviously important outlays in several OECD countriesand if they were also treated as capital outlays, the adjusted ratios of Table 6would be substantially higher for Canada, the United States, Australia andthe United Kingdom--particularly towards the end of the period.
55. Treating enterprises’ R&D expenditures as capital outlays in-creases the gross operating surplus because R&D outlays which were for-merly included in intermediate consumption are now treated as self-financed capital formation, which is part of final output. Both gross nationalsavings and gross national disposable income--the denominator in the na-tional saving ratio--are therefore increased by the value of enterprise ex-penditure on R&D. The results of the adjustment are shown in the last col-umn of Table 6. The adjusted ratios exceed the SNA ratios by between 0.2(Canada) and 1.1 percentage points (Japan). Within countries the differ-ences were remarkably stable during tile 1970s, and so have a negligible ef-fect on the growth rates over the period.
IV. Further Considerations (items not quantified)
56. The modifications of the savings definition considered in the pre-ceding section by no means exhaust all possible changes in the definition ofsavings which might appear desirable for particular topics in economicanalysis. In this section additional modifications of the savings concept willbe explored, though a quantification of their effects on the saving ratio hasnot been possible for the present study due to the lack of comparable datafor a sufficiently large group of countries. Still in man,/cases available qual-itative information permits educated guesses on how the relative positionof the United States in the international savings league would be affectedby the adjustment discussed. Several of the adjustments considered hereare controversial and the discussion only scratches the surface of problemareas which have been analyzed more intensively elsewhere, though notnecessarily in the context of saving ratios.
Military Hardware
57. The SNA treats government expenditure on military constructionand equipment as public consumption. It can be argued that such pur-chases represent investment and add to the "stock of "defense capital"which will produce "defense services" in future periods. To maintain con-sistency, such a reclassification would require the national income conceptto be supplemented by an estimate of the imputed return to the properlycomputed stock of defense capital. In principle, such treatment should be
I°OECD, The Measurement of Scientific and Technical Activities (Paris: OECD, 1980).
SAVINGS MEASUREMENT BLADES AND STURM 23
analogous to that of investment in other tangible assets which produce non-marketed output for final consumption, like owner-occupied dwellings.~Since the United States has the largest expenditure on military hardware(both absolute and in terms of GNP) in the OECD area, such an adjust-ment would increase the U.S. national saving ratio relative to other OECDcountries. 12
Production Excluded from National Accounts
58. The SNA definition of output does not include all production ac-tivities in the economy. Production may be excluded deliberately (e.g., pro-ductive activity of housewives) because of inherent difficulties of measure-ment, or because it is (illegally) concealed from the authorities for reasonsof tax evasion (i.e., the "underground" or "black" economy).13 Enlargingthe concept of production (and thus income) to include activities hithertonot included--if it could be done--would also affect saving ratios. How bigand in what direction such a change would be obviously depends on thevolume of the added production, and on which part represents consump-tion (e.g., self-supplied domestic services) and investment (e.g., black mar-ket construction) respectively. It thus seems impossible to predict in whatdirection--let alone by how much--international differences in saving ra-tios would be affected by such an adjustment without a detailed empiricalstudy. As to the relative size of unrecorded production activities, a recentOECD study~4 suggests that the volume of the "black" or "underground"economy excluded from the national accounts is much smaller than the vol-ume of activities concealed from tax collectors. This is because national ac-countants use a variety of sources and methods to cross-check their esti-mates for activities where "black" transactions are likely to be important?5However, the relative size of domestic production activities deliberately ex-cluded from the production and income accounts is likely to be quite largeand thus their inclusion may conceivably affect intercountry differences insaving ratios significantly if the relative size of such production differs be-tween countries. Assuming that all these activities are directed to the out-
~Nonmilitary government investment not considered as producer durables should inprinciple also be treated in this fashion.
~2A major reason why military hardware is classified as consumption in the SNA is thatgreat uncertainty attaches to the length of its service life. Under normal peace-time conditions,however, it appears legitimate to argue that its destruction in the relatively rare armed conflictsthat do occur should be treated as capital losses, in line with the treatment of civilian capitalassets lost in floods and earthquakes.
~3A third category of transactions excluded from the National Accounts consists of illegalactivities like gambling and drug trade; these items are ignored in this paper.
~4Cf. Derek Blades, "The Hidden Economy and the National Accounts," OECD Eco-nomic Outlook, Occasional Studies, (June 1982), pp. 28-45.
~SRecent studies in the United States and the United Kingdom suggest that the valueadded by "black" activities omitted from the national accounts might amount to at most 3 per-cent of GDP, cf. Blades, ibid.
24 SAVING AND GOVERNMENT POLICY
put of consumption goods and services (which seems questionable), theirinclusion should ceteris paribus lower the saving ratios most in those coun-tries where the labor participation rate of married women is relatively low.
Use of Nonrenewable Resources
59: Many production processes require (directly or indirectly) inputsof raw materials. Where these raw materials are taken from a limited(though unknown) stock of nonrenewable resources, it can be argued thatthe value-added share corresponding to this input (i.e., the rents receivedby the resource owner) do not represent net output but should be treated asnegative investment (and savings) much like the running down of conven-tional inventories. A corresponding adjustment to the income and productstatistics would imply a relatively larger downward adjustment of the sav-ing ratio in those countries where the share of rental income from the useof nonrenewable resources is relatively large, e.g., Norway, Canada, and theUnited States. In quantitative terms the adjustment would, however, belikely to be small because--contrary to moderately widespread opinion--the share of pure rental income from the use of depletable national re-sources in total income is minute in most OECD countries, or at least hasbeen prior to the oil price shocks in the seventies.16
60. Analogous reductions in official income measures may be appro-priate with respect to the declining quality of agricultural land due to(over-) use and more generally with respect to deterioration in quality ofthe environment (e.g., air pollution) caused by various production activi-ties. In the latter case quantification is particularly difficult because due toundefined property rights, no rental income identifiable with the resourceuse (e.g., clean air, water, etc.) accrues, but rather the benefits are widelydispersed through suboptimal product prices not reflecting total (social)cost of production. Apart from the difficulties of measurement, the appro-priate adjustment to the income and product accounts can have quite dif-ferent implications for the saving ratio: where the environmental externa-lities represent a permanent damage (the stock of resources is permanentlydecreased, as in land erosion) income and savings should be lowered byidentical amounts, entailing a decline in the saving ratio. Where the envi-ronmental damage is transitory (e.g., most types of air pollution) resourcesare not depleted and income and consumption (i.e., of clean air) should belowered by identical amounts, leading to an increase in the saving ratio.
~6Estimates by E. Denison for the share of total land rents in national income are 2.6 and3.6 percent for the United States and Northwest Europe, respectively, in the early sixties. Onlya fraction of this would correspond to the use of nonrenewable resources; cf. E. Denison, WhyGrowth Rates Differ (Washington, D.C.: The Brookings Institution, 1967), Table 4-2.

SAVINGS MEASUREMENT BLADES AND STURM 25
Learning-by-Doing
61. It has been argued in part III above that educational expenditurecan justifiably be redefined as gross savings to the extent that it maintainsor increases the stock of human capital, and thus adds to productive capac-ity. Formal education is, however, not the only activity generating humancapital. Many skills are accumulated through learning-by-doing and on thejob training. If these activities do, therefore, increase the stock of humancapital (defined as increased capacity to produce in the future), the ques-tion arises how this phenomenon can be adequately recognized in an eco-nomically more meaningful definition of savings. For jobs which effectivelyentail human capital formation (in this wider sense), total labor and capitalcost represent only a part of total value-added. Additional income is dis-tributed "in kind" to the employee in whom the newly created human capi-tal is embodied and thus saved, and total income estimates should be sup-plemented by the amount of human capital thus created.17 Doing so wouldobviously increase the gross saving ratio by increasing the adjusted incomeand gross savings measures by identical amounts. In international compari-son such an adjustment would raise the saving ratio most for those coun-tries which have been most successful in integrating additional members ofsociety into the labor force. A casual look at international employment sta-tistics suggests that on this basis the U.S. and Canadian saving ratios wouldprobably improve significantly relative to most European economies whereemployment stagnated or even declined during the last decade.
Rearing Costs and Health Expenditures
62. An even more drastic extension of the human capital concept hasbeen suggested by J. Kendrick.18 He includes under the definition of "tan-gible human capital," the cumulated rearing and maintenance cost of indi-viduals, roughly identifying these items with "necessary" consumption andhealth care expenditures respectively. As a consequence, these expendi-tures would have to be reclassified as investment rather than consumptionwhich would, of course, increase the saving ratio. In production analysis,tangible human capital and intangible human capital embodied in the for-mer would replace labor as a production factor, and gross returns on thesetypes of capital correspond to labor income in conventional analysis. TheKendrick methodology produces an adjusted national saving ratio for theUnited States which increases gradually from 43 percent in 1929 to 50 per-cent in 1969. No comparable studies are available for other countries butgiven the more rapid population growth in the United States than in most
17The time profile of income during a (professional) life might be interpreted as primafacie evidence of the amount of human capital formation specific to a job: a flat (steeply in-creasing) time profile would suggest no (large) human capital formation.
~SJohn Kendrick, Formation and Stocks of Total Capital (New York: Columbia UniversityPress, 1976).
26 SAVING AND GOVERNMENT POLICY
other OECD countries, such an adjustment is likely to favor the relativeposition of the United States in an ordering of countries according to thesize of the national saving ratio.
Different Relative Prices of Investment Goods
63. All the previous adjustments discussed referred to changes in thedefinition of savings and/or income. The reasoning that follows is qual-itatively different in that it considers the effect of relative prices on savingsratios. In countries where the relative price of investment and consumptiongoods differs significantly, identical physical amounts of investment andconsumption would imply different investment ratios, the latter being ratiosof value aggregates rather than of quantities. Since empirically investmentratios and saving ratios in most OECD countries are close to identical inthe medium run,~9 this implies that saving ratios may differ considerablybetween countries with an identical composition of physical output allo-cated to consumption and investment.2° The assumption of perfectly com-petitive world markets would weaken but not completely eliminate this pos-sible source of differences in saving ratios. As long as production factorsare immobile internationally and there are nontradeable goods and/or dif-ferential transportation costs, the relative price of investment goods maystill differ between countries.
64. It seems difficult to say a priori whether such a relative price effectplays a significant role in observed intercountry saving ratio differencesand--if so--in which direction it influences these differences. A recentcareful international comparison of relative prices of major GNP compo-nents shows, however, that intercountry relative price differentials are sub-stantial and that the relative price of investment goods is lower in theUnited States than in most other OECD countries.2~ This implies that thelow U.S. saving ratio can be interpreted simply as a reflection of the factthat "investment comes cheap" in the United States rather than entailinglow investment (relative to consumption) in physical terms. The policy im-plications of this finding would appear to be that the saving ratio may in-deed be low, but that this is nothing to worry about as far as the volume ofinvestment is concerned.
~gCf. M. Feldstein, and C. Horioka, "Domestic Saving and International Capital Flows,"The Economic Journal, 90 (June 1980), 314-329.
2°This phenomenon has been implicitly recognized in discussions of the high Japanesehousehold saving ratio, where the latter is partially explained by the high relative price ofhousing in Japan; cf. J. Shiba, "The Personal Savings Function of Urban Worker Householdsin Japan," Review of Economies and Statistics, 161 (May 1979), 200-213.
2~Cf. Irving Kravis, Alan Heston, and Robert Summers, Worm Product and Income (Balti-more: John Hopkins University Press, 1982), p. 20.
SAVINGS MEASUREMENT BLADES AND STURM 27
V. Savings Concept Relevant for Economic Growth
65. Applying different combinations of the various adjustments to theSNA saving definition discussed earlier, results in a large number of alter-native savings concepts differing considerably in size as well as the speedand even direction of change over time. For the economic policymaker it isimportant to know which of these alternative concepts is the most relevantwith respect to the policy targets he pursues.22 This section discusses thequestion of which definition of the national saving ratio is the most appro-priate to use in the analysis of economic growth and its determinants.23While this relationship seems to be of primary concern in the UnitedStates, it is by no means the only important policy aspect of savings: inmany LDCs, and recently also in several industrialized European coun-tries, policies aiming to increase savings are primarily motivated--at leastaccording to explicit statements by politicians--by the desire to createemployment opportunities through capital-widening investment. Thoughclosely related, output and employment growth targets need not have a one-to-one correspondence and would indeed imply different definitions of sav-ings as the relevant concept for policy analysis.
66. Limitation of the discussion to the national saving ratio makes itunnecessary to review those adjustments discussed above which only affectthe sectoral composition of total savings, while leaving the overall savingratio unaffected. These adjustments include the adjustment for inflation-induced capital gains and losses on financial assets, and all adjustments fordifferences in institutional arrangements except for the method of-raisingtax revenue (i.e., direct vs. consumption taxes). The latter entails differ-ences in national saving ratios only if disposable national income is meas-ured at market prices rather than at factor cost, and this suggests that inter-national comparisons of national saving ratios should be based on the latterconcept rather than on income measures including indirect taxation.
2~While this study is limited to the discussion of saving ratios, it may be useful to remindthe reader that annual changes in total national savings due to variation in the saving ratiousually do not exceed changes accounted for by variations in the level of income. Thus, poli-cies to achieve full capacity utilization would appear equally relevant if the policy objective isan increase in total savings. Of course, full capacity utilization and high saving ratios are notmutually exclusive policy objectives. In fact, there seems to be an empirically robust positivecorrelation between the two variables over the business cycles.
Z3Notwithstanding the concentration on total (or national) savings, it is recognized thatwith imperfect capital markets the sectoral distribution of savings will affect the compositionof capital formation and probably the speed of income growth associated with a given overallsaving and investment ratio. The sectoral distribution of a given amount of savings may thusitself become a legitimate policy concern.
28 SAVING AND GOVERNMENT POLICY
67. In neoclassical growth models it is normally the net saving ratiowhich codetermines the absolute growth of the capital stock, given thegrowth rates of population and technical progress. There are at least twoproblems with such a paradigm:24
-- It is the increase in the gross rather than the net capital stock whichcodetermines the growth in productive capacity.25 Wheneverscrapping differs from depreciation (the normal case in a growingeconomy), net savings will not be equal to the increase in the grosscapital stock and thus fail to be a proper indicator of capacitygrowth.26
-- If embodied technical progress is important and the official meas-ure of investment fails to take full account of the increased produc-tivity of new investment, the capital stock (measured in efficiencyunits) may rise even if net savings is zero. In this case a vintage cap-ital model may be the appropriate tool for analyzing growth, inwhich case gross savings (and investment) becomes a relevantvariable.27
These examples suggest that both the gross and the net saving ratio may berelevant in a realistic and detailed analysis of growth, rather than one orthe other.
68. In standard neoclassical growth theory, the rate of output growthis in the long run independent of the saving ratio. Changes in the latter ex-ert an influence on output growth only during the transition period fromone steady state to another. To avoid getting unduly involved in a discus-sion of the policy relevance of such models, it thus appears useful to re-place the question of which savings concept is relevant for growth analysisby the related (but not identical) question of which wealth concept is rele-vant for the determination of income levels.2s Once the appropriate wealthconcept is determined, the relevant savings concept is likewise determinedas its derivative with respect to time. Inspection of the various adjustments
24In the real world further complications arise from the openness of the economy (whichmay entail discrepancies between national savings and domestic investment) and ex ante dis-equilibrium in the goods market, entailing unintended increases in inventories, i.e., investmentwhich does not increase productive capacity. Implications of these complications are not pur-sued here.
25If fixed capital loses part of its productive capacity already during its lifetime (i.e., be-fore final scrapping), the relationship becomes even more complicated but the arguments tofollow still hold.
26Along a steady-state growth path the relative growth of the net and the gross capitalstock will, however, be the same.
27Putty-clay technology equally requires the use of vintage models and thus of gross sav-ings for growth analysis.
2Sin said neoclassical growth models, the saving ratio in the long run determines the levelof (per capita) wealth which in turn determines the level rather than the growth of (per capita)income.
SAVINGS MEASUREMENT BLADES AND STURM 29
to the definition of savings discussed above shows that in some cases thesechanges would require concommitant changes in the concept of income (oroutput) to maintain consistency in the national accounts. In these instancesthe question of which is the relevant savings or wealth concept translatesdirectly into the question of what is the relevant income concept. Thus, ifservices provided by consumer durables are deemed to be a legitimate partof a "comprehensive" or "correct" measure of income, then the "relevant"wealth concept must include the stock of consumer durables, and savingsshould be redefined to include consumer durable purchases. An analogousargument applies to the savings adjustment on account of government pur-chases of military hardware.29
69. Little discussion is required with respect to the "black economy"adjustment: it attempts to reduce measurement errors, and the smallerthese errors are kept the better.3° Whether production activities presentlydeliberately excluded from the SNA (e.g., housewives’ services and do-it-yourself activities) should be included in the income definition, thus lower-ing (raising) the saving ratio in the case where these activities representconsumption (investment), depends on what the income concept is sup-posed to measure. Where income is used as a proxy variable for welfare, in-clusion would seem desirable? l If, however, the aggregate output measure isused as an indicator determining demand pressure in the labor market orthe size of the tax base, to mention a few examples, inclusion would not bejustified. Since welfare considerations are the primary objective in pro-moting growth, it follows that the saving and income concepts chosenshould be rather more comprehensive than the concepts presently used.The inclusion of hitherto ignored production activities which qualify as in-vestment would for consistency require the computation of a correspondingcapital stock whose (imputed) rate of return would, of course, add to cur-rent income appropriately redefined whenever this capital renders con-sumption services.32
29Note, however, that as these changes are implemented, the resulting savings concept be-comes rather uninteresting for analysts concentrating on the supply of loanable lgnds by thehousehold sector: financial planners may find little comfort in being told that the householdsaving ratio is unchanged, if households have switched from investing in financial assets (e.g.,stocks and bonds) to buying consumer durables.
3°AI1 adjustments are discussed here with respect to their economic justification, ignoringstatistical difficulties of implementing any suggested adjustment. In that respect the presentstudy differs from the rationale underlying the SNA which attempts to strike a balance be-tween what is conceptually desirable and practically feasible.
2 ~The resulting concept would still be a rather imperfect indicator of welfare, ignoring im-portant aspects of welfare such as leisure time, income distribution, and relevant social indica-tors like crime rates, incidence of sickness, etc.
32In the United States this is presently done only with respect to owner-built houses.Where the capital renders production services (e.g., human capital), the returns are reflectedin higher productivity (as conventionally measured) and no imputed return should be added toincome.
3O SAVING AND GOVERNMENT POLICY
70. Generalizing this type of reasoning, it seems difficult to escape theconclusion that the part of education and R&D which permanently in-creases the productivity of labor and/or capital should be reclassified as in-vestment and thus saving for the purpose of growth analysis. Cumulatingthese intangible investments would generate an intangible capital stockpartly embodied in human beings (skills) and partly embodied in a stock ofknown production technologies and products. It has been shown that im-puting market returns to these types of intangible capital goes a consider-able way in explaining labor income differentials and the residual factor ineconomic growth?3 The part of education which does not lead to an in-crease in factor productivity should be treated analogously to investment inconsumer durables, where it leads to a permanent increase in knowledgeand understanding or as consumption (as is presently done for all educa-tion) if no such lasting effects are produced. Human capital .formation orig-inating from learning by doing should similarly add to the stock of intan-gible human capital, implying an equal (imputed) increase in income andsavings?4
71. The last item to be considered is whether the value of nonrenewa-ble resources used in current production should be deducted from currentincome on the grounds that it is equivalent to running down inventories)5The diversification efforts of economies heavily based on the exploitation ofnonrenewable resources (e.g., Nigeria, Venezuela) implicitly recognize thedissaving character of nonrenewable resource use. By saving a substantialpart (the rental income equivalent?) of their revenues from these activitiesand reinvesting it into alternative income-producing assets, they attempt toavoid the erosion of net national wealth defined in a broader way to includethe stock of nonrenewable resources.36 Recognizing the same principle ex-plicitly in the national accounts would imply the deduction of rental in-come from nonrenewable resource use from national income and savings.Doing so would seem in line with economic logic.
33For a detailed discussion of this topic see John W. Kendrick, Formation and Stocks.34It may well be that the amount of human capital formation foregone due to (youth) un-
employment during a prolonged recession matches or even exceeds the output losses conven-tionally measured, the topic seems certainly worth further investigation.
35Contrary to other stocks of capital which contribute to current output by rendering aproduction or consumption service in which economic depreciation is an unavoidable fact, astock of natural resources "only" contributes to output by being used up. There is thus no im-puted net return to stocks of natural resources, only cost of depreciation equal to the rentalincome of the resource owner.
36The asset value of natural resources relative to current income may, in some cases, be solarge as to make it economically efficient to lower the wealth income ratio by consuming partof the rental income from resource exploitation--this may presently be the case in countrieslike Kuwait and Saudi Arabia.
Pau~ A. Wachtel*
That saving rates for the major industrialized countries differ enor-mously is a well-known puzzle. The careful analysis of the OECD’s uniformNational Income Accounts by Blades and Sturm suggests that the puzzlewill continue to defy solution. This is not to fault their analysis; instead Iam inclined to conclude that a full understanding of international differ-ences in saving behavior may not be obtainable from the available data. Inthis discussion I would like to suggest an alternative framework for analysisof the available data which I think would provide a fuller understanding ofthe puzzle. Nevertheless, it is clear that answers to all the issues will be verydifficult to obtain.
To begin, we can summarize the methodological approach used byBlades and Sturm. Their point of departure is the uniform accountingscheme prepared by the OECD. They note that the conceptual definition ofsaving in those accounts can be criticized for a number of reasons. For eachof these they make adjustments to the data and note that with conceptuallyimproved definitions of saving, the intercountry variation in average savingrates for the 1970s is reduced slightly.
Although the adjustments to the data that they suggest are always rea-sonable, the corrections made do not go very far towards solving the puzzle.For example, Table 3 in Blades and Sturm shows that with the SNA defini-tion of gross household saving rates, Italy and Japan have the highest savingrates and Sweden and the United Kingdom have the lowest. Some six ad-justments later, we find that the same rankings hold (totally standardizedsaving rate, method A). The rank correlations for all nine countries in thesample of the SNA average saving rates with the two alternative totallystandardized measures are .90 and .85. Although the adjustments affect dif-ferent nations differently, the overall picture is invariant. In a few countriesa fifth or more of disposable income is saved, while in some the rates areonly a fraction of that amount.
The emphasis in the paper is on the appropriate definition of the ag-gregate saving ratio, whether it is national saving or household saving. This,I think, is the major failing of the study. It compares the overall picture--the forest for each country. Instead, I suggest more emphasis on individualtrees from each nation’s forest. The puzzle of international differences insaving rates is not solved by comparing the vast forest of savings in eachcountry. However, within each forest there are individual trees which aresimilar to or different from the corresponding trees in other forests. Per-
*Professor of Economics at the New York University Graduate School of BusinessAdministration.
31
32 SAVING AND GOVERNMENT POLICY
haps more can be learned from a comparative study of different types ofsaving activity and motivations for saving.
Blades and Sturm present aggregate saving ratios after various adjust-ments are made. My contention is that the adjustments themselves meritmore attention. They typically represent specific types of saving behaviorand the extent to which countries differ with respect to these activities mayshed light on the differences in the standard or common core definitions ofsaving. It is difficult to examine the magnitudes of the saving componentsused for the adjustments with the data in their tables which include adjust-ments to both the numerators and denominators in saving rates.
The emphasis on household saving here and in the Blades and Sturmpaper needs to be justified. Saving by households is of particular interestbecause the household sector is generally a surplus sector. That is, its net fi-nancial investment represents resources available to other sectors for capi-tal formation. The extent to which the household sector is releasing re-sources to the rest of the economy can be measured even with SNA data onpersonal saving. That is, simply subtract net housing investment from per-sonal saving. I think that this calculation would provide a valuable additionto the material presented in the article.
Using the household saving data in Table 3 as an example, the inter-relationship between SNA saving and the saving of unincorporated enter-prises, corporate enterprises, pension funds, social security funds and gov-ernment expenditures on human capital should be of interest. Thus, somesimple questions could be addressed like: Do countries with high publicpension saving have low private pension saving? Do countries with a lot ofsaving by unincorporated enterprises have less household saving? The em-phasis on a comprehensive saving ratio obscures such questions. It is im-portant to know whether differences in standard saving rates are due toparticular components or to similar variation in all the components.
A decomposition of household saving cannot be done easily with NIPAdata, but for the United States at least there is an alternative data sourcewhich is particularly useful, the Flow of Funds data. A breakdown of theFlow of Funds data on household saving which would be useful for the typeof analysis that I am proposing is found in Table 1. Average ratios to dispos-able personal income for 1970-81 are shown, along with the slope coeffi-cient from a trend equation.
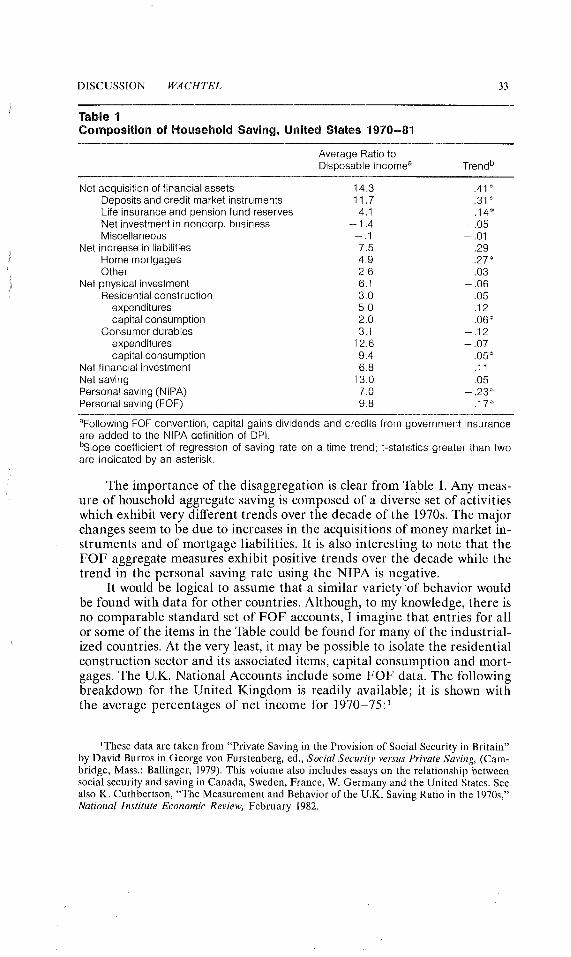
DISCUSSION WACHTEL 33
Table 1Composition of Household Saving, United States 1970-81
Average Ratio toDisposable Incomea Trendb
Net acquisition of financial assets 14,3 .41 *Deposits and credit market instruments 11.7 .31 *Life insurance and pension fund reserves 4.1 ,14*Net investment in noncorp, business - 1.4 --.05Miscellaneous - ,1 - .01
Net increase in liabilities 7.5 ,29Home mortgages 4.9 .27*Other 2,6 .03
Net physical investment 6.1 -.06Residential construction 3.0 .05
expenditures 5.0 ,12capital consumption 2.0 .06"
Consumer durables 3.1 -.12expenditures 12.6 -.07capital consumption 9.4 .05’:’
Net financial investment 6.8 .11Net saving 13.0 .05Personal saving (NIPA) 7.0 -,23*Personal saving (FOF) 9.8 .17’:’
aFollowing FOF convention, capital gains dividends and creditsare added to the NIPA definition of DPI.bSIope coefficient of regression of saving rate on a time trend;are indicated by an asterisk,
from government insurance
t-statistics greater than two
The importance of the disaggregation is clear from Table 1. Any meas-ure of household aggregate saving is composed of a diverse set of activitieswhich exhibit very different trends over the decade of the 1970s. The majorchanges seem to be due to increases in the acquisitions of money market in-struments and of mortgage liabilities. It is also interesting to note that theFOF aggregate measures exhibit positive trends over the decade while thetrend in the personal saving rate using the NIPA is negative.
It would be logical to assume that a similar variety of behavior wouldbe found with data for other countries. Although, to my knowledge, there isno comparable standard set of FOF accounts, I imagine that entries for allor some of the items in the Table could be found for many of the industrial-ized countries. At the very .least, it may be possible to isolate the residentialconstruction sector and its associated items, capital consumption and mort-gages. The U.K. National Accounts include some FOF data. The followingbreakdown for the United Kingdom is readily available; it is shown withthe average percentages of net income for 1970-75:1
~These data are taken from "Private Saving in the Provision of Social Security in Britain"by David Burros in George yon Furstenberg, ed., Social Security versus Private Saving, (Cam-bridge, Mass.: Ballinger, 1979). This volume also includes essays on the relationship betweensocial security and saving in Canada, Sweden, France, W. Germany and the United States. Seealso K. Cuthbertson, "The Measurement and Behavior of the U.K. Saving Ratio in the 1970s,"National Institute Economic Review, February 1982.
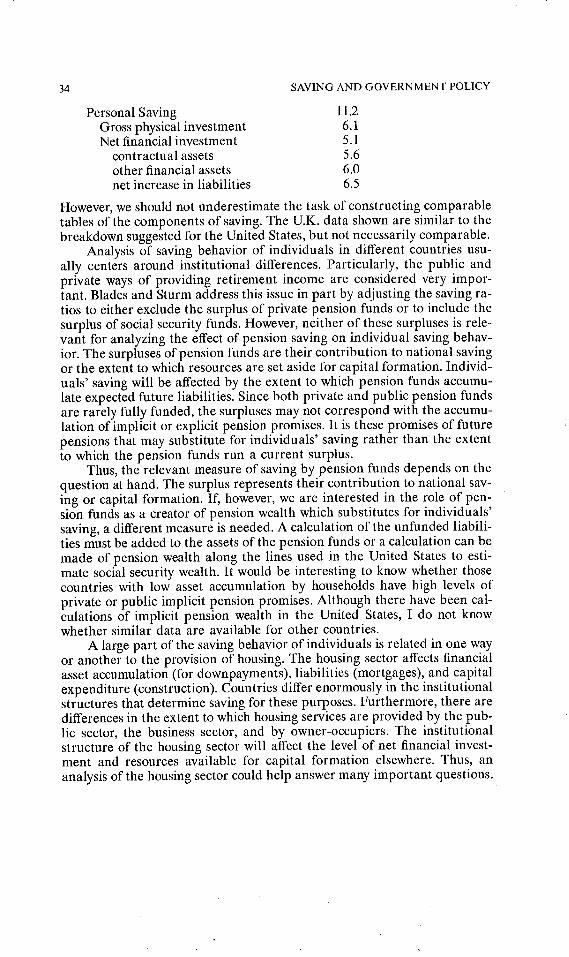
34 SAVING AND GOVERNMENT POLICY
Personal SavingGross physical investmentNet financial investment
contractual assetsother financial assetsnet increase in liabilities
11.26.15.15.66.06.5
However, we should not underestimate the task of constructing comparabletables of the components of saving. The U.K. data shown are similar to thebreakdown suggested for the United States, but not necessarily comparable.
Analysis of saving behavior of individuals in different countries usu-ally centers around institutional differences. Particularly, the public andprivate ways of providing retirement income are considered very impor-tant. Blades and Sturm address this issue in part by adjusting the saving ra-tios to either exclude the surplus of private pension funds or to include thesurplus of social security funds. However, neither of these surpluses is rele-vant for analyzing the effect of pension saving on individual saving behav-ior. The surpluses of pension funds are their contribution to national savingor the extent to which resources are set aside for capital formation. Individ-uals’ saving will be affected by the extent to which pension funds accumu-late expected future liabilities. Since both private and public pension fundsare rarely fully funded, the surpluses may not correspond with the accumu-lation of implicit or explicit pension promises. It is these promises of futurepensions that may substitute for individuals’ saving rather than the extentto which the pension funds run a current surplus.
Thus, the relevant measure of saving by pension funds depends on thequestion at hand. The surplus represents their contribution to national sav-ing or capital formation. If, however, we are interested in the role of pen-sion funds as a creator of pension wealth which substitutes for individuals’saving, a different measure is needed. A calculation of the unfunded liabili-ties must be added to the assets of the pension funds or a calculation can bemade of pension wealth along the lines used in the United States to esti-mate social security wealth. It would be interesting to know whether thosecountries with low asset accumulation by households have high levels ofprivate or public implicit pension promises. Although there have been cal-culations of implicit pension wealth in the United States, I do not knowwhether similar data are available for other countries.
A large part of the saving behavior of individuals is related in one wayor another to the provision of housing. The housing sector affects financialasset accumulation (for downpayments), liabilities (mortgages), and capitalexpenditure (construction). Countries differ enormously in the institutionalstructures that determine saving for these purposes. Furthermore, there aredifferences in the extent to which housing services are provided by the pub-lic sector, the business sector, and by owner-occupiers. The institutionalstructure of the housing sector will affect the level of net financial invest-ment and resources available for capital formation elsewhere. Thus, ananalysis of the housing sector could help answer many important questions.
DISCUSSION WACHTEL 35
For example, could low productivity growth in the United States be due toa large allocation of saving to housing rather than other capital formation?
The overall conclusion to be drawn from these comments about per-sonal saving behavior is that it is not informative to make internationalcomparisons of personal saving rates. For the analysis of national saving,an aggregate saving rate may be of greater interest. An overall measure ofthe propensity of various countries to set aside resources for capital forma-tion is an important determinant of future growth. It is interesting to ob-serve (Blades and Sturm Table 2) that the coefficient of variation in grossnational saving (.21) is only two-thirds as large as the coefficient of varia-tion for gross household saving (.33). (Gross saving is preferred to net be-cause of the differences in depreciation calculations.) The remaining inter-country differences are large and some disaggregation would still provide auseful framework.
Disaggregation of the national saving data provides important infor-mation about which sectors are providing the resources for capital forma-tion and which are using them. For example, government deficits absorbthe savings of other sectors. Generally, the household surplus is absorbedby business needs to finance its investment. It is also useful to measure theextent to which the housing sector absorbs savings and whether the foreignsector is an absorber or supplier of resources. The FOF scheme in theUnited States provides savings tables for each of the major sectors in theeconomy which can be used to analyze patterns of capital formation andsavings flows.~
A useful breakdown of gross saving and investment in the UnitedStates can be found in the NIPA as shown in Table 2. The U.S. data indicatethat the government sector absorbs saving while the foreign sector providesresources. However, the behavior of the important sectors is very variablealthough there is no apparent trend.
2See for example the author’s "Financial Prerequisites for Economic Growth" in M. Pola-kolT and T. Durkin, eds., Financial Institutions and Markets (Boston: Houghton-Mifflin, 1981).
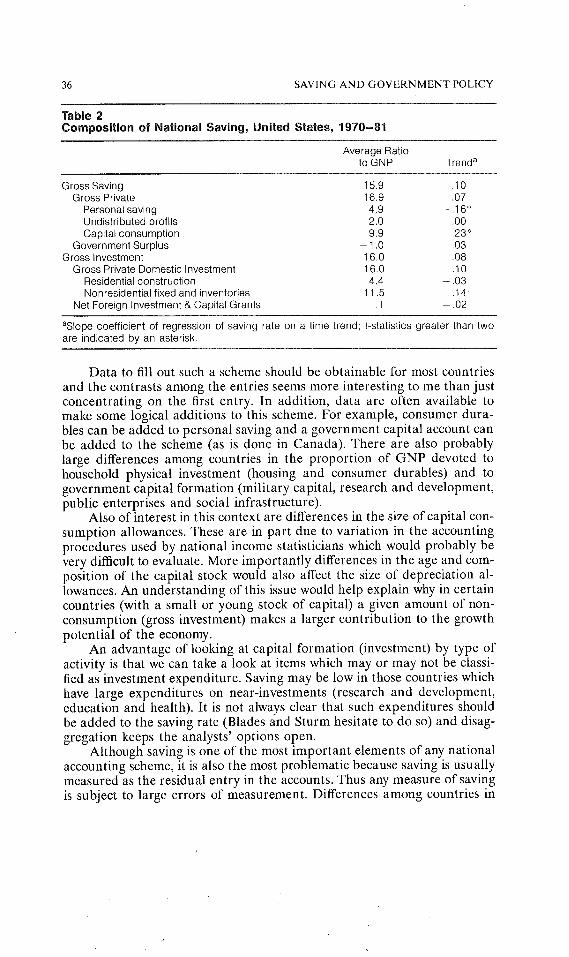
36 SAVING AND GOVERNMENT POLICY
Table 2Composition of National Saving, United States, 1970-81
Average Ratioto GNP Trenda
Gross Saving 15.9 .10Gross Private 16.9 .07
Personal saving 4.9Undistributed profits 2.0 .00Capital consumption 9.9
Government Surplus - 1.0 ,03Gross Investment 16.0 .08
Gross Private Domestic investment 16.0 .10Residential construction 4,4 -.03Nonresidential fixed and inventories 11.5 ,14
Net Foreign investment & Capital Grants ,1 -.02
aSIope coefficient of regression of saving rate on a time trend; t-statistics greater than twoare indicated by an asterisk.
Data to fill out such a scheme should be obtainable for most countriesand the contrasts among the entries seems more interesting to me than justconcentrating on the first entry. In addition, data are often available tomake some logical additions to this scheme. For example, consumer dura-bles can be added to personal saving and a government capital account canbe added to the scheme (as is done in Canada). There are also probablylarge differences among countries in the proportion of GNP devoted tohousehold physical investment (housing and consumer durables) and togovernment capital formation (military capital, research and development,public enterprises and social infrastructure).
Also of interest in this context are differences in the size of capital con-sumption allowances. These are in part due to variation in the accountingprocedures used by national income statisticians which would probably bevery difficult to evaluate. More importantly differences in the age and com-position of the capital stock would also affect the size of depreciation al-lowances. An understanding of this issue would help explain why in certaincountries (with a small or young stock of capital) a given amount of non-consumption (gross investment) makes a larger contribution to the growthpotential of the economy.
An advantage of looking at capital formation (investment) by type ofactivity is that we can take a look at items which may or may not be classi-fied as investment expenditure. Saving may be low in those countries whichhave large expenditures on near-investments (research and development,education and health). It is not always clear that such expenditures shouldbe added to the saving rate (Blades and Sturm hesitate to do so) and disag-gregation keeps the analysts’ options open.
Although saving is one of the most important elements of any nationalaccounting scheme, it is also the most problematic because saving is usuallymeasured as the residual entry in the accounts. Thus any measure of savingis subject to large errors of measurement. Differences among countries in
DISCUSSION WACHTEL 37
the size of such errors may make comparison of saving levels and trendsvery inaccurate. However, it would be very difficult to pinpoint exactly thetype or direction of errors that may appear in the accounts.
An example of a data error which affects the international comparisonof saving rates is the size of the underground economy. If nations differ inthe size of the underground economy as they probably do, then the com-parisonof saving rates can be very inaccurate. Of the countries in thesample, I guess that the severest underestimation of income occurs forItaly. But Italy already has a high personal saving rate and if income isunderestimated and consumption accurately measured, then the savingrate is even higher.
An indication of the size of the errors that creep into saving data arethe discrepancies that appear in the accounts. A glaring example is the dif-ference between U.S. personal saving calculated from the NIPA and fromthe FOF accounts (using financial data). Using a September 1982 FOFtable we find that the average absolute discrepancy was $5.7 billion for1970-75 and $39.8 billion for 1976-81. In recent years the FOF indicatessubstantially more saving; the FOF personal rate is 2.3 percentage pointshigher than the NIPA calculation for 1976-81.
A related problem that is more tractable is the revision of data. Sincesaving is a residual measurement it can change substantially when data re-visions are made. I do not know how revisions have affected the accounts ofother countries, but recent data revisions have all but wiped out the capitalshortages that seemed to appear in the United States in the 1970s. For ex-ample the revision to the accounts published at the end of 1980 increasedthe average personal saving rate for 1968-79 to 7.1 percent from 6.4 per-cent? The revisions released this summer (July 1982) increased both per-sonal saving rates and the share of business investment in GNP over thepast five years. For 1977-81, the personal saving rate is now at 6.0 percent,0.6 percent higher than reported earlier. The ratio of private fixed invest-ment to GNP increased by 0.4 percent to 16.1 percent.
To recapitulate my major criticism of the Blades and Sturm analysis isthat the accounting adjustments they make to overall saving rates leave theoverall puzzle unsolved. I suggest more emphasis on specific concepts ofeconomic activity rather than on overall saving rates. This amounts to acomparative study of the structures of various economies. I am confidentthat such studies would provide a partial solution to the puzzle. Still lack-ing is a study of differences in the proximate causes of saving. An exampleof this is the role of demographic structure in determining personal saving.
3See D. Jamroz, "Highlights of the Recent National Income and Product Account Revi-sions," Quarterly Review, Federal Reserve Bank of New York, Spring 1981.

38 SAVING AND GOVERNMENT POLICY
My own research showed that this issue is not well understood in the UnitedStates and I think that this is the case elsewhere as well.4 It is clear that agreat deal more work remains to be done. Although Blades and Sturm maynot have solved the puzzle, we can be appreciative of their efforts in pro-viding a comprehensive catalog for future attempts.
4See "Household Savings and Demographic Change: 1950-2050," Research Paper for thePresident’s Commission on Pension Policy (1981) and "Age Structure and Personal Saving Be-havior," with Charles Lieberman, in Social Security versus Private Saving.

Edward F. Den~son*
That this is a valuable paper hardly needs stating; it always is interest-ing to calculate how a change in definition alters differences among places.Blades and Sturm provide several such calculations for saving rates, as wellas evaluations of the effect of different institutional arrangements. Theseresults speak for themselves.
I shall concentrate on questions as to what definitions are most appro-priate: Blades and Sturm say the correct definition of saving d~pends onthe question analyzed and that their paper gives special attention to analy-sis of economic growtli (par. 2). I accept this as a starting point.
Saving in the Whole Economy
I shall devote most of my time to saving in the economy as a whole. It isaxiomatic that total saving should equal total investment if data for savingare to be useful in analyzing economic growth or stabilization. Conse-quently, I shall use the terms "saving rates" and "investment rates" inter-changeably. To equal investment in the national accounts, saving must notinclude revaluations of existing assets. The authors’ discussion of contin-uing inflation in their par. 48 raises a question as to whether they agreewith this, and I would welcome clarification.
Geographic Coverage
National income and product, around which the U.S. NIPAs are organ-ized, include net factor income from abroad so that the income, consump-tion, and saving of residents and the ratio of their saving to their incomeare not affected by the geographic origin of their income. OECD statistics,in contrast, center on gross domestic product, which confuses these relation-ships. Blades and Sturm are right to adjust them to a GNP basis. More de-batable is their addition of net current transfers from abroad to GNP foruse as the denominator of the saving ratio. Although it seems sensible tosuppose that recipients add transfers from abroad to income before decid-ing how to divide income between expenditures and saving, it also seemslikely thatpayers consider international transfers part of their expendituresrather than a deduction from income. At least, I believe Congress thinksthis way.
*Senior Fellow Emeritus at The Brookings Institution.
39
40 SAVING AND GOVERNMENT POLICY
Market Price or Factor Cost
Blades and Sturm do not directly consider whether valuations shouldbe at market price (as in their table 2) or at factor cost, but the question isimplicit in their discussion of the effects of consumption taxes on personalsaving rates (pars. 31-32). There is reason to prefer factor cost because itwill not help future growth if the investment rate is increased by taxes oninvestment goods that raise their relative price rather than by diversion ofresources from consumption to investment. Unfortunately, at present weare forced to use market prices because of the absence of a division of GNPat factor cost between investment and consumption and of capital con-sumption at factor cost. In their studies for OECD in the 1950s Gilbert andKravis, and Gilbert and Associates, did provide comparable gross outputdata for nine countries at both factor cost and market price.~
National or Uniform Prices
The studies just cited showed that the choice between factor cost andmarket price is less important than the choice between using its own pricesfor each country and using the same prices for all countries. Later studiesby Kravis, Heston, and Summers for the United Nations also show the im-portance of differences in price relationships. For example, consider Japanand West Germany. In 1970, gross investment was 31 percent of GDP inGermany when prices in marks were used and 40 percent in ~apan whenprices in yen were used but when the same prices, international dollars,were used for both countries the German percentage was 37 and the Japa-nese 38, only one-tenth as large a difference. Similarly, in 1973 the gap was11 percentage points in national prices and 2 points in international dol-lars. From 1973 to 1975 the situation changed. The Japanese percentagefell 7 percentage points in yen but only one point in international dollarswhile the German percentage fell sharply in both marks and internationaldollars. As a result, in 1975 the Japanese percentage was much above theGerman by either measurement.2
~Milton Gilbert and Irving B. Kravis, An International Comparison of National Productsand the Purchasing Power of Currencies: A Study of the United States, the United Kingdom,France, Germany, and Italy. Paris: Organisation for European Economic Cooperation, 1954.Milton Gilbert and Associates (Wilfred Beckerman, John Edelman, Stephen Marris, GerhardStuvel, and Manfred Teichart), Comparative National Products and Price Levels: A Study ofWestern Europe and the United States, (Paris: Organisation for European Economic Coopera-tion, 1958).
2Irving B. Kravis, Alan Heston and Robert Summers, International Comparisons of RealProduct and Purchasing Power, (Baltimore: Johns Hopkins University Press, 1978), tables 1.5and 1.6, and World Product and Income: International Comparisons of Real Gross Product,(Baltimore: Johns Hopkins University Press, 1982), tables 1.6 and 1.7.
DISCUSSION DENISON 41
Investment has been cheap in the United States. In the 1950s and1960s the U.S. gross investment ratio was much higher, compared to othercountries, when the same prices were used for all countries than when na-tional prices were used. In 1975 the relative price of capital formation con-tinued to be lowest in the United States although the difference from mostother countries had narrowed?
Although Blades and Sturm mention differences in relative prices,they do not refer to the wealth of data about them nor indicate clearly whatprices they consider appropriate (pars. 61-62). Since it is not yen, marks,and dollars but structures, equipment, and inventories that contribute toproduction, it seems to me that if international comparisons of any savingratios can contribute to analyses of levels or growth of output, it must beratios based on the same prices that are appropriate. In Why Growth RatesDiffer I took this position but suggested data in national prices should beused to appraise national effort in the form of "abstinence." (Of course, itwas net saving that was appropriate.)4
A Look at Table 2
If one postulates a few dozen other-things-being-equals, a persistentlyhigh gross saving rate leads to a large capital stock and hence a high level ofoutput, while a sharply rising gross saving rate leads to a high growth rate ofcapital stock and hence a rapid growth of output. International differencesin gross saving rates have, for the most part, persisted for a long time nowso, if they can indicate anything about international differences in capitalstock and output, it is about their levels. But can they?
I have ranked the countries from 1 to 24 by their gross saving rates, netsaving rates, and capital consumption rates. The first two sets of rates weretaken from Table 2 of the paper. The third was obtained by subtraction,which isn’t exactly right but should be close enough to rank the countriescorrectly. The rankings by gross and net saving rates put the same countriesat the top and bottom, although the correspondence vanishes once oneleaves the extremes. There is no correspondence between capital consump-tion rates and gross saving rates. Luxembourg is first in gross saving and17th in capital consumption. The next three countries by gross saving rankare 7th to 13th by capital consumption rank. The United Kingdom andUnited States rank 22nd and 24th, respectively, by gross saving but theUnited Kingdom ranks 6th and the United States 4th by capital consump-tion. On the other hand, Portugal and Turkey rank in the last four by bothmeasures so the relationship is not consistently inverse.
One has to wonder whether the numbers make sense. Firmer assur-ance about comparability of data than is provided by the authors’ assur-ance in par. 10 that data were compiled according to standard definitions .would be comforting. Has government capital consumption been included
3For 1975 price ratios see ibid., table 1.8.4Edward F. Denison, Why Growth Rates Differ: Postwar Experience in Nine Western
Countries, (Washington, D.C.: The Brookings Institution, 1967), esp. chapter 10 and p. 344.
42 SAVING AND GOVERNMENT POLICY
in gross saving in all countries, although it seems not to be in National Ac-count Statistics? Do service lives and depreciation formulas bear the sameratio to the truth in all countries? What about the international flow of re-tained earnings of corporate subsidiaries? Are government and private cap-ital consumption always valued at reproduction cost? (Par. 8 cautions theyare not.)
On the other hand, if the trouble is not, or not only, with the data, itmay mean that gross saving rates differ from those in the past; or that thedistribution of capital stock among inventories, international assets, anddepreciable assets in each service-life class differs among countries; or thatactual service lives vary from country to country. Any of these would pre-vent even accurate gross saving rates from indicating the ranking of coun-tries by capital-output ratios and leave a large question as to what useful in-formation they do convey. International differences in the composition ofinvestment or capital stock or in service lives would not, in themselves, de-stroy net saving rates as an indicator of relative capital-output ratios. Never-theless, to analyze differences in output levels it is far better to develop evencrude estimates of capital stock than to rely directly on either gross or netsaving rates. To analyze either intercountry differences in output levels oroutput growth rates in my own studies, I have always relied on capital stockestimates rather than saving rates.
Gross Versus Net Saving
I agree with the authors that there are contexts in which both grossand net saving data have uses. However, I consider gross saving to be decid-edly the subordinate series, as does the SNA. Although Blades and Sturmdo emphasize household saving, a net saving series, they seem to give prior-ity to gross saving, I shall comment on three points they make in behalf ofthe gross concept.
In par. 67 Blades and Sturm point out that it is the increase in grossrather than net capital stock that co-determines the growth of productivecapacity, and that net saving does not equal the increase in the gross stockif discards differ from depreciation. From this they conclude that gross andnet saving are both relevant to growth analysis. This is a nonsequitur, be-cause net saving almost always comes closer than gross saving to the changein gross stock. In the same par. the authors argue in behalf of gross savingthat a vintage capital model may be appropriate for analyzing growth. Thecase against vintage models is decisive, in my opinion.5 But even if a vin-tage model were desired, I fail to see how gross saving ratios could substi-tute for the age distributions that vintage models require. In par. 7 the au-thors introduce the statistical argument that net saving is less reliable thangross because capital consumption is not estimated by standard procedures.It should be noted that this argument favors gross saving only for business
5See, e.g., Edward F. Denison, Accounting for Slower Economic Growth: The United Statesin the 1970s, (Washington, D.C.: The Brookings Institution, 1979), pp. 57-58.
DISCUSSION DENISON 43
depreciation. It favors net saving with respect to government and nonprofitdepreciation, which must be estimated and added, and would do so with re-spect to depreciation on consumer durables if that were to be included. Inany case, if net saving is the appropriate series, the cure is to introducestandard procedures, not to substitute gross saving. Obviously, I do not im-ply that the authors could have done so for this paper.
Scope of Investment
Suppose output is measured by net national product and the presentscope of output is retained. What should be counted as net saving orinvestment?
Two concepts may be distinguished. One measures additions to thestock of capital that yields future services, whether or not these services willbe counted in future net national product. At the least it would includeBlades’ and Sturm’s net saving (i.e., business capital formation includingowner-occupied houses, net domestic capital formation by nonprofit insti-tutions and general government, and net foreign investment) plus net ac-quisitions of consumer and military durables.
The second, narrower concept measures additions to the stock of capi-tal that yields future services that contribute to the net national product asmeasured. This is approximately the same as net saving in the U.S. NIPAsminus capital formation by nonprofit institutions plus capital formation bygovernment enterprises.6 General government and consumer capital areexcluded. As a minor qualification to exclusion of general governmentalcapital let me note that in countries that add a small imputed interest-typereturn on government capital to their national product series, it is arguablethat government capital should be included. I prefer to exclude such in-come, a highly arbitrary number, from output.
Blades and Sturm discuss the possible reclassification of certain intan-gibles from consumption to investment and the possibility of enlarging thescope of national product so as to raise both consumption and investment. Ishall not evaluate here the desirability of such proposals when output ismeasured by net national product. I do strongly oppose all proposals to en-large the scope of investment in the NIPAs if output is to be measured byGNE Gross output is a duplicated measure that there is no reason to maxi-mize. Insofar as large output is a proper goal of society, it is net output thatmeasures success in achieving this goal. Neither is there reason to want ahigh level of gross saving (insofar as this differs from net saving). Capital-ization of government durables adds to the duplication already present inthe NIPA concept of GNP and makes it a worse output measure. Additionof consumer durables would go much further. For example, in 1978 con-sumers actually spent $199 billion for consumer durables in the UnitedStates, but consumer durables would be counted as $413 billion of GNP if
6For isolated analysis of U.S. growth, capital formation by government enterprises prob-ably should be excluded. See Edward F. Denison, Accounting for United States EconomicGrowth 1929-1969, (Washington, D.C.: The Brookings Institution, 1974), pp. 53 and 273-75.
SAVING AND GOVERNMENT POLICY
they were capitalized. Most of the difference is depreciation, which alsoadds to gross saving. Capitalizing and depreciating items like R and D andeducation expense would add further huge amounts of duplication to GNPand gross saving.7 If gross series are to be the focus of attention, I wouldstrongly oppose capitalization of any additional expenditures, whether theyare now counted like consumption expenditures in the NIPAs or omittedfrom them.
Sectors
Any division of saving by sector is inherently fragile because the own-ership of all assets and the liability for all obligations ultimately rests onindividuals. Given this limitation, the cleanest and most significant divisionis between government saving and private saving. Saving of social insur-ance funds is the only item discussed in the paper that possibly bears onthis distinction. It belongs in government saving, in my opinion, becausegovernment determines the receipts and expenditures of the funds and be-cause, in setting budgets, the rest of government saving is not determinedindependently of social insurance saving. Saving of government enter-prises, which is small in the United States but not (algebraically) every-where, is the only significant item whose proper classification seemsuncertain.
Net private saving is usually divided between personal or householdsaving and corporate or business saving. I think the most useful divisionwould confine corporate saving to corporations organized for profit--andcount all other private saving in personal saving. The NIPAs followed thispractice in the 1940s and 1950s but certain mutual financial corporationswere subsequently reclassified as corporations, mostly because they paidcorporate income tax. Blades and Sturm discuss international differencesonly in household saving. A legitimate question is whether these data aregood enough and comparable enough to warrant comparison. A parallelcomparison of business saving might help one judge whether the data looksensible.
In fact, the division of private saving between corporations and per-sons does not greatly interest me because it is difficult, if not impossible, toimprove analysis of total private saving by examining its parts. The follow-ing facts, which are based on the latest annual data for 1948 through 1981,with stability judged by the use of the absolute standard deviation in per-centage points, will suggest why. The ratio of gross private saving to GNP isabout as stable as the ratio to GNP of each one of its three major compo-nents: personal saving; undistributed corporate profits with inventory valu-
7See Edward F. Denison, Comment on "Integrated Accounts for the United States,1947-80," Survey of Current Business, May 1982, pp. 60-65.
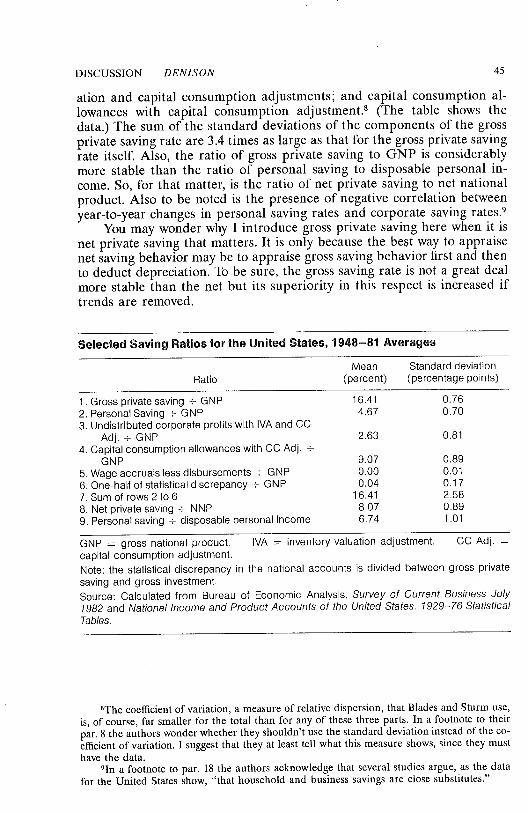
DISCUSSION DENISON 45
ation and capital consumption adjustments; and capital consumption al-lowances with capital consumption adjustment.8 (The table shows thedata.) The sum of the standard deviations of the components of the grossprivate saving rate are 3.4 times as large as that for the gross private savingrate itself. Also, the ratio of gross private saving to GNP is considerablymore stable than the ratio of personal saving to disposable personal in-come. So, for that matter, is the ratio of net private saving to net nationalproduct. Also to be noted is the presence of negative correlation betweenyear-to-year changes in personal saving rates and corporate saving rates.9
You may wonder why I introduce gross private saving here when it isnet private saving that matters. It is only because the best way to appraisenet saving behavior may be to appraise gross saving behavior first and thento deduct depreciation. To be sure, the gross saving rate is not a great dealmore stable than the net but its superiority in this respect is increased iftrends are removed.
Selected Saving Ratios for the United States, 1948-81 Averages
Mean Standard deviationRatio (percent) (percentage points)
1. Gross private saving + GNP 16.412. Personal Saving + GNP 4.673. Undistributed corporate profits with IVA and CC
Adj. :- GNP 2.634. Capital consumption allowances with CC Adj. +
GNP 9.075. Wage accruals less disbursements ÷ GNP 0.006. One-half of statistical discrepancy + GNP 0.047. Sum of rows 2 to 6 16.418. Net private saving ÷ NNP 8.079. Personal saving ÷ disposable personal income 6.74
0.760.70
0.81
0.890.010.172.580.891.01
GNP = gross national product. IVA = inventory valuation adjustment. CC Adj. =capital consumption adjustment.Note: the statistical discrepancy in the national accounts is divided between gross privatesaving and gross investment.Source: Calculated from Bureau of Economic Analysis, Survey of Current Business July1982 and National Income and Product Accounts of the United States. 1929-76 StatisticalTables.
8The coefficient of variation, a measure of relative dispersion, that Blades and Sturm use,is, of course, far smaller for the total than for any of these three parts. In a footnote to theirpar. 8 the authors wonder whether they shouldn’t use the standard deviation instead of the co-efficient of variation. I suggest that they at least tell what this measure shows, since they musthave the data.
9In a footnote to par. 18 the authors acknowledge that several studies argue, as the datafor the United States show, "that household and business savings are close substitutes."
Gregory V. Jump*
I. Introduction
Recent years have seen a renewal of interest by economists in the be-havior of personal saving. There appear to be a number of reasons for this.First, rates of personal saving in the United States, Canada, and other de-veloped countries have generally exceeded their respective historical normssince the mid-1970s, and there has been considerable interest in why thishas occurred. The most widely accepted explanation at present is that con-ventional saving measures are distorted by variations in the (expected) rateof price inflation. This explanation, which is presented by Jump (1980), J.B.Shoven and J.I. Bulow (1976), and others, essentially views the recent risein personal saving rates as a measurement error attributable to higher priceinflation rather than being the result of any behavioral change on the partof consumers. We shall refer to this as the "inflation-distortion" effect andexamine it more closely in a later section of the paper.
A second reason for the recent interest in personal saving--at least inNorth America--is that rates of personal saving in the United States andCanada, which had been of similar magnitudes throughout most of thepostwar period, suddenly began to diverge in about 1975. (See Figure 1.)The personal saving rate in Canada has been significantly higher than thatin the United States every year since then--giving rise to the question ofwhy this has occurred. Since the two economies have had similar inflationexperiences over this period, the answer does not appear to lie with theinflation-distortion effect.~ Some other factors must be involved. At presentno widely accepted explanation has been put forward, but there has beenconsiderable speculation that differences in the personal tax systems be-tween the two countries might be involved. The Canadian and U.S. per-sonal tax systems are similar in many respects, but in the mid-1970s the Ca-nadian Government instituted a number of measures aimed at givingfavored tax treatment to savers. That these measures were introduced atthe same time the Canadian saving rate began to exceed its U.S. counter-part provides reason to suspect that they may offer an explanation for thedifferential saving behavior.
A final reason for the renewed interest in personal saving has to dowith the generally sluggish growth in investment spending that has been
*Associate Professor of Economics at the University of Torontolit is worth noting that an inflation-corrected time seri~s for the personal saving rate in
Canada does not show an increase in the 1975-81 period, whereas an inflation-corrected seriesfor the United States shows a pronounced decline after 1975
46
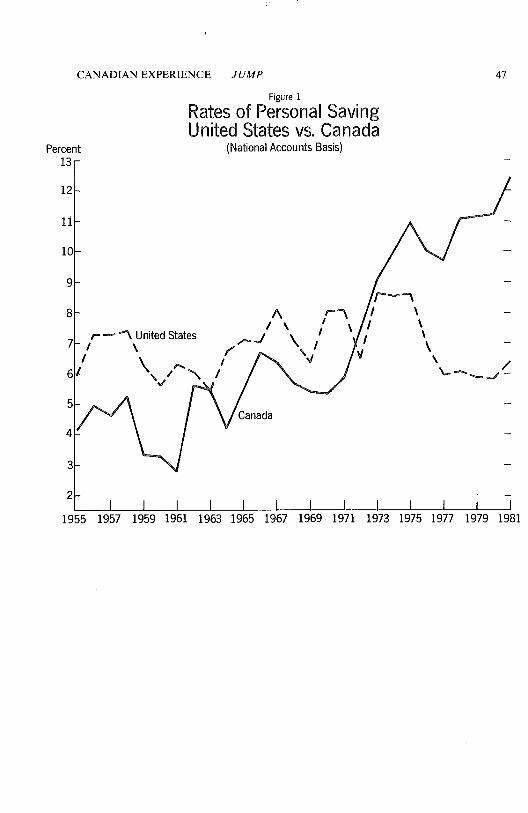
CANADIAN EXPERIENCE JUMP 47
Percent13~
1i
10
Figure 1
Rates of Personal SavingUnited States vs. Canada
(National Accounts Basis)
8
7
6
5
4
3
2
1955 1957 1959 1961 1963 1965 1967 1969 1971 1973 1975 1977 1979 1981
48 SAVING AND GOVERNMENT POLICY
observed in most developed economies over much of the past decade. Asanyone who has read a Principles text knows, investment must always beequal to saving; hence one cure for a problem of underinvestment might befor the government to provide incentives for increased personal saving.This prescription has been especially strongly endorsed by advocates of"supply-side" economics in the United States. However, the interest in us-ing saving stimuli to provide increased incentives to invest has by no meansbeen limited to supply-siders. The observation that recent rates of personalsaving in the United States, while somewhat higher than the postwar aver-age, have been low relative to saving rates in other countries, has prompteda number of economists to come out in favor of having the government usetax policy to stimulate personal saving. In view of the close similarities be-tween the Canadian and U.S. economies, Canadian experience with tax-based saving incentives is of particular interest to those who take thisposition.
The objectives of this paper are (1) to examine whether tax policieswhich promote higher rates of personal saving are indeed an effectivemeans of stimulating a permanent increase in investment, and (2) to ana-lyze recent Canadian experience in this regard. We take as given the prem-ise that higher rates of investment are desirable but question whether sav-ing incentives provide the most effective means of accomplishing this goal.The basic message to come out of the paper is that the conventional savingsconcept is an artificial construct and does not provide a reliable guide to in-vestment behavior. Policies which result in permanently increased personalsaving may not lead to greater capital formation. Conversely, policies whichresult in permanently increased investment activity may have ambiguouseffects on personal saving.
The finding that personal saving and investment do not always respondto stimuli in parallel fashion will come as no surprise to many readers. Af-ter all, Robert Barro (1974) demonstrated that a bond-financed temporaryreduction in lumpsum taxes will prompt consumers to save more withoutaltering current consumption spending or investment in physical capital.Barro’s was a temporary effect, attributable to the fact that his consumers(correctly) anticipated an increase in future taxes sufficient to retire thenewly issued government bonds. Consumers "saved" their tax reduction inthe current period in order to be able to pay those higher future taxes. Ourresults will differ from Barro’s in the sense that we are able to cite perma-nent tax reductions that lead to permanent increases in personal savingwith no effects on consumption or investment, i.e., the effects are not transi-tory but persist indefinitely.
Tax policies that have these kinds of permanent effects are more thanidle curiosity pieces. The policies instituted by the Canadian Governmentin the mid-1970s appear to be of this sort. Analysis of the Canadian poli-cies suggests that they may well have contributed to an increase in personalsaving but it is doubtful that they have provided increased incentives forcapital investment. Those U.S. economists who are envious of recent Cana-dian saving performance would do well to refocus their attention on invest-ment performance. (See Figure 2.)
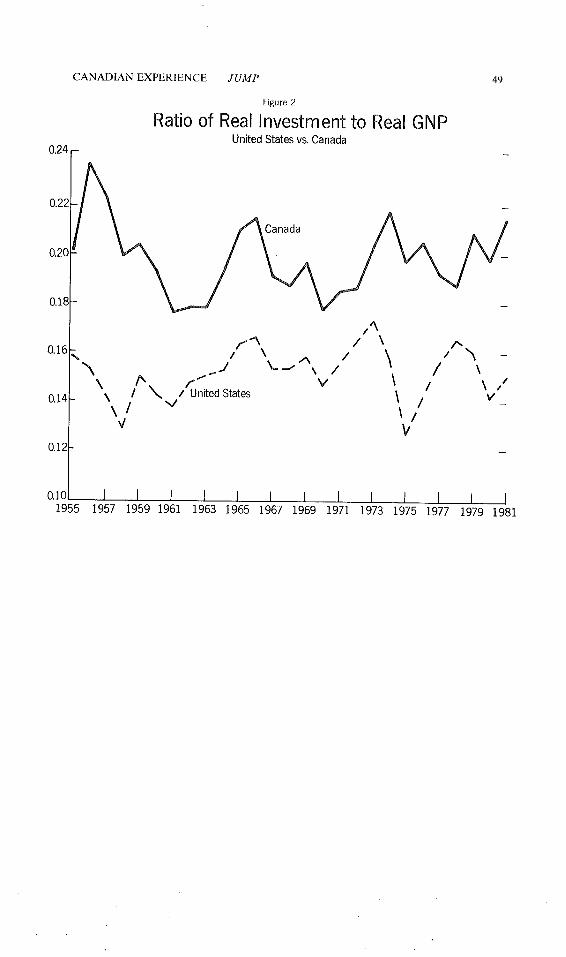
0.24
CANADIAN EXPERIENCE JUMP
Figure 2
Ratio of Real Investment to Real GNPUnited States vs. Canada
49
0.22
0.20
0.16
0.14
0.12
Canada
/
flUnited States
O.lO I I I I I I I I I t I I I1955 1957 1959 1961 1963 1965 1967 1969 1971 1973 1975 1977 1979 1981

5O SAVING AND GOVERNMENT POLICY
The outline of the remainder of the paper is as follows. In Section II ageneral equilibrium model of a closed economy is developed and its steady-state properties are investigated. The model is then used to analyze the ef-fects on equilibrium values of saving and investment of three kinds of per-manent tax changes: (1) a reduction in lumpsum taxes, (2) a reduction inincome taxes, (3) the introduction of a tax credit for personal saving. Theseparticular policies are chosen because they mirror the essential features ofthe saving incentives introduced into the Canadian tax system.
Details of the Canadian tax incentives are presented in Section III.After a brief digression on open economy considerations, these tax meas-ures are analyzed using the tools developed in the preceding section. Someempirical estimates of their impacts on measured Canadian saving ratesduring the mid and late 1970s are derived.
Some concluding observations are offered in Section IV.
H. A General Equilibrium Analysis of Selected Tax-based Saving Incentives
The purpose of this section is to develop a model capable of analyzingthe types of tax measures cited in the Introduction. The choice of model isdictated by our ultimate interest in saving and investment decisions. Sincethese are by nature intertemporal decisions, some sort of optimizinggrowth model is called for. An unfortunate feature of optimizing models isthat they invariably have very complex dynamic response paths. We willevade this complication by restricting the analysis to a static comparison ofsteady-state equilibria.
Specific features we wish the model to embody are:(1) Some mechanism whereby tax changes affect the consumption in-
vestment decision.(2) Some form of saving in addition to personal saving; otherwise
there can be no discrepancy between personal saving andinvestment
Feature (1) can be satisfied by simply introducing an income tax whichwill serve to "distort" the consumption-investment choice faced by eco-nomic agents. Feature (2) is most easily satisfied by allowing governmentsaving to exist at nonzero levels. This in turn requires that the governmenthave some means of financing negative values of saving (i.e., deficits). Thesimplest assumption to make in this regard is to assume the government fi-nances any deficits by printing money. We reject the temptation to includegovernment bond issues as an additional form of deficit finance. The addi-tion of government debt would only complicate the model without addinganything useful.
The decision to include money in the model necessitates some assump-tion as to why economic agents are willing to hold it. The simplest assump-tion is a pure transactions motive, and that is what will be adopted here. Ifwe couple this with a tax system that is neutral with regard to inflation, thetransactions motive yields a model in which money is both neutral and su-perneutral. It seems best to deal with such a system in as much as neutralityissues are not directly germane to the objectives of this paper. Some com-
CANAD1AN EXPERIENCE JUMP 51
ments on neutrality issues as they affect investment policy will, however, beoffered in the final section.
Structure of the Model
A model that possesses the features described above may be describedin brief fashion. This economy is assumed to consist of N identical individ-uals who act as price takers but possess perfect foresight regarding futurewages and prices. Each individual is finite-lived and leaves exactly one heirat the time of his death so that the population remains static. Each individ-ual supplies one (perfectly inelastic) unit of labor at all times during hislife. Individuals have bequest motives and value consumption by theirheirs in the same way they value their own consumption during theirlifetimes.2
The representative consumer faces the following optimization problemat date 0:
max. Uo = f e-Ptu(ct)dt,
subject to
ct + kt + ~nt -- (1 - ~’)[rtktWt] - Tt - ~trnt
(1)
(2)
f let -- (1 -- ~)Wt]dt <__ k, + mt (3)0a0
mt -- fiWt. (4)
The variables are defined as follows:
u = an instantaneous utility function; u’ > 0, u" < 0
ct = real consumption at date t
kt = individual holdings of capital goods at date trt = the before-tax real rate of interest at date t, equal
to the rate of return on capital
mt = holdings of real money balances at date t
vt = the rate of price inflation at date t~ = the real wage rate at date t
Tt = lumpsum taxes at date t
y = the personal income tax rate~This particular form of the bequest motive is more restrictive than necessary but greatly
simplifies the ensuing analysis,
52 SAVING AND GOVERNMENT POLICY
the rate of time preference
the ratio of real balances to real labor income,assumed constant
Note that the transactions demand for money is assumed to be basedon labor, as opposed to total, income. Because labor is perfectly inelastic-ally supplied, this guarantees the neutrality and superneutrality of moneyin the model?
First-order conditions for utility maximization are given by
= - u; [(1 - 0]. (5)u~’
Economic agents will plan rising/falling consumption streams When-ever the after-tax return to capital is greater/less than the pure rate of timepreference.
Output in this economy is generated by the constant-returns-to-scaleproduction function
Yt = F(N,K~); F, >0,F2 >0,F,, <0,F22 <,F2, >0, (6)
where Kt (= Nkt) denotes the aggregate capital stock.Capital depreciates at the rate 8 so that
~2, = I, -- 6K,. (7)
Factors are assumed to be paid the value of their marginal products;hence
FNt = W~ and F~ = r~ + 8.Note that the tax function embodied in equation (2) implies that tax
depreciation and economic depreciation are identical; i.e., owners of capi-tal are taxed on the return F/~ - 6.
The economy is assumed to be closed; hence the output market clearswhen
E= c, + I, + 6,, (8)where Ct -- Nc~ and the level of government expenditures, G, is assumedconstant at all points in time.
The government is bound by the budget constraint
where gst is the nominal money supply and Pt denotes the price level.
3If the usual assumption, mt = B[r~kt + W~], were to be made, money would not turn outto be superneutral. The reason is that under this assumption money and capital must be heldjointly in the individual’s portfolio. The acquisition of one more unit of k~ requires the indi-vidual to acquire/~r~k~ more units of real balances. The rate of return to this joint acquisitionvaries inversely with the rate of price inflation; hence the capital investment decision is not in-dependent of the rate at which money is being created.
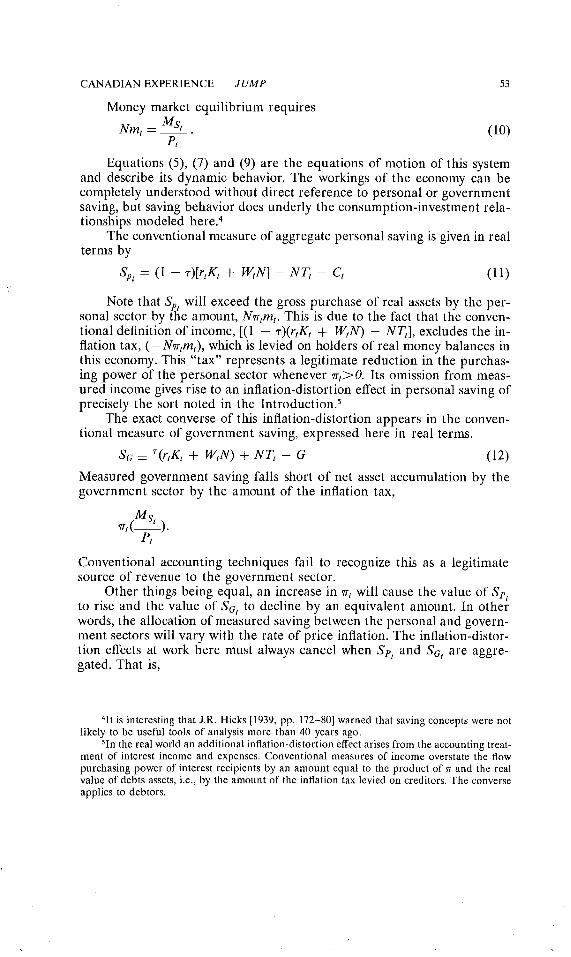
CANADIAN EXPERIENCE JUMP 53
Money market equilibrium requires
Nmt = MStPt
(10)
Equations (5), (7) and (9) are the equations of motion of this systemand describe its dynamic behavior. The workings of the economy can becompletely understood without direct reference to personal or governmentsaving, but saving behavior does underly the consumption-investment rela-tionships modeled here.4
The conventional measure of aggregate personal saving is given in realterms by
Spt = (1 - "r)[rtKt + WtN] -- NTt -- Ct (11)
Note that Spt will exceed the gross purchase of real assets by the per-sonal sector by the amount, Nwtmt. This is due to the fact that the conven-tional definition of income, [(1 - ~)(rtKt +WtN) - NTt], excludes the in-flation tax, (-N~tmt), which is levied on holders of real money balances inthis economy. This "tax" represents a legitimate reduction in the purchas-ing power of the personal sector whenever wt>0. Its omission from meas-ured income gives rise to an inflation-distortion effect in personal saving ofprecisely the sort noted in the Introduction?
The exact converse of this inflation-distortion appears in the conven-tional measure of government saving, expressed here in real terms.
sa = ~(rtI~t + W,N) + NT, - a (12)
Measured government saving falls short of net asset accumulation by thegovernment sector by the amount of the inflation tax,
Conventional accounting techniques fail to recognize this as a legitimatesource of revenue to the government sector.
Other things being equal, an increase in ~rt will cause the value of S~tto rise and the value of Sat to decline by an equivalent amount. In otherwords, the allocation of measured saving between the personal and govern-ment sectors will vary with the rate of price inflation. The inflation-distor-tion effects at work here must always cancel when S~t and Sat are aggre-gated. That is,
4It is interesting that J.R. Hicks [1939, pp. 172-80] warned that saving concepts were notlikely to be useful tools of analysis more than 40 years ago.
5In the real world an additional inflation-distortion effect arises from the accounting treat-ment of interest income and expenses. Conventional measures of income overstate the flowpurchasing power of interest recipients by an amount equal to the product of ~r and the realvalue of debts assets, i.e., by the amount of the inflation tax levied on creditors. The converseapplies to debtors.
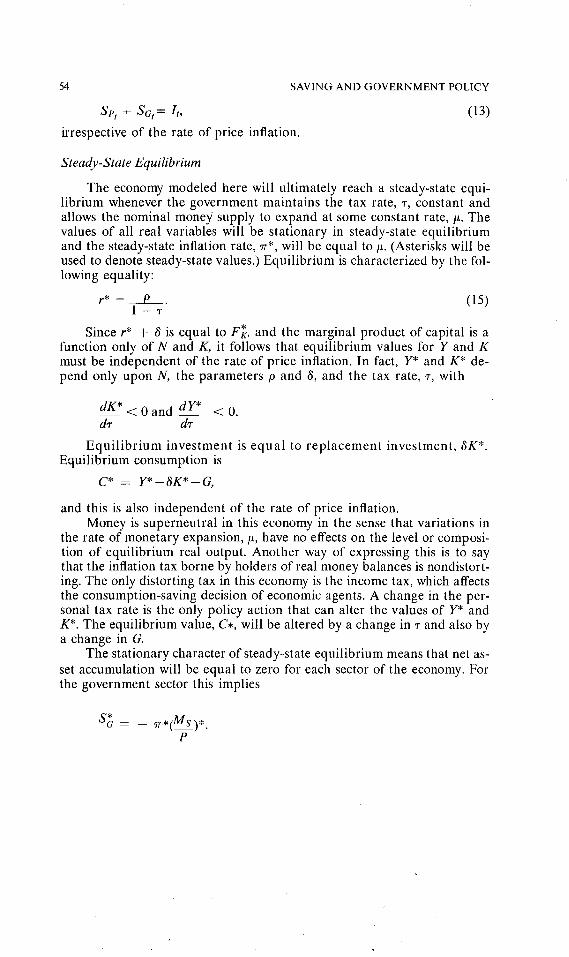
54 SAVING AND GOVERNMENT POLICY
S~"t + S~t--- L,
irrespective of the rate of price inflation.
(13)
Steady-State Equilibrium
The economy modeled here will ultimately reach a steady-state equi-librium whenever the government maintains the tax rate, % constant andallows the nominal money supply to expand at some constant rate,/~. Thevalues of all real variables will be stationary in steady-state equilibriumand the steady-state inflation rate, ~r*, will be equal to/~. (Asterisks will beused to denote steady-state values.) Equilibrium is characterized by the fol-lowing equality:
r* = 0 (15)1--~
Since r* ÷ 6 is equal to F~. and the marginal product of capital is afunction only of N and K, it follows that equilibrium values for Y and Kmust be independent of the rate of price inflation. In fact, Y* and K* de-pend only upon N, the parameters O and 3, and the tax rate, ~, with
dK* < 0 and dY* < O.d,r dr
Equilibrium investment is equal to replacement investment, 3K*.Equilibrium consumption is
C* = Y* - 3K* -- G,
and this is also independent of the rate of price inflation.Money is superneutral in this economy in the sense that variations in
the rate of monetary expansion,/~, have no effects on the level or composi-tion of equilibrium real output. Another way of expressing this is to saythat the inflation tax borne by holders of real money balances is nondistort-ing. The only distorting tax in this economy is the income tax, which affectsthe consumption-saving decision of economic agents. A change in the per-sonal tax rate is the only policy action that can alter the values of Y* andK*. The equilibrium value, C,, will be altered by a change in ¯ and also bya change in G.
The stationary character of steady-state equilibrium means that net as-set accumulation will be equal to zero for each sector of the economy. Forthe government sector this implies
S~ = _ ~r.,(Ms ),.P
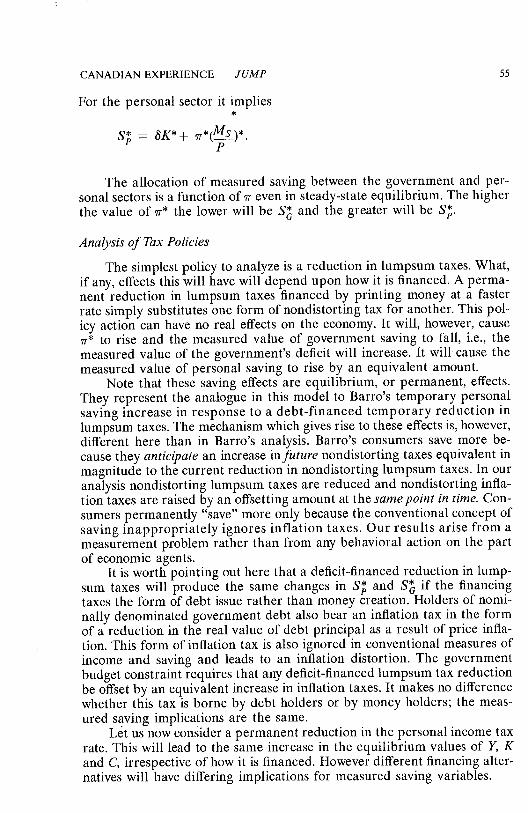
CANADIAN EXPERIENCE JUMP 55
For the personal sector it implies
S~, = 8K*+ rr*(Ms)*.P
The allocation of measured saving between the government and per-sonal sectors is a function of ~r even in steady-state equilibrium. The higherthe value of ~r* the lower will be S~ and the greater will be S~.
Analysis of Tax Policies
The simplest policy to analyze is a reduction in lumpsum taxes. What,if any, effects this will have will depend upon how it is financed. A perma-nent reduction in lumpsum taxes financed by printing money at a fasterrate simply substitutes one form of nondistorting tax for another. This pol-icy action can have no real effects on the economy. It will, however, cause~r* to rise and the measured value of government saving to fall, i.e., themeasured value of the government’s deficit will increase. It will cause themeasured value of personal saving to rise by an equivalent amount.
Note that these saving effects are equilibrium, or permanent, effects.They represent the analogue in this model to Barro’s temporary personalsaving increase in response to a debt-financed temporary reduction inlumpsum taxes. The mechanism which gives rise to these effects is, however,different here than in Barro’s analysis. Barro’s consumers save more be-cause they anticipate an increase in future nondistorting taxes equivalent inmagnitude to the current reduction in nondistorting lumpsum taxes. In ouranalysis nondistorting lumpsum taxes are reduced and nondistorting infla-tion taxes are raised by an offsetting amount at the samepoint in time. Con-sumers permanently "save" more only because the conventional concept ofsaving inappropriately ignores inflation taxes. Our results arise from ameasurement problem rather than from any behavioral action on the partof economic agents.
It is worth pointing out here that a deficit-financed reduction in lump-sum taxes will produce the same changes in S~ and S~ if the financingtaxes the form of debt issue rather than money creation. Holders of nomi-nally denominated government debt also bear an inflation tax in the formof a reduction in the real value of debt principal as a result of price infla-tion. This form of inflation tax is also ignored in conventional measures ofincome and saving and leads to an inflation distortion. The governmentbudget constraint requires that any deficit-financed lumpsum tax reductionbe offset by an equivalent increase in inflation taxes. It makes no differencewhether this tax is borne by debt holders or by money holders; the meas-ured saving implications are the same.
Let us now consider a permanent reduction in the personal income taxrate. This will lead to the same increase in the equilibrium values of Y, Kand C, irrespective of how it is financed. However different financing alter-natives will have differing implications for measured saving variables.
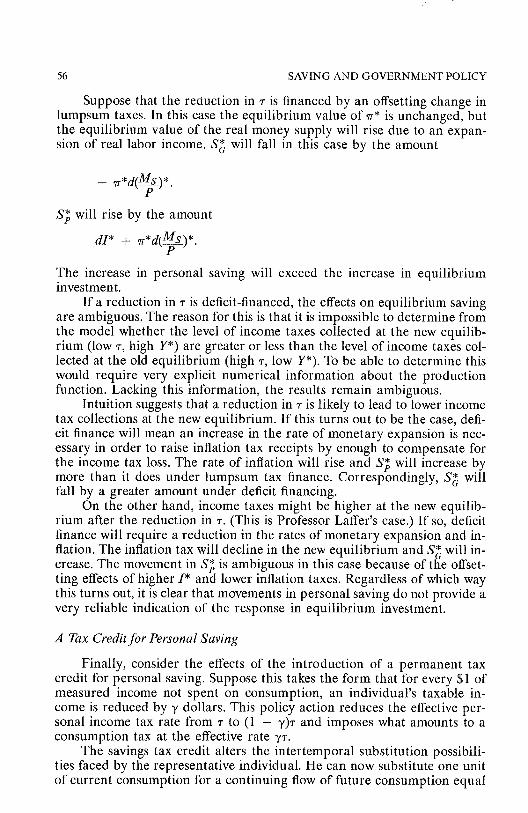
56 SAVING AND GOVERNMENT POLICY
Suppose that the re0uction in ~- is financed by an offsetting change inlumpsum taxes. In this case the equilibrium value of ~r* is unchanged, butthe equilibrium value of the real money supply will rise due to an expan-sion of real labor income. S~ will fall in this case by the amount
S~ will rise by the amount
dI* + ~r*d(~__3_s)*.
The increase in personal saving will exceed the increase in equilibriuminvestment.
If a reduction in ~- is deficit-financed, the effects on equilibrium savingare ambiguous. The reason for this is that it is impossible to determine fromthe model whether the level of income taxes collected at the new equilib-rium (low ~’, high Y*) are greater or less than the level of income taxes col-lected at the old equilibrium (high ~, low Y*). To be able to determine thiswould require very explicit numerical information about the productionfunction. Lacking this information, the results remain ambiguous.
Intuition suggests that a reduction in ¯ is likely to lead to lower incometax collections at the new equilibrium. If this turns out to be the case, defi-cit finance will mean an increase in the rate of monetary expansion is nec-essary in order to raise inflation tax receipts by enough to compensate forthe income tax loss. The rate of inflation will rise and S~ will increase bymore than it does under lumpsum tax finance. Correspondingly, St willfall by a greater amount under deficit financing.
On the other hand, income taxes might be higher at the new equilib-rium after the reduction in ~. (This is Professor Laffer’s case.) If so, deficitfinance will require a reduction in the rates of monetary expansion and in-flation. The inflation tax will decline in the new equilibrium and S~ will in-crease. The movement in S~ is ambiguous in this case because of the offset-ting effects of higher I* and lower inflation taxes. Regardless of which waythis turns out, it is clear that movements in personal saving do not provide avery reliable indication of the response in equilibrium investment.
A Tax Credit for Personal Saving
Finally, consider the effects of the introduction of a permanent taxcredit for personal saving. Suppose this takes the form that for every $1 ofmeasured income not spent on consumption, an individual’s taxable in-come is reduced by ~, dollars. This policy action reduces the effective per-sonal income tax rate from ¯ to (1 - ~,)~- and imposes what amounts to aconsumption tax at the effective rate
The savings tax credit alters the intertemporal substitution possibili-ties faced by the representative individual. He can now substitute one unitof current consumption for a continuing flow of future consumption equal
CANADIAN EXPERIENCE JUMP 57
to (I + ¥~’)(1 - r)rt. This alters the first-order conditions for utility maxi-mization to
< - ~[(1 + w)(1 - T)r, - p]. 06)
Steady-state equilibrium is now realized when
r* = P(1 + Vw)(1 -- r)
and/, = ~r* = any constant value.As long as the value of~- remains unaltered, any savings tax credit with
~, > 0 will lower the equilibrium real interest rate and lead to increases inthe values of Y*, K* and C*. Thus this type of policy action will have ex-pansionary effects on real economic activity. Whether it will actually leadto an increase in personal saving is a different matter which once again de-pends upon how this tax action is financed.
If the tax credit is financed by an offsetting change in lumpsum taxes,it will lead to a decline in Sa and an increase in S~, that exceeds the rise inI*. These results are identical with those associated with a reduction in rfinanced by an offsetting change in lumpsum taxes. They occur for thesame reasons which need not be repeated.
If the tax credit is financed by altering the rate of money creation, thesaving effects are once again ambiguous--for precisely the same reasonsthey were ambiguous in the case of a defidt-financed reduction in r. Theearlier conclusion that personal saving responses do not provide a reliableindication of the effects of tax policies on investment is appropriate onceagain.
IlL Recent Canadian Experience with Tax-Based Saving Incentives
In the mid-1970s the Government of Canada introduced several majoralterations to the personal tax treatment of investment income. Most sig-nificant in this regard were:
1. An investment income exclusion (IIE) applicable to interest, divi-dends, and capital gains from Canadian sources. Beginning with the1975 taxation year, Canadian taxpayers were permitted to excludeup to a maximum of $1,000 worth of Canadian-source investmentincome from taxable income. The $1,000 annual limitation has re-mained in effect.
2. A liberalization of the tax treatment of income allocated to retire-ment savings in the form of Registered Retirement Savings Plans(RRSPs).
58 SAVING AND GOVERNMENT POLICY
Since the early 1960s Canadian taxpayers have been permitted to es-tablish individual retirement savings plans. When the plan is "registered"with a recognized financial intermediary (e.g., a bank or a broker), it be-comes an RRSP and is eligible for special tax treatment,a RRSP funds areinvested in Canadian assets (non-Canadian assets are ineligible). Earningson these funds are not subject to tax. In addition, holders of RRSPs arepermitted to make gross new contributions to the plan, up to some annualmaximum, that are tax deductible.
Individuals are eligible to maintain RRSPs up to age 65. At age 65, theplan terminates and its holder has two options: (a) he can either declare theentire amount of funds in the RRSP as taxable income for that year, or (b)use th "funds to purchase an income-averaging annuity (sold by life insur-ance companies). If option (b) is exercised, the individual is subject to taxon the annuity payments as they are received. Most individuals choos~ op-tion (b) because this minimizes tax liabilities under the progressive Cana-dian tax system.
An individual need not wait till age 65 to terminate an RRSP. He cando so at any time but must declare the entire amount as taxable income inthe year of liquidation. Because the Canadian tax system is progressive,RRSPs are often used as a means of income averaging. An individual canestablish an RRSP in a year of high income and liquidate it in a year of lowincome, thereby reducing his lifetime tax liabilities. This motive for invest-ing in RRSPs is discussed by Michael Daly [1981] and will be ignored inthe remainder of our analysis. For all intents and purposes we will assumethat individuals hold RRSPs until retirement. Any individual who does thisand faces the same marginal tax rate at all points in time will realize anafter-tax nominal rate of return on RRSP contributions that is equal to thebefore-tax nominal rate of interest.7
RRSPs offer taxable investors an attractive alternative to the purchaseof unsheltered assets. The One thing that prevents Canadians from invest-ing even more heavily in RRSPs than they already do is the limit placed onannual contributions into these plans. Prior to 1974 the limit was set at thelesser of $2,500 or 20 percent of the earned income for a taxpayer with noemployment-based retirement plan, For other taxpayers, the sum of RRSP
6Technically RRSPs refer to registered plans held by individuals who are not also enrolledin employment-based retirement plans. Registered plans held by individuals who do also haveemployment-based pension plans are termed Registered Pension Plans (RPPs). The designa-tion RRSP used in the text is intended to cover both cases.
7To see that this is the case, consider an individual who faces a marginal tax rate of,r andinvests $1 in an RRSP L years prior to age 65. The individual is entitled to an immediate taxrebate of’r dollars. If RRSP funds earn the before-tax nominal rate of interest, i, he will haveaccumulated a total of (1 + i)L dollars at age 65. These funds can be used to purchase an in-come-averaging annuity at the date of retirement. Suppose this annuity is a consol with a be-fore-tax rate of return equal to i. Then the after-tax rate of return earned by the individual isthe value of the discount rate, R, which satisfies the following:
$1 = "r + (1 -- "r) i(1 + i)LR(1 + R)L
The value R = i does this.
CANADIAN EXPERIENCE JUMP 59
contributions and individual contributions to an employment-based retire-ment plan was limited to the lesser of $1,500 or 20 percent of earnedincome.
These limitations were sharply modified beginning with the 1974 tax-ation year. While the 20 percent of earned income restriction was retained,the dollar maximums were raised to $5,500 and $3,500 for taxpayers with-out and with employrnent-based plans, respectively. This represented a sig-nificant relaxation of the annual limitations. The $5,500 and $3,500 maxi-mums are still in effect at the present time, though the cumulated inflationthat has occured since 1974 has acted to substantially reduce their respec-tive real values.
Some Open Economy Considerations
The introduction of the $1,000 IIE reduces the effective marginal taxrate on investment income to zero for any taxpayer who earns less than$1,000 per year from investment in assets. For individuals who earn moreincome than this, the $1,000 IIE represents a lumpsum tax reduction. Theeffects of this tax measure can be analyzed with the closed economy modeldeveloped in the preceding section, provided we can show that the model isappropriate for a small, open economy like Canada. The same applies tothe effects of the increase in annual RRSP contribution limits. This policyaction represents the sort of savings tax credit analyzed in Section II fortaxpayers who are not constrained by the annual limits. For taxpayers whoare constrained, the increase in contribution limits represents a lumpsumtax reduction.
It will be argued here that the closed economy model can be applied tothe Canadian situation because both the $1,000 IIE and the special taxtreatment accorded to RRSPs are applicable only when taxpayers invest indomestic Canadian assets. Income from foreign assets is not given favor-able tax treatment under these provisions. The effect is to segment the Ca-nadian and the rest of the world capital markets and make it possible forCanadian assets to yield lower before-tax rates of return than their interna-tional counterparts.
Suppose that prior to the introduction of these tax measures, Cana-dian and the rest of the world assets were perfect substitutes. Since Canadais a small economy, Canadian investors would have faced a before-tax rateof return, ~’, determined in the rest of the world. Any change in Canadiantax laws which applies equally to investment income from all sources wouldhave no effect on ~, though it could alter the consumption-saving patterns ofCanadians. An across-the-board reduction in income taxes offset by an in-crease in lumpsum taxes, for exa~nple, would stimulate Canadians to re-duce current consumption and accumulate assets at a more rapid rate. With~ fixed in world capital markets, Canadians would have no incentive to in-crease domestic capital formation but would, instead, purchase foreign as-sets. The corresponding rise in Canadian personal saving would be exactlyoffset by a reduction in foreign saving, i.e., by a capital outflow.
60 SAVING AND GOVERNMENT POLICY
If, as was actually the case, Canadian tax authorities reduce only therate of taxation applicable to income from domestic assets, individuals willhave an incentive to divest themselves of foreign assets and purchase Cana-dian assets. If the tax rate that is reduced is a distorting tax, Canadians willalso have an incentive to reduce current consumption and accumulate as-sets at a faster rate. Since it is domestic assets that are being accumulated,the real rate of interest in Canada will be driven below the rest of the worldrate, ~, and domestic capital formation will rise. The differential treatmentof distorting taxes acts to segregate the Canadian and the rest of the worldcapit~l markets and allows the Canadian economy to come to the samelsteady-state equilibrium position achievable by a closed economy.8 Theclosed economy model developed in Section II does, therefore, provide anappropriate mechanism for analyzing the effects of recent Canadian taxpolicies.
Investment and Saving Effects
The task before us now is to determine whether the $1,000 IIE actsprincipally as a reduction in marginal tax rates or as a lumpsum tax reduc-tion to existing asset holders and to do the same for the change in RRSPcontribution limits. It obviously makes a great deal of difference as regardsthe effects of these policies on Canadian investment incentives. If these areprincipally distorting tax reductions, they should provide considerablestimulus to Canadian business investment. If, on the other hand, they areprincipally lump sum in nature, they provide little or no investmentstimulus.
Existing evidence on the distribution of investment income in Canadaleads us to believe that the $1,000 IIE acts principally as a lumpsum reduc-tion in taxes. Canadian income tax statistics for the 1979 tax year (the lat-est available) reveal that some two-thirds of total investment income in theform of interest, dividends, and taxable capital gains was earned in thatyear by taxpayers reporting gross incomes in excess of $20,000.9 The aver-age amount of investment income reported by taxpayers with gross in-comes exceeding this amount was $3,624--well in excess of the $1,000 limiton the IIE. Moreover, the average level of investment income reported bytaxpayers with 1979 incomes below $20,000 was $689. These figures do notdeny that some less wealthy taxpayers would have an incentive to save andinvest due to the IIE, but suggest that the bulk of Canadian investment ac-tivity is carried on by individuals for whom the $1,000 limit is a bindingconstraint.
8More correctly, the open economy will achieve the same steady-state equilibrium underthese circumstances only if the equilibrium real rate of interest is r* ~< ~. When r* > ~, equi-librium will not be attained and the open economy will stay at a position where its domesticreal rate of interest remains equal to ~. However, this is not a realistic possibility, for r < r*implies that domestic consumers will plan consumption streams that continually decrease overtime. This sort of behavior is a possibility we rule out as implausible
9Source: Revenue Canada, Taxation Statistics (1981 Edition). The average amount of in-vestment income exceeded $1,000 for all income classes in excess of $20,000 in 1979.
CANADIAN EXPERIENCE JUMP 61
An even stronger case can be made that the 1974 increase in RRSPcontribution limits represented primarily a lumpsum transfer to Canadiantaxpayers. The basis for this claim is that RRSPs have offered a perfect ar-bitrage opportunity to taxpayers with investment income in excess of$1,000 per year. Interest paid on funds borrowed to finance RRSP contri-butions have been tax deductible against unsheltered investment income.(Beginning with the 1982 tax year this will no longer be the case.) Thus ataxpayer who has such income--either from foreign sources or from do-mestic sources in excess of $1,000--has been able to borrow at an after-taxcost of(1 - ~-) i and earn an after-tax rate of return on a RRSP ofi. He hashad a strong incentive to undertake this arbitrage activity but will be con-strained by the annual RRSP contribution limit. The number of taxpayersin this favorable position has been at least as large as the number bound bythe $1,000 IIE limitation. It follows, therefore, that if the $1,000 IIE limita-tion is a binding constraint on the bulk of Canadian investors, the RRSPlimitations must be too.
This does not deny that changing RRSP limits in 1974 served to lowerthe effective marginal tax rates faced by many lower income Canadians. Itsimply suggests that the amount of saving and investment funds controlledby these individuals is small relative to the total.1°
What all of this means is that the 1974-75 tax incentives for saving in-troduced in Canada are best viewed as lumpsum tax reductions to upperand middle income taxpayers. We have already analyzed the implicationsof lumpsum tax reductions and found that they have no effect on the equi-librium value of investment--provided such nondistorting tax reductionsare financed by offsetting increases in other nondistorting taxes.
It is, of course, not clear how the Canadian Government financed thesetax changes inasmuch as numerous other policy actions were being taken atthe same time. We must consider the possibility that the IIE and RRSP ac-tions have caused the Canadian Government to set the overall level of per-sonal and corporate income tax rates higher than would have otherwiseprevailed. If this has occurred, then the equilibrium levels of output andinvestment are likely to be lower than would otherwise be the case. In otherwords, the IIE and RRSP policy might actually have generated perverse ef-fects on Canadian investment activity. It is difficult to say more.
There is even more ambiguity regarding the effects of these policies onmeasured saving flows. The responses of personal and government savingto a tax change are difficult to assess even when the offsetting financing pol-icy is known. When it is unknown, the situation is indeterminant. This is
~°It is worth mentioning that neither interest paid on consumer debt nor the mortgage in-terest of owner-occupants is tax deductible under Canadian tax laws. This feature of the taxsystem serves to reduce the appeal of RRSPs and the IIE even to individuals not constrainedby the annual limitations imposed by these tax policies. Any individual with outstanding con-sumer or mortgage debt can earn a marginal after-tax rate of return equal to the before-taxrate of interest, i, by simply repaying part of his debts. The opportunity to invest in RRSPs ortax-sheltered Canadian assets would not offer any reduction in effective tax rates to individualsin this position.
62 SAVING AND GOVERNMENT POLICY
unfortunate because of the considerable interest in the question of whetherthe recent divergence between Canadian and U.S. rates of personal savingcan be attributed to Canadian tax policies. While we cannot provide a defi-nite answer to that question, it is possible to compute a rough estimate ofthe maximum increment to Canadian personal saving that might be at-tributable to these policies. Such an estimate might at least give some in-sight as to whether the tax hypothesis is a credible explanation of the ob-served discrepancy in saving rates.
The maximum response of personal saving to a lumpsum tax reduc-tion occurs under deficit financing. It was shown earlier that the equilib-rium value of Sp will increase by the full amount of the tax reduction underthese circumstances--a response due entirely to the inflation-distortion ef-fect. We need only estimate the annual tax revenue costs of the $1,000 IIEand the higher RRSP contribution limits in order to derive an upper-bound estimate of the impacts of these policies on personal saving inCanada.
Using detailed taxation data for 1979, it is a relatively simple matter toestimate the tax revenue loss associated with the $1,000 IIE. Data are avail-able on the amount of the IIE by income class. An estimate of the revenueloss can be computed by multiplying the amount of IIE claimed by themarginal tax rate appropriate to each income class and aggregating the re-sults. The resulting value for the 1978 taxation year is $0.90 billion,ll
It is much more difficult to come up with an estimate of the tax reve-nue loss associated with the fact that RRSP contribution limits were higherin 1974 and after than they had been prior to 1974. It is the incremental taxreduction associated with the 1974 increase in limits that is relevant here.12Available taxation data report only the total amounts of gross RRSP con-tributions (by income class) on an annual basis. It is not possible to deter-mine by how much these values exceed the annual contributions thatwould have occurred under the pre-1974 limitations from these data. In ad-dition, taxation statistics do not report the tax-exempt accrued RRSP earn-ings from past contributions that also represent revenue losses to govern-ments. That is, the tax loss associated with RRSPs in any year is the taxforegone on the sum of gross new contributions and accrued earnings frompast contributions. To come up with an estimate of this loss some verycrude assumptions must be made.
In 1979 a total of $5.67 billion in RRSP contributions were claimed asdeductions by Canadian taxpayers. The 1974 changes acted to approxi-mately double annual contribution limits; hence something in the neigh-borhood of $2.84 billion, or one-half of the total, probably represents theincremental effect of the 1974 changes on the level of new contributions in1979. To this figure must be added some estimate of the accrued earnings
~$0.64 billion of this represented a loss in federal tax revenues and the remaining $0.26billion was a loss in provincial taxes.
~2The reason for this is that RRSPs existed prior to 1974 with no apparent effect on theCanadian-U.S. personal saving rate differential. We seek to determine whether the 1974changes in RRSP contribution limits have been a factor causing the Canadian saving rate torise relative to the U.S. rate.
CANADIAN EXPERIENCE JUMP 63
on past contributions. Assuming a 9 percent annual rate of return and that.annual contributions were $2.84 billion higher as a result of the 1974changes in every year over the 1974-79 interval, the total incremental tax-exempt income in 1979 is estimated to have been approximately $4.26 bil-lion. Assuming an effective marginal tax rate of 33 percent, the tax revenuelosses associated with this amount are estimated to have been $1.42 billion.
Under the assumption that Canadian governments used (nondistort-ing) deficit finance to offset their tax losses from the $1,000 IIE and the1974 changes in RRSP contribution limits, personal saving in Canada washigher by $2.32 billion in 1979 than might otherwise have been the case.Total personal saving was $17.81 billion in that year and the measured per-sonal saving rate (on a National Accounts basis) was 10.3 percent. Thus Ca-nadian tax incentives may have contributed as much as 1.3 percentagepoints to the 1979 personal saving rate. The effect on measured saving ratesfor the 1975-78 and 1980-81 intervals is likely to be of approximately thesame magnitude.
The average discrepancy between measured rates of personal saving inCanada and the United States from 1975 to 1981 was 4.4 percentage pointsin Canada’s favor. Canadian tax incentives can explain at best only one-fourth of this discrepancy under the most heroic of assumptions. It appears,therefore, that some factors other than Canadian tax incentives have beenresponsible for the apparent divergence in Canadian and U.S. personalsaving behavior.
IV. Concluding Observations
One conclusion to be drawn from this study is that saving behavior isdifficult to analyze in the aggregate. The main reason for this is that exist-ing measures of saving do not fully correspond with the concepts of savingthat economists have in mind. The analysis here has focused on only onemeasurement problem--the inflation-distortion effect. If that were the onlydifficulty, it could easily be solved by redefining saving on an inflation-adjusted basis, i.e., by correcting existing measures for inflation taxes. How-ever in the real world there are many other measurement problems, e.g.,what to do with consumer durable goods purchases and business saving bycorporations? The list of alterations that could be made to measured sav-ings concepts is long and the number of opinions regarding which of theseare appropriate is diverse. Existing measures may well come as close to sat-isfy.ing the majority of economists as any single set of alternatives. Thepoint to be stressed is that saving is not a particularly useful focus ofanalysis.
Fortunately, for most problems an analysis of saving behavior is notnecessary. The problem analyzed in this paper provides an illustration ofthis. If the objective of government policy is to promote increased capitalformation, it is not necessary to find policy tools that will accomplish thisresult by first enticing economic agents to save more. It is, instead, muchmore straightforward to think in terms of policy tools that will directly act
SAVING AND GOVERNMENT POLICY
to increase the after-tax rate of return on capital. Reductions in the rates oftax applied to incomes from capital investments will do this and promotehigher investment, provided such tax reductions are not financed by in-creases in other distorting taxes that fall upon investment incomes.
In the model derived in the paper, deficit finance via inflation taxesprovides a nondistorting means of finance. Inflation taxes are nondistortinghere only because the model was structured to ensure the superneutralityof money. It is worth mentioning that this is probably not the case in thereal world. A number of economists (e.g., M. Feldstein and L. Summers[1976]) have argued that the real tax burden borne by investors rises withthe rate of price inflation. If so, this helps to explain the sluggish perform-ance of investment over the past several years. Governments interested instimulating capital formation would do well to consider some form of infla-tion indexing for income from capital sources. Whether such actions wouldalso lead to higher personal saving is both ambiguous and not particularlyrelevant.
Recent Canadian experience with tax incentives provides a useful ex-ample of how focus on saving behavior can be misleading. The tax incen-tives enacted by the Government of Canada in 1974 and 1975 were essen-tially aimed at promoting capital investment by increasing personalincentives to save. Our analysis suggests that these actions were by andlarge lumpsum transfers to middle and higher income taxpayers. The poli-cies not only provide little incentive for increased investment but may ac-tually have perverse effects insofar as they have been financed by increasesin distortionary taxes. Furthermore, their effects on personal saving areambiguous.
The tax incentives may actually have caused a decline in measuredpersonal saving in Canada. At most, they may have added something in theneighborhood of 1.3 percentage points to the measured personal savingrate over the 1975-81 interval. This increment falls well short of explainingthe average 4.4 percentage point relative increase in Canadian versus U.S.rates of personal saving that has arisen over this time period. Canadian taxpolicies regarding personal saving do not appear to be capable of explain-ing this discrepancy.
REFERENCES
Barro, Robert J. "Are Government Bonds Net Wealth?" Journal of Political Economy, 82,Nov./Dec. 1974, pp. 1095-1117.
Daly, Michael J. "The Role of Registered Retirement Saving Plans in a Life-Cycle Model,"Canadian Journal of Economics, XIV, No. 3, Aug. 1981, pp. 409-21.
Feldstein, Martin, and Lawrence Summers. "Inflation, Tax Rules, and the Long-Term InterestRate," Brookings Papet’s, 1978, 1, pp. 61-99.
Hicks, John R. Value and Cat~ital. Oxford: Oxford University Press, 1939.Jump, Gregory V. "Interest Rates, Inflation Expectations, and Spurious Elements in Meas-
ured Real Income and Saving," American Economic Review, Vol. 70, No. 5, Dec. 1980,pp. 990-1004.
Shoven, J. B., and J. I. Bulow. "Inflation Accounting and Non-Financial Corporate Profits, Fi-nancial Assets and Liabilities," Brookings Papers’, 1976, 1, pp. 15-66. ~

Discussion
Alan S. Blinder*
Gregory Jump’s analysis of the U.S.-Canadian personal savings differ-ential is a nice amalgam of theory, facts, and institutional details. In manyways the paper is a model for economic writing.
He begins with an empirically important question (Why have Cana-dian households outsaved their U.S. counterparts by a wide margin in re-cent years?), formulates an interesting and tenable hypothesis (that Cana-dians are responding to tax incentives favorable to saving), and then buildsan economic model to address the issue. The model manages to be simpleand coherent without being trivial and, in applying his model to the realworld, Jump pays careful attention to several relevant facts and institu-tions. The paper neatly follows a unified thread from start to finish. I en-joyed reading it and profited from doing so.
Nonetheless, I must confess that careful study of the paper led me toconclude that the facts are a bit obscure, that the theory is not very enlight-ening, and that certain institutional details may be the proverbial Prince ofDenmark that are left out of this particular Hamlet.
1. Major Themes
Though I will have some critical things to say later, I wish to begin bystressing my broad agreement with the major themes that Jump develops inexamining the hypothesis that tax incentives account for the large differ-ence in saving rates between two countries that seem so similar. As I see it,these themes are:
(1) that conventional personal saving rates are distorted upward by in-flation because they fail to account for the automatic dissaving that occurswhen inflation erodes the real value of money fixed assets.
Jump concentrates on money itself but realizes that corporate and gov-ernment bonds are far more significant in practice. Even a casual look atthis point suggests that it is of great empirical importance. In 1979, a yearof high inflation, U.S. households saved 5.25 percent of their disposable in-come--a total of $86.2 billion,l But the disposable income figure included$207 billion of interest income, most of which really represented a return ofprincipal on previous loans. And the saving figure excluded almost $44 bil-lion in interest paid to businesses, most of which would more properly be
*Gordon S. Rentschler Memorial Professor of Economics at Princeton University.~The U.S. data have recently been revised, showing considerably more saving than previ-
ously estimated. Specifically, the personal saving rate in 1979 is now put at 5.9 percent. I usedthe older data because I needed some of the details that I do not yet have in the newer data.
65
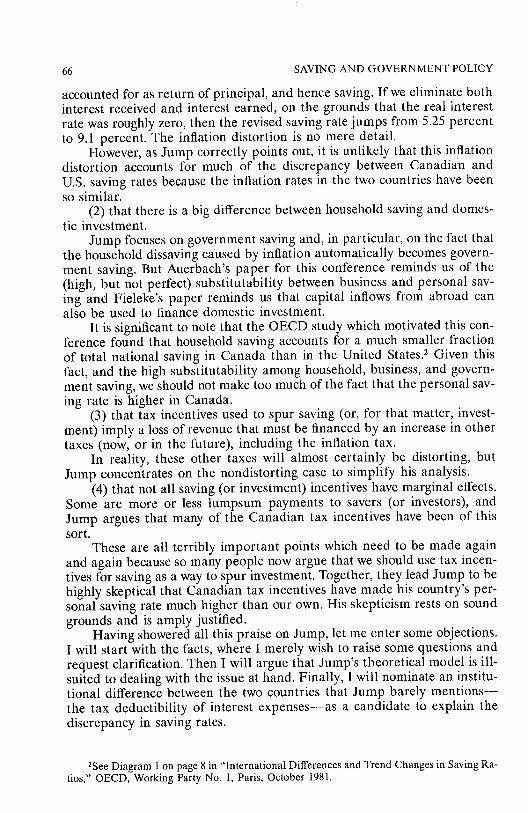
66 SAVING AND GOVERNMENT POLICY
accounted for as return of principal, and hence saving. If we eliminate bothinterest received and interest earned, on the grounds that the real interestrate was roughly zero, then the revised saving rate jumps from 5.25 percentto 9.1 percent. The inflation distortion is no mere detail.
However, as Jump correctly points out, it is unlikely that this inflationdistortion accounts for much of the discrepancy between Canadian andU.S. saving rates because the inflation rates in the two countries have beenso similar.
(2) that there is a big difference between household saving and domes-tic investment.
Jump focuses on government saving and, in particular, on the fact thatthe household dissaving caused by inflation automatically becomes govern-ment saving. But Auerbach’s paper for this conference reminds us of the(high, but not perfect) substitutability between business and personal sav-ing and Fieleke’s paper reminds us that capital inflows from abroad canalso be used to finance domestic investment.
It is significant to note that the OECD study which motivated this con-ference found that household saving accounts for a much smaller fractionof total national saving in Canada than in the United States.2 Given thisfact, and the high substitutability among household, business, and govern-ment saving, we should not make too much of the fact that the personal sav-ing rate is higher in Canada.
(3) that tax incentives used to spur saving (or, for that matter, invest-ment) imply a loss of revenue that must be financed by an increase in othertaxes (now, or in the future), including the inflation tax.
In reality, these other taxes will almost certainly be distorting, butJump concentrates on the nondistorting case to simplify his analysis.
(4) that not all saving (or investment) incentives have marginal effects.Some are more or less lumpsum payments to savers (or investors), andJump argues that many of the Canadian tax incentives have been of thissort.
These are all terribly important points which need to be made againand again because so many people now argue that we should use tax incen-tives for saving as a way to spur investment. Together, they lead Jump to behighly skeptical that Canadian tax incentives have made his country’s per-sonal saving rate much higher than our own. His skepticism rests on soundgrounds and is amply justified.
Having showered all this praise on Jump, let me enter some objections.I will start with the facts, where I merely wish to raise some questions andrequest clarification. Then I will argue that Jump’s theoretical model is ill-suited to dealing with the issue at hand. Finally, I will nominate an institu-tional difference between the two countries that Jump barely mentions--the tax deductibility of interest expenses--as a candidate to explain thediscrepancy in saving rates.
2See Diagram 1 on page 8 in "International Differences and Trend Changes in Saving Ra-tios," OECD, Working Party No. 1, Paris, October 1981.
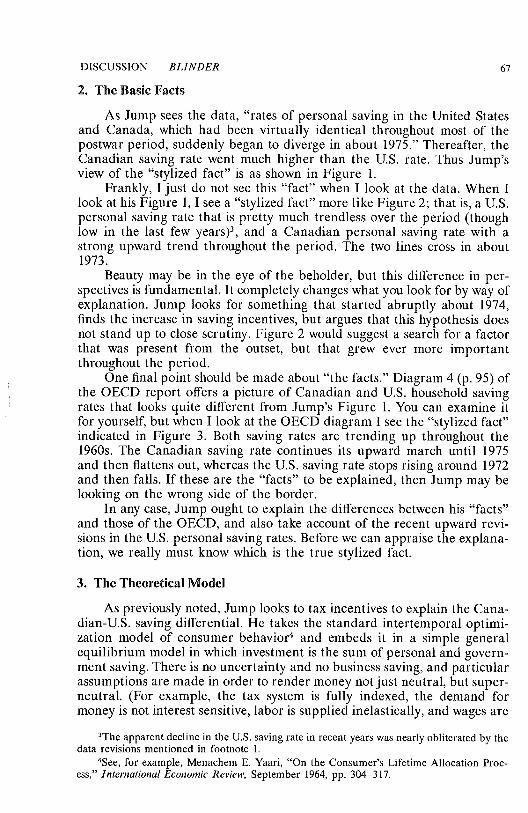
DISCUSSION BLINDER
2. The Basic Facts
67
As Jump sees the data, "rates of personal saving in the United Statesand Canada, which had been virtually identical throughout most of thepostwar period, suddenly began to diverge in about 1975." Thereafter, theCanadian saving rate went much higher than the U.S. rate. Thus Jump’sview of the "stylized fact" is as shown in Figure 1.
Frankly, I just do not see this "fact" when I look at the data. When Ilook at his Figure 1, I see a "stylized fact" more like Figure 2; that is, a U.S.personal saving rate that is pretty much trendless over the period (thoughlow in the last few years)s, and a Canadian personal saving rate with astrong upward trend throughout the period. The two lines cross in about1973.
Beauty may be in the eye of the beholder, but this difference in per-spectives is fundamental. It completely changes what you look for by way ofexplanation. Jump looks for something that started abruptly about 1974,finds the increase in saving incentives, but argues that this hypothesis doesnot stand up to close scrutiny. Figure 2 would suggest a search for a factorthat was present from the outset, but that grew ever more importantthroughout the period.
One final point should be made about "the facts." Diagram 4 (p. 95) ofthe OECD report offers a picture of Canadian and U.S. household savingrates that looks quite different from Jump’s Figure 1. You can examine itfor yourself, but when I look at the OECD diagram I see the "stylized fact"indicated in Figure 3. Both saving rates are trending up throughout the1960s. The Canadian saving rate continues its upward march until 1975and then flattens out, whereas the U.S. saving rate stops rising around 1972and then falls. If these are the "facts" to be explained, then Jump may belooking on the wrong side of the border.
In any case, Jump ought to explain the differences between his "facts"and those of the OECD, and also take account of the recent upward revi-sions in the U.S. personal saving rates. Before we can appraise the explana-tion, we really must know which is the true stylized fact.
3. The Theoretical Model
As previously noted, Jump looks to tax incentives to explain the Cana-dian-U.S, saving differential. He takes the standard intertemporal optimi-zation model of consumer behaviorg and embeds it in a simple generalequilibrium model in which investment is the sum of personal and govern-ment saving. There is no uncertainty and no business saving, and particularassumptions are made in order to render money not just neutral, but super-neutral. (For example, the tax system is fully indexed, the demand formoney is not interest sensitive, labor is supplied inelastically, and wages are
3The apparent decline in the U.S. saving rate in recent years was nearly obliterated by thedata revisions mentioned in footnote 1.
4See, for example, Menachem E. Yaari, "On the Consumer’s Lifetime Allocation Proc-ess," International Economic Review, September 1964, pp. 304-317.
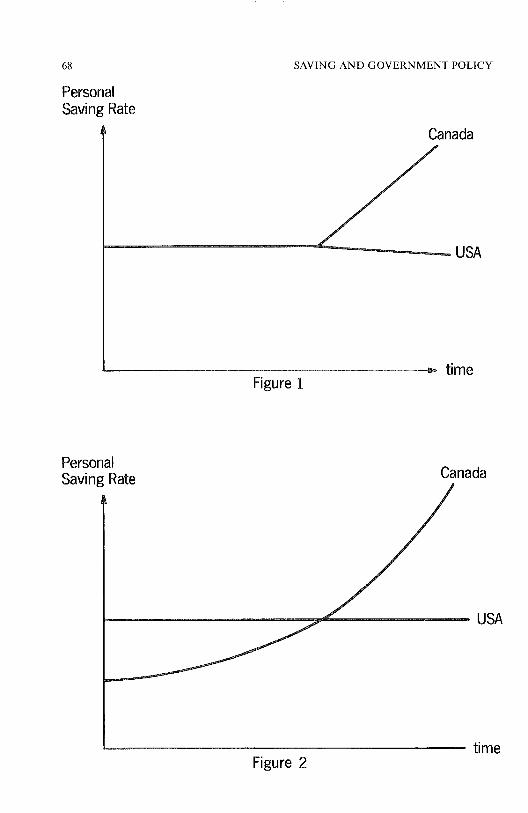
68
PersonalSaving Rate
SAVING AND GOVERNMENT POLICY
Canada
USA
Figure 1time
PersonalSaving Rate Canada
USA
Figure 2time
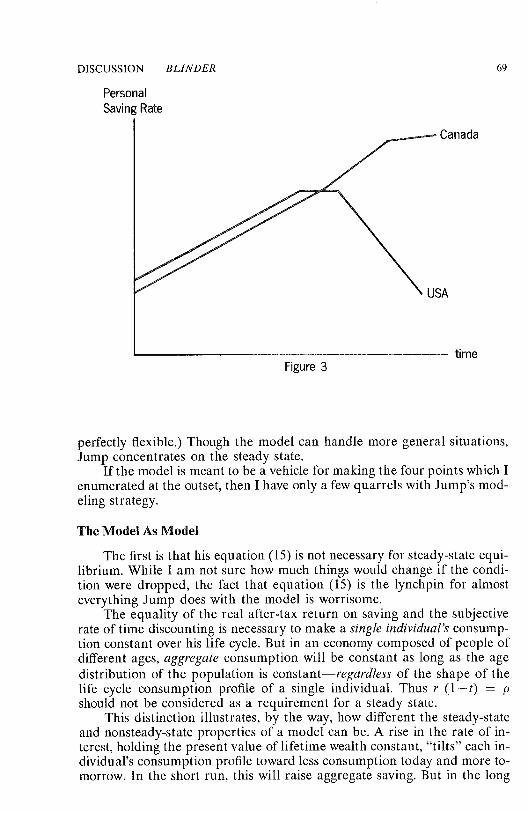
DISCUSSION BLINDER
PersonalSaving Rate
/Canada
USA
69
Figure 3time
perfectly flexible.) Though the model can handle more general situations,Jump concentrates on the steady state.
If the model is meant to be a vehicle for making the four points which Ienumerated at the outset, then I have only a few quarrels with Jump’s mod-eling strategy.
The Model As Model
The first is that his equation (15) is not necessary for steady-state equi-librium. While I am not sure how much things would change if the condi-tion were dropped, the fact that equation (15) is the lynchpin for almosteverything Jump .does with the model is worrisome.
The equality of the real after-tax return on saving and the subjectiverate of time discounting is necessary to make a single individual’s consump-tion constant over his life cycle. But in an economy composed of people ofdifferent ages, aggregate consumption will be constant as long as the agedistribution of the population is constant--regardless of the shape of thelife cycle consumption profile of a single individual. Thus r (l-t) = 0should not be considered as a requirement for a steady state.
This distinction illustrates, by the way, how different the steady-stateand nonsteady-state properties of a model can be. A rise in the rate of in-terest, holding the present value of lifetime wealth constant, "tilts" each in-dividual’s consumption profile toward less consumption today and more to-morrow. In the short run, this will raise aggregate saving. But in the long
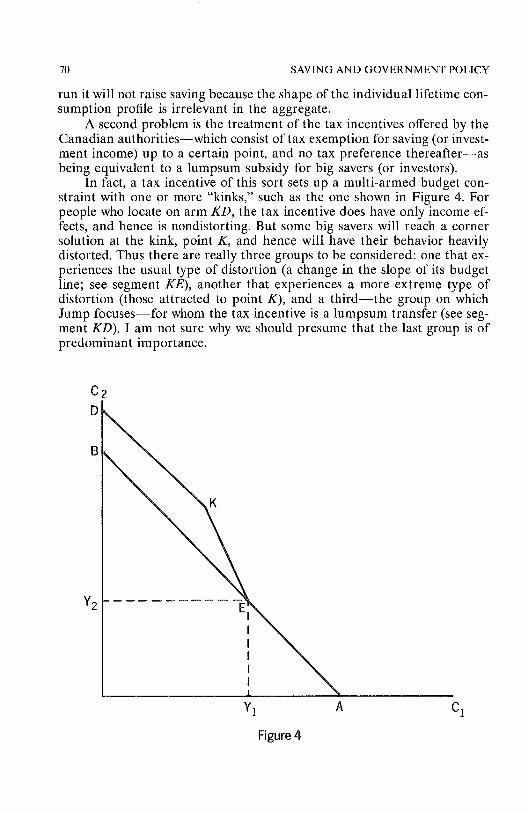
70 SAV1NG AND GOVERNMENT POLICY
run it will not raise saving because the shape of the individual lifetime con-sumption profile is irrelevant in the aggregate.
A second problem is the treatment of the tax incentives offered by theCanadian authorities--which consist of tax exemption for saving (or invest-ment income) up to a certain point, and no tax preference thereafter--asbeing equivalent to a lumpsum subsidy for big savers (or investors).
In fact, a tax incentive of this sort sets up a multi-armed budget con-straint with one or more "kinks," such as the one shown in Figure 4. Forpeople who locate on arm KD, the tax incentive does have only income ef-fects, and hence is nondistorting. But some big savers will reach a cornersolution at the kink, point K, and hence will have their behavior heavilydistorted. Thus there are really three groups to be considered: one that ex-periences the usual type of distortion (a change in the slope of its budgetline; see segment KE), another that experiences a more extreme type ofdistortion (those attracted to point K), and a third--the group on whichJump focuses--for whom the tax incentive is a lumpsum transfer (see seg-ment KD). I am not sure why we should presume that the last group is ofpredominant importance.
C2
B
Y2
Figure 4

DISCUSSION BLINDER 71
The Model and Reality
But, as I interpret Jump’s paper, the model is meant to be more thanjust a bulletin board on which to hang a few good points. It is designed tostudy the savings differential between the United States and Canada since1973. For this task, however, I find almost every aspect of the modelobjectionable.
Have the two economies been travelling along neoclassical steady-stategrowth paths? Did full employment prevail in both economies during the1970s? Is the Canadian economy closed to capital flows? Is the inflation taxnondistorting? Does either country have a tax system which taxes only realinterest income and allows deductions only for real interest expenses andtrue economic depreciation? The answer in every case is no.
It seems most unlikely that the U.S.-Canadian saving differential is asteady-state phenomenon. Neither economy was moving along a full-employment growth path during these years. Neither country’s citizenscould borrow or lend freely in a perfect capital market. Money was prob-ably neither neutral nor superneutral in either country, and the inflationtax was certainly distorting. Neither country had an indexed tax system inthe relevant sense, and both had relatively open capital markets (thoughJump’s point about the discriminatory nature of Canadian tax incentives isvalid and important). The Canadian tax law allowed interest deductionsneither for interest paid to finance purchases of consumer durables nor forhome mortgages; the U.S. tax law allowed both. And the Canadian tax lawwas not the only one to have a variety of tax incentives for saving duringthis period. The U.S. tax law included tax breaks for pensions, IRAs,Keogh accounts, and other’ provisions.
Now, I know all about abstracting from details and the virtues of "asif" reasoning. But it really seems to me that some of these phenomena maybe the essence of the problem. I am skeptical that a model which sweepsthem all under the rug can teach us much about the U.S.-Canadian savingdiscrepancy. And nothing in Jump’s paper removes this skepticism.
I also plead innocent to the charge of picking theoretical nits. At theend of the paper, Jump uses the model to put an upper bound on theamount of additional saving that might have been induced by the Canadiantax incentives. His calculation makes use of several of the aforementionedassumptions in an essential way, including the ideas that the Canadianeconomy is on a steady-state growth path, that the extra personal saving isexactly matched by higher revenues from the inflation tax, and that the in-flation tax is nondistorting. Furthermore, this calculation could be relevantto the Canadian-U.S. saving differential only if the Canadian inflation ratehad been higher than the U.S. inflation rate--which was not the case to anysignificant extent.
4. Institutional Differences
I save my most speculative comments for last. Comparisons betweenCanada and the United States come about as close to a controlled experi-
72 SAVING AND GOVERNMENT POLICY
merit as economists are ever likely to get. The two countries are similar inso many ways that we can feel almost justified in attributing whatever dif-ferences we observe to legal-institutional differences. This is the spirit ofJump’s inquiry, and I endorse it.
However, what I would have thought was the chief institutional differ-ence between the two countries--the tax deductibility of interest ex-penses-is barely mentioned by Jump. Let me cite a few numbers to illus-trate the potential importance of this issue.
With a 10 percent mortgage interest rate and an 8 percent inflationrate--numbers that are pretty typical for the 1970s, a Canadian pays a 2percent net real rate of interest if he buys a house. An American pays - 1percent if he is in the 30 percent tax bracket, and -3 percent if he is in the50 percent bracket. Even down in the 20 percent tax bracket the net after-tax rat e of interest is zero. And this ignores the fact that investments inhousing are leveraged to the hilt. Furthermore, the tax distortion in favorof borrowing gets more and more important as the inflation rate rises. Andinflation rates were rising for most of the period Jump studies.
The point, of course, is that the U.S. tax law encourages people to savein the form of houses and consumer durables, items that are not counted assaving in the national income accounts. I’ll offer myself as a case in point. Ibought my first house in Princeton in 1973 and sold it in 1977. At first Imade monthly mortgage payments that were enormous relative to my in-come. Was I being a big spender? Hardly. I was being a big saver, for the(untaxed, and quite anticipated) capital gain that came at the end was farmore enormous. A naive calculation suggests that I actually made negativeexpenditures on rent during those four years. Of course, that was not thecase. What happened was that I did most of my saving in the form of hous-ing. So did millions of other Americans.
About two-thirds of American dwellings are now owner-occupied. In1979, the Commerce Department included about $115 billion in imputedrent on these dwellings in the GNP. This amounted to 6.9 percent of dis-posable income--far more than total personal saving as conventionally de-fined. Even if we count only half of this as saving--which is probably tooconservative--the personal saving rate would have been 8.8 percent insteadof 5.2 percent.
Now, I do not pretend that these remarks offer a definitive solution tothe Canadian-U.S. saving discrepancy. The empiricism is in the best arm-chair tradition, and I would need to know more about the situation in Can-ada. But both the enormous magnitude and the particular time pattern ofthe tax distortion point the finger of suspicion at the tax deductibility of in-terest. It merits more discussion than Jump gives it.
David F. Bradford*
I would like to start my discussion by reviewing what Gregory Jumphas done in his paper examining the recent Canadian experience with taxincentives to promote personal saving. I shall then address three points,one very briefly, and two at somewhat greater length. The three points:
(i) I am skeptical of the modeling by which deficit financing is con-nected with inflation. However, I shall argue this is not a veryimportant point as far as the interesting aspect of Jump’s analy-sis is concerned.
(ii) The question of the incentive effects of Canadian tax measuresmerits a closer look, on which I make a small beginning.
(iii) Inflation tends to magnify certain differences between the taxstructures of the two countries in ways that may explain differ-ences in saving rates.
On the face of it, Jump was assigned a difficult task. The starting pointis the surprising divergence since 1976 between U.S. and Canadian rates ofhousehold saving. These had been rather similar (and low, by OECD stan-dards) until then. But since 1976 (reading from Jump’s Figure 1), the Cana-dian ratio of personal saving to income has drifted up, from about 10 per-cent to about 12 percent, while the U.S. rate has slogged along near 6percent. The question apparently posed to Jump: What role in the differ-ence between U.S. and Canadian experience has been played by the taxlaw changes introduced by the Canadian government in the mid-1970swith the objective of encouraging savings? In brief summary, these changesconsisted of allowing taxpayers to exclude from taxable income up to$1000 of (Canadian source) interest, dividends, and capital gains, and sub-stantially liberalized limits on deductible contributions to registered retire-ment savings plans (holding Canadian assets).
It is, incidentally, significant and probably unfortunate that Jump didnot take on the following question: What role did differences in the tax sys-tems of the two countries play in their records? I have in mind here twopoints. First is the artificiality of distinguishing savings- and investment-encouraging devices. It is curious how often one encounters in this contextthe apparent view that it matters (in equilibrium) whether it is the buyersor the sellers that are taxed. (I am not suggesting Jump suffers from anyconfusion on this point.) I shall have nothing more to say about the possiblebearing of changes in investment incentives on the matter under study as Ido not know the facts about the Canadian rules. However, I shall say a bit
*Professor of Economics and Public Affairs at the Woodrow Wilson School, PrincetonUniversity.
73
74 SAVING AND GOVERNMENT POLICY
more about a second aspect of differences in the two systems when I cometo discuss the implicit changes in the laws brought about by inflation.
The thought that a connection might exist between savings incentivepolicies and differences in the saving performances of the United Statesand Canada is plausible in view of the great similarity between the twoeconomies in other respects, and their close links. The OECD staff paperdistributed to conference participants (Table 21, p. 97) presents data sup-porting the view that the two economies have indeed followed similar pathsover the last 25 years. I would note in particular the close agreement in theinflation rates.
While there is thus some cause to suspect institutional differences liebehind differences in recently observed saving rates, the number of obser-vationsis small. What are the chances that a few years’ experience in a rap-idly changing world would throw out convincing evidence about the effi-cacy of a couple of tax incentives for saving? Judging from the contentiousrecord of efforts to detect in time series the responsiveness of saving to theinterest rate, we have to regard the chances as not very good. It is thereforeunderstandable that Jump eschewed an econometric attack on his subject.Like any good economist in this situation, he asked what theory can tell us,and looked to the quantitative information for rough estimates ofmagnitudes.
Although I have reservations about the particular model employed byJump, I have no quarrel with the essential conclusions of his theoreticalanalysis. That is, for a tax measure to encourage saving, it must lower thecost of future consumption in terms of present consumption. In otherwords, it must raise the rate of return received by savers. To elaborate slightly,assuming the government budget must somehow balance, as a first approx-imation the income effects of feasible tax changes must net to zero. If themarginal propensity to consume doesn’t vary systematically in the popula-tion of taxpayers (not, in my view, necessarily a good assumption), the dis-tributional consequences of feasible tax changes do not affect householdsaving, correctly measured. This is the critical point provided by theory. Ifthe tax law changes don’t raise the rate of return received by savers at themargin, they won’t influence savings.
Did the tax law changes in the mid-’70s change the rate of return tosavers? Jump correctly refines the question: Compared to what? If the sav-ing incentives reduce tax revenue, it has to be made up somewhere. So thequestion is incomplete until we specify the offsetting change. Having ar-gued theoretically that an inflation tax, attributable to increased issue ofmoney, is of a lump-sum character, Jump chooses to evaluate the hypothet-ical alternative of no savings incentives and slower money growth. The no-real-effect argument is complete if one accepts that the tax law changeswere themselves also of a lump-sum character. In this case the package ofoffsetting budgetary effects has no effect on saving, correctly measured.
However, because money issue does raise the rate of inflation, it doesbring about a mismeasurement of saving, of a kind Jump has previouslybrought to our attention. That is, neglect of household dissaving throughlost real balances, and of government saving through the offsetting change
DISCUSSION BRADFORD 75
in its monetary liabilities, leads to an overstatement of household savingand an understatement of government saving. It is this mismeasurement,and not any real savings effect, to which Jump attaches an upper-bound inthe latter part of his paper.
I come then to my first, and minor point. Even recognizing that it isonly an issue of measurement, I would take exception to Jump’s reliance ona direct connection between deficit finance and inflation in making his esti-mates. His identification of bond finance and money creation is only validin a steady-state model. In a model which permits bond finance today to beoffset by either money expansion or tax finance in the future, deficit spend-ing is not necessarily inflationary. I therefore question Jump’s assumptionthat deficit finance translated immediately into price level changes.
We are presumably not really interested in the contribution policymade to an apparent but not real difference. Correcting U.S. and Canadianhousehold saving rates for inflation involves about the same adjustment inboth, and leaves the puzzle. The interesting question remains the explana-tion of the differences in correctly measured household saving rates.
Were the saving policy changes, indeed, of a lump-sum character?First, a look at Jump’s empirical evidence. Concerning the $1000 tax-freeinvestment income (presumably net income is involved--could one borrowfrom a foreign bank and avoid the netting of interest?), Jump points outthat in 1979, two-thirds of total (not just Canadian source) investment in-come (net?) accrued to taxpayers reporting gross incomes in excess of$20,000. This implies one-third was received by taxpayers with gross in-comes below $20,000, a group with average investment income of $689.Presumably this group includes many elderly taxpayers with investment in-come in excess of $1000. But presumably also the group of taxpayers withgross income above $20,000 includes many young families in the early ac-cumulation phase of life. From these figures, one could imagine that some-thing like one~fourth of investment income was received by taxpayers stillexempt at the margin by virtue of the $1000 provision. This is not a whollynegligible magnitude.
It is also perhaps risky to identify saving with the receipt of investmentincome. Because under Canadian tax law neither interest on consumer bor-rowing nor home mortgage interest is deductible, there is a tremendous in-centive for households to direct saving first to the reduction of these liabili-ties, or at least there is a strong incentive for them thereby to avoidexceeding the $1000 exempt investment income limit. Thus, simply lookingat the evidence in connection with the $1000 investment income, it is quitepossible that a very substantial proportion of savers confronts the fullbefore-tax rate of interest at the margin. This proportion is the critical em-pirical magnitude.
As far as the registered retirement savings plan limits are concerned,Jump presents no evidence at all. Rather he relies upon the argument thathouseholds can borrow against contributions to these plans, and thereforehave every incentive to maintain contributions at the limit allowed by law(and to restrict withdrawals to the minimum required by law in the retire-ment phase). If it is possible to borrow costlessly against these plans, at a

76 SAVING AND GOVERNMENT POLICY
rate of interest that equals that received within the plan, it is certainly truethat a priori reasoning implies that nearly everyone would borrow to thehilt. However, to the extent that for many individuals the associated inter-est is not deductible, or to the extent that existing mortgages and the likeimply that they already have in effect tax-exempt saving margins, there aremany savers who will be indifferent at the margin to even such a costlessarbitrage transaction.
It is, furthermore, most unlikely that the arbitrage is totally costless. Ata minimum, one would assume that banks and other lenders would extractsome spread between the rate of return charged to borrowers against pen-sion savings, and that actually received in the savings plans. Finally, expe-rience in the United States suggests that arguments based on a priori rea-sonhag about what would be obviously sensible financial behavior may becontradicted by the facts. An interesting example is the suggestion by Mer-ton Miller and Myron Scholes that the limitation on the deductibility ofborrowing for portfolio investment purposes means that dividends are ef-fectively free of tax. While optimal on a priori grounds the implied behav-ior is clearly not borne out by the facts in the United States. Wealth ownerssimply do not borrow to the extent transactions-cost-free theory suggeststhey ought to do.
If many savers do not borrow to take advantage of the registered re-tirement savings plan (and particularly now that the law has been changedin Canada) they will often be in a position to expand their contributions orto reduce the rate at which they draw down accumulations in their retire-ment phase. During such periods they, of course, face the before-tax rate ofreturn on their savings decisions. Furthermore, even during periods inwhich the constraints on contributions or withdrawals are effectively bind-ing on savers, there will typically be more or less lengthy periods in whichthey will, nonetheless, maintain larger accumulations under liberalizedcontribution-limits. This may be seen by writing down the full householdoptimization problem subject to the savings plan limitations.
No doubt the most important question is whether a saver is confront-ing the before-tax rate of return interest at the margin. What is very strik-ing is how much more likely it is to be the case in Canada than in theUnited States. The savings incentives we have been discussing here featureimportantly: the $1000 investment income exemption and the relativelygenerous registered retirement savings plan limits. However, critically im-portant as well is the absence of the deductibility of interest on mortgageor personal borrowing. I can well imagine that for a substantial majority ofsavers in Canada the before-tax rate of interest is the relevant factor at themargin.
This brings me, then, to the way in which the inflation rate, common toboth countries, brought about effective changes in their legislation. If thequestion had been broadened to whether differences in the tax system helpexplain the differences in savings behavior, the different treatment of inter-est deductions would have been seen to be very important. Let us make thecommon assumption that during an anticipated inflation the interest rate
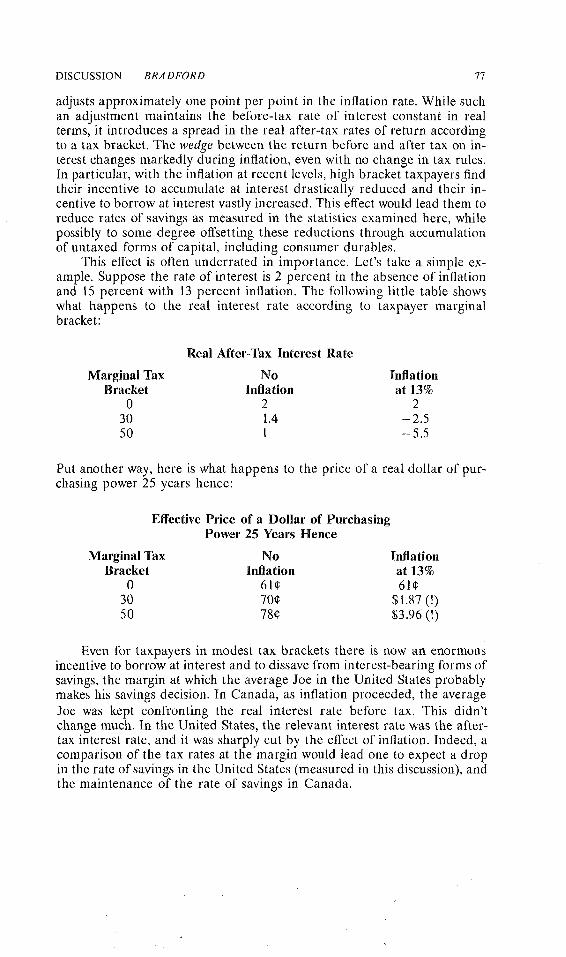
DISCUSSION BRA DFORD 77
adjusts approximately one point per point in the inflation rate. While suchan adjustment maintains the before-tax rate of interest constant in realterms, it introduces a spread in the real after-tax rates of return accordingto a tax bracket. The wedge between the return before and after tax on in-terest changes markedly during inflation, even with no change in tax rules.In particular, with the inflation at recent levels, high bracket taxpayers findtheir incentive to accumulate at interest drastically reduced and their in-centive to borrow at interest vastly increased. This effect would lead them toreduce rates of savings as measured in the statistics examined here, whilepossibly to some degree offsetting these reductions through accumulationof untaxed forms of capital, including consumer durables.
This effect is often underrated in importance. Let’s take a simple ex-ample. Suppose the rate of interest is 2 percent in the absence of inflationand 15 percent with 13 percent inflation. The following little table showswhat happens to the real interest rate according to taxpayer marginalbracket:
Real After-Tax Interest Rate
Marginal Tax No InflationBracket Inflation at 13%
0 2 230 1.4 -2.550 1 -5.5
Put another way, here is what happens to the price of a real dollar of pur-chasing power 25 years hence:
Effective Price of a Dollar of PurchasingPower 25 Years Hence
Marginal Tax No InflationBracket Inflation at 13%
0 61¢ 61¢30 70¢ $1.87 (!)50 78¢ $3.96 (!)
Even for taxpayers in modest tax brackets there is now an enormousincentive to borrow at interest and to dissave from interest-bearing forms ofsavings, the margin at which the average Joe in the United States probablymakes his savings decision. In Canada, as inflation proceeded, the averageJoe was kept confronting the real interest rate before tax. This didn’tchange much. In the United States, the relevant interest rate was the after-tax interest rate, and it was sharply cut by the effect of inflation. Indeed, acomparison of the tax rates at the margin would lead one to expect a dropin the rate of savings in the United States (measured in this discussion), andthe maintenance of the rate of savings in Canada.

78 SAVING AND GOVERNMENT POLICY
While I have the pulpit, let me close with a pious remark. There is arisk in focusing the concern of this conference on overall savings perform-ance. Our concern is more properly with efficient resource allocation, andthis has to do as much with the composition and distribution of investmentand saving as with the overall aggregates. One of the more distressing as-pects of measures that have been recently taken in this country to alter theaggregate is the undoubted distortion that they have introduced into thecomposition. Alan Auerbach will have much more to say on this aspect ofthe matter, which I think cannot be overemphasized.
Issues in the Measurement andEncouragement of Business Saving
ALan J. Auerbach*
I. Introduction
In 1981, personal saving in the United States was $106.6 billion, or 4.4percent of personal income? Net corporate saving, as defined by undistrib-uted profits net of estimated economic depreciation, was $49.5 billion, or44.0 percent of after-tax corporate profits? Thus, net private saving wasjust 6.0 percent of net national product, which was $2.6 trillion. This levelof savings is low by historical standards even in the United States, wheresavings as a fraction of income has always been low compared to most otherindustrialized countries. Moreover, it also appears to represent a shift inthe composition of private savings, from the business to the personal sector.These trends are shown in Table 1. Total private saving was between 8 and10 percent of NNP for most of the 1960s, and business saving represents al-most half this total. Total private saving shrunk in the 1970s, especially inthe last few years, but business saving has fallen even more. This low rate ofsaving in the United States, particularly by corporations, provided much ofthe impetus for the inclusion of several of the "supply side" components inthe Economic Recovery Tax Act, notably the acceleration of depreciationallowances, the reduction in the top marginal tax rate on personal"unearned" income, expanded Individual Retirement Accounts, All-Savers’certificates and the reduction in estate taxes. That these provisions, each ofwhich is targeted at individuals with well above the median family income,were generally supported by members of both parties indicates howstrongly Congress feels about increased capital formation as a policy goal.
This paper has several objectives. We begin with a discussion of busi-ness saving, what it is and what influences it. A key point to be made hereconcerns the proper definition of such saving. Next, we ask the more funda-mental question whether it matters what business saving is, as distinct froma broader savings measure. Since corporations are, ultimately, owned by in-dividuals, there would appear to be little importance to the identity of thesaver. However, analysts have traditionally looked at business saving as atleast partially independent from household behavior. While such an ap-proach may rest on assumptions about the separation of ownership andcontrol of corporations, or the inability of stockholders to "pierce the cor-porate veil," it may also be explained by the structure of the income tax.
*Associate Professor of Economics at Harvard University and Research Associate at theNational Bureau of Economic Research.
~Economic Report of the President 1982, Table B-23.21bid, Table B-82.
79
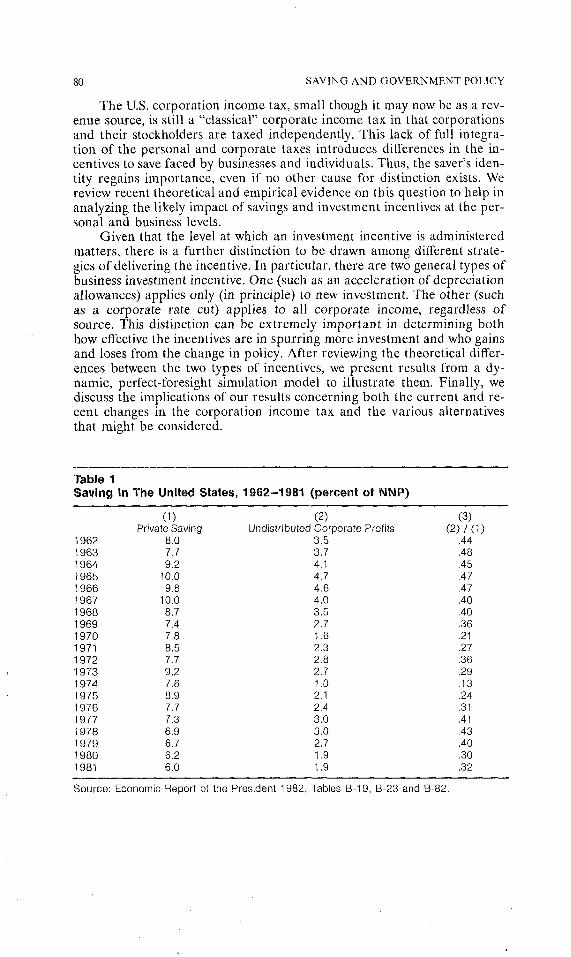
80 SAVING AND GOVERNMENT POLICY
The U.S. corporation income tax, small though it may now be as a rev-enue source, is still a "classical" corporate income tax in that corporationsand their stockholders are taxed independently. This lack of full integra-tion of the personal and corporate taxes introduces differences in the in-centives to save faced by businesses and individuals. Thus, the saver’s iden-tity regains importance, even if no other cause for distinction exists. Wereview recent theoretical and empirical evidence on this question to help inanalyzing the likely impact of savings and investment incentives at the per-sonal and business levels.
Given that the level at which an investment incentive is administeredmatters, there is a further distinction to be drawn among different strate-gies of delivering the incentive. In particular, there are two general types ofbusiness investment incentive. One (such as an acceleration of depreciationallowances) applies only (in principle) to new investment. The other (suchas a corporate rate cut) applies to all corporate income, regardless ofsource. This distinction can be extremely important in determining bothhow effective the incentives are in spurring more investment and who gainsand loses from the change in policy. After reviewing the theoretical differ-ences between the two types of incentives, we present results from a dy-namic, perfect-foresight simulation model to illustrate them. Finally, wediscuss the implications of our results concerning both the current and re-cent changes in the corporation income tax and the various alternativesthat might be considered.
Table 1Saving In The United States, 1962-1981 (percent of NNP)
(1) (2) (3)Private Saving Undistributed Corporate Profits (2) / (1)
1962 8.0 3.5 .441963 7.7 3,7 .481964 9.2 4,1 .451965 10.0 4.7 .471966 9.8 4.6 .471967 10.0 4.0 ,401968 8.7 3.5 .401969 7.4 2,7 .361970 7.8 1.6 .211971 8.5 2.3 .271972 7.7 2.8 .361973 9.2 2.7 .291974 7.6 1.0 .131975 8.9 2,1 .241976 7.7 2.4 .311977 7.3 3.0 .411978 6.9 3.0 .431979 6.7 2.7 ,401980 6.2 1.9 ,301981 6,0 1.9 .32
Source: Economic Report of the President 1982, Tables B-19, B-23 and B-82.
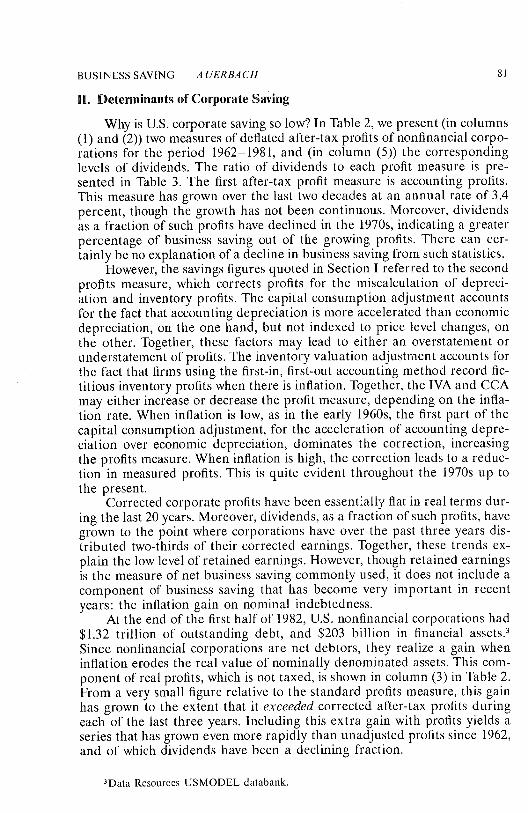
BUSINESS SAVING A UERBACH 81
II. Determinants of Corporate Saving
Why is U.S. corporate saving so low? In Table 2, we present (in columns(1) and (2)) two measures of deflated after-tax profits of nonfinancial corpo-rations for the period 1962-1981, and (in column (5)) the correspondinglevels of dividends. The ratio of dividends to each profit measure is pre-sented in Table 3. The first after-tax profit measure is accounting profits.This measure has grown over the last two decades at an annual rate of 3.4percent, though the growth has not been continuous. Moreover, dividendsas a fraction of such profits have declined in the 1970s, indicating a greaterpercentage of business saving out of the growing profits. There can cer-tainly be no explanation of a decline in business saving from such statistics.
However, the savings figures quoted in Section I referred to the secondprofits measure, which corrects profits for the miscalculation of depreci-ation and inventory profits. The capital consumption adjustment accountsfor the fact that accounting depreciation is more accelerated than economicdepreciation, on the one hand, but not indexed to price level changes, onthe other. Together, these factors may lead to either an overstatement orunderstatement of profits. The inventory valuation adjustment accounts forthe fact that firms using the first-in, first-out accounting method record fic-titious inventory profits when there is inflation. Together, the IVA and CCAmay either increase or decrease the profit measure, depending on the infla-tion rate. When inflation is low, as in the early 1960s, the first part of thecapital consumption adjustment, for the acceleration of accounting depre-ciation over economic depreciation, dominates the correction, increasingthe profits measure. When inflation is high, the correction leads to a reduc-tion in measured profits. This is quite evident throughout the 1970s up tothe present:
Corrected corporate profits have been essentlali5, flat in real terms dur-ing the last 20 years. Moreover, dividends, as a fraction of such profits, havegrown to the point where corporations have over the past three years dis-tributed two-thirds of their corrected earnings. Together, these trends ex-plain the low level of retained earnings. However, though retained earningsis the measure of net business saving commonly used, it does not include acomponent of business saving that has become very important in recentyears: the inflation gain on nominal indebtedness.
At the end of the first half of 1982, U.S. nonfinancial corporations had$1.32 trillion of outstanding debt, and $203 billion in financial assets.3Since nonfinancial corporations are net debtors, they realize a gain wheninflation erodes the real value of nominally denominated assets. This com-ponent of real profits, which is not taxed, is shown in column (3) in Table 2.From a very small figure relative to the standard profits measure, this gainhas grown to the extent that it exceeded corrected after-tax profits duringeach of the last three years. Including this extra gain with profits yields aseries that has grown even more rapidly than unadjusted profits since 1962,and of which dividends have been a declining fraction.
3Data Resources USMODEL databank.
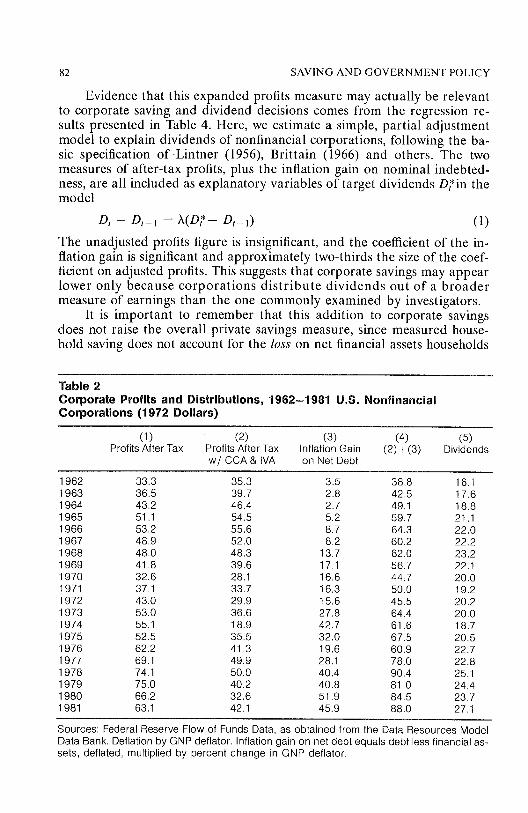
82 SAVING AND GOVERNMENT POLICY
Evidence that this expanded profits measure may actually be relevantto corporate saving and dividend decisions comes from the regression re-sults presented in Table 4. Here, we estimate a simple, partial adjustmentmodel to explain dividends of nonfinancial corporations, following the ba-sic specification of Lintner (1956), Brittain (1966) and others. The twomeasures of after-tax profits, plus the inflation gain on nominal indebted-ness, are all included as explanatory variables of target dividends D~*in themodel
Dt - D,_ 1 = ~(D?-- Dt_ 1) (1)The unadjusted profits figure is insignificant, and the coefficient of the in-flation gain is significant and approximately two-thirds the size of the coef-ficient on adjusted profits. This suggests that corporate savings may appearlower only because corporations distribute dividends out of a broadermeasure of earnings than the one commonly examined by investigators.
It is important to remember that this addition to corporate savingsdoes not raise the overall private savings measure, since measured house-hold saving does not account for the loss on net financial assets households
Table 2Corporate Profits and Distributions, 1962=1981 U.S. NonfinancialCorporations (1972 Dollars)
(1) (2) (3) (4) (5)Profits After Tax Profits After Tax Inflation Gain (2)+ (3) Dividends
w/CCA & IVA on Net Debt
1 962 33.3 35.3 3.5 38.8 16.11 963 36.5 39.7 2.8 42.5 17.61 964 43.2 46.4 2.7 49.1 18.81965 51.1 54.5 5.2 59.7 21.11966 53.2 55.6 8.7 64.3 22.01967 48,9 52.0 8.2 60.2 22.21968 48.0 48,3 13.7 62.0 23,21969 41.8 39.6 17.1 56.7 22.11970 32.6 28.1 16.6 44,7 20.01 971 37,1 33,7 16.3 50.0 19.21972 43.0 29,9 15.6 45.5 20.21 973 53.0 36.6 27.8 64.4 20.01 974 55.1 18.9 42.7 61.6 18.71975 52.5 35.5 32.0 67.5 20.51976 62.2 41,3 19.6 60.9 22.71 977 69.1 49.9 28.1 78.0 22.81 978 74,1 50.0 40.4 90.4 25.11979 75.0 40.2 40.8 81.0 24.41980 66,2 32.6 51,9 84.5 23.71 981 63.1 42.1 45.9 88.0 27,1
Sources: Federal Reserve Flow of Funds Data, as obtained from the Data Resources ModelData Bank. Deflation by GNP deflator. Inflation gain on net debt equals debt less financial as-sets, deflated, multiplied by percent change in GNP deflator.
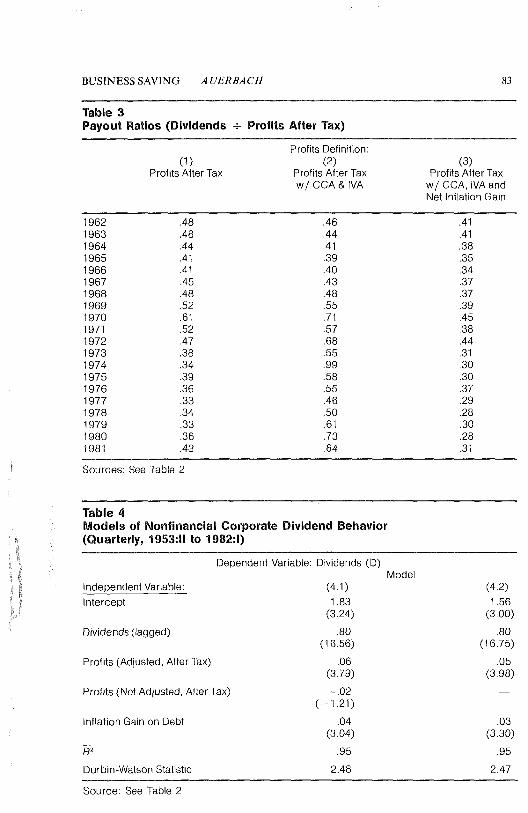
BUSINESS SAVING A UERBACH 83
Table 3Payout Ratios (Dividends ÷ Profits After Tax)
Profits Definition:(1) (2) (3)
Profits After Tax Profits After Tax Profits After Taxw/CCA & IVA w/CCA, IVA and
Net Inflation Gain
1962 .48 .46 .411963 .48 .44 .411964 .44 .41 .381965 .41 .39 .351966 .41 .40 ,341967 .45 .43 ,371968 .48 .48 .371969 .52 .55 .391970 .61 ,71 .451971 .52 .57 .381972 .47 ,68 .441973 .38 .55 .311974 .34 .99 .301975 .39 .58 .301976 .36 .55 .371977 .33 .46 .291978 ,34 .50 ,281979 ,33 .61 .301980 .36 .73 .281981 .43 .64 .31
Sources: See Table 2
Table 4Models of Non|inancial Corporate Dividend Behavior(Quarterly, 1953:11 to 1982:1)
Dependent Variable: Dividends (D)Model
Independent Variable: (4.1) (4.2)Intercept 1.83 1.56
(3.24) (3,00)
Dividends (lagged) .80 .80(16.56) (16.75)
Profits (Adjusted. After Tax) .06 .05(3.79) (3.98)
Profits (Not Adjusted, After Tax) --.02 --(-1,21)
Inflation Gain on Debt .04 .03(3,04) (3.30)
~a ,95 ,95Durbin-Watson Statistic 2.48 2.47
Source: See Table 2
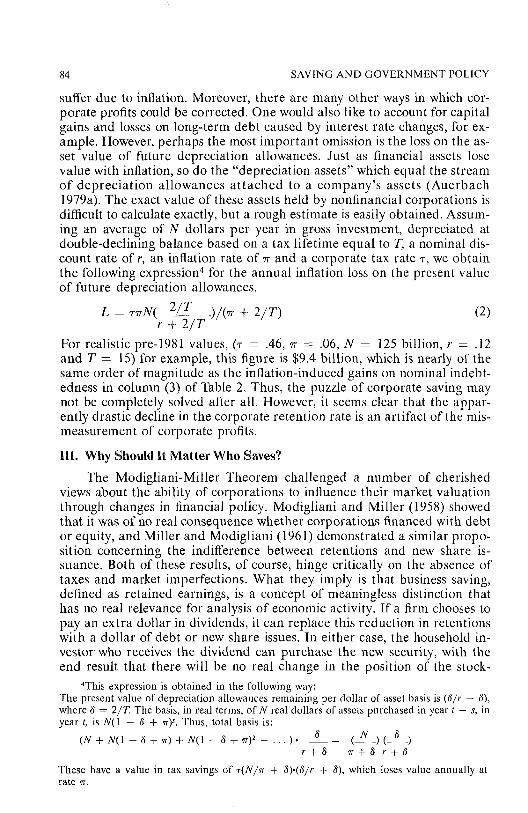
84 SAVING AND GOVERNMENT POLICY
suffer due to inflation. Moreover, there are many other ways in which cor-porate profits could be corrected. One would also like to account for capitalgains and losses on long-term debt caused by interest rate changes, for ex-ample. However, perhaps the most important omission is the loss on the as-set value of future depreciation allowances. Just as financial assets losevalue with inflation, so do the "depreciation assets" which equal the streamof depreciation allowances attached to a company’s assets (Auerbach1979a). The exact value of these assets held by nonfinancial corporations isdifficult to calculate exactly, but a rough estimate is easily obtained. Assum-ing an average of N dollars per year in gross investment, depreciated atdouble-declining balance based on a tax lifetime equal to T, a nominal dis-count rate of ~; an inflation rate of ~r and a corporate tax rate ~, we obtainthe following expression4 for the annual inflation loss on the present valueof future depreciation allowances.
L = r~N( 2IT .)/(~r ÷ 2IT) (2)r + 2/T
For realistic pre-1981 values, (r = .46, ~r = .06, N = 125 billion, r = .12and T = 15) for example, this figure is $9.4 billion, which is nearly of thesame order of magnitude as the inflation-induced gains on nominal indebt-edness in column (3) of Table 2. Thus, the puzzle of corporate saving maynot be completely solved after all. However, it seems clear that the appar-ently drastic decline in the corporate retention rate is an artifact of the mis-measurement of corporate profits.
Ill. Why Should It Matter Who Saves?
The Modigliani-Miller Theorem challenged a number of cherishedviews about the ability of corporations to influence their market valuationthrough changes in financial policy. Modigliani and Miller (1958) showedthat it was of no real consequence whether corporations financed with debtor equity, and Miller and Modigliani (1961) demonstrated a similar propo-sition concerning the indifference between retentions and new share is-suance. Both of these results, of course, hinge critically on the absence oftaxes and market imperfections. What they imply is that business saving,defined as retained earnings, is a concept of meaningless distinction thathas no real relevance for analysis of economic activity. If a firm chooses topay an extra dollar in dividends, it can replace this reduction in retentionswith a dollar of debt or new share issues. In either case, the household in-vestor who receives the dividend can purchase the new security, with theend result that there will be no real change in the position of the stock-
~This expression is obtained in the following way:The present value of depreciation allowances remaining per dollar of asset basis is (6/r + ~),where 6 = 2/T. The basis, in real terms, of N real dollars of assets purchased in year t - s, inyear t, is N(1 - 6 + ~r)s. Thus, total basis is:
(U+ U(1 - 6 + ~r) + U(1 - 6 + ~-)z + ...). ~= (N~) (~)~r+~ r+~
These have a value in tax savings of "r(N/~ + 8).(6/r + ~), which loses value annually atrate ,~.
BUSINESS SAVING A UERBACH 85
holder or the firm. However, business saving will have been reduced by adollar, and personal saving increasd by the same amount. Therefore, thebreakdown of private saving between personal and business sectors de-pends on the convention of dividend distribution, but is of no importance.One could increase business saving by inducing reductions in dividends,but this would only induce compensating responses in other financialvariables.
This irrelevance result is not consistent with the view that firms can in-fluence the welfare of their stockholders through strictly financial transac-tions. It also suggests that there is no reason for concern about business sav-ing, rather than private saving? Yet the traditional view has been thatthere are separate incentives governing the behavior of households and cor-porations, just as the tax system (in the United States) treats the sectors sep-arately. The justification for such separate treatment must lie in some formof market imperfection, either in the rationality of agents, institutional con-straints (such as differential access to capital markets by households andfirms) or taxes.
There has long been some question whether stockholders can "piercethe corporate veil" and undo any changes in saving by the corporation thatare inconsistent with their own lifetime savings plans. One cannot appealhere to liquidity constraints, for if a liquidity-constrained stockholderwishes not to save, he may respond to a firm’s additional retentions by sell-ing some of his shares in the firm. There must be a more fundamental irra-tionality present for there to be real effects, if markets are otherwise per-fect. One method that has been used to assess this possibility is theinclusion of retained earnings in a consumption or savings equation. Thenotion was that corporate source income, whether in the form of dividendsor retentions, should have the same effect on individual consumption be-havior as other disposable income. For example, Feldstein (1973) foundthat retentions had a coefficient about two-thirds the size of that on currentdisposable income in a regression of consumption on these variables pluslagged disposable income and the current unemployment rate. Column(5.1) in Table 5 presents a reestimate of this equation for the currentlyavailable sample period. (Because of a low Durbin-Watson statistic, we cor-rect for first-order serial correlation.) As is evident from the new regressionresults, the corporate retentions variable is now entirely insignificant, indi-cating an instability in Feldstein’s estimated relationship. The retentionsvariable is significant in a familiar alternative specification, presented incolumn (5.2) which includes a lagged consumption rather than lagged in-come in the regression. However, it is unclear why the coefficients of reten-tions and disposable income should be the same, even if consumers arecompletely rational. As discussed by Hall (1978), consumption should de-pend on current variables such as disposable income, retentions and unem-ployment only to the extent that they were previousl7 unpredictable. Thus,
~lndeed, one could argue further, following Barro (1974), that government deficits are ofno importance if they simply substitute for taxes, since the form in which resources are takenfrom the private sector is not important. Like the Modigliani-Miller irrelevance proposition,this result depends on the absence of distortionary taxation and the full rationality of privateagents.
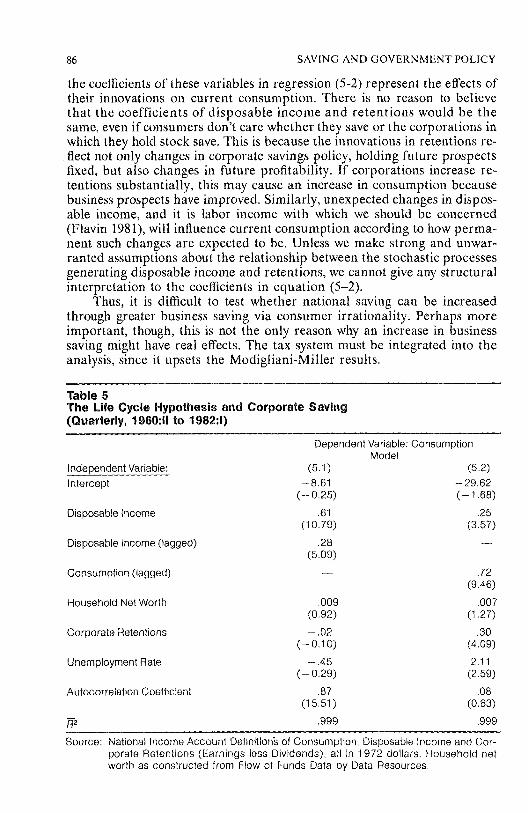
86 SAVING AND GOVERNMENT POLICY
the coefficients of these variables in regression (5-2) represent the effects oftheir innovations on current consumption. There is no reason to believethat the coefficients of disposable income and retentions would be thesame, even if consumers don’t care whether they save or the corporations inwhich they hold stock save. This is because the innovations in retentions re-flect not only changes in corporate savings policy, holding future prospectsfixed, but also changes in future profitability. If corporations increase re-tentions substantially, this may cause an increase in consumption becausebusiness prospects have improved. Similarly, unexpected changes in dispos-able income, and it is labor income with which we should be concerned(Flavin 1981), will influence current consumption according to how perma-nent such changes are expected to be. Unless we make strong and unwar-ranted assumptions about the relationship between the stochastic processesgenerating disposable income and retentions, we cannot give any structuralinterpretation to the coefficients in equation (5-2).
Thus, it is difficult to test whether national saving can be increasedthrough greater business saving via consumer irrationality. Perhaps moreimportant, though, this is not the only reason why an increase in businesssaving might have real effects. The tax system must be integrated into theanalysis, since it upsets the Modigliani-Miller results.
Table 5The Life Cycle Hypothesis and Corporate Saving(Quarterly, 1960:11 to 1982:1)
Dependent Variable: ConsumptionModel
Independent Variable: (5.1) (5.2)Intercept - 8.61 - 29.62
(- 0,25) (- 1,68)
Disposable Income .61 .25(1 o.79) (3,57)
Disposable Income (lagged) .28 --(5.09)
Consumption (lagged) -- ,72(9.46)
Household Net Worth .009 .007(0.92) (1.27)
Corporate Retentions -,02 ,30( - 0,10) (4,09)
Unemployment Rate -.45 2.11( - 0.29) (2.59)
Autocorrelation Coefficient .87 .08(15.51 ) (0.63)
~2 ,999 ,999
Source: National Income Account Definition~ of Consumption, Disposable Income and Cor-porate Retentions (Earnings less Dividends), all in 1972 dollars. Household networth as constructed from Flow of Funds Data by Data Resources,
BUSINESS SAVING A UERBACH 87
IV. Taxes and Business Saving
The United States administers a "classical" corporate income tax, un-der which corporations and their stockholders are taxed independently,with stockholders being taxed only on dividends and capital gains actuallyrealized from share ownership, rather than on all corporate income. Theclassical system of taxation has been abandoned by many European coun-tries, who have switched to either partially or completely integrated tax sys-tems (imputation systems). The logic behind taxing corporations as sepa-rate entities is unclear. Whatever its foundation, it has distortionary effectson the financial behavior of firms, and on their incentive to save and invest.
Just how the entire classical tax system does distort behavior has beenthe subject of much debate and research in recent years. The effects of thecorporate tax alone were studied by Modigliani and Miller (1963), whopointed out that the provision for interest deductibility, with no similar al-lowance for dividends, provides an incentive for pure debt finance (and,presumably, no business savings at all) at the margin. However, the situa-tion is complicated considerably by the existence of personal taxes. Thetwo salient features of the personal tax system here are the progressivity ofits marginal rates and its differential treatment of personal income fromdebt and equity. While interest payments are taxed fully, only dividendsare taxed at ordinary income rates. Through the 60 percent exclusion oflong-term capital gains, and the taxation of such gains only upon realiza-tion (a tax that is forgiven if the gain is not realized before death), personalincome from corporate equity is favorably taxed. There are two alternativeviews of how all of these taxes influence behavior, and they have very dif-ferent implications for the effects of taxation on the incentives of corpora-tions to save.
A. The Traditional View
The traditional view dictates that equity income is subject to doubletaxation because earnings are taxed first at the corporate level, and thenthrough the tax on dividends. This double taxation may be lessened to theextent that a firm returns some fraction of its earnings and distributes divi-dends later, because then these earnings are compounded at the rate of re-turn gross of personal tax; there is a deferral advantage.
Mathematically, if~- and O are the corporate and personal tax rate, c isthe accrual-equivalent of the capital gains tax, i is the after-tax rate of re-turn required by shareholders, r is the rate of return on capital investments,and p is the dividend payout rate, then the corporation’s decision to investup to the point where a dollar of investment yields just a dollar in presentvalue of after-tax equity income may be represented by the equation:
1 =f0e-i’((1 - O) [pr (1 - ~-) e~-p)’0-~)’] - c~t}dtwhere bt is the change in the investment’s values at time t. Since
Vt : e(l-p)r(l-~)tVo : e(l-p)r(l ~-)t, 1)t : (1-p)r(1-’r)e0-~’0-~1.
(3)
88 SAVING AND GOVERNMENT POLICY
Thus, equation (3) yields as a solution for the required rate of return, r:
r --= i (4)(1 -- ~-)[p(1 -- O) + (1 -- p)(1 -- c)]
That is, the effective tax rate on equity is ~- + (1 - ~-)[pO + (1 - p)c].Since no such double taxation applies to debt, it is likely (though not cer-tain) that debt finance will still be favored. However, various constraints onfirm leverage may limit the extent to which the debt advantage can be ex-plored, so that the double taxation must be experienced on some corporatesource income.
It is very much in the spirit of this traditional view of the corporate taxthat many integration proposals of the past decade were put forward. Forexample, some "partial integration" or "dividend relief" schemes, such as adividend paid or dividend received deduction, effectively would exemptfi’om corporate taxation those earnings paid out as dividends. This wouldchange equation (4) to
r= i[p(1 - O) + (1 -p)(1 - ~-)(1 - c)] (5)
bringing the tax treatment of equity closer to that of debt. Full integration,or imputation of all corporate earnings to individuals, would result in asymmetric treatment of the income from equity and debt. All such integra-tion schemes have been viewed as a way of encouraging overall saving, be-cause they would lower the tax rate on equity income. Their effect on thebreakdown between business and personal saving would be less clear. Pre-sumably, with the discouragement of dividend distributions lessened, therewould be lower retentions and a smaller share of business saving.
B. The New View
While the foregoing view of equity taxation is appropriate for the casewhere firms issue new shares and follow a pattern of fixed dividend payout,it does not necessarily describe the way firms actually behave. Corporations(excluding regulated utilities, to which special tax rules apply) rarely issuenew shares.6 As such, their equity source funds come from retentions, withthe key difference being that retentions cause an immediate reduction inthe dividend taxes suffered by stockholders. Equation (3) becomes:
(1 -- O) = 0fe-i’{(1 - O)[pr(1 - ~’)e (~-t,),’(l ~),] _ c)t)dtwhich (see Auerbach 1979b) for a detailed derivation) yields:
r= i(1 - ~)(1 - c)
(6)
(7)
The taxation of equity income depends neither on the dividend tax nor thepayout rate. Another, related implication is that the value of"Tobin’s q," or
6See Auerbach (1981) for relevant statistics.
BUSINESS SAVING A UERBACH 89
the increase in equity value per dollar of new installed capital, is (1 - O/1 - c), rather than 1. These two results are really part of the same out-come. When a firm can finance through retentions, it will do so as long as itcan increase shareholder wealth after tax. Since reinvestment avoids thedividend tax, substituting for it a lighter capital gains tax on the increase inshare value, the firm needn’t increase share valued by the full amount ofthe retention, but only (1 - O/t - c) times this amount.7 In equilibriumthis margin is arbitraged by the firm, so there can be no benefit to thestockholder from a change in the firm’s payout rate.
A corollary of this "capitalization" result is that equity only suffersdouble taxation to the extent of the very low capital gains tax. Moreover,since the dividend tax itself appears nowhere in the expression for the costof capital, (7), a cut in the dividend tax would have no direct impact on theincentive to retain and invest. In fact, since the after-tax discount rate, i, islikely to rise with a general cut in personal taxes (because taxation of alter-native forms of investment income would be lower) it would lead to a rise inthe equity cost of capital. The important finding, though, is that the tax ondistributions, rather than all income, has no effect at all on the incentive forbusinesses to invest (Bradford 1981). But because the long-run value of q is(1 - O/1 - c), a reduction in the tax on distributions would lead to awindfall gain to holders of corporate equity. Thus, any proposal that wouldprovide "dividend relief" would be ill-advised as an incentive for capitalformation. On the other hand, a reduction in the rate of corporate taxationwould encourage equity investment and, presumably, investment overall.
C. Evidence on the Competing Views
The major difference between the "old" and "new" views of how eq-uity is taxed lies in the assumed margin of finance for new investment. Un-der the old view, dividends are fixed and new investment is financed by theissuance of new shares. Under the new view, changes in dividends provideneeded equity capital.
There are obvious problems with each of these hypotheses. As men-tioned above, firms infrequently resort to the issuance of new shares. Onthe other hand, the dividend behavior of firms is very stable (see Brittain1966). A realistic compromise between these two extreme views of theworld would be the hypothesis that firms "normally" obtain their equityfunds through retentions, but cannot vary their dividends substantially inthe short run. Therefore, when large amounts of funds are required, theymust issue new shares. This type of model is a hybrid of two extreme viewsof equity policy, since firms can find themselves either in a "retentions" re-gime or a "new shares" regime, with the values of Tobin’s q and the cost ofcapital in the two regimes corresponding to those formulated above foreach of the two hypotheses. This hypothesis was tested by Auerbach (1982b)with a 20-year panel of 274 firms, using a model which relates ex post earn-
7if a dollar of dividends is foregone, the stockholder loses (1 - O) dollars after-tax. If eq-uity increases in value by q, his after tax gain is q(l -- c), given the way we have defined c.Thus, they are equal when q = (1 - O)/(1 - c).
90 SAVING AND GOVERNMENT POLICY
ings to previous financial and investment decisions. The empirical resultsstrongly support the following conclusions:
(1) Firms face a higher cost of capital when they issue new shares thanwhen they do not; and
(2) Firms held by investors in higher tax brackets face a lower cost ofcapital when investing through retentions.
These findings suggest that firms behave as predicted by the "new" view ofthe corporate tax, except when they are constrained in their dividend pol-icy and must issue more expensive new equity to finance their investments.In particular, the declining cost of equity capital with the increase in share-holder tax rates is consistent with expression (7), since the after personaltax required return, i, would presumably be negatively related to the per-sonal tax rate (and the capital gains tax rate is relatively unimportant).
Perhaps the most important implication of this evidence is that per-sonal savings incentives, such as the recently liberalized Individual Retire-ment Accounts, are likely to discourage business savings through equity-financed investment because the effective rate of taxation of personal inter-est income is reduced more than that of equity income. Moreover, that partof any tax reduction that applies to dividend income, as opposed to interestincome, is basically a lump sum transfer to the holders of corporate equity.Only with respect to equity finance through new shares does such a tax in-centive have the desired effect. In recognition of this fact, one recent alter-native proposal for corporate and personal tax integration in the UnitedStates (American Law Institute 1982) would have allowed a dividends paiddeduction against corporate taxes only to the extent that dividends are as-sociated with newly issued equity: integration for new equity only. Interest-ingly, almost the identical scheme is currently in place in Sweden8 which,like the United States, still has a classical corporation tax. Referred to asthe Annell deduction, it allows corporations to deduct against current prof-its dividends on newly issued shares for a period of up to 20 years, with thesum of deductions not exceeding the amount raised and no more than 10percent of the amount deductible in any year. Other countries, such as theUnited Kingdom, have gone to a full imputation system.
V. Transitional Differences among Savings Incentives
The foregoing analysis suggests that personal savings incentives, suchas a reduction in the rate of dividend taxation, and business incentives,such as a corporate rate reduction, may differ markedly in their effects oninvestment. These differences arise from the distortions caused by the clas-sical system of taxing corporations separately from their shareholders. Asecond way in which business and household savings incentives have dif-fered in practice is in the transition from old to new tax treatment. Businessincentives typically have been narrower in scope, in terms of focusing onnew investment, than have personal incentives. While this difference in
8See King et al (1982) for a detailed discussion.
BUSINESS SAVING A UERBACH 91
scope is not necessary in theory, political reasons may explain why it hasbeen in practice. As we shall discuss, most savings incentives have impor-tant distributional effects as well as their intended efficiency effects. Incen-tives that focus only on new assets harm members of older generations.Though this is true regardless of whether households or businesses are thedirect recipients of the tax incentives, the connection is much clearer whenit is the former.
In this section, we compare these two types of incentives theoretically,give examples of their use, and present the results of simulation experi-ments that demonstrate how important such transitional differences canbe. Since there is no theoretical importance whether the tax incentive isgiven to households or businesses, we analyze the former case.
Consider an individual who lives for two periods, receives labor in-come in the first period, and consumes in both periods, saving out of laborincome to consume in the second. This individual’s budget constraint is:
e2 = (1 + r)(wL - c0 (8)
where ca is consumption in period 1, L is labor supply, and w and r are thewage and interest rate. With taxes Or on capital income and Ow on wage in-come, the net returns to capital and labor are r(1 - O,.) and w(1 - Ow),respectively. Thus, the budget constraint may be written:
1 c~ + 1 c2 = L (9)w(1 -O,~) w(1 - Ow)(1 ÷r(1 --Or))
We may think of P~ = l/w(1 - O,~) as the price, in labor units, of first-period consumption, and P~ = l/w(1 - O,~)(1 + r(1 - Or)) as the price ofsecond-period consumption. Since P2/PI = 1/1 + r(1 - Or), a capital in-come tax has the effect of raising the price of future consumption (Feld-stein 1978). This disincentive could be removed in two structurally equiva-lent ways. Either capital income taxes could be removed, or both capitaland labor income taxes could be removed and replaced with a consumptiontax Oc. These alternative regimes would yield the following budgetconstraints:9
1 c~ + 1 c2 = L (10.a)w(1 -- O,~) w(1 -- O,~)(1 + r)
1 ca + 1 c2 = L (10.b)w(1 -Oc) w(1 -O~)(1 ÷r)
There is no difference ifOw = 0~, in which case the present of tax revenuesis also the same.
However, consumption and wage taxes differ in the timing of their col-lections. This means that a government wishing to spend all its revenues inthe first period must run a deficit under a consumption tax regime, and paythe deficit back with second period tax revenues. Again, this involves no
9The consumption tax here is defined with respect to the tax inclusive base; that is, Oc isthe fraction of gross expenditures on consumption collected in taxes.
92 SAVING AND GOVERNMENT POLICY
real distinction, but government does a greater fraction of national savingunder the wage tax than under the consumption tax.
Once we consider the actual context in which such tax changes occur,however, real differences between wage taxes and consumption ~axes areintroduced by constraints on government behavior. Exact equivalence ofthe two systems would generally require the capacity to tax different gener-ations at different rates, and to use debt policy. If government is con-strained to impose uniform tax rates (or at least a uniform progressive rateschedule) and cannot borrow, the timing differences in tax collections leadto real differences both in the transition and in the long run under the al-ternative tax regimes. This is most easily seen by comparing the differentialimpact on retired individuals, who will pay no taxes under a labor incometax, but will face an increased tax burden under a consumption tax. As aresult they will be far worse off under a consumption tax, and this addedtax revenue will enable the government to impose a lower lifetime tax bur-den on future generations. Of equal importance, the consumption tax willin this context be more efficient than a wage tax, because these taxes on theelderly are essentially lump sum in nature.
These conclusions may be illustrated by comparing the results of simu-lations presented by Auerbach, Kotlikoff and Skinner (1983) of immediatetransitions from a proportional income tax to a proportional consumptiontax and to a proportional wage tax. The simulations are based on a dy-namic, one sector general equilibrium model, which in any year is com-posed of 55 overlapping generations of individuals (each of whom may bethought of as adults who exist from age 21 to age 75) who make lifetime la-bor supply, retirement, and consumption decisions subject to perfect fore-sight. Preferences are described by an intertemporally separable, nestedCES utility function in consumption and leisure, with preference parame-ters based on relevant empirical studies. Production is assumed to obey aCobb-Douglas function in capital and labor. From the initial steady state,in which there is a proportional 30 percent income tax, the simulationstrace out the path of the economy under an immediate switch to the newtax regime. Summary statistics of the long-run and short-run effects aregiven in Table 6. In the long run, under a consumption tax, the tax rateneeded to maintain a balanced budget is only 28.29 percent, even thoughthe tax base now excludes saving. This lower tax rate is associated with ahigher level of utility. Expressed in terms of units of lifetime labor endow-ment, individuals in the long run are 6.28 percent wealthier than under theincome tax. Under a wage tax, the long-run tax rate is 41.13 percent, andlong-run welfare is reduced by 3.46 percent. These differences in long-runoutcomes of transitions to structurally identical tax regimes is reflected inthe differential impact on transition generations. Older individuals fareworse under a consumption tax; those aged 55 at the time of transition suf-fer a welfare loss of .65 percent of their full lifetime resources, and a muchlarger fraction of resources remaining. Under a wage tax, this same cohortgains .44 percent of lifetime resources. The fate of those aged 25 at the timeof the transition is reversed, with a gain under the consumption tax and aloss under a wage tax.
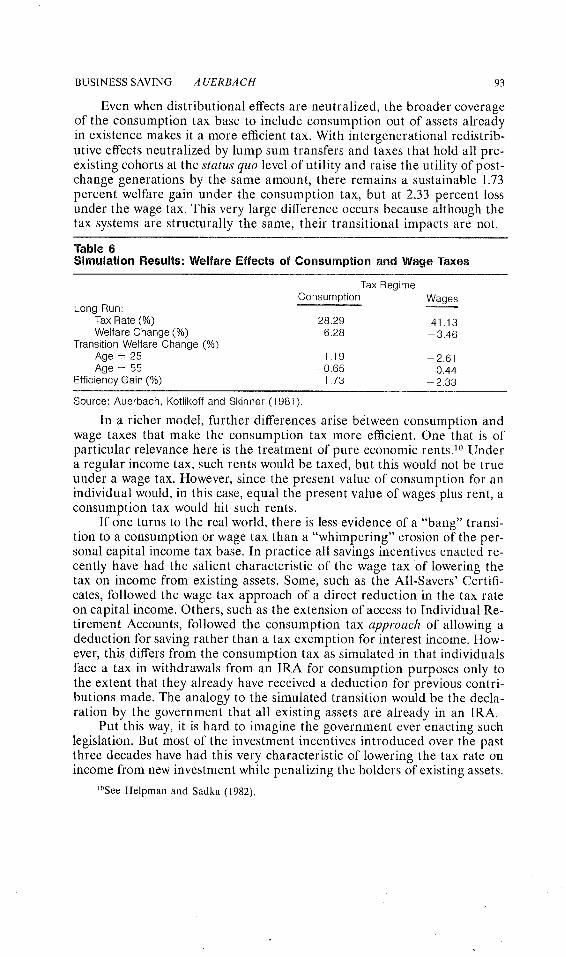
BUSINESS SAVING A UERBACH 93
Even when distributional effects are neutralized, the broader coverageof the consumption tax base to include consumption out of assets alreadyin existence makes it a more efficient tax. With intergenerational redistrib-utive effects neutralized by lump sum transfers and taxes that hold all pre-existing cohorts at the status quo level of utility and raise the utility of post-change generations by the same amount, there remains a sustainable 1.73percent welfare gain under the consumption tax, but at 2.33 percent lossunder the wage tax. This very large difference occurs because although thetax systems are structurally the same, their transitional impacts are not.
Table 6Simulation Results: Welfare Effects of Consumption and Wage Taxes
Tax RegimeConsumption Wages
Long Run:Tax Rate (%) 28.29 41.13Welfare Change (%) 6.28 -3.46
Transition Welfare Change (%)Age = 25 1.19 -2.61Age = 55 -0.65 0.44
Efficiency Gain (%) 1.73 - 2.33
Source: Auerbach, Kotlikoff and Skinner (1981).
In a richer model, further differences arise between consumption andwage taxes that make the consumption tax more efficient. One that is ofparticular relevance here is the treatment of pure economic rentsJ° Undera regular income tax, such rents would be taxed, but this would not be trueunder a wage tax. However, since the present value of consumption for anindividual would, in this case, equal the present value of wages plus rent, aconsumption tax would hit such rents.
If one turns to the real world, there is less evidence of a "bang" transi-tion to a consumption or wage tax than a "whimpering" erosion of the per-sonal capital income tax base. In practice all savings incentives enacted re-cently have had the salient characteristic of the wage tax ~of lowering thetax on income from existing assets. Some, such as the All-Savers’ Certifi-cates, followed the wage tax approach of a direct reduction in the tax rateon capital income. Others, such as the extension of access to Individual Re-tirement Accounts, followed the consumption tax approach of allowing adeduction for saving rather than a tax exemption for interest income. How-ever, this differs from the consumption tax as simulated in that individualsface a tax in withdrawals from an IRA for consumption purposes only tothe extent that they already have received a deduction for previous contri-butions made. The analogy to the simulated transition would be the decla-ration by the government that all existing assets are already in an IRA.
Put this way, it is hard to imagine the government ever enacting suchlegislation. But most of the investment incentives introduced over the pastthree decades have had this very characteristic of lowering the tax rate onincome from new investment while penalizing the holders of existing assets.
~°See Helpman and Sadka (1982).
94 SAVING AND GOVERNMENT POLICY
This is true of the investment tax credit enacted in 1962 and raised in 1975,and of the accelerated depreciation provisions of 1954, 1971, and 1981.Only the corporate tax rate cuts of 1964 and 1978 followed wage taxtreatment.
This relationship is most easily seen if we consider the most extremecase of accelerated depreciation, immediate expensing of new investments.As is well known since the work of Brown (1948), expensing is neutral un-der an income tax, because the tax contributes the same fraction to an as-set’s cost that it withdraws from its quasirents. It is simply a tax on purerent. The government may be thought of as a partner in the enterprise, butthere is no effective tax rate on capital income. But this is precisely howsaving is treated under a consumption tax: a deduction of accumulation fol-lowed by a tax on withdrawals?~ Similarly, consumption out of existing as-sets is taxed, although in a more indirect fashion. If old assets do not qual-ify for expensing, they are worth less than they otherwise would have been,by the value of the tax deduction that new assets receive. If we assume aconstant production cost for new capital, then holders of old assets realize acapital loss equal to the tax rate times the asset replacement value whenthey sell the assets in order to consume--precisely as they would if they re-ceived the full price for the asset and then had to pay a consumption tax.Like expensing, the introduction of accelerated depreciatiofi or investmenttax credits on new investment lowers the tax rate on new investment andinduces a capital loss on existing assets. This could be avoided if, as withthe Individual Retirement Accounts, all capital, whether new or existing,qualified for the new provisions. However, in contrast to personal savingsincentives, this is typically proscribed. For example, the provisions of theEconomic Recovery Tax Act dealing with the Accelerated Cost RecoverySystem expressly forbid the use of the new capital recovery schedules forassets purchased before January 1, 1981.12
This characteristic of business investment incentives is simply a differ-ent way of expressing more familiar arguments about the superior "bangfor the buck" that capital incentives such as accelerated depreciation andinvestment credits have relative to corporate rate reductions. The latter ap-ply to income from existing capital and pure economic rents, whereas theformer do not. That such an argument should be so readily accepted at thebusiness level but not at the personal level is somewhat distressing, but notdifficult to understand in light of the common practice in tax legislation de-bates of distinguishing between "business" and "people" as if the two werenot related in some fundamental way. However, given that such targetedsavings incentives seem feasible only at the business level, this constitutes astrong efficiency argument in favor of business incentives.
~Although all quasirents are taxed with expensing, new investment out of such rents re-ceives a new deduction, so only the net withdrawals are taxed.
~2While one could qualify for the new treatment by buying a used asset after the effectivedate, there would normally not be a pure tax gain from engaging in such a transaction, due tothe existing recapture provisions. See Auerbach (1982a) for further discussion.
BUSlNESS SAVING A UERBACH 95
VI. ACRS and Beyond
Recently, the Accelerated Cost Recovery System has undergone itsfirst facelift in the Tax Equity and Fiscal Responsibility Act of 1982; it is asafe bet that more will soon follow. As many analysts have pointed out,13the combination of the investment tax credit and fast write-off is more gen-erous than expensing for equipment in the three- and five-year recoveryclasses. Revenue projections suggest a continued drop in corporate tax col-lections as a fraction of government tax collections. The trend since 1965 isshown in Table 7.
The provisions of ACRS have strained the corporate tax system. Themost obvious manifestation of this is the rise and fall of tax leasing over thepast year. Leasing was introduced because the combination of low effectivetax rates in general and large immediate deductions and credits meant thatmany firms, particularly those with high growth rates, would end the yearwith negative taxable income. Because the tax system allows only a limitedcarry back (three years) and carry forward (15 years now, but still withoutany accrued interest), such companies would face the prospect, withoutleasing, of not being able to avail themselves of the benefits accorded firmswith taxable income. Leasing was liberalized to provide a paper transac-tion whereby such unused tax losses could be transferred between compa-nies. While there are a number of problems with the way these transfershave been accomplished under leasing,~4 there is nothing inherently badabout having such transfers. Certainly, the reduction in leasing activity thatwill come from the current tax legislation makes little sense from an eco-nomic perspective.
As a tool for stimulating business investment, ACRS has the above-mentioned advantage of being available only on new business investment.However, it has a number of disadvantages, aside from the difficulties facedby firms with tax losses. First of all, as with other recent tax changes suchas the capital gains tax reduction of 1978, much of the argument in favor ofACRS was couched in terms of the need to offset inflation’s effect on thevalue of depreciation allowances. However, though it more than offset thisloss in present value of depreciation allowances, it did not alter the fact thateven the current depreciation schedule still is based on historic cost andhence subject to fluctuations in value depending on the rate of inflation.Furthermore, through the simple system of three main depreciation classes,ACRS has given assets with very different economic lifetimes the same taxdepreciation pattern. This has led to a great variation in effective rates oftax across assets as well as across industries according to capital stock com-position.~5 In turn, this differential taxation can be expected to lead to amisallocation of business capital, causing an entirely unnecessary dead-weight loss.
Alternatives to ACRS that suffer neither from this sensitivity to infla-tion nor the differential asset taxation include indexed economic depreci-
~See, for example, Auerbach (1982a).~4See Warren and Auerbach (1982) for a detailed analysis.~See the Economic Report of the President (1982), Chapter 5 for relevant calculations.
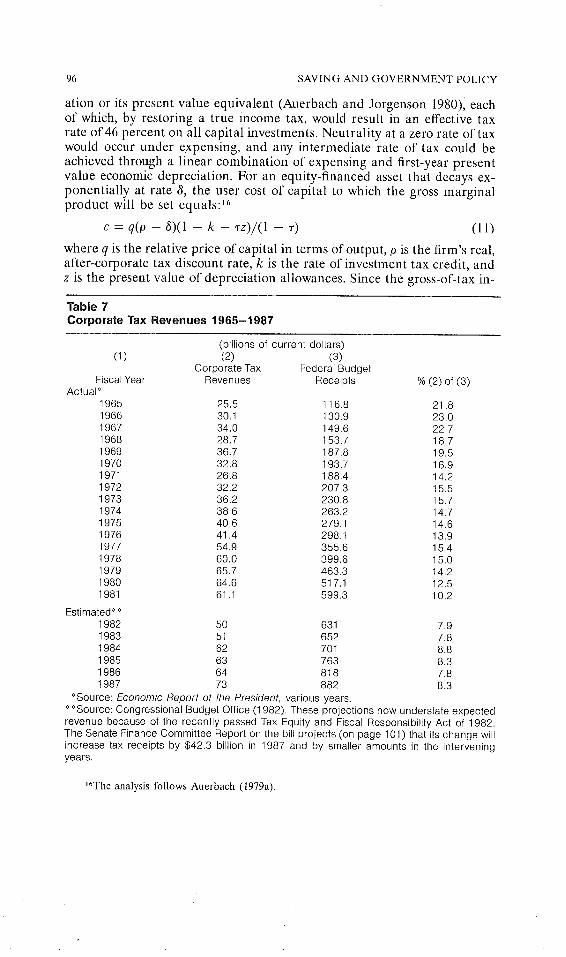
96 SAVING AND GOVERNMENT POLICY
ation or its present value equivalent (Auerbach and Jorgenson 1980)i eachof which, by restoring a true income tax, would result in an effective taxrate of 46 percent on all capital investments. Neutrality at a zero rate of taxwould occur under e,xpensing, and any intermediate rate of tax could beachieved through a linear combination of expensing and first-year presentvalue economic depreciation. For an equity-financed asset that decays ex-ponentially at rate 6, the user cost of capital to which the gross marginalproduct will be set equals:16
c=q(o +6)(1 -k -~z)/(1 -~) (11)
where q is the relative price of capital in terms of output, 0 is the firm’s real,after-corporate tax discount rate, k is the rate of investment tax credit, andz is the present value of depreciation allowances. Since the gross-of-tax in-
Table 7Corporate Tax Revenues 1965-1987
(billions of current dollars)(1) (2) (3)
Corporate Tax Federal BudgetFiscal Year Revenues Receipts % (2) of (3)
Actual~1965 25.5 116.8 21.81966 30.1 130.9 23.01967 34.0 149.6 22.71968 28,7 153.7 18.71969 36.7 187.8 19.51970 32.8 193.7 16.91971 26.8 1 88.4 14,21972 32.2 207,3 15,51973 36.2 230.8 15.71974 38,6 263.2 14.71975 40.6 279,1 14.61976 41.4 298.1 13.91977 54.9 355,6 15.41978 60.0 399.6 15.01979 65.7 463.3 14.21980 64.6 517.1 12.51981 61,1 599.3 10.2
Estimated~’:’1982 50 631 7,91983 51 652 7.81984 62 701 8.81985 63 763 8.31986 64 818 7.81987 73 882 8,3
’~Source:Econom~ Report ofthe Pres~ent, various years.’:’ ’:’Source: Congressional Budget Office (1982), These projections now understate expectedrevenue because of the recently passed Tax Equity and Fiscal Responsibility Act of 1982.The Senate Finance Committee Report on the bill projects (on page 101 ) that its change willincrease tax receipts by $42.3 billion in 1987 and by smaller amounts in the interveningyears.
~6The analysis follows Auerbach (1979a).
BUSINESS SAVING A UERBACH 97
ternal rate of return on such an asset is (c/q - 6) and real required returnis t), the effective tax rate may be expressed as:
(c _ 6) - p4= ~ (12)
Since economic depreciation would yield a present value of depreciation al-lowances of z = 6/0 ÷ 6, a system with no investment tax credit and asingle, first-year depreciation deduction of a(6/p + 6) + (1 - a) wouldyield an effective tax rate of a-r for each asset, where "r (currently .46) is thestatutory corporate rate.
This analysis assumes equity financed investment. Given the coexis-tence of debt and equity finance, it is hard to know how to measure effec-tive tax rates. Presumably, firms each choose some optimal debt-equity ra-tio, but this decision is separable from the investment decision only underrestricted circumstances. If, for example, a firm’s "debt capacity" increasesmore with investment in safe, easily identified (and, potentially, easily at-tached) capital goods, the tax advantage of debt finance may be greater forsuch goods and their effective tax rate overstated, at least relative to otherassets. While little concrete evidence for this viewpoint is available, itwould, if correct, imply that the tax disadvantage of structures underACRS might have been overstated.
Given the low current rate of corporate taxation, and all of the prob-lems that still remain, some have suggested that the corporate income taxshould be repealed. This certainly would remove the distortions of the cor-porate tax. However, particularly for assets that currently receive theequivalent of expensing, this would result in a perverse reversal of the typeof "consumption-tax capitalization" discussed above.
Consider again the simple case in which investments are expensed un-der the income tax, and imagine a transition to a situation with no incometax: in the previous context, a transition from a consumption tax regime toa wage tax regime. Assets that had received a deduction upon investmentwould now escape taxation of their quasirents, along with new assets notpermitted expensing. Since old and new assets no longer would differ intheir prospective depreciation allowances, they would sell for the sameprice, with a resulting instantaneous windfall gain for holders of previouslydiscounted old capital. The net effect would be a lump sum transfer to hold-ers of existing capital.
Naturally, the current situation is more complicated than one ofsimple expensing, but this argument suggests that it is expensing towardwhich we should move, rather than abolition. Full equivalence at the mar-gin with a zero corporate tax would be provided by extending the sametreatment to financial assets: "expensing" net nominal purchases, and con-tinuing to include interest payments in income. For the typical non financialcorpor.ati0n, this provision would represent an increase in present value tax
98 SAVING AND GOVERNMENT POL1CY
liabilities. The result would be a corporate version of the personal con-sumption tax. That is, if the firm’s annual pre-tax cash flow is:
f = X - I + zXB -- iB (13)
where X is the gross return to previous investments, I is current gross in-vestment, AB is new debt issues, and iB is interest payments, a corporatetax at rate ~- with interest deductibility and immediate expensing of invest-ment less new borrowing would yield an after-tax cash flow of (1 - ~’)f Aswith the individual, the corporation is taxed on its cash flow which, in-thi~case, represents stockholder dividends. Under the "new" view of the corpo~-rate tax described above, this is equivalent to a nondistortionary tax on dis)tributions. This method of transition to a zero tax rate at the corporatelevel, as part of the move to a consumption tax, was suggested for. theUnited Kingdom by the Meade Committee (Institute for Fiscal Studies1978).17
While such a system would increase the present value of corporatetaxes collected,18 it probably would decrease them in the short run becauseof the change in the timing of the tax payments. Rough static calculationssuggest it would be three or four years before the new tax system wouldraise more revenue than ACRS.
A remaining problem that must be addressed is that of tax losses. Un-less the corporate tax is eliminated, there will remain a number of compa-nies with unusable tax credits and deductions. Were there refundability,leasing would be unnecessary. However, moves to make even the investmenttax credit refundable have met considerable resistance in Congress, andnow leasing is being scaled back. The current system of loss carry-forwardshas two effects. Since losses carried forward do not accrue interest, and canexpire unused, firms possessing them obtain a lower present value of taxdeductions than they would under a full loss-offset. However, because of thefact that such deductions lose value over time, the firm has an incentive tooverinvest in activities that will generate taxable income against which thelosses can be used. In the extreme case, with some carry-forwards expiringunused, they represent free goods with a zero shadow price. The result maybe that firms with accrued losses are at a competitive advantage relative totaxable firms. In this light, proposals to allow carry-forwards to be takenwith interest are a mixed blessing. While they will remove the incentive forfirms to speed up the use of carry-forwards, they will also increase the like-lihood of some of the carry-forward expiring unused. One proposal thatdeals with this problem (Auerbach 1982a) would give firms a choice of car-rying losses forward with interest or taking a current lump sum payment,the latter sufficiently discounted so that it would only appeal to firms not ex-pecting to utilize the carry forwards in the future.
~TThe United Kingdom currently has an integrated tax system, expensing of equipmentand interest deductibility at the corporate level. See King et al (1982) for further discussion.
~SCalculations in Auerbach (1982a) show that under current law, effective taxation is neg-ative at the margin, taking account of the deduction of interest.
BUSINESS SAVING A UERBACH 99
VI. Conclusions
This paper has focused on structural issues related to business saving,rather than on empirical evidence concerning what we can expect specificsavings incentives to do to capital formation. This emphasis is necessary,because it is only institutional aspects of the tax system and the politicalprocess that make business saving an important concept distinct from abroader measure of national saving. In the absence of such "imperfections"in the competitive process, business saving is simply an accounting concept.
Because of inflation, even the definition of business saving is uncertain,though it appears to have followed the downward trend characterizing per-sonal saving in the United States in recent years. There is some evidencethat corporate savings policy accounts for the fact that earnings are meas-ured with error. It is difficult to evaluate the proposition that savings can beincreased by taking advantage of shareholder ignorance of firm decisions,but the existence of a classical corporation tax in the United States meansthat the overall incentive to save does depend on whether the savings isdone by businesses, through retentions, or households, through the pur-chase of new corporate securities. Another institutional difference betweenbusiness and personal savings incentives lies in the political difficulty of in-troducing targeted incentives at the personal level that induce losses in thevalue of existing assets. Such incentives are the rule at the business level,and are much more efficient in their effects.
The Accelerated Cost Recovery System has not dealt adequately withthe distortions imposed by the corporate tax, and it has made more acutethe problems caused by the tax system’s lack of a full loss offset. However,solutions to these problems exist that do not require the abolition of thecorporate tax.
Finally, one should keep in mind that the best designed business sav-ings incentives can only aid in producing a climate hospitable to increasedbusiness investment. Despite the negative tax rates of ACRS, fixed nonresi-dential investment has been lower in real over the first half of 1982 than itwas during 1981. Recent levels of real interest rates and capacity utilizationprobably will dominate any tax incentives that one can reasonably envision.
100 SAVING AND GOVERNMENT POLICY
REFERENCES
American Law Institute. 1982. Federal Tax Project Subchapter CAuerbach, A. J. 1979a. "Inflation and the Choice of Asset Life," Journal of Political Economy
87(3), June, pp. 621-638.--. 1979b. "Wealth Maximization and the Cost of Capital," Quarterly Journal of Econom-
ics 93, August, pp. 433-446. /--. 1981. "Tax Integration and the ’New View’ of the Corporate Tax: A 1980s Perspec-
tive." Proceedings of the National Tax Association Tax Institute of America.--. 1982a. "Whither the Corporate Tax?: Reform Alter ACRS," National Tax Journal 35,
September, pp. 275 286.--. 1982b. "Taxes, Firm Financial Policy and the Cost of Capital: An Empirical Analy-
sis." Harvard Institute of l~conomic Research, June.and D. Jorgenson. 1980. ~’Inflation-Proof Depreciation of Assets," Harvard Business
Review, September/October, pp. 113 118., L. J. Kotlikoff and J. Skinner. 1983. "The Efficiency Gains from Dynamic Tax Re-form," lntelvlational Economic Review, forthcoming.
Barro, R. 1974. "Are Government Bonds Net Wealth?" Journal of Political Economy 86(6), No-vember/December, pp. 1095-1117.
Bradford, D. 1981. "The Incidence and Allocation Effects of a Tax on Corporate Distribu-tions," Journal of Public Economics 15(1), February, pp. 1-22.
Brittain, J. A. 1966. Corporate Dividend Policy. Washington, D.C.: Brookings Institution.Brown, E. C. 1948. "Business-Income Taxation and Investment Incentives." In L. Metzler et
al., Income, Em.ployment and Public Policy: Essays in Honor of Alvin H. Hansen. NewYork: W. W. Norton.
Congressional Budget Office. 1982. "Baseline Projections for Fiscal Years 1983-1987," Febru-ary 5. -
Feldstein, M. S. 1973. "Tax Incentives, Corporate Saving and Capital Accumulation in theUnited States," Joarnal of Public Economics 2(2), April, pp. 159-71.
--. 1979. "The Welfare Cost of Capital Income Taxation," Journal of Political Economy86(2), April, pp. $29 $51.
Flavin, M. A. 1981. "The Adjustment of Consumption to Changing Expectations about FutureIncome," Journal of Political Economy 89(5), October, pp. 974-1009.
Hall. R. E. 1978. "Stochastic hnplications of the Life Cycle-Permanent Income Hypothesis:Theory and Evidence," Journal of Political Economy 86(6), December, pp. 971-987.
Helpman, E. and E. Sadka. 1982. "Consumption versus Wage Taxation," Quarterly Journal ofEconomics 97(2), pp. 363-372.
Institute for Fiscal Studies. 1978. The Structure and Reform of Direct Taxation. London: Allen& Unwin.
King, N. et al. 1982. The Taxation of lncome fi’om Ca.pital; A Comparative Study of the U.S.,U.K., Sweden and West Germany. National Bureau of Economic Research.
Lintner, J. 1956. "Distribution of Incomes of Corporations Among Dividends, Retained Earn-ings, and Taxes." American Economic Review Pa.pers and Proceedings 46, pp: 97-113.
Miller, M. and F. Modigliani. 1961. "Dividend Policy, Growth and the Valuation of Shares,"Joarnal of Business 34(3), pp. 411-33.
Modigliani, F. and M. Miller. 1958. "The Cost of Capital, Corporation Finance and the The-ory of Investment," American Economic Review 48, pp. 261-97.
-- and --. 1963. "Corporate Income Taxes and the Cost of Capital: A Correction,"American Economic Review 53:55-84.
U.S. Senate, Committee on Finance. 1982. Tax Eqaity and Fiscal Res.ponsibility Act of 1982,Report, July 12. Washington: U.S. Government Printing Office.
Warren, A. C. and A. J. Auerbach. 1982. "Transferability of Tax Incentives and the Fiction ofSafe Harbor Leasing," Harvard Law Review 95(8), pp. 1752-1786.

Martin Neil Baily*
Alan Auerbach has made important contributions to our understand-ing of the effects of corporate taxation and in this paper he brings togethersome of the results that he and others have formulated. He discusses the in-teractions between business and household saving decisions and analyzespolicies to promote business saving and investment.
Auerbach starts by asking how much the identity of the saver matters.If businesses save more, will consumers simply save less? He points out thatan assessment of the relative contributions to saving of businesses andhouseholds requires a careful accounting of capital gains and losses. In par-ticular, inflation has redistributed wealth from lenders to borrowers. Itwould have been helpful had he given a complete calculation with all thecapital gains and losses accounted for. He then goes on to estimate simpledividend equations and consumption functions and he argues that empiri-cal relations of this kind cannot resolve the question of whether or nothouseholds will offset changes in business saving. That may well be true,but this section of the paper did not satisfy me that the issue had been fullyexplored.
Auerbach then turns to a comparison of the new versus the old view ofbusiness taxation. The old view says (more or less) that a dollar is a dollar.At one end of the system there are the factories. At the other end are thepeople who put up the money to buy the factories and they control whathappens. The government levies various tolls on the income stream gener-ated by the factories. If all the tolls are added up, this is the total tax bur-den on capital. The gap between the pre- and post-tax rates of return issubstantial and the conclusion is often drawn that capital formation mustbe reduced by this gap, on the principle that the more heavily an activity istaxed, the less we do of it.
There are plenty of controversial issues that come up with this oldview. How are property and sales taxes treated? Are capital gains taxes be-ing overstated, since the stock market has performed poorly? But the bot-tom line, even with conservative assumptions, is still that capital pays apretty high rate of tax.
The new view of corporate taxation has provided a fascinating alterna-tive perspective. It argues that there are very big differences among typesof taxes. In particular, there is a sharp contrast between the effect of corpo-rate income taxation and dividend taxation. Because a dividend tax falls onpayouts but not on retentions, it does not discourage investment eventhough it does depress the corporation’s market value. This is a striking re-
*Senior Fellow at The Brookings Institution.
101
102 SAVING AND GOVERNMENT POLICY
suit and has the implication that a cut in personal income taxes may ac-tually depress business investment, because it increases the relative attrac-tiveness of alternative assets.
My first comment on the new view is that it is not entirely new. I recalllearning as an undergraduate that dividend taxes could encourage reten-tions and investment compared with an equivalent corporate income tax.Second, I have some misgivings about at least the purest forms of the newview. Very striking results are obtained from the models by severely re-stricting the options open to firms. At any moment in time a firm has aportfolio of assets and liabilities and presumably adjusts this portfolio inorder to maintain equilibrium, allowing both for risk and rate of return.The new models typically constrain the firm so that it cannot issue newshares or change its share of debt financing. This type of constraint is onlyvalid if the firm is at a boundary solution with respect to certain choices.That is hard to justify, because a firm could always buy bonds if it did notwish to sell them (many firms do that), it could buy up old shares if it didnot wish to sell new shares.
This is not to say that there is a complete and realistic alternativemodel of corporate behavior with conclusions different from Auerbach’s.There remain puzzles to be understood, particularly the questions of whycorporations pay dividends and why they pay "voluntary" taxes on inven-tory profits. But the point I am making is that simple deterministic modelsof corporate behavior that impose fairly arbitrary constraints can be, atmost, only suggestive guides to tax policy. There is one way to test how im-portant the new view really is. It implies very large effects of tax ratechanges on the stock market. If we do not observe those changes actuallyoccurring, then the models are in doubt. My own bottom-line on the newview/old view debate is that probably a corporate income tax depresses in-vestment more than a dividend tax, but I would be surprised if a dividendtax has no effect on investment. Think about a 100 percent tax rate.
Finally, I want to leave aside the Auerbach paper and comment brieflyon the life-cycle model of savings that is the centerpiece of this conference.This model in an appropriately general form is surely a good frameworkfor analyzing saving behavior. But it cannot explain the behavior of impor-tant fractions of the population. Studies of individual families nearing re-tirement show many with very low assets and no pensions. Their consump-tion path falls sharply as they retire and often declines further over time.Many people are somewhat irrational in their saving and consumption de-cisions. They are myopic about the future and regret decisions they madewhen they were younger. These families save less than the life-cycle modelpredicts--a fact we recognize as a society, because we have a compulsorysocial security system.
There are people, however, who save more than the life-cycle modelwould predict. The entrepreneur who works 15 hours a day seven days aweek piling up $10, $20, or $100 million is not saving for retirement either.Nor is it plausible that the utility of children and grandchildren is drivingsuch people. Wealth represents success, status and power and these are

DISCUSSION BAILY 103
what motivate the small fraction of the population who accumulate verylarge fortunes.
These doubts about the validity of the intertemporal maximizingmodel make me pragmatic about policies towards economic growth. Aneconomy with real growth works much better in many ways than a stagnanteconomy. Social decisions about how much to spend on defense and on theelderly or the very poor are easier when the economic pie is growing. As theeconomy recovers from the current recession I hope we will devote moreresources not only to new plant and equipment, but also to the develop-ment of new technologies and products.
Discussion
Robert Eisner*
Events and correctly observed and measured facts and figures have away of catching up with conventional wisdom and dogma. And so it is withthe measurement and encouragement of business saving--and investment.
Measurement of Saving
We have long heard that business and national saving and business in-vestment were unduly low. In the past decade, certain economists havebrought considerable attention to the charge that our tax system, particu-larly in its interaction with inflation, has seriously discouraged saving andinvestment, with sharply adverse effects on productivity and economicgrowth. New saving and investment incentives were urged to counteractthese alleged effects.
A climax, and perhaps a critical turning point, was reached withenactment of the so-called Economic Recovery Act of 1981. This enactmentwas followed shortly by the onset of the most severe economic recessionsince the Great Depression of the 30s, anticipation of large, long-run fed-eral budget deficits, and a significant decline in the rate of real business in-vestment that it was intended to encourage.
Alan Auerbach cannot be held responsible for the fate that has be-fallen us. He was and is among those who inveighed sharply and loudlyagainst the key Accelerated Cost Recovery System of the Tax Act of 1981.His current paper repeats early arguments against ACRS and in favor ofvarious alternatives. It also offers a thoughtful and illuminating discussionof the role of business saving under our current tax system,.as well as thelikely impact of various tax innovations.
A first question we should face is just how low business saving, totalprivate saving, and business investment really have been. As for the last, re-visions of the Bureau of Economic Analysis national income and productaccounts now make clear that, except for the current recession, the share ofgross national product going into business investment, as shown in Table 1,has been at record highs. And now the most recent revisions in the accountsoffer a sharp correction to saving figures presented by Auerbach in the firstline of his paper. On the basis of data of a few months ago, Auerbach re-ports 1981 personal saving in the United States as $106 billion, or 4.4 per-cent of personal income. The new BEA numbers (as in the Survey of Cur-rent Business, July 1982) place personal saving at $130.2 billion, or 5.4percent of personal income. BEA net private saving for 1981 is now put at
*William R. Kenan Professor of Economics at Northwestern University.
104
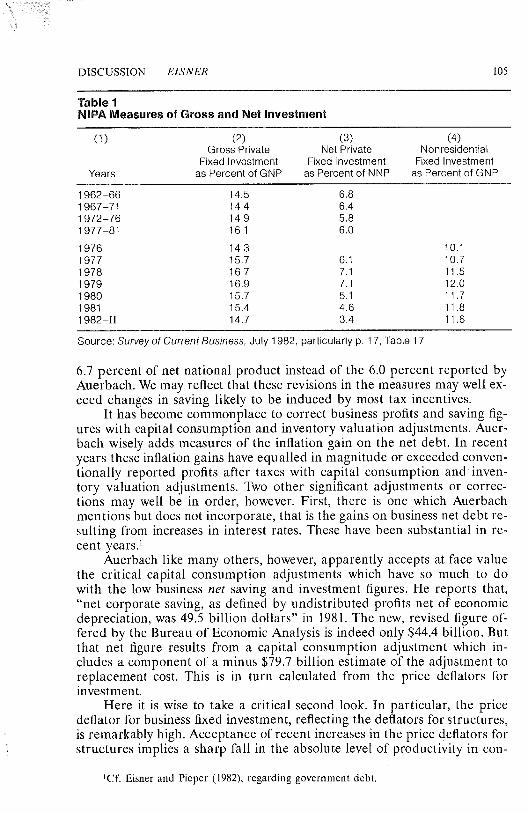
DISCUSSION EISNER 105
Table 1NIPA Measures of Gross and Net Investment
(1) (2) (3) (4)Gross Private Net Private Nonresidential
Fixed Investment Fixed Investment Fixed InvestmentYears as Percent of GNP as Percent of NNP as Percent of GNP
1962-66 14.5 6.81967-71 14,4 6.41972-76 14,9 5.81977-81 16.1 6.0
1976 14.3 10.11 977 15.7 6.1 10.71978 16.7 7.1 11.51979 16.9 7.1 12.01980 15.7 5.1 11.71981 15.4 4.6 11.81982-II 14.7 3.4 11.6
Source: Survey of Current Business, July 1982, particularly p. 17, Table 17.
6.7 percent of net national product instead of the 6.0 percent reported byAuerbach. We may reflect that these revisions in the measures may well ex-ceed changes in saving likely to be induced by most tax incentives.
It has become commonplace to correct business profits and saving fig-ures with capital consumption and inventory valuation adjustments. Auer-bach wisely adds measures of the inflation gain on the net debt. In recentyears these inflation gains have equalled in magnitude or exceeded conven-tionally reported profits after taxes with capital consumption and inven-tory valuation adjustments. Two other significant adjustments or correc-tions may well be in order, however. First, there is one which Auerbachmentions but does not incorporate, that is the gains on business net debt re-sulting from increases in interest rates. These have been substantial in re-cent years.1
Auerbach like many others, however, apparently accepts at face valuethe critical capital consumption adjustments which have so much to dowith the low business net saving and investment figures. He reports that,"net corporate saving, as defined by undistributed profits net of economicdepreciation, was 49.5 billion dollars" in 1981. The new, revised figure of-fered by the Bureau of Economic Analysis is indeed only $44.4 billion. Butthat net figure results from a capital consumption adjustment which in-cludes a component of a minus $79.7 billion estimate of the adjustment toreplacement cost. This is in turn calculated from the price deflators forinvestment.
Here it is wise to take a critical second look. In particular, the pricedeflator for business fixed investment, reflecting the deflators for structures,is remarkably high. Acceptance of recent increases in the price deflators forstructures implies a sharp fall in the absolute level of productivity in con-
~Cf. Eisner and Pieper (1982), regarding government debt.
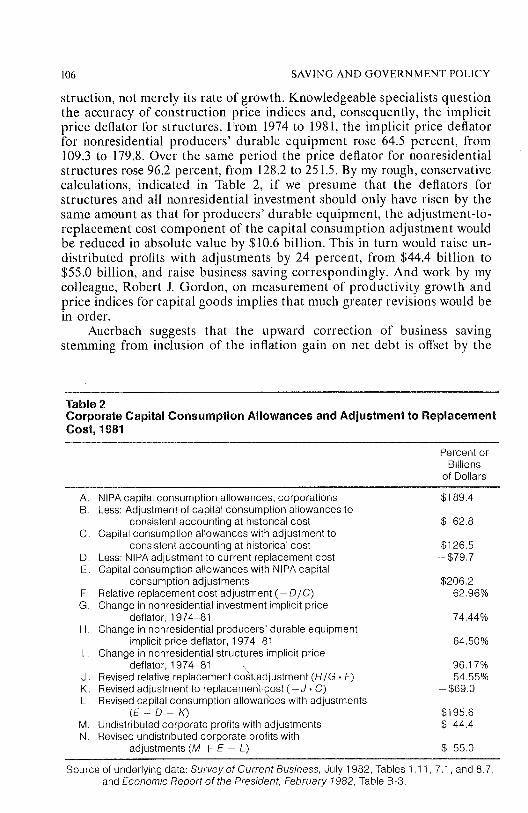
106 SAVING AND GOVERNMENT POLICY
struction, not merely its rate of growth. Knowledgeable specialists questionthe accuracy of construction price indices and, consequently, the implicitprice deflator for structures. From 1974 to 1981, the implicit price deflatorfor nonresidential producers’ durable equipment rose 64.5 percent, from109.3 to 179.8. Over the same period the price deflator for nonresidentialstructures rose 96.2 percent, from 128.2 to 251.5. By my rough, conservativecalculations, indicated in Table 2, if we presume that the deflators forstructures and all nonresidential investment should only have risen by thesame amount as that for producers’ durable equipment, the adjustment-to-replacement cost component of the capital consumption adjustment wouldbe reduced in absolute value by $10.6 billion. This in turn would raise un-distributed profits with adjustments by 24 percent, from $44.4 billion to$55.0 billion, and raise business saving correspondingly. And work by mycolleague, Robert J. Gordon, on measurement of productivity growth andprice indices for capital goods implies that much greater revisions would bein order.
Auerbach suggests that the upward correction of business savingstemming from inclusion of the inflation gain on net debt is offset by the
Table 2Corporate Capital Consumption Allowances and Adjustment to ReplacementCost, 1981
Percent orBillions
of Dollars
A. NIPA capital consumption allowances, corporationsB. Less: Adjustment of capital consumption allowances to
consistent accounting at historical costC. Capital consumption allowances with adjustment to
consistent accounting at historical costD. Less: NIPA adjustment to current replacement costE. Capital consumption allowances with NIPA capital
consumption adjustmentsF. Relative replacement cost adjustment (-D/C)G. Change in nonresidential investment implicit price
deflator, 1974-81H. Change in nonresidential producers’ durable equipment
implicit price deflator, 1974 81I. Change in nonresidential structures implicit price
deflator, 1974 81J. Revised relative replacement cos~\adjustment (H/G ¯ F)K. Revised adjustment to replacement,~cost (-J, C)L. Revised capital consumption allowances with adjustments
(E + O - K)M, Undistributed corporate profits with adjustmentsN. Revised undistributed corporate profits with
adjustments (M + E - L)
$189.4
$ 62.8
$126.5-$79,7
$206,262.96%
74,44%
64,50%
96.17%54,55%
- $69.0
$195.6$ 44.4
$ 55.0
Source of underlying data: Surveyor Current Business, July 1982, Tables 1.11,7.1, and 8.7,and Economic Report of the President, February 1982, Table B-3.
DISCUSSION EISNER 107
annual inflation loss due to reduction in the present value of tax depreci-ation allowances. But if we are to include that inflation-related loss, wemight well add the inflation gain on existing assets. Particularly if we ac-cept Bureau of Economic Analysis price deflators on new investment in es-timating the value of existing capital stocks, we find substantial positive netrevaluations, that is nominal capital gains in excess of general price in-creases. Net revaluations on tangible assets of nonfinancial corporations, asnoted in Eisner (1980), have added significantly to net business saving in thelast decade.
Taxes and Saving and Investment
Auerbach’s discussion of taxes and business saving is in many ways il-luminating, as he contrasts implications of the "traditional views," whichsee double taxation of corporate equity raised by sale of stock, and the"new view," where the implication of raising marginal funds by retainedearnings is that there is double taxation only to the extent of the minimallyeffective tax on capital gains. One may be misled, however, by Auerbacb’simplicit and explicit abstraction from debt financing. Particularly in aworld of inflation and high nominal, deductible interest cost, this makes all ¯the difference. As pointed out by Hall (1982) and Chirinko and King(1982), inflation and leverage can readily combine so that taxes on businesssaving and investment prove substantially negative. Of major importance,as noted by Chirinko and King, nominal interest rates (until the recent epi-sode of extremely tight money) have generally risen no more than, if asmuch as, the rate of inflation. The rental or user cost of capital, as a conse-quence, fell with inflation for significantly levered firms. Real, after-taxrates of interest turned very low, frequently perhaps negative.
Inflation has indeed permitted investor-borrowers to deduct high nom-inal interest rates without having to include in taxable income the reduc-tion in real value of debt to which the high interest payments relate. Theview is sometimes expressed that the tax advantage of borrowers is com-pletely offset by the high interest necessary to compensate lenders who facetaxes on nominal interest income without an offsetting reduction for thedecline in the real values of their financial assets. This ignores importantclientele effects. In fact, borrowers can be expected to be and are largelythose for whom high tax rates make interest deductions particularly valu-able, while lenders are increasingly and very largely institutions and indi-viduals with zero or low effective tax rates. Analyzing the impact of taxeson saving and investment without full note of the role of debt and interestdeductibility and, with inflation, related capital gains, is to abstract fromthe essence. It is almost like trying to explain how a plane flies after assum-ing away the atmosphere.
Before one can apply much of the type of analysis undertaken sodeftly by Auerbach, one must be careful to trace macroeconomic effects onthe basis of reasonable assumptions as to government and private behavior.Implicit in much discussion is a notion that changes in tax systems will beintroduced under a "b.alanced budget" constraint; cuts in business or indi-
108 SAVING AND GOVERNMENT POLICY
vidual tax rates will be offset by increases elsewhere, perhaps of a lump-sum nature with no efficiency loss. In fact, cuts in business and personal in-come taxes and consequent increases in business and personal saving, as wehave so recently witnessed, are accompanied by increases in governmentbudget deficits. Thus increases in private saving have been more than offsetby increases in public dissaving. As Auerbach of course knows well, but itbears repeating, business saving has little direct connection with businessinvestment, and private saving can and does differ widely from privateinvestment.
Where tax changes do alter the marginal return on saving, critical dif-ferences in results can be ignored only with extreme peril to sound analy-sis. One must first recognize that under most real-world conditions, one cannot properly abstract from income effects. A greater anticipated return onsaving may generate more or less saving, depending upon whether or notsubstitution effects outweigh income effects. This, in turn, will dependupon how great substitution effects really are. My own priors suggest thatthe elasticity of saving with respect to rates of return is very low. Most of usare unlikely to alter our consumption significantly because of modest (fre-quently poorly perceived) changes in intertemporal rates of substitution.
And complicating matters much more in the real world is the fact, asshould again be clear to all in the fall of 1982, that the economy may be farfrom a full employment general equilibrium. Tax changes which raise busi-ness or personal propensities to save may then perversely reduce nationalincome and saving.
I join with Auerbach in his criticisms of ACRS, which has indeed"strained the corporate tax system" (p. 32). To the objections to the leasingsystem, discussed in detail in Warren and Auerbach (t982), I might add theobservation that sales of tax advantages have proved a particularly ineffi-cient way of affecting incentives. Markets for such sales proved initially farfrom perfect and sellers of tax advantages frequently realized far less thanthe present value of Treasury revenues of which they disposed.
! have argued elsewhere that there was no sound evidence that the ac-celerated cost recovery system would increase business investment by any-where near foreseeable losses in tax revenues.2 Declines in real business in-vestment have more than confirmed my predictions. As Auerbach observes,increases in real interest rates and reduction in capacity utilization "prob-ably will dominate any tax incentives that one can reasonably envision"(p. 40). One may add that increases in real interest rates cannot be consid-ered independent of the tax incentives and the broad fiscal and monetarypolicy to which they are related.
I conclude with the perhaps cynical observation that much discussionof business saving in terms of measures to encourage growth and produc-tivity has missed the real policy issue. As Auerbach points out, there are se-rious questions in the measurement of business saving and the extent towhich business saving really matters in the determination of total privatesaving. There are important further issues as to the connection of business
2Chirinko and Eisner (1981) and (1982) and Eisner and Bender (1982).
DISCUSSION EISNER 109
and private saving to conventional business and private investment. Theconnection with the ultimate goal of productivity and growth is even moreremote and doubtful. These last may well relate much more to total capitalformation, both human and nonhuman, as discussed in the paper by Bladesand Sturm. My own estimates suggest that net private domestic investmentis less than one-fifth of the perhaps more relevant broad measure of capitalformation which will include all acquisition of structures and equipment bygovernment, household and nonprofit institutions as well as business, in-vestment in land, resources and research and development, and investmentin human capital in the form of education, training and health.
That leaves me to wonder whether the arguments about business savingand investment, taxes on "capital," wages and consumption, and issues ofexpensing and interest deductibility, upon which we focus so much atten-tion, are really, when all the qualifications are recognized, so important indetermining the aggregates of product, growth and welfare as they are indetermining their distribution. Encouragement of business saving and in-vestment would appear to have a much greater impact, whether successfulor not, on the wealth of some of those who participate in that saving andinvestment than on the economy as a whole. A tax incentive for business in-vestment may well affect distribution of income and wealth differently thangovernment expenditures for investment in human capital, or a tax incen-tive to encourage employment, particularly employment of youth, or minor-ities or women. Beyond our abstractions, how much is the real issue not thesize of the economic pie but how it is cut up?
REFERENCES
Blades, Derek and Peter Sturm. 1982. "The Concept and Measurement of Savings: The UnitedStates and Other Industrialized Countries." Paper in this volume.
Chirinko, Robert S. and Robert Eisner. 1981. "The Effects of Tax Policies on Investment inMacroeconometric Models: Full Model Simulations," OTA Paper 46, U.S. Departmentof the Treasury, Office of Tax Analysis, Washington, D.C. (Abbreviated version to ap-pear in Journal of Public Economics.)
--. 1982. "The Effects of Tax Parameters in the Investment Equations in MacroeconomicEconometric Models," in Marshall E. Blume, Jean Crockett, and Paul Taubman, eds.,Economic Activity and Finance (Cambridge, Ma.: Ballinger Co.), pp. 25-84. (Originallyprepared as OTA Paper 47.)
Chirinko, Robert S. and Stephen R. King. 1982. "Hidden Stimuli to Capital Formation: Debtand the Non-Adjustment of Financial Returns," Northwestern University.
Eisner, Robert. 1980. "Capital Gains and Income: Real Changes in the Value of Capital in theUnited States, 1946-1977," in Dan Usher, ed., The Measurement of Capital, Studies inIncome and Wealth, vol. 45, (University of Chicago Press for the NBER), pp. 175-346.
-- and Steven Bender. 1982. "Differential Impacts of Tax Incentives for Investment,"Journal of Policy Modeling, (vol. 4, June 1982), pp. 143-159.
-- and Paul J. Pieper. 1982. "Government Net Worth: Assets, Liabilities and Revalua-tions," Northwestern University.
Hall, Robert E. 1982. "Tax Treatment of Depreciation, Capital Gains, and Interest in an Infla-tionary Economy," in Charles R. Hulten, ed. Depreciation, Inflation and the Taxation ofIncome from Capital (Washington, D.C.; The Urban Institute). ~
Warren, Alvin C. Jr. and Alan J. Auerbach. 1982. "Transferability of Tax Incentives and theFunction of Safe Harbor Leasing," Harvard Law Review, vol. 95, no. 8 (June), pp. 1952-1986.
Macroeconomic Policy and Domestic Saving
Rudolph G. Penner*
I. Introduction
Without a radical change in monetary and fiscal policy, the UnitedStates will experience a higher ratio of deficits to GNP in the 1980s than ithas in any decade since the 1940s. It is crucial to understand the risk thatthis poses to future economic growth, but as the following review of the lit-erature indicates, economic research on the issue is in a primitive state. Pre-cise answers are far beyond our grasp, and all that we can do is describe therisks inherent in a very uncertain situation.
Although this is supposed to be a paper about macroeconomic policyand savings, it is impossible to explore the relevant issues without makingfrequent excursions into microeconomic theory. Consequently, this paper isbound to overlap with others delivered at this conference.
II. Relevant Micro Issues
Discussions of individual savings behavior are dominated by the lifecycle hypothesis put forward by Modigliani and Brumberg [1954]. The in-dividual is assumed to maximize the discounted utility provided by con-sumption over a lifetime subject to a lifetime wealth and income con-straint. As a result, the time path of consumption is much smoother thanthe time path of disposable income over a lifetime. A typical individualmight be expected to borrow in early years when income is low, save duringthe years of peak career earnings, and then dissave during the years of re-tirement. If the time of death is known with certainty and there is nobequest motive, the individual should spend his or her last penny on theday of death.
The theory can be modified to allow for uncertain lifetimes and in-come flows and for a bequest motive.
The life cycle hypothesis is ambiguous about whether increases in theafter-tax rate of return raise or lower the propensity to consume in any oneyear. A higher rate of return has an income effect and allows higher con-sumption in all years even if saving is lowered a bit. However, it also makesthe tradeoffbetween present and future consumption more favorable to thelatter. Even if the income effect is neutralized, for example, by replacing atax on capital income with a tax on wages, the relationship between thepropensity to consume and the after-tax rate of return could be positivewith a low enough elasticity of substitution between present and futureconsumption. However, Summers [1982] argues persuasively that thiswould require an odd utility function. Summers also shows that long-run
*Director of Tax Policy Studies and a resident scholar at the American EnterpriseInstitute.
110
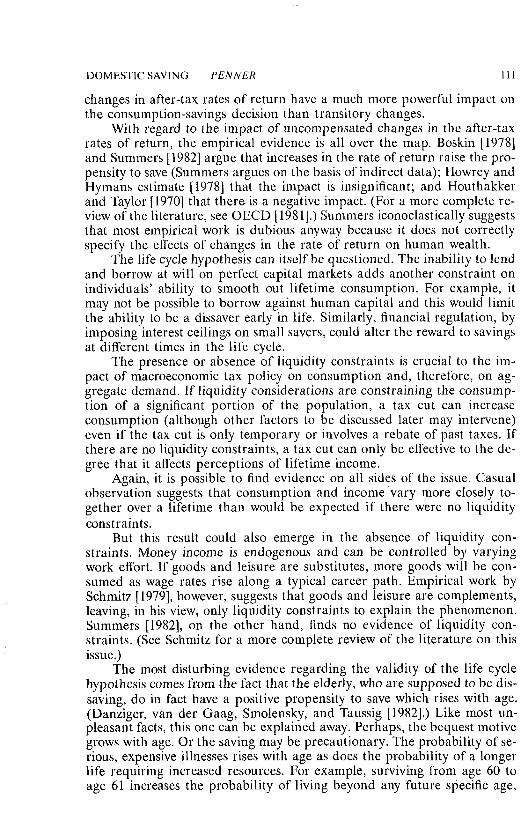
DOMEST1C SAVlNG PENNER 111
changes in after-tax rates of return have a much more powerful impact onthe consumption-savings decision than transitory changes.
With regard to the impact of uncompensated changes in the after-taxrates of return, the empirical evidence is all over the map. Boskin [1978]and Summers [1982] argue that increases in the rate of return raise the pro-pensity to save (Summers argues on the basis of indirect data); Howrey andHymans estimate [1978] that the impact is insignificant; and Houthakkerand Taylor [1970] that there is a negative impact. (For a more complete re-view of the literature, see OECD [1981].) Summers iconoclastically suggeststhat most empirical work is dubious anyway because it does not correctlyspecify the effects of changes in the rate of return on human wealth.
The life cycle hypothesis can itself be questioned. The inability to lendand borrow at will on perfect capital markets adds another constraint onindividuals’ ability to smooth out lifetime consumption. For example, itmay not be possible to borrow against human capital and this would limitthe ability to be a dissaver early in life. Similarly, financial regulation, byimposing interest ceilings on small savers, could alter the reward to savingsat different times in the life cycle.
The presence or absence of liquidity constraints is crucial to the im-pact of macroeconomic tax policy on consumption and, therefore, on ag-gregate demand. If liquidity considerations are constraining the consump-tion of a significant portion of the population, a tax cut can increaseconsumption (although other factors to be discussed later may intervene)even if the tax cut is only temporary or involves a rebate of past taxes. Ifthere are no liquidity constraints, a tax cut can only be effective to the de-gree that it affects perceptions of lifetime income.
Again, it is possible to find evidence on all sides of the issue. Casualobservation suggests that consumption and income Vary more closely to-gether over a lifetime than would be expected if there were no liquidityconstraints.
But this result could also emerge in the absence of liquidity con-straints. Money income is endogenous and can be controlled by varyingwork effort. If goods and leisure are substitutes, more goods will be con-sumed as wage rates rise along a typical career path. Empirical work bySchmitz [1979], however, suggests that goods and leisure are complements,leaving, in his view, only liquidity constraints to explain the phenomenon.Summers [1982], on the other hand, finds no evidence of liquidity con-straints. (See Schmitz for a more complete review of the literature on thisissue.)
The most disturbing evidence regarding the validity of the life cyclehypothesis comes from the fact that the elderly, who are supposed to be dis-saving, do in fact have a positive propensity to save which rises with age.(Danziger, van der Gaag, Smolensky, and Taussig [1982].) Like most un-pleasant facts, this one can be explained away. Perhaps, the bequest motivegrows with age. Or the saving may be precautionary. The probability of se-rious, expensive illnesses rises with age as does the probability of a longerlife requiring increased resources. For example, surviving from age 60 toage 61 increases the probability of living beyond any future specific age,
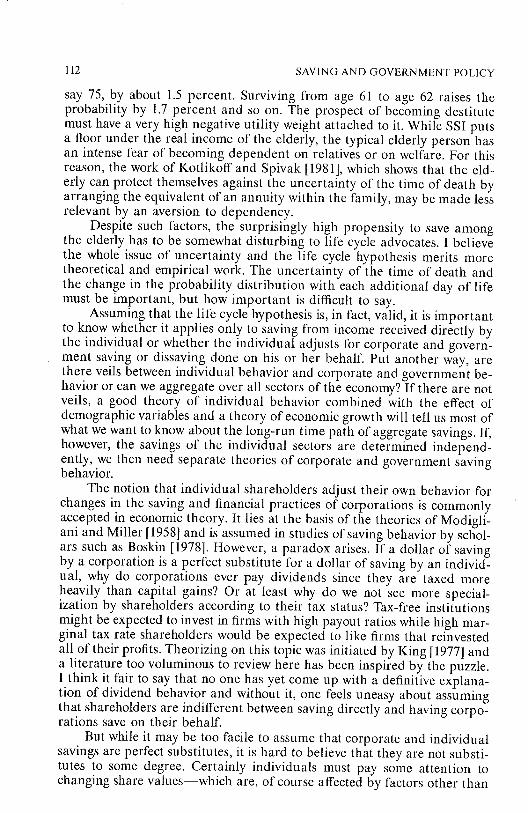
112 SAV1NG AND GOVERNMENT POLICY
say 75, by about 1.5 percent. Surviving from age 61 to age 62 raises theprobability by 1.7 percent and so on. The prospect of becoming destitutemust have a very high negative utility weight attached to it. While SSI putsa floor under the real income of the elderly, the typical elderly person hasan intense fear of becoming dependent on relatives or on welfare. For thisreason, the work of Kotlikoff and Spivak [1981], which shows that the eld-erly can protect themselves against the uncertainty of the time of death byarranging the equivalent of an annuity within the family, may be made lessrelevant by an aversion to dependency.
Despite such factors, the surprisingly high propensity to save amongthe elderly has to be somewhat disturbing to life cycle advocates. I believethe whole issue of uncertainty and the life cycle hypothesis merits moretheoretical and empirical work. The uncertainty of the time of death andthe change in the probability distribution with each additional day of lifemust be important, but how important is difficult to say.
Assuming that the life cycle hypothesis is, in fact, valid, it is importantto know whether it applies only to saving from income received directly bythe individual or whether the individual adjusts for corporate and govern-ment saving or dissaving done on his or her behalf. Put another way, arethere veils between individual behavior and corporate and government be-havior or can we aggregate over all sectors of the economy? If there are notveils, a good theory of individual behavior combined with the effect ofdemographic variables and a theory of economic growth will tell us most ofwhat we want to know about the long-run time path of aggregate savings. If,however, the savings of the individual sectors are determined independ-ently, we then need separate theories of corporate and government savingbehavior.
The notion that individual shareholders adjust their own behavior forchanges in the saving and financial practices of corporations is commonlyaccepted in economic theory. It lies at the basis of the theories of Modigli-ani and Miller [1958] and is assumed in studies of saving behavior by schol-ars such as Boskin [1978]. However, a paradox arises. If a dollar of savingby a corporation is a perfect substitute for a dollar of saving by an individ-ual, why do corporations ever pay dividends since they are taxed moreheavily than capital gains? Or at least why do we not see more special-ization by shareholders according to their tax status? Tax-free institutionsmight be expected to invest in firms with high payout ratios while high mar-ginal tax rate shareholders would be expected to like firms that reinvestedall of their profits. Theorizing on this topic was initiated by King [1977] anda literature too voluminous to review here has been inspired by the puzzle.I think it fair to say that no one has yet come up with a definitive explana-tion of dividend behavior and without it, one feels uneasy about assumingthat shareholders are indifferent between saving directly and having corpo-rations save on their behalf.
But while it may be too facile to assume that corporate and individualsavings are perfect substitutes, it is hard to believe that they are not substi-tutes to some degree. Certainly individuals must pay some attention tochanging share values--which are, of course affected by factors other than
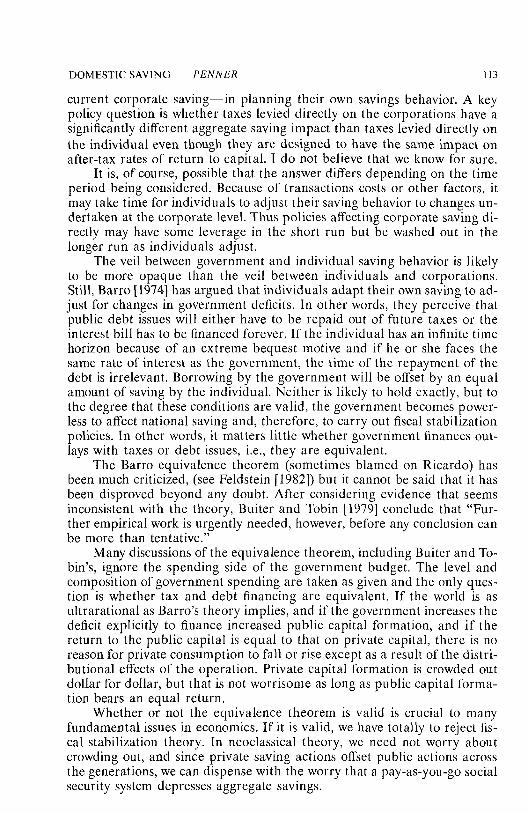
DOMESTIC SAVING PENNER 113
current corporate saving--in planning their own savings behavior. A keypolicy question is whether taxes levied directly on the corporations have asignificantly different aggregate saving impact than taxes levied directly onthe individual even though they are designed to have the same impact onafter-tax rates of return to capital. I do not believe that we know for sure.
It is, of course, possible that the answer differs depending on the timeperiod being considered. Because of transactions costs or other factors, itmay take time for individuals to adjust their saving behavior to changes un-dertaken at the corporate level. Thus policies affecting corporate saving di-rectly may have some leverage in the short run but be washed out in thelonger run as individuals adjust.
The veil between government and individual saving behavior is likelyto be more opaque than the veil between individuals and corporations.Still, Barro [1974] has argued that individuals adapt their own saving to ad-just for changes in government deficits. In other words, they perceive thatpublic debt issues will either have to be repaid out of future taxes or theinterest bill has to be financed forever. If the individual has an infinite timehorizon because of an extreme bequest motive and if he or she faces thesame rate of interest as the government, the time of the repayment of thedebt is irrelevant. Borrowing by the government will be offset by an equalamount of saving by the individual. Neither is likely to hold exactly, but tothe degree that these conditions are valid, the government becomes power-less to affect national saving and, therefore, to carry out fiscal stabilizationpolicies. In other words, it matters little whether government finances out-lays with taxes or debt issues, i.e., they are equivalent.
The Barro equivalence theorem (sometimes blamed on Ricardo) hasbeen much criticized, (see Feldstein [1982]) but it cannot be said that it hasbeen disproved beyond any doubt. After considering evidence that seemsinconsistent with the theory, Buiter and Tobin [1979] conclude that "Fur-ther empirical work is urgently needed, however, before any conclusion canbe more than tentative."
Many discussions of the equivalence theorem, including Buiter and To-bin’s, ignore the spending side of the government budget. The level andcomposition of government spending are taken as given and the only ques-tion is whether tax and debt financing are equivalent. If the world is asultrarational as Barro’s theory implies, and if the government increases thedeficit explicitly to finance increased public capital formation, and if thereturn to the public capital is equal to that on private capital, there is noreason for private consumption to fall or rise except as a result of the distri-butional effects of the operation. Private capital formation is crowded outdollar for dollar, but that is not worrisome as long as public capital forma-tion bears an equal return.
Whether or not the equivalence theorem is valid is crucial to manyfundamental issues in economics. If it is valid, we have totally to reject fis-cal stabilization theory. In neoclassical theory, we need not worry aboutcrowding out, and since private saving actions offset public actions acrossthe generations, we can dispense with the worry that a pay-as-you-go socialsecurity system depresses aggregate savings.
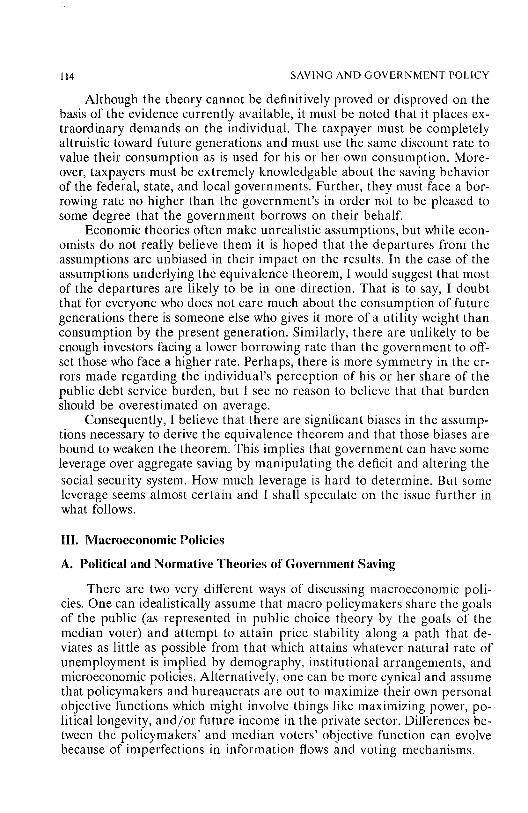
114 SAVING AND GOVERNMENT POLICY
Although the theory cannot be definitively proved or disproved on thebasis of the evidence currently available, it must be noted that it places ex-traordinary demands on the individual. The taxpayer must be completelyaltruistic toward future generations and must use the same discount rate tovalue their consumption as is used for his or her own consumption. More-over, taxpayers must be extremely knowledgable about the saving behaviorof the federal, state, and local governments. Further, they must face a bor-rowing rate no higher than the government’s in order not to be pleased tosome degree that the government borrows on their behalf.
Economic theories often make unrealistic assumptions, but while econ-omists do not really believe them it is hoped that the departures from theassumptions are unbiased in their impact on the results. In the case of theassumptions underlying the equivalence theorem, I would suggest that mostof the departures are likely to be in one direction. That is to say, I doubtthat for everyone who does not care much about the consumption of futuregenerations there is someone else who gives it more of a utility weight thanconsumption by the present generation. Similarly, there are unlikely to beenough investors facing a lower borrowing rate than the government to off-set those who face a higher rate. Perhaps, there is more symmetry in the er-rors made regarding the individual’s perception of his or her share of thepublic debt service burden, but I see no reason to believe that that burdenshould be overestimated on average.
Consequently, I believe that there are significant biases in the assump-tions necessary to derive the equivalence theorem and that those biases arebound to weaken the theorem. This implies that government can have someleverage over aggregate saving by manipulating the deficit and altering thesocial security system. How much leverage is hard to determine. But someleverage seems almost certain and I shall speculate on the issue further inwhat follows.
IlL Macroeconomic Policies
A. Political and Normative Theories of Government Saving
There are two very different ways of discussing macroeconomic poli-cies. One can idealistically assume that macro policymakers share the goalsof the public (as represented in public choice theory by the goals of themedian voter) and attempt to attain price stability along a path that de-viates as little as possible from that which attains whatever natural rate ofunemployment is implied by demography, institutional arrangements, andmicroeconomic policies. Alternatively, one can be more cynical and assumethat policymakers and bureaucrats are out to maximize their own personalobjective functions which might involve things like maximizing power, po-litical longevity, and/or future income in the private sector. Differences be-tween the policymakers’ and median voters’ objective function can evolvebecause of imperfections in information flows and voting mechanisms.
DOMESTIC SAVING PENNER 115
For most of this analysis, I shall take the idealistic view, but one theoryregarding macro policy and long-run saving requires a momentary explo-ration of the cynical view of policymaking.
Milton Friedman and others have argued that aggregate governmentspending is limited by available receipts. In other words, politicians thinklike householders and there is a limit on the dissaving that will be done bygovernment. Put another way, if we can somehow trick politicians into cut-ting taxes, it will constrain spending in the long run.
The theory is probably true at the state and local level, but a super-ficial look at federal behavior is not reassuring. During the decade of the1950s, the NIA budget was balanced on average. Government expendituresaveraged 18.4 percent of the GNE In the 1960s, the deficit equalled 0.3and spending 19.4 percent of the GNE In the 1970s the comparable figureswere 1.8 and 21.3 percent. In 1980-81 the deficit amounted to 2.2 percentof the GNP and spending 23.2 percent.
If deficits act as a constraint on spending growth, that constraint seemsto be getting weaker and weaker over time. Wagner and Buchanan [1977]explain the phenomenon by arguing that the Keynesian revolution de-stroyed the traditional fiscal norm that budgets should be balanced. Oncethe old norm was destroyed, no other disciplining rule took its place. Whilesome argued that the budget should be balanced over the cycle and Rich-ard Nixon argued that the high employment budget should be balanced,none of these new rules had the force of the old fashioned religion ofbudget balancing year after year.
Wagner and Buchanan go even further, arguing that once deficits be-come acceptable, spending growth is facilitated further by the fact that thesale of debt represents a voluntary exchange and is therefore less unpleas-ant than financing government by levying compulsory taxes.
Although the Wagner-Buchanan hypothesis would seem at first sight tobe a better explanation of recent history than the notion that deficits im-pose spending constraint, it is obvious that deficits cannot rise withoutlimit. Sargent and Wallace [1981] have shown that if noninterest spendingis a greater share of GNP than the total tax burden and if nominal interestrates exceed nominal GNP growth, the system is unstable because the inter-est bill on the debt eventually explodes. They hypothesize that the debtwill eventually be monetized under such circumstances. Accelerating infla-tion will then diminish the real interest burden on past issues of debt. It isto be hoped that either spending or tax policy would be altered before thatoccurred, and indeed, that could occur automatically.
Monetary and fiscal policy are intimately intertwined. As debt ismonetized, the tax burden rises more rapidly than GNP because of bracketcreep in a nonindexed income tax system and because the measure of capi-tal income used for tax purposes is increased as the real value of depreci-ation allowances erode, false inventory profits are created, etc. The index-ing of exemptions and tax brackets now scheduled to be implemented in1985 eliminates bracket creep but does nothing to adjust the definition ofcapital income. It is also somewhat imperfect in that many dollar amounts
116 SAVING AND GOVERNMENT POLICY
listed in the tax code are not indexed, e.g., those involving exemptions onhomeowner capital gains and unemployment insurance. Consequently,even after indexing, inflation will raise average tax rates, but to a muchlesser extent than it does today.
On the outlay side, accelerating inflation slows the growth of realspending because of time lags in the indexation of entitlement programs. Inpractice, there are also time lags in adjusting appropriations for unantici-pated inflation. Frequently, such appropriations are not adjusted at all,since politicians often find it easier to let inflation cut programs than to cutthem legislatively.
Because of such automatic adjustments in tax and spending policy, theprobability of a Sargent-Wallace debt explosion is lessened, but it cannot beruled out altogether. During the 1950s and 1960s, on- plus off-budget defi-cits seldom exceeded the net interest bill of the government and under suchcircumstances a Sargent-Wallace explosion becomes less likely. In fact, theratio of privately held debt to GNP was on a strong downward trend fromWorld War II to 1974. In six of the seven years in the 1975-81 period, how-ever, the total deficit far exceeded the net interest bill and recently, interestrates have exceeded the growth of GNR As a result, the ratio of privatelyheld debt to GNP is back up to the level of the early 70s and growing rap-idly. One hopes that Milton Friedman’s spending constraint will not beoverwhehned by Sargent and Wallace’s arithmetic, but there is nothingvery reassuring in the recent evidence.
Robert Barro [1979] has provided a normative theory of governmentdeficits or dissaving based on the assumption that there are welfare gainsassociated with keeping tax rates as constant as possible. In his model, tem-porary surges in spending, e.g., those associated with wars, are debt fi-nanced as are temporary shortfalls in revenue. The government also runsdeficits to compensate for the erosion of outstanding debt by inflation.
Cagan [1981] has investigated the last issue and differentiates theeffects of anticipated and unanticipated inflation. Presumably, all otherthings equal, investors are willing buyers of enough bonds to maintain thereal value of their portfolios in the presence of anticipated inflation, butthe issue is not so clear with regard to unanticipated inflation. Having dis-saved by surprise, will investors be willing to buy enough bonds to restoretheir wealth? It seems unlikely given that they have just suffered an unex-pected capital loss. If investors do not wish to restore their assets, there willnot automatically be a flow of saving sufficient to absorb the new debt is-sued by the Treasury in the name of keeping the real value of the nationaldebt constant. Of course, once that is said it means that we are departingfrom Barro’s world of equivalence which necessarily underlies his theory ofoptimal deficits. And once the equivalence assumption is dropped, it is noteven clear that government would want to replace the debt eroded byanticipated inflation.
Without equivalence, the government can manipulate national savingin an attempt to achieve short-term stabilization goals or long-run growthgoals. In doing this it should, of course, take account of the erosion of out-
DOMESTIC SAVING PENNER 117
standing debt in designing its policies, but many other variables are’alsoimportant and there is no presumption that deficits are appropriate so longas they do not exceed the erosion of outstanding debt or inappropriate ifthey do.
B. Stabilization Policy
Can fiscal and monetary policy manipulate aggregate demand and realeconomic activity, and so alter saving? It is not a question that would havebeen asked much 20 years ago except by a few isolated monetarists. Now itis a matter of considerable controversy.
The power of fiscal policy is, of course, quite limited in monetarist the-ory. Monetarists believe that the demand for money is fairly stable and in-elastic with respect to changes in interest rates. In such circumstances anyattempt to stimulate aggregate demand by raising the deficit simply resultsin an equal crowding out of private activity. That is somewhat of a carica-ture of the monetarist position since most think that fiscal policy can havesome small, ephemeral effect on economic activity. However, I know ofnone who believe that fiscal fine tuning could lead us to growth consistentwith full employment, price stability, and an appropriate amount of aggre-gate saving.
They also would eschew fine tuning with monetary policy even though,in monetarist and in most Keynesian theory, monetary policy can affectreal activity with an uncertain lag. Pure rational expectations theory evenrejects this proposition. (See Sargent and Wallace [1975] for the classic ar-ticle.) Monetary expansion leads people to expect inflation which, in turn,leads them to adjust wages and prices immediately. Monetary policy affectsprice levels but not real activity. Again this is a caricature. Monetary policycan affect real activity if it catches people by surprise or if price and wagemovements are restricted by long-term contracts. But the important con-clusion is that monetary and fiscal policy may be much less potent than ear-lier stabilization theory implied.
It is not, however, necessary to be a monetarist or a believer in theequivalence theorem or rational expectations to question the power of fis-cal policy. Even within traditional Keynesian analysis there is reason to askwhether macro fiscal policy has much leverage over the position of the 1Scurve.
The earlier discussion of the life cycle hypothesis suggests that, in theabsence of liquidity constraints, fiscal policy will have to alter expectationsof permanent income in order to affect aggregate consumption. In otherwords, private saving could offset public dissaving for reasons quite differ-ent from those relevant to the equivalence theorem. If changes in govern-ment spending or tax policy are deemed to be temporary, the Keynesianmultiplier could quickly be short-circuited by changes in the propensity tos ave.
After the experience of the 1970s and early 1980s, it will be particu-larly difficult for the government to convince anyone that any tax change
118 SAVING AND GOVERNMENT POLICY
is permanent. A whole succession of so-called tax cuts in the 1970s wasquickly offset by bracket creep, and the massive tax act of 198 l is so largethat no one can be confident that it will not be reversed by new legislation.
It has gone out of style to contemplate using government spending forstabilization purposes, but even if it were popular, it would face the sameproblems as tax policy in altering expectations of permanent income. Gov-ernment purchases related to things like accelerated public works programsare explicitly temporary. Changes in government transfers face problemsprecisely analogous to those faced by tax changes, and changes in grants-in-aid can be short-circuited long before the consumer is affected if, as wasoften charged with regard to President Carter’s 1977 stimulus program,they simply reduce state and local deficits at the expense of the federaldeficit.
In all of these matters the question of liquidity constraints becomescrucial. If they are important, either to individuals or to state, and localgovernments, federal spending changes or tax cuts are more likely to havean impact. Even tax rebates or explicitly temporary changes in tax orspending policy could conceivably work. As usual, the empirical evidenceon the issue is not conclusive. A particularly interesting debate regardingthe impact of the temporary Vietnam surtax occurs between Springer[1975] and Okun [1977].
C. Long-Run Growth
Even if it is assumed that government can alter the aggregate savingrate in the economy, it is not clear whether it should attempt to do so in thelong run. There is a long debate regarding the appropriateness of the rateof time preference revealed by the market place. Does it undervalue thewelfare of future generations? If so, should government intervene and pro=vide additional saving by running a surplus? Should government use differ-ent criteria in evaluating its own investments from those revealed by themarket place, especially with regard to the rate of discount and the re-quired risk premium?
The literature on such issues is voluminous, but I shall not attempt areview here. The issues may be important but they are unlikely to be at theheart of policy discussions over the next decade. There is little danger ofrunning surpluses in any of the Western democracies, (See de Larosiere[1982].) All are contending with rapidly growing entitlement programs anda public reluctant to either cut benefits or raise taxes. Deficits are the orderof the day and everyone is trying to borrow from everyone else. The UnitedStates has the added problem of a generally perceived need to reduce thetaxation of capital and to increase defense spending rapidly,
Given large deficits, it is still possible to alter the composition of taxreceipts and spending in ways that are more or less conducive to saving, in-vestment, and growth, but I shall leave most of those issues to those writingon micro policy. There is, however, one compositional issue that may beconsidered macro in content. A naive glance at the saving behavior of dif-
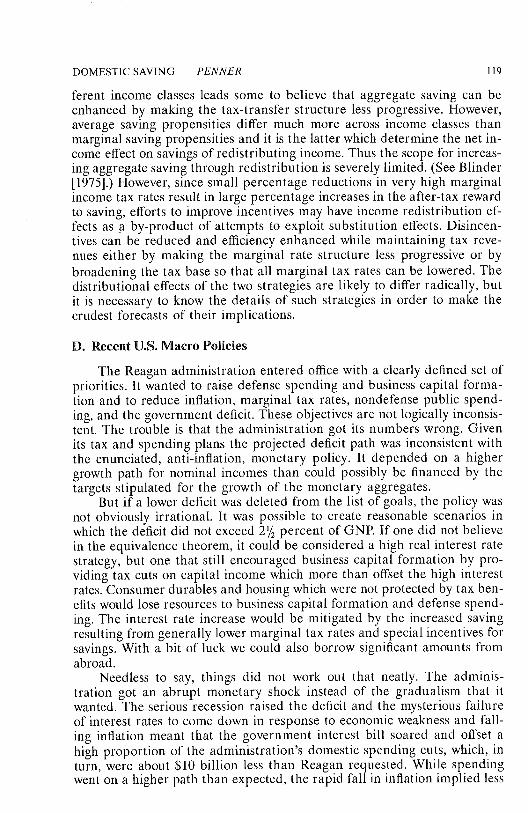
DOMESTIC SAVING PENNER 119
ferent income classes leads some to believe that aggregate saving can beenhanced by making the tax-transfer structure less progressive. However,average saving propensities differ much more across income classes thanmarginal saving propensities and it is the latter which determine the net in-come effect on savings of redistributing income. Thus the scope for increas-ing aggregate saving through redistribution is severely limited. (See Blinder[1975].) However, since small percentage reductions in very high marginalincome tax rates result in large percentage increases in the after-tax rewardto saving, efforts to improve incentives may have income redistribution ef-fects as ~a by-product of attempts to exploit substitution effects. Disincen-tives can be reduced and efficiency enhanced while maintaining tax reve-nues either by making the marginal rate structure less progressive or bybroadening the tax base so that all marginal tax rates can be lowered. Thedistributional effects of the two strategies are likely to differ radically, butit is necessary to know the details of such strategies in order to make thecrudest forecasts of their implications.
D. Recent U.S. Macro Policies
The Reagan administration entered office with a clearly defined set ofpriorities. It wanted to raise defense spending and business capital forma-tion and to reduce inflation, marginal tax rates, nondefense public spend-ing, and the government deficit. These objectives are not logically inconsis-tent. The trouble is that the administration got its numbers wrong. Givenits tax and spending plans the projected deficit path was inconsistent withthe enunciated, anti-inflation, monetary policy. It depended on a highergrowth path for nominal incomes than could possibly be financed by thetargets stipulated for the growth of the monetary aggregates.
But if a lower deficit was deleted from the list of goals, the policy wasnot obviously irrational. It was possible to create reasonable scenarios inwhich the deficit did not exceed 24 percent of GNP. If one did not believein the equivalence theorem, it could be considered a high real interest ratestrategy, but one that still encouraged business capital formation by pro-viding tax cuts on capital income which more than offset the high interestrates. Consumer durables and housing which were not protected by tax ben-efits would lose resources to business capital formation and defense spend-ing. The interest rate increase would be mitigated by the increased savingresulting from generally lower marginal tax rates and special incentives forsavings. With a bit of luck we could also borrow significant amounts fromabroad.
Needless to say, things did not work out that neatly. The adminis-tration got an abrupt monetary shock instead of the gradualism that itwanted. The serious recession raised the deficit and the mysterious failureof interest rates to come down in response to economic weakness and fall-ing inflation meant that the government interest bill soared and offset ahigh proportion of the administration’s domestic spending cuts, which, inturn, were about $10 billion less than Reagan requested. While spendingwent on a higher path than expected, the rapid fall in inflation implied less

120 SAVING AND GOVERNMENT POLICY
bracket creep and lower capital taxes than expected and the adminis-tration’s tax cuts became real tax cuts to a much greater degree thananticipated.
As a result of all of this, we appeared to be on a path toward deficitsequivalent to over 6 percent of the GNP by 1985, even if a healthy eco-nomic recovery was assumed.
The administration responded by backing a tax bill which took back aportion of the tax reductions of 1981. To a large degree the correction wasapplied to the taxation of capital income. Crudely speaking, one can arguethat the administration and Congress simply corrected for the fact that asurprising fall in inflation made 1981 tax legislation much more generoustoward capital income than they intended it to be.
However, the tax actions and budget cuts of 1982 resolve only a part ofthe long-term deficit problem. Even assuming a fairly healthy recovery weare on the road toward deficits approaching levels relative to GNP gener-ally experienced in the past only during recessions. The question now is,"What should we do about it?"
The answer depends crucially on the effects of taxes, spending, anddeficits on aggregate saving, and the foregoing review of the literature gen-erated more uncertainty than hard information regarding such issues. In-deed, a skeptic might argue that we know so little that this paper might aswell end at this point. I believe, however, that such a conclusion would rep-resent a serious misreading of what went on before. We are faced with aproblem of decisionmaking under great uncertainty. The risks must be out-lined and we must ask how they can be minimized. Knowing what we donot know will be helpful in this process.
In contending with the structural deficit problem it is first important toexamine the spending side of the budget. There the options are fairly lim-ited. In the second half of the 1980s, defense, social security (OASDI) andinterest will absorb over 70 percent of the total budget. While areas in theremaining 30 percent of the budget could stand careful scrutiny, for ex-ample, health services delivery systems, it is obvious that changes in defenseand social security policy are essential if spending cuts are to contributesignificantly to ameliorating the deficit problem. In both of those areas it isextremely difficult to make rapid changes in the outlay path. I believe it fairto say that the consensus among defense experts~is that it would be danger-ous to make immediate significant cuts in personnel, operations, training,and maintenance. The state of readiness of our forces could be compro-mised by such cuts. There is much less of a consensus about the value ofexpensive weapons systems such as the B-1 bomber, nuclear carriers, MXmissiles, etc. But cuts in the budget authority for such programs do notshow up in outlays for years. It is already too late in 1982 to achieve majorsavings in such areas before 1985.
It is equally difficult to constrain social security spending in the shortrun. Even advocates of reducing social security benefits must admit that asocial contract exists between recipients and taxpayers and that recipientsand those about to retire must be given time to plan their responses to any
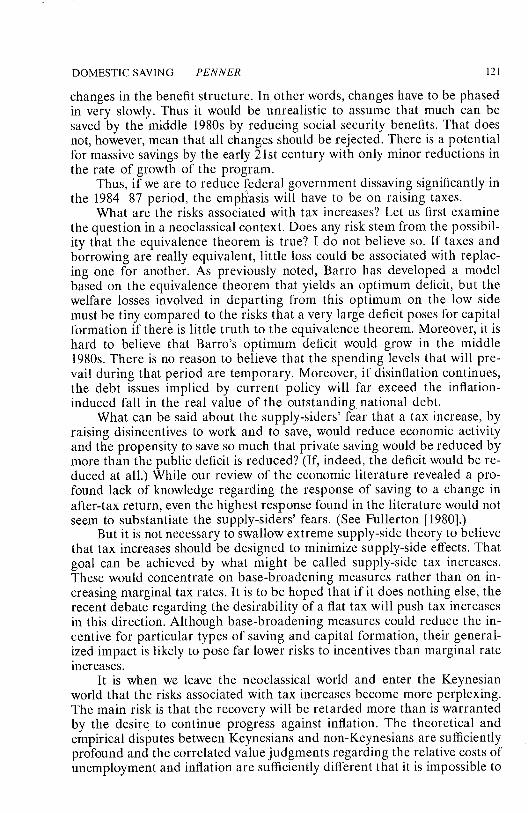
DOMESTIC SAVING PENNER 121
changes in the benefit structure. In other words, changes have to be phasedin very slowly. Thus it would be unrealistic to assume that much can besaved by the middle 1980s by reducing social security benefits. That doesnot, however, mean that all changes should be rejected. There is a potentialfor massive savings by the early 21st century with only minor reductions inthe rate of growth of the program.
Thus, if we are to reduce federal government dissaving significantly inthe 1984-87 period, the empl~asis will have to be on raising taxes.
What are the risks associated with tax increases? Let us first examinethe question in a neoclassical context. Does any risk stem from the possibil-ity that the equivalence theorem is true? I do not believe so. If taxes andborrowing are really equivalent, little loss could be associated with replac-ing one for another. As previously noted, Barro has developed a modelbased on the equivalence theorem that yields an optimum deficit, but thewelfare losses involved in departing from this optimum on the low sidemust be tiny compared to the risks that a very large deficit poses for capitalformation if there is little truth to the equivalence theorem. Moreover, it ishard to believe that Barro’s optimum deficit would grow in the middle1980s. There is no reason to believe that the spending levels that will pre-vail during that period are temporary. Moreover, if disinflation continues,the debt issues implied by current policy will far exceed the inflation-induced fall in the real value of the outstanding, national debt.
What can be said about the supply-siders’ fear that a tax increase, byraising disincentives to work and to save, would reduce economic activityand the propensity to save so much that private saving would be reduced bymore than the public deficit is reduced? (If, indeed, the deficit would be re-duced at all.) While our review of the economic literature revealed a pro-found lack of knowledge regarding the response of saving to a change inafter-tax return, even the highest response found in the literature would notseem to substantiate the supply-siders’ fears. (See Fullerton [1980].)
But it is not necessary to swallow extreme supply-side theory to believethat tax increases should be designed to minimize supply-side effects. Thatgoal can be achieved by what might be called supply-side tax increases.These would concentrate on base-broadening measures rather than on in-creasing marginal tax rates. It is to be hoped that if it does nothing else, therecent debate regarding the desirability of a flat tax will push tax increasesin this direction. Although base-broadening measures could reduce the in-centive for particular types of saving and capital formation, their general-ized impact is likely to pose far lower risks to incentives than marginal rateincreases.
It is when we leave the neoclassical world and enter the Keynesianworld that the risks associated with tax increases become more perplexing.The main risk is that the recovery will be retarded more than is warrantedby the desire to continue progress against inflation. The theoretical andempirical disputes between Keynesians and non-Keynesians are sufficientlyprofound and the correlated value judgments regarding the relative costs ofunemployment and inflation are sufficiently different that it is impossible to
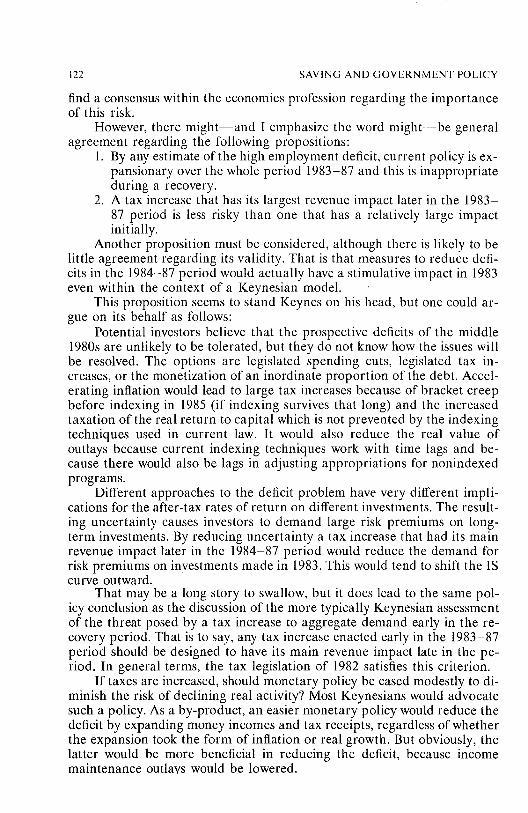
122 SAVING AND GOVERNMENT POLICY
find a consensus within the economics profession regarding the importanceof this risk.
However, there might--and I emphasize the word might--be generalagreement regarding the following propositions:
1. By any estimate of the high employment deficit, current policy is ex-pansionary over the whole period 1983-87 and this is inappropriateduring a recovery.
2. A tax increase that has its largest revenue impact later in the 1983-87 period is less risky than one that has a relatively large impactinitially.
Another proposition must be considered, although there is likely to belittle agreement regarding its validity. That is that measures to reduce defi-cits in the 1984-87 period would actually have a stimulative impact in 1983even within the context of a Keynesian model.
This proposition seems to stand Keynes on his head, but one could ar-gue on its behalf as follows:
Potential investors believe that the prospective deficits of the middle1980s are unlikely to be tolerated, but they do not know how the issues willbe resolved. The options are legislated spending cuts, legislated tax in-creases, or the monetization of an inordinate proportion of the debt. Accel-erating inflation would lead to large tax increases because of bracket creepbefore indexing in 1985 (if indexing survives that long) and the increasedtaxation of the real return to capital which is not prevented by the indexingtechniques used in current law. It would also reduce the real value ofoutlays because current indexing techniques work with time lags and be-cause there would also be lags in adjusting appropriations for nonindexedprograms.
Different approaches to the deficit problem have very different impli-cations for the after-tax rates of return on different investments. The result-ing uncertainty causes investors to demand large risk premiums on long-term investments. By reducing uncertainty a tax increase that had its mainrevenue impact later in the 1984-87 period would reduce the demand forrisk premiums on investments made in 1983. This would tend to shift the IScurve outward.
That may be a long story to swallow, but it does lead to the same pol-icy conclusion as the discussion of the more typically Keynesian assessmentof the threat posed by a tax increase to aggregate demand early in the re-covery period. That is to say, any tax increase enacted early in the 1983-87period should be designed to have its main revenue impact late in the pe-riod. In general terms, the tax legislation of 1982 satisfies this criterion.
If taxes are increased, should monetary policy be eased modestly to di-minish the risk of declining real activity? Most Keynesians would advocatesuch a policy. As a by-product, an easier monetary policy would reduce thedeficit by expanding money incomes and tax receipts, regardless of whetherthe expansion took the form of inflation or real growth. But obviously, thelatter would be more beneficial in reducing the deficit, because incomemaintenance outlays would be lowered.
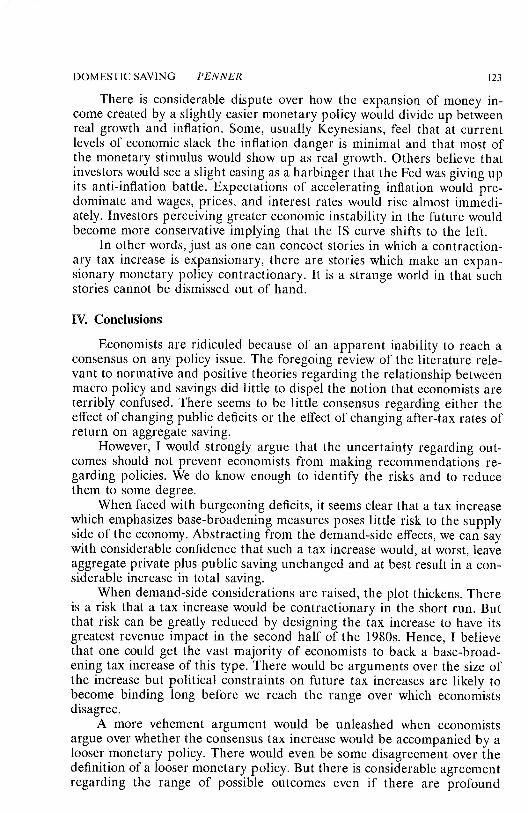
DOMESTIC SAVING PENNER 123
There is considerable dispute over how the expansion of money in-come created by a slightly easier monetary policy would divide up betweenreal growth and inflation. Some, usually Keynesians, feel that at currentlevels of economic slack the inflation danger is minimal and that most ofthe monetary stimulus would show up as real growth. Others believe thatinvestors would see a slight easing as a harbinger that the Fed was giving upits anti-inflation battle. Expectations of accelerating inflation would pre-dominate and wages, prices, and interest rates would rise almost immedi-ately. Investors perceiving greater economic instability in the future wouldbecome more conservative implying that the IS curve shifts to the left.
In other words, just as one can concoct stories in which a contraction-ary tax increase is expansionary, there are stories which make an expan-sionary monetary policy contractionary. It is a strange world in that suchstories cannot be dismissed out of hand.
IV. Conclusions
Economists are ridiculed because of an apparent inability to reach aconsensus on any policy issue. The foregoing review of the literature rele-vant to normative and positive theories regarding the relationship betweenmacro policy and savings did little to dispel the notion that economists areterribly confused. There seems to be little consensus regarding either theeffect of changing public deficits or the effect of changing after-tax rates ofreturn on aggregate saving.
However, I would strongly argue that the uncertainty regarding out-comes should not prevent economists from making recommendations re-garding policies. We do know enough to identify the risks and to reducethem to some degree.
When faced with burgeoning deficits, it seems clear that a tax increasewhich emphasizes base-broadening measures poses little risk to the supplyside of the economy. Abstracting from the demand-side effects, we can saywith considerable confidence that such a tax increase would, at worst, leaveaggregate private plus public saving unchanged and at best result in a con-siderable increase in total saving.
When demand-side considerations are raised, the plot thickens. Thereis a risk that a tax increase would be contractionary in the short run. Butthat risk can be greatly reduced by designing the tax increase to have itsgreatest revenue impact in the second half of the 1980s. Hence, I believethat one could get the vast majority of economists to back a base-broad-ening tax increase of this type. There would be arguments over the size ofthe increase but political constraints on future tax increases are likely tobecome binding long before we reach the range over which economistsdisagree.
A more vehement argument would be unleashed when economistsargue over whether the consensus tax increase would be accompanied by alooser monetary policy. There would even be some disagreement over thedefinition of a looser monetary policy. But there is considerable agreementregarding the range of possible outcomes even if there are profound
124 SAVING AND GOVERNMENT POLICY
disagreements regarding the probability weight and the social utilityweight that should be assigned to each of the possibilities. In such circum-stances we have to let the politicians choose the appropriate weights afterhearing and reading the profession’s internal arguments. That is what wepay them for.
BIBLIOGRAPHY
Barro, Robert J. "Are Government Bonds Net Wealth?", Journal of Political Economy,82:1095-1117.
-- "On the Determination of the Public Debt," Journal of Political Economy, 87:940-971.Blinder, Alan S. "Distribution Effects and the Aggregate Consumption Function," Journal of
Political Economy, 83:447-475.Boskin, Michael J. "Taxation, Saving, and the Rate of Interest," Journal of Political Economy,
86:3-27.Buiter, Willem H., and James Tobin. "Debt Neutrality: A Brief Review of Doctrine and Evi-
dence," in George M. yon Furstenberg, ed., Social Security versus Private Saving. Cam-bridge, Ma.: Ballinger Publishing Co., 1979.
Cagan, Phillip. "The Real Federal Deficit and Financial Markets," The AEI Economist, No-vember 1981, pp. 1-6.
Danziger, van der Gaag, Smolinsky and Taussig. "The Life-Cycle Hypothesis and the Con-sumption Behavior of the Elderly." Madison, Wis.: University of Wisconsin Institutefor Research on Poverty. Discussion paper, May 1982.
de Larosiere, Jacques. "Restoring Fiscal Discipline: A Vital Element of a Policy for EconomicRecovery." Address to the American Enterprise Institute, Washington, D.C., March,1982.
Feldstein, Martin. "Government Deficits and Aggregate Demand," Journal of Monetary Eco-nomics, 9:1-20.
Fullerton, Don. "On the Possibility of an Inverse Relationship Between Tax Rates and Gov-ernment Revenues." National Bureau of Economic Research, Working Paper No. 467,April, !980.
Houthakker, H. S., and Lester Taylor. Consumer Demand in the United States: Analyses andProjections. Boston: Harvard University Press, 1970.
Howrey, Philip E., and Saul H. Hymans. "The Measurement and Determination and Loan-able-Funds Saving," Brookings Papers on Economic Activity 1978, No. 3, pp. 655-705.
King, Marvyn. Public Policy and the Corporation, New York: Halsted Press, 1977.Kotlikoff, Lawrence J., and Spivak. "The Family as an Incomplete Annuities Market," Journal
of Political Economy, 89:372-391.Modigliani, Franco, and Richard Brumberg. "Utility Analysis and the Consumption Function.
An Interpretation of Cross-Section Data," in Kenneth Kurihara, ed., Post KeynesianEconomics. New Brunswick: Rut~ers University Press, 1954.
-- and Merton H. Miller. "The Cost of Capital, Corporation Finance, and the Theory ofInvestment," American Economic Review, 48:261-97.
OECD. "International Difference and Trend Changes in Saving Ratios." (The Working PartyNo, 1 of the Economic Policy Committee; document CPE/WPI (81)9), Paris 1981.
Okun, A. M. "The Personal Tax Surcharge and Consumer Demand, 1968-70," Brookings Pa-pers on Economic Activity 1971, No. 1, pp. 167-212.
Sargent, Thomas J., and Neil Wallace. "Some Unpleasant Monetarist Arithmetic," Federal Re-serve Bank of Minneapolis Quarterly Review, Fall 1981, pp. 1-17.

DOMESTIC SAVING PENNER 125
Schmitz, Robert J. "The Life Cycle of Saving and Consumption," in George M. von Fursten-berg, ed. Social Security versus Private Saving. Cambridge, Ma.: Ballinger PublishingCo., 1979.
Springer, W. L. "Did the 1968 Surcharge Really Work?", American Economic Review 65 (Sep-tember 1975) pp. 6~-58.
Summers, Lawrence H. "The Interest Elasticity of Aggregate Saving: Theory and Evidence."Massachusetts Institute of Technology, 1982. (Mimeographed.)
Wagner, Richard E., and James M. Buchanan. Democracy in Deficit: The Political Legacy ofLord Keynes. New York: Academic Press, 1977.
James Tobin*
Rudy Penner is a sensible and cautious fellow. He did his homework onrecent theoretical and econometric literature concerning national saving,seeking to dispel confusions arising from current discussions of fiscal andmonetary policies. In sadness more than anger he reports he didn’t findmany clues--because he found too many. He was tempted to throw up hishands. Indeed at the end, despairing of consensus among economists onmonetary policy, he passes the buck to politicians. But he had perseveredto the extent of guessing that economists might generally agree that growthof high employment federal deficits should be arrested, by tax increasesenacted soon but with "largest revenue impact later in the 1983-87period."
I thank Rudy for his patient journey through the journals and for thereport of his travels. I admire his eclecticism and agnosticism. Still I wishhe had worried less about constructing an economists’ consensus--youcan’t make a silk purse out of dozens of sows’ ears--and more about statinghis own considered views. In commenting on some of the subjects of Rudy’spaper, I shall be less bashful.
Life Cycles, Liquidity Constraints, and Bequest Motives
As Rudy’s account tells us, theories of saving conflict violently and sta-tistical tests are not powerful enough to choose among contradictory ex-tremes. So what should sensible fellows like Rudy and me believe?
What is the horizon of a consumer, household or individual? By hori-zon I mean the time ahead over which a consumer will spread an accretionto her current liquid resources. A snapshot cross-section would surely re-veal wide variation. Some consumers are living hand-to-mouth, some frompaycheck to paycheck. For some young families the horizon is the span ofyears until higher earnings will permit accumulation of liquid wealth.Thereafter their horizons will be remaining lifetimes or longer. Probablysome consumers’ horizons are in effect unbounded; these individuals arefree of liquidity constraints and, as Barro postulates, internalize descen-dants’ utilities and resources ad infinitum.
Because many persons who would like to consume today future wages,retirement benefits, and other assets cannot do so, Penner is right to rejectthe so-called equivalence theorem. Hence government deficits do absorbsaving for good or ill, and even temporary tax changes and transfers affectconsumption. Likewise Feldstein’s estimate of the displacement of produc-tive capital by "social security wealth" and other unfunded pension rights
*Sterling Professor of Economics at Yale University.
126
DISCUSSION TOBIN 127
is an upper limit. Liquidity-constrained workers cannot fully offset compul-sory pension contributions by dissaving, and retirees with horizons beyondtheir own lifetimes save part of their pensions. Their commonly observedstrategy--provide against the risk of prolonged life with expensive infir-mities, in the comforting knowledge that heirs will enjoy any remainder--isperfectly rational.
The life cycle model is a very useful tool if not taken literally. Themodel can easily handle liquidity constraints; it generally predicts thattheir presence will increase aggregate wealth and saving. It can also handlebequests and other intergenerational transfers, more easily if their amountsrather than descendants’ or parents’ utilities enter the individual’s utilityfunction. Without such amendments the model has trouble accounting forobserved aggregate accumulations of wealth, especially over periods whenretirement spans were much shorter than now.
What is the effect of the after-tax rate of return on aggregate wealthand saving? Theory can’t tell us, and econometric inference encounters inextreme measure the usual tedious litany of ambiguities. Yet many, manyeconomists including Rudolph Penner take for granted the premise of "sup-ply-side" policy that capital is overtaxed. If the feared explosion of publicdebt is to be averted and if, as Penner observes, the path of federal ex-penditures cannot be cut appreciably this decade, then taxing capital lessmeans taxing labor more. It may be true that the shift will increase wealthand welfare, but tighter argument and evidence than Penner reports arerequired.
I will illustrate the problem. The life cycle model implies that in asteady state of population and economic growth aggregate wealth is a mul-tiple of after-tax wage income. The numerical size of the multiplier de-pends on the age distribution, the age profile of wages, the incidence of li-quidity constraints, the utilities of consumption of adult and minorhousehold members at different ages, and other factors. Assuming theseconstant, the multiplier depends on the after-tax return to saving. To sim-plify, I assume the elasticity of this dependence to be constant. I assumealso that aggregate wealth is physical capital, that output is produced bycapital and labor and distributed to them ~_ la Cobb-Douglas, and that thegovernment purchases a constant share for public consumption financedby distinct proportional taxes on capital income and wage income.
A shift of tax burden from capital to labor will increase the wealthmultiplier assuming the relevant elasticity is positive, but decrease after-taxwages, the multiplicand. It will not necessarily increase steady-state stocksof wealth and capital. The pair of tax rates that maximizes these stocks de-pends on the parameters. I don’t know how anyone, even Larry Summers,can a priori dismiss as requiring an "odd utility function" the possibilitythat the elasticity of the multiplier with respect to after-tax return is so lowthat the maximum is reached with a wage tax rate lower than that on capi-
128 SAVING AND GOVERNMENT POLICY
tal income. Relegating algebra to a footnote~, I give here the intuitively sat-isfying solutions.
Let e be the fraction of output the government consumes, t~ and tw thetax rates on capital income and wage income respectively, a the elasticityof output with respect to capital and the pre-tax share of capital, and o theelasticity of the multiplier with respect to the after-tax return to saving.The wealth-maximizing values oft~ and t,~ are
t~* = e + (1 - e) (a -a(l°(l+o)- a)) and tw* = e - (1 e) (a~ ~ a-~ ~- b3- o(1 - o0) .
= tg > e >t,~ if o < a/(1 - a), and t~*< e < twThus t~ = e = t~*if o a/(1 - a), * * " *if o > a/(1 - a). For example, if a = ¼, the dividing line for o is ½. If o is¼, and e is ¼,tg-* - .55 and t~* = . 10. On the other hand, if o is 1 and e is ¼,t~’ = -.125 and t,*~ = .44.
Of course, maximization of wealth and capital is not welfare optimiza-tion. Other allocative effects of taxes are relevant, like the labor supply ef-fect Penner mentions. Moreover, one might seek an optimal capital stockdefined by the condition that its pre-tax rate of return equal the economy’sgrowth rate plus a social discount rate related to the growth rate of per ca-pita income due to technical progress. If this stock were obtainable giventhe government consumption share e, there might be various pairs of taxrates that would do the job.
Are governments and corporations mere veils? Are their savings anddissavings automatically offset by equal opposite shifts in household sav-ing? Sensible persons like Rudy and me will believe that institutions existbecause they matter and will not ascribe presumptive truth to Modigliani-Miller theorems, Ricardo-Barro equivalences, or Denison’s law of stock-holders’ "ultra-rationality." Agreeing with Penner, I have already ex-pressed my skepticism of the equivalence theorem for government finance.
1Let k be capital per unit of effective labor (per person-hour augmented in productivity bytechnical progress). Let net output per labor unit be U’. Pre-tax return to capital r is a/d-1,
and pre-tax wage w per labor unit is (1 - a)k% After-tax factor rewards are ugr and u~w whereui = 1 - ti. Steady state wealth demand is v*(u~’)° uww, where v is a constant determined bythe demographic and other factors mentioned in the text. The two basic equations are:
(1) v*(u~)° UwW = k wealth = capital
(2) aug + (1 - a) uw = 1 - e government budget balance
Substituting the expressions for r and w in terms of k into (1) and taking logs gives:
(3) oln aug + In (1 -oOuw + In v = (1 -a)(1 +o)ln k
Assuming o > - 1, k will be maximized by maximizing the left hand side of (3) subject to theconstraint (2). This gives the results in the text.
DISCUSSION TOBIN 129
Similar reasons for skepticism apply to corporate saving: differences be-tween companies and their owners in borrowing rates, liquidity constraints,taxes, and objectives. Retained earnings do not translate into additionalwealth for shareowners unless and until they raise market values of shares.If and as they do, the extra wealth will increase household consumption atthe expense of personal saving. But the process is slow and uncertain. Un-fortunately, there is little evidence that households have saved extra tomake up for the real capital losses they have suffered on the stocks andbonds they directly or indirectly own in the recent past. That, by the way,casts doubt on the relevance to crowding-out concerns of inflation-account-ing corrections interest to outlays in the federal budget.
The Federal Budget and the Macroeconomic Outlook
! turn to Penner’s discussion of the current scene. I will not refrainfrom calling attention to the irony of the general preoccupation with theadequacy of national saving at a time when the country’s propensity to saveis patently not the constraint on the formation of capital. Who is crowdingout what? Tight monetary policy brought record high real interest rates,devastated interest-sensitive spending, and generated the severe recession.The recession further damaged capital formation and ballooned federalbudget deficits. To complain that those deficits are crowding out private in-vestment by raising interest rates is to tell the story inside out.
A two-point reduction of unemployment would increase GNP by about4 percent, some $120 billion, of which about half would be additional sav-ing by governments, businesses, and households. Does anyone know a sup-ply-side incentive or a deficit-reducing measure that could do as much forsaving and investment as soon?
I know of course that the Fed didn’t bring the economy and investmentto their present low states for the hell of it. They did it to conquer inflation,and in their zeal probably did more than they intended. I just think we andthey should be clear about where to charge the costs, not shift them to thefederal budget. Rudy Penner is, I think, overgentle to what it is fair to callthe Feldstein policy mix, tight money and high real interest r.ates to shift re-sources from consumer durables and housing to business capital favored byincentive tax cuts. Just as wet-blanket Keynesians foretold in early 1981,the strategy didn’t work.
Forecasters looking for bright spots in the outlook for the next fivequarters invariably seize on "the consumer," buttressed by tax cuts thisyear and next and by gains in indexed transfers, and on the beginnings ofthe defense build-up. Yet economists of many camps, financial pundits withunanimity, and liberal and old-line conservative politicians of both partiesjoined the Administration in hailing recently enacted tax increases as a bigand necessary step toward recovery. Though the legislation will hit someconsumption, its main impact is to diminish business saving and investmentby withdrawing about half the concessions to capital income enacted only ayear before. If the perceived danger was that government borrowing wouldcongest the financial markets and crowd out business investment, it is hard
130 SAVING AND GOVERNMENT POLICY
to see how the 1982 bill was a remedy. Businesses that curtail investmentplans are crowded out for sure. Businesses that maintain them will in effectborrow to pay taxes; their demands on credit markets replace those of theTreasury. It would be nice if people who worry about the budget would beclear about their objectives: recovery? capital formation? politicalcosmetics?
Like Rudy, I am disturbed by the prospect that deficits even in pros-perity will combine with high interest rates to raise the debt/GNP ratiothroughout the decade. I attach an appendix on the dynamics of this ratio,with calculations showing how dramatically Reagan fiscal policy reversesthe history of the past 30 years. Yet hysteria may be not only premature, sofar is the economy from full recovery, but also overdone. My calculationdoes not indicate Sargent-Wallace instability, a real net interest rate greaterthan the economy’s growth rate. If, as my table indicates, the ratio should inthe next 10 years return to its level of the 1950s, around 50 percent, this isnot a catastrophe. As Penner says, there are some natural correctives shortof hyperinflation. The defense build-up, we can hope, is a bulge; if not, theneed for taxes to pay for it will become pretty clear.
An interesting analytical question raised in Penner’s discussion iswhether "measures to reduce deficits in the 1984-87 period would actuallyhave a stimulative impact in 1983 even within the context of a Keynesianmodel." Rudy’s tentative "yes" is based on the stimulative effect of reduc-ing uncertainty: Investors are pretty sure those deficits will be corrected,but they don’t know how. They would go forward today if they knew thecorrections would be soundly made. Does that condition cover additionaldoses of 1982 "fiscal responsibility" medicine? I was stimulated to investi-gate the question in a more Keynesian spirit.
Consider, as in Rudy’s question, two periods in neither of whici, isthere full employment. In each period the short-term interest rate r de-pends solely on contemporaneous GNP Y and on the stock of transactionsmoney M, according to the familiar LM relation. But the position of thefirst period IS curve depends on the correctly expected outcomes (Y~, r2) ofthe later period. The expectations allow for the effects of fiscal and mone-tary policies in the second period.
Investment and consumption in period 1 will be lower the higher is theexpected interest rate r2; a higher future short rate deters current spendingby lowering the present values of earnings from capital and labor. The pe-riod 1 IS curve will, however, be shifted right by increases in expectedGNP Yz, which raise those expected earnings. Given M2, rz and Y~ are tiedtogether by the second period LM curve. If it is fairly flat, moving up and/or right along it will shift first period IS to the right; the effect of higher Y~will dominate that of higher r~. But if LM is quite steep the reverse will betrue. Moving down and/or left along LM will shift first period IS to theright. This latter is what a correctly anticipated tightening of period 2 fiscalpolicy would accomplish. In the steep LM scenario future budget correc-tions increase aggregate demand today.
However, in this case the LM curve of period 1 will also be steep. Mostof the effect will be to raise r~ rather than Y~. Nothing in this Keynesian
DISCUSSION TOBIN 131
scenario supports the common story of the financial press, by which futurefiscal tightening lowers short interest rates both tomorrow and today. Andnothing in my story "stands Keynes on his head." The major effect of tight-ening fiscal policy later is to weaken aggregate demand then, which may ormay not be a good idea. The expectational effect, possibly strengtheningaggregate demand today, is at best a partial offset. In contrast, a future eas-ing of monetary policy, raising M2, would lift Y in both periods.
Figure 1 is a picture worth the above two hundred words.Full discussion of a two- or multi-period model of this kind is beyond
the scope of this comment. There are other interrelations between periods.Stocks of wealth, capital, and public debt carried over from one period tothe next affect behavior in the later period. So do price level and inflationrate transmitted from one period to the next, especially if nominal M tar-gets remain fixed. But I think the simple story of the previous paragraph isthe major mechanism relevant to the question Penner raised.
As I mentioned at the start, Rudy despaired of finding or building con-sensus on whether fiscal tightening should be accompanied by monetaryeasing. He did not even tell us his own view. I think monetary policy is thekey to recovery. Tightening of fiscal policy will, to be sure, help to providea policy mix more favorable to capital formation. But the effort will bewasted unless the Fed engineers low enough real interest rates to absorb ininvestment the resources released by government, its taxpayers, and itstransferees--plus a big fraction of the resources made idle by the reces-sion. I can see the logic of those who do not want to see recovery until infla-tion is completely vanquished. I cannot understand the logic of those whowould welcome recovery should it occur by a miraculous surge of monetaryvelocity but reject equivalent growth of money supply. They fear that aburst of money supply growth, albeit temporary, would be entirely dissi-pated in renewed inflation and have no real effects. Or they fear that enoughothers believe primitive monetarist stories to make them come true. Pennerdoesn’t count those expectations as rational, and neither do I. It is a sad daywhen irrational models, for which our profession is in large measure re-sponsible, immobilize macroeconomic policy.
Appendix: Fiscal and Monetary Policies and the Dynamics of Federal Debt
The present combination of high interest rates and large budget defi-cits raises the question whether deficits and debt will grow faster than theeconomy. Does a one dollar deficit increase the interest service on the debtso much that, with given expenditure and tax programs, the deficit and thedebt are higher relative to GNP the following year?
Suppose that the budget of year t involves a primary deficit of xt p~ y~,where Pt is the price of commodities and Yt is real GNP. The primary deficitexcludes outlays for interest on the debt and receipts from taxes on debt in-terest. Net interest outlay is i~Bt_~, where Bt_, is the outstanding stock ofpublicly held interest-bearing debt and i~ is the nominal interest rate paidon it allowing for the tax recoupments. The total debt, including that part,
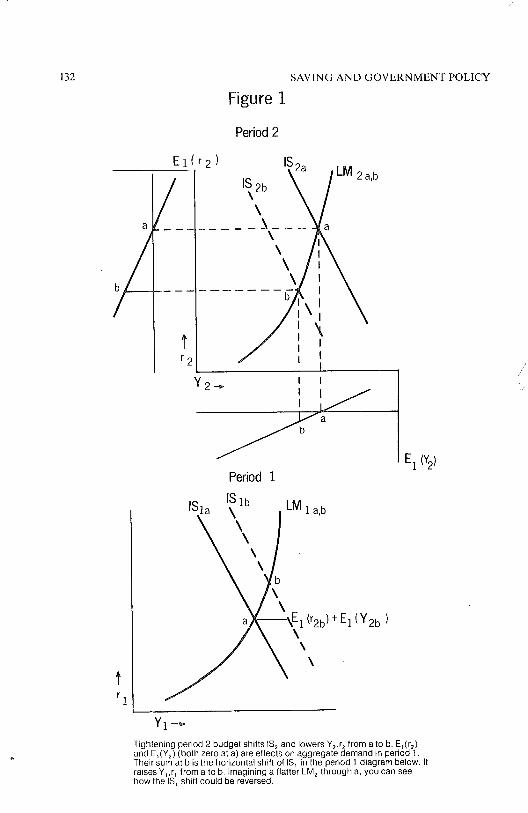
132 SAVING AND GOVERNMENT POLICY
Figure 1
Period 2
E1 r2)LM 2a,b
Period 1E1 (Y2)
LM 1 a,b
(r2b) + E; (Y2b)\
\
Tighlening period 2 budget shifts IS~ and lowers Y2,r2 from a to b. E~(r2)and E~(Y2) (both zero at a) are effects on aggregate demand in period 1.Their sum at b is the horizonfal shift of IS~ in the period 1 diagram below. Ifraises Y~ ,q from a to b. Imagining a flatler LM~ through a, you can seehow the IS~ shill could be reversed.
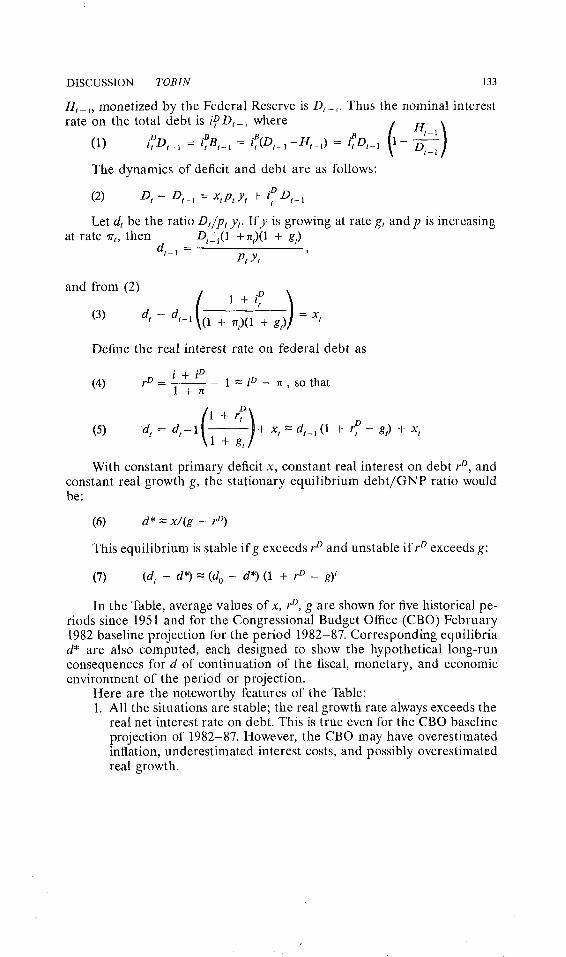
DISCUSSION TOBIN 133
Ht_,, monetized by the Federal Reserve is D~_,. Thus the nominal interestrate on the total debt is i~D,_, where [
(1) .o .B = i~(Dt l-Ht 1) .Bl1 D--~_~)-ttDt_1 = ltBt_1 _ _ = ttDt_1 -
The dynamics of deficit and debt are as follows:
(2) Ot - Dr- 1 = Xl Pt Yt + i~ Dt_ ~
Let dt be the ratio D~/pt y~. Ify is growing at rate g~ and p is increasingat rate ~r~, then Dt2~(1 +nt)(1 + gt)
O~t_1 ~ ~Pt Yt
and from (2)
(3) dt - dt-1 1 + rtt)(1 + gt) = x:
Define the real interest rate on federal debt as
i + i~9(4) r°=-- 1 = iv- rt , so thatl+n
(5) d~ = dr-1 -- + x,=d,_~(1 + r~- gt) + x,\1 +
With constant primary deficit x, constant real interest on debt rD, andconstant real growth g, the stationary equilibrium debt/GNP ratio wouldbe:
(6) d* -~ x/(g - rD)
This equilibrium is stable ifg exceeds rD and unstable ifr° exceeds g:
(7) (d, - d*)= (do - d*)(1 + rD - g)’
In the Table, average values of x, 1a), g are shown for five historical pe-riods since 1951 and for the Congressional Budget Office (CBO) February1982 baseline projection for the period 1982-87. Corresponding equilibriad* are also computed, each designed to show the hypothetical long-runconsequences for d of continuation of the fiscal, monetary, and economicenvironment of the period or projection.
Here are the noteworthy features of the Table:1. All the situations are stable; the real growth rate always exceeds the
real net interest rate on debt. This is true even for the CBO baselineprojection of 1982-87. However, the CBO may have overestimatedinflation, underestimated interest costs, and possibly overestimatedreal growth.

134 SAVING AND GOVERNMENT POLICY
2. Only in 1980-81 and in CBO 1982-87 projection is the initial debt/GNP ratio smaller than the hypothetical equilibrium. Only in thosecases, then, has the constellation indicated a value of d increasingover time. In the case of the CBO projection, which implies an even-tual debt nearly twice GNP, the rise in d is quite rapid.
3. The primary deficit was on average negative in the first two periods,from 1952 to 1966, and the combination of high real growth andnegative rD brought rapid reduction of the high debt/GNP ratio in-herited from World War II. This continued through most of the next15 years. Even though the primary deficit turned positive, the realinterest rate was very favorable.
4. After the dramatic increase in monetization (about 50 percent ofdeficits between 1958 and 1974), Fed policy has reduced seignorageto negligible amounts. This is of course a major reason for the rise inr° to positive values.
5. These calculations do not touch on the asset-demand side of equa-tions, i.e., what debt interest rates are necessary to induce the publicto hold debt in the indicated ratios to GNE It could well be that theincreasing rates necessary in the final column could impart instabil-ity to the process.
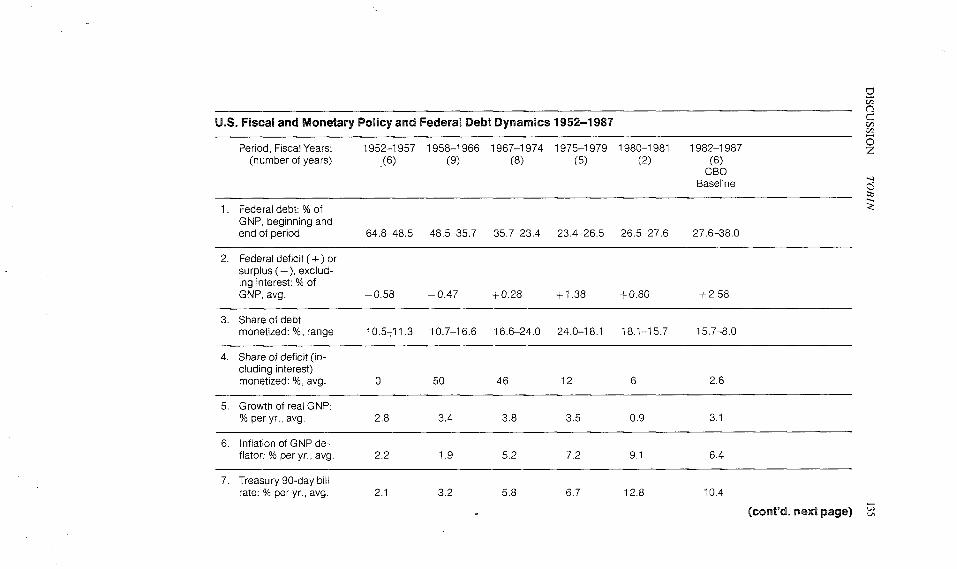
U.S. Fiscal and Monetary Policy and Federal Debt Dynamics 1952-1987
Period, Fiscal Years: 1952-1957 1958-1966 1967-1974 1975-1979 1980-1981 1982-1987(number of years) .(6) (9) (8) (5) (2) (6)
CBOBaseline
1. Federal debt: % ofGNP, beginning andend of period 64.8~,8.5 48.5-35.7 35.7-23.4 23.4-26.5 26.5-27.6 27.6-38.0
2. Federal deficit (+) orsurplus (-), exclud-ing interest: % ofGNP, avg. -0.58 -0.47 +0.28 +1.38 +0.80 +2.58
3. Share of debtmonetized: %, range 10.5~11.3 10.7-16.6 16.6-24.0 24.0-18.1 18.1-15.7 15.7-8.0
4. Share of deficit (in-cluding interest)monetized: %, avg. 0 50 46 12 6 2.6
5. Growth of real GNP:% per yr., avg. 2.8 3.4 3.8 3.5 0.9 3.1
6. Inflation of GNP de-flator: % per yr., avg. 2.2 1.9 5.2 7.2 9.1 6.4
7. Treasury 90-day billrate: % per yr., avg. 2.1 3.2 5.8 6.7 12.8 10.4
(cont’d. next page)
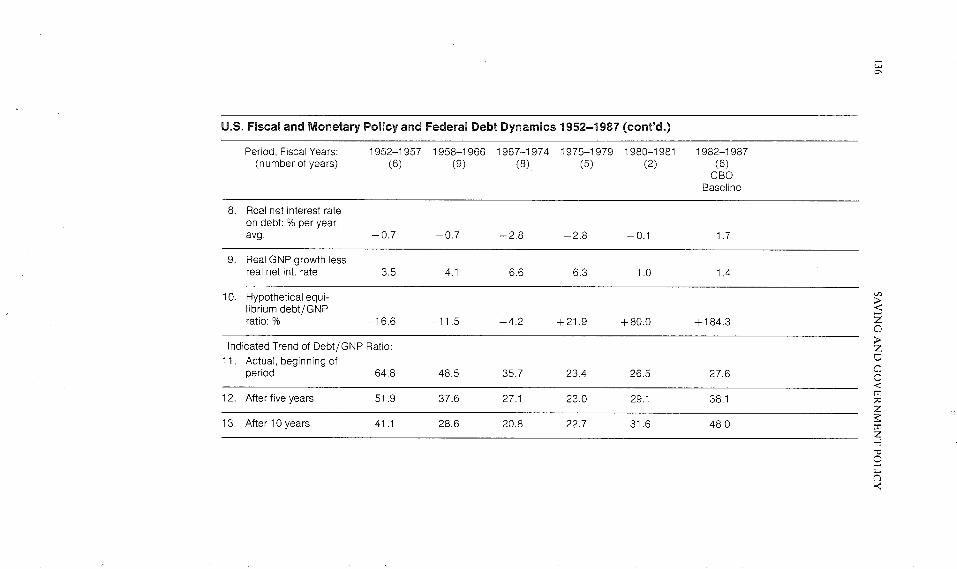
U.S. Fiscal and Monetary Policy and Federal Deb~ Dynamics 1952-1987 (con~’d.)
Period, Fiscal Years: 1952-1957 1958-1966 1967-1974 1975-!979 1980-1981 1982-1987(number of years) (6) (9) (8) (5) (2) (6)
CBOBaseline
8. Real net interest rateon debt: % per year,avg. -0.7 -0.7 -2.8 -2.8 -0.1 1.7
9. Real GNP growth lessreal net int. rate 3.5 4.1 6.6 6.3 1.0 1.4
10. Hypothetical equi-librium debt/GNPratio: % - 16.6 - 11.5 4- 4.2 + 21.9 4- 80.0 + 184.3
Indicated Trend of Debt/GNP Ratio:11. Actual, beginning of
period 64.8 48.5 35.7 23.4 26.5 27.6
12. After five years 51.9 37.6 27.1 23.0 29.1 38.1
13. After 10 years 41.1 28.6 20.8 22.7 31.6 48.0
>z
©<
z
z
©

NOTES1. Debt held by Federal Reserve and by nonfederal owners, par value, at end of fiscal year, relative to nominal GNP for fiscal year, from
fiscal year preceding the period to final year of period.2. Sum of National Income Accounts deficits less surpluses for period, relative to sum of nominal GNP for period. Debt interest outlays
(calculated by subtracting Federal Reserve payments to Treasury from "Net Interest" line of budget) are excluded in calculating defi-cit or surplus, as are estimated tax receipts recouped from such outlays, estimated at 25 percent.
3. Monetized debt is the amount held by the Federal Reserve. The denominator of the ratio is, as in line t, the monetized debt plus thedebt held outside the federal government.
4. The increment of monetized debt from beginning to end of period, divided by the increment of total debt as defined in line 1.8. [line 7 x .75 × (100 - line 4)/100] - line 6. The average Treasury bill rate for each period is taken to be the permanent cost of
financing new debt and refinancing old debt, which is reckoned at par value, given the conditions and policies of the period. It ismultiplied by .75 on the assumption that the Treasury recoups 25 percent of nominal interest outlays in taxes. The third factor reducesthe net interest cost for "seignorage," the fraction of the debt monetized by the Federal Reserve. Subtracting line 6 converts the netnominal interest rate on the debt to a real rate.
9. line 5 - line 8.10. line 2/line 9. A negative figure means that the hypothetical equilibrium debt/GNP ratio is negative, i.e., the government would be a
net lender to the private sector.12, 13. [line 11 - line 10] X [(100 + line9)/100]n + line 10. See text.
National Saving and International~ves~ment
Norman S. Fieleke*
In 1981 a number of changes were made in federal tax law, partly witha view to stimulating private saving. For example, the reductions in per-sonal income tax rates, the tax-exemption for interest on "All-Savers" cer-tificates, and the liberalization of the use of Individual Retirement Ac-counts are measures that tend to raise the after-tax rate of return on capitalinvested by individuals. For business, tax changes designed to enhanceprofitability include liberalization of provisions relating to depreciationand the investment tax credit. Thus, according to the Council of EconomicAdvisers, "Much of the Administration’s tax program is designed to in-crease the private saving of the Nation. As a consequence, both public andprivate borrowing will be accommodated more easily.’’~
Aside from the issue of whether the nation’s saving will rise in re-sponse to these measures, any such rise will fail to accommodate more do-mestic borrowing if the increased saving is invested abroad. What, then,does experience teach us about such international capital flows? If savingincreases in one country, does the increase get invested primarily in thatcountry, or is it dispersed abroad via integrated and efficient capital mar-kets? On the other hand, if a country experiences a decline in saving, per-haps because of increased government deficits, is most of that decline offsetby increased borrowing from abroad?
Questions such as these are the focus of this paper. The first sectionreviews the most relevant literature. Thereafter, some exploratory regres-sion analysis for OECD countries is undertaken, and historical data forthese countries are then considered. Finally, the analysis is extended inpart to a much larger sample of countries.
The State of the Inquiry
For at least the past two decades--indeed, since the marked advanceof convertibility in 1958--many scholars as well as practitioners have mar-velled at the seeming mobility of capital throughout most of the industrial-ized world, a mobility manifested by the behavior of particular interest
*Vice President and Economist, Federal Reserve Bank of Boston. I have benefited fromcommunication with Robert Aliber, Jeffrey Bergstrand, Barry Eichengreen, Jeffrey Sachs, andPeter Sturm, but I am responsible for any errors. The views in this paper are my own, not nec-essarily those of the Federal Reserve Bank of Boston. Viviana Rogers was research assistantfor this project.
~ Economic Report of the President Together with the Annual Report of the Council of Eco-nomic Advisers (1982), p. 96.
138
SAVING AND INTERNATIONAL INVESTMENT FIELEKE 139
rates as well as by actual capital movements. Among practitioners, nonehas experienced more convincing demonstrations of capital mobility thanthe monetary authorities who sought to maintain interest rates or foreignexchange rates at patently artificial levels. For example, on June 23, 1972,nearly $900 million poured into the Deutsche Bundesbank within the firsthour of foreign exchange trading, leading the Bank temporarily to abandonits effort to resist an appreciation of the mark; on March 1, 1973, the Bankabsorbed another $2.6 billion before again surrendering to market forces.2More recently, foreign officials have publicly protested against U.S. fiscal-monetary policy for putting upward pressure under foreign interest rates.In addition to such evidence on capital mobility from officialdom, numer-ous other indicators could be marshalled, including the fact that 26 percentof the total equity of Canadian corporations in 1980 was held by foreign-ers? The repeated references to the billions, or hundreds of billions, of dol-lars "sloshing around" in the Euromarkets and the close correlation ofshort-term interest rates (after adjustment for cost of forward cover) inChart 1 also testify to the mobility of capital between the marketsconcerned.
Considerations such as these have led many to conclude that capital ishighly mobile internationally, especially between the industrial countries.As Whitman has noted, "... much of the recent analytical work in interna-tional economics has moved away from closed-economy models to modelsbased on the fundamental assumption of a highly integrated world econ-omy." 4 In the same paper this point is illustrated by her own analysis,wherein she maintains, "Finally, there is the fact that flexible exchangerates provide only limited insulation against foreign disturbances in a worldof capital mobility." s More recently, McKinnon (1981, p. 533) has argued,"The development of the eurocurrency market now enables both firms andgovernments to borrow (or lend) internationally, on a large scale, for longperiods in a variety of convertible currencies. Clearly, the international in-tegration of capital markets in the 1980s parallels that prevailing in worldtrade in goods and services, whereas in the late 1940s national capital mar-kets were segmented by exchange controls and eurocurrency transactingdid not yet exist."
In a recent pathbreaking article Martin Feldstein and Charles Horioka(1980) have reached a different conclusion; they have found capital to be soimmobile in the long run that any new saving in an industrial country typi-cally gets invested almost exclusively in that same country, with little ornone being invested abroad! The seeming contrast between their resultsand the prevailing consensus provides the chief stimulus for this paper.
2Federal Reserve Bulletin, September 1972~ p. 765, and Ma1"ch 1973, pp. 148-49.3For 1975 the comparable figure was 35 percent. These data were supplied by staff of the
Bank of Canada and are based on Statistics Canada, Financial Flow Accounts.4Whitman (1976), p. 183.Slbid, p. 207,
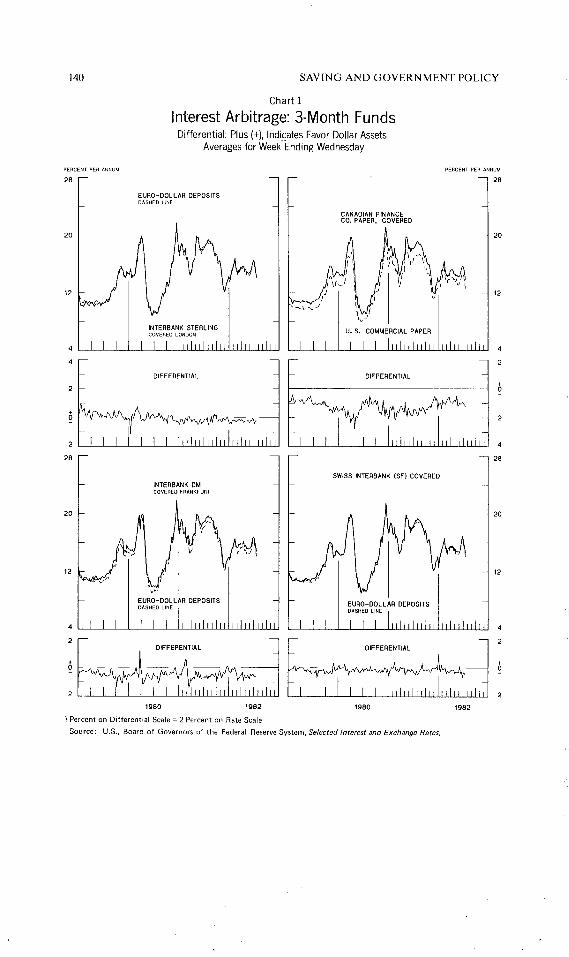
140 SAVING AND GOVERNMENT POLICY
Chart 1
Interest Arbitrage: 3-Month FundsDifferential: Plus (+), Indicates Favor Dollar Assets
Averages for Week Ending Wednesday
PERCENT PER ANNUM
20
12
4
EURO-DOLLAR DEPOSITSDASHED L~NE
CANADIAN FINANCECO. PAPER, COVERED
PERCENT PER ANNUM
-- 28
2O
12
4
2
4
28
SWISS INTERBANK (SF) COVERED--
20 20
DIFFERENTIAL
1980 1982 1980 1982
1 Percent on Differential Scale = 2 Percent on Rate ScaleSource: U.S., Board of Governors of the Federal Reserve System, Se~cted Interest and Exchange Rate~
SAVING AND INTERNATIONAL INVESTMENT FIELEKE 141
To launch the formal analysis, consider that
GNS = GNP - C + R,
where GNS is gross national saving, GNP is gross national product, C is allconsumption, public and private, and R represents net remittance andother unilateral transfer receipts from abroad. Now,
GNP = C + GDI + X- M + D,
where GDI is gross domestic investment, X and M are exports and im-ports, respectively, of goods and services (excluding factor services), and Dis dividend and other net receipts from factor services supplied other na-tions. Thus,
GNS = GDI ÷ X- M ÷ D ÷ R, orGNS = GDI ÷ NFI,
where NFI is net foreign investment, or the addition to net claims on for-eigners (or, essentially, the current account of the balance of payments);the gross saving of a nation can be invested at home or abroad.
To assess how an increment of saving within a nation gets divided be-tween domestic and foreign investment, Feldstein and Horioka estimatedthe following equation:
(1) (GDI/GDP)i = a ÷ fl(GNS/GDP)i,
where GDP is gross domestic product, or GNP -- D, and both (GDI/GDP)iand (GNS/GDP)i are average ratios for country i of the correspondingyearly ratios over long periods; one regression employed the average ratiosfor 1960-74, and others employed the average ratios for 1960-64, 1965-69,and 1970-74.6 Thus, the analysis sought to determine how sustained differ-ences in saving rates from one country to the next influence the corre-sponding investment rates, and in this long-run context the observed varia-tion in saving rates was assumed to be exogenous, reflecting basic structuraldifferences among countries rather than short-run phenomena affectingsaving and investment jointly. Equation (1) was estimated with data for 16OECD countries, and a variant employed net saving and investment inplace of gross saving and investment.
From this regression analysis Feldstein and Horioka found that the es-timated value of fl in equation (1) did not differ significantly from one,whether saving and investment were measured gross or net of depreciationallowances. The conclusion was that "nearly all of incremental saving re-
6Although Feldstein and Horioka presented their explanatory variable as (GDS!GDP),where GDS is gross domestic saving, their measure of saving is called gross national saving inpublications of the United Nations and the World Bank, and a different definition is given forgross domestic saving. The Feldstein-Horioka measure of saving is the one used in the UnitedNations System of National Accounts (S.N.A.), and this measure is characterized as "nationalsaving" in the U.N. Yearbook of National Accounts Statistics, 1979, Volume l, p. XXV. Grossnational saving is defined as GDI + X - M + D + R, while gross domestic saving is GDI +X - M; see The World Bank, World Tables, 2d ed. (1980, p. 7) and World Development Report1981 (p. 185).
142 SAVING AND GOVERNMENT POLICY
mains in the country of origin" (p. 317). A subsequent paper by Feldstein(1982) offers further support for this view.
This remarkable conclusion has significant implications for policy.First, policies to stimulate national saving may have more domestic appealif it is likely that any increased saving will be invested at home; other thingsequal, a nation receives a higher return on its saving invested at home thanon its saving invested abroad because foreign taxes are collected on earn-ings from investments abroad. Second, if saving--and more generally, cap-ital--is unlikely to be invested abroad, that fact is relevant for tax policy,because a tax on income of capital will not induce a capital exodus and acorresponding shift of the tax burden to domestic labor. Finally, eventhough a current-account balance of payments deficit corresponds to ashortfall of national saving below domestic investment, there will be littlereason to try to reduce such a deficit by enlarging national saving if vir-tually all of any increased saving is allocated to domestic investment. Thesedeductions, like the regression analysis, apply to the long run; Feldsteinand Horioka recognize the evidence that capital does flow across nationalboundaries in the short run in response to changing short-term covered-interest differentials, but they argue that in the long run capital is muchless responsive to yield differentials because of the greater risk and controlsto which long-term international investments are subjected.
While it may be appropriate, in this long-run context, to treat saving asexogenous, with investment following along, such treatment would seemmore questionable in an intermediate or short-run context. Indeed, Sachs(1981) has argued that in the intermediate term changes in domestic invest-ment rather than saving should be taken as the central exogenous variablefor purposes of explaining international capital flows, and that at least forthis time horizon changes in domestic investment tend to induce changes inthe current account of the balance of payments.7 The present paper, in fo-cusing on the role of exogenous changes in national saving, retains thelonger run perspective adopted by Feldstein and Horioka.
Abstracting from the time horizon of the analysis, Harberger (1980)has argued that domestic investment is more likely to diverge widely fromsaving in a small (and poor) country than in a large (and wealthy) country,just as they are more likely to diverge widely in a city block than for an en-tire city. Since Feldstein and Horioka include in their analysis only OECDcountries, which have relatively large incomes (both in total and per cap-ita), their results may be biased, or unrepresentative of the wider world.
The Basic Model
To provide a starting point for theorizing about the relationship be-tween net foreign investment, national saving, and domestic investment, itmay be helpful to employ some simple geometry. At the outset, assume aworld of perfect competition without any market failures (i.e., without ex-
7For comment by Feldstein on Sachs’s analysis, see Feldstein (1982, pp. 27-29).
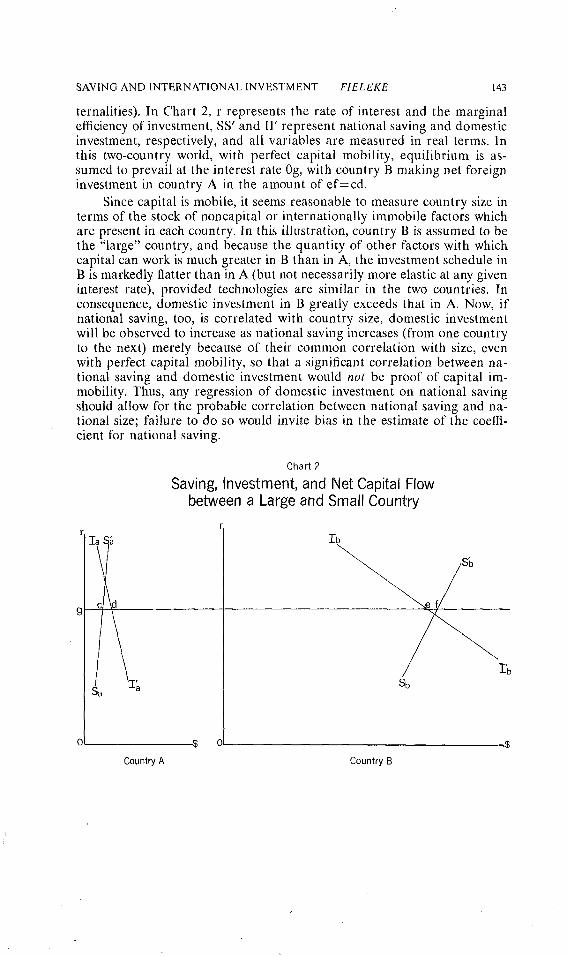
SAVING AND INTERNATIONAL INVESTMENT FIELEKE 143
ternalities)o In Chart 2, r represents the rate of interest and the marginalefficiency of investment, SS’ and II’ represent national saving and domesticinvestment, respectively, and all variables are measured in real terms. Inthis two-country world, with perfect capital mobility, equilibrium is as-sumed to prevail at the interest rate 0g, with country B making net foreigninvestment in country A in the amount of ef=cd.
Since capital is mobile, it seems reasonable to measure country size interms of the stock of noncapital or internationally immobile factors whichare present in each country. In this illustration, country B is assumed to bethe "large" country, and because the quantity of other factors with whichcapital can work is much greater in B than in A, the investment schedule inB is markedly flatter than in A (but not necessarily more elastic at any giveninterest rate), provided technologies are similar in the two countries. Inconsequence, domestic investment in B greatly exceeds that in A. Now, ifnational saving, too, is correlated with country size, domestic investmentwill be observed to increase as national saving increases (from one countryto the next) merely because of their common correlation with size, evenwith perfect capital mobility, so that a significant correlation between na-tional saving and domestic investment would not be proof of capital im-mobility. Thus, any regression of domestic investment on national savingshould allow for the probable correlation between national saving and na-tional size; failure to do so would invite bias in the estimate of the coeffi-cient for national saving.
Chart 2
Saving, Investment, and Net Capital Flowbetween a Large and Small Country
Ib
~$Country A Country B
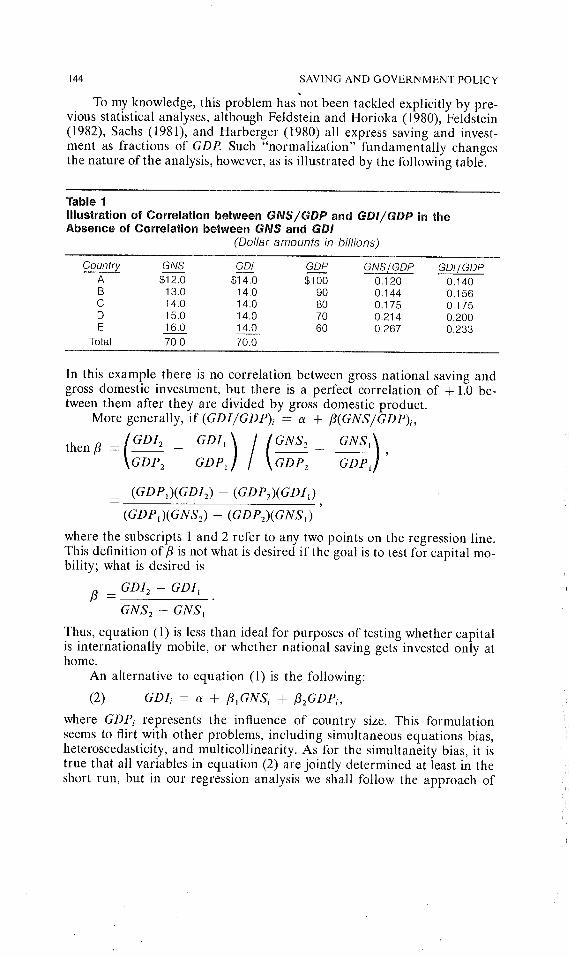
144 SAV1NG AND GOVERNMENT POLICY
To my knowledge, this problem has "not been tackled explicitly by pre-vious statistical analyses, although Feldstein and Horioka (1980), Feldstein(1982), Sachs (1981), and Harberger (1980) all express saving and invest-ment as fractions of GDP. Such "normalization" fundamentally changesthe nature of the analysis, however, as is illustrated by the following table.
Table 1Illustration of Correlation between GlffS/GDP and GDI/GDP in theAbsence of Correlation between GNS and GDI
(Dollar amounts in billions)
Country GNS GD__.J GDP GNS/GOP GDI/GDPA $12.0 $14,0 $100 0,120 0.140B 13,0 14.0 90 0.144 0.156C 14.0 14.0 80 0.175 0,175D 15.0 14,0 70 0.214 0.200E 16.0 14.0 60 0.267 0.233
Total 70.0 70.0
In this example there is no correlation between gross national saving andgross domestic investment, but there is a perfect correlation of ÷ 1.0 be-tween them after they are divided by gross domestic product.
More generally, if (GDI/GDP)i = o~ + f!(GNS/GDP)i,
then/~ =(GDI2 -GDI,)/ (GNS2 _
GNSII’
(GDP,)(GDI~) -- (GDP2)(GDI0
(GDP,)(GNS~) - (GDPz)(GNS,)
where the subscripts 1 and 2 refer to any two points on the regression line.This definition off! is not what is desired if the goal is to test for capital mo-bility; what is desired is
t8 = GDIz - GDI~
GNS2 - GNS~
Thus, equation (1) is less than ideal for purposes of testing whether capitalis internationally mobile, or whether national saving gets invested only athome.
An alternative to equation (1) is the following:
(2) GDIi = ~ + ~GNSi + ~GDPi,
where GDPi represents the influence of country size. This formulationseems to flirt with other problems, including simultaneous equations bias,heteroscedasticity, and multicollinearity. As for the simultaneity bias, it istrue that all variables in equation (2) are jointly determined at least in theshort run, but in our regression analysis we shall follow the approach of
SAVING AND INTERNATIONAL INVESTMENT F1ELEKE 145
Feldstein and Horioka and employ average long-period values of these var-iables, on the assumption that in the long run the observed variation in sav-ing and in domestic product is exogenous, corresponding to fundamentalintercountry differences in resources, time preferences, and the like, ratherthan to transient disturbances jointly influencing saving, domestic invest-ment, and domestic product. Thus, GDIi, GNSi, and GDPi are each takenas an annual average of 1971-1978 (a period which neither begins nor endswith a business cycle peak or trough for any of the countries included). Aswill be indicated, neither heteroscedasticity nor multicollinearity seems toaffect the regression results in a crucial way.
Regression Results for OECD Countries
For the variables in equation (2) it is desirable to have data expressedin a currency unit which has the same purchasing power from one countryto the next, and it is well known that use of market-determined foreign ex-change rates to convert units of one currency into another will generallyfail to yield such data. Fortunately, the OECD has recently published pur-chasing power parities for a number of OECD countries, and we have usedthese PPPs in lieu of market exchange rates to derive data expressed in dol-lars of comparable purchasing power across countries; these data were thendeflated by a price index for U.S. gross domestic product to obtain data ofconstant purchasing power over time.8 The desired data could be obtainedfor 13 OECD countries, including all of the "Big Seven" except Canada.9
The method of ordinary least squares was then used to estimate equa-tion (2) as well as several variants. The results are presented in Table 2,where GDI and NDI refer to gross and net domestic investment, respec-tively, and GNS and NNS refer to gross and net national saving, respec-tively. Because of correlation between GDP and each of the savings varia-bles, the coefficient for each explanatory variable is larger if it is used as thesole explanatory variable (aside from the intercept). However, when bothGDP and saving are included as explanatory variables, the coefficients onboth remain significant at the 0.01 level. This outcome suggests that colline-arity does not invalidate the analysis; it is also consistent with the view thata measure of country size, such as GDP, should be included.
8The price index for GDP was used because the PPPs are for GDP, because the index iscompatible with the S.N.A. (System of National Accounts), and because price indexes for theGDP components used in the regressions were not available in terms of the S.N,A.
9Countries were included only if data were available for them in terms of the "presentSystem of National Accounts;" they are listed in the note to Table 2.
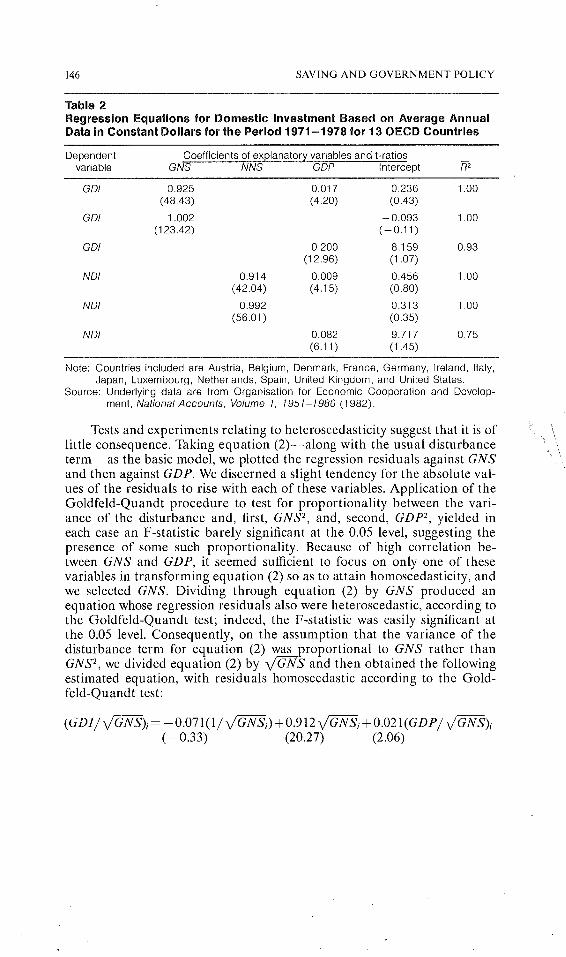
146 SAVING AND GOVERNMENT POLICY
Table 2Regression Equations for Domestic Investment Based on Average AnnualData in Constant Dollars for the Period 1971-1978 for 13 OECD Countries
Dependent Coefficients of explanatory variables and t-ratiosvariable GNS NNS GDP Intercept
GDI 0,925 0.017 0,236 1.00(48,43) (4,20) (0.43)
GDI 1.002 -0.093 1,00(123.42) (-0.11)
GDI 0.200 8.159 0,93(12.96) (1.07)
NDI 0.914 0,009 0.456 1.00(42.04) (4.15) (0.80)
NDI 0.992 0.313 1,00(56.01) (0.35)
NDI 0.082 9.717 0.75(6.11 ) (1.45)
Note: Countries included are Austria, Belgium, Denmark, France, Germany, Ireland, Italy,Japan, Luxembourg, Netherlands, Spain, United Kingdom, and United States.
Source: Underlying data are from Organisation for Economic Cooperation and Develop-ment, National Accounts, Volume 1, 1951 1980 (1982).
Tests and experiments relating to heteroscedasticity suggest that it is oflittle consequence. Taking equation (2)--along with the usual disturbanceterm--as the basic model, we plotted the regression residuals against GNSand then against GDP. We discerned a slight tendency for the absolute val-ues of the residuals to rise with each of these variables. Application of theGoldfeld-Quandt procedure to test for proportionality between the vari-ance of the disturbance and, first, GNSz, and, second, GDP2, yielded ineach case an F-statistic barely significant at the 0.05 level, suggesting thepresence of some such proportionality. Because of high correlation be-tween GNS and GDP, it seemed sufficient to focus on only one of thesevariables in transforming equation (2) so as to attain homoscedasticity, andwe selected GNS. Dividing through equation (2) by GNS produced anequation whose regression residuals also were heteroscedastic, according tothe Goldfeld-Quandt test; indeed, the F-statistic was easily significant atthe 0.05 level. Consequently, on the assumption that the variance of the
wasdisturbance term for equation (2) ,__.___proportional to GNS rather thanGNS2, we divided equation (2) by ~/GNS and then obtained the followingestimated equation, with residuals homoscedastic according to the Gold-feld-Quandt test:
(GDI/ G’~~--~)~= -O.071(1/ G-v/-~-~i)+O.912 G’~’~’N-~,.+O.O21(GDP/ G~)i(-0.33) (20.27) (2.06)
SAVING AND INTERNATIONAL INVESTMENT FIELEKE 147
Note that this kind of transformation is not the same as the "normaliza-tion" represented by equation (1), which retains the traditional intercept.Because the relevant coefficients in this transformation of equation (2) aresignifi cant at the 0.05 level (under the one-tail test appropriate) and are vir-tually identical to the corresponding coefficients reported for equation (2)in Table 2, we conclude that heteroscedasticity is probably of littleconsequence.l°
For the two regression equations in Table 2 that include GDP alongwith either GNS o~ NNS, the coefficients of both GNS and NNS not onlydiffer significantly from zero, as shown by the customary t-statistics in thetable, but they also differ from one at the 0.01 level of significance. Conse-quently, unlike Feldstein and Horioka, we can reject the hypothesis thatcapital is completely "immobile" internationally over the long term.
Nonetheless, for a country represented in these regressions, it seemsthat roughly $0.92 of each extra "dollar" saved gets invested at home in thelong run. Moreover, it does not necessarily follow that the remaining $0.08is estimated to be invested abroad. For one thing, the fine detail of the Sys-tem of National Accounts shows that the difference between gross nationalsaving and gross domestic investment consists not only of net foreign invest-ment but also of international "capital transfers," such as internationalgrants (including receipts of special drawing rights issued by the Interna-tional Monetary Fund), as well as the statistical discrepancy. As for the dis-crepancy, there seems no more reason to pretend that it is foreign invest-ment than to pretend that it is national saving, as a general rule; this matteris not inconsequential, for the magnitude of the discrepancy sometimesdwarfs that of net foreign investment?~ For these reasons, it is better to esti-mate directly the share of national saving invested abroad than simply toassume that this share is equivalent to one minus the fraction of nationalsaving estimated to be invested domestically.
Such direct estimates are reported in Table 3, where the variables aredefined as in Table 2. For the countries included, over the long run about$0.07 of each $1.00 increase in national saving is estimated to be investedabroad, whether saving is measured gross or net of capital consumption. Ineach equation the coefficients for both GDP and the savings variable aresignificant at the 0.05 level, and the sign of the coefficient for GDP, asshould be expected, is negative, indicating that for a given level of savingthe amount of foreign investment declines as country size increases. Be-cause the coefficients of determination are not so high for these equationsas for those in Table 2, we tested for nonlinear relationships by reestimatingthe first equation in Table 3 after adding squared values of the explanatoryvariables; the coefficients of these added variables were not significant atthe 0.10 level, so nonlinearity does not seem to be present. In addition, the
~°l am indebted to Stanley Black for urging an investigation of this matter. For an illustra-tion of the Goldfeld-Quandt procedure, see Kane.
~For example, in 1971 net foreign investment by the United States was -$726 million,while the statistical discrepancy was $4.1 billion.
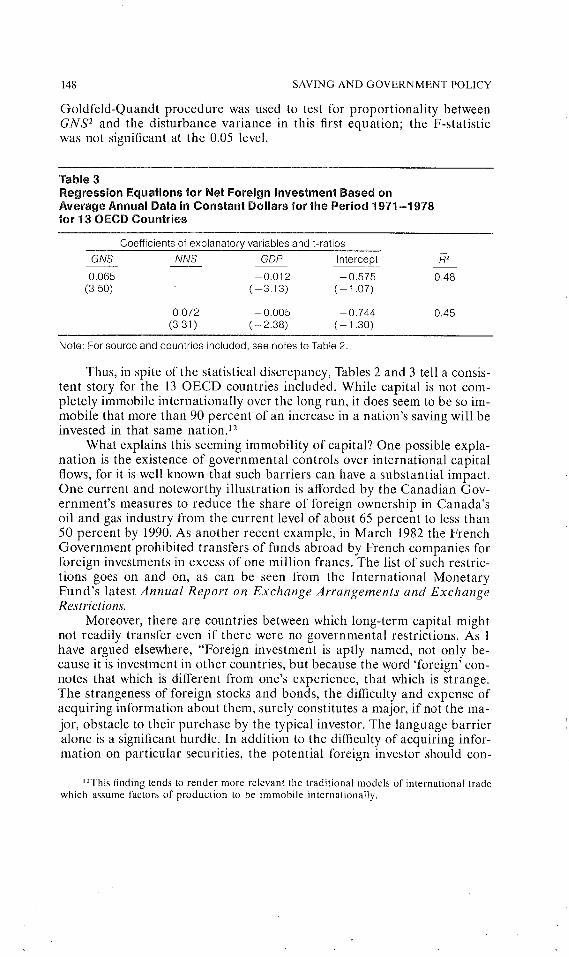
148 SAVING AND GOVERNMENT POLICY
Goldfeld-Quandt procedure was used to test for proportionality betweenGNS2 and the disturbance variance in this first equation; the F-statisticwas not significant at the 0.05 level.
Table 3Regression Equations for Net Foreign Investment Based onAverage Annual Data in Constant Dollars tot the Period 1971-1978tor 13 OECD Countries
Coefficients of explanatory variables and t-ratiosGNS NNS GDP Intercept0.065 -0.012 -0.575(3.50) ( - 3.13) ( - 1.07)
0.48
0.072 - 0.005 -0.744 0.45(3.31) ( - 2.38) ( - 1.30)
Note: For source and countries included, see notes to Table 2.
Thus, in spite of the statistical discrepancy, Tables 2 and 3 tell a consis-tent story for the 13 OECD countries included. While capital is not com-pletely immobile internationally over the long run, it does seem to be so im-mobile that more than 90 percent of an increase in a nation’s saving will beinvested in that same nationJ2
What explains this seeming immobility of capital? One possible expla-nation is the existence of governmental controls over international capitalflows, for it is well known that such barriers can have a substantial impact.One current and noteworthy illustration is afforded by the Canadian Gov-ernment’s measures to reduce the share of foreign ownership in Canada’soil and gas industry from the current level of about 65 percent to less than50 percent by 1990. As another recent example, in March 1982 the FrenchGovernment prohibited transfers of funds abroad by French companies forforeign investments in excess of one million francs. The list of such restric-tions goes on and on, as can be seen from the International MonetaryFund’s latest Annual Report on Exchange Arrangements and ExchangeRestrictions.
Moreover, there are countries between which long-term capital mightnot readily transfer even if there were no governmental restrictions. As Ihave argued elsewhere, "Foreign investment is aptly named, not only be-cause it is investment in other countries, but because the word ’foreign’ con-notes that which is different from one’s experience, that which is strange.The strangeness of foreign stocks and bonds, the difficulty and expense ofacquiring information about them, surely constitutes a major, if not the ma-jor, obstacle to their purchase by the typical investor. The language barrieralone is a significant hurdle. In addition to the difficulty of acquiring infor-mation on particular securities, the potential foreign investor should con-
~2This finding tends to render more relevant the traditional models of international tradewhich assume factors of production to be immobile internationally.
SAVING AND INTERNATIONAL INVESTMENT F1ELEKE 149
sider the risk of devaluation of the foreign currency as well as varied politi-cal risks, such as the relatively great uncertainty of recovering defaultedforeign obligations through legal proceedings.’’~3 These factors lower theexpected net return from foreign securities and raise the variance of thatreturn, thereby rendering such securities less competitive with domestic se-curities (other things equal) in the portfolio deliberations of the represen-tative investor?4
Governmental controls and, more generally, the extra costs and risksoften associated with foreign securities may serve partially to explain theapparent long-run international immobility of capital, but even in the ab-sence of these factors the long-run magnitude of net capital flows might beconstrained by balance of payments considerations. Some evidence rele-vant to this issue is examined in the next section.
OECD Country Experience in Historical Perspective
The preceding analysis suggests that at the margin only a small frac-tion of national saving in an OECD country gets allocated to net foreigninvestment, or to improving the current account of the country’s balance ofpayments, in the long run. This finding raises questions about the broaderhistorical experience of the OECD countries. How large have the current-account balances of these countries been in relation to gross national savingor gross domestic product? Has there been a tendency for these balances toincrease or to diminish in a relative importance over the years?
In order to address such questions, we have compiled time series ofrelevant data for two groups of OECD countries. For 14 countries datacould be gathered on the current-account balance, gross domestic product,and national saving beginning with 1952, the first year for which nationalsavings data were readily available for major countries. For nine countriesthe data on current-account balances and gross domestic product werereadily available back to 1948. To gain perspective on the average experi-ence of these countries, we have computed for each country the ratio of the(absolute) current-account balance to GDP, and to saving if possible, andthen taken the average of these country ratios for each year. The resultingpercentages for the two groups of countries are presented in Tables 4 and 5.Table 4 shows that in 1976, following the oil shock, current-account bal-ances in relation to national saving were, on average, nearly 14 percent, anhistorical high for the 14 countries for the 29 years under scrutiny. It is dif-ficult to discern long-term trends in either table, but the percentages havebeen relatively high in most years since 1973.
Table 6 provides selected statistics on the experience of the 14 coun-tries individually. Columns 4 and 8, which present the average yearly ratioof net lending (positive) or borrowing (negative) to gross national saving orGDP, show that Ireland has experienced by far the largest average net capi-
~3Fieleke (1971), pp. 18-19; also see Kenen (1976), pp. 24-31.~4The investor may still acquire foreign securities, of course, partly for diversification; the
point is that he would acquire even more were it not for the factors mentioned.
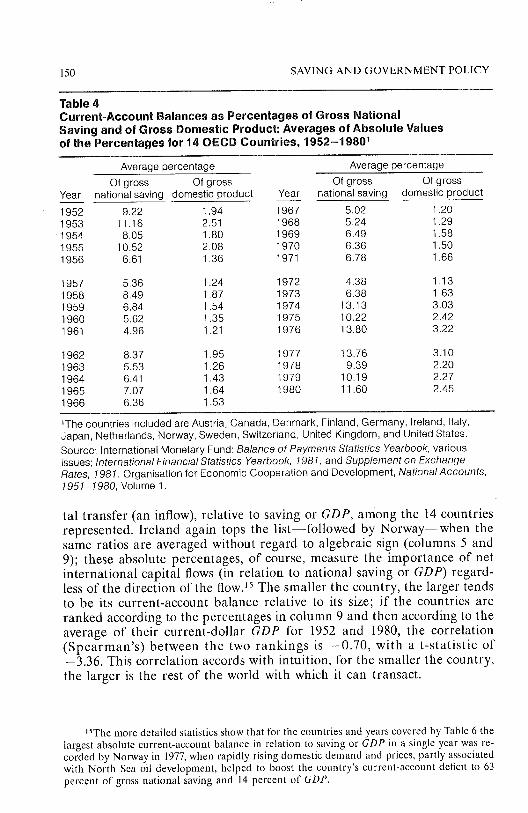
150 SAVING AND GOVERNMENT POLICY
Table 4Current-Account Balances as Percentages of Gross NationalSaving and of Gross Domestic Product: Averages of Absolute Valuesof the Percentages for 14 OECD Countries, 1952-19801
Average percentage Average percentageOf gross Of gross Of gross Of gross
Year national saving domestic product Year national saving domestic product
1952 9.22 1.94 1967 5.02 1.201953 11.16 2.51 1968 5.24 1.291954 8,05 1.80 1969 6.49 1.581955 10.52 2.08 1970 6.36 1.501956 6.61 1,36 1971 6.78 1.66
1957 5.36 1.24 1972 4.38 1.131958 8.49 1.87 1973 6.38 1.631959 6.84 1.54 1974 1 3.13 3.031960 5.62 1.35 1975 10.22 2.421961 4.96 1.21 1976 1 3.80 3.22
1962 8.37 1.95 1977 13.76 3.101963 5.53 1.26 1978 9.39 2.201964 6.41 1.43 1979 10.19 2.271965 7.07 1.64 1980 11.60 2.451966 6.36 1.53
~The countries included are Austria, Canada, Denmark, Finland, Germany, Ireland, Italy,Japan, Netherlands, Norway, Sweden, Switzerland, United Kingdom, and United States.Source: International Monetary Fund: Balance of Payments Statistics Yearbook, variousissues; International Financial Statistics Yearbook, 1981, and Supplement on ExchangeRates, 1981. Organisation for Economic Cooperation and Development, NationalAccounts,1951-1980, Volume 1.
tal transfer (an inflow), relative to saving or GDP, among the 14 countriesrepresented. Ireland again tops the list--followed by Norway--when thesame ratios are averaged without regard to algebraic sign (columns 5 and9); these absolute percentages, of course, measure the importance of netinternational capital flows (in relation to national saving or GDP) regard-less of the direction of the flow.~5 The smaller the country, the larger tendsto be its current-account balance relative to its size; if the countries areranked according to the percentages in column 9 and then according to theaverage of their current-dollar GDP for 1952 and 1980, the correlation(Spearman’s) between the two rankings is -0.70, with a t-statistic of-3.36. This correlation accords with intuition, for the smaller the country,the larger is the rest of the world with which it can transact.
~SThe more detailed statistics show that for the countries and years covered by Table 6 thelargest absolute current-account balance ha relation to saving or GDP in a single year was re-corded by Norway in 1977, when rapidly rising domestic demand and prices, partly associatedwith North Sea oil development, helped to boost the country’s current-account deficit to 63percent of gross national saving and 14 percent of GDP.
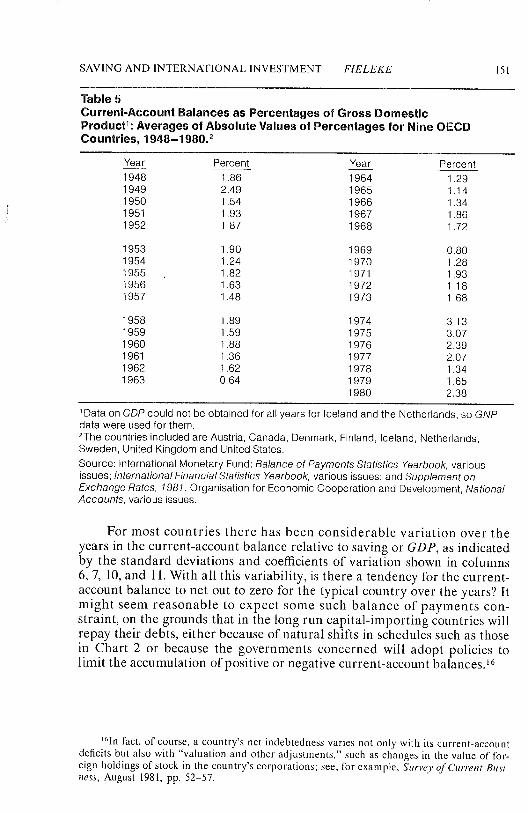
SAVING AND INTERNATIONAL INVESTMENT FIELEKE 151
Table 5Current-Account Balances as Percentages of Gross DomesticProduct1: Averages of Absolute Values of Percentages for Nine OECDCountries, 1948-1980.2
Year Percent Year Percent1948 1.86 1964 1.291949 2.49 1965 1.141950 1.54 1966 1.341951 1.93 1967 1.861952 1.87 1968 1.72
1953 1.90 1969 0.801954 1.24 1970 1.281955 1.82 1971 1.931956 1.63 1972 1.181957 1.48 1973 1.68
1958 1.89 1974 3.131959 1.59 1975 3.071960 1.88 1976 2.391961 1.36 1977 2.071962 1.62 1978 1.341963 0.64 1979 1.65
1980 2.38
1Data on GDP could not be obtained for all years for Iceland and the Netherlands, so GNPdata were used for them.2The countries included are Austria, Canada, Denmark, Finland, Iceland, Netherlands,Sweden, United Kingdom and United States.Source: International Monetary Fund: Balance of Payments Statistics Yearbook, variousissues; International Financial Statistics Yearbook, various issues; and Supplement onExchange Rates, 1981. Organisation for Economic Cooperation and Development, NationalAccounts, various issues.
For most countries there has been considerable variation over theyears in the current-account balance relative to saving or GDP, as indicatedby the standard deviations and coefficients of variation shown in columns6, 7, 10, and 11. With all this variability, is there a tendency for the current-account balance to net out to zero for the typical country over the years? Itmight seem reasonable to expect some such balance of payments con-straint, on the grounds that in the long run capital-importing countries willrepay their debts, either because of natural shifts in schedules such as thosein Chart 2 or because the governments concerned will adopt policies tolimit the accumulation of positive or negative current-account balances?6
=6In fact, of course, a country’s net indebtedness varies not only with its current-accountdeficits but also with "valuation and other adjustments," such as changes in the value of for-eign holdings of stock in the country’s corporations; see, for example, Survey of Currellt Busi-ness, August 1981, pp. 52-57.
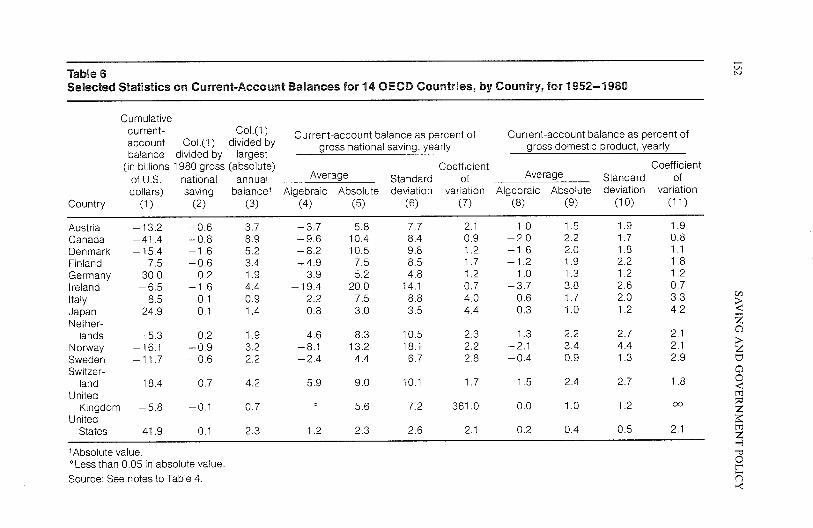
Country
AustriaCanadaDenmarkFinlandGermanyIrelandItalyJapanNether-
landsNorwaySwedenSwitzer-
landUnited
KingdomUnited
States
Cumulativecurrent- Co1.(1 ) Current-account balance as percent of Current-account balance as percent ofaccount Co1.(!) divided by gross national saving, yearly gross domestic product, yearlybalance divided by largest
(in billions 1980 gross (absolute) Coefficient Coefficientof U.S. national annual Average Standard of Average Standard ofdollars) saving balance! Algebraic Absolute deviation variation Algebraic Absolute deviation variation
(1) (2) (3) (4) (5) (6) (7) (8) (9) (10) (,11)
-13.2 -0.6 3.7 -3.7 5.8 7,7 2.1 -1.0 1.5 1.9 1.9-41.4 -0.8 8.9 -9,6 10.4 8.4 0.9 -2.0 2.2 1.7 0.8-15.4 -1.6 5.2 -8.2 10.5 9.8 1.2 -1.6 2.0 1.8 1.1-7.5 -0.6 3.4 -4.9 7.5 8.5 1.7 -1,2 1.9 2.2 1.830.0 0.2 1.9 3.9 5.2 4.8 1.2 1.0 1.3 1.2 1.2
-6.5 -1.6 4.4 -19.4 20.0 14.1 0.7 -3.7 3.8 2.6 0.78.5 0.1 0.9 2.2 7.5 8.8 4.0 0.6 1.7 2,0 3.3
24.9 0.1 1,4 0.8 3.0 3.5 4.4 0.3 1.0 1.2 4.2
°5.3 0,2 1.9 4.6 8.3 10.5 2.3 1.3 2,2 2.7 2.1-16.1 -0.9 3.2 -8.1 13.2 18.1 2,2 -2.1 3.4 4.4 2.1-11.7 -0.6 2.2 -2.4 4.4 6.7 2.8 -0.4 0.9 1.3 2.9
18.4 0.7 4.2 5.9 9.0 10.1 1.7 1.5 2.4 2.7 1.8
-5.8 -0.1 0.7 ’:’ 5.6 7.2 361.0 0.0 1.0 1.2
41,9 0.1 2.3 1.2 2.3 2.6 2.1 0.2 0.4 0.5 2.1
~ Absolute value.’=’Less than 0.05 in absolute value,Source: See notes to Table 4.
>Z
o<
o
SAVING AND INTERNATIONAL INVESTMENT F1ELEKE 153
This expectation is supported by the relatively small cumulative cur-rent-account balances reported in column 2 of Table 6. To shed some addi-tional light on this issue, we have calculated the number of years that wouldbe required for each country to reverse or offset its aggregate current-account deficit or surplus accumulated over the period 1952-1980 if thecountry were to run an annual surplus or deficit equivalent to its largest ab-solute annual balance during this period. The results, presented in column3, reveal that by this measure most countries could repay or collect their ac-cumulated deficits or surpluses within a few years; by far the longest "re-versal period," nearly nine years, would be required by Canada. Even ifthis approach substantially underestimates the reversal periods that wouldactually be required, those periods would still be short for most countries.
Although the cumulative balances shown in Table 6 are small, occa-sionally a country does record a very large current-account balance in rela-tion to gross national saving, as suggested by the measures of dispersion incolumns 6 and 7. This combination of circumstances is consistent with theview that capital is very mobile between countries but that balance of pay-ments-related considerations set fairly tight limits on cumulative net capitalflows for most countries. In particular, governments concerned about theconsequences for employment or inflation of continuing sizable current-account deficits or surpluses may adopt not merely controls but monetaryand fiscal policies designed partially to eliminate or reverse those deficits orsurpluses, influencing relative marginal efficiencies of investment in theprocess.~7
The Wider World
The regression results presented in Tables 2 and 3 suggest that for the13 OECD countries more than 90 percent of an increase in a nation’s sav-ing gets invested in that same nation over the long run. However, the worldis not confined to these 13 countries, whose experience may be unrepre-sentative, so extension of the analysis to a much larger sample of countriesis highly desirable. Such an extended application of equation (2) might notbe fruitful for want of sufficiently precise purchasing power parity data; butan equation such as (1) can be estimated using data for 87 countries com-piled by the World Bank, and the results compared with those obtained byFeldstein and Horioka from their much smaller sample of countries.~8 Onesuspects that the data for the non-OECD countries included in these 87may be generally less accurate than the OECD-country statistics, whichthemselves present formidable problems. By way of illustration for theOECD countries, the data on gross saving for the United States published
171n a discussion of external policy targets of major industrial countries, Black (1978, p.619) argues that "large [current-account] deficits or surpluses would not be sustainable over along period of time, though moderate ones could represent a stable pattern of capital flows."Insofar as the difference between GNSi and GDIi is controlled by government policy, themodels specified in equations (1) and (2) will not detect the "market" relationship between thetwo variables.
~SAs we have pointed out, equations (1) and (2) are not equivalent.
154 SAVING AND GOVERNMENT POLICY
by the OECD in 1981 contain revisions (of the data published in the prioryear) of between 8 and 11 percent for each of the years 1973 through 1978.But even though enlarging the sample might multiply the measurement er-ror, the enlargment seems justified by the need to transcend a small andperhaps unrepresentative sample.
The basic equation estimated was
(3) (GDI/GNP)i ---- a+flo (GNS/GNP)i,
where (GDI/GNP)i and (GNS/GNP)i are average ratios for country i of thecorresponding yearly ratios for 1968 through 1977, the latest year for whichthe underlying data have been published by the World Bank. Ordinaryleast squares regression results are exhibited in Table 7 for the 87 countriesas well as for selected subsets of the 87. Each coefficient of GNS/GNP issignificant at the 0.01 level.
According to these estimates, over the long term 89 percent of an in-crease in the saving rate in an industrial country goes to enhance the invest-ment rate in that country, a finding which is consistent with that of Feld-stein and Horioka and also with the estimates for 13 OECD countriespresented in Table 2. On the other hand, the comparable figure for boththe 69 nonindustrial countries and the full sample of 87 countries is only 65or 66 percent. Examination of the residuals for the regressions involvingthe 87 countries and the 69 countries disclosed that one "capital-surplusoil-exporting country," Saudi Arabia, accounted in each regression for byfar the largest absolute residual, whose size and negative sign indicated thatthe country’s actual average domestic investment rate was well below thatestimated by the regression equations.~9 Chart 3 depicts this outcome forthe first regression reported in Table 7.
The temptation was irresistible to reestimate without Saudi Arabia, onthe grounds that this "outlier" is in some way sui generis.The results ofthese reestimations are reported in Table 7 for "all [countries] but SaudiArabia" and for "nonindustrial [countries] less Saudi Arabia." These re-sults indicate that the gross domestic investment rate in an included coun-try rises by about four-fifths of an increase in the national saving rate, anestimate more closely compatible with that for the 18 industrial countries.Even after the exclusion of Saudi Arabia, however, the estimated coefficientof the saving rate is somewhat lower for the nonindustrial countries than forthe 18 industrial countries, suggesting that capital is less mobile interna-tionally for the industrial countries than for the nonindustrial countries! 20
~9"Capital-surplus oil-exporting countries," a classification employed by the World Bank,included six countries. The available data permitted only two, Libya and Saudi Arabia, to beincluded in the regression analysis.
2°Any such inference must be very tentative, partly because/3o in equation (3) should notbe interpreted as equivalent to/3~ in equation (2); see the discussion accompanying Table l.
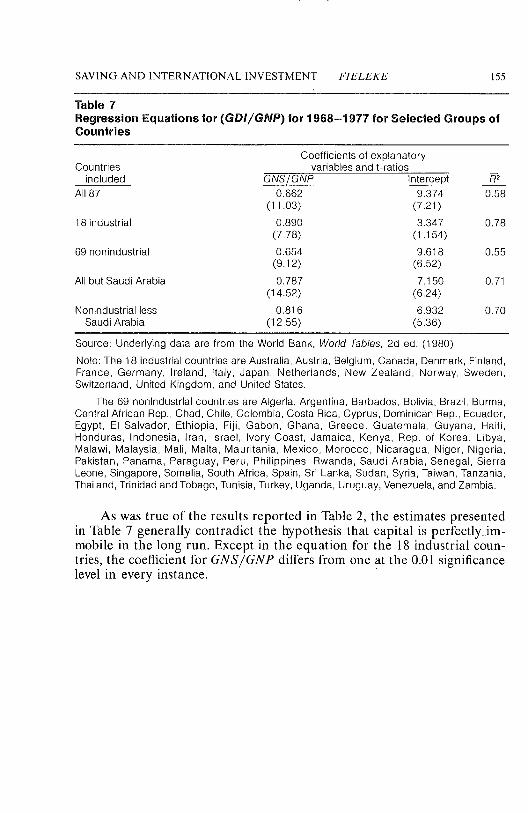
SAVING AND INTERNATIONAL INVESTMENT FIELEKE 155
Table 7Regression Equations for (GDI/GNP) for 1968-1977 for Selected Groups ofCountries
Coefficients of explanatoryCountries variables and t-ratios
included GNS/GNP Intercept ~2All 87 0.662 9.374 0.58
(11.03) (7.21)18 industrial 0.890 3.347 0.78
(7.78) (1.154)69 nonindustrial 0.654 9.618 0.55
(9.12) (6.52)All but Saudi Arabia 0.787 7.150 0.71
(14.52) (6.24)Nonindustrial less 0.816 6.932 0.70
Saudi Arabia (12.55) (5.36)
Source: Underlying data are from the World Bank, World Tables, 2d ed. (1980).Note: The 18 industrial countries are Australia, Austria, Belgium, Canada, Denmark, Finland,France, Germany, Ireland, Italy, Japan, Netherlands, New Zealand, Norway, Sweden,Switzerland, United Kingdom, and United States.
The 69 nonindustrial countries are Algeria, Argentina, Barbados, Bolivia, Brazil, Burma,Central African Rep., Chad, Chile, Colombia, Costa Rica, Cyprus, Dominican Rep., Ecuador,Egypt, El Salvador, Ethiopia, Fiji, Gabon, Ghana, Greece, Guatemala, Guyana, Haiti,Honduras, Indonesia, Iran, Israel, Ivory Coast, Jamaica, Kenya, Rep. of Korea, Libya,Malawi, Malaysia, Mali, Malta, Mauritania, Mexico, Morocco, Nicaragua, Niger, Nigeria,Pakistan, Panama, Paraguay, Peru, Philippines, Rwanda, Saudi Arabia, Senegal, SierraLeone, Singapore, Somalia, South Africa, Spain, Sri Lanka, Sudan, Syria, Taiwan, Tanzania,Thailand, Trinidad and Tobago, Tunisia, Turkey, Uganda, Uruguay, Venezuela, and Zambia.
As was true of the results reported in Table 2, the estimates presentedin Table 7 generally contradict the hypothesis that capital is perfectly_.im-mobile in the long run. Except in the equation for the 18 industrial coun-tries, the coefficient for GNS/GNP differs from one at the 0.01 significancelevel in every instance.
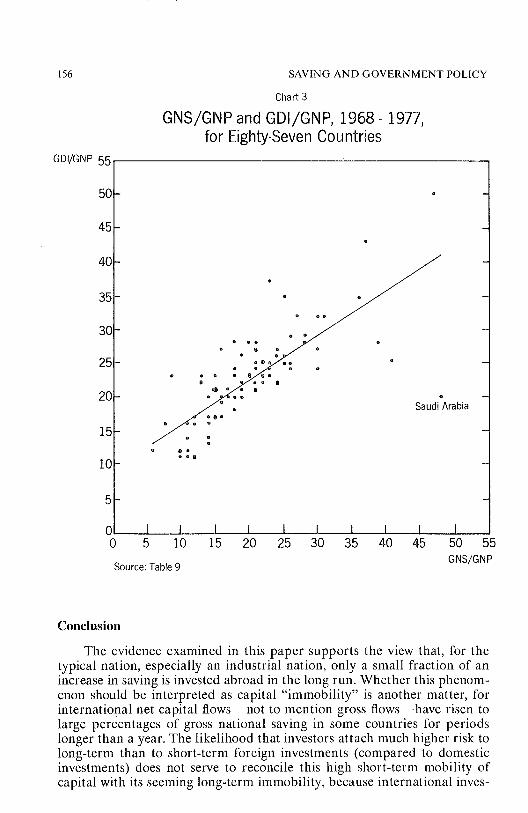
156
GDI/GNP 55
SAVING AND GOVERNMENT POLICY
Chart 3
GNS/GNP and GDI/GNP, 1968- 1977,for Eighty-Seven Countries
50-
45-
40
35
3O
25-
20-
15
10
5
0 I I0 5 10
Source: Table 9
Arabia
I I I I I I I15 20 25 30 35 40 45 50 55
GNS/GNP
Conclusion
The evidence examined in this paper supports the view that, for thetypical nation, especially an industrial nation, only a small fraction of anincrease in saving is invested abroad in the long run. Whether this phenom-enon should be interpreted as capital "immobility" is another matter, forinternational net capital flows--not to mention gross flows--have risen tolarge percentages of gross national saving in some countries for periodslonger than a year. The likelihood that investors attach much higher risk tolong-term than to short-term foreign investments (compared to domesticinvestments) does not serve to reconcile this high short-term mobility ofcapital with its seeming long-term immobility, because international inves-
SAVING AND INTERNATIONAL INVESTMENT FIELEKE 157
tors who eschewed long-term commitments could simply continue to rollover their short-term investments. A different hypothesis set forth in thispaper is that national policymakers act so as to enforce a balance of pay-ments constraint which limits the accumulation of current-account deficits(net debt) or surpluses (net claims). Although fuller testing is needed, thishypothesis helps to reconcile the high short-term international mobility ofcapital with its apparent long-term immobility.
REFERENCES
Black,Stanley W. "Policy Responses to Major Disturbances of the 1970s and Their Transmis-sion through International Goods and Capital Markets", Weltwirtschaftliches Ar-chiv, 114(4), 1978, pp. 614-41.
Boardof Governors of the Federal Reserve System. Federal Reserve Bulletin, 58 (September1972) and 59 (March 1973).
Feldstein, Martin. "Domestic Saving and International Capital Movements in the Long Runand the Short Run," paper presented at the NBER-EHESS International Seminar onMacroeconomics in Mannheim, Germany, 22 June 1982.
-- and C. Horioka. "Domestic Saving and International Capital Flows," The EconomicJournal, 90 (June 1980), pp. 314-29.
Fieleke, Norman S. The Welfare Effects of Controls over Capital Exports from the UnitedStates. Princeton Essays in International Finance, No. 82 (Princeton, N.J.: PrincetonUniversity, 1971).
Goldfeld, Stephen M. and Richard E. Quandt. "Some Tests for Homoscedasticity", Journal ofthe American Statistical Association, 60 (June 1965), pp. 539-47.
Harberger, Arnold C. "Vignettes on the World Capital Market," The American Economic Re-view, Papers and Proceedings of the 92nd Annual Meeting (May 1980), pp. 331-37.
International Monetary Fund. International Financial Statistics Supplement on ExchangeRates, 1981.
Kane,Edward J. Economic Statistics and Econometrics(New York: Harper & Row, 1968), pp.373-79.
Kenen, Peter B. Capital Mobility and Financial Intergration: A Survey. Princeton Studies in In-ternational Finance No. 39 (Princeton, N.J.: Princeton University, 1976).
McKinnon, Ronald 1. "The Exchange Rate and Macroeconomic Policy: Changing PostwarPerceptions," Journal of Economic Literature, XIX (June 1981), pp. 531-57.
Organisation for Economic Cooperation and Development. National Accounts, Vol.l, 1951-1980, 1982.
Sachs, Jeffrey D. "The Current Account and Macroeconomic Adjustment in the1970s,"Brookings Papers on Economic Activity, I (1981), pp. 201-82.
U.N. Yearbook of National Accounts Statistics, 1979 (New York: U.N. Publications, 1980).U.S. President. Economic Report of the President Together with the Annual Report of the Coun-
cil of Economic Advisers (Washington, D.C.: Government Printing Office, 1982).Whitman, Marina v.N. "International Interdependence and the U.S. Economy," in William
Fellner, ed., Contemporary Economic Problems 1976, (Washington, D.C.: American En-terprise Institute for Public Policy Research, 1976), pp. 183-223.
World Bank. World Tables, 2d ed. (Baltimore: The John Hopkins University Press, 1980).--. World Development Report (New York: Oxford University Press, 1981).
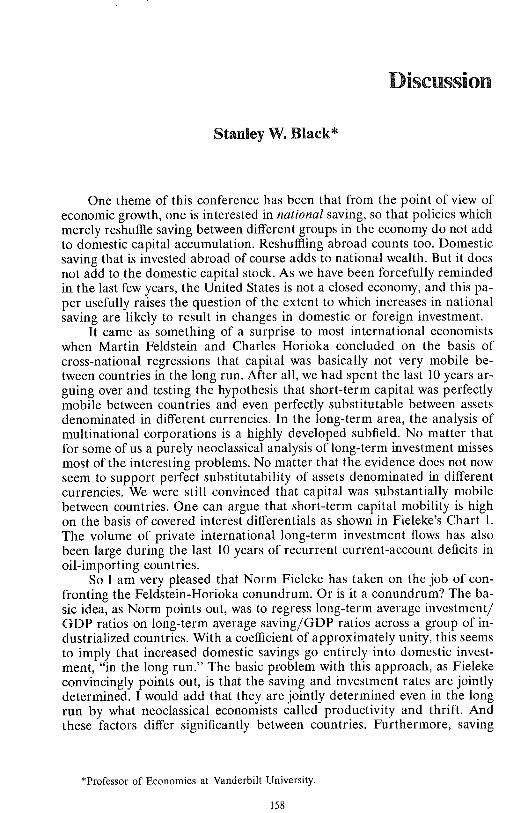
Stanley W. Black*
One theme of this conference has been that from the point of view ofeconomic growth, one is interested in national saving, so that policies whichmerely reshuffle saving between different groups in the economy do not addto domestic capital accumulation. Reshuffling abroad counts too. Domesticsaving that is invested abroad of course adds to national wealth. But it doesnot add to the domestic capital stock. As we have been forcefully remindedin the last few years, the United States is not a closed economy, and this pa-per usefully raises the question of the extent to which increases in nationalsaving are likely to result in changes in domestic or foreign investment.
It came as something of a surprise to most international economistswhen Martin Feldstein and Charles Horioka concluded on the basis ofcross-national regressions that capital was basically not very mobile be-tween countries in the long run. After all, we had spent the last 10 years ar-guing over and testing the hypothesis that short-term capital was perfectlymobile between countries and even perfectly substitutable between assetsdenominated in different currencies. In the long-term area, the analysis ofmultinational corporations is a highly developed subfield. No matter thatfor some of us a purely neoclassical analysis of long-term investment missesmost of the interesting problems. No matter that the evidence does not nowseem to support perfect substitutability of assets denominated in differentcurrencies. We were still convinced that capital was substantially mobilebetween countries. One can argue that short-term capital mobility is highon the basis of covered interest differentials as shown in Fieleke’s Chart 1.The volume of private international long-term investment flows has alsobeen large during the last 10 years of recurrent current-account deficits inoil-importing countries.
So I am very pleased that Norm Fieleke has taken on the job of con-fronting the Feldstein-Horioka conundrum. Or is it a conundrum? The ba-sic idea, as Norm points out, was to regress long-term average investment/GDP ratios on long-term average saving/GDP ratios across a group of in-dustrialized countries. With a coefficient of approximately unity, this seemsto imply that increased domestic savings go entirely into domestic invest-ment, "in the long run." The basic problem with this approach, as Fielekeconvincingly points out, is that the saving and investment rates are jointlydetermined. I would add that they are jointly determined even in the longrun by what neoclassical economists called productivity and thrift. Andthese factors differ significantly between countries. Furthermore, saving
*Professor of Economics at Vanderbilt University.
158
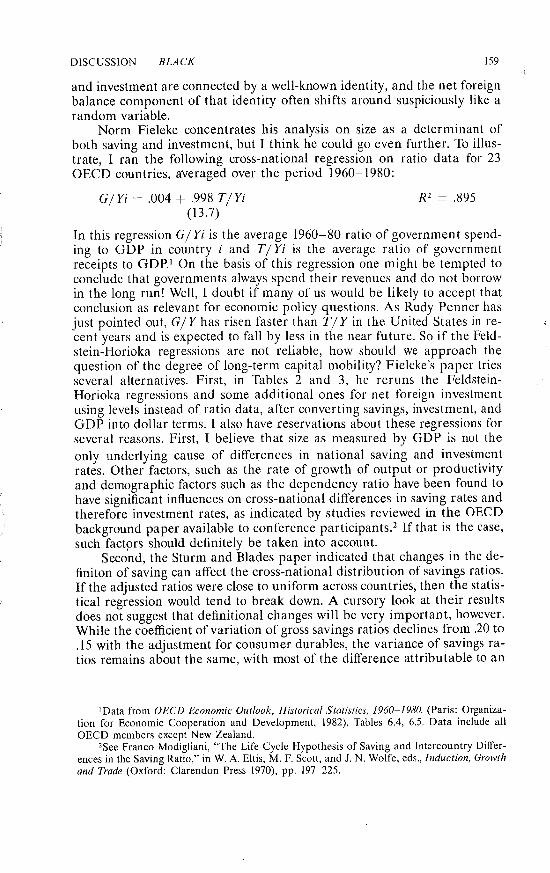
DISCUSSION BLACK 159
and investment are connected by a well-known identity, and the net foreignbalance component of that identity often shifts around suspiciously like arandom variable.
Norm Fieleke concentrates his analysis on size as a determinant ofboth saving and investment, but I think he could go even further. To illus-trate, I ran the following cross-national regression on ratio data for 23OECD countries, averaged over the period 1960-1980:
G/Yi = .004 + .998 T/Yi R2 = .895(13.7)
In this regression G/Yi is the average 1960-80 ratio of government spend-ing to GDP in country i and T/Yi is the average ratio of governmentreceipts to GDR~ On the basis of this regression one might be tempted toconclude that governments always spend their revenues and do not borrowin the long run! Well, I doubt if many of us would be likely to accept thatconclusion as relevant for economic policy questions. As Rudy Penner hasjust pointed out, G/Y has risen faster than T/Y in the United States in re-cent years and is expected to fall by less in the near future. So if the Feld-stein-Horioka regressions are not reliable, how should we approach thequestion of the degree of long-term capital mobility? Fieleke’s paper triesseveral alternatives. First, in Tables 2 and 3, he reruns the Feldstein-Horioka regressions and some additional ones for net foreign investmentusing levels instead of ratio data, after converting savings, investment, andGDP into dollar terms. I also have reservations about these regressions forseveral reasons. First, I believe that size as measured by GDP is not theonly underlying cause of differences in national saving and investmentrates. Other factors, such as the rate of growth of output or productivityand demographic factors such as the dependency ratio have been found tohave significant influences on cross-national differences in saving rates andtherefore investment rates, as indicated by studies reviewed in the OECDbackground paper available to conference participants,z If that is the case,such factprs should definitely be taken into account.
Second, the Sturm and Blades paper indicated that changes in the de-finiton of saving can affect the cross-national distribution of savings ratios.If the adjusted ratios were close to uniform across countries, then the statis-tical regression would tend to break down. A cursory look at their resultsdoes not suggest that definitional changes will be very important, however.While the coefficient of variation of gross savings ratios declines from .20 to.15 with the adjustment for consumer durables, the variance of savings ra-tios remains about the same, with most of the difference attributable to an
~Data from OECD Economic Outlook, Historical Statistics, 1960-1980. (Paris: Organiza-tion for Economic Cooperation and Development, 1982), Tables 6.4, 6.5. Data include allOECD members except New Zealand.
zSee Franco Modigliani, "The Life Cycle Hypothesis of Saving and Intercountry Differ-ences in the Saving Ratio," in W. A. Eltis, M. F. Scott, and J. N. Wolfe, eds., Induction, Growthand Trade (Oxford: Clarendon Press 1970), pp. 197 225.
160 SAVING AND GOVERNMENT POLICY
increase in the mean of savings ratios. Other factors seem to have even lessimpact on the dispersion of savings ratios.
More fundamentally, it seems to me that a simultaneous equation ap-proach is needed to sort out the long-run factors determining domestic sav-ing and investment rates and therefore net foreign investment. This wouldundoubtedly be a formidable job and is clearly beyond the scope ofFieleke’s paper. George von Furstenburg has made such an effort for theUnited States in an article in the IMF Staff Papers, so perhaps he can com-ment on the difficulties of this approach in the general discussion?
Fieleke’s next attack on the problem is to examine time series data oncurrent account balances in a group of OECD countries. The data in Tables4 and 5 show no trends. Table 6 indicates the relatively greater reliance onforeign borrowing (or lending) that is typical of smaller countries, asFieleke notes the inverse correlation between size and average absolute cur-rent balances. Table 6 further shows that current accounts are quite vari-able, which is not news to people who try to forecast their movements. Thisis the basic piece of information that ought to enable us to dispose of theFeldstein-Horioka contention. The issue of capital mobility as it affects sav-ing and investment behavior should be related to capital movements at themargin, that is, in response to some change in saving or investment incen-tives. The fact that on average most capital is invested at home is not rele-vant to the question.
Fieleke goes on to point out that cumulative current account imbal-ances do not appear very large according to his data. This, as he notes,could be in response to policy reactions to current account imbalances. Re-cently I have estimated a series of monetary policy reaction functions thatattempt to determine what internal and external factors appear to be caus-ing changes in the instruments of monetary policy in 10 OECD countries.4I found that current accounts as proxied by trade balances were significantdeterminants of policy reactions in the 1960s and 70s for France, Japan,and the United Kingdom. Some indicator of external imbalance, not alwaysthe current account, appeared to be significant for all 10 of the countries inmy sample, although the apparent magnitude of response to external fac-tors varied considerably from case to case. The United States had the small-est response to external factors and the United Kingdom the largest, atleast before Mrs. Thatcher took power.
These findings support Fieleke’s view that some part of the long-runstability in current accounts that is evident in the data arises from eco-nomic policy. One reason for such policies may be the "noneconomic" ob-jective of minimizing foreign control over domestic industry or resources,which is evident in France, Japan, Canada and elsewhere. Another reasonparticularly relevant in a period of floating exchange rates is unwillingness
3George yon Furstenburg, "Domestic Determinants of Net U.S. Foreign Investment,"IMF Staff Papers 27(4) (December 1980), pp. 637-678.
4Stanley W. Black, "The Use of Monetary Policy for Internal and External Balance in TenIndustrial Countries," in J. Frenkel, ed., Exchange Rates and International Macroeeonomics(Chicago: University of Chicago Press, 1983 forthcoming).
DISCUSSION BLACK 161
to accept the exchange risk inherent in large foreign currency debt obliga-tions. And even if governments are willing to assume such risks, limits toforeign borrowing exist even for OECD countries and occasionally arereached, as witness the cases of the United Kingdom and Italy in 1976.
Fieleke’s paper concludes with an extension of the Feldstein-Horiokamethodology to a larger group of countries, with findings that a.ppear tocontradict the Feldstein-Horioka results. For reasons stated above, I do notthink this evidence is very strong in either direction and would prefer to seethe analysis pursued in some other way.
If the question is the mobility of long-term capital, I believe the cor-rect approach is to test the responsiveness of direct foreign investment tofactors affecting its profitability. I think the results of such tests support theconclusion that capital is rather mobile. If the question is mobility of short-term capital, then evidence on arbitrage and risk premia in forward mar-kets is relevant information. Here again, I believe the tests support the con-clusion that capital is rather mobile.
I have recently heard the view that it is inappropriate to look at thecapital account of the balance of payments for such information, that wemust look instead at the determinants of domestic saving and investmentbehavior. But these are simply two sides of the same coin, as a quick look atthe national income or flow of funds accounts should tell us. Whether it iseasier to explain foreign investment by itself or as the difference betweentotal investment and domestic investment is a tactical research question,not an issue of principle.
Let me conclude with some remarks about implications for policy. Idon’t think we can analyze the effects of incentives to savings and invest-ment without considering the possibility that their impact leaks abroad. Itshould be no surprise that the investment tax credit applies only on domes-tic investment. The strenuous debates over deferral of tax on foreign sourceincome and the foreign tax credit-versus-deductibility issue should alert usto the stake that major U.S. corporations on the one hand and unions onthe other have in foreign earnings and investment. Offshore assembly is im-portant for U.S. firms and increasingly for foreign firms operating in theUnited States. These kinds of location decisions are influenced, if not deter-mined, by tax considerations. But to find out how they respond, I think wemust look to disaggregated data, not to cross-national data on long-periodaverages of aggregated data.
Reflections on Saving Behavior
Robert M. Solow*
Economics needs no special excuse to study the determinants of sav-ing. It is one of those perennial questions always on the agenda. I remem-ber being taught that the Founding Fathers, among them Hume and Smith,had definite views about saving behavior. (I even think I remember beingtaught that they held a rather sociological theory--thrifty bourgeois mer-chants, spendthrift hereditary landlords--and The Fable of the Bees con-tains the same suggestion.)
Nevertheless, it is no accident--as we deep-thinkers say--that a con-ference on government policies affecting saving should be taking placeright now. There has clearly been an upsurge of interest in the subject, inthis country and elsewhere. One source of curiosity was the apparent fall inreported household saving rates in the United States after 1970 and moreparticularly after 1975. That may turn out to have been a nonevent, partly ameasurement error, partly a short-run phenomenon, partly a shift to otherforms of saving, we are still not sure. But whether it happened or not, ithelped to focus attention on the saving rate. A more substantial impulsecame from the international comparisons, now refined and analyzed in thevaluable OECD work of Sturm and Blades. At a time when the U.S. econ-omy felt itself to be losing out in competition with other countries, espe-cially West Germany and Japan, both in international competitiveness andin general economic performance, it was natural to ask: what do they dothat we don’t do? Clearly one of the things they do is to save and invest alarger share of aggregate income.
Now, of course, raising the saving rate has become a declared object ofnational policy. The arguments offered on behalf of the policy are not al-ways cogent; and the particular policy measures proposed are not alwayseffective. But it is easy to see why questions about saving behavior are nowof special interest. A question can be of interest without being interesting:think of the somewhat related fuss about imminent "capital shortage" just afew years ago. As I mentioned at the very beginning, however, the study ofsaving is a hardy perennial. It is so closely connected with other aspects ofsocial and economic structure that the basic questions may never be per-manently settled. As the dairy industry used to say about milk, you neveroutgrow your need for the study of saving behavior.
To the eye of an economic theorist, those large international differ-ences in saving rates are the obvious target for explanation. Reasonablep~P!~ may ~iffe~ ~ou~ical distinctions between parameters. But if theory can contribute anything
*Institute Professor of Economics at the Massachusetts Institute of Technology.
162

SAVING BEHAVIOR SOLOW 163
to the study of actual saving behavior, it ought to be able to give a mean-ingful account of the possible sources of gross differences like those we seeacross countries in the figures of Sturm and Blades.
Here a digression is in order. In making international comparisons, wecan choose among the household, private, and national saving rates. A be-liever in the applicability of the Ricardo-Barro equivalence theorem wouldchoose the national saving rate. If the government budget can neither ab-sorb private saving through deficits nor supplement it through surpluses, be-cause households will take whatever offsetting actions are needed to en-force their own intertemporal plans, then it will be the national saving ratethat registers the intentions of the private economy. (There is no furtherimplication that public policy is powerless to influence the saving rate. No-body doubts that a shift from income taxation to a consumption tax wouldinduce an increase in national saving at a given level of economic activity.Any regulation that affects the private incentive to save could do as much.It is only the aggregate budget process that has no force.) Someone likePenner or me, who believes that the Ricardo-Barro proposition is a poorguide to the way the world actually works, will conclude that a country’snational saving rate is in part a political decision. Whether that decision ismade sensibly or not, economic theory will have little to say about the pub-lic component of international differences. The choice of an object for anal-ysis will be between the household saving rate and the private saving rate. !prefer the aggregate private saving rate, because any wealth-oriented the-ory of saving will suggest that increments of asset value, wherever they arelocated, will be of approximately equal relevance to the saver. It may benoticed that this is the sort of reasoning that, carried much further, leads tothe Ricardo-Barro proposition. That is as it should be, because one of myobjections to the Ricardo-Barro view is precisely that it carries a reasonableidea too far, and asks it to function in inappropriate circumstances.
Well, then, why is the private saving rate in the United States x percentand that in Japan 2x percent? There is one sort of explanation that hardlyever occurs to an economist contemplating those figures, but might be thefirst thought in the mind of a civilian. The Japanese save more because theyare the sort of people who save; they are naturally thriftier than we are. Orperhaps they live in a culture that inculcates and values the habit of thriftand the results of thrift more than ours does. Such a response would nothave seemed strange to Alfred Marshall who, if not a Founding Father, iscertainly a Great Uncle. When he came to consider saving behavior (in thePrinciples) Marshall wrote: "(T)he causes which control the accumulationof wealth differ widely in different countries and different ages. They arenot quite the same among any two races, and perhaps not even among anytwo social classes in the same race. They depend much on social and relig-ious sanctions... (T)he chief motive of saving is family a,ff, ection."
.... iT {hi{ wel’d th~ ~6ri:~dt a~g~~~ t6 t~e q~e~ti~n; it wonla be a matter ofsome importance for the agenda of this conference. The main reason weare struck by the high Japanese saving rate is because we wonder how theU.S. saving rate could be made to look more like it. If the anthropologicalexplanation were the right one, it would suggest strongly--though it does

164 SAVING AND GOVERNMENT POLICY
not prove--that there is not much public policy could do. However muchwe might wish to achieve a Japanese saving rate, and even if we wished itfor the right reasons, it is idle to suppose that we would or could Nipponizeour culture, the socialization of our children, our attitudes toward the old orto the family, or whatever it would take to achieve the goal. (This is only asuggestion and not an air-tight argument because nobody believes that na-ture and/or nurture determine the saving rate to two decimal places. Evenan unthrifty society can be induced to save more by economic incentives. Itjust seems unlikely that differences as large as those between top and bot-tom in the international pecking-order could be obliterated unless eco-nomic incentives were driven intolerably far; and maybe not even then.)
Having raised that question, I want to sketch an economic theorist’sanswer to it. Most of us hold to a life-cycle theory of saving in one form oranother. As several participants in this conference have argued, the life-cycle model is not an unmitigated success; for example, it has difficulty inaccounting for the cross-sectional distribution of wealth by age. Neverthe-less, that is the vehicle I shall use. For my purpose, familiarity and generalacceptability are all-important. It would do me no good to invent an ad hoetheory of saving for checking out the significance of "anthropological" vari-ations in the parameters. It comes easily to mind, for instance, to enterwealth itself in the representative saver’s utility function (and no doubt thiswould help to explain the continued saving of the old); but after having re-marked sagely that a stronger preference for wealth would lead one to savemore, I would have no well-worn standard with which to compare paramet-ric variations.
Even within the life-cycle context, I shall simplify, though I am nothappy about that. In igarticular I ignore uncertainty (because it is difficultto deal with and has ambiguous effects on saving), liquidity constraints (be-cause it is known that their binding presence encourages saving), and socialsecurity (because its effects are the subject of current controversy.)
In the absence of uncertainty, then, saving arises for two reasons. Thefirst is what Harrod called "hump-saving": accumulation and decumulationof assets arising because the representative household wants a lifetime con-sumption pattern that is smoother than its lifetime profile of earnings. Sav-ing for retirement is the most important factor here. The hump of assets isbuilt up during the working life and run down during retirement. It is wellunderstood that this mechanism causes the saving rate to depend on theage distribution of the population. A rapidly growing population will haverelatively fewer households of retirement age and relatively more still work-ing, and therefore generally a higher saving rate. (The burden of support-ing minor children must also be factored into such calculations.) The sec-ond reason for saving is the accumulation of a bequest to be passed on to!~ ~ ~[~!~: ~h~ e~i~n~ o~ u~ce[t~i~y abo~ inc~e ~d costlycontingencies generates a precautionary motive for saving as well.)
Sociological and cultural influences on saving behavior enter an eco-nomic model like this primarily through parameters describing tastes. Inthe life-cycle framework, there are three points at which tastes must bespecified: (1) a time-preference or utility-discount rate, (2) a weight to be
SAVING BEHAVIOR SOLO W 165
attached to the bequest motive, and (3) the choice of an instantaneous util-ity-of-consumption function, especially its concavity, which will affect thedesired degree of consumption-smoothing. It is worth pointing out that themajor analytical discussion in the literature of international comparisonsfrom the life-cycle point of view--Franco Modigliani’s 1970 article--sim-ply dismisses the possible significance of intercountry differences in tastewith the remark that the parameters of the saving function do not seem tobe very responsive to such forces within the relevant range of variation.Modigliani concludes that "... all the evidence supports both qualitativelyand quantitatively the role of the two principal variables suggested by thelife cycle model, productivity growth of income and the age structure ofthe adult population. Furthermore, these variables appear to account fortwo-thirds to four-fifths of the inter-country variance in the saving ratio."That would leave some room for policy, but not a lot, because it is far-fetched to imagine the age distribution as a tool or object of policy, and therate of productivity growth is not easily controllable either, in practice.
Until quite recently there has been little discussion of even somethingas "obvious" as the bequest motive as a source of intercountry differencesin saving rates. I have the (casual) impression that this neglect was more or.less accidental. In the early days of life-cycle theory, it was natural forModigliani and others to assume away the existence of bequests in thesearch for the simplest formulation of the theory that would highlight itsmost novel feature, the emphasis on hump-saving. Then a well-known pa-per by James Tobin used carefully constructed numerical examples to showthat hump-saving alone could generate substantial net saving in a growingpopulation. Tobin concluded that "... it seems quite possible that life cyclesaving can account for the United States capital stock." The combinationof convenience and parsimony tended to favor playing down the bequestmotive.
Lately, however, the opposite conclusion seems to have gained force.Numerical calculations by Betsy White imply that pure life-cycle saving byitself can not generate a realistically high volume of saving. Unfortunatelysuch numerical experiments are not very transparent. S0derstr~Sm com-ments: "The reason why White and (Tobin) reach such different conclusionsis not quite clear. Since their models are similar in general design, the rea-son has to be sought in differences of details, and those are numerous ...(O)ne can only say that details are very important." That is bad news forthe theorist. Nevertheless, White’s results at least suggest that it might makesense to supplement hump-saving with the desire to accumulate a bequest.SOderstr6m’s own contribution is entirely consistent with this suggestion.He too does numerical exercises with a model in which there are noplanned bequests. But there is uncertainty about time of death, and sosome individuals die unexpectedly soon, owning positive net worth which ispassed on to survivors. These transfers (also unexpected) will be saved, atleast initially, and show up in measured aggregates. In S~derstr~m’s formu-lation of the life-cycle model, these unplanned bequests turn out to be veryimportant. The model can generate saving rates as high as those observed(in Sweden, to which the model is calibrated) and even higher.
166 SAVING AND GOVERNMENT POLICY
Finally, Kotlikoff and Summers proceed differently, though stillwithin the framework of the life-cycle theory of saving. Instead of makinghypothetical calculations to show what the theory would predict for reason-able parametric specifications, they took at profiles of earnings and con-sumption by age to estimate the stock of life-cycle wealth directly. Theyfind that life-cycle wealth accounts for only a small fraction of aggregateprivate wealth in the United States. They say: "The evidence presented inthis paper rules out life-cycle hump saving as the major determinant ofcapital accumulation in the U.S. economy. Longitudinal age-earnings andage-consumption profiles do not exhibit the kinds of shapes needed to gen-erate a large amount of life-cycle wealth accumulation... Intergenerationaltransfers appear to be the major element determining wealth accumulationin the United States."
My tentative conviction is that this view of the matter is essentiallyright. It is reinforced by general qualitative considerations. The naturaltemporal habitat of a theory emphasizing the life cycle ought to be periodsof 50-100 years. Over historical time, the impression is inescapable thatsuccessive generations start (economic) life with larger per capita endow-ments of tangible wealth than their predecessors. Since the distribution ofwealth is known to be highly concentrated, this description need only applyto the relatively small group of families owning among them a large shareof the capital stock. But then it becomes important to understand how thebequest motive influences the saving rate.
I want to report one primitive experiment along this line. It is toocrude to provide more than a hint that there is something worth exploring,but I have limited myself to what could be done with pencil and paper anda small hand calculator. The version of life-cycle theory I adopt is essen-tially that described by M. Yaari.l
The representative individual is born (at age 20, say), works for 45years, lives in retirement for 10 more years, and dies. The population isconstant and so, in this one-person-shay world, the age distribution is uni-form. An individual born at time zero starts with an inheritance that I setequal to some multiple of the annual wage at time zero. (Later I put thatmultiple equal to one, so the representative person inherits wealth whosepresent value discounted back to age zero (calendar age 20) is one year’spay at the wage ruling at time zero.) The annual wage is independent of agebut grows exponentially through time at 100g = 2 percent a year. Soeverybody of working age at time t earns yoeXp(.O2t). At birth, the individ-ual disposes of the present value of the rising earnings over a 45-year work-
~Afler the conference was over, Peter Sturm called my attention to a characteristically lu-cid article by Michael Farrell ("The Magnitude of ’Rate-of-Growth’ Effects on Aggregate Sav-ings," Economic Journal LXXX (Dec. 1970), pp. 873-894) that I had missed. It is exactly in thespirit of my paper, though with much more extensive computation. As its title indicates, Far-rell’s work is aimed at the sensitivity of the saving rate to the rates of growth of population andearnings, whereas I fix those. It is hard to compare his results on other parameters with mine,but there is to my eye some hint that "incidental" details may matter. This suggests a lot ofhandles for policy, but also warns that surprises are easily possible.
SAVING BEHAVIOR SOLOW 167
ing life, plus the inheritance already described. The (real) interest rate isconstant at 3 percent a year.
The same individual, at birth, plans consumption over a 55-year lifespan. S/he maximizes
55 ~tfe u(c)dt + kv(b)o
wherej is a rate of time preference, u(.) is the instantaneous utility-of-con-sumption function, and kv(b) is the utility of contemplating a bequest ofamount b to one’s descendant. I imagine the bequest to be paid out atdeath. The number k is a parameter carrying the strength of the bequest-motive. I setj = .01 and have not bothered to try other values. We knowabout the qualitative influence of time preference on the propensity tosave. Atj = .01, a person at age zero discounts utility at age 55 by aboutone-half. Some economists have experimented with rates of time prefer-ence as high asj = .04. In that case, the discount factor over a 55-year lifespan is one-tenth; from the vantage point of age 38, I can feel that must bewrong. As usual, I have taken u(c) = c~ t,/(1-h) and experimented with afew values ofh in the range from h= 1 to h=2. I have also taken v(.) to bethe same function as u(.), even to the same value of the elasticity parame-ter. It is simply a great arithmetical simplification to do so, and thereis nothing much against it. I will come back to the bequest-parameter klater on.
The choice of a consumption profile is subject to a constraint that Ineed not write down in detail. It merely requires that the present value ofthe inheritance plus the present value of earnings over the working lifeequal the present value of the bequest plus the present value of consump-tion over the life span. All this discounting is done at the interest ratei(=.03), so there is a tacit assumption that the capital market is perfect.Many others have studied the effect of a social security scheme in this con-text, so I ignore that question.
The rest is routine. Optimal consumption at age a is proportional toexp((i-j)a/h). Since I have the interest rate (.03) bigger than the utility dis-count rate (.01), optimal consumption grows throughout the lifetime. Thereturn on savings is big enough to overcome normal impatience. If h : 1(the logarithmic utility function), consumption grows at 2 percent a year. Ifh =2, so that the marginal utility of consumption falls considerably faster,consumption grows at only 1 percent a year over the lifetime; greatersmoothing is achieved.
The level of the consumption profile and the size of the optimalbequest are determined together to meet two conditions. Consumption at
due allowance for interest earnings, any such variation in saving can betranslated through time into a corresponding change in the bequest. Op-timality requires the obvious utility-balancing at the margin. In addition,
168 SAVING AND GOVERNMENT POLICY
of course, the consumption level and the bequest are tied together throughthe lifetime budget constraint.
The first result I want to report is about the sensitivity of the savingrate to variations in the bequest parameter (called k). The model canbe calibrated to give results that are not outlandish. For instance, withthe specifications already made (time preference rate=.01, productivitygrowth rate=.02, interest rate = .03, working life =45 years, lifetime (fromage 20)=55 years, inheritance at age zero=one year’s wage at that time),the choice h= 1, k=0.7 leads to the following results: the optimal bequestis (approximately) equal to one year’s wage at the time of bequest, and anaggregate saving rate of about 12 percent. The optimizer thus leaves abequest equal to exp(55(.O2))=exp(1.1)=3 times the inheritance s/he hadreceived 55 years earlier, but that just allows for rising incomes. In calcu-lating the saving rate, national income is defined as aggregate wage incomeplus interest at 3 percent on the aggregate wealth of the populationsummed across the uniform age distribution. By the way, with these pa-rameters, the wage share in aggregate income is about 85 percent, and thewealth-income ratio is about 5:1.
Now suppose the bequest parameter is changed to k=0.8, with therest of the specification as before. The size of the optimal bequest rises byabout 15 percent. But the aggregate saving rate does not change at all totwo decimal places. If k is reduced to 0.5, the optimal bequest is 30 percentlower than with k=0.7, but again the saving rate moves imperceptibly.
Obviously I should spend my spare time replicating these calculationsfor other parameter-sets, for a growing population, for alternative initialinheritances, etc. For now, I interpret the model as saying that modestchanges in each generation’s concern for its heirs will have very little effecton the aggregate saving rate. Since more than modest changes in such atti-tudes are not likely to be achievable, there is not much to be gained in thatdirection. The intuitive reason why modest changes in the bequest motivehave so little effect on the saving rate must be something like the following.If the bequest is the order of magnitude of one year’s income, then the in-tention to accmnulate a somewhat larger estate will not call for any large in-crease in saving in any given year. The added saving effort will be spreadover a lifetime according to the standard marginal equivalences. The effecton the saving rate will be further moderated by the extra interest incomeearned en route. It seems likely that this generalization will be approxi-mately true even if the target bequest is a bit bigger than one year’s earn-ings so long as it constitutes a number of years’ earnings, that is, small com-pared with the working lifetime.
The implication for international comparisons is trickier. It is clearfrom the mathematics that a sufficiently large value of k can drive con-sumption toward zero. So it is possible in principle that Japanese save more~h~ A~i~ang ~ri~ril~ b~ they j~ get ~eh more ~fi~fa~tiOnfrom providing for their heirs. Somehow I doubt that; but it would takecomparative data on inheritances and incomes to check it out.
SAVING BEHAVIOR SOLOW 169
The second preference-indicator is h, the concavity-parameter. Herethe story is rather different. I go back to k=0.7. With logarithmic utility,h= 1, the bequest keeps pace with earnings, and the aggregate saving rate is12 percent. Let h= l l/~, so the representative saver experiences moresharply diminishing marginal utility of consumption and thus is more risk-averse, more desirous of smoothing consumption over the lifetime. Some-one with h= 1~/2 leaves a bequest about a quarter smaller than someonewith h = 1, but such a population’s saving rate falls only to 11 percent. If,however, we set h -= 1.75, the bequest falls another 6 percent below the levelath= 1 and the saving rate drops to 7½ percent; and at h=-2 (a value rec-ommended by Ragnar Frisch, I think) the saving rate falls drastically to 4percent. Evidently the effects of this parameter are strongly nonlinear, andthe impact on the saving rate can be dramatic.
Remember that these calculations automatically equate the elasticityparameters in the utility functions for bequests and for own consumption.That was done for mere arithmetical convenience, though it is perhaps notbad to assume that tastes which saturate more quickly with respect to con-sumption will do so also for bequests. Anyway, it is pretty clear that themain effect of sharper concavity is to reduce the desired rate of growth ofconsumption over the lifetime, to favor the early low-income years. It seemsto me entirely possible that the sort of difference in tastes captured by vari-ations in h could dominate international comparisons.
That would be a pessimistic conclusion from the policy standpoint.There are some puzzles, however. It goes against deeply entrenched clichesto conclude that Germans and Japanese save more than Americans becausethey are insatiable gamblers, while we are unambitious conservatives whosoon tire of the pleasures of high consumption. But of course the differ-ence, if there is one, need not refer to personality type. It could reflect insti-tutional differences that favor or disfavor the conversion of a rising incomestream into a more nearly level consumption profile. That effect could bemodified by policy, though it is hard to imagine how a democratic govern-ment would justify depriving its citizens of borrowing opportunities theyhave customarily enjoyed.
Another cliche, that Americans are more oriented toward the short runthan others, that we "want it now," does suggest itself. That sounds morelike a statement about time preference, however. I commented earlier thatsmall values of the time-preference parameter (in the neighborhood of .01)sound most plausible. A little experimentation shows that minor variationsaround so small a rate of discount do not have dramatic effects on the sav-ing rate. The possibility remains that there may be very large interculturaldifferences in time preference. They would, of course, strongly affect thesaving rate in a well-understood way. It is not clear that economic policycould, or should, do anything to increase a private saving rate that is low be-
...... cause citizens do not care much about the future~ !f there is asocial rate oftime preference that is Systematically smaller than the private rate, for thesorts of reasons that have been discussed in the literature, it would seemmore straightforward to give effect to the social interest through the gov-ernment’s contribution to the national saving rate.
170 SAVING AND GOVERNMENT POLICY
My conclusions from these "anthropological" experiments are on thewhole pessimistic. Small changes in the bequest-motive and in the rate oftime preference have only small effects on the saving rate. Drastic changeswould no doubt have large effects, but there is no opening for economic pol-icy in that observation. No democratic government could or should try de-liberately to generate big changes in the preferences of its citizens, espe-cially not when the parameters in question may have deep cultural rootsand are not obviously self-destructive.
The case of the concavity parameter is slightly different. It is far fromclear what constitutes a "small" difference in the elasticity of the marginalutility of income, but one has the impression that the saving rate is fairlysensitive to changes in the speed with which marginal utility diminishes. Itis tempting to think of this parameter as measuring risk-aversion; if it is"too much risk-aversion" that makes the saving rate "too small" then, evenif public policy can do nothing about preferences, it can certainly do some-thing about the degree of risk to which private savers are exposed. Butthere is no uncertainty in the simple model I have used as a trial horse. Weknow from other models that do admit uncertainty that there are offsettingeffects to be dealt with. Strong risk aversion (rapidly diminishing marginalutility of income or wealth) favors saving to protect the saver against pain-ful unfavorable contingencies, and also works against saving because theadded interest income is not much valued. Under certainty only the lattereffect operates; a high value of h goes against saving in order to achieve aflatter lifetime consumption profile. Somehow I doubt that governmentswill have much luck in preaching either the Puritan ethic or the pleasuresof the pot of gold at the end of the rainbow.
The life-cycle model has something to say, in principle, about the ef-fectiveness of interest rate variations in stimulating saving. As Marshallknew, of course, there are offsetting effects; bequests, for instance, arecheaper to accumulate but it takes less saving to accumulate them. The neteffect can go either way. In the model used here, it turns out that a rise inthe real rate of interest from 3 to 4 percent does indeed increase the savingrate: from 12 to a bit under 15 percent in the base case. Tobin does not ad-dress that question directly in his simulations with a life-cycle model, buthis calculations seem to imply a similar favorable effect of higher interestrates on saving. White’s calculations with an apparently similar model pro-duce the reverse effect: a higher interest rate is accompanied by a lowersaving rate. This finding points up S6derstr~m’s discouraging remark thatthe details seem to matter in these models. It might be worth someone’s ef-fort to discover just why these two experiments yield contradictory answersto important questions, but it is hard to imagine who would go to thetrouble.
When theory suggests offsetting forces, one says we are faced by an........ empirical question; but in someways that is even more discouraging~ Over
the years, we had come to accept a piece of folk-econometrics: no one hadsucceeded in finding a reliable interest rate effect on saving, and so macro-economics proceeded on the presumption that the saving rate was effec-
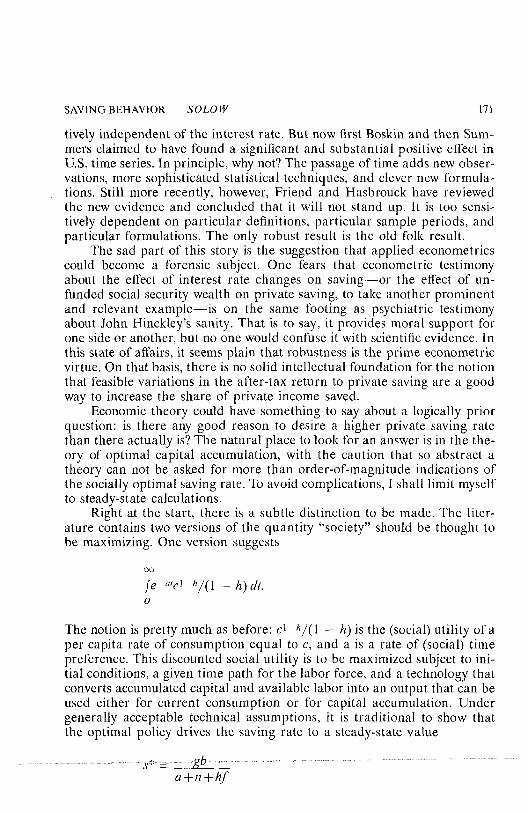
SAVING BEHAVIOR SOLOW 171
tively independent of the interest rate. But now first Boskin and then Sum-mers claimed to have found a significant and substantial positive effect inU.S. time series. In principle, why not? The passage of time adds new obser-vations, more sophisticated statistical techniques, and clever new formula-tions. Still more recently, however, Friend and Hasbrouck have reviewedthe new evidence and concluded that it will not stand up. It is too sensi-tively dependent on particular definitions, particular sample periods, andparticular formulations. The only robust result is the old folk result.
The sad part of this story is the suggestion that applied econometricscould become a forensic subject. One fears that econometric testimonyabout the effect of interest rate changes on saving--or the effect of un-funded social security wealth on private saving, to take another prominentand relevant example--is on the same footing as psychiatric testimonyabout John Hinckley’s sanity. That is to say, it provides moral support forone side or another, but no one would confuse it with scientific evidence. Inthis state of affairs, it seems plain that robustness is the prime econometricvirtue. On that basis, there is no solid intellectual foundation for the notionthat feasible variations in the after-tax return to private saving are a goodway to increase the share of private income saved.
Economic theory could have something to say about a logically priorquestion: is there any good reason to desire a higher private saving ratethan there actually is? The natural place to look for an answer is in the the-ory of optimal capital accumulation, with the caution that so abstract atheory can not be asked for more than order-of-magnitude indications ofthe socially optimal saving rate. To avoid complications, I shall limit myselfto steady-state calculations.
Right at the start, there is a subtle distinction to be made. The liter-ature contains two versions of the quantity "society" should be thought tobe maximizing. One version suggests
fe-"’c~-t’/(1 -- h) dt.o
The notion is pretty much as before: c~ t,/(1 - h) is the (social) utility of aper capita rate of consumption equal to c, and a is a rate of (social) timepreference. This discounted social utility is to be maximized subject to ini-tial conditions, a given time path for the labor force, and a technology thatconverts accumulated capital and available labor into an output that can beused either for current consumption or for capital accumulation. Undergenerally acceptable technical assumptions, it is traditional to show thatthe optimal policy drives the saving rate to a steady-state value
s*~ .............gb ................................................a+n+hf
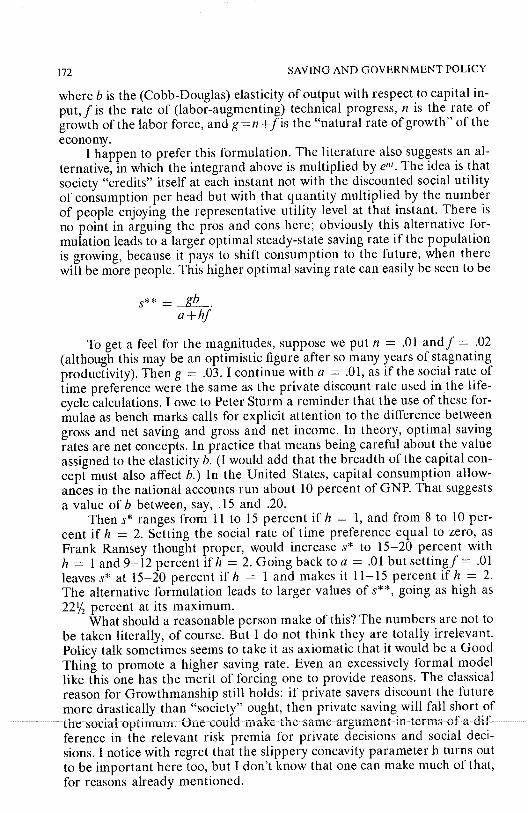
172 SAVING AND GOVERNMENT POLICY
where b is the (Cobb-Douglas) elasticity of output with respect to capital in-put, f is the rate of (labor-augmenting) technical progress, n is the rate ofgrowth of the labor force, and g = n +f is the "natural rate of growth" of theeconomy.
I happen to prefer this formulation. The literature also suggests an al-ternative, in which the integrand above is multiplied by e"t. The idea is thatsociety "credits" itself at each instant not with the discounted social utilityof consumption per head but with that quantity multiplied by the numberof people enjoying the representative utility level at that instant. There isno point in arguing the pros and cons here; obviously this alternative for-mulation leads to a larger optimal steady-state saving rate if the populationis growing, because it pays to shift consumption to the future, when therewill be more people. This higher optimal saving rate can easily be seen to be
a+hf
To get a feel for the magnitudes, suppose we put n = .01 andf = .02(although this may be an optimistic figure after so many years of stagnatingproductivity). Then g = .03. I continue with a = .01, as if the social rate oftime preference were the same as the private discount rate used in the life-cycle calculations. I owe to Peter Sturm a reminder that the use of these for-mulae as bench marks calls for explicit attention to the difference betweengross and net saving and gross and net income. In theory, optimal savingrates are net concepts. In practice that means being careful about the valueassigned to the elasticity b. (I would add that the breadth of the capital con-cept must also affect b.) In the United States, capital consumption allow-ances in the national accounts run about 10 percent of GNE That suggestsa value of b between, say, .15 and .20.
Then s* ranges from 11 to 15 percent ifh = 1, and from 8 to 10 per-cent if h = 2. Setting the social rate of time preference equal to zero, asFrank Ramsey thought proper, would increase s* to 15-20 percent withh = 1 and 9-12 percent ifh = 2. Going back to a = .01 but settingf = .01leaves s* at 15-20 percent ifh = 1 and makes it 11-15 percent ifh = 2.The alternative formulation leads to larger values of s**, going as high as221/z percent at its maximum.
What should a reasonable person make of this? The numbers are not tobe taken literally, of course. But I do not think they are totally irrelevant.Policy talk sometimes seems to take it as axiomatic that it would be a GoodThing to promote a higher saving rate. Even an excessively formal modellike this one has the merit of forcing one to provide reasons. The classicalreason for Growthmanship still holds: if private savers discount the futuremore drastically than "society" ought, then private saving will fall short of
............ the social optiin-um: One co-ald make the same argument in terms of a dif-ference in the relevant risk premia for private decisions and social deci-sions. I notice with regret that the slippery concavity parameter h turns outto be important here too, but I don’t know that one can make much of that,for reasons already mentioned.
SAVING BEHAVIOR SOLO W 173
Do we actually save too little? Presumably it is the national saving ratethat should be compared with s* (or s**). Presumably also at least some ofthe Sturm-Blades adjustments should be made to the current figures fromthe national accounts; logic would seem to call for the inclusion of con-sumer durables and at least public nonmilitary durables in the total. Inthose terms, the gross national saving rate in the United States is at least 24percent, and shows no downward trend, according to Table 13 in Sturm andBlades. In net terms, the adjusted saving rate must be close to 15 percent.That is in the ballpark bounded by the theory of optimal capital accumula-tion, and could even be on the high side. Even without consumer durables,their figure is 18.6 percent. Robert Eisner rightly calls attention to the factthat these are all steady-state calculations. If other countries are moving upto their steady-state capital stocks, while the United States is more nearlythere, a further reason for the observed international difference emerges.Leaving aside the arguments about divergence of private and social costsand benefits, the possibility exists that it doesn’t matter much that we don’tknow how to fix the saving rate, because it ain’t broke.
There is, after all, something fishy about the current enthusiasm forsaving incentives. In the first place, as I have just argued, no very good rea-sons have been proposed for believing that the national saving rate in theUnited States is too low. (I do not count merely pointing at Japan as a rea-son, although I would be happier if we understood the Japanese economybetter.) Nor do the data of Sturm and Blades suggest that the national sav-ing rate has been falling. Taking a longer period of time would almost cer-tainly reinforce that finding.
Secondly, as Jump argues convincingly for Canada, the incentives thathave been proposed and enacted for increasing the household saving rateare uncertain, maybe even perverse, in their effects. In this country, no oneargues that the All-Savers Certificates, for instance, generated any measur-able ceteris paribus rise in personal saving. If it were desirable to engineeran increase in the household saving rate, there are more effective ways: ashift from the taxation of income to the taxation of consumption is one ob-vious possibility, though I hasten to add that so drastic a change wouldneed to be considered from many points of view, especially since the needfor more personal saving is not firmly established. The particular incentivesfor saving that have been proposed--in Canada too, apparently--are souniformly in danger of turning into mere lump-sum transfers to the well-off, that a person with even an ounce of healthy cynicism is bound to won-der if that were not their primary purpose.
Third, whatever the long-run need for national saving may be, there isno intelligible case to be made that the volume of plant and equipmentspending in the United States is now or in the near future limited by an in-adequate willingness to save. At a time when capacity utilization rates are
....... below 70 percent and not visibly going up, it is hard to believe that an in,vestment boom is waiting to be touched off by incentives for personal sav-ing. (I noticed that Secretary Regan is trying to direct the public’s attentionaway from the prime rate, because he thinks that it gives the impression
174 SAVING AND GOVERNMENT POLICY
that the level of interest rates is higher than it actually is. He said some-thing about our need to get people into the banks and borrowing. Are weall Keynesians again?) As several papers in this conference have noted, itwould make far more sense to be thinking about sweetening the inducementto invest than about raising the propensity to save, and Auerbach’s papershows how it can be done.
Fourth, this whole line of argument suggests the wisdom of a policy di-rection that will be nostalgically familiar to at least two Old Growthmen inthis group: a shift toward easier credit and tighter fiscal policy, with thefirst looking after the inducement to invest and the second providing thesaving through the public budget. It goes without saying that Old Growth-men know full well that this is a policy that makes sense only when theeconomy is operating near its normal capacity to produce.
Which brings me to my fifth and last point. There is an incomparablylarger source of personal saving waiting to be tapped than any fiddlingwith the taxability of interest could generate. If I may give it a name, howabout the multiplier process? The GNP gap can hardly be a lot less than 9percent of current output. I do not know what the best estimate of the mar-ginal national propensity to save is, but if the short-run multiplier is a littleless than two, the national marginal propensity to save--counting in re-tained earnings and induced tax revenues--must be close to one-half. So amere closing of the gap would add 4 percent of GNP to the national savingrate. I understand the dangers of overheating an economy not yet out of theinflationary woods; and I realize that any initial expansionary impulsemight come in part from a step reduction in public saving. The point of thisexercise is only to underline the wisdom of Penner’s willingness to tradestimulus later for stimulus now--which I would make more overt--and toremind you "where the saving will come from."
REFERENCES
Boskin, M. "Taxation, Saving and the Rate of Interest," Journal of Political Economy, Vol. 86(1978)
Friend, I. and J. Hasbrouck. "Saving and After-Tax Rates of Return," Mimeo (1982).Kotlikoff, L. and L. Summers, "The Role of Intergenerational Transfers in Aggregate Capital
Accumulation," Journal of Political Economy, Vol. 89 (1981) 706-732.Modigliani, F. "The Life Cycle Hypothesis of Saving and Inter-country Differences in the Sav-
ing Rate," in W. A. Eltis, M. F. G. Scott, J. N. Wolfe, eds. Induction, Growth and Trade,(Essays in honor of Sir Roy Harrod) Oxford: Clarendgn Press, 1970, 197-225.
SOderstriSm, L. "The Life Cycle Hypothesis and Aggregate Household Saving," American Eco-nomic Review, Vol. 72 (!982) 590-596.
Summers, L. "Capital Taxation and Accumulation in a Life-Cycle Model," American Eco-nomic Review, Vol. 71 (1981).
Tobin, J. "Life Cycle Saving and Balanced Growth," in Fellner et al, eds., Ten Economic Stud-ies in the Tradition of h’ving Fishel; New York: Wiley, 1967, 231-256.
............... White~ ~ ~’Empirical Tests o£the LifeCycle-~-ypothesis~"AmerieanEeonomicReview, Vol~68 ...........(1978) 547-560.
Yaari, M. "On the Consumer’s Lifetime Allocation Process," International Economic Review,Vol. 5 (1964) 304-317.
Henry C. Wallich*
When I read Bob Solow’s elegant paper, I thought I had a few things tosay. After then looking at all the other papers, I realize that everything hasbeen said before. ! can only make a few remarks from, as it were, an intui-tive perspective rather than with theoretical rigor or econometric analysis.I fear that Bob is correct in suggesting that this discussion of whether tostimulate saving has some of the aspects of the discussion of John Hinck-ley’s sanity. It is always pro domo. No matter what you hear about what kindof tax change is needed, it always ends up with a tax benefit for the speakeror his constituency. I am just as suspect here as anybody else.
I share the perplexity as to the need for accelerated growth. I used tofeel quite strongly about that need, mostly on the grounds of internationalpower relationships and also in order to ward off domestic pressure for re-distribution. ! feel a little less hopeful now that those things are going to beresolved by accelerated growth, but I think growth is still a desirable objec-tive. However, I also feel uncertain whether accelerated investment is theway to get accelerated growth. Bob Solow was one of the first to cast doubtupon that seemingly obvious proposition. One proposition that I think isreasonable is that if we want more investment, then we need more savings.To fiddle with investment makes sense only if that produces more saving.The only way in which encouraging investment will raise saving is if byraising investment, we first raise interest rates and if saving then respondspositively to that higher interest rate. As Bob has pointed out, on a folkloricbasis that is a mute subject. We do not know if there is an effect or not.
As far as Bob’s parting shot is concerned to the effect that given pre-sent-day excess capacity and unemployment, there is really no need toworry about saving, I would say yes to that in a short-run view. But whenone fiddles around with anthropological parameters and thinks that maybeone can change various propensities of the population, one does have to al-low some time. Over that time, the Federal Reserve and the Congress mayget us back to a higher rate of capacity utilization.
Let me look at some of the motives for saving that appear in Solow’spaper, beginning with the life cycle hypothesis. Somehow it seems to methat in this particular area, economists are dealing with motivations as ifthey were looking at an alien species; they are not looking at human beingsbut at an ant hill and are trying to explore why they run in one direction oranother. It seems to me that the life cycle hypothesis violates a very basic
......................instincb.--the acquisitive instinct~ People do not tike to decumulate, Once .......they have got something, they like to hold on to it. They are aware that they
*Member, Board of Governors of the Federal Reserve System.
175

176 SAVING AND GOVERNMENT POLICY
cannot take it with them, and they are also aware that if they could, itwould only melt there. Nevertheless, I think there is a profound reluctanceto use up one’s savings. You see that in the way people have organized theirsavings. If we wanted to implement the life-cycle hypothesis in our personallives, then presumably we would all be buying annuities. Now we are, ofcourse, buying some annuities as well as relying on Social Security. We relyquite heavily on pension funds and some life insurance. These usually takethe form of an annuity. But the great bulk of savings, I think, is still in dis-cretionary rather than contractual form. People could have changed thatby relying more heavily on pension funds and on life insurance but theyhave not. They invest in deposits, they invest in money market instruments,they invest in securities and real estate. The Federal Reserve flow of fundstells us that these are the bulk of investment.
Now look at the bequest motive. Everybody has a desire to leave hischildren a good education. That is one bequest everybody makes who can.They like to make this bequest early in life. Perhaps that is another reasonfor including investment in human beings in total savings, with educationas part of total investment expenditure.
Other than that, the bequests that Bob analyzes are really very smallones. Two or so years’ income is not very much, and it is not only too little,it is also too late. By the time a person’s life expectancy expires at 75 or so,his children are not very far from retirement themselves and they do notneed the bequest. Moreover, they are probably making a great deal morethan daddy, at least if their daddy is in the academic line, and so he reallyis not doing a great deal for them. There may be some sense of social obli-gation here, and being near Newburyport puts me in mind of the late JohnE Marquand and The Late George Apley. You may recall in that book thatthere is a scene where George’s father tells him how to use his money. Youtake your income, the father says to George, and divide it in two equalparts. One part you set aside for saving. He does not say for bequests, hejust says "save it." The other half you again divide into two equal parts, oneof which you give to charity, and the other half, which is one-fourth of thetotal income, you spend for your living needs. Now that was a good bour-geois attitude, just like the bourgeois attitude that a man should not retireuntil he has enough to maintain his standard of living in retirement andstill save a little. As you know, the data we have on our aged seem to saythat although they may not be maintaining their standard of living, never-theless, they are still saving. This acquisitive instinct, I think, is at workrather than a bequest motive.
Last, I turn to the precautionary motive that Bob mentioned. The pa-per first eliminates uncertainty and later admits it. By eliminating uncer-tainty, Solow arrives at a very peculiar proposition, namely that risk aver-sion reduces saving, and that is quite true. If there is no uncertainty, then
.......................~h~ ConCavity ~ame~er ~g ~ly ~ ~ffe~ of maki~ ~opl~ wafi~ ~ ~avea flat income stream throughout their lives rather than to accumulate capi-tal. Therefore, they do not react to interest rates and they save little. But assoon as you give up the certainty postulate and admit uncertainty, there isa very powerful precautionary motive for saving. The great risk of the
DISCUSSION WA LLICH 177
saver, of course, is to outrun his original life expectancy. If he does not wantto invest in an annuity that would eliminate that risk, he can avoid it byplanning on living to 100 or 110. We know, of course, that no one everreaches his full life expectancy on the day of his death, but looking aheadthere is a great deal of exposure to be covered if one wants to be completelysure. We see the strength of the precautionary motive in the differentialsaving behavior in particular social groups. Farmers save more becausethey are exposed to risk, the self-employed save more because they are ex-posed to risk. That seems to be a very powerful factor.
As for the determinants that take the form of interest rate and, I wouldnote, inflation, I have nothing to add to the findings. We have a study at theBoard by Steindel which does find a positive effect of interest on saving.Bob knows that study, and I am not telling him anything new. I could giveyou some purely anecdotal evidence. We get complaints from automobiledealers who report people come into their showroom and say they have$5,000 or $10,000. They say they could buy a car for cash but they are get-ting 15 percent on their money market mutual fund and they hate to givethat up. That seems to be an influence of the interest rate on saving eventhough the person probably has money illusion because after taxes he isprobably still getting the negative real rate.
As for the effect of inflation on saving, that seems to pose a problemsimilar to that of the rate of interest on saving. Is it positive? Is it negative?Inflation influences the real rate of return. What is the real rate of returnafter tax? That we have to think about. We do not know which way thatpushes the saver. We do know that the borrower borrows more as inflationreduces his real rate after tax.
But far more important, of course, is the effect of inflation on accumu-lated past saving. If we were talking here about what I would really like todiscuss, we would not talk about how to increase saving, but how to make itpossible for people to keep the savings they already have. I know, of course,that for everybody who loses from inflation there is somebody else whogains, including these days the federal government which behaves exactlyas if its dissaving were responsive to inflation. Its debt is reduced and it re-sponds by borrowing more. In any event, the impact of inflation on pastsaving, through its redistributive effect, seems to me to be far more seriousthan the impact on new saving whatever that would be. It creates a degreeof uncertainty in people’s lives--the difficulty of knowing how to put yourchildren through college, the difficulty of knowing how to provide for oldage. It is very curious that, in the midst of this uncertainty, there have notbeen greater changes in the savings ratio of the United States than we haveobserved.
I suppose you were made aware yesterday there seemed to be a tre-mendous drop in the savings ratio in the United States in the second half of
.................... the 1970s. Excellent papers were written about it, ! have with me a paper ............here from the Federal Reserve Bulletin dated August 1980 that analyzesthis phenomenon. Unfortunately, in January 1981 and July 1982 all theseshortfalls were largely revised away. Now we have got to find a new set of

178 SAVING AND GOVERNMENT POLICY
reasons for a different set of phenomena. The savings ratio has indeed beenremarkably constant and this is in the face of a great deal of uncertainty onthe part of people who do the saving. But these people have one other wayout and that is to rely increasingly on the federal government. Under condi-tions of inflation, you cannot rely on what you may get from your insurancecompany. You cannot rely on the money you put in the savings bank, orgovernment bonds, because it may be inflated away. The only party thatcan give you certainty is the federal government with an indexed pensionand Social Security. That is a very troublesome situation. It is surprisingthat we have not developed indexed bonds. I cannot believe that the riskwould be all that high even for private issuers. If firms can deal with 10 per-cent wage increases, why can’t they deal with an increase in interest costs? Ithink the real reasons why private borrowers have not developed indexedbonds is that interest is tax deductible. Presumably the inflation premiumin an indexed bond would not be deductible.
Let me turn to some of the measures we might take other than to ma-nipulate the anthropological parameters. First, it seems to me that some-thing could be done about the income tax treatment of inflation with re-spect to holding gains. I realize that as soon as someone says do not taxinflationary holding gains, somebody else will mention the tax deductibil-ity of interest. These two things have to be weighed against each other.Something clearly should be done about the capital gains tax. The Britishhave done something very interesting. All inflation gains after a certaindate are nontaxable; that has enabled them to issue an indexed bond and tomake the inflation premium in that bond nontaxable because it is identicalwith the rate of inflation. Today, the capital gains tax for people who ac-quired their assets long ago is really a tax on capital and not on gains.Something could be done about the estate tax if one were really minded toprotect saving. The estate tax is paid almost wholly out of saving. It presum-ably ought to influence people’s desire to make bequests but apparently allit does is influence their desire to make a tax-exempt bequest to Yale, Har-vard, or MIT rather than leave it all to their children. There is the possibil-ity, that Bob discussed, of a consumption tax. One could certainly shift thebalance of saving and consumption in that way. Finally, a budget surplus tomy mind would add to saving. I cannot believe, and I do not see, thatpeople respond to this large government deficit by increasing their ownsaving. At least in the short run, there is a strong dissaving element in theposture of the federal budget.

Other Participants
ROBERT Z. ALIBER, Gradaate School of Business, University of Chicago; Amos Tuck Schoolof Business Administration, Dartmouth College
MARCELLE ARAK, Vice President, Federal Reserve Bank of New YorkKAREN ARENSON, Economics Reporter, New Ynrk TimesJEAN-PIERRE AUBRY, Deputy Chief Research Department, Bank of CanadaJOSEPH A. BAUTE, Chairman and Chief Executive Ojf!cer," Markem Corporation, Director;
Federal Reserve Bank of BostonAVRAHAM BEN-BASSAT, Assistant Director, Research Department, Bank of IsraelJOHN M. BERRY, Economics Reporter, Washington PostCARL P. BLACKWELL, Senior Advisor, Research Department, International Monetary FundROBERT H. BOYKIN, President, Federal Reserve Bank of DallasGERARD M. BRANNON, Director-Special Studies, American Council of Life InsuranceROGER E. BRINNER, Group Vice President, Chief Economist, International and Energy Divi-
sions, Data Resources, Inc.LYNN E. BROWNE, Vice President and Economist, Federal Reserve Bank of BostonNORBERT BUB, Direktot; Deutsche BundesbankCESARE CARANZA, Assistant Directot; Research Department, Banca d’ItaliaPIERANTONIO CIAMPICALI, Condirettore Centrale, Banca d’ItaliaPETER K. CLARK, Chief National Income Section, Board of Governors of the Federal Reserve
SystemPETER CRAWFORD, Vice President, Citibank, N.A.J. DEWEY DAANE, Chairman, Commerce Union BankTHOMAS E. DAVIS, Senior Vice President and Director of Research, Federal Reserve Bank of
Kansas CityROBERT W. EISENMENGER, Senior Vice President and Director of Research, Federal Re-
serve Bank of BostonEDGAR R. FIEDLER, Vice President, Economic Research, The Conference BoardJOHN FLEMM1NG, Chief Adviser; Bank of EnglandPETER FOUSEK, Senior Vice President and Director of Research, Federal Reserve Bank of
New YorkDAVID R. FRANCIS, Business Editor, The Christian Science MonitorJAMES S. HATCH, President and Chief Executive Officer, The Canaan National Bank; Direc-
tor, Federal Reserve Bank of BostonPATRIC H. HENDERSHOTT, Professor of Finance, The Ohio State University; National Bu-
reau of Economic ResearchKAREN HORN, President, Federal Reserve Bank of ClevelandTAKEO IGUCHI, Consal-General of Japan, Consulate-General of Japan in BostonJOHN H. KALCHBRENNER, Senior Vice President and Chief Economist, Shawmut Bank of
Boston, N.A.SILAS KEEHN, President, Federal Reserve Bank of ChicagoMICHAEL W. KERAN, Senior Vice President and Director of Research, Federal Reserve Bank
of San FranciscoRICHARD W. KOPCKE, Vice President and Economist, Federal Reserve Bank of BostonAKIO KURODA, Assistant Adviset; Monetary and Economic Studies Department, The Bank of
JapanROBERT L. KUTTNER, Editot; Working Papers MagazineE MICHAEL LAUB, Director; Economic and Policy Research, American Banketw AssociationMICHEL R. LIEUZE, Assistant Manager; Research Department, Bank of FranceROBERT E. LIPSEY, Professor of Economics, Queens College, CUNY," Directot; New York Of-
flee, National Bureau of Economic ResearchRAYMOND LUB~TZ, ~ec((0!~ ~h(ef O~q~’d of qq~qr~qrs of tO~ Fede~:q[ 8~�~ ~Vs’t¢~ .......
....... NEFRED"MAEABRE, Ne~S Editor, The Wall Street JournalVINCENT G. MASSARO, Senior Economist, The Conference BoardJAMES A. MclNTOSH, First Vice President, Federal Reserve Bank of BostonFRANK E. MORRIS, President, Federal Reserve Bank of Boston

DONALD J. MULLINEAUX, Senior Vice President and Chief Economist, Federal ReserveBank of Philadelphia
ALICIA H. MUNNELL, Vice President and Economist, Federal Reserve Bank of BostonPETER PAULY, Associate Professor of Economics, University of PennsylvaniaNICHOLAS S. PERNA, Manage#; Long Range Economic Research and Forecasting, General
Electric Co.WILLIAM POOLE, Consultant, Council of Economic AdvisersHARRY PRYDE, Fit~’t Vice President, National Association of Home BuildersSTEPHEN ROACH, Vice President, Morgan Guaranty Trast Co.MICHAEL RUKSTAD, Assistant Professor, Harvard Business SchoolPHILIP SAUNDERS, JR., Senior Vice President, John Hancock Mutual Life Insurance Com-
BRIAN SMITH, Associate Director of Research and Staff Vice President, United States Leagueof Savings Associations
EMIL M. SUNLEY, Director of Tax Analysis, Deloitte, Haskins & SellsRICHARD F. SYRON, Senior Vice Pt’esident, Federal Reserve Bank of BostonH. ALAN TIMM, President, Bank of Maine, N.A.; Director, Federal Reserve Bank of BostonKEVIN VILLANI, Vice President-Economic Research; Chief Economist, Federal Home Loan
Mortgage CorporationGEORGE M. VON FURSTENBERG, International Monetary FundALBERT M. WOJN1LOWER, Managing Director and Chief Economist, The First Boston Cm’-
porationHENRY S. WOODBR1DGE, JR., Chairman of the Board and Chief Executive Officer, Rhode
Island Hospital Trust National Bank; Director, Federal Reserve Bank of BostonKENNETH WRIGHT, Vice President and Chief Economist, American Council of Life Insur-
anceJOSEPHS. ZEISEL, Deputy Director; Reseatvh and Statistics, Board of Governors of the Feder-
al Reserve System