Embed Size (px)
Citation preview
Title: The impact of the Federal Reserve’squantitative easing policy on China's
financial market.
Group members: 1212802119 Huang
xinman
Course title: BA 523 International
Financial Management
Catalogue
Introduction
···································································
·························· 1
1. The definition of QE policy
································································
······· 2
2. The U.S economic background before implement QE policies
······························ 3
3. The timeline of quantitative easing policies for U.S
··········································· 4
4. The influence on China by fed's QE policies
··················································· 5
4.1 The influence on China's foreign exchange market
····································· 6
4.2 The influence on China's import and export trade
······································· 7
4.3 U.S QE policy added pressure to China's inflation
······································ 9
4.4 QE policy caused china’s commodities price rose
······································· 11
5. Suggestions of how China responds to QE policy
·············································· 14
Conclusion
···································································
······························ 16
Reference
···································································
································ 17
Introduction:
Nowadays, United State has the strongest economy in the world,
and Federal Reserve as the central bank of United State, any policy
from the Federal Reserve may affect the world's economies. May be
the country with power financial system can reduce the effect from
US monetary policies, but most emerging market countries will be
greatly influenced and may even lead to serious financial crisis
and inflation. So as the second-largest economy-China, what would
happen to China's economic and how should Chinese government handle
the impact from U.S?
1
1. The definition of QE policy.
Quantitative easing is an unconventional monetary policy used by
central banks to stimulate the national economy when a standard
monetary policy has become ineffective. A central bank implements
quantitative easing by buying financial assets from commercial
banks and other private institutions, thus increasing the monetary
base. This is distinguished from the more usual policy of buying or
selling government bonds in order to keep market interest rates at
a specified target value.
Expansionary monetary policy typically involves the central bank
buying short-term government bonds in order to lower short-term
2
market interest rates. However, when short-term interest rates are
either at, or close to, zero, normal monetary policy can no longer
lower interest rates. Quantitative easing may then be used by the
monetary authorities to further stimulate the economy by purchasing
assets of longer maturity than only short-term government bonds,
and thereby lowering long-term interest rates further out on the
yield curve. Quantitative easing raises the prices of the financial
assets bought, which lowers their yield.
Process: If the nominal interest rate is at or very near zero,
the central bank cannot lower it further. Such a situation, called
a "liquidity trap"1, can occur, for example, during deflation or
1 A liquidity trap is a situation described in Keynesian economics in which injections of cash into the private banking system by a central bank fail to lower interest rates and hence fail to stimulate economic growth.
3
when inflation is very low. In such a situation, the central bank
may perform quantitative easing by purchasing a pre-determined
amount of bonds or other assets from financial institutions without
reference to the interest rate. The goal of this policy is to
increase the money supply rather than to decrease the interest
rate, which cannot be decreased further. This is often considered a
"last resort" to stimulate the economy.
2. The U.S economic background before implement QE policies.
In the 5 years prior in 2006, as the US housing market continued
to boom and the low level of interest rate, lead to the rapid
development of the US subprime mortgage market. But with the US
4
housing market cooling, especially the short-term interest rate
rose and subprime mortgage repayment rate has also risen sharply,
buyers repayment burden increase greatly, at the same time, housing
market continues to cool has also made buyers selling house or
through the mortgage housing to refinance become difficult, This
situation directly led to a large number of subprime borrowers
cannot repay the loan on schedule, and even the banks repossessed
houses but cannot sell at a high price, then cause a huge losses
for banks, triggered the subprime crisis. As the subprime mortgage
crisis occurs, an increasing number of financial institutions and
companies face bankruptcy. On September 15, 2008, United States
5
Lehman Brothers apply for bankruptcy protection, greatly increased
turmoil in financial markets. After Federal Reserve implementing a
series of interest rate cuts and capital injection activities, the
quantitative easing policy began to implement.
The influence of subprime mortgage is just one of the reasons
that Federal Reserve implements QE policy, the other hand, The U.S
was in a situation of high unemployment rate and low inflation. The
unemployment directly led the consumption level decreased, and low
inflation may pose a risk to the economy, may even led to
deflation, which would cause long-term economic stagnation. So the
Federal Reserve has to implement unconventional monetary policy in
6
order to stimulate the economy and employment.
The third reason: traditional currency policy space is limited.
In the 1930s, at that time the U.S consumption spending, private
investment and net exports are greatly reduced. However, the Fed
thinks this big depression is just a normal economic contraction,
the Fed didn't adopt the right monetary policy to save the economy,
instead it used a currency crunch policy. As a result, in the year
1927-1929, the currency supply growth rate drops from 3.8% to 0.4%.
It is because of the Fed's policy made the weak economy become
worse. So now the Federal Reserve chairman Ben·Bernanke learned a
lesson from it, and implement the unconventional monetary policy
7
which is quantitative easing monetary policy.
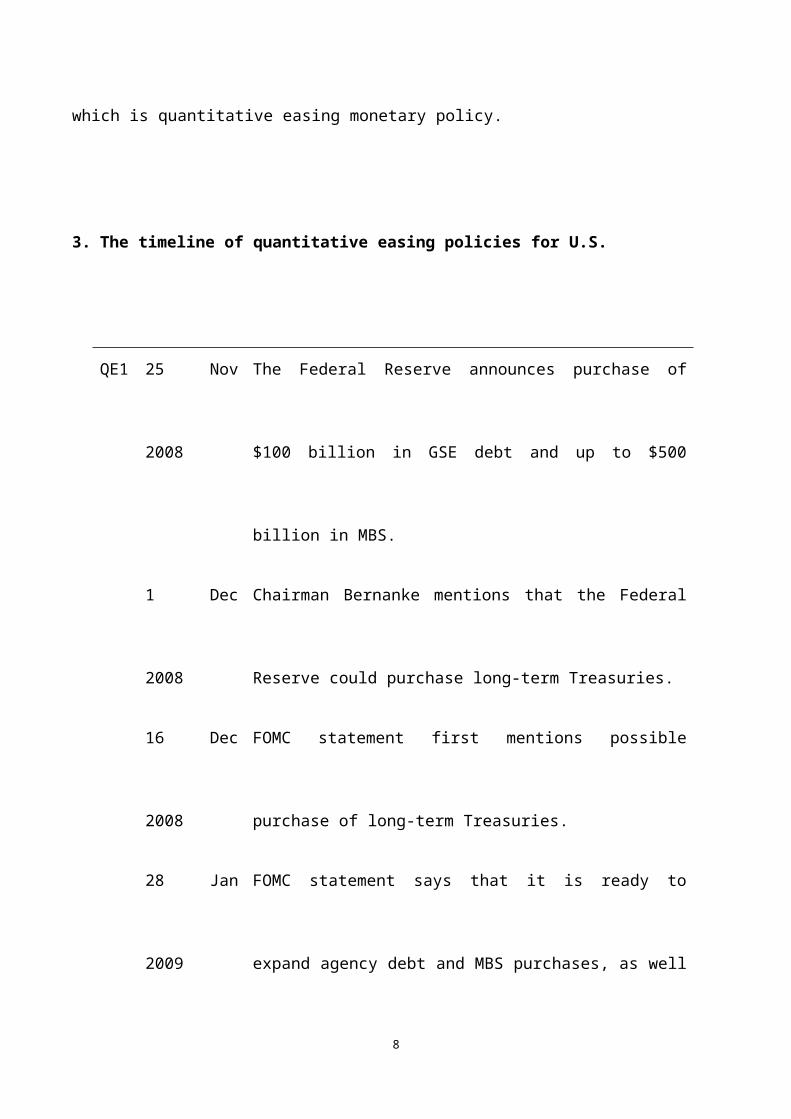
3. The timeline of quantitative easing policies for U.S.
QE1 25 Nov
2008
The Federal Reserve announces purchase of
$100 billion in GSE debt and up to $500
billion in MBS.
1 Dec
2008
Chairman Bernanke mentions that the Federal
Reserve could purchase long-term Treasuries.
16 Dec
2008
FOMC statement first mentions possible
purchase of long-term Treasuries.
28 Jan
2009
FOMC statement says that it is ready to
expand agency debt and MBS purchases, as well
8
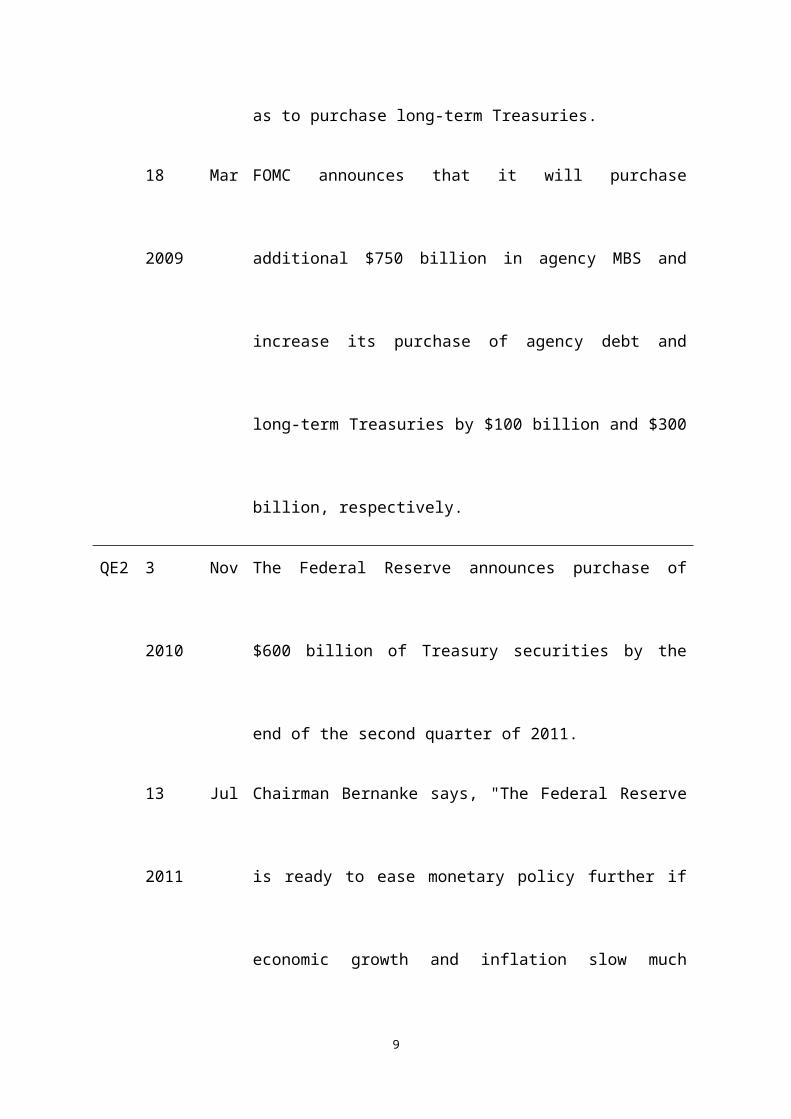
as to purchase long-term Treasuries.
18 Mar
2009
FOMC announces that it will purchase
additional $750 billion in agency MBS and
increase its purchase of agency debt and
long-term Treasuries by $100 billion and $300
billion, respectively.
QE2 3 Nov
2010
The Federal Reserve announces purchase of
$600 billion of Treasury securities by the
end of the second quarter of 2011.
13 Jul
2011
Chairman Bernanke says, "The Federal Reserve
is ready to ease monetary policy further if
economic growth and inflation slow much
9
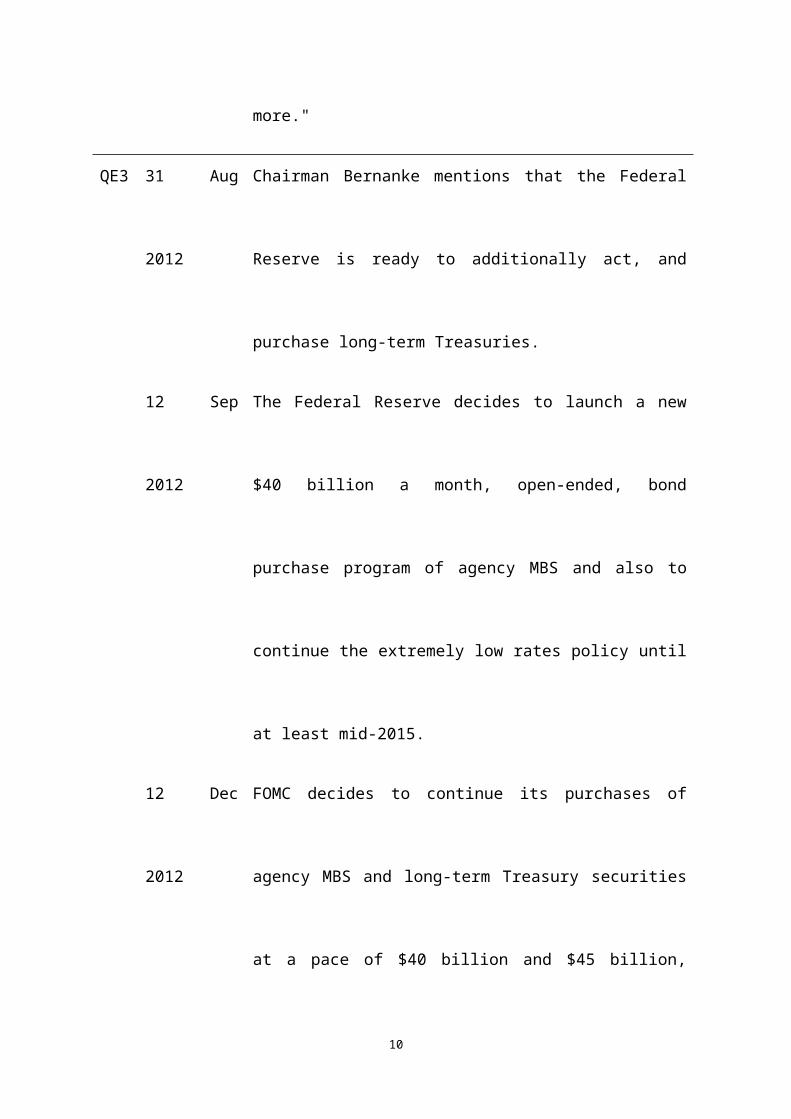
more."
QE3 31 Aug
2012
Chairman Bernanke mentions that the Federal
Reserve is ready to additionally act, and
purchase long-term Treasuries.
12 Sep
2012
The Federal Reserve decides to launch a new
$40 billion a month, open-ended, bond
purchase program of agency MBS and also to
continue the extremely low rates policy until
at least mid-2015.
12 Dec
2012
FOMC decides to continue its purchases of
agency MBS and long-term Treasury securities
at a pace of $40 billion and $45 billion,
10
respectively.
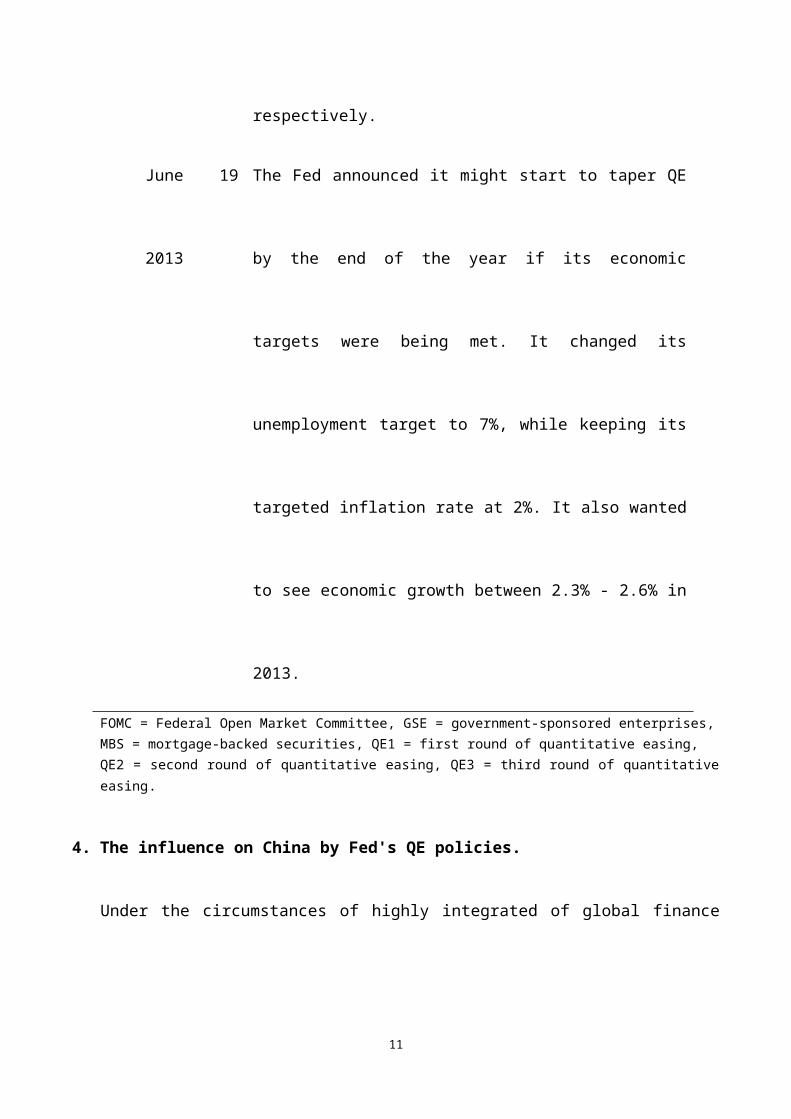
June 19
2013
The Fed announced it might start to taper QE
by the end of the year if its economic
targets were being met. It changed its
unemployment target to 7%, while keeping its
targeted inflation rate at 2%. It also wanted
to see economic growth between 2.3% - 2.6% in
2013.
FOMC = Federal Open Market Committee, GSE = government-sponsored enterprises,MBS = mortgage-backed securities, QE1 = first round of quantitative easing, QE2 = second round of quantitative easing, QE3 = third round of quantitativeeasing.
4. The influence on China by Fed's QE policies.
Under the circumstances of highly integrated of global finance
11
and economy, quantitative easing monetary policy may play a
important role of stimulation in the U.S. economy, but it was also
a double-edged sword. which means, to some extent, quantitative
easing would spark asset bubble and threaten the global economic
stability. the world's second largest economy, the impact to China-
the world's second largest economy would be incalculable.
4.1. The influence on China's foreign exchange market
China's foreign exchange market will be greatly affected by
U.S QE policy implementation. Due to U.S dollar depreciated, the
RMB against the dollar Exchange rates are forced to raise, in
the foreign exchange market a large amounts of hot money
12
outflows from US and began to speculate RMB, led to RMB further
appreciation. According to figures released by the U.S.
department of the treasury on April 30, 2013, showed, (table
4.1) the value of foreign holdings of U.S. securities, by major
investing country and type of security, as of June 30, 2012, we
can see China's holdings of US securities total amount up to
$1.59 trillion, holdings of long-term treasury debt have reached
$1.138 trillion, it is the largest holders of U.S. long-term
treasury debt, and base the latest statistics of the People's
Bank of China, China as the world's largest foreign exchange
reserves country, the amount had reached 3.4 trillion dollars in
13
March 2013. Such a huge foreign exchange reserve which means if
there has any change of the monetary policy by the US implement
that will deliver a big impact to China. If dollar depreciate 1%
which means China's foreign exchange losses would reach $15.9
billion. According to the graphic 4.2, the dollar against RMB
has depreciated by 10% from November 2008 ¥6. 83/ $ to July 2013
¥6. 13/$. This trend makes China's foreign reserve continuous to
reduce and weaken the purchasing power. On the other hand, China
as the big holder of U.S treasuries, it will face a great loss
of the foreign reserve if in the future US exits QE policy and
sale a large number of treasuries that cause the treasury prices
14
go down sharply.
15
Table 4.1: The value of foreign holdings of U.S. securities
Graphic 4.2: CNY/USD from Feb. 25, 2008 to Jul. 1, 2013
4.2. The influence on China's import and export trade
16
The implementation of QE policy by U.S. has made the dollar
against RMB depreciation, which in theory dampened Chinese
product exports to the U.S. market, and expanded China's import
from U.S. We base of the chart for further analysis, the table
4.3 showed that period between years 2008 to 2009. Which is the
period of the U.S. financial crisis and QE1's implementation,
China's imports and exports quantity to U.S. Has decreased in
some degree. China's trade surplus presented a negative growth
situation. combine the graphic 4.2, between the years 2008 to
2009, The exchange rate of RMB is rising trend. So we know that
China's export and import trade have suffered a negative impact.
17
And between the years 2010 to 2012 which is the period of QE2
and QE3. Although China's import and export amount returned to
growth, but the growth rate was felled. Look at the total trade
balance, the amount is growing, but growth rate is falling, and
base the graphic 4.2 we found that this period RMB is in the
appreciation trend too. So we got a conclusion the QE policy has
no a big effect on the growth of China's import and export
trade. It just tends to reduce the growth speed. So the
appreciation of the RMB may not be able to decide the overall
trend of the trade between China and U.S. China is still a big
exporter to U.S and the trade surplus is still in a huge amount.
18
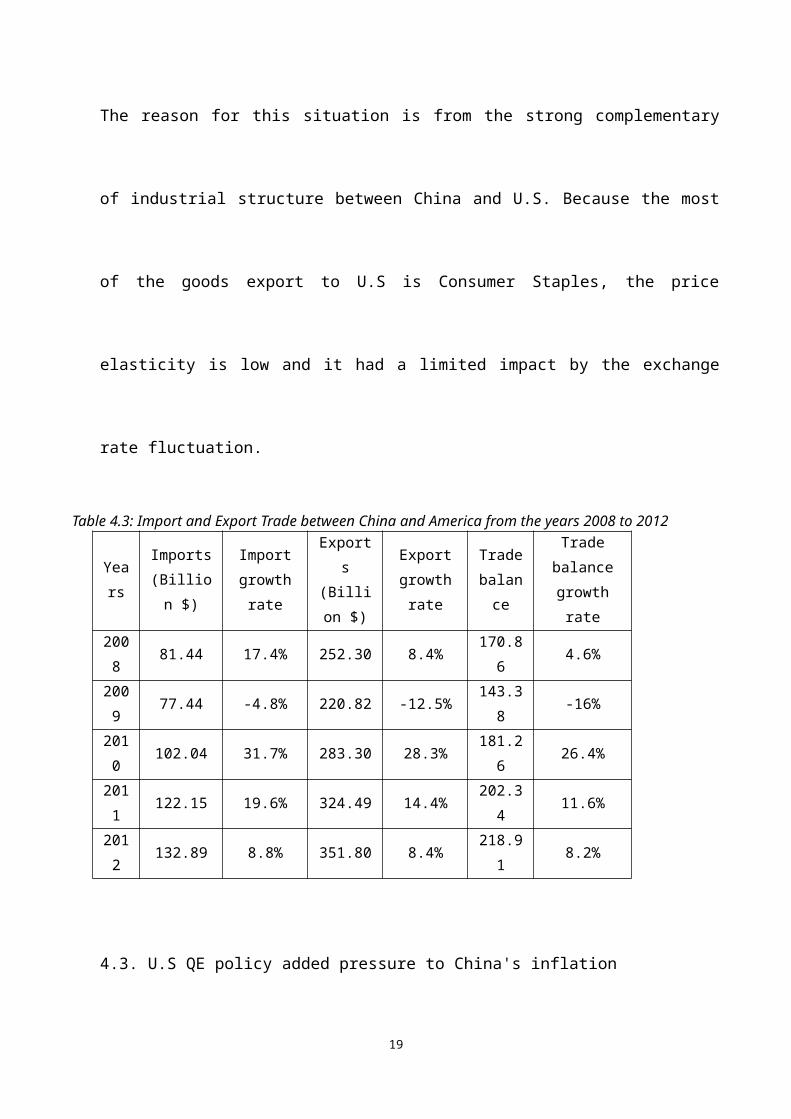
The reason for this situation is from the strong complementary
of industrial structure between China and U.S. Because the most
of the goods export to U.S is Consumer Staples, the price
elasticity is low and it had a limited impact by the exchange
rate fluctuation.
Table 4.3: Import and Export Trade between China and America from the years 2008 to 2012
Years
Imports(Billion $)
Importgrowthrate
Exports
(Billion $)
Exportgrowthrate
Tradebalance
Tradebalancegrowthrate
2008
81.44 17.4% 252.30 8.4%170.86
4.6%
2009
77.44 -4.8% 220.82 -12.5%143.38
-16%
2010
102.04 31.7% 283.30 28.3%181.26
26.4%
2011
122.15 19.6% 324.49 14.4%202.34
11.6%
2012
132.89 8.8% 351.80 8.4%218.91
8.2%
4.3. U.S QE policy added pressure to China's inflation
19
U.S. quantitative easing policy led to the dollar glut.
People's investment and consumption are greatly increased, in
theory, people should take the money engaged the activity of
investment and consumption in the U.S. thus driving U.S.
economic recovery, but in fact many funds in the market
transform to become hot money, the hot money outflow from U.S
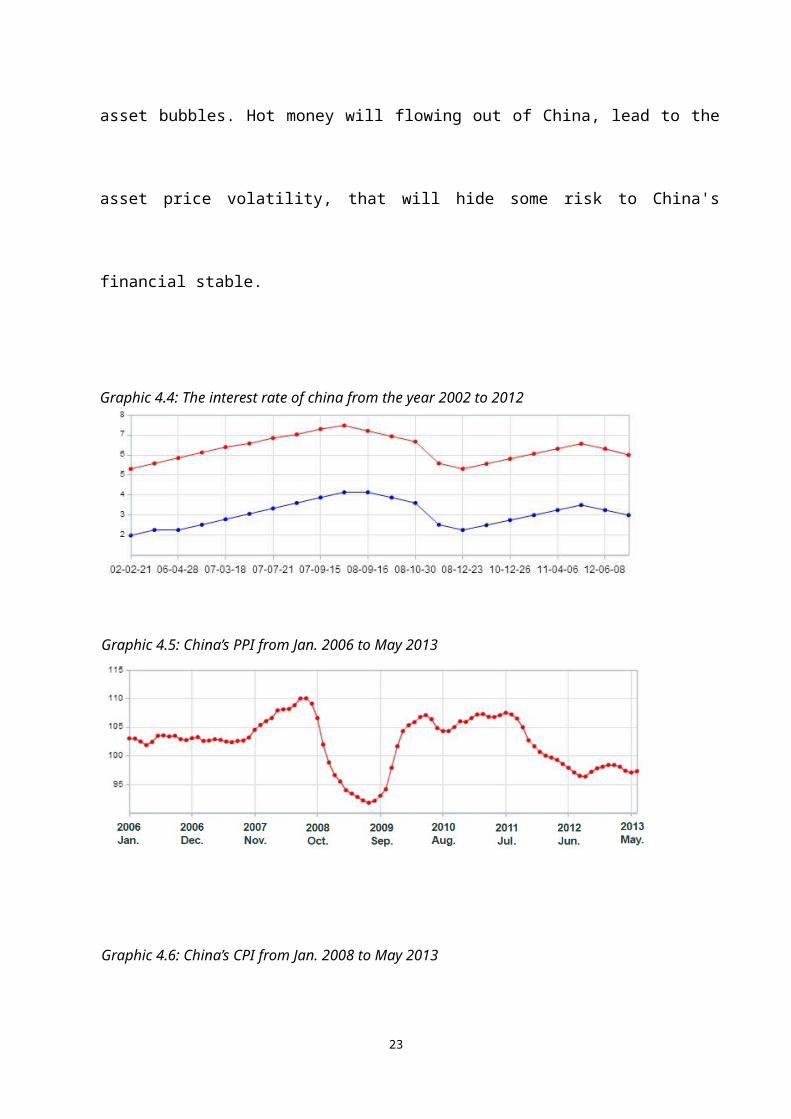
and inflow to the emerging market. According to the graphic 4.4,
in December 2008 China's one year interest rate is 2.25%. Until
now the interest rate still remains as high as 3%, and US
federal funds rates remain 0-0.25%. China's interest rates much
higher than the Federal funds rate, and the Federal Reserve is
20
unlikely to increase the interest rate in the short-term, there
is an arbitrage opportunity between US and China's interest rate
spread, so the trend of the hot money inflows will continue. In
addition, the quantitative easing monetary policy had weakened
the attraction of dollar assets to the short-term flowing
capital. Under the expectations of RMB appreciation, driven a
large number of short-term international capital flow into
China, push up asset price and even added pressures to
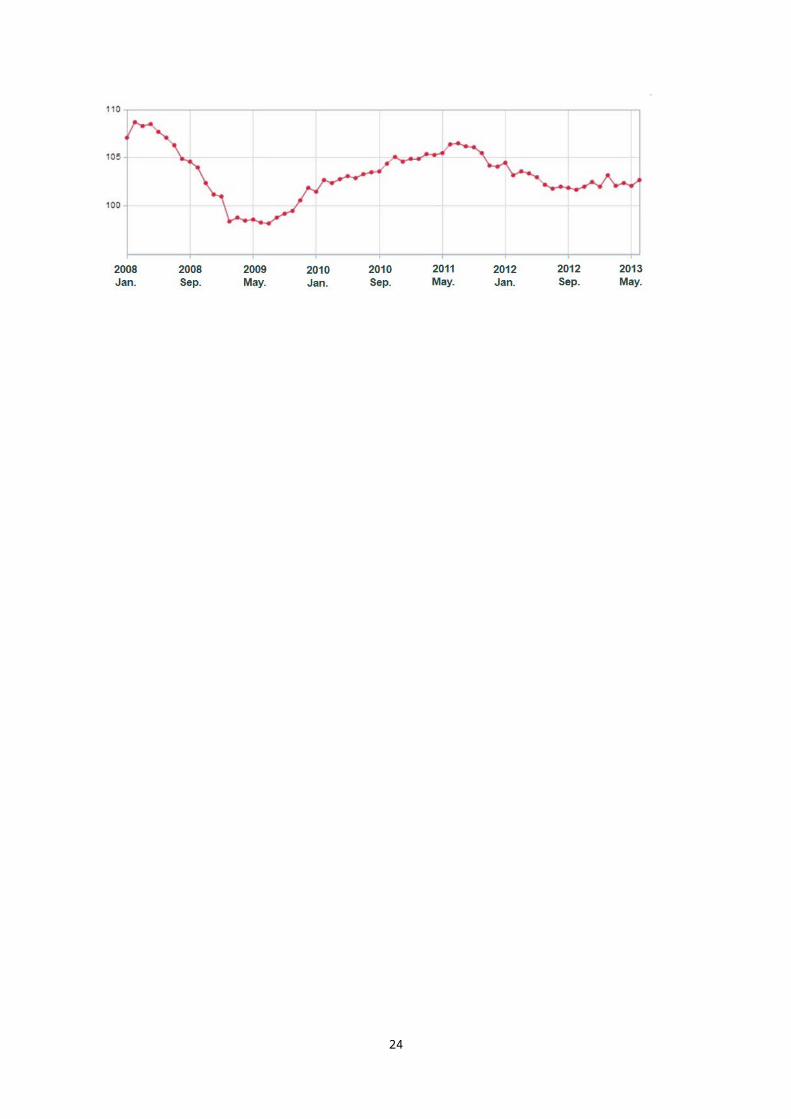
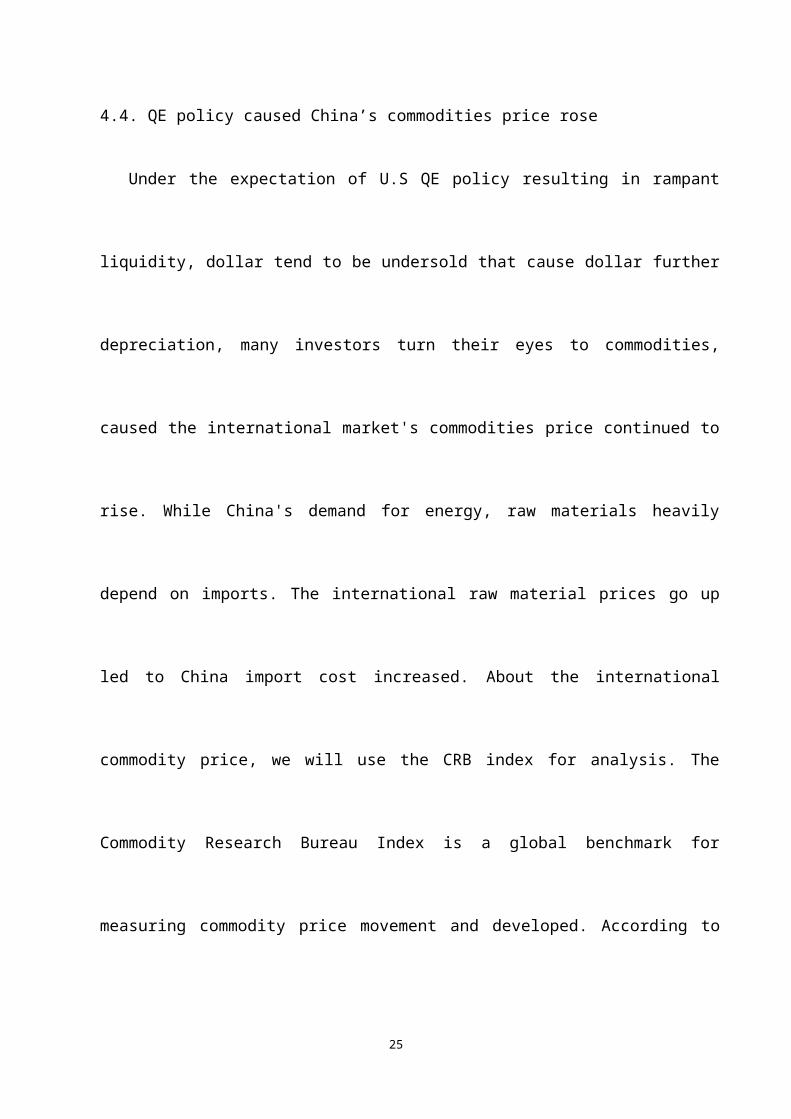
inflation. In general, inflation can be judged through the CPI
and PPI, A consumer price index (CPI) measures changes in the
price level of a market basket of consumer goods and services
21
purchased by households. A Producer Price Index (PPI) measures
the average changes in prices received by domestic producers for
their output. The graphic 4.5 and 4.6 is the PPI and CPI of
China in the recent years, we can see these two indexes were
fast increase in 2009. It means Federal Reserve’s QE policy
directly cause China's inflationary pressures. Once the U.S.
economy turning to a sustained recovery, however, the Fed will
gradually withdraw from quantitative easing and tightening the
money supply. The federal funds rate and interbank rates will
rise. That will make dollar appreciate and the government bond
yield rise, commodities price will decrease, it may burst the
22
asset bubbles. Hot money will flowing out of China, lead to the
asset price volatility, that will hide some risk to China's
financial stable.
Graphic 4.4: The interest rate of china from the year 2002 to 2012
Graphic 4.5: China’s PPI from Jan. 2006 to May 2013
Graphic 4.6: China’s CPI from Jan. 2008 to May 2013
23
24
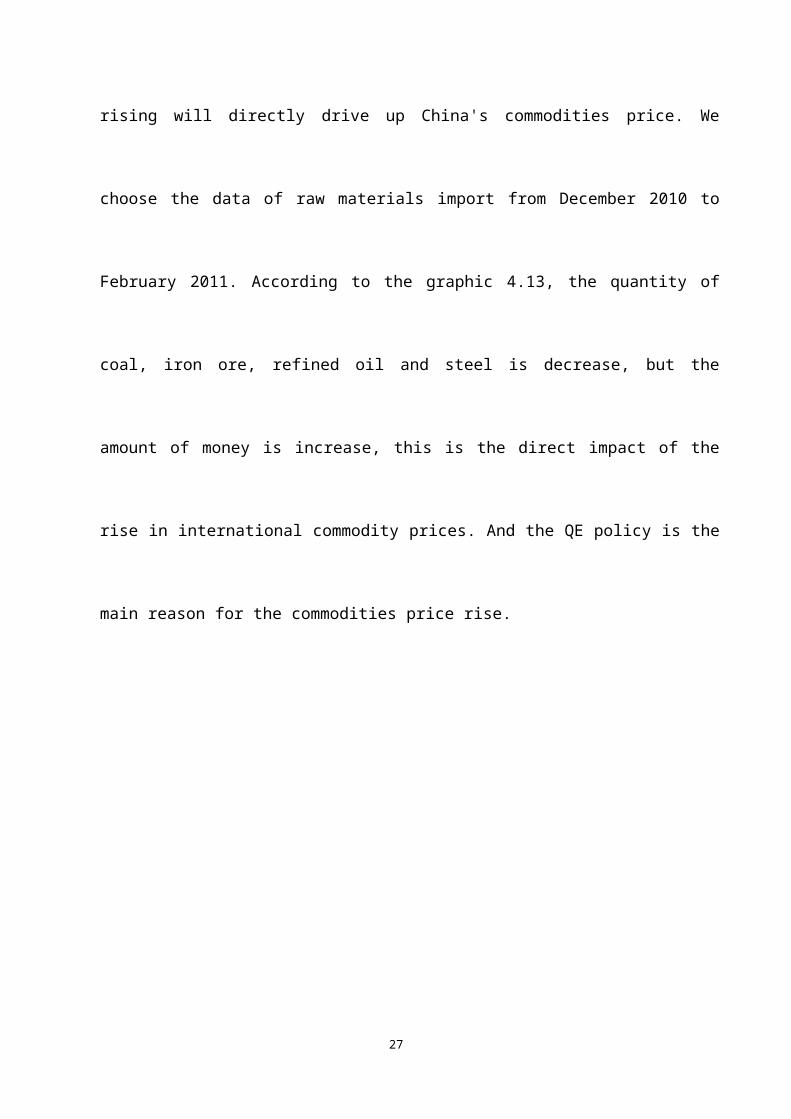
4.4. QE policy caused China’s commodities price rose
Under the expectation of U.S QE policy resulting in rampant
liquidity, dollar tend to be undersold that cause dollar further
depreciation, many investors turn their eyes to commodities,
caused the international market's commodities price continued to
rise. While China's demand for energy, raw materials heavily
depend on imports. The international raw material prices go up
led to China import cost increased. About the international
commodity price, we will use the CRB index for analysis. The
Commodity Research Bureau Index is a global benchmark for
measuring commodity price movement and developed. According to
25
the graphic 4.7, the international commodities price rose
sharply in 2009 to 2011. And there is a small pullback after
2011, but it’s still at a high level. So we found that the QE
policy has a big impact on commodities price through this
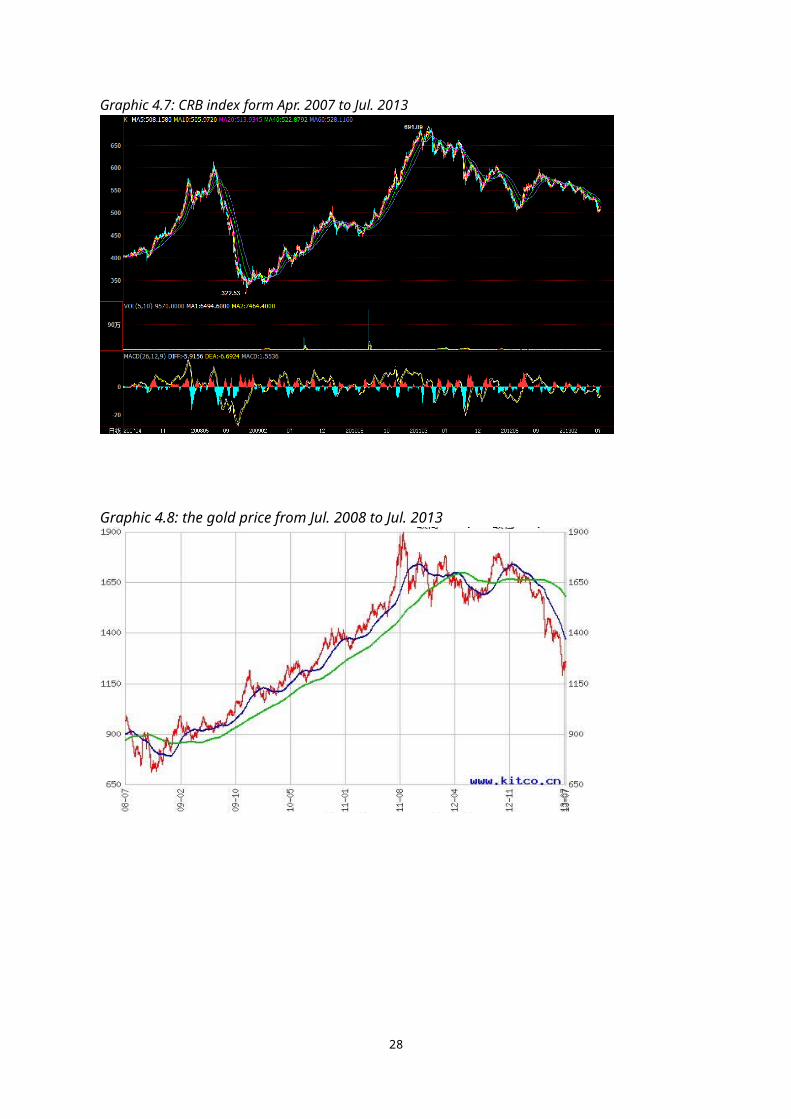
situation. Specifically, the graphic 4.8 is the gold price in
recent years, we can see the gold price rose rapidly especially
after the year of 2008 which QE policy had implemented, until
now still keep on the high level. In addition, the graphic 4.9-
4.12 showed that in the years 2009 to 2011 the high grade copper
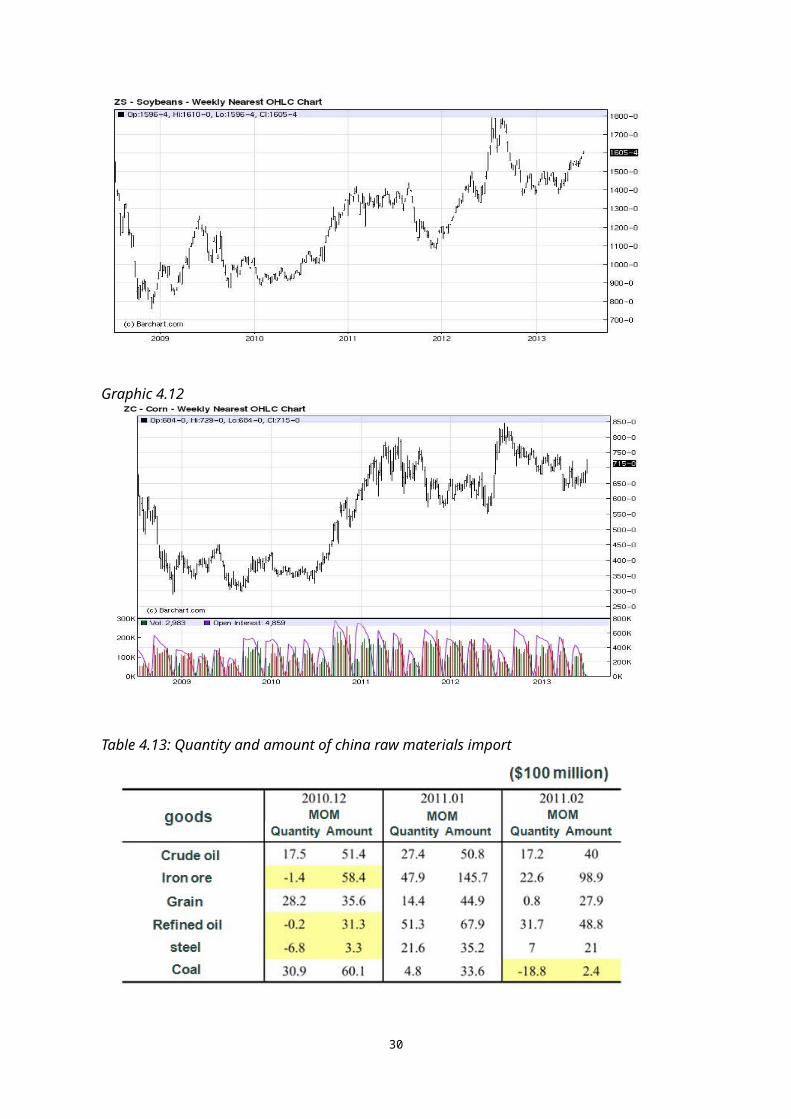
price rose by 67%, silver price rose by 167%, soybeans and corn
rose by 40.9% and 68% respectively, prices of these commodities
26
rising will directly drive up China's commodities price. We
choose the data of raw materials import from December 2010 to
February 2011. According to the graphic 4.13, the quantity of
coal, iron ore, refined oil and steel is decrease, but the
amount of money is increase, this is the direct impact of the
rise in international commodity prices. And the QE policy is the
main reason for the commodities price rise.
27
Graphic 4.7: CRB index form Apr. 2007 to Jul. 2013
Graphic 4.8: the gold price from Jul. 2008 to Jul. 2013
28
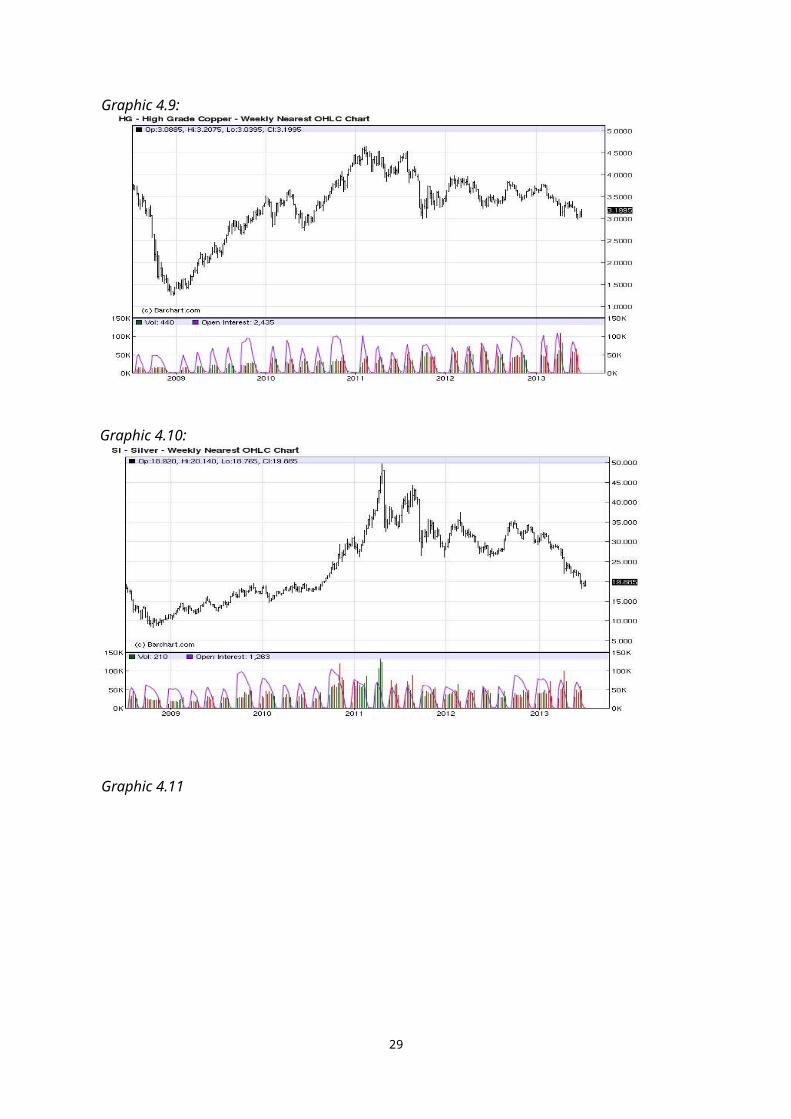
Graphic 4.9:
Graphic 4.10:
Graphic 4.11
29
Graphic 4.12
Table 4.13: Quantity and amount of china raw materials import
30
5. Suggestions of how China responds to QE policy.
1) Accelerate the process of RMB internationalization. QE policy
caused dollar depreciation and dollar depreciation caused
China's foreign exchange reserves book value decreased. If RMB
becomes an international settlement currency, it will be better
for China's trade surplus. Now U.S QE policy would undermine the
credibility of the dollar. Under this situation, China should
find the opportunity to expand the scope and scale of currency
swaps, issue more offshore RMB bonds. And Signed Bilateral Local
Currency Swap Agreement with more countries. This is an
31
important step towards the RMB internationalization. It is the
best way to deal with QE policy’s impact.
2) After the U.S implement quantitative easing monetary policy,
it caused many hot money inflows into China. So China has to
strengthen monitoring and managing the hot money inflow and
outflow. Identify measures to respond and reduce the effect of
hot money. At present China's capital account is not yet fully
open, it is still under control. Only the QFII (Qualified
Foreign Institutional Investors) and QDII (Qualified Domestic
Institutional Investors) can let the money inflow and outflow of
China. Without approval any foreign financial institutions and
32
individuals are not able to invest in China's stock and bond
market. Furthermore residents and companies in China are not
able bring any funds out or invest in oversea financial market
except the way of QDII. But now China's interest rate is 3%, and
the federal benchmark interest rate is 0-0.25%, there is a big
spread between these two countries, combine with the good
performance of China's economy and the expectation of RMB
appreciate, the hot money will try any way to avoid capital
control and enter China. So Chinese government have to
strengthen the control of the capital and stabilize China's
stock and real estate market, reduce the effect of hot money's
33
inflow.
3) Use the measures such as tax cut, loosen the restriction on
market accession , reduce the negative impact to China's economy
by the risen import price of commodities. Because the risen
price of commodities will further worsen China company's life,
most small company will face a problem of high cost and how to
survive. So government must help them reduce the burden, it can
through the tax cut, loosen the restriction on market access and
other method to help companies survive.
4) Manage liquidity to prevent excessive credit expansion, such
as raising the banks' reserve requirements or increase the scale
34
of issue central bank bills and strictly control the size of
bank loans or increased deposits and lending rates in order to
manage inflation, raise the cost of capital and preventing asset
bubbles.
Conclusion:
Through research and learning of QE policy, we can more clearly
understand QE policy has influenced China's financial market in
various aspects, such as dollar depreciation caused China's foreign
exchange reserve shrink; slow china's trade surplus growth speed;
commodities price rose led to export cost increased and hot money
inflow added pressure to inflation. China's financial market even
35
the economy would be shocked by these negative influences. China
needs the scientific management and effective measures do the
largest effort to the negative impact of QE policy, get the
opportunity from QE policy, and further perfect China financial
system.
36
Reference:
1. Li Yonggang. "US quantitative easing monetary policy' impact and
China's countermeasures". FINANCE & ECONOMICS.2011/4.
2. Michael Joyce, Ana Lasaosa, Ibrahim Stevens and Matthew Tong.
"The financial market impact of quantitative easing". Bank of
England Working Paper No. 393. July 2010, revised August 2010
3. Alan S. Blinder. "Quantitative Easing: Entrance and Exit
Strategies". Federal Reserve Bank of St. Louis review 2010.
4. NIE Yaping and QIU Lisheng. "Financial Crisis Counter Measures
under the Continuous Quantitative Easing Monetary Policy".
Proceedings of the 4th (2012) International Conference on
Financial Risk and Corporate Finance Management.
37
5. Chen Yan. "Thinking of China monetary policy under the US
quantitative easing monetary policy". Professor of East China
University of Political Science and Law School. Enterprise
Economy Financial Forum 2011/2.
6. Huang Xianfu. "Influence of the US quantitative easing policy in
emerging markets in the Asia - Pacific countries". The Asia -
Pacific economic 2011 2nd.
7. Fang Xing. "US quantitative easing policy's impact on
international trade of China and influence of RMB exchange
rate". Assistant Professor of Capital University of Economics
and Business. China's economic and trade guide magazine 2010/
38
22nd.
8. Dongchul Cho and Changyong Rhee. " Effects of Quantitative
Easing on Asia: Capital Flows and Financial Markets ". ADB
Economics Working Paper Series No. 350 June 2013.
9. Tu Fei. " US quantitative easing policy's cause and effect". PHD
of Asia - Pacific Department of China Academy of Social Sciences
Graduate School. 2010-12-26.
10. Marc Labonte. " Monetary Policy and the Federal Reserve:
Current Policy and Conditions ". Coordinator of Division
Research and Specialist February 12, 2013.
11. Monetary policy, Board of Governors of the Federal reserve
system, http://www.federalreserve.gov/monetarypolicy/default.htm
39
12. Quantitative easing, news and issue of the US economy,
http://useconomy.about.com/od/glossary/g/Quantitative-Easing.htm
13. Chinese import and export data. China's General
Administration of Customs.
http://www.haiguan.info/newdata/ndata5271.aspx
14. China's Ministry of Commerce, 14.The national information
network. http://countryreport.mofcom.gov.cn/
15. China interest rate data.
http://data.eastmoney.com/cjsj/yhll.html
16. Quantitative easing. http://wiki.mbalib.com/wiki/quantitative
easing policy
17. The crude oil price chart.
40
http://quote.eastmoney.com/qihuo/CONC.html
18. Gold price charts http://www.cngold.org
19. Barchart website,Futures,Futures Performance & Daily Line
Chart,http://www.barchart.com
20. Foreign Portfolio Holdings of U.S. Securities, as of June 30,
2012. Department of the Treasury, Federal Reserve Bank of New
York, Board of Governors of the Federal Reserve System. April
2013.
21. Gold & Foreign Exchange Reserves. The people’s bank of china.
http://www.pbc.gov.cn/publish/html/kuangjia.htm?id=2013s09.htm
41