Embed Size (px)
Citation preview
V O L U M E 7 5 • N U M B E R 5 • M A Y 1 9 8 9
FEDERAL RESERVE
BULLETIN
B O A R D OF G O V E R N O R S OF THE F E D E R A L RESERVE S Y S T E M , W A S H I N G T O N , D . C .
PUBLICATIONS C O M M I T T E E
Joseph R. Coyne, Chairman • S. David Frost • Griffith L. Garwood • Donald L. Kohn • J. Virgil Mattingly, Jr. • Michael J. Prell • Edwin M. Truman
The FEDERAL RESERVE BULLETIN is issued monthly under the direction of the staff publications committee. This committee is responsible for opinions expressed except in official statements and signed articles. It is assisted by the Economic Editing Section headed by Mendelle T. Berenson, the Graphic Communications Section under the direction of Peter G. Thomas, and Publications Services supervised by Linda C. Kyles.
Digitized for FRASER http://fraser.stlouisfed.org/ Federal Reserve Bank of St. Louis
Table of Contents
321 U.S. INTERNATIONAL TRANSACTIONS IN 1988
The U.S. merchandise trade and current account deficits narrowed substantially in 1988, marking the first year of improvement in either balance since 1981.
333 HOME EQUITY LENDING
This article uses the results of surveys con-ducted in 1988 to report on the market for consumer credit secured by home equity, especially trends in traditional home equity loans compared with those for home equity lines of credit.
345 INDUSTRIAL PRODUCTION
Industrial production was unchanged in February after having risen 0.4 percent in January.
347 STATEMENT TO CONGRESS
Alan Greenspan, Chairman, Board of Gov-ernors, outlines the views of the Board on the legislation proposed by President Bush for the reform and recovery of the thrift industry and says that it is vitally important for Congress to move promptly to consider and enact the President's proposals because prompt action is essential to maintaining public confidence in thrift institutions and their insurance fund, before the Subcom-mittee on Financial Institutions Supervi-sion, Regulation and Insurance of the House Committee on Banking, Finance and Urban Affairs, March 22, 1989.
351 ANNOUNCEMENTS
Statement by Chairman Greenspan on pol-icy on debt of developing countries.
Joint Statement on Community Reinvest-ment Act.
Revised prices for Federal Reserve re-turned check services.
Revisions to official staff commentaries on Regulations B, E, and Z.
Meeting of Consumer Advisory Council.
Extension of comment period on a series of revised proposals regarding ACH credit and debit transactions processed by Federal Re-serve Banks.
Change in Board staff.
353 RECORD OF POLICY ACTIONS OF THE FEDERAL OPEN MARKET COMMITTEE
At its meeting on February 7-8, 1989, the Committee established ranges of growth for the year of 3 to 7 percent for M2 and 3V2 to IVi percent for M3; no range was set for Ml . A monitoring range for growth of total domestic nonfinancial debt was set at 6V2 to IOV2 percent. In carrying out policy, the Committee indicated that it would continue to evaluate money growth in light of the behavior of other indicators, including infla-tionary pressures, the strength of the busi-ness expansion, and developments in do-mestic financial and foreign exchange markets.
With regard to the implementation of policy for the period immediately ahead, the Committee adopted a directive that called for maintaining the current degree of pressure on reserve conditions and for re-maining alert to potential developments that might require some firming during the inter-meeting period. Somewhat greater reserve restraint would be acceptable, or slightly lesser reserve restraint might be acceptable,
Digitized for FRASER http://fraser.stlouisfed.org/ Federal Reserve Bank of St. Louis
over the intermeeting period, depending on indications of inflationary pressures, the strength of the business expansion, the be-havior of the monetary aggregates, and de-velopments in foreign exchange and domes-tic financial markets. The reserve conditions contemplated by the Committee were expected to be consistent with growth of M2 and M3 at annual rates of around 2 percent and 3Vz percent respectively over the three-month period from December to March. It was understood that operations would continue to be conducted with some flexibility in light of the persisting uncer-tainty in the relationship between the de-mand for borrowed reserves and the federal funds rate. The intermeeting range for the federal funds rate, which provides one mechanism for initiating consultation of the Committee when its boundaries are persis-tently exceeded, was left unchanged at 7 to 11 percent.
361 LEGAL DEVELOPMENTS
Various bank holding company, bank ser-vice corporation, and bank merger orders; and pending cases.
407 DIRECTORS OF FEDERAL RESERVE BANKS AND BRANCHES
List of Directors by Federal Reserve Dis-trict.
Ai FINANCIAL AND BUSINESS STATISTICS
These tables reflect data available as of March 29, 1989.
A3 Domestic Financial Statistics A46 Domestic Nonfinancial Statistics A55 International Statistics
ALL GUIDE TO TABULAR PRESENTATION, STATISTICAL RELEASES, AND SPECIAL TABLES
A76 BOARD OF GOVERNORS AND STAFF
A78 FEDERAL OPEN MARKET COMMITTEE AND STAFF; ADVISORY COUNCILS
A80 FEDERAL RESERVE BOARD PUBLICATIONS
A83 INDEX TO STATISTICAL TABLES
A85 FEDERAL RESERVE BANKS, BRANCHES, AND OFFICES
A86 MAP OF FEDERAL RESERVE SYSTEM
V
Digitized for FRASER http://fraser.stlouisfed.org/ Federal Reserve Bank of St. Louis
U.S. International Transactions in 1988
Peter Hooper and Ellen E. Meade of the Board's Division of International Finance prepared this article.
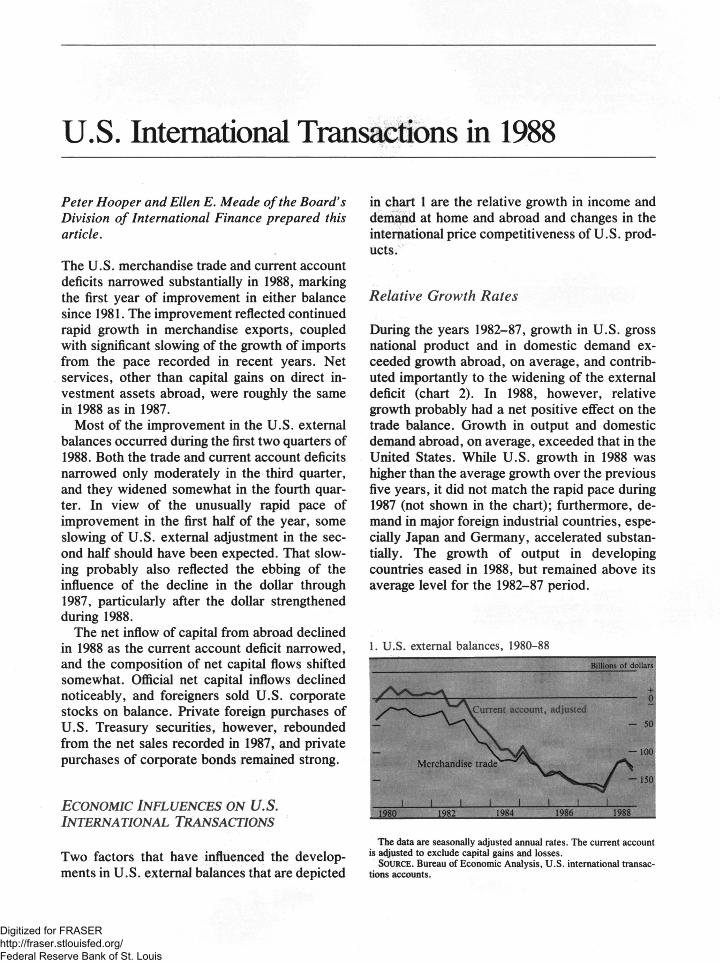
The U.S. merchandise trade and current account deficits narrowed substantially in 1988, marking the first year of improvement in either balance since 1981. The improvement reflected continued rapid growth in merchandise exports, coupled with significant slowing of the growth of imports from the pace recorded in recent years. Net services, other than capital gains on direct in-vestment assets abroad, were roughly the same in 1988 as in 1987.
Most of the improvement in the U.S. external balances occurred during the first two quarters of 1988. Both the trade and current account deficits narrowed only moderately in the third quarter, and they widened somewhat in the fourth quar-ter. In view of the unusually rapid pace of improvement in the first half of the year, some slowing of U.S. external adjustment in the sec-ond half should have been expected. That slow-ing probably also reflected the ebbing of the influence of the decline in the dollar through 1987, particularly after the dollar strengthened during 1988.
The net inflow of capital from abroad declined in 1988 as the current account deficit narrowed, and the composition of net capital flows shifted somewhat. Official net capital inflows declined noticeably, and foreigners sold U.S. corporate stocks on balance. Private foreign purchases of U.S. Treasury securities, however, rebounded from the net sales recorded in 1987, and private purchases of corporate bonds remained strong.
ECONOMIC INFLUENCES ON U.S. INTERNATIONAL TRANSACTIONS
Two factors that have influenced the develop-ments in U.S. external balances that are depicted
in chart 1 are the relative growth in income and demand at home and abroad and changes in the international price competitiveness of U.S. prod-ucts.
Relative Growth Rates
During the years 1982-87, growth in U.S. gross national product and in domestic demand ex-ceeded growth abroad, on average, and contrib-uted importantly to the widening of the external deficit (chart 2). In 1988, however, relative growth probably had a net positive effect on the trade balance. Growth in output and domestic demand abroad, on average, exceeded that in the United States. While U.S. growth in 1988 was higher than the average growth over the previous five years, it did not match the rapid pace during 1987 (not shown in the chart); furthermore, de-mand in major foreign industrial countries, espe-cially Japan and Germany, accelerated substan-tially. The growth of output in developing countries eased in 1988, but remained above its average level for the 1982-87 period.
1. U.S. external balances, 1980-88 Billions of dollars
The data are seasonally adjusted annual rates. The current account is adjusted to exclude capital gains and losses.
SOURCE. Bureau of Economic Analysis, U.S. international transac-tions accounts.
Digitized for FRASER http://fraser.stlouisfed.org/ Federal Reserve Bank of St. Louis
322 Federal Reserve Bulletin • May 1989
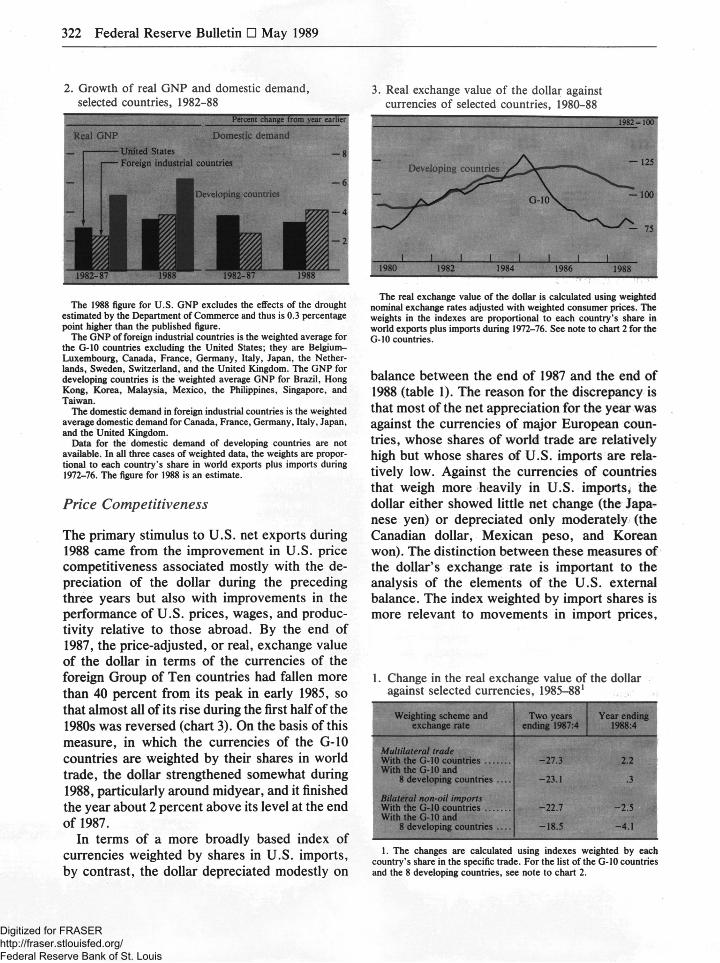
2. Growth of real GNP and domestic demand, selected countries, 1982-88
Percent change f rom year earlier
Real GNP Domestic demand . United States
Foreign industrial countries
The 1988 figure for U.S. GNP excludes the effects of the drought estimated by the Department of Commerce and thus is 0.3 percentage point higher than the published figure.
The GNP of foreign industrial countries is the weighted average for the G-10 countries excluding the United States; they are Belgium-Luxembourg, Canada, France, Germany, Italy, Japan, the Nether-lands, Sweden, Switzerland, and the United Kingdom. The GNP for developing countries is the weighted average GNP for Brazil, Hong Kong, Korea, Malaysia, Mexico, the Philippines, Singapore, and Taiwan.
The domestic demand in foreign industrial countries is the weighted average domestic demand for Canada, France, Germany, Italy, Japan, and the United Kingdom.
Data for the domestic demand of developing countries are not available. In all three cases of weighted data, the weights are propor-tional to each country's share in world exports plus imports during 1972-76. The figure for 1988 is an estimate.
Price Competitiveness
The primary stimulus to U.S. net exports during 1988 came from the improvement in U.S. price competitiveness associated mostly with the de-preciation of the dollar during the preceding three years but also with improvements in the performance of U.S. prices, wages, and produc-tivity relative to those abroad. By the end of 1987, the price-adjusted, or real, exchange value of the dollar in terms of the currencies of the foreign Group of Ten countries had fallen more than 40 percent from its peak in early 1985, so that almost all of its rise during the first half of the 1980s was reversed (chart 3). On the basis of this measure, in which the currencies of the G-10 countries are weighted by their shares in world trade, the dollar strengthened somewhat during 1988, particularly around midyear, and it finished the year about 2 percent above its level at the end of 1987.
In terms of a more broadly based index of currencies weighted by shares in U.S. imports, by contrast, the dollar depreciated modestly on
3. Real exchange value of the dollar against currencies of selected countries, 1980-88
The real exchange value of the dollar is calculated using weighted nominal exchange rates adjusted with weighted consumer prices. The weights in the indexes are proportional to each country's share in world exports plus imports during 1972-76. See note to chart 2 for the G-10 countries.
balance between the end of 1987 and the end of 1988 (table 1). The reason for the discrepancy is that most of the net appreciation for the year was against the currencies of major European coun-tries, whose shares of world trade are relatively high but whose shares of U.S. imports are rela-tively low. Against the currencies of countries that weigh more heavily in U.S. imports, the dollar either showed little net change (the Japa-nese yen) or depreciated only moderately (the Canadian dollar, Mexican peso, and Korean won). The distinction between these measures of the dollar's exchange rate is important to the analysis of the elements of the U.S. external balance. The index weighted by import shares is more relevant to movements in import prices,
1. Change in the real exchange value of the dollar against selected currencies, 1985-881
Weighting scheme and exchange rate
Two years ending 1987:4
Year ending 1988:4
Multilateral trade With the G-10 countries With the G-10 and
8 developing countries
Bilateral non-oil imports With the G-10 countries With the G-10 and
8 developing countries
-27.3 2.2
-23.1 .3
-22.7 -2 .5
-18.5 -4 .1
1. The changes are calculated using indexes weighted by each country's share in the specific trade. For the list of the G-10 countries and the 8 developing countries, see note to chart 2.
Digitized for FRASER http://fraser.stlouisfed.org/ Federal Reserve Bank of St. Louis
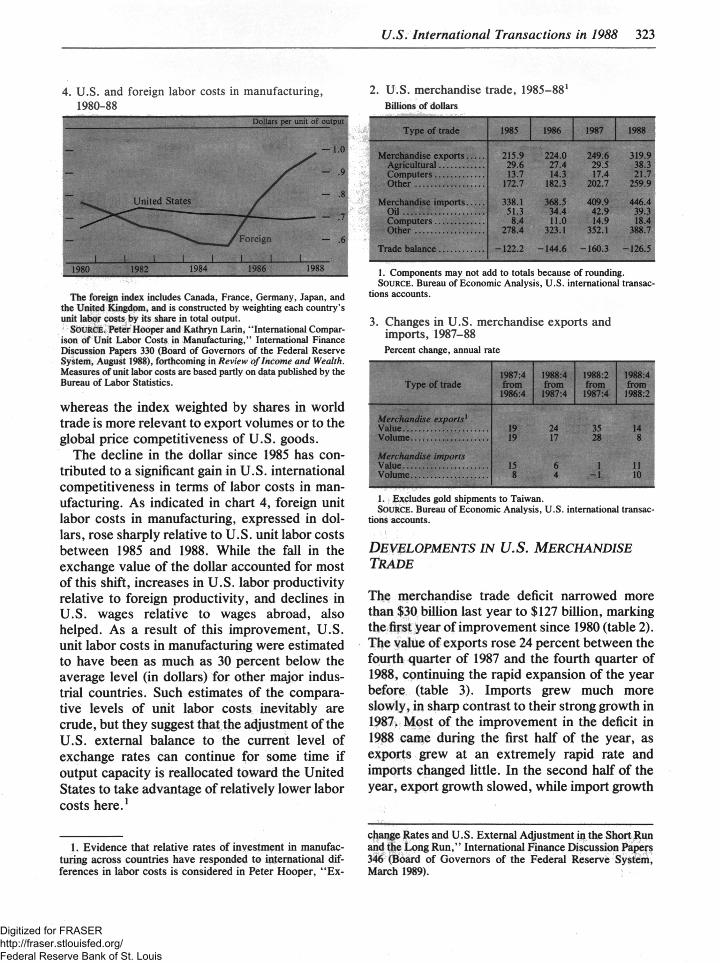
4. U.S. and foreign labor costs in manufacturing, 1980-88
The foreign index includes Canada, France, Germany, Japan, and the United Kingdom, and is constructed by weighting each country's unit labor costs by its share in total output.
SOURCE. Peter Hooper and Kathryn Larin, "International Compar-ison of Unit Labor Costs in Manufacturing," International Finance Discussion Papers 330 (Board of Governors of the Federal Reserve System, August 1988), forthcoming in Review of Income and Wealth. Measures of unit labor costs are based partly on data published by the Bureau of Labor Statistics.
whereas the index weighted by shares in world trade is more relevant to export volumes or to the global price competitiveness of U.S. goods.
The decline in the dollar since 1985 has con-tributed to a significant gain in U.S. international competitiveness in terms of labor costs in man-ufacturing. As indicated in chart 4, foreign unit labor costs in manufacturing, expressed in dol-lars, rose sharply relative to U.S. unit labor costs between 1985 and 1988. While the fall in the exchange value of the dollar accounted for most of this shift, increases in U.S. labor productivity relative to foreign productivity, and declines in U.S. wages relative to wages abroad, also helped. As a result of this improvement, U.S. unit labor costs in manufacturing were estimated to have been as much as 30 percent below the average level (in dollars) for other major indus-trial countries. Such estimates of the compara-tive levels of unit labor costs inevitably are crude, but they suggest that the adjustment of the U.S. external balance to the current level of exchange rates can continue for some time if output capacity is reallocated toward the United States to take advantage of relatively lower labor costs here.1
1. Evidence that relative rates of investment in manufac-turing across countries have responded to international dif-ferences in labor costs is considered in Peter Hooper, "Ex-
U.S. International Transactions in 1988 323
2. U.S. merchandise trade, 1985-881
Billions of dollars
Type of trade 1985 1986 1987 1988
Merchandise exports 215.9 224.0 249.6 319.9 Agricultural 29.6 27.4 29.5 38.3 Computers 13.7 14.3 17.4 21.7 Other 172.7 182.3 202.7 259.9
Merchandise imports 338.1 368.5 409.9 446.4 Oil 51.3 34.4 42.9 39.3 Computers 8.4 11.0 14.9 18.4
278.4 323.1 352.1 388.7
Trade balance -122.2 -144.6 -160.3 -126.5
1. Components may not add to totals because of rounding. SOURCE. Bureau of Economic Analysis, U.S. international transac-
tions accounts.
3. Changes in U.S. merchandise exports and imports, 1987-88 Percent change, annual rate
Type of trade 1987:4 from
1986:4
1988:4 from
1987:4
1988:2 from
1987:4
1988:4 from 1988:2
Merchandise exports1
Value Volume
Merchandise imports
Volume
19 24 35 14 19 17 28 8
15 6 1 11 8 4 - 1 10
1. Excludes gold shipments to Taiwan. SOURCE. Bureau of Economic Analysis, U.S. international transac-
tions accounts.
DEVELOPMENTS IN U.S. MERCHANDISE TRADE
The merchandise trade deficit narrowed more than $30 billion last year to $127 billion, marking the first year of improvement since 1980 (table 2). The value of exports rose 24 percent between the fourth quarter of 1987 and the fourth quarter of 1988, continuing the rapid expansion of the year before (table 3). Imports grew much more slowly, in sharp contrast to their strong growth in 1987. Most of the improvement in the deficit in 1988 came during the first half of the year, as exports grew at an extremely rapid rate and imports changed little. In the second half of the year, export growth slowed, while import growth
change Rates and U.S. External Adjustment in the Short Run and the Long Run," International Finance Discussion Papers 346 (Board of Governors of the Federal Reserve System, March 1989).
Digitized for FRASER http://fraser.stlouisfed.org/ Federal Reserve Bank of St. Louis
324 Federal Reserve Bulletin • May 1989
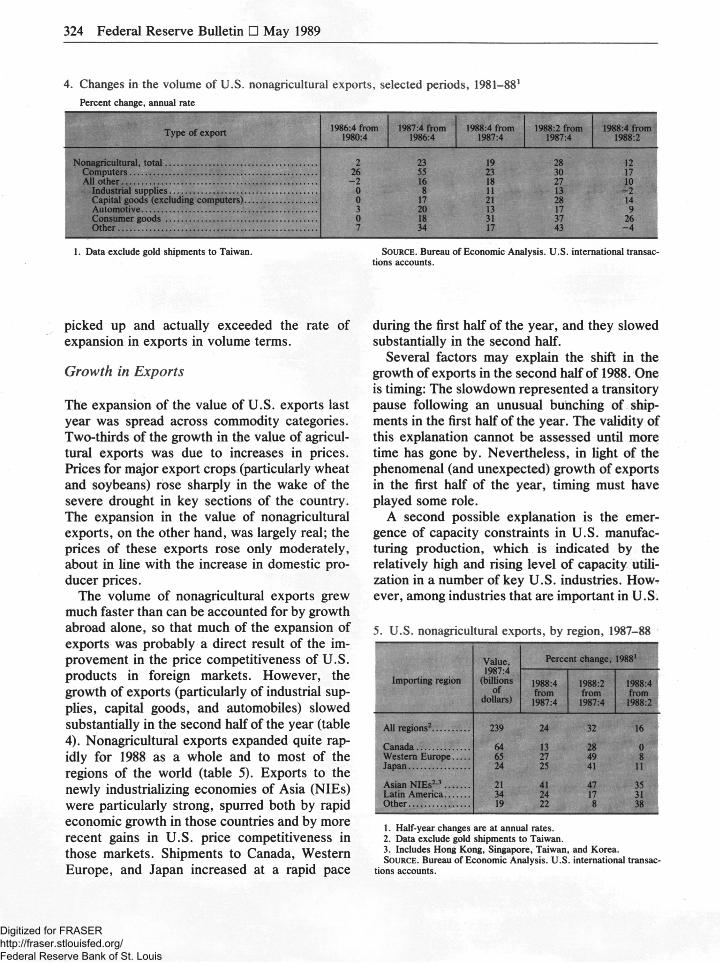
4. Changes in the volume of U.S. nonagricultural exports, selected periods, 1981-881
Percent change, annual rate
Type of export 1986:4 from 1980:4
1987:4 from 1986:4
1988:4 from 1987:4
1988:2 from 1987:4
1988:4 from 1988:2
Nonagricultural, total 2 23 19 28 12 Computers 26 55 23 30 17 All other - 2 16 18 27 10
Industrial supplies 0 8 11 13 - 2 Capital goods (excluding computers) 0 17 21 28 14 Automotive 3 20 13 17 9 Consumer goods 0 18 31 37 26 Other 7 34 17 43 - 4
1. Data exclude gold shipments to Taiwan.
picked up and actually exceeded the rate of expansion in exports in volume terms.
Growth in Exports
The expansion of the value of U.S. exports last year was spread across commodity categories. Two-thirds of the growth in the value of agricul-tural exports was due to increases in prices. Prices for major export crops (particularly wheat and soybeans) rose sharply in the wake of the severe drought in key sections of the country. The expansion in the value of nonagricultural exports, on the other hand, was largely real; the prices of these exports rose only moderately, about in line with the increase in domestic pro-ducer prices.
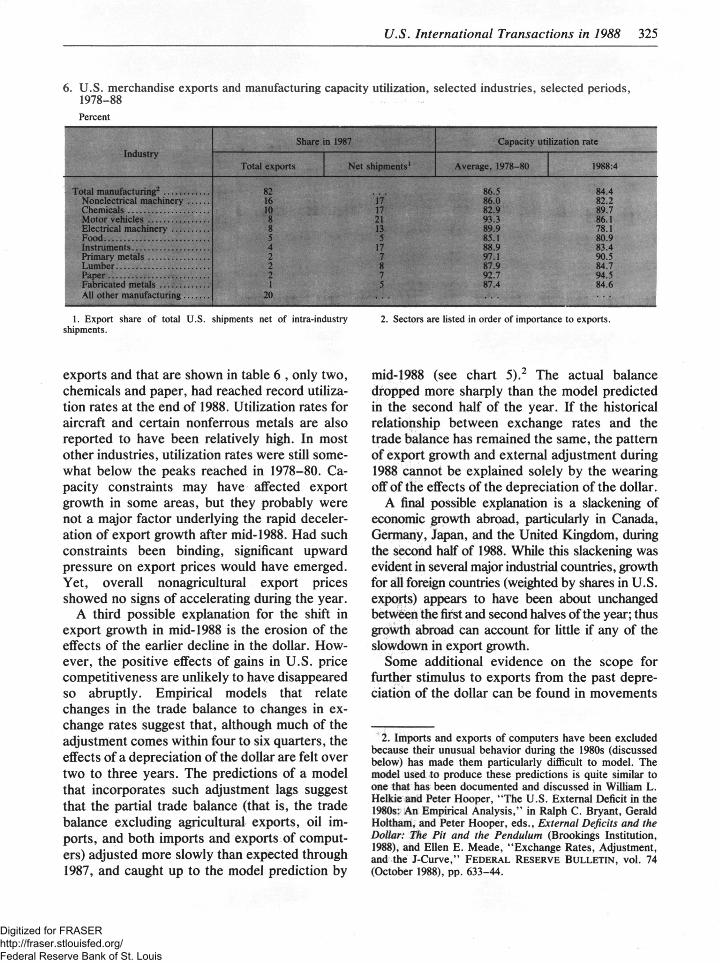
The volume of nonagricultural exports grew much faster than can be accounted for by growth abroad alone, so that much of the expansion of exports was probably a direct result of the im-provement in the price competitiveness of U.S. products in foreign markets. However, the growth of exports (particularly of industrial sup-plies, capital goods, and automobiles) slowed substantially in the second half of the year (table 4). Nonagricultural exports expanded quite rap-idly for 1988 as a whole and to most of the regions of the world (table 5). Exports to the newly industrializing economies of Asia (NIEs) were particularly strong, spurred both by rapid economic growth in those countries and by more recent gains in U.S. price competitiveness in those markets. Shipments to Canada, Western Europe, and Japan increased at a rapid pace
SOURCE. Bureau of Economic Analysis. U.S. international transac-tions accounts.
during the first half of the year, and they slowed substantially in the second half.
Several factors may explain the shift in the growth of exports in the second half of 1988. One is timing: The slowdown represented a transitory pause following an unusual bunching of ship-ments in the first half of the year. The validity of this explanation cannot be assessed until more time has gone by. Nevertheless, in light of the phenomenal (and unexpected) growth of exports in the first half of the year, timing must have played some role.
A second possible explanation is the emer-gence of capacity constraints in U.S. manufac-turing production, which is indicated by the relatively high and rising level of capacity utili-zation in a number of key U.S. industries. How-ever, among industries that are important in U.S.
5. U.S. nonagricultural exports, by region, 1987-88
Importing region
Value, 1987:4
(billions of
dollars)
Percent change, 1988'
Importing region
Value, 1987:4
(billions of
dollars)
1988:4 from 1987:4
1988:2 from 1987:4
1988:4 from
1988:2
All regions2 239 24 32 16
64 13 28 0 Western Europe 65 27 49 8 Japan 24 25 41 11
Asian NIEs2,3 21 41 47 35 Latin America 34 24 17 31 Other 19 22 8 38
1. Half-year changes are at annual rates. 2. Data exclude gold shipments to Taiwan. 3. Includes Hong Kong, Singapore, Taiwan, and Korea. SOURCE. Bureau of Economic Analysis. U.S. international transac-
tions accounts.
Digitized for FRASER http://fraser.stlouisfed.org/ Federal Reserve Bank of St. Louis
U.S. International Transactions in 1988 325
6. U.S. merchandise exports and manufacturing capacity utilization, selected industries, selected periods, 1978-88 Percent
Industry Share in 1987 Capacity utilization rate
Industry Total exports Net shipments' Average, 1978-80 1988:4
Total manufacturing2
Nonelectrical machinery Chemicals Motor vehicles Electrical machinery Food Instruments Primary metals Lumber Paper Fabricated metals All other manufacturing
82 . . . 86.5 84.4 16 17 86.0 82.2 10 17 82.9 89.7 8 21 93.3 86.1 8 13 89.9 78.1 5 5 85.1 80.9 4 17 88.9 83.4 2 7 97.1 90.5 2 8 87.9 84.7 2 7 92.7 94.5 1 5 87.4 84.6
20
1. Export share of total U.S. shipments net of intra-industry shipments.
exports and that are shown in table 6 , only two, chemicals and paper, had reached record utiliza-tion rates at the end of 1988. Utilization rates for aircraft and certain nonferrous metals are also reported to have been relatively high. In most other industries, utilization rates were still some-what below the peaks reached in 1978-80. Ca-pacity constraints may have affected export growth in some areas, but they probably were not a major factor underlying the rapid deceler-ation of export growth after mid-1988. Had such constraints been binding, significant upward pressure on export prices would have emerged. Yet, overall nonagricultural export prices showed no signs of accelerating during the year.
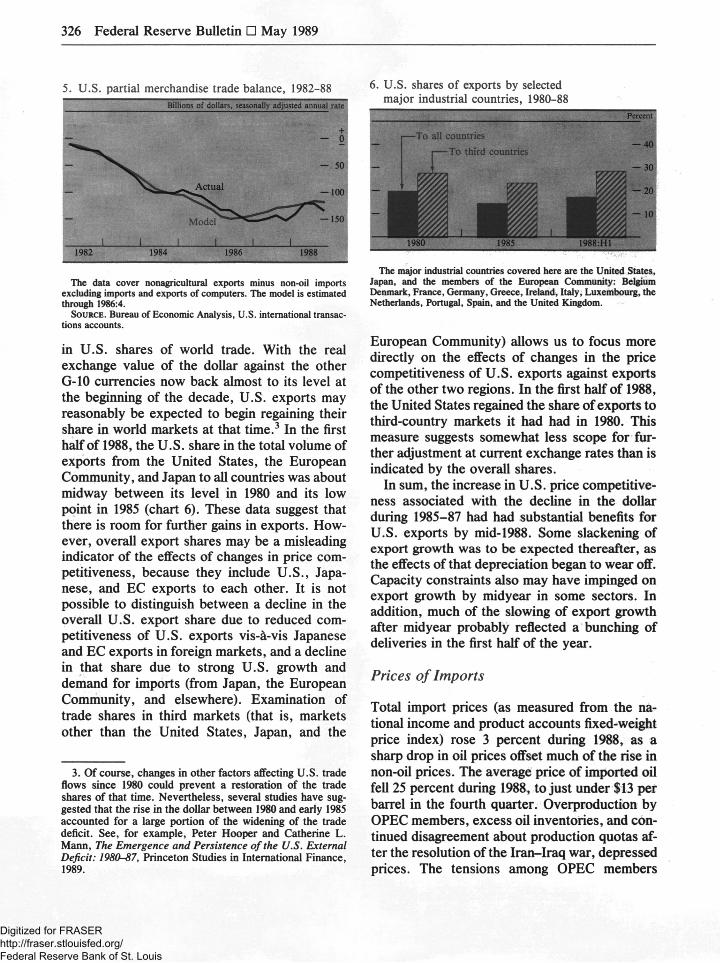
A third possible explanation for the shift in export growth in mid-1988 is the erosion of the effects of the earlier decline in the dollar. How-ever, the positive effects of gains in U.S. price competitiveness are unlikely to have disappeared so abruptly. Empirical models that relate changes in the trade balance to changes in ex-change rates suggest that, although much of the adjustment comes within four to six quarters, the effects of a depreciation of the dollar are felt over two to three years. The predictions of a model that incorporates such adjustment lags suggest that the partial trade balance (that is, the trade balance excluding agricultural exports, oil im-ports, and both imports and exports of comput-ers) adjusted more slowly than expected through 1987, and caught up to the model prediction by
2. Sectors are listed in order of importance to exports.
mid-1988 (see chart 5).2 The actual balance dropped more sharply than the model predicted in the second half of the year. If the historical relationship between exchange rates and the trade balance has remained the same, the pattern of export growth and external adjustment during 1988 cannot be explained solely by the wearing off of the effects of the depreciation of the dollar.
A final possible explanation is a slackening of economic growth abroad, particularly in Canada, Germany, Japan, and the United Kingdom, during the second half of 1988. While this slackening was evident in several major industrial countries, growth for all foreign countries (weighted by shares in U.S. exports) appears to have been about unchanged between the first and second halves of the year; thus growth abroad can account for little if any of the slowdown in export growth.
Some additional evidence on the scope for further stimulus to exports from the past depre-ciation of the dollar can be found in movements
2. Imports and exports of computers have been excluded because their unusual behavior during the 1980s (discussed below) has made them particularly difficult to model. The model used to produce these predictions is quite similar to one that has been documented and discussed in William L. Helkie and Peter Hooper, "The U.S. External Deficit in the 1980s: An Empirical Analysis," in Ralph C. Bryant, Gerald Holtham, and Peter Hooper, eds., External Deficits and the Dollar: The Pit and the Pendulum (Brookings Institution, 1988), and Ellen E. Meade, "Exchange Rates, Adjustment, and the J-Curve," FEDERAL RESERVE BULLETIN, vol. 74 (October 1988), pp. 6 3 3 - 4 4 .
Digitized for FRASER http://fraser.stlouisfed.org/ Federal Reserve Bank of St. Louis
326 Federal Reserve Bulletin • May 1989
5. U.S. partial merchandise trade balance, 1982-88 Billions of dollars, seasonally adjusted annual rate
The data cover nonagricultural exports minus non-oil imports excluding imports and exports of computers. The model is estimated through 1986:4.
SOURCE. Bureau of Economic Analysis, U.S. international transac-tions accounts.
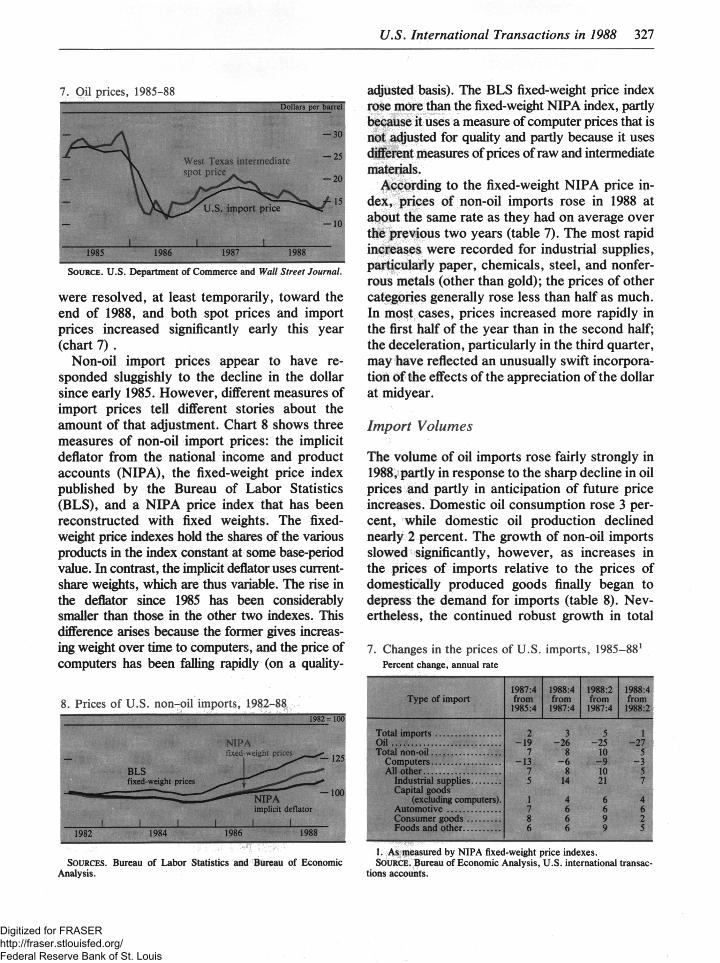
in U.S. shares of world trade. With the real exchange value of the dollar against the other G-10 currencies now back almost to its level at the beginning of the decade, U.S. exports may reasonably be expected to begin regaining their share in world markets at that time.3 In the first half of 1988, the U.S. share in the total volume of exports from the United States, the European Community, and Japan to all countries was about midway between its level in 1980 and its low point in 1985 (chart 6). These data suggest that there is room for further gains in exports. How-ever, overall export shares may be a misleading indicator of the effects of changes in price com-petitiveness, because they include U.S., Japa-nese, and EC exports to each other. It is not possible to distinguish between a decline in the overall U.S. export share due to reduced com-petitiveness of U.S. exports vis-a-vis Japanese and EC exports in foreign markets, and a decline in that share due to strong U.S. growth and demand for imports (from Japan, the European Community, and elsewhere). Examination of trade shares in third markets (that is, markets other than the United States, Japan, and the
3. Of course, changes in other factors affecting U.S. trade flows since 1980 could prevent a restoration of the trade shares of that time. Nevertheless, several studies have sug-gested that the rise in the dollar between 1980 and early 1985 accounted for a large portion of the widening of the trade deficit. See, for example, Peter Hooper and Catherine L. Mann, The Emergence and Persistence of the U.S. External Deficit: 1980-87, Princeton Studies in International Finance, 1989.
6. U.S. shares of exports by selected major industrial countries, 1980-88
Percent
The major industrial countries covered here are the United States, Japan, and the members of the European Community: Belgium Denmark, France, Germany, Greece, Ireland, Italy, Luxembourg, the Netherlands, Portugal, Spain, and the United Kingdom.
European Community) allows us to focus more directly on the effects of changes in the price competitiveness of U.S. exports against exports of the other two regions. In the first half of 1988, the United States regained the share of exports to third-country markets it had had in 1980. This measure suggests somewhat less scope for fur-ther adjustment at current exchange rates than is indicated by the overall shares.
In sum, the increase in U.S. price competitive-ness associated with the decline in the dollar during 1985-87 had had substantial benefits for U.S. exports by mid-1988. Some slackening of export growth was to be expected thereafter, as the effects of that depreciation began to wear off. Capacity constraints also may have impinged on export growth by midyear in some sectors. In addition, much of the slowing of export growth after midyear probably reflected a bunching of deliveries in the first half of the year.
Prices of Imports
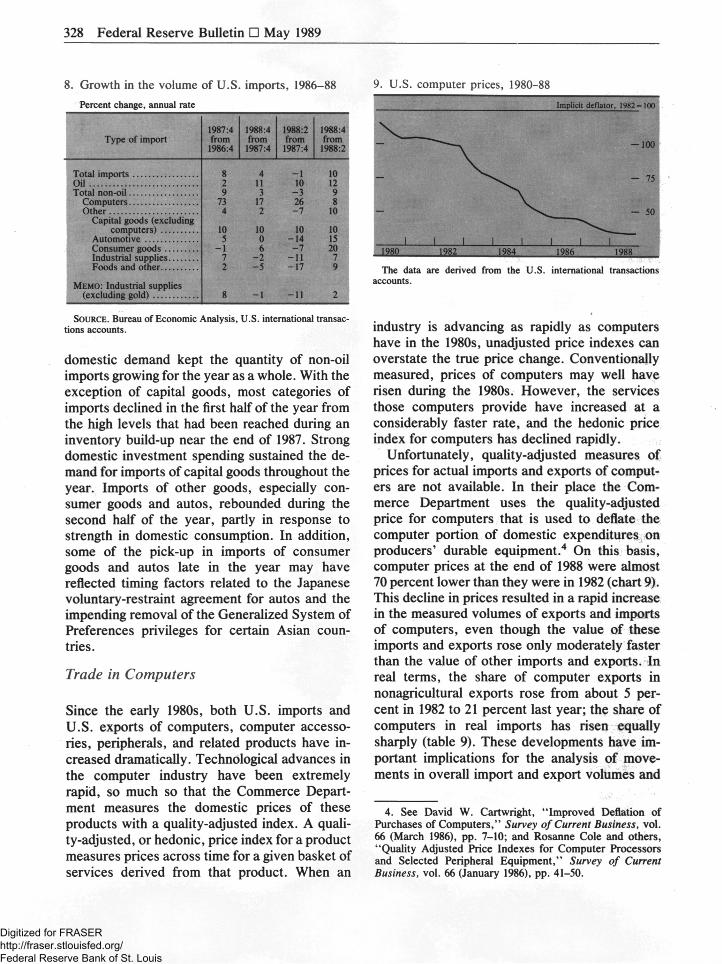
Total import prices (as measured from the na-tional income and product accounts fixed-weight price index) rose 3 percent during 1988, as a sharp drop in oil prices offset much of the rise in non-oil prices. The average price of imported oil fell 25 percent during 1988, to just under $13 per barrel in the fourth quarter. Overproduction by OPEC members, excess oil inventories, and con-tinued disagreement about production quotas af-ter the resolution of the Iran-Iraq war, depressed prices. The tensions among OPEC members
Digitized for FRASER http://fraser.stlouisfed.org/ Federal Reserve Bank of St. Louis
U.S. International Transactions in 1988 327
7. Oil prices, 1985-88 Dollars per barrel
- A . — 30
1 NJ L West Texas intermediate — 25
-
y \ spot price . - 2 0
-
x J a T ^ / U.S. import price
1 1 1
f - 1 5
— 1 0
1985 1986 1987 1988
SOURCE. U.S. Department of Commerce and Wall Street Journal.
were resolved, at least temporarily, toward the end of 1988, and both spot prices and import prices increased significantly early this year (chart 7) .
Non-oil import prices appear to have re-sponded sluggishly to the decline in the dollar since early 1985. However, different measures of import prices tell different stories about the amount of that adjustment. Chart 8 shows three measures of non-oil import prices: the implicit deflator from the national income and product accounts (NIPA), the fixed-weight price index published by the Bureau of Labor Statistics (BLS), and a NIPA price index that has been reconstructed with fixed weights. The fixed-weight price indexes hold the shares of the various products in the index constant at some base-period value. In contrast, the implicit deflator uses current-share weights, which are thus variable. The rise in the deflator since 1985 has been considerably smaller than those in the other two indexes. This difference arises because the former gives increas-ing weight over time to computers, and the price of computers has been falling rapidly (on a quality-
8. Prices of U.S. non-oil imports, 1982-88 1982= 100
NIPA It
SOURCES. Bureau of Labor Statistics and Bureau of Economic Analysis.
adjusted basis). The BLS fixed-weight price index rose more than the fixed-weight NIPA index, partly because it uses a measure of computer prices that is not adjusted for quality and partly because it uses different measures of prices of raw and intermediate materials.
According to the fixed-weight NIPA price in-dex, prices of non-oil imports rose in 1988 at about the same rate as they had on average over the previous two years (table 7). The most rapid increases were recorded for industrial supplies, particularly paper, chemicals, steel, and nonfer-rous metals (other than gold); the prices of other categories generally rose less than half as much. In most cases, prices increased more rapidly in the first half of the year than in the second half; the deceleration, particularly in the third quarter, may have reflected an unusually swift incorpora-tion of the effects of the appreciation of the dollar at midyear.
Import Volumes
The volume of oil imports rose fairly strongly in 1988, partly in response to the sharp decline in oil prices and partly in anticipation of future price increases. Domestic oil consumption rose 3 per-cent, while domestic oil production declined nearly 2 percent. The growth of non-oil imports slowed significantly, however, as increases in the prices of imports relative to the prices of domestically produced goods finally began to depress the demand for imports (table 8). Nev-ertheless, the continued robust growth in total
7. Changes in the prices of U.S. imports, 1985—88' Percent change, annual rate
Type of import 1987:4 from 1985:4
1988:4 from 1987:4
1988:2 from
1987:4
1988:4 from
1988:2
Total imports Oil
2 3 5 1 - 1 9 - 2 6 - 2 5 - 2 7
7 8 10 5 - 1 3 - 6 - 9 - 3
7 8 10 5 5 14 21 7
1 4 6 4 7 6 6 6 8 6 9 2 6 6 9 5
Total non-oil Computers All other
Industrial supplies Capital goods
(excluding computers). Automotive Consumer goods Foods and other
2 3 5 1 - 1 9 - 2 6 - 2 5 - 2 7
7 8 10 5 - 1 3 - 6 - 9 - 3
7 8 10 5 5 14 21 7
1 4 6 4 7 6 6 6 8 6 9 2 6 6 9 5
1. As measured by NIPA fixed-weight price indexes. SOURCE. Bureau of Economic Analysis, U.S. international transac-
tions accounts.
Digitized for FRASER http://fraser.stlouisfed.org/ Federal Reserve Bank of St. Louis
328 Federal Reserve Bulletin • May 1989
8. Growth in the volume of U.S. imports, 1986-88 Percent change, annual rate
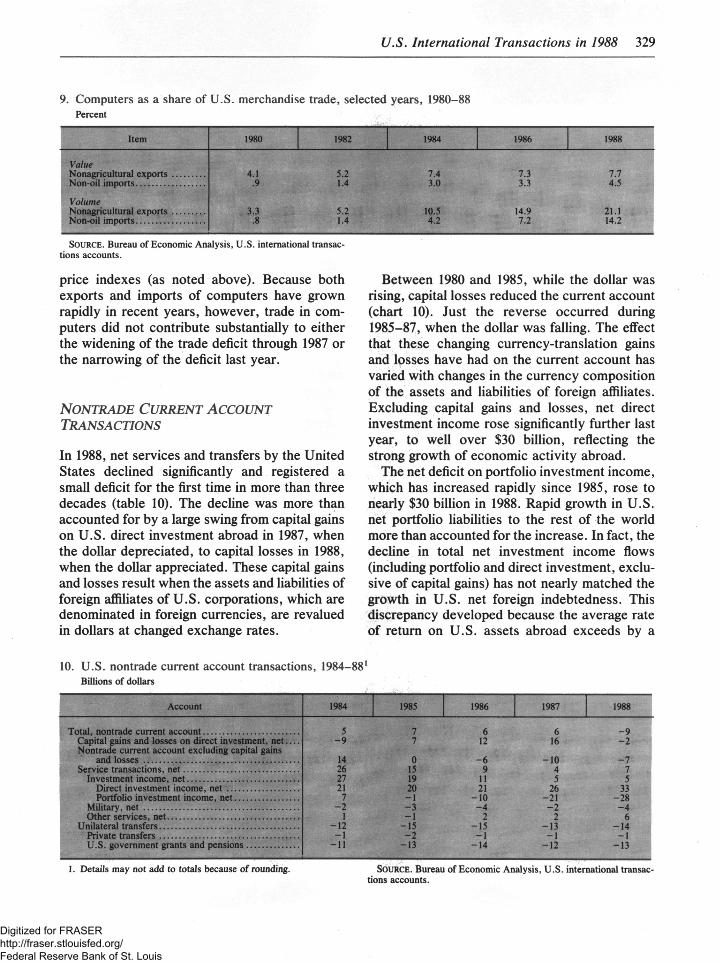
9. U.S. computer prices, 1980-88
1987:4 1988:4 1988:2 1988:4 Type of import from from from from Type of import
1986:4 1987:4 1987:4 1988:2
Total imports Oil Total non-oil
Computers Other
Capital goods (excluding computers)
Automotive Consumer goods Industrial supplies Foods and other
MEMO: Industrial supplies (excluding gold)
8 4 - 1 10 2 11 10 12 9 3 - 3 9
73 17 26 8 4 2 - 7 10
10 10 10 10 5 0 - 1 4 15
- 1 6 - 7 20 7 - 2 -11 7 2 - 5 - 1 7 9
8 - 1 -11 2
SOURCE. Bureau of Economic Analysis, U.S. international transac-tions accounts.
domestic demand kept the quantity of non-oil imports growing for the year as a whole. With the exception of capital goods, most categories of imports declined in the first half of the year from the high levels that had been reached during an inventory build-up near the end of 1987. Strong domestic investment spending sustained the de-mand for imports of capital goods throughout the year. Imports of other goods, especially con-sumer goods and autos, rebounded during the second half of the year, partly in response to strength in domestic consumption. In addition, some of the pick-up in imports of consumer goods and autos late in the year may have reflected timing factors related to the Japanese voluntary-restraint agreement for autos and the impending removal of the Generalized System of Preferences privileges for certain Asian coun-tries.
Trade in Computers
Since the early 1980s, both U.S. imports and U.S. exports of computers, computer accesso-ries, peripherals, and related products have in-creased dramatically. Technological advances in the computer industry have been extremely rapid, so much so that the Commerce Depart-ment measures the domestic prices of these products with a quality-adjusted index. A quali-ty-adjusted, or hedonic, price index for a product measures prices across time for a given basket of services derived from that product. When an
The data are derived from the U.S. international transactions accounts.
industry is advancing as rapidly as computers have in the 1980s, unadjusted price indexes can overstate the true price change. Conventionally measured, prices of computers may well have risen during the 1980s. However, the services those computers provide have increased at a considerably faster rate, and the hedonic price index for computers has declined rapidly.
Unfortunately, quality-adjusted measures of prices for actual imports and exports of comput-ers are not available. In their place the Com-merce Department uses the quality-adjusted price for computers that is used to deflate the computer portion of domestic expenditures on producers' durable equipment.4 On this basis, computer prices at the end of 1988 were almost 70 percent lower than they were in 1982 (chart 9). This decline in prices resulted in a rapid increase in the measured volumes of exports and imports of computers, even though the value of these imports and exports rose only moderately faster than the value of other imports and exports. In real terms, the share of computer exports in nonagricultural exports rose from about 5 per-cent in 1982 to 21 percent last year; the share of computers in real imports has risen equally sharply (table 9). These developments have im-portant implications for the analysis of move-ments in overall import and export volumes and
4. See David W. Cartwright, "Improved Deflation of Purchases of Computers," Survey of Current Business, vol. 66 (March 1986), pp. 7-10; and Rosanne Cole and others, "Quality Adjusted Price Indexes for Computer Processors and Selected Peripheral Equipment," Survey of Current Business, vol. 66 (January 1986), pp. 41-50.
Digitized for FRASER http://fraser.stlouisfed.org/ Federal Reserve Bank of St. Louis
U.S. International Transactions in 1988 329
9. Computers as a share of U.S. merchandise trade, selected years, 1980-88 Percent
Item 1980 1982 1984 1986 1988
Value Nonagricultural exports Non-oil imports
Volume Nonagricultural exports Non-oil imports
4.1 5.2 7.4 7.3 7.7 .9 1.4 3.0 3.3 4.5
3.3 5.2 10.5 14.9 21.1 .8 1.4 4.2 7.2 14.2
SOURCE. Bureau of Economic Analysis, U.S. international transac-tions accounts.
price indexes (as noted above). Because both exports and imports of computers have grown rapidly in recent years, however, trade in com-puters did not contribute substantially to either the widening of the trade deficit through 1987 or the narrowing of the deficit last year.
NONTRADE CURRENT ACCOUNT TRANSACTIONS
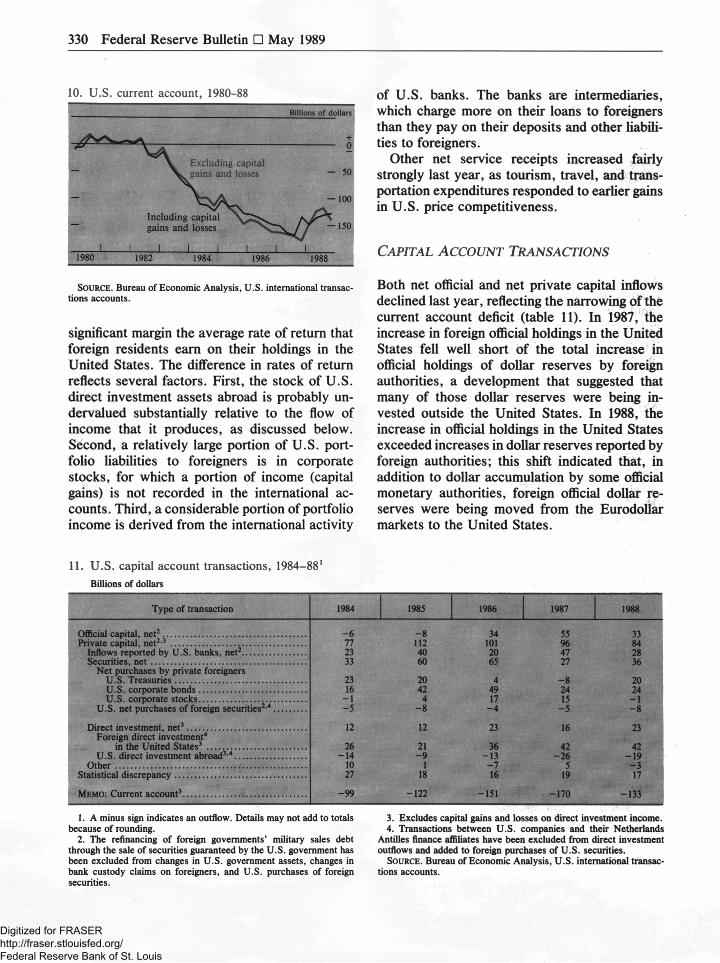
In 1988, net services and transfers by the United States declined significantly and registered a small deficit for the first time in more than three decades (table 10). The decline was more than accounted for by a large swing from capital gains on U.S. direct investment abroad in 1987, when the dollar depreciated, to capital losses in 1988, when the dollar appreciated. These capital gains and losses result when the assets and liabilities of foreign affiliates of U.S. corporations, which are denominated in foreign currencies, are revalued in dollars at changed exchange rates.
1. Details may not add to totals because of rounding.
Between 1980 and 1985, while the dollar was rising, capital losses reduced the current account (chart 10). Just the reverse occurred during 1985-87, when the dollar was falling. The effect that these changing currency-translation gains and losses have had on the current account has varied with changes in the currency composition of the assets and liabilities of foreign affiliates. Excluding capital gains and losses, net direct investment income rose significantly further last year, to well over $30 billion, reflecting the strong growth of economic activity abroad.
The net deficit on portfolio investment income, which has increased rapidly since 1985, rose to nearly $30 billion in 1988. Rapid growth in U.S. net portfolio liabilities to the rest of the world more than accounted for the increase. In fact, the decline in total net investment income flows (including portfolio and direct investment, exclu-sive of capital gains) has not nearly matched the growth in U.S. net foreign indebtedness. This discrepancy developed because the average rate of return on U.S. assets abroad exceeds by a
SOURCE. Bureau of Economic Analysis, U.S. international transac-tions accounts.
10. U.S. nontrade current account transactions, 1984-881
Billions of dollars
Account 1984 1985 1986 1987 1988
Total, nontrade current account 5 7 6 6 - 9 Capital gains and losses on direct investment, net . . . . - 9 7 12 16 - 2 Nontrade current account excluding capital gains
and losses 14 0 - 6 - 1 0 - 7 Service transactions, net 26 15 9 4 7
Investment income, net 27 19 11 5 5 Direct investment income, net 21 20 21 26 33 Portfolio investment income, net 7 - 1 - 1 0 - 2 1 - 2 8
Military, net - 2 - 3 - 4 - 2 - 4 Other services, net 1 - 1 2 2 6
Unilateral transfers - 1 2 - 1 5 - 1 5 - 1 3 - 1 4 Private transfers - 1 - 2 - 1 - 1 - 1 U.S. government grants and pensions -11 - 1 3 - 1 4 - 1 2 - 1 3
Digitized for FRASER http://fraser.stlouisfed.org/ Federal Reserve Bank of St. Louis
330 Federal Reserve Bulletin • May 1989
10. U.S. current account, 1980-88 Billions of dollars
I I I I I I 1 I 1980 1982 1984 1986 1988
SOURCE. Bureau of Economic Analysis, U.S. international transac-tions accounts.
significant margin the average rate of return that foreign residents earn on their holdings in the United States. The difference in rates of return reflects several factors. First, the stock of U.S. direct investment assets abroad is probably un-dervalued substantially relative to the flow of income that it produces, as discussed below. Second, a relatively large portion of U.S. port-folio liabilities to foreigners is in corporate stocks, for which a portion of income (capital gains) is not recorded in the international ac-counts. Third, a considerable portion of portfolio income is derived from the international activity
1. A minus sign indicates an outflow. Details may not add to totals because of rounding.
2. The refinancing of foreign governments' military sales debt through the sale of securities guaranteed by the U.S. government has been excluded from changes in U.S. government assets, changes in bank custody claims on foreigners, and U.S. purchases of foreign securities.
of U.S. banks. The banks are intermediaries, which charge more on their loans to foreigners than they pay on their deposits and other liabili-ties to foreigners.
Other net service receipts increased fairly strongly last year, as tourism, travel, and trans-portation expenditures responded to earlier gains in U.S. price competitiveness.
CAPITAL ACCOUNT TRANSACTIONS
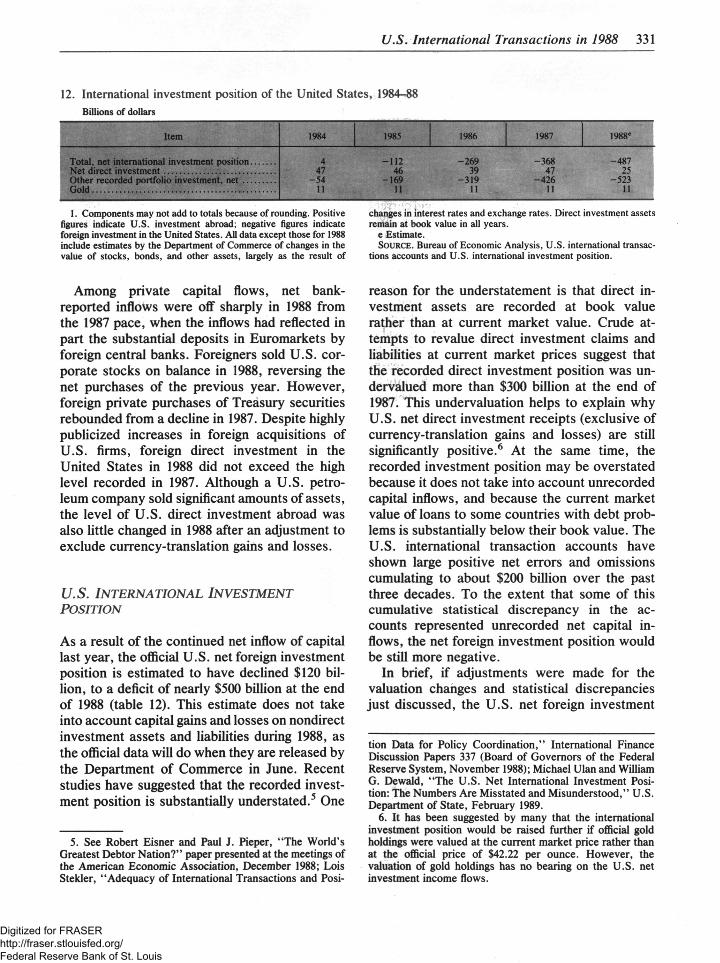
Both net official and net private capital inflows declined last year, reflecting the narrowing of the current account deficit (table 11). In 1987, the increase in foreign official holdings in the United States fell well short of the total increase in official holdings of dollar reserves by foreign authorities, a development that suggested that many of those dollar reserves were being in-vested outside the United States. In 1988, the increase in official holdings in the United States exceeded increases in dollar reserves reported by foreign authorities; this shift indicated that, in addition to dollar accumulation by some official monetary authorities, foreign official dollar re-serves were being moved from the Eurodollar markets to the United States.
3. Excludes capital gains and losses on direct investment income. 4. Transactions between U.S. companies and their Netherlands
Antilles finance affiliates have been excluded from direct investment outflows and added to foreign purchases of U.S. securities.
SOURCE. Bureau of Economic Analysis, U.S. international transac-tions accounts.
11. U.S. capital account transactions, 1984-881
Billions of dollars
Type of transaction 1984 1985 1986 1987 1988
Official capital, net2 - 6 - 8 34 55 33 Private capital, net2,3 77 112 101 9 6 84
Inflows reported by U.S. banks, net2 23 4 0 20 47 28 Securities, net 33 6 0 65 27 36
Net purchases by private foreigners U.S. Treasuries 23 20 4 - 8 20 U.S. corporate bonds 16 42 4 9 24 24 U.S. corporate stocks - 1 4 17 15 - 1
U.S. net purchases of foreign securities2'4 - 5 - 8 - 4 - 5 - 8
Direct investment, net3 12 12 23 16 23 Foreign direct investment4
in the United States3 2 6 21 36 42 42 U.S. direct investment abroad3,4 - 1 4 - 9 - 1 3 - 2 6 - 1 9
Other 10 1 - 7 5 - 3 Statistical discrepancy 27 18 16 19 17
MEMO: Current account3 - 9 9 - 1 2 2 - 1 5 1 - 1 7 0 - 1 3 3
Digitized for FRASER http://fraser.stlouisfed.org/ Federal Reserve Bank of St. Louis
U.S. International Transactions in 1988 331
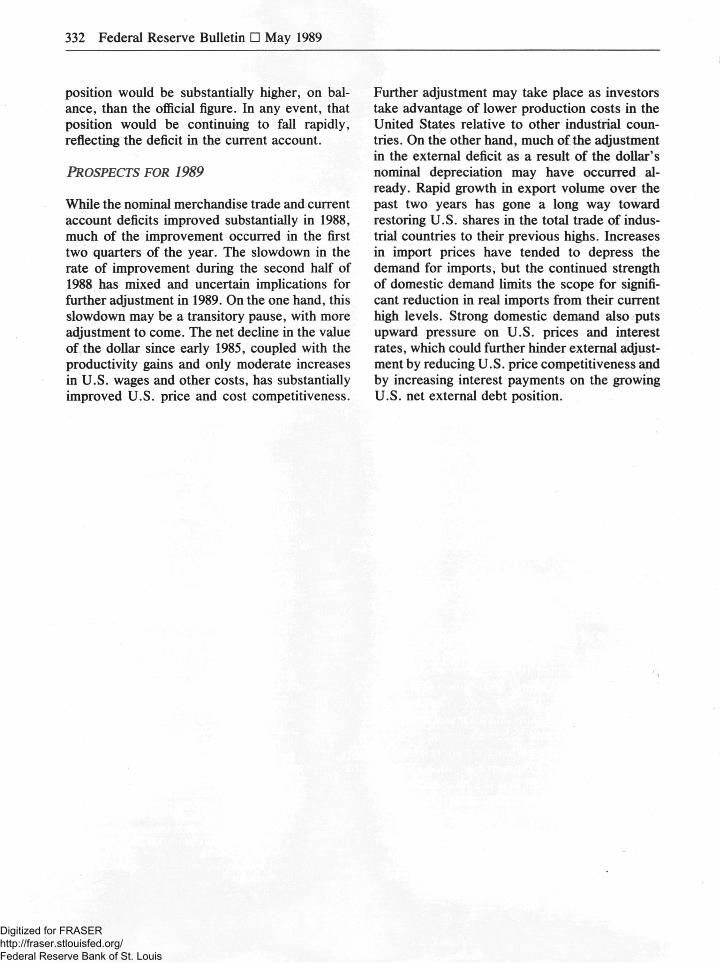
12. International investment position of the United States, 1984-88 Billions of dollars
Item 1984 1985 1986 1987 1988 e
Total, net international investment position 4 - 1 1 2 - 2 6 9 - 3 6 8 - 4 8 7 Net direct investment 47 4 6 39 4 7 25 Other recorded portfolio investment, net - 5 4 - 1 6 9 - 3 1 9 - 4 2 6 - 5 2 3 Gold 11 11 11 11 11
1. Components may not add to totals because of rounding. Positive figures indicate U.S. investment abroad; negative figures indicate foreign investment in the United States. All data except those for 1988 include estimates by the Department of Commerce of changes in the value of stocks, bonds, and other assets, largely as the result of
Among private capital flows, net bank-reported inflows were off sharply in 1988 from the 1987 pace, when the inflows had reflected in part the substantial deposits in Euromarkets by foreign central banks. Foreigners sold U.S. cor-porate stocks on balance in 1988, reversing the net purchases of the previous year. However, foreign private purchases of Treasury securities rebounded from a decline in 1987. Despite highly publicized increases in foreign acquisitions of U.S. firms, foreign direct investment in the United States in 1988 did not exceed the high level recorded in 1987. Although a U.S. petro-leum company sold significant amounts of assets, the level of U.S. direct investment abroad was also little changed in 1988 after an adjustment to exclude currency-translation gains and losses.
U.S. INTERNATIONAL INVESTMENT POSITION
As a result of the continued net inflow of capital last year, the official U.S. net foreign investment position is estimated to have declined $120 bil-lion, to a deficit of nearly $500 billion at the end of 1988 (table 12). This estimate does not take into account capital gains and losses on nondirect investment assets and liabilities during 1988, as the official data will do when they are released by the Department of Commerce in June. Recent studies have suggested that the recorded invest-ment position is substantially understated.5 One
5. See Robert Eisner and Paul J. Pieper, "The World's Greatest Debtor Nation?" paper presented at the meetings of the American Economic Association, December 1988; Lois Stekler, "Adequacy of International Transactions and Posi-
changes in interest rates and exchange rates. Direct investment assets remain at book value in all years.
e Estimate. SOURCE. Bureau of Economic Analysis, U.S. international transac-
tions accounts and U.S. international investment position.
reason for the understatement is that direct in-vestment assets are recorded at book value rather than at current market value. Crude at-tempts to revalue direct investment claims and liabilities at current market prices suggest that the recorded direct investment position was un-dervalued more than $300 billion at the end of 1987. This undervaluation helps to explain why U.S. net direct investment receipts (exclusive of currency-translation gains and losses) are still significantly positive.6 At the same time, the recorded investment position may be overstated because it does not take into account unrecorded capital inflows, and because the current market value of loans to some countries with debt prob-lems is substantially below their book value. The U.S. international transaction accounts have shown large positive net errors and omissions cumulating to about $200 billion over the past three decades. To the extent that some of this cumulative statistical discrepancy in the ac-counts represented unrecorded net capital in-flows, the net foreign investment position would be still more negative.
In brief, if adjustments were made for the valuation changes and statistical discrepancies just discussed, the U.S. net foreign investment
tion Data for Policy Coordination," International Finance Discussion Papers 337 (Board of Governors of the Federal Reserve System, November 1988); Michael Ulan and William G. Dewald, "The U.S. Net International Investment Posi-tion: The Numbers Are Misstated and Misunderstood," U.S. Department of State, February 1989.
6. It has been suggested by many that the international investment position would be raised further if official gold holdings were valued at the current market price rather than at the official price of $42.22 per ounce. However, the valuation of gold holdings has no bearing on the U.S. net investment income flows.
Digitized for FRASER http://fraser.stlouisfed.org/ Federal Reserve Bank of St. Louis
332 Federal Reserve Bulletin • May 1989
position would be substantially higher, on bal-ance, than the official figure. In any event, that position would be continuing to fall rapidly, reflecting the deficit in the current account.
PROSPECTS FOR 1989
While the nominal merchandise trade and current account deficits improved substantially in 1988, much of the improvement occurred in the first two quarters of the year. The slowdown in the rate of improvement during the second half of 1988 has mixed and uncertain implications for further adjustment in 1989. On the one hand, this slowdown may be a transitory pause, with more adjustment to come. The net decline in the value of the dollar since early 1985, coupled with the productivity gains and only moderate increases in U.S. wages and other costs, has substantially improved U.S. price and cost competitiveness.
Further adjustment may take place as investors take advantage of lower production costs in the United States relative to other industrial coun-tries. On the other hand, much of the adjustment in the external deficit as a result of the dollar's nominal depreciation may have occurred al-ready. Rapid growth in export volume over the past two years has gone a long way toward restoring U.S. shares in the total trade of indus-trial countries to their previous highs. Increases in import prices have tended to depress the demand for imports, but the continued strength of domestic demand limits the scope for signifi-cant reduction in real imports from their current high levels. Strong domestic demand also puts upward pressure on U.S. prices and interest rates, which could further hinder external adjust-ment by reducing U.S. price competitiveness and by increasing interest payments on the growing U.S. net external debt position.
Digitized for FRASER http://fraser.stlouisfed.org/ Federal Reserve Bank of St. Louis
333
Home Equity Lending
This article was prepared by Glenn B. Canner and Charles A. Luckett of the Board's Division of Research and Statistics, and Thomas A. Durkin of the Regulatory Planning and Review Section of the Office of the Secretary, with assistance from Nellie D. Middleton.
Personal borrowing secured by equity in residen-tial property has become an increasingly impor-tant component of household liabilities. Growing equity in homes, aggressive promotions by finan-cial institutions, and a revised tax code, which retains the deduction for interest on real-estate-secured debt but not on other consumer borrow-ing, all appear to have contributed to the increas-ing use of home equity loans. Such credit typically takes either of two forms.1 The first of these, referred to here as a "traditional home equity loan," is a closed-end loan extended for a specified period of time and generally requiring repayment of interest and principal in equal monthly installments.2 The second form is the newer "home equity line of credit," a revolving account secured by residential equity. These accounts permit borrowing from time to time at the account holder's discretion up to the amount of the credit line, and they typically have more flexible repayment schedules than those for the traditional home equity loans.
Until recently, relatively little statistical infor-mation has been available on home equity lend-ing. Some information about uses and users of
1. Another way homeowners may access equity in their home is to refinance an existing mortgage. When the amount borrowed in a refinancing exceeds the amount of the debt represented by the original mortgage plus closing costs, then in effect equity-secured credit has been extended. Such "excess" funds may be used in the same manner as any other home equity type of loan. Refinancings are not discussed in this article.
2. Traditional home equity loans are sometimes called second mortgages, although legally they may involve a first lien.
home equity lines of credit became available in 1988 with publication of consumer surveys spon-sored in 1987 by the Federal Reserve Board and industry-sponsored surveys of financial institu-tions (see FEDERAL RESERVE BULLETIN , June 1988, pages 361-73). In addition, the Report of Condition for year-end 1987 made available for the first time comprehensive information about amounts outstanding under home equity lines of credit at commercial banks. None of these sources revealed much about traditional home equity loans, however. To learn more about traditional home equity loans and to relate trends in these closed-end loans to available information about home equity lines of credit, the Federal Reserve Board again participated in sponsoring consumer surveys in 1988 (appendix A). This article uses the new survey results to provide a more complete report on the market for con-sumer credit secured by home equity.
HOLDINGS OF HOME EQUITY LOANS
The Federal Reserve Board has for many years sponsored surveys of consumers to gather infor-mation about their overall financial situation and about their use of specific financial services. These surveys can be used to assess the use of home equity loans over time. Before the mid-1980s, nearly all home equity loans were of the traditional type. More recent surveys provide information on consumer use of both types of home equity credit.
Consumer surveys indicate that 5.4 percent of homeowners had a home equity loan in 1977.3
By 1983, this proportion had risen only slightly,
3. Thomas A. Durkin and Gregory E. Elliehausen, 1977 Consumer Credit Survey (Board of Governors of the Federal Reserve System, 1978).
Digitized for FRASER http://fraser.stlouisfed.org/ Federal Reserve Bank of St. Louis
334 Federal Reserve Bulletin • May 1989
to 6.8 percent.4 However, surveys taken last year reveal substantial growth in the use of home equity loans since 1983.5 These most recent surveys found that 11 percent of homeowners, or roughly 6.5 million families, had a home equity loan in the second half of 1988. Closer examina-tion of the 1988 surveys shows that 5.6 percent of homeowners had a home equity line of credit, while a nearly equal proportion, 5.3 percent, had a traditional home equity loan.
Widespread consumer interest in home equity credit line plans dates to 1986, when extensive promotion of such plans by financial institutions began. In that year, the Tax Reform Act man-dated the gradual removal of federal income tax deductions for interest paid on nonmortgage con-sumer credit, enhancing the attractiveness to consumers of using mortgage instruments to fund expenditures that typically have been financed by consumer loans. Favorable interest rates compared with those on many types of consumer credit, particularly credit cards, also have en-couraged borrowing against home equity. These features of reduced interest expense and tax deductibility characterize both types of home equity loans. In addition, the convenience of being able to draw as needed against a line of credit has proved to be a particularly attractive feature of the credit line account.
According to the 1988 Surveys of Consumer Attitudes, 31 percent of the families with a home equity line of credit obtained it in 1988, and 83 percent of families with accounts had opened them since 1986. In comparison, about one-fifth of the traditional home equity loans were estab-lished in 1988, and 64 percent had been granted since 1986. Looking at 1988 originations alone, 63 percent were credit lines and 37 percent were closed-end loans. Thus, in recent years home-equity-secured credit lines have been the more popular vehicle, but consumer demand for the traditional loan has by no means evaporated.
4. "1983 Survey of Consumer Finances," (Board of Gov-ernors of the Federal Reserve System, Division of Research and Statistics).
5. "Survey of Consumer Attitudes," July-December 1988 (University of Michigan, Institute for Social Research, Sur-vey Research Center).
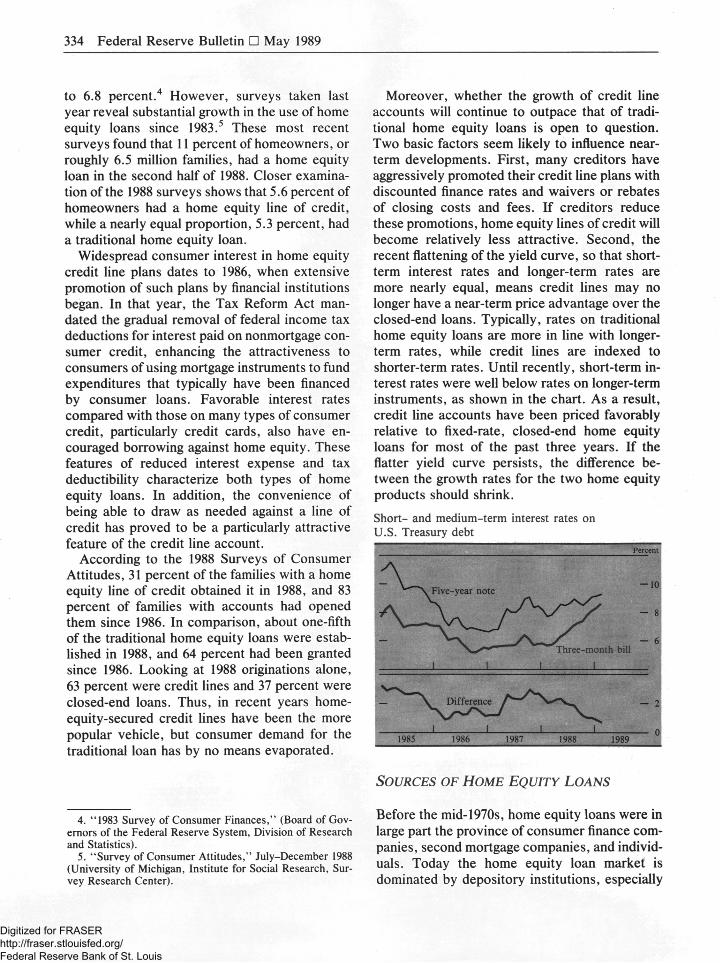
Moreover, whether the growth of credit line accounts will continue to outpace that of tradi-tional home equity loans is open to question. Two basic factors seem likely to influence near-term developments. First, many creditors have aggressively promoted their credit line plans with discounted finance rates and waivers or rebates of closing costs and fees. If creditors reduce these promotions, home equity lines of credit will become relatively less attractive. Second, the recent flattening of the yield curve, so that short-term interest rates and longer-term rates are more nearly equal, means credit lines may no longer have a near-term price advantage over the closed-end loans. Typically, rates on traditional home equity loans are more in line with longer-term rates, while credit lines are indexed to shorter-term rates. Until recently, short-term in-terest rates were well below rates on longer-term instruments, as shown in the chart. As a result, credit line accounts have been priced favorably relative to fixed-rate, closed-end home equity loans for most of the past three years. If the flatter yield curve persists, the difference be-tween the growth rates for the two home equity products should shrink.
Short- and medium-term interest rates on U.S. Treasury debt
SOURCES OF HOME EQUITY LOANS
Before the mid-1970s, home equity loans were in large part the province of consumer finance com-panies, second mortgage companies, and individ-uals. Today the home equity loan market is dominated by depository institutions, especially
Digitized for FRASER http://fraser.stlouisfed.org/ Federal Reserve Bank of St. Louis
Home Equity Lending 335
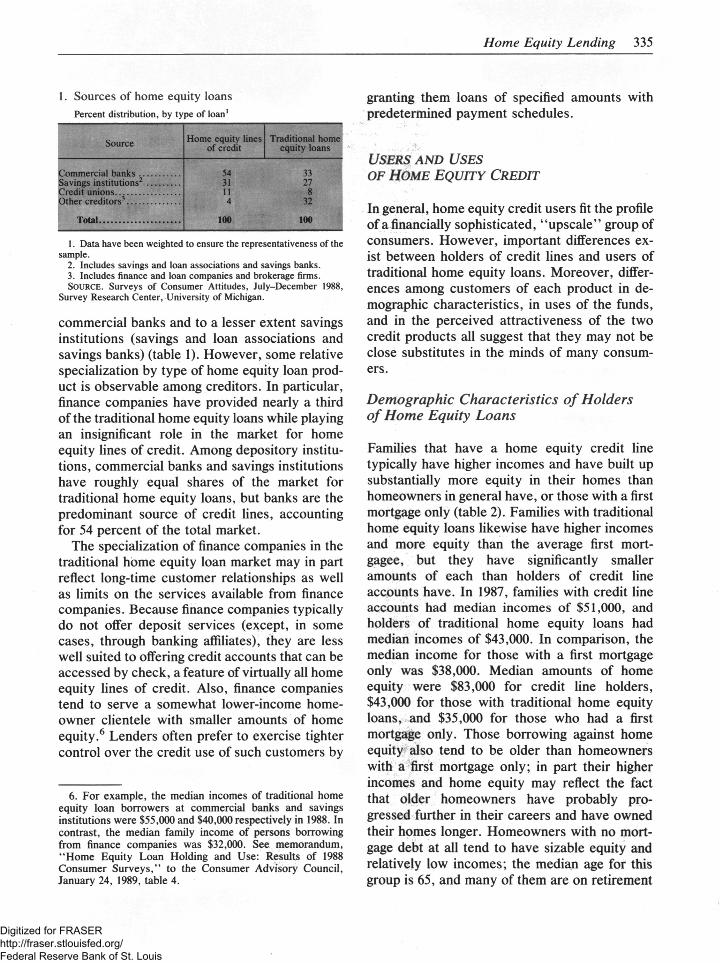
1. Sources of home equity loans Percent distribution, by type of loan1
Source Home equity lines of credit
Traditional home equity loans
Commercial banks Savings institutions2
Credit unions Other creditors3
Total
54 33 31 27 11 8 4 32
100 100
1. Data have been weighted to ensure the representativeness of the sample.
2. Includes savings and loan associations and savings banks. 3. Includes finance and loan companies and brokerage firms. SOURCE. Surveys of Consumer Attitudes, July-December 1988,
Survey Research Center, University of Michigan.
commercial banks and to a lesser extent savings institutions (savings and loan associations and savings banks) (table 1). However, some relative specialization by type of home equity loan prod-uct is observable among creditors. In particular, finance companies have provided nearly a third of the traditional home equity loans while playing an insignificant role in the market for home equity lines of credit. Among depository institu-tions, commercial banks and savings institutions have roughly equal shares of the market for traditional home equity loans, but banks are the predominant source of credit lines, accounting for 54 percent of the total market.
The specialization of finance companies in the traditional home equity loan market may in part reflect long-time customer relationships as well as limits on the services available from finance companies. Because finance companies typically do not offer deposit services (except, in some cases, through banking affiliates), they are less well suited to offering credit accounts that can be accessed by check, a feature of virtually all home equity lines of credit. Also, finance companies tend to serve a somewhat lower-income home-owner clientele with smaller amounts of home equity.6 Lenders often prefer to exercise tighter control over the credit use of such customers by
6. For example, the median incomes of traditional home equity loan borrowers at commercial banks and savings institutions were $55,000 and $40,000 respectively in 1988. In contrast, the median family income of persons borrowing from finance companies was $32,000. See memorandum, "Home Equity Loan Holding and Use: Results of 1988 Consumer Surveys," to the Consumer Advisory Council, January 24, 1989, table 4.
granting them loans of specified amounts with predetermined payment schedules.
USERS AND USES OF HOME EQUITY CREDIT
In general, home equity credit users fit the profile of a financially sophisticated, "upscale" group of consumers. However, important differences ex-ist between holders of credit lines and users of traditional home equity loans. Moreover, differ-ences among customers of each product in de-mographic characteristics, in uses of the funds, and in the perceived attractiveness of the two credit products all suggest that they may not be close substitutes in the minds of many consum-ers.
Demographic Characteristics of Holders of Home Equity Loans
Families that have a home equity credit line typically have higher incomes and have built up substantially more equity in their homes than homeowners in general have, or those with a first mortgage only (table 2). Families with traditional home equity loans likewise have higher incomes and more equity than the average first mort-gagee, but they have significantly smaller amounts of each than holders of credit line accounts have. In 1987, families with credit line accounts had median incomes of $51,000, and holders of traditional home equity loans had median incomes of $43,000. In comparison, the median income for those with a first mortgage only was $38,000. Median amounts of home equity were $83,000 for credit line holders, $43,000 for those with traditional home equity loans, and $35,000 for those who had a first mortgage only. Those borrowing against home equity also tend to be older than homeowners with a first mortgage only; in part their higher incomes and home equity may reflect the fact that older homeowners have probably pro-gressed further in their careers and have owned their homes longer. Homeowners with no mort-gage debt at all tend to have sizable equity and relatively low incomes; the median age for this group is 65, and many of them are on retirement
Digitized for FRASER http://fraser.stlouisfed.org/ Federal Reserve Bank of St. Louis
336 Federal Reserve Bulletin • May 1989
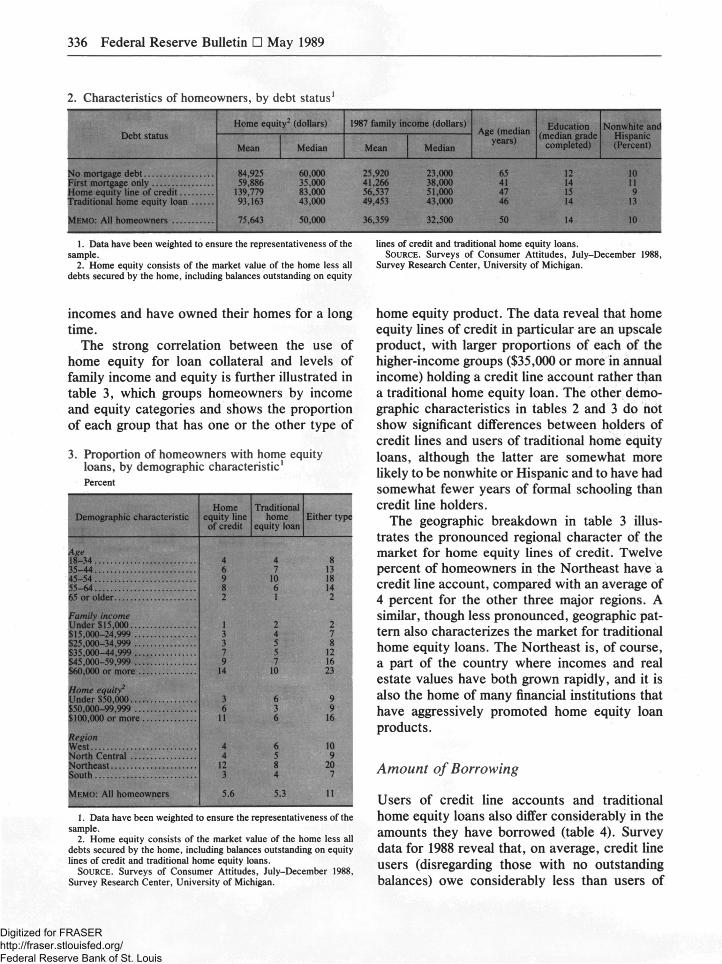
2. Characteristics of homeowners, by debt status1
Debt status Home equity2 (dollars) 1987 family income (dollars)
Age (median years)
Education (median grade
completed)
Nonwhite and Hispanic (Percent)
Debt status Mean Median Mean Median
Age (median years)
Education (median grade
completed)
Nonwhite and Hispanic (Percent)
No mortgage debt First mortgage only Home equity line of credit Traditional home equity loan
MEMO: All homeowners
8 4 , 9 2 5 6 0 , 0 0 0 2 5 , 9 2 0 2 3 , 0 0 0 65 12 10 5 9 , 8 8 6 3 5 , 0 0 0 4 1 , 2 6 6 3 8 , 0 0 0 41 14 11
139 ,779 8 3 , 0 0 0 5 6 , 5 3 7 5 1 , 0 0 0 4 7 15 9 9 3 , 1 6 3 4 3 , 0 0 0 4 9 , 4 5 3 4 3 , 0 0 0 4 6 14 13
7 5 , 6 4 3 5 0 , 0 0 0 3 6 , 3 5 9 3 2 , 5 0 0 5 0 14 10
1. Data have been weighted to ensure the representativeness of the lines of credit and traditional home equity loans. sample. SOURCE. Surveys of Consumer Attitudes, July-December 1988,
2. Home equity consists of the market value of the home less all Survey Research Center, University of Michigan, debts secured by the home, including balances outstanding on equity
incomes and have owned their homes for a long time.
The strong correlation between the use of home equity for loan collateral and levels of family income and equity is further illustrated in table 3, which groups homeowners by income and equity categories and shows the proportion of each group that has one or the other type of
3. Proportion of homeowners with home equity loans, by demographic characteristic1
Percent
Home Traditional Demographic characteristic equity line home Either type Demographic characteristic
of credit equity loan
Age 1 8 - 3 4 4 4 8 3 5 - 4 4 6 7 13 4 5 - 5 4 9 10 18 5 5 - 6 4 8 6 14 65 or older 2 1 2
Family income Under $15,000 1 2 2 $ 1 5 , 0 0 0 - 2 4 , 9 9 9 3 4 7 $ 2 5 , 0 0 0 - 3 4 , 9 9 9 3 5 8 $ 3 5 , 0 0 0 - 4 4 , 9 9 9 7 5 12 $ 4 5 , 0 0 0 - 5 9 , 9 9 9 9 7 16 $60,000 or more 14 10 23
Home equity2
Under $50,000 3 6 9 $ 5 0 , 0 0 0 - 9 9 , 9 9 9 6 3 9 $100,000 or more 11 6 16
Region 10 West 4 6 10
North Central 4 5 9 Northeast 12 8 2 0 South 3 4 7
MEMO: All homeowners 5 . 6 5 .3 11
1. Data have been weighted to ensure the representativeness of the sample.
2. Home equity consists of the market value of the home less all debts secured by the home, including balances outstanding on equity lines of credit and traditional home equity loans.
SOURCE. Surveys of Consumer Attitudes, July-December 1988, Survey Research Center, University of Michigan.
home equity product. The data reveal that home equity lines of credit in particular are an upscale product, with larger proportions of each of the higher-income groups ($35,000 or more in annual income) holding a credit line account rather than a traditional home equity loan. The other demo-graphic characteristics in tables 2 and 3 do not show significant differences between holders of credit lines and users of traditional home equity loans, although the latter are somewhat more likely to be nonwhite or Hispanic and to have had somewhat fewer years of formal schooling than credit line holders.
The geographic breakdown in table 3 illus-trates the pronounced regional character of the market for home equity lines of credit. Twelve percent of homeowners in the Northeast have a credit line account, compared with an average of 4 percent for the other three major regions. A similar, though less pronounced, geographic pat-tern also characterizes the market for traditional home equity loans. The Northeast is, of course, a part of the country where incomes and real estate values have both grown rapidly, and it is also the home of many financial institutions that have aggressively promoted home equity loan products.
Amount of Borrowing
Users of credit line accounts and traditional home equity loans also differ considerably in the amounts they have borrowed (table 4). Survey data for 1988 reveal that, on average, credit line users (disregarding those with no outstanding balances) owe considerably less than users of
Digitized for FRASER http://fraser.stlouisfed.org/ Federal Reserve Bank of St. Louis
Home Equity Lending 337
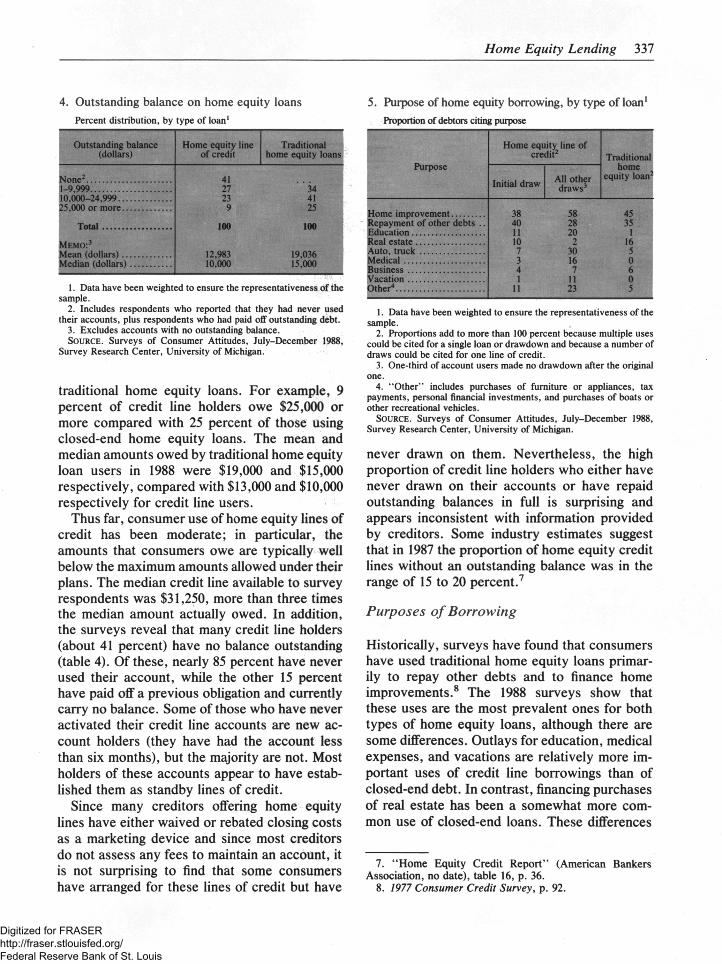
4. Outstanding balance on home equity loans Percent distribution, by type of loan1
Outstanding balance (dollars)
Home equity line of credit
Traditional home equity loans
None2
1 - 9 , 9 9 9 1 0 , 0 0 0 - 2 4 , 9 9 9 2 5 , 0 0 0 or m o r e
Total
MEMO:3
Mean (dollars) Median (dollars)
41 2 7 34 23 41
9 25
100 100
12 ,983 19 ,036 10 ,000 1 5 , 0 0 0
1. Data have been weighted to ensure the representativeness of the sample.
2. Includes respondents who reported that they had never used their accounts, plus respondents who had paid off outstanding debt.
3. Excludes accounts with no outstanding balance. SOURCE. Surveys of Consumer Attitudes, July-December 1988,
Survey Research Center, University of Michigan.
traditional home equity loans. For example, 9 percent of credit line holders owe $25,000 or more compared with 25 percent of those using closed-end home equity loans. The mean and median amounts owed by traditional home equity loan users in 1988 were $19,000 and $15,000 respectively, compared with $13,000 and $10,000 respectively for credit line users.
Thus far, consumer use of home equity lines of credit has been moderate; in particular, the amounts that consumers owe are typically well below the maximum amounts allowed under their plans. The median credit line available to survey respondents was $31,250, more than three times the median amount actually owed. In addition, the surveys reveal that many credit line holders (about 41 percent) have no balance outstanding (table 4). Of these, nearly 85 percent have never used their account, while the other 15 percent have paid off a previous obligation and currently carry no balance. Some of those who have never activated their credit line accounts are new ac-count holders (they have had the account less than six months), but the majority are not. Most holders of these accounts appear to have estab-lished them as standby lines of credit.
Since many creditors offering home equity lines have either waived or rebated closing costs as a marketing device and since most creditors do not assess any fees to maintain an account, it is not surprising to find that some consumers have arranged for these lines of credit but have
5. Purpose of home equity borrowing, by type of loan1
Proportion of debtors citing purpose
Purpose
Home equity line of credit2
Traditional home
equity loan2 Purpose
Initial draw All other draws3
Traditional home
equity loan2
Home improvement Repayment of other debts .. Education Real estate Auto, truck Medical Business Vacation Other4
3 8 5 8 45 4 0 28 35 11 2 0 1 10 2 16
7 3 0 5 3 16 0 4 7 6 1 11 0
11 23 5
1. Data have been weighted to ensure the representativeness of the sample.
2. Proportions add to more than 100 percent because multiple uses could be cited for a single loan or drawdown and because a number of draws could be cited for one line of credit.
3. One-third of account users made no drawdown after the original one.
4. "Other" includes purchases of furniture or appliances, tax payments, personal financial investments, and purchases of boats or other recreational vehicles.
SOURCE. Surveys of Consumer Attitudes, July-December 1988, Survey Research Center, University of Michigan.
never drawn on them. Nevertheless, the high proportion of credit line holders who either have never drawn on their accounts or have repaid outstanding balances in full is surprising and appears inconsistent with information provided by creditors. Some industry estimates suggest that in 1987 the proportion of home equity credit lines without an outstanding balance was in the range of 15 to 20 percent.7
Purposes of Borrowing
Historically, surveys have found that consumers have used traditional home equity loans primar-ily to repay other debts and to finance home improvements.8 The 1988 surveys show that these uses are the most prevalent ones for both types of home equity loans, although there are some differences. Outlays for education, medical expenses, and vacations are relatively more im-portant uses of credit line borrowings than of closed-end debt. In contrast, financing purchases of real estate has been a somewhat more com-mon use of closed-end loans. These differences
7. "Home Equity Credit Report" (American Bankers Association, no date), table 16, p. 36.
8. 1977 Consumer Credit Survey, p. 92.
Digitized for FRASER http://fraser.stlouisfed.org/ Federal Reserve Bank of St. Louis
338 Federal Reserve Bulletin • May 1989
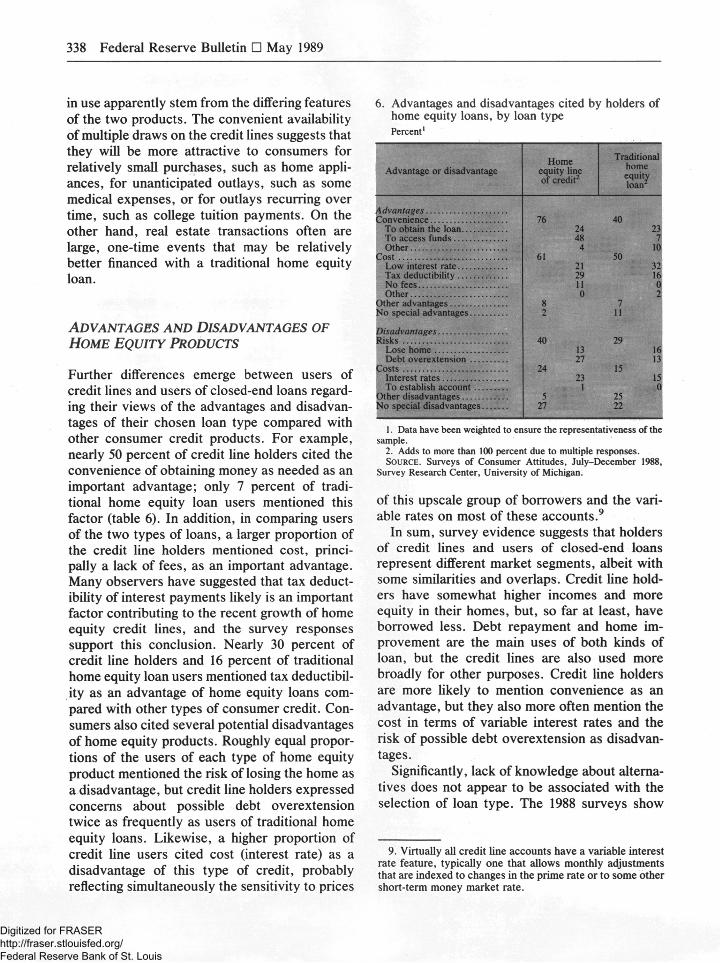
in use apparently stem from the differing features of the two products. The convenient availability of multiple draws on the credit lines suggests that they will be more attractive to consumers for relatively small purchases, such as home appli-ances, for unanticipated outlays, such as some medical expenses, or for outlays recurring over time, such as college tuition payments. On the other hand, real estate transactions often are large, one-time events that may be relatively better financed with a traditional home equity loan.
ADVANTAGES AND DISADVANTAGES OF HOME EQUITY PRODUCTS
Further differences emerge between users of credit lines and users of closed-end loans regard-ing their views of the advantages and disadvan-tages of their chosen loan type compared with other consumer credit products. For example, nearly 50 percent of credit line holders cited the convenience of obtaining money as needed as an important advantage; only 7 percent of tradi-tional home equity loan users mentioned this factor (table 6). In addition, in comparing users of the two types of loans, a larger proportion of the credit line holders mentioned cost, princi-pally a lack of fees, as an important advantage. Many observers have suggested that tax deduct-ibility of interest payments likely is an important factor contributing to the recent growth of home equity credit lines, and the survey responses support this conclusion. Nearly 30 percent of credit line holders and 16 percent of traditional home equity loan users mentioned tax deductibil-ity as an advantage of home equity loans com-pared with other types of consumer credit. Con-sumers also cited several potential disadvantages of home equity products. Roughly equal propor-tions of the users of each type of home equity product mentioned the risk of losing the home as a disadvantage, but credit line holders expressed concerns about possible debt overextension twice as frequently as users of traditional home equity loans. Likewise, a higher proportion of credit line users cited cost (interest rate) as a disadvantage of this type of credit, probably reflecting simultaneously the sensitivity to prices
6. Advantages and disadvantages cited by holders of home equity loans, by loan type Percent1
Advantage or disadvantage Home
equity line of credit2
Traditional home equity loan
Convenience 76 40 To obtain the loan 24 23 To access funds 48 7 Other 4 10
Cost 61 50 Low interest rate 21 32 Tax deductibility 29 16
11 0 Other 0 2
Other advantages 8 7 No special advantages 2 11
Disadvantages Risks 40 29
Lose home 13 16 Debt overextension 27 13
Costs 24 15 Interest rates 23 15 To establish account 1 0
Other disadvantages 5 25 No special disadvantages 27 22
1. Data have been weighted to ensure the representativeness of the sample.
2. Adds to more than 100 percent due to multiple responses. SOURCE. Surveys of Consumer Attitudes, July-December 1988,
Survey Research Center, University of Michigan.
of this upscale group of borrowers and the vari-able rates on most of these accounts.9
In sum, survey evidence suggests that holders of credit lines and users of closed-end loans represent different market segments, albeit with some similarities and overlaps. Credit line hold-ers have somewhat higher incomes and more equity in their homes, but, so far at least, have borrowed less. Debt repayment and home im-provement are the main uses of both kinds of loan, but the credit lines are also used more broadly for other purposes. Credit line holders are more likely to mention convenience as an advantage, but they also more often mention the cost in terms of variable interest rates and the risk of possible debt overextension as disadvan-tages.
Significantly, lack of knowledge about alterna-tives does not appear to be associated with the selection of loan type. The 1988 surveys show
9. Virtually all credit line accounts have a variable interest rate feature, typically one that allows monthly adjustments that are indexed to changes in the prime rate or to some other short-term money market rate.
Digitized for FRASER http://fraser.stlouisfed.org/ Federal Reserve Bank of St. Louis
Home Equity Lending 339
that 92 percent of all homeowners are aware of the availability of traditional home equity loans, and 75 percent are aware of home equity lines of credit. In comparing the two types of credit, about 90 percent of users of each type were aware of the availability of the other product. But, despite their high levels of awareness, most users of either a traditional home equity loan or of a credit line account did not seriously consider the other type of credit instrument before obtain-ing their current loan. Among homeowners with a traditional home equity loan, only 16 percent considered obtaining a line of credit instead. Similarly, among homeowners with a credit line, only 20 percent considered taking out a tradi-tional home equity loan. This lack of cross-product shopping likely reflects factors such as the differences in loan purpose discussed earlier. For instance, as previously noted, many credit line holders seem to have established their ac-counts as standby lines with no immediate use intended, and roughly three-quarters of them mentioned convenience (in one form or another) as a key advantage of that loan product.
EFFECTS OF HOME EQUITY DEBT ON THE ECONOMIC BEHAVIOR OF HOUSEHOLDS
The growing importance of home equity debt in household balance sheets may have implications for the economic behavior of households. The June 1988 BULLETIN article, for instance, ex-plored the question of how the availability of home equity credit lines might be affecting aggre-gate consumption and borrowing. That article concluded that home equity lines were primarily substituting for other types of debt and therefore had not expanded the total volume of household borrowing; likewise, it concluded that any effect on aggregate consumption was probably quite small. Another behavioral issue is whether the variable-rate structure of most home equity lines and some traditional home equity loans might affect the economic behavior of households in some way, particularly during periods when the general level of interest rates is rising. This question is addressed in the following sec-tions.
Aggregate Home Equity Debt
Before examining the sensitivity of households to movements in interest rates, it might be useful to gauge the aggregate amount of home equity debt outstanding. Comprehensive statistics are not available, but rough estimates can be constructed from reports for some lender groups together with inferences from the household surveys. Debt outstanding under home equity credit lines can be estimated at about $75 billion at the end of 1988; a less precise estimate puts the amount of traditional home equity loans somewhere be-tween $135 billion and $190 billion. The total market for home equity debt thus ranges from about $210 billion to $265 billion, or between 10 and 12 percent of all home mortgage debt on 1- to 4-family residential properties.
Commercial banks (since December 1987) and FSLIC-insured savings institutions (since June 1988) have been itemizing their receivables under credit lines on the Reports of Condition that they file quarterly with their respective supervisory agencies. These reports, which cover the two largest institutional segments of the market for home equity lines, provide a solid foundation for estimates of revolving home equity debt; a sam-ple of commercial banks also supplies such data to the Federal Reserve on a weekly basis. How-ever, because debt incurred through traditional home equity loans is not reported separately, it remains embedded in the total of home mortgage debt outstanding, with no means available to separate it out.
Responses to the consumer surveys indicated that commercial banks and savings institutions (including mutual savings banks) may have ac-counted for 85 percent of the credit line accounts in place during the second half of 1988. Compi-lations from the Reports of Condition establish that at the end of 1988, commercial banks had receivables under credit lines of $40 billion and FSLIC-insured savings institutions had $11 bil-lion. In the absence of data for mutual savings banks (MSBs), an estimate of $10 billion is used here.10 Adding the figures together gives an esti-
10. While MSBs have substantially fewer mortgage assets than commercial banks, their business is concentrated in the Northeast, which, as noted, has been a region of particularly
Digitized for FRASER http://fraser.stlouisfed.org/ Federal Reserve Bank of St. Louis
340 Federal Reserve Bulletin • May 1989
mated total of $61 billion in revolving home equity credit outstanding at these various depos-itory institutions. If this total for depositories is inflated to account for the 15 percent of credit line accounts held by other lenders, then the year-end aggregate for all lenders approached $75 billion.11
In the absence of any direct means to isolate the amounts of traditional home equity credit on lenders' books, deriving an aggregate estimate for that type of lending is more problematic. Some inferences can be drawn from the survey data, however. For instance, the survey indi-cates that the mean balance outstanding on a traditional closed-end loan is about one and one-half times the average balance on an active home equity line of credit. Further, after sub-tracting out credit line accounts with no bal-ances—about 40 percent of all accounts, accord-ing to the survey—the ratio of traditional loans to active credit line accounts is about 1.6 to 1. Multiplying together these ratios of size of bal-ance and number of loans (accounts) suggests that outstanding debt on closed-end loans may be about two and one-half times the amount of debt under credit lines. If the estimate offered here of about $75 billion in revolving credit is accurate, then traditional home equity debt may have been as much as $190 billion at year-end.
If, however, inaccuracies exist in the mean amounts of debt outstanding or in the proportion of credit line accounts with no balance that was calculated from the survey, then the above esti-mate of traditional home equity credit could be off target. For example, if industry estimates of 15 to 20 percent for inactive credit line accounts are closer to the mark, then we would have to pare the estimate of traditional home equity loans outstanding (other things equal) to about $135 billion.
heavy use of home equity accounts. Several MSBs are known to have large portfolios of home equity credit lines.
11. Based on a similar methodology, but using less com-plete data on receivables and a less reliable estimate of market shares, an estimate of $75 billion outstanding at the end of 1987 was presented in the June 1988 BULLETIN article. It now appears that the year-end 1987 figure was closer to $60 billion.
Effects of Variable Rates
With the development of adjustable-rate mort-gages early in the present decade, the interest obligation on the existing stock of household debt began to become more responsive to general movements in interest rates. This trend has con-tinued with the advent of home equity lines of credit, virtually all of which have variable rates, insofar as these credit lines have substituted for consumer debt and for traditional home equity loans that have been largely fixed in rate. In recent years, even some of these types of debt have been made with adjustable rates, but not nearly to the extent that home equity lines have been.12
The prime rate has served as, by far, the most common index to which the variable rates on home equity lines have been pegged. About three-quarters of all providers of these credit lines use the prime rate for this purpose. Rates on Treasury bills, typically of 90-day or 6-month maturity, have been used by virtually all other institutions. Two-thirds of the providers adjust rates monthly, and most of the rest adjust quar-terly. Moreover, few lenders at present provide any annual limit on rate increases. The use of market-sensitive indexes with frequent adjust-ments and little constraint on rate levels means that the average interest rate applied to the stock of credit line debt should move closely with money market rates.
How rate adjustments affect the payment ob-ligation of the typical credit line holder can be estimated with the help of the survey statistics. As noted earlier, the mean outstanding balance on an equity-secured line of credit is about $13,000. For each percentage point of interest, a borrower would pay $10.83 a month. A common markup over prime is Wi percentage points. With the prime rate at percent last spring, the typical borrower with a $13,000 balance and an interest rate of 10 percent would have paid $108 of interest each month. By December, when the prime rate had risen to IOV2 percent and the rate on credit lines thus to 12 percent, this borrower
12. In the 1988 survey of households, 16 percent of the traditional home equity loans held by respondents had an adjustable rate of interest.
Digitized for FRASER http://fraser.stlouisfed.org/ Federal Reserve Bank of St. Louis
Home Equity Lending 341
would have paid $130 in interest, assuming ap-proximately the same balance outstanding.
Whether changes in interest obligations of this magnitude might stimulate some curtailment of current spending or a reduction of debt by con-sumers is difficult to say. At the margin, these changes presumably would have some effect, but its significance is open to question. One practical consideration is that a rise in the interest rate on a credit line balance need not increase the monthly payment. Only those borrowers faced with an "interest only" minimum payment re-quirement and who customarily pay the mini-mum would necessarily be obligated to make a higher payment. More commonly, lenders set minimum payments at some percentage of the outstanding balance (for instance, Wi percent). A minimum payment of 1 Vi percent on the mean balance of $13,000 would be $195, more than enough to cover the interest payments calculated above. In these circumstances, of course, the loan balance would amortize more slowly. Bor-rowers who found this development undesirable might then adjust their behavior in some fashion.
Another consideration is that holders of credit line accounts have higher incomes than other homeowners or other households in general, as shown in table 2. They also have substantially more home equity than the average homeowner. The surveys did not obtain data on any assets of households other than home equity, but it seems clear that holders of home equity credit lines tend to be financially well situated. Therefore, higher interest payments would be unlikely to impose a serious constraint on their spending.
A broader examination of household sector behavior reveals that the cash flow of some households improves with rising interest rates because they hold variable-rate (or short-matu-rity) financial assets. In the aggregate, interest-paying assets of households exceed their inter-est-bearing liabilities by roughly 50 percent, and in 1987 households received interest of nearly $315 billion and paid out interest of about $255 billion, according to the latest available data. Many assets, like many liabilities, carry fixed rates, of course, and therefore the overall effect of rising interest rates on receipts and payments of consumers is hard to quantify. It appears likely, however, that the net cash flow to the
sector as a whole would increase with a rise in interest rates.
If increased interest receipts outweigh higher interest payments when rates rise, consumer spending might increase. However, a rise in interest rates causes the current stock of wealth to be revalued downward, which is apt to exert some pressure on spending. Moreover, taking account of even broader economic effects, higher interest rates, by raising financing costs, tend to restrain aggregate economic activity and thus to reduce labor income. This chain of economic consequences also points toward lower con-sumer spending.
In sum, variable-rate debt makes the cash flow of consumer-debtors more vulnerable to con-straint in times of rising interest rates, but, for the sector as a whole, increased interest receipts probably outweigh the higher interest payments. In any event, the positive effect on cash flow is just one way in which higher interest rates affect consumers. The negative effects of higher inter-est rates on consumer wealth and on aggregate demand operate to reduce consumer spending.
DEVELOPMENTS IN PUBLIC POLICY
In recent months, legislative and regulatory ac-tions have been taken that will influence the future development of the home equity loan market. Two statutes, the Competitive Equality Banking Act of 1987 (CEBA) and the Home Equity Loan Consumer Protection Act of 1988 (HELCPA), added new Truth-in-Lending re-quirements regarding credit linked to home equity.13 Also, in late 1988, the Federal Reserve adopted new capital adequacy guidelines.14 The guidelines establish a framework that makes reg-ulatory capital requirements more sensitive to differences in credit-risk profiles among banking
13. The Competitive Equality Banking Act of 1987 was enacted on August 10, 1987; implementing requirements under Regulation Z were adopted on November 3, 1987. The Home Equity Loan Consumer Protection Act of 1988 was enacted November 23, 1988; proposed amendments to Reg-ulation Z to implement the act were published by the Board for public comment on January 23, 1989.
14. Press release, "Risk-Based Capital Guidelines," Fed-eral Reserve System, January 19, 1989.
Digitized for FRASER http://fraser.stlouisfed.org/ Federal Reserve Bank of St. Louis
342 Federal Reserve Bulletin • May 1989
organizations. The new guidelines assign all cat-egories of housing-related credit to specific risk-weight categories and thereby, in effect, specify the amount of capital that creditors need to fund outstanding balances on home equity loans and on the undrawn portions of credit lines.
Competitive Equality Banking Act of 1987
The CEBA requires creditors to place a ceiling on the life-of-loan interest rate on adjustable-rate mortgages (ARMs). However, the statute does not specify any particular rate ceiling, leaving that choice to the discretion of the creditor, or, in some instances, to determination by the applica-ble state usury law. With respect to home pur-chase loans, the CEBA has had relatively little effect, since nearly all ARMs had life-of-loan ceilings before the statute's enactment. The sit-uation for home equity loans is different. Virtu-ally none of the credit line plans set up before the effective date of the CEBA included a ceiling on finance rates. Now any newly established home equity line with an adjustable interest rate must carry a rate ceiling.
It is difficult to assess whether the CEBA has had a meaningful influence on the market for home equity loans. However, at least some cred-itors have emphasized their relatively low ceiling rates when promoting their credit line accounts. Ultimately, competitive forces will determine the level of the rate ceiling a particular creditor needs to establish (given the other features of its prod-uct) to maintain its share of the market. Whether such ceiling rates will be low enough to signifi-cantly reduce the interest rate risk of borrowers is yet to be seen. Moreover, because creditors will find it more difficult to modify terms and conditions on home equity lines owing to the enactment of HELCPA, they may be reluctant to lock themselves into long-term contracts with relatively low rate ceilings.
Home Equity Loan Consumer Protection Act of 1988
Before the enactment of HELCPA, home equity credit plans were treated like other types of open-end credit plans for purposes of account disclosure and advertising rules under Regulation
Z. For instance, as for other open-end loan products, disclosures for home equity lines of credit had to be provided to the consumer before the first transaction. However, borrowing limits on home equity lines typically are much larger than those on other types of open-end loan products, and home equity lines entail a security interest in the consumer's home. Thus, home equity lines tend to expose the consumer to more financial risk than other open-end products do. In addition, a perception existed among some in-dustry observers that certain common features of contracts for home equity credit lines, such as the right to change unilaterally the terms and conditions of the plan at any time, were inher-ently unfair to consumers. In response to these concerns, rather than to any record of industry abuse of consumers, Congress enacted the HELCPA. The act expands the coverage of rules on disclosure and advertising for home equity lines, requires the distribution of an information brochure about them, and places a variety of substantive restrictions on contract terms and conditions.
The new disclosure rules, along with the infor-mation brochure that must be provided to loan applicants, may help consumers to better under-stand the potential benefits and risks of using home equity lines of credit. The timing of the distribution of the disclosure material to consum-ers, along with requirements for more complete advertising about the costs of credit line ac-counts, should facilitate credit shopping. None-theless, the extent of these benefits appears limited. First, as noted, consumers who obtain home equity credit lines tend to be financially well-endowed and better educated than most other consumers and thus are probably already better able to understand the potential benefits and risks.15 Moreover, consumer surveys have consistently found that credit line holders believe they received adequate information about their accounts when they opened them. Second, sur-veys indicate that only about one-third of credit line holders considered applying for an account
15. For example, as the consumer surveys reveal, holders of home equity lines are well aware that serious conse-quences (including the loss of their home) are associated with failing to repay loans as scheduled.
Digitized for FRASER http://fraser.stlouisfed.org/ Federal Reserve Bank of St. Louis
Home Equity Lending 343
with a lender other than the one they ultimately selected and thus did not shop extensively for their accounts. Together, these findings suggest that if future holders of home equity credit lines are similar to those who have already established such accounts, then the new disclosure rules are likely to have limited effects.
As mentioned, HELCPA contains several sub-stantive limitations on the way credit line plans can be structured. First, the act requires credi-tors offering plans with variable interest rates to select an index rate that is publicly available and beyond the control of the creditor. In effect, this requirement prohibits creditors from using an index such as an internal measure of cost-of-funds or their own prime rate, which roughly one-quarter of creditors have used in the past. Second, the statute prohibits creditors from ter-minating an account and accelerating payment of the outstanding balance before the scheduled expiration of the plan. However, the law protects creditors by providing three exceptions to this rule. A creditor may terminate a plan if (1) there has been fraud or material misrepresentation by the consumer in connection with the plan; (2) the consumer has failed to meet the repayment terms of the agreement; or (3) the consumer acts in a way that adversely affects the creditor's security interest. Whether the safeguards afforded credi-tors in the statute will prove adequate remains to be seen and may depend on future court deci-sions that will further clarify appropriate situa-tions in which creditors may curtail operations of their home equity line programs.
The final substantive limitation provides that creditors may not unilaterally change the terms of a home equity line after an account has been opened.16 However, the proposed regulation would allow the creditor and consumer to modify a plan after it starts by using a bilateral written agreement. Such agreements offer both parties an opportunity to make mutually beneficial changes to plans as circumstances change over time.
16. Unilateral changes that are unequivocally beneficial to the consumer, such as a reduction in an annual fee, would be permitted. Moreover, under certain circumstances creditors may freeze a consumer's access to an account or reduce the available credit line.
Capital Adequacy Guidelines
In recent years, federal banking supervisors have assessed the adequacy of the level of bank capital by comparing a bank's ratio of primary and total capital to total assets with minimum standard ratios. On December 16, 1988, the Federal Re-serve Board approved new capital guidelines. The guidelines attempt to take explicit account of differences in credit risks among banking organi-zations' assets and off-balance-sheet items by assigning each type of asset and off-balance-sheet exposure to one of several broad risk categories.
Outstanding balances on both home equity lines of credit and traditional home equity loans that are not first liens will be assigned a 100 percent weight for purposes of calculating risk-weighted assets. Those that are first liens will be assigned a 50 percent weight, provided that such loans have been made with prudent underwriting standards, have sufficient homeowner equity, and are performing in accordance with their original terms. Undrawn portions of home equity credit lines will not be assessed a capital charge if two conditions are met: first, that the bank can terminate the account, prohibit additional draws on the line, or reduce the credit line in accord-ance with the provisions of applicable federal statutes (at this time, the HELCPA); and second, that the bank reviews the status of the account at least annually. If these conditions are not met, undrawn portions of home equity lines are effec-tively assigned a 50 percent weight for purposes of calculating the amount of risk-weighted assets. Given the large volume of undrawn credit lines available to consumers (roughly twice the cur-rent level of outstanding balances), significant capital charges could be incurred by creditors if they fail to conform to these conditions.
APPENDIX: SURVEY OF CONSUMER ATTITUDES
To obtain information on the prevalence of home equity accounts and their use by homeowners, the Federal Reserve Board helped to develop questions that were included in the Survey of Consumer Attitudes for July through December
Digitized for FRASER http://fraser.stlouisfed.org/ Federal Reserve Bank of St. Louis
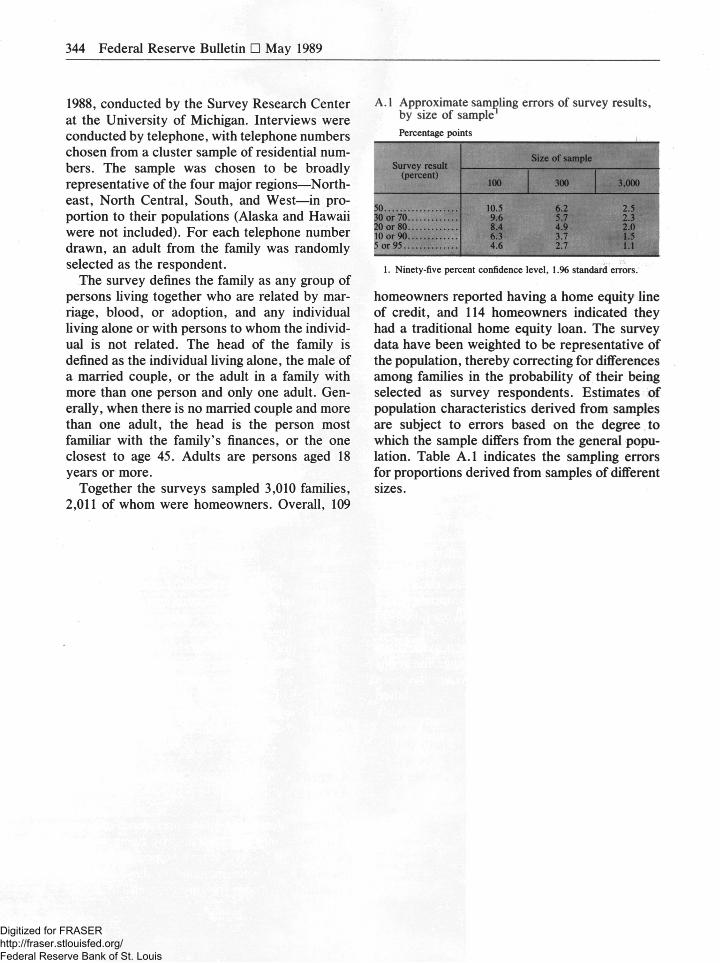
344 Federal Reserve Bulletin • May 1989
1988, conducted by the Survey Research Center at the University of Michigan. Interviews were conducted by telephone, with telephone numbers chosen from a cluster sample of residential num-bers. The sample was chosen to be broadly representative of the four major regions—North-east, North Central, South, and West—in pro-portion to their populations (Alaska and Hawaii were not included). For each telephone number drawn, an adult from the family was randomly selected as the respondent.
The survey defines the family as any group of persons living together who are related by mar-riage, blood, or adoption, and any individual living alone or with persons to whom the individ-ual is not related. The head of the family is defined as the individual living alone, the male of a married couple, or the adult in a family with more than one person and only one adult. Gen-erally, when there is no married couple and more than one adult, the head is the person most familiar with the family's finances, or the one closest to age 45. Adults are persons aged 18 years or more.
Together the surveys sampled 3,010 families, 2,011 of whom were homeowners. Overall, 109
A.l Approximate sampling errors of survey results, by size of sample Percentage points
Survey result (percent)
Size of sample Survey result
(percent) 100 300 3,000
50 10.5 6.2 2.5 30 or 70 9.6 5.7 2.3 20 or 80 8.4 4.9 2.0 10 or 90 6.3 3.7 1.5 5 or 95 4.6 2.7 1.1
1. Ninety-five percent confidence level, 1.96 standard errors.
homeowners reported having a home equity line of credit, and 114 homeowners indicated they had a traditional home equity loan. The survey data have been weighted to be representative of the population, thereby correcting for differences among families in the probability of their being selected as survey respondents. Estimates of population characteristics derived from samples are subject to errors based on the degree to which the sample differs from the general popu-lation. Table A.l indicates the sampling errors for proportions derived from samples of different sizes.
Digitized for FRASER http://fraser.stlouisfed.org/ Federal Reserve Bank of St. Louis
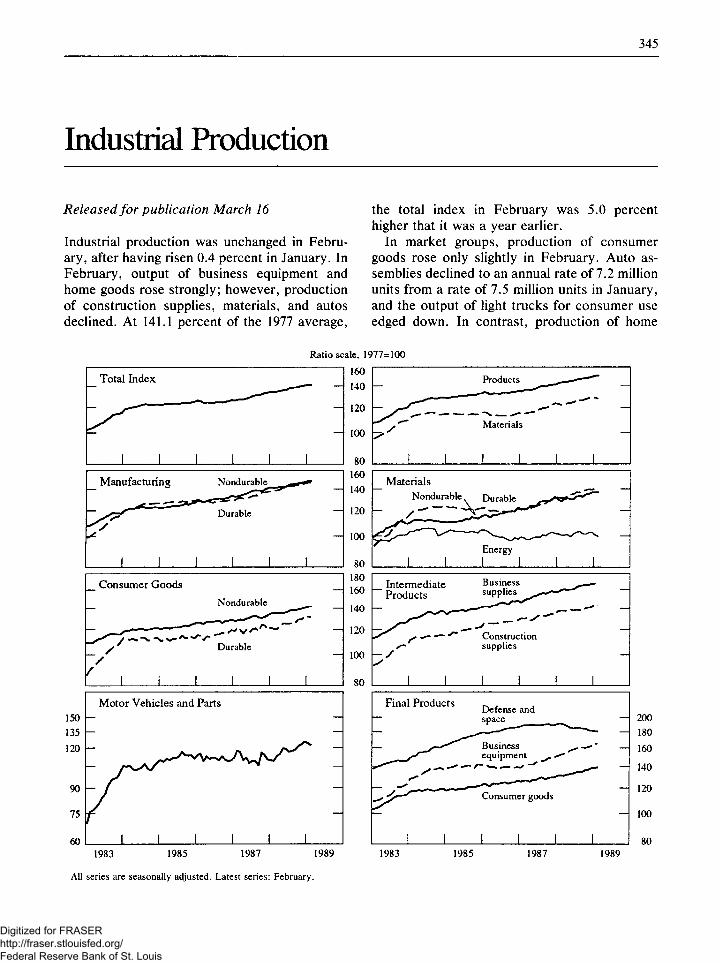
345
Industrial Production
Released for publication March 16
Industrial production was unchanged in Febru-ary, after having risen 0.4 percent in January. In February, output of business equipment and home goods rose strongly; however, production of construction supplies, materials, and autos declined. At 141.1 percent of the 1977 average,
the total index in February was 5.0 percent higher that it was a year earlier.
In market groups, production of consumer goods rose only slightly in February. Auto as-semblies declined to an annual rate of 7.2 million units from a rate of 7.5 million units in January, and the output of light trucks for consumer use edged down. In contrast, production of home
Ratio scale, 1977=100
All series are seasonally adjusted. Latest series: February.
Digitized for FRASER http://fraser.stlouisfed.org/ Federal Reserve Bank of St. Louis
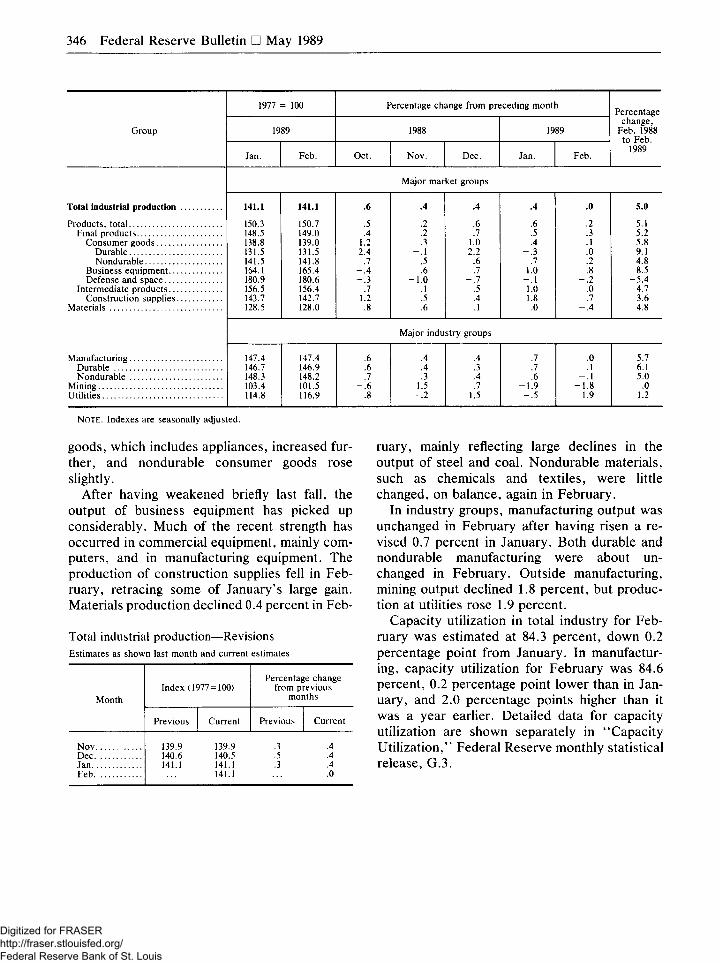
346 Federal Reserve Bulletin • May 1989
1977 = 100 Percentage change from preceding month Percentage
Group 1989 1988 1989 change,
Feb. 1988 to Feb
Jan. Feb. Oct. Nov. Dec. Jan. Feb. 1989
Major market groups
Total industrial production 141.1 141.1 .6 .4 .4 .4 .0 5.0
Products, total 150.3 150.7 .5 .2 .6 .6 .2 5.1 Final products 148.5 149.0 .4 .2 .7 .5 .3 5.2
Consumer goods 138.8 139.0 1.2 .3 1.0 .4 .1 5.8 Durable 131.5 131.5 2.4 - . 1 2.2 - . 3 .0 9.1 Nondurable 141.5 141.8 .7 .5 .6 .7 .2 4.8
Business equipment 164.1 165.4 - . 4 .6 .7 1.0 .8 8.5 Defense and space 180.9 180.6 - . 3 - 1 . 0 - . 7 - . 1 - . 2 - 5 . 4
Intermediate products 156.5 156.4 .7 .1 .5 1.0 .0 4.7 Construction supplies 143.7 142.7 1.2 .5 .4 1.8 - . 7 3.6
Materials 128.5 128.0 .8 .6 .1 .0 - . 4 4.8
Major industry groups
Manufacturing 147.4 147.4 .6 .4 .4 .7 .0 5.7 Durable 146.7 146.9 .6 .4 .3 .7 .1 6.1 Nondurable 148.3 148.2 .7 .3 .4 .6 - . 1 5.0
Mining 103.4 101.5 - . 6 1.5 .7 - 1 . 9 - 1 . 8 .0 Utilities 114.8 116.9 .8 - . 2 1.5 - . 5 1.9 1.2
NOTE. Indexes are seasonally adjusted.
goods, which includes appliances, increased fur-ther, and nondurable consumer goods rose slightly.
After having weakened briefly last fall, the output of business equipment has picked up considerably. Much of the recent strength has occurred in commercial equipment, mainly com-puters, and in manufacturing equipment. The production of construction supplies fell in Feb-ruary, retracing some of January's large gain. Materials production declined 0.4 percent in Feb-
Total industrial production—Revisions Estimates as shown last month and current estimates
Month Index (1977=100)
Percentage change from previous
months Month
Previous Current Previous Current
Nov 139.9 139.9 .3 .4 Dec 140.6 140.5 .5 .4 Jan 141.1 141.1 .3 .4 Feb 141.1 .0
ruary, mainly reflecting large declines in the output of steel and coal. Nondurable materials, such as chemicals and textiles, were little changed, on balance, again in February.
In industry groups, manufacturing output was unchanged in February after having risen a re-vised 0.7 percent in January. Both durable and nondurable manufacturing were about un-changed in February. Outside manufacturing, mining output declined 1.8 percent, but produc-tion at utilities rose 1.9 percent.
Capacity utilization in total industry for Feb-ruary was estimated at 84.3 percent, down 0.2 percentage point from January. In manufactur-ing, capacity utilization for February was 84.6 percent, 0.2 percentage point lower than in Jan-uary, and 2.0 percentage points higher than it was a year earlier. Detailed data for capacity utilization are shown separately in "Capacity Utilization," Federal Reserve monthly statistical release, G.3.
Digitized for FRASER http://fraser.stlouisfed.org/ Federal Reserve Bank of St. Louis
347
Statement to Congress
Statement by Alan Greenspan, Chairman, Board of Governors of the Federal Reserve System, before the Subcommittee on Financial Institu-tions Supervision, Regulation and Insurance of the Committee on Banking, Finance and Urban Affairs of the U.S. House of Representatives, March 22, 1989.
I am pleased to appear today before this commit-tee to outline the views of the Board of Gover-nors on the legislation proposed by President Bush for the reform and recovery of the thrift industry. The Board supports this comprehen-sive package of proposals to strengthen the thrift industry, and depository institutions generally, as well as to prevent the serious problems of the thrift industry from recurring.
The proposals in the bill include the following: (1) greatly enhanced supervisory, regulatory, and enforcement authority; (2) a new framework for resolving insolvent thrift institutions; (3) a sepa-rate insurance fund for thrift institutions under the administration of the Federal Deposit Insur-ance Corporation (FDIC); and (4) a strengthening of this new thrift fund, as well as the FDIC fund, through higher premiums.
Besides this legislative program, a number of administrative measures have been taken or are planned. As a first step to limit losses in insolvent institutions, more than 160 of them have been brought under federal control to date, and ap-proximately 60 more will be similarly addressed in the next few weeks. As part of this effort, we are contributing 170 Federal Reserve examiners to the overall task force.
Moreover, to help attract responsible buyers for troubled thrift institutions, and as a result of the important changes in the environment for interstate banking, the Federal Reserve Board intends to reconsider the tandem operations re-strictions on applications brought to the Board for acquisitions of failed or failing savings and loan associations. In addition, under a joint lend-
ing program the Federal Reserve Banks and Federal Home Loan Banks will share in meeting the liquidity needs of thrift institutions that can-not be met by Federal Home Loan Bank ad-vances under traditional collateral standards, or market sources of funds. This arrangement is consistent with Federal Reserve Bank practice of lending secured to troubled institutions until their difficulties can be resolved. Loans under this arrangement will be secured by assets of the Federal Savings and Loan Insurance Corpora-tion (FSLIC) as well as those of the troubled institution.
I would like to focus my remarks today on the two major elements of the President's program: (1) the restructuring and reform proposals, and (2) the procedures for dealing with failed savings and loan associations as well as the funding required to cover losses incurred by these insti-tutions. Before turning to this task, I believe it would be useful to recall why we are facing a thrift problem and to draw some lessons from its causes.
Today's thrift industry losses grew partly out of the vulnerability of a fixed rate, long-term, lender with relatively short-term liabilities, to changes in interest rates. As inflation, and inter-est rates, rose in the late 1970s and early 1980s, and as deposit rate ceilings were phased out, the resulting mismatch on the rising cost of deposit liabilities and the fixed return on mortgage assets produced substantial losses and a serious erosion of industry capital. Into this situation other ele-ments were added. Expanded powers were mixed with inexperienced or dishonest manage-ment, brokered deposits that fed unchecked growth, lax accounting standards, and seriously inadequate supervision, all within the context of adverse economic conditions. It is sobering how these factors led so quickly to insolvencies. In a short period, the serious, but manageable, matu-rity-mismatch problem became the disastrous asset-quality problem that we face today.
Digitized for FRASER http://fraser.stlouisfed.org/ Federal Reserve Bank of St. Louis
348 Federal Reserve Bulletin • May 1989
In evaluating this situation, I would not limit my emphasis, as some have done, to focusing only on the decline in regional economies and, in particular, on the drop in oil prices. The regional economic problems were real, but in assessing responsibility it is important to recognize that the oversupply in the real estate market in certain areas was at least partially a result of the lending by the savings and loan associations themselves. During the period 1982 to 1985, in the face of declining oil prices, commercial real estate loans of savings and loan associations increased more than $57 billion (129 percent). In many cases these loans were made with an eye principally focused on front-end fees, and without any rea-sonable assurance of repayment.
A comparison with the banking industry is instructive. While the banks do not have real estate equity investment powers, nonrecourse lending by banks for commercial real estate development projects with thin borrower equity positions often puts the bank lenders in a position in which they are very close to equity investors. Taking this into account, it is all the more sur-prising that the estimated cost of resolving the thrift problems in Texas will run about $40 bil-lion. In that state, in which the economic envi-ronment for banks and thrift institutions is iden-tical, the costs for resolving the problems of the banking industry, with assets that are much larger than those of the thrift institutions, should amount to considerably less than $10 billion. Clearly, the large absolute difference in costs and the even larger difference in costs relative to assets is evidence that the thrift industry experi-enced a systems failure, that is, a major lapse in public and private prudential standards.
To deal with these problems, the new program focuses on the supervisory and regulatory re-forms designed to ensure that the mistakes that have so adversely affected the thrift industry, its deposit insurance fund, and the taxpayers will not be repeated. A number of important steps have been proposed.
A new insurance fund for thrift institutions will be established to be administered by the FDIC, separately from the insurance fund for banks, but with special powers for the FDIC to approve applications by thrift institutions for insurance, to make examinations, to initiate enforcement
actions, to terminate insurance on an expedited basis, and to prohibit thrift institutions from exercising powers that could cause undue risk to the FSLIC insurance fund.
Moreover, the proposal puts a new emphasis on adequate capital for the thrift industry as a cushion against losses and as a restraint on excessive risktaking. Accordingly, thrift institu-tions will be required to meet bank capital stan-dards by June 1991, with the exception that they will be given 10 years to write off goodwill. For those institutions that do not meet this standard, growth can be restricted before the 1991 dead-line, and must be prohibited after this time.
Our estimates indicate that more than a major-ity of the thrift institutions with positive tangible capital under generally accepted accounting prin-ciples (GAAP) standards could meet the existing bank primary capital requirements; on a risk-adjusted basis, we estimate that nearly two-thirds would meet bank standards due largely to the favorable risk-weight given to 1- to 4-family residential mortgages under the risk-based mea-sure of capital.
If goodwill were to be immediately excluded from capital, the institutions falling below the standard would have to raise about $15 billion to $20 billion in capital to meet bank minimums. However, the proposed legislation, as noted, gives thrift institutions a 10-year period to write off the goodwill; thus, this major capital-raising effort can be spread over a number of years.
It should be emphasized that if losses continue or accelerate due to further credit deterioration or interest rate exposure, the industry's need for capital could be substantial. Those institutions that cannot meet bank capital standards as set forth in the proposed legislation would necessar-ily have their growth restricted or might be required to shrink their assets.
The administration's program also takes major steps toward restructuring the thrift supervisory and regulatory framework. Besides separating the insurance and regulatory functions, the pro-posal would create a new federal thrift regulator. The new regulator—the Chairman of the Federal Home Loan Bank System (FHLBS), who would be under the Secretary of the Treasury in the same relationship as the Comptroller of the Cur-rency—should be more independent from the
Digitized for FRASER http://fraser.stlouisfed.org/ Federal Reserve Bank of St. Louis
Statement to Congress 349
industry. Importantly, the FHLBS would be required to apply bank supervisory and account-ing standards to the savings and loan associa-tions.
Moreover, the boards of directors of the Fed-eral Home Loan Banks will be reconstituted along the lines of Federal Reserve Bank boards. This should make them more responsive to the broader public interest. In contrast to present arrangements, most of the membership of the boards will be drawn from outside the industry, including the Chairman and Vice Chairman of the boards, who will be chosen by the new chief of the Federal Home Loan Bank System. Finally, the Chairman of the FHLBS, as the new regula-tor and supervisor, would carry a mandate em-phasizing safety and soundness, and would ap-point the head supervisory agent at the Home Loan Banks who would be directly responsible to the FHLBS in Washington. These are both necessary and important reforms.
Another step recommended by the President, to which we attach great importance, is the requirement that savings and loan associations that do not meet the qualified thrift lender (QTL) test (60 percent of assets in residential-related lending) in the Competitive Equality Banking Act of 1987 must, after an appropriate transition period, become banks and be subject to the entire regulatory and supervisory regime appli-cable to banks and their holding companies. We believe that it is fully appropriate to confine the benefits of thrift status, involving both access to subsidized long-term borrowing from Federal Home Loan Banks and tax benefits, to only those institutions that devote a major part of their assets to promoting homeownership.
Another important part of the reform package is the increase in insurance premiums for both thrift institutions and banks, as well as the au-thority for the FDIC to raise premiums for both types of institutions in the light of experience. For thrift institutions in which the fund is now insolvent and in need of rebuilding, premiums under the proposal will rise in 1990 from their present level of 20.8 basis points to 23 basis points in 1991, remain at that level for three years, and then fall to 18 basis points in 1994.
For banks the current premium of 8 basis points would increase 4 basis points in 1990, and
another 3 basis points in 1991; and then would be held at that level. However, when the insurance funds reach the target for reserves of 1.25 per-cent of insured deposits, rebates would again be possible.
The level of FDIC insurance reserves as a percentage of insured deposits has dropped in recent years to the present ratio of 0.83 percent, and it is important that this trend be reversed. The proposed premium increase for banks thus stands on its own merits, quite apart from any-thing that might be done about thrift institutions, as a necessary step to maintain the integrity of the FDIC fund against future contingencies.
Another element of the President's program is a funding package designed to provide sufficient financial resources to resolve current and pro-spective insolvencies among FSLIC-insured in-stitutions. This function would be assigned to a newly created Resolution Trust Corporation (RTC), which would be managed by the FDIC and operate under the direction of the Oversight Board composed of the Secretary of the Trea-sury, the Chairman of the Federal Reserve Board, and the Attorney General. To accomplish its task, the RTC would be provided with $50 billion of funding—the proceeds of bonds issued by an RTC Funding Corporation. These funds would be used to resolve insolvent thrift institu-tions that have not received assistance from FSLIC or that will become insolvent over the next three years. Principal would be repaid with the proceeds of zero coupon bonds purchased from thrift industry resources, and the interest on the bonds would be paid with thrift industry and, if necessary, Treasury funds.
Based on data for September 30, 1988, about 470 thrift institutions, with assets of about $250 billion, are tangible capital insolvent. It seems prudent to assume that all of these institutions will require RTC assistance. We cannot know exactly what the resolution costs will be for these institutions, but based on FSLIC's estimates of the costs of its 1988 resolutions we estimate that it will cost about $40 billion to take care of these 470 institutions. Of course, many other FSLIC-insured institutions are at present thinly capital-ized, and some of these could well become insolvent during the three-year period for which RTC would be responsible for new insolvencies.
Digitized for FRASER http://fraser.stlouisfed.org/ Federal Reserve Bank of St. Louis
350 Federal Reserve Bulletin • May 1989
We have looked at the cost of resolving new and existing insolvencies under different scenar-ios, and under some, unlikely, circumstances the resolution costs could exceed $50 billion. How-ever, in our judgment, all things considered, the $50 billion should be adequate. There is, of course, much that is unknown, and that is now unknowable, that will affect this judgment. Mar-ginal adjustments may be necessary as experi-ence is gained to take account of, for example, additional costs or recoveries. The critical point is that the fundamental approach is sound, and has the necessary flexibility to adapt to changes in circumstances.
Key to the RTC's ability to minimize costs is flexibility to pursue various resolution options. Such flexibility would permit the separate mar-keting of franchises and troubled real estate portfolios, which might broaden the market and thereby increase the values of both. In particular, in cases in which no franchise value remains in an organization, the least-cost option would likely be liquidation rather than purchase and assumption. To reduce overall costs, the RTC must have the resources necessary to pursue this course.
When so much money is needed to make up for such large losses, partly from mismanagement, and in no small part due to fraud, is it reasonable to ask the taxpayers to pay any part of these costs?
It is. The basis for my answer goes far beyond the congressional pledge of the full faith and credit of the United States behind insured depos-its. The reason for public expenditure to support deposit insurance is the basic benefits to the economy as a whole that we derive from deposit insurance. The certainty and stability provided by deposit insurance benefit the nation as a whole, while they protect the individual from catastrophic loss. By giving the public confi-dence in the safety of its funds, we avoid the deposit withdrawal and the losses that disrupted the payments system and the savings and invest-ment process in the 1930s. Losses of the kind that we face today should not happen, but with the gains to society as a whole that come with deposit insurance we must accept both the pos-sibility and the reality that there will be losses to be borne by society as a whole.
Our job now is not to see to it that there are
never any losses as a result of deposit insurance; to do so would require limitations and rules that would put depository institution lenders, and the economy they serve, in a straitjacket. Such a course would be costly to growth and efficiency. Our task is to see to it that the potential for losses is minimized to the extent possible, and that steps are taken to ensure that the preventable governmental, regulatory, supervisory, and hu-man failures that were the cause of the thrift industry losses do not happen again.
The Board attaches considerable importance to the provision of the proposed legislation that calls for the Secretary of the Treasury, in con-junction with the federal financial regulators, to undertake a study of the nation's deposit insur-ance system. There are major areas of concern about the system, focusing on its apparent bias toward excessive risktaking, its tendency in the direction of differential treatment of small and large institutions, and the unintended expansion of insurance coverage through such techniques as brokering deposits that have been disaggre-gated into $100,000 segments.
A review, at both a conceptual and practical level, is needed of the consistency of an insur-ance system that evolved out of the Great De-pression, on the one hand, with today's deposit-gathering industry of both small banks and giant modern financial services organizations that op-erate across markets and national boundaries, on the other. It will be no easy task. It must be done carefully and the recommendations implemented gradually to ensure a smooth transition to modi-fied insurance arrangements.
I would like to close my testimony by stressing that it is vitally important for the Congress to move very promptly to consider and enact the President's proposals. We must make available the resources the regulators need to close insol-vent thrift institutions. We must stop the continu-ing daily losses due to operating expenses that greatly exceed income, as well as to the higher-than-normal rates that they must offer to attract deposits. In operating in this way, they not only hurt themselves and the insurance funds, but, as they drive up rates, they also injure their com-petitors and the economy as a whole. Prompt action is essential to maintaining public confi-dence in thrift institutions and their insurance fund. •
Digitized for FRASER http://fraser.stlouisfed.org/ Federal Reserve Bank of St. Louis
351
Announcements
STATEMENT ON POLICY ON DEBT OF DEVELOPING COUNTRIES
Chairman Alan Greenspan of the Federal Re-serve Board issued the following statement on March 16, 1989:
I fully support the principles put forward by Secretary Brady last Friday for helping the heavily indebted developing countries to resolve their economic and financial problems: continued economic reform in or-der to achieve sustained economic growth; timely and adequate external financial resources to support eco-nomic development; and for voluntary debt reduction supported by the international financial institutions. The challenge ahead for all of us is to reinvigorate the process and to ensure that it works.
JOINT STATEMENT ON COMMUNITY REINVESTMENT ACT
The Federal Reserve Board, the Office of the Comptroller of the Currency, the Federal Home Loan Bank Board, and the Federal Deposit In-surance Corporation ("the agencies") jointly is-sued a Community Reinvestment Act (CRA) statement on March 21, 1989. This joint state-ment revises the 1980 CRA Information State-ment issued by the agencies and reflects the experience of the agencies since 1977 in admin-istering the CRA.
The statement is designed to provide federally insured financial institutions and the public with guidance regarding the requirements of the CRA and the policies and procedures the agencies will apply during the applications process.
The statement discusses the following topics: the basic components of an effective CRA policy; the role of examination reports on CRA perfor-mance in reviewing applications; the need for periodic review and documentation by financial institutions of their CRA performance; and the role of commitments to the agencies in the appli-cations process.
The statement strongly encourages financial institutions to expand the CRA statements that are presently required to include information regarding the institution's past record of meeting its obligations under the CRA. The statement indicates that these expanded statements could form the basis for useful comment by and discus-sions with community groups regarding the insti-tution's record well before an application is filed, at a time when any issues or problems can be addressed more effectively.
The statement also discusses the role of pri-vate meetings between financial institutions and community groups in the applications process, the policy of the agencies regarding private CRA agreements, and the views of the agencies re-garding extensions of the public comment period for applications. Examples are provided in the statement of specific steps that have been taken by institutions with effective programs for meet-ing their CRA responsibilities.
REVISED PRICES FOR FEDERAL RESERVE RETURNED CHECK SERVICES
The Federal Reserve Board announced on March 16, 1989, revised prices for Federal Reserve returned check services. The prices will become effective May 1, 1989, and remain in effect through 1989.
The Board's action at this time is in response to declining check recovery rates in the latter part of 1988, after Reserve Banks began offering new returned check services on September 1, 1988. The declining rates are primarily a function of returned check revenue that was lower than anticipated and higher-than-expected costs re-sulting from the poor quality of qualified check deposits. The Federal Reserve is actively ad-dressing quality problems and is working directly with depository institutions to reduce operational costs and to improve the overall quality of re-turned check deposits.
Under the new fee schedules for returned
Digitized for FRASER http://fraser.stlouisfed.org/ Federal Reserve Bank of St. Louis
352 Federal Reserve Bulletin • May 1989
checks, the Federal Reserve anticipates recover-ing 102.9 percent of total check costs during the time that the new prices are in effect, from May through December 1989, and 100.5 percent for the full year.
The proposed raw return fees are an average of $.19 more than current fees, which brings the System average price to $.72. The proposed qualified return prices have increased an average of $.14, resulting in a new System average price of $.212. Fine sort fees were adjusted in four Districts at an average increase of $.0022.
Copies of fee schedules and deadlines for Federal Reserve Bank priced services are avail-able from District Federal Reserve Banks.
REVISIONS TO OFFICIAL STAFF COMMENTARIES ON REGULATIONS B, E, AND Z
The Federal Reserve Board issued on March 3, 1989, revisions to the official staff commentaries for three of its consumer credit protection regu-lations: Regulation B (Equal Credit Opportu-nity), Regulation E (Electronic Fund Transfers), and Regulation Z (Truth in Lending).
The revision to the Regulation B commentary addresses a recent preemption determination by the Board regarding New York law.
The revisions to the staff commentary for Regulation E clarify the disclosure requirements applicable when consumers preauthorize direct deposit of social security and other federal gov-ernment benefits.
Revisions to the Regulation Z staff commen-tary address disclosure questions raised by the emergence of reverse mortgages and questions concerning when a third-party fee may be a
finance charge in a credit transaction. Additional commentary is included that interprets the Board's uniform rule for disclosures for adjust-able-rate mortgages.
MEETING OF CONSUMER ADVISORY COUNCIL
The Federal Reserve Board announced that its Consumer Advisory Council held a meeting on March 30 and March 31, 1989.
PROPOSED ACTIONS
The Federal Reserve Board announced on March 10, 1989, that it had extended until June 2, 1989, the public comment period on a series of revised proposals regarding the finality accorded auto-mated clearinghouse (ACH) credit and debit transactions processed by Federal Reserve Banks. (54 Federal Register 8822).
CHANGE IN BOARD STAFF
The Board of Governors announced on April 5, 1989, the appointment of Patrick M. Parkinson to the official staff as Assistant Director in the Division of Research and Statistics.
Mr. Parkinson joined the Board's staff in 1980 as an economist in the Division of International Finance. In 1988, he became Chief of the Capital Markets Section in the Division of Research and Statistics. He holds a Ph.D. from the University of Wisconsin.
Digitized for FRASER http://fraser.stlouisfed.org/ Federal Reserve Bank of St. Louis
353
Record of Policy Actions of the Federal Open Market Committee
MEETING HELD ON FEBRUARY 7-8, 1989
Domestic Policy Directive
The information reviewed at this meeting sug-gested that, apart from the direct effects of the drought, economic activity had continued to ex-pand at a fairly vigorous pace. The latest infor-mation on prices indicated little change in the rate of inflation from recent trends, while labor costs had continued to accelerate.
After strong gains in the fourth quarter, total nonfarm payroll employment rose sharply in January. Although some of the strength may have reflected such temporary factors as unusu-ally mild winter weather, job gains were wide-spread; in manufacturing, sizable increases were registered in nonelectrical machinery, transpor-tation equipment, and food processing. The ci-vilian unemployment rate, at 5.4 percent, re-mained in the lower part of the range that had prevailed since the early spring of last year.
Industrial production rose appreciably further in December and January, with gains continuing at about the robust pace experienced in 1988 as a whole. Output of consumer goods advanced strongly, despite a somewhat slower pace of automobile assemblies over the two months, and production of business equipment picked up a bit. Total industrial capacity utilization moved higher, owing to a sizable jump in the utilization of manufacturing capacity to the highest level since 1979. Housing starts declined somewhat in December but were up substantially on balance for the fourth quarter as a whole, largely because of a strengthening in single-family construction. Multifamily starts have remained relatively flat in recent months.
Consumer spending was up considerably in the fourth quarter, capping a strong year. Spending on household durables rose vigorously in the
quarter; and outlays for services again advanced at a rapid pace, reflecting big increases in expen-ditures for medical care, airline travel, and rec-reation. Consumption of nondurables advanced further, after a steep rise the previous quarter, while purchases of motor vehicles were little changed over the quarter as a whole.
Indicators of business capital spending sug-gested some weakening in recent months from the rapid increases evident earlier in 1988. Real outlays for business fixed investment were esti-mated to have fallen somewhat in the fourth quarter. Softness was fairly widespread among various types of equipment, but the most pro-nounced weakness was in office and computing equipment. Nonresidential construction activity picked up in December but was estimated to have been about flat on balance for the quarter; oil drilling and expenditures on commercial buildings other than offices declined further. In-ventory investment in the manufacturing sector in the fourth quarter was little changed from the third-quarter pace, with much of the accumula-tion continuing to occur in durable goods indus-tries where demand had been strong. At the retail level, increases in nonautomobile inventories generally kept pace with the growth in sales.
Excluding food and energy, producer prices of finished goods rose sharply in December, the rise reflecting large increases for tobacco products, women's apparel, and passenger cars. Prices for intermediate materials again increased substan-tially in November and December. The most notable hikes occurred in industries such as metals, chemicals, and paper products in which capacity utilization has been high. Consumer prices, reflecting more favorable developments in the food, energy, and apparel components, rose at a somewhat slower pace in November and December. Excluding food and energy, con-sumer prices rose in the fourth quarter at about
Digitized for FRASER http://fraser.stlouisfed.org/ Federal Reserve Bank of St. Louis
354 Federal Reserve Bulletin • May 1989
the rate observed over 1988 as a whole. Re-flecting tighter market conditions, wages and salaries, and labor costs more generally, ad-vanced at a faster pace in the fourth quarter than was observed a year earlier.
The nominal U.S. merchandise trade deficit was slightly larger on average in October and November than it was in the third quarter. The value of imports rose as a sharp rise in the value of non-oil imports, especially from industrial countries, outweighed a drop in the value of oil imports resulting from a decline in oil prices. Increases were widespread across trade catego-ries but were paced by a rebound in imports of passenger cars from somewhat depressed levels in the third quarter. The value of exports was little changed as a decline in agricultural exports offset a rise in nonagricultural products.
In foreign exchange markets, the trade-weighted value of the dollar in terms of the other G-10 currencies rose substantially over the inter-meeting period and nearly reversed its decline of October and November. Despite the release of data indicating U.S. trade deficits that were larger than expected for October and November, the dollar climbed persistently from early De-cember in response to perceptions of a relative tightening of monetary policy in the United States; short-term interest rate differentials moved in favor of the dollar relative to the yen.
At its meeting on December 13-14, the Com-mittee adopted a directive calling for some im-mediate increase in the degree of pressure on reserve positions, with some further tightening to be implemented at the start of 1989 if economic and financial conditions remained consistent with the Committee's expectations. These reserve conditions were expected to be associated with growth of M2 and M3 at annual rates of about 3 percent and 6V2 percent respectively over the period from November through March. The members agreed that somewhat greater reserve restraint would, or slightly lesser reserve re-straint might, be acceptable depending on indi-cations of inflationary pressures, the strength of the business expansion, the behavior of the mon-etary aggregates, and developments in foreign exchange and domestic financial markets.
In accordance with the Committee's instruc-tions, a firming of reserve supply conditions was
carried out in two stages over the intermeeting period, although operations were complicated by continuing uncertainty about the relationship be-tween borrowing and money market conditions. In the circumstances, open market operations continued to be conducted with a special degree of flexibility. Adjustment plus seasonal borrow-ing averaged somewhat more than $500 million over the period, but such borrowing fluctuated over a wide range, including a typical bulge around the year-end. The federal funds rate rose from around 8V2 percent to a little above 9 percent during the intermeeting period.
Changes in other short-term market rates were mixed over the intermeeting period. Treasury bill rates rose somewhat on balance, although less than the federal funds rate, while rates on private market instruments were generally unchanged to slightly lower. To some extent, the firming of monetary policy had been anticipated; in addi-tion, private rates in particular were affected by the passing of year-end pressures. Bond yields declined somewhat, apparently influenced in part by the favorable effect of actual and anticipated monetary restraint on inflationary expectations. Major indexes of stock prices rose considerably over the intermeeting period.
Growth of the broader monetary aggregates weakened appreciably in January, especially M2, which apparently declined slightly after a mod-erate increase in December. The behavior of these aggregates appeared to reflect recent in-creases in short-term market rates, which in turn widened the opportunity costs of holding depos-its. Those costs were accentuated by slower-than-usual adjustments in offering rates by de-pository institutions on most of their retail deposits. Also, needs for deposits to fund credit growth were damped in this period. On average in December and January, growth of M2 was slightly below Committee expectations and that of M3 considerably below. Ml changed little on balance over the two months. For the year 1988, M2 expanded at a rate a little below and M3 at a rate around the midpoint of the Committee's ranges. Growth of total domestic nonfinancial debt moderated in 1988 to a pace around the midpoint of the Committee's monitoring range.
The staff projections prepared for this meeting suggested that the expansion was likely to mod-
Digitized for FRASER http://fraser.stlouisfed.org/ Federal Reserve Bank of St. Louis
Record of Policy Actions of the Federal Open Market Committee 355
erate in 1989 from the pace in 1988, although the adjustments related to the assumed end of the drought would be reflected in relatively strong measured growth in the first quarter. To the extent that expansion of final demand tended to remain at a pace that could foster higher inflation but was not accommodated by monetary policy, pressures would be generated in financial mar-kets that would restrain domestic spending. The staff continued to project slower growth in con-sumer spending, sharply reduced expansion of business fixed investment, and some decline in housing construction. Foreign trade was ex-pected to make a smaller contribution to growth in domestic output than in 1988. The staff antic-ipated somewhat faster increases in consumer prices and also some further cost pressures over the year ahead, especially because of reduced margins of unutilized labor and other production resources.
In the Committee's discussion of the economic situation and outlook, members commented that the expansion in business activity was generally well balanced and that continuing growth was a reasonable expectation for the year ahead. Nearly all the members believed that the risks remained on the side of greater inflation and that the Federal Reserve would need to stay espe-cially alert to inflationary developments. How-ever, views differed to some extent with regard to the likely strength of the expansion and the degree of inflationary risk. Several members stressed that, in the absence of some further monetary restraint, economic growth was likely to continue at a rate that would foster greater pressures on already strained production re-sources and induce more inflation. Other mem-bers gave more weight to indications of possible slowing in the expansion and to the possibility that the substantial restraint applied over the past year might be sufficient to foster substainable expansion without increased inflationary pres-sures. The members agreed that the chances for satisfactory economic performance over time would be greatly enhanced by progress in reduc-ing the federal budget deficit in order to contain domestic demands and to facilitate the process of adjustment in the nation's external balance.
In conformance with the usual practice at meetings when the Committee considers its long-
term objectives for monetary growth, the mem-bers of the Committee and the Federal Reserve Bank presidents not currently serving as mem-bers had prepared specific projections of eco-nomic activity, the rate of unemployment, and inflation for the year 1989. The central tendency of these forecasts pointed to somewhat slower expansion and somewhat greater inflation than had occurred in 1988. For the period from the fourth quarter of 1988 to the fourth quarter of 1989, the forecasts for growth of real GNP had a central tendency of 2Vi to 3 percent and a full range of Wi to 3!/4 percent. Forecasts of nominal GNP centered on growth rates of 6Vi to IV2 percent and ranged from 5l/2 to 8V2 percent. Estimates of the civilian rate of unemployment in the fourth quarter of 1989 were concentrated in a range of 5!/4 to 5V2 percent with a full range of 5 to 6 percent. The projected increase in the con-sumer price index centered on rates of 41/2 to 5 percent and had an overall range of 3V2 to 5V2 percent for the year. In making these forecasts, the members took account of the Committee's policy of continuing restraint on aggregate de-mand to resist any increase in inflation pressures and foster price stability over time. They also assumed that normal weather conditions and a rise in acreage under cultivation this year would increase farm output and add around 2/s of a percentage point to the growth of GNP, an amount similar to the reduction in GNP that resulted from the drought in 1988. Excluding this swing in farm output, the central tendency of the forecasts implied considerably slower growth in output than in 1988. Finally, the forecasts as-sumed that fluctuations in the foreign exchange value of the dollar would not be of sufficient magnitude to have a significant effect on the economy or prices.
In the Committee's discussion of develop-ments bearing on the economic outlook, a num-ber of members stressed that the economy had a good deal of momentum and that there was little or no current evidence of a potential slowdown or downturn in the expansion. Indeed, some recent data, including those on employment and consumer spending, could be viewed as consis-tent with some strengthening of the expansion in recent months. Reports from around the country suggested a high level of business activity in
Digitized for FRASER http://fraser.stlouisfed.org/ Federal Reserve Bank of St. Louis
356 Federal Reserve Bulletin • May 1989
many parts of the nation and at least modest improvement in some previously depressed ar-eas. On the whole, growth in production was being well maintained, buttressed by continuing expansion in exports. Other members saw a greater potential for some softening in the rate of economic growth. They referred to sectors of relative weakness in the economy, including en-ergy, nonresidential construction, and housing. With regard to the outlook for capital expendi-tures, many firms were investing in new equip-ment to improve their efficiency in competitive markets, but they generally continued to hold back on investments to expand production facil-ities. More generally, a number of members emphasized that the behavior of money, whose growth had been relatively damped for an ex-tended period and was likely to remain so in 1989 under the Committee's targets, probably was consistent with only limited strength in spending.
A key element in the outlook for business was the extent of the improvement in the nation's external trade balance. The members generally expected further gains, at least over the year ahead, but several observed that these might be considerably smaller than in 1988, given the behavior of the dollar over the past year and assuming a steady dollar in the future. Such an outcome could have the advantage of helping to moderate potential inflationary demand pres-sures in the economy but at the cost and the risks associated with a continuing need to finance massive external deficits. It also was noted that substantial improvement in the trade balance at a time of increasing pressure on productive re-sources would require the expansion in domestic demand to slow sufficiently—perhaps more than was currently anticipated—to permit added pro-duction for exports.
Turning to the outlook for inflation, several members expressed concern that, with margins of unused labor and capital relatively low, any slowing in the growth of overall demands now in train might be inadequate to prevent some rise in the underlying rate of inflation, much less to permit progress to be made in bringing inflation down. In this view the economy's current mo-mentum in association with a reduced availability of production resources clearly biased the eco-nomic risks toward greater inflation. A number of
these members expressed particular concern about recent indications of higher labor costs, which might augur escalating inflationary pres-sures. Other members saw a lesser risk that inflation would intensify, at least in the absence of unfavorable developments such as a second year of drought conditions, a sharp upturn in energy prices, or a substantial decline in the foreign exchange value of the dollar. It was difficult to judge the point at which added pres-sures on production resources might be trans-lated into stronger inflationary pressures, but several members observed that despite relatively vigorous economic growth the impact on the overall rate of inflation had been less than they might have anticipated earlier. Promising factors in the inflation outlook included the continuation of strong competitive pressures, notably compe-tition from abroad that tended to inhibit efforts to raise prices, restrained monetary growth, and generally favorable inflationary expectations as evidenced by developments in financial markets. In one view, commodity prices, while still af-fected by the impact of the drought, might be signalling at least tentatively a downturn in the overall rate of inflation.
Against the background of the members' views regarding the economic outlook and in keep-ing with the requirements of the Full Employ-ment and Balanced Growth Act of 1978 (the Humphrey-Hawkins Act), the Committee at this meeting reviewed the ranges of growth for the monetary and debt aggregates that had been established on a tentative basis in late June 1988 for the year 1989. The tentative range for M2 had been reduced by 1 percentage point to 3 to 7 percent and that for M3 by Vi percentage point to 3V2 to 7Vi percent for 1989. The monitoring range for growth of total domestic nonfinancial debt had been lowered by Vi percentage point to 6Vi to IOV2 percent for the year. The Committee had decided in June not to establish any range for Ml.
In the Committee's discussion, a majority of the members indicated that they were in favor of affirming the reduced ranges that had been set on a tentative basis in mid-1988, while the remaining members expressed a preference for some fur-ther reductions. Members who supported the tentative ranges believed that they were fully
Digitized for FRASER http://fraser.stlouisfed.org/ Federal Reserve Bank of St. Louis
Record of Policy Actions of the Federal Open Market Committee 357
consistent with progress toward price level sta-bility. Indeed, the reduction of a full percentage point in the M2 range was larger than usual and would convey in this view an appropriately strong signal of the System's commitment to an anti-inflationary policy. This lower range encom-passed money growth that was fully consistent under likely economic and financial conditions with continued expansion of spending but at the somewhat slower pace needed to contain infla-tionary pressures. A number of members also commented that the tentative ranges would pro-vide more room in subsequent years for continu-ing the desirable policy of gradually lowering the monetary growth targets to noninflationary levels while also reducing the possibility that unantici-pated economic or financial developments might require those targets to be raised on a temporary basis. Even though temporarily higher ranges might be consistent with progress toward price stability, a decision to raise the ranges could be misinterpreted as a weakening of the System's anti-inflationary resolve.
Other members believed that further reduc-tions in the ranges would provide greater assur-ance of encompassing the potential policy re-sponses and associated monetary growth that might be needed to resist inflationary pressures over the year ahead, should they prove to be especially strong. Such reductions would under-score the Committee's commitment to its longer-run objective of price stability, since achieving that objective would require lower money growth at some point than was indicated by the middle of the tentative ranges. Lower ranges for the broader aggregates would have midpoints that were more clearly below actual growth in 1988 and given the slow growth thus far this year, especially in the case of M2, would improve the prospects that expansion for the year would approximate the midpoints. Moreover, the upper ends of the tentative ranges, while below those for 1988, nonetheless remained appreciably higher than the rates of monetary growth that were likely to be consistent with price stability over time.
The Committee agreed on the desirability of retaining the relatively wide spread of 4 percent-age points between the upper and the lower ends of the growth ranges for M2 and M3. These
ranges were initially widened in 1988 in recogni-tion of the uncertain outlook for financial mar-kets and the economy and the extent to which the relationship between monetary growth and eco-nomic performance had varied over an extended period. In particular, the growth of M2 and its velocity had remained very sensitive to fluctua-tions in interest rates, reflecting in turn a ten-dency of depository institutions to adjust only sluggishly their offering rates on many types of deposit accounts. In these circumstances and against the background of the multiplicity of largely unpredictable factors affecting the econ-omy and interest rates, the appropriate rate of monetary growth remained subject to consider-able uncertainty and could not be projected within narrow ranges with any degree of confi-dence. An additional uncertainty in 1989 would be the impact of developments affecting thrift depository institutions as serious financial prob-lems at many of those institutions moved toward resolution under the aegis of new government programs. The behavior of M2 and M3 was likely to be affected by such developments, but there was only limited basis in prior experience to gauge the extent of the impact.
The members found acceptable the tentative reduction of Vi percentage point in the monitor-ing range for total domestic nonfinancial debt in 1989. As in several previous years, growth of total debt was expected to exceed that of nominal GNP. The members anticipated that the federal government would continue to place heavy de-mands on credit markets to finance its large ongoing deficits. In addition, the expansion of business borrowing would probably continue to be boosted by a widening financing gap and by the substitution of debt for equity in conjunction with leveraged buyouts and other corporate re-structuring activities. Growth of household debt might moderate somewhat, reflecting the effect of increases in interest rates in 1988 on mortgage debt and of reduced expansion in consumer credit in association with a smaller rise in outlays on consumer durables over the year.
In keeping with the Committee's tentative de-cision in late June, no member proposed the inclusion of Ml among the monetary target ranges. The Committee continued to view the prospective relationship between Ml and aggre-
Digitized for FRASER http://fraser.stlouisfed.org/ Federal Reserve Bank of St. Louis
358 Federal Reserve Bulletin • May 1989
gate measures of economic activity as too unpre-dictable to warrant reliance on this monetary measure as a guide for the conduct of monetary policy.
At the conclusion of the Committee's discus-sion, all but one of the members indicated that they favored or could accept the ranges for 1989 that had been established on a tentative basis in late June 1988. Against the background of the uncertainties that continued to surround the re-lationship between monetary growth and broad measures of economic performance, most of the members endorsed a proposal to make explicit in the directive the Committee's procedure in re-cent years of evaluating money growth in the conduct of policy in light of the behavior of other indicators, including inflationary pressures, the strength of the business expansion, and develop-ments in domestic financial and foreign exchange markets.
At the conclusion of this discussion, the Com-mittee approved for inclusion in the domestic policy directive the following paragraph relating to its longer-run policy for 1989:
The Federal Open Market Committee seeks mone-tary and financial conditions that will foster price stability, promote growth in output on a sustainable basis, and contribute to an improved pattern of inter-national transactions. In furtherance of these objec-tives, the Committee at this meeting reaffirmed its decision of late June to lower the ranges for growth of M2 and M3 to 3 to 7 percent and V/2 to IV2 percent, respectively, measured from the fourth quarter of 1988 to the fourth quarter of 1989. The monitoring range for growth of total domestic nonfinancial debt was set at 6V2 to IOV2 percent for the year. The behavior of the monetary aggregates will continue to be evaluated in the light of movements in their velocities, develop-ments in the economy and financial markets, and progress toward price level stability.
Votes for this action: Messrs. Greenspan, Corri-gan, Angell, Black, Forrestal, Heller, Johnson, Kelley, LaWare, Parry, and Ms. Seger. Vote against this action: Mr. Hoskins.
Mr. Hoskins dissented because he preferred lower ranges for the year. In his view satisfactory progress in reducing the underlying rate of infla-tion would require a degree of restraint over the year that would be likely to result in money growth at the low end of the tentative ranges, and
he believed that the ranges adopted should be more closely centered on that possible outcome. He also felt that lower ranges were desirable at this time to underscore the System's determina-tion to pursue an anti-inflationary policy.
In the Committee's discussion of policy imple-mentation for the period until the next meeting, a majority of the members indicated a preference for maintaining unchanged conditions of reserve availability, at least initially, following today's meeting. Further monetary restraint might be desirable in the near future, perhaps during the intermeeting period. However, recent informa-tion had given a somewhat mixed picture of economic and price developments, and these members preferred to wait for further confirma-tion of inflationary pressures before additional firming of monetary policy was undertaken. Ap-preciable policy tightening had been imple-mented only recently and the impact would be felt only after a considerable lag. Monetary pol-icy was now fairly restrictive, as evidenced for example by relatively high real rates of interest, a slightly inverted yield curve, and the slow growth of the monetary aggregates. The credibil-ity of the System's anti-inflationary policy was quite high. Some members expressed concern that higher interest rates would exacerbate the financial difficulties of many thrift depository institutions, weaken heavily indebted firms, and in the context of a strong dollar possibly lead to an undesired upward ratcheting of interest rates in world financial markets. It also was noted that further tightening should be approached with special caution when the dollar was under up-ward pressure in the foreign exchange markets.
Other members indicated a preference for some immediate firming of monetary policy in light of their concerns about current and prospec-tive inflationary pressures in the economy. In this view delaying further tightening would only worsen such pressures and could greatly increase the difficulty and ultimate cost of achieving the Committee's anti-inflationary objectives. More-over, while higher interest rates could have ad-verse effects on interest-sensitive sectors of the economy, a failure to arrest and to reverse infla-tion would lead to even higher interest rates and greater damage over time. Some concern also was expressed that maintenance of steady re-
Digitized for FRASER http://fraser.stlouisfed.org/ Federal Reserve Bank of St. Louis
Record of Policy Actions of the Federal Open Market Committee 359
serve conditions might disappoint market expec-tations, with adverse repercussions in present circumstances on the credibility of the System's anti-inflationary policy and thus on inflationary expectations. Should too much restraint later prove to have been applied, it could be reversed more readily and with less lasting implications for economic performance than too little re-straint, which would tend to embed inflation and inflationary expectations in the economic struc-ture.
A number of members observed that the rela-tively slow monetary expansion that had been experienced in recent months—and indeed on balance for some two years—portended restraint on prices and was a welcome development. A staff forecast suggested that money growth was likely to remain damped over coming months, with both M2 and M3 growing at the lower end of the Committee's 1989 ranges. In the view of a number of members, this might be acceptable or even desirable depending on the extent of infla-tionary pressures being experienced in the econ-omy. At the same time some members cautioned that a persistent shortfall from the ranges might be a cause for concern.
In the Committee's discussion of possible in-termeeting adjustments in the degree of reserve restraint, members generally felt that there should be a clear presumption of some further firming if the incoming information tended to confirm expectations of growing inflationary pressures. Indeed, several members indicated that such a presumption would enable them to accept a directive that called for no immediate change in the degree of reserve pressure. Some members expressed the view that developments in foreign exchange markets might have an im-portant bearing on the timing or even the desir-ability of any firming in the period ahead. More generally, the Committee agreed that consider-ation would need to be given to the usual range of factors that might call for a change in policy implementation, including the possibility that some easing might be warranted under certain conditions. For the immediate future, however, several stressed that any perceptions that mone-tary policy might be easing should be resisted.
At the conclusion of the Committee's discus-sion, all but two members indicated that they
favored or could accept a directive that called for maintaining the current degree of pressure on reserve conditions and for remaining alert to potential developments that might require some firming during the intermeeting period. Accord-ingly, somewhat greater reserve restraint would be acceptable, or slightly lesser reserve restraint might be acceptable, over the intermeeting pe-riod depending on indications of inflationary pressures, the strength of the business expan-sion, the behavior of the monetary aggregates, and developments in foreign exchange and do-mestic financial markets. The reserve conditions contemplated by the Committee were expected to be consistent with growth of M2 and M3 at annual rates of around 2 percent and V/i percent respectively over the three-month period from December to March. It was understood that operations would continue to be conducted with some flexibility in light of the persisting uncer-tainty in the relationship between the demand for borrowed reserves and the federal funds rate. The intermeeting range for the federal funds rate, which provides one mechanism for initiating con-sultation of the Committee when its boundaries are persistently exceeded, was left unchanged at 7 to 11 percent.
At the conclusion of the meeting, the following domestic policy directive was issued to the Fed-eral Reserve Bank of New York:
The information reviewed at this meeting suggests that, apart from the direct effects of the drought, economic activity has continued to expand at a fairly vigorous pace. After strong gains in the fourth quarter, total nonfarm payroll employment rose sharply in January, including a sizable increase in manufacturing. The civilian unemployment rate, at 5.4 percent in January, remained in the lower part of the range that has prevailed since the early spring of last year. Industrial production rose appreciably further in De-cember and January. Housing starts declined some-what in December but were up substantially on bal-ance in the fourth quarter. Consumer spending advanced considerably in the fourth quarter, in part reflecting stronger sales of durable goods. Indicators of business capital spending suggest some weakening in recent months. The nominal U.S. merchandise trade deficit was slightly larger on average in October and November than in the third quarter. The latest information on prices suggests little change from re-cent trends, while wages have tended to accelerate.
The federal funds rate and Treasury bill rates have
Digitized for FRASER http://fraser.stlouisfed.org/ Federal Reserve Bank of St. Louis
360 Federa l Rese rve Bulletin • May 1989
risen since the Committee meeting in mid-December; other short-term interest rates are generally un-changed to somewhat lower. Bond yields have de-clined somewhat. In foreign exchange markets, the trade-weighted value of the dollar in terms of the other G-10 currencies rose substantially over the intermeet-ing period.
M2 and M3 weakened appreciably in January, espe-cially M2. For the year 1988, M2 expanded at a rate a little below, and M3 at a rate around, the midpoint of the ranges established by the Committee. Ml has changed little on balance over the past several months; it grew about 4XA percent in 1988. Expansion of total domestic nonfinancial debt appears to have moderated somewhat in 1988 to a pace around the midpoint of the Committee's monitoring range for the year.
The Federal Open Market Committee seeks mone-tary and financial conditions that will foster price stability, promote growth in output on a sustainable basis, and contribute to an improved pattern of inter-national transactions. In furtherance of these objec-tives, the Committee at this meeting reaffirmed its decision of late June to lower the ranges for growth of M2 and M3 to 3 to 7 percent and V/2 to 7l/2 percent, respectively, measured from the fourth quarter of 1988 to the fourth quarter of 1989. The monitoring range for growth of total domestic nonfinancial debt was set at 61/2 to IOV2 percent for the year. The behavior of the monetary aggregates will continue to be evaluated in the light of movements in their velocities, develop-ments in the economy and financial markets, and progress toward price level stability.
In the implementation of policy for the immediate future, the Committee seeks to maintain the existing degree of pressure on reserve positions. Taking ac-count of indications of inflationary pressures, the strength of the business expansion, the behavior of the monetary aggregates, and developments in foreign
exchange and domestic financial markets, somewhat greater reserve restraint would, or slightly lesser re-serve restraint might, be acceptable in the intermeet-ing period. The contemplated reserve conditions are expected to be consistent with growth of M2 and M3 over the period from December through March at annual rates of about 2 and 3V2 percent, respectively. The Chairman may call for Committee consultation if it appears to the Manager for Domestic Operations that reserve conditions during the period before the next meeting are likely to be associated with a federal funds rate persistently outside a range of 7 to 11 percent.
Votes for the paragraph on short-term policy im-plementation: Messrs. Greenspan, Corrigan, Angell, Black, Forrestal, Heller, Johnson, Kelley, LaWare, and Ms. Seger. Votes against this action: Messrs. Hoskins and Parry.
Messrs . Hosk ins and Par ry dissented because they believed that a p ro m p t m o v e to greater moneta ry restraint was needed . Mr Hosk ins felt that addit ional restraint was desirable to put policy on a course that would lead toward longer-run price stability. Mr . Par ry emphas ized that inflationary p ressures appea red to be intensifying as the economy had grown to a level in excess of its long-run, noninflat ionary potent ial . Both be-lieved that any delay in implement ing more re-straint probably would aggravate inflationary pressures , the reby increasing the difficulty of achieving the Commi t t ee ' s anti-inflationary ob-jec t ives and leading to even higher interest ra tes over t ime.
Digitized for FRASER http://fraser.stlouisfed.org/ Federal Reserve Bank of St. Louis
361
Legal Developments
AMENDMENT TO REGULATION A
The Board of Governors is amending 12 C.F.R. Part 201, its Regulation A (Extensions of Credit by Federal Reserve Banks), for the purpose of increasing discount rates. The Board took this action in light of inflationary pressures on the economy.
The Board acted on requests submitted by the Boards of Directors of the twelve Federal Reserve Banks. The discount rate is the interest rate that is charged depository institutions when they borrow from their district Federal Reserve Banks.
Effective March 6, 1989, 12 C.F.R. Part 201 is amended as follows:
1. The authority citation for 12 C.F.R. Part 201 continues to read as follows:
Authority: Sections 10(a), 10(b), 13, 13a, 14(d) and 19 of the Federal Reserve Act (12 U.S.C. 347a, 347b, 343 et seq., 347c, 348 et seq., 357, 374, 374a and 461); and section 7(b) of the International Banking Act of 1978 (12 U.S.C. 347d).
2. Section 201.51 is revised to read as follows:
Section 201.51—Short-term adjustment credit for depository institutions.
The rates for short-term adjustment credit provided to depository institutions under section 201.3(a) of Reg-ulation A are:
Federal Reserve Bank Rate Effective
7.0 Feb. 24, 1989 7.0 Feb. 24, 1989 7.0 Feb. 24, 1989 7.0 Feb. 24, 1989 7.0 Feb. 24, 1989 7.0 Feb. 24, 1989
7.0 Feb. 24, 1989 7.0 Feb. 24, 1989 7.0 Feb. 24, 1989 7.0 Feb. 24, 1989 7.0 Feb. 27, 1989 7.0 Feb. 24, 1989
New York Philadelphia Cleveland Richmond
7.0 Feb. 24, 1989 7.0 Feb. 24, 1989 7.0 Feb. 24, 1989 7.0 Feb. 24, 1989 7.0 Feb. 24, 1989 7.0 Feb. 24, 1989
7.0 Feb. 24, 1989 7.0 Feb. 24, 1989 7.0 Feb. 24, 1989 7.0 Feb. 24, 1989 7.0 Feb. 27, 1989 7.0 Feb. 24, 1989
Chicago St. Louis Minneapolis Kansas City Dallas San Francisco
7.0 Feb. 24, 1989 7.0 Feb. 24, 1989 7.0 Feb. 24, 1989 7.0 Feb. 24, 1989 7.0 Feb. 24, 1989 7.0 Feb. 24, 1989
7.0 Feb. 24, 1989 7.0 Feb. 24, 1989 7.0 Feb. 24, 1989 7.0 Feb. 24, 1989 7.0 Feb. 27, 1989 7.0 Feb. 24, 1989
3. Section 201.52 is revised to read as follows:
Section 201.52—Extended credit for depository institutions.
(a) Seasonal credit. The rates for seasonal credit extended to depository institutions under section 201.3(b)(1) of Regulation A are:
Federal Reserve Bank Rate Effective
Boston 7.0 Feb. 24, 1989 New York 7.0 Feb. 24, 1989 Philadelphia 7.0 Feb. 24, 1989 Cleveland 7.0 Feb. 24, 1989
7.0 Feb. 24, 1989 7.0 Feb. 24, 1989
Chicago 7.0 Feb. 24, 1989 St. Louis 7.0 Feb. 24, 1989 Minneapolis 7.0 Feb. 24, 1989 Kansas City 7.0 Feb. 24, 1989 Dallas 7.0 Feb. 27, 1989 San Francisco 7.0 Feb. 24, 1989
(b) Other extended credit. The rates for other ex-tended credit provided to depository institutions under sustained liquidity pressures or where there are excep-tional circumstances or practices involving a particular institution under section 201.3(b)(2) of Regulation A are:
Federal Reserve Bank Rate Effective
7.0 Feb. 24, 1989 New York 7.0 Feb. 24, 1989 Philadelphia 7.0 Feb. 24, 1989 Cleveland 7.0 Feb. 24, 1989 Richmond 7.0 Feb. 24, 1989
7.0 Feb. 24, 1989
Chicago 7.0 Feb. 24, 1989 St. Louis 7.0 Feb. 24, 1989 Minneapolis 7.0 Feb. 24, 1989 Kansas City 7.0 Feb. 24, 1989 Dallas 7.0 Feb. 27, 1989 San Francisco 7.0 Feb. 24, 1989
These rates apply for the first 30 days of borrowing. For credit outstanding for more than 30 days, a flexible rate will be charged which takes into account rates on market sources of funds, but in no case will the rate charged be less than the basic discount rate plus
Digitized for FRASER http://fraser.stlouisfed.org/ Federal Reserve Bank of St. Louis
362 Federal Reserve Bulletin • May 1989
one-half percentage point. Where credit provided to a particular depository institution is anticipated to be outstanding for an unusually prolonged period and in relatively large amounts, the 30-day time period may be lengthened or shortened.
AMENDMENT TO REGULATION B
The Board of Governors is amending 12 C.F.R. Part 202, its Regulation B (Equal Credit Opportunity), by publishing in final form an addition to the official staff commentary to Regulation B. The commentary applies and interprets the requirements of Regulation B and is a substitute for individual staff interpretations of the regulation. The addition addresses a recent Board preemption determination regarding a provision of New York law.
Effective March 7, 1989, 12 C.F.R. Part 202 is amended as follows:
1. The authority citation for Part 202 continues to read:
Authority: 15 U.S.C. 1691 et seq.
2. The addition amends the commentary (12 C.F.R. Part 202, Supp. I) by adding comment 11(a) to read as follows:
Section 202.11—Relation to State Law
11(a) Inconsistent state laws 1. Preemption determination—New York. Effective November 11,1988, the Board has determined that the following provisions in the state law of New York are preempted by the federal law: • Article 15, Section 296a(l)(b)—Unlawful discrimina-
tory practices in relation to credit on the basis of race, creed, color, national origin, age, sex, marital status, or disability. This provision is preempted to the extent that it bars taking a prohibited basis into account when establishing eligibility for certain spe-cial-purpose credit programs.
• Article 15, Section 296a(l)(c)—Unlawful discrimina-tory practice to make any record or inquiry based on race, creed, color, national origin, age, sex, marital status, or disability. This provision is preempted to the extent that it bars a creditor from requesting and considering information regarding the particular characteristics (for example, race, national origin, or sex) required for eligibility for special-purpose credit programs.
AMENDMENT TO REGULATION E
The Board of Governors is amending 12 C.F.R. Part 205, its Regulation E (Electronic Fund Transfers), by publishing in final form revisions to the official staff commentary to Regulation E. The commentary applies and interprets the requirements of Regulation E and is a substitute for individual staff interpretations of the regulation. The revisions address questions that have arisen about the disclosure requirements of the regu-lation.
Effective April 1, 1989, 12 C.F.R. Part 205 contin-ues to read as follows:
1. The authority citation for Part 205 continues to read:
Authority: Pub. L. 95-630, 92 Stat. 3730 (15 U.S.C. 1693b).
2. The official staff commentary to Regulation E, Supp. II to 12 C.F.R. Part 205, is amended by revising questions 7-1 and 7-2 for section 205.7 to read as follows:
Supplement II—Official Staff Interpretations
Section 205.7—Initial Disclosure of Terms and Conditions
Q 7-1: Timing of disclosures—early disclosure. An institution is required to give initial disclosures either (1) when the consumer contracts for an EFT service or (2) before the first electronic fund transfer to or from the consumer's account. If an institution provides initial disclosures when a consumer opens a checking account and the consumer does not sign up for an EFT service until a later time, has the institution satisfied the disclosure requirements? A: Yes, if the EFT contract is between the consumer and a third party for preauthorized electronic transfers to be initiated by the third party to or from the consumer's account. In this case, the financial institu-tion need not repeat disclosures previously given unless the terms and conditions required to be dis-closed are different from those that were given.
If, on the other hand, the EFT contract is directly between the consumer and the financial institution — for the issuance of an access device, or for a telephone bill-payment plan, for example —the institution should provide the disclosures at the time of contracting.
Digitized for FRASER http://fraser.stlouisfed.org/ Federal Reserve Bank of St. Louis
Legal Developments 363
Disclosures given before the time of contracting will satisfy the regulation only if they occurred in close proximity thereto. (Section 205.7(a)) Q 7-2: Timing of disclosures—Social Security and other federal government direct deposits. In the case of direct deposits by the federal government—Social Security payments, for example—how can the finan-cial institution comply with the disclosure require-ments absent prenotification, such as in cases where the government agency no longer uses Form 1199A? A: Before direct deposit of payments such as Social Security takes place, usually the consumer and the institution both must complete a Form 1199A, and the institution can make disclosures at that time. How-ever, if a Form 1199A (or a comparable form providing notice to the institution) is not used and there is no prenotification, the institution should provide the re-quired disclosures as soon as reasonably possible after the first direct deposit is received, unless the institu-tion has previously given the disclosures (see question 7-1). (Section 205.7(a))
AMENDMENT TO REGULATION Z
The Board of Governors is amending 12 C.F.R. Part 226, its Regulation Z (Truth in Lending), by publishing revisions to the official staff commentary to Regulation Z. The commentary applies and interprets the require-ments of Regulation Z and is a substitute for individual staff interpretations of the regulation. The revisions address a variety of questions that have arisen about the regulation, and include new material and changes in existing material. The comments address, for exam-ple, disclosure questions raised by the emergence of reverse mortgage products, questions concerning the amendments to Regulation Z affecting disclosures for adjustable-rate mortgages, and questions concerning when a third party fee may be a finance charge in a credit transaction.
Effective February 28, 1989, but compliance op-tional until October 1, 1989, 12 C.F.R. Part 226 is amended as follows:
1. The authority citation for Part 226 continues to read:
Authority: Section 105, Truth in Lending Act, as amended by section 605, Pub. L. 96-221, 94 Stat. 170 (15 U.S.C. 1604 et seq.)\ section 1204(c), Competitive Equality Banking Act, Pub. L. 100-86, 101 Stat. 552.
2. The revisions amend the commentary (TIL-1, 12 C.F.R. Part 226 Supp.I) by adding comment 2(a)(25)-6; adding a sentence and a bullet at the end of comment 4(a)-3; revising the heading and text of
comments 4(b)(7) and (8)-2; adding a bullet at the end of comments 17(a)(l)-5; adding two sentences after the first sentence, and revising the second and third sen-tences and the parenthetical material in comment 17(c)(l)-8; redesignating comments 17(c)(l)-14 and -15 to be comments 17(c)(1)-15 and -16, respectively; adding comment 17(c)(l)-14; adding parenthetical ma-terial at the end of comment 18(f)(2)-1; adding three sentences at the end of comment 19(b)-l; revising the first, third and fourth sentences, adding a sentence after the third sentence, and removing the last three sentences of comment 19(b)(2)-1; revising the second, third, and fifth sentences of comment 19(b)(2)-2 rede-signating comments 19(b)(2)-3 and -4 to be comments 19(b)(2)-4 and -5, respectively; adding comment 19(b)(2)-3; adding three sentences after the second sentence in comment 19(b)(2)(iii)-l; adding a new sentence before the parenthetical material at the end of comment 19(b)(2)(v)-l; adding four sentences and parenthetical material at the end of comment 19(b)(2)(vi)-l; adding five sentences and parenthetical material at the end of comment 19(b)(2)(vii)-l; revising the third sentence in the parenthetical material after the first sentence in comment 19(b)(2)(viii)-l ; adding comments 19(b)(2)-5, -6 and -7; adding a sentence after the second sentence in comment 19(b)(2)(ix)-l; adding comments 19(b)(2)(x)-2, -3 and -4; adding a sentence after the second sentence in comment 20(c)(4)-1; re-vising comment 20(c)(5)-1; changing the references to "comment 18(f)-8" in the first sentence and in the first bullet of comment 24(b)-5 to be "comment 17(c)(1)-10"; adding comment 25(a)-3; revising the first sentence of comment 30-8; revising the last sentence in comment 30-13; removing the word "most" and changing the reference to "section 226.18(f)(4)" in comment app. D-2 to be "section 226.18(f)(l)(iv)" to read as follows:
Subpart A—General
Section 226.2—Definitions and Rules of Construction
2(a) Definitions
2(a)(25) "Security Interest"
* * * * *
6. Specificity of disclosure. A creditor need not sepa-rately disclose multiple security interests that it may hold in the same collateral. The creditor need only disclose that the transaction is secured by the collat-
Digitized for FRASER http://fraser.stlouisfed.org/ Federal Reserve Bank of St. Louis
364 Federal Reserve Bulletin • May 1989
eral, even when security interests from prior transac-tions remain of record and a new security interest is taken in connection with the transactions.
Section 226.4—Finance Charge
4(a) Definition
3. Charges by third parties. * * *
In contrast, charges imposed on the consumer by someone other than the creditor are finance charges (unless otherwise excluded) if the creditor requires the services of the third party. For example: • A fee charged by a loan broker if the consumer
cannot obtain the same credit terms from the creditor without using a broker.
4(b) Examples of Finance Charges
Paragraphs 4(b)(7) and (8)
2. Insurance written in connection with a transaction. Insurance sold after consummation in closed-end credit transactions or after the opening of a plan in open-end credit transactions is not "written in connec-tion with" the credit transaction if the insurance is written because of the consumer's default (for exam-ple, by failing to obtain or maintain required property insurance) or because the consumer requests insur-ance after consummation or the opening of a plan (although credit sale disclosures may be required for the insurance sold after consummation if it is financed).
Subpart C—Closed-End Credit
Section 226.17 —General Disclosure Requirements
17(a) Form of Disclosures Paragraph 17(a)(1)
5. Directly related. * * *
•The disclosures set forth under section 226.18(f)(1) for variable-rate transactions subject to section 226.18(f)(2).
17(c) Basis of Disclosures and Use of Estimates Paragraph 17(c)(1)
8. Basis of disclosures in variable-rate transactions. * * *
Creditors should base the disclosures only on the initial rate and should not assume that this rate will increase. For example, in a loan with an initial rate of 10 percent and a 5 percentage points rate cap, credi-tors should base the disclosures on the initial rate and should not assume that this rate will increase 5 per-centage points. However, in a variable-rate transac-tion with a seller buydown that is reflected in the credit contract, a consumer buydown, or a discounted or premium rate, disclosures should not be based solely on the initial terms. In those transactions, the dis-closed annual percentage rate should be a composite rate based on the rate in effect during the initial period and the rate that is the basis of the variable-rate feature for the remainder of the term. (See the commentary to section 226.17(c) for a discussion of buydown, dis-counted, and premium transactions and the commen-tary to section 226.19(a)(2) for a discussion of the redisclosure in certain residential mortgage transac-tions with a variable-rate feature).
14. Reverse mortgages. Reverse mortgages, also known as reverse annuity or home equity conversion mortgages, typically involve the disbursement of monthly advances to the consumer for a fixed period or until the occurrence of an event such as the con-sumer's death. Repayment of the loan (generally a single payment of principal and accrued interest) may be required to be made at the end of the disbursements or, for example, upon the death of the consumer. In disclosing these transactions, creditors must apply the following rules, as applicable: • If the reverse mortgage has a specified period for
disbursements but repayment is due only upon the occurrence of a future event such as the death of the consumer, the creditor must assume that disburse-ments will be made until they are scheduled to end. The creditor must assume repayment will occur when disbursements end (or within a period follow-ing the final disbursement which is not longer than the regular interval between disbursements). This assumption should be used even though repayment may occur before or after the disbursements are
Digitized for FRASER http://fraser.stlouisfed.org/ Federal Reserve Bank of St. Louis
Legal Developments 365
scheduled to end. In such cases, the creditor may include a statement such as "The disclosures assume that you will repay the loan at the time our payments to you end. As provided in your agreement, your repayment may be required at a different time." If the reverse mortgage has neither a specified period for disbursements nor a specified repayment date and these terms will be determined solely by reference to future events including the consumer's death, the creditor must assume that the disbursements will end upon the consumer's death (by using actuarial tables, for example) and that repayment will be required at the same time (or within a period following the date of the final disbursement which is not longer than the regular interval for disbursements). Alternatively, the creditor may base the disclosures upon another future event it estimates will be most likely to occur first. (If terms will be determined by reference to future events which do not include the consumer's death, the creditor must base the disclosures upon the occurrence of the event estimated to be most likely to occur first.) In making the disclosures, the creditor must assume that all disbursements and accrued interest will be paid by the consumer. For example, if the note has a nonrecourse provision providing that the consumer is not obligated for an amount greater than the value of the house, the creditor must nonetheless assume that the full amount to be disbursed will be repaid. In this case, however, the creditor may include a statement such as "The disclosures assume full repayment of the amount advanced plus accrued interest, although the amount you may be required to pay is limited by your agreement." Some reverse mortgages provide that some or all of the appreciation in the value of the property will be shared between the consumer and the creditor. Such loans are considered variable-rate mortgages, as de-scribed in comment 17(c)(l)-ll, and the appreciation feature must be disclosed in accordance with section 226.18(f)(1). If the reverse mortgage has a variable interest rate, is written for a term greater than one year, and is secured by the consumer's principal dwelling, the shared appreciation feature must be described under section 226.19(b)(2)(vii).
Section 226.18—Content of Disclosures
18(f) Variable Rate
Paragraph 18(f)(2)
1. Disclosure required. * * *
(See the commentary to section 226.17(a)(1) regarding the disclosure of certain directly related information in addition to the variable-rate disclosures required un-der section 226.18(f)(2)).
Section 226.19—Certain Residential Mortgage Transactions
19(b) Certain Variable-Rate Transactions 1. Coverage. * * *
In determining whether a construction loan that may be permanently financed by the same creditor is cov-ered under this section, the creditor may treat the construction and the permanent phases as separate transactions with distinct terms to maturity or as a single combined transaction. For purposes of the disclosures required under section 226.18, the creditor may nevertheless treat the two phases either as sepa-rate transactions or as a single combined transaction in accordance with section 226.17(c)(6). Finally, in any assumption of a variable-rate transaction secured by the consumer's principal dwelling with a term greater than one year, disclosures need not be provided under sections 226.18(f)(2)(ii) or 226.19(b).
Paragraph 19(b)(2) 1. Disclosure for each variable-rate program. A cred-itor must provide disclosures to the consumer that fully describe each of the creditor's variable-rate loan programs in which the consumer expresses an interest. * * *
Disclosures must be given at the time an application form is provided or before the consumer pays a nonrefundable fee, whichever is earlier. If program disclosures cannot be provided because a consumer expresses an interest in individually negotiating loan terms that are not generally offered, disclosures re-flecting those terms may be provided as soon as reasonably possible after the terms have been decided upon, but not later than the time a non-refundable fee is paid. If a consumer who has received program disclosures subsequently expresses an interest in other available variable-rate programs subject to section 226.19(b)(2), or the creditor and consumer decide on a program for which the consumer has not received disclosures, the creditor must provide appropriate disclosures as soon as reasonably possible. * * *
Digitized for FRASER http://fraser.stlouisfed.org/ Federal Reserve Bank of St. Louis
366 Federal Reserve Bulletin • May 1989
2. Variable-rate loan program defined. * * *
For example, separate loan programs would exist based on differences in any of the following loan features: * * *
In addition, if a loan feature must be taken into account in preparing the disclosures required by section 226.19(b)(2)(viii) and (x), variable-rate loans that differ as to that feature constitute separate programs under section 226.19(b)(2).
For example, separate programs would not exist based on differences in the following loan features: * * *
3. Form of program disclosures. A creditor may provide separate program disclosure forms for each ARM pro-gram it offers or a single disclosure form that describes multiple programs. A disclosure form may consist of more than one page. For example, a creditor may attach a separate page containing the historical payment example for a particular program. A disclosure form describing more than one program need not repeat information applicable to each program that is described. For exam-ple, a form describing multiple programs may disclose the information applicable to all of the programs in one place with the various program features (such as options per-mitting conversion to a fixed rate) disclosed separately. The form, however, must state if any program feature that is described is available only in conjunction with certain other program features. Both the separate and multiple program disclosures may illustrate more than one loan maturity or payment amortization—for example, by in-cluding multiple payment and loan balance columns in the historical payment example. Disclosures may be inserted or printed in the Consumer Handbook (or a suitable substitute) as long as they are identified as the creditor's loan program disclosures.
Paragraph 19(b)(2)(iii) 1. Determination of interest rate and payment. * * *
In transactions where paying the periodic payments will not fully amortize the outstanding balance at the end of the loan term and where the final payment will equal the periodic payment plus the remaining unpaid balance, the creditor must disclose this fact. For example, the disclosure might read, "Your periodic payments will not fully amortize your loan and you will be required to make a single payment of the periodic payment plus the remaining unpaid balance at the end of the loan term." The creditor, however, need not reflect any irregular final payment in the historical example or in the disclosure of the initial and maximum rates and payments.
* * *
Paragraph 19(b)(2)(v) 1. Discounted and premium interest rate. * * *
In a transaction with a consumer buydown or with a third-party buydown that will be incorporated in the legal obligation, the creditor should disclose the program as a discounted variable-rate transaction, but need not disclose additional information regarding the buydown in its program disclosures. * * *
Paragraph 19(b)(2)(vi) 1. Frequency. * * *
In certain ARM transactions, the interval between loan closing and the initial adjustment is not known and may be different from the regular interval for adjustments. In such cases, the creditor may disclose the initial adjustment period as a range of the minimum and maximum amount of time from consummation or closing. For example, the creditor might state: "The first adjustment to your interest rate and payment may occur no sooner than 6 months and no later than 18 months after closing. Subsequent adjustments may occur once each year after the first adjustment." (See comments 19(b)(2)(viii)-7 and 19(b)(2)(x)-4 for guid-ance on other disclosures when this alternative disclo-sure rule is used.) Paragraph 19(b)(2)(vii) 1. Rate and payment caps. * * *
The creditor need not disclose each periodic or overall rate limitation that is currently available. As an alter-native, the creditor may disclose the range of the lowest and highest periodic and overall rate limitations that may be applicable to the creditor's ARM transac-tions. For example, the creditor might state: "The limitation on increases to your interest rate at each adjustment will be set at an amount in the following range: between 1 and 2 percentage points at each adjustment. The limitation on increases to your inter-est rate over the term of the loan will be set at an amount in the following range: between 4 and 7 percentage points above the initial interest rate." A creditor using this alternative rule must include a statement in its program disclosures suggesting that the consumer ask about the overall rate limitations currently offered for the creditor's ARM programs. (See comments 19(b)(2)(viii)-6 and 19(b)(2)(x)-3 for an explanation of the additional requirements for a cred-itor using this alternative rule for disclosure of periodic and overall rate limitations.) * * *
Digitized for FRASER http://fraser.stlouisfed.org/ Federal Reserve Bank of St. Louis
Legal Developments 367
Paragraph 19(b)(2)(viii) 1. Index movement. * * *
For the remaining ten years, 1982-1991, the creditor need only show the remaining index values, margin and interest rate and must continue to reflect all significant loan program terms such as rate limitations affecting them.) * * *
5. Term of the loan. In calculating the payments and loan balances in the historical example, a creditor need not base the disclosures on each term to maturity or payment amortization that it offers. Instead, disclo-sures for ARMs may be based upon terms to maturity or payment amortizations of 5, 15 and 30 years, as follows: ARMs with terms or amortizations from over 1 year to 10 years may be based on a 5-year term or amortization; ARMs with terms or amortizations from over 10 years to 20 years may be based on a 15-year term or amortization; and ARMs with terms or amor-tizations over 20 years may be based on a 30-year term or amortization. Thus, disclosures for ARMs offered with any term from over 1 year to 40 years may be based solely on terms of 5, 15 and 30 years. Of course, a creditor may always base the disclosures on the actual terms or amortizations offered. If the creditor bases the disclosures on 5-, 15- or 30-year terms or payment amortizations as provided above, the term or payment amortization used in making the disclosure must be stated. 6. Rate caps. A creditor using the alternative rule described in comment 19(b)(2)(vii)-l for disclosure of rate limitations must base the historical example upon the highest periodic and overall rate limitations dis-closed under section 226.19(b)(2)(vii). In addition, the creditor must state the limitations used in the historical example. (See comment 19(b)(2)(x)-3 for an explana-tion of the use of the highest rate limitation in other disclosures.) 7. Frequency of adjustments. In certain transactions, creditors may use the alternative rule described in comment 19(b)(2)(vi)-l for disclosure of the frequency of rate and payment adjustments. In such cases, the creditor may assume for purposes of the historical example that the first adjustment occurred at the end of the first full year in which the adjustment could occur. For example, in an ARM in which the first adjustment may occur between 6 and 18 months after closing and annually thereafter, the creditor may as-sume that the first adjustment occurred at the end of the first year in the historical example. (See comment 19(b)(2)(x)-4 for an explanation of how to compute the maximum interest rate and payment when the initial adjustment period is not known.)
Paragraph 19(b)(2)(ix) 1. Calculation of payments. * * *
However, in transactions in which the latest payment shown in the historical example is not for the latest year of index values shown (such as in a five-year loan), a creditor may provide additional examples based on the initial and maximum payments disclosed under section 226.19(b)(x). * * *
Paragraph 19(b)(2)(x)
2. Term of the loan. In calculating the initial and maximum payments, the creditor need not base the disclosures on each term to maturity or payment amortization offered under the program. Instead, the creditor may follow the rules set out in comment 19(b)(2)(viii)-5. In calculating the initial and maximum payment, the terms to maturity or payment amortiza-tions selected for the purpose of making disclosures under section 226.19(b)(2)(viii) must be used. In addi-tion, creditors must state the term or payment amor-tization used in making the disclosures under this section. 3. Rate caps. A creditor using the alternative rule for disclosure of interest rate limitations described in comment 19(b)(2)(vii)-l must calculate the maximum interest rate and payment based upon the highest periodic and overall rate limitations disclosed under section 226.19(b)(2)(vii). In addition, the creditor must state the rate limitations used in calculating the maxi-mum interest rate and payment. (See comment 19(b)(2)(viii)-6 for an explanation of the use of the highest rate limitation in other disclosures.) 4. Frequency of adjustments. In certain transactions, a creditor may use the alternative rule for disclosure of the frequency of rate and payment adjustments de-scribed in comment 19(b)(2)(vi)-l. In such cases, the creditor must base the calculations of the initial and maximum rates and payments upon the earliest possi-ble first adjustment disclosed under section 226.19(b)(2)(vi). (See comment 19(b)(2)(viii)-7 for an explanation of how to disclose the historical example when the initial adjustment period is not known.)
Section 226.20—Subsequent Disclosure Requirements
20(c) Variable-Rate Adjustments
Digitized for FRASER http://fraser.stlouisfed.org/ Federal Reserve Bank of St. Louis
368 Federal Reserve Bulletin • May 1989
Paragraph 20(c)(4) 1. Contractual effects of the adjustment. * * *
In transactions where paying the periodic payments will not fully amortize the outstanding balance at the end of the loan term and where the final payment will equal the periodic payment plus the remaining unpaid balance, the amount of the adjusted payment must be disclosed if such payment has changed as a result of the rate adjustment. * * *
Paragraph 20(c)(5) 1. Fully-amortizing payment. This paragraph requires a disclosure only when negative amortization occurs as a result of the adjustment. A disclosure is not required simply because a loan calls for non-amor-tizing or partially amortizing payments. For example, in a transaction with a five-year term and payments based on a longer amortization schedule, and where the final payment will equal the periodic payment plus the remaining unpaid balance, the creditor would not have to disclose the payment necessary to fully amor-tize the loan in the remainder of the five-year term. A disclosure is required, however, if the payment dis-closed under section 226.20(c)(4) is not sufficient to prevent negative amortization in the loan. The adjust-ment notice must state the payment required to pre-vent negative amortization. (This paragraph does not apply if the payment disclosed in section 226.20(c)(4) is sufficient to prevent negative amortization in the loan but the final payment will be a different amount due to rounding.)
Subpart D—Miscellaneous
Section 226.25—Record Retention
25(a) General Rule
3. Certain variable-rate transactions. In variable-rate transactions that are subject to the disclosure require-ments of section 226.19(b), written procedures for compliance with those requirements as well as a sample disclosure form for each loan program repre-sent adequate evidence of compliance. (See comment 25(a)-2 pertaining to permissible methods of retaining the required disclosures.)
Section 226.30—Limitation on Rates
8. Manner of stating the maximum interest rate. The maximum interest rate must be stated in the credit contract either as a specific amount or in any other manner that would allow the consumer to easily ascer-tain, at the time of entering into the obligation, what the rate ceiling will be over the term of the obligation. * * *
13. Transition rules. * * * On or after that date, creditors must have the maximum rate set forth in their credit contracts and, where applicable, as part of their truth in lending disclosures in the manner pre-scribed in the applicable sections of the regulation.
AMENDMENT TO REGULATION CC
The Board of Governors is amending 12 C.F.R. Part 229, its Regulation CC (Availability of Funds and Collection of Checks), with respect to the law of Wisconsin. The Expedited Funds Availability Act provides standards for determining whether state law governing funds availabil-ity supersedes or is preempted by federal law. Under Regulation CC, the Board will issue preemption determi-nations upon request.
Effective March 31, 1989, 12 C.F.R. Part 229 is amended as follows:
1. The authority citation for 12 C.F.R. Part 229 con-tinues to read as follows:
Authority: Title VI of Pub. L. 100-86, 101 Stat. 552, 635, 12 U.S.C. §§ 4001 et seq.
2. Appendix F is amended by adding a preemption determination for the state of Wisconsin alphabetically to read as follows:
APPENDIX F—OFFICIAL BOARD INTERPRETATIONS
Wisconsin
Background
The Board has been requested, in accordance with section 229.20(d) of Regulation CC (12 C.F.R. Part 229), to determine whether the Expedited Funds
Digitized for FRASER http://fraser.stlouisfed.org/ Federal Reserve Bank of St. Louis
Legal Developments 369
Availability Act (the Act) and Subpart B (and in connection therewith, Subpart A) of Regulation CC preempt the provisions of Wisconsin law concerning availability of funds. This preemption determination specifies those provisions of the Wisconsin funds availability law that are not preempted by the Act and Regulation CC. (See also the Board's preemption determination regarding the Uniform Commercial Code, section 4-213(5), pertaining to availability of cash deposits.)
Wisconsin Statutes §§ 404.213(4m), 215.136, and 186.117 require Wisconsin banks, savings and loan associations, and credit unions, respectively, to make funds deposited in accounts available for withdrawal within specified time frames. Generally, checks drawn on the U.S. Treasury, the State of Wisconsin, or on a local government located in Wisconsin must be made available for withdrawal by the second day following deposit. (The law governing commercial banks deter-mines availability based on banking day; the laws governing savings and loan associations and credit unions determine availability based on business days.) In-state and out-of-state checks must be made avail-able for withdrawal within five days and eight days following deposit, respectively. Exceptions are pro-vided for new accounts and reason to doubt collecti-bility. In addition, Wisconsin Statutes § 404.103 per-mits commercial banks to vary these availability requirements by agreement.
Coverage
Wisconsin law defines "account", with respect to the rules governing commercial banks, as "any account with a bank and includes a checking, time, interest or savings account" [Wisconsin Statutes § 404.104(l)(a)]. The stat-utes relating to the funds availability requirements appli-cable to savings and loan associations and credit unions do not define the term "account." The federal preemption of state funds availability requirements applies only to "accounts" subject to Regulation CC, which generally consist of transaction accounts. Regulation CC does not affect the Wisconsin law to the extent that the state law applies to deposits in savings, time, and other accounts (including transaction accounts where the account holder is a bank, foreign bank, or the U.S. Treasury) that are not "accounts" under Regulation CC. (Note, however, that under § 229.19(e) of Regulation CC, Holds on Other Funds, the federal availability schedules may apply to savings, time, and other accounts not defined as "accounts" under Regulation CC in certain circum-stances.)
The Wisconsin statute applies to "items" deposited in accounts. This term encompasses instruments that are not defined as "checks" in Regulation CC
(§ 229.2(k)), such as nonnegotiable instruments, and are therefore not subject to Regulation CC's provi-sions governing funds availability. Those items that are subject to Wisconsin law but are not subject to Regulation CC will continue to be covered by the state availability schedules and exceptions.
Availability Schedules
Temporary schedule. The Wisconsin statute requires that in-state nonlocal checks be made available for withdrawal not later than the fifth day following de-posit [Wisconsin Statutes §§ 404.213(4m)(b)(2); 215.136(2)(b); 186.117(2)(b)]. This time period is shorter than the seventh business day availability required for nonlocal checks under § 229.11(c) of Regulation CC, although it is not shorter than the schedules for nonlocal checks set forth in § 229.11(c)(2) and Appendix B-l of Regulation CC. Thus, the state schedule for in-state nonlocal checks supersedes the federal schedule to the extent that it applies to an item payable by a Wisconsin bank that is defined as a nonlocal check under Regulation CC and is not subject to reduced schedules under § 229.11(c)(2) and Appendix B-l.
Permanent schedule. Under the federal permanent availability schedule, nonlocal checks must be made available for withdrawal not later than the fifth busi-ness day following deposit. The fifth day availability requirement for in-state items in the Wisconsin statute supersedes the Regulation CC time period adjustment for withdrawal by cash or similar means in the perma-nent schedule, to the extent that the in-state checks are defined as nonlocal under Regulation CC.
Next-day availability. Under the Wisconsin statute, the proceeds of state and local government checks must be made available for withdrawal by the second day following deposit, if the check is indorsed only by the person to whom it was issued [Wisconsin Statutes §§ 404.213(4m)(b)(l); 215.136(2)(b); and 186.117(2)(a)l. Regulation CC requires next-day avail-ability for these checks if they are
(1) deposited in an account of a payee of the check, (2) deposited in a depositary bank located in the same state as the state or local government that issued the check, (3) deposited in person to an employee of the depositary bank, and (4) deposited with a special deposit slip, if the depositary bank informed its customers that use of such a slip is a condition to next-day availability.
Under the federal law, if a state or local government check is not deposited in person to an employee of the depositary bank, but meets the other conditions set forth in § 229.10(c)(l)(iv), the funds must be made
Digitized for FRASER http://fraser.stlouisfed.org/ Federal Reserve Bank of St. Louis
370 Federal Reserve Bulletin • May 1989
available for withdrawal not later than the second business day following deposit. The Wisconsin statute supersedes Regulation CC to the extent that the state law does not permit the use of a special deposit slip as a condition to receipt of second-day availability.
Exceptions to the schedules. Wisconsin law pro-vides exceptions to the state availability schedules for new accounts (those opened less than 90 days) and reason to doubt collectibility [Wisconsin Statutes §§ 404.213(4m)(b); 215.136(2); and 186.117(2)]. The state availability law also permits commercial banks to vary the funds availability requirements by agreement [Wisconsin Statute § 404.103(1)]. In all cases where the federal schedule preempts the state schedule, only the federal exceptions apply. For deposits that are covered by the state availability schedule (e.g., in-state nonlocal checks), a state exception must apply in order to extend the state availability schedule up to the federal availability schedule. Once the deposit is held up to the federal availability limit under a state excep-tion, the depositary bank may further extend the hold only if a federal exception can be applied to the deposit. Any time a depositary bank invokes an ex-ception to extend a hold beyond the time periods otherwise permitted by law, it must give notice of the extended hold to its customer in accordance with § 229.13(g) of Regulation CC.
Business day thanking day. The definitions of "bus-iness day" and "banking day" in the Wisconsin stat-utes are preempted by the Regulation CC definition of those terms. For determining the permissible hold under the Wisconsin schedules that supersede the Regulation CC schedule, deposits are considered available for withdrawal on the specified number of "business days" following the "banking day" of de-posit.
Wisconsin law considers funds to be deposited, for the purpose of determining when they must be made available for withdrawal, when an item is "received at the proof and transit facility of the depository." For the purposes of this preemption determination, funds are considered deposited under Wisconsin law in accordance with the rules set forth in § 229.19(a) of Regulation CC.
Disclosures
The Wisconsin statute does not require disclosure of a bank's funds availability policy. The state law does require, however, that a bank give notice to its cus-tomer if it extends the time within which funds will be available for withdrawal due to the bank's doubt as to the collectibility of the item [Wisconsin Statutes §§ 404.213(4m)(b); 215.136(2); and 186.117(2)].
Regulation CC preempts state disclosure require-ments concerning funds availability that relate to "accounts" that are inconsistent with the federal requirements. The state requirement is different from, and therefore inconsistent with, the federal disclosure rules [§ 229.20(c)(2)]. Thus, the Wisconsin statute is preempted by Regulation CC to the extent that the state notice requirement applies to "accounts" as defined by Regulation CC. The Wisconsin requirement would continue to apply to accounts, such as savings and time accounts, not governed by the Regulation CC disclosure requirements.
AMENDMENT TO REGULATION CC
The Board of Governors is amending 12 C.F.R. Part 229, its Regulation CC (Availability of Funds and Collection of Checks) and its Commentary (Appendix E to Regulation CC). The regulation requires banks to make funds available to their customers within speci-fied times, to disclose their funds availability policies to their customers, and to handle returned checks expeditiously. Since the publication of Regulation CC, the Board has received numerous requests from banks and others for clarification of various provisions of the regulation. The Board believes that the changes to Regulation CC and its Official Commentary (Appendix E) respond to many of these questions and will aid banks in understanding and complying with the regu-lation.
The effective date for the amendment to § 229.2(e) regarding agencies of foreign banks and the amend-ment to Appendix A is August 10, 1989. All other amendments are effective April 10, 1989. 12 C.F.R. Part 229 is amended as follows:
Part 229—Availability of Funds and Collection of Checks
1. The authority citation for 12 C.F.R. Part 229 con-tinues to read as follows:
Authority: Title VI of Pub. L. 100-86, 101 Stat. 552, 635, 12 U.S.C. 4001 et seq. 2. In section 229.2, paragraphs (e)(7), (z)(5), and (cc) are revised to read as follows:
Section 229.2—Definitions,
(e) "Bank" means —
Digitized for FRASER http://fraser.stlouisfed.org/ Federal Reserve Bank of St. Louis
Legal Developments 371
(7) An "agency" or a "branch" of a "foreign bank" as defined in section 1(b) of the International Bank-ing Act (12 U.S.C. § 3101).
(z) "Paying bank" means —
(5) The state or unit of general local government on which a check is drawn and to which it is sent for payment or collection.
(cc) "Returning bank" means a bank (other than the paying or depositary bank) handling a returned check or notice in lieu of return. A returning bank is also a collecting bank for purposes of U.C.C. § 4-202(2).
3. In section 229.13, the last sentence of paragraph (e)(2) concluding text is revised to read as follows:
Section 229.13—Exceptions.
(2) Overdraft and returned check fees. * * *
The notice must state that the customer may be entitled to a refund of overdraft or returned check fees that are assessed if the check subject to the exception is paid and how to obtain a refund.
4. In section 229.16, the last sentence of paragraph (c)(3) concluding text is revised to read as follows:
Section 229.16—Specific availability policy disclosure.
(3) Overdraft and returned check fees. * * *
The notice must state that the customer may be entitled to a refund of overdraft or returned check fees that are assessed if the check subject to the delay is paid and how to obtain a refund.
5. In section 229.19, paragraph (e) is revised to read as follows:
Section 229.19—Miscellaneous.
(e) Holds on other funds. (1) A depositary bank that receives a check for deposit in an account may not place a hold on any funds of the customer at the bank, where —
(i) The amount of funds that are held exceeds the amount of the check; or (ii) The funds are not made available for with-drawal within the times specified in 229.10, 229.11, 229.12, and 229.13.
(2) A depositary bank that cashes a check for a customer over the counter, other than a check drawn on the depositary bank, may not place a hold on funds in an account of the customer at the bank, if —
(i) The amount of funds that are held exceeds the amount of the check; or (ii) The funds are not made available for with-drawal within the times specified in 229.10, 229.11, 229.12, and 229.13.
6. In section 229.31, the last sentence of paragraph (b) is revised to read as follows:
Section 229.31—Returning bank's responsibility for return of checks.
(b) Unidentifiable depositary bank. * * *
A returning bank that receives a returned check from a paying bank under § 229.30(b), or from a returning bank under this paragraph, but that is able to identify the depositary bank, must thereafter return the check expeditiously to the depositary bank.
7. In section 229.32, the word "or" is removed at the end of paragraph (a)(2)(ii), paragraph (a)(2)(iii) is rede-signated as paragraph (a)(2)(iv), and a new paragraph (a)(2)(iii) is added to read as follows:
Section 229.32—Depositary bank's responsibility for returned checks.
(ct) ^ (2) * * * (iii) If the address in the indorsement is not in the same check processing region as the address asso-ciated with the routing number of the bank in its indorsement on the check, at a location consistent with the address in the indorsement and at a branch
Digitized for FRASER http://fraser.stlouisfed.org/ Federal Reserve Bank of St. Louis
372 Federal Reserve Bulletin • May 1989
or head office associated with the routing number in the bank's indorsement; or * * *
8. In section 229.34, paragraph (a)(1), the undesignated paragraph following paragraph (a)(4), paragraph (b), (b)(1), and the undesignated paragraph after paragraph (b)(3) are revised to read as follows:
Section 229.34—Warranties by paying and returning bank.
(a) Warranties. * * *
(1) The paying bank, or in the case of a check payable by a bank and payable through another bank, the bank by which the check is payable, returned the check within its deadline under the U.C.C., Regulation J (12 C.F.R. Part 210), or § 229.30(c) of this part;
* * *
These warranties are not made with respect to checks drawn on the Treasury of the United States, U.S. Postal Service money orders, or checks drawn on a state or a unit of general local government that are not payable through or at a bank. (b) Warranty of notice of nonpayment. Each paying bank that gives a notice of nonpayment warrants to the transferee bank, to any subsequent transferee bank, to the depositary bank, and to the owner of the check that —
(1) The paying bank, or in the case of a check payable by a bank and payable through another bank, the bank by which the check is payable, returned or will return the check within its deadline under the U.C.C., Regulation J (12 C.F.R. Part 210), or § 229.30(c) of this part; * * *
These warranties are not made with respect to checks drawn on a state or a unit of general local government that are not payable through or at a bank.
9. In section 229.38(d), the first sentence is revised to read as follows:
Section 229.38—Liability.
(d) Responsibility for back of check. A paying bank, or in the case of a check payable through the paying bank and payable by another bank, the bank by which the check is payable, is responsible for damages under paragraph (a) of this section to the extent that the
condition of the check when issued by it or its cus-tomer adversely affects the ability of a bank to indorse the check legibly in accordance with § 229.35. * * *
APPENDIX A —[AMENDED]
10. Appendix A is amended by adding a new routing number to the list, under the heading Federal Home Loan Banks, in numerical order, as follows:
1130 1750 8
APPENDIX E —[AMENDED]
Section 229.2—[Amended]
11. The Commentary to section 229.2 is amended as follows:
a. In paragraph (d), removing the last sentence of the second paragraph and replacing it with two new sentences.
(d) Available for withdrawal. * * *
For purposes of this regulation, funds are considered available for withdrawal even though they are being held by the bank to satisfy an obligation of the cus-tomer other than the customer's potential liability for the return of the check. For example, funds are available for withdrawal even though they are being held by a bank to satisfy a garnishment, tax levy, or court order restricting disbursements from the ac-count, or to satisfy the customer's liability arising from the certification of a check, sale of a cashier's or teller's check, guaranty or acceptance of a check, or similar transaction.
b. In paragraph (e), revising the second paragraph. (e) Bank.
* * *
"Bank" is defined to include depository institutions, such as commercial banks, savings banks, savings and loan associations, and credit unions as defined in the Act, and U.S. branches and agencies of foreign banks. For purposes of subpart B, the term does not include corporations organized under section 25(a) of the Federal Reserve Act, 12 U.S.C. § 611-631 (Edge corporations) or corporations having an agreement or undertaking with the Board under section 25 of the
Digitized for FRASER http://fraser.stlouisfed.org/ Federal Reserve Bank of St. Louis
Legal Developments 373
Federal Reserve Act, 12 U.S.C. § 601-604a (agree-ment corporations). For purposes of subpart C, and in connection therewith, subpart A, any Federal Reserve Bank, Federal Home Loan Bank, or any other person engaged in the business of banking is regarded as a bank. The phrase "any other person engaged in the business of banking" is derived from U.C.C. § 1-201(4), and is intended to cover entities that han-dle checks for collection and payment, such as Edge and agreement corporations, commercial lending com-panies under 12 U.S.C. § 3101, certain industrial banks, and private bankers, so that virtually all checks will be covered by the same rules for forward collec-tion and return, even though they may not be covered by the requirements of subpart B. For the purposes of subpart C, and in connection therewith, subpart A, the term may also include a state or a unit of general local government to the extent that it pays warrants or other drafts drawn directly on the state or local gov-ernment itself, and the warrants or other drafts are sent to the state or local government for payment or collection.
c. In paragraphs (f) and (g), revising the last para-graph.
(f) Banking day and (g) Business day. * * *
The definition of "banking day" is phrased in terms of when "an office of a bank is open" to indicate that a bank may observe a banking day on a per-branch basis. A deposit made at an ATM or off-premise facility (such as a remote depository or a lock box) is considered made at the branch holding the account into which the deposit is made for the purpose of determining the day of deposit. All other deposits are considered made at the branch at which the deposit is received. For example, under 229.19(a)(1), funds de-posited at an ATM are considered deposited at the time they are received at the ATM. The day of deposit for such funds is determined by the banking day at the account-holding branch at the time the funds are received at the ATM. Similarly, under § 229.19(a)(3), funds deposited to a night depository, lock box, or similar facility are considered deposited when the funds are removed from the facility and are available for processing. If such a facility is not on the premises of a branch, the day of deposit is determined by the banking day at the account-holding branch. If such a facility is on branch premises, the day of deposit is determined by the banking day at the branch at which the deposit is received, whether or not it is the account-holding branch.
d. In paragraph (i), removing the second sentence
and replacing it with two new sentences, and remov-ing the last sentence and replacing it with four new sentences.
(i) Cashier's check. * * *
The definition of cashier's check includes checks provided to a customer of the bank in connection with customer deposit account activity, such as account disbursements and interest payments. The definition also includes checks acquired from a bank by non-customers for remittance purposes, including loan disbursement checks. * * *
The definition excludes checks that a bank draws on itself for other purposes, such as to pay employees and vendors, and checks issued by the bank in connection with a payment service, such as a payroll or a bill-paying service. Cashier's checks are generally sold by banks to substitute the bank's credit for the custom-er's credit and thereby enhance the collectibility of the checks. A check issued in connection with a payment service is generally provided as a conve-nience to the customer rather than as a guarantee of the check's collectibility. In addition, such checks are often more difficult to distinguish from other types of checks than are cashier's checks as defined by this regulation.
e. In paragraph (k), revising the last paragraph. (k) Check * * *
The definition of check does not include an instrument payable in a foreign currency (i.e., other than in United States money as defined in 31 U.S.C. 5101) or a credit card draft (i.e., a sales draft used by a merchant or a draft generated by a bank as a result of a cash advance). The definition of check includes a check that a bank may supply to a customer as a means of accessing a credit line without the use of a credit card.
f. In paragraph (u), adding a new sentence to the end of the second paragraph.
(u) Noncash item. * * *
(In the context of this definition, "paying bank" refers to the paying bank as defined for purposes of sub-part C.)
g. In paragraph (cc), revising the last sentence and adding a new sentence immediately following.
(cc) Returning bank * * *
A returning bank is also a collecting bank for the purpose of a collecting bank's duty to act seasonably under U.C.C. § 4-202(2) and is analogous to a collect-
Digitized for FRASER http://fraser.stlouisfed.org/ Federal Reserve Bank of St. Louis
374 Federal Reserve Bulletin • May 1989
ing bank for purposes of final settlement. (See Com-mentary to § 229.35(b)).
h. In paragraph (gg), removing the fourth sentence and replacing it with seven new sentences.
(gg) Teller's check * * *
The definition does not include checks that are drawn by a nonbank on a nonbank even if payable through or at a bank. The definition includes checks provided to a customer of the bank in connection with customer deposit account activity, such as account disburse-ments and interest payments. The definition also in-cludes checks acquired from a bank by a noncustomer for remittance purposes, including loan disbursement checks. The definition excludes checks used by the bank to pay employees or vendors and checks issued by the bank in connection with a payment service, such as a payroll or a bill-paying service. Teller's checks are generally sold by banks to substitute the bank's credit for the customer's credit and thereby enhance the collectibility of the checks. A check issued in connection with a payment service is gener-ally provided as a convenience to the customer rather than as a guarantee of the check's collectibility. In addition, such checks are often more difficult to dis-tinguish from other types of checks than are teller's checks as defined by this regulation. * * *
i. Adding a new paragraph (kk) immediately follow-ing paragraph (ii).
(kk) Unit of general local government is defined to include a city, county, parish, town, township, village, or other general purpose political subdivision of a state. The term does not include special purpose units, such as school districts, water districts, or Indian nations.
Section 229.10 —[Amended]
12. The Commentary to section 229.10(c) is amended as follows:
a. In paragraph (c) introductory text, revising the last sentence and adding two sentences to follow.
(c) Certain check deposits. * * *
For the purposes of this section, all checks drawn on a Federal Reserve Bank or a Federal Home Loan Bank that contain in the MICR line a routing number that is listed in Appendix A are subject to the next-day availability requirement if they are deposited in an account held by a payee of the check and in person to an employee of the depositary bank, regardless of the purposes for which the checks were issued. For all new accounts, even if the new account exception is not invoked, traveler's checks must be included in the
$5,000 aggregation of checks deposited on any one banking day that are subject to the next-day availabil-ity requirement. (See § 229.13(a)).
b. Revising the heading "Deposit at Staffed Teller Station" and the first paragraph under that heading.
Deposits Made to an Employee of the Depositary Bank
In most cases, next-day availability of the proceeds of checks subject to this section is conditioned on the deposit of these checks in person to an employee of the depositary bank. If the deposit is not made to an employee of the depositary bank on the premises of such bank, the proceeds of the deposit must be made available for withdrawal by the start of business on the second business day after deposit, under paragraph (c)(2) of this section. For example, second-day avail-ability rather than next-day availability would be al-lowed for deposits of checks subject to this section made at a proprietary ATM (and at a nonproprietary ATM under the permanent schedule), night deposi-tory, through the mail or a lock box, or at a teller station staffed by a person that is not an employee of the depositary bank. Second-day availability may also be allowed for deposits picked up by an employee of the depositary bank at the customer's premises; such deposits would be considered made upon receipt at the branch or other location of the depositary bank.
c. Removing the heading "Fees for Withdrawals" and the paragraph appearing under it. d. In the fifth paragraph under the heading "Special Deposit Slips," revising the second sentence.
Special Deposit Slips
* * *
If a bank only provides the special deposit slips upon the request of a depositor, however, the teller must advise the depositor of the availability of the special deposit slips, or the bank must post a notice advising customers that the slips are available upon request. * * *
13. The Commentary to section 229.11(c) is amended by revising the first sentence to read as follows:
Section 229.11—Temporary Availability Schedule
(c) Nonlocal checks. Under the temporary schedule, funds deposited by nonlocal checks must be made
Digitized for FRASER http://fraser.stlouisfed.org/ Federal Reserve Bank of St. Louis
Legal Developments 375
available for withdrawal not later than the seventh business day following the banking day the funds are deposited, except in the case of deposits in accounts of banks located outside the 48 contiguous states. * * *
14. The Commentary to section 229.13(b) is amended by adding a new sentence after the second sentence in paragraph (b) introductory text to read as follows:
Section 229.13—Exceptions
(b) Large Deposits. * * *
When the large deposit exception is applied to deposits composed of both local and nonlocal checks, the depositary bank has the discretion to choose the portion of the deposit to which it applies the excep-tion. * * *
15. The Commentary to section 229.16 is amended by adding two new paragraphs to paragraph (a) and adding a new paragraph at the end of paragraph (b) to read as follows:
Section 229.16—Specific Availability Policy Disclosure
(a) General. * * *
The disclosure must reflect the policy and practice of the bank regarding availability as to most accounts and most deposits into those accounts. In disclosing the availability policy that it follows in most cases, a bank may provide a single disclosure that reflects one policy to all its transaction account customers, even though some of its customers may receive faster availability than that reflected in the policy disclosure. Thus, a bank need not disclose to some customers that they receive faster availability than indicated in the disclo-sure. If, however, a bank has a policy of imposing delays in availability on any customers longer than those specified in its disclosure, those customers must receive disclosures that reflect the longer applicable availability periods.
A bank may disclose that funds are "available for withdrawal" on a given day notwithstanding the fact that the bank uses the funds to pay checks received before that day. For example, a bank may disclose that its policy is to make funds available from deposits of local checks on the second business day following the
day of deposit, even though it may use the deposited funds to pay checks prior to the second business day; the funds used to pay checks in this example are not available for withdrawal until the second business day after deposit because the funds are not available for all uses until the second business day. (See the definition of "available for withdrawal" in § 229.2(d).) (b) Content of Specific Policy Disclosure. * * *
A bank that provides availability based on when the bank generally receives credit for deposited checks need not disclose the time when a check drawn on a specific bank will be available for withdrawal. Instead, the bank may disclose the categories of deposits that must be available on the first business day after the day of deposit (deposits subject to § 229.10) and state the other categories of deposits and the time periods that will be applicable to those deposits. For example, a bank might disclose the four-digit Federal Reserve routing symbol for local checks and indicate that such checks as well as certain nonlocal checks will be available for withdrawal on the first or second business day following the day of deposit, depending on the location of the particular bank on which the check is drawn, and disclose that funds from all other checks will be available on the second or third business day. The bank must also disclose that the customer may request a copy of the bank's detailed schedule that would enable the customer to determine the availabil-ity of any check and must provide such schedule upon request. A change in the bank's detailed schedule would not trigger the change in policy disclosure requirement of § 229.18(e).
Section 229.19 —[Amended]
16. The Commentary to section 229.19 is amended as follows:
a. Adding a new sentence after the third sentence of paragraph (a) introductory text and removing the last sentence of the last paragraph and adding a new paragraph at the end thereof.
(a) When Funds Are Considered Deposited. * * *
Funds deposited to a deposit box in a bank lobby that is accessible to customers only during regular business hours are generally considered deposited when placed in the lobby box; a bank may, however, treat deposits to lobby boxes the same as deposits to night deposi-tories (as provided in § 229.19(a)(3)), provided a notice appears on the lobby box informing the customer when such deposits will be considered received. * * *
Digitized for FRASER http://fraser.stlouisfed.org/ Federal Reserve Bank of St. Louis
376 Federal Reserve Bulletin • May 1989
A bank is not required to remain open until 2:00 p.m. If a bank closes before 2:00 p.m., deposits received after the closing may be considered received on the next banking day. Further, as § 229.2(f) defines the term "banking day" as the portion of a business day on which a bank is open to the public for substantially all of its banking functions, a day, or a portion of a day, is not necessarily a banking day merely because the bank is open for only limited functions, such as keeping drive-in or walk-up teller windows open, when the rest of the bank is closed to the public. For example, a banking office that usually provides a full range of banking services may close at 12:00 noon but leave a drive-in teller window open for the limited purpose of receiving deposits and making cash with-drawals. Under those circumstances, the bank is con-sidered closed and may consider deposits received after 12:00 noon as having been received on the next banking day. The fact that a bank may reopen for substantially all of its banking functions after 2:00 p.m., or that it continues its back office operations throughout the day, would not affect this result. A bank may not, however, close individual teller stations and reopen them for next-day's business before 2:00 p.m. during a banking day.
b. In paragraph (e), revising the second paragraph and adding a third paragraph.
(e) Holds on other funds. * * *
This paragraph clarifies that if a customer deposits a check in an account (as defined in § 229.2(a)), the bank may not place a hold on any of the customer's funds so that the funds that are held exceed the amount of the check deposited or the total amount of funds held are not made available for withdrawal within the times required in this subpart. For example, if a bank places a hold on funds in a customer's nontransaction account, rather than a transaction account, for deposits made to the customer's transac-tion account, the bank may place such a hold only to the extent that the funds held do not exceed the amount of the deposit and the length of the hold does not exceed the time periods permitted by this regula-tion.
These restrictions also apply to holds placed on funds in a customer's account (as defined in § 229.2(a)) if a customer cashes a check at a bank (other than a check drawn on that bank) over the counter. The regulation does not prohibit holds that may be placed on other funds of the customer for checks cashed over the counter, to the extent that the transaction does not involve a deposit to an account. A bank may not, however, place a hold on any account when an on us check is cashed over the counter. On us checks are
considered finally paid when cashed (See U.C.C. § 4 -213(l)(a)). 17. The Commentary to section 229.20(c) is revised to read as follows:
Section 229.20—Relation to State Law
(c) Standards for preemption. This section describes the standards the Board will use in making determina-tions on whether federal law will preempt state laws governing funds availability. A provision of state law is considered inconsistent with federal law if it permits a depositary bank to make funds available to a cus-tomer in a longer period of time than the maximum period permitted by the Act and this regulation. For example, a state law that permits a hold of four business days or longer for local checks permits a hold that is longer than that permitted under the Act and this regulation, and therefore is inconsistent and pre-empted. State availability schedules that provide for availability in a shorter period of time than required under Regulation CC supersede the federal schedule.
Under a state law, some categories of deposits could be available for withdrawal sooner or later than the time required by this subpart, depending on the com-position of the deposit. For example, the Act and this regulation (§ 229.10(c)(l)(vii)) require next-day avail-ability for the first $100 of the aggregate deposit of local or nonlocal checks on any day, and a state law could require next-day availability for any check of $100 or less that is deposited. Under the Act and this regulation, if either one $150 check or three $50 checks are deposited on a given day, $100 must be made available for withdrawal on the next business day, and $50 must be made available in accordance with the local or nonlocal schedule. Under the state law, how-ever, the two deposits would be subject to different availability rules. In the first case, none of the pro-ceeds of the deposit would be subject to next-day availability; in the second case, the entire proceeds of the deposit would be subject to next-day availability. In this example, because the state law would, in some situations, permit a hold longer than the maximum permitted by the Act, this provision of state law is inconsistent and preempted in its entirety.
In addition to the differences between state and federal availability schedules, a number of state laws contain exceptions to the state availability schedules that are different from those provided under the Act and this regulation. The state exceptions continue to apply only in those cases where the state schedule is shorter than or equal to the federal schedule, and then only up to the limit permitted by the Regulation CC schedule. Where a deposit is subject to a state excep-
Digitized for FRASER http://fraser.stlouisfed.org/ Federal Reserve Bank of St. Louis
Legal Developments 377
tion under a state schedule that is not preempted by Regulation CC and is also subject to a federal excep-tion, the hold on the deposit cannot exceed the hold permissible under the federal exception in accordance with Regulation CC. In such cases, only one exception notice is required, in accordance with § 229.13(g). This notice need only include the applicable federal excep-tion as the reason the exception was invoked. For those categories of checks for which the state schedule is preempted by the federal schedule, only the federal exceptions may be used.
State laws that provide maximum availability peri-ods for categories of deposits that are not covered by the Act would not be preempted. Thus, state funds availability laws that apply to funds in time and savings deposits are not affected by the Act or this regulation. In addition, the availability schedules of several states apply to "items" deposited to an ac-count. The term "items" may encompass deposits, such as nonnegotiable instruments, that are not sub-ject to the Regulation CC availability schedules. De-posits that are not covered by Regulation CC continue to be subject to the state availability schedules. State laws that provide maximum availability periods for categories of institutions that are not covered by the Act would also not be preempted. For example, a state law that governs money market mutual funds would not be affected by the Act or this regulation.
Generally, state rules governing the disclosure or notice of availability policies applicable to accounts are also preempted, if they are different from the federal rules. Nevertheless, a state law requiring dis-closure of funds availability policies that apply to deposits other than "accounts," such as savings or time deposits, are not inconsistent with the Act and this subpart. Banks in these states would have to follow the state disclosure rules for these deposits.
Section 229.30—[Amended]
18. The Commentary to section 229.30 is amended as follows:
a. In paragraph (a), under the fourth numbered example, adding a new sentence to the end of the third paragraph and adding a new sentence to the end of the eighth paragraph.
(a) Return of checks. * * *
Examples
* * *
If a paying bank returns a check on its banking day of receipt without paying for the check, as permitted under U.C.C. § 4-302(a), and receives settlement for the returned check from a returning bank, it must promptly pay the amount of the check to the collecting bank from which it received the check.
* * *
Also, a paying bank is not responsible for failure to make expeditious return to a party that has breached a presentment warranty under U.C.C. § 4-207(1), not-withstanding that the paying bank has returned the check. (See Commentary to section 229.30(a).)
b. In paragraph (b), revising the fourth sentence of the second paragraph and adding two new sentences to immediately follow, and revising the first sen-tence of the third paragraph.
(b) Unidentifiable depositary bank. * * *
A paying bank returning a check under this paragraph to a bank that has not agreed to handle the check expeditiously must advise that bank that it is unable to identify the depositary bank. This advice must be conspicuous, such as a stamp on each check for which the depositary bank is unknown if such checks are commingled with other returned checks, or, if such checks are sent in a separate cash letter, by one notice on the cash letter. The returned check may not be prepared for automated return. * * *
The sending of a check to a bank that handled the check for forward collection under this paragraph is not subject to the requirements for expeditious return by the paying bank. * * *
c. Revising paragraph (f) introductory text. (f) Notice in Lieu of Return. A check that is lost or otherwise unavailable for return may be returned by sending a legible copy of both sides of the check or, if such a copy is not available to the paying bank, a written notice of nonpayment containing the informa-tion specified in § 229.33(b). The copy or written notice must clearly indicate it is a notice in lieu of return and must be handled in the same manner as other returned checks. Notice by telephone, tele-graph, or other electronic transmission, other than a legible facsimile or similar image transmission of both sides of the check, does not satisfy the requirements
Digitized for FRASER http://fraser.stlouisfed.org/ Federal Reserve Bank of St. Louis
378 Federal Reserve Bulletin • May 1989
for a notice in lieu of return. The requirement for a writing and the indication that the notice is a substitute for the returned check is necessary so that the return-ing and depositary banks are informed that the notice carries value. Notice in lieu of return is permitted only when a bank does not have and cannot obtain posses-sion of the check or must retain possession of the check for protest. A check is not unavailable for return if it is merely difficult to retrieve from a filing system or from storage by a keeper of checks in a truncation system. A notice in lieu of return may be used by a bank handling a returned check that has been lost or destroyed, including when the original returned check has been charged back as lost or destroyed as provided in § 229.35(b). A bank using a notice in lieu of return gives a warranty under § 229.34(a)(4) that the original check has not been and will not be returned.
Section 229.31—[Amended]
19. The Commentary to section 229.31 is amended as follows:
a. In paragraph (b), revising the last sentence of the introductory text and revising the last paragraph.
(b) Unidentifiable depositary bank. * * *
In the limited cases where the returning bank cannot identify the depositary bank, the returning bank may send the returned check to a returning bank that agrees to handle the returned check for expeditious return under § 229.31(a), or it may send the returned check to a bank that handled the check for forward collection, even if that bank does not agree to handle the returned check expeditiously under § 229.31(a).
* * *
As in the case of a paying bank returning a check under § 229.30(b), a returning bank returning a check under this paragraph to a bank that has not agreed to handle the check expeditiously must advise that bank that it is unable to identify the depositary bank. This advice must be conspicuous, such as a stamp on each check for which the depositary bank is unknown if such checks are commingled with other returned checks, or, if such checks are sent in a separate cash letter, by one notice on the cash letter. The returned check may not be prepared for automated return.
b. In paragraph (c), revising the parenthetical at the end of the second paragraph.
(c) Settlement. * * *
* * * (See section 229.36(d) and Commentary to sec-tion 229.35(b).)
c. In paragraph (f), adding a new sentence before the parenthetical phrase.
(f) Notice in lieu of return. * * *
Notice in lieu of return is permitted only when a bank does not have and cannot obtain possession of the check or must retain possession of the check for protest. A check is not unavailable for return if it is merely difficult to retrieve from a filing system or from storage by a keeper of checks in a truncation system. * * *
20. The Commentary to section 229.32(a) is amended by redesignating item 2(iii) as 2(iv), adding a new item 2(iii), and adding a new paragraph after the last para-graph to read as follows:
Section 229.32—Depository Bank's Responsibility for Returned Checks
(a) Acceptance of returned checks. * * *
2 * * * (iii) The depositary bank must accept returned checks at the address in its indorsement and at an address associated with its routing number in the indorsement if the written address in the indorse-ment and the address associated with the routing number in the indorsement are not in the same check processing region. Under §§ 229.30(g) and 229.31(g), a paying or returning bank may rely on the depositary bank's routing number in its indor-sement in handling returned checks and is not required to send returned checks to an address in the depositary bank's indorsement that is not in the same check processing region as the address associated with the routing number in the in-dorsement.
Under section 229.33(d), a depositary bank receiv-ing a returned check or notice of nonpayment must send notice to its customer by its midnight deadline or within a longer reasonable time.
Section 229.33—[Amended]
21. The Commentary to section 229.33 is amended as follows:
Digitized for FRASER http://fraser.stlouisfed.org/ Federal Reserve Bank of St. Louis
Legal Developments 379
a. In paragraph (a), adding a new paragraph at the end thereof.
(a) Requirement. * * *
Unless the returned check is used to satisfy the notice requirement, the requirement for notice is independent of and does not affect the requirements for timely and expeditious return of the check under § 229.30 and the U.C.C. (See § 229.30(a).) If a paying bank fails both to comply with this section and to comply with the requirements for timely and expeditious return under § 229.30 and the U.C.C. and Regulation J (12 C.F.R. Part 210), the paying bank shall be liable under either this section or such other requirements, but not both. (See § 229.38(b).) A paying bank is not responsible for failure to give notice of nonpayment to a party that has breached a presentment warranty under U.C.C. sec-tion 4-207(1), notwithstanding that the paying bank may have returned the check. (See U.C.C. §§ 4-207(1) and 4-302.)
b. In paragraph (d), revising the first sentence. (d) Notification to Customer. This paragraph requires a depositary bank to notify its customer of nonpay-ment upon receipt of a returned check or notice of nonpayment, regardless of the amount of the check or notice. * * *
22. The Commentary to section 229.34(a) is amended by revising the first and last sentence thereof to read as follows:
Section 229.34—Warranties by Paying Bank and Returning Bank
(a) Warranty of returned checks. This paragraph in-cludes warranties that a returned check, including a notice in lieu of return, was returned by the paying bank, or in the case of a check payable by a bank and payable through another bank, the bank by which the check is payable, within the deadline under the U.C.C., Regulation J, or 229.30(c); that the paying or returning bank is authorized to return the check; that the returned check has not been materially altered; and that, in the case of notice in lieu of return, the original check has not and will not be returned (see Commentary to § 229.30(f)). * * *
These warranties do not apply to checks drawn on the United States Treasury, to Postal Service money orders, or to checks drawn on a state or a unit of general local government that are not payable through or at a bank (see § 229.42).
Section 229.35—[Amended]
23. The Commentary to section 229.35 is amended as follows:
a. In paragraph (a), adding two sentences to the end of the fourth paragraph, revising the first two sen-tences in the fifth paragraph, and adding a sentence to the end of the last paragraph.
(a) Indorsement Standards. * * *
* * *
Depositary banks should not include information that can be confused with required information. For exam-ple, a nine-digit zip code could be confused with the nine-digit routing number.
A depositary bank is not required to place a street address in its indorsement; however, a bank may want to put an address in its indorsement in order to limit the number of locations at which it must accept returned checks. In instances where this address is not consistent with the routing number in the indorsement, the depositary bank is required to accept returned checks at a branch or head office consistent with the routing number. Banks should note, however, that § 229.32 requires a depositary bank to accept returned checks at the location(s) it accepts forward collection checks. * * *
* * *
The standard requires collecting and returning banks to indorse the check for tracing purposes.
b. In paragraph (b), adding four sentences to the end of the fifth paragraph and adding a new paragraph after the fifth paragraph.
(b) Liability of bank handling check. * * *
* * *
Nor does this paragraph affect a collecting bank's accountability under U.C.C. §§ 4-211(2) and (3) and 4-213(3). A collecting bank becomes accountable upon receipt of final settlement as provided in the foregoing U.C.C. sections. The term "final settle-ment" in §§ 229.31(c), 229.32(b), and 229.36(d) is intended to be consistent with the use of the term "final settlement" in the U.C.C. (e.g., U.C.C. §§ 4 -211, 4-212, and 4-213). (See also § 229.2(cc) and Commentary.)
This paragraph also provides that a bank may have the rights of a "holder" based on the handling of the
Digitized for FRASER http://fraser.stlouisfed.org/ Federal Reserve Bank of St. Louis
380 Federal Reserve Bulletin • May 1989
check for collection or return. A bank may become a holder or a holder in due course regardless of whether prior banks have complied with the indorsement stan-dard in § 229.35(a) and Appendix D.
24. The Commentary to section 229.37 is amended by revising the second sentence of the first paragraph and revising the second paragraph to read as follows:
Section 229.37—Variations by Agreement
* * *
To achieve consistency, the official comment to U.C.C. §4-103(1) (which in turn follows U.C.C. § 1-201(3)) should be followed in construing this sec-tion. * * *
The Board has not followed U.C.C. § 4-103(2), which permits Federal Reserve regulations and oper-ating letters, clearinghouse rules, and the like to apply to parties that have not specifically assented. Never-theless, this section does not affect the status of such agreements under the Uniform Commercial Code.
25. In the Commentary to section 229.38(d), the first two sentences of the second paragraph are revised to read as follows:
Section 229.38—Liability
(d) Responsibility for back of check. * * *
The paying bank or, in the case of a check payable through the paying bank and payable by another bank, the bank by which the check is payable, is responsible for the condition of the check when it is issued by it or its customer. (It would not be responsible for a check issued by a person other than such a bank or customer.) * * *
26. In the Commentary to Appendix C, under the heading "Models C-l Through C-7 Generally," a new paragraph is added after the fifth paragraph to read as follows:
APPENDIX C
Models C-l Through C-7 Generally
Banks that have used model forms C-l, C-2, or C-3 or have used forms C-4, C-5, C-6, or C-7 (which give social security benefits and payroll payments as exam-ples of preauthorized credits available the day after deposit) and that at the same time follow Treasury regulations (31 C.F.R. Part 210) and ACH association rules requiring that these credits be made available on the day the bank receives the funds are protected from civil liability under § 229.21(e). Such banks are encour-aged to disclose same-day availability for those elec-tronic payments when reordering supplies of forms.
AMENDMENT TO RULES REGARDING DELEGATION OF AUTHORITY
The Board of Governors is amending 12 C.F.R. Part 265, its Rules Regarding Delegation of Authority to delegate to each Federal Reserve Bank, after consul-tation with the Board's General Counsel, the authority to decide not to disapprove requests for director interlocks pursuant to section 205(8) of the Depository Institution Management Interlocks Act (12 U.S.C. 3204(8)) for diversified savings and loan holding com-panies.
Effective March 10, 1989, 12 C.F.R. Part 265 is amended as follows:
Part 265—Rules Regarding Delegation of Authority
1. The authority citation for 12 C.F.R. Part 265 con-tinues to read as follows:
Authority: Section ll(k), 38 Stat. 261 and 80 Stat. 1314; 12 U.S.C. 248(k).
2. A new paragraph (f)(49) is added to section 265.2 to read as follows:
Section 265.2—Specific functions delegated to Board employees and to Federal Reserve Banks.
^ * * * (49) Under the provisions of section 205(8) of the Depository Institution Management Interlocks Act (12 U.S.C. § 3204(8)), after consultation with the General Counsel of the Board, to decide not to disapprove notices to establish director interlocks with diversified savings and loan holding companies.
Digitized for FRASER http://fraser.stlouisfed.org/ Federal Reserve Bank of St. Louis
Legal Developments 381
ORDERS ISSUED UNDER BANK HOLDING COMPANY ACT
Orders Issued Under Section 3 of the Bank Holding Company Act
CB&T Bancshares, Inc. Columbus, Georgia
Order Approving Acquisition of a Bank
CB&T Bancshares, Inc., Columbus, Georgia ("CB&T"), a bank holding company within the mean-ing of the Bank Holding Company Act ("Act"), has applied for the Board's approval under section 3(a)(3) of the Act (12 U.S.C. § 1842(a)(3)) to acquire all of the voting shares of Farmers and Merchants Bank of Russell County, Phenix City, Alabama ("Bank").
Notice of the application, affording opportunity for interested persons to submit comments, has been published (54 Federal Register 999 (1989)). The time for filing comments has expired, and the Board has considered the application and all comments received in light of the factors set forth in section 3(c) of the Act.
Section 3(d) of the Act, the Douglas Amendment, prohibits the Board from approving an application by a bank holding company to acquire control of any bank located outside of the holding company's home state,1
unless such acquisition is "specifically authorized by the statute laws of the State in which [the] bank is located, by language to that effect and not merely by implication." 12 U.S.C. § 1842(d). Alabama state law permits a bank holding company located in a region that includes Georgia to acquire an Alabama bank or bank holding company, provided that Alabama bank holding companies are permitted to acquire banks or bank holding companies in the home state of the acquiring bank holding company on a reciprocal basis.2 Alabama law also requires that the banking organization to be acquired must have been in exist-ence and continuously operating for more than five years prior to the acquisition, and that the Alabama Superintendent of Banks approve the acquisition.
Georgia law also permits a bank holding company located in a region that includes Alabama to acquire a Georgia bank or bank holding company.3 Like Ala-bama, Georgia state law requires that the home state of the acquiring bank holding company permit acqui-
1. A bank holding company's home state is that state in which the operations of the bank holding company's banking subsidiaries were principally conducted on July 1, 1966, or the date on which the company became a bank holding company, whichever is later.
2. Ala. Code § 5-13A-3(l) (Supp. 1988). 3. Ga. Code Ann. § 7-1-621 (Supp. 1988).
sitions of banks and bank holding companies in that state by Georgia bank holding companies on a recip-rocal basis.
Based on its review of the relevant Alabama and Georgia statutes, the Board has determined that the Georgia statute satisfies the conditions of the Alabama regional reciprocal banking statute and that Alabama has by statute expressly authorized a Georgia bank holding company, such as CB&T, to acquire an Ala-bama bank holding company or bank, such as Bank. In this regard, Bank satisfies the longevity requirement in the Alabama statute, and the Alabama Superintendent of Banks has approved Applicant's proposal pursuant to the Alabama statute. Based on the foregoing, the Board has determined that the proposed acquisition is specifically authorized by the statute laws of Alabama and that Board approval of the proposal is not barred by the Douglas Amendment.
CB&T, a multi-bank holding company controlling 16 banking subsidiaries, is the sixth largest commercial banking organization in Georgia. CB&T controls 13 bank subsidiaries operating in Georgia with approxi-mately $1.6 billion in deposits, representing approxi-mately 3.7 percent of the total deposits in commercial banks in the state.4 Applicant also currently owns two bank subsidiaries in Florida, with total deposits of approximately $75.9 million, and another bank subsid-iary in Alabama, with total deposits of approximately $29.0 million. Based on the facts of this case, consum-mation of the proposal would have no significantly adverse effect on the concentration of resources in Alabama.
Applicant competes with Bank in the Columbus (Georgia) banking market ("Columbus market").5 Ap-plicant is the largest of eight commercial banking organizations in the market, controlling deposits of approximately $522.2 million, representing approxi-mately 42.6 percent of total deposits in commercial banking organizations in the market ("market deposits").6 Bank is the seventh largest commercial banking organization in the market, controlling depos-its of approximately $29.6 million, representing ap-proximately 2.4 percent of market deposits. Upon consummation, Applicant would remain the largest commercial banking organization in the market, con-trolling deposits of approximately $551.8 million, rep-resenting approximately 45.0 percent of total market deposits. The Columbus market is considered highly concentrated, with a Herfindahl-Hirschman Index
4. Data are as of September 30, 1988. 5. The Columbus market is approximated by Muscogee and Chat-
tahoochee counties in Georgia, Russell County in Alabama, and the city of Smiths in Lee County, Alabama.
6. Market data for commercial banks are as of June 30, 1987.
Digitized for FRASER http://fraser.stlouisfed.org/ Federal Reserve Bank of St. Louis
382 Federal Reserve Bulletin • May 1989
("HHI") of 2853, which would increase by 204 points to 3057 upon consummation of the proposal.7
Although consummation of this proposal would eliminate some existing competition in the Columbus market, seven commercial banks would continue to operate in the market after consummation of this proposal.8 In addition, the Board has considered the presence of thrift institutions in this market. The Board has previously indicated that thrift institutions have become, or have the potential to become, major competitors of commercial banks.9 In the Columbus market, thrift institutions account for a significant percentage of the total deposits.10 Based upon the size and market share of thrift institutions, the Board has concluded that thrift institutions exert a significant competitive influence that mitigates the anticompeti-tive effects of this proposal in this banking market.11
Based on the facts of record, the Board concludes that consummation of the proposal would not have a significantly adverse effect on competition in the Co-lumbus market or in any other relevant market.
The financial and managerial resources of Applicant and its subsidiaries, and Bank, are consistent with approval. In addition, considerations relating to the convenience and needs of the communities to be served by CB&T and Bank are consistent with ap-proval.
Accordingly, based on the foregoing and other facts of record, the Board has determined that the applica-tion should be, and hereby is, approved. The acquisi-tion shall not be consummated before the thirtieth calendar day following the effective date of this Order, or later than three months after the effective date of this Order, unless such period is extended for good
7. Under the revised Department of Justice Merger Guidelines (49 Federal Register 26,823 (June 29, 1984)), a market in which the post-merger HHI is over 1800 is considered highly concentrated. The Department of Justice has informed the Board that a bank merger or acquisition generally will not be challenged (in the absence of other factors indicating anticompetitive effects) unless the post-merger HHI is at least 1800 and the merger increases the HHI by at least 200 points. The Department of Justice has stated that the higher than normal HHI thresholds for screening bank mergers for anticompeti-tive effects implicitly recognizes the competitive effect of limited purpose lenders and other non-depository financial entities.
8. In addition, a state charter was recently issued to a de novo bank in the Columbus market.
9. National City Corporation, 70 FEDERAL RESERVE BULLETIN 743 (1984); The Chase Manhattan Corporation, 70 FEDERAL RESERVE BULLETIN 529 (1984); NCNB Bancorporation, 70 FEDERAL RESERVE BULLETIN 225 (1984); General Bancshares Corporation, 69 FEDERAL RESERVE BULLETIN 802 (1983); and First Tennessee National Corpo-ration, 69 FEDERAL RESERVE BULLETIN 298 (1983).
10. Thrift institutions control approximately 30 percent of the combined deposits of banks and thrifts in the market. Market deposit data for thrift institutions are as of June 30, 1986.
11. If 50 percent of deposits held by thrift institutions in the Columbus market were included in the calculation of market concen-tration, Applicant's pro forma market share would be 37.2 percent. The HHI would increase by 140 points to 2177.
cause by the Board or by the Federal Reserve Bank of Atlanta, acting pursuant to delegated authority.
By order of the Board of Governors, effective March 15, 1989.
Voting for this action: Chairman Greenspan and Governors Johnson, Seger, Angell, Heller, Kelley, and LaWare.
JENNIFER J. JOHNSON Associate Secretary of the Board
Crestar Financial Corporation Richmond, Virginia
Order Approving Merger of Bank Holding Companies and Banks, and the Establishment of Branches
Crestar Financial Corporation, Richmond, Virginia ("Crestar"), has applied for the Board's approval under section 3(a)(5) of the Bank Holding Company Act (12 U.S.C. § 1842(a)(5)) ("BHC Act"), to merge with Colonial American Bankshares Corporation, Roanoke, Virginia ("Colonial"). In addition, Crestar Bank, Richmond, Virginia, a state member bank, has applied to merge with Colonial American National Bank, Roanoke, Virginia ("Colonial Bank"), pursuant to section 18(c) of the Federal Deposit Insurance Act (12 U.S.C. § 1828(c)), and thereby to establish branches pursuant to section 9 of the Federal Reserve Act (12 U.S.C. § 321).
Notice of the proposal, affording an opportunity for interested persons to submit comments, has been given in accordance with section 3(b) of the BHC Act (54 Federal Register 66 (1989)). As required by the Bank Merger Act, reports of the competitive effects of the merger were requested from the United States Attorney General, the Comptroller of the Currency and the Federal Deposit Insurance Corporation. The time for filing comments has expired, and the Board has considered the applications and all comments received in light of the factors set forth in section 3(c) of the BHC Act and in the Bank Merger Act (12 U.S.C. § 1828(c)(5)).
Crestar is the second largest banking organization in Virginia, controlling domestic deposits of approxi-mately $7.2 billion, representing 15.5 percent of total deposits in commercial banks in the state.1 Colonial is the eleventh largest banking organization in Virginia, controlling deposits of approximately $351.9 million, representing 0.8 percent of total deposits in commer-cial banks in the state. Crestar would remain the
1. Deposit data are as of June 30, 1988.
Digitized for FRASER http://fraser.stlouisfed.org/ Federal Reserve Bank of St. Louis
Legal Developments 383
second largest banking organization in Virginia upon consummation of this proposal. Consummation of this proposal would not increase significantly the concen-tration of banking resources in Virginia.
Crestar competes directly with Colonial in the Roanoke, Virginia, banking market.2 Crestar is the sixth largest banking organization in the market, with deposits of $199.5 million, representing approximately 8 percent of deposits in commercial banks in the market ("market deposits").3 Colonial is the second largest banking organization in the market, with de-posits of $293.3 million, representing approximately 11.9 percent of market deposits. Upon consummation of the proposal, Crestar would become the second largest banking organization in the market, with de-posits of $492.8 million, representing 19.9 percent of market deposits. The Roanoke, Virginia, banking mar-ket is considered highly concentrated, with a Herfin-dahl-Hirschman Index ("HHI") of 2492.
The HHI for this market would increase by 190 points to 2682 upon consummation of the proposal, and the four-firm concentration ratio would increase from 77 percent to 85.1 percent.4
Although consummation of this proposal would eliminate existing competition between Crestar and Colonial in the Roanoke, Virginia, banking market, 10 banking institutions would continue to operate in the market following consummation of this proposal. In addition, the Board has considered the presence of thrift institutions in the market in its analysis of this proposal. The Board previously has indicated that thrift institutions have become, or have the potential to become, major competitors of commercial banks.5
Thrift institutions already exert a considerable com-petitive influence in the market as providers of NOW accounts and consumer loans, and many are engaged in the business of making commercial loans. Based upon the size, market share, and commercial lending
2. The Roanoke, Virginia, banking market is approximated by the Roanoke, Virginia, Ranally Metro Area plus the adjacent northern portion of Franklin County.
3. Market data are as of June 30, 1987. 4. Under the revised Department of Justice Merger Guidelines (49
Federal Register 26,823 (June 29, 1984)), a market in which the post-merger HHI is over 1800 is considered highly concentrated. The Department of Justice has informed the Board that a bank merger or acquisition generally will not be challenged (in the absence of other factors indicating anticompetitive effects) unless the post-merger HHI is at least 1800 and the merger increases the HHI by at least 200 points. The Department of Justice has stated that the higher than normal HHI thresholds for screening bank mergers for anticompeti-tive effects implicitly recognizes the competitive effect of limited purpose lenders and other non-depository financial entities.
5. National City Corporation, 70 FEDERAL RESERVE BULLETIN 743 (1984); NCNB Bancorporation, 70 FEDERAL RESERVE BULLETIN 225 (1984); General Bancshares Corporation, 69 FEDERAL RESERVE BUL-LETIN 802 (1983); and First Tennessee National Corporation, 69 FEDERAL RESERVE BULLETIN 298 (1983).
activities of thrift institutions in the market, the Board has concluded that thrift institutions exert a significant influence upon existing competition in the Roanoke, Virginia, banking market.6 In light of these factors and other facts of record, the Board concludes that con-summation of this proposal would not have a signifi-cantly adverse effect on existing or potential competi-tion in any relevant banking market.
In considering the convenience and needs of the communities to be served, the Board has taken into account the records of Crestar and Colonial under the Community Reinvestment Act ("CRA").7 The CRA requires the federal bank supervisory agencies to encourage financial institutions to help meet the credit needs of the local communities in which they are chartered consistent with the safe and sound operation of such institutions. To accomplish this end, the CRA requires the appropriate federal supervisory authority, in connection with its examination of financial institu-tions, to "assess the record of banks under their supervision in meeting the credit needs of their entire communities, including low- and moderate-income neighborhoods, consistent with the safe and sound operation of such institution."8 The CRA also requires the agencies to take these records into account when acting on certain applications involving the institu-tions.
The Board's experience over the years in examining bank performance under the CRA has indicated that institutions with effective programs to help meet com-munity credit needs share a number of elements. These institutions maintain outreach programs that include procedures to permit effective communication between the bank and various segments of the com-munity and formalized methods for incorporating find-ings regarding community credit needs into the devel-opment and delivery of products and services. They monitor institutional performance at the senior man-agement or board of director level and periodically evaluate new opportunities for innovative lending pro-grams, such as home mortgage and neighborhood residential rehabilitation lending and similar programs, designed to meet the credit needs of their designated community, including those of low- and moderate-income persons. An effective program also includes the use of specifically designed marketing and adver-tising plans to stimulate public awareness of the bank's
6. If 50 percent of the deposits controlled by thrift institutions were included in the calculation of market concentration, Crestar and Colonial would control approximately 7 percent and 10.3 percent of total market deposits, respectively. Upon consummation of this proposal, the HHI would increase by 144 points to 2084, and the four-firm concentration ratio for the market would be 74.1 percent.
7. 12 U.S.C. § 2901 etseq. 8. 12 U.S.C. § 2903.
Digitized for FRASER http://fraser.stlouisfed.org/ Federal Reserve Bank of St. Louis
384 Federal Reserve Bulletin • May 1989
services throughout the community, including low-and moderate-income neighborhoods, as well as sup-port of community development projects and pro-grams.
In the Board's opinion, financial institutions that make meeting their responsibilities under the CRA an integral part of their management and operational structure are best able to accomplish the goals of the statute. In that light, the Board expects banking orga-nizations to have addressed their CRA responsibilities before the submission of applications to the Board. This is in accord with the requirements of the CRA, under which an institution's record of performance in helping to meet the credit needs of its entire commu-nity is a critical factor in determining whether the institution has lived up to its responsibilities under the statute.
The Board has received comments filed jointly by The United Mine Workers of America ("UMWA") and the Metro Area Fair Banking Coalition ("MAFBC") (collectively "Protestants") regarding the CRA performance of Crestar and Colonial.9
Crestar has submitted a detailed response to the com-ments made by the UMWA and MAFBC. In this regard, the Federal Reserve Bank of Richmond ar-ranged a meeting among the parties in the context of earlier applications by Crestar Bank to establish three branch offices.10 The parties were unable to come to a resolution of all of their differences.11
Protestants have raised several questions concern-ing Crestar's Home Mortgage Disclosure Act ("HMDA") recordkeeping, lending patterns, and re-sponsiveness to and concern for the communities served by its subsidiaries. Many of these comments concerning Crestar's CRA record were raised and addressed in Crestar's previously approved branch applications.12
9. In addition, the Board has received a favorable comment from the Board Chair of S.R.O. Housing of Richmond, noting Crestar's com-mitment to housing and community development issues.
10. The applications were approved by the Federal Reserve Bank of Richmond, pursuant to authority delegated by the Board, on Decem-ber 2, 1988.
11. Although the UMWA did not submit comments on those applications, a member of the UMWA was present at the meeting.
12. Protestants allege that: Crestar's HMDA data are inaccurate; Crestar Bank, N.A., Washington, D.C. ("Crestar-DC"), and Crestar Mortgage Company, Arlington, Virginia ("Crestar Mortgage"), are pursuing discriminatory lending patterns; Crestar is deemphasizing residential mortgages in low-income neighborhoods and is failing to meet the credit needs for co-operative housing loans; Crestar-DC and Crestar Mortgage originate few loans within the District of Columbia; Crestar Mortgage sells many of its mortgages on the secondary mortgage market, thus transferring ownership of the mortgages be-yond the bounds of the community; Crestar has been unresponsive to the small business credit needs of the Washington, D.C. community and has made few Small Business Administration ("SBA") loans to minorities, females, and residents of Alexandria, Virginia, Washing-ton, D.C., or Maryland; Crestar does not originate student loans in
In addition, Protestants claim that Colonial Bank has reduced housing loans to urban areas; made more loans to upper-income white tracts than to low-income minority tracts; and originated fewer loans to minority low- and moderate-income customers than to white customers with the same income levels. Protestants have further alleged that Colonial Bank has failed to meet community credit needs for home improvement loans, multi-family mortgage loans, and federal gov-ernment-insured loans.
The Board has carefully reviewed the CRA perfor-mance record of Crestar and its subsidiary banks, and the CRA record of Colonial and its subsidiary banks, as well as Protestants' comments and Crestar's re-sponse to those comments.
Initially, the Board notes that all of Crestar's sub-sidiary banks have received satisfactory ratings from their primary regulators in examinations of their CRA performance, and that Colonial's subsidiary banks, Colonial Bank and The Mountain National Bank of Clifton Forge, Clifton Forge, Virginia ("Mountain National Bank"), also received satisfactory CRA rat-ings from the Office of the Comptroller of the Cur-rency.
In addition, the Board has considered Crestar's development of a comprehensive program that estab-lishes standards that its subsidiary banks must meet in ascertaining community credit needs, responding to those needs through the development and delivery of products and services, and monitoring and evaluating the bank's success in meeting those needs and its responsibilities under the CRA. Recently, Crestar established four regional CRA plans covering all of its subsidiary banks. As part of these plans, Crestar appointed CRA officers at the subsidiary bank level, the regional level, and the corporate level responsible for developing, implementing, and overseeing Crestar's CRA efforts. To ensure that these regional plans address community credit needs, Crestar's re-gional CRA officers are required to meet at least annually with community leaders, government offi-cials, community groups, and other individuals within their region to obtain feedback on Crestar's perfor-mance. Crestar implemented a similar plan in 1985 for the Washington, D.C. area.
Under the regional CRA plans, each regional CRA officer reports to Crestar's corporate Senior Vice President for Compliance, who has direct responsibil-ity for coordinating Crestar's CRA efforts. To ensure that Crestar's board of directors is fully informed of
Washington, D.C., or in Virginia; Crestar Bank Maryland, Bethesda, Maryland ("Crestar-MD"), originated few mortgage loans between 1985-87; and Crestar-DC's branches and ATMs are not convenient to low- and moderate-income community residents.
Digitized for FRASER http://fraser.stlouisfed.org/ Federal Reserve Bank of St. Louis
Legal Developments 385
Crestar's CRA activities, this officer makes periodic reports to the Audit Committee of Crestar's board of directors. This officer also reports directly to Crestar's corporate vice-chairman, who has ultimate manage-ment responsibility for Crestar's CRA matters.
In response to concerns raised in Crestar's previous branch applications, Crestar supplemented its 1985 CRA plan for the Washington, D.C. area with a "Greater Washington Area CRA Plan" on Decem-ber 1, 1988. As required by this plan, Crestar will develop and implement a variety of advertising and marketing strategies to communicate the availability of credit and other bank products in all segments of the community. For example, Crestar will advertise the availability of its products and services in minority audience media and neighborhood newspapers, where available, targeting specific products appropriate to the area served.13 In addition, Crestar will participate in local programs and seminars that offer community residents and small businesses technical assistance with respect to obtaining and utilizing credit. As noted, advertising and marketing are important ele-ments in an effective CRA program, and the Board expects that Crestar's CRA program to promote its services throughout its communities will include such advertising and marketing efforts.
The HMDA data appear to reflect accurately the lending practices of Crestar's banking subsidiaries in the Washington, D.C. metropolitan area, and do not indicate a pattern of discriminatory lending. More-over, under its Greater Washington Area CRA Plan, Crestar established an overall lending target of $25 million for real estate, small business, and student loans for low- and moderate-income residents of the greater Washington, D.C. metropolitan area, to be achieved within a five-year period.14 Additionally, Crestar has hired a real estate cooperative and multi-family housing lending officer, as well as lending officers for student loans and small business lending.15
13. In 1987, Crestar sponsored a weekly radio program, entitled "Money Matters", for a six-month period on a station oriented towards serving minority residents of the Washington, D.C. area.
14. Pursuant to its previous Washington area CRA agreement with the D.C. Reinvestment Alliance, Crestar has been a participant in SBA lending programs. Moreover, Crestar has already exceeded its $10 million lending target under its previous agreement, providing $4.1 million in qualifying loans to minority- and women-owned small businesses, a $520,000 qualifying non-profit developer loan, and $15.3 million in qualifying multi-family and mixed-use commercial real estate loans.
15. Crestar has indicated that it will expand its student loan program in Washington, D.C. and Maryland. In addition, Crestar has estab-lished task forces dealing with residential mortgage lending, affir-mative marketing, and small business lending, and has recently provided funds to groups promoting low-income housing and small business development in Washington, D.C., such as the Local Initia-tive Support Corporation and the Neighborhood Economic Develop-ment Corporation.
Furthermore, Crestar, in consultation with the D.C. Reinvestment Alliance, a local community group in Washington, D.C., is reviewing a study involving the feasibility of locating a branch of Crestar-DC in a low-and moderate-income neighborhood in Washington, D.C.
With regard to Colonial Bank, an analysis of HMDA data indicates that, in 1985 and 1987, Colonial Bank made the majority of its home mortgage loans within the city of Roanoke. Between 1985 and 1987, Colonial Bank increased the percentage of multi-family mort-gage loans made in urban areas and provided approx-imately three times as many home improvement loans to urban areas as to suburban areas. HMDA data also indicate that in 1985 and 1987, Colonial Bank made approximately the same number of home purchase loans per owner-occupied unit in low- and moderate-income areas as in upper-income areas. In addition, an analysis of the HMDA data for 1985 through 1987 does not indicate any pattern of prohibited discriminatory lending by Colonial Bank. Moreover, while HMDA data show that Colonial Bank has not made many home improvement, multi-family, and federal govern-ment-insured loans in the last few years, the record indicates that loans that were made in these areas were distributed throughout all income level census tracts in Roanoke, and that a greater percentage of home improvement loans and multi-family loans originated by Colonial Bank per owner-occupied unit were made in low- and moderate-income areas than in upper-income areas.
Crestar has stated that it will implement its system-wide CRA monitoring mechanism and its Western Regional CRA Plan at Colonial Bank and Mountain National Bank upon consummation of this proposal. In addition, Crestar states that it will offer FHA and VA mortgages to Colonial Bank's customers through Crestar Mortgage. These steps should further improve the CRA performance of Colonial Bank and Mountain National Bank.
Based upon this record, the Board concludes that Crestar has a satisfactory program in place to ensure that its subsidiary banks carry out their responsibilities under the CRA to help meet the credit needs of their communities, including low- and moderate-income and minority neighborhoods, and that Crestar's sub-sidiary banks are performing in accordance with that program in a manner consistent with their statutory responsibilities. As noted above, Crestar has commit-ted that it will implement this program at Colonial's subsidiary banks upon consummation of this proposal. For the foregoing reasons, and based upon the overall CRA records of Crestar and Colonial, as well as other facts of record, the Board concludes that convenience and needs considerations in this case are consistent
Digitized for FRASER http://fraser.stlouisfed.org/ Federal Reserve Bank of St. Louis
386 Federal Reserve Bulletin • May 1989
with approval of the applications.16 The Board has also determined that the financial and managerial resources and future prospects of Crestar and Colonial are consistent with approval of the proposal.17
Accordingly, based on all the facts of record in this case, the Board has determined that the applications should be, and hereby are, approved. The transactions shall not be consummated before the thirtieth calendar day following the effective date of this Order, or later than three months after the effective date of this Order, unless such period is extended for good cause by the Board or by the Federal Reserve Bank of Richmond, acting pursuant to delegated authority.
By order of the Board of Governors, effective March 14, 1989.
Voting for this action: Vice Chairman Johnson and Gover-nors Seger, Heller, Kelley, and La Ware. Absent and not voting: Chairman Greenspan and Governor Angell.
JENNIFER J. JOHNSON Associate Secretary of the Board
Midwest Financial Group Peoria, Illinois
Order Approving the Acquisition of a Bank Holding Company
Midwest Financial Group, Inc., Peoria, Illinois ("Midwest"), a bank holding company within the
16. Protestants have also requested that the Board order a public meeting or hearing to receive public testimony on the issues presented by these applications. Although section 3(b) of the BHC Act does not require a public meeting or hearing in this instance, the Board may, in its discretion, order a public meeting or hearing. See 12 C.F.R. 262.3(e). In that regard, the Board's Rules of Procedure provide that a public meeting may be held to clarify factual issues related to an application or to provide an opportunity for interested persons to testify. 12 C.F.R. 262.25(d). In addition, under the provisions of the Board's Regulation Y, 12 C.F.R. 225.23(g), the Board shall order a hearing only if there are disputed issues of material fact that cannot be resolved in some other manner.
In the Board's view, the parties have had ample opportunity to present their arguments in writing and to respond to one another's submissions. Moreover, Crestar and Protestants have met privately in the context of Crestar's recent branch application, involving many of the CRA issues raised here. In light of these facts, the Board has determined that the record has been developed through these proceed-ings and that a public meeting or hearing would serve no useful purpose in this case. Accordingly, Protestants' request for a public meeting and hearing is hereby denied.
17. Protestants also allege that Crestar has inadequate financial and managerial resources. Protestants allege that Crestar's lending poli-cies, including loans to specific companies, speculative construction loans, loans to Mexico, and Crestar-MD's loan-to-asset ratio, raise general safety and soundness concerns. The Board has examined these contentions in the context of its evaluation of the capital and overall financial condition of Crestar and the effects of this acquisition on these factors. Based upon this review, the Board has concluded that Protestants' allegations do not support an adverse finding regard-ing Crestar's financial or managerial resources.
meaning of the Bank Holding Company Act ("BHC Act"), and its wholly owned subsidiary, PMI Acqui-sitions Corporation, Peoria, Illinois ("PMI"), have applied for the Board's approval under section 3 of the BHC Act (12 U.S.C. § 1842) to acquire all of the voting shares of Peoples Mid-Illinois Corporation, Bloomington, Illinois ("Peoples"), and thereby indi-rectly acquire Peoples Bank, Bloomington, Illinois ("Bank").1
Notice of the applications, affording an opportunity for interested persons to submit comments, has been given in accordance with section 3(b) of the BHC Act (53 Federal Register 51,164 (1988)). The time for filing comments has expired, and the Board has con-sidered the applications and all comments received in light of the factors set forth in section 3(c) of the BHC Act.
Midwest is the seventh largest commercial banking organization in Illinois, controlling total deposits of approximately $1.7 billion, representing 1.6 percent of total deposits in commercial banking organizations ("total bank deposits") in the state.2 Peoples is the 59th largest commercial banking organization in Illi-nois, controlling total deposits of $236.3 million, rep-resenting 0.2 percent of total bank deposits in the state. Upon consummation of this proposal, Midwest would become the fifth largest commercial banking organization in Illinois, controlling total deposits of $1.9 billion, representing 1.8 percent of total bank deposits in the state. Based on the facts of record, consummation of this proposal would not have a significantly adverse effect on the concentration of banking resources in Illinois.
Midwest and Peoples compete directly in the Bloomington-Normal, Illinois, banking market.3 In this market, Midwest is the second largest commercial banking organization, with deposits of $158.7 million, representing 18.2 percent of the market's total bank deposits. Peoples is the largest commercial banking organization in the market, with deposits of $236.3 million, representing 27.1 percent of the market's total bank deposits. Upon consummation of this proposal, Midwest would become the largest commercial bank-ing organization in the market, controlling 45.3 percent of the market's total bank deposits. The four-firm concentration ratio would rise from 65.6 percent to 71.9 percent, and the Herfindahl-Hirschman Index
1. In connection with this application, PMI has applied to become a bank holding company.
2. Banking data are as of June 30, 1987. 3. The Bloomington-Normal banking market is approximated by
McLean County, and Kansas, El Paso, Panola, and Minonk Town-ships in Woodford County, Illinois.
Digitized for FRASER http://fraser.stlouisfed.org/ Federal Reserve Bank of St. Louis
Legal Developments 387
("HHI") of the market would increase from 1389 to 2375.4
Consummation of this proposal would eliminate some existing competition in the Bloomington-Normal banking market. The Board believes, however, that certain factors mitigate the anticompetitive effects associated with the proposal. First, numerous banks would continue to operate in the market after consum-mation of this proposal.5 In addition, the Board has considered the presence of thrift institutions in the market in its analysis of this proposal. The Board has previously indicated that thrift institutions have be-come, or have the potential to become, major compet-itors of commercial banks.6 The Bloomington-Normal banking market has seven thrift institutions, represent-ing 48.8 percent of total deposits in thrifts and com-mercial banking organizations in the market ("total market deposits"). Three of the five largest depository institutions, including the largest depository institu-tion, in the market are currently thrifts. Upon consum-mation of this proposal, three of the four largest depository institutions would be thrifts, with deposits representing 44.2 percent of total market deposits. The largest depository institution in the market upon con-summation of this proposal would continue to be a thrift, with deposits representing 29.5 percent of total market deposits. Thrifts in the market offer transaction accounts and make commercial as well as consumer loans. Based on the size and market share of thrift institutions, the Board has concluded that thrift insti-tutions exert a significant competitive influence that mitigates the anticompetitive effects of this proposal in the Bloomington-Normal banking market.7 Based on these and other facts of record in this case, the Board concludes that consummation of the proposal would
4. Under the revised Department of Justice Merger Guidelines, 49 Federal Register 26,823 (June 29, 1984), a market in which the post-merger HHI is above 1800 is considered highly concentrated. In such markets, the Justice Department is likely to challenge a merger that increases the HHI by more than 50 points. The Justice Depart-ment has informed the Board that a bank merger or acquisition generally will not be challenged (in the absence of other factors indicating anticompetitive effects) unless the post-merger HHI is at least 1800 and the merger increases the HHI by at least 200 points. The Justice Department has stated that the higher than normal HHI thresholds for screening bank mergers for anticompetitive effects implicitly recognizes the competitive effect of limited-purpose lenders and other non-depository financial entities.
5. Twenty commercial banks currently compete in the Blooming-ton-Normal market.
6. National City Corporation, 70 FEDERAL RESERVE BULLETIN 743 (1984); First National of Nebraska, Inc., 75 FEDERAL RESERVE BULLETIN 27 (1989).
7. If 50 percent of deposits held by thrift institutions in the Bloomington-Normal banking market were included in the calculation of market concentration, Midwest's pro forma market share would be 30.6 percent. The market would be considered moderately concen-trated after consummation of the proposed transaction, with the HHI increasing by 450 points to 1513 and the four-firm concentration ratio rising by 6.8 percent to 63.8 percent.
not have a significantly adverse effect on competition in the Bloomington-Normal banking market.
Midwest and Peoples also compete in the provision of discount brokerage services within the relevant banking market. The relevant product market for discount brokerage services is retail securities broker-age, which includes both discount and full-service brokerage services.8 Although consummation of this proposal would eliminate some existing competition in the provision of retail brokerage services, the Bloom-ington-Normal banking market has fourteen local sources of retail brokerage services, and a substantial number of firms outside the Bloomington-Normal banking market offer this service to customers in the banking market. In addition, Bank provides retail securities brokerage services for only a small number of customers, and Bank is not actively soliciting new customers for this service. Accordingly, consumma-tion of this proposal would not have a significantly adverse effect on existing competition for discount brokerage services in any relevant market.
The financial and managerial resources and future prospects of Midwest and Peoples are consistent with approval. Considerations relating to convenience and needs of the communities to be served are also con-sistent with approval of the applications.
Based on the foregoing and other facts of record, the Board has determined that the applications should be, and hereby are, approved. The transactions shall not be consummated before the thirtieth calendar day following the effective date of this Order, or later than three months following the effective date of this Order, unless such period is extended for good cause by the Board or by the Federal Reserve Bank of Chicago, pursuant to delegated authority.
By order of the Board of Governors, effective March 20, 1989.
Voting for this action: Chairman Greenspan and Governors Johnson, Seger, Angell, Heller, Kelley, and LaWare.
JENNIFER J. JOHNSON Associate Secretary of the Board
Orders Issued Under Section 4 of the Bank Holding Company Act
First Bank System, Inc. Minneapolis, Minnesota
Order Approving Application to Engage in the Activity of Making and Servicing Loans
8. BankAmerica Corporation, 69 FEDERAL RESERVE BULLETIN 105, 110 (1983).
Digitized for FRASER http://fraser.stlouisfed.org/ Federal Reserve Bank of St. Louis
388 Federal Reserve Bulletin • May 1989
First Bank System, Inc., Minneapolis, Minnesota, a bank holding company within the meaning of the Bank Holding Company Act ("Act"), has applied for the Board's approval under section 4(c)(8) of the Act (12 U.S.C. § 1843(c)(8)) to engage through its subsid-iary, FBS Credit Services, Inc. ("FBSCS"), Minne-apolis, Minnesota, in making extensions of credit in connection with the administration, management, col-lection, and liquidation of low-quality assets acquired from subsidiary banks of First Bank System.
Notice of the application, affording interested per-sons an opportunity to submit comments, has been duly published (53 Federal Register 51,164 (1988)). The time for filing comments has expired, and the Board has considered the application and all com-ments received in light of the public interest factors set forth in section 4(c)(8) of the Act.
First Bank System is the largest commercial banking organization in Minnesota, with total consolidated assets of $24 billion.1 It operates subsidiary banks in Minnesota, Colorado, Montana, North Dakota, South Dakota, Washington, and Wisconsin and engages in a variety of nonbanking activities.
First Bank System proposes to engage through FBSCS in making extensions of credit in connection with the administration, management, collection, and liquidation of low-quality assets acquired by FBSCS from some of the subsidiary banks of First Bank System's direct subsidiary, Central Bancorporation, Inc., Denver, Colorado. These activities are permissi-ble for bank holding companies under section 225.25(b)(1) of the Board's Regulation Y (12 C.F.R. 225.25(b)(1)).2
In every case involving an acquisition by a bank holding company under section 4 of the Act, the Board considers the effect of the acquisition on the financial condition and resources of the applicant. In this con-nection, the Board has taken into consideration that the subsidiary would be capitalized at a level commen-surate with the quality of the specific low-quality assets. Further, the Board also considered that fund-ing would be provided by sophisticated investors and would be on terms which do not expose the subsidiary to liquidity or interest rate risks. After reviewing all the facts of record relating to the overall financial condition of First Bank System, the Board has deter-mined that the financial factors relating to this appli-cation are consistent with approval, particularly in light of certain commitments made by First Bank System in connection with this proposal. In reaching this conclusion, the Board has taken into consider-
1. All banking data are as of December 31, 1988. 2 . See First Bank System, Inc., 7 2 FEDERAL RESERVE BULLETIN
660 (1986).
ation the steps First Bank System intends to take to further improve its capital position.
Consummation of the proposal will have no adverse effect on competition, as this proposal is viewed as an internal reorganization. The Board believes that the proposal is not likely to result in conflicts of interests, unsound banking practices, concentration of re-sources, or other adverse effects. Based upon the facts of record, the Board concludes that performance of the proposed activities by First Bank System can reasonably be expected to provide benefits to the public that outweigh any adverse effects.
Based upon the foregoing and all the facts of record, the Board has determined that the balance of public interest factors it is required to consider under section 4(c)(8) is favorable. Accordingly, the application is hereby approved. This determination is subject to all of the conditions set forth in Regulation Y, including sections 225.4(d) and 225.23(b)(3) (12 C.F.R. 225.4(d) and 225.23(b)(3)), and to the Board's authority to require modification or termination of the activities of the holding company or any of its subsidiaries as the Board finds necessary to assure compliance with the provisions and purposes of the Act and the Board's regulations and orders issued thereunder, or to pre-vent evasion thereof.
This transaction shall not be consummated later than three months after the effective date of this Order, unless such period is extended for good cause by the Board or by the Federal Reserve Bank of Minneapolis, pursuant to delegated authority.
By order of the Board of Governors, effective March 13, 1989.
Voting for this action: Vice Chairman Johnson and Gover-nors Seger, Heller, Kelley, and La Ware. Absent and not voting: Chairman Greenspan and Governor Angell.
JENNIFER J. JOHNSON Associate Secretary of the Board
Merchants National Corporation Indianapolis, Indiana
Order Granting Relief From Commitments Regarding Insurance Agency Activities of Subsidiary Banks
Merchants National Corporation, Indianapolis, Indi-ana ("Merchants"), a bank holding company within the meaning of the Bank Holding Company Act ("BHC Act" or "Act"), has applied under section 4(c)(8)(D) of the BHC Act (12 U.S.C. § 1843(c)(8)(D)) and section 225.25(b)(8)(iv) of the Board's Regulation Y (12 C.F.R. § 225.25(b)(8)(iv)) for approval for its
Digitized for FRASER http://fraser.stlouisfed.org/ Federal Reserve Bank of St. Louis
Legal Developments 389
wholly owned subsidiary, Anderson Banking Com-pany, Anderson, Indiana ("Anderson Bank"), to resume the conduct of certain insurance agency activ-ities authorized for state banks under Indiana law. Alternatively, Merchants seeks a Board determination that the nonbanking prohibitions of section 4 of the BHC Act do not apply to activities conducted directly by subsidiary banks of a bank holding company, thereby permitting Anderson Bank and another of Merchants's state bank subsidiaries, Mid State Bank of Hendricks County, Danville, Indiana ("Mid State Bank"), to resume insurance agency activities. In both cases the insurance agency activities would be con-ducted directly by the banks and not through subsid-iaries of the banks.
I. Background
The record shows that Anderson Bank, prior to its acquisition by Merchants, engaged directly in insur-ance agency activities since the bank's incorporation in 1916 and that Mid State Bank acquired an insurance agency in 1985.1 The banks are authorized to sell insurance directly pursuant to state law.2
On October 29, 1986, the Board approved applica-tions by Merchants under section 3 of the BHC Act to acquire Anderson Bank and Mid State Bank. 72 FED-ERAL RESERVE BULLETIN 838 (1986). The applications had been protested by various insurance industry trade groups on the ground that, as subsidiaries of a bank holding company, the insurance agency activities then being conducted by the banks pursuant to Indiana law would be prohibited by section 4 of the BHC Act, as amended by Title VI of the Garn-St Germain Depository Institutions Act of 1982.3 As discussed below, the Garn-St Germain Act amended section 4(c)(8) of the BHC Act to provide that, with seven specific exceptions, insurance activities are not closely related to banking. This amendment removed the Board's discretion to authorize insurance activities as a permissible nonbanking activity for bank holding companies under the closely related to banking stan-dard of section 4(c)(8) of the Act.
In response to the protests, Merchants committed that, unless it received Board approval in the mean-time for the banks to retain their insurance activities, it
1. Prior to consummation of this proposal, Mid State Bank will transfer the insurance activities of the subsidiary to the bank itself, which will thereafter conduct the activities directly. Anderson Bank and Mid State Bank would act as agent for a full line of property and casualty coverage, but would not sell life insurance.
2. Ind. Code § 28-1-11-2 provides that "any bank or trust company shall have power . . . to solicit and write insurance as agent or broker for any insurance company authorized to do business in this state, other than a life insurance company."
3. Pub. L. No. 97-320, codified at 12 U.S.C. § 1843(c)(8).
would cause the banks to divest the insurance agency activities within two years and, in the interim, to refrain from the sale of insurance except for the renewal of existing policies.
Merchants subsequently sought relief from these commitments. On September 10, 1987, the Board granted the requested relief on the grounds that the insurance activities would be conducted directly by the banks and, thus, would not be prohibited by section 4 of the BHC Act or consequently the insur-ance provisions of the Garn-St Germain Act. 73 FED-ERAL RESERVE BULLETIN 876 (1987). The Board's Order noted that the relief did not violate the morato-rium provisions of the Competitive Equality Banking Act of 1987 ("CEBA")4 because Merchants had ac-quired the banks involved before the moratorium. The Board also noted that the grant of relief would not increase the banks' insurance powers since the banks already had the powers by virtue of state law and those powers were not and never had been limited by the BHC Act.
Protestants sought review of the Board's decision in the United States Court of Appeals for the Second Circuit, which, on January 25, 1988, vacated the Board's Order.5 The court ruled that the Board's decision fell within the moratorium provisions of CEBA and, thus, that the Board should not have granted Merchants's request to conduct the insurance activities while the moratorium was effective. The court did not address the question of whether insur-ance activities conducted directly by the banks would be prohibited by the nonbanking provisions of section 4 of the BHC Act. The moratorium provisions have now expired, and Merchants has requested that the Board reissue the vacated Order.6
Notice of the application, affording interested per-sons an opportunity to submit comments on the pro-posal, was published (52 Federal Register 8966 (1987)). The time for filing comments has expired, and the Board has considered the application and all comments received, including those of various insur-ance trade associations ("Protestants").7
4. Pub. L. No. 100-86, 101 Stat. 552 (1987). 5. Independent Insurance Agents of America, Inc. v. Board of
Governors, 838 F.2d 627 (2nd Cir. 1988). 6. By letter dated December 8, 1988, the Board granted a request by
Merchants for an extension of time to divest the insurance agency activities of Anderson Bank and Mid State Bank until such time as the Board acts on the request of Merchants to reissue its earlier Order.
7. The Board has received comments protesting the application and the request to reissue the earlier Order from the Independent Insur-ance Agents of America, Inc., Independent Insurance Agents of New York, Inc., National Association of Casualty and Surety Agents, National Association of Life Underwriters, National Association of Professional Insurance Agents, National Association of Surety Bond Producers, New York Association of Life Underwriters, and Profes-sional Insurance Agents of New York, Inc.
Digitized for FRASER http://fraser.stlouisfed.org/ Federal Reserve Bank of St. Louis
390 Federal Reserve Bulletin • May 1989
Protestants contend that the banks do not qualify under any of the seven exemptions to the insurance provisions in the Garn-St Germain Act and that, therefore, they may not resume their insurance agency activities. With respect to Merchants's alternative argument, protestants contend that the terms and legislative history of the BHC Act and the Board's regulations indicate that the nonbanking and insurance provisions of section 4 of the BHC Act apply to all bank holding company activities, including activities conducted by a subsidiary bank of the holding com-pany. In protestants' view, a bank holding company's activities, whether conducted directly by the holding company or by any of its subsidiaries, including sub-sidiary banks, are limited by the terms of section 4 of the Act to "banking" activities and activities permit-ted under the closely related to banking standard in section 4(c)(8) of the Act (or one of the other specific exemptions in the Act, none of which are relevant here). Protestants argue that because Anderson Bank's and Mid State Bank's insurance activities are not "banking" and do not qualify under any of the insurance exemptions in section 4(c)(8), Merchants may not engage in the activities through the banks.8
After considering the comments of all interested parties and for the reasons set forth below, the Board has determined to grant Merchants's request for relief from its earlier commitments on the alternative grounds advanced by Merchants, thereby permitting Anderson Bank and Mid State Bank to resume the insurance agency activities they terminated when they were acquired by Merchants in 1986.
II. Inapplicability of Exemption D of the Garn-St Germain Act
Initially, the Board has determined that Anderson Bank and Mid State Bank do not qualify under section 4(c)(8)(D), the grandfather provision of the Garn-St Germain Act (hereinafter "exemption D"), to engage in insurance agency activities. Exemption D permits a
8. Protestants also argue that Merchants should be bound by its earlier commitments to divest the banks' insurance activities because Merchants voluntarily offered the commitments with full knowledge of their limitations and that, in any event, the commitments preclude Merchants from arguing that the provisions of section 4 of the BHC Act do not apply to the direct activities of the banks.
In the Board's view, however, the commitments contemplated that Merchants could request Board relief from the commitments. While couched in terms of seeking Board approval on the Board's applica-tion Form Y-4, the commitments did not represent a concession by Merchants that section 4 applies to the direct activities of the banks. Rather, the commitments contemplated that the application would provide a forum for evaluating the issues and arguments raised by the proposal apart from Merchants' earlier application to acquire the banks. Accordingly, the Board does not consider that the commit-ments limit either the right of Merchants to request relief or the arguments Merchants may put forward in support of that relief.
bank holding company or any of its subsidiaries to engage in any insurance agency activity in which the bank holding company or subsidiary was engaged on May 1, 1982, subject to certain geographic and func-tional limitations. Exemption D, however, applies only to entities that were bank holding companies or subsidiaries of bank holding companies on May 1, 1982. The record shows that on May 1, 1982, Ander-son Bank was not a subsidiary of a bank holding company and, therefore, does not qualify under Ex-emption D. Similarly, Mid State Bank does not qualify under Exemption D because it did not commence selling insurance until after the May 1, 1982, grandfa-ther date.9
III. Inapplicability of the Nonbanking Provisions of the BHC Act to the Direct Activities of Holding Company Banks
Accordingly, the Board has considered Merchants's alternative ground for relief. On the basis of the record before it and the comments received, the Board has determined that the direct insurance activities of An-derson Bank and Mid State Bank are not limited by the nonbanking provisions of section 4 of the BHC Act or, consequently, the insurance provisions of the Garn-St Germain Act.10 In the Board's view, the nonbanking provisions of section 4 do not limit the direct activities of holding company banks, except where the record demonstrates the type of evasion described in the Citicorp (South Dakota) case,11 a situation not present
9. Mid State Bank appears to qualify for the exemption provided in section 4(c)(8)(C) of the BHC Act for insurance agency activities conducted in a town of less than 5,000 inhabitants. In this application, Merchants initially had proposed that Mid State Bank conduct the insurance agency activities through a wholly owned subsidiary under exemption C. Merchants, however, subsequently withdrew that re-quest and amended the proposal to conduct the insurance activities directly by Mid State Bank on the basis discussed below that the nonbanking provisions of the BHC Act do not apply to the direct activities of holding company banks.
10. As noted, Title VI of the Garn-St Germain Act does not establish a prohibition on the conduct of insurance activities by bank holding companies separate from or in addition to the general non-banking prohibitions of section 4 of the BHC Act. Rather, Title VI limits the Board's discretion to authorize bank holding companies to conduct these activities under the closely related to banking exception (in section 4(c)(8) of the Act) to the general nonbanking provisions of the Act (in section 4(a)). Thus, the provisions of the Garn-St Germain Act have no applicability to situations, such as this, where the nonbanking provisions of section 4 of the Act do not apply.
11. 71 FEDERAL RESERVE BULLETIN 789 (1985). In that case, the Board found, based on the structure of the South Dakota statute, the operating plans of Citicorp, and the fact that the bank would serve primarily as an insurance subsidiary of Citicorp and would conduct only insignificant banking activities, that the acquisition of the bank was primarily, if not solely, for the purpose of enabling Citicorp to engage through the bank in various insurance activities. The Board did not address the question raised in this case regarding whether the prohibitions of section 4 of the Act apply to the direct activities of holding company banks where no evidence of evasion is presented.
Digitized for FRASER http://fraser.stlouisfed.org/ Federal Reserve Bank of St. Louis
Legal Developments 391
in the instant case.12 The Board believes this view is consistent with the terms, purposes, and legislative history of the BHC Act and the Board's regulations, prior interpretations, and longstanding practice.
A. Terms and Structure of the BHC Act
Section 4 of the BHC Act contains two provisions that together limit the nonbanking activities and invest-ments of bank holding companies. First, section 4 prohibits, with certain specific exceptions, a bank holding company from acquiring or retaining, directly or indirectly, voting shares of any company except a bank.13 The principal exception to this prohibition is for the shares of companies engaged in activities that the Board has determined are closely related to bank-ing. By its terms, this restriction in section 4 does not apply to shares of a company that is itself a bank. Thus, a bank holding company that controls an insti-tution that qualifies as a "bank" under the definition in the Act14 is not required, in order to acquire or retain the shares of the institution, to limit the institution's activities to those permitted under the closely related to banking standard of section 4 (or one of the other limited exceptions in the Act), except where the record demonstrates an evasion of the Act, such as presented in the Citicorp (South Dakota) case. It is only companies that do not qualify as "banks" under the Act that must limit their nonbanking activities to those permitted under the closely related to banking standard in section 4(c)(8) of the Act (or qualify under some other exception in section 4) in order to be acquired or retained directly or indirectly by a bank holding company.
In addition to the above limitation, section 4 of the Act provides that a bank holding company may not "engage in any activities other than . . . those of banking or of managing or controlling banks and other subsidiaries authorized under the Act or of furnishing
12. In this case, the record does not show, nor is there any allegation, that the banks would be operated by Merchants predomi-nantly as insurance agencies or that the acquisition of the banks is a device to enable the applicant to engage in insurance activities. Rather, the record shows that the insurance activities of the banks are incidental and small relative to their banking operations.
13. Section 4(a) of the Act provides: Except as otherwise provided in this Act, no bank holding company shall (1). . . acquire direct or indirect ownership or control of any voting shares of any company which is not a bank, or (2) . . . retain direct or indirect ownership or control of any voting shares of any company which is not a bank or bank holding company or engage in any activities other than (A) those of banking or of managing or controlling banks and other subsidiaries autho-rized under this Act or of furnishing services to or performing services for its subsidiaries, and (B) those permitted under para-graph (8) of subsection (c) of this section [the closely related to banking exception] . . . (emphasis supplied) 12 U.S.C. § 1843(a). 14. 12 U.S.C. § 1841(c).
services to or performing services for its subsidiaries" and activities the Board has determined to be closely related to banking. 12 U.S.C. § 1843(a)(2). Protestants contend that this provision applies not only to activi-ties conducted directly by a bank holding company, but also to activities conducted indirectly through any subsidiary of the bank holding company, including a subsidiary bank. This interpretation, however, cannot be squared with the words or structure of the statute.
The language of the activities limitation in section 4(a)(2) forbids "bank holding companies" —not "banks" —from engaging in activities other than those specified in that provision. The BHC Act defines "bank holding company" to mean any company that has control over any bank,15 a definition that clearly refers only to the parent holding company itself, not to the system as a whole or to any "subsidiary," a term that is separately defined.16
The structure of the BHC Act indicates that this provision of section 4(a)(2) of the Act was intended to apply to the activities of bank holding companies themselves, many of which are operating companies engaged directly in nonbanking activities as well as in controlling banks and companies engaged in permissi-ble nonbanking activities.17 This reading harmonizes the provisions of section 4 of the Act, with one provision limiting the types of companies the shares of which a bank holding company may acquire and retain (banks and other companies authorized under the Act), and the second limiting in a similar manner the activities in which the bank holding company itself may engage to
(1) banking, (2) managing and controlling banks and authorized nonbank companies, and (3) activities closely related to banking. Furthermore, section 4(a) of the Act distinguishes
between a bank holding company's acquiring and retaining "direct or indirect" ownership or control of any company that is not a bank, on the one hand, and the holding company's engaging in activities itself, on the other. The use of the words "direct or indirect" in the investment limitation of the Act makes clear that neither a bank holding company nor any of its subsid-iaries may own or control a nonbank company (unless exempted). In the activities limitation of section 4(a)(2), however, Congress did not use the words "directly or indirectly" to modify the word "engage". This demonstrates, in the Board's view, Congress'
15. 12 U.S.C. § 1841(a)(1). 16. 12 U.S.C. § 1841(d). 17. The portion of section 4 that authorizes a bank holding company
to engage in "banking" is intended to provide for those few situations that existed in 1956 in which the bank holding company was itself a bank. See Heller, Federal Bank Holding Company Law, § 4.02(1).
Digitized for FRASER http://fraser.stlouisfed.org/ Federal Reserve Bank of St. Louis
392 Federal Reserve Bulletin • May 1989
intent to apply the activities limitation in section 4(a)(2) to the holding company only and not to its subsidiaries.18
The reading suggested by protestants would make superfluous the provision in section 4(a)(2) restricting the types of companies that may be controlled by bank holding companies to banks and authorized nonbanks. If a bank holding company is deemed to be engaged in each activity in which a company it controls is en-gaged, as protestants suggest, the other provision of section 4 prohibiting a bank holding company from controlling nonbank companies unless engaged in per-missible activities would be unnecessary.19 Accord-ingly, the Board believes that the provision of section 4(a)(2) of the Act limiting the activities in which a bank holding company may "engage" applies only to the activities of the bank holding company itself, and that activities of subsidiaries of the bank holding company are regulated through provisions limiting the compa-nies that a bank holding company may hold the shares of or control to banks and other companies engaged in activities permitted for bank holding companies under the Act.
Protestants point to the fact that a bank may be a "subsidiary" of a bank holding company under the Act's definition as evidence that the Act does not distinguish between banking and nonbanking subsidiaries.20 That conclusion simply does not follow, however. The Act clearly distinguishes between bank-ing and nonbanking subsidiaries in section 4(a) when it permits a bank holding company to control banks without any limitation on their activities, but provides that a bank holding company may control a "company which is not a bank" only if its activities are autho-rized under the closely related to banking or other nonbanking exceptions in the Act.21
18. Protestants look to 12 U.S.C. § 1850, which establishes a competitor's standing to challenge adverse Board action regarding applications by bank holding companies to engage directly or indi-rectly in nonbanking activities, to demonstrate that the term "engage" in the BHC Act necessarily applies to the activities of a bank holding company and all its subsidiaries. In that section, however, the word "engage" is modified by the words "directly or indirectly." The activities limitation in section 4(a)(2), however, is not modified by the words "directly or indirectly."
19. Protestants suggest that Congress intentionally included a superfluous provision in order to establish a "catch-all" provision. The Board cannot accept this explanation, however, when the clear terms of the statute can be interpreted so as to give meaning to every word. See Reiter v. Sonotone Corp., 442 U.S. 330, 339 (1979).
20. 12 U.S.C. § 1841(d); also see 12 C.F.R. 225.20). 21. With respect to the Board's definition of "subsidiary" in
Regulation Y, the regulation makes clear that the definition does not apply where the context otherwise requires. 12 C.F.R. 225.2.
Protestants also point to the fact that the insurance provisions in section 4(c)(8) begin by using the term "bank holding company" but then state in Exemption D that this limitation applies also to a bank holding company and its subsidiaries. On this basis, protestants argue, the reference in section 4(a)(2) to activities engaged in by a "bank
B. Prior Board Interpretations
Since enactment of the BHC Act, the Board has not read the nonbanking prohibitions of section 4 as ap-plying to the direct activities of holding company banks. On the contrary, the Board's actions and regulations over the years have consistently inter-preted section 4 as not applying to such bank activities.22 Protestants contend otherwise, pointing to section 225.21(a) of Regulation Y, which provides that "a bank holding company or a subsidiary may not engage in . . . any activity other than . . . an activity {permitted by section 4(c)(8)}." The Board has never interpreted the provisions of Regulation Y relating to nonbanking activities as applicable to direct activities of banks, however.23 For example, the Board has never required bank holding companies that seek to acquire a bank to obtain prior approval under section 4(c)(8) for any nonbanking activities that might be engaged in directly by the bank, as would be required under protestants' construction of the statute. In ad-dition, the section upon which protestants rely appears in a subpart of the Board's rules that pertains to the "nonbanking acquisitions and activities of bank hold-ing companies." Thus, in context and consistent with the terms of section 4(a) of the Act, the reference in section 225.21(a) of Regulation Y to subsidiaries means subsidiaries other than banks.24
holding company" must also refer to activities conducted by its subsidiaries, banking and nonbanking alike. As noted, however, section 4(c)(8) sets forth an exemption to the general prohibition found in section 4(a) against a bank holding company owning shares of a nonbank company.
Because this general prohibition does not apply to shares of a bank, section 4(c)(8) must necessarily apply only to nonbank companies. Thus, in context and consistent with the prohibition in section 4, the reference in the insurance provisions to subsidiaries must mean subsidiaries to which the prohibition applies.
22. See, e.g., 12 C.F.R. 225.118(c); American Bancorp, Inc., 39 Federal Register 22,468 (June 24, 1974); Piedmont Carolina Financial Services, Inc., 59 FEDERAL RESERVE BULLETIN 766, 767-68 (1973); Cameron Financial Corp. v. Board of Governors, 497 F.2d 841, 845 (4th Cir. 1974); Board of Governors v. Investment Company Institute, 450 U.S. 46, 59 n.25 (1981); Fed. Res. Reg. Serv. 4-591 (Staff Op. January 12, 1982).
The Board notes that, contrary to protestants' implication, Cam-eron was not questioned by the Ninth Circuit ruling in Patagonia Corp. v. Board of Governors, 517 F.2d 803 (9th Cir. 1975), which distinguished Cameron and did not address the banking/nonbanking subsidiary issue. See 517 F.2d at 810-11 n.10.
23. The original Regulation Y implementing the Act's provisions, adopted immediately after passage of the Act, contained no provision restricting the activities conducted directly by banks controlled by holding companies. 21 Federal Register 5686 (1956).
24. Protestants cite several isolated phrases from various regula-tions to argue that the Board has "repeatedly affirmed that bank holding companies and all of their subsidiaries are subject to section 4." None of the examples cited, however, are persuasive. First, the Board's requirement that courier services not be conducted through a servicing arm of the bank (12 C.F.R. 225.129) was imposed to eliminate possible unfair competition and supports the view that the
Digitized for FRASER http://fraser.stlouisfed.org/ Federal Reserve Bank of St. Louis
Legal Developments 393
C. Legislative History and Purposes of the Statute
The Board's reading of the scope of the section 4(a) prohibitions is fully consistent with the Act's legisla-tive history. When the nonbanking prohibitions in section 4 were adopted in 1956 as part of the original Act, Congress gave no indication that the statute was meant to affect in any way the activities engaged in directly by holding company subsidiary banks, whose powers traditionally were determined by the authority that issued the bank's charter.25
The 1970 amendment to section 4(c)(8) reinforced the view that section 4 does not reach the direct activities of banks controlled by holding companies. During proceedings on this amendment, Congress specifically considered and rejected a proposed amendment to section 4 that would have prohibited certain specified activities, including providing insur-ance, and that arguably applied to subsidiary banks as
Board has no authority to authorize activities for banks under the BHC Act.
Second, the Board's now-repealed interpretive rule on insurance services (12 C.F.R. 225.128) referred to bank subsidiaries of bank holding companies because bank holding companies were authorized to sell credit insurance in connection with loans made by both their bank and nonbank subsidiaries.
Third, soon after enactment of the Act, the Board issued an opinion making clear that the exemption provided by section 4(c)(6) of the Act (providing that the section 4(a) prohibitions shall not apply to the acquisition of less than five percent of the voting shares of a nonbank-ing company) applies to shares held by banking subsidiaries of a bank holding company as well as shares held directly by the bank holding company itself. 12 C.F.R. 225.101. This position is consistent with section 4(a)'s prohibition against the direct and indirect ownership or control of shares of a nonbanking company. It says nothing about the application of the activities limitation of section 4(a)(2).
Finally, with respect to the Board's regulation relating to invest-ment company advisory activities (12 C.F.R. 225.125), the Board has made clear that while that regulation did define bank holding company to include both bank and nonbank subsidiaries, "the restrictions contained in the interpretation on operations of banking subsidiaries were only intended to apply where the investment advisory function was being conducted by a nonbanking subsidiary of the bank holding company." Letter denying petition of Investment Company Institute, March 8, 1974.
25. See S. Rep. No. 1095, Part 2, 84th Cong., 2d Sess. 5 (1956). The BHC Act does, however, provide the Board with certain supervisory authority over holding company banks. For example, the Board may examine any bank that is a subsidiary of a bank holding company (12 U.S.C. § 1844(c)) and is required to evaluate the management and financial condition of any bank that a bank holding company proposes to acquire (12 U.S.C. § 1842(c)).
Protestants argue that the Board's original Merchants decision is suspect because, according to protestants, the decision rested essen-tially on the premise that state banks are regulated exclusively by state law. Protestants have misread the Board's decision. As noted above, the Board recognizes that Congress intended for the OCC and the state banking authorities to remain as the primary (not exclusive) regulatory authorities responsible for their respective institutions. At the same time, the Board recognizes that the BHC Act provides the Board with certain supervisory authority over holding company banks. Second, the original decision, as well as the present one, rests on an interpretation of the explicit language of section 4 of the BHC Act.
well as bank holding companies and their nonbank subsidiaries.26
There is also no indication that when in 1982 Con-gress incorporated the general prohibition on approv-ing insurance activities into section 4(c)(8), Congress meant to expand the general nonbanking prohibitions in section 4(a). The relevant history instead indicates that Congress intended to retain the existing regula-tory framework contained in section 4. The Board has found no legislative history expressly stating that the Garn-St Germain Act was intended to limit the direct insurance activities of holding company banks.27 To the contrary, the Board explicitly advised Congress during Congressional hearings in 1980 that the draft legislation (containing substantially the same language as ultimately enacted) would not limit the insurance activities of subsidiary banks. In response to a ques-tion concerning whether "a bank owned by a bank holding company [would] be allowed to sell automo-bile casualty or collision insurance" under the pro-posed bill, the Board stated that the answer would depend on the state or federal chartering authority.28 It is clear from the legislative reports that the Garn-St Germain Act was intended to address certain Board decisions under section 4(c)(8) that allowed bank hold-ing companies to sell credit related property and
26. See 115 Cong. Rec. 33,133-34 (November 5, 1969); H.R. Rep. No. 387, 91st Cong., 1st Sess. 15 (1969); 115 Cong. Rec., E 9016-17 (daily ed. October 28, 1969) (statement of Rep. Brown); 115 Cong. Rec., H 10503 (daily ed. November 4, 1969)(statement of Rep. Stanton). Bills to Amend the Bank Holding Company Act of 1956: Hearings on S. 1052, S. 1211, S. 1664, S. 3823, and H.R. 6778 Before the Senate Comm. on Banking and Currency, 91st Cong., 2nd Sess. 144, 157-158 (1970) (statement of Arthur Burns, Chairman of the Federal Reserve Board) (hereinafter cited as 1970 Senate hearings); 1970 Senate Hearings at 179-81 (Colloquy between Senator Pack-wood and Frank Wille, Chairman of the FDIC).
27. The Board has considered protestants' references to language from the Senate Conference Report on Title VI of the Garn-St Germain Act (S. Rep. No. 97-641, 97th Cong. 2d Sess. 91 (1982), which states that Title VI would prohibit "bank holding companies and their subsidiaries" from selling and underwriting insurance. In the Board's view, in the context of the terms of the Act, the purpose of the Garn-St Germain Act, and the longstanding practice of not applying the nonbanking provisions of the Act to the direct activities of holding company banks, the reference in the report to subsidiaries was meant to refer to nonbanking subsidiaries.
The Board notes that references in earlier reports on the Title VI legislation indicate that section 4 and thus the proposed legislation would apply to bank holding companies and their "nonbank subsid-iaries." S. Rep. No. 96-923, 96th Cong., 2d Sess. 2 (1980); S. Rep. No. 97-536,97th Cong., 2d Sess 36, 38-40 (1982). See also, H.R. Rep. No. 96-845, 96th Cong., 2d Sess. 2-3 (1980) ("the BHC Act generally prohibits a bank holding company from owning the shares of any company that is not a bank.") There is no indication of any Congres-sional intent in the Title VI amendments to section 4(c)(8) of the Act to extend the coverage of the nonbanking prohibitions of section 4(a) of the Act to the direct activities of holding company banks.
28. Competition in Banking Act of1980, Hearings Before the Senate Comm. on Banking, Housing and Urban Affairs, 96th Cong., 2d Sess. 22 (1980).
Digitized for FRASER http://fraser.stlouisfed.org/ Federal Reserve Bank of St. Louis
394 Federal Reserve Bulletin • May 1989
casualty insurance.29 These Board decisions clearly did not authorize any activities for the subsidiary banks of the companies involved.
The Board believes that reading the Garn-St Ger-main Act as inapplicable to the direct insurance activ-ities of banks does not frustrate the basic remedial purposes of the Act, which were to address what Congress believed to be potential unfair competitive practices associated with provision of insurance by banking organizations. In this regard, the Board notes that prior to 1982 insurance activities conducted di-rectly by banks were not extensive, since banks were authorized to engage in these activities only in a few states and the acquisition of banks by out of state bank holding companies was not permitted. In contrast, under the Board's section 4(c)(8) decisions, on which Congress specifically focused in enacting the Garn-St Germain Act, insurance activities could be conducted by nonbank companies in a holding company system on a nationwide basis.30
In any event, the Supreme Court has held that the purpose of legislation is determined in the first in-stance with reference to the plain language of the statute and that the broad purposes of legislation cannot be relied upon to overcome the terms of the statute itself.31 As noted, in this instance, the terms of the BHC Act are clear that the direct activities of holding company banks are not restricted by section 4 of the Act.
Protestants argue that failing to interpret section 4's activities limitation to apply to banking subsidiaries of
29. See, e.g., S. Rep. No. 97-536, 97th Cong., 2d Sess. 36-37 (1982). The Board, of course, has no authority to authorize state or national banks to conduct nonbanking activities. That authorization must come from the state banking authorities or the Comptroller of the Currency, respectively.
30. After passage of the Garn-St Germain Act, in light of develop-ments Congress could not necessarily have foreseen in 1982, the direct insurance activities of banks began to expand. The growth of inter-state banking after the Supreme Court's decision in Northeast Ban-corp, Inc. v. Board of Governors, All U.S. 159 (1985), resulted in the establishment by bank holding companies of interstate networks of banks that could sell insurance. During this period there also was a general expansion in the powers of banks. Since 1982, Congress has repeatedly considered proposed legislation that would restrain the direct insurance functions of banks on a permanent basis, but no such legislation has been enacted.
31. Board of Governors v. Dimension Financial Corporation, 474 U.S. 361, 368, 373-374, (1986) ("If the statute is clear and unambig-uous, 'that is the end of the matter, for the court, as well as the agency, must give effect to the unambiguously expressed intent of Congress.' " (citations omitted)). See also, Independent Insurance Agents of America, Inc. v. Board of Governors, 835 F.2d 1452, 1456-1457 (D.C. Cir. 1987). As the Supreme Court recognized, the process of legislative compromise may result in the adoption of express exceptions that run counter to the general remedial purpose of the legislation. 474 U.S. at 374. The legislative history of the Gam-St Germain Act reveals some disagreement among members of Congress as to whether banking organizations should be prohibited completely from engaging in insurance activities. 128 Cong. Rec. S 12,220-24, 12,230 (1982).
a bank holding company will permit states to "nullify the effect" of the Act by permitting state banks to engage in nonbanking activities that are forbidden by section 4. In establishing the BHC Act framework, however, Congress was required to draw the line between banking and nonbanking activities in the Act in some manner. As the terms of the Act demonstrate, Congress rationally did so on the basis of whether the entity conducting the activity is a bank or a nonbank.32
Thus, where the company is chartered and operated as a bank under the definition in the BHC Act, it is outside the scope of the nonbanking provisions of the Act. But where the company is not a bank, it is, consistent with the line drawn by Congress in section 4, subject to the nonbanking provisions of the Act, and in order for these activities to be permissible, they must fit within one of the Act's authorizing provisions.
Protestants also rely on section 101(d) of CEBA, which amends section 3 of the BHC Act to permit qualified state-chartered savings banks to engage in any activity permitted by state law, but prohibits such savings banks from violating section 4(c)(8)'s insur-ance restrictions. 12 U.S.C. § 1842(f). Protestants as-sert that, if section 4 did not restrict the nonbanking activities of banks, an exemption for savings bank would not have been necessary, nor would Congress have had any reason to apply the insurance restric-tions uniquely to savings banks. Section 101(d), how-ever, applies only to savings banks, which are not involved in this case, and does not extend the reach of section 4 of the BHC Act.
Moreover, it does not necessarily follow that this amendment to section 3 is an indication that Congress believed the restrictions in section 4 apply to all holding company banks. This amendment may have been intended merely to confirm, for this category of "banks," the Board's longstanding view that banks may engage in state-authorized activities in the face of contrary arguments advanced by insurance trade as-sociations that the section 4 limitations apply to the direct activities of holding company banks. Congress' decision expressly to limit the insurance activities of these savings banks (in contrast to other types of holding company banks) is merely a part of a "special rule" adopted for those institutions under the BHC
32. Protestants point to several general references in the legislative history of the Act, as well as the 1966 and 1970 Amendments to the Act, to suggest that Congress intended to separate banking from nonbanking interests wherever the nonbanking interests were held, and that Congress intended for banks to divest themselves of their nonbanking interests. The Board agrees that one of the purposes of the BHC Act is to separate banking from commerce. As is evident in the terms and legislative history of the Act, Congress achieved this purpose by prohibiting banks from being affiliated within a bank holding company system with commercial companies.
Digitized for FRASER http://fraser.stlouisfed.org/ Federal Reserve Bank of St. Louis
Legal Developments 395
Act.33 In fact, as noted, the 100th Congress actively considered (although it did not adopt) legislation ex-pressly to extend these limitations to holding company banks —action that is inconsistent with protestants' interpretation of the Garn-St Germain Act.34
For the foregoing reasons, the Board has deter-mined that section 4 of the BHC Act does not limit the sale of insurance directly by Anderson Bank and Mid State Bank within the banks as proposed, and that the banks may, therefore, insofar as the BHC Act is concerned, resume within the banks the sale of insur-ance as permitted under Indiana law.35
IV. Operating Subsidiaries of State Banks
The Board emphasizes that its views regarding the coverage of section 4 in this Order pertain only where the activities are conducted directly by banks. The Order does not address the situation where the insur-ance activities are conducted by nonbank companies controlled by holding company banks. Under the Act, shares of a company held by a holding company bank are deemed to be indirectly held by the parent holding company (12 U.S.C. § 1841(g)) and, therefore, under the terms of the Act, their ownership or control by a bank holding company must qualify under the closely related to banking exception or one of the other exceptions in section 4 of the Act.36
In this regard, in 1971 the Board adopted section 225.22(d)(2) of Regulation Y (formerly section 225.4(e)), which authorizes a state bank owned by a
33. See H.R. Rep. No. 100-261, 100th Cong., 1st Sess. 130 (1987); S. Rep. No. 100-19, 100th Cong., 1st Sess. 33 (1987).
34. Protestants' reliance on the nonbank bank provisions of CEBA also is misplaced. 12 U.S.C. § 1843(f). Such provisions were enacted in order to minimize the potential for unfair competition and adverse effects associated with the grandfather provisions applied to nonbank banks and their parent holding companies, not to expand the scope of the general prohibitions in section 4.
35. Protestants request that the Board take cognizance of the public interest questions involved in the issue of whether section 4 applies to activities conducted directly by state banks. The Board is required by section 4(c)(8), in determining whether a particular activity is closely related to banking, to consider whether its performance by a bank holding company affiliate can reasonably be expected to produce public benefits that outweigh possible adverse effects. Because the Board has determined that section 4's prohibitions do not apply to activities conducted by Merchants' state bank subsidiaries, the Board need not decide whether these activities are closely related to banking or that their performance meets the net public benefits test of section 4(c)(8). The Board notes, however, that the insurance activities of the banks will be subject to the anti-tying restrictions of the 1970 Amend-ments to the BHC Act, which unlike section 4(a) explicitly apply to "banks." 12 U.S.C. § 1972(1).
36. Similarly, a bank holding company is deemed to control any company that is controlled by the holding company's subsidiaries. 12 U.S.C. § 1841(a)(2). Under section 4(a)(2) of the Act, in order for the holding company to maintain control of such a company, the company must be a "bank" or a company whose activities qualify under one of the Act's nonbanking exceptions. 12 U.S.C. § 1843(a)(2).
bank holding company to acquire and retain all (but not less than all) of the voting shares of a company, without Board approval under the Act, so long as the company engages solely in activities the parent bank may conduct directly and at locations at which the bank could conduct the activities. 12 C.F.R. § 225.22(d)(2).37 The Board adopted this regulation in order to permit holding company state banks to com-pete on equal footing with state banks that are not in a holding company system and in the absence of evi-dence that such acquisitions were resulting in evasions of the Act.38 At that time, however, the Board stated that it would review the merits of the decision from time to time in light of its experience in administering the Act.39
In December 1988, in light of a number of develop-ments, the Board asked for comment on whether to rescind this regulation, thereby requiring bank holding companies to obtain approval under section 4(c)(8) of the BHC Act prior to establishing or acquiring, through their subsidiary state banks, shares of compa-nies engaged in activities that the bank is permitted to conduct under state law, unless the transaction is otherwise authorized under the Act. 53 Federal Reg-ister 48,915 (1988). The comment period on the pro-posal ends April 28, 1989.40
V. Legislation Regarding Direct Activities of Holding Company Banks
The Board notes that the 100th Congress had under active consideration legislation that would have ap-plied the insurance prohibitions of the Garn-St Ger-
37. Section 225.22(d)(1) of Regulation Y authorizes a national bank to acquire and retain voting shares of a company in accordance with the rules of the Comptroller of the Currency. 12 C.F.R. 225.22(d)(1).
38. The regulation does not, as protestants assert, rest on the Board's "belief' that it has the authority to regulate the activities of subsidiary banks of bank holding companies.
39. The Board stated: The Board should not at this time apply the [nonbanking] restric-
tions [of the BHC Act] to subsidiaries of banks. This decision is believed warranted by considerations of equity between banks that are and are not members of bank holding companies and by the absence of evidence that acquisition by holding company banks are resulting in evasions of the purpose of the Act. The merits of this decision will be reviewed by the Board from time to time in light of its experience in administering the Act. (36 Federal Register 9292 (May 22, 1971)). 40. In December 1986, the Board asked for comment on whether to
amend 12 C.F.R. 225.22(d)(2) to prohibit bank holding companies from acquiring or retaining voting shares or control of companies engaged in real estate development activities or to limit such acquisi-tions to those situations that the Board proposed to permit for bank holding companies. 52 Federal Register 543, 551 (1987). The Board indicated that it would consider whether to apply the proposed restrictions to a wholly owned subsidiary of a holding company state bank. Contrary to protestants' implication, the proposed regulation would not bar state banks themselves that are owned by a holding company from engaging in state-authorized real estate activities within the bank.
Digitized for FRASER http://fraser.stlouisfed.org/ Federal Reserve Bank of St. Louis
396 Federal Reserve Bulletin • May 1989
main Act to the activities of holding company banks except where the bank was located in the same state as the bank holding company, the insurance activities were permissible under state law, and sales were limited to within the state. The insurance activities to be conducted by Merchants's subsidiary banks would not have been prohibited under these provisions. While this legislation was passed by the U.S. Senate and favorably reported by committees of the U.S. House of Representatives,41 no legislation was enacted into law. The Board calls to Merchants's attention, however, that subsequent Con-gressional action may modify the Board's Order granting Merchants's request for relief without providing so-called grandfather rights to continue the insurance activities. The Board retains jurisdiction over the application to act to carry out the requirements of any legislation adopted by Congress that would affect the conduct of insurance activities by Merchants's subsidiary banks under the BHC Act.
VI. Request for a Hearing
Protestants have requested that the Board grant dis-covery rights and conduct a hearing under section 5(f) of the Act (12 U.S.C. § 1844(f)) on the application in order to determine whether Merchants is attempting to evade the BHC Act, as forbidden by the Citicorp (South Dakota) decision. However, section 5(f) does not itself require that a hearing be conducted in any case; this section merely sets forth the powers the Board may exercise in any hearing or other proceeding undertaken under another provision of the Act.
Section 4(c)(8) does provide that in approving activ-ities under that provision the Board must provide notice and opportunity for hearing. However, because the Board has determined that section 4 does not apply to the direct activities of Merchants's subsidiary state banks, the Board by this Order is not approving an application under section 4(c)(8). Accordingly, pro-testants do not have the right to a hearing or discovery in this case, and the Board does not believe such a proceeding would be appropriate under the facts and circumstances of this case.42
41. S. 1886, Title VIII, § 802, 100th Cong., 2d Sess., 134 Cong. Rec. S3437 (daily ed. March 30, 1988); H.R. 5094, Title III, § 302, 100th Cong., 2d Sess., 134 Cong. Rec. H6453 (daily ed. August 4,1988), 134 Cong. Rec. H8470 (Sept. 27, 1988). See also S. Rep. No. 305, 100th Cong., 2d Sess., 108 (1988); H.R. Rep. No. 822 (Part 1), 100th Cong., 2d Sess., 166 (1988); H.R. Rep. No. 822 (Part 2), 100th Cong., 2d Sess., 80-81 (1988).
42. Even where the applicable provision requires an opportunity for a hearing, such as under section 4(c)(8), a protestant is not entitled to discovery and a hearing on every application, but only when there are material issues of fact in dispute. Connecticut Bankers Assn. v. Board of Governors, 627 F.2d 245 (D.C. Cir. 1980). In this case, there are no material issues of fact in dispute. Protestants present no specific allegations; rather, they assert that any evidence that might prove an
By order of the Board of Governors, effective March 3, 1989.
Voting for this action: Chairman Greenspan and Governors Johnson, Seger, Angell, Heller, Kelley, and LaWare.
J E N N I F E R J . J O H N S O N
Associate Secretary of the Board
PNC Financial Corp Pittsburgh, Pennsylvania
Order Approving Applications to Underwrite and Deal in Certain Securities to a Limited Extent and to Offer Full-Service Brokerage Services
PNC Financial Corp, Pittsburgh, Pennsylvania ("PNC"), a bank holding company within the meaning of the Bank Holding Company Act ("BHC Act"), has applied for the Board's approval under section 4(c)(8) of the BHC Act (12 U.S.C. § 1843(c)(8)) and section 225.23 of the Board's Regulation Y (12 C.F.R. 225.23), for its subsidiary, PNC Securities Corp, Pittsburgh, Pennsylvania ("PNCSC"), to provide investment ad-visory and brokerage services on a combined basis ("full-service brokerage") to institutional and retail customers, and to engage, to a limited extent, in underwriting and dealing in 1-4 family mortgage-re-lated securities and consumer-receivable-related secu-rities (collectively "ineligible securities").
PNC has previously received approval under the BHC Act to:
(1) engage in discount brokerage activities pursuant to section 225.25(b)(15) of Regulation Y (12 C.F.R. 225.25(b)(15)); (2) underwrite and deal in U.S. government and other bank-eligible securities pursuant to section 225.25(b)(16) of Regulation Y (12 C.F.R. 225.25(b)(16)); and (3) underwrite and deal in, to a limited extent, commercial paper and municipal revenue bonds.1
PNC, with approximately $25.0 billion in domestic deposits, is the twelfth largest commercial banking organization in the United States, with full-service banks in Delaware, Indiana, Kentucky, New Jersey,
evasive intent is in the hands of Merchants. Such a bare allegation is insufficient to show that material facts are in dispute. In any event, as noted above, the Board has determined that the factual basis for such evasion is not present in this case. Moreover, the Board retains supervisory authority to act under the BHC Act to prevent any evasion of the requirements of the Act or this Order should that situation arise in the future.
1. See PNC Financial Corp, 73 FEDERAL RESERVE BULLETIN 742 (1987).
Digitized for FRASER http://fraser.stlouisfed.org/ Federal Reserve Bank of St. Louis
Legal Developments 397
Ohio, and Pennsylvania.2 PNC engages directly and through subsidiaries in a broad range of permissible nonbanking activities in the United States.
Notice of the applications, affording interested per-sons an opportunity to submit comments on the pro-posal, has been published (54 Federal Register 3850, 6028 (1989)). The time for filing comments has ex-pired, and the Board has considered the applications and all comments received in light of the public interest factors set forth in section 4(c)(8) of the BHC Act.
The Board has previously determined that the con-duct of the proposed ineligible securities underwriting and dealing activities is consistent with section 20 of the Glass-Steagall Act, provided the underwriting subsidiary derives no more than 5 percent of its total gross revenue from underwriting and dealing in the approved securities over any two-year period.3 The Board further found that, subject to the prudential framework of limitations established in those cases to address the potential for conflicts of interest, unsound banking practices or other adverse effects, the pro-posed underwriting and dealing activities were so closely related to banking as to be a proper incident thereto within the meaning of section 4(c)(8) of the BHC Act. PNC has committed to conduct its ineligible securities underwriting and dealing activities subject to the 5 percent revenue test and the prudential limitations established by the Board in its Citicorp/ Morgan/Bankers Trust and Chemical Orders.4
The Board has previously determined that full-service brokerage for both institutional and retail customers is closely related and a proper incident to banking under section 4(c)(8) of the BHC Act, and does not violate the Glass-Steagall Act. Bank of New England Corporation, 74 FEDERAL RESERVE BULLE-TIN 700 (1988) ("Bank of New England"). See also National Westminster Bank PLC, et al., 72 FEDERAL RESERVE BULLETIN 584 (1986).5
PNC's proposal differs from prior cases in that PNCSC will provide full-service brokerage to retail customers with respect to ineligible securities that PNCSC may hold as principal in connection with its
2. Banking data are as of September 30, 1988. 3. Citicorp, J.P. Morgan & Co. Incorporated and Bankers Trust
New York Corporation, 73 FEDERAL RESERVE BULLETIN 473 (1987) ("Citicorp/Morgan/Bankers Trust"), affdsub nom., Securities Indus-try Association v. Board of Governors of the Federal Reserve System, 839 F.2d 47 (2d Cir. 1988), cert, denied, 108 S. Ct. 2830 (1988) C'SIA v. Board"); and Chemical New York Corporation, The Chase Man-hattan Corporation, Bankers Trust New York Corporation, Citicorp, Manufacturers Hanover Corporation and Security Pacific Corpora-tion, Ti FEDERAL RESERVE BULLETIN 731 (1987) ("Chemical").
4. In light of the decision in SIA v. Board, the Board has determined not to require PNC to comply with a market share limitation.
5. Ajfd sub nom. Security Industry Ass'n v. Board of Governors, 821 F.2d 810 (D.C. Cir. 1987), cert, den., 108 S. Ct. 697 (1988).
authorized underwriting and dealing activities. PNCSC will provide full and appropriate disclosure of its interest in the transaction, as required by the securities laws, the National Association of Securities Dealers and fiduciary principles.
The Board has previously authorized an underwrit-ing subsidiary to provide full-service brokerage with respect to ineligible securities that it holds as principal, but only to institutional customers. See Bankers Trust New York Company, 74 FEDERAL RESERVE BULLETIN 695 (1988) ("Bankers Trust"). PNC has made the same commitments regarding disclosure as in Bankers Trust. Specifically, PNCSC will inform its customers at the commencement of the relationship that, as a general matter, PNCSC may be a principal or may be engaged in underwriting with respect to, or may pur-chase from an affiliate, those securities for which brokerage and advisory services are provided. At the time any brokerage order is taken, the customer will be informed (usually orally) whether PNCSC is acting as agent or principal with respect to a security.
Confirmations sent to customers also will state whether PNCSC is acting as agent or principal.
The Board also notes that in its orders permitting ineligible securities underwriting and dealing, the Board has prohibited banks and thrift institutions from offering advice to customers on the purchase or sale of ineligible securities underwritten or dealt in by an underwriting subsidiary, unless adequate disclosure is given. The Board concluded that full disclosure would address the conflicts of interest potential that could arise in this situation. For the same reason, the Board believes that such disclosure is sufficient to address the conflicts of interest issue raised where the under-writing subsidiary provides advice on securities it holds as principal.
In this regard, the Board notes that in performing the full-service brokerage activity, the underwriting subsidiary would operate under a more extensive framework of prudential limitations than would be the case if the full-service brokerage activity were con-ducted by a bank, a subsidiary of a bank, or by another holding company subsidiary. These limitations require a marked operational and managerial separation of the underwriting subsidiary from its banking affiliates.
Moreover, as noted, PNCSC will conduct its bro-kerage and advisory activities within the same frame-work approved by the Board in Bank of New England. Thus, PNC has committed that, before providing any brokerage or advisory services to retail customers, PNCSC will prominently disclose in writing to each such customer that PNCSC is not a bank and is separate from any affiliated bank, and that the securi-ties sold, offered, or recommended by PNCSC are not deposits, are not insured by the FDIC, are not guar-
Digitized for FRASER http://fraser.stlouisfed.org/ Federal Reserve Bank of St. Louis
398 Federal Reserve Bulletin • May 1989
anteed by an affiliated bank, and are not otherwise an obligation of an affiliated bank, unless such is in fact the case.
Consummation of the proposal would provide added convenience to PNC's customers. In addition, the Board expects that the de novo entry of PNC into the market for these services would increase the level of competition among providers of these services. Ac-cordingly, the Board has determined that the perfor-mance of the proposed activities by PNC can reason-ably be expected to produce public benefits that would outweigh adverse effects under the proper incident to banking standard of section 4(c)(8) of the BHC Act.
Based on the above, the Board has determined to approve the proposed activities subject to all of the terms and conditions established in the Bank of New England, Citicorp!Morgan!Bankers Trust and Chemi-cal Orders, except the market share limitation and as provided above.6
Accordingly, PNC's proposed activities are hereby approved.7 The Board's determination is subject to all of the conditions set forth in the Board's Regulation Y, including those in sections 225.4(d) and 225.23(b), and to the Board's authority to require modification or termination of the activities of a bank holding com-pany or any of its subsidiaries as the Board finds necessary to assure compliance with, and to prevent evasion of, the provisions of the BHC Act and the Board's regulations and orders issued thereunder.
The transaction shall not be consummated later than three months after the effective date of this Order, unless such period is extended for good cause by the Board or by the Federal Reserve Bank of Cleveland, pursuant to delegated authority.
6. The industrial development bonds approved in those applications and for PNC in this case are only those tax-exempt bonds in which the governmental issuer, or the governmental unit on behalf of which the bonds are issued, is the owner for federal income tax purposes of the financed facility (such as airports, mass commuting facilities, and water pollution control facilities). Without further approval from the Board, PNCSC may underwrite or deal in only these types of industrial development bonds.
The Board's approval of the proposed underwriting and dealing activities extends only to PNCSC. The activities may not be con-ducted by PNC in any other subsidiary without prior Board review. Pursuant to Regulation Y, no corporate reorganization of PNCSC, such as the establishment of subsidiaries of PNCSC to conduct the activities, may be consummated without prior Board approval.
7. PNCSC may also provide services that are necessary incidents to these approved activities. Any activity conducted as a necessary incident to the ineligible securities underwriting and dealing activity must be treated as part of the ineligible securities activity unless PNCSC has received specific approval under section 4(c)(8) of the BHC Act to conduct the activity independently. Until such approval is obtained, any revenues from the incidental activity must be counted as ineligible revenue subject to the 5 percent gross revenue limit set forth in Citicorp/Morgan!Bankers Trust.
This 5 percent gross revenue limit should be calculated in accord-ance with the method stated in J.P. Morgan & Co. Incorporated, et al., 75 FEDERAL RESERVE BULLETIN 192.
By order of the Board of Governors, effective March 14, 1989.
Voting for this action: Vice Chairman Johnson and Gover-nors Seger, Heller, Kelley, and LaWare. Absent and not voting: Chairman Greenspan and Governor Angell.
J E N N I F E R J . J O H N S O N
Associate Secretary of the Board
Westpac Banking Corporation Sydney, Australia
Order Approving Application to Engage in Underwriting and Dealing in Certain Securities to a Limited Extent
Westpac Banking Corporation, Sydney, Australia, a bank holding company within the meaning of the Bank Holding Company Act ("BHC Act"), has applied for the Board's approval under section 4(c)(8) of the BHC Act (12 U.S.C. § 1843(c)(8)) and section 225.23 of the Board's Regulation Y (12 C.F.R. 225.23) for its sub-sidiary, Westpac Pollock Government Securities, Inc., New York, New York ("Company"), to engage de novo on a limited basis, in underwriting and dealing in:
(1) municipal revenue bonds, including certain in-dustrial development bonds; (2) 1-4 family mortgage-related securities; (3) commercial paper; and (4) consumer-receivable-related securities ("CRRs") (collectively "ineligible securities"). Applicant, with consolidated assets of $62.5 billion,
is the 75th largest banking organization in the world. It operates four branches in the United States in New York, Chicago, San Francisco, and Los Angeles and engages directly and through subsidiaries in a broad range of permissible nonbanking activities.1
Notice of the application, affording interested per-sons an opportunity to submit comments on the pro-posal, has been published (53 Federal Register 44,124 (1988)). The time for filing comments has expired, and the Board has considered the application and all comments received in light of the public interest factors set forth in section 4(c)(8) of the BHC Act.
The Board has previously determined that the con-duct of the proposed ineligible securities underwriting and dealing activity is consistent with section 20 of the Glass-Steagall Act, provided the underwriting subsid-iary derives no more than 5 percent of its total gross revenue from underwriting and dealing in the ap-
1. Ranking is as of September 30, 1987. All other data are as of September 30, 1988.
Digitized for FRASER http://fraser.stlouisfed.org/ Federal Reserve Bank of St. Louis
Legal Developments 399
proved securities over any two-year period.2 The Board further found that, subject to the prudential framework of limitations established in those cases to address the potential for conflicts of interest, unsound banking practices or other adverse effects, the pro-posed underwriting and dealing activities were so closely related to banking as to be a proper incident thereto within the meaning of section 4(c)(8) of the BHC Act. Applicant has committed to conduct its ineligible underwriting and dealing activities subject to the 5 percent revenue test and the prudential limita-tions established by the Board in its Citicorp/Morgan! Bankers Trust and Chemical Orders, including those relating to the treatment of Applicant's capital invest-ment in Company.3
Consummation of the proposal would provide added convenience to Applicant's customers. In addition, the Board expects that the de novo entry of Applicant into the market for these services would increase the level of competition among providers of these ser-vices. Accordingly, the Board has determined that the performance of the proposed activities by Applicant can reasonably be expected to produce public benefits which would outweigh adverse effects under the proper incident to banking standard of section 4(c)(8) of the BHC Act.4
Based on the above, the Board has determined to approve the application subject to all of the terms and conditions established in the Citicorp!Morgan!Bankers Trust and Chemical Orders, except the market share limitation.5
2. Citicorp, J.P. Morgan & Co. Incorporated and Bankers Trust New York Corporation, 73 FEDERAL RESERVE BULLETIN 473 (1987) ("Citicorp!Morgan!Bankers Trust"), ajfdsub nom., Securities Indus-try Association v. Board of Governors of the Federal Reserve System, 839 F.2d 47 (2d Cir. 1988), cert, denied, 108 S. Ct. 2830 (1988) ("S/A v. Board"); and Chemical New York Corporation, The Chase Man-hattan Corporation, Bankers Trust New York Corporation, Citicorp, Manufacturers Hanover Corporation and Security Pacific Corpora-tion, 73 FEDERAL RESERVE BULLETIN 731 (1987) ("Chemical").
3. Applicant has not proposed a market share limitation. Accord-ingly, and in light of the decision in SIA v. Board, the Board has determined not to require Applicant to comply with a market share limitation.
4. Company may also provide services that are necessary incidents to these approved activities. Any activity conducted as a necessary incident to the ineligible securities activity must be treated as part of the ineligible securities activity unless Company has received specific approval under section 4(c)(8) of the BHC Act to conduct the activity independently. Until such approval is obtained, any revenues from the incidental activity must be counted as ineligible revenue subject to the 5 percent gross revenue limit set forth in CiticorplMorgan/Bankers Trust. This 5 percent gross revenue limit should be calculated in accordance with the method stated in J.P. Morgan ct Co. Incorpo-rated, et al, 75 FEDERAL RESERVE BULLETIN 192 (Order dated January 18, 1989).
5. The industrial development bonds approved in those applications and for Applicant in this case are only those tax-exempt bonds in which the governmental issuer, or the governmental unit on behalf of which the bonds are issued, is the owner for federal income tax purposes of the financed facility (such as airports, mass commuting
The Board's determination is subject to all of the conditions set forth in the Board's Regulation Y, including those in sections 225.4(d) and 225.23(b), and to the Board's authority to require modification or termination of the activities of a bank holding com-pany or any of its subsidiaries as the Board finds necessary to assure compliance with, and to prevent evasion of, the provisions of the BHC Act and the Board's regulations and orders issued thereunder.
This transaction shall not be consummated later than three months after the effective date of this Order, unless such period is extended for good cause by the Board or by the Federal Reserve Bank of New York, pursuant to delegated authority.
By order of the Board of Governors, effective March 1, 1989.
Voting for this action: Chairman Greenspan and Governors Johnson, Kelley, and LaWare. Absent and not voting: Gov-ernors Seger, Angell, and Heller.
JENNIFER J. JOHNSON Associate Secretary of the Board
Orders Issued Under Sections 3 and 4 of the Bank Holding Company Act
Norwest Corporation Minneapolis, Minnesota
Order Approving Acquisition of a Bank Holding Company and its Banking and Nonbanking Subsidiaries
Norwest Corporation, Minneapolis, Minnesota ("Norwest"), a bank holding company within the meaning of the Bank Holding Company Act ("BHC Act"), has applied for the Board's approval under section 3(a)(5) of the BHC Act to acquire by merger The Bank Group, Inc., Wayzata, Minnesota ("BGI"), and thereby acquire its bank subsidiaries: The Bank Wayzata, Wayzata, Minnesota; The Bank North, Crystal, Minnesota; and The Bank Excelsior, Excel-sior, Minnesota. Norwest has also applied under sec-tion 4(c)(8) of the BHC Act to acquire BGI's two nonbanking subsidiaries: Wayzata Mortgage Com-
facilities, and water pollution control facilities). Without further approval from the Board, Company may underwrite or deal in only these types of industrial development bonds.
The Board's approval of the proposed underwriting and dealing activities extends only to Company. The activities may not be conducted by Applicant in any other subsidiary without prior Board review. Pursuant to Regulation Y, no corporate reorganization of Company, such as the establishment of subsidiaries of Company to conduct the activities, may be consummated without prior Board approval.
Digitized for FRASER http://fraser.stlouisfed.org/ Federal Reserve Bank of St. Louis
400 Federal Reserve Bulletin • May 1989
pany, Plymouth, Minnesota, and The I.M.F. Group, Inc., Wayzata, Minnesota, and thereby engage in certain mortgage banking activities and certain insur-ance agency activities.1
Notice of the applications, affording interested per-sons an opportunity to submit comments, has been published (53 Federal Register 50,095 (December 13, 1988)). The time for filing comments has expired, and the Board has considered the applications and all comments received in light of the factors set forth in sections 3(c) and 4(c)(8) of the BHC Act.
Norwest is the second largest commercial banking organization in Minnesota, controlling deposits of $7.4 billion, representing approximately 18.4 percent of total deposits in commercial banking organizations in the state.2 BGI, the seventh largest commercial bank-ing organization in Minnesota, controls deposits of $327 million, representing approximately 0.8 percent of total deposits in commercial banking organizations in the state. Upon consummation of this proposal, Norwest would remain the second largest banking organization in Minnesota, controlling deposits of $7.7 billion, representing approximately 19.3 percent of total deposits in commercial banks in the state. Con-summation of this proposal would not increase signif-icantly the concentration of banking resources in Min-nesota.
Norwest competes directly with BGI in the Minne-apolis-St. Paul banking market.3 Norwest is the sec-ond largest commercial banking organization in this market, with deposits of $5.6 billion, representing 22.6 percent of the market's total deposits in commercial banks. BGI is the seventh largest commercial banking organization in this market, with $327 million in de-posits, representing 1.3 percent of the market's total deposits in commercial banks. The Minneapolis-St. Paul banking market is considered to be highly con-centrated, with a four-firm concentration ratio of 74.6 percent. Upon consummation of this proposal, Nor-west would remain the second largest commercial banking organization, controlling $5.9 billion in depos-its, representing 23.9 percent of the total deposits in commercial banks in the market. The four-firm con-
1. Norwest intends to merge these subsidiaries into its existing mortgage subsidiary (Norwest Mortgage, Inc., Des Moines, Iowa) and insurance subsidiary (Norwest Insurance, Inc., Minneapolis, Minne-sota). Mortgage banking activities are authorized for bank holding companies pursuant to section 225.25(b)(1) of the Board's Regulation Y. Norwest's general insurance activities are conducted pursuant to section 4(c)(8)(G) of the BHC Act and section 225.25(b)(8)(vii) of Regulation Y.
2. State deposit and market deposit data are as of March 31, 1988. Thrift data are as of June 30, 1987.
3. The Minneapolis-St. Paul banking market is defined as the Minneapolis-St. Paul RMA adjusted to include all of Scott and Carver Counties and Lanesburgh Township in Le Sueur County, Minnesota.
centration ratio would rise from 74.6 percent to 75.8 percent and the Herfindahl-Hirschman Index ("HHI") would increase by 56 points to 2575.4
Although consummation of this proposal would eliminate existing competition between Norwest and BGI in the Minneapolis-St. Paul banking market, 107 banking institutions would continue to operate in the market. In addition, the Board has considered the presence of thrift institutions in the banking market in its analysis of this proposal. The Board previously has indicated that thrift institutions have become, or have the potential to become, major competitors of com-mercial banks.5 Thrift institutions already exert a considerable competitive influence in the market as providers of NOW accounts and consumer loans, and many are engaged in the business of making commer-cial loans. Based upon the size, market share, and commercial lending activities of thrift institutions in the market, the Board has concluded that thrift insti-tutions exert a significant influence upon existing com-petition in the Minneapolis-St. Paul banking market.6
Accordingly, in view of all the facts of record, includ-ing the small increase in concentration in the market, the Board has determined that consummation of this proposal would not have a significant adverse effect on existing competition in the Minneapolis-St. Paul bank-ing market.
The financial and managerial resources of Norwest and BGI are consistent with approval. Considerations relating to the convenience and needs of the commu-nities to be served are also consistent with approval.
Norwest has also applied, pursuant to section 4(c)(8) of the BHC Act, to acquire the two nonbanking subsidiaries of BGI. Norwest operates mortgage bank-ing and insurance subsidiaries that directly compete with BGI's subsidiaries in these activities. Consum-
4. Under the revised Department of Justice Merger Guidelines (49 Federal Register 26,823 (June 29, 1984)), any market in which the post-merger HHI is over 1800 is considered to be highly concentrated, and the Department is likely to challenge a merger that increases the HHI by more than 50 points unless other factors indicate that the merger will not substantially lessen competition. The Department of Justice has informed the Board that a bank merger or acquisition is not likely to be challenged (in the absence of other factors indicating an anti-competitive effect) unless the post-merger HHI is at least 1800 and the merger increases the HHI by at least 200 points. The Justice Department has stated that the higher than normal anti-competitive effects implicitly recognizes the competitive effects of limited-purpose lenders and other non-depository financial entities.
5. National City Corporation, 70 FEDERAL RESERVE BULLETIN 743 (1984); NCNB Bancorporation, 70 FEDERAL RESERVE BULLETIN 225 (1984); General Bancshares Corporation, 69 FEDERAL RESERVE BUL-LETIN 802 (1983); and First Tennessee National Corporation, 69 FEDERAL RESERVE BULLETIN 298 (1983) .
6. If 50 percent of the deposits controlled by thrift institutions were included in the calculation of market concentration, Norwest and BGI would control 19.9 percent and 1.2 percent of total market deposits, respectively. The HHI would increase by 46 points to 2051 upon consummation of this proposal.
Digitized for FRASER http://fraser.stlouisfed.org/ Federal Reserve Bank of St. Louis
Legal Developments 401
mation of the proposal, however, would have a de minimis effect on existing competition in this mar-ket and there are numerous competitors for these services. Accordingly, the Board concludes that the proposal would not have any significant adverse effect on existing or probable future competition in the relevant market. Furthermore, there is no evidence in the record to indicate that approval of this proposal would result in undue concentration of resources, decreased or unfair competition, conflicts of interests, unsound banking practices, or other adverse effects on the public interest. Accordingly, the Board has deter-mined that the balance of public interest factors that it must consider under section 4(c)(8) of the BHC Act is favorable and consistent with approval of the applica-tion to acquire the nonbanking subsidiaries of BGI.
Based on the foregoing and other facts of record, the Board has determined that the applications should be, and hereby are, approved. The acquisition shall not be consummated before the thirtieth calendar day follow-ing the effective date of this Order, or later than three months following the effective date of this Order
unless such period is extended for good cause by the Board or by the Federal Reserve Bank of Minneapolis, acting pursuant to delegated authority. The determi-nations as to Norwest's nonbanking activities are subject to all of the conditions contained in Regulation Y, including those in sections 225.4(d) and 225.23(b)(3) (12 C.F.R. 225.4(d) and 225.23(b)(3)), and to the Board's authority to require such modification or termination of the activities of a holding company or any of its subsidiaries as the Board finds necessary to assure compliance with the provisions and purposes of the BHC Act and the Board's regulations and orders issued thereunder, or to prevent evasion thereof.
By order of the Board of Governors, effective March 6, 1989.
Voting for this action: Chairman Greenspan and Governors Johnson, Angell, Kelley, and La Ware. Absent and not vot-ing: Governors Seger and Heller.
J E N N I F E R J . JOHNSON
Associate Secretary of the Board
Digitized for FRASER http://fraser.stlouisfed.org/ Federal Reserve Bank of St. Louis
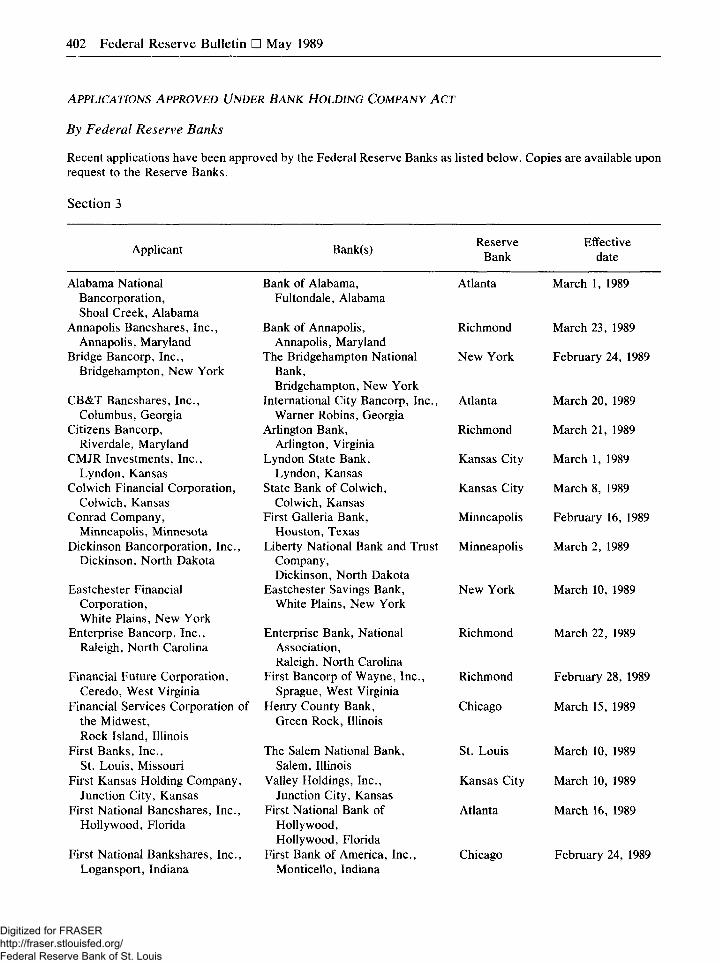
402 Federal Reserve Bulletin • May 1989
APPLICATIONS APPROVED UNDER BANK HOLDING COMPANY ACT
By Federal Reserve Banks
Recent applications have been approved by the Federal Reserve Banks as listed below. Copies are available upon request to the Reserve Banks.
Section 3
Applicant Bank(s) Reserve Bank
Effective date
Alabama National Bancorporation, Shoal Creek, Alabama
Annapolis Bancshares, Inc., Annapolis, Maryland
Bridge Bancorp, Inc., Bridgehampton, New York
Bank of Alabama, Atlanta Fultondale, Alabama
Bank of Annapolis, Richmond Annapolis, Maryland
The Bridgehampton National New York Bank, Bridgehampton, New York
Eastchester Financial Corporation, White Plains, New York
Enterprise Bancorp, Inc., Raleigh, North Carolina
Financial Future Corporation, Ceredo, West Virginia
Financial Services Corporation of the Midwest, Rock Island, Illinois
First Banks, Inc., St. Louis, Missouri
First Kansas Holding Company, Junction City, Kansas
First National Bancshares, Inc., Hollywood, Florida
First National Bankshares, Inc., Logansport, Indiana
Dickinson, North Dakota Eastchester Savings Bank, New York
White Plains, New York
Enterprise Bank, National Richmond Association, Raleigh, North Carolina
First Bancorp of Wayne, Inc., Richmond Sprague, West Virginia
Henry County Bank, Chicago Green Rock, Illinois
The Salem National Bank, St. Louis Salem, Illinois
Valley Holdings, Inc., Kansas City Junction City, Kansas
First National Bank of Atlanta Hollywood, Hollywood, Florida
First Bank of America, Inc., Chicago Monticello, Indiana
March 1, 1989
March 23, 1989
February 24, 1989
CB&T Bancshares, Inc., International City Bancorp, Inc., Atlanta March 20, 1989 Columbus, Georgia Warner Robins, Georgia
Citizens Bancorp, Arlington Bank, Richmond March 21, 1989 Riverdale, Maryland Arlington, Virginia
CMJR Investments, Inc., Lyndon State Bank, Kansas City March 1, 1989 Lyndon, Kansas Lyndon, Kansas
Colwich Financial Corporation, State Bank of Colwich, Kansas City March 8, 1989 Colwich, Kansas Colwich, Kansas
Conrad Company, First Galleria Bank, Minneapolis February 16, 1989 Minneapolis, Minnesota Houston, Texas
Dickinson Bancorporation, Inc., Liberty National Bank and Trust Minneapolis March 2, 1989 Dickinson, North Dakota Company,
March 10, 1989
March 22, 1989
February 28, 1989
March 15, 1989
March 10, 1989
March 10, 1989
March 16, 1989
February 24, 1989
Digitized for FRASER http://fraser.stlouisfed.org/ Federal Reserve Bank of St. Louis
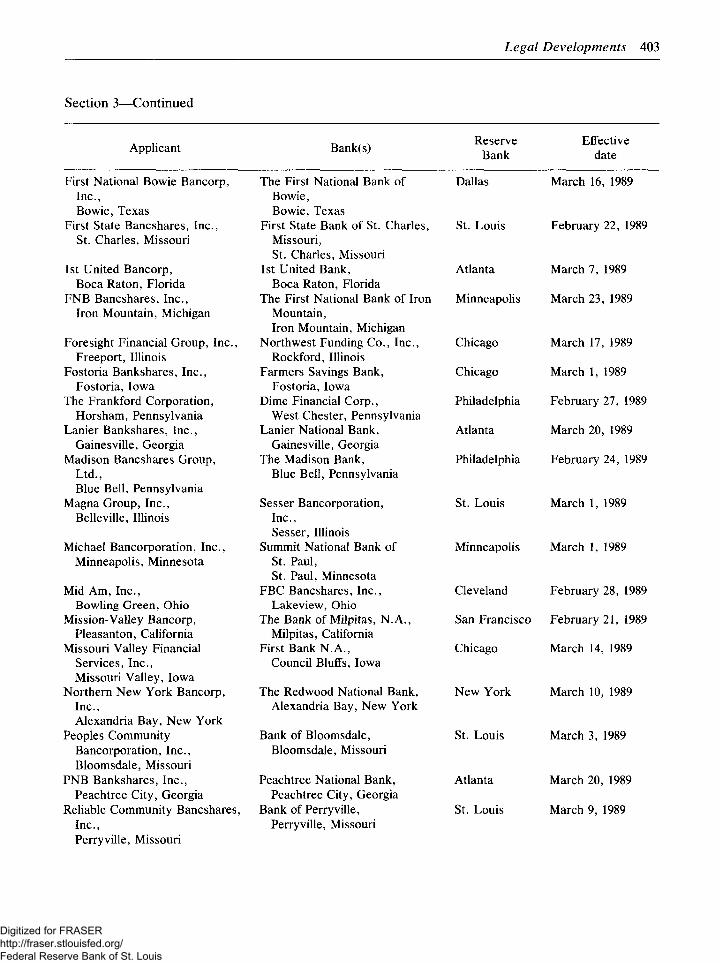
Legal Developments 403
Section 3—Continued
Applicant Bank(s) Reserve Bank
Effective date
First National Bowie Bancorp, Inc., Bowie, Texas
First State Bancshares, Inc., St. Charles, Missouri
1st United Bancorp, Boca Raton, Florida
FNB Bancshares, Inc., Iron Mountain, Michigan
Foresight Financial Group, Inc., Freeport, Illinois
Fostoria Bankshares, Inc., Fostoria, Iowa
The Frankford Corporation, Horsham, Pennsylvania
Lanier Bankshares, Inc., Gainesville, Georgia
Madison Bancshares Group, Ltd., Blue Bell, Pennsylvania
Magna Group, Inc., Belleville, Illinois
Michael Bancorporation, Inc., Minneapolis, Minnesota
Mid Am, Inc., Bowling Green, Ohio
Mission-Valley Bancorp, Pleasanton, California
Missouri Valley Financial Services, Inc., Missouri Valley, Iowa
Northern New York Bancorp, Inc., Alexandria Bay, New York
Peoples Community Bancorporation, Inc., Bloomsdale, Missouri
PNB Bankshares, Inc., Peachtree City, Georgia
Reliable Community Bancshares, Inc., Perryville, Missouri
The First National Bank of Bowie, Bowie, Texas
First State Bank of St. Charles, Missouri, St. Charles, Missouri
1st United Bank, Boca Raton, Florida
The First National Bank of Iron Mountain, Iron Mountain, Michigan
Northwest Funding Co., Inc., Rockford, Illinois
Farmers Savings Bank, Fostoria, Iowa
Dime Financial Corp., West Chester, Pennsylvania
Lanier National Bank, Gainesville, Georgia
The Madison Bank, Blue Bell, Pennsylvania
Sesser Bancorporation, Inc., Sesser, Illinois
Summit National Bank of St. Paul, St. Paul, Minnesota
FBC Bancshares, Inc., Lake view, Ohio
The Bank of Milpitas, N.A., Milpitas, California
First Bank N.A., Council Bluffs, Iowa
The Redwood National Bank, Alexandria Bay, New York
Bank of Bloomsdale, Bloomsdale, Missouri
Peachtree National Bank, Peachtree City, Georgia
Bank of Perryville, Perryville, Missouri
Dallas March 16, 1989
St. Louis February 22, 1989
Atlanta March 7, 1989
Minneapolis March 23, 1989
Chicago
Chicago
Philadelphia
Atlanta
Philadelphia
March 17, 1989
March 1, 1989
February 27, 1989
March 20, 1989
February 24, 1989
St. Louis March 1, 1989
Minneapolis March 1, 1989
Cleveland February 28, 1989
San Francisco February 21, 1989
Chicago March 14, 1989
New York March 10, 1989
St. Louis March 3, 1989
Atlanta March 20, 1989
St. Louis March 9, 1989
Digitized for FRASER http://fraser.stlouisfed.org/ Federal Reserve Bank of St. Louis
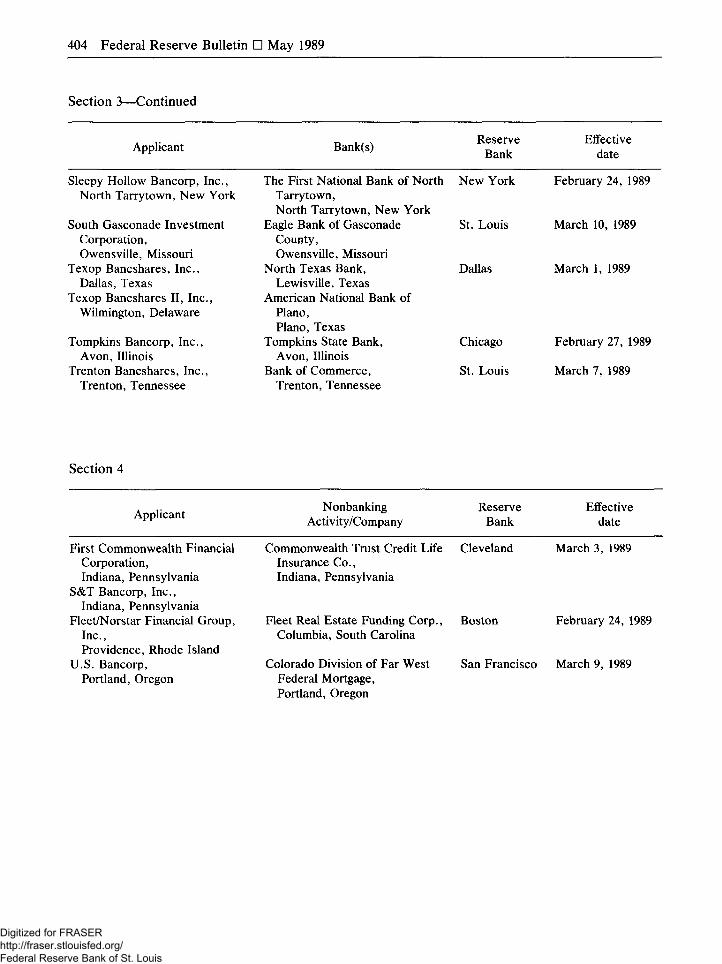
404 Federal Reserve Bulletin • May 1989
Section 3—Continued
Applicant Bank(s) Reserve Bank
Effective date
Sleepy Hollow Bancorp, Inc., North Tarry town, New York
South Gasconade Investment Corporation, Owensville, Missouri
Texop Bancshares, Inc., Dallas, Texas
Texop Bancshares II, Inc., Wilmington, Delaware
Tompkins Bancorp, Inc., Avon, Illinois
Trenton Bancshares, Inc., Trenton, Tennessee
The First National Bank of North New York Tarrytown, North Tarrytown, New York
Eagle Bank of Gasconade St. Louis County, Owensville, Missouri
North Texas Bank, Dallas Lewisville, Texas
American National Bank of Piano, Piano, Texas
Tompkins State Bank, Chicago Avon, Illinois
Bank of Commerce, St. Louis Trenton, Tennessee
February 24, 1989
March 10, 1989
March 1, 1989
February 27, 1989
March 7, 1989
Section 4
Applicant
First Commonwealth Financial Corporation, Indiana, Pennsylvania
S&T Bancorp, Inc., Indiana, Pennsylvania
Fleet/Norstar Financial Group, Inc., Providence, Rhode Island
U.S. Bancorp, Portland, Oregon
Nonbanking Activity/Company
Commonwealth Trust Credit Life Insurance Co., Indiana, Pennsylvania
Fleet Real Estate Funding Corp., Columbia, South Carolina
Colorado Division of Far West Federal Mortgage, Portland, Oregon
Reserve Effective Bank date
Cleveland March 3, 1989
Boston February 24, 1989
San Francisco March 9, 1989
Digitized for FRASER http://fraser.stlouisfed.org/ Federal Reserve Bank of St. Louis
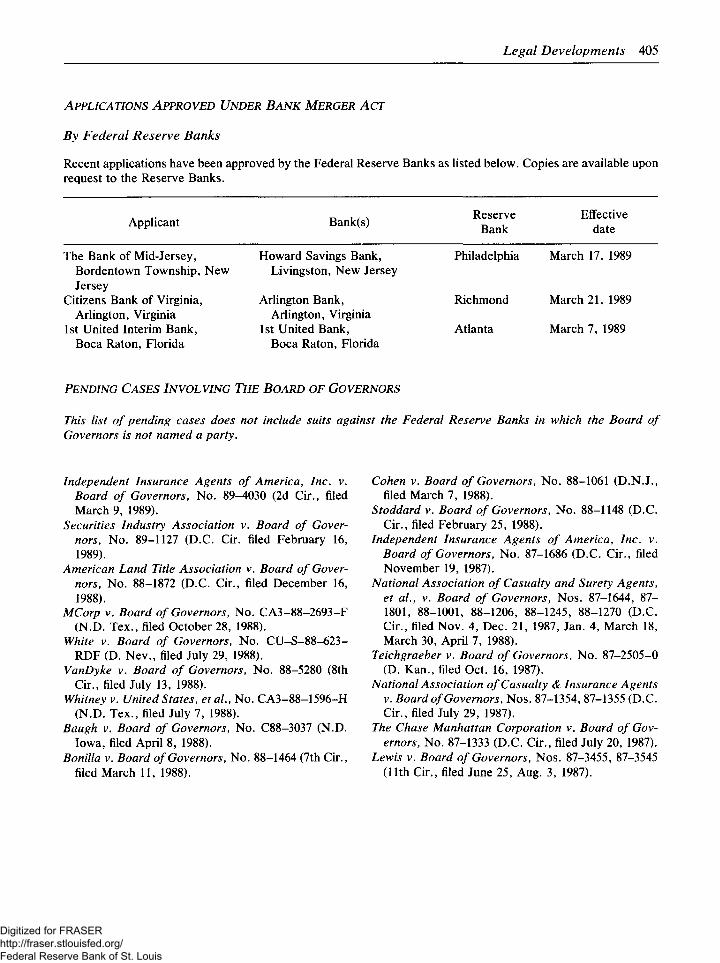
Legal Developments 405
APPLICATIONS APPROVED UNDER BANK MERGER ACT
By Federal Reserve Banks
Recent applications have been approved by the Federal Reserve Banks as listed below. Copies are available upon request to the Reserve Banks.
Applicant Bank(s) Reserve Bank
Effective date
The Bank of Mid-Jersey, Bordentown Township, New Jersey
Citizens Bank of Virginia, Arlington, Virginia
1st United Interim Bank, Boca Raton, Florida
Howard Savings Bank, Livingston, New Jersey
Arlington Bank, Arlington, Virginia
1st United Bank, Boca Raton, Florida
Philadelphia March 17, 1989
Richmond March 21, 1989
Atlanta March 7, 1989
PENDING CASES INVOLVING THE BOARD OF GOVERNORS
This list of pending cases does not include suits against the Federal Reserve Banks in which the Board of Governors is not named a party.
Independent Insurance Agents of America, Inc. v. Board of Governors, No. 89-4030 (2d Cir., filed March 9, 1989).
Securities Industry Association v. Board of Gover-nors, No. 89-1127 (D.C. Cir. filed February 16, 1989).
American Land Title Association v. Board of Gover-nors, No. 88-1872 (D.C. Cir., filed December 16, 1988).
MCorp v. Board of Governors, No. CA3-88-2693-F (N.D. Tex., filed October 28, 1988).
White v. Board of Governors, No. CU-S-88-623-RDF (D. Nev., filed July 29, 1988).
VanDyke v. Board of Governors, No. 88-5280 (8th Cir., filed July 13, 1988).
Whitney v. United States, etal., No. CA3-88-1596-H (N.D. Tex., filed July 7, 1988).
Baugh v. Board of Governors, No. C88-3037 (N.D. Iowa, filed April 8, 1988).
Bonilla v. Board of Governors, No. 88-1464 (7th Cir., filed March 11, 1988).
Cohen v. Board of Governors, No. 88-1061 (D.N.J., filed March 7, 1988).
Stoddard v. Board of Governors, No. 88-1148 (D.C. Cir., filed February 25, 1988).
Independent Insurance Agents of America, Inc. v. Board of Governors, No. 87-1686 (D.C. Cir., filed November 19, 1987).
National Association of Casualty and Surety Agents, et al., v. Board of Governors, Nos. 87-1644, 87-1801, 88-1001, 88-1206, 88-1245, 88-1270 (D.C. Cir., filed Nov. 4, Dec. 21, 1987, Jan. 4, March 18, March 30, April 7, 1988).
Teichgraeber v. Board of Governors, No. 87-2505-0 (D. Kan., filed Oct. 16, 1987).
National Association of Casualty & Insurance Agents v. Board of Governors, Nos. 87-1354, 87-1355 (D.C. Cir., filed July 29, 1987).
The Chase Manhattan Corporation v. Board of Gov-ernors, No. 87-1333 (D.C. Cir., filed July 20, 1987).
Lewis v. Board of Governors, Nos. 87-3455, 87-3545 (11th Cir., filed June 25, Aug. 3, 1987).
Digitized for FRASER http://fraser.stlouisfed.org/ Federal Reserve Bank of St. Louis
407
Directors of Federal Reserve Banks and Branches
Regional decentralization and a combination of governmental and private characteristics are im-portant hallmarks of the uniqueness of the Fed-eral Reserve System. Under the Federal Reserve Act, decentralization was achieved by division of the country into 12 Federal Reserve Districts and the establishment in each District of a separately incorporated Federal Reserve Bank with its own board of directors. The member banks in each District own the stock of their Reserve Bank and elect a majority of the board of directors of that Bank. The Board of Governors, an agency of the federal government, exercises general supervi-sion over the Reserve Banks and appoints a minority of each board of directors of the Re-serve Banks and their Branches. Thus, the Fed-eral Reserve relies importantly in the conduct of the System's affairs on the regional participation and counsel of the directors of the Federal Re-serve Banks and Branches.
The following list of directors of Federal Re-serve Banks and Branches shows for each direc-tor the class of directorship, the principal busi-ness affiliation, and the date the current term expires. Each Federal Reserve Bank has nine members on its board of directors: the member banks elect the three Class A and three Class B directors, and the Board of Governors appoints the three directors in Class C. Directors are chosen without discrimination as to race, creed, color, sex, or national origin.
DISTRICT 1—BOSTON
Class A
Class A directors of each Reserve Bank repre-sent the stockholding member banks of the Fed-eral Reserve District. Class B and Class C direc-tors represent the public and are chosen with due, but not exclusive, consideration to the in-terests of agriculture, commerce, industry, ser-vices, labor, and consumers; they may not be officers, directors, or employees of any bank. In addition, Class C directors may not be stockhold-ers of any bank. The Board of Governors desig-nates annually one Class C director as chairman of the board of directors of each District Bank and designates another Class C director as dep-uty chairman.
Each of the 25 Branches of the Federal Re-serve Banks has a board of either seven or five directors, a majority of whom are appointed by the parent Federal Reserve Bank; the others are appointed by the Board of Governors. One of the Board's appointees is designated annually as chairman of the board of that Branch in a manner prescribed by the parent Federal Reserve Bank.
The names of the chairman and deputy chair-man of the Board of directors of each Reserve Bank and of the chairman of each Branch are published monthly in the F E D E R A L RESERVE
BULLETIN. 1
1. The current list appears on page A85 of this BULLETIN.
Term expires Dec.31
Joel B. Alvord Chairman and Chief Executive Officer, Shawmut National 1989 Corporation, Hartford, Connecticut
Richard D. Wardell President and Chief Executive Officer, National Iron Bank of 1990 Salisbury, Salisbury, Connecticut
William H. Chadwick President and Chief Executive Officer, The Howard Bank, N.A., 1991 Burlington, Vermont
Digitized for FRASER http://fraser.stlouisfed.org/ Federal Reserve Bank of St. Louis
408 Federal Reserve Bulletin • May 1989
DISTRICT 1—Continued
Class B
Richard M. Oster
Stephen R. Levy
Edward H. Ladd
Class C Richard N. Cooper
Richard L. Taylor George N. Hatsopoulos
President and Chief Executive Officer, Cookson America, Inc., Providence, Rhode Island
Chairman and Chief Executive Officer, Bolt Beranek and Newman, Inc., Cambridge, Massachusetts
President and Chief Executive Officer, Standish, Ayer and Wood, Inc., Boston, Massachusetts
Maurits C. Boas Professor of International Economics, Harvard University, Cambridge, Massachusetts
President, Taylor Properties, Inc., Boston, Massachusetts Chairman of the Board and President, Thermo Electron
Corporation, Waltham, Massachusetts
Term expires
Dec. 31
1989
1990
1991
1989
1990 1991
DISTRICT 2—NEW YORK
Class A
Alberto M. Paracchini
J. Kirby Fowler
John F. McGillicuddy
Class B John A. Georges
John F. Welch, Jr. Richard L. Gelb
Class C
Cyrus R. Vance
Ellen V. Futter
Maurice R. Greenberg
Chairman of the Board and President, Banco de Ponce, 1989 Ponce, Puerto Rico
President and Chief Executive Officer, The Flemington National 1990 Bank and Trust Company, Flemington, New Jersey
Chairman of the Board and Chief Executive Officer, Manufacturers 1991 Hanover Trust Company, New York, New York
Chairman and Chief Executive Officer, International Paper, 1989 New York, New York
Chairman and Chief Executive Officer, GE, Fairfield, Connecticut 1990 Chairman and Chief Executive Officer, Bristol-Myers Company, 1991
New York, New York
Presiding Partner, Simpson Thacher and Bartlett, 1989 New York, New York
President, Barnard College, Columbia University, 1990 New York, New York
President and Chief Executive Officer, American International 1991 Group, Inc., New York, New York
-BUFFALO BRANCH
Appointed by the Federal Reserve Bank Harry J. Sullivan Norman W. Sinclair
Richard H. Popp Robert G. Wilmers
President, Salamanca Trust Company, Salamanca, New York 1989 Chairman and Chief Executive Officer, Lockport Savings Bank, 1990
Lockport, New York Operating Partner, Southview Farm, Castile, New York 1991 Chairman and Chief Executive Officer, Manufacturers and Traders 1991
Trust Company, Buffalo, New York
Digitized for FRASER http://fraser.stlouisfed.org/ Federal Reserve Bank of St. Louis
Directors of Federal Reserve Banks and Branches 409
DISTRICT 2—Continued Term expires
BUFFALO BRANCH—Continued Dec~ 31
Appointed by the Board of Governors Matthew Augustine President and Chief Executive Officer, Eltrex Industries, Inc., 1989
Rochester, New York Paul E. McSweeney Executive Vice President, United Food and Commercial Workers, 1990
District Union Local One, AFL-CIO, Amherst, New York Mary Ann Lambertsen Vice President, Human Resources, The Quaker Oats Company, 1991
Fisher-Price Division, East Aurora, New York
DISTRICT 3—PHILADELPHIA
Class A George A. Butler Chairman and Chief Executive Officer, First Pennsylvania Bank, 1989
N.A., Philadelphia, Pennsylvania Constantinos I. Costalas Chairman, President, and Chief Executive Officer, Glendale National 1990
Bank of New Jersey, Voorhees, New Jersey Gary E. Burl President, Delaware National Bank, Georgetown, Delaware 1991
Class B Carl E. Singley Charles F. Seymour Nicholas Riso
Partner, White, McClelland and Singley, Philadelphia, Pennsylvania 1989 Chairman, Jackson-Cross Company, Philadelphia, Pennsylvania 1990 Executive Vice President, AHOLD, U.S.A., 1991
Harrisburg, Pennsylvania
Class C
Peter A. Benoliel
Jane G. Pepper
Gunnar E. Sarsten
Chairman of the Board, Quaker Chemical Corporation, 1989 Conshohocken, Pennsylvania
President, The Pennsylvania Horticultural Society, 1990 Philadelphia, Pennsylvania
Chairman, President, and Chief Executive Officer, United Engineers 1991 and Constructors, Inc., Philadelphia, Pennsylvania
DISTRICT 4—CLEVELAND
Class A
Frank Wobst
William H. May
William T. McConnell
Chairman and Chief Executive Officer, Huntington Bancshares 1989 Incorporated, Columbus, Ohio
Chairman and President, First National Bank of Nelsonville, 1990 Nelsonville, Ohio
President, The Park National Bank, Newark, Ohio 1991
Class B Laban P. Jackson, Jr. Verna K. Gibson Daniel M. Galbreath
Chairman of the Board, Clearcreek Properties, Lexington, Kentucky 1989 President, The Limited Stores, Inc., Columbus, Ohio 1990 President, John W. Galbreath and Company, Columbus, Ohio 1991
Digitized for FRASER http://fraser.stlouisfed.org/ Federal Reserve Bank of St. Louis
410 Federal Reserve Bulletin • May 1989
DISTRICT 4—Continued Term expires
Class C Dec• 31
Charles W. Parry Director and Retired Chairman and Chief Executive Officer, 1989 Aluminum Company of America, Pittsburgh, Pennsylvania
Robert D. Storey Partner, Burke, Haber and Berick, Cleveland, Ohio 1990 John R. Miller Former President and Chief Operating Officer, The Standard Oil 1991
Company (Ohio), Cleveland, Ohio
—CINCINNATI BRANCH
Appointed by the Federal Reserve Bank Robert M. Duncan President, First National Bank of Louisa, Louisa, Kentucky 1989 Jack W. Buchanan President, Sphar and Company, Inc., Winchester, Kentucky 1990 Jerry L. Kirby Chairman of the Board, President, and Chief Executive Officer, 1990
Citizens Federal Savings and Loan Association, Dayton, Ohio Allen L. Davis President and Chief Executive Officer, The Provident Bank, 1991
Cincinnati, Ohio Appointed by the Board of Governors
Owen B. Butler Chairman of the Board (Retired), The Procter and Gamble 1989 Company, Cincinnati, Ohio
Marvin Rosenberg Partner, Towne Properties, Ltd., Cincinnati, Ohio 1990 Kate Ireland National Chairman, Frontier Nursing Service, Wendover, Kentucky 1991
-PITTSBURGH BRANCH
Appointed by the Federal Reserve Bank Thomas G. Dove Chairman of the Executive Committee and Chief Executive Officer, 1989
Wheeling Dollar Bank, Wheeling, West Virginia George A. Davidson, Jr. Chairman and Chief Executive Officer, Consolidated Natural Gas 1990
Company, Pittsburgh, Pennsylvania President and Chief Executive Officer, Dollar Bank, F.S.B., 1990
Pittsburgh, Pennsylvania President and Chief Executive Officer, First Commonwealth 1991
Financial Corporation, Indiana, Pennsylvania Appointed by the Board of Governors
Senior Vice President-Finance, and Chief Financial Officer, 1989 H. J. Heinz Company, Pittsburgh, Pennsylvania
President and Chief Executive Officer, Allegheny Housing 1990 Rehabilitation Corporation, Pittsburgh, Pennsylvania
Chairman and Chief Executive Officer, Braishfield Associates, Inc., 1991 New York, New York
Stephen C. Hansen
E. James Trimarchi
Karl M. von der Hey den
Milton A. Washington
James E. Haas
DISTRICT 5—RICHMOND
Class A Chester A. Duke
John F. McNair III
C. R. Hill, Jr.
President and Chief Executive Officer, Marion National Bank, 1989 Marion, South Carolina
President and Chief Executive Officer, Wachovia Bank and Trust 1990 Company, N.A. and The Wachovia Corporation, Winston-Salem, North Carolina
Chairman and President, M & M Financial Corporation and 1991 Merchants & Miners National Bank, Oak Hill, West Virginia
Digitized for FRASER http://fraser.stlouisfed.org/ Federal Reserve Bank of St. Louis
Directors of Federal Reserve Banks and Branches 411
DISTRICT 5—Continued
Class B
Thomas B. Cookerly
Jack C. Smith
Edward H. Covell
President, Broadcast Division, Allbritton Communications, Washington, D.C.
Chairman of the Board and Chief Executive Officer, K-VA-T Food Stores, Inc., Grundy, Virginia
President, The Covell Company, Easton, Maryland
Term expires
Dec. 31
1989
1990
1991
Class C Leroy T. Canoles, Jr. Hanne Merriman
Anne Marie Whittemore
President, Kaufman & Canoles, Norfolk, Virginia 1989 President and Chief Executive Officer, Honeybee, Inc., 1990
New York, New York Partner, McGuire, Woods, Battle, and Boothe, Richmond, Virginia 1991
—BALTIMORE BRANCH
Appointed by the Federal Reserve Bank Charles W. Hoff III
Raymond V. Haysbert, Sr.
H. Grant Hathaway Joseph W. Mosmiller
President and Chief Executive Officer, Farmers and Mechanics 1989 National Bank, Frederick, Maryland
President and Chief Executive Officer, Parks Sausage Company, 1990 Baltimore, Maryland
Chairman of the Board, Equitable Bank, N.A., Baltimore, Maryland 1991 Chairman of the Board, Loyola Federal Savings and Loan 1991
Association, Baltimore, Maryland
Appointed by the Board of Governors John R. Hardesty, Jr. President, Preston Energy, Inc., Kingwood, West Virginia 1989 Gloria L. Johnson Deputy Director of Administration, The Baltimore Museum of Art, 1990
Baltimore, Maryland Thomas R. Shelton President, Case Foods, Inc., Salisbury, Maryland 1991
—CHARLOTTE BRANCH
Appointed by the Federal Reserve Bank William McKay
James M. Culberson, Jr.
Crandall C. Bowles James G. Lindley
President, First Federal Savings Bank, Hendersonville, 1989 North Carolina
Chairman and President, The First National Bank of Randolph 1990 County, Asheboro, North Carolina
President, The Springs Company, Lancaster, South Carolina 1991 Chairman and Chief Executive Officer, South Carolina National 1991
Corporation, and Chairman, President and Chief Executive Officer, The South Carolina National Bank, Columbia, South Carolina
Appointed by the Board of Governors Anne M. Allen
William E. Masters Harold D. Kingsmore
Vice President, Allen Construction Company, Greensboro, North Carolina
President, Perception, Inc., Easley, South Carolina President and Chief Operating Officer, Graniteville Company,
Graniteville, South Carolina
1989
1990 1991
Digitized for FRASER http://fraser.stlouisfed.org/ Federal Reserve Bank of St. Louis
412 Federal Reserve Bulletin • May 1989
DISTRICT 6—ATLANTA
Class A Mary W. Walker
E.B. Robinson, Jr.
Virgil H. Moore, Jr.
Class B
Paul W. Green
Gary J. Chouest
Saundra H. Gray
Term expires
Dec. 31
1989 Vice Chairman, The National Bank of Walton County, Monroe, Georgia
Chairman and Chief Executive Officer, Deposit Guaranty National 1990 Bank and Deposit Guaranty Corporation, Jackson, Mississippi
Chairman and Chief Executive Officer, First Farmers and Merchants 1991 National Bank, Columbia, Tennessee
President and Chief Executive Officer, American Cast Iron Pipe 1989 Company, Birmingham, Alabama
President and Chief Executive Officer, Edison Chouest Offshore, 1990 Inc., Galliano, Louisiana
Co-Owner, Gemini Springs Farm, DeBary, Florida 1991
Class C Bradley Currey, Jr. Edwin A. Huston
Larry L. Prince
President, Rock-Tenn Company, Norcross, Georgia Senior Executive Vice President-Finance, Ryder System, Inc.,
Miami, Florida President and Chief Operating Officer, Genuine Parts Company,
Atlanta, Georgia
-BIRMINGHAM BRANCH
Appointed by the Federal Reserve Bank President and Chief Executive Officer, First National Bank of
Scottsboro, Scottsboro, Alabama Chairman and Chief Executive Officer, Central Bank of the South,
Birmingham, Alabama Chairman, President, and Chief Executive Officer, Frit Industries,
Inc., Ozark, Alabama President, First American Federal Savings and Loan Association,
Huntsville, Alabama
John H. Newman, Jr.
Harry B. Brock, Jr.
Shelton E. Allred
William F. Childress
Appointed by the Board of Governors Nelda P. Stephenson President, Nelda Stephenson Chevrolet, Inc., Florence, Alabama A.G. Trammell President, Alabama Labor Council, AFI^CIO,
Birmingham, Alabama Roy D. Terry President and Chief Executive Officer, Terry Manufacturing
Company, Inc., Roanoke, Alabama
—JACKSONVILLE BRANCH
Appointed by the Federal Reserve Bank Chairman and Chief Executive Officer, First Florida Banks, Inc.,
Tampa, Florida Chairman and President, Barnett Bank of Central Florida, N.A.,
Orlando, Florida President and Chief Executive Officer, Suncoast Schools Federal
Credit Union, Tampa, Florida Chairman, President, and Chief Executive Officer, Design
Containers, Inc., Jacksonville, Florida
A. Bronson Thayer
Charles K. Cross, Sr.
Perry M. Dawson
Samuel H. Vickers
1989 1990
1991
1989
1990
1991
1991
1989 1990
1991
1989
1990
1991
1991
Digitized for FRASER http://fraser.stlouisfed.org/ Federal Reserve Bank of St. Louis
Directors of Federal Reserve Banks and Branches 413
DISTRICT 6—Continued JACKSONVILLE BRANCH—Continued Appointed by the Board of Governors
Lana Jane Lewis-Brent Vice Chairman, President, and Chief Executive Officer, Sunshine Jr. Stores, Inc., Panama City, Florida
Winnie F. Taylor Professor of Law, University of Florida, Gainesville, Florida Hugh M. Brown President and Chief Executive Officer, BAMSI, Inc., Titusville, Florida
—MIAMI BRANCH
Appointed by the Federal Reserve Bank James H. Robinson Robert M. Taylor
President, Sun Bank/South Florida, N.A., Fort Lauderdale, Florida Chairman and Chief Executive Officer, The Mariner Group, Inc.,
Fort Myers, Florida President and Chief Executive Officer, Community Savings, F.A.,
Riviera Beach, Florida Vice Chairman and Chief Financial Officer, Republic National Bank
of Miami, Miami, Florida Appointed by the Board of Governors
Jose L. Saumat Chairman, Kaufman and Roberts, Inc., Miami, Florida Robert D. Apelgren President, Apelgren Corporation, Pahokee, Florida Dorothy C. Weaver Vice President, Intercap Investments, Inc., Miami, Florida
Frederick A. Teed
Roberto G. Blanco
-NASHVILLE BRANCH
Appointed by the Federal Reserve Bank Chairman, Sovran Financial Corporation/Central South,
Nashville, Tennessee Chairman, First National Bank & Trust Company, and Chairman
and Chief Executive Officer, First Franklin Bancshares, Inc., Athens, Tennessee
Chairman and President, Southeast Services Corporation, Knoxville, Tennessee
Chairman and Chief Executive Officer, Metropolitan Federal Savings and Loan Association, Nashville, Tennessee
Appointed by the Board of Governors Patsy R. Williams Partner, Rhyne Lumber Company, Newport, Tennessee Victoria B. Jackson President and Chief Executive Officer, Diesel Sales and Service,
Inc. and Prodiesel, Inc., Nashville, Tennessee Shirley A. Zeitlin President, Shirley Zeitlin and Co., Realtors, Nashville, Tennessee
James A. Rainey
Lawrence A. Roseberry
William Baxter Lee III
Edwin W. Moats, Jr.
—NEW ORLEANS BRANCH
Appointed by the Federal Reserve Bank Robert S. Gaddis President and Chief Executive Officer, Trustmark National Bank,
Laurel, Mississippi Ronald M. Boudreaux President and Chief Executive Officer, First National Bank of St.
Landry Parish, Opelousas, Louisiana A.F. Delchamps, Jr. Chairman, President, and Chief Executive Officer, Delchamps, Inc.,
Mobile, Alabama Stanley S. Scott President, Crescent Distributing Company, Harahan, Louisiana
Term expires
Dec. 31
1989
1990 1991
1989
1990
1990
1991
1989 1990 1991
1989
1990
1991
1991
1989 1990
1991
1989
1990
1991
1991
Digitized for FRASER http://fraser.stlouisfed.org/ Federal Reserve Bank of St. Louis
414 Federal Reserve Bulletin • May 1989
DISTRICT 6—Continued Term expires
Appointed by the Board of Governors Dec'
James A. Hefner President, Jackson State University, Jackson, Mississippi 1989 Caroline G. Theus President, Ingle wood Land and Development Company, 1990
Alexandria, Louisiana Andre M. Rubenstein Chairman, President, and Chief Executive Officer, Rubenstein 1991
Brothers, Inc., New Orleans, Louisiana
DISTRICT 7—CHICAGO
Class A B.F. Backlund
Barry F. Sullivan John W. Gabbert
Class B Paul J. Schierl
Edward D. Powers Max J. Nay lor
Class C
Robert J. Day
Marcus Alexis
Charles S. McNeer
Chairman and Chief Executive Officer, Bartonville Bank, 1989 Bartonville, Illinois
Chairman of the Board, First Chicago Corporation, Chicago, Illinois 1990 President and Chief Executive Officer, First of America 1991
Bank-LaPorte, N.A., LaPorte, Indiana
Chairman of the Board and Chief Executive Officer, Fort Howard 1989 Corporation, Green Bay, Wisconsin
President, Fire Brick Engineers, Milwaukee, Wisconsin 1990 President, Naylor Farms, Inc., Jefferson, Iowa 1991
Chairman and Chief Executive Officer, USG Corporation, 1989 Chicago, Illinois
Dean, College of Business Administration, University of Illinois at 1990 Chicago, Chicago, Illinois
Chairman of the Board and Chief Executive Officer, Wisconsin 1991 Energy Corporation, Milwaukee, Wisconsin
—DETROIT BRANCH
Appointed by the Federal Reserve Bank Ronald D. Story Chairman and President, The Ionia County National Bank of Ionia,
Ionia, Michigan 1989
James A. Aliber Chairman of the Board and Chief Executive Officer, First Federal of Michigan, Detroit, Michigan
1990
Frederik G.H. Meijer Chairman of the Board, Meijer, Incorporated, Grand Rapids, Michigan
1990
Robert J. Mylod Chairman, President, and Chief Executive Officer, Michigan National Corporation, Farmington Hills, Michigan
1991
Appointed by the Board of Governors Richard T. Lindgren Birmingham, Michigan 1989 Beverly Beltaire President, P R Associates, Inc., Detroit, Michigan 1990 Phyllis E. Peters Director, Professional Standards Review, Touche Ross and 1991
Company, Detroit, Michigan
Digitized for FRASER http://fraser.stlouisfed.org/ Federal Reserve Bank of St. Louis
Directors of Federal Reserve Banks and Branches 415
DISTRICT 8—ST. LOUIS Term expires
Class A Dec• 31
David W. Kemper II Chairman and Chief Executive Officer, Commerce Bank of St. Louis, 1989 N.A., Clayton, Missouri, and President and Chief Executive Officer, Commerce Bancshares, Inc., Kansas City, Missouri
H.L. Hembree III Chairman of the Executive Committee, Merchants National Bank, 1990 Fort Smith, Arkansas
Henry G. River President and Chief Executive Officer, First National Bank of 1991 Pinckneyville, Pinckneyville, Illinois
Class B Frank M. Mitchener, Jr. President, Mitchener Farms, Inc., Sumner, Mississippi 1989 Roger W. Schipke Senior Vice President, GE Appliances, General Electric Company, 1990
Louisville, Kentucky Thomas F. McLarty III Chairman and Chief Executive Officer, Arkla, Inc., Little Rock, Arkansas 1991
Class C H. Edwin Trusheim Chairman and Chief Executive Officer, General American Life 1989
Insurance Company, St. Louis, Missouri Janet McAfee Weakley President, Janet McAfee, Inc., Clayton, Missouri 1990 Robert L. Virgil, Jr. Dean, John M. Olin School of Business, Washington University in 1991
St. Louis, St. Louis, Missouri
—LITTLE ROCK BRANCH
Appointed by the Federal Reserve Bank Patricia M. Townsend President, Townsend Company, Stuttgart, Arkansas 1989 David Armbruster President, First America Federal Savings Bank, Fort Smith, Arkansas 1990 W. Wayne Hartsfield President and Chief Executive Officer, First National Bank, 1990
Searcy, Arkansas Barnett Grace President and Chief Executive Officer, First Commercial Bank, 1991
N.A., Little Rock, Arkansas Appointed by the Board of Governors
L. Dickson Flake President, Barnes, Quinn, Flake & Anderson, Inc., 1989 Little Rock, Arkansas
William E. Love President, Sound-Craft Systems, Inc., Morrilton, Arkansas 1990 James R. Rodgers Airport Manager, Little Rock Regional Airport, Little Rock, Arkansas 1991
—LOUISVILLE BRANCH
Appointed by the Federal Reserve Bank Morton Boyd President, First Kentucky National Corporation, Louisville, Kentucky 1989 Irving W. Bailey II Chairman, President, and Chief Executive Officer, Capital Holding 1990
Corporation, Louisville, Kentucky Wayne G. Overall, Jr. President, First Federal Savings Bank, Elizabethtown, Kentucky 1990 Douglas M. Lester Chairman, President, and Chief Executive Officer, Trans Financial 1991
Bancorp, Inc., Bowling Green, Kentucky Appointed by the Board of Governors
Thomas A. Alvey Delegate, Owensboro Council of Labor, Owensboro, Kentucky 1989 Raymond M. Burse President, Kentucky State University, Frankfort, Kentucky 1990 Lois H. Gray Chairman of the Board, James N. Gray Construction Company, 1991
Inc., Glasgow, Kentucky
Digitized for FRASER http://fraser.stlouisfed.org/ Federal Reserve Bank of St. Louis
416 Federal Reserve Bulletin • May 1989
DISTRICT 8—Continued Term expires
—MEMPHIS BRANCH Dec- 31
Appointed by the Federal Reserve Bank Michael J. Hennessey President, Munro and Company, Inc., Wynne, Arkansas 1989 Thomas M. Garrott President and Chief Operating Officer, National Bank of Commerce 1990
and National Commerce Bancorporation, Memphis, Tennessee Larry A. Watson Chairman of the Board and President, Liberty Federal Savings 1990
Bank, Paris, Tennessee Ray U. Tanner Chairman and Chief Executive Officer, Jackson National Bank and 1991
Volunteer Bancshares, Inc., Jackson, Tennessee
Appointed by the Board of Governors Sandra B. Sanderson President and Chief Executive Officer, Sanderson Plumbing 1989
Products, Inc., Columbus, Mississippi Seymour B. Johnson Owner, Kay Planting Company, Indianola, Mississippi 1990 Katherine Hinds Smythe President, Memorial Park, Inc., Memphis, Tennessee 1991
DISTRICT 9—MINNEAPOLIS
Class A Charles W. Ekstrum
Joel S. Harris James H. Hearon III
Class B Bruce C. Adams Earl R. St. John, Jr.
Duane E. Dingmann
President and Chief Executive Officer, First National Bank, 1989 Philip, South Dakota
President, Yellowstone Holding Company, Columbus, Montana 1990 Chairman of the Board and Chief Executive Officer, National City 1991
Bank, Minneapolis, Minnesota
Partner, Triple Adams Farms, Lansford, North Dakota 1989 President and Owner, St. John Forest Products, Inc., 1990
Spalding, Michigan President, Trubilt Auto Body, Inc., Eau Claire, Wisconsin 1991
Class C
Michael W. Wright
Delbert W. Johnson
John A. Rollwagen
Chairman, President, and Chief Executive Officer, Super Valu 1989 Stores, Inc., Minneapolis, Minnesota
President and Chief Executive Officer, Pioneer/Norelkote, 1990 Minneapolis, Minnesota
Chairman and Chief Executive Officer, Cray Research Inc., 1991 Minneapolis, Minnesota
—HELENA BRANCH
Appointed by the Federal Reserve Bank F. Charles Mercord President and Managing Officer, First Federal Savings Bank of 1989
Montana, Kalispell, Montana Noble E. Vosburg President and Chief Executive Officer, Pacific Hide and Fur 1990
Corporation, Great Falls, Montana Robert H. Waller President and Chief Executive Officer, First Interstate Bank of 1990
Billings, N.A., Billings, Montana
Digitized for FRASER http://fraser.stlouisfed.org/ Federal Reserve Bank of St. Louis
Directors of Federal Reserve Banks and Branches 417
DISTRICT 9—Continued Term expires
HELENA BRANCH—Continued Dec-31
Appointed by the Board of Governors Warren H. Ross President, Ross 8-7 Ranch, Inc., Chinook, Montana 1989 John F. Gardner President, Montana Resources, Inc., Butte, Montana 1990
DISTRICT 10—KANSAS CITY
Class A
Harold L. Gerhart, Jr.
Roger L. Reisher
Robert L. Hollis
Class B Richard D. Harrison
S. Dean Evans, Sr. Frank J. Yaklich, Jr.
President and Chief Executive Officer, First National Bank, 1989 Newman Grove, Nebraska
Co-Chairman, FirstBank Holding Company of Colorado, 1990 Lake wood, Colorado
Chairman of the Board and Chief Executive Officer, First National 1991 Bank and Trust Co., Okmulgee, Oklahoma
Chairman and Chief Executive Officer, Fleming Companies, Inc., 1989 Oklahoma City, Oklahoma
Partner, Evans Grain Company, Salina, Kansas 1990 President, CF & I Steel Corporation, Pueblo, Colorado 1991
Class C
Fred W. Lyons, Jr.
Thomas E. Rodriguez
Burton A. Dole, Jr.
President and Chief Executive Officer, Marion Laboratories, Inc., 1989 Kansas City, Missouri
President and General Manager, Thomas E. Rodriguez & 1990 Associates, P.C., Aurora, Colorado
Chairman and President, Puritan-Bennett Corporation, 1991 Overland Park, Kansas
—DENVER BRANCH
Appointed by the Federal Reserve Bank Henry A. True III Junius F. Baxter
Norman R. Corzine
W. Richard Scarlett III
Partner, True Companies, Casper, Wyoming 1989 Chairman of the Board and Chief Executive Officer, Bank Western, 1990
a Federal Savings Bank, Denver, Colorado President and Chief Executive Officer, First National Bank in 1991
Albuquerque and First National Financial Corporation, Albuquerque, New Mexico
Chairman and Chief Executive Officer, Jackson State Bank, 1991 Jackson Hole, Wyoming
Appointed by the Board of Governors James C. Wilson Management Consultant, Longmont, Colorado 1989 Gilbert Sanchez President, New Mexico Highlands University, 1990
Las Vegas, New Mexico Barbara B. Grogan President, Western Industrial Contractors, Inc., Denver, Colorado 1991
Digitized for FRASER http://fraser.stlouisfed.org/ Federal Reserve Bank of St. Louis
418 Federal Reserve Bulletin • May 1989
DISTRICT 10—Continued Term
—OKLAHOMA CITY BRANCH expires
Dec. 31
Appointed by the Federal Reserve Bank William H. Crawford Chairman and Chief Executive Officer, First National Bank and 1989
Trust Company, Frederick, Oklahoma W. Dean Hidy Chairman of the Board, Triad Bank, N.A., Tulsa, Oklahoma 1990 John Wm. Laisle President, MidFirst Savings and Loan Association, 1990
Oklahoma City, Oklahoma
Appointed by the Board of Governors Patience S. Latting Oklahoma City, Oklahoma 1989 John F. Snodgrass President and Trustee, The Samuel Roberts Noble Foundation, Inc., 1990
Ardmore, Oklahoma
—OMAHA BRANCH
Appointed by the Federal Reserve Bank John T. Selzer President, Scottsbluff National Bank and Trust Company, 1989
Scottsbluff, Nebraska Charles H. Thorne Chairman of the Board, First Federal Savings and Loan Association 1989
of Lincoln, Lincoln, Nebraska John R. Cochran President and Chief Executive Officer, Norwest Bank Nebraska, 1990
N.A., Omaha, Nebraska
Appointed by the Board of Governors Kenneth L. Morrison President, Morrison Enterprises, Hastings, Nebraska 1989 Herman Cain President and Chief Executive Officer, Godfather's Pizza, Inc., 1990
Omaha, Nebraska
DISTRICT 11—DALLAS
Class A Robert G. Greer T. C. Frost
Charles T. Doyle
Class B Gary E. Wood Robert L. Pfluger Charles Dickie
Williamson
Class C
Leo E. Linbeck, Jr.
Bobby R. Inman
Hugh G. Robinson
Chairman of the Board, Tanglewood Bank, N.A., Houston, Texas 1989 Chairman of the Board, The Frost National Bank, 1990
San Antonio, Texas Chairman and Chief Executive Officer, Gulf National Bank, 1991
Texas City, Texas
President, Texas Research League, Austin, Texas 1989 Rancher, San Angelo, Texas 1990 Chairman of the Board and Chief Executive Officer, 1991
Williamson-Dickie Manufacturing Company, Fort Worth, Texas
Chairman and Chief Executive Officer, Linbeck Construction 1989 Corporation, Houston, Texas
Chairman of the Board and Chief Executive Officer, 1990 Westmark Systems Inc., Austin, Texas
President, Cityplace Development Corporation, Dallas, Texas 1991
Digitized for FRASER http://fraser.stlouisfed.org/ Federal Reserve Bank of St. Louis
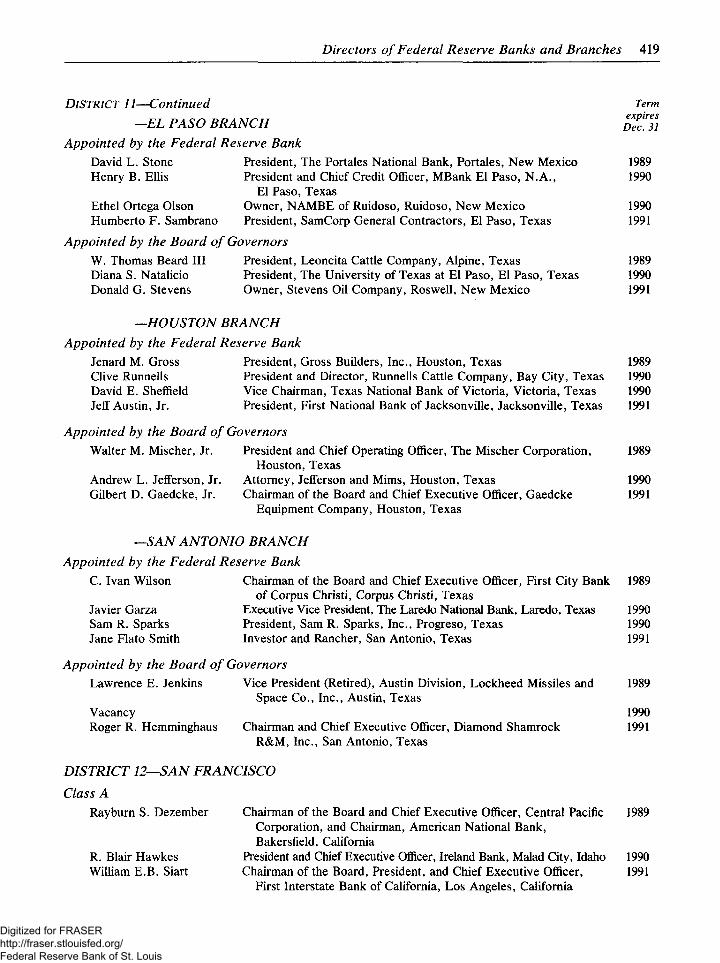
Directors of Federal Reserve Banks and Branches 419
DISTRICT 11—Continued Term —EL PASO BRANCH oTc.Tl
Appointed by the Federal Reserve Bank David L. Stone President, The Portales National Bank, Portales, New Mexico 1989 Henry B. Ellis President and Chief Credit Officer, MBank El Paso, N.A., 1990
El Paso, Texas Ethel Ortega Olson Owner, NAMBE of Ruidoso, Ruidoso, New Mexico 1990 Humberto F. Sambrano President, SamCorp General Contractors, El Paso, Texas 1991
Appointed by the Board of Governors W. Thomas Beard III President, Leoncita Cattle Company, Alpine, Texas 1989 Diana S. Natalicio President, The University of Texas at El Paso, El Paso, Texas 1990 Donald G. Stevens Owner, Stevens Oil Company, Roswell, New Mexico 1991
—HOUSTON BRANCH Appointed by the Federal Reserve Bank
Jenard M. Gross President, Gross Builders, Inc., Houston, Texas 1989 Clive Runnells President and Director, Runnells Cattle Company, Bay City, Texas 1990 David E. Sheffield Vice Chairman, Texas National Bank of Victoria, Victoria, Texas 1990 Jeff Austin, Jr. President, First National Bank of Jacksonville, Jacksonville, Texas 1991
Appointed by the Board of Governors Walter M. Mischer, Jr. President and Chief Operating Officer, The Mischer Corporation, 1989
Houston, Texas Andrew L. Jefferson, Jr. Attorney, Jefferson and Mims, Houston, Texas 1990 Gilbert D. Gaedcke, Jr. Chairman of the Board and Chief Executive Officer, Gaedcke 1991
Equipment Company, Houston, Texas
—SAN ANTONIO BRANCH Appointed by the Federal Reserve Bank
C. Ivan Wilson Chairman of the Board and Chief Executive Officer, First City Bank 1989 of Corpus Christi, Corpus Christi, Texas
Javier Garza Executive Vice President, The Laredo National Bank, Laredo, Texas 1990 Sam R. Sparks President, Sam R. Sparks, Inc., Progreso, Texas 1990 Jane Flato Smith Investor and Rancher, San Antonio, Texas 1991
Appointed by the Board of Governors Lawrence E. Jenkins Vice President (Retired), Austin Division, Lockheed Missiles and 1989
Space Co., Inc., Austin, Texas Vacancy 1990 Roger R. Hemminghaus Chairman and Chief Executive Officer, Diamond Shamrock 1991
R&M, Inc., San Antonio, Texas
DISTRICT 12—SAN FRANCISCO
Class A Rayburn S. Dezember Chairman of the Board and Chief Executive Officer, Central Pacific 1989
Corporation, and Chairman, American National Bank, Bakersfield, California
R. Blair Hawkes President and Chief Executive Officer, Ireland Bank, Malad City, Idaho 1990 William E.B. Siart Chairman of the Board, President, and Chief Executive Officer, 1991
First Interstate Bank of California, Los Angeles, California
Digitized for FRASER http://fraser.stlouisfed.org/ Federal Reserve Bank of St. Louis
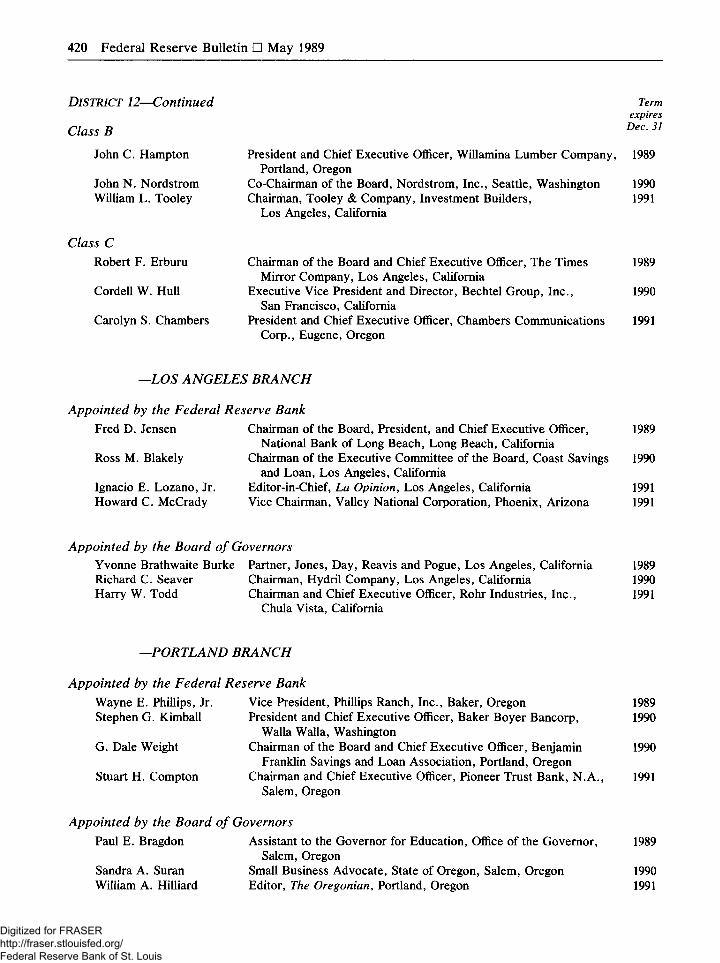
420 Federal Reserve Bulletin • May 1989
DISTRICT 12—Continued
Class B
John C. Hampton
John N. Nordstrom William L. Tooley
Class C
Robert F. Erburu
Cordell W. Hull
Carolyn S. Chambers
Term expires
Dec. 31
1989 President and Chief Executive Officer, Willamina Lumber Company, Portland, Oregon
Co-Chairman of the Board, Nordstrom, Inc., Seattle, Washington 1990 Chairman, Tooley & Company, Investment Builders, 1991
Los Angeles, California
Chairman of the Board and Chief Executive Officer, The Times 1989 Mirror Company, Los Angeles, California
Executive Vice President and Director, Bechtel Group, Inc., 1990 San Francisco, California
President and Chief Executive Officer, Chambers Communications 1991 Corp., Eugene, Oregon
-LOS ANGELES BRANCH
Appointed by the Federal Reserve Bank Fred D. Jensen
Ross M. Blakely
Ignacio E. Lozano, Jr. Howard C. McCrady
Chairman of the Board, President, and Chief Executive Officer, 1989 National Bank of Long Beach, Long Beach, California
Chairman of the Executive Committee of the Board, Coast Savings 1990 and Loan, Los Angeles, California
Editor-in-Chief, La Opinion, Los Angeles, California 1991 Vice Chairman, Valley National Corporation, Phoenix, Arizona 1991
Appointed by the Board of Governors Yvonne Brathwaite Burke Partner, Jones, Day, Reavis and Pogue, Los Angeles, California 1989 Richard C. Seaver Chairman, Hydril Company, Los Angeles, California 1990 Harry W. Todd Chairman and Chief Executive Officer, Rohr Industries, Inc., 1991
Chula Vista, California
-PORTLAND BRANCH
Appointed by the Federal Reserve Bank Wayne E. Phillips, Jr. Stephen G. Kimball
G. Dale Weight
Stuart H. Compton
Vice President, Phillips Ranch, Inc., Baker, Oregon President and Chief Executive Officer, Baker Boyer Bancorp,
Walla Walla, Washington Chairman of the Board and Chief Executive Officer, Benjamin
Franklin Savings and Loan Association, Portland, Oregon Chairman and Chief Executive Officer, Pioneer Trust Bank, N. A.
Salem, Oregon
Appointed by the Board of Governors Paul E. Bragdon Assistant to the Governor for Education, Office of the Governor,
Salem, Oregon Sandra A. Suran Small Business Advocate, State of Oregon, Salem, Oregon William A. Hilliard Editor, The Oregonian, Portland, Oregon
1989
1990
1990
1991
1989
1990 1991
Digitized for FRASER http://fraser.stlouisfed.org/ Federal Reserve Bank of St. Louis
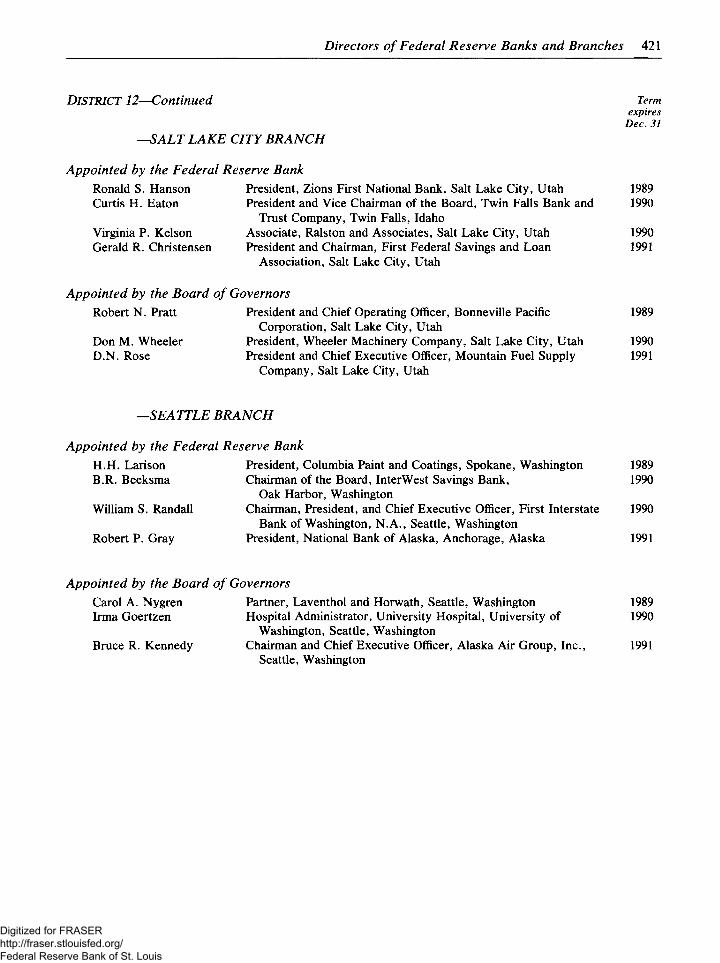
Directors of Federal Reserve Banks and Branches 421
DISTRICT 12—Continued Term expires
Dec. 31 —SALT LAKE CITY BRANCH
Appointed by the Federal Reserve Bank Ronald S. Hanson President, Zions First National Bank, Salt Lake City, Utah 1989 Curtis H. Eaton President and Vice Chairman of the Board, Twin Falls Bank and 1990
Trust Company, Twin Falls, Idaho Virginia P. Kelson Associate, Ralston and Associates, Salt Lake City, Utah 1990 Gerald R. Christensen President and Chairman, First Federal Savings and Loan 1991
Association, Salt Lake City, Utah
Appointed by the Board of Governors Robert N. Pratt President and Chief Operating Officer, Bonneville Pacific 1989
Corporation, Salt Lake City, Utah Don M. Wheeler President, Wheeler Machinery Company, Salt Lake City, Utah 1990 D.N. Rose President and Chief Executive Officer, Mountain Fuel Supply 1991
Company, Salt Lake City, Utah
—SEATTLE BRANCH
Appointed by the Federal Reserve Bank H.H. Larison President, Columbia Paint and Coatings, Spokane, Washington 1989 B.R. Beeksma Chairman of the Board, InterWest Savings Bank, 1990
Oak Harbor, Washington William S. Randall Chairman, President, and Chief Executive Officer, First Interstate 1990
Bank of Washington, N.A., Seattle, Washington Robert P. Gray President, National Bank of Alaska, Anchorage, Alaska 1991
Appointed by the Board of Governors Carol A. Nygren Partner, Laventhol and Horwath, Seattle, Washington 1989 Irma Goertzen Hospital Administrator, University Hospital, University of 1990
Washington, Seattle, Washington Bruce R. Kennedy Chairman and Chief Executive Officer, Alaska Air Group, Inc., 1991
Seattle, Washington
Digitized for FRASER http://fraser.stlouisfed.org/ Federal Reserve Bank of St. Louis
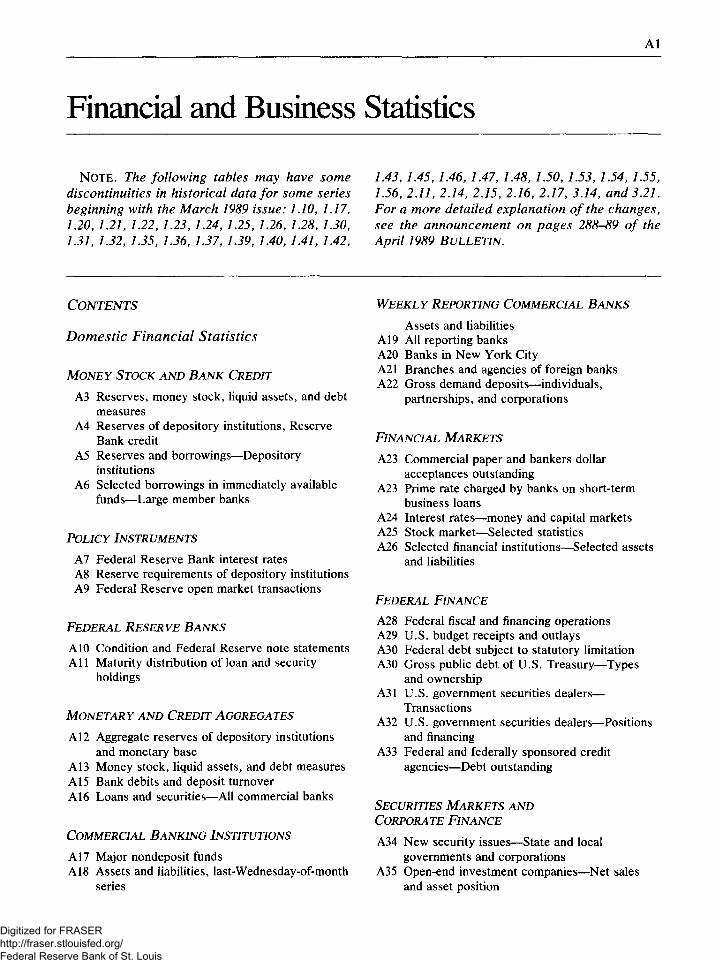
1
Financial and Business Statistics
N O T E . The following tables may have some discontinuities in historical data for some series beginning with the March 1989 issue: 1.10, 1.17, 1.20, 1.21, 1.22, 1.23, 1.24, 1.25,1.26, 1.28, 1.30, 1.31,1.32,1.35,1.36,1.37,1.39,1.40,1.41,1.42,
1.43, 1.45,1.46, 1.47,1.48, 1.50, 1.53, 1.54, 1.55, 1.56, 2.11, 2.14, 2.15, 2.16, 2.17, 3.14, and 3.21. For a more detailed explanation of the changes, see the announcement on pages 288-89 of the April 1989 BULLETIN.
WEEKLY REPORTING COMMERCIAL BANKS
Assets and liabilities A19 All reporting banks A20 Banks in New York City A21 Branches and agencies of foreign banks A22 Gross demand deposits—individuals,
partnerships, and corporations
CONTENTS
Domestic Financial Statistics
MONEY STOCK AND BANK CREDIT
A3 Reserves, money stock, liquid assets, and debt measures
A4 Reserves of depository institutions, Reserve Bank credit
A5 Reserves and borrowings—Depository institutions
A6 Selected borrowings in immediately available funds—Large member banks
POLICY INSTRUMENTS
A7 Federal Reserve Bank interest rates A8 Reserve requirements of depository institutions A9 Federal Reserve open market transactions
FEDERAL RESERVE BANKS
A10 Condition and Federal Reserve note statements A l l Maturity distribution of loan and security
holdings
MONETARY AND CREDIT AGGREGATES
A12 Aggregate reserves of depository institutions and monetary base
A13 Money stock, liquid assets, and debt measures A15 Bank debits and deposit turnover A16 Loans and securities—All commercial banks
COMMERCIAL BANKING INSTITUTIONS
A17 Major nondeposit funds A18 Assets and liabilities, last-Wednesday-of-month
series
FINANCIAL MARKETS
A23 Commercial paper and bankers dollar acceptances outstanding
A23 Prime rate charged by banks on short-term business loans
A24 Interest rates—money and capital markets A25 Stock market—Selected statistics A26 Selected financial institutions—Selected assets
and liabilities
FEDERAL FINANCE
A28 Federal fiscal and financing operations A29 U.S. budget receipts and outlays A30 Federal debt subject to statutory limitation A30 Gross public debt of U.S. Treasury—Types
and ownership A31 U.S. government securities dealers—
Transactions A32 U.S. government securities dealers—Positions
and financing A3 3 Federal and federally sponsored credit
agencies—Debt outstanding
SECURITIES MARKETS AND CORPORATE FINANCE
A34 New security issues—State and local governments and corporations
A35 Open-end investment companies—Net sales and asset position
Digitized for FRASER http://fraser.stlouisfed.org/ Federal Reserve Bank of St. Louis
2 Federal Reserve Bulletin • May 1989
A35 Corporate profits and their distribution A35 Total nonfarm business expenditures on new
plant and equipment A36 Domestic finance companies—Assets and
liabilities and business credit
REAL ESTATE
A37 Mortgage markets A38 Mortgage debt outstanding
CONSUMER INSTALLMENT CREDIT
A39 Total outstanding and net change A40 Terms
FLOW OF FUNDS
A41 Funds raised in U.S. credit markets A43 Direct and indirect sources of funds to credit
markets A44 Summary of credit market debt outstanding A45 Summary of credit market claims, by holder
Domestic Nonfinancial Statistics
SELECTED MEASURES
A46 Nonfinancial business activity—Selected measures
A47 Labor force, employment, and unemployment A48 Output, capacity, and capacity utilization A49 Industrial production—Indexes and gross value A51 Housing and construction A52 Consumer and producer prices A53 Gross national product and income A54 Personal income and saving
International Statistics
SUMMARY STATISTICS
A55 U.S. international transactions—Summary A56 U.S. foreign trade A56 U.S. reserve assets A56 Foreign official assets held at Federal Reserve
Banks
A57 Foreign branches of U.S. banks—Balance sheet data
A59 Selected U.S. liabilities to foreign official institutions
REPORTED BY BANKS IN THE UNITED STATES
A59 Liabilities to and claims on foreigners A60 Liabilities to foreigners A62 Banks' own claims on foreigners A63 Banks' own and domestic customers' claims on
foreigners A63 Banks' own claims on unaffiliated foreigners A64 Claims on foreign countries—Combined
domestic offices and foreign branches
REPORTED BY NONBANKING BUSINESS ENTERPRISES IN THE UNITED STATES
A65 Liabilities to unaffiliated foreigners A66 Claims on unaffiliated foreigners
SECURITIES HOLDINGS AND TRANSACTIONS
A67 Foreign transactions in securities A68 Marketable U.S. Treasury bonds and notes—
Foreign transactions
INTEREST AND EXCHANGE RATES
A69 Discount rates of foreign central banks A69 Foreign short-term interest rates A70 Foreign exchange rates
A71 Guide to Tabular Presentation, Statistical Releases, and Special Tables
SPECIAL TABLE
All Assets and liabilities of U.S. branches and agencies of foreign banks, September 1988
Digitized for FRASER http://fraser.stlouisfed.org/ Federal Reserve Bank of St. Louis
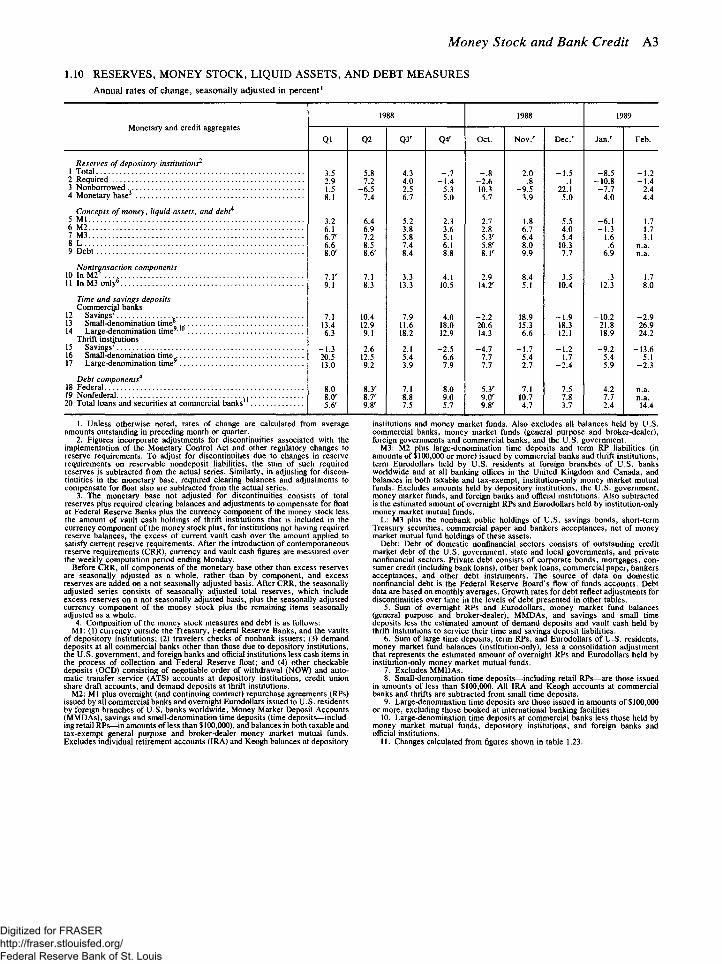
Money Stock and Bank Credit A3
1.10 RESERVES, MONEY STOCK, LIQUID ASSETS, AND DEBT MEASURES Annual rates of change, seasonally adjusted in percent1
Monetary and credit aggregates 1988 1988 1989
Monetary and credit aggregates
Q1 Q2 Q3' Q4' Oct. Nov. ' Dec.' Jan. ' Feb.
Reserves of depository institutions2
1 Total 3.5 5.8 4.3 - . 7 - . 8 2.0 - 1 . 5 - 8 . 5 - 1 . 2 2 Required 2.9 7.2 4.0 - 1 . 4 - 2 . 6 .8 .1 -10.8 - 1 . 4 3 Nonborrowed 1.5 - 6 . 5 2.5 5.3 10.3 - 9 . 5 22.1 - 7 . 7 2.4 4 Monetary base3
8.1 7.4 6.7 5.0 5.7 3.9 5.0 4.0 4.4
Concepts of money, liquid assets, and debt4
5 Ml 3.2 6.4 5.2 2.3 2.7 1.8 5.5 - 6 . 1 1.7 6 M2 6.1 6.9 3.8 3.6 2.8 6.7 4.0 - 1 . 3 1.7 1 M3 6.7r 7.2 5.8 5.1 5.3' 6.4 5.4 1.6 3.1 8 L 6.6 8.5 7.4 6.1 5.8' 8.0 10.3 .6 n.a. 9 Debt 8.<r 8.6' 8.4 8.8 8.1' 9.9 7.7 6.9 n.a.
10 Nontransaction components
10 In M2 7.1' 7.1 3.3 4.1 2.9 8.4 3.5 .3 1.7 11 In M3 only6
9.1 8.3 13.3 10.5 14.2' 5.1 10.4 12.3 8.0
Time and savings deposits
12 Commercial banks
12 Savings 7.1 10.4 7.9 4.0 - 2 . 2 18.9 - 1 . 9 -10.2 - 2 . 9 13 Small-denomination time 13.4 12.9 11.6 18.0 20.6 15.3 18.3 21.8 26.9 14 Large-denomination time • 6.3 9.1 18.2 12.9 14.3 6.6 12.1 18.9 24.2
15 Thrift institutions
Savings - 1 . 3 2.6 2.1 - 2 . 5 - 4 . 7 - 1 . 7 - 1 . 2 - 9 . 2 -13.6 16 Small-denomination time 20.5 12.5 5.4 6.6 7.7 5.4 1.7 5.4 5.1 17 Large-denomination time9
13.0 9.2 3.9 7.9 7.7 2.7 - 2 . 4 5.9 - 2 . 3
Debt components4
18 Federal 8.0 8.3' 7.1 8.0 5.3' 7.1 7.5 4.2 19 Nonfederal 8.0' 8.7' 8.8 9.0 9.0' 10.7 7.8 7.7 20 Total loans and securities at commercial banks 5.6' 9.8' 7.5 5.7 9.8' 4.7 3.7 2.4 14.4
1. Unless otherwise noted, rates of change are calculated from average amounts outstanding in preceding month or quarter.
2. Figures incorporate adjustments for discontinuities associated with the implementation of the Monetary Control Act and other regulatory changes to reserve requirements. To adjust for discontinuities due to changes in reserve requirements on reservable nondeposit liabilities, the sum of such required reserves is subtracted from the actual series. Similarly, in adjusting for discon-tinuities in the monetary base, required clearing balances and adjustments to compensate for float also are subtracted from the actual series.
3. The monetary base not adjusted for discontinuities consists of total reserves plus required clearing balances and adjustments to compensate for float at F e d e r i Reserve Banks plus the currency component of the money stock less the amount of vault cash holdings of thrift institutions that is included in the currency component of the money stock plus, for institutions not having required reserve balances, the excess of current vault cash over the amount applied to satisfy current reserve requirements. After the introduction of contemporaneous reserve requirements (CRR), currency and vault cash figures are measured over the weekly computation period ending Monday.
Before CRR, all components of the monetary base other than excess reserves are seasonally adjusted as a whole, rather than by component, and excess reserves are added on a not seasonally adjusted basis. After CRR, the seasonally adjusted series consists of seasonally adjusted total reserves, which include excess reserves on a not seasonally adjusted basis, plus the seasonally adjusted currency component of the money stock plus the remaining items seasonally adjusted as a whole.
4. Composition of the money stock measures and debt is as follows: Ml: (1) currency outside the Treasury, Federal Reserve Banks, and the vaults
of depository institutions; (2) travelers checks of nonbank issuers; (3) demand deposits at all commercial banks other than those due to depository institutions, the U.S. government, and foreign banks and official institutions less cash items in the process of collection and Federal Reserve float; and (4) other checkable deposits (OCD) consisting of negotiable order of withdrawal (NOW) and auto-matic transfer service (ATS) accounts at depository institutions, credit union share draft accounts, and demand deposits at thrift institutions.
M2: Ml plus overnight (and continuing contract) repurchase agreements (RPs) issued by all commercial banks and overnight Eurodollars issued to U.S. residents by foreign branches of U.S. banks worldwide, Money Market Deposit Accounts (MMDAs), savings and small-denomination time deposits (time deposits—includ-ing retail RPs—in amounts of less than $100,000), and balances in both taxable and tax-exempt general purpose and broker-dealer money market mutual funds. Excludes individual retirement accounts (IRA) and Keogh balances at depository
institutions and money market funds. Also excludes all balances held by U.S. commercial banks, money market funds (general purpose and broker-dealer), foreign governments and commercial banks, and the U.S. government.
M3: M2 plus large-denomination time deposits and term RP liabilities (in amounts of $100,000 or more) issued by commercial banks and thrift institutions, term Eurodollars held by U.S. residents at foreign branches of U.S. banks worldwide and at all banking offices in the United Kingdom and Canada, and balances in both taxable and tax-exempt, institution-only money market mutual funds. Excludes amounts held by depository institutions, the U.S. government, money market funds, and foreign banks and official institutions. Also subtracted is the estimated amount of overnight RPs and Eurodollars held by institution-only money market mutual funds.
L: M3 plus the nonbank public holdings of U.S. savings bonds, short-term Treasury securities, commercial paper and bankers acceptances, net of money market mutual fund holdings of these assets.
Debt: Debt of domestic nonfinancial sectors consists of outstanding credit market debt of the U.S. government, state and local governments, and private nonfinancial sectors. Private debt consists of corporate bonds, mortgages, con-sumer credit (including bank loans), other bank loans, commercial paper, bankers acceptances, and other debt instruments. The source of data on domestic nonfinancial debt is the Federal Reserve Board's flow of funds accounts. Debt data are based on monthly averages. Growth rates for debt reflect adjustments for discontinuities over time in the levels of debt presented in other tables.
5. Sum of overnight RPs and Eurodollars, money market fund balances (general purpose and broker-dealer), MMDAs, and savings and small time deposits less the estimated amount of demand deposits and vault cash held by thrift institutions to service their time and savings deposit liabilities.
6. Sum of large time deposits, term RPs, and Eurodollars of U.S. residents, money market fund balances (institution-only), less a consolidation adjustment that represents the estimated amount of overnight RPs and Eurodollars held by institution-only money market mutual funds.
7. Excludes MMDAs. 8. Small-denomination time deposits—including retail RPs—are those issued
in amounts of less than $100,000. All IRA and Keogh accounts at commercial banks and thrifts are subtracted from small time deposits.
9. Large-denomination time deposits are those issued in amounts of $100,000 or more, excluding those booked at international banking facilities.
10. Large-denomination time deposits at commercial banks less those held by money market mutual funds, depository institutions, and foreign banks and official institutions.
11. Changes calculated from figures shown in table 1.23.
Digitized for FRASER http://fraser.stlouisfed.org/ Federal Reserve Bank of St. Louis
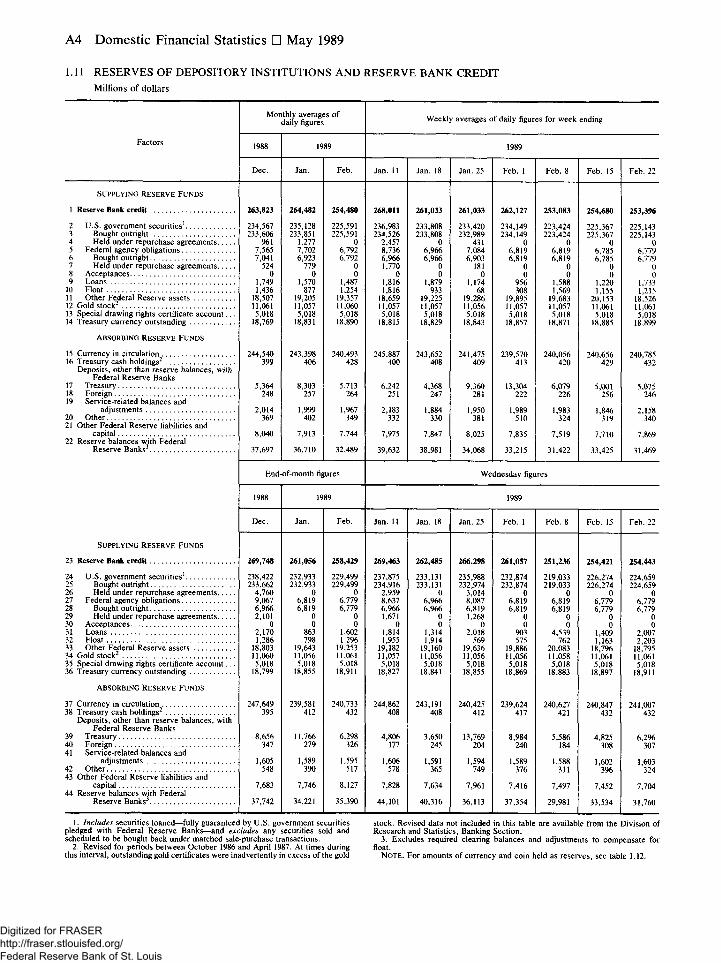
A4 Domestic Financial Statistics • May 1989
1.11 RESERVES OF DEPOSITORY INSTITUTIONS AND RESERVE BANK CREDIT Millions of dollars
Factors
Monthly averages of daily figures Weekly averages of daily figures for week ending
Factors 1988 1989 1989 Factors
Dec. Jan. Feb. Jan. 11 Jan. 18 Jan. 25 Feb. 1 Feb. 8 Feb. 15 Feb. 22
SUPPLYING RESERVE FUNDS
1 Reserve Bank credit
2 U.S. government securities1
3 Bought outright 4 Held under repurchase agreements 5 Federal agency obligations 6 Bought outright 7 Held under repurchase agreements 8 Acceptances 9 Loans
10 Float 11 Other Federal Reserve assets 12 Gold stock2
13 Special drawing rights certificate a c c o u n t . . . 14 Treasury currency outstanding
ABSORBING RESERVE FUNDS
15 Currency in circulation 16 Treasury cash holdings2
Deposits, other than reserve balances, with Federal Reserve Banks
17 Treasury 18 Foreign 19 Service-related balances and
adjustments 20 Other 21 Other Federal Reserve liabilities and
capital 22 Reserve balances with Federal
Reserve Banks3
SUPPLYING RESERVE FUNDS
23 Reserve Bank credit
24 U.S. government securities1
25 Bought outright 26 Held under repurchase agreements 27 Federal agency obligations 28 Bought outright 29 Held under repurchase agreements 30 Acceptances 31 Loans 32 Float 33 Other Federal Reserve assets 34 Gold stock2
35 Special drawing rights certificate a c c o u n t . . . 36 Treasury currency outstanding
ABSORBING RESERVE FUNDS
37 Currency in circulation 38 Treasury cash holdings2
Deposits, other than reserve balances, with Federal Reserve Banks
39 Treasury 40 Foreign 41 Service-related balances and
adjustments 42 Other 43 Other Federal Reserve liabilities and
capital 44 Reserve balances with Federal
Reserve Banks
263,823
234,567 233,606
961 7,565 7,041
524 0
1,749 1,436
18,507 11,061 5,018
18,769
244,540 399
5,364 248
2,014 369
8,040
37,697
264,482
235,128 233,851
1,277 7,702 6,923
779 0
1,570 877
19,205 11,057 5,018
18,831
243,398 406
8,303 257
1,999 402
7,913
36,710
254,480
225,591 225,591
0 6,792 6,792
0 0
1,487 1,254
19,357 11,060 5,018
18,890
240,493 428
5,713 264
1,967 349
7,744
32,489
268,011
236,983 234,526
2,457 8,736 6,966 1,770
0 1,816 1,816
18,659 11,057 5,018
18,815
245,887 400
6,242 251
2,183 332
7,975
39,632
261,033
233,808 233,808
0 6,966 6,966
0 0
1,879 933
19,225 11,057 5,018
18,829
243,652 408
4,368 247
1,884 330
7,847
38,981
261,033
233,420 232,989
431 7,084 6,903
181 0
1,174 68
19,286 11,056 5,018
18,843
241,475 409
9,360 281
1,950 381
8,025
34,068
262,127
234,149 234,149
0 6,819 6,819
0 0
956 308
19,895 11,057 5,018
18,857
239,570 413
13,304 222
1,989 510
7,835
33,215
253,083
223,424 223,424
0 6,819 6,819
0 0
1,588 1,569
19,683 11,057 5,018
18,871
240,056 420
6,079 226
1,983 324
7,519
31,422
254,680
225,367 225,367
0 6,785 6,785
0 0
1,220 1,155
20,153 11,061 5,018
18,885
240,656 429
5,001 256
1,846 319
7,710
33,425
253,396
225,143 225,143
0 6,779 6,779
0 0
1,733 1,215
18,526 11,061 5,018
18,899
240,785 432
5,075 246
2,158 340
7,869
31,469
SUPPLYING RESERVE FUNDS
1 Reserve Bank credit
2 U.S. government securities1
3 Bought outright 4 Held under repurchase agreements 5 Federal agency obligations 6 Bought outright 7 Held under repurchase agreements 8 Acceptances 9 Loans
10 Float 11 Other Federal Reserve assets 12 Gold stock2
13 Special drawing rights certificate a c c o u n t . . . 14 Treasury currency outstanding
ABSORBING RESERVE FUNDS
15 Currency in circulation 16 Treasury cash holdings2
Deposits, other than reserve balances, with Federal Reserve Banks
17 Treasury 18 Foreign 19 Service-related balances and
adjustments 20 Other 21 Other Federal Reserve liabilities and
capital 22 Reserve balances with Federal
Reserve Banks3
SUPPLYING RESERVE FUNDS
23 Reserve Bank credit
24 U.S. government securities1
25 Bought outright 26 Held under repurchase agreements 27 Federal agency obligations 28 Bought outright 29 Held under repurchase agreements 30 Acceptances 31 Loans 32 Float 33 Other Federal Reserve assets 34 Gold stock2
35 Special drawing rights certificate a c c o u n t . . . 36 Treasury currency outstanding
ABSORBING RESERVE FUNDS
37 Currency in circulation 38 Treasury cash holdings2
Deposits, other than reserve balances, with Federal Reserve Banks
39 Treasury 40 Foreign 41 Service-related balances and
adjustments 42 Other 43 Other Federal Reserve liabilities and
capital 44 Reserve balances with Federal
Reserve Banks
End-of-month figures Wednesday figures
SUPPLYING RESERVE FUNDS
1 Reserve Bank credit
2 U.S. government securities1
3 Bought outright 4 Held under repurchase agreements 5 Federal agency obligations 6 Bought outright 7 Held under repurchase agreements 8 Acceptances 9 Loans
10 Float 11 Other Federal Reserve assets 12 Gold stock2
13 Special drawing rights certificate a c c o u n t . . . 14 Treasury currency outstanding
ABSORBING RESERVE FUNDS
15 Currency in circulation 16 Treasury cash holdings2
Deposits, other than reserve balances, with Federal Reserve Banks
17 Treasury 18 Foreign 19 Service-related balances and
adjustments 20 Other 21 Other Federal Reserve liabilities and
capital 22 Reserve balances with Federal
Reserve Banks3
SUPPLYING RESERVE FUNDS
23 Reserve Bank credit
24 U.S. government securities1
25 Bought outright 26 Held under repurchase agreements 27 Federal agency obligations 28 Bought outright 29 Held under repurchase agreements 30 Acceptances 31 Loans 32 Float 33 Other Federal Reserve assets 34 Gold stock2
35 Special drawing rights certificate a c c o u n t . . . 36 Treasury currency outstanding
ABSORBING RESERVE FUNDS
37 Currency in circulation 38 Treasury cash holdings2
Deposits, other than reserve balances, with Federal Reserve Banks
39 Treasury 40 Foreign 41 Service-related balances and
adjustments 42 Other 43 Other Federal Reserve liabilities and
capital 44 Reserve balances with Federal
Reserve Banks
1988 1989 1989
SUPPLYING RESERVE FUNDS
1 Reserve Bank credit
2 U.S. government securities1
3 Bought outright 4 Held under repurchase agreements 5 Federal agency obligations 6 Bought outright 7 Held under repurchase agreements 8 Acceptances 9 Loans
10 Float 11 Other Federal Reserve assets 12 Gold stock2
13 Special drawing rights certificate a c c o u n t . . . 14 Treasury currency outstanding
ABSORBING RESERVE FUNDS
15 Currency in circulation 16 Treasury cash holdings2
Deposits, other than reserve balances, with Federal Reserve Banks
17 Treasury 18 Foreign 19 Service-related balances and
adjustments 20 Other 21 Other Federal Reserve liabilities and
capital 22 Reserve balances with Federal
Reserve Banks3
SUPPLYING RESERVE FUNDS
23 Reserve Bank credit
24 U.S. government securities1
25 Bought outright 26 Held under repurchase agreements 27 Federal agency obligations 28 Bought outright 29 Held under repurchase agreements 30 Acceptances 31 Loans 32 Float 33 Other Federal Reserve assets 34 Gold stock2
35 Special drawing rights certificate a c c o u n t . . . 36 Treasury currency outstanding
ABSORBING RESERVE FUNDS
37 Currency in circulation 38 Treasury cash holdings2
Deposits, other than reserve balances, with Federal Reserve Banks
39 Treasury 40 Foreign 41 Service-related balances and
adjustments 42 Other 43 Other Federal Reserve liabilities and
capital 44 Reserve balances with Federal
Reserve Banks
Dec. Jan. Feb. Jan. 11 Jan. 18 Jan. 25 Feb. 1 Feb. 8 Feb. 15 Feb. 22
SUPPLYING RESERVE FUNDS
1 Reserve Bank credit
2 U.S. government securities1
3 Bought outright 4 Held under repurchase agreements 5 Federal agency obligations 6 Bought outright 7 Held under repurchase agreements 8 Acceptances 9 Loans
10 Float 11 Other Federal Reserve assets 12 Gold stock2
13 Special drawing rights certificate a c c o u n t . . . 14 Treasury currency outstanding
ABSORBING RESERVE FUNDS
15 Currency in circulation 16 Treasury cash holdings2
Deposits, other than reserve balances, with Federal Reserve Banks
17 Treasury 18 Foreign 19 Service-related balances and
adjustments 20 Other 21 Other Federal Reserve liabilities and
capital 22 Reserve balances with Federal
Reserve Banks3
SUPPLYING RESERVE FUNDS
23 Reserve Bank credit
24 U.S. government securities1
25 Bought outright 26 Held under repurchase agreements 27 Federal agency obligations 28 Bought outright 29 Held under repurchase agreements 30 Acceptances 31 Loans 32 Float 33 Other Federal Reserve assets 34 Gold stock2
35 Special drawing rights certificate a c c o u n t . . . 36 Treasury currency outstanding
ABSORBING RESERVE FUNDS
37 Currency in circulation 38 Treasury cash holdings2
Deposits, other than reserve balances, with Federal Reserve Banks
39 Treasury 40 Foreign 41 Service-related balances and
adjustments 42 Other 43 Other Federal Reserve liabilities and
capital 44 Reserve balances with Federal
Reserve Banks
269,748
238,422 233,662
4,760 9,067 6,966 2,101
0 2,170 1,286
18,803 11,060 5,018
18,799
247,649 395
8,656 347
1,605 548
7,683
37,742
261,056
232,933 232,933
0 6,819 6,819
0 0
863 798
19,643 11,056 5,018
18,855
239,581 412
11,766 279
1,589 390
7,746
34,221
258,429
229,499 229,499
0 6,779 6,779
0 0
1,602 1,296
19,253 11,061 5,018
18,911
240,733 432
6,298 326
1,595 517
8,127
35,390
269,463
237,875 234,916
2,959 8,637 6,966 1,671
0 1,814 1,955
19,182 11,057 5,018
18,827
244,862 408
4,806 177
1,606 578
7,828
44,101
262,485
233,131 233,131
0 6,966 6,966
0 0
1,314 1,914
19,160 11,056 5,018
18,841
243,191 408
3,650 245
1,591 365
7,634
40,316
266,298
235,988 232,974
3,014 8,087 6,819 1,268
0 2,018
569 19,636 11,056 5,018
18,855
240,425 412
13,769 204
1,594 749
7,961
36,113
261,057
232,874 232,874
0 6,819 6,819
0 0
903 575
19,886 11,056 5,018
18,869
239,624 417
8,984 240
1,589 376
7,416
37,354
251,236
219,033 219,033
0 6,819 6,819
0 0
4,539 762
20,083 11,058 5,018
18,883
240,627 421
5,586 184
1,588 311
7,497
29,981
254,421
226,274 226,274
0 6,779 6,779
0 0
1,409 1,163
18,796 11,061 5,018
18,897
240,847 432
4,825 308
1,602 396
7,452
33,534
254,443
224,659 224,659
0 6,779 6,779
0 0
2,007 2,203
18,795 11,061 5,018
18,911
241,007 432
6,296 307
1,603 324
7,704
31,760
1. Includes securities loaned—fully guaranteed by U.S. government securities pledged with Federal Reserve Banks—and excludes any securities sold and scheduled to be bought back under matched sale-purchase transactions.
2. Revised for periods between October 1986 and April 1987. At times during this interval, outstanding gold certificates were inadvertently in excess of the gold
stock. Revised data not included in this table are available from the Division of Research and Statistics, Banking Section.
3. Excludes required clearing balances and adjustments to compensate for float.
NOTE. For amounts of currency and coin held as reserves, see table 1.12.
Digitized for FRASER http://fraser.stlouisfed.org/ Federal Reserve Bank of St. Louis
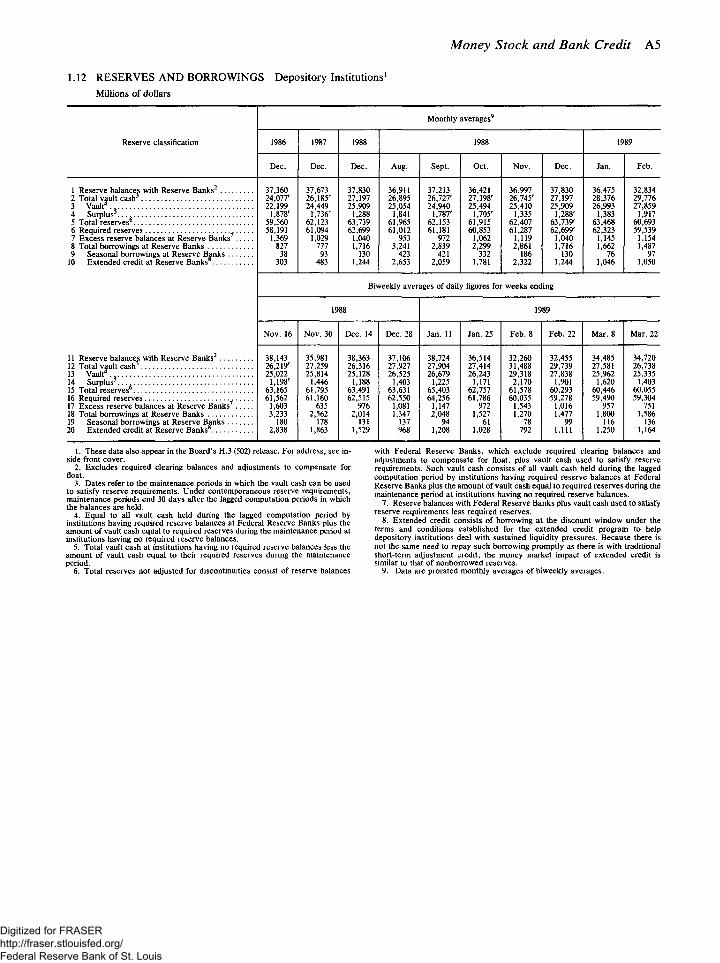
Money Stock and Bank Credit A5
1.12 RESERVES AND BORROWINGS Depository Institutions1
Millions of dollars
Monthly averages9
Reserve classification 1986 1987 1988 1988 1989 Reserve classification
Dec. Dec. Dec. Aug. Sept. Oct. Nov. Dec. Jan. Feb.
1 Reserve balances with Reserve Banks2 37,360 37,673 37,830 36,911 37,213 36,421 36,997 37,830 36,475 32,834 2 Total vault cash 24,077' 26,185' 27,197 26,895 26,727' 27,198r 26,745r 27,197 28,376 29,776 3 Vault* 22,199 24,449 25,909 25,054 24,940 25,494 25,410 25,909 26,993 27,859 4 Surplus 1,878' 1,736' 1,288 1,841 1,787' 1,705r 1,335 1,288' 1,383 1,917 5 Total reserves 59,560 62,123 63,739 61,965 62,153 61,915 62,407 63,739' 63,468 60,693 6 Required reserves 58,191 61,094 62,699 61,012 61,181 60,853 61,287 62,699' 62,323 59,539 7 Excess reserve balances at Reserve Banks 1,369 1,029 1,040 953 972 1,062 1,119 1,040 1,145 1,154 8 Total borrowings at Reserve Banks 827 777 1,716 3,241 2,839 2,299 2,861 1,716 1,662 1,487 9 Seasonal borrowings at Reserve Banks 38 93 130 423 421 332 186 130 76 97
10 Extended credit at Reserve Banks 303 483 1,244 2,653 2,059 1,781 2,322 1,244 1,046 1,050
11 Reserve balances with Reserve Banks2
12 Total vault cash3
13 Vault . 14 Surplus5 . . . . 15 Total reserves6
16 Required reserves 17 Excess reserve balances at Reserve Banks 18 Total borrowings at Reserve Banks 19 Seasonal borrowings at Reserve Banks 20 Extended credit at Reserve Banks8
Biweekly averages of daily figures for weeks ending
1988 1989
Nov. 16 Nov. 30 Dec. 14 Dec. 28 Jan.11 Jan. 25 Feb. 8 Feb. 22 Mar. 8 Mar. 22
38,143 35,981 38,363 37,106 38,724 36,514 32,260 32,455 34,485 34,720 26,219' 27,259 26,316 27,927 27,904 27,414 31,488 29,739 27,581 26,738 25,022 25,814 25,128 26,525 26,679 26,243 29,318 27,838 25,962 25,335
1,198' 1,446 1,188 1,403 1,225 1,171 2,170 1,901 1,620 1,403 63,165 61,795 63,491 63,631 65,403 62,757 61,578 60,293 60,446 60,055 61,562 61,160 62,515 62,550 64,256 61,786 60,035 59,278 59,490 59,304
1,603 635 976 1,081 1,147 972 1,543 1,016 957 751 3,233 2,562 2,014 1,347 2,048 1,527 1,270 1,477 1,800 1,586
180 178 131 137 94 61 78 99 116 136 2,838 1,863 1,529 968 1,208 1,028 792 1,111 1,250 1,164
1. These data also appear in the Board's H.3 (502) release. For address, see in-side front cover.
2. Excludes required clearing balances and adjustments to compensate for float.
3. Dates refer to the maintenance periods in which the vault cash can be used to satisfy reserve requirements. Under contemporaneous reserve requirements, maintenance periods end 30 days after the lagged computation periods in which the balances are held.
4. Equal to all vault cash held during the lagged computation period by institutions having required reserve balances at Federal Reserve Banks plus the amount of vault cash equal to required reserves during the maintenance period at institutions having no required reserve balances.
5. Total vault cash at institutions having no required reserve balances less the amount of vault cash equal to their required reserves during the maintenance period.
6. Total reserves not adjusted for discontinuities consist of reserve balances
with Federal Reserve Banks, which exclude required clearing balances and adjustments to compensate for float, plus vault cash used to satisfy reserve requirements. Such vault cash consists of all vault cash held during the lagged computation period by institutions having required reserve balances at Federal Reserve Banks plus the amount of vault cash equal to required reserves during the maintenance period at institutions having no required reserve balances.
7. Reserve balances with Federal Reserve Banks plus vault cash used to satisfy reserve requirements less required reserves.
8. Extended credit consists of borrowing at the discount window under the terms and conditions established for the extended credit program to help depository institutions deal with sustained liquidity pressures. Because there is not the same need to repay such borrowing promptly as there is with traditional short-term adjustment credit, the money market impact of extended credit is similar to that of nonborrowed reserves.
9. Data are prorated monthly averages of biweekly averages.
Digitized for FRASER http://fraser.stlouisfed.org/ Federal Reserve Bank of St. Louis
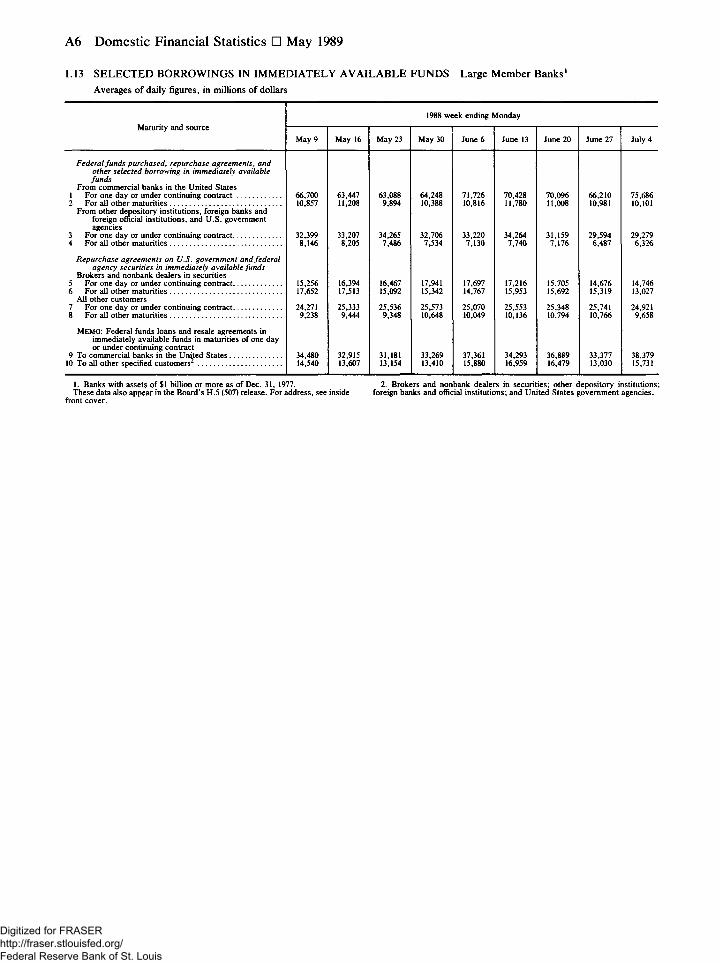
A6 Domestic Financial Statistics • May 1989
1.13 SELECTED BORROWINGS IN IMMEDIATELY AVAILABLE F U N D S Large Member Banks1
Averages of daily figures, in millions of dollars
Maturity and source 1988 week ending Monday
Maturity and source May 9 May 16 May 23 May 30 June 6 June 13 June 20 June 27 July 4
Federal funds purchased, repurchase agreements, and other selected borrowing in immediately available funds
From commercial banks in the United States 1 For one day or under continuing contract 66,700 63,447 63,088 64,248 71,726 70,428 70,096 66,210 75,686 2 For all other maturities 10,857 11,208 9,894 10,388 10,816 11,780 11,008 10,981 10,101
From other depository institutions, foreign banks and 10,816 11,008 10,981 10,101
foreign official institutions, and U.S. government agencies
3 For one day or under continuing contract 32,399 33,207 34,265 32,706 33,220 34,264 31,159 29,594 29,279 4 For all other maturities 8,146 8,205 7,486 7,534 7,130 7,740 7,176 6,487 6,326
Repurchase agreements on U.S. government and federal agency securities in immediately available funds
Brokers and nonbank dealers in securities 5 For one day or under continuing contract 15,256 16,394 16,467 17,941 17,697 17,216 15,705 14,676 14,746 6 For all other maturities 17,652 17,513 15,092 15,342 14,767 15,953 15,692 15,319 13,027
All other customers 7 For one day or under continuing contract 24,271 25,333 25,536 25,573 25,070 25,553 25,348 25,741 24,921 8 For all other maturities 9,238 9,444 9,348 10,648 10,049 10,136 10,794 10,766 9,658
MEMO: Federal funds loans and resale agreements in immediately available funds in maturities of one day or under continuing contract
9 To commercial banks in the United States 34,480 32,915 31,181 33,269 37,361 34,293 36,889 33,377 38,379 10 To all other specified customers 14,540 13,607 13,154 13,410 15,880 16,959 16,479 13,030 15,731
1. Banks with assets of $1 billion or more as of Dec. 31, 1977. 2. Brokers and nonbank dealers in securities; other depository institutions; These data also appear in the Board's H.5 (507) release. For address, see inside foreign banks and official institutions; and United States government agencies,
front cover.
Digitized for FRASER http://fraser.stlouisfed.org/ Federal Reserve Bank of St. Louis
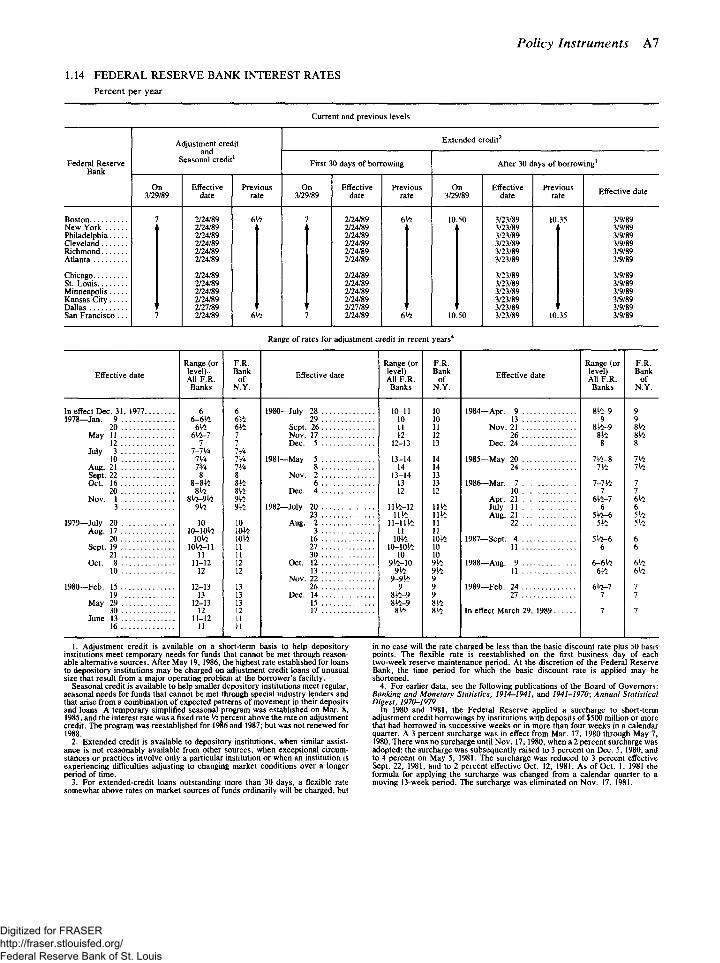
Policy Instruments A7
1.14 FEDERAL RESERVE B A N K INTEREST RATES Percent per year
Current and previous levels
Federal Reserve Bank
Adjustment credit and
Seasonal credit1
Extended credit2
Federal Reserve Bank
Adjustment credit and
Seasonal credit1 First 30 days of borrowing After 30 days of borrowing3 Federal Reserve
Bank
On 3/29/89
Effective date
Previous rate
On 3/29/89
Effective date
Previous rate
On 3/29/89
Effective date
Previous rate Effective date
Boston 7 2/24/89 6 Vi 7 2/24/89 6Vi 10.50 3/23/89 10.35 3/9/89 New York 2/24/89 2/24/89 3/23/89 3/9/89 Philadelphia 2/24/89 2/24/89 3/23/89 3/9/89 Cleveland 2/24/89 2/24/89 3/23/89 3/9/89 Richmond 2/24/89 2/24/89 3/23/89 3/9/89 Atlanta 2/24/89 2/24/89 3/23/89 3/9/89
Chicago 2/24/89 2/24/89 3/23/89 3/9/89 St. Louis 2/24/89 2/24/89 3/23/89 3/9/89 Minneapolis 2/24/89 2/24/89 3/23/89 3/9/89 Kansas City 2/24/89 2/24/89 3/23/89 3/9/89 Dallas 2/27/89 2/27/89 3/23/89 3/9/89 San Francisco . . . 7 2/24/89 6Vi 7 2/24/89 6V2 10.50 3/23/89 10.35 3/9/89
Range of rates for adjustment credit in recent years4
Effective date
In effect Dec. 31, 1977. 1978—Jan. 9
20 May 11
12 July 3
10 Aug. 21 Sept. 22 Oct. 16
20 Nov. 1
3
1979—July 20 Aug. 17
20 Sept. 19
21 Oct. 8
10
1980—Feb. 15 19
May 29 30
June 13 16
Range (or level)— All F.R. Banks
F.R. Bank
of N.Y.
Effective
6 6 1980-—July 78 . . 6-6Vi 6Vi
—July 79
6 Vi 6 Vi Sept. 76 6V2-I 1 Nov. 17 .
7 7 Dec. 5 1-1 VA 1V4
IV* 7V4 1981-—May 73/4 m
—May 8
8 8 Nov. 7 8-8Vi> 8VS 6
8 Vi 8Vi Dec. 4 8Vi-9Vi m
9 Vi m 1982--Ju ly 70 - Ju ly 73
10 10 Aug. 7 10-10V5 10H2 3 , ,
lOVi lOVi 16 10Vi-ll 1 1 77
11 1 1 30 , 11-12 1 2 Oct. 17
12 12 13 . Nov. 77
12-13 13 76 13 13 Dec. 14
12-13 13 15 12 12 17
11-12 11
11 11
Range (or level)— All F.R. Banks
F.R. Bank
of N.Y.
Effective date Range (or level)— All F.R. Banks
F.R. Bank
of N.Y.
10-11 10 1984-—Apr. 9 8Vi-9 9 10 10
—Apr. 13 9 9
11 11 Nov. 21 8Vi-9 8Vi 12 12 26 8Vi m
12-13 13 Dec. 24 8 8
13-14 14 1985-—May 20 7Vi-8 IVi 14 14
—May 24 7Vi 7Vi
13-14 13 13 13 1986-—Mar. 7 7-7 Vi 7 12 12 10 1 7
Apr. 21 6Vi-7 6Vi llVi-12 llVi July 11 6 6
1 \Vi 11 Vi Aug. 21 5Vi-6 5Vi 11-1 IVi 11
Aug. 22 5Vi 5Vi
11 11 lOVi lOVi 1987--Sep t . 4 5Vi-6 6
lO-lOVi 10 -Sep t .
11 6 6 10 10
9VS-10 9Vi 1988-- A u g . 9 6 - 6 Vi 6 Vi 9Vi 9Vi
- A u g . 11 6Vi 6Vi
9-9V2 9 9 9 1989-- F e b . 24 6Vi-7 7
8Vi-9 9 27 7 7 8Vi-9 8Vi
8 Vi 8Vi In effect March 29, 1989 . . . 7 7
1. Adjustment credit is available on a short-term basis to help depository institutions meet temporary needs for funds that cannot be met through reason-able alternative sources. After May 19, 1986, the highest rate established for loans to depository institutions may be charged on adjustment credit loans of unusual size that result from a major operating problem at the borrower's facility.
Seasonal credit is available to help smaller depository institutions meet regular, seasonal needs for funds that cannot be met through special industry lenders and that arise from a combination of expected patterns of movement in their deposits and loans. A temporary simplified seasonal program was established on Mar. 8, 1985, and the interest rate was a fixed rate Vi percent above the rate on adjustment credit. The program was reestablished for 1986 and 1987; but was not renewed for 1988.
2. Extended credit is available to depository institutions, when similar assist-ance is not reasonably available from other sources, when exceptional circum-stances or practices involve only a particular institution or when an institution is experiencing difficulties adjusting to changing market conditions over a longer period of time.
3. For extended-credit loans outstanding more than 30 days, a flexible rate somewhat above rates on market sources of funds ordinarily will be charged, but
in no case will the rate charged be less than the basic discount rate plus 50 basis points. The flexible rate is reestablished on the first business day of each two-week reserve maintenance period. At the discretion of the Federal Reserve Bank, the time period for which the basic discount rate is applied may be shortened.
4. For earlier data, see the following publications of the Board of Governors: Banking and Monetary Statistics, 1914-1941, and 1941-1970\ Annual Statistical Digest, 1970-1979.
In 1980 and 1981, the Federal Reserve applied a surcharge to short-term adjustment credit borrowings by institutions with deposits of $500 million or more that had borrowed in successive weeks or in more than four weeks in a calendar quarter. A 3 percent surcharge was in effect from Mar. 17, 1980 through May 7, 1980. There was no surcharge until Nov. 17,1980, when a 2 percent surcharge was adopted; the surcharge was subsequently raised to 3 percent on Dec. 5, 1980, and to 4 percent on May 5, 1981. The surcharge was reduced to 3 percent effective Sept. 22, 1981, and to 2 percent effective Oct. 12, 1981. As of Oct. 1, 1981 the formula for applying the surcharge was changed from a calendar quarter to a moving 13-week period. The surcharge was eliminated on Nov. 17, 1981.
Digitized for FRASER http://fraser.stlouisfed.org/ Federal Reserve Bank of St. Louis
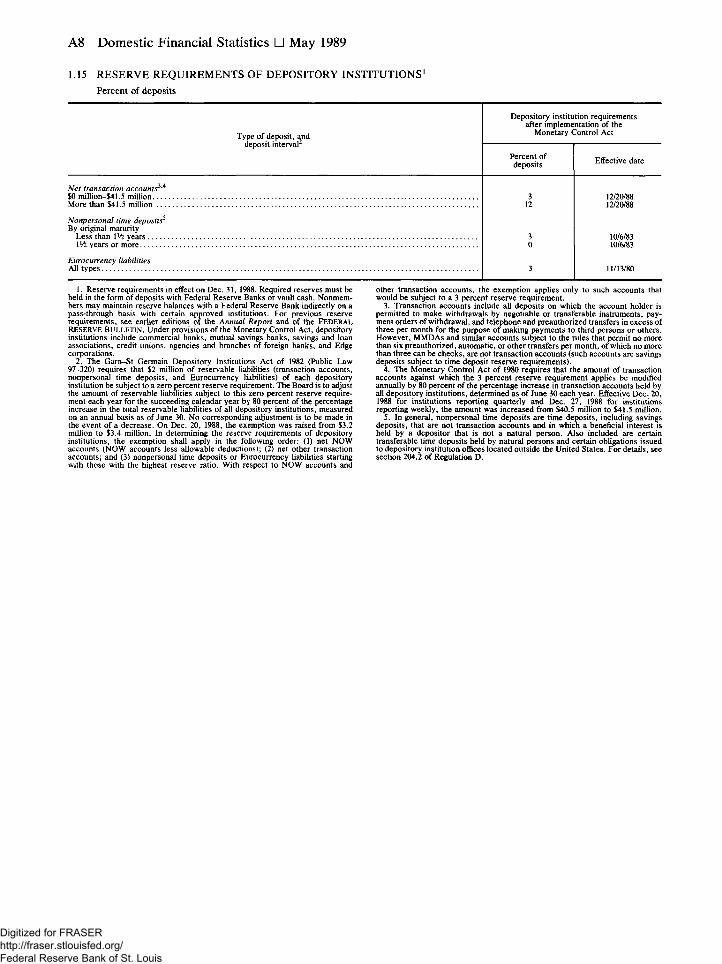
A8 Domestic Financial Statistics • May 1989
1.15 RESERVE REQUIREMENTS OF DEPOSITORY INSTITUTIONS1
Percent of deposits
Type of deposit, and deposit interval
Depository institution requirements after implementation of the
Monetary Control Act
Effective date
Net transaction accounts ' $0 million-$41.5 million More than $41.5 million . . .
Nonpersonal time deposits5
By original maturity Less than lVt years 1 Vl years or more
Eurocurrency liabilities All types
12/20/88 12/20/88
10/6/83 vsrni
11/13/80
1. Reserve requirements in effect on Dec. 31, 1988. Required reserves must be held in the form of deposits with Federal Reserve Banks or vault cash. Nonmem-bers may maintain reserve balances with a Federal Reserve Bank indirectly on a pass-through basis with certain approved institutions. For previous reserve requirements, see earlier editions of the Annual Report and of the FEDERAL RESERVE BULLETIN. Under provisions of the Monetary Control Act, depository institutions include commercial banks, mutual savings banks, savings and loan associations, credit unions, agencies and branches of foreign banks, and Edge corporations.
2. The Garn-St Germain Depository Institutions Act of 1982 (Public Law 97-320) requires that $2 million of reservable liabilities (transaction accounts, nonpersonal time deposits, and Eurocurrency liabilities) of each depository institution be subject to a zero percent reserve requirement. The Board is to adjust the amount of reservable liabilities subject to this zero percent reserve require-ment each year for the succeeding calendar year by 80 percent of the percentage increase in the total reservable liabilities of all depository institutions, measured on an annual basis as of June 30. No corresponding adjustment is to be made in the event of a decrease. On Dec. 20, 1988, the exemption was raised from $3.2 million to $3.4 million. In determining the reserve requirements of depository institutions, the exemption shall apply in the following order: (1) net NOW accounts (NOW accounts less allowable deductions); (2) net other transaction accounts; and (3) nonpersonal time deposits or Eurocurrency liabilities starting with those with the highest reserve ratio. With respect to NOW accounts and
other transaction accounts, the exemption applies only to such accounts that would be subject to a 3 percent reserve requirement.
3. Transaction accounts include all deposits on which the account holder is permitted to make withdrawals by negotiable or transferable instruments, pay-ment orders of withdrawal, and telephone and preauthorized transfers in excess of three per month for the purpose of making payments to third persons or others. However, MMDAs and similar accounts subject to the rules that permit no more than six preauthorized, automatic, or other transfers per month, of which no more than three can be checks, are not transaction accounts (such accounts are savings deposits subject to time deposit reserve requirements).
4. The Monetary Control Act of 1980 requires that the amount of transaction accounts against which the 3 percent reserve requirement applies be modified annually by 80 percent of the percentage increase in transaction accounts held by all depository institutions, determined as of June 30 each year. Effective Dec. 20, 1988 for institutions reporting quarterly and Dec. 27, 1988 for institutions reporting weekly, the amount was increased from $40.5 million to $41.5 million.
5. In general, nonpersonal time deposits are time deposits, including savings deposits, that are not transaction accounts and in which a beneficial interest is held by a depositor that is not a natural person. Also included are certain transferable time deposits held by natural persons and certain obligations issued to depository institution offices located outside the United States. For details, see section 204.2 of Regulation D.
Digitized for FRASER http://fraser.stlouisfed.org/ Federal Reserve Bank of St. Louis
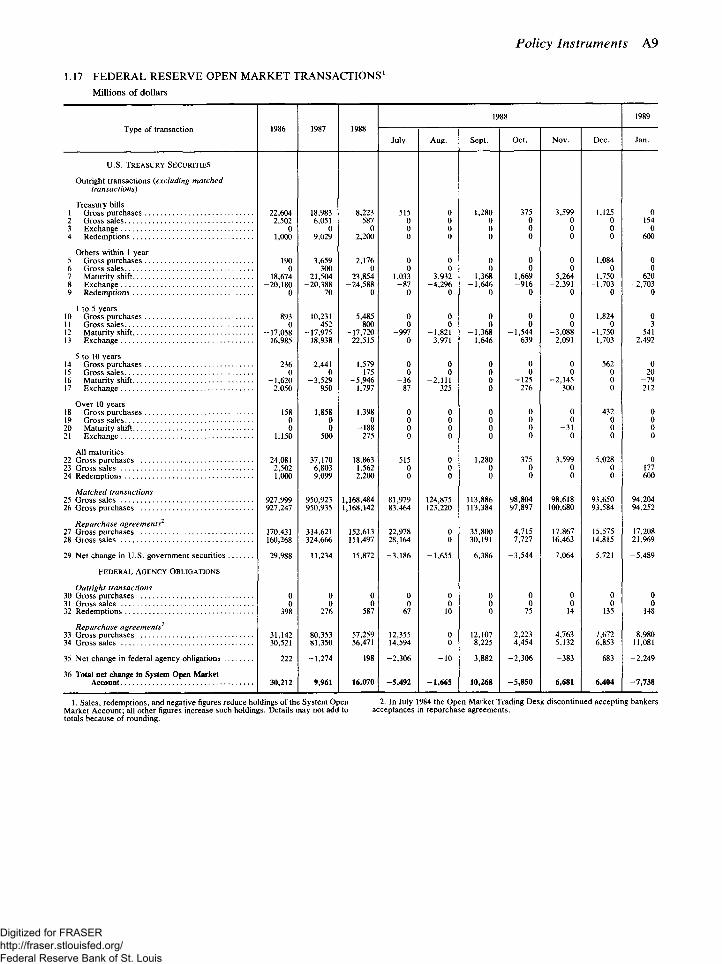
Policy Instruments A9
1.17 FEDERAL RESERVE OPEN MARKET TRANSACTIONS 1
Millions of dollars
Type of transaction 1986 1987 1988 1988 1989
Type of transaction 1986 1987 1988 July Aug. Sept. Oct. Nov. Dec. Jan.
U . S . TREASURY SECURITIES
Outright transactions (excluding matched transactions)
Treasury bills 1 Gross purchases 22,604 18,983 8,223 515 0 1,280 375 3,599 1,125 0 2 Gross sales 2,502 6,051 587 0 0 0 0 0 0 154 3 Exchange 0 0 0 0 0 0 0 0 0 0 4 Redemptions 1,000 9,029 2,200 0 0 0 0 0 0 600
Others within 1 year 5 Gross purchases 190 3,659 2,176 0 0 0 0 0 1,084 0 6 Gross sales 0 300 0 0 0 0 0 0 0 0 7 Maturity shift 18,674 21,504 23,854 1,033 3,932 1,368 1,669 5,264 1,750 620 8 Exchange -20,180 -20,388 -24,588 - 8 7 -4 ,296 -1 ,646 - 9 1 6 -2 ,391 -1 ,703 -2 ,703 9 Redemptions 0 70 0 0 0 0 0 0 0 0
1 to 5 years 10 Gross purchases 893 10,231 5,485 0 0 0 0 0 1,824 0 11 Gross sales 0 452 800 0 0 0 0 0 0 3 12 Maturity shift -17,058 -17,975 -17,720 - 9 9 7 -1 ,821 -1 ,368 -1 ,544 -3 ,088 -1 ,750 - 5 4 1 13 Exchange 16,985 18,938 22,515 0 3,971 1,646 639 2,091 1,703 2,492
5 to 10 years 14 Gross purchases 236 2,441 1,579 0 0 0 0 0 562 0 15 Gross sales 0 0 175 0 0 0 0 0 0 20 16 Maturity shift -1 ,620 -3 ,529 -5 ,946 - 3 6 -2 ,111 0 - 1 2 5 -2 ,145 0 - 7 9 17 Exchange 2,050 950 1,797 87 325 0 276 300 0 212
Over 10 years 18 Gross purchases 158 1,858 1,398 0 0 0 0 0 432 0 19 Gross sales 0 0 0 0 0 0 0 0 0 0 20 Maturity shift 0 0 - 1 8 8 0 0 0 0 - 3 1 0 0 21 Exchange 1,150 500 275 0 0 0 0 0 0 0
All maturities 22 Gross purchases 24,081 37,170 18,863 515 0 1,280 375 3,599 5,028 0 23 Gross sales 2,502 6,803 1,562 0 0 0 0 0 0 177 24 Redemptions 1,000 9,099 2,200 0 0 0 0 0 0 600
Matched transactions 25 Gross sales 927,999 950,923 1,168,484 81,979 124,875 113,886 98,804 98,618 93,650 94,204 26 Gross purchases 927,247 950,935 1,168,142 83,464 123,220 113,384 97,897 100,680 93,584 94,252
Repurchase agreements2
27 Gross purchases 170,431 314,621 152,613 22,978 0 35,800 4,715 17,867 15,575 17,208 28 Gross sales 160,268 324,666 151,497 28,164 0 30,191 7,727 16,463 14,815 21,969
29 Net change in U.S. government securities 29,988 11,234 15,872 -3 ,186 -1 ,655 6,386 -3 ,544 7,064 5,721 -5 ,489
FEDERAL AGENCY OBLIGATIONS
Outright transactions 30 Gross purchases 0 0 0 0 0 0 0 0 0 0 31 Gross sales 0 0 0 0 0 0 0 0 0 0 32 Redemptions 398 276 587 67 10 0 75 14 135 148
Repurchase agreements2
33 Gross purchases 31,142 80,353 57,259 12,355 0 12,107 2,223 4,763 7,672 8,980 34 Gross sales 30,521 81,350 56,471 14,594 0 8,225 4,454 5,132 6,853 11,081
35 Net change in federal agency obligations 222 -1 ,274 198 -2 ,306 - 1 0 3,882 -2 ,306 - 3 8 3 683 -2 ,249
36 Total net change in System Open Market Account 30,212 9,961 16,070 -5 ,492 -1 ,665 10,268 -5 ,850 6,681 6,404 -7 ,738
1. Sales, redemptions, and negative figures reduce holdings of the System Open 2. In July 1984 the Open Market Trading Desk discontinued accepting bankers Market Account; all other figures increase such holdings. Details may not add to acceptances in repurchase agreements, totals because of rounding.
Digitized for FRASER http://fraser.stlouisfed.org/ Federal Reserve Bank of St. Louis
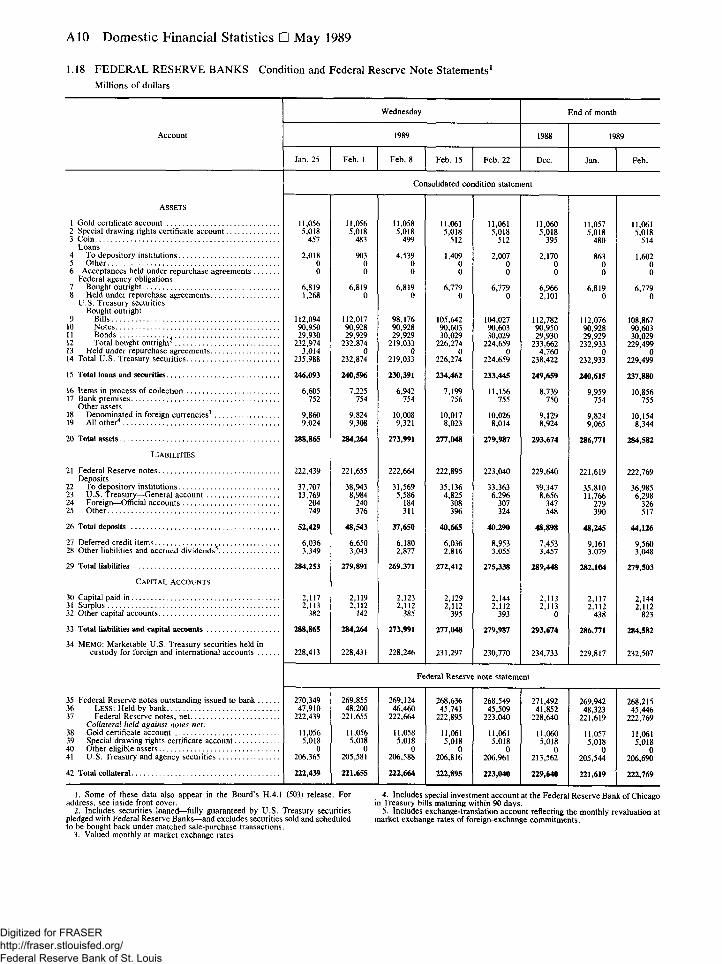
A10 Domestic Financial Statistics • May 1989
1.18 FEDERAL RESERVE BANKS Condition and Federal Reserve Note Statements1
Millions of dollars
Account
Wednesday End of month
Account 1989 1988 1989 Account
Jan. 25 Feb. 1 Feb. 8 Feb. 15 Feb. 22 Dec. Jan. Feb.
Consolidated condition statement
ASSETS
1 Gold certificate account 11,056 11,056 11,058 11,061 11,061 11,060 11,057 11,061 2 Special drawing rights certificate account 5,018 5,018 5,018 5,018 5,018 5,018 5,018 5,018 i Coin 457 483 499 512 512 395 480 514
Loans 480 514
4 To depository institutions 2,018 903 4,539 1,409 2,007 2,170 863 1,602 5 Other 0 0 0 0 0 0 0 0 6 Acceptances held under repurchase agreements 0 0 0 0 0 0 0 0
Federal agency obligations / Bought outright 6,819 6,819 6,819 6,779 6,779 6,966 6,819 6,779 8 Held under repurchase agreements 1,268 0 0 0 0 2,101 0 0
U.S. Treasury securities 2,101
Bought outright y Bills 112,094 112,017 98,176 105,642 104,027 112,782 112,076 108,867
10 Notes 90,950 90,928 90,928 90,603 90,603 90,950 90,928 90,603 l i Bonds 29,930 29,929 29,929 30,029 30,029 29,930 29,929 30,029 12 Total bought outright2 232,974 232,874 219,033 226,274 224,659 233,662 232,933 229,499 13 Held under repurchase agreements 3,014 0 0 0 0 4,760 0 0 14 Total U.S. Treasury securities 235,988 232,874 219,033 226,274 224,659 238,422 232,933 229,499
15 Total loans and securities 246,093 240,596 230,391 234,462 233,445 249,659 240,615 237,880
16 Items in process of collection 6,605 7,225 6,942 7,199 11,156 8,739 9,959 10,856 17 Bank premises 752 754 754 756 755 750 754 755
Other assets 18 Denominated in foreign currencies3 9,860 9,824 10,008 10,017 10,026 9,129 9,824 10,154 19 All other4 9,024 9,308 9,321 8,023 8,014 8,924 9,065 8,344
20 Total assets 288,865 284,264 273,991 277,048 279,987 293,674 286,771 284,582
LIABILITIES
21 Federal Reserve notes 222,439 221,655 222,664 222,895 223,040 229,640 221,619 222,769 Deposits
223,040 229,640 221,619 222,769
22 To depository institutions 37,707 38,943 31,569 35,136 33,363 39,347 35,810 36,985 23 U.S. Treasury—General account 13,769 8,984 5,586 4,825 6,296 8,656 11,766 6,298 24 Foreign—Official accounts 204 240 184 308 307 347 279 326 25 Other 749 376 311 396 324 548 390 517
26 Total deposits 52,429 48,543 37,650 40,665 40,290 48,898 48,245 44,126
27 Deferred credit items 6,036 6,650 6,180 6,036 8,953 7,453 9,161 9,560 28 Other liabilities and accrued dividends5 3,349 3,043 2,877 2,816 3,055 3,457 3,079 3,048
29 Total liabilities 284,253 279,891 269,371 272,412 275,338 289,448 282,104 279,503
CAPITAL ACCOUNTS
30 Capital paid in 2,117 2,119 2,123 2,129 2,144 2,113 2,117 2,144 31 Surplus 2,113 2,112 2,112 2,112 2,112 2,113 2,112 2,112 32 Other capital accounts 382 142 385 395 393 0 438 823
33 Total liabilities and capital accounts 288,865 284,264 273,991 277,048 279,987 293,674 286,771 284,582
34 MEMO: Marketable U.S. Treasury securities held in custody for foreign and international accounts 228,413 228,431 228,246 231,297 230,770 234,733 229,817 232,507
Federal Reserve note statement
35 Federal Reserve notes outstanding issued to bank 36 LESS: Held by bank 37 Federal Reserve notes, net
Collateral held against notes net: 38 Gold certificate account 39 Special drawing rights certificate account 40 Other eligible assets 41 U.S. Treasury and agency securities
42 Total collateral
270,349 47,910
222,439
269,855 48,200
221,655
269,124 46,460
222,664
268,636 45,741
222,895
268,549 45,509
223,040
271,492 41,852
228,640
269,942 48,323
221,619
268,215 45,446
222,769
11,056 5,018
0 206,365
11,056 5,018
0 205,581
11,058 5,018
0 206,588
11,061 5,018
0 206,816
11,061 5,018
0 206,961
11,060 5,018
0 213,562
11,057 5,018
0 205,544
11,061 5,018
0 206,690
222,439 221,655 222,664 222,895 223,040 229,640 221,619 222,769
1. Some of these data also appear in the Board's H.4.1 (503) release. For address, see inside front cover.
2. Includes securities loaned—fully guaranteed by U.S. Treasury securities pledged with Federal Reserve Banks—and excludes securities sold and scheduled to be bought back under matched sale-purchase transactions.
3. Valued monthly at market exchange rates.
4. Includes special investment account at the Federal Reserve Bank of Chicago in Treasury bills maturing within 90 days.
5. Includes exchange-translation account reflecting the monthly revaluation at market exchange rates of foreign-exchange commitments.
Digitized for FRASER http://fraser.stlouisfed.org/ Federal Reserve Bank of St. Louis
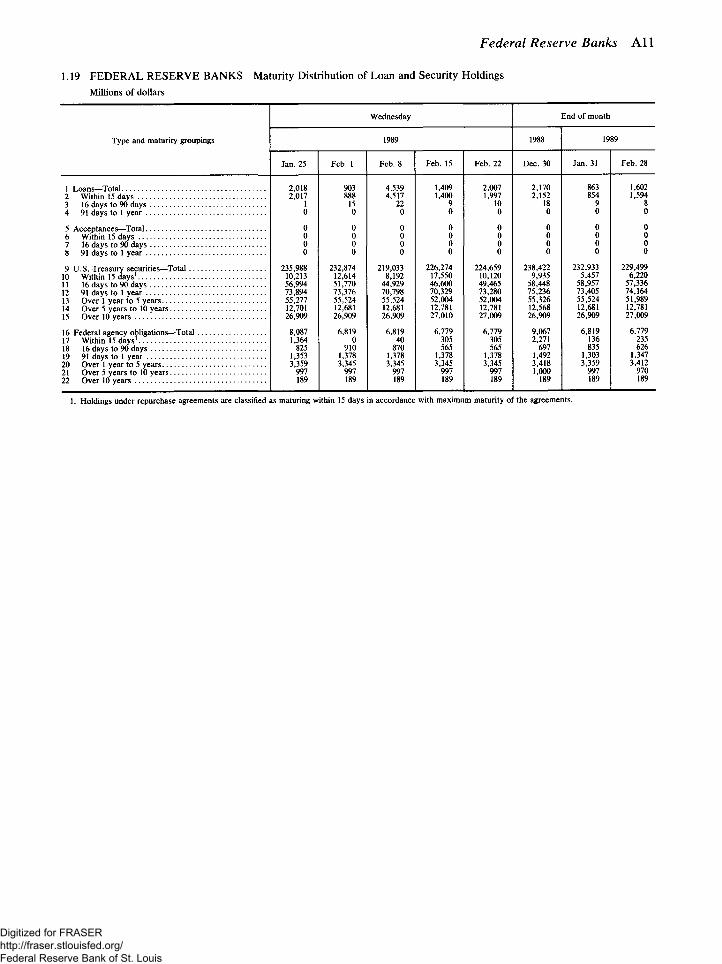
Federal Reserve Banks A11
1.19 FEDERAL RESERVE BANKS Maturity Distribution of Loan and Security Holdings Millions of dollars
Type and maturity groupings
Wednesday End of month
Type and maturity groupings 1989 1988 1989 Type and maturity groupings
Jan. 25 Feb. 1 Feb. 8 Feb. 15 Feb. 22 Dec. 30 Jan. 31 Feb. 28
1 Loans—Total 2 Within 15 days 3 16 days to 90 days 4 91 days to 1 year
5 Acceptances—Total 6 Within 15 days 7 16 days to 90 days 8 91 days to 1 year
9 U.S. Treasury securities—Total 10 Within 15 days1
11 16 days to 90 days 12 91 days to 1 year 13 Over 1 year to 5 years 14 Over 5 years to 10 years 15 Over 10 years
16 Federal agency obligations—Total 17 Within 15 days' 18 16 days to 90 days 19 91 days to 1 year 20 Over 1 year to 5 years 21 Over 5 years to 10 years 22 Over 10 years
2,018 2,017
1 0
0 0 0 0
235,988 10,213 56,994 73,894 55,277 12,701 26,909
8,087 1,364
825 1,353 3,359
997 189
903 888
15 0
0 0 0 0
232,874 12,614 51,770 73,376 55,524 12,681 26,909
6,819 0
910 1,378 3,345
997 189
4,539 4,517
22 0
0 0 0 0
219,033 8,192
44,929 70,798 55,524 12,681 26,909
6,819 40
870 1,378 3,345
997 189
1,409 1,400
9 0
0 0 0 0
226,274 17,550 46,600 70,329 52,004 12,781 27,010
6,779 305 565
1,378 3,345
997 189
2,007 1,997
10 0
0 0 0 0
224,659 10,120 49,465 73,280 52,004 12,781 27,009
6,779 305 565
1,378 3,345
997 189
2,170 2,152
18 0
0 0 0 0
238,422 9,935
58,448 75,236 55,326 12,568 26,909
9,067 2,271
697 1,492 3,418 1,000
189
863 854
9 0
0 0 0 0
232,933 5,457
58,957 73,405 55,524 12,681 26,909
6,819 136 835
1,303 3,359
997 189
1,602 1,594
8 0
0 0 0 0
229,499 6,220
57,336 74,164 51,989 12,781 27,009
6,779 235 626
1,347 3,412
970 189
1. Holdings under repurchase agreements are classified as maturing within 15 days in accordance with maximum maturity of the agreements.
Digitized for FRASER http://fraser.stlouisfed.org/ Federal Reserve Bank of St. Louis
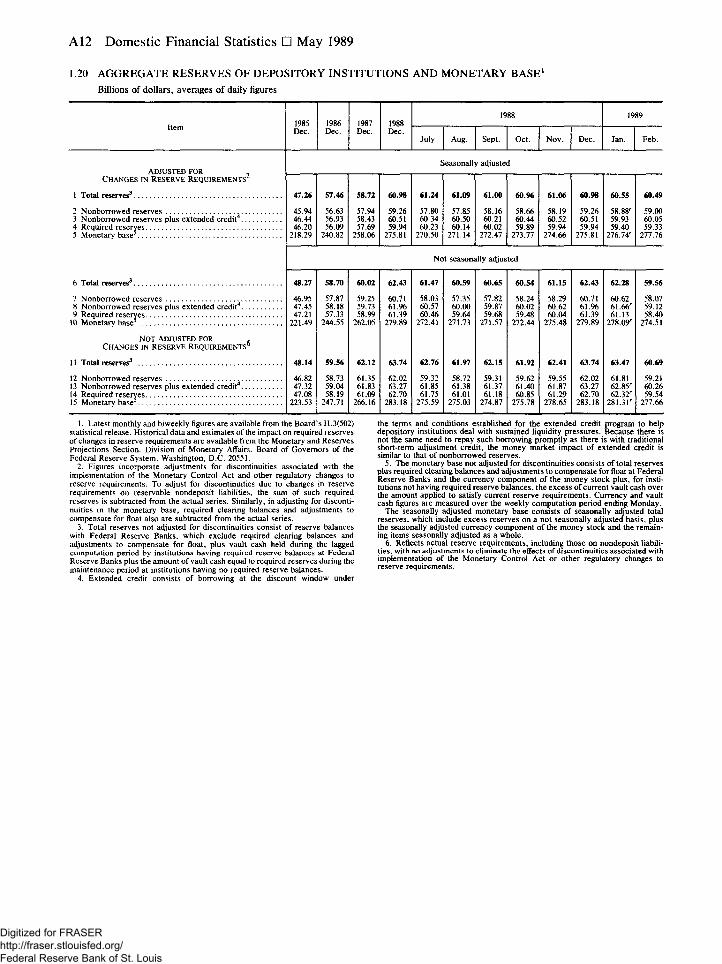
A12 Domestic Financial Statistics • May 1989
1.20 AGGREGATE RESERVES OF DEPOSITORY INSTITUTIONS AND MONETARY BASE1
Billions of dollars, averages of daily figures
1988 1989 Item 1985 1986 1987 1988 Item Dec. Dec. Dec. Dec.
July Aug. Sept. Oct. Nov. Dec. Jan. Feb.
Seasonally adjusted ADJUSTED FOR ,
CHANGES IN RESERVE REQUIREMENTS-'
1 Total reserves3 47.26 57.46 58.72 60.98 61.24 61.09 61.00 60.96 61.06 60.98 60.55 60.49
2 Nonborrowed reserves 45.94 56.63 57.94 59.26 57.80 57.85 58.16 58.66 58.19 59.26 58.88' 59.00 3 Nonborrowed reserves plus extended credit 46.44 56.93 58.43 60.51 60.34 60.50 60.21 60.44 60.52 60.51 59.93 60.05 4 Required reserves 46.20 56.09 57.69 59.94 60.23 60.14 60.02 59.89 59.94 59.94 59.40 59.33 5 Monetary base5 218.29 240.82 258.06 275.81 270.50 271.14 272.47 273.77 274.66 275.81 276.74r 277.76
Not seasonally adjusted
6 Total reserves3 48.27 58.70 60.02 62.43 61.47 60.59 60.65 60.54 61.15 62.43 62.28 59.56
7 Nonborrowed reserves 46.95 57.87 59.25 60.71 58.03 57.35 57.82 58.24 58.29 60.71 60.62 58.07 8 Nonborrowed reserves plus extended credit 47.45 58.18 59.73 61.96 60.57 60.00 59.87 60.02 60.62 61.96 61.66' 59.12 9 Required reserves 47.21 57.33 58.99 61.39 60.46 59.64 59.68 59.48 60.04 61.39 61.13 58.40
10 Monetary base 221.49 244.55 262.05 279.89 272.41 271.73 271.57 272.44 275.48 279.89 278.09" 274.51
NOT ADJUSTED FOR , CHANGES IN RESERVE REQUIREMENTS"
11 Total reserves3 48.14 59.56 62.12 63.74 62.76 61.97 62.15 61.92 62.41 63.74 63.47 60.69
12 Nonborrowed reserves 46.82 58.73 61.35 62.02 59.32 58.72 59.31 59.62 59.55 62.02 61.81 59.21 13 Nonborrowed reserves plus extended credit 47.32 59.04 61.83 63.27 61.85 61.38 61.37 61.40 61.87 63.27 62.85' 60.26 14 Required reserves 47.08 58.19 61.09 62.70 61.75 61.01 61.18 60.85 61.29 62.70 62.32' 59.54 15 Monetary base 223.53 247.71 266.16 283.18 275.59 275.03 274.87 275.78 278.65 283.18 281.31' 277.66
1. Latest monthly and biweekly figures are available from the Board's H.3(502) statistical release. Historical data and estimates of the impact on required reserves of changes in reserve requirements are available from the Monetary and Reserves Projections Section. Division of Monetary Affairs. Board of Governors of the Federal Reserve System, Washington, D.C. 20551.
2. Figures incorporate adjustments for discontinuities associated with the implementation of the Monetary Control Act and other regulatory changes to reserve requirements. To adjust for discontinuities due to changes in reserve requirements on reservable nondeposit liabilities, the sum of such required reserves is subtracted from the actual series. Similarly, in adjusting for disconti-nuities in the monetary base, required clearing balances and adjustments to compensate for float also are subtracted from the actual series.
3. Total reserves not adjusted for discontinuities consist of reserve balances with Federal Reserve Banks, which exclude required clearing balances and adjustments to compensate for float, plus vault cash held during the lagged computation period by institutions having required reserve balances at Federal Reserve Banks plus the amount of vault cash equal to required reserves during the maintenance period at institutions having no required reserve balances.
4. Extended credit consists of borrowing at the discount window under
the terms and conditions established for the extended credit program to help depository institutions deal with sustained liquidity pressures. Because there is not the same need to repay such borrowing promptly as there is with traditional short-term adjustment credit, the money market impact of extended credit is similar to that of nonborrowed reserves.
5. The monetary base not adjusted for discontinuities consists of total reserves plus required clearing balances and adjustments to compensate for float at Federal Reserve Banks and the currency component of the money stock plus, for insti-tutions not having required reserve balances, the excess of current vault cash over the amount applied to satisfy current reserve requirements. Currency and vault cash figures are measured over the weekly computation period ending Monday.
The seasonally adjusted monetary base consists of seasonally adjusted total reserves, which include excess reserves on a not seasonally adjusted basis, plus the seasonally adjusted currency component of the money stock and the remain-ing items seasonally adjusted as a whole.
6. Reflects actual reserve requirements, including those on nondeposit liabili-ties, with no adjustments to eliminate the effects of discontinuities associated with implementation of the Monetary Control Act or other regulatory changes to reserve requirements.
Digitized for FRASER http://fraser.stlouisfed.org/ Federal Reserve Bank of St. Louis
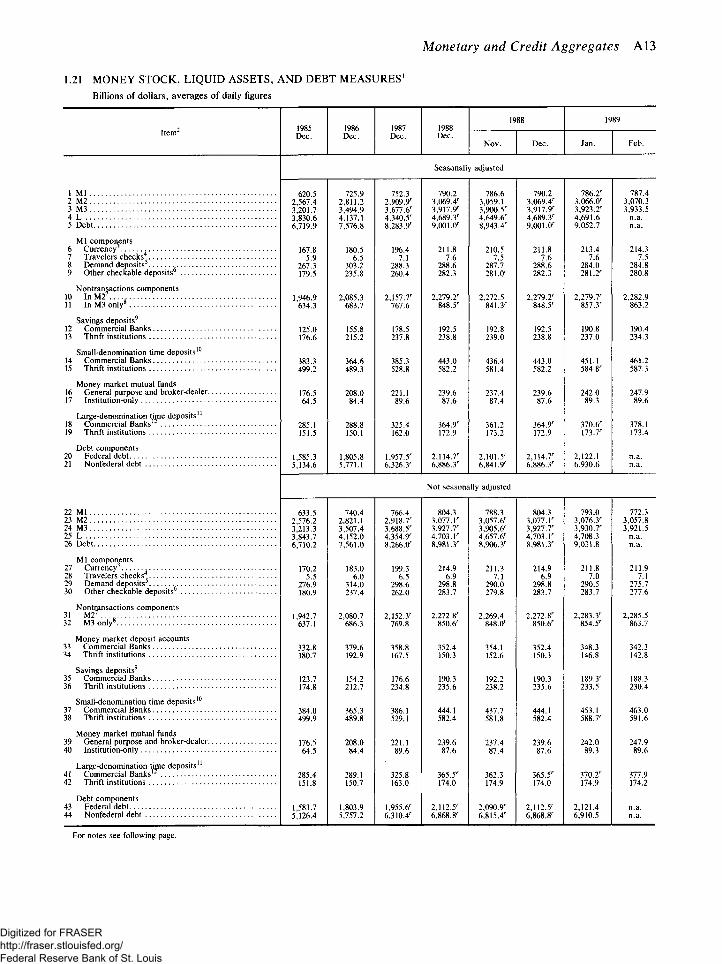
Monetary and Credit Aggregates A13
1.21 MONEY STOCK, LIQUID ASSETS, A N D DEBT MEASURES 1
Billions of dollars, averages of daily figures
Item2 1985 Dec.
1986 Dec.
1987 Dec.
1988 Dec.
1988 1989 Item2 1985
Dec. 1986 Dec.
1987 Dec.
1988 Dec.
Nov. Dec. Jan. Feb.
Seasonally adjusted
1 Ml 2 M2 3 M3 4 L 5 Debt
Ml components 6 Currency 7 Travelers checks'; 8 Demand deposits . 9 Other checkable deposits
Nontransactions components 10 In M2 . . . 11 In M3 only8
Savings deposits9
12 Commercial Banks 13 Thrift institutions
Small-denomination time deposits10
14 Commercial Banks 15 Thrift institutions
Money market mutual funds 16 General purpose and broker-dealer. 17 Institution-only
Large-denomination time deposits" 18 Commercial Banks 19 Thrift institutions
Debt components 20 Federal debt 21 Nonfederal debt
620.5 2,567.4 3,201.7 3,830.6 6,719.9
725.9 2,811.2 3,494.9 4,137.1 7,576.8
752.3 2,909.9' 3,677.6' 4,340.5'' 8,283.9'
790.2 3,069.4' 3,917.9' 4,689.3' 9,001.0'
786.6 3,059.1 3,900.5' 4,649.6' 8,943.4'
790.2 3,069.4' 3,917.9' 4,689.3' 9,001.0'
786.2' 3,066.0' 3,923.2' 4.691.6 9.052.7
787.4 3,070.3 3,933.5
n.a. n.a.
167.8 5.9
267.3 179.5
180.5 6.5
303.2 235.8
196.4 7.1
288.3 260.4
211.8 7.6
288.6 282.3
210.5 7.5
287.7 281.0'
211.8 7.6
288.6 282.3
213.4 7.6
284.0 281.2'
214.3 7.5
284.8 280.8
1,946.9 634.3
2,085.3 683.7
2,157.7r
767.6 2,279.2'
848.5' 2,272.5
841.3' 2,279.2'
848.5' 2,279.7'
857.3' 2,282.9
863.2
125.0 176.6
155.8 215.2
178.5 237.8
192.5 238.8
192.8 239.0
192.5 238.8
190.8 237.0
190.4 234.3
383.3 499.2
364.6 489.3
385.3 528.8
443.0 582.2
436.4 581.4
443.0 582.2
451.1 584.8'
461.2 587.3
176.5 64.5
208.0 84.4
221.1 89.6
239.6 87.6
237.4 87.4
239.6 87.6
242.0 89.3
247.9 89.6
285.1 151.5
288.8 150.1
325.4 162.0
364.9' 172.9
361.2 173.2
364.9' 172.9
370.6' 173.7'
378.1 173.4
1,585.3 5,134.6
1,805.8 5,771.1
1,957.5' 6,326.3'
2,114.7' 6,886.3'
2,101.5' 6,841.9'
2,114.7' 6,886.3'
2,122.1 6,930.6
n.a. n.a.
Not seasonally adjusted
22 Ml 633.5 740.4 766.4 804.3 788.3 804.3 793.0 772.3 23 M2 2,576.2 2,821.1 2,918.7' 3,077.1' 3,057.6' 3,077.1' 3,076.3' 3,057.8 24 M3 3,213.3 3,507.4 3,688.5' 3,927.7' 3,905.6' 3,927.7' 3,930.7' 3,921.5 25 L 3,843.7 4,152.0 4,354.9' 4,703.1' 4,657.6' 4,703.1' 4,708.3 n.a. 26 6,710.2 7,561.0 8,266.0' 8,981.3' 8,906.3' 8,981.3' 9,031.8 n.a.
Ml components 27 Currency3 , 170.2 183.0 199.3 214.9 211.3 214.9 211.8 211.9 28 Travelers checks 5.5 6.0 6.5 6.9 7.1 6.9 7.0 7.1 29 Demand deposits 276.9 314.0 298.6 298.8 290.0 298.8 290.5 275.7 30 Other checkable deposits 180.9 237.4 262.0 283.7 279.8 283.7 283.7 277.6
Nontransactions components 31 M2 1,942.7 2,080.7 2,152.3' 2,272.8' 2,269.4 2,272.8' 2,283.3' 2,285.5 32 M3 only8 637.1 686.3 769.8 850.6' 848.0' 850.6' 854.5' 863.7
Money market deposit accounts 33 Commercial Banks 332.8 379.6 358.8 352.4 354.1 352.4 348.3 342.3 34 Thrift institutions 180.7 192.9 167.5 150.3 152.6 150.3 146.8 142.8
Savings deposits9
35 Commercial Banks 123.7 154.2 176.6 190.3 192.2 190.3 189.3' 188.3 36 Thrift institutions 174.8 212.7 234.8 235.6 238.2 235.6 233.5 230.4
Small-denomination time deposits10
37 Commercial Banks 384.0 365.3 386.1 444.1 437.7 444.1 453.1 463.0 38 Thrift institutions 499.9 489.8 529.1 582.4 581.8 582.4 588.7' 591.6
Money market mutual funds 39 General purpose and broker-dealer 176.5 208.0 221.1 239.6 237.4 239.6 242.0 247.9 40 Institution-only 64.5 84.4 89.6 87.6 87.4 87.6 89.3 89.6
Large-denomination time deposits" 41 Commercial Banks 285.4 289.1 325.8 365.5' 362.3 365.5' 370.2' 377.9 42 Thrift institutions 151.8 150.7 163.0 174.0 174.9 174.0 174.9 174.2
Debt components 43 Federal debt 1,583.7 1,803.9 1,955.6' 2,112.5' 2,090.9' 2,112.5' 2,121.4 n.a. 44 Nonfederal debt 5,126.4 5,757.2 6,310.4' 6,868.8' 6,815.4' 6,868.8' 6,910.5 n.a.
For notes see following page.
Digitized for FRASER http://fraser.stlouisfed.org/ Federal Reserve Bank of St. Louis
A14 Domestic Financial Statistics • May 1989
NOTES TO TABLE 1.21
1. Latest monthly and weekly figures are available from the Board's H.6 (508) release. Historical data are available from the Monetary and Reserves Projection section, Division of Monetary Affairs, Board of Governors of the Federal Reserve System, Washington, D.C. 20551.
2. Composition of the money stock measures and debt is as follows: Ml: (1) currency outside the Treasury, Federal Reserve Banks, and the vaults
of depository institutions; (2) travelers checks of nonbank issuers; (3) demand deposits at all commercial banks other than those due to depository institutions, the U.S. government, and foreign banks and official institutions less cash items in the process of collection and Federal Reserve float; and (4) other checkable deposits (OCD) consisting of negotiable order of withdrawal (NOW) and auto-matic transfer service (ATS) accounts at depository institutions, credit union share draft accounts, and demand deposits at thrift institutions.
M2: Ml plus overnight (and continuing contract) repurchase agreements (RPs) issued by all commercial banks and overnight Eurodollars issued to U.S. residents by foreign branches of U.S. banks worldwide, MMDAs, savings and small-denomination time deposits (time deposits—including retail RPs—in amounts of less than $100,000), and balances in both taxable and tax-exempt general purpose and broker-dealer money market mutual funds. Excludes individual retirement accounts (IRA) and Keogh balances at depository institutions and money market funds. Also excludes all balances held by U.S. commercial banks, money market funds (general purpose and broker-dealer), foreign governments and commercial banks, and the U.S. government.
M3: M2 plus large-denomination time deposits and term RP liabilities (in amounts of $100,000 or more) issued by commercial banks and thrift institutions, term Eurodollars held by U.S. residents at foreign branches of U.S. banks worldwide and at all banking offices in the United Kingdom and Canada, and balances in both taxable and tax-exempt, institution-only money market mutual funds. Excludes amounts held by depository institutions, the U.S. government, money market funds, and foreign banks and official institutions. Also subtracted is the estimated amount of overnight RPs and Eurodollars held by institution-only money market mutual funds.
L: M3 plus the nonbank public holdings of U.S. savings bonds, short-term Treasury securities, commercial paper and bankers acceptances, net of money market mutual fund holdings of these assets.
Debt: Debt of domestic nonfinancial sectors consists of outstanding credit market debt of the U.S. government, state and local governments, and private nonfinancial sectors. Private debt consists of corporate bonds, mortgages, con-sumer credit (including bank loans), other bank loans, commercial paper, bankers acceptances, and other debt instruments. The source of data on domestic nonfinancial debt is the Federal Reserve Board's flow of funds accounts. Debt data are based on monthly averages.
3. Currency outside the U.S. Treasury, Federal Reserve Banks, and vaults of depository institutions.
4. Outstanding amount of U.S. dollar-denominated travelers checks of non-bank issuers. Travelers checks issued by depository institutions are included in demand deposits.
5. Demand deposits at commercial banks and foreign-related institutions other than those due to depository institutions, the U.S. government, and foreign banks and official institutions less cash items in the process of collection and Federal Reserve float.
6. Consists of NOW and ATS balances at all depository institutions, credit union share draft balances, and demand deposits at thrift institutions.
7. Sum of overnight RPs and overnight Eurodollars, money market fund balances (general purpose and broker-dealer), MMDAs, and savings and small time deposits.
8. Sum of large time deposits, term RPs, and term Eurodollars of U.S. residents, money market fund balances (institution-only), less the estimated amount of overnight RPs and Eurodollars held by institution-only money market funds.
9. Savings deposits exclude MMDAs. 10. Small-denomination time deposits—including retail RPs—are those issued
in amounts of less than $100,000. All individual retirement accounts (IRA) and * Keogh accounts at commercial banks and thrifts are subtracted from small time
deposits. 11. Large-denomination time deposits are those issued in amounts of $100,000
or more, excluding those booked at international banking facilities. 12. Large-denomination time deposits at commercial banks less those held by
money market mutual funds, depository institutions, and foreign banks and official institutions.
Digitized for FRASER http://fraser.stlouisfed.org/ Federal Reserve Bank of St. Louis
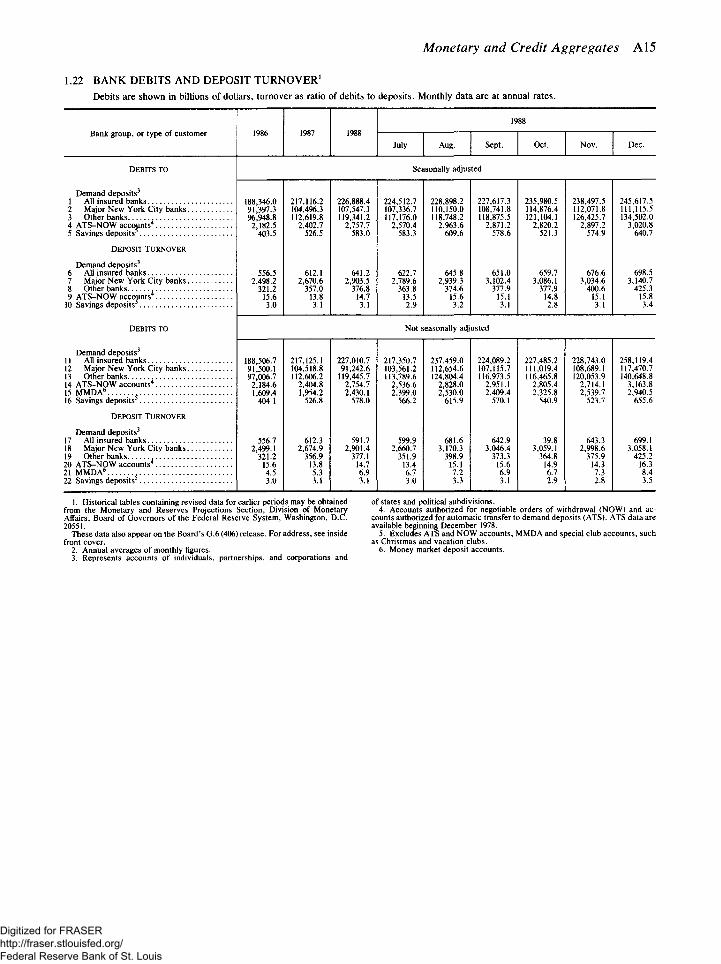
Monetary and Credit Aggregates A15
1.22 BANK DEBITS AND DEPOSIT TURNOVER1
Debits are shown in billions of dollars, turnover as ratio of debits to deposits. Monthly data are at annual rates.
1986 1987 1988 1988
1986 1987 1988 July Aug. Sept. Oct. Nov. Dec.
Seasonally adjusted
188,346.0 217,116.2 226,888.4 224,512.7 228,898.2 227,617.3 235,980.5 238,497.5 245,617.5 91,397.3 104,496.3 107,547.3 107,336.7 110,150.0 108,741.8 114,876.4 112,071.8 111,115.5 96,948.8 112,619.8 119,341.2 117,176.0 118,748.2 118,875.5 121,104.1 126,425.7 134,502.0
2,182.5 2,402.7 2,757.7 2,570.4 2,963.6 2,871.2 2,820.2 2,897.2 3,020.8 403.5 526.5 583.0 583.3 609.6 578.6 521.3 574.9 640.7
556.5 612.1 641.2 622.7 645.8 651.0 659.7 676.6 698.5 2,498.2 2,670.6 2,903.5 2,789.6 2,939.3 3,102.4 3,086.1 3,034.6 3,140.7
321.2 357.0 376.8 363.8 374.6 377.9 377.9 400.6 425.3 15.6 13.8 14.7 13.5 15.6 15.1 14.8 15.1 15.8 3.0 3.1 3.1 2.9 3.2 3.1 2.8 3.1 3.4
Not seasonally adjusted
188,506.7 217,125.1 227,010.7 217,350.7 237,459.0 224,089.2 227,485.2 228,743.0 258,119.4 91,500.1 104,518.8 91,242.6 103,561.2 112,654.6 107,115.7 111,019.4 108,689.1 117,470.7 97,006.7 112,606.2 119,445.7 113,789.6 124,804.4 116,973.5 116,465.8 120,053.9 140,648.8
2,184.6 2,404.8 2,754.7 2,536.6 2,828.0 2,951.1 2,805.4 2,714.1 3,163.8 1,609.4 1,954.2 2,430.1 2,399.0 2,530.0 2,409.4 2,325.8 2,539.7 2,940.5
404.1 526.8 578.0 566.2 615.9 570.1 540.9 523.7 655.6
556.7 612.3 591.7 599.9 681.6 642.9 39.8 643.3 699.1 2,499.1 2,674.9 2,901.4 2,660.7 3,170.3 3,046.4 3,059.1 2,998.6 3,058.1
321.2 356.9 377.1 351.9 398.9 373.3 364.8 375.9 425.2 15.6 13.8 14.7 13.4 15.1 15.6 14.9 14.3 16.3 4.5 5.3 6.9 6.7 7.2 6.9 6.7 7.3 8.4 3.0 3.1 3.1 3.0 3.3 3.1 2.9 2.8 3.5
Bank group, or type of customer
Demand deposits 1 All insured banks 2 Major New York City banks 3 Other banks 4 ATS-NOW accounts4
5 Savings deposits
DEPOSIT TURNOVER
Demand deposits3
6 All insured banks 7 Major New York City banks 8 Other banks 9 ATS-NOW accounts4
10 Savings deposits
DEBITS TO
Demand deposits 11 All insured banks 12 Major New York City banks 13 Other banks 14 ATS-NOW accounts4
15 MMDA 16 Savings deposits
DEPOSIT TURNOVER
Demand deposits3
17 All insured banks 18 Major New York City banks 19 Other banks } 20 ATS-NOW accounts4
21 MMDA 22 Savings deposits
1. Historical tables containing revised data for earlier periods may be obtained from the Monetary and Reserves Projections Section, Division of Monetary Affairs, Board of Governors of the Federal Reserve System, Washington, D.C. 20551.
These data also appear on the Board's G.6 (406) release. For address, see inside front cover.
2. Annual averages of monthly figures. 3. Represents accounts of individuals, partnerships, and corporations and
of states and political subdivisions. 4. Accounts authorized for negotiable orders of withdrawal (NOW) and ac-
counts authorized for automatic transfer to demand deposits (ATS). ATS data are available beginning December 1978.
5. Excludes ATS and NOW accounts, MMDA and special club accounts, such as Christmas and vacation clubs.
6. Money market deposit accounts.
Digitized for FRASER http://fraser.stlouisfed.org/ Federal Reserve Bank of St. Louis
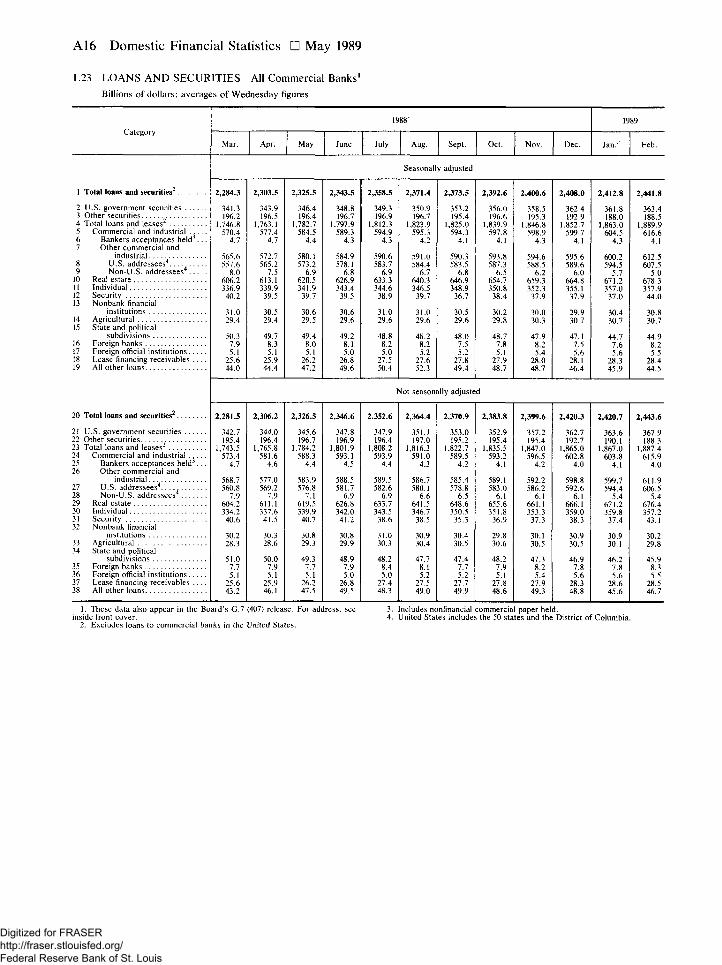
A16 Domestic Financial Statistics • May 1989
1.23 LOANS A N D SECURITIES All Commercial Banks'
Billions of dollars; averages of Wednesday figures
1988r 1989 Category Category
Mar. Apr. May June July Aug. Sept. Oct. Nov. Dec. Jan.' Feb.
Seasonally adjusted
1 Total loans and securities2 2,284.3 2,303.5 2,325.5 2,343.5 2,358.5 2,371.4 2,373.5 2,392.6 2,400.6 2,408.0 2,412.8 2,441.8
2 U.S. government securities 341.3 343.9 346.4 348.8 349.3 350.9 353.2 356.0 358.5 362.4 361.8 363.4 3 Other securities 196.2 196.5 196.4 196.7 196.9 196.7 195.4 196.6 195.3 192.9 188.0 188.5 4 Total loans and leases" 1,746.8 1,763.1 1,782.7 1,797.9 1,812.3 1,823.9 1,825.0 1,839.9 1,846.8 1,852.7 1,863.0 1,889.9 5 Commercial and industrial . . . . . 570.4 577.4 584.5 589.3 594.9 595.3 594.3 597.8 598.9 599.7 604.5 616.6 6 Bankers acceptances held . . . 4.7 4.7 4.4 4.3 4.3 4.2 4.1 4.1 4.3 4.1 4.3 4.1 7 Other commercial and
industrial 565.6 572.7 580.1 584.9 590.6 591.0 590.3 593.8 594.6 595.6 600.2 612.5 8 U.S. addressees4. 557.6 565.2 573.2 578.1 583.7 584.4 583.5 587.3 588.5 589.6 594.5 607.5 y Non-U.S. addressees 8.0 7.5 6.9 6.8 6.9 6.7 6.8 6.5 6.2 6.0 5.7 5.0
10 Real estate 606.2 613.1 620.5 626.9 633.3 640.3 646.9 654.7 659.3 664.8 671.2 678.3 n Individual 336.9 339.9 341.9 343.4 344.6 346.5 348.9 350.8 352.3 355.1 357.0 357.9 12 Security 40.2 39.5 39.7 39.5 38.9 39.7 36.7 38.4 37.9 37.9 37.0 44.0 13 Nonbank financial
institutions 31.0 30.5 30.6 30.6 31.0 31.0 30.5 30.2 30.0 29.9 30.4 30.8 14 Agricultural 29.4 29.4 29.5 29.6 29.6 29.6 29.6 29.8 30.3 30.7 30.7 30.7 15 State and political
subdivisions 50.3 49.7 49.4 49.2 48.8 48.2 48.0 48.7 47.9 47.1 44.7 44.9 16 Foreign banks 7.9 8.3 8.0 8.1 8.2 8.2 7.5 7.8 8.2 7.5 7.6 8.2 17 Foreign official institutions 5.1 5.1 5.1 5.0 5.0 5.2 5.2 5.1 5.4 5.6 5.6 5.5 18 Lease financing receivables . . . . 25.6 25.9 26.2 26.8 27.5 27.6 27.8 27.9 28.0 28.1 28.3 28.4 19 All other loans 44.0 44.4 47.2 49.6 50.4 52.3 49.4 48.7 48.7 46.4 45.9 44.5
Not seasonally adjusted
20 Total loans and securities2 2,281.5 2,306.2 2,326.5 2,346.6 2,352.6 2,364.4 2,370.9 2,383.8 2,399.6 2,420.3 2,420.7 2,443.6
21 U.S. government securities 342.7 344.0 345.6 347.8 347.9 351.1 353.0 352.9 357.2 362.7 363.6 367.9 22 Other securities 195.4 196.4 196.7 196.9 196.4 197.0 195.2 195.4 195.4 192.7 190.1 188.3 23 Total loans and leases' 1,743.5 1,765.8 1,784.2 1,801.9 1,808.2 1,816.3 1,822.7 1,835.5 1,847.0 1,865.0 1,867.0 1,887.4 24 Commercial and industrial . . . . . 573.4 581.6 588.3 593.1 593.9 591.0 589.5 593.2 596.5 602.8 603.8 615.9 25 Bankers acceptances held . . . 4.7 4.6 4.4 4.5 4.4 4.3 4.2 4.1 4.2 4.0 4.1 4.0 26 Other commercial and
industrial 568.7 577.0 583.9 588.5 589.5 586.7 585.4 589.1 592.2 598.8 599.7 611.9 27 U.S. addressees4. 560.8 569.2 576.8 581.7 582.6 580.1 578.8 583.0 586.2 592.6 594.4 606.5 28 Non-U.S. addressees 7.9 7.9 7.1 6.9 6.9 6.6 6.5 6.1 6.1 6.1 5.4 5.4 29 Real estate 604.2 611.1 619.5 626.8 633.7 641.5 648.6 655.6 661.1 666.1 671.2 676.4 30 Individual 334.2 337.6 339.9 342.0 343.5 346.7 350.5 351.8 353.3 359.0 359.8 357.2 31 Security 40.6 41.5 40.7 41.2 38.6 38.5 35.3 36.9 37.3 38.3 37.4 43.1 32 Nonbank financial
institutions 30.2 30.3 30.8 30.8 31.0 30.9 30.4 29.8 30.1 30.9 30.9 30.2 33 Agricultural 28.3 28.6 29.3 29.9 30.3 30.4 30.5 30.6 30.5 30.5 30.1 29.8 34 State and political
subdivisions 51.0 50.0 49.3 48.9 48.2 47.7 47.4 48.2 47.3 46.9 46.2 45.9 35 Foreign banks 7.7 7.9 7.7 7.9 8.4 8.1 7.7 7.9 8.2 7.8 7.8 8.3 36 Foreign official institutions 5.1 5.1 5.1 5.0 5.0 5.2 5.2 5.1 5.4 5.6 5.6 5.5 37 Lease financing receivables . . . . 25.6 25.9 26.2 26.8 27.4 27.5 27.7 27.8 27.9 28.3 28.6 28.5 38 All other loans 43.2 46.1 47.5 49.5 48.3 49.0 49.9 48.6 49.3 48.8 45.6 46.7
1. These data also appear in the Board's G.7 (407) release. For address, see 3. Includes nonfinancial commercial paper held. inside front cover. 4. United States includes the 50 states and the District of Columbia.
2. Excludes loans to commercial banks in the United States.
Digitized for FRASER http://fraser.stlouisfed.org/ Federal Reserve Bank of St. Louis
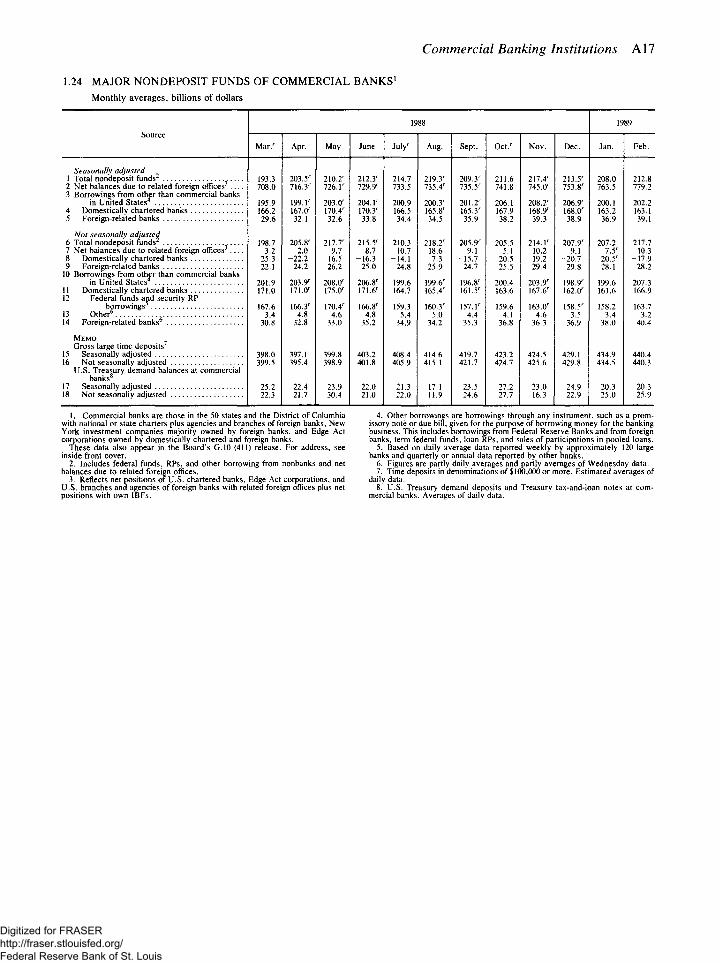
Commercial Banking Institutions A17
1.24 MAJOR NONDEPOSIT F U N D S OF COMMERCIAL BANKS 1
Monthly averages, billions of dollars
Source 1988 1989
Source M a r / Apr. May June July' Aug. Sept. Oct . ' Nov. Dec. Jan. Feb.
Seasonally adjusted 1 Total nondeposit funds2 193.3 203.5r 210.2' 212.3' 214.7 219.3' 209.3' 211.6 217.4' 213.5' 208.0 212.8 2 Net balances due to related foreign offices . . . . 708.0 716.3'' 726.1' 729.9' 733.5 735.4' 735.5' 741.8 745.0' 753.8' 763.5 779.2 3 Borrowings from other than commercial banks
in United States4 195.9 199. r 203.0' 204.1' 200.9 200.3' 201.2' 206.1 208.2' 206.9' 200.1 202.2 4 Domestically chartered banks 166.2 167.0' 170.4' 170.3' 166.5 165.8' 165.3' 167.9 168.9' 168.0' 163.2 163.1 5 Foreign-related banks 29.6 32.1 32.6 33.8 34.4 34.5 35.9 38.2 39.3 38.9 36.9 39.1
Not seasonally adjusted 6 Total nondeposit funds2 198.7 205.8' 217.7' 215.5' 210.3 218.2' 205.9' 205.5 214.1' 207.9' 207.2 217.7 7 Net balances due to related foreign offices . . . . - 3 . 2 2.0 9.7 8.7 10.7 18.6 9.1 5.1 10.2 9.1 7.5' 10.3 8 Domestically chartered banks - 2 5 . 3 -22 .2 -16 .5 - 1 6 . 3 -14 .1 - 7 . 3 -15 .7 -20 .5 -19 .2 -20 .7 - 2 0 . 5 ' - 1 7 . 9 9 Foreign-related banks 22.1 24.2 26.2 25.0 24.8 25.9 24.7 25.5 29.4 29.8 28.1 28.2
10 Borrowings from other than commercial banks in United States 201.9 203.9' 208.0' 206.8' 199.6 199.6' 196.8' 200.4 203.9' 198.9' 199.6 207.3
11 Domestically chartered banks 171.0 171.0' 175.0' 171.6' 164.7 165.4' 161.5' 163.6 167.6' 162.0' 161.6 166.9 12 Federal funds and security RP
borrowings 167.6 166.3' 170.4' 166.8' 159.3 160.3' 157.1' 159.6 163.0' 158.5' 158.2 163.7 13 Other 3.4 4.8 4.6 4.8 5.4 5.0 4.4 4.1 4.6 3.5 3.4 3.2 14 Foreign-related banks6 30.8 32.8 33.0 35.2 34.9 34.2 35.3 36.8 36.3 36.9 38.0 40.4
MEMO Gross large time deposits
15 Seasonally adjusted 398.0 397.1 399.8 403.2 408.4 414.6 419.7 423.2 424.5 429.1 434.9 440.4 16 Not seasonally adjusted 399.5 395.4 398.9 401.8 405.9 415.1 421.7 424.7 425.6 429.8 434.5 440.3
U.S. Treasury demand balances at commercial banks8
17 Seasonally adjusted 25.2 22.4 23.9 22.0 21.3 17.1 23.5 27.2 23.0 24.9 20.3 20.3 18 Not seasonally adjusted 22.3 21.7 30.4 21.0 22.0 11.9 24.6 27.7 16.3 22.9 25.0 25.9
1. Commercial banks are those in the 50 states and the District of Columbia with national or state charters plus agencies and branches of foreign banks, New York investment companies majority owned by foreign banks, and Edge Act corporations owned by domestically chartered and foreign banks.
These data also appear in the Board's G.10 (411) release. For address, see inside front cover.
2. Includes federal funds, RPs, and other borrowing from nonbanks and net balances due to related foreign offices.
3. Reflects net positions of U.S. chartered banks, Edge Act corporations, and U.S. branches and agencies of foreign banks with related foreign offices plus net positions with own IBFs.
4. Other borrowings are borrowings through any instrument, such as a prom-issory note or due bill, given for the purpose of borrowing money for the banking business. This includes borrowings from Federal Reserve Banks and from foreign banks, term federal funds, loan RPs, and sales of participations in pooled loans.
5. Based on daily average data reported weekly by approximately 120 large banks and quarterly or annual data reported by other banks.
6. Figures are partly daily averages and partly averages of Wednesday data. 7. Time deposits in denominations of $100,000 or more. Estimated averages of
daily data. 8. U.S. Treasury demand deposits and Treasury tax-and-loan notes at com-
mercial banks. Averages of daily data.
Digitized for FRASER http://fraser.stlouisfed.org/ Federal Reserve Bank of St. Louis
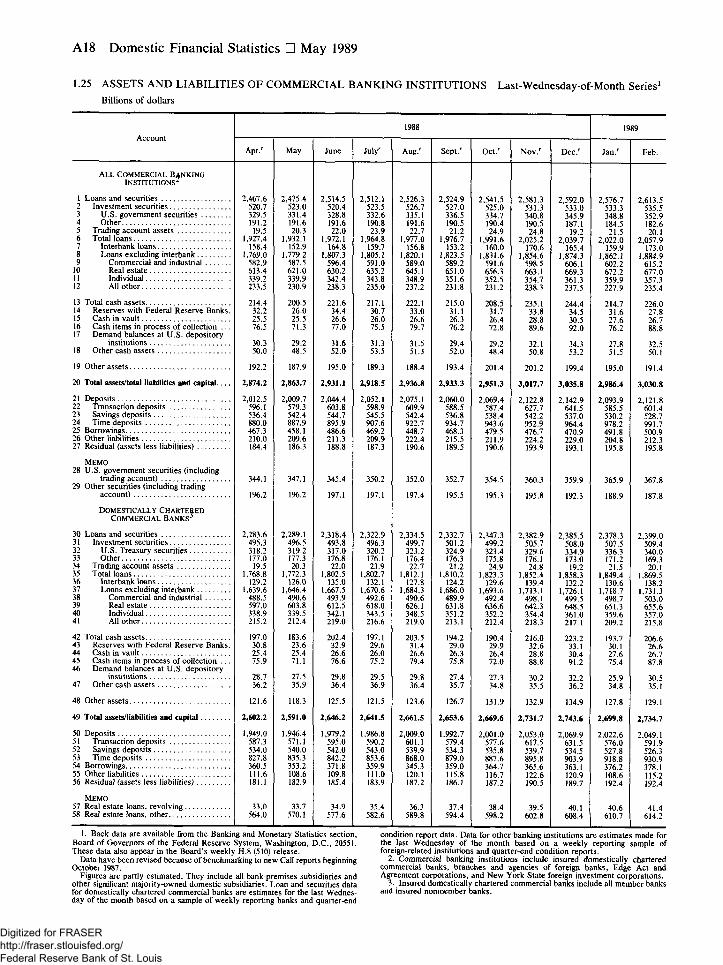
A18 Domestic Financial Statistics • May 1989
1.25 ASSETS AND LIABILITIES OF COMMERCIAL BANKING INSTITUTIONS Last-Wednesday-of-Month Series1
Billions of dollars
Account 1988
A p r / May June July' Aug / S e p t / O c t / N o v / D e c /
1989
J a n / Feb.
ALL COMMERCIAL BANKING INSTITUTIONS^
1 Loans and securities 2 Investment securities 3 U.S. government securities 4 Other 5 Trading account assets 6 Total loans 7 Interbank loans 8 Loans excluding interbank 9 Commercial and industrial
10 Real estate 11 Individual 12 All other
13 Total cash assets 14 Reserves with Federal Reserve Banks 15 Cash in vault 16 Cash items in process of collection . . 17 Demand balances at U.S. depository
institutions 18 Other cash assets
19 Other assets
20 Total assets/total liabilities and capital
21 Deposits 22 Transaction deposits 23 Savings deposits 24 Time deposits 25 Borrowings 26 Other liabilities 27 Residual (assets less liabilities)
MEMO 28 U.S. government securities (including
trading account) 29 Other securities (including trading
account)
DOMESTICALLY CHARTERED COMMERCIAL BANKS3
30 Loans and securities 31 Investment securities 32 U.S. Treasury securities 33 Other 34 Trading account assets 35 Total loans 36 Interbank loans 37 Loans excluding interbank 38 Commercial and industrial 39 Real estate 40 Individual 41 All other
42 Total cash assets 43 Reserves with Federal Reserve Banks 44 Cash in vault 45 Cash items in process of collection . . 46 Demand balances at U.S. depository
institutions 47 Other cash assets
48 Other assets
49 Total assets/liabilities and capital
50 Deposits 51 Transaction deposits 52 Savings deposits 53 Time deposits 54 Borrowings 55 Other liabilities 56 Residua) (assets less liabilities)
MEMO 57 Real estate loans, revolving 58 Real estate loans, other
2,467.6 520.7 329.5 191.2
19.5 1.927.4
158.4 1,769.0
582.9 613.4 339.2 233.5
214.4 32.2 25.5 76.5
30.3 50.0
192.2
2,874.2
2.012.5 596.1 536.4 880.0 467.3 210.0 184.4
344.1
196.2
2,283.6 495.3 318.2 177.0 19.5
1,768.8 129.2
1,639.6 488.5 597.0 338.9 215.2
197.0 30.8 25.4 75.9
28.7 36.2
121.6
2,602.2
1,949.0 587.3 534.0 827.8 360.5 111.6 181.1
33.0 564.0
2,475.4 523.0 331.4 191.6 20.3
1.932.1 152.9
1.779.2 587.5 621.0 339.9 230.9
200.5 26.0 25.5 71.3
29.2 48.5
2,863.7
2,009.7 579.3 542.4 887.9 458.1 209.6 186.3
347.1
196.2
2,289.1 496.5 319.2 177.3 20.3
1.772.3 126.0
1.646.4 490.6 603.8 339.5 212.4
183.6 23.6 25.4 71.1
27.5 35.9
2,591.0
1,946.4 571.1 540.0 835.3 353.2 108.6 182.9
33.7 570.1
2,514.5 520.4 328.8 191.6 22.0
1,972.1 164.8
1.807.3 596.4 630.2 342.4 238.3
221.6 34.4 26.6 77.0
31.6 52.0
195.0
2,931.1
2.044.4 603.8 544.7 895.9 486.6 211.3 188.8
345.4
197.1
2.318.4 493.8 317.0 176.8 22.0
1.802.5 135.0
1,667.5 493.9 612.5 342.1 219.0
202.4 32.9 26.6 76.6
29.8 36.4
125.5
2,646.2
1,979.2 595.0 542.0 842.2 371.8 109.8 185.4
34.9 577.6
2,512.1 523.5 332.6 190.8 23.9
1,964.8 159.7
1,805.1 591.0 635.2 343.8 235.0
217.1 30.7 26.0 75.5
31.3 53.5
189.3
2,918.5
2,052.1 598.9 545.5 907.6 469.2 209.9 187.3
350.2
197.1
2,322.9 496.3 320.2 176.1 23.9
1.802.7 132.1
1,670.6 492.6 618.0 343.5 216.6
197.1 29.6 26.0 75.2
29.5 36.9
121.5
2,641.5
1.986.8 590.2 543.0 853.6 359.9 111.0 183.9
35.4 582.6
2,526.3 526.7 335.1 191.6 22.7
1.977.0 156.8
1.820.1 589.0 645.1 348.9 237.2
222.1 33.0 26.6 79.7
31.5 51.3
188.4
2,936.8
2,075.1 609.9 542.4 922.7 448.7 222.4 190.6
352.0
197.4
2,334.5 499.7 323.2 176.4 22.7
1,812.1 127.8
1,684.3 490.6 626.1 348.5 219.0
203.5 31.4 26.6 79.4
29.8 36.4
123.6
2,661.5
2,009.0 601.1 539.9 868.0 345.3 120.1 187.2
36.3 589.8
2,524.9 527.0 336.5 190.5 21.2
1,976.7 153.2
1,823.5 589.2 651.0 351.6 231.8
215.0 31.1 26.3 76.2
29.4 52.0
193.4
2,933.3
2,060.0 588.5 536.8 934.7 468.3 215.5 189.5
352.7
195.5
2,332.7 501.2 324.9 176.3 21.2
1 , 8 1 0 . 2 124.2
1,686.0 489.9 631.8 351.2 213.1
194.2 29.0 26.3 75.8
27.4 35.7
2.653.6
1.992.7 579.4 534.3 879.0 359.0 115.8 186.1
37.4 594.4
2.541.5 525.0 334.7 190.4 24.9
1.991.6 160.0
1,831.6 591.6 656.3 352.5 231.2
208.5 31.7 26.4 72.8
29.2 48.4
201.4
2.951.3
2.069.4 587.4 538.4 943.6 479.5 211.9 190.6
354.5
195.3
2,347.3 499.2 323.4 175.8 24.9
1,823.3 129.6
1,693.6 492.4 636.6 352.2 212.4
190.4 29.9 26.4 72.0
27.3 34.8
131.9
2,669.6
2,001.0 577.6 535.8 887.6 364.7 116.7 187.2
38.4 598.2
2,581.3 531.3 340.8 190.5 24.8
2,025.2 170.6
1.854.6 598.5 663.1 354.7 238.3
235.1 33.8 28.8 89.6
32.1 50.8
201.2
3.017.7
2.122 .8 627.7 542.2 952.9 476.7 224.2 193.9
360.3
195.8
2,382.9 505.7 329.6 176.1 24.8
1,852.4 139.4
1,713.1 498.1 642.3 354.4 218.3
216.0 32.6 28.8
30.2 35.5
132.9
2,731.7
2,053.0 617.5 539.7 895.8 365.6 122.6 190.5
39.5 602.8
2,592.0 533.0 345.9 187.1
19.2 2.039.7
165.4 1,874.3
606.1 669.3 361.3 237.5
244.4 34.5 30.5 92.0
34.3 53.2
199.4
3.035.8
2.142.9 641.5 537.0 964.4 470.9 229.0 193.1
359.9
192.3
2.385.5 508.0 334.9 173.0
19.2 1,858.3
132.2 1,726.1
499.5 648.5 361.0 217.1
223.2 33.1 30.4 91.2
32.2 36.2
134.9
2.743.6
2,069.9 631.5 534.5 903.9 363.1 120.9 189.7
40.1 608.4
2,576.7 533.3 348.8 184.5 21.5
2,022.0 159.9
1,862.1 602.2 672.2 359.9 227.9
214.7 31.6 27.6 76.2
27.8 51.5
195.0
2,986.4
2,093.9 585.5 530.2 978.2 491.8 204.8 195.8
365.9
188.9
2.378.3 507.5 336.3 171.2 21.5
1.849.4 130.6
1.718.7 498.7 651.3 359.6 209.2
193.7 30.1 27.6 75.4
25.9 34.8
127.8
2.699.8
2,022.6 576.0 527.8 918.8 376.2 108.6 192.4
40.6 610.7
2,613.5 535.5 352.9 182.6 20.1
2,057.9 173.0
1,884.9 615.2 677.0 357.3 235.4
226.0 27.8 26.7
32.5 50.1
3,030.8
2,121.8 601.4 528.7 991.7 500.9 212.3 195.8
367.8
187.8
2.399.0 509.4 340.0 169.3 20.1
1,869.5 138.2
1,731.3 503.0 655.6 357.0 215.8
206.6 26.6 26.7 87.8
30.5 35.1
129.1
2,734.7
2.049.1 591.9 526.3 930.9 378.1 115.2 192.4
41.4 614.2
1. Back data are available from the Banking and Monetary Statistics section, Board of Governors of the Federal Reserve System, Washington, D.C., 20551. These data also appear in the Board's weekly H.8 (510) release.
Data have been revised because of benchmarking to new Call reports beginning October 1987.
Figures are partly estimated. They include all bank-premises subsidiaries and other significant majority-owned domestic subsidiaries. Loan and securities data for domestically chartered commercial banks are estimates for the last Wednes-day of the month based on a sample of weekly reporting banks and quarter-end
condition report data. Data for other banking institutions are estimates made for the last Wednesday of the month based on a weekly reporting sample of foreign-related institutions and quarter-end condition reports.
2. Commercial banking institutions include insured domestically chartered commercial banks, branches and agencies of foreign banks, Edge Act and Agreement corporations, and New York State foreign investment corporations.
3. Insured domestically chartered commercial banks include all member banks and insured nonmember banks.
Digitized for FRASER http://fraser.stlouisfed.org/ Federal Reserve Bank of St. Louis
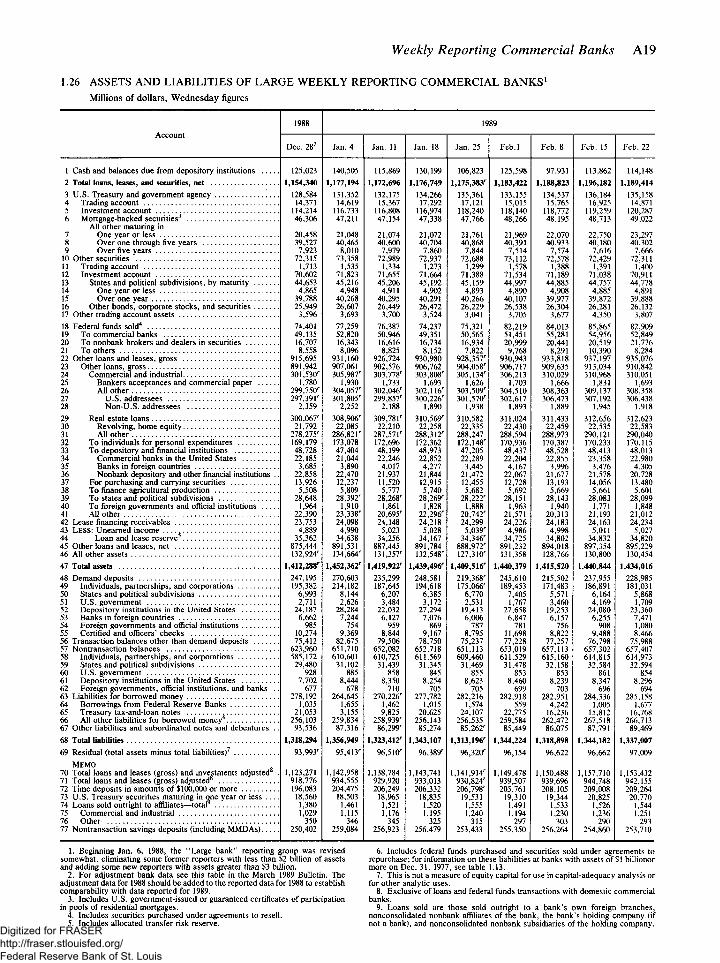
Weekly Reporting Commercial Banks A19
1.26 ASSETS A N D LIABILITIES OF LARGE WEEKLY REPORTING COMMERCIAL B A N K S 1
Millions of dollars, Wednesday figures
Account 1988 1989
Account Dec. 282 Jan. 4 Jan. 11 Jan. 18 Jan. 25 Feb.l Feb. 8 Feb. 15 Feb. 22
1 Cash and balances due from depository institutions 125,023 140,505 115,869 130,199 106,823 125,598 97,931 113,862 114,148 2 Total loans, leases, and securities, net 1,154,340 1,177,194 1,172,696 1,176,749 1,175,383' 1,183,422 1,188,823 1,196,182 1,189,414 3 U.S. Treasury and government agency 128,584 131,352 132,175 134,266 135,361 133,155 134,537 136,184 135,158 4 Trading account 14,371 14,619 15,367 17,292 17,121 15,015 15,765 16,925 14,871 5 Investment account 114,214 116,733 116,808 116,974 118,240 118,140 118,772 119,259 120,287 6 Mortgage-backed securities 46,306 47,211 47,154 47,338 47,766 48,266 48,195 48,713 49,022
All other maturing in 7 One year or less 20,458 21,048 21,074 21,072 21,761 21,969 22,070 22,750 23,297 8 Over one through five years 39,527 40,465 40,600 40,704 40,868 40,391 40,933 40,180 40,302 9 Over five years 7,923 8,010 7,979 7,860 7,844 7,514 7,574 7,616 7,666
10 Other securities 72,315 73,358 72,989 72,937 72,688 73,112 72,578 72,429 72,311 11 Trading account 1,713 1,535 1,334 1,273 1,299 1,578 1,388 1,391 1,400 12 Investment account 70,602 71,823 71,655 71,664 71,388 71,534 71,189 71,038 70,911 13 States and political subdivisions, by maturity 44,653 45,216 45,206 45,192 45,159 44,997 44,885 44,757 44,778 14 One year or less 4,865 4,948 4,911 4,902 4,893 4,890 4,908 4,885 4,891 15 Over one year 39,788 40,268 40,295 40,291 40,266 40,107 39,977 39,872 39,888 16 Other bonds, corporate stocks, and securities 25,949 26,607 26,449 26,472 26,229 26,538 26,304 26,281 26,132 17 Other trading account assets 3,596 ' 3,693 3,700 3,524 3,041 3,705 3,677 4,350 3,807 18 Federal funds sold4 74,401 77,259 76,387 74,237 75,321 82,219 84,013 85,865 82,909 19 To commercial banks 49,135 52,820 50,946 49,351 50,565 51,451 55,281 54,956 52,849 20 To nonbank brokers and dealers in securities 16,707 16,343 16,616 16,734 16,934 20,999 20,441 20,519 21,776 21 To others 8,558 8,096 8,825 8,152 7,822 9,768 8,291 10,390 8,284 22 Other loans and leases, gross 915,695 931,160 926,724 930,980 928,357' 930,943 933,818 937,197 935,076 23 Other loans, gross 891,942 907,061 902,576 906,762 904,058' 906,717 909,635 913,034 910,842 24 Commercial and industrial 301,530' 305,987' 303,778' 303,808' 305,134' 306,213 310,029 310,968 310,051 25 Bankers acceptances and commercial paper 1,780 1,930 1,733 1,693 1,626 1,703 1,666 1,831 1,693 26 All other 299,750' 304,057' 302,046' 302,116' 303,509' 304,510 308,363 309,137 308,358 27 U.S. addressees 297,391' 301,805' 299,857' 300,226' 301,570' 302,617 306,473 307,192 306,438 28 Non-U.S. addressees 2,359 2,252 2,188 1,890 1,938 1,893 1,889 1,945 1,918 29 Real estate loans 300,067' 308,906' 309,781' 310,569' 310,582 311,024 311,433 312,656 312,623 30 Revolving, home equity 21,792 22,085 22,210 22,258 22,335 22,430 22,459 22,535 22,583 31 All other 278,275' 286,821' 287,571' 288,312' 288,247 288,594 288,973 290,121 290,040 32 To individuals for personal expenditures 169,179 173,078 172,696 172,362 172,148' 170,936 170,387 170,233 170,115 33 To depository and financial institutions 48,728 47,404 48,199 48,973 47,205 48,437 48,528 48,413 48,013 34 Commercial banks in the United States 22,185 21,044 22,246 22,852 22,289 22,204 22,855 23,358 22,980 35 Banks in foreign countries 3,685 3,890 4,017 4,277 3,445 4,167 3,996 3,476 4,305 36 Nonbank depository and other financial institutions . . 22,858 22,470 21,937 21,844 21,472 22,067 21,677 21,578 20,728 37 For purchasing and carrying securities 13,926 12,237 11,520 12,915 12,455 12,728 13,193 14,056 13,480 38 To finance agricultural production 5,508 5,809 5,777 5,740 5,682 5,692 5,669 5,661 5,601 39 To states and political subdivisions 28,648 28,392' 28,268' 28,269" 28,222' 28,151 28,143 28,083 28,099 40 To foreign governments and official institutions 1,964 1,910 1,861 1,828 1,888 1,963 1,940 1,771 1,848 41 All other 22,390 23,338' 20,695' 22,296' 20,742' 21,571 20,313 21,193 21,012 42 Lease financing receivables 23,753 24,098 24,148 24,218 24,299 24,226 24,183 24,163 24,234 43 LESS: Unearned income 4,889 4,990 5,023 5,028 5,039' 4,986 4,998 5,011 5,027 44 Loan and lease reserve 35,362 34,638 34,256 34,167 34,346' 34,725 34,802 34,832 34,820 45 Other loans and leases, net 875,444 891,531 887,445 891,784 888,972' 891,232 894,018 897,354 895,229 46 All other assets 132,924' 134,664' 131,357' 132,548' 127,310' 131,358 128,766 130,800 130,454 47 Total assets 1,412,288' 1,452,362' 1,419,922' 1,439,496' 1,409,516' 1,440,379 1,415,520 1,440,844 1,434,016 48 Demand deposits 247,195 270,603 235,299 248,581 219,368' 245,610 215,502 237,955 228,985 49 Individuals, partnerships, and corporations 195,382 214,182 187,645 194,618 175,066' 189,453 171,483 186,891 181,031 50 States and political subdivisions 6,993 8,144 6,207 6,385 6,770 7,405 5,571 6,164 5,868 51 U.S. government 2,711 2,626 3,484 3,172 2,531 1,767 3,460 4,169 1,709 52 Depository institutions in the United States 24,187 28,284 22,032 27,294 19,413 27,658 19,253 24,080 23,360 53 Banks in foreign countries 6,662 7,244 6,127 7,076 6,006 6,847 6,157 6,255 7,471 54 Foreign governments and official institutions 985 754 959 869 787 781 756 908 1,080 55 Certified and officers' checks 10,274 9,369 8,844 9,167 8,795 11,698 8,822 9,488 8,466 56 Transaction balances other than demand deposits 75,412 82,675 79,506 78,750 75,237 77,228 77,257 76,798 75,988 57 Nontransaction balances 623,960 651,710 652,082 652,718 651,113 653,019 657,113 657,302 657,407 58 Individuals, partnerships, and corporations 585,172 610,601 610,725 611,569 609,460 611,529 615,160 614,815 614,973 59 States and political subdivisions 29,480 31,102 31,439 31,345 31,469 31,478 32,158 32,584 32,594 60 U.S. government 928 885 858 845 855 853 853 861 854 61 Depository institutions in the United States 7,702 8,444 8,350 8,254 8,623 8,460 8,239 8,347 8,296 62 Foreign governments, official institutions, and banks . . 677 678 710 705 705 699 703 696 694 63 Liabilities for borrowed money 278,192 264,645 270,226' 277,782 282,216 282,918 282,951 284,336 285,158 64 Borrowings from Federal Reserve Banks 1,035 1,655 1,462 1,015 1,574 559 4,242 1,005 1,677 65 Treasury tax-and-loan notes 21,053 3,155 9,825 20,625 24,107 22,775 16,236 15,812 16,768 66 All other liabilities for borrowed money6 256,103 259,834 258,939' 256,143 256,535 259,584 262,472 267,518 266,713 67 Other liabilities and subordinated notes and debentures . . 93,536 87,316 86,299' 85,274 85,262' 85,449 86,075 87,791 89,469 68 Total liabilities 1,318,294 1,356,949 1,323,412' 1,343,107 1,313,196' 1,344,224 1,318,898 1,344,182 1,337,007 69 Residual (total assets minus total liabilities)7 93,993' 95,413' 96,51(r 96,389' 96,320' 96,154 96,622 96,662 97,009
MEMO 70 Total loans and leases (gross) and investments adjusted . 1,123,271 1,142,958 1,138,784 1,143,741 1,141,914' 1,149,478 1,150,488 1,157,710 1,153,432 71 Total loans and leases (gross) adjusted 918,776 934,555 929,920 933,013 930,824' 939,507 939,696 944,748 942,155 72 Time deposits in amounts of $100,000 or more 196,083 204,475 206,249 206,332 206,798' 205,761 208,105 209,008 209,264 73 U.S. Treasury securities maturing in one year or less 18,560 18,503 18,965 18,835 19,531 19,310 19,344 20,825 20,770 74 Loans sold outright to affiliates—total 1,380 1,461 1,521 1,520 1,555 1,491 1,533 1,526 1,544 75 Commercial and industrial 1,029 1,115 1,176 1,195 1,240 1,194 1,230 1,236 1,251 76 Other 350 346 345 325 315 297 303 290 293 77 Nontransaction savings deposits (including MMDAs) 250,402 259,084 256,923 256,479 253,433 255,350 256,264 254,860 253,710
1. Beginning Jan. 6, 1988, the "Large bank" reporting group was revised somewhat, eliminating some former reporters with less than $2 billion of assets and adding some new reporters with assets greater than $3 billion.
2. For adjustment bank data see this table in the March 1989 Bulletin. The adjustment data for 1988 should be added to the reported data for 1988 to establish comparability with data reported for 1989.
3. Includes U.S. government-issued or guaranteed certificates of participation in pools of residential mortgages.
4. Includes securities purchased under agreements to resell. 5. Includes allocated transfer risk reserve.
6. Includes federal funds purchased and securities sold under agreements to repurchase; for information on these liabilities at banks with assets of $1 billionor more on Dec. 31, 1977, see table 1.13.
7. This is not a measure of equity capital for use in capital-adequacy analysis or for other analytic uses.
8. Exclusive of loans and federal funds transactions with domestic commercial banks.
9. Loans sold are those sold outright to a bank's own foreign branches, nonconsolidated nonbank affiliates of the bank, the bank's holding company (if not a bank), and nonconsolidated nonbank subsidiaries of the holding company.
Digitized for FRASER http://fraser.stlouisfed.org/ Federal Reserve Bank of St. Louis
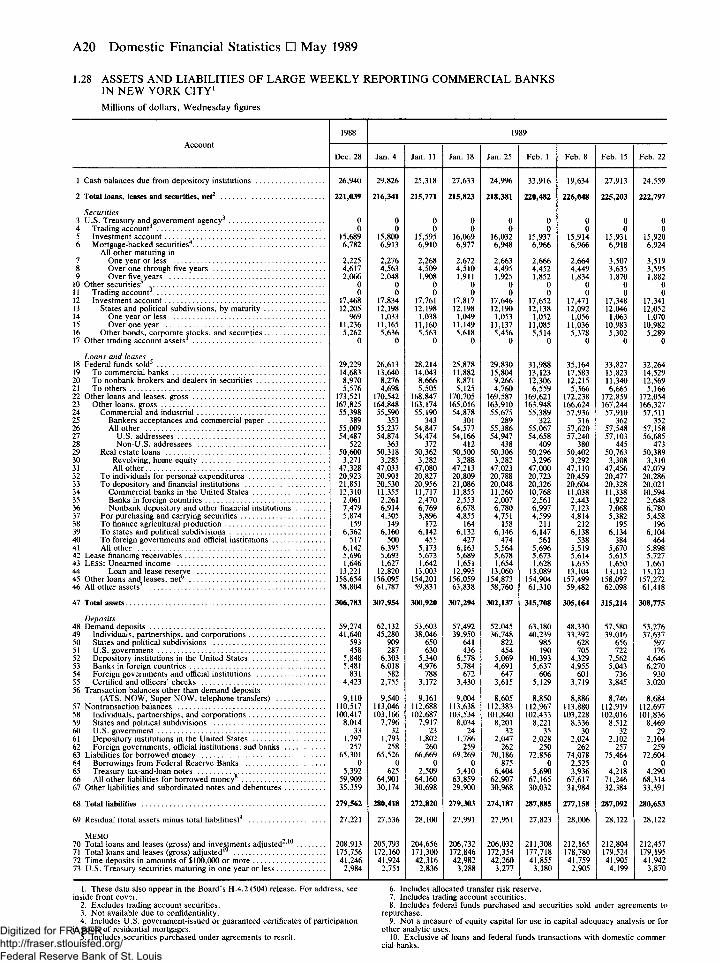
A20 Domestic Financial Statistics • May 1989
1.28 ASSETS A N D LIABILITIES OF LARGE WEEKLY REPORTING COMMERCIAL B A N K S IN NEW YORK CITY1
Millions of dollars, Wednesday figures
Account 1988 1989
Account Dec. 28 Jan. 4 Jan. 11 Jan. 18 Jan. 25 Feb. 1 Feb. 8 Feb. 15 Feb. 22
1 Cash balances due from depository institutions 26,940 29,826 25,318 27,633 24,996 33,916 19,634 27,913 24,559
2 Total loans, leases and securities, net2 221,039 216,341 215,771 215,823 218,381 220,482 226,048 225,203 222,797
Securities 3 U.S. Treasury and government agency3 0 0 0 0 0 0 0 0 0 4 Trading account3 0 0 0 0 0 0 0 0 0 5 Investment account 15,689 15,800 15,595 16,069 16,032 15,937 15,914 15,931 15,920 6 Mortgage-backed securities4 6,782 6,913 6,910 6,977 6,948 6,966 6,966 6,918 6,924
All other maturing in 7 One year or less 2,225 2,276 2,268 2,672 2,663 2,666 2,664 3,507 3,519 8 Over one through five years 4,617 4,563 4,509 4,510 4,495 4,452 4,449 3,635 3,595 9 Over five years 2,066 2,048 1,908 1,911 1,925 1,852 1,834 1,870 1,882
10 Other securities3 0 0 0 0 0 0 0 0 0 11 Trading account3 0 0 0 0 0 0 0 0 0 12 Investment account 17,468 17,834 17,761 17,817 17,646 17,652 17,471 17,348 17,341 13 States and political subdivisions, by maturity 12,205 12,198 12,198 12,198 12,190 12,138 12,092 12,046 12,052 14 One year or less 969 1,033 1,038 1,049 1,053 1,052 1,056 1,063 1,070 15 Over one year 11,236 11,165 11,160 11,149 11,137 11,085 11,036 10,983 10,982 16 Other bonds, corporate stocks, and securities 5,262 5,636 5,563 5,618 5,456 5,514 5,378 5,302 5,289 17 Other trading account assets 0 0 0 0 0 0 0 0 0
Loans and leases 18 Federal funds sold5 29,229 26,613 28,214 25,878 29,830 31,988 35,164 33,827 32,264 19 To commercial banks 14,683 13,640 14,043 11,882 15,804 13,123 17,583 15,823 14,529 20 To nonbank brokers and dealers in securities 8,970 8,276 8,666 8,871 9,266 12,306 12,215 11,340 12,569 21 To others 5,576 4,698 5,505 5,125 4,760 6,559 5,366 6,665 5,166 22 Other loans and leases, gross 173,521 170,542 168,847 170,705 169,587 169,621 172,238 172,859 172,054 23 Other loans, gross 167,825 164,848 163,174 165,016 163,910 163,948 166,624 167,244 166,327 24 Commercial and industrial 55,398 55,590 55,190 54,878 55,675 55,389 57,936 57,910 57,511 25 Bankers acceptances and commercial paper 389 353 343 301 289 322 316 362 352 26 All other 55,009 55,237 54,847 54,577 55,386 55,067 57,620 57,548 57,158 27 U.S. addressees 54,487 54,874 54,474 54,166 54,947 54,658 57,240 57,103 56,685 28 Non-U.S. addressees 522 363 372 412 438 409 380 445 473 29 Real estate loans 50,600 50,318 50,362 50,500 50,306 50,296 50,402 50,763 50,389 30 Revolving, home equity 3,271 3,285 3,282 3,288 3,282 3,296 3,292 3,308 3,310 31 All other 47,328 47,033 47,080 47,213 47,023 47,000 47,110 47,456 47,079 32 To individuals for personal expenditures 20,923 20,901 20,827 20,809 20,788 20,723 20,459 20,477 20,286 33 To depository and financial institutions 21,851 20,530 20,956 21,086 20,048 20,326 20,604 20,328 20,021 34 Commercial banks in the United States 12,310 11,355 11,717 11,855 11,260 10,768 11,038 11,338 10,594 35 Banks in foreign countries 2,061 2,261 2,470 2,553 2,007 2,561 2,443 1,922 2,648 36 Nonbank depository and other financial institutions 7,479 6,914 6,769 6,678 6,780 6,997 7,123 7,068 6,780 37 For purchasing and carrying securities 5,874 4,305 3,896 4,855 4,751 4,599 4,814 5,382 5,458 38 To finance agricultural production 159 149 172 164 158 211 212 195 196 39 To states and political subdivisions 6,362 6,160 6,142 6,132 6,146 6,147 6,138 6,134 6,104 40 To foreign governments and official institutions 517 500 455 427 474 561 538 384 464 41 All other 6,142 6,395 5,173 6,163 5,564 5,6% 5,519 5,670 5,898 42 Lease financing receivables 5,696 5,693 5,673 5,689 5,678 5,673 5,614 5,615 5,727 43 LESS: Unearned income 1,646 1,627 1,642 1,651 1,654 1,628 1,635 1,650 1,661 44 Loan and lease reserve 13,221 12,820 13,003 12,995 13,060 13,089 13,104 13,112 13,121 45 Other loans and leases, net6 158,654 156,095 154,201 156,059 154,873 154,904 157,499 158,097 157,272 46 All other assets7 58,804 61,787 59,831 63,838 58,760 61,310 59,482 62,098 61,418
47 Total assets 306,783 307,954 300,920 307,294 302,137 315,708 305,164 315,214 308,775
Deposits 48 Demand deposits 59,274 62,132 53,603 57,492 52,045 63,180 48,330 57,580 53,276 49 Individuals, partnerships, and corporations 41,640 45,280 38,046 39,950 36,748 40,239 33,392 39,016 37,637 50 States and political subdivisions 593 909 650 641 822 985 628 656 597 51 U.S. government 458 287 630 436 454 190 705 722 176 52 Depository institutions in the United States 5,848 6,303 5,340 6,578 5,069 10,393 4,329 7,562 4,646 53 Banks in foreign countries 5,481 6,018 4,976 5,784 4,691 5,637 4,955 5,043 6,270 54 Foreign governments and official institutions 831 582 788 672 647 606 601 736 930 55 Certified and officers' checks 4,423 2,755 3,172 3,430 3,615 5,129 3,719 3,845 3,020 56 Transaction balances other than demand deposits
3,719 3,845
(ATS, NOW, Super NOW, telephone transfers) 9,110 9,540 9,161 9,004 8,605 8,850 8,886 8,746 8,684 57 Nontransaction balances 110,517 113,046 112,688 113,638 112,383 112,967 113,880 112,919 112,697 58 Individuals, partnerships, and corporations 100,417 103,166 102,687 103,534 101,840 102,433 103,228 102,016 101,836 59 States and political subdivisions 8,014 7,796 7,917 8,034 8,201 8,221 8,336 8,512 8,469 60 U.S. government 33 32 23 24 32 35 30 32 29 61 Depository institutions in the United States 1,797 1,793 1,802 1,786 2,047 2,028 2,024 2,102 2,104 62 Foreign governments, official institutions, and banks 257 258 260 259 262 250 262 257 259 63 Liabilities for borrowed money 65,301 65,526 66,669 69,269 70,186 72,856 74,078 75,464 72,604 64 Borrowings from Federal Reserve Banks 0 0 0 0 875 0 2,525 0 0 65 Treasury tax-and-loan notes 5,392 625 2,509 5,410 6,404 5,690 3,936 4,218 4,290 66 All other liabilities for borrowed money 59,909 64,901 64,160 63,859 62,907 67,165 67,617 71,246 68,314 67 Other liabilities and subordinated notes and debentures 35,359 30,174 30,698 29,900 30,968 30,032 31,984 32,384 33,391
68 Total liabilities 279,562 280,418 272,820 279,303 274,187 287,885 277,158 287,092 280,653
69 Residual (total assets minus total liabilities)9 27,221 27,536 28,100 27,991 27,951 27,823 28,006 28,122 28,122
MEMO 70 Total loans and leases (gross) and investments adjusted '10 208,913 205,793 204,656 206,732 206,032 211,308 212,165 212,804 212,457 71 Total loans and leases (gross) adjusted 175,756 172,160 171,300 172,846 172,354 177,718 178,780 179,524 179,195 72 Time deposits in amounts of $100,000 or more 41,246 41,924 42,316 42,982 42,260 41,855 41,759 41,905 41,942 73 U.S. Treasury securities maturing in one year or less 2,984 2,751 2,836 3,288 3,277 3,180 2,905 4,199 3,870
1. These data also appear in the Board's H.4.2 (504) release. For address, see inside front cover.
2. Excludes trading account securities. 3. Not available due to confidentiality. 4. Includes U.S. government-issued or guaranteed certificates of participation
in pools of residential mortgages. 5. Includes securities purchased under agreements to resell.
6. Includes allocated transfer risk reserve. 7. Includes trading account securities. 8. Includes federal funds purchased and securities sold under agreements to
repurchase. 9. Not a measure of equity capital for use in capital adequacy analysis or for
other analytic uses. 10. Exclusive of loans and federal funds transactions with domestic commer-
cial banks.
Digitized for FRASER http://fraser.stlouisfed.org/ Federal Reserve Bank of St. Louis
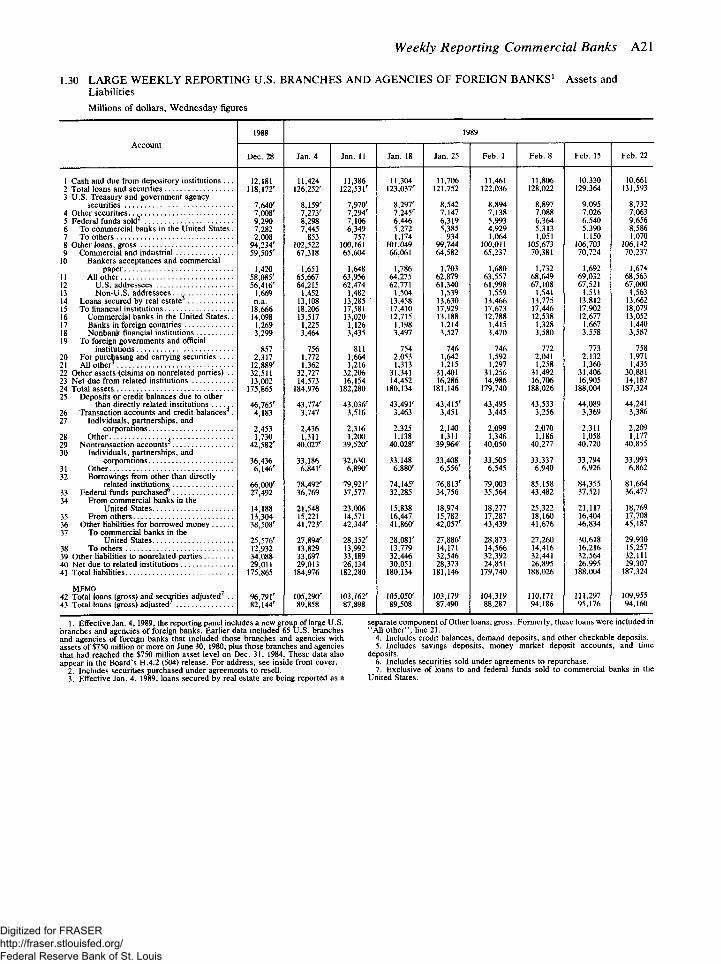
Weekly Reporting Commercial Banks A21
1.30 LARGE WEEKLY REPORTING U.S. BRANCHES A N D AGENCIES OF FOREIGN B A N K S 1 Assets and Liabilities Millions of dollars, Wednesday figures
Account 1988 1989
Account Dec. 28 Jan. 4 Jan. 11 Jan. 18 Jan. 25 Feb. 1 Feb. 8 Feb. 15 Feb. 22
1 Cash and due from depository institutions . . . 12,181 11,424 11,386 11,304 11,706 11,461 11,806 10,330 10,661 2 Total loans and securities 118,172' 126,252' 122,531' 123,037' 121,752 122,036 128,022 129,364 131,593 3 U.S. Treasury and government agency
118,172'
8,732 securities 7,640' 8,159' 7,970' 8,297' 8,542 8,894 8,897 9,095 8,732 4 Other securities. 7,008' 7,273' 7,294' 7,245' 7,147 7,138 7,088 7,026 7,063 5 Federal funds sold 9,290 8,298 7,106 6,446 6,319 5,993 6,364 6,540 9,656 6 To commercial banks in the United States. 7,282 7,445 6,349 5,272 5,385 4,929 5,313 5,390 8,586 7 To others 2,008 853 757 1,174 934 1,064 1,051 1,150 1,070 8 Other loans, gross 94,234' 102,522 100,161 101,049 99,744 100,011 105,673 106,703 106,142 9 Commercial and industrial 59,505' 67,318 65,604 66,061 64,582 65,237 70,381 70,724 70,237
10 Bankers acceptances and commercial 59,505' 67,318 65,604
paper 1,420 1,651 1,648 1,786 1,703 1,680 1,732 1,692 1,674 11 All other 58,085' 65,667 63,956 64,275 62,879 63,557 68,649 69,032 68,563 12 U.S. addressees 56,416' 64,215 62,474 62,771 61,340 61,998 67,108 67,521 67,000 13 Non-U.S. addressees. 1,669 1,452 1,482 1,504 1,539 1,559 1,541 1,511 1,563 14 Loans secured by real estate n.a. 13,108 13,285 ' 13,458 13,630 13,466 13,775 13,812 13,662 15 To financial institutions 18,666 18,206 17,581 17,410 17,929 17,673 17,446 17,902 18,079 16 Commercial banks in the United States.. 14,098 13,517 13,020 12,715 13,188 12,788 12,538 12,677 13,052 17 Banks in foreign countries 1,269 1,225 1,126 1,198 1,214 1,415 1,328 1,667 1,440 18 Nonbank financial institutions 3,299 3,464 3,435 3,497 3,527 3,470 3,580 3,558 3,587 19 To foreign governments and official
3,299 3,464
758 institutions 857 756 811 754 746 746 772 773 758 20 For purchasing and carrying securities 2,317 1,772 1,664 2,053 1,642 1,592 2,041 2,132 1,971 21 All other3 12,889' 1,362 1,216 1,313 1,215 1,297 1,258 1,360 1,435 22 Other assets (claims on nonrelated parties) . . 32,511 32,727 32,206 31,341 31,401 31,256 31,492 31,406 30,881 23 Net due from related institutions 13,002 14,573 16,154 14,452 16,286 14,986 16,706 16,905 14,187 24 Total assets 175,865 184,976 182,280 180,134 181,146 179,740 188,026 188,004 187,324 25 Deposits or credit balances due to other
175,865 184,976
than directly related institutions 46,765' 43,774' 43,036' 43,491' 43,415' 43,495 43,533 44,089 44,241 26 Transaction accounts and credit balances . 4,183 3,747 3,516 3,463 3,451 3,445 3,256 3,369 3,386 27 Individuals, partnerships, and
4,183 3,747
corporations 2,453 2,436 2,316 2,325 2,140 2,099 2,070 2,311 2,209 28 Other 1,730 1,311 1,200 1,138 1,311 1,346 1,186 1,058 1,177 29 Nontransaction accounts 42,582' 40,027' 39,520' 40,028' 39,964' 40,050 40,277 40,720 40,855 30 Individuals, partnerships, and
42,582' 40,027'
33,993 corporations 36,436 33,186 32,630 33,148 33,408 33,505 33,337 33,794 33,993 31 Other 6,146' 6,841' 6,880' 6,556' 6,545 6,940 6,926 6,862 32 Borrowings from other than directly
6,146' 6,841'
81,664 related institutions 66,000' 78,492' 79,921' 74,145' 76,813' 79,003 85,158 84,355 81,664 33 Federal funds purchased 27,492 36,769 37,577 32,285 34,756 35,564 43,482 37,521 36,477 34 From commercial banks in the
27,492
United States 14,188 21,548 23,006 15,838 18,974 18,277 25,322 21,117 18,769 35 From others 13,304 15,221 14,571 16,447 15,782 17,287 18,160 16,404 17,708 36 Other liabilities for borrowed money 38,508' 41,723' 42,344' 41,86c 42,057' 43,439 41,676 46,834 45,187 37 To commercial banks in the
38,508' 41,723'
United States 25,576' 27,894' 28,352' 28,081' 27,886' 28,873 27,260 30,618 29,930 38 To others 12,932 13,829 13,992 13,779 14,171 14,566 14,416 16,216 15,257 39 Other liabilities to nonrelated parties 34,088 33,697 33,189 32,446 32,546 32,392 32,441 32,564 32,111 40 Net due to related institutions 29,011 29,013 26,134 30,051 28,373 24,851 26,895 26,995 29,307 41 Total liabilities 175,865 184,976 182,280 180,134 181,146 179,740 188,026 188,004 187,324
MEMO 109,955 42 Total loans (gross) and securities adjusted . . 96,791' 105,290' 103,162' 105,050' 103,179 104,319 110,171 111,297 109,955
43 Total loans (gross) adjusted 82,144' 89,858 87,898 89,508 87,490 88,287 94,186 95,176 94,160
1. Effective Jan. 4, 1989, the reporting panel includes a new group of large U.S. branches and agencies of foreign banks. Earlier data included 65 U.S. branches and agencies of foreign banks that included those branches and agencies with assets of $750 million or more on June 30, 1980, plus those branches and agencies that had reached the $750 million asset level on Dec. 31, 1984. These data also appear in the Board's H.4.2 (504) release. For address, see inside front cover.
2. Includes securities purchased under agreements to resell. 3. Effective Jan. 4, 1989, loans secured by real estate are being reported as a
separate component of Other loans, gross. Formerly, these loans were included in "All other", line 21.
4. Includes credit balances, demand deposits, and other checkable deposits. 5. Includes savings deposits, money market deposit accounts, and time
deposits. 6. Includes securities sold under agreements to repurchase. 7. Exclusive of loans to and federal funds sold to commercial banks in the
United States.
Digitized for FRASER http://fraser.stlouisfed.org/ Federal Reserve Bank of St. Louis
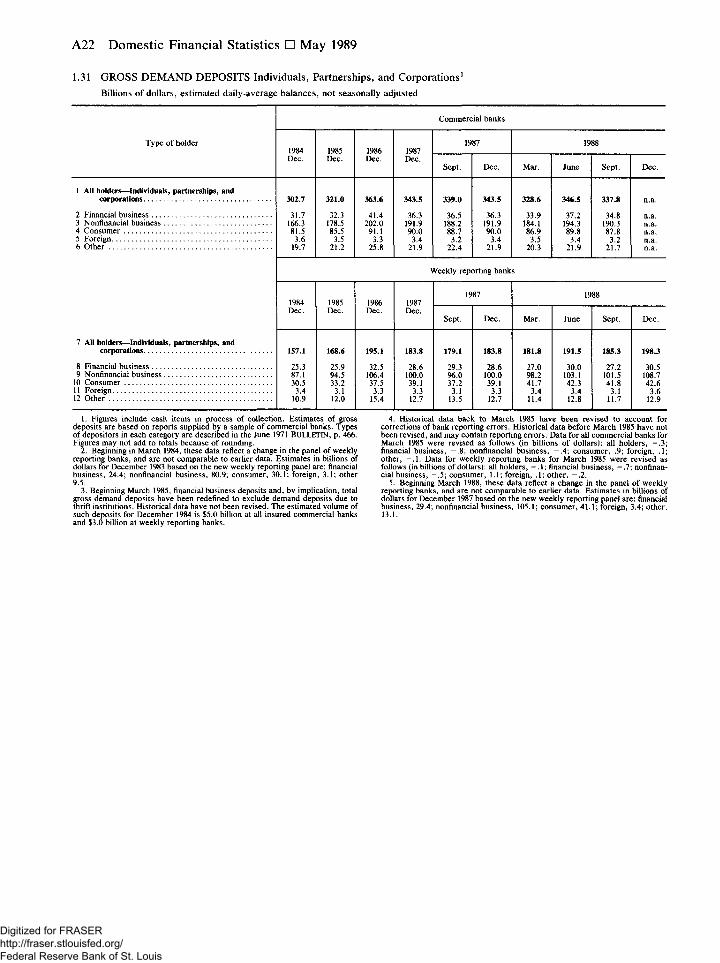
A22 Domestic Nonfinancial Statistics • May 1989
1.31 GROSS DEMAND DEPOSITS Individuals, Partnerships, and Corporations1
Billions of dollars, estimated daily-average balances, not seasonally adjusted
Commercial banks
Type of holder 1984 Dec.
1985 Dec.
1986 Dec.
1987 Dec.
1987 1988 Type of holder 1984 Dec.
1985 Dec.
1986 Dec.
1987 Dec.
Sept. Dec. Mar. June Sept. Dec.
1 All holders—Individuals, partnerships, and corporations 302.7 321.0 363.6 343.5 339.0 343.5 328.6 346.5 337.8 n.a.
2 Financial business 31.7 32.3 41.4 36.3 36.5 36.3 33.9 37.2 34.8 n.a. 3 Nonfinancial business 166.3 178.5 202.0 191.9 188.2 191.9 184.1 194.3 190.3 n.a. 4 Consumer 81.5 85.5 91.1 90.0 88.7 90.0 86.9 89.8 87.8 n.a. 5 Foreign 3.6 3.5 3.3 3.4 3.2 3.4 3.5 3.4 3.2 n.a. 6 Other 19.7 21.2 25.8 21.9 22.4 21.9 20.3 21.9 21.7 n.a.
Weekly reporting banks
1984 Dec.
1985 Dec.
1986 Dec.
1987 Dec.
1987 1988 1984 Dec.
1985 Dec.
1986 Dec.
1987 Dec.
Sept. Dec. Mar. June Sept. Dec.
7 All holders—Individuals, partnerships, and corporations 157.1 168.6 195.1 183.8 179.1 183.8 181.8 191.5 185.3 198.3
8 Financial business 25.3 25.9 32.5 28.6 29.3 28.6 27.0 30.0 27.2 30.5 9 Nonfinancial business 87.1 94.5 106.4 100.0 96.0 100.0 98.2 103.1 101.5 108.7
10 Consumer 30.5 33.2 37.5 39.1 37.2 39.1 41.7 42.3 41.8 42.6 11 Foreign 3.4 3.1 3.3 3.3 3.1 3.3 3.4 3.4 3.1 3.6 12 Other 10.9 12.0 15.4 12.7 13.5 12.7 11.4 12.8 11.7 12.9
1. Figures include cash items in process of collection. Estimates of gross deposits are based on reports supplied by a sample of commercial banks. Types of depositors in each category are described in the June 1971 BULLETIN, p. 466. Figures may not add to totals because of rounding.
2. Beginning in March 1984, these data reflect a change in the panel of weekly reporting banks, and are not comparable to earlier data. Estimates in billions of dollars for December 1983 based on the new weekly reporting panel are: financial business, 24.4; nonfinancial business, 80.9; consumer, 30.1; foreign, 3.1; other 9.5.
3. Beginning March 1985, financial business deposits and, by implication, total gross demand deposits have been redefined to exclude demand deposits due to thrift institutions. Historical data have not been revised. The estimated volume of such deposits for December 1984 is $5.0 billion at all insured commercial banks and $3.0 billion at weekly reporting banks.
4. Historical data back to March 1985 have been revised to account for corrections of bank reporting errors. Historical data before March 1985 have not been revised, and may contain reporting errors. Data for all commercial banks for March 1985 were revised as follows (in billions of dollars): all holders, - . 3 ; financial business, - . 8 ; nonfinancial business, - . 4 ; consumer, .9; foreign, .1; other, - . 1 . Data for weekly reporting banks for March 1985 were revised as follows (in billions of dollars): all holders, - . 1 ; financial business, - . 7 ; nonfinan-cial business, - . 5 ; consumer, 1.1; foreign, .1; other, - . 2 .
5. Beginning March 1988, these data reflect a change in the panel of weekly reporting banks, and are not comparable to earlier data. Estimates in billions of dollars for December 1987 based on the new weekly reporting panel are: financial business, 29.4; nonfinancial business, 105.1; consumer, 41.1; foreign, 3.4; other, 13.1.
Digitized for FRASER http://fraser.stlouisfed.org/ Federal Reserve Bank of St. Louis
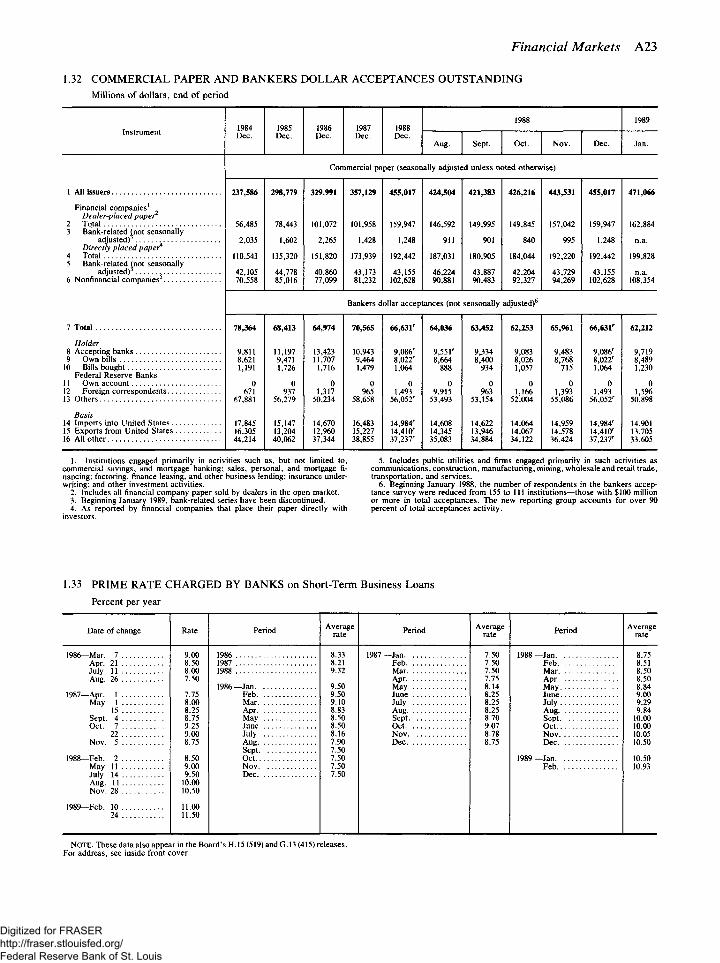
Financial Markets A23
1.32 COMMERCIAL PAPER AND BANKERS DOLLAR ACCEPTANCES OUTSTANDING Millions of dollars, end of period
1988 1989 Instrument 1984 1985 1986 1987 1988 Instrument Dec. Dec. Dec. Dec. Dec.
Aug. Sept. Oct. Nov. Dec. Jan.
Commercial paper (seasonally adjusted unless noted otherwise)
1 All issuers 237,586 298,779 329,991 357,129 455,017 424,504 421,383 426,216 443,531 455,017 471,066
Financial companies1
Dealer-placed paper 2 Total 56,485 78,443 101,072 101,958 159,947 146,592 149,995 149,845 157,042 159,947 162,884 3 Bank-related (not seasonally
56,485 78,443 101,072 101,958 159,947 146,592 149,995 149,845 157,042 159,947 162,884
adjusted) 2,035 1,602 2,265 1,428 1,248 911 901 840 995 1,248 n.a. Directly placed paper*
2,035 1,602 2,265 1,428 1,248 1,248
4 Total 110,543 135,320 151,820 173,939 192,442 187,031 180,905 184,044 192,220 192,442 199,828 5 Bank-related (not seasonally
110,543 135,320 151,820 173,939 192,442 187,031 180,905 184,044 192,220 192,442 199,828
adjusted) 42,105 44,778 40,860 43,173 43,155 46,224 43,887 42,204 43,729 43,155 n.a. 6 Nonfinancial companies 70,558 85,016 77,099 81,232 102,628 90,881 90,483 92,327 94,269 102,628 108,354
Bankers dollar acceptances (not seasonally adjusted)6
7 Total 78,364 68,413 64,974 70,565 66,63lr 64,036 63,452 62,253 65,961 66,63lr 62,212
Holder 8 Accepting banks 9,811 11,197 13,423 10,943 9,086r 9,551r 9,334 9,083 9,483 9,086r 9,719 9 Own bills 8,621 9,471 11,707 9,464 8,022r 8,664
888 8,400 8,026 8,768 8,022r 8,489
10 Bills bought 1,191 1,726 1,716 1,479 1,064 8,664
888 934 1,057 715 1,064 1,230 Federal Reserve Banks
1,191 1,726 1,479 1,064 1,057 1,064 1,230
11 Own account 0 0 0 0 0 0 0 0 0 0 0 12 Foreign correspondents 671 937 1,317 965 1,493 9,915 963 1,166 1,393 1,493 1,596 13 Others 67,881 56,279 50,234 58,658 56,052' 53,493 53,154 52,004 55,086 56,052'' 50,898
Basis 14 Imports into United States 17,845 15,147 14,670 16,483 14,984' 14,608 14,622 14,064 14,959 14,984' 14,901 15 Exports from United States 16,305 13,204 12,960 15,227 14,410r 14,345 13,946 14,067 14,578 14,4K/ 13,705 16 All other 44,214 40,062 37,344 38,855 37,237' 35,083 34,884 34,122 36,424 37,237' 33,605
1. Institutions engaged primarily in activities such as, but not limited to, commercial savings, and mortgage banking; sales, personal, and mortgage fi-nancing; factoring, finance leasing, and other business lending; insurance under-writing; and other investment activities.
2. Includes all financial company paper sold by dealers in the open market. 3. Beginning January 1989, bank-related series have been discontinued. 4. As reported by financial companies that place their paper directly with
investors.
5. Includes public utilities and firms engaged primarily in such activities as communications, construction, manufacturing, mining, wholesale and retail trade, transportation, and services.
6. Beginning January 1988, the number of respondents in the bankers accep-tance survey were reduced from 155 to 111 institutions—those with $100 million or more in total acceptances. The new reporting group accounts for over 90 percent of total acceptances activity.
1.33 PRIME RATE CHARGED BY BANKS on Short-Term Business Loans Percent per year
1986—Mar. 7 9.00 Apr. 21 8.50 July 11 8.00 Aug. 26 7.50
1987—Apr. 1 7.75 May 1 8.00
15 8.25 Sept. 4 8.75 Oct. 7 9.25
22 9.00 Nov. 5 8.75
1988—Feb. 2 8.50 May 11 9.00 July 14 9.50 Aug. 11 10.00 Nov. 28 10.50
1989—Feb. 10 11.00 24 11.50
Rate Average rate Period Average
rate Period
1986 1987 1988
1986 —Jan. Feb. Mar. Apr. May June July Aug. Sept. Oct. Nov. Dec.
8.33 8.21 9.32
9.50 9.50 9.10 8.83 8.50 8.50 8.16 7.90 7.50 7.50 7.50 7.50
1987 —Jan. Feb. Mar. Apr. May June July Aug. Sept. Oct. Nov. Dec.
7.50 7.50 7.50 7.75 8.14 8.25 8.25 8.25 8.70 9.07 8.78 8.75
1988 —Jan. Feb. Mar. Apr. May. June. July . Aug. Sept. Oct. . Nov. Dec.
1989 —Jan. Feb.
NOTE. These data also appear in the Board's H. 15 (519) and G. 13 (415) releases. For address, see inside front cover.
Digitized for FRASER http://fraser.stlouisfed.org/ Federal Reserve Bank of St. Louis
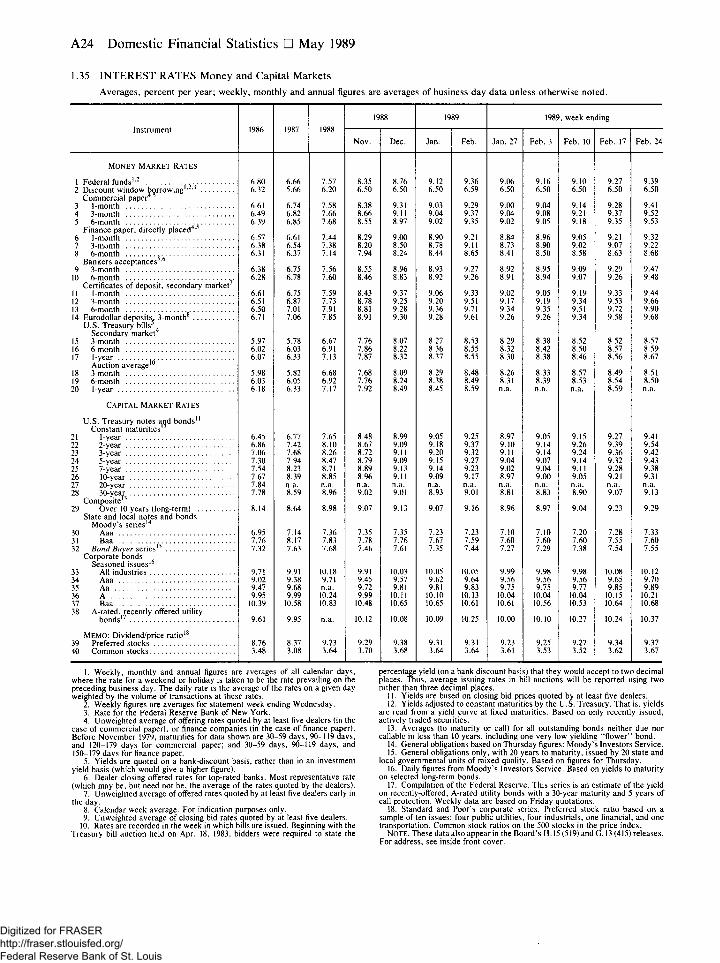
A24 Domestic Nonfinancial Statistics • May 1989
1.35 INTEREST RATES Money and Capital Markets
Averages, percent per year; weekly, monthly and annual figures are averages of business day data unless otherwise noted.
Instrument 1986 1987 1988 1988 1989 1989, week ending
Instrument 1986 1987 1988 Nov. Dec. Jan. Feb. Jan. 27 Feb. 3 Feb. 10 Feb. 17 Feb. 24
MONEY MARKET RATES
1 Federal funds' " ^ 6.80 6.66 7.57 8.35 8.76 9.12 9.36 9.06 9.16 9.10 9.27 9.39 2 Discount window borrowing' "
Commercial paper ' 6.32 5.66 6.20 6.50 6.50 6.50 6.59 6.50 6.50 6.50 6.50 6.50
3 1-month 6.61 6.74 7.58 8.38 9.31 9.03 9.29 9.00 9.04 9.14 9.28 9.41 4 3-month 6.49 6.82 7.66 8.66 9.11 9.04 9.37 9.04 9.08 9.21 9.37 9.52 5 6-month 6.39 6.85 7.68 8.55 8.97 9.02 9.35 9.02 9.05 9.18 9.35 9.53
Finance paper, directly placed 6 1-month 6.57 6.61 7.44 8.29 9.00 8.90 9.21 8.84 8.96 9.05 9.21 9.32 7 3-month 6.38 6.54 7.38 8.20 8.50 8.78 9.11 8.73 8.90 9.02 9.07 9.22 8 6-month , 6.31 6.37 7.14 7.94 8.24 8.44 8.65 8.41 8.50 8.58 8.63 8.68
Bankers acceptances 9 3-month 6.38 6.75 7.56 8.55 8.96 8.93 9.27 8.92 8.95 9.09 9.29 9.47
10 6-month 6.28 6.78 7.60 8.46 8.83 8.92 9.26 8.91 8.94 9.07 9.26 9.48 Certificates of deposit, secondary market
11 1-month 6.61 6.75 7.59 8.43 9.37 9.06 9.33 9.02 9.05 9.19 9.33 9.44 12 3-month 6.51 6.87 7.73 8.78 9.25 9.20 9.51 9.17 9.19 9.34 9.53 9.66 13 6-month 6.50 7.01 7.91 8.81 9.28 9.36 9.71 9.34 9.35 9.51 9.72 9.90 14 Eurodollar deposits. 3-month 6.71 7.06 7.85 8.91 9.30 9.28 9.61 9.26 9.26 9.34 9.58 9.68
U.S. Treasury bills Secondary market9
15 3-month 5.97 5.78 6.67 7.76 8.07 8.27 8.53 8.29 8.38 8.52 8.52 8.57 16 6-month 6.02 6.03 6.91 7.86 8.22 8.36 8.55 8.32 8.42 8.50 8.57 8.59 17 1-year 6.07 6.33 7.13 7.87 8.32 8.37 8.55 8.30 8.38 8.46 8.56 8.67
Auction average10
IS 3-month 5.98 5.82 6.68 7.68 8.09 8.29 8.48 8.26 8.33 8.57 8.49 8.51 19 6-month 6.03 6.05 6.92 7.76 8.24 8.38 8.49 8.31 8.39 8.53 8.54 8.50 20 1-year 6.18 6.33 7.17 7.92 8.49 8.45 8.59 n.a. n.a. n.a. 8.59 n.a.
CAPITAL MARKET RATES
U.S. Treasury notes aqd bonds" Constant maturities'"
21 1-year 6.45 6.77 7.65 8.48 8.99 9.05 9.25 8.97 9.05 9.15 9.27 9.41 22 2-year 6.86 7.42 8.10 8.67 9.09 9.18 9.37 9.10 9.14 9.26 9.39 9.54 23 3-year 7.06 7.68 8.26 8.72 9.11 9.20 9.32 9.11 9.14 9.24 9.36 9.42 24 5-year 7.30 7.94 8.47 8.79 9.09 9.15 9.27 9.04 9.07 9.14 9.32 9.43 25 7-year 7.54 8.23 8.71 8.89 9.13 9.14 9.23 9.02 9.04 9.11 9.28 9.38 26 10-year 7.67 8.39 8.85 8.96 9.11 9.09 9.17 8.97 9.00 9.05 9.21 9.31 27 20-year 7.84 n.a. n.a. n.a. n.a. n.a. n.a. n.a. n.a. n.a. n.a. n.a. 28 30-year 7.78 8.59 8.96 9.02 9.01 8.93 9.01 8.81 8.83 8.90 9.07 9.13
Composite13
29 Over 10 years (long-term) 8.14 8.64 8.98 9.07 9.13 9.07 9.16 8.96 8.97 9.04 9.23 9.29 State and local notes and bonds
Moody's series'4
30 Aaa 6.95 7.14 7.36 7.35 7.35 7.23 7.23 7.10 7.10 7.20 7.28 7.33 31 Baa 7.76 8.17 7.83 7.78 7.76 7.67 7.59 7.60 7.60 7.60 7.55 7.60 32 Bond Buyer series'5 7.32 7.63 7.68 7.46 7.61 7.35 7.44 7.27 7.29 7.38 7.54 7.55
Corporate bonds Seasoned issues'6
33 All industries 9.71 9.91 10.18 9.91 10.03 10.05 10.05 9.99 9.98 9.98 10.08 10.12 34 Aaa 9.02 9.38 9.71 9.45 9.57 9.62 9.64 9.56 9.56 9.56 9.65 9.70 35 Aa 9.47 9.68 n.a. 9.72 9.81 9.81 9.83 9.75 9.75 9.77 9.85 9.89 36 A 9.95 9.99 10.24 9.99 10.11 10.10 10.13 10.04 10.04 10.04 10.15 10.21 37 Baa 10.39 10.58 10.83 10.48 10.65 10.65 10.61 10.61 10.56 10.53 10.64 10.68 38 A-rated, recently offered utility
bonds'7 9.61 9.95 n.a. 10.12 10.08 10.09 10.25 10.00 10.10 10.27 10.24 10.37
MEMO: Dividend/price ratio'8
39 Preferred stocks 8.76 8.37 9.23 9.29 9.38 9.31 9.31 9.23 9.25 9.27 9.34 9.37 40 Common stocks 3.48 3.08 3.64 3.70 3.68 3.64 3.64 3.61 3.53 3.52 3.62 3.67
1. Weekly, monthly and annual figures are averages of all calendar days, where the rate for a weekend or holiday is taken to be the rate prevailing on the preceding business day. The daily rate is the average of the rates on a given day weighted by the volume of transactions at these rates.
2. Weekly figures are averages for statement week ending Wednesday. 3. Rate for the Federal Reserve Bank of New York. 4. Unweighted average of offering rates quoted by at least five dealers (in the
case of commercial paper), or finance companies (in the case of finance paper). Before November 1979, maturities for data shown are 30-59 days, 90-119 days, and 120-179 days for commercial paper; and 30-59 days, 90-119 days, and 150-179 days for finance paper.
5. Yields are quoted on a bank-discount basis, rather than in an investment yield basis (which would give a higher figure).
6. Dealer closing offered rates for top-rated banks. Most representative rate (which may be, but need not be, the average of the rates quoted by the dealers).
7. Unweighted average of offered rates quoted by at least five dealers early in the day.
8. Calendar week average. For indication purposes only. 9. Unweighted average of closing bid rates quoted by at least five dealers.
10. Rates are recorded in the week in which bills are issued. Beginning with the Treasury bill auction held on Apr. 18, 1983, bidders were required to state the
percentage yield (on a bank discount basis) that they would accept to two decimal places. Thus, average issuing rates in bill auctions will be reported using two rather than three decimal places.
11. Yields are based on closing bid prices quoted by at least five dealers. 12. Yields adjusted to constant maturities by the U.S. Treasury. That is, yields
are read from a yield curve at fixed maturities. Based on only recently issued, actively traded securities.
13. Averages (to maturity or call) for all outstanding bonds neither due nor callable in less than 10 years, including one very low yielding "flower" bond.
14. General obligations based on Thursday figures; Moody's Investors Service. 15. General obligations only, with 20 years to maturity, issued by 20 state and
local governmental units of mixed quality. Based on figures for Thursday. 16. Daily figures from Moody's Investors Service. Based on yields to maturity
on selected long-term bonds. 17. Compilation of the Federal Reserve. This series is an estimate of the yield
on recently-offered, A-rated utility bonds with a 30-year maturity and 5 years of call protection. Weekly data are based on Friday quotations.
18. Standard and Poor's corporate series. Preferred stock ratio based on a sample of ten issues: four public utilities, four industrials, one financial, and one transportation. Common stock ratios on the 500 stocks in the price index.
NOTE. These data also appear in the Board's H. 15 (519) and G. 13 (415) releases. For address, see inside front cover.
Digitized for FRASER http://fraser.stlouisfed.org/ Federal Reserve Bank of St. Louis
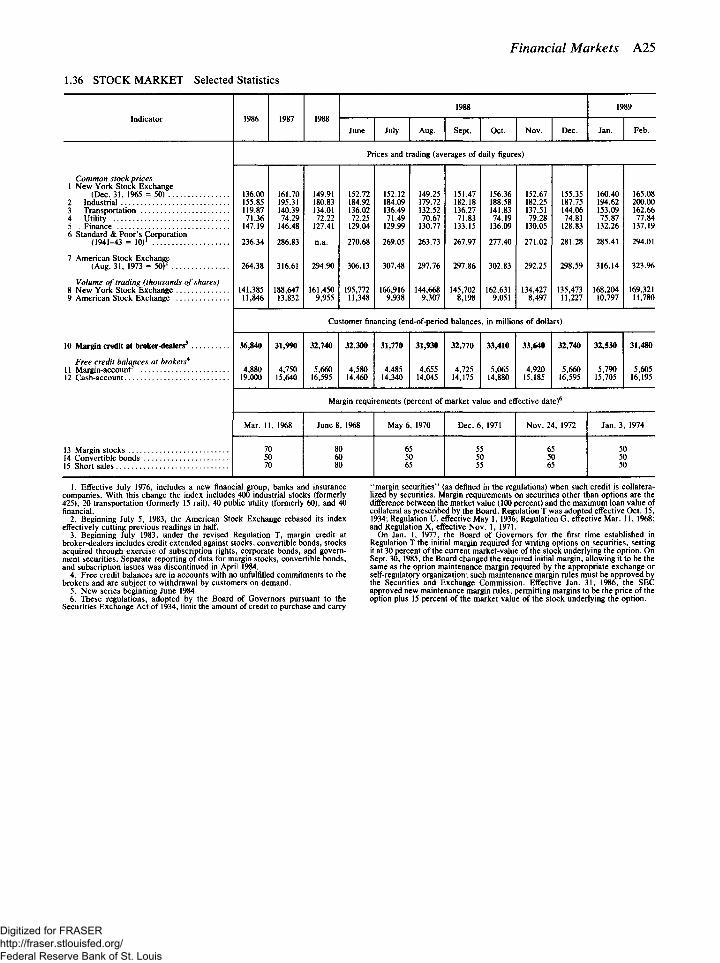
Financial Markets A25
1.36 STOCK MARKET Selected Statistics
Indicator 1986 1987 1988 1988 1989
Indicator 1986 1987 1988 June July Aug. Sept. Oct. Nov. Dec. Jan. Feb.
Prices and trading (averages of daily figures)
Common stock prices 1 New York Stock Exchange
(Dec. 31, 1965 = 50) 136.00 161.70 149.91 152.72 152.12 149.25 151.47 156.36 152.67 155.35 160.40 165.08 2 Industrial 155.85 195.31 180.83 184.92 184.09 179.72 182.18 188.58 182.25 187.75 194.62 200.00 3 Transportation 119.87 140.39 134.01 136.02 136.49 132.52 136.27 141.83 137.51 144.06 153.09 162.66 4 Utility 71.36 74.29 72.22 72.25 71.49 70.67 71.83 74.19 79.28 74.81 75.87 77.84 5 Finance 147.19 146.48 127.41 129.04 129.99 130.77 133.15 136.09 130.05 128.83 132.26 137.19 6 Standard & Poor's Corporation
(1941-43 = 10)1 236.34 286.83 n.a. 270.68 269.05 263.73 267.97 277.40 271.02 281.28 285.41 294.01
7 American Stock Exchange (Aug. 31, 1973 = 50F 264.38 316.61 294.90 306.13 307.48 297.76 297.86 302.83 292.25 298.59 316.14 323.96
Volume of trading (thousands of shares) 8 New York Stock Exchange 141,385 188,647 161,450 195,772 166,916 144,668 145,702 162,631 134,427 135,473 168,204 169,321 9 American Stock Exchange 11,846 13,832 9,955 11,348 9,938 9,307 8,198 9,051 8,497 11,227 10,797 11,780
Customer financing (end-of-period balances, in millions of dollars)
10 Margin credit at broker-dealers3
Free credit balances at brokers4
11 Margin-account 12 Cash-account
36,840 31,990 32,740 32,300 31,770 31,930 32,770 33,410 33,640 32,740 32,530 31,480
4,880 4,750 5,660 4,580 4,485 4,655 4,725 5,065 4,920 5,660 5,790 5,605 19,000 15,640 16,595 14,460 14,340 14,045 14,175 14,880 15,185 16,595 15,705 16,195
Margin requirements (percent of market vallie and effective date)6
Mar. 11, 1968 June 8, 1968 May 6, 1970 Dec. 6, 1971 Nov. 24, 1972 Jan. 3, 1974
13 Margin stocks 70 80 65 55 65 50 14 Convertible bonds 50 60 50 50 50 50 15 Short sales 70 80 65 55 65 50
1. Effective July 1976, includes a new financial group, banks and insurance companies. With this change the index includes 400 industrial stocks (formerly 425), 20 transportation (formerly 15 rail), 40 public utility (formerly 60), and 40 financial.
2. Beginning July 5, 1983, the American Stock Exchange rebased its index effectively cutting previous readings in half.
3. Beginning July 1983, under the revised Regulation T, margin credit at broker-dealers includes credit extended against stocks, convertible bonds, stocks acquired through exercise of subscription rights, corporate bonds, and govern-ment securities. Separate reporting of data for margin stocks, convertible bonds, and subscription issues was discontinued in April 1984.
4. Free credit balances are in accounts with no unfulfilled commitments to the brokers and are subject to withdrawal by customers on demand.
5. New series beginning June 1984. 6. These regulations, adopted by the Board of Governors pursuant to the
Securities Exchange Act of 1934, limit the amount of credit to purchase and carry
"margin securities" (as defined in the regulations) when such credit is collatera-lized by securities. Margin requirements on securities other than options are the difference between the market value (100 percent) and the maximum loan value of collateral as prescribed by the Board. Regulation T was adopted effective Oct. 15, 1934; Regulation U, effective May 1, 1936; Regulation G, effective Mar. 11, 1968; and Regulation X, effective Nov. 1, 1971.
On Jan. 1, 1977, the Board of Governors for the first time established in Regulation T the initial margin required for writing options on securities, setting it at 30 percent of the current market-value of the stock underlying the option. On Sept. 30, 1985, the Board changed the required initial margin, allowing it to be the same as the option maintenance margin required by the appropriate exchange or self-regulatory organization; such maintenance margin rules must be approved by the Securities and Exchange Commission. Effective Jan. 31, 1986, the SEC approved new maintenance margin rules, permitting margins to be the price of the option plus 15 percent of the market value of the stock underlying the option.
Digitized for FRASER http://fraser.stlouisfed.org/ Federal Reserve Bank of St. Louis
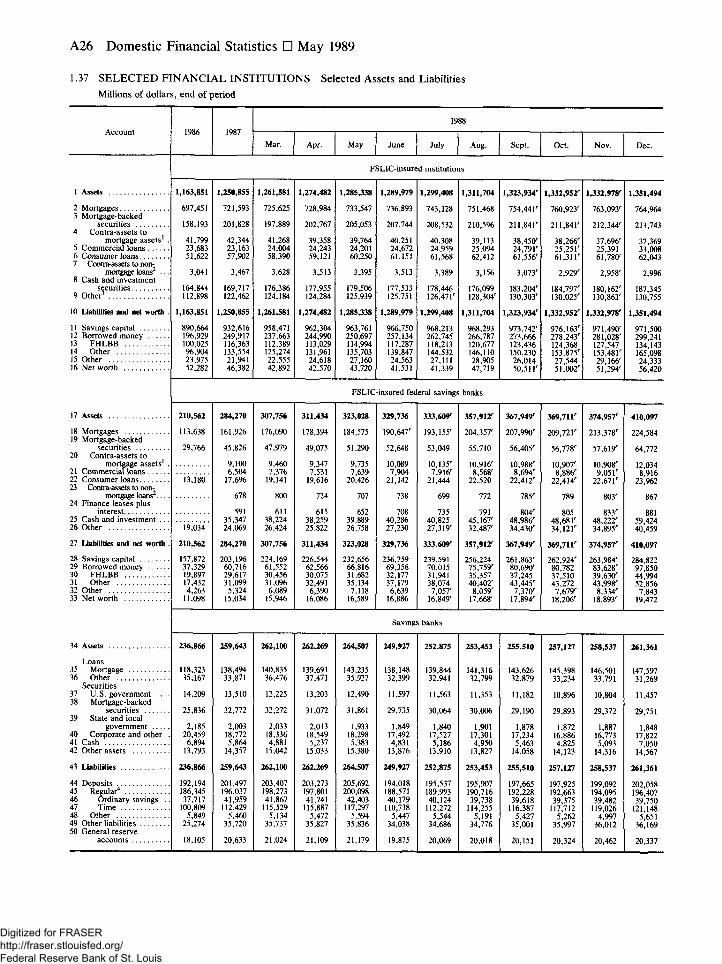
A26 Domestic Nonfinancial Statistics • May 1989
1.37 SELECTED FINANCIAL INSTITUTIONS Selected Assets and Liabilities Millions of dollars, end of period
Account 1986 1987 1988
Account 1986 1987 Mar. Apr. May June July Aug. Sept. Oct. Nov. Dec.
FSLIC-insured institutions
1 Assets 1,163,851 1,250,855 1,261,581 1,274,482 1,285,338 1,289,979 1,299,408 1,311,704 l,323,934r 1,332,952' 1,332,978' 1,351,494
2 Mortgages 697,451 721,593 725,625 728,984 733,547 736,893 743,128 751,468 754,441' 760,923' 763,093' 764,964 3 Mortgage-backed
736,893 743,128 751,468 754,441' 760,923' 763,093' 764,964
securities 158,193 201,828 197,889 202,767 205,053 207,744 208,532 210,596 211,841' 211,841' 212,344' 213,743 4 Contra-assets to
208,532 210,596 211,841' 211,841' 212,344' 213,743
mortgage assets' . 41,799 42,344 41,268 39,358 39,764 40,251 40,308 39,113 38,450' 38,266' 37,696' 37,369 5 Commercial loans 23,683 23,163 24,004 24,243 24,201 24,672 24,959 25,094 24,791' 25,251' 25,391 33,008 6 Consumer loans 51,622 57,902 58,390 59,121 60,250 61,151 61,568 62,412 61,556' 61,311' 61,780' 62,043 7 Contra-assets to non-
59,121 60,250 61,151 61,568 62,412 61,556' 61,311' 61,780' 62,043
mortgage loans2 . . . . 3,041 3,467 3,628 3,513 3,395 3,513 3,389 3,156 3,073' 2,929' 2,958' 2,9% 8 Cash and investment
3,389 3,156 3,073' 2,929' 2,958' 2,9%
securities 164,844 169,717 176,386 177,955 179,506 177,533 178,446 176,099 183,204' 184,797' 180,162' 187,345 9 Other3 112,898 122,462 124,184 124,284 125,939 125,751 126,471' 128,304' 130,303' 130,025' 130,863' 130,755
10 Liabilities and net worth . 1,163,851 1,250,855 1,261,581 1,274,482 1,285,338 1,289,979 1,299,408 1,311,704 1,323,934' l,332,952r l,332,978r 1,351,494
11 Savings capital 890,664 932,616 958,471 962,304 963,761 966,750 968,213 968,293 973,742' 976,163' 971,490' 971,500 12 Borrowed money 196,929 249,917 237,663 244,990 250,697 257,134 262,745 266,787 273,666 278,243' 281,028' 299,241 13 FHLBB 100,025 116,363 112,389 113,029 114,994 117,287 118,213 120,677 123,436 124,368 127,547 134,143 14 Other 96,904 133,554 125,274 131,961 135,703 139,847 144,532 146,110 150,230 153,875' 153,481' 165,098 15 Other 23,975 21,941 22,555 24,618 27,160 24,563 27,111 28,905 26,014 27,544 29,166' 24,333 16 Net worth 52,282 46,382 42,892 42,570 43,720 41,531 41,339 47,719 50,511' 51,002' 51,294' 56,420
FSLIC-insured federal savings banks
17 Assets
18 Mortgages 19 Mortgage-backed
securities 20 Contra-assets to
mortgage assets' 21 Commercial loans 22 Consumer loans 23 Contra-assets to non-
mortgage loans2... 24 Finance leases plus
interest 25 Cash and investment . . 26 Other
27 Liabilities and net worth
28 Savings capital . . 29 Borrowed money 30 FHLBB 31 Other 32 Other 33 Net worth
210,562
113,638
29,766
13,180
19,034
210,562
157,872 37,329 19,897 17,432 4,263
11,098
284,270 307,756 311,434 323,028 329,736 333,609r 357,912' 367,949' 369,711' 374,957' 410,097
161,926 176,090 178,394 184,575 190,647' 193,155' 204,357' 207,990' 209,721' 213,378' 224,584
45,826 47,979 49,075 51,290 52,648 53,049 55,710 56,405' 56,778' 57,619' 64,772
9,100 6,504
17,696
9,460 7,376
19,141
9,347 7,531
19,616
9,735 7,639
20,426
10,089 7,904
21,142
10,135' 7,916'
21,444
10,916' 8,568'
22,520
10,988' 8,694'
22,412'
10,907' 8,886'
22,414'
10,908' 9,051'
22,671'
12,034 8,916
23, %2
678 800 724 707 738 699 772 785' 789 803' 867
591 35,347 24,069
611 38,224 26,424
615 38,259 25,822
652 39,889 26,758
708 40,286 27,230
735 40,825 27,319'
791 45,167' 32,487'
804' 48,986' 34,430'
805 48,681' 34,121'
833' 48,222' 34,895'
881 59,424 40,459
284,270 307,756 311,434 323,028 329,736 333,609r 357,912' 367,949' 369,711' 374,957' 410,097
203,1% 60,716 29,617 31,099
5,324 15,034
224,169 61,552 30,456 31,096 6,089
15,946
226,544 62,566 30,075 32,491 6,390
16,086
232,656 66,816 31,682 35,134 7,118
16,589
236,759 69,356 32,177 37,179 6,639
16,886
239,591 70,015 31,941 38,074 7,057'
16,849'
256,224 75,759' 35,357 40,402'
8,059' 17,668'
261,863' 80,690' 37,245 43,445'
7,370' 17,894'
262,924' 80,782 37,510 43,272
7,679' 18,206'
263,984' 83,628' 39.63C 43,998'
8,334' 18,893'
284,822 97,850 44,994 52,856
7,843 19,472
Savings banks
34 Assets 236,866 259,643 262,100 262,269 264,507 249,927 252,875 253,453 255,510 257,127 258,537 261,361
Loans 35 Mortgage 118,323 138,494 140,835 139,691 143,235 138,148 139,844 141,316 143,626 145,398 146,501 147,597 36 Other 35,167 33,871 36,476 37,471 35,927 32,399 32,941 32,799 32,879 33,234 33,791 31,269
Securities 32,399 32,941 32,799 32,879 33,234 33,791 31,269
37 U.S. government 14,209 13,510 12,225 13,203 12,490 11,597 11,563 11,353 11,182 10,8% 10,804 11,457 38 Mortgage-backed
11,353 10,8% 10,804 11,457
securities 25,836 32,772 32,272 31,072 31,861 29,735 30,064 30,006 29,190 29,893 29,372 29,751 39 State and local
30,064 30,006 29,190 29,893 29,372 29,751
government 2,185 2,003 2,033 2,013 1,933 1,849 1,840 1,901 1,878 1,872 1,887 1,848 40 Corporate and other . 20,459 18,772 18,336 18,549 18,298 17,492 17,527 17,301 17,234 16,886 16,773 17,822 41 Cash 6,894 5,864 4,881 5,237 5,383 4,831 5,186 4,950 5,463 4,825 5,093 7,050 42 Other assets 13,793 14,357 15,042 15,033 15,380 13,876 13,910 13,827 14,058 14,123 14,316 14,567
43 Liabilities 236,866 259,643 262,100 262,269 264,507 249,927 252,875 253,453 255,510 257,127 258,537 261,361
44 Deposits 192,194 201,497 203,407 203,273 205,692 194,018 195,537 195,907 197,665 197,925 199,092 202,058 45 Regular4 186,345 196,037 198,273 197,801 200,098 188,571 189,993 190,716 192,228 192,663 194,095 196,407 46 Ordinary savings . . 37,717 41,959 41,867 41,741 42,403 40,179 40,124 39,738 39,618 39,375 39,482 39,750 47 Time 100,809 112,429 115,529 115,887 117,297 110,738 112,272 114,255 116,387 117,712 119,026 121,148 48 Other 5,849 5,460 5,134 5,472 5,594 5,447 5,544 5,191 5,427 5,262 4,997 5,651 49 Other liabilities 25,274 35,720 35,737 35,827 35,836 34,038 34,686 34,776 35,001 35,997 36,012 36,169 50 General reserve
35,827 35,836 34,038 34,686 34,776 35,001 35,997 36,012 36,169
accounts 18,105 20,633 21,024 21,109 21,179 19,875 20,069 20,018 20,151 20,324 20,462 20,337
Digitized for FRASER http://fraser.stlouisfed.org/ Federal Reserve Bank of St. Louis
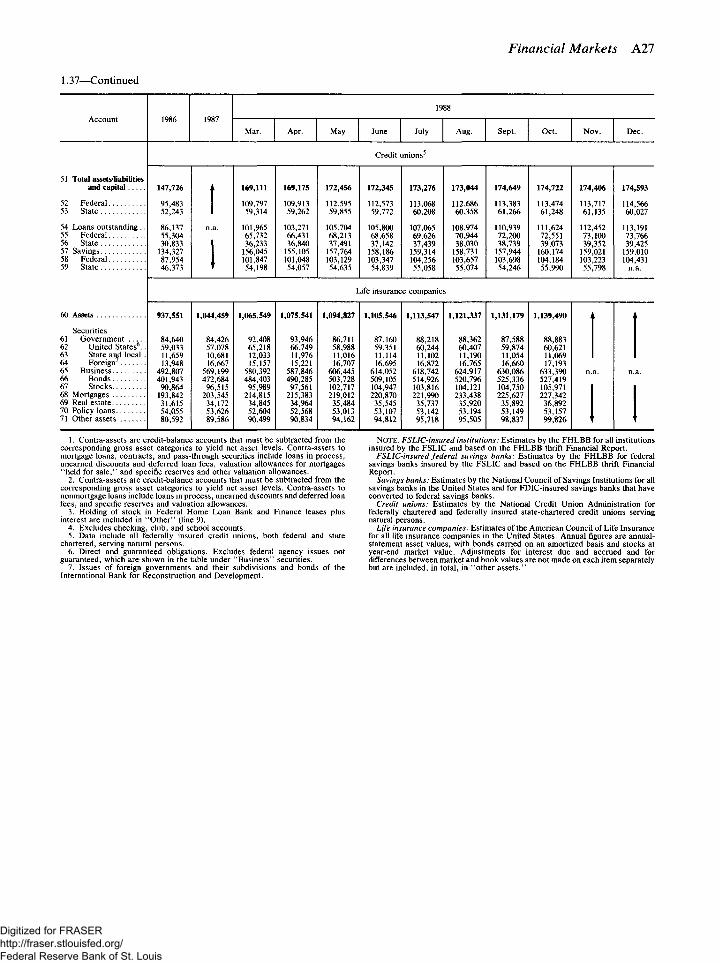
Financial Markets All
1.37—Continued
Account 1986 1987 1988
Account 1986 1987 Mar. Apr. May June July Aug. Sept. Oct. Nov. Dec.
Credit unions5
51 Total assets/liabilities and capital 147,726 f 169,111 169,175 172,456 172,345 173,276 173,044 174,649 174,722 174,406 174,593
52 Federal 95,483 109,797 109,913 112,595 112,573 113,068 112,686 113,383 113,474 113,717 114,566 a State 52,243 1 59,314 59,262 59,855 59,772 60,208 60,358 61,266 61,248 61,135 60,027
54 Loans outstanding.. 86,137 n.a. 101,965 103,271 105,704 105,800 107,065 108,974 110,939 111,624 112,452 113,191 55 Federal 55,304 65,732 66,431 68,213 68,658 69,626 70,944 72,200 72,551 73,100 73,766 56 State 30,833 1 36,233 36,840 37,491 37,142 37,439 38,030 38,739 39,073 39,352 39,425 57 Savings 134,327 156,045 155,105 157,764 158,186 159,314 158,731 157,944 160,174 159,021 159,010 58 Federal 87,954 1 101,847 101,048 103,129 103,347 104,256 103,657 103,698 104,184 103,223 104,431 59 State 46,373 1 54,198 54,057 54,635 54,839 55,058 55,074 54,246 55,990 55,798 n a.
Life insurance companies
60 Assets 937,551 1,044,459 1,065,549 1,075,541 1,094,827 1,105,546 1,113,547 1,121,337 1,131,179 1,139,490
Securities 61 Government 84,640 84,426 92,408 93,946 86,711 87,160 88,218 88,362 87,588 88,883
60,621 62 United States6.. 59,033 57,078 65,218 66,749 58,988 59,351 60,244 60,407 59,874 88,883 60,621
63 State and local . 11,659 10,681 12,033 11,976 11,016 11,114 11,102 11,190 11,054 11,069 64 Foreign 13,948 16,667 15,157 15,221 16,707 16,695 16,872 16,765 16,660 17,193 65 Business 492,807 569,199 580,392 587,846 606,445 614,052 618,742 624,917 630,086 633,390 n.a. n a. 66 Bonds 401,943 472,684 484,403 490,285 503,728 509,105 514,926 520,796 525,336 527,419 67 Stocks 90,864 96,515 95,989 97,561 102,717 104,947 103,816 104,121 104,750 105,971 68 Mortgages 193,842 203,545 214,815 215,383 219,012 220,870 221,990 233,438 225,627 227,342 69 Real estate 31,615 34,172 34,845 34,964 35,484 35,545 35,737 35,920 35,892 36,892 70 Policy loans 54,055 53,626 52,604 52,568 53,013 53,107 53,142 53,194 53,149 53,157 71 Other assets 80,592 89,586 90,499 90,834 94,162 94,812 95,718 95,505 98,837 99,826
1. Contra-assets are credit-balance accounts that must be subtracted from the corresponding gross asset categories to yield net asset levels. Contra-assets to mortgage loans, contracts, and pass-through securities include loans in process, unearned discounts and deferred loan fees, valuation allowances for mortgages "held for sale," and specific reserves and other valuation allowances.
2. Contra-assets are credit-balance accounts that must be subtracted from the corresponding gross asset categories to yield net asset levels. Contra-assets to nonmortgage loans include loans in process, unearned discounts and deferred loan fees, and specific reserves and valuation allowances.
3. Holding of stock in Federal Home Loan Bank and Finance leases plus interest are included in "Other" (line 9).
4. Excludes checking, club, and school accounts. 5. Data include all federally insured credit unions, both federal and state
chartered, serving natural persons. 6. Direct and guaranteed obligations. Excludes federal agency issues not
guaranteed, which are shown in the table under "Business" securities. 7. Issues of foreign governments and their subdivisions and bonds of the
International Bank for Reconstruction and Development.
NOTE. FSLIC-insured institutions: Estimates by the FHLBB for all institutions insured by the FSLIC and based on the FHLBB thrift Financial Report.
FSLIC-insured federal savings banks: Estimates by the FHLBB for federal savings banks insured by the FSLIC and based on the FHLBB thrift Financial Report.
Savings banks: Estimates by the National Council of Savings Institutions for all savings banks in the United States and for FDIC-insured savings banks that have converted to federal savings banks.
Credit unions: Estimates by the National Credit Union Administration for federally chartered and federally insured state-chartered credit unions serving natural persons.
Life insurance companies: Estimates of the American Council of Life Insurance for all life insurance companies in the United States. Annual figures are annual-statement asset values, with bonds carried on an amortized basis and stocks at year-end market value. Adjustments for interest due and accrued and for differences between market and book values are not made on each item separately but are included, in total, in "other assets."
Digitized for FRASER http://fraser.stlouisfed.org/ Federal Reserve Bank of St. Louis
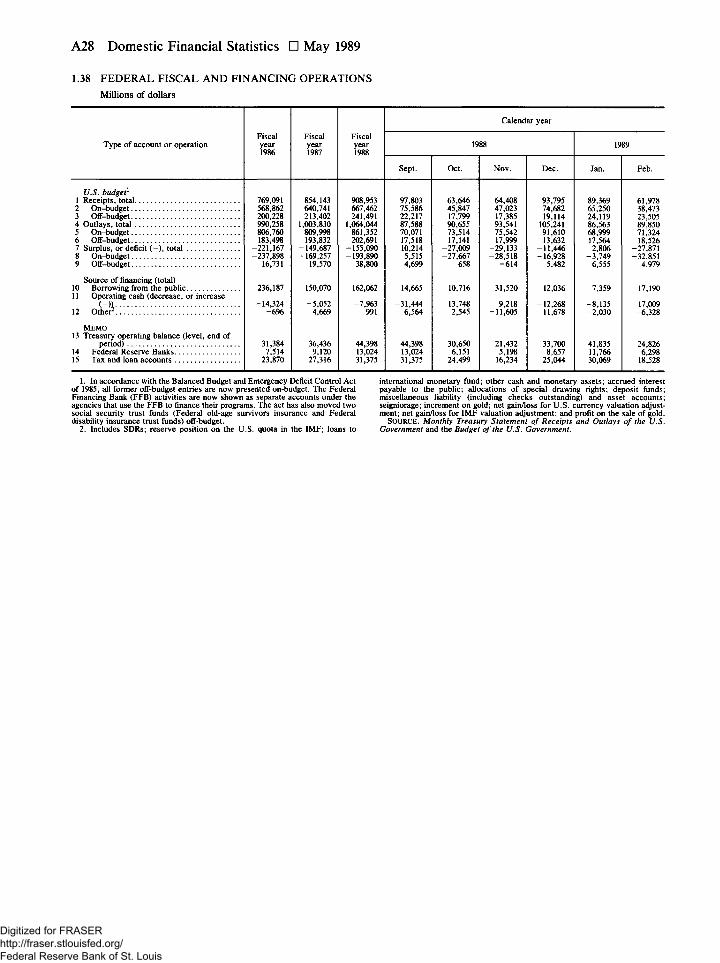
A28 Domestic Financial Statistics • May 1989
1.38 FEDERAL FISCAL AND FINANCING OPERATIONS Millions of dollars
Type of account or operation Fiscal year 1986
Fiscal year 1987
Fiscal year 1988
Calendar year
Type of account or operation Fiscal year 1986
Fiscal year 1987
Fiscal year 1988
1988 1989 Type of account or operation Fiscal year 1986
Fiscal year 1987
Fiscal year 1988
Sept. Oct. Nov. Dec. Jan. Feb.
U.S. budget1
1 Receipts, total 769,091 854,143 908,953 97,803 63,646 64,408 93,795 89,369 61,978 2 On-budget 568,862 640,741 667,462 75,586 45,847 47,023 74,682 65,250 38,473 3 Off-budget 200,228 213,402 241,491 22,217 17,799 17,385 19,114 24,119 23,505 4 Outlays, total 990,258 1,003,830 1,064,044 87,588 90,655 93,541 105,241 86,563 89,850 5 On-budget 806,760 809,998 861,352 70,071 73,514 75,542 91,610 68,999 71,324 6 Off-budget 183,498 193,832 202,691 17,518 17,141 17,999 13,632 17,564 18,526 7 Surplus, or deficit ( - ) , total -221,167 -149,687 -155,090 10,214 -27,009 -29,133 -11,446 2,806 -27,871 8 On-budget -237,898 -169,257 -193,890 5,515 -27,667 -28,518 -16,928 -3,749 -32,851 9 Off-budget 16,731 19,570 38,800 4,699 658 -614 5,482 6,555 4,979
Source of financing (total) 10 Borrowing from the public 236,187 150,070 162,062 14,665 10,716 31,520 12,036 7,359 17,190 11 Operating cash (decrease, or increase
( - ) l -14,324 -5,052 —7,963 -31,444 13,748 9,218 -12,268 -8,135 17,009 12 Other2 -696 4,669 991 6,564 2,545 -11,605 11,678 -2,030 -6,328
MEMO 13 Treasury operating balance (level, end of
period) 31,384 36,436 44,398 44,398 30,650 21,432 33,700 41,835 24,826 14 Federal Reserve Banks 7,514 9,120 13,024 13,024 6,151 5,198 8,657 11,766 6,298 15 Tax and loan accounts 23,870 27,316 31,375 31,375 24,499 16,234 25,044 30,069 18,528
1. In accordance with the Balanced Budget and Emergency Deficit Control Act of 1985, all former off-budget entries are now presented on-budget. The Federal Financing Bank (FFB) activities are now shown as separate accounts under the agencies that use the FFB to finance their programs. The act has also moved two social security trust funds (Federal old-age survivors insurance and Federal disability insurance trust funds) off-budget.
2. Includes SDRs; reserve position on the U.S. quota in the IMF; loans to
international monetary fund; other cash and monetary assets; accrued interest payable to the public; allocations of special drawing rights; deposit funds; miscellaneous liability (including checks outstanding) and asset accounts; seigniorage; increment on gold; net gain/loss for U.S. currency valuation adjust-ment; net gain/loss for IMF valuation adjustment; and profit on the sale of gold.
SOURCE. Monthly Treasury Statement of Receipts and Outlays of the U.S. Government and the Budget of the U.S. Government.
Digitized for FRASER http://fraser.stlouisfed.org/ Federal Reserve Bank of St. Louis
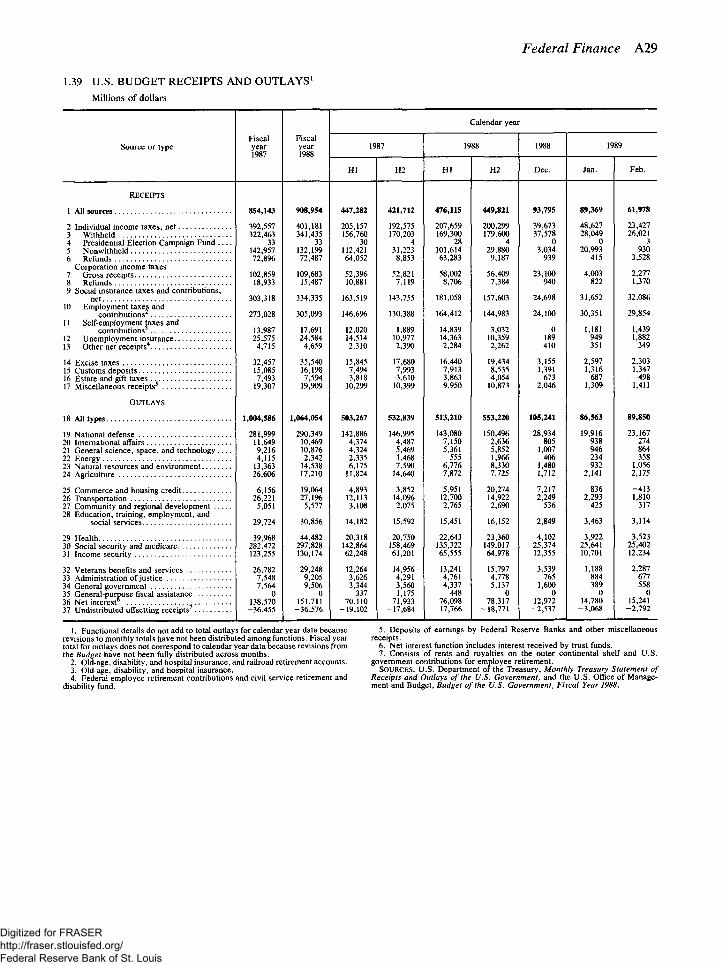
Federal Finance A29
1.39 U.S. BUDGET RECEIPTS AND OUTLAYS1
Millions of dollars
Source or type Fiscal year 1987
Fiscal year 1988
Calendar year
Source or type Fiscal year 1987
Fiscal year 1988
1987 1988 1988 1989 Source or type Fiscal year 1987
Fiscal year 1988
HI H2 HI H2 Dec. Jan. Feb.
RECEIPTS
1 All sources 854,143 908,954 447,282 421,712 476,115 449,821 93,795 89,369 61,978
2 Individual income taxes, net 392,557 401,181 205,157 192,575 207,659 200,299 39,673 48,627 23,427 3 Withheld 322,463 341,435 156,760 170,203 169,300 179,600 37,578 28,049 26,021 4 Presidential Election Campaign Fund 33 33 30 4 28 4 0 0 3 5 Nonwithheld 142,957 132,199 112,421 31,223 101,614 29,880 3,034 20,993 930 6 Refunds 72,896 72,487 64,052 8,853 63,283 9,187 939 415 3,528
Corporation income taxes 2,277 7 Gross receipts 102,859 109,683 52,396 52,821 58,002 56,409 23,100 4,003 2,277
8 Refunds 18,933 15,487 10,881 7,119 8,706 7,384 940 822 1,370 9 Social insurance taxes and contributions,
net 303,318 334,335 163,519 143,755 181,058 157,603 24,698 31,652 32,086 10 Employment taxes and
30,351 29,854 contributions 273,028 305,093 146,696 130,388 164,412 144,983 24,100 30,351 29,854 11 Self-employment taxes and
1,181 1,439 contributions 13,987 17,691 12,020 1,889 14,839 3,032 0 1,181 1,439 12 Unemployment insurance 25,575 24,584 14,514 10,977 14,363 10,359 189 949 1,882 13 Other net receipts 4,715 4,659 2,310 2,390 2,284 2,262 410 351 349
14 Excise taxes 32,457 35,540 15,845 17,680 16,440 19,434 3,155 2,597 2,303 15 Customs deposits 15,085 16,198 7,494 7,993 7,913 8,535 1,391 1,316 1,347 16 Estate and gift taxes 7,493 7,594 3,818 3,610 3,863 4,054 673 687 498 17 Miscellaneous receipts5 19,307 19,909 10,299 10,399 9,950 10,873 2,046 1,309 1,411
OUTLAYS
18 All types 1,004,586 1,064,054 503,267 532,839 513,210 553,220 105,241 86,563 89,850
19 National defense 281,999 290,349 142,886 146,995 143,080 150,496 28,934 19,916 23,167 20 International affairs 11,649 10,469 4,374 4,487 7,150 2,636 805 938 274 21 General science, space, and technology 9,216 10,876 4,324 5,469 5,361 5,852 1,007 946 864 22 Energy 4,115 2,342 2,335 1,468 555 1,966 406 234 358 23 Natural resources and environment 13,363 14,538 6,175 7,590 6,776 8,330 1,480 932 1,056 24 Agriculture 26,606 17,210 11,824 14,640 7,872 7,725 1,712 2,141 2,175
25 Commerce and housing credit 6,156 19,064 4,893 3,852 5,951 20,274 7,217 836 -413 26 Transportation 26,221 27,196 12,113 14,096 12,700 14,922 2,249 2,293 1,810 27 Community and regional development 5,051 5,577 3,108 2,075 2,765 2,690 536 425 317 28 Education, training, employment, and
3,463 3,114 social services 29,724 30,856 14,182 15,592 15,451 16,152 2,849 3,463 3,114
29 Health 39,968 44,482 20,318 20,750 22,643 23,360 4,102 3,922 3,523 30 Social security and medicare 282,472 297,828 142,864 158,469 135,322 149,017 25,374 25,641 25,402 31 Income security 123,255 130,174 62,248 61,201 65,555 64,978 12,355 10,701 12,234
32 Veterans benefits and services 26,782 29,248 12,264 14,956 13,241 15,797 3,539 1,188 2,287 33 Administration of justice 7,548 9,205 3,626 4,291 4,761 4,778 765 884 677 34 General government 7,564 9,506 3,344 3,560 4,337 5,137 1,600 389 558 35 General-purpose fiscal assistance 0 0 337 1,175 448 0 0 0 0 36 Net interest6
i 138,570 151,711 70,110 71,933 76,098 78,317 12,972 14,780 15,241 37 Undistributed offsetting receipts -36,455 -36,576 -19,102 -17,684 -17,766 -18,771 -2,537 -3,068 -2,792
1. Functional details do not add to total outlays for calendar year data because revisions to monthly totals have not been distributed among functions. Fiscal year total for outlays does not correspond to calendar year data because revisions from the Budget have not been fully distributed across months.
2. Old-age, disability, and hospital insurance, and railroad retirement accounts. 3. Old-age, disability, and hospital insurance. 4. Federal employee retirement contributions and civil service retirement and
disability fund.
5. Deposits of earnings by Federal Reserve Banks and other miscellaneous receipts.
6. Net interest function includes interest received by trust funds. 7. Consists of rents and royalties on the outer continental shelf and U.S.
government contributions for employee retirement. SOURCES. U.S. Department of the Treasury, Monthly Treasury Statement of
Receipts and Outlays of the U.S. Government, and the U.S. Office of Manage-ment and Budget, Budget of the U.S. Government, Fiscal Year 1988.
Digitized for FRASER http://fraser.stlouisfed.org/ Federal Reserve Bank of St. Louis
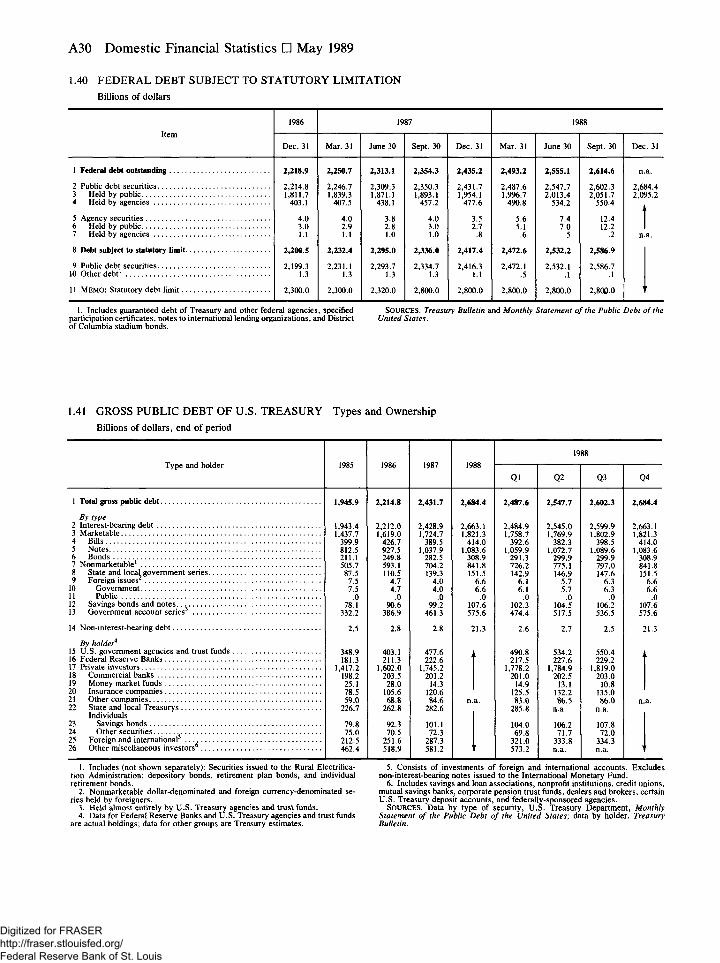
A30 Domestic Nonfinancial Statistics • May 1989
1.40 FEDERAL DEBT SUBJECT TO STATUTORY LIMITATION Billions of dollars
Item 1986 1987 1988
Item Dec. 31 Mar. 31 June 30 Sept. 30 Dec. 31 Mar. 31 June 30 Sept. 30 Dec. 31
1 Federal debt outstanding 2 ,218 .9 2 ,250 .7 2 ,313 .1 2 , 3 5 4 . 3 2 ,435 .2 2 , 4 9 3 . 2 2 , 5 5 5 . 1 2 ,614 .6 n.a.
2 Public debt securities 2,214.8 2,246.7 2,309.3 2,350.3 2,431.7 2,487.6 2,547.7 2,602.3 2,684.4 3 Held by public 1,811.7 1,839.3 1,871.1 1,893.1 1,954.1 1,996.7 2,013.4 2,051.7 2,095.2 4 Held by agencies 403.1 407.5 438.1 457.2 477.6 490.8 534.2 550.4
5 Agency securities 4.0 4.0 3.8 4.0 3.5 5.6 7.4 12.4 6 Held by public 3.0 2.9 2.8 3.0 2.7 5.1 7.0 12.2 7 Held by agencies 1.1 1.1 1.0 1.0 .8 .6 .5 .2 n.a.
8 Debt subject to statutory limit 2 ,200 .5 2 ,232 .4 2 ,295 .0 2 ,336 .0 2 ,417 .4 2 , 4 7 2 . 6 2 , 5 3 2 . 2 2 , 5 8 6 . 9
9 Public debt securities 2,199.3 2,231.1 2,293.7 2,334.7 2,416.3 1.1
2,472.1 2,532.1 .1
2,586.7 .1 10 Other debt1 1.3 1.3 1.3 1.3
2,416.3 1.1 .5
2,532.1 .1
2,586.7 .1
11 MEMO: Statutory debt limit 2,300.0 2,300.0 2,320.0 2,800.0 2,800.0 2,800.0 2,800.0 2,800.0
1. Includes guaranteed debt of Treasury and other federal agencies, specified SOURCES. Treasury Bulletin and Monthly Statement of the Public Debt of the participation certificates, notes to international lending organizations, and District United States. of Columbia stadium bonds.
1.41 GROSS PUBLIC DEBT OF U.S. TREASURY Types and Ownership Billions of dollars, end of period
Type and holder 1985 1986 1987 1988 1988
Type and holder 1985 1986 1987 1988
Q1 Q2 Q3 Q4
1 Total gross public debt 1,945.9 2 ,214 .8 2 ,431 .7 2 ,684 .4 2 , 4 8 7 . 6 2 , 5 4 7 . 7 2 , 6 0 2 . 3 2 ,684 .4
By type 2 Interest-bearing debt 1,943.4 2,212.0 2,428.9 2,663.1 2,484.9 2,545.0 2,599.9 2,663.1 i Marketable 1,437.7 1,619.0 1,724.7 1,821.3 1,758.7 1,769.9 1,802.9 1,821.3 4 Bills 399.9 426.7 389.5 414.0 392.6 382.3 398.5 414.0 5 812.5 927.5 1,037.9 1,083.6 1,059.9 1,072.7 1,089.6 1,083.6 6 Bonds 211.1 249.8 282.5 308.9 291.3 299.9 299.9 308.9 7 Nonmarketable1 505.7 593.1 704.2 841.8 726.2 775.1 797.0 841.8 8 State and local government series 87.5 110.5 139.3 151.5 142.9 146.9 147.6 151.5 y Foreign issues 7.5 4.7 4.0 6 6 6.1 5.7 6.3 6 6
10 Government 7.5 4.7 4.0 6 6 6.1 5.7 6.3 6 6 n Public .0 .0 .0 .0 .0 .0 .0 .0 12 Savings bonds and notes. 78.1 90.6 99.2 107.6 102.3 104.5 106.2 107.6 13 Government account series 332.2 386.9 461.3 575.6 474.4 517.5 536.5 575.6
14 Non-interest-bearing debt 2.5 2.8 2.8 21.3 2.6 2.7 2.5 21.3
By holder4
15 U.S. government agencies and trust funds 348.9 403.1 477.6 490.8 534.2 550.4 16 Federal Reserve Banks 181.3 211.3 222.6 217.5 227.6 229.2 17 Private investors 1,417.2 1,602.0 1,745.2 1,778.2 1,784.9 1,819.0 18 Commercial banks 198.2 203.5 201.2 201.0 202.5 203.0 19 Money market funds 25.1 28.0 14.3 14.9 13.1 10.8 20 Insurance companies 78.5 105.6 120.6 125.5 132.2 135.0 21 Other companies 59.0 68.8 84.6 n.a. 83.0 86.5 86.0 n.a. 22 State and local Treasurys 226.7 262.8 282.6 285.8 n.a. n.a.
Individuals n.a.
23 Savings bonds 79.8 92.3 101.1 104.0 106.2 107.8 24 Other securities 75.0 70.5 72.3 69.8 71.7 72.0 25 Foreign and international 212.5 251.6 287.3 321.0 333.8 334.3 26 Other miscellaneous investors 462.4 518.9 581.2 573.2 n.a. n.a.
1. Includes (not shown separately): Securities issued to the Rural Electrifica-tion Administration; depository bonds, retirement plan bonds, and individual retirement bonds.
2. Nonmarketable dollar-denominated and foreign currency-denominated se-ries held by foreigners.
3. Held almost entirely by U.S. Treasury agencies and trust funds. 4. Data for Federal Reserve Banks and U.S. Treasury agencies and trust funds
are actual holdings; data for other groups are Treasury estimates.
5. Consists of investments of foreign and international accounts. Excludes non-interest-bearing notes issued to the International Monetary Fund.
6. Includes savings and loan associations, nonprofit institutions, credit unions, mutual savings banks, corporate pension trust funds, dealers and brokers, certain U.S. Treasury deposit accounts, and federally-sponsored agencies.
SOURCES. Data by type of security, U.S. Treasury Department, Monthly Statement of the Public Debt of the United States; data by holder. Treasure Bulletin.
Digitized for FRASER http://fraser.stlouisfed.org/ Federal Reserve Bank of St. Louis
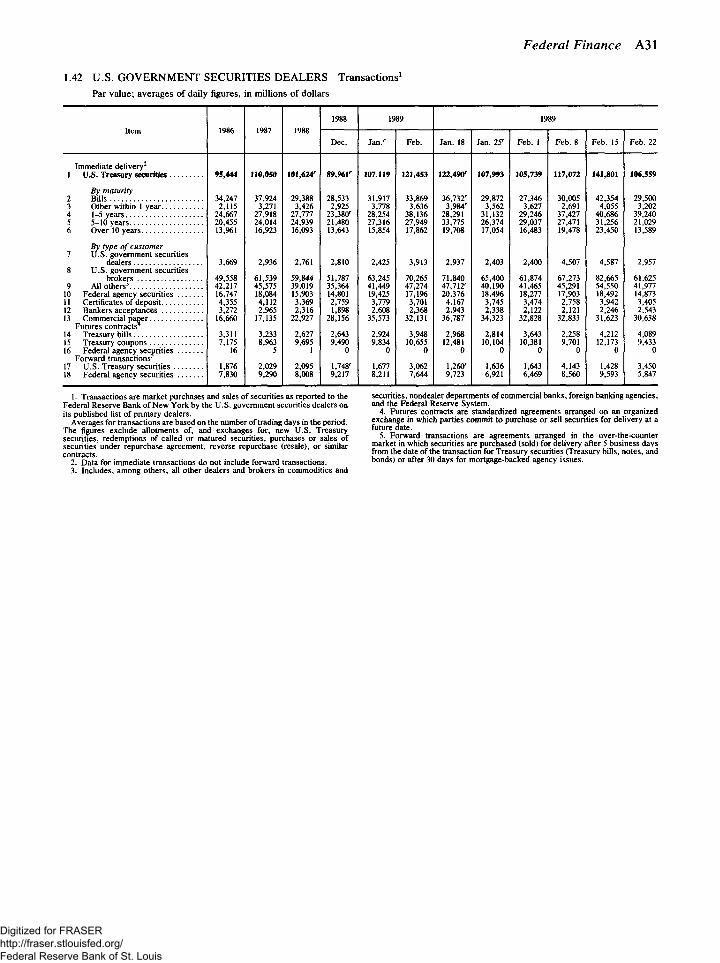
Federal Finance A31
1.42 U.S. GOVERNMENT SECURITIES DEALERS Transactions1
Par value; averages of daily figures, in millions of dollars
Item 1986 1987 1988 1988 1989 1989
Item 1986 1987 1988 Dec. Jan. ' Feb. Jan. 18 Jan. 25' Feb. 1 Feb. 8 Feb. 15 Feb. 22
Immediate delivery2
1 U.S. Treasury securities 95,444 110,050 101,624' 89,961' 107,119 121,453 122,490' 107,993 105,739 117,072 141,801 106,559
By maturity 2 Bills 34,247 37,924 29,388 28,533 31,917 33,869 36,732' 29,872 27,346 30,005 42,354 29,500 3 Other within 1 year 2,115 3,271 3,426 2,925 3,778 3,636 3,984' 3,562 3,627 2,691 4,055 3,202 4 1-5 years 24,667 27,918 27,777 23,380' 28,254 38,136 28,291 31,132 29,246 37,427 40,686 39,240 5 5-10 years 20,455 24,014 24,939 21,480 27,316 27,949 33,775 26,374 29,037 27,471 31,256 21,029 6 Over 10 years 13,961 16,923 16,093 13,643 15,854 17,862 19,708 17,054 16,483 19,478 23,450 13,589
By type of customer / U.S. government securities
dealers 3,669 2,936 2,761 2,810 2,425 3,913 2,937 2,403 2,400 4,507 4,587 2,957 8 U.S. government securities
brokers 49,558 61,539 59,844 51,787 63,245 70,265 71,840 65,400 61,874 67,273 82,665 61,625 9 All others3 42,217 45,575 39,019 35,364 41,449 47,274 47,712' 40,190 41,465 45,291 54,550 41,977
10 Federal agency securities 16,747 18,084 15,903 14,801 19,425 17,196 20,376 18,496 18,277 17,903 18,492 14,873 11 Certificates of deposit 4,355 4,112 3,369 2,759 3,779 3,701 4,167 3,745 3,474 2,758 3,942 3,405 12 Bankers acceptances 3,272 2,965 2,316 1,898 2,608 2,368 2,943 2,338 2,122 2,121 2,246 2,543 13 Commercial paper 16,660 17,135 22,927 28,156 35,573 32,131 36,787 34,323 32,828 32,833 31,623 30,638
Futures contracts 14 Treasury bills 3,311 3,233 2,627 2,643 2,924 3,948 2,968 2,814 3,643 2,258 4,212 4,089 15 Treasury coupons 7,175 8,963 9,695 9,490 9,834 10,655 12,481 10,104 10,381 9,701 12,173 9,433 16 Federal agency securities 16 5 1 0 0 0 0 0 0 0 0 0
Forward transactions 17 U.S. Treasury securities 1,876 2,029 2,095 1,748' 1,677 3,062 l ^ 1,636 1,643 4,143 1,428 3,450 18 Federal agency securities 7,830 9,290 8,008 9,217 8,211 7,644 9,723 6,921 6,469 8,560 9,593 5,847
1. Transactions are market purchases and sales of securities as reported to the Federal Reserve Bank of New York by the U.S. government securities dealers on its published list of primary dealers.
Averages for transactions are based on the number of trading days in the period. The figures exclude allotments of, and exchanges for, new U.S. Treasury securities, redemptions of called or matured securities, purchases or sales of securities under repurchase agreement, reverse repurchase (resale), or similar contracts.
2. Data for immediate transactions do not include forward transactions. 3. Includes, among others, all other dealers and brokers in commodities and
securities, nondealer departments of commercial banks, foreign banking agencies, and the Federal Reserve System.
4. Futures contracts are standardized agreements arranged on an organized exchange in which parties commit to purchase or sell securities for delivery at a future date.
5. Forward transactions are agreements arranged in the over-the-counter market in which securities are purchased (sold) for delivery after 5 business days from the date of the transaction for Treasury securities (Treasury bills, notes, and bonds) or after 30 days for mortgage-backed agency issues.
Digitized for FRASER http://fraser.stlouisfed.org/ Federal Reserve Bank of St. Louis
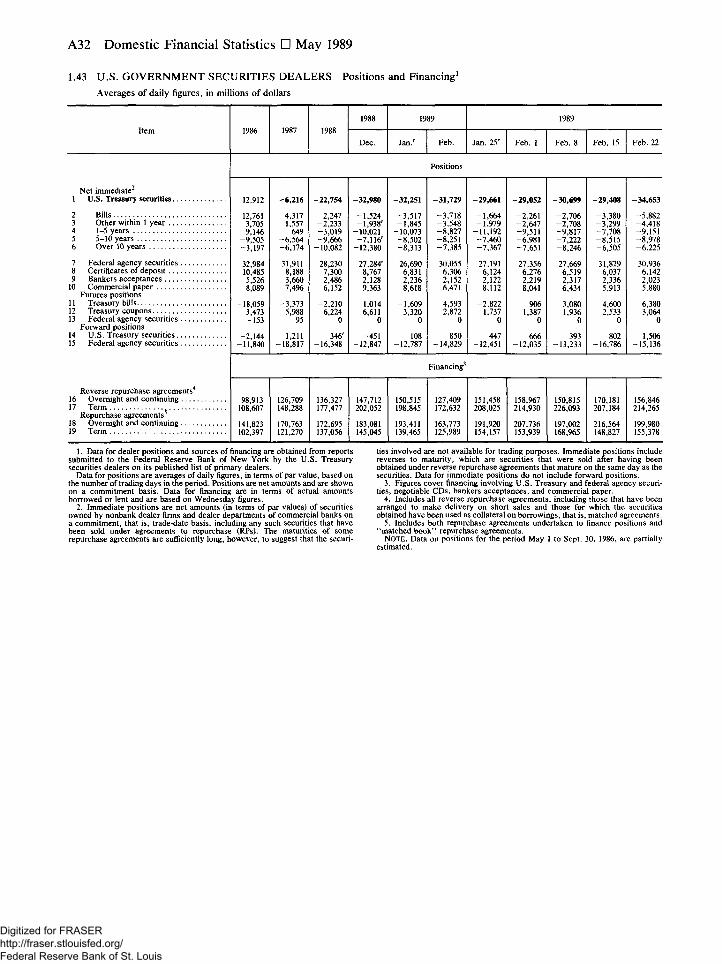
A32 Domestic Nonfinancial Statistics • May 1989
1.43 U.S. GOVERNMENT SECURITIES DEALERS Positions and Financing1
Averages of daily figures, in millions of dollars
1988 1989 1989 Item 1986 Item 1986
Dec. J an / Feb. Jan. 25' Feb. 1 Feb. 8 Feb. 15 Feb. 22
Positions
Net immediate2
1 U.S. Treasury securities 12,912 -6,216 -22,754 -32,980 -32,251 -31,729 -29,661 -29,052 -30,699 -29,408 -34,653
2 Bills 12,761 4,317 2,247 -1,524 -3,517 -3,718 -1,664 -2,261 -2,706 -3,380 -5,882 3 Other within 1 year 3,705 1,557 -2,233 -1,938 r -1,845 -3,548 -1,979 -2,647 -2,708 -3,299 -4,418 4 1-5 years 9,146 649 -3,019 -10,021 -10,073 -8,827 -11,192 -9,511 -9,817 -7,708 -9,151 5 5-10 years -9,505 -6,564 -9,666 -7,116 f -8,502 -8,251 -7,460 -6,981 -7,222 -8,515 -8,978 6 Over 10 years -3,197 -6,174 -10,082 -12,380 -8,313 -7,385 -7,367 -7,651 -8,246 -6,505 -6,225
7 Federal agency securities 32,984 31,911 28,230 27,284' 26,690 30,055 27,191 27,356 27,669 31,829 30,936 8 Certificates of deposit 10,485 8,188 7,300 8,767 6,831 6,306 6,124 6,276 6,519 6,037 6,142 9 Bankers acceptances 5,526 3,660 2,486 2,128 2,236 2,152 2,122 2,219 2,317 2,336 2,023
10 Commercial paper 8,089 7,496 6,152 9,363 8,618 6,471 8,112 8,041 6,434 5,913 5,880 Futures positions
8,089 7,496 6,152 9,363 8,618 8,041 6,434 5,913
11 Treasury bills -18,059 -3,373 -2,210 1,014 -1,609 4,593 -2,822 906 3,080 4,600 6,380 12 Treasury coupons 3,473 5,988 6,224 6,611 3,320 2,872 1,737 1,387 1,936 2,533 3,064 13 Federal agency securities -153 - 9 5 0 0 0 0 0 0 0 0 0
Forward positions 14 U.S. Treasury securities -2,144 -1,211 346' -451 108 850 447 666 393 802 1,506 lb Federal agency securities -11,840 -18,817 -16,348 -12,847 -12,787 -14,829 -12,451 -12,035 -13,233 -16,786 -15,136
Financing3
Reverse repurchase agreements4
16 Overnight and continuing 98,913 126,709 136,327 147,712 150,515 127,409 151,458 158,967 150,815 170,181 156,846 17 Term 108,607 148,288 177,477 202,052 198,845 172,632 208,025 214,930 226,093 207,184 214,265
Repurchase agreements 108,607 148,288 177,477 202,052 198,845 208,025 214,930 226,093 207,184 214,265
18 Overnight and continuing 141,823 170,763 172,695 183,081 193,411 163,773 191,920 207,736 197,002 216,564 199,980 19 Term 102,397 121,270 137,056 145,045 139,465 125,989 154,157 153,939 168,965 148,827 155,378
1. Data for dealer positions and sources of financing are obtained from reports submitted to the Federal Reserve Bank of New York by the U.S. Treasury securities dealers on its published list of primary dealers.
Data for positions are averages of daily figures, in terms of par value, based on the number of trading days in the period. Positions are net amounts and are shown on a commitment basis. Data for financing are in terms of actual amounts borrowed or lent and are based on Wednesday figures.
2. Immediate positions are net amounts (in terms of par values) of securities owned by nonbank dealer firms and dealer departments of commercial banks on a commitment, that is, trade-date basis, including any such securities that have been sold under agreements to repurchase (RPs). The maturities of some repurchase agreements are sufficiently long, however, to suggest that the securi-
ties involved are not available for trading purposes. Immediate positions include reverses to maturity, which are securities that were sold after having been obtained under reverse repurchase agreements that mature on the same day as the securities. Data for immediate positions do not include forward positions.
3. Figures cover financing involving U.S. Treasury and federal agency securi-ties, negotiable CDs, bankers acceptances, and commercial paper.
4. Includes all reverse repurchase agreements, including those that have been arranged to make delivery on short sales and those for which the securities obtained have been used as collateral on borrowings, that is, matched agreements.
5. Includes both repurchase agreements undertaken to finance positions and "matched book" repurchase agreements.
NOTE. Data on positions for the period May 1 to Sept. 30, 1986, are partially estimated.
Digitized for FRASER http://fraser.stlouisfed.org/ Federal Reserve Bank of St. Louis
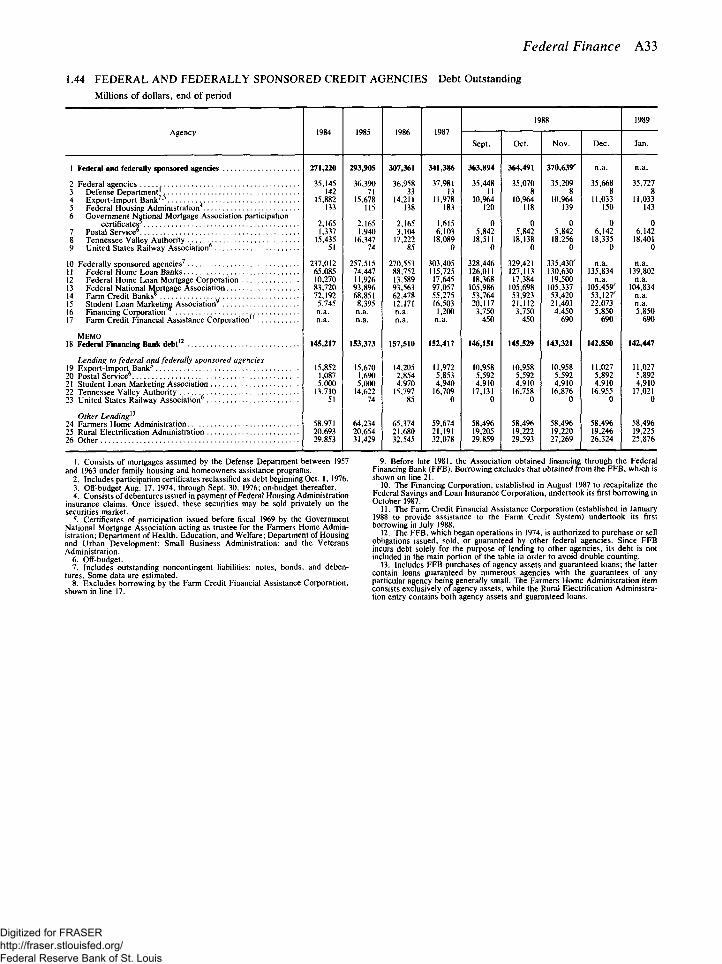
Federal Finance A33
1.44 FEDERAL AND FEDERALLY SPONSORED CREDIT AGENCIES Debt Outstanding Millions of dollars, end of period
Agency 1984 1985 1986 1987 1988 1989
Agency 1984 1985 1986 1987 Sept. Oct. Nov. Dec. Jan.
1 Federal and federally sponsored agencies 271,220 293,905 307,361 341,386 363,894 364,491 370,639" n.a. n.a.
2 Federal agencies 35,145 36,390 36,958 37,981 35,448 35,070 35,209 35,668 35,727 3 Defense Department 142 71 33 13 11 8 8 8 8 4 Export-Import Bank2-3 15,882 15,678 14,211 11,978 10,964 10,964 10,964 11,033 11,033 5 Federal Housing Administration 133 115 138 183 120 118 139 150 143 6 Government National Mortgage Association participation
certificates5 2,165 2,165 2,165 1,615 0 0 0 0 0 7 Postal Service6 1,337 1,940 3,104 6,103 5,842 5,842 5,842 6,142 6,142 8 Tennessee Valley Authority 15,435 16,347 17,222 18,089 18,511 18,138 18,256 18,335 18,401 9 United States Railway Association 51 74 85 0 0 0 0 0 0
10 Federally sponsored agencies7 237,012 257,515 270,553 303,405 328,446 329,421 335,430" n.a. n.a. 11 Federal Home Loan Banks 65,085 74,447 88,752 115,725 126,011 127,113 130,630 135,834 139,802 12 Federal Home Loan Mortgage Corporation 10,270 11,926 13,589 17,645 18,368 17,384 19,500 n.a. n.a. N Federal National Mortgage Association 83,720 93,896 93,563 97,057 105,986 105,698 105,337 105,459' 104,834 14 Farm Credit Banks 72,192 68,851 62,478 55,275 53,764 53,923 53,420 53,127' n.a. 15 Student Loan Marketing Association 5,745 8,395 12,171 16,503 20,117 21,112 21,403 22,073 n.a. 16 Financing Corporation n.a. n.a. n.a. 1,200 3,750 3,750 4,450 5,850 5,850 17 Farm Credit Financial Assistance Corporation11 n.a. n.a. n.a. n.a. 450 450 690 690 690
MEMO 18 Federal Financing Bank debt 145,217 153,373 157,510 152,417 146,151 145,529 143,321 142,850 142,447
Lending to federal and federally sponsored agencies 11,027 11,027 19 Export-Import Bank 15,852 15,670 14,205 11,972 10,958 10,958 10,958 11,027 11,027
7.0 Postal Service 1,087 1,690 2,854 5,853 5,592 5,592 5,592 5,892 5,892 21 Student Loan Marketing Association 5,000 5,000 4,970 4,940 4,910 4,910 4,910 4,910 4,910 22 Tennessee Valley Authority 13,710 14,622 15,797 16,709 17,131 16,758 16,876 16,955 17,021 23 United States Railway Association 51 74 85 0 0 0 0 0 0
Other Lending13
58,496 74 Farmers Home Administration 58,971 64,234 65,374 59,674 58,496 58,496 58,4% 58,4% 58,496 75 Rural Electrification Administration 20,693 20,654 21,680 21,191 19,205 19,222 19,220 19,246 19,225 26 29,853 31,429 32,545 32,078 29,859 29,593 27,269 26,324 25,876
1. Consists of mortgages assumed by the Defense Department between 1957 and 1963 under family housing and homeowners assistance programs.
2. Includes participation certificates reclassified as debt beginning Oct. 1, 1976. 3. Off-budget Aug. 17, 1974, through Sept. 30. 1976; on-budget thereafter. 4. Consists of debentures issued in payment of Federal Housing Administration
insurance claims. Once issued, these securities may be sold privately on the securities market.
5. Certificates of participation issued before fiscal 1969 by the Government National Mortgage Association acting as trustee for the Farmers Home Admin-istration; Department of Health, Education, and Welfare; Department of Housing and Urban Development; Small Business Administration; and the Veterans Administration.
6. Off-budget. 7. Includes outstanding noncontingent liabilities: notes, bonds, and deben-
tures. Some data are estimated. 8. Excludes borrowing by the Farm Credit Financial Assistance Corporation,
shown in line 17.
9. Before late 1981, the Association obtained financing through the Federal Financing Bank (FFB). Borrowing excludes that obtained from the FFB, which is shown on line 21.
10. The Financing Corporation, established in August 1987 to recapitalize the Federal Savings and Loan Insurance Corporation, undertook its first borrowing in October 1987.
11. The Farm Credit Financial Assistance Corporation (established in January 1988 to provide assistance to the Farm Credit System) undertook its first borrowing in July 1988.
12. The FFB, which began operations in 1974, is authorized to purchase or sell obligations issued, sold, or guaranteed by other federal agencies. Since FFB incurs debt solely for the purpose of lending to other agencies, its debt is not included in the main portion of the table in order to avoid double counting.
13. Includes FFB purchases of agency assets and guaranteed loans; the latter contain loans guaranteed by numerous agencies with the guarantees of any particular agency being generally small. The Farmers Home Administration item consists exclusively of agency assets, while the Rural Electrification Administra-tion entry contains both agency assets and guaranteed loans.
Digitized for FRASER http://fraser.stlouisfed.org/ Federal Reserve Bank of St. Louis
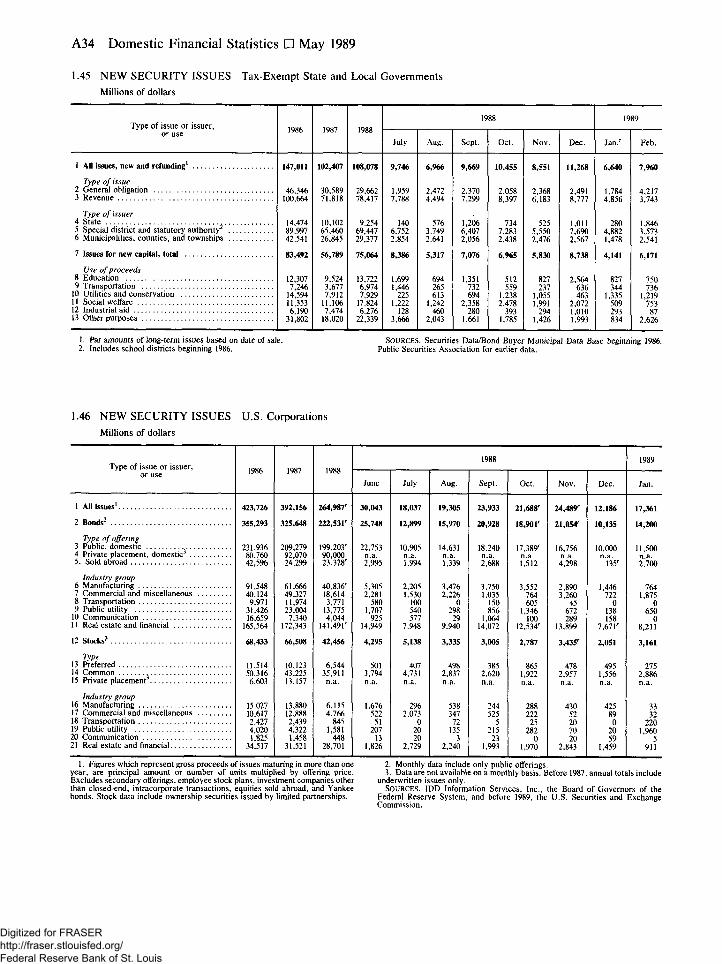
A34 Domestic Nonfinancial Statistics • May 1989
1.45 NEW SECURITY ISSUES Tax-Exempt State and Local Governments Millions of dollars
Type of issue or issuer, or use 1986 1987 1988
1988 1989 Type of issue or issuer,
or use 1986 1987 1988 July Aug. Sept. Oct. Nov. Dec. Jan.r Feb.
1 All issues, new and refunding' 147,011 102,407 108,078 9,746 6,966 9,669 10,455 8,551 11,268 6,640 7,960
Type of issue 2 General obligation 46,346 30,589 29,662 1,959 2,472 2,370 2,058 2,368 2,491 1,784 4,217 3 Revenue 100,664 71,818 78,417 7,788 4,494 7,299 8,397 6,183 8,777 4,856 3,743
Type of issuer 4 State 14,474 10,102 9,254 140 576 1,206 734 525 1,011 280 1,846 5 Special district and statutory authority 89,997 65,460 69,447 6,752 3,749 6,407 7,283 5,550 7,690 4,882 3,573 6 Municipalities, counties, and townships 42,541 26,845 29,377 2,854 2,641 2,056 2,438 2,476 2,567 1,478 2,541
7 Issues for new capital, total 83,492 56,789 75,064 8,386 5,317 7,076 6,965 5,830 8,738 4,141 6,171
Use of proceeds 8 Education 12,307 9,524 13,722 1,699 694 1,351 512 827 2,564 827 750 9 Transportation 7,246 3,677 6,974 1,446 265 732 559 237 636 344 736
10 Utilities and conservation 14,594 7,912 7,929 225 613 694 1,238 1,055 463 1,335 1,219 11 Social welfare 11,353 11,106 17,824 1,222 1,242 2,358 2,478 1,991 2,072 509 753 12 Industrial aid 6,190 7,474 6,276 128 460 280 393 294 1,010 293 87 13 Other purposes 31,802 18,020 22,339 3,666 2,043 1,661 1,785 1,426 1,993 834 2,626
1. Par amounts of long-term issues based on date of sale. 2. Includes school districts beginning 1986.
SOURCES. Securities Data/Bond Buyer Municipal Data Base beginning 1986. Public Securities Association for earlier data.
1.46 NEW SECURITY ISSUES U.S. Corporations Millions of dollars
Type of issue or issuer, or use 1986 1987 1988
1988 1989 Type of issue or issuer,
or use 1986 1987 1988 June July Aug. Sept. Oct. Nov. Dec. Jan.
1 All issues' 423,726 392,156 264,987' 30,043 18,037 19,305 23,933 21,688' 24,489' 12,186 17,361
2 Bonds2 355,293 325,648 222,531r 25,748 12,899 15,970 20,928 18,901' 21,054' 10,135 14,200
Type of offering 3 Public, domestic 231,936 209,279 199,203' 22,753 10,905 14,631 18,240 17,389' 16,756 10,000 11,500 4 Private placement, domestic 80,760 92,070 90,000 n.a. n.a. n.a. n.a. n.a. n.a. n.a. n.a. 5. Sold abroad 42,596 24,299 23,328' 2,995 1,994 1,339 2,688 1,512 4,298 135r 2,700
Industry group 6 Manufacturing 91,548 61,666 40,836' 5,305 2,205 3,476 3,750 3,552 2,890 1,446 764 7 Commercial and miscellaneous 40,124 49,327 18,614 2,281 1,530 2,226 1,035 764 3,260 722 1,875 8 Transportation 9,971 11,974 3,771 580 100 0 150 605 45 0 0 9 Public utility 31,426 23,004 13,775 1,707 540 298 856 1,346 672 138 650
10 Communication 16,659 7,340 4,044 925 577 29 1,064 100 289 158 0 11 Real estate and financial 165,564 172,343 141,491' 14,949 7,948 9,940 14,072 12,534' 13,899 7,671' 8,211
12 Stocks3 68,433 66,508 42,456 4,295 5,138 3,335 3,005 2,787 3,435' 2,051 3,161
Type 13 Preferred 11,514 10,123 6,544 501 407 498 385 865 478 495 275 14 Common 50,316 43,225 35,911 3,794 4,731 2,837 2,620 1,922 2,957 1,556 2,886 15 Private placement 6,603 13,157 n.a. n.a. n.a. n.a. n.a. n.a. n.a. n.a. n.a.
Industry group 16 Manufacturing 15,027 13,880 6,115 1,676 296 538 244 288 430 425 33 17 Commercial and miscellaneous 10,617 12,888 4,766 522 2,073 347 525 222 52 89 32 18 Transportation 2,427 2,439 845 51 0 72 5 25 20 0 220 19 Public utility 4,020 4,322 1,581 207 20 135 215 282 70 20 1,960 20 Communication 1,825 1,458 448 13 20 3 23 0 20 59 5 21 Real estate and financial 34,517 31,521 28,701 1,826 2,729 2,240 1,993 1,970 2,843 1,459 911
1. Figures which represent gross proceeds of issues maturing in more than one year, are principal amount or number of units multiplied by offering price. Excludes secondary offerings, employee stock plans, investment companies other than closed-end, intracorporate transactions, equities sold abroad, and Yankee bonds. Stock data include ownership securities issued by limited partnerships.
2. Monthly data include only public offerings. 3. Data are not available on a monthly basis. Before 1987, annual totals include
underwritten issues only. SOURCES. IDD Information Services, Inc., the Board of Governors of the
Federal Reserve System, and before 1989, the U.S. Securities and Exchange Commission.
Digitized for FRASER http://fraser.stlouisfed.org/ Federal Reserve Bank of St. Louis
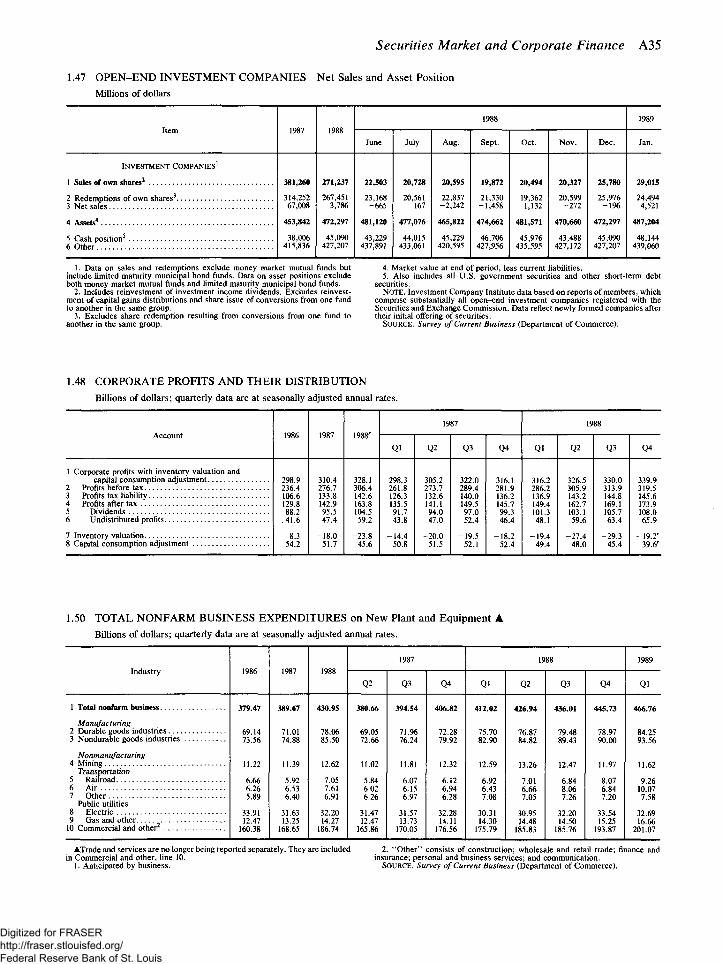
Securities Market and Corporate Finance A35
1.47 OPEN-END INVESTMENT COMPANIES Net Sales and Asset Position Millions of dollars
Item 1987 1988 1988 1989
Item 1987 1988 June July Aug. Sept. Oct. Nov. Dec. Jan.
INVESTMENT COMPANIES1
1 Sales of own shares2 381,260 271,237 22,503 20,728 20,595 19,872 20,494 20,327 25,780 29,015
2 Redemptions of own shares3 314,252 267,451 23,168 20,561 22,837 21,330 19,362 20,599 25,976 24,494 3 Net sales 67,008 3,786 -665 167 -2,242 -1,458 1,132 -272 -196 4,521
4 Assets4 453,842 472,297 481,120 477,076 465,822 474,662 481,571 470,660 472,297 487,204
5 Cash position5 38,006 45,090 43,229 44,015 45,229 46,706 45,976 43,488 45,090 48,144 6 Other 415,836 427,207 437,891 433,061 420,595 427,956 435,595 427,172 427,207 439,060
1. Data on sales and redemptions exclude money market mutual funds but include limited maturity municipal bond funds. Data on asset positions exclude both money market mutual funds and limited maturity municipal bond funds.
2. Includes reinvestment of investment income dividends. Excludes reinvest-ment of capital gains distributions and share issue of conversions from one fund to another in the same group.
3. Excludes share redemption resulting from conversions from one fund to another in the same group.
4. Market value at end of period, less current liabilities. 5. Also includes all U.S. government securities and other short-term debt
securities. NOTE. Investment Company Institute data based on reports of members, which
comprise substantially all open-end investment companies registered with the Securities and Exchange Commission. Data reflect newly formed companies after their initial offering of securities.
SOURCE. Survey of Current Business (Department of Commerce).
1.48 CORPORATE PROFITS AND THEIR DISTRIBUTION Billions of dollars; quarterly data are at seasonally adjusted annual rates.
Account 1986 1987 1988' 1987 1988
Account 1986 1987 1988'
Ql Q2 Q3 Q4 Ql Q2 Q3 Q4
1 Corporate profits with inventory valuation and capital consumption adjustment 298.9 310.4 328.1 298.3 305.2 322.0 316.1 316.2 326.5 330.0 339.9
2 Profits before tax 236.4 276.7 306.4 261.8 273.7 289.4 281.9 286.2 305.9 313.9 319.5 3 Profits tax liability 106.6 133.8 142.6 126.3 132.6 140.0 136.2 136.9 143.2 144.8 145.6 4 Profits after tax 129.8 142.9 163.8 135.5 141.1 149.5 145.7 149.4 162.7 169.1 173.9 5 Dividends 88.2 95.5 104.5 91.7 94.0 97.0 99.3 101.3 103.1 105.7 108.0 6 Undistributed profits .41.6 47.4 59.2 43.8 47.0 52.4 46.4 48.1 59.6 63.4 65.9
7 Inventory valuation 8.3 -18.0 -23.8 -14.4 -20.0 -19.5 -18.2 -19.4 -27.4 -29 .3 -19.2 r
8 Capital consumption adjustment 54.2 51.7 45.6 50.8 51.5 52.1 52.4 49.4 48.0 45.4 39.6'
1.50 TOTAL NONFARM BUSINESS EXPENDITURES on New Plant and Equipment A Billions of dollars; quarterly data are at seasonally adjusted annual rates.
Industry 1986 1987 1988 1987 1988 1989
Industry 1986 1987 1988 Q2 Q3 Q4 Ql Q2 Q3 Q4 Ql
1 Total nonfarm business 379.47 389.67 430.95 380.66 394.54 406.82 412.02 426.94 436.01 445.73 466.76
Manufacturing 2 Durable goods industries 69.14 71.01 78.06 69.05 71.96 72.28 75.70 76.87 79.48 78.97 84.25 3 Nondurable goods industries 73.56 74.88 85.50 72.66 76.24 79.92 82.90 84.82 89.43 90.00 93.56
Nonmanufacturing 4 Mining 11.22 11.39 12.62 11.02 11.81 12.32 12.59 13.26 12.47 11.97 11.62
Transportation 13.26
5 Railroad 6.66 5.92 7.05 5.84 6.07 6.12 6.92 7.01 6.84 8.07 9.26 6 Air 6.26 6.53 7.61 6.02 6.15 6.94 6.43 6.66 8.06 6.84 10.07 7 Other 5.89 6.40 6.91 6.26 6.97 6.28 7.08 7.05 7.26 7.20 7.58
Public utilities 7.05 7.58
8 Electric 33.91 31.63 32.20 31.47 31.57 32.28 30.31 30.95 32.20 33.54 32.69 9 Gas and other 12.47 13.25 14.27 12.47 13.73 14.11 14.30 14.48 14.50 15.25 16.66
10 Commercial and o the r 160.38 168.65 186.74 165.86 170.05 176.56 175.79 185.83 185.76 193.87 201.07
ATrade and services are no longer being reported separately. They are included 2. "Other" consists of construction; wholesale and retail trade; finance and in Commercial and other, line 10. insurance; personal and business services; and communication.
1. Anticipated by business. SOURCE. Survey of Current Business (Department of Commerce).
Digitized for FRASER http://fraser.stlouisfed.org/ Federal Reserve Bank of St. Louis
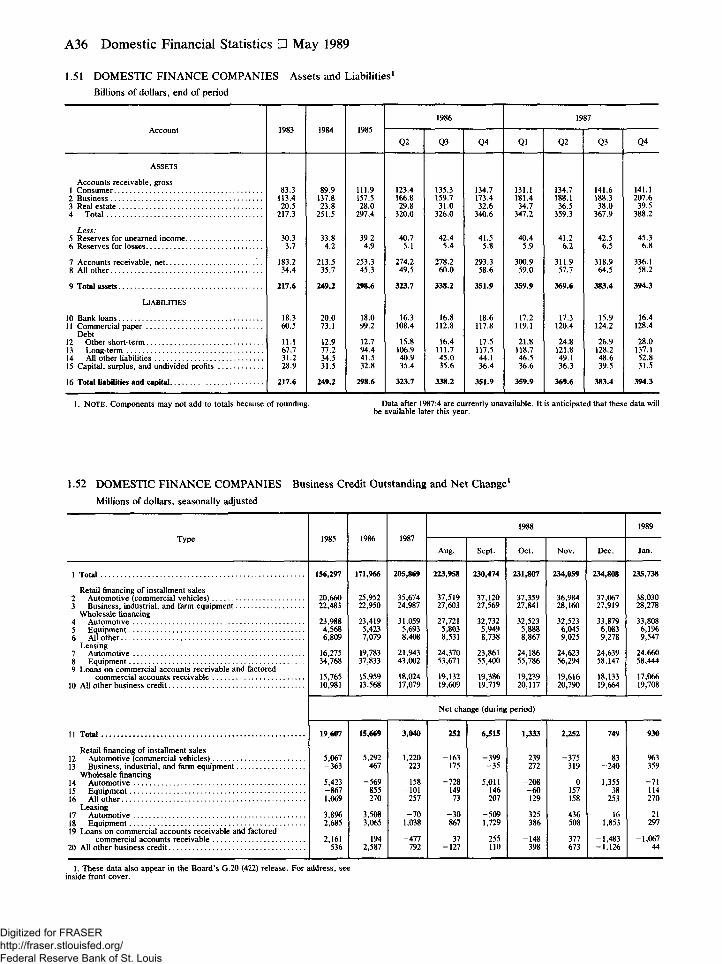
A36 Domestic Nonfinancial Statistics • May 1989
1.51 DOMESTIC FINANCE COMPANIES Assets and Liabilities1
Billions of dollars, end of period
Account 1983 1984 1985 1986 1987
Account 1983 1984 1985 Q 2 Q 3 Q4 Ql Q2 Q 3 Q4
ASSETS
Accounts receivable, gross 1 Consumer 83.3 89.9 111.9 123.4 135.3 134.7 131.1 134.7 141.6 141.1 2 Business 113.4 137.8 157.5 166.8 159.7 173.4 181.4 188.1 188.3 207.6
Real estate 20.5 23.8 28.0 29.8 31.0 32.6 34.7 36.5 38.0 39.5 4 Total 217.3 251.5 297.4 320.0 326.0 340.6 347.2 359.3 367.9 388.2
Less: 5 Reserves for unearned income 30.3 33.8 39.2 40.7 42.4 41.5 40.4 41.2 42.5 45.3 6 Reserves for losses 3.7 4.2 4.9 5.1 5.4 5.8 5.9 6.2 6.5 6.8
7 Accounts receivable, net 183.2 213.5 253.3 274.2 278.2 293.3 300.9 311.9 318.9 336.1 8 All other 34.4 35.7 45.3 49.5 60.0 58.6 59.0 57.7 64.5 58.2
9 Total assets 2 1 7 . 6 249 .2 298 .6 323 .7 3 3 8 . 2 3 5 1 . 9 3 5 9 . 9 3 6 9 . 6 3 8 3 . 4 3 9 4 . 3
LIABILITIES
10 Bank loans 18.3 20.0 18.0 16.3 16.8 18.6 17.2 17.3 15.9 16.4 11 Commercial paper 60.5 73.1 99.2 108.4 112.8 117.8 119.1 120.4 124.2 128.4
Debt 12 Other short-term 11.1 12.9 12.7 15.8 16.4 17.5 21.8 24.8 26.9 28.0 n Long-term 67.7 77.2 94.4 106.9 111.7 117.5 118.7 121.8 128.2 137.1 14 All other liabilities 31.2 34.5 41.5 40.9 45.0 44.1 46.5 49.1 48.6 52.8 15 Capital, surplus, and undivided profits 28.9 31.5 32.8 35.4 35.6 36.4 36.6 36.3 39.5 31.5
16 Total liabilities and capital 2 1 7 . 6 2 4 9 . 2 298 .6 323 .7 3 3 8 . 2 3 5 1 . 9 3 5 9 . 9 3 6 9 . 6 3 8 3 . 4 3 9 4 . 3
1. NOTE. Components may not add to totals because of rounding. Data after 1987:4 are currently unavailable. It is anticipated that these data will be available later this year.
1.52 DOMESTIC FINANCE COMPANIES Business Credit Outstanding and Net Change1
Millions of dollars, seasonally adjusted
1988 1989 Type 1985 1986 Type 1985 1986
Aug. Sept. Oct. Nov. Dec. Jan.
1 156,297 171,966 205 , 869 223 ,958 2 3 0 , 4 7 4 2 3 1 , 8 0 7 2 3 4 , 0 5 9 234 ,808 235 ,738
Retail financing of installment sales 2 Automotive (commercial vehicles) 20,660 25,952 35,674 37,519 37,120 37,359 36,984 37,067 38,030 3 Business, industrial, and farm equipment 22,483 22,950 24,987 27,603 27,569 27,841 28,160 27,919 28,278
Wholesale financing 4 Automotive 23,988 23,419 31,059 27,721 32,732 32,523 32,523 33,879 33,808 5 Equipment 4,568 5,423 5,693 5,803 5,949 5,888 6,045 6,083 6,1% 6 All other 6,809 7,079 8,408 8,531 8,738 8,867 9,025 9,278 9,547
Leasing 7 Automotive 16,275 19,783 21,943 24,370 23,861 24,186 24,623 24,639 24,660 8 Equipment 34,768 37,833 43,002 53,671 55,400 55,786 56,294 58,147 58,444 9 Loans on commercial accounts receivable and factored
commercial accounts receivable 15,765 15,959 18,024 19,132 19,386 19,239 19,616 18,133 17,066 10 All other business credit 10,981 13,568 17,079 19,609 19,719 20,117 20,790 19,664 19,708
Net change (during period)
11 19 ,607 15,669 3 , 0 4 0 252 6 , 5 1 5 1 ,333 2 , 2 5 2 749 9 3 0
Retail financing of installment sales 12 Automotive (commercial vehicles) 5,067 5,292 1,220 -163 -399 239 -375 83 %3 n Business, industrial, and farm equipment -363 467 223 175 - 3 5 272 319 -240 359
Wholesale financing 14 Automotive 5,423 -569 158 -728 5,011 -208 0 1,355 - 7 1 15 Equipment -867 855 -101 149 146 - 6 0 157 38 114 16 All other 1,069 270 257 73 207 129 158 253 270
Leasing 17 Automotive 3,896 3,508 - 7 0 - 3 0 -509 325 436 16 21 18 Equipment 2,685 3,065 1,038 867 1,729 386 508 1,853 297 19 Loans on commercial accounts receivable and factored
commercial accounts receivable 2,161 194 -477 37 255 -148 377 -1,483 -1,067 20 All other business credit 536 2,587 792 -127 110 398 673 -1,126 44
1. These data also appear in the Board's G.20 (422) release. For address, see inside front cover.
Digitized for FRASER http://fraser.stlouisfed.org/ Federal Reserve Bank of St. Louis
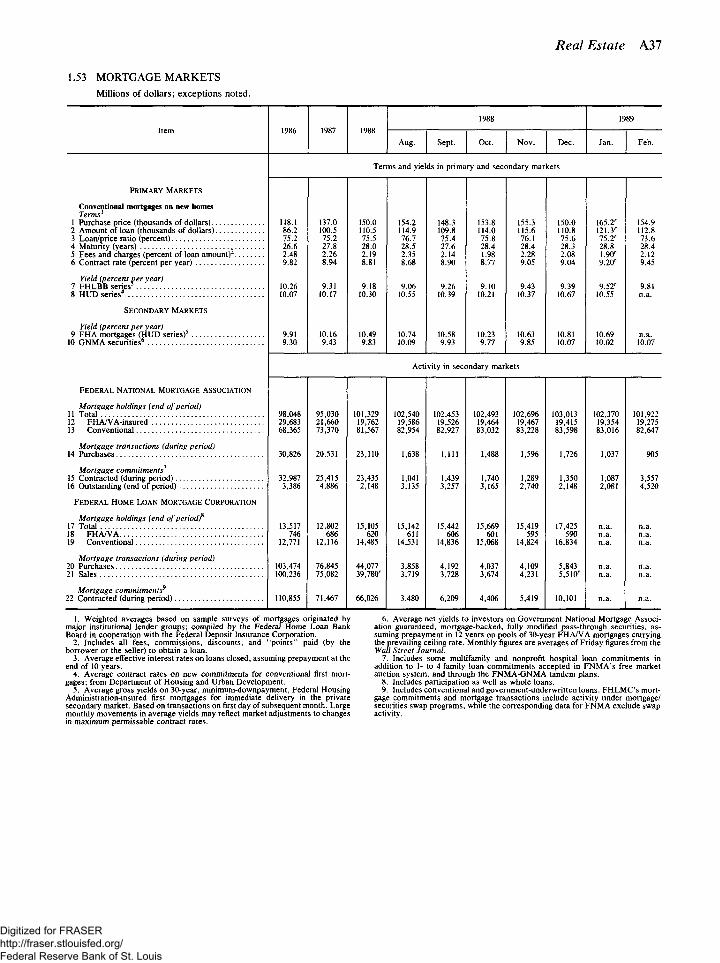
Real Estate A37
1.53 MORTGAGE MARKETS Millions of dollars; exceptions noted.
Item 1986 1987 1988 1988 1989
Item 1986 1987 1988 Aug. Sept. Oct. Nov. Dec. Jan. Feb.
Terms and yields in primary and secondary markets
PRIMARY MARKETS
Conventional mortgages on new homes Terms
1 Purchase price (thousands of dollars) 2 Amount of loan (thousands of dollars) 3 Loan/price ratio (percent) 4 Maturity (years) 5 Fees and charges (percent of loan amount) 6 Contract rate (percent per year)
Yield (percent per year) 7 FHLBB series5
8 HUD series
SECONDARY MARKETS
Yield (percent per year) 9 FHA mortgages (HUD series)5
10 GNMA securities6
118.1 86.2 75.2 26.6 2.48 9.82
10.26 10.07
9.91 9.30
137.0 100.5 75.2 27.8 2.26 8.94
9.31 10.17
10.16 9.43
150.0 110.5 75.5 28 . 0 2.19 8.81
9.18 10.30
10.49 9.83
154.2 114.9 76.7 28.5 2.35 8.68
9.06 10.55
10.74 10.09
148.3 109.8 75.4 27.6 2.14 8.90
9.26 10.39
10.58 9.93
153.8 114.0 75.8 28.4 1.98 8.77
9.10 10.21
10.23 9.77
155.3 115.6 76.1 28.4 2.28 9.05
9.43 10.37
10.63 9.85
150.0 110.8 75.6 28.3 2.08 9.04
9.39 10.67
10.81 10.07
165.2r
121.3' 75.2' 28.8 1.9C 9.2 <r
9.52r
10.55
10.69 10.02
Activity in secondary markets
FEDERAL NATIONAL MORTGAGE ASSOCIATION
Mortgage holdings (end of period) 11 Total 98,048 95,030 101,329 102,540 102,453 102,493 102,696 103,013 102,370 101,922 12 FHA/VA-insured 29,683 21,660 19,762 19,586 19,526 19,464 19,467 19,415 19,354 19,275 13 Conventional 68,365 73,370 81,567 82,954 82,927 83,032 83,228 83,598 83,016 82,647
Mortgage transactions (during period) 14 Purchases 30,826 20,531 23,110 1,638 1,111 1,488 1,596 1,726 1,037 905
Mortgage commitments7
15 Contracted (during period) 32,987 25,415 23,435 1,041 1,439 1,740 1,289 1,350 1,087 3,557 16 Outstanding (end of period) 3,386 4,886 2,148 3,135 3,257 3,165 2,740 2,148 2,081 4,520
FEDERAL HOME LOAN MORTGAGE CORPORATION
Mortgage holdings (end of period)8
17 Total 13,517 12,802 15,105 15,142 15,442 15,669 15,419 17,425 n.a. n.a. 18 FHA/VA 746 686 620 611 606 601 595 590 n.a. n.a. 19 Conventional 12,771 12,116 14,485 14,531 14,836 15,068 14,824 16,834 n.a. n.a.
Mortgage transactions (during period) 20 Purchases 103,474 76,845 44,077 3,858 4,192 4,037 4,109 5,843 n.a. n.a. 21 Sales 100,236 75,082 39,780" 3,719 3,728 3,674 4,231 5,510r n.a. n.a.
Mortgage commitments9
22 Contracted (during period) 110,855 71,467 66,026 3,480 6,209 4,406 5,419 10,101 n.a. n.a.
1. Weighted averages based on sample surveys of mortgages originated by major institutional lender groups; compiled by the Federal Home Loan Bank Board in cooperation with the Federal Deposit Insurance Corporation.
2. Includes all fees, commissions, discounts, and "points" paid (by the borrower or the seller) to obtain a loan.
3. Average effective interest rates on loans closed, assuming prepayment at the end of 10 years.
4. Average contract rates on new commitments for conventional first mort-gages; from Department of Housing and Urban Development.
5. Average gross yields on 30-year, minimum-downpayment, Federal Housing Administration-insured first mortgages for immediate delivery in the private secondary market. Based on transactions on first day of subsequent month. Large monthly movements in average yields may reflect market adjustments to changes in maximum permissable contract rates.
6. Average net yields to investors on Government National Mortgage Associ-ation guaranteed, mortgage-backed, fully modified pass-through securities, as-suming prepayment in 12 years on pools of 30-year FHA/VA mortgages carrying the prevailing ceiling rate. Monthly figures are averages of Friday figures from the Wall Street Journal.
7. Includes some multifamily and nonprofit hospital loan commitments in addition to 1- to 4-family loan commitments accepted in FNMA's free market auction system, and through the FNMA-GNMA tandem plans.
8. Includes participation as well as whole loans. 9. Includes conventional and government-underwritten loans. FHLMC's mort-
gage commitments and mortgage transactions include activity under mortgage/ securities swap programs, while the corresponding data for FNMA exclude swap activity.
Digitized for FRASER http://fraser.stlouisfed.org/ Federal Reserve Bank of St. Louis
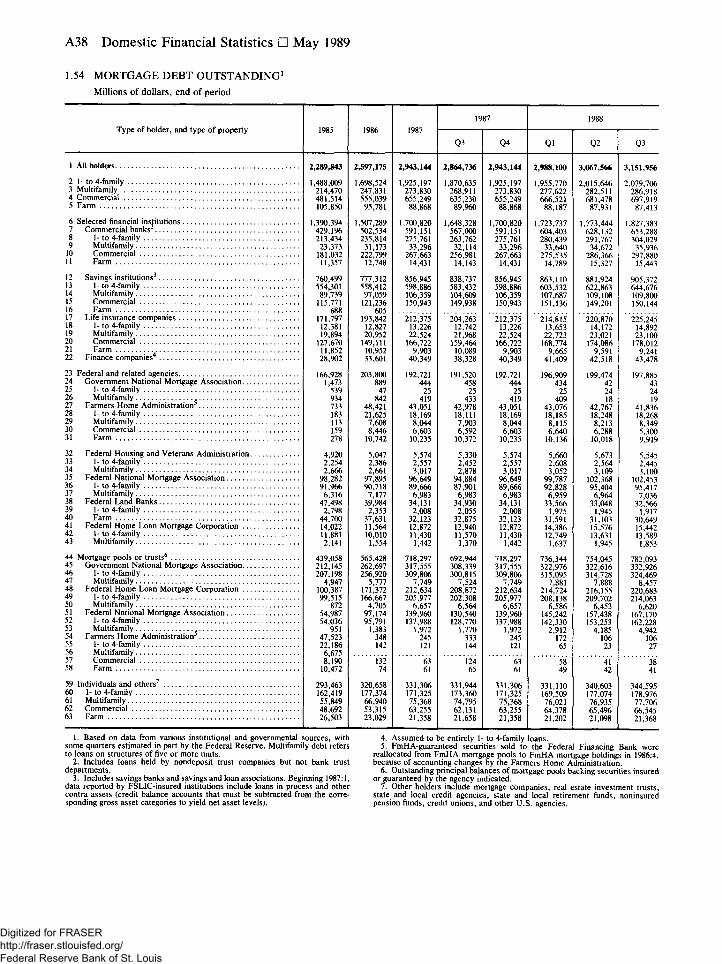
A38 Domestic Nonfinancial Statistics • May 1989
1.54 MORTGAGE D E B T O U T S T A N D I N G 1
Millions of dollars, end of period
Type of holder, and type of property 1985 1986 1987 1987 1988
1985 1986 1987 Q3 Q4 Ql Q2 Q3
2,289,843 2,597,175 2,943,144 2,864,736 2,943,144 2,988,100 3,067,566 3,151,956
1,488,009 1,698,524 1,925,197 1,870,635 1,925,197 1,955,770 2,015,646 2,079,706 214,470 247,831 273,830 268,911 273,830 277,622 282,511 286,918 481,514 555,039 655,249 635,230 655,249 666,521 681,478 697,919 105,850 95,781 88,868 89,960 88,868 88,187 87,931 87,413
1,390,394 1,507,289 1,700,820 1,648,328 1,700,820 1,723,737 1,773,444 1,827,383 429,196 502,534 591,151 567,000 591,151 604,403 628,132 653,288 213,434 235,814 275,761 263,762 275,761 280,439 291,767 304,029
23,373 31,173 33,296 32,114 33,296 33,640 34,672 35,936 181,032 222,799 267,663 256,981 267,663 275,535 286,366 297,880 11,357 12,748 14,431 14,143 14,431 14,789 15,327 15,443
760,499 777,312 856,945 838,737 856,945 863,110 881,924 905,372 554,301 558,412 598,886 583,432 598,886 603,532 622,863 644,676 89,739 97,059 106,359 104,609 106,359 107,687 109,108 109,800
115,771 121,236 150,943 149,938 150,943 151,136 149,201 150,144 688 605
150,943 151,136 149,201 150,144
171,797 193,842 212,375 204,263 212,375 214,815 220,870 225,245 12,381 12,827 13,226 12,742 13,226 13,653 14,172 14,892 19,894 20,952 22,524 21,968 22,524 22,723 23,021 23,100
127,670 149,111 166,722 159,464 166,722 168,774 174,086 178,012 11,852 10,952 9,903 10,089 9,903 9,665 9,591 9,241 28,902 33,601 40,349 38,328 40,349 41,409 42,518 43,478
166,928 203,800 192,721 191,520 192,721 196,909 199,474 197,885 1,473 889 444 458 444 434 42 43
539 47 25 25 25 25 24 24 934 842 419 433 419 409 18 19 733 48,421 43,051 42,978 43,051 43,076 42,767 41,836 183 21,625 18,169 18,111 18,169 18,185 18,248 18,268 113 7,608 8,044 7,903 8,044 8,115 8,213 8,349 159 8,446 6,603 6,592 6,603 6,640 6,288 5,300 278 10,742 10,235 10,372 10,235 10,136 10,018 9,919
4,920 5,047 5,574 5,330 5,574 5,660 5,673 5,545 2,254 2,386 2,557 2,452 2,557 2,608 2,564 2,445 2,666 2,661 3,017 2,878 3,017 3,052 3,109 3,100
98,282 97,895 96,649 94,884 96,649 99,787 102,368 102,453 91,966 90,718 89,666 87,901 89,666 92,828 95,404 95,417
6,316 7,177 6,983 6,983 6,983 6,959 6,964 7,036 47,498 39,984 34,131 34,930 34,131 33,566 33,048 32,566
2,798 2,353 2,008 2,055 2,008 1,975 1,945 1,917 44,700 37,631 32,123 32,875 32,123 31,591 31,103 30,649 14,022 11,564 12,872 12,940 12,872 14,386 15,576 15,442 11,881 10,010 11,430 11,570 11,430 12,749 13,631 13,589 2,141 1,554 1,442 1,370 1,442 1,637 1,945 1,853
439,058 565,428 718,297 692,944 718,297 736,344 754,045 782,093 212,145 262,697 317,555 308,339 317,555 322,976 322,616 332,926 207,198 256,920 309,806 300,815 309,806 315,095 314,728 324,469
4,947 5,777 7,749 7,524 7,749 7,881 7,888 8,457 100,387 171,372 212,634 208,872 212,634 214,724 216,155 220,683 99,515 166,667 205,977 202,308 205,977 208,138 209,702 214,063
872 4,705 6,657 6,564 6,657 6,586 6,453 6,620 54,987 97,174 139,960 130,540 139,960 145,242 157,438 167,170 54,036 95,791 137,988 128,770 137,988 142,330 153,253 162,228
951 1,383 1,972 1,770 1,972 2,912 4,185 4,942 47,523 348 245 333 245 172 106 106 22,186 142 121 144 121 65 23 27 6,675 8,190 132 63 124 63 58 41 38
10,472 74 61 65 61 49 42 41
293,463 320,658 331,306 331,944 331,306 331,110 340,603 344,595 162,419 177,374 171,325 173,360 171,325 169,509 177,074 178,976 55,849 66,940 75,368 74,795 75,368 76,021 76,935 77,706 48,692 53,315 63,255 62,131 63,255 64,378 65,496 66,545 26,503 23,029 21,358 21,658 21,358 21,202 21,098 21,368
1 All holders
2 1- to 4-family 3 Multifamily 4 Commercial 5 Farm
6 Selected financial institutions 7 Commercial banks 8 1- to 4-family 9 Multifamily
10 Commercial 11 Farm
12 Savings institutions3
13 1- to 4-family 14 Multifamily 15 Commercial 16 Farm 17 Life insurance companies 18 1- to 4-family 19 Multifamily 20 Commercial 21 Farm 22 Finance companies4
23 Federal and related agencies 24 Government National Mortgage Association.. 25 1- to 4-family 26 Multifamily 27 Farmers Home Administration 28 1- to 4-family 29 Multifamily 30 Commercial 31 Farm
32 Federal Housing and Veterans Administration 33 1- to 4-family 34 Multifamily 35 Federal National Mortgage Association 36 1- to 4-family 37 Multifamily 38 Federal Land Banks 39 1- to 4-family 40 Farm 41 Federal Home Loan Mortgage Corporation . . 42 1- to 4-family 43 Multifamily
44 Mortgage pools or trusts6
45 Government National Mortgage Association.. 46 1- to 4-family 47 Multifamily 48 Federal Home Loan Mortgage Corporation . . 49 1- to 4-family 50 Multifamily 51 Federal National Mortgage Association 52 1- to 4-family 53 Multifamily 54 Farmers Home Administration 55 1- to 4-family 56 Multifamily 57 Commercial 58 Farm
59 Individuals and others7
60 1- to 4-family 61 Multifamily 62 Commercial 63 Farm
1. Based on data from various institutional and governmental sources, with some quarters estimated in part by the Federal Reserve. Multifamily debt refers to loans on structures of five or more units.
2. Includes loans held by nondeposit trust companies but not bank trust departments.
3. Includes savings banks and savings and loan associations. Beginning 1987:1, data reported by FSLIC-insured institutions include loans in process and other contra assets (credit balance accounts that must be subtracted from the corre-sponding gross asset categories to yield net asset levels).
4. Assumed to be entirely 1- to 4-family loans. 5. FmHA-guaranteed securities sold to the Federal Financing Bank were
reallocated from FmHA mortgage pools to FmHA mortgage holdings in 1986:4, because of accounting changes by the Farmers Home Administration.
6. Outstanding principal balances of mortgage pools backing securities insured or guaranteed by the agency indicated.
7. Other holders include mortgage companies, real estate investment trusts, state and local credit agencies, state and local retirement funds, noninsured pension funds, credit unions, and other U.S. agencies.
Digitized for FRASER http://fraser.stlouisfed.org/ Federal Reserve Bank of St. Louis
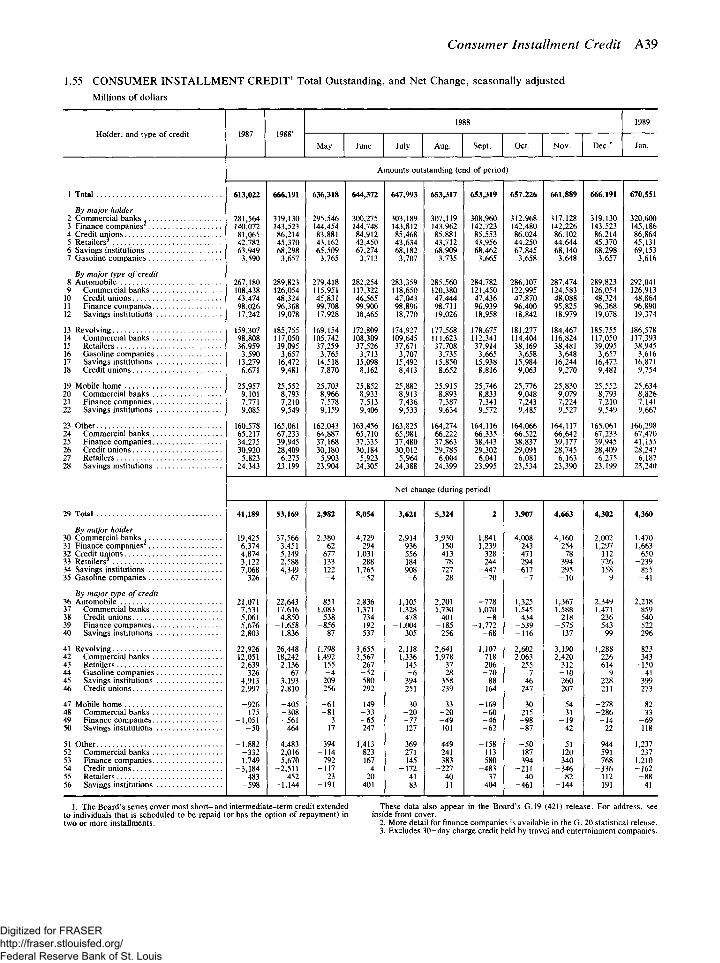
Consumer Installment Credit A39
1.55 CONSUMER INSTALLMENT CREDIT1 Total Outstanding, and Net Change, seasonally adjusted Millions of dollars
19 58 1989 Holder, and type of credit 1987 1988' Holder, and type of credit 1987 1988'
May June July Aug. Sept. Oct. Nov. Dec / Jan.
Amounts outstanding (end of period)
1 Total 613,022 666,191 636,318 644,372 647,993 653,317 653,319 657,226 661,889 666,191 670,551
By major holder 2 Commercial banks 281,564 319,130 295,546 300,275 303,189 307,119 308,960 312,968 317,128 319,130 320,600 3 Finance companies 140,072 143,523 144,454 144,748 143,812 143,962 142,723 142,480 142,226 143,523 145,186 4 Credit unions 81,065 86,214 83,881 84,912 85,468 85,881 85,553 86,024 86,102 86,214 86,864 5 Retailers 42,782 45,370 43,162 43,450 43,634 43,712 43,956 44,250 44,644 45,370 45,131 6 Savings institutions 63,949 68,298 65,509 67,274 68,182 68,909 68,462 67,845 68,140 68,298 69,153 7 Gasoline companies 3,590 3,657 3,765 3,713 3,707 3,735 3,665 3,658 3,648 3,657 3,616
By major type of credit 8 Automobile 267,180 289,823 279,418 282,254 283,359 285,560 284,782 286,107 287,474 289,823 292,041 9 Commercial banks 108,438 126,054 115,951 117,322 118,650 120,380 121,450 122,995 124,583 126,054 126,913
10 Credit unions 43,474 48,324 45,831 46,565 47,043 47,444 47,436 47,870 48,088 48,324 48,864 11 Finance companies 98,026 96,368 99,708 99,900 98,896 98,711 96,939 96,400 95,825 96,368 96,890 12 Savings institutions 17,242 19,078 17,928 18,465 18,770 19,026 18,958 18,842 18,979 19,078 19,374
13 Revolving 159,307 185,755 169,154 172,809 174,927 177,568 178,675 181,277 184,467 185,755 186,578 14 Commercial banks 98,808 117,050 105,742 108,309 109,645 111,623 112,341 114,404 116,824 117,050 117,393 15 Retailers 36,959 39,095 37,259 37,526 37,671 37,708 37,914 38,169 38,481 39,095 38,945 16 Gasoline companies 3,590 3,657 3,765 3,713 3,707 3,735 3,665 3,658 3,648 3,657 3,616 17 Savings institutions 13,279 16,472 14,518 15,098 15,492 15,850 15,938 15,984 16,244 16,472 16,871 18 Credit unions 6,671 9,481 7,870 8,162 8,413 8,652 8,816 9,063 9,270 9,481 9,754
19 Mobile home 25,957 25,552 25,703 25,852 25,882 25,915 25,746 25,776 25,830 25,552 25,634 20 Commercial banks 9,101 8,793 8,966 8,933 8,913 8,893 8,833 9,048 9,079 8,793 8,826 21 Finance companies 7,771 7,210 7,578 7,513 7,436 7,387 7,341 7,243 7,224 7,210 7,141 22 Savings institutions 9,085 9,549 9,159 9,406 9,533 9,634 9,572 9,485 9,527 9,549 9,667
23 Other 160,578 165,061 162,043 163,456 163,825 164,274 164,116 164,066 164,117 165,061 166,298 24 Commercial banks 65,217 67,233 64,887 65,710 65,981 66,222 66,335 66,522 66,642 67,233 67,470 25 Finance companies 34,275 39,945 37,168 37,335 37,480 37,863 38,443 38,837 39,177 39,945 41,155 26 Credit unions 30,920 28,409 30,180 30,184 30,012 29,785 29,302 29,091 28,745 28,409 28,247 27 Retailers 5,823 6,275 5,903 5,923 5,964 6,004 6,041 6,081 6,163 6,275 6,187 28 Savings institutions 24,343 23,199 23,904 24,305 24,388 24,399 23,995 23,534 23,390 23,199 23,240
Net change (during period)
29 Total 41,189 53,169 2,982 8,054 3,621 5,324 2 3,907 4,663 4,302 4,360
By major holder 30 Commercial banks 19,425 37,566 2,380 4,729 2,914 3,930 1,841 4,008 4,160 2,002 1,470 31 Finance companies 6,374 3,451 - 6 2 294 -936 150 -1,239 -243 -254 1,297 1,663 32 Credit unions 4,874 5,149 677 1,031 556 413 -328 471 78 112 650 33 Retailers 3,122 2,588 -133 288 184 78 244 294 394 726 -239 34 Savings institutions 7,068 4,349 122 1,765 908 727 -447 -617 295 158 855 35 Gasoline companies 326 67 - 4 -52 - 6 28 - 7 0 - 7 - 1 0 9 - 4 1
By major type of credit 36 Automobile 21,071 22,643 851 2,836 1,105 2,201 -778 1,325 1,367 2,349 2,218 37 Commercial banks 7,531 17,616 1,083 1,371 1,328 1,730 1,070 1,545 1,588 1,471 859 38 Credit unions 5,061 4,850 538 734 478 401 - 8 434 218 236 540 39 Finance companies 5,676 -1,658 -856 192 -1,004 -185 -1,772 -539 -575 543 522 40 Savings institutions 2,803 1,836 87 537 305 256 - 6 8 -116 137 99 296
41 Revolving 22,926 26,448 1,798 3,655 2,118 2,641 1,107 2,602 3,190 1,288 823 42 Commercial banks 12,051 18,242 1,492 2,567 1,336 1,978 718 2,063 2,420 226 343 43 Retailers 2,639 2,136 -155 267 145 37 206 255 312 614 -150 44 Gasoline companies 326 67 - 4 - 5 2 - 6 28 - 7 0 - 7 - 1 0 9 - 4 1 45 Savings institutions 4,913 3,193 209 580 394 358 88 46 260 228 399 46 Credit unions 2,997 2,810 256 292 251 239 164 247 207 211 273
47 Mobile home -926 -405 - 6 1 149 30 33 -169 30 54 -278 82 48 Commercial banks 175 -308 - 8 1 - 3 3 - 2 0 - 2 0 - 6 0 215 31 -286 33 49 Finance companies -1,051 -561 3 - 6 5 - 7 7 - 4 9 - 4 6 - 9 8 - 1 9 - 1 4 - 6 9 50 Savings institutions - 5 0 464 17 247 127 101 - 6 2 - 8 7 42 22 118
51 Other -1,882 4,483 394 1,413 369 449 -158 - 5 0 51 944 1,237 52 Commercial banks -332 2,016 -114 823 271 241 113 187 120 591 237 53 Finance companies 1,749 5,670 792 167 145 383 580 394 340 768 1,210 54 Credit unions -3,184 -2,511 -117 4 -172 -227 -483 -211 -346 -336 -162 55 Retailers 483 452 23 20 41 40 37 40 82 112 - 8 8 56 Savings institutions -598 -1,144 -191 401 83 11 -404 -461 -144 -191 41
1. The Board's series cover most short- and intermediate-term credit extended to individuals that is scheduled to be repaid (or has the option of repayment) in two or more installments.
These data also appear in the Board's G.19 (421) release. For address, see inside front cover.
2. More detail for finance companies is available in the G. 20 statistical release. 3. Excludes 30-day charge credit held by travel and entertainment companies.
Digitized for FRASER http://fraser.stlouisfed.org/ Federal Reserve Bank of St. Louis
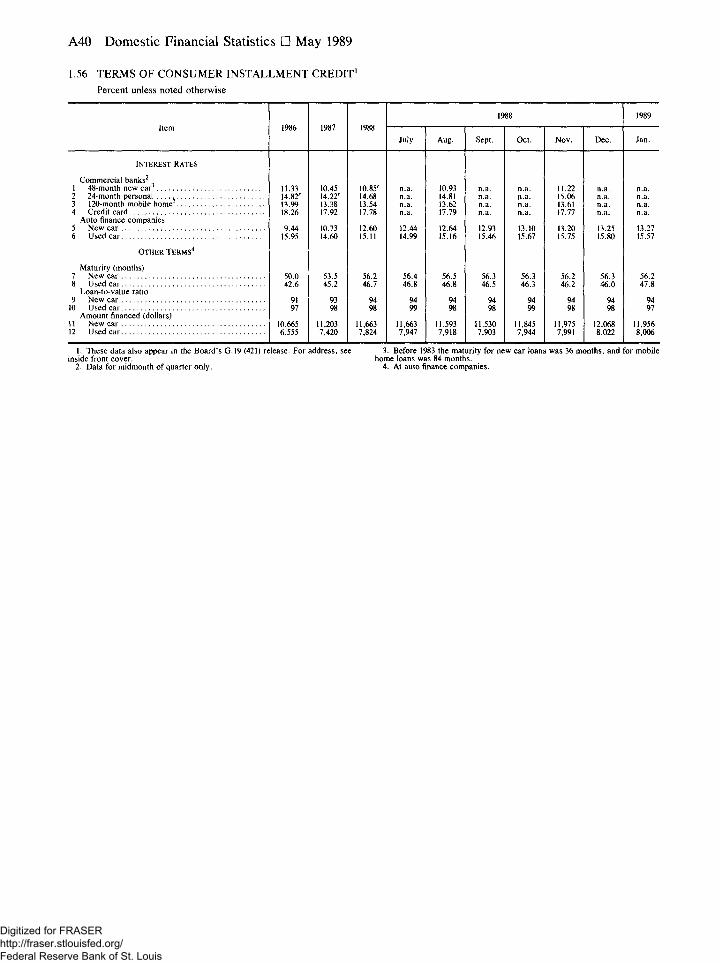
A40 Domestic Nonfinancial Statistics • May 1989
1.56 TERMS OF CONSUMER INSTALLMENT CREDIT1
Percent unless noted otherwise
Item 1986 1987 1988 1988 1989
Item 1986 1987 1988 July Aug. Sept. Oct. Nov. Dec. Jan.
INTEREST RATES
Commercial banks2
1 48-month new car3 11.33 10.45 10.85" n.a. 10.93 n.a. n.a. 11.22 n.a. n.a. 2 24-month personal 14.82r 14.22" 14.68 n.a. 14.81 n.a. n.a. 15.06 n.a. n.a. 3 120-month mobile home3 13.99 13.38 13.54 n.a. 13.62 n.a. n.a. 13.61 n.a. n.a. 4 Credit card 18.26 17.92 17.78 n.a. 17.79 n.a. n.a. 17.77 n.a. n.a.
Auto finance companies 5 New car 9.44 10.73 12.60 12.44 12.64 12.93 13.10 13.20 13.25 13.27 6 Used car 15.95 14.60 15.11 14.99 15.16 15.46 15.67 15.75 15.80 15.57
OTHER TERMS4
Maturity (months) 7 New car 50.0 53.5 56.2 56.4 56.5 56.3 56.3 56.2 56.3 56.2 8 Used car 42.6 45.2 46.7 46.8 46.8 46.5 46.3 46.2 46.0 47.8
Loan-to-value ratio 9 New car 91 93 94 94 94 94 94 94 94 94
10 Used car 97 98 98 99 98 98 99 98 98 97 Amount financed (dollars)
11 New car 10,665 11,203 11,663 11,663 11,593 11,530 11,845 11,975 12,068 11,956 12 Used car 6,555 7,420 7,824 7,947 7,918 7,903 7,944 7,991 8,022 8,006
1. These data also appear in the Board's G.19 (421) release. For address, see 3. Before 1983 the maturity for new car loans was 36 months, and for mobile inside front cover. home loans was 84 months.
2. Data for midmonth of quarter only. 4. At auto finance companies.
Digitized for FRASER http://fraser.stlouisfed.org/ Federal Reserve Bank of St. Louis
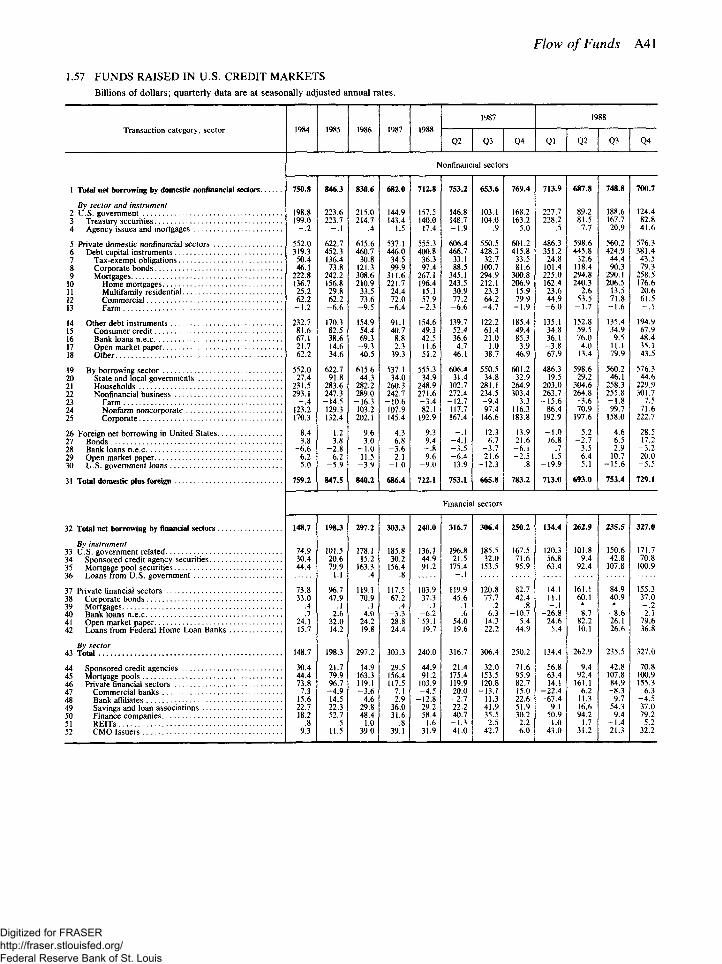
Flow of Funds A41
1.57 F U N D S R A I S E D IN U.S . CREDIT MARKETS
Billions of dollars; quarterly data are at seasonally adjusted annual rates.
Transaction category, sector 1984 1985 1986 1987 1988 1987 1988
Transaction category, sector 1984 1985 1986 1987 1988 Q2 Q3 Q4 Ql Q2 Q3 Q4
Nonfinancial sectors
1 Total net borrowing by domestic nonfinancial sectors 750.8 846.3 830.6 682.0 712.8 753.2 653.6 769.4 713.9 687.8 748.8 700.7
By sector and instrument 124.4 ? U.S. government 198.8 223.6 215.0 144.9 157.5 146.8 103.1 168.2 227.7 89.2 188.6 124.4
Treasury securities 199.0 223.7 214.7 143.4 140.0 148.7 104.0 163.2 228.2 81.5 167.7 82.8 4 Agency issues and mortgages - . 2 - . 1 .4 1.5 17.4 - 1 . 9 - . 9 5.0 - . 5 7.7 20.9 41.6
5 Private domestic nonfinancial sectors 552.0 622.7 615.6 537.1 555.3 606.4 550.5 601.2 486.3 598.6 560.2 576.3 6 Debt capital instruments 319.3 452.3 460.7 446.0 400.8 466.7 428.3 415.8 351.2 445.8 424.9 381.4 7 Tax-exempt obligations 50.4 136.4 30.8 34.5 36.3 33.1 32.7 33.5 24.8 32.6 44.4 43.5 8 Corporate bonds 46.1 73.8 121.3 99.9 97.4 88.5 100.7 81.6 101.4 118.4 90.3 79.3 9 Mortgages 222.8 242.2 308.6 311.6 267.1 345.1 294.9 300.8 225.0 294.8 290.1 258.5
10 Home mortgages 136.7 156.8 210.9 221.7 196.4 243.5 212.1 206.9 162.4 240.3 206.5 176.6 11 Multifamily residential 25.2 29.8 33.5 24.4 15.1 30.9 23.3 15.9 23.6 2.6 13.5 20.6 1? Commercial 62.2 62.2 73.6 72.0 57.9 77.2 64.2 79.9 44.9 53.5 71.8 61.5 13 Farm -1 .2 - 6 . 6 -9 .5 -6 .4 - 2 . 3 - 6 . 6 -4 .7 - 1 . 9 - 6 . 0 - 1 . 7 - 1 . 6 - . 1
14 Other debt instruments 232.7 170.3 154.9 91.1 154.6 139.7 122.2 185.4 135.1 152.8 135.4 194.9 15 Consumer credit 81.6 82.5 54.4 40.7 49.3 52.4 61.4 49.4 34.8 59.5 34.9 67.9 16 Bank loans n.e.c 67.1 38.6 69.3 8.8 42.5 36.6 21.0 85.3 36.1 76.0 9.5 48.4 17 Open market paper 21.7 14.6 -9 .3 2.3 11.6 4.7 1.0 3.9 - 3 . 8 4.0 11.1
79.9 35.1
18 Other 62.2 34.6 40.5 39.3 51.2 46.1 38.7 46.9 67.9 13.4 11.1 79.9 43.5
19 By borrowing sector 552.0 622.7 615.6 537.1 555.3 606.4 550.5 601.2 486.3 598.6 560.2 576.3 70 State and local governments 27.4 91.8 44.3 34.0 34.9 31.4 34.8 32.9 19.5 29.2 46.1 44.6 ?1 Households 231.5 283.6 282.2 260.3 248.9 302.7 281.1 264.9 203.0 304.6 258.3 229.9 ?? Nonfinancial business 293.1 247.3 289.0 242.7 271.6 272.4 234.5 303.4 263.7 264.8 255.8 301.7 73 Farm - . 4 -14.5 -16.3 -10.6 - 3 . 4 -12.7 -9 .4 3.3 -15.6 - 3 . 6 - 1 . 8 7.5 24 Nonfarm noncorporate 123.2 129.3 103.2 107.9 82.1 117.7 97.4 116.3 86.4 70.9 99.7 71.6 25 Corporate 170.3 132.4 202.1 145.4 192.9 167.4 146.6 183.8 192.9 197.6 158.0 222.7
26 Foreign net borrowing in United States 8.4 1.2 9.6 4.3 9.3 - . 1 12.3 13.9 - 1 . 0 5.2 4.6 28.5 77 Bonds 3.8 3.8 3.0 6.8 9.4 -4 .1 6.7 21.6 16.8 - 2 . 7 6.5 17.2 78 Bank loans n.e.c - 6 . 6 -2 .8 -1 .0 -3 .6 - . 8 -3 .5 -3 .7 - 6 . 1 .7 - 3 . 5 2.9 - 3 . 2 29 Open market paper 6.2 6.2 11.5 2.1 9.6 - 6 . 4 21.6 -2 .5 1.5 6.4 10.7 20.0 30 U.S. government loans 5.0 - 5 . 9 -3 .9 - 1 . 0 - 9 . 0 13.9 -12.3 .8 -19.9 5.1 -15 .6 - 5 . 5
31 Total domestic plus foreign 759.2 847.5 840.2 686.4 722.1 753.1 665.8 783.2 713.0 693.0 753.4 729.1
Financial sectors
32 Total net borrowing by financial sectors 148.7 198.3 297.2 303.3 240.0 316.7 306.4 250.2 134.4 262.9 235.5 327.0
By instrument 150.6 171.7 33 U.S. government related 74.9 101.5 178.1 185.8 136.1 196.8 185.5 167.5 120.3 101.8 150.6 171.7
34 Sponsored credit agency securities 30.4 20.6 15.2 30.2 44.9 21.5 32.0 71.6 56.8 9.4 42.8 70.8 35 Mortgage pool securities 44.4 79.9 163.3 156.4 91.2 175.4 153.5 95.9 63.4 92.4 107.8 100.9
1.1 - . 4 - . 8 - . 1 - . 4
37 Private financial sectors 73.8 96.7 119.1 117.5 103.9 119.9 120.8 82.7 14.1 161.1 84.9 155.3 38 Corporate bonds 33.0 47.9 70.9 67.2 37.3 45.6 77.7 42.4 11.1 60.1 40.9 37.0 39 Mortgages .4 .1 .1 .4 - . 1 .1 .2 .8 - . 1 * * - . 2 40 Bank loans n.e.c .7 2.6 4.0 -3 .3 -6 .2 .6 6.3 -10.7 -26.8 8.7 - 8 . 6 2.1 41 Open market paper 24.1 32.0 24.2 28.8 53.1 54.0 14.3 5.4 24.6 82.2 26.1 79.6 42 Loans from Federal Home Loan Banks 15.7 14.2 19.8 24.4 19.7 19.6 22.2 44.9 5.4 10.1 26.6 36.8
By sector 327.0 43 148.7 198.3 297.2 303.3 240.0 316.7 306.4 250.2 134.4 262.9 235.5 327.0
44 Sponsored credit agencies 30.4 21.7 14.9 29.5 44.9 21.4 32.0 71.6 56.8 9.4 42.8 70.8 45 Mortgage pools 44.4 79.9 163.3 156.4 91.2 175.4 153.5 95.9 63.4 92.4 107.8 100.9 46 Private financial sectors 73.8 96.7 119.1 117.5 103.9 119.9 120.8 82.7 14.1 161.1 84.9 155.3 47 Commercial banks 7.3 - 4 . 9 - 3 . 6 7.1 - 4 . 5 20.0 -13.1 15.0 -22.4 6.2 - 8 . 3 6.3 48 Bank affiliates 15.6 14.5 4.6 2.9 -12.8 - 2 . 7 11.3 -22.6 -67.4 11.3 9.7 - 4 . 5 49 Savings and loan associations 22.7 22.3 29.8 36.0 29.2 22.2 41.9 51.9 9.1 16.6 54.3 37.0 50 Finance companies 18.2 52.7 48.4 31.6 58.4 40.7 35.5 30.2 50.9 94.2 9.4 79.2 51 REITs .8 .5 1.0 .8 1.6 - 1 . 3 2.5 2.2 1.0 1.7 - 1 . 4 5.2 52 CMO Issuers 9.3 11.5 39.0 39.1 31.9 41.0 42.7 6.0 43.0 31.2 21.3 32.2
Digitized for FRASER http://fraser.stlouisfed.org/ Federal Reserve Bank of St. Louis
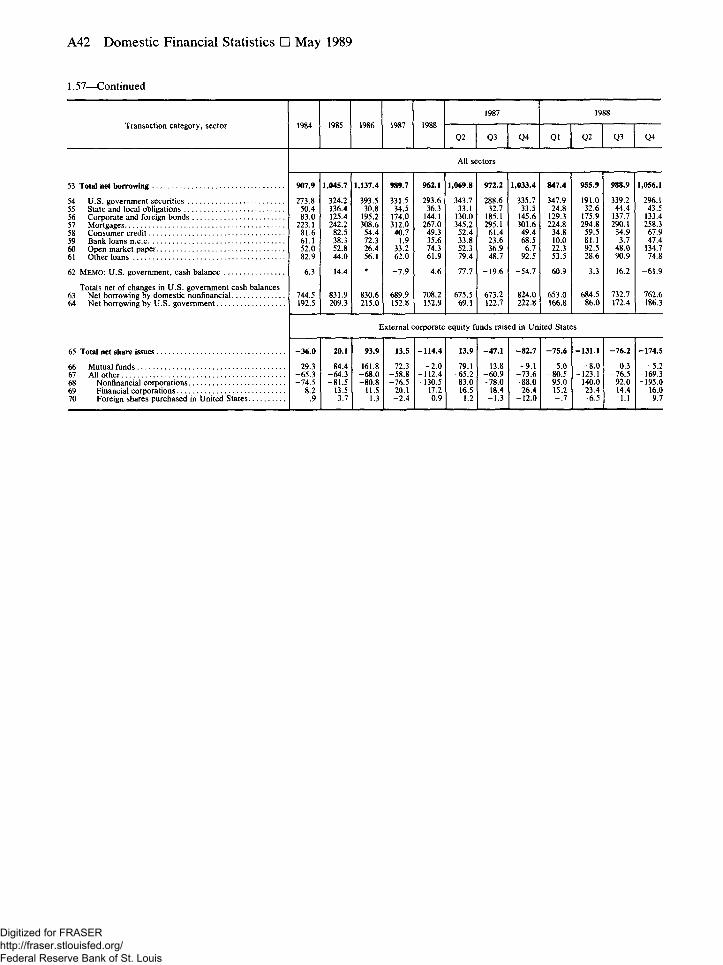
A42 Domestic Nonfinancial Statistics • May 1989
1.57—Continued
Transaction category, sector 1984 1985 1986 1987 1988 1987 1988
Transaction category, sector 1984 1985 1986 1987 1988 Q2 Q3 Q4 Q1 Q2 Q3 Q4
All sectors
53 Total net borrowing 907.9 1,045.7 1,137.4 989.7 962.1 1,069.8 972.2 1,033.4 847.4 955.9 988.9 1,056.1
54 U.S. government securities 273.8 324.2 393.5 331.5 293.6 343.7 288.6 335.7 347.9 191.0 339.2 296.1 55 State and local obligations 50.4 136.4 30.8 34.5 36.3 33.1 32.7 33.5 24.8 32.6 44.4 43.5 56 Corporate and foreign bonds 83.0 125.4 195.2 174.0 144.1 130.0 185.1 145.6 129.3 175.9 137.7 133.4 57 Mortgages 223.1 242.2 308.6 312.0 267.0 345.2 295.1 301.6 224.8 294.8 290.1 258.3 58 Consumer credit 81.6 82.5 54.4 40.7 49.3 52.4 61.4 49.4 34.8 59.5 34.9 67.9 59 Bank loans n.e.c 61.1 38.3 72.3 1.9 35.6 33.8 23.6 68.5 10.0 81.1 3.7 47.4 60 Open market paper 52.0 52.8 26.4 33.2 74.3 52.3 36.9 6.7 22.3 92.5 48.0 134.7 61 Other loans 82.9 44.0 56.1 62.0 61.9 79.4 48.7 92.5 53.5 28.6 90.9 74.8
62 MEMO: U.S. government, cash balance 6.3 14.4 * - 7 . 9 4.6 77.7 -19.6 -54.7 60.9 3.3 16.2 -61.9
Totals net of changes in U.S. government cash balances 63 Net borrowing by domestic nonfinancial 744.5 831.9 830.6 689.9 708.2 675.5 673.2 824.0 653.0 684.5 732.7 762.6 64 Net borrowing by U.S. government 192.5 209.3 215.0 152.8 152.9 69.1 122.7 222.8 166.8 86.0 172.4 186.3
External corporate equity funds raised in United States
65 Total net share issues -36.0 20.1 93.9 13.5 -114.4 13.9 -47.1 -82 .7 -75.6 -131.1 -76 .2 -174.5
66 Mutual funds 29.3 84.4 161.8 72.3 - 2 . 0 79.1 13.8 - 9 . 1 5.0 - 8 . 0 0.3 -5 .2 67 All other -65.3 -64.3 -68.0 -58.8 -112.4 -65.2 -60.9 -73 .6 -80.5 -123.1 -76.5 -169.3 68 Nonfinancial corporations -74.5 -81.5 -80.8 -76.5 -130.5 -83.0 -78.0 -88 .0 -95.0 -140.0 -92.0 -195.0 69 Financial corporations 8.2 13.5 11.5 20.1 17.2 16.5 18.4 26.4 15.2 23.4 14.4 16.0 70 Foreign shares purchased in United States .9 3.7 1.3 - 2 . 4 0.9 1.2 - 1 . 3 -12 .0 - . 7 - 6 . 5 1.1 9.7
Digitized for FRASER http://fraser.stlouisfed.org/ Federal Reserve Bank of St. Louis
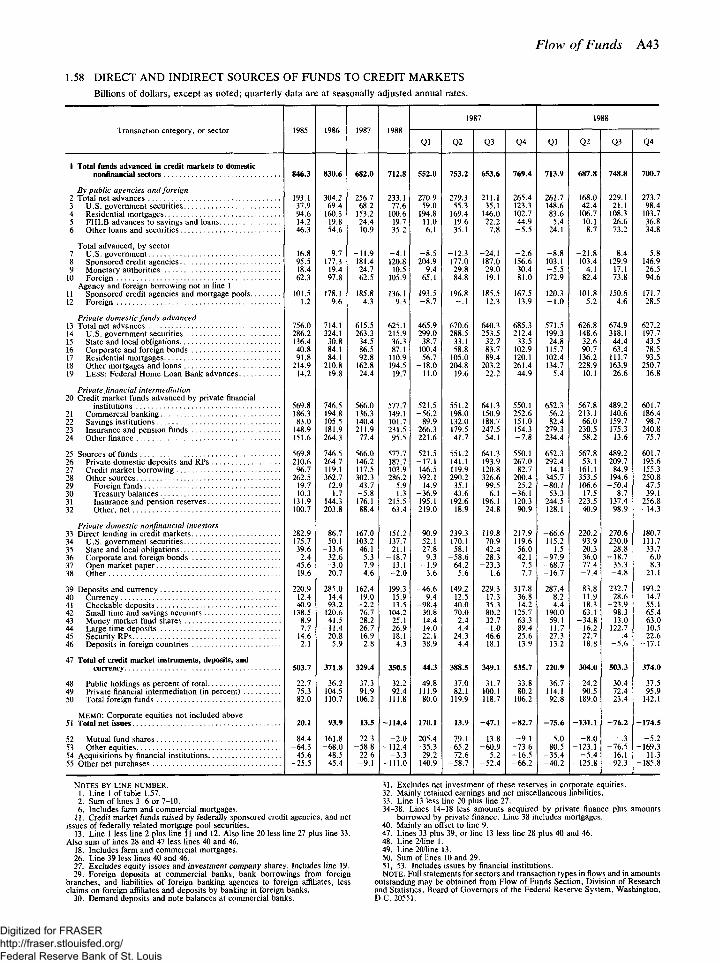
Flow of Funds A43
1.58 DIRECT A N D INDIRECT SOURCES OF F U N D S TO CREDIT MARKETS
Billions of dollars, except as noted; quarterly data are at seasonally adjusted annual rates.
Transaction category, or sector 1985 1986 1987 1988 1987 1988
Transaction category, or sector 1985 1986 1987 1988 Ql Q2 Q3 Q4 Ql Q2 Q3 Q4
1 Total funds advanced in credit markets to domestic nonfinancial sectors 846.3 830.6 682.0 712.8 552.0 753.2 653.6 769.4 713.9 687.8 748.8 700.7
By public agencies and foreign 168.0 229.1 273.7 2 Total net advances 193.1 304.2 256.7 233.1 270.9 279.3 211.1 265.4 261.7 168.0 229.1 273.7
3 U.S. government securities 37.9 69.4 68.2 77.6 59.0 55.3 35.1 123.3 148.6 42.4 21.1 98.4 4 Residential mortgages 94.6 160.3 153.2 100.6 194.8 169.4 146.0 102.7 83.6 106.7 108.3 103.7 5 FHLB advances to savings and loans 14.2 19.8 24.4 19.7 11.0 19.6 22.2 44.9 5.4 10.1 26.6 36.8 6 Other loans and securities 46.3 54.6 10.9 35.2 6.1 35.1 7.8 - 5 . 5 24.1 8.7 73.2 34.8
Total advanced, by sector 7 U.S. government 16.8 9.7 -11.9 -4 . 1 - 8 . 5 -12.3 -24.1 - 2 . 6 - 8 . 8 -21 .8 8.4 5.8 8 Sponsored credit agencies 95.5 177.3 181.4 120.8 204.9 177.0 187.0 156.6 103.1 103.4 129.9 146.9 9 Monetary authorities 18.4 19.4 24.7 10.5 9.4 29.8 29.0 30.4 - 5 . 5 4.1 17.1 26.5
10 Foreign 62.3 97.8 62.5 105.9 65.1 84.8 19.1 81.0 172.9 82.4 73.8 94.6 Agency and foreign borrowing not in line 1
11 Sponsored credit agencies and mortgage pools 101.5 178.1 185.8 136.1 193.5 196.8 185.5 167.5 120.3 101.8 150.6 171.7 12 Foreign 1.2 9.6 4.3 9.3 - 8 . 7 - . 1 12.3 13.9 - 1 . 0 5.2 4.6 28.5
Private domestic funds advanced 13 Total net advances 756.0 714.1 615.5 625.1 465.9 670.6 640.3 685.3 571.5 626.8 674.9 627.2 14 U.S. government securities 286.2 324.1 263.3 215.9 299.0 288.5 253.5 212.4 199.3 148.6 318.1 197.7 15 State and local obligations 136.4 30.8 34.5 36.3 38.7 33.1 32.7 33.5 24.8 32.6 44.4 43.5 16 Corporate and foreign bonds 40.8 84.1 86.5 87.1 100.4 58.8 83.7 102.9 115.7 90.7 63.4 78.5 17 Residential mortgages 91.8 84.1 92.8 110.9 56.7 105.0 89.4 120.1 102.4 136.2 111.7 93.5 18 Other mortgages and loans 214.9 210.8 162.8 194.5 -18.0 204.8 203.2 261.4 134.7 228.9 163.9 250.7 19 LESS: Federal Home Loan Bank advances 14.2 19.8 24.4 19.7 11.0 19.6 22.2 44.9 5.4 10.1 26.6 36.8
Private financial intermediation 20 Credit market funds advanced by private financial
institutions 569.8 746.5 566.0 577.7 521.5 551.2 641.3 550.1 652.3 567.8 489.2 601.7 21 Commercial banking 186.3 194.8 136.3 149.1 -56.2 198.0 150.9 252.6 56.2 213.1 140.6 186.4 22 Savings institutions 83.0 105.5 140.4 101.7 89.9 132.0 188.7 151.0 82.4 66.0 159.7 98.7 23 Insurance and pension funds 148.9 181.9 211.9 231.5 266.3 179.5 247.5 154.3 279.3 230.5 175.3 240.8 24 Other finance 151.6 264.3 77.4 95.5 221.6 41.7 54.1 - 7 . 8 234.4 58.2 13.6 75.7
25 Sources of funds 569.8 746.5 566.0 577.7 521.5 551.2 641.3 550.1 652.3 567.8 489.2 601.7 26 Private domestic deposits and RPs 210.6 264.7 146.2 187.7 -17.1 141.1 193.9 267.0 292.4 53.1 209.7 195.6 27 Credit market borrowing 96.7 119.1 117.5 103.9 146.5 119.9 120.8 82.7 14.1 161.1 84.9 155.3 78 Other sources 262.5 362.7 302.3 286.2 392.1 290.2 326.6 200.4 345.7 353.5 194.6 250.8 29 Foreign funds 19.7 12.9 43.7 5.9 14.9 35.1 99.5 25.2 -80.1 106.6 -50.4 47.5 30 Treasury balances 10.3 1.7 -5 .8 1.3 -36.9 43.6 6.1 -36.1 53.3 -17.5 8.7 -39.1 31 Insurance and pension reserves 131.9 144.3 176.1 215.5 195.1 192.6 196.1 120.3 244.5 223.5 137.4 256.8 32 Other, net 100.7 203.8 88.4 63.4 219.0 18.9 24.8 90.9 128.1 40.9 98.9 -14.3
Private domestic nonfinancial investors 33 Direct lending in credit markets 282.9 86.7 167.0 151.2 90.9 239.3 119.8 217.9 -66 .6 220.2 270.6 180.7 34 U.S. government securities 175.7 50.1 103.2 137.7 52.1 170.1 70.9 119.6 115.2 93.9 230.0 111.7 35 State and local obligations 39.6 -13.6 46.1 21.1 27.8 58.1 42.4 56.0 1.5 20.3 28.8 33.7 36 Corporate and foreign bonds 2.4 32.6 5.3 -18.7 9.3 -58.6 28.3 42.1 -97 .9 36.0 -18.7 6.0 37 Open market paper 45.6 - 3 . 0 7.9 13.1 - 1 . 9 64.2 -23.3 - 7 . 5 -68.7 77.4 35.3 8.3 38 Other 19.6 20.7 4.6 - 2 . 0 3.6 5.6 1.6 7.7 -16.7 - 7 . 4 - 4 . 8 21.1
39 Deposits and currency 220.9 285.0 162.4 199.3 -46.6 149.2 229.3 317.8 287.4 83.8 232.7 193.2 40 Currency 12.4 14.4 19.0 15.9 9.4 12.5 17.3 36.8 8.2 11.9 28.6 14.7 41 Checkable deposits 40.9 93.2 -2 .2 13.5 -98.4 40.0 35.3 14.2 4.4 18.3 -23.9 55.1 42 Small time and savings accounts 138.5 120.6 76.7 104.2 30.8 70.0 80.2 125.7 190.0 63.1 98.3 65.4 43 Money market fund shares 8.9 41.5 28.2 25.1 14.4 2.4 32.7 63.3 59.1 -34.8 13.0 63.0 44 Large time deposits 7.7 -11.4 26.7 26.9 14.0 4.4 - 1 . 0 89.4 11.7 -16.2 122.7 -10.5 45 Security RPs 14.6 20.8 16.9 18.1 22.1 24.3 46.6 -25 .6 27.3 22.7 - . 4 22.6 46 Deposits in foreign countries -2 .1 5.9 -2 .8 -4 .3 -38.9 - 4 . 4 18.1 13.9 -13.2 18.8 - 5 . 6 -17.1
47 Total of credit market instruments, deposits, and currency 503.7 371.8 329.4 350.5 44.3 388.5 349.1 535.7 220.9 304.0 503.3 374.0
48 Public holdings as percent of total 22.7 36.2 37.3 32.2 49.8 37.0 31.7 33.8 36.7 24.2 30.4 37.5 49 Private financial intermediation (in percent) 75.3 104.5 91.9 92.4 111.9 82.1 100.1 80.2 114.1 90.5 72.4 95.9 50 Total foreign funds 82.0 110.7 106.2 111.8 80.0 119.9 118.7 106.2 92.8 189.0 23.4 142.1
MEMO: Corporate equities not included above 51 Total net issues 20.1 93.9 13.5 -114.4 170.1 13.9 -47.1 -82.7 -75.6 -131.1 -76 .2 -174.5
52 Mutual fund shares 84.4 161.8 72.3 - 2 . 0 205.4 79.1 13.8 -9 . 1 5.0 - 8 . 0 .3 -5 .2 53 Other equities -64.3 -68.0 -58.8 -112.4 -35.3 -65.2 -60.9 -73.6 -80.5 -123.1 -76.5 -169.3 54 Acquisitions by financial institutions 45.6 48.5 22.6 - 3 . 3 29.2 72.6 5.2 -16.5 -35.4 - 5 . 4 16.1 11.3 55 Other net purchases -25.5 45.4 -9 .1 -111.0 140.9 -58.7 -52.4 -66.2 -40.2 -125.8 -92.3 -185.8
NOTES BY LINE NUMBER. 1. Line 1 of table 1.57. 2. Sum of lines 3 -6 or 7-10. 6. Includes farm and commercial mortgages.
11. Credit market funds raised by federally sponsored credit agencies, and net issues of federally related mortgage pool securities.
13. Line 1 less line 2 plus line 11 and 12. Also line 20 less line 27 plus line 33. Also sum of lines 28 and 47 less lines 40 and 46.
18. Includes farm and commercial mortgages. 26. Line 39 less lines 40 and 46. 27. Excludes equity issues and investment company shares. Includes line 19. 29. Foreign deposits at commercial banks, bank borrowings from foreign
branches, and liabilities of foreign banking agencies to foreign affiliates, less claims on foreign affiliates and deposits by banking in foreign banks.
30. Demand deposits and note balances at commercial banks.
31. Excludes net investment of these reserves in corporate equities. 32. Mainly retained earnings and net miscellaneous liabilities. 33. Line 13 less line 20 plus line 27. 34-38. Lines 14-18 less amounts acquired by private finance plus amounts
borrowed by private finance. Line 38 includes mortgages. 40. Mainly an offset to line 9. 47. Lines 33 plus 39, or line 13 less line 28 plus 40 and 46. 48. Line 2/line 1. 49. Line 20/line 13. 50. Sum of lines 10 and 29. 51. 53. Includes issues by financial institutions. NOTE. Full statements for sectors and transaction types in flows and in amounts
outstanding may be obtained from Flow of Funds Section, Division of Research and Statistics, Board of Governors of the Federal Reserve System, Washington, D.C. 20551.
Digitized for FRASER http://fraser.stlouisfed.org/ Federal Reserve Bank of St. Louis
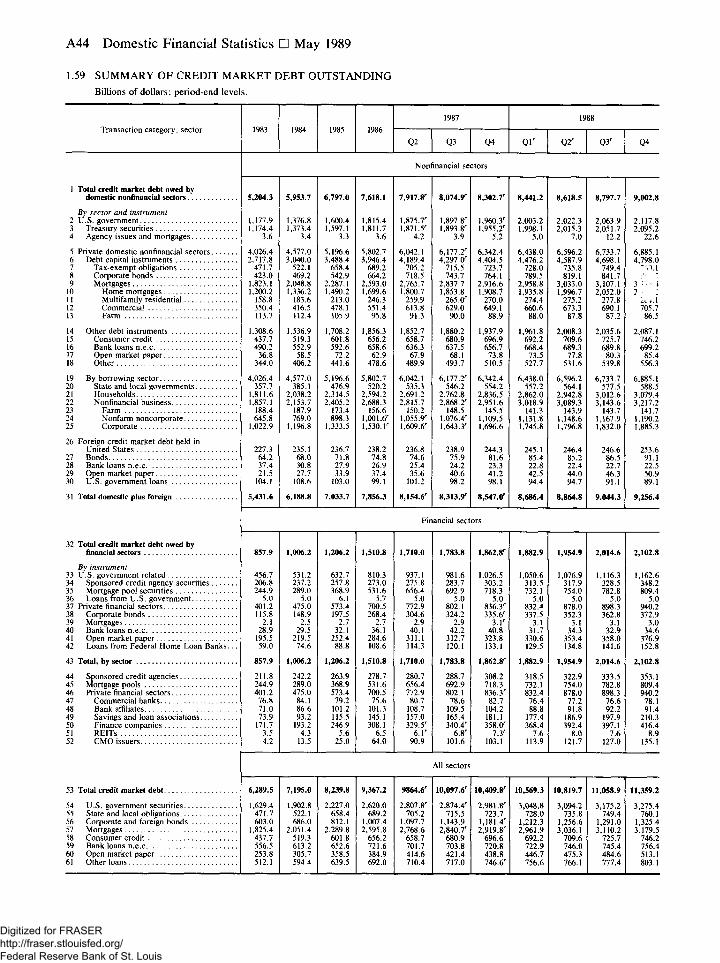
A44 Domestic Nonfinancial Statistics • May 1989
1.59 SUMMARY OF CREDIT MARKET DEBT OUTSTANDING Billions of dollars; period-end levels.
1987 1988 Transaction category, sector 1985 1986 Transaction category, sector 1985 1986
Q2 Q3 Q4 Q l ' Q2' Q3' Q4
Nonfinancial sectors
1 Total credit market debt owed by domestic nonfinancial sectors 5,204.3 5,953.7 6,797.0 7,618.1 7,917.8r 8,074.9' 8,302.7' 8,441.2 8,618.5 8,797.7 9,002.8
By sector and instrument 2 U.S. government 1,177.9 1,376.8 1,600.4 1,815.4 l,875.7r 1,897.8' 1,960.3' 2,003.2 2,022.3 2,063.9 2,117.8 3 Treasury securities 1,174.4 1,373.4 1,597.1 1,811.7 1,871.5' 1,893.8' 1,955.2' 1,998.1 2,015.3 2,051.7 2,095.2 4 Agency issues and mortgages 3.6 3.4 3.3 3.6 4.2 3.9 5.2 5.0 7.0 12.2 22.6
5 Private domestic nonfinancial sectors 4,026.4 4,577.0 5,196.6 5,802.7 6,042.1 6,177.2' 6,342.4 6,438.0 6,596.2 6,733.7 6,885.1 6 Debt capital instruments 2,717.8 3,040.0 3,488.4 3,946.4 4,189.4 4,297.0' 4,404.5 4,476.2 4,587.9 4,698.1 4,798.0 7 Tax-exempt obligations 471.7 522.1 658.4 689.2 705.2 715.5 723.7 728.0 735.8 749.4 -•',1.1 8 Corporate bonds 423.0 469.2 542.9 664.2 718.5 743.7 764.1 789.5 819.1 841.7 9 Mortgages 1,823.1 2,048.8 2,287.1 2,593.0 2,765.7 2,837.7 2,916.6 2,958.8 3,033.0 3,107.1 3 !"•:• 4
10 Home mortgages 1,200.2 1,336.2 1,490.2 1,699.6 1,800.7 1,853.8 1,908.7 1,935.8 1,996.7 2,052.0 2 < : 11 Multifamily residential 158.8 183.6 213.0 246.3 259.9 265.0' 270.0 274.4 275.2 277.8 ..1 12 Commercial 350.4 416.5 478.1 551.4 613.8 629.0 649.1 660.6 673.3 690.1 705.7 13 Farm 113.7 112.4 105.9 95.8 91.3 90.0 88.9 88.0 87.8 87.2 86.5
14 Other debt instruments 1,308.6 1,536.9 1,708.2 1,856.3 1,852.7 1,880.2 1,937.9 1,961.8 2,008.3 2,035.6 2,087.1 15 Consumer credit 437.7 519.3 601.8 656.2 658.7 680.9 696.9 692.2 709.6 725.7 746.2 16 Bank loans n.e.c 490.2 552.9 592.6 658.6 636.3 637.5 656.7 668.4 689.3 689.8 699.2 17 Open market paper 36.8 58.5 72.2 62.9 67.9 68.1 73.8 73.5 77.8 80.3 85.4 18 Other 344.0 406.2 441.6 478.6 489.9 493.7 510.5 527.7 531.6 539.8 556.3
19 By borrowing sector 4,026.4 4,577.0 5,196.6 5,802.7 6,042.1 6,177.2' 6,342.4 6,438.0 6,596.2 6,733.7 6,885.1 20 State and local governments 357.7 385.1 476.9 520.2 535.3 546.2 554.2 557.2 564.1 577.5 588.5 21 Households 1,811.6 2,038.2 2,314.5 2,594.2 2,691.2 2,762.8 2,836.5 2,862.0 2,942.8 3,012.6 3,079.4 22 Nonfinancial business 1,857.1 2,153.7 2,405.2 2,688.3 2,815.7 2,868.2' 2,951.6 3,018.9 3,089.3 3,143.6 3,217.2 23 Farm 188.4 187.9 173.4 156.6 150.2 148.5 145.5 141.3 143.9 143.7 141.7 24 Nonfarm noncorporate 645.8 769.0 898.3 1,001.6' 1,055.9"" 1,076.4' 1,109.5 1,131.8 1,148.6 1,167.9 1,190.2 25 Corporate 1,022.9 1,196.8 1,333.5 1,530. l r 1,609.6' 1,643.3' 1,696.6 1,745.8 1,796.8 1,832.0 1,885.3
26 Foreign credit market debt held in United States 227.3 235.1 236.7 238.2 236.8 238.9 244.3 245.1 246.4 246.6 253.6
27 Bonds 64.2 68.0 71.8 74.8 74.6 75.9 81.6 85.4 85.2 86.5 91.1 28 Bank loans n.e.c 37.4 30.8 27.9 26.9 25.4 24.2 23.3 22.8 22.4 22.7 22.5 29 Open market paper 21.5 27.7 33.9 37.4 35.6 40.6 41.2 42.5 44.0 46.3 50.9 30 U.S. government loans 104.1 108.6 103.0 99.1 101.2 98.2 98.1 94.4 94.7 91.1 89.1
31 Total domestic plus foreign 5,431.6 6,188.8 7,033.7 7,856.3 8,154.6' 8,313.9r 8,547.0' 8,686.4 8,864.8 9,044.3 9,256.4
Financial sectors
32 Total credit market debt owed by financial sectors 857.9 1,006.2 1,206.2 1,510.8 1,710.0 1,783.8 1,862.8' 1,882.9 1,954.9 2,014.6 2,102.8
By instrument 33 U.S. government related 456.7 531.2 632.7 810.3 937.1 981.6 1,026.5 1,050.6 1,076.9 1,116.3 1,162.6 34 Sponsored credit agency securities 206.8 237.2 257.8 273.0 275.8 283.7 303.2 313.5 317.9 328.5 348.2 35 Mortgage pool securities 244.9 289.0 368.9 531.6 656.4 692.9 718.3 732.1 754.0 782.8 809.4 36 Loans from U.S. government 5.0 5.0 6.1 5.7 5.0 5.0 5.0 5.0 5.0 5.0 5.0 37 Private financial sectors 401.2 475.0 573.4 700.5 772.9 802.1 836.3' 832.4 878.0 898.3 940.2 38 Corporate bonds 115.8 148.9 197.5 268.4 304.6 324.2 335.6' 337.5 352.3 362.8 372.9 39 Mortgages 2.1 2.5 2.7 2.7 2.9 2.9 3.1' 3.1 3.1 3.1 3.0 40 Bank loans n.e.c 28.9 29.5 32.1 36.1 40.1 42.2 40.8 31.7 34.3 32.9 34.6 41 Open market paper 195.5 219.5 252.4 284.6 311.1 312.7 323.8 330.6 353.4 358.0 376.9 42 Loans from Federal Home Loan Banks . . . 59.0 74.6 88.8 108.6 114.3 120.1 133.1 129.5 134.8 141.6 152.8
43 Total, by sector 857.9 1,006.2 1,206.2 1,510.8 1,710.0 1,783.8 1,862.8' 1,882.9 1,954.9 2,014.6 2,102.8
44 Sponsored credit agencies 211.8 242.2 263.9 278.7 280.7 288.7 308.2 318.5 322.9 333.5 353.1 45 Mortgage pools 244.9 289.0 368.9 531.6 656.4 692.9 718.3 732.1 754.0 782.8 809.4 46 Private financial sectors 401.2 475.0 573.4 700.5 772.9 802.1 836.3' 832.4 878.0 898.3 940.2 47 Commercial banks 76.8 84.1 79.2 75.6 80.7 78.6 82.7 76.4 77.2 76.6 78.1 48 Bank affiliates 71.0 86.6 101.2 101.3 108.7 109.5 104.2 88.8 91.8 92.2 91.4 49 Savings and loan associations 73.9 93.2 115.5 145.1 157.0 165.4 181.1 177.4 186.9 197.9 210.3 50 Finance companies 171.7 193.2 246.9 308.1 329.5' 340.4' 358.0' 368.4 392.4 397.1 416.4 51 REITs 3.5 4.3 5.6 6.5 6.1' 6.8' 7.3' 7.6 8.0 7.6 8.9 52 CMO issuers 4.2 13.5 25.0 64.0 90.9 101.6 103.1 113.9 121.7 127.0 135.1
All sectors
53 Total credit market debt 6,289.5 7,195.0 8,239.8 9,367.2 9864.6' 10,097.6' 10,409.8' 10,569.3 10,819.7 11,058.9 11,359.2
54 U.S. government securities 1,629.4 1,902.8 2,227.0 2,620.0 2,807.8' 2,874.4' 2,981.8' 3,048.8 3,094.2 3,175.2 3,275.4 55 State and local obligations 471.7 522.1 658.4 689.2 705.2 715.5 723.7 728.0 735.8 749.4 760.1 56 Corporate and foreign bonds 603.0 686.0 812.1 1,007.4 1,097.7 1,143.9 1,181.4' 1,212.3 1,256.6 1,291.0 1,325.4 57 Mortgages 1,825.4 2,051.4 2,289.8 2,595.8 2,768.6 2,840.7' 2,919.8' 2,961.9 3,036.1 3,110.2 3,179.5 58 Consumer credit 437.7 519.3 601.8 656.2 658.7 680.9 696.6 692.2 709.6 725.7 746.2 59 Bank loans n.e.c 556.5 613.2 652.6 721.6 701.7 703.8 720.8 722.9 746.0 745.4 756.4 60 Open market paper 253.8 305.7 358.5 384.9 414.6 421.4 438.8 446.7 475.3 484.6 513.1 61 Other loans 512.1 594 4 639.5 692.0 710.4 717.0 746.6' 756.6 766.1 777.4 803.1
Digitized for FRASER http://fraser.stlouisfed.org/ Federal Reserve Bank of St. Louis
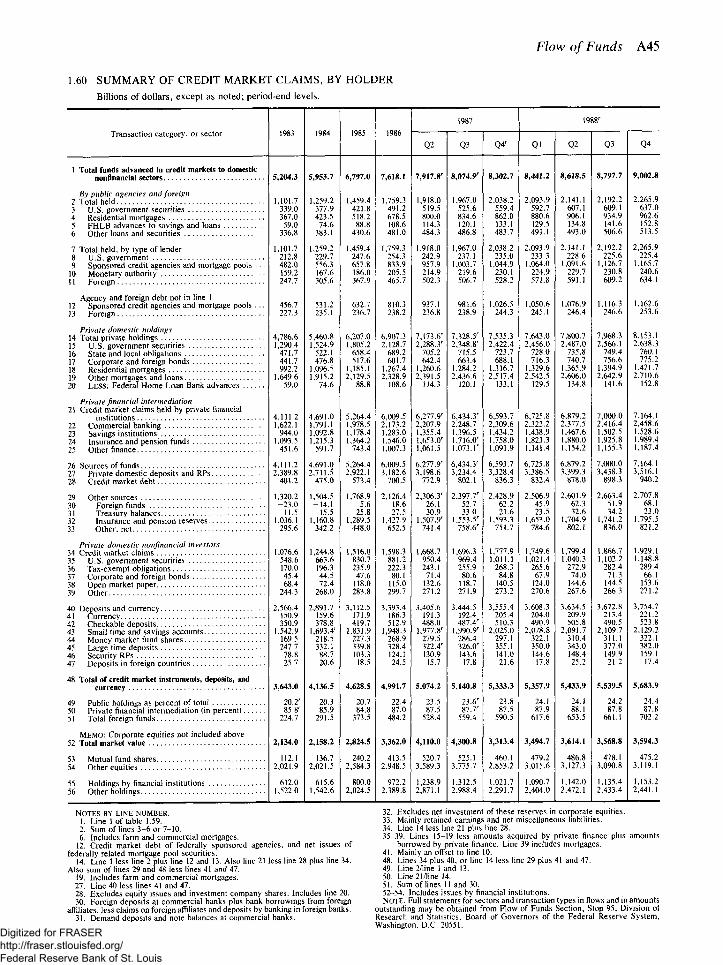
Flow of Funds A45
1.60 S U M M A R Y OF CREDIT MARKET CLAIMS, BY HOLDER
Billions of dollars, except as noted; period-end levels.
Transaction category, or sector 1983 1984 1985 1986 1987 1988'
Transaction category, or sector 1983 1984 1985 1986 Q2 Q3 Q4r Ql Q2 Q3 Q4
1 Total funds advanced in credit markets to domestic 8,074.9' 8,797.7 9,002.8 nonfinancial sectors 5,204.3 5,953.7 6,797.0 7,618.1 7,917.8r 8,074.9' 8,302.7 8,441.2 8,618.5 8,797.7 9,002.8
By public agencies and foreign 2,038.2 2,093.9 2,141.1 2,192.2 2,265.9 ? Total held 1,101.7 1,259.2 1,459.4 1,759.3 1,918.0 1,967.0 2,038.2 2,093.9 2,141.1 2,192.2 2,265.9
3 U.S. government securities 339.0 377.9 421.8 491.2 519.5 525.6 559.4 592.7 607.1 609.1 637.0 4 Residential mortgages 367.0 423.5 518.2 678.5 800.0 834.6 862.0 880.6 906.1 934.9 962.6 5 FHLB advances to savings and loans 59.0 74.6 88.8 108.6 114.3 120.1 133.1 129.5 134.8 141.6 152.8 6 Other loans and securities 336.8 383.1 430.6 481.0 484.3 486.8 483.7 491.1 493.0 506.6 513.5
7 Total held, by type of lender 1,101.7 1,259.2 1,459.4 1,759.3 1,918.0 1,967.0 2,038.2 2,093.9 2,141.1 2,192.2 2,265.9 8 U.S. government 212.8 229.7 247.6 254.3 242.9 237.1 235.0 233.3 228.6 225.6 225.4 9 Sponsored credit agencies and mortgage pools . . . 482.0 556.3 657.8 833.9 957.9 1,003.7 1,044.9 1,064.0 1,091.6 1,126.7 1,165.7
10 Monetary authority 159.2 167.6 186.0 205.5 214.9 219.6 230.1 224.9 229.7 230.8 240.6 11 Foreign 247.7 305.6 367.9 465.7 502.3 506.7 528.2 571.8 591.1 609.2 634.1
Agency and foreign debt not in line 1 1,050.6 1,076.9 1,116.3 1,162.6 1? Sponsored credit agencies and mortgage pools . . . 456.7 531.2 632.7 810.3 937.1 981.6 1,026.5 1,050.6 1,076.9 1,116.3 1,162.6
13 Foreign 227.3 235.1 236.7 238.2 236.8 238.9 244.3 245.1 246.4 246.6 253.6
Private domestic holdings 7,173.6'' 7,643.0 7,800.7 7,968.3 8,153.1 14 Total private holdings 4,786.6 5,460.8 6,207.0 6,907.3 7,173.6'' 7,328.5' 7,535.3 7,643.0 7,800.7 7,968.3 8,153.1
15 U.S. government securities 1,290.4 1,524.9 1,805.2 2,128.7 2,288.3'' 2,348.8' 2,422.4 2,456.0 2,487.0 2,566.1 2,638.3 16 State and local obligations 471.7 522.1 658.4 689.2 705.2 715.5 723.7 728.0 735.8 749.4 760.1 17 Corporate and foreign bonds 441.7 476.8 517.6 601.7 642.4 663.4 688.1 716.3 740.7 756.6 775.2 18 Residential mortgages 992.2 1,096.5 1,185.1 1,267.4 1,260.6 1,284.2 1,316.7 1,329.6 1,365.9 1,394.9 1,421.7 19 Other mortgages and loans 1,649.6 1,915.2 2,129.5 2,328.9 2,391.5 2,436.6 2,517.4 2,542.5 2,606.0 2,642.9 2,710.6 20 LESS: Federal Home Loan Bank advances 59.0 74.6 88.8 108.6 114.3 120.1 133.1 129.5 134.8 141.6 152.8
Private financial intermediation 71 Credit market claims held by private financial
6,725.8 6,879.2 7,000.0 7,164.1 4,111.2 4,691.0 5,264.4 6,009.5 6,277.9' 6,434.3' 6,593.7 6,725.8 6,879.2 7,000.0 7,164.1 ?? Commercial banking 1,622.1 1,791.1 1,978.5 2,173.2 2,207.9 2,248.7 2,309.6 2,322.2 2,377.5 2,416.4 2,458.6 73 Savings institutions 944.0 1,092.8 1,178.4 1,283.0 1,355.4 1,396.5 1,434.2 1,438.9 1,467.6 1,502.5 1,528.6 74 Insurance and pension funds 1,093.5 1,215.3 1,364.2 1,546.0 1,653.0' 1,716.0' 1,758.0 1,823.3 1,880.0 1,925.8 1,989.4 25 Other finance 451.6 591.7 743.4 1,007.3 1,061.5 1,073.1' 1,091.9 1,141.4 1,154.2 1,155.3 1,187.4
76 Sources of funds 4,111.2 4,691.0 5,264.4 6,009.5 6,277.9'' 6,434.3' 6,593.7 6,725.8 6,879.2 7,000.0 7,164.1 77 Private domestic deposits and RPs 2,389.8 2,711.5 2,922.1 3,182.6 3,198.6 3,234.4 3,328.4 3,386.5 3,399.3 3,438.3 3,516.1 28 Credit market debt 401.2 475.0 573.4 700.5 772.9 802.1 836.3 832.4 878.0 898.3 940.2
79 Other sources 1,320.2 1,504.5 1,768.9 2,126.4 2,306.3' 2,397.7' 2,428.9 2,506.9 2,601.9 2,663.4 2,707.8 30 Foreign funds -23.0 -14.1 5.6 18.6 26.1 52.7 62.2 45.9 62.3 51.9 68.1 31 Treasury balances 11.5 15.5 25.8 27.5 30.9 33.0 21.6 23.5 32.6 34.2 23.0 37 Insurance and pension reserves 1,036.1 1,160.8 1,289.5 1,427.9 1,507.9' 1,553.5'' 1,593.3 1,653.0 1,704.9 1,741.2 1,795.5 33 Other, net 295.6 342.2 448.0 652.5 741.4 758.6' 751.7 784.6 802.1 836.0 821.2
Private domestic nonfinancial investors 1,866.7 1,929.1 34 Credit market claims 1,076.6 1,244.8 1,516.0 1,598.3 1,668.7 1,696.3 1,777.9 1,749.6 1,799.4 1,866.7 1,929.1
35 U.S. government securities 548.6 663.6 830.7 881.2 950.4 969.4 1,011.1 1,021.4 1,040.3 1,102.2 1,148.8 36 Tax-exempt obligations 170.0 196.3 235.9 222.3 243.1 255.9 268.3 265.6 272.9 282.4 289.4 37 Corporate and foreign bonds 45.4 44.5 47.6 80.1 71.4 80.6 84.8 67.9 74.0 71.3 66.1 38 Open market paper 68.4 72.4 118.0 115.0 132.6 118.7 140.5 124.0 144.6 144.5 153.6 39 Other 244.3 268.0 283.8 299.7 271.2 271.9 273.2 270.6 267.6 266.3 271.2
40 Deposits and currency 2,566.4 2,891.7 3,112.5 3,393.4 3,405.6 3,444.5 3,555.4 3,608.3 3,634.5 3,672.8 3,754.7 41 Currency 150.9 159.6 171.9 186.3 191.3 192.4 205.4 204.0 209.9 213.4 221.2 47 Checkable deposits 350.9 378.8 419.7 512.9 488.0 487.4' 510.3 490.9 505.8 490.5 523.8 43 Small time and savings accounts 1,542.9 1,693.4' 1,831.9 1,948.3 1,977.8' 1,990.9' 2,025.0 2,078.8 2,091.7 2,109.7 2,129.2 44 Money market fund shares 169.5 218.5 227.3 268.9 279.5 286.4 297.1 322.1 310.4 311.1 322.1 45 Large time deposits 247.7 332.1 339.8 328.4 322.4' 326.0' 355.1 350.0 343.0 377.0 382.0 46 Security RPs 78.8 88.7 103.3 124.1 130.9 143.6 141.0 144.6 148.4 149.9 159.1 47 Deposits in foreign countries 25.7 20.6 18.5 24.5 15.7 17.8 21.6 17.8 25.2 21.2 17.4
48 Total of credit market instruments, deposits, and 5,683.9 currency 3,643.0 4,136.5 4,628.5 4,991.7 5,074.2 5,140.8 5,333.3 5,357.9 5,433.9 5,539.5 5,683.9
49 Public holdings as percent of total 20.2'' 20.3 20.7 22.4 23.5 23.6' 23.8 24.1 24.1 24.2 24.4 50 Private financial intermediation (in percent) 85.8r 85.9 84.8 87.0 87.5 87.7' 87.5 87.9 88.1
653.5 87.8 87.8
51 Total foreign funds 224.7 291.5 373.5 484.2 528.4 559.4 590.5 617.6 88.1
653.5 661.1 702.2
MEMO: Corporate equities not included above 3,594.3 52 Total market value 2,134.0 2,158.2 2,824.5 3,362.0 4,110.0 4,300.8 3,313.4 3,494.7 3,614.1 3,568.8 3,594.3
53 Mutual fund shares 112.1 136.7 240.2 413.5 520.7 525.1 460.1 479.2 486.8 478.1 475.2 54 Other equities 2,021.9 2,021.5 2,584.3 2,948.5 3,589.3 3,775.7 2,853.2 3,015.6 3,127.3 3,090.8 3,119.1
55 Holdings by financial institutions 612.0 615.6 800.0 972.2 1,238.9 1,312.5 1,021.7 1,090.7 1,142.0 1,135.4 1,153.2 56 Other holdings 1,522.0 1,542.6 2,024.5 2,389.8 2,871.1 2,988.4 2,291.7 2,404.0 2,472.1 2,433.4 2,441.1
NOTES BY LINE NUMBER. 1. Line 1 of table 1.59. 2. Sum of lines 3 -6 or 7-10. 6. Includes farm and commercial mortgages.
12. Credit market debt of federally sponsored agencies, and net issues of federally related mortgage pool securities.
14. Line 1 less line 2 plus line 12 and 13. Also line 21 less line 28 plus line 34. Also sum of lines 29 and 48 less lines 41 and 47.
19. Includes farm and commercial mortgages. 27. Line 40 less lines 41 and 47. 28. Excludes equity issues and investment company shares. Includes line 20. 30. Foreign deposits at commercial banks plus bank borrowings from foreign
affiliates, less claims on foreign affiliates and deposits by banking in foreign banks. 31. Demand deposits and note balances at commercial banks.
32. Excludes net investment of these reserves in corporate equities. 33. Mainly retained earnings and net miscellaneous liabilities. 34. Line 14 less line 21 plus line 28. 35-39. Lines 15-19 less amounts acquired by private finance plus amounts
borrowed by private finance. Line 39 includes mortgages. 41. Mainly an offset to line 10. 48. Lines 34 plus 40, or line 14 less line 29 plus 41 and 47. 49. Line 2/line 1 and 13. 50. Line 21/line 14. 51. Sum of lines 11 and 30. 52-54. Includes issues by financial institutions. NOTE. Full statements for sectors and transaction types in flows and in amounts
outstanding may be obtained from Flow of Funds Section, Stop 95, Division of Research and Statistics, Board of Governors of the Federal Reserve System, Washington, D.C. 20551.
Digitized for FRASER http://fraser.stlouisfed.org/ Federal Reserve Bank of St. Louis
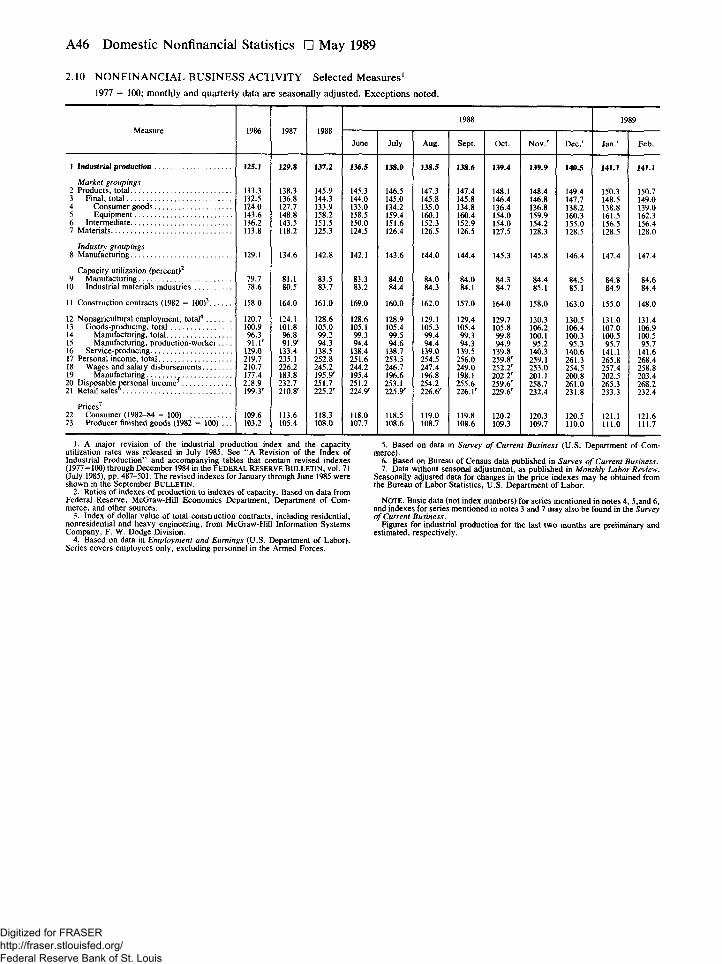
A46 Domestic Nonfinancial Statistics • May 1989
2.10 NONFINANCIAL BUSINESS ACTIVITY Selected Measures1
1977 = 100; monthly and quarterly data are seasonally adjusted. Exceptions noted.
Measure 1986 1987 1988 1988 1989
Measure 1986 1987 1988 June July Aug. Sept. Oct. Nov. ' Dec.' Jan. ' Feb.
1 Industrial production 125.1 129.8 137.2 136.5 138.0 138.5 138.6 139.4 139.9 140.5 141.1 141.1
Market groupings 2 Products, total 133.3 138.3 145.9 145.3 146.5 147.3 147.4 148.1 148.4 149.4 150.3 150.7 3 Final, total 132.5 136.8 144.3 144.0 145.0 145.8 145.8 146.4 146.8 147.7 148.5 149.0 4 Consumer goods 124.0 127.7 133.9 133.0 134.2 135.0 134.8 136.4 136.8 138.2 138.8 139.0 5 Equipment 143.6 148.8 158.2 158.5 159.4 160.1 160.4 154.0 159.9 160.3 161.5 162.3 6 Intermediate 136.2 143.5 151.5 150.0 151.6 152.3 152.9 154.0 154.2 155.0 156.5 156.4 7 Materials 113.8 118.2 125.3 124.5 126.4 126.5 126.5 127.5 128.3 128.5 128.5 128.0
Industry groupings 8 Manufacturing 129.1 134.6 142.8 142.1 143.6 144.0 144.4 145.3 145.8 146.4 147.4 147.4
Capacity utilization (percent)2
9 Manufacturing 79.7 81.1 83.5 83.3 84.0 84.0 84.0 84.3 84.4 84.5 84.8 84.6 10 Industrial materials industries 78.6 80.5 83.7 83.2 84.4 84.3 84.1 84.7 85.1 85.1 84.9 84.4
11 Construction contracts (1982 = 100)3 158.0 164.0 161.0 169.0 160.0 162.0 157.0 164.0 158.0 163.0 155.0 148.0
12 Nonagricultural employment, total4 120.7 124.1 128.6 128.6 128.9 129.1 129.4 129.7 130.3 130.5 131.0 131.4 13 Goods-producing, total 100.9 101.8 105.0 105.1 105.4 105.3 105.4 105.8 106.2 106.4 107.0 106.9 14 Manufacturing, total 96.3 96.8 99.2 99.3 99.5 99.4 99.3 99.8 100.1 100.3 100.5 100.5 15 Manufacturing, production-worker.. . . 91 . r 91.9' 94.3 94.4 94.6 94.4 94.3 94.9 95.2 95.3 95.7 95.7 16 Service-producing 129.0 133.4 138.5 138.4 138.7 139.0 139.5 139.8 140.3 140.6 141.1 141.6 17 Personal income, total 219.7 235.1 252.8 251.6 253.5 254.5 256.0 259.8' 259.1 261.3 265.8 268.4 18 Wages and salary disbursements 210.7 226.2 245.2 244.2 246.7 247.4 249.0 252.2' 253.0 254.5 257.4 258.8 19 Manufacturing 177.4 183.8 195.9' 195.4 196.6 196.8 198.1 202.2' 201.1 200.8 202.5 203.4 20 Disposable personal income 218.9 232.7 251.7 251.2 253.1 254.2 255.6 259.6' 258.7 261.0 265.3 268.2 21 Retail sales 199.3r 210.8' 225.2' 2 2 4 ^ 225.9^ 226.6' 226.1' 229.6' 232.4 231.8 233.3 232.4
Prices7
22 Consumer (1982-84 = 100) 109.6 113.6 118.3 118.0 118.5 119.0 119.8 120.2 120.3 120.5 121.1 121.6 23 Producer finished goods (1982 = 100) . . . 103.2 105.4 108.0 107.7 108.6 108.7 108.6 109.3 109.7 110.0 111.0 111.7
1. A major revision of the industrial production index and the capacity utilization rates was released in July 1985. See "A Revision of the Index of Industrial Production" and accompanying tables that contain revised indexes ( 1 9 7 7 = 100) t h r o u g h D e c e m b e r 1984 in t h e FEDERAL RESERVE BULLETIN, v o l . 71 (July 1985), pp. 487-501. The revised indexes for January through June 1985 were shown in the September BULLETIN.
2. Ratios of indexes of production to indexes of capacity. Based on data from Federal Reserve, McGraw-Hill Economics Department, Department of Com-merce, and other sources.
3. Index of dollar value of total construction contracts, including residential, nonresidential and heavy engineering, from McGraw-Hill Information Systems Company, F. W. Dodge Division.
4. Based on data in Employment and Earnings (U.S. Department of Labor). Series covers employees only, excluding personnel in the Armed Forces.
5. Based on data in Survey of Current Business (U.S. Department of Com-merce).
6. Based on Bureau of Census data published in Survey of Current Business. 7. Data without seasonal adjustment, as published in Monthly Labor Review.
Seasonally adjusted data for changes in the price indexes may be obtained from the Bureau of Labor Statistics, U.S. Department of Labor.
NOTE. Basic data (not index numbers) for series mentioned in notes 4, 5,and 6, and indexes for series mentioned in notes 3 and 7 may also be found in the Survey of Current Business.
Figures for industrial production for the last two months are preliminary and estimated, respectively.
Digitized for FRASER http://fraser.stlouisfed.org/ Federal Reserve Bank of St. Louis
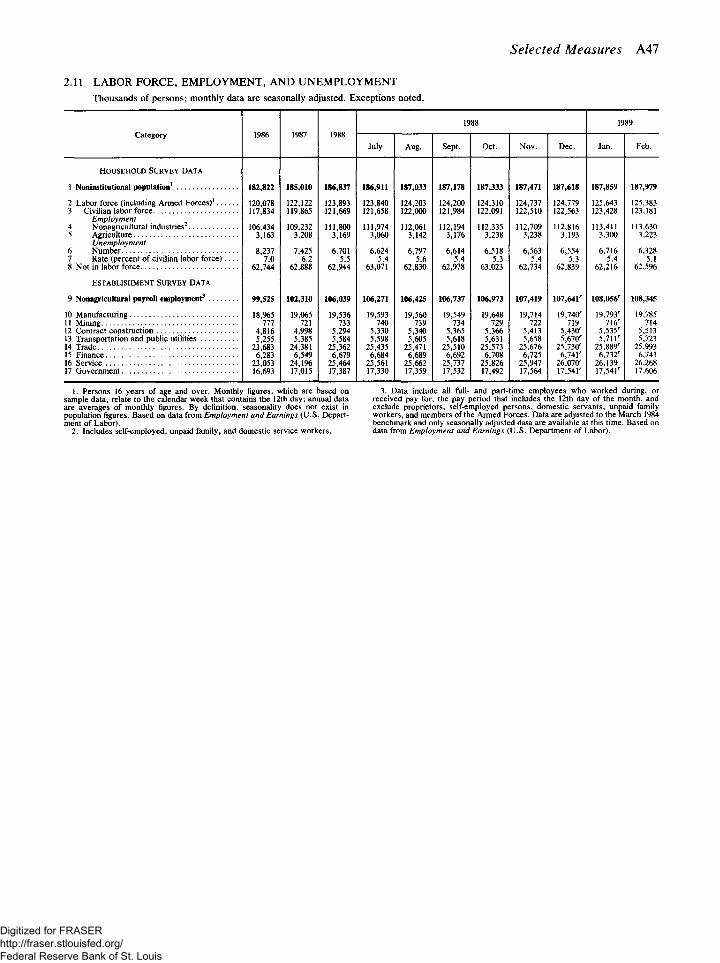
Selected Measures A47
2.11 LABOR FORCE, E M P L O Y M E N T , A N D U N E M P L O Y M E N T
Thousands of persons; monthly data are seasonally adjusted. Exceptions noted.
Category 1986 1987 1988 1988 1989
Category 1986 1987 1988 July Aug. Sept. Oct. Nov. Dec. Jan. Feb.
HOUSEHOLD SURVEY DATA
1 Noninstitutional population1 182,822 185,010 186,837 186,911 187,033 187,178 187,333 187,471 187,618 187,859 187,979
2 Labor force (including Armed Forces)1 120,078 122,122 123,893 123,840 124,203 124,200 124,310 124,737 124,779 125,643 125,383 3 Civilian labor force 117,834 119,865 121,669 121,658 122,000 121,984 122,091 122,510 122,563 123,428 123,181
Employment 117,834 119,865 121,669 121,658 122,000 121,984 122,091 122,510 122,563
4 Nonagricultural industries 106,434 109,232 111,800 111,974 112,061 112,194 112,335 112,709 112,816 113,411 113,630 5 Agriculture 3,163 3,208 3,169 3,060 3,142 3,176 3,238 3,238 3,193 3,300 3,223
Unemployment 3,163 3,208 3,169 3,060 3,142 3,238
6 Number 8,237 7,425 6,701 6,624 6,797 6,614 6,518 6,563 6,554 6,716 6,328 7 Rate (percent of civilian labor force) — 7.0 6.2 5.5 5.4 5.6 5.4 5.3 5.4 5.3 5.4 5.1 8 Not in labor force 62,744 62,888 62,944 63,071 62,830 62,978 63,023 62,734 62,839 62,216 62,596
ESTABLISHMENT SURVEY DATA
9 Nonagricultural payroll employment3 99,525 102,310 106,039 106,271 106,425 106,737 106,973 107,419 107,641r 108,056'' 108,345
10 Manufacturing 18,965 19,065 19,536 19,593 19,560 19,549 19,648 19,714 19,741/ 19,793' 19,785 11 Mining 777 721 733 740 739 734 729 722 719 716' 714 12 Contract construction 4,816 4,998 5,294 5,330 5,340 5,365 5,366 5,413 5,430r 5,535r 5,513 13 Transportation and public utilities 5,255 5,385 5,584 5,598 5,605 5,618 5,631 5,658 5,670r 5,71lr 5,723 14 Trade 23,683 24,381 25,362 25,435 25,471 25,510 25,573 25,676 25,73(K 25,889' 25,993 15 Finance 6,283 6,549 6,679 6,684 6,689 6,692 6,708 6,725 6,74V 6,732r 6,743 16 Service 23,053 24,196 25,464 25,561 25,662 25,737 25,826 25,947 26,07c 26,139 26,268 17 Government 16,693 17,015 17,387 17,330 17,359 17,532 17,492 17,564 17,541r 17,541'" 17,606
1. Persons 16 years of age and over. Monthly figures, which are based on sample data, relate to the calendar week that contains the 12th day; annual data are averages of monthly figures. By definition, seasonality does not exist in population figures. Based on data from Employment and Earnings (U.S. Depart-ment of Labor).
2. Includes self-employed, unpaid family, and domestic service workers.
3. Data include all full- and part-time employees who worked during, or received pay for, the pay period that includes the 12th day of the month, and exclude proprietors, self-employed persons, domestic servants, unpaid family workers, and members of the Armed Forces. Data are adjusted to the March 1984 benchmark and only seasonally adjusted data are available at this time. Based on data from Employment and Earnings (U.S. Department of Labor).
Digitized for FRASER http://fraser.stlouisfed.org/ Federal Reserve Bank of St. Louis
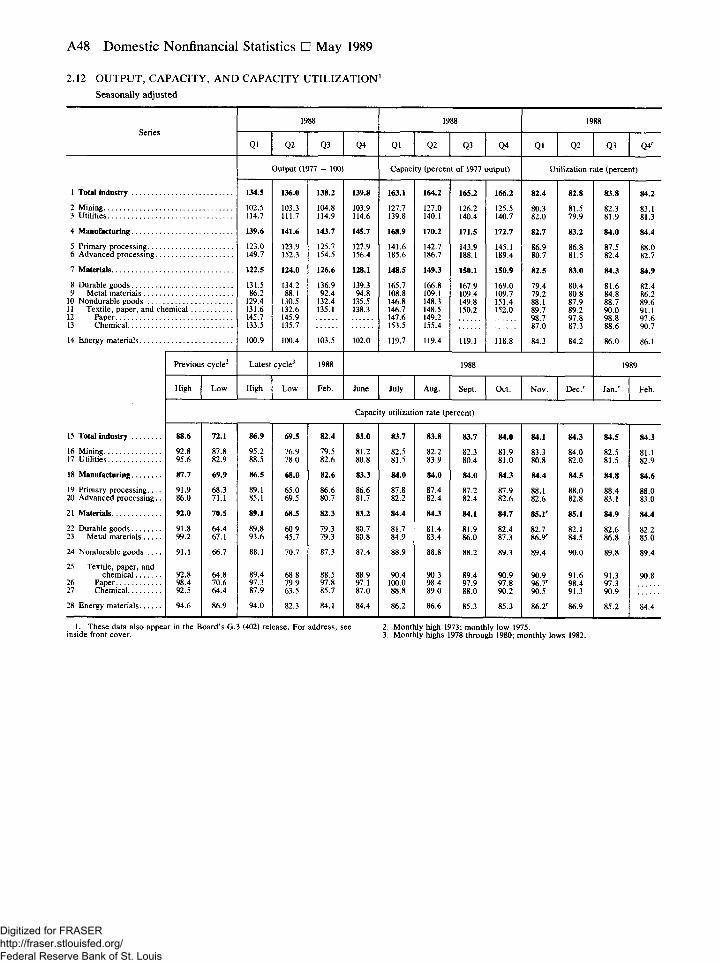
A48 Domestic Nonfinancial Statistics • May 1989
2.12 OUTPUT, CAPACITY, A N D CAPACITY UTILIZATION 1
Seasonally adjusted
Series 1988 1988 1988
Series
Ql Q2 Q3 Q4 Ql Q2 Q3 Q4 Ql Q2 Q3 Q4r
1 Total industry
2 Mining
3 Utilities
4 Manufacturing
5 Primary processing
6 Advanced processing
7 Materials
8 Durable goods 9 Metal materials
10 Nondurable goods 11 Textile, paper, and chemical
Output (1977 = 100) Capacity (percent of 1977 output) Utilization rate (percent)
1 Total industry
2 Mining
3 Utilities
4 Manufacturing
5 Primary processing
6 Advanced processing
7 Materials
8 Durable goods 9 Metal materials
10 Nondurable goods 11 Textile, paper, and chemical
134.5
102.5 114.7
139.6
123.0 149.7
122.5
131.5 86.2
129.4 131.6 145.7 133.5
100.9
136.0
103.3 111.7
141.6
123.9 152.3
124.0
134.2 88.1
130.5 132.6 145.9 135.7
100.4
138.2
104.8 114.9
143.7
125.7 154.5
126.6
136.9 92.4
132.4 135.1
139.8
103.9 114.6
145.7
127.9 156.4
128.1
139.3 94.8
135.5 138.3
163.1
127.7 139.8
168.9
141.6 185.6
148.5
165.7 108.8 146.8 146.7 147.6 153.5
119.7
164.2
127.0 140.1
170.2
142.7 186.7
149.3
166.8 109.1 148.3 148.5 149.2 155.4
119.4
165.2
126.2 140.4
171.5
143.9 188.1
150.1
167.9 109.4 149.8 150.2
166.2
125.5 140.7
172.7
145.1 189.4
150.9
169.0 109.7 151.4 152.0
82.4
80.3 82.0
82.7
86.9 80.7
82.5
79.4 79.2 88.1 89.7 98.7 87.0
84.3
82.8
81.5 79.9
83.2
86.8 81.5
83.0
80.4 80.8 87.9 89.2 97.8 87.3
84.2
83.8
82.3 81.9
84.0
87.5 82.4
84.3
81.6 84.8 88.7 90.0 98.8 88.6
86.0
84.2
83.1 81.3
84.4
88.0 82.7
84.9
82.4 86.2 89.6 91.1 97.6 90.7
86.1
134.5
102.5 114.7
139.6
123.0 149.7
122.5
131.5 86.2
129.4 131.6 145.7 133.5
100.9
136.0
103.3 111.7
141.6
123.9 152.3
124.0
134.2 88.1
130.5 132.6 145.9 135.7
100.4
163.1
127.7 139.8
168.9
141.6 185.6
148.5
165.7 108.8 146.8 146.7 147.6 153.5
119.7
164.2
127.0 140.1
170.2
142.7 186.7
149.3
166.8 109.1 148.3 148.5 149.2 155.4
119.4
82.4
80.3 82.0
82.7
86.9 80.7
82.5
79.4 79.2 88.1 89.7 98.7 87.0
84.3
82.8
81.5 79.9
83.2
86.8 81.5
83.0
80.4 80.8 87.9 89.2 97.8 87.3
84.2
83.8
82.3 81.9
84.0
87.5 82.4
84.3
81.6 84.8 88.7 90.0 98.8 88.6
86.0
84.2
83.1 81.3
84.4
88.0 82.7
84.9
82.4 86.2 89.6 91.1 97.6 90.7
86.1 14 Energy materials
134.5
102.5 114.7
139.6
123.0 149.7
122.5
131.5 86.2
129.4 131.6 145.7 133.5
100.9
136.0
103.3 111.7
141.6
123.9 152.3
124.0
134.2 88.1
130.5 132.6 145.9 135.7
100.4 103.5 102.0
163.1
127.7 139.8
168.9
141.6 185.6
148.5
165.7 108.8 146.8 146.7 147.6 153.5
119.7
164.2
127.0 140.1
170.2
142.7 186.7
149.3
166.8 109.1 148.3 148.5 149.2 155.4
119.4 119.1 118.8
82.4
80.3 82.0
82.7
86.9 80.7
82.5
79.4 79.2 88.1 89.7 98.7 87.0
84.3
82.8
81.5 79.9
83.2
86.8 81.5
83.0
80.4 80.8 87.9 89.2 97.8 87.3
84.2
83.8
82.3 81.9
84.0
87.5 82.4
84.3
81.6 84.8 88.7 90.0 98.8 88.6
86.0
84.2
83.1 81.3
84.4
88.0 82.7
84.9
82.4 86.2 89.6 91.1 97.6 90.7
86.1
Previous cycle2 Latest cycle3 1988 1988 1989
High Low High Low Feb. June July Aug. Sept. Oct. Nov. Dec / J a n / Feb.
Capacity utilization rate (percent)
15 Total industry 88.6 72.1 86.9 69.5 82.4 83.0 83.7 83.8 83.7 84.0 84.1 84.3 84.5 84.3
16 Mining 92.8 87.8 95.2 76.9 79.5 81.2 82.5 82.2 82.3 81.9 83.3 84.0 82.5 81.1 17 Utilities 95.6 82.9 88.5 78.0 82.6 80.8 81.5 83.9 80.4 81.0 80.8 82.0 81.5 82.9
18 Manufacturing 87.7 69.9 86.5 68.0 82.6 83.3 84.0 84.0 84.0 84.3 84.4 84.5 84.8 84.6
19 Primary processing 91.9 68.3 89.1 65.0 86.6 86.6 87.8 87.4 87.2 87.9 88.1 88.0 88.4 88.0 20 Advanced processing.. 86.0 71.1 85.1 69.5 80.7 81.7 82.2 82.4 82.4 82.6 82.6 82.8 83.1 83.0
21 Materials 92.0 70.5 89.1 68.5 82.3 83.2 84.4 84.3 84.1 84.7 85.lr 85.1 84.9 84.4
22 Durable goods 91.8 64.4 89.8 60.9 79.3 80.7 81.7 81.4 81.9 82.4 82.7 82.1 82.6 82.2 23 Metal materials 99.2 67.1 93.6 45.7 79.3 80.8 84.9 83.4 86.0 87.3 86.9" 84.5 86.8 85.0
24 Nondurable goods . . . . 91.1 66.7 88.1 70.7 87.3 87.4 88.9 88.8 88.2 89.3 89.4 90.0 89.8 89.4
25 Textile, paper, and chemical 92.8 64.8 89.4 68.8 88.5 88.9 90.4 90.3 89.4 90.9 90.9 91.6 91.3 90.8
76 98.4 70.6 97.3 79.9 97.8 97.1 100.0 98.4 97.9 97.8 96 T 98.4 97 3 27
28
92.5
94.6
64.4
86.9
87.9
94.0
63.5
82.3
85.7
84.1
87.0
84.4
88.8
86.2
89.0
86.6
88.0
85.3
90.2
85.3
90.5
86.2r
91.3
86.9
90.9
85.2
27
28 Energy materials
92.5
94.6
64.4
86.9
87.9
94.0
63.5
82.3
85.7
84.1
87.0
84.4
88.8
86.2
89.0
86.6
88.0
85.3
90.2
85.3
90.5
86.2r
91.3
86.9
90.9
85.2 84.4
1. These data also appear in the Board's G.3 (402) release. For address, see 2. Monthly high 1973; monthly low 1975. inside front cover. 3. Monthly highs 1978 through 1980; monthly lows 1982.
Digitized for FRASER http://fraser.stlouisfed.org/ Federal Reserve Bank of St. Louis
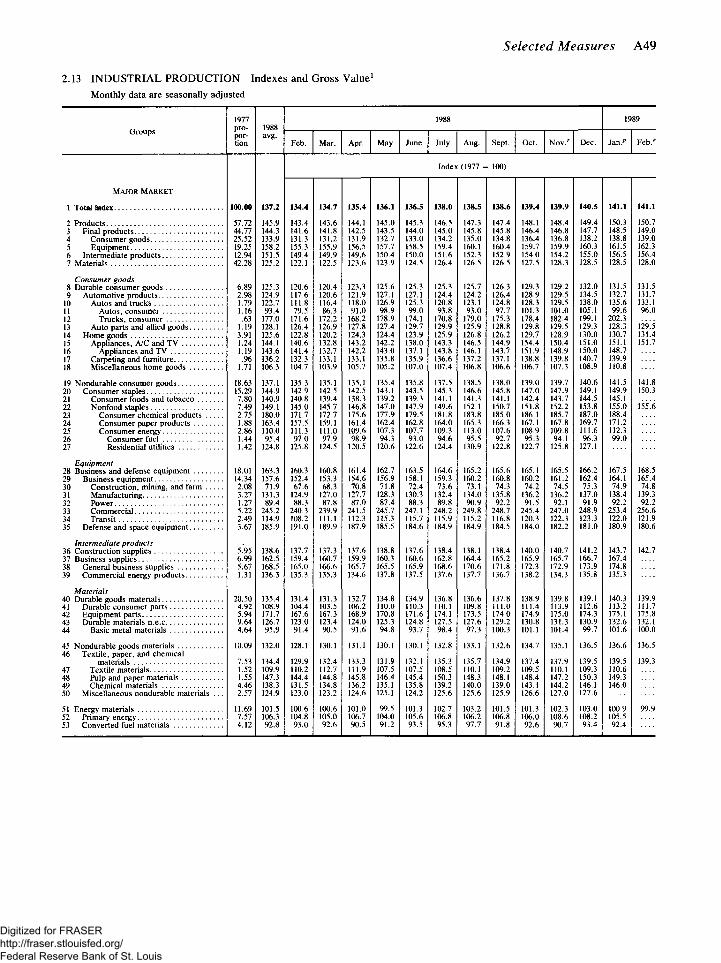
Selected Measures A49
2.13 INDUSTRIAL PRODUCTION Indexes and Gross Value1
Monthly data are seasonally adjusted
1977 1988 1989 Groups 1988 Groups por- avg.
tion avg.
Feb. Mar. Apr. May June July Aug. Sept. Oct. N o v / Dec. Jan." F e b /
Index (1977 = 100)
MAJOR MARKET
1 Total index 100.00 137 .2 134 .4 134 .7 135 .4 136.1 136 .5 138 .0 138 .5 138 .6 139 .4 139 .9 140 .5 141.1 141.1
7 Products 57.72 145.9 143.4 143.6 144.1 145.0 145.3 146.5 147.3 147.4 148.1 148.4 149.4 150.3 150.7 Final products 44.77 144.3 141.6 141.8 142.5 143.5 144.0 145.0 145.8 145.8 146.4 146.8 147.7 148.5 149.0
4 Consumer goods 25.52 133.9 131.3 131.2 131.9 132.7 133.0 134.2 135.0 134.8 136.4 136.8 138.2 138.8 139.0 Equipment 19.25 158.2 155.3 155.9 156.5 157.7 158.5 159.4 160.1 160.4 159.7 159.9 160.3 161.5 162.3
6 Intermediate products 12.94 151.5 149.4 149.9 149.6 150.4 150.0 151.6 152.3 152.9 154.0 154.2 155.0 156.5 156.4 7 Materials 42.28 125.2 122.1 122.5 123.6 123.9 124.5 126.4 126.5 126.5 127.5 128.3 128.5 128.5 128.0
Consumer goods 8 Durable consumer goods 6.89 125.3 120.6 120.4 123.3 125.6 125.3 125.3 125.7 126.3 129.3 129.2 132.0 131.5 131.5 9 Automotive products 2.98 124.9 117.6 120.6 121.9 127.1 127.1 124.4 124.2 126.4 128.9 129.5 134.5 132.7 131.7
10 Autos and trucks 1.79 122.7 111.8 116.4 118.0 126.9 125.3 120.8 123.1 124.8 128.3 129.5 138.0 135.6 133.1 11 Autos, consumer 1.16 93.4 79.5 86.3 91.0 98.9 99.0 93.8 93.0 97.7 101.3 101.0 105.1 99.6 96.0 17 Trucks, consumer .63 177.0 171.6 172.2 168.2 178.9 174.1 170.8 179.0 175.3 178.4 182.4 199.1 202.3 N Auto parts and allied goods 1.19 128.1 126.4 126.9 127.8 127.4 129.7 129.9 125.9 128.8 129.8 129.5 129.3 128.3 129.5 14 Home goods 3.91 125.6 122.8 120.2 124.3 124.4 123.9 125.9 126.8 126.2 129.7 128.9 130.0 130.7 131.4 15 Appliances, A/C and TV 1.24 144.1 140.6 132.8 143.2 142.2 138.0 143.3 146.5 144.9 154.4 150.4 151.0 151.1 151.7 16 Appliances and TV 1.19 143.6 141.4 132.7 142.2 143.0 137.1 143.8 146.1 143.7 151.9 148.9 150.0 148.7 17 Carpeting and furniture .96 136.2 132.3 133.1 133.1 135.8 135.9 136.6 137.2 137.1 138.8 139.8 140.7 139.9 18 Miscellaneous home goods 1.71 106.3 104.7 103.9 105.7 105.2 107.0 107.4 106.8 106.6 106.7 107.3 108.9 110.8
19 Nondurable consumer goods 18.63 137.1 135.3 135.1 135.1 135.4 135.8 137.5 138.5 138.0 139.0 139.7 140.6 141.5 141.8 70 Consumer staples 15.29 144.9 142.9 142.5 142.5 143.1 143.5 145.3 146.6 145.8 147.0 147.9 149.1 149.9 150.3 71 Consumer foods and tobacco 7.80 140.9 140.8 139.4 138.3 139.2 139.3 141.1 141.3 141.1 142.4 143.7 144.5 145.1 72 Nonfood staples 7.49 149.1 145.0 145.7 146.8 147.0 147.9 149.6 152.1 150.7 151.8 152.2 153.8 155.0 155.6 r\ Consumer chemical products 2.75 180.0 171.7 172.7 175.6 177.9 179.5 181.8 183.8 185.0 186.1 185.7 187.0 188.4 74 Consumer paper products 1.88 163.4 157.5 159.1 161.4 162.4 162.8 164.0 165.3 166.3 167.1 167.8 169.7 171.2 75 Consumer energy 2.86 110.0 111.3 111.0 109.6 107.3 107.7 109.3 113.0 107.6 108.9 109.8 111.6 112.3 76 Consumer fuel 1.44 95.4 97.0 97.9 98.9 94.3 93.0 94.6 95.5 92.7 95.3 94.1 96.3 99.0 27 Residential utilities 1.42 124.8 125.8 124.5 120.5 120.6 122.6 124.4 130.9 122.8 122.7 125.8 127.1
Equipment 78 Business and defense equipment 18.01 163.3 160.3 160.8 161.4 162.7 163.5 164.6 165.2 165.6 165.1 165.5 166.2 167.5 168.5 29 Business equipment 14.34 157.6 152.4 153.3 154.6 156.9 158.1 159.3 160.2 160.8 160.2 161.2 162.4 164.1 165.4 30 Construction, mining, and farm 2.08 71.9 67.6 68.3 70.8 71.8 72.4 73.6 73.1 74.3 74.2 74.5 75.3 74.9 74.8 31 Manufacturing 3.27 131.3 124.9 127.0 127.7 128.3 130.3 132.4 134.0 135.8 136.2 136.2 137.0 138.4 139.3 37 Power 1.27 89.4 88.3 87.8 87.0 87.4 88.3 89.8 90.9 92.2 91.5 92.1 91.9 92.2 92.2 33 Commercial 5.22 245.2 240.3 239.9 241.5 245.7 247.1 248.2 249.8 248.7 245.4 247.0 248.9 253.4 256.6 34 Transit 2.49 114.9 108.2 111.1 112.3 115.3 115.7 115.9 115.2 116.8 120.3 122.3 123.3 122.0 121.9 35 Defense and space equipment 3.67 185.9 191.0 189.9 187.9 185.5 184.6 184.9 184.9 184.5 184.0 182.2 181.0 180.9 180.6
Intermediate products ^
36 Construction supplies 5.95 138.6 137.7 137.3 137.6 138.8 137.6 138.4 138.1 138.4 140.0 140.7 141.2 143.7 142.7 37 Business supplies 6.99 162.5 159.4 160.7 159.9 160.3 160.6 162.8 164.4 165.2 165.9 165.7 166.7 167.4 38 General business supplies 5.67 168.5 165.0 166.6 165.7 165.5 165.9 168.6 170.6 171.8 172.3 172.9 173.9 174.8 39 Commercial energy products 1.31 136.3 135.3 135.3 134.6 137.8 137.5 137.6 137.7 136.7 138.2 134.3 135.8 135.3
Materials 40 Durable goods materials 20.50 135.4 131.4 131.3 132.7 134.8 134.9 136.8 136.6 137.8 138.9 139.8 139.1 140.3 139.9 41 Durable consumer parts 4.92 108.9 104.4 103.5 106.2 110.0 110.3 110.1 109.8 111.0 111.4 113.9 112.6 113.2 111.7 42 Equipment parts 5.94 171.7 167.6 167.3 168.9 170.8 171.6 174.1 173.5 174.0 174.9 175.0 174.3 175.1 175.8 43 Durable materials n.e.c 9.64 126.7 123.0 123.4 124.0 125.3 124.8 127.5 127.6 129.2 130.8 131.3 130.9 132.6 132.1 44 Basic metal materials 4.64 95.9 91.4 90.5 91.6 94.8 93.7 98.4 97.3 100.3 101.1 101.4 99.7 101.6 100.0
45 Nondurable goods materials 10.09 132.0 128.1 130.1 131.1 130.1 130.1 132.8 133.1 132.6 134.7 135.1 136.5 136.6 136.5 46 Textile, paper, and chemical
materials 7.53 134.4 129.9 132.4 133.3 131.9 132.1 135.3 135.7 134.9 137.4 137.9 139.5 139.5 139.3 47 Textile materials 1.52 109.9 110.2 112.7 111.9 107.5 107.5 108.5 110.1 109.2 109.5 110.1 109.3 110.6 48 Pulp and paper materials 1.55 147.3 144.4 144.8 145.8 146.4 145.4 150.3 148.3 148.1 148.4 147.2 150.3 149.3 49 Chemical materials 4.46 138.3 131.5 134.8 136.2 135.1 135.8 139.2 140.0 139.0 143.1 144.2 146.1 146.0 50 Miscellaneous nondurable materials . . . 2.57 124.9 123.0 123.2 124.6 125.1 124.2 125.6 125.6 125.9 126.6 127.0 127.6
51 Energy materials 11.69 101.5 100.6 100.6 101.0 99.5 101.3 102.7 103.2 101.5 101.3 102.3 103.0 100.9 99.9 52 Primary energy 7.57 106.3 104.8 105.0 106.7 104.0 105.6 106.8 106.2 106.8 106.0 108.6 108.2 105.5 53 Converted fuel materials 4.12 92.8 93.0 92.6 90.5 91.2 93.5 95.3 97.7 91.8 92.6 90.7 93.4 92.4
Digitized for FRASER http://fraser.stlouisfed.org/ Federal Reserve Bank of St. Louis
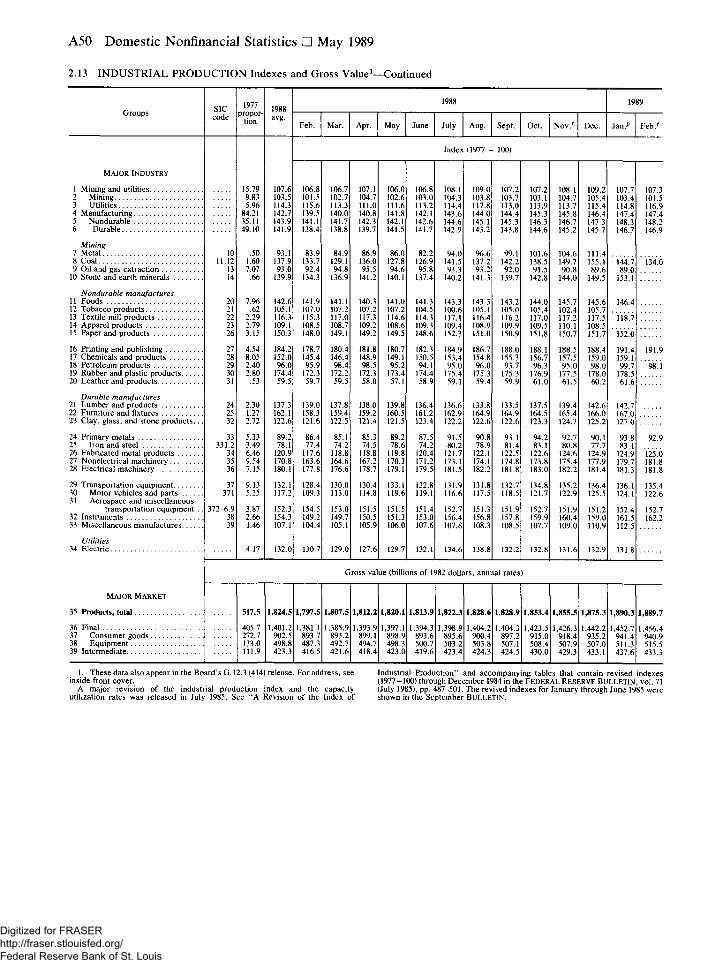
A50 Domestic Nonfinancial Statistics • May 1989
2.13 INDUSTRIAL PRODUCTION Indexes and Gross Value1—Continued
Groups 1988 1989
SIC 1988 code avg. avg.
Feb. Mar. Apr. May June July Aug. Sept. Oct. N o v / Dec. Jan." Feb.''
Index (1977 = 100)
15.79 107.6 106.8 106.7 107.1 106.0 106.8 108.1 109.0 107.2 107.2 108.1 109.2 107.7 107.3 9.83 103.5 101.5 102.7 104.7 102.6 103.0 104.3 103.8 103.7 103.1 104.7 105.4 103.4 101.5 5.96 114.3 115.6 113.3 111.0 111.6 113.2 114.4 117.8 113.0 113.9 113.7 115.4 114.8 116.9
84.21 142.7 139.5 140.0 140.8 141.8 142.1 143.6 144.0 144.4 145.3 145.8 146.4 147.4 147.4 35.11 143.9 141.1 141.7 142.3 142.1 142.6 144.6 145.1 145.3 146.3 146.7 147.3 148.3 148.2 49.10 141.9 138.4 138.8 139.7 141.5 141.7 142.9 143.2 143.8 144.6 145.2 145.7 146.7 146.9
10 .50 93.1 83.9 84.9 86.9 86.0 82.2 94.0 96.6 99.1 101.6 104.6 111.4 11.12 1.60 137.9 133.7 129.1 136.0 127.8 126.9 141.5 137.2 142.2 138.5 149.7 155.1 144.7 134.0
13 7.07 93.0 92.4 94.8 95.5 94.6 95.8 93.3 93.2 92.0 91.5 90.8 89.6 89.0 14 .66 139.9 134.3 136.9 141.2 140.1 137.4 140.2 141.3 139.7 142.8 144.0 149.5 153.1
20 7.96 142.6 141.9 141.1 140.3 141.0 141.3 143.3 143.3 143.2 144.0 145.7 145.6 146.4 21 .62 105.1 107.0 107.2 107.2 107.2 104.5 100.6 105.1 105.0 105.4 102.4 105.7 22 2.29 116.3 115.3 117.0 117.3 114.6 114.3 117.1 116.4 116.2 117.0 117.2 117.5 118.7 23 2.79 109.1 108.5 108.7 109.2 108.6 109.3 109.4 108.9 109.9 109.5 110.1 108.5 26 3.15 150.3 148.0 149.1 149.2 149.5 148.6 152.3 151.0 150.9 151.8 150.7 151.7 152.0
27 4.54 184.2 178.7 180.4 181.8 180.7 182.3 184.9 186.7 188.0 188.1 188.5 188.4 191.4 191.9 28 8.05 152.0 145.4 146.4 148.9 149.1 150.5 153.4 154.8 155.3 156.7 157.5 159.0 159.1 29 2.40 96.0 95.9 98.4 98.5 95.2 94.1 95.0 96.0 93.7 96.3 95.0 98.0 99.7 98.1 30 2.80 174.4 172.3 172.2 172.3 173.4 174.4 175.4 175.3 175.3 176.9 177.5 178.0 178.5 31 .53 59.5 59.7 59.5 58.0 57.1 58.9 59.1 59.4 59.9 61.0 61.5 60.2 61.6
24 2.30 137.3 139.0 137.8 138.0 139.8 136.4 136.6 133.8 133.5 137.5 139.4 142.6 142.7 25 1.27 162.1 158.3 159.4 159.2 160.5 161.2 162.9 164.9 164.9 164.5 165.4 166.0 167.0 32 2.72 122.6 121.6 122.5 121.4 121.5 123.4 122.2 122.6 122.6 123.3 124.7 125.2 127.0
33 5.33 89.2 86.4 85.1 85.3 89.2 87.5 91.5 90.8 93.1 94.2 92.7 90.1 93.8 92.9 331.2 3.49 78.1 77.4 74.2 74.5 78.6 74.2 80.2 78.9 81.4 83.1 80.8 77.7 83.1
34 6.46 120.9 117.6 118.8 118.8 119.8 120.4 121.7 122.1 122.5 122.6 124.6 124.9 124.9 125.0 35 9.54 170.8 163.6 164.6 167.2 170.3 171.2 173.1 174.1 174.8 173.8 175.4 177.9 179.7 181.8 36 7.15 180.1 177.8 176.6 178.7 179.1 179.5 181.5 182.2 181.8 183.0 182.2 181.4 181.3 181.8
37 9.13 132.1 128.4 130.0 130.4 133.1 132.8 131.9 131.8 132.7 134.8 135.2 136.4 136.1 135.4 371 5.25 117.2 109.3 113.0 114.8 119.6 119.1 116.6 117.5 118.5 121.7 122.9 125.5 124.1 122.6
372-6.9 3.87 152.3 154.5 153.0 151.5 151.5 151.4 152.7 151.3 151.9 152.7 151.9 151.2 152.4 152.7 38 2.66 154.3 149.2 149.7 150.5 151.3 153.0 156.4 156.8 157.8 159.9 160.4 159.0 161.5 162.2 39 1.46 107.1 104.4 105.1 105.9 106.0 107.6 107.8 108.3 108.5 107.7 109.0 110.9 112.5
4.17 132.0 130.7 129.0 127.6 129.7 132.1 134.6 138.8 132.2 132.8 131.6 132.9 131.8 4.17 132.0 130.7 129.0 127.6 129.7 132.1 134.6 138.8 132.2 132.8 131.6 132.9 131.8
MAJOR INDUSTRY
1 Mining and utilities 2 Mining 3 Utilities 4 Manufacturing 5 Nondurable 6 Durable
Mining 7 Metal 8 Coal 9 Oil and gas extraction
10 Stone and earth minerals
Nondurable manufactures 11 Foods 12 Tobacco products 13 Textile mill products 14 Apparel products 15 Paper and products
16 Printing and publishing 17 Chemicals and products 18 Petroleum products 19 Rubber and plastic products . . . . 20 Leather and products
Durable manufactures 21 Lumber and products 22 Furniture and fixtures 23 Clay, glass, and stone products.
24 Primary metals 25 Iron and steel 26 Fabricated metal products 27 Nonelectrical machinery 28 Electrical machinery
29 Transportation equipment 30 Motor vehicles and parts 31 Aerospace and miscellaneous
transportation equipment 32 Instruments 33 Miscellaneous manufactures.. . ,
Utilities 34 Electric
Gross value (billions of 1982 dollars, annual rates)
MAJOR MARKET
35 Products, total
36 Final 37 Consumer goods. 38 Equipment 39 Intermediate
517.5 1,824.5 1,797.5 1,807.5 1,812.2 1,820.1 1,813.9 1,822.3 1,828.6 1,828.9 1,853.4 1,855.5 1,875.3 1,890.3 1,889.7
405.7 1,401.2 1,381.1 1,385.9 1,393.9 1,397.1 1,394.3 1,398.9 1,404.2 1,404.3 1,423.5 1,426.3 1,442.2 1,452.7 1,456.4 272.7 902.5 893.7 893.2 899.1 898.9 893.6 895.6 900.4 897.2 915.0 918.4 935.2 941.4 940.9 133.0 498.8 487.3 492.7 494.7 498.3 500.7 503.2 503.8 507.1 508.4 507.9 507.0 511.3 515.5 111.9 423.3 416.5 421.6 418.4 423.0 419.6 423.4 424.3 424.5 430.0 429.3 433.1 437.6 433.3
1. These data also appear in the Board's G. 12.3 (414) release. For address, see inside front cover.
A major revision of the industrial production index and the capacity utilization rates was released in July 1985. See "A Revision of the Index of
Industrial Production" and accompanying tables that contain revised indexes ( 1 9 7 7 = 100) t h r o u g h D e c e m b e r 1984 in t h e FEDERAL RESERVE BULLETIN , v o l . 71 (July 1985), pp. 487-501. The revised indexes for January through June 1985 were shown in the September BULLETIN.
Digitized for FRASER http://fraser.stlouisfed.org/ Federal Reserve Bank of St. Louis
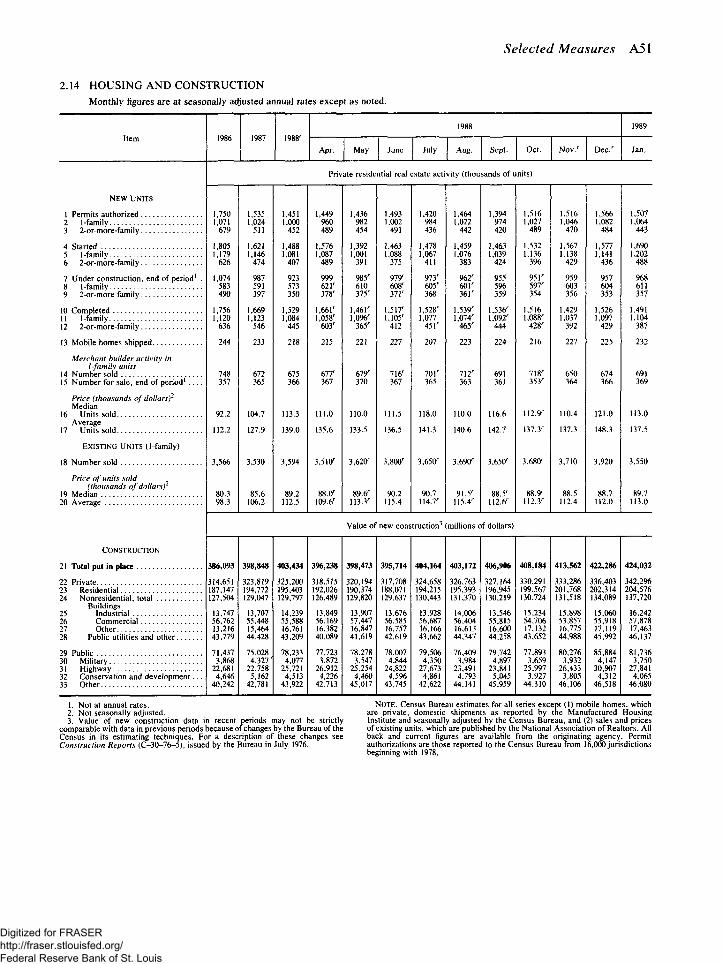
Selected Measures A51
2.14 H O U S I N G A N D CONSTRUCTION
Monthly figures are at seasonally adjusted annual rates except as noted.
Item 1986 1987 1988' 1988 1989
Item 1986 1987 1988' Apr. May June July Aug. Sept. Oct. Nov." Dec." Jan.
Private residential real estate activity (thousands of units)
NEW UNITS
1 Permits authorized 1,750 1,535 1,451 1,449 1,436 1,493 1,420 1,464 1,394 1,516 1,516 1,566 1,507 ? 1-family 1,071 1,024 1,000 960 982 1,002 984 1,022 974 1,027 1,046 1,082 1,064 3 2-or-more-family 679 511 452 489 454 491 436 442 420 489 470 484 443
4 Started 1,805 1,621 1,488 1,576 1,392 1,463 1,478 1,459 1,463 1,532 1,567 1,577 1,690 5 1-family 1,179 1,146 1,081 1,087 1,001 1,088 1,067 1,076 1,039 1,136 1,138 1,141 1,202 6 2-or-more-family 626 474 407 489 391 375 411 383 424 396 429 436 488
7 Under construction, end of period1 . 1,074 987 923 999 985" 979" 973" 962" 955 951" 959 957 968 8 1-family 583 591 573 621" 610 608" 605" 601" 596 597" 603 604 611 9 2-or-more-family 490 397 350 378" 375" 371" 368 361" 359 354 356 353 357
10 Completed 1,756 1,669 1,529 1,661" 1,461" 1,517" 1,528" 1,539" 1,536" 1,516 1,429 1,526 1,491 11 1-family 1,120 1,123 1,084 1,058" 1,096" 1,105" 1,077 1,074" 1,092" 1,088" 1,037 1,097 1,104 12 2-or-more-family 636 546 445 603" 365" 412 451" 465" 444 428" 392 429 387
13 Mobile homes shipped 244 233 218 215 221 227 207 223 224 216 227 225 232
Merchant builder activity in l-family units
14 Number sold 748 672 675 677" 679" 716" 701" 712" 691 718" 650 674 691 15 Number for sale, end of period1 357 365 366 367 370 367 365 363 361 353" 364 366 369
Price (thousands of dollars)2
Median 16 Units sold 92.2 104.7 113.3 111.0 110.0 111.5 118.0 110.0 116.6 112.9" 110.4 121.0 113.0
17 Units sold 112.2 127.9 139.0 135.6 133.5 136.5 141.3 140.6 142.7 137.3" 137.3 148.3 137.5
EXISTING UNITS ( l - f a m i l y )
18 Number sold 3,566 3,530 3,594 3,510" 3,620" 3,800" 3,650" 3,690" 3,650" 3,680" 3,710 3,920 3,550
Price of units sold 7 (thousands of dollars)'
88.0" 88.5" 88.9" 88.5 89.7 19 Median 80.3 85.6 89.2 88.0" 89.6" 90.2 90.7 91.5" 88.5" 88.9" 88.5 88.7 89.7 20 Average 98.3 106.2 112.5 109.6" 113.3" 115.4 114.7" 115.4" 112.6" 112.3" 112.4 112.0 113.0
Value of new construction3 (millions of dollars)
CONSTRUCTION
21 Total put in place 386,093 398,848 403,434 396,238 398,473 395,714 404,164 403,172 406,906 408,184 413,562 422,286 424,032
77 Private 314,651 323,819 325,200 318,515 320,194 317,708 324,658 326,763 327,164 330,291 333,286 336,403 342,2% 7.3 Residential 187,147 194,772 195,403 192,026 190,374 188,071 194,215 195,393 196,945 199,567 201,768 202,314 204,576 24 Nonresidential, total 127,504 129,047 129,797 126,489 129,820 129,637 130,443 131,370 130,219 130,724 131,518 134,089 137,720
Buildings 75 Industrial 13,747 13,707 14,239 13,849 13,907 13,676 13,928 14,006 13,546 15,234 15,898 15,060 16,242 76 Commercial 56,762 55,448 55,588 56,169 57,447 56,585 56,687 56,404 55,815 54,706 53,857 55,918 57,878 77 Other 13,216 15,464 16,761 16,382 16,847 16,757 16,166 16,613 16,600 17,132 16,775 17,119 17,463 28 Public utilities and other 43,779 44,428 43,209 40,089 41,619 42,619 43,662 44,347 44,258 43,652 44,988 45,992 46,137
79 Public 71,437 75,028 78,233 77,723 78,278 78,007 79,506 76,409 79,742 77,893 80,276 85,884 81,736 30 Military 3,868 4,327' 4,077 3,872 3,547 4,844 4,350 3,984 4,897 3,659 3,932 4,147 3,750 31 Highway 22,681 22,758 25,721 26,912 25,254 24,822 27,673 23,491 23,841 25,997 26,433 30,907 27,841 37 Conservation and development. . . 4,646 5,162 4,513 4,226 4,460 4,5% 4,861 4,793 5,045 3,927 3,805 4,312 4,065 33 Other 40,242 42,781 43,922 42,713 45,017 43,745 42,622 44,141 45,959 44,310 46,106 46,518 46,080
1. Not at annual rates. 2. Not seasonally adjusted. 3. Value of new construction data in recent periods may not be strictly
comparable with data in previous periods because of changes by the Bureau of the Census in its estimating techniques. For a description of these changes see Construction Reports (C-30-76-5), issued by the Bureau in July 1976.
NOTE. Census Bureau estimates for all series except (1) mobile homes, which are private, domestic shipments as reported by the Manufactured Housing Institute and seasonally adjusted by the Census Bureau, and (2) sales and prices of existing units, which are published by the National Association of Realtors. All back and current figures are available from the originating agency. Permit authorizations are those reported to the Census Bureau from 16,000 jurisdictions beginning with 1978.
Digitized for FRASER http://fraser.stlouisfed.org/ Federal Reserve Bank of St. Louis
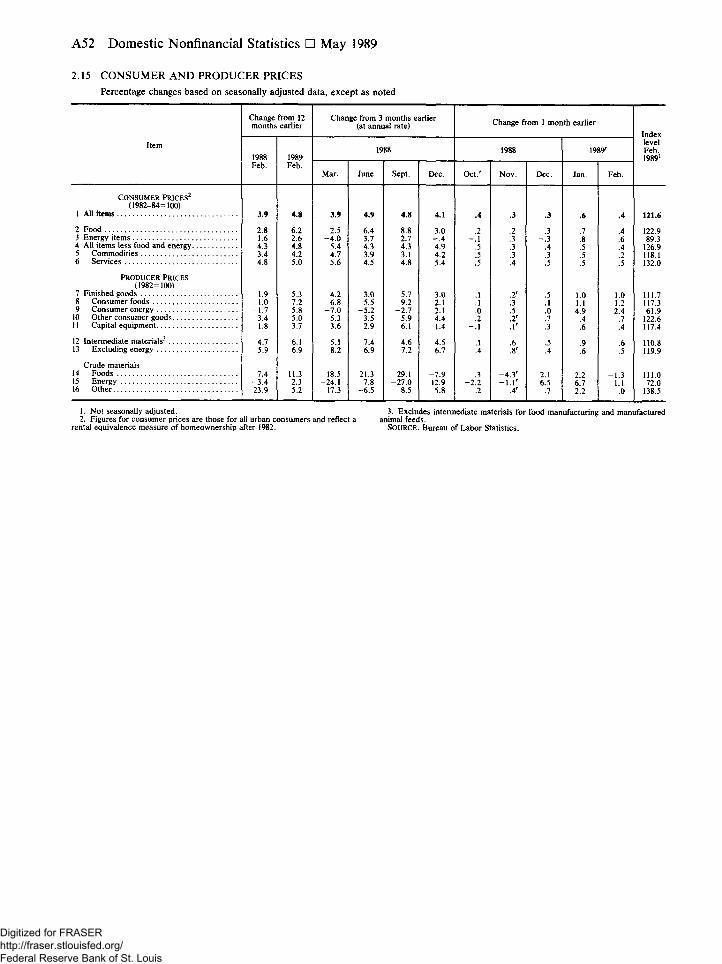
A52 Domestic Nonfinancial Statistics • May 1989
2.15 C O N S U M E R A N D PRODUCER PRICES
Percentage changes based on seasonally adjusted data, except as noted
Item
Change from 12 months earlier
Change from 3 months earlier (at annual rate) Change from 1 month earlier
Index level Feb. 1989
Item 1988 Feb.
1989 Feb.
1988 1988 1989r
Index level Feb. 1989
Item 1988 Feb.
1989 Feb.
Mar. June Sept. Dec. O c t / Nov. Dec. Jan. Feb.
Index level Feb. 1989
CONSUMER PRICES2
(1982-84=100) 1 All items 3.9 4.8 3.9 4.9 4.8 4.1 .4 .3 .3 .6 .4 121.6
2 Food 2.8 6.2 2.5 6.4 8.8 3.0 .2 .2 .3 .7 .4 122.9 3 Energy items 1.6 2.6 - 4 . 0 3.7 2.7 - . 4 - . 1 .3 - . 3 .8 .6 89.3 4 All items less food and energy 4.3 4.8 5.4 4.3 4.3 4.9 .5 .3 .4 .5 .4 126.9 5 Commodities 3.4 4.2 4.7 3.9 3.1 4.2 .5 .3 .3 .5 .2 118.1 6 Services 4.8 5.0 5.6 4.5 4.8 5.4 .5 .4 .5 .5 .5 132.0
PRODUCER PRICES (1982=100)
7 Finished goods 1.9 5.3 4.2 3.0 5.7 3.0 .1 ,2r .5 1.0 1.1
1.0 111.7 8 Consumer foods 1.0 7.2 6.8 5.5 9.2 2.1 .1 .3 .1
1.0 1.1 1.2 117.3
9 Consumer energy - 1 . 7 5.8 - 7 . 0 - 5 . 2 - 2 . 7 2.1 .0 .5 .0 4.9 2.4 61.9 10 Other consumer goods 3.4 5.0 5.3 3.5 5.9 4.4 .2 .r .7 .4 .7 122.6 11 Capital equipment 1.8 3.7 3.6 2.9 6.1 1.4 - . 1 . R .3 .6 .4 117.4
12 Intermediate materials3 4.7 6.1 5.1 7.4 4.6 4.5 .1 .6 .5 .9 .6 110.8 13 Excluding energy 5.9 6.9 8.2 6.9 7.2 6.7 .4 ,8r .4 .6 .5 119.9
Crude materials 14 Foods 7.4 11.3 18.5 21.3 29.1 - 7 . 9 .3 —4.3r 2.1 2.2 - 1 . 3
1.1 111.0
15 Energy - 3 . 4 2.3 -24 .1 7.8 - 2 7 . 0 12.9 - 2 . 2 - i . R 6.5 6.7 - 1 . 3
1.1 72.0 16 Other 23.9 5.2 17.3 - 6 . 5 8.5 5.8 .2 ,4r .7 2.2 .0 138.5
1. Not seasonally adjusted. 3. Excludes intermediate materials for food manufacturing and manufactured 2. Figures for consumer prices are those for all urban consumers and reflect a animal feeds.
rental equivalence measure of homeownership after 1982. SOURCE. Bureau of Labor Statistics.
Digitized for FRASER http://fraser.stlouisfed.org/ Federal Reserve Bank of St. Louis
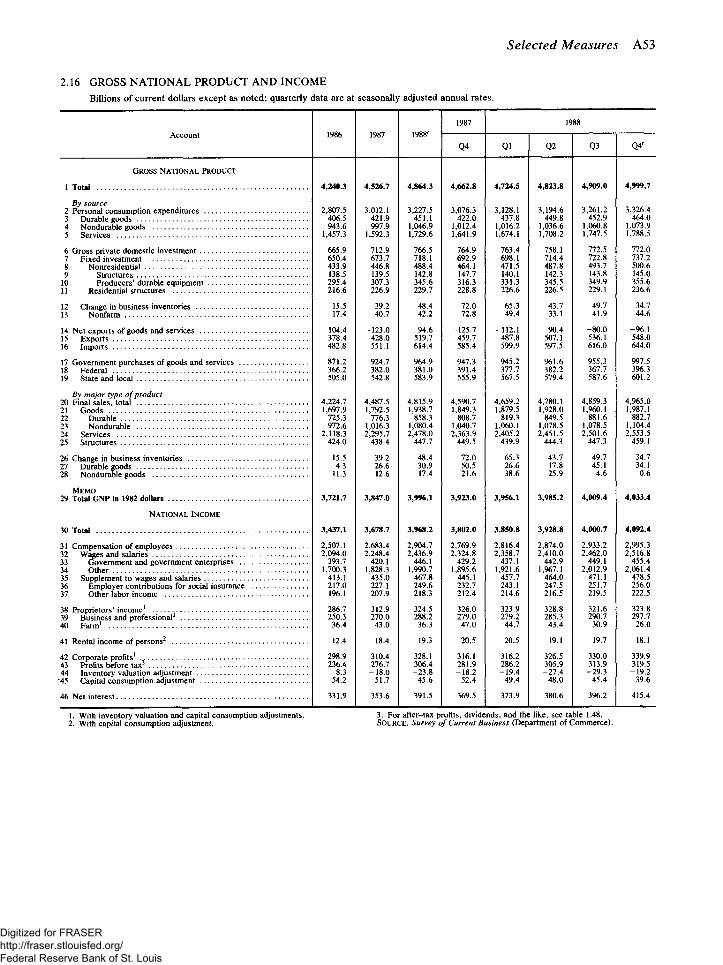
Selected Measures A53
2.16 GROSS N A T I O N A L PRODUCT A N D INCOME
Billions of current dollars except as noted; quarterly data are at seasonally adjusted annual rates.
Account 1986 1987 1988r
1987 1988
Account 1986 1987 1988r
Q4 Q1 Q2 Q3 Q4r
GROSS NATIONAL PRODUCT
1 4 , 2 4 0 . 3 4 , 5 2 6 . 7 4 , 8 6 4 . 3 4 , 6 6 2 . 8 4 , 7 2 4 . 5 4 , 8 2 3 . 8 4 , 9 0 9 . 0 4 , 9 9 9 . 7
By source 3,261.2 3,326.4 2 Personal consumption expenditures 2,807.5 3,012.1 3,227.5 3,076.3 3,128.1 3,194.6 3,261.2 3,326.4
3 Durable goods 406.5 421.9 451.1 422.0 437.8 449.8 452.9 464.0 4 Nondurable goods 943.6 997.9 1,046.9 1,012.4 1,016.2 1,036.6 1,060.8 1,073.9 5 Services 1,457.3 1,592.3 1,729.6 1,641.9 1,674.1 1,708.2 1,747.5 1,788.5
6 Gross private domestic investment 665.9 712.9 766.5 764.9 763.4 758.1 772.5 772.0 7 Fixed investment 650.4 673.7 718.1 692.9 698.1 714.4 722.8 737.2 8 Nonresidential 433.9 446.8 488.4 464.1 471.5 487.8 493.7 500.6 9 Structures 138.5 139.5 142.8 147.7 140.1 142.3 143.8 145.0
10 Producers' durable equipment 295.4 307.3 345.6 316.3 331.3 345.5 349.9 355.6 11 Residential structures 216.6 226.9 229.7 228.8 226.6 226.5 229.1 236.6
12 Change in business inventories 15.5 39.2 48.4 72.0 65.3 43.7 49.7 34.7 13 Nonfarm 17.4 40.7 42.2 72.8 49.4 33.1 41.9 44.6
14 Net exports of goods and services -104.4 -123.0 -94 .6 -125.7 -112.1 -90 .4 - 8 0 . 0 -96 .1 15 Exports 378.4 428.0 519.7 459.7 487.8 507.1 536.1 548.0 16 Imports 482.8 551.1 614.4 585.4 599.9 597.5 616.0 644.0
17 Government purchases of goods and services 871.2 924.7 964.9 947.3 945.2 961.6 955.3 997.5 18 366.2 382.0 381.0 391.4 377.7 382.2 367.7 396.3 19 State and local 505.0 542.8 583.9 555.9 567.5 579.4 587.6 601.2
By major type of product 4,859.3 4,965.0 70 Final sales, total 4,224.7 4,487.5 4,815.9 4,590.7 4,659.2 4,780.1 4,859.3 4,965.0
71 Goods 1,697.9 1,792.5 1,938.7 1,849.3 1,879.5 1,928.0 1,960.1 1,987.1 ?? Durable 725.3 776.3 858.3 808.7 819.3 849.5 881.6 882.7 73 Nondurable 972.6 1,016.3 1,080.4 1,040.7 1,060.1 1,078.5 1,078.5 1,104.4 74 Services 2,118.3 2,295.7 2,478.0 2,363.9 2,405.2 2,451.5 2,501.6 2,553.5 25 Structures 424.0 438.4 447.7 449.5 439.9 444.3 447.3 459.1
26 Change in business inventories 15.5 39.2 48.4 72.0 65.3 43.7 49.7 34.7 27 Durable goods 4.3 26.6 30.9 50.5 26.6 17.8 45.1 34.1 28 Nondurable goods 11.3 12.6 17.4 21.6 38.6 25.9 4.6 0.6
MEMO 29 Total GNP in 1982 dollars 3 , 7 2 1 . 7 3 , 8 4 7 . 0 3 , 9 9 6 . 1 3 , 9 2 3 . 0 3 , 9 5 6 . 1 3 , 9 8 5 . 2 4 , 0 0 9 . 4 4 , 0 3 3 . 4
NATIONAL INCOME
30 3 , 4 3 7 . 1 3 , 6 7 8 . 7 3 , 9 6 8 . 2 3 , 8 0 2 . 0 3 , 8 5 0 . 8 3 , 9 2 8 . 8 4 , 0 0 0 . 7 4 , 0 9 2 . 4
31 Compensation of employees 2,507.1 2,683.4 2,904.7 2,769.9 2,816.4 2,874.0 2,933.2 2,995.3 32 Wages and salaries 2,094.0 2,248.4 2,436.9 2,324.8 2,358.7 2,410.0 2,462.0 2,516.8 33 Government and government enterprises 393.7 420.1 446.1 429.2 437.1 442.9 449.1 455.4 34 Other 1,700.3 1,828.3 1,990.7 1,895.6 1,921.6 1,967.1 2,012.9 2,061.4 35 Supplement to wages and salaries 413.1 435.0 467.8 445.1 457.7 464.0 471.1 478.5 36 Employer contributions for social insurance 217.0 227.1 249.6 232.7 243.1 247.5 251.7 256.0 37 Other labor income 196.1 207.9 218.3 212.4 214.6 216.5 219.5 222.5
38 Proprietors' income1 286.7 312.9 324.5 326.0 323.9 328.8 321.6 323.8 39 Business and professional 250.3 270.0 288.2 279.0 279.2 285.3 290.7 297.7 40 Farm1 36.4 43.0 36.3 47.0 44.7 43.4 30.9 26.0
41 Rental income of persons2 12.4 18.4 19.3 20.5 20.5 19.1 19.7 18.1
47 Corporate profits1 298.9 310.4 328.1 316.1 316.2 326.5 330.0 339.9 43 Profits before tax3 236.4 276.7 306.4 281.9 286.2 305.9 313.9 319.5 44 Inventory valuation adjustment 8.3 -18 .0 -23 .8 -18 .2 -19 .4 -27 .4 -29 .3 -19 .2 45 Capital consumption adjustment 54.2 51.7 45.6 52.4 49.4 48.0 45.4 39.6
46 Net interest 331.9 353.6 391.5 369.5 373.9 380.6 396.2 415.4
1. With inventory valuation and capital consumption adjustments. 3. For after-tax profits, dividends, and the like, see table 1.48. 2. With capital consumption adjustment. SOURCE. Survey of Current Business (Department of Commerce).
Digitized for FRASER http://fraser.stlouisfed.org/ Federal Reserve Bank of St. Louis
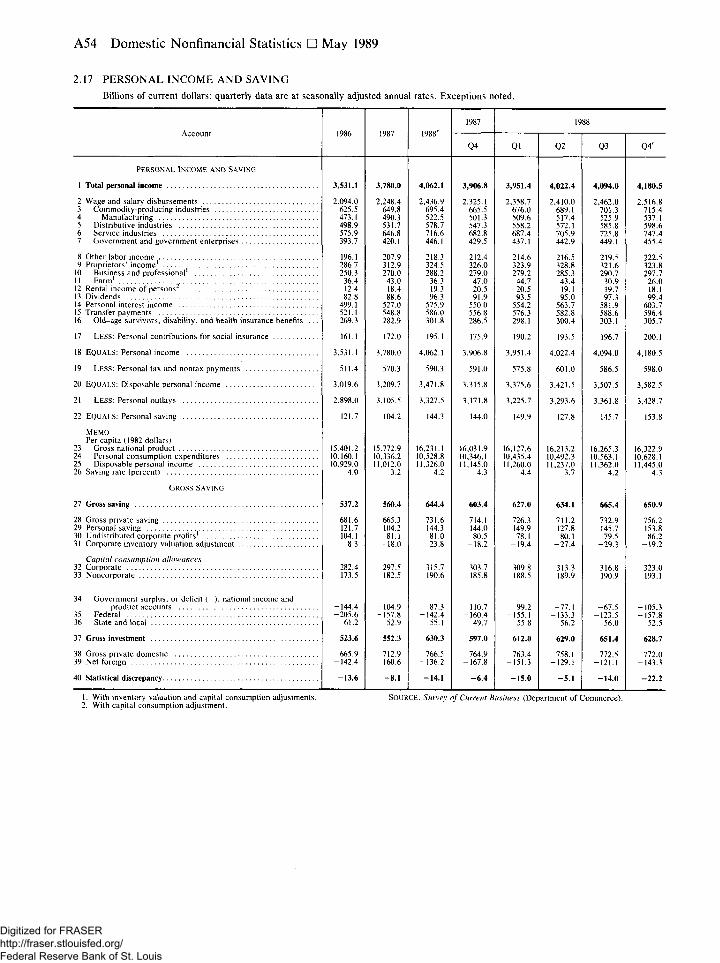
A54 Domestic Nonfinancial Statistics • May 1989
2.17 P E R S O N A L INCOME A N D SAVING
Billions of current dollars; quarterly data are at seasonally adjusted annual rates. Exceptions noted.
Account 1986 1987 1988' 1987 1988
Account 1986 1987 1988' Q4 Ql Q2 Q3 Q4'
PERSONAL INCOME AND SAVING
1 Total personal income 3,531.1 3,780.0 4,062.1 3,906.8 3,951.4 4,022.4 4,094.0 4,180.5
2 Wage and salary disbursements 2.094.0 2,248.4 2,436.9 2,325.1 2,358.7 2,410.0 2,462.0 2,516.8 3 Commodity-producing industries 625.5 649.8 695.4 665.5 676.0 689.1 701.3 715.4 4 Manufacturing 473.1 490.3 522.5 501.3 509.6 517.4 525.9 537.1 5 Distributive industries 498.9 531.7 578.7 547.3 558.2 572.1 585.8 598.6 6 Service industries 575.9 646.8 716.6 682.8 687.4 705.9 725.8 747.4 1 Government and government enterprises 393.7 420.1 446.1 429.5 437.1 442.9 449.1 455.4
8 Other labor income 196.1 207.9 218.3 212.4 214.6 216.5 219.5 222.5 9 Proprietors' income1 286.7 312.9 324.5 326.0 323.9 328.8 321.6 323.8
10 Business and professional' 250.3 270.0 288.2 279.0 279.2 285.3 290.7 297.7 li Farm1 36.4 43.0 36.3 47.0 44.7 43.4 30.9 26.0 12 Rental income of persons" 12.4 18.4 19.3 20.5 20.5 19.1 19.7 18.1 13 Dividends 82.8 88.6 96.3 91.9 93.5 95.0 97.3 99.4 14 Personal interest income 499.1 527.0 575.9 550.0 554.2 563.7 581.9 603.7 15 Transfer payments 521.1 548.8 586.0 556.8 576.3 582.8 588.6 596.4 lb Old-age survivors, disability, and health insurance benefits . . . 269.3 282.9 301.8 286.5 298.1 300.4 303.1 305.7
17 LESS: Personal contributions for social insurance 161.1 172.0 195.1 175.9 190.2 193.5 196.7 200.1
18 EQUALS: Personal income 3,531.1 3,780.0 4,062.1 3,906.8 3,951.4 4,022.4 4,094.0 4,180.5
19 LESS: Personal tax and nontax payments 511.4 570.3 590.3 591.0 575.8 601.0 586.5 598.0
20 EQUALS: Disposable personal income 3,019.6 3,209.7 3,471.8 3,315.8 3,375.6 3,421.5 3,507.5 3,582.5
21 LESS: Personal outlays 2,898.0 3,105.5 3,327.5 3,171.8 3,225.7 3,293.6 3,361.8 3,428.7
22 EQUALS: Personal saving 121.7 104.2 144.3 144.0 149.9 127.8 145.7 153.8
MEMO Per capita (1982 dollars)
23 Gross national product 15,401.2 15,772.9 16,231.1 16,031.9 16,127.6 16,213.2 16,265.3 16,322.9 24 Personal consumption expenditures 10,160.1 10,336.2 10,528.8 10,346.1 10,435.4 10,492.3 10,563.1 10,628.1 25 Disposable personal income 10,929.0 11,012.0 11,326.0 11,145.0 11,260.0 11,237.0 11,362.0 11,445.0 lb Saving rate (percent) 4.0 3.2 4.2 4.3 4.4 3.7 4.2 4.3
GROSS SAVING
27 Gross saving 537.2 560.4 644.4 603.4 627.0 634.1 665.4 650.9
28 Gross private saving 681.6 665.3 731.6 714.1 726.3 711.2 732.9 756.2 29 Personal saving 121.7 104.2 144.3 144.0 149.9 127.8 145.7 153.8 30 Undistributed corporate profits1 104.1 81.1 81.0 80.5 78.1 80.1 79.5 86.2 31 Corporate inventory valuation adjustment 8.3 -18.0 -23.8 -18.2 -19.4 -27 .4 -29.3 -19.2
Capital consumption allowances 32 Corporate 282.4 297.5 315.7 303.7 309.8 313.3 316.8 323.0 33 Noncorporate 173.5 182.5 190.6 185.8 188.5 189.9 190.9 193.1
34 Government surplus, or deficit ( - ) , national income and product accounts -144.4 -104.9 -87.3 -110.7 -99.2 -77.1 -67.5 -105.3
35 Federal -205.6 -157.8 -142.4 -160.4 -155.1 -133.3 -123.5 -157.8 36 State and local 61.2 52.9 55.1 49.7 55.8 56.2 56.0 52.5
37 Gross investment 523.6 552.3 630.3 597.0 612.0 629.0 651.4 628.7
38 Gross private domestic 665.9 712.9 766.5 764.9 763.4 758.1 772.5 772.0 39 Net foreign -142.4 -160.6 -136.2 -167.8 -151.3 -129.1 -121.1 -143.3
40 Statistical discrepancy -13.6 -8 .1 -14.1 -6 .4 -15.0 -5 .1 -14.0 -22 .2
1. With inventory valuation and capital consumption adjustments. SOURCE. Survey of Current Business (Department of Commerce). 2. With capital consumption adjustment.
Digitized for FRASER http://fraser.stlouisfed.org/ Federal Reserve Bank of St. Louis
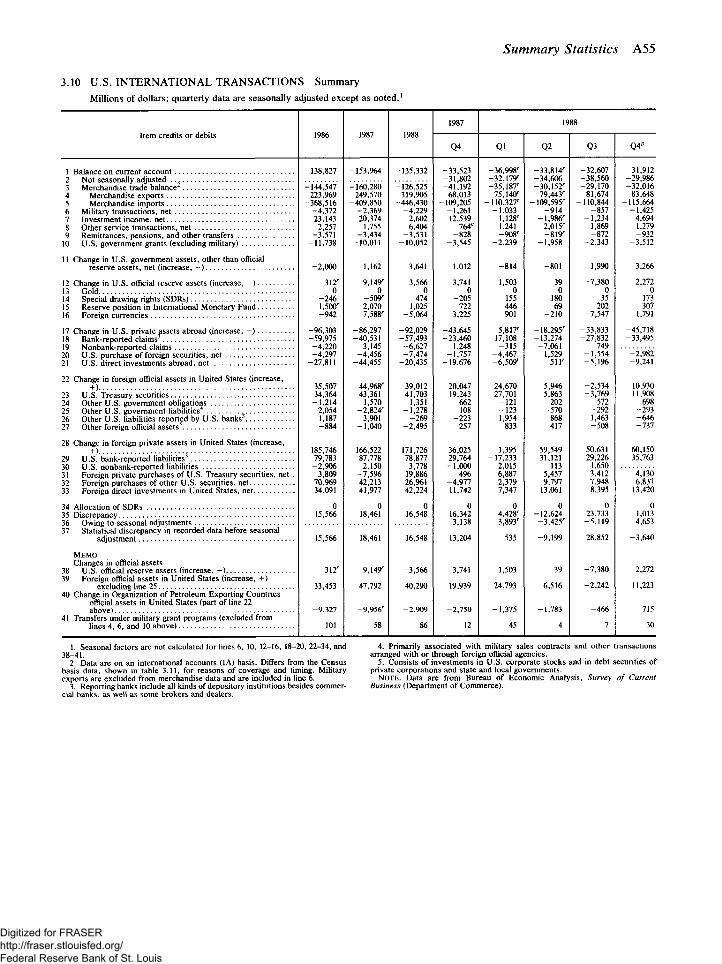
Summary Statistics A55
3.10 U.S. INTERNATIONAL TRANSACTIONS Summary Millions of dollars; quarterly data are seasonally adjusted except as noted.1
Item credits or debits 1986 1987 1988 1987 1988
1986 1987 1988 Q4 Q1 Q2 Q3 Q4"
-138,827 -153,964 -135,332 -33,523 -36,998' -33,814' -32,607 -31,912 -138,827 -153,964 -135,332 -31,802 -32,179' -34,606 -38,560 -29,986
-144,547 -160,280 -126,525 -41,192 -35,187' -30,152' -29,170 -32,016 223,969 249,570 319,905 68,013 75,140' 79,443' 81,674 83,648
-368,516 -409,850 -446,430 -109,205 -110,327' -109,595' -110,844 -115,664 -4 ,372 -2 ,369 -4 ,229 -1 ,261 -1 ,033 - 9 1 4 -857 -1,425 23,143 20,374 2,602 12,539 1,128' -1 ,986' -1 ,234 4,694
2,257 1,755 6,404 764c 1,241 2,015' 1,869 1,279 -3,571 -3 ,434 -3,531 - 8 2 8 - 9 0 8 ' - 8 7 2 - 9 3 2
-11,738 -10,011 -10,052 -3 ,545 -2 ,239 -1 ,958 -2 ,343 -3 ,512
-2 ,000 1,162 3,641 1,012 - 8 1 4 - 8 0 1 1,990 3,266
312' 9,149' 3,566 3,741 1,503 39 -7 ,380 2,272 0 0 0 0 0 0 0 0
- 2 4 6 -509 ' 474 - 2 0 5 155 180 - 3 5 173 1,50c 2,070 1,025 722 446 69 202 307 - 9 4 2 7,588' -5 ,064 3,225 901 - 2 1 0 -7 ,547 1,791
-96,303 -86,297 -92,029 -43,645 5,817' -18,295' -33,833 -45,718 -59,975 -40,531 -57,493 -23,460 17,108 -13,274 -27,832 -33,495
-4 ,220 3,145 -6 ,627 1,248 - 3 1 5 -7 ,061 749 -4 ,297 -4 ,456 -7 ,474 -1 ,757 -4 ,467 1,529 -1 ,554 -2 ,982
-27,811 -44,455 -20,435 -19,676 -6 ,509' 511' -5 ,196 -9 ,241
35,507 44,968' 39,012 20,047 24,670 5,946 -2 ,534 10,930 34,364 43,361 41,703 19,243 27,701 5,863 -3 ,769 11,908
-1 ,214 1,570 1,351 662 - 1 2 1 202 572 698 2,054 -2,824' -1 ,278 108 - 1 2 3 - 5 7 0 - 2 9 2 -293 1,187 3,901 - 2 6 9 - 2 2 3 -1 ,954 868 1,463 - 6 4 6 - 8 8 4 -1,040 -2,495 257 - 8 3 3 - 4 1 7 -508 -737
185,746 166,522 171,726 36,025 1,395 59,549 50,631 60,150 79,783 87,778 78,877 29,764 -17,233 31,121 29,226 35,763
-2 ,906 2,150 3,778 -1 ,000 2,015 113 1,650 3,809 -7 ,596 19,886 496 6,887 5,457 3,412 4,130
70,969 42,213 26,961 -4,977 2,379 9,797 7,948 6,837 34,091 41,977 42,224 11,742 7,347 13,061 8,395 13,420
0 0 0 0 0 0 0 0 15,566 18,461 16,548 16,342 4,428' -12,624 23,733 1,013 15,566 18,461 16,548
3,138 3,893' -3 ,425 ' -5 ,119 4,653
15,566 18,461 16,548 13,204 535 -9 ,199 28,852 -3 ,640
312' 9,149' -3 ,566 3,741 1,503 39 -7 ,380 2,272
33,453 47,792 40,290 19,939 24,793 6,516 -2 ,242 11,223
-9,327 -9,956' -2 ,909 -2 ,750 -1 ,375 -1 ,783 - 4 6 6 715
101 58 86 12 45 4 7 30
1 Balance on current account 2 Not seasonally adjusted 3 Merchandise trade balance2
4 Merchandise exports 5 Merchandise imports 6 Military transactions, net 7 Investment income, net 8 Other service transactions, net 9 Remittances, pensions, and other transfers
10 U.S. government grants (excluding military)
11 Change in U.S. government assets, other than official reserve assets, net (increase, - )
12 Change in U.S. official reserve assets (increase, - ) 13 Gold 14 Special drawing rights (SDRs) 15 Reserve position in International Monetary Fund 16 Foreign currencies
17 Change in U.S. private assets abroad (increase, - ) 18 Bank-reported claims 19 Nonbank-reported claims 20 U.S. purchase of foreign securities, net 21 U.S. direct investments abroad, net
22 Change in foreign official assets in United States (increase, +)
23 U.S. Treasury securities 24 Other U.S. government obligations 25 Other U.S. government liabilities4 ^ 26 Other U.S. liabilities reported by U.S. banks3
27 Other foreign official assets5
28 Change in foreign private assets in United States (increase, +) ,
29 U.S. bank-reported liabilities3
30 U.S. nonbank-reported liabilities 31 Foreign private purchases of U.S. Treasury securities, net 32 Foreign purchases of other U.S. securities, net 33 Foreign direct investments in United States, net
34 Allocation of SDRs 35 Discrepancy 36 Owing to seasonal adjustments 37 Statistical discrepancy in recorded data before seasonal
adjustment
MEMO Changes in official assets
38 U.S. official reserve assets (increase, - ) 39 Foreign official assets in United States (increase, +)
excluding line 25 40 Change in Organization of Petroleum Exporting Countries
official assets in United States (part of line 22 above)
41 Transfers under military grant programs (excluded from lines 4, 6, and 10 above)
1. Seasonal factors are not calculated for lines 6, 10, 12-16, 18-20, 22-34, and 38-41.
2. Data are on an international accounts (IA) basis. Differs from the Census basis data, shown in table 3.11, for reasons of coverage and timing. Military exports are excluded from merchandise data and are included in line 6.
3. Reporting banks include all kinds of depository institutions besides commer-cial banks, as well as some brokers and dealers.
4. Primarily associated with military sales contracts and other transactions arranged with or through foreign official agencies.
5. Consists of investments in U.S. corporate stocks and in debt securities of private corporations and state and local governments.
NOTE. Data are from Bureau of Economic Analysis, Survey of Current Business (Department of Commerce).
Digitized for FRASER http://fraser.stlouisfed.org/ Federal Reserve Bank of St. Louis
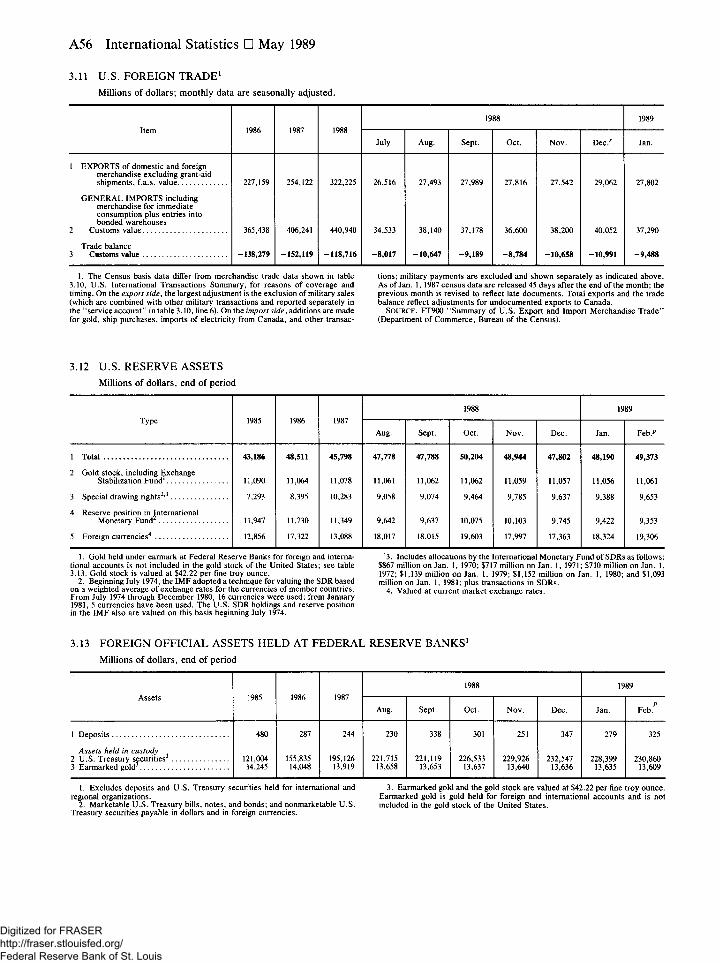
A56 International Statistics • May 1989
3.11 U.S. FOREIGN TRADE1
Millions of dollars; monthly data are seasonally adjusted.
Item 1986 1987 1988 1988 1989
Item 1986 1987 1988 July Aug. Sept. Oct. Nov. Dec / Jan.
1 EXPORTS of domestic and foreign merchandise excluding grant-aid shipments, f.a.s. value 227,159 254,122 322,225 26,516 27,493 27,989 27,816 27,542 29,062 27,802
GENERAL IMPORTS including merchandise for immediate consumption plus entries into bonded warehouses
2 Customs value 365,438 406,241 440,940 34,533 38,140 37,178 36,600 38,200 40,052 37,290
Trade balance 3 Customs value -138,279 -152,119 -118,716 -8,017 -10,647 -9,189 -8,784 -10,658 -10,991 -9,488
1. The Census basis data differ from merchandise trade data shown in table 3.10, U.S. International Transactions Summary, for reasons of coverage and timing. On the export side, the largest adjustment is the exclusion of military sales (which are combined with other military transactions and reported separately in the "service account" in table 3.10, line 6). On the import side, additions are made for gold, ship purchases, imports of electricity from Canada, and other transac-
tions; military payments are excluded and shown separately as indicated above. As of Jan. 1, 1987 census data are released 45 days after the end of the month; the previous month is revised to reflect late documents. Total exports and the trade balance reflect adjustments for undocumented exports to Canada.
SOURCE. FT900 "Summary of U.S. Export and Import Merchandise Trade" (Department of Commerce, Bureau of the Census).
3.12 U.S. RESERVE ASSETS Millions of dollars, end of period
Type 1985 1986 1987 1988 1989
Type 1985 1986 1987 Aug. Sept. Oct. Nov. Dec. Jan. Feb."
1 Total
2 Gold stock, including Exchange
Stabilization Fund1
3 Special drawing rights2'3
4 Reserve position in International Monetary Fund
5 Foreign currencies4
43,186
11,090
7,293
11,947
12,856
48,511
11,064
8,395
11,730
17,322
45,798
11,078
10,283
11,349
13,088
47,778
11,061
9,058
9,642
18,017
47,788
11,062
9,074
9,637
18,015
50,204
11,062
9,464
10,075
19,603
48,944
11,059
9,785
10,103
17,997
47,802
11,057
9,637
9,745
17,363
48,190
11,056
9,388
9,422
18,324
49,373
11,061
9,653
9,353
19,306
1. Gold held under earmark at Federal Reserve Banks for foreign and interna- 3. Includes allocations by the International Monetary Fund of SDRs as follows; tional accounts is not included in the gold stock of the United States; see table $867 million on Jan. 1, 1970; $717 million on Jan. 1, 1971; $710 million on Jan. 1, 3.13. Gold stock is valued at $42.22 per fine troy ounce. 1972; $1,139 million on Jan. 1, 1979; $1,152 million on Jan. 1, 1980; and $1,093
2. Beginning July 1974, the IMF adopted a technique for valuing the SDR based million on Jan. 1, 1981; plus transactions in SDRs. on a weighted average of exchange rates for the currencies of member countries. 4 Valued at current market exchange rates. From July 1974 through December 1980, 16 currencies were used; from January 1981, 5 currencies have been used. The U.S. SDR holdings and reserve position in the IMF also are valued on this basis beginning July 1974.
3.13 FOREIGN OFFICIAL ASSETS HELD AT FEDERAL RESERVE BANKS1
Millions of dollars, end of period
Assets 1985 1986 1987 1988 1989
Assets 1985 1986 1987 Aug. Sept. Oct. Nov. Dec. Jan.
p Feb.
1 Deposits
Assets held in custody 2 U.S. Treasury securities 3 Earmarked gold
480
121,004 14,245
287
155,835 14,048
244
195,126 13,919
230
221,715 13,658
338
221,119 13,653
301
226,533 13,637
251
229,926 13,640
347
232,547 13,636
279
228,399 13,635
325
230,860 13,609
1. Excludes deposits and U.S. Treasury securities held for international and regional organizations.
2. Marketable U.S. Treasury bills, notes, and bonds; and nonmarketable U.S. Treasury securities payable in dollars and in foreign currencies.
3. Earmarked gold and the gold stock are valued at $42.22 per fine troy ounce. Earmarked gold is gold held for foreign and international accounts and is not included in the gold stock of the United States.
Digitized for FRASER http://fraser.stlouisfed.org/ Federal Reserve Bank of St. Louis
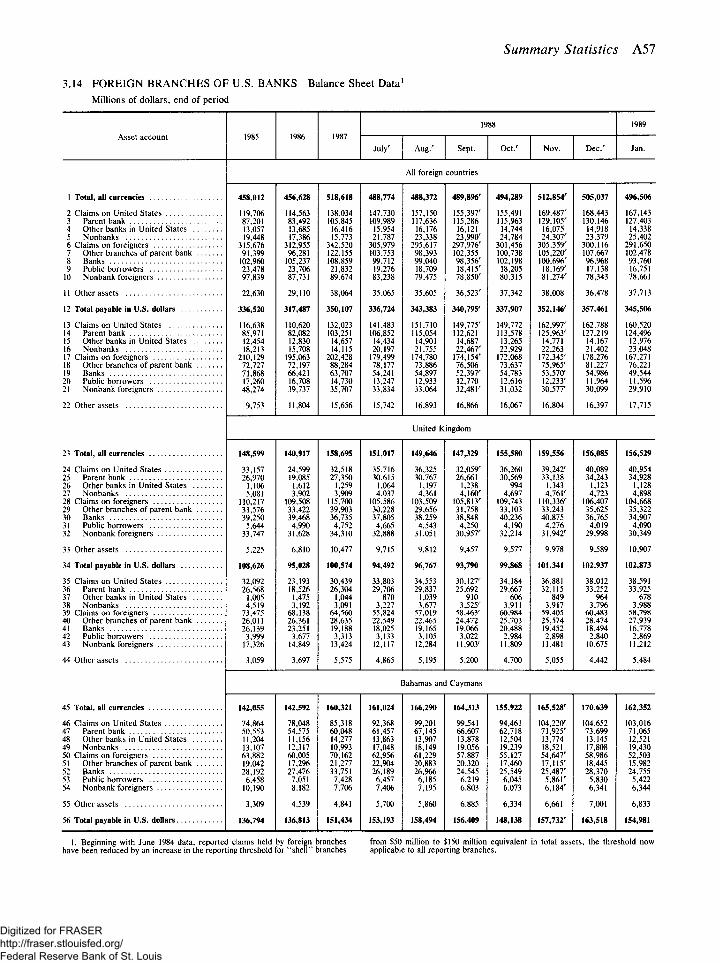
Summary Statistics A57
3.14 FOREIGN BRANCHES OF U.S. BANKS Balance Sheet Data1
Millions of dollars, end of period
Asset account 1985 1986 1987 1988 1989
Asset account 1985 1986 1987 July" Aug/ Sept. Oct." Nov. Dec." Jan.
All foreign countries
1 Total, all currencies 458,012 456,628 518,618 488,774 488,372 489,896' 494,289 512,854" 505,037 496,506
2 Claims on United States 119,706 114,563 138,034 147,730 157,150 155,397'' 155,491 169,487" 168,443 167,143 3 Parent bank 87,201 83,492 105,845 109,989 117,636 115,286 115,963 129,105" 130,146 127,403 4 Other banks in United States 13,057 13,685 16,416 15,954 16,176 16,121 14,744 16,075 14,918 14,338 5 Nonbanks 19,448 17,386 15,773 21,787 23,338 23,990" 24,784 24,307" 23,379 25,402 6 Claims on foreigners 315,676 312,955 342,520 305,979 295,617 297,976" 301,456 305,359" 300,116 291,650 7 Other branches of parent bank 91,399 96,281 122,155 103,753 98,393 102,355 100,738 105,220" 107,667 102,478 8 Banks 102,960 105,237 108,859 99,712 99,040 98,356" 102,198 100,696" 96,968 93,760 9 Public borrowers 23,478 23,706 21,832 19,276 18,709 18,415" 18,205 18,169" 17,138 16,751
10 Nonbank foreigners 97,839 87,731 89,674 83,238 79,475 78,850" 80,315 81,274" 78,343 78,661
11 Other assets 22,630 29,110 38,064 35,065 35,605 36,523" 37,342 38,008 36,478 37,713
12 Total payable in U.S. dollars 336,520 317,487 350,107 336,724 343,383 340,795" 337,907 352,146" 357,461 345,506
13 Claims on United States 116,638 110,620 132,023 141,483 151,710 149,775" 149,772 162,997" 162,788 160,520 14 Parent bank 85,971 82,082 103,251 106,852 115,054 112,621 113,578 125,963" 127,219 124,4% 15 Other banks in United States 12,454 12,830 14,657 14,434 14,901 14,687 13,265 14,771 14,167 12,976 16 Nonbanks 18,213 15,708 14,115 20,197 21,755 22,467" 22,929 22,263 21,402 23,048 17 Claims on foreigners 210,129 195,063 202,428 179,499 174,780 174,154" 172,068 172,345" 178,276 167,271 18 Other branches of parent bank 72,727 72,197 88,284 78,177 73,886 76,506 73,637 75,965" 81,227 76,221 19 Banks 71,868 66,421 63,707 54,241 54,897 52,397" 54,783 53,570" 54,986 49,544 20 Public borrowers 17,260 16,708 14,730 13,247 12,933 12,770 12,616 12,233" 11,964 11,596 21 Nonbank foreigners 48,274 39,737 35,707 33,834 33,064 32,481" 31,032 30,577" 30,099 29,910
22 Other assets 9,753 11,804 15,656 15,742 16,893 16,866 16,067 16,804 16,397 17,715
United Kingdom
23 Total, all currencies 148,599 140,917 158,695 151,017 149,646 147,329 155,580 159,556 156,085 156,529
24 Claims on United States 33,157 24,599 32,518 35,716 36,325 32,059" 36,260 39,242" 40,089 40,954 25 Parent bank 26,970 19,085 27,350 30,615 30,767 26,661 30,569 33,138 34,243 34,928 26 Other banks in United States 1,106 1,612 1,259 1,064 1,197 1,238 994 1,343 1,123 1,128 27 Nonbanks 5,081 3,902 3,909 4,037 4,361 4,160" 4,697 4,761" 4,723 4,898 28 Claims on foreigners 110,217 109,508 115,700 105,586 103,509 105,813" 109,743 110,336" 106,407 104,668 29 Other branches of parent bank 31,576 33,422 39,903 30,228 29,656 31,758 33,103 33,243 35,625 35,322 30 Banks 39,250 39,468 36,735 37,805 38,259 38,848 40,236 40,875 36,765 34,907 31 Public borrowers 5,644 4,990 4,752 4,665 4,543 4,250 4,190 4,276 4,019 4,090 32 Nonbank foreigners 33,747 31,628 34,310 32,888 31,051 30,957" 32,214 31,942" 29,998 30,349
33 Other assets 5,225 6,810 10,477 9,715 9,812 9,457 9,577 9,978 9,589 10,907
34 Total payable in U.S. dollars 108,626 95,028 100,574 94,492 96,767 93,790 99,868 101,341 102,937 102,873
35 Claims on United States 32,092 23,193 30,439 33,803 34,553 30,127" 34,184 36,881 38,012 38,591 36 Parent bank 26,568 18,526 26,304 29,706 29,837 25,692 29,667 32,115 33,252 33,925 37 Other banks in United States 1,005 1,475 1,044 870 1,039 910 606 849 964 678 38 Nonbanks 4,519 3,192 3,091 3,227 3,677 3,525" 3,911 3,917 3,796 3,988 39 Claims on foreigners 73,475 68,138 64,560 55,824 57,019 58,463' 60,984 59,405 60,483 58,798 40 Other branches of parent bank 26,011 26,361 28,635 22,549 22,465 24,472 25,703 25,574 28,474 27,939 41 Banks 26,139 23,251 19,188 18,025 19,165 19,066 20,488 19,452 18,494 16,778 42 Public borrowers 3,999 3,677 3,313 3,133 3,105 3,022 2,984 2,898 2,840 2,869 43 Nonbank foreigners 17,326 14,849 13,424 12,117 12,284 11,903" 11,809 11,481 10,675 11,212
44 Other assets 3,059 3,697 5,575 4,865 5,195 5,200 4,700 5,055 4,442 5,484
Bahamas and Caymans
45 Total, all currencies 142,055 142,592 160,321 161,024 166,290 164,313 155,922 165,528" 170,639 162,352
46 Claims on United States 74,864 78,048 85,318 92,368 99,201 99,541 94,461 104,220" 104,652 103,016 47 Parent bank 50,553 54,575 60,048 61,457 67,145 66,607 62,718 71,925" 73,699 71,065 48 Other banks in United States 11,204 11,156 14,277 13,863 13,907 13,878 12,504 13,774 13,145 12,521 49 Nonbanks 13,107 12,317 10,993 17,048 18,149 19,056 19,239 18,521 17,808 19,430 50 Claims on foreigners 63,882 60,005 70,162 62,956 61,229 57,887 55,127 54,647" 58,986 52,503 51 Other branches of parent bank 19,042 17,296 21,277 22,904 20,883 20,320 17,460 17,115" 18,445 15,982 52 Banks 28,192 27,476 33,751 26,189 26,966 24,545 25,549 25,487" 28,370 24,755 53 Public borrowers 6,458 7,051 7,428 6,457 6,185 6,219 6,045 5,861" 5,830 5,422 54 Nonbank foreigners 10,190 8,182 7,706 7,406 7,195 6,803 6,073 6,184" 6,341 6,344
55 Other assets 3,309 4,539 4,841 5,700 5,860 6,885 6,334 6,661 7,001 6,833
56 Total payable in U.S. dollars 136,794 136,813 151,434 153,193 158,494 156,409 148,138 157,732' 163,518 154,981
1. Beginning with June 1984 data, reported claims held by foreign branches from $50 million to $150 million equivalent in total assets, the threshold now have been reduced by an increase in the reporting threshold for "shell" branches applicable to all reporting branches.
Digitized for FRASER http://fraser.stlouisfed.org/ Federal Reserve Bank of St. Louis
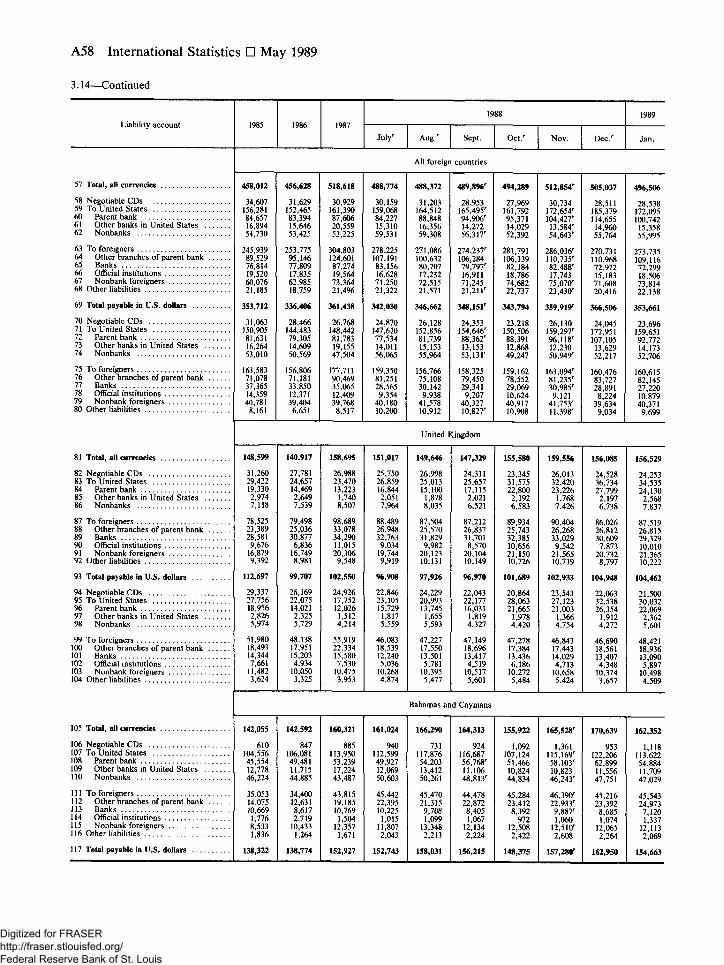
A58 International Statistics • May 1989
3.14—Continued
Liability account 1985 1986 1987 1988 1989
Liability account 1985 1986 1987 Julyr Aug/ Sept. O c t / Nov. D e c / Jan.
57 Total, all currencies
58 Negotiable CDs 59 To United States 60 Parent bank 61 Other banks in United States . 62 Nonbanks
63 To foreigners 64 Other branches of parent bank 65 Banks 66 Official institutions 67 Nonbank foreigners 68 Other liabilities
69 Total payable in U.S. dollars
70 Negotiable CDs 71 To United States 72 Parent bank 73 Other banks in United States . 74 Nonbanks
75 To foreigners 76 Other branches of parent bank 77 Banks 78 Official institutions 79 Nonbank foreigners 80 Other liabilities
81 Total, all currencies
82 Negotiable CDs 83 To United States 84 Parent bank 85 Other banks in United States 86 Nonbanks
87 To foreigners 88 Other branches of parent bank 89 Banks 90 Official institutions 91 Nonbank foreigners 92 Other liabilities
93 Total payable in U.S. dollars
94 Negotiable CDs 95 To United States 96 Parent bank 97 Other banks in United States 98 Nonbanks
99 To foreigners 100 Other branches of parent bank 101 Banks 102 Official institutions 103 Nonbank foreigners 104 Other liabilities
105 Total, all currencies
106 Negotiable CDs 107 To United States 108 Parent bank 109 Other banks in United States . 110 Nonbanks
111 To foreigners 112 Other branches of parent bank 113 Banks 114 Official institutions 115 Nonbank foreigners 116 Other liabilities
117 Total payable in U.S. dollars
All foreign countries
458 ,012 456 ,628 5 1 8 , 6 1 8 4 8 8 , 7 7 4 4 8 8 , 3 7 2 4 8 9 , 8 9 6 ' 4 9 4 , 2 8 9 512,854 R 5 0 5 , 0 3 7 4 9 6 , 5 0 6
34,607 156,281 84,657 16,894 54,730
31,629 152,465 83,394 15,646 53,425
30,929 161,390 87,606 20,559 53,225
30,159 159,068 84,227 15,310 59,531
31,203 164,512 88,848 16,356 59,308
28,953 165,495' 94,906r
14,272 56,317'
27,969 161,792 95,371 14,029 52,392
30,734 172,654'' 104,427''
13,584' 54,643'
28,511 185,379 114,655
14,960 55,764
28,538 172,095 100,742
15,358 55,995
245,939 89,529 76,814 19,520 60,076 21,185
253,775 95,146 77,809 17,835 62,985 18,759
304,803 124,601 87,274 19,564 73,364 21,496
278,225 107,191 83,156 16,628 71,250 21,322
271,086 100,632 80,707 17,232 72,515 21,571
274,237' 106,284 79,797r
16,911 71,245 21,2H r
281,791 106,139 82,184 18,786 74,682 22,737
286,036' 110,735' 82,488' 17,743 75,070' 23,43C
270,731 110,968 72,972 15,183 71,608 20,416
273,735 109,116 72,299 18,506 73,814 22,138
353 ,712 336 ,406 361 ,438 342 ,030 3 4 6 , 6 6 2 3 4 8 , 1 5 1 ' 3 4 3 , 7 9 4 3 5 9 , 9 1 9 ' 3 6 6 , 5 0 6 3 5 3 , 6 6 1
31,063 150,905 81,631 16,264 53,010
28,466 144,483 79,305 14,609 50,569
26,768 148,442 81,783 19,155 47,504
24,870 147,610 77,534 14,011 56,065
26,128 152,856 81,739 15,153 55,964
24,353 154,646' 88,362' 13,153 53,131'
23,218 150,506 88,391 12,868 49,247
26,130 159,297' 96,118' 12,230 50,949'
24,045 172,951 107,105 13,629 52,217
23,696 159,651 92,772 14,173 52,706
163,583 71,078 37,365 14,359 40,781
8,161
156,806 71,181 33,850 12,371 39,404 6,651
177,711 90,469 35,065 12,409 39,768
8,517
159,350 81,251 28,565 9,354
40,180 10,200
156,766 75,108 30,142 9,938
41,578 10,912
158,325 79,450 29,341 9,207
40,327 10,827r
159,162 78,552 29,069 10,624 40,917 10,908
163,094' 81,235' 30,985' 9,121
41,753' 11,398'
160,476 83,727 28,891 8,224
39,634 9,034
160,615 82,145 27,220 10,879 40,371
9,699
United Kingdom
148,599 140 ,917 158 ,695 151 ,017 149 ,646 147 ,329 155 ,580 159 ,556 156 ,085 156 ,529
31,260 29,422 19,330 2,974 7,118
27,781 24,657 14,469 2,649 7,539
26,988 23,470 13,223
1,740 8,507
25,750 26,859 16,844 2,051 7,964
26,998 25,013 15,100
1,878 8,035
24,311 25,657 17,115 2,021 6,521
23,345 31,575 22,800 2,192 6,583
26,013 32,420 23,226
1,768 7,426
24,528 36,734 27,799
2,197 6,738
24,253 34,535 24,130 2,568 7,837
78,525 23,389 28,581 9,676
16,879 9,392
79,498 25,036 30,877 6,836
16,749 8,981
98,689 33,078 34,290 11,015 20,306 9,548
88,489 26,948 32,763 9,034
19,744 9,919
87,504 25,570 31,829 9,982
20,123 10,131
87,212 26,837 31,701
8,570 20,104 10,149
89,934 25,743 32,385 10,656 21,150 10,726
90,404 26,268 33,029
9,542 21,565 10,719
86,026 26,812 30,609 7,873
20,732 8,797
87,519 26,815 29,329 10,010 21,365 10,222
112,697 9 9 , 7 0 7 102 ,550 9 6 , 9 0 8 9 7 , 9 2 6 9 6 , 9 7 0 101 ,689 102 ,933 104 ,948 104 ,462
29,337 27,756 18,956 2,826 5,974
26,169 22,075 14,021 2,325 5,729
24,926 17,752 12,026
1,512 4,214
22,846 23,105 15,729 1,817 5,559
24,229 20,993 13,745 1,655 5,593
22,043 22,177 16,031
1,819 4,327
20,864 28,063 21,665
1,978 4,420
23,543 27,123 21,003
1,366 4,754
22,063 32,538 26,354
1,912 4,272
21,500 30,032 22,069
2,362 5,601
51,980 18,493 14,344 7,661
11,482 3,624
48,138 17,951 15,203 4,934
10,050 3,325
55,919 22,334 15,580 7,530
10,475 3,953
46,083 18,539 12,240 5,036
10,268 4,874
47,227 17,550 13,501 5,781
10,395 5,477
47,149 18,6% 13,417 4,519
10,517 5,601
47,278 17,384 13,436 6,186
10,272 5,484
46,843 17,443 14,029 4,713
10,658 5,424
46,690 18,561 13,407 4,348
10,374 3,657
48,421 18,936 13,090 5,897
10,498 4,509
Bahamas and Caymans
142,055 142 ,592 160,321 161 ,024 166 ,290 164 ,313 155 ,922 165 ,528 ' 170 ,639 162 ,352
610 104,556 45,554 12,778 46,224
847 106,081 49,481 11,715 44,885
885 113,950 53,239 17,224 43,487
940 112,599 49,927 12,069 50,603
731 117,876 54,203 13,412 50,261
924 116,687 56,768' 11,106 48,813'
1,092 107,124 51,466 10,824 44,834
1,361 115,169' 58,103' 10,823 46,243'
953 122,206 62,899 11,556 47,751
1,118 113,622 54,884 11,709 47,029
35,053 14,075 10,669 1,776 8,533 1,836
34,400 12,631 8,617 2,719
10,433 1,264
43,815 19,185 10,769
1,504 12,357
1,671
45,442 22,395 10,225
1,015 11,807 2,043
45,470 21,315 9,708 1,099
13,348 2,213
44,478 22,872 8,405 1,067
12,134 2,224
45,284 23,412 8,392
972 12,508 2,422
46,39c 22,933' 9,887' 1,060
12,51C 2,608
45,216 23,392 8,685 1,074
12,065 2,264
45,543 24,973 7,120 1,337
12,113 2,069
138,322 138 ,774 152 ,927 152 ,743 158,031 156 ,215 148 ,375 157,28c 162 ,950 154 ,663
Digitized for FRASER http://fraser.stlouisfed.org/ Federal Reserve Bank of St. Louis
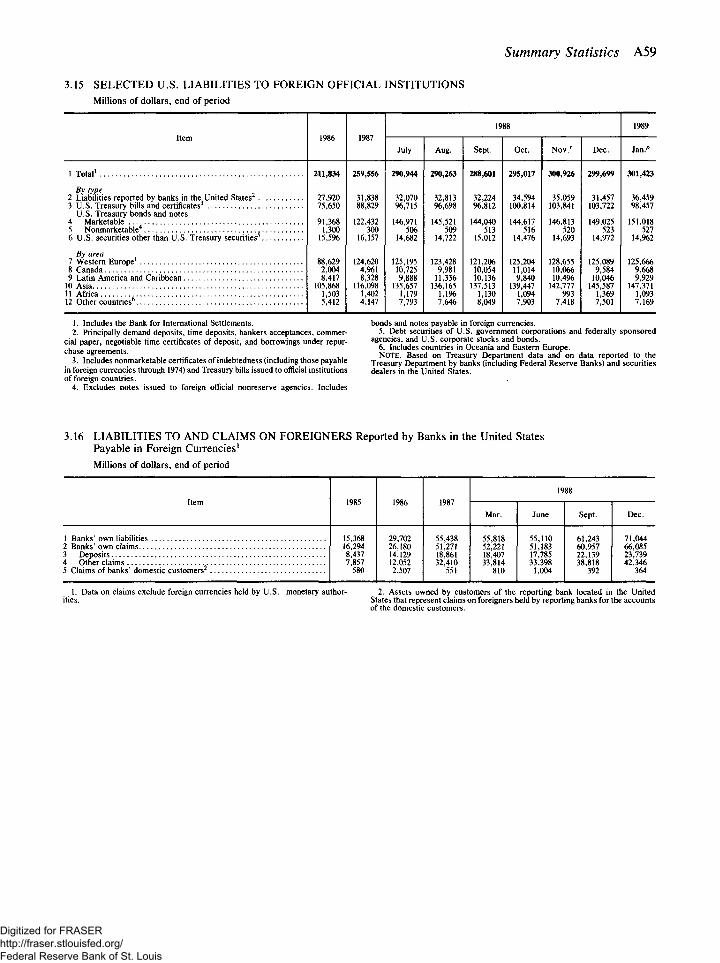
Summary Statistics A59
3.15 SELECTED U.S. LIABILITIES TO FOREIGN OFFICIAL INSTITUTIONS Millions of dollars, end of period
Item 1986 1987 1988 1989
Item 1986 1987 July Aug. Sept. Oct. N o v / Dec. Jan."
1 Total1 211,834 259,556 290,944 290,263 288,601 295,017 300,926 299,699 301,423
By type 2 Liabilities reported by banks in the United States 27,920 31,838 32,070 32,813 32,224 34,594 35,059 31,457 36,459 3 U.S. Treasury bills and certificates3 75,650 88,829 96,715 96,698 96,812 100,814 103,841 103,722 98,457
U.S. Treasury bonds and notes 96,715 100,814
4 Marketable 91,368 122,432 146,971 145,521 144,040 144,617 146,813 149,025 151,018 5 Nonmarketable 1,300 300 506 509 513 516 520 523 527 6 U.S. securities other than U.S. Treasury securities 15,596 16,157 14,682 14,722 15,012 14,476 14,693 14,972 14,962
By area 7 Western Europe 88,629 124,620 125,195 123,428 121,206 125,204 128,655 125,089 125,666 8 2,004 4,961 10,725 9,981 10,054 11,014 10,066 9,584 9,668 9 Latin America and Caribbean 8,417 8,328 9,888 11,336 10,136 9,840 10,496 10,046 9,929
10 Asia 105,868 116,098 135,657 136,165 137,513 139,447 142,777 145,587 147,371 11 1,503 1,402 1,179 1,196 1,130 1,094 993 1,369 1,093 12 Other countries6 5,412 4,147 7,793 7,646 8,049 7,903 7,418 7,501 7,169
1. Includes the Bank for International Settlements. 2. Principally demand deposits, time deposits, bankers acceptances, commer-
cial paper, negotiable time certificates of deposit, and borrowings under repur-chase agreements.
3. Includes nonmarketable certificates of indebtedness (including those payable in foreign currencies through 1974) and Treasury bills issued to official institutions of foreign countries.
4. Excludes notes issued to foreign official nonreserve agencies. Includes
3.16 LIABILITIES TO AND CLAIMS ON FOREIGNERS Reported by Banks in the United States Payable in Foreign Currencies' Millions of dollars, end of period
Item 1985 1986 1987 1988
Item 1985 1986 1987 Mar. June Sept. Dec.
1 Banks' own liabilities 15,368 29,702 55,438 55,818 55,110 61,243 71,044 2 Banks' own claims 16,294 26,180 51,271 52,221 51,183 60,957 66,085 3 Deposits 8,437 14,129 18,861 18,407 17,785 22,139 23,739 4 Other claims 7,857 12,052 32,410 33,814 33,398 38,818 42,346 5 Claims of banks' domestic customers 580 2,507 551 810 1,004 392 364
bonds and notes payable in foreign currencies. 5. Debt securities of U.S. government corporations and federally sponsored
agencies, and U.S. corporate stocks and bonds. 6. Includes countries in Oceania and Eastern Europe. NOTE. Based on Treasury Department data and on data reported to the
Treasury Department by banks (including Federal Reserve Banks) and securities dealers in the United States.
1. Data on claims exclude foreign currencies held by U.S. monetary author- 2. Assets owned by customers of the reporting bank located in the United ities. States that represent claims on foreigners held by reporting banks for the accounts
of the domestic customers.
Digitized for FRASER http://fraser.stlouisfed.org/ Federal Reserve Bank of St. Louis
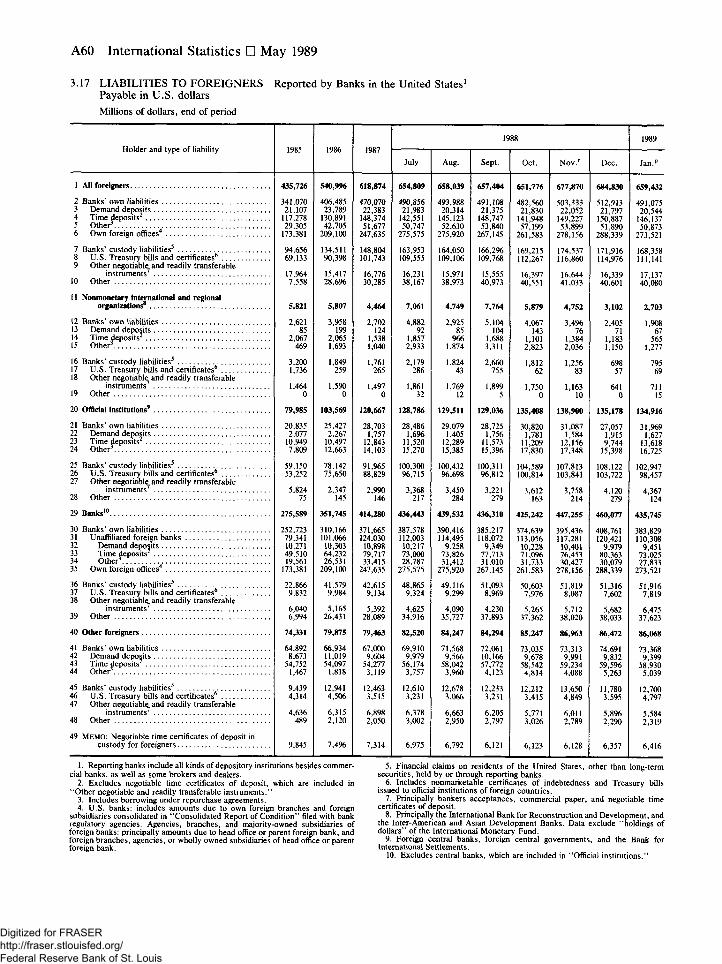
A60 International Statistics • May 1989
3.17 LIABILITIES TO FOREIGNERS Payable in U.S. dollars Millions of dollars, end of period
Reported by Banks in the United States1
1988 1989 1985 1986 1987 1985 1986 1987
July Aug. Sept. Oct. N o v / Dec. Jan."
435,726 540,996 618,874 654,809 658,039 657,404 651,776 677 ,870 684 ,830 659,432
341,070 21,107
117,278 29,305
173,381
406,485 23,789
130,891 42,705
209,100
470,070 22,383
148,374 51,677
247,635
490,856 21,983
142,551 50,747
275,575
493,988 20,314
145,123 52,630
275,920
491,108 21,375
148,747 53,840
267,145
482,560 21,830
141,948 57,199
261,583
503,333 22,052
149,227 53,899
278,156
512,913 21,797
150,887 51,890
288,339
491,075 20,544
146,137 50,873
273,521
94,656 69,133
134,511 90,398
148,804 101,743
163,953 109,555
164,050 109,106
166,296 109,768
169,215 112,267
174,537 116,860
171,916 114,976
168,358 111,141
17,964 7,558
15,417 28,696
16,776 30,285
16,231 38,167
15,971 38,973
15,555 40,973
16,397 40,551
16,644 41,033
16,339 40,601
17,137 40,080
5,821 5,807 4 ,464 7,061 4 ,749 7 ,764 5 ,879 4 ,752 3 ,102 2 ,703
2,621 85
2,067 469
3,958 199
2,065 1,693
2,702 124
1,538 1,040
4,882 92
1,857 2,933
2,925 85
966 1,874
5,104 104
1,688 3,311
4,067 143
1,101 2,823
3,4% 76
1,384 2,036
2,405 71
1,183 1,150
1,908 67
565 1,277
3,200 1,736
1,849 259
1,761 265
2,179 286
1,824 43
2,660 755
1,812 62
1,256 83
698 57
795 69
1,464 0
1,590 0
1,497 0
1,861 32
1,769 12
1,899 5
1,750 0
1,163 10
641 0
711 15
79,985 103,569 120,667 128,786 129,511 129,036 135,408 138,900 135,178 134,916
20,835 2,077
10,949 7,809
25,427 2,267
10,497 12,663
28,703 1,757
12,843 14,103
28,486 1,696
11,520 15,270
29,079 1,405
12,289 15,385
28,725 1,756
11,573 15,396
30,820 1,781
11,209 17,830
31,087 1,584
12,156 17,348
27,057 1,915 9,744
15,398
31,969 1,627
13,618 16,725
59,150 53,252
78,142 75,650
91,965 88,829
100,300 96,715
100,432 96,698
100,311 96,812
104,589 100,814
107,813 103,841
108,122 103,722
102,947 98,457
5,824 75
2,347 145
2,990 146
3,368 217
3,450 284
3,221 279
3,612 163
3,758 214
4,120 279
4,367 124
275,589 351,745 414,280 436,443 439,532 436,310 425 ,242 447 ,255 460,077 435,745
252,723 79,341 10,271 49,510 19,561
173,381
310,166 101,066
10,303 64,232 26,531
209,100
371,665 124,030
10,898 79,717 33,415
247,635
387,578 112,003
10,217 73,000 28,787
275,575
390,416 114,495
9,258 73,826 31,412
275,920
385,217 118,072
9,349 77,713 31,010
267,145
374,639 113,056
10,228 71,096 31,733
261,583
395,436 117,281
10,401 76,453 30,427
278,156
408,761 120,421
9,979 80,363 30,079
288,339
383,829 110,308
9,451 73,025 27,833
273,521
22,866 9,832
41,579 9,984
42,615 9,134
48,865 9,324
49,116 9,299
51,093 8,969
50,603 7,976
51,819 8,087
51,316 7,602
51,916 7,819
6,040 6,994
5,165 26,431
5,392 28,089
4,625 34,916
4,090 35,727
4,230 37,893
5,265 37,362
5,712 38,020
5,682 38,033
6,475 37,623
74,331 79,875 79,463 82,520 84,247 84 ,294 85,247 86, % 3 86,472 86,068
64,892 8,673
54,752 1,467
66,934 11,019 54,097
1,818
67,000 9,604
54,277 3,119
69,910 9,979
56,174 3,757
71,568 9,566
58,042 3,960
72,061 10,166 57,772
4,123
73,035 9,678
58,542 4,814
73,313 9,991
59,234 4,088
74,691 9,832
59,596 5,263
73,368 9,399
58,930 5,039
9,439 4,314
12,941 4,506
12,463 3,515
12,610 3,231
12,678 3,066
12,233 3,231
12,212 3,415
13,650 4,849
11,780 3,595
12,700 4,797
4,636 489
6,315 2,120
6,898 2,050
6,378 3,002
6,663 2,950
6,205 2,797
5,771 3,026
6,011 2,789
5,8% 2,290
5,584 2,319
9,845 7,4% 7,314 6,975 6,792 6,121 6,123 6,128 6,357 6,416
Holder and type of liability
1 All foreigners
2 Banks' own liabilities 3 Demand deposits 4 Time deposits 5 O t h e r . 6 Own foreign offices4
7 Banks' custody liabilities5
8 U.S. Treasury bills and certificates6
9 Other negotiable and readily transferable instruments
10 Other
11 Nonmonetary international and regional organizations
12 Banks' own liabilities 13 Demand deposits 14 Time deposits 15 Other
16 Banks' custody liabilities5
17 U.S. Treasury bills and certificates6
18 Other negotiable and readily transferable instruments
19 Other
20 Official institutions9
21 Banks' own liabilities 22 Demand deposits 23 Time deposits 24 Other
25 Banks' custody liabilities5
26 U.S. Treasury bills and certificates6
27 Other negotiable and readily transferable instruments
28 Other
29 Banks10
30 Banks' own liabilities 31 Unaffiliated foreign banks 32 Demand deposits 33 Time deposits 34 Other3
35 Own foreign offices4
36 Banks' custody liabilities5
37 U.S. Treasury bills and certificates6
38 Other negotiable and readily transferable instruments
39 Other
40 Other foreigners
41 Banks' own liabilities 42 Demand deposits 43 Time deposits 44 O t h e r .
45 Banks' custody liabilities5
46 U.S. Treasury bills and certificates6
47 Other negotiable and readily transferable instruments
48 Other
49 MEMO: Negotiable time certificates of deposit in custody for foreigners
1. Reporting banks include all kinds of depository institutions besides commer-cial banks, as well as some brokers and dealers.
2. Excludes negotiable time certificates of deposit, which are included in "Other negotiable and readily transferable instruments."
3. Includes borrowing under repurchase agreements. 4. U.S. banks: includes amounts due to own foreign branches and foreign
subsidiaries consolidated in "Consolidated Report of Condition" filed with bank regulatory agencies. Agencies, branches, and majority-owned subsidiaries of foreign banks: principally amounts due to head office or parent foreign bank, and foreign branches, agencies, or wholly owned subsidiaries of head office or parent foreign bank.
5. Financial claims on residents of the United States, other than long-term securities, held by or through reporting banks.
6. Includes nonmarketable certificates of indebtedness and Treasury bills issued to official institutions of foreign countries.
7. Principally bankers acceptances, commercial paper, and negotiable time certificates of deposit.
8. Principally the International Bank for Reconstruction and Development, and the Inter-American and Asian Development Banks. Data exclude "holdings of dollars" of the International Monetary Fund.
9. Foreign central banks, foreign central governments, and the Bank for International Settlements.
10. Excludes central banks, which are included in "Official institutions."
Digitized for FRASER http://fraser.stlouisfed.org/ Federal Reserve Bank of St. Louis
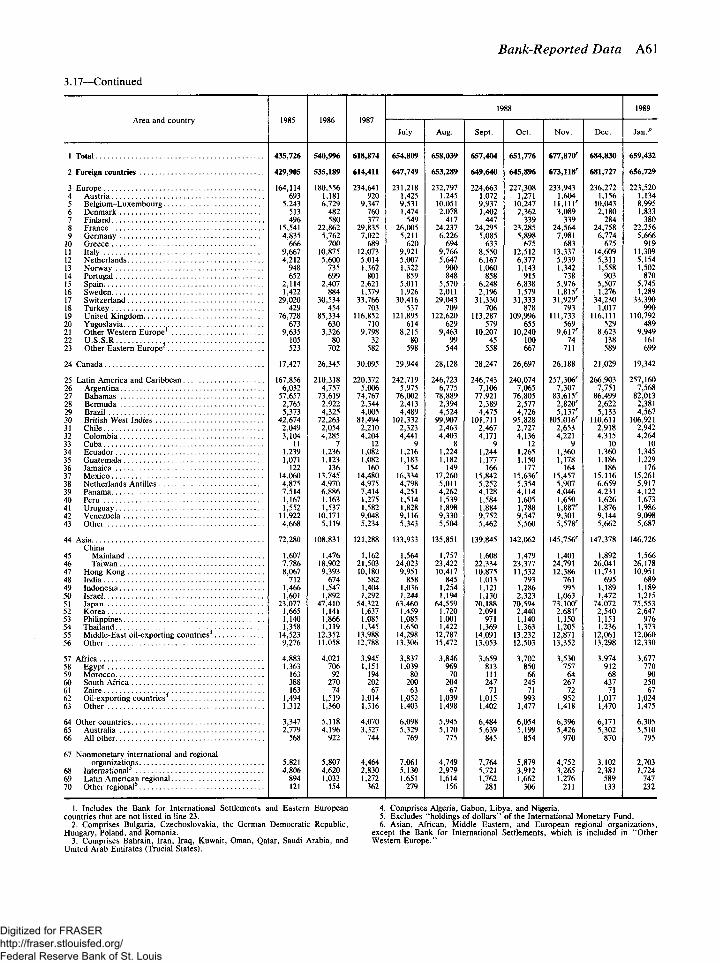
Nonbank-Reported Data A61
3.17—Continued
Area and country 1985 1986 1987 1988 1989
Area and country 1985 1986 1987 July Aug. Sept. Oct. Nov. Dec. Jan.p
1 Total 435,726 540,9% 618,874 654,809 658,039 657,404 651,776 677,870' 684,830 659,432
2 Foreign countries 429,905 535,189 614,411 647,749 653,289 649,640 645,896 673,118'' 681,727 656,729
3 Europe 164,114 180,556 234,641 231,218 232,797 224,663 227,308 233,943 236,272 223,520 4 Austria 693 1,181 920 1,425 1,245 1,072 1,271 1,604 1,156 1,134 5 Belgium-Luxembourg 5,243 6,729 9,347 9,531 10,051 9,937 10,247 i i , n r 10,043 8,995 6 Denmark 513 482 760 1,474 2,078 1,402 2,362 3,089 2,180 1,833 7 Finland 496 580 377 549 417 447 339 339 284 380 8 France 15,541 22,862 29,835 26,005 24,237 24,295 23,285 24,564 24,758 22,256 9 Germany 4,835 5,762 7,022 5,211 6,226 5,085 5,898 7,981 6,774 5,666
10 Greece 666 700 689 620 694 633 675 683 675 919 11 Italy 9,667 10,875 12,073 9,921 9,766 8,550 12,512 13,337 14,609 11,309 12 Netherlands 4,212 5,600 5,014 5,007 5,647 6,167 6,377 5,939 5,311 5,154 13 Norway 948 735 1,362 1,322 900 1,060 1,143 1,342 1,558 1,502 14 Portugal 652 699 801 859 848 858 915 738 903 870 15 Spain 2,114 2,407 2,621 5,011 5,570 6,248 6,838 5,976 5,507 5,745 16 Sweden 1,422 884 1,379 1,926 2,011 2,1% 1,579 1,815' 1,276 1,289 17 Switzerland 29,020 30,534 33,766 30,416 29,043 31,330 31,333 31,929' 34,230 33,390 18 Turkey 429 454 703 537 709 706 878 793 1,017 990 19 United Kingdom 76,728 85,334 116,852 121,895 122,620 113,287 109,9% 111,733 116,111 110,792 20 Yugoslavia 673 630 710 614 629 579 655 569 529 489 21 Other Western Europe 9,635 3,326 9,798 8,215 9,463 10,207 10,240 9,617' 8,623 9,949 22 U.S.S.R 105 80 32 80 99 45 100 74 138 161 23 Other Eastern Europe 523 702 582 598 544 558 667 711 589 699
24 Canada 17,427 26,345 30,095 29,944 28,128 28,247 26,697 26,188 21,029 19,342
25 Latin America and Caribbean 167,856 210,318 220,372 242,719 246,723 246,743 240,074 257,306' 266,903 257,160 26 Argentina 6,032 4,757 5,006 5,975 6,775 7,106 7,065 7,307 7,751 7,568 27 Bahamas 57,657 73,619 74,767 76,002 78,889 77,921 76,805 83,615' 86,499 82,013 28 Bermuda 2,765 2,922 2,344 2,413 2,394 2,389 2,577 2,820' 2,622 2,381 29 Brazil 5,373 4,325 4,005 4,489 4,524 4,475 4,726 5,137' 5,133 4,567 30 British West Indies 42,674 72,263 81,494 101,332 99,907 101,711 95,828 105,016' 110,611 106,921 31 Chile 2,049 2,054 2,210 2,323 2,463 2,467 2,727 2,653 2,918 2,942 32 Colombia 3,104 4,285 4,204 4,441 4,403 4,171 4,136 4,221 4,315 4,264 33 Cuba 11 7 12 9 8 9 12 9 10 10 34 Ecuador 1,239 1,236 1,082 1,216 1,224 1,244 1,265 1,360 1,360 1,345 35 Guatemala 1,071 1,123 1,082 1,183 1,182 1,177 1,150 1,178 1,186 1,229 36 Jamaica 122 136 160 154 149 166 177 164 186 176 37 Mexico 14,060 13,745 14,480 16,334 17,260 15,842 15,636' 15,457 15,116 15,261 38 Netherlands Antilles 4,875 4,970 4,975 4,798 5,011 5,252 5,354 5,907 6,659 5,917 39 Panama 7,514 6,886 7,414 4,251 4,262 4,128 4,114 4,046 4,231 4,122 40 Peru 1,167 1,163 1,275 1,514 1,539 1,584 1,605 1,650 1,626 1,673 41 Uruguay 1,552 1,537 1,582 1,828 1,898 1,884 1,788 1,887' 1,876 1,986 42 Venezuela 11,922 10,171 9,048 9,116 9,330 9,752 9,547 9,301 9,144 9,098 43 Other 4,668 5,119 5,234 5,343 5,504 5,462 5,560 5,578' 5,662 5,687
44 72,280 108,831 121,288 133,933 135,851 139,845 142,062 145,756' 147,378 146,726 China
45 Mainland 1,607 1,476 1,162 1,564 1,757 1,608 1,479 1,401 1,892 1,566 46 Taiwan 7,786 18,902 21,503 24,023 23,422 22,334 23,377 24,791 26,041 26,178 47 Hong Kong 8,067 9,393 10,180 9,951 10,417 10,875 11,532 12,386 11,731 10,951 48 India 712 674 582 858 845 1,013 793 761 695 689 49 Indonesia 1,466 1,547 1,404 1,036 1,254 1,121 1,286 995 1,189 1,189 50 Israel 1,601 1,892 1,292 1,244 1,194 1,130 2,323 1,063 1,472 1,215 51 Japan 23,077 47,410 54,322 63,460 64,559 70,188 70,594 73, IOC 74,072 75,553 52 Korea 1,665 1,141 1,637 1,459 1,720 2,091 2,440 2,681' 2,540 2,647 53 Philippines 1,140 1,866 1,085 1,085 1,001 971 1,140 1,150 1,151 976 54 Thailand 1,358 1,119 1,345 1,650 1,422 1,369 1,363 1,205 1,236 1,373 55 Middle-East oil-exporting countries 14,523 12,352 13,988 14,298 12,787 14,091 13,232 12,871 12,061 12,060 56 Other 9,276 11,058 12,788 13,306 15,472 13,053 12,503 13,352 13,298 12,330
57 4,883 4,021 3,945 3,837 3,846 3,659 3,702 3,530 3,974 3,677 58 Egypt 1,363 706 1,151 1,039 %9 813 850 757 912 770 59 Morocco 163 92 194 80 70 111 66 64 68 90 60 South Africa 388 270 202 200 204 247 245 267 437 250 61 Zaire 163 74 67 63 67 71 71 72 71 67 62 Oil-exporting countries 1,494 1,519 1,014 1,052 1,039 1,015 993 952 1,017 1,024 63 Other 1,312 1,360 1,316 1,403 1,498 1,402 1,477 1,418 1,470 1,475
64 Other countries 3,347 5,118 4,070 6,098 5,945 6,484 6,054 6,3% 6,171 6,305 65 Australia 2,779 4,1% 3,327 5,329 5,170 5,639 5,199 5,426 5,302 5,510 66 All other 568 922 744 769 775 845 854 970 870 795
67 Nonmonetary international and regional organizations 5,821 5,807 4,464 7,061 4,749 7,764 5,879 4,752 3,102 2,703
68 International 4,806 4,620 2,830 5,130 2,979 5,721 3,912 3,265 2,381 1,724 69 Latin American regional 894 1,033 1,272 1,651 1,614 1,762 1,662 1,276 589 747 70 Other regional 121 154 362 279 156 281 306 211 133 232
1. Includes the Bank for International Settlements and Eastern European countries that are not listed in line 23.
2. Comprises Bulgaria, Czechoslovakia, the German Democratic Republic, Hungary, Poland, and Romania.
3. Comprises Bahrain, Iran, Iraq, Kuwait, Oman, Qatar, Saudi Arabia, and United Arab Emirates (Trucial States).
4. Comprises Algeria, Gabon, Libya, and Nigeria. 5. Excludes "holdings of dollars" of the International Monetary Fund. 6. Asian, African, Middle Eastern, and European regional organizations,
except the Bank for International Settlements, which is included in "Other Western Europe."
Digitized for FRASER http://fraser.stlouisfed.org/ Federal Reserve Bank of St. Louis
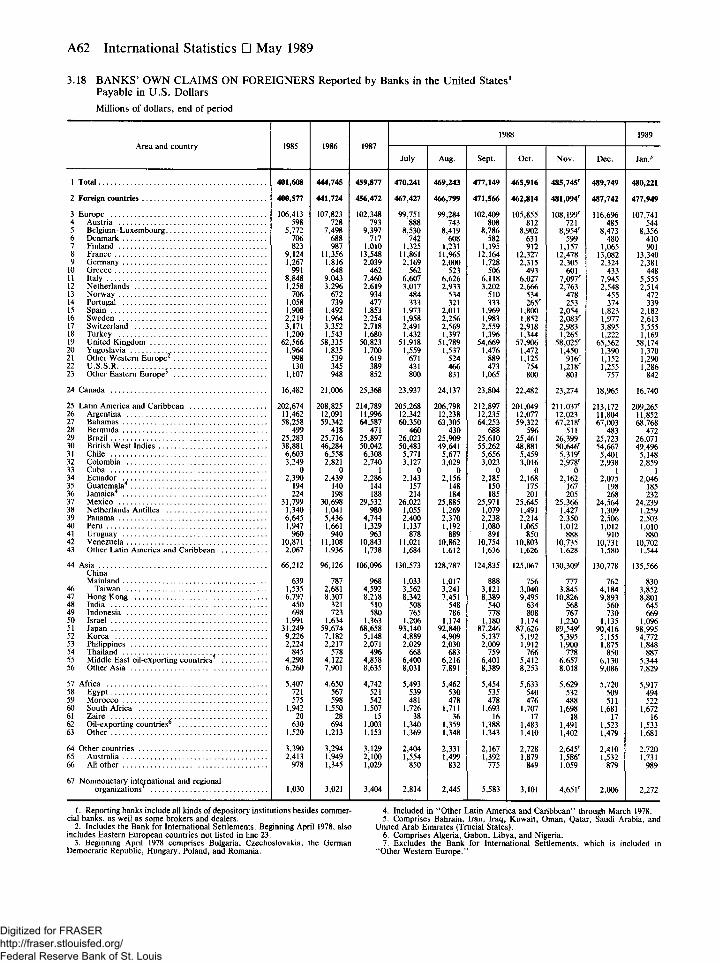
A62 International Statistics • May 1989
3.18 BANKS' OWN CLAIMS ON FOREIGNERS Reported by Banks in the United States1
Payable in U.S. Dollars Millions of dollars, end of period
Area and country 1985 1986 1987 1988 1989
Area and country 1985 1986 1987 July Aug. Sept. Oct. Nov. Dec. Jan."
1 Total 401,608 444,745 459,877 470,241 469,243 477,149 465,916 485,745' 489,749 480,221
2 Foreign countries 400,577 441,724 456,472 467,427 466,799 471,566 462,814 481,094' 487,742 477,949
3 Europe 106,413 107,823 102,348 99,751 99,284 102,409 105,855 108,199' 116,6% 107,741 4 Austria 598 728 793 888 743 808 812 721 485 544
Belgium-Luxembourg 5,772 7,498 9,397 8,530 8,419 8,786 8,902 8,954r 8,473 8,356 6 Denmark 706 688 717 742 608 582 631 599 480 410 7 Finland 823 987 1,010 1,325 1,231 1,195 912 1,157 1,065 901 8 France 9,124 11,356 13,548 11,861 11,965 12,164 12,327 12,478 13,082 13,340 9 Germany 1,267 1,816 2,039 2,169 2,000 1,728 2,315 2,305 2,324 2,381
10 Greece 991 648 462 562 523 506 493 601 433 448 11 Italy 8,848 9,043 7,460 6,607 6,626 6,118 6,027 7,097' 7,945 5,555 12 Netherlands 1,258 3,296 2,619 3,017 2,933 3,202 2,666 2,763 2,548 2,514 13 Norway 706 672 934 484 534 510 534 478 455 472 14 Portugal 1,058 739 477 333 321 333 265' 253 374 339 13 Spain 1,908 1,492 1,853 1,973 2,011 1,969 1,800 2,054 1,823 2,182 16 Sweden 2,219 1,964 2,254 1,958 2,256 1,983 1,852 2,083' 1,977 2,613 17 Switzerland 3,171 3,352 2,718 2,491 2,569 2,559 2,918 2,983 3,895 3,555 18 Turkey 1,200 1,543 1,680 1,432 1,397 1,3% 1,344 1,265 1,222 1,169 19 United Kingdom 62,566 58,335 50,823 51,918 51,789 54,669 57,906 58,025' 65,562 58,174 20 Yugoslavia 1,964 1,835 1,700 1,559 1,537 1,476 1,472 1,450 1,390 1,370 21 Other Western Europe2 998 539 619 671 524 889 1,125 916' 1,152 1,290 22 U.S.S.R 130 345 389 431 466 473 754 1,218' 1,255 1,286 23 Other Eastern Europe 1,107 948 852 800 831 1,065 800 801 757 842
24 Canada 16,482 21,006 25,368 23,937 24,137 23,804 22,482 23,274 18,965 16,740
25 Latin America and Caribbean 202,674 208,825 214,789 205,268 206,798 212,897 201,049 211,037' 213,172 209,265 26 Argentina 11,462 12,091 11,996 12,342 12,238 12,235 12,077 12,023 11,804 11,852 27 Bahamas 58,258 59,342 64,587 60,350 63,305 64,253 59,322 67,218' 67,003 68,768 28 Bermuda 499 418 471 460 430 688 5% 511 483 472 29 Brazil 25,283 25,716 25,897 26,023 25,909 25,610 25,461 26,399 25,723 26,071 30 British West Indies 38,881 46,284 50,042 50,483 49,641 55,262 48,881 50,646' 54,667 49,496 31 Chile 6,603 6,558 6,308 5,771 5,677 5,656 5,459 5, 5,401 5,148 32 Colombia 3,249 2,821 2,740 3,127 3,029 3,023 3,016 2,978' 2,938
1 2,859
1 33 Cuba 0 0 1 0 0 0 0 0 2,938
1 2,859
1 34 Ecuador 2,390 2,439 2,286 2,143 2,156 2,185 2,168 2,162 2,075 2,046 33 Guatemala4 194 140 144 157 148 150 175 167 198 185 36 Jamaica4 224 198 188 214 184 185 201 205 268 232 37 Mexico 31,799 30,698 29,532 26,022 25,885 25,971 25,645 25,366 24,564 24,239 38 Netherlands Antilles 1,340 1,041 980 1,055 1,269 1,079 1,491 1,427 1,309 1,259 39 Panama 6,645 5,436 4,744 2,400 2,370 2,238 2,214 2,350 2,506 2,503 40 Peru 1,947 1,661 1,329 1,137 1,192 1,080 1,065 1,012
888 1,012 1,010
880 41 Uruguay 960 940 963 878 889 891 850 1,012
888 910 1,010
880 42 Venezuela 10,871 11,108 10,843 11,021 10,862 10,754 10,803 10,735 10,731 10,702 43 Other Latin America and Caribbean 2,067 1,936 1,738 1,684 1,612 1,636 1,626 1,628 1,580 1,544
44 66,212 96,126 106,0% 130,573 128,787 124,835 125,067 130,309' 130,778 135,566 China
106,0% 130,573 128,787 124,835 125,067 130,309' 130,778 135,566
Mainland 639 787 968 1,033 1,017 888 756 777 762 830 46 Taiwan 1,535 2,681 4,592 3,562 3,241 3,121 3,040 3,845 4,184 3,852 47 Hong Kong 6,797 8,307 8,218 8,342 7,451 8,389 9,495 10,826 9,893 8,801 48 India 450 321 510 508 548 540 634 568 560 645 49 Indonesia 698 723 580 765 786 778 808 767 730 669 50 Israel 1,991 1,634 1,363 1,206 1,174 1,180 1,174 1,230 1,135 1,0% 51 Japan 31,249 59,674 68,658 93,140 92,840 87,246 87,626 89,549' 90,416 98,995 32 Korea 9,226 7,182 5,148 4,889 4,909 5,137 5,192 5,395 5,155 4,772 33 Philippines 2,224 2,217 2,071 2,029 2,030 2,009 1,912 1,900 1,875 1,848 34 Thailand 845 578 496 668 683 759 766 778 850 887 33 Middle East oil-exporting countries 4,298 4,122 4,858 6,400 6,216 6,401 5,412 6,657 6,130 5,344 36 Other Asia 6,260 7,901 8,635 8,031 7,891 8,389 8,253 8,018 9,086 7,829
57 Africa 5,407 4,650 4,742 5,493 5,462 5,454 5,633 5,629 5,720 5,917 38 Egypt 721 567 521 539 530 535 540 532 509 494 39 Morocco 575 598 542 481 478 478 476 488 511 522 60 South Africa 1,942 1,550 1,507 1,726 1,711 1,693 1,707 1,698 1,681 1,672 61 Zaire 20 28 15 38 36 16 17 18 17 16 62 Oil-exporting countries 630 694 1,003 1,340 1,359 1,388 1,483 1,491 1,523 1,533 63 Other 1,520 1,213 1,153 1,369 1,348 1,343 1,410 1,402 1,479 1,681
64 Other countries 3,390 3,294 3,129 2,404 2,331 2,167 2,728 2,645' 2,410 2,720 65 Australia 2,413 1,949 2,100 1,554 1,499 1,392 1,879 1,586' 1,532 1,731 66 All other 978 1,345 1,029 850 832 775 849 1,059 879 989
67 Nonmonetary international and regional organizations 1,030 3,021 3,404 2,814 2,445 5,583 3,101 4,651' 2,006 2,272
1. Reporting banks include all kinds of depository institutions besides commer-cial banks, as well as some brokers and dealers.
2. Includes the Bank for International Settlements. Beginning April 1978, also includes Eastern European countries not listed in line 23.
3. Beginning April 1978 comprises Bulgaria, Czechoslovakia, the German Democratic Republic, Hungary, Poland, and Romania.
4. Included in "Other Latin America and Caribbean" through March 1978. 5. Comprises Bahrain, Iran, Iraq, Kuwait, Oman, Qatar, Saudi Arabia, and
United Arab Emirates (Trucial States). 6. Comprises Algeria, Gabon, Libya, and Nigeria. 7. Excludes the Bank for International Settlements, which is included in
"Other Western Europe."
Digitized for FRASER http://fraser.stlouisfed.org/ Federal Reserve Bank of St. Louis
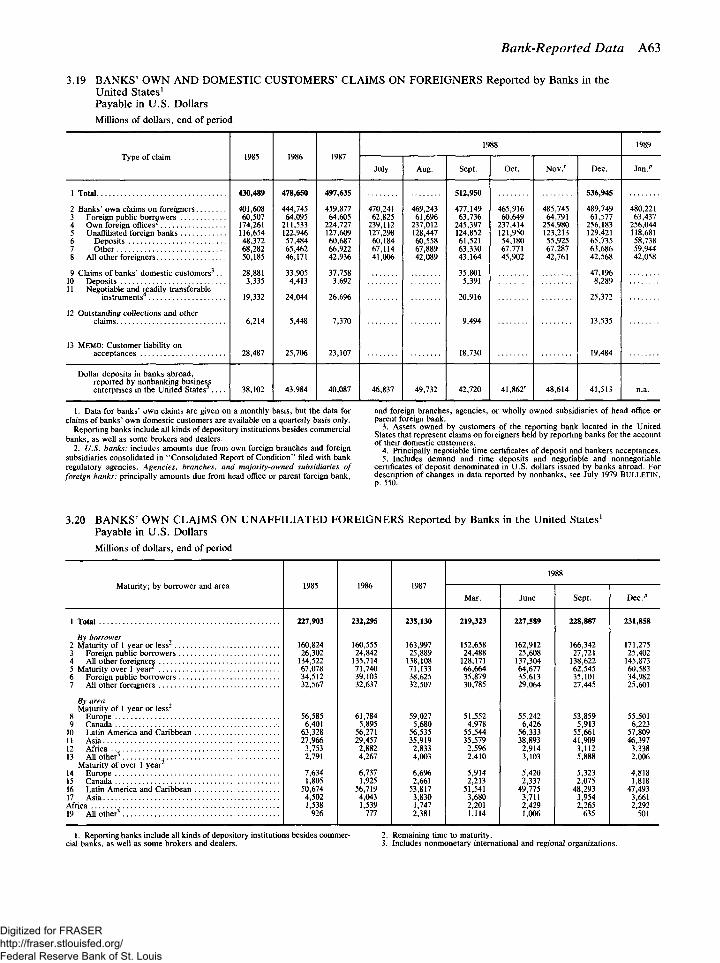
Nonbank-Reported Data A63
3.19 BANKS' OWN AND DOMESTIC CUSTOMERS' CLAIMS ON FOREIGNERS Reported by Banks in the United States1
Payable in U.S. Dollars Millions of dollars, end of period
Type of claim 1985 1986 1987 1988 1989
Type of claim 1985 1986 1987 July Aug. Sept. Oct. Nov. r Dec. Jan."
1 Total 430,489
401,608 60,507
174,261 116,654 48,372 68,282 50,185
28,881 3,335
19,332
6,214
28,487
478,650
444,745 64,095
211,533 122,946 57,484 65,462 46,171
33,905 4,413
24,044
5,448
25,706
497,635
459,877 64,605
224,727 127,609 60,687 66,922 42,936
37,758 3,692
26,696
7,370
23,107
512,950
477,149 63,736
245,397 124,852 61,521 63,330 43,164
35,801 5,391
20,916
9,494
18,730
536,945
489,749 61,577
256,183 129,421 65,735 63,686 42,568
47,196 8,289
25,372
13,535
19,484
2 Banks' own claims on foreigners 3 Foreign public borrowers 4 Own foreign offices 5 Unaffiliated foreign banks 6 Deposits 7 Other 8 All other foreigners
9 Claims of banks' domestic customers3 . . .
430,489
401,608 60,507
174,261 116,654 48,372 68,282 50,185
28,881 3,335
19,332
6,214
28,487
478,650
444,745 64,095
211,533 122,946 57,484 65,462 46,171
33,905 4,413
24,044
5,448
25,706
497,635
459,877 64,605
224,727 127,609 60,687 66,922 42,936
37,758 3,692
26,696
7,370
23,107
470,241 62,825
239,112 127,298 60,184 67,114 41,006
469,243 61,696
237,012 128,447 60,558 67,889 42,089
512,950
477,149 63,736
245,397 124,852 61,521 63,330 43,164
35,801 5,391
20,916
9,494
18,730
465,916 60,649
237,414 121,950 54,180 67,771 45,902
485,745 64,791
254,980 123,213 55,925 67,287 42,761
536,945
489,749 61,577
256,183 129,421 65,735 63,686 42,568
47,196 8,289
25,372
13,535
19,484
480,221 63,437
256,044 118,681 58,738 59,944 42,058
2 Banks' own claims on foreigners 3 Foreign public borrowers 4 Own foreign offices 5 Unaffiliated foreign banks 6 Deposits 7 Other 8 All other foreigners
9 Claims of banks' domestic customers3 . . .
430,489
401,608 60,507
174,261 116,654 48,372 68,282 50,185
28,881 3,335
19,332
6,214
28,487
478,650
444,745 64,095
211,533 122,946 57,484 65,462 46,171
33,905 4,413
24,044
5,448
25,706
497,635
459,877 64,605
224,727 127,609 60,687 66,922 42,936
37,758 3,692
26,696
7,370
23,107
512,950
477,149 63,736
245,397 124,852 61,521 63,330 43,164
35,801 5,391
20,916
9,494
18,730
536,945
489,749 61,577
256,183 129,421 65,735 63,686 42,568
47,196 8,289
25,372
13,535
19,484
11 Negotiable and readily transferable
430,489
401,608 60,507
174,261 116,654 48,372 68,282 50,185
28,881 3,335
19,332
6,214
28,487
478,650
444,745 64,095
211,533 122,946 57,484 65,462 46,171
33,905 4,413
24,044
5,448
25,706
497,635
459,877 64,605
224,727 127,609 60,687 66,922 42,936
37,758 3,692
26,696
7,370
23,107
512,950
477,149 63,736
245,397 124,852 61,521 63,330 43,164
35,801 5,391
20,916
9,494
18,730
536,945
489,749 61,577
256,183 129,421 65,735 63,686 42,568
47,196 8,289
25,372
13,535
19,484
12 Outstanding collections and other
430,489
401,608 60,507
174,261 116,654 48,372 68,282 50,185
28,881 3,335
19,332
6,214
28,487
478,650
444,745 64,095
211,533 122,946 57,484 65,462 46,171
33,905 4,413
24,044
5,448
25,706
497,635
459,877 64,605
224,727 127,609 60,687 66,922 42,936
37,758 3,692
26,696
7,370
23,107
512,950
477,149 63,736
245,397 124,852 61,521 63,330 43,164
35,801 5,391
20,916
9,494
18,730
536,945
489,749 61,577
256,183 129,421 65,735 63,686 42,568
47,196 8,289
25,372
13,535
19,484 13 MEMO: Customer liability on
430,489
401,608 60,507
174,261 116,654 48,372 68,282 50,185
28,881 3,335
19,332
6,214
28,487
478,650
444,745 64,095
211,533 122,946 57,484 65,462 46,171
33,905 4,413
24,044
5,448
25,706
497,635
459,877 64,605
224,727 127,609 60,687 66,922 42,936
37,758 3,692
26,696
7,370
23,107
512,950
477,149 63,736
245,397 124,852 61,521 63,330 43,164
35,801 5,391
20,916
9,494
18,730
536,945
489,749 61,577
256,183 129,421 65,735 63,686 42,568
47,196 8,289
25,372
13,535
19,484
Dollar deposits in banks abroad, reported by nonbanking business enterprises in the United States . . . . 38,102 43,984 40,087 46,837 49,732 42,720 41,862r 48,614 41,513 n.a.
1. Data for banks' own claims are given on a monthly basis, but the data for claims of banks' own domestic customers are available on a quarterly basis only.
Reporting banks include all kinds of depository institutions besides commercial banks, as well as some brokers and dealers.
2. U.S. banks: includes amounts due from own foreign branches and foreign subsidiaries consolidated in "Consolidated Report of Condition" filed with bank regulatory agencies. Agencies, branches, and majority-owned subsidiaries of foreign banks: principally amounts due from head office or parent foreign bank,
and foreign branches, agencies, or wholly owned subsidiaries of head office or parent foreign bank.
3. Assets owned by customers of the reporting bank located in the United States that represent claims on foreigners held by reporting banks for the account of their domestic customers.
4. Principally negotiable time certificates of deposit and bankers acceptances. 5. Includes demand and time deposits and negotiable and nonnegotiable
certificates of deposit denominated in U.S. dollars issued by banks abroad. For description of changes in data reported by nonbanks, see July 1979 BULLETIN, p. 550.
3.20 BANKS' OWN CLAIMS ON UNAFFILIATED FOREIGNERS Reported by Banks in the United States1
Payable in U.S. Dollars Millions of dollars, end of period
Maturity; by borrower and area 1985 1986 1987 1988
Maturity; by borrower and area 1985 1986 1987 Mar. June Sept. Dec."
1 Total 227,903 232,295 235,130 219,323 227,589 228,887 231,858
By borrower 2 Maturity of 1 year or less 160,824 160,555 163,997 152,658 162,912 166,342 171,275 3 Foreign public borrowers 26,302 24,842 25,889 24,488 25,608 27,721 25,402 4 All other foreigners 134,522 135,714 138,108 128,171 137,304 138,622 145,873 5 Maturity over 1 year2 67,078 71,740 71,133 66,664 64,677 62,545 60,583 6 Foreign public borrowers 34,512 39,103 38,625 35,879 35,613 35,101 34,982 7 All other foreigners 32,567 32,637 32,507 30,785 29,064 27,445 25,601
By area Maturity of 1 year or less
8 Europe 56,585 61,784 59,027 51,552 55,242 53,859 55,501 9 Canada 6,401 5,895 5,680 4,978 6,426 5,913 6,223
10 Latin America and Caribbean 63,328 56,271 56,535 55,544 56,333 55,661 57,809 11 Asia 27,966 29,457 35,919 35,579 38,893 41,909 46,397 12 Africa 3,753 2,882 2,833 2,5% 2,914 3,112 3,338 13 All other3 2,791 4,267 4,003 2,410 3,103 5,888 2,006
Maturity of over 1 year2
14 Europe 7,634 6,737 6,696 5,914 5,420 5,323 4,818 15 Canada 1,805 1,925 2,661 2,213 2,337 2,075 1,818 16 Latin America and Caribbean 50,674 56,719 53,817 51,541 49,775 48,293 47,493 17 Asia 4,502 4,043 3,830 3,680 3,711 3,954 3,661
1,538 1,539 1,747 2,201 2,429 2,265 2,292 19 All other3 926 777 2,381 1,114 1,006 635 501
1. Reporting banks include all kinds of depository institutions besides commer- 2. Remaining time to maturity, cial banks, as well as some brokers and dealers. 3. Includes nonmonetary international and regional organizations.
Digitized for FRASER http://fraser.stlouisfed.org/ Federal Reserve Bank of St. Louis
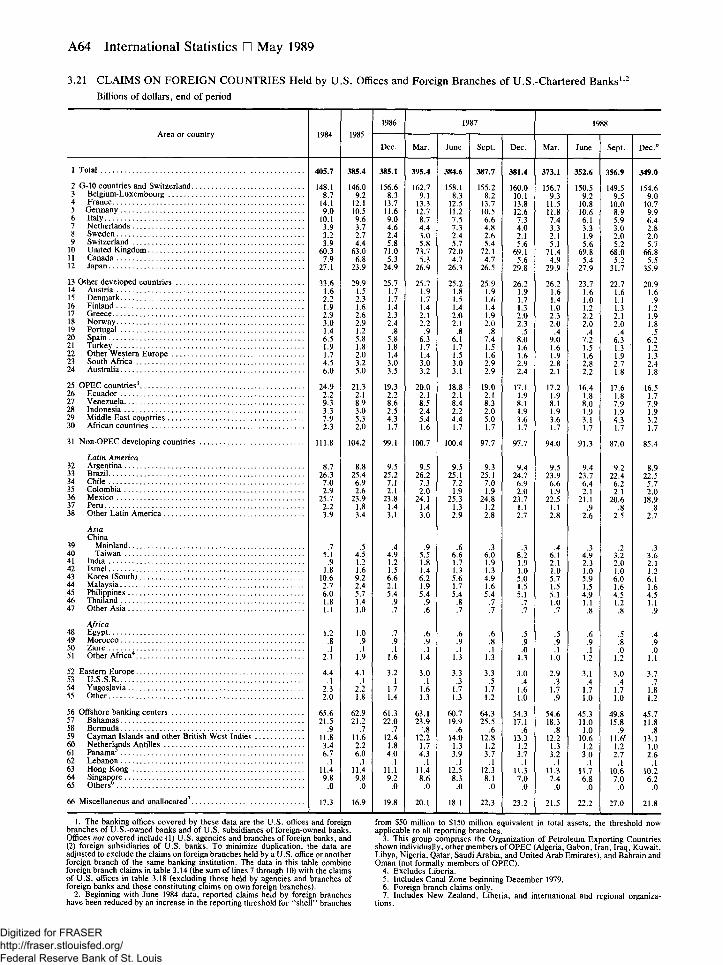
A64 International Statistics • May 1989
3.21 CLAIMS ON FOREIGN COUNTRIES Held by U.S. Offices and Foreign Branches of U.S.-Chartered Banks12
Billions of dollars, end of period
Area or country 1984 1985 1986 1987 1988
Area or country 1984 1985 Dec. Mar. June Sept. Dec. Mar. June Sept. D e c /
1 Total 405.7 385.4 385.1 395.4 384.6 387.7 381.4 373.1 352.6 356.9 349.0
2 G-10 countries and Switzerland 148.1 146.0 156.6 162.7 158.1 155.2 160.0 156.7 150.5 149.5 154.6 3 Belgium-Luxembourg 8.7 9.2 8.3 9.1 8.3 8.2 10.1 9.3 9.2 9.5 9.0 4 France 14.1 12.1 13.7 13.3 12.5 13.7 13.8 11.5 10.8 10.0 10.7 5 Germany 9.0 10.5 11.6 12.7 11.2 10.5 12.6 11.8 10.6 8.9 9.9 6 Italy 10.1 9.6 9.0 8.7 7.5 6.6 7.3 7.4 6.1 5.9 6.4 7 Netherlands 3.9 3.7 4.6 4.4 7.3 4.8 4.0 3.3 3.3 3.0 2.8 8 Sweden 3.2 2.7 2.4 3.0 2.4 2.6 2.1 2.1 1.9 2.0 2.0 9 Switzerland 3.9 4.4 5.8 5.8 5.7 5.4 5.6 5.1 5.6 5.2 5.7
10 United Kingdom 60.3 63.0 71.0 73.7 72.0 72.1 69.1 71.4 69.8 68.0 66.8 11 Canada 7.9 6.8 5.3 5.3 4.7 4.7 5.6 4.9 5.4 5.2 5.5 12 Japan 27.1 23.9 24.9 26.9 26.3 26.5 29.8 29.9 27.9 31.7 35.9
13 Other developed countries 33.6 29.9 25.7 25.7 25.2 25.9 26.2 26.2 23.7 22.7 20.9 14 Austria 1.6 1.5 1.7 1.9 1.8 1.9 1.9 1.6 1.6 1.6
1.1 1.6
15 Denmark 2.2 2.3 1.7 1.7 1.5 1.6 1.7 1.4 1.0 1.6 1.1 .9
16 Finland 1.9 1.6 1.4 1.4 1.4 1.4 1.3 1.0 1.2 1.3 1.2 17 Greece 2.9 2.6 2.3 2.1 2.0 1.9 2.0 2.3 2.2 2.1 1.9
1.8 18 Norway 3.0 2.9 2.4 2.2 2.1 2.0 2.3 2.0 2.0 2.0 1.9 1.8
19 Portugal 1.4 1.2 .8 .9 .8 .8 .5 .4 .4 .4 .5 20 Spain 6.5 5.8 5.8 6.3 6.1 7.4 8.0 9.0 7.2 6.3 6.2 21 Turkey 1.9 1.8 1.8 1.7 1.7 1.5 1.6 1.6 1.5 1.3 1.2 22 Other Western Europe 1.7 2.0 1.4 1.4 1.5 1.6 1.6 1.9 1.6 1.9 1.3 23 South Africa 4.5 3.2 3.0 3.0 3.0 2.9 2.9 2.8 2.8 2.7
1.8 2.4 1.8 24 Australia 6.0 5.0 3.5 3.2 3.1 2.9 2.4 2.1 2.2
2.7 1.8
2.4 1.8
25 OPEC countries3 24.9 21.3 19.3 20.0 18.8 19.0 17.1 17.2 16.4 17.6 1.8
16.5 26 Ecuador 2.2 2.1 2.2 2.1 2.1 2.1 1.9
8.1 1.9 8.1
1.8 17.6 1.8 1.7
27 Venezuela 9.3 8.9 8.6 8.5 8.4 8.3 1.9 8.1
1.9 8.1 8.0 7.9 7.9
28 Indonesia 3.3 3.0 2.5 2.4 2.2 2.0 1.9 1.9 1.9 1.9 1.9 29 Middle East countries 7.9 5.3 4.3 5.4 4.4 5.0 3.6 3.6 3.1 4.3 3.2 30 African countries 2.3 2.0 1.7 1.6 1.7 1.7 1.7 1.7 1.7 1.7 1.7
31 Non-OPEC developing countries 111.8 104.2 99.1 100.7 100.4 97.7 97.7 94.0 91.3 87.0 85.4
Latin America 32 Argentina 8.7 8.8 9.5 9.5 9.5 9.3 9.4 9.5 9.4 9.2 8.9 33 Brazil 26.3 25.4 25.2 26.2 25.1 25.1 24.7 23.9 23.7 22.4 22.5 34 Chile 7.0 6.9 7.1 7.3 7.2 7.0 6.9 6.6 6.4 6.2 5.7 35 Colombia 2.9 2.6 2.1 2.0 1.9 1.9 2.0 1.9 2.1 2.1 2.0 36 Mexico 25.7 23.9 23.8 24.1 25.3 24.8 23.7 22.5 21.1 20.6
.8 18.9
.8 37 Peru 2.2 1.8 1.4 1.4 1.3 1.2 1.1 1.1 .9 20.6
.8 18.9
.8 38 Other Latin America 3.9 3.4 3.1 3.0 2.9 2.8 2.7 2.8 2.6 2.5 2.7
Asia China
39 Mainland .7 .5 .4 .9 .6 .3 .3 .4 .3 .2 .3 40 Taiwan 5.1 4.5 4.9 5.5 6.6 6.0 8.2 6.1 4.9 3.2 3.6 41 India .9 1.2 1.2 1.8 1.7 1.9 1.9 2.1 2.3 2.0 2.1 42 Israel 1.8 1.6 1.5 1.4 1.3 1.3 1.0 1.0 1.0 1.0 1.2 43 Korea (South) 10.6 9.2 6.6 6.2 5.6 4.9 5.0 5.7 5.9 6.0 6.1 44 Malaysia 2.7 2.4 2.1 1.9 1.7 1.6 1.5 1.5 1.5 1.6 1.6 45 Philippines 6.0 5.7 5.4 5.4 5.4 5.4 5.1 5.1 4.9
1.1 4.5 4.5
1.1 46 Thailand 1.8 1.4 .9 .9 .8 .7 .7 1.0 4.9 1.1 1.2
.8
4.5 1.1
47 Other Asia 1.1 1.0 .7 .6 .7 .7 .7 .7 .8 1.2 .8 .9
Africa 48 Egypt 1.2 1.0 .7 .6 .6 .6 .5 .5 .6 .5 .4 49 Morocco .8 .9 .9 .9 .9 .8 .9 .9
.1 .9 1
.8 .9 50 Zaire .1 .1 .1 .1 .1 .1 .0
.9
.1 .9 1 0 .0
1.1 51 Other Africa4 2.1 1.9 1.6 1.4 1.3 1.3 1.3 1.0 1.2 1.2 .0
1.1
52 Eastern Europe 4.4 4.1 3.2 3.0 3.3 3.3 3.0 2.9 3.1 3.0 3.7 53 U.S.S.R .1 .1 .1 .1 .3 .5 .4 .3 .4 .4 .7
1.8 54 Yugoslavia 2.3 2.2 1.7 1.6 1.7 1.7 1.6 1.7 1.7 1.7 .7
1.8 55 Other 2.0 1.8 1.4 1.3 1.3 1.2 1.0 .9 1.0 1.0 1.2
56 Offshore banking centers 65.6 62.9 61.3 63.1 60.7 64.3 54.3 54.6 45.3 49.8 45.7 57 Bahamas 21.5 21.2 22.0 23.9 19.9 25.5 17.1 18.3
.8 11.0 15.8 11.8
.8 58 Bermuda .9 .7 .7 .8 .6 .6 .6 18.3
.8 1.0 .9 11.8
.8 59 Cayman Islands and other British West Indies 11.8 11.6 12.4 12.2 14.0 12.8 13.3 12.2 10.6 11.6r 13.1 60 Netherlands Antilles 3.4 2.2 1.8 1.7 1.3 1.2 1.2 1.3 1.2 1.2 1.0 61 Panama 6.7 6.0 4.0 4.3 3.9 3.7 3.7 3.2 3.0
.1 2.7
.1 2.6
.1 62 Lebanon .1 .1 .1 .1 .1 .1 .1 .1 3.0
.1 2.7
.1 2.6
.1 63 Hong Kong 11.4 11.4 11.1 11.4 12.5 12.3 11.3 11.3 11.7 10.6 10.2 64 Singapore 9.8 9.8 9.2 8.6 8.3 8.1 7.0 7.4 6.8 7.0 6.2 65 Others6 .0 .0 .0 .0 .0 .0 .0 .0 .0 .0 .0
66 Miscellaneous and unallocated7 17.3 16.9 19.8 20.1 18.1 22.3 23.2 21.5 22.2 27.0 21.8
1. The banking offices covered by these data are the U.S. offices and foreign branches of U.S.-owned banks and of U.S. subsidiaries of foreign-owned banks. Offices not covered include (1) U.S. agencies and branches of foreign banks, and (2) foreign subsidiaries of U.S. banks. To minimize duplication, the data are adjusted to exclude the claims on foreign branches held by a U.S. office or another foreign branch of the same banking institution. The data in this table combine foreign branch claims in table 3.14 (the sum of lines 7 through 10) with the claims of U.S. offices in table 3.18 (excluding those held by agencies and branches of foreign banks and those constituting claims on own foreign branches).
2. Beginning with June 1984 data, reported claims held by foreign branches have been reduced by an increase in the reporting threshold for "shell" branches
from $50 million to $150 million equivalent in total assets, the threshold now applicable to all reporting branches.
3. This group comprises the Organization of Petroleum Exporting Countries shown individually, other members of OPEC (Algeria, Gabon, Iran, Iraq, Kuwait, Libya, Nigeria, Qatar, Saudi Arabia, and United Arab Emirates), and Bahrain and Oman (not formally members of OPEC).
4. Excludes Liberia. 5. Includes Canal Zone beginning December 1979. 6. Foreign branch claims only. 7. Includes New Zealand, Liberia, and international and regional organiza-
tions.
Digitized for FRASER http://fraser.stlouisfed.org/ Federal Reserve Bank of St. Louis
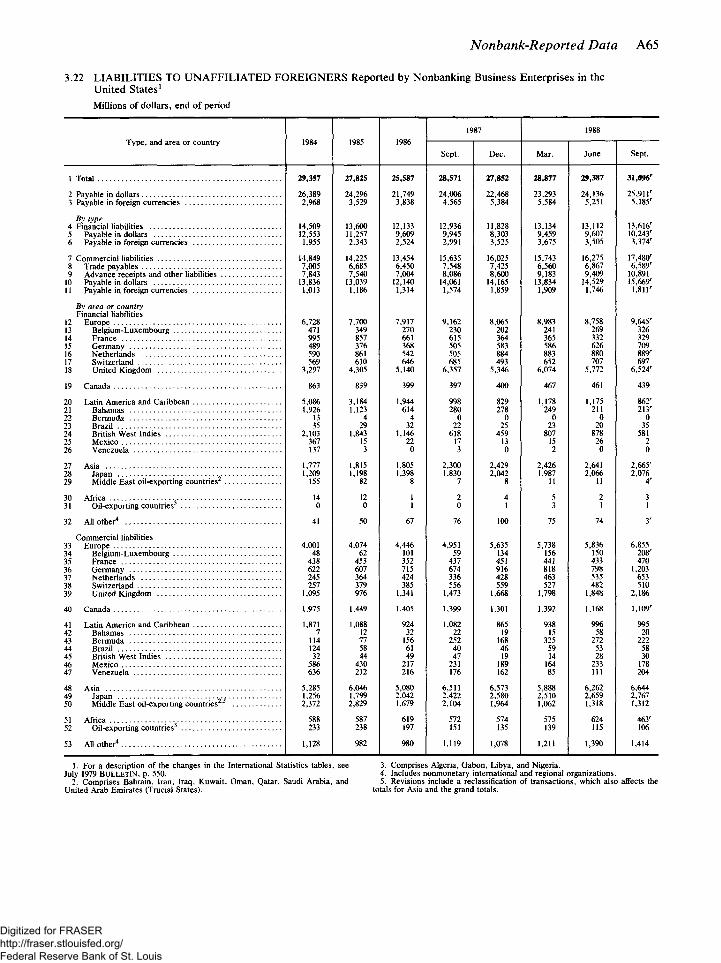
Nonbank-Reported Data A65
3.22 LIABILITIES TO UNAFFILIATED FOREIGNERS Reported by Nonbanking Business Enterprises in the United States1
Millions of dollars, end of period
Type, and area or country 1984 1985 1986 1987 1988
1984 1985 1986 Sept. Dec. Mar. June Sept.
29,357 27,825 25,587 28,571 27,852 28,877 29,387 31,096'
26,389 24,296 21,749 24,006 22,468 23,293 24,136 25,911' 2,968 3,529 3,838 4,565 5,384 5,584 5,251 5,185'
14,509 13,600 12,133 12,936 11,828 13,134 13,112 13,616' 12,553 11,257 9,609 9,945 8,303 9,459 9,607 10,243'
1,955 2,343 2,524 2,991 3,525 3,675 3,505 3,374'
14,849 14,225 13,454 15,635 16,025 15,743 16,275 17,480' 7,005 6,685 6,450 7,548 7,425 6,560 6,867 6,589' 7,843 7,540 7,004 8,086 8,600 9,183 9,409 10,891
13,836 13,039 12,140 14,061 14,165 13,834 14,529 15,669" 1,013 1,186 1,314 1,574 1,859 1,909 1,746 1,811'
6,728 7,700 7,917 9,162 8,065 8,983 8,758 9,645' 471 349 270 230 202 241 269 326 995 857 661 615 364 365 332 329 489 376 368 505 583 586 626 709 590 861 542 505 884 883 880 889^ 569 610 646 685 493 652 707 697
3,297 4,305 5,140 6,357 5,346 6,074 5,772 6,524'
863 839 399 397 400 467 461 439
5,086 3,184 1,944 998 829 1,178 1,175 862' 1,926 1,123 614 280 278 249 211 213'
13 4 4 0 0 0 0 0 35 29 32 22 25 23 20 35
2,103 1,843 1,146 618 459 807 878 581 367 15 22 17 13 15 26 2 137 3 0 3 0 2 0 0
1,777 1,815 1,805 2,300 2,429 2,426 2,641 2,665' 1,209 1,198 1,398 1,830 2,042 1,987 2,066 2,076
155 82 8 7 8 11 11 4 '
14 12 1 2 4 5 2 3 0 0 1 0 1 3 1 1
41 50 67 76 100 75 74 3'
4,001 4,074 4,446 4,951 5,635 5,738 5,836 6,855 48 62 101 59 134 156 150 208'
438 453 352 437 451 441 433 470 622 607 715 674 916 818 798 1,203 245 364 424 336 428 463 535 653 257 379 385 556 559 527 482 510
1,095 976 1,341 1,473 1,668 1,798 1,848 2,186
1,975 1,449 1,405 1,399 1,301 1,392 1,168 1,109'
1,871 1,088 924 1,082 865 938 996 995 7 12 32 22 19 15 58 20
114 77 156 252 168 325 272 222 124 58 61 40 46 59 53 58 32 44 49 47 19 14 28 30
586 430 217 231 189 164 233 178 636 212 216 176 162 85 111 204
5,285 6,046 5,080 6,511 6,573 5,888 6,262 6,644 1,256 1,799 2,042 2,422 2,580 2,510 2,659 2,767 2,372 2,829 1,679 2,104 1,964 1,062 1,318 1,312
588 587 619 572 574 575 624 463' 233 238 197 151 135 139 115 106
1,128 982 980 1,119 1,078 1,211 1,390 1,414
1 Total
2 Payable in dollars 3 Payable in foreign currencies
By type 4 Financial liabilities 5 Payable in dollars 6 Payable in foreign currencies
7 Commercial liabilities 8 Trade payables 9 Advance receipts and other liabilities . .
10 Payable in dollars 11 Payable in foreign currencies
By area or country Financial liabilities
12 Europe 13 Belgium-Luxembourg 14 France 15 Germany 16 Netherlands 17 Switzerland 18 United Kingdom
19 Canada
20 Latin America and Caribbean 21 Bahamas 22 Bermuda 23 Brazil 24 British West Indies 25 Mexico 26 Venezuela
27 Asia 28 Japan 29 Middle East oil-exporting countries .
30 Africa
31 Oil-exporting countries3
32 All other4
Commercial liabilities 33 Europe 34 Belgium-Luxembourg 35 France 36 Germany 37 Netherlands 38 Switzerland 39 United Kingdom 40 Canada
41 Latin America and Caribbean 42 Bahamas 43 Bermuda 44 Brazil 45 British West Indies 46 Mexico 47 Venezuela
48 Asia 49 Japan . 50 Middle East oil-exporting countries •
51 Africa 52 Oil-exporting countries
53 All other4
1. For a description of the changes in the International Statistics tables, see July 1979 BULLETIN, p. 550.
2. Comprises Bahrain, Iran, Iraq, Kuwait, Oman, Qatar, Saudi Arabia, and United Arab Emirates (Trucial States).
3. Comprises Algeria, Gabon, Libya, and Nigeria. 4. Includes nonmonetary international and regional organizations. 5. Revisions include a reclassification of transactions, which also affects the
totals for Asia and the grand totals.
Digitized for FRASER http://fraser.stlouisfed.org/ Federal Reserve Bank of St. Louis
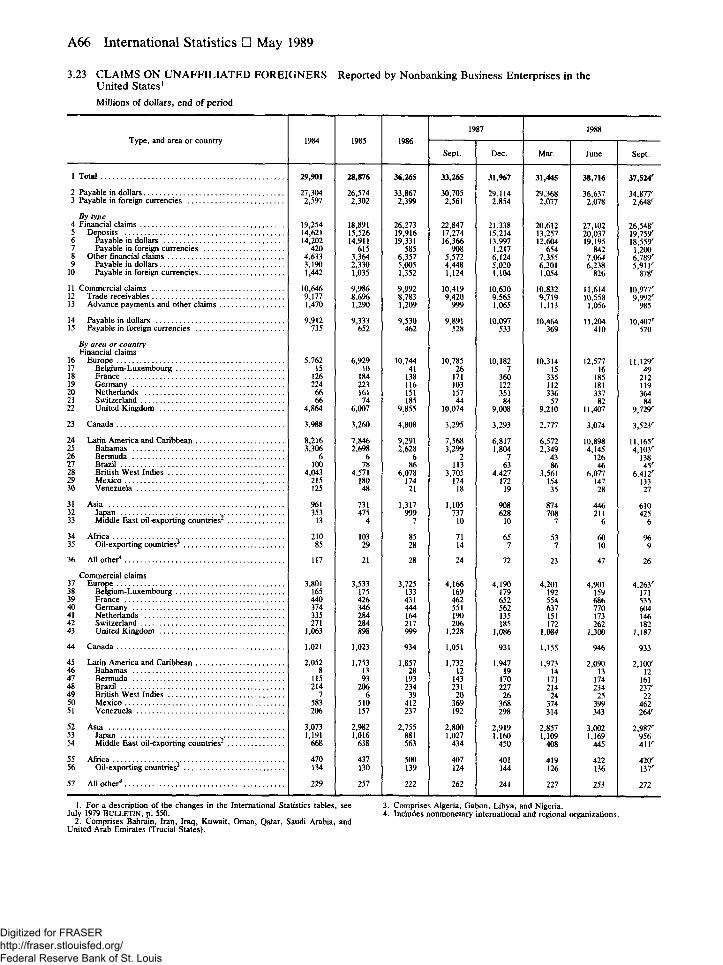
A66 International Statistics • May 1989
3.23 CLAIMS ON UNAFFILIATED FOREIGNERS Reported by Nonbanking Business Enterprises in the United States1
Millions of dollars, end of period
Type, and area or country 1984 1985 1986 1987 1988
Type, and area or country 1984 1985 1986 Sept. Dec. Mar. June Sept.
1 Total 29,901 28,876 36,265 33,265 31,967 31,445 38,716 37,524r
2 Payable in dollars 27,304 26,574 33,867 30,705 29,114 29,368 36,637 34,877' 3 Payable in foreign currencies 2,597 2,302 2,399 2,561 2,854 2,077 2,078 2,648r
By type 4 Financial claims 19,254 18,891 26,273 22,847 21,338 20,612 27,102 26,548' 5 Deposits 14,621 15,526 19,916 17,274 15,214 13,257 20,037 19,759" 6 Payable in dollars 14,202 14,911 19,331 16,366 13,997 12,604 19,195 18,559" 7 Payable in foreign currencies 420 615 585 908 1,217 654 842 1,200 8 Other financial claims 4,633 3,364 6,357 5,572 6,124 7,355 7,064 6,789' 9 Payable in dollars 3,190 2,330 5,005 4,448 5,020 6,301 6,238 5,911'
10 Payable in foreign currencies 1,442 1,035 1,352 1,124 1,104 1,054 826 878'
11 Commercial claims 10,646 9,986 9,992 10,419 10,630 10,832 11,614 10,977' 12 Trade receivables 9,177 8,696 8,783 9,420 9,565 9,719 10,558 9,992' 13 Advance payments and other claims 1,470 1,290 1,209 999 1,065 1,113 1,056 985
14 Payable in dollars 9,912 9,333 9,530 9,891 10,097 10,464 11,204 10,407' 15 Payable in foreign currencies 735 652 462 528 533 369 410 570
By area or country Financial claims
16 Europe 5,762 6,929 10,744 10,785 10,182 10,314 12,577 11,129' 17 Belgium-Luxembourg 15 10 41 26 7 15 16 49 18 France 126 184 138 171 360 335 185 212 19 Germany 224 223 116 103 122 112 181 119 20 Netherlands 66 161 151 157 351 336 337 364 21 Switzerland 66 74 185 44 84 57 82 84 22 United Kingdom 4,864 6,007 9,855 10,074 9,008 9,210 11,407 9,729'
23 Canada 3,988 3,260 4,808 3,295 3,293 2,777 3,074 3,523'
24 Latin America and Caribbean 8,216 7,846 9,291 7,568 6,817 6,572 10,898 11,165' 25 Bahamas 3,306 2,698 2,628 3,299 1,804 2,349 4,145 4,103' 26 Bermuda 6 6 6 2 7 43 126 138 27 Brazil 100 78 86 113 63 86 46 45' 28 British West Indies 4,043 4,571 6,078 3,705 4,427 3,561 6,077 6,412' 29 Mexico 215 180 174 174 172 154 147 133 30 Venezuela 125 48 21 18 19 35 28 27
31 Asia 961 731 1,317 1,105 908 874 446 610 32 Japan 353 475 999 737 628 708 211 425 33 Middle East oil-exporting countries'1 13 4 7 10 10 7 6 6
34 Africa 210 103 85 71 65 53 60 96 35 Oil-exporting countries3 85 29 28 14 7 7 10 9
36 All other4 117 21 28 24 72 23 47 26
Commercial claims 37 Europe 3,801 3,533 3,725 4,166 4,190 4,201 4,901 4,263' 38 Belgium-Luxembourg 165 175 133 169 179 192 159 171 39 France 440 426 431 462 652 554 686 535 40 Germany 374 346 444 551 562 637 770 604 41 Netherlands 335 284 164 190 135 151 173 146 42 Switzerland 271 284 217 206 185 172 262 182 43 United Kingdom 1,063 898 999 1,228 1,086 1,084 1,300 1,187
44 Canada 1,021 1,023 934 1,051 931 1,155 946 933
45 Latin America and Caribbean 2,052 1,753 1,857 1,732 1,947 1,973 2,090 2,100' 46 Bahamas 8 13 28 12 19 14 13 12 47 Bermuda 115 93 193 143 170 171 174 161 48 Brazil 214 206 234 231 227 214 234 237' 49 British West Indies 7 6 39 20 26 24 25 22 50 Mexico 583 510 412 369 368 374 399 462 51 Venezuela 206 157 237 192 298 314 343 264'
52 Asia 3,073 2,982 2,755 2,800 2,919 2,857 3,002 2,987' 53 Japan 1,191 1,016 881 1,027 1,160 1,109 1,169 956 54 Middle East oil-exporting countries 668 638 563 434 450 408 445 411'
55 Africa 470 437 500 407 401 419 422 42C 56 Oil-exporting countries 134 130 139 124 144 126 136 137'
57 All other4 229 257 222 262 241 227 253 272
1. For a description of the changes in the International Statistics tables, see 3. Comprises Algeria, Gabon, Libya, and Nigeria. July 1979 BULLETIN, p. 550. 4. Includes nonmonetary international and regional organizations.
2. Comprises Bahrain, Iran, Iraq, Kuwait, Oman, Qatar, Saudi Arabia, and United Arab Emirates (Trucial States).
Digitized for FRASER http://fraser.stlouisfed.org/ Federal Reserve Bank of St. Louis
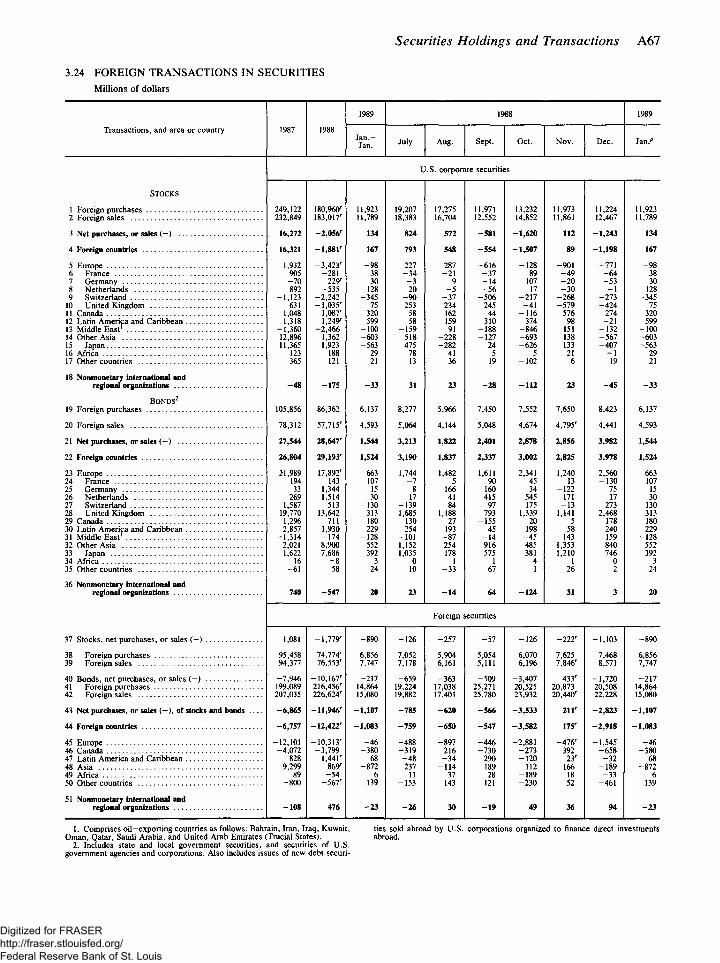
Securities Holdings and Transactions A67
3.24 FOREIGN TRANSACTIONS IN SECURITIES Millions of dollars
1989 1988 1989
Transactions, and area or country 1987 1988 J a n . -Jan. July Aug. Sept. Oct. Nov. Dec. Jan."
U.S. corporate securities
STOCKS
1 Foreign purchases 249,122 180,960' 11,923 19,207 17,275 11,971 13,232 11,973 11,224 11,923 2 Foreign sales 232,849 183,017' 11,789 18,383 16,704 12,552 14,852 11,861 12,467 11,789
3 Net purchases, or sales (—) 16,272 -2 ,056 ' 134 824 572 - 5 8 1 -1 ,620 112 -1 ,243 134
4 Foreign countries 16,321 -1 ,881' 167 793 548 - 5 5 4 -1 ,507 89 -1 ,198 167
5 Europe 1,932 -3 ,423 ' - 9 8 227 287 - 6 1 6 - 1 2 8 - 9 0 1 - 7 7 1 - 9 8 6 France 905 - 2 8 1 38 - 3 4 - 2 1 - 3 7 89 - 4 9 - 6 4 38 7 Germany - 7 0 229' 30 - 3 9 - 1 4 107 - 2 0 - 5 3 30 8 Netherlands 892 - 5 3 5 128 20 - 5 - 5 6 17 - 3 0 - 1 128 9 Switzerland -1 ,123 -2 ,242 - 3 4 5 - 9 0 - 3 7 - 5 0 6 - 2 1 7 - 2 6 8 - 2 7 3 - 3 4 5
10 United Kingdom 631 -1 ,035 ' 75 253 234 245 - 4 1 - 5 7 9 - 4 2 4 75 11 Canada 1,048 1,087' 320 58 162 44 - 1 1 6 576 274 320 12 Latin America and Caribbean 1,318 1,249' 599 58 159 310 374 98 - 2 1 599 13 Middle East1 -1 ,360 -2 ,466 - 1 0 0 - 1 5 9 91 - 1 8 8 - 8 4 6 151 - 1 3 2 - 1 0 0 14 Other Asia 12,896 1,362 - 6 0 3 518 - 2 2 8 - 1 2 7 - 6 9 3 138 - 5 6 7 - 6 0 3 15 Japan 11,365 1,923 - 5 6 3 475 - 2 8 2 24 - 6 2 6 133 - 4 0 7 - 5 6 3 16 Africa 123 188 29 78 41 5 5 21 - 1 29 17 Other countries 365 121 21 13 36 19 - 1 0 2 6 19 21
18 Nonmonetary international and regional organizations - 4 8 - 1 7 5 - 3 3 31 23 - 2 8 - 1 1 2 23 - 4 5 - 3 3
BONDS2
19 Foreign purchases 105,856 86,362 6,137 8,277 5,966 7,450 7,552 7,650 8,423 6,137
20 Foreign sales 78,312 57,715' 4,593 5,064 4,144 5,048 4,674 4,795' 4,441 4,593
21 Net purchases, or sales ( - ) 27,544 28,647' 1,544 3,213 1,822 2,401 2,878 2,856 3,982 1,544
22 Foreign countries 26,804 29,193' 1,524 3,190 1,837 2,337 3,002 2,825 3,978 1,524
23 Europe 21,989 17,892' 663 1,744 1,482 1,611 2,341 1,240 2,560 663 24 France 194 143 107 - 7 5 90 45 13 - 1 3 0 107 25 Germany 33 1,344 15 8 166 160 34 - 1 2 2 75 15 26 Netherlands 269 1,514 30 17 41 415 545 171 17 30 27 Switzerland 1,587 513 130 - 1 3 9 84 97 175 - 1 3 273 130 28 United Kingdom 19,770 13,642 313 1,685 1,188 793 1,339 1,141 2,468 313 29 Canada 1,296 711 180 130 27 - 1 5 5 20 5 178 180 30 Latin America and Caribbean 2,857 1,930 229 254 193 45 198 58 240 229 31 Middle East1 -1 ,314 - 1 7 4 - 1 2 8 - 1 0 1 - 8 7 - 1 4 - 4 5 143 159 - 1 2 8 32 Other Asia 2,021 8,900 552 1,152 254 916 485 1,353 840 552 33 Japan 1,622 7,686 392 1,035 178 575 381 1,210 746 392 34 Africa 16 - 8 3 0 1 1 4 - 1 0 3 35 Other countries - 6 1 - 5 8 24 10 - 3 3 - 6 7 - 1 26 2 24
36 Nonmonetary international and regional organizations 740 - 5 4 7 20 23 - 1 4 64 - 1 2 4 31 3 20
Foreign securities
37 Stocks, net purchases, or sales ( - ) 1,081 -1 ,779 ' - 8 9 0 - 1 2 6 - 2 5 7 - 5 7 - 1 2 6 - 2 2 2 ' -1 ,103 - 8 9 0
38 Foreign purchases 95,458 74,774' 6,856 7,052 5,904 5,054 6,070 7,625 7,468 6,856 39 Foreign sales 94,377 76,553' 7,747 7,178 6,161 5,111 6,196 7,846' 8,571 7,747
40 Bonds, net purchases, or sales ( - ) -7 ,946 -10 ,167 ' - 217 - 6 5 9 - 3 6 3 - 5 0 9 - 3 , 4 0 7 433' -1 ,720 - 2 1 7 41 Foreign purchases 199,089 216,456' 14,864 19,224 17,038 25,271 20,525 20,873 20,508 14,864 42 Foreign sales 207,035 226,624' 15,080 19,882 17,401 25,780 23,932 20,440' 22,228 15,080
43 Net purchases, or sales (—), of stocks and bonds . . . . -6 ,865 -11,946' -1 ,107 - 7 8 5 - 6 2 0 - 5 6 6 -3 ,533 211' -2 ,823 -1 ,107
44 Foreign countries -6 ,757 -12 ,422' -1 ,083 - 7 5 9 - 6 5 0 - 5 4 7 -3 ,582 175' -2 ,918 -1 ,083
45 Europe -12,101 -10 ,313 ' - 4 6 - 4 8 8 - 8 9 7 - 4 4 6 -2 ,881 - 4 7 6 ' -1 ,545 - 4 6 46 Canada -4 ,072 -3 ,799 - 3 8 0 - 3 1 9 216 - 7 3 0 - 2 7 3 392 - 6 5 8 - 3 8 0 47 Latin America and Caribbean 828 1,441' 68 - 4 8 - 3 4 290 - 1 2 0 23' - 3 2 68 48 9,299 869' - 8 7 2 237 - 1 1 4 189 112 166 - 1 8 9 - 8 7 2 49 Africa 89 - 5 4 6 11 37 28 - 1 8 9 18 - 3 3 6 50 Other countries - 8 0 0 - 5 6 7 ' 139 - 1 5 3 143 121 - 2 3 0 52 - 4 6 1 139
51 Nonmonetary international and regional organizations - 1 0 8 476 - 2 3 - 2 6 30 - 1 9 49 36 94 - 2 3
1. Comprises oi l-export ing countries as follows: Bahrain, Iran, Iraq, Kuwait, ties sold abroad by U.S. corporations organized to finance direct investments Oman, Qatar, Saudi Arabia, and United Arab Emirates (Trucial States). abroad.
2. Includes state and local government securities, and securities of U.S. government agencies and corporations. Also includes issues of new debt securi-
Digitized for FRASER http://fraser.stlouisfed.org/ Federal Reserve Bank of St. Louis
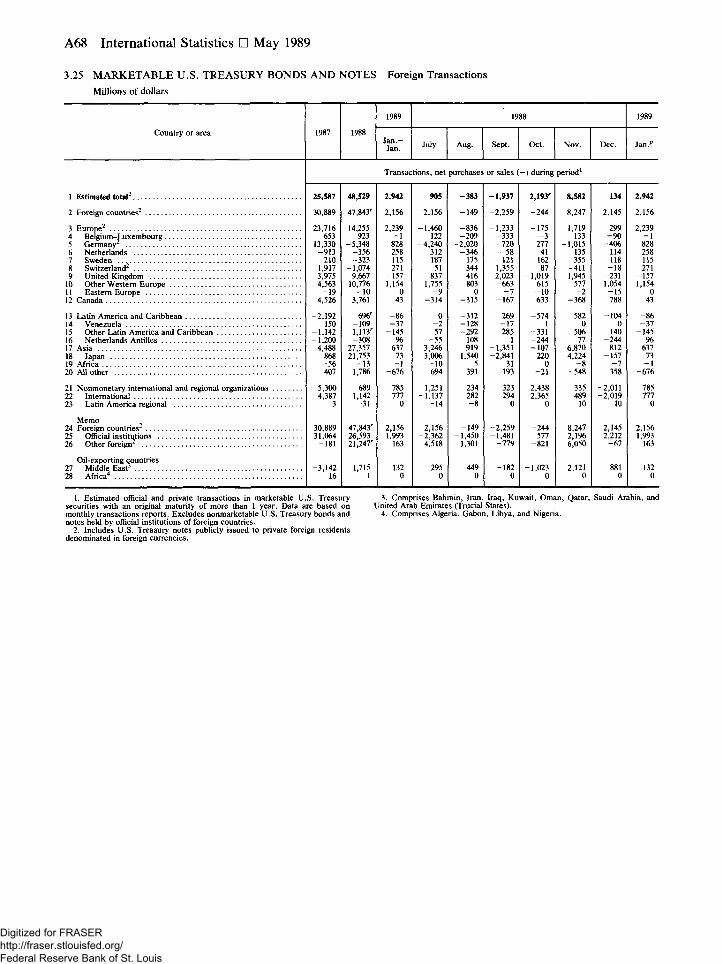
A68 International Statistics • May 1989
3.25 MARKETABLE U.S. TREASURY BONDS AND NOTES Foreign Transactions Millions of dollars
1989 1988 1989
Country or area 1987 1988 J a n . -Jan. July Aug. Sept. Oct. Nov. Dec. Jan."
Transactions, net purchases or sales ( - ) during period1
1 Estimated total2
2 Foreign countries2
3 Europe2
4 Belgium-Luxembourg 5 Germany 6 Netherlands 7 Sweden 8 Switzerland2
9 United Kingdom 10 Other Western Europe 11 Eastern Europe 12 Canada
13 Latin America and Caribbean 14 Venezuela 15 Other Latin America and Caribbean 16 Netherlands Antilles 17 Asia 18 Japan 19 Africa 20 All other
21 Nonmonetary international and regional organizations 22 International 23 Latin America regional
Memo 24 Foreign countries 25 Official institutions 26 Other foreign2
Oil-exporting countries 27 Middle East3
28 Africa4
2 5 , 5 8 7 48 ,529 2 ,942 905 - 3 8 3 - 1 , 9 3 7 2,193R 8 , 5 8 2 134 2 ,942
30,889 47,843r 2,156 2,156 -149 -2,259 -244 8,247 2,145 2,156
23,716 14,255 2,239 -1,460 -836 -1,233 -175 1,719 299 2,239 653 923 - 1 122 -209 -333 - 3 133 - 9 0 - 1
13,330 -5,348 828 -4,240 -2,020 -720 277 -1,015 -406 828 -913 -356 258 312 -346 - 5 8 41 135 -114 258
210 -323 -115 -187 175 -121 -162 355 118 -115 1,917 -1,074 271 - 5 1 344 -1,355 87 -411 - 1 8 271 3,975 9,667 -157 837 416 2,023 -1,019 1,945 -231 -157 4,563 10,776 1,154 1,755 803 -663 615 577 1,054 1,154
- 1 9 - 1 0 0 - 9 0 - 7 - 1 0 - 2 - 1 5 0 4,526 3,761 43 -314 -315 -167 633 -368 788 43
-2,192 696r - 8 6 0 -312 269 -574 582 -104 - 8 6 150 -109 - 3 7 - 2 -128 - 1 7 1 0 0 - 3 7
-1,142 1,113r -145 57 -292 285 -331 506 140 -145 -1,200 —308 96 - 5 5 108 1 -244 77 -244 96
4,488 27,357 637 3,246 919 -1,351 -107 6,870 812 637 868 21,753 73 3,006 1,540 -2,841 220 4,224 -157 73 - 5 6 - 1 3 - 1 - 1 0 5 31 0 - 8 - 7 - 1 407 1,786 -676 694 391 193 - 2 1 -548 358 -676
-5,300 689 785 -1,251 -234 323 2,438 335 -2,011 785 -4,387 1,142 777 -1,137 -282 294 2,365 489 -2,019 777
3 - 3 1 0 - 1 4 - 8 0 0 10 10 0
30,889 47,843' 2,156 2,156 -149 -2,259 -244 8,247 2,145 2,156 31,064 26,593 1,993 -2,362 -1,450 -1,481 577 2,196 2,212 1,993
-181 21,247r 163 4,518 1,301 -779 -821 6,050 - 6 7 163
-3,142 1,715 1
132 295 449 -182 -1,023 2,121 881 132 16
1,715 1 0 0 0 0 0 0 0 0
1. Estimated official and private transactions in marketable U.S. Treasury securities with an original maturity of more than 1 year. Data are based on monthly transactions reports. Excludes nonmarketable U.S. Treasury bonds and notes held by official institutions of foreign countries.
2. Includes U.S. Treasury notes publicly issued to private foreign residents denominated in foreign currencies.
3. Comprises Bahrain, Iran, Iraq, Kuwait, Oman, Qatar, Saudi Arabia, and United Arab Emirates (Trucial States).
4. Comprises Algeria, Gabon, Libya, and Nigeria.
Digitized for FRASER http://fraser.stlouisfed.org/ Federal Reserve Bank of St. Louis
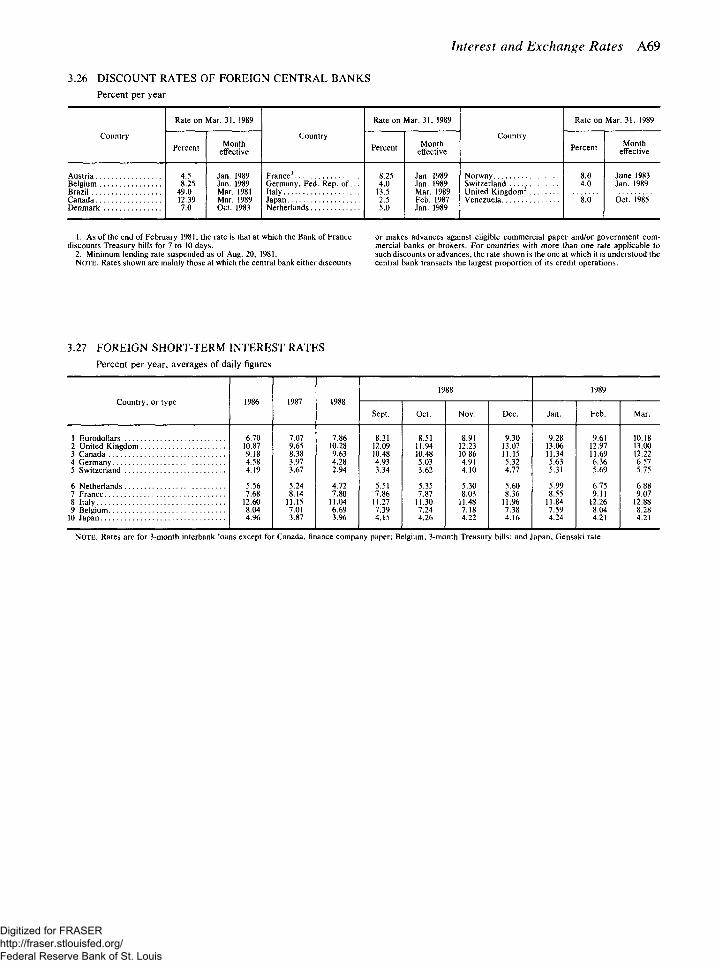
Interest and Exchange Rates A69
3.26 DISCOUNT RATES OF FOREIGN CENTRAL BANKS Percent per year
Country
Rate on Mar. 31, 1989
Month effective
Country
Rate on Mar. 31, 1989
Percent Month effective
Country
Rate on Mar. 31, 1989
Percent Month effective
Aust r ia . . Belgium . Brazil . . . Canada . . Denmark
4.5 8.25
49.0 12.39 7.0
Jan. 1989 Jan. 1989 Mar. 1981 Mar. 1989 Oct. 1983
France Germany, Fed. Rep. of, Italy Japan Netherlands
8.25 4.0
13.5 2.5 5.0
Jan. 1989 Jan. 1989 Mar. 1989 Feb. 1987 Jan. 1989
Norway Switzerland . United Kingdom' Venezuela
8.0 4.0
June 1983 Jan. 1989
1. As of the end of February 1981, the rate is that at which the Bank of France discounts Treasury bills for 7 to 10 days.
2. Minimum lending rate suspended as of Aug. 20, 1981. NOTE. Rates shown are mainly those at which the central bank either discounts
or makes advances against eligible commercial paper and/or government com-mercial banks or brokers. For countries with more than one rate applicable to such discounts or advances, the rate shown is the one at which it is understood the central bank transacts the largest proportion of its credit operations.
3.27 FOREIGN SHORT-TERM INTEREST RATES Percent per year, averages of daily figures
Country, or type 1986 1987 1988 1988 1989
Country, or type 1986 1987 1988 Sept. Oct. Nov. Dec. Jan. Feb. Mar.
1 Eurodollars 6.70 7.07 7.86 8.31 8.51 8.91 9.30 9.28 9.61 10.18 2 United Kingdom 10.87 9.65 10.28 12.09 11.94 12.23 13.07 13.06 12.97 13.00 3 Canada 9.18 8.38 9.63 10.48 10.48 10.86 11.15 11.34 11.69 12.22 4 Germany 4.58 3.97 4.28 4.93 5.03 4.91 5.32 5.63 6.36 6.57 5 Switzerland 4.19 3.67 2.94 3.34 3.62 4.10 4.77 5.31 5.69 5.75
6 Netherlands 5.56 5.24 4.72 5.51 5.35 5.30 5.60 5.99 6.75 6.88 7 France 7.68 8.14 7.80 7.86 7.87 8.03 8.36 8.55 9.11 9.07 8 Italy 12.60 11.15 11.04 11.27 11.30 11.48 11.96 11.84 12.26 12.88 9 Belgium 8.04 7.01 6.69 7.39 7.24 7.18 7.38 7.59 8.04 8.28
10 Japan 4.96 3.87 3.96 4.15 4.26 4.22 4.16 4.24 4.21 4.21
NOTE. Rates are for 3-month interbank loans except for Canada, finance company paper; Belgium, 3-month Treasury bills; and Japan, Gensaki rate.
Digitized for FRASER http://fraser.stlouisfed.org/ Federal Reserve Bank of St. Louis
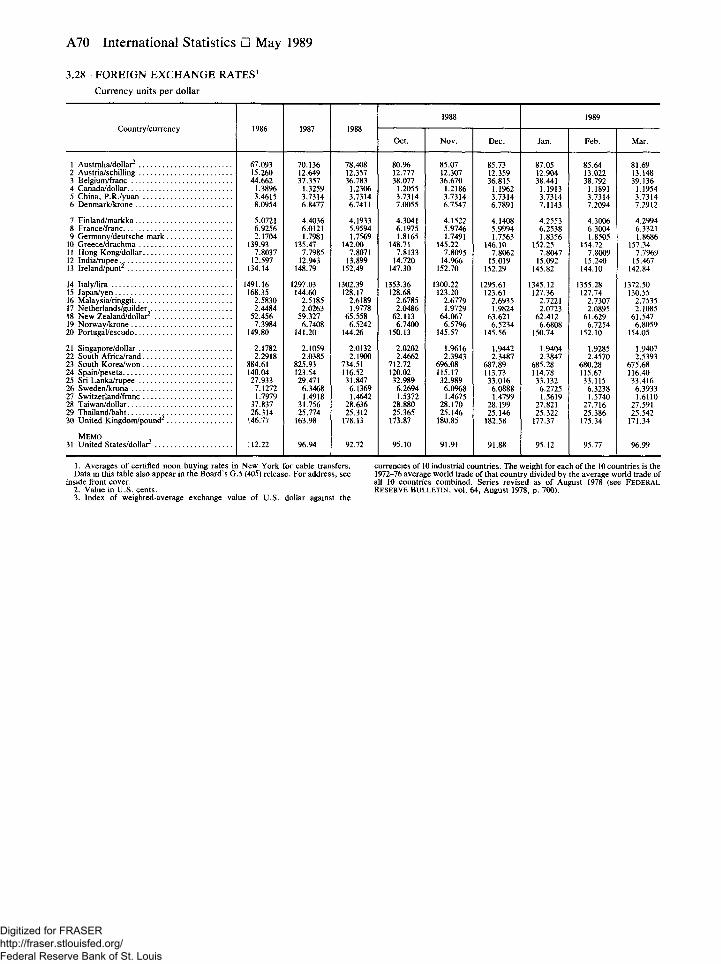
A70 International Statistics • May 1989
3.28 FOREIGN EXCHANGE RATES1
Currency units per dollar
Country/currency 1986 1987 1988 1988 1989
1986 1987 1988 Oct. Nov. Dec. Jan. Feb. Mar.
67.093 70.136 78.408 80.96 85.07 85.73 87.05 85.64 81.69 15.260 12.649 12.357 12.777 12.307 12.359 12.904 13.022 13.148 44.662 37.357 36.783 38.077 36.670 36.815 38.441 38.792 39.136
1.3896 1.3259 1.2306 1.2055 1.2186 1.1962 1.1913 1.1891 1.1954 3.4615 3.7314 3.7314 3.7314 3.7314 3.7314 3.7314 3.7314 3.7314 8.0954 6.8477 6.7411 7.0055 6.7547 6.7891 7.1143 7.2094 7.2912
5.0721 4.4036 4.1933 4.3041 4.1522 4.1408 4.2553 4.3006 4.2994 6.9256 6.0121 5.9594 6.1975 5.9746 5.9994 6.2538 6.3004 6.3321 2.1704 1.7981 1.7569 1.8165 1.7491 1.7563 1.8356 1.8505 1.8686
139.93 135.47 142.00 148.71 145.22 146.10 152.25 154.72 157.34 7.8037 7.7985 7.8071 7.8133 7.8095 7.8062 7.8047 7.8009 7.7969
12.597 12.943 13.899 14.720 14.966 15.019 15.092 15.240 15.467 134.14 148.79 152.49 147.30 152.70 152.29 145.82 144.10 142.84
1491.16 1297.03 1302.39 1353.36 1300.22 1295.61 1345.12 1355.28 1372.50 168.35 144.60 128.17 128.68 123.20 123.61 127.36 127.74 130.55
2.5830 2.5185 2.6189 2.6785 2.6779 2.6935 2.7221 2.7307 2.7535 2.4484 2.0263 1.9778 2.0486 1.9729 1.9824 2.0723 2.0895 2.1085
52.456 59.327 65.558 62.113 64.067 63.621 62.412 61.629 61.547 7.3984 6.7408 6.5242 6.7400 6.5796 6.5234 6.6808 6.7254 6.8059
149.80 141.20 144.26 150.13 145.57 145.56 150.74 152.10 154.05
2.1782 2.1059 2.0132 2.0202 1.9616 1.9442 1.9404 1.9285 1.9407 2.2918 2.0385 2.1900 2.4662 2.3943 2.3487 2.3847 2.4570 2.5393
884.61 825.93 734.51 712.72 696.08 687.89 685.28 680.28 675.68 140.04 123.54 116.52 120.02 115.17 113.73 114.78 115.67 116.40 27.933 29.471 31.847 32.989 32.989 33.016 33.132 33.115 33.416
7.1272 6.3468 6.1369 6.2694 6.0968 6.0888 6.2725 6.3238 6.3933 1.7979 1.4918 1.4642 1.5372 1.4675 1.4799 1.5619 1.5740 1.6110
37.837 31.756 28.636 28.880 28.170 28.199 27.821 27.716 27.591 26.314 25.774 25.312 25.365 25.146 25.146 25.322 25.386 25.542
146.77 163.98 178.13 173.87 180.85 182.58 177.37 175.34 171.34
112.22 96.94 92.72 95.10 91.91 91.88 95.12 95.77 96.99
1 Australia/dollar^ 2 Austria/schilling 3 Belgium/franc 4 Canada/dollar 5 China, P.R./yuan 6 Denmark/krone
7 Finland/markka 8 France/franc 9 Germany/deutsche mark
10 Greece/drachma 11 Hong Kong/dollar 12 India/rupee.. 13 Ireland/punt
14 Italy/lira 15 Japan/yen 16 Malaysia/ringgit 17 Netherlands/guilder 18 New Zealand/dollar2 . . . 19 Norway/krone 20 Portugal/escudo
21 Singapore/dollar 22 South Africa/rand 23 South Korea/won 24 Spain/peseta 25 Sri Lanka/rupee 26 Sweden/krona 27 Switzerland/franc 28 Taiwan/dollar 29 Thailand/baht 30 United Kingdom/pound2
MEMO 31 United States/dollar3 . . .
1. Averages of certified noon buying rates in New York for cable transfers. Data in this table also appear in the Board's G.5 (405) release. For address, see
inside front cover. 2. Value in U.S. cents. 3. Index of weighted-average exchange value of U.S. dollar against the
currencies of 10 industrial countries. The weight for each of the 10 countries is the 1972-76 average world trade of that country divided by the average world trade of all 10 countries combined. Series revised as of August 1978 (see FEDERAL RESERVE BULLETIN , v o l . 64 , A u g u s t 1978, p . 700) .
Digitized for FRASER http://fraser.stlouisfed.org/ Federal Reserve Bank of St. Louis
A71
Guide to Tabular Presentation, Statistical Releases, and Special Tables
GUIDE TO TABULAR PRESENTATION
Symbols and Abbreviations
c Corrected e Estimated p Preliminary r Revised (Notation appears on column heading when
about half of the figures in that column are changed.) * Amounts insignificant in terms of the last decimal place
shown in the table (for example, less than 500,000 when the smallest unit given is millions)
0 Calculated to be zero n.a. Not available n.e.c. Not elsewhere classified IPCs Individuals, partnerships, and corporations REITs Real estate investment trusts RPs Repurchase agreements SMSAs Standard metropolitan statistical areas . . . Cell not applicable
General Information
Minus signs are used to indicate (1) a decrease, (2) a negative figure, or (3) an outflow.
"U.S. government securities" may include guaranteed issues of U.S. government agencies (the flow of funds figures also include not fully guaranteed issues) as well as direct
obligations of the Treasury. "State and local government" also includes municipalities, special districts, and other po-litical subdivisions.
In some of the tables, details do not add to totals because of rounding.
STATISTICAL RELEASES
List Published Semiannually, with Latest Bulletin Reference
Issue Page Anticipated schedule of release dates for periodic releases December 1988 A77
SPECIAL TABLES
Published Irregularly, with Latest Bulletin Reference
Assets and liabilities of commercial banks, March 31, 1987 October 1987 A70 Assets and liabilities of commercial banks, June 30, 1987 February 1988 A70 Assets and liabilities of commercial banks, September 30, 1987 April 1988 A70 Assets and liabilities of commercial banks, December 31, 1987 June 1988 A70 Assets and liabilities of U.S. branches and agencies of foreign banks, December 31, 1987 June 1988 A76 Assets and liabilities of U.S. branches and agencies of foreign banks, March 31, 1988 September 1988 A82 Assets and liabilities of U.S. branches and agencies of foreign banks, June 30, 1988 January 1989 A78 Assets and liabilities of U.S. branches and agencies of foreign banks, September 30, 1988 May 1989 A72 Terms of lending at commercial banks, February 1988 May 1988 A70 Terms of lending at commercial banks, May 1988 September 1988 A70 Terms of lending at commercial banks, August 1988 January 1989 A72 Terms of lending at commercial banks, November 1988 April 1989 All Pro forma balance sheet and income statements for priced service operations, June 30, 1987 November 1987 A74 Pro forma balance sheet and income statements for priced service operations, September 30, 1987 February 1988 A80 Pro forma balance sheet and income statements for priced service operations, March 31, 1988 . . . August 1988 A70
Special tables begin on next page. Digitized for FRASER http://fraser.stlouisfed.org/ Federal Reserve Bank of St. Louis
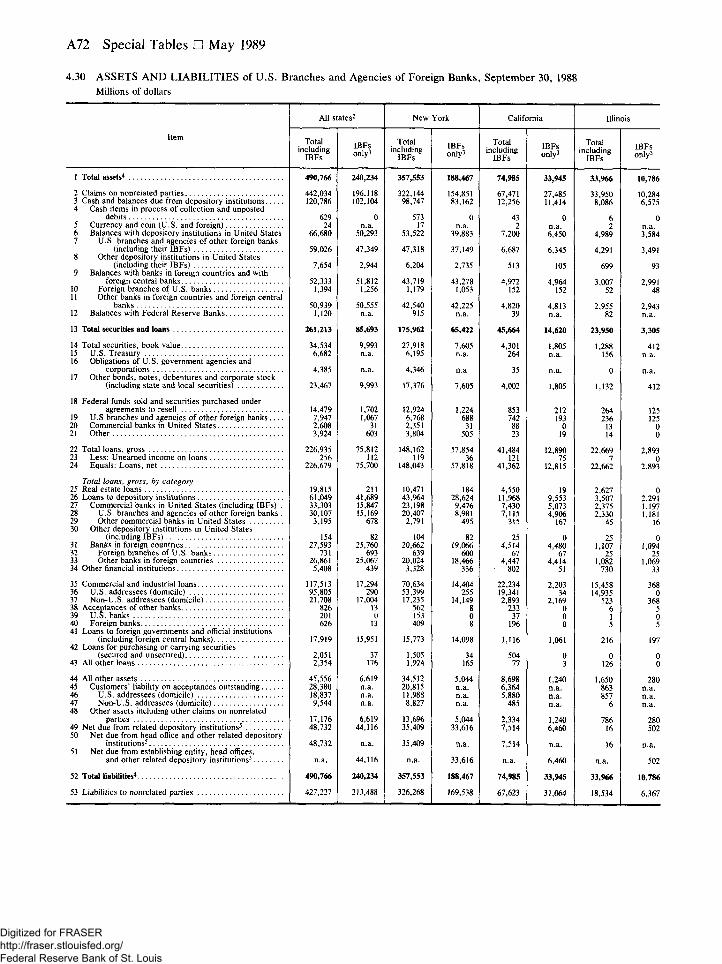
All Special Tables • May 1989
4.30 ASSETS AND LIABILITIES of U.S. Branches and Agencies of Foreign Banks, September 30, 1988 Millions of dollars
Item
All states2 New York California Illinois
Item Total including
IBFs IBFs only3
Total including
IBFs IBFs only3
Total including
IBFs IBFs only3
Total including
IBFs IBFs only3
1 Total assets4 490,766 240,234 357,553 188,467 74,985 33,945 33,966 10,786
2 Claims on nonrelated parties 442,034 196,118 322,144 154,851 67,471 27,485 33,950 8,086
10,284 i Cash and balances due from depository institutions 120,786 102,104 98,747 83,162 12,256 11,414
33,950 8,086 6,575
4 Cash items in process of collection and unposted 83,162 12,256 11,414 6,575
debits 629 0 573 0 43 0 6 0 5 Currency and coin (U.S. and foreign) 24 n.a. 17 n.a. 2 n.a. 2 n.a. 6 Balances with depository institutions in United States 66,680 50,293 53,522 39,883 7,200 6,450 4,989 3,584 7 U.S. branches and agencies of other foreign banks
53,522 39,883 7,200 6,450 4,989 3,584
(including their IBFs) 59,026 47,349 47,318 37,149 6,687 6,345 4,291 3,491 8 Other depository institutions in United States
6,687 6,345 4,291 3,491
(including their IBFs) 7,654 2,944 6,204 2,735 513 105 699 93 y Balances with banks in foreign countries and with
2,735
foreign central banks 52,333 51,812 43,719 43,278 4,972 4,964 3,007 2,991 10 Foreign branches of U.S. banks 1,394 1,256 1,179 1,053 152 152 52 48 n Other banks in foreign countries and foreign central
1,179 1,053 52 48
banks 50,939 50,555 42,540 42,225 4,820 4,813 2,955 2,943 12 Balances with Federal Reserve Banks 1,120 n.a. 915 n.a. 39 n.a. 82 n.a.
13 Total securities and loans 261,213 85,693 175,962 65,422 45,664 14,620 23,950 3,305
14 Total securities, book value 34,534 9,993 27,918 7,605 4,301 1,805 1,288 412 15 U.S. Treasury 6,682 n.a. 6,195 n.a. 264 n.a. 156 n.a. 16 Obligations of U.S. government agencies and
corporations 4,385 n.a. 4,346 n.a. 35 n.a. 0 n.a. 17 Other bonds, notes, debentures and corporate stock
(including state and local securities) 23,467 9,993 17,376 7,605 4,002 1,805 1,132 412
18 Federal funds sold and securities purchased under agreements to resell 14,479 1,702 12,924 1,224 853 212 264 125 iy U.S branches and agencies of other foreign b a n k s . . . . 7,947 1,067 6,768 688 742 193 236 125
20 Commercial banks in United States 2,608 31 2,351 31 88 0 13 0 21 Other 3,924 603 3,804 505 23 19 14 0
22 Total loans, gross 226,935 75,812 148,162 57,854 41,484 12,890 22,669 2,893 23 Less: Unearned income on loans 256 112 119 36 121 75 7 0 24 Equals: Loans, net 226,679 75,700 148,043 57,818 41,362 12,815 22,662 2,893
Total loans, gross, by category 25 Real estate loans 19,815 211 10,471 184 4,550 19 2,627 0 26 Loans to depository institutions 61,049 41,689 43,964 28,624 11,968 9,553 3,507 2,291 27 Commercial banks in United States (including IBFs) . 33,303 15,847 23,198 9,476 7,430 5,073 2,375 1,197 28 U.S. branches and agencies of other foreign banks . 30,107 15,169 20,407 8,981 7,115 4,906 2,330 1,181 29 Other commercial banks in United States 3,195 678 2,791 495 315 167 45 16 30 Other depository institutions in United States
3,195 2,791 45 16
(including IBFs) 154 82 104 82 25 0 25 0 31 Banks in foreign countries 27,593 25,760 20,662 19,066 4,514 4,480 1,107 1,094 32 Foreign branches of U.S. banks 731 693 639 600 67 67 25 25 33 Other banks in foreign countries 26,861 25,067 20,024 18,466 4,447 4,414 1,082 1,069 34 Other financial institutions 5,408 439 3,328 336 802 51 730 33
35 Commercial and industrial loans 117,513 17,294 70,634 14,404 22,234 2,203 15,458 368 36 U.S. addressees (domicile) 95,805 290 53,399 255 19,341 34 14,935 0 37 Non-U.S. addressees (domicile) 21,708 17,004 17,235 14,149
8 2,893 2,169 523 368
38 Acceptances of other banks 826 13 562 14,149
8 233 0 6 5 39 U.S. banks 201 0 153 0 37 0 1 0 40 Foreign banks 626 13 409 8 196 0 5 5 41 Loans to foreign governments and official institutions
(including foreign central banks) 17,919 15,951 15,773 14,098 1,116 1,061 216 197 42 Loans for purchasing or carrying securities
1,061
(secured and unsecured) 2,051 37 1,505 34 504 0 0 0 43 All other loans 2,354 176 1,924 165 77 3 126 0
44 All other assets 45,556 6,619 34,512 5,044 8,698 1,240 1,650 280 45 Customers' liability on acceptances outstanding 28,380 n.a. 20,815 n.a. 6,364 n.a. 863 n.a. 46 U.S. addressees (domicile) 18,837 n.a. 11,988 n.a. 5,880 n.a. 857 n.a. 47 Non-U.S. addressees (domicile) 9,544 n.a. 8,827 n.a. 485 n.a. 6 n.a. 48 Other assets including other claims on nonrelated
n.a.
parties 17,176 6,619 13,696 5,044 2,334 1,240 786 280 49 Net due from related depository institutions5 48,732 44,116 35,409 33,616 7,514 6,460 16 502 50 Net due from head office and other related depository
7,514 6,460
institutions5 48,732 n.a. 35,409 n.a. 7,514 n.a. 16 n.a. 51 Net due from establishing entity, head offices,
7,514 16 n.a.
and other related depository institutions5 n.a. 44,116 n.a. 33,616 n.a. 6,460 n.a. 502
52 Total liabilities4 490,766 240,234 357,553 188,467 74,985 33,945 33,966 10,786
53 Liabilities to nonrelated parties 427,227 213,488 326,268 169,538 67,623 31,064 18,534 6,367
Digitized for FRASER http://fraser.stlouisfed.org/ Federal Reserve Bank of St. Louis
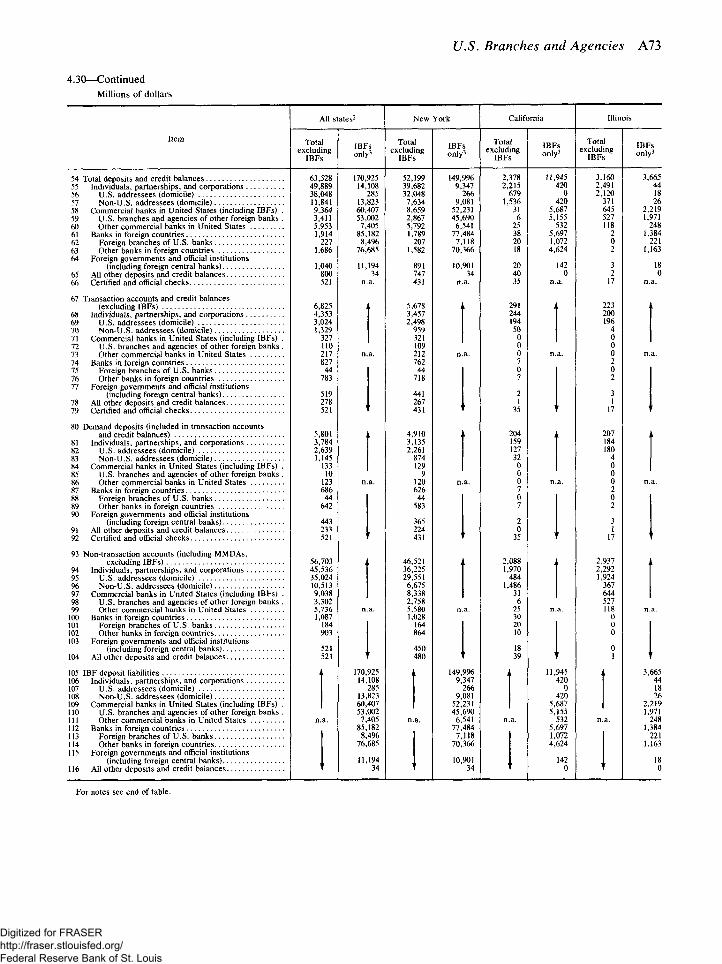
U.S. Branches and Agencies A73
4.30—Continued Millions of dollars
Item
All states2 New York California Illinois
Item Total excluding
IBFs IBFs only3
Total excluding
IBFs IBFs only3
Total excluding
IBFs IBFs only3
Total excluding
IBFs IBFs only3
54 Total deposits and credit balances 63,528 170,925 52,199 149,996 2,378 11,945 3,160 3,665 55 Individuals, partnerships, and corporations 49,889 14,108 39,682 9,347 2,215 420 2,491 44 56 U.S. addressees (domicile) 38,048 285 32,048 266 679 0 2,120 18 57 Non-U.S. addressees (domicile) 11,841 13,823 7,634 9,081 1,536 420 371 26 58 Commercial banks in United States (including IBFs) . 9,364 60,407 8,659 52,231 31 5,687 645 2,219 59 U.S. branches and agencies of other foreign banks . 3,411 53,002 2,867 45,690 6 5,155 527 1,971 60 Other commercial banks in United States 5,953 7,405 5,792 6,541 25 532 118 248 61 Banks in foreign countries 1,914 85,182 1,789 77,484 38 5,697 2 1,384 62 Foreign branches of U.S. banks 227 8,496 207 7,118 20 1,072 0 221 63 Other banks in foreign countries 1,686 76,685 1,582 70,366 18 4,624 2 1,163 64 Foreign governments and official institutions
20 142 18 (including foreign central banks) 1,040 11,194 891 10,901 20 142 3 18 65 All other deposits and credit balances 800 34 747 34 40 0 2 0 66 Certified and official checks 521 n.a. 431 n.a. 35 n a. 17 n.a.
67 Transaction accounts and credit balances (excluding IBFs) 6,825 5,678 291 223
68 Individuals, partnerships, and corporations 4,353 3,457 244 200 69 U.S. addressees (domicile) 3,024 2,498 194 196 70 Non-U.S. addressees (domicile) 1,329 959 50 4 71 Commercial banks in United States (including IBFs) . 327 321 0 0 72 U.S. branches and agencies of other foreign banks . 110 109 0 0 73 Other commercial banks in United States 217 n a. 212 n.a. 0 n a. 0 n a. 74 Banks in foreign countries 827 762 7 2 75 Foreign branches of U.S. banks 44 44 0 0 76 Other banks in foreign countries 783 718 7 2 77 Foreign governments and official institutions
3 (including foreign central banks) 519 441 2 3 78 All other deposits and credit balances 278 267 1 1 79 Certified and official checks 521 431 35 17
80 Demand deposits (included in transaction accounts 207 and credit balances) 5,801 4,910 204 207
81 Individuals, partnerships, and corporations 3,784 3,135 159 184 82 U.S. addressees (domicile) 2,639 2,261 127 180 83 Non-U.S. addressees (domicile) 1,145 874 32 4 84 Commercial banks in United States (including IBFs) . 133 129 0 0 85 U.S. branches and agencies of other foreign banks . 10 9 0 0 86 Other commercial banks in United States 123 n.a. 120 n.a. 0 n.a. 0 n a. 87 Banks in foreign countries 686 626 7 2 88 Foreign branches of U.S. banks 44 44 0 0 89 Other banks in foreign countries 642 583 7 2 90 Foreign governments and official institutions
(including foreign central banks) 443 365 2 3 91 All other deposits and credit balances 233 224 0 1 92 Certified and official checks 521 431 35 17
93 Non-transaction accounts (including MMDAs, excluding IBFs) 56,703 46,521 2, 088 2,937
94 Individuals, partnerships, and corporations 45,536 36,225 1,970 2,292 95 U.S. addressees (domicile) 35,024 29,551 484 1,924 96 Non-U.S. addressees (domicile) 10,513 6,675 1,486 367 97 Commercial banks in United States (including IBFs) . 9,038 8,338 31 644 98 U.S. branches and agencies of other foreign banks . 3,302 2,758 6 527 99 Other commercial banks in United States 5,736 n a. 5,580 n.a. 25 n a. 118 n a.
100 Banks in foreign countries 1,087 1,028 30 0 101 Foreign branches of U.S. banks 184 164 20 0 102 Other banks in foreign countries 903 864 10 0 103 Foreign governments and official institutions
(including foreign central banks) 521 450 18 0 104 All other deposits and credit balances 521 480 39 1
105 IBF deposit liabilities 170,925 149,996 11,945 3,665 106 Individuals, partnerships, and corporations 14,108 9,347 420 44 107 U.S. addressees (domicile) 285 266 0 18 108 Non-U.S. addressees (domicile) 13,823 9,081 420 26 109 Commercial banks in United States (including IBFs) . 60,407 52,231 5,687 2,219 110 U.S. branches and agencies of other foreign banks . 53,002 45,690 5,155 1,971 111 Other commercial banks in United States n. a. 7,405 n.a. 6,541 n.a. 532 n a. 248 112 Banks in foreign countries 85,182 77,484 5,697 1,384 113 Foreign branches of U.S. banks 8,496 7,118 1,072 221 114 Other banks in foreign countries 76,685 70,366 4,624 1,163 115 Foreign governments and official institutions
(including foreign central banks) 11,194 10,901 142 18 116 All other deposits and credit balances 34 34 0 0
For notes see end of table.
Digitized for FRASER http://fraser.stlouisfed.org/ Federal Reserve Bank of St. Louis
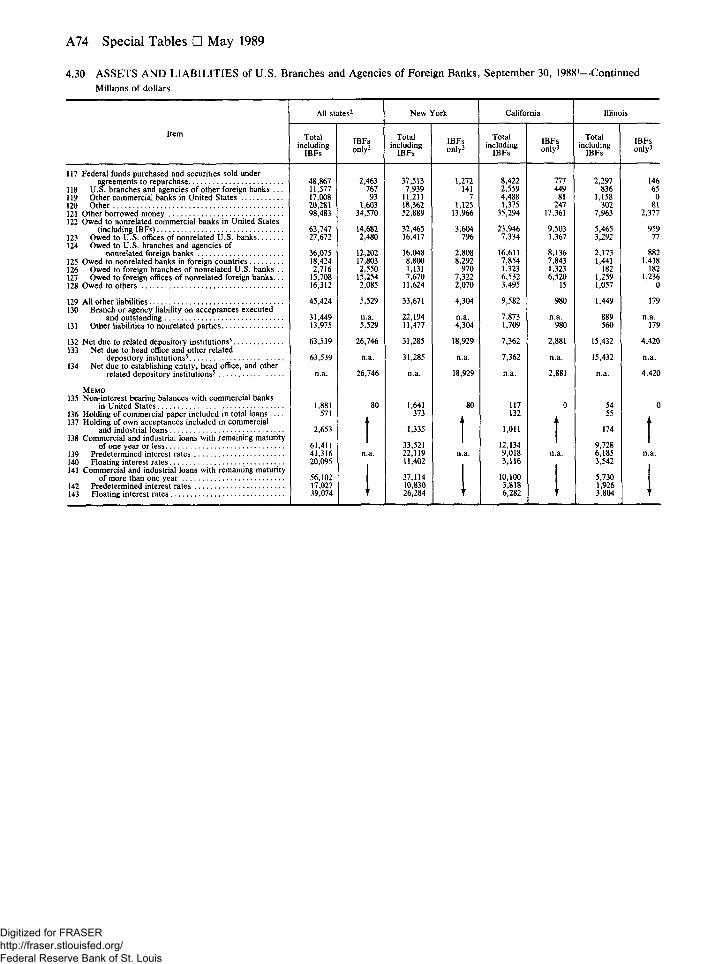
A74 Special Tables • May 1989
4.30 ASSETS AND LIABILITIES of U.S. Branches and Agencies of Foreign Banks, September 30, 19881—Continued Millions of dollars
Item
All states2 New York California Illinois
Item Total including
IBFs IBFs only3
Total including
IBFs IBFs only3
Total including
IBFs IBFs only3
Total including
IBFs IBFs only3
117 Federal funds purchased and securities sold under agreements to repurchase 48,867 2,463 37,513 1,272 8,422 777 2,297 146
118 U.S. branches and agencies of other foreign banks . . . 11,577 767 7,939 141 2,559 449 836 65 119 Other commercial banks in United States 17,008 93 11,211 7 4,488 81 1,158 0 170 Other 20,281 1,603 18,362 1,125 1,375 247 302 81 121 Other borrowed money 98,483 34,570 52,889 13,966 35,294 17,361 7,963 2,377 177. Owed to nonrelated commercial banks in United States
(including IBFs) 63,747 14,682 32,465 3,604 23,946 9,503 5,465 959 123 Owed to U.S. offices of nonrelated U.S. banks 27,672 2,480 16,417 796 7,334 1,367 3,292 77 124 Owed to U.S. branches and agencies of
nonrelated foreign banks 36,075 12,202 16,048 2,808 16,611 8,136 2,173 882 125 Owed to nonrelated banks in foreign countries 18.424 17,803 8,800 8,292 7,854 7,843 1,441 1,418 126 Owed to foreign branches of nonrelated U.S. banks . . 2,716 2,550 1,131 970 1,323 1,323 182 182 127 Owed to foreign offices of nonrelated foreign banks . . . 15,708 15,254 7,670 7,322 6,532 6,520 1,259 1,236 128 Owed to others 16,312 2,085 11,624 2,070 3,495 15 1,057 0
129 All other liabilities 45,424 5,529 33,671 4,304 9,582 980 1,449 179 130 Branch or agency liability on acceptances executed
22,194 7,873 and outstanding 31,449 n.a. 22,194 n.a. 7,873 n.a. 889 n.a. 131 Other liabilities to nonrelated parties 13,975 5,529 11,477 4,304 1,709 980 560 179
132 Net due to related depository institutions5 63,539 26,746 31,285 18,929 7,362 2,881 15,432 4,420 133 Net due to head office and other related
depository institutions5 63,539 n.a. 31,285 n.a. 7,362 n.a. 15,432 n.a. 134 Net due to establishing entity, head office, and other
related depository institutions5 n.a. 26,746 n.a. 18,929 n.a. 2,881 n.a. 4,420
MEMO 135 Non-interest bearing balances with commercial banks
in United States 1,881 80 1,641 80 117 0 54 0 136 Holding of commercial paper included in total loans . . . . 571 373 132 55 137 Holding of own acceptances included in commercial 4
1,335 4
1,011 F
and industrial loans 2,653 1,335 1,011 174 138 Commercial and industrial loans with remaining maturity | 1 1 |
of one year or less 61,411 33,521 12,134 9,728 139 Predetermined interest rates 41,316 n.a. 22,119 n.a. 9,018 n.a. 6,185 n.a. 140 Floating interest rates 20,095 11,402 3,116 3,542 141 Commercial and industrial loans with remaining maturity 1 1
of more than one year 56,102 37,114 10,100 5,730 147 Predetermined interest rates 17,027 1 10,830 1 3,818 1 1,926 1 143 Floating interest rates 39,074 T 26,284 T 6,282 t 3,804 t
Digitized for FRASER http://fraser.stlouisfed.org/ Federal Reserve Bank of St. Louis
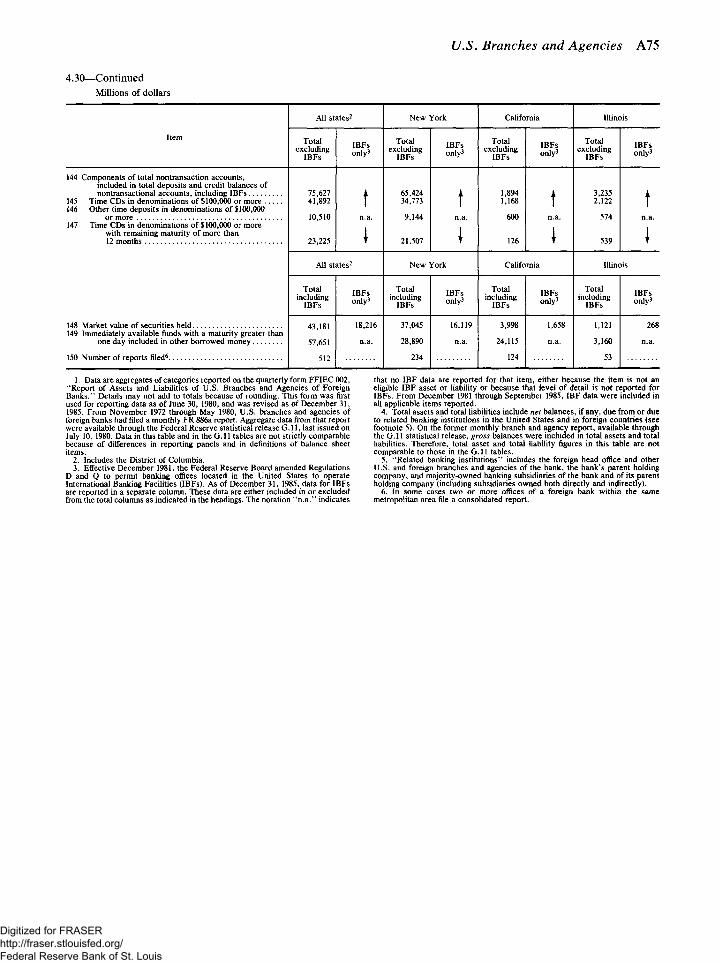
U.S. Branches and Agencies A75
4.30—Continued Millions of dollars
Item
All states2 New York California Illinois
Item Total excluding
IBFs IBFs only3
Total excluding
IBFs IBFs only3
Total excluding
IBFs IBFs only3
Total excluding
IBFs IBFs only3
144 Components of total nontransaction accounts, included in total deposits and credit balances of nontransactional accounts, including IBFs
145 Time CDs in denominations of $100,000 or more 146 Other time deposits in denominations of $100,000
or more 147 Time CDs in denominations of $100,000 or more
with remaining maturity of more than 12 months
148 Market value of securities held 149 Immediately available funds with a maturity greater than
one day included in other borrowed money
75,627 41,892
10,510
23,225
t n.a.
1
65,424 34,773
9,144
21,507
t n.a.
1 1,894 1,168
600
126
t n.a.
1
3,235 2,122
574
539
t n.a.
1
144 Components of total nontransaction accounts, included in total deposits and credit balances of nontransactional accounts, including IBFs
145 Time CDs in denominations of $100,000 or more 146 Other time deposits in denominations of $100,000
or more 147 Time CDs in denominations of $100,000 or more
with remaining maturity of more than 12 months
148 Market value of securities held 149 Immediately available funds with a maturity greater than
one day included in other borrowed money
All states2 New York California Illinois
144 Components of total nontransaction accounts, included in total deposits and credit balances of nontransactional accounts, including IBFs
145 Time CDs in denominations of $100,000 or more 146 Other time deposits in denominations of $100,000
or more 147 Time CDs in denominations of $100,000 or more
with remaining maturity of more than 12 months
148 Market value of securities held 149 Immediately available funds with a maturity greater than
one day included in other borrowed money
Total including
IBFs IBFs only3
Total including
IBFs IBFs only3
Total including
IBFs IBFs only3
Total including
IBFs IBFs only3
144 Components of total nontransaction accounts, included in total deposits and credit balances of nontransactional accounts, including IBFs
145 Time CDs in denominations of $100,000 or more 146 Other time deposits in denominations of $100,000
or more 147 Time CDs in denominations of $100,000 or more
with remaining maturity of more than 12 months
148 Market value of securities held 149 Immediately available funds with a maturity greater than
one day included in other borrowed money
43,181
57,651
512
18,216
n.a.
37,045
28,890
234
16,119
n.a.
3,998
24,115
124
1,658
n.a.
1,121
3,160
53
268
n.a.
43,181
57,651
512
37,045
28,890
234
3,998
24,115
124
1,121
3,160
53
1. Data are aggregates of categories reported on the quarterly form FFIEC 002, "Report of Assets and Liabilities of U.S. Branches and Agencies of Foreign Banks." Details may not add to totals because of rounding. This form was first used for reporting data as of June 30, 1980, and was revised as of December 31, 1985. From November 1972 through May 1980, U.S. branches and agencies of foreign banks had filed a monthly FR 886a report. Aggregate data from that report were available through the Federal Reserve statistical release G . l l , last issued on July 10, 1980. Data in this table and in the G. 11 tables are not strictly comparable because of differences in reporting panels and in definitions of balance sheet items.
2. Includes the District of Columbia. 3. Effective December 1981, the Federal Reserve Board amended Regulations
D and Q to permit banking offices located in the United States to operate International Banking Facilities (IBFs). As of December 31, 1985, data for IBFs are reported in a separate column. These data are either included in or excluded from the total columns as indicated in the headings. The notation "n .a . " indicates
that no IBF data are reported for that item, either because the item is not an eligible IBF asset or liability or because that level of detail is not reported for IBFs. From December 1981 through September 1985, IBF data were included in all applicable items reported.
4. Total assets and total liabilities include net balances, if any, due from or due to related banking institutions in the United States and in foreign countries (see footnote 5). On the former monthly branch and agency report, available through the G. l l statistical release, gross balances were included in total assets and total liabilities. Therefore, total asset and total liability figures in this table are not comparable to those in the G. l l tables.
5. "Related banking institutions" includes the foreign head office and other U.S. and foreign branches and agencies of the bank, the bank's parent holding company, and majority-owned banking subsidiaries of the bank and of its parent holding company (including subsidiaries owned both directly and indirectly).
6. In some cases two or more offices of a foreign bank within the same metropolitan area file a consolidated report.
Digitized for FRASER http://fraser.stlouisfed.org/ Federal Reserve Bank of St. Louis
A76
Federal Reserve Board of Governors ALAN GREENSPAN, Chairman MARTHA R . SEGER MANUEL H. JOHNSON, Vice Chairman WAYNE D. ANGELL
OFFICE OF BOARD MEMBERS
JOSEPH R. COYNE, Assistant to the Board DONALD J. WINN, Assistant to the Board BOB STAHLY MOORE, Special Assistant to the Board
LEGAL DIVISION
J. VIRGIL MATTINGLY, JR., General Counsel RICHARD M. ASHTON, Associate General Counsel OLIVER IRELAND, Associate General Counsel RICKI R. TIGERT, Associate General Counsel SCOTT G. ALVAREZ, Assistant General Counsel MARYELLEN A. BROWN, Assistant to the General Counsel
OFFICE OF THE SECRETARY
WILLIAM W . WILES, Secretary JENNIFER J. JOHNSON, Associate Secretary BARBARA R. LOWREY, Associate Secretary
DIVISION OF CONSUMER AND COMMUNITY AFFAIRS
GRIFFITH L . GARWOOD, Director GLENN E. LONEY, Assistant Director ELLEN MALAND, Assistant Director DOLORES S. SMITH, Assistant Director
DIVISION OF BANKING SUPERVISION AND REGULATION
WILLIAM TAYLOR, Staff Director DON E. KLINE, Associate Director FREDERICK M. STRUBLE, Associate Director WILLIAM A. RYBACK, Deputy Associate Director STEPHEN C. SCHEMERING, Deputy Associate Director RICHARD SPILLENKOTHEN, Deputy Associate Director HERBERT A. BLERN, Assistant Director JOE M. CLEAVER, Assistant Director ROGER T. COLE, Assistant Director JAMES I. GARNER, Assistant Director JAMES D. GOETZINGER, Assistant Director MICHAEL G. MARTINSON, Assistant Director ROBERT S. PLOTKIN, Assistant Director SIDNEY M. SUSSAN, Assistant Director LAURA M. HOMER, Securities Credit Officer
DIVISION OF INTERNATIONAL FINANCE
EDWIN M. TRUMAN, Staff Director LARRY J. PROMISEL, Senior Associate Director CHARLES J. SLEGMAN, Senior Associate Director DAVID H. HOWARD, Deputy Associate Director ROBERT F. GEMMILL, Staff Adviser DONALD B. ADAMS, Assistant Director PETER HOOPER III, Assistant Director KAREN H. JOHNSON, Assistant Director RALPH W. SMITH, JR., Assistant Director
DIVISION OF RESEARCH AND STATISTICS
MICHAEL J. PRELL, Director EDWARD C. ETTIN, Deputy Director THOMAS D. SIMPSON, Associate Director LAWRENCE SLIFMAN, Associate Director MARTHA BETHEA, Deputy Associate Director PETER A. TINSLEY, Deputy Associate Director MYRON L. KWAST, Assistant Director SUSAN J. LEPPER, Assistant Director PATRICK M. PARKINSON, Assistant Director MARTHA S. SCANLON, Assistant Director DAVID J. STOCKTON, Assistant Director JOYCE K. ZICKLER, Assistant Director LEVON H. GARABEDIAN, Assistant Director
(Administration)
DIVISION OF MONETARY AFFAIRS
DONALD L . KOHN, Director DAVID E . LINDSEY, Deputy Director BRIAN F. MADIGAN, Assistant Director RICHARD D. PORTER, Assistant Director NORMAND R.V. BERNARD, Special Assistant to the Board
OFFICE OF THE INSPECTOR GENERAL
BRENT L. BOWEN, Inspector General BARRY R. SNYDER, Assistant Inspector General
Digitized for FRASER http://fraser.stlouisfed.org/ Federal Reserve Bank of St. Louis
and Official Staff H . ROBERT HELLER JOHN P . LA WARE EDWARD W . KELLEY, JR.
OFFICE OF STAFF DIRECTOR FOR MANAGEMENT
S. DAVID FROST, Staff Director EDWARD T. MULRENIN, Assistant Staff Director PORTIA W. THOMPSON, Equal Employment Opportunity
Programs Officer
DIVISION OF HUMAN RESOURCES MANAGEMENT
DAVID L . SHANNON, Director JOHN R. WEIS, Associate Director ANTHONY V. DIGIOIA, Assistant Director JOSEPH H. HAYES, JR., Assistant Director FRED HOROWITZ, Assistant Director
OFFICE OF THE CONTROLLER
GEORGE E . LIVINGSTON, Controller STEPHEN J. CLARK, Assistant Controller (Programs and
Budgets) DARRELL R. PAULEY, Assistant Controller (Finance)
DIVISION OF SUPPORT SERVICES
ROBERT E . FRAZIER, Director GEORGE M. LOPEZ, Assistant Director DAVID L. WILLIAMS, Assistant Director
OFFICE OF THE EXECUTIVE DIRECTOR FOR INFORMATION RESOURCES MANAGEMENT
ALLEN E. BEUTEL, Executive Director STEPHEN R. MALPHRUS, Deputy Executive Director
DIVISION OF HARDWARE AND SOFTWARE SYSTEMS
BRUCE M . BEARDSLEY, Director THOMAS C. JUDD, Assistant Director ELIZABETH B. RIGGS, Assistant Director ROBERT J. ZEMEL, Assistant Director
DIVISION OF APPLICATIONS DEVELOPMENT AND STATISTICAL SERVICES
WILLIAM R . JONES, Director DAY W. RADEBAUGH, Assistant Director RICHARD C. STEVENS, Assistant Director PATRICIA A. WELCH, Assistant Director
OFFICE OF STAFF DIRECTOR FOR FEDERAL RESERVE BANK ACTIVITIES
THEODORE E. ALLISON, Staff Director
DIVISION OF FEDERAL RESERVE BANK OPERATIONS
CLYDE H . FARNSWORTH, JR., Director DAVID L. ROBINSON, Associate Director C. WILLIAM SCHLEICHER, JR., Associate Director BRUCE J. SUMMERS, Associate Director CHARLES W. BENNETT, Assistant Director JACK DENNIS, JR., Assistant Director EARL G. HAMILTON, Assistant Director JOHN H. PARRISH, Assistant Director LOUISE L. ROSEMAN, Assistant Director FLORENCE M . YOUNG, Adviser
Digitized for FRASER http://fraser.stlouisfed.org/ Federal Reserve Bank of St. Louis
A78 Federal Reserve Bulletin • May 1989
Federal Open Market Committee FEDERAL OPEN MARKET COMMITTEE
MEMBERS
ALAN GREENSPAN, Chairman E. GERALD CORRIGAN, Vice Chairman
WAYNE D . ANGELL MANUEL H . JOHNSON JOHN P. LAWARE ROGER GUFFEY SILAS KEEHN THOMAS C. MELZER H . ROBERT HELLER EDWARD W . KELLEY, JR. MARTHA R. SEGER
RICHARD F . SYRON
ALTERNATE MEMBERS
EDWARD G. BOEHNE W . LEE HOSKINS JAMES H . OLTMAN ROBERT H . BOYKIN GARY H . STERN
STAFF
DONALD L. KOHN, Secretary and Economist NORMAND R.V. BERNARD, Assistant Secretary GARY P. GILLUM, Deputy Assistant Secretary J. VIRGIL MATTINGLY, JR., General Counsel ERNEST T. PATRIKIS, Deputy General Counsel MICHAEL J. PRELL, Economist EDWIN M . TRUMAN, Economist ANATOL B. BALBACH, Associate Economist RICHARD G. DAVIS, Associate Economist
PETER D. STERNLIGHT, Manager for Domestic Operations, System Open Market Account SAM Y. CROSS, Manager for Foreign Operations, System Open Market Account
THOMAS E. DAVIS, Associate Economist DAVID E. LINDSEY, Associate Economist ALICIA H. MUNNELL, Associate Economist LARRY J. PROMISEL, Associate Economist KARL A. SCHELD, Associate Economist CHARLES J. SLEGMAN, Associate Economist THOMAS D. SIMPSON, Associate Economist LAWRENCE SLIFMAN, Associate Economist
FEDERAL ADVISORY COUNCIL
DONALD N . BRANDIN, President SAMUEL A. McCULLOUGH, Vice President
J. TERRENCE MURRAY, First District WILLARD C. BUTCHER, Second District SAMUEL A. MCCULLOUGH, Third District THOMAS H. O'BRIEN, Fourth District FREDERICK DEANE, JR., Fifth District KENNETH L. ROBERTS, Sixth District
B. KENNETH WEST, Seventh District DONALD N. BRANDIN, Eighth District LLOYD P. JOHNSON, Ninth District JORDAN L. HAINES, Tenth District JAMES E. BURT III, Eleventh District PAUL HAZEN, Twelfth District
HERBERT V . PROCHNOW, Secretary WILLIAM J. KORSVIK, Associate Secretary
Digitized for FRASER http://fraser.stlouisfed.org/ Federal Reserve Bank of St. Louis
A79
and Advisory Councils CONSUMER ADVISORY COUNCIL
JUDITH N. BROWN, Edina, Minnesota, Chairman WILLIAM E. ODOM, Dearborn, Michigan, Vice Chairman
NAOMI G. ALBANESE, Greensboro, North Carolina GEORGE H. BRAASCH, Chicago, Illinois BETTY TOM CHU, Arcadia, California CLIFF E. COOK, Tacoma, Washington JERRY D. CRAFT, Atlanta, Georgia DONALD C. DAY, Boston, Massachusetts R.B.(JOE) DEAN, JR., Columbia, South Carolina RICHARD B. DOBY, Denver, Colorado WILLIAM C. DUNKELBERG, Philadelphia, Pennsy lvan ia RICHARD H . FINK, Washington , D . C . JAMES FLETCHER, Chicago , Il l inois STEPHEN GARDNER, Dal las , T e x a s ELENA G. HANGGI, Little Rock, Arkansas JAMES HEAD, Berkeley, California
ROBERT A . HESS, W a s h i n g t o n , D . C . RAMON E. JOHNSON, Salt Lake City, Utah BARBARA KAUFMAN, San Francisco, California A. J. (JACK) KING, Kalispell, Montana MICHELLE S. MEIER, W a s h i n g t o n , D . C . RICHARD L. D. MORSE, Manhattan, Kansas LINDA K. PAGE, Columbus, Ohio SANDRA PHILLIPS, Pittsburgh, P e n n s y l v a n i a VINCENT P. QUAYLE, Baltimore, Maryland CLIFFORD N . ROSENTHAL, N e w Y o r k , N e w Y o r k ALAN M. SPURGIN, New York, New York RALPH E. SPURGIN, Columbus, Ohio DAVID P. WARD, Peapack, New Jersey LAWRENCE WINTHROP, Port land, O r e g o n
THRIFT INSTITUTIONS ADVISORY COUNCIL
GERALD M. CZARNECKI, Honolulu, Hawaii, President DONALD B. SHACKELFORD, Columbus, Ohio, Vice President
CHARLOTTE CHAMBERLAIN, Glendale , California ROBERT S. DUNCAN, Hattiesburg, Mississippi ADAM A. JAHNS, Chicago, Illinois H. C. KLEIN, Jacksonville, Arkansas PHILIP E. LAMB, Springfield, Massachusetts
JOE C. MORRIS, Overland Park, Kansas JOSEPH W . MOSMILLER, Ba l t imore , Mary land Louis H. PEPPER, Seattle, Washington MARION O. SANDLER, Oakland, California CHARLES B. STUZIN, Miami, Florida
Digitized for FRASER http://fraser.stlouisfed.org/ Federal Reserve Bank of St. Louis
A80
Federal Reserve Board Publications
For ordering assistance, write PUBLICATIONS SER-VICES, MS-138, Board of Governors of the Federal Reserve System, Washington, D.C. 20551 or telephone (202) 452-3244. When a charge is indicated, payment should accom-pany request and be made payable to the Board of Governors of the Federal Reserve System. Payment from foreign resi-dents should be drawn on a U.S. bank.
THE FEDERAL RESERVE SYSTEM—PURPOSES AND FUNC-TIONS. 1984. 120 pp.
ANNUAL REPORT. ANNUAL REPORT: BUDGET REVIEW, 1988-89 . FEDERAL RESERVE BULLETIN. Monthly . $20.00 per year or
$2.00 each in the United States, its possessions, Canada, and Mexico; 10 or more of same issue to one address, $18.00 per year or $1.75 each. Elsewhere, $24.00 per year or $2.50 each.
BANKING AND MONETARY STATISTICS. 1914-1941. (Reprint of Part I only) 1976. 682 pp. $5.00.
ANNUAL STATISTICAL DIGEST 1974-78. 1980. 305 pp. $10.00 per copy. 1981. 1982. 239 pp. $ 6.50 per copy. 1982. 1983. 266 pp. $ 7.50 per copy. 1983. 1984. 264 pp. $11.50 per copy. 1984. 1985. 254 pp. $12.50 per copy. 1985. 1986. 231 pp. $15.00 per copy. 1986. 1987. 288 pp. $15.00 per copy. 1987. 1988. 272 pp. $15.00 per copy.
HISTORICAL CHART BOOK. Issued annually in Sept. $1.25 each in the United States, its possessions, Canada, and Mexico; 10 or more to one address, $1.00 each. Else-where, $1.50 each.
SELECTED INTEREST AND EXCHANGE RATES—WEEKLY SE-RIES OF CHARTS. Weekly. $24.00 per year or $.60 each in the United States, its possessions, Canada, and Mexico; 10 or more of same issue to one address, $22.50 per year or $.55 each. Elsewhere, $30.00 per year or $.70 each.
THE FEDERAL RESERVE ACT, and other statutory provisions affecting the Federal Reserve System, as amended through April 20, 1983, with Supplements covering amendments through August 1987. 576 pp. $7.00.
REGULATIONS OF THE BOARD OF GOVERNORS OF THE FEDERAL RESERVE SYSTEM.
ANNUAL PERCENTAGE RATE TABLES (Truth in Lend ing— Regulation Z) Vol. I (Regular Transactions). 1969. 100 pp. Vol. 11 (Irregular Transactions). 1969. 116 pp. Each volume $2.25; 10 or more of same volume to one address, $2.00 each.
INTRODUCTION TO FLOW OF FUNDS. 1980. 68 pp. $1.50 each; 10 or more to one address, $1.25 each.
PUBLIC POLICY AND CAPITAL FORMATION. 1981. 326 pp. $13.50 each.
FEDERAL RESERVE REGULATORY SERVICE. Loos e l ea f ; up-dated at least monthly. (Requests must be prepaid.)
Consumer and Community Affairs Handbook. $75.00 per year.
Monetary Policy and Reserve Requirements Handbook. $75.00 per year.
Securities Credit Transactions Handbook. $75.00 per year. The Payment System Handbook. $75.00 per year. Federal Reserve Regulatory Service. 3 vols. (Contains all
three Handbooks plus substantial additional material.) $200.00 per year.
Rates for subscribers outside the United States are as follows and include additional air mail costs:
Federal Reserve Regulatory Service, $250.00 per year. Each Handbook, $90.00 per year.
THE U . S . ECONOMY IN AN INTERDEPENDENT WORLD: A MULTICOUNTRY MODEL, M a y 1984. 590 pp. $14.50 each.
WELCOME TO THE FEDERAL RESERVE. PROCESSING A N APPLICATION THROUGH THE FEDERAL RE-
SERVE SYSTEM. Augus t 1985. 30 pp. INDUSTRIAL PRODUCTION—1986 EDITION. D e c e m b e r 1986.
440 pp. $9.00 each. FINANCIAL FUTURES AND OPTIONS IN THE U . S . ECONOMY.
December 1986. 264 pp. $10.00 each.
CONSUMER EDUCATION PAMPHLETS Short pamphlets suitable for classroom use. Multiple copies are available without charge.
Consumer Handbook on Adjustable Rate Mortgages Consumer Handbook to Credit Protection Laws Federal Reserve Glossary A Guide to Business Credit and the Equal Credit Opportunity
Act A Guide to Federal Reserve Regulations How to File A Consumer Credit Complaint If You Use A Credit Card
Series on the Structure of the Federal Reserve System The Board of Governors of the Federal Reserve System The Federal Open Market Committee Federal Reserve Bank Board of Directors Federal Reserve Banks Organization and Advisory Committees
A Consumer's Guide to Mortgage Lock-Ins A Consumer's Guide to Mortgage Closings A Consumer's Guide to Mortgage Refinancing Making Deposits: When Will Your Money Be Available?
Digitized for FRASER http://fraser.stlouisfed.org/ Federal Reserve Bank of St. Louis
A81
PAMPHLETS FOR FINANCIAL INSTITUTIONS Short pamphlets on regulatory compliance, primarily suit-able for banks, bank holding companies and creditors.
Limit of 50 copies
The Board of Directors' Opportunities in Community Rein-vestment
The Board of Directors' Role in Consumer Law Compliance Combined Construction/Permanent Loan Disclosure and Regulation Z
Community Development Corporations and the Federal Re-serve
Construction Loan Disclosures and Regulation Z Finance Charges Under Regulation Z How to Determine the Credit Needs of Your Community Regulation Z: The Right of Rescission The Right to Financial Privacy Act Signature Rules in Community Property States: Regulation B Signature Rules: Regulation B Timing Requirements for Adverse Action Notices: Regula-
tion B What An Adverse Action Notice Must Contain: Regulation B Understanding Prepaid Finance Charges: Regulation Z
STAFF STUDIES: Summaries Only Printed in the Bulletin
Studies and papers on economic and financial subjects that are of general interest. Requests to obtain single copies of the full text or to be added to the mailing list for the series may be sent to Publications Services.
Staff Studies 115-125 are out of print.
114. MULTIBANK HOLDING COMPANIES: RECENT EVI-DENCE ON COMPETITION AND PERFORMANCE IN BANKING MARKETS, by Timothy J. Curry and John T. Rose. Jan. 1982. 9 pp.
126. DEFINITION AND MEASUREMENT OF EXCHANGE MAR-KET INTERVENTION, by Donald B. Adams and Dale W. Henderson. August 1983. 5 pp. Out of print.
127. U . S . EXPERIENCE WITH EXCHANGE MARKET INTER-VENTION: JANUARY-MARCH 1975, by Margaret L . Greene. August 1984. 16 pp. Out of print.
128. U . S . EXPERIENCE WITH EXCHANGE MARKET INTER-VENTION: SEPTEMBER 1977-DECEMBER 1979, by Mar-garet L. Greene. October 1984. 40 pp. Out of print.
129. U . S . EXPERIENCE WITH EXCHANGE MARKET INTER-VENTION: OCTOBER 1980-OCTOBER 1981, by Margaret L. Greene. August 1984. 36 pp.
130. EFFECTS OF EXCHANGE RATE VARIABILITY ON INTER-NATIONAL TRADE AND OTHER ECONOMIC VARIABLES: A REVIEW OF THE LITERATURE, by Victoria S. Farrell with Dean A. DeRosa and T. Ashby McCown. January 1984. Out of print.
131. CALCULATIONS OF PROFITABILITY FOR U . S . DOLLAR-DEUTSCHE MARK INTERVENTION, b y Laurence R. Ja-cobson. October 1983. 8 pp.
132. TIME-SERIES STUDIES OF THE RELATIONSHIP BE-TWEEN EXCHANGE RATES AND INTERVENTION: A RE-VIEW OF THE TECHNIQUES AND LITERATURE, by K e n -neth Rogoff. October 1983. 15 pp.
133. RELATIONSHIPS AMONG EXCHANGE RATES, INTER-VENTION, AND INTEREST RATES: A N EMPIRICAL IN-
vestigation, by Bonnie E. Loopesko. November 1983. Out of print.
134. SMALL EMPIRICAL MODELS OF EXCHANGE MARKET INTERVENTION: A REVIEW OF THE LITERATURE, b y Ralph W. Tryon. October 1983. 14 pp. Out of print.
135. SMALL EMPIRICAL MODELS OF EXCHANGE MARKET INTERVENTION: APPLICATIONS TO CANADA, GER-MANY, AND JAPAN, by Deborah J. Danker, Richard A. Haas, Dale W. Henderson, Steven A. Symansky, and Ralph W. Tryon. April 1985. 27 pp. Out of print.
136. THE EFFECTS OF FISCAL POLICY ON THE U . S . ECON-OMY, by Darrell Cohen and Peter B. Clark. January 1984. 16 pp. Out of print.
137. THE IMPLICATIONS FOR BANK MERGER POLICY OF FINANCIAL DEREGULATION, INTERSTATE BANKING, AND FINANCIAL SUPERMARKETS, b y S t e p h e n A . Rhoades. February 1984. Out of print.
138. ANTITRUST LAWS, JUSTICE DEPARTMENT GUIDE-LINES, AND THE LIMITS OF CONCENTRATION IN LOCAL BANKING MARKETS, by James Burke. June 1984.14 pp. Out of print.
139. SOME IMPLICATIONS OF FINANCIAL INNOVATIONS IN THE UNITED STATES, by Thomas D. Simpson and Patrick M. Parkinson. August 1984. 20 pp.
140. GEOGRAPHIC MARKET DELINEATION: A REVIEW OF THE LITERATURE, by John D. Wolken. November 1984. 38 pp. Out of print.
141. A COMPARISON OF DIRECT DEPOSIT AND CHECK PAY-MENT COSTS, by William Dudley. November 1984. 15 pp. Out of print.
142. MERGERS AND ACQUISITIONS BY COMMERCIAL BANKS, 1960-83, by Stephen A. Rhoades. December 1984. 30 pp. Out of print.
143. COMPLIANCE COSTS AND CONSUMER BENEFITS OF THE ELECTRONIC FUND TRANSFER ACT: RECENT SUR-VEY EVIDENCE, by Frederick J. Schroeder. April 1985. 23 pp. Out of print.
144. SCALE ECONOMIES IN COMPLIANCE COSTS FOR CON-SUMER CREDIT REGULATIONS: THE TRUTH IN LEND-ING AND EQUAL CREDIT OPPORTUNITY LAWS, b y Gregory E. Elliehausen and Robert D. Kurtz. May 1985. 10 pp.
145. SERVICE CHARGES AS A SOURCE OF BANK INCOME AND THEIR IMPACT ON CONSUMERS, b y Glenn B . Canner and Robert D. Kurtz. August 1985. 31 pp. Out of print.
146. THE ROLE OF THE PRIME RATE IN THE PRICING OF BUSINESS LOANS BY COMMERCIAL BANKS, 1977-84 , by Thomas F. Brady. November 1985. 25 pp.
147. REVISIONS IN THE MONETARY SERVICES (DIVISIA) INDEXES OF THE MONETARY AGGREGATES, by H e l e n T. Farr and Deborah Johnson. December 1985. 42 pp.
148. THE MACROECONOMIC AND SECTORAL EFFECTS OF THE ECONOMIC RECOVERY TAX ACT: SOME SIMULA-TION RESULTS, by Flint Brayton and Peter B. Clark. December 1985. 17 pp.
149. THE OPERATING PERFORMANCE OF ACQUIRED FIRMS IN BANKING BEFORE AND AFTER ACQUISITION, by Stephen A. Rhoades. April 1986. 32 pp.
150. STATISTICAL COST ACCOUNTING MODELS IN BANK-ING: A REEXAMINATION AND AN APPLICATION, by John T. Rose and John D. Wolken. May 1986. 13 pp.
151. RESPONSES TO DEREGULATION: RETAIL DEPOSIT PRICING FROM 1983 THROUGH 1985, b y Patrick I. Ma-honey, Alice P. White, Paul F. O'Brien, and Mary M. McLaughlin. January 1987. 30 pp.
Digitized for FRASER http://fraser.stlouisfed.org/ Federal Reserve Bank of St. Louis
A82
152. DETERMINANTS OF CORPORATE MERGER ACTIVITY: A REVIEW OF THE LITERATURE, by Mark J. Warshawsky. April 1987. 18 pp.
153. STOCK MARKET VOLATILITY, by Carolyn D . D a v i s and Alice P. White. September 1987. 14 pp.
154. THE EFFECTS ON CONSUMERS AND CREDITORS OF PROPOSED CEILINGS ON CREDIT CARD INTEREST RATES, by Glenn B. Canner and James T. Fergus. October 1987. 26 pp.
155. THE FUNDING OF PRIVATE PENSION PLANS, by Mark J. Warshawsky. November 1987. 25 pp.
156. INTERNATIONAL TRENDS FOR U . S . BANKS AND BANK-ING MARKETS, by James V. Houpt. May 1988. 47 pp.
157. M 2 PER UNIT OF POTENTIAL G N P AS AN ANCHOR FOR THE PRICE LEVEL, by Jeffrey J. Hallman, Richard D. Porter, and David H. Small. April 1989. 28 pp.
REPRINTS OF BULLETIN ARTICLES
Most of the articles reprinted do not exceed 12 pages.
Limit of 10 copies Foreign Experience with Targets for Money Growth. 10/83. Intervention in Foreign Exchange Markets: A Summary of
Ten Staff Studies. 11/83.
A Financial Perspective on Agriculture. 1/84. Survey of Consumer Finances, 1983. 9/84. Bank Lending to Developing Countries. 10/84. Survey of Consumer Finances, 1983: A Second Report.
12/84. Union Settlements and Aggregate Wage Behavior in the
1980s. 12/84. The Thrift Industry in Transition. 3/85. A Revision of the Index of Industrial Production. 7/85. Financial Innovation and Deregulation in Foreign Industrial
Countries. 10/85. Recent Developments in the Bankers Acceptance Market.
1/86. The Use of Cash and Transaction Accounts by American
Families. 2/86. Financial Characteristics of High-Income Families. 3/86. Prices, Profit Margins, and Exchange Rates. 6/86. Agricultural Banks under Stress. 7/86. Foreign Lending by Banks: A Guide to International and
U.S. Statistics. 10/86. Recent Developments in Corporate Finance. 11/86. Measuring the Foreign-Exchange Value of the Dollar. 6/87. Changes in Consumer Installment Debt: Evidence from the
1983 and 1986 Surveys of Consumer Finances. 10/87. U.S. International Transactions in 1988. 5/89. Home Equity Lines of Credit. 6/88.
Digitized for FRASER http://fraser.stlouisfed.org/ Federal Reserve Bank of St. Louis
A83
Index to Statistical Tables References are to pages A3-A75 although the prefix "A" is omitted in this index ACCEPTANCES, bankers (See Bankers acceptances) Agricultural loans, commercial banks, 19, 20 Assets and liabilities (See also Foreigners)
Banks, by classes, 18-20 Domestic finance companies, 36 Federal Reserve Banks, 10 Financial institutions, 26 Foreign banks, U.S. branches and agencies, 21, 72-75
Automobiles Consumer installment credit, 39, 40 Production, 49, 50
BANKERS acceptances, 9, 23, 24 Bankers balances, 18-20. (See also Foreigners) Bonds (See also U.S. government securities)
New issue s, 34 Rates, 24
Branch banks, 21, 57 Business activity, nonfinancial, 46 Business expenditures on new plant and equipment, 35 Business loans (See Commercial and industrial loans)
CAPACITY utilization, 48 Capital accounts
Banks, by classes, 18 Federal Reserve Banks, 10
Central banks, discount rates, 69 Certificates of deposit, 24 Commercial and industrial loans
Commercial banks, 16, 19, 72-73 Weekly reporting banks, 19-21
Commercial banks Assets and liabilities, 18-20 Commercial and industrial loans, 16, 18, 19, 20, 21 Consumer loans held, by type, and terms, 39, 40 Loans sold outright, 19 Nondeposit funds, 17 Real estate mortgages held, by holder and property, 38 Time and savings deposits, 3
Commercial paper, 23, 24, 36 Condition statements (See Assets and liabilities) Construction, 46, 51 Consumer installment credit, 39, 40 Consumer prices, 46, 48 Consumption expenditures, 53, 54 Corporations
Nonfinancial, assets and liabilities, 35 Profits and their distribution, 35 Security issues, 34, 67
Cost of living (See Consumer prices) Credit unions, 26, 39. (See also Thrift institutions) Currency and coin, 18 Currency in circulation, 4, 13 Customer credit, stock market, 25
DEBITS to deposit accounts, 15 Debt (See specific types of debt or securities) Demand deposits
Banks, by classes, 18-21 Ownership by individuals, partnerships, and
corporations, 22 Turnover, 15
Depository institutions Reserve requirements, 8 Reserves and related items, 3, 4, 5, 12
Deposits (See also specific types) Banks, by classes, 3, 18-20, 21 Federal Reserve Banks, 4, i o Turnover, 15
Discount rates at Reserve Banks and at foreign central banks and foreign countries (See Interest rates)
Discounts and advances by Reserve Banks (See Loans) Dividends, corporate, 35
EMPLOYMENT, 47 Eurodollars, 24
FARM mortgage loans, 38 Federal agency obligations, 4, 9, 10, 11, 31, 32 Federal credit agencies, 33 Federal finance
Debt subject to statutory limitation, and types and own-ership of gross debt, 30
Receipts and outlays, 28, 29 Treasury financing of surplus, or deficit, 28 Treasury operating balance, 28
Federal Financing Bank, 28, 33 Federal funds, 6, 17, 19, 20, 21, 24, 28 Federal Home Loan Banks, 33 Federal Home Loan Mortgage Corporation, 33, 37, 38 Federal Housing Administration, 33, 37, 38 Federal Land Banks, 38 Federal National Mortgage Association, 33, 37, 38 Federal Reserve Banks
Condition statement, 10 Discount rates (See Interest rates) U.S. government securities held, 4, 10, 11, 30
Federal Reserve credit, 4, 5, 10, 11 Federal Reserve notes, 10 Federal Savings and Loan Insurance Corporation insured
institutions, 26 Federally sponsored credit agencies, 33 Finance companies
Assets and liabilities, 36 Business credit, 36 Loans, 39, 40 Paper, 23, 24
Financial institutions Loans to, 19, 20, 21 Selected assets and liabilities, 26
Float, 4 Flow of funds, 41, 43, 44, 45 Foreign banks, assets and liabilities of U.S. branches and
agencies, 21, 72-75 Foreign currency operations, 10 Foreign deposits in U.S. banks, 4, 10, 19, 20 Foreign exchange rates, 70 Foreign trade, 56 Foreigners
Claims on, 57, 59, 62, 63, 64, 66 Liabilities to, 20, 56, 57, 59, 60, 65, 67, 68
GOLD Certificate account, 10 Stock, 4, 56
Digitized for FRASER http://fraser.stlouisfed.org/ Federal Reserve Bank of St. Louis
A84
Government National Mortgage Association, 33, 37, 38 Gross national product, 53
HOUSING, new and existing units, 51
INCOME, personal and national, 46, 53, 54 Industrial production, 46, 49 Installment loans, 39, 40 Insurance companies, 26, 30, 38 Interest rates
Bonds, 24 Consumer installment credit, 40 Federal Reserve Banks, 7 Foreign central banks and foreign countries, 69 Money and capital markets, 24 Mortgages, 37 Prime rate, 23
International capital transactions of United States, 55-69 International organizations, 59, 60, 62, 65, 66 Inventories, 53 Investment companies, issues and assets, 35 Investments (See also specific types)
Banks, by classes, 18, 19, 20, 21, 26 Commercial banks, 3, 16, 18-20, 38 Federal Reserve Banks, 10, 11 Financial institutions, 26, 38
LABOR force, 47 Life insurance companies (See Insurance companies) Loans (See also specific types)
Banks, by classes, 18-20 Commercial banks, 3, 16, 18-20 Federal Reserve Banks, 4, 5, 7, 10, 11 Financial institutions, 26, 38 Insured or guaranteed by United States, 37, 38
MANUFACTURING Capacity utilization, 48 Production, 48, 50
Margin requirements, 25 Member banks (See also Depository institutions)
Federal funds and repurchase agreements, 6 Reserve requirements, 8
Mining production, 50 Mobile homes shipped, 51 Monetary and credit aggregates, 3, 12 Money and capital market rates, 24 Money stock measures and components, 3, 13 Mortgages (See Real estate loans) Mutual funds, 35 Mutual savings banks (See Thrift institutions)
NATIONAL defense outlays, 29 National income, 53
OPEN market transactions, 9
PERSONAL income, 54 Prices
Consumer and producer, 46, 52 Stock market, 25
Prime rate, 23 Producer prices, 46, 52 Production, 46, 49 Profits, corporate, 35
REAL estate loans Banks, by classes, 16, 19, 20, 38 Financial institutions, 26
Real estate loans—Continued Terms, yields, and activity, 37 Type of holder and property mortgaged, 38
Repurchase agreements, 6, 17, 19, 20, 21 Reserve requirements, 8 Reserves
Commercial banks, 18 Depository institutions, 3, 4, 5, 12 Federal Reserve Banks, 10 U.S. reserve assets, 56
Residential mortgage loans, 37 Retail credit and retail sales, 39, 40, 46
SAVING Flow of funds, 41, 43, 44, 45 National income accounts, 53
Savings and loan associations, 26, 38, 39, 41. (See also Thrift institutions)
Savings banks, 26, 38, 39 Savings deposits (See Time and savings deposits) Securities (See also specific types)
Federal and federally sponsored credit agencies, 33 Foreign transactions, 67 New issues, 34 Prices, 25
Special .drawing rights, 4, 10, 55, 56 State and local governments
Deposits, 19, 20 Holdings of U.S. government securities, 30 New security issues, 34 Ownership of securities issued by, 19, 20, 26 Rates on securities, 24
Stock market, selected statistics, 25 Stocks (See also Securities)
New issues, 34 Prices, 25
Student Loan Marketing Association, 33
TAX receipts, federal, 29 Thrift institutions, 3. (See also Credit unions and Savings
and loan associations) Time and savings deposits, 3, 13, 17, 18, 19, 20, 21 Trade, foreign, 56 Treasury cash, Treasury currency, 4 Treasury deposits, 4, 10, 28 Treasury operating balance, 28 UNEMPLOYMENT, 47 U.S. government balances
Commercial bank holdings, 18, 19, 20 Treasury deposits at Reserve Banks, 4, 10, 28
U.S. government securities Bank holdings, 18-20, 21, 30 Dealer transactions, positions, and financing, 32 Federal Reserve Bank holdings, 4, 10, 11, 30 Foreign and international holdings and transactions, 10,
30, 68 Open market transactions, 9 Outstanding, by type and holder, 26, 30 Rates, 24
U.S. international transactions, 55-69 Utilities, production, 50
VETERANS Administration, 37, 38
WEEKLY reporting banks, 19-21 Wholesale (producer) prices, 46, 52
YIELDS (See Interest rates)
Digitized for FRASER http://fraser.stlouisfed.org/ Federal Reserve Bank of St. Louis
A85
Federal Reserve Banks, Branches, and Offices FEDERAL RESERVE BANK Chairman President Vice President branch, or facility Zip Deputy Chairman First Vice President in charge of branch BOSTON* 02106 George N. Hatsopoulos Richard F. Syron
Richard N. Cooper Robert W. Eisenmenger
NEW YORK* 10045 Cyrus R. Vance E. Gerald Corrigan Ellen V. Futter James H. Oltman
Buffalo 14240 Mary Ann Lambertsen John T. Keane
PHILADELPHIA 19105
CLEVELAND* 44101
Cincinnati 45201 Pittsburgh 15230
RICHMOND* 23219
Baltimore 21203 Charlotte 28230 Culpeper Communications and Records Center 22701
Peter A. Benoliel Gunnar E. Sarsten
Charles W. Parry John R. Miller
Owen B. Butler James E. Haas
Hanne Merriman Leroy T. Canoles, Jr.
Thomas R. Shelton William E. Masters
Edward G. Boehne William H. Stone, Jr.
W. Lee Hoskins William H. Hendricks
Robert P. Black Jimmie R. Monhollon
Charles A. Cerino1
Harold J. Swart1
Robert D. McTeer, Jr.1
Albert D. Tinkelenberg1
John G. Stoides1
ATLANTA 30303 Bradley Currey, Jr. Robert P. Forrestal Larry L. Prince Jack Guynn Delmar Harrison1
Birmingham 35283 Nelda P. Stephenson Fred R. Herr1
Jacksonville 32231 Winnie F. Taylor James D. Hawkins1
Miami 33152 Jose L. Saumat James Curry III Nashville 37203 Patsy R. Williams Donald E. Nelson New Orleans 70161 James A. Hefner Robert J. Musso
CHICAGO* 60690 Robert J. Day Silas Keehn Marcus Alexis Daniel M. Doyle
Detroit 48231 Richard T. Lindgren Roby L. Sloan1
ST. LOUIS 63166 Robert L. Virgil, Jr. Thomas C. Melzer H. Edwin Trusheim James R. Bowen
Little Rock 72203 L. Dickson Flake John F. Breen1
Louisville 40232 Thomas A. Alvey Howard Wells Memphis 38101 Seymour B. Johnson Ray Laurence
MINNEAPOLIS 55480 Michael W. Wright Gary H. Stern John A. Rollwagen Thomas E. Gainor
Helena 59601 Warren H. Ross Robert F. McNellis
KANSAS CITY 64198
Denver 80217 Oklahoma City 73125 Omaha 68102
Fred W. Lyons, Jr. Burton A. Dole, Jr.
James C. Wilson Patience S. Latting Kenneth L. Morrison
Roger Guffey Henry R. Czerwinski
Kent M. Scott David J. France Harold L. Shewmaker
DALLAS 75222
El Paso 79999 Houston 77252 San Antonio 78295
Bobby R. Inman Hugh G. Robinson
Diana S. Natalicio Andrew L. Jefferson, Jr. Lawrence E. Jenkins
Robert H. Boykin William H.Wallace Tony J. Salvaggio1
Sammie C. Clay Robert Smith, III1
Thomas H. Robertson
SAN FRANCISCO 94120
Los Angeles 90051 Portland 97208 Salt Lake City 84125 Seattle 98124
Robert F. Erburu Carolyn S. Chambers
Yvonne B. Burke Paul E. Bragdon Don M. Wheeler Carol A. Nygren
Robert T. Parry Carl E. Powell John F. Hoover1
Thomas C. Warren2
Angelo S. Carella1
E. Ronald Liggett1
Gerald R. Kelly1
•Additional offices of these Banks are located at Lewiston, Maine 04240; Windsor Locks, Connecticut 06096; Cranford, New Jersey 07016; Jericho, New York 11753; Utica at Oriskany, New York 13424; Columbus, Ohio 43216; Columbia, South Carolina 29210; Charleston, West Virginia 25311; Des Moines, Iowa 50306; Indianapolis, Indiana 46204; and Milwaukee, Wisconsin 53202.
1. Senior Vice President. 2. Executive Vice President.
Digitized for FRASER http://fraser.stlouisfed.org/ Federal Reserve Bank of St. Louis
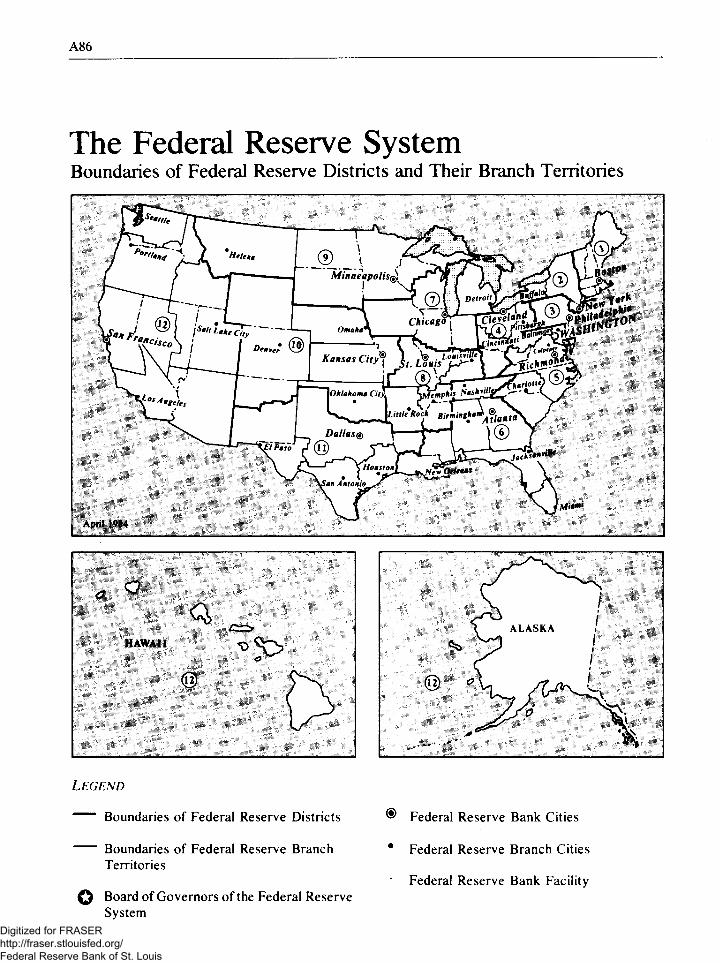
A86
The Federal Reserve System Boundaries of Federal Reserve Districts and Their Branch Territories
LEGEND
Boundaries of Federal Reserve Districts
Boundaries of Federal Reserve Branch Territories
Q Board of Governors of the Federal Reserve System
® Federal Reserve Bank Cities
* Federal Reserve Branch Cities
Federal Reserve Bank Facility
Digitized for FRASER http://fraser.stlouisfed.org/ Federal Reserve Bank of St. Louis


