Embed Size (px)
Citation preview

Statistical Tables
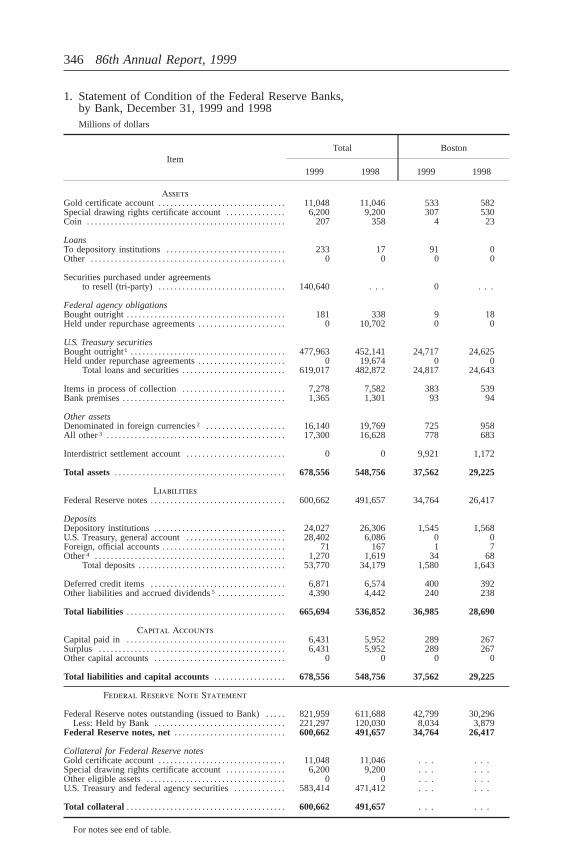
1. Statement of Condition of the Federal Reserve Banks,by Bank, December 31, 1999 and 1998Millions of dollars
ItemTotal Boston
1999 1998 1999 1998
AssetsGold certificate account. . . . . . . . . . . . . . . . . . . . . . . . . . . . . . . . 11,048 11,046 533 582Special drawing rights certificate account. . . . . . . . . . . . . . . 6,200 9,200 307 530Coin . . . . . . . . . . . . . . . . . . . . . . . . . . . . . . . . . . . . . . . . . . . . . . . . . . 207 358 4 23
LoansTo depository institutions. . . . . . . . . . . . . . . . . . . . . . . . . . . . . . 233 17 91 0Other . . . . . . . . . . . . . . . . . . . . . . . . . . . . . . . . . . . . . . . . . . . . . . . . . 0 0 0 0
Securities purchased under agreementsto resell (tri-party) . . . . . . . . . . . . . . . . . . . . . . . . . . . . . . . . 140,640 . . . 0 . . .
Federal agency obligationsBought outright. . . . . . . . . . . . . . . . . . . . . . . . . . . . . . . . . . . . . . . . 181 338 9 18Held under repurchase agreements. . . . . . . . . . . . . . . . . . . . . . 0 10,702 0 0
U.S. Treasury securitiesBought outright1 . . . . . . . . . . . . . . . . . . . . . . . . . . . . . . . . . . . . . . . 477,963 452,141 24,717 24,625Held under repurchase agreements. . . . . . . . . . . . . . . . . . . . . . 0 19,674 0 0
Total loans and securities. . . . . . . . . . . . . . . . . . . . . . . . . . 619,017 482,872 24,817 24,643
Items in process of collection. . . . . . . . . . . . . . . . . . . . . . . . . . 7,278 7,582 383 539Bank premises. . . . . . . . . . . . . . . . . . . . . . . . . . . . . . . . . . . . . . . . . 1,365 1,301 93 94
Other assetsDenominated in foreign currencies2 . . . . . . . . . . . . . . . . . . . . 16,140 19,769 725 958All other3 . . . . . . . . . . . . . . . . . . . . . . . . . . . . . . . . . . . . . . . . . . . . . 17,300 16,628 778 683
Interdistrict settlement account. . . . . . . . . . . . . . . . . . . . . . . . . 0 0 9,921 1,172
Total assets . . . . . . . . . . . . . . . . . . . . . . . . . . . . . . . . . . . . . . . . . . . 678,556 548,756 37,562 29,225
LiabilitiesFederal Reserve notes. . . . . . . . . . . . . . . . . . . . . . . . . . . . . . . . . . 600,662 491,657 34,764 26,417
DepositsDepository institutions. . . . . . . . . . . . . . . . . . . . . . . . . . . . . . . . . 24,027 26,306 1,545 1,568U.S. Treasury, general account. . . . . . . . . . . . . . . . . . . . . . . . . 28,402 6,086 0 0Foreign, official accounts. . . . . . . . . . . . . . . . . . . . . . . . . . . . . . . 71 167 1 7Other4 . . . . . . . . . . . . . . . . . . . . . . . . . . . . . . . . . . . . . . . . . . . . . . . . 1,270 1,619 34 68
Total deposits. . . . . . . . . . . . . . . . . . . . . . . . . . . . . . . . . . . . . 53,770 34,179 1,580 1,643
Deferred credit items. . . . . . . . . . . . . . . . . . . . . . . . . . . . . . . . . . 6,871 6,574 400 392Other liabilities and accrued dividends5 . . . . . . . . . . . . . . . . . 4,390 4,442 240 238
Total liabilities . . . . . . . . . . . . . . . . . . . . . . . . . . . . . . . . . . . . . . . . 665,694 536,852 36,985 28,690
Capital AccountsCapital paid in . . . . . . . . . . . . . . . . . . . . . . . . . . . . . . . . . . . . . . . . 6,431 5,952 289 267Surplus . . . . . . . . . . . . . . . . . . . . . . . . . . . . . . . . . . . . . . . . . . . . . . . 6,431 5,952 289 267Other capital accounts. . . . . . . . . . . . . . . . . . . . . . . . . . . . . . . . . 0 0 0 0
Total liabilities and capital accounts . . . . . . . . . . . . . . . . . . 678,556 548,756 37,562 29,225
Federal Reserve Note Statement
Federal Reserve notes outstanding (issued to Bank). . . . . 821,959 611,688 42,799 30,296Less: Held by Bank. . . . . . . . . . . . . . . . . . . . . . . . . . . . . . . . . 221,297 120,030 8,034 3,879
Federal Reserve notes, net. . . . . . . . . . . . . . . . . . . . . . . . . . . . 600,662 491,657 34,764 26,417
Collateral for Federal Reserve notesGold certificate account. . . . . . . . . . . . . . . . . . . . . . . . . . . . . . . . 11,048 11,046 . . . . . .Special drawing rights certificate account. . . . . . . . . . . . . . . 6,200 9,200 . . . . . .Other eligible assets. . . . . . . . . . . . . . . . . . . . . . . . . . . . . . . . . . . 0 0 . . . . . .U.S. Treasury and federal agency securities. . . . . . . . . . . . . 583,414 471,412 . . . . . .
Total collateral . . . . . . . . . . . . . . . . . . . . . . . . . . . . . . . . . . . . . . . . 600,662 491,657 . . . . . .
For notes see end of table.
346 86th Annual Report, 1999
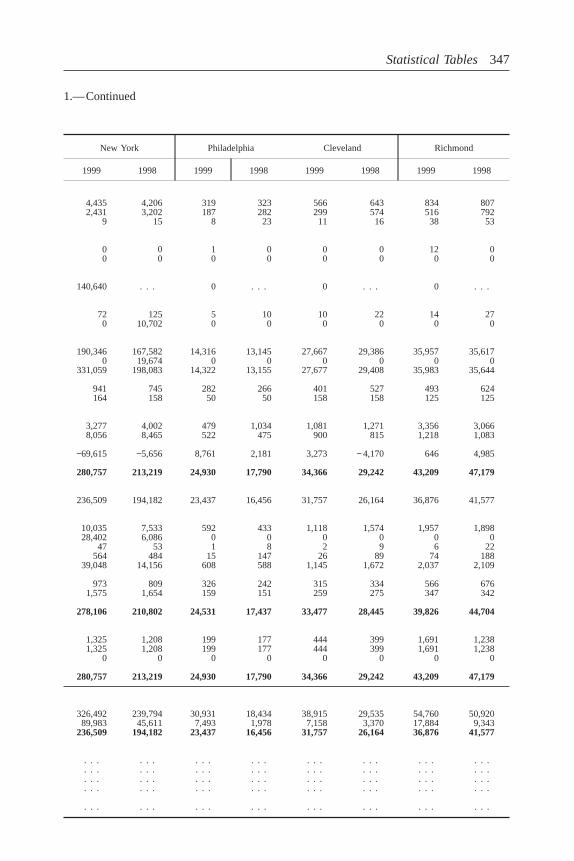
1.—Continued
New York Philadelphia Cleveland Richmond
1999 1998 1999 1998 1999 1998 1999 1998
4,435 4,206 319 323 566 643 834 8072,431 3,202 187 282 299 574 516 792
9 15 8 23 11 16 38 53
0 0 1 0 0 0 12 00 0 0 0 0 0 0 0
140,640 . . . 0 . . . 0 . . . 0 . . .
72 125 5 10 10 22 14 270 10,702 0 0 0 0 0 0
190,346 167,582 14,316 13,145 27,667 29,386 35,957 35,6170 19,674 0 0 0 0 0 0
331,059 198,083 14,322 13,155 27,677 29,408 35,983 35,644
941 745 282 266 401 527 493 624164 158 50 50 158 158 125 125
3,277 4,002 479 1,034 1,081 1,271 3,356 3,0668,056 8,465 522 475 900 815 1,218 1,083
−69,615 −5,656 8,761 2,181 3,273 − 4,170 646 4,985
280,757 213,219 24,930 17,790 34,366 29,242 43,209 47,179
236,509 194,182 23,437 16,456 31,757 26,164 36,876 41,577
10,035 7,533 592 433 1,118 1,574 1,957 1,89828,402 6,086 0 0 0 0 0 0
47 53 1 8 2 9 6 22564 484 15 147 26 89 74 188
39,048 14,156 608 588 1,145 1,672 2,037 2,109
973 809 326 242 315 334 566 6761,575 1,654 159 151 259 275 347 342
278,106 210,802 24,531 17,437 33,477 28,445 39,826 44,704
1,325 1,208 199 177 444 399 1,691 1,2381,325 1,208 199 177 444 399 1,691 1,238
0 0 0 0 0 0 0 0
280,757 213,219 24,930 17,790 34,366 29,242 43,209 47,179
326,492 239,794 30,931 18,434 38,915 29,535 54,760 50,92089,983 45,611 7,493 1,978 7,158 3,370 17,884 9,343
236,509 194,182 23,437 16,456 31,757 26,164 36,876 41,577
. . . . . . . . . . . . . . . . . . . . . . . .
. . . . . . . . . . . . . . . . . . . . . . . .
. . . . . . . . . . . . . . . . . . . . . . . .
. . . . . . . . . . . . . . . . . . . . . . . .
. . . . . . . . . . . . . . . . . . . . . . . .
Statistical Tables 347
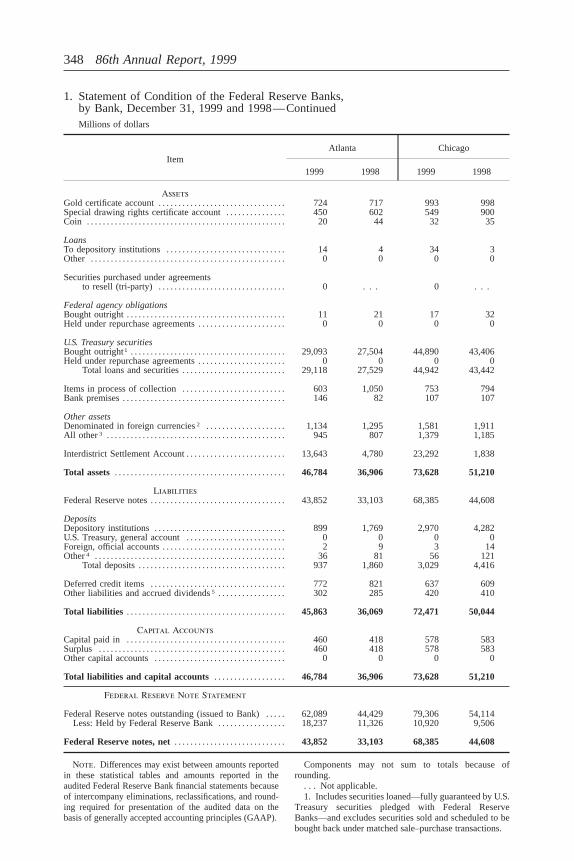
1. Statement of Condition of the Federal Reserve Banks,by Bank, December 31, 1999 and 1998—ContinuedMillions of dollars
ItemAtlanta Chicago
1999 1998 1999 1998
AssetsGold certificate account. . . . . . . . . . . . . . . . . . . . . . . . . . . . . . . . 724 717 993 998Special drawing rights certificate account. . . . . . . . . . . . . . . 450 602 549 900Coin . . . . . . . . . . . . . . . . . . . . . . . . . . . . . . . . . . . . . . . . . . . . . . . . . . 20 44 32 35
LoansTo depository institutions. . . . . . . . . . . . . . . . . . . . . . . . . . . . . . 14 4 34 3Other . . . . . . . . . . . . . . . . . . . . . . . . . . . . . . . . . . . . . . . . . . . . . . . . . 0 0 0 0
Securities purchased under agreementsto resell (tri-party) . . . . . . . . . . . . . . . . . . . . . . . . . . . . . . . . 0 . . . 0 . . .
Federal agency obligationsBought outright. . . . . . . . . . . . . . . . . . . . . . . . . . . . . . . . . . . . . . . . 11 21 17 32Held under repurchase agreements. . . . . . . . . . . . . . . . . . . . . . 0 0 0 0
U.S. Treasury securitiesBought outright1 . . . . . . . . . . . . . . . . . . . . . . . . . . . . . . . . . . . . . . . 29,093 27,504 44,890 43,406Held under repurchase agreements. . . . . . . . . . . . . . . . . . . . . . 0 0 0 0
Total loans and securities. . . . . . . . . . . . . . . . . . . . . . . . . . 29,118 27,529 44,942 43,442
Items in process of collection. . . . . . . . . . . . . . . . . . . . . . . . . . 603 1,050 753 794Bank premises. . . . . . . . . . . . . . . . . . . . . . . . . . . . . . . . . . . . . . . . . 146 82 107 107
Other assetsDenominated in foreign currencies2 . . . . . . . . . . . . . . . . . . . . 1,134 1,295 1,581 1,911All other3 . . . . . . . . . . . . . . . . . . . . . . . . . . . . . . . . . . . . . . . . . . . . . 945 807 1,379 1,185
Interdistrict Settlement Account. . . . . . . . . . . . . . . . . . . . . . . . . 13,643 4,780 23,292 1,838
Total assets . . . . . . . . . . . . . . . . . . . . . . . . . . . . . . . . . . . . . . . . . . . 46,784 36,906 73,628 51,210
LiabilitiesFederal Reserve notes. . . . . . . . . . . . . . . . . . . . . . . . . . . . . . . . . . 43,852 33,103 68,385 44,608
DepositsDepository institutions. . . . . . . . . . . . . . . . . . . . . . . . . . . . . . . . . 899 1,769 2,970 4,282U.S. Treasury, general account. . . . . . . . . . . . . . . . . . . . . . . . . 0 0 0 0Foreign, official accounts. . . . . . . . . . . . . . . . . . . . . . . . . . . . . . . 2 9 3 14Other4 . . . . . . . . . . . . . . . . . . . . . . . . . . . . . . . . . . . . . . . . . . . . . . . . 36 81 56 121
Total deposits. . . . . . . . . . . . . . . . . . . . . . . . . . . . . . . . . . . . . 937 1,860 3,029 4,416
Deferred credit items. . . . . . . . . . . . . . . . . . . . . . . . . . . . . . . . . . 772 821 637 609Other liabilities and accrued dividends5 . . . . . . . . . . . . . . . . . 302 285 420 410
Total liabilities . . . . . . . . . . . . . . . . . . . . . . . . . . . . . . . . . . . . . . . . 45,863 36,069 72,471 50,044
Capital AccountsCapital paid in . . . . . . . . . . . . . . . . . . . . . . . . . . . . . . . . . . . . . . . . 460 418 578 583Surplus . . . . . . . . . . . . . . . . . . . . . . . . . . . . . . . . . . . . . . . . . . . . . . . 460 418 578 583Other capital accounts. . . . . . . . . . . . . . . . . . . . . . . . . . . . . . . . . 0 0 0 0
Total liabilities and capital accounts . . . . . . . . . . . . . . . . . . 46,784 36,906 73,628 51,210
Federal Reserve Note Statement
Federal Reserve notes outstanding (issued to Bank). . . . . 62,089 44,429 79,306 54,114Less: Held by Federal Reserve Bank. . . . . . . . . . . . . . . . . 18,237 11,326 10,920 9,506
Federal Reserve notes, net. . . . . . . . . . . . . . . . . . . . . . . . . . . . 43,852 33,103 68,385 44,608
Note. Differences may exist between amounts reportedin these statistical tables and amounts reported in theaudited Federal Reserve Bank financial statements becauseof intercompany eliminations, reclassifications, and round-ing required for presentation of the audited data on thebasis of generally accepted accounting principles (GAAP).
Components may not sum to totals because ofrounding.
. . . Not applicable.1. Includes securities loaned—fully guaranteed by U.S.
Treasury securities pledged with Federal ReserveBanks—and excludes securities sold and scheduled to bebought back under matched sale–purchase transactions.
348 86th Annual Report, 1999
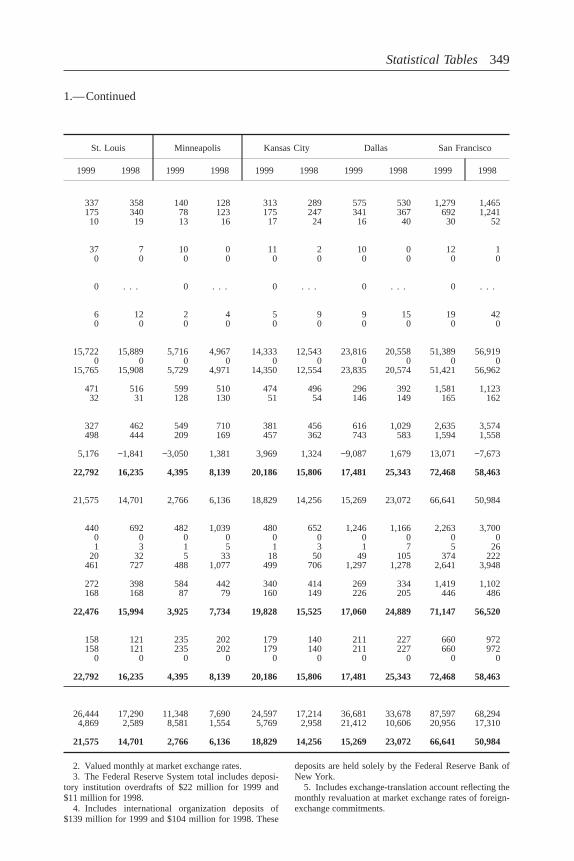
1.—Continued
St. Louis Minneapolis Kansas City Dallas San Francisco
1999 1998 1999 1998 1999 1998 1999 1998 1999 1998
337 358 140 128 313 289 575 530 1,279 1,465175 340 78 123 175 247 341 367 692 1,24110 19 13 16 17 24 16 40 30 52
37 7 10 0 11 2 10 0 12 10 0 0 0 0 0 0 0 0 0
0 . . . 0 . . . 0 . . . 0 . . . 0 . . .
6 12 2 4 5 9 9 15 19 420 0 0 0 0 0 0 0 0 0
15,722 15,889 5,716 4,967 14,333 12,543 23,816 20,558 51,389 56,9190 0 0 0 0 0 0 0 0 0
15,765 15,908 5,729 4,971 14,350 12,554 23,835 20,574 51,421 56,962
471 516 599 510 474 496 296 392 1,581 1,12332 31 128 130 51 54 146 149 165 162
327 462 549 710 381 456 616 1,029 2,635 3,574498 444 209 169 457 362 743 583 1,594 1,558
5,176 −1,841 −3,050 1,381 3,969 1,324 −9,087 1,679 13,071 −7,673
22,792 16,235 4,395 8,139 20,186 15,806 17,481 25,343 72,468 58,463
21,575 14,701 2,766 6,136 18,829 14,256 15,269 23,072 66,641 50,984
440 692 482 1,039 480 652 1,246 1,166 2,263 3,7000 0 0 0 0 0 0 0 0 01 3 1 5 1 3 1 7 5 26
20 32 5 33 18 50 49 105 374 222461 727 488 1,077 499 706 1,297 1,278 2,641 3,948
272 398 584 442 340 414 269 334 1,419 1,102168 168 87 79 160 149 226 205 446 486
22,476 15,994 3,925 7,734 19,828 15,525 17,060 24,889 71,147 56,520
158 121 235 202 179 140 211 227 660 972158 121 235 202 179 140 211 227 660 972
0 0 0 0 0 0 0 0 0 0
22,792 16,235 4,395 8,139 20,186 15,806 17,481 25,343 72,468 58,463
26,444 17,290 11,348 7,690 24,597 17,214 36,681 33,678 87,597 68,2944,869 2,589 8,581 1,554 5,769 2,958 21,412 10,606 20,956 17,310
21,575 14,701 2,766 6,136 18,829 14,256 15,269 23,072 66,641 50,984
2. Valued monthly at market exchange rates.3. The Federal Reserve System total includes deposi-
tory institution overdrafts of $22 million for 1999 and$11 million for 1998.
4. Includes international organization deposits of$139 million for 1999 and $104 million for 1998. These
deposits are held solely by the Federal Reserve Bank ofNew York.
5. Includes exchange-translation account reflecting themonthly revaluation at market exchange rates of foreign-exchange commitments.
Statistical Tables 349
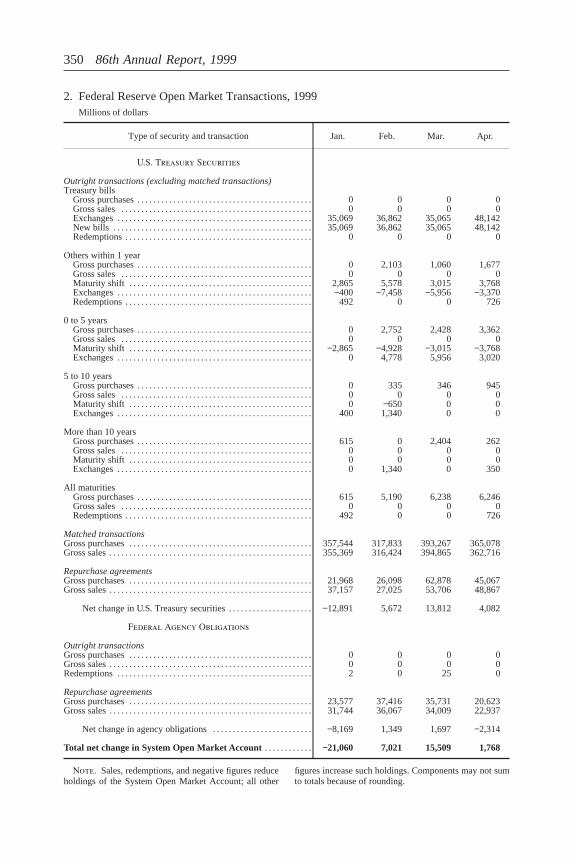
2. Federal Reserve Open Market Transactions, 1999Millions of dollars
Type of security and transaction Jan. Feb. Mar. Apr.
U.S. Treasury Securities
Outright transactions (excluding matched transactions)Treasury bills
Gross purchases. . . . . . . . . . . . . . . . . . . . . . . . . . . . . . . . . . . . . . . . . . . . 0 0 0 0Gross sales. . . . . . . . . . . . . . . . . . . . . . . . . . . . . . . . . . . . . . . . . . . . . . . . 0 0 0 0Exchanges. . . . . . . . . . . . . . . . . . . . . . . . . . . . . . . . . . . . . . . . . . . . . . . . . 35,069 36,862 35,065 48,142New bills . . . . . . . . . . . . . . . . . . . . . . . . . . . . . . . . . . . . . . . . . . . . . . . . . . 35,069 36,862 35,065 48,142Redemptions. . . . . . . . . . . . . . . . . . . . . . . . . . . . . . . . . . . . . . . . . . . . . . . 0 0 0 0
Others within 1 yearGross purchases. . . . . . . . . . . . . . . . . . . . . . . . . . . . . . . . . . . . . . . . . . . . 0 2,103 1,060 1,677Gross sales. . . . . . . . . . . . . . . . . . . . . . . . . . . . . . . . . . . . . . . . . . . . . . . . 0 0 0 0Maturity shift . . . . . . . . . . . . . . . . . . . . . . . . . . . . . . . . . . . . . . . . . . . . . . 2,865 5,578 3,015 3,768Exchanges. . . . . . . . . . . . . . . . . . . . . . . . . . . . . . . . . . . . . . . . . . . . . . . . . −400 −7,458 −5,956 −3,370Redemptions. . . . . . . . . . . . . . . . . . . . . . . . . . . . . . . . . . . . . . . . . . . . . . . 492 0 0 726
0 to 5 yearsGross purchases. . . . . . . . . . . . . . . . . . . . . . . . . . . . . . . . . . . . . . . . . . . . 0 2,752 2,428 3,362Gross sales. . . . . . . . . . . . . . . . . . . . . . . . . . . . . . . . . . . . . . . . . . . . . . . . 0 0 0 0Maturity shift . . . . . . . . . . . . . . . . . . . . . . . . . . . . . . . . . . . . . . . . . . . . . . −2,865 −4,928 −3,015 −3,768Exchanges. . . . . . . . . . . . . . . . . . . . . . . . . . . . . . . . . . . . . . . . . . . . . . . . . 0 4,778 5,956 3,020
5 to 10 yearsGross purchases. . . . . . . . . . . . . . . . . . . . . . . . . . . . . . . . . . . . . . . . . . . . 0 335 346 945Gross sales. . . . . . . . . . . . . . . . . . . . . . . . . . . . . . . . . . . . . . . . . . . . . . . . 0 0 0 0Maturity shift . . . . . . . . . . . . . . . . . . . . . . . . . . . . . . . . . . . . . . . . . . . . . . 0 −650 0 0Exchanges. . . . . . . . . . . . . . . . . . . . . . . . . . . . . . . . . . . . . . . . . . . . . . . . . 400 1,340 0 0
More than 10 yearsGross purchases. . . . . . . . . . . . . . . . . . . . . . . . . . . . . . . . . . . . . . . . . . . . 615 0 2,404 262Gross sales. . . . . . . . . . . . . . . . . . . . . . . . . . . . . . . . . . . . . . . . . . . . . . . . 0 0 0 0Maturity shift . . . . . . . . . . . . . . . . . . . . . . . . . . . . . . . . . . . . . . . . . . . . . . 0 0 0 0Exchanges. . . . . . . . . . . . . . . . . . . . . . . . . . . . . . . . . . . . . . . . . . . . . . . . . 0 1,340 0 350
All maturitiesGross purchases. . . . . . . . . . . . . . . . . . . . . . . . . . . . . . . . . . . . . . . . . . . . 615 5,190 6,238 6,246Gross sales. . . . . . . . . . . . . . . . . . . . . . . . . . . . . . . . . . . . . . . . . . . . . . . . 0 0 0 0Redemptions. . . . . . . . . . . . . . . . . . . . . . . . . . . . . . . . . . . . . . . . . . . . . . . 492 0 0 726
Matched transactionsGross purchases. . . . . . . . . . . . . . . . . . . . . . . . . . . . . . . . . . . . . . . . . . . . . .357,544 317,833 393,267 365,078Gross sales. . . . . . . . . . . . . . . . . . . . . . . . . . . . . . . . . . . . . . . . . . . . . . . . . . .355,369 316,424 394,865 362,716
Repurchase agreementsGross purchases. . . . . . . . . . . . . . . . . . . . . . . . . . . . . . . . . . . . . . . . . . . . . . 21,968 26,098 62,878 45,067Gross sales. . . . . . . . . . . . . . . . . . . . . . . . . . . . . . . . . . . . . . . . . . . . . . . . . . . 37,157 27,025 53,706 48,867
Net change in U.S. Treasury securities. . . . . . . . . . . . . . . . . . . . . −12,891 5,672 13,812 4,082
Federal Agency Obligations
Outright transactionsGross purchases. . . . . . . . . . . . . . . . . . . . . . . . . . . . . . . . . . . . . . . . . . . . . . 0 0 0 0Gross sales. . . . . . . . . . . . . . . . . . . . . . . . . . . . . . . . . . . . . . . . . . . . . . . . . . . 0 0 0 0Redemptions. . . . . . . . . . . . . . . . . . . . . . . . . . . . . . . . . . . . . . . . . . . . . . . . . 2 0 25 0
Repurchase agreementsGross purchases. . . . . . . . . . . . . . . . . . . . . . . . . . . . . . . . . . . . . . . . . . . . . . 23,577 37,416 35,731 20,623Gross sales. . . . . . . . . . . . . . . . . . . . . . . . . . . . . . . . . . . . . . . . . . . . . . . . . . . 31,744 36,067 34,009 22,937
Net change in agency obligations. . . . . . . . . . . . . . . . . . . . . . . . . −8,169 1,349 1,697 −2,314
Total net change in System Open Market Account. . . . . . . . . . . . −21,060 7,021 15,509 1,768
Note. Sales, redemptions, and negative figures reduceholdings of the System Open Market Account; all other
figures increase such holdings. Components may not sumto totals because of rounding.
350 86th Annual Report, 1999
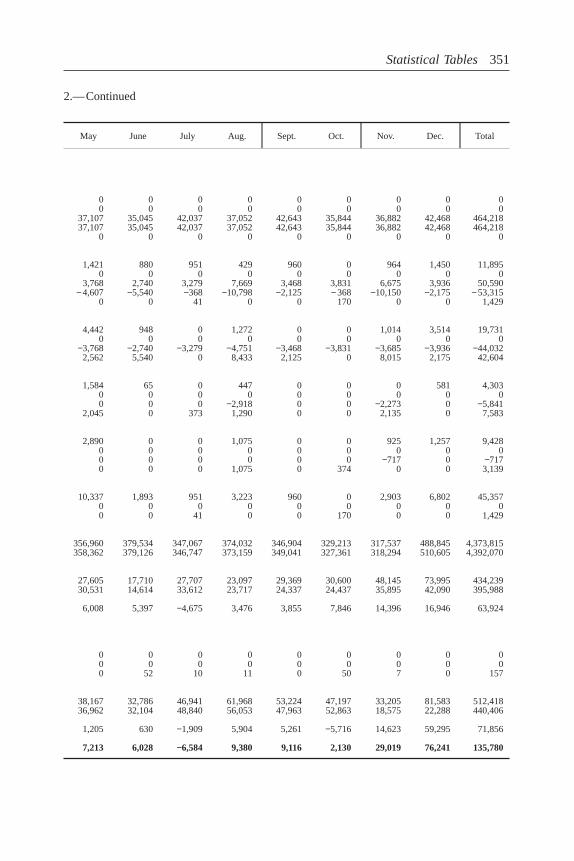
2.—Continued
May June July Aug. Sept. Oct. Nov. Dec. Total
0 0 0 0 0 0 0 0 00 0 0 0 0 0 0 0 0
37,107 35,045 42,037 37,052 42,643 35,844 36,882 42,468 464,21837,107 35,045 42,037 37,052 42,643 35,844 36,882 42,468 464,218
0 0 0 0 0 0 0 0 0
1,421 880 951 429 960 0 964 1,450 11,8950 0 0 0 0 0 0 0 0
3,768 2,740 3,279 7,669 3,468 3,831 6,675 3,936 50,590− 4,607 −5,540 −368 −10,798 −2,125 − 368 −10,150 −2,175 − 53,315
0 0 41 0 0 170 0 0 1,429
4,442 948 0 1,272 0 0 1,014 3,514 19,7310 0 0 0 0 0 0 0 0
−3,768 −2,740 −3,279 −4,751 −3,468 −3,831 −3,685 −3,936 −44,0322,562 5,540 0 8,433 2,125 0 8,015 2,175 42,604
1,584 65 0 447 0 0 0 581 4,3030 0 0 0 0 0 0 0 00 0 0 −2,918 0 0 −2,273 0 −5,841
2,045 0 373 1,290 0 0 2,135 0 7,583
2,890 0 0 1,075 0 0 925 1,257 9,4280 0 0 0 0 0 0 0 00 0 0 0 0 0 −717 0 −7170 0 0 1,075 0 374 0 0 3,139
10,337 1,893 951 3,223 960 0 2,903 6,802 45,3570 0 0 0 0 0 0 0 00 0 41 0 0 170 0 0 1,429
356,960 379,534 347,067 374,032 346,904 329,213 317,537 488,845 4,373,815358,362 379,126 346,747 373,159 349,041 327,361 318,294 510,605 4,392,070
27,605 17,710 27,707 23,097 29,369 30,600 48,145 73,995 434,23930,531 14,614 33,612 23,717 24,337 24,437 35,895 42,090 395,988
6,008 5,397 −4,675 3,476 3,855 7,846 14,396 16,946 63,924
0 0 0 0 0 0 0 0 00 0 0 0 0 0 0 0 00 52 10 11 0 50 7 0 157
38,167 32,786 46,941 61,968 53,224 47,197 33,205 81,583 512,41836,962 32,104 48,840 56,053 47,963 52,863 18,575 22,288 440,406
1,205 630 −1,909 5,904 5,261 −5,716 14,623 59,295 71,856
7,213 6,028 −6,584 9,380 9,116 2,130 29,019 76,241 135,780
Statistical Tables 351
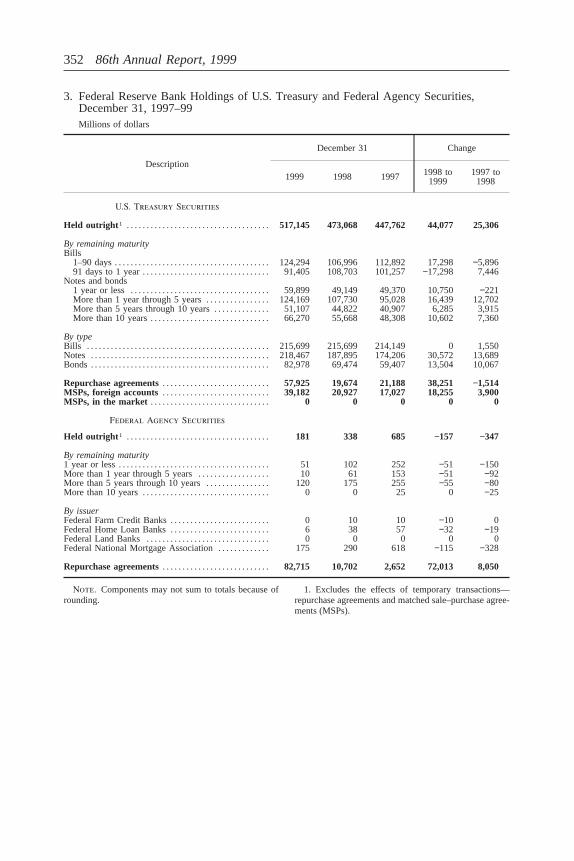
3. Federal Reserve Bank Holdings of U.S. Treasury and Federal Agency Securities,December 31, 1997–99Millions of dollars
Description
December 31 Change
1999 1998 1997 1998 to1999
1997 to1998
U.S. Treasury Securities
Held outright 1 . . . . . . . . . . . . . . . . . . . . . . . . . . . . . . . . . . . . 517,145 473,068 447,762 44,077 25,306
By remaining maturityBills
1–90 days. . . . . . . . . . . . . . . . . . . . . . . . . . . . . . . . . . . . . . .124,294 106,996 112,892 17,298 −5,89691 days to 1 year. . . . . . . . . . . . . . . . . . . . . . . . . . . . . . . . 91,405 108,703 101,257 −17,298 7,446
Notes and bonds1 year or less. . . . . . . . . . . . . . . . . . . . . . . . . . . . . . . . . . . 59,899 49,149 49,370 10,750 −221More than 1 year through 5 years. . . . . . . . . . . . . . . . 124,169 107,730 95,028 16,439 12,702More than 5 years through 10 years. . . . . . . . . . . . . . 51,107 44,822 40,907 6,285 3,915More than 10 years. . . . . . . . . . . . . . . . . . . . . . . . . . . . . . 66,270 55,668 48,308 10,602 7,360
By typeBills . . . . . . . . . . . . . . . . . . . . . . . . . . . . . . . . . . . . . . . . . . . . . .215,699 215,699 214,149 0 1,550Notes . . . . . . . . . . . . . . . . . . . . . . . . . . . . . . . . . . . . . . . . . . . . .218,467 187,895 174,206 30,572 13,689Bonds. . . . . . . . . . . . . . . . . . . . . . . . . . . . . . . . . . . . . . . . . . . . . 82,978 69,474 59,407 13,504 10,067
Repurchase agreements. . . . . . . . . . . . . . . . . . . . . . . . . . . 57,925 19,674 21,188 38,251 −1,514MSPs, foreign accounts. . . . . . . . . . . . . . . . . . . . . . . . . . . 39,182 20,927 17,027 18,255 3,900MSPs, in the market . . . . . . . . . . . . . . . . . . . . . . . . . . . . . . 0 0 0 0 0
Federal Agency Securities
Held outright 1 . . . . . . . . . . . . . . . . . . . . . . . . . . . . . . . . . . . . 181 338 685 −157 −347
By remaining maturity1 year or less. . . . . . . . . . . . . . . . . . . . . . . . . . . . . . . . . . . . . . 51 102 252 −51 −150More than 1 year through 5 years. . . . . . . . . . . . . . . . . . 10 61 153 −51 −92More than 5 years through 10 years. . . . . . . . . . . . . . . . 120 175 255 −55 −80More than 10 years. . . . . . . . . . . . . . . . . . . . . . . . . . . . . . . . 0 0 25 0 −25
By issuerFederal Farm Credit Banks. . . . . . . . . . . . . . . . . . . . . . . . . 0 10 10 −10 0Federal Home Loan Banks. . . . . . . . . . . . . . . . . . . . . . . . . 6 38 57 −32 −19Federal Land Banks. . . . . . . . . . . . . . . . . . . . . . . . . . . . . . . 0 0 0 0 0Federal National Mortgage Association. . . . . . . . . . . . . 175 290 618 −115 −328
Repurchase agreements. . . . . . . . . . . . . . . . . . . . . . . . . . . 82,715 10,702 2,652 72,013 8,050
Note. Components may not sum to totals because ofrounding.
1. Excludes the effects of temporary transactions—repurchase agreements and matched sale–purchase agree-ments (MSPs).
352 86th Annual Report, 1999
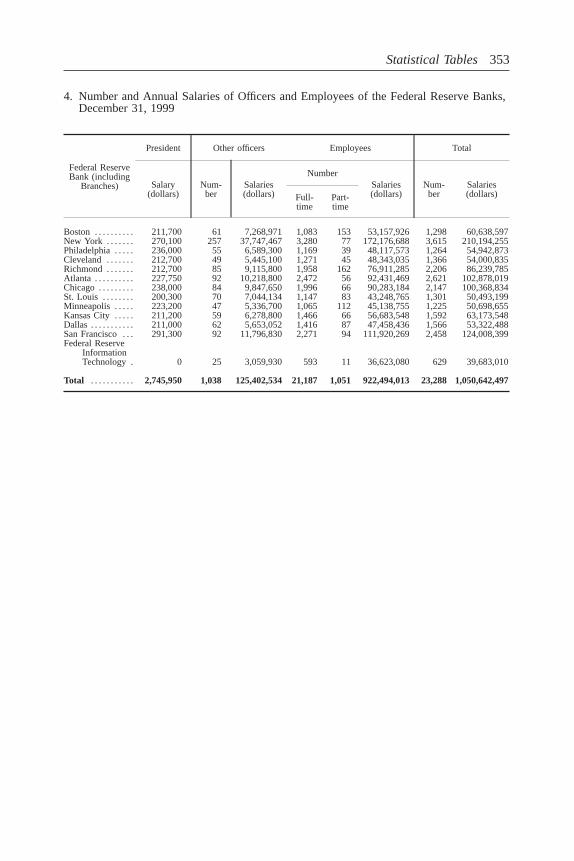
4. Number and Annual Salaries of Officers and Employees of the Federal Reserve Banks,December 31, 1999
Federal ReserveBank (including
Branches)
President Other officers Employees Total
Salary(dollars)
Num-ber
Salaries(dollars)
NumberSalaries(dollars)
Num-ber
Salaries(dollars)Full-
timePart-time
Boston . . . . . . . . . . 211,700 61 7,268,971 1,083 153 53,157,926 1,298 60,638,597New York . . . . . . . 270,100 257 37,747,467 3,280 77 172,176,688 3,615 210,194,255Philadelphia. . . . . 236,000 55 6,589,300 1,169 39 48,117,573 1,264 54,942,873Cleveland . . . . . . . 212,700 49 5,445,100 1,271 45 48,343,035 1,366 54,000,835Richmond . . . . . . . 212,700 85 9,115,800 1,958 162 76,911,285 2,206 86,239,785Atlanta . . . . . . . . . . 227,750 92 10,218,800 2,472 56 92,431,469 2,621 102,878,019Chicago. . . . . . . . . 238,000 84 9,847,650 1,996 66 90,283,184 2,147 100,368,834St. Louis . . . . . . . . 200,300 70 7,044,134 1,147 83 43,248,765 1,301 50,493,199Minneapolis . . . . . 223,200 47 5,336,700 1,065 112 45,138,755 1,225 50,698,655Kansas City . . . . . 211,200 59 6,278,800 1,466 66 56,683,548 1,592 63,173,548Dallas . . . . . . . . . . . 211,000 62 5,653,052 1,416 87 47,458,436 1,566 53,322,488San Francisco . . . 291,300 92 11,796,830 2,271 94 111,920,269 2,458 124,008,399Federal Reserve
InformationTechnology . 0 25 3,059,930 593 11 36,623,080 629 39,683,010
Total . . . . . . . . . . . 2,745,950 1,038 125,402,534 21,187 1,051 922,494,013 23,288 1,050,642,497
Statistical Tables 353
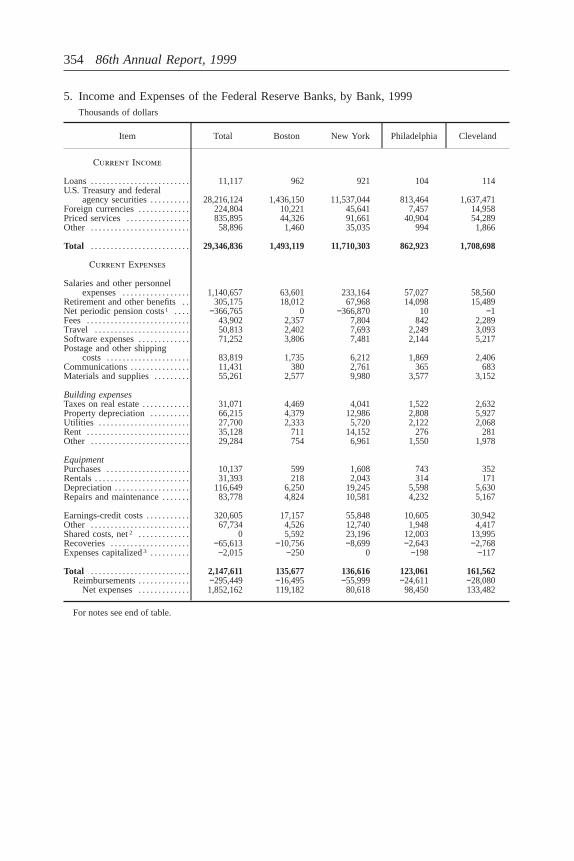
5. Income and Expenses of the Federal Reserve Banks, by Bank, 1999Thousands of dollars
Item Total Boston New York Philadelphia Cleveland
Current Income
Loans . . . . . . . . . . . . . . . . . . . . . . . . . 11,117 962 921 104 114U.S. Treasury and federal
agency securities. . . . . . . . . . 28,216,124 1,436,150 11,537,044 813,464 1,637,471Foreign currencies. . . . . . . . . . . . . 224,804 10,221 45,641 7,457 14,958Priced services. . . . . . . . . . . . . . . . 835,895 44,326 91,661 40,904 54,289Other . . . . . . . . . . . . . . . . . . . . . . . . . 58,896 1,460 35,035 994 1,866
Total . . . . . . . . . . . . . . . . . . . . . . . . . 29,346,836 1,493,119 11,710,303 862,923 1,708,698
Current Expenses
Salaries and other personnelexpenses. . . . . . . . . . . . . . . . . 1,140,657 63,601 233,164 57,027 58,560
Retirement and other benefits . . 305,175 18,012 67,968 14,098 15,489Net periodic pension costs1 . . . . −366,765 0 −366,870 10 −1Fees . . . . . . . . . . . . . . . . . . . . . . . . . . 43,902 2,357 7,804 842 2,289Travel . . . . . . . . . . . . . . . . . . . . . . . . 50,813 2,402 7,693 2,249 3,093Software expenses. . . . . . . . . . . . . 71,252 3,806 7,481 2,144 5,217Postage and other shipping
costs . . . . . . . . . . . . . . . . . . . . . 83,819 1,735 6,212 1,869 2,406Communications. . . . . . . . . . . . . . . 11,431 380 2,761 365 683Materials and supplies. . . . . . . . . 55,261 2,577 9,980 3,577 3,152
Building expensesTaxes on real estate. . . . . . . . . . . . 31,071 4,469 4,041 1,522 2,632Property depreciation. . . . . . . . . . 66,215 4,379 12,986 2,808 5,927Utilities . . . . . . . . . . . . . . . . . . . . . . . 27,700 2,333 5,720 2,122 2,068Rent . . . . . . . . . . . . . . . . . . . . . . . . . . 35,128 711 14,152 276 281Other . . . . . . . . . . . . . . . . . . . . . . . . . 29,284 754 6,961 1,550 1,978
EquipmentPurchases. . . . . . . . . . . . . . . . . . . . . 10,137 599 1,608 743 352Rentals. . . . . . . . . . . . . . . . . . . . . . . . 31,393 218 2,043 314 171Depreciation. . . . . . . . . . . . . . . . . . . 116,649 6,250 19,245 5,598 5,630Repairs and maintenance. . . . . . . 83,778 4,824 10,581 4,232 5,167
Earnings-credit costs. . . . . . . . . . . 320,605 17,157 55,848 10,605 30,942Other . . . . . . . . . . . . . . . . . . . . . . . . . 67,734 4,526 12,740 1,948 4,417Shared costs, net2 . . . . . . . . . . . . . 0 5,592 23,196 12,003 13,995Recoveries. . . . . . . . . . . . . . . . . . . . −65,613 −10,756 −8,699 −2,643 −2,768Expenses capitalized3 . . . . . . . . . . −2,015 −250 0 −198 −117
Total . . . . . . . . . . . . . . . . . . . . . . . . . 2,147,611 135,677 136,616 123,061 161,562Reimbursements. . . . . . . . . . . . . −295,449 −16,495 −55,999 −24,611 −28,080
Net expenses. . . . . . . . . . . . . 1,852,162 119,182 80,618 98,450 133,482
For notes see end of table.
354 86th Annual Report, 1999
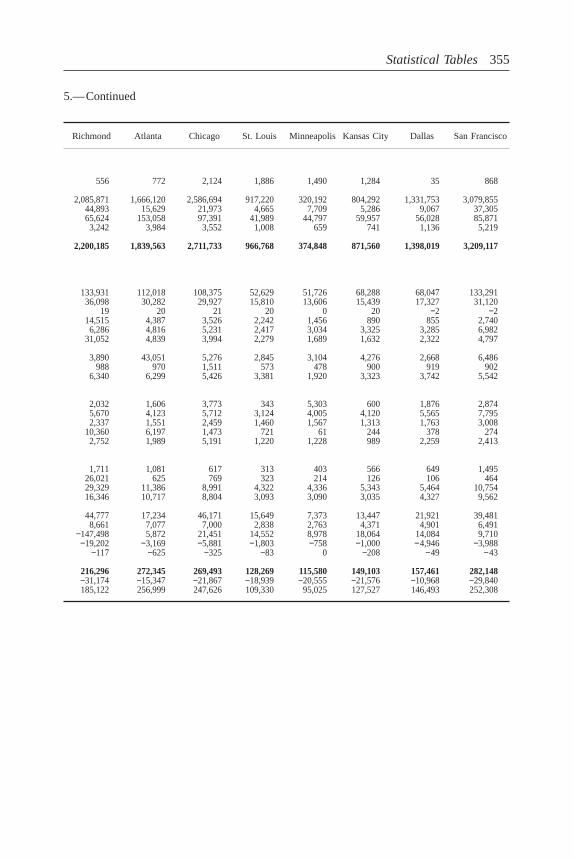
5.—Continued
Richmond Atlanta Chicago St. Louis Minneapolis Kansas City Dallas San Francisco
556 772 2,124 1,886 1,490 1,284 35 868
2,085,871 1,666,120 2,586,694 917,220 320,192 804,292 1,331,753 3,079,85544,893 15,629 21,973 4,665 7,709 5,286 9,067 37,30565,624 153,058 97,391 41,989 44,797 59,957 56,028 85,8713,242 3,984 3,552 1,008 659 741 1,136 5,219
2,200,185 1,839,563 2,711,733 966,768 374,848 871,560 1,398,019 3,209,117
133,931 112,018 108,375 52,629 51,726 68,288 68,047 133,29136,098 30,282 29,927 15,810 13,606 15,439 17,327 31,120
19 20 21 20 0 20 −2 −214,515 4,387 3,526 2,242 1,456 890 855 2,7406,286 4,816 5,231 2,417 3,034 3,325 3,285 6,982
31,052 4,839 3,994 2,279 1,689 1,632 2,322 4,797
3,890 43,051 5,276 2,845 3,104 4,276 2,668 6,486988 970 1,511 573 478 900 919 902
6,340 6,299 5,426 3,381 1,920 3,323 3,742 5,542
2,032 1,606 3,773 343 5,303 600 1,876 2,8745,670 4,123 5,712 3,124 4,005 4,120 5,565 7,7952,337 1,551 2,459 1,460 1,567 1,313 1,763 3,008
10,360 6,197 1,473 721 61 244 378 2742,752 1,989 5,191 1,220 1,228 989 2,259 2,413
1,711 1,081 617 313 403 566 649 1,49526,021 625 769 323 214 126 106 46429,329 11,386 8,991 4,322 4,336 5,343 5,464 10,75416,346 10,717 8,804 3,093 3,090 3,035 4,327 9,562
44,777 17,234 46,171 15,649 7,373 13,447 21,921 39,4818,661 7,077 7,000 2,838 2,763 4,371 4,901 6,491
−147,498 5,872 21,451 14,552 8,978 18,064 14,084 9,710−19,202 −3,169 −5,881 −1,803 −758 −1,000 −4,946 −3,988
−117 −625 −325 −83 0 −208 −49 −43
216,296 272,345 269,493 128,269 115,580 149,103 157,461 282,148−31,174 −15,347 −21,867 −18,939 −20,555 −21,576 −10,968 −29,840185,122 256,999 247,626 109,330 95,025 127,527 146,493 252,308
Statistical Tables 355
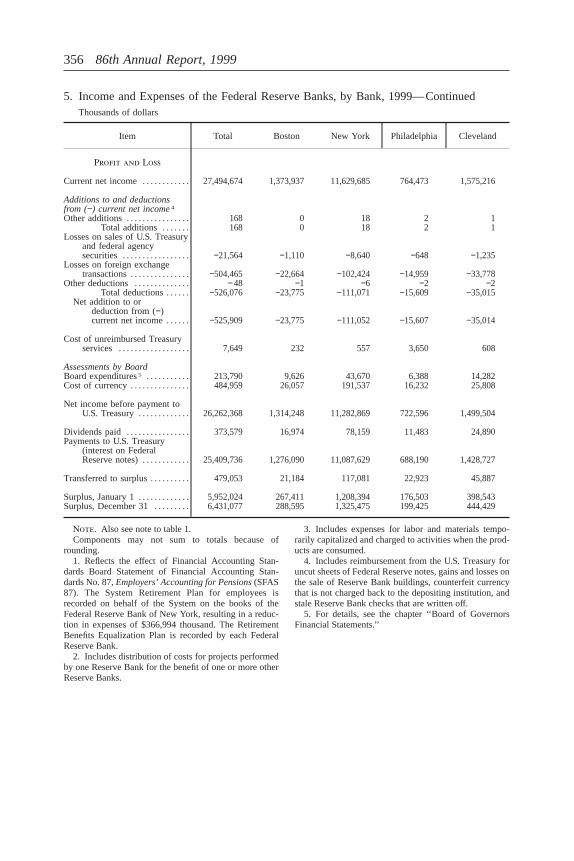
5. Income and Expenses of the Federal Reserve Banks, by Bank, 1999—ContinuedThousands of dollars
Item Total Boston New York Philadelphia Cleveland
Profit and Loss
Current net income. . . . . . . . . . . . 27,494,674 1,373,937 11,629,685 764,473 1,575,216
Additions to and deductionsfrom (−) current net income4Other additions. . . . . . . . . . . . . . . . 168 0 18 2 1
Total additions . . . . . . . 168 0 18 2 1Losses on sales of U.S. Treasury
and federal agencysecurities . . . . . . . . . . . . . . . . . −21,564 −1,110 −8,640 −648 −1,235
Losses on foreign exchangetransactions. . . . . . . . . . . . . . . −504,465 −22,664 −102,424 −14,959 −33,778
Other deductions. . . . . . . . . . . . . . − 48 −1 −6 −2 −2Total deductions. . . . . . −526,076 −23,775 −111,071 −15,609 −35,015
Net addition to ordeduction from (−)current net income. . . . . . −525,909 −23,775 −111,052 −15,607 −35,014
Cost of unreimbursed Treasuryservices . . . . . . . . . . . . . . . . . . 7,649 232 557 3,650 608
Assessments by BoardBoard expenditures5 . . . . . . . . . . . 213,790 9,626 43,670 6,388 14,282Cost of currency. . . . . . . . . . . . . . . 484,959 26,057 191,537 16,232 25,808
Net income before payment toU.S. Treasury. . . . . . . . . . . . . 26,262,368 1,314,248 11,282,869 722,596 1,499,504
Dividends paid . . . . . . . . . . . . . . . . 373,579 16,974 78,159 11,483 24,890Payments to U.S. Treasury
(interest on FederalReserve notes). . . . . . . . . . . . 25,409,736 1,276,090 11,087,629 688,190 1,428,727
Transferred to surplus. . . . . . . . . . 479,053 21,184 117,081 22,923 45,887
Surplus, January 1. . . . . . . . . . . . . 5,952,024 267,411 1,208,394 176,503 398,543Surplus, December 31. . . . . . . . . 6,431,077 288,595 1,325,475 199,425 444,429
Note. Also see note to table 1.Components may not sum to totals because of
rounding.1. Reflects the effect of Financial Accounting Stan-
dards Board Statement of Financial Accounting Stan-dards No. 87,Employers’ Accounting for Pensions(SFAS87). The System Retirement Plan for employees isrecorded on behalf of the System on the books of theFederal Reserve Bank of New York, resulting in a reduc-tion in expenses of $366,994 thousand. The RetirementBenefits Equalization Plan is recorded by each FederalReserve Bank.
2. Includes distribution of costs for projects performedby one Reserve Bank for the benefit of one or more otherReserve Banks.
3. Includes expenses for labor and materials tempo-rarily capitalized and charged to activities when the prod-ucts are consumed.
4. Includes reimbursement from the U.S. Treasury foruncut sheets of Federal Reserve notes, gains and losses onthe sale of Reserve Bank buildings, counterfeit currencythat is not charged back to the depositing institution, andstale Reserve Bank checks that are written off.
5. For details, see the chapter ‘‘Board of GovernorsFinancial Statements.’’
356 86th Annual Report, 1999
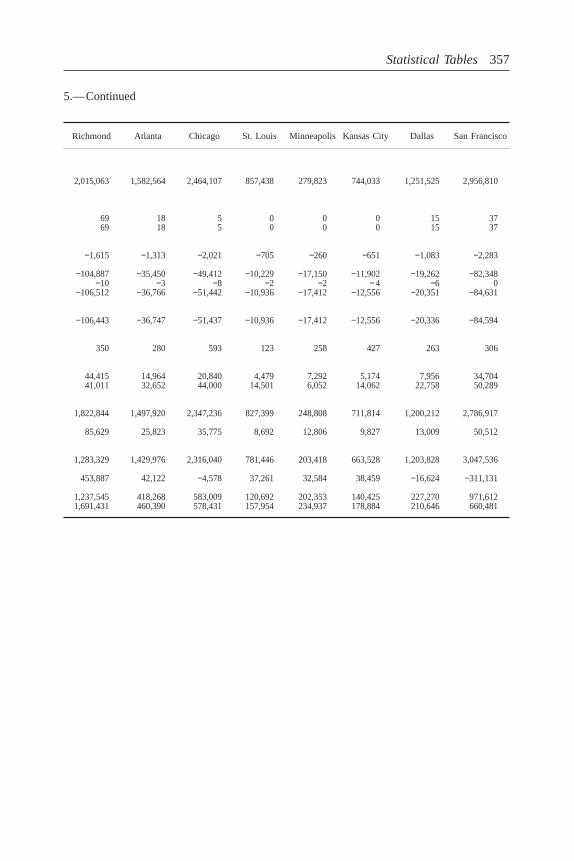
5.—Continued
Richmond Atlanta Chicago St. Louis Minneapolis Kansas City Dallas San Francisco
2,015,063 1,582,564 2,464,107 857,438 279,823 744,033 1,251,525 2,956,810
69 18 5 0 0 0 15 3769 18 5 0 0 0 15 37
−1,615 −1,313 −2,021 −705 −260 −651 −1,083 −2,283
−104,887 −35,450 −49,412 −10,229 −17,150 −11,902 −19,262 −82,348−10 −3 −8 −2 −2 − 4 −6 0
−106,512 −36,766 −51,442 −10,936 −17,412 −12,556 −20,351 −84,631
−106,443 −36,747 −51,437 −10,936 −17,412 −12,556 −20,336 −84,594
350 280 593 123 258 427 263 306
44,415 14,964 20,840 4,479 7,292 5,174 7,956 34,70441,011 32,652 44,000 14,501 6,052 14,062 22,758 50,289
1,822,844 1,497,920 2,347,236 827,399 248,808 711,814 1,200,212 2,786,917
85,629 25,823 35,775 8,692 12,806 9,827 13,009 50,512
1,283,329 1,429,976 2,316,040 781,446 203,418 663,528 1,203,828 3,047,536
453,887 42,122 −4,578 37,261 32,584 38,459 −16,624 −311,131
1,237,545 418,268 583,009 120,692 202,353 140,425 227,270 971,6121,691,431 460,390 578,431 157,954 234,937 178,884 210,646 660,481
Statistical Tables 357
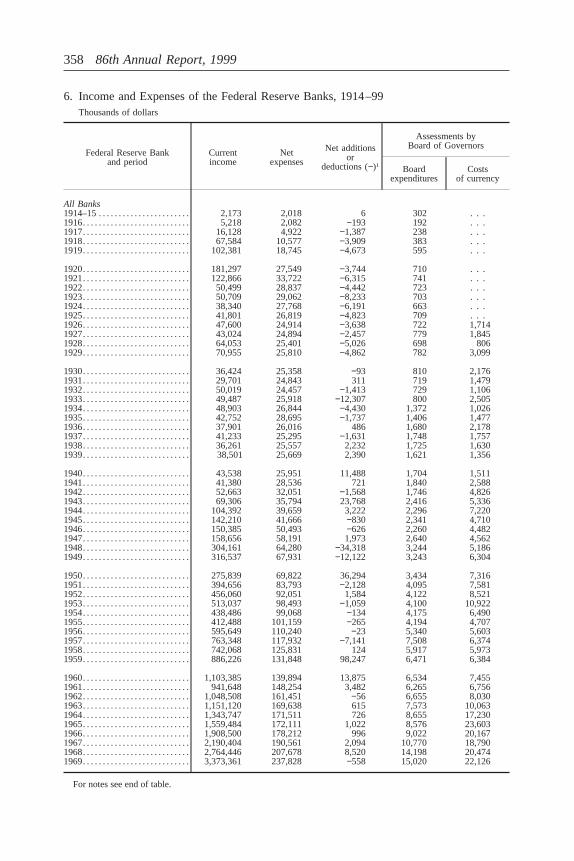
6. Income and Expenses of the Federal Reserve Banks, 1914–99Thousands of dollars
Federal Reserve Bankand period
Currentincome
Netexpenses
Net additionsor
deductions (−)1
Assessments byBoard of Governors
Boardexpenditures
Costsof currency
All Banks1914–15. . . . . . . . . . . . . . . . . . . . . . . 2,173 2,018 6 302 . . .1916. . . . . . . . . . . . . . . . . . . . . . . . . . . 5,218 2,082 −193 192 . . .1917. . . . . . . . . . . . . . . . . . . . . . . . . . . 16,128 4,922 −1,387 238 . . .1918. . . . . . . . . . . . . . . . . . . . . . . . . . . 67,584 10,577 −3,909 383 . . .1919. . . . . . . . . . . . . . . . . . . . . . . . . . . 102,381 18,745 −4,673 595 . . .
1920. . . . . . . . . . . . . . . . . . . . . . . . . . . 181,297 27,549 −3,744 710 . . .1921. . . . . . . . . . . . . . . . . . . . . . . . . . . 122,866 33,722 −6,315 741 . . .1922. . . . . . . . . . . . . . . . . . . . . . . . . . . 50,499 28,837 −4,442 723 . . .1923. . . . . . . . . . . . . . . . . . . . . . . . . . . 50,709 29,062 −8,233 703 . . .1924. . . . . . . . . . . . . . . . . . . . . . . . . . . 38,340 27,768 −6,191 663 . . .1925. . . . . . . . . . . . . . . . . . . . . . . . . . . 41,801 26,819 −4,823 709 . . .1926. . . . . . . . . . . . . . . . . . . . . . . . . . . 47,600 24,914 −3,638 722 1,7141927. . . . . . . . . . . . . . . . . . . . . . . . . . . 43,024 24,894 −2,457 779 1,8451928. . . . . . . . . . . . . . . . . . . . . . . . . . . 64,053 25,401 −5,026 698 8061929. . . . . . . . . . . . . . . . . . . . . . . . . . . 70,955 25,810 −4,862 782 3,099
1930. . . . . . . . . . . . . . . . . . . . . . . . . . . 36,424 25,358 −93 810 2,1761931. . . . . . . . . . . . . . . . . . . . . . . . . . . 29,701 24,843 311 719 1,4791932. . . . . . . . . . . . . . . . . . . . . . . . . . . 50,019 24,457 −1,413 729 1,1061933. . . . . . . . . . . . . . . . . . . . . . . . . . . 49,487 25,918 −12,307 800 2,5051934. . . . . . . . . . . . . . . . . . . . . . . . . . . 48,903 26,844 −4,430 1,372 1,0261935. . . . . . . . . . . . . . . . . . . . . . . . . . . 42,752 28,695 −1,737 1,406 1,4771936. . . . . . . . . . . . . . . . . . . . . . . . . . . 37,901 26,016 486 1,680 2,1781937. . . . . . . . . . . . . . . . . . . . . . . . . . . 41,233 25,295 −1,631 1,748 1,7571938. . . . . . . . . . . . . . . . . . . . . . . . . . . 36,261 25,557 2,232 1,725 1,6301939. . . . . . . . . . . . . . . . . . . . . . . . . . . 38,501 25,669 2,390 1,621 1,356
1940. . . . . . . . . . . . . . . . . . . . . . . . . . . 43,538 25,951 11,488 1,704 1,5111941. . . . . . . . . . . . . . . . . . . . . . . . . . . 41,380 28,536 721 1,840 2,5881942. . . . . . . . . . . . . . . . . . . . . . . . . . . 52,663 32,051 −1,568 1,746 4,8261943. . . . . . . . . . . . . . . . . . . . . . . . . . . 69,306 35,794 23,768 2,416 5,3361944. . . . . . . . . . . . . . . . . . . . . . . . . . . 104,392 39,659 3,222 2,296 7,2201945. . . . . . . . . . . . . . . . . . . . . . . . . . . 142,210 41,666 −830 2,341 4,7101946. . . . . . . . . . . . . . . . . . . . . . . . . . . 150,385 50,493 −626 2,260 4,4821947. . . . . . . . . . . . . . . . . . . . . . . . . . . 158,656 58,191 1,973 2,640 4,5621948. . . . . . . . . . . . . . . . . . . . . . . . . . . 304,161 64,280 −34,318 3,244 5,1861949. . . . . . . . . . . . . . . . . . . . . . . . . . . 316,537 67,931 −12,122 3,243 6,304
1950. . . . . . . . . . . . . . . . . . . . . . . . . . . 275,839 69,822 36,294 3,434 7,3161951. . . . . . . . . . . . . . . . . . . . . . . . . . . 394,656 83,793 −2,128 4,095 7,5811952. . . . . . . . . . . . . . . . . . . . . . . . . . . 456,060 92,051 1,584 4,122 8,5211953. . . . . . . . . . . . . . . . . . . . . . . . . . . 513,037 98,493 −1,059 4,100 10,9221954. . . . . . . . . . . . . . . . . . . . . . . . . . . 438,486 99,068 −134 4,175 6,4901955. . . . . . . . . . . . . . . . . . . . . . . . . . . 412,488 101,159 −265 4,194 4,7071956. . . . . . . . . . . . . . . . . . . . . . . . . . . 595,649 110,240 −23 5,340 5,6031957. . . . . . . . . . . . . . . . . . . . . . . . . . . 763,348 117,932 −7,141 7,508 6,3741958. . . . . . . . . . . . . . . . . . . . . . . . . . . 742,068 125,831 124 5,917 5,9731959. . . . . . . . . . . . . . . . . . . . . . . . . . . 886,226 131,848 98,247 6,471 6,384
1960. . . . . . . . . . . . . . . . . . . . . . . . . . . 1,103,385 139,894 13,875 6,534 7,4551961. . . . . . . . . . . . . . . . . . . . . . . . . . . 941,648 148,254 3,482 6,265 6,7561962. . . . . . . . . . . . . . . . . . . . . . . . . . . 1,048,508 161,451 −56 6,655 8,0301963. . . . . . . . . . . . . . . . . . . . . . . . . . . 1,151,120 169,638 615 7,573 10,0631964. . . . . . . . . . . . . . . . . . . . . . . . . . . 1,343,747 171,511 726 8,655 17,2301965. . . . . . . . . . . . . . . . . . . . . . . . . . . 1,559,484 172,111 1,022 8,576 23,6031966. . . . . . . . . . . . . . . . . . . . . . . . . . . 1,908,500 178,212 996 9,022 20,1671967. . . . . . . . . . . . . . . . . . . . . . . . . . . 2,190,404 190,561 2,094 10,770 18,7901968. . . . . . . . . . . . . . . . . . . . . . . . . . . 2,764,446 207,678 8,520 14,198 20,4741969. . . . . . . . . . . . . . . . . . . . . . . . . . . 3,373,361 237,828 −558 15,020 22,126
For notes see end of table.
358 86th Annual Report, 1999
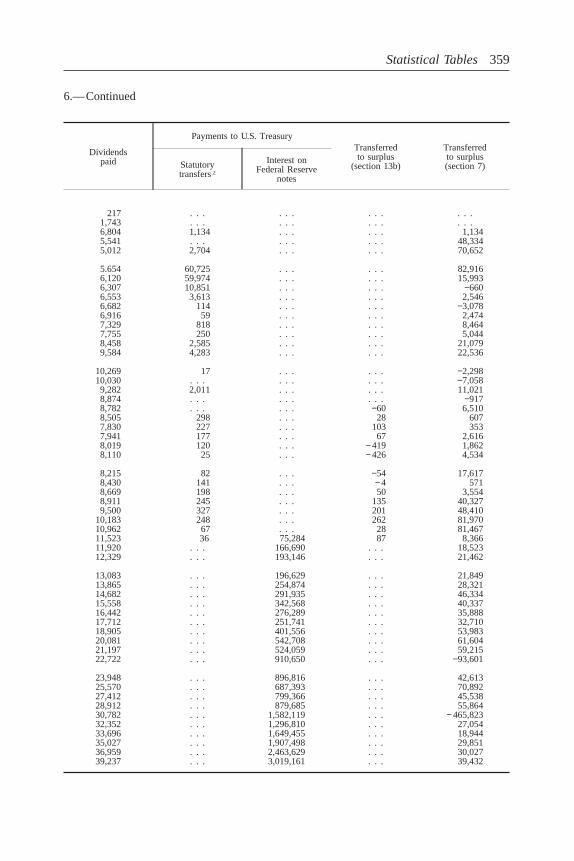
6.—Continued
Dividendspaid
Payments to U.S. TreasuryTransferredto surplus
(section 13b)
Transferredto surplus(section 7)Statutory
transfers2Interest on
Federal Reservenotes
217 . . . . . . . . . . . .1,743 . . . . . . . . . . . .6,804 1,134 . . . . . . 1,1345,541 . . . . . . . . . 48,3345,012 2,704 . . . . . . 70,652
5.654 60,725 . . . . . . 82,9166,120 59,974 . . . . . . 15,9936,307 10,851 . . . . . . −6606,553 3,613 . . . . . . 2,5466,682 114 . . . . . . −3,0786,916 59 . . . . . . 2,4747,329 818 . . . . . . 8,4647,755 250 . . . . . . 5,0448,458 2,585 . . . . . . 21,0799,584 4,283 . . . . . . 22,536
10,269 17 . . . . . . −2,29810,030 . . . . . . . . . −7,0589,282 2,011 . . . . . . 11,0218,874 . . . . . . . . . −9178,782 . . . . . . −60 6,5108,505 298 . . . 28 6077,830 227 . . . 103 3537,941 177 . . . 67 2,6168,019 120 . . . − 419 1,8628,110 25 . . . − 426 4,534
8,215 82 . . . −54 17,6178,430 141 . . . − 4 5718,669 198 . . . 50 3,5548,911 245 . . . 135 40,3279,500 327 . . . 201 48,410
10,183 248 . . . 262 81,97010,962 67 . . . 28 81,46711,523 36 75,284 87 8,36611,920 . . . 166,690 . . . 18,52312,329 . . . 193,146 . . . 21,462
13,083 . . . 196,629 . . . 21,84913,865 . . . 254,874 . . . 28,32114,682 . . . 291,935 . . . 46,33415,558 . . . 342,568 . . . 40,33716,442 . . . 276,289 . . . 35,88817,712 . . . 251,741 . . . 32,71018,905 . . . 401,556 . . . 53,98320,081 . . . 542,708 . . . 61,60421,197 . . . 524,059 . . . 59,21522,722 . . . 910,650 . . . −93,601
23,948 . . . 896,816 . . . 42,61325,570 . . . 687,393 . . . 70,89227,412 . . . 799,366 . . . 45,53828,912 . . . 879,685 . . . 55,86430,782 . . . 1,582,119 . . . − 465,82332,352 . . . 1,296,810 . . . 27,05433,696 . . . 1,649,455 . . . 18,94435,027 . . . 1,907,498 . . . 29,85136,959 . . . 2,463,629 . . . 30,02739,237 . . . 3,019,161 . . . 39,432
Statistical Tables 359
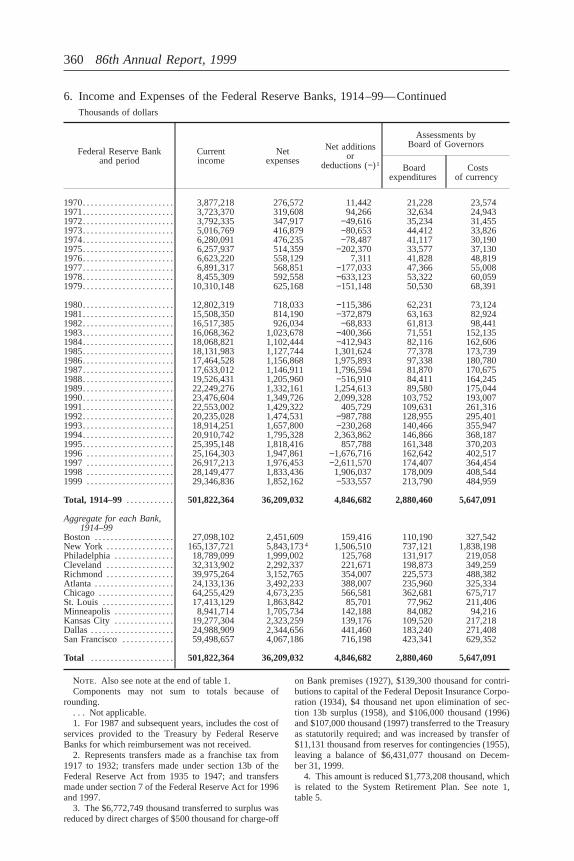
6. Income and Expenses of the Federal Reserve Banks, 1914–99—ContinuedThousands of dollars
Federal Reserve Bankand period
Currentincome
Netexpenses
Net additionsor
deductions (−)1
Assessments byBoard of Governors
Boardexpenditures
Costsof currency
1970. . . . . . . . . . . . . . . . . . . . . . . 3,877,218 276,572 11,442 21,228 23,5741971. . . . . . . . . . . . . . . . . . . . . . . 3,723,370 319,608 94,266 32,634 24,9431972. . . . . . . . . . . . . . . . . . . . . . . 3,792,335 347,917 −49,616 35,234 31,4551973. . . . . . . . . . . . . . . . . . . . . . . 5,016,769 416,879 −80,653 44,412 33,8261974. . . . . . . . . . . . . . . . . . . . . . . 6,280,091 476,235 −78,487 41,117 30,1901975. . . . . . . . . . . . . . . . . . . . . . . 6,257,937 514,359 −202,370 33,577 37,1301976. . . . . . . . . . . . . . . . . . . . . . . 6,623,220 558,129 7,311 41,828 48,8191977. . . . . . . . . . . . . . . . . . . . . . . 6,891,317 568,851 −177,033 47,366 55,0081978. . . . . . . . . . . . . . . . . . . . . . . 8,455,309 592,558 −633,123 53,322 60,0591979. . . . . . . . . . . . . . . . . . . . . . . 10,310,148 625,168 −151,148 50,530 68,391
1980. . . . . . . . . . . . . . . . . . . . . . . 12,802,319 718,033 −115,386 62,231 73,1241981. . . . . . . . . . . . . . . . . . . . . . . 15,508,350 814,190 −372,879 63,163 82,9241982. . . . . . . . . . . . . . . . . . . . . . . 16,517,385 926,034 −68,833 61,813 98,4411983. . . . . . . . . . . . . . . . . . . . . . . 16,068,362 1,023,678 −400,366 71,551 152,1351984. . . . . . . . . . . . . . . . . . . . . . . 18,068,821 1,102,444 −412,943 82,116 162,6061985. . . . . . . . . . . . . . . . . . . . . . . 18,131,983 1,127,744 1,301,624 77,378 173,7391986. . . . . . . . . . . . . . . . . . . . . . . 17,464,528 1,156,868 1,975,893 97,338 180,7801987. . . . . . . . . . . . . . . . . . . . . . . 17,633,012 1,146,911 1,796,594 81,870 170,6751988. . . . . . . . . . . . . . . . . . . . . . . 19,526,431 1,205,960 −516,910 84,411 164,2451989. . . . . . . . . . . . . . . . . . . . . . . 22,249,276 1,332,161 1,254,613 89,580 175,0441990. . . . . . . . . . . . . . . . . . . . . . . 23,476,604 1,349,726 2,099,328 103,752 193,0071991. . . . . . . . . . . . . . . . . . . . . . . 22,553,002 1,429,322 405,729 109,631 261,3161992. . . . . . . . . . . . . . . . . . . . . . . 20,235,028 1,474,531 −987,788 128,955 295,4011993. . . . . . . . . . . . . . . . . . . . . . . 18,914,251 1,657,800 −230,268 140,466 355,9471994. . . . . . . . . . . . . . . . . . . . . . . 20,910,742 1,795,328 2,363,862 146,866 368,1871995. . . . . . . . . . . . . . . . . . . . . . . 25,395,148 1,818,416 857,788 161,348 370,2031996 . . . . . . . . . . . . . . . . . . . . . . 25,164,303 1,947,861 −1,676,716 162,642 402,5171997 . . . . . . . . . . . . . . . . . . . . . . 26,917,213 1,976,453 −2,611,570 174,407 364,4541998 . . . . . . . . . . . . . . . . . . . . . . 28,149,477 1,833,436 1,906,037 178,009 408,5441999 . . . . . . . . . . . . . . . . . . . . . . 29,346,836 1,852,162 −533,557 213,790 484,959
Total, 1914–99 . . . . . . . . . . . . 501,822,364 36,209,032 4,846,682 2,880,460 5,647,091
Aggregate for each Bank,1914–99
Boston . . . . . . . . . . . . . . . . . . . . 27,098,102 2,451,609 159,416 110,190 327,542New York . . . . . . . . . . . . . . . . . 165,137,721 5,843,1734 1,506,510 737,121 1,838,198Philadelphia. . . . . . . . . . . . . . . 18,789,099 1,999,002 125,768 131,917 219,058Cleveland . . . . . . . . . . . . . . . . . 32,313,902 2,292,337 221,671 198,873 349,259Richmond . . . . . . . . . . . . . . . . . 39,975,264 3,152,765 354,007 225,573 488,382Atlanta . . . . . . . . . . . . . . . . . . . . 24,133,136 3,492,233 388,007 235,960 325,334Chicago. . . . . . . . . . . . . . . . . . . 64,255,429 4,673,235 566,581 362,681 675,717St. Louis . . . . . . . . . . . . . . . . . . 17,413,129 1,863,842 85,701 77,962 211,406Minneapolis . . . . . . . . . . . . . . . 8,941,714 1,705,734 142,188 84,082 94,216Kansas City . . . . . . . . . . . . . . . 19,277,304 2,323,259 139,176 109,520 217,218Dallas . . . . . . . . . . . . . . . . . . . . . 24,988,909 2,344,656 441,460 183,240 271,408San Francisco. . . . . . . . . . . . . 59,498,657 4,067,186 716,198 423,341 629,352
Total . . . . . . . . . . . . . . . . . . . . . 501,822,364 36,209,032 4,846,682 2,880,460 5,647,091
Note. Also see note at the end of table 1.Components may not sum to totals because of
rounding.. . . Not applicable.1. For 1987 and subsequent years, includes the cost of
services provided to the Treasury by Federal ReserveBanks for which reimbursement was not received.
2. Represents transfers made as a franchise tax from1917 to 1932; transfers made under section 13b of theFederal Reserve Act from 1935 to 1947; and transfersmade under section 7 of the Federal Reserve Act for 1996and 1997.
3. The $6,772,749 thousand transferred to surplus wasreduced by direct charges of $500 thousand for charge-off
on Bank premises (1927), $139,300 thousand for contri-butions to capital of the Federal Deposit Insurance Corpo-ration (1934), $4 thousand net upon elimination of sec-tion 13b surplus (1958), and $106,000 thousand (1996)and $107,000 thousand (1997) transferred to the Treasuryas statutorily required; and was increased by transfer of$11,131 thousand from reserves for contingencies (1955),leaving a balance of $6,431,077 thousand on Decem-ber 31, 1999.
4. This amount is reduced $1,773,208 thousand, whichis related to the System Retirement Plan. See note 1,table 5.
360 86th Annual Report, 1999
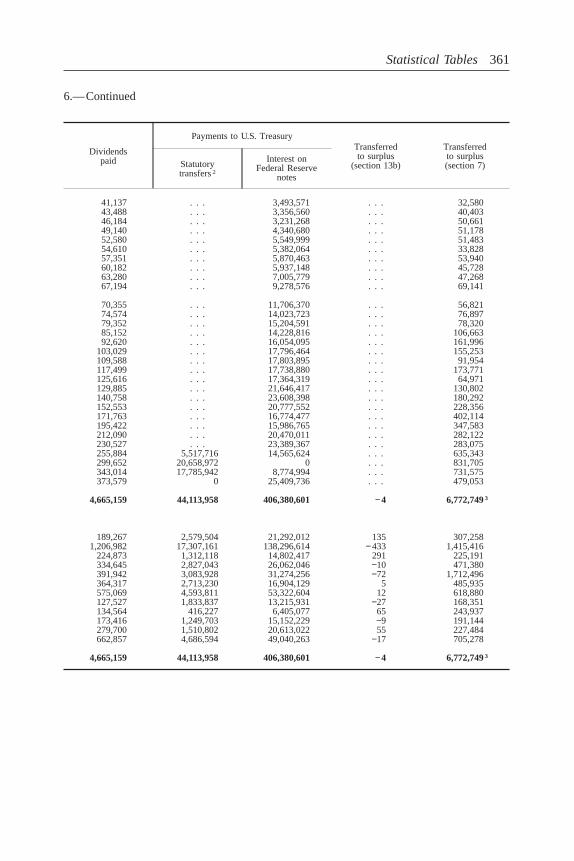
6.—Continued
Dividendspaid
Payments to U.S. TreasuryTransferredto surplus
(section 13b)
Transferredto surplus(section 7)Statutory
transfers2Interest on
Federal Reservenotes
41,137 . . . 3,493,571 . . . 32,58043,488 . . . 3,356,560 . . . 40,40346,184 . . . 3,231,268 . . . 50,66149,140 . . . 4,340,680 . . . 51,17852,580 . . . 5,549,999 . . . 51,48354,610 . . . 5,382,064 . . . 33,82857,351 . . . 5,870,463 . . . 53,94060,182 . . . 5,937,148 . . . 45,72863,280 . . . 7,005,779 . . . 47,26867,194 . . . 9,278,576 . . . 69,141
70,355 . . . 11,706,370 . . . 56,82174,574 . . . 14,023,723 . . . 76,89779,352 . . . 15,204,591 . . . 78,32085,152 . . . 14,228,816 . . . 106,66392,620 . . . 16,054,095 . . . 161,996
103,029 . . . 17,796,464 . . . 155,253109,588 . . . 17,803,895 . . . 91,954117,499 . . . 17,738,880 . . . 173,771125,616 . . . 17,364,319 . . . 64,971129,885 . . . 21,646,417 . . . 130,802140,758 . . . 23,608,398 . . . 180,292152,553 . . . 20,777,552 . . . 228,356171,763 . . . 16,774,477 . . . 402,114195,422 . . . 15,986,765 . . . 347,583212,090 . . . 20,470,011 . . . 282,122230,527 . . . 23,389,367 . . . 283,075255,884 5,517,716 14,565,624 . . . 635,343299,652 20,658,972 0 . . . 831,705343,014 17,785,942 8,774,994 . . . 731,575373,579 0 25,409,736 . . . 479,053
4,665,159 44,113,958 406,380,601 − 4 6,772,7493
189,267 2,579,504 21,292,012 135 307,2581,206,982 17,307,161 138,296,614 − 433 1,415,416
224,873 1,312,118 14,802,417 291 225,191334,645 2,827,043 26,062,046 −10 471,380391,942 3,083,928 31,274,256 −72 1,712,496364,317 2,713,230 16,904,129 5 485,935575,069 4,593,811 53,322,604 12 618,880127,527 1,833,837 13,215,931 −27 168,351134,564 416,227 6,405,077 65 243,937173,416 1,249,703 15,152,229 −9 191,144279,700 1,510,802 20,613,022 55 227,484662,857 4,686,594 49,040,263 −17 705,278
4,665,159 44,113,958 406,380,601 − 4 6,772,7493
Statistical Tables 361
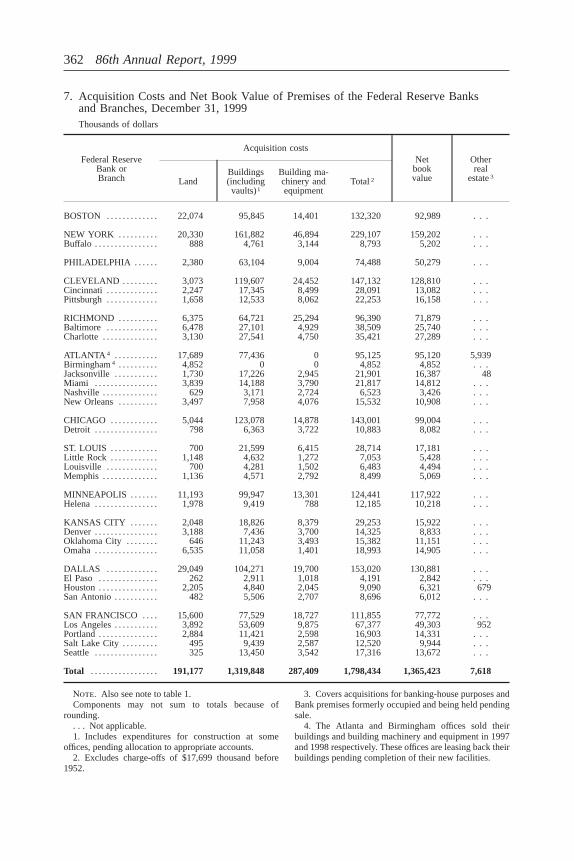
7. Acquisition Costs and Net Book Value of Premises of the Federal Reserve Banksand Branches, December 31, 1999Thousands of dollars
Federal ReserveBank orBranch
Acquisition costsNet
bookvalue
Otherreal
estate3LandBuildings(includingvaults)1
Building ma-chinery andequipment
Total2
BOSTON . . . . . . . . . . . . . 22,074 95,845 14,401 132,320 92,989 . . .
NEW YORK . . . . . . . . . . 20,330 161,882 46,894 229,107 159,202 . . .Buffalo . . . . . . . . . . . . . . . . 888 4,761 3,144 8,793 5,202 . . .
PHILADELPHIA . . . . . . 2,380 63,104 9,004 74,488 50,279 . . .
CLEVELAND . . . . . . . . . 3,073 119,607 24,452 147,132 128,810 . . .Cincinnati . . . . . . . . . . . . . 2,247 17,345 8,499 28,091 13,082 . . .Pittsburgh . . . . . . . . . . . . . 1,658 12,533 8,062 22,253 16,158 . . .
RICHMOND . . . . . . . . . . 6,375 64,721 25,294 96,390 71,879 . . .Baltimore . . . . . . . . . . . . . 6,478 27,101 4,929 38,509 25,740 . . .Charlotte . . . . . . . . . . . . . . 3,130 27,541 4,750 35,421 27,289 . . .
ATLANTA 4 . . . . . . . . . . . 17,689 77,436 0 95,125 95,120 5,939Birmingham4 . . . . . . . . . . 4,852 0 0 4,852 4,852 . . .Jacksonville . . . . . . . . . . . 1,730 17,226 2,945 21,901 16,387 48Miami . . . . . . . . . . . . . . . . 3,839 14,188 3,790 21,817 14,812 . . .Nashville . . . . . . . . . . . . . . 629 3,171 2,724 6,523 3,426 . . .New Orleans. . . . . . . . . . 3,497 7,958 4,076 15,532 10,908 . . .
CHICAGO . . . . . . . . . . . . 5,044 123,078 14,878 143,001 99,004 . . .Detroit . . . . . . . . . . . . . . . . 798 6,363 3,722 10,883 8,082 . . .
ST. LOUIS . . . . . . . . . . . . 700 21,599 6,415 28,714 17,181 . . .Little Rock . . . . . . . . . . . . 1,148 4,632 1,272 7,053 5,428 . . .Louisville . . . . . . . . . . . . . 700 4,281 1,502 6,483 4,494 . . .Memphis . . . . . . . . . . . . . . 1,136 4,571 2,792 8,499 5,069 . . .
MINNEAPOLIS . . . . . . . 11,193 99,947 13,301 124,441 117,922 . . .Helena . . . . . . . . . . . . . . . . 1,978 9,419 788 12,185 10,218 . . .
KANSAS CITY . . . . . . . 2,048 18,826 8,379 29,253 15,922 . . .Denver . . . . . . . . . . . . . . . . 3,188 7,436 3,700 14,325 8,833 . . .Oklahoma City . . . . . . . . 646 11,243 3,493 15,382 11,151 . . .Omaha. . . . . . . . . . . . . . . . 6,535 11,058 1,401 18,993 14,905 . . .
DALLAS . . . . . . . . . . . . . 29,049 104,271 19,700 153,020 130,881 . . .El Paso . . . . . . . . . . . . . . . 262 2,911 1,018 4,191 2,842 . . .Houston. . . . . . . . . . . . . . . 2,205 4,840 2,045 9,090 6,321 679San Antonio. . . . . . . . . . . 482 5,506 2,707 8,696 6,012 . . .
SAN FRANCISCO . . . . 15,600 77,529 18,727 111,855 77,772 . . .Los Angeles. . . . . . . . . . . 3,892 53,609 9,875 67,377 49,303 952Portland. . . . . . . . . . . . . . . 2,884 11,421 2,598 16,903 14,331 . . .Salt Lake City. . . . . . . . . 495 9,439 2,587 12,520 9,944 . . .Seattle . . . . . . . . . . . . . . . . 325 13,450 3,542 17,316 13,672 . . .
Total . . . . . . . . . . . . . . . . . 191,177 1,319,848 287,409 1,798,434 1,365,423 7,618
Note. Also see note to table 1.Components may not sum to totals because of
rounding.. . . Not applicable.1. Includes expenditures for construction at some
offices, pending allocation to appropriate accounts.2. Excludes charge-offs of $17,699 thousand before
1952.
3. Covers acquisitions for banking-house purposes andBank premises formerly occupied and being held pendingsale.
4. The Atlanta and Birmingham offices sold theirbuildings and building machinery and equipment in 1997and 1998 respectively. These offices are leasing back theirbuildings pending completion of their new facilities.
362 86th Annual Report, 1999
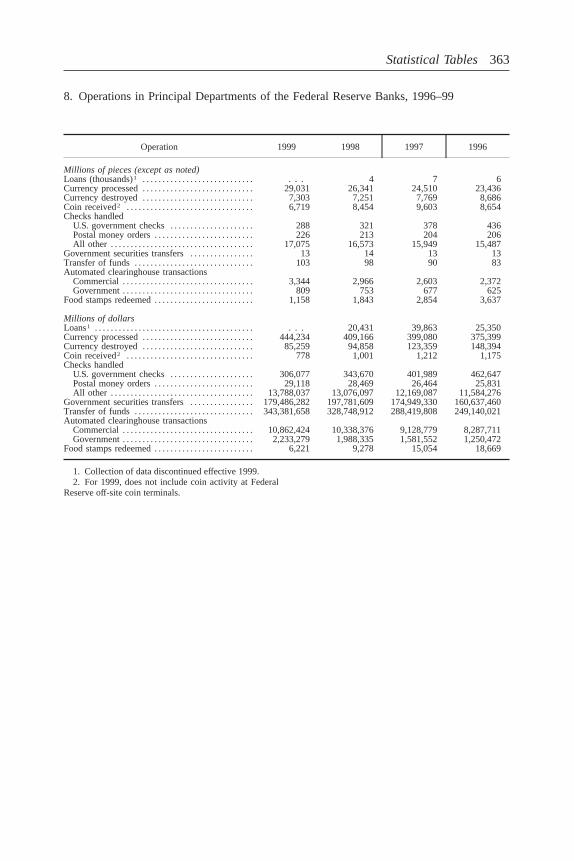
8. Operations in Principal Departments of the Federal Reserve Banks, 1996–99
Operation 1999 1998 1997 1996
Millions of pieces (except as noted)Loans (thousands)1 . . . . . . . . . . . . . . . . . . . . . . . . . . . . . . . 4 7 6Currency processed. . . . . . . . . . . . . . . . . . . . . . . . . . . . 29,031 26,341 24,510 23,436Currency destroyed. . . . . . . . . . . . . . . . . . . . . . . . . . . . 7,303 7,251 7,769 8,686Coin received2 . . . . . . . . . . . . . . . . . . . . . . . . . . . . . . . . 6,719 8,454 9,603 8,654Checks handled
U.S. government checks. . . . . . . . . . . . . . . . . . . . . 288 321 378 436Postal money orders. . . . . . . . . . . . . . . . . . . . . . . . . 226 213 204 206All other . . . . . . . . . . . . . . . . . . . . . . . . . . . . . . . . . . . . 17,075 16,573 15,949 15,487
Government securities transfers. . . . . . . . . . . . . . . . 13 14 13 13Transfer of funds. . . . . . . . . . . . . . . . . . . . . . . . . . . . . . 103 98 90 83Automated clearinghouse transactions
Commercial. . . . . . . . . . . . . . . . . . . . . . . . . . . . . . . . . 3,344 2,966 2,603 2,372Government. . . . . . . . . . . . . . . . . . . . . . . . . . . . . . . . . 809 753 677 625
Food stamps redeemed. . . . . . . . . . . . . . . . . . . . . . . . . 1,158 1,843 2,854 3,637
Millions of dollarsLoans1 . . . . . . . . . . . . . . . . . . . . . . . . . . . . . . . . . . . . . . . . . . . 20,431 39,863 25,350Currency processed. . . . . . . . . . . . . . . . . . . . . . . . . . . . 444,234 409,166 399,080 375,399Currency destroyed. . . . . . . . . . . . . . . . . . . . . . . . . . . . 85,259 94,858 123,359 148,394Coin received2 . . . . . . . . . . . . . . . . . . . . . . . . . . . . . . . . 778 1,001 1,212 1,175Checks handled
U.S. government checks. . . . . . . . . . . . . . . . . . . . . 306,077 343,670 401,989 462,647Postal money orders. . . . . . . . . . . . . . . . . . . . . . . . . 29,118 28,469 26,464 25,831All other . . . . . . . . . . . . . . . . . . . . . . . . . . . . . . . . . . . . 13,788,037 13,076,097 12,169,087 11,584,276
Government securities transfers. . . . . . . . . . . . . . . . 179,486,282 197,781,609 174,949,330 160,637,460Transfer of funds. . . . . . . . . . . . . . . . . . . . . . . . . . . . . . 343,381,658 328,748,912 288,419,808 249,140,021Automated clearinghouse transactions
Commercial. . . . . . . . . . . . . . . . . . . . . . . . . . . . . . . . . 10,862,424 10,338,376 9,128,779 8,287,711Government. . . . . . . . . . . . . . . . . . . . . . . . . . . . . . . . . 2,233,279 1,988,335 1,581,552 1,250,472
Food stamps redeemed. . . . . . . . . . . . . . . . . . . . . . . . . 6,221 9,278 15,054 18,669
1. Collection of data discontinued effective 1999.2. For 1999, does not include coin activity at Federal
Reserve off-site coin terminals.
Statistical Tables 363
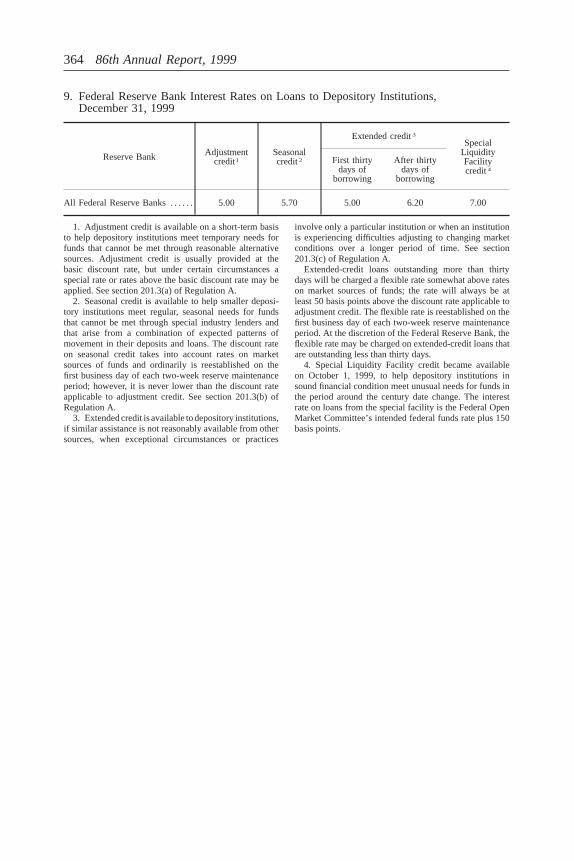
9. Federal Reserve Bank Interest Rates on Loans to Depository Institutions,December 31, 1999
Reserve Bank Adjustmentcredit1
Seasonalcredit2
Extended credit3Special
LiquidityFacilitycredit4
First thirtydays of
borrowing
After thirtydays of
borrowing
All Federal Reserve Banks. . . . . . 5.00 5.70 5.00 6.20 7.00
1. Adjustment credit is available on a short-term basisto help depository institutions meet temporary needs forfunds that cannot be met through reasonable alternativesources. Adjustment credit is usually provided at thebasic discount rate, but under certain circumstances aspecial rate or rates above the basic discount rate may beapplied. See section 201.3(a) of Regulation A.
2. Seasonal credit is available to help smaller deposi-tory institutions meet regular, seasonal needs for fundsthat cannot be met through special industry lenders andthat arise from a combination of expected patterns ofmovement in their deposits and loans. The discount rateon seasonal credit takes into account rates on marketsources of funds and ordinarily is reestablished on thefirst business day of each two-week reserve maintenanceperiod; however, it is never lower than the discount rateapplicable to adjustment credit. See section 201.3(b) ofRegulation A.
3. Extended credit is available to depository institutions,if similar assistance is not reasonably available from othersources, when exceptional circumstances or practices
involve only a particular institution or when an institutionis experiencing difficulties adjusting to changing marketconditions over a longer period of time. See section201.3(c) of Regulation A.
Extended-credit loans outstanding more than thirtydays will be charged a flexible rate somewhat above rateson market sources of funds; the rate will always be atleast 50 basis points above the discount rate applicable toadjustment credit. The flexible rate is reestablished on thefirst business day of each two-week reserve maintenanceperiod. At the discretion of the Federal Reserve Bank, theflexible rate may be charged on extended-credit loans thatare outstanding less than thirty days.
4. Special Liquidity Facility credit became availableon October 1, 1999, to help depository institutions insound financial condition meet unusual needs for funds inthe period around the century date change. The interestrate on loans from the special facility is the Federal OpenMarket Committee’s intended federal funds rate plus 150basis points.
364 86th Annual Report, 1999
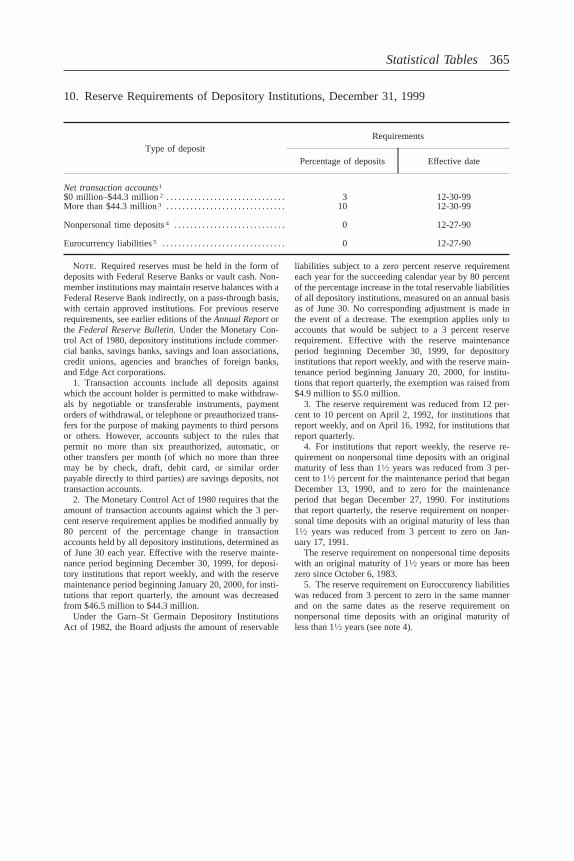
10. Reserve Requirements of Depository Institutions, December 31, 1999
Type of depositRequirements
Percentage of deposits Effective date
Net transaction accounts1
$0 million–$44.3 million2 . . . . . . . . . . . . . . . . . . . . . . . . . . . . . . 3 12-30-99More than $44.3 million3 . . . . . . . . . . . . . . . . . . . . . . . . . . . . . . 10 12-30-99
Nonpersonal time deposits4 . . . . . . . . . . . . . . . . . . . . . . . . . . . . 0 12-27-90
Eurocurrency liabilities5 . . . . . . . . . . . . . . . . . . . . . . . . . . . . . . . 0 12-27-90
Note. Required reserves must be held in the form ofdeposits with Federal Reserve Banks or vault cash. Non-member institutions may maintain reserve balances with aFederal Reserve Bank indirectly, on a pass-through basis,with certain approved institutions. For previous reserverequirements, see earlier editions of theAnnual Reportorthe Federal Reserve Bulletin.Under the Monetary Con-trol Act of 1980, depository institutions include commer-cial banks, savings banks, savings and loan associations,credit unions, agencies and branches of foreign banks,and Edge Act corporations.
1. Transaction accounts include all deposits againstwhich the account holder is permitted to make withdraw-als by negotiable or transferable instruments, paymentorders of withdrawal, or telephone or preauthorized trans-fers for the purpose of making payments to third personsor others. However, accounts subject to the rules thatpermit no more than six preauthorized, automatic, orother transfers per month (of which no more than threemay be by check, draft, debit card, or similar orderpayable directly to third parties) are savings deposits, nottransaction accounts.
2. The Monetary Control Act of 1980 requires that theamount of transaction accounts against which the 3 per-cent reserve requirement applies be modified annually by80 percent of the percentage change in transactionaccounts held by all depository institutions, determined asof June 30 each year. Effective with the reserve mainte-nance period beginning December 30, 1999, for deposi-tory institutions that report weekly, and with the reservemaintenance period beginning January 20, 2000, for insti-tutions that report quarterly, the amount was decreasedfrom $46.5 million to $44.3 million.
Under the Garn–St Germain Depository InstitutionsAct of 1982, the Board adjusts the amount of reservable
liabilities subject to a zero percent reserve requirementeach year for the succeeding calendar year by 80 percentof the percentage increase in the total reservable liabilitiesof all depository institutions, measured on an annual basisas of June 30. No corresponding adjustment is made inthe event of a decrease. The exemption applies only toaccounts that would be subject to a 3 percent reserverequirement. Effective with the reserve maintenanceperiod beginning December 30, 1999, for depositoryinstitutions that report weekly, and with the reserve main-tenance period beginning January 20, 2000, for institu-tions that report quarterly, the exemption was raised from$4.9 million to $5.0 million.
3. The reserve requirement was reduced from 12 per-cent to 10 percent on April 2, 1992, for institutions thatreport weekly, and on April 16, 1992, for institutions thatreport quarterly.
4. For institutions that report weekly, the reserve re-quirement on nonpersonal time deposits with an originalmaturity of less than 11⁄2 years was reduced from 3 per-cent to 11⁄2 percent for the maintenance period that beganDecember 13, 1990, and to zero for the maintenanceperiod that began December 27, 1990. For institutionsthat report quarterly, the reserve requirement on nonper-sonal time deposits with an original maturity of less than11⁄2 years was reduced from 3 percent to zero on Jan-uary 17, 1991.
The reserve requirement on nonpersonal time depositswith an original maturity of 11⁄2 years or more has beenzero since October 6, 1983.
5. The reserve requirement on Euroccurency liabilitieswas reduced from 3 percent to zero in the same mannerand on the same dates as the reserve requirement onnonpersonal time deposits with an original maturity ofless than 11⁄2 years (see note 4).
Statistical Tables 365
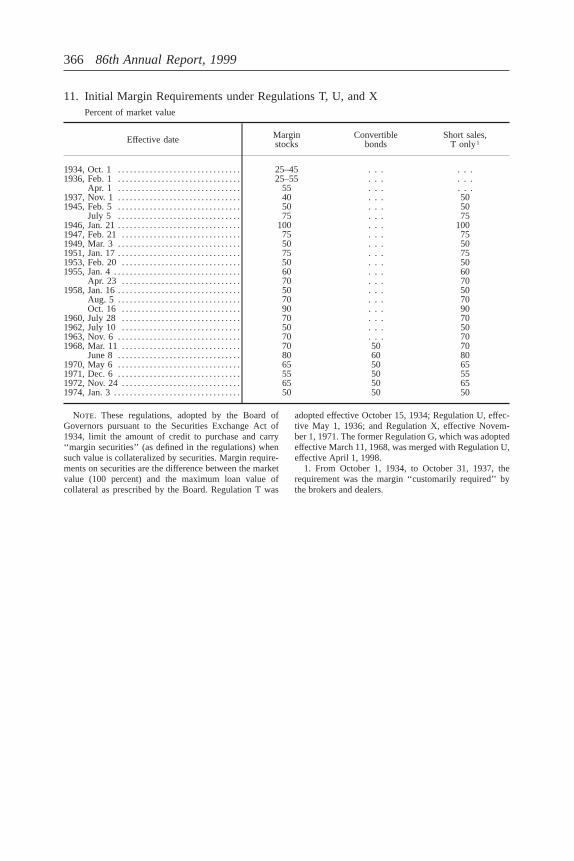
11. Initial Margin Requirements under Regulations T, U, and XPercent of market value
Effective date Marginstocks
Convertiblebonds
Short sales,T only1
1934, Oct. 1 . . . . . . . . . . . . . . . . . . . . . . . . . . . . . . . 25–45 . . . . . .1936, Feb. 1 . . . . . . . . . . . . . . . . . . . . . . . . . . . . . . . 25–55 . . . . . .
Apr. 1 . . . . . . . . . . . . . . . . . . . . . . . . . . . . . . . 55 . . . . . .1937, Nov. 1 . . . . . . . . . . . . . . . . . . . . . . . . . . . . . . . 40 . . . 501945, Feb. 5 . . . . . . . . . . . . . . . . . . . . . . . . . . . . . . . 50 . . . 50
July 5 . . . . . . . . . . . . . . . . . . . . . . . . . . . . . . . 75 . . . 751946, Jan. 21. . . . . . . . . . . . . . . . . . . . . . . . . . . . . . . 100 . . . 1001947, Feb. 21. . . . . . . . . . . . . . . . . . . . . . . . . . . . . . 75 . . . 751949, Mar. 3 . . . . . . . . . . . . . . . . . . . . . . . . . . . . . . . 50 . . . 501951, Jan. 17. . . . . . . . . . . . . . . . . . . . . . . . . . . . . . . 75 . . . 751953, Feb. 20. . . . . . . . . . . . . . . . . . . . . . . . . . . . . . 50 . . . 501955, Jan. 4. . . . . . . . . . . . . . . . . . . . . . . . . . . . . . . . 60 . . . 60
Apr. 23 . . . . . . . . . . . . . . . . . . . . . . . . . . . . . . 70 . . . 701958, Jan. 16. . . . . . . . . . . . . . . . . . . . . . . . . . . . . . . 50 . . . 50
Aug. 5 . . . . . . . . . . . . . . . . . . . . . . . . . . . . . . . 70 . . . 70Oct. 16 . . . . . . . . . . . . . . . . . . . . . . . . . . . . . . 90 . . . 90
1960, July 28 . . . . . . . . . . . . . . . . . . . . . . . . . . . . . . 70 . . . 701962, July 10 . . . . . . . . . . . . . . . . . . . . . . . . . . . . . . 50 . . . 501963, Nov. 6 . . . . . . . . . . . . . . . . . . . . . . . . . . . . . . . 70 . . . 701968, Mar. 11. . . . . . . . . . . . . . . . . . . . . . . . . . . . . . 70 50 70
June 8 . . . . . . . . . . . . . . . . . . . . . . . . . . . . . . . 80 60 801970, May 6 . . . . . . . . . . . . . . . . . . . . . . . . . . . . . . . 65 50 651971, Dec. 6. . . . . . . . . . . . . . . . . . . . . . . . . . . . . . . 55 50 551972, Nov. 24. . . . . . . . . . . . . . . . . . . . . . . . . . . . . . 65 50 651974, Jan. 3. . . . . . . . . . . . . . . . . . . . . . . . . . . . . . . . 50 50 50
Note. These regulations, adopted by the Board ofGovernors pursuant to the Securities Exchange Act of1934, limit the amount of credit to purchase and carry‘‘margin securities’’ (as defined in the regulations) whensuch value is collateralized by securities. Margin require-ments on securities are the difference between the marketvalue (100 percent) and the maximum loan value ofcollateral as prescribed by the Board. Regulation T was
adopted effective October 15, 1934; Regulation U, effec-tive May 1, 1936; and Regulation X, effective Novem-ber 1, 1971. The former Regulation G, which was adoptedeffective March 11, 1968, was merged with Regulation U,effective April 1, 1998.
1. From October 1, 1934, to October 31, 1937, therequirement was the margin ‘‘customarily required’’ bythe brokers and dealers.
366 86th Annual Report, 1999
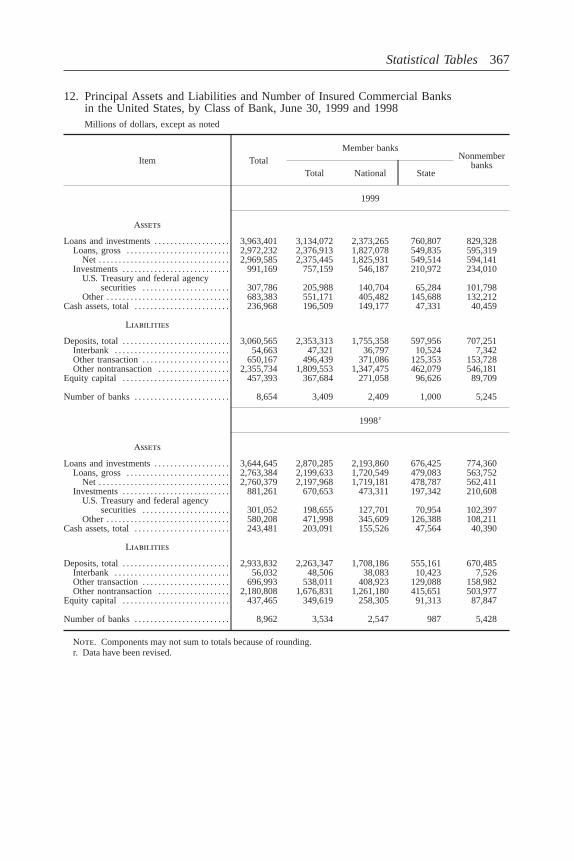
12. Principal Assets and Liabilities and Number of Insured Commercial Banksin the United States, by Class of Bank, June 30, 1999 and 1998Millions of dollars, except as noted
Item TotalMember banks
Nonmemberbanks
Total National State
1999
Assets
Loans and investments. . . . . . . . . . . . . . . . . . . 3,963,401 3,134,072 2,373,265 760,807 829,328Loans, gross. . . . . . . . . . . . . . . . . . . . . . . . . . 2,972,232 2,376,913 1,827,078 549,835 595,319
Net . . . . . . . . . . . . . . . . . . . . . . . . . . . . . . . . . 2,969,585 2,375,445 1,825,931 549,514 594,141Investments. . . . . . . . . . . . . . . . . . . . . . . . . . . 991,169 757,159 546,187 210,972 234,010
U.S. Treasury and federal agencysecurities . . . . . . . . . . . . . . . . . . . . . . 307,786 205,988 140,704 65,284 101,798
Other . . . . . . . . . . . . . . . . . . . . . . . . . . . . . . . 683,383 551,171 405,482 145,688 132,212Cash assets, total. . . . . . . . . . . . . . . . . . . . . . . . 236,968 196,509 149,177 47,331 40,459
Liabilities
Deposits, total. . . . . . . . . . . . . . . . . . . . . . . . . . . 3,060,565 2,353,313 1,755,358 597,956 707,251Interbank . . . . . . . . . . . . . . . . . . . . . . . . . . . . . 54,663 47,321 36,797 10,524 7,342Other transaction. . . . . . . . . . . . . . . . . . . . . . 650,167 496,439 371,086 125,353 153,728Other nontransaction. . . . . . . . . . . . . . . . . . 2,355,734 1,809,553 1,347,475 462,079 546,181
Equity capital . . . . . . . . . . . . . . . . . . . . . . . . . . . 457,393 367,684 271,058 96,626 89,709
Number of banks. . . . . . . . . . . . . . . . . . . . . . . . 8,654 3,409 2,409 1,000 5,245
1998r
Assets
Loans and investments. . . . . . . . . . . . . . . . . . . 3,644,645 2,870,285 2,193,860 676,425 774,360Loans, gross. . . . . . . . . . . . . . . . . . . . . . . . . . 2,763,384 2,199,633 1,720,549 479,083 563,752
Net . . . . . . . . . . . . . . . . . . . . . . . . . . . . . . . . . 2,760,379 2,197,968 1,719,181 478,787 562,411Investments. . . . . . . . . . . . . . . . . . . . . . . . . . . 881,261 670,653 473,311 197,342 210,608
U.S. Treasury and federal agencysecurities . . . . . . . . . . . . . . . . . . . . . . 301,052 198,655 127,701 70,954 102,397
Other . . . . . . . . . . . . . . . . . . . . . . . . . . . . . . . 580,208 471,998 345,609 126,388 108,211Cash assets, total. . . . . . . . . . . . . . . . . . . . . . . . 243,481 203,091 155,526 47,564 40,390
Liabilities
Deposits, total. . . . . . . . . . . . . . . . . . . . . . . . . . . 2,933,832 2,263,347 1,708,186 555,161 670,485Interbank . . . . . . . . . . . . . . . . . . . . . . . . . . . . . 56,032 48,506 38,083 10,423 7,526Other transaction. . . . . . . . . . . . . . . . . . . . . . 696,993 538,011 408,923 129,088 158,982Other nontransaction. . . . . . . . . . . . . . . . . . 2,180,808 1,676,831 1,261,180 415,651 503,977
Equity capital . . . . . . . . . . . . . . . . . . . . . . . . . . . 437,465 349,619 258,305 91,313 87,847
Number of banks. . . . . . . . . . . . . . . . . . . . . . . . 8,962 3,534 2,547 987 5,428
Note. Components may not sum to totals because of rounding.r. Data have been revised.
Statistical Tables 367
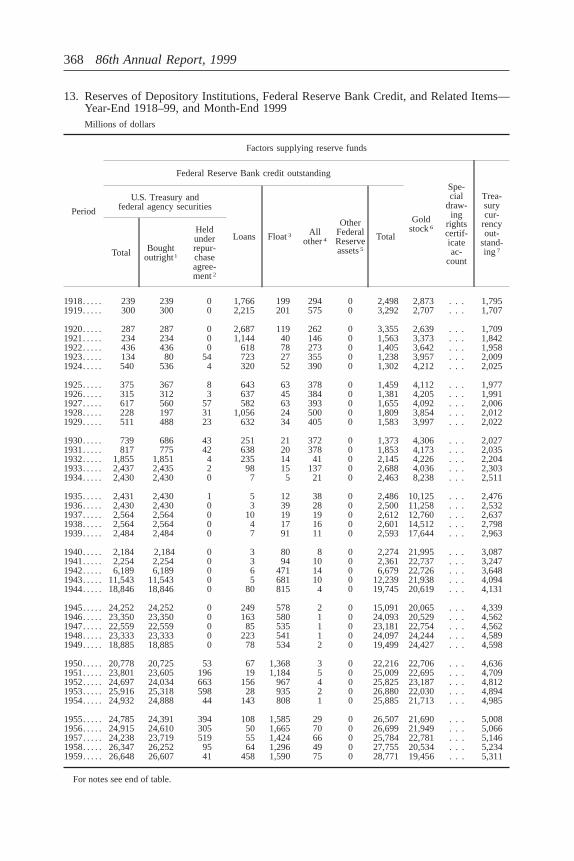
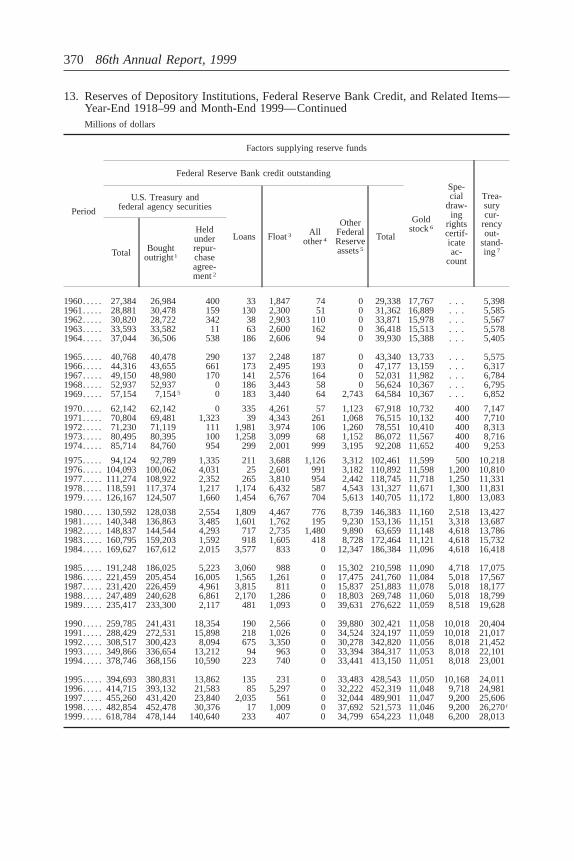
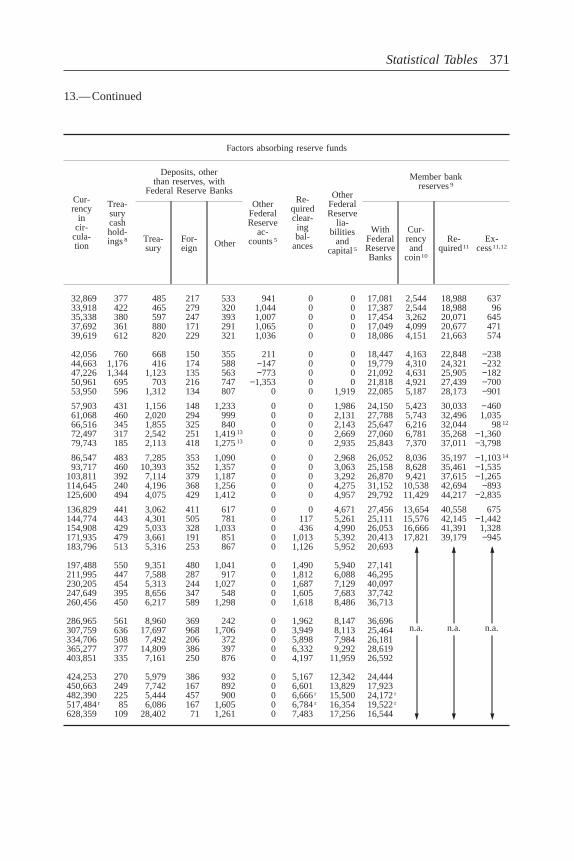
13. Reserves of Depository Institutions, Federal Reserve Bank Credit, and Related Items—Year-End 1918–99, and Month-End 1999Millions of dollars
Period
Factors supplying reserve funds
Federal Reserve Bank credit outstanding
Goldstock6
Spe-cial
draw-ing
rightscertif-icateac-
count
Trea-surycur-
rencyout-
stand-ing7
U.S. Treasury andfederal agency securities
Loans Float3 Allother4
OtherFederalReserveassets5
Total
Total Boughtoutright1
Heldunderrepur-chaseagree-ment2
1918. . . . . 239 239 0 1,766 199 294 0 2,498 2,873 . . . 1,7951919. . . . . 300 300 0 2,215 201 575 0 3,292 2,707 . . . 1,707
1920. . . . . 287 287 0 2,687 119 262 0 3,355 2,639 . . . 1,7091921. . . . . 234 234 0 1,144 40 146 0 1,563 3,373 . . . 1,8421922. . . . . 436 436 0 618 78 273 0 1,405 3,642 . . . 1,9581923. . . . . 134 80 54 723 27 355 0 1,238 3,957 . . . 2,0091924. . . . . 540 536 4 320 52 390 0 1,302 4,212 . . . 2,025
1925. . . . . 375 367 8 643 63 378 0 1,459 4,112 . . . 1,9771926. . . . . 315 312 3 637 45 384 0 1,381 4,205 . . . 1,9911927. . . . . 617 560 57 582 63 393 0 1,655 4,092 . . . 2,0061928. . . . . 228 197 31 1,056 24 500 0 1,809 3,854 . . . 2,0121929. . . . . 511 488 23 632 34 405 0 1,583 3,997 . . . 2,022
1930. . . . . 739 686 43 251 21 372 0 1,373 4,306 . . . 2,0271931. . . . . 817 775 42 638 20 378 0 1,853 4,173 . . . 2,0351932. . . . . 1,855 1,851 4 235 14 41 0 2,145 4,226 . . . 2,2041933. . . . . 2,437 2,435 2 98 15 137 0 2,688 4,036 . . . 2,3031934. . . . . 2,430 2,430 0 7 5 21 0 2,463 8,238 . . . 2,511
1935. . . . . 2,431 2,430 1 5 12 38 0 2,486 10,125 . . . 2,4761936. . . . . 2,430 2,430 0 3 39 28 0 2,500 11,258 . . . 2,5321937. . . . . 2,564 2,564 0 10 19 19 0 2,612 12,760 . . . 2,6371938. . . . . 2,564 2,564 0 4 17 16 0 2,601 14,512 . . . 2,7981939. . . . . 2,484 2,484 0 7 91 11 0 2,593 17,644 . . . 2,963
1940. . . . . 2,184 2,184 0 3 80 8 0 2,274 21,995 . . . 3,0871941. . . . . 2,254 2,254 0 3 94 10 0 2,361 22,737 . . . 3,2471942. . . . . 6,189 6,189 0 6 471 14 0 6,679 22,726 . . . 3,6481943. . . . . 11,543 11,543 0 5 681 10 0 12,239 21,938 . . . 4,0941944. . . . . 18,846 18,846 0 80 815 4 0 19,745 20,619 . . . 4,131
1945. . . . . 24,252 24,252 0 249 578 2 0 15,091 20,065 . . . 4,3391946. . . . . 23,350 23,350 0 163 580 1 0 24,093 20,529 . . . 4,5621947. . . . . 22,559 22,559 0 85 535 1 0 23,181 22,754 . . . 4,5621948. . . . . 23,333 23,333 0 223 541 1 0 24,097 24,244 . . . 4,5891949. . . . . 18,885 18,885 0 78 534 2 0 19,499 24,427 . . . 4,598
1950. . . . . 20,778 20,725 53 67 1,368 3 0 22,216 22,706 . . . 4,6361951. . . . . 23,801 23,605 196 19 1,184 5 0 25,009 22,695 . . . 4,7091952. . . . . 24,697 24,034 663 156 967 4 0 25,825 23,187 . . . 4,8121953. . . . . 25,916 25,318 598 28 935 2 0 26,880 22,030 . . . 4,8941954. . . . . 24,932 24,888 44 143 808 1 0 25,885 21,713 . . . 4,985
1955. . . . . 24,785 24,391 394 108 1,585 29 0 26,507 21,690 . . . 5,0081956. . . . . 24,915 24,610 305 50 1,665 70 0 26,699 21,949 . . . 5,0661957. . . . . 24,238 23,719 519 55 1,424 66 0 25,784 22,781 . . . 5,1461958. . . . . 26,347 26,252 95 64 1,296 49 0 27,755 20,534 . . . 5,2341959. . . . . 26,648 26,607 41 458 1,590 75 0 28,771 19,456 . . . 5,311
For notes see end of table.
368 86th Annual Report, 1999
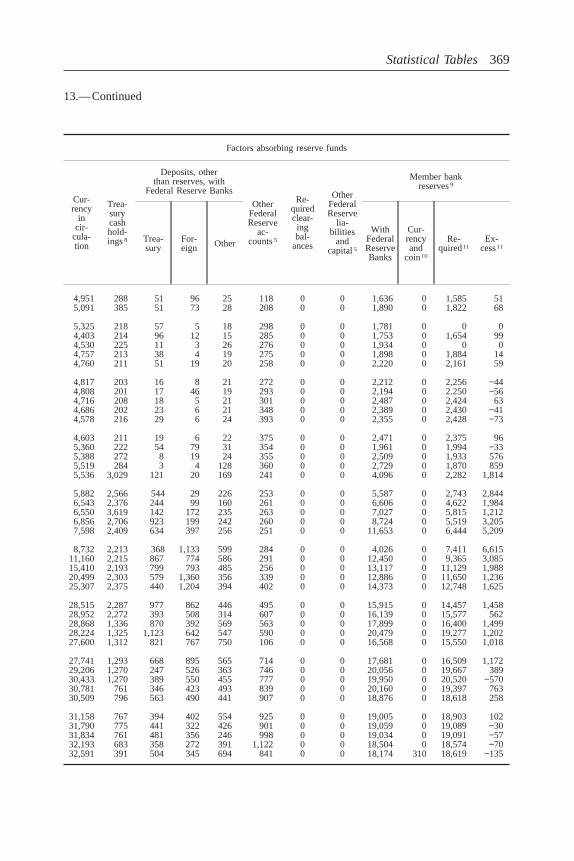
13.—Continued
Factors absorbing reserve funds
Cur-rency
incir-
cula-tion
Trea-surycashhold-ings8
Deposits, otherthan reserves, with
Federal Reserve Banks
OtherFederalReserve
ac-counts5
Re-quiredclear-ingbal-
ances
OtherFederalReserve
lia-bilities
andcapital5
Member bankreserves9
Trea-sury
For-eign Other
WithFederalReserveBanks
Cur-rencyand
coin10
Re-quired11
Ex-cess11
4,951 288 51 96 25 118 0 0 1,636 0 1,585 515,091 385 51 73 28 208 0 0 1,890 0 1,822 68
5,325 218 57 5 18 298 0 0 1,781 0 0 04,403 214 96 12 15 285 0 0 1,753 0 1,654 994,530 225 11 3 26 276 0 0 1,934 0 0 04,757 213 38 4 19 275 0 0 1,898 0 1,884 144,760 211 51 19 20 258 0 0 2,220 0 2,161 59
4,817 203 16 8 21 272 0 0 2,212 0 2,256 −444,808 201 17 46 19 293 0 0 2,194 0 2.250 −564,716 208 18 5 21 301 0 0 2,487 0 2,424 634,686 202 23 6 21 348 0 0 2,389 0 2,430 −414,578 216 29 6 24 393 0 0 2,355 0 2,428 −73
4,603 211 19 6 22 375 0 0 2,471 0 2,375 965,360 222 54 79 31 354 0 0 1,961 0 1,994 −335,388 272 8 19 24 355 0 0 2,509 0 1,933 5765,519 284 3 4 128 360 0 0 2,729 0 1,870 8595,536 3,029 121 20 169 241 0 0 4,096 0 2,282 1,814
5,882 2,566 544 29 226 253 0 0 5,587 0 2,743 2,8446,543 2,376 244 99 160 261 0 0 6,606 0 4,622 1,9846,550 3,619 142 172 235 263 0 0 7,027 0 5,815 1,2126,856 2,706 923 199 242 260 0 0 8,724 0 5,519 3,2057,598 2,409 634 397 256 251 0 0 11,653 0 6,444 5,209
8,732 2,213 368 1,133 599 284 0 0 4,026 0 7,411 6,61511,160 2,215 867 774 586 291 0 0 12,450 0 9,365 3,08515,410 2,193 799 793 485 256 0 0 13,117 0 11,129 1,98820,499 2,303 579 1,360 356 339 0 0 12,886 0 11,650 1,23625,307 2,375 440 1,204 394 402 0 0 14,373 0 12,748 1,625
28,515 2,287 977 862 446 495 0 0 15,915 0 14,457 1,45828,952 2,272 393 508 314 607 0 0 16,139 0 15,577 56228,868 1,336 870 392 569 563 0 0 17,899 0 16,400 1,49928,224 1,325 1,123 642 547 590 0 0 20,479 0 19,277 1,20227,600 1,312 821 767 750 106 0 0 16,568 0 15,550 1,018
27,741 1,293 668 895 565 714 0 0 17,681 0 16,509 1,17229,206 1,270 247 526 363 746 0 0 20,056 0 19,667 38930,433 1,270 389 550 455 777 0 0 19,950 0 20,520−57030,781 761 346 423 493 839 0 0 20,160 0 19,397 76330,509 796 563 490 441 907 0 0 18,876 0 18,618 258
31,158 767 394 402 554 925 0 0 19,005 0 18,903 10231,790 775 441 322 426 901 0 0 19,059 0 19,089 −3031,834 761 481 356 246 998 0 0 19,034 0 19,091 −5732,193 683 358 272 391 1,122 0 0 18,504 0 18,574 −7032,591 391 504 345 694 841 0 0 18,174 310 18,619−135
Statistical Tables 369
13. Reserves of Depository Institutions, Federal Reserve Bank Credit, and Related Items—Year-End 1918–99 and Month-End 1999—ContinuedMillions of dollars
Period
Factors supplying reserve funds
Federal Reserve Bank credit outstanding
Goldstock6
Spe-cial
draw-ing
rightscertif-icateac-
count
Trea-surycur-
rencyout-
stand-ing7
U.S. Treasury andfederal agency securities
Loans Float3 Allother4
OtherFederalReserveassets5
Total
Total Boughtoutright1
Heldunderrepur-chaseagree-ment2
1960. . . . . 27,384 26,984 400 33 1,847 74 0 29,338 17,767 . . . 5,3981961. . . . . 28,881 30,478 159 130 2,300 51 0 31,362 16,889 . . . 5,5851962. . . . . 30,820 28,722 342 38 2,903 110 0 33,871 15,978 . . . 5,5671963. . . . . 33,593 33,582 11 63 2,600 162 0 36,418 15,513 . . . 5,5781964. . . . . 37,044 36,506 538 186 2,606 94 0 39,930 15,388 . . . 5,405
1965. . . . . 40,768 40,478 290 137 2,248 187 0 43,340 13,733 . . . 5,5751966. . . . . 44,316 43,655 661 173 2,495 193 0 47,177 13,159 . . . 6,3171967. . . . . 49,150 48,980 170 141 2,576 164 0 52,031 11,982 . . . 6,7841968. . . . . 52,937 52,937 0 186 3,443 58 0 56,624 10,367 . . . 6,7951969. . . . . 57,154 7,1545 0 183 3,440 64 2,743 64,584 10,367 . . . 6,852
1970. . . . . 62,142 62,142 0 335 4,261 57 1,123 67,918 10,732 400 7,1471971. . . . . 70,804 69,481 1,323 39 4,343 261 1,068 76,515 10,132 400 7,7101972. . . . . 71,230 71,119 111 1,981 3,974 106 1,260 78,551 10,410 400 8,3131973. . . . . 80,495 80,395 100 1,258 3,099 68 1,152 86,072 11,567 400 8,7161974. . . . . 85,714 84,760 954 299 2,001 999 3,195 92,208 11,652 400 9,253
1975. . . . . 94,124 92,789 1,335 211 3,688 1,126 3,312 102,461 11,599 500 10,2181976. . . . . 104,093 100,062 4,031 25 2,601 991 3,182 110,892 11,598 1,200 10,8101977. . . . . 111,274 108,922 2,352 265 3,810 954 2,442 118,745 11,718 1,250 11,3311978. . . . . 118,591 117,374 1,217 1,174 6,432 587 4,543 131,327 11,671 1,300 11,8311979. . . . . 126,167 124,507 1,660 1,454 6,767 704 5,613 140,705 11,172 1,800 13,083
1980. . . . . 130,592 128,038 2,554 1,809 4,467 776 8,739 146,383 11,160 2,518 13,4271981. . . . . 140,348 136,863 3,485 1,601 1,762 195 9,230 153,136 11,151 3,318 13,6871982. . . . . 148,837 144,544 4,293 717 2,735 1,480 9,890 63,659 11,148 4,618 13,7861983. . . . . 160,795 159,203 1,592 918 1,605 418 8,728 172,464 11,121 4,618 15,7321984. . . . . 169,627 167,612 2,015 3,577 833 0 12,347 186,384 11,096 4,618 16,418
1985. . . . . 191,248 186,025 5,223 3,060 988 0 15,302 210,598 11,090 4,718 17,0751986. . . . . 221,459 205,454 16,005 1,565 1,261 0 17,475 241,760 11,084 5,018 17,5671987. . . . . 231,420 226,459 4,961 3,815 811 0 15,837 251,883 11,078 5,018 18,1771988. . . . . 247,489 240,628 6,861 2,170 1,286 0 18,803 269,748 11,060 5,018 18,7991989. . . . . 235,417 233,300 2,117 481 1,093 0 39,631 276,622 11,059 8,518 19,628
1990. . . . . 259,785 241,431 18,354 190 2,566 0 39,880 302,421 11,058 10,018 20,4041991. . . . . 288,429 272,531 15,898 218 1,026 0 34,524 324,197 11,059 10,018 21,0171992. . . . . 308,517 300,423 8,094 675 3,350 0 30,278 342,820 11,056 8,018 21,4521993. . . . . 349,866 336,654 13,212 94 963 0 33,394 384,317 11,053 8,018 22,1011994. . . . . 378,746 368,156 10,590 223 740 0 33,441 413,150 11,051 8,018 23,001
1995. . . . . 394,693 380,831 13,862 135 231 0 33,483 428,543 11,050 10,168 24,0111996. . . . . 414,715 393,132 21,583 85 5,297 0 32,222 452,319 11,048 9,718 24,9811997. . . . . 455,260 431,420 23,840 2,035 561 0 32,044 489,901 11,047 9,200 25,6061998. . . . . 482,854 452,478 30,376 17 1,009 0 37,692 521,573 11,046 9,200 26,270r
1999. . . . . 618,784 478,144 140,640 233 407 0 34,799 654,223 11,048 6,200 28,013
370 86th Annual Report, 1999
13.—Continued
Factors absorbing reserve funds
Cur-rency
incir-
cula-tion
Trea-surycashhold-ings8
Deposits, otherthan reserves, with
Federal Reserve Banks
OtherFederalReserve
ac-counts5
Re-quiredclear-ingbal-
ances
OtherFederalReserve
lia-bilities
andcapital5
Member bankreserves9
Trea-sury
For-eign Other
WithFederalReserveBanks
Cur-rencyand
coin10
Re-quired11
Ex-cess11,12
32,869 377 485 217 533 941 0 0 17,081 2,544 18,988 63733,918 422 465 279 320 1,044 0 0 17,387 2,544 18,988 9635,338 380 597 247 393 1,007 0 0 17,454 3,262 20,071 64537,692 361 880 171 291 1,065 0 0 17,049 4,099 20,677 47139,619 612 820 229 321 1,036 0 0 18,086 4,151 21,663 574
42,056 760 668 150 355 211 0 0 18,447 4,163 22,848−23844,663 1,176 416 174 588 −147 0 0 19,779 4,310 24,321 −23247,226 1,344 1,123 135 563 −773 0 0 21,092 4,631 25,905 −18250,961 695 703 216 747 −1,353 0 0 21,818 4,921 27,439 −70053,950 596 1,312 134 807 0 0 1,919 22,085 5,187 28,173−901
57,903 431 1,156 148 1,233 0 0 1,986 24,150 5,423 30,033−46061,068 460 2,020 294 999 0 0 2,131 27,788 5,743 32,496 1,03566,516 345 1,855 325 840 0 0 2,143 25,647 6,216 32,044 9812
72,497 317 2,542 251 1,41913 0 0 2,669 27,060 6,781 35,268−1,36079,743 185 2,113 418 1,27513 0 0 2,935 25,843 7,370 37,011−3,798
86,547 483 7,285 353 1,090 0 0 2,968 26,052 8,036 35,197−1,10314
93,717 460 10,393 352 1,357 0 0 3,063 25,158 8,628 35,461−1,535103,811 392 7,114 379 1,187 0 0 3,292 26,870 9,421 37,615−1,265114,645 240 4,196 368 1,256 0 0 4,275 31,152 10,538 42,694−893125,600 494 4,075 429 1,412 0 0 4,957 29,792 11,429 44,217−2,835
136,829 441 3,062 411 617 0 0 4,671 27,456 13,654 40,558 675144,774 443 4,301 505 781 0 117 5,261 25,111 15,576 42,145−1,442154,908 429 5,033 328 1,033 0 436 4,990 26,053 16,666 41,391 1,328171,935 479 3,661 191 851 0 1,013 5,392 20,413 17,821 39,179−945183,796 513 5,316 253 867 0 1,126 5,952 20,693
197,488 550 9,351 480 1,041 0 1,490 5,940 27,141211,995 447 7,588 287 917 0 1,812 6,088 46,295230,205 454 5,313 244 1,027 0 1,687 7,129 40,097247,649 395 8,656 347 548 0 1,605 7,683 37,742260,456 450 6,217 589 1,298 0 1,618 8,486 36,713
286,965 561 8,960 369 242 0 1,962 8,147 36,696307,759 636 17,697 968 1,706 0 3,949 8,113 25,464n.a. n.a. n.a.334,706 508 7,492 206 372 0 5,898 7,984 26,181365,277 377 14,809 386 397 0 6,332 9,292 28,619403,851 335 7,161 250 876 0 4,197 11,959 26,592
424,253 270 5,979 386 932 0 5,167 12,342 24,444450,663 249 7,742 167 892 0 6,601 13,829 17,923482,390 225 5,444 457 900 0 6,666r 15,500 24,172r517,484r 85 6,086 167 1,605 0 6,784r 16,354 19,522r628,359 109 28,402 71 1,261 0 7,483 17,256 16,544
Statistical Tables 371
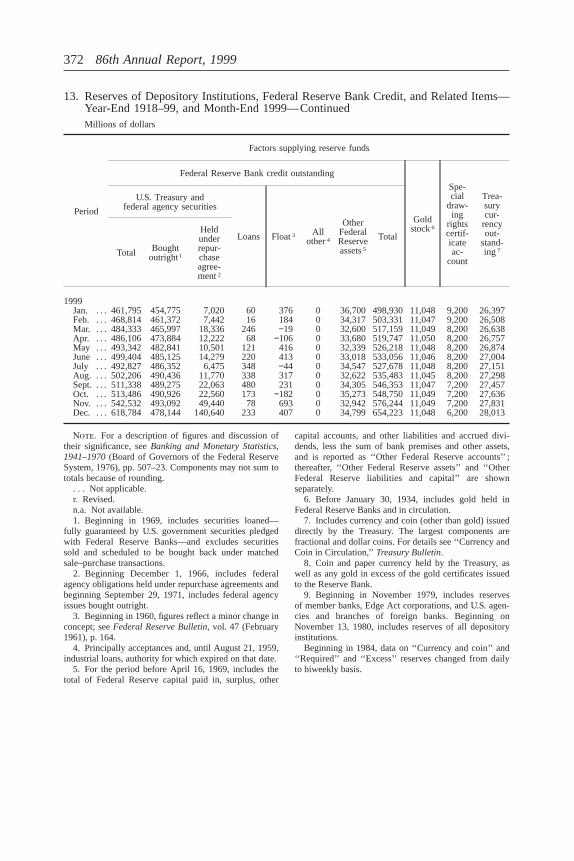
13. Reserves of Depository Institutions, Federal Reserve Bank Credit, and Related Items—Year-End 1918–99, and Month-End 1999—ContinuedMillions of dollars
Period
Factors supplying reserve funds
Federal Reserve Bank credit outstanding
Goldstock6
Spe-cial
draw-ing
rightscertif-icateac-
count
Trea-surycur-
rencyout-
stand-ing7
U.S. Treasury andfederal agency securities
Loans Float3 Allother4
OtherFederalReserveassets5
Total
Total Boughtoutright1
Heldunderrepur-chaseagree-ment2
1999Jan. . . . 461,795 454,775 7,020 60 376 0 36,700 498,930 11,048 9,200 26,397Feb. . . . 468,814 461,372 7,442 16 184 0 34,317 503,331 11,047 9,200 26,508Mar. . . . 484,333 465,997 18,336 246 −19 0 32,600 517,159 11,049 8,200 26,638Apr. . . . 486,106 473,884 12,222 68 −106 0 33,680 519,747 11,050 8,200 26,757May . . . 493,342 482,841 10,501 121 416 0 32,339 526,218 11,048 8,200 26,874June . . . 499,404 485,125 14,279 220 413 0 33,018 533,056 11,046 8,200 27,004July . . . 492,827 486,352 6,475 348 −44 0 34,547 527,678 11,048 8,200 27,151Aug. . . . 502,206 490,436 11,770 338 317 0 32,622 535,483 11,045 8,200 27,298Sept. . . . 511,338 489,275 22,063 480 231 0 34,305 546,353 11,047 7,200 27,457Oct. . . . 513,486 490,926 22,560 173 −182 0 35,273 548,750 11,049 7,200 27,636Nov. . . . 542,532 493,092 49,440 78 693 0 32,942 576,244 11,049 7,200 27,831Dec. . . . 618,784 478,144 140,640 233 407 0 34,799 654,223 11,048 6,200 28,013
Note. For a description of figures and discussion oftheir significance, seeBanking and Monetary Statistics,1941–1970(Board of Governors of the Federal ReserveSystem, 1976), pp. 507–23. Components may not sum tototals because of rounding.
. . . Not applicable.r. Revised.n.a. Not available.1. Beginning in 1969, includes securities loaned—
fully guaranteed by U.S. government securities pledgedwith Federal Reserve Banks—and excludes securitiessold and scheduled to be bought back under matchedsale–purchase transactions.
2. Beginning December 1, 1966, includes federalagency obligations held under repurchase agreements andbeginning September 29, 1971, includes federal agencyissues bought outright.
3. Beginning in 1960, figures reflect a minor change inconcept; seeFederal Reserve Bulletin, vol. 47 (February1961), p. 164.
4. Principally acceptances and, until August 21, 1959,industrial loans, authority for which expired on that date.
5. For the period before April 16, 1969, includes thetotal of Federal Reserve capital paid in, surplus, other
capital accounts, and other liabilities and accrued divi-dends, less the sum of bank premises and other assets,and is reported as ‘‘Other Federal Reserve accounts’’ ;thereafter, ‘‘Other Federal Reserve assets’’ and ‘‘OtherFederal Reserve liabilities and capital’’ are shownseparately.
6. Before January 30, 1934, includes gold held inFederal Reserve Banks and in circulation.
7. Includes currency and coin (other than gold) issueddirectly by the Treasury. The largest components arefractional and dollar coins. For details see ‘‘Currency andCoin in Circulation,’’Treasury Bulletin.
8. Coin and paper currency held by the Treasury, aswell as any gold in excess of the gold certificates issuedto the Reserve Bank.
9. Beginning in November 1979, includes reservesof member banks, Edge Act corporations, and U.S. agen-cies and branches of foreign banks. Beginning onNovember 13, 1980, includes reserves of all depositoryinstitutions.
Beginning in 1984, data on ‘‘Currency and coin’’ and‘‘Required’’ and ‘‘Excess’’ reserves changed from dailyto biweekly basis.
372 86th Annual Report, 1999
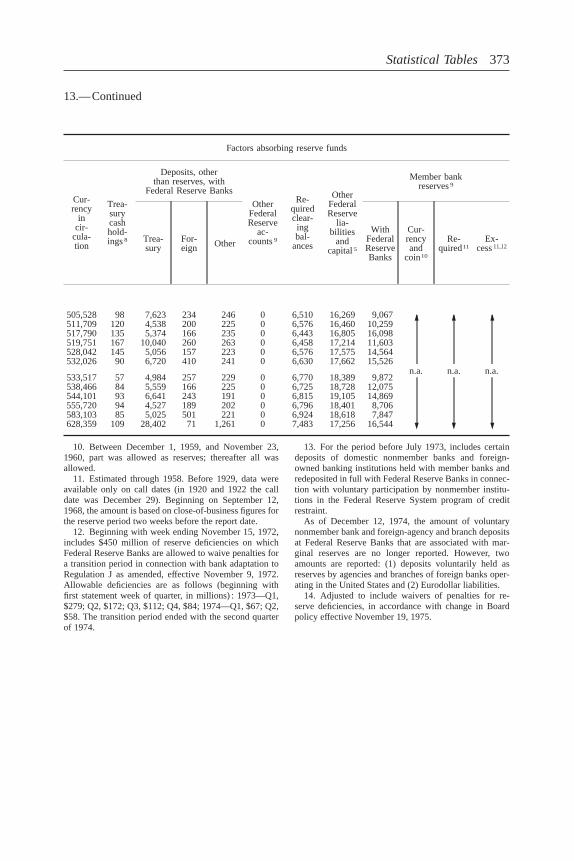
13.—Continued
Factors absorbing reserve funds
Cur-rency
incir-
cula-tion
Trea-surycashhold-ings8
Deposits, otherthan reserves, with
Federal Reserve Banks
OtherFederalReserve
ac-counts9
Re-quiredclear-ingbal-
ances
OtherFederalReserve
lia-bilities
andcapital5
Member bankreserves9
Trea-sury
For-eign Other
WithFederalReserveBanks
Cur-rencyand
coin10
Re-quired11
Ex-cess11,12
505,528 98 7,623 234 246 0 6,510 16,269 9,067511,709 120 4,538 200 225 0 6,576 16,460 10,259517,790 135 5,374 166 235 0 6,443 16,805 16,098519,751 167 10,040 260 263 0 6,458 17,214 11,603528,042 145 5,056 157 223 0 6,576 17,575 14,564532,026 90 6,720 410 241 0 6,630 17,662 15,526
533,517 57 4,984 257 229 0 6,770 18,389 9,872n.a. n.a. n.a.
538,466 84 5,559 166 225 0 6,725 18,728 12,075544,101 93 6,641 243 191 0 6,815 19,105 14,869555,720 94 4,527 189 202 0 6,796 18,401 8,706583,103 85 5,025 501 221 0 6,924 18,618 7,847628,359 109 28,402 71 1,261 0 7,483 17,256 16,544
10. Between December 1, 1959, and November 23,1960, part was allowed as reserves; thereafter all wasallowed.
11. Estimated through 1958. Before 1929, data wereavailable only on call dates (in 1920 and 1922 the calldate was December 29). Beginning on September 12,1968, the amount is based on close-of-business figures forthe reserve period two weeks before the report date.
12. Beginning with week ending November 15, 1972,includes $450 million of reserve deficiencies on whichFederal Reserve Banks are allowed to waive penalties fora transition period in connection with bank adaptation toRegulation J as amended, effective November 9, 1972.Allowable deficiencies are as follows (beginning withfirst statement week of quarter, in millions) : 1973—Q1,$279; Q2, $172; Q3, $112; Q4, $84; 1974—Q1, $67; Q2,$58. The transition period ended with the second quarterof 1974.
13. For the period before July 1973, includes certaindeposits of domestic nonmember banks and foreign-owned banking institutions held with member banks andredeposited in full with Federal Reserve Banks in connec-tion with voluntary participation by nonmember institu-tions in the Federal Reserve System program of creditrestraint.
As of December 12, 1974, the amount of voluntarynonmember bank and foreign-agency and branch depositsat Federal Reserve Banks that are associated with mar-ginal reserves are no longer reported. However, twoamounts are reported: (1) deposits voluntarily held asreserves by agencies and branches of foreign banks oper-ating in the United States and (2) Eurodollar liabilities.
14. Adjusted to include waivers of penalties for re-serve deficiencies, in accordance with change in Boardpolicy effective November 19, 1975.
Statistical Tables 373
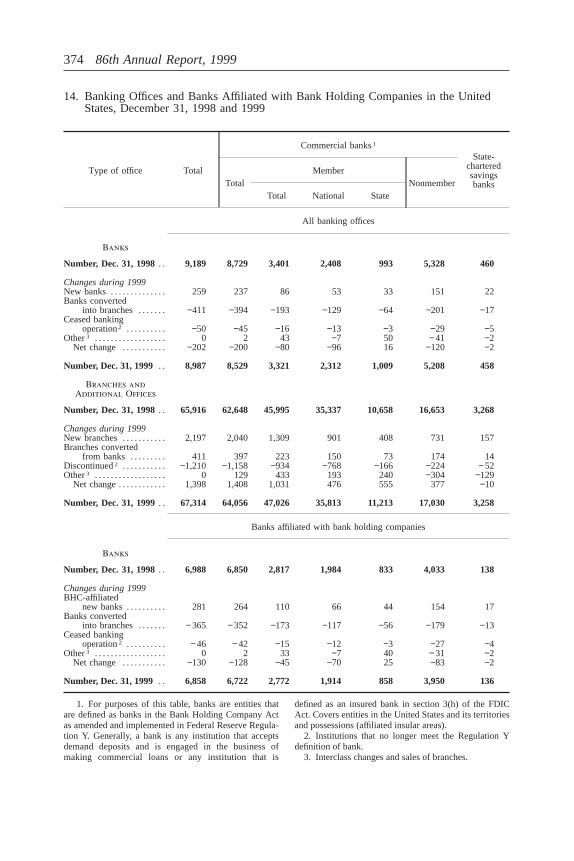
14. Banking Offices and Banks Affiliated with Bank Holding Companies in the UnitedStates, December 31, 1998 and 1999
Type of office Total
Commercial banks1
State-charteredsavingsbanksTotal
MemberNonmember
Total National State
All banking offices
Banks
Number, Dec. 31, 1998. . 9,189 8,729 3,401 2,408 993 5,328 460
Changes during 1999New banks. . . . . . . . . . . . . . 259 237 86 53 33 151 22Banks converted
into branches. . . . . . . −411 −394 −193 −129 −64 −201 −17Ceased banking
operation2 . . . . . . . . . . −50 −45 −16 −13 −3 −29 −5Other3 . . . . . . . . . . . . . . . . . . 0 2 43 −7 50 − 41 −2
Net change . . . . . . . . . . . −202 −200 −80 −96 16 −120 −2
Number, Dec. 31, 1999. . 8,987 8,529 3,321 2,312 1,009 5,208 458
Branches andAdditional Offices
Number, Dec. 31, 1998. . 65,916 62,648 45,995 35,337 10,658 16,653 3,268
Changes during 1999New branches. . . . . . . . . . . 2,197 2,040 1,309 901 408 731 157Branches converted
from banks . . . . . . . . . 411 397 223 150 73 174 14Discontinued2 . . . . . . . . . . . −1,210 −1,158 −934 −768 −166 −224 − 52Other3 . . . . . . . . . . . . . . . . . . 0 129 433 193 240 −304 −129
Net change. . . . . . . . . . . . 1,398 1,408 1,031 476 555 377 −10
Number, Dec. 31, 1999. . 67,314 64,056 47,026 35,813 11,213 17,030 3,258
Banks affiliated with bank holding companies
Banks
Number, Dec. 31, 1998. . 6,988 6,850 2,817 1,984 833 4,033 138
Changes during 1999BHC-affiliated
new banks. . . . . . . . . . 281 264 110 66 44 154 17Banks converted
into branches. . . . . . . − 365 − 352 −173 −117 −56 −179 −13Ceased banking
operation2 . . . . . . . . . . − 46 − 42 −15 −12 −3 −27 −4Other3 . . . . . . . . . . . . . . . . . . 0 2 33 −7 40 − 31 −2
Net change . . . . . . . . . . . −130 −128 −45 −70 25 −83 −2
Number, Dec. 31, 1999. . 6,858 6,722 2,772 1,914 858 3,950 136
1. For purposes of this table, banks are entities thatare defined as banks in the Bank Holding Company Actas amended and implemented in Federal Reserve Regula-tion Y. Generally, a bank is any institution that acceptsdemand deposits and is engaged in the business ofmaking commercial loans or any institution that is
defined as an insured bank in section 3(h) of the FDICAct. Covers entities in the United States and its territoriesand possessions (affiliated insular areas).
2. Institutions that no longer meet the Regulation Ydefinition of bank.
3. Interclass changes and sales of branches.
374 86th Annual Report, 1999
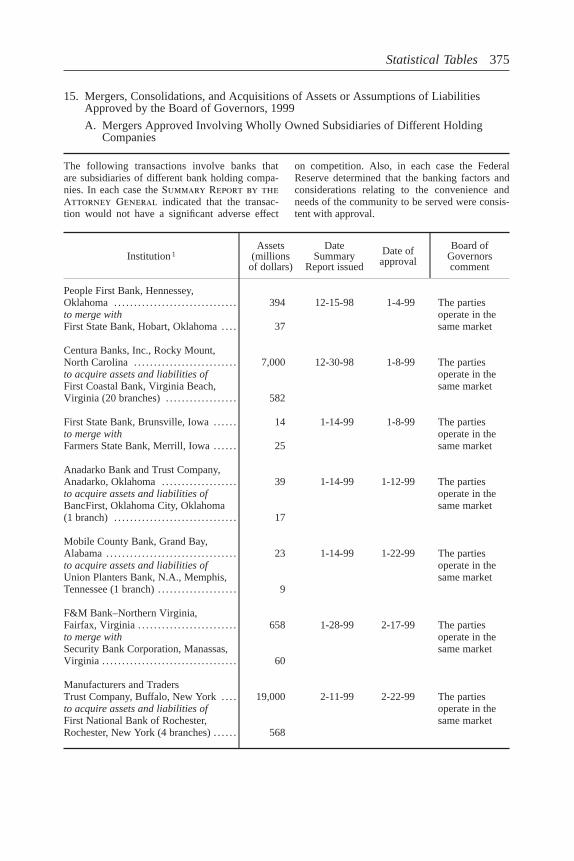
15. Mergers, Consolidations, and Acquisitions of Assets or Assumptions of LiabilitiesApproved by the Board of Governors, 1999
A. Mergers Approved Involving Wholly Owned Subsidiaries of Different HoldingCompanies
The following transactions involve banks thatare subsidiaries of different bank holding compa-nies. In each case theSummary Report by theAttorney General indicated that the transac-tion would not have a significant adverse effect
on competition. Also, in each case the FederalReserve determined that the banking factors andconsiderations relating to the convenience andneeds of the community to be served were consis-tent with approval.
Institution1Assets
(millionsof dollars)
DateSummary
Report issued
Date ofapproval
Board ofGovernorscomment
People First Bank, Hennessey,Oklahoma . . . . . . . . . . . . . . . . . . . . . . . . . . . . . . . 394 12-15-98 1-4-99 The parties
operate in thesame market
to merge withFirst State Bank, Hobart, Oklahoma. . . . 37
Centura Banks, Inc., Rocky Mount,North Carolina . . . . . . . . . . . . . . . . . . . . . . . . . . 7,000 12-30-98 1-8-99 The parties
operate in thesame market
to acquire assets and liabilities ofFirst Coastal Bank, Virginia Beach,Virginia (20 branches). . . . . . . . . . . . . . . . . . 582
First State Bank, Brunsville, Iowa. . . . . . 14 1-14-99 1-8-99 The partiesoperate in thesame market
to merge withFarmers State Bank, Merrill, Iowa. . . . . . 25
Anadarko Bank and Trust Company,Anadarko, Oklahoma. . . . . . . . . . . . . . . . . . . 39 1-14-99 1-12-99 The parties
operate in thesame market
to acquire assets and liabilities ofBancFirst, Oklahoma City, Oklahoma(1 branch) . . . . . . . . . . . . . . . . . . . . . . . . . . . . . . . 17
Mobile County Bank, Grand Bay,Alabama. . . . . . . . . . . . . . . . . . . . . . . . . . . . . . . . . 23 1-14-99 1-22-99 The parties
operate in thesame market
to acquire assets and liabilities ofUnion Planters Bank, N.A., Memphis,Tennessee (1 branch). . . . . . . . . . . . . . . . . . . . 9
F&M Bank–Northern Virginia,Fairfax, Virginia. . . . . . . . . . . . . . . . . . . . . . . . . 658 1-28-99 2-17-99 The parties
operate in thesame market
to merge withSecurity Bank Corporation, Manassas,Virginia . . . . . . . . . . . . . . . . . . . . . . . . . . . . . . . . . . 60
Manufacturers and TradersTrust Company, Buffalo, New York. . . . 19,000 2-11-99 2-22-99 The parties
operate in thesame market
to acquire assets and liabilities ofFirst National Bank of Rochester,Rochester, New York (4 branches). . . . . . 568
Statistical Tables 375
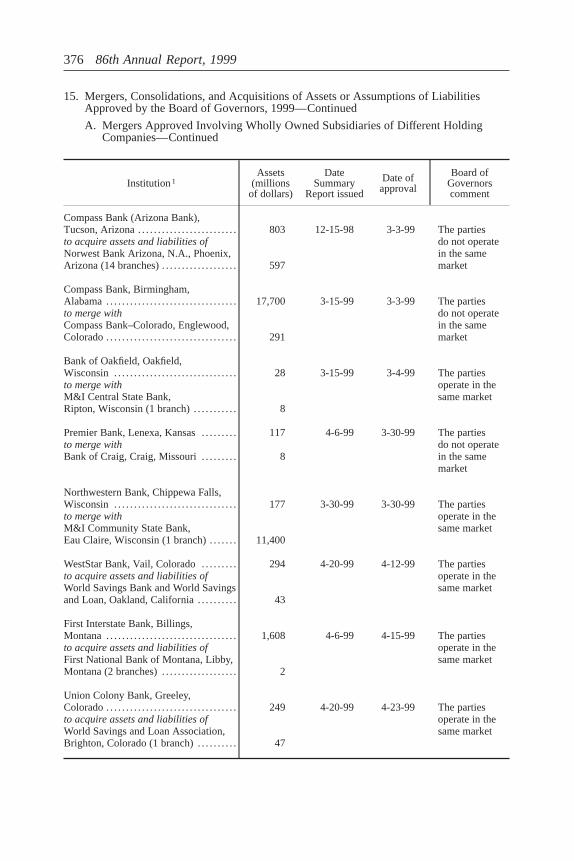
15. Mergers, Consolidations, and Acquisitions of Assets or Assumptions of LiabilitiesApproved by the Board of Governors, 1999—Continued
A. Mergers Approved Involving Wholly Owned Subsidiaries of Different HoldingCompanies—Continued
Institution1Assets
(millionsof dollars)
DateSummary
Report issued
Date ofapproval
Board ofGovernorscomment
Compass Bank (Arizona Bank),Tucson, Arizona. . . . . . . . . . . . . . . . . . . . . . . . . 803 12-15-98 3-3-99 The parties
do not operatein the samemarket
to acquire assets and liabilities ofNorwest Bank Arizona, N.A., Phoenix,Arizona (14 branches). . . . . . . . . . . . . . . . . . . 597
Compass Bank, Birmingham,Alabama. . . . . . . . . . . . . . . . . . . . . . . . . . . . . . . . . 17,700 3-15-99 3-3-99 The parties
do not operatein the samemarket
to merge withCompass Bank–Colorado, Englewood,Colorado. . . . . . . . . . . . . . . . . . . . . . . . . . . . . . . . . 291
Bank of Oakfield, Oakfield,Wisconsin . . . . . . . . . . . . . . . . . . . . . . . . . . . . . . . 28 3-15-99 3-4-99 The parties
operate in thesame market
to merge withM&I Central State Bank,Ripton, Wisconsin (1 branch). . . . . . . . . . . 8
Premier Bank, Lenexa, Kansas. . . . . . . . . 117 4-6-99 3-30-99 The partiesdo not operatein the samemarket
to merge withBank of Craig, Craig, Missouri. . . . . . . . . 8
Northwestern Bank, Chippewa Falls,Wisconsin . . . . . . . . . . . . . . . . . . . . . . . . . . . . . . . 177 3-30-99 3-30-99 The parties
operate in thesame market
to merge withM&I Community State Bank,Eau Claire, Wisconsin (1 branch). . . . . . . 11,400
WestStar Bank, Vail, Colorado. . . . . . . . . 294 4-20-99 4-12-99 The partiesoperate in thesame market
to acquire assets and liabilities ofWorld Savings Bank and World Savingsand Loan, Oakland, California. . . . . . . . . . 43
First Interstate Bank, Billings,Montana. . . . . . . . . . . . . . . . . . . . . . . . . . . . . . . . . 1,608 4-6-99 4-15-99 The parties
operate in thesame market
to acquire assets and liabilities ofFirst National Bank of Montana, Libby,Montana (2 branches). . . . . . . . . . . . . . . . . . . 2
Union Colony Bank, Greeley,Colorado. . . . . . . . . . . . . . . . . . . . . . . . . . . . . . . . . 249 4-20-99 4-23-99 The parties
operate in thesame market
to acquire assets and liabilities ofWorld Savings and Loan Association,Brighton, Colorado (1 branch). . . . . . . . . . 47
376 86th Annual Report, 1999
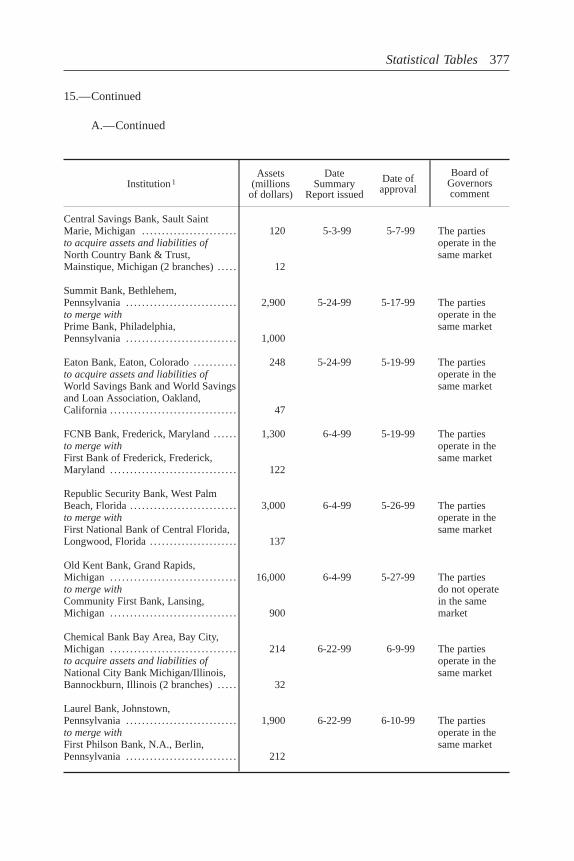
15.—Continued
A.—Continued
Institution1Assets
(millionsof dollars)
DateSummary
Report issued
Date ofapproval
Board ofGovernorscomment
Central Savings Bank, Sault SaintMarie, Michigan . . . . . . . . . . . . . . . . . . . . . . . . 120 5-3-99 5-7-99 The parties
operate in thesame market
to acquire assets and liabilities ofNorth Country Bank & Trust,Mainstique, Michigan (2 branches). . . . . 12
Summit Bank, Bethlehem,Pennsylvania. . . . . . . . . . . . . . . . . . . . . . . . . . . . 2,900 5-24-99 5-17-99 The parties
operate in thesame market
to merge withPrime Bank, Philadelphia,Pennsylvania. . . . . . . . . . . . . . . . . . . . . . . . . . . . 1,000
Eaton Bank, Eaton, Colorado. . . . . . . . . . . 248 5-24-99 5-19-99 The partiesoperate in thesame market
to acquire assets and liabilities ofWorld Savings Bank and World Savingsand Loan Association, Oakland,California . . . . . . . . . . . . . . . . . . . . . . . . . . . . . . . . 47
FCNB Bank, Frederick, Maryland. . . . . . 1,300 6-4-99 5-19-99 The partiesoperate in thesame market
to merge withFirst Bank of Frederick, Frederick,Maryland . . . . . . . . . . . . . . . . . . . . . . . . . . . . . . . . 122
Republic Security Bank, West PalmBeach, Florida. . . . . . . . . . . . . . . . . . . . . . . . . . . 3,000 6-4-99 5-26-99 The parties
operate in thesame market
to merge withFirst National Bank of Central Florida,Longwood, Florida. . . . . . . . . . . . . . . . . . . . . . 137
Old Kent Bank, Grand Rapids,Michigan . . . . . . . . . . . . . . . . . . . . . . . . . . . . . . . . 16,000 6-4-99 5-27-99 The parties
do not operatein the samemarket
to merge withCommunity First Bank, Lansing,Michigan . . . . . . . . . . . . . . . . . . . . . . . . . . . . . . . . 900
Chemical Bank Bay Area, Bay City,Michigan . . . . . . . . . . . . . . . . . . . . . . . . . . . . . . . . 214 6-22-99 6-9-99 The parties
operate in thesame market
to acquire assets and liabilities ofNational City Bank Michigan/Illinois,Bannockburn, Illinois (2 branches). . . . . 32
Laurel Bank, Johnstown,Pennsylvania. . . . . . . . . . . . . . . . . . . . . . . . . . . . 1,900 6-22-99 6-10-99 The parties
operate in thesame market
to merge withFirst Philson Bank, N.A., Berlin,Pennsylvania. . . . . . . . . . . . . . . . . . . . . . . . . . . . 212
Statistical Tables 377
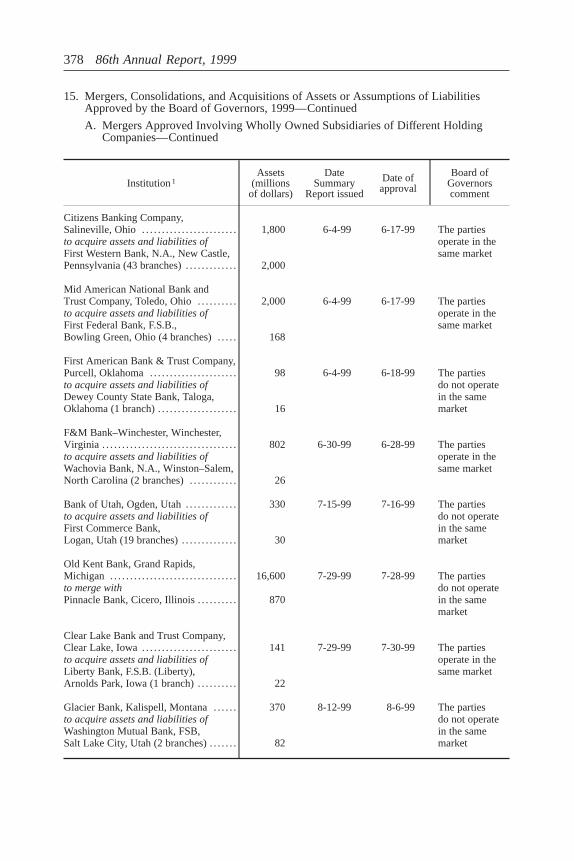
15. Mergers, Consolidations, and Acquisitions of Assets or Assumptions of LiabilitiesApproved by the Board of Governors, 1999—Continued
A. Mergers Approved Involving Wholly Owned Subsidiaries of Different HoldingCompanies—Continued
Institution1Assets
(millionsof dollars)
DateSummary
Report issued
Date ofapproval
Board ofGovernorscomment
Citizens Banking Company,Salineville, Ohio . . . . . . . . . . . . . . . . . . . . . . . . 1,800 6-4-99 6-17-99 The parties
operate in thesame market
to acquire assets and liabilities ofFirst Western Bank, N.A., New Castle,Pennsylvania (43 branches). . . . . . . . . . . . . 2,000
Mid American National Bank andTrust Company, Toledo, Ohio. . . . . . . . . . 2,000 6-4-99 6-17-99 The parties
operate in thesame market
to acquire assets and liabilities ofFirst Federal Bank, F.S.B.,Bowling Green, Ohio (4 branches). . . . . 168
First American Bank & Trust Company,Purcell, Oklahoma. . . . . . . . . . . . . . . . . . . . . . 98 6-4-99 6-18-99 The parties
do not operatein the samemarket
to acquire assets and liabilities ofDewey County State Bank, Taloga,Oklahoma (1 branch). . . . . . . . . . . . . . . . . . . . 16
F&M Bank–Winchester, Winchester,Virginia . . . . . . . . . . . . . . . . . . . . . . . . . . . . . . . . . . 802 6-30-99 6-28-99 The parties
operate in thesame market
to acquire assets and liabilities ofWachovia Bank, N.A., Winston–Salem,North Carolina (2 branches). . . . . . . . . . . . 26
Bank of Utah, Ogden, Utah. . . . . . . . . . . . . 330 7-15-99 7-16-99 The partiesdo not operatein the samemarket
to acquire assets and liabilities ofFirst Commerce Bank,Logan, Utah (19 branches). . . . . . . . . . . . . . 30
Old Kent Bank, Grand Rapids,Michigan . . . . . . . . . . . . . . . . . . . . . . . . . . . . . . . . 16,600 7-29-99 7-28-99 The parties
do not operatein the samemarket
to merge withPinnacle Bank, Cicero, Illinois. . . . . . . . . . 870
Clear Lake Bank and Trust Company,Clear Lake, Iowa. . . . . . . . . . . . . . . . . . . . . . . . 141 7-29-99 7-30-99 The parties
operate in thesame market
to acquire assets and liabilities ofLiberty Bank, F.S.B. (Liberty),Arnolds Park, Iowa (1 branch). . . . . . . . . . 22
Glacier Bank, Kalispell, Montana. . . . . . 370 8-12-99 8-6-99 The partiesdo not operatein the samemarket
to acquire assets and liabilities ofWashington Mutual Bank, FSB,Salt Lake City, Utah (2 branches). . . . . . . 82
378 86th Annual Report, 1999
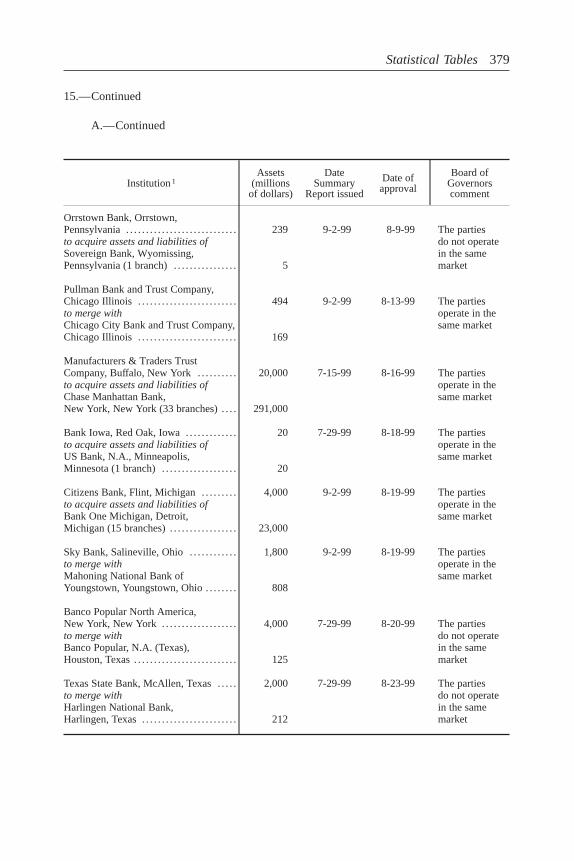
15.—Continued
A.—Continued
Institution1Assets
(millionsof dollars)
DateSummary
Report issued
Date ofapproval
Board ofGovernorscomment
Orrstown Bank, Orrstown,Pennsylvania. . . . . . . . . . . . . . . . . . . . . . . . . . . . 239 9-2-99 8-9-99 The parties
do not operatein the samemarket
to acquire assets and liabilities ofSovereign Bank, Wyomissing,Pennsylvania (1 branch). . . . . . . . . . . . . . . . 5
Pullman Bank and Trust Company,Chicago Illinois . . . . . . . . . . . . . . . . . . . . . . . . . 494 9-2-99 8-13-99 The parties
operate in thesame market
to merge withChicago City Bank and Trust Company,Chicago Illinois . . . . . . . . . . . . . . . . . . . . . . . . . 169
Manufacturers & Traders TrustCompany, Buffalo, New York. . . . . . . . . . 20,000 7-15-99 8-16-99 The parties
operate in thesame market
to acquire assets and liabilities ofChase Manhattan Bank,New York, New York (33 branches). . . . 291,000
Bank Iowa, Red Oak, Iowa. . . . . . . . . . . . . 20 7-29-99 8-18-99 The partiesoperate in thesame market
to acquire assets and liabilities ofUS Bank, N.A., Minneapolis,Minnesota (1 branch). . . . . . . . . . . . . . . . . . . 20
Citizens Bank, Flint, Michigan. . . . . . . . . 4,000 9-2-99 8-19-99 The partiesoperate in thesame market
to acquire assets and liabilities ofBank One Michigan, Detroit,Michigan (15 branches). . . . . . . . . . . . . . . . . 23,000
Sky Bank, Salineville, Ohio. . . . . . . . . . . . 1,800 9-2-99 8-19-99 The partiesoperate in thesame market
to merge withMahoning National Bank ofYoungstown, Youngstown, Ohio. . . . . . . . 808
Banco Popular North America,New York, New York . . . . . . . . . . . . . . . . . . . 4,000 7-29-99 8-20-99 The parties
do not operatein the samemarket
to merge withBanco Popular, N.A. (Texas),Houston, Texas. . . . . . . . . . . . . . . . . . . . . . . . . . 125
Texas State Bank, McAllen, Texas. . . . . 2,000 7-29-99 8-23-99 The partiesdo not operatein the samemarket
to merge withHarlingen National Bank,Harlingen, Texas. . . . . . . . . . . . . . . . . . . . . . . . 212
Statistical Tables 379
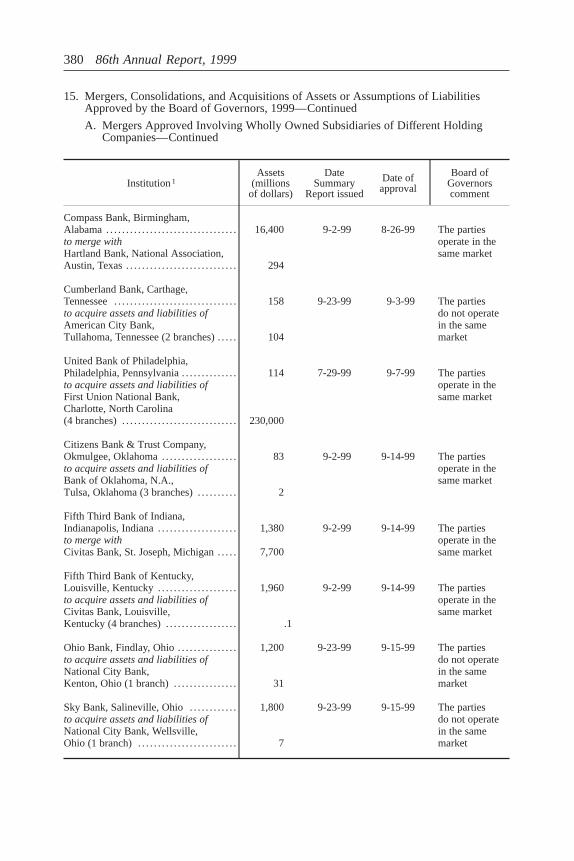
15. Mergers, Consolidations, and Acquisitions of Assets or Assumptions of LiabilitiesApproved by the Board of Governors, 1999—Continued
A. Mergers Approved Involving Wholly Owned Subsidiaries of Different HoldingCompanies—Continued
Institution1Assets
(millionsof dollars)
DateSummary
Report issued
Date ofapproval
Board ofGovernorscomment
Compass Bank, Birmingham,Alabama. . . . . . . . . . . . . . . . . . . . . . . . . . . . . . . . . 16,400 9-2-99 8-26-99 The parties
operate in thesame market
to merge withHartland Bank, National Association,Austin, Texas. . . . . . . . . . . . . . . . . . . . . . . . . . . . 294
Cumberland Bank, Carthage,Tennessee. . . . . . . . . . . . . . . . . . . . . . . . . . . . . . . 158 9-23-99 9-3-99 The parties
do not operatein the samemarket
to acquire assets and liabilities ofAmerican City Bank,Tullahoma, Tennessee (2 branches). . . . . 104
United Bank of Philadelphia,Philadelphia, Pennsylvania. . . . . . . . . . . . . . 114 7-29-99 9-7-99 The parties
operate in thesame market
to acquire assets and liabilities ofFirst Union National Bank,Charlotte, North Carolina(4 branches). . . . . . . . . . . . . . . . . . . . . . . . . . . . . 230,000
Citizens Bank & Trust Company,Okmulgee, Oklahoma. . . . . . . . . . . . . . . . . . . 83 9-2-99 9-14-99 The parties
operate in thesame market
to acquire assets and liabilities ofBank of Oklahoma, N.A.,Tulsa, Oklahoma (3 branches). . . . . . . . . . 2
Fifth Third Bank of Indiana,Indianapolis, Indiana. . . . . . . . . . . . . . . . . . . . 1,380 9-2-99 9-14-99 The parties
operate in thesame market
to merge withCivitas Bank, St. Joseph, Michigan. . . . . 7,700
Fifth Third Bank of Kentucky,Louisville, Kentucky. . . . . . . . . . . . . . . . . . . . 1,960 9-2-99 9-14-99 The parties
operate in thesame market
to acquire assets and liabilities ofCivitas Bank, Louisville,Kentucky (4 branches). . . . . . . . . . . . . . . . . . .1
Ohio Bank, Findlay, Ohio. . . . . . . . . . . . . . . 1,200 9-23-99 9-15-99 The partiesdo not operatein the samemarket
to acquire assets and liabilities ofNational City Bank,Kenton, Ohio (1 branch). . . . . . . . . . . . . . . . 31
Sky Bank, Salineville, Ohio. . . . . . . . . . . . 1,800 9-23-99 9-15-99 The partiesdo not operatein the samemarket
to acquire assets and liabilities ofNational City Bank, Wellsville,Ohio (1 branch). . . . . . . . . . . . . . . . . . . . . . . . . 7
380 86th Annual Report, 1999
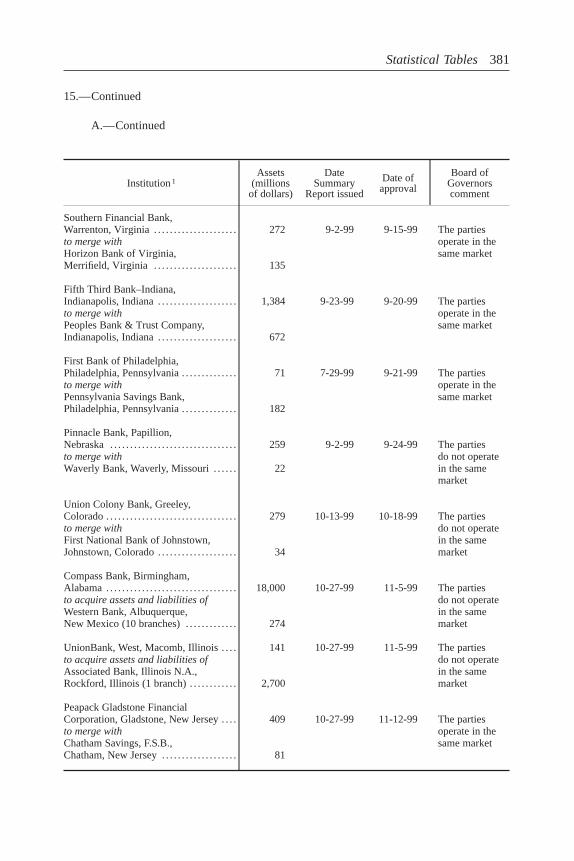
15.—Continued
A.—Continued
Institution1Assets
(millionsof dollars)
DateSummary
Report issued
Date ofapproval
Board ofGovernorscomment
Southern Financial Bank,Warrenton, Virginia. . . . . . . . . . . . . . . . . . . . . 272 9-2-99 9-15-99 The parties
operate in thesame market
to merge withHorizon Bank of Virginia,Merrifield, Virginia . . . . . . . . . . . . . . . . . . . . . 135
Fifth Third Bank–Indiana,Indianapolis, Indiana. . . . . . . . . . . . . . . . . . . . 1,384 9-23-99 9-20-99 The parties
operate in thesame market
to merge withPeoples Bank & Trust Company,Indianapolis, Indiana. . . . . . . . . . . . . . . . . . . . 672
First Bank of Philadelphia,Philadelphia, Pennsylvania. . . . . . . . . . . . . . 71 7-29-99 9-21-99 The parties
operate in thesame market
to merge withPennsylvania Savings Bank,Philadelphia, Pennsylvania. . . . . . . . . . . . . . 182
Pinnacle Bank, Papillion,Nebraska. . . . . . . . . . . . . . . . . . . . . . . . . . . . . . . . 259 9-2-99 9-24-99 The parties
do not operatein the samemarket
to merge withWaverly Bank, Waverly, Missouri. . . . . . 22
Union Colony Bank, Greeley,Colorado. . . . . . . . . . . . . . . . . . . . . . . . . . . . . . . . . 279 10-13-99 10-18-99 The parties
do not operatein the samemarket
to merge withFirst National Bank of Johnstown,Johnstown, Colorado. . . . . . . . . . . . . . . . . . . . 34
Compass Bank, Birmingham,Alabama. . . . . . . . . . . . . . . . . . . . . . . . . . . . . . . . . 18,000 10-27-99 11-5-99 The parties
do not operatein the samemarket
to acquire assets and liabilities ofWestern Bank, Albuquerque,New Mexico (10 branches). . . . . . . . . . . . . 274
UnionBank, West, Macomb, Illinois. . . . 141 10-27-99 11-5-99 The partiesdo not operatein the samemarket
to acquire assets and liabilities ofAssociated Bank, Illinois N.A.,Rockford, Illinois (1 branch). . . . . . . . . . . . 2,700
Peapack Gladstone FinancialCorporation, Gladstone, New Jersey. . . . 409 10-27-99 11-12-99 The parties
operate in thesame market
to merge withChatham Savings, F.S.B.,Chatham, New Jersey. . . . . . . . . . . . . . . . . . . 81
Statistical Tables 381
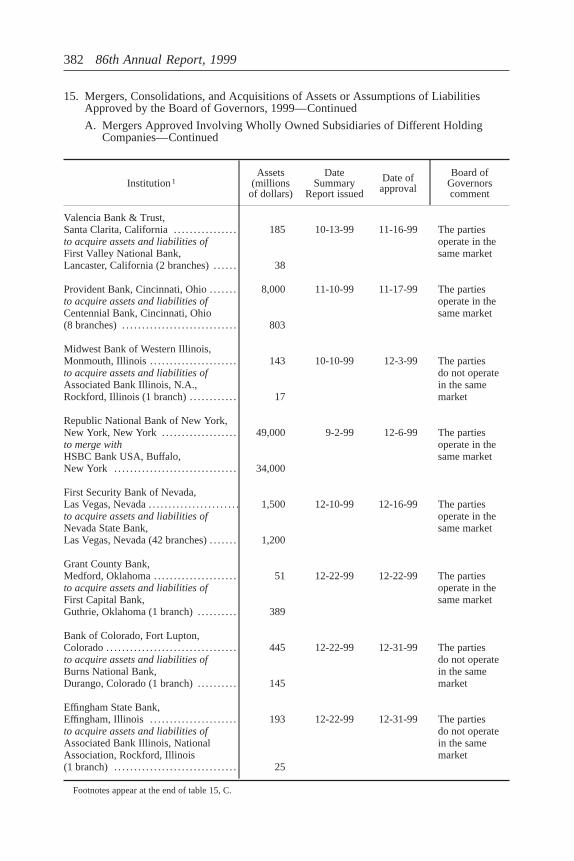
15. Mergers, Consolidations, and Acquisitions of Assets or Assumptions of LiabilitiesApproved by the Board of Governors, 1999—Continued
A. Mergers Approved Involving Wholly Owned Subsidiaries of Different HoldingCompanies—Continued
Institution1Assets
(millionsof dollars)
DateSummary
Report issued
Date ofapproval
Board ofGovernorscomment
Valencia Bank & Trust,Santa Clarita, California. . . . . . . . . . . . . . . . 185 10-13-99 11-16-99 The parties
operate in thesame market
to acquire assets and liabilities ofFirst Valley National Bank,Lancaster, California (2 branches). . . . . . 38
Provident Bank, Cincinnati, Ohio. . . . . . . 8,000 11-10-99 11-17-99 The partiesoperate in thesame market
to acquire assets and liabilities ofCentennial Bank, Cincinnati, Ohio(8 branches). . . . . . . . . . . . . . . . . . . . . . . . . . . . . 803
Midwest Bank of Western Illinois,Monmouth, Illinois. . . . . . . . . . . . . . . . . . . . . . 143 10-10-99 12-3-99 The parties
do not operatein the samemarket
to acquire assets and liabilities ofAssociated Bank Illinois, N.A.,Rockford, Illinois (1 branch). . . . . . . . . . . . 17
Republic National Bank of New York,New York, New York . . . . . . . . . . . . . . . . . . . 49,000 9-2-99 12-6-99 The parties
operate in thesame market
to merge withHSBC Bank USA, Buffalo,New York . . . . . . . . . . . . . . . . . . . . . . . . . . . . . . . 34,000
First Security Bank of Nevada,Las Vegas, Nevada. . . . . . . . . . . . . . . . . . . . . . . 1,500 12-10-99 12-16-99 The parties
operate in thesame market
to acquire assets and liabilities ofNevada State Bank,Las Vegas, Nevada (42 branches). . . . . . . 1,200
Grant County Bank,Medford, Oklahoma. . . . . . . . . . . . . . . . . . . . . 51 12-22-99 12-22-99 The parties
operate in thesame market
to acquire assets and liabilities ofFirst Capital Bank,Guthrie, Oklahoma (1 branch). . . . . . . . . . 389
Bank of Colorado, Fort Lupton,Colorado. . . . . . . . . . . . . . . . . . . . . . . . . . . . . . . . . 445 12-22-99 12-31-99 The parties
do not operatein the samemarket
to acquire assets and liabilities ofBurns National Bank,Durango, Colorado (1 branch). . . . . . . . . . 145
Effingham State Bank,Effingham, Illinois . . . . . . . . . . . . . . . . . . . . . . 193 12-22-99 12-31-99 The parties
do not operatein the samemarket
to acquire assets and liabilities ofAssociated Bank Illinois, NationalAssociation, Rockford, Illinois(1 branch) . . . . . . . . . . . . . . . . . . . . . . . . . . . . . . . 25
Footnotes appear at the end of table 15, C.
382 86th Annual Report, 1999
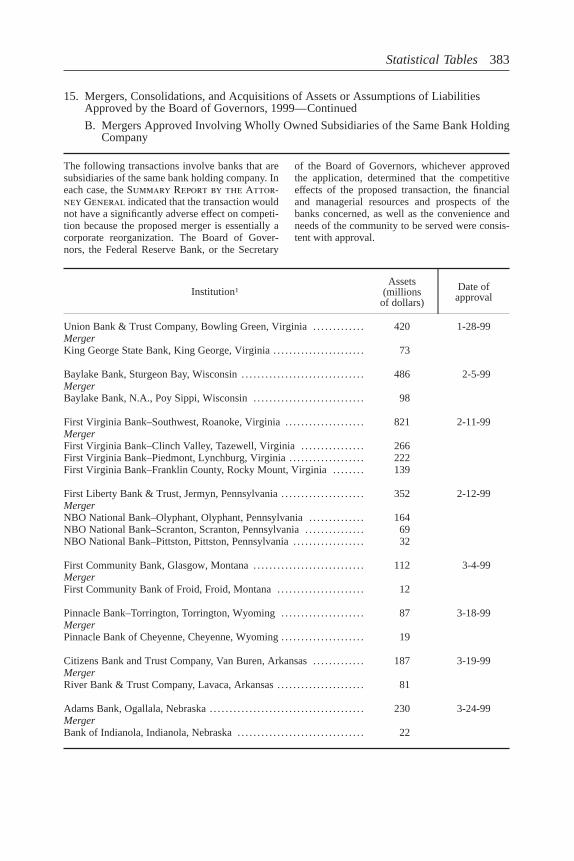
15. Mergers, Consolidations, and Acquisitions of Assets or Assumptions of LiabilitiesApproved by the Board of Governors, 1999—Continued
B. Mergers Approved Involving Wholly Owned Subsidiaries of the Same Bank HoldingCompany
The following transactions involve banks that aresubsidiaries of the same bank holding company. Ineach case, theSummary Report by the Attor-ney General indicated that the transaction wouldnot have a significantly adverse effect on competi-tion because the proposed merger is essentially acorporate reorganization. The Board of Gover-nors, the Federal Reserve Bank, or the Secretary
of the Board of Governors, whichever approvedthe application, determined that the competitiveeffects of the proposed transaction, the financialand managerial resources and prospects of thebanks concerned, as well as the convenience andneeds of the community to be served were consis-tent with approval.
Institution1Assets
(millionsof dollars)
Date ofapproval
Union Bank & Trust Company, Bowling Green, Virginia. . . . . . . . . . . . . 420 1-28-99MergerKing George State Bank, King George, Virginia. . . . . . . . . . . . . . . . . . . . . . . 73
Baylake Bank, Sturgeon Bay, Wisconsin. . . . . . . . . . . . . . . . . . . . . . . . . . . . . . . 486 2-5-99MergerBaylake Bank, N.A., Poy Sippi, Wisconsin. . . . . . . . . . . . . . . . . . . . . . . . . . . . 98
First Virginia Bank–Southwest, Roanoke, Virginia. . . . . . . . . . . . . . . . . . . . 821 2-11-99MergerFirst Virginia Bank–Clinch Valley, Tazewell, Virginia. . . . . . . . . . . . . . . . 266First Virginia Bank–Piedmont, Lynchburg, Virginia. . . . . . . . . . . . . . . . . . . 222First Virginia Bank–Franklin County, Rocky Mount, Virginia. . . . . . . . 139
First Liberty Bank & Trust, Jermyn, Pennsylvania. . . . . . . . . . . . . . . . . . . . . 352 2-12-99MergerNBO National Bank–Olyphant, Olyphant, Pennsylvania. . . . . . . . . . . . . . 164NBO National Bank–Scranton, Scranton, Pennsylvania. . . . . . . . . . . . . . . 69NBO National Bank–Pittston, Pittston, Pennsylvania. . . . . . . . . . . . . . . . . . 32
First Community Bank, Glasgow, Montana. . . . . . . . . . . . . . . . . . . . . . . . . . . . 112 3-4-99MergerFirst Community Bank of Froid, Froid, Montana. . . . . . . . . . . . . . . . . . . . . . 12
Pinnacle Bank–Torrington, Torrington, Wyoming. . . . . . . . . . . . . . . . . . . . . 87 3-18-99MergerPinnacle Bank of Cheyenne, Cheyenne, Wyoming. . . . . . . . . . . . . . . . . . . . . 19
Citizens Bank and Trust Company, Van Buren, Arkansas. . . . . . . . . . . . . 187 3-19-99MergerRiver Bank & Trust Company, Lavaca, Arkansas. . . . . . . . . . . . . . . . . . . . . . 81
Adams Bank, Ogallala, Nebraska. . . . . . . . . . . . . . . . . . . . . . . . . . . . . . . . . . . . . . . 230 3-24-99MergerBank of Indianola, Indianola, Nebraska. . . . . . . . . . . . . . . . . . . . . . . . . . . . . . . . 22
Statistical Tables 383
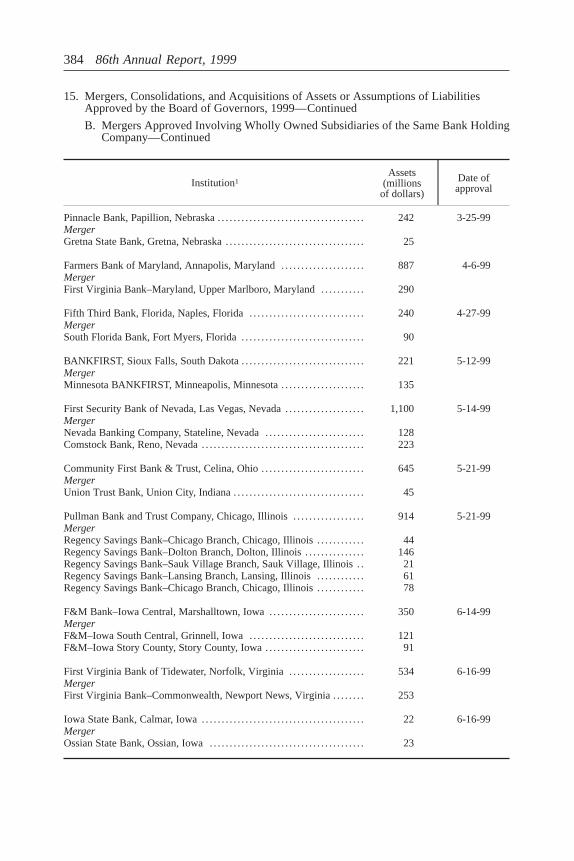
15. Mergers, Consolidations, and Acquisitions of Assets or Assumptions of LiabilitiesApproved by the Board of Governors, 1999—Continued
B. Mergers Approved Involving Wholly Owned Subsidiaries of the Same Bank HoldingCompany—Continued
Institution1Assets
(millionsof dollars)
Date ofapproval
Pinnacle Bank, Papillion, Nebraska. . . . . . . . . . . . . . . . . . . . . . . . . . . . . . . . . . . . . 242 3-25-99MergerGretna State Bank, Gretna, Nebraska. . . . . . . . . . . . . . . . . . . . . . . . . . . . . . . . . . . 25
Farmers Bank of Maryland, Annapolis, Maryland. . . . . . . . . . . . . . . . . . . . . 887 4-6-99MergerFirst Virginia Bank–Maryland, Upper Marlboro, Maryland. . . . . . . . . . . 290
Fifth Third Bank, Florida, Naples, Florida. . . . . . . . . . . . . . . . . . . . . . . . . . . . . 240 4-27-99MergerSouth Florida Bank, Fort Myers, Florida. . . . . . . . . . . . . . . . . . . . . . . . . . . . . . . 90
BANKFIRST, Sioux Falls, South Dakota. . . . . . . . . . . . . . . . . . . . . . . . . . . . . . . 221 5-12-99MergerMinnesota BANKFIRST, Minneapolis, Minnesota. . . . . . . . . . . . . . . . . . . . . 135
First Security Bank of Nevada, Las Vegas, Nevada. . . . . . . . . . . . . . . . . . . . 1,100 5-14-99MergerNevada Banking Company, Stateline, Nevada. . . . . . . . . . . . . . . . . . . . . . . . . 128Comstock Bank, Reno, Nevada. . . . . . . . . . . . . . . . . . . . . . . . . . . . . . . . . . . . . . . . . 223
Community First Bank & Trust, Celina, Ohio. . . . . . . . . . . . . . . . . . . . . . . . . . 645 5-21-99MergerUnion Trust Bank, Union City, Indiana. . . . . . . . . . . . . . . . . . . . . . . . . . . . . . . . . 45
Pullman Bank and Trust Company, Chicago, Illinois. . . . . . . . . . . . . . . . . . 914 5-21-99MergerRegency Savings Bank–Chicago Branch, Chicago, Illinois. . . . . . . . . . . . 44Regency Savings Bank–Dolton Branch, Dolton, Illinois. . . . . . . . . . . . . . . 146Regency Savings Bank–Sauk Village Branch, Sauk Village, Illinois . . 21Regency Savings Bank–Lansing Branch, Lansing, Illinois. . . . . . . . . . . . 61Regency Savings Bank–Chicago Branch, Chicago, Illinois. . . . . . . . . . . . 78
F&M Bank–Iowa Central, Marshalltown, Iowa. . . . . . . . . . . . . . . . . . . . . . . . 350 6-14-99MergerF&M–Iowa South Central, Grinnell, Iowa. . . . . . . . . . . . . . . . . . . . . . . . . . . . . 121F&M–Iowa Story County, Story County, Iowa. . . . . . . . . . . . . . . . . . . . . . . . . 91
First Virginia Bank of Tidewater, Norfolk, Virginia. . . . . . . . . . . . . . . . . . . 534 6-16-99MergerFirst Virginia Bank–Commonwealth, Newport News, Virginia. . . . . . . . 253
Iowa State Bank, Calmar, Iowa. . . . . . . . . . . . . . . . . . . . . . . . . . . . . . . . . . . . . . . . . 22 6-16-99MergerOssian State Bank, Ossian, Iowa. . . . . . . . . . . . . . . . . . . . . . . . . . . . . . . . . . . . . . . 23
384 86th Annual Report, 1999
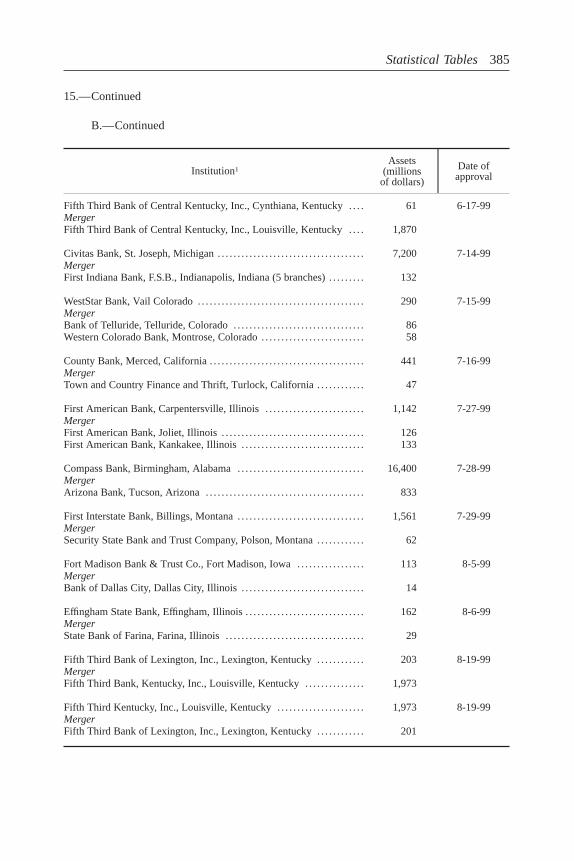
15.—Continued
B.—Continued
Institution1Assets
(millionsof dollars)
Date ofapproval
Fifth Third Bank of Central Kentucky, Inc., Cynthiana, Kentucky. . . . 61 6-17-99MergerFifth Third Bank of Central Kentucky, Inc., Louisville, Kentucky. . . . 1,870
Civitas Bank, St. Joseph, Michigan. . . . . . . . . . . . . . . . . . . . . . . . . . . . . . . . . . . . . 7,200 7-14-99MergerFirst Indiana Bank, F.S.B., Indianapolis, Indiana (5 branches). . . . . . . . . 132
WestStar Bank, Vail Colorado. . . . . . . . . . . . . . . . . . . . . . . . . . . . . . . . . . . . . . . . . . 290 7-15-99MergerBank of Telluride, Telluride, Colorado. . . . . . . . . . . . . . . . . . . . . . . . . . . . . . . . . 86Western Colorado Bank, Montrose, Colorado. . . . . . . . . . . . . . . . . . . . . . . . . . 58
County Bank, Merced, California. . . . . . . . . . . . . . . . . . . . . . . . . . . . . . . . . . . . . . . 441 7-16-99MergerTown and Country Finance and Thrift, Turlock, California. . . . . . . . . . . . 47
First American Bank, Carpentersville, Illinois. . . . . . . . . . . . . . . . . . . . . . . . . 1,142 7-27-99MergerFirst American Bank, Joliet, Illinois. . . . . . . . . . . . . . . . . . . . . . . . . . . . . . . . . . . . 126First American Bank, Kankakee, Illinois. . . . . . . . . . . . . . . . . . . . . . . . . . . . . . . 133
Compass Bank, Birmingham, Alabama. . . . . . . . . . . . . . . . . . . . . . . . . . . . . . . . 16,400 7-28-99MergerArizona Bank, Tucson, Arizona. . . . . . . . . . . . . . . . . . . . . . . . . . . . . . . . . . . . . . . . 833
First Interstate Bank, Billings, Montana. . . . . . . . . . . . . . . . . . . . . . . . . . . . . . . . 1,561 7-29-99MergerSecurity State Bank and Trust Company, Polson, Montana. . . . . . . . . . . . 62
Fort Madison Bank & Trust Co., Fort Madison, Iowa. . . . . . . . . . . . . . . . . 113 8-5-99MergerBank of Dallas City, Dallas City, Illinois. . . . . . . . . . . . . . . . . . . . . . . . . . . . . . . 14
Effingham State Bank, Effingham, Illinois. . . . . . . . . . . . . . . . . . . . . . . . . . . . . . 162 8-6-99MergerState Bank of Farina, Farina, Illinois. . . . . . . . . . . . . . . . . . . . . . . . . . . . . . . . . . . 29
Fifth Third Bank of Lexington, Inc., Lexington, Kentucky. . . . . . . . . . . . 203 8-19-99MergerFifth Third Bank, Kentucky, Inc., Louisville, Kentucky. . . . . . . . . . . . . . . 1,973
Fifth Third Kentucky, Inc., Louisville, Kentucky. . . . . . . . . . . . . . . . . . . . . . 1,973 8-19-99MergerFifth Third Bank of Lexington, Inc., Lexington, Kentucky. . . . . . . . . . . . 201
Statistical Tables 385
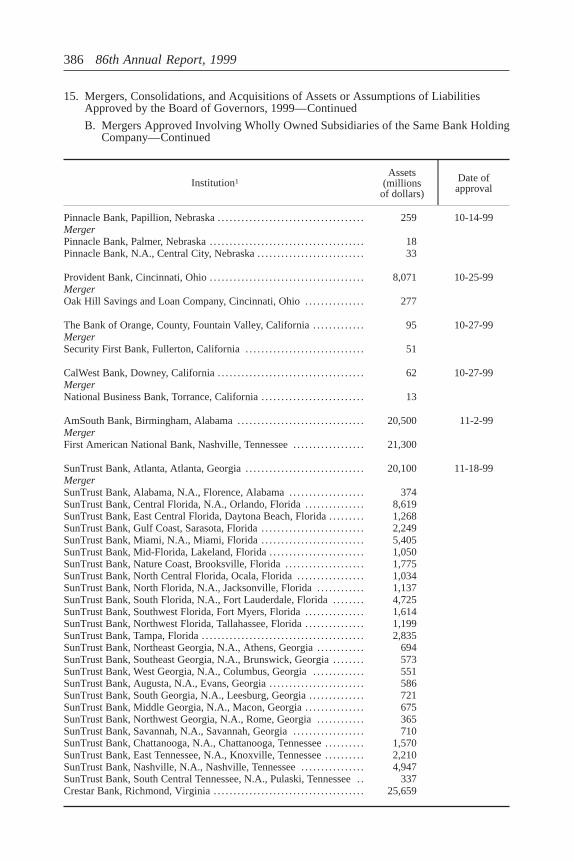
15. Mergers, Consolidations, and Acquisitions of Assets or Assumptions of LiabilitiesApproved by the Board of Governors, 1999—Continued
B. Mergers Approved Involving Wholly Owned Subsidiaries of the Same Bank HoldingCompany—Continued
Institution1Assets
(millionsof dollars)
Date ofapproval
Pinnacle Bank, Papillion, Nebraska. . . . . . . . . . . . . . . . . . . . . . . . . . . . . . . . . . . . . 259 10-14-99MergerPinnacle Bank, Palmer, Nebraska. . . . . . . . . . . . . . . . . . . . . . . . . . . . . . . . . . . . . . . 18Pinnacle Bank, N.A., Central City, Nebraska. . . . . . . . . . . . . . . . . . . . . . . . . . . 33
Provident Bank, Cincinnati, Ohio. . . . . . . . . . . . . . . . . . . . . . . . . . . . . . . . . . . . . . . 8,071 10-25-99MergerOak Hill Savings and Loan Company, Cincinnati, Ohio. . . . . . . . . . . . . . . 277
The Bank of Orange, County, Fountain Valley, California. . . . . . . . . . . . . 95 10-27-99MergerSecurity First Bank, Fullerton, California. . . . . . . . . . . . . . . . . . . . . . . . . . . . . . 51
CalWest Bank, Downey, California. . . . . . . . . . . . . . . . . . . . . . . . . . . . . . . . . . . . . 62 10-27-99MergerNational Business Bank, Torrance, California. . . . . . . . . . . . . . . . . . . . . . . . . . 13
AmSouth Bank, Birmingham, Alabama. . . . . . . . . . . . . . . . . . . . . . . . . . . . . . . . 20,500 11-2-99MergerFirst American National Bank, Nashville, Tennessee. . . . . . . . . . . . . . . . . . 21,300
SunTrust Bank, Atlanta, Atlanta, Georgia. . . . . . . . . . . . . . . . . . . . . . . . . . . . . . 20,100 11-18-99MergerSunTrust Bank, Alabama, N.A., Florence, Alabama. . . . . . . . . . . . . . . . . . . 374SunTrust Bank, Central Florida, N.A., Orlando, Florida. . . . . . . . . . . . . . . 8,619SunTrust Bank, East Central Florida, Daytona Beach, Florida. . . . . . . . . 1,268SunTrust Bank, Gulf Coast, Sarasota, Florida. . . . . . . . . . . . . . . . . . . . . . . . . . 2,249SunTrust Bank, Miami, N.A., Miami, Florida. . . . . . . . . . . . . . . . . . . . . . . . . . 5,405SunTrust Bank, Mid-Florida, Lakeland, Florida. . . . . . . . . . . . . . . . . . . . . . . . 1,050SunTrust Bank, Nature Coast, Brooksville, Florida. . . . . . . . . . . . . . . . . . . . 1,775SunTrust Bank, North Central Florida, Ocala, Florida. . . . . . . . . . . . . . . . . 1,034SunTrust Bank, North Florida, N.A., Jacksonville, Florida. . . . . . . . . . . . 1,137SunTrust Bank, South Florida, N.A., Fort Lauderdale, Florida. . . . . . . . 4,725SunTrust Bank, Southwest Florida, Fort Myers, Florida. . . . . . . . . . . . . . . 1,614SunTrust Bank, Northwest Florida, Tallahassee, Florida. . . . . . . . . . . . . . . 1,199SunTrust Bank, Tampa, Florida. . . . . . . . . . . . . . . . . . . . . . . . . . . . . . . . . . . . . . . . . 2,835SunTrust Bank, Northeast Georgia, N.A., Athens, Georgia. . . . . . . . . . . . 694SunTrust Bank, Southeast Georgia, N.A., Brunswick, Georgia. . . . . . . . 573SunTrust Bank, West Georgia, N.A., Columbus, Georgia. . . . . . . . . . . . . 551SunTrust Bank, Augusta, N.A., Evans, Georgia. . . . . . . . . . . . . . . . . . . . . . . . 586SunTrust Bank, South Georgia, N.A., Leesburg, Georgia. . . . . . . . . . . . . . 721SunTrust Bank, Middle Georgia, N.A., Macon, Georgia. . . . . . . . . . . . . . . 675SunTrust Bank, Northwest Georgia, N.A., Rome, Georgia. . . . . . . . . . . . 365SunTrust Bank, Savannah, N.A., Savannah, Georgia. . . . . . . . . . . . . . . . . . 710SunTrust Bank, Chattanooga, N.A., Chattanooga, Tennessee. . . . . . . . . . 1,570SunTrust Bank, East Tennessee, N.A., Knoxville, Tennessee. . . . . . . . . . 2,210SunTrust Bank, Nashville, N.A., Nashville, Tennessee. . . . . . . . . . . . . . . . 4,947SunTrust Bank, South Central Tennessee, N.A., Pulaski, Tennessee . . 337Crestar Bank, Richmond, Virginia. . . . . . . . . . . . . . . . . . . . . . . . . . . . . . . . . . . . . . 25,659
386 86th Annual Report, 1999
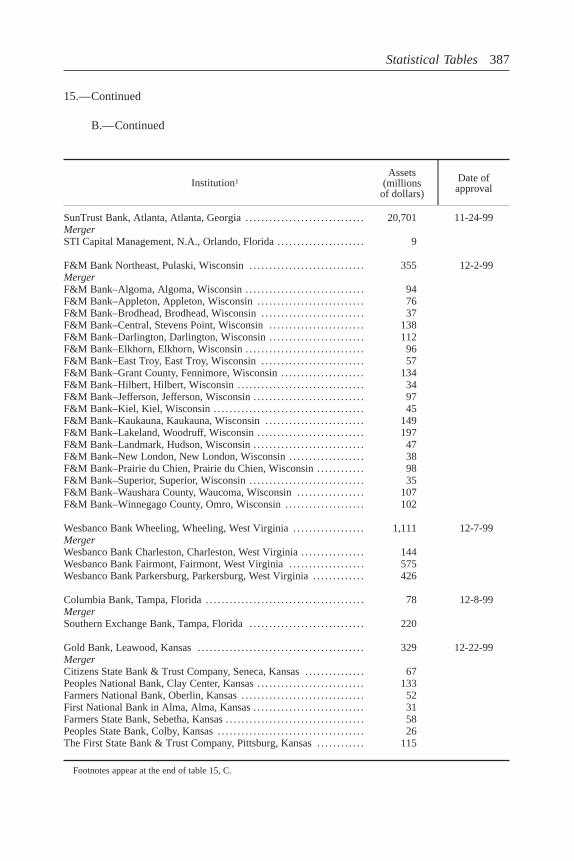
15.—Continued
B.—Continued
Institution1Assets
(millionsof dollars)
Date ofapproval
SunTrust Bank, Atlanta, Atlanta, Georgia. . . . . . . . . . . . . . . . . . . . . . . . . . . . . . 20,701 11-24-99MergerSTI Capital Management, N.A., Orlando, Florida. . . . . . . . . . . . . . . . . . . . . . 9
F&M Bank Northeast, Pulaski, Wisconsin. . . . . . . . . . . . . . . . . . . . . . . . . . . . . 355 12-2-99MergerF&M Bank–Algoma, Algoma, Wisconsin. . . . . . . . . . . . . . . . . . . . . . . . . . . . . . 94F&M Bank–Appleton, Appleton, Wisconsin. . . . . . . . . . . . . . . . . . . . . . . . . . . 76F&M Bank–Brodhead, Brodhead, Wisconsin. . . . . . . . . . . . . . . . . . . . . . . . . . 37F&M Bank–Central, Stevens Point, Wisconsin. . . . . . . . . . . . . . . . . . . . . . . . 138F&M Bank–Darlington, Darlington, Wisconsin. . . . . . . . . . . . . . . . . . . . . . . . 112F&M Bank–Elkhorn, Elkhorn, Wisconsin. . . . . . . . . . . . . . . . . . . . . . . . . . . . . . 96F&M Bank–East Troy, East Troy, Wisconsin. . . . . . . . . . . . . . . . . . . . . . . . . . 57F&M Bank–Grant County, Fennimore, Wisconsin. . . . . . . . . . . . . . . . . . . . . 134F&M Bank–Hilbert, Hilbert, Wisconsin. . . . . . . . . . . . . . . . . . . . . . . . . . . . . . . . 34F&M Bank–Jefferson, Jefferson, Wisconsin. . . . . . . . . . . . . . . . . . . . . . . . . . . . 97F&M Bank–Kiel, Kiel, Wisconsin. . . . . . . . . . . . . . . . . . . . . . . . . . . . . . . . . . . . . . 45F&M Bank–Kaukauna, Kaukauna, Wisconsin. . . . . . . . . . . . . . . . . . . . . . . . . 149F&M Bank–Lakeland, Woodruff, Wisconsin. . . . . . . . . . . . . . . . . . . . . . . . . . . 197F&M Bank–Landmark, Hudson, Wisconsin. . . . . . . . . . . . . . . . . . . . . . . . . . . . 47F&M Bank–New London, New London, Wisconsin. . . . . . . . . . . . . . . . . . . 38F&M Bank–Prairie du Chien, Prairie du Chien, Wisconsin. . . . . . . . . . . . 98F&M Bank–Superior, Superior, Wisconsin. . . . . . . . . . . . . . . . . . . . . . . . . . . . . 35F&M Bank–Waushara County, Waucoma, Wisconsin. . . . . . . . . . . . . . . . . 107F&M Bank–Winnegago County, Omro, Wisconsin. . . . . . . . . . . . . . . . . . . . 102
Wesbanco Bank Wheeling, Wheeling, West Virginia. . . . . . . . . . . . . . . . . . 1,111 12-7-99MergerWesbanco Bank Charleston, Charleston, West Virginia. . . . . . . . . . . . . . . . 144Wesbanco Bank Fairmont, Fairmont, West Virginia. . . . . . . . . . . . . . . . . . . 575Wesbanco Bank Parkersburg, Parkersburg, West Virginia. . . . . . . . . . . . . 426
Columbia Bank, Tampa, Florida. . . . . . . . . . . . . . . . . . . . . . . . . . . . . . . . . . . . . . . . 78 12-8-99MergerSouthern Exchange Bank, Tampa, Florida. . . . . . . . . . . . . . . . . . . . . . . . . . . . . 220
Gold Bank, Leawood, Kansas. . . . . . . . . . . . . . . . . . . . . . . . . . . . . . . . . . . . . . . . . . 329 12-22-99MergerCitizens State Bank & Trust Company, Seneca, Kansas. . . . . . . . . . . . . . . 67Peoples National Bank, Clay Center, Kansas. . . . . . . . . . . . . . . . . . . . . . . . . . . 133Farmers National Bank, Oberlin, Kansas. . . . . . . . . . . . . . . . . . . . . . . . . . . . . . . 52First National Bank in Alma, Alma, Kansas. . . . . . . . . . . . . . . . . . . . . . . . . . . . 31Farmers State Bank, Sebetha, Kansas. . . . . . . . . . . . . . . . . . . . . . . . . . . . . . . . . . . 58Peoples State Bank, Colby, Kansas. . . . . . . . . . . . . . . . . . . . . . . . . . . . . . . . . . . . . 26The First State Bank & Trust Company, Pittsburg, Kansas. . . . . . . . . . . . 115
Footnotes appear at the end of table 15, C.
Statistical Tables 387
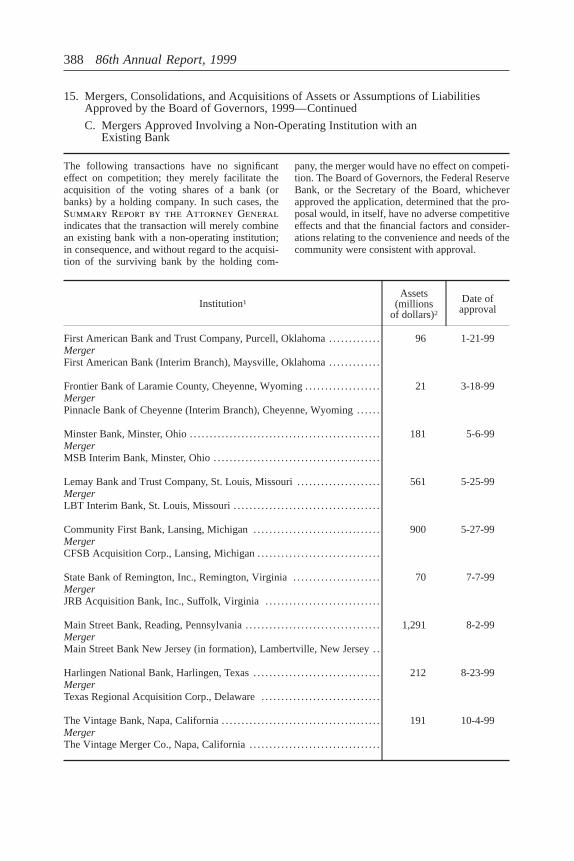
15. Mergers, Consolidations, and Acquisitions of Assets or Assumptions of LiabilitiesApproved by the Board of Governors, 1999—Continued
C. Mergers Approved Involving a Non-Operating Institution with anExisting Bank
The following transactions have no significanteffect on competition; they merely facilitate theacquisition of the voting shares of a bank (orbanks) by a holding company. In such cases, theSummary Report by the Attorney Generalindicates that the transaction will merely combinean existing bank with a non-operating institution;in consequence, and without regard to the acquisi-tion of the surviving bank by the holding com-
pany, the merger would have no effect on competi-tion. The Board of Governors, the Federal ReserveBank, or the Secretary of the Board, whicheverapproved the application, determined that the pro-posal would, in itself, have no adverse competitiveeffects and that the financial factors and consider-ations relating to the convenience and needs of thecommunity were consistent with approval.
Institution1Assets
(millionsof dollars)2
Date ofapproval
First American Bank and Trust Company, Purcell, Oklahoma. . . . . . . . . . . . . 96 1-21-99MergerFirst American Bank (Interim Branch), Maysville, Oklahoma. . . . . . . . . . . . .
Frontier Bank of Laramie County, Cheyenne, Wyoming. . . . . . . . . . . . . . . . . . . 21 3-18-99MergerPinnacle Bank of Cheyenne (Interim Branch), Cheyenne, Wyoming. . . . . .
Minster Bank, Minster, Ohio. . . . . . . . . . . . . . . . . . . . . . . . . . . . . . . . . . . . . . . . . . . . . . . . 181 5-6-99MergerMSB Interim Bank, Minster, Ohio. . . . . . . . . . . . . . . . . . . . . . . . . . . . . . . . . . . . . . . . . .
Lemay Bank and Trust Company, St. Louis, Missouri. . . . . . . . . . . . . . . . . . . . . 561 5-25-99MergerLBT Interim Bank, St. Louis, Missouri. . . . . . . . . . . . . . . . . . . . . . . . . . . . . . . . . . . . .
Community First Bank, Lansing, Michigan. . . . . . . . . . . . . . . . . . . . . . . . . . . . . . . . 900 5-27-99MergerCFSB Acquisition Corp., Lansing, Michigan. . . . . . . . . . . . . . . . . . . . . . . . . . . . . . .
State Bank of Remington, Inc., Remington, Virginia. . . . . . . . . . . . . . . . . . . . . . 70 7-7-99MergerJRB Acquisition Bank, Inc., Suffolk, Virginia. . . . . . . . . . . . . . . . . . . . . . . . . . . . .
Main Street Bank, Reading, Pennsylvania. . . . . . . . . . . . . . . . . . . . . . . . . . . . . . . . . . 1,291 8-2-99MergerMain Street Bank New Jersey (in formation), Lambertville, New Jersey . .
Harlingen National Bank, Harlingen, Texas. . . . . . . . . . . . . . . . . . . . . . . . . . . . . . . . 212 8-23-99MergerTexas Regional Acquisition Corp., Delaware. . . . . . . . . . . . . . . . . . . . . . . . . . . . . .
The Vintage Bank, Napa, California. . . . . . . . . . . . . . . . . . . . . . . . . . . . . . . . . . . . . . . . 191 10-4-99MergerThe Vintage Merger Co., Napa, California. . . . . . . . . . . . . . . . . . . . . . . . . . . . . . . . .
388 86th Annual Report, 1999
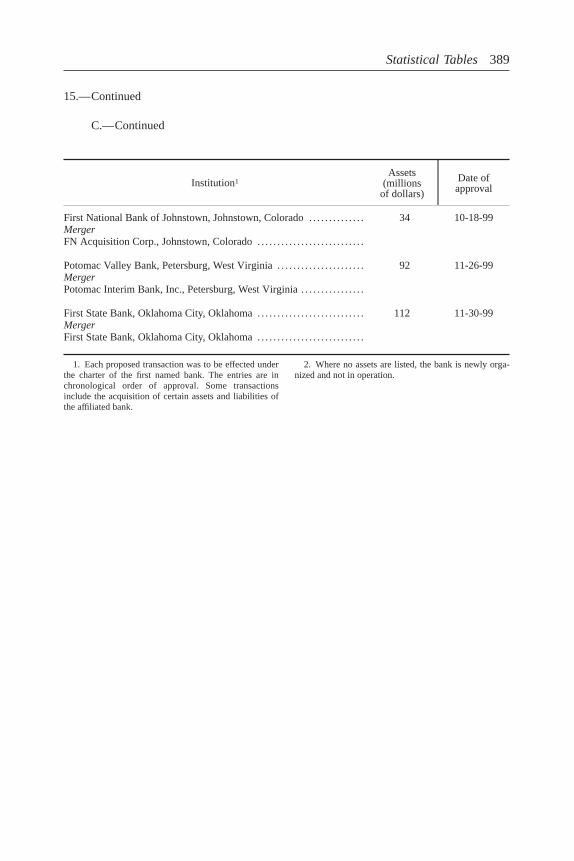
15.—Continued
C.—Continued
Institution1Assets
(millionsof dollars)
Date ofapproval
First National Bank of Johnstown, Johnstown, Colorado. . . . . . . . . . . . . . 34 10-18-99MergerFN Acquisition Corp., Johnstown, Colorado. . . . . . . . . . . . . . . . . . . . . . . . . . .
Potomac Valley Bank, Petersburg, West Virginia. . . . . . . . . . . . . . . . . . . . . . 92 11-26-99MergerPotomac Interim Bank, Inc., Petersburg, West Virginia. . . . . . . . . . . . . . . .
First State Bank, Oklahoma City, Oklahoma. . . . . . . . . . . . . . . . . . . . . . . . . . . 112 11-30-99MergerFirst State Bank, Oklahoma City, Oklahoma. . . . . . . . . . . . . . . . . . . . . . . . . . .
1. Each proposed transaction was to be effected underthe charter of the first named bank. The entries are inchronological order of approval. Some transactionsinclude the acquisition of certain assets and liabilities ofthe affiliated bank.
2. Where no assets are listed, the bank is newly orga-nized and not in operation.
Statistical Tables 389


