Embed Size (px)
Citation preview
LIQUIDITY PROVISION DURING THE CRISIS OF 1914:
PRIVATE AND PUBLIC SOURCES
BY MARGARET M. JACOBSON*
ELLIS W. TALLMAN**
For presentation at: the Workshop on Monetary and Financial History held at the Federal Reserve Bank of Atlanta, June 24-27, 2013 *Federal Reserve Bank of Cleveland ** Oberlin College and Federal Reserve Bank of Cleveland Disclaimer: These are the views of the authors and not those of the Federal Reserve Bank of Cleveland or the Federal Reserve System.
INTRODUCTION
• Compares 1914 to the outcomes of the National Banking Era panics of 1873, 1893, and 1907
• Explores why crisis prevention mechanisms were better in 1914 than in the other crises
• 1914 supported stable deposit levels to promote the expansion of the aggregate money supply
• Investigates the previously overlooked palliative role of clearing house loan certificates in the New York City
OUTLINE
• Background
• Data
• Empirical Methods and Results
• Discussion/Extensions
• Conclusions
BACKGROUND
• Crisis of 1914 in the United States
• Not a major event
• But could have been
• Before the Federal Reserve System was operational
• Fed “operational” in mid-November 1914
• Liquidity crisis – but no banking panic
• Intervention by policymakers and market participants
• Policymaker intervention (public liquidity provision)
• Issuance of Aldrich-Vreeland emergency currency
• Market participants (private liquidity provision)
• Clearing house loan certificates (CHLCs)
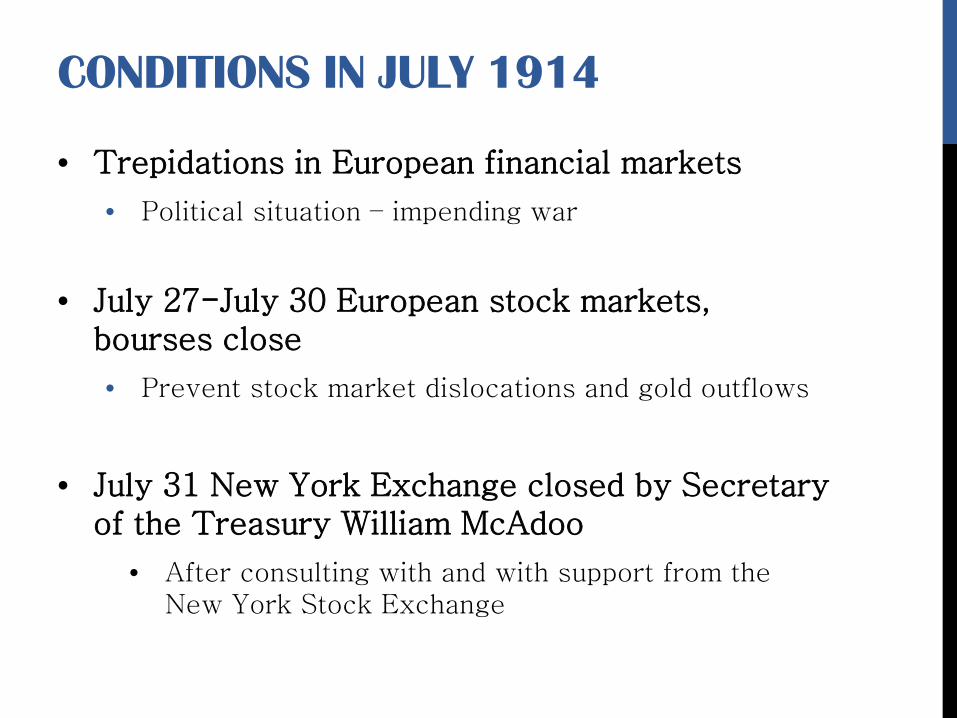
CONDITIONS IN JULY 1914
• Trepidations in European financial markets
• Political situation – impending war
• July 27-July 30 European stock markets, bourses close
• Prevent stock market dislocations and gold outflows
• July 31 New York Exchange closed by Secretary of the Treasury William McAdoo
• After consulting with and with support from the New York Stock Exchange
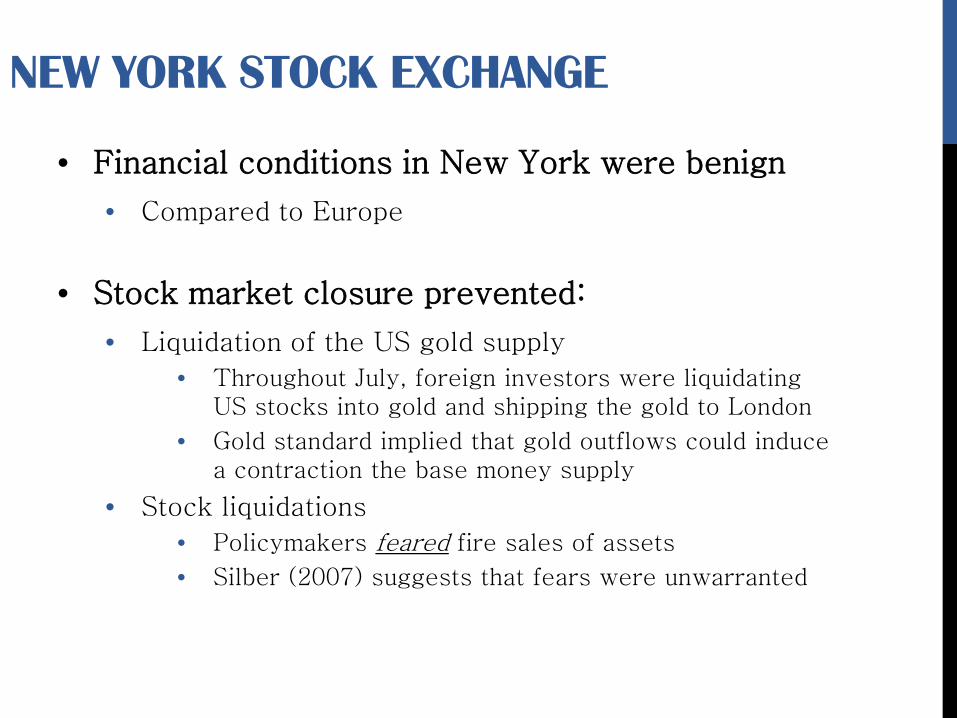
NEW YORK STOCK EXCHANGE
• Financial conditions in New York were benign
• Compared to Europe
• Stock market closure prevented:
• Liquidation of the US gold supply
• Throughout July, foreign investors were liquidating US stocks into gold and shipping the gold to London
• Gold standard implied that gold outflows could induce a contraction the base money supply
• Stock liquidations
• Policymakers feared fire sales of assets
• Silber (2007) suggests that fears were unwarranted
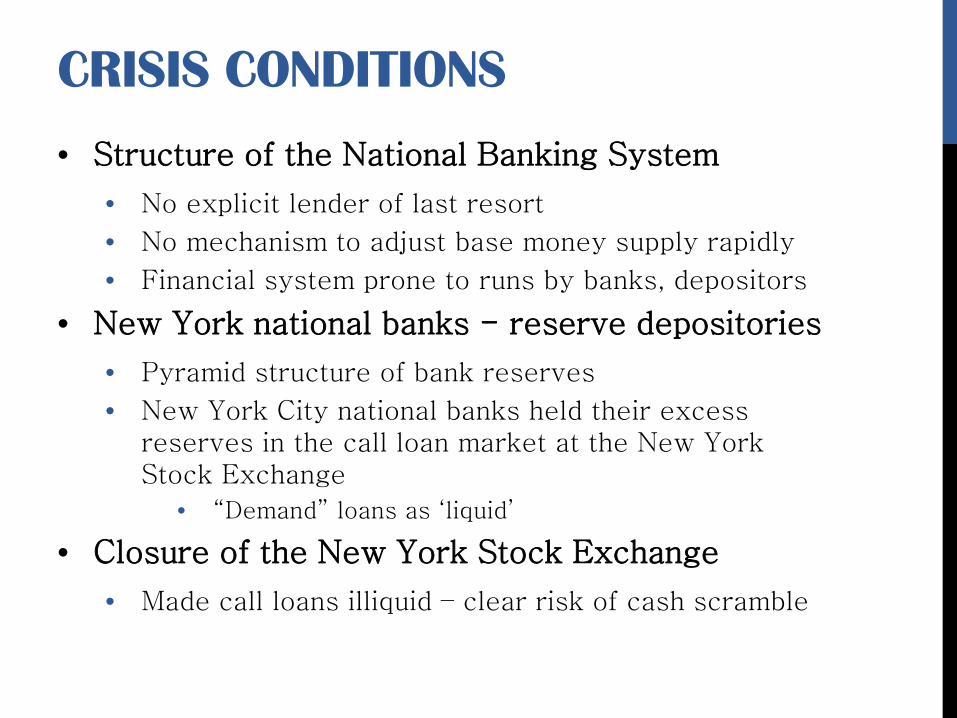
CRISIS CONDITIONS
• Structure of the National Banking System
• No explicit lender of last resort
• No mechanism to adjust base money supply rapidly
• Financial system prone to runs by banks, depositors
• New York national banks - reserve depositories
• Pyramid structure of bank reserves
• New York City national banks held their excess reserves in the call loan market at the New York Stock Exchange
• “Demand” loans as ‘liquid’
• Closure of the New York Stock Exchange
• Made call loans illiquid – clear risk of cash scramble
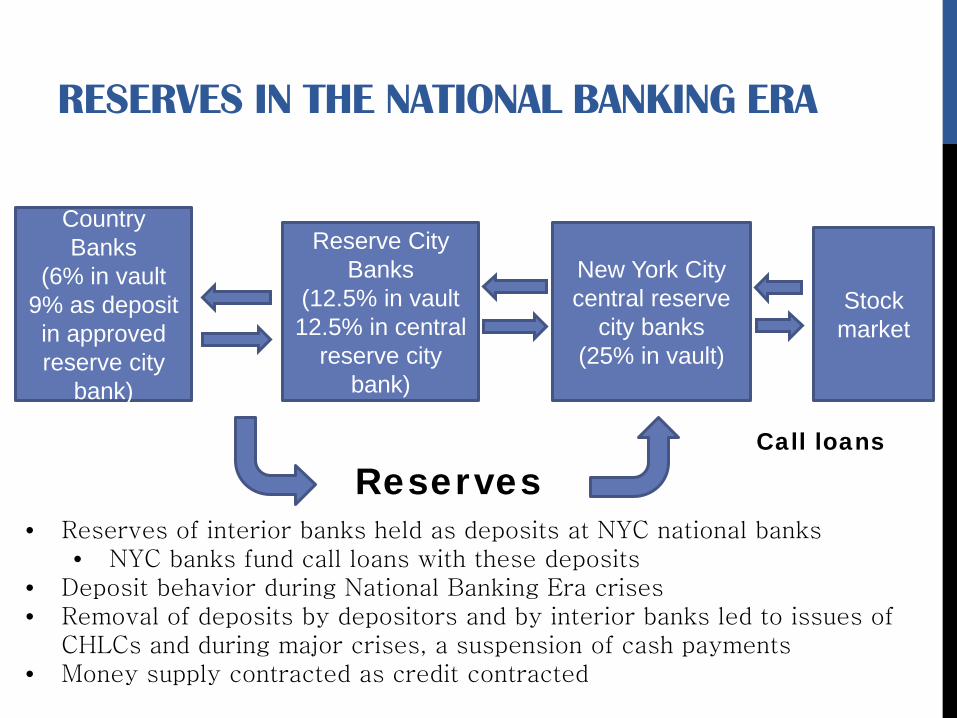
RESERVES IN THE NATIONAL BANKING ERA
Country Banks
(6% in vault 9% as deposit in approved reserve city
bank)
Reserve City Banks
(12.5% in vault 12.5% in central
reserve city bank)
New York City central reserve
city banks (25% in vault)
Stock market
Reserves Call loans
• Reserves of interior banks held as deposits at NYC national banks • NYC banks fund call loans with these deposits
• Deposit behavior during National Banking Era crises • Removal of deposits by depositors and by interior banks led to issues of
CHLCs and during major crises, a suspension of cash payments • Money supply contracted as credit contracted
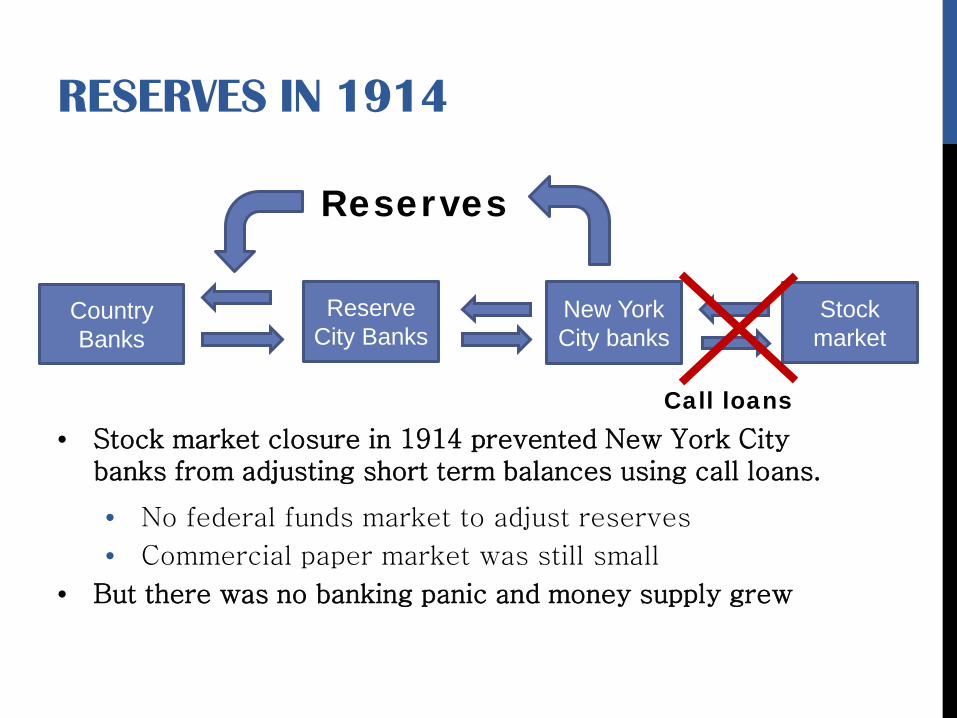
RESERVES IN 1914
Country Banks
Reserve City Banks
New York City banks
Stock market
• Stock market closure in 1914 prevented New York City banks from adjusting short term balances using call loans.
• No federal funds market to adjust reserves
• Commercial paper market was still small
• But there was no banking panic and money supply grew
Reserves
Call loans
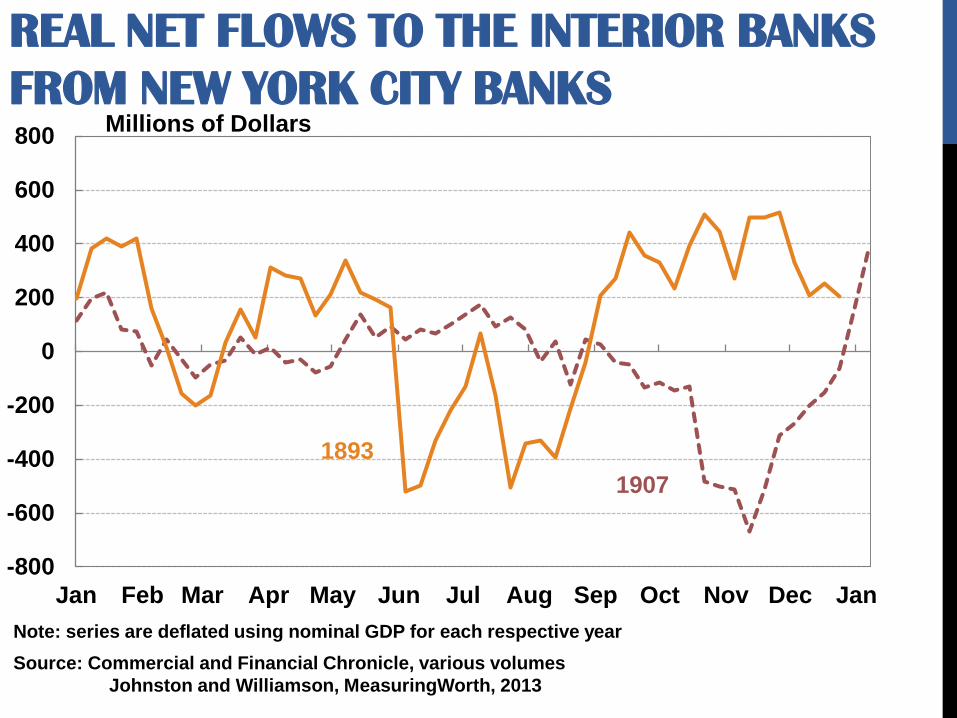
REAL NET FLOWS TO THE INTERIOR BANKS FROM NEW YORK CITY BANKS
-800
-600
-400
-200
0
200
400
600
800
Jan Feb Mar Apr May Jun Jul Aug Sep Oct Nov Dec Jan
Millions of Dollars
Source: Commercial and Financial Chronicle, various volumes Johnston and Williamson, MeasuringWorth, 2013
Note: series are deflated using nominal GDP for each respective year
1893 1907
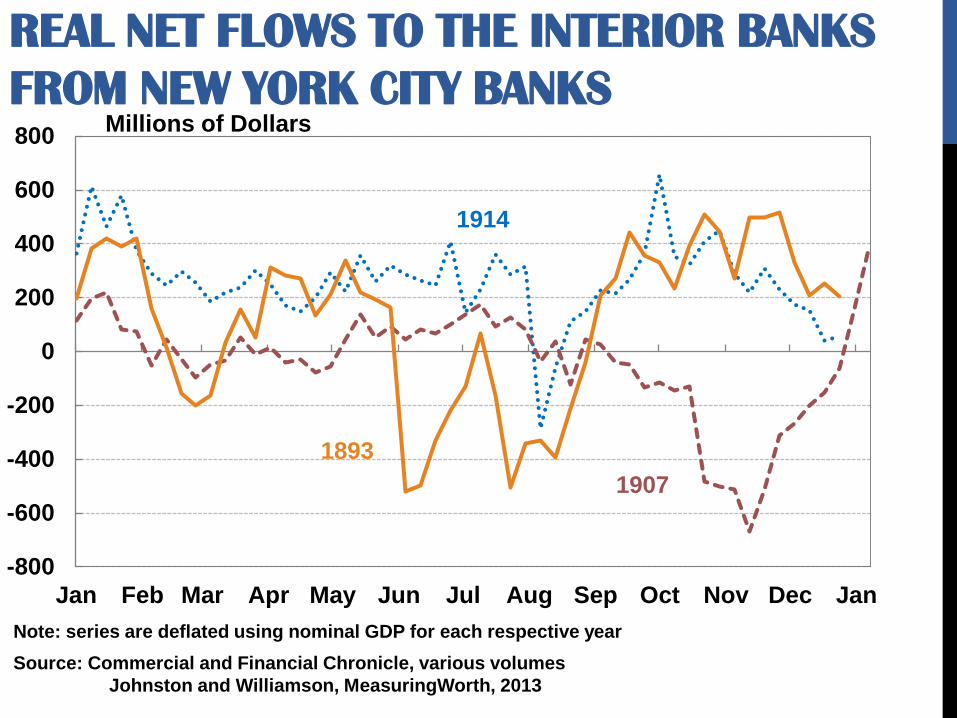
REAL NET FLOWS TO THE INTERIOR BANKS FROM NEW YORK CITY BANKS
-800
-600
-400
-200
0
200
400
600
800
Jan Feb Mar Apr May Jun Jul Aug Sep Oct Nov Dec Jan
1914
Millions of Dollars
Source: Commercial and Financial Chronicle, various volumes Johnston and Williamson, MeasuringWorth, 2013
Note: series are deflated using nominal GDP for each respective year
1893 1907
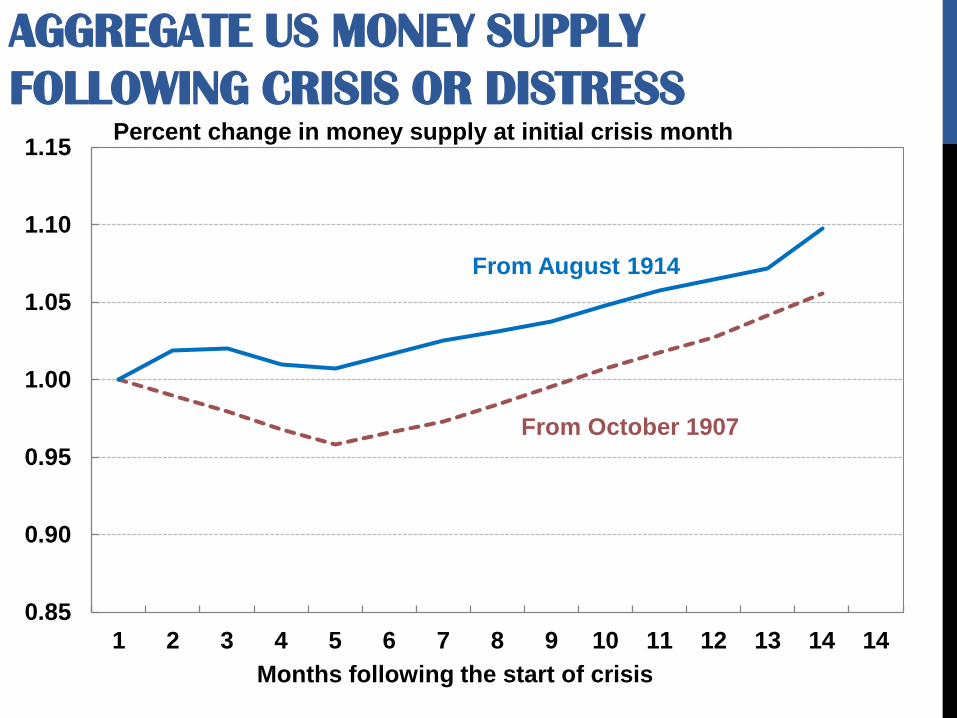
AGGREGATE US MONEY SUPPLY FOLLOWING CRISIS OR DISTRESS
0.85
0.90
0.95
1.00
1.05
1.10
1.15
1 2 3 4 5 6 7 8 9 10 11 12 13 14 14Months following the start of crisis
Percent change in money supply at initial crisis month
From August 1914
From October 1907
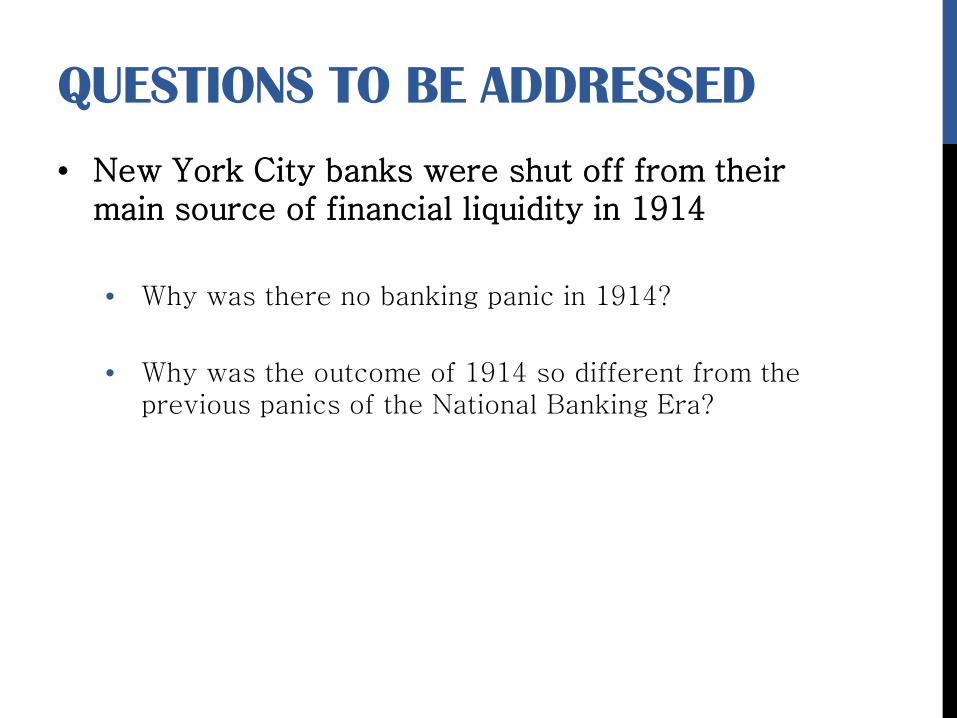
QUESTIONS TO BE ADDRESSED
• New York City banks were shut off from their main source of financial liquidity in 1914
• Why was there no banking panic in 1914?
• Why was the outcome of 1914 so different from the previous panics of the National Banking Era?
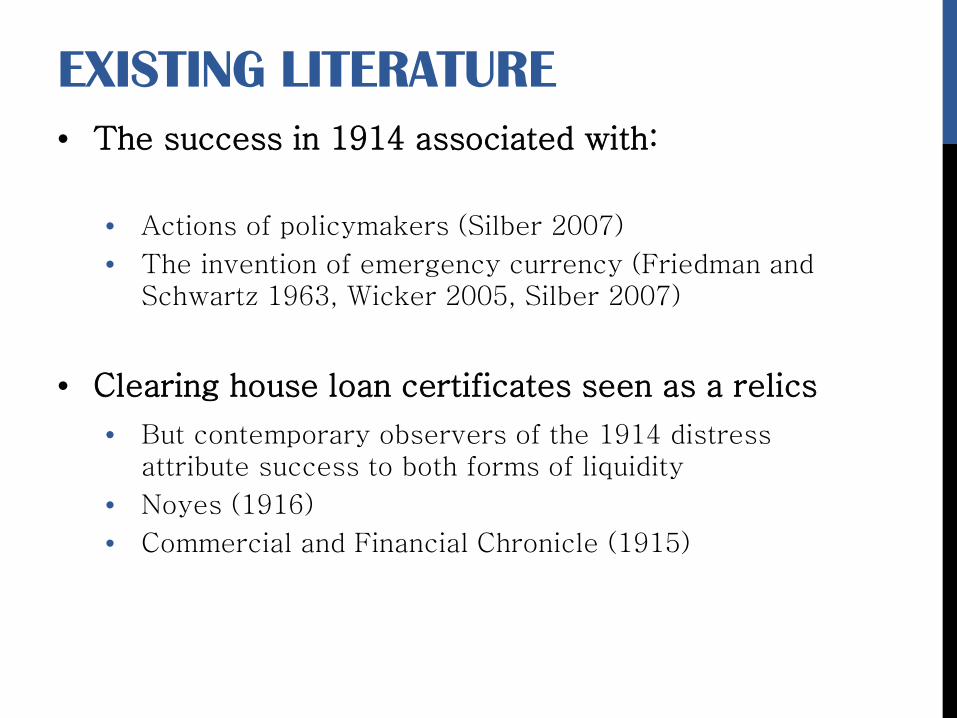
EXISTING LITERATURE • The success in 1914 associated with:
• Actions of policymakers (Silber 2007)
• The invention of emergency currency (Friedman and Schwartz 1963, Wicker 2005, Silber 2007)
• Clearing house loan certificates seen as a relics
• But contemporary observers of the 1914 distress attribute success to both forms of liquidity
• Noyes (1916)
• Commercial and Financial Chronicle (1915)
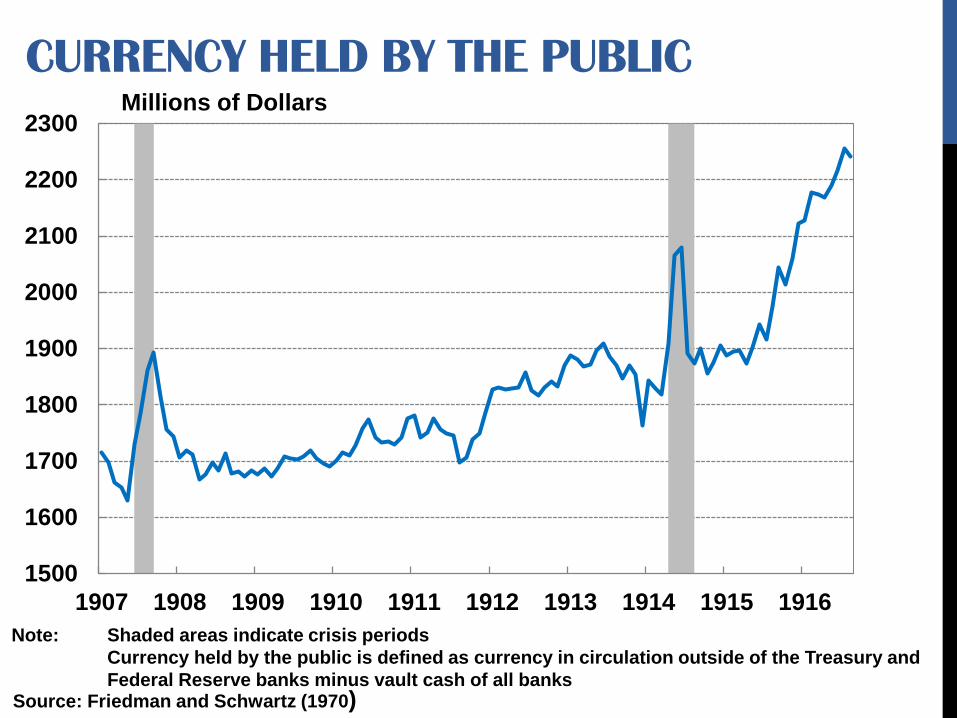
CURRENCY HELD BY THE PUBLIC
1500
1600
1700
1800
1900
2000
2100
2200
2300
1907 1908 1909 1910 1911 1912 1913 1914 1915 1916
Millions of Dollars
Source: Friedman and Schwartz (1970)
Note: Shaded areas indicate crisis periods Currency held by the public is defined as currency in circulation outside of the Treasury and Federal Reserve banks minus vault cash of all banks
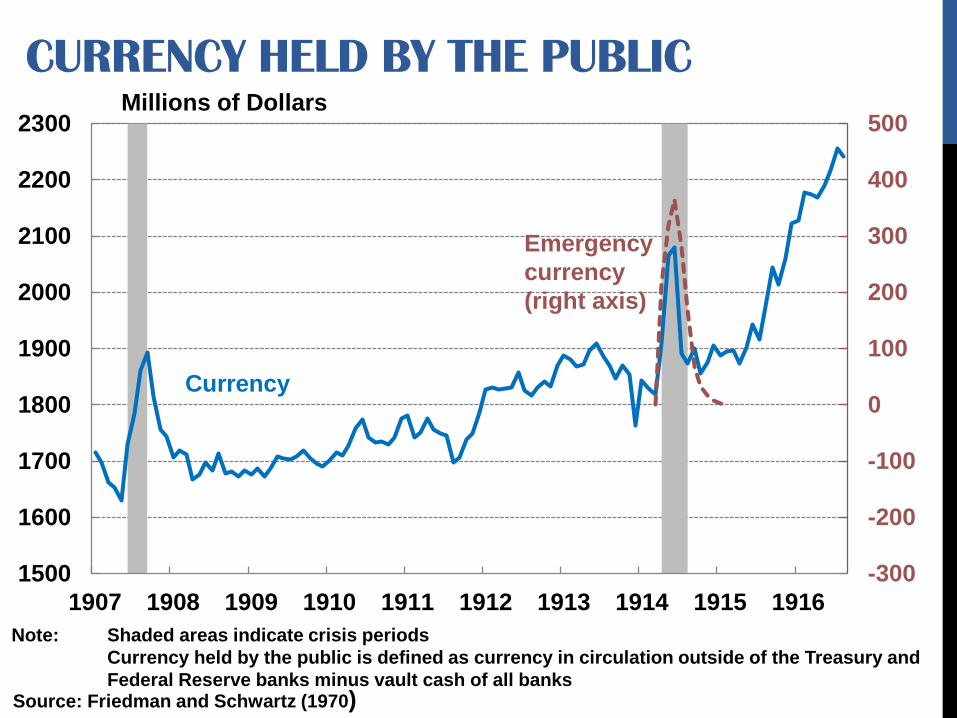
CURRENCY HELD BY THE PUBLIC
-300
-200
-100
0
100
200
300
400
500
1500
1600
1700
1800
1900
2000
2100
2200
2300
1907 1908 1909 1910 1911 1912 1913 1914 1915 1916
Millions of Dollars
Source: Friedman and Schwartz (1970)
Note: Shaded areas indicate crisis periods Currency held by the public is defined as currency in circulation outside of the Treasury and Federal Reserve banks minus vault cash of all banks
Currency
Emergency currency (right axis)
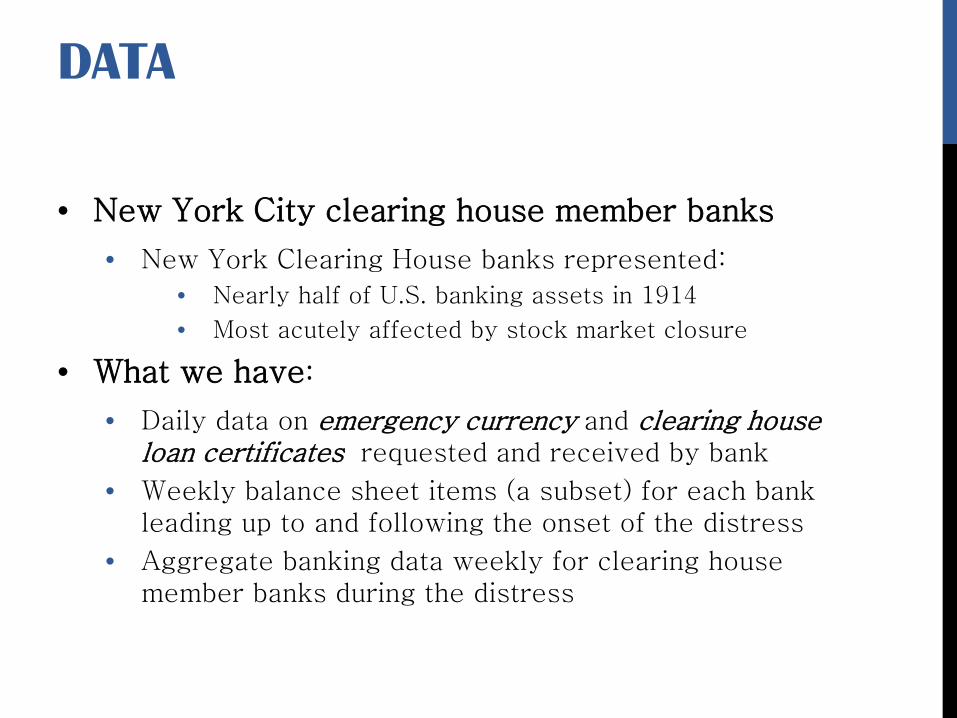
DATA
• New York City clearing house member banks
• New York Clearing House banks represented:
• Nearly half of U.S. banking assets in 1914
• Most acutely affected by stock market closure
• What we have:
• Daily data on emergency currency and clearing house loan certificates requested and received by bank
• Weekly balance sheet items (a subset) for each bank leading up to and following the onset of the distress
• Aggregate banking data weekly for clearing house member banks during the distress
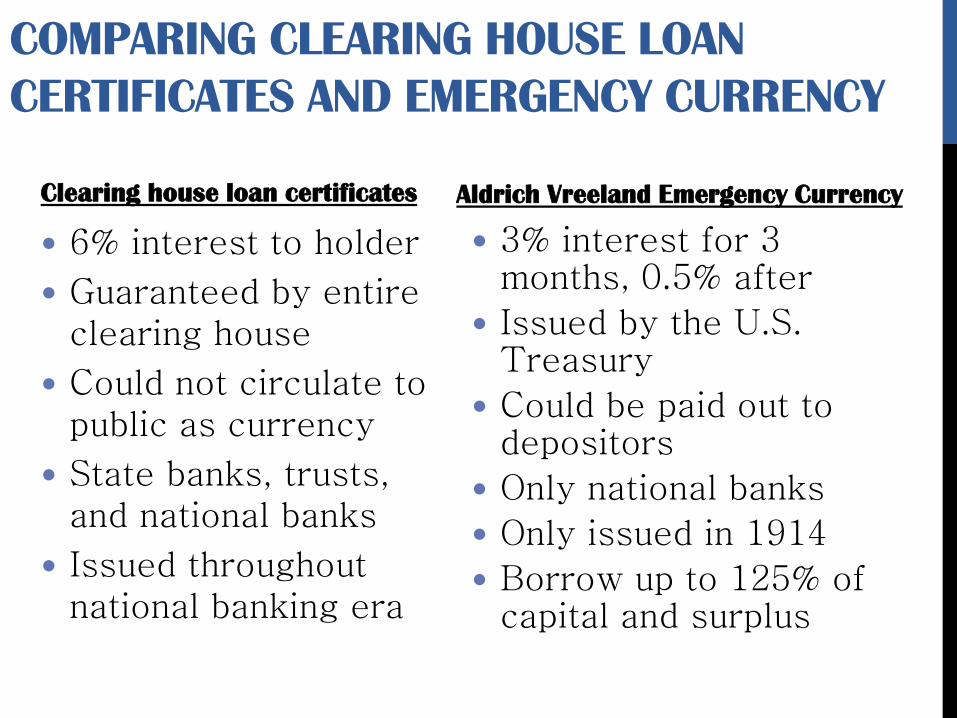
COMPARING CLEARING HOUSE LOAN CERTIFICATES AND EMERGENCY CURRENCY
6% interest to holder
Guaranteed by entire clearing house
Could not circulate to public as currency
State banks, trusts, and national banks
Issued throughout national banking era
3% interest for 3 months, 0.5% after
Issued by the U.S. Treasury
Could be paid out to depositors
Only national banks
Only issued in 1914
Borrow up to 125% of capital and surplus
Clearing house loan certificates Aldrich Vreeland Emergency Currency
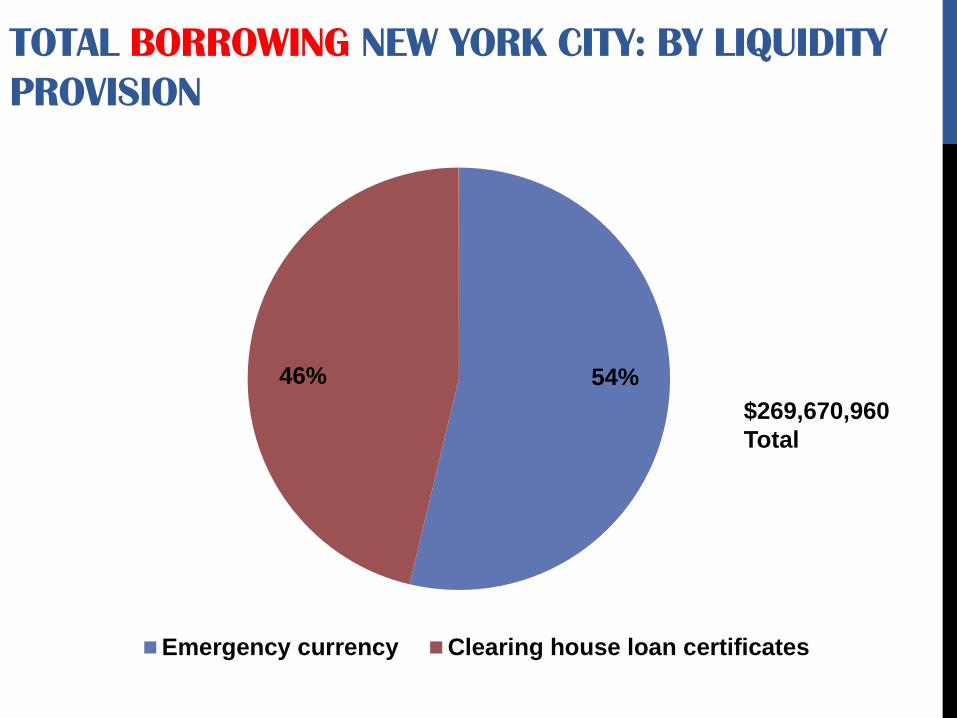
TOTAL BORROWING NEW YORK CITY: BY LIQUIDITY PROVISION
54% 46%
Emergency currency Clearing house loan certificates
$269,670,960 Total
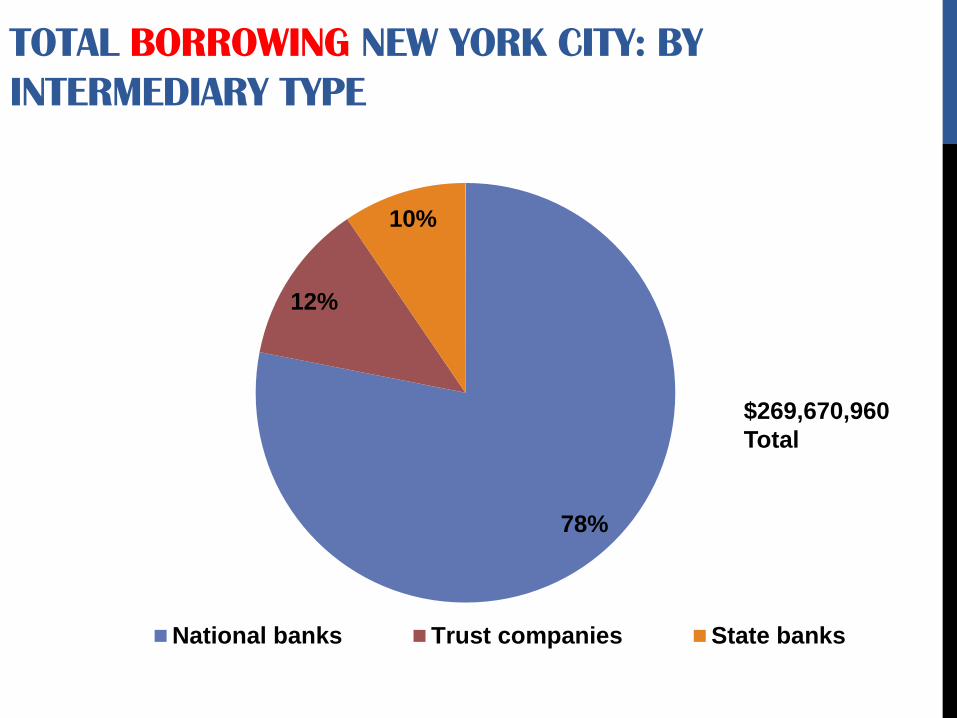
TOTAL BORROWING NEW YORK CITY: BY INTERMEDIARY TYPE
78%
12%
10%
National banks Trust companies State banks
$269,670,960 Total
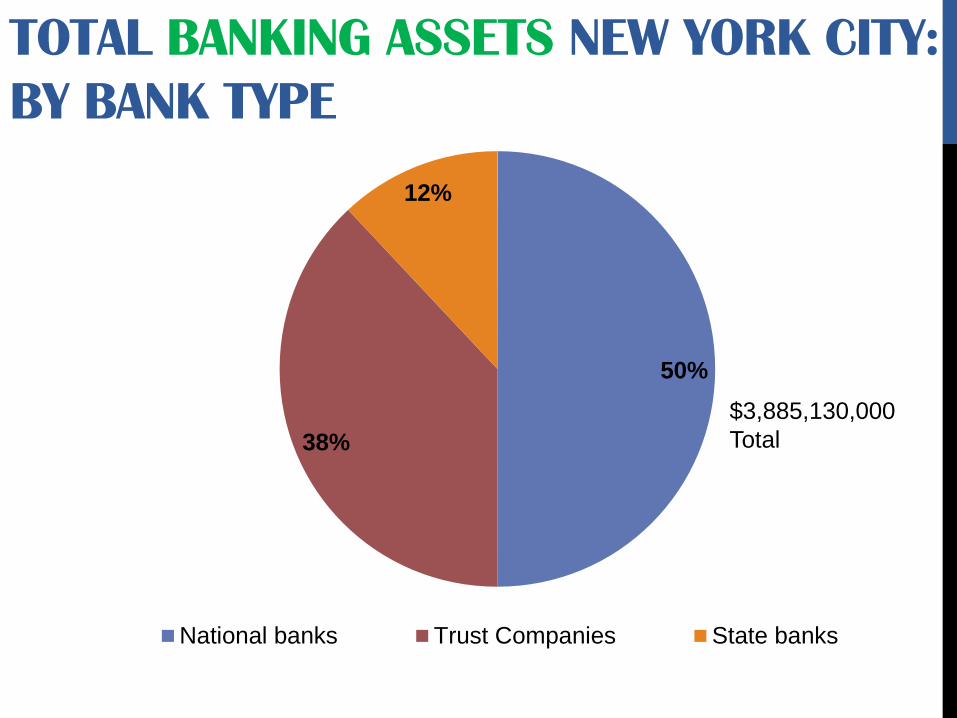
TOTAL BANKING ASSETS NEW YORK CITY: BY BANK TYPE
50%
38%
12%
National banks Trust Companies State banks
$3,885,130,000 Total
0
20
40
60
80
100
120
140
160
Aug-1914 Sep-1914 Oct-1914 Nov-1914 Dec-1914 Jan-1915 Feb-1915
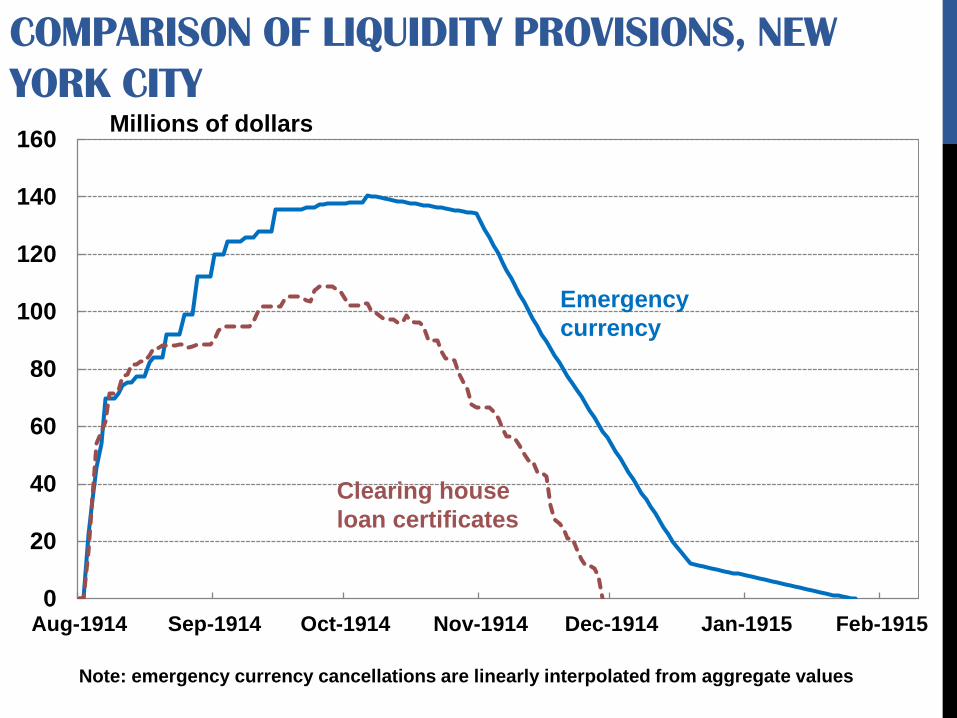
COMPARISON OF LIQUIDITY PROVISIONS, NEW YORK CITY
Emergency currency
Clearing house loan certificates
Millions of dollars
Note: emergency currency cancellations are linearly interpolated from aggregate values
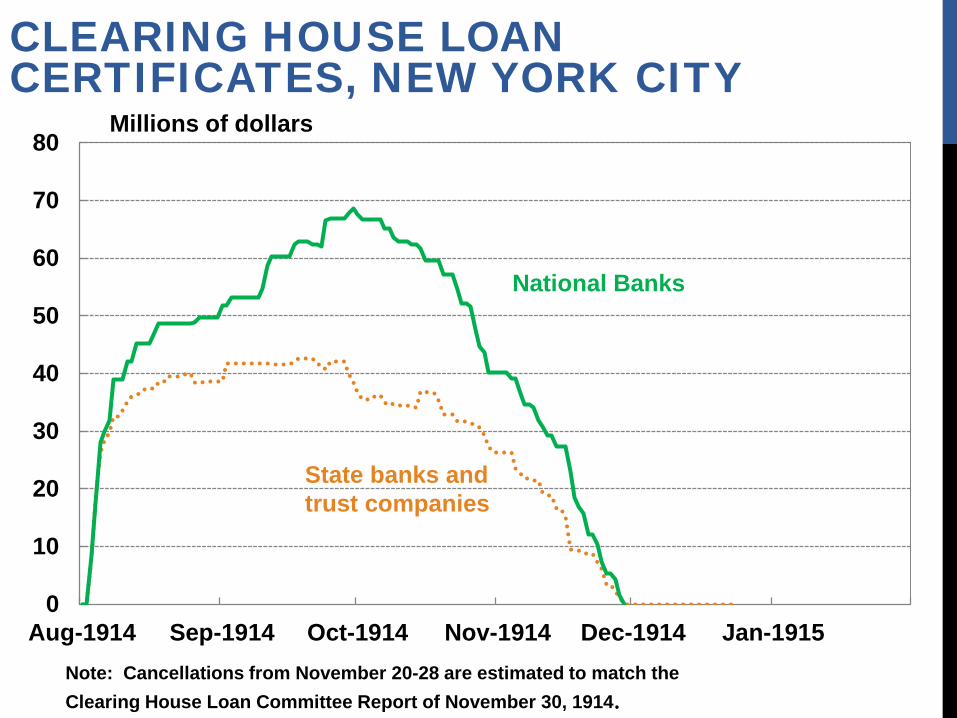
CLEARING HOUSE LOAN CERTIFICATES, NEW YORK CITY
Millions of dollars
0
10
20
30
40
50
60
70
80
Aug-1914 Sep-1914 Oct-1914 Nov-1914 Dec-1914 Jan-1915
National Banks
State banks and trust companies
Note: Cancellations from November 20-28 are estimated to match the Clearing House Loan Committee Report of November 30, 1914.
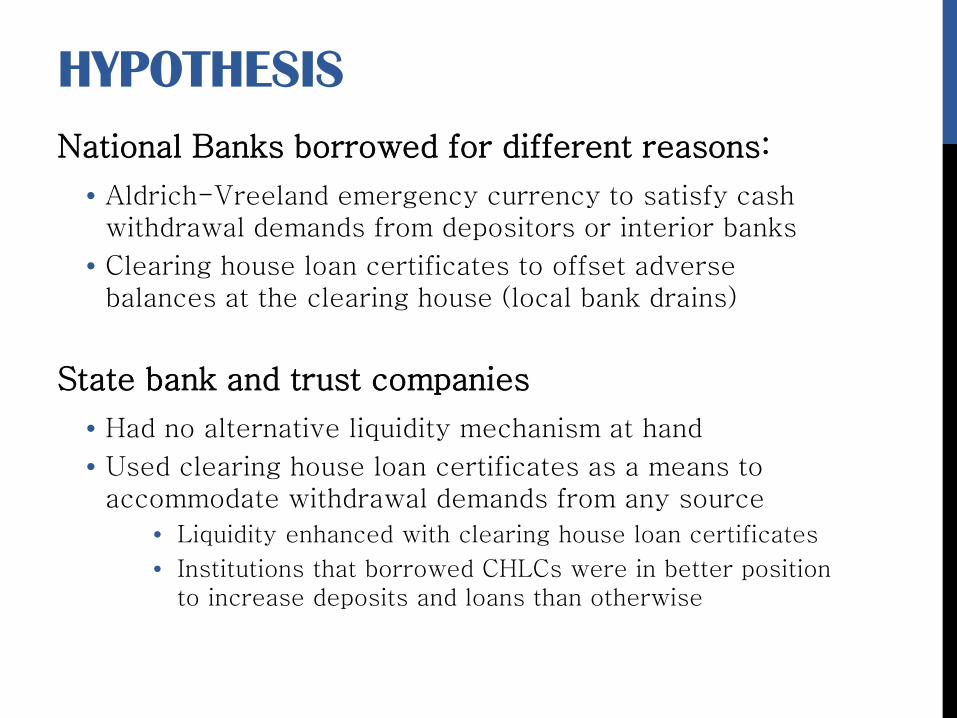
HYPOTHESIS National Banks borrowed for different reasons:
• Aldrich-Vreeland emergency currency to satisfy cash withdrawal demands from depositors or interior banks
• Clearing house loan certificates to offset adverse balances at the clearing house (local bank drains)
State bank and trust companies
• Had no alternative liquidity mechanism at hand
• Used clearing house loan certificates as a means to accommodate withdrawal demands from any source
• Liquidity enhanced with clearing house loan certificates
• Institutions that borrowed CHLCs were in better position to increase deposits and loans than otherwise
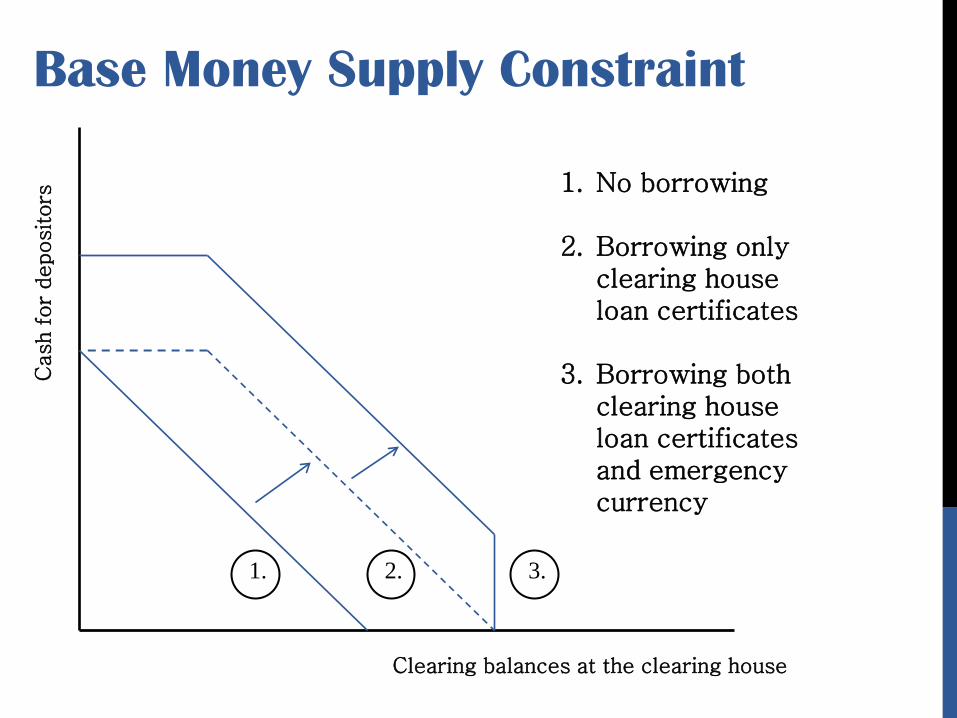
Cash f
or
depositors
Clearing balances at the clearing house
Base Money Supply Constraint
1. 2. 3.
1. No borrowing
2. Borrowing only clearing house loan certificates
3. Borrowing both clearing house loan certificates and emergency currency
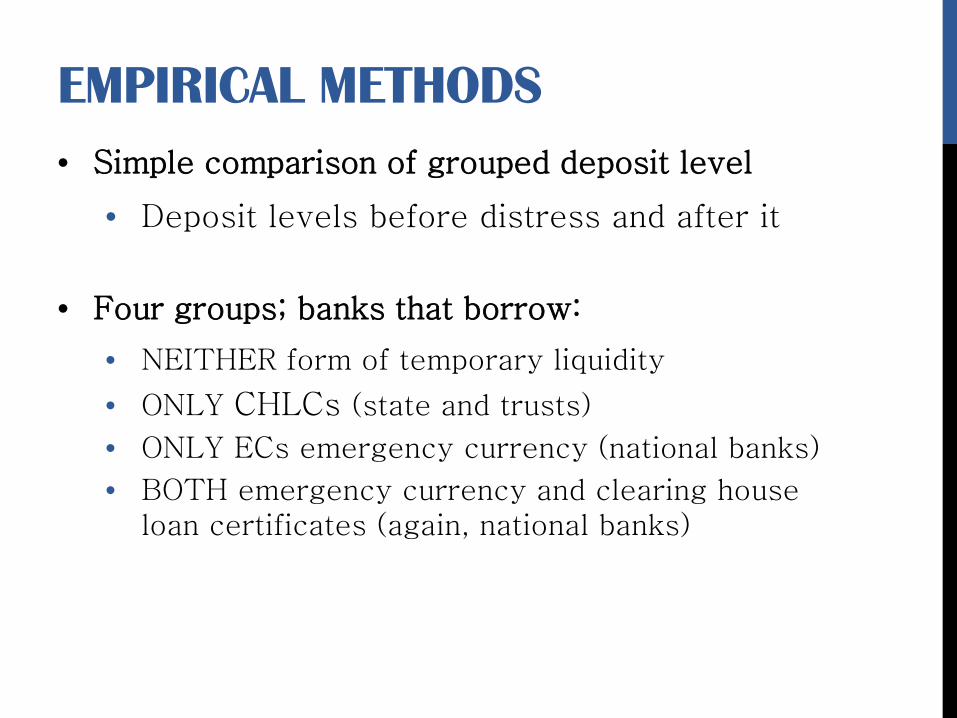
EMPIRICAL METHODS • Simple comparison of grouped deposit level
• Deposit levels before distress and after it
• Four groups; banks that borrow:
• NEITHER form of temporary liquidity
• ONLY CHLCs (state and trusts)
• ONLY ECs emergency currency (national banks)
• BOTH emergency currency and clearing house loan certificates (again, national banks)
EMPIRICAL METHODS
• Hypothesis:
• 1: Borrowers of temporary liquidity in either form should maintain deposit levels in midst of distress.
• Examine data for 1914 to assess evidence
• Further: Compare with earlier NBE panics
• Compare pre- and post-distress deposit levels to analogous measures from previous NBE crises
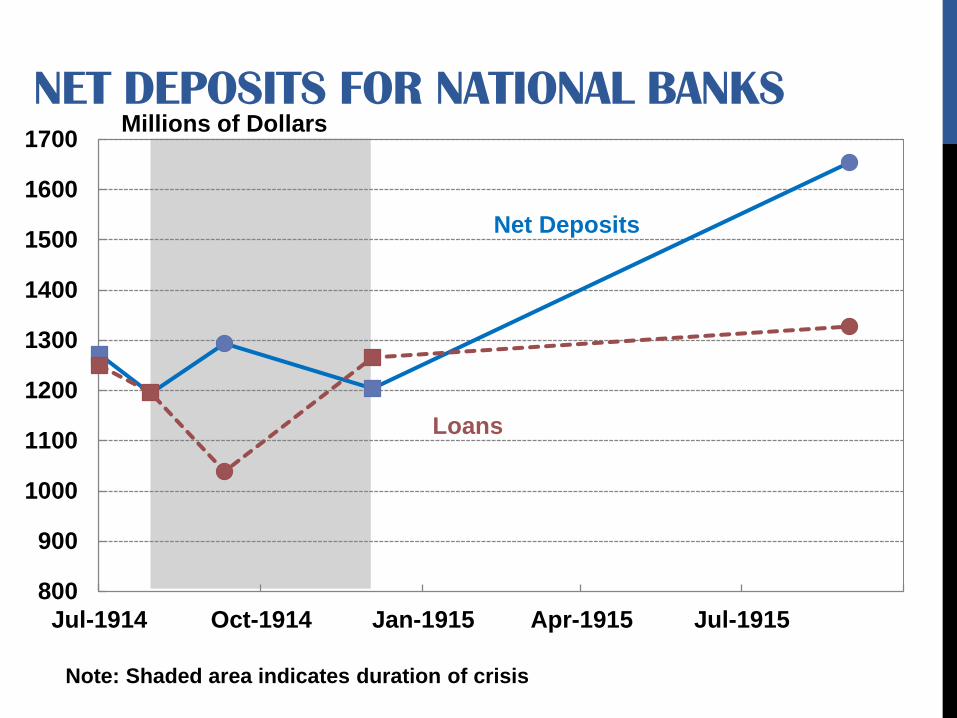
800
900
1000
1100
1200
1300
1400
1500
1600
1700
Jul-1914 Oct-1914 Jan-1915 Apr-1915 Jul-1915
Loans
Net Deposits
NET DEPOSITS FOR NATIONAL BANKS Millions of Dollars
Note: Shaded area indicates duration of crisis
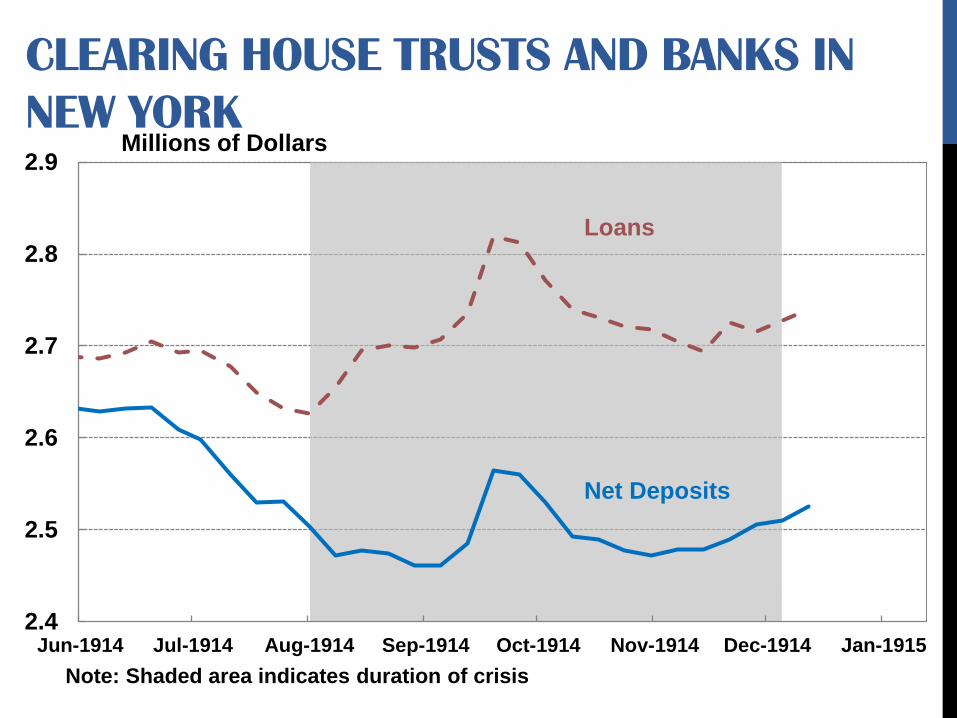
CLEARING HOUSE TRUSTS AND BANKS IN NEW YORK
2.4
2.5
2.6
2.7
2.8
2.9
Jun-1914 Jul-1914 Aug-1914 Sep-1914 Oct-1914 Nov-1914 Dec-1914 Jan-1915
Millions of Dollars
Loans
Net Deposits
Note: Shaded area indicates duration of crisis

-400
-300
-200
-100
0
100
200
300
400
500
800
900
1000
1100
1200
1300
1400
1500
1600
1700
Jul-1914 Oct-1914 Jan-1915 Apr-1915 Jul-1915
NET DEPOSITS FOR NATIONAL BANKS Millions of Dollars
Loans
Net Deposits
Total borrowing (right axis)
Note: Shaded area indicates duration of crisis
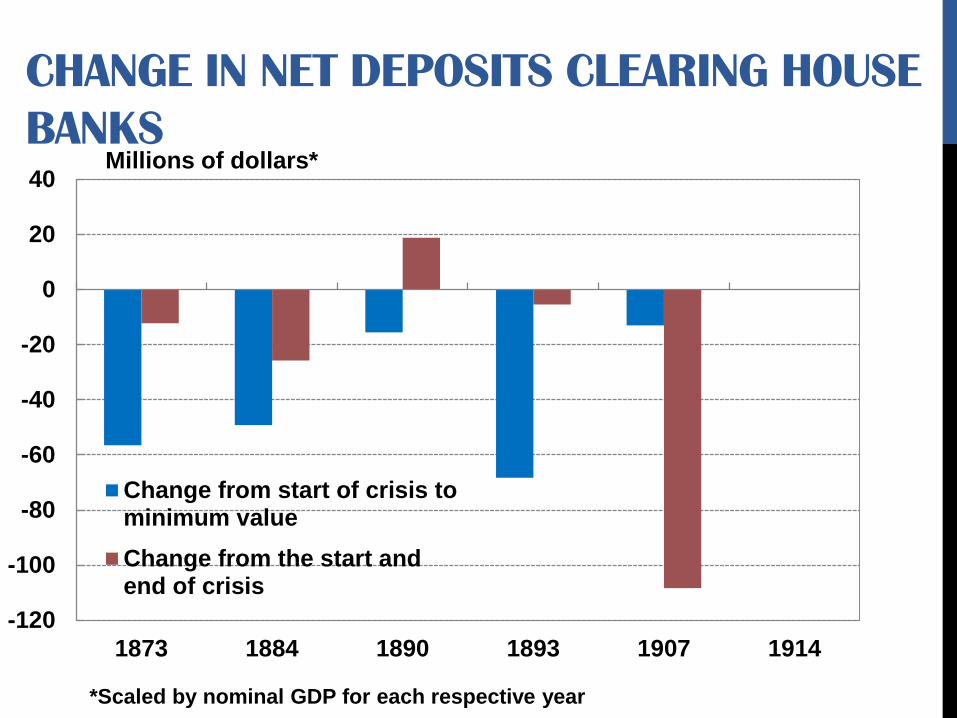
CHANGE IN NET DEPOSITS CLEARING HOUSE BANKS
-120
-100
-80
-60
-40
-20
0
20
40
1873 1884 1890 1893 1907 1914
Change from start of crisis tominimum valueChange from the start andend of crisis
Millions of dollars*
*Scaled by nominal GDP for each respective year
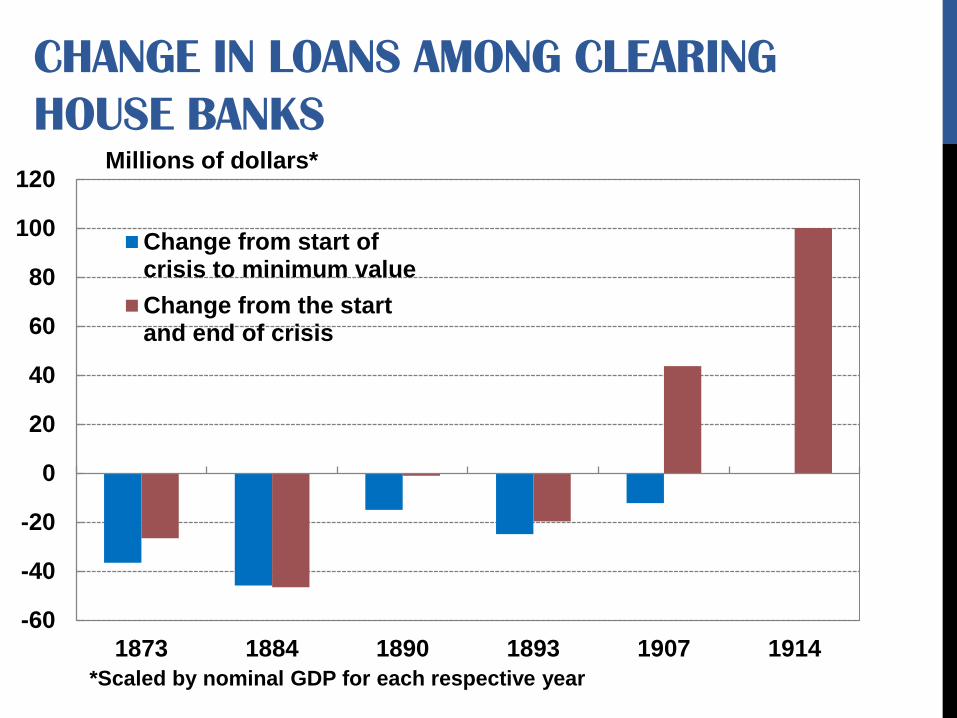
CHANGE IN LOANS AMONG CLEARING HOUSE BANKS
-60
-40
-20
0
20
40
60
80
100
120
1873 1884 1890 1893 1907 1914
Change from start ofcrisis to minimum valueChange from the startand end of crisis
Millions of dollars*
*Scaled by nominal GDP for each respective year
DATA SUMMARY
• Banking activity and intermediation
• Contracted during the three major NBE panics
• Remained flat in 1914.
• Is borrowing status associated with deposit level changes?
• Examine net deposit levels from the August and December weekly reports in the Commercial and Financial Chronicle
• Group data by borrowing status – four groups

TOTAL NET DEPOSITS BY BORROWING STATUS
9.29
15.28
-3.06
2.09
-5
0
5
10
15
20
Emergencycurrency only
Clearing houseloan certificates
only
Both No borrowing
%
%
%
%
December 1914 – August 1914 percent change
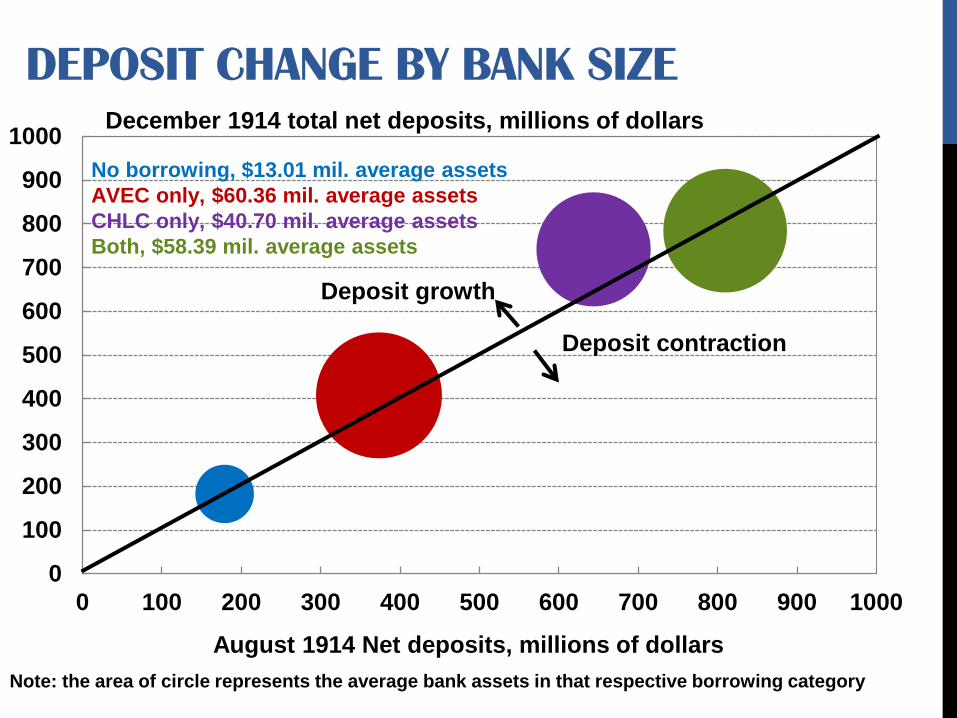
DEPOSIT CHANGE BY BANK SIZE
0
100
200
300
400
500
600
700
800
900
1000
0 100 200 300 400 500 600 700 800 900 1000
No borrowing, $13.01 mil. average assets AVEC only, $60.36 mil. average assets CHLC only, $40.70 mil. average assets Both, $58.39 mil. average assets
Deposit growth
Deposit contraction
December 1914 total net deposits, millions of dollars
August 1914 Net deposits, millions of dollars Note: the area of circle represents the average bank assets in that respective borrowing category
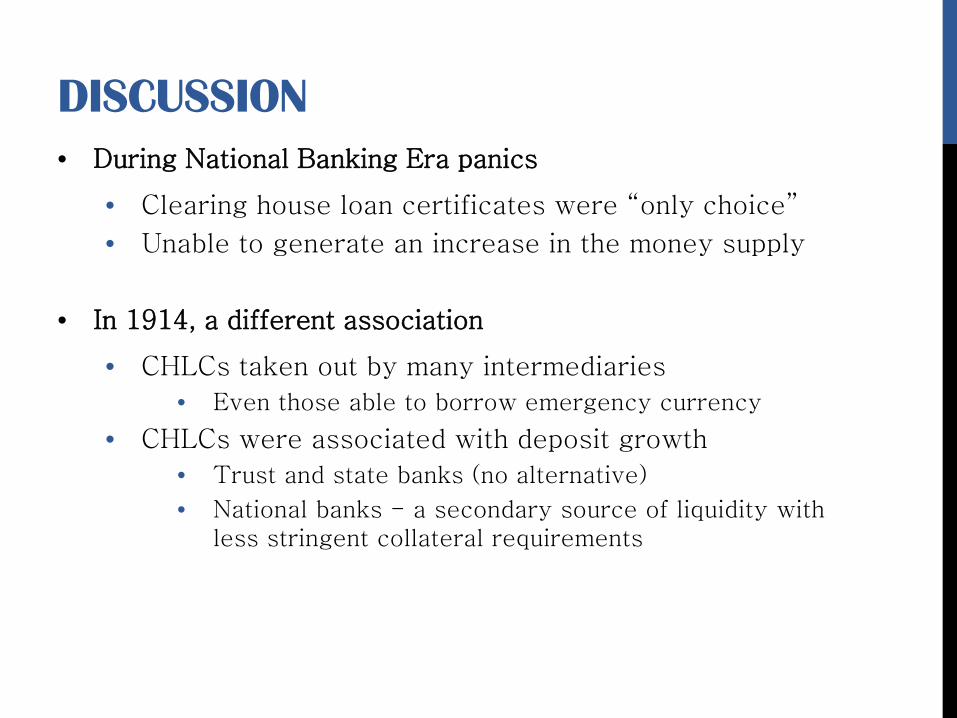
DISCUSSION • During National Banking Era panics
• Clearing house loan certificates were “only choice”
• Unable to generate an increase in the money supply
• In 1914, a different association
• CHLCs taken out by many intermediaries
• Even those able to borrow emergency currency
• CHLCs were associated with deposit growth
• Trust and state banks (no alternative)
• National banks - a secondary source of liquidity with less stringent collateral requirements
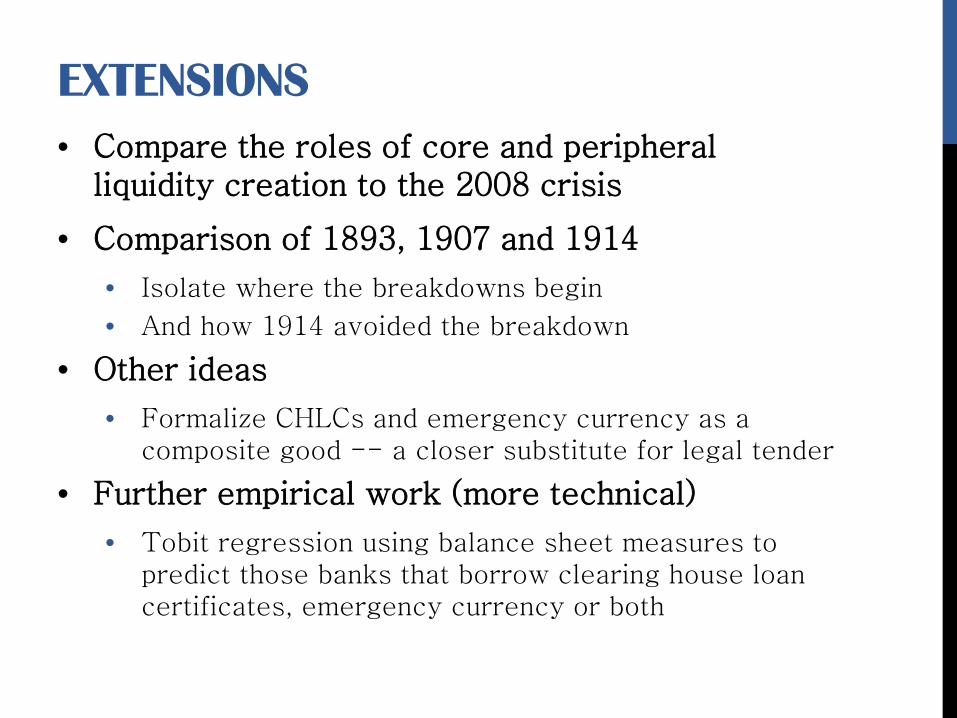
EXTENSIONS • Compare the roles of core and peripheral
liquidity creation to the 2008 crisis
• Comparison of 1893, 1907 and 1914
• Isolate where the breakdowns begin
• And how 1914 avoided the breakdown
• Other ideas
• Formalize CHLCs and emergency currency as a composite good -- a closer substitute for legal tender
• Further empirical work (more technical)
• Tobit regression using balance sheet measures to predict those banks that borrow clearing house loan certificates, emergency currency or both
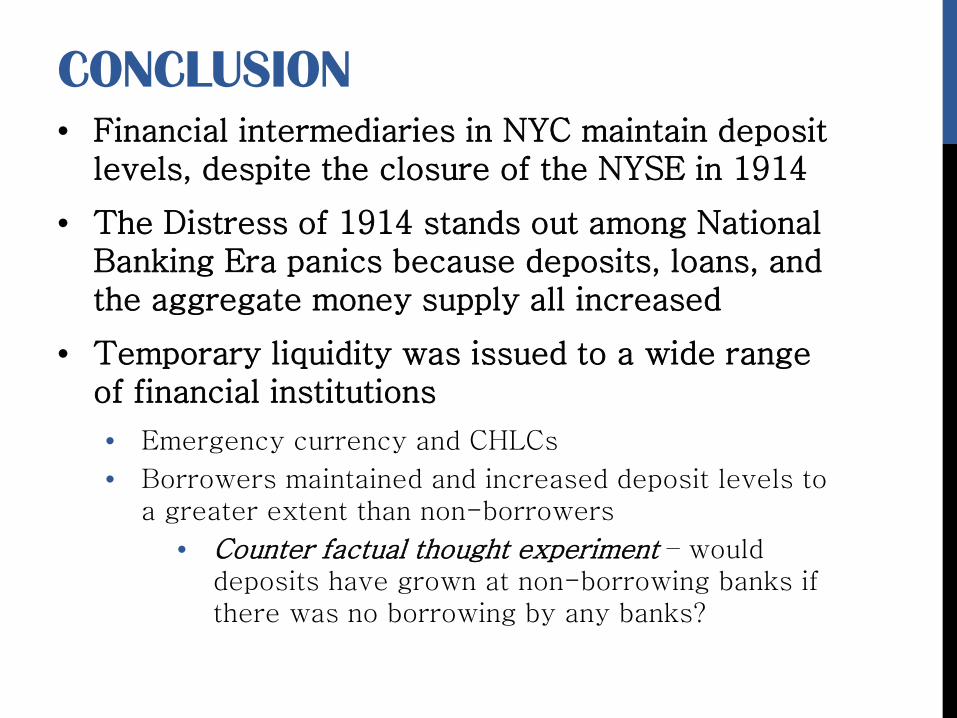
CONCLUSION • Financial intermediaries in NYC maintain deposit
levels, despite the closure of the NYSE in 1914
• The Distress of 1914 stands out among National Banking Era panics because deposits, loans, and the aggregate money supply all increased
• Temporary liquidity was issued to a wide range of financial institutions
• Emergency currency and CHLCs
• Borrowers maintained and increased deposit levels to a greater extent than non-borrowers
• Counter factual thought experiment – would deposits have grown at non-borrowing banks if there was no borrowing by any banks?


