Embed Size (px)
Citation preview

P
Sa
b
c
U
a
ARR2AA
JEGZ
KEPDI
1
dveaoomtd
m
cito
1h
The Quarterly Review of Economics and Finance 52 (2012) 333– 347
Contents lists available at SciVerse ScienceDirect
The Quarterly Review of Economics and Finance
jo u rn al hom epage: www.elsev ier .com/ locate /qre f
rofit distribution management by Islamic banks: An empirical investigation
ayd Farooka,1, M. Kabir Hassanb,∗, Gregory Clinchc,2
Global Head of Islamic Capital Markets, Thomson Reuters, 10th Floor, West Tower, Bahrain Financial Harbour, PO Box 1030, BahrainDepartment of Economics and Finance, University of New Orleans, New Orleans, LA 70148, USADepartment of Accounting and Business Information Systems, Business and Economics Building, ‘The Spot’, 198 Berkeley Street, (Building 110),niversity of Melbourne, 3010 Victoria, Australia
r t i c l e i n f o
rticle history:eceived 19 February 2011eceived in revised form7 December 2011ccepted 13 April 2012vailable online 26 April 2012
EL classification:4421
a b s t r a c t
The objective of this paper is to ascertain whether Islamic banks do in fact manage profit distributions andif so, what factors are associated with the extent of profit distribution management. The results suggestthat most Islamic banks manage profit distributions, with the extent of profit distribution directly relatedto religiosity, financial development, asset composition, and existence of discretionary reserves, while itis inversely related to market familiarity with Islamic banking, market concentration, depositor fundingreliance and the age of the Islamic bank.
© 2012 The Board of Trustees of the University of Illinois. Published by Elsevier B.V. All rights reserved.
12
eywords:arnings managementrofit distributioneterminants
td
stradfi
slamic banking
. Introduction
Islamic banks have the implicit flexibility to manage theirepositor profit distributions ex post as a result of being able toary the management fee attributable to the shareholders. To thatxtent, Sundararajan (2005) finds that Islamic banks do in fact man-ge profit distributions towards interest rates for his limited samplef 14 banks. He derives his sample from 8 countries (not specified)ver the years 2002 and 2003.3 His assertion that Islamic banks
anage profit distributions relies on the strong significant correla-ion between market deposit interest rates and the distributions toepositors for the Islamic banks in his sample. This is in contrast to
∗ Corresponding author. Tel.: +1 504 280 6163; fax: +1 504 280 6397.E-mail addresses: [email protected] (S. Farook),
[email protected] (M.K. Hassan), [email protected] (G. Clinch).1 Tel.: +973 1750 2033.2 Tel.: +61 3 834 46446; fax: +61 3 934 92397.3 Sundararajan’s sample of Islamic banks is widely dispersed from a number of
ountries (8 in total) and there is nothing in the results to suggest that this effects limited to regulatory regimes in specific countries. However, it is acknowledgedhat the sample may have limited generalisability due to the limited number ofbservations (18 in total). This study seeks to remedy that limitation.
t
qdtbttwbttti
062-9769/$ – see front matter © 2012 The Board of Trustees of the University of Illinoisttp://dx.doi.org/10.1016/j.qref.2012.04.007
he insignificant correlation between asset returns and depositoristribution rates for the Islamic banks in his sample.
While Islamic banks have an explicit contractual obligation tohare profits with depositors, Sundararajan’s (2005) results essen-ially imply that Islamic banks may face competition costs whichequire an implicit contractual condition between the depositorsnd the bank to provide distributions similar to market basedeposit interest rates. This study extends Sundararajan’s study byrst expanding the sample size, and second, considering factorshat might be related to profit distribution management.
Besides being attractive economic questions by themselves, theuestions of whether and why Islamic banks manage their profitistributions are interesting since the extent of profit distribu-ion management may have a bearing on the risk outlook of theank itself. To the extent that the bank engages in profit distribu-ion management, it is arguably taking on more equity risk andhereby shielding investment depositors from the risk associatedith the asset portfolio of the bank. This would implicitly require
ank management to be more cautious about the risk profile of
heir investments and ensure that the shareholders’ equity is nothreatened. Alternatively, if the bank is not engaging in profit dis-ribution management, the bank is passing on equity risk to thenvestment depositors. Being able to pass on equity risk to the. Published by Elsevier B.V. All rights reserved.

3 f Econ
itaw
wewtTwa
btebisusvmfcm
bMlSat
Yctuttdtoff
Storo
2
itaits
c
sldrvr22bsp(a
aIsbt
oascoS(tSfte
trtdsiwiaeotIcp
2I
tfprofit distributions to depositors. These are the characteristics ofthe Muslim population and the characteristics of competition in
34 S. Farook et al. / The Quarterly Review o
nvestment depositors, the bank may have heightened incentiveso engage in riskier investments and thereby increase moral haz-rd, under the implicit assumption that investment account holdersill absorb some of the losses (Cihak & Hesse, 2010).4
This setting provides the principal motivation to investigatehether Islamic banks manage their profit distributions in an
nlarged sample of Islamic banks and what factors are associatedith the extent to which they manage their profit distributions
owards market based interest rates or away from asset returns.he extent to which they manage profit distributions to depositorsill also have implications on the Islamic bank’s financial stability
nd financial reporting incentives.This paper analyses two issues related to profit management
y Islamic banks. First, the paper provides systematic evidence ofhe phenomenon of profit distribution management as anecdotallyvidenced by Sundararajan (2005) using a full sample of Islamicanks. This objective is addressed in the results section by compar-
ng depositor profit distributions with a range of other measuresuch as market deposit rates and asset return rates for each individ-al bank, country wise and for the aggregate sample of banks. Theecond objective is to ascertain the factors that are associated withariation in the extent to which depositor profit distributions areanaged towards market based depositor interest rates and away
rom fundamental return on assets. This objective is addressed byonducting several regression analyses on an original empiricalodel developed in this study.The evidence gathered in this study suggests that most Islamic
anks manage profit distributions, with Islamic banks in Brunei,alaysia and the United Arab Emirates demonstrating consistently
ower average profit distribution management (based on Assetpreads). In contrast, Islamic banks in Bahrain, Indonesia, Pakistannd Saudi Arabia have consistently higher average profit distribu-ion management (based on Asset Spreads).
With the exception of banks from Bahrain, Kuwait, Turkey andemen, there is no evidence to suggest all Islamic banks in a specificountry systematically and consistently manage profit distribu-ions towards deposit rates and away from asset rates. No commonnderlying factor between these countries can potentially be foundo ascertain why Islamic banks systematically manage profit dis-ributions The results suggest that Islamic banks do manage profitistributions and such discretionary activity is directly relatedo religiosity, financial development, asset composition, existencef discretionary reserves, while it is inversely related to marketamiliarity with Islamic banking, market concentration, depositorunding reliance and the age of the Islamic bank.
The paper is divided into five sections. Following introduction,ection 2 develops the theory to explain the factors associated withhe variation in profit sharing, while the subsequent section devel-ps the specific hypotheses to be tested. Section 3 discusses theesearch design and Section 4 provides a description and analysisf the results, while Section 5 concludes this chapter.
. Literature and hypothesis development
Islamic banks have developed two reserves called profit equal-sation reserve (PER) and investment risk reserves (IRR) to be ableo pay the investment account holders (IAH) a steady rate of returnnd keep their capital intact. The PER is created by deductions from
ncome earned on investments prior to profit allocation betweenhe bank and its IAH. The IRR is built up by appropriations from thehare of profit allocated to the IAH after deduction of the bank’s4 This is under the assumption that banks do not have other risk managementonstraints imposed by regulators such as capital adequacy based asset risk weights.
t
rtc
omics and Finance 52 (2012) 333– 347
hareholders. The use of these reserves (PER and IRR) has simi-arities with the use of conventional revenue reserves to smoothividend payouts to shareholders. Whereas in case of conventionaleserves that belong to shareholders and are reflected in their sharealue, the IAH has no right to vote for or against the use of theseeserves decided by the bank board of directors (Archer & Karim,006; Archer, Karim, & Sundararajan, 2010; Sundararajan, 2007,008). The calculation and use of PER and IRR are decided by Islamicanks based on their own discretion and there are no specificupervisory disclosure requirements regarding this. Indeed, theublicly available information on these reserves is rather limitedSundararajan, 2005). Literature on income smoothing practicesre limited, and results are mixed at best.
Using firm-level data over the period 2001–2006, Taktak, Zouari,nd Boudriga (2010) examine income smoothing practices inslamic banks and test the use of Loan Loss Provisions (LLP) totabilise net income. Their results show that, unlike conventionalanks, Islamic banks do not use LLPs to smooth their income. Ratherhey use IRR and PER to maintain stable income.
Using a sample of Islamic and conventional banks for the periodf 2000–2003 in Gulf Cooperation Council (GCC) countries, Zoubind Al-Khazali (2007) find support for income smoothing hypothe-is. They find that banks in GCC use LLPs to smooth their income. Inase of Malaysian banks, Ismail and Be Lay (2002) also find evidencef earnings management using LLP over the period 1997–1999.imilar results were also found by Shahimi, Ismail, and Ahmad2006), based on a sample of 15 Malaysian Islamic banks overhe period 1996–2003. However, later Ismail, Shaharudin, andamudhram (2005), using again Malaysian Islamic banking datarom 1998 to 2001, show that bank managers do not LLP to smoothheir earnings, but they use security gains/losses to smooth theirarnings.
A large proportion of the target market of Islamic banks is likelyo be sensitive to market based price measures such as interestates, particularly if these banks operate in competitive contrac-ual environments with other Islamic and conventional banks andeposit taking institutions. As a result, Islamic banks may be pres-ured in varying degrees to provide distributions similar to othernstitutions or risk losing their depositor base.5 The extent to
hich Islamic banks actually manage distributions to their depos-tors towards market based interest benchmarks will not only bessociated with the pressures on the bank through its contractualnvironment, termed demand side factors, but also by the bank’swn characteristics which define its interactions with this contrac-ual environmental, termed supply side factors. This is because theslamic bank is likely to position itself in the market based on itsomparative advantage and this positioning will be reflected in itsroduct or service attributes.
.1. Demand side analysis of profit distribution management ofslamic banks
Given the potential markets for Islamic banks, there are essen-ially two broad inter-related factors which will have implicationsor the extent to which Islamic banks are pressured to manage
he market for interest bearing deposits.
5 In the Islamic banking literature, this risk has been termed displaced commercialisk. It essentially refers to the risk that investors will withdraw their funds in droves,hereby subjecting the bank to insolvency, if the returns paid demonstrate a trendontrary to the investors’ expectations of instruments/deposits of a similar nature.

f Econ
2
tialbcI(mwgb
Heam
2
apbofbtpdttnwotTbriTbrbdb
HeaI
2p
eiw2ivttfa
aahmdotEcud
sitedmp
btt
Hebc
2
atoaLtbfbcp
iHepwotto
Hebi
2
ti
S. Farook et al. / The Quarterly Review o
.1.1. Islamic religious commitment in a marketBased on the assumption that Islamic banks’ principal cus-
omers are Muslims, the extent of aggregate religious commitmentn a particular country will influence the behaviour of the bank. If
higher proportion of consumers fall into the category of Shari’ahoyalists (strictly religious observant) or the Floating segment (com-ination of religion and market forces) as a result of their religiousommitment, it is likely that they will be more concerned aboutslamic legitimacy rather than meeting interest rate benchmarksprice insensitive). As a result, the pressure on Islamic banks to
eet such benchmarks will also be relatively lower. Hence, thereill be an inverse association between the extent of Islamic reli-
ious commitment in a country and the extent to which Islamicanks manage depositor profit distributions towards interest rates.
1. Ceteris Paribus, there is a negative relationship between thextent of profit distribution management towards interest rates by
particular Islamic bank and the level of Islamic religious commit-ent in the country of operation.
.1.2. Familiarity with Islamic bank operating structureThe floating segment of the market is potentially concerned
bout religious prohibitions on usury/interest, but is neverthelessrice and feature sensitive. This segment’s customers may switchetween banks based on price or religious legitimacy, dependingn which end of the market spectrum they belong to. However,or both ends of the floating segment market, their decision wille tempered by their familiarity or understanding of their con-ractual relationship with Islamic banks and consequently theirrice based switching incentives may be reduced or heightened. Ifepositors are aware that Islamic banks are in principle supposedo provide profit based distributions, they will have less incentiveo immediately switch in years where the profit distributions doot meet other interest based benchmarks, in the hope that theyill also receive better distributions in years of better performance
f the underlying assets. This is likely to result in less pressure onhe Islamic bank to manage distributions towards interest rates.he intuition for this proposition is derived from views of Islamicankers who cite the lack of awareness among customers as theeason why there is a dearth of product variety (implying a lack ofnvestment products with varying risk/return profiles) (Fida, 2006).hey were of the opinion that this would change as customers get aetter understanding of the operations of Islamic banking throughepeated interaction with Islamic banks and promotion of Islamicanking as an industry. Accordingly, an inverse relationship is pre-icted between the extent of the market’s familiarity with Islamicanking and the level of profit distribution management.
2. Ceteris paribus, there is a negative relationship between thextent of profit distribution management towards interest rates by
particular Islamic bank and the level of market familiarity withslamic banking in a particular country.
.1.3. Financial market development and investment/depositroduct positioning
Financially developed markets are characterised by the pres-nce of numerous value added informational and financialntermediaries which assist in reducing uncertainty associated
ith risky assets and increasing investor confidence (Ndikumana,005). This infrastructure of intermediaries assists individuals and
nstitutions by providing information about and access to a wideariety of asset classes that produce comparably greater returns
han plain vanilla deposit based products, while diversifying unsys-ematic risk. To the extent that uncertainty is reduced, investorseel less need to worry when investing and therefore are encour-ged to invest more rather than save (Lehmann, 1997). In thetgtt
omics and Finance 52 (2012) 333– 347 335
bsence of such informational and financial intermediaries whossist investors to assess and mitigate risks, investors are appre-ensive to place their funds in risky investments. Rather, they areore willing to place their funds in capital protected plain vanilla
eposits, which offer a strong certainty of low returns regardlessf market risk. This is bolstered by an implicit deposit guaran-ee by most governments in underdeveloped financial systems.ven if individuals or institutions wanted to invest, the transactionosts required to diversify the individual investor’s risk exposure innderdeveloped markets is likely to outweigh the benefits of suchiversification.
As a result, poorly developed financial markets will impose atronger pressure on Islamic banks to provide stable market basednterest distributions with implicit, if not explicit capital protec-ion. In contrast, well developed financial markets will provide annvironment conducive for Islamic banks to promote an array ofeposit/investment products with varying risk/return profiles thatatch the underlying asset returns of the bank rather than just
lain vanilla deposit products.Accordingly, it is predicted that there is an inverse relationship
etween the level of financial market development and the extento which Islamic banks manage their depositors’ profit distribu-ions towards interest rates.
3. Ceteris paribus, there is a negative relationship between thextent of profit distribution management by a particular Islamicank and the level of financial market development in a particularountry.
.1.4. Competition in the market for depositsThe large majority of countries where Islamic banks operate
re characterised by a dual banking system where both conven-ional and Islamic banks co-exist. These banks compete with eachther for deposit shares. As mentioned earlier, Islamic banks have
definitive comparative advantage when considering the Shari’ahoyalist segment of the market. However, the other two markets,he Conventional Loyalists (those who park their deposits in interest-earing accounts) and Floating segments, are sensitive to price andeatures to varying degrees. For these market segments, Islamicanks would face competition with other Islamic banks and evenonventional banks, particularly if they are competing on solelyrice terms.
Consequently, Islamic banks will be pressured to match thenterest rates provided by such banks in a bid to gain market share.owever, the extent to which this pressure is applied and thextent to which Islamic banks yield to this pressure by managingrofit distributions will be dependent on the level of concentrationithin the market, with Islamic banks retaining a significant share
f a concentrated market having less need to manage distributionso depositors. Hence, an inverse relationship is predicted betweenhe level of bank concentration in a particular country and the levelf profit distribution management by Islamic banks.
4. Ceteris paribus, there is a negative relationship between thextent of profit distribution management by a particular Islamicank and the level of concentration in a particular country’s bank-
ng market.
.1.5. Economic environmentThe cyclical fluctuations of the country’s economy will affect
he financial performance of Islamic banks in that country. Specif-cally, poor economic conditions such as a recession might lead
o increases in the unemployment rate and decreases in businessrowth. Both businesses and individuals may therefore be unableo service their credit obligations to Islamic banks. These poten-ial defaults will certainly cause direct write-downs or increases
3 f Econ
i(fdofiaep
Heaw
2a
bui
2
sbhtaoaec
abtrcaioaafir
ihctrmtsisstHtaI
wmtat
eitwiptam
Heaa
2
tvtstf
diahmmadod
Hee
2d
oaiiusimath
ms
36 S. Farook et al. / The Quarterly Review o
n provisions. As a result, the portfolio of assets funded by the IAHinvestment account holder) may perform poorly and any profitrom performing credit will be offset by losses caused by write-owns and provisioning. Consequently, Islamic banks will have toffset such losses to maintain competitive returns to IAH by sacri-cing their own profits and perhaps even the shareholders’ capitalnd reserves. Hence, an inverse relationship is predicted betweenconomic conditions as measured by GDP growth and the level ofrofit distribution management by Islamic banks.
5. Ceteris paribus, there is a negative relationship between thextent of profit distribution management towards interest rates by
particular Islamic bank and the GDP growth of the country inhich the respective Islamic bank operates.
.2. Supply side analysis of Islamic bank characteristics and theirssociation with profit distribution management
The following sections attempt to describe the implications ofank characteristics on profit distribution management. In partic-lar, the bank’s exposure to loan assets, the aggregate depositors’
nfluence on the bank, and the existence of reserves are examined.
.2.1. Asset composition (LA/TA ratio)The asset composition of an Islamic bank, specifically its expo-
ure to fixed rate financing, may affect the extent to which theank manages profit distributions to depositors. Due to the pro-ibition of interest in Islamic law, Islamic banks are restricted inhe type of instruments they can utilise to mobilise deposits. Sincell banks have incentives to reduce their overall risk, Islamic banksver-invest in low risk debt-like instruments instead of the otherlternative which is high risk profit sharing instruments. To thatxtent, some Islamic banks have up to 90% of their asset portfoliooncentrated in fixed rate debt instruments.
Generally, the only types of debt or debt like instruments theyre allowed to use are lease structures, cost plus profit mark-upased financing or deferred sale financing. A key characteristic ofhese instruments (with the exception of lease financing) is that theate of profit (interest rate) is determined at the inception of theontract. Since many of these instruments have contract periodsnywhere between 3 months to 8 years, Islamic banks are lockednto that rate of interest for the period of the contract, regardlessf whether market interest rates are changing. In the event of andverse interest rate change, Islamic banks face a fund gap betweensset returns which are fixed at inception and liabilities (depositors’unds) which are sensitive in varying degrees to changes in marketnterest rates (Rosly, 1999). This fixed rate exposure is termed profitate risk (the Islamic equivalent to interest rate risk).
If Islamic banks share their profits and losses fully with depos-tors, there is no profit rate risk per se. However, if depositorsave expectations to receive a particular rate of return based onompetitive rates, then Islamic banks have to smooth profits toheir depositors, resulting in an equivalent effect as interest rateisk. Conventional banks usually deal with over-exposures to mis-atches with derivatives such as interest rate swaps or by moving
hose assets off balance sheet. Islamic banks cannot avail them-elves of the various conventional derivative instruments availablen the market to mitigate profit rate risk such as profit/interest ratewaps, as a result of Islamic legal restrictions. Islamic law prohibitspeculative activities and transactions which do not involve theransfer of tangible assets, as opposed to financial assets or risk.
ence, artificial derivatives and debt sale are largely disallowed inhe Islamic finance space. Until recently, there have been no widelyvailable Islamic alternatives to such instruments and thereforeslamic banks were at a relative disadvantage to conventional banks
saud
omics and Finance 52 (2012) 333– 347
hich, assuming that such hedging derivatives are available in thearket, are able to manage their exposures appropriately. In addi-
ion, Islamic banks are not allowed to sell the resulting debt basedssets and move them off-balance sheet to reduce their exposureo the fixed rate assets.
Hence, the extent of fixed rate loan assets will determine thextent to which the Islamic bank is exposed to returns mismatchn the event of market wide interest rate changes. Consequently,he extent of fixed rate loan assets will also determine the extent tohich Islamic banks have to manage profit distributions to depos-
tors, with a higher exposure demanding a larger magnitude ofrofit distribution management, vice versa. Hence, it is predictedhat there is a direct relationship between the level of loan assetss a percentage of total assets and the extent of profit distributionanagement.
6. Ceteris paribus, there is a positive relationship between thextent of profit distribution management towards interest rates by
particular Islamic bank and the proportion of Islamic loan assetss a percentage of total assets.
.2.2. Influence of depositors on bank decision makingSince Islamic banks extract a significant management fee from
he gross profit distributions to their depositors, they are reliant inarying degrees on depositors to generate earnings. Since Conven-ional Loyalists and the Floating market segments are interest rateensitive, individual Islamic banks will feel pressured to manageheir distributions to their depositors if their reliance on depositorunding for revenue is substantial, all other things being equal.
On the other hand, Islamic banks with a relatively smallerepositor base compared to shareholders funds will not be so
nclined to manage profit distributions as the risk of collapsing as result of large scale depositor withdrawal (bank runs) is not asigh. These banks are less likely to engage in profit distributionanagement to satisfy the demands of the depositors. They areore likely to provide distributions that are consistent with their
sset returns. This is because shareholders are not fully reliant onepositors’ funds for their own profits. Hence, the degree of reliancen depositors’ funds will be associated with the extent to whichepositors profit distributions are managed.
7. Ceteris paribus, there is a positive relationship between thextent of depositor profit distribution management towards inter-st rates and the extent of reliance on the depositors’ funding.
.2.3. Existence of reserves and ease in providing interest likeistributions
While shareholders may have stronger resistance to volatilityf cash flows due to diversification and ‘insider information’, theyre still inclined to reduce such volatility as a result of the costst imposes on the valuation of their assets. This is particularly sof they are institutional shareholders who are accountable to theirnit holders for fluctuations in their investments. The same rea-oning applies to bank regulators and managers who have strongncentives to ensure that shareholders earnings are not volatile. For
anagers, their reputation in the labour market is at stake if theyre seen to be responsible for volatile performance. For regulators,he systemic stability of the banking system is at risk if banks haveigher earnings volatility (DeYoung & Roland, 2001).
As a result, numerous Islamic banks have initiated a ‘reserve’echanism to manage distributions to their depositors without
ubjecting the banks’ earnings to higher volatility. Essentially, any
urplus revenues from depositors’ funds, over and above accept-ble benchmark distributions for depositors, are ‘stored’ for futuretilisation in the event that future revenues do not satisfy theepositors’ range of acceptable distributions. The reserves can of
f Econ
trwdfn
vativwptte
Hee
2
ipbclaidyetbtidaa
Hea
3
3
aatisaatcufr
lf
cfSmdobbvfabCfte
optlfEAAs
3
ttmm
me
D
wDD
IM
F
F
S. Farook et al. / The Quarterly Review o
wo types, as recognised by the AAOIFI. The profit equalisationeserve can be established to smooth distributions to depositors,hereas the investment risk reserve can be established to protectepositors from risk of principal loss. Both of them are accountedor as part of the depositor’s equity, although such amounts mayot be distributed to depositors.
These reserve mechanisms essentially shield shareholders inarying degrees from fluctuations in shareholder earnings whichre associated with profit distribution management. Consequently,his shield will encourage more active risk taking by banks, know-ng that their depositors profit distributions are protected inarying degrees from fluctuations in revenues and cash flows. Evenithout increasing the risk profile of their asset portfolios, it isrobable that banks would be more comfortable in managing dis-ributions to depositors if they had a ‘reserve’. Hence, it is predictedhat the existence of reserves are positively associated with thextent of profit distribution management by Islamic banks.
8. Ceteris paribus, there is a positive relationship between thextent of depositor profit distribution management towards inter-st rates and the existence of discretionary reserves.
.2.4. New banks attempting to instill confidenceDue to the significant start-up costs associated with initialis-
ng operations, it is rare for new businesses to make profits in thereliminary years of their operations. In the case of banks, it maye exacerbated because they may not be able to fully utilise theapital deposited by investors. In this situation, banks may haveow aggregate revenues relative to their capital base (depositorsnd shareholders). Since Islamic bank depositors share their prof-ts with the shareholders and bear all losses, this would imply thatepositors would have to share in the low returns in the first fewears, at least in theory. This in fact may be contrary to the inter-sts of the Islamic bank, as it may lead the investment depositorso withdraw their deposits and place them in banks that provideetter returns. To mitigate this risk, Islamic banks will manage dis-ributions to depositors to instill confidence in them, even thought may result in immediate losses for the bank. Therefore, it is pre-icted that there is a negative relationship between the relativege of an Islamic bank and the extent of profit distribution man-gement.
9. Ceteris paribus, there is a negative relationship between thextent of profit distribution management towards interest ratesnd the age of the particular Islamic bank.
. Research design
.1. Sample and data
The initial dataset is comprised of an unbalanced panel ofpproximately 50 Islamic banks with a minimum of 5 years and
maximum of 7 years per bank ranging from the period of 1993o 2005. All bank specific data, including revenues, profits, depos-tors’ profit distributions and other financial variables have beenourced from Bankscope’s database which contains the actualnnual reports and pro-forma financial information for all listednd unlisted banks in the world. Key financial statement informa-ion for the statistical tests is hand collected from the Bankscopeollection of annual reports. The pro-forma data has not beentilised as it does not factor the difference in financial accountingor Islamic banks and hence does not contain many of the categories
equired for the empirical tests.Macro-economic information, specifically GDP Growth Rates,ending, deposit, and currency exchange rates, has been sourcedrom the Economist Intelligence Unit’s database. Data for the
C
omics and Finance 52 (2012) 333– 347 337
ountry variable: financial market development has been sourcedrom the International Monetary Fund’s International Financialtatistics database. The alternative variables for financial develop-ent are derived from Beck, Demirgüc-Kunt, and Levine’s (2007)
atabase available online at the World Bank website. The numberf years of Islamic bank operation is compiled from a collection ofooks, websites and journal articles, while the size of the Islamicanking industry is calculated by summing up the assets of all indi-idual Islamic banks and Islamic bank windows in each countryor each year. The size of the banking industry of each country islso compiled in a similar fashion, summing up the size of eachank. The religious affiliation of a population is compiled from theIA World Factbook (2007). Where applicable, the data is adjustedor inflation and as such expressed in January US dollars utilisinghe Economist Intelligence Unit’s (EIU) currency exchange rates forach respective year.
The full final dataset gives a range of approximately 194–207bservations for approximately 37 banks in 17 countries. The sam-le is representative to the extent that it covers every Islamic bankhat publishes annual reports and for which data is available pub-icly. The sample includes all the Islamic banks with available datarom the following countries: Algeria, Bahrain, Bangladesh, Brunei,gypt, Indonesia, Jordan, Kuwait, Malaysia, Pakistan, Qatar, Saudirabia, Senegal, Tunisia, Turkey, United Arab Emirates and Yemen.
number of the banks have missing data and therefore all years ofuch banks could not be incorporated in the statistical tests.
.2. Empirical model
Multiple Ordinary Least Square (OLS) regressions are utilisedo ascertain the factors affecting profit distribution managementowards interest rates. The dependent variable: profit distribution
anagement (DEP-PDM) and the number of approaches taken toeasure it are explained in detail after the model is introduced.The profit distribution management model employs approxi-
ately 194 bank-year observations to run the following regressionquation:
EP-PDMi,t = �1MUSLIM-POPk,t + �2FAMILIARk,t + �3FDk,t
+ �4CONCk,t + �5GDPGRk,t + �6LA/TAi,t
+ �7DEPOSITi,t + �8RESERVi,t + �9BANK-AGE
+ �10COUNTRYk + �11Tt + �i + εi,t (1)
hereependent variableEP-PDMk Extent of depositor profit distribution management for
Islamic bank i. We explain this variable below.
ndependent variablesUSLIM-POPk Proportion of Muslim population as a percentage of total
population in country k. This variable is utilised to test H1
which examines the effect of Islamic religious commitmenton profit distribution management by Islamic banks.
AMILIARk Market familiarity with Islamic bank contractual structureproxied by the average number of years Islamic bankinghas been in operation in a respective country at country kOR the percentage of Islamic bank assets as a proportion oftotal banking assets in country k at year t; This variable isutilised to test H2 which examines the effect of marketfamiliarity with Islamic banking (particularly the floatingsegment) on profit distribution management.
Dk Financial development index of country k; This variable isutilised to test H3
ONCk Herfindahl concentration index of the banking market incountry k at year t; this variable is utilised to test H4 whichposits the relationship between the extent ofconcentration in the banking system and the level of profitdistribution management.

3 f Econ
G
L
D
R
B
C
∑
t
�ε
dttT
adab
tteapaabd
tdcIfactcsd
aiar
pa
gfianrttmaptpip
cbtDcapiemm
4
4
otIcksaccevtd(S1ai1satTbtrate is reported in inverse, its reasonableness is not immediatelyassessable.
38 S. Farook et al. / The Quarterly Review o
DPGRk GDP Growth Rate of the country k in which the Islamic bankoperates. This variable is utilised to test H5, which relates theextent of profit distribution management to the economiccondition of the country.
A/TAi Ratio of Islamic loan assets to total assets for bank i at year t.This variable is utilised to test H6, which relates the extent ofprofit distribution management to the Islamic bank’s exposureto Islamic loan assets.
EPOSITi Reliance on depositor’s funds proxied by depositors funds’ as apercentage of total assets for bank i at year t. This variable isutilised to test H7, which relates the extent of profitdistribution management to the extent of reliance ondepositors for shareholder profits.
ESERVi Dummy variable that equals 1 for banks that havediscretionary reserves and 0 otherwise for bank i at year t. Thisvariable is utilised to tests the implications of H8, which positthat the existence of discretionary reserves impacts upon theextent of profit distribution management.
ANK-AGEi,t Number of years of the respective Islamic bank operation. Thisvariable is utilised to test H9, which posits that banks early intheir life will attempt to manage profit distributions towardsinterest rates to instil confidence in their investors.
ontrol variables17
k=1
Countryk Country dummy
2005∑
=1998
Tt Year dummy (only for bank year specific tests)
i Bank specific coefficienti,t Error term
The tests attempting to ascertain the factors associated withepositors’ profit distribution management are original. Hence,he quality of the results may suffer from misspecification ofhe variables. A summary of the variables utilised is given inable 1.
Depositors profit distribution management (DEP-PDM) – This vari-ble aims to capture the extent to which a bank manages its profitistribution towards interest rates and away from fundamentalsset returns. A number of approaches are taken to measure theank-year specific variable.
The first bank-year specific measure of depositors profit dis-ribution management utilised is the absolute spread betweenhe return on assets (ROA) (after considering all expenses butxcluding depositors profits) and the return on investmentccount holder’s (ROIAH) (Asset Spread). The Asset Spread isotentially the closest indicator of the profit distribution man-gement measure, since it considers all revenues and expensesnd provides the spread between total asset return on theank’s asset and services portfolio and the distributions paid toepositors.
The second measure of profit distribution management ishe absolute inverse of the spread between average competitiveeposit rates for all banks for a particular year for a particularountry and the average rate of distributed profits by a particularslamic bank in that particular year (Deposit Spread). This allowsor the determination of the magnitude of profit distribution man-gement towards the average deposit rate of the respective hostountry, with a larger inverse value indicating greater profit dis-ribution management. The inverse spread is utilised to ensureonsistency and relationship between the results for this mea-ure and the other measures of profit distribution managementiscussed.
The third approach measures the absolute spread between theverage return on equity and the average rate of depositors prof-ts distributed (equity spread), on the presumption that a high
bsolute spread indicates profit distribution management. Theate of depositors’ profit distributed is calculated by dividing the fomics and Finance 52 (2012) 333– 347
rofits distributed by the total depositors’ base (excluding currentccounts which are not entitled to profits).
A common limitation of these measures is the effect of aggre-ation of the depositors’ profit rates. Because financial statementgures aggregate the total amount paid to depositors (numerator)nd also aggregate the total depositor base (denominator), there iso viable method by which the exact depositor profit distributionate for each investment account can be deciphered. For instance,he numerator of the measure is potentially the sum of profit dis-ributions from a number of accounts. A 6 month savings account
ay have a different rate of profit applied to a 5 year investmentccount. Further, the depositor base may be composed of differingroportions of each account. When such information is aggregated,he true rate of return on each deposit account type cannot be deci-hered and only an aggregate rate can be deduced. This potentially
mplies that the measure does not capture the true distribution rateaid to depositors with accuracy.
To compensate for the limitations of each measure and theommon limitation discussed, a combined measure of profit distri-ution management is also constructed. This measure multiplieshe Asset Spread and the inverse of the Deposit Spread. Theeposit Spread is transformed into an absolute number. A highombined result implies a high degree of profit distribution man-gement; where as a low combined result implies limited or norofit distribution management. This produces a variable that
ncreases with the extent of profit distribution management. How-ver, this measure relies on the quality of the two underlyingeasures and is therefore reflective of the accuracy of thoseeasures.
. Empirical results
.1. Descriptive statistics
The first objective of this study is to provide systematic evidencef the phenomenon of profit distribution management as anecdo-ally evidenced by Sundararajan (2005) using a larger sample ofslamic banks. Sundararajan’s (2005) results only demonstrate theorrelation between net return on assets, return on equity, mar-et deposit rates with returns to investment depositors through aeries of simple scatterplots. His regression results do not provide
clear indication of the significance of each variable and henceannot be relied upon for empirical verification. As a result, theyannot be used for comparative analysis of the results. Table 2(Pan-ls A–C) provide the descriptive statistics for the major dependentariables utilised in this study, for the aggregate sample, by coun-ry and by bank respectively. Table 2(Panel A) reports standardescriptive statistics for depositor profit distribution managementDEP-PDM) and its variations. As is evident, the maximum Assetpread recorded is 11.9% with a mean and standard deviation of.8% and 2.1%, respectively. For Deposit Spread, the mean is 89.697nd the standard deviation is 92.665. The equity spread maximums 55% and the mean and standard deviation are similar at 11.4 and1.2% respectively. The spreads reported seem to be reasonableince the Asset Spreads are quite small whereas the equity spreadsre significant. This indicates that the banks provide higher returnso equity holders in compensation for the exposure to higher risk.he maximum asset and equity spreads reported may be driveny the hyper inflation in countries such as Turkey, where infla-ion drove up interest rates to extreme highs. Since the deposit
Table 2(Panel B) reports the country wise descriptive analysisor the two main variations of DEP-PDM, Asset Spread and Deposit

S. Farook et al. / The Quarterly Review of Economics and Finance 52 (2012) 333– 347 339
Table 1Variable definitions.
Variable Definition References Predict sign Variable unique/critical to the present study
Dependent variableDEP-PDM 1. Absolute spread between ROA (excluding
depositors returns) and average return oninvestment account holders funds (ROIAH) (AssetSpread)2. Absolute inverse of the spread between nationalaverage deposit rates and average depositors profitdistribution (Deposit Spread)3. Absolute spread between average depositorsprofit distribution rate and return on equity(Equity Spread)4. Asset Spread × 1/Deposit Spread (CombinedSpread)
Original
Independent variablesMUSLIM-POP Level of religious commitment in a country proxied
by proportion of total population that is MuslimFarook, Hassan,and Lanis(2011)
− Tests whether religious commitment reduces theextent of profit distribution management
FAMILIAR Market familiarity with Islamic banks proxied bynumber of years first Islamic banking operation incountry of particular bank OR ratio of Islamicassets (full fledged Islamic banks only) to totalbank assets
Original − Tests whether familiarity of Islamic banking reducesthe extent of profit distribution management
FD Rescaled 0–10 index of the aggregate sum of (1)ratio of broad money to GDP, (2) ratio of the assetsof deposit money banks to assets of central bankand deposit money banks, (3) reserve ratio, (4)ratio of credit to the private sector by depositmoney banks to GDP.
Creane, Goyal,Mobarak, & Sab(2006)
− Tests whether financial development decreases thelevel of profit distribution management
CONC Banking market concentration proxied byHerfindahl concentration index measured by sumof the squares of the market shares of eachindividual bank
Tirole (1990) − Tests whether competition in the banking marketincreases profit distribution management
GDPGR Growth of real per capita gross domestic product(GDP)
Cihak andHesse (2010),Fonseca andGonzalez(2005)
− Cross-country variable to assess the economicpro-cyclical impacts on profit distributionmanagement
LA/TA Ratio of Islamic loan assets (short and long term)to total assets of each bank
Original − Tests whether the bank’s exposure to Islamic loanassets increases the extent of profit distributionmanagement, on the basis that fixed rate loan assetslead to higher returns mismatch
DEPOSIT Ratio of depositors funding to total assets(depositors funding is defined by Profit Sharingdepositors, unrestricted depositors funds, savingsand investment accounts)
Original + Tests whether the reliance on depositors fundingaffects the extent of profit distribution management,on the basis that increased reliance will make the bankyield to profit expectations of depositors
RESERV Dummy variable that equals 1 for banks that havediscretionary reserves (profit equalisation reserveor investment risk reserve) and 0 otherwise
Original + Tests whether the existence of reserves affects thedecision to manage profit distributions, on theassumption that it provides easier access todiscretionary manipulation
BANK-AGE Number of years of bank operation or Dummyvariable that equals 1 for banks that have beenestablished 4 years prior to year t and 0 otherwise
Original − Tests whether Islamic banks early in their life are moresusceptible to profit distribution management
COUNTRY Country dummy with each country being assignedan ordinal value
Control N/A Control
TIME Year dummy with each year having an ordinalvalue
Control N/A Control
� Bank specific co-efficient to control for other Control N/A Control
SaaSvaAt1(
dc
lieo
unidentified bank specific effects
pread. Tunisia has the highest average Asset Spread at 10.59% withn equally high Deposit Spread of 422.29. Kuwait has the higherverage Deposit Spread of 483.81. Malaysia has the lowest Assetpread, suggesting that the two Islamic banks in Malaysia pro-ide economic returns, rather than managed returns. However, theverage Deposit Spread is very high, conflicting with the averagesset Spread, which is much lower. Nevertheless, it is evident that
his may be attributable to 1 or 2 years, since the median is lower at20.44. Similar results are recorded for the United Arab EmiratesUAE), which have very low Asset Spreads, indicating low profit
cnl
istribution management. Yemen, Turkey and Pakistan all record aombination of low asset and Deposit Spread.
Panel C reports additional statistics on DEP-PDM and its under-ying fundamentals. Column 1 of Panel 3 reports whether thendividual countries’ mean Asset Spreads are significantly differ-nt from the mean Asset Spread for the aggregate sample. Thebservations from each country are included in the aggregate mean
alculation. Bahrain and Tunisia have Asset Spreads which are sig-ificantly different from the sample mean at the 1% confidenceevel, while Bangladesh, Indonesia and Yemen have Asset Spreads

340 S. Farook et al. / The Quarterly Review of Economics and Finance 52 (2012) 333– 347
Table 2Descriptive statistics. Panel A: displays the descriptive statistics for the four variations of the dependent variable: depositor profit distribution management (DEP-PDM) withobservations ranging from 243 to 247. Extreme outliers are excluded from the results. Panel B: shows the descriptive statistics by country for the two major variations of thedependent variable: depositor profit distribution management (DEP-PDM) Asset Spread and Deposit Spread. Panel C: provides certain specific country wise analysis of themain dependent variables DEP-PDM Asset Spread and Deposit Spread. Test (1) displays the significance (or otherwise) of difference in means between each country’s meanAsset Spread and the mean Asset Spread for the aggregate sample. Test (2) displays the Pearson and Spearman correlation statistics between Asset Spread and Deposit Spread.Test (3) and (4) displays the correlation statistics between the underlying constructs of DEP-PDM, which are ROIAH and ROA for Asset Spread and ROIAH and Deposit Ratesfor Deposit Spread. Panel D: provides the bank wise descriptive statistics (mean and median) for the dependent variable DEP-PDM (Combined Spread and Asset Spread).Panel E: The following table displays the descriptive statistics for the main independent variables utilised in this study.
Variables N Min Max Mean S.D. Skewness S.E. kurtosis Kurtosis S.E. kurtosis
Panel A: Descriptive analysis for dependent variable (DEP-PDM) variationsDEP-PDM 1 (Asset Spread) 248 0.000 0.119 0.018 0.021 2.208 0.155 5.401 0.308DEP-PDM 2 (Deposit Spread) 239 1.431 468.904 89.697 92.665 1.737 0.157 2.972 0.314DEP-PDM 3 (Equity Spread) 246 0 0.558 0.114 0.112 1.516 0.155 2.366 0.309DEP-PDM 4 (Comb. Spread) 247 0.002 19.950 1.403 2.673 4.379 0.155 22.395 0.309
Country Asset Spread Deposit Spread
N Mean Median S.D. Min Max N Mean Median S.D. Min Max
Panel B: Country wise descriptive analysis for DEP-PDMAlgeria 6 3.02% 2.94% 1.03% 1.95% 4.23% 6 115.61 85.15 113.87 12.00 338.93Bahrain 39 3.84% 1.98% 4.81% 0.12% 25.07% 38 65.52 39.23 61.67 5.03 234.57Bangladesh 41 1.46% 0.90% 1.68% 0.07% 7.76% 41 110.16 84.37 88.01 12.79 397.31Brunei 4 0.69% 0.67% 0.17% 0.51% 0.92% 4 112.64 104.93 74.58 46.24 194.47Egypt 16 1.65% 0.96% 2.54% 0.01% 10.26% 16 83.12 36.69 120.74 10.17 492.15Indonesia 14 3.40% 1.19% 6.13% 0.03% 23.06% 13 59.98 18.09 77.43 4.84 286.40Jordan 13 1.05% 0.91% 0.73% 0.40% 3.07% 13 95.52 63.80 110.05 21.04 428.08Kuwait 8 1.53% 1.46% 0.17% 1.42% 1.92% 8 483.81 266.67 725.80 64.78 2240.15Malaysia 16 0.57% 0.20% 0.96% 0.03% 3.83% 16 353.98 120.44 897.84 28.25 3700.39Pakistan 10 2.35% 1.86% 1.46% 1.10% 5.71% 10 33.28 23.12 23.35 18.32 90.58Qatar 15 1.83% 1.07% 2.01% 0.03% 6.34% 15 138.88 92.08 111.17 15.15 405.90Saudi Arabia 11 2.58% 2.79% 1.82% 0.06% 6.05% 11 148.85 68.97 182.77 14.87 645.48Senegal 4 1.71% 1.64% 1.43% 0.04% 3.53% 4 187.93 194.95 133.79 38.99 322.83Tunisia 11 10.59% 0.35% 13.70% 0.01% 29.67% 7 422.29 349.68 312.22 23.19 852.82Turkey 15 1.83% 1.66% 1.34% 0.08% 5.41% 15 4.25 2.85 3.63 1.43 11.76UAE 20 0.87% 0.69% 0.73% 0.08% 2.87% 21 381.11 98.75 949.74 24.39 4226.54Yemen 11 1.82% 1.42% 1.39% 0.69% 5.48% 11 15.79 15.38 5.40 7.94 29.22Total 254 0.024 0.011 0.043 0.000 0.297 249 148.75 64.78 403.42 1.43 4226.54
Country N (1) (2) (3) (4)
Asset Spreadsig diff. frommean
Correlation Asset Spread-Deposit Spread Correlation ROIAH-ROA Correlation ROIAH-Deposit Rates
Levene’s test Pearson Sig Spearman Sig Pearson Sig Spearman Sig Pearson Sig Spearman Sig
Panel C: Country wise descriptive analysis for DEP-PDMa
Algeria 6 0.378 0.680 0.829 ** 0.592 0.257 −0.082 −0.029Bahrain 39 0.001 *** −0.675 *** −0.824 *** 0.869 *** 0.880 *** 0.152 0.221Bangladesh 41 0.056 ** −0.173 −0.079 0.552 *** 0.650 *** 0.401 ** 0.289 *
Brunei 4 0.205 −0.128 0.200 0.993 *** 0.933 *** 0.050 0.000Egypt 16 0.682 −0.234 −0.359 0.970 *** 0.947 *** 0.453 0.333Indonesia 14 0.018 ** −0.362 −0.313 −0.592 ** 0.165 0.556 ** 0.385Jordan 13 0.070 * −0.326 −0.495 * 0.590 ** 0.610 ** 0.790 *** 0.835 ***
Kuwait 8 0.074 * 0.912 *** 0.524 0.979 *** 0.810 ** 0.963 *** 0.976 ***
Malaysia 16 0.068 * −0.115 −0.374 0.687 *** 0.921 *** 0.878 *** 0.955 ***
Pakistan 10 0.369 −0.077 −0.006 0.590 * 0.745 ** 0.371 0.468Qatar 15 0.753 0.316 0.111 0.368 0.547 ** 0.952 *** 0.958 ***
Saudi Arabia 11 0.607 −0.352 −0.382 0.622 * 0.587 * 0.588 * 0.523Senegal 4 0.507 −0.904 * −1.000 *** 0.770 0.200 N/A N/A N/A N/ATunisia 11 0.000 *** −0.570 −0.429 0.905 *** 0.927 *** 0.853 *** 0.892 ***
Turkey 15 0.201 0.711 *** 0.486 * 0.879 *** 0.818 *** 0.173 0.214UAE 20 0.033 ** −0.119 0.281 0.846 *** 0.800 *** 0.703 *** 0.701 ***
Yemen 11 0.248 0.831 *** 0.664 ** 0.211 0.355 −0.090 −0.075Total 254 −0.135 ** −0.397 *** 0.541 *** 0.772 *** 0.254 *** 0.633 ***
Bank name Country Count Combined Spread Asset Spread
Mean Median Mean Median
Panel D: Bank wise descriptive analysis for DEP-PDMBanque Al Baraka d’Algerie Algeria 10 4.2 2.6 3.02% 2.94%Al Baraka Islamic Bank BSC Bahrain Bahrain 14 0.8 0.6 2.44% 1.69%Bahrain Islamic Bank B.S.C. Bahrain 13 0.7 0.4 0.54% 0.37%Kuwait Finance House Bahrain Bahrain 4 1.4 0.8 13.12% 11.88%Shamil Bank of Bahrain EC Bahrain 13 0.8 0.5 6.57% 7.37%Al-Arafah Islamic Bank Bangladesh 9 1.1 0.8 0.77% 0.78%Islami Bank Bangladesh Bangladesh 14 0.6 0.4 0.85% 0.90%

S. Farook et al. / The Quarterly Review of Economics and Finance 52 (2012) 333– 347 341
Table 2(Continued)
Bank name Country Count Combined Spread Asset Spread
Mean Median Mean Median
Oriental Bank Ltd Bangladesh 8 3.0 1.3 2.60% 3.47%Shahjalal Bank Bangladesh 5 1.4 1.2 2.88% 1.75%Social Investment BankLtd Bangladesh 10 1.5 0.8 1.46% 0.94%Islamic Bank of Brunei bhd. Brunei 8 0.4 0.4 0.71% 0.71%Islamic Development Bank of Brunei Bhd. Brunei 5 1.2 1.2 0.67% 0.67%Egyptian Saudi Finance Bank Egypt 13 1.2 1.1 2.14% 0.63%Faisal Islamic Bank of Egypt Egypt 14 0.3 0.4 1.43% 1.06%PT Bank Muamalat Indonesia Indonesia 10 0.4 0.2 4.30% 1.13%Bank Syariah Mandiri Indonesia 6 0.7 0.6 1.76% 1.88%Islamic International Arab Bank Jordan 8 0.9 0.9 1.28% 1.04%Jordan Islamic Bank for Fin and Inv Jordan 14 0.6 0.3 0.78% 0.86%Kuwait Finance House Kuwait 13 3.5 3.6 1.53% 1.46%Bank Muamalat Malaysia Berhad Malaysia 7 0.3 0.3 0.45% 0.19%Bank Islam Malaysia Berhad Malaysia 11 1.5 0.3 0.65% 0.22%Faysal Bank Ltd Pakistan 6 0.8 0.4 2.19% 2.01%Meezan Bank Limited Pakistan 6 0.7 0.3 2.51% 1.60%Qatar International Islamic Bank Qatar 14 0.8 0.5 1.27% 0.77%Qatar Islamic Bank SAQ Qatar 11 3.3 1.5 2.46% 2.13%Al Rajhi Bank Saudi Arabia 6 1.8 1.6 3.55% 3.18%Bank Al-Jazira Saudi Arabia 6 4.0 0.9 1.42% 0.92%Banque Islamique du Sénégal Senegal 9 1.9 1.7 1.71% 1.64%Beit Ettamouil Saoudi Tounsi – B.E.S.T. Tunisia 12 1.0 1.0 4.52% 0.32%Kuwait Turkish Participation Bank Inc Turkey 9 0.1 0.0 2.31% 1.88%Asya Katilim Bankasi AS Turkey 8 0.1 0.0 1.29% 1.22%Abu Dhabi Islamic Bank UAE 8 2.4 0.4 0.51% 0.47%Dubai Islamic Bank plc UAE 13 0.8 0.6 0.99% 0.91%Emirates Islamic Bank PJSC UAE 3 1.4 1.4 0.53% 0.53%Sharjah Islamic Bank UAE 4 2.9 2.6 1.62% 1.36%Islamic Bank of Yemen for Fin & Inv Yemen 8 0.6 0.4 2.94% 2.43%Tadhamon International Islamic Bank Yemen 10 0.2 0.2 1.18% 1.01%
Independent variables N Minimum Maximum Mean S.D.
Panel E: Descriptive analysis for independent variablesMUSLIM POP 348 0.604 1 0.889 0.104FAMILIAR 348 1 30 16.658 6.317CONC 294 0.047 0.593 0.196 0.131FD 330 1.600 10.378 4.368 1.803GDPGR 341 −13.1 34 5.160 3.573LA/TA 232 0.057 0.893 0.549 0.192DEPOSIT 281 0.013 0.936 0.646 0.194BANK AGE 342 0 30 12.325 7.781
* Significant at the 0.10 level.
ific co
wl
SrtCrvtpwaaSar
tfl
rramRAdmRddcJDitT
** Significant at the 0.05 level.*** Significant at the 0.01 level.
a Levene’s test for equality of variances compares the Asset Spread Mean for spec
hich are significantly different from the sample mean at the 5%evel.
In Column 2 of Panel C the correlation between the Assetpread and the Deposit Spread is compared. If banks are managingeturns to investment depositors, a significantly positive correla-ion would be found between Asset Spread and Deposit Spread.ontrary to such intuition, Bahrain has a significantly negative cor-elation between Asset Spread and Deposit Spread, which lends aiew that banks manage away from deposit returns, while simul-aneously managing towards asset returns, contrary to the basicremise of this study. The aggregate sample results are similarith a significantly negative correlation between Asset Spread
nd Deposit Spread. However, Bahrain, Kuwait, Turkey and Yemenll demonstrate a positive significant correlation between Assetpreads and Deposit Spreads indicating profit distribution man-gement away from fundamental asset returns towards depositates.
To further assess the robustness of the DEP-PDM measures,he correlation between return on investment account holdersunds (ROIAH) and total return on assets (ROA) along with corre-ation between the ROIAH and deposit rates are calculated. These
imet
untries to the aggregate sample Asset Spread Mean.
esults would verify the conclusions of Sundararajan (2005), whoseesults demonstrate that the Islamic banks return on investmentccount holders funds generally have stronger correlation witharket deposit rates than with return on assets. The ROIAH and
OA provide the fundamental observations required to calculatesset Spread, while the ROIAH and Deposit Rates provide the fun-amental observations required to calculate Deposit Spread. Whileost countries display a strong correlation between ROIAH and
OA, it is the correlation between ROIAH and Deposit Rates whichetermines whether the banks are systematically managing profitistributions. This is particularly true when countries with highorrelation have weaker ROA-ROIAH correlations. Islamic Banks inordan, Kuwait, Malaysia and Qatar demonstrate stronger ROIAH-eposit Rates correlations relative to ROA-ROIAH correlations,
ndicating that there some evidence to suggest that banks from par-icular countries are systematically managing profit distributions.hese results also clarify Sundararajan’s finding that Islamic banks
nvestment deposit returns demonstrate a strong correlation witharket deposit rates than with return on assets. While his resultsxtend across his full sample, the results reported here only applyo certain countries. In contrast to his finding utilising 14 banks

3 f Econ
ibm
Ssu8I1vFaaTm
4
adm
aotwce
mmsmFndmnrep
0mmv
DrrsntsigpcrcTva
inpcog
aramabIa
pdnatrct0tbtfitmfisadme
acttdoP
agswN
ltlsto profit distribution management (DEP-PDM) at a confidence levelof 5%.
42 S. Farook et al. / The Quarterly Review o
n 8 countries, the overall correlations tend to suggest that Islamicanks have a stronger correlation with return on assets than witharket deposit rates.Panel D provides the DEP-PDM Asset Spread and Combined
pread for each bank in the sample. Panel E displays the descriptivetatistics for the independent variables. The average Muslim pop-lation (MUSLIM-POP) in the sample countries is approximately8.9%, with a minimum of 60.4%. There are countries that have had
slamic banks for up to 30 years, with a mean of approximately6.6 years, as indicated by the variable FAMILIAR (ISYR). Anotherariation of the FAMILIAR measurement demonstrates that Islamicinancial Assets in the host countries range from less than 1% topproximately 75%. The variation in the Islamic loan to assets ratios a percentage of total assets ranges from 5.7% to 89% (mean: 54%).he average depositor funding for all observations are 65% with ainimum of 13% and a maximum of 93%.
.2. Regression analysis
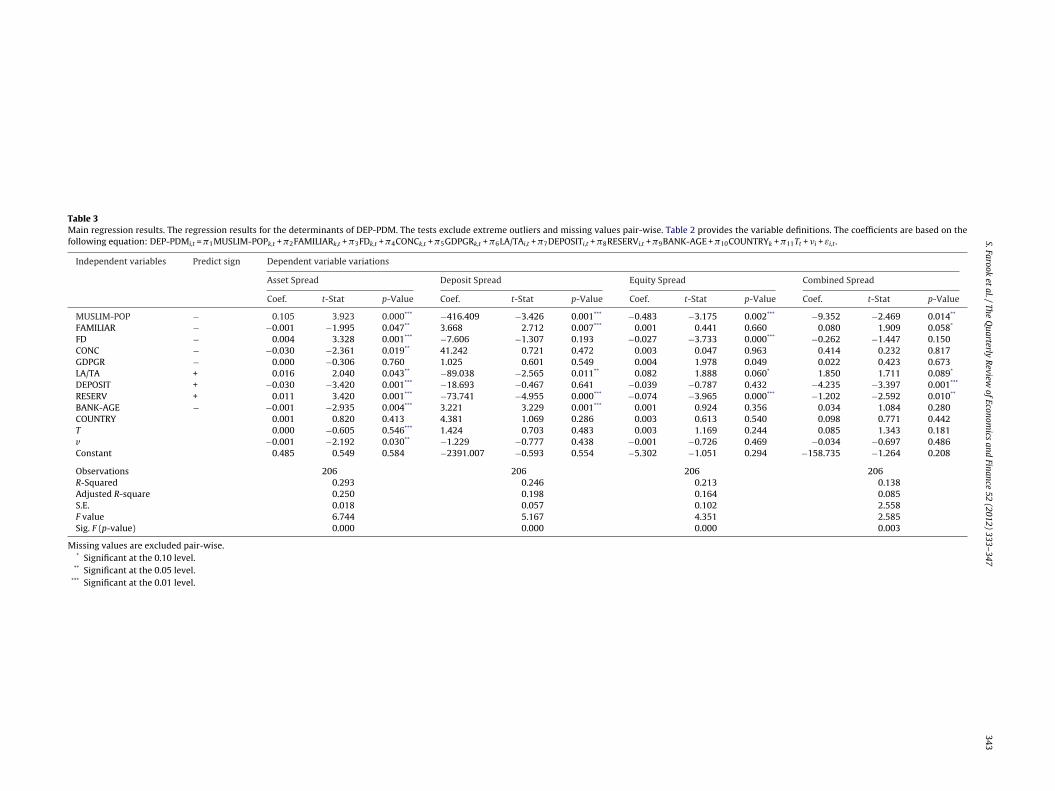
The second objective of this study is to ascertain the factors thatre associated with variation in the extent to which depositor profitistributions are managed away from asset returns and towardsarket deposit rates.Table 3 provides the regression statistics utilising four vari-
tions of the dependent variable: DEP-PDM, excluding extremeutliers. Missing values for each variable were excluded pair-wise,hereby maximising the sample size. A total of 206 observationsere available for the tests. All the tests were checked for signifi-
ant collinearity by reviewing both the variance inflation factor forach variable and the eigenvalues.
The Asset Spread tests are considered to be the most robustodel, since it has the least potential to suffer from estimation oreasurement error. The other measures: Deposit Spread, equity
pread and Combined Spread are likely to suffer from measure-ent/estimation error as a result of their underlying constructs.
urther, the Asset Spread measures the variations in accountingumbers (the difference between rate of return on assets andepositor profit distribution) whereas Deposit Spread relies onarket deposit rate averages, which is likely to see substantial
oise within a year. The equity spread on the other hand utiliseseturn on equity, which is considered to be much more volatile, asvidenced in the descriptive results. Hence, the analysis is princi-ally focused on the DEP-PDM Asset Spread results.
The adjusted R-square for the regression models range from.250 in the Asset Spread model to 0.085 in the Combined Spreadodel. The strength of the Asset Spread measure as found in theseodels was the main criterion for selecting this as the key proxy
ariable in later tests.H1 predicts that there is a negative relationship between
EP-PDM and MUSLIM-POP, based on the intuition that highereligiosity should result in less price sensitivity. Islamic banks inelatively Muslim dominated populations (a proxy for religiosity)hould be less concerned with price movements and therefore theeed to manage profit distributions to depositors will be less. Con-rary to this hypothesis, the variable MUSLIM-POP has a highlyignificantly positive relationship with DEP-PDM. This essentiallyndicates that Islamic banks that operate in relatively more reli-ious environments have a greater propensity to manage depositorrofits than those that operate in less religious environments. Thereould be two potential explanations for this. First, the proxy foreligiosity is likely to be mis-specified. Religiosity in a particularly
ountry may not necessary be linked to the percentage of Muslims.herefore, this variable may be proxying for an omitted correlatedariable not considered in this study. However, in the absence ofny objective cross-country variable that measures religiosity, thisnp
omics and Finance 52 (2012) 333– 347
s the closest available indicator. Second, there may be a valid ratio-ale for a positive relationship that is contrary to the relationshipredicted in this study. Islamic banks in predominantly Muslimountries may have to compete with other Islamic banks as a resultf greater Islamic financial services penetration and therefore havereater need to manage profit distributions.
As predicted, there is a negative association between FAMILIARnd DEP-PDM (Asset Spread). According to H2, there is an inverseelationship between the number of years of Islamic banking oper-tion in the host country and the extent of profit distributionanagement. This is based on the intuition that Islamic bank man-
gers will have less need to manage profit distributions as Islamicank customers gain more understanding and familiarity with
slamic bank operations. The results concur with such a predictiont the 5% confidence level.
The third hypothesis (H3) relates the propensity to managerofit distributions to the extent of financial development. It is pre-icted that increased financial development will lead to a decreasedeed to manage profit distributions, since Islamic banks will beble to play a more diversified role within the financial system andherefore not need to manage profit distributions towards depositates of return. Contrary to this prediction, the coefficient for finan-ial development is significantly positive at the 5% level. However,he magnitude of the relationship is very small at approximately.1%. This result could potentially be attributed to the specifica-ion issues related to the dependent variable. In particular, it coulde argued that banks in relatively more developed financial sys-ems derive a larger proportion of their income from conventionalnancing, such as investment banking, fees and commissions andrading. The bulk of this income is generally not shared with invest-
ent depositors since Islamic banks usually invest the depositors’unds into the low risk pool of financing assets. As a result, banksn financially developed economies are more likely to have aignificant spread between total asset returns (which includesll these forms of non-shared income) and distributions paid toepositors. Hence, the variable DEP-PDM (Asset Spread) will beore accentuated for the banks in these financially developed
conomies.The fourth hypothesis (H4) predicts that the propensity to man-
ge profit distributions will be inversely related to the level ofoncentration in a particular country’s banking market, on the basishat concentrated markets provide more leeway for Islamic bankso distribute performance based returns. Consistent with this pre-iction, a significant negative relationship is found between levelf concentration (CONC) and profit distribution management (DEP-DM).
The fifth hypothesis (H5) predicts that the propensity to man-ge profit distributions will be inversely related to the economicrowth of a country, since Islamic banks will be under more pres-ure to manage profits in recessionary years as a result of greaterrite-downs of asset portfolios and higher loan loss provisioning.o significant result is found between DEP-PDM and GDPGR.6
The sixth hypothesis (H6) predicts that the proportion of Islamicoan assets as a percentage of total assets will be directly relatedo the extent of profit distribution by the Islamic bank, with theoan/assets ratio representing the exposure to profit rate risk. Con-istent with this prediction, the variable LA/TA is positively related
6 In separate sensitivity tests where the outliers were retained, a significantlyegative relationship is found between DEP-PDM and GDPGR, consistent with therediction.
S. Farook
et al.
/ The
Quarterly
Review
of Econom
ics and
Finance 52 (2012) 333– 347
343
Table 3Main regression results. The regression results for the determinants of DEP-PDM. The tests exclude extreme outliers and missing values pair-wise. Table 2 provides the variable definitions. The coefficients are based on thefollowing equation: DEP-PDMi,t = �1MUSLIM-POPk,t + �2FAMILIARk,t + �3FDk,t + �4CONCk,t + �5GDPGRk,t + �6LA/TAi,t + �7DEPOSITi,t + �8RESERVi,t + �9BANK-AGE + �10COUNTRYk + �11Tt + �i + εi,t .
Independent variables Predict sign Dependent variable variations
Asset Spread Deposit Spread Equity Spread Combined Spread
Coef. t-Stat p-Value Coef. t-Stat p-Value Coef. t-Stat p-Value Coef. t-Stat p-Value
MUSLIM-POP − 0.105 3.923 0.000*** −416.409 −3.426 0.001*** −0.483 −3.175 0.002*** −9.352 −2.469 0.014**
FAMILIAR − −0.001 −1.995 0.047** 3.668 2.712 0.007*** 0.001 0.441 0.660 0.080 1.909 0.058*
FD − 0.004 3.328 0.001*** −7.606 −1.307 0.193 −0.027 −3.733 0.000*** −0.262 −1.447 0.150CONC − −0.030 −2.361 0.019** 41.242 0.721 0.472 0.003 0.047 0.963 0.414 0.232 0.817GDPGR − 0.000 −0.306 0.760 1.025 0.601 0.549 0.004 1.978 0.049 0.022 0.423 0.673LA/TA + 0.016 2.040 0.043** −89.038 −2.565 0.011** 0.082 1.888 0.060* 1.850 1.711 0.089*
DEPOSIT + −0.030 −3.420 0.001*** −18.693 −0.467 0.641 −0.039 −0.787 0.432 −4.235 −3.397 0.001***
RESERV + 0.011 3.420 0.001*** −73.741 −4.955 0.000*** −0.074 −3.965 0.000*** −1.202 −2.592 0.010**
BANK-AGE − −0.001 −2.935 0.004*** 3.221 3.229 0.001*** 0.001 0.924 0.356 0.034 1.084 0.280COUNTRY 0.001 0.820 0.413 4.381 1.069 0.286 0.003 0.613 0.540 0.098 0.771 0.442T 0.000 −0.605 0.546*** 1.424 0.703 0.483 0.003 1.169 0.244 0.085 1.343 0.181v −0.001 −2.192 0.030** −1.229 −0.777 0.438 −0.001 −0.726 0.469 −0.034 −0.697 0.486Constant 0.485 0.549 0.584 −2391.007 −0.593 0.554 −5.302 −1.051 0.294 −158.735 −1.264 0.208
Observations 206 206 206 206R-Squared 0.293 0.246 0.213 0.138Adjusted R-square 0.250 0.198 0.164 0.085S.E. 0.018 0.057 0.102 2.558F value 6.744 5.167 4.351 2.585Sig. F (p-value) 0.000 0.000 0.000 0.003
Missing values are excluded pair-wise.* Significant at the 0.10 level.
** Significant at the 0.05 level.*** Significant at the 0.01 level.
344S.
Farook et
al. /
The Q
uarterly R
eview of
Economics
and Finance
52 (2012) 333– 347
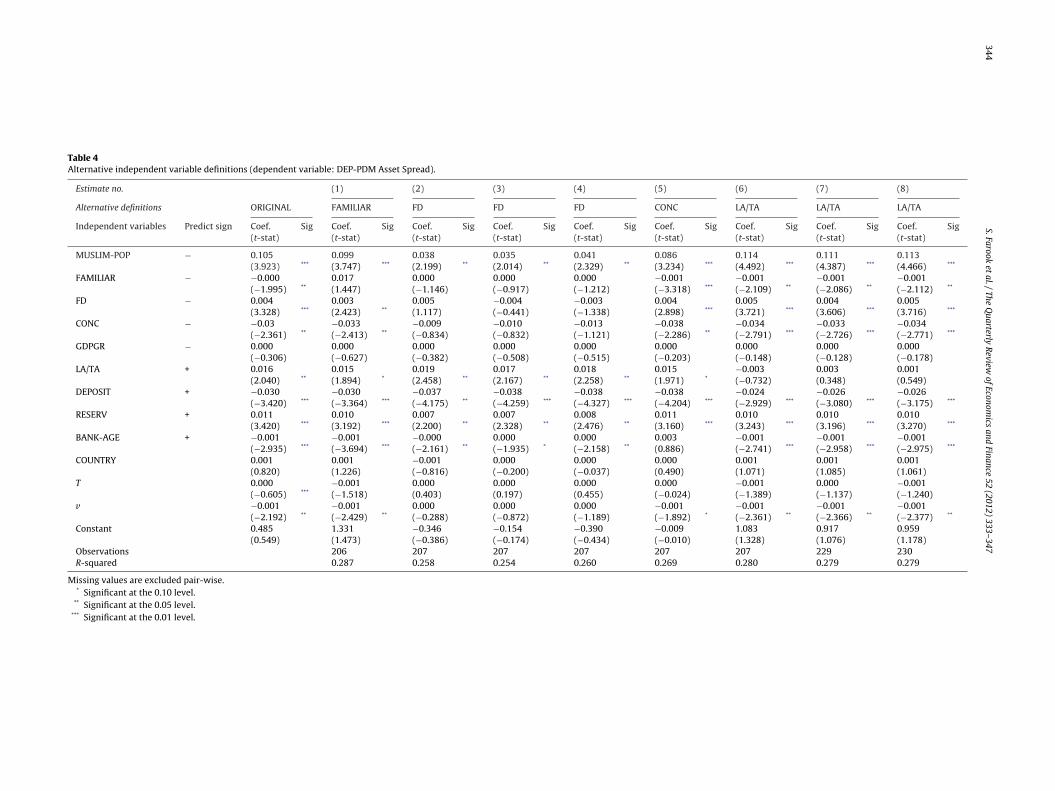
Table 4Alternative independent variable definitions (dependent variable: DEP-PDM Asset Spread).
Estimate no. (1) (2) (3) (4) (5) (6) (7) (8)
Alternative definitions ORIGINAL FAMILIAR FD FD FD CONC LA/TA LA/TA LA/TA
Independent variables Predict sign Coef.(t-stat)
Sig Coef.(t-stat)
Sig Coef.(t-stat)
Sig Coef.(t-stat)
Sig Coef.(t-stat)
Sig Coef.(t-stat)
Sig Coef.(t-stat)
Sig Coef.(t-stat)
Sig Coef.(t-stat)
Sig
MUSLIM-POP − 0.105 0.099 0.038 0.035 0.041 0.086 0.114 0.111 0.113(3.923) *** (3.747) *** (2.199) ** (2.014) ** (2.329) ** (3.234) *** (4.492) *** (4.387) *** (4.466) ***
FAMILIAR − −0.000 0.017 0.000 0.000 0.000 −0.001 −0.001 −0.001 −0.001(−1.995) ** (1.447) (−1.146) (−0.917) (−1.212) (−3.318) *** (−2.109) ** (−2.086) ** (−2.112) **
FD − 0.004 0.003 0.005 −0.004 −0.003 0.004 0.005 0.004 0.005(3.328) *** (2.423) ** (1.117) (−0.441) (−1.338) (2.898) *** (3.721) *** (3.606) *** (3.716) ***
CONC − −0.03 −0.033 −0.009 −0.010 −0.013 −0.038 −0.034 −0.033 −0.034(−2.361) ** (−2.413) ** (−0.834) (−0.832) (−1.121) (−2.286) ** (−2.791) *** (−2.726) *** (−2.771) ***
GDPGR − 0.000 0.000 0.000 0.000 0.000 0.000 0.000 0.000 0.000(−0.306) (−0.627) (−0.382) (−0.508) (−0.515) (−0.203) (−0.148) (−0.128) (−0.178)
LA/TA + 0.016 0.015 0.019 0.017 0.018 0.015 −0.003 0.003 0.001(2.040) ** (1.894) * (2.458) ** (2.167) ** (2.258) ** (1.971) * (−0.732) (0.348) (0.549)
DEPOSIT + −0.030 −0.030 −0.037 −0.038 −0.038 −0.038 −0.024 −0.026 −0.026(−3.420) *** (−3.364) *** (−4.175) ** (−4.259) *** (−4.327) *** (−4.204) *** (−2.929) *** (−3.080) *** (−3.175) ***
RESERV + 0.011 0.010 0.007 0.007 0.008 0.011 0.010 0.010 0.010(3.420) *** (3.192) *** (2.200) ** (2.328) ** (2.476) ** (3.160) *** (3.243) *** (3.196) *** (3.270) ***
BANK-AGE + −0.001 −0.001 −0.000 0.000 0.000 0.003 −0.001 −0.001 −0.001(−2.935) *** (−3.694) *** (−2.161) ** (−1.935) * (−2.158) ** (0.886) (−2.741) *** (−2.958) *** (−2.975) ***
COUNTRY 0.001 0.001 −0.001 0.000 0.000 0.000 0.001 0.001 0.001(0.820) (1.226) (−0.816) (−0.200) (−0.037) (0.490) (1.071) (1.085) (1.061)
T 0.000 −0.001 0.000 0.000 0.000 0.000 −0.001 0.000 −0.001(−0.605) *** (−1.518) (0.403) (0.197) (0.455) (−0.024) (−1.389) (−1.137) (−1.240)
v −0.001 −0.001 0.000 0.000 0.000 −0.001 −0.001 −0.001 −0.001(−2.192) ** (−2.429) ** (−0.288) (−0.872) (−1.189) (−1.892) * (−2.361) ** (−2.366) ** (−2.377) **
Constant 0.485 1.331 −0.346 −0.154 −0.390 −0.009 1.083 0.917 0.959(0.549) (1.473) (−0.386) (−0.174) (−0.434) (−0.010) (1.328) (1.076) (1.178)
Observations 206 207 207 207 207 207 229 230R-squared 0.287 0.258 0.254 0.260 0.269 0.280 0.279 0.279
Missing values are excluded pair-wise.* Significant at the 0.10 level.
** Significant at the 0.05 level.*** Significant at the 0.01 level.

S. Farook et al. / The Quarterly Review of Economics and Finance 52 (2012) 333– 347 345
Table 5Regression analysis: split sample tests (dependent variable: DEP-PDM Asset Spread).
Estimate no. Sample split ORIGINAL ABS VALUE (1) POSITIVE (2) NEGATIVE (3) RAW VALUE
Independent variables Predict sign Coef. (t-stat) Sig Coef. (t-stat) Sig Coef. (t-stat) Sig Coef. (t-stat) Sig
MUSLIM-POP − 0.105 0.157 0.084 0.019(3.923) *** (3.195) *** (2.175) * (0.508)
FAMILIAR − −0.001 −0.001 0.000 0.000(−1.995) ** (−1.425) (−0.081) (0.275)
FD − 0.004 0.007 0.004 0.001(3.328) *** (2.784) *** (1.938) * (0.727)
CONC − −0.030 −0.058 −0.037 −0.008(−2.361) ** (−2.443) ** (−1.768) * (−0.437)
GDPGR − 0.000 0.000 0.000 0.001(−0.306) (0.343) (0.039) (1.134)
LA/TA + 0.016 0.018 0.001 0.023(2.040) ** (1.277) (0.090) (2.121) **
DEPOSIT + −0.030 −0.049 −0.033 0.025(−3.420) *** (−2.791) *** (−2.202) ** (2.037) **
RESERV + 0.011 0.024 0.002 −0.001(3.420) *** (3.978) *** (0.505) (−0.285)
BANK-AGE − −0.001 −0.001 −0.001 0.000(−2.935) *** (−2.077) ** (−2.197) ** (0.829)
COUNTRY 0.001 0.003 −0.001 0.005(0.820) (1.914) * (−0.474) (3.951) ***
T 0.000 −0.002 −0.001 −0.001(−0.605) *** (−1.641) (−0.771) (−0.822)
v −0.001 −0.002 0.000 −0.002(−2.192) ** (−2.830) *** (−0.181) (−3.457) ***
Constant 0.485 2.994 1.274 0.954(0.549) (1.593) (0.757) (0.769)
Observations 206 75 121 207R-squared 0.293 0.426 0.287 0.187
Missing values are excluded pair-wise.* Significant at the 0.10 level.
rawtcegaad
rprpc
cpbaly
haatpt
Spltsi
4
tdaafii(mccicntuae
** Significant at the 0.05 level.*** Significant at the 0.01 level.
The seventh hypothesis (H7) predicts that there is a positiveelationship between the extent of profit distribution managementnd depositors’ funds as a percentage of total assets (DEPOSIT),hich represents the extent of reliance on depositors’ funds. Con-
rary to this hypothesis, a significant negative relationship (1%onfidence level) exists between DEPOSIT and DEP-PDM. Onexplanation for this could be that Islamic banks are subject toreater scrutiny over their accounts as they get larger or adopt
larger depositor base. This inhibits the Islamic bank managers’bility to manage profit distributions without being explicitlyetected.
Consistent with the eighth hypothesis (H8), a significant positiveelationship (1% confidence level) exists between the magnitude ofrofit distribution management and the existence of discretionaryeserves. This confirms the intuition that the ability to managerofit distributions is increased with the creation of dedicated dis-retionary reserves to that effect.
Also, consistent with the ninth hypothesis (H9), a signifi-ant negative relationship is found between the magnitude ofrofit distribution management and the operational years of aank. This confirms the intuition that banks in their earlier yearsre more inclined to manage profit distributions as a result ofower operating revenues and sub-optimal financing in thoseears.
In summary, some significant results were found to support theypotheses when utilising Asset Spread as the dependent vari-ble. However, the effects of financial market development (FD)
nd reliance on depositor funding (DEPOSIT) on profit distribu-ion management (DEP-PDM) Asset Spread were contrary to theredictions made. The same tests were carried out with alterna-ive definitions of the dependent variable, including the Depositdctb
pread, equity spread and Combined Spread. However, owing tooor specification of the underlying constructs as discussed ear-
ier, such tests yield inconclusive and insignificant results. Hence,he evidence provides some support for a number of the hypothe-es, but only when one proxy for profit distribution managements employed: Asset Spread.
.3. Sensitivity analyses
Further tests are conducted utilising alternative definitions ofhe independent variables, where available (Table 4). In test 1, theefinition of the variable FAMILIAR is changed to include Islamicssets as a percentage of total assets in the local economy. It yields
positive, but insignificant coefficient. Alternative definitions ofnancial development (FD) are also considered in tests 2–4, includ-
ng stock market capitalisation (SMKC), total value of stocks tradedSMTV) and stock market turnover ratio (SMTO) respectively. These
easures yield inconclusive results, contrary to the original finan-ial development measure. An alternative measurement of marketoncentration (CONC) is also utilised in test 5. Instead of the orig-nal year specific market concentration values, an average marketoncentration value is taken over the 4 years (2002–2005). Theegative relationship between concentration and profit distribu-ion management still holds. Alternative definitions of LA/TA aretilised in tests 6–8. The first LA/TA test replaces Islamic loanssets with the Bankscope definition of loan assets. This is consid-red to be a weaker representation of loan assets, since Bankscope
oes not consider the specific types of debt financing that areharacteristic of Islamic banks. The tests yield no significant rela-ionship. The underlying rationale of the variable LA/TA is thatanks with more loan assets will tend to have greater returns
3 f Econ
mIeat
otsnib(yTareMItSt(awnatfv
itTs(
D
drp
AStSS
D
5
pbbiosbAIdaBhSaKcacd
mPdTctridm
tdiddlidpap
46 S. Farook et al. / The Quarterly Review o
ismatches when market deposit rates change. The variableslamic loan assets to total assets is replaced by interest rev-nue/total revenue and net interest income/total income in test 7nd 8. The tests do not yield any significant coefficients, but retainheir direction.
Tests are also conducted on split samples and the raw valuef DEP-PDM Asset Spread (Table 5). The original test considershe absolute value of the Asset Spread, since the objective of thetudy is to measure the determinants of variation in spread, andot necessarily positive and negative variations. Hence, the pos-
tive and negative spreads might provide differing relationshipsetween Asset Spread and its proposed determinants. The first testtest 1) considers only the positive DEP-PDM Asset Spreads andields a relatively higher R-squared of 0.426 (original test: 0.293).he results remain largely similar, with the variables FAMILIARnd LA/TA dropping in significance but retaining their directionalelationship with Asset Spread. The second test (test 2) consid-rs only negative Asset Spreads and yields an R-squared of 0.287.ost of the variables drop in significance and the variables FAMIL-
AR, LA/TA, RESERV lose complete significance. This demonstrateshat the model has more predictive power for positive Assetpread (where the return on assets is higher than the profit dis-ribution rates) compared to negative Asset Spread. The final testtest 3) considers the raw Asset Spread as the dependent vari-ble. This model loses the majority of significant relationshipsith the exception of LA/TA and DEPOSIT, which retains their sig-ificance. The directional relation between the variable DEPOSITnd DEP-PDM Asset Spread changes to positive as predicted inhe model. However, these results are likely to have resultedrom noise generated in the calculation of the raw dependentariable.
Table 4 employs alternative definitions of some of the mainndependent variables. A detailed explanation of the varia-ions in each test (numbered 1–8) are given below, whileable 2 provides the variable definitions for the originaltudy. The dependent variable in all the tests are DEP-PDMAsset Spread).
The coefficients are based on the following equation:
EP-PDMi,t = �1MUSLIM-POPk,t + �2FAMILIARk,t + �3FDk,t
+ �4CONCk,t + �5GDPGRk,t + �6LA/TAi,t
+ �7DEPOSITi,t + �8RESERVi,t + �9BANK-AGE
+ �10COUNTRYk + �11Tt + �i + εi,t
Independent variable definitions
Test no. Alternativevariable
Definition
1 FAMILIAR Number of years of Islamic banking operation inthe country in which the Islamic bank isheadquarted.
2 FD Stock market capitalisation of the main stockmarket in which the Islamic bank is located (Ito2007)
3 FD Total value of stocks traded (Ito 2007)4 FD Stock market turnover (Ito 2007)5 CONC Average Herfindahl concentration index for the
years 2002–2005 for the country in which theIslamic bank is headquartered.
6 LA/TA Bankscope definition of loan assets/total assets7 LA/TA Interest revenue over total revenue8 LA/TA Interest Income over total income
Table 5 provides the results of split samples with the depen-ent variable Asset Spread (total average return on assets − averageeturn to IAH) being split into positive and negative values androvided in its raw form. The first column indicates the absolute
TasI
omics and Finance 52 (2012) 333– 347
sset Spread, the second column (test 1) provides the positive Assetpreads, the third column (test 2) the negative Asset Spreads andhe fourth column (test 3) both the raw positive and negative Assetpread. The dependent variable in all the tests are DEP-PDM (Assetpread).
The coefficients are based on the following equation:
EP-PDMi,t = �1MUSLIM-POPk,t + �2FAMILIARk,t + �3FDk,t
+ �4CONCk,t + �5GDPGRk,t + �6LA/TAi,t
+ �7DEPOSITi,t + �8RESERVi,t + �9BANK-AGE
+ �10COUNTRYk + �11Tt + �i + εi,t
. Conclusion
This study was an attempt to understand the phenomenon ofrofit distribution management, a discretionary activity conductedy Islamic banks which has no direct parallels for conventionalanks. As a result of the profit sharing relationship with their
nvestment depositors, Islamic banks are able to manage the extentf profits shared with their depositors based on market circum-tances. The evidence gathered in this study suggests that Islamicanks may potentially be managing profit distributions. If thesset Spread measures are considered to be the most robust,
slamic banks in Brunei, Malaysia and the United Arab Emiratesemonstrating consistently lower average profit distribution man-gement (based on Asset Spreads). In contrast, Islamic banks inahrain, Indonesia, Pakistan and Saudi Arabia have consistentlyigher average profit distribution management (based on Assetpreads). However, if the correlation between the Asset Spreadnd Deposit Spread are considered, then Islamic banks in Bahrain,uwait, Turkey and Yemen can be considered to systematically andonsistently manage profit distributions towards deposit rates andway from asset rates. There is no consistent evidence for the otherountries to suggest that the Islamic banks there manage profitistributions.
The most significant factors associated with profit distributionanagement (DEP-PDM Asset Spread) were religiosity (MUSLIM-
OP), financial development (FD), market concentration (CONC),epositor reliance (DEPOSIT), and age of the Islamic bank (AGE).here is also limited support for the familiarity (FAMILIAR), assetomposition (LA/TA) and discretionary reserves (RESERV) fac-ors. While all of these factors had a definite and significantelationship with profit distribution management, the religios-ty, financial development and depositor reliance factors hadirectional relationships that were contrary to the predictionsade.These results have potential policy implications for regula-
ors of Islamic banks and financial institutions, who may want toevelop an indigenous Islamic financial system, independent of the
nfluence of benchmark deposit rates. Since the extent of profitistribution management is directly related to the existence ofiscretionary reserves, the allowance given by regulators to estab-
ish such reserves might be counter-productive and may actuallynduce such profit distribution management activities where itid not exist before. However, such conclusions have to be tem-ered by the fact that the results do not indicate causality per se,nd therefore reserves may have been an outcome of increasedrofit distribution management and not the other way around.
he fact that depositor profit distribution management is inverselyssociated with market familiarity and depositor funding relianceuggests that regulators should encourage the dissemination ofslamic finance knowledge to the wider public and increase the
f Econ
il
R
A
A
B
C
C
C
D
F
F
F
I
I
L
N
R
S
S
S
S
T
T
Z
F
H
H
J
K
K
L
L
S. Farook et al. / The Quarterly Review o
nvestment depositor funding base of Islamic banks, to ensureower levels of profit distribution management.
eferences
rcher, S., & Karim, R. A. A. (2006). On capital structure, risk sharing and capital ade-quacy in Islamic banks. International Journal of Theoretical and Applied Finance,9(3), 269–280.
rcher, S., Karim, R. A. A., & Sundararajan, V. (2010). Supervisory, regulatory, andcapital adequacy implications of profit-sharing investment accounts in Islamicfinance. Journal of Islamic Accounting & Business Research, 1(1), 10–31.
eck, T., Demirgüc-Kunt, A., & Levine, R. (2007). A new database on finan-cial structure and economic development. World Bank. Available fromhttp://econ.worldbank.org. Accessed on 31 January 2007
entral Intelligence Agency. (2007). The World Factbook. Available fromhttps://www.cia.gov/cia/publications/factbook/ Accessed on 05 April 2007.
ihak, M., & Hesse, H. (2010, December). Islamic banks and financial stability: Anempirical analysis. Journal of Financial Services Research, 38(2–3), 95–113.
reane, S., Goyal, R., Mobarak, A. M., & Sab, R. (2006). Measuring financial devel-opment in the Middle East and North Africa: A new database. IMF Staff Papers,53(3), 479–511.
eYoung, R., & Roland, K. P. (2001). Product mix and earnings volatility at commer-cial banks: Evidence from a degree of total leverage model. Journal of FinancialIntermediation, 10, 54–84.
arook, S., Hassan, M. K., & Lanis, R. (2011). Determinants of corporate social respon-sibility disclosure: The case of Islamic banks. Journal of Islamic Accounting andBusiness Research, 2(2), 114–141.
ida, H. R. (2006). Growing business prospect of Islamic banking. TheDaily Star. 28th August 2006. Available at http://www.thedailystar.net/2006/08/28/d608281503138.htm.
onseca, A. R., & Gonzalez, F. (2005). Cross-country determinants of bank incomesmoothing by managing loan loss provisions. University of Oviedo Working Paper.
smail, A. G., & Be Lay, A. T. (2002). Bank loans portfolio composition and the dis-closure of loan loss provision: An empirical evidence of Malaysian banks. AsianReview of Accounting, 10(1), 147–162.
smail, A. G., Shaharudin, R. S., & Samudhram, A. R. (2005). Do Malaysian banksmanage earnings through loan loss provisions? Journal of Financial Reportingand Accounting, 3(1), 41–47.
ehmann, S. D. (1997). Investment under uncertainty and financial market develop-ment: A q-theory approach. Central Bank of Chile Working Paper, 17.
dikumana, L. (2005). Financial development, financial structure and domesticinvestment: International evidence. Journal of International Money and Finance,24, 651–673.
osly, S. (1999). Al-bay’ bithaman ajil financing: Impacts of Islamic banking perfor-mance. Thunderbird International Business Review, 41, 461–480.
S
omics and Finance 52 (2012) 333– 347 347
hahimi, S., Ismail, A. G., & Ahmad, S. (2006). A panel data analysis of fee incomeactivities in Islamic banks. J.KAU: Islamic Economics, 19(2), 23–35.
undararajan, V. (2005). Risk measurement and disclosure in Islamic finance andthe implications of profit sharing investment accounts. In Proceedings of thesixth international conference on Islamic economics and finance, Vol. 1 Jakarta,(pp. 119–152).
undararajan, V. (2007). Risk characteristics of Islamic product: Implications forrisk measurements and supervision. In S. Archer, & R. A. A. Karim (Eds.), Islamicfinance: The regulatory challenge (pp. 40–68). Singapore: Wiley.
undararajan, V. (2008). Issues in managing profit equalization reserves and invest-ment risk reserves in Islamic banks. Journal of Islamic Economics, Banking andFinance, 4(1), 1–12.
aktak, N. B., Zouari, S. B. S., & Boudriga, A. (2010). Do Islamic banks use loan lossprovisions to smooth their results? Journal of Islamic Accounting and BusinessResearch, 1(2), 114–127.
irole, J. (1990). The theory of industrial organisation (1st edition). Cambridge, MA:MIT Press. (4th reprint)
oubi, T. A., & Al-Khazali, O. (2007). Empirical testing of the loss provisions of banksin the GCC region. Managerial Finance, 33(7), 500–511.
urther reading
assan, M. K., & Bashir, A. H. (2005). Determinants of Islamic banking profitability.In M. Iqbal, & R. Wilson (Eds.), Islamic perspectives on wealth creation. Edinburgh:Edinburgh University Press.
assan, M. K., Joseph, F., & Bashir, A.-Z. (2003). Dividend signalling hypothesis andshort-term asset concentration of Islamic interest-free banking. Islamic Eco-nomic Studies, 11(1), 1–30.
obst, A. (2007). The economics of Islamic finance and securitization. IMF WorkingPaper, 07/117. Washington: International Monetary Fund.
anagaretnam, K., Lobo, G. J., & Mathieu, R. (2004). Earnings management to reduceearnings variability: Evidence from bank loan loss provisions. Review of Account-ing and Finance, 3(1), 128–148.
arim, R. A. A. (1995). The nature and rationale of a conceptual framework forfinancial reporting by Islamic banks. Accounting and Business Research, 25(100),285–300.
aeven, L., & Levine, R. (2007). Is there a diversification discount in financial conglo-morates? Journal of Financial Economics, 85(2).
iu, C., & Ryan, S. (2006). Income smoothing over the business cycle: Changes inbanks’ coordinated management of provisions for loan losses and loan charge-
offs from the pre-1990 bust to the 1990s boom. The Accounting Review, 81(2),421–441.undararajan, V., & Errico, L. (2002). Islamic financial institutions and products in theglobal financial system: Key issues in risk management and challenges ahead. IMFWorking Paper, 02/192. Washington: International Monetary Fund.


