Embed Size (px)
Citation preview

International Journal of Management Sciences and Business Research, 2014 ISSN (2226-8235) Vol-3, Issue 10
http://www.ijmsbr.com Page 36
Assessing Relative Efficiency of Islamic Banks in Bahrain: An Application of Data
Envelopment Analysis
Author’s Details (1)
Prof. Minwir Al-Shammari. College of Business Administration University of Bahrain (2)
Dr. Seref Turen. College of
Business AdministrationUniversity of Bahrain
Abstract The purpose of this paper is to measure the comparative operating efficiency of retail Islamic banks operating in the
Kingdom of Bahrain over the sample period 2010-2013. The study employed Data Envelopment Analysis (DEA) model as
a non-parametric multi-criteria methodology for assessing relative efficiency of Decision-Making Units (DMUs). The
variables considered are the financial information gathered from the financial statements issued by the investigated
banks. The paper computes banks technical, pure technical, and scale efficiency scores, areas of efficiency improvements,
and composite reference sets of the relatively inefficient banks.
Keywords: Bahrain, Islamic Banks, Data Envelopment Analysis Technical Efficiency, Pure technical efficiency, and Scale
Efficiency
Introduction
Inherently, banks and the banking sector especially in
developing countries play a vital role in the economy.
Therefore, many studies suggest that the efficiency of
banks directly affects national economic growth. As to
the Islamic banking and finance, in global terms, is still
relatively small part of the global financial system but it
is one which is growing rapidly thanks to openness to all
and not restricted to Muslims only. As it is well known,
operations of Islamic financial institutions are
predominantly based on a profit and loss sharing
principle. An Islamic bank does not charge interest yet
participates in yield stemming from usage of the funds
whereas its account holder shares profit of the bank in
accordance with a predetermined ratio because of
partnership between the Islamic bank and its account
holder. Hence, Islamic finance particularly concentrates
on the transaction and it gives room all types of
institutions if Islamic or conventional to participate in as
long as the underlying transaction and asset is Sharia’a
(Islamic Law) compliant.
The study aims to measure the technical, pure technical,
and scale efficiency scores of Islamic banks in Bahrain
over the period of 2010-2013 using a non-parametric
multi-criteria methodology known as Data Envelopment
Analysis (DEA). Furthermore, it seeks to find banks'
areas of efficiency improvement and best reference sets.
The rest of the study is organized as follows: brief
review of the Islamic banking sector in Bahrain, review
of related literature, the DEA models, methodology of
the study, empirical findings, and concluding remarks.
Islamic Banking Sector in Bahrain
The name Bahrain means “two seas” in Arabic, referring
to the seas that surround the Gulf island nation. Bahrain
is home to the great deal of Islamic financial institutions
in the Middle East. According to the report by Oxford
Business Group (2012), the sector contributed $25.4
billion USD, and its market share in total banking assets
rose from 1.8% in 2000 to 13.3% in 2012. In addition,
Bahrain also hosts some regulatory authorities which
provide international standards for the sector, such as
Islamic International Rating Agency, International
Islamic Financial Market, General Counsel for Islamic
Banks and Institutions and Accounting and Auditing
Organization for Islamic Financial Institutions.
As one of the world’s leading centers for Islamic
finance, the birth of the sector dates back to 1978 when
Bahrain Islamic Bank was set up. Islamic banking in the
Kingdom of Bahrain gained momentum in the early
1980s with the issue of 4 licenses; one was an offshore
banking unit whereas remainders were investment
banking licenses. During the 1990s, a total of 8 licenses
were issued to institutions seeking to pursue Islamic
banking services. The Kingdom has a strong Islamic
finance infrastructure in place together with her 26
Islamic bank licenses, 7 Islamic insurance so-called
Takaful companies and 2 re-takaful companies operating
in the country when it is considered that Islamic finance
in its modern form is a relatively young industry.
DEA for Assessing Efficiency of Islamic Banks
The concept of efficiency is generally referred to as the
ratio of input elements used by a production organization
to its production output. Relative efficiency is a concept
proposed by Farrel (1957) to measure technical
efficiency (TE) of production units through comparison

International Journal of Management Sciences and Business Research, 2014 ISSN (2226-8235) Vol-3, Issue 10
http://www.ijmsbr.com Page 37
with composite unit, or reference set, which has similar
input and output structure.
DEA is a linear programming model to assess relative
efficiency of decision-making units (DMUs) that use
multiple incommensurable input and multiple
incommensurable output measures. DEA assesses
efficiency by estimating a production frontier boundary
based on input or output orientation. That is, the
performance of each DMU is measured relative to the
performance of all other DMUs. The relative efficiency
of a DMU is defined as the ratio of the sum of its
weighted outputs, to the sum of its weighted inputs. The
DMU being evaluated can be judged relatively
inefficient if the composite unit requires less input to
obtain the output achieved by the unit being evaluated,
or judged relatively efficient if the composite unit
requires at least the same amount of input as the unit
being evaluated.
A large part of existing literature examines the efficiency
of Islamic banks. A summary of previous studies on the
efficiency of Islamic Banks is compiled in Table 1. Said
(2013) measures overall technical efficiency of Islamic
banks operating in the MENA region by employing
DEA during the financial crisis of 2007-2009. He finds
out that the Islamic banks of the region on average are
technically inefficient. In addition, the decomposition of
technical efficiency as pure and scale shows that
examined banks have problems in the allocation of
resources between their inputs and outputs mix
compared to Islamic banks operating in GCC countries.
Zainal and Ismail (2012) examine the efficiency of 17
Islamic banks operating in Malaysia by using DEA
considering total deposits, personal expenses and fixed
assets as inputs and total financing and advances and
together with other earning assets as output for the
period of 2006 and 2010. The research reveals that the
local Islamic banks scored higher technical and scale
efficiency than those of foreign owned Islamic banks.
Yet, foreign owned Islamic banks are better in terms of
pure technical efficiency.
Noor and Ahmad (2012) examine the efficiency of
Islamic banking sector in 25 countries with 78 examples
including Bahrain, Bangladesh, Brunei, Egypt, Gambia,
Indonesia, Iran, Iraq, Jordan, Kuwait, Malaysia,
Mauritania, Pakistan, Palestine, Saudi Arabia,
Singapore, Syria, Thailand, Turkey, UAE, Qatar, UK,
South Africa, Sudan and Yemen, during the period
1992-2009. Findings show that a

International Journal of Management Sciences and Business Research, 2014 ISSN (2226-8235) Vol-3, Issue 10
http://www.ijmsbr.com Page 38
Table 1: Summary of previous DEA studies on the efficiency of Islamic banks
AUTHOR OBSERVATION
PERIOD COUNTRIES
ANALYZED INPUTS OUTPUTS
Said (2013) 2007-2009 MENA Countries Labor Cost
Fixed Asset
T. Deposits
T. Loans
Liquid Assets
Other Income
Zainal and Ismail (2012)
2006-2010 Malaysia T. Deposits Personal Expenses
Fixed Assets
T. Loans Other Earning Assets
Noor and Ahmed
(2012)
1992-2009 25 Different
Countries
T. Deposits
Labor Cost T. Assets
T. Loans
Income Other Earning Assets
Abu-Alkheil et.al
(2012)
2005-2008 UK T. Deposits and short term
funding
T. Expenses
T. Staff Cost
T. Loans
T. Revenues
Pramuka (2011) 2003-2009 Indonesia T. Deposits
Overhead Expenses Physical Capital
Profit Before tax and
financing
Moussawi and Obeid
(2011)
2005-2008 GCC Countries T. Earning Assets
Commission Revenues
T. Deposits Fixed Assets
Interest Expense
Personnel Expenses
Other Operating Expenses
Mostafa (2011) 2009 100 Islamic banks
of the World
T. Assets
Equity
Net Income
ROA
ROE
Onour and Abdulla (2011)
2007-2008 Sudan Salaries and Wages T. Deposits
Net Loans Net Income
Mostafa (2007) 2005 GCC Countries T. Assets
Capital
Net Profit
ROA ROE
Sufian (2007) 2001-2005 Malaysia T. Deposits
Loan Loss Provisions
T. Loans
Investments
Sufian (2006) 2001-2004 Malaysia T. Deposits Labor Expenses
T. Assets
T. Loans Income
Yudistira (2004) 1997-2000 In and out of
Middle East
Staff Costs
Fixed Assets T. Deposits
T. Loans
Other Income Liquid Assets
positive relationship exists between bank efficiency and
size and profitability, while a negative relationship exists
between bank efficiency and loan intensity and
capitalization. In addition to this pure technical
efficiency has greater influence in determining the total
technical inefficiency of the world Islamic banking
sector.
Abu-Alkheil et al (2012) investigate the relative
efficiency of Islamic Bank of Britain by applying two-
stage DEA to determine the impact of internal and
external factors on bank’s efficiency over the period
from 2005 to 2008. The results indicate that the Islamic
Bank of Britain is technically inefficient. It has also
relatively poor financial performance that bank’s
inefficiency results in both size and management issues.
Pramuka (2011) provides empirical evidence of Islamic
bank efficiency in Indonesia using stochastic frontier
approach over the period 2003 and 2009. He finds that
full-fledged banks are more efficient in making profit
compared to Islamic windows. Therefore, Islamic banks
should focus on making loan to the industry rather than
investing in financial markets.

International Journal of Management Sciences and Business Research, 2014 ISSN (2226-8235) Vol-3, Issue 10
http://www.ijmsbr.com Page 39
Moussawi and Obeid (2011) investigate the productive
performance of Islamic banks of the GCC countries
during 2005-2008. DEA is used to decompose the
productive efficiency into technical efficiency, allocation
efficiency and cost efficiency for a sample of 23 Islamic
banks. The findings reveal that the technical inefficiency
and allocation inefficiency increase bank costs by about
14% and 29%, respectively.
Mostafa (2011) attempted to measure the relative
efficiency of top 100 Islamic banks in the world through
DEA by using cross-sectional data for the year 2009. He
points out that the performance of several banks were
sub-optimal which means that there are potential for
significant improvements. He emphasizes on the asset
mismanagement in certain banks where considerable
scope for reduction of those assets is.
Onour and Abdalla (2011) analyze 12 Islamic banks in
Sudan for 2007 and 2008 to determine the efficiency
using DEA. They find that only 2 banks in the sample
score technical efficiency level whereas smallest banks
score pure technical efficiency but are scale inefficient.
They suggest this result as evidence that government and
private ownership is not a constraint of managerial and
scale efficiency but bank’s size is important factor for
scale efficiency.
Mostafa (2007) examines the relative efficiency of the
top 50 banks in GCC region using DEA to the cross-
sectional data for the year 2005. The results indicate that
the performance of several banks is sub-optimal,
indicating the potential for significant improvement.
Sufian (2007) measure the performance of 17 Islamic
banks of Malaysian Banking sector during the period of
2001-2005. Several efficiency estimates of individual
banks are calculated using DEA method. Risk factor is
included by incorporating problem loans as non-
discretionary input variable. He finds out that scale
inefficiency dominates pure technical inefficiency in the
Islamic banking sector of Malaysia. Besides, foreign
banks exhibit higher technical efficiency than domestic
peers.
Sufian (2006) works on Malaysian Islamic banking
sector for the period of 2001 and 2004 by using DEA.
The intermediation approach is applied to the
specification of input-output variables. He observes that
the scale inefficiency dominates pure technical
inefficiency in the sector which means that the banks are
operating at the wrong scale of operations. Besides,
domestic Islamic banks shows higher technical
efficiency compared to that of their foreign peers
whereas foreign ones are relatively more efficient in
controlling their operating costs.
Yudistira (2004) test the stability and efficiency of 18
Islamic banks from in and out of Middle Eastern
countries for the period of 1997 to 2000. In this study,
technical, pure technical and scale efficiency measures
are computed through non-parametric DEA. Findings
show that the overall efficiency results suggest that
inefficiency is over 10 % which can be considered quite
low compared to many commercial banks. Islamic banks
suffered from the crisis of 1989-1999 but recovered very
well after those turbulent times. In addition, small and
medium sized Islamic banks exhibit diseconomies of
scale.
DEA Models
DEA basic models are two types: CCR model of
Charnes, Cooper and Rhodes (1978) and BCC Model of
Banker, Charnes and Cooper (1984).
CCR Model
The CCR model is a fractional and nonlinear model that
includes multiple incommensurable inputs and multiple
incommensurable outputs based on the assumption of
constant returns to scale (CRS), viz. scale of economies
does not change as size of the service facility increases.
The CCR fractional and nonlinear DEA model can be
solved by one of two linear programming formulations.
The first formulation, which had output-orientation,
maximizes the ratio of weighted multiple outputs to
weighted multiple inputs and constrains the weighted
sum of inputs to be unity. In output-oriented
formulation, attention is focused on augmenting outputs
for a given available level of inputs to increase
efficiency. The second formulation, which had input-
oriented, is the dual of the first model and its attention is
focused on reducing inputs given certain level of outputs
to increase efficiency.. In input-oriented formulation,
managers are assumed to have more control over the
inputs rather than outputs.
BBC Model
The BBC model differs from the CCR model only in
addressing the impact of economy of scale on relative
efficiency, by adding a new assumption of returns to
scale (RTS), viz. variable returns to scale (VRS) which
is divided into these two types (Kumar and Gulati,
2008):
Increasing returns to scale (IRS): it implies that
an increase in size of service operations

International Journal of Management Sciences and Business Research, 2014 ISSN (2226-8235) Vol-3, Issue 10
http://www.ijmsbr.com Page 40
increases DMU efficiency. For example, a bank
is assumed to be too small for its scale of
operations and an increase in size leads to
improvement in efficiency.
Decreasing returns to scale (DRS): it implies
that a reduction in scale of production increases
efficiency, then, there is no efficiency gain by
increasing the scale of production. Inappropriate
size of a DMU (small or large) may sometimes
be a cause for technical inefficiency. For
example, a bank is assumed to be too large for
the volume of activities that it conducts and a
reduction in size of its service operations
improves its efficiency.
DEA Efficiency Evaluations
Efficiency of DMUs may result from factors such as the
best utilization of resources; scale of the production
process, prices of inputs, etc. Major types of efficiency
evaluations of DMUs can be divided into three types
(Kumar and Gulati, 2008):
Overall technical efficiency (TE): it is used to
measure input-oriented or output-oriented
efficiency under the CRS assumption.
Pure technical efficiency (PTE): it is derived
from the BCC model to measure efficiency
under the VRS assumption that is due to
managerial intervention in organizing the bank's
inputs, and
Scale efficiency (SE): it is the ratio of TE to
PTE.
Methodology and Data Description
Model
The adopted input-oriented DEA model represents the dual of the output-oriented linear programming formulation. The
objective function of the adopted DEA model is to minimize the relative efficiency score and the linear programming
formulation is expressed as follows:
Min Z =
n
i
ij x1
s.t.
n
i
iijj nixx1
);,...,2,1(
n
i
rrjj mryy1
0 );,...,2,1(
n
i
j
1
;1
).,...,2,1(0 Njj
where the following notation is used:
Z: efficiency score;
j : weights attached to inputs and outputs of bank j;
Xi : inputs and outputs of the particular bank whose efficiency is being evaluated.
Xij: observed value of input i for bank j;
Yrj: observed value of output r for bank j;
Data
The population of the study represents six retail Islamic banks in Bahrain. Therefore, the study uses a total population
sampling. The selected banks, viz. Decision-Making Units (DMUs), were as follows:
DMU1 = Al-Baraka Islamic Bank
DMU2 = Al-Salam Bank
DMU3 = Bahrain Islamic Bank
DMU4= Ithmar Bank
DMU5 = Khaleeji Commercial Bank

International Journal of Management Sciences and Business Research, 2014 ISSN (2226-8235) Vol-3, Issue 10
http://www.ijmsbr.com Page 41
DMU6 = Kuwait Finance House
The input measures were total assets and total owner's equity whereas the output measures were total operating income
and net profit (loss). Banking data were gathered from web sites of the banks. The total number of inputs and outputs has
been planned not to exceed the number of DMUs as suggested by Charnes et al. (1994) in order to discriminate between
efficient and inefficient banks. The input and output data used in the study represents six Bahraini Islamic banks over the
period 2010-2013 (Table 2).
Table 2: Input and output data for the years 2010-2013 (Figures in Million BDs)
Inputs Outputs
Total
Assets
Total
Owner's
Total
Operating
Net
Profit
Adjusted
Net Profit
Equity Income (Loss) (Loss)
2010
DMU1 5,987.5 685.0 248.3 1.7 3.48
DMU2 856.6 201.9 22.4 7.3 14.66
DMU3 935.600 100.600 17.300 -39.700 0.23
DMU4 2,543.700 247.500 85.050 -52.700 0.30
DMU5 419.200 118.100 12.500 -6.500 0.04
DMU6 1,446.600 360.200 75.600 9.300 18.65
2011
DMU1 6468 678.4 279.4 0.980 1.99
DMU2 923.9 200.6 12.7 0.5 0.99
DMU3 839.100 101.300 26.100 -17.300 0.52
DMU4 2601.100 217.400 65.900 -23.300 0.70
DMU5 447.500 118.900 14.700 0.518 1.05
DMU6 1,537.300 372.900 77.000 9.600 19.49
2012
DMU1 534.7 63.6 15.40 -4.0 0.10
DMU2 942.00 208.10 23.10 10.30 20.86
DMU3 832.800 69.700 24.400 -36.100 0.90
DMU4 2,724.100 222.100 87.500 -10.100 0.25
DMU5 473.100 119.400 10.600 0.751 1.52
DMU6 1,437.000 381.800 60.300 8.700 17.62
DMU1 614.9 62.1 16.4 0.34 0.69
DMU2 1,088.00 246.10 26.10 12.40 25.23
DMU3 910.200 78.100 36.900 6.100 12.41
2013 DMU4 2,790.900 200.400 75.300 -29.900 1.03
DMU5 542.200 100.010 7.000 -19.000 0.66
DMU6 1,565.000 367.700 53.100 5.800 11.80
As the basic DEA model requires all numbers to be non-negative and preferably strictly positive (no zero values), many
data sets that include negative numbers have been revised. Negative net income and net profit have been revised to
positive values and, accordingly, other data sets have been proportionally adjusted. Furthermore, and in order to unify the
currency value for all measures used, values expressed in US dollars were converted into Bahraini Dinars (BD) where 1
BD = US $ 0.377.
Empirical Findings and Discussion

International Journal of Management Sciences and Business Research, 2014 ISSN (2226-8235) Vol-3, Issue 10
http://www.ijmsbr.com Page 42
In analyzing the data, The DEA model was run twice, once under the CRS assumption and then under the variable returns
to scale (VRS) assumption with input orientation option. Table 3 presents the descriptive statistics (minimum, maximum,
mean, and standard deviation) of the selected input and output variables for the Islamic banks over the period 2010-2013.
Table 3: Descriptive Statistics of the Variables Employed in the Model (Minimum, Maximum, and Mean Figures in
Million BDs)
Name Minimum Maximum Mean Standard
Deviation
2010
Total Assets 419.2 5,987.5 2,031.5 2,070.5
Total Owner's Equity 100.6 685.0 285.6 217.2
Total Operating Income 12.5 248.3 76.9 89.6
Adjusted Net Profit (Loss) 0.04 18.65 6.2 8.3
2011
Total Assets 447.5 101.3 2136.2 2,251.4
Total Owner's Equity 101.3 678.4 281.6 217.0
Total Operating Income 2136.2 281.6 79.3 101.7
Adjusted Net Profit (Loss) 2251.4 217.0 4.1 7.5
2012
Total Assets 473.1 2,724.1 1,157.3 841.5
Total Owner's Equity 63.6 381.8 177.5 120.5
Total Operating Income 10.6 87.5 36.9 30.4
Adjusted Net Profit (Loss) 0.1 20.9 6.9 9.6
2013
Total Assets 542.2 2,790.9 1,251.9 839.0
Total Owner's Equity 62.1 367.7 175.7 118.8
Total Operating Income 7.0 75.3 35.8 25.1
Adjusted Net Profit (Loss) 0.66 25.2 8.6 9.8
Technical, Pure Technical, and Scale Efficiencies
Using the preceding DEA model and data for the 6 Bahraini Islamic banks, TE, PTE and SE annual scores as well as
means and standard deviations are calculated for the period from 2010 to 2013 and reported in Tables 4-6.
The CRS assumption is applied in measuring TE of DMUs wherein there is no significant relationship between the
DMU's scale of operations and its efficiency. As shown in Table 4, the number of fully efficient Islamic banks as per TE
was three in 2010 and 2012 and two in 2011 and 2013. The TE scores presented high standard deviations. The DMUs
showed high dispersion in terms of TE scores. The mean TE score was 83 percent in 2010 but dropped to 73 percent in

International Journal of Management Sciences and Business Research, 2014 ISSN (2226-8235) Vol-3, Issue 10
http://www.ijmsbr.com Page 43
2011 and increased to 80 percent in 2012 but dropped to 77 percent in 2013. The average TE scores of suggest that the
Islamic Banking sector in Bahrain is highly efficient as overall. The low number of fully efficient Islamic banks means
that there is a large room for improvement.
The PTE measurement adopts the VRS assumption after eliminating the scale inefficiency by dividing the TE score by the
PTE score. Table 5 showed that the number of fully PTE banks was 6 in 2010 and 2013, 4 in 2011, and 5 in 2012. The
PTE scores presented high standard deviations for 3 DMUS and zero for the rest of DMUs. The mean PTE score that was
100 percent in 2010 but dropped to 91 percent in 2011 and increased to 94 percent in 2012 and reached 100 percent in
2013. The average PTE scores were higher than those of the TE scores of Islamic Banking sector in Bahrain for the same
period.
Table 4: TE for Bahraini Islamic Banks (2010-2013)
2010 2011 2012 2013 Mean Standard
Deviation
DMU1 1.00 1.00 0.69 0.66 0.84 0.188
DMU2 1.00 0.28 1.00 1.00 0.82 0.360
DMU3 0.47 0.71 1.00 1.00 0.80 0.256
DMU4 0.95 0.75 1.00 0.80 0.88 0.119
DMU5 0.57 0.66 0.39 0.32 0.49 0.157
DMU6 1.00 1.00 0.73 0.84 0.89 0.132
Mean 0.83 0.73 0.80 0.77 0.78 0.20
Standard
Deviation 0.24 0.27 0.25 0.26 0.15
Table 5: PTE for Bahraini Islamic Banks (2010-2013)
2010 2011 2012 2013 Mean Standard
Deviation
DMU1 1.00 1.00 1.00 1.00 1.00 0.000
DMU2 1.00 0.58 1.00 1.00 0.90 0.210
DMU3 1.00 1.00 1.00 1.00 1.00 0.000
DMU4 1.00 0.88 1.00 1.00 0.97 0.060
DMU5 1.00 1.00 0.62 1.00 0.91 0.190
DMU6 1.00 1.00 1.00 1.00 1.00 0.000
Mean 1.00 0.91 0.94 1.00 0.96 0.08
Standard
Deviation 0.00 0.17 0.16 0.00 0.05
In measuring the SE of DMUs, the VRS assumption is used wherein there is a disproportional change in output compared
with any change in inputs. As shown in Table 6, the number of pure SE Islamic banks was three in 2010 and 2012 and 2
in 2011 and 2013. The mean SE score was 83 percent in 2010 but dropped to 78 percent in 2011 and increased to 84
percent in 2012 but dropped to 77 percent in 2013. The DMUs showed a high dispersion in terms of SE scores as

International Journal of Management Sciences and Business Research, 2014 ISSN (2226-8235) Vol-3, Issue 10
http://www.ijmsbr.com Page 44
evidenced by the average SE scores presented high standard deviations. The high dispersion in SE of DMUs may be due
to the dispersion in input/output configuration and the size of operations.
Table 6: SE for Bahraini Islamic Banks (2010-2013)
2010 2011 2012 2013 Mean Standard
Deviation
DMU1 1.00 1.00 0.69 0.66 0.84 0.188
DMU2 1.00 0.49 1.00 1.00 0.87 0.255
DMU3 0.47 0.71 1.00 1.00 0.80 0.256
DMU4 0.95 0.84 1.00 0.80 0.90 0.093
DMU5 0.57 0.66 0.63 0.32 0.55 0.155
DMU6 1.00 1.00 0.73 0.84 0.89 0.132
Mean 0.83 0.78 0.84 0.77 0.81 0.18
Standard
Deviation
0.24 0.20 0.18 0.26 0.13
Areas for Efficiency Improvement and Efficiency Reference Set
DMUs strive to operate at most productive scale size i.e., with CRS, in order to minimize costs and maximize revenue. In
the short run, DMUs may operate in the zone of (IRS) or (DRS). However, in the long run, they will move towards CRS
by becoming larger or smaller to survive in the competitive market.
The move towards efficient operations could involve scaling up or scaling down of size based on efficiency of a
hypothetical best-practice composite reference unit. DEA constructs a hypothetical composite unit based on all units in the
reference group. The input consumed by a DMU that can be reduced to a certain level without worsening output is known
as slack. A hypothetical best-practice composite reference unit is made up of a subset of units that should be emulated by
a given inefficient DMU in order to improve the efficiency of its operation. It identifies inputs that have to be reduced and
outputs that need to be increased in order to make a particular DMU efficient. This information may help decision makers
to determine whether the size of representative DMU in the particular industry is appropriate or not (Kumar and Gulati,
2008).
The ranges of improvements (in Million BDs) needed for DMUs inputs and outputs to reach TE efficiency are
documented in Tables 7-9 (based on the CRS assumption with input orientation). Table 7 shows areas of improvements in
2010 for inefficient banks, viz. DMU3, DMU4, and DMU5 whereas the rest of DMUs are efficient and, therefore, require
no changes in their inputs and outputs. The reference DMU for each of DMU3 and DMU4 is DMU1 and the reference for
DMU5 is DMU6.
Table 7 also shows that the efficiency of DMU3 can be improved by decreasing total assets from 935.6 to 417.137 (a
slack of 518.463), decreasing total owner's equity from 100.6 to 47.727, and increasing net profit from 0.226 to 0.242. The
efficiency of DMU4 can be improved by decreasing total assets from 2543.7 to 2050.722, decreasing total owner's equity
from 247.5 to 234.633, and increasing net profit from 0.3 to 1.192. The efficiency of DMU5 can be improved by
decreasing total assets from 419.2 to 239.187 and decreasing total owner's equity from 118.1 to 59.557 and increasing net
profit from 0.037 to 3.084.
Table 7: Areas for Efficiency Improvement and Reference Set in 2010 (Million BDs)
International Journal of Management Sciences and Business Research, 2014 ISSN (2226-8235) Vol-3, Issue 10
http://www.ijmsbr.com Page 45
Total Assets Total Owner's
Equity
Total
Operating
Income
Adjusted Net
Profit (Loss)
Reference
DMU
DMU1 5987 to 5987 685 to 685 248.3 to 248.3 3.479 to 3.479 DMU1
DMU2 856.6 to 856.6 201.9 to 201.9 22.4 to 22.4 14.662 to 14.662 DMU2
DMU3 935.6 to 417.137 100.6 to 47.727 17.3 to 17.3 0.226 to 0.242 DMU1
DMU4 2543.7 to 2050.722 247.5 to 234.633 85.05 to 85.05 0.3 to 1.192 DMU1
DMU5 419.2 to 239.187 118.1 to 59.557 12.5 to 12.5 0.037 to 3.084 DMU6
DMU6 1446.6 to 1446.6 360.2 to 360.2 75.6 to 75.6 18.653 to 18.653 DMU6
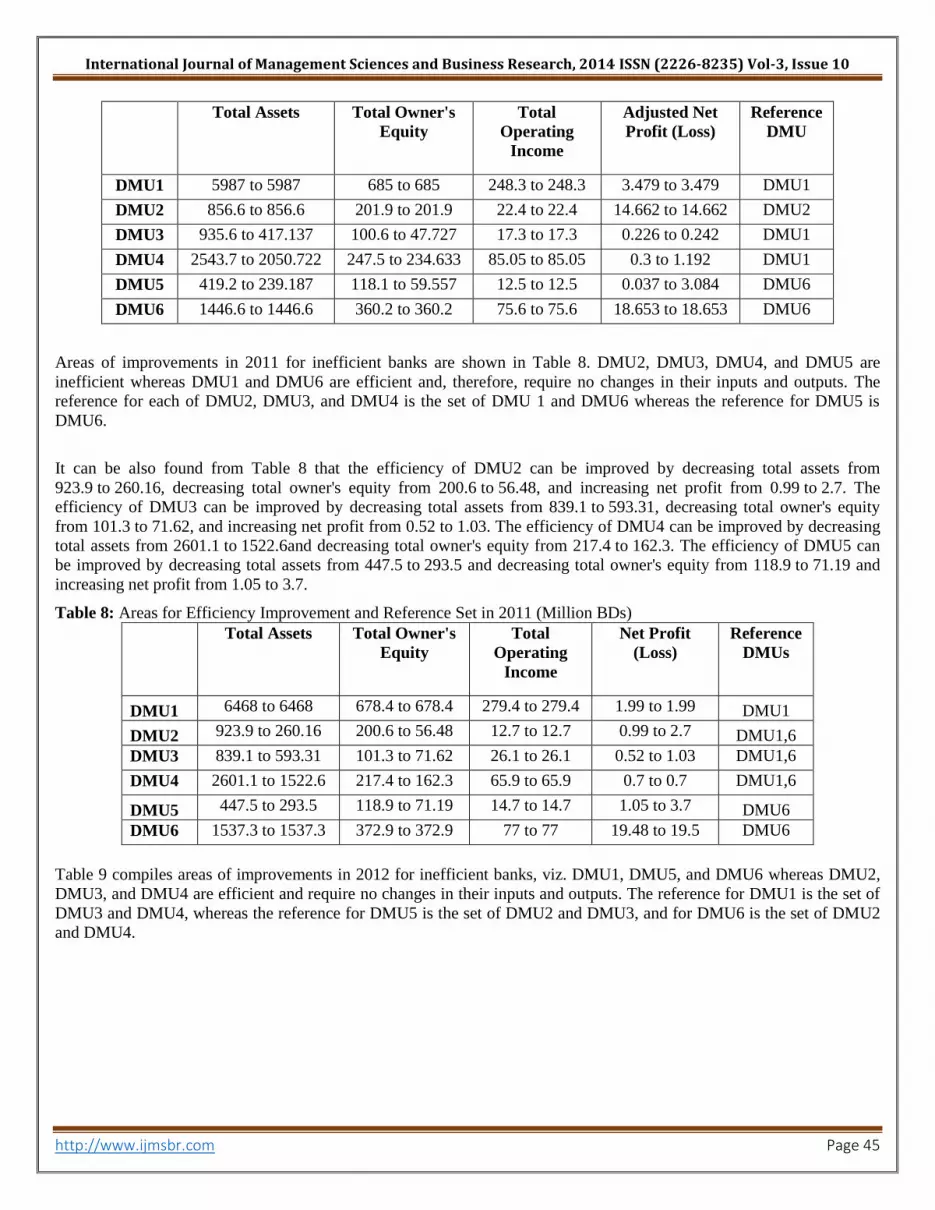
Areas of improvements in 2011 for inefficient banks are shown in Table 8. DMU2, DMU3, DMU4, and DMU5 are
inefficient whereas DMU1 and DMU6 are efficient and, therefore, require no changes in their inputs and outputs. The
reference for each of DMU2, DMU3, and DMU4 is the set of DMU 1 and DMU6 whereas the reference for DMU5 is
DMU6.
It can be also found from Table 8 that the efficiency of DMU2 can be improved by decreasing total assets from
923.9 to 260.16, decreasing total owner's equity from 200.6 to 56.48, and increasing net profit from 0.99 to 2.7. The
efficiency of DMU3 can be improved by decreasing total assets from 839.1 to 593.31, decreasing total owner's equity
from 101.3 to 71.62, and increasing net profit from 0.52 to 1.03. The efficiency of DMU4 can be improved by decreasing
total assets from 2601.1 to 1522.6and decreasing total owner's equity from 217.4 to 162.3. The efficiency of DMU5 can
be improved by decreasing total assets from 447.5 to 293.5 and decreasing total owner's equity from 118.9 to 71.19 and
increasing net profit from 1.05 to 3.7.
Table 8: Areas for Efficiency Improvement and Reference Set in 2011 (Million BDs)
Total Assets Total Owner's
Equity
Total
Operating
Income
Net Profit
(Loss)
Reference
DMUs
DMU1 6468 to 6468 678.4 to 678.4 279.4 to 279.4 1.99 to 1.99 DMU1
DMU2 923.9 to 260.16 200.6 to 56.48 12.7 to 12.7 0.99 to 2.7 DMU1,6
DMU3 839.1 to 593.31 101.3 to 71.62 26.1 to 26.1 0.52 to 1.03 DMU1,6
DMU4 2601.1 to 1522.6 217.4 to 162.3 65.9 to 65.9 0.7 to 0.7 DMU1,6
DMU5 447.5 to 293.5 118.9 to 71.19 14.7 to 14.7 1.05 to 3.7 DMU6
DMU6 1537.3 to 1537.3 372.9 to 372.9 77 to 77 19.48 to 19.5 DMU6
Table 9 compiles areas of improvements in 2012 for inefficient banks, viz. DMU1, DMU5, and DMU6 whereas DMU2,
DMU3, and DMU4 are efficient and require no changes in their inputs and outputs. The reference for DMU1 is the set of
DMU3 and DMU4, whereas the reference for DMU5 is the set of DMU2 and DMU3, and for DMU6 is the set of DMU2
and DMU4.

International Journal of Management Sciences and Business Research, 2014 ISSN (2226-8235) Vol-3, Issue 10
http://www.ijmsbr.com Page 46
Table 9: Areas for Efficiency Improvement and Reference Set in 2012 (Million BDs)
Total Assets Total Owner's
Equity
Total
Operating
Income
Net Profit
(Loss)
Reference
DMUs
DMU1 534.7 to 534.7 63.6 to 43.7 15.4 to 17.03 0.1 to 0.1 DMU3,4
DMU2 942 to 942 208.1 to 208.1 23.1 to 23.1 20.9 to 20.9 DMU2
DMU3 832.8 to 832.8 69.7 to 69.7 24.4 to 24.4 0.9 to 0.9 DMU3
DMU4 2724.1 to 2724.1 222.1 to 222.1 87.5 to 87.5 0.25 to 0.25 DMU4
DMU5 473.1 to 473.1 119.4 to 46.17 10.6 to 13.6 1.5 to 1.5 DMU2,3
DMU6 1437 to 2064.3 381.8 to 278.5 60.3 to 60.3 17.6 to 17.6 DMU2,4
Table 9 also shows that the efficiency of DMU1 can be improved by decreasing total owner's equity from 63.6 to 43.7.
The efficiency of DMU5 can be improved by decreasing total owner's equity from 119.4 to 46.17. The efficiency of
DMU6 can be improved by increasing total assets from 1437 to 2064.3 and decreasing total owner's equity from
381.8 to 278.5.
Table 10 documents areas of improvements in 2013 for inefficient banks, viz. DMU1, DMU4, DMU5, and DMU6 are
inefficient whereas DMU2 and DMU3 are efficient and, therefore, require no changes in their inputs and outputs. The
reference for each of DMU1, DMU4, DMU5, and DMU6 is DMU3.
Table 10 also shows that the efficiency of DMU1 can be improved by decreasing total assets from 614.9 to 404.533,
decreasing total owner's equity from 62.1 to 34.711, and increasing net profit from 0.69 to 5.516. The efficiency of DMU4
can be improved by decreasing total assets from 2790.9 to 1857.4, decreasing total owner's equity from 200.4 to 159.375,
and increasing net profit from 1.03 to 25.324. The efficiency of DMU5 can be improved by decreasing total assets from
542.2 to 172.667 and decreasing total owner's equity from 100.01 to 14.816 and increasing net profit by 0.66 to 2.354.
The efficiency of DMU6 can be improved by decreasing total assets from 1565 to 1309.8 and decreasing total owner's
equity from 367.7 to 112.388 and increasing net profit from 11.8 to 17.858.
Table 10: Areas for Efficiency Improvement and Reference Set in 2013 (Million BDs)
Total Assets Total Owner's
Equity
Total
Operating
Income
Net Profit
(Loss)
Reference
DMU
DMU1 614.9 to 404.5 62.1 to 34.7 16.4 to 16.4 0.69 to 5.51 DMU3
DMU2 1088 to 1088 246.1 to 246.1 26.1 to 26.1 25.2 to 25.2 DMU2
DMU3 910.2 to 910.2 78.1 to 78.1 36.9 to 36.9 12.4 to 12.4 DMU3
DMU4 2790.9 to 1857.4 200.4 to 159.4 75.3 to 75.3 1.03 to 25.3 DMU3
DMU5 542.2 to 172.7 100.01 to 14.8 7 to 7 0.66 to 2.4 DMU3
DMU6 1565 to 1309.8 367.7 to 112.4 53.1 to 53.1 11.8 to 17.9 DMU3
Concluding Remarks
The DEA model provides a useful insight into measurement of efficiency of Islamic banks in Bahrain over time. During
the sampled period 2010-2013, half of the Islamic banks were relatively efficient in managing their financial resources in
2010 and 2012, and two thirds were inefficient in 2011 and 2013. The mean efficiency indicated a negative change in
2011 compared to 2010 and in 2013 compared to 2012. One bank (DMU5) has consistently been relatively inefficient
compared to its peers over the period 2010-2013.

International Journal of Management Sciences and Business Research, 2014 ISSN (2226-8235) Vol-3, Issue 10
http://www.ijmsbr.com Page 47
The empirical results showed that three banks as per TE, six banks as per PTE and three banks as per SE were relatively
efficient in 2010. In 2011, the results showed that two banks as per TE, four banks as per PTE and two banks as per SE
were relatively efficient. In 2012, the results showed that three banks as per TE, five banks as per PTE and three banks as
per SE were relatively efficient. The results also showed that in 2013, two banks as per TE, six banks as per PTE and two
banks as per SE were relatively efficient.
The main contribution of this study is to provide management with information with regards to input and output
improvements needed to reach optimal efficiency scores. It also provides information to relatively best practice banks in
the composite set in the Kingdom of Bahrain as financial capital of the Middle East with its most diversified economy in
the region and locate the relatively inefficient banks by comparison with the best practice ones.
Based on the findings of the study, it can be suggested for inefficient Bahraini Islamic banks that look into the option of
reducing their total assets and total owner's equity while net profits are augmented in order to catch the relative efficiency
level of their competitors. At a later stage, an advanced test might be conducted for a longer period to accurately specify
the relatively inefficient DMUs.
References
Abu-Alkheil, A. M., Burghof, H. P. and Khan, W. A.
(2012). Islamic Commercial Banking in Europe: A
Cross-country and Inter-bank Analysis of Efficiency
Performance. International Business & Economics
Research Journal, 11(6), 647-75.
Banker, R. D., A. Charnes, and W. W. Cooper (1984).
Some Models foe Estimating Technical and Scale
Inefficiencies in Data Envelopment Analysis.
Management Science, 30(9), 1078-1092.
Charnes, A., Cooper, W.W., and Rhodes, E. (1978).
Measuring the Efficiency of Decision-Making Units.
European Journal of Operational Research, 2 (6), 429-
44.
Charnes, A., Cooper, W., Lewin, A. and Seiford, L.
(1994). Data Envelopment Analysis- Theory,
Methodology and Applications. Boston: Kluwer
Academic Publishers Group, Norwell, Massachusetts,
USA.
Kumar, S. and Gulati, R. (2008). An Examination of
Technical, Pure Technical, and Scale Efficiencies in
Indian Public Sector Banks using Data Envelopment
Analysis. Eurasian Journal of Business and Economics,
1(2), 33-69.
Mostafa, M. (2007). Modeling the Efficiency of GCC
Banks: A DEA Analysis. International Journal of
Productivity and Performance Management, 56(7), 623-
43.
Mostafa, M. (2011). Modeling Islamic Banks’
Efficiency: A Non-Parametric Frontier Approach.
International Journal of Islamic and Middle Eastern
Finance and Management, 4(1), 7-29.
Moussawi, C. and Obeid, H. (2011). Evaluating the
Productive Efficiency of Islamic Banking in GCC: A
Non-Parametric Approach. International Management
Review, 7(1), 10-21.
Noor, M. A. and Ahmad, N. H. (2012). The
Determinants of Efficiency of Islamic Banks. The IUP
Journal of Bank Management, 11(2), 32-70.
Oxford Business Group (2012).
http://www.oxfordbusinessgroup.com. Accessed on 3rd
August 2014.
Onour, I. and Abdalla, A. (2011), Scale and Technical
Efficiency of Islamic Banks in Sudan: Data
Envelopment Analysis. MPRA Working paper, No.
29885,
http://econpapers.repec.org/paper/pramprapa/29885.htm.
Accessed on 3rd August 2014.
Pramuka, B. A. (2011). Assessing Profit efficiency of
Islamic Banks in Indonesia: An Intermediation
Approach. Journal of Economics Business and
Accountancy. 14(1), 79-88.
Said, A. (2013). Evaluating the Overall Technical
Efficiency of Islamic Banks Operating in the MENA
Region during the Financial Crisis. International
Journal of Economics and Financial Issues, 3(2), 426-
434.
Sufian, F. (2006). Size and Returns to Scale of Islamic
Banking Industry in Malaysia: Foreign vs Domestic

International Journal of Management Sciences and Business Research, 2014 ISSN (2226-8235) Vol-3, Issue 10
http://www.ijmsbr.com Page 48
Banks. Journal of Economics and Management, 14(2),
147-175.
Sufian, F. (2007). The Efficiency of Islamic Banking
Industry: A Non-Parametric Analysis with Non-
Discretionary Input Variable. Islamic Economic Studies,
14, 53-87
Yudistira, D. (2004). Efficiency in Islamic Banking: An
Empirical Analysis of Eighteen Banks. Islamic
Economic Studies, 12(1), 1-19.
Zainal, N. S. and Ismail, M. (2012), Islamic Banking
Efficiency: A DEA Approach. 3rd
International
Conference on Business and Economics Research
Proceedings, Bandung, Indonesia, pp. 1952-65.


