Embed Size (px)
Citation preview
Bank Muscat SAOG
FOR THE SIX MONTHS PERIOD ENDED 30 JUNE 2021
INTERIM CONDENSED CONSOLIDATED FINANCIAL STATEMENTS

INTERIM CONDENSED CONSOLIDATED FINANCIAL STATEMENTSFOR THE SIX MONTHS PERIOD ENDED 30 JUNE 2021
Page No.
1 Chairman's Report
2 Interim condensed consolidated statement of financialposition 1
3 Interim condensed consolidated statement ofcomprehensive income 2
4 Interim condensed consolidated statement of changes inequity 3
5 Interim condensed consolidated statement of cash flows 4
6 Notes to the interim condensed consolidated financialstatements 5-28
Contents


Page 1
INTERIM CONDENSED CONSOLIDATED STATEMENT OF FINANCIAL POSITIONAS AT 30 JUNE 2021
Unaudited Audited Unaudited30-Jun-2021 31-Dec-2020 30-Jun-2020
Notes RO' 000 RO' 000 RO' 000ASSETS
Cash and balances with Central Banks 843,368 656,898 920,160Due from banks 3 774,789 574,786 608,133Loans and advances 4 7,897,288 7,731,286 7,812,130Islamic financing receivables 4 1,340,576 1,251,369 1,183,942Investments securities 5 1,732,371 1,847,349 1,651,570Other assets 6 231,455 320,688 212,176Property, equipment and software 66,516 71,389 71,360TOTAL ASSETS 12,886,363 12,453,765 12,459,471
LIABILITIES AND EQUITYLIABILITIESDeposits from banks 7 1,185,594 939,621 897,273Customers' deposits 8 7,518,162 7,428,737 7,601,416Islamic customers' deposits 8 1,151,542 1,029,768 1,044,052Sukuk 90,594 90,600 90,594Euro medium term notes 390,453 390,570 391,634Other liabilities 9 452,659 469,802 436,814Taxation 36,680 47,821 29,817Subordinated liabilities 6,600 13,198 19,775
10,832,284 10,410,117 10,511,375EQUITYEquity attributable to equity holders of parent:Share capital 10 357,448 324,952 324,952Share premium 531,535 531,535 531,535General reserve 397,168 397,168 384,078Legal reserve 108,318 108,318 103,160Revaluation reserve 4,904 4,904 4,904Subordinated loan reserve 13,090 13,090 13,090Cash flow hedge reserve (48) (140) (195)Cumulative changes in fair value (2,832) (3,683) (8,927)Foreign currency translation reserve (2,161) (2,407) (2,525)
Impairment reserve / restructured loan reserve 2,347 2,356 2,373Retained earnings 514,310 537,555 465,651Total equity attributable to the equity holders 1,924,079 1,913,648 1,818,096Perpetual Tier I capital 130,000 130,000 130,000TOTAL EQUITY 2,054,079 2,043,648 1,948,096TOTAL LIABILITIES AND EQUITY 12,886,363 12,453,765 12,459,471Net assets per share (in RO) 0.538 0.589 0.559 Contingent liabilities and commitments 11 1,819,398 1,866,147 2,151,997The interim condensed consolidated financial statements were approved by the Board of Directors on 27 July 2021.The attached notes 1 to 27 form part of these interim condensed consolidated financial statements.

Page 2
INTERIM CONDENSED CONSOLIDATED STATEMENT OF COMPREHENSIVE INCOMEFOR THE SIX MONTHS PERIOD ENDED 30 JUNE 2021
Unaudited Unaudited -for six months period ended- -for three months period ended-
30-Jun-2021 30-Jun-2020 30-Jun-2021 30-Jun-2020
Notes RO' 000 RO' 000 RO' 000 RO' 000Interest income 12 221,336 221,633 112,375 109,451Interest expense 13 (69,825) (74,254) (36,148) (36,765)Net interest income 151,511 147,379 76,227 72,686Income from Islamic financing / investments 12 37,715 34,119 19,401 17,076Distribution to depositors 13 (20,787) (20,965) (10,928) (10,461)Net income from Islamic financing 16,928 13,154 8,473 6,615Net interest income and income from Islamic financing 168,439 160,533 84,700 79,301
Commission and fee income (net) 14 53,620 44,279 25,721 18,106Other operating income 15 21,076 20,411 11,300 12,190OPERATING INCOME 243,135 225,223 121,721 109,597
OPERATING EXPENSESOther operating expenses (86,429) (83,749) (43,842) (38,299) Depreciation (8,686) (10,283) (4,163) (5,132)
(95,115) (94,032) (48,005) (43,431)Net impairment losses on financial assets 16 (35,328) (48,190) (17,245) (22,456)
(130,443) (142,222) (65,250) (65,887)PROFIT BEFORE TAXATION 112,692 83,001 56,471 43,710Tax expense (18,047) (13,438) (8,971) (7,394)PROFIT FOR THE PERIOD 94,645 69,563 47,500 36,316 OTHER COMPREHENSIVE (EXPENSE) INCOMENet other comprehensive income (expense) to be reclassified to profit or loss in subsequent periods, net of tax:Translation of net investments in foreign operations 246 (229) 15 93Change in fair value through other comprehensive income (FVOCI) debt investments (699) (1,466) (155) 6,523Change in fair value of cash flow hedge 92 (161) 92 7
(361) (1,856) (48) 6,623Net Other comprehensive (expense) not to be reclassified to profit or loss in subsequent periods, net of tax:Change in fair value of FVOCI equity investments 950 (10,345) 2,230 2,288
950 (10,345) 2,230 2,288OTHER COMPREHENSIVE (EXPENSE) INCOME FOR THE PERIOD 589 (12,201) 2,182 8,911TOTAL COMPREHENSIVE INCOME FOR THE PERIOD 95,234 57,362 49,682 45,227
Total comprehensive income for the period attributable toEquity holders of Parent Company 95,234 57,362 49,682 45,227
Profit attributable toEquity holders of Parent Company 94,645 69,563 47,500 36,316
Earnings per share (in RO) - Basic and diluted 17 0.025 0.018 0.013 0.010
Items in other comprehensive income are disclosed net of tax.The attached notes 1 to 27 form part of these interim condensed consolidated financial statements.

Page 3
INTERIM CONDENSED CONSOLIDATED STATEMENT OF CHANGES IN EQUITYFOR THE SIX MONTHS PERIOD ENDED 30 JUNE 2021
Attributable to equity holders of parent
Share capital
Share premium
General reserve
Legal reserve
Revaluation reserve
Subordinated loan reserve
Cash flow hedge
reserve
Cumulative changes
in fair value
Foreign currency
translation reserve
Impairment reserve /
Reserve for restructured
accountsRetained
profits Total
Perpetual Tier I
Capital TotalRO' 000 RO' 000 RO' 000 RO' 000 RO' 000 RO' 000 RO' 000 RO' 000 RO' 000 RO' 000 RO' 000 RO' 000 RO' 000 RO' 000
Balance at 1 January 2021 324,952 531,535 397,168 108,318 4,904 13,090 (140) (3,683) (2,407) 2,356 537,555 1,913,648 130,000 2,043,648 Profit for the period - - - - - - - - - - 94,645 94,645 - 94,645 Other comprehensive (expense) income - - - - - - 92 251 246 - - 589 - 589 Total comprehensive income - - - - - - 92 251 246 - 94,645 95,234 - 95,234 Transfer within equity upon disposal of FVOCI equity investments - - - - - - - 600 - - (600) - - - Dividends paid (note 10 ) - - - - - - - - - - (81,238) (81,238) - (81,238) Issue of bonus shares (note 10 ) 32,496 - - - - - - - - - (32,496) - - - Transfer from restructured reserve to retained earnings - - - - - - - - - (9) 9 - - - Interest paid on perpetual Tier 1 capital - - - - - - - - - - (3,565) (3,565) - (3,565)
Balance as at 30 June 2021 357,448 531,535 397,168 108,318 4,904 13,090 (48) (2,832) (2,161) 2,347 514,310 1,924,079 130,000 2,054,079
Attributable to equity holders of parent
Share capital
Share premium
General reserve
Legal reserve
Revaluation reserve
Subordinated loan reserve
Cash flow hedge
reserve
Cumulative changes
in fair value
Foreign currency
translation reserve
Impairment reserve /
Reserve for restructured
accountsRetained
earnings Total
Perpetual Tier I
Capital TotalRO' 000 RO' 000 RO' 000 RO' 000 RO' 000 RO' 000 RO' 000 RO' 000 RO' 000 RO' 000 RO' 000 RO' 000 RO' 000 RO' 000
Balance at 1 January 2020 309,478 531,535 384,078 103,160 4,904 13,090 (34) (372) (2,296) 2,606 526,487 1,872,636 130,000 2,002,636 Profit for the period - - - - - - - - - - 69,563 69,563 - 69,563 Other comprehensive (expense) income - - - - - - (161) (11,811) (229) - - (12,201) - (12,201) Total comprehensive (expense) income - - - - - - (161) (11,811) (229) - 69,563 57,362 - 57,362 Transfer within equity upon disposal of FVOCI equity investments - - - - - - - 3,256 - - (3,256) -
- -
Dividends paid (note 10 ) - - - - - - - - - (108,317) (108,317) - (108,317) Issue of bonus shares (note 10 ) 15,474 - - - - - - - - - (15,474) - - - Transfer from restructured reserve to retained earnings - - - - - - - - - (233) 233 - - - Interest paid on perpetual Tier 1 capital - - - - - - - - - - (3,585) (3,585) - (3,585)
Balance as at 30 June 2020 324,952 531,535 384,078 103,160 4,904 13,090 (195) (8,927) (2,525) 2,373 465,651 1,818,096 130,000 1,948,096
Appropriations to legal reserve and sub-ordinated loan reserve are made on an annual basis.
The attached notes 1 to 27 form part of these interim condensed consolidated financial statements.
(Unaudited)
(Unaudited)
Page 4
INTERIM CONDENSED CONSOLIDATED STATEMENT OF CASH FLOWSFOR THE SIX MONTHS PERIOD ENDED 30 JUNE 2021
Unaudited Unaudited30-Jun-2021 30-Jun-2020
RO' 000 RO' 000OPERATING ACTIVTIESProfit for the period before taxation 112,692 83,001 Adjustments for :Depreciation 8,686 10,283 Net impairment on financial assets 35,328 48,190 (Profit) / Loss on sale of Property and equipment (20) (9) (Profit) / Loss on investments (1,591) 1,923 Dividend income (2,163) (4,237)Operating profit before working capital changes 152,932 139,151
Due from banks (20,845) 50,695 Loans and advances (217,935) (119,594) Islamic financing receivables (94,931) (10,360) Other assets 90,681 (21,556) Deposits from banks 134,773 300,155 Customers' deposits 89,425 524,874 Islamic customer deposits 121,774 (6,712) Other liabilities 8,624 12,457 Cash from / (used in) operating activities 264,498 869,110Income taxes paid (29,708) (31,661) Net cash from / (used in) operating activities 234,790 837,449
INVESTING ACTIVTIESDividend income 2,163 4,237 Purchase of investments (97,952) (108,551) Proceeds from sale of investments 52,234 29,035 Net movement in property and equipment (3,793) (2,152) Net cash used in investing activities (47,348) (77,431)
FINANCING ACTIVITIESDividends paid (81,238) (108,317) Interest on Perpetual Tier I capital (3,565) (3,585) Subordinated loan paid (6,545) (6,545) Net cash used in financing activities (91,348) (118,447)
NET CHANGE IN CASH AND CASH EQUIVALENTS 96,094 641,571 Cash and cash equivalents at 1 January 1,202,078 982,185 CASH AND CASH EQUIVALENTS AT 30 June 1,298,172 1,623,756
Cash and cash equivalent comprises of the following:Cash and balances with Central Banks 842,868 919,656 Treasury bills 515,782 594,925 Due from banks 437,980 401,057 Deposits from banks (498,458) (291,882)
1,298,172 1,623,756 The attached notes 1 to 27 form part of these interim condensed consolidated financial statements.

_____________________________________________________________________________________
Page 5
NOTES TO THE INTERIM CONDENSED CONSOLIDATED FINANCIAL STATEMENTSFOR THE SIX MONTHS PERIOD ENDED 30 JUNE 2021
1. LEGAL STATUS AND PRINCIPAL ACTIVITIES
Bank Muscat SAOG (the Bank or the Parent Company) is a joint stock company incorporated in the Sultanate of Omanand is engaged in commercial and investment banking activities through a network of 174 branches (30 June 2020 :170 branches) within the Sultanate of Oman and one branch each in Riyadh, Kingdom of Saudi Arabia and Kuwait. TheBank has representative offices in Dubai, United Arab Emirates, Singapore and Tehran, Iran. The Bank operates inOman under a banking license issued by the Central Bank of Oman (CBO) and is covered by its deposit insurancescheme. The Bank has its primary listing on the Muscat Securities Market.
As at 30 June 2021, the Bank and its subsidiary (together, the Group) operates in 6 countries (2020: 6 countries) andemployed 3,848 employees (30 June 2020: 3,821 employees).
During 2013, the Parent Company inaugurated "Meethaq Islamic banking window" (“Meethaq”) in the Sultanate ofOman to carry out banking and other financial activities in accordance with Islamic Shari’a rules and regulations.Meethaq operates under an Islamic banking license granted by the CBO on 13 January 2013. Meethaq’s Shari’aSupervisory Board is entrusted to ensure Meethaq's adherence to Shari’a rules and principles in its transactions andactivities. The principal activities of Meethaq include: accepting customer deposits; providing Shari'a compliant financingbased on various Shari'a compliant modes; undertaking Shari'a compliant investment activities permitted under theCBO's Regulated Islamic Banking Services as defined in the licensing framework. Meethaq has 24 branches (June 2020 - 21 branches) in the Sultanate of Oman.
2. BASIS OF PREPARATION AND ACCOUNTING POLICIES2.1 BASIS OF PREPARATION
The unaudited interim condensed consolidated financial statements for the six months period ended 30 June 2021 ofthe Bank are prepared in accordance with International Accounting Standard (IAS) 34, 'Interim Financial Reporting',applicable regulations of the Central Bank of Oman (CBO) and the Capital Market Authority (CMA).
The unaudited interim condensed financial statements have been prepared on the historical cost basis, modified toinclude the revaluation of freehold land and buildings and the measurement at fair value of derivative financialinstruments, FVOCI investment securities and investment recorded at fair value through profit or loss. The carryingvalues of recognised assets and liabilities that are designated as hedged items in fair value hedges that would otherwisebe carried at amortised cost are adjusted to record changes in the fair values attributable to the risks that are beinghedged in effective hedge relationships.
The Islamic window operation of the Parent Company; "Meethaq" uses Financial Accounting Standards ("FAS"), issuedby Accounting and Auditing Organisation for Islamic Financial Institutions ("AAOIFI"), for preparation and reporting ofits financial information. Meethaq's financial information is included in the results of the Bank, after adjusting financialreporting differences, if any, between AAOIFI and IFRS.
The functional currency of the Bank is the Rial Omani (RO). These unaudited interim condensed consolidated financialstatements of the Bank are prepared in Rial Omani, rounded to the nearest thousands, except as indicated.
The unaudited interim condensed consolidated financial statements do not contain all information and disclosuresrequired for full financial statements prepared in accordance with International Financial Reporting Standards andshould be read in conjunction with the Group's annual consolidated financial statements as at 31 December 2020. Inaddition, results of the Group for the period ended 30 June 2021 are not necessarily indicative of the results that maybe expected for the financial year 2021.

_____________________________________________________________________________________
Page 6
NOTES TO THE INTERIM CONDENSED CONSOLIDATED FINANCIAL STATEMENTSFOR THE SIX MONTHS PERIOD ENDED 30 JUNE 2021
2. BASIS OF PREPARATION AND ACCOUNTING POLICIES (continued)2.1 BASIS OF PREPARATION (continued)
In March 2021, Parent Company sold 72.71% stake in its wholly owned subsidiary, Muscat Capital Company (cjsc) (MC), based in Riyadh, Kingdom of Saudi Arabia to SICO BSC (c), a leading regional asset manager, broker, market maker and investment bank (licensed as a wholesale bank by the Central Bank of Bahrain), after obtaining all relevant approvals. The acquisition took place by way of a share swap valued at RO 5.6 million, with 38,563,894 of SICO’s treasury shares swapped for a majority stake amounting to 4,362,491 shares out of MC’s 6,000,000 total outstanding shares. As a result of the transaction, SICO owns 72.71 per cent of MC while Bank Muscat owns a 9 per cent stake in SICO.
Due to above transaction, the Parent Company shareholding in MC was effectively reduced from 100% to 27.29%. The Group lost control over MC due to disposal of 72.71% stake with control to SICO. Resultantly, MC has been accounted for as disposal of subsidiary and retained stake of 27.29% has been recognized as an FVOCI investment. The statement of profit or loss contains income and expenses of MC upto the date of disposal and assets and liabilities of MC (before acquisition accounting) have been derecognized in full in the statement of financial position at 30 June 2021.
2.2 NEW STANDARDS, IMPLEMENTATIONS AND AMENDMENTS IN EXISTING STANDARDS
The accounting policies adopted in the preparation of the interim condensed consolidated financial statements are consistent with those followed in the preparation of the Group’s annual consolidated financial statements for the year ended 31 December 2020, except for the adoption of new standards effective as of 1 January 2021. The Bank has not early adopted any standard, interpretation or amendment that has been issued but is not yet effective.Several amendments apply for the first time in 2021, but do not have an impact on the interim condensedconsolidated financial statements of the Bank. The above amendments are effective from 1 January 2021.
2.3 COVID-19 RELATED UPDATESDuring H1-21, the Central Bank of Oman had issued certain circulars relating to COVID-19:
1) As per circular BDD/CBS/CB/FLCs/2021/1436 dated 15 March 2021, wherein taking cognizance of the continuing impact of COVID-19 on business/housholds and to support the banks, CBO has extended the following relaxations:
- Request for deferment of loans instalments / interest / profit for affected borrowers, particularly SME’s without impacting risk classification extended till 30 September 2021. - No interest-on-interest on the deferred loan instalments to be charged for all affected borrowers. - Banks should make efforts to reschedule loans of affected borrowers, without impacting the risk classification. - All loans linked to Government projects allowed deferment of risk classification from upto 30 September 2021. - Deferral of instalments for Omani citizens who have been laid-off extended by another 12 months. Further, there will be no interest / profit for the entire deferral period. - Deferral of instalments for Omani nationals who's salary has been reduced extended till 30 September 2021. Further, there will be no interest/ profit for the entire deferral period. - Consequent to the withdrawals of allowance of Govt. units employees, banks allowed to either exceed Debt Burden Ratio or extend the regulatory tenor. - Requirement of valuation of residential property every 3 years for 35% risk weight is suspended for 2021, provided a desktop valuation is undertaken and Property has been subjected to valuation by a recognized estate agent at least once, in the last 5 years. - Relaxation in LCR upto 75% allowed on a case to case basis. - Banks to consider reducing existing fees and to abstain from introducing new ones until Dec 2021 - Temporary relief on cheque returned extended till 30 September 2021 - Reduction of interest rate on discounting of T-Bills by another 25 bps.

_____________________________________________________________________________________
Page 7
NOTES TO THE INTERIM CONDENSED CONSOLIDATED FINANCIAL STATEMENTSFOR THE SIX MONTHS PERIOD ENDED 30 JUNE 20212.3 COVID-19 RELATED UPDATES (continued)
- Increase in the tenor of repo operation upto a maximum of 6 months & foreign currency swaps upto 1 year. - Reduction of interest rate on rediscounting of Bill of Exchange/ Promissory note by further 50 bps.2) As per circular BSD/CB/&FLCs/2021/002 dated 18 March 2021, CBO has provided the following relaxations related to suspension of two-track approach and SICR criteria assesment for 2021: - Temporary suspension of the two-track approach / parallel run for the computation of additional provisions as per CBO norms for 2021 only. - Temporary suspension of Significant Increase in Credit Risk (SICR) criteria assessments for additional accounts for 2021 only. - Banks & FLCs shall continue to apply rationale approach towards post-model adjustments and management overlays by applying multiple macro-economic scenarios with careful application of probability weights to each of such scenarios while computing ECL on portfolio basis.
Impact on ECL and Capital adequacyDuring 2020, given the emerging nature of the health and economic crisis at that point time, the bank was of the view that the forward looking macro economic data and the PD term structures published by economists and rating agencies during 2020 was yet to reasonably reflect the impact of the economic disruption caused by Covid 19 and also to fully factor in the financial intervention by the relevant state authorities. Hence based on regulatory and IASB guidance, as a measure of prudence, wherever necessary, the bank had applied post model adjustments and management judgement overlays while computing the ECL.
During H1-2021, the Bank has now applied the latest available macro-economic variables and PD term structures in its ECL computations. The Bank remains vigilant of the evolving market and business conditions and its potential impact on the ECL and continues to hold adequate amount of collective and precautionary provisions as a mitigant.
Besides, the bank has also applied in its capital adequacy calculations the “Prudential filter” under interim adjustment arrangement for Stage-1 and Stage-2 ECL. The impact of above filter on the bank's regulatory capital is 36 bps.
Although above measures are not exhaustive and may not fully counteract the impact of COVID-19 in the short run, they will mitigate the long-term negative impact of the pandemic. In response to this crisis, the Bank continues to monitor and respond to all liquidity and funding requirements. As at the reporting date the liquidity, funding and capital position of the Bank remains strong and is well placed to absorb the impact of the current disruption.

______________________________________________________________________________________________
Page 8
NOTES TO THE INTERIM CONDENSED CONSOLIDATED FINANCIAL STATEMENTSFOR THE SIX MONTHS PERIOD ENDED 30 JUNE 2021
3. DUE FROM BANKSUnaudited Audited Unaudited
30-Jun-2021 31-Dec-2020 30-Jun-2020RO' 000 RO' 000 RO' 000
At amortised cost / FVOCINostro balances 91,414 114,074 82,731Inter-bank placements 579,812 384,782 402,996Loans to banks 107,254 78,426 89,084
778,480 577,282 574,811Less: impairment loss allowance (3,691) (2,496) (4,770)
774,789 574,786 570,041At FVTPLInter-bank placements - - 38,092
774,789 574,786 608,133
4. LOANS AND ADVANCES / ISLAMIC FINANCING RECEIVABLESLoans and advances - Conventional banking
Unaudited Audited Unaudited30-Jun-2021 31-Dec-2020 30-Jun-2020
RO' 000 RO' 000 RO' 000Corporate loans 3,981,247 3,974,065 4,010,836Overdrafts and credit cards 305,687 290,748 313,629Loans against trust receipts 440,436 463,147 509,501Bills purchased and discounted 114,776 111,448 99,872Personal and housing loans 3,465,342 3,254,009 3,217,429
8,307,488 8,093,417 8,151,267Less: Impairment loss allowance (410,200) (362,131) (339,137)
7,897,288 7,731,286 7,812,130
Islamic financing receivablesUnaudited Audited Unaudited
30-Jun-2021 31-Dec-2020 30-Jun-2020RO' 000 RO' 000 RO' 000
Housing finance 491,308 491,809 486,886Corporate finance 845,825 751,408 686,050Consumer finance 42,330 42,099 40,939
1,379,463 1,285,316 1,213,875Less: Impairment loss allowance (38,887) (33,947) (29,933)
1,340,576 1,251,369 1,183,942

______________________________________________________________________________________________
Page 9
NOTES TO THE INTERIM CONDENSED CONSOLIDATED FINANCIAL STATEMENTSFOR THE SIX MONTHS PERIOD ENDED 30 JUNE 2021
4. LOANS AND ADVANCES / ISLAMIC FINANCING RECEIVABLES (continued)
Movement in impairment loss is analysed below:
Unaudited Audited Unaudited30-Jun-2021 31-Dec-2020 30-Jun-2020
RO' 000 RO' 000 RO' 0001 January 396,078 314,786 314,786Impairment for credit losses 79,716 106,039 63,789Interest reserved during the period 9,183 18,086 8,569Recoveries from impairment for credit losses (21,024) (34,711) (15,464)Reserve Interest recovered during the period (3,002) (5,546) (2,086)Written off during the period (11,753) (3,186) (803)Transfer from / (to) Memorandum portfolio (156) 638 363Foreign currency translation difference 70 (19) (85)Other movements (25) (9) 1At 30 June / 31 December 449,087 396,078 369,070
The maturity profile of loans and advances / Islamic financing receivables was as follows
Unaudited Audited Unaudited30-Jun-2021 31-Dec-2020 30-Jun-2020
RO' 000 RO' 000 RO' 000On demand or within 1 month 1,242,008 1,361,429 1,530,0341 to 3 months 634,590 562,576 537,4224 to 12 months 865,675 677,430 708,8061 to 5 years 2,221,739 2,362,313 2,159,831More than 5 years 4,273,852 4,018,907 4,059,979
9,237,864 8,982,655 8,996,072
5. INVESTMENT SECURITIES
Unaudited Audited Unaudited
30-Jun-2021 31-Dec-2020 30-Jun-2020RO' 000 RO' 000 RO' 000
Equity investments:Measured as at FVTPL 17,525 20,765 24,240 Designated as at FVOCI 76,986 79,451 73,024 Net equity investments 94,511 100,216 97,264
Debt investments:Measured at FVOCI 64,052 61,989 62,242 Measured at amortised cost 1,579,819 1,688,877 1,494,594 Gross Debt investments 1,643,871 1,750,866 1,556,836 Less: Impairment loss allowance (6,011) (3,733) (2,530) Net debt investments 1,637,860 1,747,133 1,554,306
Total investment securities 1,732,371 1,847,349 1,651,570
At 30 June 2021, loans and advances on which contractual interest is not being accrued or has not been recognised amounted to RO340.5 million (31 December 2020: RO 337.8 million, 30 June 2020: RO 340.1 million).Contractual interest reserved and recoverythereof is shown under net interest income and income from Islamic financing in the statement of comprehensive income.
Page 10
NOTES TO THE INTERIM CONDENSED CONSOLIDATED FINANCIAL STATEMENTSFOR THE SIX MONTHS PERIOD ENDED 30 JUNE 2021
5. INVESTMENT SECURITIES (continued)As at 30 June 2021 Amortised(unaudited) FVTPL FVOCI Cost Total
RO' 000 RO' 000 RO' 000 RO' 000Quoted equities:
Foreign securities 1,653 59,192 - 60,845 Other services sector - 5,995 - 5,995 Unit funds 2,469 - - 2,469 Financial services sector 576 6,226 - 6,802 Industrial sector - 1,825 - 1,825
4,698 73,238 - 77,936 Unquoted equities:
Foreign securities 4,163 2,108 - 6,271 Local securities 8,664 1,640 - 10,304
12,827 3,748 - 16,575 Equity investments 17,525 76,986 - 94,511 Less: Impairment loss allowance - - - - Net equity investments 17,525 76,986 - 94,511 Quoted debt:
Government bonds - 3,544 978,158 981,702 Foreign bonds - 33,983 5,064 39,047 Local bonds - 21,748 75,088 96,836
- 59,275 1,058,310 1,117,585 Unquoted debt:
Treasury bills - - 515,782 515,782 Local bonds - 4,777 5,727 10,504
- 4,777 521,509 526,286 Gross debt investments - 64,052 1,579,819 1,643,871 Less: Impairment loss allowance - (2,576) (3,435) (6,011) Net debt investments - 61,476 1,576,384 1,637,860 Net investments 17,525 138,462 1,576,384 1,732,371
As at 31 December 2020 Amortised(Audited) FVTPL FVOCI Cost Total
RO' 000 RO' 000 RO' 000 RO' 000Quoted equities:
Foreign securities 4,552 63,738 - 68,290 Other services sector - 6,153 - 6,153 Unit funds 5,132 - - 5,132 Financial services sector 582 5,614 - 6,196 Industrial sector - 1,689 - 1,689
10,266 77,194 - 87,460 Unquoted equities:
Foreign securities 2,041 602 - 2,643 Local securities 8,156 1,655 - 9,811 Unit funds 302 - - 302
10,499 2,257 - 12,756 Net equities portfolio 20,765 79,451 - 100,216 Quoted debt:
Government bonds - 2,425 919,472 921,897 Foreign bonds - 31,252 5,074 36,326 Local bonds - 22,664 75,046 97,710
- 56,341 999,592 1,055,933 Unquoted debt:
Treasury bills - - 676,041 676,041 Local bonds - 5,649 13,243 18,892
- 5,649 689,284 694,933 Gross debt portfolio - 61,990 1,688,876 1,750,866 Less: Impairment loss allowance - (2,874) (859) (3,733) Net debt portfolio - 59,116 1,688,017 1,747,133 Net investments 20,765 138,567 1,688,017 1,847,349
Page 11
NOTES TO THE INTERIM CONDENSED CONSOLIDATED FINANCIAL STATEMENTSFOR THE SIX MONTHS PERIOD ENDED 30 JUNE 2021
5. INVESTMENT SECURITIES (continued)
The movement in impairment of debt investments is summarised as followsUnaudited Audited Unaudited
30-Jun-2021 31-Dec-2020 30-Jun-2020RO' 000 RO' 000 RO' 000
At 1 January 3,733 1,613 1,613Provided /(reversed) during the period / year 2,279 2,122 919Other movements (1) (2) (2)At 31 March / 31 December 6,011 3,733 2,530
6. OTHER ASSETS
Unaudited Audited Unaudited
30-Jun-2021 31-Dec-2020 30-Jun-2020RO' 000 RO' 000 Unaudited
Acceptances 152,714 143,736 120,174Less: impairment loss allowance (226) (178) (130)Net Acceptances 152,488 143,558 120,044Other debtors and prepaid expenses 29,320 49,793 38,267Positive fair value of derivatives 30,109 35,429 39,089Deferred tax asset 7,641 7,294 9,136Others 11,897 84,614 5,640
231,455 320,688 212,176
7. DEPOSITS FROM BANKS
Unaudited Audited Unaudited
30-Jun-2021 31-Dec-2020 30-Jun-2020RO' 000 RO' 000 RO' 000
Inter bank borrowings 415,237 350,677 305,141Vostro balances 66,922 40,696 43,129Other money market deposits 703,435 548,248 549,003
1,185,594 939,621 897,273

Page 12
NOTES TO THE INTERIM CONDENSED CONSOLIDATED FINANCIAL STATEMENTSFOR THE SIX MONTHS PERIOD ENDED 30 JUNE 2021
8. CUSTOMERS' DEPOSITS
Conventional customers' deposits
Unaudited Audited Unaudited
30-Jun-2021 31-Dec-2020 30-Jun-2020RO' 000 RO' 000 RO' 000
Deposit accounts 2,377,858 2,325,602 2,464,613Savings accounts 3,081,384 3,013,526 2,940,019Current accounts 1,782,377 1,767,473 1,868,281Call accounts 226,922 258,564 272,934Margin accounts 49,621 63,572 55,569
7,518,162 7,428,737 7,601,416
Islamic customers' deposits
Unaudited Audited Unaudited
30-Jun-2021 31-Dec-2020 30-Jun-2020RO' 000 RO' 000 RO' 000
Deposit accounts 620,858 543,837 595,795Savings accounts 294,210 266,680 244,515Current accounts 98,839 114,207 103,747Call accounts 53,889 24,796 19,621Margin accounts 83,746 80,248 80,374
1,151,542 1,029,768 1,044,052
The maturity profile of customer's deposits (including Islamic customers' deposits) was as follows:
Unaudited Audited Unaudited
30-Jun-2021 31-Dec-2020 30-Jun-2020RO' 000 RO' 000 RO' 000
On demand or within 1 month 936,157 827,796 852,2541 to 3 months 763,152 818,809 739,6724 to 12 months 2,173,614 2,011,988 2,004,6771 to 5 years 3,226,684 3,280,928 3,484,605More than 5 years 1,570,097 1,518,984 1,564,260
8,669,704 8,458,505 8,645,468

Page 13
NOTES TO THE INTERIM CONDENSED CONSOLIDATED FINANCIAL STATEMENTSFOR THE SIX MONTHS PERIOD ENDED 30 JUNE 2021
9. OTHER LIABILITIESUnaudited Audited Unaudited
30-Jun-2021 31-Dec-2020 30-Jun-2020RO' 000 RO' 000 RO' 000
Other liabilities and accrued expenses 169,139 155,459 160,559Acceptances 152,714 143,736 120,174Impairment on financial guarantees 37,144 63,607 50,533Impairment on undrawn commitments and unutilised limits 9,638 8,999 9,422Lease liabilities 45,684 48,159 48,690Negative fair value of derivatives 22,037 32,001 30,804Unearned discount and interest 8,723 9,579 8,349Employee end of service benefits 6,714 7,396 7,417Deferred tax liability 866 866 866
452,659 469,802 436,814
10. SHARE CAPITAL AND DIVIDEND
Shareholders of the Bank who hold 10% or more of the bank's shares are given below:Unaudited Audited Unaudited
30-Jun-2021 31-Dec-2020 30-Jun-2020RO' 000 RO' 000 RO' 000
Number of shares heldRoyal Court Affairs 844,805,580 768,005,073 768,005,073 Dubai Financial Group LLC 420,590,963 382,355,421 382,355,421
% of shareholdingRoyal Court Affairs 23.63% 23.63% 23.63%Dubai Financial Group LLC 11.77% 11.77% 11.77%
11. CONTINGENT LIABILITIESUnaudited Audited Unaudited
30-Jun-2021 31-Dec-2020 30-Jun-2020RO' 000 RO' 000 RO' 000
CONTINGENT LIABILITIESLetters of credit 348,108 307,091 365,872 Guarantees 1,471,290 1,559,056 1,786,125
1,819,398 1,866,147 2,151,997
COMMITMENTSIrrevocable credit commitments 314,595 394,619 358,777 Purchase of property and equipment 601 682 967 Partly paid shares 3,112 3,884 2,905
318,308 399,185 362,649
In the Bank's annual general meeting held on 23 March 2021 the shareholders approved a dividend of 35%, 25% inthe form of cash and 10% in the form of bonus shares. Thus shareholders received cash dividend of RO 0.025 perordinary share of RO 0.100 each aggregating to RO 81.238 million on Bank’s existing share capital. In addition, theyreceived bonus shares in the proportion of 1 share for every 10 ordinary shares aggregating to 324,952,253 shares ofRO 0.100 each amounting to RO 32.496 million.
The authorised share capital of the Parent Company is 4,500,000,000 shares of RO 0.100 each (2020: 3,500,000,000 of RO 0.100 each). At 30 June 2021, 3,574,474,792 shares of RO 0.100 each (31 December 2020: 3,249,522,539 shares of RO 0.100 each) have been issued and fully paid. The Bank's shares are listed in Muscat Securities Market, Bahrain stock exchange and London stock exchange. Listing in London stock exchange is through Global Depository Receipts issued by the Bank.

Page 14
NOTES TO THE INTERIM CONDENSED CONSOLIDATED FINANCIAL STATEMENTSFOR THE SIX MONTHS PERIOD ENDED 30 JUNE 2021
12. INTEREST INCOME / INCOME ON ISLAMIC FINANCING / INVESTMENTUnaudited Unaudited Unaudited Unaudited
30-Jun-2021 30-Jun-2020 30-Jun-2021 30-Jun-2020RO' 000 RO' 000 RO' 000 RO' 000
Loans and advances 190,263 194,389 96,384 96,386 Due from banks 3,571 7,651 1,908 2,982 Investments 27,502 19,593 14,083 10,083
221,336 221,633 112,375 109,451 Islamic financing receivable 33,693 30,915 17,373 15,455 Islamic due from banks 21 503 17 262 Islamic investment 4,001 2,701 2,011 1,359
37,715 34,119 19,401 17,076 259,051 255,752 131,776 126,527
13. INTEREST EXPENSE / DISTRIBUTION TO DEPOSITORSUnaudited Unaudited Unaudited Unaudited
30-Jun-2021 30-Jun-2020 30-Jun-2021 30-Jun-2020RO' 000 RO' 000 RO' 000 RO' 000
Customer's deposits 54,799 56,247 27,934 28,517 Subordinated liabilities 295 672 109 297 Bank borrowings 5,474 8,901 2,851 3,910 Euro medium term notes 9,257 8,434 5,254 4,041
69,825 74,254 36,148 36,765 Islamic customers deposits 16,104 15,836 8,456 8,123 Islamic bank borrowings 2,258 2,710 1,252 1,128 Sukuk 2,425 2,419 1,220 1,210
20,787 20,965 10,928 10,461 90,612 95,219 47,076 47,226
14. COMMISSION AND FEES INCOME (NET)
15. OTHER OPERATING INCOMEUnaudited Unaudited Unaudited Unaudited
30-Jun-2021 30-Jun-2020 30-Jun-2021 30-Jun-2020RO' 000 RO' 000 RO' 000 RO' 000
Foreign exchange 17,096 17,785 8,603 8,544Changes in fair value of financial assets 1,204 (1,862) 1,088 1,207Net realised gain (loss) on sale of fair value investments 387 (61) 400 (128)Dividend income 2,163 4,237 1,116 2,348Other income 226 312 93 219
21,076 20,411 11,300 12,190
16. NET IMPAIRMENT LOSSES ON FINANCIAL ASSETSUnaudited Unaudited Unaudited Unaudited
30-Jun-2021 30-Jun-2020 30-Jun-2021 30-Jun-2020RO' 000 RO' 000 RO' 000 RO' 000
(Impairment) / reversal of impairment for credit losses: - Due from banks (1,195) (4,004) (177) (3,618) - Loans and advances to customers (79,716) (63,789) (38,040) (28,689) - Financial guarantees 26,491 3,353 12,528 1,617 - Acceptances (48) 14 (48) 86 - Loan commitments / unutilised limits (640) 1,314 (901) 665 - Investments (2,279) (919) (1,347) (134)
(57,387) (64,031) (27,985) (30,073)
Recoveries from impairment losses 21,024 15,464 10,597 7,472Recoveries from loans written off earlier 1,035 377 143 145
22,059 15,841 10,740 7,617 (35,328) (48,190) (17,245) (22,456)
-for six months period ended- -for three months ended-
-for six months period ended- -for three months ended-
-for six months period ended- -for three months ended-
-for six months period ended- -for three months ended-
The commission and fees shown in the interim condensed consolidated statement of comprehensive income is net off commission and fees paid of RO 682 thousands (30 Jun 2020 : RO 696 thousands).
Dividend income recognised on FVOCI investments during the period ended 30 June 2021 is RO 1,695 thousands. (30 June 2020: RO 3,575 thousands), out of which RO 154 thousands (30 June 2020: RO 61 thousand) pertains to investments sold during this period.
Interest expense on customer deposits include accruals towards prize schemes of RO 5.5 million (30 June 2020: RO 5.5 million) offered by the bank to its saving deposit holders. Profit distribution on Islamic customers deposits include accruals towards prize schemes of RO 0.75 million (30 June 2020: RO 0.5 million) to its saving deposit holders.

____________________________________________________________________________________________________
Page 15
NOTES TO THE INTERIM CONDENSED CONSOLIDATED FINANCIAL STATEMENTSFOR THE SIX MONTHS PERIOD ENDED 30 JUNE 2021
17. EARNINGS PER SHARE
Unaudited Unaudited Unaudited Unaudited hree months period ended-
30-Jun-2021 30-Jun-2020 30-Jun-2021 30-Jun-2020RO' 000 RO' 000 RO' 000
Profit for the period 94,645 69,563 47,500 36,316 Less: Interest on Perpetual Tier I capital (3,565) (3,585) (1,802) (1,802) Profit attributable to ordinary shareholders of parent company for basic and diluted earnings per share (RO 000's) 91,080 65,978 45,698 34,514
Weighted average number of shares in issue during the period (000's) 3,574,475 3,574,475 3,574,475 3,574,475 Basic and diluted earnings per share (RO) 0.025 0.018 0.013 0.010
18. RELATED PARTY TRANSACTIONS
Unaudited Audited Unaudited30-Jun-2021 31-Dec-2020 30-Jun-2020
RO' 000 RO' 000 RO' 000a) Directors and senior managementLoans and advances 594 746 861 Current, deposit and other accounts 1,935 1,688 1,709b) Major shareholders and othersLoans and advances (gross) 119,029 126,724 186,382 Current, deposit and other accounts 53,125 23,787 20,510Customers' liabilities under documentary credits, guarantees and other commitments 5,576 6,256 7,081
Unaudited Unaudited Unaudited Unaudited -for six months period ended- -for three months period ended-
30-Jun-2021 30-Jun-2020 30-Jun-2021 30-Jun-2020RO' 000 RO' 000 RO' 000 RO' 000
a) Directors and senior managementInterest income 14 18 6 2 Interest expenditure 25 24 11 11 b) Major shareholders and othersInterest income 3,105 5,068 1,582 2,503 Interest expenditure 255 357 157 258
Unaudited Audited Unaudited30-Jun-2021 31-Dec-2020 30-Jun-2020
RO' 000 RO' 000 RO' 000Royal Court Affairs 13,772 - 39,436 HE Sheikh Mustahail Ahmed Al Mashani Group Companies 29,334 33,176 42,166 Others 82,093 100,550 112,722
125,199 133,726 194,324
Unaudited Unaudited Unaudited Unaudited -for six months period ended- -for three months period ended-
30-Jun-2021 30-Jun-2020 30-Jun-2021 30-Jun-2020RO' 000 RO' 000 RO' 000 RO' 000
Royal Court Affairs 98 140 76 127 HE Sheikh Mustahail Al Mashani Group Companies 157 217 81 131 Others 25 24 11 11
280 381 168 269
Directors remuneration and sitting fees during the period ended 30 June 2021 is RO 235 thousands (30 June 2020: RO 133 thousands)
Items of expense which were paid to related parties or holders of 10 percent or more of the bank's shares, or their family members, during the period can be further analysedas follows:
Basic earnings per share are calculated by dividing the profit attributable to ordinary shareholders (after adjusting for interest on perpetual tier I capital) for the period by the weighted average number of ordinary shares oustanding during the period as follows:
-for six months period ended-
The income and expenses in respect of related parties included in the interim condensed consolidated financial statements are asfollows:
Loans, advances or receivables and non-funded exposure due from related parties or holders of 10 percent or more of Banks shares, or their family members, less all provisions and write-offs, is further analysed as follows:
In the ordinary course of business, the Group conducts transactions with certain of its directors, shareholders, senior management and companies in which they have a significant interest. The terms of these transactions are approved by the Bank’s Board and Management. The balances in respect of related parties included in the interim condensed consolidated statement of financial position as at the reporting date are as follows:
There are no instruments that are dilutive in nature, hence the basic and diluted earnings per share are same for both the periods.

_________________________________________________________________________________________________________
Page 16
NOTES TO THE INTERIM CONDENSED CONSOLIDATED FINANCIAL STATEMENTSFOR THE SIX MONTHS PERIOD ENDED 30 JUNE 2021
19. DERIVATIVES
As at 30 June 2021 Positive Negative Notional(unaudited) fair value fair value total 0-3 months 4-12 months > 12 months
RO' 000 RO' 000 RO' 000 RO' 000 RO' 000 RO' 000
Cash flow hedge - 56 6,545 - 6,545 - Interest rate swaps 18,874 18,009 843,084 - 69,454 773,630 Commodities purchase contracts 1,628 331 38,417 24,184 14,233 - Commodities sale contracts 636 1,838 38,418 24,185 14,233 - Forward purchase contracts 322 1,731 1,516,943 539,819 287,089 690,035 Forward sales contracts 8,649 72 1,507,040 535,936 284,159 686,945 Total 30,109 22,037 3,950,447 1,124,124 675,713 2,150,610
As at 31 December 2020 Positive Negative Notional(audited) fair value fair value total 0-3 months 4-12 months > 12 months
RO' 000 RO' 000 RO' 000 RO' 000 RO' 000 RO' 000
Fair value hedge 1,592 - 192,500 - 192,500 - Cash flow hedge - 164 13,090 - 13,090 - Interest rate swaps 25,554 24,615 743,215 - 70,392 672,823 Commodities purchase contracts 1,263 191 27,978 20,077 7,901 - Commodities sale contracts 209 1,251 27,978 20,077 7,901 - Forward purchase contracts 684 293 1,723,478 1,259,448 444,446 19,584 Forward sales contracts 6,127 5,487 1,718,539 1,259,679 439,514 19,346 Total 35,429 32,001 4,446,778 2,559,281 1,175,744 711,753
As at 30 June 2020 Positive Negative Notional(unaudited) fair value fair value total 0-3 months 4-12 months > 12 months
RO' 000 RO' 000 RO' 000 RO' 000 RO' 000 RO' 000
Fair value hedge 2,593 - 192,500 - 192,500 - Cash flow hedge - 230 19,635 - - 19,635 Interest rate swaps 22,611 22,611 808,349 - 197,254 611,095 Commodities purchase contracts 2,767 2,524 73,476 57,820 13,972 1,684 Commodities sale contracts 2,714 2,629 73,476 57,820 13,972 1,684 Forward purchase contracts 507 1,646 2,086,751 1,045,018 975,586 66,147 Forward sales contracts 7,897 1,164 2,075,544 1,041,749 968,828 64,967 Total 39,089 30,804 5,329,731 2,202,407 2,362,112 765,212
Notional amounts by term to maturity
Notional amounts by term to maturity
Notional amounts by term to maturity

________________________________________________________________________________________________________
Page 17
NOTES TO THE INTERIM CONDENSED CONSOLIDATED FINANCIAL STATEMENTSFOR THE SIX MONTHS PERIOD ENDED 30 JUNE 2021
20. SEGMENTAL INFORMATION
Unaudited Unaudited Unaudited Unaudited Unaudited Unaudited
30-Jun-202030-Jun-
2020 30-Jun-2020 30-Jun-2021 30-Jun-2021 30-Jun-2021RO' 000 RO' 000 RO' 000 RO' 000 RO' 000 RO' 000
Total International Oman Oman International Total221,633 5,899 215,734 Interest income 218,293 3,043 221,336(74,254) (3,420) (70,834) Interest expense (68,916) (909) (69,825)
34,119 - 34,119 Income from Islamic financing 37,715 - 37,715(20,965) - (20,965) Distribution to depositors (20,787) - (20,787)
44,279 1,705 42,574 Commission and fee income (net) 52,901 719 53,62020,411 2,787 17,624 Other operating income 20,737 339 21,076
225,223 6,971 218,252 239,943 3,192 243,135Operating expenses
(83,749) (2,434) (81,315) Other operating expenses (84,371) (2,058) (86,429)(10,283) (307) (9,976) Depreciation (8,483) (203) (8,686)(94,032) (2,741) (91,291) (92,854) (2,261) (95,115)
(48,190) (9,367) (38,823)Net impairment losses on financial assets (35,526) 198 (35,328)
(13,438) (207) (13,231) Tax expense (18,028) (19) (18,047)(155,660) (12,315) (143,345) (146,408) (2,082) (148,490)
69,563 (5,344) 74,907 Profit (Loss) for the period 93,535 1,110 94,645Other information
12,459,471 460,081 11,999,390 Total assets 12,574,456 311,907 12,886,36310,511,375 398,465 10,112,910 Total liabilities 10,584,640 247,644 10,832,284
Management has determined the operating segments based on the reports reviewed by the executive committee that are used to make strategicdecisions. The committee considers the business from both a geographic and product perspective. Geographically, management considers theperformance of whole bank in Oman and International markets. The Oman market is further segregated into corporate, consumer, wholesale andIslamic banking as all of these business lines are located in Oman. Segment information in respect of geographical locations is as follows:

_________________________________________________________________________________________________________________
Page 18
NOTES TO THE INTERIM CONDENSED CONSOLIDATED FINANCIAL STATEMENTSFOR THE SIX MONTHS PERIOD ENDED 30 JUNE 2021
20. SEGMENTAL INFORMATION (continued)
Corporate Consumer Wholesale International Islamic 30 June 2021 banking banking banking banking* Subtotal banking Total(unaudited) RO '000 RO '000 RO '000 RO '000 RO '000 RO '000 RO '000Segment revenueNet interest income 56,806 71,107 21,318 2,280 151,511 - 151,511 Net income from Islamic financing - 16,928 16,928 Commission, fees and other income 10,648 35,594 25,889 710 72,841 1,855 74,696 Operating income 67,454 106,701 47,207 2,990 224,352 18,783 243,135
Segment costsOperating expenses (16,227) (61,276) (7,938) (3,111) (88,552) (6,563) (95,115) Impairment (net) (15,859) (8,664) (2,313) (2,815) (29,651) (5,677) (35,328) Tax expense (5,515) (5,732) (5,762) (19) (17,028) (1,019) (18,047)
(37,601) (75,672) (16,013) (5,945) (135,231) (13,259) (148,490) Segment profit for the period 29,853 31,029 31,194 (2,955) 89,121 5,524 94,645 Segment assets 4,393,665 3,635,265 2,903,219 296,557 11,228,706 1,657,657 12,886,363 Segment liabilities 3,201,032 4,508,811 1,408,356 247,644 9,365,843 1,466,441 10,832,284
Corporate Consumer Wholesale International Islamic 30 June 2020 banking banking banking banking* Subtotal banking Total(unaudited) RO '000 RO '000 RO '000 RO '000 RO '000 RO '000 RO '000Segment revenueNet interest income 59,170 68,058 17,672 2,479 147,379 - 147,379 Net income from Islamic financing - - - - - 13,154 13,154 Commission, fees and other income 9,927 29,408 19,067 4,504 62,906 1,784 64,690 Operating income 69,097 97,466 36,739 6,983 210,285 14,938 225,223
Segment costsOperating expenses (16,383) (58,656) (9,132) (3,585) (87,756) (6,276) (94,032) Impairment (net) (18,157) (10,556) (5,357) (10,200) (44,270) (3,920) (48,190) Tax expense (5,153) (4,214) (3,318) - (12,685) (753) (13,438)
(39,693) (73,426) (17,807) (13,785) (144,711) (10,949) (155,660) Segment profit for the period 29,404 24,040 18,932 (6,802) 65,574 3,989 69,563 Segment assets 4,480,045 3,365,854 2,684,992 454,538 10,985,429 1,474,042 12,459,471 Segment liabilities 3,667,547 4,377,694 774,674 398,465 9,218,380 1,292,995 10,511,375
Note: * International banking includes overseas operations and cost allocations from Oman operations
The Group reports the segment information by the following business segments Corporate, Consumer, Wholesale, International and Islamic banking. Thefollowing table shows the distribution of the Group's operating income, net profit and total assets by business segments:

_______________________________________________________________________________________________________
Page 19
NOTES TO THE INTERIM CONDENSED CONSOLIDATED FINANCIAL STATEMENTSFOR THE SIX MONTHS PERIOD ENDED 30 JUNE 2021
21. ASSET LIABILITY MATURITYThe asset and liability maturity profile was as follows:
Unaudited Audited Unaudited30-Jun-2021 31-Dec-2020 30-Jun-2020
RO' 000 RO' 000 RO' 000ASSETSOn demand or within 1 month 2,509,409 2,415,673 2,737,9241 to 3 months 1,156,337 1,154,523 1,237,2094 to 12 months 1,314,695 1,084,746 1,150,8461 to 5 years 2,952,702 3,073,828 2,755,617More than 5 years 4,953,220 4,724,995 4,577,875
12,886,363 12,453,765 12,459,471LIABILITIES AND EQUITYOn demand or within 1 month 1,502,720 1,323,846 1,272,6491 to 3 months 1,014,025 1,026,195 913,0194 to 12 months 2,546,368 2,453,678 2,427,4311 to 5 years 4,194,757 4,025,321 4,334,698More than 5 years 3,628,493 3,624,725 3,511,674
12,886,363 12,453,765 12,459,471MISMATCHOn demand or within 1 month 1,006,689 1,091,827 1,465,2751 to 3 months 142,312 128,328 324,1904 to 12 months (1,231,673) (1,368,932) (1,276,585)1 to 5 years (1,242,055) (951,493) (1,579,081)More than 5 years 1,324,727 1,100,270 1,066,201
- - -
Mismatch represents difference between assets and liabilities for each maturity band.
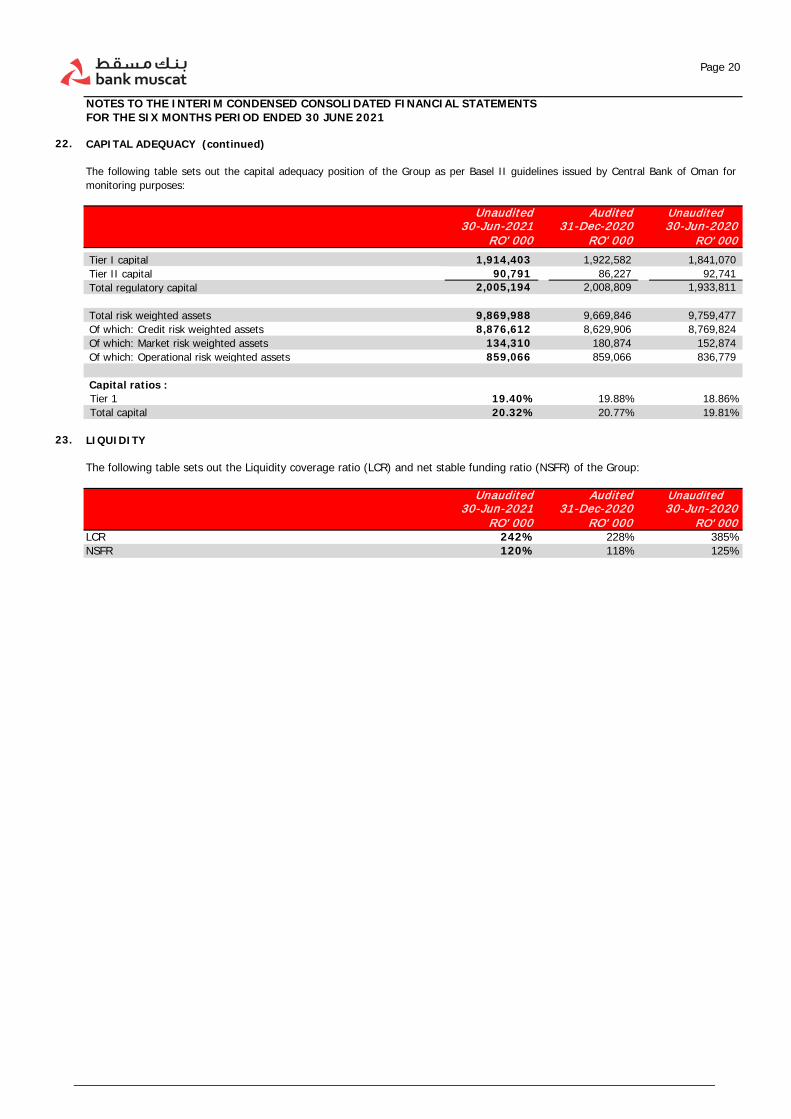
22. CAPITAL ADEQUACY
Unaudited Audited Unaudited30-Jun-2021 31-Dec-2020 30-Jun-2020
RO' 000 RO' 000 RO' 000 Common Equity Tier I capital 1,765,240 1,778,717 1,699,323 Perpetual Tier I capital 130,000 130,000 130,000 Tier I capital 1,895,240 1,908,717 1,829,323 Tier II capital 109,954 100,092 99,252 Total regulatory capital 2,005,194 2,008,809 1,928,575
Total risk weighted assets 9,869,988 9,669,846 9,759,477 Of which: Credit risk weighted assets 8,876,612 8,629,906 8,769,824 Of which: Market risk weighted assets 134,310 180,874 152,874 Of which: Operational risk weighted assets 859,066 859,066 836,779
Capital ratios : Common Equity Tier 1 17.88% 18.39% 17.41%Tier 1 19.20% 19.74% 18.74%Total capital 20.32% 20.77% 19.76%
The following table sets out the capital adequacy position of the Group as per Basel III regulatory requirements
_______________________________________________________________________________________________________
Page 20
NOTES TO THE INTERIM CONDENSED CONSOLIDATED FINANCIAL STATEMENTSFOR THE SIX MONTHS PERIOD ENDED 30 JUNE 2021
22. CAPITAL ADEQUACY (continued)
Unaudited Audited Unaudited30-Jun-2021 31-Dec-2020 30-Jun-2020
RO' 000 RO' 000 RO' 000 Tier I capital 1,914,403 1,922,582 1,841,070 Tier II capital 90,791 86,227 92,741 Total regulatory capital 2,005,194 2,008,809 1,933,811
Total risk weighted assets 9,869,988 9,669,846 9,759,477 Of which: Credit risk weighted assets 8,876,612 8,629,906 8,769,824 Of which: Market risk weighted assets 134,310 180,874 152,874 Of which: Operational risk weighted assets 859,066 859,066 836,779
Capital ratios : Tier 1 19.40% 19.88% 18.86%Total capital 20.32% 20.77% 19.81%
23. LIQUIDITY
The following table sets out the Liquidity coverage ratio (LCR) and net stable funding ratio (NSFR) of the Group:
Unaudited Audited Unaudited30-Jun-2021 31-Dec-2020 30-Jun-2020
RO' 000 RO' 000 RO' 000LCR 242% 228% 385%NSFR 120% 118% 125%
The following table sets out the capital adequacy position of the Group as per Basel II guidelines issued by Central Bank of Oman formonitoring purposes:
_______________________________________________________________________________________________________
Page 21
NOTES TO THE INTERIM CONDENSED CONSOLIDATED FINANCIAL STATEMENTSFOR THE SIX MONTHS PERIOD ENDED 30 JUNE 2021
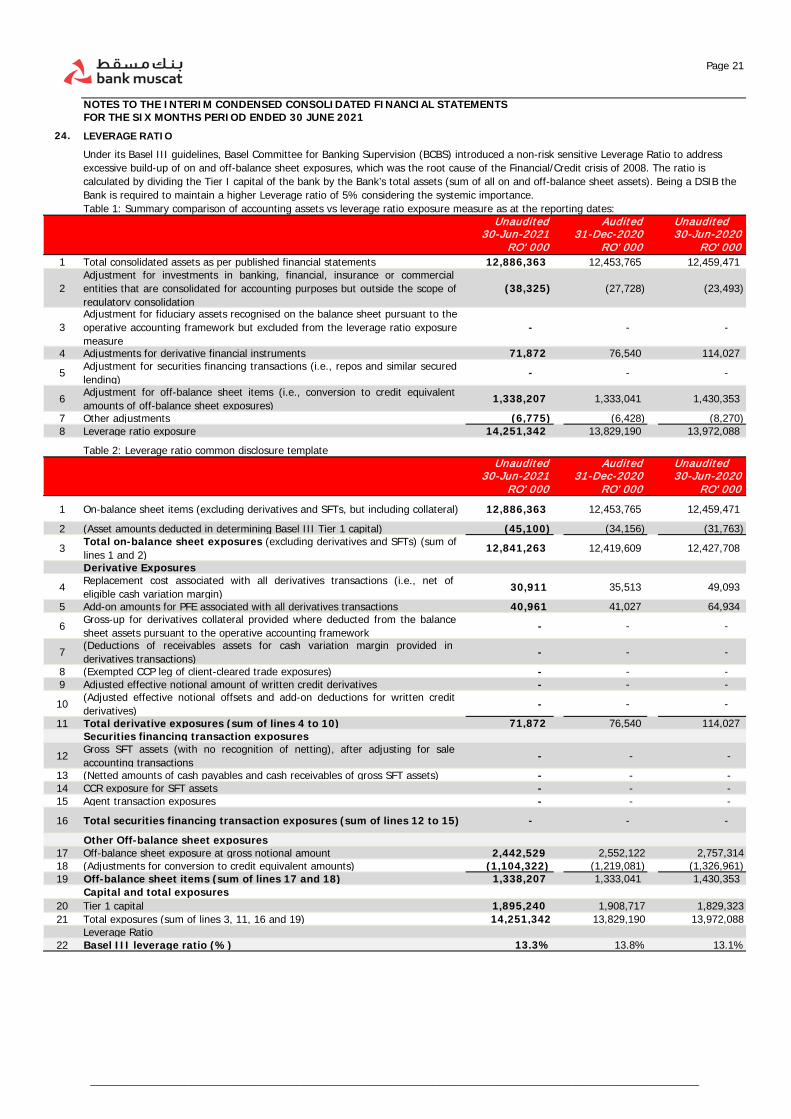
24. LEVERAGE RATIO
Unaudited Audited Unaudited30-Jun-2021 31-Dec-2020 30-Jun-2020
RO' 000 RO' 000 RO' 0001 Total consolidated assets as per published financial statements 12,886,363 12,453,765 12,459,471
2Adjustment for investments in banking, financial, insurance or commercialentities that are consolidated for accounting purposes but outside the scope ofregulatory consolidation
(38,325) (27,728) (23,493)
3Adjustment for fiduciary assets recognised on the balance sheet pursuant to theoperative accounting framework but excluded from the leverage ratio exposuremeasure
- - -
4 Adjustments for derivative financial instruments 71,872 76,540 114,027
5 Adjustment for securities financing transactions (i.e., repos and similar securedlending) - - -
6 Adjustment for off-balance sheet items (i.e., conversion to credit equivalentamounts of off-balance sheet exposures) 1,338,207 1,333,041 1,430,353
7 Other adjustments (6,775) (6,428) (8,270) 8 Leverage ratio exposure 14,251,342 13,829,190 13,972,088
Unaudited Audited Unaudited30-Jun-2021 31-Dec-2020 30-Jun-2020
RO' 000 RO' 000 RO' 0001 On-balance sheet items (excluding derivatives and SFTs, but including collateral) 12,886,363 12,453,765 12,459,471
2 (Asset amounts deducted in determining Basel III Tier 1 capital) (45,100) (34,156) (31,763)
3 Total on-balance sheet exposures (excluding derivatives and SFTs) (sum oflines 1 and 2) 12,841,263 12,419,609 12,427,708
Derivative Exposures
4 Replacement cost associated with all derivatives transactions (i.e., net ofeligible cash variation margin) 30,911 35,513 49,093
5 Add-on amounts for PFE associated with all derivatives transactions 40,961 41,027 64,934
6 Gross-up for derivatives collateral provided where deducted from the balancesheet assets pursuant to the operative accounting framework - - -
7 (Deductions of receivables assets for cash variation margin provided inderivatives transactions) - - -
8 (Exempted CCP leg of client-cleared trade exposures) - - - 9 Adjusted effective notional amount of written credit derivatives - - -
10 (Adjusted effective notional offsets and add-on deductions for written creditderivatives) - - -
11 Total derivative exposures (sum of lines 4 to 10) 71,872 76,540 114,027 Securities financing transaction exposures
12 Gross SFT assets (with no recognition of netting), after adjusting for saleaccounting transactions - - -
13 (Netted amounts of cash payables and cash receivables of gross SFT assets) - - - 14 CCR exposure for SFT assets - - - 15 Agent transaction exposures - - -
16 Total securities financing transaction exposures (sum of lines 12 to 15) - - -
Other Off-balance sheet exposures17 Off-balance sheet exposure at gross notional amount 2,442,529 2,552,122 2,757,31418 (Adjustments for conversion to credit equivalent amounts) (1,104,322) (1,219,081) (1,326,961) 19 Off-balance sheet items (sum of lines 17 and 18) 1,338,207 1,333,041 1,430,353
Capital and total exposures20 Tier 1 capital 1,895,240 1,908,717 1,829,32321 Total exposures (sum of lines 3, 11, 16 and 19) 14,251,342 13,829,190 13,972,088
Leverage Ratio22 Basel III leverage ratio (%) 13.3% 13.8% 13.1%
Under its Basel III guidelines, Basel Committee for Banking Supervision (BCBS) introduced a non-risk sensitive Leverage Ratio to address excessive build-up of on and off-balance sheet exposures, which was the root cause of the Financial/Credit crisis of 2008. The ratio is calculated by dividing the Tier I capital of the bank by the Bank’s total assets (sum of all on and off-balance sheet assets). Being a DSIB the Bank is required to maintain a higher Leverage ratio of 5% considering the systemic importance.Table 1: Summary comparison of accounting assets vs leverage ratio exposure measure as at the reporting dates:
Table 2: Leverage ratio common disclosure template

____________________________________________________________________________________________
Page 22
NOTES TO THE INTERIM CONDENSED CONSOLIDATED FINANCIAL STATEMENTSFOR THE SIX MONTHS PERIOD ENDED 30 JUNE 2021
25. CREDIT QUALITY ANALYSIS
25.1 Financial instruments by stagesThe following table discloses the stage-wise gross exposure, impairment and net exposure of only those financial assets that are tested for impairment under IFRS 9: RO’000
30 June 2021 Stage 1 Stage 2 Stage 3 Total
Gross exposureCentral Bank balances 187,653 - - 187,653 Due from Banks 758,032 20,448 - 778,480 Loans and advances / Islamic financing receivables 7,419,084 1,927,394 340,473 9,686,951
Investment Securities at FVOCI 57,100 6,952 - 64,052 Investment Securities at amortized Cost 1,567,872 11,947 - 1,579,819 Total funded gross exposure 9,989,741 1,966,741 340,473 12,296,955 Financial guarantee contracts 1,207,421 579,137 32,840 1,819,398 Acceptances 101,633 51,031 50 152,714 Loan Commitment/Unutilised limits 1,649,748 489,283 - 2,139,031 Total non-funded gross exposure 2,958,802 1,119,451 32,890 4,111,143 Total gross exposure 12,948,543 3,086,192 373,363 16,408,098
ImpairmentCentral Bank balances - - - - Due from Banks 1,871 1,820 - 3,691 Loans and advances / Islamic financing receivables 26,752 147,682 274,653 449,087
Investment Securities at FVOCI 258 2,318 - 2,576 Investment Securities at amortized Cost 2,639 796 - 3,435 Total funded impairment 31,520 152,616 274,653 458,789 Financial guarantee contracts 2,527 8,076 26,541 37,144 Acceptances 66 114 46 226 Loan Commitment/Unutilised limits 5,659 3,979 - 9,638 Total non-funded impairment 8,252 12,169 26,587 47,008 Total impairment 39,772 164,785 301,240 505,797
Net exposureCentral Bank balances 187,653 - - 187,653 Due from Banks 756,161 18,628 - 774,789 Loans and advances / Islamic financing receivables 7,392,332 1,779,712 65,820 9,237,864
Investment Securities at FVOCI 56,842 4,634 - 61,476 Investment Securities at amortized Cost 1,565,233 11,151 - 1,576,384 Total funded net exposure 9,958,221 1,814,125 65,820 11,838,166 Financial guarantee contracts 1,204,894 571,061 6,299 1,782,254 Acceptances 101,567 50,917 4 152,488 Loan Commitment/Unutilised limits 1,644,089 485,304 - 2,129,393 Total net non-funded exposure 2,950,550 1,107,282 6,303 4,064,135 Total net exposure 12,908,771 2,921,407 72,123 15,902,301
Stage 1: 78.9% of gross exposure in scope for IFRS 9 is in Stage 1 and has not experienced a significant increase in credit risk since origination.Stage 2: 18.8% of gross exposure is in Stage 2 and has seen an increase in credit risk since origination. These assets are the key driver of increase in impairment allowances under IFRS9.Stage 3: 2.3% of gross exposure is in Stage 3 which is credit impaired including defaulted assets and someforbearance assets.

____________________________________________________________________________________________
Page 23
NOTES TO THE INTERIM CONDENSED CONSOLIDATED FINANCIAL STATEMENTSFOR THE SIX MONTHS PERIOD ENDED 30 JUNE 2021
25. CREDIT QUALITY ANALYSIS (continued)
25.1 Financial instruments by stagesThe following table discloses the stage-wise gross exposure, impairment and net exposure of only those financial assets that are tested for impairment under IFRS 9: RO’000
31-Dec-20 Stage 1 Stage 2 Stage 3 Total
Gross exposureCentral Bank balances 167,005 - - 167,005 Due from Banks 575,695 1,587 - 577,282 Loans and advances / Islamic financing receivables 7,222,932 1,817,979 337,822 9,378,733
Investment Securities at FVOCI 54,177 7,813 - 61,990 Investment Securities at amortized Cost 1,688,876 - - 1,688,876 Total funded gross exposure 9,708,685 1,827,379 337,822 11,873,886 Financial guarantee contracts 1,208,844 584,374 72,929 1,866,147 Acceptances 70,859 72,827 50 143,736 Loan Commitment/Unutilised limits 1,769,745 495,840 - 2,265,585 Total non-funded gross exposure 3,049,448 1,153,041 72,979 4,275,468 Total gross exposure 12,758,133 2,980,420 410,801 16,149,354
ImpairmentCentral Bank balances - - - - Due from Banks 979 1,517 - 2,496 Loans and advances / Islamic financing receivables 19,538 111,777 264,763 396,078
Investment Securities at FVOCI 137 2,737 - 2,874 Investment Securities at amortized Cost 859 - - 859 Total funded impairment 21,513 116,031 264,763 402,307 Financial guarantee contracts 1,930 13,176 48,501 63,607 Acceptances 53 101 24 178 Loan Commitment/Unutilised limits 4,192 4,807 - 8,999 Total non-funded impairment 6,175 18,084 48,525 72,784 Total impairment 27,688 134,115 313,288 475,091
Net exposureCentral Bank balances 167,005 - - 167,005 Due from Banks 574,716 70 - 574,786 Loans and advances / Islamic financing receivables 7,203,394 1,706,202 73,059 8,982,655
Investment Securities at FVOCI 54,040 5,076 - 59,116 Investment Securities at amortized Cost 1,688,017 - - 1,688,017 Total funded net exposure 9,687,172 1,711,348 73,059 11,471,579 Financial guarantee contracts 1,206,914 571,198 24,428 1,802,540 Acceptances 70,806 72,726 26 143,558 Loan Commitment/Unutilised limits 1,765,553 491,033 - 2,256,586 Total net non-funded exposure 3,043,273 1,134,957 24,454 4,202,684 Total net exposure 12,730,445 2,846,305 97,513 15,674,263
Stage 1: 79% of gross exposure in scope for IFRS 9 is in Stage 1 and has not experienced a significant increase in credit risk since origination.Stage 2: 18.5% of gross exposure is in Stage 2 and has seen an increase in credit risk since origination. These assets are the key driver of increase in impairment allowances under IFRS9.Stage 3: 2.5% of gross exposure is in Stage 3 which is credit impaired including defaulted assets and someforbearance assets.

____________________________________________________________________________________________
Page 24
NOTES TO THE INTERIM CONDENSED CONSOLIDATED FINANCIAL STATEMENTSFOR THE SIX MONTHS PERIOD ENDED 30 JUNE 2021
25. CREDIT QUALITY ANALYSIS (continued)
25.2 COMPARISON OF IFRS 9 WITH CENTRAL BANK OF OMAN (CBO) NORMS
a. RO '000As per CBO
normsAs per IFRS 9 Difference
35,328 35,328 -
438,227 505,797 (67,570)
3.51% 3.51% -
0.42% 0.42% 0.00%
b. RO '000
Asset classification as per CBO norms
Asset classification as per IFRS 9
Gross amount Provision as per CBO norms
Reserve interest as
per CBO norms
Provision as per IFRS 9
Difference Net carrying amount
Interest recognised as per IFRS
9
(1) (2) (3) (4) (5) (6) (7) =
(4)+(5)-(6) (8) = (3)-(6) (9)
Standard Stage 1 8,177,117 104,050 - 28,622 75,428 8,148,495 - Stage 2 1,101,768 16,100 - 90,371 (74,271) 1,011,397 - Stage 3 - - - - - - - Sub total 9,278,885 120,150 - 118,993 1,157 9,159,892 -
Special Mention Stage 1 - - - - - - - Stage 2 846,074 17,143 5 59,917 (42,769) 786,157 - Stage 3 - - - - - - - Sub total 846,074 17,143 5 59,917 (42,769) 786,157 -
Substandard Stage 1 - - - - - - - Stage 2 - - - - - - - Stage 3 32,488 7,530 468 7,998 - 24,490 - Sub total 32,488 7,530 468 7,998 - 24,490 -
Doubtful Stage 1 - - - - - - - Stage 2 - - - - - - - Stage 3 29,047 14,493 740 15,544 (311) 13,503 - Sub total 29,047 14,493 740 15,544 (311) 13,503 -
Loss Stage 1 - - - - - - - Stage 2 - - - - - - - Stage 3 311,828 238,030 39,668 277,698 - 34,130 - Sub total 311,828 238,030 39,668 277,698 - 34,130 -
Other items not covered under CBO circular BM 977 and related instructions
Stage 1 4,771,426 - - 11,150 (11,150) 4,760,276 -
Stage 2 1,138,350 - - 14,497 (14,497) 1,123,853 - Stage 3 - - - - - - - Sub total 5,909,776 - - 25,647 (25,647) 5,884,129 -
Total Stage 1 12,948,543 104,050 - 39,772 64,278 12,908,771 - Stage 2 3,086,192 33,243 5 164,785 (131,537) 2,921,407 - Stage 3 373,363 260,053 40,876 301,240 (311) 72,123 - Total 16,408,098 397,346 40,881 505,797 (67,570) 15,902,301 -
c. Restructured loans RO '000
Asset classification as per CBO norms
Asset classification as per IFRS 9
Gross amount Provision as per CBO norms
Reserve interest as
per CBO norms
Provision as per IFRS 9
Difference Net carrying amount
Interest recognised as per IFRS
9
(1) (2) (3) (4) (5) (6) (7) =
(4)+(5)-(6) (8) = (3)-(6) (9)Classified as performing Stage 1 - - - - - - -
Stage 2 254,565 5,108 - 38,911 (33,803) 215,654 - Stage 3 - - - - - - - Sub total 254,565 5,108 - 38,911 (33,803) 215,654 -
Classified as non-performing
Stage 1 - - - - - - -
Stage 2 - - - - - - - Stage 3 85,573 64,117 7,226 71,654 (311) 13,919 - Sub total 85,573 64,117 7,226 71,654 (311) 13,919 -
Total Stage 1 - - - - - - - Stage 2 254,565 5,108 - 38,911 (33,803) 215,654 - Stage 3 85,573 64,117 7,226 71,654 (311) 13,919 - Total 340,138 69,225 7,226 110,565 (34,114) 229,573 -
The following tables are as per the requirements of CBO circular BM 1149:
Net NPL ratio **
As at 30 June 2021 (Unaudited )
Impairment loss charged to statement of comprehensive income (net of recoveries)*
Provisions required as per CBO norms / held as per IFRS 9 *
Gross NPL ratio **
* Note: Impairment loss and provisions held above includes unallocated provision created by the bank
** NPL ratios are calculated on the basis of funded non performing loans and funded exposures
Comparison of provision held as per IFRS 9 and required as per CBO norms
Impairment charge and provisions held

____________________________________________________________________________________________
Page 25
NOTES TO THE INTERIM NOTES TO THE INTERIM CONDENSED CONSOLIDATED FINANCIAL STATEMENTSFOR THE SIX MONTHS PERIOD ENDED 30 JUNE 2021
25. CREDIT QUALITY ANALYSIS (continued)
25.2 COMPARISON OF IFRS 9 WITH CENTRAL BANK OF OMAN (CBO) NORMS
a. RO '000
As per CBO norms
As per IFRS 9
Difference
81,038 81,038 -
446,435 475,091 (28,656)
3.62% 3.62% -
0.81% 0.81% 0.00%
b. RO '000
Asset classification as per CBO norms
Asset classification as per IFRS 9
Gross amount
Provision as per CBO norms
Reserve interest as
per CBO norms
Provision as per IFRS 9
Difference Net carrying amount
Interest recognised
as per IFRS 9
(1) (2) (3) (4) (5) (6) (7) =
(4)+(5)-(6)(8) = (3)-
(6) (9)Standard Stage 1 7,964,731 109,486 - 20,519 88,967 7,944,212 -
Stage 2 1,029,737 10,454 - 71,369 (60,915) 958,368 - Stage 3 - - - - - - - Sub total 8,994,468 119,940 - 91,888 28,052 8,902,580 -
Special Mention Stage 1 - - - - - - - Stage 2 789,830 13,207 - 41,752 (28,545) 748,078 - Stage 3 - - - - - - - Sub total 789,830 13,207 - 41,752 (28,545) 748,078 -
Substandard Stage 1 - - - - - - - Stage 2 - - - - - - - Stage 3 28,693 7,053 566 7,619 - 21,074 - Sub total 28,693 7,053 566 7,619 - 21,074 -
Doubtful Stage 1 - - - - - - - Stage 2 - - - - - - - Stage 3 41,125 19,288 1,373 20,661 - 20,464 - Sub total 41,125 19,288 1,373 20,661 - 20,464 -
Loss Stage 1 - - - - - - - Stage 2 - - - - - - - Stage 3 340,983 247,228 37,780 285,008 - 55,975 - Sub total 340,983 247,228 37,780 285,008 - 55,975 -
Other items not covered under CBO circular BM 977 and related instructions
Stage 1 4,793,402 - - 7,169 (7,169) 4,786,233 -
Stage 2 1,160,853 - - 20,994 (20,994) 1,139,859 - Stage 3 - - - - - - - Sub total 5,954,255 - - 28,163 (28,163) 5,926,092 -
Total Stage 1 12,758,133 109,486 - 27,688 81,798 12,730,445 - Stage 2 2,980,420 23,661 - 134,115 (110,454) 2,846,305 - Stage 3 410,801 273,569 39,719 313,288 - 97,513 - Total 16,149,354 406,716 39,719 475,091 (28,656) 15,674,263 -
c. Restructured loans
Asset classification as per CBO norms
Asset classification as per IFRS 9
Gross amount
Provision as per CBO norms
Reserve interest as
per CBO norms
Provision as per IFRS 9
Difference Net carrying amount
Interest recognised
as per IFRS 9
(1) (2) (3) (4) (5) (6) (7) =
(4)+(5)-(6)(8) = (3)-
(6) (9)Classified as performing Stage 1 - - - - - - -
Stage 2 253,097 5,106 - 25,223 (20,117) 227,874 - Stage 3 - - - - - - - Sub total 253,097 5,106 - 25,223 (20,117) 227,874 -
Classified as non-performing Stage 1 - - - - - - -
Stage 2 - - - - - - - Stage 3 87,668 64,178 6,829 71,007 - 16,661 - Sub total 87,668 64,178 6,829 71,007 - 16,661 -
Total Stage 1 - - - - - - - Stage 2 253,097 5,106 - 25,223 (20,117) 227,874 - Stage 3 87,668 64,178 6,829 71,007 - 16,661 - Total 340,765 69,284 6,829 96,230 (20,117) 244,535 -
The following tables are as per the requirements of CBO circular BM 1149:
As at 31 December 2020 (Audited )
Provisions required as per CBO norms / held as per IFRS 9 *
Impairment charge and provisions held
Impairment loss charged to statement of comprehensive income (net of recoveries)*
Net NPL ratio **
* Note: Impairment loss and provisions held above includes unallocated provision created by the Group
** NPL ratios are calculated on the basis of funded non performing loans and funded exposures
Comparison of provision held as per IFRS 9 and required as per CBO norms
Gross NPL ratio **

_______________________________________________________________________________________________________________________
Page 26
NOTES TO THE INTERIM CONDENSED CONSOLIDATED FINANCIAL STATEMENTSFOR THE SIX MONTHS PERIOD ENDED 30 JUNE 2021
26. FAIR VALUE INFORMATION
As of 30 June 2021Designated as at FVTPL
Designated as at FVOCI
Amortised cost
Total carrying
value Fair valueLevel
RO' 000 RO' 000 RO' 000 RO' 000 RO' 000
Cash and balances with Central Banks - - 843,368 843,368 843,368 3
Due from banks - 41 774,748 774,789 780,276 2,3Loans and advances and Islamic financing receivables - - 9,237,864 9,237,864 9,378,954 3
Investment securities 17,525 138,462 1,576,384 1,732,371 1,769,931 1,2,3Positive fair value of derivatives 30,109 - - 30,109 30,109 2
47,634 138,503 12,432,364 12,618,501 12,802,638
Deposits from banks - - 1,185,594 1,185,594 1,187,298 3
Customers’ deposits and Islamic customer deposits - - 8,669,704 8,669,704 8,702,389 3
Sukuk - - 90,594 90,594 90,594 1 Euro medium term notes - - 390,453 390,453 438,095 1 Subordinated liabilities - - 6,600 6,600 6,600 3
Negative fair value of derivatives 22,037 - - 22,037 22,037 2 22,037 - 10,342,945 10,364,982 10,447,013
As of 31 December 2020Designated as at FVTPL
Designated as at FVOCI
Amortised cost
Total carrying
value Fair valueLevel
RO' 000 RO' 000 RO' 000 RO' 000 RO' 000
Cash and balances with Central Banks - - 656,898 656,898 656,898 3
Due from banks - 9,625 565,161 574,786 579,753 2,3Loans and advances and Islamic financing receivables - - 8,982,655 8,982,655 9,069,385 3
Investment securities 20,765 138,567 1,688,017 1,847,349 1,873,486 1,2,3Positive fair value of derivatives 35,429 - - 35,429 35,429 2
56,194 148,192 11,892,731 12,097,117 12,214,951
Deposits from banks - - 939,621 939,621 940,210 3
Customers’ deposits and Islamic customer deposits - - 8,458,505 8,458,505 8,408,860 3
Sukuk - - 90,600 90,600 90,027 1 Euro medium term notes - - 390,570 390,570 404,743 1 Subordinated liabilities - - 13,198 13,198 13,090 3
Negative fair value of derivatives 32,001 - - 32,001 32,001 2 32,001 - 9,892,494 9,924,495 9,888,931
Based on the valuation methodology outlined below, the fair values of all on and off-balance sheet financial instruments at reporting datesare considered by the Board and Management not to be materially different to their book values:
____________________________________________________________________________________________
Page 27
NOTES TO THE INTERIM CONDENSED CONSOLIDATED FINANCIAL STATEMENTSFOR THE SIX MONTHS PERIOD ENDED 30 JUNE 2021
26. FAIR VALUE INFORMATION (continued)
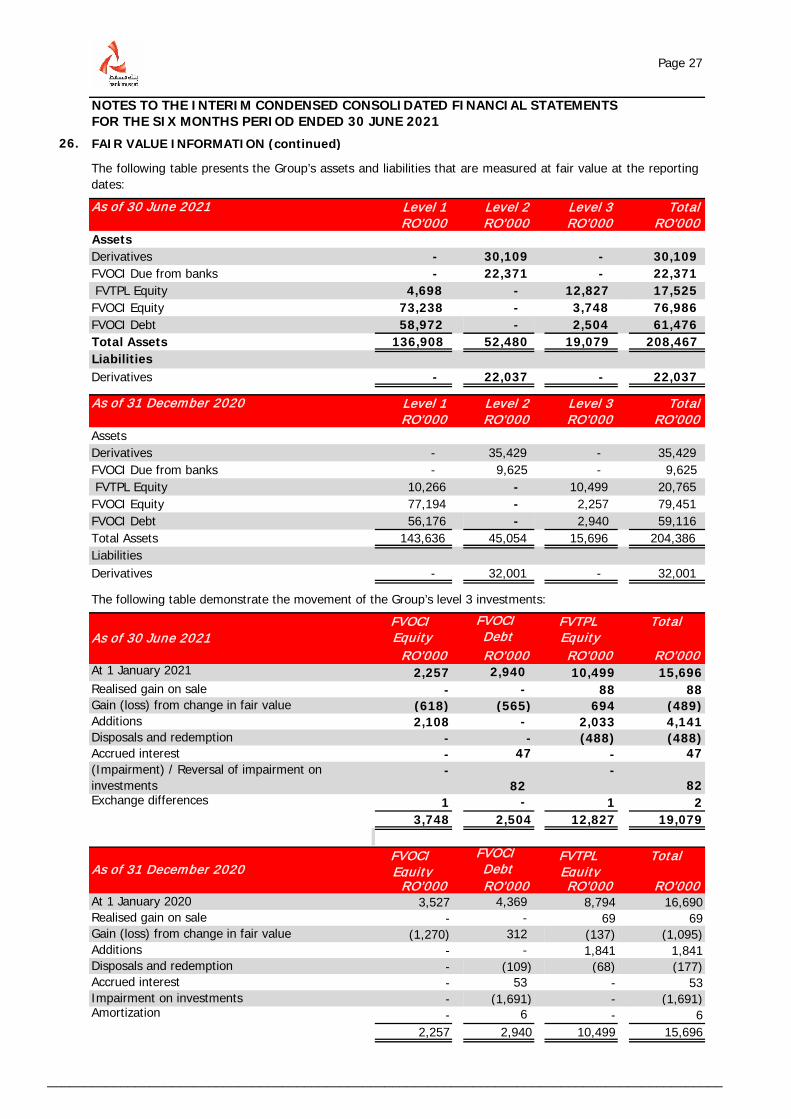
As of 30 June 2021 Level 1 Level 2 Level 3 TotalRO’000 RO’000 RO’000 RO’000
AssetsDerivatives - 30,109 - 30,109 FVOCI Due from banks - 22,371 - 22,371 FVTPL Equity 4,698 - 12,827 17,525 FVOCI Equity 73,238 - 3,748 76,986 FVOCI Debt 58,972 - 2,504 61,476 Total Assets 136,908 52,480 19,079 208,467 LiabilitiesDerivatives - 22,037 - 22,037
As of 31 December 2020 Level 1 Level 2 Level 3 TotalRO’000 RO’000 RO’000 RO’000
AssetsDerivatives - 35,429 - 35,429 FVOCI Due from banks - 9,625 - 9,625 FVTPL Equity 10,266 - 10,499 20,765 FVOCI Equity 77,194 - 2,257 79,451 FVOCI Debt 56,176 - 2,940 59,116 Total Assets 143,636 45,054 15,696 204,386 LiabilitiesDerivatives - 32,001 - 32,001
The following table demonstrate the movement of the Group’s level 3 investments:
As of 30 June 2021FVOCI Equity
FVOCI Debt
FVTPL Equity
Total
RO’000 RO’000 RO’000 RO’000At 1 January 2021 2,257 2,940 10,499 15,696 Realised gain on sale - - 88 88 Gain (loss) from change in fair value (618) (565) 694 (489)Additions 2,108 - 2,033 4,141 Disposals and redemption - - (488) (488)Accrued interest - 47 - 47 (Impairment) / Reversal of impairment on investments
- 82
- 82
Exchange differences 1 - 1 2 3,748 2,504 12,827 19,079
As of 31 December 2020FVOCI Equity
FVOCI Debt
FVTPL Equity
Total
RO’000 RO’000 RO’000 RO’000At 1 January 2020 3,527 4,369 8,794 16,690 Realised gain on sale - - 69 69 Gain (loss) from change in fair value (1,270) 312 (137) (1,095)Additions - - 1,841 1,841 Disposals and redemption - (109) (68) (177)Accrued interest - 53 - 53 Impairment on investments - (1,691) - (1,691)Amortization - 6 - 6
2,257 2,940 10,499 15,696
The following table presents the Group’s assets and liabilities that are measured at fair value at the reportingdates:

Page 28
NOTES TO THE INTERIM CONDENSED CONSOLIDATED FINANCIAL STATEMENTSFOR THE SIX MONTHS PERIOD ENDED 30 JUNE 2021
26. FAIR VALUE INFORMATION (continued)
27. Comparative figures
As of 30 June 2021, 46% (31 December 2020: 49% ) of the level 3 equity securities were valued on thebasis of fair valuation carried out in accordance with appropriate valuation techniques based on incomeapproach (discounting of cash flows), market approach (using prices or other relevant informationgenerated by market transactions of identical or similar entities), cost approach or a combination thereof.Unobservable inputs are used to measure fair value to the extent that relevant observable inputs are notavailable, using the best information available in the circumstances. These might include banks own dataand would consider all information about market participant assumptions that is reasonably available.
There are no transfers of securities between Level 1, 2 and 3 during the period. Further, there is nochange in the techniques used for fair valuation of level 3 securities during the period.
As of 30 June 2021, 54% (31 December 2020: 51%) of the level 3 equity securities were valued on thebasis of latest available capital accounts statements of the investee companies received from independentfund managers as at 31 March 2021 or at a later date and adjusted for subsequent cash flows till 30 June2021 or based on net asset values received from independent fund managers as at 31 March 2021 or at alater date.
The debt investments were valued on fair value basis. Valuation is based on Risk adjusted discount rate(yield) considering a reasonable range of estimates. A significant decrease in the credit quality wouldresult in a lower fair value with significant increase in the spread above the risk-free rate and vice-versa.The Group holds adequate provisioning on the above investments as of the reporting date.
Certain corresponding figures for 2020 have been reclassified / regrouped in order to conform to thepresentation for the current year. Such reclassifications / regroupings do not affect previously reportedprofit or equity.


