Embed Size (px)
Citation preview
Comparative Financial PerformanceAssessment of Islamic Banks andTraditional Banks in Bangladesh
Md. Masud Rana1, Md. Abu Issa Gazi2, Mobarak Hossain3
Abstract
This paper has looked into the comparative performance assessment of Islamic banks and
Traditional banks in Bangladesh for the period 2007- 2011. Financial ratios have been
employed to measure the capital adequacy, Assets quality, Management efficiency, profitability,
liquidity performance of five Islamic banks and five traditional banks. The study found that the
performance of the both of the banking sector in Bangladesh is satisfactory as almost all of the
sample banks has at least more than 11% risk weighted asset, the classified loan to total loan
of this sector is decreasing gradually and also found that profitability is being increasing
significantly over last five years and the overally the study found Islamic banking sector has
better capital adequacy, Asset quality management ability, Management efficiency, Profitability
and Liquidity position than Traditional banking sector.
Key words: Financial Performance, Commercial Banks, ROA, ROE, EPS, P/E Ratio,
Islamic Banks etc.
1.1 Introduction:
1 Lecturer, Dept. of Business Administration, Northern UniversityBangladesh 2 Senior Lecturer, Dept. of Business Administration, People’s University of Bangladesh3 M. Phil Research Fellow, Dept. of Management, Islamic University of Kushtia

Banks are the key financial establishments that play a dynamic
role in the country’s economy. Globalization in the banking
sector has thrown up opportunities as well as challenges.
Competition is getting edge day by day. It paces with the
continuous development occurring in the tremendous competitive
environment.
The existence of banking sector is not a new matter, as itsexistence was long ago. But the new thing is that how it isoperating and presenting its activities for the purpose ofserving customer requirements to increase their well being in thesense of wealth. Banks also provide many services for clients tomake their life easy in a busy environment. In this competitiveenvironment in today’s world, banks increase their facilities infavor of their customers to retain them and capture more share ofthe market to be leader. Interest is one of the main factors inattracting customers and also one of the significant factors inincreasing extra income from providing loans besides otherservice income. So, it can be said that conventional bankingsystems are interest-based system.
Bangladesh is one of the largest Muslim countries of the world.The people of this country are deeply committed to Islamic way oflife mentioned in the Quran and Sunnah. But it is not easy forthe people to establish and designed their economic lives inaccordance with Shariah. The very objective of Shariah to promotethe welfare of the people that lies in safeguarding their faith,their life, their prosperity and their wealth. In this regard toestablish a banking world that run according to the Shariah, theconcept of Islamic banking arises.
In Bangladesh there are 47 banks are working very successfully.Their current performance and financial position are quitesatisfactory. If we look at the banking sector of Bangladesh,then four categories of bank are available like nationalizedcommercial Banks, Private commercial banks, foreign commercialbanks, Development Finance Institutions. As well as banking
sectors can also be categorized into traditional bank and Shariabased Islami bank. As both types of banks in Bangladesh are nowin a stable position and performing very smoothly, so it is veryimportant to analyze the current growth and financial position.This paper has been initiated to analyze the financialperformance of the some selected banks in both categories of bankin Bangladesh through various statistical as well as financialand accounting Techniques.
1.2 Objectives of the Study: Though a lot of studies have beencompleted on performance analysis of banking industry in home andaboard but the chances for further study is still remained openfor researcher. The specific objectives of the study are asfollows.
To assess the comparative growth and development of theselected banks.
To find out the financial performance and financial positionof the sample banks.
To pin point the causes of poor financial performance andsuggest some measure measures to overcome the problems.
1.3 Research Methodology
This study is exclusively based on secondary source ofinformation. The relevant data and information were collectedfrom Stock Exchanges, Annual Reports of different commercialbanks of Bangladesh, Bangladesh Bank, Securities and ExchangeCommission and web sites of the respective commercial banks.In addition to the study purpose, different publishedarticles, books, newspaper, and websites have also beenreviewed and consulted. For analyzing purposes variousfinancial and accounting ratios also have been used likecapital adequacy ratios, Assets quality ratios, Managementefficiency ratios, Profitability ratios such as Return onassets, return on equity, earning per share, price earningsratio, and Liquidity ratios. It would be also used simple
average trend analysis for the analysis of the performance.Thefollowing Islami banks are selected for the study. The banksare Islami Bank of Bangladesh Limited(IBBL), Social IslamiBank Limited(SIBL), Al-Arafah Islami Bank (AIAIB), ShahjalalIslami Bank Limited (ShaIBL), First security Islami BankLimited(FSIBL), and out of the traditional bank, it isselected Prime Bank limited (PBL), Mercantile BankLimited(MBL), Dutch Bangla Bank Limited (DBBL), Bank AsiaLimited(BAL), National Bank Limited (NBL), The sample bankscover only private Islamic banks that are incorporated inBangladesh and Private Commercial banks and most of the banksare within 2nd generation. So out of the 30 banks, the studyhas covered 10 banks purposively and the Sample represents33.33% of total population.
This study is mainly based on data from secondary sources. Therelevant data and information were collected from StockExchanges, As a source of data, annual reports of the concernbanks have been selected because, annual reports are publishedand communicated by the banks compulsorily in every year.Schedule banks statistics Bangladesh Bank, Securities andExchange Commission and web sites of the respective commercialbanks also have been used for study purpose. In additiondifferent published articles, books, newspaper, and websiteshave also been reviewed and consulted. For analyzing purposes,statistical measures; Descriptive statistics like mean,standard deviation, growth percentage & coefficient ofvariation.
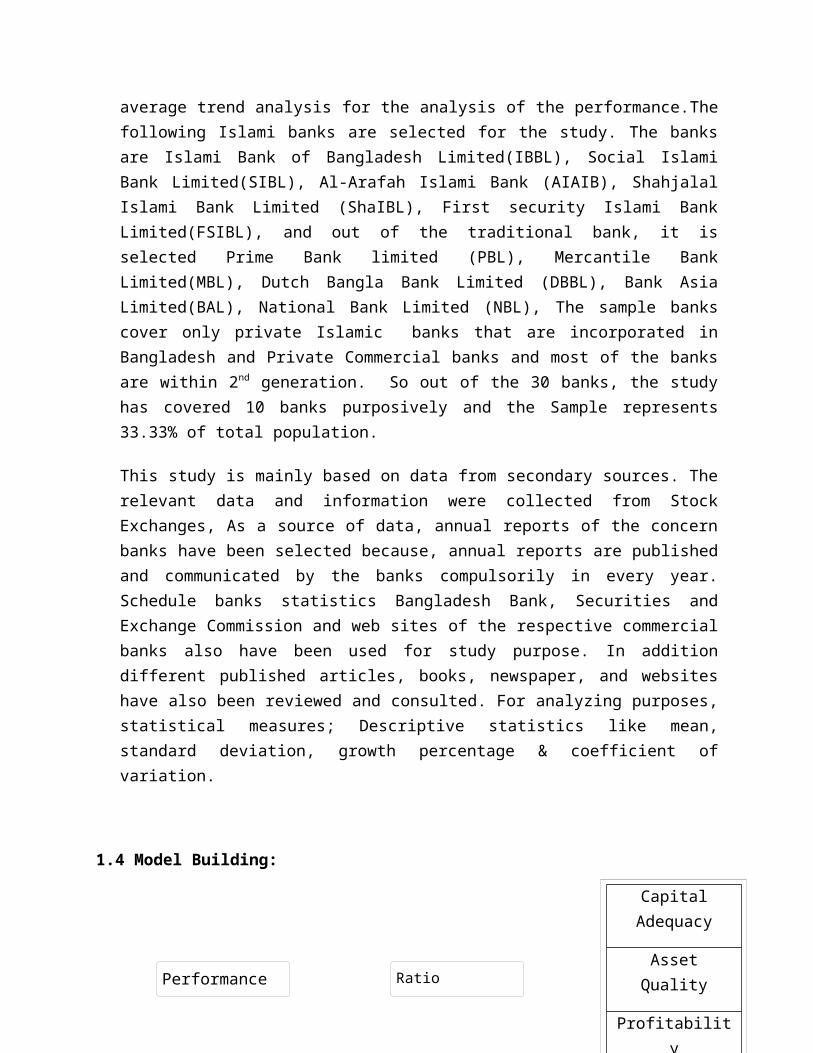
1.4 Model Building:
Ratio Analysis
Performance
CapitalAdequacy
AssetQuality
Profitability
=
1.5 Review of Literature:
Tanbir and Kashfia in their article “Performance Evaluation of SelectedPrivate Bank in Bangladesh”analyzed the development and growth ofselected private commercial Banks of Bangladesh. The writersobserved that all the selected commercial banks are able toachieve a stable growth of branches, employees, deposits, loans &advances, net income, and earnings per share during the period of2002-2006.
Salma and Sarahat published an article “Performance Evaluation ofAgricultural Banks in Bangladesh” and found that the performance ofthis sector has a major impact on the overall economicdevelopment of the country. For efficient performance of thissector proper credit facilities and adequate support is essentialboth from government and private sector.
Mabwe and Robert in investigate the performance of South Africa’scommercial banking sector for the period 2005- 2009 in theirarticle “A Financial Ratio Analysis of Commercial Bank Performance in SouthAfrica”. The study found that overall banking performance wasincreased considerably in the first two years of the study. Asignificant change in trend is noticed at the onset of the globalfinancial crisis in 2007, reaching its peak during 2008-2009.This resulted in falling profitability, low liquidity anddeteriorating credit quality in the South African Banking sector.
Ahasan described in his study “A comparative analysis on differentscheduled banks performance in Bangladesh: A wake up call for NCBs and DFIs”that over the years NCBs owns the highest number of branches butperform very poorly whereas FCBs possess the least number of
CapitalAdequacy
AssetQuality
Profitability
branches but with outstanding performance. It is also revealedthat from 2004 PCBs outperforming NCBs and taking over most oftheir business with their highly competitive services.
Analysis and Finding:
2.2 Performance Assessment through Ratio analysis
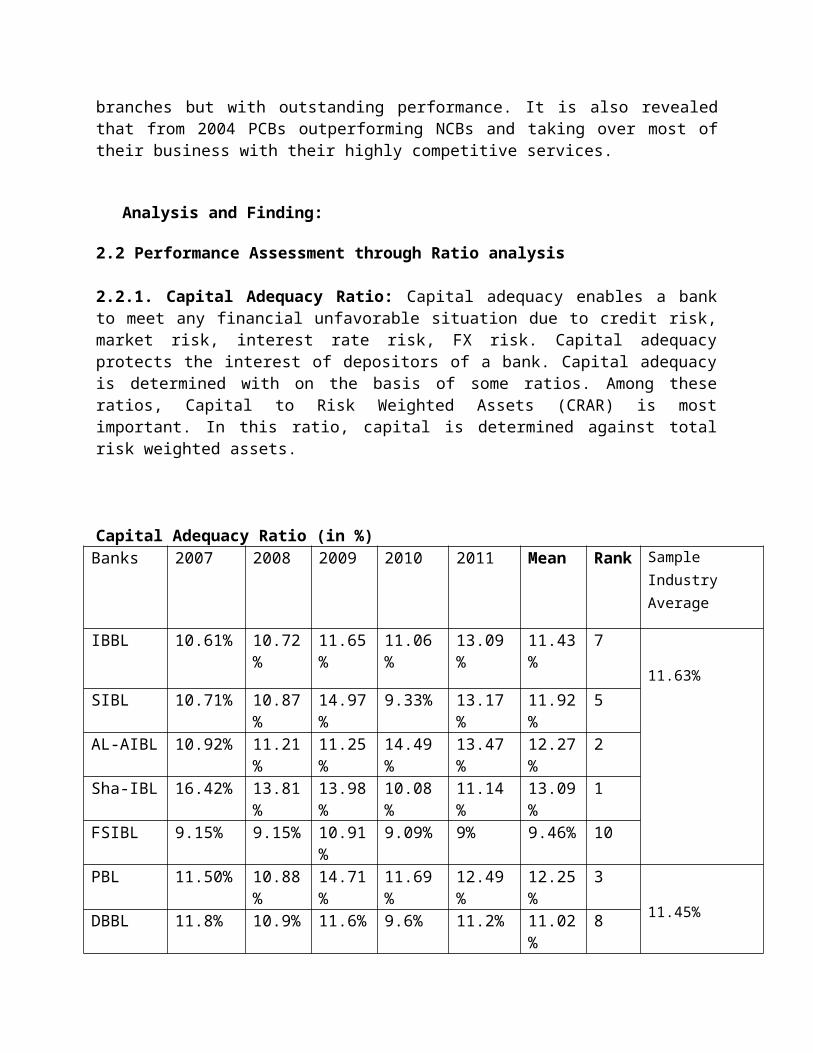
2.2.1. Capital Adequacy Ratio: Capital adequacy enables a bankto meet any financial unfavorable situation due to credit risk,market risk, interest rate risk, FX risk. Capital adequacyprotects the interest of depositors of a bank. Capital adequacyis determined with on the basis of some ratios. Among theseratios, Capital to Risk Weighted Assets (CRAR) is mostimportant. In this ratio, capital is determined against totalrisk weighted assets.
Capital Adequacy Ratio (in %)Banks 2007 2008 2009 2010 2011 Mean Rank Sample
Industry Average
IBBL 10.61% 10.72%
11.65%
11.06%
13.09%
11.43%
7
11.63%SIBL 10.71% 10.87
%14.97%
9.33% 13.17%
11.92%
5
AL-AIBL 10.92% 11.21%
11.25%
14.49%
13.47%
12.27%
2
Sha-IBL 16.42% 13.81%
13.98%
10.08%
11.14%
13.09%
1
FSIBL 9.15% 9.15% 10.91%
9.09% 9% 9.46% 10
PBL 11.50% 10.88%
14.71%
11.69%
12.49%
12.25%
3
11.45%DBBL 11.8% 10.9% 11.6% 9.6% 11.2% 11.02%
8
MBL 11.67% 10.17%
10.48%
9.13% 10.60%
10.41%
9
BAL 14.88% 8.11% 12.27%
11.25%
11.28%
11.56%
6
NBL 13.11% 13.42%
8.61% 12.29%
12.65%
12.02%
4
Source: Annual Report and Self Study
From the above table, it is clear that Shajalal islami bank hasthe highest average capital adequacy ratio of 13.09% which meansthe bank has the highest ability to meet credit risk, marketrisk, interest rate risk and FX risk as well as it can be saidthat the depositor of this bank is mostly protected. Again if welook at the other banks, its capital adequacy is alsosatisfactory. Again it is observed that the capital adequacyratio of Islami Banking sector is quite better than thetraditional banking sector.
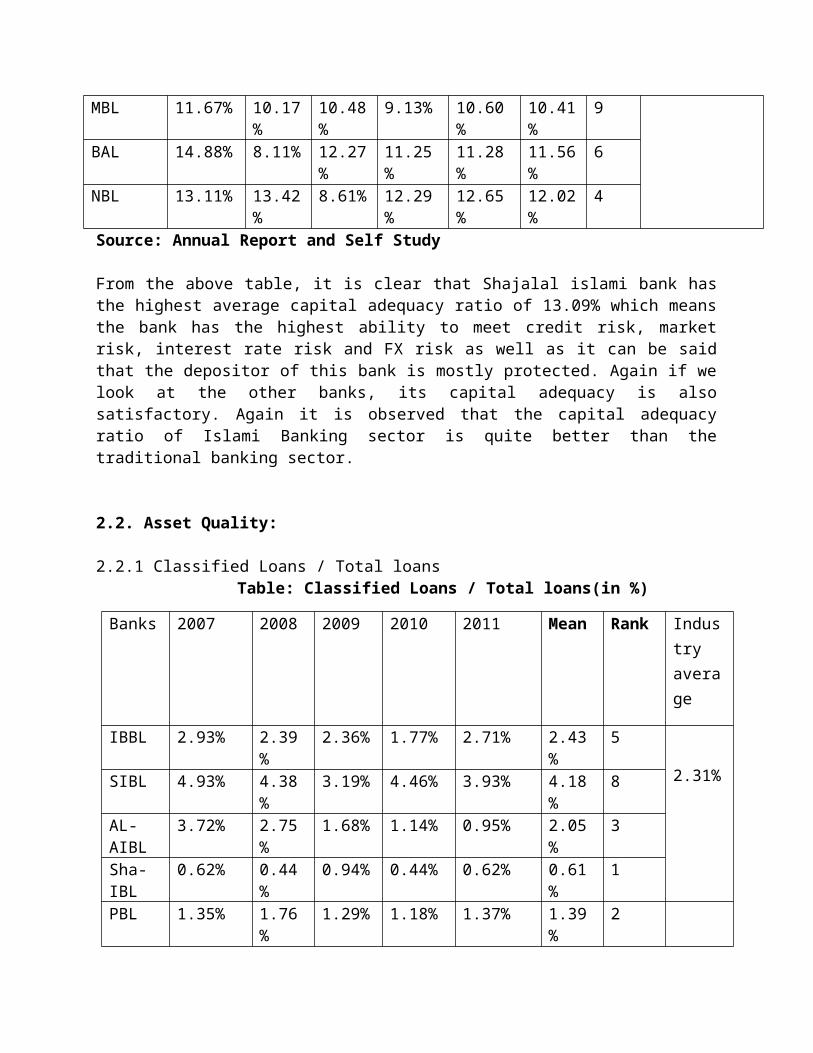
2.2. Asset Quality:
2.2.1 Classified Loans / Total loansTable: Classified Loans / Total loans(in %)
Banks 2007 2008 2009 2010 2011 Mean Rank Industry average
IBBL 2.93% 2.39%
2.36% 1.77% 2.71% 2.43%
5
2.31%SIBL 4.93% 4.38%
3.19% 4.46% 3.93% 4.18%
8
AL-AIBL
3.72% 2.75%
1.68% 1.14% 0.95% 2.05%
3
Sha-IBL
0.62% 0.44%
0.94% 0.44% 0.62% 0.61%
1
PBL 1.35% 1.76%
1.29% 1.18% 1.37% 1.39%
2
2.70%
DBBL 3.3% 3.3% 2.5% 2.4% 2.7% 2.84%
7
MBL 2.80% 2.96%
2.59% 1.78% 2.61% 2.55%
6
BAL 2.44% 2.68%
1.56% 1.62% 2.72% 2.20%
4
NBL 4.53% 5.39%
5.96% 3.96% 2.83% 4.53%
9
Source: Annual Report and Self Study
Classified loan is that loan which falls in danger of default.
Classified loans have unpaid interest and principal outstanding
and it is unclear whether the bank will be able to recoup the
loan proceeds from the borrower. So, every company wants to
minimize this type of loans. The bank that has lower rate of
classified loan to total loan is in better position in market.
From the table, it is seen that Sha-IBL has minimum rate of
classified loan to total loan where NBL has the highest rate.
Moreover the rate of classified loan to total of Islami Banking
sector is lower than that of Traditional bank.
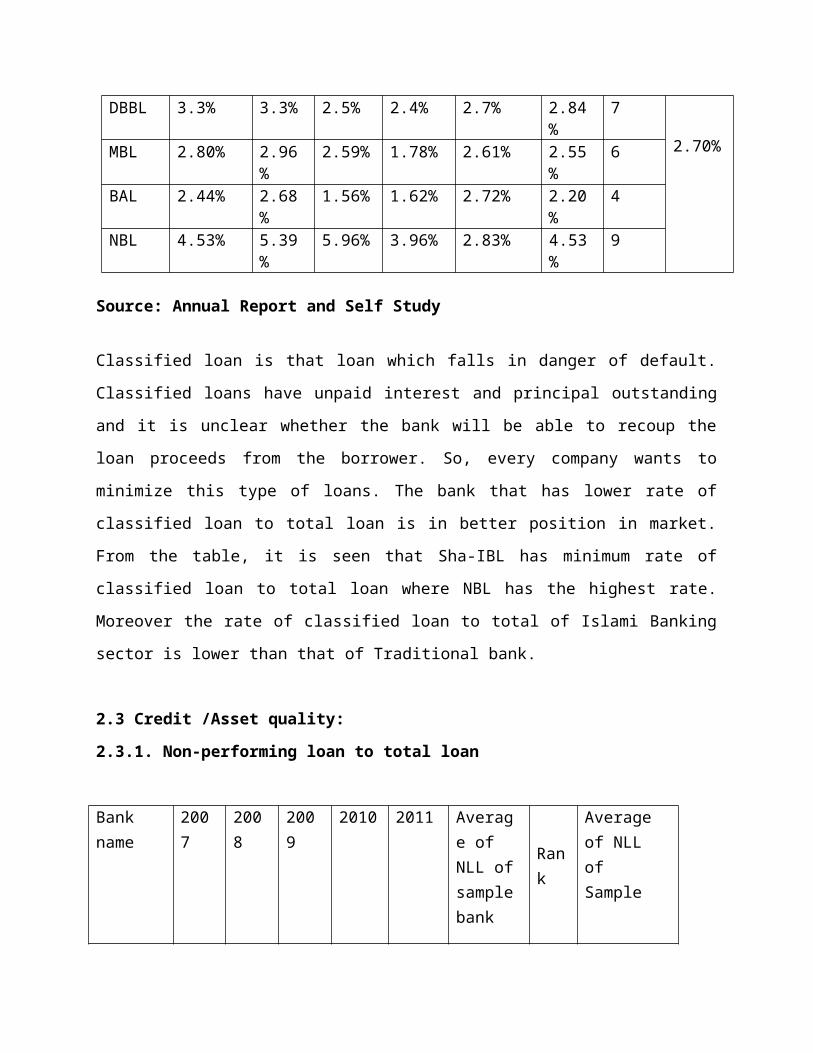
2.3 Credit /Asset quality:
2.3.1. Non-performing loan to total loan
Bank name
2007
2008
2009
2010 2011 Average of NLL ofsamplebank
Rank
Average of NLL of Sample

Industry
Al arafah IB
0.037
0.029
0.016
0.011
.009 0.0204or
2.04%
3 0.0141 or 1.41%
Shah Jalal IB
.006
.004
.009
0.01 0.01 0.0078or
0.78%
1
Prime Bank
0.013
0.016
0.012
0.011
0.013
0.013 or
1.3%
2 0.0189 or
1.81%
Mercantile Bank
0.028
0.028
0.025
0.017
0.026
0.0248or
2.48%
Source: Annual Report and Self Study
From the above calculation, it is understood that out of the twodifferent types of banks, Average NLL of islami bank is betterthan traditional bank as the Average percentage is 0.0189% and0.0141% respectively. Again if we look at the individual bank weobserved that among the Islami bank Nonperformance Loan to TotalLoan Sh-IBL is the first position and Al-AIBL IB is the secondposition and then among the traditional bank Mercantile bank isthe first position, and Prime bank is the second position.Overally out of four banks Shahjalal bank has the highest NLLandMercantile bank has the lowest.
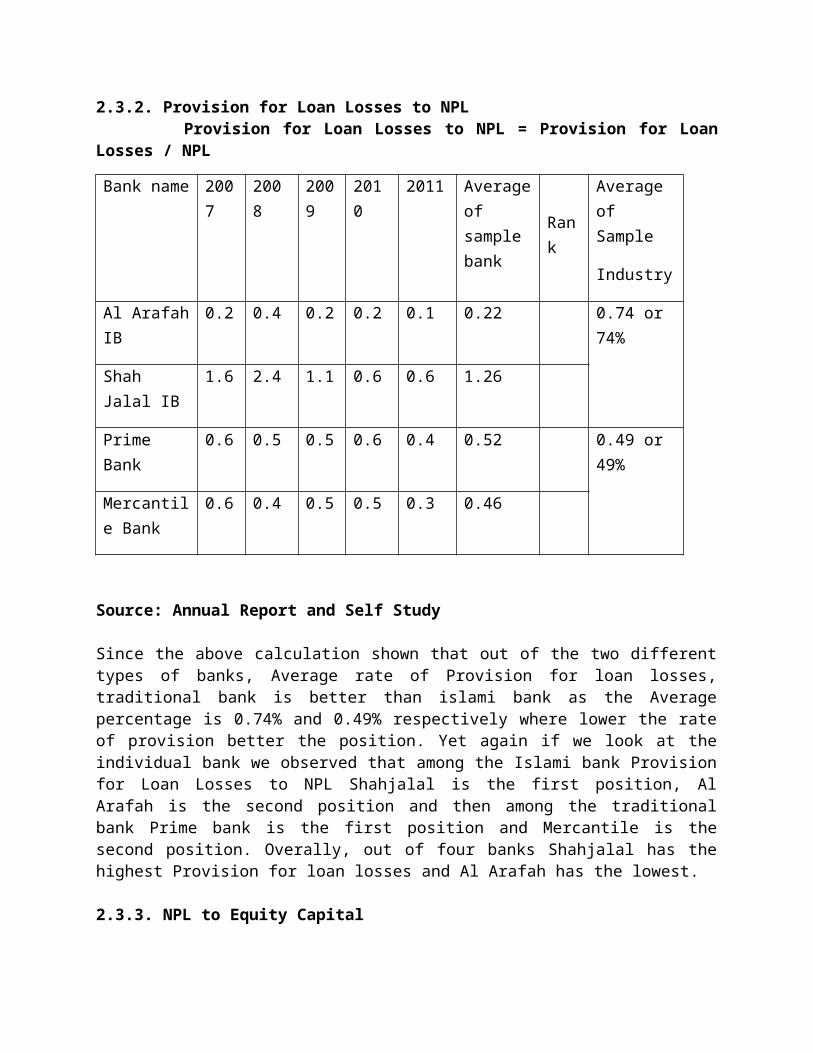
2.3.2. Provision for Loan Losses to NPL Provision for Loan Losses to NPL = Provision for LoanLosses / NPL
Bank name 2007
2008
2009
2010
2011 Averageof sample bank
Rank
Average of Sample
Industry
Al ArafahIB
0.2 0.4 0.2 0.2 0.1 0.22 0.74 or 74%
Shah Jalal IB
1.6 2.4 1.1 0.6 0.6 1.26
Prime Bank
0.6 0.5 0.5 0.6 0.4 0.52 0.49 or 49%
Mercantile Bank
0.6 0.4 0.5 0.5 0.3 0.46
Source: Annual Report and Self Study
Since the above calculation shown that out of the two differenttypes of banks, Average rate of Provision for loan losses,traditional bank is better than islami bank as the Averagepercentage is 0.74% and 0.49% respectively where lower the rateof provision better the position. Yet again if we look at theindividual bank we observed that among the Islami bank Provisionfor Loan Losses to NPL Shahjalal is the first position, AlArafah is the second position and then among the traditionalbank Prime bank is the first position and Mercantile is thesecond position. Overally, out of four banks Shahjalal has thehighest Provision for loan losses and Al Arafah has the lowest.
2.3.3. NPL to Equity Capital
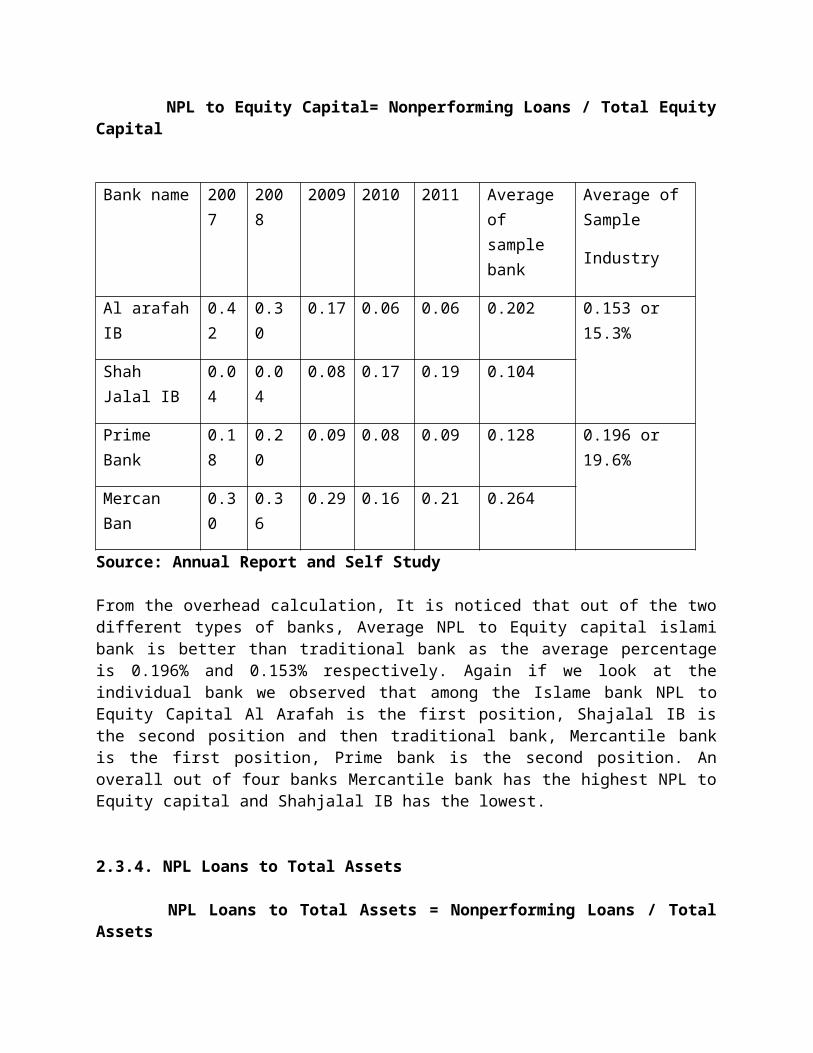
NPL to Equity Capital= Nonperforming Loans / Total EquityCapital
Bank name 2007
2008
2009 2010 2011 Average of sample bank
Average ofSample
Industry
Al arafahIB
0.42
0.30
0.17 0.06 0.06 0.202 0.153 or 15.3%
Shah Jalal IB
0.04
0.04
0.08 0.17 0.19 0.104
Prime Bank
0.18
0.20
0.09 0.08 0.09 0.128 0.196 or 19.6%
Mercan Ban
0.30
0.36
0.29 0.16 0.21 0.264
Source: Annual Report and Self Study
From the overhead calculation, It is noticed that out of the twodifferent types of banks, Average NPL to Equity capital islamibank is better than traditional bank as the average percentageis 0.196% and 0.153% respectively. Again if we look at theindividual bank we observed that among the Islame bank NPL toEquity Capital Al Arafah is the first position, Shajalal IB isthe second position and then traditional bank, Mercantile bankis the first position, Prime bank is the second position. Anoverall out of four banks Mercantile bank has the highest NPL toEquity capital and Shahjalal IB has the lowest.
2.3.4. NPL Loans to Total Assets
NPL Loans to Total Assets = Nonperforming Loans / TotalAssets
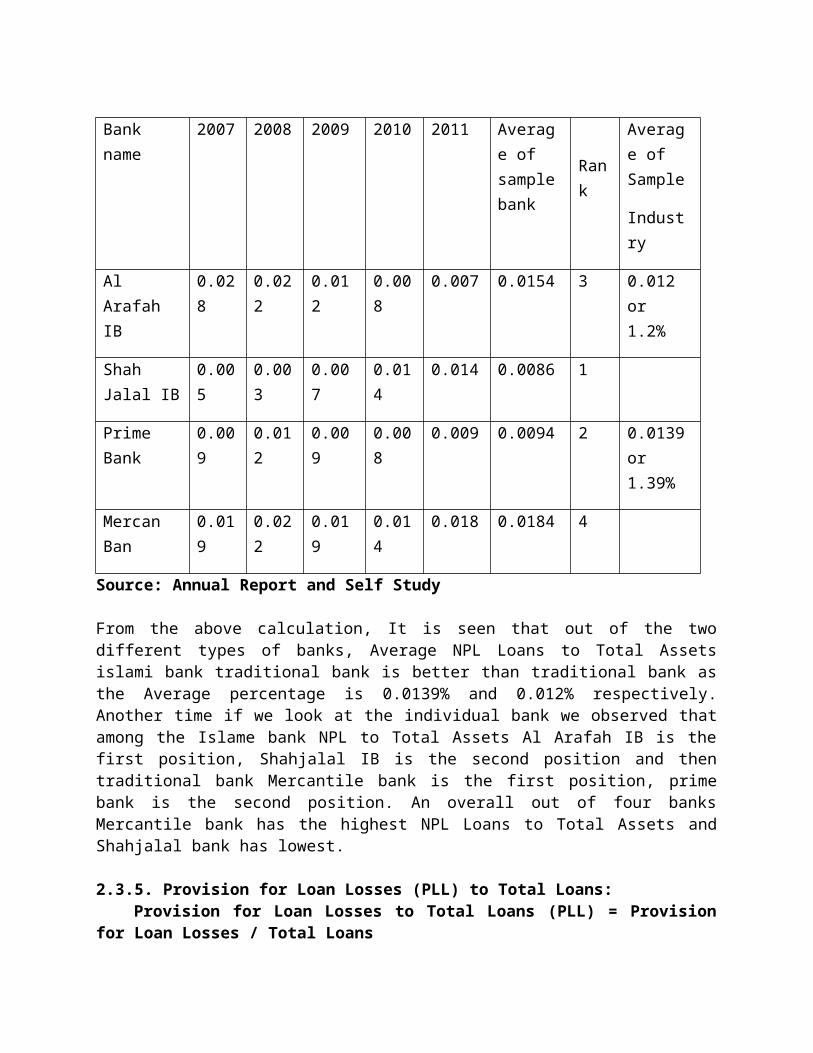
Bank name
2007 2008 2009 2010 2011 Average of samplebank
Rank
Average of Sample
Industry
Al Arafah IB
0.028
0.022
0.012
0.008
0.007 0.0154 3 0.012 or 1.2%
Shah Jalal IB
0.005
0.003
0.007
0.014
0.014 0.0086 1
Prime Bank
0.009
0.012
0.009
0.008
0.009 0.0094 2 0.0139or 1.39%
Mercan Ban
0.019
0.022
0.019
0.014
0.018 0.0184 4
Source: Annual Report and Self Study
From the above calculation, It is seen that out of the twodifferent types of banks, Average NPL Loans to Total Assetsislami bank traditional bank is better than traditional bank asthe Average percentage is 0.0139% and 0.012% respectively.Another time if we look at the individual bank we observed thatamong the Islame bank NPL to Total Assets Al Arafah IB is thefirst position, Shahjalal IB is the second position and thentraditional bank Mercantile bank is the first position, primebank is the second position. An overall out of four banksMercantile bank has the highest NPL Loans to Total Assets andShahjalal bank has lowest.
2.3.5. Provision for Loan Losses (PLL) to Total Loans: Provision for Loan Losses to Total Loans (PLL) = Provisionfor Loan Losses / Total Loans

Bank name 2007 2008 2009 2010 2011 Average of samplebank
Average of Sample
Industry
IBBL 0.02 0.02 0.02 0.01 0.02 0.018
0.00872 or 0.872%
Al ArafahIB
0.010
0.011
0.004
0.002
0.001 0.0056
Shah Jalal IB
0.001
0.0008
0.002
0.004
0.005 0.00256
Prime Bank
0.008
0.009
0.007
0.005
0.005 0.0068
0.0096 or 0.96%Mercan
Ban0.017
0.013
0.013
0.009
0.008 0.012
Bank Asia 0.014
0.016
0.007
0.004
0.009 0.01
Source: Annual Report and Self Study
From the above calculation, it is seen that out of the twodifferent types of banks, Average Provision for Loan Losses toTotal Loans islami bank is better than traditional bank as theAverage percentage is 0.0096 and 0.00872 respectively. Again ifwe look at the individual bank we observed that among the Islamebank Provision for Loan Losses to Total Loans IBBL is the firstposition, Al Arafah is the second position,Shahjalal is the thirdposition and traditional banks Mercantile is the firstposition,Bank Asia is the second position and Prime bank is thethird position. An overall out of six banks IBBL has the highestProvision for Loan Losses to Total Loans and Shahjalal bank hasthe lowest.
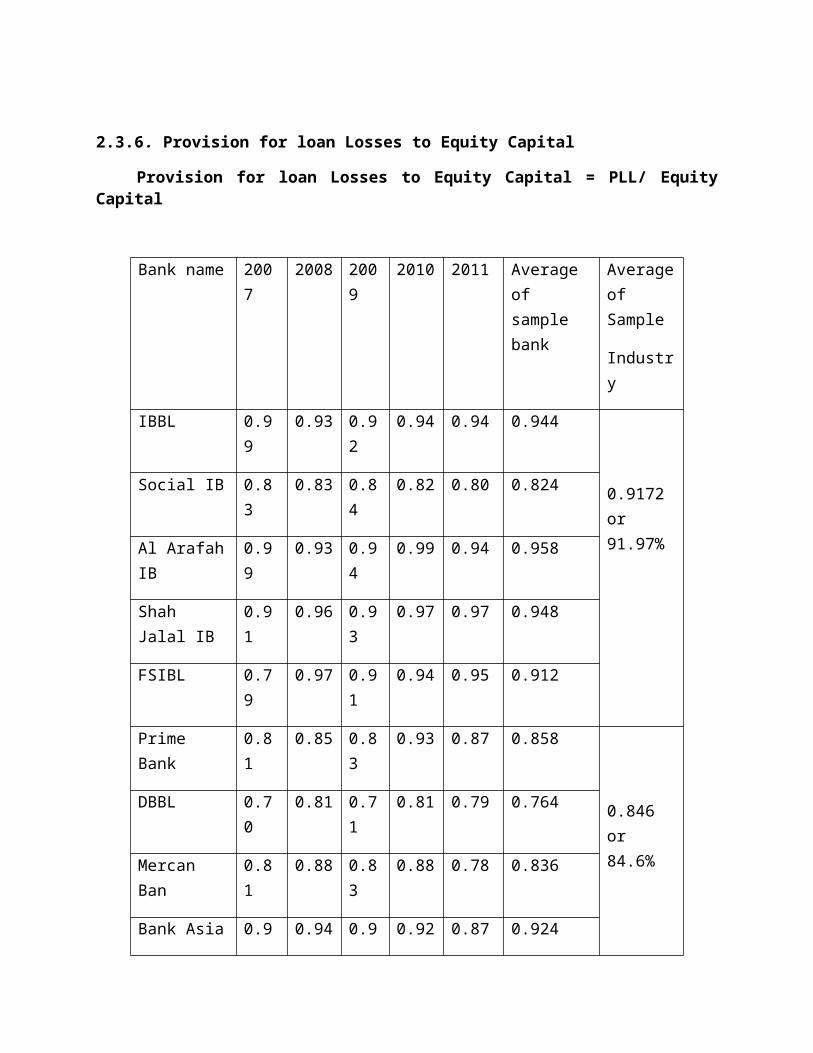
2.3.6. Provision for loan Losses to Equity Capital
Provision for loan Losses to Equity Capital = PLL/ EquityCapital
Bank name 2007
2008 2009
2010 2011 Average of sample bank
Averageof Sample
Industry
IBBL 0.99
0.93 0.92
0.94 0.94 0.944
0.9172 or 91.97%
Social IB 0.83
0.83 0.84
0.82 0.80 0.824
Al ArafahIB
0.99
0.93 0.94
0.99 0.94 0.958
Shah Jalal IB
0.91
0.96 0.93
0.97 0.97 0.948
FSIBL 0.79
0.97 0.91
0.94 0.95 0.912
Prime Bank
0.81
0.85 0.83
0.93 0.87 0.858
0.846 or 84.6%
DBBL 0.70
0.81 0.71
0.81 0.79 0.764
Mercan Ban
0.81
0.88 0.83
0.88 0.78 0.836
Bank Asia 0.9 0.94 0.9 0.92 0.87 0.924
4 5
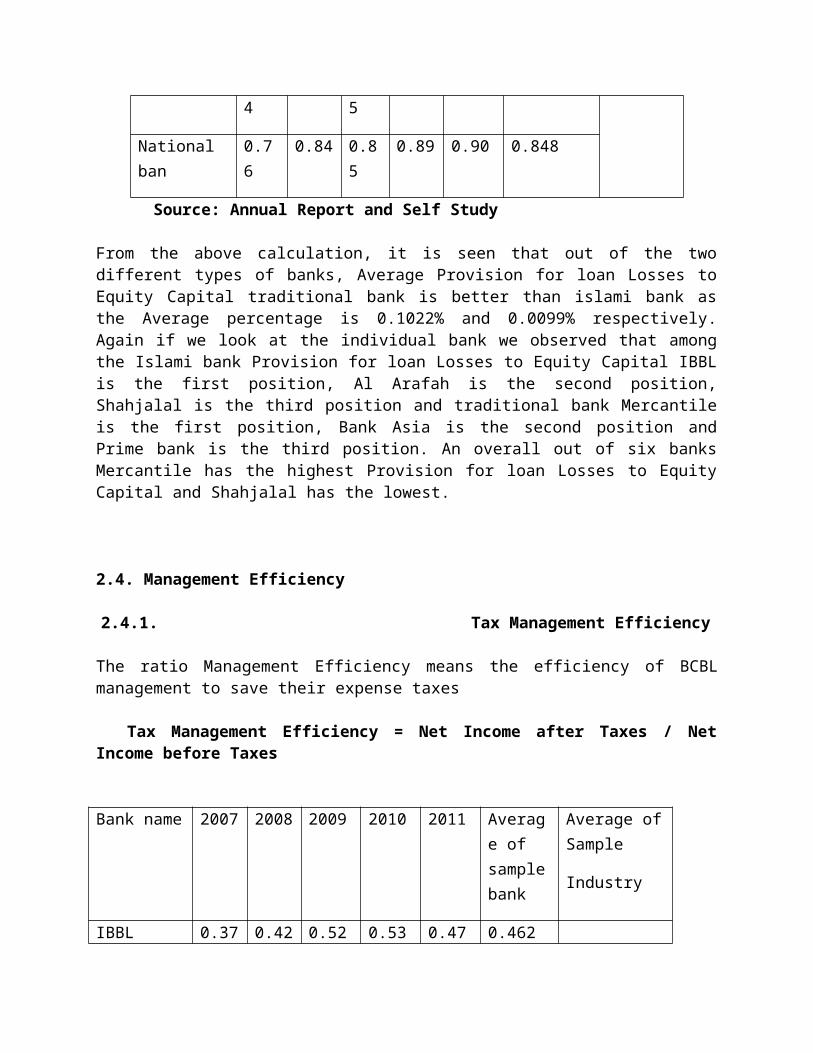
National ban
0.76
0.84 0.85
0.89 0.90 0.848
Source: Annual Report and Self Study
From the above calculation, it is seen that out of the twodifferent types of banks, Average Provision for loan Losses toEquity Capital traditional bank is better than islami bank asthe Average percentage is 0.1022% and 0.0099% respectively.Again if we look at the individual bank we observed that amongthe Islami bank Provision for loan Losses to Equity Capital IBBLis the first position, Al Arafah is the second position,Shahjalal is the third position and traditional bank Mercantileis the first position, Bank Asia is the second position andPrime bank is the third position. An overall out of six banksMercantile has the highest Provision for loan Losses to EquityCapital and Shahjalal has the lowest.
2.4. Management Efficiency
2.4.1. Tax Management Efficiency
The ratio Management Efficiency means the efficiency of BCBLmanagement to save their expense taxes
Tax Management Efficiency = Net Income after Taxes / NetIncome before Taxes
Bank name 2007 2008 2009 2010 2011 Average of samplebank
Average ofSample
Industry
IBBL 0.37 0.42 0.52 0.53 0.47 0.462
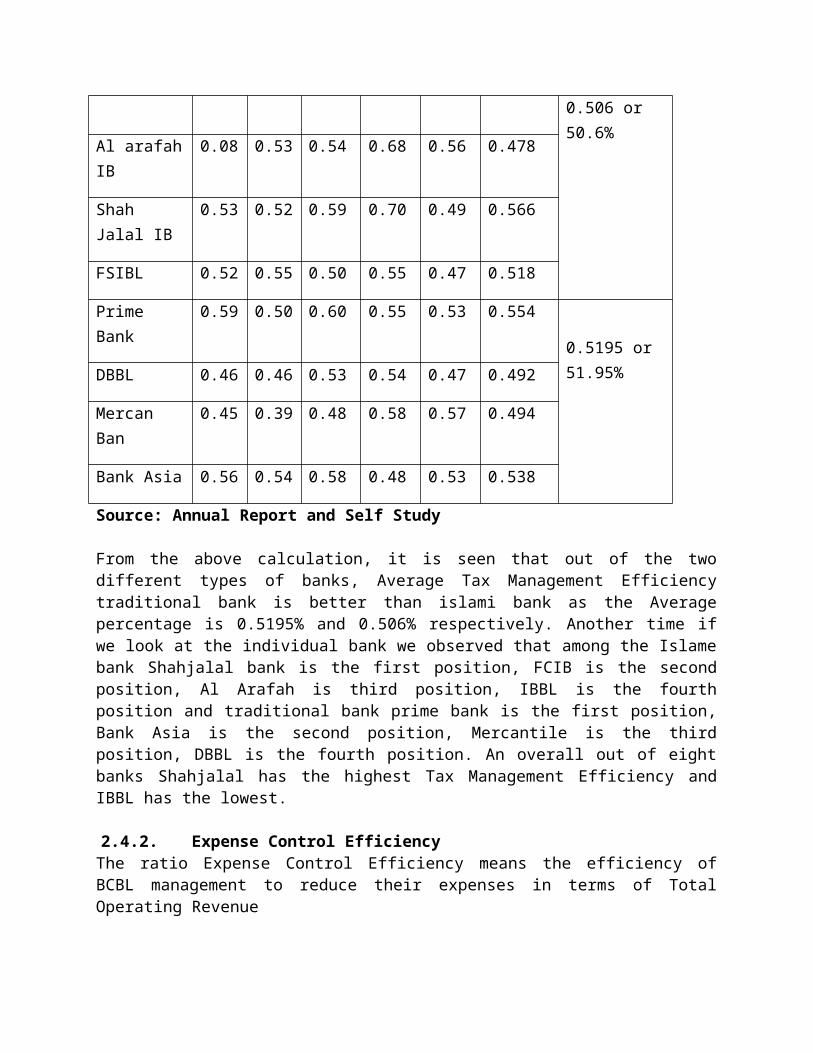
0.506 or 50.6%
Al arafahIB
0.08 0.53 0.54 0.68 0.56 0.478
Shah Jalal IB
0.53 0.52 0.59 0.70 0.49 0.566
FSIBL 0.52 0.55 0.50 0.55 0.47 0.518
Prime Bank
0.59 0.50 0.60 0.55 0.53 0.554
0.5195 or 51.95%DBBL 0.46 0.46 0.53 0.54 0.47 0.492
Mercan Ban
0.45 0.39 0.48 0.58 0.57 0.494
Bank Asia 0.56 0.54 0.58 0.48 0.53 0.538
Source: Annual Report and Self Study
From the above calculation, it is seen that out of the twodifferent types of banks, Average Tax Management Efficiencytraditional bank is better than islami bank as the Averagepercentage is 0.5195% and 0.506% respectively. Another time ifwe look at the individual bank we observed that among the Islamebank Shahjalal bank is the first position, FCIB is the secondposition, Al Arafah is third position, IBBL is the fourthposition and traditional bank prime bank is the first position,Bank Asia is the second position, Mercantile is the thirdposition, DBBL is the fourth position. An overall out of eightbanks Shahjalal has the highest Tax Management Efficiency andIBBL has the lowest.
2.4.2. Expense Control EfficiencyThe ratio Expense Control Efficiency means the efficiency ofBCBL management to reduce their expenses in terms of TotalOperating Revenue
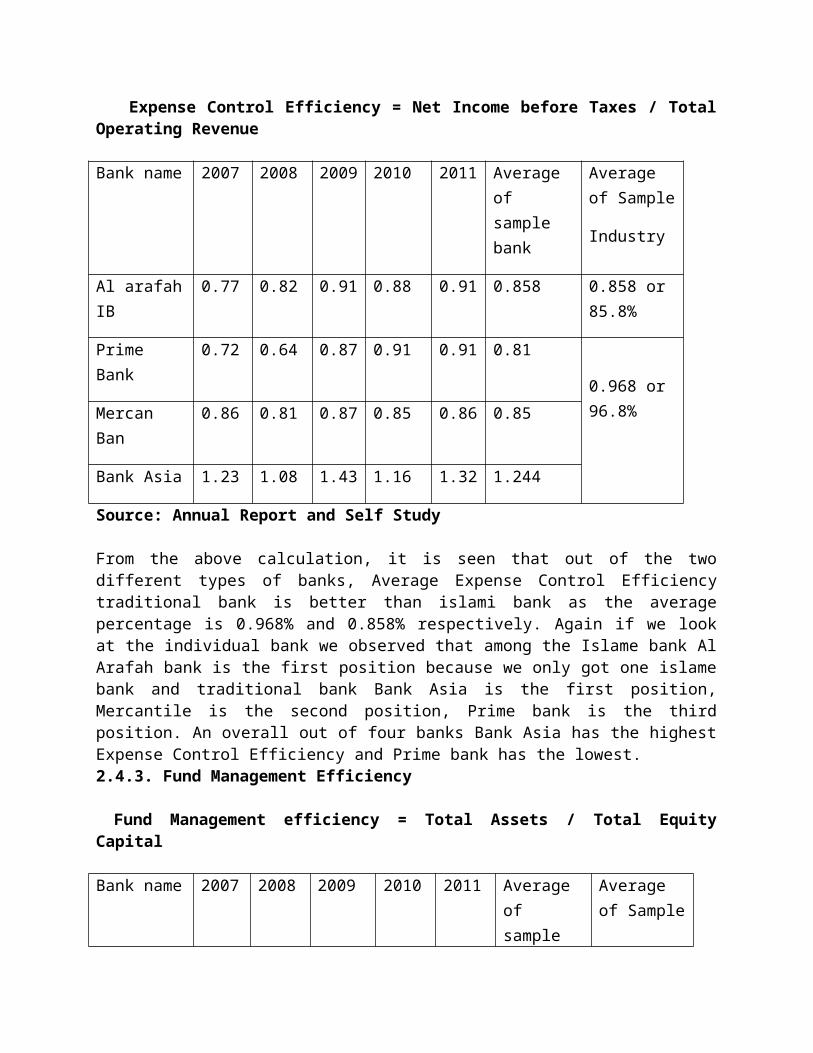
Expense Control Efficiency = Net Income before Taxes / TotalOperating Revenue
Bank name 2007 2008 2009 2010 2011 Average of sample bank
Average of Sample
Industry
Al arafahIB
0.77 0.82 0.91 0.88 0.91 0.858 0.858 or 85.8%
Prime Bank
0.72 0.64 0.87 0.91 0.91 0.81
0.968 or 96.8%Mercan
Ban0.86 0.81 0.87 0.85 0.86 0.85
Bank Asia 1.23 1.08 1.43 1.16 1.32 1.244
Source: Annual Report and Self Study
From the above calculation, it is seen that out of the twodifferent types of banks, Average Expense Control Efficiencytraditional bank is better than islami bank as the averagepercentage is 0.968% and 0.858% respectively. Again if we lookat the individual bank we observed that among the Islame bank AlArafah bank is the first position because we only got one islamebank and traditional bank Bank Asia is the first position,Mercantile is the second position, Prime bank is the thirdposition. An overall out of four banks Bank Asia has the highestExpense Control Efficiency and Prime bank has the lowest.2.4.3. Fund Management Efficiency
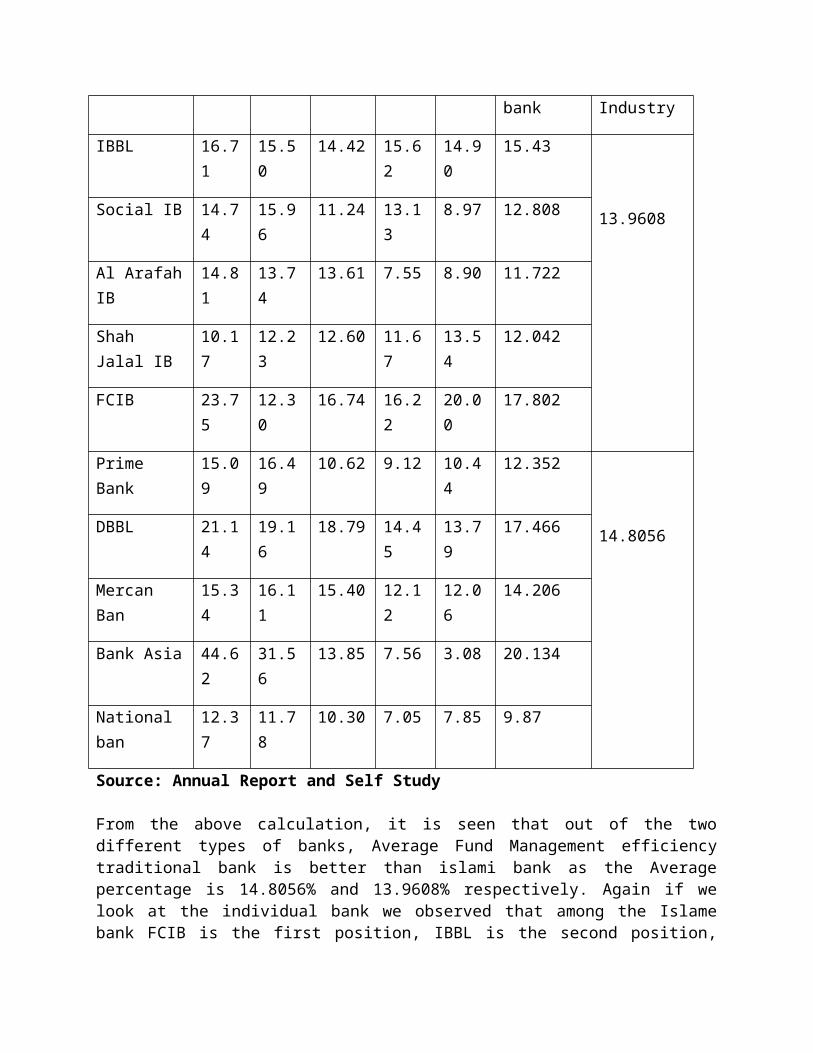
Fund Management efficiency = Total Assets / Total EquityCapital
Bank name 2007 2008 2009 2010 2011 Average of sample
Average of Sample
bank Industry
IBBL 16.71
15.50
14.42 15.62
14.90
15.43
13.9608Social IB 14.74
15.96
11.24 13.13
8.97 12.808
Al ArafahIB
14.81
13.74
13.61 7.55 8.90 11.722
Shah Jalal IB
10.17
12.23
12.60 11.67
13.54
12.042
FCIB 23.75
12.30
16.74 16.22
20.00
17.802
Prime Bank
15.09
16.49
10.62 9.12 10.44
12.352
14.8056DBBL 21.14
19.16
18.79 14.45
13.79
17.466
Mercan Ban
15.34
16.11
15.40 12.12
12.06
14.206
Bank Asia 44.62
31.56
13.85 7.56 3.08 20.134
National ban
12.37
11.78
10.30 7.05 7.85 9.87
Source: Annual Report and Self Study
From the above calculation, it is seen that out of the twodifferent types of banks, Average Fund Management efficiencytraditional bank is better than islami bank as the Averagepercentage is 14.8056% and 13.9608% respectively. Again if welook at the individual bank we observed that among the Islamebank FCIB is the first position, IBBL is the second position,
Social is the third position, Shahjalal is the fourth position,Al Arafah is the fifth position and traditional bank Bank Asiais the first position, DBBL is the second position, Mercantileis the third position, Prime bank is the fourth position,National bank is the fifth position. An overall out of ten banksBank Asia has the highest Fund Management efficiency andNational bank has the lowest.
2.5. Profitability:
2.5.1. Return on Assets (ROA)
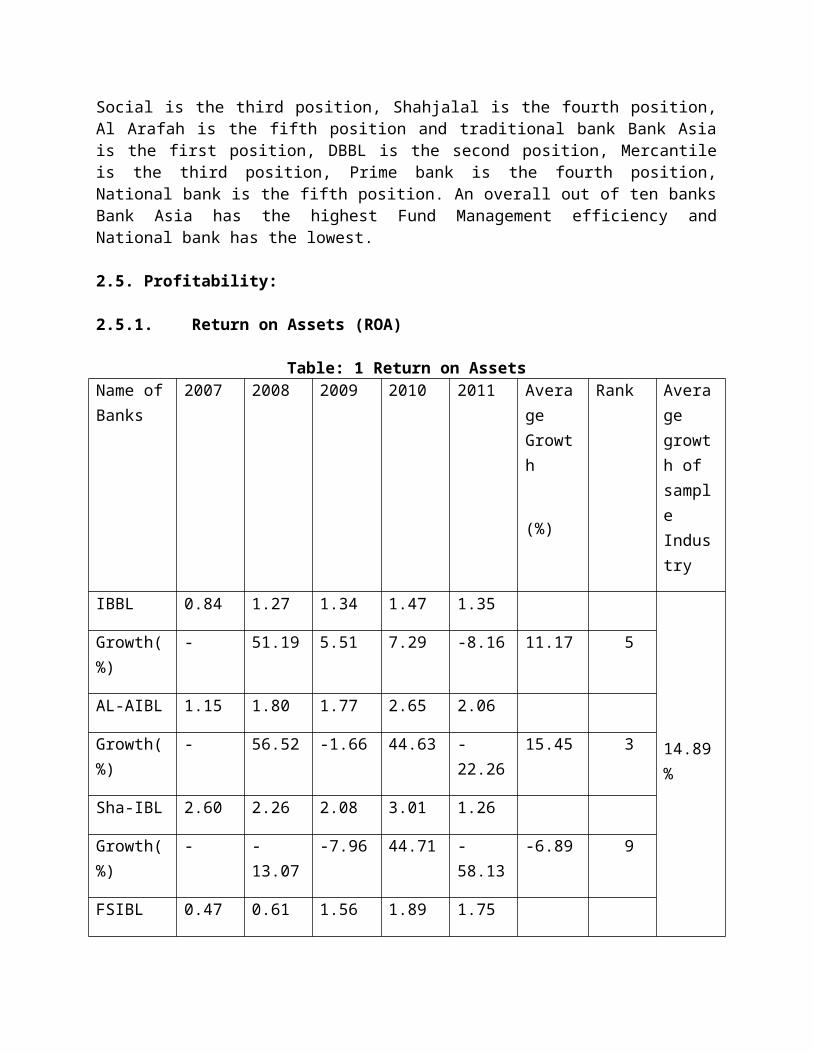
Table: 1 Return on AssetsName ofBanks
2007 2008 2009 2010 2011 Average Growth
(%)
Rank Average growth of sample Industry
IBBL 0.84 1.27 1.34 1.47 1.35
14.89%
Growth(%)
- 51.19 5.51 7.29 -8.16 11.17 5
AL-AIBL 1.15 1.80 1.77 2.65 2.06
Growth(%)
- 56.52 -1.66 44.63 -22.26
15.45 3
Sha-IBL 2.60 2.26 2.08 3.01 1.26
Growth(%)
- -13.07
-7.96 44.71 -58.13
-6.89 9
FSIBL 0.47 0.61 1.56 1.89 1.75
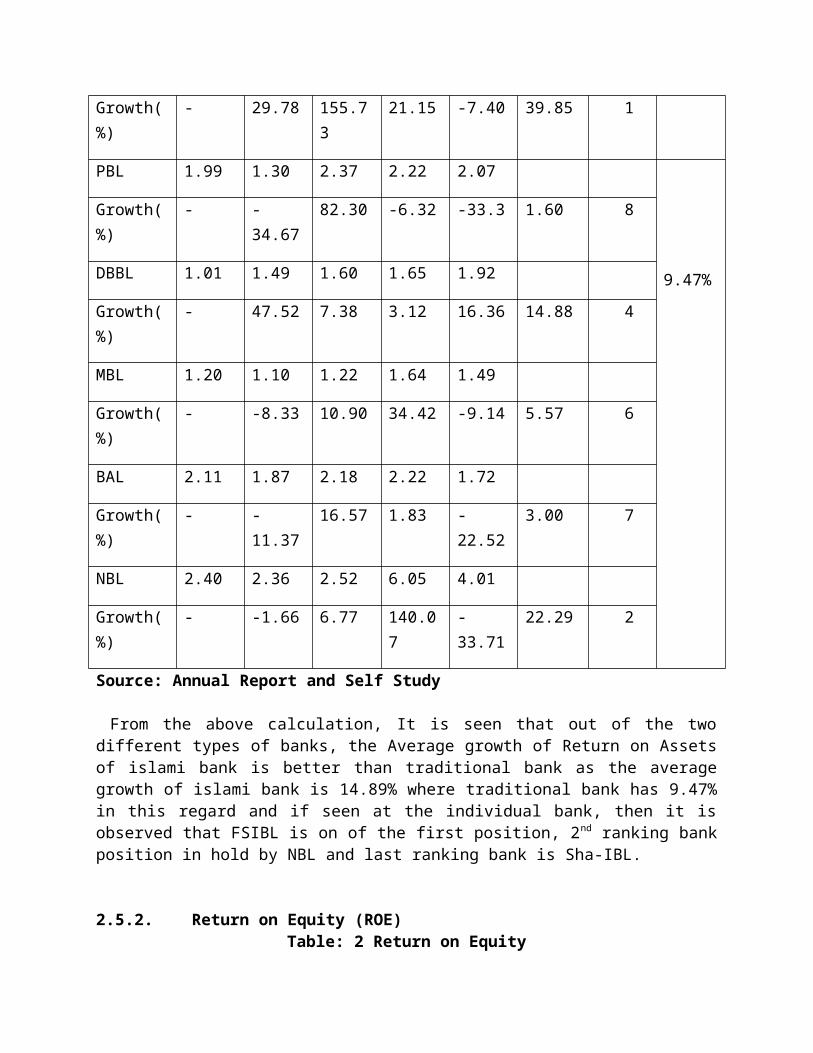
Growth(%)
- 29.78 155.73
21.15 -7.40 39.85 1
PBL 1.99 1.30 2.37 2.22 2.07
9.47%
Growth(%)
- -34.67
82.30 -6.32 -33.3 1.60 8
DBBL 1.01 1.49 1.60 1.65 1.92
Growth(%)
- 47.52 7.38 3.12 16.36 14.88 4
MBL 1.20 1.10 1.22 1.64 1.49
Growth(%)
- -8.33 10.90 34.42 -9.14 5.57 6
BAL 2.11 1.87 2.18 2.22 1.72
Growth(%)
- -11.37
16.57 1.83 -22.52
3.00 7
NBL 2.40 2.36 2.52 6.05 4.01
Growth(%)
- -1.66 6.77 140.07
-33.71
22.29 2
Source: Annual Report and Self Study
From the above calculation, It is seen that out of the twodifferent types of banks, the Average growth of Return on Assetsof islami bank is better than traditional bank as the averagegrowth of islami bank is 14.89% where traditional bank has 9.47%in this regard and if seen at the individual bank, then it isobserved that FSIBL is on of the first position, 2nd ranking bankposition in hold by NBL and last ranking bank is Sha-IBL.
2.5.2. Return on Equity (ROE)Table: 2 Return on Equity
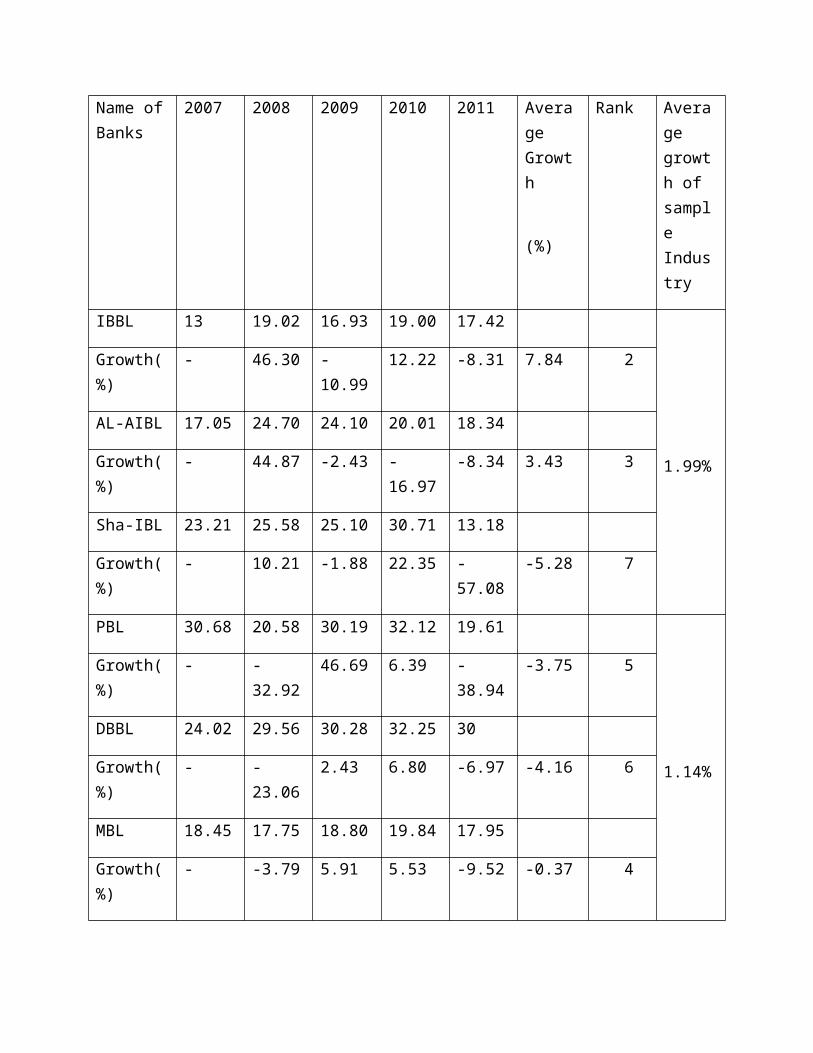
Name ofBanks
2007 2008 2009 2010 2011 Average Growth
(%)
Rank Average growth of sample Industry
IBBL 13 19.02 16.93 19.00 17.42
1.99%
Growth(%)
- 46.30 -10.99
12.22 -8.31 7.84 2
AL-AIBL 17.05 24.70 24.10 20.01 18.34
Growth(%)
- 44.87 -2.43 -16.97
-8.34 3.43 3
Sha-IBL 23.21 25.58 25.10 30.71 13.18
Growth(%)
- 10.21 -1.88 22.35 -57.08
-5.28 7
PBL 30.68 20.58 30.19 32.12 19.61
1.14%
Growth(%)
- -32.92
46.69 6.39 -38.94
-3.75 5
DBBL 24.02 29.56 30.28 32.25 30
Growth(%)
- -23.06
2.43 6.80 -6.97 -4.16 6
MBL 18.45 17.75 18.80 19.84 17.95
Growth(%)
- -3.79 5.91 5.53 -9.52 -0.37 4

BAL 31.36 23.00 32.03 32.12 19.61
Growth(%)
- -27.15
39.26 .28 -38.94
-5.32 8
NBL 31.57 28.38 27.53 48.96 29.96
Growth(%)
- -10.10
-2.99 77.84 38.80 20.71 1
Source: Annual Report and Self Study
From the above calculation, It is seen that out of the twodifferent types of banks, the Average growth of Return on Equityof islami bank is better than traditional bank as the averagegrowth of islami bank is 1.99% where traditional bank has1.14%by the way and if look at the individual bank, then it isobserved that is on of the first position NBL, 2nd ranking bankposition in hold by IBBL and the last ranking bank BAL.
2.5.3. Earning Per Share:
Table: 3 Earning Per Share
Name ofBanks
2007 2008 2009 2010 2011 Average Growth
(%)
Rank Average growth of sample Industry
IBBL 3.00 4.33 4.59 4.46 4.84
Growth(%)
- 44.22 6.00 -2.83 8.52 11.18 4

6.20%SIBL 17.60 17.20 18.39 2.15 1.81
Growth(%)
- -2.27 6.91 -88.30
-15.81
-19.89
9
AL-AIBL 2.51 3.72 2.00 4.14 3.73
Growth(%)
- 48.20 -46.23
107 -9.90 19.81 1
Sha-IBL
Growth(%)
FSIBL 3.20 7.35 1.42 1.61 1.71
Growth(%)
- 129.68
-80.68
13.38 6.21 13.72 2
PBL 6.16 4.33 7.83 5.69 4.70
3.67%
Growth(%)
- -29.70
80.83 -27.33
-17.39
1.28 7
DBBL 23.74 5.48 5.69 10.01 10.75
Growth(%)
- -76.92
3.83 75.92 7.39 2.04 6
MBL 30.05 28.53 30.67 41.04 34.90
Growth(%)
- -5.05 7.50 34.52 -14.96
4.40 5
BAL 52.02 39.38 61.88 64.26 36.5
Growth(%)
- -24.29
57.13 3.85 -43.18
-1.30 8
NBL 5.33 7.27 4.69 7.97 7.07
Growth(%)
- 36.40 -35.49
69.93 -11.29
11.91 3
Source: Annual Report and Self Study
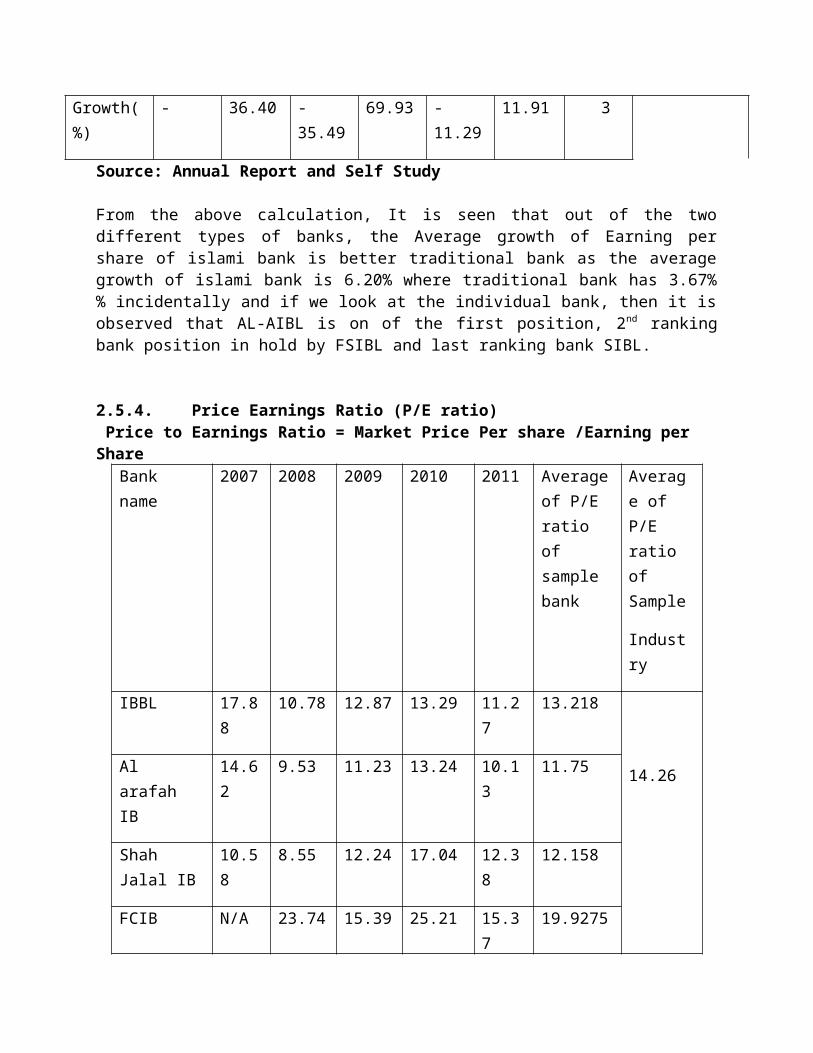
From the above calculation, It is seen that out of the twodifferent types of banks, the Average growth of Earning pershare of islami bank is better traditional bank as the averagegrowth of islami bank is 6.20% where traditional bank has 3.67%% incidentally and if we look at the individual bank, then it isobserved that AL-AIBL is on of the first position, 2nd rankingbank position in hold by FSIBL and last ranking bank SIBL.
2.5.4. Price Earnings Ratio (P/E ratio) Price to Earnings Ratio = Market Price Per share /Earning per Share
Bank name
2007 2008 2009 2010 2011 Averageof P/E ratio of sample bank
Average of P/E ratio of Sample
Industry
IBBL 17.88
10.78 12.87 13.29 11.27
13.218
14.26Al arafah IB
14.62
9.53 11.23 13.24 10.13
11.75
Shah Jalal IB
10.58
8.55 12.24 17.04 12.38
12.158
FCIB N/A 23.74 15.39 25.21 15.37
19.9275
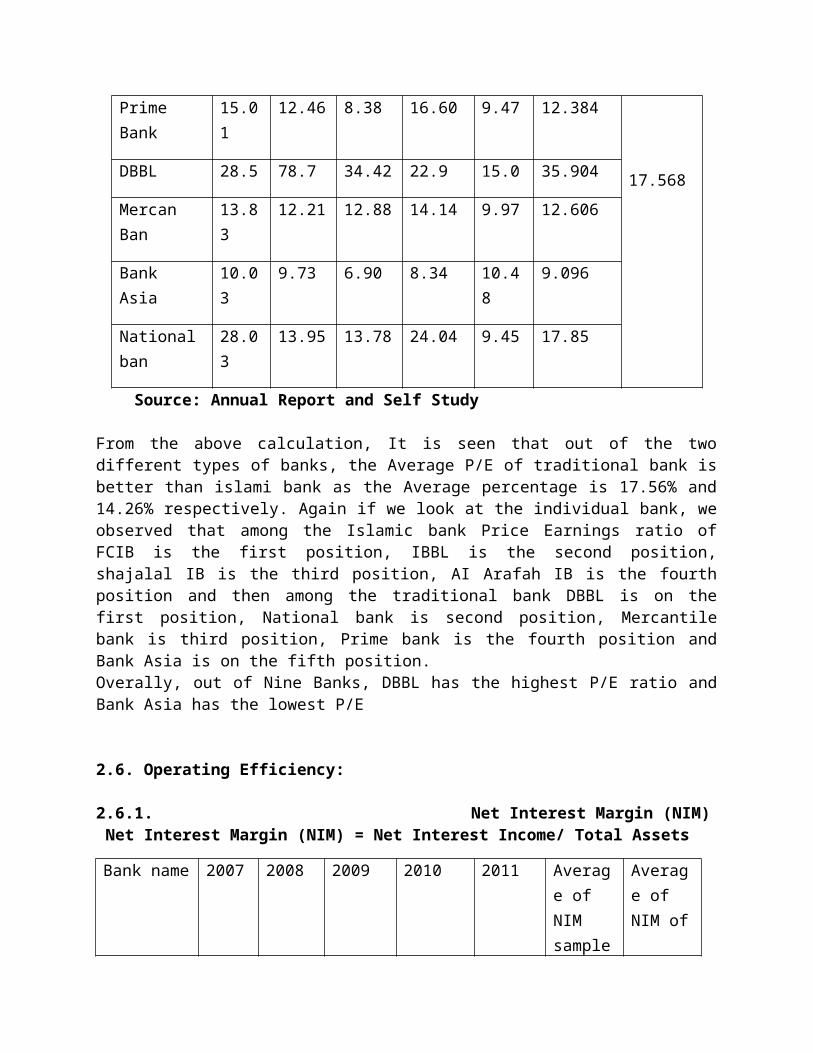
Prime Bank
15.01
12.46 8.38 16.60 9.47 12.384
17.568DBBL 28.5 78.7 34.42 22.9 15.0 35.904
Mercan Ban
13.83
12.21 12.88 14.14 9.97 12.606
Bank Asia
10.03
9.73 6.90 8.34 10.48
9.096
Nationalban
28.03
13.95 13.78 24.04 9.45 17.85
Source: Annual Report and Self Study
From the above calculation, It is seen that out of the twodifferent types of banks, the Average P/E of traditional bank isbetter than islami bank as the Average percentage is 17.56% and14.26% respectively. Again if we look at the individual bank, weobserved that among the Islamic bank Price Earnings ratio ofFCIB is the first position, IBBL is the second position,shajalal IB is the third position, AI Arafah IB is the fourthposition and then among the traditional bank DBBL is on thefirst position, National bank is second position, Mercantilebank is third position, Prime bank is the fourth position andBank Asia is on the fifth position.Overally, out of Nine Banks, DBBL has the highest P/E ratio andBank Asia has the lowest P/E
2.6. Operating Efficiency:
2.6.1. Net Interest Margin (NIM) Net Interest Margin (NIM) = Net Interest Income/ Total Assets
Bank name 2007 2008 2009 2010 2011 Average of NIM sample
Average of NIM of
bank Sample
Industry
IBBL 0.02%
0.03% 0.02% 0.02% 0.03% 0.024%
0.045 or 4.5%
Al arafahIB
0.02%
0.03% 0.02% 0.01% 0.37% 0.09%
Shah Jalal IB
0.03%
0.02% 0.02% 0.02% 0.02% 0.022%
Prime Bank
0.02%
0.01% 0.01% 0.02% 0.02% 0.016%
0.0239or 2.39%
Mercan Ban
0.02%
0.02% 0.03% 0.03% 0.02% 0.024%
Bank Asia .008%
0.01% 0.02% 0.05% 0.07% 0.0316%
National ban
0.02%
0.03% 0.02% 0.02% 0.03% 0.024%
Source: Annual Report and Self Study
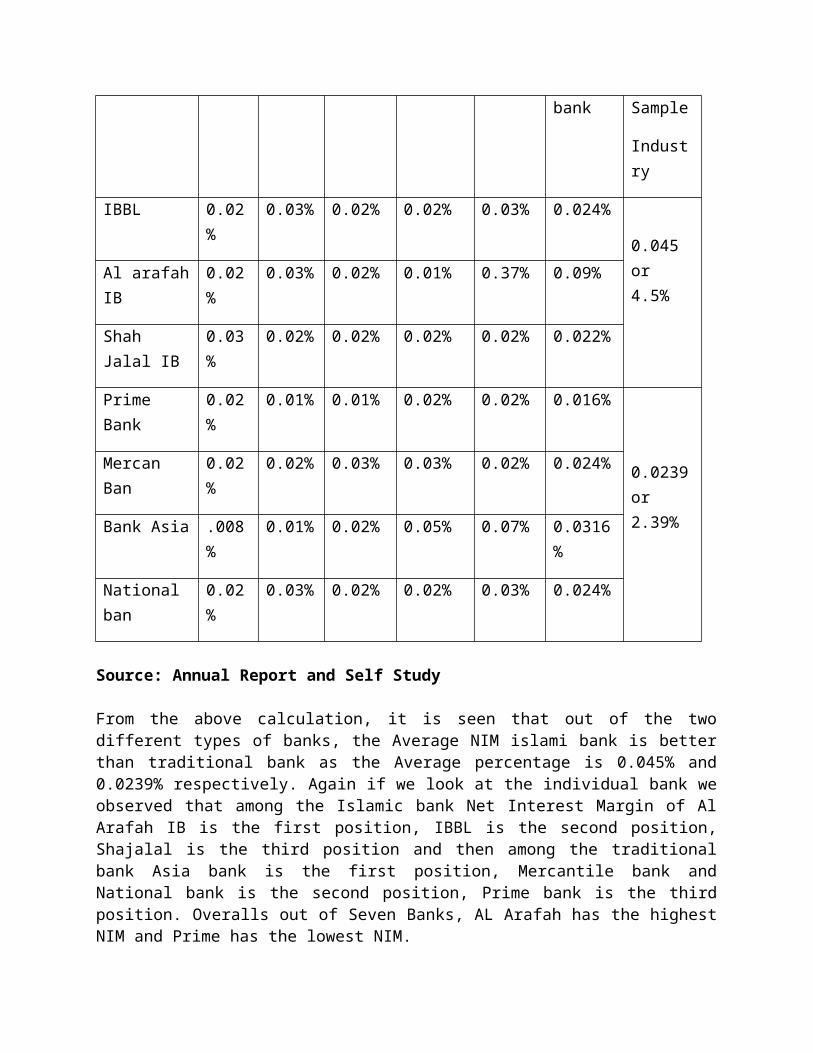
From the above calculation, it is seen that out of the twodifferent types of banks, the Average NIM islami bank is betterthan traditional bank as the Average percentage is 0.045% and0.0239% respectively. Again if we look at the individual bank weobserved that among the Islamic bank Net Interest Margin of AlArafah IB is the first position, IBBL is the second position,Shajalal is the third position and then among the traditionalbank Asia bank is the first position, Mercantile bank andNational bank is the second position, Prime bank is the thirdposition. Overalls out of Seven Banks, AL Arafah has the highestNIM and Prime has the lowest NIM.
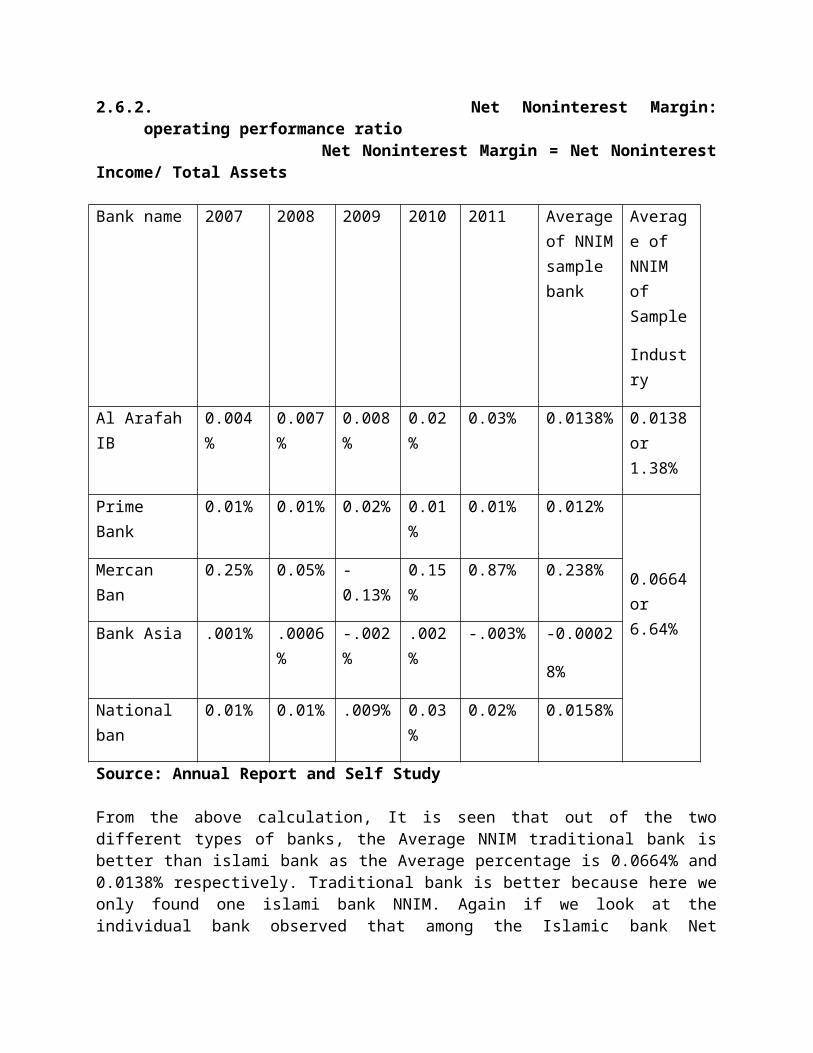
2.6.2. Net Noninterest Margin:operating performance ratio
Net Noninterest Margin = Net NoninterestIncome/ Total Assets
Bank name 2007 2008 2009 2010 2011 Averageof NNIMsample bank
Average of NNIM of Sample
Industry
Al ArafahIB
0.004%
0.007%
0.008%
0.02%
0.03% 0.0138% 0.0138or 1.38%
Prime Bank
0.01% 0.01% 0.02% 0.01%
0.01% 0.012%
0.0664or 6.64%
Mercan Ban
0.25% 0.05% -0.13%
0.15%
0.87% 0.238%
Bank Asia .001% .0006%
-.002%
.002%
-.003% -0.0002
8%
National ban
0.01% 0.01% .009% 0.03%
0.02% 0.0158%
Source: Annual Report and Self Study
From the above calculation, It is seen that out of the twodifferent types of banks, the Average NNIM traditional bank isbetter than islami bank as the Average percentage is 0.0664% and0.0138% respectively. Traditional bank is better because here weonly found one islami bank NNIM. Again if we look at theindividual bank observed that among the Islamic bank Net
Interest Margin Al Arafa IB I only got it and then among thetraditional bank mercantile bank is the first position, Nationalbank is the second position, Prime bank is the third position,and Bank Asia is the list position.
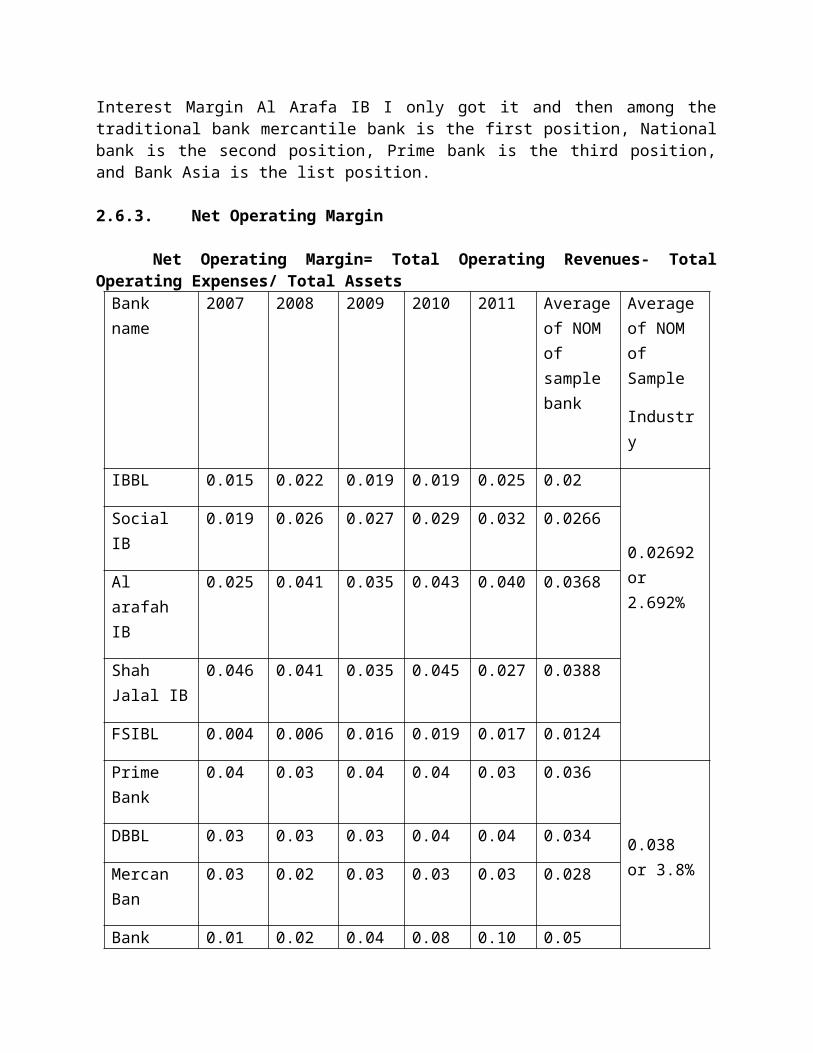
2.6.3. Net Operating Margin
Net Operating Margin= Total Operating Revenues- TotalOperating Expenses/ Total AssetsBank name
2007 2008 2009 2010 2011 Averageof NOM of sample bank
Averageof NOM of Sample
Industry
IBBL 0.015 0.022 0.019 0.019 0.025 0.02
0.02692or 2.692%
Social IB
0.019 0.026 0.027 0.029 0.032 0.0266
Al arafah IB
0.025 0.041 0.035 0.043 0.040 0.0368
Shah Jalal IB
0.046 0.041 0.035 0.045 0.027 0.0388
FSIBL 0.004 0.006 0.016 0.019 0.017 0.0124
Prime Bank
0.04 0.03 0.04 0.04 0.03 0.036
0.038 or 3.8%
DBBL 0.03 0.03 0.03 0.04 0.04 0.034
Mercan Ban
0.03 0.02 0.03 0.03 0.03 0.028
Bank 0.01 0.02 0.04 0.08 0.10 0.05
Asia
Nationalban
0.03 0.04 0.03 0.06 0.05 0.042
Source: Annual Report and Self Study
From the above calculation, It is seen that out of the twodifferent types of banks, theAverage NOM traditional bank isbetter than islami bank as the Average percentage is 0.038% and0.02692% respectively. Again if look at the individual bank weobserved that Among the Islame bank Net Operating MarginShahjalalIslame bank is the first position, Al ArafahIslame bankis the second position, Social Islame bank is the thirdposition, IBBL is the fourth position, FCIB is the fifthposition and then among the traditional bank Bank Asia is thefirst position, National bank is the second position, Prime bankis the third position, DBBL is the fourth position, Mercantileis the fifth position. An overall out of ten banks Bank Asia hasthe highest NOM and FCIB is the lowest position.
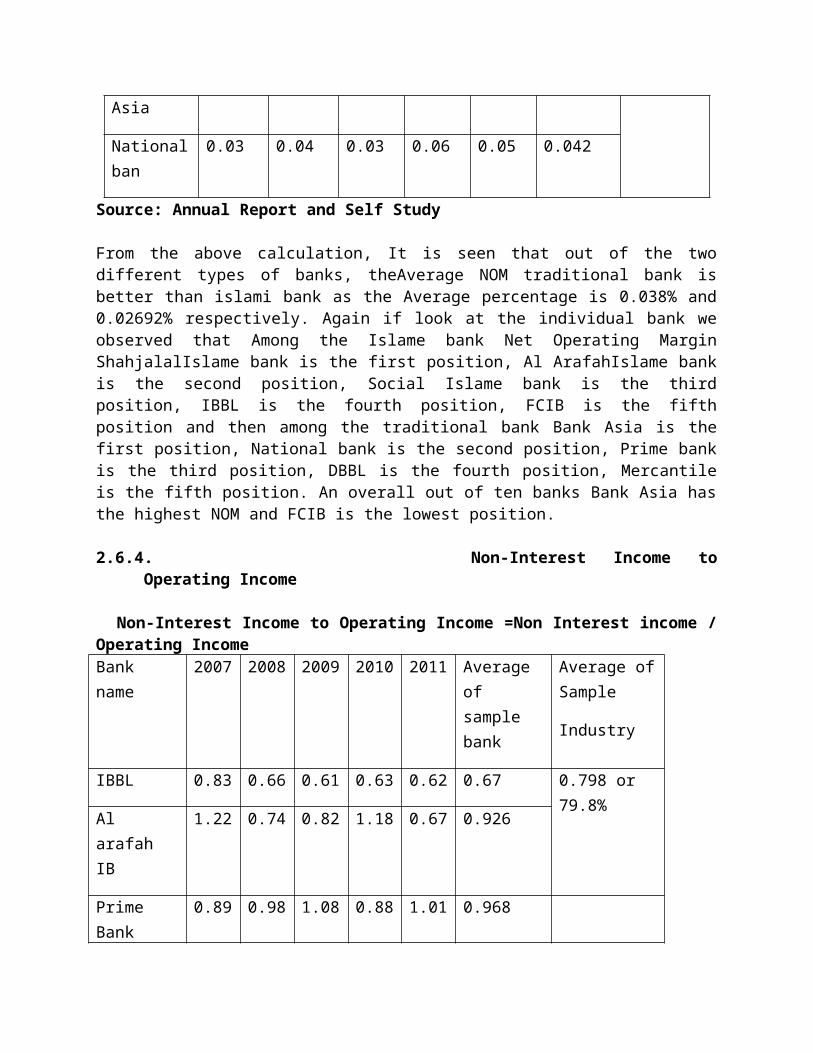
2.6.4. Non-Interest Income toOperating Income
Non-Interest Income to Operating Income =Non Interest income /Operating IncomeBank name
2007 2008 2009 2010 2011 Average of sample bank
Average ofSample
Industry
IBBL 0.83 0.66 0.61 0.63 0.62 0.67 0.798 or 79.8%
Al arafah IB
1.22 0.74 0.82 1.18 0.67 0.926
Prime Bank
0.89 0.98 1.08 0.88 1.01 0.968
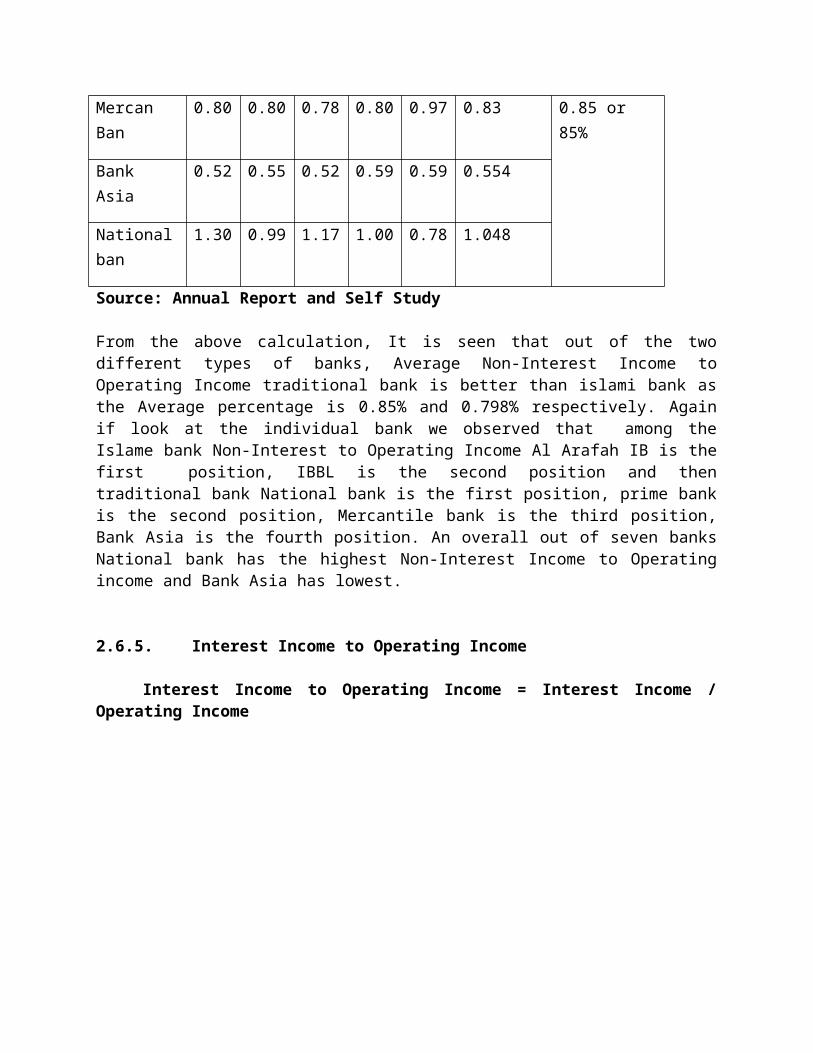
0.85 or 85%
Mercan Ban
0.80 0.80 0.78 0.80 0.97 0.83
Bank Asia
0.52 0.55 0.52 0.59 0.59 0.554
Nationalban
1.30 0.99 1.17 1.00 0.78 1.048
Source: Annual Report and Self Study
From the above calculation, It is seen that out of the twodifferent types of banks, Average Non-Interest Income toOperating Income traditional bank is better than islami bank asthe Average percentage is 0.85% and 0.798% respectively. Againif look at the individual bank we observed that among theIslame bank Non-Interest to Operating Income Al Arafah IB is thefirst position, IBBL is the second position and thentraditional bank National bank is the first position, prime bankis the second position, Mercantile bank is the third position,Bank Asia is the fourth position. An overall out of seven banksNational bank has the highest Non-Interest Income to Operatingincome and Bank Asia has lowest.
2.6.5. Interest Income to Operating Income
Interest Income to Operating Income = Interest Income /Operating Income
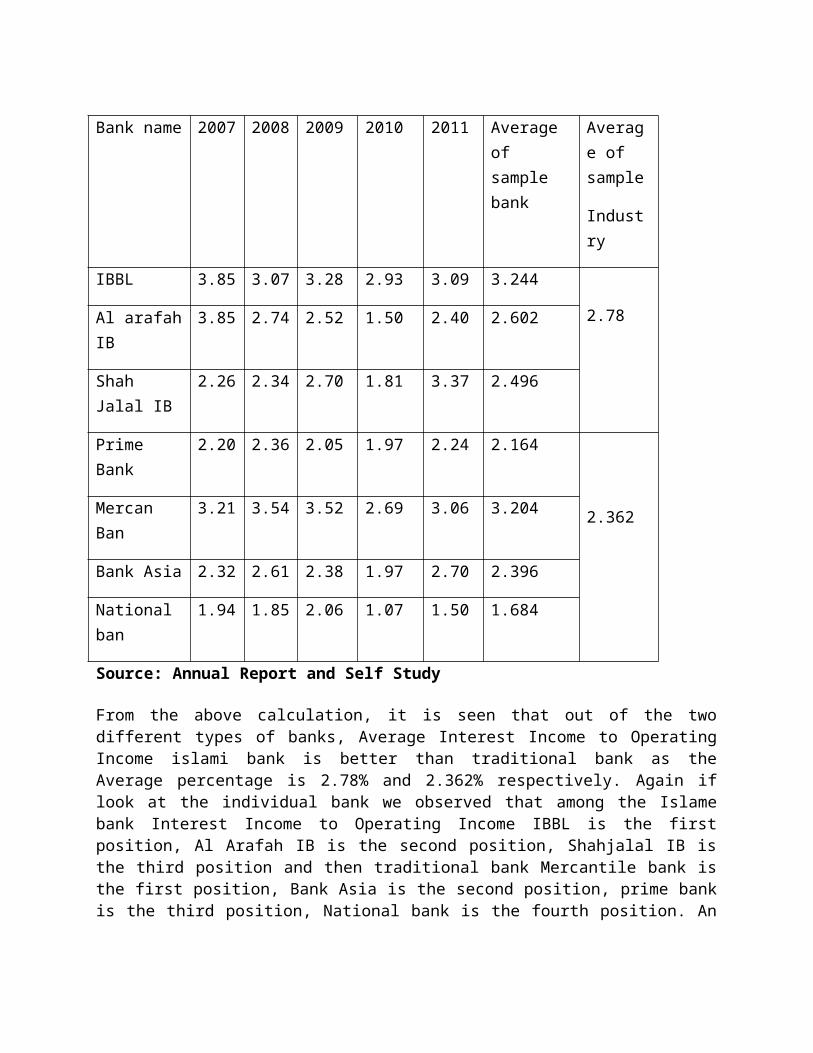
Source: Annual Report and Self Study From the above calculation, it is seen that out of the twodifferent types of banks, Average Interest Income to OperatingIncome islami bank is better than traditional bank as theAverage percentage is 2.78% and 2.362% respectively. Again iflook at the individual bank we observed that among the Islamebank Interest Income to Operating Income IBBL is the firstposition, Al Arafah IB is the second position, Shahjalal IB isthe third position and then traditional bank Mercantile bank isthe first position, Bank Asia is the second position, prime bankis the third position, National bank is the fourth position. An
Bank name 2007 2008 2009 2010 2011 Average of sample bank
Average of sample
Industry
IBBL 3.85 3.07 3.28 2.93 3.09 3.244
2.78Al arafahIB
3.85 2.74 2.52 1.50 2.40 2.602
Shah Jalal IB
2.26 2.34 2.70 1.81 3.37 2.496
Prime Bank
2.20 2.36 2.05 1.97 2.24 2.164
2.362Mercan Ban
3.21 3.54 3.52 2.69 3.06 3.204
Bank Asia 2.32 2.61 2.38 1.97 2.70 2.396
National ban
1.94 1.85 2.06 1.07 1.50 1.684
overall out of seven banks IBBL has the highest Interest Incometo Operating Income and National bank has lowest.
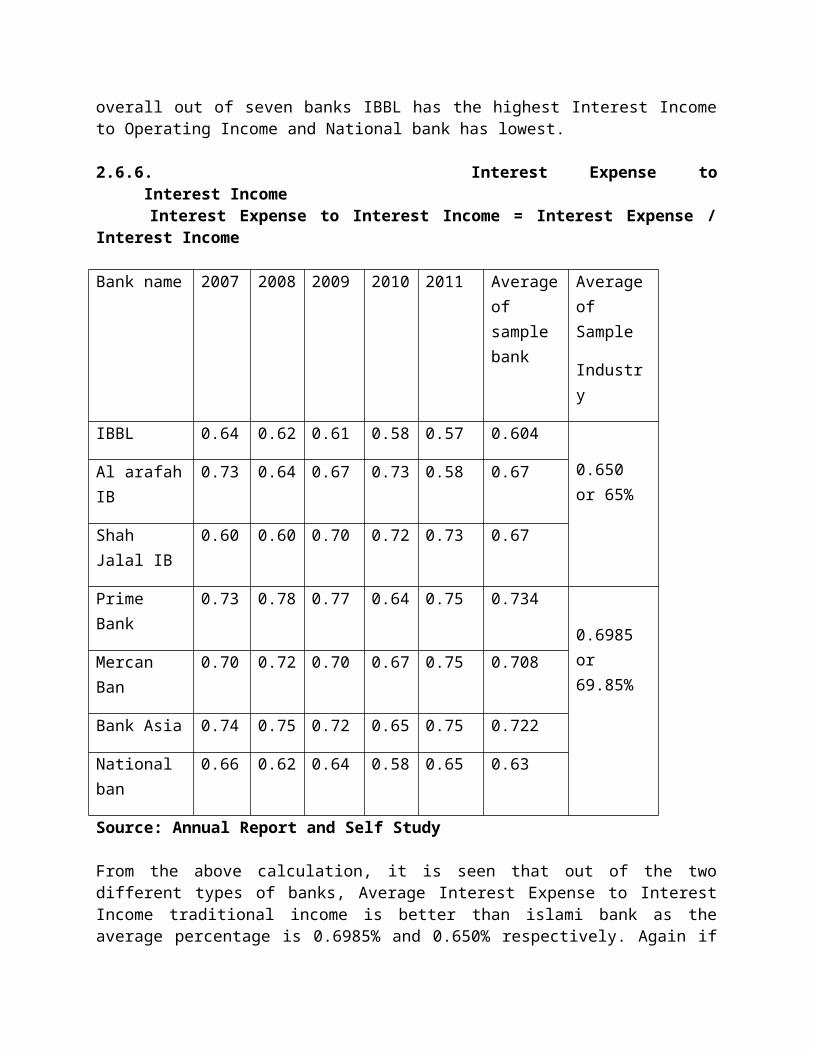
2.6.6. Interest Expense toInterest Income
Interest Expense to Interest Income = Interest Expense /Interest Income
Bank name 2007 2008 2009 2010 2011 Averageof sample bank
Averageof Sample
Industry
IBBL 0.64 0.62 0.61 0.58 0.57 0.604
0.650 or 65%
Al arafahIB
0.73 0.64 0.67 0.73 0.58 0.67
Shah Jalal IB
0.60 0.60 0.70 0.72 0.73 0.67
Prime Bank
0.73 0.78 0.77 0.64 0.75 0.734
0.6985 or 69.85%
Mercan Ban
0.70 0.72 0.70 0.67 0.75 0.708
Bank Asia 0.74 0.75 0.72 0.65 0.75 0.722
National ban
0.66 0.62 0.64 0.58 0.65 0.63
Source: Annual Report and Self Study
From the above calculation, it is seen that out of the twodifferent types of banks, Average Interest Expense to InterestIncome traditional income is better than islami bank as theaverage percentage is 0.6985% and 0.650% respectively. Again if
appearance at the individual bank we observed that among theIslame bank Interest Expense to Interest Income Al Arafah IB &Shajalal IB is the first position, IBBL is the second positionand then traditional bank Prime bank is the first position, BankAsia is the second position, Mercantile bank is the thirdposition, National bank is the fourth position. An overall outof seven banks Prime bank has the highest Interest Expense toInterest Income and IBBL has the lowest.
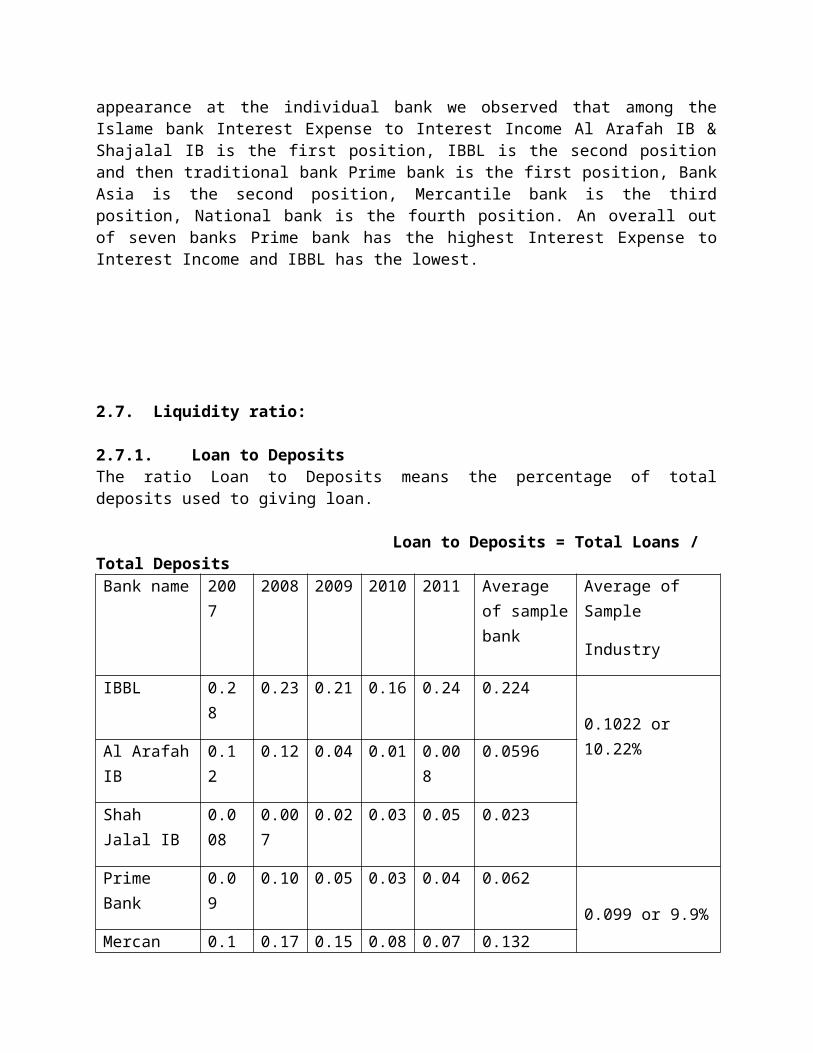
2.7. Liquidity ratio:
2.7.1. Loan to DepositsThe ratio Loan to Deposits means the percentage of totaldeposits used to giving loan.
Loan to Deposits = Total Loans / Total DepositsBank name 200
72008 2009 2010 2011 Average
of samplebank
Average of Sample
Industry
IBBL 0.28
0.23 0.21 0.16 0.24 0.224
0.1022 or 10.22%Al Arafah
IB0.12
0.12 0.04 0.01 0.008
0.0596
Shah Jalal IB
0.008
0.007
0.02 0.03 0.05 0.023
Prime Bank
0.09
0.10 0.05 0.03 0.04 0.062
0.099 or 9.9%Mercan 0.1 0.17 0.15 0.08 0.07 0.132
Ban 9
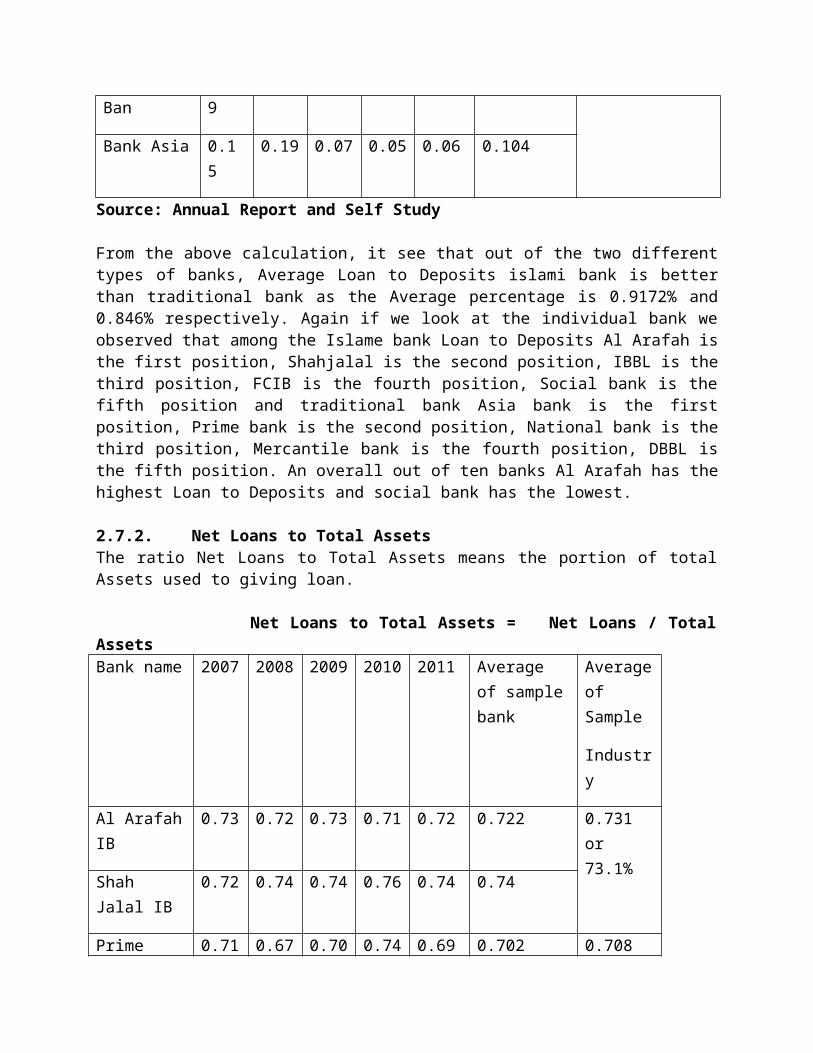
Bank Asia 0.15
0.19 0.07 0.05 0.06 0.104
Source: Annual Report and Self Study
From the above calculation, it see that out of the two differenttypes of banks, Average Loan to Deposits islami bank is betterthan traditional bank as the Average percentage is 0.9172% and0.846% respectively. Again if we look at the individual bank weobserved that among the Islame bank Loan to Deposits Al Arafah isthe first position, Shahjalal is the second position, IBBL is thethird position, FCIB is the fourth position, Social bank is thefifth position and traditional bank Asia bank is the firstposition, Prime bank is the second position, National bank is thethird position, Mercantile bank is the fourth position, DBBL isthe fifth position. An overall out of ten banks Al Arafah has thehighest Loan to Deposits and social bank has the lowest.
2.7.2. Net Loans to Total AssetsThe ratio Net Loans to Total Assets means the portion of totalAssets used to giving loan.
Net Loans to Total Assets = Net Loans / TotalAssetsBank name 2007 2008 2009 2010 2011 Average
of samplebank
Averageof Sample
Industry
Al ArafahIB
0.73 0.72 0.73 0.71 0.72 0.722 0.731 or 73.1%
Shah Jalal IB
0.72 0.74 0.74 0.76 0.74 0.74
Prime 0.71 0.67 0.70 0.74 0.69 0.702 0.708
Bank or 70.8%
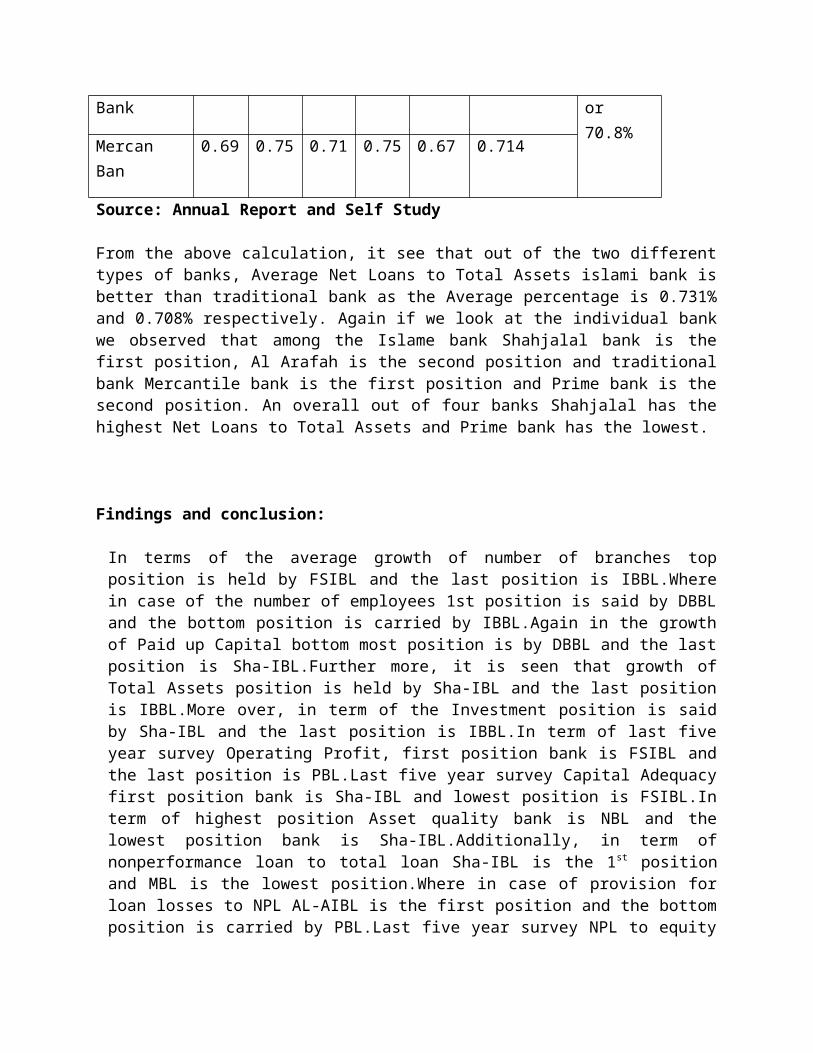
Mercan Ban
0.69 0.75 0.71 0.75 0.67 0.714
Source: Annual Report and Self Study
From the above calculation, it see that out of the two differenttypes of banks, Average Net Loans to Total Assets islami bank isbetter than traditional bank as the Average percentage is 0.731%and 0.708% respectively. Again if we look at the individual bankwe observed that among the Islame bank Shahjalal bank is thefirst position, Al Arafah is the second position and traditionalbank Mercantile bank is the first position and Prime bank is thesecond position. An overall out of four banks Shahjalal has thehighest Net Loans to Total Assets and Prime bank has the lowest.
Findings and conclusion:
In terms of the average growth of number of branches topposition is held by FSIBL and the last position is IBBL.Wherein case of the number of employees 1st position is said by DBBLand the bottom position is carried by IBBL.Again in the growthof Paid up Capital bottom most position is by DBBL and the lastposition is Sha-IBL.Further more, it is seen that growth ofTotal Assets position is held by Sha-IBL and the last positionis IBBL.More over, in term of the Investment position is saidby Sha-IBL and the last position is IBBL.In term of last fiveyear survey Operating Profit, first position bank is FSIBL andthe last position is PBL.Last five year survey Capital Adequacyfirst position bank is Sha-IBL and lowest position is FSIBL.Interm of highest position Asset quality bank is NBL and thelowest position bank is Sha-IBL.Additionally, in term ofnonperformance loan to total loan Sha-IBL is the 1st positionand MBL is the lowest position.Where in case of provision forloan losses to NPL AL-AIBL is the first position and the bottomposition is carried by PBL.Last five year survey NPL to equity
capital first position bank is Sha-IBL and the last positionbank is MBL.Further more, it is seen that NPL loans to totalassets the first position bank is Sha-IBL and the last positionbank is MBL.Where in case of provision for loan losses to totalloans Sha-IBL is the first position and BAL is the lowestposition.In terms of the average of sample industry provisionfor loan losses to equity capital is the first position bank isDBBL and the last position bank is AL-AIBL.The growth of Returnon Assets position is held by FSIBL and the last position isSha-IBL.Average of sample industry tax management efficiencyFSIBL is the first position and IBBL is the lowestposition.Average of sample industry expense control efficiencyBAL is the first position and the last position bank PBL.Interm of highest position fund management efficiency bank is BALand the lowest position bank is NBL.The growth of Return onEquity first position bank is NBL and the last position bank isBAL.In this survey see Earning per Share first position bank isAL-AIBL and the last position bank is SIBL.Price earnings ratiohighest position bank is DBBL and the lowest position bank isNBL.Average of sample industry net interest margin AL-AIBL isthe highest position and lowest position bank is PBL.Furthermore, it is seen that net noninterest margin the first positionbank is MBL and the lowest position is BAL.In terms of theaverage of sample industry net operating margin highestposition bank BAL and the lowest position is FSIBL.Where incase of the non-interest income to operating income NBL is thefirst position and the lowest position bank is BAL.Interestincome to operating income top position is IBBL and bottomposition is NBL.Further, in term of interest expense tointerest income top position is PBL and the bottom position isIBBL.
So, Over ally, it can be said that the performance of the both ofthe banking sector in Bangladesh is satisfactory as almost all ofthe sample banks has at least more than 11% risk weighted asset,the classified loan to total loan of this sector is decreasinggradually. On the other hand, profitability is being increasingsignificantly over last five years. However, if it is compared to
the Islamic Banking sector and Traditional banking sector, it isfound that Islamic banking sector has better capital adequacy,Asset quality management ability, Management efficiency,Profitability and Liquidity position than Traditional bankingsector. So in fine it can be said that the performance of IslamicBank in Bangladesh is more pleasing than Traditional Bank.
Reference:
Al Shammari, M., & Salimi, A. (1998). “Modeling the operatingefficiency of banks, A parametric methodology.” Journal of LogisticInformation Management, Vol. 11. pp. 5-17.
Dutta, D. D. K. & Bhattacharjee, D. M. K. (2001). “Theassessment of financial and operatingperformance of the cementindustry: A case study of confidence cement ltd.” The ChittagongUniversity, Journal of Commerce, Vol. 16, pp. 1-16.
Hye, D.M.A. & Rahman, M.A. (1997). “Performance of SelectedPrivate Sector General Insurance Companies in Bangladesh”,Chittagong University Studies (Commerce), Vol. 13, pp. 137-160.
Jahangir, N., Shill, S., & Haque, M. A. J. (2007). “Examinationof Profitability in the Context of Bangladesh Banking Industry”,ABAC Journal, Vol. 27, No. 2, pp. 36-46.
LIN, W.C., LIU, C.F., & CHU, C.W. (2005). “Performance efficiencyevaluation of the Taiwan’s shipping Industry: An application ofDEA”, Proceeding of the Transportation Studies, Vol. 5, pp. 467-476.
Ohlson, J.A. (1980). “Financial Ratios and the ProbabilisticPrediction of Bankruptcy”, Journal of Accounting Research, Vol.19, No.1, pp. 61-80.
Pandey, I.M. (1979). Financial Management, Vikas Publishing HousePvt. Ltd, New Delhi, pp. 109-116.
Prasanna (1995). The Investment Game, New Delhi, McGraw HillPublishing Co. Limited, pp.172.
Shaikh, M. A. H., & Miah, M. A.S. (1979). “Financial Position andPerformance analysis of Bangladesh Shilpa Bank”, IslamicUniversity Studies (part C), Vol. 1, No. 2, December, p p. 207-225.
Sina, M. A., & Matubber, M. A. A. (1998). “Financial StatementAnalysis of Khulna NewsprintMills Limited”, Islamic University Studies(part C), Vol. 1, No. 2, December, pp.179-189.
Samad, A. (2004). “Bahrain Commercial Bank’s Performance during1994-2001.”Credit and Financial Management Review, 10(1), pp. 33-40.
Salauddin, A. (2001). “Profitability of Pharmaceutical Companies of Bangladesh”. Journal of Commerce, Chittagong University, Vol. 16,pp. 54-64.


