Embed Size (px)
Citation preview
Phylogenetic Position of a Copper Age Sheep (Ovis aries)Mitochondrial DNACristina Olivieri1, Luca Ermini2, Ermanno Rizzi3, Giorgio Corti3, Stefania Luciani1, Isolina Marota1,
Gianluca De Bellis3, Franco Rollo1*
1 Laboratorio di Archeo-Antropologia molecolare/DNA Antico, Scuola di Bioscienze e Biotecnologie, University of Camerino, Camerino, Italy, 2 Section of Haemato-
Oncology, The Institute of Cancer Research, Sutton, United Kingdom, 3 Istituto di Tecnologie Biomediche, Consiglio Nazionale delle Ricerche, Segrate, Italy
Abstract
Background: Sheep (Ovis aries) were domesticated in the Fertile Crescent region about 9,000-8,000 years ago. Currently, fewmitochondrial (mt) DNA studies are available on archaeological sheep. In particular, no data on archaeological Europeansheep are available.
Methodology/Principal Findings: Here we describe the first portion of mtDNA sequence of a Copper Age European sheep.DNA was extracted from hair shafts which were part of the clothes of the so-called Tyrolean Iceman or Otzi (5,350 - 5,100years before present). Mitochondrial DNA (a total of 2,429 base pairs, encompassing a portion of the control region,tRNAPhe, a portion of the 12S rRNA gene, and the whole cytochrome B gene) was sequenced using a mixed sequencingprocedure based on PCR amplification and 454 sequencing of pooled amplification products. We have compared thesequence with the corresponding sequence of 334 extant lineages.
Conclusions/Significance: A phylogenetic network based on a new cladistic notation for the mitochondrial diversity ofdomestic sheep shows that the Otzi’s sheep falls within haplogroup B, thus demonstrating that sheep belonging to thishaplogroup were already present in the Alps more than 5,000 years ago. On the other hand, the lineage of the Otzi’s sheepis defined by two transitions (16147, and 16440) which, assembled together, define a motif that has not yet been identifiedin modern sheep populations.
Citation: Olivieri C, Ermini L, Rizzi E, Corti G, Luciani S, et al. (2012) Phylogenetic Position of a Copper Age Sheep (Ovis aries) Mitochondrial DNA. PLoS ONE 7(3):e33792. doi:10.1371/journal.pone.0033792
Editor: Carles Lalueza-Fox, Institut de Biologia Evolutiva - Universitat Pompeu Fabra, Spain
Received November 23, 2011; Accepted February 17, 2012; Published March 23, 2012
Copyright: � 2012 Olivieri et al. This is an open-access article distributed under the terms of the Creative Commons Attribution License, which permitsunrestricted use, distribution, and reproduction in any medium, provided the original author and source are credited.
Funding: This study was supported by a Ministero per l’Istruzione, l’Universita e la Ricerca (MIUR) research project ‘‘Tecniche Biomolecolari in Archeo-Antropologia per una nuova storia delle malattie’’. The funders had no role in study design, data collection and analysis, decision to publish, or preparation of themanuscript.
Competing Interests: The authors have declared that no competing interests exist.
* E-mail: [email protected]
Introduction
Sheep (Ovis aries), have provided a farmed source of food, wool
and hide since the Neolithic Agricultural period and represent one
of the earliest to have been domesticated. Archaeozoological
evidence suggests that sheep were probably first domesticated in
the Fertile Crescent region in the Near East, around 9,000-8,000
years before present (b.p.) and spread out from the domestication
centers in Europe, Asia, and Africa during the subsequent few
thousand years [1].
Recent advances in genetics and the use of mitochondrial DNA
(mtDNA) to characterize sheep genetic diversity are elucidating
the origins of domestic sheep and their human-mediated global
migrations. Studies performed on the control region fragment
and/or the cytochrome b (cytB) gene of mtDNA of modern sheep
from a wide geographical range describe five different haplogroups
(A, B, C, D, and E) [2,3,4,5,6,7,8] into which the domestic sheep’s
genetic diversity divides. Haplogroup A and haplogroup B are the
most frequent. These two haplogroups have been found in every
geographic region where the domestic sheep have been sampled.
In particular, haplogroup A is mainly represented in Asian breeds,
while haplogroup B is found in high frequency in breeds sampled
in Europe [2,3]. Haplogroup C, on the other hand, is less frequent.
Only few samples have been isolated in Asia, within the Fertile
Crescent, and in Europe within the Caucasus and the Iberian
Peninsula [5,6,8,9,10]. Haplogroup D and haplogroup E have
been recently identified and, at the present are the rarest; sheep
belonging to these two haplogroups have only been found in the
Caucasus and Turkey [8,9]. A recent study on the complete
mitochondrial genome of ten domestic sheep and six wild sheep
examined the relationship between domestic and wild sheep. The
phylogenetic analysis confirms the division of domestic sheep into
the five (A, B, C, D, E) haplogroups [11].
The development of technologies for the analysis of ancient DNA
(aDNA) has opened a new field for inter-disciplinary work on
documenting domestication. Ancient DNA sheds a more direct light
on the process, potentially allowing a definitive identification of the
particulars of domestication. Despite the relative abundance of
reports on the analysis of mtDNA from modern sheep, at the
present, little data are available for archaeological sheep [12,13,14]
and in particular no data exist for European ancient sheep.
The most important archaeological discovery of the century was
perhaps the finding of the mummified corpse of a prehistoric man,
popularly known as the ‘‘Tyrolean Iceman’’ or ‘‘Otzi’’. The
PLoS ONE | www.plosone.org 1 March 2012 | Volume 7 | Issue 3 | e33792
mummy was found at 3,270 m above sea level on the Alps, near
the Austro-Italian border. Radiocarbon dating indicated an age
between 5,350 and 5,100 years [15] corresponding to the Copper
Age (Calcholithic). The mummy has been the object of a number
of scientific investigations. Recently we have sequenced the whole
mitochondrial genome of the mummy. We have found that it
belongs to a K1 haplogroup branch (K1o) not yet identified in
modern populations [16].
A remarkable feature of this archaeological discovery is that the
body was not found alone, but accompanied by the remains of
clothes and equipment. Otzi’s clothes were mainly made of
leather, and fur. They have been the object of scientific
investigations since their discovery. Microscopic analysis indicated
that the majority of the animal hairs are those of red deer (Cervus),
while the remainders are goat hair [17]. In 1992, Lange [18]
identified some parts of the clothing as tanned skin from chamois
(Rupicapra). More recently, using a matrix-assisted laser desorp-
tion/ionization time-of-flight mass spectrometric (MALDI-TOF
MS)-based analytical method, two samples from Otzi’s fur
garments and one sample of his legging were assigned to sheep,
while the upper leather of his shoes was assigned to cattle [19].
Here we report the sequencing of two mtDNA fragments of
sheep (Ovis aries) identified from the genetic analysis of black
animal hair shafts which were part of the Otzi’s clothes. Hairs
have been preserved in glacier ice at an average temperature of
about 210uC. These conditions have previously been shown to
preserve the DNA of the mummy [16] and of associated animal
and plant remains [20]. The Copper Age sheep sequences have
been determined using massive sequencing of pooled amplification
products by 454/Roche Genome Sequencer; this method has
already been proven highly effective in producing the complete
sequence of the mummy mitochondrial genome [16]. In addition,
the preservation degree of the hair DNA has been further assessed
through the analysis of nucleotide misincorporations. Finally,
phylogenetic analysis was also performed to test the consistency of
the sequences obtained and to explore the relationship between
the Copper Age sheep mtDNA and the modern sheep mtDNA.
Currently, a clear nomenclature for clustering domestic sheep
mitochondrial sequences based on signature mutations along
different branches is missing. In order to fill this gap, here we
propose a cladistic signature notation based on world-wide
mitochondrial control region-cytochrome B (cytB) domestic sheep
sequence diversity (334 sequences available in Gen Bank).
Results
Sequencing of the Copper Age sheep mtDNADNA was successfully extracted from hair shafts collected from
Otzi’s fur clothing. To identify the species to which the hairs
belong, the DNA extracted was PCR amplified using the MBos
L1269/MBos H1346 universal oligonucleotide primer pair for
mammal DNA (Table S1) [20]. The system is designed to bind to
an approximately 117 base pair (bp) long fragment of the mtDNA
12S ribosomal RNA gene. The amplification product was then
cloned and four clones were analyzed by Sanger sequencing. The
consensus sequence was compared with the sequences deposited in
GenBank by using a BLAST search. The sequence corresponded
100% to that of sheep (Ovis aries).
Following species identification, the DNA extracted was PCR
amplified using two sets of 15 and 13 oligonucleotide primer pairs
(Table S1), respectively. The first set encompasses part of the
mitochondrial control region, part of the 12S rRNA coding region
(MT-RNR1) and tRNAPhe (reference sequence NC001941
positions 15,983-592). The second primer set encompasses a
1,224 bp fragment of the complete cytB gene. All the 28
amplifications gave positive results. The products were diluted to
equal concentrations, pooled and used as a substrate to prepare a
library for sequencing using a GS-454/Roche Genome Sequencer
(FLX Roche 454 LifeSciences). The sequencer yielded a total of
1,635 reads which were further processed by means of the GS
Amplicon Variant Analyzer application (Roche) resulting in 1,276
reads (,78% of the total); 359 reads were discarded because they
either lacking one or both primers (179 reads) or were shorter than
50 bp (primer dimers, 15 reads) or were longer than 50 bp but
showed no specific match or no match at all when used to scan the
NCBI database (165 reads). Processed reads were assigned to 28
distinct clonal groups, which were assembled together on the basis
of the overlapping tracts and their position in relation to sheep
reference mtDNA sequence (NC001941). The 28 clonal groups
showed a coverage ranging from 8 to 124 reads, corresponding to
a mean coverage of about 45 and a median coverage of about 40
reads. During the assembly step of the reads, it was noted that the
Ovis aries L16570/Ovis aries H60 amplification system was
represented by three non complete reads only. For this reason, the
PCR product was cloned into a plasmid vector and 10 clones were
sequenced with conventional Sanger technology.
As a control, the 28 PCR products were sequenced also with
conventional Sanger technology. Given that the 454 sequencing
does not efficiently processes indels and homopolymeric regions,
these were the object of a particularly accurate scrutiny [21,22,23].
In particular three indels (2 insertion and 1 deletion) were found in
the sequences obtained by Sanger sequencing (Ovis aries L484/
Ovis aries H592, Ovis aries L16221/Ovis aries H16386 and Ovis
aries L16378/Ovis aries 16499), while 454 sequencing gave
ambiguous results. In this case the indels were confirmed by a
further PCR amplification and Sanger sequencing.
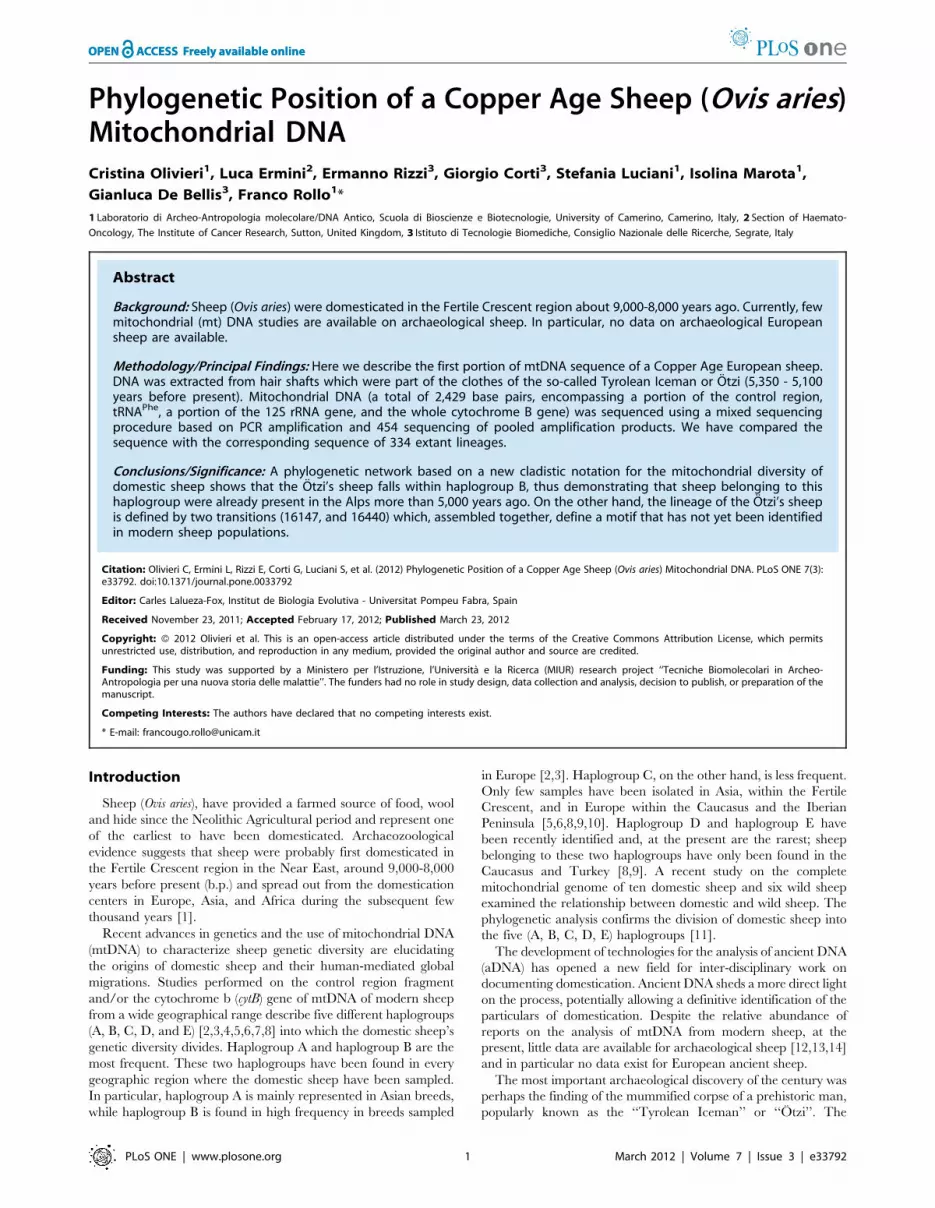
The polymorphisms in the Copper Age sheep obtained by the
two methods (454 and Sanger sequencing) compared to
NC001941 are reported in Table 1. We can observe that all the
polymorphisms are in the ‘‘mtCR’’ region. On the other hand the
cytB fragment does not show differences with the reference
sequence (Table 1).
The comparison between the reads obtained by the 454/Roche
Genome Sequencer and the sequences achieved by direct
Table 1. Copper Age sheep nucleotide polymorphismsrelative to Ovis aries reference sequence (NC001941).
Nucleotide positionReference sequence(NC001941) Copper Age Sheep
16128 C T(454)(S)
161736 T C/T(454);T(S)
16147 T C(454)(S)
16343 T C(454)(S)
16343 ins C(454)(S)
163536 C T(454);C(S)
16440 T C(454)(S)
16472 T del-T (454)(S)
281 T C(454) (S)
565 ins G(454)(S)
(454): nucleotide polymorphism analyzed by 454 technology; (S): nucleotidepolymorphism variations analyzed by Sanger technology; 6: ambiguousnucleotide position.doi:10.1371/journal.pone.0033792.t001
Ovis aries Mitochondrial DNA
PLoS ONE | www.plosone.org 2 March 2012 | Volume 7 | Issue 3 | e33792
conventional Sanger sequencing shows the presence of two
ambiguous nucleotides at positions 16173 and 16353.
The nucleotide position 16173 was amplified by Ovis aries
L16154/Ovis aries H16267 and Ovis aries L16119/Ovis aries
H16182 amplification systems. In the three Sanger sequences (two
sequences of Ovis aries L16154/Ovis aries H16267 and one
sequence of Ovis aries L16119/Ovis aries H16182), this position
unambiguously showed a thymine. All 454 reads corresponding to
Ovis aries L16119/Ovis aries H16182 amplification system
showed a thymine, but only half reads obtained from the Ovis
aries L16154/Ovis aries H16267 amplification system showed a
thymine, the remaining half showed a cytosine. Taking into
account that, all the three Sanger sequences showed a thymine at
position 16173, and that a cytosine at the same nucleotide position
has been never described in modern sheep, in the final mtDNA
Copper Age sheep a thymine was used.
The 16353 nucleotide position was determined using Ovis aries
L16221/Ovis aries H16386 amplification system. The sequences
obtained by 454 technology showed a thymine in this position.
However, a thymine in position 16353 was never described in
modern sheep. In order to resolve this issue, we have checked this
nucleotide position using two independent PCR amplifications
followed by direct sequencing. In both cases we found a cytosine in
position 16353. We therefore decided to use a 16353 cytosine in
the Copper Age sheep sequence.
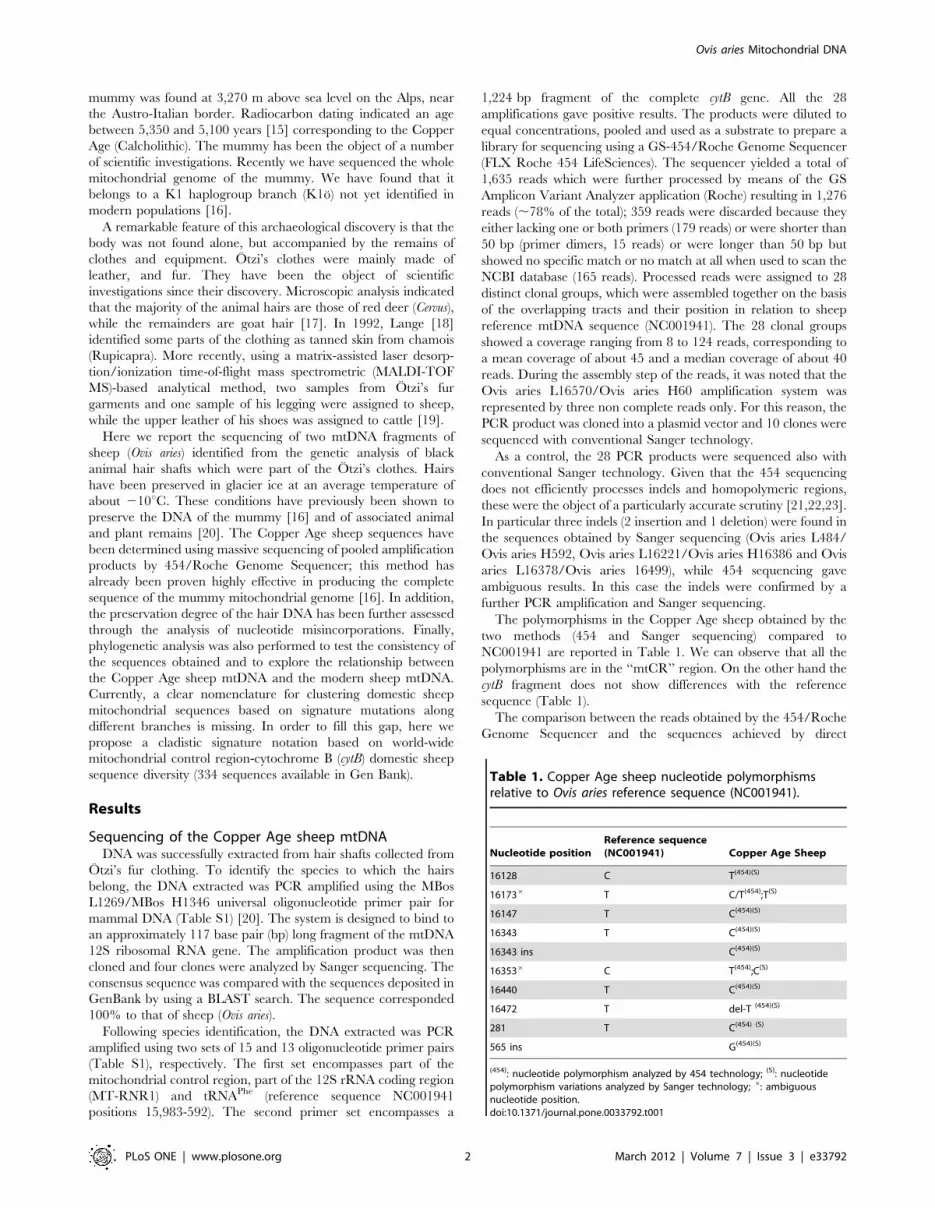
Nucleotide misincorporation analysisStatistical analysis was applied to compare the nucleotide
misincorporation values calculated in the Copper Age sheep, Otzi
and modern mtDNA sequences. In Table S2 are reported the
nucleotide misincorporation rates (m) observed in each 454 clonal
group analyzed for the Copper Age mtDNA sequences. The Two
Sample T-Tests and non-parametric Mann-Whitney tests showed
that the null hypothesis (H0) can be rejected when Copper Age sheep
mtDNA reads are compared both with modern human mtDNA
reads [24] and with Otzi’s mtDNA sequences [16,24] (Table S3). The
box-plot (Figure 1), employed to compare the m values in the sheep
mtDNA sequences to the values obtained in the Otzi’s and modern
mtDNA sequences [24], demonstrate that the m value variability in
the sheep sequences is far from the m values in modern sequences and
closer to the variability found in Otzi’s sequences. In particular, the
mean and median m values in the sheep sequences (5.4761023 and
4.9761023, respectively) are lower than the values noted in the Otzi’s
sequences (mean: 7.2661023, median: 7.0661023).
Taking into account type 1 and type 2 nucleotide misincorpora-
tions in the Copper Age sheep sequences we observed an
overrepresentation of the type 2 (type 1:type 2 ratio ,1:4). An
analogous state was remarked when individual 454 clonal groups
were considered. The Two Sample T-Tests and non-parametric
Mann-Whitney tests were performed to accept or reject the H0
hypothesis that the number of type 1 and type 2 transitions in the
sheep, Otzi and modern human mtDNA sequences are the same.
In the case of type 1, the tests support the H0 hypothesis for the
Copper Age Sheep and Otzi mtDNA sequences and reject the null
hypothesis for the comparison between Copper Age Sheep and
modern human mtDNA sequences (Table S4A).
Regarding type 2 transitions the H0 hypothesis is rejected both
in the comparison involving Copper Age sheep and modern
Figure 1. Nucleotide misincorporation rate (m) in Copper Age sheep, Copper Age human (Otzi) and modern human mtDNA. The plotcomprises a box and whiskers. A line is drawn across the box to represent the median; the bottom of the box is the first quartile (Q1) and the top isthe third quartile (Q3). The lower whisker extends to the lowest value within the lower limit, while the upper whisker extends to the highest valuewithin the upper limit. The limits are defined by: Q1+1.5 (Q3-Q1) (lower limit) and Q3+1.5 (Q3-Q1) (upper limit). The asterisk represent the outlier, avalue beyond the whiskers.doi:10.1371/journal.pone.0033792.g001
Ovis aries Mitochondrial DNA
PLoS ONE | www.plosone.org 3 March 2012 | Volume 7 | Issue 3 | e33792

human mtDNA sequences, and in the statistical tests between
Copper Age sheep and Otzi mtDNA sequences. The results of the
tests are reported in Table S4B. The box-plot graph in Figure 2
displays the variability of type 1 and type 2 transitions in the
Copper Age sheep mtDNA, Otzi mtDNA and in the modern
human mtDNA sequences. Clearly, the bigger difference between
the three samples is represented by type 2 transition. The
variability of the type 2 transitions in the sheep sequences is
highly different from the values showed in the modern human
mtDNA, alternatively is close to the values found in the Otzi
mtDNA sequences. In detail, the mean and median of type 2
values in the sheep sequences (1.1961022 and 8.5361022,
respectively) are lower than the values marked in the Otzi’s
sequences (mean: 1.7061022, median: 1.5561022).
A portrait of modern domestic sheep phylogenyWe used a combined mtCR-cytB region (2027 bp) to describe
the phylogenetic relationships of modern domestic sheep (Ovis aries)
and to infer the phylogenetic position of the Copper Age sheep.
For this purpose we retrieved from Gene Bank 335 published
world-wide mtCR-cytB sequences (Table S5) and determined the
mtDNA sequence of an ancient sheep. Our analysis detected a
total number of 210 segregating sites characterizing 161
haplotypes.
We inferred a median joining network by making use of
sequence variation and by placing an Ovis vignei mtDNA as
outgroup. The inferred network showed 374 substitutions with 333
transitions and 41 transversions. Two nucleotide transitions at
positions 16440 and 16453 occurred with the highest frequency
within the network and can be reported as the fastest sites or
hotspots (Figure S1).
The topology of our world-wide mtDNA network based on 336
sequences matched published trees [7] in most respects, with
certain minor exceptions of details (Figure 3). The network
identified mutations along different branches which provide
motifs, or signature polymorphisms, for clustering different
branches as suggested by Richards et al. [25]. Consequently, here
we introduce a new cladistic notation for the worldwide
mitochondrial diversity of domestic sheep. We define a mtDNA
cluster within the network as a group of at least three different
haplotypes sharing a motif (at least two signature polymorphisms)
or a single signature polymorphism which occurs only once within
the world-wide network. For sake of simplicity, we apply this
criterion of classification only to clusters budding from the
predominant haplotype of each haplogroup. We only make use
of this criterion for clusters showing a coherent geographic or
breed distribution. Our nomenclature also refers to Meadows et al.
[7] who analysed combined 197 mtCR-cytB sequences in domestic
sheep and reported five haplogroups termed A, B, C, D and E. We
refer to paraphyletic collection of mtDNAs outside these five main
clades with a star letter (i.e. A*).
Our phylogenetic network shows that 90% of the mtDNA pool
can be clearly grouped into two big clades referred as haplogroup
A and haplogroup B.
Figure 2. Nucleotide misincorporations number for type 1 and type 2 transitions in Copper Age sheep, Copper Age human (Otzi)and modern human mtDNA. The plot comprises a box and whiskers. A line is drawn across the box to represent the median; the bottom of thebox is the first quartile (Q1) and the top is the third quartile (Q3). The lower whisker extends to the lowest value within the lower limit, while theupper whisker extends to the highest value within the upper limit. The limits are defined by: Q1+1.5 (Q3-Q1) (lower limit) and Q3+1.5 (Q3-Q1) (upperlimit). The asterisk represent the outlier, a value beyond the whiskers.doi:10.1371/journal.pone.0033792.g002
Ovis aries Mitochondrial DNA
PLoS ONE | www.plosone.org 4 March 2012 | Volume 7 | Issue 3 | e33792

Haplogoup A shows a predominant haplotype (H_3) from
which a star-like phylogeny departs. This haplotype contains 24%
of the haplogroup A mtDNA pool. One large subclade within the
cluster can be assigned by the transversion 400ART and includes
17 haplotypes of domestic sheep from India. We propose that this
signature polymorphism defines a geographically defined subclus-
ter of A, named sub-haplogroup A1. Within this subcluster the
transversion 401ART clusters only sheep of the bannur breed
(Table S5). Another sub-cluster of sequences from India, A2, is
defined by two transitions of the motif 16129–16564. This sub-
cluster comprises only garole breed sheep (Table S5). Haplogroup
A is defined by the motif 291, 14467, 14653, 16097, 16209, 16217,
16440, 16453 and 16602.
The Ovis aries reference sequence (NC001941) fall within the
haplogroup B where the predominant haplotype H_4 incorporates
about 15% of mtDNA pool classified within haplogroup B. A star-
like phylogeny departs from this haplotype. According to our
clustering criteria we may define two sub-clusters of haplogroup B,
one characterised by the transition 16264, and one by the
transition 364. Both polymorphisms happen only once in the
world-wide network. However the hypothetical subcluster defined
by 16264 comprises sheep from Austria (breed: tyrolean stone) and
Israel (breed: awassi), two breeds geographically and morpholog-
ically distant and, for this reason, we prefer to mention it only as a
feasible subcluster of B rather than to assign a name to it. For the
same reason we only report the subcluster defined by 364 which
comprises breeds from Turkey, Austria and Finland.
Six haplotypes H_120, H_118, H_96, H_103, H_46 and H_49
are placed within the branch connecting haplogroups A and B.
Although we can not resolve the cluster of these haplotypes, they
share 7 or 8 out of 9 signature polymorphisms with haplogroup B
and, we decided to classify them as paraphyletic groups B* [25].
The network shows a branch leading to a super-cluster CE
defined by the motif 291, 14365, 14551, 14634, 14854, 14971,
15097, 16133, 16156 and 16546.
Haplogroup C is characterised by the motif 69, 160, 14554,
14893, 15148, 16101 and 16444 and comprises 7% of the
sequences within the network. Haplogroup C includes only sheep
from Middle East. We can also define as subcluster C1 defined by
the transition 14486.
Haplogroup E consists of only two haplotypes containing four
sheep from Middle East and characterised by the transition 16202.
This haplogroup should be clustered with caution as the small
number of sequences included could be inadequate to define a
haplogroup, but we prefer to delineate it as, already reported by
Meadows et al. [7].
A long branch gemming from A haplogroup characterised by
the motif 291, 14239, 14293, 14401, 14416, 14624, 14854, 14986,
Figure 3. Median-joining phylogenetic network of modern sheep based on 336 sequences and rooted with Ovis vignei (H_2). Eachcluster symbolized by a circle refers to a haplogroup. Line connecting each circle represents phylogenetic branches. Numbers along each branch aretransitions and refer to nucleotide positions variants relative to Ovis aries reference sequence (NC_001941). * paraphyletic group.doi:10.1371/journal.pone.0033792.g003
Ovis aries Mitochondrial DNA
PLoS ONE | www.plosone.org 5 March 2012 | Volume 7 | Issue 3 | e33792

16129, 16217, 16400, 16420, 16444 and 16546 leads to the
haplotype H_6. Two sequences (Table S5) reported as cluster
haplogroup D [7], make this haplotype. As, at the present, there is
only one small in size haplotype within this cluster, we prefer to
label it as paraphyletic haplogroup D*. The nucleotide position
291 showed along the D* branch and also in the lineage towards
the super-cluster CE is a reverse transition TRC which restore the
nucleotide carried by the Ovis aries reference sequence.
A schematic representation of the sheep phylogenetic network is
shown in Figure S2 while the detailed world-wide sheep phylogeny
is displayed in Figure S3.
In order to delineate the geographical distribution of each
haplogroup we clustered the samples in four main world-wide
regions, Southern Central Asia, Europe, Middle East and
Oceania. No mtCR-cytB sequences from Africa or America have
been found in the scientific literature. The frequencies and
geographical distribution of each haplogroup are reported in
Table S6 and Figure S3 respectively. Haplogroup A is the most
representative cluster in Southern Central Asia while haplogroup
B is the most frequent within Europe and Oceania. The Middle
East on the other hand, shows the presence of all inferred
haplogroups. The haplogroup frequencies in Oceania may be
under estimated due the small number of sequences considered
(Table S5).
The ancient sheep sequence within a modernphylogenetic network
To test the consistency of the Copper Age sheep mtDNA
assembly and to determine the phylogenetic position, we placed the
ancient mtCR-cytB sequence in the inferred phylogenetic network
[16,26]. The Copper Age sheep’s sequence falls within haplogroup
B with all the mutational-motif positions that identify this
haplogroup (Figure 3 and Table 1). The Copper Age sheep’s
sequence shares a transition at position 16147 with two single
sequences belonging to a Tibetan breed sheep from Mongolia
(Genbank number: AY879433/AY879554; H_50) and to a Turkish
Cine Capari breed (Genbank numbers; DQ852187/DQ851990;
H_105). The transition 16440 leading to the Copper Age sheep is
one of two most frequent transitions of the network (Figure S1) and
can not be regarded as a transition that defines a lineage.
Discussion
Authenticity and accuracy of the Copper Age sheepmtDNA sequences
It has been shown that the hairs, compared to other samples
(such as bone and teeth), are largely resistant to penetration by
contaminant DNA during the handling by human [27]. Therefore
the hairs represent a more reliable and more contamination-
resistant tissue for use in ancient DNA analyses than others. In our
case we have animal (sheep) hairs that have been preserved for
approximately 5,000 years under glacier ice at an average
temperature of about 210uC. These conditions have been
previously shown to preserve the DNA of the mummy and of
associated animal and plant remains [16,20]. In the case of the
present study, therefore, contamination is probably not a problem,
but we have also adopted strict laboratory conditions to ensure the
authenticity of our results as reported in Materials and Methods.
(a) The Copper Age sheep sequences have been determined
using massive sequencing of pooled amplification products
using 454/Roche Genome Sequencer. The power of this
method has been demonstrated in the analysis of the Otzi’s
complete mitochondrial genome [16].
(b) The consensus mtDNA sequences obtained through the
massive sequencing have been compared with the sequences
obtained by direct Sanger sequencing. Ambiguous nucleo-
tide positions detected during the comparison have been
elucidated by performing several independent PCR ampli-
fications followed by direct Sanger sequencing. In particular,
in the case of the amplification system Ovis aries L16570/
Ovis aries H60 we cloned the amplification products in a
plasmid and sequenced several clones using Sanger technol-
ogy. This approach allowed us to overcome the low coverage
obtained by the 454 platform for this sequence.
(c) The 454 sequencing does not efficiently processes indels and
homopolymeric regions [21,22,23] and these were object of
an accurate scrutiny. In particular, to confirm three indels
detected with 454, the relevant DNA segments were PCR
amplified and Sanger sequenced twice (Table 1).
(d) The authenticity of the sequences obtained was further
tested by analyzing the nucleotide misincorporation rate.
This analysis has shown that the sequences obtained through
massive sequencing are characterized by an higher number
of type 2 transitions compared to type 1 transitions (Figure 2).
This result is consistent with the post-mortem pattern of
cytosine deamination that characterizes the ancient DNA
sequences [24].
In conclusion, the ‘‘modus operandi’’ implemented in our work
guarantees that the Copper Age sheep mtDNA sequences
obtained are authentic and accurate. The excellent preservation
conditions of the specimen and the strict laboratory procedures
employed, make extremely unlikely the contamination by modern
sheep DNA. Consequently, we think that additional controls like
multiple DNA extractions and replication of the results in another
laboratory are unnecessary.
The Copper Age sheep mtDNA preservation issueSeveral studies have investigated the possibility of analyzing the
DNA extracted from ancient hair shafts. Mitochondrial DNA has
been successfully extracted from old hair samples, including
,64,800 year-old bison [28], Siberian mammoths dating from
,46,000 and ,18,500 years BP [29], a ,4,000-year-old extinct
Palaeo-Eskimo [30], 100-years-old Native Americans [31]. The
relevance of hair shafts, in the aDNA studies, is linked to the minor
susceptibility of these samples to contamination by exogenous
sources of DNA. This resistance to the incorporation of
contaminant DNA could be related to the hydrophobic nature
of the proteins filling hair cuticle cells and to the impermeable
nature of the keratin structures forming the hair shaft [32].
In this context, hairs shafts collected from the Otzi’s clothing,
represent an excellent starting point to carry out molecular studies.
Furthermore, the environmental history and preservation of the
sample in the ice until its discovery [33] could suggest a good
degree of DNA conservation. A preliminary DNA amplification,
using mammal universal primers, and the subsequent sequencing
of the 12S mtDNA hair shafts, for the purpose of identifying the
species belonging to the sample, have shown that the extracted
DNA matched the sheep (Ovis aries) genetic material. It is
extremely interesting to note that all the clones contained
fragments of the sheep mtDNA and none of them contained
contaminant human DNA.
The state of DNA preservation in the hair shafts sample has
been also assessed by analysis of the nucleotide misincorporation
rate (m) and the extent of the type 1 and type 2 nucleotide
misincorporations in the reads achieved following the 454
sequencing of the PCR products. In particular, the DNA damage
Ovis aries Mitochondrial DNA
PLoS ONE | www.plosone.org 6 March 2012 | Volume 7 | Issue 3 | e33792
has been evaluated comparing the mtDNA sequences from hairs
shafts with other sequences (mummy mtDNA sequences and
modern human mtDNA sequences) taken from the literature [24].
The nucleotide misincorporation rates (m), dependent on DNA
damage and on polymerase error, in the Copper Age sheep
mtDNA sequences are lower than those found for the Otzi
mtDNA sequences [16,24] and obviously, higher than those found
for modern human mtDNA [24], where the DNA damage is
negligible. Going in detail, concerning the type 1 transitions, most
likely due to the errors of the polymerase, the statistical analysis
demonstrates that there is no statistically important difference in
the amount of type 1 in the three samples: Copper Age sheep
mtDNA, Otzi mtDNA and modern human mtDNA sequences.
Consequently, the lower m rates in the sheep mtDNA compared
with the Otzi mtDNA data seem to be attributable to the lower
incidence of the type 2 transitions in the sheep mtDNA and
therefore to the lower incidence of the cytosine hydrolytic
deamination in the sheep mtDNA, that represents the main cause
of miscoding lesions in ancient samples [24,34]. The relatively low
levels of hydrolytic damage induced lesions among sheep mtDNA
sequences could be explained by the low quantities of free water
associated with the keratin-packed hair cells that may also reduce
hydrolytic damage of the DNA [28].
The excellent DNA preservation in the sheep hair shafts and the
absence of contaminant DNA could be finally explained taking
into account the Otzi clothing tanning process. In 2010 a study
performed on the Otzi’s leather clothes has highlighted a high
concentration of calcium salts of saturated fatty acids. The
researchers concluded that tanning of the Iceman’s clothes partly
consisted of saponified land animal fats, which had been physically
incorporated, mainly in the form of calcium stearate [35]. The
saponification process possibly generated a superior water-
repellent effect on the leather and fur of the Otzi’s clothing giving
rise to a protective shield against the contaminations and the
hydrolytic damage of the DNA.
To conclude, our data confirm that the hair shafts represents an
excellent start point to carry out genetic analysis. Moreover, the
statistic analysis on the nucleotide misincorporations show that,
although the two samples used to obtain the sheep and Otzi
mtDNA sequences have been preserved until the discovery at the
same condition, the mtDNA preserved in the hair shafts sample is
less susceptible to damage, in particular to cytosine hydrolytic
damage.
Phylogenetic analysisSheep were domesticated in the Fertile Crescent region in the
Near East, around 9,000-8,000 years BP and spread out of the
domestication centers in Europe, Asia, and Africa during the next
few thousand years. After a very long period of soft selection,
about two hundred years ago - with the introduction of the breed
concept - the sheep have been subjected to stronger selection
pressures. In particular, autochthonous breeds in some areas have
been replaced with more competitive breeds and highly productive
breeds have been selected for their reproductive traits. As a
consequence, the selection pressures imposed by humans gave rise
to the disappearance of many locally adapted breeds and, to some
extent, to the loss of the genetic background [36].
The sheep analyzed in this study, the oldest sheep sample from
Europe analysed until now, dated back about 5,350-5,100 years
ago, did not undergo the later selection pressures, thus the genetic
background is still preserved and available to provide information
about the domestication history of the sheep.
To evaluate the relationship between the Copper Age sheep and
modern domestic sheep, we have reconstructed a world-wide sheep
phylogenetic network based on 334 mtCR-cytB sequences, and
formulated a new cladistic notation for the mitochondrial diversity of
domestic sheep. Our network attests to the branching structure of the
sheep mtDNA genealogy, according to previously published trees [7]
and shows a geographically robustness as sheep geographically close
are clustered together. Few branches show a different degree of
geographical bias when sheep coming from different locations are
grouped together. This bias may be due to an undefined degree of
homoplasy [37], sequencing errors [38] or a long history of sheep
domestication, breeding and human migrations.
The phylogenetic network constructed represents all the
haplogroups defined nowadays in the world-wide modern sheep
and, it may be a useful reference for application in future studies
dealing with mtDNA of domestic sheep. Further investigations
using the complete sequencing of modern and ancient sheep
mtDNA genomes should, in the future, allow researchers to
enhance our clustering criteria and broaden the sheep phyloge-
netic diversity and haplogroups classification with considerable
precision.
The phylogenetic analysis of the Copper Age sheep places the
sample within haplogroup B, that represents the main haplogroup
in the modern European sheep. The phylogenetic position of the
Copper Age sheep strengthens its authenticity as the sequence
bears all mutations defining the haplogroup B and does not show
any phantom mutations or mosaic structure [26,39]. The lineage
of the Copper Age sheep is defined by two transitions 16147 and
16440 that together define a motif. The 16147 transition is not
rare but may be geographically localised to the Asian continent as,
at present, no modern European sheep show this polymorphism.
The Copper Age sequence is the only European sheep carrying
this polymorphism which may have arisen as a solitary mutation
along the branch. We may speculate that the polymorphism 16147
together with the transition 16440 may indicate an ancient
European branch that has disappeared over the time or perhaps,
may refer to a very rare motif still not found within modern
domestic sheep.
Materials and Methods
Ancient-DNA WorkWe performed all manipulations of ancient-DNA sample at the
Laboratorio di Archeo-Antropologia Molecolare/DNA Antico of
the Camerino University, in a dedicated facility into which no
modern animal DNA has ever been introduced. This facility is
composed of an antechamber, in which the operator wears a full-
body sterile suit, gloves, a face screen, a breathing mask, and a
laboratory. Both environments are equipped with UV lights and a
positive-pressure air-filtering system providing 99.97% particle
elimination and a complete change of air every 10 min. We
frequently clean all surfaces with bleach.
Sample collectionRemains of the Otzi ’s clothing were recovered during the 1991
and 1992 archaeological explorations of the mummy site. In 1992
one of us (F.R.) obtained small specimens (in the range of
approximately 100–200 mg each), from Lorenzo dal Ri, director
of the archaeological superintendency of Bolzano, Italy, to
perform DNA analyses. No further authorization was required.
Since then the specimens have been kept in our laboratory at
220uC.
DNA extractionFor DNA extraction we utilized 35 mg of black hair shafts
which were part of the specimens obtained in 1992. The hairs
Ovis aries Mitochondrial DNA
PLoS ONE | www.plosone.org 7 March 2012 | Volume 7 | Issue 3 | e33792
were cut into small (,0.5 cm) fragments. Subsequently the sample
was manually washed several times with sterile H2O to remove
any mud, and debris from the outside of the hairs. Digestion of the
hairs was performed overnight at 55uC with rotation, using 600 ml
of following digestion buffer: 10 mM Tris-HCl (pH 8.00), 10 mM
NaCl, 2% w/v SDS, 5 mM CaCl, 2,5 mM EDTA (pH 8.00),
40 mM dithiothreitol (DTT; Cleland’s reagent) and 10% protein-
ase K solution (.600 Mau/ml, Qiagen) [29]. After a lysis phase,
the DNA was extracted using a phenol-chloroform protocol. The
DNA fraction was precipitated from the final supernatant by
centrifugation at 13,500 g for 5 min after the addition of 1/10
volume of 2 M sodium acetate and 2.5 volumes of cold (220uC)
ethanol. Finally, the DNA precipitates were re-suspended in 20 ml
of sterile distilled water and stored at 280uC until use. We
prepared extraction blanks throughout the procedure.
Primer Design, PCR Amplification and mtDNAsequencing
Three regions of the mitochondrial DNA (mtDNA) genome were
sequenced. The first region, corresponding to a fragment of the 12S
ribosomal RNA (rRNA) gene (12SrDNA), was generated using
PCR system for mammal DNA (Mbos L1269/Mbos H1346) that
bind to a fragment of 117 bp in length (calculated on the basis of the
Bos taurus sequence) [20]. The second region match and with a
1,204 bp fragment encompassing part of the mitochondrial control
region (mtCR), part of the 12S rRNA coding region (MT-RNR1)
and tRNAPhe (reference sequence NC001941 positions 16,004-592;
in this paper this region will be referred to as ‘‘mtCR’’). Finally the
third region corresponded to a 1,225 bp fragment of the Ovis aries
cytochrome b (cyt b) (NC001941 positions 14,103–15,327). Two sets
of overlapping primers were designed from reference sequence to
amplify these two last regions. In particular, sixteen and thirteen
primer pairs were used to cover the two regions.
To design the primers we aligned different published sequences
of Ovis aries in the Gene Bank. We selected primers located in the
most conservative regions in order to keep the number of
polymorphic positions in the oligonucleotides to a minimum.
The PCR systems were directly tested on the ancient-DNA
template, and no positive (i.e., modern DNA) control was used, to
minimize the risk of contamination.
We performed DNA amplifications in 100 ml of reaction mix of
the following composition: 10 mM Tris-HCl (pH 8.3), 50 mM
KCl, 2.5 mM MgCl2, 2.5 enzyme units of Taq polymerase
(HotStarTaq DNA polymerase, QIAGEN), 200 mM each dNTP,
300 ng each primer, and 1 ml of DNA template (diluted 1:40 to
reduce the effect of Taq polymerase inhibitors). We pretreated the
reaction mixture with DNase (2 enzyme units for 30 min at room
temperature) to eliminate any contaminant DNA and subsequent-
ly inactivated the DNase by heating to 95uC for 15 min. The
thermal profile was as follows: 1 min at 95uC, 50 s at the relevant
annealing temperature, and 1 min at 72uC, with a final extension
of 10 min at 72uC. The number of cycles ranged from 45 to 55.
To reduce the extent of errors generated by the reaction, we never
reamplified any PCR product; only PCR products obtained after a
first amplification round were used for the subsequent analysis.
The list of oligonucleotide primer-pairs utilized and the
corresponding annealing temperatures are given in Table S1.
Amplification products were checked by electrophoresis on 2%
(w/v) agarose, purified using the High Pure PCR Product
purification kit (Roche Molecular Biochemicals, Mannheim,
Germany). The products of the Mbos L1269/Mbos H1346 and
Ovis aries L16570/Ovis aries H60 amplification systems were
cloned, using the pGEM-T Easy Vector System (Promega Corp.,
Madison, WI) and the recombinant plasmids were isolated using a
Miniprep kit (Promega, Madison, WI). We assessed insert size and
DNA concentration using gel electrophoresis. The other PRC
products were direct sequenced. DNA sequences were obtained
using an ABI-Prism 310 automated DNA sequencer in the BMR-
Genomics sequencing service (University of Padua). The sequenc-
es were checked and analyzed by Sequence Scanner version 1.0
(Applied Biosystems, Foster City, CA), and aligned with the
program BioEdit v.7.0.9.
454 sample preparation and 454 platform sequencingThe amplification products were diluted to equal concentra-
tions, then pooled in equimolar proportion and used as a substrate
for the pyrosequencing reaction [16,40]. We further spectropho-
tometrically quantitated and purified the mixture (MinElute PCR
Purification Kit, QIAGEN, Hilden, Germany), and we checked
the fragments length using the Agilent 2100 Bioanalyzer (Agilent
Technologies, Palo Alto, CA, USA).. Sample was prepared as
suggested by the 454/Roche GS FLX library preparation
protocol. Because of the short size of the template, we did not
perform any DNA fragmentation. The obtained sstDNA library
was checked with Agilent 2100 Bioanalyzer and quantitated by
RiboGreen RNA Quantitation Kit (Invitrogen, Carlsbad, CA).
After emulsion PCR, we loaded the enriched beads onto 1/16th of
PicoTiterPlate, than the sample was sequenced using the 454/
Roche Genome Sequencer. Reads were processed using GS
Amplicon Variant Analyzer application (AVA) by Roche and .the
resulting multi-alignments were then used to generate the
consensus sequences by a home-made Python script, which
assigned the most frequent base at each position.
Nucleotide Misincorporation AnalysisThe consensus sequence for each group of clones, produced by
454/Roche Genome Sequencer, was determined from the shared
bases and the remaining interclone base differences (nucleotide
misincorporation) were attributed to either post-mortem damage
(miscoding lesions) or polymerase error. For each set of clones, the
nucleotide misincorporation rate (m) was calculated in accordance
with Olivieri et al. [24], and the number and type of nucleotide
misincorporations were assessed according to Gilbert et al. [41].
Two-Sample T-Tests and non-parametric Mann-Whitney tests
were performed to compare the nucleotide misincorporation rate
(m) between: (a) Copper Age sheep mtDNA sequences and Otzi
mtDNA sequences [16]; (b) Copper Age sheep mtDNA sequences
and modern human mtDNA sequences [24]. To highlight the
distribution of m among the three groups of sequences, the m rates
for each of them were represented using a box-plot. Similarly, Two-
Sample T-Tests and non-parametric Mann-Whitney tests were
used to compare the number of type 1 and type 2 transitions in the
three groups of mtDNA sequences. Moreover, the values of these
transitions were plotted to display their distribution. The statistical
analysis was performed using the Minitab 15.1.0.0 software.
Phylogenetic AnalysisThe mtCR and cytB sequences obtained from Copper Age
sheep were concatenated and aligned with the equivalent region of
Ovis aries reference sequence (Gene bank accession number:
NC001941). A full set of 334 Ovis aries sequences available in
GenBank, and one sequence from Ovis vignei were also aligned with
the ancient sequence control-region sequence using the ClustalW
software implemented by the BioEdit program version 7.0.9 [42].
A phylogenetic network of the combined mtCR-cytB dataset of 336
sequences (Table S2) was constructed using Network 4.5 program
(http://www.fluxus-technology.com), employing the median join-
ing algorithm [43]. To reduce the probability of incorrect and
Ovis aries Mitochondrial DNA
PLoS ONE | www.plosone.org 8 March 2012 | Volume 7 | Issue 3 | e33792
inaccurate phylogenies in the network and faulty interpretations of
global haplogroup relationships, sequence gaps (insertions and
deletions in the alignment) were excluded from the analysis. In
addition to achieve an easily readable network, nucleotide
positions were weighted in inverse proportion to the number of
mutations observed for each position. The Ovis aries reference
sequence (Gene bank accession number: NC001941), was also
used for the identification of nucleotide positions. In accordance
with previously published works [7] we have drawn our network
employing the median joining algorithm [43] instead of using the
more robust reduced median [44]. We are aware of the fact that
the former algorithm may over resolve the phylogeny and
eliminate some reticulations of links that should be evaluated
during the construction of the network.
Supporting Information
Figure S1 Hot Spots in the mtCR-cyt B region, showingall the positions that appear .4 times in the network.(TIFF)
Figure S2 Schematic tree for world-wide sheep mito-chondrial variation. Each cluster symbolized by a circle refers
to a haplogroup. Line connecting each circle represent phyloge-
netic branches. Dashed line describes a well a link leading to a
paraphyletic group. Numbers along each branch are transitions
and refer to nucleotide positions variants relative to Ovis aries
reference sequence (NC_001941). * paraphyletic group.
(TIFF)
Figure S3 Geographical distribution of haplogroupswithin four main geographic areas: Southern CentralAsia, Europe, Middle East and Oceania.(TIFF)
Table S1 Primer Systems Utilized, with the Corre-sponding Product Length and Annealing Temperature.
(DOC)
Table S2 Nucleotide misincorporation rate (m) withineach Copper Age sheep mtDNA group of reads.
(DOC)
Table S3 Two Sample T-Tests and non-parametricMann- Whitney tests between the values of m (nucleotidemisincorporation rate) in Copper Age mtDNA, OtzimtDNA and modern human mtDNA.
(DOC)
Table S4 Two Sample T-Tests and non-parametricMann- Whitney tests between the values of type 1 (A)and type 2 (B) in Copper Age sheep mtDNA, Otzi mtDNAand modern human mtDNA.
(DOC)
Table S5 Sequences employed to infer the Ovis ariesmtDNA phylogeny including the Copper Age sheep.
(DOC)
Table S6 Distribution of haplogroups (in percentage)within different geographic area. The outgroup sequence
Ovis Vignei is excluded. *Paraphyletic group.
(DOC)
Author Contributions
Conceived and designed the experiments: FR GDB. Performed the
experiments: CO ER IM. Analyzed the data: CO LE GC SL IM FR.
Wrote the paper: CO LE FR.
References
1. Ryder ML (1984) Sheep. In: Mason IL, ed. Evolution of Domesticated Animals.
London/New York: Longman Group. pp 63–84.
2. Wood NJ, Phua SH (1996) Variation in the control region sequence of the sheep
mitochondrial genome. Anim Genet 27: 25–33.
3. Hiendleder S, Mainz K, Plante Y, Lewalski H (1998) Analysis of mitochondrial
DNA indicates that domestic sheep are derived from two different ancestral
maternal sources: no evidence for contributions from urial and argali sheep.
J Hered 89: 113–120.
4. Hiendleder S, Kaupe B, Wassmuth R, Janke A (2002) Molecular analysis of wild
and domestic sheep questions current nomenclature and provides evidence for
domestication from two different subspecies. Proc Biol Sci 269: 893–904.
5. Guo J, Du LX, Ma YH, Guan WJ, Li HB, et al. (2005) A novel maternal lineage
revealed in sheep (Ovis aries). Anim Genet 36: 331–336.
6. Pedrosa S, Uzun M, Arranz JJ, Gutierrez-Gil B, San Primitivo F, et al. (2005)
Evidence of three maternal lineages in Near Eastern sheep supporting multiple
domestication events. Proc Biol Sci 272: 2211–2217.
7. Meadows JR, Cemal I, Karaca O, Gootwine E, Kijas JW (2007) Five ovine
mitochondrial lineages identified from sheep breeds of the near East. Genetics
175: 1371–1379.
8. Meadows JR, Li K, Kantanen J, Tapio M, Sipos W, et al. (2005) Mitochondrial
sequence reveals high levels of gene flow between breeds of domestic sheep from
Asia and Europe. J Hered 96: 494–501.
9. Tapio M, Marzanov N, Ozerov M, Cinkulov M, Gonzarenko G, et al. (2006)
Sheep mitochondrial DNA variation in European, Caucasian, and Central
Asian areas. Mol Biol Evol 23: 1776–1783.
10. Pereira F, Davis S, Pereira L, McEvoy B, Bradley DG, et al. (2006) Genetic
signatures of a Mediterranean influence in Iberian Peninsula sheep husbandry.
Mol Biol Evol 23: 1420–1426.
11. Meadows JRS, Hiendleder S, Kijas JW (2011) Haplogroup relationships
between domestic and wild sheep resolved using a mitogenome panel. Heredity
106: 700–706.
12. Cai D, Han L, Zhang XL, Zhou H, Zhu H (2007) DNA analysis of
archaeological sheep remains from China. J Archaeol Sci 34: 1347–1355.
13. Cai D, Tang Z, Yu H, Han L, Ren X, et al. (2011) Early history of Chinese
domestic sheep indicated by ancient DNA analysis of Bronze Age individuals.
J Archaeol Sci 38: 896–902.
14. Horsburgh KA, Rhines A (2010) Genetic characterization of an archaeological
sheep assemblage from South Africa’s Western Cape. J Archaeol Sci 11:
2906–2910.
15. Bonani G, Ivy SD, Hajdas I, Niklaus TR, Suter M (1994) Ams C-14 Age-
Determinations of Tissue, Bone and Grass Samples from the Otztal Ice Man.
Radiocarbon 36: 247–250.
16. Ermini L, Olivieri C, Rizzi E, Corti G, Bonnal R, et al. (2008) Complete
mitochondrial genome sequence of the Tyrolean Iceman. Curr Biol 18:
1687–1693.
17. Wittig M, Wortmann G (1992) Untersuchungen an Haaren aus den
Begleitfunden des Eismannes vom Hauslabjoch - Vorlaufige Ergebnisse. In:
C HF, Platzer W, Spindler K, eds. In Der Mann im Eis, vol 1. Innsbruck:
Universitat Innsbruck. 273 p.
18. Lange J (1992) Vorlaufige Befunde der Untersuchungen an Pelzlederproben. In:
Hopfel F, Platzer W, Spindler W, eds. In Der Mann im Eis, Innsbruck. 419 p.
19. Hollemeyer K, Altmeyer W, Heinzle E, Pitra C (2008) Species identification of
Oetzi’s clothing with matrix-assisted laser desorption/ionization time-of-flight
mass spectrometry based on peptide pattern similarities of hair digests. Rapid
Commun Mass Spectrom 22: 2751–2767.
20. Rollo F, Ubaldi M, Ermini L, Marota I (2002) Otzi’s last meals: DNA analysis of
the intestinal content of the Neolithic glacier mummy from the Alps. P Natl
Acad Sci USA 99: 12594–12599.
21. Hoffmann S, Otto C, Kurtz S, Sharma C, Khaitovich P, et al. (2009) Fast
mapping of short sequences with mismatches, insertions and deletions using
index structures. PLoS Comput Biol 5: e1000502.
22. Huse SM, Huber JA, Morrison HG, Sogin ML, Welch DM (2007) Accuracy
and quality of massively parallel DNA pyrosequencing. Genome Biol 8: R143.
23. Margulies M, Egholm M, Altman WE, Attiya S, Bader JS, et al. (2005) Genome
sequencing in microfabricated high-density picolitre reactors. Nature 15: 376–380.
24. Olivieri C, Ermini L, Rizzi E, Corti G, Bonnal R, et al. (2010) Characterization
of nucleotide misincorporation patterns in the iceman’s mitochondrial DNA.
PLoS One 5: e8629–e8629.
25. Richards MB, Macaulay VA, Bandeltv HJ, Sykes BC (1998) Phylogeography of
mitochondrial DNA in western Europe. Ann Hum Genet 62: 241–260.
26. Gilbert MT, Bandelt HJ, Hofreiter M, Barnes I (2005) Assessing ancient DNA
studies. Trends Ecol Evol 20: 541–544.
Ovis aries Mitochondrial DNA
PLoS ONE | www.plosone.org 9 March 2012 | Volume 7 | Issue 3 | e33792
27. Gilbert MT, Menez L, Janaway RC, Tobin DJ, Cooper A, et al. (2006)
Resistance of degraded hair shafts to contaminant DNA. Forensic Sci Int 156:208–212.
28. Gilbert MT, Wilson AS, Bunce M, Hansen AJ, Willerslev E, et al. (2004)
Ancient mitochondrial DNA from hair. Curr Biol 14: 463–464.29. Gilbert MT, Tomsho LP, Rendulic S, Packard M, Drautz DI, et al. (2007)
Whole-genome shotgun sequencing of mitochondria from ancient hair shafts.Science 317: 1927–1930.
30. Gilbert MT, Kivisild T, Grønnow B, Andersen PK, Metspalu E, et al. (2008)
Paleo-Eskimo mtDNA genome reveals matrilineal discontinuity in Greenland.Science 320: 1787–1789.
31. Baker LE, McCormick WF, Matteson KJ (2001) A silica-based mitochondrialDNA extraction method applied to forensic hair shafts and teeth. J Forensic Sci
46: 126–130.32. Fraser RB, MacRae TP, Rogers GE (1972) Keratins: Their Composition,
Structure and Biosynthesis; E. TC, ed. Springfield.
33. Spindler K (1994) The Man in the Ice London Weidenfeld and Nicolson.34. Brotherton P, Endicott P, Sanchez JJ, Beaumont M, Barnett R, et al. (2007)
Novel high-resolution characterization of ancient DNA reveals C.U-type basemodification events as the sole cause of post mortem miscoding lesions. Nucleic
Acids Res 35: 5717–5728.
35. Puntener AG, Moss S (2010) Otzi, the iceman and his leather clothes. Chimia(Aarau) 64: 315–320.
36. Taberlet P, Coissac E, Pansu J, Pompanon F (2011) Conservation genetics of
cattle, sheep, and goats. Comptes Rendus Biologies 334: 247–254.
37. Page RDM, Holmes EC (1998) Molecular Evolution: A Phylogenetic Approach
Wiley-Blackwell.
38. Salas A, Carracedo A, Macaulay V, Richards M, Bandelt HJ (2005) A practical
guide to mitochondrial DNA error prevention in clinical, forensic, and
population genetics. Biochem Biophys Res Commun 30: 891–899.
39. Bandelt HJ (2005) Mosaics of ancient mitochondrial DNA: positive indicators of
nonauthenticity. Eur J Hum Genet 13: 1106–1112.
40. Lari M, Rizzi E, Mona S, Corti G, Catalano G, et al. (2011) The complete
mitochondrial genome of an 11,450-year-old aurochsen (Bos primigenius) from
Central Italy. BMC Evol Biol 31: 32.
41. Gilbert MT, Hansen AJ, Willerslev E, Rudbeck L, Barnes I, et al. (2003)
Characterization of genetic miscoding lesions caused by postmortem damage.
Am J Hum Genet 72: 48–61.
42. Hall TA (1999) BioEdit: a user-friendly biological sequence alignment editor and
analysis program for Windows 95/98/NT. Nucl Acids Symp Ser 41: 95–98.
43. Bandelt HJ, Forster P, Rohl A (1999) Median-joining networks for inferring
intraspecific phylogenies. Mol Biol Evol 16: 37–48.
44. Bandelt HJ, Forster P, Sykes BC, Richards MB (1995) Mitochondrial portraits of
human populations using median networks. Genetics 141: 743–753.
Ovis aries Mitochondrial DNA
PLoS ONE | www.plosone.org 10 March 2012 | Volume 7 | Issue 3 | e33792