Embed Size (px)
Citation preview
Journal of Archaeological Science (1998) 25, 1259–1271Article No. as980301
Dental Microwear and Diet in Domestic Sheep (Ovis aries) andGoats (Capra Hircus): Distinguishing Grazing and Fodder-fedOvicaprids using a Quantitative Analytical Approach
Ingrid L. Mainland
Department of Archaeology and Prehistory, Northgate House, West Street, Sheffield, S1 4ET, U.K.
(Received 1 August 1997, revised manuscript accepted 23 March 1998)
In recent years, dental microwear analysis has attracted considerable interest as a potential method for reconstructingancient diet. This article presents results from research exploring the potential of dental microwear analysis in thereconstruction of domestic ungulate diet through the quantitative analysis of diet-microwear relationships in moderngrazing and fodder-fed sheep and goats. Diet-related microwear patterning is identified in the modern populationsexamined and it is concluded that with investigation of a wider range of modern diets, dental microwear analysis willemerge as a valuable and insightful approach for the investigation of diet in ancient livestock. ? 1998 Academic Press
Keywords: MICROWEAR, PALAEODIET, ARCHAEOZOOLOGY, GRAZING, FODDER, SHEEP, GOAT.
Introduction
I n recent years, the potential of dental microwearanalysis for investigating ancient diet has attractedconsiderable interest within both archaeology and
palaeontology. A relationship between diet and dentalmicrowear has been demonstrated for several modernspecies and it is apparent that broad dietary adapta-tions, e.g., folivory versus frugivory (Teaford &Walker, 1984; Teaford & Runestad, 1992), browsingversus grazing (Walker, Hoek & Perez, 1978; Solounias& Moelleken, 1992), as well as more subtle, seasonal orshort-term variation in diet (Walker, Hoek & Perez,1978; Teaford & Robinson, 1989; Solounias & Hayek,1993) can be detected using microwear. It is maintainedthat these distinctions can be used to identify diet inindividuals from archaeological or palaeontologicalcontexts and several such studies have been undertakenon ancient humans and various extinct mammals (e.g.,Teaford & Walker, 1984; Solounias, Teaford & Walker,1988; Molleson, Jones & Jones, 1993; Ungar, 1996).
Theoretically, the analysis of microwear allows adirect relationship to be established between an animaland its diet. Application of such techniques to thequestion of ancient livestock diet would, therefore, bemore informative than many of the sources tradition-ally available within archaeology (bioarchaeology,structural, documentary, etc.), which cannot readily beused to identify the diet of a particular animal or evenparticular species and consequently cannot easily re-solve many of the more interesting and important
12590305–4403/98/121259+13 $30·00/0
questions regarding animal husbandry in the past: e.g.,how did the provision of fodder or grazing vary fordifferent species (e.g., sheep versus cattle), for animalswith different functions (e.g., meat versus milk produc-ers), between different settlements (e.g., rich versuspoor, upland versus lowland) or between seasons(Mainland, 1998)?
To establish the potential of dental microwear analy-sis for reconstructing archaeological livestock diet, therelationship between diet and dental microwear wasexamined in modern sheep and goats with a welldocumented diet prior to death (Mainland, 1994).Research focused on three aspects of ovicaprid micro-wear: (1) how do microwear patterns vary across theocclusal surface of ovicaprid teeth; (2) does the micro-wear of fodder-fed ovicaprids differ from that ofgrazing ovicaprids; (3) do grazing microwear patternsvary with season or pasture type? Two methodologieswere developed specifically for the exploration of thesequestions: a qualitative approach based on visual ordescriptive characteristics of the enamel surface and aquantitative approach based on the frequency anddimensions of microwear defects. The following paperreviews one aspect of this research: distinguishingfodder-fed ovicaprids from grazing ovicaprids usingquantitative analytical techniques. Occlusal variationin ovicaprid microwear, the effects of pasture type andseason on ovicaprid microwear and the identifica-tion of diet-related microwear patterning using a quali-tative analytical approach are dealt with elsewhere(Mainland, 1994, 1997).
? 1998 Academic Press
1260 I. L. Mainland
Materials and methods
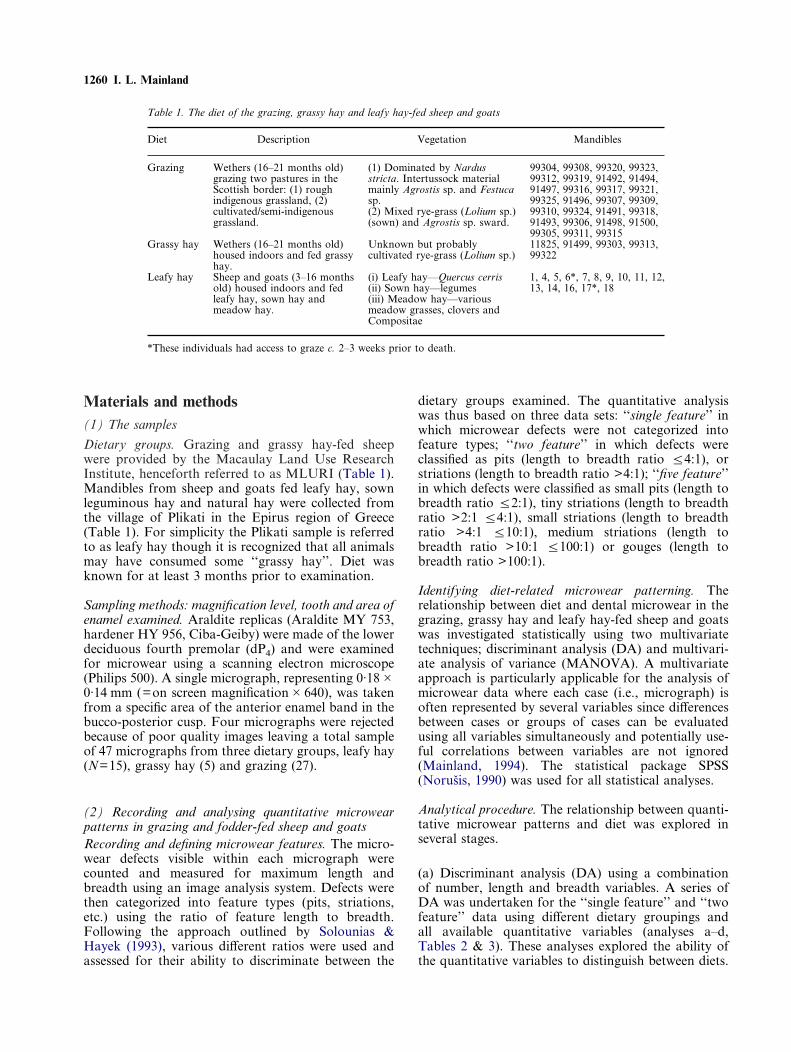
(1) The samplesDietary groups. Grazing and grassy hay-fed sheepwere provided by the Macaulay Land Use ResearchInstitute, henceforth referred to as MLURI (Table 1).Mandibles from sheep and goats fed leafy hay, sownleguminous hay and natural hay were collected fromthe village of Plikati in the Epirus region of Greece(Table 1). For simplicity the Plikati sample is referredto as leafy hay though it is recognized that all animalsmay have consumed some ‘‘grassy hay’’. Diet wasknown for at least 3 months prior to examination.
Sampling methods: magnification level, tooth and area ofenamel examined. Araldite replicas (Araldite MY 753,hardener HY 956, Ciba-Geiby) were made of the lowerdeciduous fourth premolar (dP4) and were examinedfor microwear using a scanning electron microscope(Philips 500). A single micrograph, representing 0·18#0·14 mm (=on screen magnification#640), was takenfrom a specific area of the anterior enamel band in thebucco-posterior cusp. Four micrographs were rejectedbecause of poor quality images leaving a total sampleof 47 micrographs from three dietary groups, leafy hay(N=15), grassy hay (5) and grazing (27).
(2) Recording and analysing quantitative microwearpatterns in grazing and fodder-fed sheep and goats
Recording and defining microwear features. The micro-wear defects visible within each micrograph werecounted and measured for maximum length andbreadth using an image analysis system. Defects werethen categorized into feature types (pits, striations,etc.) using the ratio of feature length to breadth.Following the approach outlined by Solounias &Hayek (1993), various different ratios were used andassessed for their ability to discriminate between thedietary groups examined. The quantitative analysiswas thus based on three data sets: ‘‘single feature’’ inwhich microwear defects were not categorized intofeature types; ‘‘two feature’’ in which defects wereclassified as pits (length to breadth ratio ¦4:1), orstriations (length to breadth ratio >4:1); ‘‘five feature’’in which defects were classified as small pits (length tobreadth ratio ¦2:1), tiny striations (length to breadthratio >2:1 ¦4:1), small striations (length to breadthratio >4:1 ¦10:1), medium striations (length tobreadth ratio >10:1 ¦100:1) or gouges (length tobreadth ratio >100:1).
Identifying diet-related microwear patterning. Therelationship between diet and dental microwear in thegrazing, grassy hay and leafy hay-fed sheep and goatswas investigated statistically using two multivariatetechniques; discriminant analysis (DA) and multivari-ate analysis of variance (MANOVA). A multivariateapproach is particularly applicable for the analysis ofmicrowear data where each case (i.e., micrograph) isoften represented by several variables since differencesbetween cases or groups of cases can be evaluatedusing all variables simultaneously and potentially use-ful correlations between variables are not ignored(Mainland, 1994). The statistical package SPSS(Norusis, 1990) was used for all statistical analyses.
Analytical procedure. The relationship between quanti-tative microwear patterns and diet was explored inseveral stages.
Table 1. The diet of the grazing, grassy hay and leafy hay-fed sheep and goats
Diet Description Vegetation Mandibles
Grazing Wethers (16–21 months old) (1) Dominated by Nardus 99304, 99308, 99320, 99323,grazing two pastures in the stricta. Intertussock material 99312, 99319, 91492, 91494,Scottish border: (1) rough mainly Agrostis sp. and Festuca 91497, 99316, 99317, 99321,indigenous grassland, (2) sp. 99325, 91496, 99307, 99309,cultivated/semi-indigenous (2) Mixed rye-grass (Lolium sp.) 99310, 99324, 91491, 99318,grassland. (sown) and Agrostis sp. sward. 91493, 99306, 91498, 91500,
99305, 99311, 99315Grassy hay Wethers (16–21 months old) Unknown but probably 11825, 91499, 99303, 99313,
housed indoors and fed grassy cultivated rye-grass (Lolium sp.) 99322hay.
Leafy hay Sheep and goats (3–16 months (i) Leafy hay—Quercus cerris 1, 4, 5, 6*, 7, 8, 9, 10, 11, 12,old) housed indoors and fed (ii) Sown hay—legumes 13, 14, 16, 17*, 18leafy hay, sown hay and (iii) Meadow hay—variousmeadow hay. meadow grasses, clovers and
Compositae
*These individuals had access to graze c. 2–3 weeks prior to death.
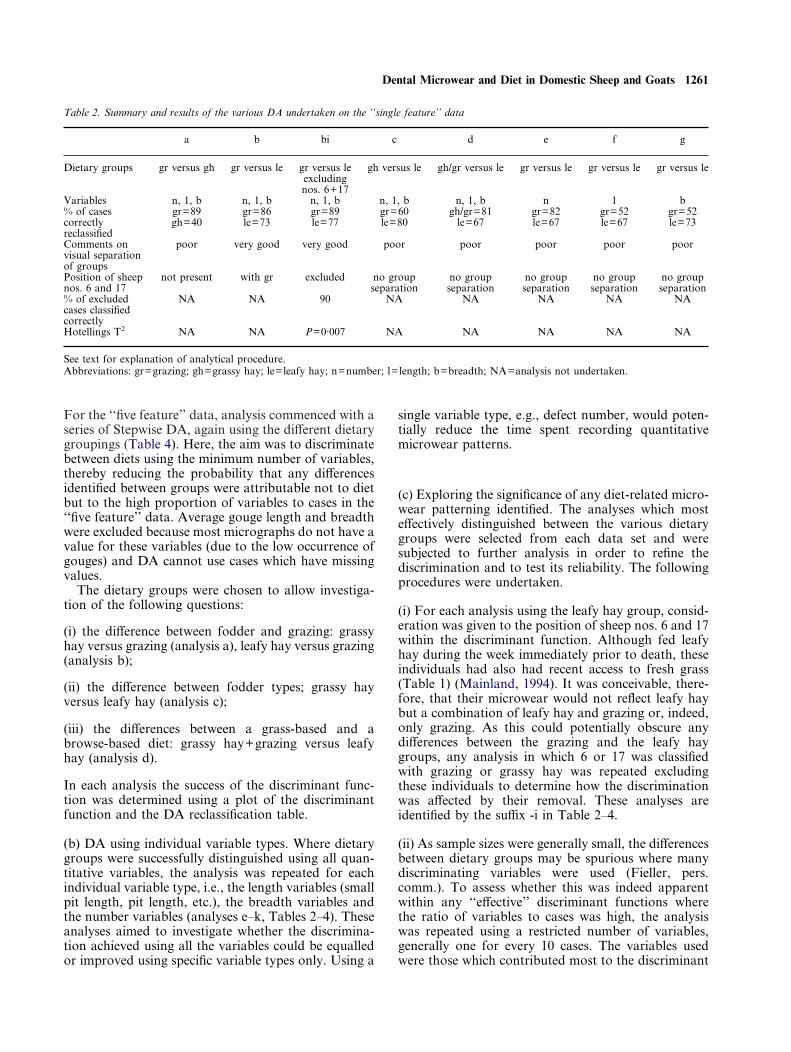
(a) Discriminant analysis (DA) using a combinationof number, length and breadth variables. A series ofDA was undertaken for the ‘‘single feature’’ and ‘‘twofeature’’ data using different dietary groupings andall available quantitative variables (analyses a–d,Tables 2 & 3). These analyses explored the ability ofthe quantitative variables to distinguish between diets.
Dental Microwear and Diet in Domestic Sheep and Goats 1261
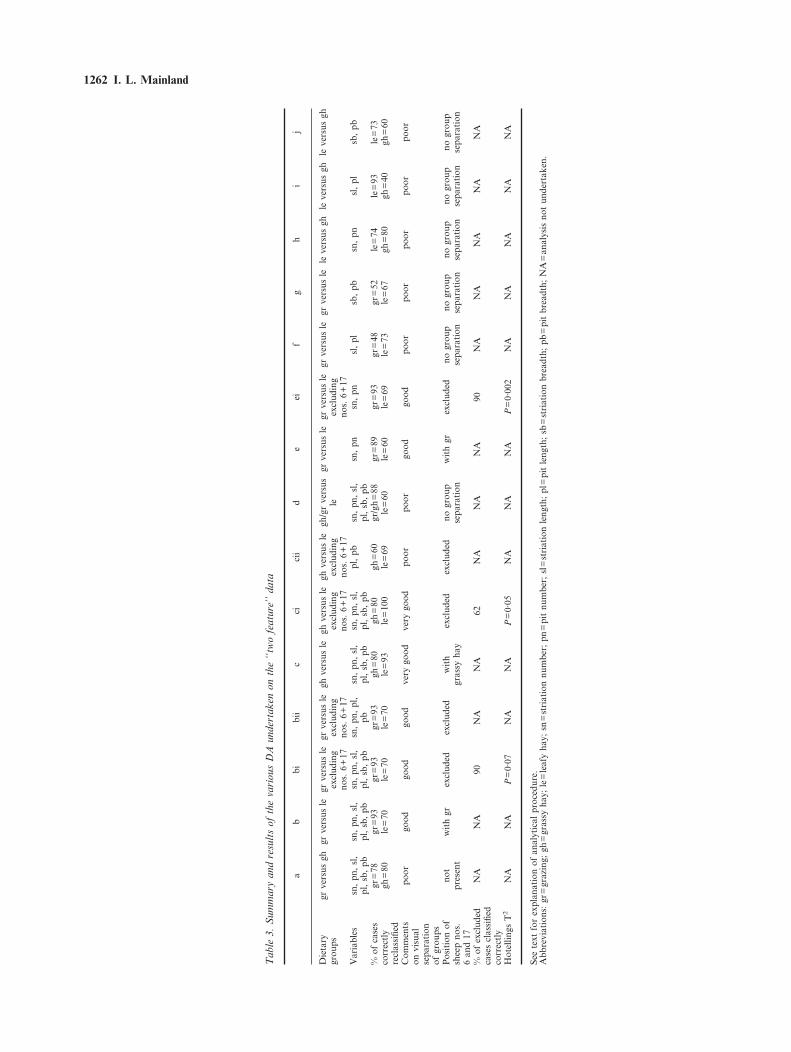
For the ‘‘five feature’’ data, analysis commenced with aseries of Stepwise DA, again using the different dietarygroupings (Table 4). Here, the aim was to discriminatebetween diets using the minimum number of variables,thereby reducing the probability that any differencesidentified between groups were attributable not to dietbut to the high proportion of variables to cases in the‘‘five feature’’ data. Average gouge length and breadthwere excluded because most micrographs do not have avalue for these variables (due to the low occurrence ofgouges) and DA cannot use cases which have missingvalues.
The dietary groups were chosen to allow investiga-tion of the following questions:
(i) the difference between fodder and grazing: grassyhay versus grazing (analysis a), leafy hay versus grazing(analysis b);
(ii) the difference between fodder types; grassy hayversus leafy hay (analysis c);
(iii) the differences between a grass-based and abrowse-based diet: grassy hay+grazing versus leafyhay (analysis d).
In each analysis the success of the discriminant func-tion was determined using a plot of the discriminantfunction and the DA reclassification table.
(b) DA using individual variable types. Where dietarygroups were successfully distinguished using all quan-titative variables, the analysis was repeated for eachindividual variable type, i.e., the length variables (smallpit length, pit length, etc.), the breadth variables andthe number variables (analyses e–k, Tables 2–4). Theseanalyses aimed to investigate whether the discrimina-tion achieved using all the variables could be equalledor improved using specific variable types only. Using a
single variable type, e.g., defect number, would poten-tially reduce the time spent recording quantitativemicrowear patterns.
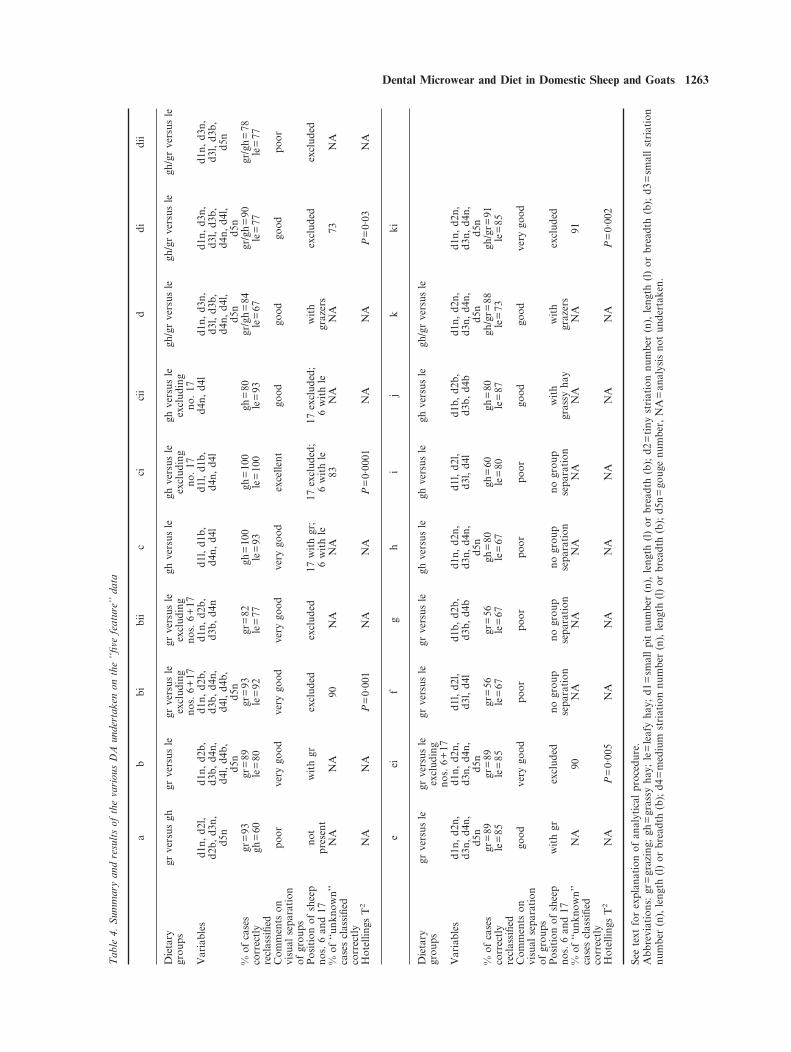
Table 2. Summary and results of the various DA undertaken on the ‘‘single feature’’ data
a b bi c d e f g
Dietary groups gr versus gh gr versus le gr versus le gh versus le gh/gr versus le gr versus le gr versus le gr versus leexcludingnos. 6+17
Variables n, 1, b n, 1, b n, 1, b n, 1, b n, 1, b n 1 b% of cases gr=89 gr=86 gr=89 gr=60 gh/gr=81 gr=82 gr=52 gr=52correctly gh=40 le=73 le=77 le=80 le=67 le=67 le=67 le=73reclassifiedComments on poor very good very good poor poor poor poor poorvisual separationof groupsPosition of sheep not present with gr excluded no group no group no group no group no groupnos. 6 and 17 separation separation separation separation separation% of excluded NA NA 90 NA NA NA NA NAcases classifiedcorrectlyHotellings T2 NA NA P=0·007 NA NA NA NA NA
See text for explanation of analytical procedure.Abbreviations: gr=grazing; gh=grassy hay; le=leafy hay; n=number; l=length; b=breadth; NA=analysis not undertaken.
(c) Exploring the significance of any diet-related micro-wear patterning identified. The analyses which mosteffectively distinguished between the various dietarygroups were selected from each data set and weresubjected to further analysis in order to refine thediscrimination and to test its reliability. The followingprocedures were undertaken.
(i) For each analysis using the leafy hay group, consid-eration was given to the position of sheep nos. 6 and 17within the discriminant function. Although fed leafyhay during the week immediately prior to death, theseindividuals had also had recent access to fresh grass(Table 1) (Mainland, 1994). It was conceivable, there-fore, that their microwear would not reflect leafy haybut a combination of leafy hay and grazing or, indeed,only grazing. As this could potentially obscure anydifferences between the grazing and the leafy haygroups, any analysis in which 6 or 17 was classifiedwith grazing or grassy hay was repeated excludingthese individuals to determine how the discriminationwas affected by their removal. These analyses areidentified by the suffix -i in Table 2–4.
(ii) As sample sizes were generally small, the differencesbetween dietary groups may be spurious where manydiscriminating variables were used (Fieller, pers.comm.). To assess whether this was indeed apparentwithin any ‘‘effective’’ discriminant functions wherethe ratio of variables to cases was high, the analysiswas repeated using a restricted number of variables,generally one for every 10 cases. The variables usedwere those which contributed most to the discriminant
1262 I. L. Mainland
Tab
le3.
Sum
mar
yan
dre
sult
sof
the
vari
ous
DA
unde
rtak
enon
the
‘‘tw
ofe
atur
e’’
data
ab
bibi
ic
cici
id
eei
fg
hi
j
Die
tary
grve
rsus
ghgr
vers
usle
grve
rsus
legr
vers
usle
ghve
rsus
legh
vers
usle
ghve
rsus
legh
/gr
vers
usgr
vers
usle
grve
rsus
legr
vers
usle
grve
rsus
lele
vers
usgh
leve
rsus
ghle
vers
usgh
grou
psex
clud
ing
excl
udin
gex
clud
ing
excl
udin
gle
excl
udin
gno
s.6+
17no
s.6+
17no
s.6+
17no
s.6+
17no
s.6+
17V
aria
bles
sn,
pn,
sl,
sn,
pn,
sl,
sn,
pn,
sl,
sn,
pn,
pl,
sn,
pn,
sl,
sn,
pn,
sl,
pl,
pbsn
,pn
,sl
,sn
,pn
sn,
pnsl
,pl
sb,
pbsn
,pn
sl,
plsb
,pb
pl,
sb,
pbpl
,sb
,pb
pl,
sb,
pbpb
pl,
sb,
pbpl
,sb
,pb
pl,
sb,
pb%
ofca
ses
gr=
78gr
=93
gr=
93gr
=93
gh=
80gh
=80
gh=
60gr
/gh
=88
gr=
89gr
=93
gr=
48gr
=52
le=
74le
=93
le=
73co
rrec
tly
gh=
80le
=70
le=
70le
=70
le=
93le
=10
0le
=69
le=
60le
=60
le=
69le
=73
le=
67gh
=80
gh=
40gh
=60
recl
assi
fied
Com
men
tspo
orgo
odgo
odgo
odve
rygo
odve
rygo
odpo
orpo
orgo
odgo
odpo
orpo
orpo
orpo
orpo
oron
visu
alse
para
tion
ofgr
oups
Pos
itio
nof
not
wit
hgr
excl
uded
excl
uded
wit
hex
clud
edex
clud
edno
grou
pw
ith
grex
clud
edno
grou
pno
grou
pno
grou
pno
grou
pno
grou
psh
eep
nos.
pres
ent
gras
syha
yse
para
tion
sepa
rati
onse
para
tion
sepa
rati
onse
para
tion
sepa
rati
on6
and
17%
ofex
clud
edN
AN
A90
NA
NA
62N
AN
AN
A90
NA
NA
NA
NA
NA
case
scl
assi
fied
corr
ectl
yH
otel
lings
T2
NA
NA
P=
0·07
NA
NA
P=
0·05
NA
NA
NA
P=
0·00
2N
AN
AN
AN
AN
A
See
text
for
expl
anat
ion
ofan
alyt
ical
proc
edur
e.A
bbre
viat
ions
:gr
=gr
azin
g;gh
=gr
assy
hay;
le=
leaf
yha
y;sn
=st
riat
ion
num
ber;
pn=
pit
num
ber;
sl=
stri
atio
nle
ngth
;pl
=pi
tle
ngth
;sb
=st
riat
ion
brea
dth;
pb=
pit
brea
dth;
NA
=an
alys
isno
tun
dert
aken
.
Dental Microwear and Diet in Domestic Sheep and Goats 1263
Tab
le4.
Sum
mar
yan
dre
sult
sof
the
vari
ous
DA
unde
rtak
enon
the
‘‘five
feat
ure’
’da
ta
ab
bibi
ic
cici
id
didi
i
Die
tary
grve
rsus
ghgr
vers
usle
grve
rsus
legr
vers
usle
ghve
rsus
legh
vers
usle
ghve
rsus
legh
/gr
vers
usle
gh/g
rve
rsus
legh
/gr
vers
usle
grou
psex
clud
ing
excl
udin
gex
clud
ing
excl
udin
gno
s.6
+17
nos.
6+
17no
.17
no.
17V
aria
bles
d1n,
d2l,
d1n,
d2b,
d1n,
d2b,
d1n,
d2b,
d1l,
d1b,
d1l,
d1b,
d4n,
d4l
d1n,
d3n,
d1n,
d3n,
d1n,
d3n,
d2b,
d3n,
d3b,
d4n,
d3b,
d4n,
d3b,
d4n
d4n,
d4l
d4n,
d4l
d3l,
d3b,
d3l,
d3b,
d3l,
d3b,
d5n
d4l,
d4b,
d4l,
d4b,
d4n,
d4l,
d4n,
d4l,
d5n
d5n
d5n
d5n
d5n
%of
case
sgr
=93
gr=
89gr
=93
gr=
82gh
=10
0gh
=10
0gh
=80
gr/g
h=
84gr
/gh
=90
gr/g
h=
78co
rrec
tly
gh=
60le
=80
le=
92le
=77
le=
93le
=10
0le
=93
le=
67le
=77
le=
77re
clas
sifie
dC
omm
ents
onpo
orve
rygo
odve
rygo
odve
rygo
odve
rygo
odex
celle
ntgo
odgo
odgo
odpo
orvi
sual
sepa
rati
onof
grou
psP
osit
ion
ofsh
eep
not
wit
hgr
excl
uded
excl
uded
17w
ith
gr;
17ex
clud
ed;
17ex
clud
ed;
wit
hex
clud
edex
clud
edno
s.6
and
17pr
esen
t6
wit
hle
6w
ith
le6
wit
hle
graz
ers
%of
‘‘unk
now
n’’
NA
NA
90N
AN
A83
NA
NA
73N
Aca
ses
clas
sifie
dco
rrec
tly
Hot
ellin
gsT
2N
AN
AP
=0·
001
NA
NA
P=
0·00
01N
AN
AP
=0·
03N
A
eei
fg
hi
jk
ki
Die
tary
grve
rsus
legr
vers
usle
grve
rsus
legr
vers
usle
ghve
rsus
legh
vers
usle
ghve
rsus
legh
/gr
vers
usle
grou
psex
clud
ing
nos.
6+
17V
aria
bles
d1n,
d2n,
d1n,
d2n,
d1l,
d2l,
d1b,
d2b,
d1n,
d2n,
d1l,
d2l,
d1b,
d2b,
d1n,
d2n,
d1n,
d2n,
d3n,
d4n,
d3n,
d4n,
d3l,
d4l
d3b,
d4b
d3n,
d4n,
d3l,
d4l
d3b,
d4b
d3n,
d4n,
d3n,
d4n,
d5n
d5n
d5n
d5n
d5n
%of
case
sgr
=89
gr=
89gr
=56
gr=
56gh
=80
gh=
60gh
=80
gh/g
r=88
gh/g
r=91
corr
ectl
yle
=85
le=
85le
=67
le=
67le
=67
le=
80le
=87
le=
73le
=85
recl
assi
fied
Com
men
tson
good
very
good
poor
poor
poor
poor
good
good
very
good
visu
alse
para
tion
ofgr
oups
Pos
itio
nof
shee
pw
ith
grex
clud
edno
grou
pno
grou
pno
grou
pno
grou
pw
ith
wit
hex
clud
edno
s.6
and
17se
para
tion
sepa
rati
onse
para
tion
sepa
rati
ongr
assy
hay
graz
ers
%of
‘‘unk
now
n’’
NA
90N
AN
AN
AN
AN
AN
A91
case
scl
assi
fied
corr
ectl
yH
otel
lings
T2
NA
P=
0·00
5N
AN
AN
AN
AN
AN
AP
=0·
002
See
text
for
expl
anat
ion
ofan
alyt
ical
proc
edur
e.A
bbre
viat
ions
:gr
=gr
azin
g;gh
=gr
assy
hay;
le=
leaf
yha
y;d1
=sm
all
pit
num
ber
(n),
leng
th(l
)or
brea
dth
(b);
d2=
tiny
stri
atio
nnu
mbe
r(n
),le
ngth
(l)
orbr
eadt
h(b
);d3
=sm
all
stri
atio
nnu
mbe
r(n
),le
ngth
(l)
orbr
eadt
h(b
);d4
=m
ediu
mst
riat
ion
num
ber
(n),
leng
th(l
)or
brea
dth
(b);
d5n
=go
uge
num
ber,
NA
=an
alys
isno
tun
dert
aken
.
1264 I. L. Mainland
function, as indicated by the value of the discriminantcoefficient. These analyses are identified by the suffix -iiin Tables 2–4.
(iii) The classification rate given by SPSS is an overlyoptimistic estimation because the same cases are usedto both derive and test the function (Norusis, 1990). Toachieve a more realistic impression of the classificationrate in an ‘‘effective’’ function, a quarter of the caseswere excluded from the analysis and were then classi-fied according to the function derived using the re-maining cases (Fieller, pers. comm.; Norusis, 1990).
(iv) Effective discriminations were analysed for statisti-cal significance using multivariate analysis of variance(MANOVA) (Hotellings T2 statistic, Tables 2–4). Theunivariate F-test statistic was then used to identifywhich variables had a significant impact on the dis-crimination (Tables 5–7). Variables which were notnormally distributed were transformed using eithernatural logs or square roots. In all statistical tests,results were regarded as significant where P¦0·05.
Results
(1) Grazing versus grassy hayNo differences could be identified between microweararising from the consumption of fresh and dried grassin any of the analyses undertaken on the three quanti-tative data sets (analysis a, Tables 2–4).
(2) Grazing versus leafy hay
(a) DA. The leafy hay-fed sheep and goats could beseparated from the grazing sheep using the length,breadth and number variables combined (analysis b) ineach of the three quantitative data sets (Tables 2–4).Discrimination was also achieved using the numbervariables only (analysis e) in the ‘‘two feature’’ and‘‘five feature’’ data. Differences could not, however, beidentified between the two diets using the length vari-ables only (analysis f) or the breadth variables only(analysis g) in any data set.(b) Exploring the significance of the differences ident-ified between leafy hay and grazing. In each successfulanalysis, the two ‘‘leafy hay’’ sheep which had beengrazing shortly before slaughter were classified with thegrazing sheep (Tables 2–4). Repeating these analyseswithout nos. 6 and 17 consistently gave an improveddiscrimination (analysis bi and ei in Tables 2–4). Sinceit is apparent that these individuals do obscure differ-ences between the grazing and leafy hay samples, onlyanalyses from which they were excluded were exploredfurther for significance and reliability. In total, there-fore, five DA successfully discriminated between graz-ing and leafy hay: analysis bi in the ‘‘single feature’’,‘‘two feature’’ and ‘‘five feature’’ data; analysis ei in the‘‘two feature’’ and ‘‘five feature’’ data.
It is probable that the separation of the two dietarygroups in these analyses reflects actual differencesbetween the microwear of grazing and leafy hay-fedsheep and goats rather than random patterning withinthe data. In each case, the discrimination achieved wasrigorous enough to withstand the removal of variablesand all revised reclassification rates were very high(Tables 2–4). Furthermore, in all but one (bi on the‘‘two feature’’ data), analysis between group differ-ences were highly significant (P<0·01). The consistentclassification of the two grazing sheep from Greece(nos. 6 and 17) with the Scottish grazers suggests,moreover, that the microwear variation identified doesreflect diet (i.e., graze versus leafy hay) and cannotmerely be explained by geographic differences betweenthe two sampling sites.
The univariate statistics for the MANOVA indicatethat the microwear patterning largely responsiblefor the separation of grazing and leafy hay can besummarized as follows. Sheep and goats fed leafy hayhave a greater number of and wider defects (analysisbi, ‘‘single feature’’), a greater number of pits andstriations (analysis ei, ‘‘two feature’’) and a greaternumber of small pits and medium striations (analysis biand ei, ‘‘five feature’’) than grazing sheep (Table 5,Figures 1 & 2).
The best overall discrimination, in terms of reclassi-fication rate and visual separation along the discrimi-nant function is given by analyses bi and ei in the ‘‘fivefeature’’ data (Figures 3 & 4, Table 4). Of the remain-ing analyses, bi on the ‘‘single feature’’ data alsoachieves an acceptable discrimination both visuallyand in the proportion of cases correctly reclassifiedfrom each dietary group (Figure 5, Table 2). Theanalyses undertaken on the ‘‘two feature’’ data (bi andei) are less satisfactory, mainly because of the ratherhigh number of leafy hay individuals assigned to theincorrect group (30% in bi, 31% in ei).
(3) Leafy hay versus grassy hay
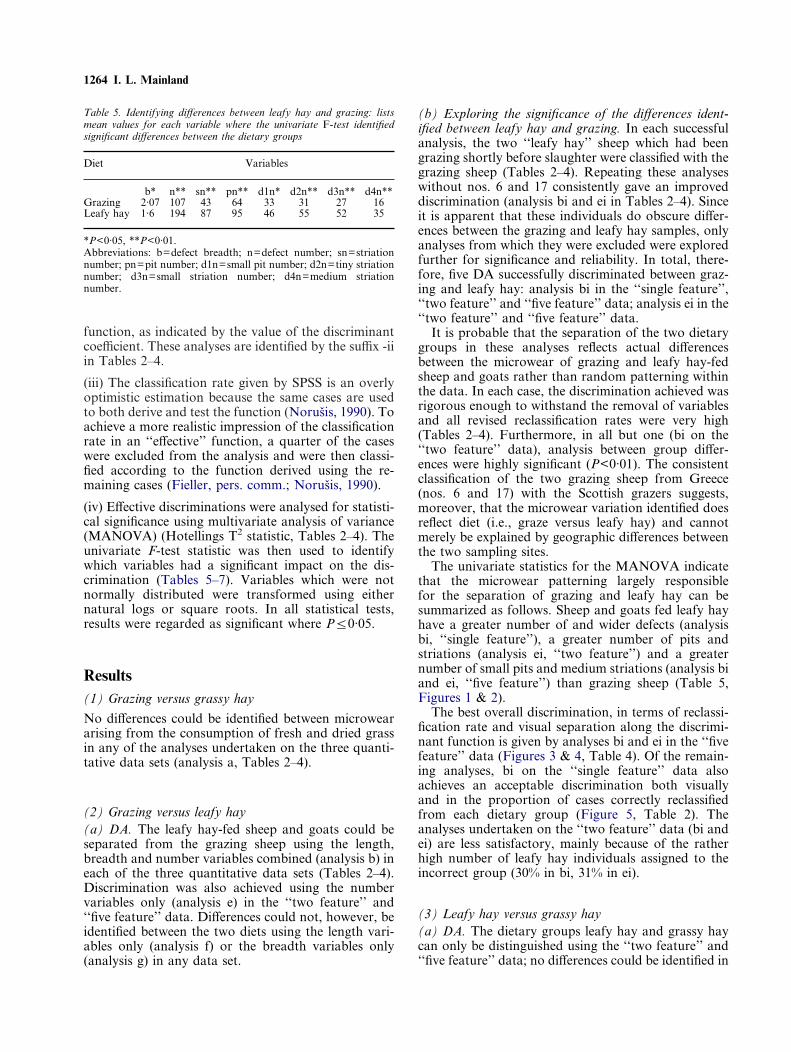
Table 5. Identifying differences between leafy hay and grazing: listsmean values for each variable where the univariate F-test identifiedsignificant differences between the dietary groups
Diet Variables
b* n** sn** pn** d1n* d2n** d3n** d4n**Grazing 2·07 107 43 64 33 31 27 16Leafy hay 1·6 194 87 95 46 55 52 35
*P<0·05, **P<0·01.Abbreviations: b=defect breadth; n=defect number; sn=striationnumber; pn=pit number; d1n=small pit number; d2n=tiny striationnumber; d3n=small striation number; d4n=medium striationnumber.
(a) DA. The dietary groups leafy hay and grassy haycan only be distinguished using the ‘‘two feature’’ and‘‘five feature’’ data; no differences could be identified in
Dental Microwear and Diet in Domestic Sheep and Goats 1265
the ‘‘single feature’’ data (Tables 2–4). In both datasets, discrimination was achieved using a combinationof number, length and breadth variables (analysis c).When used separately, neither the number, length norbreadth variables could differentiate between the twodiets (analyses h–j).
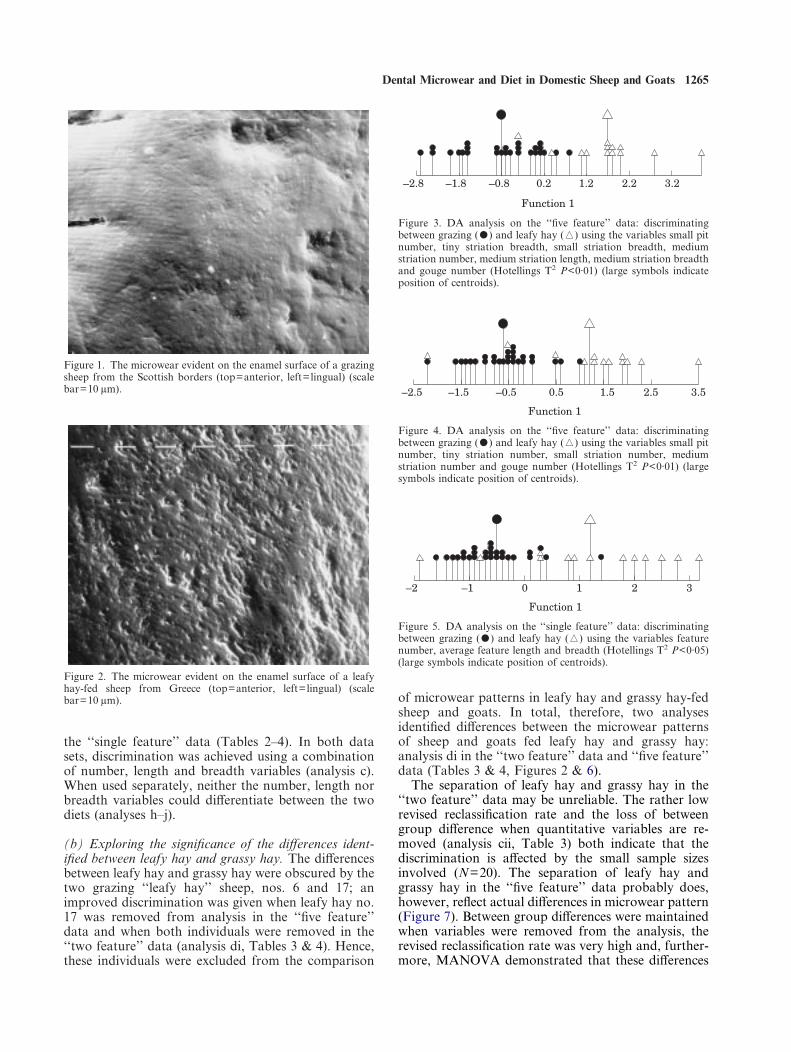
Figure 1. The microwear evident on the enamel surface of a grazingsheep from the Scottish borders (top=anterior, left=lingual) (scalebar=10 ìm).
Figure 2. The microwear evident on the enamel surface of a leafyhay-fed sheep from Greece (top=anterior, left=lingual) (scalebar=10 ìm).
–2.8 –1.8 –0.8 0.2 1.2 2.2 3.2
Function 1
Figure 3. DA analysis on the ‘‘five feature’’ data: discriminatingbetween grazing (-) and leafy hay (0) using the variables small pitnumber, tiny striation breadth, small striation breadth, mediumstriation number, medium striation length, medium striation breadthand gouge number (Hotellings T2 P<0·01) (large symbols indicateposition of centroids).
–2.5 –1.5 –0.5 0.5 1.5
Function 1
2.5 3.5
Figure 4. DA analysis on the ‘‘five feature’’ data: discriminatingbetween grazing (-) and leafy hay (0) using the variables small pitnumber, tiny striation number, small striation number, mediumstriation number and gouge number (Hotellings T2 P<0·01) (largesymbols indicate position of centroids).
–2 –1 0 1 2
Function 1
3
Figure 5. DA analysis on the ‘‘single feature’’ data: discriminatingbetween grazing (-) and leafy hay (0) using the variables featurenumber, average feature length and breadth (Hotellings T2 P<0·05)(large symbols indicate position of centroids).
(b) Exploring the significance of the differences ident-ified between leafy hay and grassy hay. The differencesbetween leafy hay and grassy hay were obscured by thetwo grazing ‘‘leafy hay’’ sheep, nos. 6 and 17; animproved discrimination was given when leafy hay no.17 was removed from analysis in the ‘‘five feature’’data and when both individuals were removed in the‘‘two feature’’ data (analysis di, Tables 3 & 4). Hence,these individuals were excluded from the comparison
of microwear patterns in leafy hay and grassy hay-fedsheep and goats. In total, therefore, two analysesidentified differences between the microwear patternsof sheep and goats fed leafy hay and grassy hay:analysis di in the ‘‘two feature’’ data and ‘‘five feature’’data (Tables 3 & 4, Figures 2 & 6).
The separation of leafy hay and grassy hay in the‘‘two feature’’ data may be unreliable. The rather lowrevised reclassification rate and the loss of betweengroup difference when quantitative variables are re-moved (analysis cii, Table 3) both indicate that thediscrimination is affected by the small sample sizesinvolved (N=20). The separation of leafy hay andgrassy hay in the ‘‘five feature’’ data probably does,however, reflect actual differences in microwear pattern(Figure 7). Between group differences were maintainedwhen variables were removed from the analysis, therevised reclassification rate was very high and, further-more, MANOVA demonstrated that these differences
1266 I. L. Mainland
were highly significant (P=0·0001) (Table 4). Themicrowear patterns of grassy hay-fed and leafy hay-fedsheep and goats differ mainly in the number of mediumstriations present: leafy hay having a higher number(Table 6).
(4) A grass-based (grassy hay/grazing) versus abrowse-based (leafy hay) diet
(a) DA. Ovicaprids consuming a grass-based diet canonly be distinguished from those on a browse-baseddiet using the ‘‘five feature’’ data (Tables 2–4). Dis-crimination was achieved using a combination ofnumber, length and breadth variables (analysis d) andby the number variables separately (analysis k).Neither the length nor breadth variables could differ-entiate between the two groups (analyses l and m).
(b) Exploring the significance of the differences ident-ified between a grass-based (grassy hay/grazing) and abrowse-based (leafy hay) diet. An improved discrimi-nation was given by the removal of the two grazing‘‘leafy hay’’ sheep (analyses di and ki, Table 4) andthese individuals were thus excluded from subsequentanalyses. In total, therefore, two analyses identifieddifferences between a grass-based and a browse-baseddiet: di and ki in the ‘‘five feature’’ data (Table 4).
In analysis ki, the highly significant results given bythe MANOVA together with the low ratio of variablesto cases and the high revised reclassification rate indi-cates that actual differences in microwear patterns arereflected (Table 4, Figure 8). The discrimination givenby analysis di is less satisfactory both in terms of visualseparation and the revised reclassification rate (Table4) and it is apparent that the inclusion of length andbreadth variables hinders the separation of the twogroups. The univariate statistics for analysis ki indicatethat a browse-based diet differs from a grass-based dietin having a higher frequency of small pits, smallstriations and medium striations (Table 7).
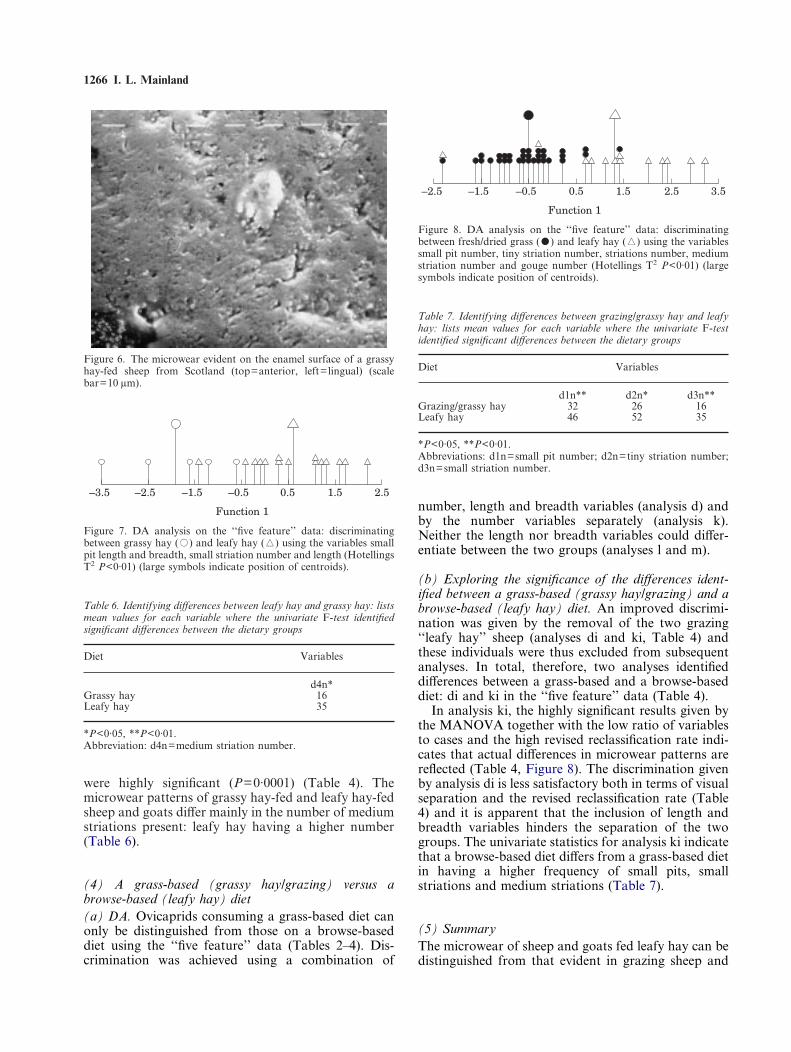
Figure 6. The microwear evident on the enamel surface of a grassyhay-fed sheep from Scotland (top=anterior, left=lingual) (scalebar=10 ìm).
–3.5
Function 1
–2.5 –1.5 –0.5 0.5 1.5 2.5
Figure 7. DA analysis on the ‘‘five feature’’ data: discriminatingbetween grassy hay (,) and leafy hay (0) using the variables smallpit length and breadth, small striation number and length (HotellingsT2 P<0·01) (large symbols indicate position of centroids).
Table 6. Identifying differences between leafy hay and grassy hay: listsmean values for each variable where the univariate F-test identifiedsignificant differences between the dietary groups
Diet Variables
d4n*Grassy hay 16Leafy hay 35
*P<0·05, **P<0·01.Abbreviation: d4n=medium striation number.
–2.5 –1.5 –0.5 0.5 1.5
Function 1
2.5 3.5
Figure 8. DA analysis on the ‘‘five feature’’ data: discriminatingbetween fresh/dried grass (-) and leafy hay (0) using the variablessmall pit number, tiny striation number, striations number, mediumstriation number and gouge number (Hotellings T2 P<0·01) (largesymbols indicate position of centroids).
Table 7. Identifying differences between grazing/grassy hay and leafyhay: lists mean values for each variable where the univariate F-testidentified significant differences between the dietary groups
Diet Variables
d1n** d2n* d3n**Grazing/grassy hay 32 26 16Leafy hay 46 52 35
*P<0·05, **P<0·01.Abbreviations: d1n=small pit number; d2n=tiny striation number;d3n=small striation number.
(5) SummaryThe microwear of sheep and goats fed leafy hay can bedistinguished from that evident in grazing sheep and
Dental Microwear and Diet in Domestic Sheep and Goats 1267
from sheep fed grassy hay using a quantitative analyti-cal approach (Tables 2–4, Figures 3–5 & 7). Leafyhay-fed sheep/goats can additionally be separated fromgrazing/grassy hay combined (Table 4, Figure 8). Nodifferences are, however, found between the microwearof grazing and grassy hay-fed sheep.
The microwear of leafy hay-fed sheep and goatsdiffers from that of grazing and grassy hay-fed sheepmainly in the frequency of microwear defects (Tables5–7). Leafy hay has a greater number of total micro-wear defects, of pits and striations and of small pitsand medium striations than grazing sheep and agreater number of medium striations than grassy hay-fed sheep. Likewise, leafy hay has a greater number ofsmall pits, small striations and medium striations thangrazing/grassy hay combined. Leafy hay also differsfrom grazing in having narrower defects.
Discussion
(1) Applicability of the quantitative data setsOf the three quantitative data sets used to explorediet-microwear relationship, the ‘‘five feature’’ datawas found to be the most successful, closely followedby the ‘‘single feature’’ data, while the ‘‘two feature’’data were less useful. Analyses of the ‘‘five feature’’data make most use of the number of defects, whileanalyses of the ‘‘one-feature’’ data rely on number andbreadth variables. In practise, the same data must berecorded for the three sets of analyses and the samevariables used (length and breadth data are used todistinguish the defect categories in the ‘‘two-feature’’and ‘‘five-feature’’ data), but exclusion of the ‘‘two-feature’’ data would make analysis of results faster.
The quantitative analytical approach described herecould find no differences between the microwear ofgrazing and grassy hay-fed sheep. These diets were,however, distinguished using a qualitative approachin which variables describing microwear feature mor-phology and enamel surface characteristics (e.g.,presence/absence of prism relief, deep/shallow features)were used to identify diet-related microwear pattern-ing (Mainland, 1997). Future studies of ovicapridmicrowear ought, therefore, to consider analyticalapproaches which combine both qualitative andquantitative variables (Mainland, 1997).
(2) The turn-over rate of dental microwear patterns indomestic sheep and goatsSheep nos. 6 and 17 can be used to give some indica-tion of the duration of microwear patterns in domesticsheep and goats since their diet changed shortly beforeslaughter (Table 1). Although these individuals willhave received a diet similar to the other leafy hayanimals immediately prior to death, namely a mixtureof leafy hay, meadow hay and sown leguminous hay,both were grazing up until approximately 1 week
before slaughter. Their consistent classification withthe grazing MLURI sheep indicates that a week isinsufficient time for leafy/meadow/sown hay to eradi-cate the effects of the grazing episodes. The turn overrate of microwear in domestic sheep and goats maynot, therefore, be as fast as has been suggested forsome mammals; in laboratory fed monkeys, forexample, microwear patterns changed completelywithin one to two weeks (Teaford & Oyen, 1989a, b). Itis possible that this reflects the low abrasiveness oflegume and leafy hay. Solounias (unpubl. data quotedin Walker & Teaford, 1989) has calculated that al-though gross tooth wear in wild grazing ruminants isvery rapid (c.10 ìm a day), that of browsers is less so(<1 ìm).
(3) Microwear patterns and formation in ungulatesThe quantitative microwear patterns of grazing andgrassy hay-fed sheep (both separately and in combina-tion) can be distinguished from those evident in ovi-caprids fed leafy hay. This, together with the absenceof any differences between grazing and grassy hay,indicates that what may be reflected is a distinctionbetween browsing (leafy hay) and grazing (grassy hay/grazing) microwear patterns. The microwear exhibitedby the Plikati (leafy hay) and MLURI (grazing/grassyhay) ovicaprids does not, however, conform to thebrowsing-grazing dichotomy documented in other un-gulate species, in which browsing is characterized byenamel surfaces with extensive prism relief and fewmicrowear features, typically pits, while grazing isassociated with heavily striated enamel surfaces(Walker, Hoek & Perez, 1978; Solounias, Teaford &Walker, 1988; Solounias & Moelleken, 1992; Solounias& Hayek, 1993; Hayek et al., 1992). In contrast, theleafy hay-fed sheep are characterized by a high fre-quency of microwear defects, both pits and striations,whereas the grazing and grassy hay-fed sheep havefewer overall features with an emphasis on pits, thoughstriations are also common (Tables 5–7). Prism relief,although evident in the samples examined, cannotreadily be detected using a quantitative approach andis thus discussed in more detail elsewhere (Mainland,1994, 1997).
The traditional explanation for microwear forma-tion in browsing and grazing ungulates equates thestriated enamel surfaces of grazers with a diet high inopal phytoliths, the hard, abrasive siliceous particlesfound in abundance in grasses; the prevalence of pitsand prism relief in browsers is attributed to the lowfrequency of phytoliths in the dicotyledon speciesfavoured by most browsers (Walker, Hoek & Perez,1978; Solounias, Teaford & Walker, 1988; Solounias &Moelleken, 1992). Several authors have also identifieddietary toughness, as reflected by fibre-content, as acausal factor: a low-fibre diet, such as is found inbrowsers (Hofmann, 1989), is associated with an em-phasis on pits (Teaford, 1993) and a low frequency of
1268 I. L. Mainland
Table 8. Comparing the microwear patterns of the grazing and fodder-fed sheep and goats with those of other grazingand browsing ungulates (averages for the grazing and browsing ungulates are based on Solounias & Moelleken, 1992)
DietDeciduous fourth premolar
(mandibular) Second molar (maxillary)
Pit no. Striation Defect Pit no. Striation Defectno. no. no. no.
Grazing 62 33 95 26 7 32sheepGrassy 51 35 86 33 10 43hay-fedsheepLeafy hay-fed 95 87 182 40–60* 15–25* 55–85*sheepGrazing – – – 8 51 59ruminantsBrowsing – – – 21 19 40ruminants
*These figures are an estimate, based on the differences evident in microwear defect frequency between the M2 anddP4 in the grassy hay-fed and grazing sheep.
microwear features (Solounias & Moelleken, 1992).The absence of a heavily striated enamel surface in theMLURI grazing/grassy hay-fed sheep and the rela-tively high frequency of microwear features in thePlikati leafy hay-fed ovicaprids casts doubt on thesemodels for microwear formation in ungulates and,therefore, require some explanation.
It is necessary first to exclude the possibility thatthese atypical microwear patterns reflect the method-ology employed. The methods used to examine ovi-caprid microwear differ from Solounias, Teaford &Walker (1988) in the choice of tooth (the dP4 instead ofthe M2) and magnification level (c.# 640 as opposedto#500), both of which could potentially have af-fected quantitative assessments of microwear pattern-ing (Gordon, 1982, 1988). Analysis of 10 M2s from thegrazing and grassy hay-fed sheep using Solounias’smethods indicates, however, that although magnifica-tion and tooth choice do indeed have some impact onthe type and overall frequency of features recorded,neither can be held solely responsible for the atypicalpatterning of these sheep: as in the dP4, the microwearof these individuals exhibits few striations and is com-parable to that conventionally attributed to browsingrather than grazing ruminants (Table 8). Maxillaryteeth were not examined from the leafy hay sample, butan indication of probable microwear frequencies canbe given if it is assumed that magnification level andtooth position will have a similar effect on leafy haymicrowear as was observed in the MLURI samples(Table 8). These figures again suggest that microwearpatterns in leafy hay are not typical of browsing rumi-nants but exhibit a greater total number of features, pitsand striations.
The absence of a typical browsing microwear patternin the leafy hay-fed sheep can perhaps be attributed totwo factors. Firstly, their diet consisted of a mixture oflow- and high-phytolith accumulating species (oakleaves=low phytolith, leguminous hay=low phytolith,
meadow grasses=high phytolith (Piperno, 1988))unlike the wild browsing ruminants whose diet willhave consisted primarily of browse species low inphytoliths and fibre (Hofmann, 1989). Secondly, theharvesting, drying and storage processes involved inthe production of leafy hay could potentially createa diet very different in toughness or abrasivenessthan that of the free-browsing ruminants examinedby Solounias, Teaford & Walker (1988), or indeedfree-browsing ovicaprids.
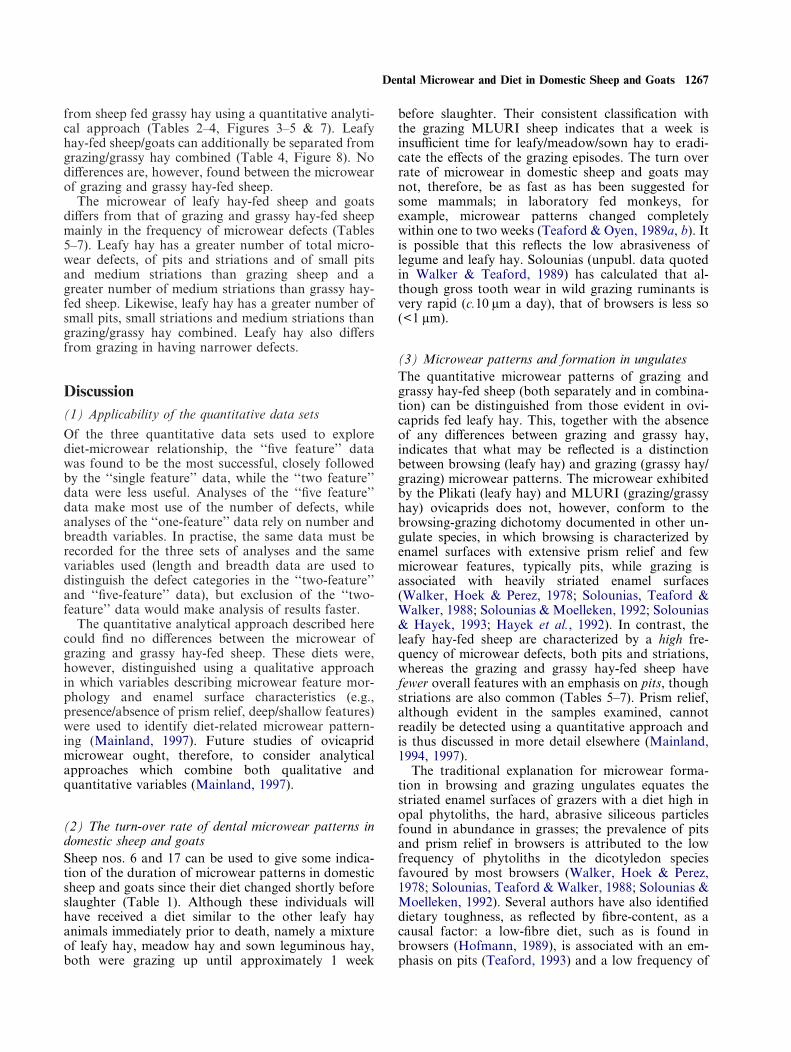
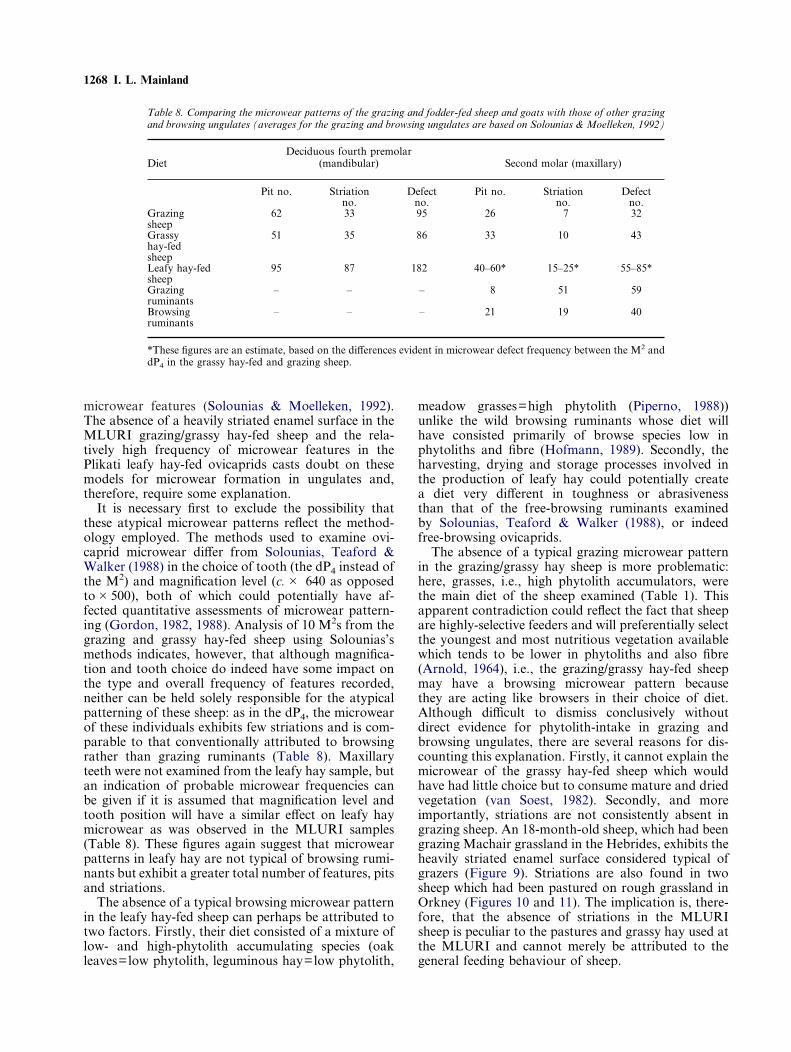
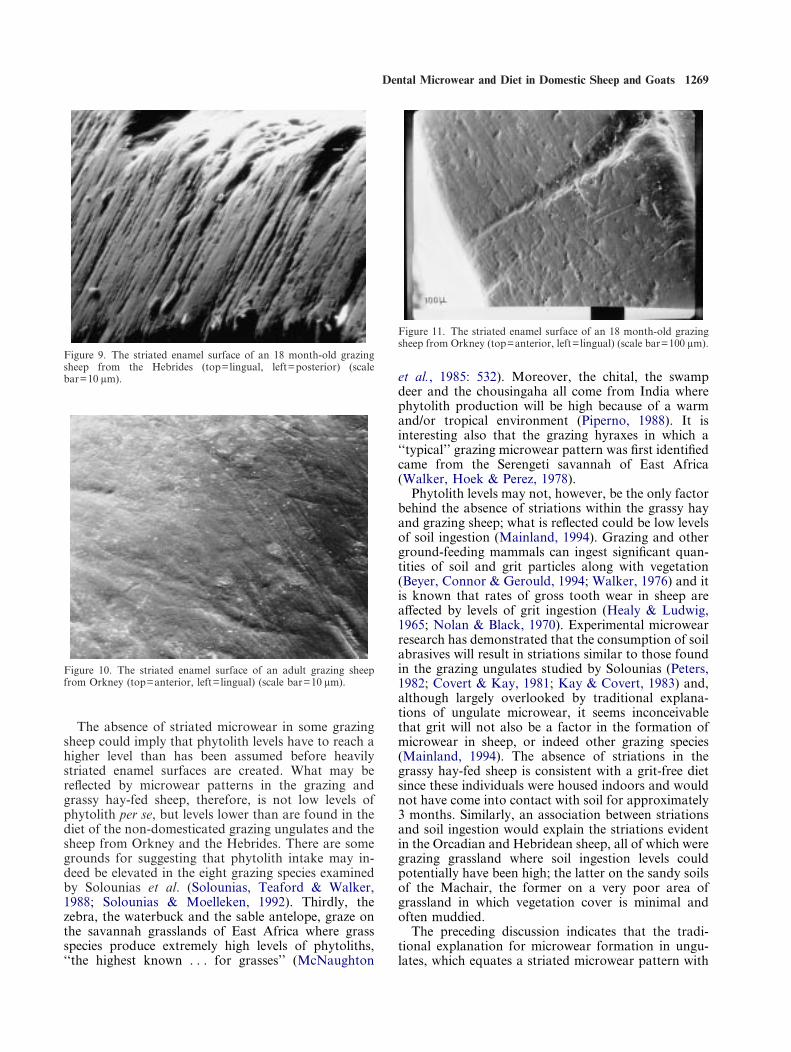
The absence of a typical grazing microwear patternin the grazing/grassy hay sheep is more problematic:here, grasses, i.e., high phytolith accumulators, werethe main diet of the sheep examined (Table 1). Thisapparent contradiction could reflect the fact that sheepare highly-selective feeders and will preferentially selectthe youngest and most nutritious vegetation availablewhich tends to be lower in phytoliths and also fibre(Arnold, 1964), i.e., the grazing/grassy hay-fed sheepmay have a browsing microwear pattern becausethey are acting like browsers in their choice of diet.Although difficult to dismiss conclusively withoutdirect evidence for phytolith-intake in grazing andbrowsing ungulates, there are several reasons for dis-counting this explanation. Firstly, it cannot explain themicrowear of the grassy hay-fed sheep which wouldhave had little choice but to consume mature and driedvegetation (van Soest, 1982). Secondly, and moreimportantly, striations are not consistently absent ingrazing sheep. An 18-month-old sheep, which had beengrazing Machair grassland in the Hebrides, exhibits theheavily striated enamel surface considered typical ofgrazers (Figure 9). Striations are also found in twosheep which had been pastured on rough grassland inOrkney (Figures 10 and 11). The implication is, there-fore, that the absence of striations in the MLURIsheep is peculiar to the pastures and grassy hay used atthe MLURI and cannot merely be attributed to thegeneral feeding behaviour of sheep.
Dental Microwear and Diet in Domestic Sheep and Goats 1269
Figure 9. The striated enamel surface of an 18 month-old grazingsheep from the Hebrides (top=lingual, left=posterior) (scalebar=10 ìm).
Figure 10. The striated enamel surface of an adult grazing sheepfrom Orkney (top=anterior, left=lingual) (scale bar=10 ìm).
Figure 11. The striated enamel surface of an 18 month-old grazingsheep from Orkney (top=anterior, left=lingual) (scale bar=100 ìm).
The absence of striated microwear in some grazingsheep could imply that phytolith levels have to reach ahigher level than has been assumed before heavilystriated enamel surfaces are created. What may bereflected by microwear patterns in the grazing andgrassy hay-fed sheep, therefore, is not low levels ofphytolith per se, but levels lower than are found in thediet of the non-domesticated grazing ungulates and thesheep from Orkney and the Hebrides. There are somegrounds for suggesting that phytolith intake may in-deed be elevated in the eight grazing species examinedby Solounias et al. (Solounias, Teaford & Walker,1988; Solounias & Moelleken, 1992). Thirdly, thezebra, the waterbuck and the sable antelope, graze onthe savannah grasslands of East Africa where grassspecies produce extremely high levels of phytoliths,‘‘the highest known . . . for grasses’’ (McNaughton
et al., 1985: 532). Moreover, the chital, the swampdeer and the chousingaha all come from India wherephytolith production will be high because of a warmand/or tropical environment (Piperno, 1988). It isinteresting also that the grazing hyraxes in which a‘‘typical’’ grazing microwear pattern was first identifiedcame from the Serengeti savannah of East Africa(Walker, Hoek & Perez, 1978).
Phytolith levels may not, however, be the only factorbehind the absence of striations within the grassy hayand grazing sheep; what is reflected could be low levelsof soil ingestion (Mainland, 1994). Grazing and otherground-feeding mammals can ingest significant quan-tities of soil and grit particles along with vegetation(Beyer, Connor & Gerould, 1994; Walker, 1976) and itis known that rates of gross tooth wear in sheep areaffected by levels of grit ingestion (Healy & Ludwig,1965; Nolan & Black, 1970). Experimental microwearresearch has demonstrated that the consumption of soilabrasives will result in striations similar to those foundin the grazing ungulates studied by Solounias (Peters,1982; Covert & Kay, 1981; Kay & Covert, 1983) and,although largely overlooked by traditional explana-tions of ungulate microwear, it seems inconceivablethat grit will not also be a factor in the formation ofmicrowear in sheep, or indeed other grazing species(Mainland, 1994). The absence of striations in thegrassy hay-fed sheep is consistent with a grit-free dietsince these individuals were housed indoors and wouldnot have come into contact with soil for approximately3 months. Similarly, an association between striationsand soil ingestion would explain the striations evidentin the Orcadian and Hebridean sheep, all of which weregrazing grassland where soil ingestion levels couldpotentially have been high; the latter on the sandy soilsof the Machair, the former on a very poor area ofgrassland in which vegetation cover is minimal andoften muddied.
The preceding discussion indicates that the tradi-tional explanation for microwear formation in ungu-lates, which equates a striated microwear pattern with
1270 I. L. Mainland
the opal phytoliths in grasses, may be an oversimplifi-cation and demonstrates the need for new models ofmicrowear formation. The weakness of existing modelsreflects a reliance on assumed levels of dietary abrasive-ness and toughness: in only one study of ungulatemicrowear has any attempt been made to identifyactual agents behind microwear formation (Walker,Hoek & Perez, 1978). The development of more accu-rate explanations for ungulate microwear can only,therefore, be achieved by combining future analyses ofmicrowear with studies which seek explicitly to identifyfactors behind any microwear patterning identified,e.g., by evaluating the abrasiveness, toughness andacidity of vegetation available to the animals examinedand/or the amount of abrasives actually consumed(e.g., Kemble, 1986). Thus, although an attempt hasbeen made to identify potential factors behind micro-wear formation in the ovicaprids examined fromGreece and Scotland, these explanations must remainspeculative until research in progress on actual phyto-lith and grit levels within their diet is completed(Kemble, Mainland & Halstead, in prep.).
Conclusions: The Potential of DentalMicrowear Analysis for DietaryReconstructionA relationship was identified between diet and dentalmicrowear in the domestic sheep and goats examined:the sheep and goats fed leafy hay could be distin-guished from grazing sheep and from those fed grassyhay. There can be some confidence in attributing thetrends identified to diet; rigorous procedures werefollowed while sampling, recording and analysingmicrowear patterns and non-dietary factors such assample size, the methodological approach employed orocclusal variation in microwear pattern are unlikely tohave influenced the results (Mainland, 1994). Never-theless, it would be premature to use these results toreconstruct diet within an archaeological context.First, a rather limited range of diets has been exam-ined. Hence, although the microwear of leafy hay-fedsheep and goats can be distinguished from grazing andgrassy hay-fed sheep, it is unclear whether differenceswould also be apparent between leafy hay and a diet offresh browse or indeed between grazing sheep andbrowsing ovicaprids. Secondly, it is becoming apparentthat the microwear of grazing animals may be morevariable than had previously been anticipated. Anyvariation in microwear between different pasturescould potentially mask any differences between grazingand fodder and dietary reconstruction cannot, there-fore, be considered until the range of grazing micro-wear is established more fully.
The variability evident in the microwear of grazingsheep, along with the absence of a ‘‘typical’’ browsingpattern in the Plikati ovicaprids, which had consumedbrowse material, albeit dried, must additionally bring
into question the universal applicability of dietaryreconstruction using the Solounias model of browsing-grazing microwear patterns in wild ungulates, whichrelates a heavily striated enamel surface to grazers andpitted enamel surfaces to browsers (Solounias, Teaford& Walker, 1988; Solounias & Moelleken, 1992;Solounias & Hayek, 1993; Hayek et al., 1992). It hasbeen argued that the microwear patterns of the grazingand leafy hay-fed ovicaprids reflect diet in general andare not peculiar to sheep or goats. There are, therefore,no reasons to suspect that similar variability will not befound within other grazing and browsing animals. Theabsence of any such variability in the species examinedby Solounias et al. may partially be attributable to anemphasis on species from particular environments,namely savannah grasslands or tropical climates.Recent attempts to reconstruct the diet of ungulatespecies from palaeontological contexts may be ratherpremature, therefore, and should certainly not beapplied to ecological contexts radically different fromthe low-latitude grasslands represented by Solounias’smodern grazing/browsing ungulates.
At present, it is difficult to assess conclusivelywhether microwear patterns can be used to reconstructdiet in an archaeological context because of the uncer-tainty concerning microwear variation within grazing,browsing and fodder-fed sheep and goats. Neverthe-less, the results obtained so far are encouraging and itis anticipated that with investigation of a wider rangeof modern diets, dental microwear analysis will emergeas a valuable and insightful approach for the investi-gation of diet in ancient livestock. Such studies willideally be based on analytical approaches which com-bine both qualitative and quantitative variables andmust be undertaken in conjunction with researchwhich seeks explicitly to identify microwear formationprocesses for any microwear patterning identified.
AcknowledgementsThis research would not have been possible withoutthe cooperation of the Macaulay Land Use ResearchInstitute, in particular Iain Wright and Harry Sangster,and the villagers of Plikati who allowed Paul Halsteadto collect mandibles left over from Easter dinner. Theanalysis of maxillary teeth was undertaken in collabo-ration with Dr Nikos Solounias of New York Instituteof Technology. This paper has benefited from criticalcomment by Paul Halstead and Glynis Jones.
ReferencesArnold, G. W. (1964). Factors within plant associations affecting the
behaviour and performance of grazing animals. In (D. J. Crisp,Ed.) Grazing in Terrestrial and Marine Environments. Oxford:Blackwell, pp. 133–154.
Beyer, W. N., Connor, E. E. & Gerould, S. (1994). Estimates of soilingestion by wildlife. Journal of Wildlife Management 58, 375–382.
Covert, H. & Kay, R. F. (1981). Dental microwear and diet:Implications for determining the feeding behaviours of extinct
Dental Microwear and Diet in Domestic Sheep and Goats 1271
primates, with a comment on the dietary pattern of Sivapithecus.American Journal of Physical Anthropology 55, 331–336.
Gordon, K. D. (1982). A study of microwear on Chimpanzee molars:Implications for dental microwear analysis. American Journal ofPhysical Anthropology 59, 195–215.
Gordon, K. D. (1988). A review of methodology and quantificationin dental microwear analysis. Scanning microscopy 2, 1139–1147.
Hayek, L. A. C., Bernor, R. L., Solounias, N. & Steigerwald, P.(1992). Preliminary studies of hipparionine horse diet as measuredby tooth microwear. Annales Zoologica Fennici 28, 187–200.
Healy, W. B. & Ludwig, T. G. (1965). Wear of sheep’s teeth. I. Therole of ingested soil. New Zealand Journal of Agricultural Research8, 737–752.
Hofmann, R. R. (1989). Evolutionary steps of ecophysiologicaladaptation and diversification in ruminants: a comparative view oftheir digestive system. Oecologia 78, 443–457.
Kay, R. F. & Covert, H. H. (1983). True grit: a microwearexperiment. American Journal of Physical Anthropology 61, 33–38.
Kemble, M. (1986). Opal phytoliths versus grit particles: implicationsfor microwear studies of sheep teeth. B.Sc. Dissertation. Depart-ment of Archaeology and Prehistory, University of Sheffield.
Mainland, I. L. (1994). An evaluation of the potential of dentalmicrowear analysis for reconstructing the diet of domesticated sheep(Ovis aries) and goats (Capra hircus) within an archaeologicalcontext. Ph.D. Thesis. University of Sheffield.
Mainland, I. L. (1998). The lamb’s last supper: the role of dentalmicrowear analysis in reconstructing livestock diet in the past. In(M. Charles, G. Jones & P. Halstead, Eds) The Archaeology ofFodder. Environmental Archaeology 1, 55–62.
Mainland, I. L. (1997). A qualitative approach to dental microwearanalysis. In (A. Sinclair, E. Slater, & J. Gowlett, Eds) Archaeologi-cal Sciences 1995: Proceedings of a Conference on the Applicationof Scientific Methods to Archaeology. Oxford: Oxbow BooksMonograph Series, pp. 213–221.
McNaughton, S. J., Tarrant, J. L., McNaughton, M. M. & Davis,R. H. (1985). Silica as a defence against herbivory and a growthpromoter in African grasses. Ecology 66, 528–535.
Molleson, T., Jones, K. & Jones, S. (1993). Dietary changes and theeffect of food preparation on microwear patterns in the lateNeolithic of Abu Hureya, Northern Syria. Journal of HumanEvolution 24, 455–468.
Nolan, T. & Black, W. J. M. (1970). Effect of stocking rate on toothwear in ewes. Irish Journal of Agricultural Research 9, 187–196.
Norusis, M. J. (1990). SPSS/PC+Advanced Statistics 4·0. Chicago:SPSS Inc., U.S.A.
Peters, C. R. (1982). Electron-optical microscope study of incipientdental microdamage from experimental seed and bone crushing.American Journal of Physical Anthropology 57, 283–301.
Piperno, D. (1988). Phytolith analysis. An archaeological and geologi-cal perspective. London: Academic Press.
van Soest, P. J. (1982). Nutritional Ecology of the Ruminant.Corvallis, Oregon: OB Books.
Solounias, N. & Hayek, L. A. C. (1993). New methods of toothmicrowear analysis and application to dietary determination oftwo extinct ungulates. Journal of Zoology 229, 421–445.
Solounias, N. & Moelleken, S. M. C. (1992). Tooth microwearanalysis of Eotragus sansaniensis (Mammalia Ruminantia): one ofthe oldest known bovids. Journal of Vertebrate Palaeontology 12,113–121.
Solounias, N., Teaford, M. & Walker, A. (1988). Interpreting thediet of extinct ruminants: the case of a non-browsing giraffid.Paleobiology 14, 287–300.
Teaford, M. F. (1993). Dental microwear and diet in extinct Thero-pithecus: preliminary analysis. In (N. G. Jablonski, Ed.) Thero-pithecus: The Life and Death of a Primate Genus. Cambridge:CUP, pp. 24–35.
Teaford, M. F. & Oyen, O. J. (1989a). Differences in the rate ofmolar wear between monkeys raised on different diets. Journal ofDental Research 68, 1513–1518.
Teaford, M. F. & Oyen, O. J. (1989b). In vivo and in vitro turnover indental microwear. American Journal of Physical Anthropology 80,447–460.
Teaford, M. F. & Robinson (1989). Seasonal or ecological differ-ences in diet and molar microwear in Cebus nigrivittatus. AmericanJournal of Physical Anthropology 80, 391–401.
Teaford, M. F. & Runestad, J. A. (1992). Dental microwear and dietin Venezuelan primates. American Journal of Physical Anthropol-ogy 88, 347–364.
Teaford, M. F. & Walker, A. (1984). Quantitative differences indental microwear between primate species with different diets anda comment on the presumed diet of Sivapithecus. American Journalof Physical Anthropology 64, 191–200.
Ungar, P. S. (1996). Dental microwear of European Miocene catar-rhines: evidence for diets and tooth use. Journal of HumanEvolution 31, 335–366.
Walker, P. L. (1976). Wear striations on the incisors of cerco-pithecoid monkeys as an index of diet and habitat preferences.American Journal of Physical Anthropology 45, 299–308.
Walker, A. C. & Teaford, M. F. (1989). Inferences from quantitativeanalysis of dental microwear. Folia Primatol 53, 177–189.
Walker, A. C., Hoek, H. & Perez, L. (1978). Microwear of mamma-lian teeth as an indicator of diet. Science 201, 908–910.


