Embed Size (px)
Citation preview
Molecular Characterization of Coimbatore Breed of Sheep (Ovis aries) in South India 1
Molecular Characterization of Coimbatore Breed of Sheep(Ovis aries) in South India
P Kumarasamy1, S Prema2, P Ganapathi3, S M K Karthickeyan4 and P Kanakaraj5
A total of 27 microsatellite primer sets specific for sheep were used in the study. The numberof observed alleles ranged from three to eight with a mean of 6.889 0.85 across all loci.The most frequent number of alleles was five (41%) and the least frequent number of alleleswas three, seven and eight (7%). The size of alleles ranged from 72-220 bp. In total, 143alleles were observed on 27 loci. The frequency of the alleles ranged from 0.0166-0.7245.Of the 27 loci, the effective number of alleles ranged from 3.72-6.33. The mean number ofeffective alleles was 4.9325 0.60 across all loci. The Polymorphism Information Content(PIC) values in the present study ranged from 0.3966-0.8096. Based on the PIC values, itwas found that 93% of these markers showed values of more than 0.5, indicating that thesemicrosatellite markers can be effectively used for molecular characterization and geneticdiversity studies. The results of the X2 test of goodness of fit revealed that the populationwas in Hardy-Weinberg Equilibrium (HWE) proportions for 19 microsatellite loci. Theremaining eight loci departed from HWE. The observed heterozygosity ranged from0.6250-0.8462 with a mean of 0.7404 0.06 while the expected heterozygosity rangedfrom 0.7211-0.8422 with a mean of 0.8106 0.03. Population inbreeding estimate (FIS)indicates heterozygote deficiency was observed to be 0.0666 with a range from –0.0063(OarHH72)-0.2233 (OarJMP29). Though positive FIS values were observed in 20 loci, theyreflect inbreeding in Coimbatore sheep. The markers used in the study were highlyinformative and high heterozygosity value is indicative of the higher amount of geneticvariability that can be exploited for their improvement.
Introduction
In India, there are 42 recognized breeds of sheep distributed in different agroclimaticzones of the country. Tamilnadu state is endowed with eight breeds of sheep, of whichfive are hairy meat type viz., Madras Red, Mecheri, Kilakarsal, Ramnad White and Vemburand three are wool type viz., Coimbatore, Trichy Black and Nilagiri (Acharya, 1982).
Keywords: Coimbatore sheep, Microsatellites, Allele frequency, PIC,2 test
©2009 The Icfai University Press. All Rights Reserved.
1 Associate Professor, Department of Animal Genetics and Breeding, Madras Veterinary College, Chennai600007, India; and the corresponding author. E-mail: [email protected]
2 Senior Research Fellow, Department of Animal Genetics and Breeding, Madras Veterinary College,Chennai 600007, India. E-mail: xxxxxxxxxxxxxxx
3 Post Graduate Student, Department of Animal Genetics and Breeding, Madras Veterinary College,Chennai 600007, India. E-mail: xxxxxxxxxxxx
4 Associate Professor, Livestock Research Station, Kattupakkam, Kattankolathur Post, Chenglepet603203, India. E-mail: xxxxxxxxxxxx
5 Professor and Head, Department of Animal Genetics and Breeding, Madras Veterinary College,Chennai 600007, India. E-mail: xxxxxxxxxxx
RA pl.provide mail ids

The Icfai University Journal of Genetics & Evolution, Vol. II, No. 3, 20092
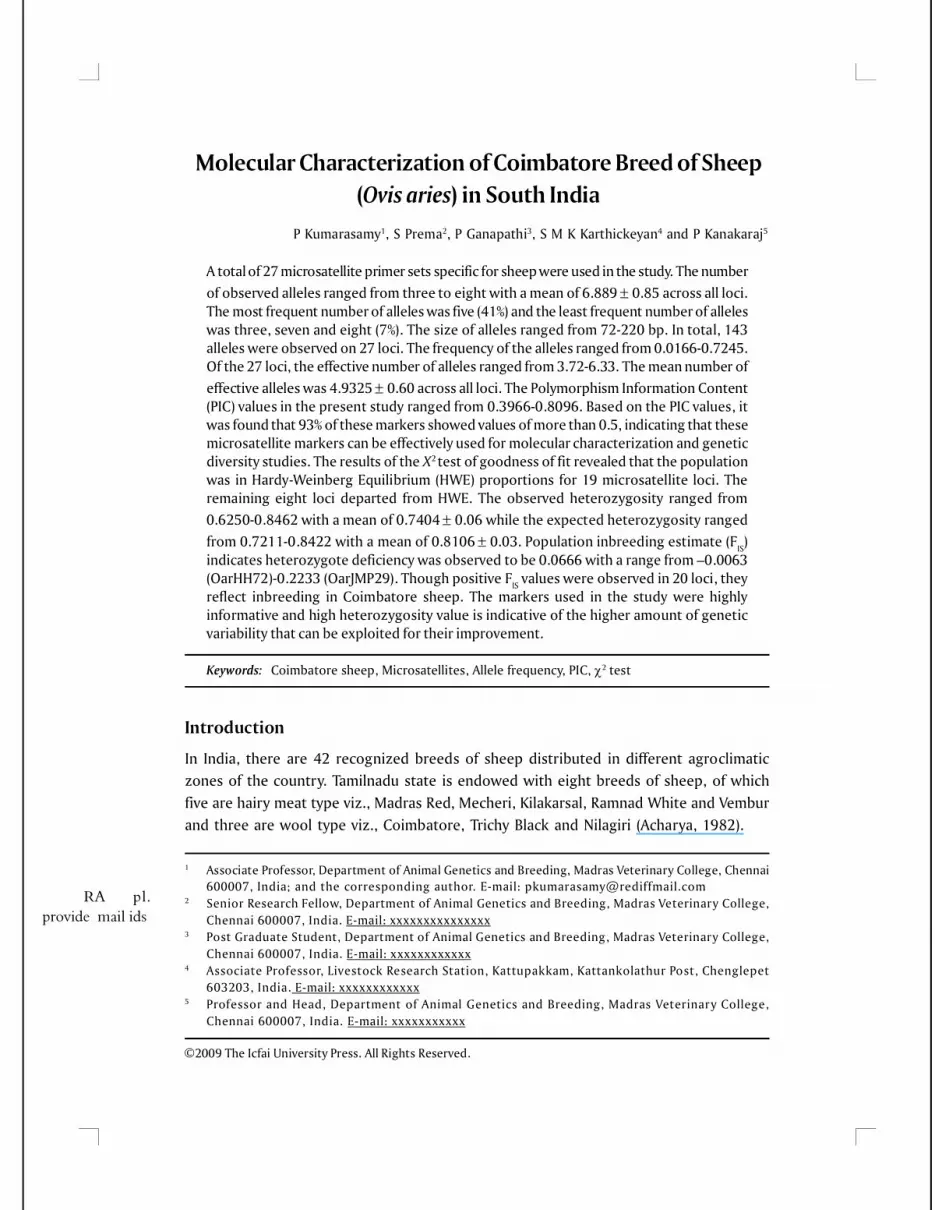
Coimbatore sheep, also known by the synonyms, Kurumbai Adu and Coimbatore Kurumbai,produce coarse carpet wool in addition to their use mainly as meat animals. The breedingtract of Coimbatore sheep is Coimbatore district of Tamilnadu, flocks are highly migratoryand medium-sized animals with compact body are penned for manure. They are white incolor with varying extent of black or tan coat and fleece in the head and neck, which mayalso extend up to the shoulder or back (Figure 1). They are docile and hardy with fastergrowth rate and early maturity.
The first step towards conservation of livestock genetic resources is the geneticcharacterization with respect to phenotypic parameters, unique qualities and utility.Subsequently, finding out the genetic architecture through molecular means andevolutionary relationship with other related breeds would provide valuable informationabout the breed for taking up conservation measures. Considering these facts, the presentstudy was carried out to characterize the Coimbatore breed of sheep using the molecularmarker, such as microsatellites.
DNA Samples
The microsatellite analysis was carried out in a sample of 50 unrelated Coimbatoresheep reared in the villages of Sulur taluk in Tamilnadu state, India. The samples were
Figure 1: Breeding Tract of Coimbatore Sheep
Photograph of Coimbatore Sheep,Ram and Ewe
Molecular Characterization of Coimbatore Breed of Sheep (Ovis aries) in South India 3
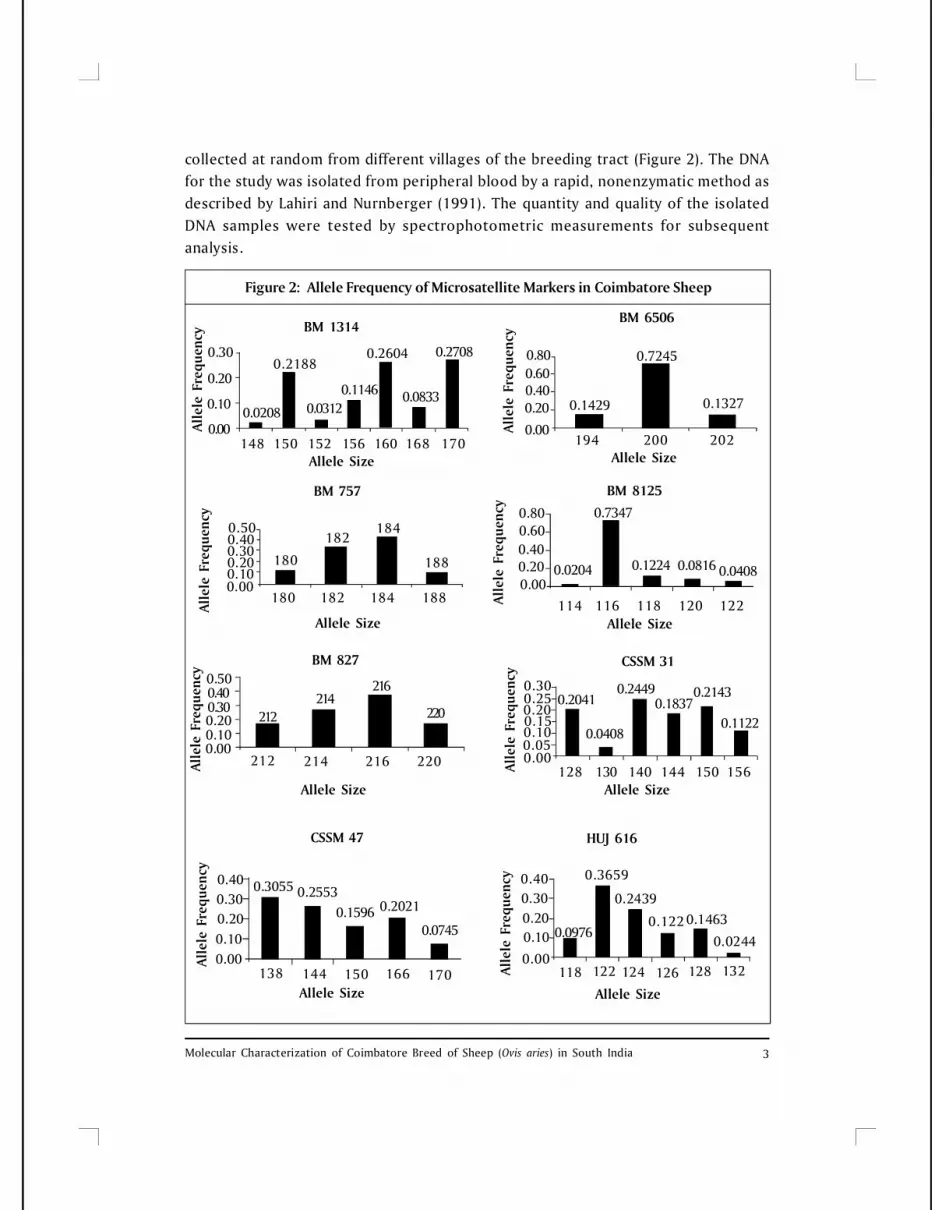
collected at random from different villages of the breeding tract (Figure 2). The DNAfor the study was isolated from peripheral blood by a rapid, nonenzymatic method asdescribed by Lahiri and Nurnberger (1991). The quantity and quality of the isolatedDNA samples were tested by spectrophotometric measurements for subsequentanalysis.
Figure 2: Allele Frequency of Microsatellite Markers in Coimbatore Sheep
0.30
0.20
0.10
0.00148 150 152 156 160 168 170
0.27080.2604
0.08330.11460.0312
0.2188
0.0208
BM 1314
Alle
le F
requ
ency
Allele Size
0.800.600.400.20
0.00194 200 202
Allele Size
0.1429
0.7245
0.1327
BM 6506
Alle
le F
requ
ency
0.500.400.300.200.100.00
180 182 184 188
188
184182
180
BM 757
Allele Size
Alle
le F
requ
ency
BM 8125
0.800.600.400.200.00
0.0204
0.7347
0.1224 0.0816 0.0408
114 116 118 120 122Allele Size
Alle
le F
requ
ency
CSSM 31
Alle
le F
requ
ency
0.300.250.200.150.100.050.00
128 130 140 144 150 156Allele Size
0.2041
0.0408
0.24490.1837
0.2143
0.1122
Alle
le F
requ
ency 0.50
0.400.300.200.100.00
212 214 216 220
220
216214
212
Allele Size
BM 827
0.400.300.200.100.00
138 144 150 166 170
Alle
le F
requ
ency
Allele Size
0.3055 0.25530.1596 0.2021
0.0745
CSSM 47
0.400.300.200.10
0.00118 122 124 126 128 132
0.0244
0.14630.122
0.2439
0.3659
0.0976
Alle
le F
requ
ency
Allele Size
HUJ 616

The Icfai University Journal of Genetics & Evolution, Vol. II, No. 3, 20094
Microsatellite Amplification
As per the secondary guidelines of Food and Agriculture Organization of United Nations(FAO, 2004), a total of 27 microsatellite markers were selected to screen the populationof Coimbatore sheep. The amplification of DNA was carried out using thermal cycler(MJ Research) with the PCR reaction mixture of 20 L. The mixture was prepared byadding 50-100 ng of template DNA; 1.5 M MgCl2; five picomoles each of forward andreverse primers; 0.75 units of Taq DNA Polymerase and 100 M dNTPs. Amplificationwas carried out with annealing temperatures ranging from 51 °C to 60 °C for differentprimers for 30 cycles. Amplified PCR products were resolved through a 6% denaturingPAGE along with a single stranded 10 bp DNA ladder (Invitrogen, USA) as marker andthe PCR products were sized after silver-staining procedure as recommended by Lujianget al. (2005).
Computation and Statistical Analysis
The microsatellite alleles were sized using Diversity Database software (BioRad, USA)and followed by manual verification. Genetic variation was quantified by calculatingobserved and effective number of alleles, observed heterozygosity, expectedheterozygosity and within breed heterozygotes deficiency (FIS) following the POPGENEprogram version 1.31 (Yeh et al., 1999). The Polymorphism Information Content (PIC) ofmicrosatellite loci was estimated using the formula given by Botstein et al. (1980) usingNei’s formula (1978). An exact test was used to determine deviations from the HardyWeinberg Equilibrium (HWE) using the GENEPOP software package version 3.2a (Raymondand Rousset, 1995). HWE tests were performed for each locus and all loci. Geneticbottleneck effect was inferred for the population using the qualitative graphical method(mode shift analysis) under the assumption of two-phase microsatellite mutation model(TPM), implemented in the program BOTTLENECK version 1.2.02 (Cornuet and Luikart,1996). This program is based on the principle that any population that has experienced arecent reduction in its effective population size exhibits a correlative reduction in theallele numbers and gene diversity at polymorphic loci.
Results and Discussion
Number of Observed Alleles and Their Frequencies
In the present study, the number of observed alleles ranged from three (BM6506 andOMHC1) to eight (TGLA377 and OarCP20) with a mean of six across all loci. The mostfrequent number of alleles was five (41% ) and the least frequent number of alleles wasthree, seven and eight (7%). The size of alleles ranged from 72 (OarCP20)-220 bp (BM827).In total, 143 alleles were observed on the 27 loci studied. The frequency of the allelesranged from 0.0166-0.7245 across all loci. The allele frequency is depicted inFigure 2. Similarly, 125 alleles were observed on the 25 loci in Nilagiri sheep with the
Molecular Characterization of Coimbatore Breed of Sheep (Ovis aries) in South India 5
frequency of the alleles ranged from 0.0104-0.5781 (Haris Girish et al., 2007). 126 alleleswere observed at 25 microsatellite in Muzzafarnagri sheep breed with the number ofobserved alleles varying between two and eight, the average being 5.04(Arora and Bhatia, 2004). In Garole sheep, the observed number of alleles reported was6.2 (Sodhi et al., 2003), which is a little higher than that of the present study. In Nali andChokla sheep breeds (carpet wool breeds of northwestern India), a total of 138 and 133alleles, respectively, were reported. The number of observed allele ranged from three toten in Nali and two to eight in Chokla with the respective means of 5.52 and 5.32 alleles(Sodhi et al., 2005), which is similar to the observation of the present study. In Magrabreed of sheep, another carpet wool breed of northwestern India, the number of observedalleles ranged from three to ten with a mean of 5.7 (Arora and Bhatia, 2006). In exotic sheepbreeds, a wide range of number of observed alleles were reported, two to four(Gutierrez-Espelata et al., 2000) and 7-28 (Pariset et al., 2003).
Effective Number of Alleles
Of the 27 loci studied, the effective number of alleles ranged from 3.72 (OarCP20)-6.33(OarJMP8). The mean number of effective alleles was 4.9325 0.60 across all loci (Table 1).The effective number of alleles at each locus provides information on predominant alleles.The results of the present study are similar to the earlier reports of 3.84 effective numberof alleles in Nilagiri sheep (Haris Girish et al., 2007), 3.73 in Garole sheep (Sodhi et al.,2003), 3.64 alleles in Muzzafarnagri sheep (Arora and Bhatia, 2004), 3.34 in Nali and 3.27 inChokla sheep (Sodhi et al., 2005) and 3.8 in Magra sheep (Arora and Bhatia, 2006).
Polymorphism Information Content
The PIC values for the 27 loci are presented in Table 1. In general, the PIC values aresuggestive of high polymorphic nature of the microsatellite loci analyzed. The PIC valuesin the present study ranged from 0.3966 (BM6506)-0.8096 (TGLA377). Based on the PICvalues, it was found that 93% of these markers showed values of more than 0.5, indicatingthat these microsatellite markers can effectively be used for molecular characterizationand genetic diversity studies.
Among the Indian sheep breeds, the PIC values were ranged from 0.4587-0.8277 with amean of 0.6485 in Nilagiri sheep (Haris Girish et al., 2007), 0.533-0.808 in Muzzafarnagrisheep (Arora and Bhatia, 2004) and 0.210-0.831 and 0.346-0.768 in Nali and Chokla sheepbreeds, respectively (Sodhi et al., 2005) and 0.347-0.849 in Magra sheep (Arora and Bhatia,2006) using ovine-specific microsatellite markers. Among the exotic sheep breeds, the lowestPIC value has 0.20 (Jandurova et al., 2005) and the highest of 0.89 (Arranz et al., 2001).
Hardy-Weinberg Equilibrium
The results of the X2 test of goodness of fit (Table 1) revealed that the population was inHWE proportions for eight microsatellite loci. The remaining 19 loci departed from

The Icfai University Journal of Genetics & Evolution, Vol. II, No. 3, 20096
HWE, which might be either due to the presence of unobserved null alleles (non-amplifyingalleles) or the consequences of several years of intensive selection practiced in thepopulation of Coimbatore sheep. On the contrary, the systematic or dispersive forceshave not influenced those loci under HWE. The reports on Indian sheep breed Nilagiriwas in HWE proportions for 17 microsatellite loci and the remaining eight loci departedfrom HWE (Haris Girish et al., 2007). The reports on exotic sheep breeds revealed similardeparture of the populations from HWE at various microsatellite loci (Diez-Tascon et al.,2000; Tomasco et al., 2002; Alvarez et al., 2004; Jandurova et al., 2005; Ivankovic et al.,2005; and Calvo et al., 2006). On the other hand, some of the reports showed that thesheep populations studied were in HWE for the respective microsatellite loci (Gutierrez-Espelata et al., 2000; and Soysal et al., 2005).
Estimation of Observed and Expected Heterozygosity
Genetic diversity can be measured as the amount of actual or potential heterozygosity.The estimates of heterozygosity for each locus are given in Table 1. The observedheterozygosity ranged from 0.6250 (OarHH41)-0.8462 (CSSM31) with the mean of 0.7404
0.06 while the expected heterozygosity ranged from 0.7211 (OarCP20)-0.8422 (OarJMP8)with a mean of 0.8106 0.03. The high heterozygosity values estimated in the presentstudy could be attributed to low level of inbreeding, low selection pressure and large numberof alleles. The genetic markers having a higher number of alleles per locus and a higherdegree of heterozygosity are more useful for population and individual typing. The very lowlevel of inbreeding related to the population size estimated in the present study could notlead to the possibility of fixation of alleles. The high heterozygosity values obtained in theCoimbatore sheep were in accordance with those reported in French Mutton Merino (0.679;Diez-Tascon et al., 2000), Swiss sheep breeds (0.67; Saitbekova et al., 2001), Nilagiri (0.7213;Girish et al., 2007), Garole (0.673; Sodhi et al., 2003), Muzzafarnagri (0.697; Arora and Bhatia,2004), Spanish sheep (0.776; Calvo et al., 2006), Czech and Slovak sheep breeds (0.736; Jandurovaet al., 2005), Baltic sheep breeds (0.71; Tapio et al., 2005), Pag Island sheep (0.833; Ivankovicet., 2005), Turkish sheep breeds (0.75; Soysal et al., 2005), Nali and Chokla sheep breeds(0.67; Sodhi et al., 2005) and Magra sheep (0.69; Arora and Bhatia, 2006).
Within-Population Inbreeding Estimate
Population inbreeding estimate (FIS) indicates heterozygote deficiency observed to be0.0666 with a range from –0.0063 (OarHH72)-0.2233 (OarJMP29). Though positive FIS
values were observed in 20 loci, reflects inbreeding in Coimbatore sheep. The shortageof heterozygotes (6.66%) and excess of homozygotes might be attributed to a number offactors viz., Wahlund effect if population subdivision is occurring, assortative mating(sample relatedness), linkage with loci under selection (genetic hitchhiking), populationheterogeneity, null alleles (non-amplifying alleles) or inbreeding. Positive FIS valuesuggested inbreeding to be one of the main causes for lack of heterozygotes in Jalauni

Molecular Characterization of Coimbatore Breed of Sheep (Ovis aries) in South India 7
1. BM1314 7 5.3651 148-170 0.7575 36.87** 0.7692 0.8136 0.0545
2. BM6506 3 4.8450 194-202 0.3966 42.99** 0.7600 0.7936 0.0423
3. BM757 4 4.7961 180-188 0.6118 64.92** 0.7407 0.7915 0.0641
4. BM8125 5 3.9765 114-122 0.4101 20.23 NS 0.7692 0.7485 –0.0277
5. BM827 4 5.0625 212-220 0.6707 43.62** 0.7778 0.8025 0.0308
6. CSSM31 6 4.5369 128-156 0.7749 09.26 NS 0.8462 0.7929 –0.0854
7. CSSM47 5 4.8286 138-170 0.7295 45.88** 0.7308 0.7929 0.0784
8. HUJ616 6 4.5684 118-132 0.7252 63.90** 0.6951 0.8204 0.1521
9. OarAE129 5 4.2832 140-152 0.7445 21.11** 0.7727 0.7665 –0.0081
10. OarCP20 8 3.7194 72-90 0.7228 14.36 NS 0.6667 0.7311 0.0882
11. OarCP34 5 4.3860 114-124 0.6726 13.50 NS 0.7600 0.7720 0.0155
12. OarCP38 6 5.9039 110-132 0.7506 31.25 NS 0.7692 0.8306 0.0739
13. OarFCB128 7 4.5896 100-122 0.7719 13.83 NS 0.7917 0.7821 –0.0122
14. OarFCB20 5 5.2258 92-102 0.7215 40.63* 0.6296 0.8036 0.2214
15. OarFCB48 6 4.9706 118-132 0.7927 94.08** 0.7308 0.7988 0.0852
16. OarHH35 6 5.2000 122-140 0.7426 35.36* 0.7308 0.8077 0.0952
17. OarHH41 5 4.7603 120-130 0.6653 39.99** 0.6250 0.7899 0.2088
18. OarHH47 5 4.5000 134-142 0.6666 64.80** 0.7957 0.7778 –0.0179
19. OarHH64 5 4.7170 118-132 0.6738 25.31* 0.6800 0.7800 0.1371
20. OarJMP29 5 5.1200 110-122 0.7401 18.16 NS 0.6250 0.8047 0.2233
21. OarJMP8 4 6.3353 144-160 0.6827 47.12* 0.6957 0.8422 0.1740
22. OarHH72 5 5.8182 120-134 0.5926 28.31NS 0.8330 0.8281 –0.0063
23. RM4 4 4.9021 132-140 0.5914 74.23** 0.7083 0.7900 0.1101
24. TGLA137 5 5.6306 144-160 0.6849 33.82* 0.8400 0.8224 –0.0214
25. TGLA377 8 4.5801 84-100 0.8096 69.32** 0.7391 0.7817 0.0544
26. OMHC1 3 5.3333 178-182 0.5430 68.31** 0.7917 0.8125 0.0256
27. BM6526 6 4.223 144-174 0.7143 42.99** 0.7600 0.7936 0.0423
Mean 6.889 4.9325 – – – 0.7404 0.8106± 0.0666±0.85±0.60 – – – ±0.06 0.03 –
Table 1: Number of Observed and Effective Alleles, Size of Alleles, PolymorphismInformation Content (PIC), Observed and Expected Heterozygosity at 27 Microsatellite Loci
in Coimbatore Sheep
Note: NS– Not significant; * – Significant (p < 0.05); ** – Highly significant (p < 0.01).
Sl.
No.
Locu
s
Obs
erve
d Al
lele
s
Effe
ctiv
e Al
lele
s
Alle
le S
ize
Ran
ge (b
p)
PIC
HW
E(x
2 Val
ue)
Obs
erve
d
Expe
cted
Wit
hin
Popu
lati
onIn
bree
ding
Est
imat
e(F
IS)

The Icfai University Journal of Genetics & Evolution, Vol. II, No. 3, 20098
sheep. In the absence of detailed past information about this breed it is, however,difficult to identify precisely which past demographic factors affected the current geneticstructure of this breed.
The FIS reported in most of the literature indicated various levels of inbreedingas –0.0551 in Nilagiri sheep (Haris Girish et al., 2007), 0.19 in Sarda sheep (Pariset etal., 2003), 0.066 in Spanish breeds (Alvarez et al., 2004), 0.009 in Spanish sheep(Calvo et al., 2006) and 0.033 in Turkish sheep breeds (Soysal et al., 2005). Among theIndian sheep breeds, Arora and Bhatia (2004) reported a mean FIS value of 0.058 inMuzzafarnagri indicating a very low rate of inbreeding in that population. However,a high rate of inbreeding was reported in Nali and Chokla (0.397 and 0.299 respectively;Sodhi et al, 2005) and Magra (0.159; Arora and Bhatia, 2006) sheep breeds.
Conclusion
Large number of loci revealed in Coimbatore sheep breed with respect to 27 microsatellitemarkers screened in the study. In regard to PIC, 93% of these markers showed values ofmore than 0.5 suggests that these markers are highly informative for characterization ofCoimbatore sheep. It also opens up the scope for exploiting the genetic variability inthe population for conservation. Detailed studies on comparative analysis with otherIndian sheep breeds will determine the genetic distance and relationship of Coimbatoresheep breed.
Acknowledgment: The authors express sincere gratitude to the Director, NBAGR, Dr Gurmej
Singh, Principal Scientist I/c Network Projects, Dr B P Mishra, Coordinator, Network Projects-Core
Laboratory, National Bureau of Animal Genetic Resources, Karnal, for the administrative and
financial support by the Indian Council of Agricultural Research (ICAR, New Delhi) through ICAR
Network Projects-Core Laboratory. They also thank Tamilnadu Veterinary and Animal Sciences
University for providing necessary facilities for this study.
References
1. Acharya R M (1982), “Sheep and Goat Breeds of India”, FAO Animal Production andHealth Paper 30, Food and Agriculture Organization of the United Nations, Rome,pp. vii+190.
2. Alvarez I, Royo L J, Fernandez I, Gutierrez E Gomez J P and Goyache F(2004), “Genetic Relationships and Admixture Among Sheep Breeds fromNorthern Spain Assessed Using Microsatellites”, J. Anim . Sci . , Vol. 82,pp. 2246-2252.
3. Arora R and Bhatia S (2006), “Genetic Diversity of Magra Sheep from India UsingMicrosatellite Analysis”, Asian-Aust. J. Anim. Sci., Vol. 19, pp. 938-942.
^

Molecular Characterization of Coimbatore Breed of Sheep (Ovis aries) in South India 9
4. Arora R and Bhatia S (2004), “Genetic Structure of Muzzafarnagri Sheep Based onMicrosatellite Analysis”, Small Rumin. Res., Vol. 54, pp. 227-230.
5. Arranz J J, Bayon Y and San Primitivo F (2001), “Genetic Variation at MicrosatelliteLoci in Spanish Sheep”, Small Rumin. Res., Vol. 39, pp. 3-10.
6. Botstein D, White R L, Skolnick M and Davis R W (1980), “Construction of GeneticLinkage Maps in Man Using Restriction Fragment Length Polymorphisms”, AmericanJournal of Human Genetics, Vol. 32, pp. 314-331.
7. Calvo J H, Bouzada J A, Jarado J J and Serrano M (2006), “Genetic Substructure ofSpanish Manchega Sheep Breed”, Small Rumin. Res., Vol. 64, pp. 116-125.
8. Cornuet J M and Luikart G (1996), “Description and Power Analysis of Two Tests forDetecting Recent Population Bottlenecks from Allele Frequency Data”, Genetics,Vol. 144, pp. 2001-2014.
9. Diez-Tascon C, Little John R P, Almedia P A R and Crawford A M (2000), “GeneticVariation within the Merino Sheep Breed: Analysis of Closely Related PopulationsUsing Microsatellites”, Anim. Genet., Vol. 31, pp. 243-251.
10. FAO (2004), “Secondary Guidelines for Development of National Farm Animal GeneticResources Management Plans for Global Management of Cattle Genetic ResourcesUsing Reference Microsatellites Global Projects for the Maintenance of DomesticAnimal Genetic Diversity (MoDAD)”. [http://www.fao.org/dad-is/]
11. Gutierrez-Espelata G A, Kalinowski S T, Boyce W M and Hedrick P W (2000), “GeneticVariation and Population Structure in Desert Bighorn Sheep: Implications ofConservation”, Cons. Genet., Vol. 1, pp. 3-15.
12. Haris Girish S N, Sivaselvam S M K Karthickeyan and R Saravanan (2007), “MolecularCharacterization of Nilagiri Sheep (Ovis aries) of South India Based on Microsatellites”,Asian-Aust. J. Anim. Sci., Vol. 20, No. 5, p. 633.
13. Ivankovic A, Dovc P, Karvar T, Caput P, Mioc B, Pavic V, Stuhec V and Leto J (2005),“Genetic Characterization of the Pag Island Sheep Breed Based on Microsatelliteand mtDNA Data”, Small Rumin. Res., Vol. 57, pp. 167-174.
14. Jandurova O M, Kott T, Kottova B, Czernekova V and Milerski M (2005), “GeneticRelationships Among Sumova, Valachian and Improved Valachian Sheep”, Small Rumin.Res., Vol. 57, pp. 157-165.
15. Lahiri D K and Nurnberger J I (1991), “A Rapid Non-Enzymatic Method for thePreparation of DNA from Blood for RFLP Studies”, Nucl. Acids Res., Vol. 19, p. 5444.

The Icfai University Journal of Genetics & Evolution, Vol. II, No. 3, 200910
Reference # 66J-2009-08-0x-01
RA pl. chk not inref list
16. Lujiang Qu, Xianyao Li, Guiqin Wu and Ning Yang (2005), “Efficient and SensitiveMethod of DNA Silver Staining in Polyacrylamide Gels”, Electrophoresis, Vol. 26,pp. 99-101.
17. Nei M (1978), “Estimation of Average Heterozygosity and Genetic Distance from aSmall Number of Individuals”, Genetics, Vol. 89, pp. 583-590
18. Nei M (1987), Molecular Evolutionary Genetics, Columbia University Press, New York.
19. Pariset L, Savarese M C, Cappuccio I and Valentini A (2003), “Use of Microsatellitesfor Genetic Variation and Inbreeding Analysis in Sarda Sheep Flocks of Central Italy”,J. Anim. Breed. Genet., Vol. 120, pp. 425-432.
20. Raymond M and Rousset F (1995), “GENEPOP (Version 1.2): Population GeneticsSoftware for Exact Tests and Ecumenicism”, Journal of Heredity, Vol. 86, pp. 248-249.
21. Saitbekova N, Schlapfer J, Dolf G and Gaillard C (2001) “Genetic Relationship inSwiss Sheep Breeds Based on Microsatellite Analysis”, J. Anim. Breed. Genet., Vol.118, pp. 379-387.
22. Sodhi M, Mukesh M and Bhatia S (2005), Characterizing Nali and Chokla SheepDifferentiation with Microsatellite Markers, Small Rumin. Res. (In press).
23. Sodhi M, Mukesh M, Arora R, Tantia M S and Bhatia S (2003), “Genetic Structure ofGarole—a Unique Indian Microsheep Assessed Using Microsatellite Markers”, Ind.J. Dairy Sci., Vol. 56, pp. 167-173.
24. Soysal M I, Koban E, Ozkan E, Altunok Z, Bulut M Nizamlioglu and Togan (2005),“Evolutionary Relationship Among Three Native and two Cross Breed Sheep ofTurkey: Preliminary Results”, Rev. Med. Vet., Vol. 156, pp. 289-293.
25. Tapio I, Tapio M, Grislis Z, Holm L E, Jeppsson S, Kantanen J, Miceikiene I, OlsakerI, Viinalass H and Eythorsdottir (2005), “Unfolding of Population Structure in BalticSheep Breeds Using Microsatellite Analysis”, Heredity, Vol. 94, pp. 448-456.
26. Tomasco I, Wlasicit G and Lessa E P (2002), “Evaluation of Polymorphism in TenMicrosatellite Loci in Uruguayan Sheep Flocks”, Genet. Mol. Biol., Vol. 25, pp. 37-41.
27. Yeh F C, Boyle T, Rongcai Y, Ye Z and Xian J M (1999), Popgene, Version 1.31,A Microsoft Windows Based Freeware for Population Genetic Analysis, University of Alberta,Edmonton.


