Embed Size (px)
Citation preview
International Journal of Business and Management December, 2008
1
Contents
Commoditization – Coming to a company near you 3
Andrew Holmes & John Ryan
Brand Loyalty in Fast Moving Consumer Good Markets: The Role of Bonds 7
Rose Leahy
Analysis and Comparison of ARCH Effects for Shanghai Composite Index and NYSE Composite
Index
20
Xinghao Liao & Guangdong Qi
Analysis of American Potential Benefits At the Back of “Considerable” Sino-American Trade Deficit 25
Peng Luo
Evaluating Direct Marketing Practices on the Internet via the Fuzzy Cognitive Mapping Method 31
Selcuk Burak Hasiloglu & Recai Cinar
Research on the Quality Competence in Manufacturing Industry 39
Xiaoping Ma & Zhijun Han
Corporate Governance and Audit Independence: Empirical Evidence of Iranian Bankers 44
Mahdi Salehi
The Analysis on the Factors Which Affecting Price Dispersion between Traditional Retail Channel
and Internet Retail Channel
52
Xujin Pu
Suggestion on Promoting Agricultural Insurance in China 57
Yu Zheng, Juan Zhang & Wangxi Wang
The Importance of Soft Factors for Quality Improvement: Case Study of Electrical and Electronics
Firms in Malaysia
60
Muhammad Madi Bin Abdullah, Zainal Ariffin Ahmad & Azman Ismail
An Econometric Study on Impact of Futures Trading On the Stability of Stock Index in India 70
Sathya Swaroop Debasish & Bhagaban Das
Green Marketing and Sustainable Development of Garment Industry-A Game between Cost and
Profit
81
Huanfeng Li & Weimin Cai
On the Legal and Market Analysis of “Direct Selling” in China 86
Yu Tian
Small and Medium Sized Enterprises Development under Trade Liberalisation: A Survey of Nigerian
Experience
92
Obokoh, Lawrence Ogechukwu
On the Basis and Predicament of Applying Organizational Support Theory to Chinese Public Human
Resource Management
102
Huali Wu
Vol. 3, No. 12 International Journal of Business and Management
2
Contents
Key Antecedents of Organizational CitizenshipBehavior (OCB) in the Banking Sector of Pakistan 106
Zirgham ullah Bukhari
Study on the Bridge Surface Deicing System in Yuebei Section of Jingzhu Highway 116
Shunqing Li & Xi Ye
The Challenges of Evolving and Developing Management Indigenous Theories and Practices in Africa 122
Benjamin James Inyang
Income Elasticity of Time Deposit in the Context of Bangladesh 133
Arup Kumar Sinha, Muntasir Chaudhury & A. H. M. R. Imon
Organizational Culture and Its Themes 137
Shili Sun
Necessarity of Practicing Green Manufacturing in Iron Industry from the Point of Social Responsibility 142
Zhihong Zhang & Xi Tian
Corporate Environmental Reporting: An Emerging Issue in the Corporate World 146
Alok Kumar Pramanik, Nikhil Chandra Shil & Bhagaban Das
A New Idea about Ricardo’s Comparative Advantage Theory on Condition of Multi-Commodity and
Multi-Country
155
Yiqian Tian
An Analysis of Business Challenges Faced by Foreign Multinationals Operating the Chinese Market 169
Jianlian Wu
The Modification of PCFR Parameters in Material Preparation Logic for EOL Stage 175
Wenxing Zhou & Yachao Wang
Causal Links between Foreign Direct Investment and Exports: Evidence from Malaysia 177
Siti Hajar Samsu, Alias Mat Derus, Ai-Yee,Ooi & Mohd Fahmi Ghazali
International Journal of Business and Management December, 2008
3
Commoditization – Coming to A Company Near You
Andrew Holmes, Partner, Paricint
No. 4, 19 Buckingham Street, London, WC2N 6EG, United Kingdom E-mail: [email protected]
Professor John Ryan (Corresponding author) Academic Dean
Hult International Business School
46 - 47 Russell Square, London, WC1B 4JP, United Kingdom
Tel: 44- 795- 176 -5549 E-mail: [email protected]
Abstract
The issue of commoditization has been receiving more attention in recent times. First the debate is now about how quickly commoditization is sweeping across the corporate world; in sectors and functions which we had previously thought were safe from it. And second, it is the depth and breadth to which commoditization is now penetrating; no longer the preserve of the blue collar worker it is beginning to spread into white collar work that is usually considered immune to the negative impacts of commoditization, particularly as it requires the application of intellect, skill and expertise which unlike blue collar work is generally harder to automate. Like so many processes that play out in the business world, it may have started quite slowly and in quite limited areas, but it is speeding up and extending its reach.
Keywords: Commoditization, Competition, Offshoring, Skills
1. Shifting gear
Commoditization is no longer just about machinery, computers and plant. Nor is it about the odd industry or two. It is beginning to be about people, human capital, skills and expertise and it is spreading into those industries that have previously held up their margins and kept out the competition. Two obvious and quite simple examples spring to mind, the first is project management and the second is software development and maintenance.
A decade ago, being a project manager was special; there was some kudos attached to the title, as the skills, knowledge and expertise were quite limited and restricted to a relatively few specialists. Project managers could earn decent salaries and could expect to do so well into the future. But things have changed since then. Project managers, although still critical to the average corporate are more common, cost less, and the kudos attached to the title has diminished considerably. In fact most project managers prefer to be called programme managers these days because of the status that programme managers have over project managers. Why has this happened? There are a few reasons. First the number of qualified project managers has increased significantly – no wonder when the demand for their skills has grown as organizational complexity and the need for effective change has increased. The basics of supply and demand have meant that project managers can now be hired more cheaply than in the past. Second professional bodies, academics and practitioners alike have strived to improve the quality and repeatability of the underlying processes of project management, thereby opening them up to the forces of commoditization. The introduction of detailed standards, processes and a proliferation of courses which train people to the same level all help to demystify the art of project management and lower the bar to entry. In essence it has allowed much of the tacit knowledge of experienced project managers to be distilled and codified so that it can become explicit and reusable. Finally, the increasing use of technology, aided and abetted by this codification, has reduced some of the toil and intellectual horse power required to execute the project management processes. Some argue that it releases the project manager to do more value-added work and concentrate on leadership and direction. Others believe that it has dumbed down the project manager, or has at least allowed the process of project management to be undertaken by someone who is lesser qualified, more junior and ultimately cheaper to employ.
A similar argument can be applied to software development and maintenance, which has also seen dramatic shifts in the profitability of the industry and the incomes of those employed within it. Back in the 1950s software development and IT in general were in their infancy. The sheer complexity and associated costs of building systems was a major inhibitor to its use. However, as waves of innovation continued to yield major advances in technology, organizations started to harness IT to good effect to the point where it is now ubiquitous and according to some commentators at least, no longer matters. Over the intervening 50-60 years, the process of building and maintaining technology systems has been simplified and

Vol. 3, No. 12 International Journal of Business and Management
4
codified. And although there are still plenty of problems associated with building complex enterprise-wide applications, there are many examples of packaged based solutions which are capable of addressing the needs of any business. As software systems became more widespread the number of people involved with the profession increased and whilst there were limited or no standards in place, those who were in software could command high salaries, especially if they happened to have knowledge of the latest technology, software language or operating system. Over time as standards were developed, methods for the creation of software systems were designed and promulgated and technologies were stabilised and became more reliable, the need for highly paid specialists reduced. The only blip on this otherwise smooth path towards commoditization was Year 2000 and the global panic that ensued, but the effects of this were short lived.
There are plenty of similarities to the changes we have witnessed in project management, but there are also at least four additional factors that have accelerated the commoditization of the software professional. The first is increasingly held belief that IT no longer matters because it is so much part of the fabric of the average organization that it is no longer capable of generating strategic advantage. The second is the rise of highly educated software engineers further east and especially in India. This has allowed companies to develop systems to similar or higher levels of quality but at a fraction of the cost. Heinrich von Pierer of Siemens summed this up incredibly well when he said: ‘For the same money it takes to hire 2,000 German software developers, I can get 12,000 in China. This process is commonly known as labour arbitrage. The third is the dominance of a small number of software platforms and applications that have allowed organizations to standardize their use of IT and eliminate the need for bespoke systems. And finally, the ongoing maintenance of software has been pushed out to lower cost providers because it is no longer perceived to be core to the business. The impact has been to depress the incomes of the software engineering professional and reduce the margins of those providing IT services, mainly through increased competition and the availability of cheap labour.
Simple examples perhaps but they begin to illustrate the forces and factors which are helping to bring commoditization onto the agenda of a wide range of organizations, both large and small. Of course, if it was just about the commoditization of certain types of resources, then maybe organizations wouldn’t need to worry. But there are other things to consider which are also helping to drive commoditization deep into the heart of the corporation. Some of the factors which are bearing down include:
The intellectual competition coming from Asia, and especially India and China who now produce some four million graduates every year. What makes this number even more daunting is the fact that between 30 and 50 per cent of these graduates are unemployed in their home countries, which leaves a vast number of intelligent workers to be mopped up by the global economy.
Western economies are aging fast and have to adjust to the realities of longer working lives with a less productive workforce. This represents a major issue for employers who have to deal with the problem of motivating middle aged employees who are feeling increasingly disaffected and rejected (both by their employers who have failed to live up to the promise of lifetime employment which offered progression and challenging careers and by the state itself, which is no longer capable of providing for them in their old age). This is something that a recent Harvard Business Review article termed middlescence. The article claims that this is a major issue confronting large numbers of organizations and according to its authors, organizations which fail to deal with the issues that middlescence presents are sitting on a time-bomb that will continue to tick louder and louder as the baby boomers on which today’s organizations were built retire in droves. Given that fifty per cent of the working population can be considered middlescent, this is something that isn’t going away. In another recent book, The Living Dead, David Bolchover outlines the sheer waste that exists in the typical organization; staff who are bored, unproductive, surfing the net and doing very little in the way of work all contribute to the sense of futility that many workers feel in their working lives. Ironically the lack of productivity, motivation and innovation that is associated with middlescence and the living dead provides a healthy breeding ground for the further commoditization of work. Organizations will have no choice but to seek out more productive, innovative and effective employees, principally overseas, in order to insulate themselves from the impact of a disaffected and unproductive workforce.
Just as the number of smart graduates increases in the East, the number declines in the West. Fewer students are pursuing science and engineering degrees which is making it much harder for companies to innovate. There seems to be a misconception that creative degrees will be the engine of growth for the future economy; creative does not automatically equate to innovative. This makes it difficult for corporates to escape the commoditization trap and sets them on a path to obsolescence. There is also a noticeable dumbing down in education levels which is exacerbating the problem. But that is not the whole story, because the number of jobs which genuinely require graduate level capabilities is declining due to the impacts of technology and process driven change (see next points).
Technology continues to disrupt the status quo, opening up new opportunities to competitors and facilitating the shift of labour to low cost economies. This is especially true of the internet which is making it much easier to compete on cost, which increasingly matters in a globalized market. As well as opening up new competition, technology continues to eliminate high paying jobs as business processes are subsumed into enterprise wide and package-based applications.
International Journal of Business and Management December, 2008
5
Work continues to be codified and systematised in order to increase the efficiency of core business processes so that organizations can reduce their overheads and focus their capital on innovation and maintaining or reducing the costs of their goods and services. Achieving a balance is not easy, but the majority of organizations will have little choice but to maintain a focus on cost containment in order to compete. When the balance is wrong it can set the organization onto a downward spiral of cost cutting and lower performance which can result in their ultimate failure. The fundamental problem with competing on cost is that there is always someone else who is willing to cut their costs even further than you.
There is a growing imbalance between the number of graduates and the jobs that require graduate level skills and capabilities. In the past it was possible for graduates to walk into well paid jobs and expect a career which allowed them to both apply their new found expertise and offer them long-term progression. However because the number of graduates has been growing faster than graduate level jobs there is now a glut of degree holders. According to the US Labour Department’s Bureau of Labour statistics there are 2.6 graduate job seekers for every graduate level job. People with graduate level skills working in jobs which do not require those feeds the turn-up and tune-off approach of dealing with the 7-10 hours they spend in the office – the living dead as mentioned above. And although not in the middlescent zone just yet, it won’t be long before a whole new tranche of demotivated employees enters that difficult mid-career period .
A whole generation has been brought up in a world where goods and services can be obtained cheaply. Unless we are dealing with luxury goods, no one wants to pay more than they have to for the products and services they buy. The availability of cheap goods and services has been significantly enhanced through the internet, where prices can be readily assessed and where it is possible for one product/service to be compared to another, with the lower cost provider usually winning out and from the influx of well educated immigrants who are willing to work for lower incomes. However, there are downsides to this focus on cost. First as it forces organizations to concentrate on their costs and overheads to the detriment of everything else. Not a bad thing perhaps, but when this begins to affect peoples’ income and employability it starts to create issues. Second it makes it harder for them to innovate and build the products and services on which their future depends. And finally it starts them onto the race to the bottom, where the death spiral of cost reduction leaves the organization hollowed out and bereft of the talent it needs to survive in a commoditized world.
These and many other factors work together to create an environment in which the commoditization of products, services and people is possible. Commoditization may not be new for some, but for many it is a new reality that needs to be understood and responded to. There is little point is hoping that it will not happen to your business or you as an individual because hope is not a strategy.
2. The commoditized zone
Commoditization is a very real threat to every organization and it is comparatively straightforward to identify the early warning signs, which include:
Increasing competition
Prevalence of me-too products and services
A belief that all suppliers are fundamentally the same
The decreasing desire on the customer’s part to look at new options or features
An increasing preference for customers to select on the basis of price and little else
A reluctance for customers to pay for anything they consider unnecessary
Increasing pressures on margins.
Strong brands might help to insulate the organization from some of the worst impacts, but as we have seen in the past with organizations such as IBM, even the strongest and most dominant organizations come under threat from time to time. Even for those organizations which operate within a safe sector, such as energy for example, commoditization is still an issue they have to address, especially in terms of their non-core activities. At its extreme, commoditization leaves the leaders of corporations with a very simple and stark choice: do we allow ourselves to become commoditized and hence do our best to survive, or do we do our best to avoid it? Of course for some, the former may be the only choice open to them and for many it will probably be a mix of both. Naturally there is a strategic choice involved as some organizations can be considered to be driving commoditization. In doing so they are gaining first mover advantage. Take Easy Everything, which has a range of companies under its umbrella which are initiating a wave of commoditization in a number of sectors, most notably Easy Jet, but also cinemas, car hire, cruise liners, and hotel accommodation. As the zone of commoditization continues to expand, organizations must do everything they can to ensure they can compete without either destroying the value they offer to their customers or going out of business because their underlying costs are just too high to compete with the leaner more efficient companies which are emerging from India, China, South America and Asia. These companies are able to lower their prices without destroying their business.
Vol. 3, No. 12 International Journal of Business and Management
6
Of course commoditization is not just about organizations; it is also about people, especially because the success of any business depends on having staff with the right mix of skills, attitudes and behaviours. We have been hearing for a long time now about the war for talent and how this is going to affect the viability of corporation everywhere. More recently, and as some of the points made above allude to, we have had our attention diverted to the impacts of the impending loss of the Boomer Generation. All this is fine, but the war for talent only really affects a comparatively small number of employees with the experience and expertise which is currently in demand and the Boomer Generation won’t all be retiring tomorrow; in fact the last boomer won’t be hanging up their boots for another 18 years and perhaps longer given that so few of them have saved enough to retire with a comfortable income. If we look back only a few years the war for talent was a huge issue until downsizing hit the corporate world and the combined impacts of the September 11th terrorist attacks and the bursting of the tech bubble ensured that the war for talent was placed firmly on the back burner. But the war for talent is not a static phenomenon because the skills required in the workplace continually shift. Whilst IT and especially knowledge of legacy applications was in high demand in the last few years of the last century, the emergence of highly skilled Indian IT experts has essentially commoditized IT to the point where staff and consultancies alike can no longer command the six figure salaries they got used to. No more war for talent here then – despite all the doom laden projections claiming that there were not enough software engineers to cope with the anticipated demand for technology solutions. If you look across the wider economy, it seems that the war for talent is shifting to a war for low grade operational staff. Such people are either required to serve others in the increasingly service oriented economy or act as glorified machine minders. An extreme view perhaps, but the impact of technology is dumbing down the world of work to the point where the glut of graduates both here and the emerging economies will wind up in jobs which will barely test their skills. This hollowing out is something that Charles Handy discussed in his book the Empty Raincoat as far back as 1994. His metaphor was the doughnut in which the essential core of the organization which contained all of the necessary jobs and employees is surrounded by an open and flexible space which is filled by contractors, consultants and these days’ outsourcers. Coming back to the war for talent, it is clear that Handy’s model provides another lens through which this can be viewed. The talent war, as far as it exists, is raged at the core of the doughnut not necessarily beyond it.
Commoditization is therefore a significant threat to the traditional career. The requirement to reinvent oneself many times over during working life, long a mantra of the management guru, is becoming a reality for many. Reinvention may mean job changes for those seeking challenge and opportunity outside a single organization or it might mean adapting to the changing organizational setting for those who remain within a single company over their working life – although this is becoming increasingly unlikely. Whatever form it might take, it is a skill that few genuinely have. Ensuring that skills, expertise, attitudes and behaviours remain in synch with the local and global economies is vital for the future employee. With China and India churning out vast numbers of intelligent graduates who are willing to work (at least for the time being) for a fraction of what it costs to employ a Western equivalent, the current wave of outsourcing and offshoring is unlikely to slow anytime soon. What is significant is that the current and future waves of both outsourcing and offshoring will be focused on white collar work. Manufacturing has been declining in the west for so long now that there is little left to offshore which makes white collar work the next and most obvious target.
But before organizations and individuals throw up their arms in despair, it is important to note that commoditization is not all bad and if approached in the right way the organization and individual can succeed. What is clear is that there is a choice involved and that choice is about responding to the threats and opportunities which commoditization represents.
References
Bosshart, D. (2007). Cheap? The real cost of living in a low price, low wage world, (London: Kogan Page), pp. 50.
Morrison R., Erickson T., and Dychtwald, K. (2006). Managing Middlescence, Harvard Business Review, pp. 1.
Bolchover, S., (2005) .The Living Dead, Chichester: Capstone.
Uchitelle, L., (2006) .The Disposable American, New York: Alfred Knopf, pp. 66.
Handy, C., (1994) .The Empty Raincoat, London: Hutchinson, pp. 66-79.
International Journal of Business and Management December, 2008
7
Brand Loyalty in Fast Moving
Consumer Good Markets: The Role of Bonds
Rose Leahy
Department of Management and Marketing, Cork Institute of Technology
Rossa Avenue, Bishopstown, Cork, Ireland
Tel: 353-21-4369-590 E-mail: [email protected]
Abstract
This paper examines the concept of brand loyalty in Fast Moving Consumer Good (FMCG) markets. The primary objective of the study was to explore why loyalty develops in FMCG markets from the consumers’ perspective. In addition, this study explored the consumers’ perspective on the types of bonds that exist in FMCG markets and the role of bonds in the development of brand loyalty.
The dominant conclusion arising from this study is that brand loyalty exists in FMCG markets for both cognitive and emotional reasons. Essentially this research determined that the development of brand loyalty is predicated on the development of customer-brand bonds. This research concludes that the challenge for marketers is to develop and nurture the bonds that lead to and that can strengthen brand loyalty. The research also concludes that brand loyalty studies in the future should focus on both cognitive and emotional reasons for brand loyalty and the role of bonds therein. Exploring brand loyalty in this way should assist in the analysis of and understanding of brand loyalty in FMCG markets and should consequently result in the development of effective marketing strategies designed to build brand loyalty.
Keywords: Brand loyalty, Bonds, Cognitive loyalty, Emotional loyalty
1. Introduction
This paper examines brand loyalty in Fast Moving Consumer Good (FMCG) markets from the consumers’ perspective. The central thrust of the marketing activities of a firm is often viewed in terms of development, maintenance, or enhancement of customers’ loyalty toward its products or services (Dick and Basu, 1994). Given that the marketplace is increasingly characterised by unpredictability, diminishing product differentiation and heightened competitive pressure, brand loyalty becomes all the more important. Discovering the reasons why loyalty develops is essential, if sound marketing strategies in the pursuit of that loyalty are to be developed. There is a large volume of extant literature on brand loyalty, however the investigation of brand loyalty development from the consumers’ perspective has been given scant attention. This paper therefore, presents new empirical evidence on the development of brand loyalty in FMCG markets, and draws particular attention to the role of bonds in loyalty development in order to bridge that gap.
2. Brand loyalty
Brand loyalty, is a measure of the attachment that a customer has to a brand. Essentially, brand loyalty refers to a consumer’s consistent repurchase of a favoured brand. Considerable discussion exists in the literature over the definition and dimensionality of loyalty (Ball et al. 2004). According to Aaker (1991) brand loyalty reflects how likely a customer will be to switch to another brand, especially when that brand makes a change, either in price or product features. In line with Aaker’s (1991) description of loyalty, Fournier and Yao (1997) note that there appears to be general agreement in the literature that brand loyalty refers to a biased behavioural response to choose one brand out of a set of alternative brands.
There are many advantages of brand loyalty. Primarily, it is clear that it is much less costly to retain customers than to attract new ones, and existing customers represent a substantial entry barrier to competitors, in part, because the cost of enticing customers to change loyalties is often prohibitively expensive (Aaker, 1996). There is also the advantage of trade leverage, ensuring preferred shelf space for preferred brands and additionally brand loyalty provides a firm with time to respond to competitive moves (Aaker, 1991). According to Delgado-Ballester and Munuera-Aleman (2001) the interest in brand loyalty derives from the value that loyalty generates to companies in terms of:
A substantial entry barrier to competitors
An increase in the firm’s ability to respond to competitive threats
Vol. 3, No. 12 International Journal of Business and Management
8
Greater sales and revenue
A customer base less sensitive to the marketing efforts of competitors
Further, Rowley (2005) identifies the benefits of brand loyalty as:
Lower customer price sensitivity
Reduced expenditure on attracting new customers
Improved organisational profitability
Caudron (1993) and Olsen (1997), however, argue that the ever-increasing proliferation of brands, price competitiveness, and the strength of own label brands have all worked to drive down brand loyalty. It has been suggested that a loyal customer is an oxymoron in today’s market place. Research has shown that there is a 50% chance that a shopper will switch from their normal brand to a competitor’s brand, which is on promotion, and furthermore that two thirds of shoppers claim to always compare prices before choosing a product (Pressey and Mathews, 1998). Research in the UK across different industry sectors has shown that more than 95% of retail petrol buyers buy more than one brand; about 85% of customers shop at more than one grocery retailer and personal investors will, on average, subscribe to three different financial services companies (Knox and Macklan, 1998). Given these tendencies, it is not surprising that marketers are increasingly interested in understanding the sources of loyalty and the mechanisms through which it comes about (Wernefelt, 1991).
When developing an understanding of loyalty, it is essential to describe what loyalty is not (Fournier and Yao, 1997) to enable the true dynamics of brand loyalty to be understood. Essentially brand loyalty is not satisfaction with a brand nor is it repeat purchase behaviour (inertia). Both of these concepts are explored in the following sections.
2.1 Satisfaction
Satisfaction can be broadly characterised as a post purchase evaluation of product quality given prepurchase expectations (Kotler, 1991). Anderson and Sullivan (1993) found that satisfaction among consumers has a positive impact on repurchase intentions. They argue, that by consistently providing high satisfaction a resulting higher repurchase intention among consumers should be observed. This finding is supported by Cronin and Taylor (1992) who found that satisfaction has a significant positive influence on repurchase intentions. However, while satisfaction is widely regarded as an important indicator of repurchase intentions, satisfaction with a product does not ensure the development of loyalty.
Burger and Cann (1994) found that satisfaction does not guarantee that the same supplier will be used again for the next purchase. Research has shown that each year, US companies lose 15-20% of their customers, many of whom were considered satisfied. Indeed, it is not uncommon to have high levels of customer satisfaction and still be losing customers (Reicheld, 1997). This can occur because satisfied customers leave for the lure of competitors’ offers (Mittal and Lassar, 1998). Customer satisfaction measures how well a customer’s expectations are met by a given transaction. Customer loyalty on the other hand, measures how likely a customer is to return (Bowen and Shoemaker, 1998). Therefore, in attempting to enhance loyalty among consumers, marketers need to ask what drives loyalty beyond satisfaction (Mittal and Lassar, 1998). In this context, it is essential for marketers to understand how loyalty differs from repeat purchase behaviour.
2.2 Repeat Purchase Behaviour (Inertia)
Brand loyalty is not the same as repeat purchase behaviour (Light, 1993). Repeat purchase behaviour, means that the consumer is merely buying a product repeatedly without any particular feeling for it. Where a brand is bought out of habit merely because less effort is required, inertia is said to be present (Solomon et al. 1999). Many people tend to buy the same brand almost every time they go to a shop and such a consistent pattern of behaviour is often due to the presence of inertia. It is argued in these cases that there is little or no underlying commitment to the product (Solomon et al. 1999). In essence, the consumer passively accepts a brand.
In contrast, the concept of brand loyalty implies that a consumer has some real preference for the brand and makes a conscious decision to continue buying the same brand (Solomon et al. 1999). Loyalty therefore is present only when consumers evaluate available brands and make a deliberate choice for one of those. In other situations, repeat purchasing is inertia to stay with the present brand. Aaker (1991) is of the opinion that an enormous amount of inertia exists in consumer choice, and that consequently there is a need, when examining loyalty to clearly differentiate between situations where inertia or loyalty is present.
Despite differentiating between loyalty, satisfaction and inertia, it is argued that understanding of the phenomenon of brand loyalty remains lacking, with no universally agreed definition (Fournier and Yao, 1997; Uncles et al. 2003). This may be as a result of two different theoretical research orientations to the study of brand loyalty. The first orientation focuses on loyalty expressed in terms of revealed behaviour and cognitive thought processes, while the
International Journal of Business and Management December, 2008
9
second orientation focuses on attitudes and the meaning and hedonic-emotive aspects of brand loyalty (Delgado-Ballester and Munuera-Aleman, 2001; Uncles et al. 2003). Essentially, brand loyalty studies have focused on loyalty as a result of cognitive decision making or as a result of positive attitudes. The following sections examine both orientations.
2.3 Brand Loyalty and Cognitive Decision Making
Loyalty expressed in terms of cognitive decision making and consumer behaviour has traditionally received most attention in the literature (Uncles et al. 2003) but is limited according to Fournier (1998) as it fails to truly inform the phenomenology of brand–customer interactions. Loyalty as a result of cognitive decision making occurs when, through trial and error a brand, which provides a satisfactory experience is chosen. Rational thought processes dominate where loyalty to the brand is the result of repeated satisfaction with the brand (Uncles et al. 2003). This perspective has primarily centred on the relationships between perceived quality, satisfaction and loyalty (Delgado-Ballester and Munuera-Aleman, 2001). Interestingly, Chaudhuri and Holbrook (2001) recently suggested that behavioural loyalty tends to lead to greater market share.
Despite large amounts of research examining brand loyalty as a result of cognitive decision making, many argue that this approach to the study of brand loyalty fails to capture its nuances with a growing body of literature over the last decade analysing brand loyalty at an emotional level. Recognising the importance of attitudinal and emotional aspects of brand loyalty, increasing numbers of researchers now argue that there must be a strong attitudinal commitment to a brand for true loyalty to exist.
2.4 Brand Loyalty and Positive Brand Attitudes
Examination of loyalty in this way focuses on the attitudes that consumers hold towards brands. These attitudes are seen as taking the form of a consistently favourable set of stated beliefs towards the brand purchased (Uncles et al.
2003). Research of brand loyalty at this level has dominated the literature for the last decade or more, with studies primarily examining the role that brands play in the lives of consumers. Concepts such as brand identity and brand personality, coupled with the role of brands as relationship partners, has resulted in a relationship perspective to the study of brand loyalty governing much of this literature (Blackston, 1993; Dick and Basu, 1994 and Fournier 1998). Those in support of this perspective argue that people relate to brands much like they relate to other people and delving into loyalty is much like studying interpersonal relationships. A significant brand provides meaning and is important to a person because it connects with their life, and they have behavioural, attitudinal and emotional involvement (Varey, 2002). The essence of a brand–customer relationship resembles the typical “personal” relationship between two people (Schleuter, 1992, 4). Essentially, the stronger the relationship, the greater the brand loyalty.
It is argued that this perspective is suitable in a marketing environment where brands at a functional level all appear to deliver great performances (Roberts, 2005) and are thus difficult to differentiate on the basis of that performance. The emotional and attitudinal reasons for loyalty in such instances are regarded by many as being more suited to the building of brand loyalty, than the rational, cognitive, behavioural perspective that traditionally dominated the literature.
Examination of loyalty from an attitudinal perspective, however, is not without its critics. Dabholkar (1999) believes that attitudinal and relationship perspectives on brand loyalty have applicability problems when examining purchases in FMCG markets, while Oliver (1999) has argued that there is little systematic empirical research to corroborate or refute the attitudinal perspective on brand loyalty. Indeed, Delgado-Ballester et al. (2003) state that there are few studies that are informative about brand–customer interactions, despite the fact that the idea of brand–customer relationships is not new. Despite these reservations, loyalty studies at an attitudinal level continue to dominate the more recent literature on brand loyalty.
2.5 Brand Loyalty and the Role of Bonds
An examination of brand loyalty is incomplete without an analysis of the development of bonds. Bonds are those which join two parties together, and when present can lead to the development of brand loyalty. Bonds can be of either a structural or a social nature (Rao and Perry, 2002). Fournier (1998) refers to structural bonds as substantively grounded and social bonds as emotionally based. The literature proposes that bonds of a social nature develop between customers and brands. Trust and commitment, followed by interdependence are the most mentioned social bonds in the literature (Rao and Perry, 2002). Other social bonds include reciprocity, empathy, cooperation, and satisfaction. According to De Chernatony (2001) bonds are present where consumers are loyal for either cognitive or emotional reasons, however it is interesting to note that the type and nature of bonds that develop where consumers are loyal for emotional reasons have traditionally received more attention in the literature than the types of bonds that develop for cognitive reasons.
It is argued that as bonds grow in intensity, the attachment that the customer has for the brand deepens (Vincent and De Chernatony, 1999). Connections such as these demonstrate the powerful emotional attachments that can form when brands connect with customers in deep and significant ways. Fournier (1998) proposes that bonds can range in intensity from superficial to liking, friendly affection, passionate love and addictive obsession, and where these bonds exist the
Vol. 3, No. 12 International Journal of Business and Management
10
brand contributes to the customers’ life in significant ways. According to Uncles et al. (2003), marketers must understand why bonds exist and attempt to nurture them to enhance the strength of the consumers’ attitudes towards a brand and thus strengthen the loyalty that exists.
Thus, it is apparent from the literature that bonds can lead to loyalty and can strengthen the loyalty that exists, however it is also possible that bonds can exist without the presence of loyalty. For example, a customer may have trust in a brand and be satisfied with a brand and yet switch to an alternative brand on offer for a variety of reasons. Interestingly however, while bonds can exist without the presence of brand loyalty, it is evident that loyalty cannot be present without the existence of bonds. For example, if a customer is loyal to a brand and engages in consistent repurchasing of a favoured brand, bonds such as satisfaction are inevitably present. In summary therefore it can be said that:
Bonds can lead to and can strengthen brand loyalty but do not guarantee brand loyalty, however brand loyalty cannot
be present without the existence of bonds.
It is argued that the development of effective marketing strategies is dependent on knowing if and why loyalty does/can exist, and the type and nature of bonds that lead to the development of loyalty. In this context therefore, there is a necessity to discover from the consumers’ perspective the types of bonds that exist in FMCG exchange situations and the role of bonds in the development of loyalty.
3. Research methodology
Qualitative research methods are seen as particularly appropriate for the marketing domain. The fundamental reason is the need to understand phenomena surrounding marketing. In seeking understanding, qualitative research methods based on the ethos of an interpretive philosophy serve marketing management decision making better than many other research methods (Carson et al. 2001). Interpretive qualitative research methods are valuable for in-depth understanding of phenomena in the marketing domain and provide flexibility and suitability therein.
To enable in-depth exploration of the dominant issues, in-depth interviews were chosen for the current research. According to Easterby-Smith et al. (1991) the in-depth interview technique is necessary to understand the constructs that the interviewee uses as a basis for his or her own opinions and beliefs about a particular matter or situation. The focus of the in-depth interviews for this research was on understanding informants’ views on loyalty in FMCG markets. The researcher followed the advice of Siedman (1991, 45) and continued interviewing until she felt “enough”
respondents had been surveyed. This saturation and sufficiency point was reached having interviewed fifteen respondents, at which point no new information was deemed to be forth coming and the interviewer was at a stage where she could almost predict the respondents’ answers.
All interviews were taped and fully transcribed afterwards. Notes were also taken during the interviews to aid in the transcribing and to remind the researcher of any further ideas or inspirational thoughts that were generated during the interviews. All interviews ranged in length from 45 minutes to 1.5 hours. The demographic profiles of interview respondents are presented in Table 1. As can be seen a broad range of respondents were interviewed enabling in-depth exploration of the research topic.
Insert Table 1 here
There are many approaches prescribed for the analysis and interpretation of qualitative data, approaches, which are often difficult to articulate and make explicit (Jones, 1985). Initial reading of the transcripts focused upon evaluation of the main issues that arose, while subsequent readings focused on making sense of and seeking out points that were relevant and interesting to the debate. Areas where there appeared to be either consensus or divergence of opinion also emerged allowing for comparisons and convergence of ideas and points to surface. Guba (1978) refers to this as convergence and divergence, and Babbie (1998) refers to it as similarities and dissimilarities. All interviews were individually interpreted in order to preserve contextual meaning, while interpretation across interviews was required in order to assess overarching themes (Thompson et al. 1989).
4. Discussion of research findings
The following sections present an analysis of the dominant research findings and are explored in the context of the extant literature.
4.1 Loyalty as a Result of Cognitive Decision Making
Researchers, who examine brand loyalty using rational or cognitive criteria, argue that loyalty to a brand is the result of repeated satisfaction with that brand and not because of any strongly held attitude or deeply held commitment to the brand (Uncles et al. 2003). The consumer chooses a brand that provides a satisfactory experience, and measurement of that satisfaction will centre on repurchase or purchase frequency. As identified, it is important to distinguish between loyalty and repeat purchase behaviour. Only where consumers evaluate different brands, and make a deliberate decision to purchase one of those brands, is loyalty manifested, otherwise repeat purchasing results from inertia, where the same
International Journal of Business and Management December, 2008
11
product is bought out of habit. Many in the literature rule out behaviour as a dominant measure of loyalty, arguing that behaviour does not imply that loyalty exists, but that it may merely reflect happenstance (Uncles et al. 2003), in effect, inertia. Interestingly, some respondents provide some evidence to support this assertion:
People might only remain loyal out of habit. I think you will always get a certain amount of people who will remain
loyal out of habit.
Male, 35, B
In this context, the intention throughout the in-depth interviews was to discover the reasons why loyalties do exist among respondents, in an attempt to differentiate between repurchase inertia and repurchase loyalty. As a result, respondents detailed specific reasons for the existence of loyalties over and above mere inertia to stay with one brand:
You’ll only become loyal if you like the brand. Its quality we’re looking for. What we want from the brand in terms of
taste and quality is what is important to us.
Female, 28, C1
Essentially, many respondents proved to be very rational in their purchase behaviour, seeking out brands that provide a satisfactory experience:
I’m loyal on the basis of quality, tried and trusted and it doesn’t really matter what the brand is as long as it does the
right job.
Female, 34, C1
Furthermore, respondents indicated that value for money was of great importance in the development of brand loyalties. The research indicates that consumers might become loyal if they perceive they are getting good value:
Loyalty depends on the quality of the product and value for money.
Male, 29, C1
From the research findings it is clear that many consumers expect value for money and do not want to spend money on something when they are not getting value:
I think the only way a company can create loyalty is to give value, to give a quality product at a reasonable price.
Female, 45, C1
Such a view is also seen to support those who found that two–thirds of shoppers always compare prices before choosing a product. Arguably this results from the increase in price competition in mass consumer markets.
On initial examination therefore, loyalty appears to be founded on preference, quality and perceived value for money, factors which are seen to transcend the many psychological reasons given for loyal behaviour:
I’m very loyal to Dove shampoo. I find it really good and I always buy it. It works for me and I would not be tempted
over to a competitor.
Female, 45, C1
A significant point to emerge from the research is that for some consumers the name, image or personality of the brand is irrelevant. Rather, what drives their purchase decision is their liking of the product, essentially their liking for the functional performance of the product. For these consumers the brand is immaterial:
I go with my likes more than anything else, as opposed to it being a particular brand as such. I go with what I like the
best.
Female, 30, C1 I don’t drink Barry’s tea because its Barry’s tea, I drink it because I like it. I eat what I like whether it’s branded or not.
Female, 40, C2
This finding supports Moriarty et al. (1996), who found that instead of having a desire to have a relationship with a company or a brand, some consumers are more concerned with the product offering. This significant finding indicates that for many consumers, functional benefits of the brand guide the purchase decision.
In this context, there appears to be significant evidence from the research findings to suggest that cognitive reasoning can explain much of the brand loyalties that develop in mass markets. It could further be argued that, while other researchers have identified many deep psychological reasons for loyalty (for example, Aaker, 1996; Beardi, 2000; Schultz 2000), practical reasons such as taste preference and quality emerge from the current research as important
Vol. 3, No. 12 International Journal of Business and Management
12
determinants of loyalty in FMCG markets. It is apparent from respondents to this study that practical considerations such as preference, quality and value for money may be enough to drive much brand loyalty in FMCG markets.
This finding is significant and requires further examination as it supports traditional methods of examining brand loyalty in terms of repeated satisfaction with a brand. It also supports a small cohort of more recent researchers who argue that examining brand loyalties from this perspective has more relevance for FMCG markets than does the relationship/attitudinal perspective (for example, Dabholkar, 1999; Dowling, 2002). It should also provide an important future research area, given that a substantial body of branding literature suggests that cognitive decision making is not that significant when it comes to brand loyalties in mass consumer markets. Many who adopt the attitudinal perspective to brand loyalty rule out rational behaviour as a dominant measure of that loyalty, arguing that behaviour and satisfaction may not be enough to confirm that true loyalty is present. Based on respondents to the current research, it appears that a significant group of consumers base their purchase decisions on strong rational criteria, where cognitive decision–making dominates, out of which loyalties may develop.
4.2 Loyalty as a Result of Positive Attitudes
When probed about any deeper psychological attachments that might exist to brands, rational arguments were diluted, allowing for other conceptualisations to surface. Tradition and nostalgia were dominant among these conceptualisations, with many respondents also expressing deep affections for certain brands:
I buy some brands because my Mum bought them and I grew up with them. I suppose a lot of it is nostalgic, where
something reminds you of the past and the emotions surrounding that.
Female, 36, C1
I think tradition is one of the most important reasons for loyalty. I suppose it is familiarity and what you’ve grown up
with.
Male, 34, B
These findings support Fournier (1998), who found nostalgia and tradition high among reasons for loyal behaviour in mass consumer markets. Those who study loyalty in this manner also examine the emotional and psychological attachments that consumers have to brands. Measurement studies of loyalty from an emotional perspective take the form of investigating how much people like the brand, feel committed to it and have positive beliefs and feelings about it; essentially they measure consumers’ attitudes. Loyalty at this level is likely to be deeper than that developed at a cognitive level because it is rooted at a psychological level and is demonstrative of commitment to a brand:
I don’t know what I’d use without Howards OneWay. I’d never think the same of my brown bread if it wasn’t made
with Howards. My mother used it and everyone I ever knew baked with it and I think it’s superior. I would be
devastated if it was gone because I’ve been using it for years and years.
Female, 60, C2
In this case, the brand provides meaning and is important to the person because it connects with her life. She is likely to expend time and resources in order to ensure this consistent purchase behaviour, behaviour which has endured through a generation and is likely to continue into the future. The age of the respondent is important. At sixty years of age, this respondent had many years of purchasing and of using the brand, as had her mother before her. Therefore, a deep-rooted commitment to and nostalgia for the brand is evident.
Where loyalty exists at this attitudinal level it is likely that the brand will seem like a friend to the consumer, towards which they have a sense of commitment and belonging:
I am committed to purchasing Nescafe into the future. It’s always perfect and I think I will always buy it.
Female, 30, C1
In such instances the brand becomes an integral part of the consumer’s daily life, and progressively the role that the brand plays becomes more important to the consumer:
I am very loyal to Kelloggs. They give the image of good family life and a good start to the day and without them that
crutch would be gone. I’ve bought into that.
Female, 34, C1
In support, therefore, of those who examine brand loyalty in terms of both patronage and attitude, this research has found that significant loyalties can develop where the consumer holds favourable attitudes towards the brand, and the brand plays a meaningful role in the life of the consumer. This finding reflects the dominant literature on brand loyalty in recent years, where the focus of most loyalty studies has been on the attitudinal perspective. As revealed, however, this study has also found that a dominant reason for loyal behaviour in FMCG markets is repeated satisfaction with a brand. Thus, an interesting perspective on brand loyalty emerges, where cognitive reasoning and positive attitudes are both revealed as reasons for brand loyalty in FMCG markets. This indicates that research studies going forward should
International Journal of Business and Management December, 2008
13
focus on both the cognitive and the attitudinal perspectives on loyalty, rather than the either or approaches to those studies that have dominated research in the area.
4.3 The Role of Bonds in the Development of Brand Loyalty
The role that bonds play at both a cognitive and emotional level in the development of brand loyalty is essential to explore, if the nuances and dimensionality of brand loyalty are to be truly understood. As identified earlier, trust, commitment, interdependence, reciprocity, empathy, cooperation, and satisfaction are the most mentioned bonds in the literature.
Trust is defined in the literature as a feeling of security held by the consumer that the brand will meet his/her consumption expectations (Dellagado-Ballester and Munuera-Aleman, 2001). In this way it is likely that consumers will develop an emotional or psychological attachment to the brand. Interestingly, respondents to the research exhibit a high level of trust in brands:
I would have trust in a brand that I buy regularly and that I haven’t had a bad experience with.
Female, 60, C2
Such observations support the many definitions of trust in the literature where trust is defined as confidence that one will find what is desired. The literature also indicates that trust evolves over time (Blau, 1964; Rempel et al. 1985; Sheaves and Barnes, 1996). Support for this assertion was found among respondents who largely agreed that trust has to be built through experience of using the brand:
Brands have to win my trust, I don’t trust new brands, I trust what I use all the time.
Female, 34, B
Trust, therefore, is learnt over time. Respondents to the current research did not place trust in new brands that they had no prior experience with. Thus, the existence of either repeat purchase or loyal behaviour is essential to the development of trust. Interestingly, trust was found to be present where loyalties developed as a result of cognitive reasoning and also where loyalties developed as a result of emotional attachments to brands:
I always buy L’Oreal Shampoo because I think it is the best shampoo available. I have full trust in it to meet my
expectations every time I use it.
Female, 28, C1
I am totally loyal to Batchelors’ Beans. They were the beans we grew up with. We never had any other brand of
beans in the house, and so I believe that they are the best available. Since I moved out of home 8 years ago they are
the only beans I will ever buy. I have complete trust in them, they are an essential purchase in the weekly shop.
Female, 34, B
As such, it is apparent that consumers can have trust in brands to perform regardless of the nature of the loyalty that exists. This is an important finding, and indicates that where consumers have trust in brands they are likely to continue purchasing that brand in the future. In this context it is argued that, if commitment is to develop, trust must be present (Johnson et al. 1999). While respondents to the research displayed relatively high levels of trust in brands that they are loyal to, in general the same levels of commitment were not expressed, with respondents showing varying degrees of commitment:
I find that I am changing a lot of brands lately and so I don’t think I have much commitment anymore.
Female, 34, B
Interestingly, the desire for choice appears to be the main reason for the lack of commitment exhibited by respondents. It is apparent from the research that consumers reject companies’ attempts at choice reduction and so is reluctant to commit to any brand in the long term:
Even though I might be loyal to certain brands now, if another brand comes along that’s as good I can change. Yes, if a
certain product satisfied me the brand wouldn’t bother me.
Female, 34, C1
Such an observation supports Crosby et al. (1990), who in the relationship–marketing literature found that consumers jump ship to other more attractive deals, regardless of their previous relationship status. In such cases the consumer might be reflective of what Rowley (2005) termed the convenience seeker, someone who engages in regular repeat purchase behaviour, but is susceptible to promotions from other brands:
No, I would always be watching around for what else is on offer so no, I wouldn’t be committed for the long-term.
Female, 36, C1
Vol. 3, No. 12 International Journal of Business and Management
14
In general, however, respondents indicated that they have what can be termed temporary commitment to many brands. Essentially, regardless of whether loyalty exists for cognitive or emotional reasons, respondents show consistent repurchase behaviour but are not inclined to say that they will continue to show similar behaviour in the future:
I have trust in brands but not commitment. Commitment wouldn’t be a word that I’d use. Yes, I buy a brand this
week and probably next week but that doesn’t mean that I’m committed to it; not commitment to the extent that I’d say
I’ll buy this brand into the future.
Female, 60, C2
It can be seen in such situations that, while consumers indicate loyal tendencies to a brand, they are reluctant to use the term commitment in describing those tendencies. It appears that this is so, given the desire for choice that most respondents to the research indicated. Essentially, even though they may show signs of committed behaviour, they are reluctant to describe it as such, given that they want other choices available to them, regardless of whether they wish to purchase from those available choices or not. Such a finding supports that of Fournier and Yao (1997: 460) who described such feelings as those which do not lie “in formal pledges of fidelity or anticipated future commitments.”
This finding is in contrast to that, where it was found that high levels of long-term commitment and attachments to brands can and do exist in certain circumstances. Examples of this include the women who would only use Howards OneWay and Nescafe as discussed earlier. High levels of commitment were also discovered in situations where consumers are forced into loyalty with a particular brand:
The only brand I would say I am truly committed to is Persil, and that’s out of necessity because I am allergic to most of
the other washing powders.
Female, 40, C2
In the context of these examples it can be concluded that certain brands provide meaning and satisfaction, feel like a friend and offer functional, emotional and self-expressive benefits to the customer. The research findings indicate that this can occur in situations where there is either temporary commitment, or high levels of long-term commitment to a brand. When exploring the nature of brand–customer bonding in this way, Fournier and Yao (1997, 461) discovered that certain brands act “like a true best friend.” Further evidence of such brand–customer bonding was also found among respondents to the research:
You can build a bond with a brand, you trust brands and I agree with the notion of a customer–brand bond because you
have an image of what the brand is and that is important to you, and that is the reason you continue to buy the brand.
Female, 28, C1
Bonds such as satisfaction and contentment are indicated by the following respondent:
I always buy Aquafresh because I think it’s the best toothpaste on the market. I am completely satisfied with it. Even if
Colgate was on promotion I wouldn’t switch over.
Female, 32, C1
Respondents to the research regularly discussed their feelings about brands in this way. Evidence of bonds such as empathy, fulfilment and satisfaction were present in many of the discussions with respondents:
I will always use Pampers for my daughter; they make me feel that I am a better mother because I feel that I am using
the best product for her.
Female, 34,
Such perceptions of a brand typically result in the development of strong bonds between the customer and the brand. Where such bonds exist, Fournier (1998) argues that the brand contributes to the customers’ life in significant ways:
I have used Flahavans oatmeal for years and I would be devastated if it was taken off the shelves for some reason. To
me it signifies health and a good life, and I feel I need it in my life.
Female, 60, C2
This perspective indicates that certain brands can add meaning to the life of a consumer. Indeed support for this perspective was found throughout the current research:
I always buy Persil because I trust it and I think that it plays a big role in keeping my clothes perfect and, as such, my
clothes are an extension of myself so for me the Persil brand is very important.
Female, 28, C1
The research findings indicate that brand–customer bonds grow stronger as the commitment of the customer for the brand intensifies. Evidence of very high levels of commitment to brands was found among some respondents to the research:
International Journal of Business and Management December, 2008
15
I will drink no tea other than Barrys. Years ago when I lived abroad, both in the Isle of Man and in London I had
Barrys sent over in the post to me, or when someone was coming to visit they would bring it. I never bought any other
tea when I was living away.
Female, 36, C1
Indeed, Fournier and Yao (1997, 460) describe the nature of that commitment as lying in the “emotional bond” that the customer has for a brand. It is important for marketers to understand the reasons why these bonds exist and to attempt to nurture them to enhance the strength of the consumers’ attitudes towards a brand.
The current research confirms that, where loyalties develop as a result of emotional attachments, strong bonds can form where the brand becomes established in the life of the consumer. The research also indicates that bonds can form where consumers are loyal for cognitive reasons. It could be argued given the research findings that bonds are likely to be stronger where consumers are loyal for emotional reasons (as shown in the Howards OneWay, Pampers and Persil examples). It is probable that it is for this reason, coupled with the swing in loyalty studies from behavioural to attitudinal, that bonding at an emotional level has received more attention in the literature over the past decade, than bonding at a cognitive level. Researchers have predominantly explored the nature of bonds that are present for deep, emotional reasons. This study however, indicates the necessity to refocus attentions at bonding at a cognitive level, given the many cognitive reasons given for loyal behaviour by respondents to the research.
Synthesis of the current research findings therefore, indicates that the debate in the literature over cognitive V emotive reasons for loyalty should be replaced with an appreciation that both have relevance for the study of brand loyalty in FMCG markets. While some consumers might be loyal because a brand “reaches into the consumers’ heart as well as
their mind and creates an intimate, emotional connection that the consumer can’t live without” (Roberts, 2005), it is also the case that a consumer might be loyal simply as a result of repeated satisfaction with that brand.
Progressing this thinking even further, the research findings also indicate that future thinking on brand loyalty would benefit from consideration of cognitive and emotive reasons for loyalty as interdependent determinants. It can be argued that cognitive reasons for loyalty such as quality and taste preference might over time develop into an emotional attachment to a brand, where the consumer develops affection for that brand. Similarly it can be argued that if a consumer has affection for a brand or buys a brand for reasons of tradition it is probable that they like the taste of it and believe in its quality. In this context it can be argued that cognitive reasons underpin emotional reasons for loyalty. Building on this argument, this research further proposes that cognitive reasons for loyalty can also incorporate an attitudinal perspective. For example, it is apparent that loyalty to a brand for reasons of liking the taste or quality can be described as loyalty for reasons of positive attitude towards the brand. As such it can be argued that the polarisation of cognitive and emotive determinants of loyalty might be replaced with a study of brand loyalty that moves to a more central position. This thinking is illustrated in Figure 1.
Insert Figure 1 here
Building on Figure 1, it can be argued that where bonds develop at a cognitive level, they can develop in intensity if the reasons for loyalty become more emotional as the consumer becomes more attached to the brand. For example, over time ‘liking’ a brand for reasons of trust in and satisfaction with that brand might develop into ‘love’ for a brand if the reason for loyalty becomes more emotional. Further to this it is argued that similar bonds support loyalty at both a cognitive and emotional level. For example, a consumer might be loyal because of the quality of the brand and thus be satisfied with the brand; similarly a consumer might be loyal for reasons of nostalgia and also be satisfied with the brand. As illustrated in the diagram it is also possible that the presence of loyalty might lead to the development of bonds that initially did not underpin that loyalty. Thus, a consumer might have trust in a brand, and as the loyalty that exists to that brand strengthens, other bonds such as empathy and fulfilment might develop. In this context it must be remembered that while bonds underpin loyalty, further bonds can also develop where consumers are loyal. Thus, both consumer behaviour and marketing literatures should benefit from an in-depth exploration of the nature of brand–customer bonding that recognises that bonds develop for different reasons and in different contexts. In this way the important and complex area of customer–brand bonding might receive more attention that it has hitherto, paving the way for an informative insight into the determinants of loyalty. As a result, those interested in nurturing customer loyalty might be better positioned for such endeavours.
5. Conclusion
This paper has presented new empirical data on the development of brand loyalty in FMCG markets from the consumers’ perspective. In the context of the research findings, an interesting perspective on brand loyalty emerges. In exploring the reasons why loyalty develops in FMCG markets, it was determined that cognitive reasons are as important as emotional reasons for the development of that loyalty. Recent literature has focused on brand loyalty as a result of positive attitudes and has focused on the role of brands as relationship partners for consumers. Consequently, the cognitive reasons for loyalty have been largely ignored. Findings from this research indicate that future studies of
Vol. 3, No. 12 International Journal of Business and Management
16
brand loyalty should focus on both the cognitive and emotional reasons for loyalty, and move away from the either or
approach that has dominated recent brand loyalty literature. In this context, the research findings also indicate that cognitive and emotional reasons for brand loyalty are interdependent and so naturally lend themselves to the study of brand loyalty where they are regarded as such. Consequently, the development of emotional loyalty to a brand that is founded on cognitive reasons should receive attention in future research studies.
Findings from this research indicate that it would be appropriate to explore the nature of brand loyalty in FMCG markets using bonding terminologies and theories. While the idea of describing brand loyalty in the context of bonds is not entirely new, it has thus far received little attention in the literature. It can be argued that describing the nature of brand loyalty using bonding terminology is appropriate as it facilitates the investigation of the attachments that customers have for brands. This research has determined that bonds are necessary if loyalty is to develop and that bonds are important in strengthening any loyalty that may already exist to a brand. In addition, the focus on bonds should enable marketers to develop appropriate marketing strategies that could be used to nurture these bonds and to reinforce the bonds that are present. In the context of the findings it can now be argued that strategies designed to encourage and maintain customer loyalty should be focused on nurturing the bond(s) that the consumer has with the brand.
The research findings also indicate that bonds can develop for both cognitive and emotional reasons. As indicated above, this research has discovered that loyalty studies in the future should focus on both the cognitive and emotional reasons for the development of brand loyalty. In this venture, the bonds that underpin loyalty of either a cognitive or emotional perspective are essential to explore.
As evidenced in this research, loyalty can and does exist in FMCG markets, and thus where marketers are interested in retaining a loyal group of customers, indications from this research are that strategies designed to build bonds, where appropriate, are apt in that endeavour. As identified, bonds underpin loyalty, therefore in the pursuit of loyalty it is logical to consider the type and nature of bonds that lead to that loyalty. This understanding can assist in the analysis of brand loyalty and in the explanations why brand loyalties develop.
References
Aaker, D. (1991). Managing Brand Equity: Capitalising on the Value of a Brand Name, NY: The Free Press.
Aaker, D. (1996). Building Strong Brands, NY: The Free Press.
Anderson, E. and Sullivan, M. (1993). The Antecedents and Consequences of Customer Satisfaction for Firms, Marketing Science, Vol. 12, No. 2, pp. 125-143.
Babbie, E. (1998). The Practice of Social Research, 8th Edition, Wadsworth Publishing Company.
Ball, D., Coelho, P. and Machas, A. (2004). The Role of Communication and Trust in Explaining Customer Loyalty, An Extension to the ECSI Model, European Journal of Marketing, Vol. 38, No. 9-10, pp. 1272-1293.
Beardi, C. (2000). Revved up to Relate; FCB Finds Brand Loyalty Mirrors Interpersonal Relationships, Advertising Age,Vol. 71, November 6th, pp.86.
Blackston, M. (1993). Beyond Brand Personality: Building Brand Relationships, In Brand Equity and Advertising:
Advertising’s Role in Building Strong Brands, Aaker, D. and Biel, A. (eds). Hillsdale, NJ; Erlbaum, pp. 113-124.
Blau, P. (1964). Exchange and Power in Social Life, John Wiley and Sons, Inc. NY.
Bowen, J. and Shoemaker, S. (1998). Loyalty: A Strategic Commitment, Cornell Hotel and Restaurant Administration
Quarterly February, Vol. 39, No. 1, pp. 12-26.
Burger, P. and Cann, C. (1994). Relationship Marketing, Culture and Customer Satisfaction: Some Empirical Results,In Research Conference Proceedings, Relationship Marketing, Theory, Methods and Applications, Sheth, J. (ed)., Vol. 4.
Carson, D., Gilmore, A., Perry, C. and Gronhaug, K. (2001). Qualitative Marketing Research, Sage.
Caudron, S. (1993). Brand Loyalty: Can it be Revived? Industry Week, April 5th. Vol. 242, No. 7, pp. 11-13.
Chaudhuri, A. and Holbrook, M. (2001). The Chain of Effects form Brand Trust and Brand Affect to Brand Performance: The Role of Brand Loyalty, Journal of Marketing, Vol. 65, pp. 81-93.
Chernatony, L. (2001). Build Brands that you can believe in, Centaur Publishing.
Cronin, J. and Taylor, S. (1992). Measuring Service-Quality: A Reexamination and Extension, Journal of Marketing,Vol. 56, pp. 55-68.
Crosby, L., Evans, K. and Cowles, D. (1990). Relationship Quality in Services Selling: An Interpersonal Influence Perspective, Journal of Marketing, Vol. 54, July, pp. 68-81.
International Journal of Business and Management December, 2008
17
Dabholkar, P. (1999). Expectancy Value Models, in the Elgar Companion to Consumer Research and Economic Psychology, Earl, P. and Kemp, S. (eds)., Edward Elgar, Cheltenham, pp. 201-208.
Delgado-Ballester, E. and Munuera-Aleman, J. (2001). Brand Trust in the Context of Consumer Loyalty, European
Journal of Marketing, Vol. 35, No. 11-12, pp. 1238-1258.
Delgado-Ballester, E., Munuera-Aleman, J. and Yague-Guillen, M. (2003). Development and Validation of a Brand Trust Scale, International Journal of Market Research, Vol. 45, Issue. 1, pp. 35-56.
Dick, A. and Basu, K. (1994). Customer Loyalty: Toward an Integrated Conceptual Framework, Journal of Marketing
Science, Vol. 22, No. 2, pp. 99-113.
Dowling, G. (2002). Customer Relationship Management: In B2C Markets, Often Less is More, California
Management Review, Spring, Vol. 44, Issue. 3, pp. 87-105.
Easterby-Smith, M., Thorpe, R. and Lowe, A. (1991). Management Research, an Introduction, London: Sage.
Fournier, S. (1998). Consumers and Their Brands: Developing Relationship Theory in Consumer Research, Journal of
Consumer Research, March, Vol. 24, No. 4, pp. 343-374.
Fournier, S. and Yao, J. (1997). Reviving Brand Loyalty: A Reconceptualisation within the Framework of Consumer-Brand Relationships, International Journal of Research in Marketing, Vol. 14, No. 5, pp. 451-472.
Guba, E. (1978). Toward a Methodology of Naturalistic Inquiry in Educational Evaluation, Center for the Study of Evaluation, University of California, Los Angeles.
Johnson, W., Chinuntdej, N. and Weinstein, A. (1999). Creating Value Through Customer and Supplier Relationships, In Proceedings of the 15th Annual IMP Conference, McLoughlin, D. and Horan, C. (eds). UCD.
Jones, S. (1985). Depth Interviews, in Applied Qualitative Research, Walker, R. (ed), London, Gower.
Knox, S., and Maklan, S. (1998). Competing on Value, London: Pitman.
Kotler, P. (1991). Marketing Management: Analysis, Planning, Implementation and Control, New Jersey: Prentice Hall.
Light, L. (1993). Reinforce Loyalty to your ‘Brand’, Folio: the Magazine for Magazine Management, November, Vol. 22, No. 20, pp.78.
Mittal, B. and Lassar, W. (1998). Why do Customers Switch? The Dynamics of Satisfaction Versus Loyalty, The
Journal of Services Marketing, Vol. 12, No. 3, pp. 177-194.
Moriarty, S., Gronstedt, A. and Duncan, T. (1996). Effective Relationship Links in Consumer Markets, In Contemporary Knowledge of Relationship Marketing, Research Conference Proceedings, Emory Atlanta, Sheth, J. and Parvatiyar, A. (eds). pp. 162-174.
Oliver, R. (1999). Whence Customer Loyalty? Journal of Marketing, Vol. 63, pp. 33-44.
Olsen, B. (1997). Brand Loyalty and Consumption Patterns, the Lineage Factor, In Contemporary Marketing and Consumer Behaviour, pp. 245-278.
Olsen, B. (1997). Brand Loyalty and Consumption Patterns, the Lineage Factor, In Contemporary Marketing and Consumer Behaviour, pp. 245-278.
Pressey, A. and Mathews, B. (1998). Relationship Marketing and Retailing: Comfortable Bedfellows? International
Journal of Customer Relationship Management, June-July, Vol. 1, Issue1, pp. 39-54.
Rao, S. and Perry, C. (2002). Thinking about Relationship Marketing: Where are we now? Journal of Business and
Industrial Marketing, Vol. 17, No. 7, pp. 598-614.
Reicheld, F. (1997). Exclusive Interview with Frederick F. Reichheld, CRM Newsletter, Issue 2.
Rempel, J., Holmes, J. and Zanna, M. (1985). Trust in Close Relationships. Journal of Personality and Social
Psychology, Vol. 49, No. 1, pp. 95-112.
Roberts, K. (2005). The Future Beyond Brands, www.lovemarks.com.
Rowley, J. (2005). The Four Cs of Customer Loyalty, Marketing Intelligence and Planning, Vol. 23, No. 6, pp. 574-581.
Schleuter, S. (1992). Get to the ‘Essence’ of a Brand Relationship, Marketing News, Vol. 26, No. 2, pp. 4.
Schultz, H. (2000). In the Future of Brands, Twenty Five Visions, Clifton, R. and Maughan, E. (eds)., Interbrand Group Plc. MacMillan.
Sheaves, D. and Barnes, J. (1996). The Fundamentals of Relationships: An Exploration of the Concept to Guide Marketing Implementation, Advances in Services Marketing and Management, Vol. 5, pp. 215-245.
Siedman, I. (1991). Interviewing as Qualitative Research, London Teachers College Press.
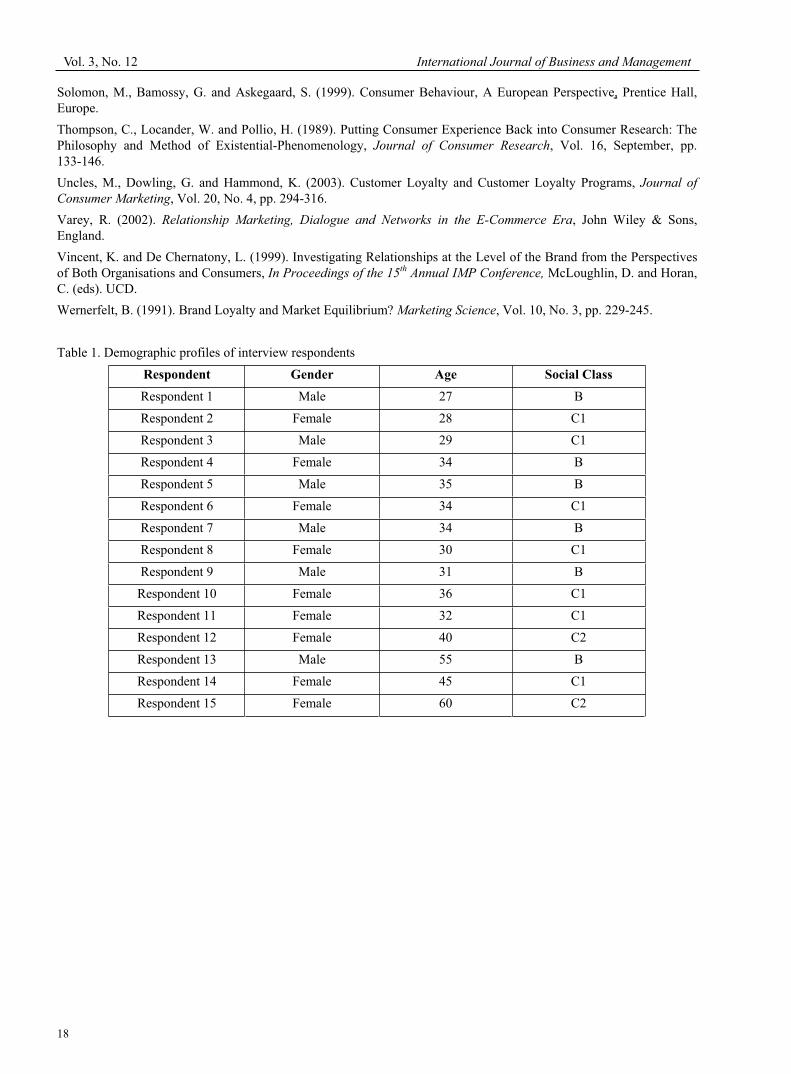
Vol. 3, No. 12 International Journal of Business and Management
18
Solomon, M., Bamossy, G. and Askegaard, S. (1999). Consumer Behaviour, A European Perspective, Prentice Hall, Europe.
Thompson, C., Locander, W. and Pollio, H. (1989). Putting Consumer Experience Back into Consumer Research: The Philosophy and Method of Existential-Phenomenology, Journal of Consumer Research, Vol. 16, September, pp. 133-146.
Uncles, M., Dowling, G. and Hammond, K. (2003). Customer Loyalty and Customer Loyalty Programs, Journal of
Consumer Marketing, Vol. 20, No. 4, pp. 294-316.
Varey, R. (2002). Relationship Marketing, Dialogue and Networks in the E-Commerce Era, John Wiley & Sons, England.
Vincent, K. and De Chernatony, L. (1999). Investigating Relationships at the Level of the Brand from the Perspectives of Both Organisations and Consumers, In Proceedings of the 15th Annual IMP Conference, McLoughlin, D. and Horan, C. (eds). UCD.
Wernerfelt, B. (1991). Brand Loyalty and Market Equilibrium? Marketing Science, Vol. 10, No. 3, pp. 229-245.
Table 1. Demographic profiles of interview respondents
Respondent Gender Age Social Class
Respondent 1 Male 27 B
Respondent 2 Female 28 C1
Respondent 3 Male 29 C1
Respondent 4 Female 34 B
Respondent 5 Male 35 B
Respondent 6 Female 34 C1
Respondent 7 Male 34 B
Respondent 8 Female 30 C1
Respondent 9 Male 31 B
Respondent 10 Female 36 C1
Respondent 11 Female 32 C1
Respondent 12 Female 40 C2
Respondent 13 Male 55 B
Respondent 14 Female 45 C1
Respondent 15 Female 60 C2
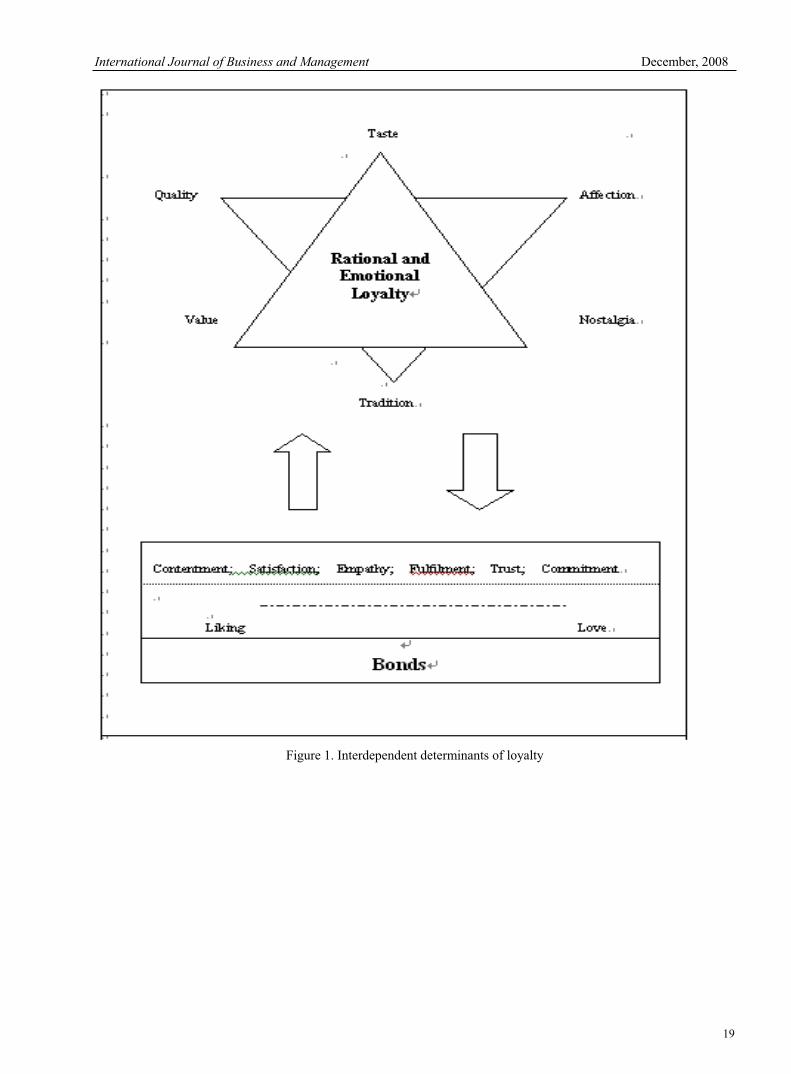
International Journal of Business and Management December, 2008
19
Figure 1. Interdependent determinants of loyalty
Vol. 3, No. 12 International Journal of Business and Management
20
Analysis and Comparison of ARCH Effects
for Shanghai Composite Index and NYSE Composite Index
Xinghao Liao, Guangdong Qi
School of Finance, Shanghai University of Finance and Economics
Shanghai 200439, China
E-mail: [email protected]
Abstract
In this article, we used ARCH class model to analyze and compare the income fluctuations of Shanghai Stock Market and NYSE, and obtained the characters of fluctuation for two markets and the models which fitted to describe them. At the same time, we also analyzed the fluctuation overflow effect of two markets, validated the character that Chinese stock market was not relatively mature and possessed low international market integration degree, and put forward relative policy advances.
Keywords: Shanghai composite index, NYSE composite index, ARCH class model, Fluctuation overflow
1. Introduction
In the domain of finance, the data of time sequence always put up characters such as convergence and lever effect, but traditional method researching financial data could not consider these characters, which induce the predictive ability of model is bad. Since Engle put forward ARCH model in 1982 (Engle, 1982, pp. 987-1008), the domain of conditional heteroscedasticity developed very quickly, and many variations of ARCH model occurred, and the most representative model is the generalized ARCH model which was put forward by Bollerslev in 1986 (Bollerslev, 1986, pp. 309-327), i.e. GARCH model, and it is extensively applied in the financial research and actual operation.
Since 2005, as the emerging market, Chinese stock market has been more and more concerned by the world, and in less than two years, the stock market values of Shanghai and Shenzhen was doubling more. The increase speed makes most markets in the world amazing. However, there are many gaps between Chinese markets with international financial market, which is undeniable, for example, the financial products in Chinese capital market is relatively few, and the structure is too single, and the fluctuation is large, and the behaviors of market control still exist. Comparing with that, in those mature international capital markets such as the capital markets in UN, US and many developed capitalism countries, the fluctuation is small, and the financial products is very abundant, the market order is good and the financial supervision system is mature. In this article, we will use the NYSE as the representation of international mature financial market and take Shanghai Stock Exchange as the representation of Chinese markets, analyze and compare the fluctuation of daily yield for two markets composite index to try to find out the deficiencies and reasons existing in Chinese stock market relative to the mature market.
2. Introduction of ARCH class of model
One obvious character of the financial time sequence is the conditional heteroscedasticity, and the ARCH class of model has been extensively applied in the domain of financial measurement. GARCH model is most extensively adopted in the research of fluctuation, which is defined by the average value equation and the conditional variance.
2.1 Model of ARCH
ARCH model is the simplest ARCH class of model, and it supposes the conditional variance of t term is the function of residual error from t-1 term to t-q term, i.e. the fluctuation is self-correlative, and the form of ARCH (q) is
q
i
itit
1
20
2
and the non-negative condition is ),,2,1(0,00 qii .
2.2 Model of GARCH
The GARCH model is generalized ARCH model, and it supposes the conditional variance is former conditional
International Journal of Business and Management December, 2008
21
variance based on the simple ARCH model, i.e. the conditional variance is self-correlative, and the form of GARCH (p, q) is
2 2 20
1 1
q p
t i t i j t j
i j
Where, 0, 0p q , the non-negative condition is 0 0, 0( 1,2, , ), 0( 1,2, , )i ji q j p, and to
make the conditional variance stable, it must fulfill the condition (Bollerslev, 1986, P.309-327),
1 1
1q p
j i
i j
and its value reflects the durative of the fluctuation.
2.3 Model of GJR-GARCH
GJR-GARCH model (Glosten, 1993, P. 1779-1801) overcomes the limitation that GARCH model cannot describe the positive and negative reaction of collision, and its form is
2 2 2 20 1 1
1 1
q p
t i t i j t j t t
i j
I
where, 1
1
1
1( 0)
0( 0)t
t
t
I , and under the same limitation condition with GARCH model, the non-negative condition
also requires 1 0 .
2.4 Model of EGARCH
Like GJR-GARCH model, the EGARCH model also could be used to deal with the time sequence obtained by the lever effect. It was put forward by Nelson in 1991 (Nelson, 1991, P. 347-370), and its form is
2 20
1 1
2log log
p qt j t j
t i t i j j
i j t j t jh h
In a comparison among ARCH, GARCH, EGARCH and other more complex half-parameter and zero-parameter models, Pagan and Schwert (Pagan, 1990, P. 267-290) proved that simple EGARCH (1, 1) could implement modeling to the financial time sequence.
3. Data selection and basic analysis
In this article, we select the data of Shanghai Stock Exchange from Jan 10, 2003 to Dec 28, 2007, and to make the analysis possess comparison, the data of NYSE are also in the same period. The backgrounds include that Chinese economy had been developed very quickly since China joined in WTO, and US basically cast off the shadow of 9.11 in 2003 and its economy begun to recover to stable status. The computation formula of yield used in the article is
)/ln(100 1ttt ppr , where, tr is the daily logarithm yield (%), tp and 1tp are respectively the index values in t term and t-1 term.
The descriptive stat. results of two markets are seen in Table 1.
The daily yield average of Shanghai composite index is 0.11%, and the daily yield average of NYSE composite index is 0.05%, and the former is twice than the latter, which indicates as the emerging market, the yield of China stock market is higher, and it also explains why international idle money continually has flowed into China in recent years. In addition, we can obviously see that large fluctuation existed in both markets, and the result showed negative deflection, and the kurtosis exceeded 3, which indicated the yield distributions of two markets were non-normal, and comparing with NYSE composite index, Shanghai composite index had more obvious and larger deflection and higher kurtosis, so the possibility that the yield of Shanghai Stock Exchange kept away from the average was higher, and higher risk existed in Shanghai stock market, and the market was not stable and large deflection would always occur in the party with negative yield. From the descriptive statistic, as the emerging market, the yield of Shanghai Stock Exchange was obviously higher than such mature market as NYSE, and the market of Shanghai was not mature like NYSE, and large fluctuation existed in it.
Implement ADF test to the daily yield sequence of samples. The test result showed the ADF test t stat. of Shanghai composite index daily yield sequence is -14.3858 under the significance level of 1%, and it was obviously lower than
Vol. 3, No. 12 International Journal of Business and Management
22
the critical of -3.4386 under the significance level of 1%. The ADF test t stat. of NYSE composite index daily yield sequence is -15.6572 under the significance level of 1%, and it was obviously lower than the critical of -3.4386 under the significance level of 1%. So we reject the original hypothesis, i.e. two groups of daily yield sequence have no unit root, and they are stable sequence.
We implement self-correlative and deviated self-correlative coefficient analysis with 25-order to Shanghai composite index and NYSE composite index, and the results showed that in all time lags, the self-correlative function value and the deviated self-correlative function value of yield were small, and they were smaller than 0.07, so the daily yield sequences of Shanghai composite index and NYSE composite index were not self-correlative.
Implement self-regression with 10-order lag items to the yields of two markets, and test ARCH effect to the residual error. For the Shanghai composite index, the F statistic of ARCH effect test is 9.965872, and the LM statistic is 48.04335. For the NYSE composite index, the F statistic of ARCH effect test is 18.95560, and the LM statistic is 88.36852. The statistics of two markets are very significant, which indicate the ARCH effect exists in the daily yield data of Shanghai composite index and NYSE composite index.
4. Fluctuation analysis of ARCH model
Implement modeling to the yield sequence, and respectively use ARCH (1), GARCH (1, 1), GJR-GARCH (1, 1) and EGARCH (1, 1) models to describe the daily yield heteroscedasticity of Shanghai composite index and NYSE composite index, and the estimation results are seen in Table 2 (values in the bracket are t statistics).
From Table 2, the 1 coefficients of GARCH model cluster are big and pass the significant test, which indicates the stock price fluctuation possesses “long-term memory”, i.e. the fluctuation of past price is correlative with the fluctuation of infinite term price. In the equation of conditional variance, the coefficients 1 and 1 are significantly positive, which indicates past fluctuation has positive and released influence to the future fluctuation of the market, so the clustered phenomena occurs in the stock market fluctuation. 11 is closed to 1, which indicates the reaction function of stock fluctuation to the exterior concussion is degressive by a relatively slow speed, and the big fluctuation in the stock market cannot be eliminated in the short term. In addition, because 11 in ARCH (1), GARCH (1, 1) and GJR-GARCH (1, 1) are smaller than 1, so the conditional variance sequence of yield is stable, and the model can be predicted.
Estimate two markets by the GJR-GARCH (1, 1) model, we find the yield of Shanghai composite index has no obvious lever effect, but the negative concussion brings smaller fluctuation than the positive concussion. It also indicates under immature market, investors are not rational enough, and higher average yield and big fluctuation will induce more short-term investors, and when the market possesses big positive yield, investors will close out and induce big fluctuation. Comparing with Shanghai composite index, NYSE composite index has obvious lever effect, and its behavior is consistent with our anticipation to the mature market.
5. Explanation degree comparison of various models
For the regression result, every model has certain limitation, but we can try to find out the best models for two markets. The proofs to judge the model include information principle, F statistic and logarithm maximum likelihood method. But for the nonlinear model, the maximum likelihood method is the best choice, so we adopt the logarithm maximum likelihood method to rank the model, and the results are seen in Table 3.
From the information principle method and the maximum likelihood method, for the Shanghai stock market, the best fluctuation descriptive model is EGARCH model, which is consistent with Liqing and Zhao, Lijia’s conclusions (Li, 2004, pp. 31-32), and though the symbols of the asymmetric item don’t accord with the anticipation, but maybe the unconformity just indicates the characters of Chinese stock market, i.e. bigger positive yield will bring bigger fluctuation. For the NYSE stock market, the best model is GJR-GARCH, which indicates NY stock market has strong lever effect which doesn’t exist in Shanghai stock market.
6. Overflow effect of Shanghai and Shenzhen Stock Markets fluctuation
Estimate Shanghai composite index by EGARCH model and estimate NYSE composite index by GJR-GARCH model, and respectively obtain the conditional variance data sequence GARCH01 and GARCH02 of the residual item, and implement Granger causality test to both sequences and the results are seen in Table 4.
From the test results, we can see that the influence of Shanghai stock market on New York stock market is not notable, and the influence of New York stock market on Shanghai stock market is small, which indicates though the market value of Chinese stock market, but after all the capital market of China is not opening, so the influences whether from interior to exterior or from exterior to interior is very limited, and the investment of QDII would obviously reduce the investment risk of domestic investors.
International Journal of Business and Management December, 2008
23
7. Conclusion
To compare the daily yields of two markets by the modeling of ARCH class model, we can see that the lever effect almost doesn’t exist in Shanghai stock market, but the lever effect of NYSE stock market is more obvious, which reasons are mainly that Chinese government often intervenes the stock market and stabilize the price, and it also indicates participators’ gambling attitudes are strong. At the same time, from the analysis of ARCH-M class model, we can see that Chinese investors could obviously avoid the risk and require higher return for the investment with high risk, but US investors have not same strong avoidance degree to the risk comparatively.
The test result of fluctuation overflow effect is that the fluctuation overflow effect of two markets is not obvious, and the influence of Chinese stock market on NYSE stock market is stronger. Of course, the Granger causality test only checks up the statistical causality relationship and it doesn’t indicate the causality relationship with actual meanings certainly exist or doesn’t exist in both markets. And the conclusion only could be referred.
As the emerging market, the average income of Shanghai stock market is higher than NYSE stock market, but the stronger fluctuation also indicates Chinese investors’ investment concept is not strong, their investment behaviors are easily suffered by all kinds of information, and the Shanghai stock market is not mature. These fluctuation characters of Shanghai stock market could provide decision-making references to avoid risks for investors and implement market supervision for the management department. In addition, the big fluctuations of Chinese stock market are mainly induced by the policy interferences of management department, and most so-called concussions belong to policy concussion. Therefore, the management department should be more careful when coming on policies, really realize “information symmetry”, hold well the adjustment degree of policy, and consider the market control from long-term view to make the policy more reasonable and consecutive.
References
Bollerslev T. (1986). Generalized Autoregressive Conditional Heteroskedasticity. Journal of Econometrics, No. 31, pp. 309-327.
Engle R F. (1982). Autoregressive Conditional Heteroskedasticity with Estimates of the Variance of UK inflation. Econometrica, No. 50, pp. 987-1008.
Glosten L R, Jagannathan R. and Runkle D E. (1993). On the Relation between the Expected Value and Volatility of the Nominal Excess Return on Stocks. The Journal of Finance, No. 48(5), pp. 1779-1801.
Li Q and Zhao L J. (2004). The Applied Research of the ARCH Model in the Stock Market in China. Xi’an Finance, No. 11, pp. 31-32.
Nelson D B. (1991). Conditional Heteroskedasticity in Asset Returns: A New Approach. Econometrica, No. 59(2), pp. 347-370.
Pagan A R and Schwert G W. (1990). Alternative Models for Conditional Stock Volatility. Journal of Econometrics, No. 45(12), pp. 267-290.
Table 1. Descriptive Stat. of two markets income
Descriptive Stat. of Shanghai composite index income
Average Median Max. Min. Standard deviation
Deflection Kurtosis Jarque-Bera
0.114430 0.094522 7.890344 -9.256154 1.534343 -0.324148 6.400324 603.1188
Descriptive Stat. of NYSE composite index income
Average Median Max. Min. Standard deviation
Deflection Kurtosis Jarque-Bera
0.050530 0.088661 3.087640 -3.596156 0.818359 -0.276442 4.711740 159.0871
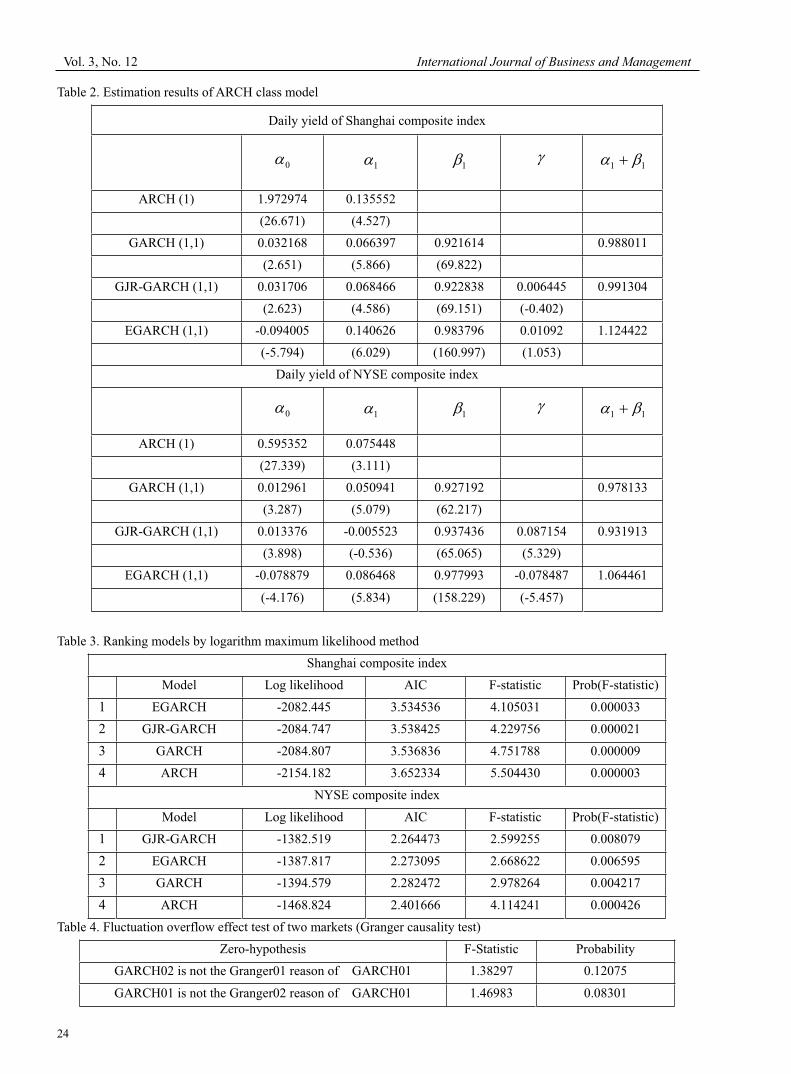
Vol. 3, No. 12 International Journal of Business and Management
24
Table 2. Estimation results of ARCH class model
Daily yield of Shanghai composite index
0 1 1 11
ARCH (1) 1.972974 0.135552
(26.671) (4.527)
GARCH (1,1) 0.032168 0.066397 0.921614 0.988011
(2.651) (5.866) (69.822)
GJR-GARCH (1,1) 0.031706 0.068466 0.922838 0.006445 0.991304
(2.623) (4.586) (69.151) (-0.402)
EGARCH (1,1) -0.094005 0.140626 0.983796 0.01092 1.124422
(-5.794) (6.029) (160.997) (1.053)
Daily yield of NYSE composite index
0 1 1 11
ARCH (1) 0.595352 0.075448
(27.339) (3.111)
GARCH (1,1) 0.012961 0.050941 0.927192 0.978133
(3.287) (5.079) (62.217)
GJR-GARCH (1,1) 0.013376 -0.005523 0.937436 0.087154 0.931913
(3.898) (-0.536) (65.065) (5.329)
EGARCH (1,1) -0.078879 0.086468 0.977993 -0.078487 1.064461
(-4.176) (5.834) (158.229) (-5.457)
Table 3. Ranking models by logarithm maximum likelihood method
Shanghai composite index
Model Log likelihood AIC F-statistic Prob(F-statistic)
1 EGARCH -2082.445 3.534536 4.105031 0.000033
2 GJR-GARCH -2084.747 3.538425 4.229756 0.000021
3 GARCH -2084.807 3.536836 4.751788 0.000009
4 ARCH -2154.182 3.652334 5.504430 0.000003
NYSE composite index
Model Log likelihood AIC F-statistic Prob(F-statistic)
1 GJR-GARCH -1382.519 2.264473 2.599255 0.008079
2 EGARCH -1387.817 2.273095 2.668622 0.006595
3 GARCH -1394.579 2.282472 2.978264 0.004217
4 ARCH -1468.824 2.401666 4.114241 0.000426
Table 4. Fluctuation overflow effect test of two markets (Granger causality test)
Zero-hypothesis F-Statistic Probability
GARCH02 is not the Granger01 reason of GARCH01 1.38297 0.12075
GARCH01 is not the Granger02 reason of GARCH01 1.46983 0.08301
International Journal of Business and Management December, 2008
25
Analysis of American Potential Benefits
At the Back of “Considerable” Sino-American Trade Deficit Peng Luo
College of Economics & Management, Dalian University
Dalian 116622, China
Tel: 86-411-8740-2730 E-mail: [email protected]
Abstract
The paper investigates reasons why there are large gaps in foreign trade statistics between China and America. Different statistic calibers, neglect of transit trade and transit added value, processing trade and industry transference, American increased direct investments in China, American multinational companies’ operation in China and the adoption of export control policy to China have done great deal in this. Through analysis, finally we find that US has obtained great benefits at the back of trade deficits. It has become a powerful weapon to open Chinese market.
Keywords: Trade deficit, Processing trade, Export control policy
1. Introduction
The problem of unbalanced Sino-America trade has aroused extensive world attention recently. According to Chinese statistics, the US trade deficit to China begins from 1993 with 6.3 billion US dollars. In 2007, that amount reaches 163.3 billion US dollars. Till the first seven months of 2008, that amount has already reaches 91.7 billion US dollars. But according to the US statistics, US trade deficit to China begins from 1983 with a 0.3 billion US dollars. In 2007, the amount is 256.3 US dollars and in the first seven months of 2008, the amount is 142.3 billion US dollars. (See table 1) In 2000, China has become the largest trade deficit country with US instead of Japan and is the largest origin of American trade deficit.
Data resource: Chinese data comes from Ministry of Commerce of PRC, http://www.mofcom.gov.cn; American data comes from Ministry of Commerce of USA, http://www.census.gov
Statistic differences between two countries are to be found a normal phenomenon if view the present situation and history of economy and trade of every two countries. But such large statistic gaps between China and America are seldom seen. What is the reason? Has America really lost great deal of benefits in Sino-American trade? How shall we relieve the unbalanced contradiction of Sino-American trade?
2. To view the problem of unbalanced Sino-American trade objectively
2.1 There are statistic caliber differences between China and America
2.1.1 In statistic principle and method, China uses CIF price to calculate total volume of import goods and FOB price for export while America uses Customs value, which is the value according to the market price of export country estimated by US Customs, to calculate the total volume of import goods and FAS price for export. The export volume in FAS price is about 7% lower than that in FOB price due to the delivery charges from dock to ship. In this way, America reduces the export and enlarges the import volume to a certain extent.
2.1.2 In statistic scope, America uses overall trade system and frontier is the statistic boundary by which the goods imported into America and stored in free trade zone and bonded warehouse are to be listed while China adopts specialized trade system using Customs boundary as statistic boundary and the goods stored in the bonded warehouse are not to be listed. This brings about the result of larger American statistic scopes than China and increases the US trade deficits.
2.1.3 America carries out its trade statistic according to origin principle which means the nation of goods is justified by the original producing place, which is the manufacturing place, producing place or processing place where substantial changes take place. But till now, there aren’t any uniform implementing rules around the world. The American methods in confirming the origin of goods lead to statistic differences on both sides.
2.2 America neglects transit trade and transit added value
2.2.1 About import
In American statistics, the import value is over-estimated because of the neglect of transit trade and transit added value.
Vol. 3, No. 12 International Journal of Business and Management
26
A very large part of Sino-American trade is transit trade via the third party. According to Chinese statistics, 60% of Chinese export to America is transported via Hong Kong and other countries or regions. But according to analysis of American statistics, only 20% of Chinese goods are delivered to America directly; the other 80% is transported through the third party. The added value of goods in the third party after leaving China obviously can not be listed as Chinese export. The conclusion made by US-China Joint Commission on Commerce and Trade is that the average appreciation rate of goods exported from China mainland to America via Hong Kong is as high as 40.7% which is much higher than that in usual circumstances and the appreciation rates of some major transit goods such as toys and clothes even reach and beyond 100%.
2.2.2 About export
In American statistics, the export value is under-estimated because of the neglect of transit trade. According to the analysis of expert of US-China Joint Commission on Commerce and Trade, in US export statistics, the transit trade via HK accounts for about a quarter of HK’s statistics.
2.3 Processing trade and industry transference play an important role
Chinese trade surplus mainly comes from processing trade and the major section of export is from foreign-funded enterprises. Processing trade is one of the most important factors in the increasing process of Chinese export trade and has reaches as high as 70% of total export volume to America. The actual service income China gets finally accounts for only a small percentage if deduct the material cost and delivery management fee. It apparently does not tally with the realities if the final import price from China is viewed as entire export to America.
One of the reasons why Chinese processing trade develops so fast is that countries or regions like USA, Japan, HK and Taiwan adopt the industry transfer policy in order to reduce the producing cost. Along with the transfer of labor-intensive industry of Asia-Pacific countries and regions to China, China has increasingly turned into the principle manufacture base of labor-intensive products and has accordingly occupied dominant position in Chinese export product structure. In the past 20 years or so, countries and regions as Japan, Korea, HK, Taiwan, Singapore and others have always been the primary suppliers of American labor-intensive products. Now China is accepting the industry transferred from these countries and regions and at the same time inherits their shares of American market to a large extent. According to the data announced publicly by USA Department of Commerce, American trade deficit with China has been sharply increased from 2.8 billion US dollars in 1987 to 33.8 billion US dollars in 1995, but synchronous deficit to Korea, Singapore and Taiwan dropped from 34 billion US dollars to 7.8 billion US dollars.
2.4 American enterprises increase their direct investments in China
In face of fierce international competition, more and more American multinational corporations are regarding China as their export terrace. Among the American top 500 enterprises, there have been already over 400 which invest directly in China. These include major industries as machinery, metal, oil, electron, communication, chemistry, textile, light industry, food, agriculture, medicine, finance, insurance etc. Most of those already-ingoing enterprises are of import substitution type with a primary investing purpose of occupying Chinese market. Bearing such strong characters of import substitution, the investments of these enterprises are doomed to reduce Chinese import from America which leads to large Sino-American trade deficits.
2.5 A large part of Chinese export to America comes from American companies operated in China
America carries out optimal allocation system of production factors around the world by transferring those production and manufacturing links of low added value to China with a purpose of taking advantages of Chinese cheap labors in processing and then re-import to America. Statistics show that over half of the increased volumes of Sino-American trade are achieved by American enterprises located in China, many of whom are members of American manufacture association. Dell computer, Wal-mart, Motorola and Texas Instruments Company are all the leading export companies to America and Wal-mart itself accounts for over one seventh of Chinese total export volume to America.
2.6 America adopts export control to China
For the past many years, America adopted discriminatory export control policy to China which is the principle barrier restricting American export to China. It has exerted profound influences on bilateral trade. American Export Control
Regulations divides all countries (except Canada) into 7 groups. From strict to loose, they are Z, S, Y, W, Q, T and V-group accordingly. China was listed in Y-group in 1949 when the new state was established. After the Korean War broke out, the US Commerce Department listed China in Z-group which meant totally prohibitive. Along with the recovery of Sino-American foreign relations in 1979, the American government released the technology restrictions to China and set up a P-group for China exclusively in 1980 in order to show difference with the former Soviet Union. In 1983, Reagan-administration downgraded China to V-group again. But in American policy making and implementation, there are still many discriminatory regulations which do not let China enjoy the real treatment of V-group countries. The Sino-American relationship came into dismal state after June 1989. American government stopped the discussion
International Journal of Business and Management December, 2008
27
of releasing export control policy to China. Since 1990s the American government made a new series of sanction arrangements to China which included many export control items and made Sino-American economic and trade relationship suffered serious consequences. Especially after George W. Bush came into power, facing the daily-increasing trade deficit with China, the government adopted a much more strict policy restricting American high-tech products exported to China. Since then new changes have taken place in Sino-American balanced trade relationship and American trade surplus have changed into deficit step by step. A research made by international economy research institute in Washington shows that US loses export opportunities of as much as 3.5 to 13.5 billion US dollars to China every year due to export control policy in Chinese market.
3. American benefits at the back of trade deficits
3.1 Analysis on American benefits among the trade deficits from the point of Sino-US import-export product structure
Sino-American trade deficit is virtually a kind of compensatory trade deficit. From the imported commodities point of view, America mainly imports labor-intensive commodities as textiles, clothes, shoes, toys and household appliance etc. from China which reflects Chinese competitive advantages of labor-intensive commodities in international market. Recently Chinese high-tech products export volume has been increasing, but the processing is the main method and accounts for more than 90% with only less than 10% in ordinary trade method.
3.1.1 Be good to the adjustment of American economic structure
Most of Chinese commodities exported to America come from those industries in which no commodities are produced in America. Chinese labor-intensive export products to America do not affect American industrial production and employment and do not scramble for the international market share of American products as well. It is a kind of beneficial supplement to American economic structure and is good to the adjustment of American economic structure.
3.1.2 These cheap imported commodities not only satisfy the domestic demands but also are good to restraining inflation. Chinese products are both cheap in price and of high quality which are helpful in restraining American inflation and can bring substantial benefits to numerous consumers. If imported from other countries, American consumers will spend 20 billion US dollars more for the commodities as clothes, shoes, toys and electrical appliance etc. At the same time, America mainly exports high-tech and monopolistic products and China mainly exports products with low added value. According to the principle of international price scissors, considerable profits flow into America.
3.1.3 The entering of Chinese cheap products in large quantities into America causes American consumers to save large amount expenditure to deposit or invest and this plays an active role in US economic development.
3.2 Reconsider American trade deficit combining the benefits of distribution patterns of international division of labor
3.2.1 China, with rapid development of economy, has become an important resource of increased benefits of many multinational enterprises. Many American multinational enterprises have realized that, in order to keep competitive station they must grasp the opportunities of Chinese market. They adopt localization strategy and obtain large amount benefits in host countries by internal trade and price transference. Many of them, Motorola and Wal-mart, for example, have obtained abundant benefits thereout. Statistics show that in 2001, only 5% of income of the 44 listed companies in America came from Chinese market. In 2006, that number has reached 108. Besides, an article in Wall Street Daily
announced that in 2007, 80% of American multinational companies in China being interviewed achieved profits while in 1998 nearly one third were in a state of deficit.
3.2.2 A majority of benefits of processing trade is obtained by American enterprises taking the low added value into consideration. Processing trade accounts for nearly 70% of total Sino-US trade. IPOD, mp3 player, the present starring product of Apple Corporation, is assembled in China. The price of the final finished product is about 265 US dollars. How is the benefit distributed? Chinese companies which assemble them get only about 4 US dollars in profit. The companies which design chip get about 5 US dollars and Apple Corporation gets 65 US dollars in profit. Because of Apple Corp.’s success, their stock price increased from 21 US dollars to 64 US dollars within last one year. In Sino-US trade statistics, American trade deficit is increased by 1.5 billion US dollars if “import” IPOD from China and this leads to an increase of 16 billion US dollars of American domestic wealth.
3.3 Trade deficit has become a powerful weapon of America to open Chinese market
As viewed from the situation of past few years, American government seldom required Chinese voluntary export restraints of certain commodities as what has been done with Japan. It put most of its focus on Chinese market access issues. Because America is a powerful service trading country with the largest service trade surplus, it wants to use surplus in service trade to offset deficit in goods trade and gain more benefits along with the opening of Chinese telecommunication and finance market. So America brings forward tough requirements in issues of Chinese service market opening.
Furthermore, US dollars obtained by China in high price have returned to America again in the form of buying American bond which equals to the discount loans from other countries. By the end of July 2008, the national debt of
Vol. 3, No. 12 International Journal of Business and Management
28
the United States hold by China has been up to as much as 518.7 billion US dollars and has become the second-largest holder of country. It plays an active role in developing US economy and balancing current account deficit.
4. Countermeasures for dealing with unbalanced Sino-US trade
4.1 Adopt the right US trade strategy to promote the smooth development of trade between the two countries
4.1.1 Taking “development, equality, mutual benefits” as the spirit to deal with bilateral economic and trade relations. “We should try our best to avoid the economic and trade issues politicized and bear in mind the long-term interests while dealing with bilateral trade issues,” U.S. senior negotiators expressed the common desire of Sino-US economic and trade relations in the future through translation in a joint news conference.
4.1.2 Attach great importance to the role of US interest groups. In an open and pluralistic political framework of the United States, interest groups play a decisive role in US government's decision-making. For example, US government released restrictions on exports of computer standards twice in early 2002 and early 2003. This was promoted by over 20 corporations including high-tech giants as Intel, Microsoft and IBM etc. Someone refers American interest groups as “the fourth component of the government”. So we must strive for the support of friendly American interest groups.
4.1.3 Communicate positively and understand comprehensively. Promoting free trade accords with Sino-US fundamental and long-term interests. In September 2006, Chinese chairman Mr. Hujintao and American president Mr. Bush initiated mutually the establishment of Sino-US strategic economic dialogue. This is the highest ranking among the existing 20 consultation mechanisms. Till June 2008, China and US have been going on for four strategic economic dialogues with a focus on the long-term and strategic issues in the economic relations and have set up a framework for long-term and steady economic and trade development between the two countries. From this point of view, strategic economic dialogues play an irreplaceable role in promoting healthy development, preventing economic and trade frictions from being politicized and eliminating non-economic factors on the economic and trade barriers. Besides, China and US should actively develop roles of non-governmental organizations as Guild, Chamber of Commerce and so on, fully contact with the US interest groups and let them play a role of bridge and tie in Sino-US trade.
4.2 Develop technology trade, promote US to release export control
Sino-US trade has contents of both tangible and intangible trade among which technology transfer, the teaching of technology experience and management have the same features as service trade and the sales of technical equipments have the same features as tangible goods trade. Technology trade plays a greater role in Chinese industrial structure upgrade and is important to the balance of US trade deficit.
Technology trade is not only in favor of changing US trade deficit but also conducive to further improving and strengthening the Sino-US trade relations. This is a realistic way out of solving Sino-US trade deficit. In the process of establishing sound, transparent, cost-effective technology market, encouraging every country to carry out fine and open competition in technology export to China, US government will take into account their economic interests and market share which plays an important role in promoting US government to release dual-use technology exports to China.
4.3 Promote the transformation and upgrading of processing trade, and enhance its contribution to China's economic
growth
At present, China's processing trade has become the main force of economic growth and has occupied half of the total import and export. In recent years, processing trade has been the major source of Chinese foreign trade surplus. In 2006, Chinese foreign trade surplus is 144.26 billion US dollars among which processing trade surplus accounts for 61.43%. Chinese large trade surplus to US is mainly caused by processing trade.
For this reason, Chinese government should guide processing trade by policy measures in order to facilitate the realization of the industrial structure upgrade; improve and standardize the management of deep processing; work out relevant policies to support and guide enterprises to develop overseas processing trade; go high-tech and high added-value path to promote processing trade's contribution to the increase of national economy.
4.4 Encourage enterprises to operate multinationally and support those qualified enterprises to invest in America
directly
The Government must make great efforts to support enterprises, especially industrial enterprises to invest directly in America and at the same time do a good job of macro-guidance in business consulting and information supply. This will not only avoid trade barriers, significantly reduce trade friction, but also be able to introduce advanced technology and management experiences more effectively and enhance the comprehensive international competitiveness of Chinese enterprises.
Acknowledgement
This research was supported by Canadian Center of Science and Education (B2008-121).
International Journal of Business and Management December, 2008
29
References
Blustein & Paul. (2004). U.S. cites China in complaint to WTO. Washington Post, No. 19, pp. 22-26.
Craig Elwell. (2006). The US trade deficit: cause, consequences and cures. World Economic Collection, No. 17, pp. 145-156.
Jacques Morisset. (2005). Unfair trade: empirical evidence in world commodity markets over the past 25 years. International Business, No. 4, pp. 97-107.
James Jackson. (2007). Foreign investment in US securities. CRS Report for Congress Order Code, No. 3, pp. 66-79.
Liu, Jianjiang. (2007) Inspiration from interaction of huge U.S. trade deficit with the industrial structure adjustment and low unemployment rate. Contemporary Finance, No. 17, pp. 72-75.
Mckinnon Ronald. (2007). The East Asian Dollar Standard. China Economic Review, No.7, pp. 35-38.
Michael Spence. (2007). We are all in it together (China and US economies). Wall Street Journal, No. 15, pp. 37-43.
Mu, Liangping & Zhang, Jingchun. (2006). Sino-US trade deficit with the United States changes of protection policy. International Economic Review, No. 9, pp. 48-51
Peter K. Yu. (2005). From pirates to partners (episode two): Protecting intellectual property in post-WTO China.
Beijing: Machineary publishing corp. (Chapter 4).
Qi, Guanhua. (2008). Figures of Sino-US trade deficits were misleading: http://www.mofcom.gov.cn. (July 7, 2008).
Tang, Renwu. (2005). World economy integration. World Economic Collection, No. 15, pp. 477-485.
W. A. Lewis. (2007). World production, prices and trade. Manchester School of Economics and Social Science, No. 20, pp. 105-38.
Wang, Jian. (2004). Gold: Effect and countermeasures to dollarization. China Securities News, No. 38, pp. 295-302.
Wang, Li. (2007). Analysis of economic and trade relations between China and the United States in the first half of 2006. International Economic Cooperation, No. 11, pp. 34-37.
Wang, Ping. (2007). Rules of origin problems in processing trade. Economic Finance and Trade, No. 9, pp. 52-55.
Wang, Xuekun. (2008) The transition of China's foreign trade development strategy. Internatioinal Trade, No. 5, pp. 14-16.
Yin, Xiangshuo. (2006). Trade structure is more important: Unbalanced and asymmetric situation of Chinese dependence degree and import-export trade. Internatioinal Trade, No. 3, pp. 10-17.
Zeng, Ka. (2006). Complementary trade structure and U.S.-China negotiations over intellectual property rights. East
Asia, No. 20, pp. 54-80.
Zhang, Luqing & Wang, Li. (2005). Sino-US trade prospect effected by five hot items. International Business Daily, No. 12, pp. 129-136.
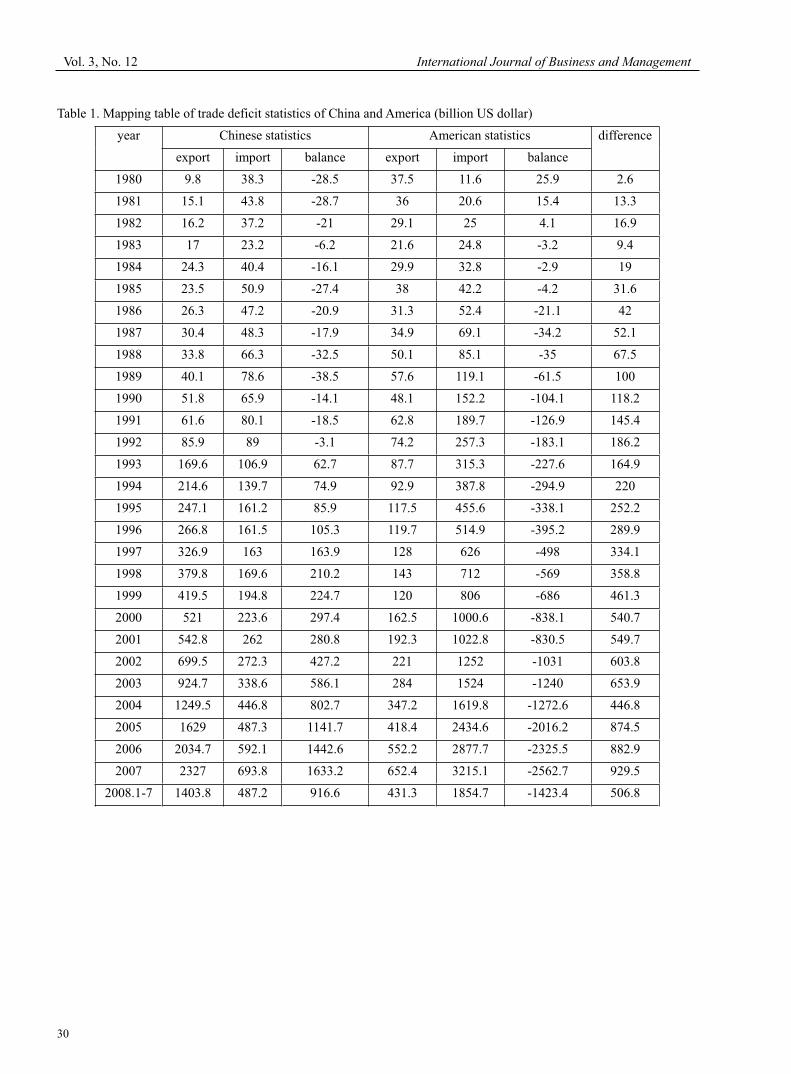
Vol. 3, No. 12 International Journal of Business and Management
30
Table 1. Mapping table of trade deficit statistics of China and America (billion US dollar)
year Chinese statistics American statistics difference
export import balance export import balance
1980 9.8 38.3 -28.5 37.5 11.6 25.9 2.6
1981 15.1 43.8 -28.7 36 20.6 15.4 13.3
1982 16.2 37.2 -21 29.1 25 4.1 16.9
1983 17 23.2 -6.2 21.6 24.8 -3.2 9.4
1984 24.3 40.4 -16.1 29.9 32.8 -2.9 19
1985 23.5 50.9 -27.4 38 42.2 -4.2 31.6
1986 26.3 47.2 -20.9 31.3 52.4 -21.1 42
1987 30.4 48.3 -17.9 34.9 69.1 -34.2 52.1
1988 33.8 66.3 -32.5 50.1 85.1 -35 67.5
1989 40.1 78.6 -38.5 57.6 119.1 -61.5 100
1990 51.8 65.9 -14.1 48.1 152.2 -104.1 118.2
1991 61.6 80.1 -18.5 62.8 189.7 -126.9 145.4
1992 85.9 89 -3.1 74.2 257.3 -183.1 186.2
1993 169.6 106.9 62.7 87.7 315.3 -227.6 164.9
1994 214.6 139.7 74.9 92.9 387.8 -294.9 220
1995 247.1 161.2 85.9 117.5 455.6 -338.1 252.2
1996 266.8 161.5 105.3 119.7 514.9 -395.2 289.9
1997 326.9 163 163.9 128 626 -498 334.1
1998 379.8 169.6 210.2 143 712 -569 358.8
1999 419.5 194.8 224.7 120 806 -686 461.3
2000 521 223.6 297.4 162.5 1000.6 -838.1 540.7
2001 542.8 262 280.8 192.3 1022.8 -830.5 549.7
2002 699.5 272.3 427.2 221 1252 -1031 603.8
2003 924.7 338.6 586.1 284 1524 -1240 653.9
2004 1249.5 446.8 802.7 347.2 1619.8 -1272.6 446.8
2005 1629 487.3 1141.7 418.4 2434.6 -2016.2 874.5
2006 2034.7 592.1 1442.6 552.2 2877.7 -2325.5 882.9
2007 2327 693.8 1633.2 652.4 3215.1 -2562.7 929.5
2008.1-7 1403.8 487.2 916.6 431.3 1854.7 -1423.4 506.8
International Journal of Business and Management December, 2008
31
Evaluating Direct Marketing Practices
On the Internet via the Fuzzy Cognitive Mapping Method
Selcuk Burak Hasiloglu (Corresponding author)
Department of Marketing, Faculty of Economic and Administrative Sciences
University of Pamukkale
Denizli 20070, Turkey
E-mail: [email protected]
Recai Cinar
Department of Business, Industrial Arts Education Faculty
University of Gazi
Golbasi Ankara 06830, Turkey
E-mail: [email protected]
Abstract
Many kinds of tools are used in direct marketing applications on the Internet with e-mail and the being the most important among these. On the other hand, the Internet brings some negative factors like spam and virus. Naturally these factors affect direct marketing applications on the Internet negatively. The objective of the present study is to evaluate these factors, which are carried out in this application. To reach this goal, a fuzzy cognitive mapping method is made use of in the study.
Keywords: Internet, Direct marketing, Fuzzy cognitive mapping
1. Introduction
Today, information is the main source of the economy and puts the classical triad of raw material-capital-labor, which is necessary for manufacturing, down to the second priority. The information society opens a new revolution to people, which is developing at a rattling rate. Besides the information source of this revolution, its most important quality is the invalidity of economic theories. The Internet and similar information-based technologies, the means of the information society, are among the sources of the change experienced in economy. The first stages of the information technology started with the appearance of the computer and continued until its introduction to homes and small enterprises. The second stage, which is based on the Internet, appears in the 1990s with web technologies used to transfer information within the organization and in the international platform via wireless lines. By means of a lot of new technologies, especially information technologies, small enterprises are able to reach the scale economy and sources owned by the big enterprises. Small enterprises in this economy are not in a position to keep themselves under such heavy loads as the bigger ones do.
Accompanying the information society, information and communication technologies contribute a lot to commercialization, thus having economic value. Under the effect of global intensive competition, enterprises are making more and more efforts to increasingly use advanced information technologies and to adapt to new work processes. The enterprises making use of information technologies reduce costs, thus becoming process-inclined institutions. Information technologies do away with the distances between the enterprises, thus bringing together suppliers, business partners, clients and rivals (Tapscott, 1996, pp. 54-56). Developments in information and communication technologies, the Internet in particular, provide new facilities for the production, storage, management, integration and use of information.
The Internet is also an effective tool used in direct marketing applications. Direct marketing applications carried out on the Internet are grouped in to two technical terms: web and e-mail. Web has got a technology of which feedbacks can be measured in every step ranging from presentations, advertisement and supporting services and even order-sale procedures, all of which are the activities of the companies to exist on the Internet. E-mail is a technology that has the capacity to reach potential customers, to realize the dependence and promotion strategies within the body of direct
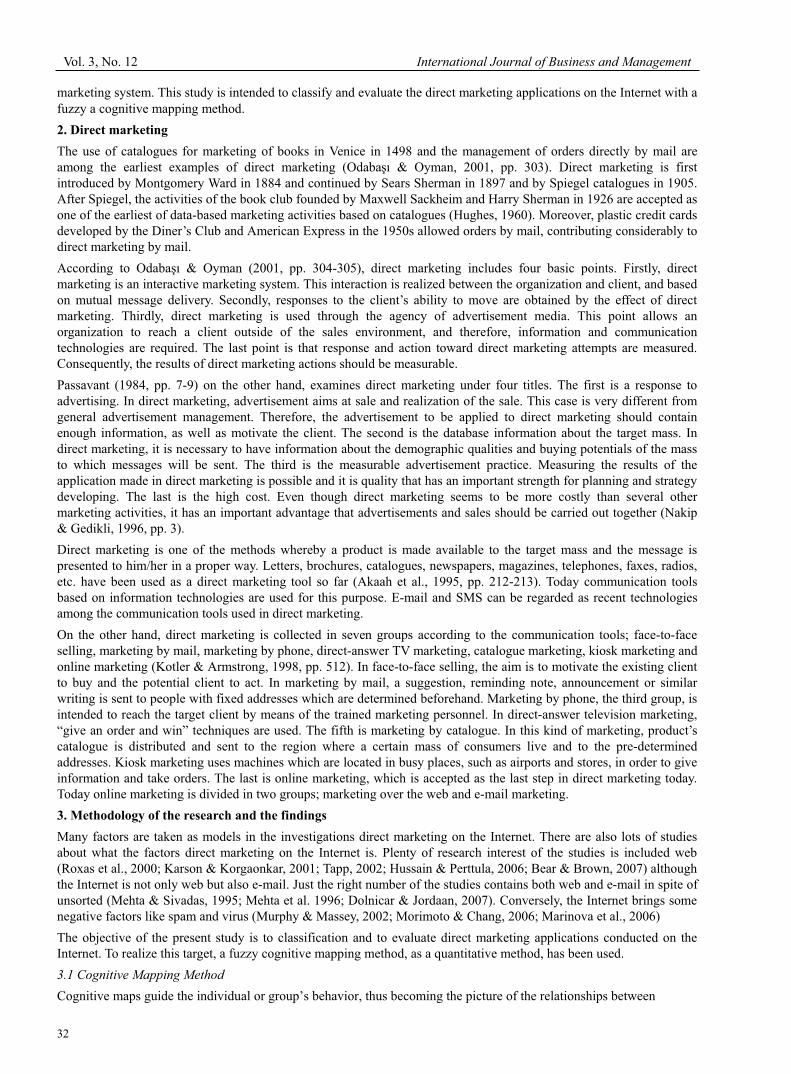
Vol. 3, No. 12 International Journal of Business and Management
32
marketing system. This study is intended to classify and evaluate the direct marketing applications on the Internet with a fuzzy a cognitive mapping method.
2. Direct marketing
The use of catalogues for marketing of books in Venice in 1498 and the management of orders directly by mail are among the earliest examples of direct marketing (Odaba ı & Oyman, 2001, pp. 303). Direct marketing is first introduced by Montgomery Ward in 1884 and continued by Sears Sherman in 1897 and by Spiegel catalogues in 1905. After Spiegel, the activities of the book club founded by Maxwell Sackheim and Harry Sherman in 1926 are accepted as one of the earliest of data-based marketing activities based on catalogues (Hughes, 1960). Moreover, plastic credit cards developed by the Diner’s Club and American Express in the 1950s allowed orders by mail, contributing considerably to direct marketing by mail.
According to Odaba ı & Oyman (2001, pp. 304-305), direct marketing includes four basic points. Firstly, direct marketing is an interactive marketing system. This interaction is realized between the organization and client, and based on mutual message delivery. Secondly, responses to the client’s ability to move are obtained by the effect of direct marketing. Thirdly, direct marketing is used through the agency of advertisement media. This point allows an organization to reach a client outside of the sales environment, and therefore, information and communication technologies are required. The last point is that response and action toward direct marketing attempts are measured. Consequently, the results of direct marketing actions should be measurable.
Passavant (1984, pp. 7-9) on the other hand, examines direct marketing under four titles. The first is a response to advertising. In direct marketing, advertisement aims at sale and realization of the sale. This case is very different from general advertisement management. Therefore, the advertisement to be applied to direct marketing should contain enough information, as well as motivate the client. The second is the database information about the target mass. In direct marketing, it is necessary to have information about the demographic qualities and buying potentials of the mass to which messages will be sent. The third is the measurable advertisement practice. Measuring the results of the application made in direct marketing is possible and it is quality that has an important strength for planning and strategy developing. The last is the high cost. Even though direct marketing seems to be more costly than several other marketing activities, it has an important advantage that advertisements and sales should be carried out together (Nakip & Gedikli, 1996, pp. 3).
Direct marketing is one of the methods whereby a product is made available to the target mass and the message is presented to him/her in a proper way. Letters, brochures, catalogues, newspapers, magazines, telephones, faxes, radios, etc. have been used as a direct marketing tool so far (Akaah et al., 1995, pp. 212-213). Today communication tools based on information technologies are used for this purpose. E-mail and SMS can be regarded as recent technologies among the communication tools used in direct marketing.
On the other hand, direct marketing is collected in seven groups according to the communication tools; face-to-face selling, marketing by mail, marketing by phone, direct-answer TV marketing, catalogue marketing, kiosk marketing and online marketing (Kotler & Armstrong, 1998, pp. 512). In face-to-face selling, the aim is to motivate the existing client to buy and the potential client to act. In marketing by mail, a suggestion, reminding note, announcement or similar writing is sent to people with fixed addresses which are determined beforehand. Marketing by phone, the third group, is intended to reach the target client by means of the trained marketing personnel. In direct-answer television marketing, “give an order and win” techniques are used. The fifth is marketing by catalogue. In this kind of marketing, product’s catalogue is distributed and sent to the region where a certain mass of consumers live and to the pre-determined addresses. Kiosk marketing uses machines which are located in busy places, such as airports and stores, in order to give information and take orders. The last is online marketing, which is accepted as the last step in direct marketing today. Today online marketing is divided in two groups; marketing over the web and e-mail marketing.
3. Methodology of the research and the findings
Many factors are taken as models in the investigations direct marketing on the Internet. There are also lots of studies about what the factors direct marketing on the Internet is. Plenty of research interest of the studies is included web (Roxas et al., 2000; Karson & Korgaonkar, 2001; Tapp, 2002; Hussain & Perttula, 2006; Bear & Brown, 2007) although the Internet is not only web but also e-mail. Just the right number of the studies contains both web and e-mail in spite of unsorted (Mehta & Sivadas, 1995; Mehta et al. 1996; Dolnicar & Jordaan, 2007). Conversely, the Internet brings some negative factors like spam and virus (Murphy & Massey, 2002; Morimoto & Chang, 2006; Marinova et al., 2006)
The objective of the present study is to classification and to evaluate direct marketing applications conducted on the Internet. To realize this target, a fuzzy cognitive mapping method, as a quantitative method, has been used.
3.1 Cognitive Mapping Method
Cognitive maps guide the individual or group’s behavior, thus becoming the picture of the relationships between
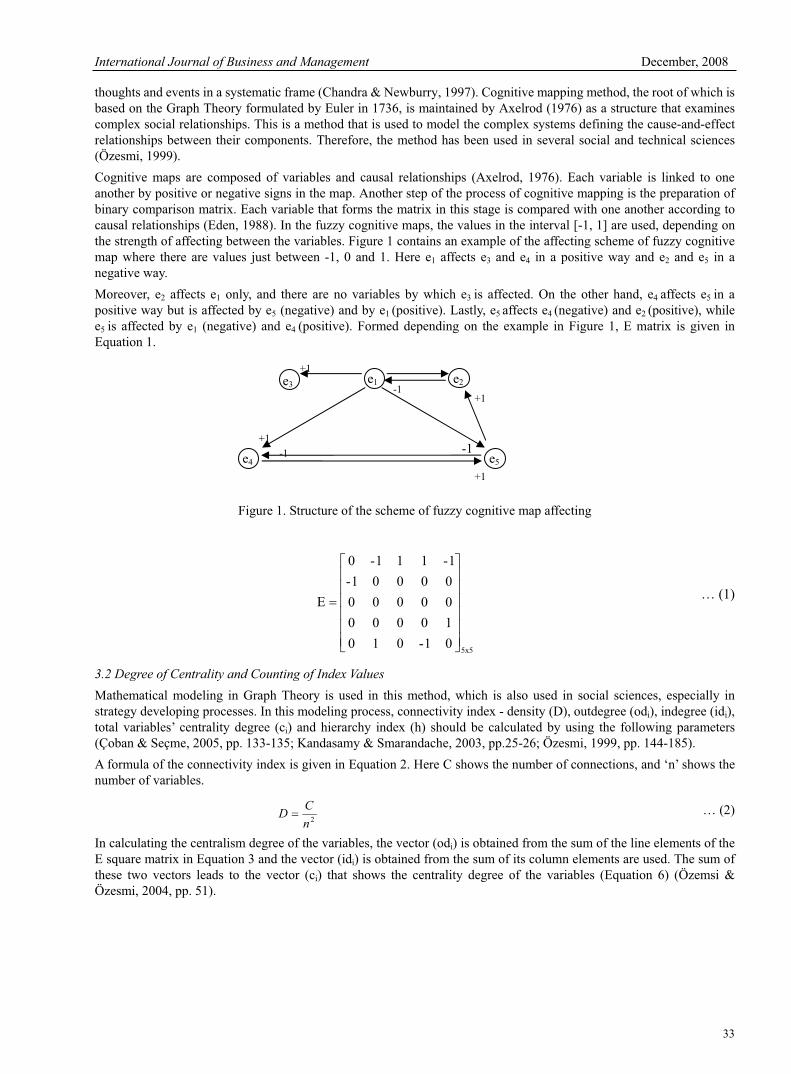
International Journal of Business and Management December, 2008
33
thoughts and events in a systematic frame (Chandra & Newburry, 1997). Cognitive mapping method, the root of which is based on the Graph Theory formulated by Euler in 1736, is maintained by Axelrod (1976) as a structure that examines complex social relationships. This is a method that is used to model the complex systems defining the cause-and-effect relationships between their components. Therefore, the method has been used in several social and technical sciences (Özesmi, 1999).
Cognitive maps are composed of variables and causal relationships (Axelrod, 1976). Each variable is linked to one another by positive or negative signs in the map. Another step of the process of cognitive mapping is the preparation of binary comparison matrix. Each variable that forms the matrix in this stage is compared with one another according to causal relationships (Eden, 1988). In the fuzzy cognitive maps, the values in the interval [-1, 1] are used, depending on the strength of affecting between the variables. Figure 1 contains an example of the affecting scheme of fuzzy cognitive map where there are values just between -1, 0 and 1. Here e1 affects e3 and e4 in a positive way and e2 and e5 in a negative way.
Moreover, e2 affects e1 only, and there are no variables by which e3 is affected. On the other hand, e4 affects e5 in a positive way but is affected by e5 (negative) and by e1 (positive). Lastly, e5 affects e4 (negative) and e2 (positive), while e5 is affected by e1 (negative) and e4 (positive). Formed depending on the example in Figure 1, E matrix is given in Equation 1.
Figure 1. Structure of the scheme of fuzzy cognitive map affecting
5x501-010
10000
00000
00001-
1-111-0
E … (1)
3.2 Degree of Centrality and Counting of Index Values
Mathematical modeling in Graph Theory is used in this method, which is also used in social sciences, especially in strategy developing processes. In this modeling process, connectivity index - density (D), outdegree (odi), indegree (idi),total variables’ centrality degree (ci) and hierarchy index (h) should be calculated by using the following parameters (Çoban & Seçme, 2005, pp. 133-135; Kandasamy & Smarandache, 2003, pp.25-26; Özesmi, 1999, pp. 144-185).
A formula of the connectivity index is given in Equation 2. Here C shows the number of connections, and ‘n’ shows the number of variables.
2n
CD … (2)
In calculating the centralism degree of the variables, the vector (odi) is obtained from the sum of the line elements of the E square matrix in Equation 3 and the vector (idi) is obtained from the sum of its column elements are used. The sum of these two vectors leads to the vector (ci) that shows the centrality degree of the variables (Equation 6) (Özemsi & Özesmi, 2004, pp. 51).
+1
-1-1
+1
e1 e2e3
e4 e5
+1
-1
+1

Vol. 3, No. 12 International Journal of Business and Management
34
nnn3n2n1
3n333231
2n232221
1n131211
e...eee
e...eee
e...eee
e...eee
E i=1,..,n ; j=1,…,n … (3)
n
j
iji eod1
i=1,..,n … (4)
n
j
jii eid1
i=1,..,n … (5)
iii idodc i=1,..,n … (6)
To analyze the hierarchical features of the cognitive map, Equation 8 is necessary. The hierarchy index (h) is within the interval [0, 1]. If h= 0, the cognitive map is accepted as “fully democratic”; if h=1, the cognitive map is accepted as “fully hierarchical” (Özesmi & Özesmi, 2004, 51; MacDonald, 1983).
n
odn
i
i
od1
n
odn
i
odi
od1
2
2 … (7)
1
122
2
nh od … (8)
3.3 Collecting the Data
While collecting data, the participants were requested to draw cognitive maps stating the factors affecting direct
marketing on the Internet. A focus study group consisting of 7 participants composed of experts was formal to deal with
the subject of the study. To that end, attention has been paid to the fact that the members of the study group in this
research should be the academicians of marketing or the staff of a private sector marketing department.
3.4 Findings
Table 1 contains the variable (n), connection numbers (C) and connection index (D) of the individual cognitive maps named for each cognitive map. Decision cognitive map is formed with their combination. As can be seen in the table the average connection index, (the density value of the individual cognitive maps) is found as 0,645 and the connection index of the decision cognitive map is found to be 0,640.
Table 1. Density data
Maps Variable N Connection C Density D
Indi
vidu
al
Cog
niti
ve M
aps Number of maps 7 7
Total 30 83
Average 4,286 11,857 0,645
Standard error 0,565 2,314
Standard deviation 1,496 6,122
Decision Cognitive Map 5 16 0,640
Figure 2 presents the decision cognitive map. The map shows 5 variables and 16 connections. The first of the variables
is e-mail, the second is the mailing lists also known as listserv (or lists), the third is spam&viruses, the fourth are web
sites and the fifth are forums. The matrix that represents this map is given in Equation 9. The calculations made to
analyze the hierarchical value of the cognitive map have yielded to the value of ‘h’ as h=0,264. This finding suggests
that the cognitive map is closer a democratic structure.
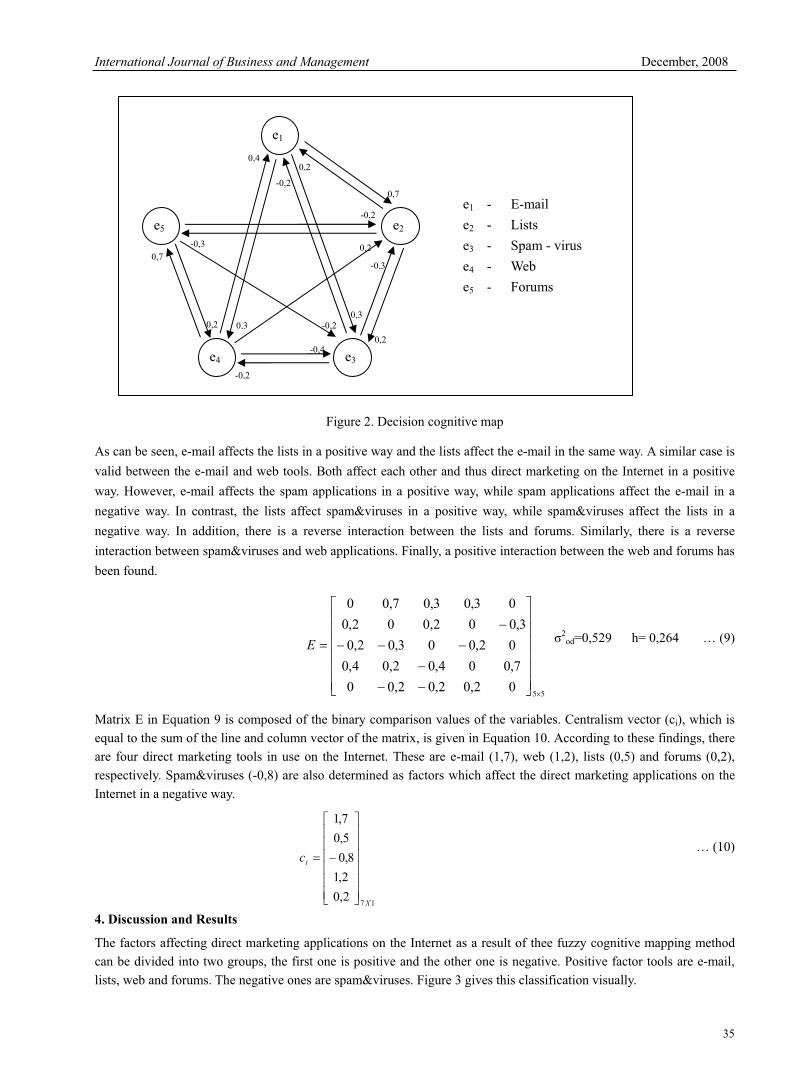
International Journal of Business and Management December, 2008
35
Figure 2. Decision cognitive map
As can be seen, e-mail affects the lists in a positive way and the lists affect the e-mail in the same way. A similar case is
valid between the e-mail and web tools. Both affect each other and thus direct marketing on the Internet in a positive
way. However, e-mail affects the spam applications in a positive way, while spam applications affect the e-mail in a
negative way. In contrast, the lists affect spam&viruses in a positive way, while spam&viruses affect the lists in a
negative way. In addition, there is a reverse interaction between the lists and forums. Similarly, there is a reverse
interaction between spam&viruses and web applications. Finally, a positive interaction between the web and forums has
been found.
5502,02,02,00
7,004,02,04,0
02,003,02,0
3,002,002,0
03,03,07,00
E2od=0,529 h= 0,264 … (9)
Matrix E in Equation 9 is composed of the binary comparison values of the variables. Centralism vector (ci), which is
equal to the sum of the line and column vector of the matrix, is given in Equation 10. According to these findings, there
are four direct marketing tools in use on the Internet. These are e-mail (1,7), web (1,2), lists (0,5) and forums (0,2),
respectively. Spam&viruses (-0,8) are also determined as factors which affect the direct marketing applications on the
Internet in a negative way.
172,0
2,1
8,0
5,0
7,1
X
ic … (10)
4. Discussion and Results
The factors affecting direct marketing applications on the Internet as a result of thee fuzzy cognitive mapping method
can be divided into two groups, the first one is positive and the other one is negative. Positive factor tools are e-mail,
lists, web and forums. The negative ones are spam&viruses. Figure 3 gives this classification visually.
e1 - E-mail
e2 - Lists
e3 - Spam - virus
e4 - Web
e5 - Forums
0,3
0,7
0,2
-0,2
e1
e2
e3e4
e5
0,3
-0,2
-0,3
-0,3
0,4
0,2
-0,4
0,7
-0,2
-0,20,2
0,2
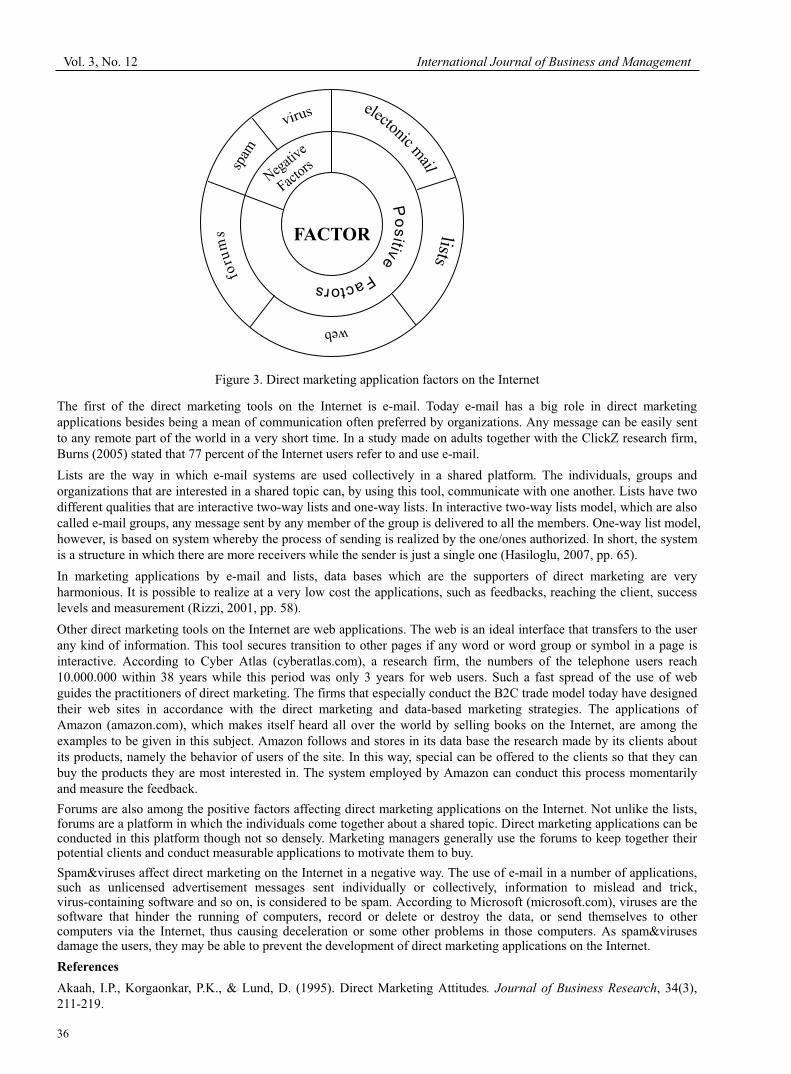
Vol. 3, No. 12 International Journal of Business and Management
36
Figure 3. Direct marketing application factors on the Internet
The first of the direct marketing tools on the Internet is e-mail. Today e-mail has a big role in direct marketing applications besides being a mean of communication often preferred by organizations. Any message can be easily sent to any remote part of the world in a very short time. In a study made on adults together with the ClickZ research firm, Burns (2005) stated that 77 percent of the Internet users refer to and use e-mail.
Lists are the way in which e-mail systems are used collectively in a shared platform. The individuals, groups and organizations that are interested in a shared topic can, by using this tool, communicate with one another. Lists have two different qualities that are interactive two-way lists and one-way lists. In interactive two-way lists model, which are also called e-mail groups, any message sent by any member of the group is delivered to all the members. One-way list model, however, is based on system whereby the process of sending is realized by the one/ones authorized. In short, the system is a structure in which there are more receivers while the sender is just a single one (Hasiloglu, 2007, pp. 65).
In marketing applications by e-mail and lists, data bases which are the supporters of direct marketing are very harmonious. It is possible to realize at a very low cost the applications, such as feedbacks, reaching the client, success levels and measurement (Rizzi, 2001, pp. 58).
Other direct marketing tools on the Internet are web applications. The web is an ideal interface that transfers to the user any kind of information. This tool secures transition to other pages if any word or word group or symbol in a page is interactive. According to Cyber Atlas (cyberatlas.com), a research firm, the numbers of the telephone users reach 10.000.000 within 38 years while this period was only 3 years for web users. Such a fast spread of the use of web guides the practitioners of direct marketing. The firms that especially conduct the B2C trade model today have designed their web sites in accordance with the direct marketing and data-based marketing strategies. The applications of Amazon (amazon.com), which makes itself heard all over the world by selling books on the Internet, are among the examples to be given in this subject. Amazon follows and stores in its data base the research made by its clients about its products, namely the behavior of users of the site. In this way, special can be offered to the clients so that they can buy the products they are most interested in. The system employed by Amazon can conduct this process momentarily and measure the feedback.
Forums are also among the positive factors affecting direct marketing applications on the Internet. Not unlike the lists, forums are a platform in which the individuals come together about a shared topic. Direct marketing applications can be conducted in this platform though not so densely. Marketing managers generally use the forums to keep together their potential clients and conduct measurable applications to motivate them to buy.
Spam&viruses affect direct marketing on the Internet in a negative way. The use of e-mail in a number of applications, such as unlicensed advertisement messages sent individually or collectively, information to mislead and trick, virus-containing software and so on, is considered to be spam. According to Microsoft (microsoft.com), viruses are the software that hinder the running of computers, record or delete or destroy the data, or send themselves to other computers via the Internet, thus causing deceleration or some other problems in those computers. As spam&viruses damage the users, they may be able to prevent the development of direct marketing applications on the Internet.
References
Akaah, I.P., Korgaonkar, P.K., & Lund, D. (1995). Direct Marketing Attitudes. Journal of Business Research, 34(3), 211-219.
FACTOR
International Journal of Business and Management December, 2008
37
Axelrod, R. (1976). Structure of Decision, the Cognitive Maps of Political Elites. NJ Princeton: University Press.
Baer, A.G., & Brown, C. (2007). Adoption of E-Marketing by Direct-Market Farms in the Northeastern United States. Journal of Food Distribution Research, 38 (2), 1-11.
Burns,E.(2005).E-mail Marketing Headache. The ClickZ Network, 25 (Apr’07): http://www.clickz.com/showPage.html?page=3500066.
Chandra, R., & Newburry, W. (1997). A Cognitive Map of the International Business Field. International Business
Review, 6 (4), 387-410.
Çoban, O, & Seçme, G. (2005). Prediction of Socio-Economical Consequences of Privatization at the Firm Level with Fuzzy Cognitive Mapping. Information Sciences, 169, 131-159.
Dolnicar, S., & Jordaan, Y. (2007). A Market-Oriented Approach to Responsibly Managing Information Privacy Concerns in Direct Marketing. Journal of Advertising, 36 (2), 123-149.
Eden, C. (1998). Cognitive Mapping. European Journal of Operation Research, 36, 1-13.
Hasiloglu, S.B. (2007). Elektronik Posta ile Pazarlama (E-mail marketing). stanbul: Beta Yayınevi.
Hughes, M.A. (1960). The Coplete Database Marketer. Chicago: IRWIN Professional Publishing.
Hussain, M., & Perttula, W. (2006). The Benefits and Effective Application of Audio in Direct Marketing on the Internet. Journal of Internet Commerce, 5 (1), 87-100.
Kandasamy, W.B.V., & Smarandache, F. (2003). Fuzzy Cognitive Maps and Neutrosophic Cognitive Maps. USA, Phoenix: Publishing Online Co. Xiquan, 2003.
Karson, E., & Korgaonkar, P. (2001). The Broadened Concept of Direct Marketing Advertising. Marketing Management
Journal, 11(1), 82-93.
Keane, T., & Wang, P. (1995). Applications for the Lifetime Value Model in Modern Newspaper Publishing. Journal of
Direct Marketing, 9 (2), 59-66.
Kotler, P., & Armstrong, G. (1998). Principles of Marketing. New Jersey: Prentice Hall.Co.
MacDonald, N. (1983). Trees and Networks in Biological Models. New York: John Wiley and Sons, 1983 from: Ozesmi, U., & Ozesmi, L. (2004). Ecological models based on people’s knowledge: a multi-step fuzzy cognitive mapping approach. Ecological Modeling, 176, 43-64.
Marinova, A., Murphy, J., & Massey, B.L. (2002). Permission E-mail Marketing as a Means of Targeted Promotion. Cornell Hotel & Restaurant Administration Quarterly, 43(1), 61-69.
Mehta, R., & Sivadas, E. (1995). Direct Marketing on the Internet: An Empirical Assessment of Consumer Attitudes. Journal of Direct Marketing, 9 (3), 21-32.
Mehta, R., Grewal, R., & Sivadas, E. (1996). International Direct Marketing on the Internet: Do Internet Users Form a Global Segment? Journal of Direct Marketing, 10 (1), 45-58.
Melville, N., Stevens, A., Plice, R.K., & Pavlov, O.V. (2006). Unsolicited Commercial E-Mail: Empirical Analysis of a Digital Commons. International Journal of Electronic Commerce, 10(4), 143-168.
Morimoto, M., & Chang, S. (2006). Consumers' Attitudes toward Unsolicited Commercial E-mail and Postal Direct Mail Marketing Methods: Intrusiveness, Perceived Loss of Control, and Irritation. Journal of Interactive Advertising, 7 (1), 8-20.
Nakip, M., & Gedikli, C. (1996). Do rudan Pazarlama ve ebeke Yoluyla Pazarlama Sistemi (Direct marketing and network marketing system). Pazarlama Dünyası Dergisi, 59, 2-15.
Odaba ı, Y., & Oyman, M. (2001). Pazarlama leti imi Yönetimi. stanbul: MediaCat.
Özesmi, U. (1999). Conservation Strategies for Sustainable Resource use in the Kızılırmak Delta in Turkey. Minnesota: University of Minnesota Ph.D. Thesis from: Çoban, O., & Seçme G. (2005). Prediction of socio-economical consequences of privatization at the firm level with fuzzy cognitive mapping. Information Sciences, 169, 131-159.
Ozesmi, U., & Ozesmi, L. (2004). Ecological Models Based on People’s Knowledge: A Multi-Step Fuzzy Cognitive Mapping Approach. Ecological Modelling, 176, 43-64.
Passavant, P.A. (1984). Direct Marketing Strategy. The Direct Marketing Handbook. NewYork: McGraw-Hill Book Company.
Rizzi, J. (2001). Precision E-Mail Marketing. Direct Marketing, 64 (7), 56-60.
Roxas, M.L., Peek, L., Peek, G., & Hagemann, T. (2000). A Preliminary Evaluation of Professional Accounting Services:

Vol. 3, No. 12 International Journal of Business and Management
38
Direct Marketing on the Internet. Journal of Services Marketing, 14 (6/7), 595-606.
Tapp, A. (2002). Proactive or Reactive Marketing? The Influence of the Internet on Direct Marketing. Journal of
Database Marketing, 9 (3), 238-247.
Tapscott, D. (1996). The Digital Economy. New York: McGraw-Hill.
Verhoef, P.C., Spring, P.N., Hoekstra, J.C., & Leeflang, P.S.H. (2003). The Commercial Use of Segmentation and Predictive Modelling Techniques for Database Marketing in the Netherlands. Decision Support Systems, 34 (4), 471 – 481.
International Journal of Business and Management December, 2008
39
Research on the Quality Competence in Manufacturing Industry
Xiaoping Ma, Zhijun Han
Economics and Management School
Nanjing University of Science and Technology
Nanjing 210094, China
Tel: 86-25-8431-5400 E-mail: [email protected]
Abstract
In this article, we established the evaluation index system of manufacturing quality competence, implemented the comprehensive evaluation of quality competence by AHP (Analytic Hierarchy Process), empirically studied the evaluation objects including more than one thousand manufacturing enterprises, and validated the rationality of the evaluation index system and the evaluation method.
Keywords: Quality competence, Quality competence index, AHP, Manufacturing
1. Introduction of the problem
The so-called quality competence is the ability that the organization acquires sustainable competitive predominance and realizes sustainable development in virtue of excellent quality, and it can be measured by the quality competence index. In this article, we established the evaluation index system of manufacturing quality competence, and evaluated and analyzed the quality competence of the evaluation objects including more than one thousand manufacturing enterprises.
2. Index system of quality competence
The index system of manufacturing quality competence can be divided into four layers including object layer, criterion layer, judgment layer and index layer. The object layer is the first class index, i.e. “the manufacturing quality competence index”, the criterion layer is the second class index which includes two indexes such as “explicit competence” and “potential competence”, and the judgment layer is the third class index which includes “practicality quality”, “performance”, “technical innovation”, “human resource” and “quality management ability”, and the index layer includes 11 indexes, and the concrete structure is seen in Table 1.
3. Evaluation analysis method of quality competence
The evaluation of quality competence belongs to the problem of multiple index comprehensive evaluation. The multiple index comprehensive evaluation methods usually include subjective weight average method, AHP, main components analysis method and factor analysis method. The evaluation of quality competence can be evaluated by above methods, and in this article, we adopt AHP to analyze and evaluate the quality competence.
(1) Establishing judgment matrix
Judgment matrix is the core of AHP, and it is acquired by the comparison between two factors, and its factor ija can be confirmed by Table 2.
The judgment matrix obtained by this way is A =
nnnn
n
n
aaa
aaa
aaa
...
............
...
...
21
22221
11211
.
(2) Confirmation of weight
There are many single ranking methods to confirm the weight W from the judgment matrix A, but the eigenvector method put forward by T. L. Saaty is the optimal method. The method first solves the character equation AW= maxW,where, max is the maximum latent root of matrix A, W is the character vector corresponding to max. We can obtain the weight by the normalization to W. All works can be implemented by Matlab.
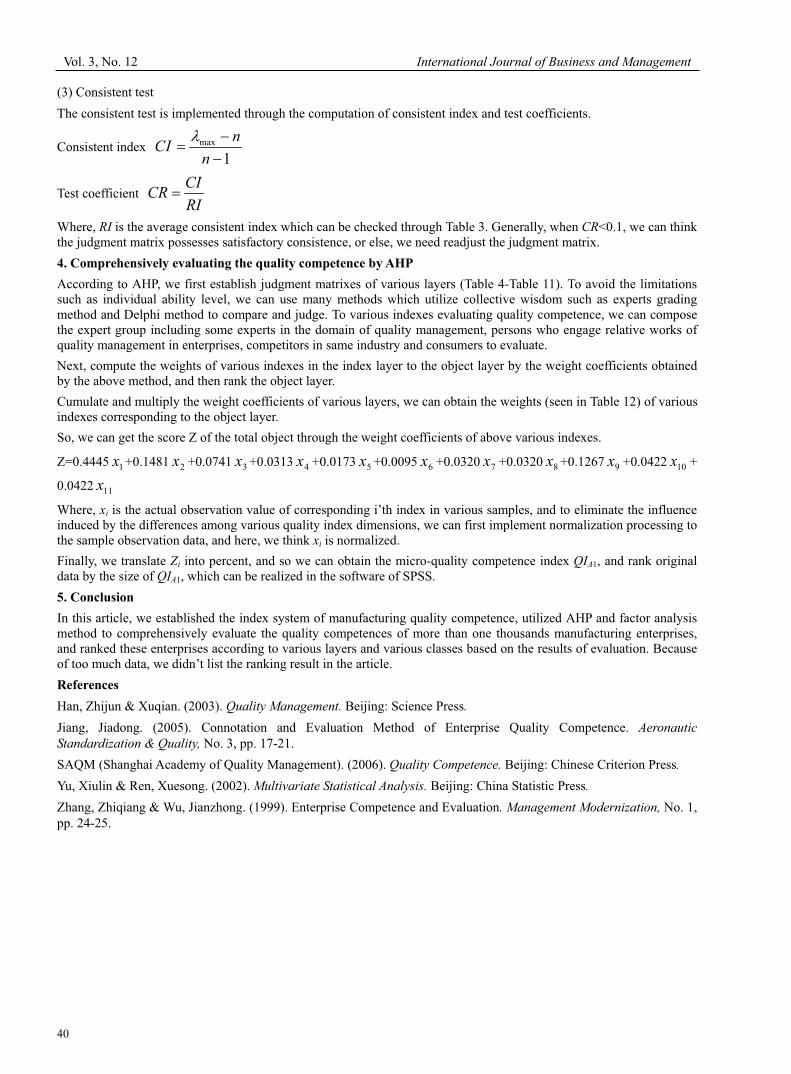
Vol. 3, No. 12 International Journal of Business and Management
40
(3) Consistent test
The consistent test is implemented through the computation of consistent index and test coefficients.
Consistent index max
1
nCI
n
Test coefficient CI
CRRI
Where, RI is the average consistent index which can be checked through Table 3. Generally, when CR<0.1, we can think the judgment matrix possesses satisfactory consistence, or else, we need readjust the judgment matrix.
4. Comprehensively evaluating the quality competence by AHP
According to AHP, we first establish judgment matrixes of various layers (Table 4-Table 11). To avoid the limitations such as individual ability level, we can use many methods which utilize collective wisdom such as experts grading method and Delphi method to compare and judge. To various indexes evaluating quality competence, we can compose the expert group including some experts in the domain of quality management, persons who engage relative works of quality management in enterprises, competitors in same industry and consumers to evaluate.
Next, compute the weights of various indexes in the index layer to the object layer by the weight coefficients obtained by the above method, and then rank the object layer.
Cumulate and multiply the weight coefficients of various layers, we can obtain the weights (seen in Table 12) of various indexes corresponding to the object layer.
So, we can get the score Z of the total object through the weight coefficients of above various indexes.
Z=0.4445 1x +0.1481 2x +0.0741 3x +0.0313 4x +0.0173 5x +0.0095 6x +0.0320 7x +0.0320 8x +0.1267 9x +0.0422 10x +
0.0422 11x
Where, xi is the actual observation value of corresponding i’th index in various samples, and to eliminate the influence induced by the differences among various quality index dimensions, we can first implement normalization processing to the sample observation data, and here, we think xi is normalized.
Finally, we translate Zi into percent, and so we can obtain the micro-quality competence index QIA1, and rank original data by the size of QIA1, which can be realized in the software of SPSS.
5. Conclusion
In this article, we established the index system of manufacturing quality competence, utilized AHP and factor analysis method to comprehensively evaluate the quality competences of more than one thousands manufacturing enterprises, and ranked these enterprises according to various layers and various classes based on the results of evaluation. Because of too much data, we didn’t list the ranking result in the article.
References
Han, Zhijun & Xuqian. (2003). Quality Management. Beijing: Science Press.
Jiang, Jiadong. (2005). Connotation and Evaluation Method of Enterprise Quality Competence. Aeronautic
Standardization & Quality, No. 3, pp. 17-21.
SAQM (Shanghai Academy of Quality Management). (2006). Quality Competence. Beijing: Chinese Criterion Press.
Yu, Xiulin & Ren, Xuesong. (2002). Multivariate Statistical Analysis. Beijing: China Statistic Press.
Zhang, Zhiqiang & Wu, Jianzhong. (1999). Enterprise Competence and Evaluation. Management Modernization, No. 1, pp. 24-25.
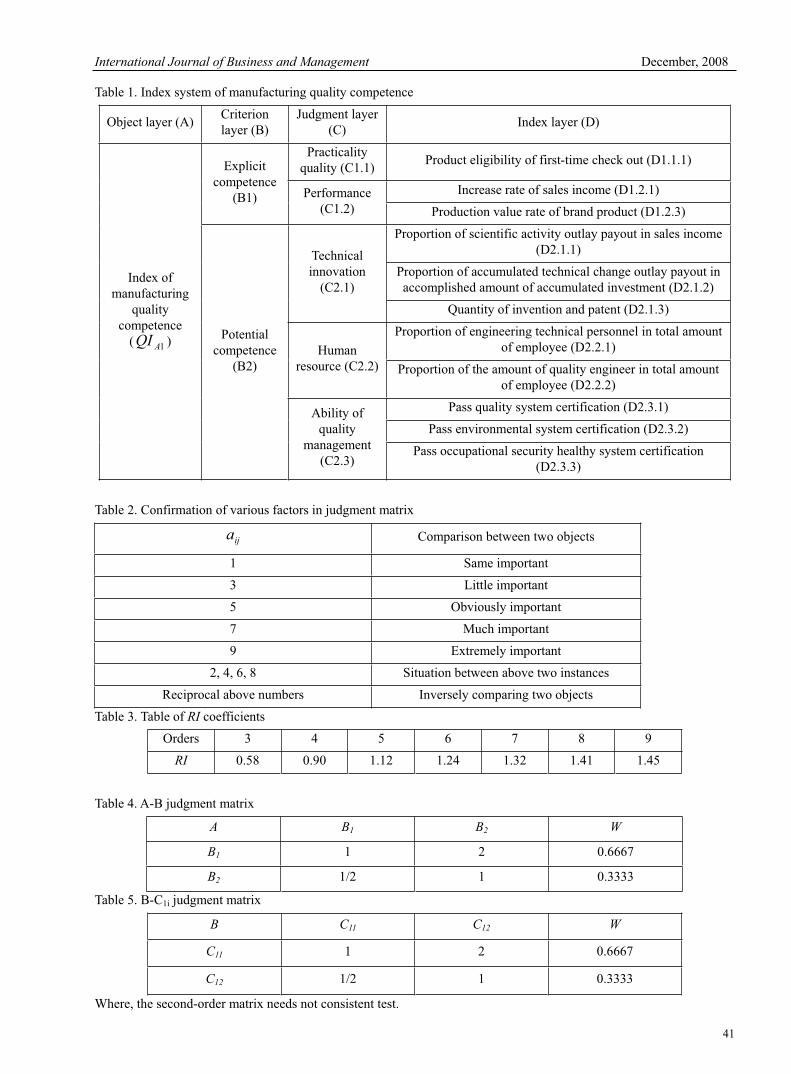
International Journal of Business and Management December, 2008
41
Table 1. Index system of manufacturing quality competence
Object layer (A) Criterion layer (B)
Judgment layer (C)
Index layer (D)
Index of manufacturing
quality competence
( 1AQI )
Explicit competence
(B1)
Practicalityquality (C1.1)
Product eligibility of first-time check out (D1.1.1)
Performance (C1.2)
Increase rate of sales income (D1.2.1)
Production value rate of brand product (D1.2.3)
Potential competence
(B2)
Technical innovation
(C2.1)
Proportion of scientific activity outlay payout in sales income (D2.1.1)
Proportion of accumulated technical change outlay payout in accomplished amount of accumulated investment (D2.1.2)
Quantity of invention and patent (D2.1.3)
Human resource (C2.2)
Proportion of engineering technical personnel in total amount of employee (D2.2.1)
Proportion of the amount of quality engineer in total amount of employee (D2.2.2)
Ability of quality
management (C2.3)
Pass quality system certification (D2.3.1)
Pass environmental system certification (D2.3.2)
Pass occupational security healthy system certification (D2.3.3)
Table 2. Confirmation of various factors in judgment matrix
ija Comparison between two objects
1 Same important
3 Little important
5 Obviously important
7 Much important
9 Extremely important
2, 4, 6, 8 Situation between above two instances
Reciprocal above numbers Inversely comparing two objects
Table 3. Table of RI coefficients
Orders 3 4 5 6 7 8 9
RI 0.58 0.90 1.12 1.24 1.32 1.41 1.45
Table 4. A-B judgment matrix
A B1 B2 W
B1 1 2 0.6667
B2 1/2 1 0.3333
Table 5. B-C1i judgment matrix
B C11 C12 W
C11 1 2 0.6667
C12 1/2 1 0.3333
Where, the second-order matrix needs not consistent test.

Vol. 3, No. 12 International Journal of Business and Management
42
Table 6. B-C2i judgment matrix
B C21 C22 C23 W
C21 1 1 1/4 0.1744
C22 1 1 1/3 0.1919
C23 4 3 1 0.6337
Where, max =3.0091, CI=0.00455, RI=0.5800, CR=0.0078<0.1000.
Table 7. C-D11i judgment matrix
C D111 W
D111 1 1
Table 8. C-D12i judgment matrix
C D121 D122 W
D121 1 2 0.6667
D122 1/2 1 0.3333
Table 9. C-D21i judgment matrix
C D211 D212 D213 W
D211 1 2 3 0.5390
D212 1/2 1 2 0.2972
D213 1/3 1/2 1 0.1638
Where, max =3.0093, CI=0.00465, RI=0.5800, CR=0.0080<0.1000.
Table 10. C-D22i judgment matrix
C D221 D222 W
D221 1 1 0.5000
D222 1 1 0.5000
Table 11. C-D23i judgment matrix
C D231 D232 D233 W
D231 1 3 3 0.6000
D232 1/3 1 2 0.2000
D233 1/3 1 1 0.2000
Where, max =3.0000, CI=0, RI=0.5800, CR=0<0.1000.

International Journal of Business and Management December, 2008
43
Table 12. Weighted coefficients of various indexes
First-time
check out 1x
Sales increase
2x
Production
value of
brand 3x
Outlay of
science and
technology
4x
Outlay of
technical
change 5x
Invention and
patent 6x
0.4445 0.1481 0.0741 0.0313 0.0173 0.0095
Technical personnel
7x
Quality personnel
8x
Quality
system 9x
Environment
system 10x
Security
system 11x
0.0320 0.0320 0.1267 0.0422 0.0422
Vol. 3, No. 12 International Journal of Business and Management
44
Corporate Governance and Audit
Independence: Empirical Evidence of Iranian Bankers
Mahdi Salehi
Accounting and Management Department, Zanjan University
D.N. 1 Nagilo Alley, Hidaj City, Zanjan Province, Zanjan, Iran
Tel: 98-91-2142-5323 E-mail:[email protected]
Abstract
External auditors occupy a unique position in the business community when they perform an audit for clients. The auditors are called upon to attest to financial statements and to safeguard the interest of various parties. However, in recent years the audit practice because of several scandals has been undermined. This empirical study shows that several factors affect on audit independence in Iran. The results show that there is a huge difference between auditors and bankers on audit independence. The author has come to the conclusion that for solving this problem well-established corporate governance can improve audit independence.
Keywords: Audit independence, Corporate governance, Iran
1. Introduction
Separation of ownership from management and limited liability of members are the two major features of corporate bodies (companies) that necessitate giving a separate thought to the governance of these organizations. For such an important advantage to stakeholders and managers, not much of accountability was created for them initially. Traditionally a company was seen as a self-regulatory body which is a part of regulatory market mechanism, thus making it accountable primarily to the market and to its members. Rapid growth in the size of the companies and the consequent complexities in their structures have, however, challenged this traditional perspective all over the world; that is why corporate governance has became a topic of hot discussion in well-developed as well as developing countries. The global movement for better corporate governance progressed by fits and starts from the 1980s. Corporate governance is the implementation of best corporate practices which enhance shareholders value in the long run at the same time protecting the interests of other stakeholders. High-profile business failures such as Enron Corp., WorldCom, Inc., and Global Crossing, Ltd. have focused public’s attention on how management manipulates earnings in an apparent attempt to deceive the unwary public. Public confidence in corporate governance structures and the ability of corporate boards to monitor and control management’s behavior has been reduced to very low levels.
Corporate governance deals with laws, practices and implicit rules that determine the company’s ability to take informed managerial decisions vis-à-vis its claimants in particular, shareholders, creditors, customers, the state and employees.
The present thrust on corporate governance is historical in nature. It seems that the concept has become widely circulated because of audit failure. The basic objective of audit process is to ensure that the operations of an enterprise are carried out in good faith by the management without using the resources to satisfy self-interest. An auditor is expected to render his opinion on management’s operations from the viewpoint of carrying out such functions in good faith. It is important to note that the focus of corporate governance, in its broadest interpretation, incorporates this objective of audit process itself. Then the question arises as to why we should focus on corporate governance now, when we can achieve the objective of the verification of management working in good faith. The reason is that audit has itself failed in the realization of the avowed objective of verifying the operations carried out by the management. One of the major reasons for the failure of audit effectiveness is the absence of auditor independence and this factor alone paved they way for corporate governance. In recent years the failure of auditor independence has necessitated for a thrust on corporate governance in Iran, as a sequel to the global phenomenon. The need for the study arises because (i) audit effectiveness has failed paving the way for corporate governance; and (ii) the crucial issue of auditor independence has not been empirically tested in Iran. With the background of this problem, the present study aims at empirically testing the factors that hinder audit independence and also the factors that enhance auditor independence. The remainder of this paper argues about corporate governance, and auditor independence regarding which, the author believes, there is a strong relationship between both of them.
International Journal of Business and Management December, 2008
45
2. Corporate governance
Despite that the term corporate governance is relatively new; the aspects surrounding it have been around since the first half of the century (Berle and Means 1932; Smith, 1776). In the modern society the very first corporate governance codes were established in the USA in the 1970s, a period in which the corporate sector of the country was confronted with a wave of mergers and hostile takeovers. In 1978, a report was published by the so-called Business Roundtable entitled “The role and composition of the board of directors of the large publicly owned corporation” as a response to a trend of increased corporate criminal behaviour, as well as to support the establishment of new laws to set clear boundaries to hostile takeovers (Aguilera and Cuervo-Cazzura, 2004). In Europe, the first code was established in 1992 with the issuing of the so-called “Cadbury Report”. This report was published after increased public concern about a series of unexpected failures of major British companies such as Polly Peck, P&C, BCCI and Maxwell (Parkinson, 1993). The Cadbury Report in1992, containing a code of best practices for listed companies, added an additional source of regulation to the British corporate governance environment in parallel with the relevant legislation. The widely accepted positive outcomes of that initiative have instigated the adoption of similar codes of best practice in almost all European Union countries. Yet, the appreciation for codes as an instrument to improve corporate governance systems increased only after 1997. Between 1992 and 1997 only three countries (Spain, The Netherlands and France) established a code. From 1998 several other European countries decided to come up with their own version of a corporate governance code. By 2004, a total of 22 European countries has established their own code, and in some cases even more than one.
Referring to more recent work that has been done on corporate governance, Shleifer and Vishny (1997) define corporate governance by stating that it ‘deals with the ways in which suppliers of finance to corporations assure themselves of getting a return on their investment’. Taking a broad perspective on the issues, Gillan and Starks (1998) define corporate as the system of laws, rules, and factors that control operations at a company. Irrespective of the particular definition used, researchers often view corporate mechanisms as falling into one of two groups: those internal to firms and those external to firms. Of course, firms are more than just boards, managers, shareholders, and debt holders.
As demonstrated by Pass (2004, pp. 52), corporate governance actually deals with the “duties and responsibilities of a company’s board of directors in managing the company and their relationships with the shareholders of the company and the stakeholder groups”. To put it into effective work, in essence, such dealing should be appropriately governed, regulated, imposed and enforced. Hart (1995) suggests “corporate governance issues arise in an organization whenever two conditions are present. First, there is an agency problem, or conflict of interest, involving members of the organization – these might be owners, managers, workers or consumers. Second, transaction costs are such that this agency problem cannot be dealt with through a contract”. Garvey and Swan (1994) assert that “governance determines how the firm’s top decision makers (executives) actually administer contracts”, while they also argue that governance arises when such contracts are incomplete. In accordance to the above, John and Senbet (1998) define corporate governance in a more comprehensive way since they argue that it ‘deals with mechanisms by which stakeholders of a corporation exercise control over corporate insiders and management such that their interests are protected’. It is worth noting that by the term stakeholders we mean not just shareholders, but also debt holders as well as non-financial stakeholders such as employees, suppliers, customers, and other interested parties.
Reviewing the various definitions of corporate governance it is clear that they all refer to the existence of conflicts of interest between insiders and outsiders arising from the separation of ownership and control. During the recent past a growing interest in corporate governance has been observed. In the first place, the efficiency of the prevailing governance mechanisms has been questioned while this debate has intensified following financial scandals and business failures and, more recently, a number of high visibility accounting frauds allegedly perpetrated by managers (Enron, WorldCom).
The definition of corporate differs depending on one’s view of the world. Many existing studies in good corporate governance have focused on: the roles of non-executive versus executive members of the board (Pass, 2004), the independence of the board of directors (Zandstra, 2002), the role, independence and disclosure of audit committee (Rezaee et al., 2003), the enforcement of compliance and role of internal auditors (Vinten, 1998, 2000, 2002). They are altogether grouped into under mentioned values of corporate governance perspectives:
Accountability (Spira, 2001);
Integrity (Grant, 2003);
Efficiency (Walker and Fox, 2002); and
Transparency (Rezaee et al., 2003).
To explain the primary impediments to good governance, the International Swaps and Derivatives Association (ISDA) (2002) reminds us that modern economic theory has established an approach to construct the corporate governance through the separation of two main functions in firms, which are:
Vol. 3, No. 12 International Journal of Business and Management
46
(1) Principals; the owners of the companies who hold claims over the net income of the company’s business no matter whether it is positive or negative, who then appoint the agent; and
(2) Agents; who execute duties and responsibilities in the companies on behalf of the principals.
This separation is however, linked and governed through proper “agency relationship” at various levels, among others “between shareholders and boards of directors, between boards and senior management, between senior and subordinate levels of management” (ISDA, 2002, pp. 4). In such a principal-agent relationship, there is always “inherent potential for conflicts within a firm because the economic incentives faced by the agents are often different from those faced by the principals” (ISDA, 2002, p. 5).
According to ISDA (2002), all companies are exposed to agency problems, and to some extent develop action plans to deal with them. These include establishing such measures as: “controls on the actions of agents, monitoring the actions of agents, financial incentives to encourage agents to act in the interest of the principals, and separation of risk taking functions from control functions” (ISDA, 2002, pp. 5).
It is safe to say that, corporate governance covers all aspects of firms; therefore the existence of good corporate governance wills great effect firms. Furthermore, now a day’s firms should think in interdisciplinary way; it means they have to accept new conditions. According to Wilson (2000), new rules of corporate conduct could be considered as:
Legitimacy: To earn and retain social legitimacy, the corporation must define its basic mission in terms of the social purpose it is designed to serve rather than as the maximization of profit.
Governance: The corporation must be thought of, managed, and governed more as a community of stakeholders and less as the property of investors.
Equity. The corporation must strive to achieve greater perceived fairness in the distribution of economic wealth and in its treatment of all stakeholder interests.
Environment. The corporation must integrate the practices of restorative economics and sustainable development into the mainstream of its business strategy.
Employment. The corporation must rewrite the social contract of work to reflect the values of the new workforce and increase both the effectiveness and loyalty of employees and the corporation.
Public/private-sector relationships. To ensure the success of the power shift, corporations must work closely with governments to achieve a viable and publicly accepted redefinition of the roles and responsibilities of the public and private sectors.
Ethics. The corporation must elevate and monitor the level of ethical performance in all its operations in order to build the trust that is the foundation of sound relationships with all stakeholder groups.
In accounting and auditing dimensions, the corporate governance may play vital role, because good corporate governance leads to more audit independence; in other words there is a positive relationship between corporate governance and audit independence. One of the key elements of audit practice is independence as explained hereunder.
3. Origin of auditor independence
Independent auditing is an essential feature of efficient capital markets. The auditing profession in the developed world has long argued that the main objective of independent audits is to render an expert opinion on the fairness of financial statements. Independence both historically and philosophically, is the foundation of the public accounting profession and upon its maintenance depend the profession's strength and its stature. The concept of auditor independence has varied over the last 150 years. In a general sense, auditor independence has borne a relationship to the prevailing commercial environment in different time periods. There has not, however, been a clear transition from one concept of auditor independence to another. The initial concept of auditor independence, which arose during the nineteenth century, was based on the premise, primarily British in origin, that the principal duty of professional accountants and auditors was the oversight of absentee investments in the existing and former colonies of the British Empire. The concept of auditor independence during this era did not conceive of auditors as advocates for audited entities. British investors explicitly forbade auditors from investing or working in the businesses that they audited. At the same time, as long as auditors maintained their primary loyalty to the investors back home, the scope of professional accounting services could be reasonably broad.
This initial concept of auditor independence changed during the late nineteenth and early twentieth century. During this time there was an economic shift from capital coming primarily from foreign sources to capital deriving primarily from domestic sources. The crux of the management-auditor relationship is often viewed in terms of the independence and objectivity of the auditors. However, in order to form an independence and objective view of something the auditors need to be aware of it.
International Journal of Business and Management December, 2008
47
3.1 Definitions on auditor independence
The concept of auditor independence has been argued from many perspectives. Many research works have been conducted on the auditor independence. From amongst them some of the important definitions and views have been presented in the following paragraphs.
The auditor independence has been defined by International Auditing Practices Committee of the International Federation of Accountants in its I.A.G.-3, sept 1980 as the auditor should be straight forward, honest and sincere in his approach to his professional work. He must be fair and must not allow prejudice or bias to override his objectivity. He should maintain an impartial attitude and both be and appear to be free of any interest which might be regarded, whatever its actual effect, as being incompatible with integrity and objectivity.
Moizier (1991) viewed in an economic sense, the term auditor independence. There is an expectation that the auditor will have performed an audit that will have reduced the chances of a successful negligence lawsuit to a level acceptable to the auditor. In the language of economics the auditor will perform auditor work until the cost of undertaking more work is equal to the benefit the auditor derives in terms of the reduction in the risk of a successful lawsuit being possible. This then represents the minimum amount of work that the reader can expect the auditor to perform. However, all auditors are individuals with different attitudes to risk and return and so one auditor's minimum standard of audit work will not necessarily be that of a colleague.
3.2 Importance of auditor independence
The audit of accounts in the corporate sector by an independent auditor is obligatory by statute which defines his duties rights and powers, It is essential because of the separation of ownership from the management in the corporate sector as the former needs someone who can keep a professional watch on the latter and to whom they can trust for the reliability of accounts as the preparation of financial statement is the prerogative of the management. The auditor has not much to suggest on the form and adequacy of financial statement and independent auditor is responsible for his report.
The reliability of an audit report is nothing but the degree of trust reposed by its users. The various users are bound to react differently because of the variation in their nature and objectives.
The following are some of the important features of auditor independence:
The reliability of auditor's independence depends on auditor's independence on the one hand, and the degree of his experience, competence and knowledge, on the other.
The independence of the auditor is of prime importance as his report is persuasive and subjective in nature.
Independence is a state of mind and implies that auditors should remain firm enough to withstand any type of influence.
Independence is of prime importance as wide spectrums of users are interested in his professional report and if his independence is not maintained, expectations of users will be belied.
The auditor is beholden to be independent without resorting to confuse rather than enlighten the business community by his work and report on the task entrusted to him in a clear straight forward manner
Traditional view of auditor independence is that lack of independence will reduce the importance placed on audit reports and that investment and loan decisions will be impaired.
Watts and Zimmerman (1983) have argued that auditors have incentives to maintain their independence, even in the absence of governmental regulations, so that self-monitoring might be sufficient. At least since the Securities Acts, independence has been the focus of almost constant controversy, debate, and analysis.
There is widespread agreement by regulators, accounting practitioners, and auditing academics that auditor independence enhances auditor credibility. It is argued that independence enhances the credibility of financial statement on two grounds. First, independent auditors increase the likelihood that financial statements conform to generally accepted accounting principles (GAAP). Second, investors are more likely to rely on the financial statements if the auditor is independent. Under this set of arguments, auditor independence plays a central role in enhancing the credibility of financial statements, and any threat to auditor independence has undesirable effects on capital markets (SEC 2000).
4. Empirical evidences regarding auditor independence
Auditor independence is an issue that has been debated since the birth of the profession. The global conception among users of accounts is, and has always been-quite rightly threat. If one wants to place trust in the auditors report, it must be a precondition that the views expressed by the auditor are based on objectivity. Objectivity can only be achieved if the auditor is independent of the client.
Vol. 3, No. 12 International Journal of Business and Management
48
Audit independence has been a significant issue in accounting literature in recent years. This is often tested by statistical analysis of the relationship between audit fees, non-audit fees, qualified audit reports etc. There is a broad range of accounting literature that investigates whether the independence of the auditor has been actually impaired. Majority of the perceived independence research has emanated from the developed countries, especially in the United States, where there have been two government commissions, viz., The Cohen Commission (1978) and the Treadway Commission (1987) with many debates about the effect of management advisory services on the independence of the auditors. However, the views of natural shareholders have not been sought in much of this research.
Schulte (1965) specifically focused on Non-Audit Services (NASs). Third parties were asked whether management consulting seriously impaired CPA’s audit independence. There were great variations in views. It was found that 43 percent did not think so (indeed 20 percent indicated that their confidence in audit reports were thereby improved), 33 percent did think so and remaining 24 percent were unsure.
Titard (1971) undertook a similar study, asking financial statement users on whether NAS’s provision to audit clients may result in CPA’s losing some of their audit independence. The interesting feature of this study was that this same question was asked with respect to 33 specific types of services. Over 20 percent of respondents answered in the affirmative to five types of service: mergers and acquisitions (32 percent), executive recruitment (27 percent), policy determination (27 percent), personal appraisal and/or selection (23 percent), and executive and wage incentive plans (21 percent). It was noticeable that no single item was checked by more than one-third of respondents, although 49 percent answered “Yes” to an initial question asking about NAS generically. Respondents were asked also whether each service should be prohibited assuming separation of personnel. For the above five services, the percentage agreeing was between 10 percent and 20 percent.
Emby and Davidson (1997) conducted an experiment using auditors to examine the impact of four factors (including NAS provision) on auditor’s ability resist management pressure in a dispute over the disclosure of a contingent claim. They found that auditors were more likely to insist on disclosure when they provided the client with NAS.
Hussey (1999) asked the UK finance directors about a range of issues concerning the familiarity threat and auditor independence. One question asked whether auditors should be allowed to undertake other than audit work for the same client. The majority agreed that joint provision should be allowed, however 20 percent of independent public respondents disagreed, compared to 13 percent of private company respondents.
Kornish and Levine (2000), a survey commissioned by the ISB indicated that respondents believed that the evolution of audit firms into consulting fields was logical and provision of most consulting services was not likely to create real problem of independence.
It is believed that auditor’s responsibility and independence are crucial issues underlying the independent auditing function and has significant implications on the development of auditing standards and practices. In this regard, a survey was taken up by Lin (2004) in China with respect to audit objectives, auditor's obligation to detect and reporting frauds and third party liability of auditors. The study evidenced the emergence of the expectation gap in China and the majority of audit independence by reducing governmental control or intervention and moving towards self-regulation of the profession. This study has a limitation in the sense that it should cast light on understanding of the institutional setting and updated development of independent audits in China and may also serve as an annotation to the recent accounting reform debates in the western world.
Myers (2005) perceived that audit independence is fundamental to the profession credibility. The audit independence can be viewed from two angles: (i) Actual independence is the achievement of actual freedom from bias, personal interest, prior commitment to an interest, or susceptibility to undue influence or pressure; and (ii) perceived independence is the belief of financial report users that actual independence has been achieved.
5. Research methodology
The study focuses on the perceptions of auditors and bankers on auditor independence. It is generally held that economic considerations basically influence the level of auditor independence leading to effectiveness or effectiveness of audit process.
5.1 Hypotheses of the study
In carrying out the study, the following hypotheses were identified:
(i) Audit independence is lower due to self-interest of the auditors;
(ii) The self-interest reducing the audit independence is perceived with higher weighted points by the bankers than the auditors; and
(iii) Auditors perceive lower actual values for economic consideration than the bankers.
International Journal of Business and Management December, 2008
49
The influence of economic considerations on auditor independence was considered through eight variables given in the ensuing table. The present empirical study has focused on the perception of 185 bankers and 201 professional chartered accountants of Iran. The questionnaire consisted of five variables, which were held to decrease audit independence and four variables, which were held to increase audit independence in Iran. All these variables were to be rated by the sample respondents on 5-point Likert’s scale having the ratings of “strongly disagree” (1) and “strongly agree” (5). The statistical tools used in the study included mean value, median value, standard deviation, Mann-Whitney test and Z value for the purpose of analysis and interpretation.
6. Results of analyses
Table 1 highlights the results of respondents’ perceptions comprising of auditors and bankers on economic and regulatory considerations affecting the independence of auditors and eight factors are included to study of these factors on auditor independence. It is interesting to note that both the auditors and bankers recognize that these factors influence auditor independence. Furthermore, according to the Mann-Whitney test there is a significant difference between two parties on all eight factors (p<0.05). In the other words, there is a significant perception gaps in all factors between auditors and bankers in Iran. The auditors perceived the independence level by assigning the mean value of 3.95 implying that these factors reduced independence of auditors. However, the bankers expected more from auditors in eight dimensions and they expected that the ill affects of these factors affecting independence should be reduced and they assigned the mean value of 4.125.
Insert Table 1
Further, the auditors’ perceptions of the economic and considerations like client’s economic worth, , receiving gifts and presentations from management, in the executive function at low level rather than bankers, while the perceptions regarding audit market competition, the regulatory framework, the corporate governance, the great use of audit committees and professional ethic guidance are higher than bankers’. It is interesting to note that the auditors believe the corporate governance effects on audit independence. In other words the well-corporate governance increase audit independence. The auditors also believe audit market competition reduces audit independence and audit committees and professional ethic guidance increase audit independence. However, bankers do not agree on these matters with auditors. The bankers believe the economic dependence of the auditor on the client, receiving payment from non-audit services, receiving gifts and presentations from management and receiving gifts and presentations from management do seriously affect audit independence and impair independence of Iranian auditors.
7. Conclusion
The new concept of auditor independence requires one that specifically incorporates the propositions that auditors should not be advocates for their clients, and management should not be able to influence the audit fee and the scope of the audit. Without a transition to this concept, auditor independence standards will most likely be primarily cosmetic and will not provide sufficient assurance that auditor is in fact independent from client management. The primary purpose of an independent audit is not the detection of fraudulent financial reporting, as long as the public's perceptions remain the way they are. The auditor's best protection against empty pockets is to look for fraudulent financial reporting with each and every independent audit regardless of whether it will have a material effect on the statements. Audit opinion on financial statements renders the level of truth and fairness in preparing and presenting the financial statements and also of representational faithfulness of corporate governance. As mentioned before, the auditors strongly believe that corporate governance in Iran will increase audit independence, therefore, it is crucial to Iranian finance sectors to well-establish corporate governance according to business requirements. In addition, the present empirical study reveals a low level of auditor independence and this level indicates the pathetic situation in the ineffective audit process. If auditors eulogize audit as the sacred act of them, bankers and third parties condemn it as a perfunctory legal duty devoid of any credibility. Recognizing this failure of audit process, the authors have embarked upon cleansing the corporate Iran through the much hyped corporate governance, the effectiveness of which is still under doubt needing proactive institutional framework in Iranian soil.
References
Aguilera, R. and Cuervo-Cazzura A (2004). Codes of Corporate Governance Worldwide: What is the Trigger? Organisation Studies, Vol. 25 No. 3, pp. 415-43.
Berle, A., and Means G (1932). The Modern Corporation and Private Property, Macmillan, New York, NY.
Cohen Commission. (1978). Report of the Commission on Auditors’ Responsibilities; Conclusions and
Recommendations, New York: American Institute of Certified Public Accountants.
Emby, C., and Davidson R.A. (1997) .The Effects of Power factors on Auditor Independence, Paper presented at the 1997 International Symposium on Audit Research in Singapore.
Vol. 3, No. 12 International Journal of Business and Management
50
Garvey, G. and P Swan (1994) .The Economics of Corporate Governance: Beyond the Marshallian firm, Journal of
Corporate Finance, Vol. 1, pp. 139-74.
Gillan, S. and Starks L (1998) .A Survey of Shareholder Activism: Motivation and Empirical Evidence, Contemporary
Finance Digest, Vol. 2, No. 3, pp. 10-34.
Grant, G. (2003) .The Evolution of Corporate Governance and its Impact on Modern Corporate A Tale of America, Management Decision, Vol. 41, No. 9, pp. 923-34.
Hart, O. (1995) .Corporate Governance, Some Theory and Applications, The Economic Journal, Vol. 105, pp. 687-689.
Hussey, R., (1999). The Familiarity Threat and Auditor Independence, Corporate Governance, Vol. 7, No. 2, April, pp. 190-197.
International Swaps and Derivatives Association (ISDA) (2002). 17th Annual General Meeting, Berlin, April.
John, K. and Senbet L (1998). Corporate Governance and Board Effectiveness, Journal of Banking and Finance, Vol. 22, pp. 371-403.
Kornish, L., and Levine C.B. (2000). Discipline with Common Agency: The Case of Audit and Non-audit Services,
SSRN, Working Paper.
Lin, J. Z., and Chen F. (2004). An Empirical Study of Audit ‘Expectation Gap’ in The People’s Republic of China, International Journal of Auditing, Vol. 8, pp. 93-115.
Moizier, P., (1991). Independence in Current Issues in Auditing, (eds.,) by M Sherer and S Turley, Paul Chapman publishing Ltd.
Myers, P.J., (2005). Perceived Auditor Independence: The Neglected Views of Natural Shareholders,http://aux.Zicklin.branch.cuny.edu/critical/html2/8112myers.html
Parkinson, J. (1993). Corporate Power and Responsibility: Issues in the Theory of Company Law, Oxford University Press, Oxford.
Pass, C. (2004). Corporate Governance and the Role of Non-Executive Directors in Large UK Companies: An Empirical Study, Corporate Governance, Vol. 4, No. 2, pp. 52-63.
Rezaee, Z., Olibe K and Minmier G (2003). Improving Corporate governance: the Role of Audit Committee Disclosures, Managerial Auditing Journal, Vol. 18, No. 6/7, pp. 530-7.
Schulte, T.A. Jr., (1965) .Compatibility of Management Consulting and Auditing, The Accounting Review, July, pp. 587-593.
SEC (2000). Final Rule: Revision of the commission’s Auditor Independence Requirements, Release No. 33-7870, Securities and Exchange Commission [Available at http://www.sec.gov/rules/final/33-7919.htm.
Shleifer, A. and Vishny R (1997) .A Survey of Corporate Governance, Journal of Finance, Vol. 52, pp. 737-75.
Smith, A. (1776) .Campbell, R. and Skinner, A. (Eds.), An Enquiry into the Nature and Causes of the Wealth of Nations
(1976 re-edition), Clarendon Press, Oxford.
Spira, L. (2001). Enterprise and Accountability: Striking a Balance, Management Decision, Vol. 39, No. 9, pp. 739-48.
Titard, P.L., (1971). Independence and MAS-Opinions of Financial Statements Users, Journal of Accountancy, July, No.1, pp. 47-52.
Treadway Commission (1987). Fraudulent Financial Reporting, New York: American Institute of Certified Public Accountants.
Vinten, G. (1998) .Corporate Governance: An International State-of-the-Art, Managerial Auditing Journal, Vol. 13, No. 7, pp. 419-31.
Vinten, G. (2000). Corporate Governance: the Need to Know, Industrial and Commercial Training, Vol. 32, No. 5, pp. 173-8.
Vinten, G. (2002). The Corporate Governance lessons of Enron, Corporate Governance, Vol. 2, No. 4, pp. 4-9.
Walker, G. and Fox M, (2002) .Corporate Governance Reform in East Asia, Corporate Governance, Vol. 2, pp. 84-89.
Watts, R., and Zimmerman J. (1983). Agency Problems, Auditing, and the Theory of the Firm: Some Evidence, Journal
of Law and Economics, No. 26, pp. 613-33.
Wilson, I. (2000). The New Rules: Ethics, Social Responsibility and Strategy, Strategy &Leadership, Vol. 28, No. 3, pp. 12-16.
Zandstra, G. (2002). Enron, Board Governance and Moral Failings, Corporate Governance, Vol. 2, No. 2, pp. 16-19.
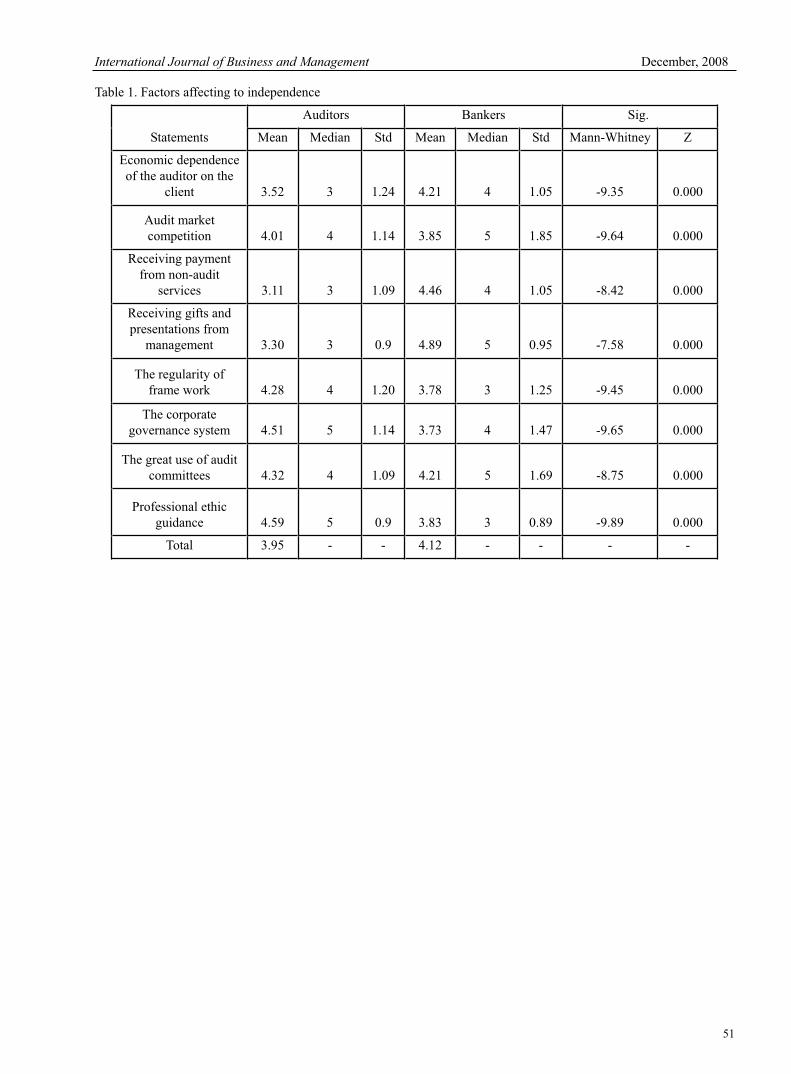
International Journal of Business and Management December, 2008
51
Table 1. Factors affecting to independence
Statements
Auditors Bankers Sig.
Mean Median Std Mean Median Std Mann-Whitney Z
Economic dependence of the auditor on the
client 3.52 3 1.24 4.21 4 1.05 -9.35 0.000
Audit market competition 4.01 4 1.14 3.85 5 1.85 -9.64 0.000
Receiving payment from non-audit
services 3.11 3 1.09 4.46 4 1.05 -8.42 0.000
Receiving gifts and presentations from
management 3.30 3 0.9 4.89 5 0.95 -7.58 0.000
The regularity of frame work 4.28 4 1.20 3.78 3 1.25 -9.45 0.000
The corporate governance system 4.51 5 1.14 3.73 4 1.47 -9.65 0.000
The great use of audit committees 4.32 4 1.09 4.21 5 1.69 -8.75 0.000
Professional ethic guidance 4.59 5 0.9 3.83 3 0.89 -9.89 0.000
Total 3.95 - - 4.12 - - - -
Vol. 3, No. 12 International Journal of Business and Management
52
The Analysis on the Factors Which Affecting Price
Dispersion between Traditional Retail Channel and Internet Retail Channel
Xujin Pu
Business School, Jiangnan University
Wuxi 214122, China
E-mail: [email protected]
Abstract
With network economy springing up and communication technology expanding fast, the retailing channels composed of Internet retail channel become the choice of many traditional retailers. Price dispersion always exists between traditional retail channel and Internet retail channel. In this text, we bring forward the model about traditional retail channel and internet retail channel based on classical hotelling linear city model. We find the price dispersion will be different when the parameters affecting the price in Internet retail channel are different. In some conditions, the price in Internet retail channel will be lower than in traditional retail channel, but in other conditions, the price in Internet retailchannel will be higher than in traditional retail channel.
Keywords: Network economy, Retailing, Internet retail channel, Price dispersion
1. Introduction
The importance of the Internet as a marketplace has substantially grown over the past decade, even though expectations have been dramatically tempered since early 2000.A distinctive feature of doing business electronically is that transactions no longer require the physical coordination of buyers and sellers: market participants find each other at their screens. There are many aspects of market interaction which are affected by this online nature of trade. On the supply side, we may think of all kinds of cost be reductions, resulting from new ways of organizing production and sales processes. On the demand side, the major impact of the Internet is on consumers’ ability to acquire information about firms and their prices.
With the rapid growth of e-commerce, more and more conventional retailers (such as Wal-Mart, Carrefour, etc) have started selling online. It is interesting to see how these conventional retailers compete with online-only retailers on the Web. Online retailing promises the potentials of low barrier of entry, easy access to information, and low transaction costs. But elimination of intermediaries is not without disadvantage. The role of intermediaries is to efficiently create and satisfy demand, through advertising and customer education, providing market coverage, gathering market information, providing breadth of assortment, breaking bulk, processing orders, customer support, etc. So, traditional retail channel and Internet retail channel will exist in the same market for a long time.
According to the view of Vaian (Varian, Hal R., 1980, pp. 651-659), the price dispersion here, is defined as the distribution of prices of an item across sellers at a given point time. There is comprehensive price dispersion phenomenon in commodity market, while the reason of different commodity is distinct respectively. Obviously, the price difference of same products between traditional retail channel and Internet retail channel is the typical price dispersion phenomenon.
The study of our paper is related to the following two research fields. On the one hand, several studies have examined multi-channel supply chain. Rhee and Park (Rhee.B.,Park,S.Y., 2000)study a hybrid channel design problem, assuming that there are two consumer segments: a price sensitive segment and a service sensitive segment. Chiang et al.(Chiang,W.D.Chhajed, 2004)examine a price-competition game in a dual channel supply chain(Boyaci Boyaci,T., 2004)studies stocking decisions for both the manufacturer and retailer in multi-channel supply chain (Viswanathan,V., 2005, pp. 483-496)studies the competition across online, traditional and hybrid channels using a variant of circular city model. Tsay and Agrawa(Tsay, A.N.Agrawal., 2004, b) provide an excellent review of recent work in the area and examine different ways to adjust the manufacturer-reseller relationship.
On the other hand, the price dispersion phenomena have gained a lot of attention. (StiglerStigler,Grorge J., 1961, pp. 213-237)considers that price dispersion phenomena is the result of imperfect price information.Salop and Stiglitz (Salop,Steven, Joseph E.Stiglitz., 1982, pp. 1121-1130)get the asymmetric pure strategy Nash equilibrium of when the
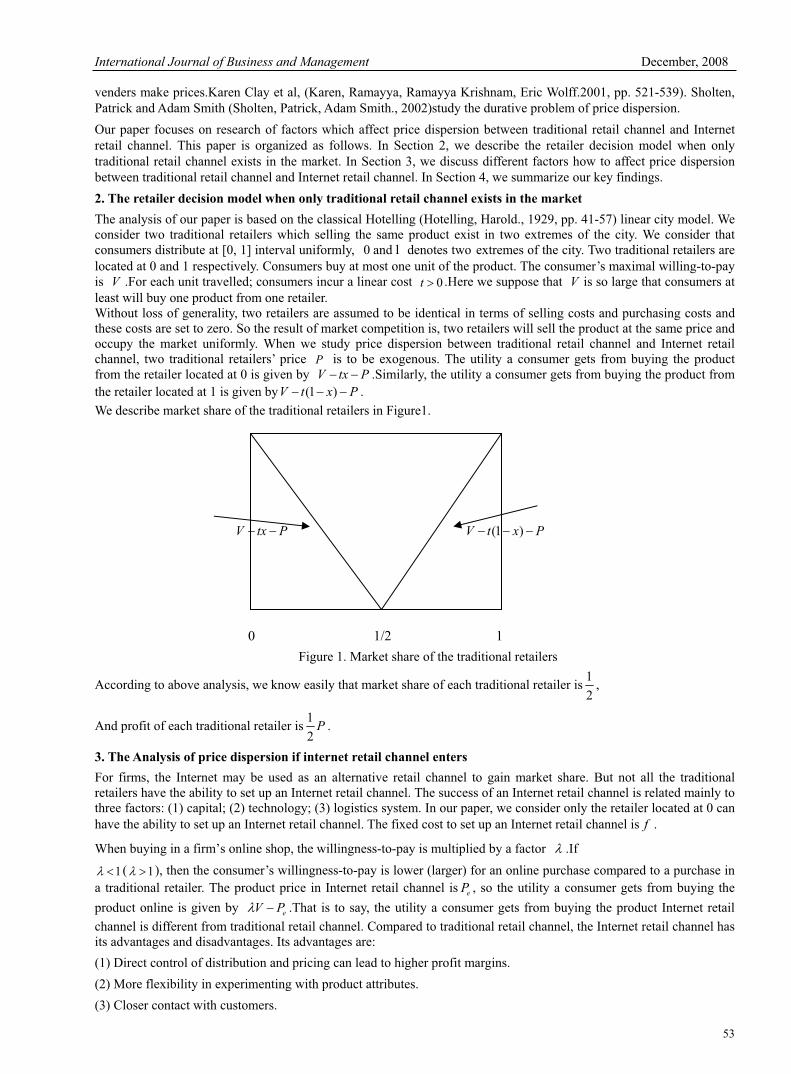
International Journal of Business and Management December, 2008
53
venders make prices.Karen Clay et al, (Karen, Ramayya, Ramayya Krishnam, Eric Wolff.2001, pp. 521-539). Sholten, Patrick and Adam Smith (Sholten, Patrick, Adam Smith., 2002)study the durative problem of price dispersion.
Our paper focuses on research of factors which affect price dispersion between traditional retail channel and Internet retail channel. This paper is organized as follows. In Section 2, we describe the retailer decision model when only traditional retail channel exists in the market. In Section 3, we discuss different factors how to affect price dispersion between traditional retail channel and Internet retail channel. In Section 4, we summarize our key findings.
2. The retailer decision model when only traditional retail channel exists in the market
The analysis of our paper is based on the classical Hotelling (Hotelling, Harold., 1929, pp. 41-57) linear city model. We consider two traditional retailers which selling the same product exist in two extremes of the city. We consider that consumers distribute at [0, 1] interval uniformly, 0 and1 denotes two extremes of the city. Two traditional retailers are located at 0 and 1 respectively. Consumers buy at most one unit of the product. The consumer’s maximal willing-to-pay is V .For each unit travelled; consumers incur a linear cost 0t .Here we suppose that V is so large that consumers at least will buy one product from one retailer. Without loss of generality, two retailers are assumed to be identical in terms of selling costs and purchasing costs and these costs are set to zero. So the result of market competition is, two retailers will sell the product at the same price and occupy the market uniformly. When we study price dispersion between traditional retail channel and Internet retail channel, two traditional retailers’ price P is to be exogenous. The utility a consumer gets from buying the product from the retailer located at 0 is given by V tx P .Similarly, the utility a consumer gets from buying the product from the retailer located at 1 is given by (1 )V t x P .
We describe market share of the traditional retailers in Figure1.
V tx P (1 )V t x P
0 1/2 1
Figure 1. Market share of the traditional retailers
According to above analysis, we know easily that market share of each traditional retailer is1
2,
And profit of each traditional retailer is1
2P .
3. The Analysis of price dispersion if internet retail channel enters
For firms, the Internet may be used as an alternative retail channel to gain market share. But not all the traditional retailers have the ability to set up an Internet retail channel. The success of an Internet retail channel is related mainly tothree factors: (1) capital; (2) technology; (3) logistics system. In our paper, we consider only the retailer located at 0 can have the ability to set up an Internet retail channel. The fixed cost to set up an Internet retail channel is f .
When buying in a firm’s online shop, the willingness-to-pay is multiplied by a factor .If
1( 1), then the consumer’s willingness-to-pay is lower (larger) for an online purchase compared to a purchase in a traditional retailer. The product price in Internet retail channel is eP , so the utility a consumer gets from buying the
product online is given by eV P .That is to say, the utility a consumer gets from buying the product Internet retail
channel is different from traditional retail channel. Compared to traditional retail channel, the Internet retail channel has its advantages and disadvantages. Its advantages are:
(1) Direct control of distribution and pricing can lead to higher profit margins.
(2) More flexibility in experimenting with product attributes.
(3) Closer contact with customers.
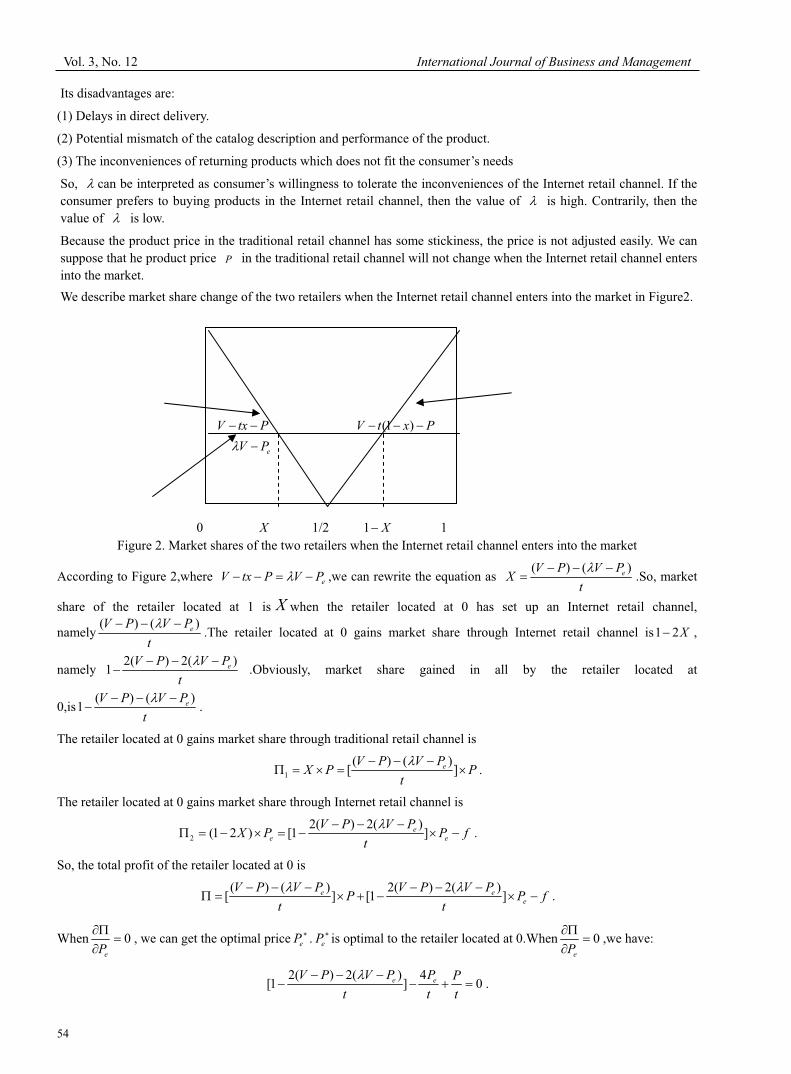
Vol. 3, No. 12 International Journal of Business and Management
54
Its disadvantages are:
(1) Delays in direct delivery.
(2) Potential mismatch of the catalog description and performance of the product.
(3) The inconveniences of returning products which does not fit the consumer’s needs
So, can be interpreted as consumer’s willingness to tolerate the inconveniences of the Internet retail channel. If the consumer prefers to buying products in the Internet retail channel, then the value of is high. Contrarily, then the value of is low.
Because the product price in the traditional retail channel has some stickiness, the price is not adjusted easily. We can suppose that he product price P in the traditional retail channel will not change when the Internet retail channel enters into the market.
We describe market share change of the two retailers when the Internet retail channel enters into the market in Figure2.
0 X 1/2 1 X 1
Figure 2. Market shares of the two retailers when the Internet retail channel enters into the market
According to Figure 2,where eV tx P V P ,we can rewrite the equation as ( ) ( )eV P V P
Xt
.So, market
share of the retailer located at 1 is X when the retailer located at 0 has set up an Internet retail channel,
namely( ) ( )eV P V P
t.The retailer located at 0 gains market share through Internet retail channel is1 2X ,
namely2( ) 2( )
1 eV P V P
t.Obviously, market share gained in all by the retailer located at
0,is( ) ( )
1 eV P V P
t.
The retailer located at 0 gains market share through traditional retail channel is
1
( ) ( )[ ]eV P V P
X P Pt
.
The retailer located at 0 gains market share through Internet retail channel is
2
2( ) 2( )(1 2 ) [1 ]e
e e
V P V PX P P f
t.
So, the total profit of the retailer located at 0 is
( ) ( ) 2( ) 2( )[ ] [1 ]e e
e
V P V P V P V PP P f
t t.
When 0eP
, we can get the optimal price eP . eP is optimal to the retailer located at 0.When 0eP
,we have:
2( ) 2( ) 4[1 ] 0e eV P V P P P
t t t.
V tx P (1 )V t x P
eV P
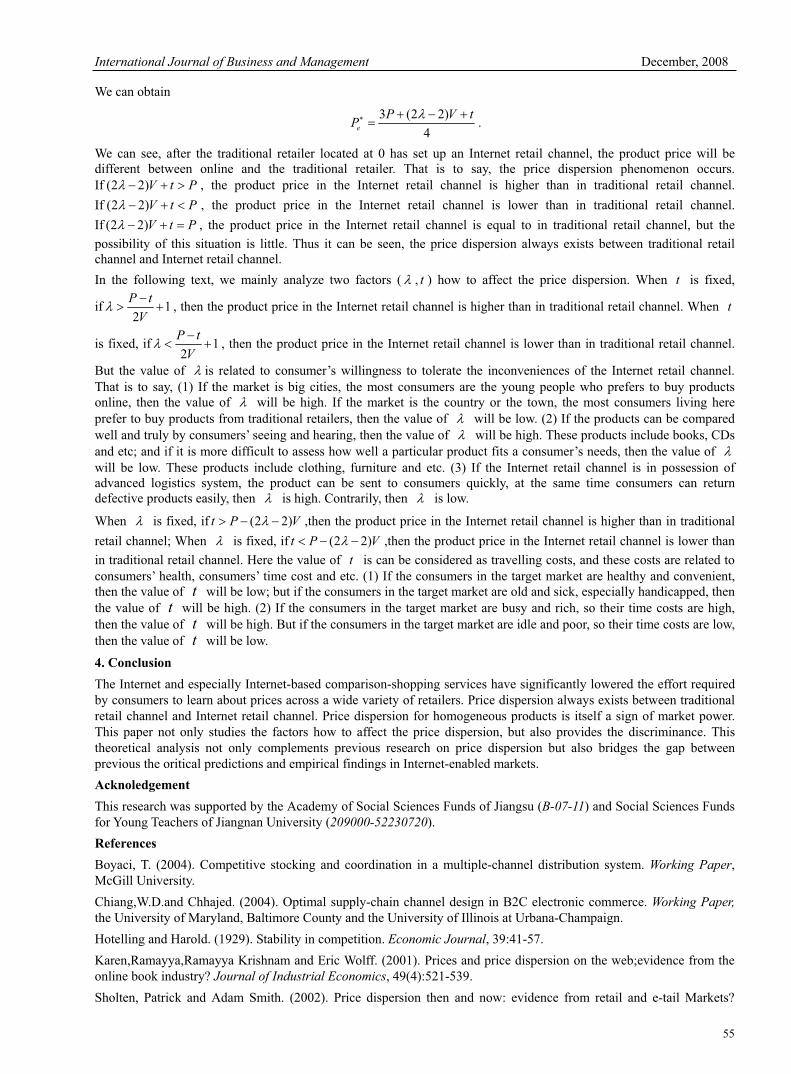
International Journal of Business and Management December, 2008
55
We can obtain
3 (2 2)
4e
P V tP .
We can see, after the traditional retailer located at 0 has set up an Internet retail channel, the product price will be different between online and the traditional retailer. That is to say, the price dispersion phenomenon occurs. If (2 2)V t P , the product price in the Internet retail channel is higher than in traditional retail channel.
If (2 2)V t P , the product price in the Internet retail channel is lower than in traditional retail channel.
If (2 2)V t P , the product price in the Internet retail channel is equal to in traditional retail channel, but the
possibility of this situation is little. Thus it can be seen, the price dispersion always exists between traditional retail channel and Internet retail channel.
In the following text, we mainly analyze two factors ( , t ) how to affect the price dispersion. When t is fixed,
if 12
P t
V, then the product price in the Internet retail channel is higher than in traditional retail channel. When t
is fixed, if 12
P t
V, then the product price in the Internet retail channel is lower than in traditional retail channel.
But the value of is related to consumer’s willingness to tolerate the inconveniences of the Internet retail channel. That is to say, (1) If the market is big cities, the most consumers are the young people who prefers to buy products online, then the value of will be high. If the market is the country or the town, the most consumers living here prefer to buy products from traditional retailers, then the value of will be low. (2) If the products can be compared well and truly by consumers’ seeing and hearing, then the value of will be high. These products include books, CDs and etc; and if it is more difficult to assess how well a particular product fits a consumer’s needs, then the value of will be low. These products include clothing, furniture and etc. (3) If the Internet retail channel is in possession of advanced logistics system, the product can be sent to consumers quickly, at the same time consumers can return defective products easily, then is high. Contrarily, then is low.
When is fixed, if (2 2)t P V ,then the product price in the Internet retail channel is higher than in traditional
retail channel; When is fixed, if (2 2)t P V ,then the product price in the Internet retail channel is lower than
in traditional retail channel. Here the value of t is can be considered as travelling costs, and these costs are related to consumers’ health, consumers’ time cost and etc. (1) If the consumers in the target market are healthy and convenient, then the value of t will be low; but if the consumers in the target market are old and sick, especially handicapped, then the value of t will be high. (2) If the consumers in the target market are busy and rich, so their time costs are high, then the value of t will be high. But if the consumers in the target market are idle and poor, so their time costs are low, then the value of t will be low.
4. Conclusion
The Internet and especially Internet-based comparison-shopping services have significantly lowered the effort required by consumers to learn about prices across a wide variety of retailers. Price dispersion always exists between traditional retail channel and Internet retail channel. Price dispersion for homogeneous products is itself a sign of market power. This paper not only studies the factors how to affect the price dispersion, but also provides the discriminance. This theoretical analysis not only complements previous research on price dispersion but also bridges the gap between previous the oritical predictions and empirical findings in Internet-enabled markets.
Acknoledgement
This research was supported by the Academy of Social Sciences Funds of Jiangsu (B-07-11) and Social Sciences Funds for Young Teachers of Jiangnan University (209000-52230720).
References
Boyaci, T. (2004). Competitive stocking and coordination in a multiple-channel distribution system. Working Paper,McGill University.
Chiang,W.D.and Chhajed. (2004). Optimal supply-chain channel design in B2C electronic commerce. Working Paper,
the University of Maryland, Baltimore County and the University of Illinois at Urbana-Champaign.
Hotelling and Harold. (1929). Stability in competition. Economic Journal, 39:41-57.
Karen,Ramayya,Ramayya Krishnam and Eric Wolff. (2001). Prices and price dispersion on the web;evidence from the online book industry? Journal of Industrial Economics, 49(4):521-539.
Sholten, Patrick and Adam Smith. (2002). Price dispersion then and now: evidence from retail and e-tail Markets?

Vol. 3, No. 12 International Journal of Business and Management
56
Working Paper forthcoming in Advances in Applied Microeconomics.
Rhee, B. and Park, S.Y. (2000). Online stores as a new direct channel and emerging hybrid channel system.Working
paper, HKUST.
Salop, Steven and Joseph E.Stiglitz. (1982).The theory of sales: a simple model of equilibrium price dispersion with identical agents?The American Economic Review, 2(5):1121-1130.
Stigler and Grorge J. (1961).The economics of information? Journal of Political Economy, 69:213-237.
Tsay,A.N. andAgrawal. (2004b).Modeling conflict and coordination in multi-channel distribution systems: a review .Forthcoming in Supply Chain Analysis in the eBusiness Era.
Varian, Hal R. (1980). Model of sales? The American Economic Review, 70(4):651-659.
Viswanathan,V. (2005).Competing across technology-differentiated channels: The impact of network externalities and switching costs. Management Science, 51(3):483-496.
International Journal of Business and Management December, 2008
57
Suggestion on Promoting Agricultural Insurance in China
Yu Zheng
School of Management, Xi’an Polytechnic University
19 Jinhua South Road, Xi’an 710048, China
Tel: 86-29-8233-0193 E-mail: [email protected]
Juan Zhang
Applied Technology College, Xi’an Polytechnic University
19 Jinhua South Road, Xi’an 710048, China
Wangxi Wang
China Flight Test Establishment
8 Shifeiyuanlu Road, Xi’an 710089, China
Abstract
During the practice of agricultural insurance in over 20 years, Chinese agricultural insurance has been facing many problems, i.e. short of legal and political support, insurance awareness, supply and demand etc. In order to promote Chinese agriculture insurance market, we have to adopt relevant measures.
Keywords: Chinese agricultural insurance, Problem, Suggestion
1. Status quo of agricultural insurance in China
China is an agricultural country. It is also one of the countries which suffer from serious natural calamities. According to statistics report from National Bureau of Statistics of China, the total planting area was 122.08 million hectare, the planting area which has been hit by natural calamities was 38.8 million hectare in 2005, and increased 3.91 million hectare compare to previous year. Frequent natural calamities have brought farmers heavy economic losses. The economic losses which caused by natural calamities was 108 billion Yuan in 2005, and increased 37 billion Yuan compare to previous year. So that develop Chinese agricultural insurance becomes more and more urgent now.
In 80s of 20th century, the Chinese insurance system began to be gradually recovered. Since 1982, civil administration departments, agriculture departments and insurance companies issued agricultural insurances one after the other, it presented fast uptrend. The income of agricultural insurance premium was 862 million Yuan in 1992. At the same time, loss ratio increased largely, the loss ratio of agricultural insurance reached 119% in 1991. However, along with lessened support from government, especially, when PICC started to change into commercial insurance company, agricultural insurance shrank step by step. In 2000, the income of agricultural insurance premium decreased to 387 million Yuan, and it continuously dropped to 300 million Yuan in 2002. In other words, one farmer paid less than 1 Yuan for insurance at that time. Because of the long deficit of agricultural insurance, insurance companies cancelled agricultural insurances in succession.
Three-Nong Problems have been paid more and more attention recent years, as well as China entered WTO, the sheltering effect of agricultural insurance for agriculture, countryside and farmers becomes prominent, and agricultural policy insurance has been paid attention to. In 2004, the CIRC has launched agricultural insurance experimental units in 9 provinces and cities. The agricultural insurance premium has increased obviously, and the loss ratio has shown a sharp decrease in 2005.
2. Problems of China’s agricultural insurance
Chinese Agricultural Insurance has been facing many problems which obstruct its development.
1) Agricultural insurance is short of legal and political support. There is no special agricultural insurance law in China. Moreover, the insurance law does not put a clear identity for agricultural insurance. So, the default would cause problem inevitably.
Vol. 3, No. 12 International Journal of Business and Management
58
2) Farmers are lack of insurance awareness in China. Most farmers still do not get used to participate in agricultural insurance. They have fluke mind when face risks. In Fact, some farmers are very poor therefore they cannot bear the premium. It requires government to publicize agricultural insurance among farmers intensively. Moreover, offering more preferential policies for agricultural insurance.
3) The dispersive management of agricultural insurance fund cannot promote the development of agricultural insurance. Usually, insurance companies manage agricultural insurance together with commercial insurance, which cause agricultural insurance fund to be used as a part of property insurance fund, and the profit of property insurance to be used to cover the loss of agricultural insurance. So that agricultural insurance fund is lack of individual account, means check agricultural insurance fund together with other insurance funds. Although some insurance companies have fished out some methods for checking agricultural insurance separately, they still haven’t given up using property insurance to support agricultural insurance.
4) Conflicts between supply and demand of the agricultural insurance. On the one hand, the conflicting management aim exists between agricultural insurance and commercial insurance. If operation is commercialized, insurance companies have to bear risks from both nature and market. In order to cover these risks, insurance companies require insureds to pay high premium. As we know, the insureds of agricultural insurance are mostly poor farmers in China, if the agricultural insurance premium is high, insureds can not afford it; if the agricultural insurance premium is low, insurance companies can not maintain their operations. So it leads to blur common benefit between insureds and insurance companies. On the other hand, simplex source of fund restricts the development of agricultural insurance. Nowadays, the fund of agricultural insurance mainly comes from premium which paid by insureds. Agricultural insurance premium is still very high for poor farmers in China. Although agricultural insurance is to protect insureds, and insureds should pay for the premium, but due to low incomes of insureds, only depends on premiums which paid by insureds to aggregate agricultural insurance fund is very difficult. This simplex and unstable source is one of the main reasons caused unsuccessful of agricultural insurance. Furthermore, agricultural insurance coverage has been controlled strictly, and with complex operation, which cause insureds and insurance companies sometimes have large divergence, so usually insureds have to give up to buy agricultural insurance.
5) Unreasonable category structure of agricultural insurance causes unreasonable structure of agricultural insurance fund. Obtaining maximize profit is the aim for insurance companies. Normally, insurance companies prefer to offer agricultural insurances which with high short-term return and low risk. However, they rarely issue long-term insurance, due to its high uncertainty and risk. This causes the unstable of agricultural insurance fund.
Why it shows dead-alive situation in China? The surface reasons are: 1) heavy deficit of agricultural insurance. 2) insurance companies are willing to issue types of risk with high profit, whereas, unwilling to issue types of risk with high management costs and high risk. 3) farmers’ low income and lacking insurance awareness cause low cover activity.
In fact, the essential reason which leads to the dead-alive situation is the incomplete system of agricultural insurance in China. For a long time, except the remission of sales tax, there is no other support policy from Chinese government. Agricultural insurances are almost standard commercial insurances. No other than this agricultural insurance system causes the standstill of Chinese agricultural insurance.
3. Suggestions on developing China’s agricultural insurance
How to develop China’s agricultural insurance?
Firstly, strengthen legislation is a key issue. During the development of agricultural insurance, national will plays a leading role. Moreover, grant-in-aid, financial support and tax preference etc. also play great effect. Besides, the aim of agricultural insurance is to promote steady development of agriculture, not with the aim of gaining profit. Therefore, Insurance law which applies to commercial insurance is unsuitable for agricultural insurance. So set up a suitable agricultural insurance law to support Chinese agricultural insurance is very important.
Secondly, due to the simplex source and dispersive management of agricultural insurance fund, set up modern collection and management system for agricultural insurance fund is also very important. At the same time, constitute perfect regulation and policy for agricultural insurance fund, including its collection methods & instruments, the checking method which different from commercial insurance fund, as well as the ownership & management right of agricultural insurance fund, so that make it go on the track of institutionalization and law-based.
Thirdly, owing to the impact of environment and paying capacity in different places in China, the gap of insurance capacity is very large, so set legal types of risk for agriculture insurance is very necessary. In terms of law of large numbers, the bigger participation rate of insurance, the bigger stability coefficient, and the more logical. It is possible to set legal types of risks based on the regional difference, for example, Third Party Liability (TPL) in auto insurance. It is helpful to improve people’s insurance awareness, increase fund for insurance companies, and steady the management of agricultural insurance.
International Journal of Business and Management December, 2008
59
Finally, reinsurance is also necessary for crops in order to scatter risks further. The same method of agricultural insurance in Western countries is that use administrative means to constitute multiple reinsurance system. It is possible to be applied in Chinese agricultural insurance. Constitute reinsurance system can improve the activity of agricultural insurance operators, conduct operational emphases, increase the income of handling charge and enhance the management level.
References
Chen Danli and Zhou Lie. (2006). Empirical Study on the Situation of Agricultural Insurance’s Development in China. Southeast University. pp. 12-18.
Du Yankun .(2005). The Basic Thought to Construct Agriculture Policy Insurance System. Economic Information Daily.
Xiao Shengting and Zhang Jingyu. (2007). Research on Agricultural Insurance Modes in China. University of Skovde. pp. 13-19.
Yuan Jianhua. (2008). Study on Models of Policy-rated Agricultural Insurance Company. Modern Finance &
Economics, No. 2, pp. 32-36.
Vol. 3, No. 12 International Journal of Business and Management
60
The Importance of Soft Factors for Quality Improvement:
Case Study of Electrical and Electronics Firms in Malaysia
Muhammad Madi Bin Abdullah (Corresponding author)
College of Business Management and Accounting, Universiti Tenaga Nasional Bandar Muadzam Shah 26700, Pahang, Malaysia
Tel : 60-19-3230-223 E-mail :[email protected]
Zainal Ariffin Ahmad School of Management, Universiti Sains Malaysia
Penang 11800, Malaysia
Tel: 60-46-532-534 E-mail:[email protected]
Azman Ismail Faculty of Cognitive Sciences & Human Development, Universiti Malaysia Sarawak
Kota Samarahan 94300, Sarawak, Malaysia
Tel : 60-82-581-388 E-mail:[email protected]
Abstract
This study examines the influence of four selected soft factors (management commitment, employee involvement, training and education, and reward and recognition) on quality improvement within 255 Malaysian electrical & electronics (E&E) firms. Despite extensive research on quality management and quality improvement, very little empirical research has examined this area of study specifically in the E&E sector. The results of this study revealed that management commitment, employee involvement, training and education, and reward and recognition are significantly positively associated with firms’ quality improvement practice. Also, employee involvement was perceived as a dominant soft factor for quality improvement; it was associated with significant improvements in firms’ quality improvement. This study contributes to a better understanding of the influence of soft factors on organizational quality improvement among firms within the context of the Malaysian E&E sector. Suggestions for future research are discussed.
Keywords: Soft factors, Malaysia, Electrical and electronics firms, Quality improvement
1. Introduction
Business firms all over the world including the Malaysian firms have to maintain and enhance their competitiveness in the face of fierce global competition, changing markets and technological break through. Also, since the implementation of ASEAN Free Trade Area (AFTA) agreement in 1992, competition has become intense among the ASEAN countries (Zadry and Yusof, 2006). Facing this challenge, manufacturing and service firms should produce high-quality goods and services (Evans and Lindsay, 2002). Therefore, Malaysian firms would lose ground to competitors if they do not responsive to the global changes. To compete in this global market, Malaysian manufacturers have long realized that they need to produce quality goods and services (Agus and Abdullah, 2000). Quality improvement (QI) has been recognized by many firms as a strategy to compete in the market. Higher quality implies lower costs and increased productivity, which in turn gives the firm a greater market share and better competitive advantage (Deming, 1982; Evans and Lindsay, 2002). Literature has shown that quality improvement has been applied as a way of improving activities and performance either in small or large firms using both factual data (Easton and Jarrell, 1998; Hendricks and Singhal, 2001) and perceptual data (Powell, 1995; Samson and Terziovski, 1999; Kaynak, 2003; Prajogo and Sohal, 2006). Several other empirical researches have also supported the proposition that high quality has a positive relationship with firm performance (Flynn et al., 1997; Heras, 2006; Sharma, 2006, Sila, 2007; Chung et al., 2008). Whereas these empirical studies devoted to quality improvement focused on manufacturing firms, service sector or a combination of manufacturing and service firms, only a few studies have analyzed quality improvement practice in Electrical and Electronics (E&E) firms (Ismail et al., 1998; Agus, 2001; Eng Eng and Yusof, 2003). Moreover, the quality process and
International Journal of Business and Management December, 2008
61
performance among the E&E firms in Malaysia is still below the level expected to generate the required economic national growth in realizing to be a high tech industrial nation by 2020 (Idris et al., 1996; Best and Rasiah, 2003).
At present, there is very little empirical literature on quality improvement within the context of the Malaysian E&E industry; particularly on how quality improvement among these firms are affected by other factors that have attracted considerable attention in the quality literature. Because the E&E industry is considered to be one of the major contributors to the global economy, quality improvement is strategically and tactically important for gaining a competitive advantage. Moreover, this industry differs from other industries in its organizational structures, responses to the environment, and managerial styles, as well as in how firms compete. Accordingly, more empirical research should be conducted on the factors that can truly promote and enhance the successful QI practices in these firms. Thus, QI plays an important role towards the productivity and performance of organizations and for the continuous survival of Malaysian E&E firms. This paper aims to examine the influence of selected four soft factors (SF), namely management commitment, employee involvement, training and education, and reward and recognition on quality improvement (QI) in 255 E&E firms in Malaysia. This study examines: (i) the relationship between the four SF and QI and (ii) to what extent the four SF collectively explain QI.
2. Quality improvement
According to quality literature, theory of quality management has been developed from three sources: (i) contribution from quality leaders (Juran, 1951; Crosby, 1979; Deming, 1986), (ii) measurement studies (Saraph et al., 1989; Flynn et al., 1994; Anderson et al., 1995) and (iii) evaluation models (Deming prize, MBNQA, ISO 9000). Deming (1986) is widely regarded as the master who developed Japan’s “road map” to quality improvement. The road map is basic, simple, consists of readily available technology, and relies on common sense. He defines quality as “satisfying the customer, not merely to meet his expectations, but to exceed them”. It is very clear to us that Deming’s philosophy thus focus on the customer. His main ideation is that quality starts from the customer and it also finishes with them. His “chain reaction” theory suggested that improvement in quality lead to lower costs because they result in less rework, fewer mistakes, fewer delays and snags, and better use of time and resources. Lower costs, in turn lead to productivity improvement and therefore with better quality and lower prices, a firm can achieve higher market share and thus stay in business.
Crosby (1979) defines quality as conformance to requirements and the requirements of a product need to be defined and specified clearly so that they are properly understood. His philosophy is that higher quality reduces costs and raises profits to the organizations and it is similar to the theory that was proposed by Deming. Juran (1951) considers quality management as three basic processes (Juran Trilogy): quality planning, quality control, and quality improvement. Juran defines quality, as “quality is customer satisfaction” or “fitness for use”. Feigenbaum (1983) from USA defines quality as the total composite product and service characteristics of marketing, manufacture and maintenance through which the product and service in use will meet the expectations of the customer. He also stresses that total quality management (TQM) covers the full scope of the product and service “life cycle” from product conception through production and customer service. In other words, quality improvement is a continuing process to improve the product and service quality of the firm in order to meet customer satisfaction.
2.1 Soft Factors of Quality Improvement
Literature has identified the key factors for successful quality improvement implementation. These factors have been provided by contributions from quality leaders (Deming, 1982; Juran, 1982), formal evaluation models (EQA, MBNQA, Deming Award) and measurement studies (Flynn et al., 1994; Saraph et al., 1989). This theory has identified the quality improvement practices. The soft factors are the behavioral aspects of management or the “human factors”, such as leadership, human resource management (HRM), employee involvement and empowerment (Rahman, 2004).
Several scholars have identified the soft factors or group soft factors of quality improvement which have a positive influence on quality improvement (Lu and Sohal, 1993; Shin et al., 1998; Yusof and Aspinwall, 1999; Rahman and Bullock, 2005). Alongside with these studies, there were also some other general studies that carried out specifically in Malaysian context which has also identified the soft factors of quality improvement such as leadership, employee training, communication, employee reward and supplier relation (Idris et al., 1996; Agus, 2001; Eng Eng and Yusof, 2003). Besides, the quality improvement models such as Malcolm Baldridge, European Foundation for Quality Management, and the Deming Prize have also identified soft factors such as leadership, process management, training, communication, teamwork, learning as the key aspects for effective quality improvement. These soft factors are key to quality improvement because the may have a positive impact on firm performance.
2.1.1 Management Commitment
Chrusciel and Field (2003) defined top management commitment as an active and visible support or commitment from the management of the organization, often in the form of a champion for the application. These authors have also cited this factor as a critical (important) for performance excellence-an organizational change strategy (critical success
Vol. 3, No. 12 International Journal of Business and Management
62
factors). Top management support or commitment is the most frequently cited factors for a successful implementation of quality improvement (Atkinson and Naden, 1989; Van der Wiele and Brown, 1998) and leadership of top management have also appeared with diverse variants in different researchers in the quality field.
Top management and the entire staff of an organization must be committed to the improvement of quality in all aspects of their operations because the commitment of top management especially is crucial to the success of organization (Barozyk 2000). Successful implementation of quality improvement strategies requires effective leadership from upper management in the organization and the leadership and upper management support would be the ultimate drivers of quality improvement practices in any organizations (Deming, 1986; Juran, 1989; Sashkin, 1993; Waldman, 1994). Saraph et al., (1989), Flynn et al., (1994), Anderson et al., (1995), Black and Porter (1996), Ahire et al., (1996), Rao et al., (1997), and Forza and Fillipini (1998) have researched leadership as one of the key dimension of quality management in their studies. Leadership enables an organization to engage in continuous improvement and facilitate the organization’s quality improvement efforts (Gibson, 1990; Gryna, 1991). Thus, we propose the following hypothesis:
H1: Managers perceive that management commitment will be positively related to the quality improvement in their organizations.
2.1.2 Employee Involvement
Employee involvement (EI) refers to any activity by which employees participate in work-related decisions and improvement activities, with the objectives of tapping the creative energies of all employees and improving their motivation (Evans and Lindsay, 2002). By total involvement, employees at all levels in the organization are empowered to improve their outputs by coming together in new and flexible work structures to solve problems, improve processes, and satisfy customers (Tenner and DeToro, 1992).
Employee empowerment is essential to improve quality control (Ahire et al., 1996). Empowerment means to enable others to act by giving power to them to take charge (Hitt, 1995) and this empowerment occurs when people are involved in setting, owning and implementing a joint vision, responsibility is distributed close to decision making so that people are motivated to learn what they are held accountable (Watkins and Marsick, 1999; Karia & Ahmad, 2000). It also means giving people authority to make decisions based on what they feel is right, to have control over their work, to take risks and learn from mistakes, and to promote change (Evans and Lindsay, 2002). Empowered workers are encouraged to prevent and detect errors early in the production process itself rather than relying on final inspection at the final stage. Therefore, empowerment leads to significant savings by reducing defects and the need for rework (Barker and Cagwin, 2000). Therefore, we propose the following hypothesis:
H2: Managers perceive that employee involvement will be positively related to the quality improvement in their organizations
2.1.3 Training and Education
Training refers to a planned effort by a company to facilitate employees’ learning of job-related competencies and these competencies include knowledge, skills, or behaviors that are critical for successful job performance (Noe, 2008). Therefore, training and education is important for continual updating and improvement in organizations (Deming, 1986). Many research results revealed that training and education is one of the most important elements (factors) in a successful implementation of quality improvement (e.g., Mann, 1992).
Training and education is also an integral part of the quality initiative and investment in training and education is vitally important for the success of quality improvement effort. Employees should be regarded as valuable, long-term resources worthy of receiving education and training throughout their career (Zhang, 2000). Educating and training all employees provides the information they need on the mission, vision, direction, and strategy of the organization as well as the skills they need to secure quality improvement and resolve quality problems (Tenner and DeToro, 1992). For a continuous improvement process like quality improvement, employee-both management and workers require the proper tools and knowledge. People are an organization’s most valuable resource; they want to do a good job, but they do not know how, therefore management must take responsibility for helping them and companies that committed to quality improvement will invest heavily in training and education of their employees (Evans and Lindsay, 2002). Thus, we propose the following hypothesis:
H3: Managers perceive that training and education will be positively related to the quality improvement in their organizations.
2.1.4 Reward and Recognition
Reward and recognition can be defined as benefits—such as increased salary, bonuses, and promotion—which are conferred as public acknowledgement of superior performance with respect to goals (Juran and Gryna, 1993). Recognition and reward activities in organizations should effectively stimulate employee commitment to quality improvement activities otherwise these activities are failures and working condition improvements, salary promotions,
International Journal of Business and Management December, 2008
63
position promotions, financial awards for excellent suggestions are good methods for recognition and reward (Zhang, 2000).
An important feature of any quality improvement program is showing due recognition for improved performance by any individual, section, and department or division within the company (Dale and Plunkett, 1990) and to effectively support their quality efforts, management of the organizations need to implement an employee compensation system that can strongly links quality and customer satisfactions with pays. Many other writers have also highlighted the importance and criticality of the rewards and recognitions in the quality improvement process (Martinez-Lorente et al., 1998; Rao et al., 1999; Dayton, 2001; Li et al., 2001; Everett, 2002). Thus, we propose the following hypothesis:
H4: Managers perceive that reward and recognition will be positively related to the quality improvement in their organizations.
3. Methodology
3.1 Population and Sample
The target population of this study is made up of all 676 E&E firms from West Malaysia. The sample firms were drawn through simple random sampling from the list obtained from the Federal Malaysian Manufacturers (FMM) (FMM-MATRADE, 2003). A total of 550 structured questionnaires with closed questions were mailed to the selected firms. Firstly, a pre-test was carried out with 15 firms. This pre-test helped to improve the structure and content of the questionnaire. Finally, the research is based on data from 255 respondents and this made the final sample. The questionnaire was answered by the managers in charge of the quality area in E&E firm.
3.2 Measurements
The measures for the soft factors (SF) were based on Zhang (2000). The quality improvement practices (QI) was based on the instrument developed by Flynn et al. (1994). The questionnaire contains information on both, the soft part of quality improvement practices (soft quality practices) and as well as the hard aspects (hard quality practices) which make up the overall quality improvement in the manufacturing firms. Each was assessed on a ten-point Likert’s scale continuum.
4. Results
A principal component factor analysis with varimax rotation was employed to validate the construct validity and the results are presented in Table 1. There was no cross loading of items in the factor analysis. The factor analysis matrices showed that all the five constructs were uni-factorial. The eigenvalues ranged from 3.02 to 4.54. The item loading for each factor is rather high with a minimum loading of 0.61. The factors accounted for 57% to 62% of the variance observed in the respective data. The Cronbach’s alpha varies from 0.83 to 0.89 and considered to be good (Peterson, 1994). Bartlett’s test for sphericity results indicate that data do not produce identity matrix and are thus considered approximately multivariate normal and acceptable for factor analysis and other multivariate statistical tests. The Kaiser-Meyer-Olkin (KMO) values are all above than 0.70 indicating that the distribution of values is adequate for running factor analysis (Peterson, 1994).
Table 2 provides the descriptive analysis and the correlation matrix for all the variables that incorporated in the study. The correlation coefficients indicate the strength of the association between the variables. A coefficient is considered significant if the p-value is less than 0.05. There is significant correlation between all the independent variables. Out of 13 correlations, all coefficients are larger than .40. There are no high correlations of 0.90 or above. Hence, collinearity and multicollinearity do not present data problems in this research (Hair et al., 1998).
Our results show that the dependent variable—firms’ quality improvement—was most highly correlated with employee involvement, with a coefficient of 0.54 (see Table 3). This shows that employee involvement was perceived as a dominant factor for quality improvement practice. In sum, our findings indicate that managers who perceived a greater awareness of soft factors exhibited more positive reactions towards organizational quality improvement. Based on the ten-point scale used, the overall mean QI rating was 6.41 (see Table 3) implying that the overall level of QI was fairly good in the sampled firms. The findings in Table 3 also indicated that the mean ratings for the independent variables in descending order of high to low were management commitment (8.25), training and education (6.97), reward and recognition (6.72), and employee involvement (6.37). Table 3 also shows that all the four SF (four independent variables) were significantly positively associated with the dependent variable (QI) (see figures in bold). These results showed that the four SF have a positive correlation with QI practice. Therefore, the four SF have an impact on quality improvement. In this sense, organizational QI will increase when the firms emphasize more on the four SF.
4.1 Relationship between the Soft Factors and Quality Improvement
To find out the best set of predictors of QI, a-four predictors multiple linear regression model was proposed. The four-predictor variables are management commitment (X1), employee involvement (X2), training and education (X3), and reward and recognition (X4). The criterion variable is quality improvement (Y). The equation of the proposed
Vol. 3, No. 12 International Journal of Business and Management
64
multiple linear regression model was as follows:
Y = b0 + b1X1 + b2X2 + b3X3 + b4X4 + e
Where: b0 = Constant, e = Error
To determine the best set of predictor variable in predicting QI, a stepwise regression method was used. Based on the stepwise method used, all the four predictor variables were found to be of significance in explaining Y or QI. They are management commitment (X1), employee involvement (X2), training and education (X3) and reward and recognition (X4). The Durbin–Watson of 1.83 (see Table 3) falls within the acceptable range (1.5 < D < 2.5), indicating that there is no autocorrelation problem in the data and that the error term is independent. The results indicate no multicollinearity problem: the multicollinearity statistics show that the tolerances for all elements of corporate culture are greater than 0.10 and that the Variation Inflation Factors (VIF) is all less than 10 (Hair et al., 1998). Histogram and normal P-P plots of the standardized residuals also indicate normality of the error term, while a scatter plot shows consistent variance of error terms (homoscedasticity). A partial regression plot indicates linearity of the relationship between independent and dependent variables. From these analyses, it can be concluded that the multiple regression analysis model generated in this study meets the five assumptions required to ensure validity of its significance test (Ooi et al., 2005). Thus, there is a statistically significant relationship between the four soft factors and firms’ quality improvement.
The R-square of .88 implies that the four predictor variables explain about 87.6% of the variance/variation in the QI. This is a very good and respectable result. The ANOVA table revealed that the F-statistics (148.34) is extremely large and the corresponding p-value is highly significant (0.0001) or lower than the alpha value of .05. This indicates that the four-predictor variables have a significant impact on QI. As depicted in the Table 3, the estimated final model is as below:
QI = 1.99 + 0.16 (MComt) + 0.48 (EI) + 0.06 (T&Ed) + 0.20 (R&R) + e
The results indicate that the four soft factors—management commitment (b = 0.16, p < 0.05), employee involvement (b = 0.48, p < 0.05), training and education (b = 0.06, p < 0.05), and reward and recognition (b = 0.20, p < 0.05) are positively associated with firms’ quality improvement. Thus, hypotheses H1, H2, H3, and H4 of the study are supported. Therefore, it can be argued that all these four soft factors are directly involved in improvements in firms’ quality improvement. This also suggests that the greater the extent to which these soft factors are present, the greater will be the quality improvement in the firms. Moreover, the findings also indicate that the most important soft factor for quality improvement is employee involvement, which was significant at the 0.0001 (p < 0.05) levels.
5. Discussion
The overall objective of this study was to investigate the influence of four soft factors on quality improvement within the context of the Malaysian E&E firms. The results indicate that employee involvement was perceived as a dominant soft factor for quality improvement in the sampled firms since there was a strong association with firms’ quality improvement. By personally involving or participating in quality improvement activities, employees in the organization can acquire new knowledge, see the benefits of the quality disciplines, and obtain a sense of accomplishment by solving quality problems. This finding supports the studies of Bullington et al. (2002), Al-Omaim et al. (2003), Baidoun (2003), and Baidoun and Zairi (2003).
The results of this study also reveal that managers’ perceptions of the four soft factors are positively related to firms’ quality improvement, with those perceiving a greater degree of awareness of the soft factors exhibiting more positive reactions towards their quality improvement. Besides employee involvement, the findings also indicate the importance of management commitment, training and education, and reward and recognition for predicting organizational quality improvement. Top management commitment is the key to continuous improvement and the internal driver of the company quality improvement efforts because they create, disseminate, and sustain clear and visible quality values along with systems and processes to guide all activities of the company toward the delivery of added value to customers. This finding is consistent with the previous findings of Deming (1982), Juran (1989), Saraph et al. (1989) and Forza and Fillipini (1998). In addition, training and development was also found to have a positive contribution towards quality improvement. This suggests that training and educational programs in the firms help to enhance their employee’s knowledge, skills and behaviors which ultimately improve the quality of products and services. This findings support the previous empirical studies that have found training and education as a critical factor for the successful quality improvement implementation in organization (Thiagarajan and Zairi, 1997; Quazi and Padibjo, 1998; Yusof and Aspinwall, 1999; Zhang et al., 2000; Calisir et al., 2001; Dayton, 2001; Pun, 2001). Finally, reward and recognition also was found to have significant positive contributions towards quality improvement in the sampled firms. This indicates that both recognition and rewards have motivating effects on people at workplace. An appropriate system of recognition and reward is critical to any company’s quality improvement implementation program; particularly the quality improvement process since it offers greater involvement to ordinary working people. The present result is consistent with the findings of Easton and Jarrell (1998), Rao et al. (1999), Dayton (2001), Li et al. (2001) and Everett (2002).
International Journal of Business and Management December, 2008
65
6. Implications
6.1 Implications for Managers
The study results suggested that soft factors such as management commitment, employee involvement, training and education, and reward and recognition are significantly positively associated with overall QI. This implies to the managers that by focusing and implementing the four soft factors in E&E firms, it would promote overall QI in the firms. Thus, the managers should understand that effective implementation of the SF will lead to greater quality improvement. The implication is that managers need to focus more on the SF to achieve for higher QI. This study shows that strong and committed leadership in an organization is essential for the successful and enduring quality programs. Therefore the managers should play an important role in the entire firm’s QI implementation. In terms of customers, firm managers must also take the initiative to make adjustments to improve continuously the quality of their products, which is necessary for increasing self-confidence and pride of the workforce in serving the customers. In order to achieve this, managers have to increase awareness—their own as well as all employees—of the changing needs of customer demands and markets, as well as heightened worldwide competition for better quality products.
In relation to employee involvement, firm managers should realize that to empower employees and to develop an appropriate culture for continuous QI requires training the employees to improve their interactive skills (such as communication, effective meeting, empowerment and leadership skills), and training in problem identification and solving skills, quality improvement skills, and other technical skills. Managers must also ensure that employees in the organization should be continually developed and given adequate training and education on prescriptions, methods and the concept of quality that usually included quality improvement principles, team skills, communication skills and problem solving skills. In this sense, the firm must provide the employees with continuous training and education in work related and statistical techniques so that problem identification and problem solving abilities of them at all levels are enhanced and improved continuously. In terms of reward and recognition, the managers must realize that employees in organization are more likely to share their ideas for work improvements when managers give them credit and recognition for their contributions to the organizations. Employee recognition programs can enhance effective employee relations by communicating to all employees that the organization cares about their ideas and is willing to reward them for their initiatives and efforts.
6.2 Theoretical Implications
This study contributes to the discipline of quality management by showing that there exist a strong relationship between SF and QI, and that the proposed multiple linear regression model may be generalizable in Malaysian firms for effective QI implementation. Based on these ideas, managers can prepare themselves, their employees, and their organizations for the consequences of changes, to the benefits of all stakeholders in the organization. The managers by using the proposed framework would be able to gauge the amount of variances in quality improvement which can be accounted by the identified determinants (SF) which are the independent variables in the study. It can then serve as a guide for the organizations to take the necessary steps to improve the current management practices by concentrating more on the soft factors which will facilitate and enhance QI.
7. Limitations and future research
This study is subject to several limitations: (1) the cross-sectional nature of the data, (2) the sample in the study included only the private E&E firms in West Malaysia, and (3) several other SF may have been not considered. Given these limitations, further research might be carried out in three directions. First, a longitudinal research would complement this work to support these relationships on a longitudinal basis. Second, other member countries in ASEAN such as Singapore, Brunei and Thailand could be included in order to make comparisons in terms of QI practices. Also, it may be replicated in the service sector which would provide further validation and reinforcement to the model proposed in this study. Third, future studies could look into the possible inclusion of several other soft factors such as communication (Black and Porter, 1996), quality culture (Ahire et al., 1996) and teamwork (Yusof and Aspinwall, 1999; Karia and Ahmad, 2000) in relation to QI.
8. Conclusion
In sum, this paper reports the empirical results showing the relationship between SF and QI based on the responses of quality managers from 255 E&E firms in Malaysia. Building on previous studies in this area, this paper presents new results evidencing the importance of the soft factors in quality improvement, namely employee involvement, reward and recognition, management commitment and training and education. All four SF in this study have shown to significantly and positively influence quality improvement practices in the E&E firms.
References
Agus, A., & Abdullah, M. (2000). Total quality management practices in manufacturing companies in Malaysia: An exploratory analysis, Total Quality Management, 8, pp. 1041-1051.
Vol. 3, No. 12 International Journal of Business and Management
66
Agus, A. (2001). The structural linkages between TQM, product quality performance, and business performance: Preliminary empirical study in Electronics companies, Singapore Management Review, Vol. 27, pp. 87-105.
Ahire, S.L., Golhar, D.Y., & Waller, M.A. (1996). Development and validation of TQM implementation constructs, Decision Sciences, 27, 23-56.
Al-Omaim., N, Zairi, M., & Ahmed, A.M. (2003). Generic framework for TQM implementation within Saudi context:
An empirical study, Working paper series, School of Management, University of Bradford, UK.
Anderson, J.C., Rungtusanatham, M., Schroeder, R. G. & Devaraj (1995). A path analytic model of a theory of quality management underlying the Deming management method: preliminary empirical findings. Decision sciences, 26, 637-658.
Atkinson, P.E. & Naden, J. (1989). Total Quality Management: Eight lessons to learn from Japan. Management services,
33 (3), 6-10.
Baidoun S. (2003). An empirical study of critical factors of TQM in Palestinian organizations, Logistics Information
Management, 16, 156-171.
Baidoun, S., & Zairi, M. (2003). A proposed model of TQM implementation in the Palestinian context, Total Quality
Management and Business Excellence, 14, 1193-1211.
Barker, K.J. & Cagwin, D. (2000). New evidence relating TQM to financial performance: An empirical study of
manufacturing firms. The University of Texas at Brownsville.
Barozyk, C. (2000). A TQM approach to creating competitive advantage in the global economy. The international conference on quality management. Engineering Purdue University, USA.
Best, M.H., & Rasiah, R. (2003). Malaysian Electronics: At the crossroads. United Nations Industrial Development Organization (UNIDO), Vienna.
Black, S., & Porter, L.J. (1996). An empirical model for quality management, Total Quality Management, 6, 149-164.
Bullington, S.F., Easley, J.Y., Greenwood, A.G., & Bullington, K.E. (2002). Success factors in initiating versus maintaining a quality improvement process, Engineering Management Journal, 14, 8-14.
Calisir, F., Bayraktar, C. & Beskese, B. (2001). Implementing the ISO 9000 standards in Turkey: a study of large companies’ satisfaction with ISO 9000. Total Quality Management, 12 (4), 429-438.
Chrusciel, D. & Field, D.W. (2003). From critical success factors into criteria for performance excellence- an organizational change strategy. Journal of Industrial Technology, 19 (4), 2-11.
Chung, Y.C., Tien, S.W., Hsiang, C.H. and Tsai, C.H. (2008), “A study of the business value of Total Quality Management”, Total Quality Management & Business Excellence, Vol. 19, No. 4, pp. 367-379.
Crosby, P.B. (1979). Quality is free. New York: McGraw-Hill, Inc.
Dale, B.G. & Plunkett, J.J. (1990). Managing Quality. New York: Philip Allan.
Dayton, N.A. (2001). Total quality management critical success factors, a comparison: The UK versus the USA, Total
Quality Management, 12 (3), 293-298.
Deming, W.E. (1982). Quality, Productivity and Competitive Position. Cambridge, MA: MIT Center for Advanced Engineering study, USA.
Deming, W.E. (1986). Out of the Crisis. Cambridge: University press.
Easton, G.S., & Jarrell, S.L. (1998). The effects of total quality management on corporate performance: An empirical investigation, Journal of Business, 71, 253-307.
Eng Eng, Q., & Yusof, S.M. (2003). A survey of TQM practices in the Malaysian electrical and electronics industry, Total Quality Management & Business Excellence, 14, 63-67.
Evans, J.R., & Lindsay, W.M. (2002). The Management and Control of Quality, 5th ed. (USA: South Western, Madison Road).
Everett, C. (2002). Penn states commitment to quality improvement. Quality Progress, 35 (1), 44-49.
Feigenbaum, A.V. (1983). Total quality control (3rd ed.). New York: McGraw-Hill Book Co.
Flynn, B.B., Schroeder, R.G., & Sakakibara, S. (1994). A framework for quality management research and an associated measurement instrument, Journal of Operations Management, 11, 339-366.
Flynn, B.B., Schroeder, R.G., Flynn, E.J., Sakakibara, S., & Bates, K.A. (1997). World-class manufacturing project: Overview and selected results, International Journal of Operations & Production Management, 17, 671-685.
International Journal of Business and Management December, 2008
67
Fmm-Matrade (2003). Directory . Electrical & Electronics. 2nd ed. 2003/04. FMM and Matrade. Malaysia.
Forza, C. & Filippini, R. (1998). TQM impact on quality conformance and customer satisfaction: A causal model. International Journal of Production Economics, 55, 1-20.
Gibson, T.C. (1990). Helping leaders accept leadership of total quality management. Quality Progress, 23, 45-47.
Gryna, F.M. (1991). The quality director of the ‘90s. Quality Progress, 24, 51-54.
Hair, J.F., Anderson, R.E., Tatham, R.L., & Black, W.C. (1998). Multivariate data analysis. New Jersey: Prentice Hall International Inc.
Hendricks, K.B., & Singhal, V.R. (2001). Firm characteristics, total quality management, and financial performance, Journal of Operations Management, 19, 269-285.
Heras, I. (2006). How quality management models influence company results- conclusions of an empirical study based on the Delphi method, Total Quality Management & Business Excellence, 17, 775-794.
Hitt, W. (1995). The learning organization: some reflection on organizational renewal. Leadership and Organizational
Development Journal, 16(8), 17-25.
Idris, M.A., McEwan, W., & Belavendram, N. (1996). The adoption of ISO and total quality management in Malaysia, The TQM Magazine, 8, 65-68.
Ismail, M.Y., Baradie, M.E.I., & Hashmi, M.S.J. (1998). Quality management in the manufacturing industry: Practice Vs Performance, Computers & Industrial Enggineering, 35, 519-522.
Juran, J.M. (1951). Quality Control Handbook, New York: McGraw-Hill.
Juran, J. (1982). Juran on quality improvement (New York, NY: Juran Institute).
Juran, J.M. (1989). Universal approach to managing quality. Executive Excellence, 65, 15-17.
Juran, J.M. & Gryna, F.M. (1993). Quality planning and analysis. (3rd ed). New York: McGraw-Hill.
Karia, N. & Ahmad, Z. A. (2000). Quality Practices that Pay: Empowerment and Teamwork, Malaysian Management
Review, Vol. 35, No. 2.
Kaynak, H. (2003). The relationship between TQM practices and their effects on firm performance, Journal of
Operations Management, 21, 405-435.
Li, E., Zhao, X. & Lee, T.S. (2001). Quality management initiatives in Hong Kong’s Banking industry: a longitudinal study. Total Quality management, 12 (4), 451-468.
Lu, E., & Sohal, A. (1993). Success factors, weaknesses and myths concerning TQM implementation in Australia, Total Quality Management, 4, 245-255.
Mann, R.S. (1992). The development of a framework to assist in the implementation of TQM. Unpublished Ph.D. thesis, Department of Industrial Studies, University of Liverpool, UK.
Martinez-Lorente, A.R., Gallego-Rodriguez, A. & Dale, B.G. (1998). Total quality management and company characteristics: an examination, Quality Management Journal, 5(4), 59-71.
Noe, R. A. (2008). Employee Training & Development. New York, NY: McGraw-Hill.
Powell, T.C. (1995). Total quality management as competitive advantage: a review and empirical study, Strategic
Management Journal, 16, 15-37.
Peterson, R.A. (1994). A meta-analysis of Cronbach’s coefficient alpha. Journal of Consumer Research, 21, 381-391.
Prajogo, D.I., & Sohal, A.S. (2006). The relationship between organization strategy, total quality management (TQM) and organization performance-the mediating role of TQM, European Journal of Operational Research, 168, 35-50.
Pun, K. F. (2001). Cultural influences on total quality management adoption in Chinese Enterprises: an empirical study. Total Quality Management, 12 (3), 323-342.
Quazi, H.A., & Padibjo, S. R. (1998). A journey toward total quality management through ISO certification: A study on small and medium sized enterprises in Singapore. International Journal of Quality and Reliability Management, 15, 489-508.
Rahman, S. (2004). The future of TQM is past. Can TQM be resurrected? Total Quality Management, 15, 411-422.
Rahman, S., & Bullock, P. (2005). Soft TQM, hard TQM, and Organizational Performance Relationships: an Empirical Investigation, Omega, 33, 73-83.
Rao, S.S., Ragunathan, T.S. & Solis, L.E. (1997). Does ISO 9000 have an effect on quality management practices? An international empirical study. Total Quality Management, 13 (1), 53-67.
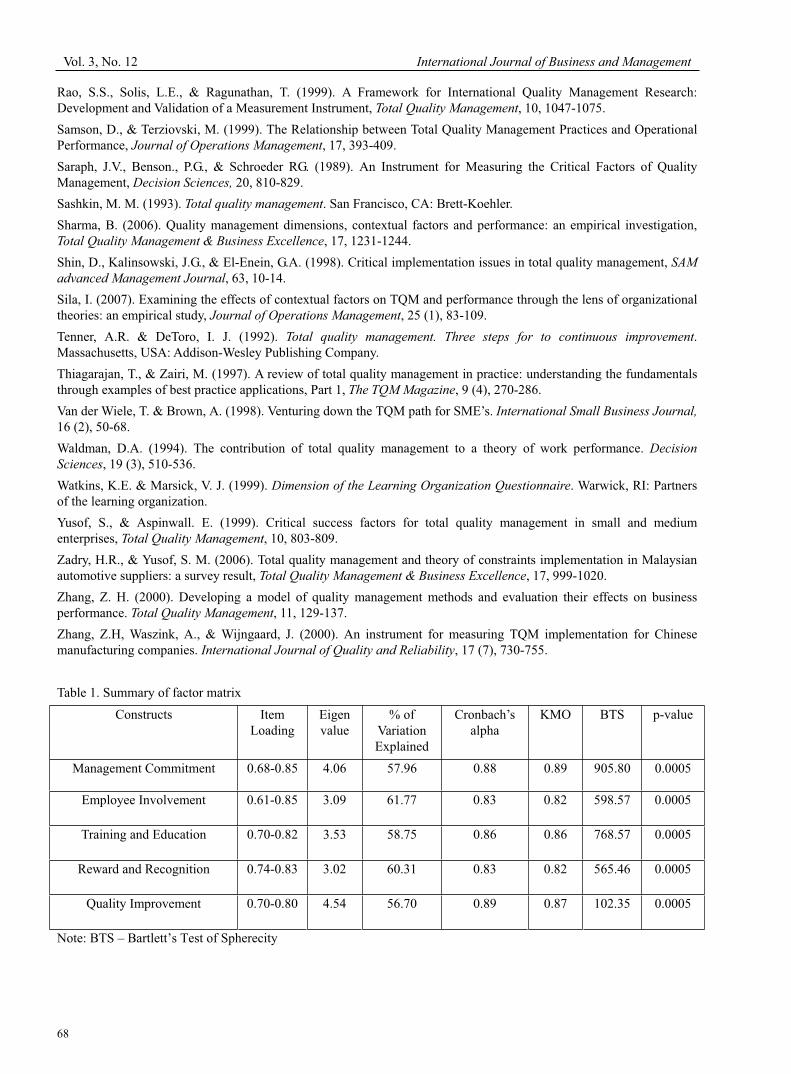
Vol. 3, No. 12 International Journal of Business and Management
68
Rao, S.S., Solis, L.E., & Ragunathan, T. (1999). A Framework for International Quality Management Research: Development and Validation of a Measurement Instrument, Total Quality Management, 10, 1047-1075.
Samson, D., & Terziovski, M. (1999). The Relationship between Total Quality Management Practices and Operational Performance, Journal of Operations Management, 17, 393-409.
Saraph, J.V., Benson., P.G., & Schroeder RG. (1989). An Instrument for Measuring the Critical Factors of Quality Management, Decision Sciences, 20, 810-829.
Sashkin, M. M. (1993). Total quality management. San Francisco, CA: Brett-Koehler.
Sharma, B. (2006). Quality management dimensions, contextual factors and performance: an empirical investigation, Total Quality Management & Business Excellence, 17, 1231-1244.
Shin, D., Kalinsowski, J.G., & El-Enein, G.A. (1998). Critical implementation issues in total quality management, SAM
advanced Management Journal, 63, 10-14.
Sila, I. (2007). Examining the effects of contextual factors on TQM and performance through the lens of organizational theories: an empirical study, Journal of Operations Management, 25 (1), 83-109.
Tenner, A.R. & DeToro, I. J. (1992). Total quality management. Three steps for to continuous improvement.Massachusetts, USA: Addison-Wesley Publishing Company.
Thiagarajan, T., & Zairi, M. (1997). A review of total quality management in practice: understanding the fundamentals through examples of best practice applications, Part 1, The TQM Magazine, 9 (4), 270-286.
Van der Wiele, T. & Brown, A. (1998). Venturing down the TQM path for SME’s. International Small Business Journal,
16 (2), 50-68.
Waldman, D.A. (1994). The contribution of total quality management to a theory of work performance. Decision
Sciences, 19 (3), 510-536.
Watkins, K.E. & Marsick, V. J. (1999). Dimension of the Learning Organization Questionnaire. Warwick, RI: Partners of the learning organization.
Yusof, S., & Aspinwall. E. (1999). Critical success factors for total quality management in small and medium enterprises, Total Quality Management, 10, 803-809.
Zadry, H.R., & Yusof, S. M. (2006). Total quality management and theory of constraints implementation in Malaysian automotive suppliers: a survey result, Total Quality Management & Business Excellence, 17, 999-1020.
Zhang, Z. H. (2000). Developing a model of quality management methods and evaluation their effects on business performance. Total Quality Management, 11, 129-137.
Zhang, Z.H, Waszink, A., & Wijngaard, J. (2000). An instrument for measuring TQM implementation for Chinese manufacturing companies. International Journal of Quality and Reliability, 17 (7), 730-755.
Table 1. Summary of factor matrix
Constructs Item Loading
Eigenvalue
% of Variation Explained
Cronbach’s alpha
KMO BTS p-value
Management Commitment 0.68-0.85 4.06 57.96 0.88 0.89 905.80 0.0005
Employee Involvement 0.61-0.85 3.09 61.77 0.83 0.82 598.57 0.0005
Training and Education 0.70-0.82 3.53 58.75 0.86 0.86 768.57 0.0005
Reward and Recognition 0.74-0.83 3.02 60.31 0.83 0.82 565.46 0.0005
Quality Improvement 0.70-0.80 4.54 56.70 0.89 0.87 102.35 0.0005
Note: BTS – Bartlett’s Test of Spherecity
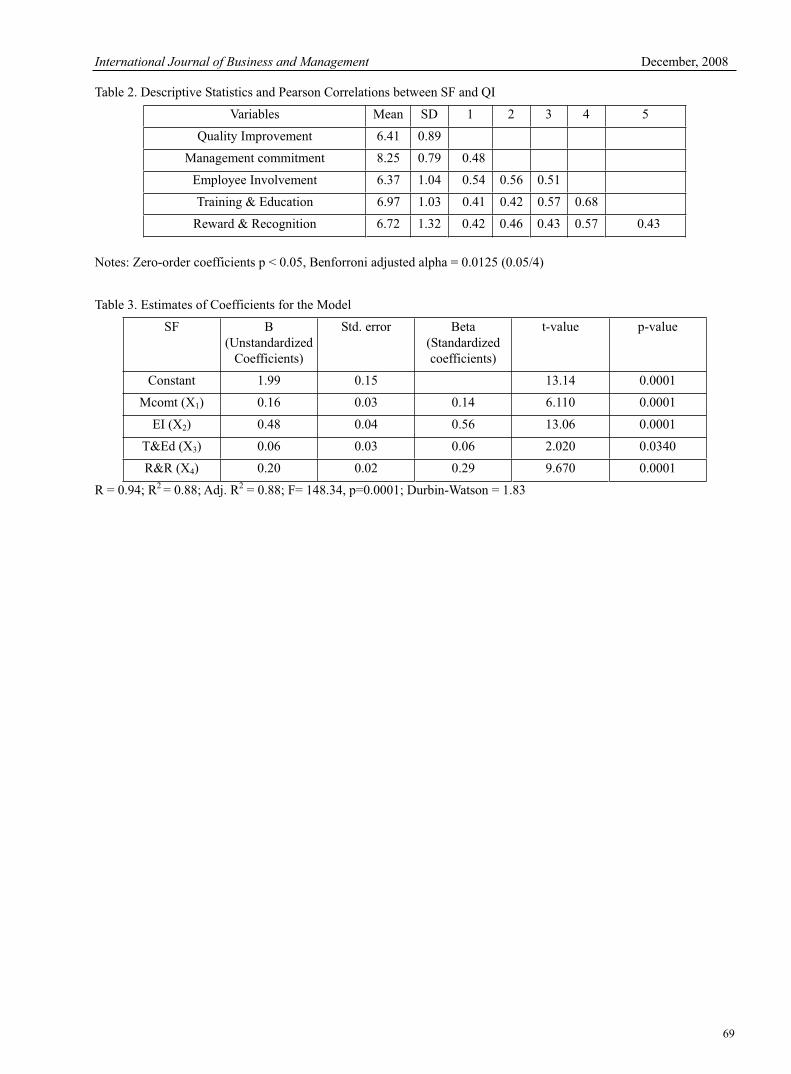
International Journal of Business and Management December, 2008
69
Table 2. Descriptive Statistics and Pearson Correlations between SF and QI
Notes: Zero-order coefficients p < 0.05, Benforroni adjusted alpha = 0.0125 (0.05/4)
Table 3. Estimates of Coefficients for the Model
SF B(Unstandardized
Coefficients)
Std. error Beta(Standardized coefficients)
t-value p-value
Constant 1.99 0.15 13.14 0.0001
Mcomt (X1) 0.16 0.03 0.14 6.110 0.0001
EI (X2) 0.48 0.04 0.56 13.06 0.0001
T&Ed (X3) 0.06 0.03 0.06 2.020 0.0340
R&R (X4) 0.20 0.02 0.29 9.670 0.0001
R = 0.94; R2 = 0.88; Adj. R2 = 0.88; F= 148.34, p=0.0001; Durbin-Watson = 1.83
Variables Mean SD 1 2 3 4 5
Quality Improvement 6.41 0.89
Management commitment 8.25 0.79 0.48
Employee Involvement 6.37 1.04 0.54 0.56 0.51
Training & Education 6.97 1.03 0.41 0.42 0.57 0.68
Reward & Recognition 6.72 1.32 0.42 0.46 0.43 0.57 0.43
Vol. 3, No. 12 International Journal of Business and Management
70
An Econometric Study on Impact of Futures
Trading On the Stability of Stock Index in India
Sathya Swaroop Debasish
P.G. Department of Business Management, Fakir Mohan University
Balasore, Orissa 756019, India
Bhagaban Das (Corresponding author)
P.G. Department of Business Management, Fakir Mohan University
Balasore, Orissa 756019, India
Abstract
The effect of futures trading on the stability of index returns is studied by taking a case of BSE Sensex stock index (India). The stability of BSE Sensex returns (measured by unconditional volatility) is examined by using two statistical tests namely Kolmogorov Smirnov 2-sample test and Wilcoxon Rank Sum test, and by use of daily observations on the BSE SENSEX index over the period of study is from Jan 1996 to Dec 2007. The conditional volatilities of monthly returns in the pre and post futures periods are examined after adjusting for major macroeconomic factors. Controlling for the effects of macroeconomic variables this study finds no evidence, apart from the month of May 2004 and May 2006, which monthly BSE Sensex index volatility has increased after inception of the BSE Sensex Futures market. Further, the volatility of daily returns in the post futures period was higher than in the pre futures period but the volatility of monthly returns remained unchanged.
Keywords: Stock market, BSE Sensex, Conditional volatility, Futures trading, Parametric test
1. Introduction
In the late nineties, many emerging and transition economies have introduced derivative contracts, raising interesting issues unique to these markets. Emerging stock markets operate in very different economic, political, technological and social environments than markets in developed countries like the USA or the UK. This paper explores the impact of the introduction of Futures trading on cash market volatility in an emerging capital market like India. The study uses a leading stock index in India namely, BSE Sensex on which futures trading. The impact of futures introduction on the conditional and unconditional volatilities of the underlying stock index (BSE Sensex) is examined during pre-futures and post-futures period. Apart from this, the post-futures volatility is studied excluding the months on which Sensex crashed namely May 2004 and May 2006. The Indian capital market has witnessed a major transformation and structural change from the past one decade as a result of ongoing financial sector reforms. Gupta (2002) has rightly pointed out that improving market efficiency, enhancing transparency, checking unfair trade practices and bringing the Indian capital market up to a certain international standard are some of the major objectives of these reforms. Due to such reforming process, one of the important step taken in the secondary market is the introduction of derivative products in two major Indian stock exchanges (viz. NSE and BSE) with a view to provide tools for risk management to investors and also to improve the informational efficiency of the cash market. The Indian capital markets have experienced the launching of derivative products on June 9, 2000 in BSE (Bombay Stock Exchange) by the introduction of BSE Sensex index futures. Just after one year, index options were also introduced to facilitate the investors in managing their risks. Later stock options and stock futures on underlying stocks were also launched in July 2001 and November 2001 respectively. In India, derivatives were mainly introduced with view to curb the increasing volatility of the asset prices in financial markets and to introduce sophisticated risk management tools leading to higher returns by reducing risk and transaction costs as compared to individual financial assets. Though the onset of derivative trading has significantly altered the movement of stock prices in Indian spot market, it is yet to be proved whether the derivative products has served the purpose as claimed by the Indian regulators.
Two main bodies of theories exist in literature about the relationship between derivatives market and underlying spot markets and both are contradictory to each other. Theses theories are: a) A ‘Destabilizing forces” hypothesis that predicts increased volatility caused by more highly levered and speculative participants; and b) A ‘Market completion’
International Journal of Business and Management December, 2008
71
or ‘Non-destabilization’ hypothesis , that says futures market provides an additional route by which information can be transmitted and therefore will reduce volatility in spot. The effect of the inception of stock index futures contracts on the underlying stock markets is a principal concern of the regulatory agencies, exchanges, and investors. The issue is important because corporations raise equity capital by issuing shares. Regulatory agencies might conclude that restrictions on futures trading are in the public interest if, in fact, futures trading increase the stock market and if this increased volatility increases the expected return required by investors to hold stocks. The results of this study are crucial to investors, stock exchange officials and regulators. Futures contracts and derivatives play a very important role in the price discovery process and in completing the market. Their role in risk management for institutional investors and mutual fund managers need hardly be overemphasized. This role as a tool for risk management clearly assumes that derivatives trading do not increase market volatility and risk. The results of this study will throw some light on the effects of Index futures introduction on the efficiency and volatility of the underlying cash markets.
2. Literature review
The spot and futures markets provide investors with an opportunity to trade in the same underlying security. It is quite logical, therefore, to anticipate a trading induced dynamic relationship between the two markets. A salient aspect of this relationship is the question: Does futures trading impact spot market volatility? In other words, does futures trading stabilize or destabilize the spot market. Theoretically, one may find justification for both the stabilizing propositions. Seemingly opposite views about the impact of futures trading on spot market arise from the complex, interdependent nature of the relationship between the two markets. Research evidence has not been conclusive either. The studies of Harris, 1989; Brorsen, 1991; Lee and Ohk, 1992; Kamara et.al., 1992; Antoniou and Holmes,1995 show that the volatility in the underlying spot market increases after the introduction of futures trading. The contrary evidence may be found in the works of Bessembinder and Seguin (1992). Then, there are some studies that show that the futures trading does not impact the spot market (Edwards, 1988; Darrat and Rahman, 1995; Hodgson and Nicholls, 1991). The inconclusiveness of the research also manifests itself in the findings that volatility is higher for bear markets than bull markets (Maberly 1989), and that bad news increases the volatility more than the good news. (Koutmous et.al., 1996). Studies in the Indian market find that volatility of the underlying market declined after introduction of derivatives trading (Thenmozhi, 2002; Gupta, 2002; Raju and Karnade, 2003; and Nath, 2003).
Theoretical studies on the effects of futures trading on the spot return volatility shows that the effect is ambiguous. Most of the empirical studies suggest that the introduction of a futures market has stabilized, or at least not destabilized, the underlying spot market. Kamara (1982) in his study finds that a financial future trading reduces the cost of entry of small traders into the financial markets. Stein (1987) concluded that introducing new speculators into the markets improves risk sharing and increases liquidity, but can make cash prices more noisy and reduce net social welfare if these new speculators are less informed than traders already in the market. Futures trading can increase cash price volatility if increases liquidity causes cash prices to reflect new information more quickly. In this case, the increase in cash price volatility should increase net social welfare. Many, authors find no significant volatility effect associated with stock index future listing. Others, including Maberly, Allen and Gilbert (1989), Brorson (1991), Lee and Ohk (1992), Antoniou and Holmes (1995) and Gulen and Mayhew (2000) report a volatility increase in highly developed markets such as the United states, United Kingdom, and Japan. Those who argue that futures market increases stock market volatility, support this argument based on the observation that because of their high degree of leverage, futures markets are likely to attract uninformed traders. The lower level of information of futures traders with respect to cash market traders is likely to increase the asset volatility. Cox (1976), Figlewski (1981) and Stein (1987) found results supporting this in their studies. On the other hand Antoniou, Holmes and Priestly (1998) and Gulen and Mayhew (2000) find evidence that volatility decreased with future listings in many other countries. The opposite current of literature claims that futures markets play an important role of price discovery, and have a beneficial effect on the underlying cash markets.
Bessenbinder and Seguin(1992) and others, attempted to test whether the introduction of stock index futures affects the volume- volatility relationship in the spot market, and whether spot market volatility is contemporaneously related to trading volume or open interest in the futures market. These authors find that the unexpected component of future trading activity (measured by volume or open interest) is positively related to spot market volatility, suggesting that futures market volume responds to unexpected volatility events. The expected component of trading activity however, was found to be negatively related to spot market volatility, suggesting that futures markets help to stabilize cash markets. Hussein Gulen and Stewart Mayhew (2000) examined stock market volatility before and after the introduction of index futures in 25 countries. They then tested whether spot volatility after the introduction is released to futures market volumes and open interest. The study was conducted over a general time between 1973 and 1997 using the excess returns over the world market index. They used a variety of models like GJR-GARCH, non liner GARCH, (NGARCH) and exponential GARCH (EGARCH). To estimate the impact of futures introduction they incorporated a multiplicative dummy in the variance equation. To study the effect of trading activity, they broke the data series of open interest and volume into expected and expected components using an ARIMA model, restricting to five of less AR and
Vol. 3, No. 12 International Journal of Business and Management
72
MA terms. They found that futures trading are related to an increase in conditional volatility in US and Japan, but in the rest of the countries studied, they found no significant effect. They found that except for US and Japan, volatility tends to be lower in periods when open interest is high. During periods when volatility is high and in periods when future volume was high, it was driven by the unexpected component of volume.
In the Indian context, there are few significant studies in the last decade. Shenbagarman , P. (2003) examined the impact of introduction of NSE Nifty index futures on Nifty index using an event study over the period from October 1995 to December 2002. She concluded that futures trading has not lead to a change in the volatility of the underlying stock index but the structure of volatility seems to have in changed post-futures period. The study also finds that day-of-the-week effect seems to have dissipated after futures introduction. Saurabh Kumar , Gauri Mohan and Sriharsha Pappu (2004) analyzed the data of NSE NIFTY July 13, 1998 to July 11, 2002 to measure the impact of futures trading on National Stock Exchange (NSE) of India and concluded that introduction of future had increased the efficiency of market by quicker dissemination of information. But change in volatility of the underlying stock market could not be completely attributed to the introduction of futures trading.
M Thenmozhi and M Sony Thomas (2004) analyzed the relationship between stock index futures and corresponding stock market volatility of the NSE-Nifty using the GARCH technique. Taking the data from1995 to 2003, the study concluded the reduction of volatility in the underlying stock market and increased market efficiency. Nagaraj K S and Kotha Kiran Kumar (2004) studied the impact of Index futures trading on spot market volatility using the data from June 12,2000 to February 27, 2003 of S&P CNX NSE Nifty. Using ARMA-GARCH model, the study also examined the effect of the September 11, terrorist attack; the relation between futures trading activity; and spot volatility has strengthened, implying that the market has become more efficient and assimilating the information into its prices. Very recently, Singh and Bhatia (2006) analyzed the impact of futures trading on spot market volatility in India using NSE Nifty index. Using the (1, 1) variant of the Generalized Auto Regressive Coefficient of Heteroskedasticity (GARCH 1,1) , the study shows that daily spot market volatility in India has marginally declined sicne the introduction of futures trading in India. The study also shows a simultaneously significant improvement in the information coefficient and reduction in the persistence coefficient, implying growing market efficiency of the Indian stock market.
3. Objectives of the study
The specific objectives of this study are as follows:
a) To examine the effect of introduction of futures trading on the stability of BSE Sensex.
b) To measure the conditional volatilities of daily returns on BSE Sensex before and after futures trading.
c) To compare the conditional volatilities of monthly returns of BSE Sensex over pre-futures and post-futures periods, after adjusting macroeconomic factors.
d) To investigate whether futures trading have contributed to market crash in BSE Sensex (during May 2004 & May 2006) in the post-futures period.Appendix-1 provides the list of ten biggest falls in BSE Sensex.
4. Data and sources
The data employed in this study comprises of daily observations on the BSE SENSEX index. The daily and monthly closing prices (in spot market) were obtained from the official web page of Bombay Stock Exchange (www.bseindia.com ). The period of study is from Jan 1996 to Dec 2007. BSE SEnsex is a well diversified 30 stocks index (based on market weighted capitalization method) representing about 62.49% of the total market capitalization at Bombay Stock Exchange (BSE) as on 31st December, 2007. The base year selected for BSE Sensex index is 1978-79.Index futures on BSE Sensex were introduced on 9 June 2000. Floor trading time for both the NSE Nifty and BSE Sensex is from 9.55 to 15.30 IST (Indian Standard Time). The price of a futures contract is measured in index points multiplied by the contract multiplier, which are 200 for the BSE SENSEX contract. Trading takes place in the 3 nearest delivery months, although volume in the far contract is very small. At any point in time there are only three contracts available for trading, with 1 month, 2 months and 3 months to expiry. These contracts expire on last Thursday of the expiry month and have a maximum of 3-month expiration cycle. The BSE provides a fully automated screen based trading system for futures and spot market transactions, on a nationwide basis and an online monitoring and surveillance mechanism. It supports an order driven market which provides complete transparency of trading operations and operates on strict price-time priority. The BSE SENSEX comprises 30 leading Indian companies listed at Bombay Stock Exchange (BSE). The study had used two most popular statistical/econometric packages for analysis, namely SPSS 11.5 version and Eviews 3.0.
5. Research methodology
This article investigates the effects of the BSE Sensex index futures market on the stability of the underlying cash index (BSE Sensex) from 1995 through 2007. Two methods are used to examine these effects. First the unconditional
International Journal of Business and Management December, 2008
73
volatilities of returns on the cash index are compared before and after futures trading. Second, conditional volatilities, controlling for the effects of macroeconomic factors, are compared.
This study extends an earlier studies by Edwards (1988) and Harris (1989) in two ways. First, the changes in volatilities of daily and monthly returns are examined using parametric and nonparametric tests. The variance, ratio F tests used by Edwards (1988a, b) are sensitive to the underlying assumption of normally distributed stock returns. This study rejects the hypotheses that daily and monthly returns are examined using parametric and nonparametric tests are used and it is found that the dispersion of daily Nifty and Sensex returns are significantly higher in the post futures period (June 12, 2000 to December 31, 2007) than in the pre futures period (January 1, 1995 to June 9, 200). This study does not reject the hypothesis that the dispersion of monthly returns (for both indices) in the two periods are equal. Upon further investigation, statistically significant evidence is found that the distribution of daily returns could be frequently (and non event induced) changing. Consequently, one cannot conclude that the significant increases in the volatility of daily Nifty and Sensex returns after the inception of futures trading is necessarily futures induced.
Second while Harris (1989) examines individual stocks adjusting for the effects of firm attributes, this study examines the volatility of the monthly returns of the BSE Sensex index conditional on macroeconomic effects based on Chen, Roll and Ross (1986), henceforth CRR. Empirical studies of the effects of stock index futures trading on the stability of the cash market are “ one shot” event studies examining characteristics of returns about the effects of futures trading, one must rule out all other possible explanations that could have had the same timing. While it is impossible to control for and refute all conceivable alternatives to the hypothesis that the inception of futures trading affects the volatility of stock returns, there is a need to account for the most likely alternative explanations. The two most likely alternative explanations for changes in the volatility of stock returns are microeconomic factors and macroeconomic. Harris (1989) investigates the former and this study investigates the latter. The stability of the residual volatility is tested after adjusting for the effects of macroeconomic factors as identified in CRR.
5.1 Univariate Stability Tests
The stability issue is examined further by using two statistical tests that do not depend on the assumption of normally distributed stock returns. The first assumption is of normally distributed stock returns. The first nonparametric test is the Kolmogorov Smirnov two-sample test that test whether two independent samples come from populations with the same distribution. The two tailed version of this test is sensitive to any difference in the sample distributions such as location (Central tendency), dispersion, skewness, or kurtosis. The procedure measures the largest absolute difference between the two cumulative distribution functions. If this difference is larger than a critical value, then the null hypothesis that the two distributions are identical is rejected. The second nonparametric test is the Wilcoxon Rank Sum test. This test is especially likely to reject the null hypothesis when the populations have unequal locations (central tendencies). The Wilcox on Rank sum test pools the observations from the two samples and then ranks these observations from the smallest to the largest. The test statistic depends on the totals of the ranks for both samples. If the probability distributions are identical, then these rank rums will be of similar size.
The BSE Sensex crash of May 14 2004 and May 18 2006 regulatory agencies like SEBI (Securities Exchange Board of India) to implement various measures designed to reduce volatility in the stock market. Because the popular press seems to equate volatility with “big” absolute price movements in the stock market, the hypothesis that there are more utilizes in the daily returns of the S & P 500 index since the inception of futures trading is tested. Assuming outliers were as likely before futures trading as after, a big return is defined as an outlier that is identified by using the interquartile range calculated from the entire sample. This procedure classifiers only three monthly returns as outliers out of the 156 months in the sample: March 1980(-10%), January 1987 (+13%), and October 1987 (-22%). For daily data, 114 of the 3286 observations are classified as outliers.
5.2 Multivariate Stability Tests
Apart from comparing the unconditional volatility of returns before and after futures inception, we also study the other factors that influences stock returns. The conditional volatilities of monthly returns in the pre and post futures periods are also examined after adjusting for macroeconomic effects. This is done by testing the stability of the residual volatility after the effects of the macroeconomic factors, based on CRR, are removed.
CRR suggest that the following factors affect stock returns:
a) Innovations in the rate of productive activity.
b) Unanticipated changes in the default risk Premium.
c) Unanticipated changes in the discount rate.
d) Unanticipated price level changes.
e) Changes in expected inflation.
Vol. 3, No. 12 International Journal of Business and Management
74
The CRR calculations of the proxies for the factors are replicated a follows. The monthly growth in industrial production, MP1, proxies innovations in the rate of productive activity. This factor is calculated as MPt = Log [ IPt+1 / IPt], where IP is the Industrial Production Index (not seasonally adjusted) taken from the PRWORESS data base of CMIE (Center for Monitoring Indian Economoy). Following CRR, IP is led by one month to make industrial production and stock returns contemporaneous. The default risk factor, URPt = BAAt - LGB1, is end of period monthly returns on BAA bonds minus the end of period monthly return on long term government bonds. The LGB (long government bonds) returns series is from RBI (Reserve Bank of India) bulletin. The BAA returns series are calculated from BAA yields obtained from Moody’s Bond Record using the procedure described in Schwert (1989).The third factor, unanticipated changes in the discount rate, can be approximated with unanticipated return on long-term bonds (URL) using the formula UTSt = LGBt - TBt. GBt is the end of period monthly return on long term government bonds and TBt
is the end of period return on one month T (treasury) bills. Both series are from the PRWORESS data base of CMIE.The fourth factor called unanticipated price level changes is measured taking the value of unanticipated inflation factor (UI) given as the difference between actual inflation (It) minus expected inflation { E(It | t-1)}.
The fifth factor called changes in expected inflation is estimated by using Fama & Gibbons’ (1984) methodology as did
CRR. Defining It -= log [CPIt/CPIt-1], let the change in the ex-post real rate of interest be : Ut= (TBt-1 – It) – (TBt-2 – It-1),
where TBt-1 is the return on one-month T-bills from t-1 to t. Estimating ø from the moving average process Ut-øUt-1, the
estimated expected real rate of interest from t-1 to t at timet-1 is : E(Rt ) = TBt-2 – It-1 )- øUt-1 . From the Fischer equation,
expected inflation is {E (It | t-1)} = TBt-1 – E (Rt | t-1), and the unanticipated inflation is UIt = It – E (It | t-1).
Further, the following regression is estimated for the entire sample, the futures and the post futures sub samples where
SPt is the monthly return (with out dividends) on the BSE Sensex Index.
SPt = 0 + 1 (M Pt ) + 2(URPt ) + 3(UTSt ) + 4 (UIt ) + 5(DEIt ) + t ……. (1)
6. Analysis and findings
Table 1report summary statistic for daily and monthly BSE Sensex returns from Jan 1996 to Dec.2007. The mean and standard deviation of both daily and monthly returns in the post futures period are higher than those in the pre futures period. Using an F test as in Edwards ( 1988a, b). Table 2 shows that one cannot reject the null hypothesis that the variance of monthly returns is the same for the pre and post futures periods, but this null hypothesis is rejected for daily returns. These variance ratio tests are, however, sensitive to the assumption of normally distributed stock returns. Table I also reports normally tests for daily and monthly returns. The null hypothesis that daily and monthly returns are normally distributed is rejected at a 0.0001 level for all but two subgroups: the monthly returns in the pre futures subgroup and the monthly returns in the post futures subgroup without the crash of May 2004 & May 2006. The relative size of the skewness and kurtosis measures suggest that the normality rejections stem primarily from leptokurtosis.
Table 2 report the results of the two nonparametric tests. For daily data, the Wilcoxon rank Sum test does not reject the null hypothesis that the pre futures and the post futures subgroups have the same distribution while the Kolmogrove Smirnov test does reject. The results of the two nonparametric tests are consistent with the hypothesis that the daily location (Mean) has not changed but the daily dispersion (Variance) has changed between the periods. For monthly data, neither the Wilcoxon Rank Sum nor the Kolmogorov-Smirnov test rejects the null hypothesis that the pre futures and post futures returns have the same distribution. These results are consistent with the hypothesis that neither the monthly location (mean) nor the monthly dispersion (variance) has changed between the subgroups. The nonparametric tests thus suggest that the daily volatility of the BSE Sensex returns is higher after futures trading commenced, but the volatility of returns is unchanged.
One possible alternative explanation of why a change in daily volatility is found, but not in monthly volatility, is simply that the monthly test has less statistical power than the daily test. Another possible alternative explanation for a change in daily volatility, but not in monthly volatility, is that the distribution of daily returns is frequently and randomly changing, whereas the distribution of monthly returns is not so. Although they do not test the significance of these annual changes, both Edwards (1988) and Harris (1989) report substantial changes in the variance of daily BSE Sensex returns from year to year. In a similar manner, this study attempts to examine this possibility for daily BSE Sensex returns from year to year. To investigative this possibility, the parametric and non-parametric test based on two alternative (nonevent induced) splitting of the data set: i) 1997 – 1999 versus 2000 – 2007 and (ii) 1997 – 2000 versus 2001 – 2007 are retested. The results are similar to those reported in Table 2.
Using the Kolmogorov Smirnov test, it is found that the hypothesis that the two samples come from populations with the same distribution is always rejected (at conventional levels, with and without the crash) for daily returns, but never for monthly returns. Consequently, it can be concluded from Tables 1 and 2 and futures trading has no significant effect
International Journal of Business and Management December, 2008
75
on the volatility of monthly returns. But it cannot be concluded from tables I and II that the significant increases in the volatility of daily returns in the post futures subgroup is necessarily related to the inception of futures trading.
Table 3 presents the results of the outlier test of daily returns. Using the binomial distribution, this test calculates the probability of observing a number of outliers that is at least as extreme a were observed in the post-futures group if outliers were randomly distributed among all observations. That test confirms that there are significantly more daily return outliers (low, high, and total) in the post futures trading period than in the pre futures trading period. Excluding the months of May 2004 & May 2006, however, low daily outliers are statistically no more frequent in the post futures period than in the pre futures period. With or without May 2004 & May 2006, daily high outliers are significantly more prevalent in the post futures period. These last two facts counter popular press perceptions that futures period. These last two facts counter popular press perceptions that futures trading are associated with only “big” daily declines in the stock market.
The outlier test and the data in table 3 illustrate the effects of May 2004 & May 2006 crash on the distribution of daily stock returns. Twenty three of the 42 trading days in May 2004 & May 2006 are classified as outliers, with 8 of them classified as low outliers. In fact, the months of May 2004 & May 2006 accounts for 14 of the 127 daily outliers consisting 8 low outliers and 6 high outliers. Including the months of May 2004 & May 2006, one can reject, at the 5% level, the null hypothesis that there are no more low daily outliers in the post futures era than in the sample. Including the months of May 2004 & May 2006, this null hypothesis cannot be rejected at conventional levels.
Table 4 presents results of regression of results in which the moving average parameter for expected inflation (ø) is estimated using all data for three study periods, namely pre-futures, post-futures and entire study sample. For the pre-futures period, the model as a whole is significant, as the F-value shows, though the only significant regressor is the default risk factor. It is to be noted that the default risk factor, URPt = BAAt - LGB1, is end of period monthly returns on BAA bonds minus the end of period monthly return on long term government bonds. An unexpected increase in the default risk over the monthly holding period reduces end-of-period BAA bond prices relative to end-of-period LGB bond prices; and thus, reduces the difference in the end-of-period monthly returns. Consequently the negative value of the coefficient of the default risk factor implies that the BSE Sensex returns increase with default risk. In the post-futures period, the model as a whole is also significant and two regressors are significantly positive: Unanticipated changes in the discount rate, and Unanticipated price level changes. The negative correlation of -0.67 between the ‘Unanticipated changes in the discount rate’ and default premium suggests that the finding that the default premium is significant in the pre-futures period while ‘Unanticipated changes in the discount rate’ factor is significant in the post-futures period may be as a result of multicollinearity and not an economic result.
Before testing whether the conditional variance between two periods is different, it is necessary to test the stability of the regression coefficients in eq. (1) between the periods. Table 5 presents the results of Weerahandi’s (1987) test of regression coefficient stability. This test allows for unequal variances across the subgroups. The Weerhandi test does not reject the hypothesis that the regression coefficients are stable between the pre- and post-futures periods.
To test the hypothesis that the conditional variances for the pre and post futures eras are equal, the Goldfeld Quandt test is used. This test examines the residuals from the same regression model fitted separately to the two subgroups. The null hypothesis is that the variance of the errors in another part of the sample. Dropping some observation out of the middle of the sample increases the power of this test. Table 6 presents the result this test. Including the crash, the Goldfield Quant test rejects the null hypothesis of equal conditional variances and the conditional volatility in the post futures period is lower ( but not significantly lower) than that of the pre futures period.
While the causes of the crash of May 2004 and May 2006 are not yet known extant literature suggest that is was not caused by futures trading. The tests used in this study fail to reveal the evidence that stock index future trading has destabilized the stock market based on monthly returns.
7. Conclusion
This paper has explored the impact of the introduction of Futures trading on cash market volatility in an emerging capital market like India by taking a leading stock index in India namely, BSE Sensex on which futures trading is available. The impact of futures introduction on the conditional and unconditional volatilities of the underlying stock index (BSE Sensex) is examined. In a stock market marked with higher uncertainty due to global factors, the stability issue is examined further by using two statistical tests. It is responsibility of regulatory agencies like SEBI (Securities Exchange Board of India) to implement various measures designed to reduce volatility in the stock market.
In this study, the Parametric and nonparametric tests that the volatility of daily returns in the post futures period was higher than in the pre futures period but the volatility of monthly returns remained unchanged. Further investigation, however, reveals statistically significant evidence that the distribution of daily returns could that the significant increases in the volatility of daily returns after the inception of futures trading is necessarily futures induced. Controlling for the effects of macroeconomic variables this study finds no evidence, apart from the month of May 2004
Vol. 3, No. 12 International Journal of Business and Management
76
and May 2006 that monthly BSE Sensex index volatility has increased after inception of the BSE Sensex Futures market. In fact, excluding May 2004 & May 2006, the conditional volatility of index returns is slightly lower in the post futures era. While the causes of the Sensex crash are not fully known, there is no evidence that stock index futures trading has an adverse effect on market stability. Finally as Working (1963) noted in judging the net social benefits of a futures market, it is not necessary to find that the futures market stabilizes the underlying cash market, but only that futures trading does not destabilize it. The hedging benefits of the futures market are then sufficient to conclude that the existence of the futures market increases net social welfare. No evidence is found here that the stock index futures market destabilizes the underlying cash market based on monthly returns. The findings and the wide use of stock index futures by hedgers suggest that returns. The findings and the wide use of stock index futures by hedgers suggest that the introduction of stock index futures may have increased net social welfare.
References
Abhyankar, A. (1998). Linear and non linear Granger causality: evidence from the UK stock index futures market. The
Journal of Futures Market, 18(5), 519-540.
Antoniou, A.,& Holmes, P. (1995). Futures trading, information and spot price volatility: Evidence for the FTSE-100 stock index futures contract using GARCH. Journal of Banking and Finance, 19, 117–129.
Bessembinder, Hendrik and Seguin, Paul J (1992), Futures trading activity and stock price volatility, The Journal of
Finance, Vol.57, No.5, p. 2015-2034.
Brorsen, B. W. (1991). Futures trading, transaction costs, and stock market volatility. The Journal of Futures Markets,11, 153–163.
Chen,N.F., Roll,R. and Ross,S.A., (1986). Economic factors and the stock market. Journal of business, vol. 59, p.383-403.
Cox, C. C. (1976). Futures Trading and Market Information. Journal of Political Economy, 84, 1215-37.
Darrat, A. F., & Rahman, S. (1995). Has futures trading activity caused stock price volatility? Journal of Futures
Markets, 15, 537–557.
Dickey, D. A., and Fuller, W. A. (1979). Distribution of Estimates for Autoregressive Time Series with a Unit Root. Journal of American Statistical Association, 74:427-431.
Edwards, F.R. (1988). Futures trading and cash market volatility: Stock index and interest rate futures. The Journal of
futures markets, 8, 421-439.
Fama, E. F. (1965). The Behavior of Stock-Market Prices. The Journal of Business, 38, 1, 34-105.
Figlewski, S. (1981). Futures Trading and Volatility in the GNMA Futures. Journal of Finance, 36, 445-456.
Gulen, H. and Mayhew, S. (2000). Stock Index Futures Trading and Volatility in International Equity Markets. The
Journal of Futures Markets, 20, 7, 661-685.
Gupta.O.P. and Kumar, Muneesh (2002). Impact of Introduction of index futures on stock volatility: The Indian experience. NSE Initiative, 25p.
Harris, L. H., (1989). The October 1987 S&P 500 stock-futures basis. Journal of Finance, 44, 77-99.
Hogson, A. and Nicholls, D. (1991). The Impact of Index Futures Market on Australian Share Market Volatility. Journal of Business Finance and Accounting, 18, 267-280.
Kamara, A., (1982). Issues in Futures Markets: A Survey. Journal of Futures Market, 2, 261-94.
Koutmas, G. and Tucker, M. (1996). Temporal Relationship and Dynamic Interactions between Spot and Futures Stock Markets. Journal of Futures Markets, 16, 55-69.
Lee, S.B. and Ohk, K.Y. (1992). Stock Index Futures Listing Structural Change in Time Varying Volatility. Journal of
Futures Markets, 12, pp. 493-509.
Maberly, E.D., (1987). An Analysis of Trading and Nontrading Period Returns for the Value Line Composite Index; Spot versus Futures: A Note. Journal of Futures Markets, 7, 5, 497-500.
Nagraj K S and Kumar Kotha Kiran (2004). Index futures trading and spot market volatility: Evidence from an emerging market. The ICFAI Journal of Applied Finance, 10, 8, 5-15.
Nath, Golaka C. (2003). Interlinkages among global equity markets- A cointegration approach. Decision, 30, 2, 77-108.
Saurabh Kumar, Gauri Mohan and Sriharsha Pappu (2003). Impact of Derivatives on the Volatility and Liquidity of the underlying: An Indian stock market perspective. [Online] Available,www.ssrn.com ( March 12 , 2006)
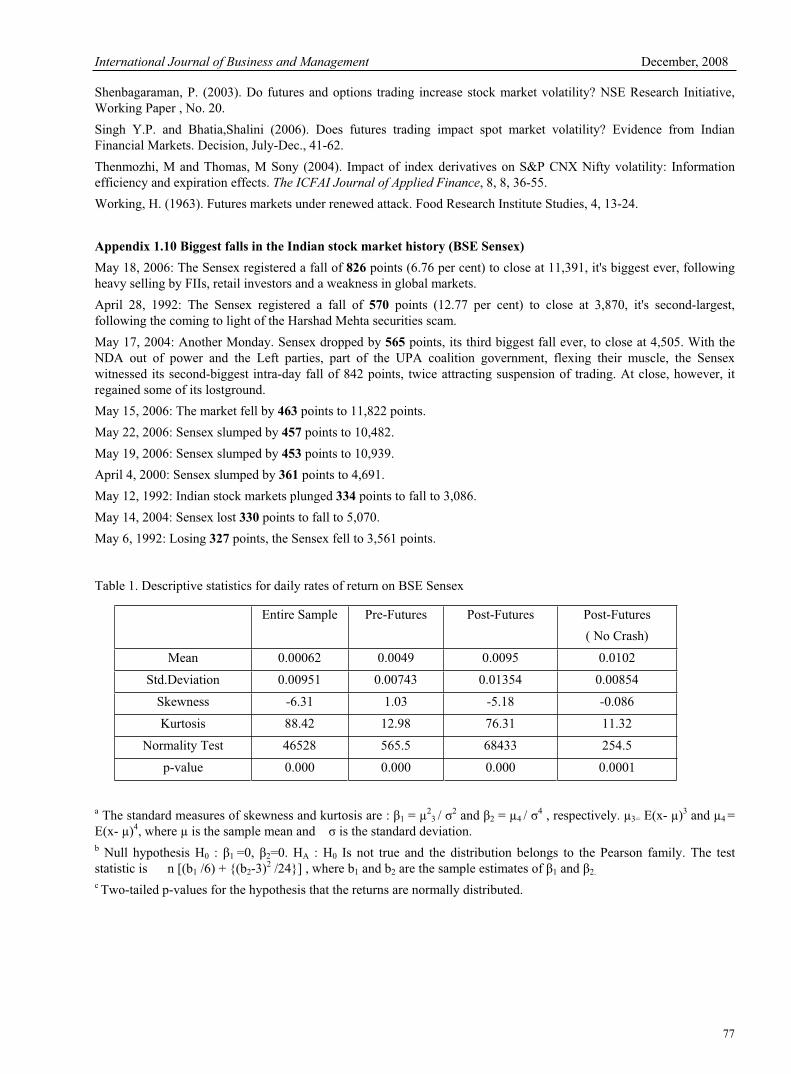
International Journal of Business and Management December, 2008
77
Shenbagaraman, P. (2003). Do futures and options trading increase stock market volatility? NSE Research Initiative, Working Paper , No. 20.
Singh Y.P. and Bhatia,Shalini (2006). Does futures trading impact spot market volatility? Evidence from Indian Financial Markets. Decision, July-Dec., 41-62.
Thenmozhi, M and Thomas, M Sony (2004). Impact of index derivatives on S&P CNX Nifty volatility: Information efficiency and expiration effects. The ICFAI Journal of Applied Finance, 8, 8, 36-55.
Working, H. (1963). Futures markets under renewed attack. Food Research Institute Studies, 4, 13-24.
Appendix 1.10 Biggest falls in the Indian stock market history (BSE Sensex)
May 18, 2006: The Sensex registered a fall of 826 points (6.76 per cent) to close at 11,391, it's biggest ever, following heavy selling by FIIs, retail investors and a weakness in global markets.
April 28, 1992: The Sensex registered a fall of 570 points (12.77 per cent) to close at 3,870, it's second-largest, following the coming to light of the Harshad Mehta securities scam.
May 17, 2004: Another Monday. Sensex dropped by 565 points, its third biggest fall ever, to close at 4,505. With the NDA out of power and the Left parties, part of the UPA coalition government, flexing their muscle, the Sensex witnessed its second-biggest intra-day fall of 842 points, twice attracting suspension of trading. At close, however, it regained some of its lostground.
May 15, 2006: The market fell by 463 points to 11,822 points.
May 22, 2006: Sensex slumped by 457 points to 10,482.
May 19, 2006: Sensex slumped by 453 points to 10,939.
April 4, 2000: Sensex slumped by 361 points to 4,691.
May 12, 1992: Indian stock markets plunged 334 points to fall to 3,086.
May 14, 2004: Sensex lost 330 points to fall to 5,070.
May 6, 1992: Losing 327 points, the Sensex fell to 3,561 points.
Table 1. Descriptive statistics for daily rates of return on BSE Sensex
a The standard measures of skewness and kurtosis are : 1 = µ23 / 2 and 2 = µ4 / 4 , respectively. µ3= E(x- µ)3 and µ4 =
E(x- µ)4, where µ is the sample mean and is the standard deviation. b Null hypothesis H0 : 1 =0, 2=0. HA : H0 Is not true and the distribution belongs to the Pearson family. The test statistic is n [(b1 /6) + {(b2-3)2 /24}] , where b1 and b2 are the sample estimates of 1 and 2.
c Two-tailed p-values for the hypothesis that the returns are normally distributed.
Entire Sample Pre-Futures Post-Futures Post-Futures
( No Crash)
Mean 0.00062 0.0049 0.0095 0.0102
Std.Deviation 0.00951 0.00743 0.01354 0.00854
Skewness -6.31 1.03 -5.18 -0.086
Kurtosis 88.42 12.98 76.31 11.32
Normality Test 46528 565.5 68433 254.5
p-value 0.000 0.000 0.000 0.0001
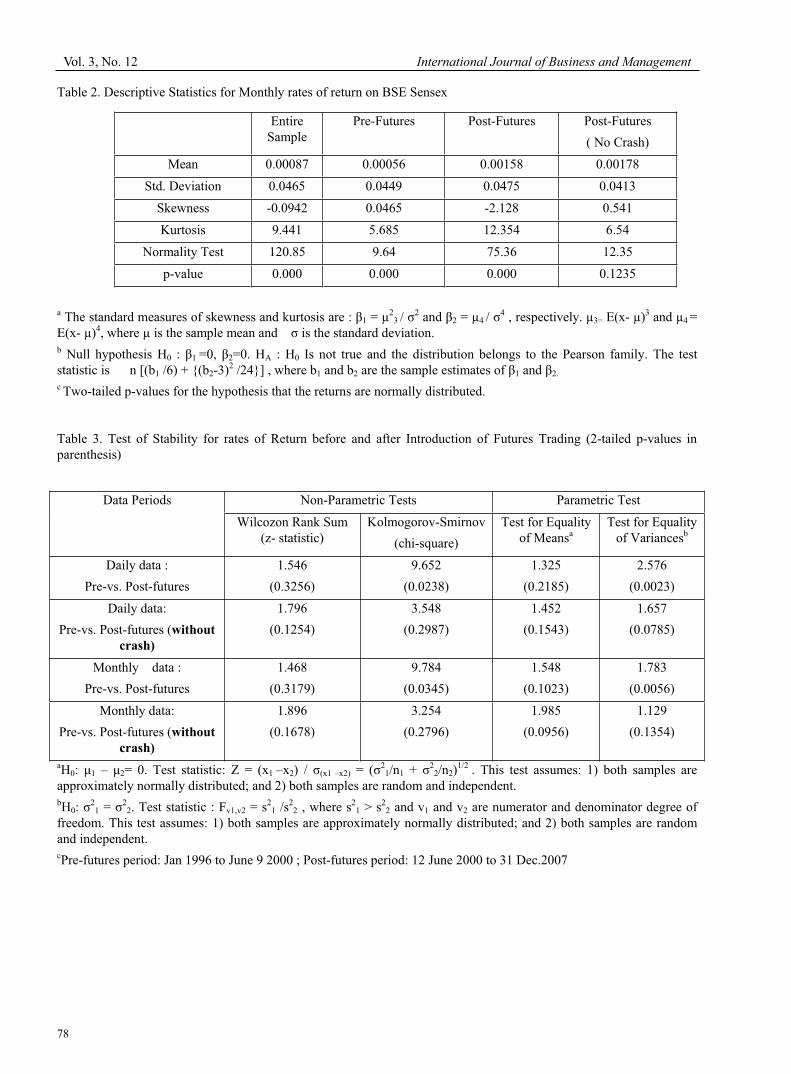
Vol. 3, No. 12 International Journal of Business and Management
78
Table 2. Descriptive Statistics for Monthly rates of return on BSE Sensex
a The standard measures of skewness and kurtosis are : 1 = µ23 / 2 and 2 = µ4 / 4 , respectively. µ3= E(x- µ)3 and µ4 =
E(x- µ)4, where µ is the sample mean and is the standard deviation. b Null hypothesis H0 : 1 =0, 2=0. HA : H0 Is not true and the distribution belongs to the Pearson family. The test statistic is n [(b1 /6) + {(b2-3)2 /24}] , where b1 and b2 are the sample estimates of 1 and 2.
c Two-tailed p-values for the hypothesis that the returns are normally distributed.
Table 3. Test of Stability for rates of Return before and after Introduction of Futures Trading (2-tailed p-values in parenthesis)
aH0: µ1 – µ2= 0. Test statistic: Z = (x1 –x2) / (x1 –x2) = ( 21/n1 + 2
2/n2)1/2 . This test assumes: 1) both samples are
approximately normally distributed; and 2) both samples are random and independent. bH0:
21 = 2
2. Test statistic : Fv1,v2 = s21 /s
22 , where s2
1 > s22 and v1 and v2 are numerator and denominator degree of
freedom. This test assumes: 1) both samples are approximately normally distributed; and 2) both samples are random and independent. cPre-futures period: Jan 1996 to June 9 2000 ; Post-futures period: 12 June 2000 to 31 Dec.2007
Entire Sample
Pre-Futures Post-Futures Post-Futures
( No Crash)
Mean 0.00087 0.00056 0.00158 0.00178
Std. Deviation 0.0465 0.0449 0.0475 0.0413
Skewness -0.0942 0.0465 -2.128 0.541
Kurtosis 9.441 5.685 12.354 6.54
Normality Test 120.85 9.64 75.36 12.35
p-value 0.000 0.000 0.000 0.1235
Data Periods Non-Parametric Tests Parametric Test
Wilcozon Rank Sum (z- statistic)
Kolmogorov-Smirnov
(chi-square)
Test for Equality of Meansa
Test for Equality of Variancesb
Daily data :
Pre-vs. Post-futures
1.546
(0.3256)
9.652
(0.0238)
1.325
(0.2185)
2.576
(0.0023)
Daily data:
Pre-vs. Post-futures (without
crash)
1.796
(0.1254)
3.548
(0.2987)
1.452
(0.1543)
1.657
(0.0785)
Monthly data :
Pre-vs. Post-futures
1.468
(0.3179)
9.784
(0.0345)
1.548
(0.1023)
1.783
(0.0056)
Monthly data:
Pre-vs. Post-futures (without
crash)
1.896
(0.1678)
3.254
(0.2796)
1.985
(0.0956)
1.129
(0.1354)
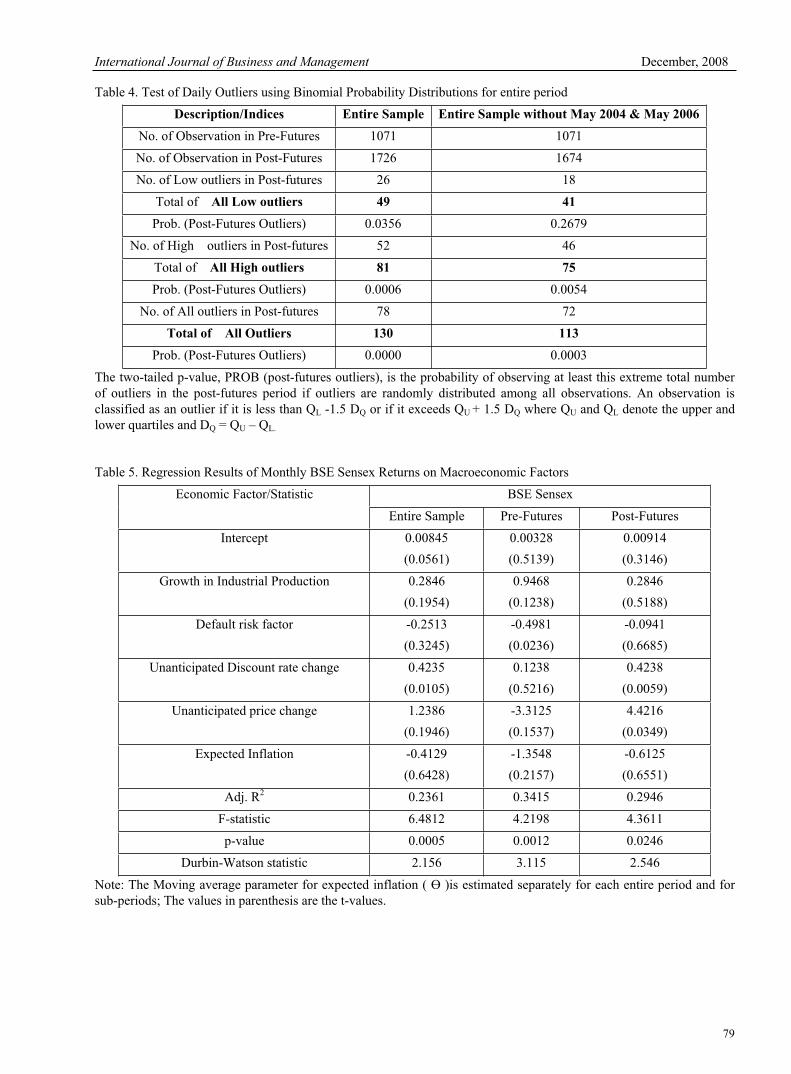
International Journal of Business and Management December, 2008
79
Table 4. Test of Daily Outliers using Binomial Probability Distributions for entire period
Description/Indices Entire Sample Entire Sample without May 2004 & May 2006
No. of Observation in Pre-Futures 1071 1071
No. of Observation in Post-Futures 1726 1674
No. of Low outliers in Post-futures 26 18
Total of All Low outliers 49 41
Prob. (Post-Futures Outliers) 0.0356 0.2679
No. of High outliers in Post-futures 52 46
Total of All High outliers 81 75
Prob. (Post-Futures Outliers) 0.0006 0.0054
No. of All outliers in Post-futures 78 72
Total of All Outliers 130 113
Prob. (Post-Futures Outliers) 0.0000 0.0003
The two-tailed p-value, PROB (post-futures outliers), is the probability of observing at least this extreme total number of outliers in the post-futures period if outliers are randomly distributed among all observations. An observation is classified as an outlier if it is less than QL -1.5 DQ or if it exceeds QU + 1.5 DQ where QU and QL denote the upper and lower quartiles and DQ = QU – QL.
Table 5. Regression Results of Monthly BSE Sensex Returns on Macroeconomic Factors
Economic Factor/Statistic BSE Sensex
Entire Sample Pre-Futures Post-Futures
Intercept 0.00845
(0.0561)
0.00328
(0.5139)
0.00914
(0.3146)
Growth in Industrial Production 0.2846
(0.1954)
0.9468
(0.1238)
0.2846
(0.5188)
Default risk factor -0.2513
(0.3245)
-0.4981
(0.0236)
-0.0941
(0.6685)
Unanticipated Discount rate change 0.4235
(0.0105)
0.1238
(0.5216)
0.4238
(0.0059)
Unanticipated price change 1.2386
(0.1946)
-3.3125
(0.1537)
4.4216
(0.0349)
Expected Inflation -0.4129
(0.6428)
-1.3548
(0.2157)
-0.6125
(0.6551)
Adj. R2 0.2361 0.3415 0.2946
F-statistic 6.4812 4.2198 4.3611
p-value 0.0005 0.0012 0.0246
Durbin-Watson statistic 2.156 3.115 2.546
Note: The Moving average parameter for expected inflation ( )is estimated separately for each entire period and for sub-periods; The values in parenthesis are the t-values.
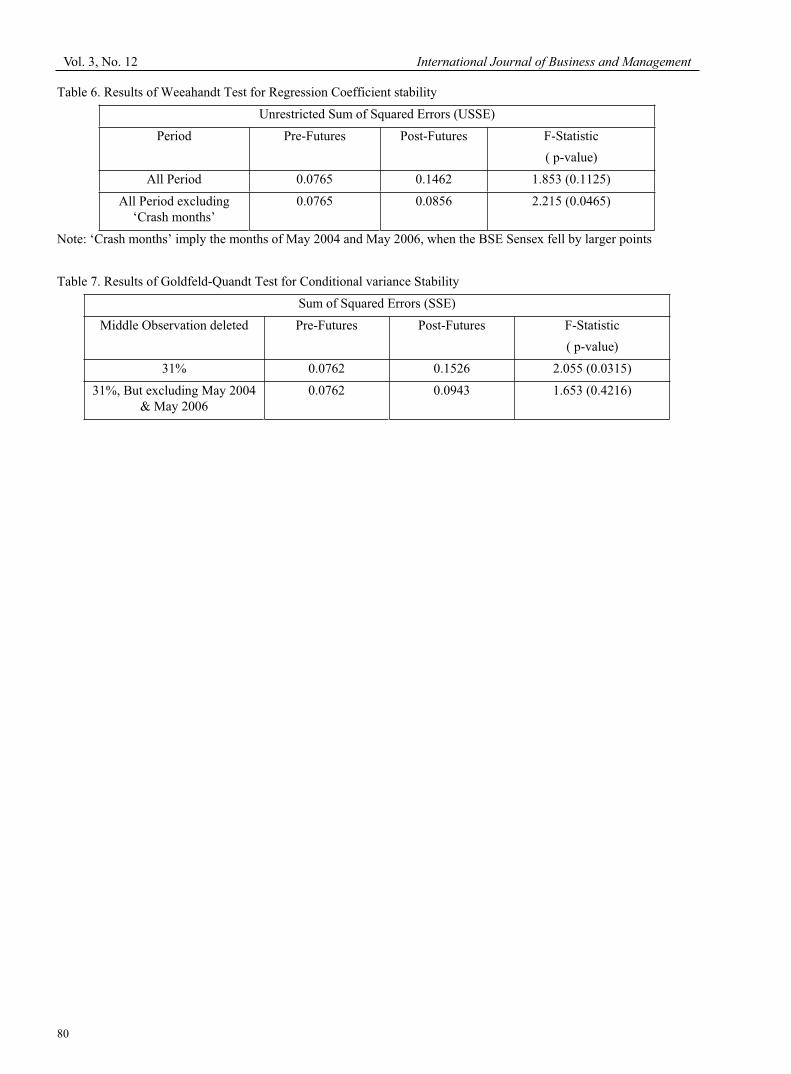
Vol. 3, No. 12 International Journal of Business and Management
80
Table 6. Results of Weeahandt Test for Regression Coefficient stability
Unrestricted Sum of Squared Errors (USSE)
Period Pre-Futures Post-Futures F-Statistic
( p-value)
All Period 0.0765 0.1462 1.853 (0.1125)
All Period excluding ‘Crash months’
0.0765 0.0856 2.215 (0.0465)
Note: ‘Crash months’ imply the months of May 2004 and May 2006, when the BSE Sensex fell by larger points
Table 7. Results of Goldfeld-Quandt Test for Conditional variance Stability
Sum of Squared Errors (SSE)
Middle Observation deleted Pre-Futures Post-Futures F-Statistic
( p-value)
31% 0.0762 0.1526 2.055 (0.0315)
31%, But excluding May 2004 & May 2006
0.0762 0.0943 1.653 (0.4216)
International Journal of Business and Management December, 2008
81
Green Marketing and Sustainable Development of Garment
Industry-A Game between Cost and Profit
Huanfeng Li
College of Management, Tianjin Polytechnic University
Tianjin 300387, China
Tel: 86-22-8395-6464 E-mail: [email protected]
Weimin Cai
College of Management, Tianjin Polytechnic University
Tianjin 300387, China
Tel: 86-22-8395-6773 E-mail: [email protected]
Abstract
This paper introduces how green marketing influences the sustainable development of garment industry. It analyses the cost and profit to implement green marketing, both in a short term and in the long run. In a short term the cost may increase. However, in the long run, the income will overweigh the cost. There’re five reasons: reduced cost, expanding export by broking down green barriers, establishing the enterprise’s green image, being more competitive and avoiding green tax. Therefore, implementing green marketing is pivotal to the sustainable development of garment industry.
Keywords: Green marketing, Sustainable development, Cost, Profit
1. Introduction to green marketing
Nowadays, a concept of “green marketing” is becoming more and more popular. It began in Europe in the early 1980s when specific products were identified as being harmful to the earth’s atmosphere. Terms like Phosphate Free, Recyclable, Refillable, Ozone Friendly, and environmentally friendly are some of the things consumers most often associate with green marketing. While these terms are green marketing claims, in general green marketing is a much broader concept, one that can be applied to consumer goods, industrial goods and even services. For example, around the world there are resorts that are beginning to promote themselves as "ecotourism" facilities, i.e., facilities that "specialize" in experiencing nature or operating in a fashion that minimizes their environmental impact. Thus green marketing incorporates a broad range of activities, including product modification, changes to the production process, packaging changes, as well as modifying advertising.
The American Marketing Association (AMA) defined the green marketing as: the study of the positive and negative aspects of marketing activities on pollution, energy depletion and no energy resource depletion. This definition has three key components: 1) it is a subset of the overall marketing activity; 2) it examines both the positive and negative activities; and 3) a narrow range of environmental issues are examined. It ensures that the interests of the organization and all its consumers are protected, as voluntary exchange will not take place unless both the buyer and seller mutually benefit.
Mankind has unlimited wants while limited recourses on the earth. Green marketing looks at how marketing activities utilize these limited resources, while satisfying consumers wants, both of individuals and industry, as well as achieving the selling organization's objectives.
2. Relationship between green marketing and the sustainable development of garment industry
The traditional production and consumption fashion has brought the humanity great material wealth, but at the same time, it also brought a lot of new problems: population explosion, the uneven income, the environmental pollution, the waste of resources, energy crisis, and worse ecology. Facing the new challenge, the humanity realizes they must change the original production and consumption way, and seeks a new sustainable production and consumption way. Sustainable development, which means satisfying the contemporary needs without sacrificing the future generations’ benefit, arises.
The garment enterprises’ sustainable development is the basis of the sustainable development of garment industry. The sustainable development of garment industry requires their enterprises to pay more attention to the long-time prosperity,
Vol. 3, No. 12 International Journal of Business and Management
82
not merely with an eye to the temporary benefit. Or else, their incorrect operating activities will cause the abuse of resources and destruction to environment. These then cause a markup in the price of materials and also affect the enterprise’s image. Consequently the sustainable development is demolished.
These problems could be solved by green marketing. In an enterprise’s operating activities, marketing is the most important part. As the export of Chinese garment expanded sharply, many kinds of green trade barriers are frequently used; the implementation of green marketing has appeared rather important and urgent. Further more, it appears that all types of consumers, both individual and industrial are becoming more concerned and aware about the natural environment. In a 1992 study of 16 countries, more than 50% of consumers in each country, other than Singapore, indicated they were concerned about the environment. A 1994 study in Australia found that 84.6% of the sample believed all individuals had a responsibility to care for the environment. A further 80% of this sample indicated that they had modified their behavior, including their purchasing behavior, due to environmental reasons. Recently the statistics from the United Nations said, presently 40% of Europeans prefer to purchasing green product; 67% of Duchess and 82% of Germans take environment into consideration when shopping, more than half of English consumers are willing to pay a higher price to purchase green commodity; 77% of Americans said enterprise's green image affects their purchase behavior. The development and production of ecology textile and green environmental protection clothing will become a new hotspot.
As demands change, it can be assumed that enterprises marketing goods with environmental characteristics will have a competitive advantage over enterprises marketing non-environmentally responsible alternatives. The development of green marketing could guarantee the sustainable development of garment industry.
3. Analysis of cost and profit to implement green marketing
3.1 In a short time
As society becomes more concerned with the natural environment, businesses have begun to modify their behavior in an attempt to address society's "new" concerns. Some businesses have been quick to accept concepts like environmental management systems and waste minimization, and have integrated environmental issues into all organizational activities. However, what businesses pursue is the maximum profit. There are still a majority of businesses, who believe that promoting green marketing costs too much, and will reduce their profit. So they have little motivation to carry out green marketing. In a short-term of view, they are correct in a sense. The increased cost and reduced profit caused by implementing green marketing are as follows:
3.1.1 Expense on R & D
Green product is a dispensable part of green marketing. Green product refers to product that doesn’t contain harmful component itself, and also has no pollution to the environment during its production. The production of green product required high technology. Therefore, enterprises must create new technology or production line. There’re two channels: one is to develop green product by themselves. This requires investing more funds into R&D to attract the talented people and purchase advanced equipments needed; the other channel is to buy others’ advanced technique or green materials which are much more expensive than the common ones. Both will increase the cost.
In Europe and the United nations, expense on R&D accounts for 3%-5% in the total sales volume, some even reaching 10%; however, the number is only 0.7%-1% in China. From these figures, we can see that our domestic enterprises haven’t paid enough attention to research and development. So if they want to produce green product, there’s still a long way to go.
3.1.2 Higher price lower sales volume
Green marketing doesn’t refer solely to the promotion or advertising of products with environmental characteristics. Itconsists of all activities designed to generate and facilitate any exchanges intended to satisfy human needs or wants, such that the satisfaction of these needs and wants occurs, with minimal detrimental impact on the natural environment. From design, production, to sale and after-purchase service all should be green. Because the high cost of green clothing in production craft, raw materials and some other aspects, in order to guarantee the anticipated profit, the enterprise has no choice but to enhance the price. So its price is much higher comparing with other clothing.
For instance, some fiber and clothing, which contain "green textile”, are in great demand continuously. Some T.-shirt can be sold at the price of more than RMB400 Yuan in our domestic market. Thus, it’s more difficult for marketers to promotion their products to consumers. They must not only win the consumers’ approval of the green product, but let them accept the relatively high price. Thereupon, such awkward situation appeared: on one hand the media and the involved department are warmly propagandizing green clothing; on the other hand, these products sold in supermarkets and shopping malls are less than 10%. Because marketers have to spend more time in selling the green product than selling common ones, they would rather sell the latter.
All these above will surely make the sales volume drop, and at last income would be influenced.
International Journal of Business and Management December, 2008
83
Lack of consumers’ recognition, Green marketing has not been widely accepted in our country. Some people even have no idea of green marketing, let alone buy green product. Moreover, there’re still a large part of consumers, especially the low-income class, thinking more of the product’s utilities, comparing with its environmental protection function. For instance, if he/she wants to buy a coat, one kind is beautiful, comfortable and cheap, but not environmental protection, while the other kind is but expensive, they probably choose the former one. As a result, green product will not be as popular as we thought.
Another reason for this is some sellers are only concerned about the profit and never care about the market order, so spurious products flood the market. It has huge influence on the consumer’s belief in green industry. Besides, many kinds of folk authentication appeared, bringing much puzzle and harm to the consumer. Consumers’ worry certainly can affect their purchase. The price of regular green clothing is over high, while product that with moderate price is difficult to distinguish if it’s genuine or fake, so consumers would rather not buy the green ones.
3.2 In the Long Run
From those above, it seems the implementation of green marketing would probably reduce enterprises’ profit. But in a long-range view, the cost actually not necessarily increases, instead, it will drop and the income can increase.
First, Enterprises may use green marketing in an attempt to address cost or profit related issues. There’re three ways to do this: in one case, when attempting to minimize waste, enterprises are often forced to re-examine their production processes. In these cases they often develop more effective production processes that not only reduce waste, but reduce the need for some raw materials. This serves as a double cost savings, since both waste and raw material are reduced.
In another case, enterprises attempt to find end-of-pipe solutions, instead of minimizing waste. In these situations enterprises try to find markets or uses for their waste materials, where one enterprise's waste becomes another enterprise's input of production. One Australian example of this is an enterprise who produces acidic waste water as a by-product of production and sells it to an enterprise involved in neutralizing base materials.
The last way in which cost or profit issues may affect enterprises' environmental marketing activities is that new industries may be developed. This can occur in two ways: 1) a enterprise develops a technology for reducing waste and sells it to other enterprises; or 2) a waste recycling or removal industry develops For example, enterprises that clean the oil in large industrial condensers increase the life of those condensers, removing the need for replacing the oil, as well as the need to dispose of the waste oil. This reduces operating costs for those owning the condensers and generates revenue for those enterprises cleaning the oil.
Second, such green trade barriers as quality level, environmental standard, and health epidemic prevention increase sharply. Only in 2002 EU and US has set more than ten new stipulations, including “green technology standard”, “green environment mark”, “green inspect regime” and “green allowance”. At present, the most important standard of ecology textile in the world is “Oko-Tex Standard 100”.The test object of this standard involves amount of residue of free formaldehyde, polychlorinated biphenyls alkalinity acidity, amount of residue of insecticide and ant mildew compound and so on, demanding to control in pH, color fastness, formaldehyde, harmful heavy metal element, pentachlorophenol and some other respects.
Among over 18000 large garment enterprises in our country, there are few passing the National Environment Sign Product Authentication. Presently, only a few companies such as Baoxi Bird, Copper Cattle, Shanshan and so on have passed that authentication. This is because too many textile companies didn’t pay enough attention to environment protection. In the past years, when Beijing Copper Cattle Stock Corp. exported child clothing to Japan, the importer would always check whether the content of formaldehyde in the material exceeded the normal standard. Besides, other chemical substance contained in textiles, such as heavy metal and nitrogen dye, are also limited by developed country. Western Europe, North America and Japan have their own textile environmental standard, and textiles that cannot reach their standard are forbidden to import.
In 2000, the export value infected by green barriers was about $8 billion, while the number reached $15 billion in 2003. Its influence has grown bigger year by year. Only through green marketing, can these barriers be broken down.
Third, carrying out green marketing is helpful to establish the enterprise’s green image and green brand, and increase consumers’ recognition. At present the enterprises that established green brand have obtained the benefit. For example, recently, one kind of clothing made by natural colored cotton called “ecology clothing" appeared in Shenzhen market, and received a warmly welcome. It is said during the production process of the materials - natural colored cotton, no chemical pesticide or fertilizer is used. This avoided the chemical’s destruction to the environment and harm to the human body especially babies’ skin. It is purely natural and environmental protection. Another example is the Xinjiang Shihezi 8.1 cotton textile limited liability company. It has already passed the ISO9002 quality system authentication. The company will make full use of its resources superiority: the high quality upland cotton, the long soft color cotton and natural colored cotton, to develop production of green environmental protection fiber.
Vol. 3, No. 12 International Journal of Business and Management
84
Nowadays, competition in the garment market both domestic and abroad is rather intensive. Many domestic garment enterprises are working hard in "green textile". At present the shirts which are lucky in market are all made by cellulose textile fiber, which is good to the environment, such brand as “Ming Xun”, “Kai Kai”, "the Luo Mongolia", “Ya Ge Er” and “the conch”. They all add “retuning to the nature” to their main products’ development, especially "the Luo Mongolia", selecting high-tech native cellulose textile fiber as its materials. Cellulose, Soya fiber and so on have become the focus of the development of green textile and garment.
Establishing green image and green brand, can make the enterprise more competitive, guarantee its market share and promote product sales. Finally, enterprise’s long-term development could be achieved.
Fourth, as the deterioration of environment, especially the "Virulent clothing" event happened frequently, consumer starts to be aware of the importance of “green clothing”. Most of the textiles and clothing are directly contact with our skin, so it’s easily to threaten the human body’s security. Now a popular parlance in the society “toxin and disease coming from wardrobe” is correct in some extent. It has been confirmed by a scientific experiment that there’re 12 kinds of coloring matter have carcinogenicity, and 10 kinds has skin allergy. This has no alternative but to cause many consumers to be heavyhearted.
Consumer is "God" and consumer's purchase tendency affects the development direction of the product directly. We can see an example abroad: recently a poll to consumers in the second big retail store in Sweden indicates: 85% of consumers are willing to pay high price for the clean environment; In Canada, 80% of consumers would rather pay an extra 10% to purchase product which is beneficial to the environment; 40% of Europeans like purchasing product with environment symbol not the traditional product; 37% of Japanese consumers only choose and purchase product with environment symbol. As green tide surges wave upon wave, green clothing has already been in fashion in many countries. Switzerland had promoted "the environmental protection clothing" as early as 1994; The Spanish fashionable clothing design center also had promoted "the green clothing”.
Given these figures, it can be assumed that green consumer has a worldwide current. Although green clothing starts a little later in our country compared to the developed country, the consumer already started to awaken. More and more people tend to pursue green product and pay more attention to product security, health and harmlessness. This can bring market opportunity to the enterprise. Enterprises marketing goods with environmental characteristics will have a competitive advantage over enterprises marketing non-environmentally responsible alternatives. For example, the average profit before tax of the English 14 biggest green companies reaches 31%, going far beyond the non-green enterprise's level.
Fifth, implementing green marketing can avoid paying green tax. Green tax is a kind of tax imposed on pollution behavior or contaminations by the government. It has been adopted in developed countries, while it’s still at the start stage in our country. At present, the taxation object in our country including: discharging waste gas, waste water, garbage and producing noise and so on, and thus the green tax includes air pollution tax (including sulphur dioxide tax, carbon dioxide tax and so on), water pollution tax, the solid waste tax (including trash tax, drink vessel tax, lubricating oil tax, waste battery tax and so on) and noise tax. The scope of green tax is extremely wide, including nearly all behavior that causes environmental pollution. It can be set in any stage, from production, circulation to exchange.
Our government has gone about levying green tax, learning from the examples of other countries’. If the enterprises’ operating process causes environment pollution, even if the environment may accommodate itself, enterprises still have to pay for it. On the contrary, if the enterprise carries out green marketing, and protects the environment, it not only needn’t pay tax but probably can gain some award from the government to praise its behavior. Therefore, from this point, implementing green marketing is rather necessary.
4. Conclusion
Environmental issues influence all human activities. As consumers are more concerned about the environment and their health, green marketing of garment enterprise has become urgent. It ensures the interests of the organization and all its consumers are protected too. Both the buyer and seller mutually benefit.
Enterprises as the main body of garment industry play an active role in the operating activity. The enterprises must establish new green marketing thinking, give up the temporary benefit and pursue the persistent environmental protection profit. Only by doing this, can they stand firm in the international market competition and realize continuous thriving. And finally achieve the sustainable development of garment industry.
References
Fuller and Donald. (1999-2001). Marketing Mix Design-For-Environment (Dfe): A Systems Approach, Journal of
Business Administration & Policy Analysis.Vol. 27-29, pp. 309-336, 28p, 2 diagrams.
Kara, Sami1, Ilyas Mazhar, Muhammad1, Kaebernick and Hartmut. (2004) Lifetime prediction of components for reuse: an overview. International Journal of Environmental Technology & Management, Vol. 4, Issue 4, pp. 1-1, 1p.

International Journal of Business and Management December, 2008
85
Prothero, Andrea, Fitchett, and James A. (2000) Greening Capitalism: Opportunities for a Green Commodity, Journal
of Macromarketing, Vol. 20, Issue 1, pp. 46, 10p.
Zhu Qinghua, Sarkis, Joseph2Geng and Yong1. (2005). Green supply chain management in China: pressures, practices and performance. International Journal of Operations & Production Management, Vol. 25, Issue 5, pp. 449-468, 20p.
Vol. 3, No. 12 International Journal of Business and Management
86
On the Legal and Market Analysis of “Direct Selling” in China
Yu Tian
Northwest University of Politics and Law
Xi’an 710063, China
E-mail: [email protected]
Abstract
By exploring the origins and literal translations of “direct selling”, “multi-level marketing”, and “pyramid scheme” and analyzing the principles of laws, the principles of market economy, and the relationship between laws and regulations and market principles, this thesis concludes the positive meanings and the unscientific points of Regulation on
Administration of Direct Sales & Regulation on Prohibition of Chuanxiao, expecting to founding a sound theoretical basis for the amendment and perfect of laws in the direct selling field.
Keywords: Direct selling, Illegal multi-level, Pyramid scheme
1. The positive meanings of the two Regulations and the social effect after the issue
1.1 Positive meanings
On Dec. 1st, 2005, the Regulation on Administration of Direct Sales & Regulation on Prohibition of Chuanxiao issued by the Ministry of Commerce of the People's Republic of China put in force in China. Afterwards, direct selling is formally taken as a legal activity in China. But multi-level marketing will be prohibited as an illegal activity. (The law of China takes multi-level marketing as an illegal activity, which means: organizers or operators take in new members, calculate and pay salaries one member according to the number of new members who join in the multi-level marketing, introduced by one member directly or indirectly, or the sales performances. Or, the organizer asks new members to hand in a sum of money as a precondition to join in. Or, by means of developing new members, the organizer or the operator ask members to invite more people join in, forming a multi-level relationship. The salaries of members at certain level are based on the sales of members at a lower level. By this way, the organizer and the member at top level obtain interests illegally, disturbing normal economic order, and affecting social stability. The great difference between direct selling and multi-level marketing according to the law of China relies in: all direct sellers are normally trained by the direct selling companies and any direct seller is not allowed to develop new followers or form multiple levels; the direct selling companies pay direct sellers salaries according to their sales; the total salary (includes wages, rewards, bonuses, or other economic benefits) of one direct seller should not exceed 30% of his sales.)
Firstly, the positive meaning of the two Regulations normally establish the legal position of direct selling and the illegal position of multi-level marketing by laws in China, what serve as definite rules for national commerce and business management agencies and juridical institutions in administration and execution (Gazette of the State Council of the People’s Republic of China, 2005).
Secondly, due to the popularization and execution of the two Regulations and the fast reform of commercial circulation system, China’s distribution industry is already open. Sorts of distribution models, ideas, and management methods appear in succession, what exerts certain positive effects on the perfect and development of modern market economic system.
Thirdly, after the direct selling, as an industry with easy entrances, gets protection from laws, it becomes a nice choice in employment. According to the Analysis and Investment Consulting Report on China Direct Selling Industry issued by China Investment Consulting in Jan. 2008, “till 2006, there are about 3 million direct sellers or so. In next few years, about 70 million people will be engaged in direct selling.” It will help to relieve social employment pressure and make best use of human resource.
Fourthly, according to China’s commitments to WTO, China will cancel restrictions on foreign capitals founding businesses in no-fixed location wholesale and service field and constitutes Regulations that are in accordance with WTO principles and China’s commitments after the entry into WTO. To issue the Regulation on Administration of
Direct Sales is to fulfill the commitment. It is meaningful. (Details are from the World Codes of Conduct constituted by the World Federation of Direct Selling Associations. The “no-fixed location wholesale or retail” is also named as “no-shop sale”. It refers to the commercial activity that sells final consumers commodities or services without retailers’
International Journal of Business and Management December, 2008
87
fixed shops. The “no-shop sale” includes three types: direct marketing, direct selling, and auto sale.)
1.2 Analyze the social effect after the execution of the two Regulations in recent three years
A prominent phenomenon appears after the execution of the two Regulations. The distribution companies that accept normal direct selling education loss their bases of values all at once. Quite a lot of direct sellers are lost. Performances of companies with certificates decline wholly. The policy risks caused by the execution of the two Regulations hurt traditional large companies mostly. Companies with certificates of direct selling face challenges of “no market”. The following cases rightly illustrate the fact.
Many large-sized companies, such as the Harbin Pharmaceutical Group, declare to enter the direct selling industry in succession. At last, they fail, such as the well-known Onlly Company. It has founded the direct selling team and invited specialized firms to make market researches and designs. It has even established specific series of products for direct selling before its failure. Similarly, Procter & Gamble (Guangzhou) suffers from a terrible fate. Even for USANA, the world first-class direct selling company, the result is same. One fundamental reason for them stopping entering China’s direct selling market is the greater risks in policies and laws. Similarly, it is also the reason for why other companies, such as Qizheng Tibetan Medicine Company, grow slowly in the direct selling field. It is hard for companies to master and execute the state policies and laws. Therefore, companies have no choice but adopt relatively conservative tactics in case of suffering from failures.
Fulong’s reform of system. Here the “reform” is to turn multi-level structure into single-level structure and regulate the rate less than 30%. Fulong Company, also named as “little Amway”, offers us a typical case. Originally, customers can buy its oral liquid (its retail price is 200 RMB per box) at a preferential price 167 RMB per box. If buy more, customers can enjoy a discount from 6% to 21%. After the reform, customers buy the oral liquid at the retail price. Preferential prices are only for customers who spend more than 750 RMB in its oral liquid in one month. The preferential discount cannot be accumulated. If customers want lowest preferential price, they have to spend another 750 RMB in the oral liquid in one month. This reform is regarded as a “self-destructive”. It brings about nothing but poor business performances and loose cooperation. However, in order to obey the rules of two Regulations, many direct selling companies have to adjust themselves even at the price of future development to get legal certificates.
As a matter of fact, no matter how formal companies that have already got or are applying for certificates are, rules in the two Regulations are definite. If companies escape from investigations of execution institutions, everything will be ok. If not, almost all companies will suffer from questions. Companies have to survive form a dilemma. To follow the Regulations means poor profitability. To implement the multi-level direct selling will be canceled by execution institutions. (Gang Zhen, 2007, p. 12-13)
Mr. Weihua Zeng, the office director of Direct Selling Professional Commission of China Marketing Association, in his thesis concludes the development of direct selling in China in recent years after the execution of the two Regulations,“since the issue of the two Regulations in China, it has experienced two years’ execution. As for the development of direct selling at present, “dilemma” is right for depicting the fact. Companies with certificates have to reform themselves unwillingly. Illegal companies realize further development by any possible means. China’s direct selling is far from a legal and normal development. It is still in a confusing condition today.” (Weihua Zeng, 2008, p. 48)
Viewing from the general effects, the transformation of direct selling companies based on present laws make them get in a dilemma.
2. Legal analysis on direct selling
Why the effects exerted by the direct selling during years of operations since its birth in western countries or regions are far different from that in China. Reasons are multiple. To identify the root of the problem is the key for resolutions.
2.1 Errors in the application of legal concepts of “direct selling” and “multi-level marketing”
(1) International organizations’ definition of direct selling
As for the definition of direct selling, the World Federation of Direct Selling Association (WFDSA for short) defines it as: in a place except fixed retail shops (such as personal home, office or other places), independent direct sellers introduce products or services to consumers by face-to-face presentation and demonstration and realize sales.
Face to face presentation, demonstration, and sale of products or services, usually at the home or office of a prospect by the independent direct sales representatives. Employed by firms such as Avon, Mary Kay, and Tupperware, direct selling differs from network marketing in that it offers little or no incentives for recruiting ever increasing number of sales representatives. The direct seller is: a person who is a member of a distribution system of a direct selling company. A direct seller may be an independent commercial agent, independent contractor, independent dealer or distributor, employed or self-employed representative, franchisee or the like. (Details are from the World Codes of Conduct
constituted by WFDSA: Direct Seller: A Direct Seller is a person who is a member of a distribution system of a Direct Selling company. A Direct Seller may be an independent commercial agent, independent contractor, independent dealer
Vol. 3, No. 12 International Journal of Business and Management
88
or distributor, employed or self-employed representative, franchisee or the like.) According to these definitions, direct selling, as a matter of fact, means the direct seller sells and popularizes products or services directly to consumers by face-to-face presentation and demonstration. The direct seller gets salaries according to the sales. The door-to-door sale promotion is the earliest traditional way of direct selling.
(2) China’s legal definition of direct selling
The direct selling regulated in the Regulation on Administration of Direct Sales in China is not the same with the definition of WFDSA.
According to China’s Regulation on Administration of Direct Sales, the direct selling is a selling method, in which direct selling company recruits direct sellers who directly sell products to final consumers at no- fixed places. By referencing from the contents of Measures for Managing Trainings for Direct Sellers and Regulation on Prohibition of
Chuanxiao issued at the same time, the greatest difference between China’s legal explanation to direct selling and the WFDSA explanation lies in not only the different definitions and requirements for the subjects of direct selling, but also the former imposes narrow and strict limits on the selling methods. The differences are mainly:
First of all, although the former positions direct seller as a member of direct selling company’s marketing system, it focuses on the independence of direct seller as an independent individual seller. The later emphasizes that the direct seller must be recruited by direct selling company and has to pass strict training examinations, and in marketing the direct seller must wear the certificate as a seller. (Details are from the Measures for Managing Trainings for Direct
Sellers) These rules make China’s direct seller is not an independent individual seller but more like a state servant. Although almost no direct seller wears the certificate, these rules make direct seller’s commercial activities tend to be embarrassing.
Secondly, in the definition of direct selling the former definitely distinguishes the legal multi-level direct selling from some commercial activities that obtain profits by cheating or fake multi-level direct selling, namely the “multi-level marketing” in China. The former strongly opposes and forbids these cheating pyramid selling organizations and names them as “pyramid schemes”. (Details are from the website of WFDSA: http://www.wfdsa.org/legal_reg/index.cfm?fa=pyramid. Publications) (Charles Mackay & Joseph De La Vega, 2000) The later regards the multi-level direct selling as illegal multi-level marketing and strictly forbids the multi-level direct selling teams as cheating pyramid selling system. It only regards single-level direct selling as legal. (Details are from the Article 7 in the Regulation on Prohibition of Chuanxiao.)
These analyses prove that the connotations of direct selling definitions are far different though China uses the same term with WFDSA. Professionals name it as “Chinese-style direct sales”.
(3) Confusions caused by the application of the “multi-level marketing (Chuanxiao)” concept in laws
As a matter of fact, the connotation of world universal concept of direct selling includes single-level direct selling and multi-level direct selling. Both the direct selling concept and the multi-level marketing concept are from western market economy. They origins from An American term “direct selling”. Because of people’s different understandings to the term, it turns into “direct selling” and “multi-level marketing” after being translated into Chinese. If we translate the two terms back to English, it is only the term “direct selling” but not the “pyramid schemes” since the later has not a connotation of multi-level direct selling. Therefore, strictly speaking, in a cultural and original sense, direct selling is equal to multi-level marketing. They are just two names for one term. However, the law of China defines the multi-level marketing as an illegal concept. Its connotation includes the “pyramid schemes” forbidden by the world and also the “multi- level direct selling” confirmed by the world. Therefore, in this paper, the author takes the term “illegal multi-level” as the key word. Since the pyramid scheme is a kind of multi-level cheating “selling” activity, it is one of connotations of “illegal multi-level”. Although there are sharp differences between multi-level direct selling and pyramid schemes, the multi-level direct selling is also one of connotations of “illegal multi-level” since it has been confirmed as an illegal activity by the law of China.
For certain law or regulation, firstly its words and terms should be more precise than that in other fields. In the perspective of culture and origins of terms, the two Regulations fail to define the two legal terms “direct selling” and “multi-level marketing” scientifically, precisely, and internationally.
As a result, in the official English version of Regulation on Prohibition of Chuanxiao, a Chinese-style legal term “Chuanxiao” appears. For the two Regulations, the English versions are respectively Regulation on Administration of
Direct Sales and Regulation on Prohibition of Chuanxiao. (Details are from the Chinese-English versions of two Regulations, published by China Legal Publishing House, 2006)
Apparently, in a sense, it is not easy to explain the Chinese-style legal term “Chuanxiao” to Chinese. So, it will be hard to introduce its pronunciation and meaning to foreigners. Today, no matter what it is the direct selling market or the theoretical field, the economic field or the legal field, the Chinese field or the English field, nobody translates the
International Journal of Business and Management December, 2008
89
“multi-level marketing” as “Chuanxiao” or accepts this translation, except for the Chinese-English version of Regulation on Prohibition of Chuanxia issued by China. As a result, the issue becomes more confusing due to the unclear term.
According to these analyses, the legal term “multi-level marketing (Chuanxiao)” may cause confusions in three aspects at least. (1) Neglect the common recognition to the use of legal term. Both “Chuanxiao” and “direct sales” origin from “direct selling”. They originally have legal connotations but with different names. However, since the issue of the two Regulations, “Chuanxiao” tends to be illegal, and “direct sales” legal. The absence of the rationality and continuousness of literal and conceptual connotation leads to confusions for people’s understanding. (2) Conflict with the law of English-Chinese translation. Generally speaking, the transliteration is only for appellation (names, places, countries, or articles, etc.). If break this law and adopt the transliteration for legal term, not only foreigners can not understand its meanings, but more people will adopt this method for other terms. Finally, the Chinese-English translation will be in a mess. (3) Fail to follow the international concept in the direct selling market and arouse numerous conflicts. These conflicts make linguists at a loss in translation. They have to betray the law of translation and transliterate the “multi-level marketing” as “Chuanxiao”. Secondly, it obstructs and restrains the development of domestic companies and the internationalized normalization of direct selling mode. (Yin Wu, 2008). Besides, it makes the operation of the well-known foreign-funded direct selling company embarrassing in world market.
2.2 The legal basis for the existence of China’s direct selling system
The development of China’s direct selling industry has experienced four stages: the first stage is the entry of direct selling industry into China (1990-1993), represented by the register of American Avon, Sunrider, and Amway in China. At that moment, no more domestic companies enter this industry and the legalization and relevant policies are still an absence. The concept means “multi-level marketing” instead of “direct selling”.
The second stage is an exploring period with disordered industrial development and unclear government supervision policies (1994-1998). During this period, foreign investments, especially Taiwan companies, rush into this industry. And many domestic companies follow their steps. The market becomes more confusing. The government begins to interfere with the direct selling market gradually and constitutes some policies and laws, mainly including the Notice for
Forbidding the Illegal Activity of Multi-Level Chuanxiao issued by the State Administration of Industry & Commerce on Aug. 11th, 1994, the Notice for Checking the Illegal Activity of Multi-Level Chuanxiao issued on Sep. 22ed, 1994, and the Notice for Stopping to Develop Multi-Level Chuanxiao Companies issued by the Office of State Council on Sep. 22ed, 1995. Soon, the State Administration of Industry & Commerce constitutes the Rules for Checking and Clearing
up Multi- Level Chuanxiao Companies and approves 41 companies starting multi-level marketing businesses for the first time. The Rules for Administration of Chuanxiao issued on Jan. 10th, 1997 offers detailed regulations on direct selling, with a hope of regulating market orders and forbidding the illegal activities in direct selling. The guiding lines are: permit its existence, restrict its development, manage it strictly, and set pilot places carefully.
The third stage is the transformation period (1998-2005). Some multi-level marketing companies’ illegal systems and illegal pyramid schemes’ “mouse meetings” trigger serious social problems. The government takes multi-level marketing as an illegal activity and forbids it completely. During this period, the government constitutes a series of policies, mainly including the On Forbidding the Multi-Level Chuanxiao Business Activity issued by the State Administration for Industry & Commerce on Apr. 18th, 1998, the Notice of Forbidding the Multi-Level Chuanxiao
Business Activity issued by the State Council on Apr. 21st, regulating that “stopping all multi-level marketing business activities right once”, and the Notice on Issues of Foreign-Funded Multi-Level Chuanxiao Companies Transforming the
Selling Ways issued by three Ministries (Ministry of Foreign Trade and Economic Cooperation, PRC, State Administration for Industry & Commerce, Ministry of Domestic Trade, PRC) on June 18th, 1998. Since the year of 1998, the direct selling and the multi-level marketing are completely forbidden in China.
The fourth stage is a re-opening period (after 2005). Due to China’s commitment to WTO, the two Regulations issued in late 2005 partially fulfill the commitment in WTO agreement, what makes China enter a limited Chinese-style direct selling stage. During this period, besides the Regulation on Administration of Direct Sales & Regulation on Prohibition
of Chuanxiao issued by the Ministry of Commerce, PRC, there are a series of equipped measures and regulations, including Suggestions for Strengthening the Supervision and Management of Direct Sales, the Regulations for
Industrial and Commercial Administrative Institutions and Police Striking Chuanxiao, the Functional Positions for
Supervising Direct Sales in State Administration for Industry & Commerce, the Regulations on Internal Structure and
Personnel Composition, the Management Rules for Direct Sellers’ Training, the Regulations on the Pay and Use of
Direct Sales Companies’ Deposits, the Management Rules for Direct Sales Company Releasing and Reporting
Information. Till then, China has basically founded the legal basis for the direct selling system.
According to the law of China, multi-level marketing is illegal but direct selling is legal. The Chinese-style legal concepts fail to match the world definitions. In the legal and institutional aspect, the government keeps in strengthening the Chinese-style administration and supervision mode and constructs a supervision system for the direct selling market
Vol. 3, No. 12 International Journal of Business and Management
90
and the institutions of direct selling, including the issue of market entrance, for which the State Administration for Industry & Commerce and the Ministry of Commerce, PRC, set up an approval communication mechanism. Compared with other countries, China’s legal system and mechanism for direct selling is too strict and consume too much national resources. Here, the author has already analyzed the unfavorable market effects under this system.
3. Domestic market conditions, legal environment, and the reform
3.1 An awkward circle
Companies are the most active and important roles in market economy, whose development reflects market trends. From companies, we can understand the general market conditions and the legal environment.
China’s market economy origins from the planned economy. Although it experiences long-term economic system reform, the planed economy still marks its features on the market, which makes the market not a real commodity economic market. In China’s market, there are many aspects that conflict with commodity economy. In specific, they are:
Firstly, the market dominated by state-owned enterprises gives economic priority to state-owned enterprises. With special privileges, state-owned enterprises can get amounts of resources at no prices. The group or people who control and manage national resources enjoy special rights regulated by laws, but do not shoulder relevant legal obligations and responsibilities. (China does not have the Law of Anti-Corruption, the Law of Anti-Commercial Bribe, and the Civil
Codes and Commercial Codes. Although the Anti-unfair Competition Law has been issued, it merely lists the illegal activities but not regulate on how to punish these forbidden activities. Even with regulations, it is hard to put into effect under the condition that “the law readily forgives the oversights of the masses”.) Under present system, the monopoly companies face no competitors due to their special rights. Their tremendous profits are usually at the price of serious waste of resources. The privileges of state-owned enterprises established by laws make the operation of market economy abnormal, unfair, and contradictory since the very beginning.
Secondly, private enterprises mostly develop themselves at the edge of policy and law under the special living environment. On one hand, private enterprises cannot get rid of their “original sins”. On the other hand, they have to rely on these sins for existence. In a sense, it is an inevitable choice for them. To develop at the edge is only an ideal illusion. Once risks appear in the macro market, private enterprise will become the victims. Therefore, private enterprises pursue for more interests at any price. Short-term activities are common.
Thirdly, many foreign-funded enterprises, especially the one with powerful strengths, operate normally at their homelands. After entering China, impacted by China’s commercial environment and system, some foreign-funded enterprises may commit errors or crimes, such as commercial bribe, poor-quality commodity dumping, betraying commercial morals, unfair competition, and degrading consumers’ rights and interests. People name this phenomenon as “When in Rome, do as the Romans do”. (Li Ma, 2008, pp. 39; Yun Liang, 2007; Fei Li, 2007)
Apparently, from the legal positions and market operations of the three important economic subjects in China’s market, we can clearly understand the market state and legal environment in which China’s legal system of direct selling comes into being. Indeed it is not easy. On one hand, the “invisible hand” in market tries to turn the single-level direct selling into multi-level direct selling (Adam Smith, 2006); On the other hand, the law of China takes multi-level marketing as an illegal activity, which makes most direct selling companies survive at the edge (Yu Tian, 2008). However, the most unendurable fact is that the whole direct selling market runs into a vicious circle. Policies and laws are negatively always used as a relief for the vicious result of market operation. Their original function of protecting contract freedom, fairness and just, sincerity and credit, orderly competition and stable development of market seems to be ignored. Since policies and laws play such a role in market, it is understandable for some well-known companies giving up the direct selling mode in case of being stuck by risks of policies and laws (N. Gregory Mankiw, 2002).
3.2 The future reform of market conditions and legal environment
China’s direct selling market has same economic operational laws with the whole macro market. They face the same fundamental problem. Therefore, the reform of direct selling market conditions and legal environment is not just for one industry or field. As we extremely emphasize on the market freedom and normalization, if without the social democratic mechanism as the base, or administrative monopoly and tight administrative regulation refusing to quit from the stage, the monopoly on natural resources, economic monopoly, and unfair competition will be lasting for a long period, and scientific and reasonable market freedom and normalization will be impossible (Zeng Weihua, 2008, pp. 48).
In 2008, more and more people realize the coming of “economy winter”. By reviewing the law of China’s economic development during the 30 years since the reform and opening policy in 1978, some economists conclude that China’s economic reform is always trying “mistakes” and interests groups will give up their vested interests by no means. Evolvement of government policies in market comes along with the macro adjustment and control that costs more than ever. In this “economy winter”, the greatest victim is not the direct selling companies but the private manufacturing
International Journal of Business and Management December, 2008
91
workshops that create the myth of “made in China”. Their losses cause a tremendous waste of commercial resources and also generate some by-product effects, including the rise of unemployment, the hollow regional industry economy, and the decline of monopoly companies’ profits. “Investments drive demands ----policies serve as an emergency brake -----crises loosen market policies”. It has already become the logical law of China’s macro- economic policies in recent 30 years (Wang Xiaobo, 2008).
The policy logics are to protect the vested interests. Each circulation sharpens social contradiction and makes it hard to settle this contradiction. It is the right time for designers of policies and laws to reconsider this issue. A positive and radical reform is a resolution for settling the sharpen market contradictions and improving the bad legal environment, and also an important subject for China’s sustainable development in future.
References
Adam Smith. (2006). The Wealth of Nations. Xi’an: Shaanxi Normal University Press.
Charles Mackay & Joseph De La Vega. Translated by Xiang, Zhen. (2000). Extraordinary Popular Delusions and the
Madness of Crowds. Hainan: Hainan Publishing House.
Li, Fei. (2007). Why transnational companies commit bribe crimes frequently. China Philanhropy Time, Aug. 28th.
Liang, Yun. (2007). Bribe in China, be punished in America. Win Weekly, No.1571.
Ma, Li. (2008). Probe into the China’s silence to the Lucent Bribe Case. Faren Magazine, No. Z1, pp. 39.
N. Gregory Mankiw. (2002). Principles of Economics. Beijing: China Machine Press. Sep.
Tian, Yu. (2008). Comments on reasons for the confusion of legal “direct selling” and illegal “multi-level marketing”. Legal & Economy, No. 9.
Wang, Xiaobo. (2008). Eight law of China’s “winter”. The Financial Times (Chinese). Aug. 5th.http://www.ftchinese.com/sc/story.jsp?id=001020998&pos=MID_HLB&loc=DAILY%20EMAIL&[email protected]
Wu, Yin. (2008). The failure of national direct selling market in China market. Contemporary Direct Selling, No. 6.
Zeng, Weihua. (2008). Analyses and thoughts on China’s direct selling development. Contemporary Economics, No. 6, pp. 48.
Zhen, Guang. (2007). On the failure of direct selling company in transformation. Knowledge Economy: Health, No. 4, pp. 12-13.
(2005). Regulation on Administration of Direct Sales. & Regulation on Prohibition of Chuanxiao. Gazette of the State
Council of the People’s Republic of China, No. 29, Oct. 20th.
Vol. 3, No. 12 International Journal of Business and Management
92
Small and Medium Sized Enterprises Development under Trade Liberalisation: A Survey of Nigerian Experience
Obokoh, Lawrence Ogechukwu (ACA) (Corresponding Author)
School of Management and Business, Cledwyn Building, Penglais Campus, University of Wales
Aberystwyth, SY23 3DD
E-mail: [email protected]
Abstract
This study reviews the policies implemented by the Nigerian government over the years to assist the development of manufacturing small and medium sized enterprises (SMEs) in Nigeria following the implementation of Trade liberalisation policy in 1986. The aim of the liberalise trade policy was to encourage competition and improve efficiency in the use of local resources; yet most Nigerian SMEs still find it difficult to compete and merely struggle to survive the liberalised economic environment in Nigeria. The result of the study of a sample of 500 manufacturing SMEs operating in Lagos State reveals that despite the laudable policies, the effects are not felt by most manufacturing SMEs due to improper planning and the absence of favourable investment climate necessary for these policies to be effective.
Keywords: SMEs, Government, Trade liberalisation, Manufacturing, Nigerian, Policy, Export
1. Introduction
The aim of this article is to present some initial findings from a longitudinal study of the impact of economic liberalisation on Small and medium sized enterprises (SMEs) development in Nigeria. The study motivated by the fact that SMEs in Nigeria and elsewhere are recognized as one of the principal driving forces in sustainable economic development because of their role in job creation, stimulation of entrepreneurial skills and private ownership of businesses (Udechukwu, 2003, Katwalo and Madichie, 2008). Due to their size and innovativeness SMEs are able to adapt to changes in market conditions besides helping to diversify the economy through exports and international trade (UNECE, 2003). Udechukwu (2003) also asserts that SMEs development is an essential element in the growth strategy of most economies and holds particular significance for developing countries like Nigeria because they are flexible to market changes. It has been suggested that the increasing prevalence of the flexibility and specialisation of SMEs persuades many business analysts to believe in SMEs` strategic role in the industrial structure of developing nations (Berry, 2002). But due to their small size and meagre financial bases, they remain rather vulnerable to external shocks often experienced in the global market as a result of trade liberalisation (Madichie, 2007; Vickery, 2008). Therefore, given favourable policy environment there is reasonable assurance that SMEs can compete successfully both in the local and global market (Briggs, 2007). Base on this premise, the Nigerian government embarked upon trade liberalisation with the aim of allowing SMEs which are considered to be more efficient in adapting to market/environmental changes than large firms to develop and grow in a competitive business environment created by the liberalisation policy (Dawson, 1994).
Trade liberalisation is the measure taken by the government to reduce anti-export bias, import controls a well as non-tariff barriers and exchange rate distortions (Santos-Paulino and Thirlwall, 2004, F51). The Nigerian government implemented trade liberalisation in order to create a competitive business environment with the removal of restrictions on international trade, capital flow and interest rates, deregulation of price control in the commodity market and the privatization of all government parastatal. Since trade liberalisation is also accompanied by currency devaluation, the Nigerian government also adopted the floating exchange rate in place of the administratively managed (adjustable peg) exchange system (Odusola and Akinlo, 2001; Agbeyegbe, Stotsky and WoldeMariam, 2006). The deregulation process proceeded simultaneously in all sectors of the economy with the exception of the labour market (Akinlo, 1996).
This paper discusses trade liberalisation policy and government development schemes introduced by the Nigerian government for SMEs development as a result of the implementation of the policy. It questions why programmes designed by the government under the trade liberalisation package have so far failed to achieve tangible results. This then necessitates the need for this paper to assess the possible/ plausible causes for these failures. In view of the factors responsible for SMEs’ programme failures. Drawing from a sample of 500 Lagos-based manufacturing SMEs
International Journal of Business and Management December, 2008
93
investigated over 1986 to 2006, the study examines how SMEs in Nigeria can exploit export opportunities in the international market under a liberalised trade regime.
2. Review of related literature
Trade liberalisation is an important component of Structural Adjustment Programme (SAP), aimed at opening up economies to increased international trade by either reducing or eliminating protection for domestic industries (Jubilee Australia, 2006). In addition, the policy is often implemented along with the devaluation of currency in order to make the exports of the devaluing country’s export cheaper in the international market (Agbeyegbe, Stotsky and WoldeMariam, 2006; Obadan, 2006). The ultimate aim is to remove taxes on exports, restrictions on imports and the reduction of import tariffs. Sachs and Warner (1995) using a cross-country growth model argued that trade liberalisation leads to higher growth rates in poorer countries than in richer countries. In the same vein, Ajayi (2003) reports that the removal of barriers to trade has increased the flow of trade by 16-fold in the last 50 years with the world exports of goods and services almost tripled in real terms between 1970 and year 2000. However, the share of developing countries contribution to world trade is still very low because their exports are predominantly primary products. In another study, Dollar (1992) linked economies that are outward-oriented through liberalised trade with rapid economic growth. Greenaway, Morgan and Wright (2002) evaluated the impact of trade liberalisation on 70 developing countries and found a significant positive relationship between trade liberalisation and economic growth.
Nishimizu and Robinson (1984) study on trade policies and productivity change in semi-industrialised countries explored the impact of trade regimes on total factor productivity (TFP) growth within a quantitative framework in a study of four countries, namely Korea, Turkey, former Yugoslavia and Japan as the comparator. The analysis of the inter-industry differences in TFP growth rates at the two-digital level, found that substantial portions of variation in TFP growth rates can be explained by the output growth allocated to export expansion and import substitution in Korea, Turkey and former Yugoslavia, but interestingly not in Japan. They concluded that import substitution regimes seem to be negatively correlated with TFP change, whereas export expansion regimes are positively correlated with TFP changes. In another study by Kruger and Tuncer (1982) on Turkey, sectoral level data were used to provide support that trade liberalisation improves efficiency. They concluded that periods of faster growth in total factor productivity coincided with periods of greater liberalisation.
Frankel and Romer (1999) and Irwin and Tervio (2002) in their separate and independent studies also suggest that countries that are more open to trade tend to experience higher growth rates and per capita incomes than closed economies. Klenow and Rodriguez-clare (1997) used general equilibrium model to establish that a greater number of intermediate input combinations results in productivity gains and higher output, despite using the same capital and labour inputs which exhibits the economics increasing returns to scale.
However, there are other arguments that suggest that trade liberalisation improves resource allocation in the short run or raise growth rates permanently as there are other arguments that suggest the contrary. Rodriguez and Rodrik (2000) argued that trade policies do affect the volume of trade, but there is no strong reason to expect the effect on growth to be quantitatively or qualitatively similar to the consequences of changes in trade volumes that arise as reductions in transport costs or increases in world demand. Trade restrictions represent policy responses to real or perceived market imperfections or are used as mechanisms for rent-extraction. They believe that trade policies work differently from natural or geographical barriers to trade and other exogenous determinants. Khan and Zahler (1985) asserts that trade can promote growth from the supply side but, if the balance of payments worsens due to fall in the price of the country’s tradable, growth may be adversely affected from the demand side because the payments deficits resulting from liberalisation are unsustainable and cannot be easily corrected by relative price of non-tradable or real exchange rate adjustments.
In another stimulating study, Weisbrot and Baker (2002) argue that trade liberalisation may not be the only key to rapid economic growth and development. They noted that the success of some countries that experienced accelerated growth did not follow a simple path of trade liberalisation because the government directed the economy through the use of subsidies, protection for favoured industries and restriction on capital account flows. Rodrik (1998) asserts that the growth performance of those Asian countries that gained from open trade can be attributed to how they managed key macroeconomic shocks rather than trade policy alone.
Shafaeddin (2005) posits that trade liberalisation is necessary when an industry reaches a certain level of maturity provided it is undertaken gradually and selectively. However, Bretton Wood institution’s methodology of liberalisation is likely to lead to the destruction of infant industries as well as hamper the emergence of new ones – a situation that would only serve to confine low income countries to the production and exports of primary commodities. This assertion captures the prevailing situation in most countries in Sub Sahara Africa (SSA) especially Nigeria that implemented rapid trade liberalisation. This is because Nigeria has lost its competitive manufacturing edge due to the demise most SMEs and has become increasingly dependent on petroleum as the major source of foreign exchange (Albaladejo, 2003).
Vol. 3, No. 12 International Journal of Business and Management
94
Winters (2004) pointed out that the methodological problems of previous studies linking liberalized trade to higher income creates some uncertainties because cross-country studies have difficulty in measuring openness, establishing causality and isolating the effects of trade liberalisation. He went further to state that trade liberalisation alone is not sufficient to boost growth but can only work when accompanied by other policies that ensure safe business and political environment besides a good regulatory legal framework that protects all stakeholders in the economy. In the same vein, Hübler, Menkhoff, and Suwanaporn, (2008) report that the ‘average effects’ of cross-country regression hide different experiences of countries that have implemented liberalization and they suggested the need for the use of micro level data in the study of the effects of liberalization.
According to Thirlwall (2000, pp. 6), “There can be little doubt that, historically, trade has acted as an important engine of growth for countries at different stages of development, not only by contributing to a more efficient allocation of resources within countries, but also by transmitting growth from one part of the world to another. Not all countries … share equally in the growth of trade or its benefits. This will depend on: the production and demand characteristics of the goods that a country produces and trades; the domestic economic policies pursued, and the trading regime it adopts”. Looking at the various arguments, the Nigerian government has extensively implemented policies aimed at ensuring an open market economy in order to encourage competition and the needed economic growth. But to what extent has the government pursued and implemented policies that ensure adequate provision of infrastructure for SMEs on the backdrop of the neo-liberal policy that preclude it from provision of public goods in Nigeria? This and other questions will be clearly explored from the findings of this study.
3. Methodology
To achieve its objectives, this paper utilised a structured questionnaire survey administered to 500 manufacturing SMEs operating in Lagos State to achieve its objectives. The questionnaire was design by the researcher for the purpose of this study and was divided into five sections with each section dealing with each variable that affects the performance of manufacturing SMEs that we set out to explore. A total of 369 valid responses were received which represent 73.8 percent. Interviews were conducted on 50 SMEs among the 369 respondents that granted the request to be interviewed in their questionnaires.
This survey was able to achieve this modest rate of response because the researcher employed the services of 10 Survey Attendants to administer and collect the questionnaires. The Survey Attendants were given 50 questionnaires each to administer to the respondents. The questionnaires were dropped and collected same day or dropped and picked the following day or at times at a later date depending on the respondents. To ensure high return rate and that the questionnaires were not left in the hands of the respondents, the Survey Attendants were advised to administer an average of 5 questionnaires in one day. A log of all the questionnaires were kept in order to keep track of the number of questionnaire administered and returned, ensure commitment and sincerity of the Survey Attendants while at the same time protect the identities of the sampled SMEs. In addition, the Survey Attendants were given the choice to pick the sample area for the survey they wish to administer the questionnaire assigned to them based on their residential propinquity to the sample areas. As a follow up to the structured questionnaires, interviews were conducted on 50 SMEsfrom the 369 respondents that granted the request to be interviewed in the returned. The questionnaire survey and structured interviews took a period of six months, between June and December 2007.
The survey was selective and purposive because the survey targeted only manufacturing SMEs irrespective of their line of products and also due to time and budget constraints. Lagos State was divided into five areas (clusters) for this purpose with more questionnaires distributed in areas with higher concentration of manufacturing SMEs. Only SMEs engaged in manufacturing activities were sampled and some of the returned questionnaires were invalidated because they were mistakenly administered to SMEs in the service sector or because the sampled firms cannot be classified as either small or medium sized enterprises due to the number of employees or capital base.
Prior to the questionnaire survey and structured interview, a pilot survey was conducted on 50 manufacturing SMEs in November 2006 in Ibadan, Oyo State of Nigeria. The preliminary survey was undertaken to validate and test whether the survey questionnaire designed for the study was properly done to capture the information needed to achieve the objectives of the study. It was at the pilot stage that it was observed that most of SMEs that participated were not comfortable giving out certain information such as sales, profit and cost figures which were vital for attaining the objectives of the study.
This observation partly informed the amendments in terms of reframing; reducing the number of questions and the removal of some of the areas most SMEs were not comfortable with. As a result, the decision to use structured interview to support the questionnaire survey which would enable the researcher specifically request those information from the willing sampled SMEs in the questionnaire survey was also taken after the pilot study.
The data obtained from this primary source was triangulated with secondary data from the Central Bank of Nigeria (CBN), while the presentation of data was purely descriptive. Given time and budget constraints, the study limited the
International Journal of Business and Management December, 2008
95
survey to SMEs operating in Lagos – a city chosen owing to the fact that it has the highest concentration of SMEs in Nigeria. It is pertinent to also point out that the emphasis of the methodology is not to present a statistically representative result considering the population and size of Nigeria (with over 120 million), but to highlight the main obstacles preventing SMEs exploring opportunities abroad and hence perpetuating their ‘permanent infancy’ and ultimate mortality – even in the face of a well planned liberalised trade regime by various Nigerian government.
4. Trade liberalization and government development schemes for SMEs
The Nigerian government, since 1986 implemented various programmes such as exchange rate deregulation, removal of import and export licenses and Small Scale Industrial Credit Scheme (SSICSs), aimed at assisting the development of SMEs as part of trade liberalisation policy (Dawson, 1994). Part of the trade liberalisation policy was envisaged would pave the way for a competitive business environment for SMEs and Multinational Corporations (MNCs) in Nigeria. The liberalisation policy was aimed at making locally manufactured product more competitive both in the domestic and international market. While the removal of restrictions on imports was to allow free flow of goods and investments in order to make raw materials cheap and available to manufacturing SMEs (Vachani, 1994). The policy was also to encourage SMEs explore export opportunities that would help reduce government dependence on petroleum as the major source of foreign exchange. Despite these programmes, it has been observed that their impact on the performance of SMEs have been less than satisfactory (Mambula, 2002). This is attributable to some factors that governments and policy makers in Nigeria have failed to take into consideration in the design and implementation of SME development programmes. Most SMEs in Nigeria either remain small, moribund or shut down within few years of operation. In particular, this phenomenon has become more prevalent under the liberalised trade arrangements occasioned by Structural Adjustment Programme (SAP) (Ekpenyong, 2002; Rodriguez and Berry, 2002).
The dismal results of the series of government programmes for SMEs development and the inability of the manufacturing SMEs to sustain domestic market needs for manufactured goods in Nigeria became evident in the early 1980s following the fall in the international market price for crude oil. The drop in revenue from the sale of crude oil resulted in the inability of the Nigerian government to meet her import bills. This then led to a serious balance of payment deficit exacerbated by the absence of active private sector to provide domestic substitutes for imported goods (Adenikiju and Chete, 2002). The realisation of this vital role of the private sector (SMEs) necessitated the need for economic reform that culminated in trade liberalisation.
The economic reform process commenced with the implementation of SAP in 1986 by the Nigerian government on the recommendation of the Bretton Woods Institutions – notably the International Monetary Fund (IMF) and the World Bank (Okome, 1999). It has been argued that liberalisation is an unwritten requirement for economic integration which is the conditional lending policy of IMF based on adherence to SAP (Aisbett, 2003). The main objective of the SAP in Nigeria was to introduce locally manufactured products to the international market through increased local output (Madeley, 2000). This programme led to the complete liberalisation of the Nigerian economy which prompted the government to remove all forms of protection for SMEs in terms of sourcing for raw materials, finance and foreign exchange. This resulted in the increase in the cost of financing imported input which compelled SMEs and other local producers to source production inputs locally (Dawson, 1994; Madichie, 2008).
Prior to the reform, it was widely believed that the Nigerian economy was highly controlled by the government through import and export restrictions, regulation of interest rates and exchange rates through the CBN (Akinlo and Odusola, 2003). The deregulation exercise was then envisaged would create a level playing ground that would enhance competition and eliminate wastage of scare resources. Thereby increase SMEs participation towards sustainable economic development in Nigeria through greater export of their products. The deregulation exercise instead of improving access to foreign exchange, created gap between the official and parallel exchange rate that constituted a disincentive to export-oriented policy of the Nigerian government against potential exporters (Akinlo and Odusola, 2003; Briggs, 2007).
Other development programmes for SMEs include the setting up of industrial estates, establishment of specialised financial institutions such as the Small Scale Industrial Credit Scheme (SSICSs), Small and Medium Industry Equity Investment Scheme (SMIEIS), Nigerian Industrial Development Bank (NIDB), Nigerian Bank for Commerce and Industry (NBCI) to provide long-term credit to SMEs, the National Economic Reconstruction Fund (NERFUND) set up in 1990 to grant medium to long-term local and foreign loans to SMEs located in the rural areas (Anyanwu, 2003; Briggs, 2007).
In the formulation and implementation of these incentive schemes aimed at encouraging SMEs both for domestic and exports production, infrastructures were left out of the scheme. It is obvious that the availability of infrastructure contributes positively to SMEs performance because it represents an intermediate input to production. Infrastructure quality affects the profitability of production, level of income, output and employment creation and hence poverty alleviation (Adenikinju, 2005).The responsibility for the provision of enabling business environment; hence infrastructure lies with the government. But this has changed in recent times with the governments’ adoption of the
Vol. 3, No. 12 International Journal of Business and Management
96
IMF/World Bank policy of SAP anchored on neo-liberal economic policy. The policy precludes the government from direct participation in economic activities – a move that has resulted in the deplorable condition of infrastructure in Nigeria owing to poor budgetary outlays towards expansion and rehabilitation of existing ones (Lee and Anas 1992; Agboli and Ukaegbu, 2006). This state of infrastructure has adversely affected the profitability performance of SMEs.
It should be noted that trade and financial market liberalisation were pursued at the same time in Nigeria. An approach Ayadi and Hyman (2006) assert that the government implemented so many policies within a short space of time. McCulloch et al, (2001) observed that governments in developing countries pursued macroeconomic stabilisation and adjustment programmes simultaneously which contained different forms of liberalisation. The idea of exchange rate liberalisation in Nigeria was to make imports less attractive with the resultant low value of the naira. However, the import oriented consumption pattern of Nigerian population makes this unworkable (Akinlo and Odusola, 2003). This is because the effectiveness of exchange rate deregulation in reducing import requires that the import elasticity of demand be greater than one which is contrary to the import demand in Nigeria. This coupled with the free flow of finished goods militated against manufacturing SMEs competitiveness after liberalisation.
5. Data presentation and analysis
This section, presents the information from the data of the study analysed using Statistical Packages for Social Science (SPSS) 16.0.
5.1. Characteristics of Sampled Firms
From table 1, 107 directors of sampled firms participated in filling out the questionnaires which represents 29% of total valid sample. While 173 managers representing 46.9% filled the questionnaire. The number of secretaries and other officials of sampled firm that filled the questionnaires in place of director and mangers are 41 and 48 representing 11.1% and 13% respectively.
In terms of the age of sampled firms, a total of 51 SMEs representing 13.8% fall into firms that have been in existence for 21 years and over. The economic reform process that culminated in the complete liberalisation of the Nigerian economy commenced in 1986 which leaves us with 51 SMEs out of the 369 sampled SMEs to obtain retrospective information on changes from 1986 to 2006. A total of 115 and 103 sampled SMEs fall under the category of businesses that were established within the past 10 years, put together represents 59.1% of sampled firms. A total number of 62 and 38 firms fall into the category of businesses established within the past 20 years and represents 27.1% of sample. The trend gives an indication that only few businesses among the ones sampled have been able to survive through the years of economic reforms process in Nigeria.
It was observed from the survey questionnaire that 176 firms representing 47.7% of sampled SMEs are into manufacturing alone. This means that they have manufacturers’ representatives who have outlets to help sell their products on their behalves. A total of 193 representing 52.3% manufacture and also distribute their products in addition to having manufacturers’ representatives. Apart from this, the outputs of some of the sampled SMEs are not large enough to warrant the use of manufacturers’ representatives. Those that manufacture and at the same time retail their products see the measure as a strategy to eliminate middle men so as to reduce final product price and in order to gain more market share. These firms are already faced with stiff competition from imported finished products and the only way they can survive is to sell their manufactured products on their own. Besides they claim that most of the retailers shun their products because of the very small margin of profit compared to the imported products which gives more profit margins to the retailers. Besides Nigerians prefer buying imported products some because of the ecstatic value attached them apart from their quality.
5.2. Impact of Liberalisation on Sampled SMEs
From Table 2, it can clearly be seen that despite the concession on duty on imported raw materials by the Nigerian government, 51.5% of the surveyed SMEs still source their raw materials locally as opposed to only 6.2% that depended on imports. In a worse case scenario 42.3% obtained their raw materials from both local and international sources – thereby spreading their risk portfolio in the event of another government u-turn. It was also observed that the depreciation of the Naira (the unit of currency in Nigeria) increased the cost of sourcing raw materials from abroad – a situation that has only served to compound the already high costs of production, which more often than not is reflected in the final product prices. They are then compelled to make use of local raw materials and in some cases re-cycle some input materials such as plastics and tins. This result is consistent with Dawson (1994) that reported an increase in the use of re-cycled product by SMEs.
The majority of the sampled SMEs experienced increase in production which represents 66.1% while 24% experienced decrease after the implementation of trade liberalisation. Those that experience decrease in production level attributes this to the fact that they were engage in the production of goods that were close substitutes to cheaper imports from abroad. In terms of selling their products on the international market, only 14.9% export their products to the neighbouring West African countries while 85.1% sell their products in the domestic market. Despite the fact that
International Journal of Business and Management December, 2008
97
66.1% experienced increase in production, 44.4% experienced decrease in turnover as against the 36.9% that achieved increase in turnover while 18.7% did not notice any change in turnover. The decreases in turnover are in congruence with the trend of reported decrease in profit level as 78.6% of respondents reported decrease in profit as against just 8.4% that experienced increase in profit. Those that did not notice any changes in profit level represent 13% of sampled SMEs. This is contrary to Akinlo and Odusola (2003) study that revealed a decrease in production level but consistent with the decrease in turnover that was reported in this study.
The respondents also pointed out that the increase in production was an attempt to take advantage of the increased market and availability of cheap labour following trade liberalisation. Unfortunately most SMEs were not better off for two main reasons: First, they often faced with accumulated inventory due to low demand occasioned by the fall in real income of the population as a result of the depreciating naira. Second, the cost of production also contributed drastically in eroding the profit of SMEs. The respondents linked this pathetic situation to erratic power supply since they had to channel some of their resources to generating their own power. In addition, the absence of cheap indigenous technology that would have eased their production cost compels them to import production machinery at exorbitant prices. These machines due to high replacement costs are continuously used well over their economic useful lives. Ekpenyong (2002) study on the impact of SAP on SMEs in Nigeria also revealed drop in sales due to poor purchasing power of Nigerian following rising inflation as result of the devaluation of the naira. The increased cost of operation observed in this study, supports the findings of Lee and Anas (1992); Agboli and Ukaegbu (2006) who found in their study that the trade policy led to low budgetary allocation for the maintenance of infrastructure by the government. This has resulted in the deplorable state of infrastructure and compels most SMEs to spend substantial part of their resources/profit on self provision of needed facilities.
6. Conclusions and implication
It has become clear that the primary reasons for the failure of SMEs schemes in Nigeria are not particularly unique – lack of involvement in the planning process inadvertently leads to lack of trust or trepidation which creates a situation of ‘them’ and ‘us’. Among the common symptoms to the problems of manufacturing SMEs in Nigeria are (i) poor access to finance – mostly due to the inability of the legal and regulatory framework to protect creditors (Banks) against loan default from SMEs bad debt. This has prompted banks to request for collaterals beyond what SMEs can provide; (ii) the inability of SMEs to seek professional advice or employ a skilled labour force (as a result of small budgets) to manage specialised areas of their business such as bookkeeping; (iii) inability to prepare feasibility studies which makes some of them venture into businesses with neither prior knowledge of the business concept nor any idea of the cost implications; (iv) inconsistency in the application of government policies for SMEs development - i.e. the lack of information on the real needs and operational difficulties of SMEs by the government agencies responsible for the design and implementation of SME development programmes – most of which were often designed without putting into consideration the peculiar nature and level of education of supposed beneficiaries.
Moreover in the absence of functional infrastructure such as steady power supply, portable water supply, good access roads, telecommunication network especially in the rural areas, and the chances of SMEs exploring and competing favourably in the international market are very limited. The depreciation of the naira with the resultant increase in the price of raw materials and imported production equipment coupled with the absence of indigenous technology make SMEs rely on imported capital equipment which further worsens their chances in the international marketplace. The conclusions of this study are consistent with a study undertaken about five years ago – where Albaladejo (2003) argued that Nigeria had lost her competitive manufacturing edge in the non-oil sector. Available record from the CBN indicates that export of petroleum products has persistently contributed to the lion share of Nigeria’s total export and stood at about 95% in the last quarter of 2004 while the non-oil export continues to trail behind with an all time low performance in 1994 of 2.6% of total exports since 1980 (CBN 2004). In order to hasten the diversification of the Nigerian economy from the huge dependence on oil money, the government needs to leverage the oil money into tangible investments such as the provision of infrastructure conducive to manufacturing – a sector that has now become dominated by SMEs – who have also become highest employers but ironically remain uncompetitive in the regional and international markets.
Acknowledgement
The Author wishes to acknowledge the contributions of Dr Nompumelelo Obokoh for editing the paper, Dr Kyaruzi Imani, participants at the 2008 IAABD conference held at the University of Florida, USA and two anonymous referees for their insightful comments on previous version of this paper.
Vol. 3, No. 12 International Journal of Business and Management
98
References
Adenikinju, A.F. (2005). Productivity Performance in Developing Countries: Country Case Studies, Nigeria. United Nations Industrial Development Organisation.
Adenikinju, A.F., & Chete, L.N. (2002). Productivity, Market Structure and Trade Liberalisation in Nigeria. AERC
Research Paper 126, African Economic Research Consortium, Nairobi.
Adjustment Program, 1986-1993. West Africa Review: [Online] Available at http://www.icaap.org/iuicode?101.1.1.9] (November 17, 2005).
Agbeyegbe, T.D, Stotsky, J. & WoldeMariam, A. (2006). “Trade liberalisation, exchange rate changes, and tax revenue in Sub-Saharan Africa”, Journal of Asian Economics, Vol. 17, pp. 261-284.
Agboli, M. & Ukaegbu, C.C. (2006). Business Environment and Entrepreneurial Activity in Nigeria: Implications for Industrial Development. Journal of Modern African Studies, Vol. 44, No. 1, pp. 1–30.
Aisbett, E. (2003). Globalization, Poverty and Inequality: are the criticisms vague, vested, or valid? A Paper prepared for the NBER Pre-conference on Globalization, Poverty and Inequality.
Ajayi, S. I. (2003). Globalisation and Africa. Journal of African Economies, Vol. 12, pp. 120-150.
Ajibefun, I.A., & Daramola, A.G. (2003). Efficiency of Microentreprises in Nigerian Economy. AERC Research Paper
134, African Economic Research Consortium, Nairobi.
Akinlo, A. E., & Odusola, A. F. (2003). Assessing the impact of Nigeria's Naira Depreciation on Output & Inflation. Applied Economics, Vol. 35, No. 6, pp. 691 -703.
Akinlo, A.E. (1996). The Impact of Adjustment Programme on Manufacturing Industries in Nigeria, 1986-1991: A Sample Study. African Development Review, Vol. 16, pp. 73-93.
Albaladejo, M. (2003). Industrial Realities in Nigeria: From Bad to Worse. QEH Working Paper Series QEHWPS101, pp. 1 – 23.
Anyanwu C.M. (2003). The Role of Central Bank of Nigeria in Enterprises Financing in Central Bank of Nigeria (Eds) Seminar on Small and Medium Industries Equity Investment Scheme (SMIEIS) CBN training Centre, Lagos. pp. 20-31.
Ayadi, O.F., & Hyman, L. (2006). “Financial Liberalization and Price Rigidity in the Nigerian Banking System,” Managerial Financial, Vol. 32 (7), 557-568.
Berry, A. (2002). The Role of the Small and Medium Enterprise Sector in Latin America and Similar Developing Economies. Seton Hall Journal of Diplomacy and International Relations, pp. 104-119.
Briggs, I. N. (2007). Nigeria: Mainstreaming Trade Policy into National Development Strategies. African Trade
Policy Centre (ATPC) Work in Progress No.52, Economic Commission for Africa. Brookings Papers on Economic
Activity; No.1; ABI/INFORM Global pg. 1Business Management, Vol. 40, No. 1, pp. 58-65.
CBN (2005). Central Bank of Nigeria Statistical Bulletin. 15, Abuja.
Dawson, J. (1994). Responses to Adjustment- the Marginalisation of Small Enterprises in Nigeria. Small Business
Enterprise Development, Vol. 5, No. 2, pp. 18-24.
Dollar, D. (1992). Outward-Oriented Developing Economies Really Do Grow More Rapidly: Evidence from 95 LDCs, 1976-85. Economic Development and Cultural Change, Vol. 40, No. 3, pp. 523-544.
Egwaikhide, F.O. (1999). Determinants of imports in Nigeria: A dynamic specification. AERC Research Paper 91,African Economic Research Consortium, Nairobi.
Ekpenyong, D.B. (2002). Performance of Small Scale Enterprises in Nigeria during the Structural Adjustment Programme Implementation: Survey Findings. Journal of Financial Management & Analysis, Vol. 15, No. 1, pp. 38-50.
Frankel, J., & Romer, D., (1999). Does Trade Cause Growth?. American Economic Review, Vol. 89, No. 3, pp. 379-399.
Greenaway D., Morgan, W. & Wright, W. P. (2002). Trade Liberalisation and Growth in Developing Countries. Journal of Development Economics, Vol. 67, pp. 229-244.
Hübler, O., Menkhoff, L. & Suwanaporn, C. (2008), “Financial Liberalisation in EmergingMarkets: How Does Bank Lending Change?” The World Economy, pp. 393-415.
Irwin, D. A., & Tervio M. (2002). Does Trade Raise Income? Evidence from the Twentieth Century. Journal of International Economics, Vol. 58, No.1, pp. 1-18.
Jubilee,Australia.(2006). Drop the Debt: Debt Jargon. [Online] Available at http://www.jubileeaustralia.org/512_jubilee_debt_jargon.php (April 4, 2007).
International Journal of Business and Management December, 2008
99
Katwalo, A.M & Madichie, N. O. (2008). Entrepreneurial and cultural dynamics: a gender kaleidoscope of Ugandan Microenterprise. International Journal of Entrepreneurship and Small Business. Vol. 5, No. 3/ 4, pp. 337-348.
Khan, M.S. & Zahler, R. (1985). Trade and Financial Liberalisation Given External Shocks and Inconsistent Domestic Policies. IMF Staff Papers, Vol. 32, pp. 22–55.
Klenow, P. J. & Rodriguez-Clare, A. (1997). Quantifying Variety Gains from Trade Liberalisation. Graduate School of Business, University of Chicago, unpublished.
Kruger, A.O. & Tuncer, B., (1982). An Empirical Test of the Infant Industry Argument. American Economic Review, Vol. 72, No. 5, pp. 1142-1152.
Lee, K.S., & Anas A. (1992). Costs of Deficient Infrastructure: The Case of Nigerian Manufacturing. Urban Studies,Vol. 29, No. 7, pp. 1071-1092 (22).
Madeley, J. (2000). Trade and Hunger: An Overview of Case Studies on the Impact of Trade Liberalisation on Food Security. [Online] Available at www.forumsyd.se (May 20, 2006).
Madichie, N. (2007). Better off out? Costs and benefits of sub-Saharan Africa’s membership of the World Trade Organization. Journal of African Business, Vol. 8, No. 1, pp. 5-30.
Madichie, N. (2008). An Evaluation of the Country-of-Origin Effects on the Nigerian Guinness Brand. In: Veloutsou, C. & Papadopoulos, N. (Eds.) Marketing in Dynamic Environments: Contemporary Research Advances. Athens, Greece: ATINER Press, Chapter 10, pp. 117-128.
Mambula, C. (2002). Perceptions of SME Growth Constraints in Nigeria. Journal of Small Business Management, Vol.40, No. 1, pp. 58-65.
McCulloch, N.,Winters, L.A., & Cirera, X. (2001). Trade Liberalisation and Poverty: A Handbook, Centre for Economic Policy Research. London.
Nigeria. In Central Bank of Nigeria (Eds) Seminar on Small and Medium Industries Equity Investment Scheme (SMIEIS) CBN training Centre, Lagos, pp. 6-18.
Nishimizu, M., & Robinson, S., (1984). Trade Policies and Productivity Change in Semi-Industrialised Countries. Development Research Paper, World Bank.
Okome, Mojubaolu Olufunke. (1999). State and Civil Society in Nigeria in the Era of Structural
Rodriguez, E., &Berry, A. (2002). SMEs and the New Economy: Philippine Manufacturing in the 1990s. In Charles Harvey and Boon-Chye Lee, (Eds), The Role of SMEs in National Economies in East Asia. Cheltenham: Edward Elgar.
Rodríguez, F., & Rodrik, D. (2000). Trade Policy and Economic Growth: A Sceptic's Guide to the Cross-National Evidence. CEPR Discussion Paper , No. 2143. London, Centre for Economic Policy Research.
Rodrik, D. (1998). Trade Policy and Economic Performance in Sub-Saharan Africa. NBER
Sachs, J. D., & Warner, A. (1995). Economic Reform and the Process of Global Integration.
Santos,Paulino,A.,&Thirlwall, A. P. (2004). The Impact of Trade Liberalisation on Exports, Imports and the Balance of Payments of Developing Countries. The Economic Journal, Vol. 114, pp. F50–F72.
Shafaeddin, S.M. (2005). Trade Liberalisation and Economic Reform in Developing countries: Structural Change or De-Industrialization? Discussion Paper, No. 179, United Nations Conference on Trade and Development.
Thirlwall, A.P. (2000). Trade, Trade Liberalisation and Economic Growth: Theory and Evidence. Economic Research Paper, No. 63, the African Development Bank.
Udechukwu, F.N. (2003). Survey of Small and Medium Scale Industries and their Potentials in.
UNECE (2003). Small and Medium-Sized Enterprises in Countries in Transition. United Nations Economic Commission for Europe Series: Entrepreneurship and SMEs, United Nations, New York and Geneva.
Vachani, S. (1994). The Impact of Economic Liberalisation on Small Companies’ Competitiveness. Small Business
Enterprise Development, Vol. 5, No. 2, pp. 41-46.
Vickery, J. (2008). How and why do Small Firms Manage Interest Rate Risk? Journal of Financial Economics, 87, pp. 446-470.
Weisbrot, M., & Baker, D. (2002). The Relative Impact of Trade Liberalisation on Developing countries. Center For
Economic and Policy Research, Washington D.C.
Winters, L. A. (2004). Trade Liberalisation and Economic Performance: An Overview. EconomicJournal, Vol. 114, pp. F4-F21.Working Paper 6562, Cambridge, MA: National Bureau of Economic Research.
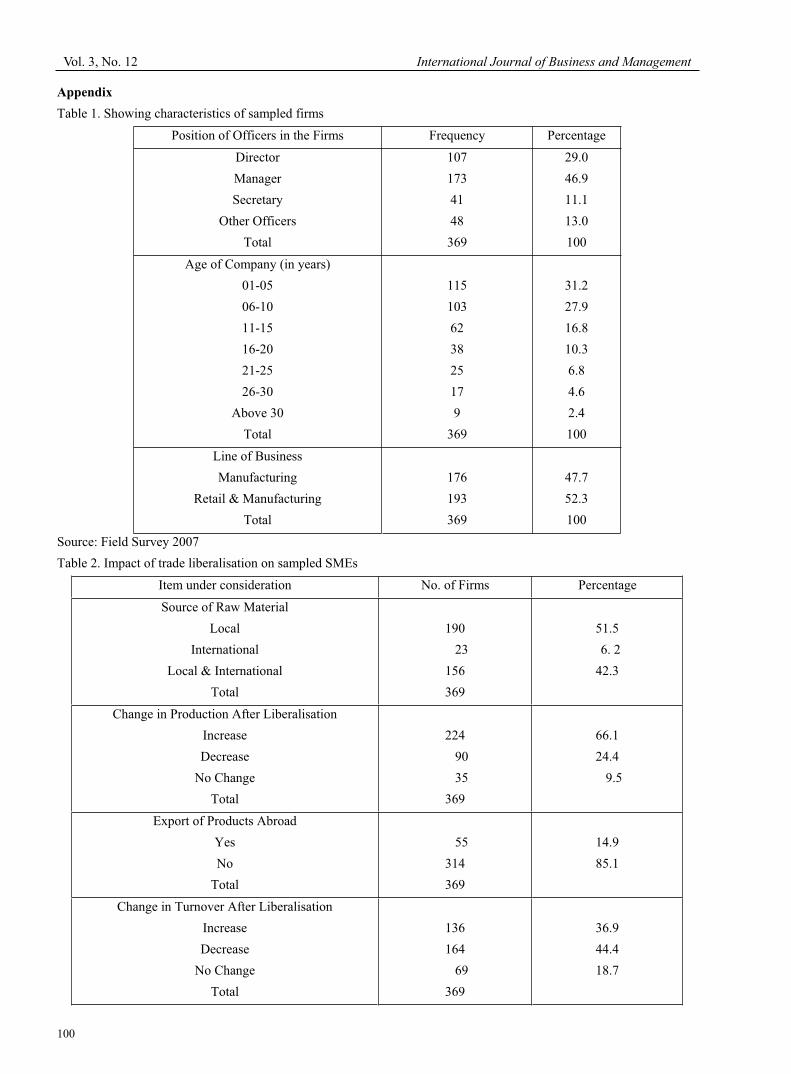
Vol. 3, No. 12 International Journal of Business and Management
100
Appendix
Table 1. Showing characteristics of sampled firms
Position of Officers in the Firms Frequency Percentage
Director
Manager
Secretary
Other Officers
Total
107
173
41
48
369
29.0
46.9
11.1
13.0
100
Age of Company (in years)
01-05
06-10
11-15
16-20
21-25
26-30
Above 30
Total
115
103
62
38
25
17
9
369
31.2
27.9
16.8
10.3
6.8
4.6
2.4
100
Line of Business
Manufacturing
Retail & Manufacturing
Total
176
193
369
47.7
52.3
100
Source: Field Survey 2007
Table 2. Impact of trade liberalisation on sampled SMEs
Item under consideration No. of Firms Percentage
Source of Raw Material
Local
International
Local & International
Total
190
23
156
369
51.5
6. 2
42.3
Change in Production After Liberalisation
Increase
Decrease
No Change
Total
224
90
35
369
66.1
24.4
9.5
Export of Products Abroad
Yes
No
Total
55
314
369
14.9
85.1
Change in Turnover After Liberalisation
Increase
Decrease
No Change
Total
136
164
69
369
36.9
44.4
18.7
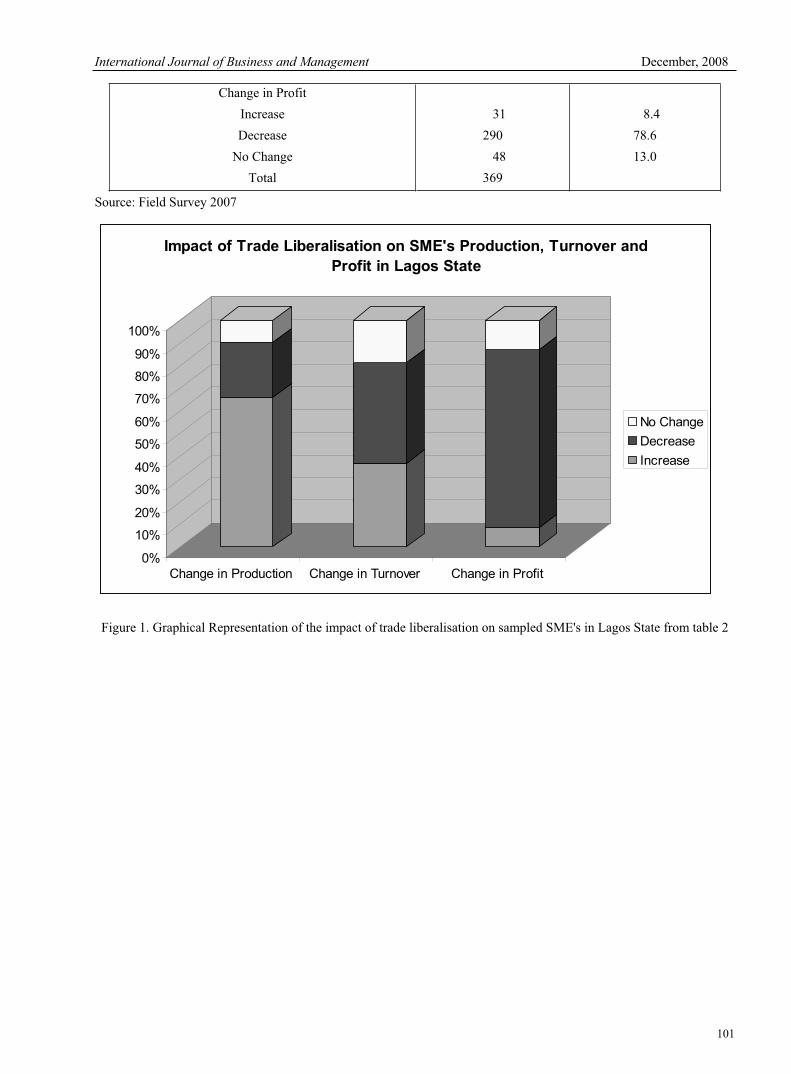
International Journal of Business and Management December, 2008
101
Change in Profit
Increase
Decrease
No Change
Total
31
290
48
369
8.4
78.6
13.0
Source: Field Survey 2007
0%
10%
20%
30%
40%
50%
60%
70%
80%
90%
100%
Change in Production Change in Turnover Change in Profit
Impact of Trade Liberalisation on SME's Production, Turnover and
Profit in Lagos State
No Change
Decrease
Increase
Figure 1. Graphical Representation of the impact of trade liberalisation on sampled SME's in Lagos State from table 2
Vol. 3, No. 12 International Journal of Business and Management
102
On the Basis and Predicament of Applying Organizational
Support Theory to Chinese Public Human Resource Management
Huali Wu
College of Mathematics and Information Sciences, Guangxi University
Nanning 530007, China
E-mail:[email protected]
Abstract
Organizational Support Theory emphasizes on the concerns and attentions of organizations to employees. It can arouse employees’ a sense of obligation to help organizations to reach objectives, enhancing employees’ emotional commitments to organizations, and make employees dedicate to organizations willingly. At present, this theory has already been studied and applied to Chinese enterprises’ human resource development and management field. But seldom does it be referenced by the public management field. This paper, by introducing the Organizational Support Theory, tries to analyze the basis of taking reference from the Organizational Support Theory for Chinese public human resource management and the possible predicaments, with the hope of founding a base for further studies on this subject.
Keywords: Organizational support, Public sector, New public management, Government failure, Predicament
1. A brief introduction to organizational support theory
In 1986, Eisenberger and other scholars firstly advanced the concepts of Organizational Support Theory (OST) and the Perceived Organizational Support (POS) (Eisenberger, R., Huntington, R., Hutchison, S., &Sowa, D., 1986, p500-507). In their opinion, Organizational Support Theory means an explanation to organizations’ promises to economy and emotion, considering the social exchange concept and the reward principle. According to this theory, organizations’ concerns are important reasons for employees working for and dedicating to organizations. Organizations’ promises to employees go first, then employees’ commitments to organizations. With this basis, Rensis Likert advanced that leaders and members in an organization should form a mutual support relationship, according to the need of “self-fulfillment men”. In his opinion, in any organization, if followers perceive the supports and concerns of leaders in work, and realize their values, they will response to the leaders’ decision positively. Contrarily, if they do not perceive the concerns of leaders, or even have a sense of losing dignity and personal values, they will response to the leaders’ decision negatively.
Perceived Organizational Support is one concept of Organizational Support Theory. It refers to employees’ overall perception to organizations’ concerns on their contributions and welfare. An element analysis finished by Rhoades and Eisenberger in 2002 show that three factors affect employees’ perceived organizational support, namely fairness of procedures, support from leaders, and rewards and work conditions. Employees always take the way of leaders treating them as a reflection of organizational support. The rewards that associate with perceived organizational support in a positive correlation, supportive work conditions, and leaders’ understanding and praise can drive employees to generate the perceived organizational support (Eisenberger, R., Fasolo, P., & Davis-La Mastro, V., 1990, p. 51-59).
Organizational Support Theory offers many new implications for human resource management field. It is an independent theory differing from the Psychological Contract Theory. Its meanings are: Firstly, make employees generate a sense of obligation to help organizations to achieve objectives; Secondly, improve employees’ expectation for leaders’ concerns and praises; Thirdly, enhance employees’ emotional commitments to organizations, and strengthen organizations’ cohesion and employees’ stability; Fourthly, assist organizations to realize goals. Theoretically, these meanings cover almost any organization, including public sectors. At present, this theory has already been studied and applied to Chinese enterprises’ human resource management field. Some researchers have introduced this theory to school human resource management, hoping to dealing with the teachers’ career fatigue issue (Xinrong Liu, 2007; Yuping Cao, 2005). But seldom does it be referenced by the public management field.
International Journal of Business and Management December, 2008
103
2. Basis for referencing from organizational support theory for Chinese public human resource management
field
In author’s opinion, to reference from Organizational Support Theory for Chinese public human resource management is reasonable in theories and practices.
2.1 Theoretical basis ------ “New Public Management” Theory and “Government Failure” Theory
Since the 80s, 20th century, the “New Public Management” in England, America, and other western countries is a new public administrative theory and management mode. It is also a mainstream thought for the unprecedented administrative reform happened in western countries in recent years (Tianxiang Chen, 2007, p. 71-76). According to this management theory, the management methods that have already been employed successfully by private sectors, such as performance management, management by objectives, organizational development, and human resource development, can be appropriately applied to public sectors to improve the management efficiency and management level of public management. Pollitt, in his Managerialism and the Public Services: the Anglo-American Experience, mentioned: “New public management mainly consists of classical Taylorism management principles. It emphasizes on the implementation of commercial management theories, methods, technologies, and modes in the management of public sectors.” The development of market economy continues to push China’s public management socialization. To improve public service quality and public management efficiency has already become a need of the time, which makes “New Public Management” Theory serves as a theoretical basis for applying the Organizational Support Theory to public management field.
Buchanan’s “Government Failure” Theory applies the traditional “economic man” assumption to government management. In his opinion, government managers, similar to parties in market transaction, pursue for maximum personal interests in all activities, what results in not all government activities effective (Junrong Zeng & Guoquan Chen, 2001, p. 61). According to his theory, abilities of government are limited. We must build up a competition-based limited government to replace the omnipotent “almighty government”. Under the condition of market economy, the government, as an “economic man”, should introduce advanced corporate management ideas and theories into government reform and management, for the sake of expediting the compatibility of government and market economy.
2.2 Practical basis ------ the association of management manners and private sectors has already become a trend for
modern public sectors’ human resource management reform, and to construct a high-efficient government has already
become a need of the knowledge economic time.
Along with the continuous perfect and development of market economy, the statuses of government public sectors, market, and the public are changing. The relationship between government public sectors and social public becomes a relationship between public service providers and customers from a relationship between administrators and followers. Public sectors should redefine their functions and realize the marketization of some functions. Meanwhile, for necessary obligations and services, governments should give priority to social public interests. In this trend, the cost-efficiency concept, performance management, customer first idea, and to apply a competition and market mechanism to government public sectors and management have been adopted by many countries. To construct a high-efficient government has already become the need of the knowledge economic time. Therefore, referencing from the effective management methods in private enterprises for government public sectors has become a trend of modern public sectors’ human resource management reform.
3. Possible predicament for referencing from organizational support theory for Chinese public human resource
management field
Although many fields have tried to adopt this theory, it is hard to take reference from Organizational Support Theory for Chinese public sectors’ human resource management. Possible predicaments are mainly:
3.1 The “goal lost” caused by the inherent commonweal of public sectors’ human resource development and
management
Public sector management has characters of commonweal and public law. In detail: (1) Public sectors aim at pursuing for social benefits. (2) Public sectors emphasize on dedication. (3) Public sectors give priority to group interests rather than personal interests. Correspondingly, workers in public sectors, as individuals, pursue for personal interests, whose activities give priority to self needs. According to Maslow’s Hierarchy Theory of Needs, workers, as individuals, need for physical, material, and psychological satisfaction, from the lower to higher level. These needs are personal and different for individuals. It means to unify organizational objectives and personal goals in organizations will face more challenges. The commonweal character of public sector management will obstruct the satisfaction of personal needs in a sense. Frequently, workers in public sectors have to give up personal goals and needs in order to follow organizational objectives or obey the dedication idea. Therefore, to apply “Organizational Support Theory” to public sectors will face a “goal lost” predicament.
Vol. 3, No. 12 International Journal of Business and Management
104
3.2 The incentive problem caused by the inflexible personnel flow in Chinese public sectors’ human resource
management
For a long period, Chinese public sectors are conservative in the flow of human resource. The inflexible flow mechanism becomes a prominent problem. The flow mechanism includes horizontal and vertical aspects. In the horizontal aspect, many public sectors still adopt the lifelong employment system for civil servants. The more popular, the more primary the public sector is. Under this system, there are no reasonable rules for hiring or dismissing workers. A tag “enter easily but quit hardly” is popular among public workers. Work performances can not be reflected materially in appraisals. As a result, public workers will possess an idea of “same for the good and the bad”, which will kill workers’ trusts in organizations and disturb an effective application of personnel incentive theories. In the vertical aspect, after continuous reform and adjustment, the promotion rules for Chinese civil servants have been gradually turned into “associating promotions with performances” from former “according to work experiences and ages”. Many local governments issue some management methods for personnel flow. However, because of more workers and less positions, the vertical flow is still inflexible. According to Temporary Regulation of Civil Servants, state administrative sectors adopt a position assorting system. Civil servants’ positions are assorted into leading positions and non-leading positions, including fifteen levels that are relevant to twelve positions respectively. In practice, some civil servants are engaged in fields of commerce and industry, taxation, quality supervision and inspection, and environment protection. They are responsible for social management and market supervision. Because of more civil servants worked in these fields but less position for relevant agencies, promotions become more difficult. According to data from Chenzhou Personnel Information Website, 70% of civil servants are primary clerks or senior clerks. Most of them merely become senior clerks from primary clerks during their 30-40 career years (Zeng Wu, 2008). Incentive objectives are realized by the flow of employees to a great degree (such as effective introduction, promotion, or degradation). As employees find that their expected personnel flow does not happen, they may reject organizational decisions and lost the perceived organizational support.
3.3 The damage to fairness caused by “authority control” of public management
For powers, scholars hold different ideas. Max Weber defines it as “a possibility of one person or some persons in certain social activity fulfilling a will without regard to other participators’ resistance”. Thomas Hobbes regards power as “a current way to obtain any future evident interest”. Dennis H. Wrong thinks “power is certain people’s ability of affecting others”. Although these definitions focus on different points, they reveal the nature of power from different angles. That is, power is a kind of strength, which can or may generate certain expected conditions or results.
Public management is a set of institution, system, and mechanism arrangement that help government-centered public sectors to integrate social resources to realize effective governance over social public business. It means public management should aim at serving the society. However, the realization of this goal must rely on the implementation of effective governance methods. Governance needs security, not only material security and institutional security, but also power security. Power is a deterrent force. In public management field, its deterrent force is endowed by the state, which can eliminate confusions by effective controls at different levels, guaranteeing the stability of the state. Machiavelli in his The Prince demonstrates the necessity and importance of power in state governance. Power is a primary element for state existence and operation. The management without power is unimaginable. Therefore, in order to reach the goal, public management has to rely on the participation of power. However, in practice, due to subjective factors’ effects, power is inevitably abused for getting personal interests. Suppose the “Organizational Support Theory” has been used for reference or formally applied to public management field to deal with problems in public sectors’ human resource management. With this assumption, the application of “Organizational Support Theory” in public sectors is also a part of executing public management, which has to depend on power either. Therefore, it can not avoid an abuse of power. Finally, it may arouse a sense of unfairness and frustrate employees.
At present, Organizational Support Theory has not been used or popularized in Chinese public management field. In author’s opinion, since we encourage the socialization of public management and emphasize on services today, the application of this theory in public sectors’ human resources management field will energetically drive the public management reform. The key is to find out a way stepping out the predicament and in accordance with development needs.
4. Conclusion
To sum up, Organizational Support Theory is an incentive theory for human resource management that emphasizes on employees’ perceived organizational support and consistency of organizational objectives and personal goals. This theory is to make employees work for organizations willingly by giving them perceived organizational support, which is common in almost all organizations. To use this theory for reference in public sectors’ human resource management field has theoretical and practical basis. However, because of public sectors’ commonweal character, paramountcy of state power, and the aging incentive mechanism, to use Organizational Support Theory for reference in Chinese public sectors’ human resource management still faces some difficulties that affect its positive effects.
International Journal of Business and Management December, 2008
105
In author’s opinion, the essence of Organizational Support Theory is good for organizational development and realization of organizational objectives. The main reasons for predicaments are executors and relevant institution makers’ subjective motives, ideas, attitudes, ethics, and morals in executing the theory. No matter what it is the predicament caused by characters of public management or the predicament caused by self mechanism of human resource management, the key for the solution is to improve the self qualities of organizational members. According to the requirements of present Chinese administrative ethics construction, to integrate “external control” with “internal control” effectively and improve overall quality of civil servants can help to find out a way out of predicament.
References
Cao, Yuping. (2005). Organizational support for relieving teachers’ burnout in universities. Economic Management, No. 21.
Chen, Tianxiang. (2007). New public management: effects and assessment. Journal of Sun Yatsen University (Social
Science Edition), No. 3, pp. 71-76.
Eisenberger, R., Fasolo, P., & Davis-La Mastro, V. (1990). Periceved organizational support and employee diligence, commitment, and innovation. Journal of Applied Psychology, No. 75, pp. 51-59.
Eisenberger, R., Huntington, R., Hutchison, S., &Sowa, D. (1986). Perceived organizational support. Journal of Applied
Psychology, No. 71, pp. 500-507.
Liu, Xinrong. (2007). An organizational support theory analysis of dealing with teaching burnout in universities. Journal of China Institute of Industrial Relations, No.4.
Qi, Guanghua. (2000). China public human resource management under new economy. Chinese Public Administration,No. 6, pp. 54-57.
Wu, Zeng. (2008). Several issues about the Civil Servant Law. www.czpb.Gov.cn. 25th, June.
Yan, Longzhu. (2006). Human Resource Management in Public Sectors. Xiamen: Xiamen University Press.
Zeng, Junrong & Chen, Guoquan. (2001). To study administration by economic method ------ Review on Buchanan's Visions of the State. Chinese Public Administration, No. 7, pp. 61.
Vol. 3, No. 12 International Journal of Business and Management
106
Key Antecedents of Organizational Citizenship
Behavior (OCB) in the Banking Sector of Pakistan
Zirgham ullah Bukhari
Army Public College of Management Sciences
Ordnance Road, Rawalpindi, Pakistan
E-mail: [email protected]
Abstract
The study is focused on the effects of Altruism, Conscientiousness, and Civic Virtue (three of the antecedents of Organizational Citizenship Behavior - OCB) and their relationship with Organizational Citizenship Behavior (OCB) in the Banking Sector of Pakistan. As per previous studies it has been hypothesized that there exists a direct and significant relationship between the antecedents chosen and Organizational Citizenship Behavior (OCB). Results prove that all the above mentioned antecedents have significant positive relationship with OCB. The purpose of this study is to invoke Organizational Citizenship Behavior (OCB) in Pakistani organizations.
Keywords: Organizational citizenship behavior (OCB), Altruism, Conscientiousness, Civic virtue, Banking sector, Pakistan
1. Introduction
Organizational Citizenship Behavior is relatively new concept considered under Organizational Behavior. The major research, in this relatively infant field of study has mainly taken place in the 1990s and still continuing at a stable pace. The research taking place currently is focused on establishing the relationship of OCB with its three aspects (commonly referred to, in the literature as the facets of OCB). The reason for choosing OCB as a research ground is its positive relationship with unit performance, which means by measuring OCB we can get one step closer in increasing the unit performance.
Interestingly researchers define OCB in not very much different contexts and backgrounds, also there is much consistency found in their ways of interpreting OCB. Jacqueline et al. (2004) refers, OCB to be an extra-role behavior i.e. it is any behavior not officially required by the organization; rather its practice depends solely on the consent of employee as a consequence of the organizational environment. OCB makes the impact on organization effectiveness; OCB should have a particular impact on the overall effectiveness of organizations by adding to the social framework of the work environment (Todd, 2003). I have chosen altruism, conscientiousness, and, civic virtue among the Big Five facets of OCB.
There is profound relation between OCB and Altruism; it is commonly referred to as the helping behavior of an employee, towards its fellow employees. Todd (2003) found that Altruism, for instance, usually is interpreted to reflect the willingness of an employee to help a coworker, also is referred to and explained as the selflessness of an employee towards organization.
Conscientiousness is another important antecedent of OCB, much of the studies have taken place to study its relationship with OCB. Konovsky & Organ (1996) found in their study that, conscientiousness was significantly inter-related to all types (facets) of OCB. According to Neihoff & Yen (2004), more conscientious employees will stay informed with up-to-date knowledge about products or services offered.
The third selected antecedent that affects OCB is Civic Virtue, it is a behavior exposed by taking part in the unofficial activities of the organization, which are not mandatory and obligatory, but result in the social cohesiveness within the organization. As per Borman et al. (2001) the definition of civic virtue is, to involve oneself responsibly in and being concerned about the life of the company.
To this date, most of the research in the field of Organizational Behavior (OB) was held in the geographical context of western culture, In sub continental region; culture, environment, values and norms are totally different and need a separate study to make HR practices applicable more meticulously, many western multinational companies are moving in this region because of cheap labor and immense potential market, so this study would principally be targeted to help in a better understanding of the OCB in a different geographical context. This research will focus on different banks of the region.
International Journal of Business and Management December, 2008
107
2. Literature review
2.1 Organizational Citizenship Behavior (OCB)
OCB typically refers to behaviors that positively impact the organization or its members (Poncheri, 2006). OCB can be defined as defending the organization when it is criticized or urging peers to invest in the organization (Turnipseed & Rassuli, 2005), or a behavior that exceeds routine expectations (Joireman et al. 2006). OCB can be affected by instilling in employees a perception of expertise in their job tasks (Todd, 2003). There is persuasive evidence that OCB is an outcome consistent with a social exchange relationship (Deckop et al. 1999). Organizational concern emerged as the motive most closely related to OCB directed towards the organization (Dick et al. 2006). OCBs yield significantly higher outcomes in the long term than in the short term for the organization (Joireman et al. 2006). The importance of OCB can be realized by the argument of Koys (2001) who suggests; Organizational citizenship behavior had an impact on profitability but not on customer satisfaction. Also (Jacqueline et al. 2004) individuals engage in OCB as a form of reciprocity based on organizational treatment. The ‘best’ performing workers produced the strongest link between performance and functional participation, which is a helping-type (Altruism) OCB, as found by Turnipseed & Rassuli (2005). Employee attitudes were found to influence subsequent organizational citizenship. Indeed, as citizenship appears to consist of discretionary behaviors, how the employee perceives the organization (as evidenced by his/her attitude toward it) would likely predispose this employee to either perform or withhold such performance (Dick et al. 2006). Results indicate that perceptions of citizenship performance predict overall performance equally well across all task performance levels (Coole, 2003). Results from the studies of Yorges (1999) suggest, that creating a group atmosphere can have detrimental consequences, particularly regarding OCB (due to competition). Deckop et al. (1999) argue that, for employees low in value commitment, a pay-for-performance system appears to be a disincentive for engaging in OCB. To the extent organizations can manage their relationship with employees; they are more likely to engage in OCB (Jacqueline et al. 2004). The belief among theorists is that as more employees engage in OCB, the organization becomes more successful (Neihoff & Yen, 2004). OCB and CWB (Counterproductive Work Behavior) were significantly negatively correlated (Baker, 2005), which means that a person high on OCB scale will not show any such behavior posing an adverse effect to production. Interestingly, the study of Deckop et al. (1999) yields, that; the age of employee had (s) a negative and a marginally significant effect on OCB. Such behavior (i.e. Organizational
Citizenship Behavior) might enhance coworkers’ or supervisors’ productivity, help coordinate activities, increase the stability of organizational performance, and help the organization attract and retain employees (Borman, 2004). As Pakistan particularly and Asia in general are different from the rest of the world, if culture is made the origin of segregation, Gautam et al. (2006) argues that citizenship behavior within an organization may vary, with change in geographic context; OCB is enacted differently in different cultural contexts – that what it means to be a ‘good citizen’ may vary. Employees who perform citizenship behaviors may be more likely to elicit support from their organizations (Moorman et al. 1998). After all above arguments there also exist a view regarding OCB i.e. OCB is an extra-role behavior that is not formally evaluated (Pond et al. 1997).
2.2 Antecedents of Organizational Citizenship Behavior (OCB)
There are many factors that can contribute to the determination of Organizational Citizenship Behavior (OCB) which include Altruism, Conscientiousness, Civic Virtue, Sportsmanship, Courtesy, etc. but the factors that have been researched to have a significant relationship with Organizational Citizenship Behavior, are the first three i.e. Altruism, Conscientiousness, and Civic Virtue. As Borman et al. (2001) finds Altruism and conscientiousness are the two major or overarching dimensions of OCB.
2.2.1 Altruism
Todd (2003) Altruism, for instance, usually is interpreted to reflect the willingness of an employee to help a coworker, also is referred to and explained as the selflessness of an employee towards organization. Also, as per, (Redman & Snape, 2005) ‘Altruism’ is concerned with going beyond job requirements to help others with whom the individual comes into contact. Altruism is accounted as a one of the significant antecedents of Organizational Citizenship Behavior (OCB), reason being, as Pare’ & Tremblay (2000) explains - behaviors such as helping a colleague who has been absent from work, helping others who have heavy workloads, being mindful of how one’s own behavior affects others’ jobs, and providing help and support to new employees represent clear indications of an employee’s interest for its work environment. Socially driven values emphasizing the group over individual concerns are likely to encourage altruistic behaviors benefiting the group. Altruism and compassion may arise as a natural consequence of experiences of interconnection and oneness (Vieten et al. 2006). Altruism or helping coworkers makes the work system more efficient because one worker can utilize his or her slack time to assist another on a more urgent task (Neihoff & Yen, 2004). Redman & Snape (2005), ‘altruism’ involves helping specific individuals in relation to organizational tasks. The altruistic person can obtain utility from other persons' utility (by convincing them with their selflessness aspect of
personality) (Wu, 2001). Rush & Allen (2001) states that, an abundant body of social psychological research indicates that there are gender differences with regard to helping behavior and altruism. Participants (employees) who were
Vol. 3, No. 12 International Journal of Business and Management
108
allowed to work individually (i.e., did not perceive any group boundaries) were much more likely to engage in altruism and courtesy behaviors as found by Yorges (1999). The measure of altruism may be akin to citizenship behavior directed toward one’s colleagues (resulting in the benefit of the organization) as established by Brennan & Skarlicki (2004). Altruism encourages teamwork and cooperation, allowing employees to increase the pool of available knowledge (Neihoff & Yen, 2004).
H1: based on above research findings we can argue that altruism is an antecedent of OCB; hence Altruism will show
direct and positive relation with OCB.
2.2.2 Conscientiousness
‘Conscientiousness’ refers to discretionary behaviors that go beyond the basic requirements of the job in terms of obeying work rules, attendance and job performance (Redman & Snape, 2005). In other words, conscientiousness means the thorough adherence to organizational rules and procedures, even when no one is watching. It is believed to be, the mindfulness that a person never forgets to be a part of a system (organization). Conscientiousness, and Openness are all better predictors of decision-making performance when adaptability is required than decision-making performance prior to unforeseen change (Lepine et al. 2000). Konovsky & Organ (1996) found in their study that, conscientiousness was significantly related to all five types of OCB. Also, Conscientiousness was significantly related to Generalized Compliance and to Civic Virtue, (two of the antecedents of Organizational Citizenship Behavior). More conscientious employees will stay informed with up-to date knowledge about products or services offered (Neihoff & Yen, 2004). High conscientious individuals, in contrast, persisted longer than individuals lower in conscientiousness whether or not there was an additional benefit and whether or not they varied the procedure while performing (Sansone et al. 1999). Conscientiousness, with its emphasis on responsibility and dedication, is likely to underlie the first motive for interpersonal helping—taking the initiative to engage in behaviors for the good of the organization - conscientiousness can be expressed in numerous ways in organizations and, most obviously, in terms of job performance (King et al. 2005). Conscientiousness affects important work outcomes (Roberts et al. 2005). Theoretically, conscientiousness may be an important predictor of workplace behaviors because it provides the organization and direction that are necessary to produce targeted behaviors (King et al. 2005). Higher values are associated with greater conscientiousness when combined (Yorges, 1999). Conscientiousness accounted for unique variance in citizenship targeted toward the organization, as researched by Ladd & Henry (2000). Lowery & Krilowicz (1996), Supervisory evaluations of performance were found to be determined by Altruism and Conscientiousness as well as by objective job performance.
H2: after a comprehensive literature review on the relationship of OCB and conscientiousness we can argue that
Conscientiousness will prove positive correlation with OCB
2.2.3 Civic Virtue
‘Civic Virtue’ refers to behaviors that demonstrate a responsible concern for the image and wellbeing of the organization (Redman & Snape, 2005). Borman et al. (2001) defines civic virtue as responsibly involving oneself in and being concerned about the li fe of the company. Civic virtue is behavior indicating that an employee responsibly participates in, and is concerned about the life of the company (represented by voluntary attendance at meetings) (Todd, 2003). Baker (2005) explains Civic Virtue is responsible, constructive involvement in the political processes of the organization. As mentioned earlier, Conscientiousness was (is) significantly related to Generalized Compliance and to Civic Virtue (Konovsky & Organ, 1996). There was (is) an impact of fairness for only a single form of OCB (Civic Virtue), as found by Bacharach & Jex (2000). As per Redman & Snape (2005) the civic virtue is positively predicted by commitment to customers and co-workers (hence resulting in the behavior, beneficial to the organization) with evidence of partial mediation by global commitment. Neihoff & Yen (2004), acts of civic virtue would include employees offering suggestions for cost improvements or other resource-saving ideas, which might directly influence operating efficiency. Coole (2003) argues that civic virtue was more limited in their relation to organizational effectiveness; i.e. the more the organization is effective the chances of emergence of this very behavioral aspect is the most. Extraversion was (is) negatively related to the citizenship behaviors of Altruism, Civic Virtue, and Conscientiousness (Baker, 2005). Todd (2003) points out that, it is noteworthy that some different types of OCBs such as helping behavior and civic virtue appear to impact distinct measures of organizational effectiveness in their own ways. Civic virtue is more likely to involve a purposeful contribution (in OCB) by employees compared to other dimensions (Jacqueline et al. 2004). If employees identify strongly with the organization (i.e., high civic virtue), one would expect them to exert extra effort to improve their productivity, resulting in improved efficiency (Neihoff & Yen, 2004).
H3: the above research shows that civic virtue is an important antecedent of OCB and Civic Virtue will have a positive
relationship with OCB.
Insert Figure 1 here
International Journal of Business and Management December, 2008
109
3. Theoretical framework
In the diagram given at the end of the study (Appendix I), the theoretical framework is showing the relationship among OCB and its antecedents (Altruism, Conscientiousness, and Civic Virtue); which will be helpful in testing the postulates and certain relationships and will also improve the understanding of the dynamics of the situation.
4. Participants, measures and methodology
4.1 Participants
The employees of different banks in the cities of Rawalpindi and Islamabad were the participants in my study. The survey was conducted on random basis i.e. questionnaires were without any discrimination or bias. Mine is a cross-sectional study as I have collected the data only once. Due to some limitations (discussed in following pages) the sample consists of 176 employees from the above mentioned sector, but the accuracy has not been compromised. It is expected, that all respondents have provided the response honestly and correctly up to their understanding and comprehension of the questionnaire.
4.2 Measures
In my survey, responses were rated on the Likert scale format, with answer ranging from 1 to 5 (1 = never and 5 = always). To measure Organizational Citizenship Behavior (OCB); I used OCB measure developed by Lee and Allen (2002) and a measure of contextual performance developed by Motowidlo and Van Scotter (1994). To measure the chosen antecedents of OCB i.e. Altruism, Conscientiousness, and Civic Virtue I adopted the relevant sections of Organization Citizenship Behavior Questionnaire, developed by Podsakoff et al., 1990; Podsakoff & MacKenzie, 1994.
The respondents were assured of confidentiality to guarantee the fairness of responses (questionnaire appended). To avoid any oversight due to a non-serious attitude I tried to utilize the time off of employees to fill the questionnaires. Also the respondents were provided with full explanation of the questionnaire.
4.3 Methodology
After the collection of data, scores were developed for the chosen constructs, by averaging the responses to items comprising each dimension (OCB, Altruism, Conscientiousness, and Civic Virtue). Then on acquired means, different analyses were employed particularly Correlation and Regression, to investigate about the presence of relationship (if any) between OCB and its constructs, their significance along with the direction.
5. Results
5.1 Demographic Analyses
The subsequent Figure 2 in Appendix I has tabulated the demographics data on the basis of age, gender and education level of respondents with their description range and frequency.
Insert Figure 2 here
Data shows that 56 respondents fall between the age bar of 18 to 26 and the high frequency between 26 to 36 years show that most of the employees are in this sorting; the overall frequency between 36 to 44 is 18 whereas 25 employees were 45 years of age and above. The education categorization shows that most of the respondents were well educated, only 22 of them were below the graduate level, and rest of them were either graduates or were post graduates. The data also reveals that the ratio of male respondents is higher than females. One of the big reasons of this difference in ratio is our Pakistani culture in which, it is not acceptable by the masses to let women work in any sector, other than medical and teaching. Although a new moderate era has taken a slight start but still people are reluctant, but we can expect this gap to be filled soon. Moreover, a good percentage i.e. 79% of employees had spent more than two years with their current organizations.
5.2 Correlation Analyses
Insert Figure 3 here
Different software’s were used to calculate the aforementioned (and following) values of correlation and regression, particularly MS Excel and SPSS software. Here 2nd column is showing the means of responses, 3rd column is showing the standard deviation of these means, the last three columns are depicting the inter-relationship between OCB and the selected antecedents, as well as their relationship among themselves. All the values are positive and significant up to 0.01 (**). Our concern is mainly with the fourth column of the table which is showing the correlation between OCB and chosen antecedents.
5.3 Regression Analysis
Insert Figure 4a here
Insert Figure 4b here
Vol. 3, No. 12 International Journal of Business and Management
110
The Regression analysis suggests that the chosen antecedents account for more than 50% of the variation in OCB among the employees of different banks in Pakistan.
6. Discussion
This research offer strong indications, that the selected antecedents have deep impact on OCB in the Banking Sector of Pakistan. It was expected that geographical, cultural and environmental factors may cause some deviation and contradictions from the results found by earlier researchers who considered only Western culture in their research but to my surprise the values weren’t much different than those yielded by preceding western researches. OCB has a vital importance to an organization; because if personnel are not willing to work and their work directions are not parallel to the organizational objectives then the organization cannot achieve the operational efficiency. As without OCB there won’t be much concern present among the employees about the promotion and benefit of the organization.
This research included three variables; the first one was “Altruism” which is also referred to and explained as the selflessness of an employee towards the organization. The applied analyses yield significant results, providing the evidence that H1 is true. The analyses show that the value of the correlation between OCB and Altruism is 0.418**. If the workforce of an organization have the enthusiasm to help one another and are selfless in achieving the organizational goals, it will naturally result in the development of, OCB in the organization and consequently the organization itself. In my research area, the Banking Sector of Pakistan, it was observed that the notion of HRM (Human Resource Management) till now, has not rooted deep into the base of the organizations. Incentives for motivation being provided to the employees only include huge financial spurs, keeping in view the economy of the geographic region.
The second variable i.e. Conscientiousness, was also identified to have a tremendous role in the development of OCB. Conscientiousness is a personality dimension that can be defined as the magnitude of adherence to the rules and norms of an organizational setting. Conscientiousness can also help to make the environment of the organization better and calm and it can help to make affable relationship with peers. The results shown in correlation table indicate that the relationship between OCB and Conscientiousness was significantly positive i.e. 0.428**. There may be a conflict between our value and the value found by previous researchers, the reason for the delineation may be, as in this part of the world, many of the employees do not have a definite set of organizational code, to adhere to; which results in low score by the respondents on Conscientiousness scale.
Finally, Civic Virtue was the last among the chosen antecedents of OCB. Civic Virtue can be explained as the willing involvement of the personnel in the routine and non-routine matters of his/her organization for the projection of a good image of the organization. The correlation result is showing the significant result on the relationship between OCB and Civic Virtue. The value yielded by this study for correlation between OCB and Civic Virtue is .405(**). In this region of the world people focus more on income rather than getting themselves involved in efforts to improve the impression of their organization. It is a common understanding in society that one who is politically and financially strong and one who has good acquaintanceship with the higher ups in the management, would not have any trouble surviving. But by interpreting the results, it can be concluded that in most of the private organizations, the commitment of employees with their organization and work is increasing with the level of awareness. Employees are realizing the fact that not only the office work but the other office related routines can also play a role in the betterment of the organization and consequently, for the employees themselves. In sum it is expected that the idea of civic virtue is emerging in organizations, but we will have to give it some time to let it reach to its prudent level.
A mere observation of the respondents’ attitude towards the organization (during the filling of questionnaires) inferred that citizenship behavior develops its pedigree with the passage of time i.e. it was observed that, the longer the period of affiliation, the stronger was the citizenship behavior, also it was observed that more the satisfaction among the employees regarding the organization, caring for their employees, high was the rating on OCB scale. The research also capitulates that the citizenship behavior has a very significant effect on the stability of the organizational structure.
7. Implications
The rationale of this research was to test the relationship between OCB and its chosen antecedents, in a different cultural context i.e. Pakistan’s Corporate Sector. Even though it was found in literature that the cultural context moderates the relationship to a significant level, but interestingly this study proves otherwise, i.e. the results were directionally as well as magnitude wise consistent with the Western researchers.
Firstly employees projecting altruistic behavior i.e. to help out their coworkers with their work related problems will demonstrate OCB, which in return will act as a benefactor for the entire organization. It will also result in employees having faith in each other which may cause the employee relationship, of supervisor subordinate at vertical level, and peers at horizontal level to boom.
Secondly those employees showing a due concern towards the progress of their organization by performing activities that will boon the organization, this behavior also leads to the betterment of environment and behavior within the
International Journal of Business and Management December, 2008
111
organization. If employees strictly adhere to the rules and regulation then it will automatically result in some positive effects, which may include timeliness, decrease in employee absenteeism, resulting in turn in the prosperity of the organization.
Finally if employees take part in activities not mandatory by the organization but which result in the impression of the organization to prosper, then the social life within the organization will become pleasant, which at the end of the day will result in satisfied employees and may cause the employees to develop vigorous and frictionless relationships among themselves.
8. Limitations
It is felt by the researchers that there is an ample room for research in this field but the lack of resources poses a serious limitation. Also it is believed that the sample size is not enough to represent the whole industry and there is a slight possibility that the future research in the same industry may yield a bit different results.
It was found during the survey that maximum employees had no concept of OCB, the researchers made their honest efforts to make every respondent understand the questionnaire so that the research is productive, but it is felt that the following researchers should translate the language of questionnaire so that it is easily interpreted by the respondents.
Finally, it is advised to the future researchers to include antecedents like Tenure, Salary, Job Satisfaction (JS) and Organizational Commitment (OC) etc. in their studies, as it was experienced that they may have an impact on the determining of OCB among the workforce of an establishment.
References
Allen, T., & Rush, M.(2001). The Influence of Rate Gender on Ratings of Organizational Citizenship Behavior'. Journal
of Applied Social Psychology, Vol. 31, No.12, pp. 2561-2587.
Bacharach, D., & Jex, S. (2000). Organizational Citizenship and Mood: An Experimental Test Of Perceived Job Breadth'. Journal of Applied Social Psychology, Vol. 30, No. 3, pp. 641-663.
Baker, B. (2005). The Good, the Bad and The Ugly: the Mediating Role of Attribution Style in the Relationship Between
Personality and Performance. North Carolina State University.
Borman, W., Penner, L., Allen, T., & Motowidlo, S. (2001). Personality Predictors of Citizenship Performance. International Journal of Selection and Assessment.
Borman, W.C. (2004). The Concept of Organizational Citizenship. Personnel Decisions Research Institutes, Inc., Tampa, Florida, and University of South Florida.
Brennan, A., & Skarlick, D. (2004). Personality and Perceived Justice as Predictors of Survivors’ Reactions Following Downsizing1. Journal of Applied Social Psychology, Vol. 34, No. 6, pp. 1306-1328.
Coole, D.R. (2003). The Effects of Citizenship Performance, Task Performance, and Rating Format on Performance Judgments, University of South Florida.
Deckop, J., Mangal, R & Circa, C. (1999). Getting More that You Pay For: Organizational Citizenship Behavior and Pay for Performance Plan. Academy of Management Journal. Vol. 42, No. 4, pp. 420-428.
Dick, R.,Grojean, M., Christ, O., & Wieseke, J. (2006). Identity and the Extra Mile: Relationships between Organizational Identification and Organizational Citizenship Behaviour. British Journal Of Management, Vol. 17, pp.283–301.
Gautam, T., Dick, R., Wagner, U., Upadhyay, N., &Davis, A. (2005). Organizational Citizenship Behavior and Organizational Commitment in Nepal. Asian Journal of Social Psychology, No. 8, pp. 305–314.
Jacqueline, A-M.,Shapiro, C., Kessler, I., & Purcell, J. (2004). Exploring Organizationally Directed Citizenship Behaviour: Reciprocity or ‘It’s my job’? Journal of Management Studies, Vol. 41, pp. 1.
Joireman, J.,Daniels, D., Falvy, J., & Kamdar, D. (2006). Organizational Citizenship Behavior as Function Of Empathy Consideration of Future Consequences, And Employee Time Horizon: An Initial Exploration Using An In-Basket Simulation of OCBs. Journal of Applied Social Psychology, Vol. 36, No. 9, pp. 2266–2292.
King, E., George, J., & Hebl, M. (2005). Linking Personality to Helping Behaviors at Work: An Interactional Perspective Journal of Personality. Blackwell Publishing, Vol. 73, No. 3.
Konovsky, M., & Organ, D. (1996). Dispositional and Contextual Determinants of Organizational Citizenship Behavior. Journal of Organizational Behavior, Vol. 17, pp. 253-266.
Koys, D.J. (2001). The Effects of Employee Satisfaction, Organizational Citizenship Behavior, and Turnover on Organizational Effectiveness: A Unit-Level, Longitudinal Study. Personnel Psychology, S4.
Ladd, D., & Henry, R. (2000). Helping Coworkers and Helping the Organization: The Role of Support Perceptions,
Vol. 3, No. 12 International Journal of Business and Management
112
Exchange Ideology, and Conscientiousness. Journal of Applied Social Psychology, Vol. 30, No.10, pp. 2028-2049.
Lepine, J.,Colquitt, J., & Eriz, A. (2000). Adaptability to Changing Task Contexts: Effects of General Cognitive Ability, Conscientiousness, and Openness to Experience. Personnel Psychology.
Lowery, C., & Krilowicz, T. (1996). Effects of Organizational Citizenship Behaviors: Evidence from Production Supervisors. International Journal of Selection and Assessment.
Moorman, R., Blakely, G., & Neihoff, B. (1998). Does Received Organizational Support Mediate the Relationship Between Procedural Justice And Organizational Citizenship Behavior. Academy of Management Journal. Vol. 41, No. 3, pp. 351-371.
Pare, G., & Tremblay, M. (2000). The Measurement and Antecedents of Turnover Intentions Among it Professionals, Scientific Series.
Poncheri, R. (2006). The Impact of Work Context on the Prediction of Job Performance. North Carolina State University.
Pond, S., Nacoste, R., Mohr, M., & Rodriguez, C. (1997). The Measurement Of Organizational Citizenship Behavior: Are We Assuming Too Much? Journal of Applied Social Psychology, Vol. 27, No. 17, pp. 1527-1 544.
Redman, T., & Snape, E. (2005). I to Wed: The Role of Consciousness Transformation in Compassion and Altruism. Journal of Management Studies, Vol. 42, No. 2.
Roberts, Et Al. (2005). The Structure of Conscientiousness: An Empirical Investigation Based on Seven Major Personality Questionnaires. Personal Psychology, Vol. 58, pp. 103-139.
Sansone. C., Wiebe, D., & Morgan, C. (1999). Self-Regulating Interest: The Moderating Role of Hardiness and Conscientiousness. Journal of Personality, Vol. 67, No. 4.
Todd, S. (2003) A Causal Model Depicting the Influence of Selected Task and Employee Variables on Organizational Citizenship Behavior.
Turnipseed, D., & Rassuli, A. (2005). Performance Perceptions of Organizational Citizenship Behaviours at Work: A Bi-Level Study Among Managers And Employees. British Journal of Management, Vol. 16, pp. 231–244.
Vieten, C., Amorok, T., & Schlitz, M. (2005). I to Wed: The Role of Consciousness Transformation in Compassion and Altruism. The Joint Publication Board of Zygon, Vol. 41, No. 4.
Wu, Z. (2001). Altruism and the Family Firm: Some Theory. University of Calgary.
Yen, H., & Neihoff, B. (2004). Organizational Citizenship Behavior and Organizational Effectiveness: Finding Relationship in Taiwanese Banks. Journal of Applied Social Psychology, Vol. 34, No. 8, pp. 1617-1637.
Yorges, S. (1999). The Impact of Group Formation and Perceptions of Fairness on Organizational Citizenship Behaviors. Journal of Applied Social Psychology, Vol. 29, No. 7, pp. 1444-1471.
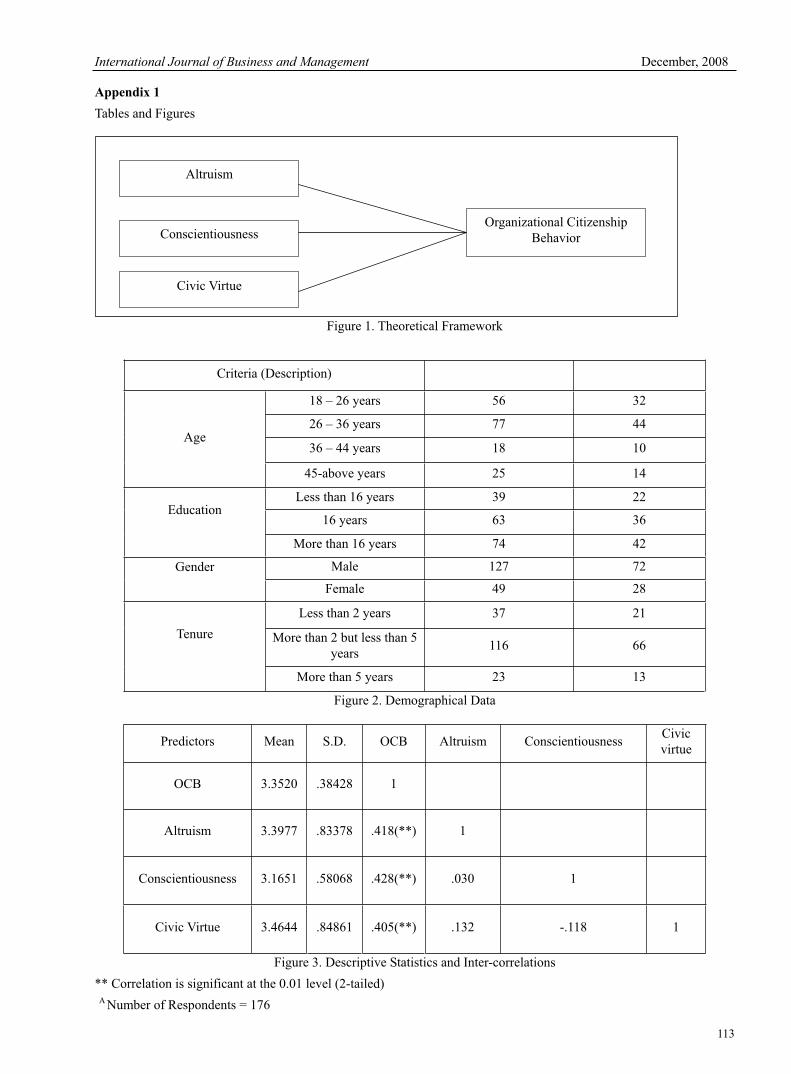
International Journal of Business and Management December, 2008
113
Appendix 1
Tables and Figures
Figure 1. Theoretical Framework
Criteria (Description)
Age
18 – 26 years 56 32
26 – 36 years 77 44
36 – 44 years 18 10
45-above years 25 14
EducationLess than 16 years 39 22
16 years 63 36
More than 16 years 74 42
Gender Male 127 72
Female 49 28
Tenure
Less than 2 years 37 21
More than 2 but less than 5 years
116 66
More than 5 years 23 13
Figure 2. Demographical Data
Figure 3. Descriptive Statistics and Inter-correlations
** Correlation is significant at the 0.01 level (2-tailed) A Number of Respondents = 176
Predictors Mean S.D. OCB Altruism Conscientiousness Civic virtue
OCB 3.3520 .38428 1
Altruism 3.3977 .83378 .418(**) 1
Conscientiousness 3.1651 .58068 .428(**) .030 1
Civic Virtue 3.4644 .84861 .405(**) .132 -.118 1
Altruism
Conscientiousness
Civic Virtue
Organizational Citizenship Behavior
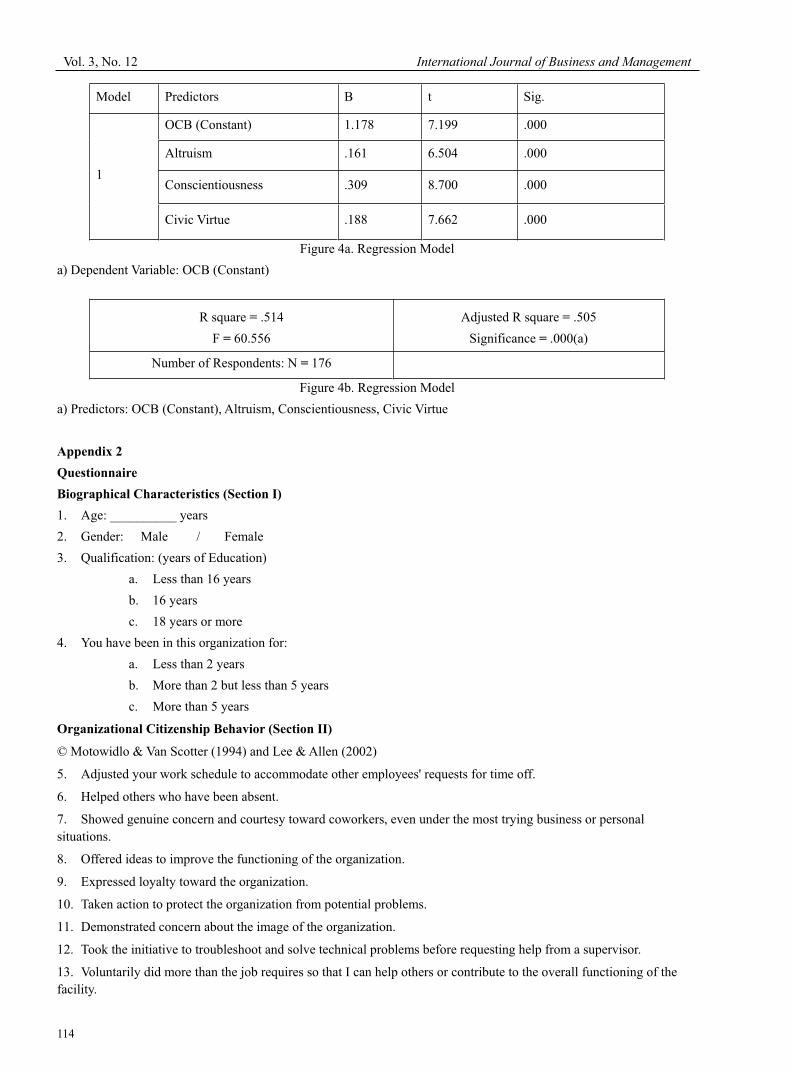
Vol. 3, No. 12 International Journal of Business and Management
114
Model Predictors B t Sig.
1
OCB (Constant) 1.178 7.199 .000
Altruism .161 6.504 .000
Conscientiousness .309 8.700 .000
Civic Virtue .188 7.662 .000
Figure 4a. Regression Model
a) Dependent Variable: OCB (Constant)
Figure 4b. Regression Model
a) Predictors: OCB (Constant), Altruism, Conscientiousness, Civic Virtue
Appendix 2
Questionnaire
Biographical Characteristics (Section I)
1. Age: __________ years
2. Gender: Male / Female
3. Qualification: (years of Education)
a. Less than 16 years
b. 16 years
c. 18 years or more
4. You have been in this organization for:
a. Less than 2 years
b. More than 2 but less than 5 years
c. More than 5 years
Organizational Citizenship Behavior (Section II)
© Motowidlo & Van Scotter (1994) and Lee & Allen (2002)
5. Adjusted your work schedule to accommodate other employees' requests for time off.
6. Helped others who have been absent.
7. Showed genuine concern and courtesy toward coworkers, even under the most trying business or personal situations.
8. Offered ideas to improve the functioning of the organization.
9. Expressed loyalty toward the organization.
10. Taken action to protect the organization from potential problems.
11. Demonstrated concern about the image of the organization.
12. Took the initiative to troubleshoot and solve technical problems before requesting help from a supervisor.
13. Voluntarily did more than the job requires so that I can help others or contribute to the overall functioning of the facility.
R square = .514
F = 60.556
Adjusted R square = .505
Significance = .000(a)
Number of Respondents: N = 176
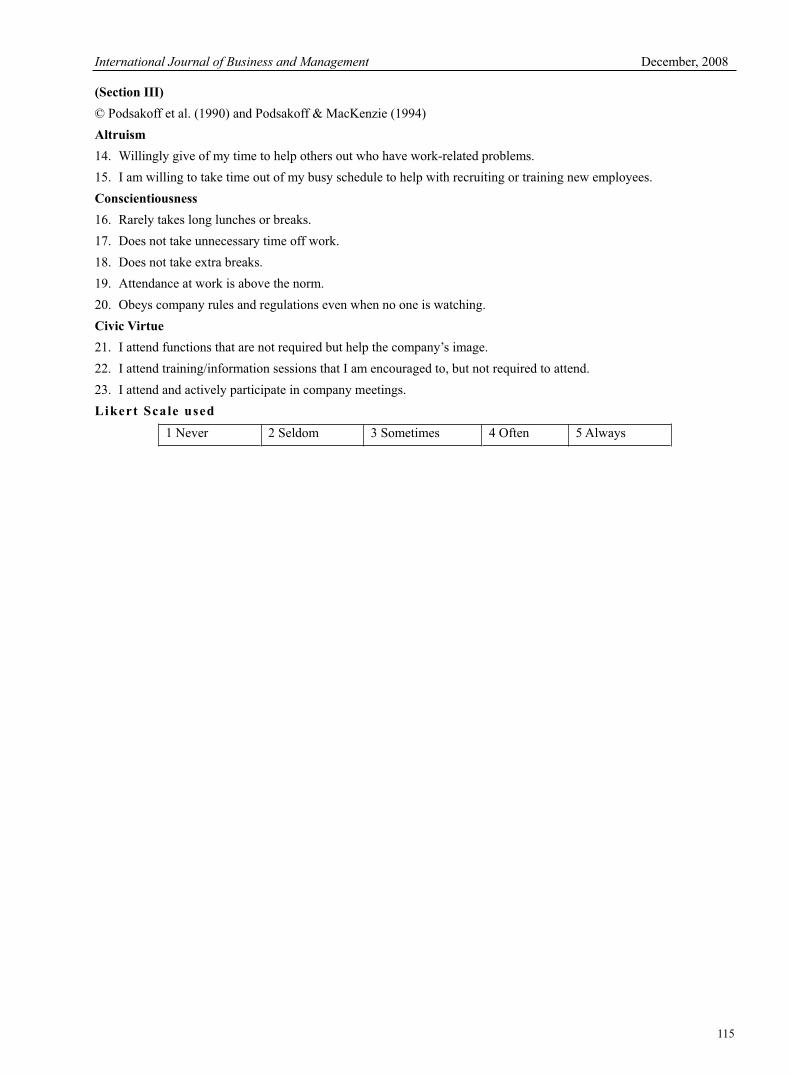
International Journal of Business and Management December, 2008
115
(Section III)
© Podsakoff et al. (1990) and Podsakoff & MacKenzie (1994)
Altruism
14. Willingly give of my time to help others out who have work-related problems.
15. I am willing to take time out of my busy schedule to help with recruiting or training new employees.
Conscientiousness
16. Rarely takes long lunches or breaks.
17. Does not take unnecessary time off work.
18. Does not take extra breaks.
19. Attendance at work is above the norm.
20. Obeys company rules and regulations even when no one is watching.
Civic Virtue
21. I attend functions that are not required but help the company’s image.
22. I attend training/information sessions that I am encouraged to, but not required to attend.
23. I attend and actively participate in company meetings.
Likert Scale used
1 Never 2 Seldom 3 Sometimes 4 Often 5 Always
Vol. 3, No. 12 International Journal of Business and Management
116
Study on the Bridge Surface Deicing
System in Yuebei Section of Jingzhu Highway
Shunqing Li, Xi Ye
The Third Co. Ltd., China Zhongtie Major Bridge Engineering Group
Guangzhou 510800, China
Tel: 86-20-3686-8699 E-mail:[email protected]
Abstract
The bad snowy weather in early 2008 induced large scale damages of the transportation system in Southern provinces of China, and seriously influence the normal running of society and economy. The establishment of highway deicing and snow-melting system has been the urgent task. Because of the structure characters and the particularity of construction technology of bridge system, its system design and construction become in to the key problems. In this article, combining the characters of bridge section in Yuebei section of Jingzhu Highway, we compared present highway and bridge snow-melting deicing technologies, and selected proper technologies to establish the corresponding deicing program to enhance the traffic quality and reduce the quantity of accident.
Keywords: Bridge, Deicing technology comparison, Deicing program
1. Introduction
In the cold areas of north China, long freezing time and large snowfall induce road surface friction coefficient decreases obviously than other seasons, which makes vehicle running and breaking become difficult, and easily induces traffic accidents, and largely reduces the traffic ability of highway, and brings large losses to human living and social economy. The snow disaster of south China in Jan of 2008 knocked the alarm bell for local traffic management department, so it is imperative to establish corresponding emergency snow-melting and deicing system under the situation. For the development of highway and bridge snow-melting and deicing system, foreign and domestic relative industrial management departments and scientific research institutions have made active attempts.
In 1992, under the united support of US DOE, DOT, Federal Highway Administration and National Base Research Fund, US begun to implement the plan of HBT (Heated Bridge Technologies), and systematically studied the problem of heating snow-melting and deicing for highway and bridge. Since 1998, US OSU (Oklahoma State University) begun to develop the research about the heat liquid cycle snow-melting and deicing technology for highway and bridge under the financial support of DOE, Federal Highway Administration and Oklahoma Traffic Office, and established the largest highway and bridge expert experiment system in the world. The Terrestrial Heat Center in Oregon Institute of Technology implemented comprehensive comparison and analysis to the highway surface snow-melting and deicing technology, and empirical studied the ramp section in the Oak Ridge highway and Wyoming Cheyenne highway in Virginia.
Since 1994, Japan Misawa Environmental Technology Co, Ltd developed about 40 items of highway snow-melting and deicing sample engineering by virtue of terrestrial heat and solar energy early or late, and made large contributions for the protection of biological environment. In 1995, Japan National Resource Environment Research Institute established the first automatic highway surface heat storage cycle heat liquid snow-melting and deicing system in the city of Ninohe by the help of OECD and IEA, and the test indicated that the system could save 84% of electrical energy than the heating cable system. Cooperating with Yamaguchi University, Japan 8th Technical Consultation Company carefully studied and compared the snow-melting and deicing scheme of Ushinogou highway tunnel exit, and finally adopted the mode of the heating tube with natural resources.
In 1994, cooperating with Zurich Polydynamics Ltd, Switzerland Highway and Bridge Committee developed the energy storage snow-melting and deicing experiment on the bridge in the Darligen Section of Switzerland A8 Highway. Scholars in Poland Warsaw University simulated and computed the solar energy heat storage transfer process which buried pipes under the bridge surface. Since 1980, Iceland begun to utilize its abundant terrestrial heat resource, extended the application of road snow-melting and deicing engineering, and the utilization area in the whole Iceland has achieved 740 thousand m2 at present.
International Journal of Business and Management December, 2008
117
At present, urban road snow removing in China mainly depends on snow-melting and deicing and manual cutting ice and removing snow, and the snow removing on main highways gives priority to chemical snow-melting and mechanical removing. The physical snow-melting is only limited in colleges and scientific research institution or small scale experiment because of late researches. Li, Yanfeng and Wu, Haiqin of Beijing University of Technology, and Harbin Institute of Technology implemented former researches to the electrical heating highway surface and bridge snow removing technology, and Zhuqing and Zhaojun of Tianjin University implemented detailed theoretical research about the application of solar energy soil heat storage technology in highway snow-melting and deicing with Tianjin Municipal Development Ltd.
2. Applicability comparison of modern deicing technologies in Yuebei section
The deicing system is the representative capital dense system, and it needs to be invested by large scale manpower, material resources and financial resources in the process of development, construction and operation. At present, the usual snow-melting and deicing technologies mainly include manual snow and ice removing, chemical snow and ice melting, mechanical snow and ice removing and physical snow and ice removing technology.
The manual deicing method could remove ice and snow with better effect.
The chemical deicing technology is to bestrew chemical medicaments on the highway surface to reduce the melting point and melt snow and ice, and accordingly remove snow and ice, and this method is a sort of highway surface ice and snow removing measure in international common use.
The mechanical deicing technology is the method which utilizes machines to remove snow and ice from the highway surface.
The physical deicing technology mainly includes following aspects at present.
(1) Energy storage highway deicing technology is to establish the energy storage cycle system which could heat the highway surface through the flow of heat liquid stored in the cycle pump in ice and snow weather, and accordingly achieve the effect of removing snow and ice.
(2) Electrothermal process highway surface deicing technology is to lay heating resistance wire or electric materials, and electrify and heating the highway surface to deice when ice and snow come.
(3) Heating mechanical composite deicing technology is to combine mechanical method with heating method, exert their own advantages and increase the efficiency of removing ice and snow. According to the analysis among various deicing technologies, and the comparison results are seen in Table 1.
Yuebei section of Jiangzhu Highway is located in mountainous region of special geographical environment, and the highway network combination has special characters. So we should seriously select proper snow-melting and deicing technology to realize the optimization of benefit and cost. There are 74 bridges which are 14% of total mileage in Yuebei section of Jingzhu highway, where the quantity of larger bridge which span exceeds 500 meters is four. Under general situation, the bridge surface spreading is smaller than 10cm. So, it is very important that the adopted heating mode or radiating materials don’t influence the normal work status of bridge surface, and the spreading of heating system should not influence the using performance of waterproof and use of bridge surface. The construction of bridge surface heating system needs special technical requirement, and at the same time, the bridge is exposed in air, and it has multiple radiating surfaces, and the air circulates quickly, and the heat consumption is much larger than pure highway surface, and the utilization rate of heat efficiency or heat is much lower than the highway surface, so we need develop the control system which can automatically adjust the energy supply tension according to exterior environment temperature and air flow speed. Because the bridge temperature fields induced by heating are different, so the temperature difference between bridge surface and girder bottom will induce additive temperature stress. Therefore, the bridge surface deicing system design will face more limitations.
Though the manual deicing method could eliminate the ice layer on the bridge surface, but it has low efficiency, expensive charge, and too long response waiting time, and it will influence vehicle traffic and safety and induce the damage of bridge surface when working. Chemical deicing would easily damage the environment on both sides of the highway, the vegetation will wither and the drinking water will be polluted. At the same time, chloride deicing agent will largely influence the performance of the structure of the material. The costs that induce structure cauterization and damage environment because of using chloride deicing agents was 4% of GDP, and the repair charge every year is about 200 billion dollars which is 4 times of initial construction charge. 50% of 102 bridges investigated in Copenhagen have serious reinforcing steel bar corruption. The crossroad at Xizhimen of Beijing has been only used for 20 years, but serious concrete flaking and reinforcing steel bar corruption occurred in bridge surface and pier. The simple mechanical deicing method has slow speed and the cutting method and knocking method could easily damage the highway surface, and it will form water leakage and structure damage. And the purchase and maintenance costs of machine are too high, the operation personnel are deficient, and the flexibility is bad, which all limit the large scale using of mechanical
Vol. 3, No. 12 International Journal of Business and Management
118
deicing method. Because of large energy consumption and expensive operation charge, the electric heating highway surface deicing technology can not be implemented, and it is only be the assistant measure to be considered. Because of the limitation of the length of bridge section, the energy storage highway deicing technology which buries cycle liquid pipe under the bridge surface should be seriously considered to use, and the application of this technology could fully utilize natural regenerated energy resource and save energy, and the surface heat storage rate can achieve 36%, and the efficiency of environmental protection and reasonable resource using is very obvious, and it is very convenient to implement automatization and disposal in time. But its concrete implementation needs implement large scale highway surface pipe spreading, the establishment of environmental supervision control system and energy supply system, and it needs consuming large manpower, material and financial resources, and should implement comprehensive plan as a whole, so this technology is fit for the deicing scheme in the new building highway bridge.
Heating mechanical composite deicing technology utilizes the heating equipment to heat the frozen ice and snow before removing ice and snow, and properly enhance the temperature of ice and snow layer, reduce the tension of the ice and snow layer, reduce the difficulty removing snow, and enhance the speed of mechanically removing ice and snow. The technology could improve the original deicing machine to make its performance accord with the requirement of composite deicing technology and effectively reduce the initial charge, and effectively reduce the damage of highway surface and bridge surface and extend the using life of highway and bridge effectively. Based on the comparison of performance indexes of various technologies and economic feasibilities, in this article, we apply the heating mechanical composite deicing technology in the bridge surface deicing scheme in Yuebei section of Jingzhu Highway.
3. Bridge surface deicing program in Yuebei section of Jingzhu highway
3.1 Heating mechanical composite deicing method
The thickness and tension of the snow and ice layer largely influence the snow-removing and deicing effect. Table 2 is the relationship that the anti-cutting intension coefficient of manual hardening snow changes with temperature and density. Table 3 is the relationship of the rigidity of ice changes with the temperature. Therefore, the anti-cutting tension and compressive stress of the ice and snow layer obviously increase with the decrease of temperature and the increase of density, and the ice and snow layer is denser and the temperature is lower, and it is harder to be removed. Therefore, the simple mechanical deicing method has slow speed and the cutting method and knocking method could easily damage the highway surface, and it will form water leakage and structure damage to the highway surface.
The method in the article will utilize the heating equipment to properly enhance the temperature of the ice layer before deicing and reduce the tension of the snow and ice layer and the resistance of mechanical shovel, and enhance the removing clearance rate and work speed. And the method will control the temperature of the ice layer to make the average temperature lower than 0 oC, so the ice layer could not be melted, which can avoid consuming large heat quantity because of the melting of ice, and reduce energy consumption and cost. There are many heating methods, where the microwave heating and far infrared heating are deserved to be adopted. But the microwave heating method needs specially develop special equipments, and especially the leakage of microwave will harm human and environment. In this article, we put forward the mature direct-fired far infrared heating method to deice the ice, which uses liquid-petrol gas as fuel and has little environmental pollution. Figure 1 is the sketch of heating mechanical composite snow removing and deicing design, and it is composed by a tractor and a half-hang deicing car dragged by the tractor. The ice and snow removing method still adopt the mechanical method, and the head of the tractor is the snow shovel designed according to advanced surface, and the snow shovel will quickly shovel the snow, and the half-hang car loads the heating equipment to remove the ice, the mightiness steel wire roller and cutting shovel. The snow shovel shovels the snow, and when the ice snow layer is thinner, the far infrared equipment is used to heat the ice snow layer and reduce the anti-cutting and compressive stress of the snow and ice layer, and then the steel wire brush and the cutting shove are utilized to clear the thinner ice and snow layer stayed on the bridge surface, and the design forming certain angle between the steel wire brush and the cutting shovel with the advance direction will push the ice and snow to the side of the bridge.
The advanced snow shovel with automatic avoiding equipment and strong profile modeling ability includes four sections, which can press close to the highway surface furthest. From the highway snow removing standard, under the premise avoiding damaging highway surface, the snow shovel could reduce 10~6cm of the ice snow layer, and when the depth of snow ice layer is thinner, the far infrared heating equipment is utilized to enhance the average temperature of ice and snow, reduce the cutting tension of machine, enhance the clearance rate and reduce the damage to removing knife. In the scheme of the article, we want to adopt metal fiber burner to make far infrared radiator, and the burner adopts pre-mixed gas surface burning technology. Comparing with other surface burners, the burning tension of the metal fiber burner is high, the adjustment range is large (same burn could realize red fire or blue fire), and the burning is very equal, and the burning efficiency is high (the radiation efficiency of infrared ray could achieve 50%), and it possesses low pollution release, low pressure dropping, high adverse security, good heat expansion control, anti-heat collision, quick cooling and response control. The experiment indicated in the opening environment, the surface
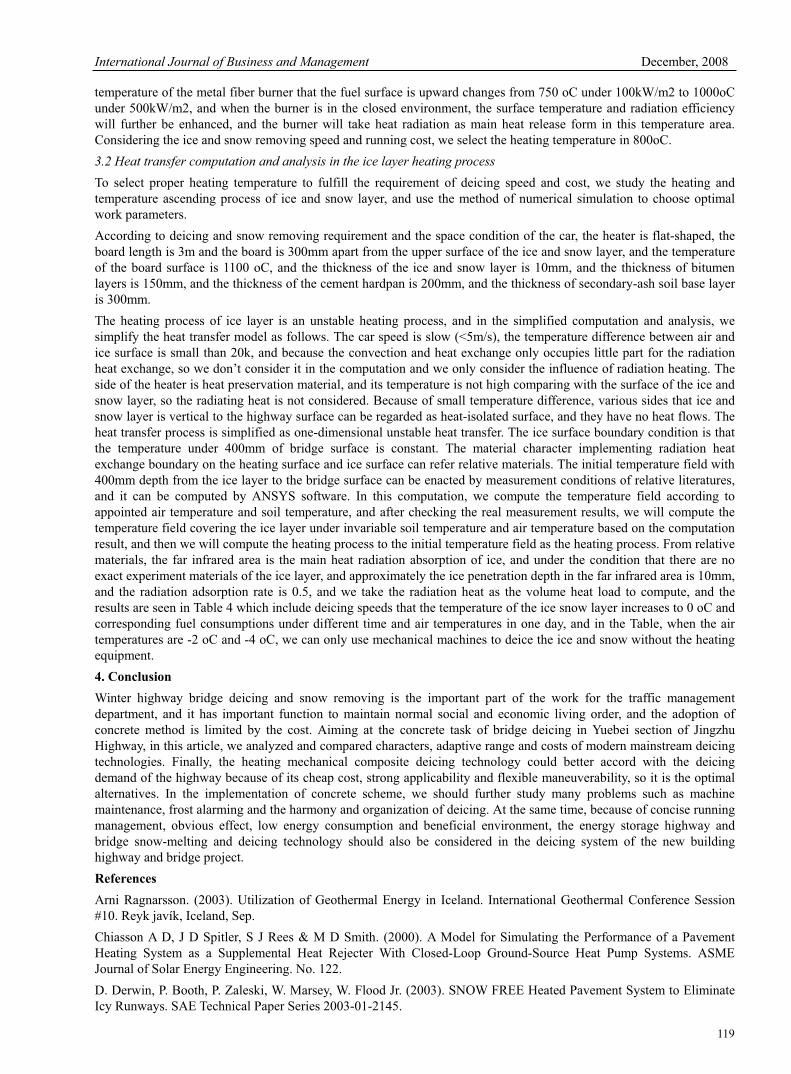
International Journal of Business and Management December, 2008
119
temperature of the metal fiber burner that the fuel surface is upward changes from 750 oC under 100kW/m2 to 1000oC under 500kW/m2, and when the burner is in the closed environment, the surface temperature and radiation efficiency will further be enhanced, and the burner will take heat radiation as main heat release form in this temperature area. Considering the ice and snow removing speed and running cost, we select the heating temperature in 800oC.
3.2 Heat transfer computation and analysis in the ice layer heating process
To select proper heating temperature to fulfill the requirement of deicing speed and cost, we study the heating and temperature ascending process of ice and snow layer, and use the method of numerical simulation to choose optimal work parameters.
According to deicing and snow removing requirement and the space condition of the car, the heater is flat-shaped, the board length is 3m and the board is 300mm apart from the upper surface of the ice and snow layer, and the temperature of the board surface is 1100 oC, and the thickness of the ice and snow layer is 10mm, and the thickness of bitumen layers is 150mm, and the thickness of the cement hardpan is 200mm, and the thickness of secondary-ash soil base layer is 300mm.
The heating process of ice layer is an unstable heating process, and in the simplified computation and analysis, we simplify the heat transfer model as follows. The car speed is slow (<5m/s), the temperature difference between air and ice surface is small than 20k, and because the convection and heat exchange only occupies little part for the radiation heat exchange, so we don’t consider it in the computation and we only consider the influence of radiation heating. The side of the heater is heat preservation material, and its temperature is not high comparing with the surface of the ice and snow layer, so the radiating heat is not considered. Because of small temperature difference, various sides that ice and snow layer is vertical to the highway surface can be regarded as heat-isolated surface, and they have no heat flows. The heat transfer process is simplified as one-dimensional unstable heat transfer. The ice surface boundary condition is that the temperature under 400mm of bridge surface is constant. The material character implementing radiation heat exchange boundary on the heating surface and ice surface can refer relative materials. The initial temperature field with 400mm depth from the ice layer to the bridge surface can be enacted by measurement conditions of relative literatures, and it can be computed by ANSYS software. In this computation, we compute the temperature field according to appointed air temperature and soil temperature, and after checking the real measurement results, we will compute the temperature field covering the ice layer under invariable soil temperature and air temperature based on the computation result, and then we will compute the heating process to the initial temperature field as the heating process. From relative materials, the far infrared area is the main heat radiation absorption of ice, and under the condition that there are no exact experiment materials of the ice layer, and approximately the ice penetration depth in the far infrared area is 10mm, and the radiation adsorption rate is 0.5, and we take the radiation heat as the volume heat load to compute, and the results are seen in Table 4 which include deicing speeds that the temperature of the ice snow layer increases to 0 oC and corresponding fuel consumptions under different time and air temperatures in one day, and in the Table, when the air temperatures are -2 oC and -4 oC, we can only use mechanical machines to deice the ice and snow without the heating equipment.
4. Conclusion
Winter highway bridge deicing and snow removing is the important part of the work for the traffic management department, and it has important function to maintain normal social and economic living order, and the adoption of concrete method is limited by the cost. Aiming at the concrete task of bridge deicing in Yuebei section of Jingzhu Highway, in this article, we analyzed and compared characters, adaptive range and costs of modern mainstream deicing technologies. Finally, the heating mechanical composite deicing technology could better accord with the deicing demand of the highway because of its cheap cost, strong applicability and flexible maneuverability, so it is the optimal alternatives. In the implementation of concrete scheme, we should further study many problems such as machine maintenance, frost alarming and the harmony and organization of deicing. At the same time, because of concise running management, obvious effect, low energy consumption and beneficial environment, the energy storage highway and bridge snow-melting and deicing technology should also be considered in the deicing system of the new building highway and bridge project.
References
Arni Ragnarsson. (2003). Utilization of Geothermal Energy in Iceland. International Geothermal Conference Session #10. Reyk javík, Iceland, Sep.
Chiasson A D, J D Spitler, S J Rees & M D Smith. (2000). A Model for Simulating the Performance of a Pavement Heating System as a Supplemental Heat Rejecter With Closed-Loop Ground-Source Heat Pump Systems. ASME Journal of Solar Energy Engineering. No. 122.
D. Derwin, P. Booth, P. Zaleski, W. Marsey, W. Flood Jr. (2003). SNOW FREE Heated Pavement System to Eliminate Icy Runways. SAE Technical Paper Series 2003-01-2145.
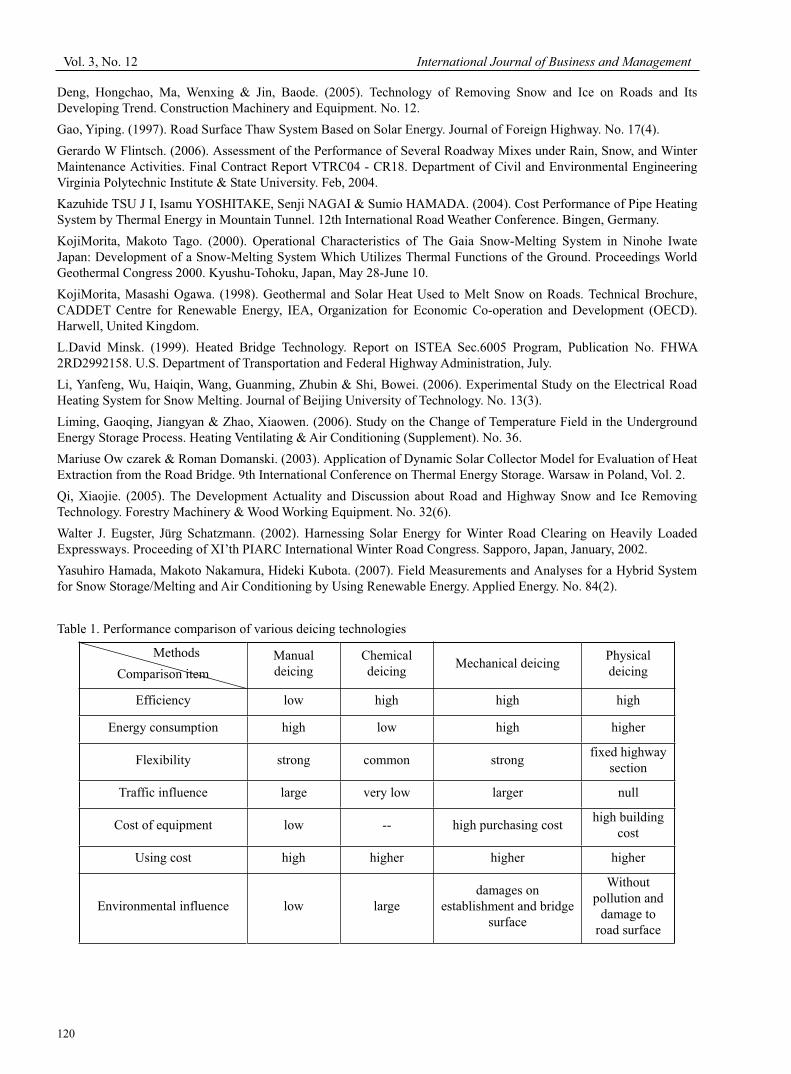
Vol. 3, No. 12 International Journal of Business and Management
120
Deng, Hongchao, Ma, Wenxing & Jin, Baode. (2005). Technology of Removing Snow and Ice on Roads and Its Developing Trend. Construction Machinery and Equipment. No. 12.
Gao, Yiping. (1997). Road Surface Thaw System Based on Solar Energy. Journal of Foreign Highway. No. 17(4).
Gerardo W Flintsch. (2006). Assessment of the Performance of Several Roadway Mixes under Rain, Snow, and Winter Maintenance Activities. Final Contract Report VTRC04 - CR18. Department of Civil and Environmental Engineering Virginia Polytechnic Institute & State University. Feb, 2004.
Kazuhide TSU J I, Isamu YOSHITAKE, Senji NAGAI & Sumio HAMADA. (2004). Cost Performance of Pipe Heating System by Thermal Energy in Mountain Tunnel. 12th International Road Weather Conference. Bingen, Germany.
KojiMorita, Makoto Tago. (2000). Operational Characteristics of The Gaia Snow-Melting System in Ninohe Iwate Japan: Development of a Snow-Melting System Which Utilizes Thermal Functions of the Ground. Proceedings World Geothermal Congress 2000. Kyushu-Tohoku, Japan, May 28-June 10.
KojiMorita, Masashi Ogawa. (1998). Geothermal and Solar Heat Used to Melt Snow on Roads. Technical Brochure, CADDET Centre for Renewable Energy, IEA, Organization for Economic Co-operation and Development (OECD). Harwell, United Kingdom.
L.David Minsk. (1999). Heated Bridge Technology. Report on ISTEA Sec.6005 Program, Publication No. FHWA 2RD2992158. U.S. Department of Transportation and Federal Highway Administration, July.
Li, Yanfeng, Wu, Haiqin, Wang, Guanming, Zhubin & Shi, Bowei. (2006). Experimental Study on the Electrical Road Heating System for Snow Melting. Journal of Beijing University of Technology. No. 13(3).
Liming, Gaoqing, Jiangyan & Zhao, Xiaowen. (2006). Study on the Change of Temperature Field in the Underground Energy Storage Process. Heating Ventilating & Air Conditioning (Supplement). No. 36.
Mariuse Ow czarek & Roman Domanski. (2003). Application of Dynamic Solar Collector Model for Evaluation of Heat Extraction from the Road Bridge. 9th International Conference on Thermal Energy Storage. Warsaw in Poland, Vol. 2.
Qi, Xiaojie. (2005). The Development Actuality and Discussion about Road and Highway Snow and Ice Removing Technology. Forestry Machinery & Wood Working Equipment. No. 32(6).
Walter J. Eugster, Jürg Schatzmann. (2002). Harnessing Solar Energy for Winter Road Clearing on Heavily Loaded Expressways. Proceeding of XI’th PIARC International Winter Road Congress. Sapporo, Japan, January, 2002.
Yasuhiro Hamada, Makoto Nakamura, Hideki Kubota. (2007). Field Measurements and Analyses for a Hybrid System for Snow Storage/Melting and Air Conditioning by Using Renewable Energy. Applied Energy. No. 84(2).
Table 1. Performance comparison of various deicing technologies
Methods
Comparison item
Manual deicing
Chemical deicing
Mechanical deicing Physicaldeicing
Efficiency low high high high
Energy consumption high low high higher
Flexibility strong common strong fixed highway
section
Traffic influence large very low larger null
Cost of equipment low -- high purchasing cost high building
cost
Using cost high higher higher higher
Environmental influence low large damages on
establishment and bridge surface
Without pollution and
damage to road surface
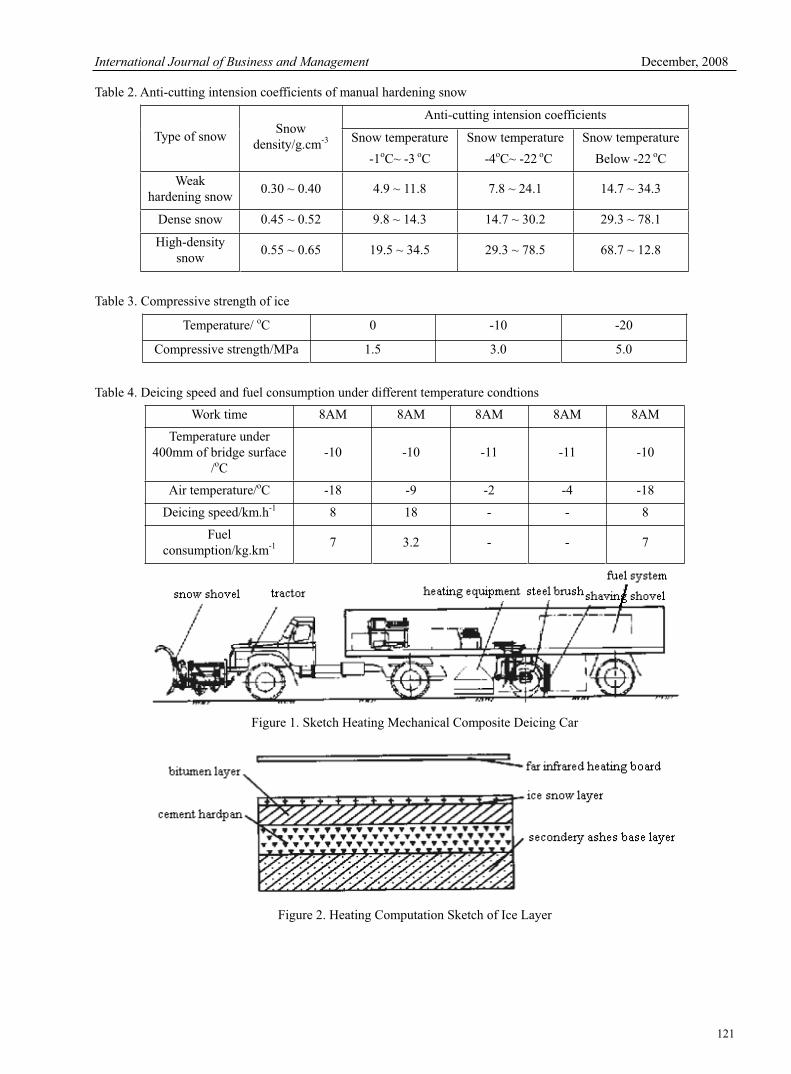
International Journal of Business and Management December, 2008
121
Table 2. Anti-cutting intension coefficients of manual hardening snow
Type of snow Snow
density/g.cm-3
Anti-cutting intension coefficients
Snow temperature
-1oC~ -3 oC
Snow temperature
-4oC~ -22 oC
Snow temperature
Below -22 oC
Weak hardening snow
0.30 ~ 0.40 4.9 ~ 11.8 7.8 ~ 24.1 14.7 ~ 34.3
Dense snow 0.45 ~ 0.52 9.8 ~ 14.3 14.7 ~ 30.2 29.3 ~ 78.1
High-density snow
0.55 ~ 0.65 19.5 ~ 34.5 29.3 ~ 78.5 68.7 ~ 12.8
Table 3. Compressive strength of ice
Temperature/ oC 0 -10 -20
Compressive strength/MPa 1.5 3.0 5.0
Table 4. Deicing speed and fuel consumption under different temperature condtions
Work time 8AM 8AM 8AM 8AM 8AM
Temperature under 400mm of bridge surface
/oC-10 -10 -11 -11 -10
Air temperature/oC -18 -9 -2 -4 -18
Deicing speed/km.h-1 8 18 - - 8
Fuelconsumption/kg.km-1 7 3.2 - - 7
Figure 1. Sketch Heating Mechanical Composite Deicing Car
Figure 2. Heating Computation Sketch of Ice Layer
Vol. 3, No. 12 International Journal of Business and Management
122
The Challenges of Evolving and Developing
Management Indigenous Theories and Practices in Africa
Benjamin James Inyang
Department of Business Management, University of Calabar P.M.B. 1115 Calabar, Nigeria
E-mail: [email protected]
Abstract
The evolution and development of indigenous management theories and practices in Africa has been seriously affected and retarded by colonialism. The colonial administration introduced western management theories and practices, considered as the drivers and the panacea for the continent’s socio-politico-economic development. Western scholarship and literature generally devalued and deprecated the astonishing management prowess and practices of early African civilizations, as evidenced, for example, in the building of the great Egyptian pyramids. These foreign management systems generally failed to achieve the expected goals as they discountenanced African cultural inertia and social milieu. The paper argued for the development of indigenous African management philosophy, which will be rooted in the African culture, value system and beliefs, to provide the practical way for the efficient and effective running of organizations in Africa, with its global competitiveness. The Ubuntu management system and the “new management techniques”, which emphasize humanness, communalism and African patriotism, provide the veritable starting point for the development of indigenous African management philosophy.
Keywords: African management philosophy, Ubuntu, New management techniques, Management theories, Management practices, Management principles
1. Introduction
Scholarly conceptualization from Europe and the United States of America concerning management in Africa have tended to disparage its development, creating a binary management systems of “developed” western management theories and concepts and “underdeveloped” African management thoughts. Western management literature stridently emphasizes this dichotomy, with unabated importation of western management theories and practices to Africa at the detriment of developing indigenous African management theories, which will accommodate the continent’s cultural inertia. Gbadamosi (2003) aptly notes that:
“Western management concepts and writings have dominated the thinking of academics and managers in Africa for a long-time. Such writings have not shown how culture might be taken into account in managerial practice” (pp. 274).
There in no doubt that “management in Africa is strongly rooted in cultural beliefs and traditions” (Fashoyin, 2005, pp. 43). The arrival of colonialism in Africa in the 19th century disrupted the people’s cultural beliefs and traditions, and thus “triggered the beginning of what may be called “colonized African management” according to (Eze, 1995, pp. 136-137). The colonial regimes in Africa created both administrative bureaucracies and colonial companies to exploit the vast natural resources of the continent. A workforce was created made up of the best African brains and trained in western management principles and practices to supply energies for the colonial establishments. “These trained and elevated brains comprised the pioneer group of foreign-loyalist African managers who make up today’s African management” (Eze, 1995, pp. 137). The colonial training has not created the salubrious conditions for nurturing African indigenous management practices. Rather, “the colonial training is psychologically emasculating in terms of self-and national identity” (Eze, 1995, pp. 137). The blanket application of those principles and/or the “unmodified transplantation of those practices which are being utilized in the industrialized countries” (Deihl, 1984, pp. 247) has not in any way helped in the progress of developing indigenous African management theories and practices. There was an erosion of African management thought system. Africans, for example, have been skilful managers have a systematic approach based on historical and practical experience to move from the real to the ideal (Osuntokun, 2001).
Any management education programme that facilitates the entrenchment of western management theories and practices in Africa is not desirable. The desire training “must enable the African manager to transform imported theories and concepts into acceptable cultural norms which can then be applied to management practices in Africa” (Fashoyin, 2005, pp. 45). This can further create the opportunity for the development of indigenous African management principles and practices, which will recognize and accommodate our cultural social, political and environmental factors.
International Journal of Business and Management December, 2008
123
This paper presents the thesis that there is extant knowledge of African management practices and philosophy, which apparently western scholarship deprecates and in its stead, imposes on the continent foreign, western management principles, theories and practices. The challenges of developing indigenous theories and the obvious consequences of this transfer of management knowledge to Africa are discussed. he paper finally advocates an agenda for developing indigenous African management theories and practices that will help advance the course of development in the continent.
2. Extant knowledge of management in Africa
Management as a human responsibility and a process that drives economic development and activities is as old as human civilization or history. Africa as part of the global community has existed in her own unique ways and unique cultures and managed the environment subsistently throughout history. The quiet of this environment was extensively disrupted in the 19th century when the Europeans scrambled for and partitioned Africa. This marked the beginning of colonialism in Africa where the people’s thought processes and cultures were altered through western “civilization” influences. African management thought was a major culprit of these western influences.
Management literature, which bourgeoned in the west paid scant attention to African civilization, which was no doubt driven by African management prowess. A few of the western textbooks that discussed management history acknowledge the great pyramids in Egypt as depicting early outstanding management activities in Africa. Griffin (2005) notes that: “The practice of management can be traced back thousands of years. The Egyptians used the management functions of planning, organizing and controlling when they constructed the pyramids” (pp. 42). These great pyramids, which were built in 2900B.C. are a classic example of management and co-ordination. It is interesting to note that one pyramid required 100,000 men, working for 20 years, covering 13 acres, using 2.3 million blocks, each weighing an average of 2.5 tons. In fact, an even more astonishing description of Egyptian management prowess is presented by George (1968):
“The building of the pyramids with a technology that would be considered primitive by modern standards, affords us testimony of the managerial and organizational abilities of ancient Egypt … The managerial planning of where the stone were to be quarried, when, what size, and how they were to be transported required the practice of what today might well be called long-range planning. By using masses of labour the Egyptians were able to accomplish tasks that astonish us. While their system of organization may appear unwieldy, cumbersome, and even wasteful, they actually had no reasons to economize on labour since more peasants, mercenaries, and slaves were always available simply for the asking … We find also that the Egyptians were aware of sound managerial practices and principles. They understood and appreciated, for example managerial authority and responsibility, and they recognized the value of pooling out job descriptions in detail” (pp. 4-5).
Unfortunately, despite the acknowledgement of the existence of such high-level management skills in Africa, management as practiced in Egypt was tagged “pre-scientific”, a connotation of uncivilized management practice. Even though the Egyptian management accomplishments were significant and remembered today, “they provided limited information about how to actually manage” according to Bartol and Martin (1991, pp. 41). The authors went further to distinguish between management practice and management knowledge by stating: “Thus there is a major difference between practicing management well and adding to knowledge about the field of management so that others also can learn to manage” (Bartol and Martin, 1991, pp. 41).
Arguments of this nature fail to recognize the fact that both management practice and management knowledge are not mutually exclusive, and they are required as they provide necessary conditions for nurturing well-grounded management knowledge in our society today. The astonishing Egyptian management practice is a strong and evident system that would have served as a precursor to the evolution and development of indigenous African management theory and practices, if allowed to grow organically without interference from the western management theories.
Formal treatment of the history of management theories and practices among western scholars are wont to trace their provenance to classical theories and scientific management theory or Taylorism (eg. Bartol and Martin, 1991; Bateman and Zeithaml, 1993; Wren, 1994; Kreitner, 1995; Griffin, 2005; Payne, Youngcourt and Watrous, 2006; Hartley, 2006; and Yoo, Lemak and Choi, 2006). These textbooks and publications make no reference to other great ancient civilizations in Africa like Timbuktu, Songhai, Empire of Mali, and Mapungunbwe (Diop, 1987). The composite effect of colonialism and the disparagement of scholarship in management is the denial of African management system, and the continuing subjugation of African management to western management theories and practices.
3. Understanding the basic concepts in management: principles, theories and practices
The identification of extant knowledge of management in Africa unequivocally presents sound conditions for the nurturing of management principles, theories and practices, similar to those developed in the United States of America and Europe. The early management activities in Africa were no doubt based on sound principles, which serve the
Vol. 3, No. 12 International Journal of Business and Management
124
foundation for management theories and practices. These basic concepts in management are presented here in the context of developing indigenous African management philosophy.
3.1 Management principles
Building a case for African management theories and practices requires one to understand the principles. The principles of management enhance the individual’s understanding of what management entails, and also prepares him for the task of analyzing management issues and appreciating their values in society. Principles in management are considered as fundamental truths existing at a given time, and which explain the relationships that exist between two or more sets of variables. Principles are intended to guide thoughts and actions. They are developed from experience acquired through our interaction with the environment in the normal course of working, and carrying out responsibilities in organizational setting.
There are several of these principles of management in western management literature (e.g. Fayol’s (1949) fourteen principles of management). The African situation is rather unfortunate since colonialism did not permit the nurturing of indigenous management principles. If these principles were developed, they would have furnished the framework for theorizing in management, within the African context.
The benefits of developing African management principles would be the promotion of research in management. The principles would also help in the attainment of social objectives (Jaja & Zep-Obipi, 1992). Through the application of principles, the manager co-ordinates the efforts of individuals thereby, reaching the social attainment by summation of the various individual objectives. Principles facilitate management analysis and set the benchmark for training of managers.
Osuala(2000) notes the value of management principles in helping mangers make more accurate decisions, since principles are developed from experience and can be applied. Principles enable people pass information from one generation to the next, and thus avoiding waste of re-inventing the wheel.
3.2 Management theories
In its simplest conceptualization, a theory is a systematic grouping of related principles. Management theory therefore serves as a means of classifying pertinent management knowledge. According to Nwachukwu (1992), management theory “is a synthesis of the concepts and principles of management. Management theory attempts to present in a concerted manner those facts about human behaviour in organization” (pp. 6-7). Management theory is scientific in nature relying on observation of events, and analysis of facts to generate hypotheses. A hypothesis represents a general statement of logical or systematic relationship embracing a set of observations. Tested and validated hypotheses are called principles.
Management theory increases managerial efficiency by providing the guidelines to help the managers solve problems in the organization. The theory also helps in crystallizing the nature of management – in terms of analyzing management job and the training of managers. Management theory formulation brings about improvement in research and management practice, leading logically to the attainment of social goals and human development. Porth and Mccall (2001) note that management theories emphasize the importance of an organization’s ability to acquire and leverage knowledge that produces meaningful change and innovation.
A related concept to management theory that needs clarification for our purpose is organization theory. Organization theory as a discipline studies the structure and design of organization. It explains, “how organizations are actually designed and suggests the appropriate structural design to improve organizational effectiveness” (Robbins, 1983, pp. 7). Organization theory is therefore the study of the structure and functioning of organizations and behaviour of social groups and individuals within them (Pugh, 1966). The central concern here is with people who are aggregated into departments and organizations - both recognizing differences in structure and behavioural differences.
Organization theory as a way thinking about organization is different from management theory. Organization theory is considered as a set of variables describing the parameters of organization. It attempts to predict the effect of certain structural arrangement on performance and behaviour (Rao & Narayana, 1998). On the other hand, management theory is interested in facts and sound principles, which prescribe what to do to achieve desired outcome in the organization (Daft, 1986). Management theory is therefore related to management practice.
3.3 Management practice
Management theory provides the basis for management practice, and the practice in turn helps to reinforce the development of management theory. Management practice therefore involves the translation of existing management knowledge and theories into action that will result in the achievement of the dual goals of organizational efficiency and effectiveness. Management practitioners and professionals are in the vanguard of management practice, and their practice provides opportunity for reviewing existing management theories and even developing new ones.
International Journal of Business and Management December, 2008
125
Management theorists and practitioners reinforce one another and are in a continuous process of interaction. The knowledge of both is required to improve our understanding of management in society.
The basic concepts in management as presented above have not been properly developed as well as received adequate attention in African management literature.The influences of colonialism and western management education, theories and practices have a telling effect on their development in Africa. The extant knowledge of management practices and activities in Africa were not allowed to evolve and develop as indigenous African management theories and practices. The implications of this western management transfer are discussed in the following section.
4. Transferability of management and implications for Africa
As already pointed out, a major component of colonialism in the African continent is the transfer of western management theories and practices, and education to the autochthonous population of Africa. This was intended to expediently create a pool of qualified labour force to serve the colonial administration and bureaucracy and its diverse interests – and logically leading to economic development. In fact, “the transfer of foreign management knowledge and practices was thus regarded as an essential ingredient of the modernization process” (Usdiken, 1996, pp. 35). This is in adumbration or tandem with Guillen’s (1994) proposition that economic backwardness leads to a stronger tendency to import ideas from more advanced countries as well as to imitate them. The general impression often held about Africa is that of a continent suffering from varying degrees of mis-management (e.g. De Sardan, 1999), poor management (e.g. Kiggundu, 1989), inappropriate management (Dia, 1996; Iguisi, 1997), and under management (Drucker, 1974). The widespread belief is that managerial inefficiencies, which retarded economic growth in Africa were essentially due to lack of qualified managers (Safavi, 1981; Kiggundu, 1991; Eze, 1995; and Waiguchu, Tiagha and Mwaura, 1999). The emphasis was then shifted to western management education to produce the qualified managers to service both the public and private sectors of the economy. Currently, there is widespread provision of technical assistance in the managerial area in the “form of the creation of educational institutions whose objectives are the training of indigenous individuals in western management principles and techniques” (Deihl, 1984, pp. 247).
The universalization of management education and principles has affected the evolution of indigenous African management theories and practices, which would have recognized cultural inertia. Culture, is considered as that complex whole which includes knowledge, beliefs, art, law, morals, custom, and any other capabilities and habits that the individual acquires as a member of society. Culture impacts on management practices. Studies have shown that the practice of management is heavily influenced by the traditions, values and habits of a people as well as their political, economic and social contexts (Oshagbemi, 1984; Thomas & Schonken, 1998; Edoho, 2001; Horwitz, 2002; Jackson, 2004; and Fashoyin, 2005).
The issues of colonialism and colonial mentality are worth further emphasis. The domination of the people by the colonialists has left a strong mark of dependence on the Africans. Though the continent is independent now, our thinking, mode of reasoning, educational system, language are still tied to the colonial influence. This colonial garment, which we have not been able to throw away has in fact, affected our growth in every facet of life. It has affected our being able to develop purely indigenous management principles and theories as we rely solely on the legacies of the colonialists. “The mentality, which we imbibed from the colonial masters, has affected our thought process and social life. It has also affected the culture of our people who have thrown their culture to the winds in preference to the western culture” (Inyang, 2007, pp. 153).
The disruptive effect of the importation of western management theories and education and the resultant clash with African management thought and practices is captured by Nzelibe (1986) thus: “Development of the principles of management was marred, however, by contact with the western world, contact marked by decades of economic exploitation, social oppression and the importation of scientific management, all of which have left acute problems for management today” (pp. 153).
For Kiggundu (1991) colonialism was used as an instrument for destroying local institutions and management practices which were replaced with western administrative structures considered superior to those of the Africans. In effect, indigenous African managerial perspectives were either jettisoned or undervalued (Afro-Centre Alliance, 2001).
Another area where colonialism and western scientific management scholarship impact on Africans is in the representation and portrayal of African leadership and management in organization studies literature of the west. Nkomo (2006) in an extensive leadership theory and management review identifies the problems of representation and identity, where African leadership and management is portrayed subserviently to that of the west. The use of western benchmarks in the evaluation of African leadership and management led to the conclusion that Africa’s stunted growth or underdevelopment was essentially due to poor leadership and management, and that the application of western leadership and management theories was the needed panacea to the complex social, economic and political problems of the continent.
Vol. 3, No. 12 International Journal of Business and Management
126
The African educational system has also come under the heavy influence of colonialism. Across the continent, African business schools and management faculties in the universities and other tertiary institutions have not found it expedient to completely review the colonial business curricular, several years after independence. The preponderance of foreign course contents, literature, models, principles, theories, etc have not in any way helped in the development of indigenous African management theories and management practices.
The specific, sad commentary noted here about Nigeria is, in fact, a depiction across the countries of Africa. In his foreword to Ejiofor’s (1987) Management in Nigeria: theories and issues, Udo Udo-Aka, a renowned management scholar, draws attention to the urgent need to develop indigenous management principles and concepts to help handle our peculiar problems. He writes in the foreword:
“Nigerian management experts have the great and necessary challenge of evolving management principles and styles which are tailored to meet the needs of our environment. Gone are the days when our schools curricular were dominated by only foreign principles, concepts and background. Our urgent need now is to use that experience to develop the type of curricular that would take cognizance of the peculiarities of our environment” (Ejiofor, 1987, pp. v).
Ejiofor in his work re-echoed this sentiments. Sadly enough, several years after these sentiments were expressed no significant change has been noticed in the orientation and practice of management in Nigeria. There is no obvious change in paradigm as much of our management theories; principles and practices are still western-oriented. Our management curricular in schools has not changed. According to Inyang (2007): “This has impacted seriously on the state of management research, thereby slowing the pace of management development and management education in Nigeria. We need to improve on our management research and develop Nigerian models, which will assist us in tackling or addressing the problems confronting management practice in the country” (pp. 154). By extension, this point is applicable to the entire continent, which is in need of sound management research and education that should evolve organically from Africa’s indigenous management thought, reflecting its social milieu and culture.
Another implication of this colonial development and management transfer in Africa is the introduction of the concept of wage employment. Wage employment was a novelty in African countries as economic activities were centered around the family. There was no need for external recruitment of labour. “The only thing akin to recruitment was communal exchange of labour, and of course, there was no cash nexus involved, that is, economic relations were not moderated by exchange of labour for payment of monetary rewards” (Inyang and Akpama, 2002, pp. 15). Eze (1995) notes that during the pre-colonial era, “there was no organizational paid work or employment under the modern organizational structural management; rather, there were family work, community work, and kingdom work” (pp.134-135). The advent of the Europeans and the attendant commercial activities gradually altered this picture. Wage employment became the order of the day in both the public and private sectors of the economy. For services to be obtained and to meet the demands of society – luxuries and taxation – introduced by the colonial administrators, the people embraced wage employment.
This strange development disrupted the communal life of Africans, and who, quite grudgingly accepted the new mode of economic activity. Writing about the African industrial man, Ahiauzu (1999) argues the fact “that wage employment in African communities did not evolve from the traditional mode of work organization, but was introduced to the Africans by the colonial administrators, in a manner that was uncomfortable to the early African workers, has created a dysfunctional impression towards wage-employment among average Africans”(pp. 2). The unenthusiastic response of the African worker toward wage employment tends to affect his attitude and work behaviour in the strange industrial organization he finds himself. This has often led to the unjustified stigmatization of the African worker variously as lazy (Dumont, 1960), lacking in motivation (Kiggundu, 1988 and Blunt and Jones, 1991), and low commitment and loyalty to the organization (Jones, 1986). Ahiauzu (1999) notes that “African managers very often compare the performance of their workers with that of workers in advanced industrial countries, and very easily condemn the African work as lazy, without giving thought to the fact that African workers have a history, which is quite different from that of the industrial societies”(pp. 2-3). Writing in the same vein, Abudu (1986) states that: “This picture of a lazy, leisure-loving African does not stand rigorous examination. The flourishing agriculture, commerce, and industry of pre-colonial Africa belie the notion of the lazy African … Others have spoken eloquently of the industriousness not the laziness, of Africans. If African performance was different in industry, then an explanation for that difference must be sought” (pp. 24).
The African worker has two worlds: the world of work and the world of home and community. Many writers often overlooked this dual existence with the African worker and his work behaviour. There is need for a better understanding of these issues and to reconcile the differences between life at the work place and life at home and community. The work place is seen as an impersonal system where the worker has no locus of control, while at home and community, the worker sees himself in a humanistic locus where people attach human values to all forms of community interactions and actions. The existing tensions must be reconciled and according to Jackson (2004), a cross-cultural approach is most appropriate in this task.
International Journal of Business and Management December, 2008
127
5. The Challenges or difficulties of developing indigenous management theories
There are several difficulties that are confronting management scholars in developing indigenous African management theories to serve the needs of the continent. Some of these factors, apart from colonialism and western management transfer are:
5.1 Lack of research facilities
The governments in Africa have not been able to play their roles by providing research facilities and grants to encourage both basic and applied researches. Most researches have been killed because the originator or researcher did not come from a favoured tribe. Many other researchers have been frustrated by bureaucratic bottlenecks. The private sector too, has not contributed significantly to research efforts in Africa.
5.2 Intra cultural differences
“Africa has a greater degree of ethnic, cultural and linguistic pluralism than other continents” (Ogundele, 2006, pp. 238). These differences have made it difficult in having a common idea or front in the area of development of a consistent and acceptable management practice. Apart from religious differences which have also affected the development of management thought, the power struggle between one tribe and the other has affected the acceptability of a culturally bound theory of management over the other. Ethnicity, which can also cause divisiveness among ethnic groups and some people receiving political patronage from the authority, affects the process of developing management theory.
5.3 Inability of our managers to document their experiences
Many of our managers apart from not realizing that they are veritable sources of information to the search for indigenous management theory find it difficult to document their experiences. According to (Jaja and Zeb-Opibi, 1999) “The managers themselves did nothing to encourage the development of the management principles and theory. Their major interest was on quick service and money. To achieve that end, the areas of their greatest emphasis were technical know-how or technology, cost and the balance sheet. Through ignorance no inquiry was made into proper and adequate administrative functions and ideal leadership styles” (pp. 16).
5.4 The relative newness of management as a discipline in our academic institutions
The relative newness of the study of management in our universities has affected its acceptability, credibility and relevance in our system. Management as it were has not evolved as a local curriculum but a curriculum wholly transferred from foreign university programmes or brochures. The study of management has suffered from lack of indigenous literature that would propagate African management rather than the management theories and practices of the west.
The above challenges or difficulties are, however, not insurmountable as many African scholars are beginning to advocate the evolution and development of indigenous African management theories and practices. This advocacy is presented in the next section.
6. Evolving and developing African management philosophy
The legion of problems associated with colonialism and the international transfer of western management theories to Africa has recently, rekindled interest among African scholars to search for and propagate the concept of African management philosophy. This is an attempt to develop indigenous management knowledge and practices, which are rooted in the African culture, value system and beliefs, and to use this management knowledge to run organizations efficiently and effectively. According to Edoho (2001), African management philosophy is:
“The practical way of thinking about how to effectively run organizations – be they in the public or private sectors – on the basis of African ideas and in terms of how social and economic life is actually experienced in the region. Such thinking must be necessarily interwoven with the daily existence and experience in Africa and its contextual reality” (pp. 74).
As noted earlier, the building of the Egyptian pyramids and African civilizations reflected in the Songhai and Mali Empires, Timbuktu, etc have shown unequivocally the African management prowess. These early management activities in the continent must be recognized, developed and integrated into the global management literature. The establishment and institutionalization of the indigenous African management systems is the surest way to enhance African development – economically, politically, and socially (Mbigi 1997; Blunt and Jones, 1997; Kamocho, 2000; Mangaliso, 2001; Anyansi-Archibong, 2001; Ngambi, 2004; and Mbigi 2005).
A few African scholars of note have started the advocacy for indigenous African management philosophy that would serve the need of the African continent. In South Africa for example, there is an emerging philosophical thought system derived from African culture, beliefs, values and behaviours known as Ubuntu, (a Bantu word meaning, broadly, sharing and community). Mangaliso (2001) defines Ubuntu as “humaneness – a pervasive spirit of caring and community, harmony and hospitality, respect and responsiveness – that individuals and groups display for one another.
Vol. 3, No. 12 International Journal of Business and Management
128
Ubuntu is the foundation for the basic values that manifest themselves in the ways African people think and behave towards each other and everyone else they encounter”(pp. 24). Ubuntu philosophy according to (Poovan, du Toit and Engelbrecht, 2006) allows managers to tap into the familiar African values to build and reinforce teams effectiveness by:
(i) pooling resources for survival – maintaining productivity and effectiveness depends on shared values and individual contribution: encourage focus on communal (vs differences) with reliance to minimize threat to survival through conflict;
(ii) engineering unified situations – the spirit of solidarity, that is, mutual regard among members and individual adhesion to the group; create situations defined by ‘group’ behaviours – sit together, focus, on each other, co-ordinate behaviour;
(iii) enhancing social oneness and participation – set up informal opportunities based on traditional ‘pal abre’ – central village location for gatherings, activities, mediation, decisions, events and rituals.
Ubuntu is therefore considered as an important value of African culture that can form the foundation of African management philosophy that is in tune with the peoples of Africa. It is argued by its proponents that Ubuntu, adopted as a system of management practice for competitive advantage has universal appeal beyond the shores of the continent (Mbigi, 2005; Mangaliso, 2001). Mangaliso (2001) points out that:
“Incorporating Ubuntu principles in management hold the promise of superior approaches to managing organizations. Organizations infused with humanness, a pervasive spirit of caring and community, harmony and hospitality, respect and responsiveness will enjoy more sustainable competitive advantage” (pp. 32).
Therefore, Ubuntu as a management system emphasizes teamwork, attention to relationships, mutual respect and empathy between leader and followers, and participative decision-making. These are very fundamental principles of management, which hold promise for improving organization activities and functioning in Africa.
Beyond Ubuntu, Eze (1995) in his critical thesis advocates the “new management techniques, which will serve as the basis for developing African management philosophy, to enhance the efficient and effective management of African resources. The fifteen ‘techniques’, which he identifies, are summarized below to illustrate the issues of management in Africa:
6.1 Management by self-revolution (MBSR.)
This involves a critical examination of the weakness of the black race in order to develop in Africans the qualities of self-acceptance, self-knowledge, self-trust, self-pride, self-protection and self-reliance, so that the African will be free from foreign manipulation and become independent, inventive self.
6.2 Management by ethnic-groups integration (MBEI)
This would be achieved through workshops, to break down ethnic differences, hostilities and prejudices, and to narrow the workers’ social distances by forging new cultural elements at national and organizational levels. Without ethnic integration, national unity and stability, successful adoption of management may not be feasible.
6.3 Management by attitude change (MBAC)
Again, this would be achieved through workshops in order to develop a more positive attitude and the willingness and determination to change.
6.4 Management by patriotism (MBP)
This involves instilling a patriotic pride and esteem in the workforce through series of orientation activities, laboratory exercises, and successful leadership acts.
6.5 Management by incentive conversion (MBIC)
In this case workshops are designed to re-orient the African workers away from spiritual-world incentives to material world incentives; away from religious-social motives to scientific and factual goals.
6.6 Management by non-corruption (MBNC)
The attitudinal change programmes aimed at changing African managers’ bribery and corruption practices by re-orienting to corporate and national goals. Corruption is antithetical to management.
6.7 Management by impartiality and meritocracy (MBIM)
This is to counter autocratic management and inculcate fairness, equity and recognition in management practices through impartiality in personnel matters.
International Journal of Business and Management December, 2008
129
6.8 Management by accountability (MBA)
This means encouraging managers to be accountable.
6.9 Management by performance appraisal (MBPA)
This involves using objective methods of appraisal.
6.10 Management by free-zone (MBFZ)
This is to encourage the free transfer of indigenous knowledge by creating foreign, expatriate and multinational free zones for African mangers to act themselves, engage in trial and error ventures and practice creative and innovative management. He suggests that other nations like Japan, Korea, Taiwan and India have applied this, and this could be applied in Africa.
6.11 Management by risk-taking (MBRT)
To overcome one of the main sources of Africa’s underdevelopment, which is unwillingness to take risk, African managers must be trained to develop risk-taking attitudes, which are crucial to effective management transfer. This is related to the activity of creating foreign-free zones.
6.12 Management by research and development (MBRD)
This is to counter the reluctance of multinational companies in Africa to establish R & D departments. Indigenous talents can be encouraged and developed by developing capabilities for continuous discoveries, innovations, transformations and invention in African managers.
6.13 Management by basic revolutions (MBR)
These basic revolutions should be aimed at the self, psychological, nationalistic, language, cultural, agricultural and educational aspects. These revolutions are necessary to prevent another “partition of Africa” by foreign creditors and international financial institutions, and to bring about an effective African management.
6.14 Management by planned adaptation (MBPA)
This is an encompassing management device by, which modern management can be transferred. To be successfully in this exercise, all the above management techniques must be systematically applied and effected in black African countries.
6.15 Management by human relations (MBHR)
This technique is to overcome the authoritarian management system imposed by the colonial regimes and multinational companies in Africa. MBHR will develop a more human relationship-based management philosophy that reflects patriotism, nationalism, equal participation, full delegation, human rights, belongingness, ownership, and humanness (pp. 168-175).
The above approach by Eze (1995) is a critical attempt aimed at giving indigenous African management self-confidence to reflect national and indigenous interest, rather than the management principles and practices of the multinational companies and western interests. The common thread that is obvious from the above scholarly advocacy of Ubuntu and the “new management techniques” that will suite the aspirations and developmental needs of Africa, is the humanistic, communalistic and participatory management practices, accommodating African cultural inertia and its social milieu. This embryonic African management philosophy holds lots of promises for the continent if the different strands are effectively nurtured and integrated to provide an alternative to foreign models and management theories, which are apparently unsuitable to the African countries. A study of a diverse South African work force found that imported European and US management practices had limited success; whereas a leadership model that considered cultural differences and emphasized Afro-centric values improved overall performance (British Council Management Express, 2007).
African scholars of management have the onerous responsibility of developing their research skills, to enhance the proper articulation of African management knowledge and practices, toward evolving a coherent indigenous management theory. The emphasis is on the need to develop local concepts and theories of management that are in line with our peculiar situations or circumstances and that will be most effective in achieving our development goals. Eze (1995), in his critical thesis asserts that:
“The recommended fifteen management techniques are considered the most effective methods of achieving adequate preparation of the African management soil and successful adaptation and transfer of modern management. Whatever the form of management that will be transferred, the national management considered most relevant to black African development is the one that is inward-looking, patriotic, nationalistic, revolutionary, adaptive, creative and productive”(pp. 175-176).
Vol. 3, No. 12 International Journal of Business and Management
130
The evolution of African management philosophy has a patriotic flavour, providing the tonic for African cultural renaissance and a reinvention of the African management prowess, astonishingly demonstrated in our early civilizations. The governments in Africa and the private sector should step up efforts by way of releasing funds and making adequate their budgetary provisions for funding research works that bear on management activities. This will serve a major contribution to the development of indigenous African management philosophy.
7. Conclusion
Colonialism has enduring impact in the continent of Africa. Traditional economic relationships were completely altered, and replaced with the western economic system, which was essentially cash nexus in nature. Colonial administrative structures were created and imposed on the people, and this in no small way truncated the development of indigenous African administrative system, which apparently, had been accountable for the building of the continent’s early civilizations of Egypt and others.
African management thoughts and practices, which under lied these early civilizations of Africa were seriously affected by colonialism and equally devalued and deprecated by western scholarship. This is the bane of African management development. The dominance of western management theories and practices, which are apparently considered as drivers of economic development, have seriously affected the evolution of indigenous African management. There are legions of problems associated with the unwholesome transfer of western management models and theories to Africa. Unfortunately, these theories, which failed to recognize cultural inertia, have not provided the panacea for the overall development of the continent, and neither are the theories suitable for application in our Africa’s peculiar circumstances.
The evolution of indigenous African management philosophy is therefore considered as a sine qua non for the development of Africa. This philosophy is rooted in African culture, value system and beliefs, and the derived management knowledge will help the African organizations function more efficiently and effectively. The Ubuntu
management system and the “new management techniques” as advocated by African management scholars, set the revolutionary agenda for evolving an indigenous African management philosophy that will emphasize our cultural traits of humanness, communalism, and participatory decision-making in organizational life. African governments and the private sector must support the development of African management philosophy through creating an enabling environment for management research and the provision of adequate research funds or grants.
Acknowledgement
This paper was presented at the International Conference on Business and Information BAI2008 organized by Academy of Taiwan Information Systems Research, College of Business, National Tapei University and sponsored by Shih-Chien University and Hanyang University, held at Marriott Hotel, Seoul, South Korea, on 7-9 July 2008.
References
Abudu, F. (1986). Work attitudes of Africans, with special reference to Nigeria. International Studies of Management
and Organization, 16 (2):17-36.
Afro-Centric Alliance. (2001). Indigenizing organizational change: localization in Tanzania and Malawi. Journal of
Managerial Psychology, 16 (1):59-78.
Ahiauzu, A. (1999). The African industrial man. Port Harcourt, Nigeria: Cimrat Publications.
Anyansi-Archibong, C. B. (2001). Toward an African-oriented management theory. In F. M. Edoho (Ed.), Management
Challenges for Africa in the Twenty-first Century: theoretical and applied perspectives (pp. 63-72). Westport, CT: Praeger.
Bartol, K.M. & Martin, D.C. (1991). Management. New York: McGraw-Hill.
Bateman, T.S., & Zeithaml, C. P. (1993). Management: function and strategy (2nd Edition). Burr Ridge, Illinois: Irwin.
Blunt, P. & Jones, M. L. (1992). Managing organizations in Africa. Berlin: Walter de Gruyter.
Blunt, P. & Jones, M. L. (1997). Exploring the limits of western leadership theory in East Asia and Africa. Personnel
Review, 26, 6-23.
British Council Management Express. (2007). Globalization and management practices in Africa. [Online] Available: www.britishcouncil.org/nigeria(January 10, 2008).
Daft, R. L. (1986). Organizational theory and design (2nd Ed.), New York: McGraw-Hill.
Deihl, L. (1984). Management theory versus practice in developing countries. In P.N.O. Ejiofor & V.A. Aniagoh (Eds.), Managing the Nigerian Worker (pp. 247-25). Ibadan: Longman Nig. Ltd.
De Sardan, J. P. O. (1999). A moral economy of corruption in Africa? The Journal of Modern African Studies, 37 (1):25-52.
International Journal of Business and Management December, 2008
131
Dia, M. (1996). Africa’s management in the 1990s and beyond. Washington, D.C.: World Bank.
Diop, C.A. (1987). Pre-colonial black Africa. Westport, CT: Lawrence Hill & Company.
Drucker, P. F. (1974). Management: tasks, responsibilities, practices. Oxford: Butterworth-Heinemann.
Dumont, R. (1960). False start in Africa. London: Andre Deutsh.
Edoho, F.M. (2001). (Ed.) Management challenges for Africa in the twenty-first century: theoretical and applied
perspectives. Westport, CT: Praeger.
Edoho, F. M. (2001). Management in Africa: the quest for a philosophical framework. In F. M. Edoho (ed.), Management challenges for Africa in the twenty-first century: theoretical and applied perspectives (pp. 73-90). Westport, CT: Praeger.
Ejiofor, P.N.O. (1987). Management in Nigeria: theories and issues (2nd edition). Lagos: Africana-FEP Publishers Limited.
Eze, N. (1995). Human resource management in Africa: problems and solutions. Lagos, Nigeria: Zomex Press.
Fashoyin, T. (2005). Management in Africa. Lagos Organization Review, 1(1):43-45. This article was first published in the Regional Encyclopedia of Business and Management: Management in Emerging Countries, (pp. 169-175) edited by Malcolm Warner, 2000, Thomson Learning.
Fayol, H. (1949). General and industrial management. Translated, C. Stones. Marshfield, Mass: Pitman Publishing
Gbadamosi, G. (2003). HRM and the commitment rhetoric: challenges for Africa. Management Decision,41(3):274-280.
George, C. S. (1968). The history of management thought. Englewood Cliffs. N. J: Prentice-Hall.
Griffin, R. (2005). Management, 8th Edition. Boston: Houghton-Mufflin.
Guillen, M.F. (1994). Models of management. Chicago: University Press.
Hartley, N.T. (2006). Management history: an umbrella model. Journal of Management History, 12 (3):278-292.
Horwitz, F.M. (2002). Whither South African Management? In M. Warner & P. Joynt (eds), Managing across culture , pp.215-220. London: Thomson Learning.
Iguisi, O. (1997). The Role of Culture In Appropriate Management and Indigenous Development. Proceedings of the
First African Seminar on Culture dimensions to appropriate management in Africa. Makere University Kampala, Uganda, December 1995, Paris: UNESCO, 18-46.
Inyang, B. J. (2007). Management theory: principles and practice, 2nd edition: Calabar, Nigeria: Merb Publishers.
Inyang, B. J. & Akpama, A. M. (2002). Personnel management practice in Nigeria. Calabar, Nigeria: Merb Business Centre.
Jackson, T. (2004). Management and change in Africa: a cross-cultural perspective. New York: Routledge.
Jaja, S. A. & Zeb-Obipi, I. (1999). Management: elements and theories. Port Harcourt, Nigeria: Pearl Publishers.
Jones, M. L. (1986). Management development: an African focus. Management Education and Development,
17(3):302-16 (and reproduced in International Studies of Management and Organization (1989), 19(1):74-90.
Kamoche, K. (2000). Sociological paradigms and human resources: an African context Aldershot: Ashgate.
Kiggundu, M.N. (1988). Africa. In R. Nath (ed.) Comparative management: a regional view. Cambridge, M.A: Ballinger.
Kiggundu, M.N. (1989). Managing organizations in developing countries. West Harford, CT: Kumarian Press.
Kiggundu, M.N. (1991). The challenge of management development in sub-saharan Africa. Journal of Management
Development, 10(6):32-47.
Kreitner, R. (1995). Management.6th Edition. Bostom: Houghton Miffin Company.
Mangaliso, M.P. (2001). Building competitive advantage from Ubuntu: management lessons from South African. Academy of Management Executive, 153(3):23-23.
Mbigi, L. (1997). Ubuntu: the African dream in management. Pretoria: Knowledge Resources.
Mbigi, L. (2005). The spirit of African leadership. Johannesburg: Knowledge Resources.
Ngambi, H. (2004). African leadership: lessons from the chiefs. In T.A.Meyer & I. Boninelli (Eds.), Conversations in
leadership: South African perspective (pp. 107-132). Johannesburg: Knowledge Resources.
Vol. 3, No. 12 International Journal of Business and Management
132
Nkomo, S. M. (2006). Images of ‘African leadership and management’ in organization studies: tensions, contradictions and revisions. Inaugural Lecture presented in the University of South Africa, Pretoria, on 7 March 2006. [Online] Available: Isaunisa.uc.za/news/archive/march/vol.1/docs/Inaugural-Stella-Nkomo.Pdf (January 3, 2008)
Nwachukwu, C. C. (1992). Management theory and practice. Onitsha, Nigeria: Africana FEP Publishers Limited.
Nzelibe, C. O. (1986). The evolution of African management thought. International Studies of Management and
Organization, 16 (2):6-16.
Ogundele, O. J. K. (2006). Management and organization: theory and behaviour. Lagos, Nigeria: Molofin Nominee.
Oshagbemi, T. A. (1984). The management of culture for effective performance. In P.N.O. Ejiofor & V.A. Aniagoh. (Eds.), Managing the Nigerian Worker (pp. 253-256). Ibadan: Longman Nig. Ltd.
Osuala, E. C. (2002). Business Management. Onitsha, Nigeria: Cape Publishers International Limited.
Osuntokun, J. (2001). Some thoughts on traditional African idea of management. The Journal of Cultural Studies, 3(1):99-107.
Payne, S. C., Youngcourt, S. S. & Watrous, K. M. (2006). Portrayals of F. W. Taylor across textbooks. Journal of
Management History, 12 (4):385-407.
Poovan, N., du Toit, M.K. & Engelbrecht, A.S. (2006). The effect of social value of Ubuntu on team effectiveness. South African Journal of Business Management, 37 (3):219-233.
Porth, S. J., & Mccall, J. (2001). Contemporary management theories and Catholic social teaching: similarities and differences. Review of Business, 22 (3):8-21.
Pugh, D. S. (1966). Modern organization theory: a psychological and sociological study. Psychological Bulletin, 66 (21):235-251.
Rao, V. S. P. & Narayana, P. S. (1998). Organization theory and behaviour 2nd Rev. Ed. Delhi: Konark Publishers PVT. LTD.
Robbins, S. P. (1983). Organization theory. New York: Prentice-Hall.
Safavi, F. (1981). A model of management education in Africa. Academy of Management Review, 6 (2):319-331.
Thomas, A. & Schonken, J. (1998). Culture-specific management movement. South African Journal of Business
Management, 29 (2):53-76.
Usdiken, B. (1996). Importing theories of management and organization: the case of Turkish academia. International
Studies of Management and Organization, 26(3):33-45.
Waiguchu, J. M., Tiagha, E. & Mwara, M. (1999). Management and organizations in Africa: a handbook and reference.
Westport, CT: Quorum Books.
Wren, D. A. (1994). The evolution of management thought, (4th ed.), New York: Wile.
Yoo, J. W. Lemak, D.J. & Choi, Y. (2006). Principles of management and competitive strategies: using Fayol to implement Porter. Journal of Management History, 12 (4):352-368.
International Journal of Business and Management December, 2008
133
Income Elasticity of Time Deposit in the Context of Bangladesh
Arup Kumar Sinha (Corresponding author)
Department of Economics, East West University
43 Mohakhali, Dhaka 1212, Bangladesh
Tel: 88-15-5630-2377 E-mail: [email protected], [email protected]
Muntasir Chaudhury
Department of Economics, East West University
43 Mohakhali, Dhaka 1212, Bangladesh
E-mail: [email protected]
A. H. M. R. Imon
Institute of Mathematical Research, University Putra Malaysia
Malaysia
E-mail: [email protected]
Abstract
In the start of this paper we investigated the roles played by components real per capita income and deposit rate in the determination of time deposit and subsequently we tried to show that time deposit is income elastic. Hausman Specification Test is used to check for simultaneity in the endogenous variables. VIF is used to see the presence of multicollinearity and stepwise regression is used to determine the model to estimate the time deposit efficiently.
Keywords: Hausman specification test, VIF, Stepwise regression, Time deposit
1. Introduction
Banks and financial institutes are always making efforts to increase their money deposits. They are making different policies time to time to do it. Because the more the deposits they have the more the investment they can make in different sectors and possibly earn more profit leading to contribution in economy. That is why we were interested to determine the factors on which the deposit depends and finally measures the elasticity (Ball, L., 2001, pp.31-44) considered the problem of money demand in the long run (Markus Knell and Helmut Stix 2005, pp.513-533) considered the problem of income elasticity of money demand. In our study we focused on time deposit instead the total deposit. There is no doubt that total deposit plays an important role in economy. But since the savings accounts have more flexibility to allow the account holder to withdraw the deposit, if money needed people by nature do not hesitate to withdraw it. But if they deposit their money for a fixed time period with the hope of more return, they look for alternative means to cope the situation instead of withdrawing fixed or time deposits. Another logic to use time deposit is that it is fixed for certain time period that accounts better for the ability of the banks to generate investment. From these points we concentrated on time deposit.
For the analysis we collected data on time deposit, deposit rate (weighted), per capita GDP, GDP deflector over the time period 1980-2006 (see ECONSTATS). We used per capita GDP and GDP deflector to estimate the per capita real income and used per capita real income for the estimation purpose. In our paper we will be using the term ‘income’ to refer per capita real income and ‘deposit’ to refer time deposit.
2. Selection and estimation of Model
According to economic models used in previous studies, time deposit is theoretically dependent on deposit rate and real income. In our study we have shown the effect to theses two variables in the determination of time deposit and subsequently the income elasticity of time deposit in the context of Bangladesh.
We had strong belief that simultaneity exist between the variables deposit rate and time deposit. We took these two variables as endogenous and per capita real income as exogenous variable and set the following simultaneous equation system.
Vol. 3, No. 12 International Journal of Business and Management
134
1132211 eXYY
(1)
21212 eYY
(2)
Where, 1Y = Time deposit, 2Y = Deposit rate, 1X = Per capita real income.
Surprisingly Hausman Specification Test to check for simultaneity led us to not to reject the null hypothesis of no simultaneity present in the endogenous variables with the p-value 0.196 (see Appendix A.1).
This absence of simultaneity helps us to set the model in the following way.
eXXY 22110
(3)
Where, Y = Time deposit, 1X = Per capita Real income, and 2X = Deposit rate.
To postulate the model we used collinearity diagnostic to check the presence of multicollinearity. The value of VIF is 1.338 (see App. A.2) which strongly recommend the absence of multicollinearity problem.
In the next step we run the stepwise regression method to fit the model (see App. A.3) which excludes deposit rate. Deposit rate indeed is insignificant in explaining the variation of time deposit in the context of Bangladesh. The reason for deposit rate to be insignificant might be the lack of alternative available to customers who have surplus income. The lack of substitute to savings has made the long-term deposit unresponsive to deposit rate. Since the availability of investment opportunity is not sufficient people with surplus income has no other alternative to time deposit. Whatever the deposit rate might be is certainly better than holding hard cash. So as the income of people is going up so does the time deposit.
Based on the above findings we finally set the following model for our desired estimate.
eXY 110
(4)
Where, Y and1X represent the same as it is in model (3).
3. Findings
The value of R2 for this model is 0.963 (see App. A.3) large enough to take the decision that model (4) is an efficient model to estimate time deposit. The intercept 0 = -177596.45 (p-value = 0.00). The negative intercept may be interpreted as de-saving which signifies that when income goes down a certain level they start withdrawing their deposit. This result is consistent with the economic theories and absolutely logical. That says people maintain a smooth consumption path.
The estimated value of 1 = 1655.09 (p-value= 0.00) which indicates that with the increase of income time deposit increase significantly. Again, the elasticity coefficient for this model is 5.20 which is greater than 1. The approximation of the coefficient of independent variable income is greater than one reflects the fact that, time deposit is a luxury good. That means after a certain level of real income the percentage increase in long-term savings is greater then the percentage change in income.
So the demand for deposit is going up with increase in income but the deposit rate changes little and the increase in time deposit is mainly due to increase in income.
References
Ball, L. (2001). Another look at long-run money demand. Journal of Monetary Economics, 47(1), 31–44.
Chatterjee, S., & Hadi, A. S. (2006). Regression Analysis by Examples, (4th ed.). New York: Wiley.
Gujarati. Damodar N. (2003). Basic econometrics. (4th ed.). New York: McGraw-Hill.
Laidler, D. E. W. (1993). The Demand for Money. Theories, Evidence, and Problems. (4th ed.). New York: HarperCollins College Publisher.
Markus Knell and Helmut Stix (2005). The Income Elasticity of Money Demand: A Meta Analysis of Empirical Results.Journal of Economic Surveys, 19(3), 513-533.
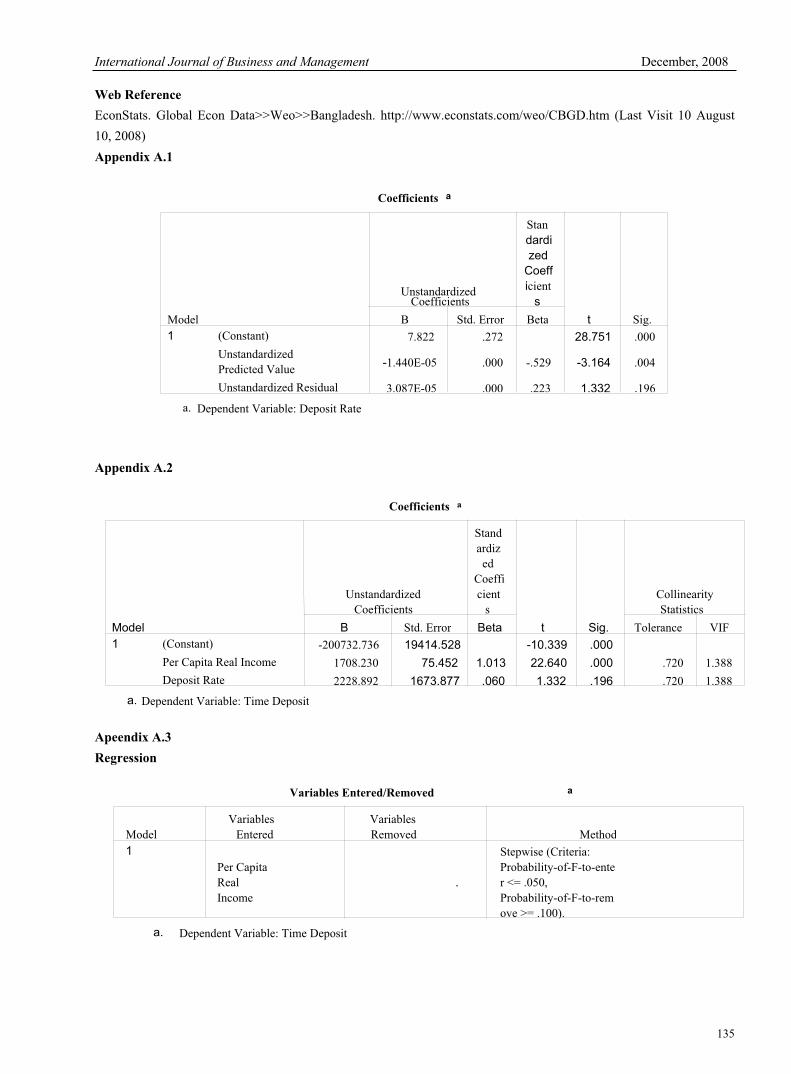
International Journal of Business and Management December, 2008
135
Web Reference
EconStats. Global Econ Data>>Weo>>Bangladesh. http://www.econstats.com/weo/CBGD.htm (Last Visit 10 August
10, 2008)
Appendix A.1
Appendix A.2
Apeendix A.3
Regression
Coefficients a
7.822 .272 28.751 .000
-1.440E-05 .000 -.529 -3.164 .004
3.087E-05 .000 .223 1.332 .196
(Constant)
UnstandardizedPredicted Value
Unstandardized Residual
Model
1
B Std. Error
UnstandardizedCoefficients
Beta
Standardi
zed
Coeff
icients
t Sig.
Dependent Variable: Deposit Ratea.
Coefficients a
-200732.736 19414.528 -10.339 .000
1708.230 75.452 1.013 22.640 .000 .720 1.388
2228.892 1673.877 .060 1.332 .196 .720 1.388
(Constant)
Per Capita Real Income
Deposit Rate
Model
1
B Std. Error
UnstandardizedCoefficients
Beta
Standardized
Coefficient
s
t Sig. Tolerance VIF
CollinearityStatistics
Dependent Variable: Time Deposita.
Variables Entered/Removed a
Per CapitaRealIncome
.
Stepwise (Criteria:Probability-of-F-to-enter <= .050,Probability-of-F-to-remove >= .100).
Model
1
VariablesEntered
VariablesRemoved Method
Dependent Variable: Time Deposita.
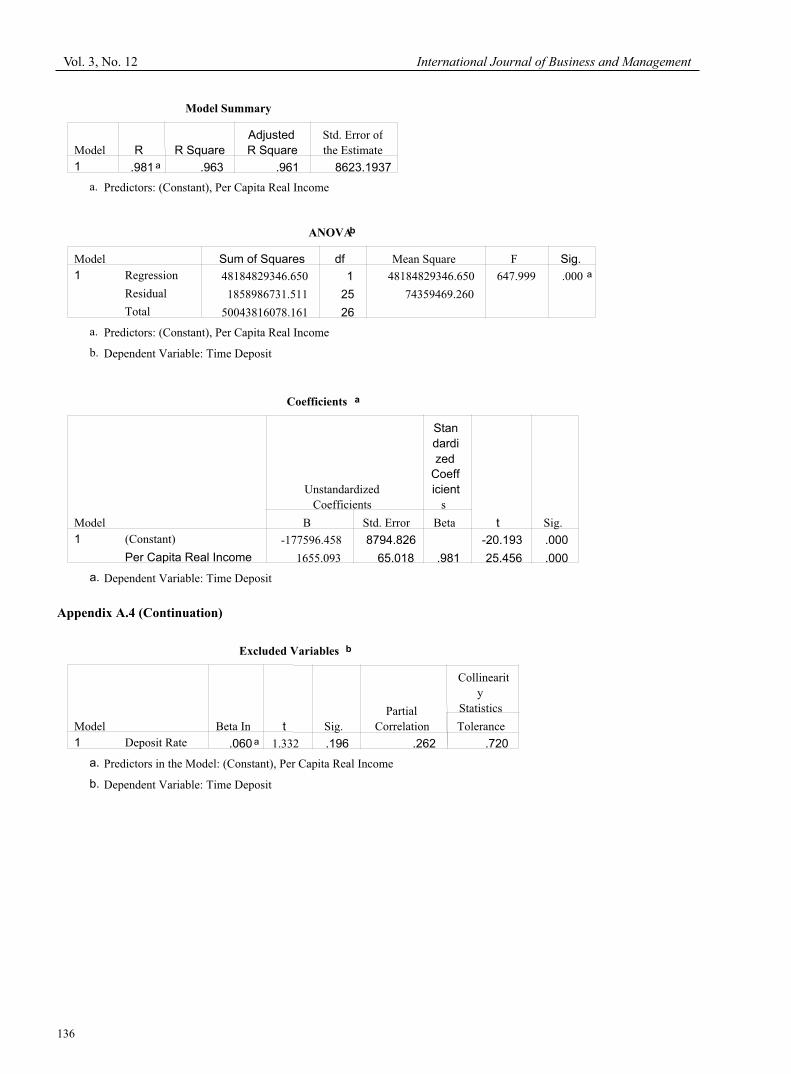
Vol. 3, No. 12 International Journal of Business and Management
136
Appendix A.4 (Continuation)
Model Summary
.981 a .963 .961 8623.1937
Model
1
R R Square
Adjusted
R Square
Std. Error ofthe Estimate
Predictors: (Constant), Per Capita Real Incomea.
ANOVAb
48184829346.650 1 48184829346.650 647.999 .000 a
1858986731.511 25 74359469.260
50043816078.161 26
Regression
Residual
Total
Model
1
Sum of Squares df Mean Square F Sig.
Predictors: (Constant), Per Capita Real Incomea.
Dependent Variable: Time Depositb.
Coefficients a
-177596.458 8794.826 -20.193 .000
1655.093 65.018 .981 25.456 .000
(Constant)
Per Capita Real Income
Model
1
B Std. Error
UnstandardizedCoefficients
Beta
Stan
dardi
zed
Coeff
icient
s
t Sig.
Dependent Variable: Time Deposita.
Excluded Variables b
.060 a 1.332 .196 .262 .720Deposit Rate
Model
1
Beta In t Sig.Partial
Correlation Tolerance
Collinearity
Statistics
Predictors in the Model: (Constant), Per Capita Real Incomea.
Dependent Variable: Time Depositb.
International Journal of Business and Management December, 2008
137
Organizational Culture and Its Themes
Shili Sun
School of Foreign Languages, Ludong University
No.186 Hongqi Middle Road, Zhifu District, Yantai 264025, Shandong Province, China
Tel: 86-535-668-1098 E-mail: [email protected]
Abstract
As one of the key ‘stable factors’, culture within an organization is playing a critical role in the organization’s everyday operations. Although the culture literature has at times focused on the culture of an organization as shared basic assumptions (Schein, 1985), or as metaphors within organizations (Morgan, 1986, 1997), it is not sufficient to attempt to understand and measure them. This paper explores organizational culture in general, some definitions and implications of organizational culture are reviewed from different perspectives, and Cliffe’s cultural themes are addressed with the use of Scholes’ cultural web and Hofstede’s onion diagram model of organizational culture.
Keywords: Culture, Organizational culture, Cultural themes
1. Organizational culture
Historically, there are numberless definitions about organizational culture, which is defined in many different ways in the literature. Perhaps the most commonly known definition is “the way we do things around here” (Lundy & Cowling, 1996). Organizational culture is manifested in the typical characteristics of the organization, in other words, organizational culture should be regarded as the right way in which things are done or problems should be understood in the organization. It is widely accepted that organizational culture is defined as the deeply rooted values and beliefs that are shared by personnel in an organization.
Ogbonna (1992) declaring that organizational cultures are the outcomes of ‘… the interweaving of an individual into a community and the collective programming of the mind that distinguishes members … it is the values, norms, beliefs and customs that an individual holds in common with other members of a social unit or group …’.
Another opinion from Bro Uttal (1983) who regarded organization culture as a system of shared values (what is important) and beliefs (how things work) that interact with a company’s people, organization structures, and control systems to produce behavioral norms (the way we do things around here).
In another perspective, culture may be considered as ‘software’ within an organization, since it is ‘software’, so, managers are supposed to study carefully and try to find how does each element of ‘software’ works on the basis of ‘hardware’ (simply regarding an organization as an operating hardware).
Generally speaking, organization culture is the “set theory” of important values, beliefs, and understandings that members share in common, culture provides better (or the best) ways of thinking, feeling and reacting that could help managers to make decision and arrange activities of organization. A successful organization should have strong cultures that can attract, hold, and reward people for performing roles and achieving goals, whereas strong cultures are usually characterized by dedication and co-operation in the service of common values. So, how much does an employee involve for an organization at their best should be recognized clearly.
Andrew Brown (1995, 1998) stated the definition of organizational culture in his book Organizational Culture is as follows:
“Organizational culture refers to the pattern of beliefs, values and learned ways of coping with experience that have
developed during the course of an organization’s history, and which tend to be manifested in its material arrangements
and in the behaviours of its members.”
In contrast, other authors such as Schein (1985a) have suggested that culture is best thought of as a set of psychological predispositions (which he calls ‘basic assumptions’) that members of an organization possess, and which leads them to think and act in certain ways.
So, Schein (1985, Ch.1) offers another approach to understanding the concept of organizational culture. For him, it is:
“A pattern of shared basic assumptions that a group learns as it solves its problems of external adaptation and internal
integration, that has worked well enough to be considered valid and, therefore, to be taught to new members as the correct way to perceive, think and feel in relation to those problems.”
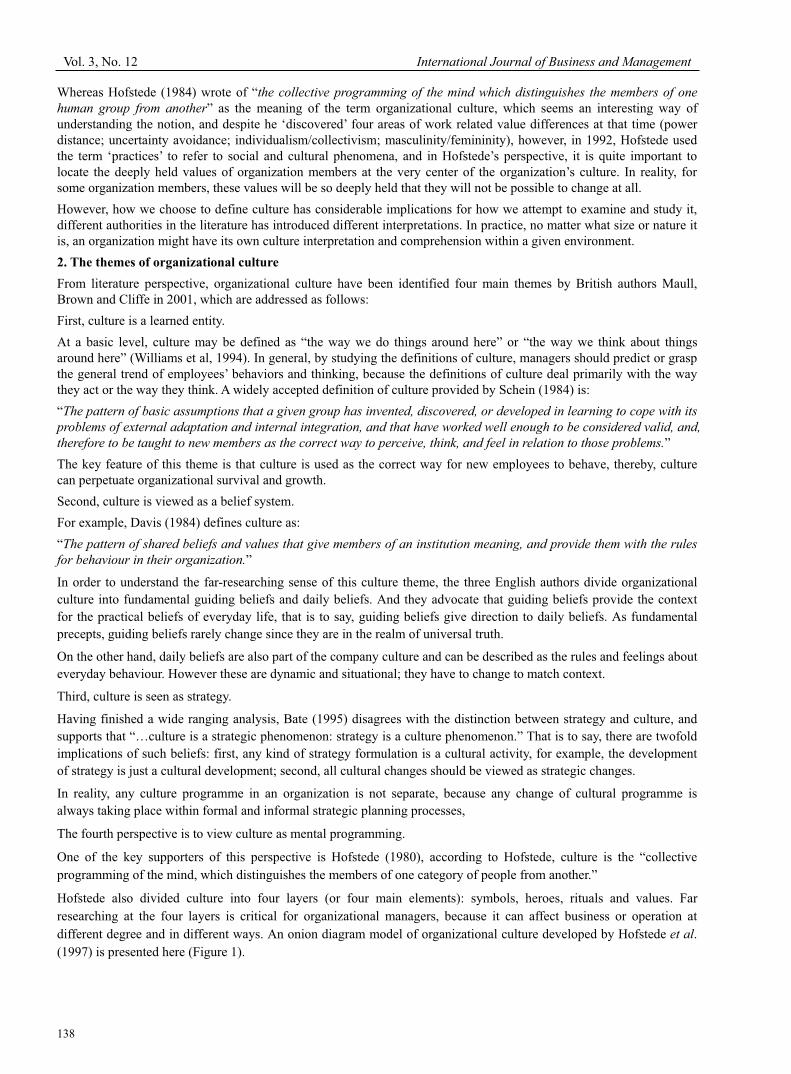
Vol. 3, No. 12 International Journal of Business and Management
138
Whereas Hofstede (1984) wrote of “the collective programming of the mind which distinguishes the members of one
human group from another” as the meaning of the term organizational culture, which seems an interesting way of understanding the notion, and despite he ‘discovered’ four areas of work related value differences at that time (power distance; uncertainty avoidance; individualism/collectivism; masculinity/femininity), however, in 1992, Hofstede used the term ‘practices’ to refer to social and cultural phenomena, and in Hofstede’s perspective, it is quite important to locate the deeply held values of organization members at the very center of the organization’s culture. In reality, for some organization members, these values will be so deeply held that they will not be possible to change at all.
However, how we choose to define culture has considerable implications for how we attempt to examine and study it, different authorities in the literature has introduced different interpretations. In practice, no matter what size or nature itis, an organization might have its own culture interpretation and comprehension within a given environment.
2. The themes of organizational culture
From literature perspective, organizational culture have been identified four main themes by British authors Maull, Brown and Cliffe in 2001, which are addressed as follows:
First, culture is a learned entity.
At a basic level, culture may be defined as “the way we do things around here” or “the way we think about things around here” (Williams et al, 1994). In general, by studying the definitions of culture, managers should predict or grasp the general trend of employees’ behaviors and thinking, because the definitions of culture deal primarily with the way they act or the way they think. A widely accepted definition of culture provided by Schein (1984) is:
“The pattern of basic assumptions that a given group has invented, discovered, or developed in learning to cope with its
problems of external adaptation and internal integration, and that have worked well enough to be considered valid, and,
therefore to be taught to new members as the correct way to perceive, think, and feel in relation to those problems.”
The key feature of this theme is that culture is used as the correct way for new employees to behave, thereby, culture can perpetuate organizational survival and growth.
Second, culture is viewed as a belief system.
For example, Davis (1984) defines culture as:
“The pattern of shared beliefs and values that give members of an institution meaning, and provide them with the rules
for behaviour in their organization.”
In order to understand the far-researching sense of this culture theme, the three English authors divide organizational culture into fundamental guiding beliefs and daily beliefs. And they advocate that guiding beliefs provide the context for the practical beliefs of everyday life, that is to say, guiding beliefs give direction to daily beliefs. As fundamental precepts, guiding beliefs rarely change since they are in the realm of universal truth.
On the other hand, daily beliefs are also part of the company culture and can be described as the rules and feelings about everyday behaviour. However these are dynamic and situational; they have to change to match context.
Third, culture is seen as strategy.
Having finished a wide ranging analysis, Bate (1995) disagrees with the distinction between strategy and culture, and supports that “…culture is a strategic phenomenon: strategy is a culture phenomenon.” That is to say, there are twofold implications of such beliefs: first, any kind of strategy formulation is a cultural activity, for example, the development of strategy is just a cultural development; second, all cultural changes should be viewed as strategic changes.
In reality, any culture programme in an organization is not separate, because any change of cultural programme is always taking place within formal and informal strategic planning processes,
The fourth perspective is to view culture as mental programming.
One of the key supporters of this perspective is Hofstede (1980), according to Hofstede, culture is the “collective
programming of the mind, which distinguishes the members of one category of people from another.”
Hofstede also divided culture into four layers (or four main elements): symbols, heroes, rituals and values. Far
researching at the four layers is critical for organizational managers, because it can affect business or operation at
different degree and in different ways. An onion diagram model of organizational culture developed by Hofstede et al.
(1997) is presented here (Figure 1).
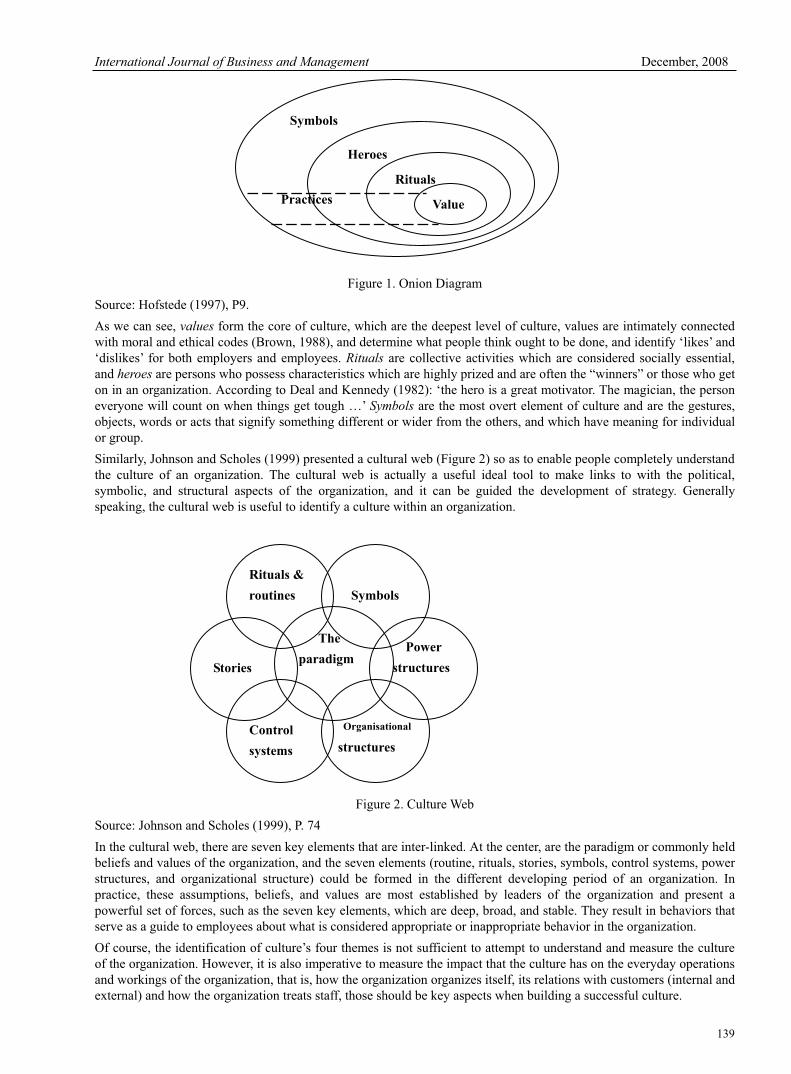
International Journal of Business and Management December, 2008
139
Figure 1. Onion Diagram
Source: Hofstede (1997), P9.
As we can see, values form the core of culture, which are the deepest level of culture, values are intimately connected with moral and ethical codes (Brown, 1988), and determine what people think ought to be done, and identify ‘likes’ and ‘dislikes’ for both employers and employees. Rituals are collective activities which are considered socially essential, and heroes are persons who possess characteristics which are highly prized and are often the “winners” or those who get on in an organization. According to Deal and Kennedy (1982): ‘the hero is a great motivator. The magician, the person everyone will count on when things get tough …’ Symbols are the most overt element of culture and are the gestures, objects, words or acts that signify something different or wider from the others, and which have meaning for individual or group.
Similarly, Johnson and Scholes (1999) presented a cultural web (Figure 2) so as to enable people completely understand the culture of an organization. The cultural web is actually a useful ideal tool to make links to with the political, symbolic, and structural aspects of the organization, and it can be guided the development of strategy. Generally speaking, the cultural web is useful to identify a culture within an organization.
Figure 2. Culture Web
Source: Johnson and Scholes (1999), P. 74
In the cultural web, there are seven key elements that are inter-linked. At the center, are the paradigm or commonly held beliefs and values of the organization, and the seven elements (routine, rituals, stories, symbols, control systems, power structures, and organizational structure) could be formed in the different developing period of an organization. In practice, these assumptions, beliefs, and values are most established by leaders of the organization and present a powerful set of forces, such as the seven key elements, which are deep, broad, and stable. They result in behaviors that serve as a guide to employees about what is considered appropriate or inappropriate behavior in the organization.
Of course, the identification of culture’s four themes is not sufficient to attempt to understand and measure the culture of the organization. However, it is also imperative to measure the impact that the culture has on the everyday operations and workings of the organization, that is, how the organization organizes itself, its relations with customers (internal and external) and how the organization treats staff, those should be key aspects when building a successful culture.
Symbols
Heroes
Rituals
ValuePractices
The
paradigm
Rituals &
routines Symbols
Stories
Power
structures
Control
systems
Organisational
structures
Vol. 3, No. 12 International Journal of Business and Management
140
3. The importance of organizational culture
Hofstede (1997) said that culture influence how people behaviour and think, so, it is important to understand culture within an organization; whereas Jim Grieves (2000) strongly supported that organizational development can promote humanistic values, so, earlier in 1982, Deal and Kennedy advocated that organization development should be combined with organizational culture effectively, in order to make people work efficiently.
When we talk about the role of organizational culture in an organization, it is normally better to start from two perspectives which were provided by E. C. Martins and F. Terblanche (2003): the functions of organizational culture and the influence that organizational culture has on the different processes in the organization.
Normally, the functions of organizational culture manifest itself in two aims: first, creating the feeling of identity among personnel and commitment to the organization; second, creating a competitive edge to enable the members (especially new members) in the organization to well understand acceptable behaviour and social system stability (Martins, 2000).
It is the fact that organizational culture can offer a shared system of meanings, which forms the basis of communication and mutual understanding. If the organizational culture doses not fulfill these functions in a satisfactory way, the culture may significantly reduce the efficiency of an organization (Furnham & Gunter, 1993).
On the other hand, organizations use different resources and processes to guide behaviour and change. Organizational culture is playing an indirect role in influencing behaviour by using reasonable managerial tools, such as strategic direction, goals, tasks, technology, structure, communication, decision making, cooperation and interpersonal relationships, and so forth, which are all designed to do things (Martins & Terblanche, 2003).
In order to become an efficient organization, the importance of culture should not be neglected (Schneider & Barsoux, 1997), because culture has an impact on how the organization is run. Earlier in the year of 1986, Gareth Morgan argued that an organization is basically a human nature operation, so he stressed the need to build organizations around people rather than techniques.
Additionally, according to Campbell and Stonehouse(1999), culture can also have influence on: employee motivation; employee morale and ‘good will’; productivity and efficiency; the quality of work; innovation and creativity and the attitude of employees in the workplace.
In terms of an organization’s development, organizational culture can be used as different tools to help the organization reach success. First, organizational culture is a powerful tool for improving business performance (Brown, 1995), it can also be a competitive advantage against the organization’s competitors, for example, some companies like Hewlett-Packard and IBM, the organizational culture within the two companies has become a competitive advantage over their competitors.
Secondly, organizational culture can be a tool of management control. Managers could use selected rites, stories, symbols and common values to control and direct employee behaviour. From the future perspective, this form of control could be cheaper and could build commitment to the organization and its goals.
Hence, Buchanan and Huczynski (1997) argued that management today is moving from bureaucratic control to humanistic control. In the current society, organizations are seeking to satisfy their members’ needs by providing satisfying work tasks or a pleasant team working life through internal control, and all those aims could be achieved with the help of their organizational culture, and only with a complete and pleasant understanding of organizational culture, individuals would more willing to commit themselves to their organizations.
Similarly, Hellriegel et al (2001) also add that organizational culture has the potential to enhance organizational performance, individual satisfaction, problems solving, and so on.
However, not all scholars agree with the above opinions about culture’s roles. Some researchers argue that organizational culture is partly the outcome of society factors. Johnson and Scholes (1999) have pointed out, that significant value of society change is becoming more and more complex and is out-of-date, and therefore, those right things or decisions, such as strategies, which were acceptable and successful in the past, may not be used today.
What’s more, more employees have begun to feel that organizational cultures established many years ago are out of step with the contemporary values, thus, the need to determine which attributes of an organization’s culture should be preserved and which should be modified is constant.
4. Conclusion
Every organization has its own unique culture or value set, and different organization may have its own comprehension of culture meaning. The culture of the organization is typically created unconsciously, based on the values of the top management or the founders of an organization.
In order to achieve a successful culture, managers shouldn’t ignore organizational culture and its themes, because culture can be used as a competitive advantage during organizational development, and a strong culture (one in which
International Journal of Business and Management December, 2008
141
beliefs and values are widely shared and strongly held) can also offer many advantages, such as cooperation, control, communication or commitment. Meanwhile, the importance of organizational culture is growing as the result of several recent developmets, and the cultural themes can be used constantly to measure the culture of the organization.
References
Andrew Brown. (1995, 1998). Organisational Culture. (2nd ed). Pitman Publishing. pp. 9, 33, 176.
Bate, P. (1995). Strategies for Cultural Change. Butterworth-Heinemann, Oxford.
Buchanan, D. & Huczynski, A. (1997). Organisational Behaviour: An Introductory Text. (3rd ed). Prentice Hall.
David Campbell, George Stonehouse & Bill Houston. (1999). Business Strategy. Butterworth Heinemann. pp. 47-48.
Davis, S.M. (1984). Managing Corporate Culture. Ballinger, Cambridge, MA.
Deal, T.E. & Kennedy, A.A. (1982). Corporate Cultures. The Rites and Rituals of Corporate Life. Addison-Wesley, Reading, MA.
Martins, E.C. & Terblanche, F. (2003). Building organizational culture that stimulates creativity and innovation. European Journal of Innovation Management, Vol. 6, No. 1, pp. 64-74.
Furnham, A. & Gunter, B. (1993). Corporate Assessment: Auditing a Company’s Personality. Routledge, London.
Hellriegel, Slocum & Woodman. (2001). Organisational Behavior. (9th ed). South-Western. pp. 523.
Hofstede, G. (1984). Cultural Consequences: International Differences in Work Values. Sage, Beverly Hills.
Hofstede, G. (1992). Culture and Organisations: Software of the Mind. McGraw Hill, Maidenhead.
Hofstede, G. (1980). Culture’s Consequences. Sage, Beverly Hills, CA.
Hofstede, G. (1997). Culture and Organisations: Software of the Mind: Intercultural Cooperation and its importance for Survival. McGraw-Hill.
Jim Grieves. (2000). Introduction: the origins of organizational development. The Journal of Management Development,Volume 19, Number 5, pp. 345-447.
Johnson, G & Scholes, K. (1999). Exploring Corporate Strategy. (5th ed). Prentice Hall.
Martins, E.C. (2000). The influence of organizational culture on creativity and innovation in a university library. MLnf dissertation, University of South Africa, Pretoria.
Morgan, G. (1986). Images of Organisation. Beverly Hills, Cali.: Sage.
Morgan, G. (1997). Images of Organisation. Thousand Oaks, CA: Sage.
Ogbonna, E. (1992). Managing Organisational Culture: Fantasy or Reality?. Journal of Human Resource Management.Volume 3, Number 2, pp. 42-54.
Maull, R., Brown, P. & Cliffe, R. (2001). Organisational culture and quality improvement. International Journal of
Operations & Production Management, Vol. 21, No. 3, pp. 302-326.
Rollinson, Edwards & Broadfield. (1998). Organisational behaviour and analysis. Addison Wesley. pp. 535.
Schein, E.H. (1985). Organisational Culture and Leadership. Jossey Bass, San Francisco.
Schein, E.H. (1985a). How Culture Forms, Develops and Changes. San Francisco, Calif.: Jossey Bass. pp. 17-43.
Schneider, S. C. & Barsoux, J. L. (1997). Managing Across Cultures. Prentice Hall.
Williams, A., Dobson, P. & Walters, M. (1994). Changing Culture: New Organisational Approaches. (2nd ed). Cromwell Press, Wiltshire.
Vol. 3, No. 12 International Journal of Business and Management
142
Necessarity of Practicing Green Manufacturing in
Iron Industry from the Point of Social Responsibility
Zhihong Zhang, Xi Tian
School of Accounting, Shandong Economic University
Jinan 250014, Shandong, China
E-mail: [email protected], [email protected]
Abstract
On the basis of analyzing the present situation of iron industry and related literature, points were put out that iron industry in China is now in a dilemma, and social responsibility is default. Then analysis of the relationship between green manufacturing and corporate social responsibility is done. Taking Jinan Steel and Iron Group Corporation for an example, changes are compared from many aspects. Quantitative analysis was used to illustrate the effect of green manufacturing. Results show that measures of green manufacturing taken by in iron industry are effective, and it is feasible and necessary to practice green manufacturing in iron industry.
Keywords: Iron industry, Green manufacturing, Social responsibility
1. Introduction
China is the largest iron production and consumption country in the world. In 1996, Steel output exceeded 100 million tons in China, and China became the first iron production country. Statistical data revealed that in the first half of 2007 cumulative output of crude steel were 237.1 million tons, a 17.8% increase.
Iron industry is one of the biggest industries of resource consumption and pollution emission. Relevant data show that, in iron industry, the total energy consumption amounts to 14.71%. In the past five years, the comprehensive energy consumption per ton of iron has reduced by179 kgce/t, but there is still a large gap to achieve the level in developed countries that is between 12% and 15%.
Corporate social responsibility for Iron Industry should contain the duty for environmental protection, resources protection and rational utilization. As the basic industry of national economy, iron industry must bear both economic responsibility and social responsibility. However, in real life the default of social responsibility is serious. Panyue, the administrator of China State Environmental Administration, points out that in Tangshan Region, 70 iron enterprises are built without any environmental capacity, including 80% illegal enterprises.
Traditional manufacturing mode that practicing in iron industry of China is one important factor that caused above problems. Green manufacturing mode is developed in recent years. Some researches show that two advantages of practicing green manufacturing can be presented. On one hand, sustainable development strategy could be guaranteed. On the other hand, considerable economic benefits could be gained for enterprises. The cycle of “material—production—flotsam—material” can be constructed in industry enterprises with saving energy, reducing loss and reducing pollution (Tang Jianwen, 2006, pp. 82). If green manufacturing can be put into practice successfully, the contradiction between environmental pollution and sustainable development will be effectively solved (Yin Ruiyu, 2002, pp. 3), (Liu Fei, Zhang Hua, 1999, pp. 326), (Zhang Xinming, Duan Xiong, 2002, pp. 43). So it is feasib le and necessary for iron industry in China to adopt the green manufacturing mode. Studies Discussion on green manufacturing by scholars are widely, but yet not in-depth in practice application.
2. Advantage of green manufacturing and its relationship with corporate social responsibility
2.1 Advantage of Green Manufacturing
Compared with traditional manufacturing mode, it has some obvious advantages to practicing green manufacturing. In addition, there exists some indivisible relations between green manufacturing and corporate social responsibility, namely, green manufacturing, economic and social benefits can be simultaneity gained with the enterprise’s value to be improved. It has been proved that energy consumption and pollution brought by applying traditional manufacturing mode is so high. That social sustainable development would be threatened. Meanwhile, pollution problem is considered fully in green manufacturing (Yin Ruiyu, 2002, pp. 3). Some scholars pointed out that human-oriented development is principle in the green manufacturing mode, and various advanced techniques and modern management methods are major means, enhancing economic benefits, improving social benefits and increasing ecological benefits are objectives.
International Journal of Business and Management December, 2008
143
2.2 Relationship between Green Manufacturing and Corporate Social Responsibility
Corporate social responsibility is to answer why social responsibility should be taken, whether it should be taken, for whom it should be taken and what moral criterions should be based on (Shen Hongtao, Shen Yifeng, 2007). Corporate social responsibility gives consideration to not only social benefits, but also economic benefits (Zhang Ming, 2007, pp. 81-82), (Kanazawa, 1988, pp. 105). So long as undertaking corporate social responsibility insistently, both capital return from society and all kinds of support from stakeholders can be aroused (A.B.Carroll, 2004, pp. 39). Compared with small-sized enterprises, stakeholders in large and medium-sized enterprises do well in undertaking corporate social responsibility. As a result, the operating performance and organizational performance in large and medium-sized enterprises are better than that in small-sized enterprises. So there is positive correlation between undertaking corporate social responsibility and operating performance (Li Youhuan, 2007, pp. 100).
3. Example of practicing green manufacturing in China
Green manufacturing as an advanced manufacturing mode has been considered as an effective guarantee for sustainable development and enhancing international competitive position now in China. Moreover, some evidences of its effects on environmental protection and corporate social responsibility are provided constantly. Nowadays, most of iron industries in China is aware of its development bottleneck, and make efforts to improve their traditional manufacturing mode and management mode. In these years some Chinese iron enterprises, such as Bao Steel, Shougang, Jinan Steel and Lai Steel, have already started to practice green manufacturing and get benefit from it. And this can be proved by Jinan Steel Company in Shandong Province. It is taking green manufacturing to put into effect, and enterprise performance and corporate social responsibility have come true gradually.
3.1 About Jinan Steel
Last century, traditional manufacturing mode had been used in iron industry of China. The principal characteristics include mass production, mass consumption and mass disposal, which caused serious pollution, such as smoke, dust, waste water and waste residue. As a result, Jinan Steel bear large cost expense, energy crisis and social and public pressure. Especially in 1998, the most serious crisis occurred. The crisis came from the great declined price of iron in China which resulted in the loss of 404 million RMB. On the other hand, influenced by financial crisis in Southern-east Asian, steel export had been seriously shrike, which had reduced by 60% compared with that of last year.
To deal with this crisis, Jinan Steel began to follow the path of new industrialization road and to practice green manufacturing.
3.2 Jinan Steel’s Green Manufacturing
Though studying and developing in advanced manufacturing mode during the past 10 years, green manufacturing mode based on its characteristics has been built up. And some new concept has been brought forward, for instance, they think that pollutants are the resources that be placed on the wrong place, and Jinan Steel only manufacture product, but not rubbish. Under the guidance of the mode, Jinan Steel began to adjust process structure, change the economic growth mode, and improve the quality of management. Then enterprise core competence has reinforced, and enterprise development has also been speeded up greatly with a series of potential changes (Huang Enhong, Yan Fengtao, 2006, pp. 71).
During the 9th five-year plan period, according to innovation concepts, such as benchmarking, and itself’s efforts, the purpose of increasing income, and reducing cost was achieved by Jinan Steel.
Accomplished the target of energy saving and consumption reduction, the next strategy of strongly promote clean manufacture (precise, strong, beautiful are the key words) was put forward to continuously develop for the purpose of making itself a famous enterprises in China.
During the past 10 years, Jinan Steel has profoundly been aware of the importance of sustainable development. Recycle economy theory is exercised perfectly in Jinan Steel (Cheng Hongwen, Ye Bingji, 2005, pp. 50).
According to statistical data, 170 projects of green manufacturing have been brought into effect. Utilization ratio of resource and energy has greatly increased and environmental quality has largely improved. In a word, green manufacturing not only brings the economic, social and environmental benefits, but also improves enterprise’s technical innovation ability.
3.3 Analysis on Income Effect Brought by Green Manufacturing in Jinan Steel
Jinan Steel benefits much from green manufacturing. The annual production has greatly increased. Meanwhile, the harmonious development of environment, resource and economy has come true. Thus it will promote the sustainable development of society.
Profit increase of Jinan Steel depends on the improvement of product quality, cost reduction, and the effective use of resource and energy. Related data was described by Table 1.
Vol. 3, No. 12 International Journal of Business and Management
144
From Table 1, we can see that during the period of practicing green manufacturing, prime operating revenue, income before tax and net income are increased greatly. In 2005 and 2006, the increase of income before tax and net income is less than that of prime operating revenue which shows that cost from prime operation and interrelated expenses are high. In 2007, the increase of net income is more quickly than that of income before tax which shows that Jinan Steel, after practicing green manufacturing for years, has benefited from its mode.
By the implementation of green manufacturing, the environment quality of Jinan Steel has been significantly improved. At the same time, total amount of various pollutants has been greatly decreased. And compared with 1995, the amount of industrial dust per square kilometer had been reduced by 53 % in 2005.
3.4 Social Responsibility in Jinan Steel
With the mode of green manufacturing, Jinan Steel develops techniques of waste treatment for bearing its social responsibility. For instance, in 2006, a special sewage treatment station was built, that can treat sewage 7200 tons every day. All of these measures settle some environmental problems in Jinan.
Owing to practicing green manufacturing, the development of high science and technology becomes quickly. Now in Jinan Steel high extra-value-added product has passed 60%, and the quality of these products has met the requirement of international enterprises. Some world top 500 enterprises, such as Hitachi, ABB, Caterpillar, have signed contracts with Jinan Steel.
4. Conclusion
“High energy consumption and pollution” constrains the development of iron industry. Confronted with such bottleneck, green manufacturing, an advanced manufacturing mode has been considered as an effective mode to solve such problem.
Based on analyzing the present situation of iron industry, it is figured out that the energy saving and emission reduction are arduous, besides corporate social responsibility is default. Meanwhile, study shows that making use of green manufacturing, the responsibility of environmental protection can be bear. Enterprise’s sustainable development can be achieved effectively. By comparing the income data before and after practicing green manufacturing, we can see the necessarity and superiority of practicing green manufacturing in iron industry.
Under the mode of green manufacturing, not only has enterprise performance been improved, but also social responsibility has been improved.
References
A.B.Carroll. (2004). ’Enterprises and SocietY-Management of Ethics and Stakeholders[Translated by.Huang Yuping]’. Beijing: China Machine Press, 39.
Cheng Hongwen, Ye Bingji. (2005). ‘Circulating Economy Book of Jigang’. Environmental Economy, 6, 50.
Huang Enhong, Yan Fengtao. (2006). ‘Practice and Exploration of Constructing Resource Saving Enterprise in Jigang’. Shandong Metallurgy, 6, 71.
Kanazawa. (1988). ‘Contemporary Economic Law [Translated by. Liu Rui]’. Liaoning: Liaoning People’s Press, 105.
Li Youhuan. (2007). ‘Corporate Social Responsibility-the Trend of Globalized Economy’. Chinese Academic Periodicals, 7, 100.
Liu Fei, Zhang Hua. (1999). ‘Connotation and Significance of Green Manufacturing’, National Natural Science
Foundation of China, 6,326.
Shen Hongtao, Shen Yifeng. (2007).‘Origins and Evolutions of Corporate Social Responsibility’. Shanghai: Century
Publication Group.
Tang Jianwen. (2006). ‘Green manufacturing’. Journal of Gangdong PlytechnicNnormal University, 82
Wu Xia, Kuang Xubo. (2008). ‘Developing Green Manufacturing and Promoting Sustainable Development of Machinery Manufacturing’. Market Modernization, 2, 252.
Yin Ruiyu. (2002). ‘Energy-saving, Clean Production, Green Manufacturing and Sustainable Development of Steel Industry’. Iron and steel, 3.
Zhang Ming. (2007). ‘Study on Corporate Social Responsibility of China in WTO Entry— Based on Harmoniousness’. Shanghai: Fudan University, 81-82.
Zhang Xinming, Duan Xiong. (2002). ‘The Concept, Connotation and Philosophical Significance of Green Manufacturing’. Science, Technology and Dialectics, 2, 48. (2006). ‘The Study on Green Manufacturing’s Dynamical Mechanism’. Beijing: Beijing University of Technology, 1.
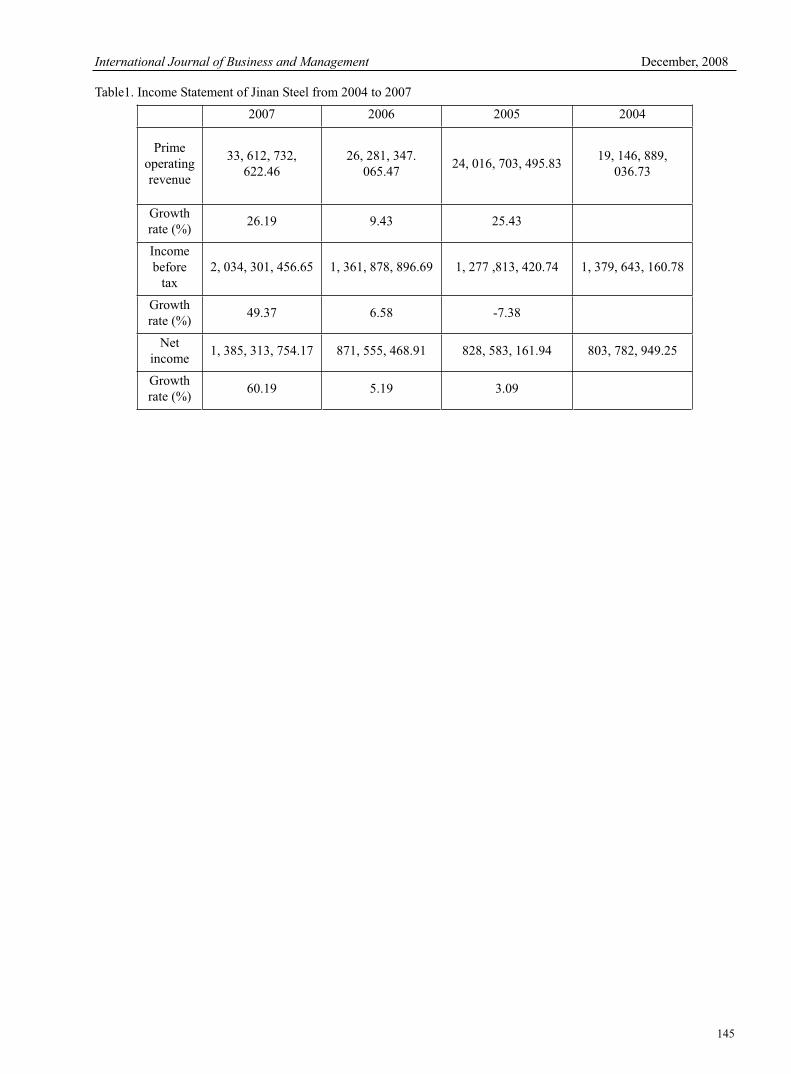
International Journal of Business and Management December, 2008
145
Table1. Income Statement of Jinan Steel from 2004 to 2007
2007 2006 2005 2004
Prime operating revenue
33, 612, 732, 622.46
26, 281, 347. 065.47
24, 016, 703, 495.83 19, 146, 889,
036.73
Growth rate (%)
26.19 9.43 25.43
Income before
tax 2, 034, 301, 456.65 1, 361, 878, 896.69 1, 277 ,813, 420.74 1, 379, 643, 160.78
Growth rate (%)
49.37 6.58 -7.38
Netincome
1, 385, 313, 754.17 871, 555, 468.91 828, 583, 161.94 803, 782, 949.25
Growth rate (%)
60.19 5.19 3.09
Vol. 3, No. 12 International Journal of Business and Management
146
Corporate Environmental Reporting:
An EmergingIssue in the Corporate World
Alok Kumar Pramanik
Department of Commerce, Bhatter College
P.O. – Dantan, Pin 721426, Dist. – Paschim Medinipur (West Bengal)
Tel: 32-2925-3481 Email: [email protected]
Nikhil Chandra Shil, ACMA (Corresponding Author)
Department of Business Administration, East West University
43, Mohakhali C/A, Dhaka 1212, Bangladesh
Tel: 18-1928-9589 (M) Email: [email protected]
Bhagaban Das
P.G. Department of Business Management, Fakir Mohan University
P.O. – Balasore, Pin 756019, Orissa, India
E-mail: [email protected]
Abstract
Corporate environmental reporting becomes a crucial issue in today’s corporate reporting. The present status and future focus gives every indication that it is going to capture a permanent position in the bundle of general-purpose financial statement. Because, the corporate reporting is for the stakeholders and every stakeholders show a keen interest on such disclosure. Protecting the environment is the social responsibility and commitment of corporations towards the society. It is believed that corporation is responsible for the environmental crisis and so they should pay for this (cost-benefit trade off). However, reporting is mostly guided by standards, guidelines etc. And, we do not have any standards designed for such disclosure. So, such reporting is still voluntary that has no specific format and style. Voluntary disclosure often leads to non-disclosure and mandatory disclosure leads to minimal disclosure. Thus, environmental disclosure should have both type of orientation, as it is a question of life and sustainability. The paper gives a conceptual discussion on corporate environmental reporting and guidelines. It also gives a literature review of current reporting practices to highlights the developments till date. And, this concludes that the level, extent and style of disclosure are not satisfactory at all in any respect. The professionals and respective regulatory authorities should come forward with stricter standards and guidelines to this issue that is the demand of time.
Keywords: Corporate environmental reporting, Corporate environmental report, Environmental accounting, Financial reporting
1. Introduction
The awareness of the environment and man’s ability to cause damage started from the fifties of last Century. In 1972, a World Conference was held in Stockholm where heads of States from all over the world came together for the first time to consider the state of the Globe as a whole, which ultimately gave birth to a special UN Agency titled UN Environmental Program (UNEP) to deal with environmental issues. In the mid-eighties, on the basis of changing situation and becoming the environmental issues a worldwide phenomenon in the developed and the developing countries, World Commission on Environment and Development (WCED), known as Bruntland Commission was established by the UN. The Commission published a report called “Our Common Future”’ in 1987, with the proposed concept of ‘sustainable development’. This concept received worldwide acceptance and led to the convening of the UN Conference on Environment and Development (UNCED) in Rio de Janerio, Brazil in 1992, known as “EARTH SUMMIT”. In this conference, heads of different States signed four agreed document including the Agenda 21. The Agenda 21 contains a checklist of do’s and don’ts to protect the environment through the next Century. Particularly, the
International Journal of Business and Management December, 2008
147
role of corporate entities in respect of overall management of the environment has been duly recognized in this conference.
In recent years, adverse environmental effect of economic development has become a matter of great public concern all over the world. Gradually, environment is becoming a much more urgent economic, social and political problem. Accountant, as the prime custodian and light bearers of economic development, can no longer shut their eyes to the effect of environmental issues on business management, accounting, auditing and disclosure system. Protection of environment and the potential involvement of accountants is becoming a common subject of discussion among the accountants all over the world. Now-a-days, accountant are expected to take a proactive role in the environmental protection process.
Ultimately, corporate environmental accounting and reporting has been considered by the accountants as an important issue. It has now also become a “global issue” with a pressing need to harmonize accounting and reporting of environmental costs and liabilities. The global community considered it necessary to determine the best practice in accounting for environmental transactions and events in the financial statements and associated notes. Still date, accountants face the problem of how to place an “objective value” of the environmental impacts. Unfortunately, no one has developed an acceptable, objective and verifiable measurement technique. But, the problem is not outside the scope of accounting as because accountants are able to measure other ‘uncertain costs’. But, in fact, formulation of valuation, accounting and reporting technique is a great challenge to the accounting profession considering the corporate entity’s responsibility towards environmental protection.
We intentionally picked the title of the paper as corporate environmental reporting. More emphasis is given on reporting though reporting is the secondary issue. We believe that if we have a good number of qualitiful reporting, it will guide us to build a conceptual framework for both accounting and reporting standards. We have gone through various research findings to highlight current reporting practices and in most of the cases, the studies concluded that environmental reporting is not satisfactory at all. Everybody feels the absence of standards to this effect. Corporate environmental reporting is discussed in full with special reference to India.
2. Literature review
Deegan and Gordon (1996) examined the environmental disclosure practices of Australian companies revealing lowvoluntary environmental disclosure in Australia. Cunningham and Gadenne (2003) investigated whether an enhancement in environmental regulations acts as a momentum for changes in annual report disclosure behavior and concluded that environmental regulation acts as an impetus for companies to include information on certain environmental issues in the annual report. Harte and Owen (1991) analyzed the annual reports of 30 British companies to investigate the environmental reporting in their annual reports and suggested for external standards on environmental reporting. Gray et al. (2001) examined the relation between corporate characteristics and environmental disclosures by taking a sample of 100 UK companies drawn from the Center for Social and Environmental Accounting Research (CSEAR). The authors observed that the volume of disclosure is related to the turnover, capital employed, number of employees and profit, as larger and more profitable firms have disclosed more environmental information. Fortes (2002) examined the significance of environmental reporting in Sweden and observed that environmental reporting showed notable benefits to businesses.
Gamble et al. (1995) investigated the quality of environmental disclosures in 10K and annual reports for 234 companies and concluded that companies belonging to petroleum refining, hazardous waste management, steel works and blast furnaces industries provided the highest quality of disclosures. ACCA published a report entitled “The State of Corporate Environmental Reporting in Singapore in 2002” that summarized the findings of a study of the latest annual reports, and any stand-alone reports, of 160 listed companies and 13 Government Linked Companies (GLCs) and Statutory Boards (SBs). Some 14% of listed companies and 23% of GLCs and SBs had some form of CER. Rajapakse (2003) carried out a study on environmental reporting practices in Sri Lanka and found no sign of any significant improvement in social and environmental reporting. Lodhia (2002), in his study that explained environmental reporting in Fiji, reports that the current practices in Fiji were far from satisfactory; with limited disclosures in corporate annual reports and in these reports the focus was good news disclosures. Imam (1999) conducted a study on environmental reporting in Bangladesh and reported that environmental disclosures remain at a minimal level. Shil and Iqbal (2005) conducted a study based on the annual reports of 121 companies in Bangladesh and found that only 13 companies (11 percent) out of 121 disclosed the environment related information in a qualitative way. Rahman and Muttakin (2005) selected 196 companies in Bangladesh for their study out of which 125 are manufacturing companies and the rest 71 are service companies that gives same result.
Savage (1994) examined corporate social disclosure practices in South Africa. He pointed out that environmental accounting needs much more attention in this country and descriptive and assertive reporting reins supreme vis-à-vis quantitative and audited form of disclosures. Niskala (1994) studied environmental accounting issues in Finland and concludes that issues relating to environmental accounting are just beginning to be widely discussed in Finland. Surmen
Vol. 3, No. 12 International Journal of Business and Management
148
and Kaya (2003) studied environmental accounting and reporting in Turkey and found that like other developing countries, Turkey has not seen environmental issues as a priority. Nuhoglu (2003) also examined environmental reporting practices in Turkish companies and reported that Turkish companies’ reports were lower standard and prepared much less seriously vis-à-vis multinational companies’ reports.
Romlah et al. (2002) studied the practices in Malaysian companies and showed that 74 out of 362 companies (20.44 percent) is environmentally sensitive industries and provide environmental information in their annual reports. The study by Thompson (2002) reveals that 7 of the top ten largest Malaysian companies provide information on environmental issues. Ahmed and Sulaiman (2004) examined the extent and type of voluntary environmental disclosures in annual reports for the year 2000 by Malaysian companies belonging to construction and industrial products industries and concluded that the extent of environmental disclosure was very low and was scattered throughout the report without any concentration. Thomson and Zakarai (2004) examined the extent, nature and form of corporate social and environmental disclosure made by Malaysian companies and observed that the corporate environmental reporting of these companies was poor in quality and low in quantity.
Bhate (2002) investigated the extent to which consumers of India are aware of environmental issues and it was found that Indians are most involved with environmental issues. Paul and Pal (2001) examined corporate environmental reporting in the annual reports of 23 companies for the sample period of 13 years ( i.e., from 1986-87 to 1998-99 ) and concluded that reporting is gaining momentum with the passage of time even in the absence of any compulsion and standards or guidelines.
3. Conventional financial accounting and reporting model and need for environmental accounting and reporting
The conventional model of financial accounting and reporting is one that emphasizes the importance of financial performance. The annual report deriving from the conventional model highlights financial assets and liabilities, shareholders’ worth, operating income and changes in the financial position of the enterprise over the reporting period. The conventional model contains relatively little by way of predictive or forward-looking information.
The conventional model routinely ignores environmental issues. The conventional model of financial reporting minimizes the role to non-financial data. Although the environment has played a larger role in corporate strategy over the last decade, it is nevertheless apparent that annual reports at present fail to convey either the significance of environmental issues to the reporting entity or any adequate description of how corporate management is attempting to integrate environmental strategy into overall corporate strategy.
The objective of financial statements as contained in the “Objectives of Financial Statements” issued by International Standards on Accounting and Reporting is to provide information about the financial position of an enterprise, which is useful to a wide range of users in making decisions and is necessary for the accountability of management for resources entrusted to it. The environment is a resource that is significant to many enterprises, and it must be managed efficiently for the benefit of both the enterprise and the society.
And ultimately, issues associated with accounting for the environment have become increasingly relevant to enterprise (whether they be businesses, non-profit organizations or govt. enterprises) as the pollution of the environment has become a more prominent economic, social and political problem throughout the world. Steps are being taken at the national and international level to protect the environment and to reduce, prevent and mitigate the effects of pollution. As a consequence, enterprises are now expected, or even required, to disclose information about their environmental policies, environmental objectives, and programs undertaken, and the expenditures incurred in pursuit of these policies, objectives and programs, and to disclose and provide for environmental risks.
Topics of environmental accounting and reporting have received substantial interest from academic researchers for the past three decades. (Deegan and Gordan 1996; Freedman and Jaggi 1988; Gray and Owen 1988; O’Donovan and Gibson 2000). It is agreed that all parties should play an active role to preserve and maintain the environment. Corporate, especially, are expected to play the most active role since their activities have caused most harm to the environment. Moreover, corporations also have more resources to undertake preservation activities. Past research on environmental management accounting issues looking into on how environmental issue can be incorporated in the overall accounting system of a corporation. In the environmental costing aspect, environment related cost should be assigned to products and processes, since they most probably produce residuals that are harmful to the environment.
4. Corporate environmental reporting
Corporate Environmental Reporting (CER), as a recognized sub-set of corporate reporting, is now a decade old. The emergence of corporate environmental reporting in the 1990’s has been an important development, not only in terms of environmental management, but also more generally for overall corporate governance. At present, the subject of environmental reporting is gaining prominence as a “hot issue” in the financial reporting community. It also becomes an international phenomenon and as result many companies specially those with a high public profile or perceived environmental impact have felt increasingly obliged to report externally to stakeholders on their environmental
International Journal of Business and Management December, 2008
149
performance. And ultimately, the companies in different countries have started the practice of making environmental disclosure in their annual report.
4.1 CER: A Conceptual Analysis
Corporate Environmental Reporting can be defined as an umbrella term that describes various means by which companies disclose information on their environmental activities to the users. This should not be confused with corporate environmental reports, which represents only one form of corporate environmental reporting. A Corporate Environmental Report is a tool to communicate a company’s environmental performance.
Corporate environmental reporting is the process by which a corporation communicates information regarding the range of its environmental activities to a variety of Stakeholders including employees, local communities, shareholders, customers, government and environmental groups.
4.2 CER: Objectives, Importance and Methods
Financial Accounting Standard Board (1994, FAS – 1) defines the main objectives of financial reporting as:
“……………to provide information that is useful to present and potential investors and creditors and other users in making rational investment, credit and similar decisions. The information should be comprehensible to those who have a reasonable understanding of business and economic activities and are willing to study the information with reasonable diligence”.
The objectives for environmental reporting can be expressed in the light of the above main objectives of financial reporting as follows:
“……… to provide information to present and potential stakeholders in making rational decisions. The information should be comprehensible to those who have a reasonable understanding of business and economic activities as well as of environmental impacts caused through these activities and who are willing to study the information with reasonable diligence”. Some writers have considered environmental disclosure in annual reports as very significant. “………..Corporate reports which disclose the performance and position of companies without significant environmental cost reporting will be showing a distorted view of the business” (Pizzey 1998). Corporate Environmental Reporting serves many different purposes for different stakeholders, which are:
It empowers people with the information they need to hold corporations accountable and invites shareholders more fully into the process of corporate goal-setting;
It permits investors to harness the power of the capital markets to promote and ensure environmentally-superior business practices;
It allows companies and their Stakeholders to measure companies’ adherence to the standards set forth in their statements of environmental principle, and their various goals and objectives;
As an internal driver of change, it helps illuminate weaknesses and opportunities and set new goals;
It will allow society to understand the false implications of corporate activity thereby to design more sustainable local and global systems.
The main reason for incorporation of environmental information within the annual reports is to increase stakeholders’ awareness of the company’s activities, performance, and interactions with the environment. It was hoped that stakeholders might use the information to assist their decision-making process (Jones 2000).
The methods of reporting among the companies have grown over the years. Many means of reporting were relied upon in conveying environmental information to stakeholders. Among them are newsletters, press release, magazine and corporate booklets (Zeghal and Ahmed 1990). Nevertheless, annual report has been the primary means of corporate reporting and it is the fundamental source of environmental reporting. The usage of annual reports has grown over the years; environmental information was reported in one of the sections in the report and later as separate section. Subsequently, the practice grew with the introduction of “Stand-alone” environmental reports (O’ Donovan 1999).
5. Factors influencing CER
Corporate environmental reporting awards are one of the global initiatives designed in promoting and encouraging business organization to actively disclose and report their environmental issues. Among them are the “GREEN REPORTING AWARDS” in Japan, the ACCA Awards in U.K. and the “WWF Annual Environmental Award’ in South Africa.
Besides awards, pressures from various groups have also influenced the development of voluntary exercises. On the other hand, internal pressures from employees are due to their worries on the work environment and wanting to ensure that the company in which they are working for is doing the right thing environmentally. Again, the top management is interested on the financial benefits that environmental strategy can offer to the business. A range of external groups
Vol. 3, No. 12 International Journal of Business and Management
150
including environmental organization, Government and public community are also increasingly demanding for extensive environmental reporting (Tilt 1994).
The initiatives to make environmental reporting mandatory for certain countries have also exerted pressures for environmental reporting. Denmark regulated the matter in 1996, the Netherlands and Norway in 1999, Sweden also made the environmental disclosure mandatory. In U.S.A., companies having more than 10 employees will have to report on specified toxic emission to the US Environmental Protection Agency.
For the rest of the world, environmental disclosures are encouraged through the voluntary local and international guidelines, such as, the Coalition for Environmentally Responsible Economics (CERES) Principles, the Global Environmental Management Initiatives (GEMI), the European Union Eco-Management and Audit Scheme and Global Reporting Initiative (GRI). These guidelines design and build acceptance of a common framework for reporting environmental information in sustaining corporate public accountability.
6. Standard setting bodies: initiatives to formulate environmental accounting standards
The professional accounting bodies were typically slow in formulating accounting standards as regards environmental issues. The survey of current activities and developments in environmental accounting and auditing carried out by the “Federation of European Accountants” (FEE 1993) reported none of the accounting standard-setting bodies in the countries reviewed was involved at that time in setting standards in relation to environmental accounting matters.
However, by the mid-1990s, professional bodies in Belgium, Denmark, Germany, the Netherlands and the United Kingdom, all had taken some initiatives in this regard. Furthermore, some national accounting standard setting bodies had begun the proves of examining (i) the need for accounting standards on environmental issues; and (ii) the need for guidance so that extant accounting policy could cope with the increasing financial impact of the environment on companies. It was all very slow and reactionary although the U.K. bodies – IAAEW, ICAS, ACCA and CIMA – had all sponsored research projects concerned with environmental accounting.
Perhaps, one of the most positive initiatives from the accounting bodies was the ACCA’s Environmental Reporting Award Scheme (ERAS). The scheme was having a major influence on the direction of environmental reporting in the United Kingdom and elsewhere in Europe by highlighting ‘good’ and ‘better’ practices and publishing companies attempts in the environmental reporting field.
At present, a global environmental accounting standard is under consideration by the International Accounting Standards Committee (IASC). The emergence of the World Bank, United Nations and International Federation of Accountants (IFAC) to come out with an environmental guidance document has added pressure on the International Accounting Standards Committee to come out with an environmental standard.
The Federation of European Accountants (FEE) has also requested the IASC to add stricter on environmental accounting guidance procedures. Although many of the IASC’s general standards have applicability, still a standard addressing specific environmental issues is necessary.
The International Accounting Standards Committee, now International Accounting Standards Board, working hard to formulate a global environmental accounting standard to close the gap among nations with regard to environmental accounting practices.
At present, International Accounting Standards Board has completed ‘core’ set of standards including all new standards that are particularly relevant to environmental issues. The standards are:
IAS 3: Impairment of Assets (issued in June, 1998 and effective from the accounting period beginning on or after 1st
July, 1999);
IAS 3: Provisions, Contingent liabilities and Contingent Assets (Issued on September, 1998 and effective from the
accounting period beginning on or after 1st July, 1999);
IAS 3: Intangible Assets (issued on October, 1998 and effective from the accounting period beginning on or after 1st
July, 1999)
7. Corporate environmental reporting guidelines
Although environmental reporting is still compared to financial reporting, a relatively new practice, many
guideline/approaches have been developed so far for the structuring of environmental reports. It appears that three
groups are attempting to develop guidelines for the same. These are:
International / National Industrial Organization;
Government Initiatives; and
Initiatives from Accountancy Bodies.
International Journal of Business and Management December, 2008
151
7.1 Proposal from Industrial Organization
The first proposal from industrial organizations as regards the guidelines for the structure and contents of environmental reports came from the American CERES Organization (Coalition for Environmental Responsible Economics) in continuation of the work performed as a result of the Exxon Valdez disaster in 1989. This was released as the Valdez Principles in 1989 and presented as a 10-point environmental ethic devised to assist corporations in their transition to safe and sustainable practice including guidance for environmental reporting. Since then other international and national business organizations have issued guidelines.
The Public Environmental Reporting Initiative (PERI) was established in 1993 by nine leading North American Corporation. PERI issued reporting guidelines to help organizations in improving environmental reporting. The PERI guidelines are general to allow organizations to choose an appropriate format, style and level of details. There is no emphasis on the need for quantitative data except with regard to emissions.
The Global Environmental management Initiative (GEMI), U.S. based organization designed to evaluate an organization’s against the 16-Principles defined within the International Chamber of Commerce’s (ICC’s) “Business Charter for Sustainable Development”.
The European Chemical Industry Council produced a detailed reporting guideline in 1998 entitled “Responsible Care – Health, Safety and Environmental Guidelines” in response to stakeholders demand. The World Business Council for Sustainable Development was formed by the merger of the World Industry Council for the Environment (WICE) and the Business Council for Sustainable Development in 1993. IN 1994, it published a manager’s guide to environmental reporting practices and performance. In the 1994 report (UNEP – Technical Report No. 24) “Company Environmental Reporting : A Measure of the Progress of Business & Industry Towards Sustainable Development”, UNEP/Sustainability Ltd., identified 50 reporting ingredients which can be used as a guide when reporting. In 1996, UNEP published a follow-up report, “Emerging Stakeholders”. In 1999, Global Reporting Initiative (GRI) launched its exposure draft “Sustainability Reporting Guidelines”.
7.2 Proposals Based on Government Initiatives
Several environmental reporting guidelines have been passed by the government initiative; among them EMAS Environmental Statement and the Danish Green Accounting Legislation are important. The European Union’s Eco-Management and Audit Scheme requires participating companies to produce an environmental statement to provide specific public information on its environmental performance.
The (U.K. Government) Advisory Committee on Business and the Environment (ACBE) has developed guidelines with an emphasis on the need of the financial sector (Environmental Reporting and the Financial Sector – An Approach to Good Practice). Among another information, the guidelines include examples of financial disclosures and environmental performance that have material financial information.
7.3 Proposal from Accountancy Bodies
Accountancy bodies have also taken part in the environmental debate in recent years and have issued some guidelines regarding environmental reporting. The Canadian Institute of Chartered Accountants (CICA) has produced a guidance document aimed at developing a framework for the reporting information about how organizations perform in accordance with standards and expectations of environmental conduct and responsibility. In addition, the Association of Certified Chartered Accountants (ACCA), U.K. and the Institute of Chartered Accountants of England and Wales (ICAEW) have also issued their guidelines regarding corporate environmental reporting.
8. Legislation/ Statute on environmental reporting
An increasing number of countries impose requirement on companies to report on their environmental performance. Denmark was the first country to adopt legislation on public environmental reporting. In this country, the companies are required to prepare a so-called “Green Account”. In the Netherlands, new legislation on mandatory environmental reporting has been adopted. Both Danish and Dutch regulations require reporting to the authorities and to the public. In Norway, the new Accounting Act requires that all companies include environmental information in the annual report from 1999 onwards. In Sweden, similar legislation has been adopted for mandatory environmental disclosure in annual financial reports. In U.S.A., the companies are required to submit data on emissions of specified toxic chemicals to the Environmental Protection Agency under the Toxic Release Inventory (TRI). In addition, the Securities and Exchange Commission (SEC) requires disclosures on legislative compliance, judicial proceedings and liabilities relating to the environment in Form K-10. In Canada, the SEC requires public companies to report the current and future financial or operational effects on environmental protection requirements in an Annual Information Form. Australian companies are now expected to give information on performance with regard to the environmental regulations that apply to them. In addition, a National Pollutant Inventory (NPI) is being created which requires industrial companies to report emission
Vol. 3, No. 12 International Journal of Business and Management
152
and inventories for specified chemicals. In the European Union, based on Article 15 of the Integrated Pollution Prevention and Control (IPPC) Directive, Member States will be required to register emission data from large companies and report this data to the Commission.
9. Environmental reporting in Asian countries
In Asian countries, there is no statutory requirement for companies to disclose environmental information in their annual reports. In Japan, the Japanese Industrial Association KEIDANREN’s “Global Environmental Charter” promulgated in 1991, calls for companies to publicize relevant information, carry out educational activities on their measures for protecting the environment and provide users with information on the appropriate use and disposal (including re-cycling) of their products. The Korean Securities Exchange Commission followed suit by enacting in 1996 a provision in the Corporate Accounting Standards (CAS), which requires the inclusion of environmental information in the form of accompanying footnotes to the corporate financial report. In Bangladesh, there is no professional or legal requirement for environmental disclosure in their annual reports of companies. However, despite this lack of regulation, it is found that a very few progressive companies are making environmental disclosures in their annual reports purely on a voluntary basis. In Hong Kong, there is no statutory requirement for listed companies to quantify report and disclose environmental information to the public. Environmental Reporting in Sri Lanka is predominantly voluntary. In Sri Lanka, there is neither a prescribed professional standard nor legal framework addressing the issues of environmental reporting. Currently, there is no statutory requirement in Malaysia that requires publicly listed companies to disclose environmental information to the public. In Malaysia, the most commonly included disclosure item found in the annual reports of the companies with Corporate Environmental Policy (CEP) is “environmental policies or company concern for the environment”.
10. Corporate environmental reporting: Indian scenario
Following the end of the British Rule, India plunged into a serious series of troubles and communal riots. And India was not in a position to pay proper attention to the matters relating to environment. The First Five Year Plan was implemented with a view to economic development of the country. The Second Five Year Plan designed for industrial development, paid no attention to the harmful consequences of nature that would have to face with the growth of industry. Hence, the plans remained unconcerned about protecting nature.
The public awareness towards environmental issues like environmental pollution, environmental preservation and environmental development has grown tremendously at the beginning of the seventies. This is evident from the contemporary regulatory regime that is being enforced for businesses by the Central and State Government of India. Various pieces of legislation have been enacted since mid-70’s for the protection of environment.
In 1974, the Water (Prevention and Control of Pollution) Act 1974 came into effect to prevent watercourses both surface and underground from pollution. Subsequently, the Water (Prevention and Control of Pollution) Cess Act, 1977 was passed. Again in 1981, another act was enacted to prevent air from pollution that came to be known as Air (Prevention and Control of Pollution) Act, 1981.
The Bhopal disaster was an eye-opener to the Government, resulting in the enactment of a more comprehensive and well-knitted act known as Environmental (Protection) Act, 1986. In 1991, the Public Utility Insurance Act 1991 was also enacted.
Moreover, from time to time, various rules have been notified to regulate environmental hazardous material, which are:
The Water (Prevention and Control of Pollution) Rules, 1975;
The Water (Prevention and Control of Pollution) Cess Rules, 1978;
The Environment (Protection) Rules, 1986;
The Manufacture, Storage and Import of Hazardous Chemical Rules, 1989;
The Public Utility Insurance Rules 1991;
The Environment Impact assessment Notification, 1994;
The Environment Import assessment (Public Hearing) Notification Rules, 1998;
Noise Pollution (Regulation & Control) Rules, 2000.
But, in the context of requiring environment-related information from businesses on a periodic basis, the first public pronouncement was made by the Central Government in 1991. The Ministry of Environment and Forest has proposed that “every company shall, in the report of its Board of Directors, disclose briefly the particulars of compliance with environmental laws, steps taken or proposed to be taken towards adoption of clean technologies for prevention of pollution, waste minimization, waste re-cycling and utilization pollution control measures, investment on environmental protection and impact of these measures on waste reduction , water and other resource conservation. The Ministry has
International Journal of Business and Management December, 2008
153
also examined the Company Laws so that the aforesaid proposal on environmental reporting by the companies could be put into effect. Incidentally, such a proposal did not find a place in the Companies Bill, 1993. As regards the accounting and reporting aspects of environmental protection, some companies in India do make policy statement in their Annual Reports. These are, however, mentioned in the Chairman’s or Director’s report. The companies do not disclose any quantitative facts on expenditures incurred, and targets set and achieved.
In India, level of environmental related disclosure in the corporate annual reports, both financial and non-financial, is not an encouraging level. Neither the Company Law nor the accounting standard / guidelines issued by the Institute of Chartered Accountants of India prescribed disclosure norms for the environment-related matter in the corporate financial statements.
11. Conclusion
In different countries, the accounting and reporting practices in respect of environmental issues have become mandatory. But in many countries, no such mandate has been issued. Now, it is the urgent need to take steps globally and nationally to formulate the accounting and valuation technique as well as the reporting guidelines to incorporate these issues in the corporate accounting and reporting system. The present status of voluntary reporting should not be continued for long. Rigid guidelines in the form of standards, rules or acts should be enacted and implemented in this respect so that a sort of compulsion becomes in force. Once the corporations start to incur environmental costs more than environmental liabilities, only then they can ensure equitable treatment towards the environment. For doing businesses in future, corporate world should turn their attention towards the long-term sustainability of the environment. And, accountants’ role to this effect is of paramount importance as a compiler and presenter of information.
References
Ahmed, N. N. N. and Sualiman, M. (2004). Environmental disclosures in Malaysian annual reports: A Legitimacy theory perspective. International Journal of Commerce & Management, 14(1), 44-58.
Bhate, S. (2002). One world, One environment, One vision: Are we close to achieving this? An Explanatory Study of Consumer Environmental Behavior across three countries. Journal of Consumer Behavior, 2(2), 169 – 184.
Cunningham, S. and Gadenne, D. (2003). Do corporations perceive Mandatory Publication of Pollution Information For Key Stakeholders As a Legitimacy Threat? Journal of Environmental Assessment Policy & Management, 5(4) 523 – 549.
Deegan, C. and Gordon, B. (1996). A Study of the environmental disclosure practices of Australian Companies. Accounting and Business Research, 26(3), 562- 683.
FEE (1993). Environmental Accounting and Auditing: Survey of Current Activities and Developments. Bruxelles: The Fédération des Experts Comptables Européens.
Fortes, H. (2002). The Need for environmental reporting by companies. Greener Management International (Winter), 77-92.
Freedman, M. and Jaggi, B. (1988). An Analysis of the association between pollution disclosure and economic performance. Accounting, Auditing and Accountability Journal, 4(4).
Gamble, G. O., Hsu, K., Kite, D. and Radtke, R. R. (1995). Environmental Disclosure in Annual Reports and 10Ks: An Examination. Accounting Horizons, 9(3), 34 – 54.
Gray, R., Javad, M., Power, D. and Sinclair, C. D. (2001). Social and Environmental Disclosure and Corporate characteristics: a Research Note and Extension. Journal of Business Finance & Accounting, 28(3) & (4), 327 – 356.
Gray, R and Owen, D. (1988). Corporate Social Reporting: Emerging Trends in accountability and the social contract. Accounting, Auditing & Accountability Journal, 1(1).
Harte, G. and Owen, D. (1991). Environmental Disclosure in the Annual Reports of British Companies: Research Note. Accounting, Auditing & Accountability Journal, 4(3), 51-61.
Imam, S. (1999). Environmental Reporting in Bangladesh. Social and Environmental Accounting, 19(2), 12-14.
Jones, K. (2000). Commission of the European Communities. D.G. Environment – Study on Environment Reporting by Companies. Centre for Environmental Informatics, University of Sunderland, March.
Lodhia, S. K. (2002). Social and environmental Reporting in Fiji: A Review of Recent Corporate Annual Reports. Social and Environmental Accounting, 20(1), 15 –18.
Niskala, M. (1994). Environmental Accounting Issues in Finland. Social and Environmental Accounting, 14(1), 13 –14.
Nuhoglu, E. (2003). An Explanatory Study of Website Environmental Reporting in Turkey. Social and Environmental
Accounting, 23(1), 1 – 5.
Vol. 3, No. 12 International Journal of Business and Management
154
O’Donovan, G. and Gibson, K. (2000). Environmental disclosures in the corporate annual reports: a longitudinal Australian study. Paper presented at the 6th Interdisciplinary Environmental Association Conference, Montreal, Canada, 21 – 25 June.
O’ Donovan, G. (1999). Managing Legitimacy Through Increased Corporate Reporting: An Explanatory Study. Interdisciplinary Environmental Review, 1(1).
Paul, K. C. and Pal, B. (2001). Corporate Environmental Reporting in India. Indian Accounting Review (December), 27 – 45.
Pizzey, A. (1998). Financial Reporting of Environmental Matters. CIMA Students, No. 18.
Rahman, M. A. and Muttakin, M. B. (2005). Corporate Environmental Reporting Practices in Bangaldesh - A Study of Some Selected Companies. The Cost & Management, 33(4), 13-21.
Rajapakse, B. (2003). Environmental Reporting Expectation Gap: Evidence from Private Sector Organizations in Sri Lanka. IWE Journal, 3, 99 -199.
Romlah, J., Takiah, M. I. and Nordin, M. (2002). An Investigation of Environmental Disclosures: Evidence from selected industries in Malaysia. International Journal of Business and Society, 3(2), 55 – 68.
Savage, A. A. (1994). Corporate Social Disclosure Practices in South Africa: A Research Note. Social & Environmental
Accounting, 14(1), 2 – 4.
Shil, N. C. and Iqbal, M. (2005). Environmental Disclosure - a Bangladesh Perspective. The Cost & Management,33(4), 85-93.
Surman, Y. and Kaya, U. (2003). Environmental Accounting & Reporting Applications in Turkish Companies which have ISO Certificate. Social & Environmental Accounting, 23(1), 6 –8.
Thompson, P. and Zakarai (2004). Corporate Social Responsibility Reporting in Malaysia. Journal of Corporate
Citizenship, 13, 125 – 136.
Thompson, P. (2002). Corporate environmental reporting in Singapore and Malaysia: Progress and Prospect. Research paper series No. 11/2002, Center for Europe – Asia Business Research, Nottingham University Business School, The University of Nottingham, Malaysia Campus, Kuala Lumpur.
Tilt, C. A. (1994). The influence of External Pressure Groups on Corporate Social Disclosure. Accounting , Auditing &
Accountability Journal, 7(4).
Zeghal, D. and Ahmed, S. (1990). Comparison of Social Responsibility Information Disclosure Media used by the Canadian Firms. Accounting, Auditing and Accountability Journal, 3(1).
International Journal of Business and Management December, 2008
155
A New Idea about Ricardo’s Comparative Advantage
Theory on Condition of Multi-Commodity and Multi-Country
Yiqian Tian
School of Economics, Tianjin University of Commerce
Tianjin 300134, China
E-mail: [email protected]
Abstract
Today, many theories prove the imperfection and limits of David Ricardo’s comparative advantage theory. This paper offers necessary explanations and creates a model for the n*n condition (n countries and n commodities) derived from the comparative advantage theory. It is a static equilibrium analysis based on the original model. This paper advances the final distribution methods and ways for the n*n model of multi-commodity trade.
Keywords: Comparative advantage theory, Premise and condition, Multi-commodity trade
1. Introduction
Recent development of the comparative advantage theory is to catch up with the perfection of the mainstream theory, exogenous comparative advantage theory, and its challenges. In recent researches on comparative advantage theory, a prominent phenomenon is: a so-called new mainstream (Helpman & Krugman, 1985; Grossman & Helpman, 1989, 1990) comes into being based on criticizing traditional comparative advantage theory by introducing the economy of scales and product differentiation, represented by Krugman, Helpman, and Grossman. By commenting on this new mainstream, other scholars develop the comparative advantage theory from different angles, including specialization, technology difference, system, and game theory.
These new development is far different from the original comparative advantage theory. This paper advances the viewpoint and model based on Ricardo’s original model. This paper is based on long-term thoughts on the comparative advantage theory, namely the deficiencies of static optimal distribution theoretical model for the multi-country and multi-commodity condition that is seldom studied by others, trying to offer some explanations and creations for the two aspects. In model derivation, three preconditions are necessary: (1) no discussion for intermediate products; (2) no discussion for the probability that small countries could not supply sufficient products for other countries’ demand by specialized production; (3) regardless of any condition that disturbs free trade.
2. Could the comparative advantage theory settle the multi-commodity production and trade?
The following discussions are all about the no ties condition (all commodities have different comparative advantages).
2.1 A brief introduction to relevant explanations in Paul R. Krugman’s International Economics: Theory and Policy, 6e.
In page 26, Krugman analyzes the comparative advantages of many goods under the title “Comparative advantage with many goods”. (The most convincible way is to identify other countries demands for the goods and calculate the average price of the goods in these countries besides the country A. For example, the goods a:
P*a (B, C, D…) = ( PBa QB
a+ PCa QC
a+ PDa QD
a+ PEa QE
a+…)/(QBa+QC
a+QDa+…)
Here for the sake of simple explanation, suppose all countries have same demand for certain goods and calculate the arithmetic average. Ronald W. Jones also employs this assumption in analyzing problems.)
Suppose both country A and B produce n kinds of commodities, namely commodity 1, commodity 2… commodity n. A spends labor aLi (i means any kind of commodity) in producing every kind of commodity. Its wage rate is w. B spends labor a*Li in producing every kind of commodity. Its wage rate is w*.
The direct and final conclusion: as w×a Li <w*×a* Li, one country focuses on specialized production of certain commodity. As w×a Li>w*×a* Li, feign countries focus on specialized production of the commodity.
Apparently, w×aLi is rightly the cost of producing certain commodity. That is from the definition of Smith’s absolute advantage. In other words, in this model, it is probable to draw a conclusion that contradicts the comparative advantage theory.
Vol. 3, No. 12 International Journal of Business and Management
156
2.2 Krugman’s comparative advantage analysis and extension
Suppose n=3, country A and B produce three commodities, a, b, and c at the same time. Prices (costs) are displayed in table 1 as follow.
Comparing two countries’ costs in producing a, b, and c, then:
4/2<9/4<7/3, namely Pa/P*a<Pc/P*c<Pb/P*b …………………. “*” stands for the country B.
Obviously, according to the comparative advantage theory, commodity a, and b respectively in two sides of the inequality has comparative advantage and comparative disadvantage. Therefore, even under the condition of n>2, Krugman’s “comparative advantage” analysis is not convincible.
A has comparative advantage in producing a (choose to producing a by specialization and exporting a) and comparative disadvantage in producing b (choose to import b). But for c, A has comparative disadvantage compared with a, and comparative advantage compared with b. It is hard to determine which country produces c and its trade conditions. Or, according to model deduction, no country chooses to produce c because no matter which country produces c, the country will lose higher returns from producing a, or b (Ricardo’s comparative advantage theory offers detailed reasons. It is unnecessary to explain it again). Therefore, as n>=3, a problem is always there: only two commodities will be produced finally. A just produces a, and B only produces b (that is determined by the fixedness of opportunity cost). For multiple demands, it is impractical. As for this problem, Xiaokai Yang and other scholars do not give better explanations. They only make infra-marginal analysis and even deny the comparative advantage completely. Many experts probe into the multiple demand issue and explain the trade of commodity c. But they fail to analyze this issue from the maximum welfare.
Therefore, traditional comparative advantage theory confronts challenges in the multi-commodity issue. Most theorists, such as Professor Qi Liang, prefer to empirical analysis. They hold a similar opinion: “The vertical analysis is improper for multi-commodity trade. The proper analysis is based on absolute advantage theory and DFS model. (Qi Liang & Erzhen Zhang, 2002)” According to analyses above, with the assumption of comparative advantage, the DFS model is not right.
2.3 An explanation under bilateral trade
The comparative advantage theory cannot explain the multi-commodity trade between two countries, because the direct result is that only two commodities will be produced, what is impractical as a matter of fact. Therefore, for this issue (namely the multi-commodity trade between two countries), the comparative advantage theory is denied.
For this issue, there is an idea. That is, even there are many countries the comparative advantage theory does not allow the existence of more countries than commodities in trade (suppose i refers to the number of countries, j the number of commodities. As i<j, it is inevitable that some commodities could not be produced at last. Finally, j is equal to i). In other words, if evaluate Ricardo’s model practically, this model can only explain such a condition that the number of countries is larger than the kinds of commodities in trade. But, whether it is means a denial to Ricardo’s model?
In fact, from daily economic life, we find that comparative advantage is usually an overall index, no matter what it is international trade or inter-provincial trade. In other words, people employ this concept widely. So, the significance of Ricardo’s model in practice is not less than any trade theory. Its essence lies in: for one country or region, how to select production in order to reach optimal welfare. Different editions of Senior International Trade Theory offer excellent analyses on two-commodity trade among n countries. Get each country’s costs for producing two commodities respectively, calculate the ratio of two commodities’ costs, and get an inequality. Establish the world relative price according to the two countries in two sides of the inequality. Then, countries in the middle of the inequality select their specialized production by comparing their domestic ratios with the world relative price (reference from Wen Hai’s Senior International Trade Theory). Therefore, the internal mechanism of Ricardo’s model is that the number of countries is not less than the kinds of commodities.
Come back to the original issue. Ricardo’s model does not concern the multi-country or multi- commodity condition. Then, how to explain the necessity of people consuming the third commodity? Starting from the internal thoughts of this model, if the consumption of the third commodity is necessary, the third country exists. Therefore, we can explain the commodity c production and trade between two countries. For example, as the country C joins in, a new price table (table 2) is as follow:
Obviously,
Pc/P’c<Pb/P’b<Pa/P’a ………………………………… “’ ”stands for the country C.
In the bilateral trade between A and C, A will produce and export c. Then, there is the consumption of c among the three countries, what is close to the fact. Therefore, even without the issue of demand diversity, it is possible for the appearance of the third commodity in Ricardo’s comparative advantage theory (of course, if change the numbers or in
International Journal of Business and Management December, 2008
157
the final effective equilibrium the country A may not produce c. But in the optimal equilibrium under different standards, to produce c is inevitable, what is different in theory from an inevitable lack of producing c in two countries). So, with the predetermined assumption, the comparative advantage theory is more reasonable than the comparative advantage identified by people directly.
The final bilateral trade is in table 3 as follow:
From this table, we can notice a clear trade combination. Comparative advantages arrange three countries’ production and trade. However, specific quantitative analysis needs to know the demands of each country for three commodities, and introduce other limits and discussions. For example, in the table 3, B imports a from A and C. Suppose B gives priority to C in imports because the absolute cost of an in C is lower than that in A. As C could not supply sufficient a, B chooses to import a from A. Another example, the assumption of fixed opportunity cost makes us agree that the optimal trade results in each country producing one commodity by specialization but the distribution ways could not be established due to different standards. The bilateral trade that lays particular stress on opportunity cost and the multi-lateral trade that lay particular stress on minimum absolute cost will result in different equilibrium, and even consider the probability of non-specialized production combination (in order to understand the issue of multi-country and multi-commodity trade, we can take reference from Ronald W. Jones’ Comparative Advantage Theory and Tariffs:
A Multi-country, Multi-commodity Model. The author puts forward some assumptions and mentions that the optimal equilibrium of multi- lateral trade is usually more efficient than that of two kinds of bilateral trade.
That is the condition of bilateral trade, what is not the optimal and efficient production and trade for the 3*3 condition described in Ricardo’s model. Next, we make specific analysis.
3. Model: how to distribute production is more efficient under the n*n condition (n countries and n
commodities)?
3.1 The most efficient solution
Firstly understand the difference between optimal efficiency and real equilibrium. In other words, the most efficient distribution is to realize the maximum total welfare of all countries. But the stable equilibrium may result in different distribution. It is only a regular Nash bilateral equilibrium. Here, the standard is: multi-lateral trade is most efficient. Next, we discuss this issue further.
Except the precondition of multi-country and multi-commodity, other assumptions are the same with Ricardo’s comparative advantage model. Suppose j refers to the number of countries, and i the kinds of commodities. Here, we mainly discuss the common condition as i=j (j>=3). In other words, under the condition of n*n, how to distribute is most efficient. For other two conditions, i<j, i>j, the analysis can adopt the method introduced next, because the method does not regulate the relationship of i and j. Here we choose i=j, for the sake of easy explanation.
Here we do not consider the distribution method advanced by Ronald W. Jones, because he introduces two much complex assumptions and he merely makes dynamic analysis on the n*n condition, without a systematic explanation for the form of efficiency. The author of this paper puts forward a definite static analysis method (Ricardo’s model is static) and deduces a universal model according to the most efficient distribution.
Display a conclusion: the best distribution is inevitably to make each country produce one commodity respectively by specialization, which is determined by the fixed opportunity cost.
Next, list the combinations of country and commodity. Countries are A, B, C, ……, and commodities a, b, c, ……. Before the trade, each country produce all commodities and i=j.
The table 4 displays all commodities’ costs (=prices).
According to this table, suppose the method for a country determining its commodity with most comparative advantage. In other words, use all commodities’ prices in one country (such as A) to divide the average prices of relevant commodities in other countries and get n numbers, among which the minimum value is decisive. The process is as follow:
The average price of commodity a: P*a(B,C,D…)=(PBa + PC
a + PDa + PE
a +…)/(n-1)
The average price of commodity b: P*b(B,C,D…)=(PBb + PC
b + PDb + PE
b +…)/(n-1)
The average price of commodity c: P*c(B,C,D…)=(PBc + PC
c + PDc + PE
c +…)/(n-1)
The average price of commodity d: P*d(B,C,D…)=(PBd + PC
d + PDd + PE
d +…)/(n-1)
……
For the sake of calculation and observation, get the table 5 as follow:
It is insufficient to compare two countries’ commodity with most comparative advantage since there are more than two countries. In table 5, use each commodity’s “price in country A” to divide its “average price in other countries” and get
Vol. 3, No. 12 International Journal of Business and Management
158
n groups of rates, what is sufficient multi-lateral comparison. According to the meanings of comparative advantage, the smaller the rate, the more the commodity of the country has comparative advantage. Therefore, by finding out the minimum rate in the group, we can identify the commodity with most comparative advantage in country A (but it does not mean A must produce this commodity by specialization, because A is not necessarily the country that has the greatest advantage in producing this commodity (As another country joins in the comparison mentioned above, this country may possess the greatest comparative advantage in producing the commodity and the rate is maybe smaller. Then, compared with country A, this country is more appropriate for producing the commodity (has greater advantages than A).). For example, as:
PAa/ P*a(B,C,D…)< PA
b/ P*b(B,C,D…) < PAc/ P*c (B,C,D…)< PA
d /P*d(B,C,D…)<...
We can conclude: The commodity a in country A possesses the greatest comparative advantage in the world.
Then, replace A with B and repeat the process. We can get a group of rates of prices in B to average prices in other countries. Find out the minimum rate. Next, C, D, ……
For every country, repeat this process and get n groups of rates finally and get n minimum rates. Then, compare these minimum rates and take the smallest one. For example, if the smallest rate is PB
d/ P*d(A,C,D…), B has greatest comparative advantage in producing d (comparing with other commodities). So, B will produce d by specialization. Then, exclude B and d from the comparison (surely, in comparing these rates, besides identifying the minimum rate that determines the specialized production, we may find certain country possesses the greatest comparative advantage in producing other commodity (it happens in the country that possesses greatest comparative advantages in producing different commodities. If two countries possess comparative advantage in producing one commodity, choose the minimum value), which should be excluded. If not, it will not affect the final result, because the fact will not be changed that the country possesses the greatest comparative advantage in producing this commodity) and repeat a series of procedures in other countries and commodities. By this way, determine which country produces which commodity by specialization. By means of repetitive exclusion, get the most efficient distribution.
Then, explain this method further. At the very beginning, we make an assumption: use the prices of commodities in one country to divide the average prices of respective commodities in other countries and get the minimum rate that will determines the commodity with greatest comparative advantage in one country. This assumption is reasonable. Although these rates are meaningless, the n^2 rates from repeating the process for all countries can precisely reflect the comparative advantages of these countries in producing respective commodities.
Afterwards, generally each country is corresponding to n rates. Then identify the minimum of n^2 rates, which apparently determines the first country and its commodity with greatest comparative advantage. No matter what it is horizontal or vertical comparison, the country and the commodity represented by this minimum possess the greatest comparative advantage. These comparisons are based on the 2*n model and the n*2 model in the comparative advantage theory. Finally, the repetitive exclusions are determined by the fixedness of opportunity cost. And every selection is the combination of one country and one commodity with the greatest comparative advantage among the left. Each selection experiences three procedures: (1) get the rates of prices of commodities in each remaining country to average prices of respective commodities in other remaining countries; (2) compare these rates; (3) select the minimum and determine the country and the commodity with the greatest comparative advantage.
As i is not equal to j, we can adopt this method discussed above to identify each country’s specialized commodity. Then, for remaining countries and commodities, we can adopt the method offered in common trade textbooks to make decision. Here, we mainly develop the essential thoughts of Ricardo model.
That is a way to establish the most efficient distribution for the multi-country and multi-commodity model. By this way, we can deal with the quantitative evaluation and efficiency issue in table 3 (see table 6).
By calculations based on the method discussed above, get the most efficient distribution.
Firstly compare prices in country A with average prices in other countries, so 2×4/(2+3), 2×7/(3+7),
2×9/(4+10). Then get a group of rates for country A: 8/5, 7/5, 9/7.
Similarly, a group of rates for country B: 4/7, 3/7, 8/19
And a group of rates for country C: 3/3, 7/5, 20/13
Obviously, the smallest rate is 8/19. Therefore, country B possesses the greatest comparative advantage in producing commodity c. So, country B chooses to produce commodity c by specialization. Then, consider the comparative advantages of country A and country C for producing commodity a and commodity b. Apparently, 7/7<4/3. Therefore, country C possesses comparative advantages in producing commodity a. And country A possesses comparative advantage in producing commodity b. Therefore, the most efficient distribution is: country A produces commodity b by specialization, country B commodity c, and country C commodity a. According to analyses above, it is the most
International Journal of Business and Management December, 2008
159
efficient distribution.
3.2 Practical significance
We should know that this distribution is optimal in theory. Practical world is crueler than theory. However, if some countries realize an integration of politics and economy, this theory discussed above will be meaningful since it can help to reach economic efficiency.
In fact, the non-self-governed regions in one country have already realized or have been close to realize the optimal distribution of production. Different endowments in different regions lead to the division and specialization. Some regions (such as some cities in Shanxi province) have rich coal, and some (such as the new seaside zone in Tianjin) have developed manufacturing industry. For example, Shanghai and Shenzhen have advantages in financial services. That is a rudiment of full comparative advantage efficiency.
4. Conclusion
According to the analysis, the comparative advantage theory meets difficulties in analyzing multi-commodity trade. But we should not deny this theory wholly. In analyzing the multi-commodity trade between two countries, by means of the classical model regardless of multiple demands, two countries only produce two commodities at last due to free trade, which can illustrate the importance of demands. But we should not deny Ricardo’s comparative advantage because of something outside assumptions. In analyzing the comparative advantage in multi-country and multi-commodity trade, we can get better results.
The comparative advantage theory relies in comparing opportunity costs. But we should not regard all two-factors as comparative advantages (such as the analysis based on wages and factors demands mentioned in Krugman’s book). Apparently, that is absolute advantage theory in essence.
In general, Ricardo’s comparative advantage theory is still applicable in multi-commodity trade. Its explanations (under the condition of following the assumptions) for commodity production and trade are acceptable. For example, the efficient distribution for the n*n condition deduced by use offers maximum and most efficient welfare by taking full advantage of comparative advantage thought.
Ricardo’s comparative advantage theory is always disputable in academic field. However, it is the disputable theory that makes trade theory more perfect, such as the dynamic comparative advantage theory, and the model combined with factor endowment theory. This paper is merely a tentative exploration, further thoughts and deductions based on Ricardo’s model as the author questions the traditional comparative advantage model. Some questions wait for new solutions.
References
Balassa, Bela. (1963). An empirical demonstration of classical comparative cost theory. Review of Economics and
Statistics. August.
Dixit & V. Norman. (1980). Theory of International Trade. Cambridge: Cambridge University Press.
Liang, Qi & Zhang, Erzhen. (2002). Re-discussion on comparative advantage theory. Quarterly Journal of Economics,No. 2.
Paul R. Krugman. (2006). International Economics: Theory and Policy, 6e.
Robert Feenstra. (2003). Advanced International Trade: Theory and Evidence.
Ronald W. Jones. (1961). Comparative advantage theory and tariffs: a multi-country, multi-commodity model. Review
of Economic Study.
Wooland, A.D. (1982). International Trend and Resource Allocation. North-Holland, Amsterdam, New York, Oxford.
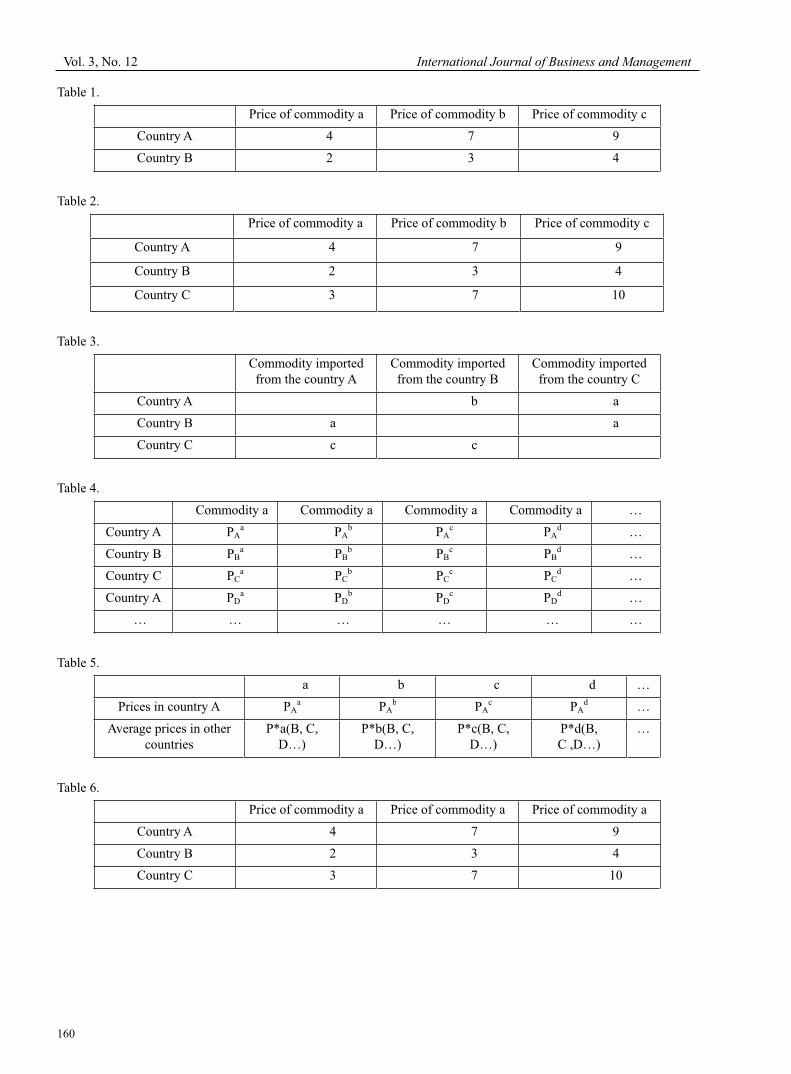
Vol. 3, No. 12 International Journal of Business and Management
160
Table 1.
Price of commodity a Price of commodity b Price of commodity c
Country A 4 7 9
Country B 2 3 4
Table 2.
Price of commodity a Price of commodity b Price of commodity c
Country A 4 7 9
Country B 2 3 4
Country C 3 7 10
Table 3.
Commodity imported from the country A
Commodity imported from the country B
Commodity imported from the country C
Country A b a
Country B a a
Country C c c
Table 4.
Commodity a Commodity a Commodity a Commodity a …
Country A PAa PA
b PAc PA
d …
Country B PBa PB
b PBc PB
d …
Country C PCa PC
b PCc PC
d …
Country A PDa PD
b PDc PD
d …
… … … … … …
Table 5.
a b c d …
Prices in country A PAa PA
b PAc PA
d …
Average prices in other countries
P*a(B, C, D…)
P*b(B, C, D…)
P*c(B, C, D…)
P*d(B,C ,D…)
…
Table 6.
Price of commodity a Price of commodity a Price of commodity a
Country A 4 7 9
Country B 2 3 4
Country C 3 7 10
International Journal of Business and Management December, 2008
169
An Analysis of Business Challenges
Faced by Foreign Multinationals Operating the Chinese Market
Jianlian Wu
International Management, University of Nottingham
Ningbo 315100, China
E-Mail: [email protected], [email protected]
Abstract
China’s rapid economic growth has presented numerous opportunities and challenges for foreign firms there. Many large corporations have established a China centre to coordinate and control their operations in the country. As firms have increased their presence in China, their concerns are increasingly focused on implementing successful management practices and strategies. This article describes the challenges and difficulties that multinational companies faced in Chinese market. It analyses roles played by the human resource function in these China, culture differences, social environment and other factors.
Keywords: Challenge, Multinationals, Chinese market
1. Introduction
Over the last few decades, the process of globalization has created unprecedented opportunities for global business investment and trade. Many multinational companies are attempting to expand their business international by many entry strategies such as joint venture and subsidiary. While China, with over 1.3 billion population and 9.6 million square kilometers (China Popin, 2008) has become a valuable land for foreign multinational companies. They try to enter the Chinese market by using many different strategies. For example, Siemens set up its representative office in Beijing in 1982 (Fryxell, Butler, and Choi 2004); Coca Cola operated a wholly foreign-owned enterprise that produced beverage concentrate in Shanghai and is direct joint-venture partner in a similar facility in Tianjin (Weisert, 2001). Furthermore, China’s successfully accessed World Trade Organization (WTO) in 2001 had provided numerous opportunities for foreign companies; the international economic and business trade had been developed expeditiously in China recent years. In the first half of 2005, total United States trade with China grew almost 24%, to $96 billion. Foreign Investors launched about 41,000 new companies in China in 2003. There were roughly 460,000 approved foreign companies in China at the end of 2003 (Zhou, Lu, and Jiang 2005). However, there are some challenges that foreign multinational companies faced when they operating business in China such as the human resources management, cultural differences and negotiation problems, which have affected foreign business operation and development.
This paper is to discuss the different challenges that multinational companies suffered in Chinese market. It will firstly indicate the localized staffing strategy that foreign multinationals used for human resource management in Chinese market. Then will point out the difficulties of attracting and retaining qualified managerial staff in China for multinational companies’ operation. Some other challenges that multinational companies faced when doing business in China will be mentioned later. This paper will also provide some practical recommendations for human resource management in the final part of the essay. The major emphasis of this paper is on the various problems of attracting and retaining qualified managerial staff for foreign multinational companies in Chinese market. Some attention is also given to local staff incentive policies.
2. Human resource challenges
Human resource management (HRM) has become one of the most popular issues in international management and business practice recently. As the increasingly important of qualified staff in multinational companies, the international human resource management models had been developed (Chen and Wilson 2003). In the beginning, multinational companies adopt standardization of human resource management, which believed coherence strategy and coordinate practice can lead to operational effectiveness and efficiency. However, they met difficulties after the international dimension becoming more and more popular as a result of changes in operating environment and structures (McGraw and Harley 2003). Different people in different countries have different culture and conception on organization behavior. The diversity and complexity of cross-nation and cross-culture may result in strategy conflicts for multinational companies when they implemented international standardized human resource management (Daft, 2007). In order to
Vol. 3, No. 12 International Journal of Business and Management
170
overcome these difficulties and reduce cost, more multinational companies began to localize employment in host countries. Localization of Human Resource Management has hence emerged as the times require.
According to Noe et. al (2006, p. 5), Human Resource Management is a branch of an organization which recruits and develops personnel to promote the organization’s objectives. It involves interviewing applicants, training staff, and employee retention. Compensation, benefits, employee relations, health, safety, and security issues are a few of the aspects of the Human Resource Management division. Human resource is a crucial factor which could be a competitive advantage for company’s long term development and reputation (Decenzo & Robbins 1999). While China, with over 3/4 of world population and millions of university graduates each year had been considered as a huge labour market for multinational companies. After its entry of WTO, many foreign companies entered in Chinese market and are planning their localized staff strategy in China. However, the progress of human resource management system has not corresponded with the rapid growth of economic development in China, many of foreign companies discovered that recruiting and retaining qualified managerial staff is different and difficult in Chinese market (Zhu and Dowhng, Summer 2000 & Dessler 2006). It is gradually found that hire the qualified managerial staff is a big challenge for multinational companies when operating the Chinese market due to many reasons.
2.1 Short of talent
There are four main problems foreign multinational companies faced when they attracting and retaining qualified managerial staff in China. One is the shortage of talent. The talent in this can be defined as the young people who are upward, progressing, professional and efficient. Over the past years, China has witnessed millions of university graduates each year after the universal access plan was proposed by the Chairman of Jiang Zheming (Higher Education 2004). Unfortunately, the huge market did not return more talent to the country. The Chinese Ministry of Education claimed that the ratio of science graduates and arts graduates is unbalanced in the past five years. More and more young people major in arts rather than science with certain reasons (Ministry of Education PRC, 2006). In China, the major of arts such as management, marketing and language is vacuous and atechnic, which emphasize on theory and perception; differ from science, it has no opportunity to take practice and exercise. On the other hand, the major of arts in Chinese universities is a single subject, not related with other basic necessary knowledge such as finance, mathematics or information technology, students can pass the exam easier and finished school successfully with no skills and techniques (Huang, 2003). As a matter of fact, except a diploma, they have not received any kind of training and can not achieve the initial goal of the course; they also did not possess strong skill in language and no strategic thinking in management after graduate. In other words, they lose their competitive advantages and are not qualified managerial staff on the job. This prevalence of arts in universities would ultimately result in the increase of talent shortage. By contraries, foreign multinational companies operating in China want to attract a specific type of talent with advanced technical skills and deeply understand international management techniques (Leininger, 2004). They expected the qualified managerial group not only to be competent but also help to set up organization culture.
Nevertheless, things did not develop optimistically in the aspect of science graduates. Recent years, multinational companies finding that few Chinese graduates major in science are qualified in their occupation. The direct of McKinsey Company in Shanghai office had reported that less than ten percent of Chinese job candidates, on average, would be suitable for work in a foreign company in the nine occupations: engineers, finance workers, accountants, qualitative analysts, generalists, life science researchers, doctors, nurses, and support staff (Farrell & Grant 2005). Although there is less number of students study science, the outcome is not better prospect than arts due to the bias of education system. In China, the main characteristic of education in universities is much more towards theory compare to other countries such as America or United Kingdom (Taura, 2005, Farrell & Grant 2005). During the school, Chinese students did not get much practical experience in the project, and did not obtain the cooperation skill in team work; obviously, they can not achieve practical solutions for a project in the job. Hence, the young graduates who get high grade and win scholarship in school actually can not perform well in the job. The argument of talent shortage in China is becoming true.
2.2 The differences of social environment
On the other hand, the differences in culture, labour market, and employment systems between China and other countries create challenges for multinational companies attracting and maintain qualified staff in Chinese market (Bjorkman and Lu 1999). In the past time of China, there was no human resource management in enterprise, three "iron" (fixed) practices replaced conventional human resource management. During the industry period, the government would manage all of the company’s operation, and the managers were informed what to product and how to product by the government (Dessler, 2006). In 1980s, after the Chinese opening-up and reforming policy has been introduced by Deng Xiaoping, the concept of human resource management has been developed because of the return of foreign companies (Deng, 2001). Whereas, young people were usually assigned to jobs by the state, and the human resource management did not function well since it was purely administrative in nature. In this situation, the people who have been assigned job were considered as lifetime employment in China, which is also named “iron rice bowl” (Gross &
International Journal of Business and Management December, 2008
171
Dyson, 1996). The iron position means that the managers can keep their job all of their lives and the payment are not related to performance. The iron wage have been given also indicates that managers need not responsible for workers’ salary and the company’s benefits. The managers are not motivated as there is no extra incentive if they work hard. Therefore, the managers’ working efficiency would much lower than expected. They will commonly come later and leave earlier or even be absent to do private personal things in the working time; they will lose their technical skills and be difficult to train, after a period of time, most of the managers will strain their attitudes towards work and ultimately depreciate their personal value (Francesco & Gold, 2005). Accordingly, when foreign multinationals start running business in China, they had encountered many difficulties in human resource management, and found that attracting qualified managerial staff in China is a challenge.
2.3 Compensation and benefits
Employed compensation and benefits system is another factor that influenced the human resource management for multinational companies in China (Tian, 2007). Watson Wyatt had conducted a survey in China recent years, and finally found that the dominant reason for local Chinese qualified staff to leave their company is to find a better-paid job (Leininger, 2004). China’s economy has been experiencing a rapid development after the entry of WTO, and the turnover rate in China mainland has ranked the highest in Asia. The salary has also raised approximate 8 percent annually in the past five years (Leininger, 2007). These promising increases have lead to the growth of wage rate in China and this trend is expected to continue in China. In multinational companies, the salary of employees, in particular the wage of Chinese managerial staff is much depends on their performance, which means there is not much compensation and benefits for Chinese staff. A related consequence for this pay system is an increasing number of job dissatisfaction with the qualified and experienced staff. Watson Wyatt had conducted a Worldwide’s 2006–07 WorkChina Employee Attitude Survey in 100 companies in China to investigate the employee’s attitudes towards their payment, the latest result showed that only 23 percent of employees are satisfied with their compensation and benefits (Leininger, 2007, p. 28).
In the opposite, Chinese staff could get a variety of compensation and benefits in domestic companies, especially for the qualified managerial employees. China’s state-owned enterprises are the main competitor which had occupied most of Chinese qualified employees. The large number entry of foreign companies and rapid growth of salary in China, had affected a reform of pay system in the state-owned enterprises. Besides the basic wage, the qualified managerial staff has welfare entitlement and be paid a variety of social insurance, which had been called “five insurance and one fund” in China. It includes media insurance, unemployment insurance, working-related injury insurance, bearing insurance, endowment insurance and house fund (Juni, 2005). After employees have been with a company for a period of time, some managerial staff will be treated family-friendly benefits, which are supportive of caring for their family (Delenzo & Robbins, 1999). Moreover, employees can spend the holiday with their families on Chinese traditional festivals, such as Tomb-sweeping Day, Mid-autumn Day, and Double Ninth Day and so on. All of these compensation and benefits have improved a sense of job security working in China’s state-owned enterprises. Employees are motivated and treasured their stable incomes and social welfare; they struggle hard to increase their productivity which could help them survive and remain in the company (Chiu, 2005). Many foreign multinational companies have realized this issue and are planning to invest more in Chinese market, they establishing rewards and pay program to attract Chinese qualified staff, but there are still some obstacles suffered which have to overcome and find a feasible solution in required time.
2.4 Expatriate failure
As the shortage of qualified and experienced staff in China, it is difficult to engage local employees in the beginning, and many multinational companies have used expatriate top management team to establish their operations (Qi & Lange, 2005). An expatriate is someone who has chosen to live in a country other than the one in which he or she legally resides (Noe, Hollenbeck, Gerhart and Wright, 2006). It is important to refer that an expatriate is different from an immigrant. In General, most expatriates do not plan on residing in their new country permanently, and if they do, they plan on retaining their native citizenship for practical purposes. Immigrants, by contrast, usually plan on residing permanently in a new country and acquiring permanent citizenship there (What is an Expatriate, 2007). With the economic globalization, most multinational companies need expatriates to manage the subsidiaries, because they are more familiar with management techniques and methods used in the multinational companies than local employees. However, many companies have faced a high failure rate of expatriates. Most expatriates returned earlier or have a poor job performance in China (Walsh & Zhu 2007, Harzing, 1995). A research conducted on the expatriate failure rates in the U.S., European, and Japanese multinational companies, has showed that about 76% U.S. Multinational companies have a 10% to 40% failure rate, and the rates in the majority of European and Japanese multinational companies are 5% more than the U.S. (Tung cited by Hill, 2005). There are many reasons for expatriate failure, but the main reason is culture shock. Many expatriates become lost, confused and anxious in new country because of the unfamiliar situations and different cultural norms and values (Neuliep, 2003). Especially, when the culture in China clashed with their own
Vol. 3, No. 12 International Journal of Business and Management
172
culture and their family was separated, they would feel homesick, confounded, depressed, irritable, stressed and furious.
The expatriate failure would bring in many negative results for multinational companies. First of all, the work productivity and efficiency of expatriates would be abated. Owing to the uneasy feeling in host country, expatriates would not exert their efforts to achieve excellence during the working time. They became unenthusiasm, absentminded and abandon the working responsibility in their current position. Moreover, one major factor that multinational companies sent expatriates is to promote localization staff in Chinese market (Selmer, 2004). Some expatriates would be reluctant to contribute to the localized process in China because of culture shock. They may resist to training up Chinese local staff and not being motivated to help local managers prepare to their new jobs. As a result, the local staff gains little chance to be progressed and qualified, which would consequently worsen Chinese talent shortage for multinational companies. Apart from this, the expatriate failure would lead to substantively cost for companies, including direct and indirect cost. It is reported that the expatriate compensation packages are typically much costly than locals. For example, an expatriate manager in China typically receives at least three times more than a local manager in total salary and benefits, including hardship allowances and other perquisites (Wong & Law, 1999). In some cases, expatriates even cost ten times more. Therefore, the expatriate program does not improve the situation on China’s tight talent market, but also causes a financial pressure for companies.
3. Other challenges
3.1 Culture differences
Besides of the aspect of human resource management, there are some other challenges that foreign multinational company met in Chinese market. Culture is also an important factor which has influenced the international operation of business in China. People from different countries always have different traditions and attitudes towards business. If foreigners want to manage business in China, they firstly need to understand the fundamentals of Chinese though and study of the Chinese business culture. In China, three philosophy traditions — Confucianism, Taoism, and Buddhism had dominated Chinese people for thousands of years, people considered them as philosophy rather than religion (Fang, 2006). The Confucianism refers to human relationship, which oriented Chinese people’s thinking and way of behavior; the main contribution is to ask people trust each other, avoid conflict and keep harmonious between each other. So when doing business negotiation with Chinese, foreigners may discover Chinese are a group of “gentlemen” with implicative and transigent (Ghauri & Fang, 2001). Taoism is a kind of doctrine which is famous for Yin Yang principle of dualism. The latter feng shui which is probably the most popular belief in Chinese businessman is derived from Yin Yang Eight Diagrams principle. It indicates that people’s fortune are affected by their environment, and more specially, the position of building relative to its physical environment and the interior layout and arrangement of furniture can influence the events occur to the occupants of the building (Tsang 2004, p. 925). Many Chinese businessmen believe feng shui and consider it as a main strategy for business success. These philosophy traditions have been the roots of Chinese culture, which would play an important role in business behavior and decision-making. However, it is a big challenge for the foreigners because the unique business values and beliefs in China are and fundamentally different from other countries especially western countries. On the other hand, because of the deep influence by Confusion, people in China would rather believe people more than any other contracts during the business activities. So if foreign multinationals want to do business in Chinese market, they need to take a people oriented approach and establish a high level of trust relationship with Chinese partners, which is called “guanxi” in China (Ghauri & Fang 2001, Graham & Lam, 2003).
3.2 Guanxi
Guanxi is another intricate aspect of Chinese business cultural phenomenon which had challenged foreigners to much extent. Dunfee and Warrant (2001, p. 2) pointed that “the core idea of guanxi involves relationships between or among individuals creating obligations for the continued exchange of favors”. It is regarded as an individual strategy for developing and maintaining business in China. Recently, Guanxi is becoming increasing important in Chinese society since many Chinese people have established guanxi and use it to carry out business in a number of ways, such as gifts, banquet and priority. It also can be a source of power and advantage for companies if it is operated appropriately in the right time and right occasion (Tsang, 1998). However, guanxi is not easy to obtain as the guanxi based alone is insufficient to establish a strong guanxi, and neither the strong guanxi can not influence other’s decision-making in business achievement (Gao & Tian, 2004). For foreigners, understand the importance of guanxi and build a strong network in Chinese business environment is a difficulty. On the other hand, government plays an outstanding and profound role in Chinese business. Under the condition of central planning economy before 1980s, the government is taking charge of Chinese economy and business operations; the vestige still exist 20 years later, business procedures and behaviors are restricted by government laws and regulations (Gao, 2006). In such a case, it is admittedly that to build a good and close guanxi in China especially with Chinese government is necessary for foreign multinational companies. Furthermore, acquiring the permission of government would facilitate the business process and management. Thereby, if the foreign multinational companies expected to succeed their business in China, they firstly have to learn guanxi and use it to keep a good relationship with Chinese government.
International Journal of Business and Management December, 2008
173
4. Conclusion
To sum up, there are a number of different challenges that multinational company operating the Chinese market. It could be culture differences, government limitations and human resource management problems. While attracting and retaining commitment managerial staff is considered as the main challenge that faced in China since the insatiable demand for a limited number of qualified managerial staff. Although multinational company has realized the human resource management problems in China and introduced a variety of employee retention strategies, it also faced some challenges in attracting and retaining qualified managerial staff. For example, the short of talent in China due to the unpractical education system and embarrassing output of university graduates; different recruitment and selection system between foreign companies and China; un-perfect salary incentives for Chinese staff; and high expatriate failure rate in China mainly because of culture shock. In order to win the talent war, it is suggested that multinational company should firstly pay more attention on the recruitment process to ensure the employees’ quality. On the other hand, the company can establish the internal training courses or schools to improve employees’ abilities and skills. Additionally, the compensation and benefits mechanism should also be concerned as the rising labor cost and high turnover rates in China. When discussing the other challenges such as culture differences and Guanxi involvement, it refers that foreign multinationals should learn the fundamental of Chinese business culture and keep a good relationship with Chinese government.
There are wide-ranging managerial implications of this research. A central assertion is that some aspects of human resource problems can be managed by multinational company itself through setting a good employment system, and there are strategic and economic benefits associated with doing so. An appropriate selection mechanism strategically supports business activities by developing a group of qualified managerial staff and setting a high company recruitment standard which consequently gain a good reputation. Economically, the systematic implementation of faire compensation and benefits in China can help the company save cost on retaining qualified managerial staff. Furthermore, the internal solutions of human resource problems apply to all organizations; both multinational companies which are attempting to attract qualified managerial staff and public institutions that want to develop qualified managerial staff on their own by this approach. On the other hand, it should be noted that the human resource problems is not only the business issue involved in multinational companies, but also suffered in Chinese domestic companies recent years. Many Chinese state companies such as state-owned enterprises, bank, and hospital are facing these challenges. This would be another interesting research area which is not covered in this paper.
References
Ahlstrom, D, Foley, S , Young, M.N. & Chan, E.S. (2005). ‘Human Resource Strategies in Post-WTO China’. Thunderbird International Business Review, 47-3, 263–285.
Bjorkman, I & Lu, Y. (1999). ‘A Corporate Perspective on the Management of Human Resources in China’, Journal of
World Business, 34-1, 16-25.
Chen, S.H. & Wilson, M. (2003). ‘Standardization and Localization of Human Resource Management in Sino-Foreign Joint Ventures’, Asia Pacific Journal of Management, 20-242, 397-408.
China Popin 2008. [Online] Available: http://www.cpirc.org.cn/tjsj/tjsj_cy_detail.asp?id=9229 (March 13, 2008).
Chiu, C.C.H. (2005). ‘Changing Experiences of Work in Reformed State-Owned Enterprises in China’, Organization
Studies, 27-5, 677-697. Retrieved March 22, 2008, from SAGE Publications Online.
Daft, R.L. (2007). Understanding the Theory and Design of Organizations. USA: Thomson South-Western.
Decenzo, D.A. & Robbins, S.P. (1999). Human Resource Management. New York: John Wiley & Sons, Inc.
Deng, P. (2001). ‘WFOEs: ‘The Most Popular Entry Mode in China’. Business Horizons, 44 -4, 63-72.
Dessler, G. (2003). Human Resource Management. America: Pearson Education Ltd.
Dessler, G. (2006). ‘Expanding into China? What Foreign Employers Should Know About Human Resource Management in China Today’.. SAM Advanced Management Journal, 7-49, 70-75.
Dunfee, T.W. & Warrant, D.E. (2001). ‘Is Guanxi Ethical? A Normative Analysis of Doing Business in China’. Journal
of Business Ethics, 32, 191-204.
Fang, T. (2006). ‘Negotiation: The Chinese Style’. Journal of Business and Industrial Marketing, 21-1, 50-60.
Farrell, D. & Grant, A. (2005). Addressing China’s Looming Talent Shortage, McKinsey& Company, Shanghai, October.
Francesco, A.M. & Gold,B.A. (2005). International Organizational Behaviour. Hamilton: Pearson Prentice Hall.
Fryxell, G.E. & Butler, J. & Choi, A. (2004). ‘Successful Localization Programs in China: An Important Element in Strategy Implementation’. Journal of World Business, 39, 268–282.
Vol. 3, No. 12 International Journal of Business and Management
174
Gao, Y. & Tian, Z. (2004). ‘How Firms Influence the Government Policy Decision-Making in China’. Singapore
Management Review, 28-1, 73-85.
Gao, Y. (2006). ‘Building Guanxi with Government for Foreign Companies in China: A Case Study’. The Business
Review, 6-2, 119-125.
Ghauri, P. & Fang, T. (2001) ‘Negotiating with the Chinese: A Social-Cultural Analysis’. Journal of World Business,
36-3, 303-325.
Graham, J. L. & Lam, N.M. (2003). ‘The Chinese Negotiation’, Harvard Business Review, October, 82-91.
Gross, A. & Dyson, P. (1996). The iron rice bowl cracks - China's economic policy. [Online] Available: http://findarticles.com/p/articles/mi_m3495/is_n7_v41/ai_18581220 (March 20, 2008).
Harzing, A.W. (1995). The Persistent Myth of High Expatriate Failure Rates.[Online] Available: http://users.anet.com/~smcnulty/docs/failure.pdf(April 18, 2008).
Higher Education 2004, [Online] Available: http://english.china.com/zh_cn/education/educational_system/11020788/20040929/11898613.html (March 18, 2008).
Hill, W.L. (2005). International Business: Competing in the Global Marketplace (International ed.). New York: McGraw-Hill,.
http://www.dtcchina.um.dk/NR/rdonlyres/0447E1CF-98F4-42E2-AE35-3E683A66B0AD/0/HRissuesinChina.pdf (March 22, 2008).
Huang, F.T. (2003). ‘Policy and Practice of the Internationalization of Higher Education in China’. Journal of Studies in International Education, 7-3, 225-240. Retrieved March 20, 2008, from SAGE Publications Online.
Jandt, F.E. (2007). An Introduction to International Communication. London: SAGE Publications.
Juni, R. (2005). HR-issues in China. [Online] Available.
Leininger, J. ( 2004). ‘The Key to Retention: Committed Employees’. The China Business Review, May/June 2004, 16-39.
Leininger, J. (2007). ‘Recent Compensation and Benefit Trends in China’. July-August 2007, 28-30.
McGraw, P. & Harley, B. (2003). ‘Industrial Relation and Human Resource Management Practices in Australian and Overseas-owned Workplaces: Global or Local?’. The Journal of Industrial Relations, 45-1, 1-22. Retrieved Mach 11, 2008, from SAGE Publications Online.
Ministry of Education The People’s Republic of China 2006. [Online] Available: http://www.moe.edu.cn/edoas/website18/en/planning_n.htm (Mach 11, 2008).
Neuliep, J.W. (2003). Intercultural Communication: A Contextual Approach. USA: Houghton Mifflin.
Noe, R.A., Hollenbeck, J.R., Gerhart, B. & Wright, P.A. (2006). Human Resource Management: gaining a competitive advantage. New York: McGraw-Hill International Edition.
Qi, G. & Lange, G. (2005). Preventing Expatriate Failure- A Research on the Expatriate Selection and Training.[Online] Available: http://eprints.bibl.hkr.se/archive/00000673/01/preventingexpatriatefailure-Group11_Gao_Qi_&_Grit_Lange.pdf. (May 01, 2008).
Selmer, J. (2004) ‘Expatriates’ Hesitation and the Localization of Western Business Operations in China’. International Journal of Human Resource Management, 15-6, 1094-1107.
Taura, R. (2005). Japanese Companies’ HRM Strategies in China. Japan: Nomura Research Institute, Ltd.
Tian, X.W. (2007). Managing International Business in China. Cambridge: Cambridge University Press.
Tsang, E.W.K. (1998). ‘Can guanxi be a source of sustained competitive advantage for doing business in China?’. Academy of Management Executive, 12- 2, 64-73.
Tsang, E.W.K. (2004). ‘Toward a Scientific Inquiry into Superstitious Business Decision-Making’. Organization
Studies, 25-6, 923-946.
Walsh, J. & Zhu, Y. (2007). ‘Local Complexities and Global Uncertainties: A Study of Foreign Ownership and Human Resource Management in China’. The International Journal of Human Resource Management, 18-2, 49-267.
Weisert, D. (2001). ‘Coca-Cola in China: Quenching the Thirst of a Billion’. The China Business Review, Jul/Aug, 52-56.
What is an Expatriate 2007? [Online] Available: http://www.wisegeek.com/what-is-an-expatriate.htm (Mach 11, 2008).
Wong, C.S. & Law, K.S. (1999). ‘Managing Localization of Human Resources in the PRC: A Practical Model’. Journal
of World Business, 34:1, 26-40.
International Journal of Business and Management December, 2008
175
The Modification of PCFR Parameters
in Material Preparation Logic for EOL Stage
Wenxing Zhou, Yachao Wang
College of Management, Tianjin Polytechnic University
Tianjin 300160, China
E-mail: [email protected]
Abstract
When enterprises begin to emphasize the department of customer service, the material preparation of safety stock becomes into the first problem for enterprises, and in various stages of safety stock preparation, the material preparation in the stage of EOL (End of Life) is the most important stage. In this article, we studied the PCFR of EOL stage in order to offer references for the material preparation in the stage of EOL for enterprise and increase the accuracy of material preparation in the stage of EOL for the department of customer service.
Keywords: Customer service, Safety stock, Last buy, PCFR
With the enhancement of customers’ living level, their demands for products are not only limited in the function but more and more emphasized corresponding quality of after service customers would enjoy when quality problems occurs, i.e. after service or customer service what we usually called. Especially for the day when various product markets of supply and demand are gradually saturated, customer service more and more becomes into the concern focus for global famous brands, and enterprises begin to gradually transfer their views from the development of market to the establishment and perfection of customer service department. The satisfactory degree or customers’ public praise will directly decide the market appropriation of the product brand market to some extent.
In numerous factors influencing customer service department, the safety stock water level of servicing material preparation is the very important one. The main influencing factor of safety stock water level rests with the period (Note 1) of material purchase, but in this article, we only study PCFR which is the key factor to influence the computation of Last Buy when the customer service department makes Last Buy in the stage of EOL.
As we know, for the center of customer service (Note2), the material preparation of safety stock can be divided into three stages according to the production cycle of product, i.e. the material preparation in the stage of NPI (New Product Introduce), the material preparation in the stage of MP (Multi-Produce), and the material preparation in the stage of EOL. For the stages of NPI and MP, the arrival of materials is only the problem of time, and the deficiency of materials is only temporary phenomena. But in the stage of product EOL, corresponding products will not be produced, but products are still in the stage of sale, i.e. even if the production is stopped at once, the products in sale still need warranted (Note3) period, so the customer service department still should prepare enough materials until the sales products pass the warranted period (Note4). Because the materials of EOL could not be obtained subsequently, so the accuracy of the quantity of Last Buy in the stage of EOL should fulfill the requirements such as fulfilling all products in the warranted period(Note5) at least, and proper quantity to prevent the production of dead materials and the cost increase of customer service department. Certainly, too much material preparation only influences the cost of customer service department, and too less material preparation could not fulfill the demands and induce the reduce of customer satisfactory degree and market proportion. So the confirmation of the quantity of Last Buy is the problem that enterprises must emphasize in this stage.
At present, we found many complex formulas about Last Buy quantity are very far from the actual demand quantity, so we summarized the following applied computation logic of Last Buy quantity as follows.
1. If the preparation materials are servicing materials, so the formula is
Components Qty= Sales quantity of finished product* PCFR* the proportion that the damaged ratio of the raw materials makes up the damaged ratio of the finished products- Stock- Total Usage
2. If the preparation materials are sales products, so the formula is
Buffer Qty= Sales quantity of finished product* PCFR* Dead Rate- Stock- Total Usage
Here, PCFR represents the accumulative damaged ratio of estimation (Note6), Dead Rate represent the proportion that
Vol. 3, No. 12 International Journal of Business and Management
176
the finished products which could not be repaired make up the finished products repaired back, Stock represents present stock, and Total Usage represents the quantity that the servicing materials or finished products have been used or consumed.
From the formulas, we can see that the sales data, Stock and Total Usage are easily obtained, and the Dead rate could be computed according the actual servicing situation (Note7).
PCFR is the accumulative product damaged ratio when the sale products pass the warranted period (Note8) in the future from the first month of sale to now. And because PCFR is the estimation, so the problem of accuracy exists and the computation of PCFR is one difficulty to compute (Note9) EOL safety stock for enterprises all along. In this article, we primarily studied PCFR, and hoped to offer some references for enterprises.
Suppose the average PCFR of all models up to OOW (Note10) is 4.5%, and usually if certain future model is about to EOL, 4.5% will be the measured standard to compute PCFR, and every enterprise will possess its own computation method. In the computation method of this article, we take 4.5% as the experience value of PCFR, and we adjust the value of PCFR according to the proportion of actual servicing materials consumption and theoretical materials consumption to make the value of PCFR more approach the reasonable value.
Computation of CFR:
Suppose: M= actual consumption/ theoretical consumption
A. If M 5, so check up the accuracy of PCFR with relative technicians.
B. If M [3, 5], so PCFR=3*4.5%*0.6+4.5%*0.4.
C. If M 3, so CFR= (M+1)*4.5%/2.
Use above values of PCFR in the EOL buffer formula to compute.
Where, actual consumption= HQ consumption of customer service- the stocks of every maintenance point*1.2- OTW.
(Note: 1.2 is the stock of outsourcing maintenance point which could not be computed).
Theoretical consumption= present sales quantity* 4.5%* Dead Rate.
Modification: For EOL with substitute relationship, the higher order (Note11) could substitute the lower order (Note11) to make a group, and when the maximum order product (Note11) of the group is about to EOL, we make EOL for the whole group, and then compute according to above formula.
The study of PCFR in the article is only based on electric products, and for other products, there should be different computation methods.
References
Axsater S & Zhang, Wenfa. (1999). A Joint Replenishment Policy for Multi-echelon Inventory Control. Int J Production
Economics.
M. Ettl et al. (2000). A Supply Network Model with Base-stock Control and Service Requirements. Operations
Research.
Notes
Note 1. TAT (Turn Around Time)
Note 2. customer service center
Note 3. warranty
Note 4. are all out of warranty
Note 5. in warranty
Note 6. is Predict Cumulated Failure Rate
Note 7. repair unit
Note 8. are out of warranty
Note 9. calculate
Note 10. all OOW (Out Of Warranty) Model
Note 11. Model
International Journal of Business and Management December, 2008
177
Causal Links between Foreign Direct
Investment and Exports: Evidence from Malaysia
Siti Hajar Samsu (Corresponding author)
School of Business and Economics, Universiti Malaysia Sabah
Locked Bag 2073, Kota Kinabalu 88999, Sabah, Malaysia
Tel: 60-88-320-000 Ext 1551 E-mail: [email protected], [email protected]
Alias Mat Derus
Kulliyyah of Economics and Management Science
International Islamic University Malaysia
P.O Box 10, Kuala Lumpur 50728, Malaysia
Tel: 60-36-196 Ext 4850 E-mail: [email protected]
Ai-Yee, Ooi
Labuan International School of Business and Finance
Universiti Malaysia Sabah, Labuan International Campus
Jalan Sg Pagar, W.P Labuan 87000, Malaysia
Tel: 60-87- 466-713 E-mail: [email protected]
Mohd Fahmi Ghazali
Labuan International School of Business and Finance
Universiti Malaysia Sabah, Labuan International Campus
Jalan Sg Pagar, W.P Labuan 87000, Malaysia
Tel:60-87- 466-715 E-mail: [email protected]
Abstract
Malaysia has encouraged foreign investment not only for its role in technology transfer but also for its contribution to Malaysian exports. Therefore, the aim of this study is to investigate empirically the causal relationship between FDI inflows and exports in Malaysia. The methodologies of stationarity of time series and the multivariate Granger concept of causality were employed to carry out the investigation. The finding that time series variables are cointegrated implies that there is a long term relationship between them. The results appear to support the effectiveness of the outward looking orientation policy deployed in this country.
Keywords: Foreign direct investment, Export, Causality, Cointegration, Malaysia
1. Introduction
The present study chooses to fill the gap by investigating the issue with annual data for the sample period of 1970-2003. This paper intends to carry out an econometric analysis to investigate interlinkages between the two variables. Although FDI has been the primary mechanism linking countries’ economies, the issues of what FDI means for trade are of particular interest in the context of policies for trade and FDI. Therefore, the motivation of this current study is to empirically investigate the causal relationship between export and FDI inflows by means of the Granger causality test in the cointegration and error correction model framework for annual data from 1970 to 2003.
In the case of Malaysia, the government opted for more liberal policies favoring the private sector especially foreign direct investment participation. Responding to this swift change of policies, the domestic private sector has received an
Vol. 3, No. 12 International Journal of Business and Management
178
aggressive inflow of FDI to ensure the sustained expansion in output growth. Moreover, since its adoption of the policy adjustment and liberalization in the mid 1980s, Malaysia’s external trade has expanded at even higher rates. Hence, Malaysia had become one of the fastest growing economies before the financial crisis of 1997. Since FDI and trade are important for growth and development, it is important to understand the interlinkages between the two.
The positive relationship between FDI inflows and exports in relation to economic performance has been broadly accepted; however, the empirical work on the relationship is relatively limited. Survey and empirical results are always uncertain, which necessitates a formal testing. Most of the existing research stresses complementarity and substitutability relationships between exports and FDI. However, many of these studies do not discuss the issue of causality between inflows of FDI and exports. The existing literature on the Malaysian position in relation to this subject matter proves to be inadequate.
The rest of the paper is organized as follows. In section two, gives a brief discussion about the data set used and outlines the methodology employed. Section three, consisted of discussion and empirical results, concluding remarks with main finding and policy implications are summarized in the last section four.
2. Data and methodology
2.1 Data
The data which used for this study is the yearly data for the period from 1970 to 2003. Our analysis is based on time series data at the national level which is on Exports, Foreign direct investment inflows, Gross Domestic product. All of the data are extracted from different published sources i.e. the International Monetary Fund (IMF) International Financial statistics, Yearbook (Various years), Department of Statistics, Yearbook of Statistics Malaysia (DOS), Malaysia International Trade and Industry (MITI) and Balance of Payment, Annual Report of Bank Negara Malaysia.
2.2 Tests for Stationarity
In any econometric studies, the first step in our methodology is to check the stationarity of the variables used as regressors in the model to be estimated. The variables used in the specified model required the test for the existence of unit root. The unit root test is used for individual variables of time series data with the purpose of ensuring the variables are integrated. In fact, non stationary series could result in spurious regression.
The ADF test is based on the regression equation with the inclusion of a constant and a trend of the form:
t = 0 + t + 1t +k
i 1i it + t (1)
Where Xt = Variables of interest in the logarithm forms at time trend t, it expresses the first differences with klags, is the white noise residual of zero mean and constant variance. The coefficients { .,1,,,0 ......, kt } are parameters being estimated. The null and the alternative hypothesis for the existence of unit root in variable t is;
0 : = 0 ( tX is non stationary or contains a unit root)
1 : < 0 ( tX is stationary or non unit root)
The null hypothesis of the unit root test is that the series are non stationary. Then, if the value AIC (Akaike Information Criterion) is greater than t-statistic, the probability (p-value) is less than the level of significance; we can reject the nullhypothesis. In other words, if the estimated value for is significantly less than zero i.e. rejects the null hypothesis =0, then the series is stationary. Conversely, if we cannot reject the null hypothesis, this means that the time series have a unit root process. However, usually it is likely to be stationary in the first differences as asserted in studies such as Hakim and Rashidian (2002) and Adjaoud and Abdul Rahman (1996).
2.3 Tests for Cointegration
After having completed examination of the stationary of each time series, the next step is to figure out the level of cointegration between the examined variables. For simplicity, this step investigates whether the stochastic trends in the examined variable, which is supposed to contain unit roots, have a long term relationship.
For the cointegration test, the most common used methods are the Engle and Granger (1987) and the Johansen (1988) and Johansen and Juselius (1990) method. The Johansen and Juselius test is a method of cointegration testing based on the maximum likelihood estimation of the VAR model to determine the number of cointegrating vectors in the analysis. In this technique, two test statistics are involved in identifying the number (r) of cointegrating vectors, namely the trace test statistics and the maximum eigenvalue test statistics. The trace statistics hypothesize the null hypothesis that there are at most r cointegrating vectors against the alternative of r or more cointegrating vectors. Meanwhile, the maximal eigenvalue statistics tests are for r cointegrating vectors against the alternative of r+1 cointegrating vectors. It is widely
International Journal of Business and Management December, 2008
179
accepted that the Johansen and Juselius approach is more powerful than the Engle and Granger tests, hence we decided to use the Johansen and Juselius method to test for the long run relationship at integrated variables.
In this study, we employ the Johansen and Juselius method to test for the long run relationship between variables in a multivariate model using Johansen’s full information maximum likelihood procedure. The analysis is based on the following equations:
pttttt yyyy ...........1211 (2)
Where ty is a k- vector of non stationary 1(1) variables, with i=1,…, is a lag operator and t is a the white
noise residual of zero mean and constant variance. The lag order must be determined using Akaike’s Information
Criterion (AIC).
2.4 Test for Granger (temporal) Causality with VECM
The next step involved is testing for Granger causality among the variables. We thus proceed with our causality test using the first difference version of the variables under study. The cointegration between two or more variables is sufficient to demonstrate the presence of causality in at least in one direction (Granger, 1988). Although cointegration indicates the presence or absence of Granger causality, it does not indicate the direction of causality between the variables. Thus, the causality test helps us to verify whether change in any series can be explained by the other two series. The concept of causality is initially introduced by Granger (1969). Hakim and Rashidian (2002) briefly explain about the causality test. In addition, all series need to be stationary in order to avoid spurious causality. Much of the previous literatures demonstrated the use of non stationary macroeconomic variables in regression would produce spurious results and lead to misleading conclusions (Gujarati, 2003). This view is also supported by Granger (1988), which stated that standard tests for causality are valid only if there exists cointegration between the examined variables. Thus, we can conclude that the prerequisite of causality testing is to check the cointegrating properties of the variables.
We employed the vector autoregression (VAR) technique and regressed on its own lags and the lag of other variables. To examine the causal linkages among these variables, we specify and estimate a vector error correction model (VECM) which can be expressed as follows:
tt
t
p
i
it
p
i
it
p
i
i
ect
GDPFDIEXPEXP
14
11
3311
2211
110 lnlnlnln (3)
tt
t
p
i
it
p
i
it
p
i
i
ect
EXPGDPFDIFDI
14
11
3311
2211
110 lnlnlnln (4)
tt
p
i
it
p
i
it
p
i
i
ect
FDIEXPGDPGDP
146
1331
1221
1110 lnlnlnln
(5)
Where ectt-1 is the error correction term generated from the cointegrated regression from the Johansen multivariable
process, t are disturbance terms, denote first differences required to induce stationary for corresponding
variables and the estimated coefficient of 1 , 2 …… 3 indicates the ‘short run’ causal effects, shown by the F-test of
the explanatory variables whereas the coefficient of 1tect measures the ‘long run’ causal relationship implied
through the significance of the t-statistics. The relevant error correction term must be included to avoid misspecification
and omission of important constraints. The lag structure is determined by using Akaike’s minimum Final Prediction
Error (FPE) Criterion.
Vol. 3, No. 12 International Journal of Business and Management
180
3. Estimations results
3.1 Time Series properties of the Data
As it is well known, the unit root test objective is to test whether the potential macro variables in estimation are stationary. The unit root test results both with and without time trend are reported in Table 3.1. The table reports the results of the Augmented Dickey Fuller (ADF) and Philips Perron (PP) tests on these variables. The Akaike Information Criteria was used to select the optimum lag lengths required in each case.
The testing results from panel A propose that all the variables considered have unit roots. The estimated ADF t-statistics less than the corresponding critical values reveals that the null hypothesis of the unit root (non stationary) cannot be rejected for most of the variables at the 10% level of significance. This implies that most of the variables are stochastic at all levels, then it will be further confirmed that the variables are integration of order 1. From Panel B, the null hypothesis could be rejected for the differences of the series. In other words, the time series data are first difference stationary. One advantage of the PP test over the ADF test is that the PP tests are robust to general forms of heteroskedasticity in the error term µt (Philips and Perron, 1988). Taking this view for the results of stationarity collectively, greater reliance is placed on the PP results.
3.2 Cointegration and Johansen Test
If all variables have unit root and they have the same order of integration, then the likelihood ratio test is used to find out the number of cointegrating vectors. Therefore, if there is one or more than one cointegrating vector, then the long run combination among the variables can be found, even though they may drift apart in the short run. The possibility of cointegration between the variables included in the model is examined by estimating the cointegrating regression described in equation (2).
Table 3.2 represents the Johansen cointegration test results for the cointegration rank r. The null hypothesis is rejected, thus suggesting that there is certainly at least one cointegrating vector in each sample to show the stable long run relations between these variables. Evidence from the table shows that the null hypothesis of r = 0 or there is no cointegration is rejected at 5% and 1% level of significance by trace statistics and maxi Eigenvalue tests. Evidence from Table 3.2 confirms that the number of statistically significant cointegration vectors is equal to two for trace statistics and one cointegrating vector for maximal eigenvalue. This implies that there exists a significant cointegrating relationship connecting three variables and we can conclude that there is a long run relationship among the variables under study.
Our result is supported by Dritsaki, Adamopoulus (2004) who assert that there exists a long term relationship between LEXP, LGDP, and LFDI which long run estimated elasticities relative to exports suggest that foreign direct investments are inelastic to exports.
The export cointegration equation suggests that the FDI and GDP influence Malaysian exports in the long run. The long run estimated elasticities relative to exports suggests that foreign direct investment is inelastic to exports, while output growth is elastic to export. The study result seems to support our study expectations of the linkages between FDI and exports growth in the long run. It is likely to show that an increase in FDI inflows may boost or enhance movements in Malaysian exports.
Co-integration Equation
InEXP= 0.765039 + 2.752742
(0.02643) (0.03958)
Causality Analysis with VECM
A.M.M. Masih and R. Masih (1996) stress that the vector error correction modeling is used to observe an additional channel for causal linkage among cointegrated variables. He added that the VECM approach allows us to distinguish between short term and long term Granger causality. Hakim and Rashidian (2002) further explain that by using the VECM two sources of causality are detected. First, the traditional channel of causality through the F-statistics of the lagged explanatory variables which demonstrates short term causal effects, whereas the second additional channel is implied through the significance of the lagged error correction term which represents long run causality.
The evidence of the co-integration presented in Table 3.2 indicates that we should proceed with the error correction model (ECM) in order to combine both the long run information and short run dynamic in the model. The results of the multivariate causality from the VECM are presented in Table 3.3. From the results we can see the existence of a long term equilibrium relationship between foreign direct investment and exports. The empirical result of the estimated error correction models indicates the significance of the error correction term (ECT) which confirms the long run relationship between exports and its regressors.
International Journal of Business and Management December, 2008
181
The direction of causality is in line with our prior expectations for the current study. From the causality result, it appears that causality flows from foreign direct investment to exports in the long run. Specifically, this reflects an exports growth in manufactured goods which is through foreign involvement in the manufacturing sector which is parallel with the trends in Malaysia whereby 40% to 60% of FDI inflows are directed towards the manufacturing sector compared with other sectors i.e. oil and gas, and services. The findings match up with the analysis of Zhang et al., (2001) who examine the relationship between inward direct foreign investment and Chinese exports which found that FDI leads exports for China as a whole.
4. Conclusion
The main result of this study was that the FDI inflows and exports are cointegrated in the period of analysis. The finding that the time series variables were cointegrated implies that there was a long term relationship between them. Even though the empirical results from the VECM showed there was no causality effect in the short run between FDI inflows and exports, it still supported the validity that FDI inflows have a positive effect on exports in the long run. The causal linkages suggest the direction running from FDI inflows to exports. It is clear that expansion of exports can results from FDI, if there are relatively large differences in resource endowments between the home countries and host country (Liu et al., 2001). The positive association between these two variables is an evidence of a beneficial impact of FDI on exports. These results provide further insight into the role played by FDI in the effectiveness of the export oriented policy deployed in this country. Its seems that the findings of this study support the hypothesis made by Dollar (1992) and Jun and Singh (1995) which acknowledge that outward oriented economies particularly those exploiting their export potential attract more foreign direct investment. Phang (1998) whose study was about foreign direct investment at Malaysia’s balance of payments position, found that FDI is attracted to countries with high trade potential and the export.
The policy implications are straightforward. For rapid expansion of exports, trade liberalization policies have to promote on sectors that will trigger FDI inflows to Malaysia. Specifically, sectors which are able exploit exporting capabilities built on local suppliers. This approach must take into account a way to defeat poor linkages between foreign firms and local industry; as past study reveals that technology transfers remain poor in host country. Thus, Asian countries have been facing a low value added and poor record of technology transfer. However, for effective policy analysis studies may be undertaken using data at the disaggregate level. Economically speaking, this means that host government should promote activities as a potential exports which make use of our comparative advantage. In addition, FDI should be seen as a supplement, not as a substitute for local capital resources.
References
Adjaoud, F. & Abdul Rahman. (1996). A Note on the Temporal Variability of Canadian Financial Services Stock Returns, Journal of Banking & Finance, 20, 165-177.
Masih, A. M. M., & Masih, R.(1996). Empirical Tests to Discern the Dynamic Causal Chain in Macroeconomic. Activity: New Evidence from Thailand and Malaysia Based on a Multivariate Cointegration/Vector error.correction Modeling Approach, Journal of Policy Modeling, 18 (5), 531-560.
Dritsaki, M., Dritsaki, C., & Adamopoulus, A. (2004). A causal relationship between trade, foreign direct investment and Economic Growth for Greece. American Journal of Applied Sciences, 1 (3), 230-235.
Engle, R.T., & Granger, C.W.J. (1987). Cointegration and Error Correction: Representation, Estimation and Testing, Econometrica , 55, 251-276.
Granger, C.W.J.(1988). Some Recent Development in the Concept of Causality. Journal of Econometrics, 39, 199-211.
Granger, C.W.J. (1986). Development in the study of cointegrated economic variables, Oxford Bulletin of Economics
and Statistics, Vol. 48, 213-228.
Granger, C.W.J. (1969). Investigating Causal Relations by Econometric and Cross Spectral Method, Econometrica, Vol. 37, No. 3, 424-438.
Granger, C.W.J., & Newbold, P. (1974). Spurious regression in Econometrics, Journal of Econometrics, Vol. 2, 111-120.
Johansen, S. & Juselius, K. (1990). Maximum Likelihood Estimation and Inference on cointegration with Application to the Demand for money. Oxford Bulletin of Economics and Statistics, 52, 169-210.
Johansen, S. (1988). Statistical analysis of cointegration vectors. Journal of Economic Dynamics and Control, 12, 231-254.
Liu, X., Wang, C., & Wei, Y. (2001). Causal links between foreign direct investment and trade in China, China
Economic Review, 12, 190-202.
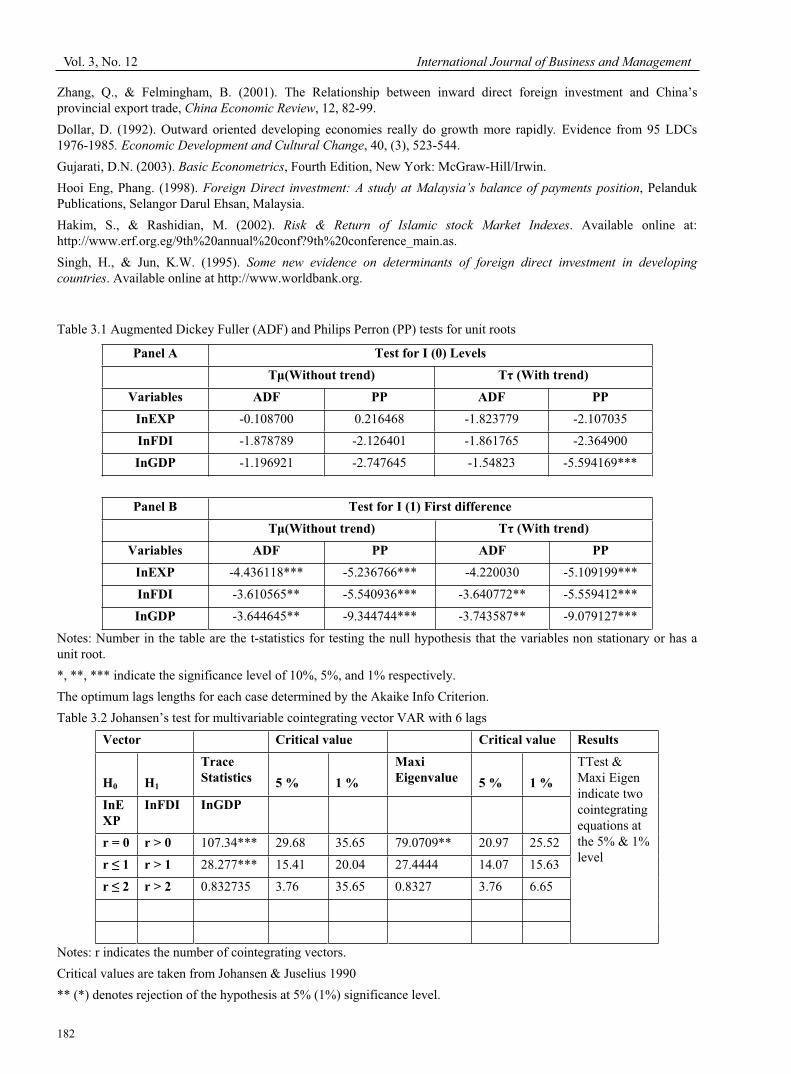
Vol. 3, No. 12 International Journal of Business and Management
182
Zhang, Q., & Felmingham, B. (2001). The Relationship between inward direct foreign investment and China’s provincial export trade, China Economic Review, 12, 82-99.
Dollar, D. (1992). Outward oriented developing economies really do growth more rapidly. Evidence from 95 LDCs 1976-1985. Economic Development and Cultural Change, 40, (3), 523-544.
Gujarati, D.N. (2003). Basic Econometrics, Fourth Edition, New York: McGraw-Hill/Irwin.
Hooi Eng, Phang. (1998). Foreign Direct investment: A study at Malaysia’s balance of payments position, Pelanduk Publications, Selangor Darul Ehsan, Malaysia.
Hakim, S., & Rashidian, M. (2002). Risk & Return of Islamic stock Market Indexes. Available online at: http://www.erf.org.eg/9th%20annual%20conf?9th%20conference_main.as.
Singh, H., & Jun, K.W. (1995). Some new evidence on determinants of foreign direct investment in developing
countries. Available online at http://www.worldbank.org.
Table 3.1 Augmented Dickey Fuller (ADF) and Philips Perron (PP) tests for unit roots
Panel A Test for I (0) Levels
µ(Without trend) (With trend)
Variables ADF PP ADF PP
InEXP -0.108700 0.216468 -1.823779 -2.107035
InFDI -1.878789 -2.126401 -1.861765 -2.364900
InGDP -1.196921 -2.747645 -1.54823 -5.594169***
Panel B Test for I (1) First difference
µ(Without trend) (With trend)
Variables ADF PP ADF PP
InEXP -4.436118*** -5.236766*** -4.220030 -5.109199***
InFDI -3.610565** -5.540936*** -3.640772** -5.559412***
InGDP -3.644645** -9.344744*** -3.743587** -9.079127***
Notes: Number in the table are the t-statistics for testing the null hypothesis that the variables non stationary or has a unit root.
*, **, *** indicate the significance level of 10%, 5%, and 1% respectively.
The optimum lags lengths for each case determined by the Akaike Info Criterion.
Table 3.2 Johansen’s test for multivariable cointegrating vector VAR with 6 lags
Vector Critical value Critical value Results
H0 H1
Trace
Statistics 5 % 1 %
Maxi
Eigenvalue 5 % 1 %
TTest & Maxi Eigen indicate two cointegrating equations at the 5% & 1% level
InE
XP
InFDI InGDP
r = 0 r > 0 107.34*** 29.68 35.65 79.0709** 20.97 25.52
r 1 r > 1 28.277*** 15.41 20.04 27.4444 14.07 15.63
r 2 r > 2 0.832735 3.76 35.65 0.8327 3.76 6.65
Notes: r indicates the number of cointegrating vectors.
Critical values are taken from Johansen & Juselius 1990
** (*) denotes rejection of the hypothesis at 5% (1%) significance level.

International Journal of Business and Management December, 2008
183
Table 3.3 Dynamic MultivariateCausality Analysis through Vector error correction modeling (VECM) VAR with 2 lags
Dependent
Variable
Independent variables
F-Statistics T-Statistics
lnEXP lnFDI lnGDP For ECTt-1
(1) lnEXP - 1.396702 8.165046*** 2.66836***
(2) lnFDI 0.1904 - 0.950317 -0.27559
(3) lnGDP 2.028217 5.94809** - 3.88316***
Notes: *, **, *** denote significance at 10%, 5% and 1% respectively. Statistics on lagged EC terms are t-ratio and measure long run causality, while statistics on lagged independent variables are F-statistics and evaluate short run causality.
Editorial Board
Balakrishnan Parasuraman Universiti Malaysia Sabah, Malaysia
Benjamin James. Inyang University of Calabar, Nigeria
Dennis Yao Dzansi Central University of Technology, South Africa
Donald Henry Ah Pak Xi’an Jiaotong-Liverpool University, China
Goi Chai Lee Curtin University of Technology, Malaysia
Guneratne Wickremasinghe Victoria University, Australia
Hafizi Muhamad Ali Universiti Utara Malaysia, Malaysia
K. G. Viswanadhan NSS College of Engineering, India
Mahdi Salehi Zanjan University, Iran
Muhammad Madi Bin Abdullah Universiti Tenaga Nasional, Malaysia
Selcuk Burak Hasiloglu Pamukkale University, Turkey
Susan Sun Canadian Center of Science and Education, Canada
Ying Jin Qingdao Technological University, China