Embed Size (px)
Citation preview

j Form ApprovedREPORT DOCUMENTATION PAGE 0MB No. 0704-0188
Public reporting burden for this collection of information is estimated to average 1 hour per response, Incuing the time for reviewing instructions, searching existing data sources,gathering and maintaining the data needed, and completing and reviwing the collection of information. Send comments regarding this burden estimate or any other aspect of thiscollection of information, including suggestions for reducing this burden, to Washington Headquarters Services, Directorate for Information Operations and Reports, 1215 JeffersonDavis Highway, Suite 1204, Arlington, VA 22202-4302, and to the Office of Management and Budget. Paperwork Reduction Project (0704-0188), Washington, DC 20503.
1. AGENCY USE ONLY (Leave blank) 2. REPORT DATE 3. REPORT TYPE AND DATES COVERED
I Mar 95 I Final Oct 91 - Mar 954. TITLE AND SUBTITLE 5. FUNDING NUMBERS
CONVENTIONAL WEAPONS EFFECTS ON REINFORCED SOIL WALLS PE - 61102F
Project - 2302CW
6. ATHORS) ' TICTask - 93WL004
Richard A. Reid E7. PERFORMING ORGANIZATION NAME(S) AI 8. PERFORMING ORGANIZATION
WL/FIVCS REPORT NUMBER
139 BARNES DRIVE, SUITE 2 BTYNDALL AFB BFL 32403 OSR .9 5- 0 3 14
9. SPONSORING/MONITORING AGENCY NAME(S) AND ADDRESS(ES) 10. SPONSORING/MONITORING
AFOSR/NA AGENCY REPORT NUMBER
110 DUNCAN AVE, SUITE B115BOLLING AFBWASHINGTON DC 20332-0001
11. SUPPLEMENTARY NOTES ['uyAFI;*$1__II________I__-_l_ Amu
12a. DISTRIBUTION /AVAILABILITY STATEMENT 12b. DISTRIBUTION CODE
This report has been reviewed by the Public AffairsOffice and is releasable to the National TechnicalInformation Service (NTIS). At NTIS, it will be avail-able to the general public, including foreign nations.
13. ABSTRACT (Maximum 200 words)
A more quantitative understanding of the response of reinforced soil walls to explosions inthe retained fill was developed via a single degree of freedom model developed, by Drake, et al(1987). A series of full-scale tests were conducted to investigate the response of the walls to free-field blast pressures, and detailed analysis of the test data suggested inertial stresses generatedduring the crater formation process, not blast pressures, were the governing loading condition.Using full and small-scale test data, the validity of the model is demonstrated through a consistentrelationship between system stiffness and displacement. The consistency of thestiffness/displacement relationship for full and scaled tests suggest the centrifuge providesreasonable models of full-scale reinforced soil walls.
Application of the test data to the model yields order of magnitude results in prediction ofultimate wall panel displacements. The approach and results of this study provides a significantdeparture from previous research by identifying the loading mechanisms that govern response, theinfluence of the engineering properties of the materials, and validation of a model that provides aquantitative description of the physical response of the reinforced soil wall.
14. SUBJECT TERMS 15. NUMBER OF PAGES
Reinforced soil, conventional weapons, protective structures, 388geosynthetics, geogrid, centrifuge, soil dynamics, inertial 16. PRICE CODE
stress, plastic stress.17. SECURITY CLASSIFICATION 18. SECURITY CLASSIFICATION 19. SECURITY CLASSIFICATION 20. LIMITATION OF ABSTRACT
OF REPORT OF THIS PAGE OF ABSTRACT
Unclassified Unclassified Unclassified UL
NSN 7540-01-280-5500 Standard Form 298 (Rev. 2-89)Prescribed by ANSI Sid. Z39-18298-102

GENERAL INSTRUCTIONS FOR COMPLETING SF 298
The Report Documentation Page (RDP) is used in announcing and cataloging reports. It is importantthat this information be consistent with the rest of the report, particularly the cover and title page.Instructions for filling in each block of the form follow. It is important to stay within the lines to meetoptical scanning requirements.
Block 1. Agency Use Only(L eave blank). Block 12a. Distribution/Availability Statement.Denotes public availability or limitations. Cite any
Block 2. Report Date. Full publication date availability to the public. Enter additionalincluding day, month, and year, if available (e.g. 1 limitations or special markings in all capitals (e.g.Jan 88). Must cite at least the year. NOFORN, REL, ITAR).
Block 3. Type of Report and Dates Covered. DOD - See DoDD 5230.24, "DistributionState whether report is interim, final, etc. If S ee o n Technicalapplicable, enter inclusive report dates (e.g. 10 Statmentso cJun8 - 0Jun8).Documents."Jun 87- 30 Jun 88). DOE - See authorities.
Block 4. Title and Subtitle. A title is taken from NASA - See Handbook NHB 2200.2.
the part of the report that provides the most NTIS - Leave blank.meaningful and complete information. When areport is prepared in more than one volume, Block 12b. Distribution Code.repeat the primary title, add volume number, andinclude subtitle for the specific volume. Onclassified documents enter the title classification DOD Eave blank.in parentheses. DOE - Enter DOE distribution categories
from the Standard Distribution for
Block 5. Funding Numbers. To include contract Unclassified Scientific and Technical
and grant numbers; may include program Reports.
element number(s), project nUmber(s), task NASA Leave blank.
number(s), and work unit number(s). Usethe NTIS - Leave blank.
following labels:
C - Contract PR - Project Block 13. Abstract. Include a brief (MaximumG - Grant TA - Task 200 words) factual summary of the mostPE - Program WU - Work Unit significant information contained inthe report.
Element Accession No.
Block 6. Author(s). Name(s) of person(s) Block 14. Subiect Terms. Keywords or phrasesresponsible for writing the report, performing identifying major subjects in the report.the research, or credited with the content of thereport. If editor or compiler, this should followthe name(s). Block 15. Number of Pages. Enterthetotal
number of pages.Block7. Performing Organization Name(s) andAddress(es). Self-explanatory. Block 16. Price Code. Enter appropriate price
Block 8. Performing Organization Report code (NTIS only).Number. Enter the unique alphanumeric reportnumber(s) assigned by the organization Blocks 17.- 19. Security Classifications. Self-
explanatory. Enter U.S. Security Classification in
Block 9. Sponsoring/Monitoring Agency Name(s) accordance with U.S. Security Regulations (i.e.,and Address(es). Self-explanatory. UNCLASSIFIED). If form contains classified
information, stamp classification on the top andBlock 10. Sponsoring/Monitoring Agency bottom of the page.Report Number. (If known)
Block 11. Supplementary Notes. Enter Block 20. Limitation of Abstract. This block mustinformation not included elsewhere such as: be completed to assign a limitation to thePrepared in cooperation with...; Trans. of...; To be abstract. Enter either UL (unlimited) or SAR (samepublished in.... When a report is revised, include as report). An entry in this block is necessary ifa statement whether the new report supersedes the abstract is to be limited. If blank, the abstractor supplements the older report. is assumed to be unlimited.
Standard Form 298 Back (Rev. 2-89)

EXECUTIVE SUMMARY
A. OBJECTIVE
The objective of this effort is to understand the load deformation behavior of a soilelement reinforced with synthetic inclusions when the element is subjected to high strain rateloading from a chemical explosion within the soil mass.
B. BACKGROUND
Conventional reinforced concrete protective structures are currently used by the UnitedStates Air Force to shelter aircraft, munitions, command and control facilities and othercritical warfighting functions from conventional weapons attack. The advantages ofreinforced concrete as a construction material include its ability to be designed to a specificstrength, ability to be placed in any size or shape, and well known blast responsecharacteristics. Some disadvantages to reinforced concrete include its high cost, longconstruction time, reliance on large amounts of quality construction materials, and the needfor skilled labor. Therefore, reinforced concrete is not well suited for use where modemconstruction techniques and support are not available, or when expedient construction isrequired.
Alternatively, particulate media such as soil may be used for the construction ofprotective shelters when reinforced with synthetic inclusions. Thin stackable concrete panelsare used to form the walls of the shelter. The synthetic reinforcement material is tied to thepanels and the entire structure is buried with soil. Previous research in this area has focusedon relating peak ground shock pressures and accelerations to the response of the structure,however this approach has been unsuccessful. To fully understand the dynamics of theinteraction between the various materials within the time domain, a fundamentally basedapproach is necessary.
C. SCOPE
In order to achieve research objectives, a five-phased technical approach was developedas follows: 1) conduct a literature review for (a) response of reinforced soil, and itscomponents to high strain rate loading, (b) numerical codes for evaluating reinforced soilresponse to ground shock, and (c) physical model testing of reinforced soil systems; 2)develop a test plan and designs for full-scale explosive tests of reinforced soil retaining walls;3) construct and test walls, collect and reduce data; 4) estimate residual displacements offull and small-scale wall panels via a single degree of freedom model; and 5) use the simplemodel to conduct a parametric study of the influence of specific design variables on wallpanel response.

D. METHODOLOGY
A single degree of freedom model was modified to characterize the response ofparticulate media with synthetic inclusions to high strains caused by chemical explosionswithin the media. A series of six full-scale tests were conducted to provide data for modelvalidation, and data from scaled centrifuge tests were used as an independent test of themodel. The model is then used to predict system displacements to the high strain rate loadsand these predictions are then compared to measured test data.
E. TEST DESCRIPTION
Four reinforced soil walls were constructed with a granular media reinforced with a highdensity polyethylene inclusions. The face of the wall was confined with thin concrete panelstied into the inclusions. Five hundred pound Mark-82 bombs were detonated within themedia and test measurements included dynamic stresses within the soil mass, strains on thereinforcement, and accelerations of the concrete facing panels.
F. CONCLUSIONS
A successful series of six explosive tests were performed on four geogrid reinforced soilwalls. Since this type of instrumented test series had never been successfully performedbefore, this research has created a unique data base on the response of reinforced soil wallsto free-field blast pressures. This research suggests two loading mechanisms are presentwhen an explosion takes place in a granular media with synthetic inclusions. First is thehigh amplitude, short duration blast pressure wave. This is followed by the inertial or plasticstress wave, which has two components. The first component is the loading that takes placewhile the entire soil mass from the crater/soil interface to the wall panel is in compression.This is the mass movement resisted by the mass of the soil and the energy absorbed by thesoil mass. Once the inertial wave decays and the entire mass is not in compression, stresseson the concrete elements are transferred to the reinforcement and boundary frictional forces,and the resistance of the inclusion becomes mobilized. Research over the past two decadeshas attempted to relate residual displacements to the peak free-field blast pressures andaccelerations. The results of this research suggest the inertial pressure wave, and not theblast pressure wave, is the load mechanism that results in the most significant response of thesystem. The single degree of freedom model was validated using full and small-scale testdata and provided consistent results across scales. This research suggests this model may beappropriate for evaluating system response to both blast pressure and inertial wave loading.Using measured test data, prediction of displacements for the full-scale tests yielded order ofmagnitude results. For the scaled tests, the model predicted displacements within 20 percentof measured. Finally, comparison of full and scaled tests show the centrifuge studies providereasonable models of full-scale tests.
2

G. RECOMMENDATIONS
A predictive model for the amplitude and duration of inertial stresses from explosions inparticulate media has not been developed. The development of such a model would providea means of quantifying the inertial stress waves for a range of explosive weights andparticulate media. Incorporation of this type of model would provide a forcing function foruse in the single degree of freedom model used in this research, resulting in a valuable toolthat could be applied in optimization of designs.
Accession For' .i.m
DT!C T-0['
Justifi cation •
3

CONVENTIONAL WEAPONS EFFECTS ON REINFORCED SOIL WALLS
A ThesisPresented to
The Academic Faculty
by
Richard Alan Reid
In Partial Fulfillmentof the Requirements for the Degree
Doctor of Philosophy in Civil Engineering
Georgia Institute of TechnologyMarch 1995
Copyright c 1995 by Richard A. Reid

CONVENTIONAL WEAPONS EFFECTS ON REINFORCED SOIL WALLS
Approved:
Glenn J. Wix irman
Date Approved &"

Dedicated to my wife Kathy and our children, Lindsey, Timothy and Rebecca;
my parents, Wallace and Virginia Reid; and in loving memory
of my sister, Deidre Reid Nelson

Acknowledgements
In the eight years it has taken to complete this degree, many people have
worked on my behalf towards the achievement of this elusive goal. I mention
those whose efforts were significant, knowing full well that many others made
important contributions but whom are too numerous to mention specifically.
I would like to thank Dr. Jean-Lou Chameau for his singular efforts while I
was a student in absentia. Without his interest and influence, obtaining this
degree would not have been. Dr. Glenn J. Rix had the difficult task of
assisting in the development of this thesis and ensuring the requirements of the
college were met. His adherence to standards of academic excellence motivated
me to reach beyond my limitations and better prepare me for my future. Also,
Dr. Leland T. Long, who influenced me to develop a greater understanding of
wave behavior, which played an important role in the analysis of my research.
Dr. Robert C. Bachus, who for over ten years has been my teacher, colleague,
and mentor. He has assisted me in so many ways over my academic and
professional career that he has my eternal gratitude and respect. Finally, Dr. J.
David Frost, for his constructive contributions toward this thesis and preparing"I
me for entering academia.
iv

MSgt John Pigg, USAF, Charlie Smith, Don Kirchman, Fred LaLuzerne,
Ed Lockard, Bennie Burdett, and Jim Jones of the USAF Civil Engineering
Laboratory, Tyndall AFB, FL, provided the intense labor necessary for
construction of the test walls in the oppressive Florida heat and humidity.
Their motivation came not from just doing their job, but a unselfish and sincere
desire to do whatever necessary to help me complete this research. TSgt Scott
Kortum, USAF and Bill Naylor provided all data collection instrumentation
support. Mr. Carl Hollopeter, made significant contributions toward the
development of the procedures used to install strain gages on geogrid as well as
assist with test instrumentation. Mr. Mike Purcell, provided test photography
and video support, assisted with his vast experience in the handling of
explosives, and technical input on the behavior and data collection on
explosions in soils. Mike is my strongest ally, and I value his constant support
and friendship. Dr. Doug Merkle, whose engineering expertise, friendship and
guidance have helped me on this and other research projects. He made his vast
personal technical library available to me and has contributed greatly to my
professional development. Also, Mr. Steve Butler and Ms. Michelle Newsome,
for preparation of many of the figures. Finally, Dr. Jim Collin, whose
generous support guidance were critical to this research.
v

I would also like to recognize Lt. Col. Steve Boyce, USAF for research
support from the USAF Office of Scientific Research, Washington, DC. His
personal interest in my obtaining a Ph.D. provided me with an introduction to
Dr. Chameau and funding for this research. I am indebted to him for his
unselfish efforts that led to the resurrection my degree program.
Fellow students Wes Spang and Dr. Roger Meier who assisted in my return
to college and shared a common pursuit of midlife career change. Seph Scott,
the department machinist, for lots of coffee and conversation, and to Ken
Thomas, CE department, for 10 years of friendship and support.
My parents, Wallace and Virginia Reid, who taught me the virtues of hard
work and perseverance that are two necessary elements in both completing a
Ph.D. and being successful in life. It is said that parents are so busy trying to
give their children what they didn't have, that they forget to give us what they
did have. They gave me both. Their love, support, teachings and guidance are
the greatest gifts a child can receive.
Finally, and most importantly, my wife Kathy and our children, Lindsey,
Timothy and Rebecca. The sacrifices you have made out of your love for me
were significant and unselfish. Many times you were my only source of hope
and motivation, especially during that bleak year of 1994. I love you forever.
vi

TABLE OF CONTENTS
DEDICATION ii
ACKNOWLEDGEMENTS iv
TABLE OF CONTENTS vii
LIST OF TABLES xiv
LIST OF FIGURES xvii
SUMMARY xxvii
CHAPTER
I. INTRODUCTION 1
Objective 1Background 2United States Air Force Relevance 7Scope 11Applications 11Organization 12
II. EXPLOSIONS IN SOIL 15
Introduction 15Explosions in Soil 15Terminology 17Estimation of Free-field Pressure 18Crater Formation 22Inertial Pressures 24Partition of Wave Energy at Boundaries 26
vii

TABLE OF CONTENTS (CONT.)
CHAPTER
III. EARTH BERMS AND REINFORCED SOIL INBLAST-RESISTANT STRUCTURES 30
Introduction 30Soil Berms 30Reinforced Soil Systems 32Explosive Testing of Reinforced Soil Structures 34
Full-Scale Tests 35Physical Model Tests 43Comparison of Model and Full-Scale Materials 43
Phase I Tests 45Phase II Tests 48
Evaluation of Centrifuge Test Data for Further Analysis 52Numerical Models 53
Evaluation of Previous Research 57
IV. EQUATION OF MOTION 61
Introduction 61Development of The Equation of Motion 63Validity For Reinforced Concrete Walls 67Application to Reinforced Soil Walls 68
V. FULL-SCALE TEST DESIGN 69
Introduction 69Type of Reinforcement 70
Selection of Geogrid Type 72Type of Facing Panel 74Test Structure Dimensions 74Soil Type and Properties 76Number of Tests 78Weapon Size 78Weapon Location 79
viii

TABLE OF CONTENTS (CONT.)
CHAPTER
Weapon Placement 80Data Collection 81
Data Acquisition System 81Firing System 82Gages 83
Soil Pressure Interface Gages 84Accelerometers 88Strain Gages 89Free-Field Pressure Gages 92
High Speed Camera 93Reinforced Soil Wall Design 94Test Wall Construction 95
VI. TEST DATA AND DATA REDUCTION 97
Introduction 97Overview of Test Parameters 97Overall Instrumentation Success 100Test Data 103High Speed Film 113Effect of Reinforcement Stiffness 118Ground Shock Coupling Factor 121Failure Mechanisms 123Data Reduction 125Wall Panel Peak Velocities and Displacements 125Panel Impulse Loads 126Prediction of Compressive Wave Stress Within the
Retained Backfill 129Attenuation Coefficient 129Predicted Versus Measured Free-Field Pressure 132Estimation of Free-Field Stresses 135
Free-Field Pressure at Gage Locations 135Geogrid Strains 139
Strain of UX 1400HT Geogrid 140
ix

TABLE OF CONTENTS (CONT.)
CHAPTER
Strain of UX 1500HT Geogrid 142Summary 142
VII. MODEL VALIDATION USING FULL AND SMALL-SCALEPRESSURE WAVE DATA 144
Introduction 144Determination of Stiffness Per Unit Area 145
Numerical Integration 145Numerical Loading Function 148System Stiffness of Full-Scale Walls 150
Independent Model Test Using Scaled Test Data 161Stiffness Per Unit Area for Centrifuge Tests 162Solution of the Equation of Motion for Scaled Testsand Blast Pressure Wave 162
Summary 166
VIII. EVALUATION OF INERTIAL LOADING AND RESPONSE
MECHANISMS 168
Introduction 168Organization 168Inertial Wave Loading Mechanisms 169Application of the Model to Inertial Loading 171Prediction of Displacement Due to Mass Movement 177Prediction of Displacement Due to Pullout Loading 182Response of Scaled Tests to Inertial Wave Loading 185
Centrifuge Test Number 27 186Centrifuge Test Number 20 187Centrifuge Test Number 26 187Centrifuge Test Number 28 188Centrifuge Test Number 29 and 32 188
Pullout Resistance of Nylon Mesh Reinforcing Material 188Results of Numerical Integration 190
x

TABLE OF CONTENTS (CONT.)
CHAPTER
Discussion of Centrifuge Evaluation 190Application to Full-Scale Tests 197Dynamic Pullout Resistance Function of Geogrid Reinforcement 198Prediction of Displacement - Panel 2, Test 5Prediction of Displacement - Panel 1, Test 5 202Prediction of Displacement - Panel 2, Test 6 202Sources of Error 203Approximation of Boundary Friction 205Discussion of Full-Scale Test Evaluation 207
IX. INFLUENCE OF DESIGN PARAMETERS ON WALLDISPLACEMENT 210
Introduction 210Evaluation Matrix 210Results of Evaluation, Test Five 211Results of Evaluation, Test Six 213Comparison of Evaluations 215Methods to Reduce Wall Panel Displacement 219
Decrcasing Forcing Function Amplitude 220Backfill Minimization 220Predetonation Screens 220Overlay Systems 220
Increasing Resistance of Structure 221Top Restraint 221Increase in Backfill Unit Weight 221Vertical Reinforcement 222Soil Stabilization 222Increase Pullout Resistance 223
X. CONCLUSIONS AND RECOMMENDATIONS 224
Introduction 224Summary of Conclusions 225
xi

TABLE OF CONTENTS (CONT.)
CHAPTER
Recommendations 229
APPENDIX A - INSTALLATION OF STRAIN GAGES 231
Introduction 231Materials 231Surface Preparation 232Attachment 233Protective Coating 234Deviations and Additions to This Procedure 235
Protection of the Leadwires 235Tie-Down of the Leadwires 236Protection of the Strain Gages 236
Results of Test One 237Modification of Strain Gage Installation Procedures 237
Addition of Bondable Terminals 237Use of Low Temperature Solder 238Reinforcement of the Geogrid Ribs 238Strain Gage Protective Coating 239
Success Rate 239
APPENDIX B - TEST WALL CONSTRUCTION 240
Introduction 240Test Site 240Fabrication of Wall Panels 241Leveling Pad and Site Preparation 243Wall Construction 244
Introduction 244Base Row Panels 245Placement of Backfill 246Placement of Geogrid Reinforcement 247Second Row of Panels 248
Minimum Geogrid Embedment Length 251
xii

TABLE OF CONTENTS (CONT.)
CHAPTER
APPENDIX C - DATA PLOTS 253
BIBLIOGRAPHY 351
VITA 358
xiii

LIST OF TABLES
Table Title
2.1 Typical Soil Properties For the Drake-LittleEquation (Drake, et a!, 1989) 21
3.1 Summary of Full-Scale Explosive Tests on Reinforced
Soil Walls 36-38
3.2 Replica Scaling Relationships (Scott & Morgan, 1977) 44
3.3 Phase I Centrifuge Test Matrix 46
3.4 Phase II Centrifuge Test Matrix 49
3.5 Centrifuge Test Parameters - Prototype Scale 53
3.6 Numerical Evaluation Test Matrix 55
5.1 Properties of Geogrid Reinforcement (TensarEarth Technologies, Inc., 1992) 73
5.2 Summary of Backfill Densities and Moisture Contents 96
6.1 Test Summary 99
6.2 Summary of Gage Operability, All Tests 101
6.3 Summary of Average ".avespeeds 103
6.4 Wall One, Test One Data 108
6.5 Wall Two, Test Two Data 109
xiv

LIST OF TABLES (CONT.)
Table Tide
6.6 Wall Two, Test Three Data 110
6.7 Wall Three, Test Four Data 111
6.8 Wall Three, Test Five Data 112
6.9 Peak Panel Accelerations, Velocities,& p" ace. en.s. 127All Tests 127
6.10 Summary of Interface Pressure and Impulse 128
6.11 Attenuation Coefficients 131
6.12 Free-field Pressures, Predicted and Measured 133
6.13 Calculated Peak Free-field Pressures (in psi) at the Center ofEach Instrumented Panel 136
6.14 Calculated Free-Field Pressures at Each Strain Gage Locationand Peak Compressive Strain 137
7.1 Free-Field Stress Decay Constant 149
7.2 Integration for Stiffness Per Unit Area, Test 5,Panel No. 2 153
7.3 Attenuation and Decay Coefficients - CentrifugeTests 20, 26-29, 32 164
8.1 Predicted and Measured Displace-m.,.ents - c.. e, TtL
8.2 Predicted and Observed Displacements - Full-Scale Tests 2203
xv

LIST OF TABLES (CONT.)
Table Title
8.3 Summary of Predicted Displacements With andWithout Friction 208
9.1 Model Evaluation Matrix 211
9.2 Evaluation Matrix Results - 25 Foot Standoff 212
9.3 Evaluation Matrix Results, 20 "Foot St.and,,.off' 214
xvi
LIST OF FIGURES
Figure Title
1.1 Aerodynamic Deflection (Ferritto, et al, 1988) 5
1.2 Schematic of Wrapped Face Geotextile Wall(Koerner, 1990) 6
1.3 Example of Protective Soil Berm (Drake, etL, 9I IN9) 8
1.4 Reinforced Soil Bunker (Reid, 1991) 9
2.1 Typical Half Crater Profile (Headquarters,Department of the Army, 1986) 17
2.2 Inertial Pressure Wave (Lower Plot) Time History(Davies and Williams, 1990) 26
3.1 1990 Test Structure, Negev Desert, Israel 40
3.2 Plan & Profile of Wall Panel Deflections,
1990 Test Structure (Eytan and Reid, 1993) 41
3.3 Typical Centrifuge Test Wall 50
4.1 Free Body Diagram of Wall Panel With Wave, Interaction(Drake, et al, 1987) 65
5.1 Georgia Stabilized Earth Pane! 75
5.2 Grain Size Curve, Sky X Soil 77
5.3 Schematic of Test Wall Design 85
xvii

LIST OF FIGURES (CONT.)
Figure Title
5.4 Position of Strain Gages, Tests 2 and 3 90
5.5 Position of Strain Gages, Tests 4 and 5 91
6.1 Typical Test Wall 98
6.2 Plan and Profile ,4 Weapon Location 99
6.3 Typical Acceler.,,don Record 104
6.4 Typical Soil/Panel Interface Pressure Record 105
6.5 Typical Free-field Pressure Record 106
6.6 Typical Strain Gage Record 107
6.7 Pressure & Impulse From Blast Wave and InertialWave Loading, Centrifuge Test Data 116
6.8 Acceleration, Velocity and Displacement FromBlast & Inertial Wave, Centrifuge Test Data 117
6.9 Test Two (Posttest) 30 ft Standoff, UX 1400 HT 119
6.10 Test Four (Posttest), 30 ft Standoff, UX 1500 HT 119
6.11 Test Three (Posttest) 25 ft Standoff, UX 1400 HT 120
6.12 Test Five (Posttest) 25 ft Standoff, UX 1500 HT 120
6.13 Test One (Posttest) 20 ft Standoff, UX 1400 HT 122
6.14 Test Six (Posttest) 20 ft St: jloff, UX 1500 HT 122
XVIIi
LIST OF FIGURES (CONT.)
Figure Title
6.15 Ground Shock Coupling Factor as a Function of ScaledDepth of Burst for Air, Soil, and Concrete(Drake, et al, 1989) 124
6.16 Plot of Calculated vs. Measured Free-Field Pressure 134
6.17 Free-Field Pressure vs. Geogrid CompressiveStrain, Tests 2-5 138
7.1 Trapezoidal Rule of Integration (AI-Khaafajiand Tooley, 1986) 147
7.2 Measured and Predicted Free-Field Stress vs.Time, Test 5, Gage Fl 151
7.3 Measured and Predicted Free-Field Stress vs.Time, Test 4, Gage Fl 152
7.4 k vs. Displacement, Test 5, Panel 2 154
7.5 log k vs. log Displacement, Test 5, Panel 2 155
7.6 Log k vs. Log Displacement, Tests 1-5 156
7.7 Measured and Predicted Free-Field Stressesvs. Time, Test 1, Gage F2 158
7.8 Log k vs. Log Displacement, Tests 2-5 159
7.9 Scaled Test Panel Numbering System (Ole", ,of, 1093) 163
7.10 Stiffness vs. Displacement, Full-Scale and C"in-'-"- L%. - a "'" ,
xix

LIST OF FIGURES (CONT.)
Figure Title
8.1 Free-Field Pressure, Scaled Test 27, Gage P5 170
8.2 Schematic of Free-Field Pressure Wave Loading 172
8.3 Schematic of Mass Movement Loading 173
8.4 Schematic of Pullout Loading 174
8.5 Typical Acceleration Plot From Centrifuge Tests 176
8.6 Free-Field Pressure Time H ,istoy•. Scaled Tet 26 194'.eA racet ')Q 104
8.7 Free-Field Pressure Time History - Sc.aled Test 2.. , 1
8.8 Dynamic Pullout Response of Tensar UX 1500HTGeogrid (Yuan, et al, 1993) 199
9.1 Pullout Resistance as a Function of Geogrid Stiffness(Juran and Chen, 1988) 218
B. 1 Detail of Clamps and Wooden Wedges 250
C. I Free-Field Pressure Gage Fl, Test 1 254
C.2 Free-Field Pressure Gage F2, Test 1 255
C.3 Free-Field Pressure Gage F3, Test 1 256
C.4 Soil Pressure Interface Gage P2, Test 1 257
C.5 Soil Pressure Interface Gage P3, Test 1 258
C.6 Soil Pressure Interface Gage P4, Test 1 259
xx
AflA2991qS9

LIST OF FIGURES (CONT.)
Figure Title
C.7 Soil Pressure Interface Gage P5, Test 1 260
C.8 Soil Pressure Interface Gage P6, Test 1 261
C.9 Accelerometer Al, Test 1 262
C. 10 Accelerometer A2, T;t 1 263
C.11 Accelerometer A3, Test 1 264
C.12 Accelerometer A4, Test 1 265
C.13 Accelerometer A5, Test 1 266
C. 14 Accelerometer A6, Test 1 267
C.15 Free-Field Pressure Gage F2, Test 2 26,o
C.-16 Soil Pressure Interface Gage P1, Test 2 269
C. 17 Soil Pressure Interface Gage P3, Test 2 270
C. 18 Soil Pressure Interface Gage P4, Test 2 271
C. 19 Soil Pressure Interface Gage P5, Test 2 272
C.20 Soil Pressure Interface Gage P6, Test 2 273
C.21 Accelerometer AI, Test 2 274
C.22 Accelerometer A2, Test 2 275
C.23 Accelerometer A3, Test 2 276
xxi
ADA293552

LIST OF FIGURES (CONT.)
Figure Title
C.24 Accelerometer A4, Test 2 277
C.25 Accelerometer A5, Test 2 278
C.26 Strain Gage 57, Test 2 279
C.27 Strain Gage S8, Test 2 280
C.28 Strain Gage 59, Test 2 281
C.29 Strain Gage S 11, Test 2 282
C.30 Strain Gage S12, Test 2 283
C.31 Free-Field Pressure Gage Fl, Test 3 284
C.32 Free-Field Pressure Gage F2, Test 3 285
C.33 Free-Field Pressure Gage F3, Test 3 286
C.34 Soil Pressure Interface Gage P2, Test 3 287
C.35 Soil Pressure Interface Gage P3, Test 3 288
C.36 Soil Pressure Interface Gage P4, Test 3 289
C.37 Soil Pressure Interface Gage PS, Test 3 290
C.38 Soil Pressure Interface Gage P6, Test 3 291
C.39 Accelerometer Al, Test 3 292
xxii
ADA293552

LIST OF FIGURES (CONT.)
Figure Title
C.40 Accelerometer A2, Test 3 293
C.41 Accelerometer A3, Test 3 294
C.42 Accelerometer A4, Test 3 295
C.43 Accelerometer A5, Test 3 296
C.44 Accelerometer A6, Test 3 297
C.45 Strain Gage S7, Test 3 298
C.46 Strain Gage S8, Test 3 299
C.47 Strain Gage S9, Test 3 300
C.48 Strain Gage SI0, Test 3 301
C.49 Strain Gage SII, Test 3 302
C.50 Free-Field Pressure Fl, Test 4 303
C.51 Free-Field Pressure F2, Test 4 304
C.52 Free-Field Pressure F3, Test 4 305
C.53 Soil Pressure Interface Gage P1, Test 4 306
C.54 Soil Pressure Interface Gage P2, Test 4 307
C.55 Soil Pressure Interface Gage P3, Test 4 303
C.56 Soil Pressure Interface Gage P4, Test 4 309
xxiii
ADA293552

LIST OF FIGURES (CONT.)
Figure Title
C.57 Soil Pressure Interface Gage P5, Test 4 310
C.58 Soil Pressure Interface Gage P6, Test 4 311
C.59 Accelerometer Al, Test 4 312
C.60 Accelerometer A2, Test 4 313
C.61 Accelerometer A3, Test 4 314
C.62 Accelerometer A4, Test 4 315
C.63 Accelerometer A5, Test 4 316
C.64 Accelerometer A6, Test 4 317
C.65 Strain Gage SI, Test 4 318
C.66 Strain Gage S2, Test 4 319
C.67 Strain Gage S3, Test 4 320
C.68 Strain Gage S4, Test 4 321
C.69 Strain Gage S5, Test 4 322
C.70 Strain Gage S6, Test 4 323
C.71 Strain Gage S7, Test 4 324
C.72 Strain Gage S8, Test 4 325
C.73 Strain Gage SI 1, Test 4 326
xxiv

LIST OF FIGURES (CONT.)
Figure Title
C.74 Strain Gage S12, Test 4 327
C.75 Free-Field Gage Fl, Test 5 328
C.76 Free-Field Gage F2, Test 5 329
C.77 Free-Field Gage F3, Test 5 330
C.78 Soil Pressure Interface Gage Pl, Test 5 331
C.79 Soil Pressure Interface Gage P2, Test 5 332
C.80 Soil Pressure Interface Gage P3, Test 5 333
C.81 Soil Pressure Interface Gage P4, Test 5 334
C.82 Soil Pressure Interface Gage P5, Test 5 335
C.83 Soil Pressure Interface Gage P6, Test 5 336
C.84 Accelerometer Al, Test 5 337
C.85 Accelerometer A2, Test 5 338
C.86 Accelerometer A3, Test 5 339
C.87 Accelerometer A4, Test 5 340
C.88 Accelerometer A5, Test 5 341
C.89 Accelerometer A6, Test 5 342
C.90 Strain Gage SI, Test 5 343
xxv

LIST OF FIGURES (CONT.)
Figure Title
C.91 Strain Gage S2, Test 5 344
C.92 Strain Gage S3, Test 5 345
C.93 Strain Gage S4, Test 5 346
C.94 Strain Gage S5, Test 5 347
C.95 Strain Gage S8, Test 5 348
C.96 Strain Gage SI1, Test 5 349
C.97 Strain Gage S12, Test 5 350
xxvi
i JI-

SUMMARY
A more quantitative understandfing nf the re-pnse, •f re;ifr,.. cn;I walle
to explosions in the retained fill was deeloped via a sige der ee. of freedvo
model developed by Drake, et al (1987). A series of full-scale tests were
conducted to investigate the response of the walls to free-field blast pressL:es,
and detailed analysis of the test data suggested inertial stresses generated during
the crater formation process, not blast pressures, were the governing loading
condition. Using full and small-scale test data, the validity of the model is
demonstrated through a consist,,nt relationship between system stiffness and
displacement. The consistency of the stiffness/displacement relationship for full
and scaled tests suggest the centrifuge provides reasonable models of full-scale
reinforced soil walls.
Application of the test data to the model yields order ,.f magnitude re.,,INt
in prediction of ultimate wall panell . Tha , °,,d resuts of
this study provides a significant departure from previous res.a.rch by identifyin.-
the loading mechanisms that govern response, the influence of the engineering
properties of the materials, and validation of a model that provides a
quantitative description of the physical response of the reinforced soil wall.
xxvii

CHAPTER I
INTRODUCTION
OL~ective
The objective of this research was to develop a methodology for evaluating
the response of reinforced soil walls with concrete facing panels to ground
shock pressures from buried explosions. Previous research has qualitatively
demonstrated that reinforced soil resists ground shock pressures, however, a
fundamentally based approach to the identification of loading mechanisms or the
respective influence of design variables has not been presented. To achieve this
objective, a single degree of freedom model for a yielding wall which assumes
continuity of stresses and displacemenft at te soil/wall interrface will he
developed. The model will be validated using N-1 and sm.all.-sc"ale W... date.
from reinforced soil walls subjected to explosions in the retained ba.-ff.'ll. This
methodology for the evaluation of walls to resist ground shock and the
influence of various design parame-'rs will be used to demonstrate the practical
applications of this research.

Background
The United States (US) Air Force enjoys a degree of mobility unmatched
by any other Air Force in history. Since World War 11, the United States has
typically conducted warfighting operations from a network of main and satellite
operating bases located across the world. However, the end of the Cold War
and reduction in threat of global war has lead to the closing of many overseas
US Air Force Bases. At the same time, ;rn regional rnnffictq
outside the sphere of influence of remaining US bases, cupled witVh,.,. a 2rowin.'"256
reluctance on the part of many nations to allow establishment of foreign
military bases on their soil, requires the ability to rapidly build a warfighting
airbase, typically called a "bare base*. The expedient nature of these bases
necessitates the use of temporary construction methods: tents, wood frame
structures, or lightweight metal buildings. Although functional, these structures
provide little protection from blast overpressure or small arms fire. Structural
hardening may be beyond the capabilities of the logistical trial and engineering
forces. The rapid construction of blast and fragment resistant barriers or
shelters is necessary at bare bases to ensure survivahbHity from enemy attack.
Throughout history, a wide variety of nateri'is and designs have beeny used
to protect communities, trading posts, and other strato.-g. ,,as-ses. '"-..
2

materials, such as soil and rock, trees, barriers created by terrain or water, and
naturally formed tunnels and ravines were used for centuries. As the science of
civil engineering progressed, new materials became available for construction:
mortar, brick, concrete, reinforced concrete, steel, and a variety of synthetic
materials. These construction techniques, although efficient and effective,
require some major manufacturing,, process to create the necessary materials.
heavy equipment to move and install the ma•ea, and *"A "u&te &f It;le, lao,
for construction. Building protective shelters in a ,are bIae en,,vAA'ironmet
requires minimizing dependence on highly skilled labor and manufactured
materials. This can be achieved through the use of geologic materials. These
materials have many advantages to the engineer: worldwide availability,
relative low cost, simple construction techniques, and the ability to modify their
engineering properties. For these reasons, reinforced soil systems may provide
a means for rapid construction of protective shelters worldwide.
Soil is one of the least expensive, simplest, most widely used, effective,
and oldest means of protection against military and terrorist attacks. To protect
an above ground building or an aircraft with soil requires building a high soil
barrier or berm. These berms require large. ,; soilf q-.1.antitiwa h' n. ... f. the. angle
of repose of (he soil. Berms can also create blowing dust ,A dbris as well as
create a problem due to erosion. Despite these drawbacks, extensive testing
3

has proved soil berms are effective in reducing both leeward airblast pressures
and fragment penetration (US Office of Civil Defense, 1941; Hyndman, et al,
1987; Hyde, 1989; Sues, et al, 1991). Air pressure reduction comes from the
aerodynamic reflection of shock waves, as shown in Fig. 1.1. However, if the
detonation occurs in the soil mass it creates ground shock pressures
approximately seven times greater than the same explosion in air (Drake, et al,
1989). Therefore, the design =Jalysis must attempt tM maYimieP, the air space
between the explosion and the target, yet ma nt;an -nougaryh qo;i c,,oe r nre-ventI,€U • €• ~ ~ ~ ba %PWA, VWu.a•.a %Wt•,, a r -., -v*•. w,.... o*
fragmentation penetration. Thc larger the soIl mass ,,,ound° th" " ,..,,, the.,
greater probability of detonation occurring within the soil, resulting in large
ground shock pressures transmitted to the target. The utility of soil berms
could be increased through a reduction in the volume of the berm and increased
control of the dust and erosion by replacing one of the berm slopes with a
vertical wall. One method for reducing soil berm volume as well as dust and
erosion problems is to build a wall of reinforced soil. Reinforced soil is a
composite material consisting of soil and high tensile strength materials such as
steel strips or geosynthetics. A single face of a reinforced soil berm can be
constructed to approximately vertical with or wih out facing panels. This
greatly reduces the amount of soil and therefor.th,., sae, needd.. If a tynical
berm has side slopes of 2 ft. in the horizontal dimension for ever ft. ot height
4

MAIN BLAST WAVE MAIN BLAST WAVE
BERM R EFLECTIVEWAVE MI
'MAsN .IMAIN
4e0 imWAYN
(A) SHCCK WAVE BEFORE REACHNG (C) FORMATION CF CIFFRACOTE WAVE.BERM CBSTRUCICN.
, ,LMAIN BLAsT "JAvU
MAIN BLAST WAVE MAIN B W
REFLECTIVE
(9) FORMAlTON OP REFLECTED WAVE. (0) PAR'iAL ENVE.OPMENTOCF SThUC'rWJRE BY
REE.FLECED IFFRAC.ED WAVI .
RIMAIN LAT WAVE
Figure 1.1 Aerodynamic Deflection (Ferritto, et al,,.,988)QQ
5
W A V S
i ,,,U
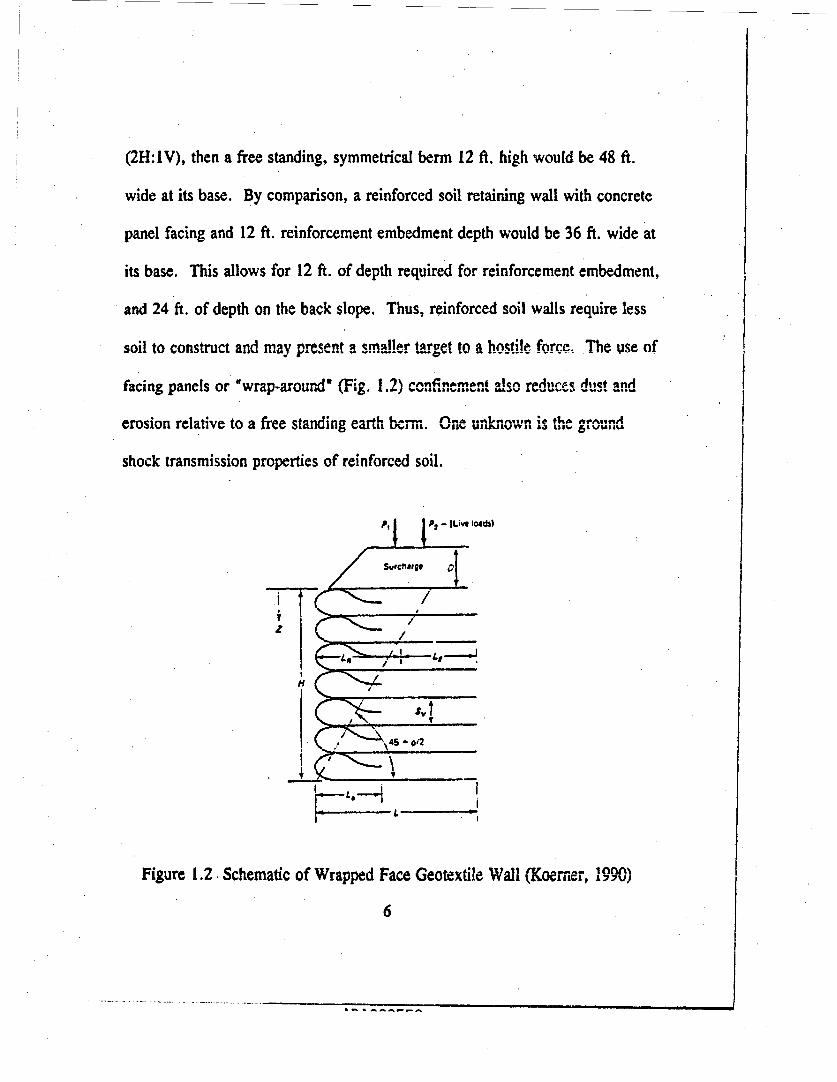
(2H:IV), then a free standing, symmetrical berm 12 ft. high would be 48 ft.
wide at its base. By comparison, a reinforced soil retaining wall with concrete
panel facing and 12 ft. reinforcement embedment depth would be 36 ft. wide at
its base. This allows for 12 ft. of depth required for reinforcement embedment,
and 24 ft. of depth on the back slope. Thus, reinforced soil walls require less
soil to construct and may present a smaller target to a hostile force. The, use of
facing panels or *wrap-around* (Fig. 1.2) cfmnalso redu•,.A, d,,tt and
erosion relative to a free standing earth berin, Ce u.kn...w. I is Lt,,% ,,."&.,,
shock transmission properties of reinforced soil.
P2 - Ilivs loa)
-,eCh"t
S
Figure 1.2 Schematic of Wrapped Face Geotextile Wall (Koerner, 190v)
6

Due to the demonstrated effectiveness of un:reinforced .... b s'l is"n
reducing leeward airblast pressures, it was hypothesized tha: reinforced soil
structures could provide similar protection from blast loads. It is proposed that
instead of building a structure and then protecting it with an earth berm as
shown in Fig. 1.3, an entire structure could be built with reinforced soil, i.e.
effectively closing in an area with reinforced soil. An example of this
alternative design concept is shown in Fig. 1.4. In this case the facing material
would serve as the interior wall, surrounded by the soil backfill. The response
of reinforced soil embankments to airblast is conservatively assumed to eqal,
that of unr einforced benns, however, th.e. reonse o..f these ctrii..tis.. t1%
explosions in the soil backfill has yet to bedet•0rmineA.0.,A"""- In o.r t. dAev eAVoF
design methodologies for reinforced soil subjected o bl...at lad, LM, r..s.o.s.
of these systems to such loading must be established. The full-scale explosive
testirng of reinforced soil systems, coupled with previous physical model tests
and numerical analysis will establish the response of these systems to
groundshock loading.
United States Air Force Relevance
This research is a key element in the larger effort to develop a design
methodology for the use of reinforced soil in protective shel:ers. This would
7
ADA9q'•~ql

SECT :ON
La5
PLAN
I 1I I
I I
I II II I
I
Figure 1.3 Example of Protective Soil Berm (Drake, ct al, 1989)
8
ADA293552

Figure 1.4 Reinforced Soil Bunkeer (Reid, 1991)
ADA293552

provide a cost effective alternative to reinforced concrete shelter designs
currently preferred. With the maturation of this technology, it would be
possible to use this design methodology for construction of permanent
protective structures at bare and main operating bases. It is proposed that
reinforced soil construction would provide the following advantages to
reinforced concrete construction:
- maximrizes use of in-situ materials
- utilizes existig Air Force civil e,,gneern,, manpow,,,
equipment and skills
- more rapid construction
- commercially available technology
- decreased cost
- can withstand greater deformations
- requires much less steel and concrete
- can absorb significant amounts of energy
Finally, reinforced concrete protective construction is not used at bare bases
because of cost, time, and constructability constraints. Therefore there is no
protective shelter construction at bare bases, only expedient means such as
sandbags and revetments are used. The use of "enforced soi1 w yttems for
shelters at bare bases would fill this existing void.
10
ADA293552

In order to achieve the previously stated research objectives, a scope of
work was developed. This scope specified the five-phased technical approach
as follows:
- conduct a literature review for: (1) response of reinforced soil,
and its components to explosive loading, (2) numerical codes for
evaluating reinforced soil response to explosive ground shock,
and (3) physical model testing of reinfored, oiA . e,,, ;
develop a test plan and designs for full-scale explosi:C testS of
reinforced soil retaining walls;
- construct and test walls, collect and reduce data;
- estimate residual displacements of full and small-scale wall
panels via a single degree of freedom model;
- use the simple model to conduct parametric study of the
influence of specific design variables on wall panel response.
Applications
Although the focus of this research was towrd the uis of reinfnrced eomi
structures for military use, this concept does have some commercial
applications. Reinforced soil has been used for construction of Ur,, ... ot-ae-t
11
dikes around petrochemical storage and liquid natural gas facilities for both spill
containment and resilience to explosive damage. Heike, et al (1991) gives an
example of such a design used around an oil tank farm. The qualities
reinforced soil possesses for these applications include resistance to explosion,
flooding/liquid attack, thermal shock, and fire (Reinforced Earth Company,
undated). Also, reinforced soil can be used to surround large areas to protect
against terrorist attack.
Organization
The remaining sections of this report are organized as follows:
Chapter II - Discusses how the energy from an explosion in soil is
transferred to the soil mass and the prediction of the resulting
pressures
Chapter III - Presents previous research on the full a.d small-icale explosive
testing of unreinforced Soil berms and reinforced soil walls, as
well as results from numerical evaluations
Chapter IV - Details the development of a single degree of freedom model for
predicting the response of yielding walls to ground shock, and
the validity of this equation for reinforced concrete. wa! design
12

Chapter V - Details all aspects of test design including the -aterials
selected for each component, the size and design of the
structure, the type, number and installation of each data
gathering device, weapon size, location and installation, soil
type and properties, number of tests and weapon firing system
Chapter VI - Presents the data measured in each test, test observations, failure
mechanisms and data reduction
Chapter VII - This chapter establishes the. validity of the single degree of
freedom model for predicting the response of the rneinforced P.oil
walls to pressure wave loading and deeo.p,, the relationship
between system stiffness and displacement
Chapter VIII - Test data are evaluated to define each loading mechanism act,:_
upon the walls in the time domain. The data are then used to
evaluate each loading mechanism and predict displacements for
full and small-scale tests
Chapter IX - The single degree of freedom model is used to demonstrate how
variations in design parameters influence ultimate wall panel
displacements, as well as other methods that may improve
design performance
Chapter X - Presents research conclusions and recommendations
13

Appendix A - Details the strain gage installation procedures for all tests
Appendix B - Describes the test site and details construction methods used for
each wall, panel fabrication and installation of the leveling pad
Appendix C - Contains plots of each data recording made during full-scale
tests
14

CHAPTER II
EXPLOSIONS IN SOIL
Introduction
As one might expect, the detonation of an explosive can have a significant
impact on its surrounding media. This chapter will present how, upon
detonation, the potential energy in a weapon is transferred to the surrounding
media, how the materials are affected by this massive transfer of energy, and
methods for predicting the magnitude of the blast-induced pressure wave.
Explosions- InSoil
Baker (1973) defines an explosion as "a prooess by which a pressure waveof finite amplitude is generaved in air by a rpid ree-as. nfP. nry.• In air thi.
pressure wave is often called the blast wavd, , , oriast;i groun.d i; i., ,'',
ground shock.
Upon initiation of an explosion, a detonation wave propagates through the
explosive at a velocity of up to 23,000 ft/sec (Baker, 1973). This velocity is so
much greater than the stress wave velocity in soils that the detonation of the
15

explosive material is completed before the pressure wave arrives to the soil
around the charge surface. The explosive pressures are thus assumed to act on
the surrounding soil simultaneously. Immediately after detonation the explosive
gases exist at high pressures within the explosive cavity causing crushing or
large deformations of the surrounding soil. The deformation of this
surrounding soil initiates a shock wave that propagates away from the source at
or near supersonic speeds.
Once the explosion cavity reaches its ma,,mam volume, the cavity will
decrease in volume (collapse), decreasing the vlume" ".d ias."."nraLS, theW ,,'I
pressure. The gases expand again and new waves are produced. This process
decays rapidly, such that the second wave is negligible when compared to the
first (Henrych, 1979).
As the radial distance between the pressure wave and the detonation source
increases, explosive energy is dispersed over an ever increasing volume of soil
(geometric attenuation), and the overpressure rapidly decreases. When the
overpressure decreases below the soil strength limit, soI particle rearrangement
ceases, thus changing the deformation character. Beyond this distance, soil
structure will remain unchanged and the wave behavior can be evaluated via
elastic theory. A typical half-crater profile is. Shown in Fig. 2.1.
16

Pi.. ....TI ZON
S~A=RN APAIT A"SCNCOK
0*:NALZ , GROUND . C'OSURF=ACF.
FALL.-
Fu e ASTiC ZONE C P Ro UE CRATER DptnohP lbUlT;JA ZONE"• •
Pt.,A $TIC ZONE
008 0 00FTI' OP IURS'r ELAS'iIC ,'',
ra-APPARENT RIADUS CNVIt*_,OP9[
€ ,,APPARF'qT DKIPTK
T!•1RUE RADIUS
TI• RUE 01F"H
GZ " IROUND ZERO.
US Army• Corp•s ofT Enginzeers
Figure 2.1 Typical Half Crater Profile (Headquarters, Department of the
Army, 1986)
Terminology
Throughout the literature, a variety of terms are used for the pressures that
emanate from a subsurface explosion. Two different pressures will be
discussed in this thesis; free-field and inerti~al preur.-.,
The crushing or deformation of the soil around the explo I ,,ia.,, y
after detonation initiates a pressure wave that radiates rapidly away from the
17

explosive source. This wave may have velocities on the order of 1000 f'--t
depending on the characteristics of the media as discussed later in this chapter.
This high amplitude, short duration compressive pulse will be referred to as the
free-field pressure or pressure wave. The amplitude is governed by charge
weight and ground shock coupling factor, but may be on the order of thousands
of psi for several milliseconds. In some literature this may be referred to as the
ground shock or stress wave.
As the free-field pressure radiates away from the source, the soil in the
proximity of the detonation is accelerated under the for~ce of the Continued
expansion of the gases within the explosive. ,t.. Tie respon-e of the..oil.o
this loading develops over a relatively longer pe.riod of tie a-nd results in
inertial pressures from the plastic movement of the soil mass, irfluenced
primarily by charge weight and the ground shock coupling factor. This will be
referred to as the inertial pressure. Davies and Williams (1992) referred to this
as inertial loading.
Estimation of Free-field Pressure
A variety of methods exist for the quantitative estimation of peak free-field
pressure at any point around an explosive source (Headquarters, Department of
the Army, 1986; Drake, et al, 1989; Drake and Little, 1983; Westine and
18
II"

Friesenhahn, 1983; Henrych, 1979). These empirical equations have been
developed from both nuclear and conventional explosive tests. For
conventional detonations, the solution provided by Drake and Little (1983),
herein referred to as the Drake-Little equation, has been widely used and is the
method presented in both US Air Force and US Army protective construction
design manuals for use in practice. The primary advantage of the Drake-Little
equation is that it was derived based on an extensive empirical database, issimple to use, allows for input of the. variables thot rnntro. r-n-sle nr prero'
attenuation with distance from the explosIve, ,a nd,- .o ,Vl; ,.,Itc Th"
Drake-Little equation is generally preS,-,ACtd &3:
o {.f C P60 R )(2.1)
where: P = peak pressure in psi p = mass density (lb-secelft')
f = ground shock coupling factor W = charge weight (lb.)
n = attenuation coefficient R distance to explosion (ft)
c = soil compression wave velocity in ft/sec
Upon inspection of this equation it is evident that the predicted pressure is
highly dependent upon the values of c and n. The other factors V, I/ Lreknown or can be estimated reasonably acc.'-rtely. The value-. of c andA n ran be,
19

obtained through trial tests in the field, or through estimation using the values
presented in Table 2.1. Unfortunately, to all but the most experienced users,
estimation of seismic velocity and attenuation coefficient through the use of
tables will only provide order of magnitude answers. However, using values of
c and n obtained from field tests, the Drake-Little equation works well for most
soil conditions.The value of c is generally called dhe compressinn wave ve!ocity and, based
on the values given in Table 2.1, s•erve a- an appr'vinate inde for gromnd
shock prediction purposes. This parameter may "also be1 estfimated, thr.n,..h a
relationship between the stiffness and density of the soIl as:
C (2.2)
where: M initial tangent constrained modulus of the soil.
The constrained modulus may be obtained through resonant column tests.
The resonant column test is generally used to determine the shear modulus at
low strains, and in combination with Young's modulus may be uied to calculate
Poissons ratio. Poissons ratio and Young's modulus may then he wiqed tn
determine constrained modulus as:
20

Table 2.1 Typical Soil Properties For the Drake-Little Equation(Drake et al, 1989)
Dry Unit Total Air-Filled Seismic AttenuationWeight Unit Voids Velocity Coefficient
-Y4 (pcO Weight (%) c (fps) n-( (PcO
Dry desert alluvium and plays. 93-100 >25 2,0004,200 3.0-3.2.partially :emencd 87
Loose, dry. poorly graded mand 80 90 >30 600 3.0-3.5
Loose, wet , poorly graded aend 97 1 16 10 500-600 3.0with free standing water
Dene, dry and, poorly graded 90 104 32 900-1,300 2.5-2.75
Dense, wet sand, poorly graded, with 108 124 9 1,000 2.73free standing water
Very denbe dry sand. high relative 105 * 30 1.600 2.5density
Wet Silty-.clay 95-100 120-125 9 700.900 2.75-3.0
Moist, loose, ablycy sand 100 122 5.10 1,000 2.75-3.0
Wet sandy clay, above water table 95 120-125 4 1.000-1,100 2.25
Nearly saturated sand, below 1-4 1.800-4,9W0 2.0-2.25water table
Satutated sandy clay, below water t00 125 < 3.000-6,600 1.5table
Satr•rted stiff clay, satrated 120-130 0> 5,000 1,5clay-shale
21

= E(2.3)20-1
and,
M= E(1-p . (2.4)
where,
E = Young's modulus (F/L2) M = constrained modulus (F/L-)
= Poisson's ratio
Detailed discussion on the measurement and calculation of these properties
for ground shock evaluations can be obtained from Das (1983).
The Drake-Little equation will be used in this rseach to estimate peak soil
pressures at locations where pressure gages were no, locmated (i.e. at a qtrain
gage locations), and to validate free-field pressure m..asu.i..•m . Fr.efieA d
pressure gages were used to measure the pressure-time response of the soil, and
those data were used to establish the speed of the compressive wave in the soil
(c) and the attenuation coefficient (n). This will be further discussed in
Chapter VI.
SCrater For~m..tion
When a subsurface detonation occurs near a soil/air interface, the free-field
pressure wave reaches the soil surface and acts as a source of surface waves.
22
ADA293552

The pressure wave is reflected from the free surface back towards the explosion
cavity, and then reflects off the cavity surface in a repeating process of rapidly
decreasing intensity. During this time, the soil above the cavity is continually
moving upwards by the expanding gases until it is ejected from the ground,
leaving behind a crater (Henrych, 1979). Discussions on the empirical
estimation of pressure wave amplitudes, veloci.es, -and Crater Si7,.s are. de.tailed
by Drake, et al (1989); Baker (1973); Crawford, et -1 (1971); and
Headquarters, Department of the Army (19806). A more ,f.nAmn.aent•,l disacssion
of explosive-induced wave theory and crater formation is presented by Henrych
(1979).
Figure 2.1 presented a schematic drawing of a typical half crater with the
different zones identified. The apparent crater is defined as the crater that is
visible on the surface. The true crater is the hole actually excavated by the
explosion, but is normally filled with loose, disassociated material and debris
(fallback) and is underlain by material that has b:en crushed and fractured but
has not experienced significant displacement, referred to as the rupture zone.
Near the true crater/rupture zone interfce, shear failure, has ca, .-td narticle
crushing and fracturing, the severity of which .',..s. w;th dti,,h Thest.
shear failures diminish as the rupture zone/plastic zone interface iC rached. A
the plastic zone, soil particles have small permanent displacements decreasing
23
ADA293552

to infinitesimal values when the transition to the elastic zone is reached (Drake,
et al, 1989).
The extent of these zones varies with the type of soil and size of explosion,
and prediction of the boundary locations is difficult. Vesic (1965) presented
empirical equations for estimating the radiaus of the eXplosive cavity and theplastic zone. This prediction methodoogy, like others of its ,e;, , ;i hbAed
upon the data base of numerous nuclear explosions cOnduC.... d4 u.And pr..jec.t
Plowshare research, sponsored by the then Livermore Radiation Labora-tory "n•
the 1960's. Pressure measurements in the various zones are not presented, and
zonal boundaries were based upon the level of disturbance observed in. sand
columns installed around the detonation location. Because of the differences in
the charge weights between a nuclear explosion and a typical chemical
explosion, these methods do not provide reasonable estimations of crater sizes
and the extent of the disturbed zones for small chemical explosions.
Inertia] Pressures
Inertial pressures have generally not cu,,e-,,, thle, denigno.f ,,.trtev,.
structures. Beiew-ground, reinforced concrete pror'cti' otr"'rs o"e
generally designed to withstand near-miss detonations oi weapons where th,
structure is located within the explosive crater, where relationships between
24
ADA293552

free-field pressures and structural response provide an effective means of
predicting structural response. Because of this, little research has been
performed on the measurement and prediction of inertial pressures.
Analytical methodologies for he prediction of inertial pressures have not
been presented in the literature. Davies and Williams (.1992.) performed an
explosive test in a geotechnical cent...ri,,,e. and ,e•.ented,• ,on data plot (Fig 2 .2
showing the peak inertial wave amplitude of 17.1 pi,, UUraLioLn vf 3.3 10 for, a
prototype 35 pound detonation in a fine sand. A polystyrehe barrier of low
acoustic impedance was located between the detonation and the pressure gage,
and this data represents an inertial waveform. Other published data has not
been identified.
Baylot (1992) modified the DYNA-3D (Whirley and Hallquist, 1991) code
to model the free-field stress environment in the area immediately around the
explosion. Previous models required decoupling assumptions to be made so the
detonation of the charge in the soil is not included in the calculation. The
Baylot model included modeling the charge, soil, and structure in the
calculation. Baylot's modification then focused on nre-dicting free-f-Ild
pressures in the area within six feet of the exp"os"""i "•, or -"eta ,A insAid %'hW
explosive crater where the soil is ejected. This model does not a-•,mpt to
describe inertial pressures outside the rupture zone. Future improvements of
25
IIII _________________ _______________________

(v)(r aft,o|rc• Efld D-,$PIl
2000 E IC, OOCMPo -T ( lQeat Eoc ýi v
IZ 45 C iS 23 25 30IDISPLACEMCNT OF RE:NFORCCrMENT•-Izt.2
Figure 2.2 Inertial Pressure Wave (Lower Plot) Time History(Davies and Williams, 1992)
this model and an increase in test data may provide methods for estimating
inertial pressures in soil from subsurface explosions.
Partition of Wave Energy at Boundaries
The effect of boundaries between two dissimilar materials on wave
propagation can be significant. An incident wave can reflect and refract at
different amplitudes, angles and mode~s, When an explosion occurs in the
backdill of a reinforced soil wall with concrete facing eleme~nts, .eompression
26

waves will propagate radially. These pressure waves will strike the soil/air
interface (surface), generating surface and shear waves as well as reflected
pressure waves. The pressure wave will also strike the soil/concrete boundary
at the wall face. Part of this pressure wave will be transmitted into the
concrete panel, and i•,,rt will be reflected. The relative amplitude and direction
of propagation of the waves reflected r .:d refracted at the boundaries can be
estimated utilizing relationships developed from elastic theory.
Simple relationships exist for determining the reflection c.ff~hienit of
compression (P) or shear (S) wavesa of normal inidene-" , ,;th tw hq;sc
assumptions. The diplacement must be con.:in.ous acrs %h,%,, b .Uda t(n%
separation) and the net stress on the boundary must be zero (Waters, 19801)
Based on these assumptions the relationship between the stress wave amplitudes
is:
A, +Ar At (2.5)
and,
p.CIAI - P2C2A2 = p2 C2 AC (2.6)
where:
27

A, = amplitude of the incident stress wave
A, = amplitude of the reflected stress wave
A, amplitude of the transmitted stress wave
p = mass density of the medium
c = compression wave velocity of the medium
Rearranging Eq. 2.6 yields:
Ar PiC 1-P 2 C2 (2.7)A4 p1C14p 2c2
By using Eq. 2.7 a relationship bectWeen A, and Ai cat be de,,lVopedI
assuming the mass densities and wave velocities of the espietiT media a.--
known.
For example, if a soil has a mass density (p,) of 3.26 lb-sec"ifr,
compression wave velocity (c,) of 1000 ft/sec and concrete has a mass density
(p2) of 4.66 lb-sec?/ft' and compression wave velocity of 10,000 ft/sec, then
AjA- -0.87 and 0.13 Ai = A,. Therefore, for normal incidence the
transmitted wave amplitude in the concrete is 13% of the incident wave
amplitude, which is a significant reduction. This demonstrates that the partition
of energy at the soillconcrete boundary must be considere- when relating blastpressure wave amplitudes measured or pedi. ;in so;i to% thes r.eonse n the
28

wall. If the angle of perpendicular incidence is 90 degrees, and 0 degrees is
parallel incidence, the amplitude of the transmitted wave decreases with the
angle of incidence. Therefore the magnitude of the transmitted wave is at a
maximum for the case of perpendicular incidence. The evaluation of test data
in this report will focus on the portions of the stricture. subjected to
compression waves of perpendicular incidence, representg., the maxImm
transmitted stress.
29

CHAPTER III
EARTH BERMS AND REINFORCED SOIL IN BLAST-RESISTANTSTRUCTURES
Introduction
Previous research has provided qualitative and quantitative evidence that
earthen barriers can provide protection to structures from conventional weapon
detonations. A review of this research is presented in this chapter to
demonstrate the effectiveness of these barriers, establish the state-of-the-art,
provide a basis for the design of the full-scale test series, and establish data
collection requirements. This review identified previous full-scale explosive
tests using unreinforced earth berms, full and small-scale (1:30) explosive tests
on reinforced soil walls, and numerical analysis of reinfnorced soil wails
subjected to explosions in the soil backfill.
Soil Berms
The effectiveness of unreinforced soil berms for mitigating leeward shock
pressures led to the hypothesis that reinforced soil systems could be used for
30

the same purpose. A review of full-scale test data quantifies this ef'fectiven.ess,
but yields empirical data points, and not theoretical solutions.
In the early 1980's, the US Air Force Engineering and Services Laboratory
sponsored a series of weapons effects tests on reinforced concrete walls both
with ar4 without earth berms (Coltharp, et al, 1985). The walls were 5.4 ft. in
height, 13.1 ft. long, and 12.8 in. thick. In each test the reinforced concrete
walls were exposed to a surface detonation of a weapon of specified threat.
The peak pressure measured on the unbermrex wall was 8700 psi, and
occurred 1.0 ft. up from the base, of the wil. The wall w,11 then nrntrcted
with a 3.3 ft. high soil berm, and then tested with a ie.apono., of qlsize • ,and
standoff distance. The pressure at 1.0 ft. up from the base of the .
measured 589 psi, an order of magnitude pressure reduction. Consequently, the
earth berm also reduced the acceleration and deflection of the concrete wall by
at least 50 per cent. This effect may have been even more pronounced had the
entire face of the wall been covered with the earth berm.
A variety of reports and design manuals discuss the effectiveness of earth
berms, but equations for calculating pressure reductions for designs are not
presented. The US Army conventional weapons design manual (Headquarters,
Department of the Army, 1986) simply states "Mounded structures are
essentially aboveground structures with an ear---h ,overin*; hnwevPr, they ari
31

not subject to failure from the airblast of conventional weapons. Mounded
structures should be checked for penetration and cratering from direct hits if the
design threat includes direct hits." This is also supported by the US Air Force
design manual, Section Five (Drake, et al, 1989) which concludes "In general,
air-induced ground shock is not a significant threat for conventional weapons
against completely buried targets."
Other references (US Office of Civil Defense, 1941; Hyndnman, et al. 1987;
Hyde, 1989; Sues, et al, 1991; H -eadquarters, Department of the Army 19C961
Co!tharp, ct al, 1985; and National Defense ResArch Com.m3iee 1 oallCAA
show in varying levels of detail the effectiveness of earth be•..•ms for protection
against airblast and fragment penetration. However, soil berms may not be
effective if the explosion takes place within the soil berm.
Reinforced Soil Systems
Reinforced soil systems may provide two advantages compared to free-
standing unreinforced berms: 1) they can be built at steeper slopes, thereby
reducing the size of the berm and probability of w-apon detonation within the
soil mass; and 2) if detonation occurs within the soil mass, the reinforced soil
berm may reduce the soil pressure im,.inge,, on !eew,•ard side of the berm.
32

Reinforced soil walls will not offer any size advantage when compared to earth
berms that are placed against an existing structure, provided that structure can
withstand the lateral pressures of the earth berm.
The reinforcement of soil is defined at the "inclusion of resistant elements
in a soil mass to improve its mechanical properties" (Mitchell and Villet, 1987).
The reinforcement of soil is analogous to the reinforcement of Portland Cement
concrete. Both soil and concrete are weak in tension, but strong in
compression. To exploit their strengths, and minimiz their ,e,,netse, each
is made into a composite material by adding reinforcement. This ,re....r.e.en
gives the soil or concrete increased tensile strength without adversely affecting
compressive strength. This reinforcement may be synthetic materials, steel, or
natural fibers. In the context of this report the term "Reinforced Earth" will
mean the steel strip reinforcement process as patented by the Reinforced Earth
Company. "Reinforced soil" will refer to soil reinforced with any material, not
to exclude steel reinforcement.
Between 1970 and 1987, over 1726 million square yards of geosynthetics
representing $3.1 billion have been used in a wide range of civil engineering
applications (Koerner, 1990). Between 1991 and 1992 approximateiy 877
million square yards of geotextiles and ,,,membrn.s wre, proued
worldwide (Fluet, 1993). The primary uses of these materials in A'.cd lAndfill
33

liners, wall and embankment soil stabilization, drainage materials, and
separation layers in pavement subgrades. As of 1990, there were over 12,000
Reinforced Earth structures in service throughout the world (Reinforced Earth
Company, 1990).
As the use of reinforced soil has grown, it h.. become a stand_.rd
construction methodology and new and in;•novati've' ,appicatin•; e bheing
explored. Recently, reinforced soil has been used to const.ruct .ilitar°.. shelte.s
that may be exposed to the detonation of conventional weapons. This
construction has taken place despite the absence of design guidance tailored to
the severe dynamic loads impinged on shelters by conventional weapons.
Specific designs have been accepted on a case by case basis, but only after
conducting a "pass/fail" explosive test. Specific, fundamentally sound design
guidance does not exist for design and analysis that would eliminate the need
for case by case pass/fail explosive acceptance testing.
Explosive Testing of Reinforced Soil Structures
Various full-.cale tests, numerical and small-sal model'•ing effnrts have-
taken place to investigate how high strain rate loading affects. r,;nforce•d si.;
This research has been dove to investigate the response of rein"fOrced oI to,.%'0
34

explosive or earthquake loads. This early work has helped to demonstrate the
effectiveness of reinforced soil under dynamic loading.
The response of full-scale reinforced soil walJs to explosi.ve loading has
been evaluated on a number of occasions inclSdi, b n et aW. (1977),
the Central Engineering Directorate of the French M•inist-y ofUDefnse
1975/1976 (Elias, 1978; Reinforced Earth Company, undated), the German
Federal Office of Military Engineering and Procurement, 1979 (Reinforced
Earth Company, undated), the Israeli Air Force in 1980 and 1987 (Eytan,
1988), the Directorate of Weapons Engineering, Royal Australian Air Force,
1987 (Reinforced Earth Company, undated), and the US and the Israel Air
Force in 1990 (Eytan and Reid, 1993; Reid, 1990, 1991). Each of these walls
used the patented Reinforced Earth construction process.
Table 3.1 summarizes some of the important parameters of each of these
tests. In each of these tests, bombs were detonated in either the retained soil
backfill such that the blast pressure wave, impnge,,,,d ,upn the, c,,; t;! , ,id thf
wall face or bombs were detonated in front of the wall face such that th
exposed wall face was subjected to the blast pressure wave. Most of the testas
were conducted on free-standing reinforced soil walls with concrete or metal
35

U
*1 �- �
� ;�*I3 -ho
�In
08 -�
I-i �ho
0�b.
* _ -C �- C C C
ho ho
�C M- - I� M
C0 -
�
i-u1) co�*-.�
OW Q�n
* - - - - - U*b -ho0 -
&' A
6) _ p
Li..e�W 'S
�p.
.� .2�
00
*� ho
'V gI.-
UN
.0 "*� U
'� � � �- -- � *�
U. �
*1�
I- *�.� '� - -ki �; � *Oh �d E
- - Oh - - - Oh
o
- C-
o.0
I..' -
&0I- C4�� �= � �
U.
*a
I *� (,� - -
Ij1�
ADA293552

U.1z d
~ ~JH
~ g ~ a fvu
ti lei c
~ C.4~Dgn I
19eica a a a
Z
1/ L - --
ADA2355

facing. The most detailed information on these tests from available reference
material was on the latter two tests conducted in Israel (1987, 1990).
In these U-shaped shelters the concrete facing panels formed the interior walls
of the shelter, leaving an exterior exposed soil berm. The roof was cast-in-
place concrete with a soil cover. Figure 3.1 shows a picture of the shelter
tested in Israel in 1990. One additional detail of the 1990 Israel tp.et nnt
included in the table was an airblast test co..nsisti of Adetonati;ng moe,. than 2n
tons of explosives 93.5 ft. from the interior wall. This external detonation
caused no measurable damage to the shelter, even though it was observed that
the entire structure was within the fireball of the explosion.
One observation resulting from the 1990 Israel test was the stress
concentrations present where the steel reinforcing strips anchor into the
concrete facing panels. The point of connection between the reinforcing strips
and the concrete panels were the first areas on the panels to fail. Even if the
panel did not fail, an X-shaped crack pattern would develop between the four
anchoring points. When panel failure did occur., it was initially caused by the
panel cracking and separating from each of the anchor points.
Another observation was the consistent p"a""r* of ,,,, dorlntiat;n In
each detonation in the soil backfill, the weapon was placed at t'e ,r ieg.;,,ht c,-
the wall. The panels directly in front of the detonation suffered the most
39
Wi .1..-. �1
.i*t � C
., .) l.A
U 'S.; _4)
4 :� � 'I,
.� 4. k -
. . 4 t&�... .ti*jf'S @0
- .. S.3 3 U,
t� .1S*.* *
4)
4 .�. S *j *�*� *:.i.* r�.4
gil -
4)I-
* I- @0
-. �..
*. 4i';I> � I�. �'*I�\
'.4.. A�' �
444 "
3, 1
� �; V .� ��

displacement, followed ",y each adjacent panel. The adjacent panels .also
exhibited rotational displacement, with displacement decreasing as distance
from the detonation increased. Figure 3.2 shows the plan and profile of
4 0 .'o4 ' .9 5 .3 X -
2.9- 5.7 10.6 24.7 4217. 47 96.5 . 56.8
8.5 .3 0. 3. 51.3 8*3.9 75.4 53.9 25.3 15. 5 IS 5.5 35.' 2.' 2.0 I. 1
o2. '3 elo13.9 48.8 42.7 * . 0 3 ., 4
.: 7 2. .1 5.: . 316 ..... -.
SECTION 5-5
I 1 ll I I I I I I I I I I I
iII I i t q II II TI 7-7N qif a W ta * m 46 asD C4~
SECTION 7-7
r4 1V aii Cii CI I 1 11N109- ~ ~ ~ C V 94 C' ~ ~ rN
Figure 3.2 Plan and Profile of Wall Panel Deflections, 1990 Test Structure.(Eytan and Reid, 1993)
41

deflections (in centimeters) of each corner of the panels and each layer of
panels as well as the elevation of the bomb. The radius of most significant
displacement around the center of detonation is approximately 2.5 panel widths.
This pattern was observed for each standoff distance used in the test series.
Damage was relatively symmetrical about the point of maximum displacement.
Finally, the presence of a roof or floor boundary on a panel greatly reduced the
displacement of that panel when compared to- panels that were nny hounded by
other panels.
The tests identified during this review were all conducted usi, g +I%- p,,,,
Reinforced Earth construction process, and many were faced with concrete
panels. In these tests, little information is reported on the type, density, and
moisture content of the backfill soils. Pressure, deformation and acceleration
data were rarely collected. Therefore, it is difficult to ascertain what design
variables affect the response of these systems to dynamic loads. The previous
full-scale tests have demonstrated that the inherent flexibility of reinforced soil
allows it to survive the severe loading conditions of a c~crventional weapon
detonation, as long as the detonation does not occur too close to the. wall
panels. However, these tests did not assess what ds;in va•riable afecte, the
performance of these structures, nor clearly identify the l•-,AdCig ehi.,, . ..
42

Therefore, these tests have done little to help develop an approach for the
design of reih.forced soil walls subjected to blast loads.
Physical Model-Tests
The full-scale tests mentioned above helped demonstrate the ability of
reinforced soil to withstand explosive loads. in an effort to improve theperformance of these shelters, the US Air Force Civ,; Enoprlno L hnratniy
sponsored research projects to investigate the primary design ,ari.able that
affect the dynamic response of reinforced soil MBachus, et al, 197793; Re:id, eAt ,
1993; Olen, et al, 1993, 1995). A series of 1:30 scale tests were conducted
undet -i two-phase program in a geotechnical centrifuge located at the USAF
Civil Epz.-k '"-q Laboratory at Tyndall Air Force Base (AFB), Florida.
Comparison of Model- an, :-ull-Scale Materials
In replica scaling, the scaled material properties of the model under the
influence of high levels of gravity must match those of the prototype structure.
The replica scaling relationships used in the design of the models are presented
in Table 3.2.
The facing panels were constructed of EXTERN 62.5., a light-eight, hig,-
strength, composite material made of pultruded vinyl ester resin and fibe"glass
reinforcement which has a unit weight of 111 pcf. The scaled facing panels
43

were 2 in. x 2 in. which is a scaled 5 ft. square panel. To model the mass o'
the full-scale panel the thickness of the scaled panels was 0.253 in, which is a
scaled 7.59 in. panel. This thickness does not match the 5.5 in. thickness of a
typical full-scale panel, however modeling the mass of the panel was of grez r
importance than modeling panel thickness (Olen, et al, 1993). The
reinforcement used in the scaled test was a nylon mesh material of ultimate
static tensile strength of 3480 lb/in. This compares well to Tensar UXI500
Table 3.2 Replica Scaling Re.lationships %(5c.tt & MMr..an, 1.0,77)
Quantity Full-Scale (Prototype) Model (at g level n)
Linear Dimension I I/n
Area I .a 2
Volume I 1A9
Time 1 I/n
Velocity 1
Acceleration I ...... _n
Mass 1 tIn1
Force , 1/'2
Energy I In1
Stress I I
Strain 1 !
Den sity . 1_ .. .. ..___ ... .....
44
ii 1j ,-I

geogrid which has an ultimate static tensile strength of 3653 lb/in. The
modulus of the nylon mesh material was not presented.
Phase I Tests. These tests consisted of constructing 1:30 scale reinforced
soil walls and measuring their response to explosive detonations in the soil
backfill. The objectives of the Phase I test series (Bachus, et al. 1993; Reid et
al, 1993) were: 1) to investigate aMed compa-e the ,rO,,Se of0va-ious
reinforced soil wall systems subjected to dlynai loading; 2) V to ,obti data
which could be compared to results gathered from numerical m-, lodeling , met..d
and full-scale tests; 3) to provide guidance for further full-scale tests; and 4) to
validate the use of the centrifuge as a viable means of studying dynamically
loaded geotechnical structures. A total of nine centrifuge tests were conducted
under this test phase.
Bachus, et al (1993) provide a detailed discussion of the scaling technique,
test equipment, test instrumentation, data collection, model materials and
sample construction. The parameters evaluated in these scale tests included the
reinforcement type, length, and width, use of restraint at the top of the wall.
and variations in the location of the explosive rldtonatnn. Two repli'at.
geogrid walls were tested to evaluate the reproducibility of 't"s results.
45

After each test, the displacement of each of the 2 in. by 2 in. wall, panels
was measured. This was done by taking the average of the measured
displacements at each of the four corners of the individual panels. Average
total wall displacement (ATWD) was determined as average displacements of
all 31 panels. The results of these tests are summarized in Table 3.3.
Pressure, acceleration and deformation measurements were made on the
center column of panels as part of each test. The free-field pressure data were
reported to match the values predicted by Cr'-Wep (Hyde., 1988), while themeasured accelerations did not show a"ny tren4 nor di they match preitions
This was primarily attributed to the presence of a .layer of 21.:.h d•nsi.-ty
Table 3.3 Phase [ Centrifuge Test Matrix
Study Tesa No. Variation Average Total WallDisplacement
Effects of Embedment 6 8 in. Geogrid 0.24 in.Length 1 6 in. Oeogrid 0.22 in.
5 4.2 in. Geogrid 0.31 in._I
Type of 2 0.0063 in. Steel Strip 0.45 in.Reinforcement 4 0.0126 in. Steel Strip 0.32 in.
Model Geometry 3 Top Restraint Decreased 90%
Weapon Placement 9 6 in. Standoff Wall Failed
Repeatability 7 10 in. Standoff, & 6 0.26 in.8 in. Geogrid 0.22 in.
46

polyethylene placed on the back face, which was used to attach the
reinforcement to the panel. Impulse, or the area under the pressure vs. time
plots, was not reported.
When the failure of any of the wall panels occurred, it was due to excessive
deflection. Wall panels would move forward relative to the plane of the wall.
and, without any underlying support, collapse. No rupture of the reinforcementor pullout of reinforcement from the .o1 -was rennrt•ed
When wall panels deflected, they did so due to Mhe ,efor.ation of the
backfill soil. The soil, reinforcement and wall panels were reported to move as
one under the influence of the explosion. Deformation due to pullout or
relative motion between the reinforcement and confining soil was not observed.
Some of the conclusions reported in this study were:
- Horizontal distance between the weapon and the wall was a
significant parameter.
- Significant increases in displacement occurred when the roof
was removed.
- Above a minimum length for static stability, reinforcement
length was not a factor in wall response.
- Reinforcement width and type were signf1lc4=t fa4to i0 -,"
response.
47

- Based on limited testing, the centrifuge is an appropriate tool
for investigation of the response of reinforced soil walls
subjected to blast loads.
- Rupture of the reinforcement did not occur.
- In each test, the pattern of panel displacement was similar.
Phase 11 Tests. Based on the success of the first test series, a second phase
of testing (Olen, et al, 1993, 1995) was initiated with the following objectives:
1) to conduct a series of reliability tests on the. c.entrifug,. to% q,,An,,tif, the. !n,,,;t
of random variation of wall response on nominally ident..:..i t 3sam..IpS, and.
2) to conduct a parametric study of reinforced soil wall system components in
order to identify key parameters which contribute to the most stable wall
system. The Phase II centrifuge test matrix consisted of 16 production tests as
shown in Table 3.4.
Tests 6-16 were conducted to quantify the statistical variation of identical
models. These tests quantified variations in displacements, pressures,
accelerations and wave speeds due to random variation in model construction,
test conditions, instrumentation, etc. For each test a 1:30 sc-ale model
reinforced soil will 6 in. high by 20 in. long w cnt.u,,,,,A ;nctp,,,ntd an,,
subjected to the effects of an explosive charge buried in the ba-cf11i. ThDe test
48

samples were accelerated in a centrifuge to 30 g's simulating a 20 ft. high by
50 ft. long reinforced soil wall subjected to a buried blast from a MK-82 (500
lb) general purpose bomb 21.1 ft. from the back face of the wall (Fig. 3.3).
Table 3.4 Phase II Centrifuge Test Ma' f
Study Test No. Variation From Average Total WallBaseline Displacement
Effects of 22 4.2 in. Embedment 0.369 in.Reinforcement 23 3 ReinforcingCoverage Area Strips/Panel 0.324 in.
24 1 ReinforcingStrip/Panel 0.414 in.
28 15 in. Embedment 0.251 in.
Effects of Facing 17 4 in. x 2 in. Panels 0.345 in.Panel Geometry 30 4 in. x 1 in. Panels 0.315 in.
31 2 in. x l in. Panels 0.361 in.
Effects of Soil Type 18 89 pif Tyndall Sand 0.462 in.& Density 20 90 pcf Sky X Sand 0.477 in.
26 95 pcf Tyndall Sand 0.377 in.27 9S pcf Wet Sky X 0.376 in.
Sand
Effects of Overall 19 Includes Roof 0.277 in.Model Geometry 21 6.5 in. Weapon 0.598 in.
Standoff25 Decreased Coupling 0.286 in.
Effect of 29 Reduced TensileReinforcement Strength 0.389 in.
Strength 32 Include ShearResistance BetweenReinforcing Strips 0 389 in.
Baseline 6 in. Embedment 0.324 in.103 pcf Tyndall Sand
8. in. WeaponStandoff
49
49

.A.1
L~
Figure 3.3 Typical Centrifuge Test Wall
Some of the conclusions of the Phase 11 centrfuge study are as follows:
-Soft density was the most significant factor influencing wall response.
As soil density increased, wall displacements decreased.
-Reducing standoff distance by 2 in. (5 ft. at full-scale)
significantly increases wall residual displacements, peak pressures and
accelerations, and wave speeds.
50
- Reducing reinforcement tensile strength significantly increased wall
residual displacement at the sides of the wall, but not as much as
should be expected for a large reduction in reinforcement strength.
- Two soil types with slight property differences produce
different results. Although wall residual displacements were similar,
peak pressures and accelerations measured in Sky X sand were
significantly lower than those in the Tyndall Beach sand at similar
densities.
- Using one continuous sheet of soilrenfrceen, as opse to
several strips, significantly increases wallr--i-..' ea:,U.. .. ,Ii,
sides of the walls, but did not reduce them at the wall center.
- Facing panel geometry does not significantly affect wall response.
- The amount of reinforcing used in the wall does not significantly
affect wall response (provided the minimum amount of soil
reinforcement is used to maintain static stability).
- The roof structure significantly reduces panel residual displacements
in the top row of panels only.
- A reduction in coupling factor reduces wall panel residua!l
displacements.
51
S. .. .. .. g 1 I i ii i

Evaluation of Centrifuge Test Data for Further Analysis
Each of the individual acceleration, soil pressure interface, and free field
pressure data records from the 16 centrifuge tests were evaluated for use in this
research. In 10 of the tests, residual diSplacem.nts of panel No. 2 (closest to
the detonation), were within + 1.5 in. of each other at nrntotype. srale (M Il in
at 1:30 scale). Tests with larger residual . wer. so,,ht ,,t to
provide data well outside the range of statistical variations. From the data set,
six centrifuge tests were selected for evaluation. The design parameters for
each of these tests are presented in Table 3.5. Tests 20 and 27 were models of
full-scale Tests 5 and 6 conducted as part of this research and detailed in
Chapter V. Tests 26 and 28 were constructed with a different backfill material,
allowing for evaluation of test data with respect to changes in the material
properties of the backfill. Also, the difference in measured displacements
between Tests 26 and 28, at full-scale, was over 0.39 ft. Finally, Tests 29 and
32 provided clear data records of the measurementq necessarv for the
evaluation, and are included in the evalation. Test 29 wa const.,cted with
geogrid of reduced tensile strength, and in Test 32 one each beVb.Ai layer. ,,a0"
installed as a continuous sheet connected to each panel, rather than individual
strips.
52
ADA293552
Table 3.5 Centrifuge Test Parameters - Prototype Scale
Test Soil p (lb- Weapon Variable UltimateNumber Type sec2lft') Standoff Displacement,
(ft.) Center Panel(ft.)
20 Sky X 2.80 21.1 Full-Scale 2.33Model
26 Tyndall 2.95 21.1 Reduced Unit 1.76Sand Weight
27 Sky X 3.0 25 Full-Scale 1.63Model
28 Tyndall 3.2 21.1 37.5 ft. Grid 1.37Sand Embedment
29 Tyndall 3.2 21.1 Reduced 1.67Sand Tensile
Strength
32 Tyndall 3.2 21.1 Continuous 1.56Sand Reinforcement
Numerical Models
The development of numerical models to predict the behavior of reinforced
soil to dynamic loads has primarily focused on the seismic response of these
systems (Yogendrakumar, et "a, 1992). These ,m,,odels. ha.,ve 00Ced heulla
test data presented by Richardson, et al (1k9 7 to eVaLate, ,l oUtpj,,- ,",w,," ,ata.
In order to model the response of reinforced soil to a large explosion in the soil
backfill, a new model or modified model would be necessary.
53

Bachus, ct al (1993) present an effort to modify the computer model
DYNA-3D (Whirley & Hallquist, 1991) to address the response of geogrid-
reinforced soils to explosions in the soil backfill. This model was tested
through previous full-scale test data and explosive centrifuge tests presented by
Bachus, et al (1993). Once operational, a series of 14 analyses were conducted
to evaluate the effect of various parameters on the performance of a geogrid
reinforced wall. The test matrix is shown in Tale 3.6.
The standard analysis used in the tAst matri was a "mO - 14.8 f,. high,
with six layers of Tensar UX 1600 geogrid, 14.8 ft. long. Each layer of
geogrid is attached to the center of a concrete facing panel 2.46 ft. high and
0.48 ft. thick. The prototype soil used for the wall and foundation wa3 a clean
sand with a friction angle of 35 degrees. To reduce the computer time needed
and therefore expand the parametric analysis, a two-dimensional, plane-strain
model was used. The explosive charge was initiated at selected distances
behind the wall face and 7.38 ft. below the ground surface. The charge weight
was 197 pounds of TNT and assumed to be fully coupled with the ground.
The loading resulting from the explosive detonation within the soil was
modeled by describing the horizontal component of the ve.1l,,.-thm, hi-t .•y fnr
selected nodes in the finite element mesh. The velocity-time histories were
calculated using equations from Drake, et al (1989). which estimates particle
54

Table 3.6 Numerical Evaluation Test Matrix (Bachus, et al, 1993)
'rest Test Variable
PSI Standard Analysis
PS2 Reinforcement stiffness decreased by two orde.rs of magnii,,de
PS3 Reinforcement stiffness increased "t *..,,o orde•s ,,€f , ;gnitude,
PS4 Length of reinforcement reduced
PS5 Standard analysis without roof
PS6 Standard weapon 20 ft. from boundary
PS7 Large 500 lb. weapon 10 ft. from boundary
PS8 Large weapon 20 ft. from boundary
PS9 Large weapon 40 ft. from boundary
PSIB Standard weapon located at base of wall
PS1S Standard analysis with soil/reinforcement interface frictioncoefficient reduced from 0.9 to 0.7
PS1W Standard analysis wlsoilf,.fnoss decreaesd by a ... rtr of 10
P1I PIHI Standard analysis with 0 incrcas•d €"-3 to 4,, A.td g.*ec
PSIN Standard analysis without gravity initialization
55

velocity from the free-field blast pressure wave, but does not include prediction
of inertial wave particle velocities.
The conclusions of this parametric study are summarized as follows:
- Weapon size and distance are critical parameters which influenced wall
behavior much more than any other parameter.
- Wall panel motions decrease as soil strength and stiffness increase. This
effect appears to be more important than reinforcement stiffness.
- Wall panel displacement decra, se- with incre•sing reinforrc.ment
stiffness in a nonlinear fashion. An increase of or ,,ade.rs of
magnitude in reinforcement stiffness leads to approximam,•.y a 4701
percent decrease in average peak displacement of the wall facing.
- Increasing the relative compaction of the soil will lead to enhanced
performance.
- Within the range investigated, reinforcement length has little effect on the
behavior of the reinforced system, provided the length meets static
design criteria.
- The reinforcement is subject to very high compressive stresses as the blast
wave passes through the system.
- Dynamic tensile stresses do not develop u.til after the blast ,v, jw
reached the facing.
56

- Dynamic tensile stresses develop relatively slowly in the reinforcement.
Rise times of tens of milliseconds are predicted by the numerical code.
- Reinforcement rupture and excessive deflection were the only observed
failure mechanisms. Very little relative movement between the
reinforcement and tht soil (pullout) was observed.
The version of DYNA-3D used for that reserh program *,aas effective for
general parametric evaluations, however further refinements were necessary for
quantitative analysis, as detailed by Bachus, et al (1993).
Evaluation of Previous Research
The dynamic response of reinforced soil systems has been evaluated in full
and small-scale testing programs, and through numerical analysis. These
testing and analysis programs were reviewed as part of this research in order
to: 1) evaluate how previous research could be applied to this program; 2)
develop a clear understanding of what additional renearch contributions could be
made to further the state-of-the-art; 3) identaiify, ptential fa;ltu, mphonemq.
and, 4) provide a basis for design of this research test.
The previous full-scale tests have shown reinforced soil can contain and
survive explosions: 1) in the backfill; 2) in front of the wall face; and 3)
behind the soil berm. However, each of these tests have had little or no data
57

collected. The most comprehensive dF ýa from a full-scale test is the deflection
data presented by Eytan and Reid (1993). This test also showed th• steel
reinforcement strips tended to cause stress concentrations at the point where
they anchor into the facing pane.l, ,cAing the. mn•ls• t -brap ano'rt Their
report also provides a detailed presentatioR of waUlI pAne , Isl.,.,. FuI_
scale pressure and acceleration data are almost non-existent, and in each,, of
these tests no measured soil properties are presented. This lack of full-scale
test data provides little information of use in the validation of numerical or
small-scale models. All previous full-scale tests have been performcd on steel
strip reinforced walls. No full-scale test data exists for the response of geogrid
reinfarced soil walls to explosive loads.
The small-scale (1:30) test results have demonstrated what design
parameters have the most effect on the response of reinforced soil walls. Soil
properties, location of the weapon, and tyne of re.inforceme-nt were three
parameters that significantly affect wal r esponse. Onc,, ,-n,,obh reinforrement
exists for static stability, increasing the length, coveranet areAr- Vor number-" WA
layers of reinforcement had little effect on the response of scaled walls. Also
the assumed failure modes, reinforcement rupture and pullout, were not
observed. The effects of the three primary design variables, soil properties,
58

weapon location, and reinforcement type on wall response nteeds" to be v.lidaQUt
through full-scale tests.
The DYNA-3D code, specifically altered to address the dynamic response
of reinforced soil, confirmed many of the conclusions of the 1:30 scale test.
This included confirming that the r, . .. .... ieinforcement, weapon size
and location, and soil properties had the most significant effect on system
response. Also, reinforcement length (over that required for static stability) and
soil/reinforcement interface friction had little effect on wal! respon, f. The
numerical model did show rupture of reinforcement is a potential fa,, .,.e ,
however this was not observed in the 1:30 scale tests. The primar.y faiure
mode observed in the numerical model was excessive deflection of the wall
facing panels. Finally, the model shows an explosion in the reinforced backfill
causes the reinforcement to be subjected to compression before tension. The
data generated by this model requires validation via a full-scale test.
The information discovered through the literature review has shown a need
for a full-scale test of a reinforced soil wall subjected to an explosive detonation
in the soil backfill, coupled with the development of a fundamentally based
approach for relating loading mechanisms and the .ngneering properties of the
materials to the residual behavior of thywll. Previou researrh h1n helned
develop potential failure modes and a better understanding of the phy"ical
59

response of the structure, which is valuable in developing a design for the
prcposed test program. However, the influence of specific design variables are
based solely on post-test measurements, ane ,tot fundamentally sound
relationships. The coupling of a %.damental equation of motion with detailed
nressure, acceleration, -. .in and displacement data collected from full-scale
testing is nec,,sary to further develop our understanding of dynamic response
of reinforced soil.
60

CHAPTER IV
EQUATION OF MOTION
Introduction
The design of structures to resist the effects of ground.... C f1roGM16
conventional weapons is often founded on design methods developed for nuclear
weapons threats. The nature of nuclear-generated load pulses are such that
structural loads have small spatial gradients and are not greatly affected by
structural deformations (Drake, et al, 1987).
The conventional weapons used in this research yield loads that are spatially
variable across the dimensions of the test structure, change significantly at soil
structure boundaries, and are. affected by the deformation of the structure.
Therefore, a model for reinforced soil walls must consider motion of the system
in response to the imposed stresses.
Early design approaches considered buried , o..,cree walls tA k ,snti&dno
and therefore designed to withstand stresses that are twice that of the If,-,-": -9Id
stresses. Drake, et al (1987), developed a more rational approach for the
solution of a yielding wall by considering displacement boundary conditions.
61

For buried reinforced concrete walls, this approach determined that the
groundshock stresses transmitted to the structure were less than the free-field
soil stresses at the soil/structure interface. Newmark and Haltiwanger (1962)
made the general statement that observed structure loads were usually less than
free-field loads because of an "arching" phenomena. To the geotechnical
engineer, these differences in structural loads are analogous to the difference
between at rest earth pressure (K,) and active eart.h pressure (K.. That is.
small amounts of structural yiel-d;in c-an reslt in sonif'icnt prescura rplief
The equations developed by Drake, et al (10.97) UAWC icr€i,,, in, ,C ;. the
design of reinforced concrete shelters over the highly conSernoative .,,, u,,ild,,
wall design method.
The unyielding design approach was not considered to be appropriate for a
reinforced soil wall because individual reinforced soil wall elements have
neither the mass nor displacement-controlled boundary conditions that would
resist panel motion. If the boundaries of the wall elements were fixed, the lack
of reinforcing steel and small section thickness would result in failure of the
concrete panels under the imposed blast stresses. Reinforced so~l is recognized
as a flexible system, as stated by Christopher, et a! (1990.);
62

One of the greatest advantages of mechanically stabilized soil structures istheir flexibility and capability to absorb deformations due to poor subsoilconditions in the foundations. Also, based on observations in seismicallyactive zones, reinforced soil structures have demonstrated a higher resistanceto seismic loading than rigid concrete structures.
It will be shown that an equatio.n. of motion hnaed nn the wnrk by Drake. et
al (1987) can be adapted to model the response of a reinafa,.rce, ,o;jl ,,l with
concrete panel facing to blast pressure loads. The ultimate objective of ,hids
application is a methodology to evaluate wall panel behavior based on the
applied pressures.
Development of The Equation of Motion
The basic physical principles of wave propagation through elastic solids are
applied to the partition of energy across the boundary of two media (Waters,
1981). The boundary conditions assume continuity of both stress and
displacement between the soil and ,he structure. These conditions can be stated
as
C1 - a,, + o (4.1)
63

where ai is the interface stress, a, is the stress reflected from the structure and
o'f is the free-field incident stress produced by the explosion. Continuity of
displacements requires that
rt - Or 11 0(4.2)
where Oft is the particle velcity ,,,,.;.,, ,ih ,. i the p,'t.;iAl, velocity of
the reflected wave and 0 is the velocity of the str"ctsur'e ,.;,, v:lcity and
stress can be related by the impedance of the media via the,--latio,, hip
(Bangash, 1993):
Or P CLCI (4.3)
where p is the mass density of the soil and CL is the longitudinal wavespeed of
the soil.
Combining Eqs. 4.3 and 4.1 yields
oi = a PC0Or (4.4)
64

and combining Eqs. 4.2 and 4.4 gives
01i -Ol±'- PCL(off - ) (4.5)
Figure 4.1 shows a free body diagrm ,.%f the str,-h,,irft wh wav, ;,iterac-i;on
and cross sectional area (A).
V
A . . A
Figure 4.1 Free Body Diagram of Wall Panel With Wave Interaction(Drake, ,. al, 1987)
Summation of the horizontal forces in flhe f.ree body diagram res.,,,t, i. ,
65
MrAM.AM"4M M ý A

- pALI + R(U) (4.6)
where p, is the mass density of the structure, L is the thickness of She structure,and R(u) is the resistance per unit area of the structure.
From Eqs. 4.5 Qnd 4.6,
P.LO - PCL(lff - e) + R(u) a f (4.7)
which is the equation of motion for the struct-U that VIA cl :udes"' the inte"a c.ion
effect. Applying the assumptions used in Eq. 4.3, it can also be shown, that
m PCLO (4.8)
and substituting Eq. 4.8 into Eq. 4.7 yields
p Pd L + PCLL + R(U) - 2 olt (4.9)
the final equation of motion.
66
inh 7RAq F i i ha, i lI24/94/ IARA19AM5q2

This equation is of the form of a single degree of freedom system and
assumes continuity of both stress and displacement between the soil and the
wall. The equation resembles that of a single degree of freedom system with
damping. howe%er the damping term is the result of satisfying the boundary
conditions and is not related to viscotis or frictional damping effects. The
resistance function represents the resistance of the s!,,cture per unit area, and is
dependent upon the displacement of the wall (Drake, ct al, 19.7).
Validity For Reinforced Concrete, Walls
The validity of the equation of motion for predicting the deflection of
buric.A concrete structures subjected to buried explosions was also presented by
Drake. et al (1987). The test case was modeled as a one way slab with fixed
ends. Drake, et al (1989) presented tables for calculating the resistance
function for various types of beams and slabs based upon the moment capacities
and shear capacities of the appropriate elements. In the test case, the peak free-
field stress exceeds the calculated resistance of the struct, re by a factor of nine.
The model predicted the maximum deflection within ±30 perce.n.t of measured
values. The model tended to underestimate peak deflections and permanent
deflections. Drake attributed these differences to the overprediction of stiffnes
67
ADA293552
using the handbook methods and that, in the valid~1 ion test, the entire structure
translated before the peak deflection occurred, further reducing interface loads.
Application to Reinforced Soil Walls
The equation will be adapted for use in subsequent chapters to evaluate the
response of the wall panels to the free-field and inertial pr±,sures. The
adaptation wil! require modification of the resistarnce function to appropriately
model the resistance of reinforced soil walls, and w.11 be discussed in detail in
Chapters VII and VIII.
To apply the equation of motion to reinforced soil wails requircs valia•to•n",
through test data. Chapters V and VI will discuss the development and results
of a full-scale test program to measure the response of reinforced soil walls to
blast pressure wave.
68
ADA293552

CHAPTER V
FULL-SCALE TEST DESIGN
Intr ction
Based upon the literature review and the needs of the research sponsor, a
research program was developed to evaluate the response of a series of full-
scale geogrid-reinforced soil walls to explosive detonations in the retained
backfill. The research program test parameters considers two of the primary
design variables identified in previous small-scale and numerical analysis
research programs while balancing overall research objectives against the
constraints of time, budget, and capability. This chapter will dkiscss how the
information derived from the literature review. affectedA the, ,,est par,,,., r,
selection and sizing of materials, weapon size and placement, test
instrumentation, and design of the test walls.
69
ADA293552

Type of Reinforcement
The selection of the reinforcement material was based on three factors: the
needs of the research sponsor, the, ad,,,ancmen t ,f reseonrch and eliminatinn nf
a potential failure mode. First of all, the research sponsor .l;timAtel, is to ,Wse0
the results of this research to help develop a design meth-dology for
shelters built of reinforced soil. These shelters must be rapidly erectable in
remote areas of the world. In choosing between inextensible (metal strip) and
extensible (geosynthetic) reinforcement, logistical requirements are of
paramount concern. The components of the reinforced soil structure may have
to be stored for many years and then on short notice be shipped to a location
for use. The design for this shelter would be done as needed, although some
non-site-specific pre-design may be possible in advance. It is likely, however,
that soil conditions will not be Lkown at the fime tmh.f shelter comp.onents are
procured; therefore maximum flexibility is impe--ti,,.
The inability to perform design before procurement of mateilsm-ans
reinforcement must be cut to length in the field. Geosynthetic materials can be
cut to any length during the installation process, and waste is minimized. Steel
strip reinforcement may be shortened in the field, however that wastes the
70
ADA293552
excess reinforcement. It is difficult to lengthen steel strip reinforcement in the
field.
Steel strip reinforcement is generally recommended in frictional soils,
preferably sands and gravels (Christopher, et al, 1990), whereas geogrid type
materials can be used in both clays and sands. Also, if facing panels are not
available, geogrid reinforcement can be used to construct a wall with a "wrap
around" face as long as some liner material is available to contain the soil.
Also, steel strip reinforcement generally is connected to the facing panels at
four anchors. As shown in the 1990 tests (Eytan and Reid, 1993), these anchor
points are susceptible to failure. The transfer of load from the panel to the
reinforcement should take place over a larg, " area M, red-ie stress
concentrations and reduce the occurrence of thhis ptent,;I faU;ilr mode.
Geogrid reinforcement can be embedded into the concre1te f"acin p l"" o0-ver the
entire roll width which distributes the reinforcement stress over a larger arca of
panel. Finally, steel is subject to corrosion.
It was also noted in the literature review that all previous full-scale tests
had been performed on steel strip reinforced walls, but that no pressure or
acceleration data was collected. The scaled test walls were reinforced primarily
with geogrids, but did not have appropriate full-scale test data for data
71
ADA293552

validation. Because of these considerations, geogrid reinforcement was chosen
for use in this test program.
Selection of Geogrid Type
The first constraint that affected the selection of geogrid material was the
requirement to embed the geogfrid into ,he concrete foc;in pane, m. o,-,-t•d
materials are made of coated polyester which has been sh,,wn .. .. r.L...ad w.Ihen
embedded in portland cement concrete. High-density polyethylene (HDPE) is
resistant to degradation (hydrolysis) in the alkaline environment created by the
concrete panel and has excellent stiffness properties under rapid loading (Reid
and Collin, 1995).
The two HDPE geogrids selected for this test series were Tensar Earth
Technology, Inc. UX 1400HT and UX 1500HT. A summary of the properties
of these grids is shown in Table 5.1. As Table 5.1 shows, the two geogrids are
very similar in many respects. The key differences are in tensile modulus and
strength. The difference in tensile modulus at2t 2t stvn ia fIctor of two.
The creep-limited strength of UX 1500HT is 1.7 !,,Cs., t•.t. ,f thes UXV 4N• Tr
Because these materials are similar except for tensile modulus an"d streng"1
they were chosen for use in this test. For two equal tests, the performance
difference in wall deflection could then be primarily attributed to the tensile
72
ADA293552

stiffness or strength of the reinforcement. However, as shown in Chapter III,
the deformation of the walls in scaled tests were not significantly affected by
changes in reinforcement strength. This suggests that if the geogrid does not
rupture, differences in displacements may be affected more by reinforcement
stiffness than strength. By using these geogridq data would he availahle to
compare to the conclusion drawn from the numedcal anlyo; that
reinforcement stiffness is a primary factor affecting wall deflection.
Table 5.1 Properties of Geogrid Reinforcement(Tensar Earth Technologies, Inc., 1992)
Property Test Method .UX 1400 HT UX 1500 HT
Apertures: Along Roll Length Calipers 9.5 in. 9.5 in.
Apertures: Along Roll Width Calipers 0.66 in. 0.66 in.
Rib Thickness ASTM D1777-64 0.03 in. 0.055 in.
Junction Thickness ASTM D1777-64 0.10 in. 0.16 in.
Creep Limited Strength ASTM D5262 1,600 lb/ft 2,700 lb/ft
Tensile Modulus GRI GGI-87 50,000 lb/ft 100,000 lb/ft
Roll Length 98 ft. 99 ft.
Roll Width 4.3 ft. 4.3 ft.
Roll Weight 38 lbs. 55 lbs.
73
ADA293552
Type of Facing ?aniel
Numerous facing panel shapes are used in reinforced soil wall construction:
cruciform, Georgia Stabilized Earth, Modular Block, full height tilt-up panels,
modular block and others. A Georgia Stabilized Earth panel shape (Fig. 5.1)
was selected since a local contractor had experience in their fabrication and
could fabricate them on site within the test schedule.
Test Structure Dimensions
Design of the test wall was based upon ensuring the. walls were long
enough to capture the full effe.t of thec bl"as loads, with maximum
displacements at the centerline, and negligible displacem.,ents atl Uthe eudges Of th
wall face. The wall height was based upon compatibility with previous
research.
As shown in Fig. 3.2, the most significant deflections occur within a zone
approximately five panel widths wide, centered about the load source. To
capture this damage on the planned tests, the wall face should be five panels
wide. The face of the wall should also be 30 ft. wide, to ensure it is wider
then the explosive crater. Therefore, the center full section of wall was
designed to be five panels wide, with each panel 6 ft., wide., The, height of the
test wall should be compatible with previous te,.st. The 199.0 f•l.-..._ test
used walls approximately 12.3 ft. in height. The 1:30 scale model, toll
74
ADA293552

w z
'wu
L CC-
1000
ADA293552

discussed by Bachus, et al (1993) and Olen, et al (1993), were scaled 15 ft.
high walls. Because of the large amount of scaled test data, and the ability to
do more scaled testing as needed, the full-scale test wall height of 15 ft. was
acceptable. To provide a symmetrical wail face, each panel should be 5 ft. in
height and 6 ft. wide, making the-oerll wall apnrrYirnatlv 79) ft. at itq haeP
and 16.5 ft. high (this includes 1.5 ft. embedrment dep,,h).
Soil Type and Properties
After the wall size was determined, earthwork for construction had to be
considered. Based on the overall dimensions of the test wall, a least 1400 yd3
of backfill would be needed. Because of the amount of soil needed and the
limited budget, a local sand was chosen as the backfill material. The sand is
referred to as Sky X (Sky Ten) sand, a SP-SM sand whose name derives from
tne test range where the tests were conducted.
The grain size distribution is shown in Fig. 5.2. The coefficient of
uniformity is C,, = 1.63 and D50 = 0.24 mm categoiZing- ths; cc a ,,n-fn, fine
sand. Based on the results of modified Proctor tests on the ,back•ll SOVI, M%,
maximum dry unit weight was 101.8 pcf at 11.3% water content. Finally,
based on consolidated drained triaxial tests at confining pressures of 50 to 300
psi, the angle of internal friction of the sand was 33 degrees.
76
ADA293552
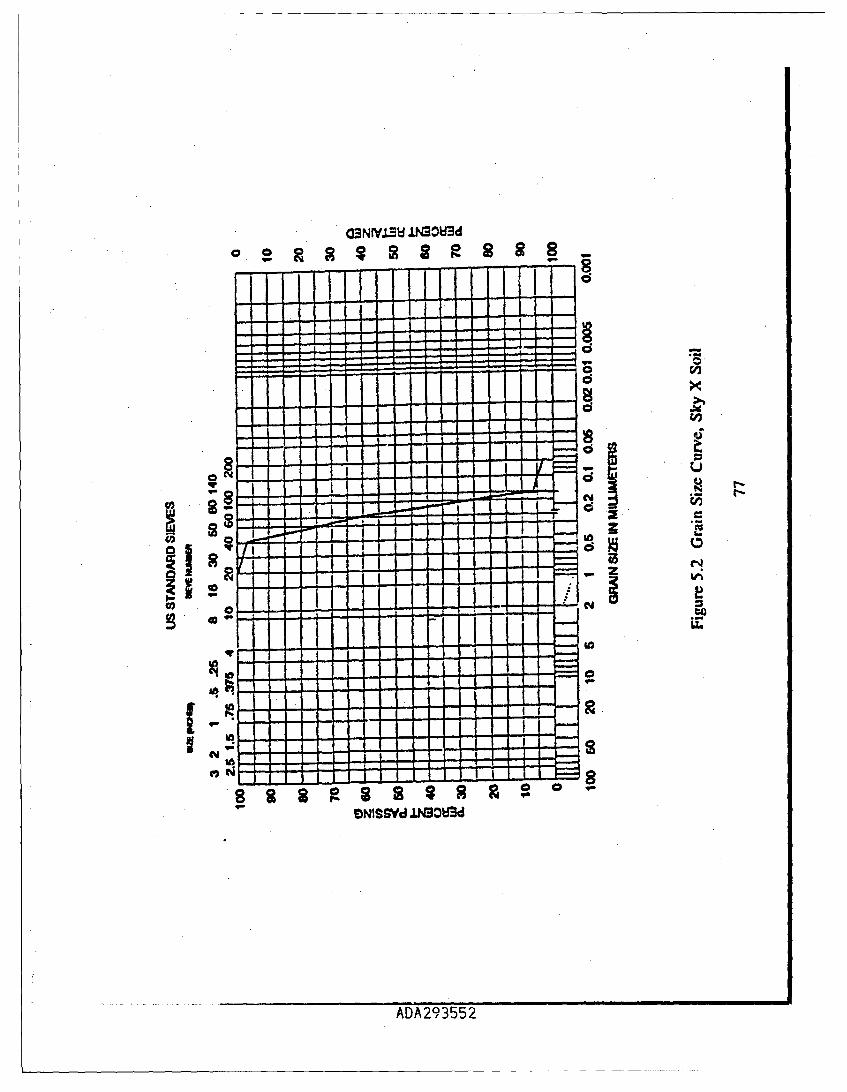
CBNIVI±=V J.30tId
-1 h
L
I A2
-A -1
Ii~~~ ~ t~~~y :1
0~~ - -1 - Lo
ADA2013552

Number of Tests
It has been established that three of the primary design variables that affect
the design of a reinforced soil wall subjected to explosive loads are: 1) soil
properties; 2) reinforcement stiffness; and, 3) weapon size and placement.
Due to research program limitations, it was decided to evaluate only two of
these variables: the stiffness of the reinforcement and the weapon size and
placement. To maximize the usage of ,ac, wh l, a twA-stai tet W
performed. In the first of two stages, the .-,e"apon stando, f wa,, c 6, t
hopefully cause only minor deflections. Following this first test th.., b-,vOb
cratar was repaired and a second bomb was placed closer to the wall in order to
cause moderate displacements of the wall panels. At Nis point, the wall
sustained enough damage to make it unusable for future tests. A duplicate wall
was constructed and the weapon located such that it caused h.avy damage.
After these tests, two more walls were built to the same specifications but
with a much stiffer reinforcement material. Tests were then conducted with
weapons at the same standoff distances.
Weapg n SiZe
Many previous explosive tests on hardened reinforced concrete .shel5,ters a ndUf
reinforced soil used 5Wt lb. cased general purpose bombs (GP) as an explosive
source. These bombs are referred to as Mark-82 or MK-82 bombs. The 1:30
78
ADA293552

scale tests also used a scaled explosive designed to model the MK-82. To
maintain continuity between these tests, and because of ready access to the
necessary number of MK-82 bombs, this weapon was chosen for use in this test
series. The MK-82 bomb is an aerodynamic, low-drag cast iron bomb designed
to be carried and delivered from under the wing of supersoic aircraft, however
it has also been delivered from the bomb bay ,bf r h,. Mbr,. T•, , a MV K-Q
contains approximately 192 pounds of . xpiOC., .6:.. fillar, which is the
cxplosive equivalent to 264 lbs. of TNT (Dobtatz and Crawford, 1985). The
192 pounds of explosive is referred to the Net Explosive Weight (NEW) of H-6
in the weapon. The remaining weight of the weapon comes from the cast iron
casing.
Weapon Location
The distance between the explosive source and the retaining wall has a
significant impact on the response of the wall. In the first of two tests on a
wall, the weapon had to be close enough to cause the n,.,res.o pope , ,-te
and for the wall panels to move. AAA...,.., .... A. ,• V%' ICU U1.....A
away in order to prevent catastrophic failure of the wall. Based on the review
of previous full and small-scale test data, a weapon standoff distance of 20 ft.
was selected for the first test. If this distance caused mirnor damage, then
subsequent tests would use standoff distances of 15 and 10 ft. If the 20-ft.
79
ADA293bb2Y

standoff caused moderate damage, tests would be conducted at 25 and 15 ft.
Finally, if the 20-ft. standoff caused major damage, further tests would use 30
and 25-ft. standoffs.
Weapon PlacementThe placement of the bomb required a methodology allowing for placing
the weapon after construction was ,,,,l.te,= ,hie nv.t:,; ;n* l nver the
location of the explosive. Safety restrictions prevented .Sai,,v th , bmb, its th
backfill until the date of testing.
After completion of constniction, a small hole was excavated at the
required distance behind the wall to a depth of ten ft. Since the bombs are five
ft. in length, if the nose of the bOmb rests at a depth of ten ft. then the center
of the bomb will be 7.5 fi. from the top of the wall. This places the center of
the bomb directly in line with the soil pressure interface gage on the centermost
panel. A PVC pipe, refei'ed to as the "bomb tube", 12 ft. long and
approximately 18 in. in diameter vas set in the center of the excavation.
Backfill material was replaced in the excavation and c,.rartcted.
On the day of each test, the bomb was devered to ,,t, .nd. car,. ed. A
crane would then pick the bomb up and then lower it into the tube. Once the
oomb was in placr, the bomb tube was lifted out of the ground.
80
ADA293552

The rationale behind this process was to simulate how a.- air delivered
weapon might impact the soil. An air delivered weapon would penetrate the
soil, looe soil would collapse in over the hole made by the bomb, and the
bomb would detonate, This method was devised to simulate that process, while
still providing complete control over the weapon location,
DataC1
To further understand of the response of the wall to the test loads, pressure,
acceleration, strain and displacement measurements were collected during
testing. The data collection design was de,,eloped to provide pressure and
acceleration data similar to that collected in the scaled tests. Also, geogrid
strains were measured to determine the response of the geogrid to blast
pressures. This section will discuss the specific types of gages, data collection
system, firing system, and some miscellaneous components of the
instrumentation.
Data Acquisiton System
A Pacific Instruments Portable Data Acquisition System Model 5700 was
used to record the data during each test. With the slave enclosure this system
is a 32 channel fully programmable transient recorder that can record samples
at rates of up to 1,000,000 samples per second per channel. The digitized data
81
ADA293552 L __ __ _ _ _

is recorded in a solid state non-volatile memory with a capacity of 256,000 data
points. To prepare the data acquisition system requires preprogramming each
data channel for each test. This programming required the input of each gage's
characteristics into the computer. The gages were connected directly to the
data acquisition system via instrumentation Cable fi.rom Apha Cooration,
Type-L, which was a four strand shieldeu cable. This data acquisition system
was connected to the firing system.
The 32 channels are divided into 4 groups of 8 channels each. One channel
in each group was reserved for input of the firing pulse. This gave each group
a signal for "zero time"; the time the firing pulse was sent to detonate the
bomb. Normally, one channel for the entire system is needed for firing pulse
input, but any failure for this information to be transmitted between groups
makes it impossible to determine when each gage reads the blast load with
respect detonation time, preventing time dependent comparisons betweengroups. To be conservative, one zero time c" el wa. r
chlanill' was reserve~d per group.
Using four channels for zero time left 28 channels for recording test data.
Eiring SystM
A Reynolds Industries Systems Incorporated FS-17 firing system was used
in this test. This key-operated firing system consists of a control module which
inputs 28 volts DC into a firing module containing a high voltage discharge
82
ADA293552

capacitor that emits a nominal 2000V DC signal to the exploding bridge wire
ordinance. The exploding bridge initiates the explosion of the detcord, which
in turn detonates C-4 explosive in the bomb fuse well, which in turn detonated
the bomb. When the firing module capacitor builds up enough charge (2000V)
a fire signal is sent to the high speed camera. The camera would turn on, and
once the film reached the proper speed it sends a signal to the control module
which in turn signals the firing module to discharge the capacitor. The
capacitor then discharges, sending 2000WV to the expioding bridge wire which
initiates the blast.
Four different gage types were used to measure test data: 1) soil interface
pressure gages; 2) free-field soil pressure gages; 3) accelerometers; and, 4)
strain gages.
The soil interface pressure gages were produced by the Kulite Corporation,
Model number VM-750 with pressure ranges up to 200 psi. Free-field soil
pressure gages were manufactured by the Kulite Corporation, Model number
LQ-090U with a range of 200 psi. The acct.lerometers were manufactured by
the Endevco Corporation. These p;,ZOres,;it;yv, gage, Mode! numher 2262 CA
had ranges up to 1000 g's. The strain gages were Type EP-8-250BG-I 20,
83
ADA293552

manufactured by Measurements Group, In.c. All gages -'e're cai.ratedA prior to.
use in any of the tests.
Without other full-scale test data to use as a comparison, gage sizing was
based primarily on the Phase I centrifuge test program data. The peak
acceleration measured during that test series was approximately 350 g's at
prototype scale. Using a factor of safety of two, the initial gage size selected
for the full-scale tests was 1,000 g's.
Soil pressure gages were located on the order of 20 ft. from the detonation,
and in the centrifuge the pressures measured at that range were on the order of
100 psi. Applying a factor of safety of two, 200 psi free-i-fir.eld and .. il pressure
interface gages were selected. Gage measurements were eva•,lated afte,.r each,
test to determine if the gage ranges were appropriate to coiNct the most
significant data.
Soil Pressure Interface Gages, Soil interface pressure gages were used to
measure the ground shock transmitted to the back side of the wall panels.
Because the gages are expensive and due to limits on the n'inber of channels of
data that could be collected, six panels were fitted with these gages. The panels
subjected to the highest levels of stress were fitted with these pressure gages.
The gages were numbered PI-P6 correspondin.g to papnels numbered 1-6 in Fig.
5.3. The blast wave and pressures were ascumed to be osymmetri•cl ahnut the
center of the wall. Also, most of the deflection, based on preio4,,, fate,
84
ADA293552

* z z
11lo- ILL I 0f 4c z
Iz 02 I1.1co
Coc
uss z
C .i~..II ElDA293552E

should be contained within two and one half panel widths of the centerline.
Therefore, these six gages should collect the most significant data.
In order to measure the blast pressure on the soil side of the wall panels,
soil pressure interface gages had to be mounted such that the gage face was
flush with the soil side of the panel. It was decided to install the gages after
construction, as opposed to casting the gages into the panels or placing them
during construction. Installing the gages during coqstrnwCtiori has four
disadvantages. First, these expensive 020;eC ,,Ios d woul C,, M jh;Of t enit-n
damage due to shoveling, heavy equipment, and osure. Seon,,yato. o. f•UIJII•|I 4SAUJ• %ýAF• aU &gI- %P-%,lA&tJtJ, OV111%, VAJ
the walls were to be tested more then once. If, 'large va"iation" " ,.t III Mhe
predicted stress between the two tests, then the gage has to be sized to the
larger stress level. This can make reading of the small stress levels less
accurate. Third, if a gage fails between installation and test time (which may
be many weeks), or between tests, then the gage is lost. Finally, casting gages
into the panels or installing during construction would make it extremely
difficult to retrieve gages after each test. Therefore, it wts desired that a gage
mount system be developed that allowed for installation of the soil pressure
interface gages after construction and just prior to testing, and iheir subsequent
removal after each test.
A gage mount was designed for the soil pressure intera"ce .a.... "L ..a..
mounts were 5 1/2 in. long, 3 1/2 in. diameter steel cylinders. The mounts
86
ADA293552

were capped at one end, with a 314 in. hole in the center of.te cap..
outside of the mount, a 1 1/2 in. diameter, 1/4 in. thick nylon lining was
countersunk into the cap. Centered in the nylon lining is a 314 in. diameter
hole that aligned with the hole in the end cap. Using a pair of forceps, a soil
pressure interface gage could be pushed into the hole into the end cap, and the
face of the gage would be flush with the end cap, which in turn was flush with
the back face of the wall panel, Two, 3 in. diameter plates, one nylon and the
other steel, with 3/4 in. diameter holes in the center sliede! into the gpae mount
and over the gage. With four screws, these pate. "An& iht,,ed ,,ain;., th,11nd
cap and gage, providing a rigid mount for the gage. The gage was h•ud in
place by the nylon inserts on both sides, which would minimize any ringing
effects from the steel cylinder. Twenty-four of these gage mounts were cast
into panels for use in the test series. The mounts were covered with duct tape
during casting to prevent concrete from entering the gage mount. This tape
was removed prior to construction.
To ensure the gage was bearing against soil, a 3/4 in. diameter tamping rod
was fabricated. Prior to gage installation, additional sand was forced into the
hole in the end cap and compacted with the taming rod. Te preure gave
would be installed and removed. Upon re,. va,,,,te age ac.e w,1,d hb
inspected, and if soil residue covered the gage face, then the gage w.u.d bUe
installed into the gage mount. If soil residue did not cover the gage face,
87
ADA293552

additional soil was tamped into the hole until satisfactory results were achieved.
Acelerometers. In order to develop load-deformation relationships on the
panels, the movement of each panel fitted with a soil pressure interface gage
was measured. An accelerometer was placed on the exposed surface on each of
those panels, and numbered A1-A6. Hence, six accelerometers were used in
each test.
The accelerometers were installed on the face nf tp- cnnt'rPti. nne p kh
adjacent to the location of the soil pressure int.r.ga. Accelerometer.
could not be affixed to the concrete directly because the gages ould. eAsily
separate from the concrete. To provide a rigid and uniform bearing surface for
the accelerometers, gage mounts were cast into the panels that also had the soil
pressure interface gages cast into them. The accelerometer mounts were 2 in.
by 2 in. steel plates with 10-32 National Fine (NF) threads tapped into the
center of the plate. Four-two in. pieces of threaded rod were welded onto the
corner of each plate. These rods, when cast into the panels, would ensure the
accelerometer plate remained a rigid part of the panel. The plates were placed
face down into the panel forms next to the soil pressure gage mounts, with the
rods extending into the panel. The th.readed hole10 as, covered on both side.
with aluminum tape to prevent concrete from filling the th,•. •" Cor,,,., ,wa
then carefully poured into the forms. Prior to testing, the protective tape was
88
ADA293552

removed from the accelerometer plate and the accelerometer was then screwed
into the plate.
Strain Gages. One objective of this test was to understand loading and
failure mechanisms within the reinforced soil mass. It was not understood how
much relative motion would occur between the soil and the reinforcement, or if
the motion of the panels would cause an elastic or plastic response in the
reinforcement. It was of interest to try to measrc the strain in the
reinforcement with respect to disance, bh•in;d, th, nanel as well as distance. frnm
the centerline. Because strain gages are inexpensive, and hc,,a,,. ^f flu
potential high failure rate (due to the fragility of the gages and p.v-,-ssb"
construction damage) twelve strain gages would be attached to the
reinforcement on each test. Strain gages are identified as gages SI through
S12.
The strain gages were placed on the layer of geogrid above and clos.-st to
the vertical center of the wall and identified in Fig. 5.3. The gages would be
placed in line on the upper layer of grid on the center panel. Three gages
would be placed along the centerline of the grid layer, and three at the edge of
center piece of grid, three ribs in from the edge. Three L mre gages would be
placed in line at three ribs in from the edge of the grid lay.,er •anii;,,nt in the.
center, and three more along the centerline of the grid adjacent to the center
piece, as detailed in Figs. 5.4 and 5.5. The attachment of the strain gages to
89
ADA293552

F 3 c
0
0z
x x x
x x
ADA2355

I-j
x x
.2 E
0
0 • 0
x x x-.U
P -f , U, j•
X- -ADx x 23-F.. . 0_ . . . x _ • _ L _ L .
U ,U ,.
ADA29355

the geogrid is a difficult problem. This has been successfully done for
laboratory creep and extension tests (Oglesby, 1992), and those methods were
used (Appendix A).
Once the strain gages were installed onto the geogrid in the lab. the gaged
grid was transported to site and instalPled. The protected lead wires were fedbetween gaps in the wall panels so they ,o,,d• beac ,, fr,,m the w.... fAc. .
Each gage was then hand covered with soil to against"onstruct"on
damage. When construction of the first wall was complete, a circuit tcst M,1
each strain gage was performed through the leadwires. These tests showed a
break in every circuit. This failure was suspected to be in the connection
between the lead wires and the strain gages.
Before the second wall was constructed, modifications to the strain gage
mounting process were made, and the surviral rate of the gages increased
significantly. The modified procedures used for installing the strain gages for
each subsequent test are also detailed in Appendix A.Free-field Pressure GaPes. Three freree-field r-.------e , re placed
within the soil backfill to measure the g,.Cundsh,, in thei &e w1ho,.re rtrstingages were attached to the geogrid. The gages wcre placed diry;"" 'n liN"'
between the explosive source and the wall adjacent to strain gages SI-S3 (Figs.
5.4 and 5.5). These gages were numbered FI-F3.
92
ADA293552
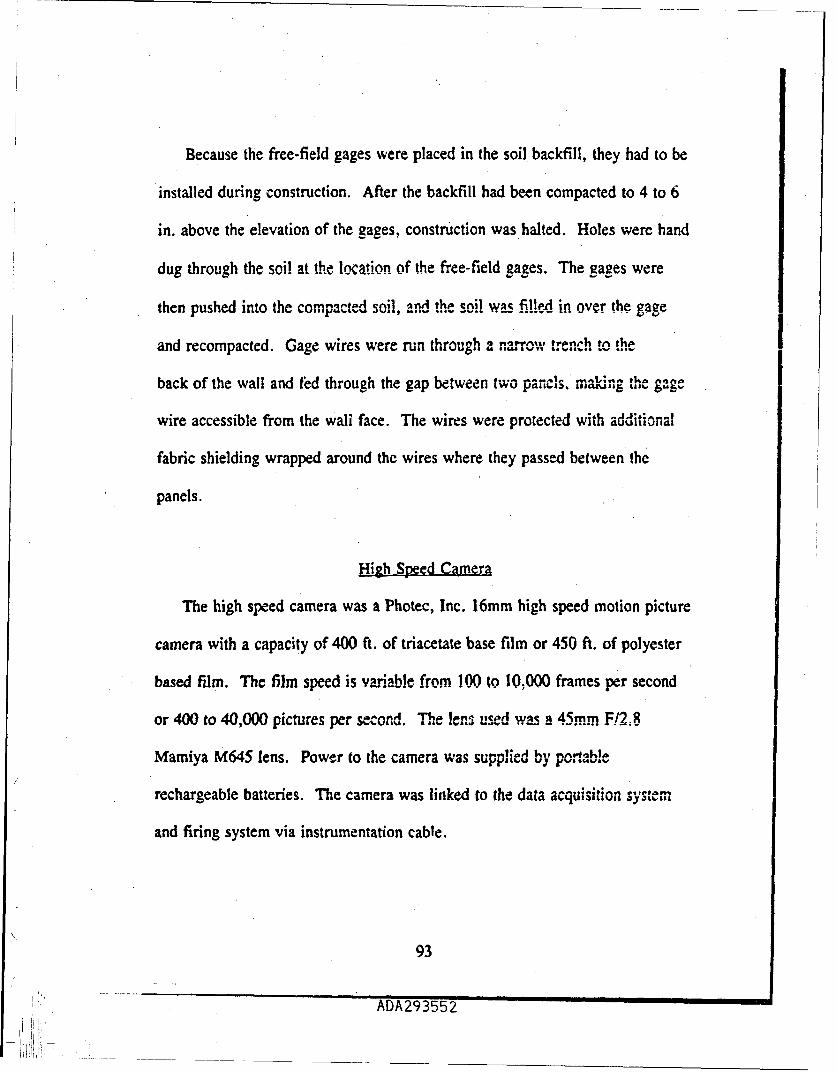
Because the free-field gages were placed in the soil backfill, they had to be
installed during construction. After the backfill had been compacted to 4 to 6
in. above the elevation of the gages, construction was halted. Holes were hand
dug through the soil at the location of the free-field gages. The gages were
then pushed into the compacted Soil, and the sil wa.S filled in nver the gagethen ~ ~ ~ ~ ~ ~ ~ 02 the comact tn! at... p.... ,,
and recompacted. Gage wires were run through a narrow trench to the
back of the wall and Wed through the gap between two pancs,, ,n-akn the bgag
wire accessible from the wali face. The wires were protected with additional
fabric shielding wrapped around the wires where they passed between the
panels.
High Speed Camera
The high speed camera was a Photec, Inc. 16mm high speed motion picture
camera with a capacity of 400 ft. of triacetate base film or 450 ft. of polyester
based film. The film speed is variable from 100 to 10,000 frames per second
or 400 to 40,000 pictures per second. The lens used wa a 45.-m F/2;8
Mamiya M645 lens. Power to the camera was supplied by p,,,•otAble
rechargeable batteries. The camera was linked to the data acquisition system
and firing system via instrumentation cable.
93
ADA293552
-- _____________________________________-___

Reinforced Soil Wall Desigza
With selection of the soil, geosynthetic reinforcement, wall panel type, and
instrumentation complete, the embedment lengths of the reinforcement were
selected using procedures outlined by Christopher. et al (1990). Based on this
design, the maximum embedment length of the geogrid was 8.25 ft., with seven
layers of reinforcement. Tensar Earth Technology, Inc., located in Atlanta. I,
GA was providing the geogrid for this test. To take advant.age of their
expertise in working with Jheir owr ,,,,na-s, ,he, were ini;ed tn ,s,•IwT,,.the
design for this problem. Using the Tensar r_ d ... nfor.., Reai.in, wa!
Analysis program called 'TENSWAL' (Version 3. 1), they recomm.endd a
design embedment length of 12 ft., with nine layers of reinforcement. This
embedment length was shortened on the tapered ends of the wall, and two of
the layers of reinforcement were not embedded into the wall panels. The
overall design is detailed in Fig. 5.3. Although !he TENSWAL design was
more conservative, it was selected for use in this test. Due to the unique nature
of the test, degree of uncertainty, and lack of data on the response of geogrid
reinforced walls to explosive loading, the. conservative design was deemed most
appropriate.
94
ADA293552

Test Wall Comisajin
Standard procedures for the construction of the walls were used for each
wall. Details of the test site and procedures used for fabrication of the wall
panels, leveling pad and wall construction are detailed in Arpendx B.
During construction of each wall, soil densihy and moistLre content tests
were performed using a nuclear density gage. A summary of these
measurements is presented in Table 5.2. The standard dcviativn of the unit
weight and water content measurements from Test On--- are incoersistent with the
other tests. This may be due to the extended peri,.., ofe ..,- tt we,.
experienced during construction that may have affected the moisture,,,,,"" and"
unit weight of some lifts. Also, inexperience with constructioa may also be a
cause since Wall One was the first wall constructed by this particular work
crew.
Field unit weights exceed those of the Proctor tests, suggesting the
compactive effort in the field differed from that in the laboratory tests.
95
AFl II i II IYI III

Table 5.2 Summary of Backfill Densities and "14 i"-- Co"ntenIt
Test I Test 2 Test 3 Test 4 Test 5 Test 6
No. of 42 21 21 8 8 33Samples
Average 108.8 pcf 108.0 pcf 108.0 pcf 105.7 prf 105.7 pcf 104.9 pcf
Unit Wgt.
StandardDeviation 5.1 2.0 2.0 2.4 2.4 2.4
Average 11.3 % 9.6% 9.6% 7.51 7.5% 4.4%Water%•
StandardDeviation 6. I 0.9 0.9 0.9 0.9 0.9
Note: ydyJ.-M = 101.8 pcf woC,..um= 11.3%
96
ADA293552

CHAPTER VI
TEST DATA AND DATA REDUCTION
Introduction
A total of six full-scale explosive tests were conducted on four geogrid
reinforced soil walls between February 17th and August 4th, 1993. Figure 6.1
shows a typical test wall. This chapter includes a summary of test design
parameters, instrumentation types, success of data collection efforts, all
collected test data and test observations, and initial data reduction. Test data
are summarized in tables and individual time history plots of gage recordings
are presented in the Appendix C.
Overview of Test Parameters
The only variations in the constructed walls were the weapon standoff
distance and reinforcement stiffness as summarized in Table 6.1. The standoff
distance is also identified by the variable x, which is also used in Figure 6.2 to
show the weapon location for each test. The final overall condition of the wall,
or residual condition, is identified under the result column of Table 6.1.
97
ADA293552

rex ...
U3AC<Si. t
C4 .4� /
*�'�-' ict
I 'S
4 N' 449j 7,�?5't 1 a
N C
'L?
�' fl�Ct1
£� a...N.&�4M�' � 4 tC( *ka.�,., iv"-trw
PV -,
'�' .4 a.Ai'
½ 'ZNCu'-I,.- N
C '�'1V 4jst<� %4 �4 ½
$ N':Jijit�
ADA293552

Table 6.1 Test Summary
TEST NUMBER GEOGRID WEAPON RESULTSTANDOFF (X)
WALL ONE 1 UX1400HT 20 ft. WALL FAILED
WALL TWO 2 UXI400HT 30 ft. WALL SURVIVED
WALL TWO 3 UXI400HT 25 At. WALL FAILED
WALL THREE 4 LrXIS00HT 30 ft. WALL SURVIVED
WALL THREE 5 UXIS00HT 25 ft. WALL SURVIVED
WALL FOUR 6 UXI.'S00HT 20 ft. I PANEL FAILED
2g.s" Ix
______________________X *Standoff
Distance0 *weapon5Location
is't
Figure 6.2 Plan and Profile of Weapon Location
99
ADA293552

Overall Instrumentation Success
Wall panel accelerations, soil/panel interface pressures, geogrid strains and
free-field soil pressure gages were used in each test as detailed in Chapter V.
Table 6.2 summarizes, for each test and gage, which gages were finctional
during the tests and if usable data was obtained. A blank cell in Table 6.2
indicates the gage did not work, X denotes gage worked, and X* denotes gage
worked but, in the author's judgoement the data was invalid. Th. prefix
designations are as follows:
F = Free-field Pressure Gage A = Accelerometer
S = Strain Gage P = Soil Pressure Interface Gage
After construction of the first wall, and prior to testing, a check of the
wires leading to each of the twelve strain gages determined each circuit was
broken. Therefore, no strain measurements could be. taken during this test.
These failures were attributed to construction damage and strain gage
installation procedures for subsequent tests were changed as discussed in
Appendix A.
The difference between the number of strain gages that survived
construction and the number of gages that provid•ed ushl. data canonot be-
completely accounted for. However, two possible reasons for this difference
are proposed. First, there may have been an error in the programming of the
data recording system that created an incompatibility between the output of the
100
ADA293552

Table 6.2 Summary of Gage Operability, All Tests
Test 1 Test 2 Test 3 Test 4 Test 5 Test 6
P1 X* X X X X X
P2 X X* x X X _____
P3 X X X x X _____
P4 X X x x x X
PS X X X X X X*
P6 X x X X X ___
Al X X x X X*
A42 x X X X x ___*_
A43 X X X X x X
A4 X X X X x X*
AS X x x x x _____
A6 X X* X X x ____
F1 X* X* X X _____ _____
F2 x X X X X X
F3 X X* X* X X X*
SI X* Xe x X Xe
S2 X* X* X X X
53 XC X0 xX
S4 X* X* X x ____
55_____ X* X X X
S6 __ _ _ _ X* X ______
S7 X X X _____ _ _ _
S8 X X X X Xe.
S9 __ __ _ X X _ __ _ __ _
S10 X* X Xe
S11 x x x x
S12 ýX x X X
101
ADA293552

gage and the recording system. This should not be a pruoblem., but isa potental
source of error. Another reason may be complete or partial debonding of the
strain gage from the geogrid. In this case, the gage would measure a .;.aplete
circuit with the appropriate resistance when tested, however it would not
measure any geogrid strain.
The number of strain gages providing usable data improved dramatically in
Tests 4 and 5. This may be due to two factors: 1) improvement in gage
installation quality with experience; and 2) the. stiffer UX 15001.T geogrid
used in Tests 4 and 5 did not flex ma ,,uch ac the UTT t1nT. A .- re
flexible geogrid may be more prone to separate from, th.ta, gage, S uriV n
installation and handling yet still test as a complete circuit. Also, increadsing
geogrid flexibility may increase its tendency to distort during installation, and
the electrical connections to the strain gages may have broken under this
movement.
In either case, careful handling of geogrid mounted with strain gages during
installation and construction is important, as is becoming familiar and
competent in the procedures of properly installing strain gages on geogrid. In
the case of this test, the strain gage installation procedures resulted in an
improvement from 0 percent g.e surviv.a . to ever. percent Page purvival.
In almost every case, the gages that collected unu,,sable d.ta recored, I
haphazard arrangement of lines that were clearly distinct from the oth"- ... E..
102
ADA293552

Only two gages that collected unusable data, F1 fro-m Test I and F3 from Test
2, recorded clean plots. However, the magnitude of the peak pressures were so
great that the data was not considered valid. In Test 6, no usable data was
collected due to a major system error in the data recorder.
Test Data
Figures 6.3 through 6.6 show typ;ical 'dat•a p.lot f,,.r ncce-lration, soi'!panel
interface pressure, free-field pressure, and gelogrid stra-." The data collecteG
from Tests I through 5 is summarized in Tables 6.3 through 6.8, re..pe .+p...I..
Table 6.3 summarizes the average of the wavespeed measurements in each test.
These wavespeeds were used in the Drake-Little equation to predict ground
shock pressures at all gage locations within the backfill (Chapter VII).
Table 6.3 Summary of Average Wavespeeds
Test 1 Test 2 Test 3 Test 4 Test 5 Test 6
Average 1065.8 1000.4 935.3 1084.7 935.6 No DataWavespeed
(ft/sec)
StandardDeviation 131.1 132.2 126.1 181.7 171.6 No Data
(ft/sec)L
103
ADA293552

* I____ I ____ i____ ____ ____ ____ Lao
I _____ _____ _____
N
I 1�
I.0
I I11)I. ____ __
___ ________ ____ I._____ - -� 0 * -
I q. -�Cu* I.* U
i *�* �__ __ ____ __ oj
___ ___ -4-
I * I________________ _______ ___ ___I I..-
* I____ __ __ I -
* I *
ii I j I
I � ______ I ______________ 1**TI I
i I I ____
I I 1.I * I
('.5) NOLV�3I3�V
_______ _______ 0
ADA293552

CI.
__ I ___
_____ I _____ __________
I I 0U
I. '16
U_______ ____ __ U
Y U- ,�
t ar�
IaiLl Ol�*; *5
I U
I:F-..
C
I..
____* : i�___ __ ii
-*------*--, -- C
* I -� I -
* I I
i-v o i-v
(wd) 3�flSS3�3d
ADA293552

2I II I
_______ ________ '1 ______ ______________I4A
__ __ I__ __
_____ _____ _____ C
Ii I'I
T -�
I I? -�
_____ ___ Li U. 4
_____ aft- OG
.1I I
___ ___ .1. ___ ___ ___
I I____________ I ____________ _________________________
0 0 S S q.
(1sd) �flSS�b�d
ADA 29 355 2

N
______ ______ LrI? *�
* aU) N0w *� -
UF
C I -
(9o-�) NiV�±S
ADA293552.
- �

Table 6.4 Wall One, Test One Data
Gage Distance Peak Arrival WavespeedNumber From Pressure Time (ms) (ftisec)
Explosion (ft) (psi)
PI 20.6 No data No data No data
P2 20.0 4.8 20.7 966.2
P3 20.6 7.2 18.5 1113.5
P4 21.0 3.4 24.0 875.0
P5 21.0 37.9 19.7 1066.0
P6 23.3 2.0 25.0 932.0
F1 17.6 99.5 14.1 1248.2
F2 16.6 174.3 13.0 1276.9
F3 15.9 409.6 12.0 1325.0Gage Distance Peak Arrival Wavespeed
Number 'Flom Acceleration Time (ms) (ftlsec)t ,,, ion (ft) (g s)
Al 20.6 28 21.1 976.3
A2 20.0 40 19.0 1052.6
A3 20.6 90 18.5 1113.5
A4 21.0 26 21.7 967.7
A5 21.0 88 20.4 1029.4
A6 23.3 20 23.8 979.0
108
ADA293552

Table 6.5 Wall Two, Test Two Data
Gage Distance From Peak As-rval WavespoedNumber Explosion (ft) Pressure Time (ms) (ft/..ec)
PI 30.4 7.1 32.9 924.0
P2 30.0 No Data No Data No Data
P3 30.4 2.9 32.6 932.5
P4 30.7 061 39.6 795.3
PS 30.7 1.27 32.7 938.8
P6 32.3 7.0 35.1 920.2
Fl 25 .0 88,520 28.4 880.3
F2 26.0 17.9 25.3 1027.7
F3 27.5 No Data No Data NoData
Ga.e Dibtance From Peak Arrival WavespeedNumber Explosion (ft) Acceleration Time (ms) (fl/sec)
_('s)
At 30.4 20 29.7 1023.6
A2 30.0 6 31.6 949.4
A3 30.4 4.5 32.1 947.0
A4 30.7 15.5 33.2 924.7
AS 30.7 16 33.5 916.4
A6 32.3 No Data No Data No Data
Gage Distahce From Compressive Net Strain Arrival WavespeedNumber Explosion (fi) Strata ()IS) (A.S) Time (ins) (ftlsec)
S1.6. 10 4o Dama NoData NoDus No Data No Data
S7 27;9 4089.3 2434.1 20.7 1347.8
so 27. I 4332.7 4332.7 24.4 1110.7
$9 26.2 2434.1 1849.9 26.2 1000.0
$11 27.5 3991.9 3699.5 23.0 1195,7
5$2 26.6 27748 2774.8 22.7 1171,8
109
.Afl3A9)qt
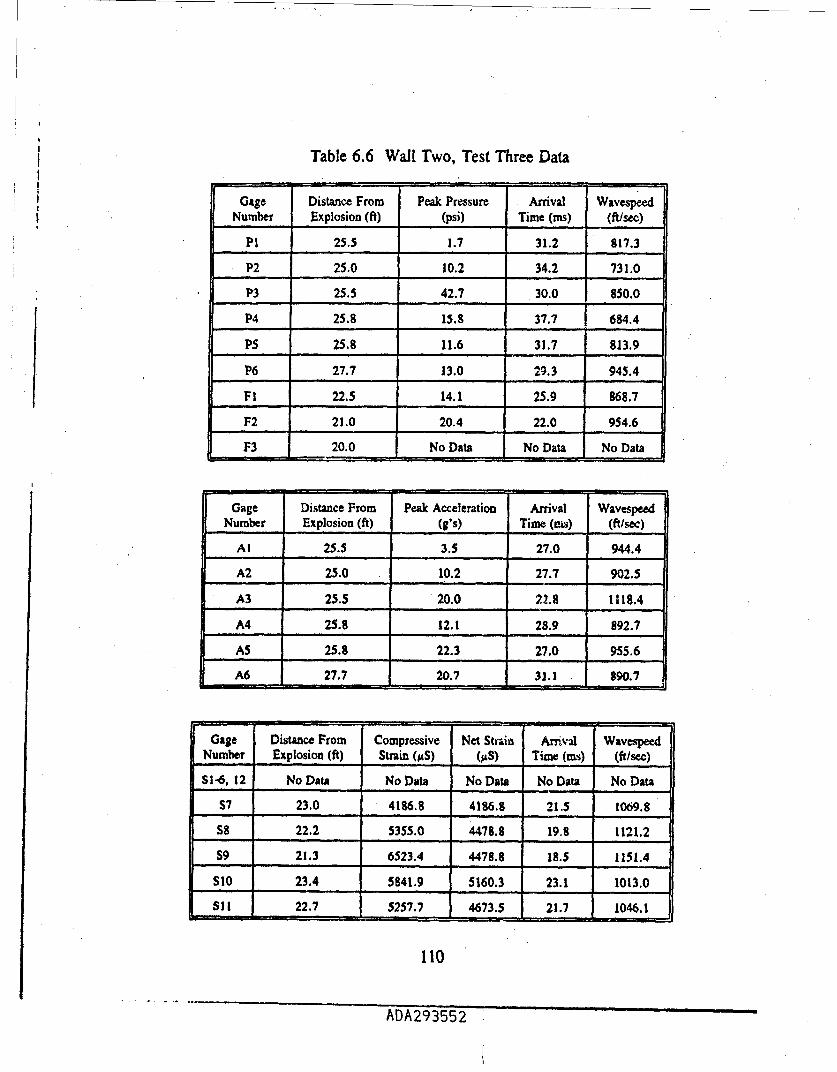
Table 6.6 Wall Two, Test Three Data
Gage Distance From Peak Pressure Arrival WavespeedNumber Explosion (ft) (psi) Time (ms) (ft/sec)
P1 25.5 1.7 31.2 817.3
P2 25.0 10.2 34.2 731.0
P3 25.5 42.7 30.0 850.0
P4 25.8 15.8 37.7 684.4
PS 25.8 11.6 31.7 813.9
P6 27.7 13.0 29.3 945.4
F1 22.5 14.1 25.9 868.7
F2 21.0 20.4 22.0 954.6
F3 20.0 No Data No Data No Data
Gage Distance From Peak Acceleration Arrival Wavespeed
Number Explosion (ft) (g's) Time (wa) (ft/sec)
Al 25.5 3.5 27.0 944.4
A2 25.0 10.2 27.7 902.5
A3 25.5 20.0 2"2.8 1118.4
A4 25.8 12.1 28.9 892.7
AS 25.8 22.3 27.0 955.6
A6 27.7 20.7 31.1 890.7
Gage Distance From Compressive Net Strain Arrival WavespeedNumber Explosion (ft) Strain (fiS) (AS) Time (ans) (ft/sec)
SI-6, 12 No Data No Data No Data No Data No Data
S7 23.0 4186.8 4186.8 21.5 1069.8
S& 22.2 5355.0 4478.8 19.8 1121.2
S9 21.3 6523.4 4478.8 18.5 1151.4
SIO 23.4 5841.9 5160.3 23.1 1013.0
S I1 22.7 5257.7 4673.5 21.7 1046.1
110
ADA293552

/
/
Table 6.7 Wall Three, Test Four Data
Gage Number Distance From Peak Pressure (psi) Arrival Time WavespeedExplosion (a) (mS) (M'sec)
P1 30.4 1.3 38.0 300.0
P2 30.0 3.6 31.5 952.4
P3 30.4 34.3 31.3 971.3
P4 30.7 6.7 34.7 $84.7 \
PS 30.7 6.9 34.7 884.7
P6 32.3 5.4 33.6 961.3
Fl 27.8 14.1 28.4 978.9
F2 25.6 15.4 25.8 992.2
P3 25.0 21.6 23.9 1046.0
Gage Distance From Compressivt Net StWan Arrival Time WavespeedNumber Explosion (A) Strata (f)S) () S) (1., (f,'ec)
S9-10 No Data No Data No Data No Data No Data
SI 27.8 2190.6 924.9 21.5 1293.0
S2 27.0 3115.7 2142.0 20.3 1330.1
S3 26.1 4284.0 2920.9 13.9 1381.0
S4 27.9 2335.4 1898.6 21.6 1291.7
SS 27.0 2969.3 2M93.0 20.5 1317.
S6 26.2 3894.6 2628.3 20.1 1303.S
S7 23.1 1654.9 1265.4 23.8 1180.7
SS 27.2 2921.2 2142.2 21.7 1253.4
S11 27.6 2433.5 1703.9 21.4 1289.7
S12 26.8 3213.0 2044.7 20.6 1301.0
Gage Number Distance From Peak Acceleration (g's) Arrival Time WavcspcdExplosion (ft) (mm) (ft/sec)
Al 30.4 4.4 32.0 950.0
A2 30.0 9.3 32.2 931.7
A3 30.4 14.6 28.2 107 .0
A4 30.7 13.1 36.0 852.2
AS 30.7 34.9 31.7 968.5
A6 32.3 12.5 35.0 922.9
ADA293552

Table 6.8 Wall Three, Test Five Data
Gage Distance from Peak Pressure Arrival Wavespt-ed
Number Explosion (ft) (psi) Time (ms) (ftlsec)
PI 25.5 2.2 37.0 689.2
P2 25.0 4.8 34.0 735.3
P3 25.5 45.7 26.7 955.1
P4 25.8 2.5 40.4 638.6
P5 25.8 9.0 31.0 832.3
P6 27.7 4.8 37.3 742.6
Fl 22.8 21.5 25.4 897.6
F2 20.6 37.0 23.0 895.6
F3 20.2 49.7 19.2 1047.7
Gage Nunber Distance From Peak Acceleration (g's) Arival Time WavespeedExploslon (ft) (Ma) (Wavc)
At 25.5 16.0 34.3 743.4
A2 25.0 8.4 23.8 168.1
A3 25.5 31.4 24.5 1040.8
A4 25.3 9.1 36.2 712.7
AS 25.8 49.6 28.3 911.7
A6 27.7 12.3 31.2 837.1
OGge Diutanca From Compressive Tenaile Strain Net Strain Arrival WavcipeedNumber ExploSaon (ft) Strin (US) (,US) (.S) Time (ms) (Wxc)
S6-7,9-10 No Data No Data No Data No Data No Data No Data
$1 22.8 2823.1 7107.5 .37617 20.2 1128.7
S2 22.0 5647.2 0 3213.1 98.5 1189.2
S3 21.1 4673.5 0 4673.5 17.4 1212.7
S4 22.9 4235.4 6036.6 -16.$.5 20.5 1117.1
35 20.0 584.2 376.3 0 22.1 905.0
So 22.3 4868.2 0 3213.0 19.3 1155.4
SI1 22.8 4040.6 0 2395.4 20.4 1117.7
S12 22.0 3310.4 0 2142.0 20.0 1100.0
112
ADA293552

High Speed Film
All tests were filmed with a high speed camera as discussed in Chapter V.
The film from Test 1 was overexposed, and therefore only video recordings of
the test were obtained. The Test 1 high speed film was overexposed due to achange in the natural lighting betwePn the time the camera settings were made
and detonation. Setting of the camera apertre had to be completed , efo•re final
arming of the weapon, and in this case some cloud cover., 1 r cl ....toedn
test event.
Review of the high speed film from Tests 2 through 5, in concert wit' a
review of the other test data lead to an interesting discovery. The information
presented from previous full and model-scale tests suggests wall displacements
were caused by the blast pressure wave. Based on an assumed soil wavespeed
of 1000 ft/sec, it was anticipated the pressure wave data would be collected
starting at 20 to 30 milliseconds after detonation, depending upon standoff
distance. Therefore, the data recording system was set to receive data for 105
ms after detonation, providing a factor of safety of three to four for receiving
the pressure wave data. Gage data collec•.a oted ,shows p,,,.urp., arAlpratinnm and
strains all being received in that time span and the gage readings retun .o.zero
before the data recorders shut down. Based on the data collected and post-test
visual observations, the residual wall displacements were assumed to have been
113
ADA293552

caused by the pressure wave. However, the high speed film proves that
assumption to be incorrect.
When viewing the high speed film, a timing light flashes on the screen
every millisecond. Careful review of the film from Tests 2 through 5 and
observation of the timing light, it was noted that even after 100 milliseconds no
observable wall motion had taken ,iaC... Even though the. pressure wave had
passed and the wall panel accelerations ,er as lage a, 90 o', wall mtionn
was not evident. It was not until more than 200 m'lliSeCon. s after deto,,nt.at;in
that wall motion began. This simple observation leads the author to suggest
that two loading mechanisms act on the wall from an explosion.
The first loading mechanism is suggested to be the pressure wave generated
by the explosion in the backfill. The second is the pressure caused by the
expanding cavity or cratering of the soil. This cavity expansion can be thought
of as a crater formed in two directions, vertical and lateral. The bombs were
covered with 7.5 ft. of soil, and in the lateral dimension, 20, 25, or 30 ft. of
soil separated the bomb from the wal! face. The cavity expansion pressure
followed the path of least resistance, and therefore the mgiin crater was formed
above the bomb. However, the wall face was close en.o,,,,,h to, the bmbh SCuh
that the cratering forces also impinged on the wall face. Based on post-tes"
observations, the two tests conducted at a 30-ft. standoff distance caused little
114
ADA293552 " ' ", I

deformation of the wall face, so this two dimensional cratering effect was most
pronounced at standoff distances less than 30 ft.
In general terms, the explosive pressure wave moves through the soil at
approximately 1000 ft/sec and impacts the wall. While this is taking place the
explosive crater is still not fully developed. In relative terms the crater
develops slowly (Henrych, 1979). However, the expanding gases forming the
surface crater also displace the soi! in the lateral dirp.ctinn, and this ¢cuses the
soil, geogrid reinforcement and wall , ,,,y,, , ,, m ,,,,.mn, la o..,Therefore, the data presented in this chapter chac•erize t..h= a response of
the test walls to the explosive pressure wave, and the more significant pressure
caused by the expanding gas cavity will be evaluated via scaled test data in
Chapter Vi11. Scaled test data provides an example of the relationship between
acceleration, velocity and displacement, as well as pressure and impulse from
the respective loading mechanisms as shown in Figs. 6.7 and 6.8. As may be
seen from the centrifuge data in Fig. 6.7, initial inertial pressures arrive at
approximately 3 ms after detonation. Since time scales as 1/n in the centrifuge,
at 30 g's this arrival time corresponds to 90 ms at prototype scale. Impulse
pressures increase significantly at 4 to 5 s, which is 120 to 150 rns at
prototype scale. Significant motion of the wall pan"-"l %we • Tobserve.. ,nn the high
speed film at a time of approximately 200 ms after detonation, which..
corresponds well with the centrifuge gage data. This level of agreement
115
ADA293552

U)12 F! ou ~~~- . -...... "-.E',A ..
Uj INR LVV
IL
.2. 0. 2. 4. 0. 8. 10. 1t 14. 16. 18.TIME (msec)
I I IrDETONATION
0 1 I I I
INERTIAL WAVE
LUL sLA ST WAVE! i
-2. 0. 2. 4. 6. 8. Ic. 12. 14. 15. -1.
TIME (msec)
Figure 6.7 Pressure and Impulse From Blast Wave and Inertial Wave Loading,Centrifuge Test Data
116
ADA293552

Iii l 6 t Iz BLAST WAVE 7.INERT[~l WAVE I.IL '
.j I i
.•2. 0. 2. 4. 6. S. 10. 12. 14. '16. Is.TIME (msec)
0 ; . 2. 4. 6. 0. Ia. 12. 14. 16 18
TIME (rmiee)
I___
"w, , ________ * i
U) I _ _ _ _ _ _ _ _ _ _ _ _
•2. 0. 2. 4 S. 8. 10. 12, 14. 16. 16.TIME (msec)
Figure 6.8 Acceleration, Velocity and Displacement From Blast and Inerat Ia 1
Wave, Centrifuge Test Data
117
ADA293552

suggests the scaled data may have measured the response of the walls to the
inertial pressure wave.
Effect of Reinforcement Stiffness
One of the primary objectives of this test series was to evaluate how
changes in geogrid reinforcement stiffness affect wa!l panel displacements.
Prior to testing it was assumed residu-Aal displacements we caued by the
incident pressure wave. After reviewing the U"t data-a-" and high ,-.Asp A.1i1m, iL i-
evident that the movement of the wall panels is caused by the laterdA movement
of the soil during the explosive crater cavity expansion. Since the data were
not collected for a long enough period of time, no data exists to quartify the
change in wall panel displacements as a function of reinforcement stoffness.
Lacking quantitative data, some qualitative observations can be made based
on post-test photographs. Figures 6.9 and 6.10 are post-test photographs of
Tests 2 and 4, respectively. Both walls were tested at 30 ft. explosion standoff
distances, one reinforced with UX 1400HT geogrid (Fig. 6.9), the other with
UX 1500HT geogrid. In both tests, little re•sid•alu displcnrenment was observed.
Figures 6.11 and 6.12 are post-test photographs ,of Te,., 3 'nI d,
respectively. Both were tested at a weapon standoff of 25 ft. The wall
reinforced with the UX 1400HT (Fig. 6.11) geogrid completely failed and only
118
ADA293552
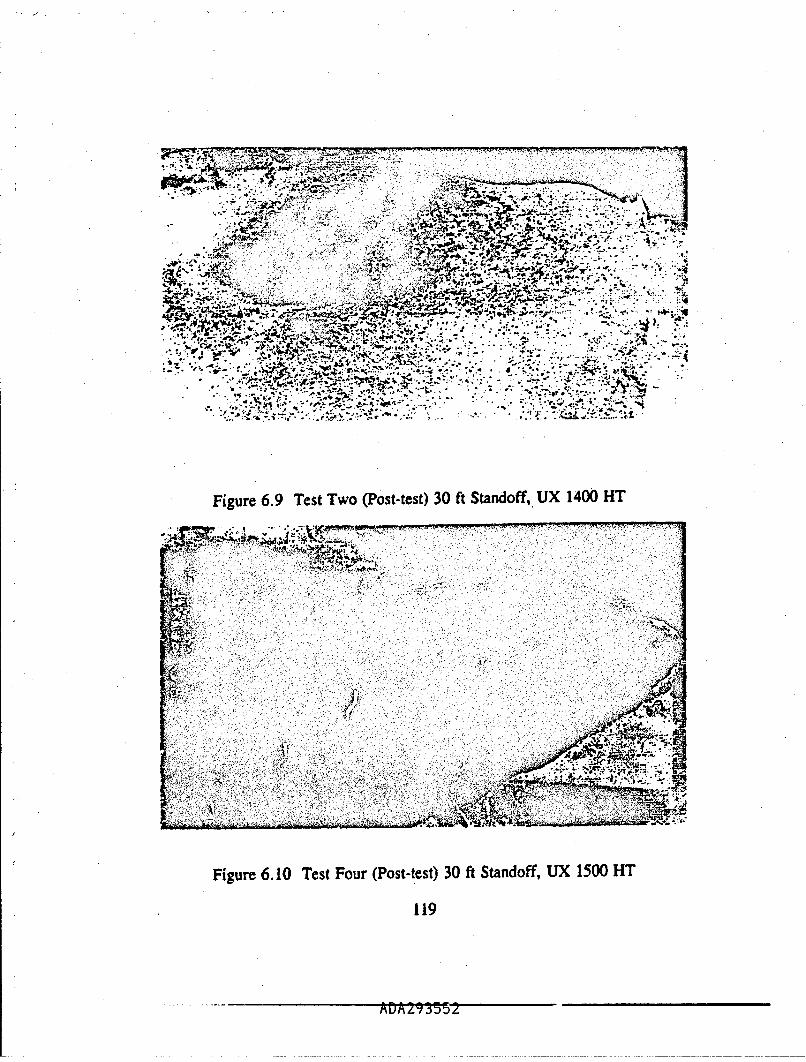
*~~~~o c%%tW.~ .- ~
.4-:
m~li
{ < b--S
Figue 6.10 est our Pos-tes)30ft t andff .r 1500 HT
~.- m~iC<.. tir~7 ..119a
*.j',-;$"k, D - .* *

A -
~%WtvbRi#~ 9, A
'r
Figure 6.11 Test Thre (Post-test) 25 ft Standoff, UX 1400 HT
-r tn
4.20
ADA293552

portions of the wing walls remained standing. At the same standoff distance,
the wall reinforced with the UX 1500HT geogrid remained standing, although
lateral displacements of Panel One were observed to be approximately one ft.
Figurcs 6.13 and 6.14 show post-test photographs for Tests 1 and 6,
respectively. At a standoff distance of 20 ft, the wall reinforced with UX
1400HT geogrid (Fig. 6.13) failed. The wing wails remained in place, but the
center section was completely failed. With the, UX l5•5'00HT ,,o,,,., ,,nly? one,
wall panel failed. Panel One failed when the top layer of ge....d lst its
confining soil. The lower layer of geogrid remained in place, so the panel
rotated 180 degrees and came to rest face to face with Panel Two, hanging by
one layer of geogrid.
Based on these observations, the hypothesis that wall panel displacement is
reduced when geogrid stiffness is increased, all other factors being equal, is
qualitatively shown to be valid.
Ground Shock Coupling Factor
The preceding sections have summarized all meassurements made dufring this
test series. Other necessary data necessary for data analysi;c ;,includ, the. oroiund
shock coupling factor and charge weight.
121
ADA293552

F &¶, .it't
-j
t o. :v r;rit
J-0W
Fiur 6.3Ts9nPs-et 2 tSadfU 40H
.........A4~
Ott $
Figure 6.13 Test One (Post-test) 20 ft Standoff, UX 1400 HT
122

The magnitude of ground motions and stresses initiated by an explosion is
enhanced as the weapon penetrates more deeply into the soil. The coupling
factor f is defined as the ratio of the ground shock magnitude from a partially
buried or shallow-buried weapon (near surface burst), to that from a filly
buried weapon (contained burst) in the s•a;.c mediuvm. (Drake, etal, 1989).
This parameter is used as a reduction factor applied to grOu.d shock for a
contained detonation to account for the effect, of a shallow weapon detonation
depth. Figure 6.15 shows the ground shock coupling factor as a function of
scaled depth of explosion for air, soil and concrete.. For this test series, the
depth of explosion (d) is 7.5 ft. and the weight of charge (W) is 192 lbs. From
Fig. 6.15 this yields a ground shock coupling factor of 0.99 for all tests, or that
the maximum ground shock magnitude will be generated. In Chapter VII both
the charge weight and ground shock coupling factor will be necessary for the
estimation of free-field soil pressures.
Failure Mrs.ktsms
In Tests I and 3, complete failure of numerous wall pancis was obser;ed,
but geogrid rupture was not observed in either test. The soil, geogrid and wall
panels all appeared to move as one unit under the influence of the cavity
expansion pressure. However, as shown in the post-test photographs, the wall
123
An A )r )Q

panels exhibited differential lateral displacement relative to Von anoth,,er. In
each of the cases where failure was observed, the panels at the base of the wall
(especially Panel Three) moved outward. The panels above the lower panels
did not move out as much, and the upper panels to lose their underlying
support. The backfill began to spill out, causing the geogrid to lose its
confining soil and, in concert with the loss of support from the lower panels,
caused failure of the walls. Furthers detail on loading and failure mechanisms
are discussed in Chapter VIII.
100
oAIR
"".4
0
oC IoEý
I , ,0-o o 0.2 0 .4 ,.6 o o . L4
SCALED DEPTH OF BURST, d/VWV. OtItlb"VS
Figure 6.15 Ground Shock Coupling Factor as a Function of Scaled Depth ofBurst for Air, Soil and Concrete (Drake, et al, 1989)
124
ADDA293552

/
Data-Reduction
From the data obtained in this test seri,• , the wall pnanel v 1oelot.q..
displacements and impulses will be established for ..,re k -•L, pressues.-.,.,
Free-field pressure data are used to determine the attenuation coeffcient Of th1"
backfill soil, which in turn is applied to calculate the free-field pressure
environment at any point in the retained backfill. These data are then reviewed
for consistency and to determine if any unique relationships exist between any
of the categories of data. Following that initial investigation, these data are
applied in Chapter VII toward the validation of an equation of motion for the
walls in this test series.
Wall Panel Peak Velocities and Dispnlacements
In each test the acceleration as a fun,,io,, o e crde-A for siY wail
panels. Acceleration data were recorded for approximately 100 mis, capturing
panel acceleration caused by the pressure wave. Initial wall panel acceleration
occurred between 18.5 to 36 ms after detonation, depending upon weapon
standoff distance and soil wavespeed, and typically returned to zero within
approximately 15 ms after the initial arrival. Through integration of this
portion of the curve, maximum panel velocity is obtained. Maximum velocity
occurs when the acceleration returns to zero: therefore peak acceleration and
125
ADA293552

maximum velocity do not occur simultaneously. Double integration of the
acceleration curve yields an estimation of wall panel displacement from the
blast pressure wave. The integrations were performed using the computer
program DPLOT/W (Hyde, undated), and are summarized in Table 6.9.
Displacement values are very small, but are consistent and within an order
of magnitude of each other. Double integration of acceleration provides
approximate displacements but their very,,..ll ,h,._ ,",•,,t..failure. was not
a result of the blast pressure wave loading. These dpaIceme.nts,*,,,c w r#e alsn tnn
small to be observed from the high speed film.
"Panel Impulse Loads
Soil pressure interface gages measured the transmitted stress to Panels No.
1-6 for each of the tests. The panel numbering was detailed in Fig. 5.3. The
area under the pressure time history curve is defined as impulse, and Table
6.10 shows the results of the integration of each soil interface pressure curve.
Determination of impulse allows for consideration of both load amplitude and
duration. Since it appears the free-field blast pre ssre wave caused only
minimal displacements of the wall panels, the inerface stress vs,,,es will not be
used in subsequent analysis.
126
ADA293b52 - -

Table 6.9 Peak Panel Accelerations, Velocities, and Displacements, All Tests
Test Number Gage Number Peak Acceleration Velocity Displacement (in)_(a') (fsec)
1 Al 28 0.172 0.017
A .) 40 0.0727 0.007
1 A3 90 0.2087 0.0053
A4 26 0.1319 0.0073
1 AS 88 0.1390 0.003
1 A6 20 0.0537 0.0016
2 Al 20 0.1092 0.0082
2 A2 6 0.0419 0.0046
2 A3 4.5 0.0174 0.0005
2 A4 15.8 0.0747 0.0048
2 A5 16 0.0675 0.0053
3 At 3.5 0.0088 0.0015
3 A2 10.2 0.1006 0.0088
3 A3 20.0 0.0839 0.0010
3 A4 12.1 0.0711 0.0039
3 AS 22.3 0.1127 0.0078
3 A6 20.7 0.0892 0.0044
4 At 4.4 0.0363 0.0005
4 A2 9.3 0.0589 0.0037
4 A3 15.1 0.0930 0.0074
4 A4 13.1 0.0872 0.0056
4 AS 34.9 0.2108 0.0123
4 A6 12.5 0.0664 0.0045
5 At 16 0.0402 0.0247
5 A2 8.4 0.0650 0.0244
5 AS 31.4 0.1369 0.0158
S A4 9.1 0.0504 0.0245
S AS 49.6 0.1889 0.0068
S A6 12.3 0.0504 0.0056
127
ADA293552

Table 6.10 Summary of Interface Pressure and Impulse
Test Number Gage Number Peak Pressure Impulse(psi) (psi-sec)
1 P2 4.8 0.0125
1 P3 7.2 0.0161
1 P4 3.4 O.00u9
1 P5 37.9 0.0910
2 P1 7.1 0.0235
2 P3 2.9 0.0106
2 P4 0.61 0.0018
2 P6 7.0 0.0234
3 P1 1.7 0.0126
3 P2 10.2 0.0466
3 P3 42.7 0.3310
3 P4 15.8 0.0502
3 P5 11.6 0.0485
3 P6 13,0 0.0927
4 P1 1.3 0,0162
4 P2 8.6 0.0454
4 P3 34.3 0.1613
4 P4 6.7 0.0368
4 PS 6.9 0.0206
4 P6 5.4 0.0217
5 P1 2.2 0.029
5 P2 4.8 0.0217
5 P3 45.7 0.2891
5 P4 2.5 0.0088
5 P5 9.0 0.0334
5 P6 4.8 0.0138
128
ADA293552

-.o
Prediction of Compressive Wave Stress Within the Retained Backfill
Because there was a limit on the total number of gages that could be used
in each te-, free-field pressure measurements could not be made at every wall
panel or at every strain gage location. The following sections will present how
free-field pressures may be estimated at any point in the soil backfill. In each
test, three free-field gages measured the stress-history of the compressive wave
in the backfill. These measureme•nts will ho ,usd to backca..c!late. soil
compressive wave speed and the atteu"atilon" ceffiie,, (n, i•a Eq. 2.1.(n O-
the attenuation coefficient is established for cat-h test,, it will b , U3,d iA .
with the average wavespeed from all gage measurements to estimate free-fiel• •
pressure at c wch free-field pressure gage location. These ca!'.ulated and
measured values of free-field pressure will be compared to establish the
viability of this method for free-field stress predictions. Equation 2.1 will then
be used to predict free-field pressures at every instrumented panel and strain
gage location.
Attenuation Coefficient
The Drake-Little equation (Eq. 27.1) can be u-sed t• establish the. attenuation
coefficient for the soil in each test. Equation 2.1 can be re-arrangOe in the
following manner to determine the attenuation coefficient (n):
129
ADA293552
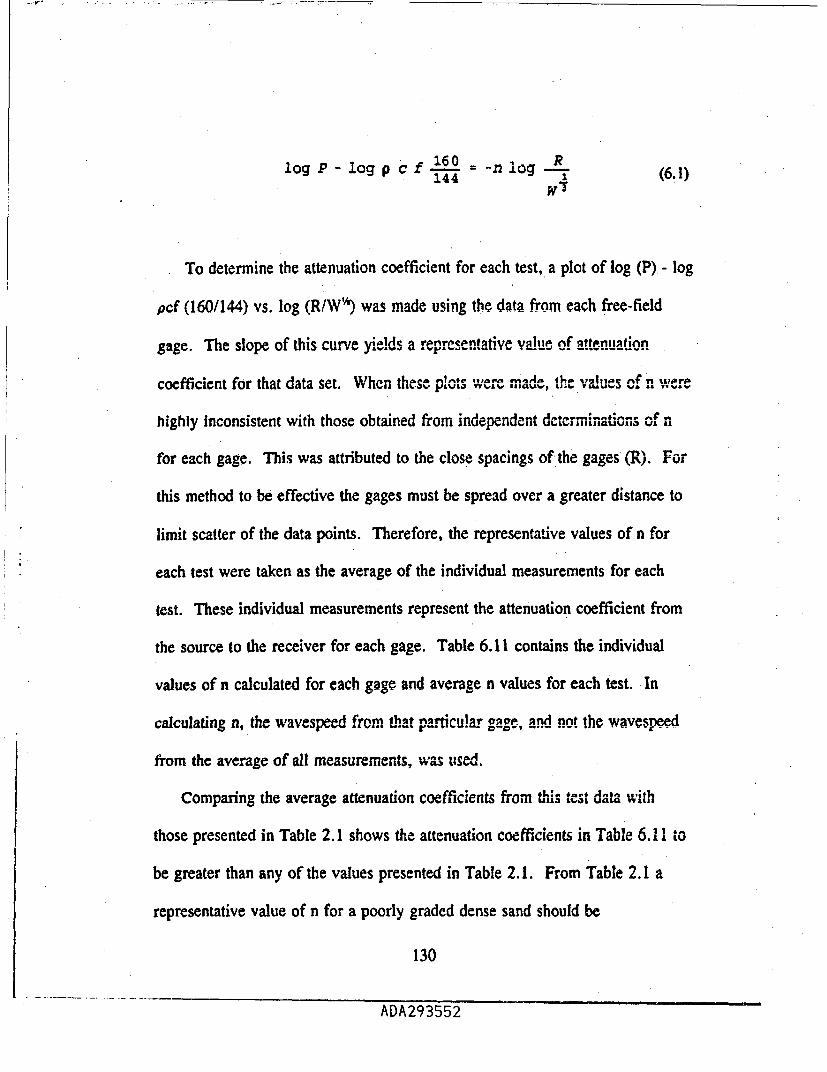
1ogP- logp cff 160 _-nLog (6.1)144' " 61
To determine the attenuation coefficient for each test, a plot of log (P) - log
pcf (160/144) vs. log (R!W'*) was made using the data from each free-field
gage. The slope of this curve yields a representative wha.e nVf ttenulation
coefficient for that data set. When these ph-"" were m,..ade,,U.,, he, v..alu of n were
highly inconsistent with those obtained from independent determinations of n
for each gage. This was attributed to the close spacings of the gages (R). For
this method to be effective the gages must be spread over a greater distance to
limit scatter of the data points. Therefore, the representative values of n for
"each test were taken as the average of the individual measurements for each
test. These individual measurements represent the attenuation coefficient from
the source to the receiver for each gage. Table 6.11 contains the individual
values of n calculated for each gage and average n values for each test. In
calculating n, the wavespeed from Lhat pnarticlar gage, and not the. wavesrpe.d
from the average of all measurements, was used.
Comparing the average attenuation coefficients from this test data with
those presented in Table 2.1 shows the attenuation coefficients in Table 6.1 1 to
be greater than any of the values presented in Table 2.1. From Table 2.1 a
representative value of n for a poorly graded dense sand should be
130
ADA293552

Table 6.11 Attenuation Coefficients
Test FI (psi) F2 (psi) F3 (psi) nI n2 03 Average a
1 99.5 174.3 No Data 3.45 3.13 No Data 3.29
2 No Data 17.9 No Data No Data 3.56 No Data 3.56
3 14.1 20.4 No Data 3.99 3.99 No Data 3.99
4 14.1 15.4 21.6 3.51 3.66 3.52 3.56
5 21.5 37.0 49.7 3.65 3.55 3.48 3.56
approximately 2.5 - 2.75, compared to values of 3.29 - 3.99 obtained from this
test data. This was also noted by Olen, et al (1993) who identified two possible
reasons for this difference. First, was the prse.nce of tht. silt fraction of the
Sky X sand, although the small percent of fines wouldin .,^, no be,,,,.ctedA Io makeo
that large a difference. A second reason was based upon observations of te
Sky X sand under a scanning electron microscope (SEM). The sand particles
were coated by a non-quartz (possibly organic) coating that would reduce the
interparticle friction and increase attenuation in this soil. Therefore, the n
values presented in Table 6.11 are considered valid. As previously stated in
this report, using n values from Table 2.1 in the Drake-Little equation only
provides an order of magnitude estimation of free-field pressure due to the
131
ADA293552

difficulty in estimating n. To increase the accuracy of the equation, field
measured values of n are necessary.
Predicted Versus Measured Free-Field Pressure
With the attenuation coefficient for each test thus established, Eq. 2.1 was
used- to predict the peak free-field soil pressure at each free-field gage location.
In the previous section, specific values ofc and n were intaMisheld for acrh
free-field gage. In this section, thIe aV'rage 1111e,,,,,-p,,c fr all Mer•,c,,,mente
as summarized in Table 6.3 and the average In values. fr.o,,m, Table 6.11 w i .I "L,
used to predict free-field pressure. A summary of these cWulati"n. is shown
in Table 6.12, and Fig. 6.16 presents a plot of calculated vs. measured free-
field pressures. This was done to evaluate how well free-field pressures
calculated using average c and n values in Eq. 2.1 varied from using values
specific to that gage. These calculations provide an indication of how well the
equation predicts free-field blast compressive stresses at any point in the soil
mass. From these data, the standard error of the estimated free-field pressure
is 8.5 psi. The range of values of the calculated free-feld stress was
132
ADA293552

Table 6.12 Free-field Pressures, Predicted and Measured
Test Gage C p (lb- R (ft) n Calculated Measured(ft/sec) sec2/ft) Free-field Free-field
Pressure Pressure(psi)(psi)
1 F2 1065.8 3.379 17.6 3.29 101.0 99.5
I F3' 1065.8 3.379 16.6 3.29 122.4 174.3
2 F2 1000.4 3.354 26.0 3.56 17.4 17.9
3 Fl 935.3 3.354 22.5 3.99 15.1 14.1
3 F2 935.3 3.354 21.0 3.99 19.9 20.4
4 FI 1084.7 3.283 27.8 3.56 14.5 14.1
4 F2 1084.7 3.283 25.6 3.56 19.5 15.4
4 F3 1084.7 3.283 25.0 3.56 21.2 21.6
5 Fl 935.6 3.283 22.8 3.56 25.4 21.5
5 F2 935.6 3.283 20.6 3.56 36.4 37.0
5 F3 935.6 3.283 20.0 3.56 40.4 49.7
14.1 - 174.3 psi. If the data from Test l, gage F3 is eliminated from the data
set, the standard error is reduced to 3.8 psi. Based on this agreement between
calculated and measured pressures, the average n and c values from each test
can be used in Eq. 2.1 to predict free-field stresses within any point within the
soil mass.
133
ý,ADA293552

UL
U.S
0 U..
IL'O
w4
co co v co co I
osdSw 0nSdG3438 ~vnDV
ADA29355

Estimation of Free-Field Stresses
The measurements obtained in these tests quantified the response of the wall
and geogrid to the free field blast pressures. Pressures will be estimated via
Eq. 2.1 and then related to the measured strains, accelerations, velocities and
displacements. Values of c, p, and n are given in Table 6,!2, and the R
distance for each gage is listed in Tables 6.4 through 6.8.
Free-Field Pressure at Gage Locations
Table 6.13 lists the calculated free-field pressures at the center of each
instrumented wall panel, corresponding to the locations of both the soil
interface pressure gages and accelerometers. Table 6.14 lists the calculated
free-field pressures at each strain gage location, and Fig. 6.17 presents a plot of
peak stress vs. geogrid strain. It was initially anticipated that free-field
pressures at each panel could be related to other test measurements. These
analysis yielded no direct relationship between the values in Table 6.13 and
individual test measurements of interface stress and acceleration.
As was observed in the scaled tests, the magnitud, of the- individjal pre.s.ure
and acceleration measurements did not show any obcr•"'aable trends Wfid.ithi. A
test. For instance, in Test 2 the panel furthest from the detonation recorded
pressure in excess or equal to all other panels within that test. Acceleration
measurements also followed the same type of scatter. As expected, when
135

weapon standoff distance decreased (all other factors being equal) measured
pressure and acceleration tended to increase. This being the case, a more
fundamental approach to relating test data to measured response was required,
as will be discussed in Chapter VIII.
Table 6.13 Calculated Peak Free Field Pressures (in psi) at the Centerof Each Instrumented Panel
Panel Test I Test 2 Tea 3 Test 4 Test 3
1 60.2 10.0 9.2 1 10.6 17.0
2 66.3 10.4 9.9 11.1 18.3
3 60.2 10.0 9.2 10.6 17.0
4 56.5 9.6 8.8 10.2 16.3
5 56.5 9.6 8.8 10.2 16.3
6 40.1 8.0 6.6 8.5 12.7
136
ADA293552

Table 6.14 Calcu!ated Free-Field Pressures at Each Strain Gage Locationand Peak Compressive Strain
Test Gage Calculated Free-field Compressive Strain
Pressue (Poi) (,a S'Ttin)
2 S7 13.4089.3
S 58 150 4132,7
2 S9 16,9 '.434 1
2 S1t 142 3991.9
2 S12 160 27749
3 S7 17,9 41363
3 Si 160 35 50
3 S9 18I 65234
3 S1O 129 5841.9
3 SlI 14 6 5237.7
4 51 14.5 2190,6
a S2 161 3115,7
4 S3 1$,2 428.0
4 $4 143 2385.4
4 S5 16.1 2969 3
4 S6 17.9 38946
4 S7 14.0 16549
4 S8 15 7 2921.2
4 SI1 149 2433.5
4 S12 165 32130
5 St 23.4 .81.3,1
5 S2 73 A 56472
S S3 33 4 4'M5735
3 54 250 421,4
5 is 404 584 2
S S8 t764 0,01*2
1 1 :3.,4 4N4( 6
12 233 3A10 4
137

x x
4..
Pul0 S~ 1IJ3V iio
A"A'0U L

Geogrid Strains
The motivation for measuring strains on the geogrid was the assumption
that tensile strains in the geogrid would be observed and then related to the
movement of the wall panels, However, as discussed previously, data
collection had ceased by the time significant wall panel motion occurred.
Therefore, with two exceptions, only ,.--opressive strain ws .rra-nrd as the
compression wave moved through the backfill. Th.;,,4imat f.,efi.!, bl•t
pressure was determined for each gage location, but the actual stress appli to,,
the geogrid is unknown. The level of uncertainty in establishing the stresses
applied to the reinforcement and the confined compressive modulus of the
geogrid present numerous uncertainties that prevent a more detailed evaluation
of the strain gage data. However, a qualitative discussion of the measurements
will be presented based upon the estimated free-field blast pressure and
measured strains. The measurement of compressive strains in the geogrids
confirms the conclusions presented by Bachus, et al. (1993) that the
reinforcement is subjected to compressio, during t. blat wave loading.
The compressive strain of the UX 1500HT geogrid behaves as expected.
As shown in Fig. 6.17, compressive strain increases with increasing fr.e-fiCed
stress. Also, the UX 1500HT grid requires higher levels of free-field stress to
achieve the same compressive strains measured in the UX 1400HT geogrid.
The behavior of the UX 1400HT grid is not as straightforward. Figure 6.17
139
An• Q • iiii i I i I II II

shows that the strain associated with 15 psi free-field stress varies from 2500 -
6500 (E-06). This does not match the expectation that increases in strain
require some commensurate increase in stress.
The strain gage data also exhibits some scatter, and this may be attributed
to the effects of placement and compaction of the soil around the area of the
reinforcement that was instrumented, After compaction of the backfill, each
portion of geogrid mounted with a str,', gae may nt be .n the sam. initial
orientation. This may cause the geogrid to flie., U,,Ard r , dAnw ard,,. in
addition to some twisting of the geogrid. The strain response Of tOe ,geoi•d,..;,
could be affected by the initial position of the grid in relation to the location of
the explosion.
Of the 28 strain gage recordings made in four tests, only three gages
recorded any tensile strain, and only two gages of these recorded any net tensile
strain. All tensile strains were recorded during Test 5, and the magnitude of
the tensile strains were not directly related to position or free-field stress level.
No clear rationale for this observation can be made based on either the test
measurements or observations.
Strain of UX 1400HT Geogrid. Relating t,.he pneA;dte,,d free-field prir•.
to the geogrid strains assumes that the direction or orientation of the loma (i.e.
pressure wave), with respect to each gage, is the same for all strain gages.
Figure 5.4 shows the position of the strain gages in relation to the explosion.
140
AflA29qq'

In Test 2 (standoff distance = 30 ft) strain measurements were obtained from
gages $7-$9 and Si 1-S12, in Test 3 (standoff distance = 25 ft), gages $7-51.
All of these gages are on the layer of grid that is not directly between the
explosion and the wall. Rather, the position of these gages is such that the
free-field pressure impinges the ges"abc at, som.e anal.- Rr,, , nf thi, the. free,-
field stresses presented in Fig. 6.17 for the UX ,400HT r m1ay be reate,
than the stresses that were applied parallel to the strain gage.
For Test 2, Table 6.14 supports this conclusion. The gages closest to the
detonation recorded lower values of strain than the gages further away. One
potential cause for this is that the gages further away were more in line with the
orientation of the pressure wave. The peak pressures do not vary significantly
because the gages are spaced about 10 in. apart, and the effect of orientation
was gre.ater than the pressure decay over this short distance. An unsuccessful
attempt was made to correct these stresses by calculating the free-field stress
vector parallel to the strain gages. Since the calculated -stresses at each strain
gage were relatively equal, and since the strain g-ages , wer. c.-sely paedn" the
stress vector parallel to each strain gages also remained approximately equa.l.
For Test 3, the stresses presented in Fig. 6.17 may also be greater than the
stresses actually applied parallel to the strain gage. With the exception of one
gage, the strain gage set that recorded data for Test 3 was the same as Test 2.
However, as shown in Table 6.14, the Test 3 strain gages closest to the weapon
141
gl3Agg1qq
recorded the greatest strains. This is the reverse of the trend observed in Test
2. This was the second test of this wall, and the residual displacement caused
by Test 2 may have put the geogrid in tension, and that tension may have
affected the compressive strain response recorded in Test 3.
Strain of UX 1500HT Geogrid. In Test 4 strain gages SI-S8 and S11-S12
recorded data; for Test 5, gages S1-S5, S8, and Si 1-S12. In these tests,
referring to Fig. 5.5, these strain gages are generally located between theexplosion and the wall. Therefore, the pr,,essre ;,, Pg A 14 mv oaknprqllv he
assumed to be representative of the actual pressures thato w "r I parae th
strain gage. For that reason, the data follows the expected tren•o•f incu,•.sing
strain with increasing compressive stress.
Sulmmar
The full-scale test series has generated an extensive data base of
accelerations, pressures, and geogrid strains measuring the response of a
geogrid reinforced soil wall to blast wave pressures. Also, original methods
were developed for installing strain gages on uniaxial geogrid that survives bothconstruction damage and ground shock ,r-essur, The cgnificanre nf the
inertial pressure wave on the response of the waols heas been C,,1.t.-Htv-
established, however these pressures were not measured in the full-sc al" teto.
142
ADA293552

The full-scale test data provides the necessary input to develop a si•,'li:id
model of the response of a reinforced soil wall to pressure wave loading based
on the work of Drake, et al (1987). This model is discussed in Chapter VII.
As an independent test, the scaled test data will also be applied to the model.
This model provides a qualitative methodology for relating how well the scaled
tests model the full-scale tests. The relationship between full and small-scale
test data must be established before the more extensive scaled data base can be
used to evaluate the response of reinforced soil wjt tn inertia! pressures in
Chapter VIII.
143
ADA293552

"CHAPTER VII
MODEL VALIDATION USING FULL AND SMALL-SCALEPRESSURE WAVE DATA
Introduction
The full-scale tests provide extensive data on the response of the walls to
free-field pressures. However, the high speed film indicated that the blast
pressure is not the only loading mechanism acting on the wall, and that other
loading mechanisms may be governing response. Previous empirical research
has been unsatisfactory in describing the loading mechanisms and why specific
design variables affect residual displacements (Ba-zhu:. et al, 1993, Olen, et al,
1993, Eytan and Reid, 1993). Therefore, a more rational approach to
evaluating the load mechanisms and influence of design v..iab!es is nec-ssay_
The yielding wall model proposed by Drake, et aul (119917) andl d;icsedA ;in
Chapter IV appears to provide a good model for the dynamic response of
reinforced soil walls. For consistency, the model, or the framework of the
model, will be used to provide a more complete description of the loading
mechanisms and their relationship with respect to time, and how the properties
144
ADA293552

of the materials considered in the model affect the response of the wall to each
load mechanism.
In this chapter, the yielding wall model will be adapted to reinforced soil
walls to evaluate the stiffness per Lin-it ara of full and m.al!-sca_!e reinforced
soil walls. The consistency of this model wvithin an ;in al;A..1 ti testand from
test to test provides a qualitative method for evalu. air, ting .the v .alidty of2 tkhe mode,,l
for blast pressure wave loading.
Determination of Stiffness Per Unit Area
Numerical Integration
The mass densities of the materials and acceleration and pressure time
histories obtained in the full-scale tests provide the necessary input to evaluate
the stiffness per unit area for pressure wave loading. The equation of motion
for a yielding wall was previously presented as:
peLU(t) + PCLC(t) + R(U) 2off(t) (7.1)
The resistance function is given an assumed form of:
R(u) ku(t) (7.2)
145
ADA293552
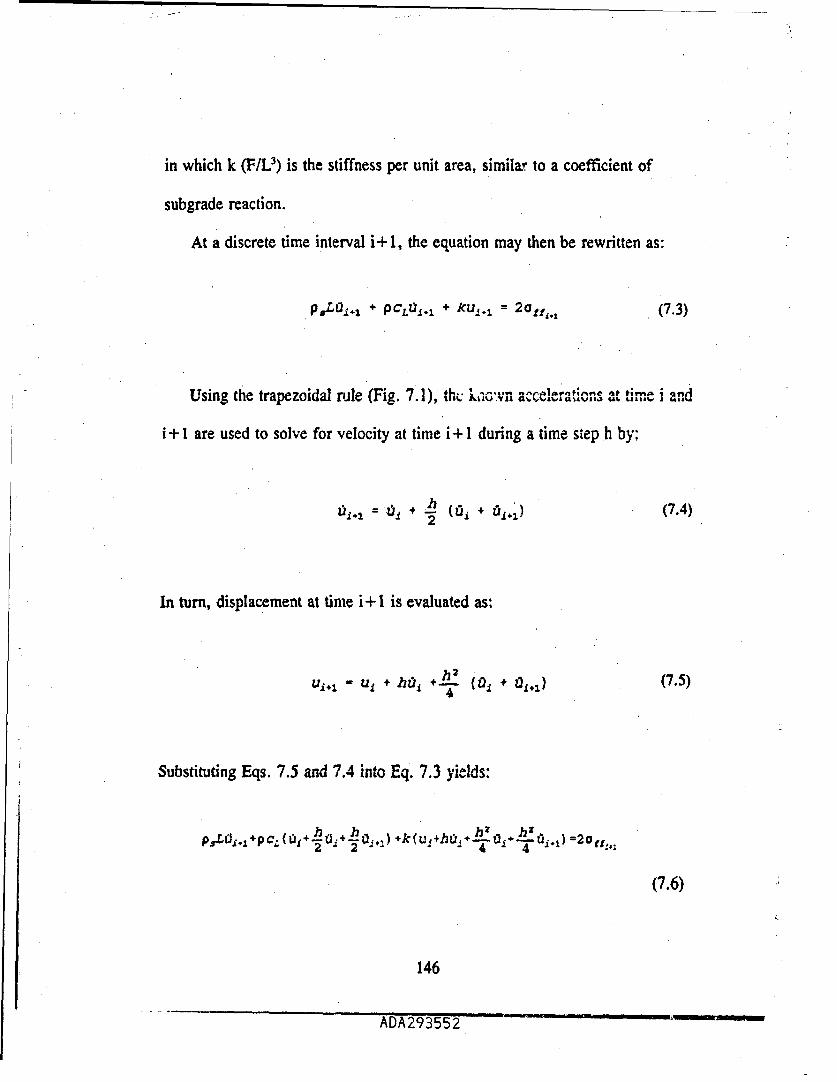
in which k (F/L3) is the stiffness per unit area, similar to a coefficient of
subgrade reaction.
At a discrete time interval i+ 1, the equation may then be rewritten as:
pOL0. 1 + PcLt.. + =U.. 2 Oat. (7.3)
Using the trapezoidal rule (Fig. 7.1), thc L- 1cwn, aCCLeratio .i,,"16 ,, i and
i+ 1 are used to solve for velocity at time i+ 1 during a time step h by-
= ( + ) (7.4)
In turn, displacement at time i+ I is evaluated as:
ui- U, + ho - (0. + 221,1) (7.5)
Substituting Eqs. 7.5 and 7.4 into Eq. 7.3 yid:,,-
P'Lji-+PC~f,+Pj 0")4 4
(7.6)
146
ADA293552

Ac:ual function-
func-,ion
tU, + 1.
Figure 7.1 Trapezoidal Rule of Integration (AI-Khafaji and Tooley, 19086)
Finally, Eq. 7.6 is rearranged to solve for k.
2" (r) hao.()-PCtO( ýj~)+-a.k1f,,2 12Uk(t) + hli(t) + -- I•-(-( +±-01i,1(t)
(7.7)
The resistance function, R(u) may hu calcula by muliply;ing dC•nl•m•i-nt by
the coefficient k.
147
ADA293552

An example of the numerical solution is as follows:
.Given: Gii, iiPi~..., Pi, Pi+o ,9, ui
For time t=i
a. Solve Eq. 7.7 for
b. Solve Eq. 7.2 for !1
For time t=i+l
a. Solve Eq. 7.4 for 0, +1
b. Solve Eq. 7.5 for uj+1
c. Solve Eq. 7.7 for kl+I
d. Solve Eq. 7.2 for R +1
e. i=i+l, return to step a and repeat at intervals (0.001 sec)
over entire time period of interest
Numerical Loading Function
The free-field stress can be characterized by an exponentially decaying
pulse having an immediate rise to pe•ak stress (Headquarters. Dept. of the
Army, 1986) in the form:
ofa(t.) = oo e'8• (7.8)
148
ADA293552

where ao is the peak free-field stress, a is the decay constant and t is the
elapsed time after arrival. Equation 7.8 may be rearranged as:
Lzn Of _1 (7.9)'Jo
Plotting the Ln afflf,, versus time yields a curve whose slope is equal to -a.
Peak free-field pressures for each panel location were presented in Chapter
VI. In each test, free-field pressure gags wer lnrated within two ft. of the
wall, not at the wall panel/soil interface. :,,., FhMae atu a repreentative.
decay constant for each test is calculated and then apple toA Mh predicted pe.
free-field stress at the panel locations for use in the equation of motion.
Table 7.1 presents a summary of the decay constants for full-scale Tests 1-5
from the gage located closest to the wall (Gage No. FI). Typical plots
comparing measured free-field stresses and those predicted using Eq. 7.6 and
Table 7.1 Free-Field Stress Decay Constant
Test 1 2 34 5
x(/sec) 152.3 86.2 114.2 92.5 161.7
149
ADA293552

the decay constants from Table 7.1 are presented in Figs. 7.2 and 7.3. These
plots assume an immediate rise time to peak stress, followed by an exponenth!
decay.
System Stiffness of Full-Scale Test Walls
Twenty seven acceleration time histories from the. fiveh fl!l-qcale teqts with
their associated free-fie!d loading f,'nctio;-Ms ,we9,re e.rvlt,,ped ismp,-ni•y i,,dno
the approach detailed above. Figure 6.3 prset. a typical acelration time
history, and all others are found in Appendix C. Table 7.2 shows a detaieU
example of the integration of the data from wall panel No. 2, Test 5. Figure
7.4 shows how system stiffness decreases with displacement, and Fig. 7.5
shows log k vs. log u. As expected, the calculated stiffness initially assumes a
very high value and rapidly decays. This is a result of the almost instantaneous
rise of free. field pressures to peak values, while peak acceleration is not
achieved until a few milliseconds later. As the acceleration, velocity and
displacement of the yielding wall increases, the stiffness and pressures decrease.
Figure 7.6 demonstrates the level of ,-,nnct,-.ey hbetw-en the. fid-scale, test
data. The data from nine accele-rometers did .,,,t fall withinA;. tgUp.. g,,
including all from Test 1. Test 1 data do plot relationships of the same ,v,,, a,
the others in Fig. 7.6, however they do not fall completely within the rest of
the data group. Since the entire data set from Test I does not match the
150
ADA293552

00
0'- o/0
N)
I (0
00 -I,��1CI H
0 � I V
� I 0,< -�Iw
q�.
� C-, N it
I 0
C-,LIII 7 � it
-�
I..
'Ujo
.3 I
* CU
/ I0/ A
a. VN
a.N
U. -�* 0
ifl 0 0 0
(N (N
(lid) �UASS3�id

LUU
5 - -40
.(I,. 3u SSU

Table 7.2 Integration for Stiffness Per Unit Area, Test 5, Panel No. 2
TIE CCUVIA"O" PRESSVPf VMLCfl DISPLACEMENT1 K I SISTANCt
m*.c q-# pif ftIl ft I b-ft ° DO
0 0 o 0o o0 1 01 0.34 2835.2 j 3. E-C , I.CE•07 4.70.+09 I 1
2 1.05 2241.3 1.:9E-03 9.53E.07 1.35E+09 12.90
3 -1-4 1937 1 2.44E-03 1.01E-C6 7.CE B .08 8004 1.26_ 1122.3 j 3.70E-03 2.92E.00 I4.41 * .0 . 1287
s I .'2-3 1300. 1 3.C7E-03 50.4 E .0 6 1 3.41108.0 1723- .2,1.1 117 .1 .4 : ..... 7.58E-06 2.33C-08 1769
.7 . ., 2.9S t9933 1. 17E.03 I 1.09-05 1.21E -_0_ 131'8 484 -9 S. 495!-03 1 1.35E.os 6. 83E-07 1 _ 22
95 47 - 722.3 1.00.02 1.72E.05 4.1SE +0 I 71A10 4 ,64 614.9 1.sIE-02 2.47E-03 2.51 E+•07 i. s
11 I S3 5s3. l 2.03Z-02 3.73EOS 1.$5E 5.07 I S77
12 1 3.79j 44S 2.SM802j S.AMOS 9.3SSE 406 SAO13 I 506 i 373.5 12968.-02 I7.74E.CSJ 6.49f +06 . 50214 i 46 4 322 I 3.4EC2 j 1.CSE.04 j 4.47E-.06 4A9
Is 377 9 273.9 3,87E802 I1.37E-04 3.22E +04 440
is 2.S3 233 4.138e02 1.73E-04 2.41 E.00 41517 0.34 193 3 4.359,-02 I 2.12E,04 1.33E.06 3881 0.42 _ .7 4.421-02 . 214E.04 1.4ce-06 3SS19 1,26 1.. ".5 4.SOE02 I 2.SEa04 1.08E +06 322
20 2.S3 "2 1 4.698E-02 3.43f-04 .73E -OS 300
21 1.69 _ 103., 4.10E.02 3.89F-04 7.32E*80 20S
22 0.14 so 3 3.03E-02 4.37E-04 6.258+01 273
2A3 .0.42 75.1 5.05E.02 4.68E-04 5.2E 8+05 25524 0.42 63.9 9,0s.02 6.361-04 4.40E +OS i 23825 1.26 54.4 .131.02 S.171-04 3,1 E1#OS 2 224
2, ' .1 -2 , 46.3 S 26F42 6,34.f04 3.33.8.* O0 21627 1.;3 L8S•1.02 0.O14. 4 30 7OfO U12
2i 0,42 33.5 F 471-02 1 7.431804 2.3e 3-S' 210
2 -0.42 23.S S 7E.02 7.97E-04 I 2.S 05os 20330 ,,0 .2.2 S.4E[01 3.s2.•O4 2.279+OS 19330 04 20.0 3 .41E-02 0,07E-04 2,079+0S 1a32 80.4 17.4 I 02 I.S1144 1.158+0O 187
33 0.42 14.9 S.6-..02 1.02E-03 1.48,05 1I734 t 0 M Y2.7 S,68C-02 1.07E-03 1.739+05 16631 . 0 10.6 5.66E4-2 1.131.03 1.631-01 164
3a -0.42 9.2 S.64(-02 1.191803 I 1.128+05 111
37 0 7,* 1,6El-02 . 1.24•-03 1 1.4:1 *05 174
36 042 6.4 1.41-,0_ 2 1.301003 1.321+C•06 17S
39 0.42 65 9.40-02 i1.36803 1.3C *.01 176
410 4 O;,O4- 41 0 0-2 1 478-03 11.0 175 c% -- ?
153

C?
w C
0~
14/ql14

-uJ
UL
* N0
ui-
atW- W4.)L
C)2
ADA293SS

-to0u
9- U
(C.1/ql)SS3NJ1o
-DA29355
behavior of the other data, rather than just select gages, the most likely source
of this deviation is attributed to an inconsistency in the numerical forcing
function and the actual forcing function, as shown in Fig. 7.7. From a review
of the test data no specific rationale for the behavior of the measured free-field
pressures in Test 1 can be made. The revised log k vs. log displacement plot
for Tests 2-5 is shown in Fig. 7.8.
The data presented in Fig. 7.8 was investigated for any trends that may be
responsible for the spread in the data. These nield leve! of exci.aiton, or
weapon standoff distance, relative panel location to i;ves"igat ,effcts ,.,A.te t•
boundary conditions, and the unit weight of the backfill. Of the four sets of
scaled test data included in Fig. 7.8, two are from tests with weapon standoff
distances of 20 ft., the other two were at 25 ft., and the unit weights of the
soils were within 5 percent of each other. This analysis showed no discernable
trend related to the relative position of the individual data plots using the above
criteria. Based on the test data as plotted on a log-log scale, the stiffness does
not appear to be significantly effected by changes in these parameters.
As previously stated, the resistance function is equal to the product of
stiffness and displacement. From Fig. 7.8 this value is on the order of loO0
psf. The concrete panels used in these tests resisted at their top and bottom by
the friction of the other panels, and had free boundaries along t;heir sid.eS,
157
ADA293552

(IN
LUU
L)L
*ii
LUL
r- 0 (Am
Ild NnSSA
ADA29355

00
0"
(Cd I qI SSAi
Jill,

suggesting these panels best represent a one-way slab. The one-way action may
be assumed as long as the displacements are small and displacement at the
boundaries does not occur. Calculating the resistance of a one-way slab from
the tables presented by Drake, et al (1989) and using the design parameters of
the panels yielded a resistaince function of 1224 n,'f Thi; s,,o,,s the test data,
provides a value of resistance of the same order of magnid"e" as those.
estimated by Drake, et al (1989) for a concrete slab. At the small
displacements caused by the free-field blast pressure wave, the measured
response of the system is that of the wall panel, and not a composite system.
This analysis has provided the first evidence that the resistance function
provides a relationship between free-field blast pressures and wall panel
accelerations and displacements. Previous research (Bachus, et al, 1993; Olen,
et al, 1993) had attempted to establish correlations between peak values of
pressure, acceleration, and displacement. These correlations proved unreliable.
The approach presented herein sugge-sts. that th.e data iS reliable and
reproducible, but must be evaluated in the time domin. B"av, on this analy,;.
of the model using test data, the model appears to be valid for the range of data
and systems tested in this study.
160

IndeWndent Model Test Using Scaled Test Data
The centrifuge test data, identified in Chapter III, provide an independent
data set for testing the validity of the model. The six centrifuge tests selected
include two that model the fall-scalle tests, and four that were constructed with
a different backfill soil. This test will determ.ine if the stifLn.qss vs.
displacement relationship established for the model is cos.,ist"et %4when apnpd• A to
tests conducted at different scales and soil types.
This evaluation required discretization of the free-field pressure data to
determine the decay constant of the free-field pressure. Also, the attenuation
coefficient of the soil was determined from the free-field pressure data as
detailed in Chanter VI. The attenuation coefficient was then used in Eq. 2.1 to
solve for peak stress at the wall panel location. These data were necessary for
the numerical loading function in the equation of motion. Next, the
acceleration time history of the wall panel of interest was discretized to provide
the necessary input data for the equtin o.f m. ton. With thif data and the
material property data, the equation of motion was solved,, merical| ly to
establish the relationship between stiffness and displacement. This process
provides an independent test of the model, and if successful, provides a basis
for establishing the validity of the centrifuge tests.
161
SD A AI- 5 .-

Stiffness Per Unit Area for Centrifuge Tests
In the centrifuge tests, three panels were instrumented in each test to
establish panel acceleration; these panels are numbered 6, 16 and 27 as shown
in Fig. 7.9, corresponding to panels 1, 2 and 3 in the full-scale test. These
panels will be referred to as panel 1, 2 and 3 within this text for continuity.
Soil pressure interface gages were located directly behind these three panels and
free-field pressure gages wwre located within the soil backfill or attached to the
centrifuge container wall.
Solution of the Equation of Motion for S.,,ed Tests and Blast . Pressu.re. Wave
The attenuation coefficient of each of the centrifuge tests and IIh d.cay
constant of the free-field blast pressure wave are shown in Table 7.3. In Test
20, the free-field pressure wave gages show an immediate rise to a value of
peak stress, but did not decay due to unknown disturbance. These data could
be used to obtain peak stress and arrival time for calculating the attenuation
coefficient, but a decay constant could not be established. As an
approximation, the decay constant from Test 27 will be used for Test 20, since
both tests used the same sized weapon and soil type.
The attenuation cc..fficients for Tests 20 and 27 using the Sky X sand, are
within the range of values measured in t"he f•,..,.cst (Tabe1,, 6.! ), whi,,h
162
AL A 293552

21 2 3 19 18 1"17 116 151 14 113 12 1211
31 30 29 28 27 26 25 24 23 22
Figure 7.9 Scaled Test Pa en Nus1,,,,,•,In, system. (len, -t -l 199•3
were 3.29 to 3.99. The values for Tyndall Beach Sand, used in Tests 26, 28,
29 and 32 compares well with the value of 3.5 for sands in Table 2. 1. The
decay constants for Tests 26 and 28 are also in the range of values measured in
the full-scale tests (Table 7.1). For Tests 29 and 32, the decay of the free-fieid
blast pressure wave was best represented bya linear function instead of an
exponential function. The linear decay equations for these tests are shown in
Table 7.3. At the present time, no clear rationale for the linear decay observed
in these two tr-sts can be established.
The results of the numerical solution of 0t% equat;on of mot,-n for the fidl-
scale tests and centrifuge tests are plotted as stiffness vs.,dslac" et as sChwnu'
in Fig. 7. 10. For Tests 20 and 27, the full and small-scale test data provide.
163
ADA 25-52

similar results when compared to the stiffness vs. displacement plot for the full-
scale tests. The data obtained from Tests 26, 28, 29 and 32 consistently have a
higher stiffness for a given level of displacement. The model appears to be
consistent across scales as demonstrated by the agreement between the full-scale
and model-scale data for the Sky X sand. Also, th . difference between theel ,o,, a 611anti smail-rl.pt, 4e or'oim~ti
material properties of the wall panels used, at fulla, It .ls.. i ccAnt
Table 7.3 Attenuation and Decay Coefficients - Centrifuge Tests 20, 26-29, 32
Test Number Attenuation Coefficient Dxzy Constant (Ir)
20 3.8 137.95
26 3.02 163.17
27 3.74 137.95*
28 3.32 100.45
29 3.38 99.4-8517.34(.%t)-
32 3.26 107.23-9595.52(At)-
* assumed e2l-to decay cowstant -torI'Pe 20.
nliear decay provided better fit than exponential
164
Job 7649 FV ch e2Te 2 3G5/24/95 SOA32052 - .......Operator ID: Machine ID: COM-i Job Name- zikGzj3j.6.

La.]
XJ z U).~( ( j
{~j> A~ ~. >. 9
UY LA I
9- 0
IC1/q SSN.)i
ADA29355

for in the model, and did not effect the consistency of the results of Tests 20
and 27 when compared to full-scale. As the material properties of the wall
panel are accounted for in the first term of the equation of motion, the soil
properties are accounted for in the second term. The model also addresses
different levels of excitation through the stress term, and for the Sky X sand
was consistent at both full and small scale.
The data from Tests 26, 28, 29 and 32 appear to he representative when
compared to the peak values of stress ,,,4 ,-.Iracerati.n ,.thane inn dsmir
scaled tests. Finally, the form of the curve for these tests is ,-, ."t ',1,h th.
others, except that it lies above the rest of the group. With tcst data availabeC
for only two soil types, it is unclear as to whether this represents a trend based
on soil type, or if this represents test scatter.
The use of the scaled data in the model provides an independent test of the
validity of the equation. Since this equation has never been applied in this
manner, it was necessary to test the relationship with multiple data sets.
Summar
The yielding wall model also provides a means of relating test press.ur.es;
accelerations and velocities on a fundamental t'ba.i 3 ,, opps,. 04 C;,,,pI
comparing peak values of test measurements. The application of the moel to
166
"ADA293552

data from full'-scale and model-scale tests on reinforced soil walls has resulted
in a consistent relationship between wall stiffness and displacement. As a
result, the model is considered valid for the small displacements caused by the
blast. pressure wave. Further investigation is required to determine if the
relationship between stiffness "and, displaCeme, ;ses,.t•;, t, changes in sol
type. Based on the agreement of the full and small-scal data, the " ,,ol
provides a basis for moving forward and addressing the more critical issue of
the inertial wave loading.
167
ADA293552

CHAPTER VIII
EVALUATION OF INERTIAL LOADING AND RESPONSE MECHANISMS
Introduction
Olen, et al (1993) present test data from a series of 1:30 scale explosive
tests on geogrid reinforced soil walls in a gebtechnical centrifuge. Two of the
tests within this scaled test program simulated full-scale tests conducted in this
research program, as well as fourteen others using a similar sand. The data
from selected tests will be evaluated within the framework of the equation of
motion to study the response of the walls to the inertial l3ading mechanisms and
evaluate the design variables that most affect wall displacements.
Organization
The data necessary to solve the equation of "'otoan for eachf, loaditg
mechanism is not available from any single test, so data from various tests must
be sequentially evaluated to assemble the necessary values for analysis. The
free-field pressure wave displacements were evaluated in Chapter VII, and this
Chapter will estimate the response to the inertial wave loading within the
168
ADA293552
framework of the equation of motion. Centrifuge tests. that modeled the fNll-
scale tests provide data on the inertial loading that was not o)bta;inA ;n the fill-
scale test series. These data will be applied to the full-sc.,,- , tes3t srUc,.,U,.r W
predict the wall panel displacements. The results of the evaluation will be
discussed and the relative influence of the design parameters for each loading
mechanism will be established.
Inertial Wave Loading Mechanisms
The displacement of the wall panels under the influence of the inertial wave
can be separated into two components: 1) mass movement and. 2) geogrid
pullout. In this analysis, these effects will be evaluatead independently and then
superimposed.
Free-field soil pressure gages were loc,,ated i, ,, t gh,,,tainAd All , f.he%
centrifuge tests. Data from one such gage from Test 27 is shown in Fig. 8. .
This gage is 15 ft. from the detonation at prototype scale. These data shows
the inertial wave arrives 45 ms at prototype scale after detonation and has a
duration of 135 ms at prototype scale, therefore it is traveling at a velocity of
333 ft/sec. Assuming a crater radius of 10 ft., and using Fig. 8.1 as a
169
ADA293552

4L4
,. S- II
4-
10
I - -
ADA293552

representative pressure time history, the mass of soil between the crater/soil
interface and wall panel is being compressed for a period of 135 ms. During
this time period, the soil m-ss is assumed to be accelerated as a uniform block,
resisted only by the mass of the soil. This component of the inertial wave
loading will be referred to as mass movement.
Once the inertial pressure wave at the crater/soil interface decays to zero,
the soil in that area returns to a static state, Up until this time, stresses on the
wall panels could not be resisted by !oad transfer to the goa-nrid hbrause the
geogrid was moving with the entire mass. Once the soil -Ar'ond shm .,,,,
closest to the crater returns to a static state, the geogrid provides resist:an" .
the pressures on the wall panel. At this time, pressures on the wall panel are
transferred to the geogrid which now becomes engaged and the pullout
resistance of the geogrid is mobilized. This component of the inertial wave
loading is referred to as the pullout loading. Figures 8.2 through 8.4 show
respectively the free-field, mass movement and pullout loading mechanisms.
Application of the Model to Inertial Loading
Ideally, the Drake, et al (1987) model could be used to predint the re nnse
of the soil mass to inertial wave loading using measured was-l pane!
171
ADA293552

* I.i.
* * .*. . so:.
so .. : 6S**,** '. a:*
*0 * .so
I**. so ~ . * *F
.:. so * .. so
I. so so* .
a. 0F**
ADA293552 *

Sjd U2 ee,(
* *. *. '. "-
* * * e ** e . e*.*.•m
* * .* 0e••
* **o °;.*-" ...
*. a.< *..* eo.
* ..* . . . S * *'
* .*** .* ** e* * o•••ei
* . o **. . *oo *** eeo
* . .* o .l o. e *o
'e* *• Se*
* .*.S * • S .
• *
ADA29355

A0
- i -! i ',E
SoU#U
ADA293552

accelerations and pressures. However, limitations in the test data prevent full
exploitation of the model due to the significant noise (Fig. 8.5) in the
acceleration gage data after the arrival of the blast pressure wave and a lack of
agreement between measured displacements and those obtained via integration.
After arrival of the blast wave, severe noisp i nhserved throughout the rest of
the acceleration time history. The primary source of this is ;attributed to
reflections from the 4ides and bottom of the steel centrifuge containment vessel.
The test wall was in direct contact with the sides and base of the steel
containment vessel, and the contact area between the wall and bucket were
sealed with caulk to prevent sand leakage. The level of noise causes significant
fluctuations in both the positive and negative direction, effectively obscuring the
true acceleration signal. Secor.dly, double integration of the acceleration time
histories provides estimates of displacement that are an order of magnitude
below those obtained from post-test measurements. The level of control
exercised over the measurement of the displacement!s after each test suggests
that they are more representative than. t.hose obta..ned from integrationn.
Alternatively, pressure gages provided comparatively clear me-s,•Urem-e.nts nf
pressure with respect to time. Their response did not have the significant
fluctuations or noise as observed in the acceleration plots. These gages were
located on the back face of the facing panels, suggesting the surrounding soil
175
AUAL'93b52

Al
moor_EMIU
ADA293552

provided an element of damping from the vibrations that resulted in the
significant noise recorded by the accelerometers.
Therefore, tl - i-noel will be evaluated using measured pressures to
estimate accelerations, which in turn are used to estimate velocities and
oisplacements. The following sections are devoted to the prediction of the wall
panel displacements due to inertial loading, first for the scaled tests, then for
the ful-scale tests. Each component of the inertial loadine is evaluated
indep-ndently "nd superimposed. Thie framework of the Drake modiel will be
solved numerically for each component of Oneth dipacement for hbth Full and
small-scale test data.
Prediction of Displacement Due to Mass Movement
The equation of motion is adapted for evaluation of the mass movement of
the soil/wall system. In Chapter IV, Eq. 4.6 shows that:
C11(t) - mb•oka7;1ock(t) + R(u) (8.1)
In Eq. 8.1, ai (t) is the free-field inertial stress, 0(t) is the acceleration of
the all of the soil between the crater and w,"al an,,d m it ;it ma, t The rtiitsnre
term represents the friction resisting the mass movement. However, Ohe, enire
177
ADA293552

!
embankment is assumed to be moving as a uniform block, as observed from the
high speed film of full-scale tests. The boundary resistance will be assumed to
be zero, an assumption that is most "alid in the area between the explosion and
the center area of the wall. The frictional effects increase with distance from
the wall centerline, so study of Panel 2, the centermost panel, will be least
affected by boundary (i.-,. interslice) friction. Assuming neglgiible boundaryd
re~sistance, the resistance term drops out, , ,. o ,..1 "'";#rg;n'
S0tbl o(k (8.2)M~bl ock
whet.:
b~l,(t) = acceleration of soil/reinforcement/wall Panel System
load on Soil/reinforcement/wall Panel System
mblock = mass of soil/reinforcement/wall Panel Systern
Alternatively, this may be expressed in terms of the impulse-momentum
relationship:
OW = b- k a f 0) da (8.3)
178
ADA293552

and evaluated over the time of duration of the plastic stress wave on the crater
soil interface as determined from the gage data.
In this form, the equation of motion provides a means for estimating the
displacement of the reinforced soil wall and the retained fill between the
explosion and the wall during the period of time the entire mass is subjected to
a dynamic compressive stress. The centriff-ge test data includes a free-field
pressure gage located at a distance that c.,r.,pnd t,-, the. aroimat. cente.r..
of the mass of soil between the explosion cavity and the wall face. The gages
with lear data traces record both the free-field pressure wave and the inertiCl
pressure wave. This form of pressure time history is used as the forcing
function for the mass movement analysis. For this analysis, the mass of soil
will be treated as a rigid block, assigned a unit area directly between the
weapon and the center of wall Panel 2. This element best represents the one-
dimensional behavior of the model. The equation of motion is solved
numerically, based upon the assumptions that the mass of soil between the
explosion and the wall moves as a single mass under the influence of thet . m a €::r~ r • ... e _ _•n tL-r o f th e
inertial pressure wave, and that ,he pressureoneasu-ored it the ce
sliding block is a representative pressure for the entire block. Numercal
evaluation of this equation using measured pressures over the time of pressure
179
ADA2935-

application provides an acceleration time history, and velocity and
displacements are determined by integration over small time steps.
To solve the equation numerically using measured inertial pressures, the
size of the sliding block must be established. The evaluation is on a per unit
area basis, however the length of the block must be established by estimating
the size of the explosion cavity.
The true crater diameter is the diameter of the cyinrial.;,oi1 ,,a.s that is
ejected during the explosion. This value will differ from. postL-t e
measurements of crater diameter, referred to as the apparent crater. The
apparent crater diameter differs from the true crater because of the amount of
ejected soil that falls back into the crater, as well as changes in the diameter
due to slope stability failures that occur after the decay of the explosive
pressures. Henrych (1979) presents an empirical method with experimentally
determined constants for estimation of the radius of the cavity created during
the detonation. For a cylindrical charge the explosive cavity will have a
cylindrical shape (except at the terminal regions) whose radius is:
R,,d Kd /v (8.4)
.180
ADA293552

where:
R, = cavity radius in m
I• = constant = .35 m/ kg" for sandy soils
W - charge weight in kg
For the 192 pound cylindrical charges used in tUe, fll I•fd ,a,-S"-A- _.tet Iseries, Eq. 8.4 predicts a cavity radius of 10.7 ft. Post-test measurements from [
the full-scale tests of apparent crater radius at the crater lip were approximately
17 to, 18 ft. and of 12 ft. depth. The average apparent crater radii from the
scaled tests were 16.3 ft. at prototype scale. Estimation of true crater radius
from post-test measurements of the full-scale tests were in the range of 8.5 -
13.5 ft. The value estimated from Eq. 8.4 provides a representative value for
true crater radius.
The length of the sliding block is estimated by subtracting the true crater
rarlius from the distance between the L,1. Aeapon and the. wall hle, mass of the
block is obtained from the product of the length of the" bl,,.ock a,,nd mass density
of the soil.
The velocity of the block at time t = i+I is determined by:
181
ADA293552

o (- (O *+ (8.5)
Displacement at time t = i+ 1 is estimated by:
U.1, U! + *(1) + (8.6)
r-M. #Igb lA~nnh f,41' M t hm •at thpa ;no-rt;,j| nToa irp
The evaluation is repeated over t..,e l-engt vo &AM%, ,.. the i.e.i. presre
was measured at 0.006 ms time steps. After the inertial pressure at the cavity
surface decays to zero, it is assumed the soil returns to a static state and further
deformation of the wall panels is resisted by the transfer of stress from the wall
panel to the geogrid reinforcement.
Prediction of Displacement Due to Pullout Loading
During the first component of inertial loading, the resistance was assumed
to be zero. However, during the pullout component of inertial loading the
geogr;d is now embedded in S.ttic Soil, therefore the ".yitane- will now
assume a value determined from the pullout re;stnce of the geod. The
mass term now becomes the wall panel mass per unit area, the ea'ace .. t.Casas
182
ADA293552

is the measured stress at the soil/panel interface, and the acceleration is the
acceleration of the wall panel.
As presented in Chapter IV and repeated again, the equation of motion for
the interface stress on a moving w"1i .- ne! is:
0 M(t) -- m 1• +1 t) R(U) (8.7)
where:
ai (t) = interface stress at the soil/panel interface
mblock = wall panel mass per unit area
0(t) acceleration of the wall panel
R(u) = resistance provided by the geogrid
In the centrifuge tests, the interface stress was measured by gages attached
to the wall panels at the soil!wall panel iterfae. The resstaance of the wall
panel is assumed to be primarily based upon th,, ,,.n" t rtisctAncrp f th..
geogrid reinforcement. The pullout resistance of the W818-i,4 whch is
developed by wall displacement, is established as a function of displacement.
The resistance of the geogrid for the applied normal stress must be converted to
a resistance per unit area for use in the equation. This requires multiplying the
183
ADA293552

pullout resistance of the geogrid times the width of the geogrid attached to each
panel. This gives the pullout resistance in terms of force. Dividing the pullout
force by the cross sectional area of the panel yields the resistance per unit area.
Dividing the pullout resistance per unit area by the amount of displacement
required to achieve full resistance gives the slope of the resistance function for
pullout vs. displacement curve. The resistance fbinction in Eq. 8.7 becomesre ro ..... nfr il itmr.- rl it
ku(t), where k is the slope of the resistan",e,.,,,c"n for pullout. u.e. .ad ,,(
is the displacement. Once enough displacement is a.4hiee to daeelop AM
pullout resistance, the pullout resistance assumes a constant value (•Rcj , where
u,, is defined as the displacement required to achieve R..
Numerical solution of Eq. 8.7 yields the wall panel displacement after
sliding block motion has ceased. The acceleration of the wall panel at time step
t = i-l is calculated by:
.1 - -(0., R(u)) (8.8)
Velocity is then calculated by:
184
ADA293552

4 -- h( + 0)(8.9)
where: uj < u. R(u) = ku,
ui=>u, R(u) Ra,
Displacement is calculated as:
ui+,t= uj ( I.i+ 0i) (8.10)
Solving the above equations using the pressure time history for the inertial
stress from the soil pressure interface gage on the wall panel and the pullout
resistance of the geogrid over the time of loading yields the displacement due to
the transfer of stress from the wall panel to the geogrid reinforcement.
Response of Scaled Tests to Inertial Wave Loading
In this section, each of the six centifuge tent data Sets will he. individually
evaluated using the equation of motion to predict.k. ,sidual di,,ace-m'nt. T.e
unique parameters of each test and evaluation will be discussed idia y,
followed by a summary of the results of the model calculations.
185
ADA293552

.C,€nrifuge Test Number 27
Centrifuge Test 27 was a scaled test of full-scale Test 5. The backfill
material was the Sky X sand compacted to a total unit weight of 107.8 pcf at 10
pý,Lcent water content. In full-scale Test 5, the unit weight of the backfill was
105.7 pcf at 7.5 percent water content.
As previously established, the equivalent fulM-scale radius of the explosion
cavity was 10.7 ft. The distance betveen th, eapoun. a.nd wall was 24.9 ft, s
the length of the soil mass between the caity and wall is 14.2 ft. For a sectionwith unit area, the mass of the block equal to 47.54 t.- -214,. ."A #,Uh mass vf
the facing panel is 2.18 lb-sec2/ft, making the total mass of the block 49.72 Ib-
sec2/ft.
In this test, a free field pressure gage was located 15 ft. at prototype scale
from the detonation. The center of the block is 17.8 ft. from the detonation.
The inertial wave pressure time history for this gage will be assumed to be a
representative pressure for the block, and these pressure values will be used as
the forcing function for the sliding block. Using this mass of block and the
pressure time history, the sliding block model was solved rsnmerially over the
time of inertial wave load duration, which waTs 135 t u.ll-•ale.
186
ADA293552

Centrifuge Test Number 20
Centrifuge Test 20 used the same soil as Test 27, however the weapon
standoff distance was reduced to 21.1 ft. and the unit weight of the backfill was
reduced to 90 pcf.
In this test, the mass of the slidi hg block • tnI,,r th.n thnt nf Tesqt 27
because the explosion standoff distance is reduced by alm, ,,. , 4. I-th c-se,
the length of the sliding block is 10.4 ft. and the mass of the block- and panel i
31.3 lb-sec-/ft. Also, the free-flie pressure gage in the backfill did not record
a clear trace of the inertial pressur.; wave. As an approximate solution, the
inertial pressure data from Test 27 will be used as the forcing function for this
test. This pressure was recorded 15 ft. from the detonation, and the center of
the sliding block in this test is 16 ft. from the detonation.
Centrifuge Test Number 26
In centrifuge Test 26 the backfill material was a dry Tyndal! Beach Sand. a
poorly graded fine sand. The unit weight was. 95 pdf, and the, we-apon s•.andff
distance was 21.1 ft. The length of the sliding vhock is AVt a f t. a mac,
of the block is 32.9 lb-seO/ft. The free-field inertial pressures measured for
this test at the approximate center of the sliding block was used as the forcing
function in this analysis.
187
ADA293552

,_ntdfuge Test Number 28
Centrifuge Test 28 also used the Tyndall Beach Sand at a unit weight of
107.8 pcf and a weapon standoff distance of 21.1 ft. In this test, the
reinforcement length was increased from 15 ft. to 37.5 ft. This increase in
embedment length had a negligible effect on the wall panel displacements and
crater sizes when compared to the control tests, therefore the inc.rease in length
will not be factored into this analrsis. Th l.,ngth ofthe sliin block is 1. 4
ft., and the mass is 37.0 lb-sec 2/ft.
Centrifuge Tests Number 29 and 32
Centrifuge Tests 29 and 32 were of the same overall design as Test 28 with
one exception. In Test 29 the reinforcement tensile strength was reduced by
punching holes in the geogrid reinforcement across both its length and width.
In Test 32 each layer of geogrid consisted of one continuous sheet across the
entire width of the wall instead of individual sheets attached to each panel. For
Tests 29 and 32 these changes in design had little effect on the displacement of
the center panel. Since the mass of the soil and explosion size was identical to
Test 28, the length of the sliding block is in A f , vln th, mnce k q7 n lh.
seclft.
Pullout Resistance of the Nylon Mesh Reinforcing Material. T1,. pu,,lout
resistance of the nylon mesh material used in the centrifuge tests was not
188
ADA293552

known. Attempts were made to determine this value in the laboratory, however
in a 1 g environment the material would rupture at all but the lowest values of
normal stress due to excessive stresses at the mesh/clamp interface. In the
absence of a reliable measured value, the pullout capacity of the nylon mesh
was estimated to be 1320 lb/ft. This value is a credible value for pullout
resistance of some geogrid materials. Yuan, et al (1993) and Bachus, et al
(1993) present the dynamic pullout resistance, of varinou geogrids. at normal
stresses similar to those in this centrifuage mode. The estimated pu!!o,,t
capacity of the nylon mesh is within the range of I100-301•,0l•b/ftp• e ntd•,"" in
these sources. Approximately 0.19 ft. of displacement was required to achieve
full pullout resistance.
Because this approach used an assumed pullout capacity of the nylon mesh
material, the predictions based on this one test may not be entirely
representative of actual response. However, using this pullout resistance in
other evaluations of the centrifuge data with differing forcing functions and soil
type and comparing predicted vs. measured displacements will provide tests of
this model and its ability to predict the apprnximate magnitude of the
resistance, whose individual components ar still unknO.M.
189
ADA293552
- ii

Results of Numerical Evaluation
The results of each of the evaluations are presented in Table 8.1. The
displacements from the centrifuge tests are converted to full-scale.
Table 8.1 Predicted and Measured Displacements - Scaled Tests
Test Pressure Predicted Predicted Total MeasuredNumber Wave Sliding Block Pullout Displacement Displacement
Displacement Displacement Displacement Predicted By (ft)fit) (ft) (ft) Model (ft)
20 0.01 1.41 0.64 2.06 2.33
26 0.01 1.17 0.20 1.38 1.78
27 0.01 0.75 0.66 1.42 1.63
28 0.01 0.78 0.39 1.18 1.37
29 0.01 0.89 0.35 1.24 1.67
32 0.01 1.20 0.18 1.38 1.56
Discussion of Centrifuge Evaluation
Evaluation of the model results provides further insight into the effect of
various design parameters on the wall panel displacements. These predictions
provide excellent results when compared to those obtained by post-test
measurements, and also show trends that compare well with those obtained by
empirical testing.
190
ADA293552

Based upon this evaluation and data used, expected trends are present in the
results. In Test 20 the weapon standoff distance was 5 ft. closer than Test 27,
and the unit weight of the soil in Test 20 was 13 pcf lower than that of Test 27.
As expected, the decrease in weapon standoff distance resulted in increased wall
panel displacement. The combination of the increase in the forcing function
and decrease in soil unit weight case the mass movement of Test 20 to be
almost twice that of Test 27. The difference in pullout displacement Aso
follows the same trend. The decrease in -eao"n" st",s,,andoff tance s;,,iicat
affects both displacement mechanisms. The peak interface pressures f-or Test
20 are approximately 1000 psi, while the peak interface pressures for Test 2.7
are approximately 500 psi. Displacement due to pullout is controlled first by
the peak stresses that exceed the pullout resistance, coupled with the length of
time these stresses are applied.
Tests 26 and 28 were constructed with Tyndall Beach Sand and the unit
weight of Test 26 was 13 pcf lower than that of Test 28 while the weapon
standoff distance was constant for both tests. The displacement due to mass
movement was greater for the test with lower Lin-it! weight (Teot 26); yet its
pullout displacement was less than that of the soil of gre.oatr ,,,,t weight (Test
28). This may have been caused by interaction between the wa.. pai,,C.t
191
ADA293552

The edges of each panel were keyed, providing a certain amount of
interlock. The center row of panels was bounded by panels on all four sides,
while the top row was bounded on three sides, and therefore had less bounda-y
resistance. When exposed to the same pressures under mass movement, the top
row of panels will displace further than the center row. In Test 26 the reduced
unit weight caused more mass movement, and the top panel may have moved
the center panel with it due to the interlock at their boundary, providing
pressure relief to the center panel. Ther pressure data from these tests may
support this analysis. The area u %.&" .A,. ;4, UM£ý. ....... 7 16UI V
from Test 26 is almost twice that of Test 20. However them peak ,intrf'ace,.
stresses of Test 26 never exceed 5 psi, whereas the peak interface stre;ises of
Test 28 are as high as 12 psi. This mechanism of pressure relief be responsible
for the difference in pullout response. The small changes in unit weight of a
specific soil type increases the mass of the block and may cause subtle changes
in the engineering properties of the soil. This change may either reduce
displacement through increased mass or because the increased unit weight alters
the form of the inertial pressure wave.
Tests 26 and 28 were conducted on the same soil type at ,.nit weightis f 95
and 103 pcf respectively. Free-field preassure measo•.r.'ent wer , ,
test at the same distance from the detonation. ITe peak va"lUCS of the" il"%rti
192
ADA293552

stress wave were 56 and 66 psi for Tests 26 and 28, respectively, as shown in
Figs. 8.6 and 8.7. The area under the inertial pressure time curves, defined as
impulse, are also similar. The impulses are 74 and 82 psi-msec for Tests 26
and.28. This evidence suggests that the ,.e;tj .tres lwav manid ,A
durations are not significantly effected by an appom 8 ¢t change in
unit weight, for a given soil type, and therefore increase in soil unit weight
serves mainly to decrease accelerations during the mass movement of the soil
block.
The results of Tests 29 and 32 should be of the same order as Test 28 since
each parameter was constant except for the reinforcement strength. Post-test
measurements show the reinforcement strength had little effect on ultimate
displacements, therefore model predictions should be similar. The results from
Test 29 are very close to Test 28, and although the ultimate displacement of
Test 32 is similar to Tests 28 and 29, the amount of displacement pr,,.t•P;,t,from each component of the inertial wave d,.fers f.r Tet. The1 ier.i.l
•tLaJ Avg Tes01 t *... l ieiAAAUQ
pressures of Test 32 measured on the gage. ,lcated wituin the so11 mass was of
slightly lower amplitude and longer duration than those of Tests 28 and 2'9, and
this longer duration would cause more mass movement. The difference in the
pressure wave for this test cannot be accounted for since the explosion and soil
properties were equal for each test.
193
ADA293552

_ _ ___ _ g Oin
______ CSEE
__ __ __I_
I__ ____ __L
UID r
7 I- 0 %
(jsd~.; S3N
ADA29355

i700
____ ta- _C
_ Ik
U)
I ~ g
LA
(Isd)unsmi
ADA2355

In each case, the model underpredicted displacement. The accelerations
predicted by the model are generally less than 100 g's, however in some cases
accelerations jumped to values between 100-200 g's, and in one case, 500 g's.
The higher accelerations were observed during spikes in pressures and generally
lasted for I to 2 ms. The high accelerations may be a result of inadequate
consideration of resisting forces. One such force is the stunJctura& resistance of
the wall. The scaled test wall panels had la, Joints ,rou.nd ,h.;. hir,,,,ndri,.n
providing some interlock between the panels. At the ends of the wal, the
panels were sealed against the containment bucket with caulk. These boun•dary.
conditions may have prevented the wall panels from acting independently, and
therefore some structural resistance is likely to exist.
As best as could be estimated from the acceleration plots, accelerations
during inertial wave loading reach peak values of 30 - 100 g's. This is of the
same order of magnitude as the accelerations calculated by the model, with the
model exceeding those estimated from test data by as much as a factor of two.
This evaluation was made after filtering ont high-frequencv noise in the 100 to
200 kHz range.
An increase in resistance from the forces not a^,,o,,unt for ,,,w, de,-rese
accelerations and displacements. However, the model is currently
underpredicting displacements by 10 to 20 percent. The measured centrifuge
196
ADA293552

displacements that were used for comparisen may also contain some error.
When the centrifuge bucket containing the test wall was accelerated, the test
walls rotated from a vertical orientation to horizontal. While in flight, the wall
was tested, then decelerated back to vertical. The rotation of the wall in the
bucket during .deceleration may have caused increases in displacement. This
possibility was also supported by the centrfiuge operator (Purcell, 1995).
however qualitative measurements were no m,•ad.
Results of previous scaled tests and numerical analysis 0onc1-dae ,h, ,,,it
weight of soil, size and location of the explosion, and geogrid stili,:ess w,,• the
three parameters having the most significant effect on wall panel displacement.
Evaluation of the centrifuge data has shown decreases in unit weight primarily
affect the response of the wall to mass movement, and explosion location affect
both the mass movement and pullout loading mechanisms. Geogrid stiffness
was not evaluated in the scaled tests, therefore this parameter could not be
specifically addressed. This simple analysis is in agreement with the trends
observed in the scaled tests.
Application to Full-Scale Tests
The scaled tests provided the necessary data for use in this Model, witht
exception of the pullout resistance of the nylon mesh material. In the full-scale
197
ADA293552

test, the pullout resistance of the reinforcing material is known, but the inertial
pressures are not. In this section, the equation of motion will be used to
predict panel displacements using a known pullout resistance and the inertial
pressures from the replica tests.
The model has provided a means of e.a.aing th, , Ad-efo atioc, of the,
scaled test walls. This same analysis technique will be used to pVedit. th
displacement of full-scale Tests 5 and 6, which are full-scale versions of
centrifuge Tests 27 and 20. The only difference between these tests is the scale
and the pullout resistance of the reinforcing material. To achieve this, the
equation of motion was solved using the resistance of the geogrid as the
resistance function for the pullout loading.
Dynamic Pullout Resistance Function of GeogridReinfogrcemert
The dynamic pullout resistance of Tensar I.TX.1500HT geogrid in Sky X
sand was determined by Yuan, et a. (1993) via pro,--dures deta.led by Bachus,
et al (1993). Results of these tests for various normalu sotree aSh"own in
Fig. 8.8. These data will be used to establish the resistance function for the
equation of motion when evaluating the response to pullout loading.
Using the unit weight of the soil from Test 5, the normal stress for each
geogrid layer is established, and pullout resistance is obtained from Fig. 8.8.
198
ADA293552

90oo-I .-.5 SERIES N\U'18ER 3 AND 4: TENSAR UXI53OHTI GEC�C (MACH!NE DIRECTION) IN S<Y X SAND
- TEST SERIES NUMEER 3.-----. ,TEST SERIES NUMBER -
-..
"5coo --
.* 4CC0 !
o "
DO--
2000 --
1COO
0 2 4 6 8 10 62 14 16 18 20
NORMAL STRESS (psi)
Figure 8.8 Dynamic Pullout Response of Tensar UX 1500 HT GoG61Ar
(Yuan, et al, 1993)
199
ADA293552

Extrapolation will be used for normal stresses below those plotted on the curve.
The embedded width of each geogrid layer was 4.3 ft., and ultimate pullout
force is obtained by multiplying the total width of grid by its respective pullout
resistance. Resistance per unit area is obtained by dividing the pullout force by
the cross sectional area of the wall panel, which for Test 5 was 30 f. The
amount of displacement required to achieve full pullout reita~nre was notpresented. Bachus, et al, 1993, report on pUfllout toets of Ten,,r T..... .... T
geogrid in sands. For normal stresses of 2.5-5.3 psi, the pullout-di""acm"n
curve remained approximately linear until displacements approached 0.19 ft.
The pullout resistance at this displacement were 500 to 1500 lb/ft.
For Panel 2, the normal stress at the top layer of geogrid is 4.9 psi, and for
the lower layer, 6.1 psi. From Fig. 8.8, the pullout resistance of the top layer
of grid is 1400 lb/ft and 1600 lb/ft for the lower layer. Based on the width of
each layer, the pullout force is 12,900 lbs., or 430 psf of panel. The
development of full pullout resistance is assumed to increase linearly with
displacement. The displacement required to achieve nat! pullout resistance is
0. 19 ft., making the slope of the pullout rsi'gon"" fo,',tindlacement cUrve.
2263 lb/ft of displacement per unit area. If a geogrid of diffAer...ent .puo,,Ut
resistance was used, the pullout resistance function would be established in the
same manner using different values for ultimate pullout resistance and the
200
ADA293552
displacement required to achieve that resistance. The relationship between
pullout resistance and tensile modulus, and their effect on the pullout resistance
function, are discussed in Chapter IX.
Prediction of Displacement - Pane! 2. Test 5
For this test, the inertial pressures are not knwn. T rfrce.ment used
in Test 5 was the UX 1500HT. The inability to characte"ize ,th ie.rtial waMV:
within the soil mass and the subsequent soil response required using Small-s-Mae
data as the best estimate of the inertial wave stresses. Since centrifuge Test 27
was a replica model of this test, the inertial wave pressures from this test will
be applied this full-scale test. For the weapon standoff distance of 25 ft. and
true crater radius of 10.7 ft., the mass of the slid~rg block and concrete panel is
49.3 lb-secO/ft.
Analysis of the sliding block model resulted in a predicted displacement of
0.75 ft and displacement due to pullout was 3.34 ft, for a total displacement of
4.09 feet. The displacement observed after the test for this panel was 0.67-
0.83 ft., which is approximately 25 percent of w"hI*at the mod!! ,., predicts. a
upon these results, this analysis overpredicts the displacement of the wall pane!.
201
ADA293552

Prediction of Displacement. Panel 1. Test 5
In this case, the pullout resistance of the geogrid was recalculated to
account for the reduction due to the decrease in normal stress. Using the
inertial pressure time history from centrifuge Test 27, Panel I was applied to
Panel 1, full-scale Test 5. The block movement of the wall is 0.75 ft. and the
predicted pullout related displacement is 1,31 ft., for a total of 2.06 ft.
Observed displacement of the w'all panel was 1. 33 - 1.5 ft. This estimate. is
approximately 25 percent greater that obe'selSA
Prediction of Displacement. Panel 2. Test 6
This test had a weapon standoff distance of 20 ft., which is close to the 21-
ft. standoff distance used in centrifuge Test 20. The length of the soil block
used in the block analysis was 9.3 ft. with a mass of 32.5 lb-sec2/ft. The
pullout resistance function will be the same as that of wall Five, Panel 2. This
remains relatively unchanged because the difference in unit weight between
Tests 5 and 6 was only 0.8 pcf. The sliding block displacement for this test
was predicted as 1.2 feet, and pullout displacement was 0.97 feet, for a total
displacement of 2.17 feet. Observed Lis,,aciem, for thb pane! were. 1-1. 2 ft
The prediction is approximately 50 percent greater than, ,oe,,d. a %~.A bJu..."m
of each prediction is presented in Table 8.2.
202
ADA293552

Sources of Error
Based on the results of this first analysis using the known pullout resistance
of the geogrid, four potential sources of error are identified: 1) the pressure
time histories from the scaled tests are not representative of those at full-scale
2) the sliding block model, 3) frictional drag of the moving soil mass on the
geogrid, and 4) boundary frictional forces,
Table 8.2 Predicted and ObserIv:ed F,,Dc n FleaI, Tects
Test Blast Predicted Total Pullout Total ObservedPressure Sliding Block Displacement Predicted Displacement
Wave Displacement (ft) Displacement (ft)Displacement (ft) (ft)(ft)__ _ _ _ ___ _ _ _ _ __ _ _ _ _
5 -Panel 1 0.03 0.75 1.31 2.09 1.33-1.5
5 -Panel 2 0.02 0.75, 3.75 4.52 0.66-0.83
6 -Panel 2 No Data 1.2 0.97 2.17 1.0-1.17
One difference between the ,%vnn,;n" c in ,heb AuM ,nd small-scale, tesqt were
the boundary conditions. The centrifuge soil was Con..fined iin a MeIta V,-sase
that is 20 in. x 20 in, where 20 in. equals 50 ft. at prototype scale. The
detonation of the bomb was in the center of the backfill, 25 ft. away from the
203
ADA293552

sides of the vessel at prototype scale. This confinement is approximately 10 ft.
from the edge of the resulting explosive crater. The expanding soil around the
explosion is restricted on three sides, which may tend to increase the pressure
in the direction of the yielding wall. Applying those pressures to the full scale
tests may yield greater accelerations, resulting in greater displacements.
The second source of error may be attributed to preciction of the mass
movement component of the inertial wave ,",a'. T.e b&ocw mW,- asmes
rigid body motion of the soil between the explosion cavity and the, wall fac.
This essentially means all of the force applied to the block directly re."Its in
acceleration of the mass. Since the soil mass is not a rigid body, some of the
input forces are expended through compression of the soil. This simple model
will therefore overpredict the mass movement of the soil by not accounting for
this influence. The use of the inertial stress time history from the approximate
center of the block may have helped reduce this error, but only serves as an
approximation.
The third source of error is related to increased stresses on the geogrid due
to the frictional drag of the confir.ing soil. The ine.tial ,ave doIes not decay to
zero over the entire soil mass at one time. Rather, it deacay, to zero at the
cavitylsoil interface, and then progresses through the soil mass as a f ,,.tion ,f
the wave velocity. With some of the soil returning to a static state, and some
204
ADA293552

being compressed, the compressing soil will cause frictional drag on the
geogrid, increasing the pullout force on the grid. These forces are not
considered in the moe.l, therefore the model may be underpredicting the tensile
forces on the geogrid.
The fourth source of error is the contribution of panel boundary resistances.
Post-test observations from full-scale tests provide some evidence that frictionalforces at the panel boundaries may afte d;•n1rnnt Tn many ea. wall
a^.....................- Lnr tel
r nels become jammed against each othe•r du•""i"" th tet... Als, th• for stel
alignment rods on each panel may also become engaged. IA many cas.e, it w,,s
observed that the rods were severely bent due to the differential movement of
the wall panels. Finally, frictional forces exist at the top and bottom of each
panel at their contact points. When differential displacement occurs between
panels, these forces may either increase of decrease the forces on the panel,
depending upon the direction of relative motion. The relative contributions of
these frictional forces are difficult to quantify.
Approximation of Boundary Friction
The estimation of static boundary frictions may be incorporated in this
model, however the interactions between the i Vidualpa',, nel a, ,,lonment
pins change rapidly and may either increase resistance or load, depending on
205
ADA293552

the directions of relative motion. As a simple approximation of the complex
mobilization of the contribution of boundary frictional forces, the analysis will
be repeated using static panel contact friction added to the pullout resistance
function.
In this test, wood spacers were placed at the base of each panel during
construction. Panel 2 rested on two of these spacers, and Panel 1. rested on
Panel 2, also separated by two spacers. Robbins and Riskowski (1990)
presented a mean value of appr,, ma.';,.,"ih 0.6 for tb. ,cr•,;,,,nt nf ,tnati" frirtignn
for wood on smooth concrete. The weight of the panel i. ap, ,oi "h' 220n
pounds, and the frictional resistance was determined by taking the normal fo.rce
at the upper and lower edge of the panel and multiplying by the coefficient of
static friction yielding a total frictional resistance of 3960 pounds. On a per
unit area, this resistance becomes 132 psf. The resistance function for this
evaluation becomes:
R(u) = 132 + 2263u for u < 0.19 ft.
R(u) = 132 + 2263(.19) = 562 psf for u > 0.19 ft.
206
ADA293552

For Test 5, Panel 1, boundary friction is reduced because it has no other
panels resting upon it, and the pullout resistance is reduced due to the reduction
in overburden. The relationship for resistance becomes:
R(u) = 44 + 752.6u for u < 0. 9 ft.
R(u) = 187 psf for u => 0.19 ft.
The evaluation for pullout displa•cment . , aepsa foI. each of the, &saw e
evaluated previously, and are the results are summ.ardized III A , T .Jae 8.
Discussion of Full-Scale Test Evaluation
Applying the model to the full-scale test provided conservative estimations
of displacements that exceed observed by 20-30 percent when friction was
considered. Consideration of friction made a significant difference to reducing
the displacement of Panel 2, Test 5, and a smaller influence on the other cases.
The majority of the error is suggested to be in the use of the centrifuge
pressure time history and the mass movement portion of the mode-L However,
the data trends follow the expectations that dea,. in.,, w,,,,,an s,.t-ndff distanc-e
207
ADA293552

Table 8.3 Summary of Predicted Displacem-ents Wi , t Ua W•ithout itM.i.on
Test Blast Pressure Total Total ObservedWave Predicted Predicted Displacement
Displacement Displacement Displacement (ft)(ft) No Friction With
(ft) Friction(ft)
5 - Panel 0.03 2.09 1.71 1.33-1.51 ,____________ _____________ ________,___ ____________
5 - Panel 0.02 4.52 1.12 0.66-0.83
6 - Panel No Data 2.17 1.76 1.0-1.172
increases wall panel displacements for both loading mechanisms. Comparing
the results of the two panels from Test 5 shows decreasing the resistance
function through decreased overburden stresses on the geogrid and decreased
boundary frictional resistances greatly increases displacement due to pullout.
An extreme case of the effect of increased boundary resistances was also
shown in the centrifuge tests. In centrifuge Test 19, a steel bar was placed at
along the top edge of the wall and attached to the c ntri.f bucket wll. This
rigid frictional boundary condition reduced the %,Aae,,n, of th, ,,, wal
panels by approximately 40 percent when compared to that of ihe control te-sts
without the top restraint. The introduction of frictional resistance at the
208
ADA293552
Ai i:

boundaries provides reductions in displacement, both in the model predictions
and as observed in testing. However, too much restraint at the panel
boundaries could lead to failure of the concrete panels. This was observed in
the full-scale tests on walls reinforced with inextensible reinforcement (Eytan
and Reid (1993), where the presence of a frictional boundary at the top of the
wall resulted in flexural panel failure.The introduction of boun(.,'ry frictional resistance provided a method for
increasing the effectiveness of the mode',And pro•didAA rnnttt.nt rpmuts when
applied to panels with variations in 'th-eirfrictinal rce. In this ,na,,si, the
use of boundary static frictions provided a simple approximation -i .. ote coplex
mobilization of boundary forces. Further evaluation of the resistance forces
will be discussed in Chapter IX.
209
ADA293552
CHAPTER IX
INFLUENCE OF DESIGN PARAMETERS ON WALL DISPLACEMENT
Introductioa
The development of a model to evaluate" t" response of the lVl 4d .94% ....1.
scale test data provides a tool to investigate the relative influence of1 t.le desi:...
variables considered in the model on wall panel displacements. In this chapter,
the results of full-scale Tests 5 and 6, wall panel two, will be used as control
tests. Changes to different design variables will be made and input into the
model to compare the output with that of the control test for a constant forcing
function time history. The forcing function time histories from centrifuge Tests
20 and 27 will be used, provides data for 21 and 25-ft. weapcn standoffs.
Evaluation Matrixob 1jnlag~mP nt nrp,
The parameters in this model that may effect wall pane! -.dispce.....ar.
the coefficient of static friction between the wall panels, p., urnit .e,,, of the
backfill material, and pullout resistance of the geogrid. The percent changes in
each parameter are representative of the range of values available for use in
210
'ADA293552

design. The evaluation matrix that will be applied to each loading hiunction is
presented in Table 9.1.
Table 9.1 Model Evaluation Matrix
Parameter j . Unit Unit Pullout Pullout PulloutWgt Wgt Resistance Resistance Resistance
%Change +50% -50% -+-20% -24% +25% -25% +100%
Results of Evaluation. Test Five
The results of the evaluation matrix for Test 5, Panel 2 are presented in
Table 9.2. The evaluation of the influence of the design variables considered in
this model show that increasing the unit weight of the backfill soil and
significantly increasing the pullout resistance of the reinforcement have the
greatest influence on reducing wall panel displacements when compared to the
control test. Both of these parameters decreased displacements by 15 and 20
percent, respectively over the control test. Increases in the frictional resistance
anm" smaller increases in pullout resistance also; to a lesser extent, reduce
prcdicted displacements.
In terms of increasing displacement, red.ucion in h, ,,,; ,ei;h, of Ch o sl.
has a significant effect on panel displacement when compared to the control
211
ADA293552

- -I
-• .•' '0 @ 0
S*i
-- - A -
AD2 055

test. The reduction in unit weight is detrimental since it reduces the resistance
to the mass movement of the soil when tile entire mass is under compression,
and, to a lessor extent, decreases the norr, al stresses on the geogrid, thereby
decreasing its resistance to pullout. Deci.-ising the pullout resistance by 25
percent also lead to a significant increase in displacement. Reduction in the
boundary frictional forces also increases wall panel displacements by almost 60
percent over the control test.
Coupling the results of a specific set of parameters &Iso demonstrates a
consistent trend. When resistance is increased, dpaceme,,,o are reAd,,,-,e n
the order of 10 percent. When resistance is decreased, displace.ment. incrase
on the order of 100 percent. This suggests this specific test wall design offered
a low factor of safety, meaning the design may not be appropriate for the
loading condition.
Results of Evaluation. Test Six
The results of the evaluation for Test 6, Panel 2 are presented in Table 9.3.
Significant increases in pullout resistance and backfill unit weight have the
greatest influence on reducing wall panel displacement, followed by increasing
boundary frictional resistance and a 25 percent increa3e in pu-nllot re•qitance.
213

I -
a s0 ' N
V
nR
- - DA293552

Again, decreasing backfill unit weight has the greatest influence on
increasing wall panel displacement, followed equally be a 25 percent decrease
in pullout resistance and decreasing boundary frictional resistance. When
resistance was increased or decreased, displacements increased or decreased
accordingly on the order of 10 percent.
Comparison of Evaluations
As expected, both evaluations provide similar conclusions as to the
influence of these design parameters on increasing or decreasing wall panel
displacement. When resistance was increased, the predicted displacements were
reduced by 10-20 percent over their respective control tests. What is
significant to note is that in the evaluation for Test 5, any decrease in resistance
lead to significant increases in displacement, much more so than Test 6. This
highlights the significance of the relationship between interface stress amplitude
and duration of loading. In Test 5, the interface stress remains between 300
and 500 psf for periods on the order of tens of mi;!iseconds. The, reductions in
resistance in this evaluation resulted in re"sistnc"-e tha werea-w I ccfan tho-
interface stress for many iterations, resulting in significant Jis M.cmn.ts.. A AI,
Test 6, the pressure time history was somewhat different. The interface
pressures in Test 6 during some time steps exceeds 1000 psf, and then drops to
215
ADA293552

less than 250 psf before increasing again. The reduction in resistance in Test 6
did not have as significant effect on results as Test 5 because of the differences
in the pressure time histories, especially the duration of the pressure when it
exceeds resistance. This example serves to highlight that in the development of
techniques to estimate the magnitude and duration of the inertial stress waves,
errors on the order of several milliseconds in predicting the load duration could
have significant results on the predicatnn nf system resonse, In the Control
tests for each evaluation, when te appiled str.oe exceed them resisntn,,e hv
approximately 100 psf for a duration of 30 ms, an adudi ti onad 0.0, ft. vo
displacement was predicted. This results in approximately 0.2 ft. displacement
in 0.1 sec. This sensitivity suggests simple techniques to estimate amplitude
and duration of the plastic stress wave may not appropriate for use in this
analysis.
In terms of the unit weight of the backfill, the results of this evaluation are
confirmed by empirical results. Three identical scaled tests were performed
with variations in unit weight of backfill (Olen, et al 1993). At prototype scale,
the displacement of wall panel two for backfi! densities of 103, 95, and 89 pcf
were 1.49, 1.76, and 2.49 feet respectively. Fig,,',ure-s, 8.6 .nd. 8.7 Show changes
in unit weight do not seem to significantly affect incrtial stres-"s w e - o
therefore increased unit weight does not appear to alter the forcing function.
216
ADA293552

Second, the normal stress on the geogrid is not significantly altered by small
changes in unit weight, therefore decreased displacement due to increases in
unit weight are not related to minor changes in the pullout resistance function.
Based upon this analysis, the primary contribution of increased unit weight is to
reduce displacement due to the mass movement component of the inertial wave
loading.
Increasing the pullout resistance by incre-sin 0L t e ,.•1,,.. ,f th...
reinforcement also reduces displacement as shown in the model evaluation and
validated by the full-scale tests. Increases in pullout resistance may be achieved
by decreasing the extensibility of the reinforcement through influencing the load
transfer mechanisms between the reinforcement ahd soil (Juran and Chen,
1988). Increasing the extensibility of the reinforcement results in nonuniform
stress distributions on the reinforcement, resulting in stress concentrations in the
geogrid in the area near the facing panel. Alternatively, decreasing the
extensibility results in more uniform stress distribution over the reinforcement.
Juran and Chen (1988) report incr eed pullout resisqtance and decreased
displacement with increasing tensile'e stiffness•o, all, ,her. facto-r.s being equal.. In
short, increasing geogrid stiffness provides increases in pullot rit.,tnce an
less displacement to achieve those higher levels of resistance (Fig. 9.1). This is
very important in this research program, where during the inertial wave
217
ADA293552

2000 E. 1OQO0MPPo - IV.)(Rear Eft£ D, pl I
10
-J
2 34 5 10 15 20 25 30DISPLACEMENT OF REINFORCEMEN17nmm
Figure 9.1 Pullout Resistance as a Function of Geogrid Stif.es.s(Juran and Chen, 1988)
propagation the geogrid tail may be statically confined and the soil closer to the
wall may still be in compression while stresses are being applied to the wall
panel. 'The stiffer geogrid would reduce the opportunity for large stress
concentrations occurring in the zone of soil being compressed by the inertial
wave. This confirms the observations from the full-scale tests, as previously
discussed, where the increase in geogri.d stiffness between tests 1 and 3 and 5-6
resulted in significant reductions in wall pane! disp!acemen!,
218
ADA293552

Methods to Reduce Wall Panrel Displacement
The results of this research have shown that the wall, as designed for this
research program, is not appropriate to completely mitigate the effects of a
fully coupled explosion of a 500 lb. at distances less than 30 ft. from the wall
facing. Both designs did survive detonations at 30 ft. and one survived 25 and
20 ft. standoff detonations. Therefore, for an expedient shelter, the structure
may provide one time protection, but the wall panel displacements may make
the structure vulnerable to subsequent exnpnsions. If more predictable and
permanent protection is required, the engineer would defer to moreo- traditional
designs using reinforced concrete.
However, since many weapons have smaller charge weights, adri not every
explosion takes place in the retained backfill other design parameters, some not
specifically addressed in this research, may increase the level of protection
offered by reinforced soil walls. This section will summarize how the design
of these structures can be improved, based on the results of this research and
the results of other research in related areas. The improvements fall in two
categories: reducing the forcing function or increasing the resistance of the
structure.
219
ADA293552
Decreasing Forcing Function Amplitude
The full-scale and centrifuge tests have shown that increasing the distance
between the explosion and the wall significantly reduces the residual wall panel
displacements. This same effect may be achieved by preventing the explosion
from becoming fully coupled in the soil by reducing the depth of penetration an
Backfill Minimization. In these research tests, the backfill soil extended
well beyond the embedment depth of the soil reinforcement. The retained fill
should extend back from the wall as short a distance as possible, This
decreases the chance of a weapon lAndin ;n the hbackfill hv preenting a mrlie~ r
target. In previous tests (Eytan and Reid, 1991-), four 5)00 lb * bombs ,ere
placed on the slope of the backfill of a reinforced soil wall. This test caus,,•, 4,-1
measurable displacement of the wall panels, suggesting that most of the blast
energy was dissipated into the surrounding air instead of the soil mass. This is
one simple method of increasing the effectiveness of a given design.
Predetonation Screens. Many weapons use contact fuses to initiate
detonations. The presence of a thin concrete or steel superstructure around the
target provides a method of initiating an explosion at or near the surface of the
soil, serving to minimize the coupling between the explosion and the soil mass.
Overlay Systems. Another method for redcing the penetratinn capability
of projectiles is to overlay the exposed face of the soil wit., rock r ,.,.Ubb
220
ADA293552
.1

concrete deflection grids (Underwood and Wo-tmoreland, 1993; Rohani, 1987;
Creighton, 1982). These materials also provide a method for altering the
flightpath of penetrating weapons and inducing detonation. Rock rubble
overlays provide a simple and effective upgrade, especially against smaller
classes of weapons.
Increasing Resistance of.Structure.
For a given forcing function, methods identified a- part of thi- research
well as from other sources provide some methods to increase the resistance of
reinforced soil walls to explosion effects.
Top Restraint, As previously discussed and as detailed in other research
(Olen, et al, 1994; Eytan and Reid, 1993), the presence of a displacement
controlled boundary at the top of the wall greatly reduces panel displacements
along the top row of panels. This is particularly beneficial because the top
layer of panels have the least resistance to reinforcement pullout because of the
relatively low normal stresses on the reinforcement.
Increase in Backfill Unit Weight, As d,.,,mp,- nr pvinitdv in thi. rhanter
increases in the unit weight of the backfill also appear to reuc' th,
displacement of the wall panels by increasing the resistance to the mass
movement of the soillwall system.
221
ADA293552

Vertical Reinforcement. Another method to decrease the inertial pressures
on the wall would be to install vertical layers of geogrid between the explosion
and the wall. This may present a unique challenge during installation, but
research in this area demonstrates the potential of this system. Ohrt (1995) has
investigated the effects of geogrid layers_ in reducing the size of explosive
craters. Testing conducted as put of this research cnnsisted of placing layer(s)
of uniaxial or biaxial geogrid placed between the-,j exp.sio. a the soil.s ..'.ae.
Preliminary results show that crater diameters are signif.icantly rd.ucAed, by
placing two layers of uniaxial geogrid at perpendicular orientations in the soil
above the weapon. These layers of geogrid are believed to reduced the
magnitude of the propagating inertial stresses. The decrease in crater size
suggests vertical reinforcement may show promise towards reducing inertial
stresses propagating in the horizontal direction, just as horizontal reinforcement
appears to reduce inertial stresses propagating in the vertical direction.
Soil Stabilization. One method for reducing the size of explosion craters in
airfield pavements has been to provide a thick aggregate layer under the
pavement surface or to stabilize the pavement bs mat,.eri with cement.
These methods limit the propagation of the inertial stresses by i.;creaso the
strength of the soil.
222
.A A293552 ,,*.*,.**...* ,

Increase Pullout Resistance. As shown previously in this chapter,
increasing the pullout resistance of the geogrid also reduces wall panel
displacement by transferring stresses more uniformly over the geogrid towards
the geogrid tail that is confined with static soil while other portions of the
geogrid/soil may still be in compression.
223
ADA293552

CHAPTER X
CONCLUSIONS AND RECOMMENDATIONS
Introduction
Current methods of evaluating the design of reinforced soil walls to
explosion induced groundshock are extremely limited, consisting primarily of
proof testing. Previous scaled testing qualitatively identified that load
magnitude, backfill unit weight, and the tensile modulus of the reinforcement
were the design parameters that had the most significant effect on reducing wall
panel displacements, To develop a more quantitative understanding of the
parameters affecting wall respone, the. problem was studied within the
framework of a model of yielding wallh pres.ent.dA hv nrake, e.t s! (1•7). A
series of full-scale tests were conducted to inve..... te IL,. response," 01a UhW wal.
to free-field blast pressures, and detailed analysis of test data suggested incrtial
stresses, not blast pressures, were the governing loading condition. The Drake
model was adapted to provide a more quantitative approach to understanding
the phenomena of inertial wave loading in the time domain. The validity of the
model was established via full-scale data, and checked with scaled data. The
224
ADA293552

validated model was then used to study the inertial wave loading. The
approach and results of this study provides a significant departure from
previous research by identifying the loading mechanisms that govern response,
the influence of the engineering properties of the materials, and validation of a
model that provides a quantitative description of the physical response of the
reinforced soil wall.
In this section, a brief summary is presented of the most significant
conclusions of this first test of a eognrid-reinffrceM tnil retaining wall with
concrete facing panels subjected to loads fr"om exploios j the r.tined
backfill. Details on the development of each conclusion are discsod
throughout the text of this report. Based on the experience of this research,
recommendations are suggested as to further investigations that would
contribute to providing further progress in this research area.
Summary of Conclusions
1. A successful series of six explosive tests were performed on four geogrid
reinforced walls. Since this type of instrumented tcst series had never been
successfully preformed before, this reseach hac Crpetpd I i.nims,, data base on
the response of the reinforced soil walls to freeofield hbat ,r e.CQ,.,,
225
ADA293552

2. This research suggests two loading mecha1,•lsis a,, e present'L whwen a--
explosion takes place in the retained backfill. First is the high amplitude, short
duration blast pressure wave. This is followed by the inertial or plastic stress
wave, which has two components. First is the loading that takes place while
the entire soil mass from the crater/soil interface to the wall panel is in
compression. This is the mass movement resisted by the mass of the soil and
energy absorbed by the compression of the soil mass. Once the inertial wave
decays in the region of the geogrid tail, stresses on the facing panel are
transferred to the reinforcement and boundary frictional forces. and the pullout
resistance of the soil/reinforcement be"omes m.biize.
3. Research conducted over the past two decades has t-e--pt'd to eAte-
residual wall displacements to the free-field blast pressures and accelerations.
The results of this research have shown that the inertial pressure wave, and not
the blast pressure wave, is the load mechanism that results in the most
significant displacement of the wall panels.
4. The model proposed by Drake, et al (1987) was applied in this research to
the three loading components to provide increased understanding of the loading
mechanisms and system response. The model was validated for the. pressure
wave response using full and sma-scawle test data and pr.Vid... rnn...tPn..
226
ADA293552

results across scales. However, further investigation is necessary to determine
the sensitivity of the model to changes in soil type. Because of limitations in
test data, the model was adapted for evaluation of the inertial wave loading.
However, this research suggests this model may be appropriate for evaluating
wall response to both the blast pressure and inertial wave loading.
5. The equatkit of motion provides a means for evaluatinr the response of the
walls to the two components of ine;.r;ia! wave lo•adinag Evluating tht Pninatinn
of motion in terms of interface stress pr"vided a esf estimating t"he % Ui.W"j
related displacements of the wall panels based upon .. a.u.e. intrace'"
pressures and reinforcement pullout resistance. The resistance function in this
equation was modified to consider both the pullout resistance of the
reinforcement and the resistance offered by the boundary frictional forces.
Boundary frictional forces were estimated by conventional static means.
Considering the mass of soil as a rigid block, the displacement due to the mass
movement of the soil was estimated via the equation of motion, resisted only by
the mass of the soil and wall panel. Using measured soil pressures from the
scaled tests, prediction of displacement using the equation of motion yilde
order of magnitude results. For the scaled tesft, the model pre&rdicted
displacements within 20 percent of measured. The primary source of erro. ,.r
the full-scale analysis is attributed the application of the scaled test pressure
227
ADA293552

time histories to the full-scale tests. The rigid block assumption in the mass
movement analysis, estimation of boundary frictional resistances and the
superposition of the mass movement and pullout displacements are three
additional sources of error.
6. As qualitatively shown in previous. r r, the ,,it weight of the backfill
material and tensile modulus of the reinforcement 9W.e ,th tw engUneenng
properties that have the most significant effect on reducing wall panel,
displacements. For two similar sands, increasing unit weight was shown to
reduce the mass movement of the soil/wall system primarily through mass, not
through any significant increase in shear resistance. Empirical test results
indicates increasing the tensile modulus of the geogrid reduces pullout related
displacement through increased pullout resistance. The stiffer reinforcement
provides more uniform stress distribution over the embedded length of geogrid,
transfrring the stress to the area of grid embedded in static soil, and away
from the compressive zone.
7. For the materials and stresses used in this ,..luat,,n go,,id ,,pt,.., ,
not observed.
8. The Drake-Little equation, as used in this research to predict free-field blast
wave pressures, predicted free-field stresses with a standard error of 8.5 psi,
228
ADA293552

and is therefore considered a viable method for estimating free-field stresses
within a reinforced soil mass.
9. Original procedures for installing strain gages on geogrid that would survive
the installation, field construction, and free-field blast and inertial pressureswere developed and modified during this test Series. By the final test series,
the gage survival rate was 80 percent.
10. Based upon the comparison of the full and smal-sal test. data, the,.
centrifuge studies provide reasonable models of full-scale tests.
Recommendations
Based on the experience of this study, recommendations for further
research are presented that, in the author's opinion, would lead to further
progress in the study of this subject.
1. A model that, for a given explosion in soil, characterizes the amplitude and
duration of the inertial stress wave in a sem,-.f,.,e soil mas. wn.d-
provide a means of quantifying these stresses for a range of w'eapn sizes anA
standoff distances, as well as their spatial variations. Incorporation of thi3
model with the Drake model would provide a means of further study into this
research area.
229
ADA293552

2. Data from full or scaled testing that details the inertial stress wave is very
limited, for either the infinite or semi infinite case. Further test data would be
necessary to validate any modeling of inertial stresses.
3. Current models for soil reinforcement interaction are based upon modelling
the behavior observed in standard pullout testing with various levels of success.
The interaction between the soil and reinforcement when large strains in the soil
mass are propagating through the -einforce-d 7onet tow•_rd the wall pane! may
not be represented by current m.odels. Inve,,,gt•in of the• ffioet 0f thic loading
condition on the soil/reinforcement interaction estbish hx labuoratorY pu.l.ut
test results compare to this unique loading condition.
230
ADA293552

APPENDIX A
INSTALLATION OF STRAIN GAGES
Introduction
The preparation, attachment, and moating procedure for attaching straingages to polymer geogrids described in this appendixT was on rsearch by
Oglesby, et al (1992). Much of this procedure, Adevelp, d and ,,liejdtA. ,..
strain measurements of unconfined geogrid in laboratory te.sile e,, is
included herein. These procedures were used for attaching the strain gages
during full-scale Test One. Based on the experience of this first test, a series
of modifications were made to the procedures, greatly increasing the survival
rate of the gages. These modifications are also detailed in this appendix.
Materials
1) Micro Measurement's (MM) EP-08-250BG-120 strain gages
2) MM's A-12 adhesive
3) non-aggressive cellophane tape, 3 strand wire (MM 326-DTV), andstandard tools for strain gage work
4) 000 steel wool, 220 and 400 grit wet/ddr sandpaper
5) laboratory grade alcohol for cleaning
6) large spring clamps
231
ADA293552

7) 0.25 in. thick aluminum bar stock
8) 0.25 in. thick medium density closed cell neoprere sponge
9) oven with sufficient capacity for samples, capable of holding 125 degreesFahrenheit for four hours or longer
10) aluminum foil
11) rubber cement
12) TYGON tubing
13) GE (or similar) 35 year silicon rubber General Housh.ld Seal•ant
Surface Preparation
The surface preparation procedure developed uses commonly available
materials. A clean, metal topped table was used as a firm surface for all
preparation and gluing. Laboratory grade alcohol on gauze pads was used for
cleaning the geogrid surface before and after each abrasive. The surface was
wiped until no residue or discoloration showed on the gauze pad each time. A
cross-hatch pattern was used with each abrasive, 45 degrees clockwise and
counter-clockwise from :.•' direction in which the grid wa to he teqted. 000
steel wool was the first abrasive used. Pav;"i h.ar , hdbe,, -rfill not to
damage or peel the edge of the tensile rib, the rib surface was scN,,,red, u4.2si
the cross-hatch pattern to completely cover the surface, seven times. This
number of repetitions was sufficient to completely degloss the surface. After
232
ADA293552

cleaning, 220 grit wet/dry sandpaper was used. The surface was abraded fvur
times using the cross-hatch pattern. This produced a roughened surface without
actually removing the geogrid material. After cleaning, the third and final
abrasive, 400 grit wet/dry sandpaper was used. As with the 220 grit
sandpaper, the surface was abraded four times using the cross-hatch pattern.
The final cleaning with alcohol was very thorough. The prepared surface
appears smooth, with a dull finish.
The techniques used to glue the stain gages to the geogri. . are imiar t,.
those used for attaching strain gages to other surfaces. Care was taken in
handling the gages so that all surfaces stayed clean. Non-aggressive cellophane
tape was used to hold the gage, and align it properly on the prepared surface.
The tape was then pulled back from one end, lifting the aligned gage from the
geogrid. A small amount of adhesive was then placed on the geogrid or foil
strip, and the strain gage was placed back onto the prepared surface. Using a
firm, smooth stroke, the tape is pressed down to spread the adhesive and
remove any bubbles. Very detailed instructions for this typ of gluing
technique are available from strain gage manufacturers.
233
ADA293552

To apply uniform pressure while the adhesive sets required placing clamps
over the strain gages. One neoprene pad was placed on the cellophane tape
covering the strain gage. The two aluminum blocks were placed over each side
of the geogrid rib, sandwiching the neoprene, gage, and geogrid in between.
Everything was held together using a spring clamp. It is important to center
the clamp so that the pressure. is evenly aphlied. After the strain gages were
glued and clamped in place, the s.amlesc ure placed4 in a Irge. oven, cilmps
attached, at 125 degrees Fahrenheit, for at leas. fo"ra -ho" Afier the samp!les
were removed from the oven, they were allowed to cool ,,,ermig,.;t ,,efore the,
clamps were removed. The neoprene sponges and the cellophane tape should
be removed carefully to avoid damaging the gages. At this time the leadwires
can be soldered to the strain gages.
Protective Coating
Six thin coats of rubber cement were applied to the entire strain gage
surface, exposed leadwires, and soldered connections. Each coat was allowed
to dry at least ten minutes before another coat was applied. The silicon caulk,
a transparent medium which allows the glued Vaa,,. to •e observed, was then
applied. Two long pieces of TYGON tubing were s,,lit and nlaced- ar,,nd the
geogrid rib and strain gage to act as a mold and to contain the caulk. The
234
ADA293552

caulk will cure in about 24 hours at 125 degrees Fahrenheit, or in 3 to 4 days
at room temperature. After the caulk was cured, the TYGON tubirg "mold"
was removed.
Deviations ind Additions to This Proedure
Protection of the Leadwires, ec.ause.. t..b......wires wi.d.. he rnv..d with
many feet of soil backfill, subjected to the stresses of 'the ea.th.6 movig ,a
compaction equipment, and had to pass through the gaps between the facing
panels to be accessible, the leadwires had to have additional protection. In this
case, each 12 ft. long leadwire was passed through approximately 10 ft. of 1/4
in. diameter TYGON tubing. Since passing wire through long lengths of small
diameter tubing is analogous to pushing wet spaghetti through a soda straw, a
procedure for feeding the wire through the tubing was developed. For all tests,
the leadwire used was Micro-Measurements 326-DTV stranded tinned-copper
wire, 3-conductor twisted cable, with vinyl insulation.
First, a 12 ft. piece of nylon string was obtained, and a small knot was tied
on one end. One end of the 1/4 in. TYGON tubing "Wars attzCheA to, a v.,a,,,m
source and the knotted end of the string was inserted into thC voth-er end of the
tubing. If the tubing was free of kinks or other defects, the string would then
pass through the tubing to the end connected to the vacuum source.
235
ADA293552

The string was then attached to a 12 ft. piece of stiff wire, anrd the string
was pulled through the tube, pulling the wire with it. Once through the tube,
the wire was soldered to the strain gage lead wire, and then again pulled
through the tubing. Now the leadwires were encased in a protective tubing.
This process was developed through trial and error, and made best use of the
materials and equipment on hand.
Tie - Down -of the Leadwires. Another step added to the above procedures
was the use of plastic tie downs to provide str-an relief to the !eadwires, and
reduce the stress on the soldered co"-¶-"';- o €,ns. Afteh le-,-,,h.,Lzadwire .were- sold.ered
to the strain gages, a plastic tie was wrapped around the geog.itud 6 .k ,%aV%'
encased leadwire and tightened, within an inch of the soldered connectionl. A
second plastic tie was used a few inches further away from the soldered
connection. This prevented the self weight of the wire from breakng I
soldered connection.
Protection of the Strain Gages. Due to the potential for construction
damage to the strain gages, the TYGON tube used on each rib to ccntain the
silicon caulk was left in place.
236
ADA293552

Results of Test One
After completion of construction of the first test wall, a test of the strain
gages determined that none of t.,e connections between the leadwires and the
strain gages had survived construction. It was hypothesized that there was afailure in the soldered connections between the. ledwirP. and strain ga,
therefore the strain gage installation proced-res h oa , , ;• tfn nr.vpnt a
reoccurrence of this problem in subscquent tests.
Modification of Strain Gage Installation Procedures
The stiff soldered connection between the strain gages and the leadwires
was breaking under construction and installation stresses. To improve the
survivability of the strain gages, modifications were made to the ;train gage
installation procedures.
Addition of Bondable Terminals
To provide strain relief between the soldered Ikadwires and the strain gage,bondable terminals were epoxied to the eovrid rib adjfamceant to tho. q-nlrder tAhr.
of the gage. These were attached to the geogrid rib usi:g the ,ame prcedues
used for the strain gages. Both the bondable terminals and the strain gages
could be installed at the same time. The instrumen, leadwires were then
237
ADA293552

soldered to the bondable terminals adjacent to the gage, and "mal-l f-ible,
jumper wires, curved to form strain-relief hoops, were then connected fron' the
terminals to the gage solder tabs. The specific bondable terminals used for all
subsequent tests were Micro-Measurements terminals number CTF-50-C.
Use of Low TempratureSolder
The high temperature solder used in the first test required temperatures in
the 600-800 degrees F to melt the solder. To melt the solder at this
temperature required long contat timec teo the snlder nnd strain gage.: This lea
to some melting of the geogrid. To reduce the contact time between the
soldering iron and the solder and strain gage, a lowertempr•at,,re,"'- solde.r w,
used. The specific solder used for all subsequent tests was Micro-
Measurements solder #361A-20R. This solder would melt at 361 degrees F,
and greatly reduced heat transfer to the geogrid. Soldering at specific
temperatures required the use of a temperature control soldering station that
allowed for complete control of the temperature of the soldering iron.
Reinforcement of the Geogrid Ribs
The flexible geogrid ribs on which the strain gages were mounted tended to
bend during handling, stressing the soldered connection betwee.n the leadwires
and the strain gages. To help stiffen the ribs, "ih;o"U"t af,,f€ec.i, th,, e,, .oar-All
238
ADA293552

strength of the geogrid, thin wooden sticks ("popsicle sticks") were glued to the
underside of the rib using rubber cement. This helped prevent excessive
bending of the geogrid ribs, without significantly affecting the strength
properties of the geogrid.
Strain Gage Protective CoatingThe use of six coats of rubber c-eme-nt t- cnat th, stain gage. and .oldered
connections was time consuming and had unkn,,own pro,,,tie Tn crs.p the
process, and to provide specified performance, two coats of ,Micro--
Measurements M-Coat D coating material was used for all subsequent tests.
This material provided a hard coating capable of high elongation. This material
provides a good moisture barrier and negligible electrical leakage.
Success Rate
Using these procedurt... ith the modifications mentioned above, the
survival rate for these strain gages increased to over 80 percent.
239
ADA293552

APPENDIX B
TEST WALL CONSTRUCTION
Introduction
This section will discuss the test site, fabrication of the concrete wall
panels, pouring the leveling pad, and construction of the embankment.
Test Site
The test site selected for this project was the Sky X test site 1'r'•- in thp Ieastern section of Tyndall Air Force Base, near a Ci... '-,ty, Floida. Lilt; V-
site is a designated research and develOpret tc-st ae 0 buy
1100 ft. in size. The maximum Net Explosive Weight of explosives authorized
for detonation at the site is 1000 lbs. equivalent TNT. This site was chosen
because it is an approved explosive test site, and also due to its proximity to the
available laborers, heavy equipment, borrow pit, instrumentation, and research
offices/labs. Having this site locally available greatly reduced the project cost.
240
ADA293552

Within the test area many potential sites were evaluated for use. A site was
selected near the remains of an existing hardened shelter used in an earlier
research project. Only the first test wall was constructed on this site, because
with each successive lift it became more difficult for the heavy equipment to get
to and operate on the top of the embankment. The next three walls were
constructed near: the first on a location lower in elevation. This allowed the
equipment easier access to the top of the embankment since it could be reachbd
via a soil bridge constructed from the nearby higher ground.
Fabrication of Wall Panels
A commercial fabrication company was hired to fabricate the wall panels
needed for this test. A contract for approximately S29,000.00 was let to United
International, Inc. of Birmingham, Alabama, to be executed by their office in
Fairhope, Alabama.
A total of 160 panels were fabricated with a total area of wall facing of
approximately 1093 sq. ft. per wall. This yielded a fabrication cost of
approximately $6.64 per sq. ft., fabricated on site and not including
construction of the actual test wall. This cost included the ne-esarv spacers
and joint materials used in construction.
241
ADA293552
i ,

A series of 12 wooden forms were built for pouring of the panels. The
standard steel forms for the panels were committed to another job, so wooden
forms were used to speed delivery time. A concrete pad was poured to provide
a smooth and level location for panel fabrication. After the forms were set in
place they were lined with form grease and the reinforcing cages were placed
into the forms on metal saddles. Two 3 Ft. Inng pn;!p. nf the apprnpriate
geogrid were wire tied to the reinforcing cage, one centered between h.e middle
and the top of the panel, the other centered between the miuddle and thebase o,•,f
the panel. This would result in a 30 in. spacing Of geogrid layers. Standard
4000 psi ready mix concrete was delivered to the site and poured into each of
the forms. The concrete was vibrated and then hand finished.
In 24 of the full sized panels, metal soil pressure gage mounts were cast
into their geometric center. Also, a 2 by 2 in. metal plate with 4 anchor legs
was placed into these same 24 panels, such that the meta!l plate was on what
would be the exposed face of the wall panel. Each plate had a small hole
tapped into it for mounting of the a,,c-ce.lero.me.ters..
After an initial cure time of approxim...,ely, 8 I.R hou,, the frmq were•a, l~s .. 1• La. AJ ,w ,., .. ....- .- .. .
stripped and the panels moved to temporary storage to c-omp,-,-ete "an
await for construction to begin. When the panels were moved after the iAnitia
cure time, they were lifted by the geogrid and not the lifting eyes embedded in
242
ADA293552

the panels. This was done because the concrete was too "green" and therefore
not strong enough yet to prevent the lifting eyes from pulling out of the
concrete. Before the panels were stacked, the edges of the panels were
inspected and any excess concrete that might have squeezed through the forms
was chipped off.
The concrete panels were placed in stacks of five pane.s or less. Wooden
dunnage was placed between the panels. It was -,treM•Ml nmrortAnt that the
dunnage pieces were lined up axially. If the dunnage Wae.. , andomly ,l.aced,
there is a chance the lower panels could crack and break under the .tr.sses.
Finally, the panel faces could not come in direct contact with the wood
dunnage, because it can cause a permanent stain on the panel face. Therefore,
each piece of dunnage had plastic separators on the side exposed to the panel
face.
Leveling Pad and Site Preparation
Before construction could begin, the site was cleared and leveled and a
leveling pad was installed. The test site was an area of silty sand and with
intermittent grassy areas. The top 6 to 12 in. of soil was ,remWve.dPMI ,,o, t, p id alC
level working table for construction. At the proposed location of the conret
facing panels, a ditch was constructed for the pouring of a leveling pad. This
243
ADA293552

ditch was 100 feet long, approximately 2 ft. deep, and 3 ft. wide at its base.
The embankments of the ditch were tapered outward to allow room for working
the screed boards after pouring. Metal forms were then placed in the ditch and
leveled. The final pad surface had to be level to ensure the facing panels fit
together properly. The forms were placed such that the leveling pad would be
1 ft. thick and 18 in. wide. No reinforcing steel was placed in the forms. The
steel was not required because the ,,dI nnlyv e.rvedL to provide a level base for
the facing panels to rest upon, and ,vma nt d-sinda, nlati hpnrina fnntina
Prior to pouring the concrete, a transit wras "°v'+ f" ,.ka.,+- thp 1,i,,l nt thp fekrm
and guide the final adjustments. The concrete was poiu,r,.,, ,,,uu,, ,
surface was screeded smooth.
Wall- Construction
Introduction
This section will generically discuss the procedures used for construction of
the reinforced soil walls. Construction procedures were modeled after those
performed on any commercial reinforced soil retaining wall project. With the
exception of the instrumentation, no special allowance were- m.adde during the
erection of these walls. Also, attention to detail ,"waas ,neCesbSry to e-nsure*. the s•i
instrumented panels on each wall were installed in their proper place u.r
244
ADA293552

overlooked amid all the activity of construction. Finally, no drainage system
was designed into the embankment due to the short design life of the project.
Base Row Panels
Prior to placing the first panels, a string line was established to over the
length of the leveling pad to ensure proper alignment of the wall partis. The
51h in. thick panels were to be (.entered on the 18 in. wide leveling pad. The
string line was placed so that each panel would rest 2 in. away from it to
prevent any interference between the pa,,nl and she st.ing A teel tape
measure was used to ensure proper offset between the string andA the %AnCeIs
While the string line was being established, an all terrain work'fift, w.a.3
moving the concrete panels to the site. When picking up panels from a stack
extreme care had to be taken to ensure the forklift tines did not catch on the
geogrid tails sticking out of each panel. When a partial stack was to be picked
up, long planks were placed between the panels such that the forklift tines
would be above the geogrid, separated from the geogrid by the wooden planks.
With the stringline in place and panels at the site, placement of the panels
could begin. First, two 6 ft. by 20 in. panels were lowered into place. The
distance between these panels was uge, such thataA ft. hby 40 in. high pairel
could fit between them. After the first two panels wer3 Set, a 6 ft. b in.
245
'"ADA'293552 " "

panel was set between them. Each panel was separated flom ...e adja..e.
panels by a ½/7 in. gap. After the panels were set, the 6 ft. by 40 in. panel was
clamped to the two adjacent panels. Next, another 6 ft. by 20 in. panel was set
in place, spaced such that a 6 ft. by 40 in. panel could fit between them. After
the second 6 ft. by 40 in. panel was set, it was clamped to the adjacent panels.
This process was repeated until the entire first row of panels was in place.
Once the first row was set, each 6 ft. by 40 in. panel was restrained with
wooden shoring. A clamp was placed at the top center of the panel, and a long
2 in. by 4 in. board was nailed to the Clam.. Thes paneal ,ws the.. ,,€., tnward.
the backfill side to provide an inward batter of approx..imately, 1A o-f1 anl All. ,-
ft. of panel height. The amount of batter depends upon tUh-e type or0f ei,,fVorcinII
material and backfill soil. A course backfill requires less batter then a fine soil,
and a higher tensile modulus geogrid requires less batter then a lower tensile
modulus geogrid. The shoring was then nailed to a heavy stake driven into the
ground in front of the wall.
Placement of Backfill
With the first row of panels in place, soil was then placed in front of the
wall to ensure the proper embedment depth whih in this case was 5 feet.
Before backfill could be placed behind he wa, , gaps t,,,n the f.21s
246
ADA293552I ,Ii i

had to be covered to prevent soil loss through the cracks. In this case, filter
cloth strips were placed over the joints on the backfill side of the wall, and this
material was glued directly to the backside of the panels. With the jointscovered, backfill soil was then placed and comactef,,d h h'.- sht ,l sin ,,, the
elevation of the first layer of A. Vor thi proje.ct, tI&"h soil waS plac..•.
leveled and compacted with a track,,ed John Dere .D-1J uulldozer. T1e
bulldozer remained at least 4 ft. away fron. the concreie panels. This distance
may increase or decrease, depending ,,pon the size of the heavy equipment.
Once the soil was in place, the geogrid reinforcement was installed.
Placement of Geogrid Reinforcement
The geogrid roll was placed behind the first panel and connected to the
geogrid tail that extended out from behind the panel. The pieces of geogrid
were overlapped, and aligned so the ribs from one piece could be woven into
the gaps of the other piece. A plastic Bodkin bar ,,, the-n pue,,s-, hed ,,etk,# ,h,
two layers of geogrid over its entire lg.. The g,-;.rId w,0 then .unredA to
the specified embedment length, and cut from th , ro, wiUL h a ,aor nifMU. ,I,,s
was repeated until the entire first layer of geogrid was in place. Once the
geogrid was in place, soil could be p!--ced over the grid starting at one end of
the wall. Two long steel rods are pushed through the ends of the geogrid mesh
247
ADA293552

and driven into the soil with a sledgehammer. Workers then pulled on each
rod, effectively prestressing the geogrid. The bulldozer pushed soil over the
prestressed grid, starting in the area just behind the wall panels and working
back. Soil was placed such that the equipment never came in contact with the
geogrid. Once the first piece of grid was covered, the next piece of grid was
prestressed, and the whole process repeated. The lifts of soil were placed to
the level just below the horizontal gapn at the top of the 20 in. high . pane, The.
bulldozer then made repeated paassves. ov" erl, thle b&&f a unil; w ns say
compaction was achieved, as confirmed by a n-,-eAr -,e,, gage.#v
Second Row of Panela
The next row consisted of seven full (6 ft. by 5 ft.) panels. Two 1/2 in.
spacers are placed on the top edge of the panel upon which the next panel will
rest. These spacers are made of rubber for a permanent wall, however 5ince
this wall was temporary, 4 in. by 4 in. by 1/2 in. wooden shims were used.
Metal alignment pins are placed in the holes on the edges of the in-place
panels. The clamp is removed from the panel and the next panel is guided into
the alignment pins and set into place. Once the pan! is in place, a!d bfore
the crane is released from the panel, the. alinment of the pnel ks aidj.....
The gap between the panels is set and the base of the .A.e iA in j, g ,,,h the
248
ADA293552

panel below it. Crow bars were used to make the necessary panel adjustments.
The panel is then loosely clamped to the adjacent panels. Next, the batter of
the panel is adjusted. Two wooden wedges were driven into the horizontal gap
between the panels until the desired batter is achieved, and then the clamps are
tightened. Details of the clamps and wooden wedges are detailed in Fig. B. 1.
This process was repeated until the entire row of panels was installed. At this
time the first layer of "loose" geogrid was installed.
The design for this wall called for two additional layers of geogrid that
were not attached to the panels ('loose' grid). These grids were placed at the
locations shown in Fig. 5.3. Seven piesof geogrid wr,- nplaed 2 ft. and five.
pieces placed 4.5 ft. up from the base of th.I wail oI 6 It. VV A.Cete rs. T.12e eSU Wf
the grid were bent up 90 degrees upward against thie back of the •anel -.. T hisb
geogrid was not prestressed.
Once in place, the filter material was glued over the gaps, and the next lifts
of soil were placed until they reached the level of the next layer of grid.
Since the heavy equipment could not operate near the back face of the
retaining wall, some measures had to be taken to achieve soil compaction in
that area. First of all, soil placed directly behind the wall was stomped down
by foot. This was continued until no further significant compaction could be
observed. Secondly, large volumes of water were spraved hehind the wall for
249
ADA293552

20
.1 ?w
03
ADA29355

hydraulic compaction. This was observed to work well in the silty sand.
Although these methodologies are not precise, the densities in this region were
similar to the area compacted by the heavy equipment.
Before the third course of panels could be installed, the wooden shoring had
to be removed. After this was done, the panel installation process was repeated
until the wall was completed.
Throughout the construction process, tean h,•,7., allonmant
and spacing of the panels were checked. If the alignment on the LowVer laye..s
had been poor, some of the upper panels may not fit into the remaining space.
Also, backfill soil density was maintained through periodic checks with a
nuclear density gage. Density measurements are presented in Table 5.2.
Minimum Geogrid Embedment Length
The wall design called for embedment length to decrease with decreasing
wall height. The outermost panels had design geogrid embedment lengths of 6
and 7 ft. During construction of the first wall, it was found that these short
embedment lengths interfered with the construiction pro_-.;,.. When a layer of
grid was placed, long metal bars were inserted th,.ro"gh the tail of grid .ayerq nd
pulled to provide some pretensioning of the geogrid. When the tail Of the g. •d
layer was this close to the wall, the heavy equipment could not place the soil
251
ADA293552

without endangering the workers pretensioning the grid or getting too cdose to
the wall face. On all subsequent walls, the reinforcement length at the edges of
the wall was increased to 8.5 ft. which allowed the heavy equipment to safely
place the backfill without any interference from the workers while still
maintaining a safe distance from the wall.
252
ADA293552

APPENDIX C
DATA PLOTS
253
ADA293552

* I
* I
I 1*
LL
_____________! _____ ______ _"____
' A-A 9-55D 3 I , 1

I I
i U
CA
SI ,
0 D3Aunss3ud
ADA293552 "

F I
I : °
T
I
-
"a
ADA293552

SI I I-i-FT
i I •I C-
__.___ _ __ __ * •- ---- r--,)
- --.. ......
7;.'
(ted) aunss'vdd
ADA29•35'5"2.... ..

*I I a I ,:
SI 4"
• i i, I v•
I a
_ _ 1.• • '-.
ADA_ 355 .......

2l
I.. _
N. did
Itd3ncv
AD235

I . i '
__!,_ _ __ ____
I I j~~u
, I -!

U-I
'7
* I-'C,, Oq'.0
@0,
0
"'-S-
1's' - '.0I N0
00
00
'4
* S S* * *
N '4 SISd 'OJ1�SSQJu�i 'S J�91UI 1103

I [IV
-d__ IA11,
349 Fiche 3 05/24/95 ODA32A5t••

rw,
I-4
E.0
I.- �
N U '0
0
U
'4
S
S S SS'4
S'5 'UO1�VJ9�9OO��
ADA293552

* tI
44
_4_
. ... ..... ....
ff-
I low
AkV
-i C Ta4
WIS) OLLVW13:)E
ADA29355

_____ I _ ____ _lea
______ -4 1___ -
in;
_ _ _ _ I I 4,7
___ I__33*
ADA29355

J J1~ .: - m-
I I-,Me-
NOLr"71303

R C4
£ ,_ ! _ _
- i i .
ADA293552"

-2
w Ii______~~~(Sd ____ ________ __
_______ __ADA293552-

It _____ I _____ _________
.I .0
_ _ _ - -,_ _ -I , ,[ _ __ -i __ 0
' I • ! ,
_ _ I _ _i _f , UI-
{•d) 3nSSA..
AD2955 _ I _ili

I -
I _ _ N
S7 1
I ___ __i
-' -iI -l 0m
2 °
• • -
-r. ! w
ri am A Ci 0 .•
ADA293552

I 0
I tI Iii I I ___-___
__ ___ ___ ___I
_______ _______ _______ 0I Co
I I.I -
__ __ _ Cu
I I_ _ _I
C,,
-� 00
____ ____- I 1�WI WI WI
(gad) miflSS3bid
ADA293552

*1CA
I Ui
_ _ _isd _ _ _ _ _ _ _ _
ADA29355
I Gi
I I i_ _ _ _ _ _ _ _ U
______ f
ADA293552

_ _ ISME:
41e
NOUVW3130*
ADA293552
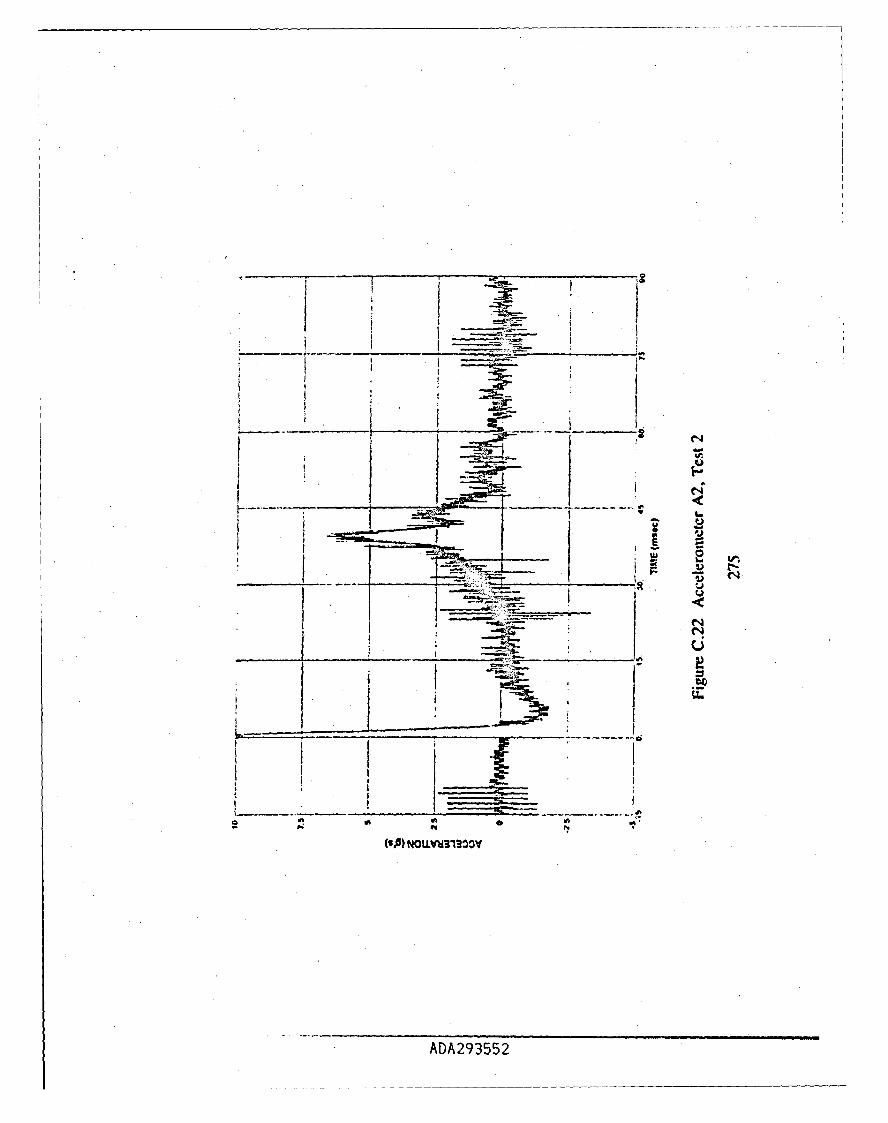
I I • : -
I I"-,,,,•
______ ____as I U
o J M
ADA29355

�1 -S
___ __ I I
<if.4
I U_____ ________ 1*-
7--i__ __ I
- CF - c�)
_____ _____C
___ I __
7-i 1 � ------7___Lz�m___0
(mB) NoaY�raxJv
ADA293552

* Ir
I IN
Elz - r
________ I-

_- II ':•- .1
-, - ,I
.... - . . .,
- I _ _ F•_____-•_-_ F• .
ADA293552.. . .. ' -

ip..
*I
0 ca
I *
tI II
* I.* I ___ __ __ __
I I I a r.(90-3) NWYi'S
ADA293552

* I,___ _ _. _ __ __ _ _ __
I I"
I I _
1 (NI ;
ADA293552

I 9,
__ __ __ __ ,,
L ...
- ---- I
_ _ _ _
__ _ _ _ _ _ _
(
I I
I1....• o-
(90"t) fl•Cl.
AD__I35_

II
I 4
!" F
"'• ++ . . .1+- --
- ~ I I
I + i -
(90-3) Nnrdis
ADA293552

* a.
__ _ _ _ _ _ _ _ ___
I -.- I :
- - Co
(WB~) NW"S±
ADA293552
MIA!

I.
__ I I.
I -
__ __ _ IL1. .0
'S
__ __ ____I__ I-
*'1�
K 00
- __________ � I
_______ _______ _______ I _______I -
I Li*1
______________ ______________ I I
I ________________ __________________ ______________
U, U, U'
ft N N
(tid) �
ADA293552

1 _ __ _ __ __ __ __ __ __ __ __ __
*I
I 4)
II wIii
LC.
Oad) 3unsgsld
ADA293552

Id4fid ± __sv
ADA29355

_______ f 1 1 _______
I __ I ___
.9.---- -
f I I _____I __ I ____
1---- -- -o
I I I.I II In
___ ___I .
_ _ _ 0
7____ _____I, I Ii______ - I I ___
U)U -
I CI U
i- r�7r. In
I UInI-.
0..
__ __ I __
_ _ __ _I- -,,---- � = . - - -o
U)
___ ___ __ -- .--- I.;.
1 �Li �..t___2 0 0
ADA293552

I _ _ _ I . I "_ _
LIP
' J| •' I II 0
I- ,
ADA293552

I- * I,
I I '•
*i I .t
SI is.
It t" -d
I -~ I
ADA293552 •|1 iII

*1 I I*!d - binss
__ ADA293552

_____ ____ _ ___ I
i~~i I _ __ _
_ _ _ _ -I - _;
I I 7'_ _ _ _ I
* _ _ _to
-Isd un t
_______ADA293552

1P
____ ____ ___ ___ 1 ~ -.-.--------- ____ ___
ae
IIp
____ ___ ____ _ _ ____ _ _ ____ I ____ _ L
pi 4
(S5 N.M*33
ADA29355

7 -2
______ - 0
I -�
I I-� I___ _____
I -�__ - ____ I 0I I.r r
-� .-I--� I
___ -� ___ 4I...U
___ ___ ___ __ _____ ___ U-i E0
__ -� r� ___ _ I I- �_____ ______ -� - ______________ -I o
.�- I
* _ I___
___ __ 2 UU1�
I *
I.-� - -. * * LLq
I _____ _____ _____ _____
I.______ ________________________ _____ I.I_______ ___________________________ --- ______
0 0 *fl
*(gB) �oum�iioov
ADA293552
I I -

g-I
SI..•
-- V'
le a
"1'
1 2
ADA293552"

C-.-�
1<
(sfl) NOUV�3�9O�V
ADA293552

9\
* ¶I"
I i'I • "
'02
12.6) NOUIVU•'31303
ADA293552 ..

M II
_ _ _ _ _aNOLL~ld-l3=
ADA29355

- I
- _ _ _I_ _ _ _ _ I0_
___-(9-3 I _ _ _ _il j
-DA2355

-Cd,
Lso3) NrCdL
ADA293552

I
I _ _"_ _ _
S U
*L
* I -;
(go-") NrvviS
ADA293552
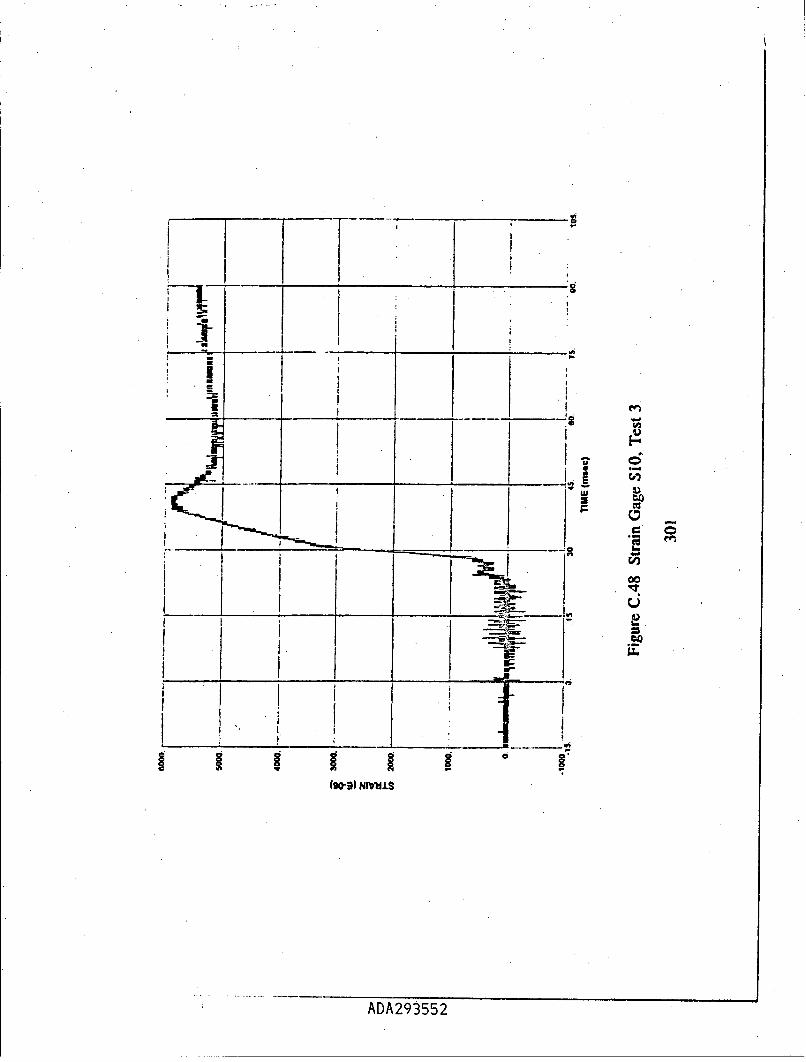
lC
"* - I
- I_I I"
IIII-
________ I-I•
- I,,• N' 0,
; ADA29355

f I I-
* UE
-. _ . * - -
I i -
ic
(90"3) Nrfd's
! i•,ADA293552

__1-I __
I K
I.
LJ�
0
* -o
± -____ aI-
* I* I
_______ _________________I
IC* I
1�___ ___ ___ ______-.I_
______ _______________ .9
Vh WI
(asd) �flSS3�5d
ADA293552 � I

-i I S
t177 I __ I
, 1' 1 - -___ _., _
--_ . . I _ _i I- _ _ _ _ •
S--- '7, - 'I - ... .......
, _ I •- 'II _ __ _ -
i- i i I :
* 1W U,
-- 4- _I •'----I.1 I L
i v)i
(Isd) s•f•lsud
ADA293552

cl 0iI ~1 ;-1 __
hed awnsssu
ADA29355

IIL
Utz
~~Li
o I
-IlkB-P
__ i i:"_____L
(!sdl uJ~nSSVd ,
ADA293552

I -r1 - 1-� -�
I II.. ________________ i I
___ I ___ I
I -
I I I ___ _____ I __ __ - ___ -. __ __I -
*1
__ ___ __ H4
Azw1' _______ _______ dF
- F-UI- �
____ ___ ___ ___ U0�
I Id.�
_I_ _____Jo_ II,
ri S S
ADA293552

I i. I
Iid unsu
ADA2355
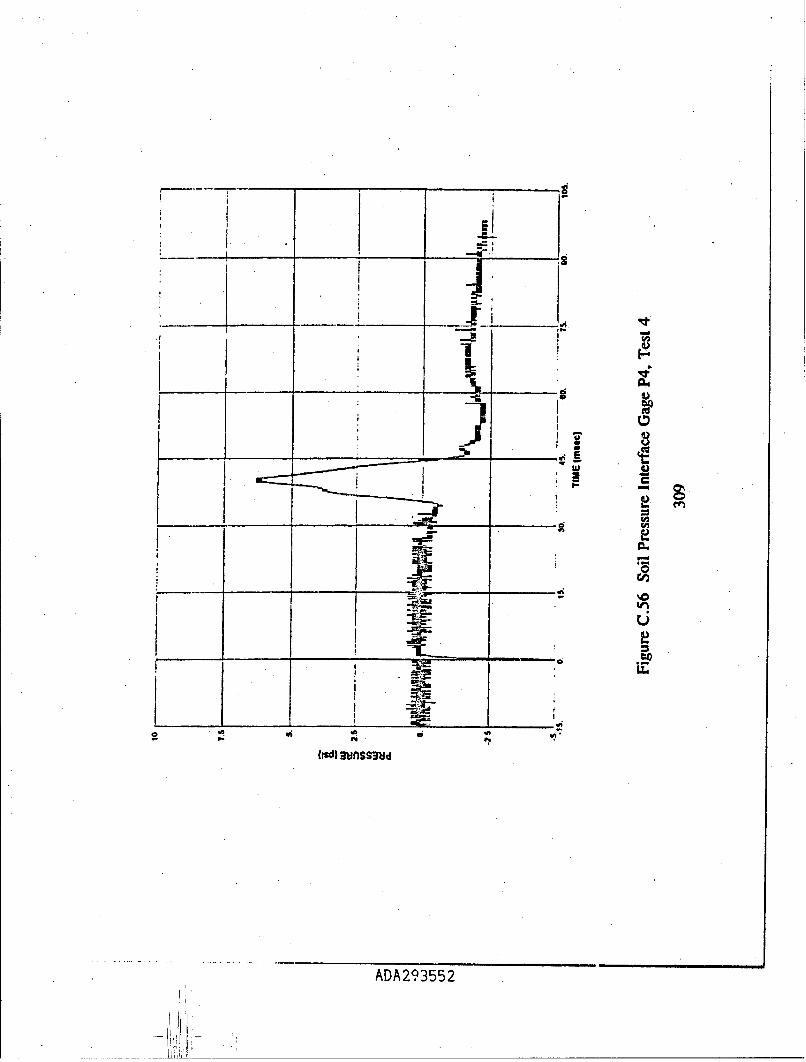
i °n
0oi
ii
I
ADA293552
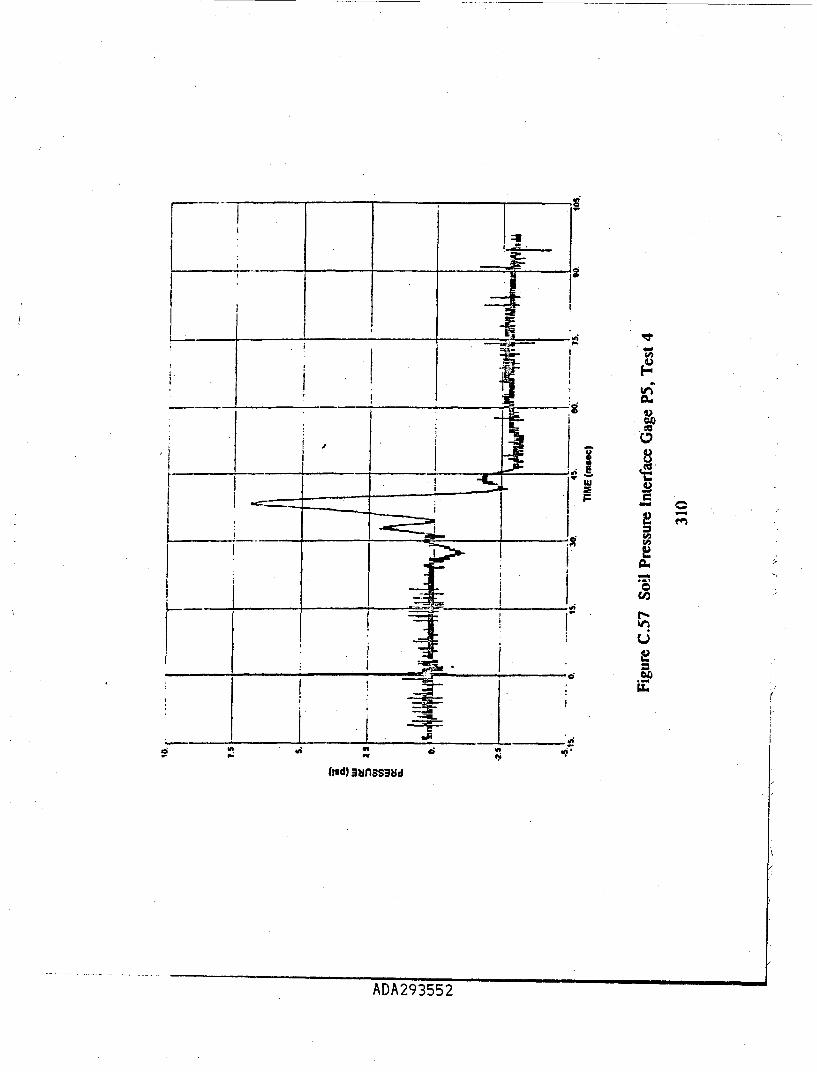
TLL
I-U
9- I~i
AMd) 252I ifS
ADA293552

t " II -I
- -
______ _ _____(!_ _____ __ __ ____d
AD2955

I
____ ____ ____ I ________
0
_________ ________ -aB
- -
-� �=-
Ii a E
_____ ___________ Cw i- N
U -.
U
q ft e
('A) NOU.V��3O�V
AIA9

I ��0
-. 1� r
U)0
I *
U*
I- U, aI- C�
I __
_____ I* - * - *
o *1'0 0
(.6) NOIJ.Y�3i3OOY
ADA293552

S! --
_ _ I 4
* E
•" 'TC($,) N LL1.3" 0•
ADA2355

V . -- I
.1.'
a UJE
U -d
I. U
ADA293552 IIII
_M I.
41~
NOU"3130D
AD2955

I 2o
___________ _____16
.1 _____ f ___I.
ADA293552

I r_...!
II .- , i
I I
_17.
ADA293552

I
-1m
1ii -- lN~l .
_ _ _293t2 ..._"_ _"

, .
. I4
•
I.
I!. ' •1
_(______ I - -.$
ADA293I.-

I'00
i- 1 21
(90-3) Nrvi.Lg
ADA293552

Uf-4
J 1i
SIi
-I-_- _
(W03) NrqMS.L
ADA2935 "52.. .... " "

-- I.-
ADA2355

I -
S_ _, _ -- I ,
f--
S...... " _ __ _ _ •i
(gon-) Nrv•±u
ADA293552

I I
_ _ _... .. .. .I U*
_ _ _ ,,__ ____ 3- ,C',•
tU
(bo-g| NIV~L
ADA293552

* - -'
I I"
I _ _ 1 -.
(90"3) Nrnii
ADA293552

a7
I (;5
_ _ _ _- _ _ _ _ _ _ _ _I! I - , C-
I
(Wo-3) N•VIS
ADA293552

*19
I Im
____ ___ ___ _ __ ____ _____C)
____ _ __ _ _____
ii 46__ vi___
(isd) unssu
___I___ _ADA293552_

- a
,½ I
ADA2935 1 .....

I'
I. ___ FI 1 __ ft
__ I __ __ __
I I4.'
-- ______ I ______ _____ _______
L�.
ftCW0
* w
� 0.6 �-� e�
_______ _______ ft -�
__________ _________ _____________________ _________ __________ I.____ ___ ________ ___ ____ Li
I-
I j __________
* i ft
0 2 0 0
(!sd) unss�d
ADA293552

1*,rS i-El _
- 00____ ___ ____ _ _ ___ _ __ ___amu
___d ___I___d
________________________ ______________A D A 2 9 3 5 5 2 ____________________
___ ___ -__ 2
7... -_
__ _ __ I U,
(�6
1)'U
b.sU
-E
0 e�h. r�
-I U,U,
I I)b..0..
_ I._ I
____ ___ ____ I-
*47w pi
A�)A99�c�9
- -14
I 1a
w -z
(ledl snsSI-
ADA29355

0.
_ _ _ _ _ _ _ _ _ _ _ _4 'Nfr
IW
ADA293552
_ ___ _-g
I____________ ____
_____ ______________ - ,- _____ .-ft
I $ I
vz
I - I 4)
4)00(U
__ __ __ __ C' IU,
N
______ ______ ______ 42[ILL ___ ______ I1�
_ -I�._o a 4 0 '4
Old) 3�anss�I
ADA293552

I -
(!Sd| guns$•id
"A^DA293552 . ..

lw
ADI A2.____ _ ____ wL______
a * " ,
... .!_ A- -29,355"

* ( r
.1 _______ _______ _______ ______ _______
______- -a- - ______
Ii
-� I I._ _ I--
r__ I _
I-I - N
___ ___ ii____ ____ ____ a-
1w
_ I 01- 00I -� t) ff�
____ UiI�&i�1 U
_ _ _ _ I1* I..
I H I
- -- ___ C
I�II'
dl
(3,5) NOW�13�DV
ADA293552

-F-'
~ADA29 3552

uq
I I -
NOLL"13:)O
AD2955

I { :
j <J
I I_ _ _ _
[1 . I .
II
ADA29'3552 .. . ... ' ''' -

K. _K ......
CDC
ci-
NOLV3100
ADA293552

I E-___________I - _____X
I 1 6
*gp3 In l
AD2955

/
______ _____ ______ sq
I -� -- aI I _ _ _ I _
-________ I _______ _______ _______
1 f.:1
_ _�jz1__ I_
* I
______ ___ 1L J� 1�* I-
I j -
____ ___ C,
I II I 4-.L �I2
C-)* 2
_ if _ITI I _IA
7Tr___________ I__
o C C aa a a a a
IA 3a a a e a a
AflA99�c9

I _ _ _
I 'o
I _ _ _ _I _•
_____,___ "___ ____ _____ _______

7Y7
_______ ______ S
*
ii (.)U)
I ______________
I I--___ __I. I e
.7(9O*�) Nr�±S

-~7 F,77
Irl
en
_____ ____IL
I -~ 9-uw
(g~r~ NI"%
ADA293552

_ _ 2_. .... ... . . .
-4
I• . • * • • .
ISO3 NI9.
__LJLADA293552

i , I
ADA29355

1 I
___________ __________ 1 r* .3
________ _______I.- S.
_______ 1)I-i
___ __ __ I U
I., 0
__ i __ __ __ __
1* I
I I U
-2..!I -�
I -
'�F._I
1 1(�o�) NIV�B±3
ADA293552

BIBLIOGRAPHY
AI-Khafaji, A.W. and Tooley, J.R., Numerical Methods in EngneeringPrac , Holt, Rinehart, and Winston, Inc., New York, 1986.
Anderson, J.C., The Seismic Design Handbook, edited by Farzad Naeim, VanNostrand Reinhold, New York, New York, 1989.
Bachus, R.C., Fragaszy, R.J., Jaber, M, Olen, K.L., Yuan, Z., and Jewell.R."Dynamic Response of Reinforcd Soil Systems, Volume I and II," ReportNumber ESL-TR-92-47, Air Force Civil Engineering Support Agency, TyndallAir Force Base, Florida, March 1993.
Baker, W.E., Explosions in Air, University of Texas Press, Austin, Texas,1973.
Bangash, M.Y.H., Impact and Explosion: Analysis and Design, CRCPress, Inc. Boca Raton, FL, 1993.
Baylot, J.T., 'Parameters Affecting Loads on Buried Structures Subjected toLocalized Blast Effects,"WES-TR-SL-92-9, US Army Engineer WaterwaysExperiment Station, Vicksburg, MS, April 1992.
Christopher, B.R.; Gill, S.A.; Giroud, J.P.; Juran, I; Mitchell, J.K.; Schlosser,F; and Dunnicliff, J., "Reinforced Soil Structures: Volume 1. Design andConstruction Guidelines", Report Number FHWA-RD-89-043, U.S.Department of Transportation, Federal Highway Administration, McLean,Virginia, November, 1990.
Coltharp, D.R., Vitayaudom, K.P., and Kiger, S.A., 'Semihardened FacilityDesign Criteria Improvement," Report Number ESL-TR-85-32, Air ForceEngineering and Services Center, Tyndall Air Force Base, Florida, September1985.
351
ADA293552

Crawford, R.E., et al, "Protection From Nonnuclear Weapons," ,iý,oortNumber AFWL-TR-70-127, Air Force Weapons Laboratory, Kirti4'; I AirForce Base, New Mexico, February 1971.
Creighton, D.C., "Non-Normal Projectile Penetration in Soil and Rock: User'sGuide for Computer Code PENCO2D," Technical Report SL-82-7, U.S. ArmyEngineer Waterways Experiment Station, Vicksburg, MS, September, 1982.
Das', B.M, Fundamentals of' Soil Dynamics, Elsevier Science Publishers, NewYork, 1983.
Davies, M.C.R. and Williams, A.J., "Centrifuge Modelling the Protection ofBi-ied Structures Subjected to Blast Loading," Structures Under Shock andImpact II, Proceedings of the Second International Conference, 1992,Portsmouth, U.K., P.S. Bulson, Editor, 16-18 June, 1992.
Dobratz, B.M. and Crawford, P.C., "Lawrence Livermore National LaboratoryExplosives Handbook: Properties of Chemical Explosives and ExplosiveSimulants," Report Number UCRL-52997-Chg 2, January 1985.
Drake, J.L., and Little, C.D., "Ground Shock From Penetrating ConventionalWeapons", Symposium Proceedings From The Interaction of Non-NuclearMunitions With Structures, U.S. Air Force Academy, Colorado, May 1983,pp. 1-6.
Drake, J.L., Frank, R.A., and Rochefort, M.A., "A Simplified Method ForThe Prediction Of The Ground Shock Loads On Buried Structures,"Symposium Proceedings From The Interaction of Conventional Munitions WithStructures, Mannheim, FRG, March 1987, pp. 3-14.
Drake, J.L., Twisdale, L.A., Frank, R.A., Dass, W.C., Rochefort, M.A.,Walker, R.E., Britt, J.R., Murphy, C.E., Slawson, T.R., and Sues, R.H.,"Protective Construction Design Manual," Report Number ESL-TR-87-57, AirForce Engineering and Services Center, Tyndall Air Force Base, Florida,November, 1939.
Elias, V., "Teits on the Effects of Explosive Charges on Reinforced EarthWalls", Proce.-Aings of the 18th Explosive Safety Seminar, San Antonio, Texas,September, 1978.
352
ADA293552

Eytan, R., "Short Distance Explosion Test in Armee Type Structure - Finalreport", (Published In Hebrew) (Confidential) Israel Air Force CivilEngineering Division, Engineering and Projects Branch, Tel Aviv, Israel, 1988.
Eytan, R., and Reid, R.A., "Reinforced Soil AmmunitionMagazine: Full Scale Tests - 1990, Detailed Report" (Confidential), (Publishedin Hebrew), Israel Air Force Civil Engineering Division, Engineering andProjects Branch, Tel Aviv, Israel, and U.S. Air Force Civil EngineeringSupport Agency, Tyndall Air Force Base, Florida, July 1993.
Ferritto, J., Tancreto, J., and Hager, K., "Design Procedures and Effectivenessof Reinforced Earth Berms for Enhancing Facility Survivability", ReportNumber UG-0013, Naval Civil Engineering Laboratory, Port Hueneme, CA,March 1988.
Fluet, I.E., "Geosynthetics in North America: A Rigorous Attempt to Make aShort Story Long", Proceedings Geosynthetics '93 Conference, Vol. 1,Vancouver, British Columbia, Canada, 1993, page 6.
Headquarters, Department of the Army, "Fundamentals of Protective Designfor Conventional Weapons," Technical Manual TM 5-855-1, November, 1986.
Heike, T.T., Patterson, M.A., and Kerr, J.R,, "Geogrid ReinforcedContainment Dykes for Mountainside Oil Tank Farm in Seismic Zone,"Conference Proceedings, Geosynthetics '91, Atlanta, GA, 1991, pp. 861-878.
Hemrych, J., The Dynamics of Explosion and-Its Use, Elsevier ScientificPublishing Company, New York, 1979.
Hyde, D.W., ConWep (Conventional Weapons Effects), computer programs,United States A-my Waterways Experiment Station, Vicksburg, MS, February1988.
Hyde, D.W., "NATO Semi-Hardened Facility Test", Report Number ESL-TR-89-06, Air Force Engineering and Services Center, Tyndall Air Force Base,Florida, 1989.
353
ADA293552

Hyde, D.W., DPLOT/W, computer program, version 0.72.11.19, United StatesArmy Waterways Experiment Station, Vicksburg, MS, undated.
Hyndman, D., Bultman, E., "Bitburg and Aircraft Revetment Tests -Conventional High-Explosives Blast and Shock (CHEBS) Tests 9 and 10",Report Number AFWL-TR-8646, U.S. Air Force Weapons Laboratory,Kirtland Air Force Base, New Mexico, 1987.
Juran, I. and Chen, C.L., "Soil-Geotextile Pull-Out Interaction Properties:Testing and Interpretation," Transportation Research Board, No. 1188,Transportation Research Board, National Research Council, Washington, DC,1988, pp. 37-47.
Juran, I., Knochenmus, G., Acar, Y.B., and Arman, A., "Pull-Out Responseof Geotextiles and Geogrids (Synthesis of Available Experimental Data),"Proceedings of the Symposium on Geosynthetics for Soil Improvement,Geotechnical Special Publication No. 18, ASCE, Edited by R.D. Holtz, May1988, pp. 92-111.
Koerner, R.M., Designing With Geosynthetics, Englewood Cl1f1, Ne, Jer. S"......Prentice-Hall, Inc., 1990.
Kolsky, H., Stress Waves in Solids, Dover Publications, Inc., New York, NewYork, 1963.
Lindholm, U.S., "Techniques in Metal Research," Edited by R.F. Bunshah,Vol. 5, Part 1, Interscience, N.Y., 1971.
Mitchell, J.K. and Villet, W.B., "Reinforcement of Earth Slopes andEmbankments," National Cooperative Highway Research Program Report 290,Transportation Research Board, 1987, p. 323.
National Defense Research Committee, "Effects of Impact and Explosion,",Volume I, Office of Scientific Research and Development, Washington. D.C.,1946.
Nzwnmark, N.M. and Haltiwanger, J.D., "Principles and Practices for Designof Hardened Structures", SWC-TDR-62-138, Air Force Special WeaponsCenter, Kirtland Air Force Base, NM, December 1962.
354
ADA293552

Oglesby, J.W., Mahmoodzadegan, B., and Griffin, P.M., "Evaluation of.Methods and Materials Used to Attach Gages to Polymer Grids for High StrainRate Conditions," Louisiana Transportation Research Center, Draft ReportNumber FHWA/LA-92/, Baton Rouge, LA, December 1992.
Ohrt, A., Personal communication, US Army Waterways Experiment Station,Vicksburg, MS, February, 1995.
Olen, K.L., Fragaszy, R.J., Purcell, M.R., and Cargill, K.W., "DynamicResponse of Reinforced Soil Systems: Phase II," Draft Report Submitted to theUS Air Civil Engineering Laboratory, Tyndall Air Force Base, Florida,December, 1993.
Olen, K.L., Fragaszy, R.J., Purcell, M.R., and Cargill, K.W., "Response ofReinforced Soil Walls to Explosive Loading: Part I - Centrifuge Modeling,"Proceedings of Geosynthetics '95 Conference, IFAI, Nashville, TN, 1995.
Purcell, M.R., Personal Communication, Applied Research Associates, TyndallAFB, FL, February, 1995.
Reid, R.A., "Reinforced Soil Munitions Bunker Test", The Military Engineer,August 1990, Vol 82, Number 537, PP 51-52.
Reid, R.A., "Full-Scale Blast Test of a Reinforced Soil Bunker", Proceedingsof the 5th Internationales Symposium Interaktion Kan Ventioneller Munition mitSchutzbauten, Monnheim, Federal Republic of Germany, April 1991.
Reid, R.A., Bachus, R.C., Olen, K.L., and Fragaszy, R., "Response ofGeogrid-Reinforced Soil Subjected to Blast Loading", Proceedings of the SixthInternational Symposium on Interaction of Nonnuclear Munitions WithStructures", Panama. City, Florida, May 1993, pp 253-258.
Reid, R.A. and Colliji, J.G., "Response of Geogrid-Reinforced Retaining Wallto Explosive Loading: Part H1 - Full-Scale Tests", Proceedings of Geosynthetics'95 Conference, iFAI, Nashville, TN, 1995.
The Reinforced Earth Company Brochure "Family of ConstructionTechnologies", McLean, Virginia, USA, 1990.
355
ADA293552

The Reinforced Earth Company Brochure, "Reinforced Earth ProtectiveStructures for Industrial and Military Applications", undated, McLean,Virginia.
Richardson, G.N., Feger, D., Fong, A., and Lee, K.L., "Seismic Testing ofReinforced Earth Walls", Journal of the Geotechnical Engineering Division,ASCE, Vol 103, No. GTI, January 1977.
Robbins, P.E. and Riskowski, G.L., "Coefficient of Static Friction For WoodBulkheads on Building Floors", Journal of the American Society of AgriculturalEngineers, ASAE, Vol. 33, No. 6, November-December, 1990.
Rohani, B., "Shielding Methodology for Conventional Kinetic EnergyWeapons," Technical Report SL-87-8, U.S. Army Engineer WaterwaysExperiment Station, Vicksburg, MS, 1987, Secret.
Ross, C.A., "Split-Hopkinson Pressure Bar Tests", Report Number ESL-TR-88-82, Air Force Engineering and Services Center, Tyndall Air Force Base,Florida, March 1989.
Scott, R.F. and Morgan, N.R., "Feasibility and Desirability of Constructing aVery Large Centrifuge for Geotechnical Studies," Report 760-170, NationalScience Foundation, Washington, D.C., 1977.
Sues, R.H., Murphy, C.E., and Frank, R.A., "Protective Construction DesignManual Change 5, Expedient hardening Methods for Structures Subjected to theEffects of Non-Nuclear Munitions", Report Number ESL-TR-87-57, Air ForceEngineering and Services Center, Tyndall Air Force Base, Florida, June 1991.
Tensar Earth Technologies Inc., 'Specification Sheets, UX 1400 HT and UX1500 HT," Morrow, GA., 1992.
Tuan, C.Y. and Merkle, D.H., "Advanced Panel and Connection System ForReinforced Soil," Report Number ESL-TR-92-76, Air Force Civil EngineeringSupport Agency, Civil Engineering Laboratory, Tyndall Air Force Base,Florida, March 1993.
Underwood, J.M. and Westmoreland, M.K., "Penetration Countermeasures,"Proceedings of the Sixth International Symposium on Interaction of NonnuclearMunitions With Structures", Panama City, Florida, May 1993, pig. 50-55.
356
ADA293552

United States Office of Civil Defense, "Report of Bomb Tests on Materials andStructures", Washington, D.C., 1941.
Vesic, A.S., "Cratering By Explosives as an Earth Pressure Problem",Proceedings of the Sixth International Conference on Soil Mechanics andFoundation Engineering, Volume II, Montreal, Canada, September, 1965.
Veyera, G.E., Charlie, W.A., and Ross, C.A., "Strain-Rate Eff4ects inUnsaturated Soils", Proceedings of the Sixth International Symposium onInteraction of Nonnuclear Munitions With Structures", Panama City, Florida,May 1993, pp 300-304.
Veyera, G.E., "Uniaxial Stress-Strain Behavior of Unsaturated Soil at HighStrain Rates", Report Number WL-TR-93-3512, Air Force WrightLaboratories, Wright-Patterson AFB, OH, November 1993.
Whirley, R.G. and Hallquist, J.O., "DYNA3D A Nonlinear Explicit, Three-Dimensional Finite Element Code For Solid and Structural Mechanics - UserCode," Report Number UCRL-MA-107254, Lawrence Livermore NationalLaboratory, Livermore, California, May 1991.
Waters, K.H., Reflection Seismology, John Wiley and Sons, New York, 1981.
Westine, P.S., and Friesenhahn, G.J., "Free-Field Ground Shock PressuresFrom Buried Detonations In Saturated and Unsaturated Soils", SymposiumProceedings From The Interaction of Non-Nuclear Munitions With Structures,U.S. Air Force Academy, Colorado, May 1983, pp. 12-16.
Yogendrakumar, M., Bathurst, R.J., and Finn, W.D.L, "Dynamic ResponseAnalysis of Reinforced-Soil Retaining Wall', Journal of GeotechnicalEngineering, ASCE, Vol. 118, No. 8, August, 1992,
Yuan, Z., Swan, R.H. and Cargill, K.W., "Final Report on Direct Shear andPullout Testing, Phase II Study, Dynamic Response of Reinforced SoilSystems", laboratory report submitted by GeoSyntec Consultants to AppliedResearch Associates, Gulf Coast Division, Tyndall AFB, FL, December 22,1993.
357
ADA293552

VITA
Richard Alan Reid was born on September 8, 1959 in Biddeford, Maine.
He is the sixth child of Wallace and Virginia Reid. His elementary education
was at Kennebunkport Consolidated School and Kennebunk High School.
Supported by an Air Force Scholarship, he attended The Citadel in
Charleston, SC from August 1977 to May 1981, where he earned hisBachelor's degree in Civil Engircn;, .a. Aft..r arnfinn hi d to
Ellsworth AFB, South Dakota, where he s-"rCvae hacs , ,invrn, .nf,en ,-,,o;nei-r
and later, pavement engineer. In 1934 he was assiged. to te ii.,
of Technology, earndng a Master's in Civil Engineering, and c.m.pleting hi:.:
Ph.D. course requirements. In 1988 he was reassigned to the Air Force Civil
Engineering Laboratory, Tyndall AFB, Florida, managing Civil Engineering
research. He obtained his professional engineering license in Florida in 1990.
In 1994, he left the Air Force, returning to Georgia Tech to complete his Ph.D.
Upon completion of his Doctorate, he accepted a position as Assistant Professor
of Civil Engineering at South Dakota State University, Brookings, SD.
He married Kathleen Ruth Kreger of Huron, SD on June 1, 1985, and they
have three children, Lindsey Kathleen. Timothy Alan, and Rebecca Erin.
358


