Embed Size (px)
Citation preview

The Business Intelligence Journal (BIJ) is published by the Business Intelligence Service of London, UK (BIS) in collaboration with the European Business School (Cambridge, UK) and the Business Management and Economics Department at the School of Doctoral Studies of the European Union (Brussels, Belgium), as semiannual open access content publication.
July
- 2 01
2 - Semiannual Publication
Volume 5Number 2
Editorial Note 201
Profile of Authors Included in this Number 202
Information for Contributors 204
ArticlesVision or Psychic Prison 207
Khuram Shahzad
The Assessment of Social Reporting on behalf of Accepted Corporations Listed in Tehran Stock Exchange 214
Hosseyn karbasi yazdi, Kobra Hemmati, Ali Bayat
Data Warehousing 224
Ofori Boateng, Jagir Singh, Greeshma, P Singh
Wavelet Transform, Neural Networks and The Prediction of S&P Price Index: A Comparative Study of Backpropagation Numerical Algorithms
235
Salim Lahmiri
Dimensions of Spiritual Tourism in Tuiticorin District of Tamil Nadu in India – A Critical Analysis 245
S. Vargheese Antony Jesurajan, S. Varghees Prabhu
Architecture for Mobile Marketing in Android: Advertising Through Business Intelligence 252
Paulo Renato de Faria
Identification of Demand through Statistical Distribution Modeling for Improved Demand Forecasting 260
Murphy Choy, Michelle L.F. Cheong
The Impact of Intellectual Capital Disclosure on Capital Markets: An Overview 267
Zahra Mousavi, Nasrollah Takhtaei
Islamic – Bank Selection Criteria In Malaysia: An AHP Approach 271
Muhamad Abduh, Mohd Azmi Omar
Appraising the Role of Strategy Implementation in Export Performance: A Case from Middle East 282
Seyed Hossein Jalali
Factors Affecting the End-User Computing Satisfaction 292
Mohsen Dastgir, Ahmad S. Mortezaie
International Financial Reporting Standard (IFRS): Benefits, Obstacles and Intrigues for Implementation in Nigeria 299
Ikpefan Ochei Ailemen, Akande A.O
Continued on back cover

© Copyright 2012: IIU Press and Research Centre A.C.This is an open access content publication recognized by the Scholarly Publishing and Academic Resources Coalition of the European Union (SPARC Europe) and distributed worldwide by the Directory of Open Access Journals (DOAJ) of the Lund University Libraries (Lund, Sweden). Printed in Canada.
ISBN: 978-1-4251-8179-6
ISSN: 1918-2325


Assessing the Impact of Non-Discretionary Variables on the Performance of Pharmacy Retail Stores Using DEA Approach
308
Smriti Pande, Dr. G.N. Patel
Buyer Supplier Relationship in Manufacturing Industry - Findings from Indian Manufacturing Sector 319
Manoj Kumar Mohanty, Dr. P. Gahan
Analysis of the Relationship Between Emotional Intelligence and Stress Caused by the Organisation: A Study of Nurses
334
Zeynep Kalyoncu, Semra Guney, Mahmut Arslan, Salih Guney, Evren Ayranci
Lossless Data Compression for Energy Efficient Transmission Over Wireless Network 347
Prof. Saurabh Mittal
Maintaining Database: Business Intelligence Tool for Competitive Advantage 352
Veena Tewari Nandi
Impact of Business Intelligence Systems in Indian Telecom Industry 358
Dr. Poonam Kumar
Anti-Money Laundering Policy and its Effects on Bank Performance in Nigeria 367
Idowu Abiola, Obasan Kehinde A.
Prediction of Financial Distress for Tunisian Firms: A Comparative Study Between Financial Analysis and Neuronal Analysis
374
Manel Hamdi
Using Association Rules for Evaluating and Predicting Risk Factors in Business Intelligence System 383
Mohammad JafarTarokh, Elham Teymournejad
Comparing the Information Content of Iranian Vs. IAS Based Operating Cash Flows 395
Vali Khodadadi, Zahra Nikbakht, Nader Nikbakht
Case StudiesThe Relationships Between GDP, Export and Investment: Case Study Iran 401
Mahmoud Abolpour Mofrad
Analysis of Using a Business Intelligence Tool (COGNOS) in a Company to Result in More Efficient and Intuitive Company in the Current Era
406
Kirankumar Gollapudi, Sunil Kumar Jangeti, Avinash Reddy Kotapati
Announcements 410
Continued From Front Cover

2012 Business Intelligence Journal 201
Business Intelligence Journal - July, 2012 Vol.5 No.2
SPARC Europe
DIRECTORY OF
JOURNALSOPEN ACCESS
Business Intelligence Journal by Business Intelligence Service is licensed under a Creative Commons Attribution 2.0 UK: England & Wales License. Further tips for using the supplied HTML and RDF are here: http://creativecommons.org/learn/technology/usingmarkup
In collaboration with the European Business School, Cambridge, UK and the School of Doctoral Studies of the European Union based in Brussels, Belgium, the Business Intelligence Service of London, UK (BIS) publishes the Business Intelligence Journal
(BIJ) as a semi-annual scientific and academic open access journal, which includes research analysis and inquiry into issues of importance to the international business community. Articles within the BIJ examine emerging trends and concerns, among others, in the areas of general management, business law, public responsibility and ethics, marketing theory and applications, business finance and investment, general business research, business and economics education, production/operations management, organizational behavior and theory, strategic management policy, management organization, statistics and econometrics, personnel development and industrial relations, technology and innovation, case studies and management information systems. The goal of the BIJ is to broaden the knowledge of business professionals and academicians by including valuable insight to business-related information, by fostering cutting-edge research work and by providing open access to original research, information and ideas contained within the journal’s pages. All articles in the BIJ are peered reviewed; the BIJ has been granted the Seal of the Scholarly Publishing and Academic Resources Coalition of the European Union (SPARC Europe). The BIJ is an open access publication distributed worldwide by the Directory of Open Access Journal (DOAJ) of the Lund University Libraries, Sweden for the Business Intelligence Research Centre of London.
EDITORIAL NOTE
European Business School, School of Graduate Studies
Cambridge, UK.
European Business School, Singapore.
Brussels, Belgium
The Oxford Association of Management
Ibkan ConsultantsInvestment Bankers
School of Doctoral Studies(European Union) Isles Internationale
Université Brussels, Belgium.
Business Intelligence ServiceLondon, UK
Lund University Libraries Sweden.
Seal of the Scholarly Publishing and Academic Resources Coalition
(Granted to the Business Intelligence Journal on the 20th day of August, 2008)
Editorial Board Editorial Department
Reviewers Coordinators
Editorial Design
Publisher
Associate Editors:
Dr. Katherinna KurlenkoEuropean Union Analogue Standards Certification Committee, Brussels, Belgium
Prof. José Carlos AriasBusiness Intelligence Research Centre of London, UK
Dr. Jünger AlbingerSchool of Doctoral Studies of the European Union, Brussels, Belgium
Prof. Eric PalmeEuropean Business School, Cambridge, UK
Dr. Zeng LishengEuropean Business School, Singapore
Dr. Mathew BockThe Cambridge Association of Managers, Cambridge, UK
Dr. Henk Haegeman The Oxford Association of Management, Oxford, UK
Michael SummersSusan G. BootsMartin A. MillerKenneth C. MichaelsAnita PetersRoger PuigRobert Miller
Pablo Gamez OlivoEric Veloz Montaño
IIU Press and Research Centre, A.C.ISSN 1918 2325http://www.saycocorporativo.com/saycouk/BIJ/journals.htmlThe Business Intelligence Journal is an Open Access journal Printed in Canada© Copyrights: IIU Press and Research Centre, A.C.
The Business Intelligence Journal (BIJ)Published by the Business Intelligence Service, London, UK (BIS) for the Business Intelligence Research Centre145 St. John Street, 2nd Floor,London EC1V 4PY, United [email protected]
Editor: Dr. Anne SurreyManaging Editor: Dr. Paul Stenzel
Accounting and Finance: Prof. Ira JoubertHuman Resources: Prof. Beverly Lanting Marketing: Prof. Frans CooperOperations and Production: Prof. Guy Le RoyInformation and Knowledge Management: Prof. Mitsuaki UnoLeadership and Corporate Policy: Prof. Tui UnterthinerChange, Conflict and Crisis: Prof. Takako IwagoMathematical and Quantitative Methods: Prof. Maria NicklenMicroeconomics: Prof. Carlo GrunewaldMacroeconomics and Monetary Economics: Prof. Stephen L. FreinbergInternational Economics: Prof. Mitchell AlvarezEconomic Thought and Methodology: Prof. Vincent Haidinger
Business Intelligence Journal

Business Intelligence Journal - July, 2012 Vol.5 No.2
202 Business Intelligence Journal July
Article 1: Vision or Psychic Prison
Author: Khuram Shahzad – Lecture/PhD Scholar University of Management & Technology, Lahore, Pakistan.email: [email protected]
Article 2: The Assessment of Social Reporting on behalf of Accepted Corporations Listed in Tehran Stock Exchange.
Author: 1 - Hosseyn karbasi yazdi – Islamic Azad University, Center of Tehran branch, Tehran, Iran.2 - Kobra Hemmati – Islamic Azad University, Zanjan branch, Zanjan, Iran.3 - Ali Bayat – Islamic Azad University, Zanjan branch, Zanjan, Iran.email: [email protected]
Article 3: Data Warehousing
Author: 1 - Ofori Boateng – (PhD) Professor University of Northern Virginia.2 - Jagir Singh – University of Northern Virginia.3 - Greeshma – University of Northern Virginia.4 - P Singh – University of Northern Virginia.
Article 4: Wavelet Transform, Neural Networks and The Prediction of S&P Price Index: A Comparative Study of Backpropagation Numerical Algorithms
Author: Salim Lahmiri – Department of Computer Science, University of Quebec at Montreal, Canada.email: [email protected]
Article 5: Dimensions of Spiritual Tourism in Tuiticorin District of Tamil Nadu in India – A Critical Analysis
Author: 1 - S. Vargheese Antony Jesurajan – Assistant Professor in Commerce, St.Xavier’s College, Palayamkottai – 627 002e-mail: [email protected] - S. Varghees Prabhu – Assistant Professor in Management, RVS KVK Institute of Management Studies, Trichy – 621 303e-mail: [email protected]
Article 6: Architecture for Mobile Marketing in Android: Advertising Through Business Intelligence
Author: Paulo Renato de Faria – Computer Scientist by Unicamp, Mba in Business Intelligence by Veris Ibta, and Software Analyst at Instituto De Pesquisas Eldorado.
Article 7: Identification of Demand through Statistical Distribution Modeling for Improved Demand Forecasting
Author: 1 - Murphy Choy – School of Information Systems, Singapore Management University, 80, Stamford Road, Singapore 178902.email: [email protected] - Michelle L.F. Cheong – School of Information Systems, Singapore Management University, 80, Stamford Road, Singapore.email: [email protected]
Article 8: The Impact of Intellectual Capital Disclosure on Capital Markets: An Overview
Author: 1 - Zahra Mousavi – Department of Accounting ,Andimshk Branch , Islamic Azad University , Andimeshk , Iran.2 - Nasrollah Takhtaei – Department of Accounting ,Dezfoul Branch , Islamic Azad University , Dezfoul , Iran.email: [email protected]
Article 9: Islamic – Bank Selection Criteria In Malaysia: An AHP Approach
Author: 1 - Muhamad Abduh – IIUM Institute of Islamic Banking and Finance, International Islamic University Malaysia.email: [email protected] - Mohd Azmi Omar – IIUM Institute of Islamic Banking and Finance, International Islamic University Malaysia.
Article 10: Appraising the Role of Strategy Implementation in Export Performance: A Case from Middle East
Author: Seyed Hossein Jalali – MA of International Business, Faculty of Management & Accounting, Allameh Tabatabai University, Tehran, Iran.email: [email protected]
Article 11: Factors Affecting the End-User Computing Satisfaction
Author: 1 - Mohsen Dastgir – Professor in Accounting & Finance, Islamic Azad University-Science and Research Branch-Esfahan, Iran.email: [email protected] - Ahmad S. Mortezaie – MA in Accounting, Shahid Chamran University-Iranemail: [email protected]
Article 12: International Financial Reporting Standard (IFRS): Benefits, Obstacles and Intrigues for Implementation in Nigeria
Author: 1 - Ikpefan, Ochei Ailemen – Ph.D (Banking & Finance), ACA, ACIB Department of Banking & Finance, Covenant University, Ota, Ogun State.email: [email protected] - Akande, A.O – BSc (Business Administration), MBA Department of Business Studies, Covenant University, Ota.email: [email protected]
Business Intelligence JournalProfile of Authors Included in this Number

2012 203
Business Intelligence Journal - July, 2012 Vol.5 No.2
In order to make contact with any of the Authors referred to above, please forward your request to: [email protected], including BIJ’s edition (BIJ Volume 5, Number 2, July 2012), article’s and author’s names with your requirement. BIJ’s Editor will be glad to submit your requests or inquiries before authors.
Article 13: Assessing the Impact of Non-Discretionary Variables on the Performance of Pharmacy Retail Stores Using DEA Approach
Author: 1 - Smriti Pande – Senior Research Fellow Birla Institute of Management Technology Plot No. 5, Knowledge Park- II, Institutional Area Greater Noida (U.P) – 201306.email: [email protected] - Dr. G.N. Patel – Professor Birla Institute of Management Technology Plot No. 5, Knowledge Park- II, Institutional AreaGreater Noida (U.P) – 201306.email: [email protected]
Article 14: Buyer Supplier Relationship in Manufacturing Industry - Findings from Indian Manufacturing Sector
Author: 1 - Manoj Kumar Mohanty – Asst. Manager-Projects, Larsen & Toubro Limited, Kansbahal, Sundargarh, Orissa, India – 770034.email: [email protected] - Dr. P. Gahan – Professor – Business Administration Department, Sambalpur University, Burla, Orissa, India – 768019.email: [email protected]
Article 15: Analysis of the Relationship Between Emotional Intelligence and Stress Caused by the Organisation: A Study of Nurses
Author: 1 - Zeynep Kalyoncu, Semra Guney and Mahmut Arslan – Hacettepe University, Faculty of Economics and Administrative Sciences, Department of Business Administration, Ankara, Turkey.email: [email protected], [email protected], [email protected] - Salih Guney – İstanbul Aydin University, Faculty of Economics and Administrative Sciences, Department of Economics and Finance, İstanbul, Turkey.email: [email protected] - Evren Ayranci – (Corresponding Author) İstanbul Aydin University, Faculty of Economics and Administrative Sciences, Department of Business Administration (in English), İstanbul, Turkey.email: [email protected]
Article 16: Lossless Data Compression for Energy Efficient Transmission Over Wireless Network
Author: Prof. Saurabh Mittal – Area Chairperson, Asia-Pacific Institute of Management, New Delhi.email: [email protected], [email protected]
Article 17: Maintaining Database: Business Intelligence Tool for Competitive Advantage
Author: Veena Tewari Nandi – Faculty Member and the Head of Centre for Corporate Citizenship in the Asia Pacific Institute of Management.email: [email protected]
Article 18: Impact of Business Intelligence Systems in Indian Telecom Industry
Author: Dr. Poonam Kumar – Asst. Professor Asia Pacific Institute of Management, New Delhi (INDIA).email: [email protected]
Article 19: Anti-Money Laundering Policy and its Effects on Bank Performance in Nigeria
Author: 1 - Idowu, Abiola – Dept. of Management and Accounting Faculty of Management Sciences Ladoke Akintola University of Technology, P.M.B. 4000, Ogbomoso. Oyo State. Nigeria.email: [email protected] - Obasan, Kehinde A. – (Corresponding Author) Department of Business Administration, Faculty of Social and Management Sciences Olabisi Onabanjo University, Ago-Iwoye, Ogun State, Nigeria.email: [email protected]
Article 20: Prediction of financial distress for Tunisian firms: A comparative study between Financial analysis and neuronal analysis
Author: Manel Hamdi – International Finance Group Tunisia, Faculty of Management and Economic Sciences of Tunis, Tunisia, El Manar University, Tunis cedex, C.P. 2092, El Manar Tunisiaemail: [email protected]
Article 21: Using Association Rules for Evaluating and Predicting Risk Factors in Business Intelligence System
Author: 1 - Mohammad JafarTarokh – Department of Industrial Engineering, K.N. Toosi University of Technology, Tehran, Iran2 - Elham Teymournejad – Department of Industrial Engineering, K.N. Toosi University of Technology, Tehran, Iran
Article 22: Comparing the Information Content of Iranian Vs. IAS Based Operating Cash Flows
Author: 1 - Vali Khodadadi – M.A. in Accounting, Islamic Azad University, Mahshahr brunch, Khuzestan, Iran2 - Zahra Nikbakht – Department of accounting, payame noor university, PO. BOX 19395-3697 Tehran, Iran3 - Nader Nikbakht – M.A. in Accounting
Case Studies 1: The Relationships Between GDP, Export and Investment: Case Study Iran
Author: Mahmoud Abolpour Mofrad – Faulty of Azad University Branch of Firouz Abad
Case Studies 2: Analysis of Using a Business Intelligence Tool (COGNOS) in a Company to Result in More Efficient and Intuitive Company in the Current Era
Author: 1 - Kirankumar Gollapudi – M. BA Student, University of Northern Virginia, USAemail: [email protected] - Sunil Kumar Jangeti – M.S Student, University of Northern Virginia, USAemail: [email protected] - Avinash Reddy Kotapati – M.S Student, University of Northern Virginia, USAemail: [email protected]

Business Intelligence Journal - July, 2012 Vol.5 No.2
204 Business Intelligence Journal July
INFORMATION FOR CONTRIBUTORS
Electronic submission of manuscripts is strongly encouraged, provided that the text, tables, and figures are included in a single Microsoft Word file (preferably in Times New Roman, 12 size font)
Submit manuscript as e-mail attachment to the BIJ Editorial Office at: [email protected]. A manuscript number will be mailed to the corresponding author within the following 7 days.
The cover letter should include the corresponding author’s full address and telephone/fax numbers and should be in an e-mail message sent to the Editor, with the file, whose name should begin with the first author’s surname, as an attachment. The authors may also suggest two to four reviewers for the manuscript (BIJ may designate other reviewers).
BIJ will only accept manuscripts submitted as e-mail attachments.
Article Types
Three types of manuscripts may be submitted:Regular Articles: These should describe new and
carefully confirmed findings, and research methods should be given in sufficient detail for others to verify the work. The length of a full paper should be the minimum required to describe and interpret the work clearly.
Short Communications: A Short Communication is suitable for recording the results of complete small investigations or giving details of new models, innovative methods or techniques. The style of main sections need not conform to that of full-length papers. Short communications are 2 to 4 printed pages (about 6 to 12 manuscript pages) in length.
Reviews: Submissions of reviews and perspectives covering topics of current interest are welcome and encouraged. Reviews should be concise and no longer than 4-6 printed pages (about 12 to 18 manuscript pages). Reviews manuscripts are also peer-reviewed.
Review Process
All manuscripts are reviewed by an editor and members of the Editorial Board or qualified outside
reviewers. Decisions will be made as rapidly as possible, and the journal strives to return reviewers’ comments to authors within 3 weeks. The editorial board will re-review manuscripts that are accepted pending revision. It is the goal of the BIJ to publish manuscripts within the following BIJ edition after submission.
Regular Articles
All portions of the manuscript must be typed double-spaced and all pages numbered starting from the title page.
The Title should be a brief phrase describing the contents of the paper. The Title Page should include the authors’ full names and affiliations, the name of the corresponding author along with phone, fax and e-mail information. Present addresses of authors should appear as a footnote.
The Abstract should be informative and completely self-explanatory, briefly present the topic, state the scope of the work, indicate significant data, and point out major findings and conclusions. The Abstract should be 100 to 200 words in length. Complete sentences, active verbs, and the third person should be used, and the abstract should be written in the past tense. Standard nomenclature
Should be used and abbreviations should be avoided. No literature should be cited.
Following the abstract, about 3 to 10 key words that will provide indexing references to should be listed.
A list of non-standard Abbreviations should be added. In general, non-standard abbreviations should be used only when the full term is very long and used often. Each abbreviation should be spelled out and introduced in parentheses the first time it is used in the text.
The Introduction should provide a clear statement of the problem, the relevant literature on the subject, and the proposed approach or solution. It should be understandable to colleagues from a broad range of disciplines.
Materials and methods should be complete enough to allow possible replication of the research. However,
Business Intelligence Journal - July, 2012 Vol.5 No.2
2012 Business Intelligence Journal 205
only truly new research methods should be described in detail; previously published methods should be cited, and important modifications of published methods should be mentioned briefly. Capitalize trade names and include the manufacturer’s name and address. Subheadings should be used. Methods in general use need not be described in detail.
Results should be presented with clarity and precision. The results should be written in the past tense when describing author’s findings. Previously published findings should be written in the present tense. Results should be explained, but largely without referring to the literature. Discussion, speculation and detailed interpretation of data should not be included in the Results but should be put into the Discussion section.
The Discussion should interpret the findings in view of the results obtained in this and in past studies on the topic. State the conclusions in a few sentences at the end of the paper. The Results and Discussion sections can include subheadings, and when appropriate, both sections can be combined.
The Acknowledgments of people, grants, funds, etc should be brief.
Tables should be kept to a minimum and be designed to be as simple as possible. Tables are to be typed double-spaced throughout, including headings and footnotes. Each table should be on a separate page, numbered consecutively in Arabic numerals and supplied with a heading and a legend. Tables should be self-explanatory without reference to the text. The details of the research methods should preferably be described in the legend instead of in the text. The same data should not be presented in both table and graph form or repeated in the text.
Figure legends should be typed in numerical order on a separate sheet. Graphics should be prepared using applications capable of generating high resolution GIF, TIFF, JPEG or PowerPoint before pasting in the Microsoft Word manuscript file. Tables should be prepared in Microsoft Word. Use Arabic numerals to designate figures and upper case letters for their parts (Figure 1). Begin each legend with a title and include sufficient description so that the figure is understandable without reading the text of the manuscript. Information given in legends should not be repeated in the text.
References: In the text, a reference identified by means of an author’s name should be followed by the date of the reference in parentheses. When there are more than two authors, only the first author’s name should be mentioned, followed by ‘et al’. In the event that an author cited has had two or more works published during the same year, the reference, both in the text and in the reference list, should be identified by a lower case letter like ‘a’ and ‘b’ after the date to distinguish the works.
Examples:
Smith (2000), Wang et al. (2003), (Kelebeni, 1983), (Usman and Smith, 1992), (Chege, 1998; Chukwura, 1987a,b; Tijani, 1993, 1995), (Kumasi et al., 2001)
References should be listed at the end of the paper in alphabetical order. Articles in preparation or articles submitted for publication, unpublished observations, personal communications, etc. should not be included in the reference list but should only be mentioned in the article text (e.g., A. Kingori, University of Nairobi, Kenya, personal communication). Journal names are abbreviated according to Chemical Abstracts. Authors are fully responsible for the accuracy of the references.
Examples:
Papadogonas TA (2007). The financial performance of large and small firms: evidence from Greece. Int. J. Financ. Serv. Manage. 2(1/2): 14 – 20.
Mihiotis AN, Konidaris NF (2007). Internal auditing: an essential tool for adding value and improving the operations of financial institutions and organizations. Int. J. Financ. Serv. Manage. 2(1/2): 75 – 81.
Gurau C (2006). Multi-channel banking in Romania: a comparative study of the strategic approach adopted by domestic and foreign banks Afr. J. Financ. Servic. Manage. 1(4): 381 – 399.
Yoon CY,Leem CS (2004).Development of an evaluation system of personal e-business competency and maturity levels Int. J. Electron. Bus. 2(4): 404 – 437.

Business Intelligence Journal - July, 2012 Vol.5 No.2
206 Business Intelligence Journal July
Short Communications
Short Communications are limited to a maximum of two figures and one table. They should present a complete study that is more limited in scope than is found in full-length papers. The items of manuscript preparation listed above apply to Short Communications with the following differences: (1) Abstracts are limited to 100 words; (2) instead of a separate Materials and Methods section, research methods may be incorporated into Figure Legends and Table footnotes; (3) Results and Discussion should be combined into a single section.
Proofs and Reprints
Electronic proofs will be sent (e-mail attachment) to the corresponding author as a PDF file. Page proofs are considered to be the final version of the manuscript. With the exception of typographical or minor clerical errors, no changes will be made in the manuscript at the proof stage. Because BIJ will be published online without access restrictions, authors will have electronic access to the full text (PDF) of the article.
Authors can download the PDF file from which they can print unlimited copies of their articles.
Copyright
Submission of a manuscript implies: that the work described has not been published before (except in the form of an abstract or as part of a published lecture, or thesis) that it is not under consideration for publication elsewhere; that if and when the manuscript is accepted for publication, the authors agree to automatic transfer of the copyright to the publisher.
Costs for Authors
Revision, edition and publishing costs will be totally paid by the IIU Press & Research Centre A.C. and authors’ sole contribution will be providing BIS with their invaluable work.
Publication Decisions
Decisions by the editor of all submitted manuscripts reflect the recommendations of members of the Editorial Board and other qualified reviewers using a “blind” review process. Reviewers’ comments are made available to authors. Manuscripts that are inappropriate or insufficiently developed may be returned to the authors without formal review for submission to a more suitable journal or for resubmission to BIJ following further development.
Manuscripts submitted will be judged primarily on their substantive content, though writing style, structure and length will also be considered. Poor presentation is sufficient reason for the rejection of a manuscript. Manuscripts should also be written as concisely and simply as possible, without sacrificing clarity or meaningfulness of exposition. Manuscripts will be evaluated by the editor when first received, on their contribution-to-length-ratio, meaning that manuscripts with strong contributions will be assigned more pages than those making narrower contributions. Papers intended to make very extensive contributions (over 35 double-space pages, using one inch margins and Times New Roman twelve-pitch font) will, at discretion of the editor, be allotted additional space. Authors are expected to get and use feedback from colleagues prior to submitting a manuscript for formal review.

2012 207
VISION OR PSYCHIC PRISON
Khuram ShahzadLecture/PhD Scholar
University of Management & Technology, Lahore, PakistanEmail: [email protected]
AbstractPsychic prison-Plato’s cave metaphor introduced a compelling concept that how organizations can get trapped by their favored ways
of thinking and thus fail to adapt to the environmental changes and demands. This metaphor provides organizations with a subjective clue that how organizations can be trapped in their favored ways of thinking and mental models which ultimately lead them to a state of psychic prison. However, little is known about the antecedent(s) which might lead organizations to this psychic prison mentality. Therefore, this paper aims to identify the factor(s) which objectively contribute toward this psychic prison mentality. This paper holds the view that despite its initial success and utility, “organization’s vision” after a certain period of time creates an internal environment which limits organization to see outside of the vision’s boundaries and thus leads organization toward a state where organization becomes psychic prison of its vision. Key words: Vision; Psychic Prison; Favored Ways of Thinking; Mental Models; Organization Memory; Failure of Unconscious; Vision Failure.
In his book “Images of organization” Morgan (1986) introduced a metaphor of Psychic Prison–Plato’s Cave. Metaphor views organizations as socially constructed realities that emerge out of the unconscious preoccupations of organizational members (Morgan, 1986). These socially constructed realities construct organization’s culture which is experienced by organizational members usually as confining and problematic. Morgan (1986) further explains that these preconceived realities become unconscious traps for people that eventually force them to think in certain favored ways, prevent them to look at the other possible worlds, and thus lead them to a psychic prison mentality. These imprisoned mentalities can be observed in organizational decision making process where narrowed strategic directions result in the failure of organization to adapt to the wider and multiple direction seeker environment. Indeed, this metaphor sheds a powerful light on an area that over time becomes a trap for organization, however this metaphor provides organization with a very subjective insight and hence does not objectively determines the factor(s) that might lead organizations to this psychic trap. This paper however aims to specifically identify the dynamics of this psychic prison phenomenon, and aims to identify the factors which tangibly lead organizations to failures because of their inability to match to the environmental demands as a result of psychic prison mentality. In this study it is hypothesized that “organization’s vision” (also called leader’s vision) has great potential to serve as a determinant of organization’s psychic prison mentality.
Reality of Vision
In a fast-changing world, where survival and growth of organizations is continuously under the attack of complex and dynamic environment, a fundamental question that “what needs an organization to stay competitive and profitable” arises. To different scholars and consultants, probably the only answer of this daunting question is organization’s vision (Kantabutra & Avery, 2010). Among researchers it has widely been acknowledged that vision is indispensible for effective leadership, change, and strategy implementation process in organization. Through a unified direction and sense of purpose, vision, helps organizational members to develop flexible systems and to integrate the whole organization (Orton & Weick, 1990). Vision has also been found positively correlated with organizational performance (Baum, Locke, & Kirkpatrick, 1998). Although much emphasis has been given by scholars and management consultants to the dire need of espousing an organizational vision (Kantabutra & Avery, 2007), no one, so far has looked at some disadvantages that this popular phenomenon might carry. When it comes to vision, it’s important to let organizations know that how they can go terribly wrong as how they can go remarkably right. In order to ensure growth and sustainability organizations need to understand the difference between ‘‘positive’’ and ‘‘negative’’ visions (Senge, 1990) as well as the difference between ‘‘strong’’ and ‘‘weak’’ visions (Rafferty & Griffin, 2004). According to a saying “everything carries within it the seeds for its own destruction”. Since, everything
Shahzad K. - Vision or Psychic Prison
Khuram Shahzad
Business Intelligence Journal - July, 2012 Vol.5 No.2
208 Business Intelligence Journal July
contains positives as well as some negatives; aim of this paper is not to deny or reduce the glory of vision, instead the aim is to highlight the potential drawbacks of vision.
Research Gap
Indeed, focusing on the negative side of ‘vision’ is a dicey business; however it’s essential to acknowledge that ‘vision’ can have its darker side. This paper holds a view that despite of the importance and great utility of vision in organizations, it at the same time leads organization toward a state where organization becomes psychic prison because of its vision. Psychic prison is a stage, as stated earlier, where organizations get trapped in their consciously/unconsciously built favored methods, beliefs, perceptions, mental models, processes, and ways of information processing which eventually limit organizations to see into the more relevant and contemporary realities of the dynamic business world.
Since the phenomenon of organizational vision holds the potential to raise the problem of psychic prison, this paper begins by addressing the definitional issues involved in linking the definition with the proceeding stages of vision development, vision articulation, and vision implementation. Paper then, through the established concepts and theories, discusses the processes through which ‘vision’ is articulated and implemented within organizations and role of leaders in getting individuals/groups aligned with their vision by establishing cognitive and structural artifacts of organizations. Finally, paper explains that how as a natural outcome of ‘vision’ organizations start looking into environmental opportunities/threats through ‘vision lenses’ and become unable to capture realities outside the vision lenses’ focus. Since the vision development and vision articulation have been seen as the primary responsibilities of organization’s leader (Hirai, 1995; Kolzow, 1999; Oshagbemi & Gill, 2003), the role of vision as determinant of organization’s psychic prison will be discussed both from vision and leader perspective. No scholarly effort has been made in this regard before to gauge the potential drawbacks of ‘vision’.
Defining Vision
For almost three decades, despite the clear importance of vision in organization (Blanchard & Stoner, 2004) any consensus among scholars regarding the definition of vision has not been built so far (Kantabutra, 2008; Kantabutra & Avery, 2002). Like various previous management concepts
this definitional variance is not new, however for this paper it seems critical to look into the definitional variance as the way vision is defined has a great bearing on the vision’s propensity to make organizations think in their preferred/favored ways and thus fail to respond to environmental changes competitively. It is pertinent to mention here that in this paper the word “organization” depicts the accumulative thinking patterns of all organizational members.
Despite the presence of definitional issue of vision most of the scholars have developed a consensus that vision is not something unachievable instead it is a fascinating desired state for individuals, groups, or organizations which they have resources to reach at. For instance Stewart (1993) defines Vision as “the concept of creating a description of what we could be in the future.” Parikh & Neubauer (1993) define vision as an appearance of a desired future state, an answer to the question “What do we want to create?” Parikh & Neubauer (1993) further posit that, “unlike a traditional strategic planning approaches, a vision is a future to be created, and not a forecast.” Synder & Graves (1994) have defined vision and its delivery in a more comprehensive and objective way. According to Synder & Graves vision is a discussable image of the future (target) towards which organization/leader aims its whole resources and energies (i.e. strategies, structures, processes, technologies etc.). Contrary to the above definitions Ziegler (1991) however states that vision is only a metaphor for human visualization, not a desired future “out there”. However for present study definition proposed by Parikh & Neubauer (1993) will be used to prove study’s claim that vision eventually leads organizations to a psychic prison mentality.
Several points can be made from above definitions. These definitions in common try to capture the distance between existing and desired states of organization and acknowledge the ability of organization to accurately gauge and achieve this distance through the rational decision making. Desired state, like a painter, is shaped but not explored and at the given point in time holds the very objective future picture of all the strategic, functional and operational destinations of the organization. However, advocates of complexity theory, argue that due to the missing link between the cause-and-effect of existing and future state, it is impossible for organizations to depict a specific desired future and then connecting that future back to the required organizational actions (Stacey, 2007). Similarly McMaster (1996) posits that “survival (of an organization) is contingent on a design that balances the forces of an ecology in such a way that a stable base identity is created—an identity with enormous flexibility in its specifics and applications.”
2012 209
From the above discussion it can also be deduced that the future picture is based on the knowledge and realities of present age. Desired future is something which is relative, and not absolute. Since the vision demonstrates a difference between existing and desired state, on the basis of previous knowledge, wisdom, experiences and cognitive abilities organizational leaders only try to shape a fascinating future of the organization in relation to present state. It is worthwhile to note here that the effectiveness and greatness of shaped future is still very subjective in its nature and solely based on the meanings given to current realities by the leader. From symbolic interactionists’ view vision is developed as a result of the interaction between leader’s personal thinking, insights, and socially constructed meanings. It is also pertinent to understand that one thing which looks little or obsolete today, might have been viewed as very fascinating and big in previous times.
Vision Development & Implementation
Since present study claims that despite its initial success vision gradually over a period of time limits organization’s ability to capture multiple realities, it is pertinent to understand the process through which it over a period of time happens. One of the key assumptions taken in this study is the effective development, communication, and implementation of the vision in organizations. Organizations where the vision is symbolic, or is not well communicated, or is not implemented, or is not reflected in organizational activities/actions, the phenomena of vision as psychic prison will not be applicable.
Vision arises to encode and provide the necessary interpretations for the organizational members by developing their mental models aligned with vision’s priorities (Burton & Ramiller, 1997). Mental model is one’s cognitive process of making sense about the world (Wind & Crook, 2005). Mental model consists of the adaptive belief constructs, values system, deep-seated assumptions, pictures/images, and generalizations which individual’s use to make sense about the world around them (Burns, 2005; Senge, 1990). These mental models also serve as a base for people to make further sense about organizational as well as personal actions and initiatives. Alignment of individual’s mental model with vision’s priorities is the key in effective vision realization. However it is argued that this alignment is won at the cost of the submission of organizational member’s thoughts conflicting with vision priorities. This is one of the factors which leave organization
compelled to interpret its actions through a unified and commonly shared reality. Individuals interpret information according to their mental construction of reality by using their cognitive constructs (Reger, Gustafson, Demarie, & Mullane, 1994). Construction of mental models is greatly influenced by the ‘cognitive style’ which is the way people acquire, process, and disseminate information in organizations (Hayes & Allinson, 1998). Organizations (led by vision) intend to develop a ‘collective cognitive climate’ where the information conflicting with or challenging to vision’s priorities is filtered, and only opportunities/threats aligned with vision’s priorities are considered. Most of the researchers have acknowledged this stage as disastrous and predictor of organization failure. Various scholars have prescribed a solution of this problem that organizations should constantly stay connect with their environments and should always question their established business’s philosophies and assumptions. However the application of this fancy recipe carries some daunting questions. For instance, is the organization’s interpretation of environmental threats/opportunity objective or subjective? Is the individual’s process of challenging or questioning to the current realities objective or subjective? Are there some mediating/moderating factors that might influence the way individuals/organizations interpret their environments and make sense for future actions? The only possibility of the application of above-said recipe is the ‘Yes’ answer of atleast first two questions, which of course cannot be the case. Similarly the ‘yes’ answer of third question also proves the very subjective nature of individuals/organizations’ information-processing or interpretation system. While deciding on what information should be acquired and how it should be interpreted the role of individuals is very important as they make these decisions in the light of organization’s previous events, experiences, and insights (James & Gerardo, 1991). Neustadt & May (1986) have suggested that organizations must realize the fact that “the future has no place to come from but the past.”
It is argued that, for individuals/organizations, looking into new realities without being influenced by already established realities is almost impossible or atleast very difficult. It is also pertinent for someone to understand that mental models, once developed, sustain for a longer period of time irrespective of their further usefulness (Wind & Crook, 2005). Since mental models are fundamentally required for human reasoning, it is argued that people often get stuck with their old mental models even though when those models do not reflect the accurate reality. Although the
Shahzad K. - Vision or Psychic Prison
Khuram Shahzad
Business Intelligence Journal - July, 2012 Vol.5 No.2
210 Business Intelligence Journal July
individuals have their own mental models the development of these mental models however is based on the interaction with others (Hayes & Allinson, 1998). The danger involve in this interaction process is the natural emergence of ‘like-minded groups’ having the mental models resisting divergent thinking but inspiring stereotypical thinking (Hayes & Allinson, 1998). In order to bring any change in organization’s course it is necessary to change the old mental models of people (Wind & Crook, 2005) however, people strongly disregard any information conflicting with their old mental models. They deny to consider any option which is not explained by their existing mental reality (Wind & Crook, 2005).
Due to the strong influence of personal as well as environmental characteristics visions vary from person to person. Leaders usually develop their vision in a very specific way sometimes by being totally rationale or intuitive, sometimes by being totally subjective or objective, and sometimes by using a unique mixture of these. However, all the leaders frequently intend to influence their followers to adopt and act on the leader’s vision by using multiple practices such as exercising authority, through intellectual stimulation, by setting goals, by punishing and rewarding, through team building, or by restructuring the jobs. The danger involved in this process is the tendency of leaders to consciously or unconsciously uplift people having ‘yes attitude’ and natural passion toward the leader’s vision. This ‘yes’ surrounding often leaves leaders unable to receive information important for organizational change and survival. Just like so many other imaginative and fascinating leadership characteristics purposed by scholars, leaders, in this case as well, are usually advised to avoid building such kind of ‘yes’ surrounding and are advised to encourage diversity of thoughts in their followers. However it is pertinent to know that it is easier said than done. Developing such kind of normative abilities in leaders become impossible as sometimes because of the paradoxical nature one trait can be developed only at the cost of other. It is argued that for a visionary leader it is always important to have individuals/groups committed with their leader’s vision. Leader-member exchange theory (Deluga, 1998) explains the way leaders develop their relationships with individuals/groups that they lead. Theory posits that leaders always develop relationships with specific individuals/groups in unique ways and delegate high level responsibilities, decision making, and access to resources to those in close relations. These individuals/groups are expected to be fully devoted and faithful to
their leader. Because of the delegated authorities these selected people can greatly influence other organizational members and thus can expedite the vision articulation process. It is therefore argued that the selection of loyal and committed individuals/groups by leader is, by and large, based on the individuals/groups tendency to show adherence to the leader’s vision about the organization future. In simple words when leaders communicate their vision to organizational members, those having ‘yes’ notion are selected and those having ‘no’ notion are rejected to be the inner-group members of the leader.
It is pertinent to understand that organizations are information-processing systems (Tushman & Nadler, 1978), where previously stored information called ‘organizational memory’ has great bearing on the way organizations further acquire, process, and retain information for present as well as future actions (James & Gerardo, 1991; Richardson-Klavehn & Bjork, 1988). Organization’s memory consists of past events, strategic orientation, commitments, goals, assumptions, behaviors, and standard operating procedures (Hall, 1984) that, when converted into mental and structural artifacts, have consequential impacts on organizational outcomes (James & Gerardo, 1991).
It has widely been acknowledged that the acquisition and retrieval of knowledge and experience from memory largely influence individuals’ behaviors (Anderson, 1980). Organizations use information to resolve problems and to make future decisions, however organization’s cognitive structures (accumulative effect of employees’ cognitive structures) form the way that information is acquired and processed (James & Gerardo, 1991). Although information is acquired and interpreted at individual level however the individuals’ interpretations become institutionalized through sharing and enforcing. This institutionalization enables organization to preserve the past knowledge, learning, and behaviors, even in times when major employees leave the organization (Weick & Gilfillan, 1971). It is therefore argued that these institutionalized cognitive structures consequently restrict organizations to feel the variance that gradually takes place between the organization’s desired destinies and emerging environmental actualities. This blindness from emerging aspects of environment causes organizations to compromise their effectiveness (Walsh & Fahey, 1986) and thus leads organizations to the full-blown crises (Nystrom & Starbuck, 1984). March (1972) has declared memory as an ‘enemy of organizations’, an enemy that fortifies the status quo by underpinning the single-loop-learning (Argyris & Schon, 1978).
2012 211
Vision as Psychic Prison
It is pertinent to note that visions are abstract and are not one-time specific goal or behavioral change that can be easily accepted and then discarded. Instead, vision is a generic guideline for a wider range of business activities and people behaviors for an extended period of time. Organizational vision may function in its early stage by providing organizational members with a platform to develop their sense making and by asking them to surrender their previous meanings and self-defined realities.
Organizations are created and sustained by conscious and unconscious efforts. People develop conscious and unconscious patterns of constructing realities which are ultimately reflected in organizations. Since, vision provides organizations with a powerful framework of desired future to construct realities, people of the organizations become imprisoned or confined by the images, ideas, thoughts, and actions derived from the vision. Vision embraces the implicit images and leads organization to view, analyze and respond in a distinctive yet partial order.
Vision by relating present to some futuristic ideal and by building fascinating expectations can/should become an aspiration for individuals and organization. These expectations then establish a conceptual framework and a sensible image for the people (Tushman & Romanelli, 1985). Similarly, vision provides organizations with strategic frameworks in order to answer various key strategic questions such as “what business/es are/can we in” and “which business can we safely avoid”? How and with what will we compete? (Sull, 1999). These strategic answers are ultimately reflected in mental models and cognitive patterns of organizational members through which they see in complex environment and fit the information into an established framework. Indeed these frameworks help members to see, but also blind organizations by consolidating on certain things with firm believe that only these things matter. Consequently, these cognitive frames also called mental models constrict organizations by preventing them from noticing new realities and paradigm shifts. This is the point where organizations become trapped in their favored ways of thinking and doing things because of the initial success brought by past patterns. However, any change in environmental composition coverts their previously winning formulas into failures. It is pertinent to remember that this conversion of beacon frames into blinders or psychic prison is not the exception in organizational social system; instead “it is rule”.
In order to stay competitive organizations intend to continuously develop links between their past and present by utilizing their acquired knowledge and past experiences to device future strategies. However, this decision making process confirms that there are atleast more than one futures that an organization can shape and pursue, and that selection of one desirable future (vision), by and large, is based on past and usually results in an elimination of alternative futures. Similarly, vision depends upon the availability or attainability of organizational resources, cognitive path dependence, and the collective consciousness of the larger social environment. According to a saying “what we see means what we don’t see” vision leaves organizations compelled not to see realities other than their own created ones.
Similarly, vision at its articulation phase breeds another organizational phenomenon of groupthink (Janis, 1972). Groupthink arises when organizational members develop shared illusion as a result of unconscious self-affirming process in order to develop conformity and cohesiveness. It is not necessary that driving force of groupthink will always be vision but in most cases after a reasonable period of time vision becomes culture of the organization. According to Freud unconscious processes are created by the culture, and that the unconscious and culture are thus really two sides of the same coin. Because of the deep-rooted shared realities among organizational members culture, in case of any change, strongly resists (Chin et al., 2002, p. 366). Organization becomes psychic prison when its members make their sense about realities through the glasses of vision and thus discourage thinking damaging the shared vision.
Based on the Morgan’s psychic prison’s metaphor following elements can be noticed:• Cave people are chained in a way that they cannot move• The only thing that they can see is the wall in front of
them• Behind them fire throws shadows on the wall• Cave people associate shadows with reality which is
only reality they know• One member gets exposed to another world, and
explains the new reality to others• Cave’s members resist
This paper views both vision and organizational members chained on the floor of cave. Vision is the only reality which they believe in and act on. Both organization and its members have become so enamored of the idealized future that they are unable to see competing and more
Shahzad K. - Vision or Psychic Prison
Khuram Shahzad
Business Intelligence Journal - July, 2012 Vol.5 No.2
212 Business Intelligence Journal July
successful realities. In addition they are highly committed to expend enormous amount of energy, passion and resources to get that reality. The higher their commitment, the less willing they are to see the viability of competing realities. Whatever they see on the wall is a shadow thrown by the vision. Since, vision is the only defined reality for them exploration of any new world would be resisted. Vision as psychic prison depicts a natural outcome of organizational vision that is a result of unconscious process yet uncontrollable by nature. After knowing the role of unconscious in organization, efforts might be taken to manage the unconscious. However, it seems impossible as unconscious by nature is uncontrollable.”(Morgan, 1986).
References
Anderson, J. R. (1980). Cognitive psychology and its implications: San Francisco: Freeman and Company.
Argyris, C., & Schon, D. A. (1978). Organizational learning: A theory of action perspective: Reading, MA: Addison-Wesley.
Baum, J. R., Locke, E. A., & Kirkpatrick, S. A. (1998). A longitudinal study of the relation of vision and vision communication to venture growth in entrepreneurial firms. Journal of Applied Psychology, 83(1), 43-54.
Blanchard, K., & Stoner, J. (2004). The vision thing: Without it you’ll never be a world-class organization. Leader to Leader, 31, 21-28.
Burns, K. (2005). Mental models and normal errors. In H. Montgomery, R. Lipshitz & B. Brehmer (Eds.), How professionals make decisions (pp. 15-28): Mahwah, NJ: Lawrence Erlbaum Associates.
Burton, S., E., & Ramiller, N. C. (1997). The Organizing Vision in Infortnation Systems Innovation. Organization Science, 8(5), 458-474.
Deluga, R. J. (1998). Leader-member exchange quality and effectiveness ratings: The role of subordinate-supervisor conscientiousness similarity. Group and Organization Management, 23(2), 189-216.
Hall, R. I. (1984). The natural logic of management policy making: Its implications for the survival of an organization. Management Science, 30(8), 905-927.
Hayes, J., & Allinson, C. W. (1998). Cognitive style and the theory and practice of individual and collective learning in organizations. Human Relations, 51(7), 847-871.
Hirai, Y. (1995). Information processing in vision and memories: Baifukan.
James, P. W., & Gerardo, R. U. (1991). Organizational Memory. The Academy of Management Review, 16(1), 57-91.
Janis, I. L. (1972). Victims of groupthink: Houghton Mifflin Boston.
Kantabutra, S. (2008). Vision effects in Thai retail stores: Practical implications. International Journal of Retail & Distribution Management, 36(4), 323-342.
Kantabutra, S., & Avery, G. C. (2002). Proposed model for investigating relationships between vision components and business unit performance. Journal of Management & Organization, 8(2), 22-39.
Kantabutra, S., & Avery, G. C. (2007). Vision effects in customer and staff satisfaction: an empirical investigation. Leadership & Organization Development Journal, 28(3), 209-229.
Kantabutra, S., & Avery, G. C. (2010). The power of vision: Statements that resonate. Journal of Business Strategy, 31(1), 37-45.
Kolzow, D. (1999). A perspective on strategic planning: what’s your vision? Economic development review, 16(2), 5-10.
March, J. G. (1972). Model bias in social action. Review of Educational Research, 42(4), 413-429.
McMaster, M. D. (1996). The Intelligence Advantage: Organizing for Complexity: Newton, MA, Butterworth, Heinemann.
Morgan, G. (1986). Images of organization. Beverly Hills: Sage Publications.
Neustadt, R. E., & May, E. R. (1986). Thinking in time: The uses of history for decision makers: New York: Free Press.
Nystrom, P. C., & Starbuck, W. H. (1984). To avoid organizational crises, unlearn. Organizational Dynamics, 12(4), 53-65.
Orton, J. D., & Weick, K. E. (1990). Loosely coupled systems: A reconceptualization. Academy of Management Review, 15(2), 203-223.
Oshagbemi, T., & Gill, R. (2003). Gender differences and similarities in the leadership styles and behaviour of UK managers. Women in Management Review, 18(6), 288-298.
Parikh, J., & Neubauer, F. (1993). Corporate visioning. International review of strategic management, 4, 105-116.
2012 213
Rafferty, A. E., & Griffin, M. A. (2004). Dimensions of transformational leadership: Conceptual and empirical extensions. The Leadership Quarterly, 15(3), 329-354.
Reger, R. K., Gustafson, L. T., Demarie, S. M., & Mullane, J. V. (1994). Reframing the organization: Why implementing total quality is easier said than done. Academy of Management Review, 19(3), 565-584.
Richardson-Klavehn, A., & Bjork, R. A. (1988). Measures of Memory. Annual Review of Psychology, 39, 475-543.
Senge, P. M. (1990). The fifth discipline: Mastering the five practices of the learning organization: Doubleday, New York, NY.
Stacey, R. D. (2007). Strategic Management and Organisational Dynamics: The Challenge of Complexity (5 ed.): Pearson Education, Prentice Hall, Financial Times.
Stewart, J. (1993). Future state visioning--A powerful leadership process. Long range planning, 26(6), 89-98.
Sull, D. N. (1999). Why good companies go bad. Harvard Business Review, 77(4), 42-56.
Synder, N. H., & Graves, M. (1994). Leadership and vision. Business Horizons(January-February), 1-7.
Tushman, M. L., & Nadler, D. A. (1978). Information processing as an integrating concept in organizational design. Academy of Management Review, 3(3), 613-624.
Tushman, M. L., & Romanelli, E. (1985). Organizational evolution: A metamorphosis model of convergence and reorientation. In L. L. Cummings & B. M. Staw (Eds.), Research in organizational behavior (pp. 171-222): Greenwich, CT: JAI Press.
Walsh, J. P., & Fahey, L. (1986). The role of negotiated belief structures in strategy making. Journal of Management, 12(3), 325-338.
Weick, K. E., & Gilfillan, D. P. (1971). Fate of arbitrary traditions in a laboratory microculture. Journal of Personality and Social Psychology, 17, 179-191.
Wind, Y., & Crook, C. (2005). The power of impossible thinking: Transform the business of your life and the life of your business: Upper Saddle River, NJ: Wharton School.
Ziegler, W. (1991). Envisioning the future. Futures, 23(5), 516-527.
Shahzad K. - Vision or Psychic Prison
Khuram Shahzad
Business Intelligence Journal - July, 2012 Vol.5 No.2
214 Business Intelligence Journal July
THE ASSESSMENT OF SOCIAL REPORTING ON BEHALF OF ACCEPTED CORPORATIONS LISTED IN TEHRAN STOCK
EXCHANGE
Hosseyn Karbasi YazdiIslamic Azad University, Center of Tehran branch, Tehran, Iran.
Kobra HemmatiIslamic Azad University, Zanjan branch, Zanjan, Iran.
Ali BayatIslamic Azad University, Zanjan branch, Zanjan, Iran.
Email: [email protected]
AbstractDuring the recent years that many changes have accomplished in economy and social expectations, typically the accounting world
has confronted the society with the socio-environmental effects of industries development. According to these changes in society and environment, accounting also affects from it s environment. In this study the feasibility of social reporting on behalf of accepted corporations listed in Tehran stock exchange has been studied. In this survey we accumulate required data about corporations using a questionnaire and due to the obviousness of statistical population size to estimate the sample size. Conclusions of research indicate that factors such as lack of appropriate accounting information system, lack of awareness of managers about the social cost and nonexistence of legal standards and high social reporting costs causes the avoidance of social reporting on behalf of Iranian corporations. Key words: Social Reporting, Free Economy Democracy, The Theory of Political Economy, Legitimacy Theory.
In recent years, the terms “corporate social responsibility” and “sustainability” have become Commonplace. There has been growing awareness of the impact of corporate behavior, not just on shareholders, but on other stakeholders. Additionally, there has also been an increased willingness to consider a greater variety of persons and groups as “legitimate stakeholders”, with interests that deserve consideration– such as employees, customers, suppliers and creditors, as well as local communities, developing nations and the environment.
Over the past half century, other companies do not evaluate the economic aspect but also in terms of performance and ethics are part of the community are assessed. Every social institution (the companies are not excluded) in the community through an explicit or implicit social contract of work, and the path of social and environmental responsibility is a crucial factor that leads to long-term sustainability of activities (khoshtinat and raei, 2004).
In generally, social responsibility can be define a lifelong commitment to social responsibility and ethical behavior of
firms Partake in the economic development and improved living conditions work force and their families and the local community and society (Castka et al., 2007).
It is almost trite to say that corporations and corporate activity have an enormous impact on the natural environment. This is particularly true when considering the use made of primary resources for the manufacture of products, the utilization of energy and water, and the production of waste and emissions, and a growing awareness of “climate change” have resulted in greater attention being paid to these impacts. For this reason, the activities and behaviors of corporations cannot be ignored or overlooked when considering appropriate measures to be taken in relation to environmental protection and sustainable development.
Social reporting, including client performance reports in relation to employment status of employees, training them, establishing facilities, perimeter security, employment, health, work, community service and charitable work related expenses, costs and environment, that the efficiency of resource use by companies to clarify the status of the show and the business community used (Ghos, 2006).
2012 215
Karbasi Y. H., Hemmati K., Bayat Ali - The Assessment of Social Reporting on behalf of Accepted Corporations Listed in Tehran Stock Exchange
Hosseyn Karbasi Yazdi,Kobra Hemmati, Ali Bayat
The role of business in society is changing dramatically. A growing alarm in the community in recent years is the manager of environmental and social impacts are very responsible, large companies, once, when his sole concern as a social tool than spent, looked beyond it. Managers Found maximize shareholder income, not only the community but now most of this demand. This raises many questions and demands that must be answered in terms of social responsibility (Mackey and Barney, 2007).
Thus, a desire to encourage companies to act socially responsibly, to ensure development is sustainable and to allow all stakeholders to make informed assessments of corporate activities and practices, necessarily leads to a consideration of sustainability reporting. To what extent should listed public corporations be expected to engage in “non-financial” reporting and disclosure of “material business risks”, particularly those with an environmental impact? This paper will firstly seek to define the key concepts of corporate social responsibility, sustainability disclosure and triple-bottom-line reporting. The current sustainability disclosure obligations placed on listed public companies in Australia will then be described and analyzed, particularly in the context of environmental impacts. The outcomes of recent Australian inquiries which considered the issue of sustainability disclosure will also be reviewed. This paper will then consider whether compulsory sustainability disclosure maybe an appropriate option for the Australian position, and conclude with a comment on likely future developments.
Countries like Britain, America, Australia, who were pioneers in research on corporate social responsibility it also provides the standards and laws have developed, But in Iran, however, that this paragraph "g" Preface to the financial statements, and community information needs, they are considered virtually nothing has been done about it. Therefore in this study was to examine the views of corporate managers on the feasibility of social reporting Using the results of the research necessary to develop standards be clear in this regard by the competent authorities. This article will continue to be Theoretical research in the next section, background research and provide research, the proposed research method and research findings will be reviewed and analyzed. Finally, the research proposals and final section will summarize the results of the study.
Theoretical Research
Integrating corporate social and environmental reporting into traditional financial reporting has to gain an
overall acceptance yet, but more and more entities tend to disclose such information in order to give confidence to stakeholders. Theoretical and empirical work on corporate social reporting as well as on environmental reporting have undergone a development nearly completely separated from the development of traditional financial accounting and reporting. We propose an overview of existing practice and requirements for entities’ activity disclosure. Our research aims the participation to the professional judgment construction and modeling, according to free manifestation of entity’s accounting and reporting policies. We focus on fundamental research that is related to inductive accounting theory and uses scientific methods for identification of corporate reporting theoretical and practical difficulties in European and international economic entities.
The research in the field of information disclosure and social performance of the three theories are used, there are theories on corporate social responsibility theories system-oriented approach, system-oriented approach to the community and allow us to disclose information on the role of information between enterprises, governments and individuals, groups, focus. In the system-oriented approach in perspective, it is assumed that the works of a society in which it affects and is affected (Windsor, 2006).
Theory of Political Economy
Theory of political economy in a broad sense is a long history and it has different definitions. Political economy theory of the interaction strength, the holders of power conversion systems is produced. As a framework, the theory of political economy, is focused on the exchange market, But this theory is primarily their emphasis on studying all the changes that can occur in the underlying structures, And social institutions such as government relations and legislative institutions, each institution of power and economy of production and exchange of goods and services that the system has to analyze. In fact, this theory as a framework for economic, political and social life in which it has been defined (Deegan, 2002).
Political economy theory is ambivalent and just as Marx does Is needed between these two aspects of the political economy of the middle class is established by Ajy S. Mill and his followers. In theory, Marxist political economy (classical) and system issues such as conflict of interest in them, inequality and the role of government and is used in the analysis, But the theory of political economy the middle class will not only interactions between different groups in a pluralistic world. These elements are the same if it is to
Business Intelligence Journal - July, 2012 Vol.5 No.2
216 Business Intelligence Journal July
be considered. These two views are in two different ways to approach issues. Compromise with each other and not be fundamentally important issues in the analysis, it is Marxism. In view of the middle class as relatively less important issues are considered (Tinker and Okcabol, 1991).
Theory of Legitimacy
The views presented in the theory of legitimacy- is built on the theory of political economy foundation- Argues that organizations will be there as long as the community deems them a legitimate and in other words, the social contract between companies and individual members of society That society as a collection of individuals, organizations and recognize the use of natural resources and labor offers. Organizations have used these resources and goods and services provided to the community that may be leave positive or negative effects on the environment. Enterprises to survive and their activity must to convince society that the social benefits are more than social costs for the community (Mathews, 1997).
Legitimacy theory is based directly on the concept that if society understands the social contract in violation, its life will be threat (Wood et al, 2001). The clearest definition of legitimacy theory that is expressed by Lynd Bloom: He believes that legitimacy, status or circumstances that if the value system of coordination among institutions with a larger value system of the society, which organization is parts it (Lindblom, 1994).
The legitimacy as a source that organization Life depends on it, and the organization can affect the source or to manipulate it. When managers feel that the activity is consistent with the social contract, the theory predicts that the legitimacy of treatment strategies. Legitimacy theory is based on such perceptions. Any curative strategy must be disclosed (Deegan, 2002).
The Theory of Stakeholders Groups
Stakeholder’s theory considers the company from both branches of moral theory (or command) and the administrative branch (or positive). Ethical branch state the organization how behave with its Stakeholder’s groups. In fact focuses on the organization responsibility. In contrast, category management emphasizes the need to manage special Stakeholders (Ullmann, 1985).
Many entities are just beginning to understand how stakeholders want them to measure, manage and account for the full range of their activity impacts on society and environment. The best way to ensure the financial success going forward is to expand the overlap between the business interests and the interests of society and environment. Transparency and accountability, along with a close working relationship with the stakeholders, will grow the business, serve the shareholders’ interests and create a better world. This type of report therefore must reflect the growing commitment to work with labor, business partners, government agencies and environmental and community stakeholders.
Gary and his colleagues in the branch of management theory about Stakeholders state: on the based this view Stakeholders who are organizations In order to achieve the own future benefits need to manage their. If these groups are important for the organization, it is doing more efforts in managing its relations with them. Information is the key element that organizations be able to used to manage (or manipulate) the stakeholder groups to gain their approval and to discourage them from supporting or opposing the organization. Organization has motivation to disclose information to stakeholder groups (strong) to show that the organization acts in accordance with their expectations (Gray, owen and Adams, 1996).
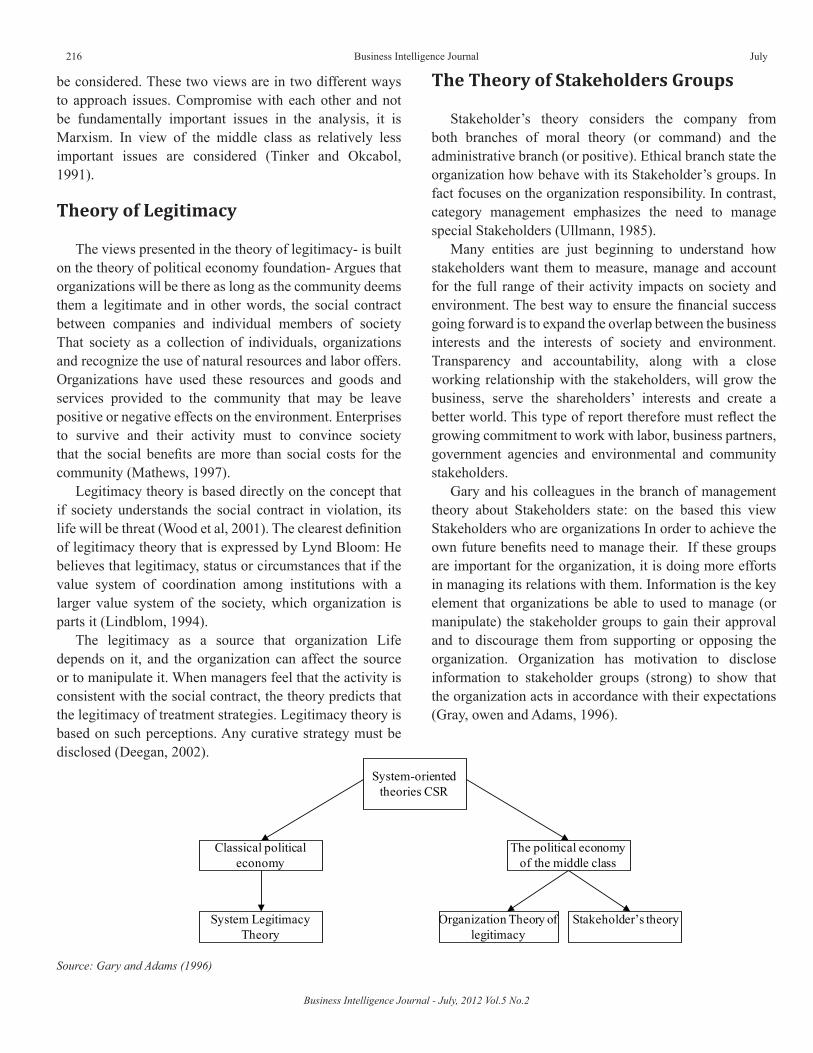
System-orientedtheories CSR
The political economy of the middle class
Classical politicaleconomy
Stakeholder’s theoryOrganization Theory of legitimacy
System Legitimacy Theory
Source: Gary and Adams (1996)
2012 217
Literature Review
Recent years have witnessed a significant increase in the number of major companies in Europe, the USA and Australia proclaiming their social responsibility credentials, and backing up their claims by producing substantial paper, or web based, environmental, and more recently, social and sustainability reports. Cooper and Owen (2007) critically evaluate the degree of institutional reform, designed to empower stakeholders, and thereby enhance corporate accountability in UK quoted companies. It is concluded that both forms of disclosure offer little in the way of opportunity for facilitating action on the part of organizational stakeholders, and cannot therefore be viewed as exercises in accountability. Perhaps not surprisingly in view of the fall-out from Enron and similar affairs, reputation building appears to provide a primary motivating factor for companies going down the Corporate Social Responsibility (CSR) path. Notwithstanding the democratizing potential of corporate social reporting claimed by the Green Reporting Initiative and Accountability, severe reservations have been expressed in the academic accounting literature as to the degree of participatory role played by stakeholders in the process (Cooper and Owen, 2007).
Corporate social reporting is a method of self presentation and impression management, conducted by companies to ensure various stakeholders are satisfied with their public behavior (Hooghienstra, 2000; Palten, 2002). For Gray et al, (1996) corporate social reporting is the process of communicating the social and environmental effects of organizations economic actions to particular interest groups within the society at large. The usefulness of social and environmental disclosure to all those affected by the activities of a business has been the focus of many researchers for the past decades. The emphasis of these researches was toward the importance of disclosure to both internal and external users. After all the purpose of accounting is to provide information that is potentially useful for economic decisions and aims to assess the impact of an organization or company on people both inside and outside (Longstreth and Rosenblum,1973; Rockness and Williams 1988; Gray et al, 1995; Gamble et al, 1996; Deegan and Rankin, 1997; and O’Donovan, 2002).
In line with this position, quite a number of studies have indicated a substantial increase in social and environmental disclosure in annual reports (Hogner, 1982; Tinker and Niemark, 1987; and Guthrie and parker, 1987). However, some studies revealed poor and inconsistent information regarding the quality of social and environmental disclosure
in annual accounts of corporations (United nations, 1992; Gamble et al 1996 and Gray, 2000). For some studies, it is not the quality of disclosure that is the focus but the relationship between social performance and financial performance of corporations. However the positions of these researches are different.
For some studies the relationship is positive (Bragdon and Marlin, Moskowitz,1972; Bowman and Haire, Moskowitz, Parker and Eilbert,1975;Belkaoui, Heinze,1976; Sturdivant and Ginter, 1977; Spicer, Ingram, Bowman, 1978; Fry, Klein, and Meiners, 1982; Freeman, 1984; Newgren et al, Clarkson et al, Solomon and Hansen, 1985; Rockness et al, Cowen et al, Spencer and Taylor, Wokutch and Spencer, Connell and Shapiro 1987; Morris et al, Fombrun and Shanley, 1990; Raihi-Belkaoui, 1992; Hart and Ahuja, Waddock and Graves, Johnson and Greening, 1994; Mitchell et al, 1997; Berman et al, 1999; Orlitzky et al, 2003 and Vogel, 2005 ).The findings of some other studies, established a negative relationship to exist between corporate social performance and corporate financial performance (Vance, 1975; Strachan et al, Shane and Spicer, Wier, Eckbo, 1983; Jarrel and Peltzman, Wartick and Cochran, Power and kranz, 1985; Pruitt and Peterson, 1986; Davidson et al 1987; Hoffer et al, Davidson and Worell, 1988; Bromilley and Marcus, Rockness , 1989; Wood and Jones, 1995; Arffin and Mahan, 1997; Milne and Adler, 1999; Husted 2000; and McWilliams and Siegel, 2001). Others argued the relationship was inconclusive (Alexander, 1978; Abbott and Mosen, 1979; Ingram and Frazier, 1983; Aurperle et al, 1985; Freedman and Jaggi, 1986; Pava and Krausz, 1996; and Orlitzky et at, 2003).
While some companies produce electronic comprehensive reports of all their global social and environmental impacts, others are struggling to implement localised environmental management systems (Line et al., 2002). However, environmental and social impacts vary greatly from industry to industry. Guthrie et al., (2007) find that the sample companies reported more on industry-specific issues than general environmental and social issues. This finding also highlights the need for researchers examining environmental and social disclosures to consider incorporating industry-specific items into their disclosure instruments. The study also finds that the companies tended to use corporate websites for their 4.
Environmental and social reporting, indicating the need for researchers to consider alternative media (Jackson and Quotes, 2002).
The position of some researches is that, the relationship though positive has no impact and it is inconclusive (Fry and
Karbasi Y. H., Hemmati K., Bayat Ali - The Assessment of Social Reporting on behalf of Accepted Corporations Listed in Tehran Stock Exchange
Hosseyn Karbasi Yazdi,Kobra Hemmati, Ali Bayat
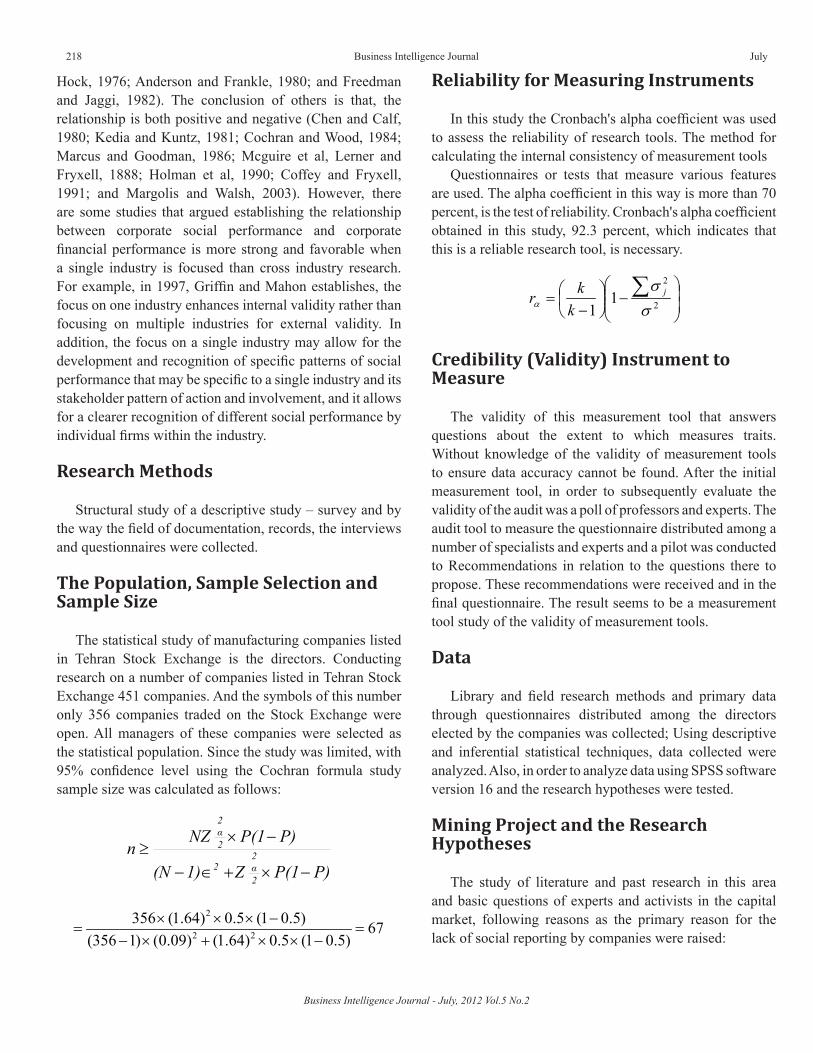
Business Intelligence Journal - July, 2012 Vol.5 No.2
218 Business Intelligence Journal July
Hock, 1976; Anderson and Frankle, 1980; and Freedman and Jaggi, 1982). The conclusion of others is that, the relationship is both positive and negative (Chen and Calf, 1980; Kedia and Kuntz, 1981; Cochran and Wood, 1984; Marcus and Goodman, 1986; Mcguire et al, Lerner and Fryxell, 1888; Holman et al, 1990; Coffey and Fryxell, 1991; and Margolis and Walsh, 2003). However, there are some studies that argued establishing the relationship between corporate social performance and corporate financial performance is more strong and favorable when a single industry is focused than cross industry research. For example, in 1997, Griffin and Mahon establishes, the focus on one industry enhances internal validity rather than focusing on multiple industries for external validity. In addition, the focus on a single industry may allow for the development and recognition of specific patterns of social performance that may be specific to a single industry and its stakeholder pattern of action and involvement, and it allows for a clearer recognition of different social performance by individual firms within the industry.
Research Methods
Structural study of a descriptive study – survey and by the way the field of documentation, records, the interviews and questionnaires were collected.
The Population, Sample Selection and Sample Size
The statistical study of manufacturing companies listed in Tehran Stock Exchange is the directors. Conducting research on a number of companies listed in Tehran Stock Exchange 451 companies. And the symbols of this number only 356 companies traded on the Stock Exchange were open. All managers of these companies were selected as the statistical population. Since the study was limited, with 95% confidence level using the Cochran formula study sample size was calculated as follows:
P)P(1Z1)(N
P)P(1NZn
2
2α2
2
2α
−×+∈−
−×≥
2
2 2
356 (1.64) 0.5 (1 0.5) 67(356 1) (0.09) (1.64) 0.5 (1 0.5)
× × × −= =
− × + × × −
Reliability for Measuring Instruments
In this study the Cronbach's alpha coefficient was used to assess the reliability of research tools. The method for calculating the internal consistency of measurement tools
Questionnaires or tests that measure various features are used. The alpha coefficient in this way is more than 70 percent, is the test of reliability. Cronbach's alpha coefficient obtained in this study, 92.3 percent, which indicates that this is a reliable research tool, is necessary.
−
−= ∑
2
2
11 σ
σα
j
kkr
Credibility (Validity) Instrument to Measure
The validity of this measurement tool that answers questions about the extent to which measures traits. Without knowledge of the validity of measurement tools to ensure data accuracy cannot be found. After the initial measurement tool, in order to subsequently evaluate the validity of the audit was a poll of professors and experts. The audit tool to measure the questionnaire distributed among a number of specialists and experts and a pilot was conducted to Recommendations in relation to the questions there to propose. These recommendations were received and in the final questionnaire. The result seems to be a measurement tool study of the validity of measurement tools.
Data
Library and field research methods and primary data through questionnaires distributed among the directors elected by the companies was collected; Using descriptive and inferential statistical techniques, data collected were analyzed. Also, in order to analyze data using SPSS software version 16 and the research hypotheses were tested.
Mining Project and the Research Hypotheses
The study of literature and past research in this area and basic questions of experts and activists in the capital market, following reasons as the primary reason for the lack of social reporting by companies were raised:
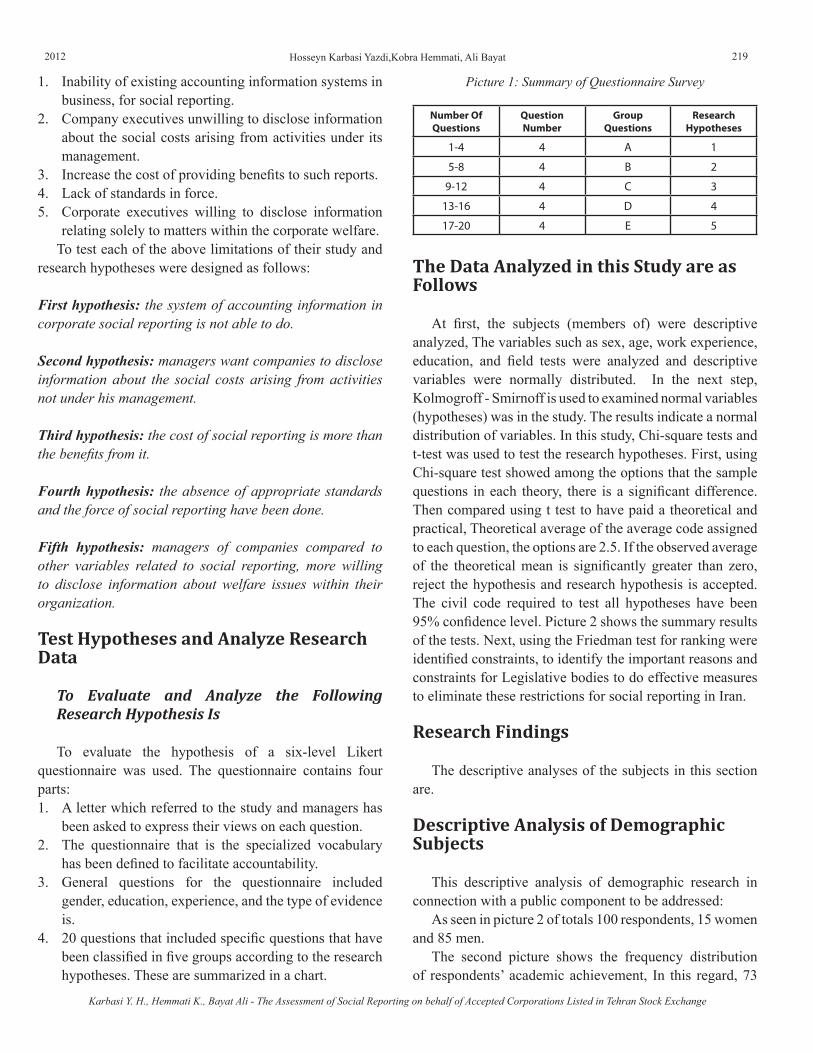
2012 219
1. Inability of existing accounting information systems in business, for social reporting.
2. Company executives unwilling to disclose information about the social costs arising from activities under its management.
3. Increase the cost of providing benefits to such reports.4. Lack of standards in force.5. Corporate executives willing to disclose information
relating solely to matters within the corporate welfare.To test each of the above limitations of their study and
research hypotheses were designed as follows:
First hypothesis: the system of accounting information in corporate social reporting is not able to do.
Second hypothesis: managers want companies to disclose information about the social costs arising from activities not under his management.
Third hypothesis: the cost of social reporting is more than the benefits from it.
Fourth hypothesis: the absence of appropriate standards and the force of social reporting have been done.
Fifth hypothesis: managers of companies compared to other variables related to social reporting, more willing to disclose information about welfare issues within their organization.
Test Hypotheses and Analyze Research Data
To Evaluate and Analyze the Following Research Hypothesis Is
To evaluate the hypothesis of a six-level Likert questionnaire was used. The questionnaire contains four parts:1. A letter which referred to the study and managers has
been asked to express their views on each question.2. The questionnaire that is the specialized vocabulary
has been defined to facilitate accountability.3. General questions for the questionnaire included
gender, education, experience, and the type of evidence is.
4. 20 questions that included specific questions that have been classified in five groups according to the research hypotheses. These are summarized in a chart.
Picture 1: Summary of Questionnaire Survey
Number Of Questions
Question Number
Group Questions
Research Hypotheses
1-4 4 A 1
5-8 4 B 2
9-12 4 C 3
13-16 4 D 4
17-20 4 E 5
The Data Analyzed in this Study are as Follows
At first, the subjects (members of) were descriptive analyzed, The variables such as sex, age, work experience, education, and field tests were analyzed and descriptive variables were normally distributed. In the next step, Kolmogroff - Smirnoff is used to examined normal variables (hypotheses) was in the study. The results indicate a normal distribution of variables. In this study, Chi-square tests and t-test was used to test the research hypotheses. First, using Chi-square test showed among the options that the sample questions in each theory, there is a significant difference. Then compared using t test to have paid a theoretical and practical, Theoretical average of the average code assigned to each question, the options are 2.5. If the observed average of the theoretical mean is significantly greater than zero, reject the hypothesis and research hypothesis is accepted. The civil code required to test all hypotheses have been 95% confidence level. Picture 2 shows the summary results of the tests. Next, using the Friedman test for ranking were identified constraints, to identify the important reasons and constraints for Legislative bodies to do effective measures to eliminate these restrictions for social reporting in Iran.
Research Findings
The descriptive analyses of the subjects in this section are.
Descriptive Analysis of Demographic Subjects
This descriptive analysis of demographic research in connection with a public component to be addressed:
As seen in picture 2 of totals 100 respondents, 15 women and 85 men.
The second picture shows the frequency distribution of respondents’ academic achievement, In this regard, 73
Karbasi Y. H., Hemmati K., Bayat Ali - The Assessment of Social Reporting on behalf of Accepted Corporations Listed in Tehran Stock Exchange
Hosseyn Karbasi Yazdi,Kobra Hemmati, Ali Bayat

Business Intelligence Journal - July, 2012 Vol.5 No.2
220 Business Intelligence Journal July
of respondents have a bachelor's degree and 25 graduate degrees and a doctoral degree are also 2.
Other hand the second picture shows the frequency distribution of study respondents.
In this connection 67 with a degree in accounting and economics degree and 25 degree 4 and 2 people in management and engineering fields with other field are 2.
Picture 2 shows the frequency distribution of respondents' work experience. In this regard, 8 of the respondents with work experience from 0 to 5 years and 37 between 6 and 10 years of experience and 32 people have between 11 to 15 years of experience, And 19 patients with 16 to 20 years of experience and 4 people with work experience are more than 21 years.
SexCumulative Percent of Frequency
Percent of Frequency Frequency
Men 15% 15% 15
Women 100% 85% 85
Total 100% 100
Education
BS and lower 73% 73% 73
MA 98% 25% 25%
PhD 100% 2% 2
Total 100% 100
Work Experience
Less than 10 years 45% 45% 45
10 to 20 Years 96% 51% 51
Over 20 Years Experience 100% 4% 4
Total 100% 100
Field
Accounting, Management and Economics
96% 96% 96
Engineering 98% 2% 2
Other Fields 100% 2% 2
Total 100% 100
Picture 3 - The chi-square test of the hypothesis that options-related questions
Picture 2 - Descriptive analysis of research subjects
Hypothesis d.f= 5 Statistics 2χ p-valve
Hypothesis1 5 173.8 0.000**
Hypothesis2 5 287.99 0.000**
Then compared using t test to test the practical and theoretical hypotheses has been average. Picture 4 shows the results of the test.
Picture 4 - Summary of Test Research Hypotheses
Hypothesis
The sample average
M
Sample standard deviation
s
The test
statistic t
d.f p-valueApprove or reject the
hypothesis
Hypothesis1 1.87 0.730 -8.688 99 0.000** H0rejected
Hypothesis2 2.3125 0.5689 -3.296 99 0.001** H0rejected
Hypothesis3 2.92 0.642 6.466 99 0.000** H0 not rejected
Hypothesis4 3.42 0.532 17.304 99 0.000** H0 not rejected
Hypothesis5 3.41 0.646 14.087 99 0.000** H0 not rejected
* All tests at the 5% significance level have been tested.
Using the hypothesis test results can be concluded that between accounting information systems, binding standards and social reports and social reporting significant relationship exists and assumptions based on test results and this can be concluded and Managers are not want to expose the social costs arising from the activities of business units under its management. And managers are only willing to provide information that shows the positive aspects in order to draw public Favorable image of their company. Therefore it is necessary to disclose information about the social effects of organizational activities by competent authorities is required.
Based on test findings, the research hypothesis, the first and second and third and fourth and fifth research hypothesis is confirmed.
Other Findings
Also in this study to determine the priority and importance for each of the obstacles mentioned were lack of social reporting in Iran from the perspective of corporate managers Friedman test was used. Picture 5 shows the results of the test.
Hypothesis d.f= 5 Statistics 2χ p-valve
Hypothesis3 5 125.87 0.000**
Hypothesis4 5 146.25 0.000**
Hypothesis5 5 300.25 0.000**
** 99% confidence level is significant.
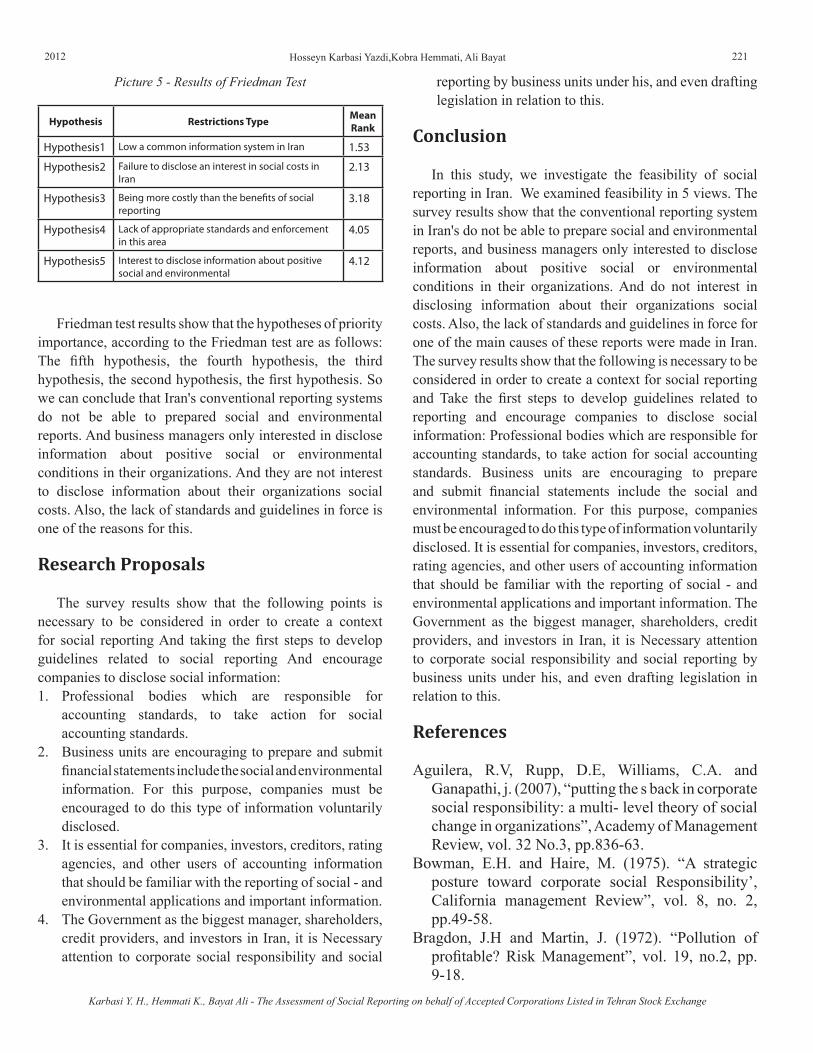
2012 221
Picture 5 - Results of Friedman Test
Hypothesis Restrictions Type Mean Rank
Hypothesis1 Low a common information system in Iran 1.53
Hypothesis2 Failure to disclose an interest in social costs in Iran
2.13
Hypothesis3 Being more costly than the benefits of social reporting
3.18
Hypothesis4 Lack of appropriate standards and enforcement in this area
4.05
Hypothesis5 Interest to disclose information about positive social and environmental
4.12
Friedman test results show that the hypotheses of priority importance, according to the Friedman test are as follows: The fifth hypothesis, the fourth hypothesis, the third hypothesis, the second hypothesis, the first hypothesis. So we can conclude that Iran's conventional reporting systems do not be able to prepared social and environmental reports. And business managers only interested in disclose information about positive social or environmental conditions in their organizations. And they are not interest to disclose information about their organizations social costs. Also, the lack of standards and guidelines in force is one of the reasons for this.
Research Proposals
The survey results show that the following points is necessary to be considered in order to create a context for social reporting And taking the first steps to develop guidelines related to social reporting And encourage companies to disclose social information:1. Professional bodies which are responsible for
accounting standards, to take action for social accounting standards.
2. Business units are encouraging to prepare and submit financial statements include the social and environmental information. For this purpose, companies must be encouraged to do this type of information voluntarily disclosed.
3. It is essential for companies, investors, creditors, rating agencies, and other users of accounting information that should be familiar with the reporting of social - and environmental applications and important information.
4. The Government as the biggest manager, shareholders, credit providers, and investors in Iran, it is Necessary attention to corporate social responsibility and social
reporting by business units under his, and even drafting legislation in relation to this.
Conclusion
In this study, we investigate the feasibility of social reporting in Iran. We examined feasibility in 5 views. The survey results show that the conventional reporting system in Iran's do not be able to prepare social and environmental reports, and business managers only interested to disclose information about positive social or environmental conditions in their organizations. And do not interest in disclosing information about their organizations social costs. Also, the lack of standards and guidelines in force for one of the main causes of these reports were made in Iran. The survey results show that the following is necessary to be considered in order to create a context for social reporting and Take the first steps to develop guidelines related to reporting and encourage companies to disclose social information: Professional bodies which are responsible for accounting standards, to take action for social accounting standards. Business units are encouraging to prepare and submit financial statements include the social and environmental information. For this purpose, companies must be encouraged to do this type of information voluntarily disclosed. It is essential for companies, investors, creditors, rating agencies, and other users of accounting information that should be familiar with the reporting of social - and environmental applications and important information. The Government as the biggest manager, shareholders, credit providers, and investors in Iran, it is Necessary attention to corporate social responsibility and social reporting by business units under his, and even drafting legislation in relation to this.
References
Aguilera, R.V, Rupp, D.E, Williams, C.A. and Ganapathi, j. (2007), “putting the s back in corporate social responsibility: a multi- level theory of social change in organizations”, Academy of Management Review, vol. 32 No.3, pp.836-63.
Bowman, E.H. and Haire, M. (1975). “A strategic posture toward corporate social Responsibility’, California management Review”, vol. 8, no. 2, pp.49-58.
Bragdon, J.H and Martin, J. (1972). “Pollution of profitable? Risk Management”, vol. 19, no.2, pp. 9-18.
Karbasi Y. H., Hemmati K., Bayat Ali - The Assessment of Social Reporting on behalf of Accepted Corporations Listed in Tehran Stock Exchange
Hosseyn Karbasi Yazdi,Kobra Hemmati, Ali Bayat
Business Intelligence Journal - July, 2012 Vol.5 No.2
222 Business Intelligence Journal July
Castka, P.Bamber, E.F. Bamber, D.F. and F.M. sharp. (2004). “Integrating corporate social Responsibility (CSR) in to ISO Management system- In search of a Feasible CSR Management system Framework”, The TQM magazine, vol. 16, No.3, pp.216-224.
Deegan, C. and Rankin, M. (1996). “Do Australian company report environmental News objectively? An analysis of environmental protection authority’, Accounting, Auditing and Accountability journal”, vol. 9, no. 2 pp. 50 – 67.
Deegan, C. (2002). “The legitimizing Effect of social and Environmental Disclosures-A Theoretical Foundation”, Accounting Auditing & Accountibility journal. Vol.15, No.3. Pp.282-311.
Fombrun C, and Shanley, M. (1990). What’s in a name? Reputation building and corporate strategy’, Academy of management Journal”, vol. 33, no. 2, pp. 233-58. 17 Friedman, M. 1962. “Capitalism and freedom’, Chicago, University of Chicago Press.
Fry, F.L. and Hock, R. J. (1976). Who claims corporate responsibility? The biggest and the worst’, Business and society review”, vol. 18, pp. 62 – 5
Forughi,D. pourhossein, S. (2008), “Managers' attitudes about social accounting disclosure”, ”, Iranian Journal of Accounting and Auditing Review, No. 52 - pp 70-55, Summer.
Fryxell, G.E and Wang, J. (1994). “The fortune corporate reputation index: reputation for what? Journal of management”, vol. 20, no. 1, pp. 1-4.
Gamble G.O., Hsu, K. Jackson, C. and Tollerson, C.D. (1996). “Environmental disclosure in annual reports: An international disclosure: An International perspective’, The International Journal of Accounting”, Vol. 4, pp. 247 – 268.
Ghos. S, management accountant. Calcvtta- 2006 myicwai. Com. Social accounting and social responsibility reporting.
Gray, owen and Adams, (1996). Accounting and Accountability, chapter, pp.88-123.
Gray R, Kouhy, R. and lavers S. (1995b), “Methodological themes: Constructing a research data base of social and environmental reporting by UK companies’, Accounting journal “, vol. 8 no. pp. 2 78 – 101.
Harts, S. L. and Ahuja, G. (1994). Does it pay to be Green? Paper presented at the national meetings of the Academy of management, Dallas. 18
Hogner, R. H (1982). “Corporate Social Reporting: Eight decades of development at US steel’, Research
in Corporate Social Performance and Policy”, vol. 4 pp. 243 – 250.
Hooghienstra, R. (2000). Corporate communication impression management: New perspective why companies engage in corporate social reporting’, journal of Business Ethics”, vol. 27 pp. 35 – 68.
Jaggi, B. and freedman, M. (1992). “An examination of the impact of pollution performance on economic and market performance: pulp and paper firms’, Journal of Business Finance and Accounting”, vol. 19, no. 5 pp. 697 – 713.
Lindblom, C.K, (1994), “the organizational Legitimacy for corporate social performance and disclosure”, paper presented at the critical perspectives on Accounting conference, Newyork, published in Accounting & Accountability. Prentice Hall. Pp.46-48.
Longstreth, B. and Rosenbloom, H.D (1973). Corporate Social Responsibility and the Institutional Investment, praeger publishers.
Markowitz, M. 1975. “Profiles in corporate responsibility: The ten worst and the ten best’, Business and Society Review”, vol. 38, pp. 28-42.
Mackey, A, Mackey, T.B, and Barney, J.B, (2007), “in vestor preferences and corporate strategies”, Academy of management Review, nol, 32No. 3. pp.817-35.
McWilliams, A. and Siegel, D. (2001). “Social responsibility: A theory of the firm perspective,’ Academy of management Review”, vol. 26, pp. 117 – 127.
Milne, M. J. and Adler, R. W. (1999). “Exploring the reliability of social and environmental disclosure content analysis’, Accounting, Auditing & Accountability Journal”, vol. 12, no. 2 pp. 237 – 256.
Morris, S. A., Rehbein, J., Hosseini, C. and Armacost, R.L. (1990). Building a profile of socially Responsive firms, pp. 297-303 in D.J wood and Martello, W.E (Ed.), proceedings of the international Association of Business and Society. 20
Moskowitz, M. (1972). “Choosing Socially Responsible stocks’, Business and Society Review “, vol.10, pp. 71-75.
Mathews, M.R, (1997), “socially responsible accounting”, chapters 6-pp.130-138.
Newgren, K.E., Rasher A.A., LaRoe, M.E and Szabo, M.R (1985). Environmental Assessment and corporate Performance: A longitudinal analysis
2012 223
using market-Determined Performance measure, pp.153-64 in L.E Preston (Ed.) Research in Corporate Social Performance and policy, vol. 7 Greenwich, CT, JAI.
O’Donovan, G. (2002). “Environmental disclosures in the annual report: Extending the applicability and predictive power of legitimacy theory,’ Accounting, Auditing & Accountability Journal”, vol. 15, no 3, 344 – 371.
Orlitzky M., Schmidt, F.L and Ryness, S. (2003). “Corporate social and financial performance: A Meta analysis’, Organization Studies”, vol. 24 pp. 403 – 411.
Pava M.L and Krausz, J. (1996). Corporate Social Responsibility and Financial Performance: The Paradox of Social Cost: West port, CT: Quorum Books.
Khoshtinat, M. raei, H. (2004), “Social impact of accounting information on investors' decisions”, Iranian Journal of Accounting and Auditing Review, No. 30, pp 92-73, autumn.
Tinker, A.M. and okcabol, F. (1991): Fatal attractions in the agency relationship”, Britidh Accounting Review, 23(4). Pp.183-188.
Ullmann, A.E, (1985), “Data in search of a theory: A critical examination of relationship amony social performance, social disclosure and economic
performance of us firm”, Academy of management Review, 10(3). Pp.540-54.
Raihi- Belkaoui, A. (1992). “Executive compensation, organizational effectiveness social performance and firm performance: An Empirical investigation’, Journal of Business and finance and Accounting vol. 19, no. 1, pp. 25-38.
Rockness, J. and Williams, P.F. (1988). “A descriptive study of social responsibility mutual funds’, Accounting Organization and Society”, vol. 34 pp. 397 – 411.
Scherer A. G and palazzo, C. (2008). “Globalization and corporate social responsibility’, Oxford presses.
Sturdivant F.D, and Ginter, J.L. (1977). “Corporate social responsiveness. management attitude and economic performance’, California management Review’’, vol. 19, no. 3, pp.30-39.
Wier, P. (1983). “The cost of anti-merger lawsuit: Evidence from the stock market’, Journal of financial Economics vol. 11 pp. 207 – 24.
Windsor, D. (2006), “corporate responsibility: There key approaches”. Journal of management studies, vol.43.No. 1, pp.93-114.
Wood ward, D.Edwards, P. and Birkin, F. (2001), “some Evidence on Executives views of corporate social Responsibility”, British Accounting Review, vol.33, No.3, pp.357.
Karbasi Y. H., Hemmati K., Bayat Ali - The Assessment of Social Reporting on behalf of Accepted Corporations Listed in Tehran Stock Exchange
Hosseyn Karbasi Yazdi,Kobra Hemmati, Ali Bayat
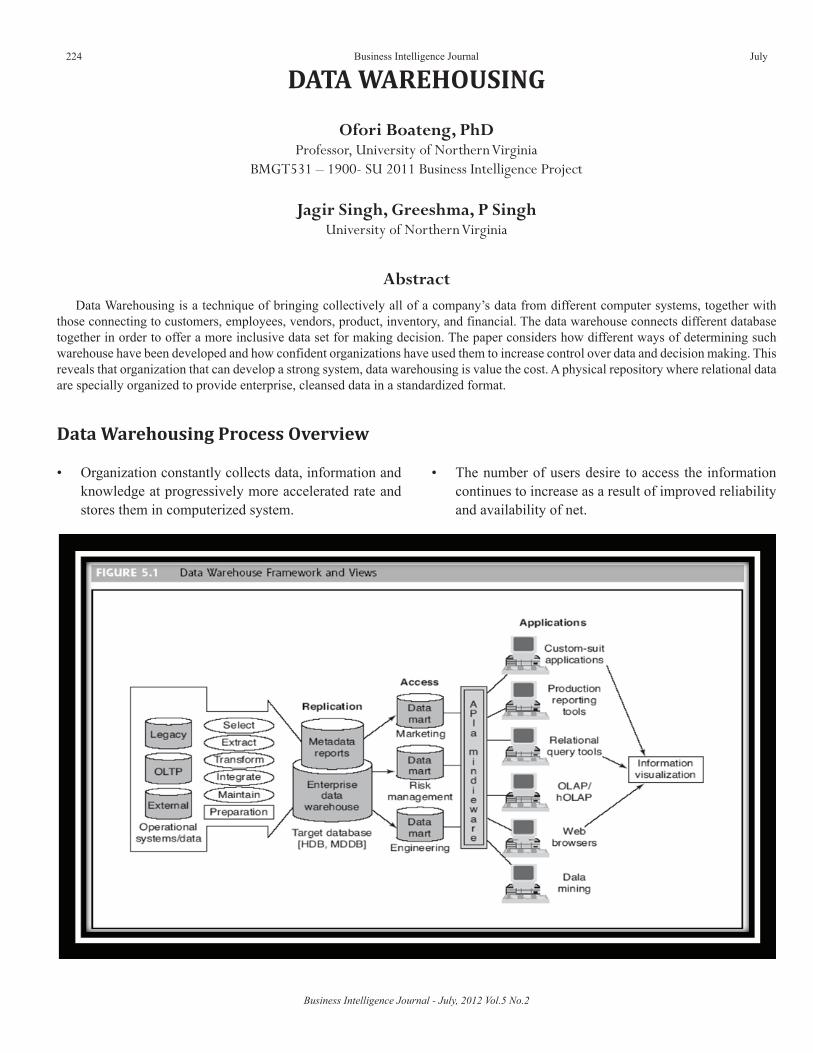
Business Intelligence Journal - July, 2012 Vol.5 No.2
224 Business Intelligence Journal July
DATA WAREHOUSING
Ofori Boateng, PhDProfessor, University of Northern Virginia
BMGT531 – 1900- SU 2011 Business Intelligence Project
Jagir Singh, Greeshma, P SinghUniversity of Northern Virginia
AbstractData Warehousing is a technique of bringing collectively all of a company’s data from different computer systems, together with
those connecting to customers, employees, vendors, product, inventory, and financial. The data warehouse connects different database together in order to offer a more inclusive data set for making decision. The paper considers how different ways of determining such warehouse have been developed and how confident organizations have used them to increase control over data and decision making. This reveals that organization that can develop a strong system, data warehousing is value the cost. A physical repository where relational data are specially organized to provide enterprise, cleansed data in a standardized format.
Data Warehousing Process Overview
• Organization constantly collects data, information and knowledge at progressively more accelerated rate and stores them in computerized system.
• The number of users desire to access the information continues to increase as a result of improved reliability and availability of net.
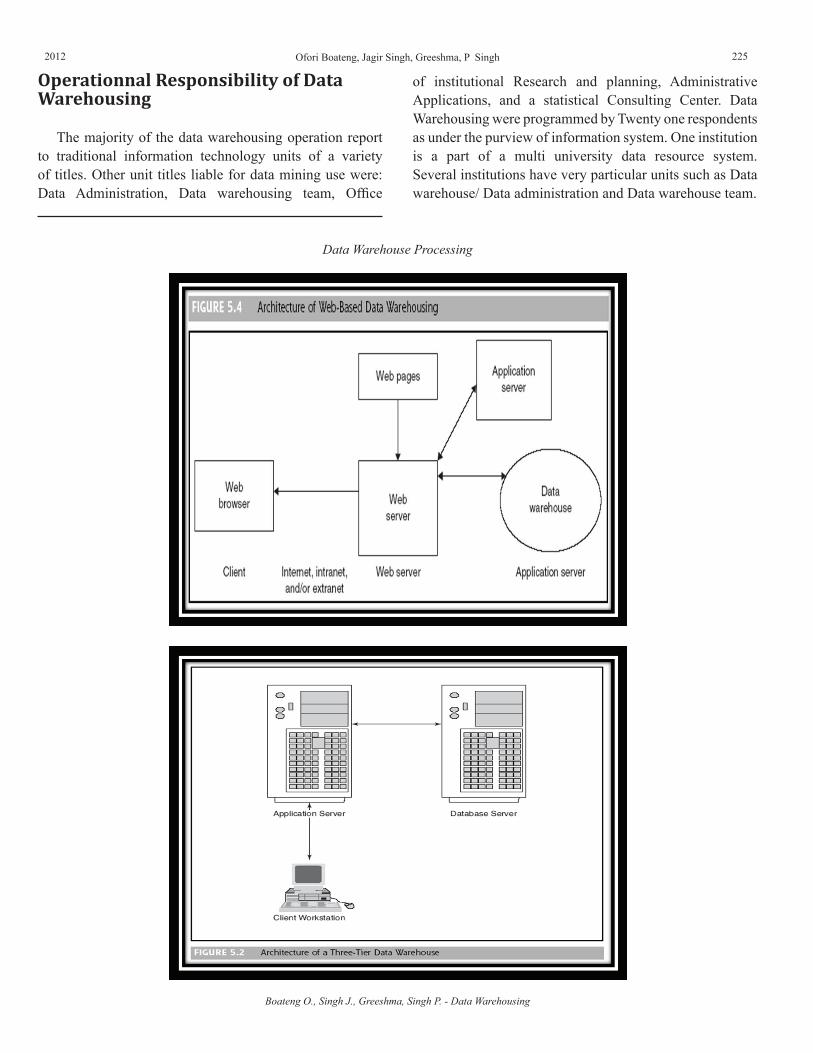
2012 225
Boateng O., Singh J., Greeshma, Singh P. - Data Warehousing
Ofori Boateng, Jagir Singh, Greeshma, P Singh
Operationnal Responsibility of Data Warehousing
The majority of the data warehousing operation report to traditional information technology units of a variety of titles. Other unit titles liable for data mining use were: Data Administration, Data warehousing team, Office
Data Warehouse Processing
of institutional Research and planning, Administrative Applications, and a statistical Consulting Center. Data Warehousing were programmed by Twenty one respondents as under the purview of information system. One institution is a part of a multi university data resource system. Several institutions have very particular units such as Data warehouse/ Data administration and Data warehouse team.
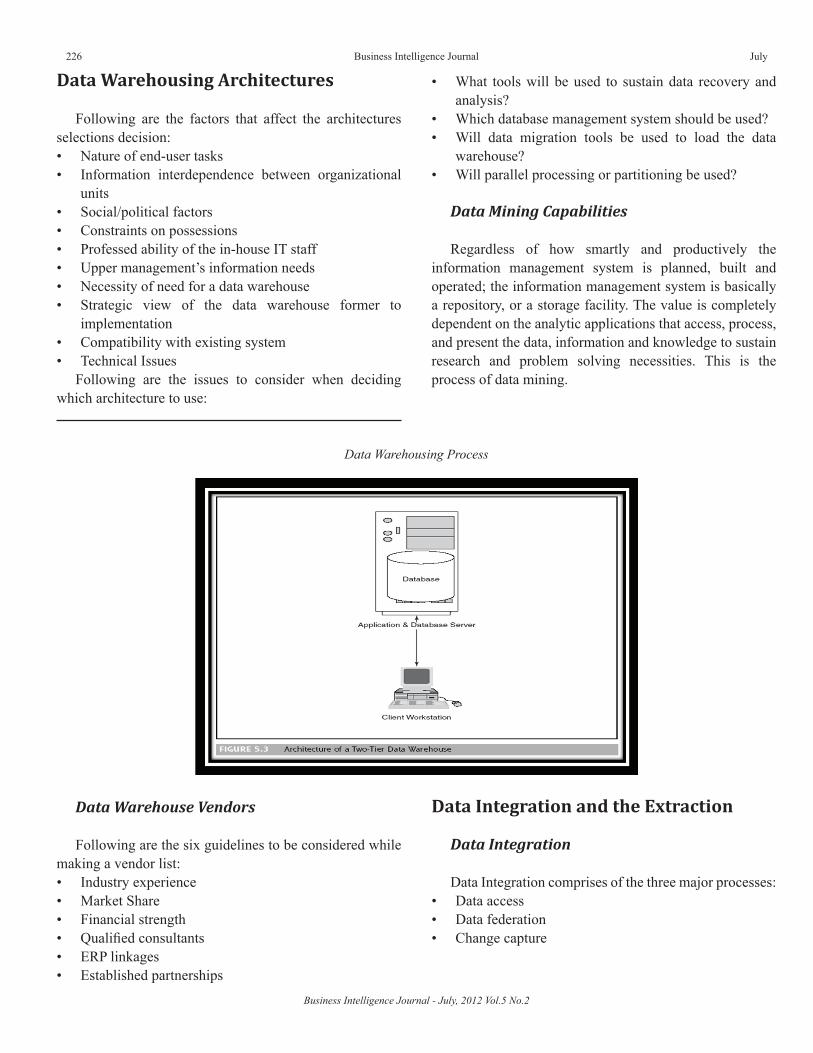
Business Intelligence Journal - July, 2012 Vol.5 No.2
226 Business Intelligence Journal July
Data Warehousing Architectures
Following are the factors that affect the architectures selections decision:• Nature of end-user tasks• Information interdependence between organizational
units• Social/political factors• Constraints on possessions • Professed ability of the in-house IT staff • Upper management’s information needs• Necessity of need for a data warehouse• Strategic view of the data warehouse former to
implementation• Compatibility with existing system• Technical Issues
Following are the issues to consider when deciding which architecture to use:
• What tools will be used to sustain data recovery and analysis?
• Which database management system should be used?• Will data migration tools be used to load the data
warehouse?• Will parallel processing or partitioning be used?
Data Mining Capabilities
Regardless of how smartly and productively the information management system is planned, built and operated; the information management system is basically a repository, or a storage facility. The value is completely dependent on the analytic applications that access, process, and present the data, information and knowledge to sustain research and problem solving necessities. This is the process of data mining.
Data Warehousing Process
Data Warehouse Vendors
Following are the six guidelines to be considered while making a vendor list:• Industry experience• Market Share• Financial strength• Qualified consultants• ERP linkages• Established partnerships
Data Integration and the Extraction
Data Integration
Data Integration comprises of the three major processes:• Data access• Data federation• Change capture
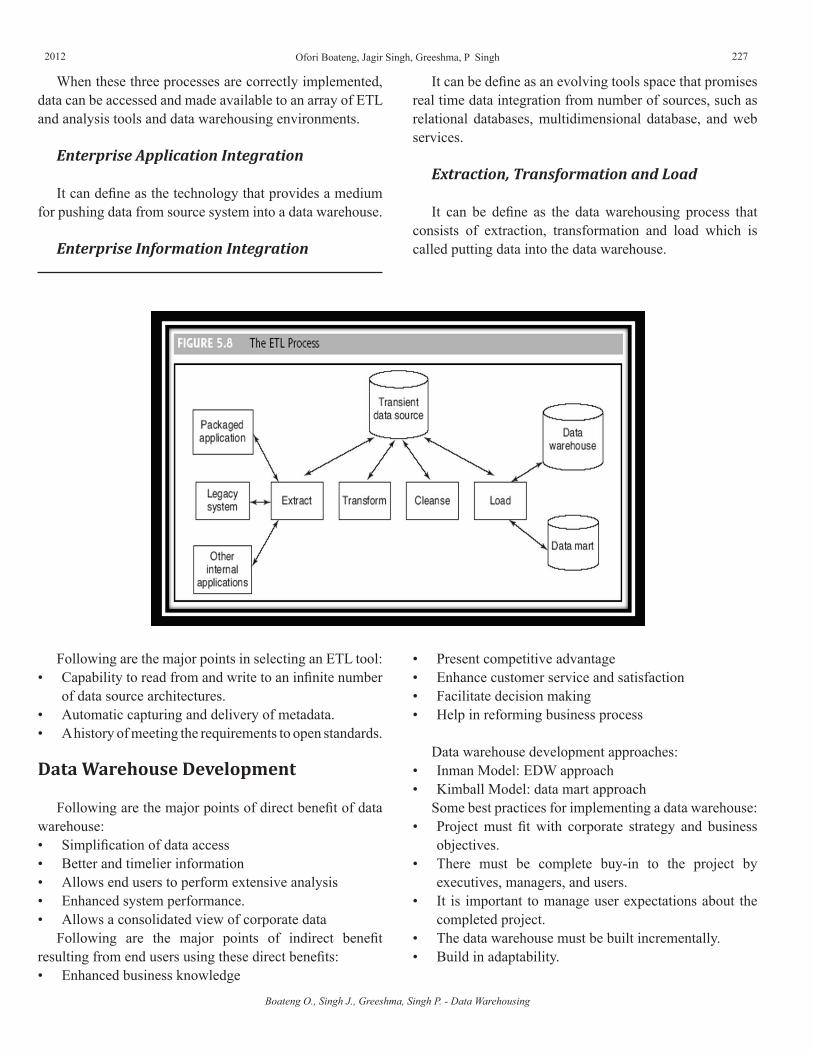
2012 227
When these three processes are correctly implemented, data can be accessed and made available to an array of ETL and analysis tools and data warehousing environments.
Enterprise Application Integration
It can define as the technology that provides a medium for pushing data from source system into a data warehouse.
Enterprise Information Integration
It can be define as an evolving tools space that promises real time data integration from number of sources, such as relational databases, multidimensional database, and web services.
Extraction, Transformation and Load
It can be define as the data warehousing process that consists of extraction, transformation and load which is called putting data into the data warehouse.
Following are the major points in selecting an ETL tool:• Capability to read from and write to an infinite number
of data source architectures.• Automatic capturing and delivery of metadata.• A history of meeting the requirements to open standards.
Data Warehouse Development
Following are the major points of direct benefit of data warehouse:• Simplification of data access• Better and timelier information • Allows end users to perform extensive analysis• Enhanced system performance.• Allows a consolidated view of corporate data
Following are the major points of indirect benefit resulting from end users using these direct benefits:• Enhanced business knowledge
• Present competitive advantage• Enhance customer service and satisfaction• Facilitate decision making• Help in reforming business process
Data warehouse development approaches:• Inman Model: EDW approach• Kimball Model: data mart approach
Some best practices for implementing a data warehouse:• Project must fit with corporate strategy and business
objectives.• There must be complete buy-in to the project by
executives, managers, and users.• It is important to manage user expectations about the
completed project.• The data warehouse must be built incrementally.• Build in adaptability.
Boateng O., Singh J., Greeshma, Singh P. - Data Warehousing
Ofori Boateng, Jagir Singh, Greeshma, P Singh
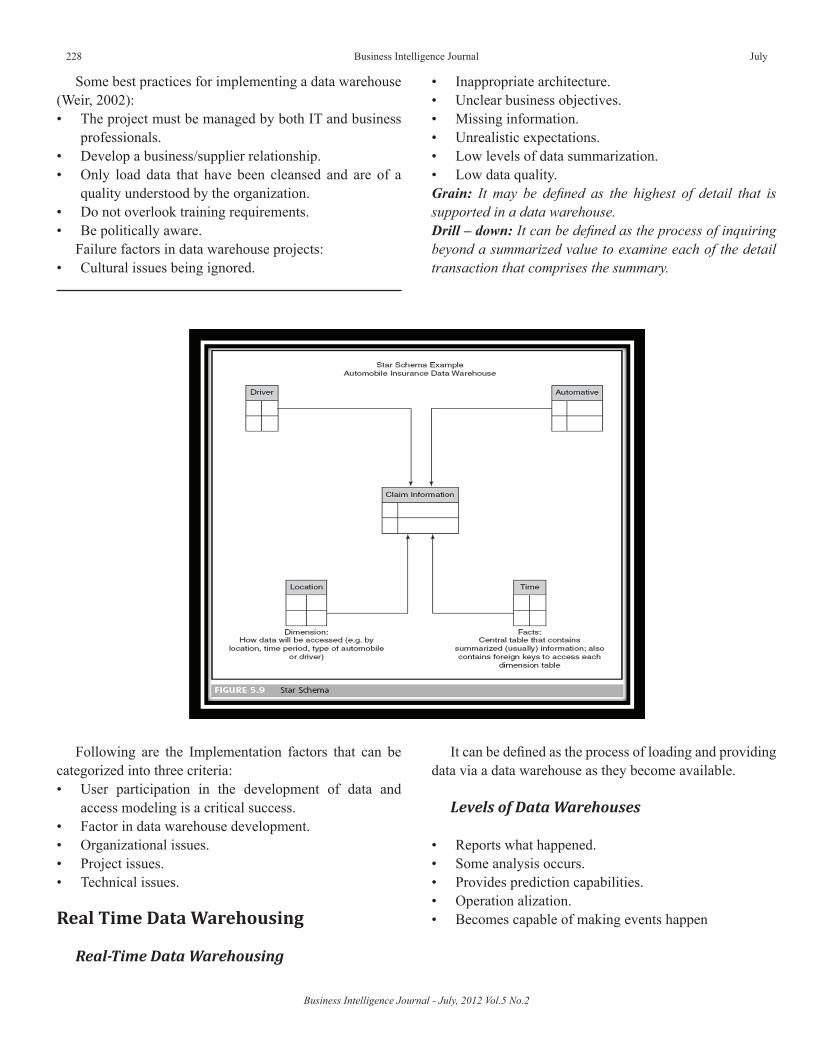
Business Intelligence Journal - July, 2012 Vol.5 No.2
228 Business Intelligence Journal July
Some best practices for implementing a data warehouse (Weir, 2002):• The project must be managed by both IT and business
professionals.• Develop a business/supplier relationship.• Only load data that have been cleansed and are of a
quality understood by the organization.• Do not overlook training requirements.• Be politically aware.
Failure factors in data warehouse projects:• Cultural issues being ignored.
• Inappropriate architecture.• Unclear business objectives.• Missing information.• Unrealistic expectations.• Low levels of data summarization.• Low data quality. Grain: It may be defined as the highest of detail that is supported in a data warehouse.Drill – down: It can be defined as the process of inquiring beyond a summarized value to examine each of the detail transaction that comprises the summary.
Following are the Implementation factors that can be categorized into three criteria:• User participation in the development of data and
access modeling is a critical success.• Factor in data warehouse development.• Organizational issues.• Project issues.• Technical issues.
Real Time Data Warehousing
Real-Time Data Warehousing
It can be defined as the process of loading and providing data via a data warehouse as they become available.
Levels of Data Warehouses
• Reports what happened.• Some analysis occurs.• Provides prediction capabilities.• Operation alization.• Becomes capable of making events happen
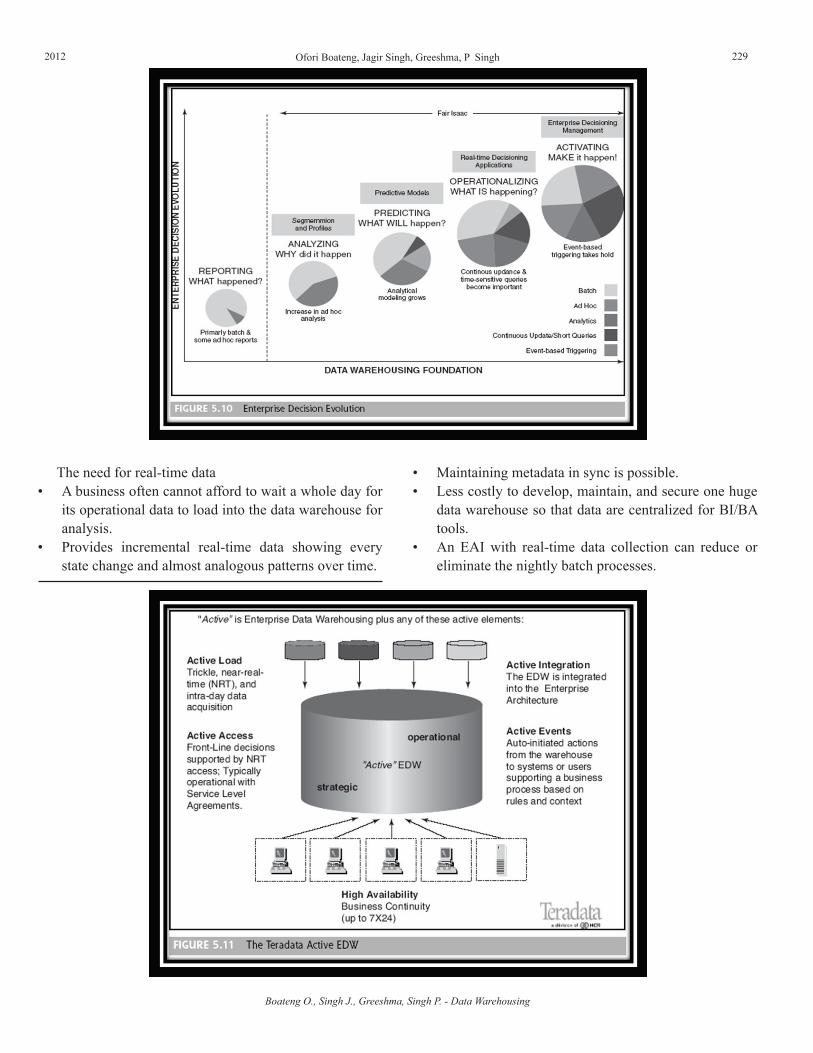
2012 229
The need for real-time data• A business often cannot afford to wait a whole day for
its operational data to load into the data warehouse for analysis.
• Provides incremental real-time data showing every state change and almost analogous patterns over time.
• Maintaining metadata in sync is possible.• Less costly to develop, maintain, and secure one huge
data warehouse so that data are centralized for BI/BA tools.
• An EAI with real-time data collection can reduce or eliminate the nightly batch processes.
Boateng O., Singh J., Greeshma, Singh P. - Data Warehousing
Ofori Boateng, Jagir Singh, Greeshma, P Singh
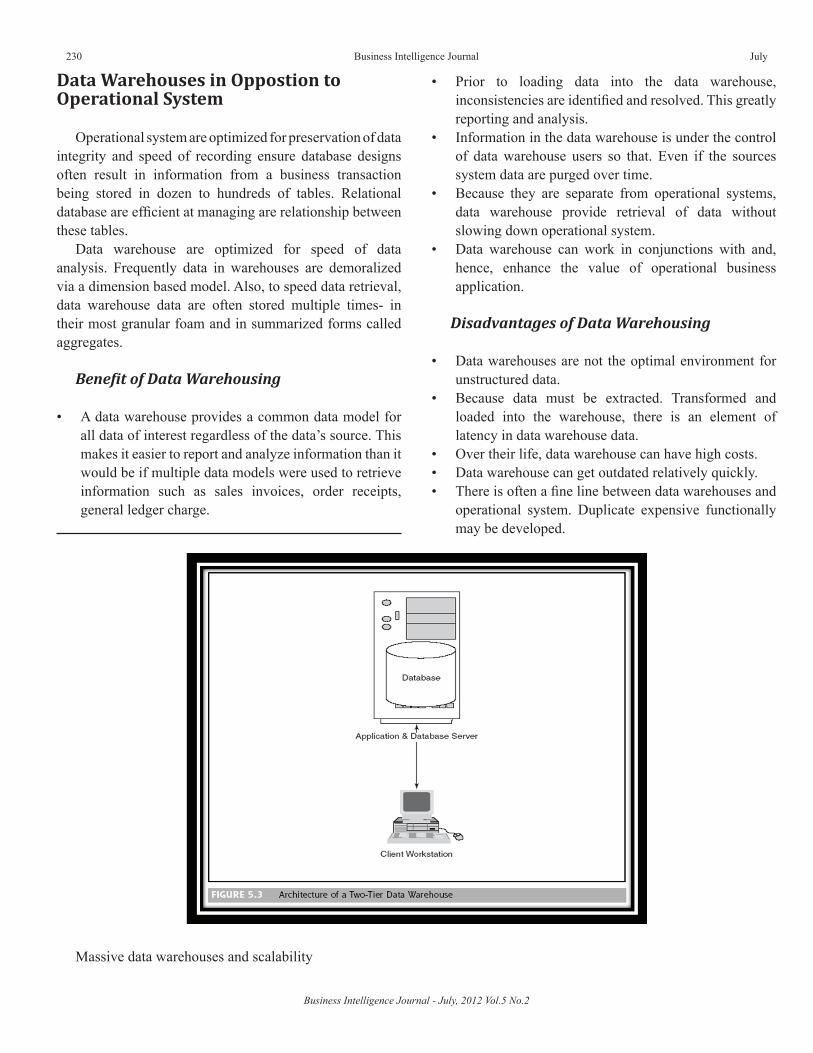
Business Intelligence Journal - July, 2012 Vol.5 No.2
230 Business Intelligence Journal July
Data Warehouses in Oppostion to Operational System
Operational system are optimized for preservation of data integrity and speed of recording ensure database designs often result in information from a business transaction being stored in dozen to hundreds of tables. Relational database are efficient at managing are relationship between these tables.
Data warehouse are optimized for speed of data analysis. Frequently data in warehouses are demoralized via a dimension based model. Also, to speed data retrieval, data warehouse data are often stored multiple times- in their most granular foam and in summarized forms called aggregates.
Benefit of Data Warehousing
• A data warehouse provides a common data model for all data of interest regardless of the data’s source. This makes it easier to report and analyze information than it would be if multiple data models were used to retrieve information such as sales invoices, order receipts, general ledger charge.
• Prior to loading data into the data warehouse, inconsistencies are identified and resolved. This greatly reporting and analysis.
• Information in the data warehouse is under the control of data warehouse users so that. Even if the sources system data are purged over time.
• Because they are separate from operational systems, data warehouse provide retrieval of data without slowing down operational system.
• Data warehouse can work in conjunctions with and, hence, enhance the value of operational business application.
Disadvantages of Data Warehousing
• Data warehouses are not the optimal environment for unstructured data.
• Because data must be extracted. Transformed and loaded into the warehouse, there is an element of latency in data warehouse data.
• Over their life, data warehouse can have high costs.• Data warehouse can get outdated relatively quickly.• There is often a fine line between data warehouses and
operational system. Duplicate expensive functionally may be developed.
Massive data warehouses and scalability
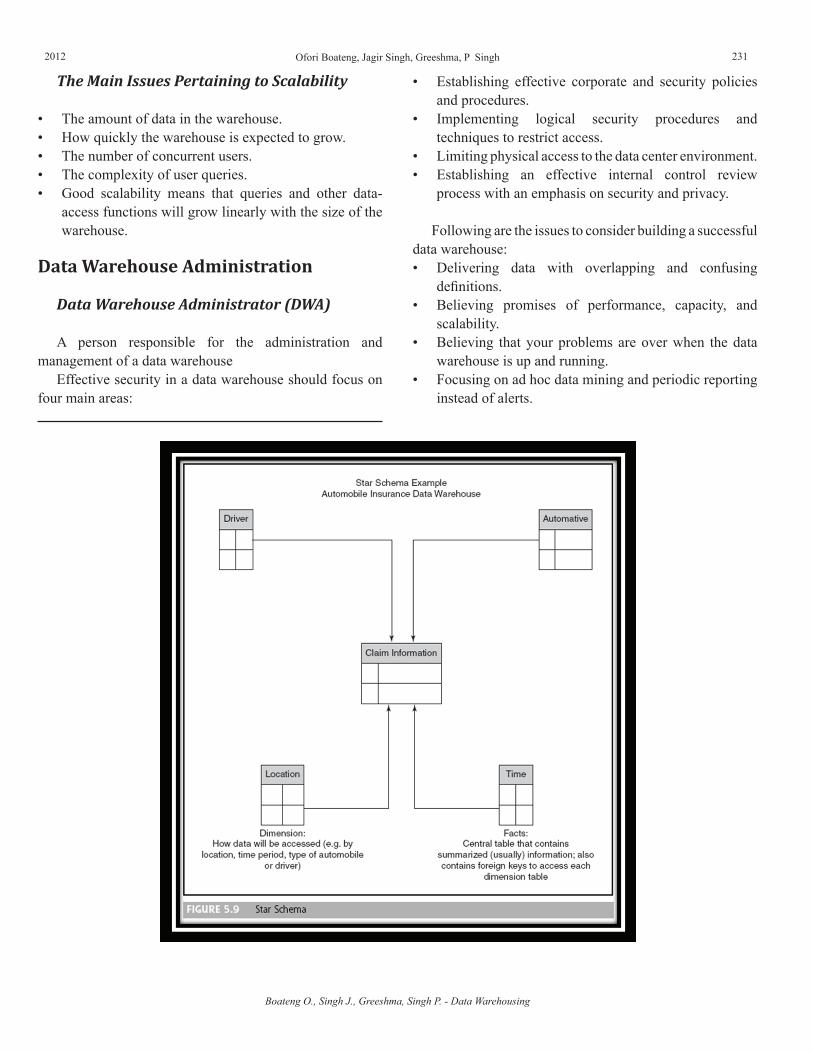
2012 231
The Main Issues Pertaining to Scalability
• The amount of data in the warehouse.• How quickly the warehouse is expected to grow.• The number of concurrent users.• The complexity of user queries.• Good scalability means that queries and other data-
access functions will grow linearly with the size of the warehouse.
Data Warehouse Administration
Data Warehouse Administrator (DWA)
A person responsible for the administration and management of a data warehouse
Effective security in a data warehouse should focus on four main areas:
• Establishing effective corporate and security policies and procedures.
• Implementing logical security procedures and techniques to restrict access.
• Limiting physical access to the data center environment.• Establishing an effective internal control review
process with an emphasis on security and privacy.
Following are the issues to consider building a successful data warehouse:• Delivering data with overlapping and confusing
definitions.• Believing promises of performance, capacity, and
scalability.• Believing that your problems are over when the data
warehouse is up and running.• Focusing on ad hoc data mining and periodic reporting
instead of alerts.
Boateng O., Singh J., Greeshma, Singh P. - Data Warehousing
Ofori Boateng, Jagir Singh, Greeshma, P Singh
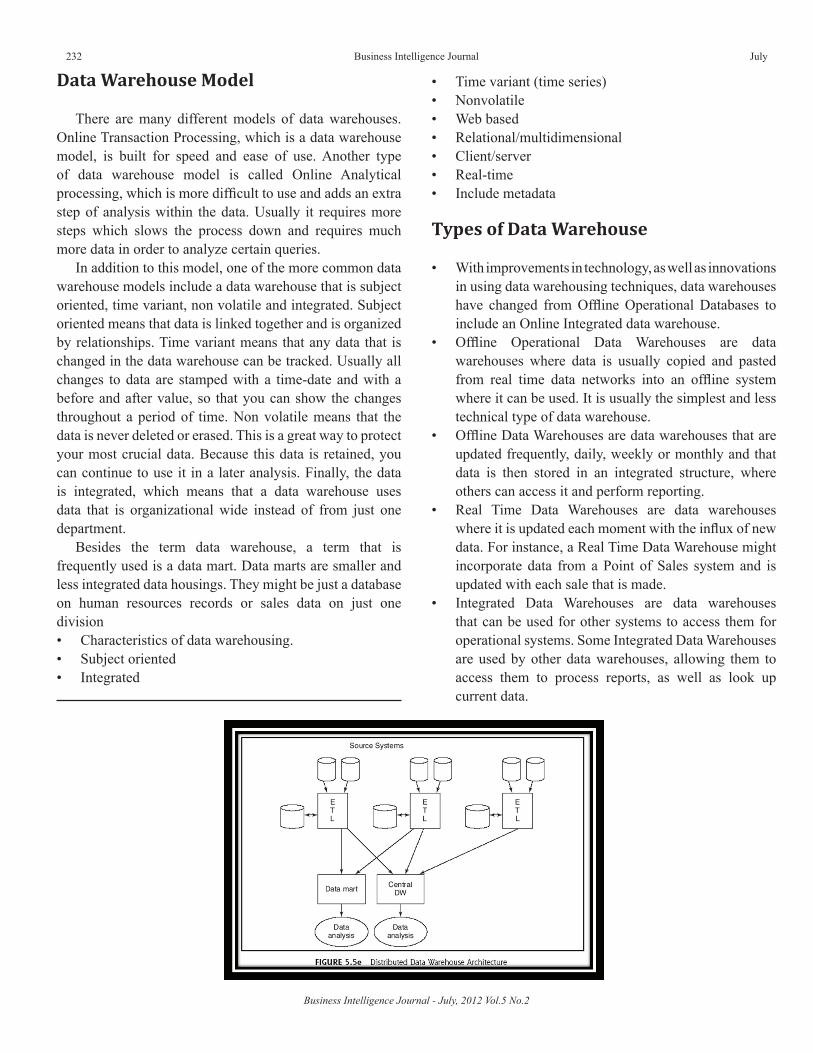
Business Intelligence Journal - July, 2012 Vol.5 No.2
232 Business Intelligence Journal July
Data Warehouse Model
There are many different models of data warehouses. Online Transaction Processing, which is a data warehouse model, is built for speed and ease of use. Another type of data warehouse model is called Online Analytical processing, which is more difficult to use and adds an extra step of analysis within the data. Usually it requires more steps which slows the process down and requires much more data in order to analyze certain queries.
In addition to this model, one of the more common data warehouse models include a data warehouse that is subject oriented, time variant, non volatile and integrated. Subject oriented means that data is linked together and is organized by relationships. Time variant means that any data that is changed in the data warehouse can be tracked. Usually all changes to data are stamped with a time-date and with a before and after value, so that you can show the changes throughout a period of time. Non volatile means that the data is never deleted or erased. This is a great way to protect your most crucial data. Because this data is retained, you can continue to use it in a later analysis. Finally, the data is integrated, which means that a data warehouse uses data that is organizational wide instead of from just one department.
Besides the term data warehouse, a term that is frequently used is a data mart. Data marts are smaller and less integrated data housings. They might be just a database on human resources records or sales data on just one division• Characteristics of data warehousing.• Subject oriented • Integrated
• Time variant (time series)• Nonvolatile• Web based • Relational/multidimensional • Client/server • Real-time • Include metadata
Types of Data Warehouse
• With improvements in technology, as well as innovations in using data warehousing techniques, data warehouses have changed from Offline Operational Databases to include an Online Integrated data warehouse.
• Offline Operational Data Warehouses are data warehouses where data is usually copied and pasted from real time data networks into an offline system where it can be used. It is usually the simplest and less technical type of data warehouse.
• Offline Data Warehouses are data warehouses that are updated frequently, daily, weekly or monthly and that data is then stored in an integrated structure, where others can access it and perform reporting.
• Real Time Data Warehouses are data warehouses where it is updated each moment with the influx of new data. For instance, a Real Time Data Warehouse might incorporate data from a Point of Sales system and is updated with each sale that is made.
• Integrated Data Warehouses are data warehouses that can be used for other systems to access them for operational systems. Some Integrated Data Warehouses are used by other data warehouses, allowing them to access them to process reports, as well as look up current data.
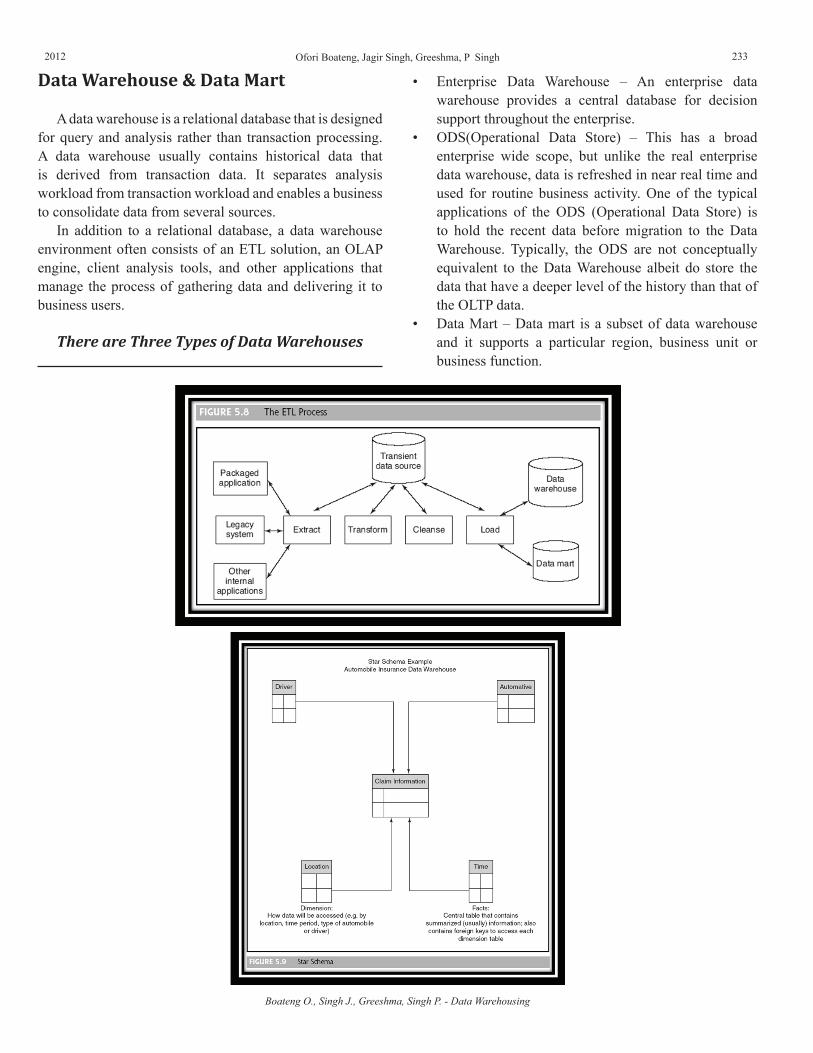
2012 233
Data Warehouse & Data Mart
A data warehouse is a relational database that is designed for query and analysis rather than transaction processing. A data warehouse usually contains historical data that is derived from transaction data. It separates analysis workload from transaction workload and enables a business to consolidate data from several sources.
In addition to a relational database, a data warehouse environment often consists of an ETL solution, an OLAP engine, client analysis tools, and other applications that manage the process of gathering data and delivering it to business users.
There are Three Types of Data Warehouses
• Enterprise Data Warehouse – An enterprise data warehouse provides a central database for decision support throughout the enterprise.
• ODS(Operational Data Store) – This has a broad enterprise wide scope, but unlike the real enterprise data warehouse, data is refreshed in near real time and used for routine business activity. One of the typical applications of the ODS (Operational Data Store) is to hold the recent data before migration to the Data Warehouse. Typically, the ODS are not conceptually equivalent to the Data Warehouse albeit do store the data that have a deeper level of the history than that of the OLTP data.
• Data Mart – Data mart is a subset of data warehouse and it supports a particular region, business unit or business function.
Boateng O., Singh J., Greeshma, Singh P. - Data Warehousing
Ofori Boateng, Jagir Singh, Greeshma, P Singh
Business Intelligence Journal - July, 2012 Vol.5 No.2
234 Business Intelligence Journal July
Conclusion
In this paper we have described a met model for data warehouse operational processes and techniques to design, administrate and facilitate the evolution of the data warehouse through the exploitation of the entities of this met model. This met model takes advantage of the clustering of its entities in logical, physical and conceptual perspectives, involving a high level conceptual description, which can be linked to the actual structural and physical aspects of the data warehouse architecture. This approach is integrated with the results of previous research, where data Warehouse architecture and quality met models have been proposed assuming the same categorization.
The physical perspective of the proposed met model covers the execution details of Data warehouse processes. At the same time, the logical perspective is capable of modeling the structure of complex.
References
Sakaguchi, Toru, Mark N. Frolick. "A Review of the Data Warehousing Literature." http://www.people.memphis.edu/~tsakagch/dw-web.htm.
"Managing and Maintaining the Data Warehouse." Systems Techniques, Inc. http://www.systecinc.com/white/roles.htm.
Orr, Ken. "Data Warehousing Technology." http://www.kenorrinst.com/dwpaper.html.
Vizard, Michael. "Distinguishing Data Marts." InfoWorld. Mar 2, 1998. Vol 2.
Brobst, Stephen A. and Venkatesa, AVR, “What is Active Data Warehousing?,” Abridged from “Active Warehousing,” Teradata Review Spring 1999. http://www.ncr.com/repository/articles/data_warehousing/what_is_active_dw.html .
U. Fayyad, G. Piatetsky-Shapiro, P. Smyth, & R. Uthurusamy, Advances in Knowledge.
Discovery & Data Mining. Cambridge, MA (The AAAI Press/The MIT Press) 1996.
Firestone, Joseph M. "Data Warehouses and Data Marts: A Dynamic View." http://www.softwarejobs.com/firestone.html.
Inmon, Bill (1992). Building the Data Warehouse. Wiley.
"Ten Mistakes to Avoid." The Data Warehousing Institute. http://www.dw-institute.com/papers/10mistks.htm.
Dorsey, Paul. "Data Warehouses, Ad Hoc Query Tools and Other Ways to Destroy Your Company." http://www.dulcian.com/destroy.htm.
Zicker, John, “Real-Time Data Warehousing,” DM Review March 1998 http://www.dmreview.com/master_sponsor.cfm?NavID=55&EdID=676
Joseph M. Firestone, "Data Mining and KDD: A Shifting Mosaic," White Paper No.2, Executive Information Systems, Inc. Wilmington, DE, March 12, 1997.
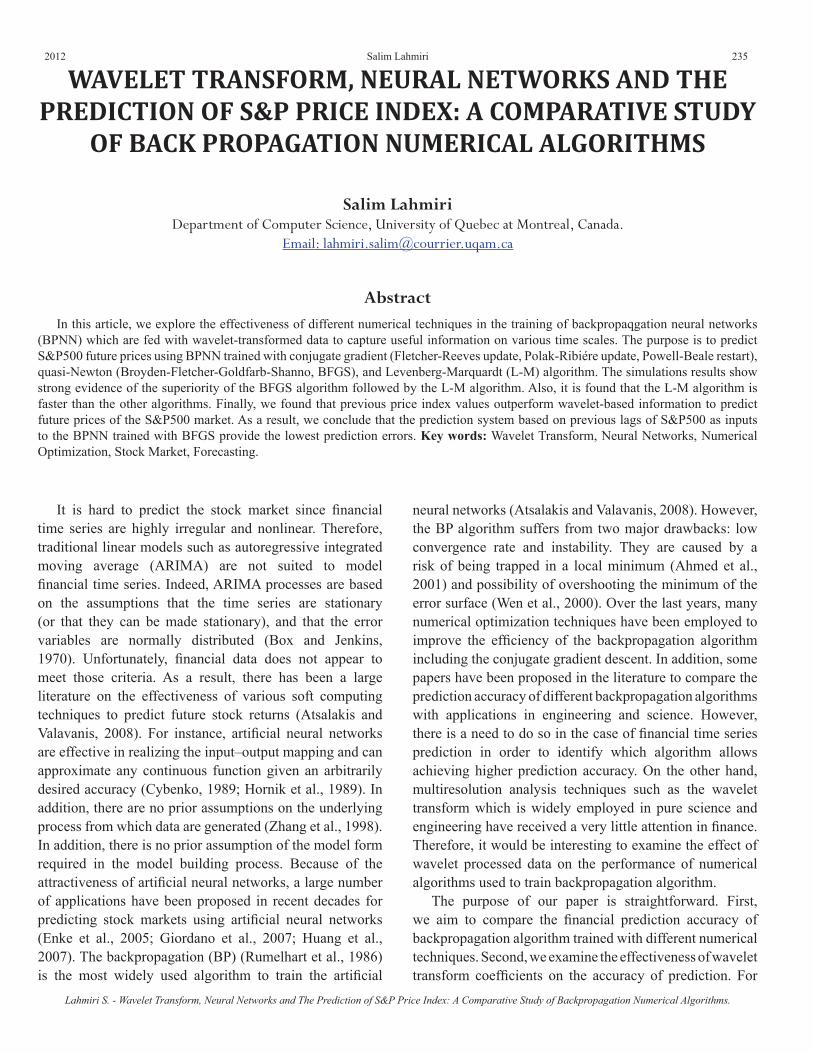
2012 235
WAVELET TRANSFORM, NEURAL NETWORKS AND THE PREDICTION OF S&P PRICE INDEX: A COMPARATIVE STUDY
OF BACK PROPAGATION NUMERICAL ALGORITHMS
Salim LahmiriDepartment of Computer Science, University of Quebec at Montreal, Canada.
Email: [email protected]
AbstractIn this article, we explore the effectiveness of different numerical techniques in the training of backpropaqgation neural networks
(BPNN) which are fed with wavelet-transformed data to capture useful information on various time scales. The purpose is to predict S&P500 future prices using BPNN trained with conjugate gradient (Fletcher-Reeves update, Polak-Ribiére update, Powell-Beale restart), quasi-Newton (Broyden-Fletcher-Goldfarb-Shanno, BFGS), and Levenberg-Marquardt (L-M) algorithm. The simulations results show strong evidence of the superiority of the BFGS algorithm followed by the L-M algorithm. Also, it is found that the L-M algorithm is faster than the other algorithms. Finally, we found that previous price index values outperform wavelet-based information to predict future prices of the S&P500 market. As a result, we conclude that the prediction system based on previous lags of S&P500 as inputs to the BPNN trained with BFGS provide the lowest prediction errors. Key words: Wavelet Transform, Neural Networks, Numerical Optimization, Stock Market, Forecasting.
It is hard to predict the stock market since financial time series are highly irregular and nonlinear. Therefore, traditional linear models such as autoregressive integrated moving average (ARIMA) are not suited to model financial time series. Indeed, ARIMA processes are based on the assumptions that the time series are stationary (or that they can be made stationary), and that the error variables are normally distributed (Box and Jenkins, 1970). Unfortunately, financial data does not appear to meet those criteria. As a result, there has been a large literature on the effectiveness of various soft computing techniques to predict future stock returns (Atsalakis and Valavanis, 2008). For instance, artificial neural networks are effective in realizing the input–output mapping and can approximate any continuous function given an arbitrarily desired accuracy (Cybenko, 1989; Hornik et al., 1989). In addition, there are no prior assumptions on the underlying process from which data are generated (Zhang et al., 1998). In addition, there is no prior assumption of the model form required in the model building process. Because of the attractiveness of artificial neural networks, a large number of applications have been proposed in recent decades for predicting stock markets using artificial neural networks (Enke et al., 2005; Giordano et al., 2007; Huang et al., 2007). The backpropagation (BP) (Rumelhart et al., 1986) is the most widely used algorithm to train the artificial
neural networks (Atsalakis and Valavanis, 2008). However, the BP algorithm suffers from two major drawbacks: low convergence rate and instability. They are caused by a risk of being trapped in a local minimum (Ahmed et al., 2001) and possibility of overshooting the minimum of the error surface (Wen et al., 2000). Over the last years, many numerical optimization techniques have been employed to improve the efficiency of the backpropagation algorithm including the conjugate gradient descent. In addition, some papers have been proposed in the literature to compare the prediction accuracy of different backpropagation algorithms with applications in engineering and science. However, there is a need to do so in the case of financial time series prediction in order to identify which algorithm allows achieving higher prediction accuracy. On the other hand, multiresolution analysis techniques such as the wavelet transform which is widely employed in pure science and engineering have received a very little attention in finance. Therefore, it would be interesting to examine the effect of wavelet processed data on the performance of numerical algorithms used to train backpropagation algorithm.
The purpose of our paper is straightforward. First, we aim to compare the financial prediction accuracy of backpropagation algorithm trained with different numerical techniques. Second, we examine the effectiveness of wavelet transform coefficients on the accuracy of prediction. For
Lahmiri S. - Wavelet Transform, Neural Networks and The Prediction of S&P Price Index: A Comparative Study of Backpropagation Numerical Algorithms.
Salim Lahmiri
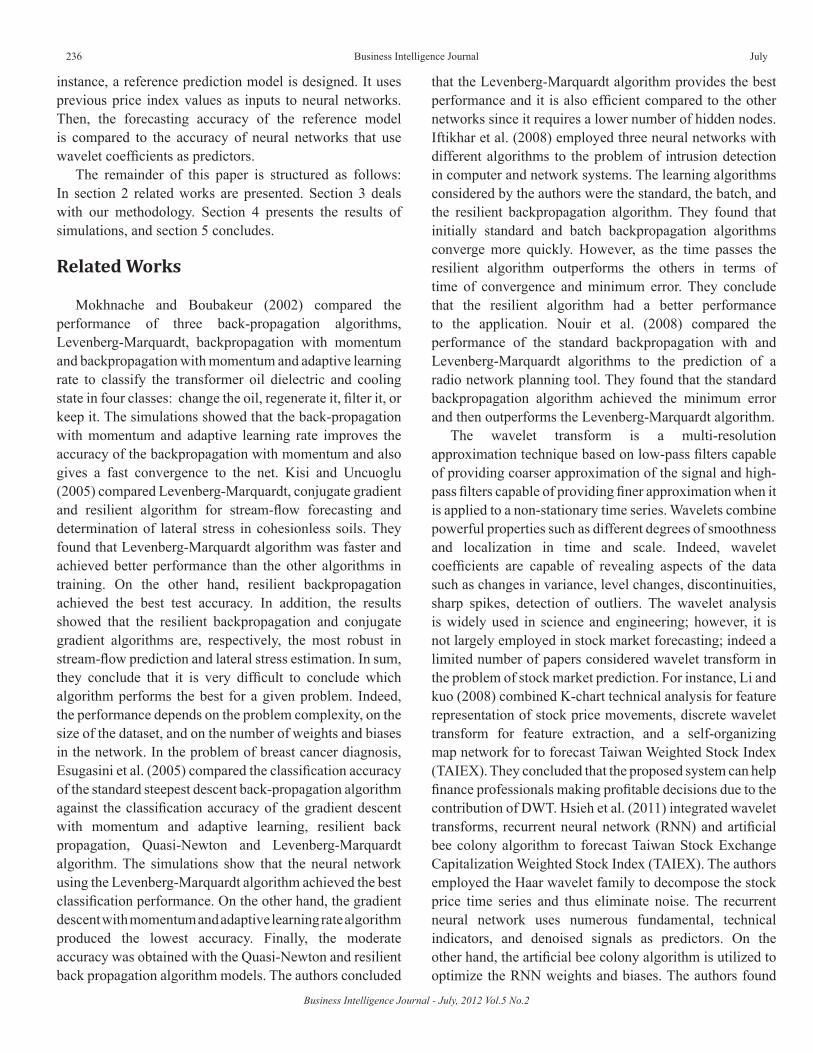
Business Intelligence Journal - July, 2012 Vol.5 No.2
236 Business Intelligence Journal July
instance, a reference prediction model is designed. It uses previous price index values as inputs to neural networks. Then, the forecasting accuracy of the reference model is compared to the accuracy of neural networks that use wavelet coefficients as predictors.
The remainder of this paper is structured as follows: In section 2 related works are presented. Section 3 deals with our methodology. Section 4 presents the results of simulations, and section 5 concludes.
Related Works
Mokhnache and Boubakeur (2002) compared the performance of three back-propagation algorithms, Levenberg-Marquardt, backpropagation with momentum and backpropagation with momentum and adaptive learning rate to classify the transformer oil dielectric and cooling state in four classes: change the oil, regenerate it, filter it, or keep it. The simulations showed that the back-propagation with momentum and adaptive learning rate improves the accuracy of the backpropagation with momentum and also gives a fast convergence to the net. Kisi and Uncuoglu (2005) compared Levenberg-Marquardt, conjugate gradient and resilient algorithm for stream-flow forecasting and determination of lateral stress in cohesionless soils. They found that Levenberg-Marquardt algorithm was faster and achieved better performance than the other algorithms in training. On the other hand, resilient backpropagation achieved the best test accuracy. In addition, the results showed that the resilient backpropagation and conjugate gradient algorithms are, respectively, the most robust in stream-flow prediction and lateral stress estimation. In sum, they conclude that it is very difficult to conclude which algorithm performs the best for a given problem. Indeed, the performance depends on the problem complexity, on the size of the dataset, and on the number of weights and biases in the network. In the problem of breast cancer diagnosis, Esugasini et al. (2005) compared the classification accuracy of the standard steepest descent back-propagation algorithm against the classification accuracy of the gradient descent with momentum and adaptive learning, resilient back propagation, Quasi-Newton and Levenberg-Marquardt algorithm. The simulations show that the neural network using the Levenberg-Marquardt algorithm achieved the best classification performance. On the other hand, the gradient descent with momentum and adaptive learning rate algorithm produced the lowest accuracy. Finally, the moderate accuracy was obtained with the Quasi-Newton and resilient back propagation algorithm models. The authors concluded
that the Levenberg-Marquardt algorithm provides the best performance and it is also efficient compared to the other networks since it requires a lower number of hidden nodes. Iftikhar et al. (2008) employed three neural networks with different algorithms to the problem of intrusion detection in computer and network systems. The learning algorithms considered by the authors were the standard, the batch, and the resilient backpropagation algorithm. They found that initially standard and batch backpropagation algorithms converge more quickly. However, as the time passes the resilient algorithm outperforms the others in terms of time of convergence and minimum error. They conclude that the resilient algorithm had a better performance to the application. Nouir et al. (2008) compared the performance of the standard backpropagation with and Levenberg-Marquardt algorithms to the prediction of a radio network planning tool. They found that the standard backpropagation algorithm achieved the minimum error and then outperforms the Levenberg-Marquardt algorithm.
The wavelet transform is a multi-resolution approximation technique based on low-pass filters capable of providing coarser approximation of the signal and high-pass filters capable of providing finer approximation when it is applied to a non-stationary time series. Wavelets combine powerful properties such as different degrees of smoothness and localization in time and scale. Indeed, wavelet coefficients are capable of revealing aspects of the data such as changes in variance, level changes, discontinuities, sharp spikes, detection of outliers. The wavelet analysis is widely used in science and engineering; however, it is not largely employed in stock market forecasting; indeed a limited number of papers considered wavelet transform in the problem of stock market prediction. For instance, Li and kuo (2008) combined K-chart technical analysis for feature representation of stock price movements, discrete wavelet transform for feature extraction, and a self-organizing map network for to forecast Taiwan Weighted Stock Index (TAIEX). They concluded that the proposed system can help finance professionals making profitable decisions due to the contribution of DWT. Hsieh et al. (2011) integrated wavelet transforms, recurrent neural network (RNN) and artificial bee colony algorithm to forecast Taiwan Stock Exchange Capitalization Weighted Stock Index (TAIEX). The authors employed the Haar wavelet family to decompose the stock price time series and thus eliminate noise. The recurrent neural network uses numerous fundamental, technical indicators, and denoised signals as predictors. On the other hand, the artificial bee colony algorithm is utilized to optimize the RNN weights and biases. The authors found

2012 237
that their approach outperformed previous methods found in the literature to predict TAIEX. Wang et al. (2011) used discrete wavelet transform and backpropagation neural networks to predict monthly closing price of the Shanghai Composite Index. For instance, low-frequency signals were fed to neural networks to predict the future value of the stock index. They found that wavelet signals improve the accuracy of neural networks in comparison with previous studies.
Methodology
Neural Networks and Numerical Algorithms
The Multi-layer perceptron (MLP) networks trained using backpropagation (BP) algorithm are the most popular choice in neural network applications in finance (Atsalakis and Valavanis, 2008). The MLP networks are feed forward neural networks with one or more hidden layers which is capable to approximate any continuous function up to certain accuracy just with one hidden layer (Cybenko, 1989; Funahashi, 1989). The MLP consists of three types of layers. The first layer is the input layer and corresponds to the problem input variables with one node for each input variable. The second layer is the hidden layer used to capture non-linear relationships among variables. The third layer is the output layer used to provide predicted values. In this paper, the output layer has only one neuron corresponding to the prediction result. The relationship between the output yt and the input xt is given by:
∑ ∑= =
⋅+⋅+=
q
j
p
itjijjt xwwfwwy
1 1,,00
where wi,j (i=0,1,2,…,p;j=1,2,…,q) and wj (j=0,1,2,…,q) are the connection weights, p is the number of input nodes, q is the number of hidden nodes, and f is a nonlinear activation function that enables the system to learn nonlinear features. The most widely used activation function for the output layer are the sigmoid and hyperbolic functions. In this paper, the hyperbolic transfer function is employed and is given by:
( ) ,11
2
2
x
x
eexf −
−
+−
=
The MLP is trained using the backpropagation (BP) algorithm and the weights are optimized. The objective function to minimize is the sum of the squares of the difference between the desirable output (yt,p) and the predicted output (yt,d) given by:
( ) ∑∑==
=−=1
2
1
2,, 5.05.0
ttdtpt eyyE
The training of the network is performed by the well-known Backpropagation (Rumelhart et al., 1986) algorithm trained with the steepest descent algorithm given as follows:
kkk gw α−=∆
where, ∆ wk is a vector of weights changes, gk is the current gradient, α k is the learning rate that determines the length of the weight update. Thus, in the gradient descent learning rule, the update is done in the negative gradient direction. In order to avoid oscillations and to reduce the sensitivity of the network to fast changes of the error surface (Jang and Mizutani, 1997), the change in weight is made dependent of the past weight change by adding a momentum term:
1−∆+−=∆ kkkk wpgw α
where, p is the momentum parameter. Furthermore, the momentum allows escaping from small local minima on the error surface (Castillo and Soria, 2003). Unfortunately, the gradient descent and gradient descent with momentum do not produce the fastest convergence, and even are often too slow to converge. One solution to speed up rate of convergence is to use numerical optimization techniques which can be broken into three categories: conjugate gradient algorithms, quasi-Netwon algorithms, and Levenberg-Marquardt algorithm. In particular, this paper compares the prediction performance of the following algorithms: quasi-Newton (Broyden-Fletcher-Goldfarb-Shanno, BFGS), conjugate gradient (Fletcher-Reeves update, Polak-Ribiére update, Powell-Beale restart), and Levenberg-Marquardt algorithm. The algorithms are briefly described in Table 1, and are well presented in Scales (1985) and Jorge and Wright (2006).
Lahmiri S. - Wavelet Transform, Neural Networks and The Prediction of S&P Price Index: A Comparative Study of Backpropagation Numerical Algorithms.
Salim Lahmiri

Business Intelligence Journal - July, 2012 Vol.5 No.2
238 Business Intelligence Journal July
Table 1. Description of the conjugate, quasi-Newton (secant), and L-M algorithms
Algorithm Computation of search direction Description
Fletcher-Reeves (conjugate) 00 gp −=
kkk pw α=∆
1−+−= kkkk pgp β
11 −−′′
=kk
kkk gg
ggβ
(1) iteration starts by searching in the steepest descent direction. (2) Charalambous (1992) search line method is employed to find the optimal current search direction α .
(3) Next (update) search direction β is found such that it is conjugate to previous search directions.
Polak-Ribiere (conjugate) 00 gp −=
kkk pw α=∆
1−+−= kkkk pgp β
11
1
−−
−
′′∆
=kk
kkk gg
ggβ
Update is made by computing the product of the previous change in the gradient with the current gradient divided by the square of the previous gradient.
Powell-Beale restarts (conjugate)
21 2.0 kkk ggg ≥′−
Update of Search direction is reset to the negative of the gradient only when this condition is satisfied.
BFGS (quasi-Newton) kkk gHw ′−=∆ H is the Hessian (second derivatives) matrix.
Levenberg-Marquardt (L-M) kkk gHw ′−=∆
JJH ′=′
eJg ′=
J is the Jacobian matrix (first derivatives) and e is a vector of network errors.
The Wavelet Approach
The wavelet transform (WT) (Daubechies, 1990) is designed to address the problem of nonstationary signals. The original signal is decomposed into two types of components; namely approximation of the signal (high-scale and low-frequency components), and details of the signal (low-scale and high-frequency components). The continuous wavelet transform (CWT) is defined by:
( ) ( ) ( )dtttxbaCWT ba∫+∞
∞−
= *,, ψ
where x(t) represents the analyzed signal, a and b represent the scaling factor and translation along the time axis, respectively, and the superscript (*) denotes the
( )
−
=a
bta
tba ψψ 1,
where ψ (t) represents the wavelet. Following the methodology in (Wang et al., 2011), the price index time series are decomposed using the discrete wavelet transform (DWT) with Daubechies (db3) as mother wavelet and with six decomposition levels. Finally, the low-frequency components are used in this paper as inputs to artificial neural networks to predict future stock market price index. Figure 1 shows the block diagram of the wavelet-BP approach.
complex conjugate. The function ψa,b(.) is obtained by scaling the wavelet at time b and scale a as follows:
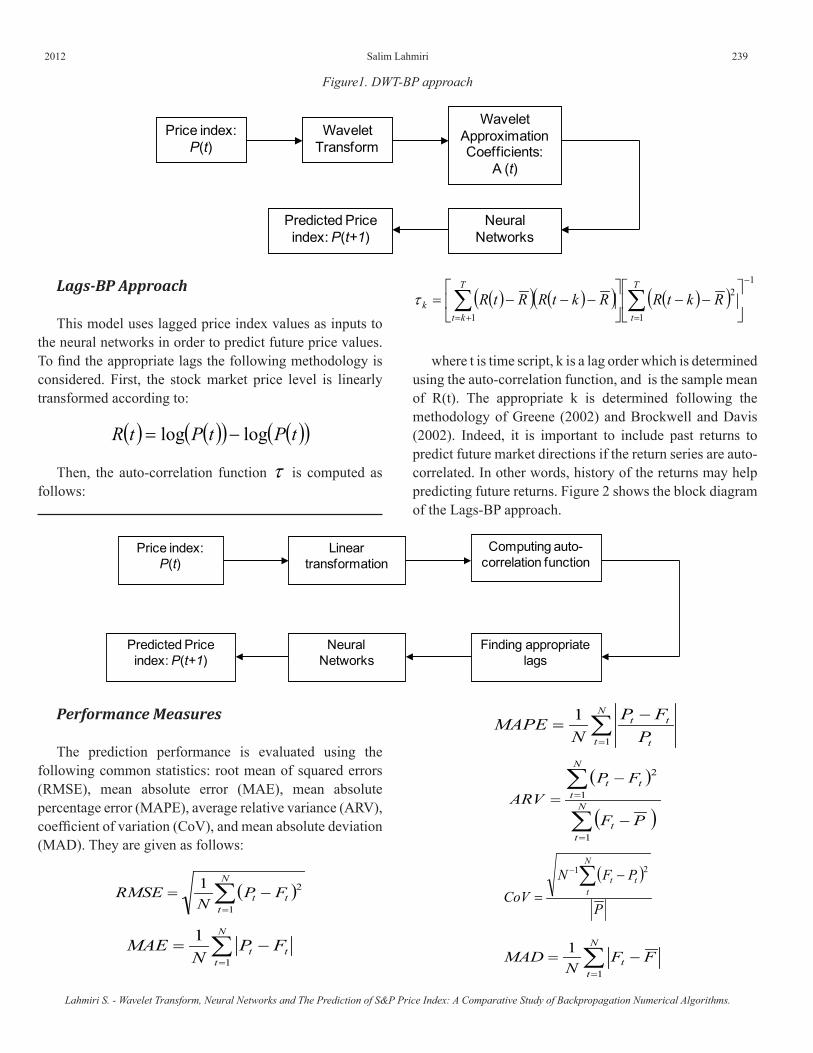
2012 239
WaveletApproximationCoefficients:
A (t)
Price index: P(t)
Wavelet Transform
Neural Networks
Predicted Price index: P(t+1)
Figure1. DWT-BP approach
Lags-BP Approach
This model uses lagged price index values as inputs to the neural networks in order to predict future price values. To find the appropriate lags the following methodology is considered. First, the stock market price level is linearly transformed according to:
( ) ( )( ) ( )( )tPtPtR loglog −=
Then, the auto-correlation function τ is computed as follows:
( )( ) ( )( ) ( )( )1
1
2
1
−
=+=
−−
−−−= ∑∑
T
t
T
ktk RktRRktRRtRτ
where t is time script, k is a lag order which is determined using the auto-correlation function, and is the sample mean of R(t). The appropriate k is determined following the methodology of Greene (2002) and Brockwell and Davis (2002). Indeed, it is important to include past returns to predict future market directions if the return series are auto-correlated. In other words, history of the returns may help predicting future returns. Figure 2 shows the block diagram of the Lags-BP approach.
Computing auto-correlation function
Price index: P(t)
Linear transformation
Finding appropriate lags
Predicted Price index: P(t+1)
Neural Networks
Performance Measures
The prediction performance is evaluated using the following common statistics: root mean of squared errors (RMSE), mean absolute error (MAE), mean absolute percentage error (MAPE), average relative variance (ARV), coefficient of variation (CoV), and mean absolute deviation (MAD). They are given as follows:
( )∑=
−=N
ttt FP
NRMSE
1
21
∑=
−=N
ttt FP
NMAE
1
1
∑=
−=
N
t t
tt
PFP
NMAPE
1
1
( )
( )∑
∑
=
=
−
−= N
tt
N
ttt
PF
FPARV
1
1
2
( )
P
PFNCoV
N
ttt∑ −
=
− 21
∑=
−=N
tt FF
NMAD
1
1
Lahmiri S. - Wavelet Transform, Neural Networks and The Prediction of S&P Price Index: A Comparative Study of Backpropagation Numerical Algorithms.
Salim Lahmiri

Business Intelligence Journal - July, 2012 Vol.5 No.2
240 Business Intelligence Journal July
where Pt, Ft, and F are respectively the true price, forecasted price and the average of forecasted prices over the testing (out-of-sample) period t =1 to N.
Experimental Results
The initial sample of the S&P500 daily prices is from October 2003 to January 2008, with no missing values. All neural networks are trained with 80% of the entire sample and tested with the remaining 20%. Figure 3 shows the
decomposition of the index price series – P(t) – using the wavelet transform.; where s, ai and di represent respectively the price index, approximation signal, and details signals at level i. Figure 4 shows the auto-correlation function up to 10 lags. Since τ is nonzero for k=1 and k=2, it means that the series is serially correlated. In addition, the values of the auto-correlation function die quickly in the first three lags which is a sign that the series obeys a low-order autoregressive (AR) process; for example an AR(2). Therefore, the number of lags to be included in the prediction models is up to k=2.
Figure 3. Price Index Series Decomposed Using the DWT.
The performance of each numerical optimization technique given the type of input (lags or DWT coefficients) in terms of MAD, RMSE, and MAE is shown in Figure 5; in terms of ARV and MAPE is shown in figure 6; and in terms of CoV is shown in Figure 7. For instance, Figure 5 shows clearly that BFGS, L-M, and Powell-Beale outperform Fletcher-Reeves and Polak-Ribiére algorithm whether using lags or DWT approach according to MAD, RMSE, and MAE statistics. In addition, BFGS perform slightly better
than the L-M algorithm. On the other hand, the simulations results show evidence that BFGS, L-M, and Powell-Beale provide higher accuracy with previous price index values as inputs than with DWT approximation coefficients. On the other hand, based on ARV and MAPE statistics, BFGS, L-M, and Powell-Beale outperform Fletcher-Reeves and Polak-Ribiére algorithm both for lags and DWT approach (Figure 6). In addition, BFGS perform clearly much better than the L-M algorithm. The simulations results also show
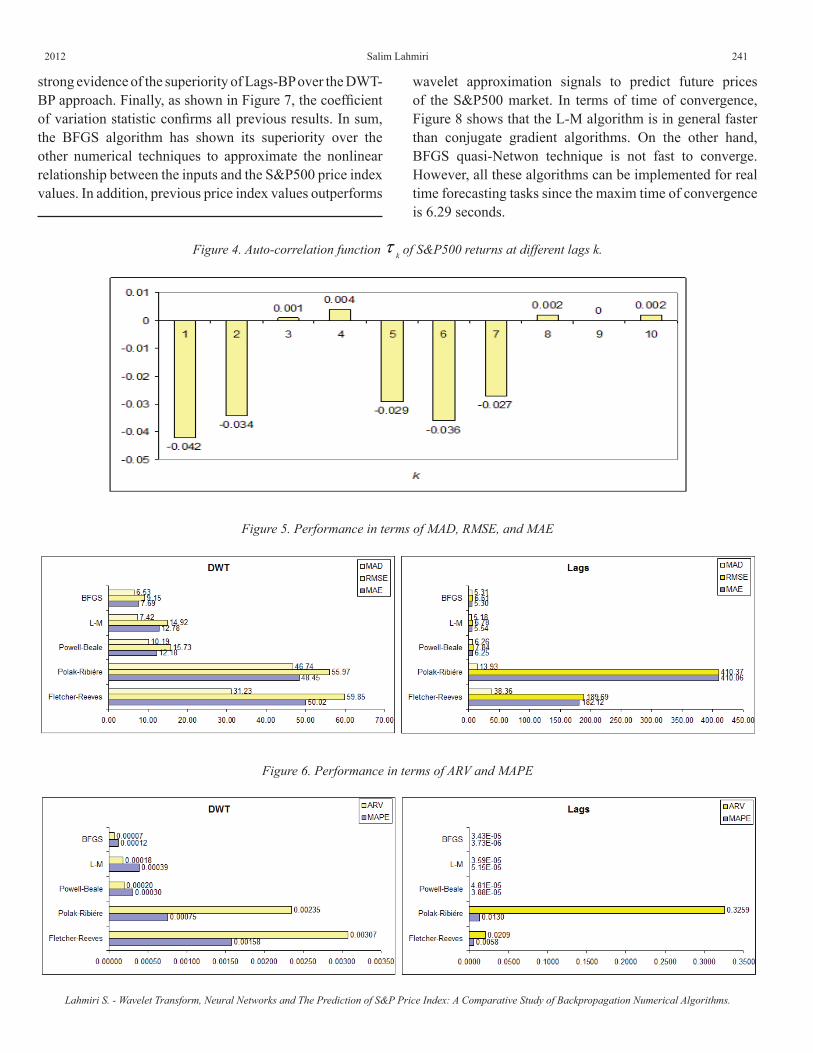
2012 241
strong evidence of the superiority of Lags-BP over the DWT-BP approach. Finally, as shown in Figure 7, the coefficient of variation statistic confirms all previous results. In sum, the BFGS algorithm has shown its superiority over the other numerical techniques to approximate the nonlinear relationship between the inputs and the S&P500 price index values. In addition, previous price index values outperforms
wavelet approximation signals to predict future prices of the S&P500 market. In terms of time of convergence, Figure 8 shows that the L-M algorithm is in general faster than conjugate gradient algorithms. On the other hand, BFGS quasi-Netwon technique is not fast to converge. However, all these algorithms can be implemented for real time forecasting tasks since the maxim time of convergence is 6.29 seconds.
Figure 4. Auto-correlation function τ k of S&P500 returns at different lags k.
Figure 5. Performance in terms of MAD, RMSE, and MAE
Figure 6. Performance in terms of ARV and MAPE
Lahmiri S. - Wavelet Transform, Neural Networks and The Prediction of S&P Price Index: A Comparative Study of Backpropagation Numerical Algorithms.
Salim Lahmiri
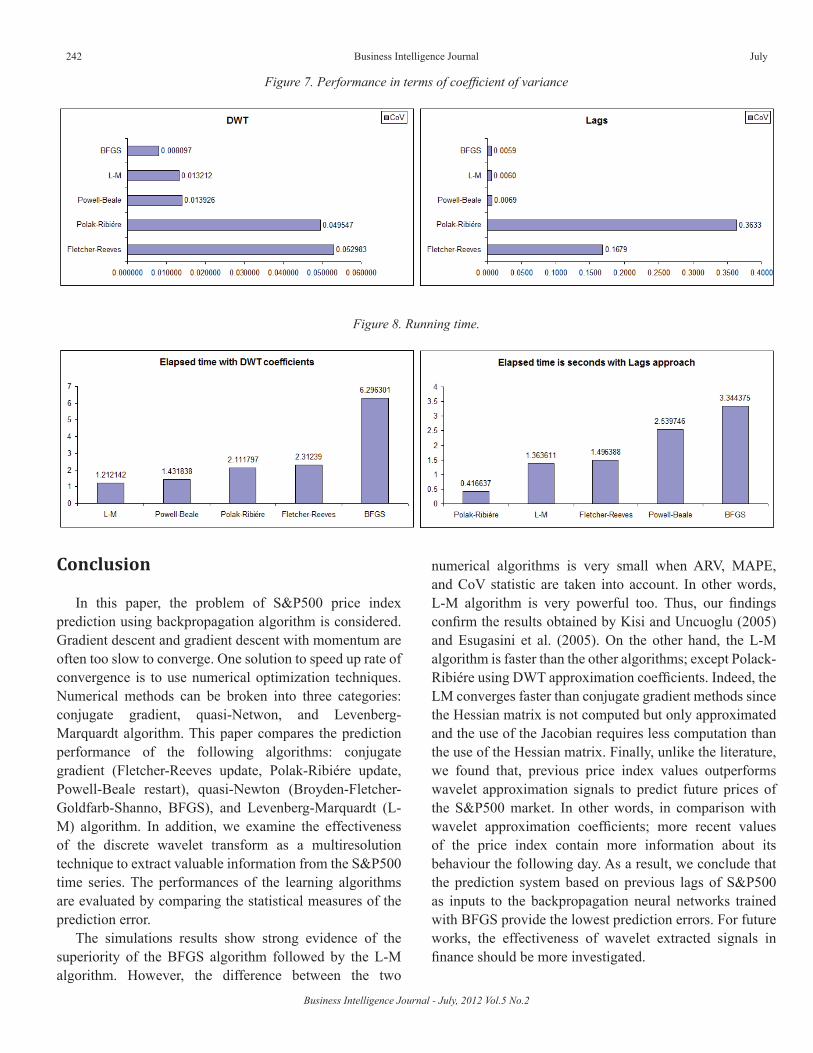
Business Intelligence Journal - July, 2012 Vol.5 No.2
242 Business Intelligence Journal July
Figure 7. Performance in terms of coefficient of variance
Figure 8. Running time.
Conclusion
In this paper, the problem of S&P500 price index prediction using backpropagation algorithm is considered. Gradient descent and gradient descent with momentum are often too slow to converge. One solution to speed up rate of convergence is to use numerical optimization techniques. Numerical methods can be broken into three categories: conjugate gradient, quasi-Netwon, and Levenberg-Marquardt algorithm. This paper compares the prediction performance of the following algorithms: conjugate gradient (Fletcher-Reeves update, Polak-Ribiére update, Powell-Beale restart), quasi-Newton (Broyden-Fletcher-Goldfarb-Shanno, BFGS), and Levenberg-Marquardt (L-M) algorithm. In addition, we examine the effectiveness of the discrete wavelet transform as a multiresolution technique to extract valuable information from the S&P500 time series. The performances of the learning algorithms are evaluated by comparing the statistical measures of the prediction error.
The simulations results show strong evidence of the superiority of the BFGS algorithm followed by the L-M algorithm. However, the difference between the two
numerical algorithms is very small when ARV, MAPE, and CoV statistic are taken into account. In other words, L-M algorithm is very powerful too. Thus, our findings confirm the results obtained by Kisi and Uncuoglu (2005) and Esugasini et al. (2005). On the other hand, the L-M algorithm is faster than the other algorithms; except Polack-Ribiére using DWT approximation coefficients. Indeed, the LM converges faster than conjugate gradient methods since the Hessian matrix is not computed but only approximated and the use of the Jacobian requires less computation than the use of the Hessian matrix. Finally, unlike the literature, we found that, previous price index values outperforms wavelet approximation signals to predict future prices of the S&P500 market. In other words, in comparison with wavelet approximation coefficients; more recent values of the price index contain more information about its behaviour the following day. As a result, we conclude that the prediction system based on previous lags of S&P500 as inputs to the backpropagation neural networks trained with BFGS provide the lowest prediction errors. For future works, the effectiveness of wavelet extracted signals in finance should be more investigated.
2012 243
References
Ahmed WAM, Saad ESM, Aziz ESA (2001). Modified Back Propagation Algorithm for Learning Artificial Neural Networks. Proceedings of the Eighteenth National Radio Science Conference (NRSC): 345-352.
Atsalakis GS, Valavanis KP (2008). Surveying Stock Market Forecasting Techniques – Part II: Soft Computing Methods. Expert Systems with Applications. 36: 5932-5941.
Box G, Jenkins G (1970). Time Series Analysis: Forecasting and Control. Holden-Day.
Cybenko G (1989). Approximations by Superpositions of a Sigmoidal Function. Mathematics of Control, Signals, and Systems. 2: 303-314.
Enke D, Thawornwong S (2005). The Use of Data Mining and Neural Networks for Forecasting Stock Market Returns. Expert Systems with Applications. 29: 927-940.
Esugasini E, Mashor MY, Isa N, Othman N (2005). Performance Comparison for MLP Networks Using Various Back Propagation Algorithms for Breast Cancer Diagnosis. Lecture Notes in Computer Science. 3682 : 123-130.
Giordano F, La Rocca M, Perna C (2007). Forecasting Nonlinear Time Series with Neural Network Sieve Bootstrap. Computational Statistics and Data Analysis. 51: 3871-3884.
Hornik K, Stinnchcombe M, White H (1989). Multi-layer Feed Forward Networks are Universal Approximators. Neural Networks. 2: 359-366.
Huang W, Lai. KK, Nakamori Y, Wang SY, Yu L (2007). Neural Networks in Finance and Economics Forecasting. International Journal of Information Technology and Decision Making. 6: 113-140.
Iftikhar A, Ansari MA, Mohsin S (2008). Performance Comparison between Backpropagation Algorithms Applied to Intrusion Detection in Computer Network Systems. 9th WSEAS International Conference on Neural Networks (NN’08): 231-236.
Kişi Ö, Uncuoglu E (2005). Comparaison of Three Back-Propagation Training Algorithms for Two Cases Studies. Indian Journal of Engineering & Materials Sciences. 12: 434-442.
Mokbnache L, Boubakeur A (2002). Comparison of Different Back-Propagation Algorithms used in
The Diagnosis of Transformer Oil. IEEE Annual Report Conference on Electrical Insulation and Dielectric Phenomena: 244-247.
Wang J-Z, Wang J-J, Zhang Z-G, Guo S-P (2011). Forecasting Stock Indices with Back Propagation Neural Network. Expert Systems with Applications. 38: 14346-14355.
Wen J, Zhao JL, Luo SW, Han Z (2000). The Improvements of BP Neural Network Learning Algorithm. Proceedings of the 5th Int. Conf. on Signal Processing WCCC-ICSP. 3:1647-1649.
Nouir Z, Sayrac ZB, Fourestié B, Tabbara W, Brouaye F (2008). Comparison of Neural Network Learning Algorithms for Prediction Enhancement of a Planning Tool. http://confs.comelec.telecom-paristech.fr/EW2007/papers/1569014736.pdf
Zhang G, Patuwo BE, Hu MY (1998). Forecasting with Artificial Neural Networks: The State of The Art. International Journal of Forecasting. 14: 35-62.
Hsieh T-J, Hsiao HF, Yeh W-C (2010). Forecasting Stock Markets using Wavelet Transforms and Recurrent Neural Networks: An Integrated System Based on Artificial Bee Colony Algorithm. Applied Soft Computing. 11 (2): 2510-2525.
Li S-T, Kuo S-C (2008). Knowledge Discovery in Financial Investment for Forecasting and Trading Strategy Through Wavelet-Based SOM Networks. Expert Systems with Applications. 34: 935-951.
Funahashi K. (1989). On The Approximate Realisation of Continuous Mappings by Neural Networks. Neural Networks. 2: 183-192.
Rumelhart DE, Hinton GE, Williams RJ (1986). Learning Representations by Back–Propagating Errors. Nature. 323: 533-536.
Jang J-SR., Sun C-T, Mizutani E (1997). Neuro-Fuzzy and Soft Computing: A Computational Approach to Learning and Machine Intelligence. NJ: Prentice-Hall.
Ramírez E, Castillo O, Soria J (2003). Hybrid System for Cardiac Arrhythmia Classification with Fuzzy k-Nearest Neighbors and Multi Layer Perceptrons Combined by a Fuzzy Inference System. The International Joint Conference on Neural Networks (IJCNN), 18-23 July, Barcelona, Spain.
Scales LE (1985). Introduction to Non-Linear Optimization. New York, Springer-Verlag.
Jorge N, Wright SJ (2006). Numerical Optimization. 2nd Edition. Springer.
Lahmiri S. - Wavelet Transform, Neural Networks and The Prediction of S&P Price Index: A Comparative Study of Backpropagation Numerical Algorithms.
Salim Lahmiri

Business Intelligence Journal - July, 2012 Vol.5 No.2
244 Business Intelligence Journal July
Charalambous C (1992). Conjugate Gradient Algorithm for Efficient Training of Artificial Neural Networks. IEEE Proceedings. 139 (3): 301-310.
Daubechies I (1990). The wavelet Transform, Time-Frequency Localization and Signal Analysis. IEEE Transactions in Information Theory. 36 (5): 961-1005.
Greene WH (2002). Econometric Analysis. Prentice Hall; 5th edition.
Brockwell PJ, Davis RA (2002). Introduction to Time Series and Forecasting. Springer; 8th Printing.
2012 245
DIMENSIONS OF SPIRITUAL TOURISM IN TUITICORIN DISTRICT OF TAMIL NADU IN INDIA – A CRITICAL ANALYSIS
S.Vargheese Antony JesurajanAssistant Professor in Commerce, St.Xavier’s College (Autonomous),
Palayamkottai – 627 002.Email: [email protected]
S.Varghees PrabhuAssistant Professor in Management, RVS KVK Institute of Management Studies,
Trichy – 621 303.Email: [email protected]
AbstractTourism is a fast growing industry which has vast and inexhaustible potentials to enhance national income, foreign exchange reserves
and opportunities of employment to the growing millions or the countries. The size and economic significance of travel and tourism have attracted the attention of many countries in actively promoting tourism as a way to stimulate their economies. The world tourism organization has recognized the potential of tourism sector for the purpose of poverty alleviation by increased job creation; consequently, many developing countries are improving their tourism planning and developments approaches. The objective of this research article is to study the satisfaction level of tourist and determinants of spiritual tourism and problems faced by tourist in Tuiticorin district. The number of samples collected for this study is 150 tourists and the type of sampling used is convenient sampling. Simple percentage analysis, chi-square test and Garret ranking technique have been employed for the purpose of analyzing the data. Some of the major findings regarding the problems faced by the tourists include: pollution and lack of cleanliness, beggars nuisance, lack of sanitary facility and exploitation by taxi and vehicle operators. This study will be relevant and significant to the present Indian scenario. Key words: Tourist, Spiritual Tourism.
Tourism industry occupies an important place in the world’s economy. It is the fastest growing sectors of the economy now-a-days and is expected to generate more income and employment as well as foreign exchange. Tourism can be broadly categorized into international tourism and inter-regional tourism. Both the types hold better prospects and contribute towards the economic development of a particular national region. Tourism is of major economic and social significance in both developed and developing countries. It provides direct and indirect employment opportunities and raises the standard of living and quality of the resident population. It also supports and helps to find arts, folk traditions, festivals and events and provides a market for local crafts and manufacturing.
The tourism industry in India is substantial and vibrant and the country is fast becoming a major global destination. India’s travel and tourism industry is one of most profitable industries in the country, and also created with contributing a substantial amount of foreign exchange. India’s tourism sector is projected to grow at 8.8 per cent ahead of China’s over the next 10 years. According to WTTC, capital
investment in the India tourism sector is expected to touch the $21.4 billion mark in 2014. This will be about 7.8 per cent of the total investment received by the country in that year.
Statement of the Problem
The national economy becomes increasingly dependent on the growing size of the tourist market. Tourism gains economic and social significance for its potentials to provide employment, generate income, earn foreign exchange, contribute towards regional development and encourage cultural exchange and national integration. Tourism industry is thus a highly complex one of many firms contributing different products and services to the tourists.
Thus the growth of tourism industry creates market for different industries and thus it contributes towards the development overall economy of a nation. For our country tourism has immense importance in the context of promoting 3 E’s employment, (foreign) exchange and
S.Vargheese A. J., S.Varghees P. - Dimensions of Spiritual Tourism in Tuiticorin District of Tamil Nadu in India – A Critical Analysis.
S.Vargheese Antony Jesurajan, S.Varghees Prabhu
Business Intelligence Journal - July, 2012 Vol.5 No.2
246 Business Intelligence Journal July
entrepreneurism which are very much lacking, despite the country has avenues for multiple varieties for tourism. They are still unexploited to the optimum level. Many factors hamper the growth of the tourism industry in India. Moreover, the profile and problems of tourism vary type to type. These need a serious and focused study and suitable solutions. Spiritual tourism is an important component of an Indian tourism industry as India is a land of spirtituality endowned with many places of worships, pilgrim centres and religious monuments etc., Tuiticorin district of Tamil Nadu is also blessed with many such places. However, spiritual tourism in this district has not been paid due attention by the government and the researchers. The avenues for the spiritual tourism in this district are not fully explored and the deficiencies and problems are not properly assessed. An in-depth study on the spiritual tourism issues and problems in the districts will help to promote spiritual tourism in the district in specific and the tourism industry in general. This prompted the researcher to choose this topic for his study.
Literature Review
Sharpley, R. and Sundaram, P. (2005), “Tourism: a sacred journey? The case of ashram tourism, India” identifies two principal groups of visitors, namely ‘permanent tourists’ who have immersed themselves indefinitely in a spiritual ‘Other’, and temporary visitors. The latter are categorised into sub-groups which point to a variety of spiritual and non-spiritual motives. The paper concludes that there is a continuum of spirituality inherent in tourism, though this is related to tourists' experience rather than initial motivation.
Kadir H. Din (2002), “Islam and Tourism: Patterns, Issues, and Options”, described the pattern of tourist arrival in Muslim countries and examines the extent to which the religious factor has a bearing on policy and development strategy affecting tourism. Drawing illustration from Malaysia where Islam is the state religion, this study suggests that, although the doctrine of Islam encourages travel and hospitable behaviour, it has little influence on the mode of tourism development in Muslim countries. While certain regulations prohibit prostitution, gambling, and the consumption of alcoholic beverages in most Muslim countries, religion does not exert any significant influence on the operation of tourist-related activities. Indeed, virtually all ideas and policy precepts which inform tourism planning and management are western-inspired.
Hasan, MD. Tanveer Bin (2010), “A Study on Spiritual Tourism (Mazar)”, Spiritual tourism is not a typical type
of tourism like other tourism sectors. The class & taste of tourists differ significantly here. Spiritual tourism is a journey to a sacred place or shrine of importance to a person’s beliefs or faith. It’s a tour for attaining spiritual improvement or getting creator’s bliss. There are different types of religions in the world & different modes of spiritual tour to the respective religions for attaining the devotee’s religious & moral improvement.
Frances McGettigan, Corina Griffin, Fiona Candon (2011), “The role of a religious tourism strategy for the West and North West of Ireland in furthering the development of tourism in the region” aims to explain how a bottom-up and inter-regional approach was adopted to drive the process to develop a religious spiritual tourism strategy for the region. Details of the strategy are outlined in the paper and in particular, an examination of the successful implementation process.
Objectives of the Study
1. To find out the satisfaction level of tourists in Tuiticorin district.
2. To find out the determinants of spiritual tourism among the tourists.
3. To find out the problems faced by the spiritual tourists in the study area.
4. To offer findings and suggestions.
Methodology
Area of the Study
In this study an effort had been taken to examine the dimensions of spiritual tourism in Tuiticorin district of Tamil Nadu. This study covers the important spiritual tourist places in Tuiticorin district such as Tiruchendur, Manapad, Nava Thirupathi and Tuiticorin.
Sources of the Data
This empirical and exploratory study is based on both primary data and secondary data. Primary data has been used as the main source of the study and it was collected from 150 visitors of spiritual tourist spots in Tuiticorin district such as Tiruchendur, Manappadu, Nava Thirupathi and Tuiticorin Our Lady of Snows Church. The primary data was collected through a pre-structured interview schedule carefully designed after a pilot study and several discussions with scholars and officials of tourism
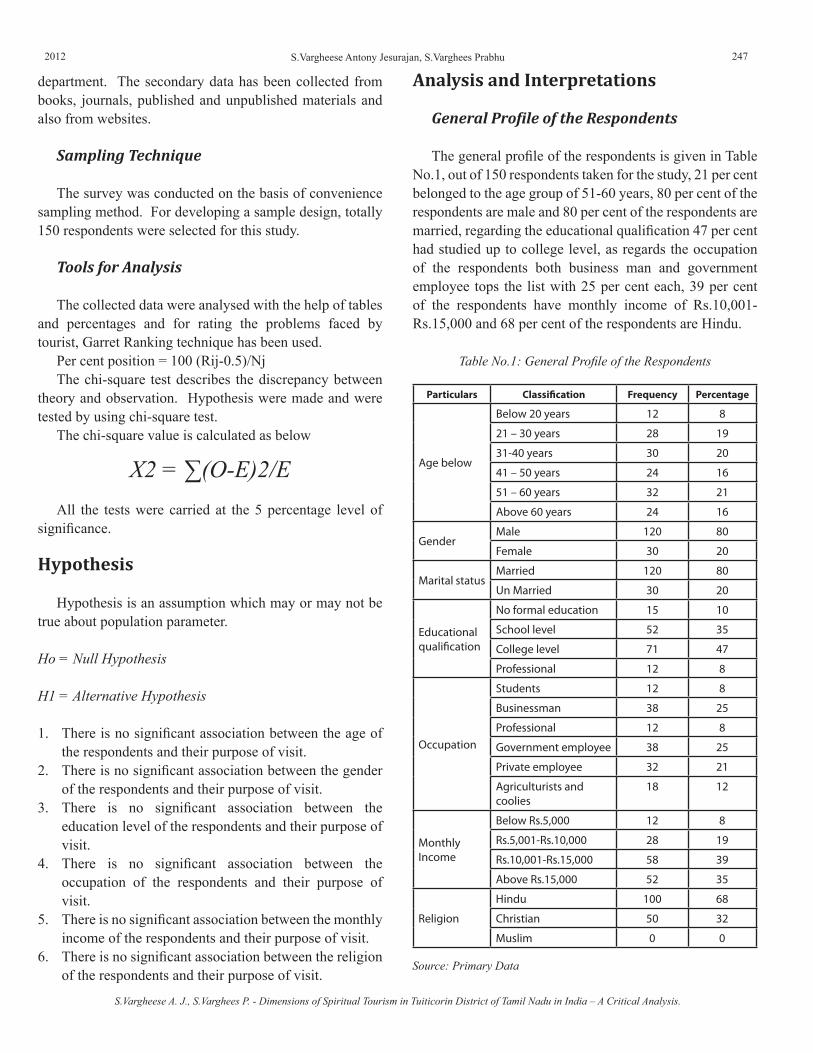
2012 247
department. The secondary data has been collected from books, journals, published and unpublished materials and also from websites.
Sampling Technique
The survey was conducted on the basis of convenience sampling method. For developing a sample design, totally 150 respondents were selected for this study.
Tools for Analysis
The collected data were analysed with the help of tables and percentages and for rating the problems faced by tourist, Garret Ranking technique has been used.
Per cent position = 100 (Rij-0.5)/NjThe chi-square test describes the discrepancy between
theory and observation. Hypothesis were made and were tested by using chi-square test.
The chi-square value is calculated as below
X2 = ∑(O-E)2/EAll the tests were carried at the 5 percentage level of
significance.
Hypothesis
Hypothesis is an assumption which may or may not be true about population parameter.
Ho = Null Hypothesis
H1 = Alternative Hypothesis
1. There is no significant association between the age of the respondents and their purpose of visit.
2. There is no significant association between the gender of the respondents and their purpose of visit.
3. There is no significant association between the education level of the respondents and their purpose of visit.
4. There is no significant association between the occupation of the respondents and their purpose of visit.
5. There is no significant association between the monthly income of the respondents and their purpose of visit.
6. There is no significant association between the religion of the respondents and their purpose of visit.
Analysis and Interpretations
General Profile of the Respondents
The general profile of the respondents is given in Table No.1, out of 150 respondents taken for the study, 21 per cent belonged to the age group of 51-60 years, 80 per cent of the respondents are male and 80 per cent of the respondents are married, regarding the educational qualification 47 per cent had studied up to college level, as regards the occupation of the respondents both business man and government employee tops the list with 25 per cent each, 39 per cent of the respondents have monthly income of Rs.10,001-Rs.15,000 and 68 per cent of the respondents are Hindu.
Particulars Classification Frequency Percentage
Age below
Below 20 years 12 8
21 – 30 years 28 19
31-40 years 30 20
41 – 50 years 24 16
51 – 60 years 32 21
Above 60 years 24 16
GenderMale 120 80
Female 30 20
Marital statusMarried 120 80
Un Married 30 20
Educational qualification
No formal education 15 10
School level 52 35
College level 71 47
Professional 12 8
Occupation
Students 12 8
Businessman 38 25
Professional 12 8
Government employee 38 25
Private employee 32 21
Agriculturists and coolies
18 12
Monthly Income
Below Rs.5,000 12 8
Rs.5,001-Rs.10,000 28 19
Rs.10,001-Rs.15,000 58 39
Above Rs.15,000 52 35
Religion
Hindu 100 68
Christian 50 32
Muslim 0 0
Source: Primary Data
Table No.1: General Profile of the Respondents
S.Vargheese A. J., S.Varghees P. - Dimensions of Spiritual Tourism in Tuiticorin District of Tamil Nadu in India – A Critical Analysis.
S.Vargheese Antony Jesurajan, S.Varghees Prabhu

Business Intelligence Journal - July, 2012 Vol.5 No.2
248 Business Intelligence Journal July
Determinants of Spiritual Toruism
The pattern of visits by the respondents is given in Table No.2. 93 per cent of the respondents are domestic tourists belonging to the other states and other districts of Tamil Nadu, the main sources of information about the spiritual tourist spots to the visitors in the study area are their friends and relatives amounts to 63 per cent. 43 per cent of the respondents visit the tourist spots to fulfill their religious vows and obligations. 39 per cent of the visitors spent at least 2 days in the spiritual tourism spots, 53 per cent of the respondents visit the places once in a year,51 per cent of the respondents visit the spiritual spots whenever they have the free time, 78 per cent of the respondents visit the places by accompanying less than 5 members, 55 per cent of the respondents visit the places with their family members, 67 per cent of the respondents made spot bookings for happy stay, among the spot booking respondents 41 per cent of the respondents made by themselves without any help. 33 per cent of the respondents made advance bookings for their happy stay, among the advanced booking 35 per cent of the respondents made with the help of tour operators, 45 per cent of the respondents used road transport for easy access of spiritual spots, 52 per cent of the respondents used lodge and cottage for their accommodation, 61 per cent of the respondents depend on the hotels for their refreshments.
Particulars Classification Frequency Percentage
Nativity
Other country 10 7
Other state 24 16
Other district 68 45
Local 48 32
Sources
Friends and relatives 94 63
Tour operators/Travel agents
26 17
Advertisement from Tourism Department
18 12
Websites 12 8
Purpose of visit
Fulfilling a religious vows / Obligations
65 43
Pilgrimage 13 9
Leisure / Recreation 8 5
Mental relief / relaxation 42 28
Spiritual enlightens 22 15
Number of days spent
Less than one day 40 27
1 – 2 days 59 39
3 – 4 days 41 27
More than 4 days 10 7
Table No.2 Determinants of Spiritual Tourism
Particulars Classification Frequency Percentage
Time gap
Once in a year 58 53
Once in a month 46 42
Every week 6 5
Time of visit
Festival times 25 17
Summer holidays 48 32
Other free times 77 51
Number of members accompanied
Less than 5 members 117 78
5 – 10 members 23 15
Above 10 members 10 7
Members accompanied
Family members 83 55
Friends 42 28
Co-workers 25 17
Types of booking
Advance booking 37 33
On the spot booking 73 67
Mode of advance bookings
On line bookings 10 28
Through tour operators 13 35
Through travel agents 8 22
Through tourism departments
6 15
Mode of the on the spot bookings
Self initiative 41 57
With the help of agents/brokers
22 30
Through tourist guides 10 13
Mode of transport
Road transport 68 45
Air transport 18 12
Train transport 64 43
Type of accommodation
Lodge/cottage 57 52
Community halls 19 17
Temple campus 11 10
Friends/relatives house 23 21
Mode of refreshment
Self-cooking/arranged cooking
58 39
Hotels 92 61
Source: Primary Data
Level of Satisfaction
The level of satisfaction of the visitors is the main factor that determines the post-visit behaviour and attitude towards the tourism centres as well as the tour decisions. Visitors’ satisfaction level is mainly based on the various facilities and support systems available in the tourism centres and the comfort and convenience they experience there. To verify this view, twelve facilities that determine the level of satisfaction were identified. They are; accommodation, food, transportation, shopping facilities, guidance information services, banking services, communication facilities, vehicle parking facilities, peaceful atmosphere,
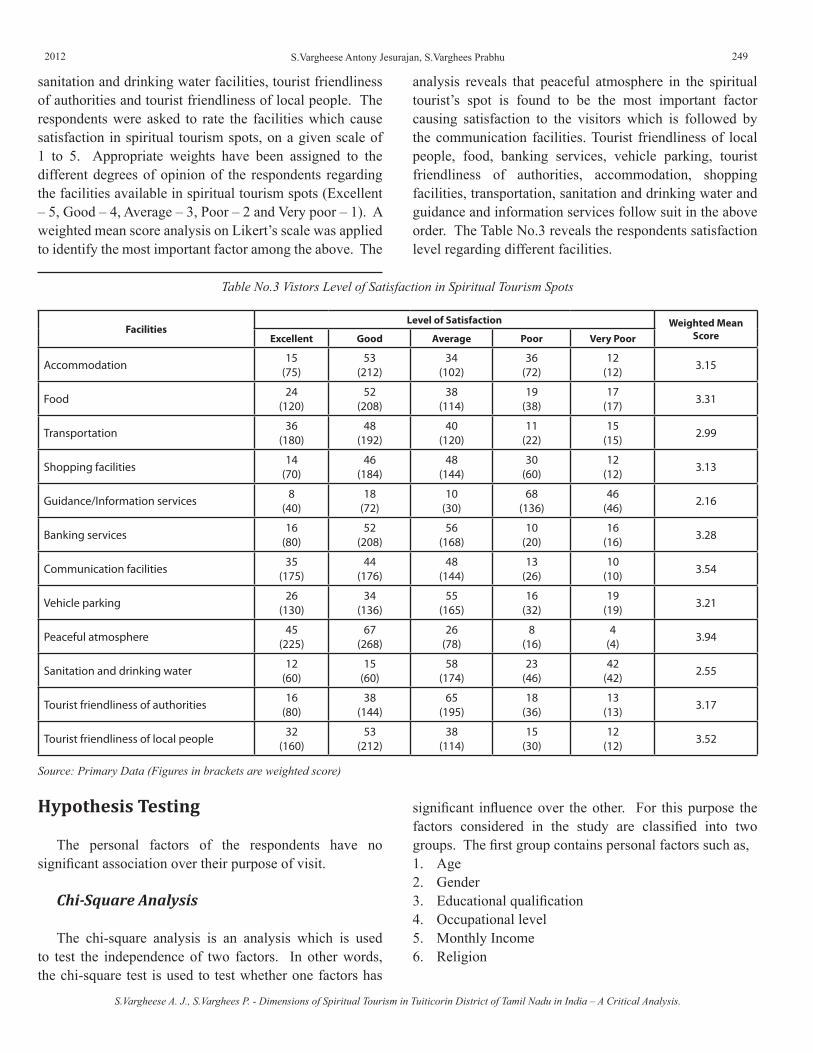
2012 249
sanitation and drinking water facilities, tourist friendliness of authorities and tourist friendliness of local people. The respondents were asked to rate the facilities which cause satisfaction in spiritual tourism spots, on a given scale of 1 to 5. Appropriate weights have been assigned to the different degrees of opinion of the respondents regarding the facilities available in spiritual tourism spots (Excellent – 5, Good – 4, Average – 3, Poor – 2 and Very poor – 1). A weighted mean score analysis on Likert’s scale was applied to identify the most important factor among the above. The
FacilitiesLevel of Satisfaction Weighted Mean
ScoreExcellent Good Average Poor Very Poor
Accommodation 15(75)
53(212)
34(102)
36(72)
12(12) 3.15
Food 24(120)
52(208)
38(114)
19(38)
17(17) 3.31
Transportation 36(180)
48(192)
40(120)
11(22)
15(15) 2.99
Shopping facilities 14(70)
46(184)
48(144)
30(60)
12(12) 3.13
Guidance/Information services 8(40)
18(72)
10(30)
68(136)
46(46) 2.16
Banking services 16(80)
52(208)
56(168)
10(20)
16(16) 3.28
Communication facilities 35(175)
44(176)
48(144)
13(26)
10(10) 3.54
Vehicle parking 26(130)
34(136)
55(165)
16(32)
19(19) 3.21
Peaceful atmosphere 45(225)
67(268)
26(78)
8(16)
4(4) 3.94
Sanitation and drinking water 12(60)
15(60)
58(174)
23(46)
42(42) 2.55
Tourist friendliness of authorities 16(80)
38(144)
65(195)
18(36)
13(13) 3.17
Tourist friendliness of local people 32(160)
53(212)
38(114)
15(30)
12(12) 3.52
analysis reveals that peaceful atmosphere in the spiritual tourist’s spot is found to be the most important factor causing satisfaction to the visitors which is followed by the communication facilities. Tourist friendliness of local people, food, banking services, vehicle parking, tourist friendliness of authorities, accommodation, shopping facilities, transportation, sanitation and drinking water and guidance and information services follow suit in the above order. The Table No.3 reveals the respondents satisfaction level regarding different facilities.
Table No.3 Vistors Level of Satisfaction in Spiritual Tourism Spots
Source: Primary Data (Figures in brackets are weighted score)
Hypothesis Testing
The personal factors of the respondents have no significant association over their purpose of visit.
Chi-Square Analysis
The chi-square analysis is an analysis which is used to test the independence of two factors. In other words, the chi-square test is used to test whether one factors has
significant influence over the other. For this purpose the factors considered in the study are classified into two groups. The first group contains personal factors such as,1. Age2. Gender3. Educational qualification4. Occupational level5. Monthly Income6. Religion
S.Vargheese A. J., S.Varghees P. - Dimensions of Spiritual Tourism in Tuiticorin District of Tamil Nadu in India – A Critical Analysis.
S.Vargheese Antony Jesurajan, S.Varghees Prabhu
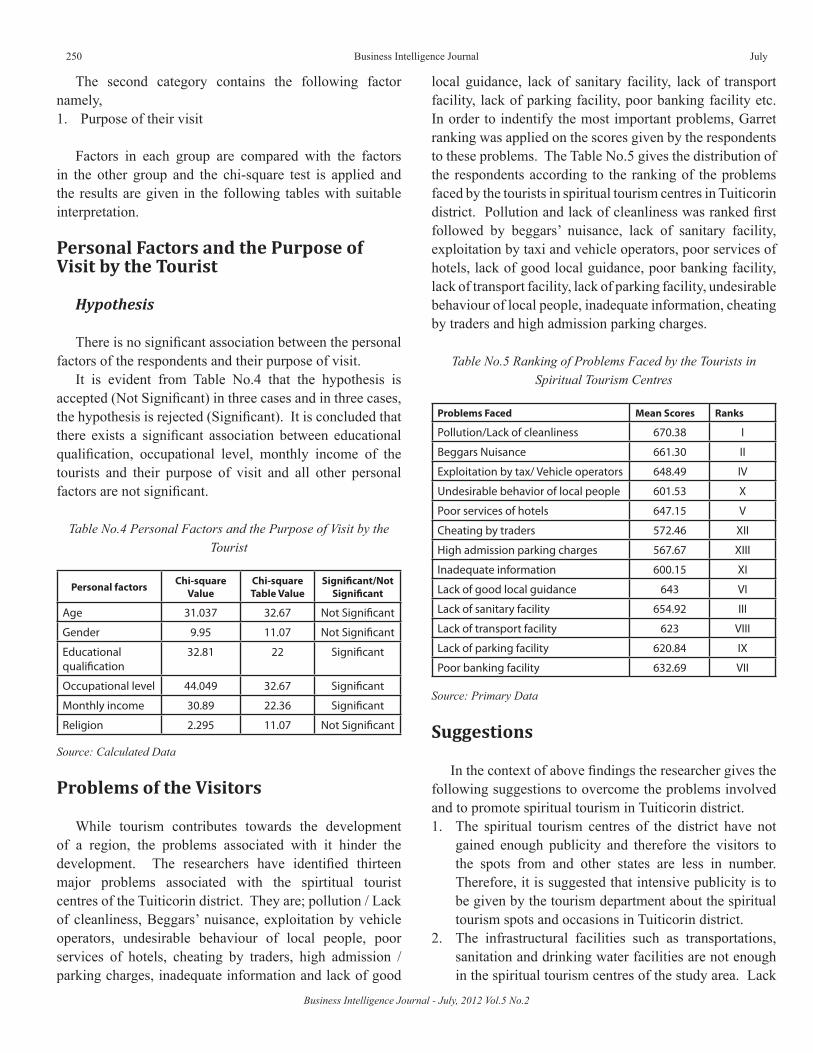
Business Intelligence Journal - July, 2012 Vol.5 No.2
250 Business Intelligence Journal July
The second category contains the following factor namely,1. Purpose of their visit
Factors in each group are compared with the factors in the other group and the chi-square test is applied and the results are given in the following tables with suitable interpretation.
Personal Factors and the Purpose of Visit by the Tourist
Hypothesis
There is no significant association between the personal factors of the respondents and their purpose of visit.
It is evident from Table No.4 that the hypothesis is accepted (Not Significant) in three cases and in three cases, the hypothesis is rejected (Significant). It is concluded that there exists a significant association between educational qualification, occupational level, monthly income of the tourists and their purpose of visit and all other personal factors are not significant.
Table No.4 Personal Factors and the Purpose of Visit by the Tourist
Personal factors Chi-square Value
Chi-square Table Value
Significant/Not Significant
Age 31.037 32.67 Not Significant
Gender 9.95 11.07 Not Significant
Educational qualification
32.81 22 Significant
Occupational level 44.049 32.67 Significant
Monthly income 30.89 22.36 Significant
Religion 2.295 11.07 Not Significant
Source: Calculated Data
Problems of the Visitors
While tourism contributes towards the development of a region, the problems associated with it hinder the development. The researchers have identified thirteen major problems associated with the spirtitual tourist centres of the Tuiticorin district. They are; pollution / Lack of cleanliness, Beggars’ nuisance, exploitation by vehicle operators, undesirable behaviour of local people, poor services of hotels, cheating by traders, high admission / parking charges, inadequate information and lack of good
Table No.5 Ranking of Problems Faced by the Tourists in Spiritual Tourism Centres
Problems Faced Mean Scores Ranks
Pollution/Lack of cleanliness 670.38 I
Beggars Nuisance 661.30 II
Exploitation by tax/ Vehicle operators 648.49 IV
Undesirable behavior of local people 601.53 X
Poor services of hotels 647.15 V
Cheating by traders 572.46 XII
High admission parking charges 567.67 XIII
Inadequate information 600.15 XI
Lack of good local guidance 643 VI
Lack of sanitary facility 654.92 III
Lack of transport facility 623 VIII
Lack of parking facility 620.84 IX
Poor banking facility 632.69 VII
Source: Primary Data
local guidance, lack of sanitary facility, lack of transport facility, lack of parking facility, poor banking facility etc. In order to indentify the most important problems, Garret ranking was applied on the scores given by the respondents to these problems. The Table No.5 gives the distribution of the respondents according to the ranking of the problems faced by the tourists in spiritual tourism centres in Tuiticorin district. Pollution and lack of cleanliness was ranked first followed by beggars’ nuisance, lack of sanitary facility, exploitation by taxi and vehicle operators, poor services of hotels, lack of good local guidance, poor banking facility, lack of transport facility, lack of parking facility, undesirable behaviour of local people, inadequate information, cheating by traders and high admission parking charges.
Suggestions
In the context of above findings the researcher gives the following suggestions to overcome the problems involved and to promote spiritual tourism in Tuiticorin district.1. The spiritual tourism centres of the district have not
gained enough publicity and therefore the visitors to the spots from and other states are less in number. Therefore, it is suggested that intensive publicity is to be given by the tourism department about the spiritual tourism spots and occasions in Tuiticorin district.
2. The infrastructural facilities such as transportations, sanitation and drinking water facilities are not enough in the spiritual tourism centres of the study area. Lack
2012 251
of cleanliness and beggars’ nuisance are the most important problems faced by the tourists in the study area. Therefore, the government authorities especially the local authorities should pay the special attention on their inconveniences and make necessary arrangements to correct them.
3. The spiritual tourism of the study area is exploited by the local transport operators and this is found to be one of the most important problems they face. Therefore, it is suggested that the exploitation by the local transport operators is to be checked by strict enforcement of rules and licensing mechanism by the government, especially the local government authorities.
4. The quality of the hospitality service in the study area is found to be poor in the spiritual tourism centres of the study area. Therefore, it is suggested that the government authorities should take necessary steps to enhance the quality of the hospitality services provided in the study area.
5. The spiritual tourism centres of the Tuiticorin district are not equally popular. Therefore, the tourism department should take necessary steps to promote less popular spiritual tourism centres like Nava Thiruppathi, Manappadu and Kalugumalai through intensive publicity.
6. Since spiritual tourism contributes to the development of locality the local people are to be oriented in tourist-friendly-values and a tourist-supportive-system is to be evolved. The nuisance by local people especially by the misuse by beggars and the exploitation by the local vendors and service providers are to be checked seriously by the Government authorities and the authorities of the worship places.
Conclusion
In spiritual tourism a tourist seeks for peace of mind and a sense of spiritual satisfaction. Even though the visitors to the spiritual tourism spots of Tuiticorin district are satisfied with peaceful atmosphere they experience and the friendliness of the local people, they are dissatisfied with
the basic infrastructure like sanitation and drinking water facilities, lack of cleanliness and exploitation by the local vehicle operators. If these problems are addressed properly and enough publicity is given the spiritual tourism avenues of the Tuiticorin district shall be explored to the optimum level.
References
Sharpley, R. and Sundaram, P. (2005), ‘Tourism: a sacred journey? The case of ashram tourism, India’. International Journal of Tourism Research, 7: 161–171.
Hasan, MD. Tanveer Bin, ‘A Study on Spiritual Tourism (Mazar)’ (January 9, 2010).
Bhatia, A.K., ‘Tourism Development Principles and Practices’, Sterling Publishers, New Delhi, 1998.
Gupta, V.K, ‘Tourism in India’, New Delhi, Gain Publishing House 1987.
Hutichinson, ‘International Tourism’, Sterling Publishers, New Delhi, 1969.
Pram Nath Seth, Sushma Seth Bhat, ‘An Introduction to Travel and Tourism’, Sterling Publishers, New Delhi, 1994.
Krishnan K.Kamra, ‘Economics of Tourism’, Kanishka Publications and Distributiors – New Delhi, 2001.
P.Wilson, ‘Implication of Tourism in India’, Oct – 1980.
Praveen Sethi, ‘Handbook of Effective Travel and Tourism’, Rajat Publication – New Delhi 1999.
Kadir Din , ‘Islam and tourism : Patterns, issues, and options’, Annals of Tourism Research, Volume 16, Issue 4, 1989, Pages 542-563
Frances McGettigan, Corina Griffin, Fiona Candon, “The role of a religious tourism strategy for the West and North West of Ireland in furthering the development of tourism in the region”, International Journal of Business and Globalisation 2011 - Vol. 7, No.1 pp. 78 - 92
Websites: www.tourism.nic.in, www.worldtourism.org, www.indiantoruism.org, www.tamilnadutourism.org.
S.Vargheese A. J., S.Varghees P. - Dimensions of Spiritual Tourism in Tuiticorin District of Tamil Nadu in India – A Critical Analysis.
S.Vargheese Antony Jesurajan, S.Varghees Prabhu

Business Intelligence Journal - July, 2012 Vol.5 No.2
252 Business Intelligence Journal July
ARCHITECTURE FOR MOBILE MARKETING IN ANDROID:ADVERTISING THROUGH BUSINESS INTELLIGENCE
Paulo Renato de FariaComputer Scientist by Unicamp, MBA in Business Intelligence by Veris IBTA,
and software analyst at Instituto de Pesquisas Eldorado
AbstractConduct a bibliographic survey to find a system architecture proposal which enables to gather information from social networks and
accomplish data mining over existent data marts in a company to find customer preferences and suggest customized advertisements. A solution that is robust and intelligent enough to deliver coupons by email or SMS only when a customer is near the store with your AndroidTM mobile device. A system that also allows collecting promotion metrics to control an advertising campaign and analyze your efficiency. Abbreviations: (BI) Business Intelligence, (OLAP) On-line Analytic Processing, (JSON) JavaScript Object Notation, (Anatel) National Regulatory Agency of Telecommunications in Brazil, (MMS) Multimedia Messaging Service, (ETL) Extract, Transform and Load, (ERP) Enterprise Resource Planning. Key words: Marketing, Mobile Device, Geographic Data Warehouse, Business Intelligence, Android.
With the recent explosion into the number of mobile device with internet connection capabilities and the ability to show more sophisticated content, the possibility to reach customers with customized advertising becomes each day more attractive, and in some areas, crucial for some companies survival.
For this reason, this study intend to answer the following question: is it possible to obtain geolocalization information from mobile devices, cross with information from social networks and also from dimensional models available in the companies to provide advertising with the customized content to raise sales?
This article will survey the existent technologies in AndroidTM and BI to find a viable architecture proposal to reach a marketing solution for mobile advertising for companies, discussing the metrics and the most important components.
Methodology
The methodology used was the bibliographic research with the reading, analysis and interpretation of technical articles, books and sites from the areas and technologies involved. It was studied products existent in the market and it was done some simple tests to validate the access to obtain data from social networks.
Basic Concepts
To unity these two areas: marketing and business intelligence, first we need to explain the core concepts.
By marketing we understand that “(...) is to touch the customers’ repressed necessities and demonstrate how to fulfil them through products and/or services.” (Nóbrega, Moacir, 2008, our translation). By Business Intelligence we will define as “deliver information in the right time, to the right people and with the right content.” (Abbey, M; Corey, M.; Taub, B, 2001)
In the way to implant BI in the corporations, many of them employ OLAP, which “(...) involves measures or numeric data from several dimensions, requiring supporting models for forecasts, statistical analysis and tendencies” (Serra, Laércio 2002 p. 157, our translation).
With these concepts in mind, mobile marketing through business intelligence can be defined as the capacity to integrate information about users, besides device and store location, to deliver customized advertising capable of satisfying customer desires.
Market's vision
According to a balance from Anatel announced in March 2011, it is estimated that the total number of mobile phone subscribers in Brazil reached 207.5 million. Around the world, it was produced approximately 67 millions of Android devices in 2010, the huge increase of 800% in comparison with 2009.
It is not an exaggeration anymore from science fiction to imagine a situation from mobile advertising as described by Kotler (2007): “Many claim that we passed from e-marketing and e-business to m-business, which means that the entire wireless system can occupy much of our life.
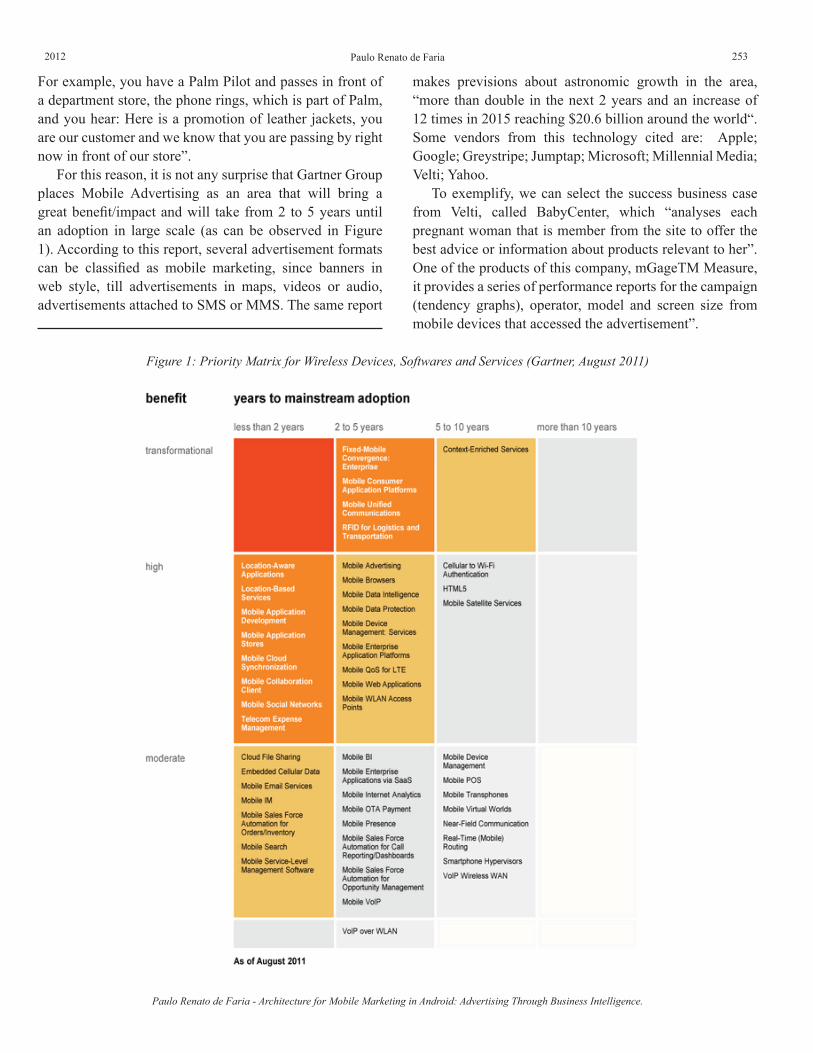
2012 253
Paulo Renato de Faria - Architecture for Mobile Marketing in Android: Advertising Through Business Intelligence.
Paulo Renato de Faria
For example, you have a Palm Pilot and passes in front of a department store, the phone rings, which is part of Palm, and you hear: Here is a promotion of leather jackets, you are our customer and we know that you are passing by right now in front of our store”.
For this reason, it is not any surprise that Gartner Group places Mobile Advertising as an area that will bring a great benefit/impact and will take from 2 to 5 years until an adoption in large scale (as can be observed in Figure 1). According to this report, several advertisement formats can be classified as mobile marketing, since banners in web style, till advertisements in maps, videos or audio, advertisements attached to SMS or MMS. The same report
makes previsions about astronomic growth in the area, “more than double in the next 2 years and an increase of 12 times in 2015 reaching $20.6 billion around the world“. Some vendors from this technology cited are: Apple; Google; Greystripe; Jumptap; Microsoft; Millennial Media; Velti; Yahoo.
To exemplify, we can select the success business case from Velti, called BabyCenter, which “analyses each pregnant woman that is member from the site to offer the best advice or information about products relevant to her”. One of the products of this company, mGageTM Measure, it provides a series of performance reports for the campaign (tendency graphs), operator, model and screen size from mobile devices that accessed the advertisement”.
Figure 1: Priority Matrix for Wireless Devices, Softwares and Services (Gartner, August 2011)
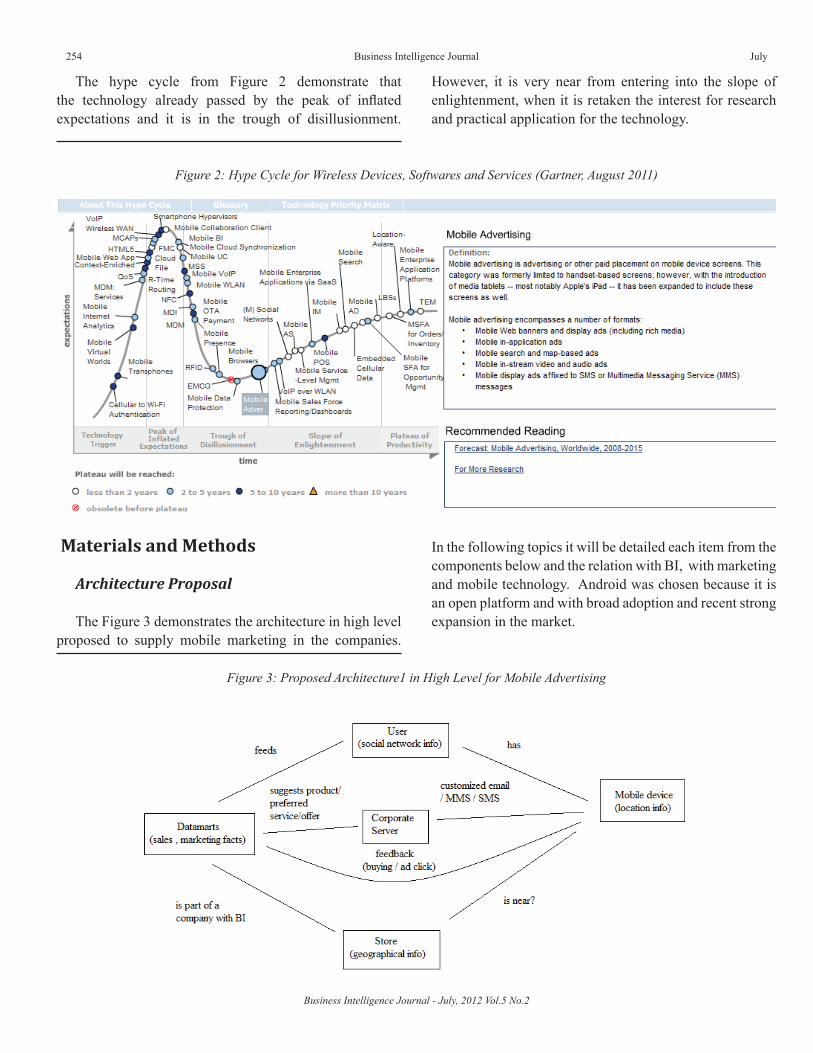
Business Intelligence Journal - July, 2012 Vol.5 No.2
254 Business Intelligence Journal July
The hype cycle from Figure 2 demonstrate that the technology already passed by the peak of inflated expectations and it is in the trough of disillusionment.
However, it is very near from entering into the slope of enlightenment, when it is retaken the interest for research and practical application for the technology.
Figure 2: Hype Cycle for Wireless Devices, Softwares and Services (Gartner, August 2011)
Materials and Methods
Architecture Proposal
The Figure 3 demonstrates the architecture in high level proposed to supply mobile marketing in the companies.
In the following topics it will be detailed each item from the components below and the relation with BI, with marketing and mobile technology. Android was chosen because it is an open platform and with broad adoption and recent strong expansion in the market.
Figure 3: Proposed Architecture1 in High Level for Mobile Advertising
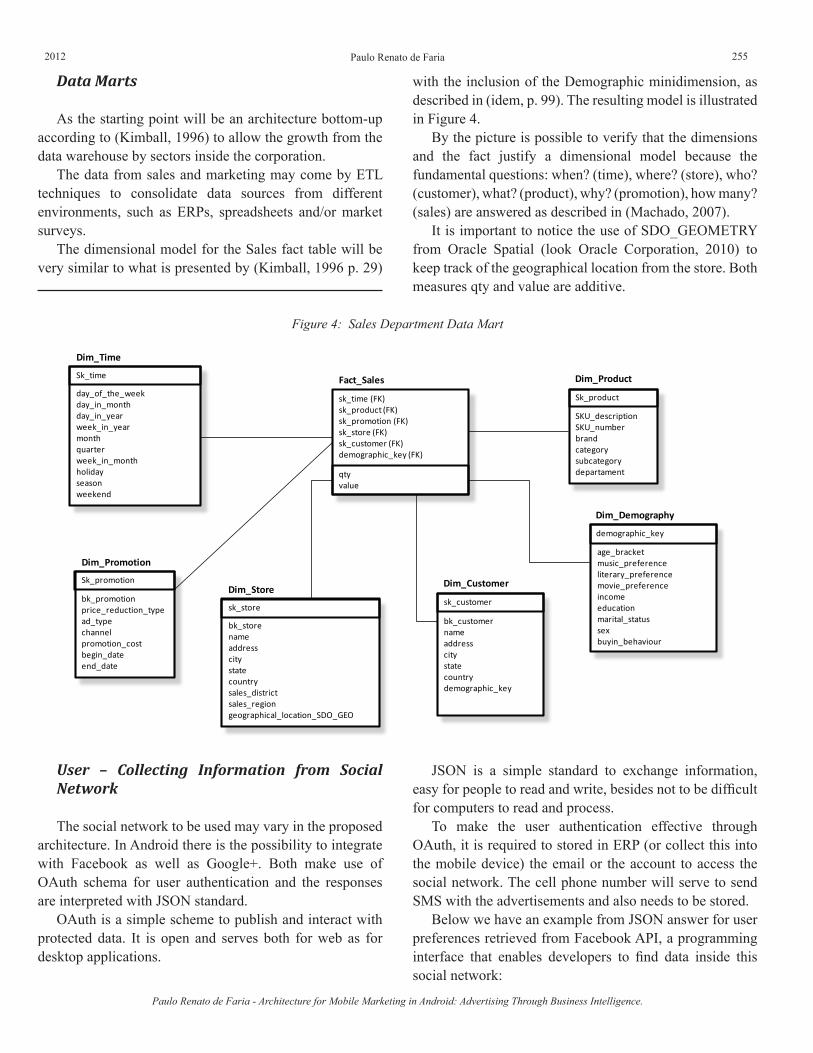
2012 255
Data Marts
As the starting point will be an architecture bottom-up according to (Kimball, 1996) to allow the growth from the data warehouse by sectors inside the corporation.
The data from sales and marketing may come by ETL techniques to consolidate data sources from different environments, such as ERPs, spreadsheets and/or market surveys.
The dimensional model for the Sales fact table will be very similar to what is presented by (Kimball, 1996 p. 29)
with the inclusion of the Demographic minidimension, as described in (idem, p. 99). The resulting model is illustrated in Figure 4.
By the picture is possible to verify that the dimensions and the fact justify a dimensional model because the fundamental questions: when? (time), where? (store), who? (customer), what? (product), why? (promotion), how many? (sales) are answered as described in (Machado, 2007).
It is important to notice the use of SDO_GEOMETRY from Oracle Spatial (look Oracle Corporation, 2010) to keep track of the geographical location from the store. Both measures qty and value are additive.
Figure 4: Sales Department Data Mart
User – Collecting Information from Social Network
The social network to be used may vary in the proposed architecture. In Android there is the possibility to integrate with Facebook as well as Google+. Both make use of OAuth schema for user authentication and the responses are interpreted with JSON standard.
OAuth is a simple scheme to publish and interact with protected data. It is open and serves both for web as for desktop applications.
JSON is a simple standard to exchange information, easy for people to read and write, besides not to be difficult for computers to read and process.
To make the user authentication effective through OAuth, it is required to stored in ERP (or collect this into the mobile device) the email or the account to access the social network. The cell phone number will serve to send SMS with the advertisements and also needs to be stored.
Below we have an example from JSON answer for user preferences retrieved from Facebook API, a programming interface that enables developers to find data inside this social network:
Sk_time
day_of_the_weekday_in_monthday_in_yearweek_in_yearmonthquarterweek_in_monthholidayseasonweekend
Dim_Time
sk_time (FK)sk_product (FK)sk_promotion (FK)sk_store (FK)sk_customer (FK)demographic_key (FK)
qtyvalue
Fact_Sales
Sk_product
SKU_descriptionSKU_numberbrandcategorysubcategorydepartament
Dim_Product
Sk_promotion
bk_promotionprice_reduction_typead_typechannelpromotion_costbegin_dateend_date
Dim_Promotion
sk_store
bk_storenameaddresscitystatecountrysales_districtsales_regiongeographical_location_SDO_GEO
Dim_Storesk_customer
bk_customernameaddresscitystatecountrydemographic_key
Dim_Customer
demographic_key
age_bracketmusic_preferenceliterary_preferencemovie_preferenceincomeeducationmarital_statussexbuyin_behaviour
Dim_Demography
Paulo Renato de Faria - Architecture for Mobile Marketing in Android: Advertising Through Business Intelligence.
Paulo Renato de Faria
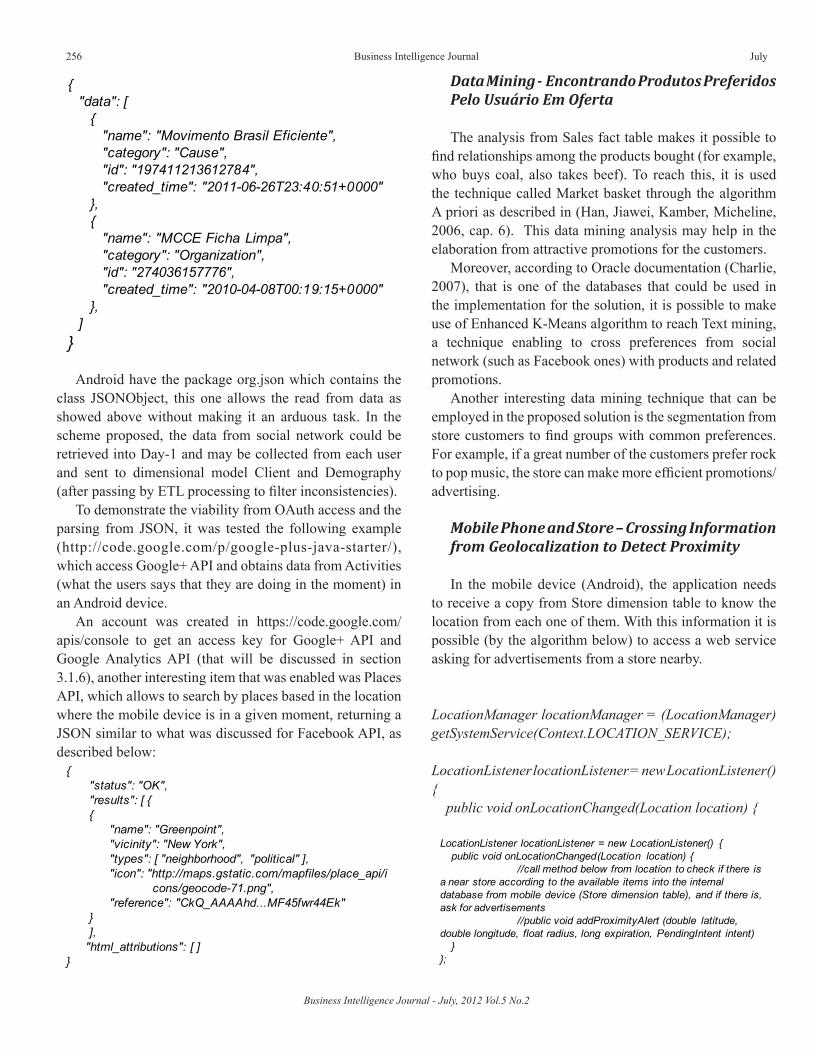
Business Intelligence Journal - July, 2012 Vol.5 No.2
256 Business Intelligence Journal July
{"data": [
{"name": "Movimento Brasil Eficiente","category": "Cause","id": "197411213612784","created_time": "2011-06-26T23:40:51+0000"
},{
"name": "MCCE Ficha Limpa","category": "Organization","id": "274036157776","created_time": "2010-04-08T00:19:15+0000"
},]
}
Android have the package org.json which contains the class JSONObject, this one allows the read from data as showed above without making it an arduous task. In the scheme proposed, the data from social network could be retrieved into Day-1 and may be collected from each user and sent to dimensional model Client and Demography (after passing by ETL processing to filter inconsistencies).
To demonstrate the viability from OAuth access and the parsing from JSON, it was tested the following example (http://code.google.com/p/google-plus-java-starter/), which access Google+ API and obtains data from Activities (what the users says that they are doing in the moment) in an Android device.
An account was created in https://code.google.com/apis/console to get an access key for Google+ API and Google Analytics API (that will be discussed in section 3.1.6), another interesting item that was enabled was Places API, which allows to search by places based in the location where the mobile device is in a given moment, returning a JSON similar to what was discussed for Facebook API, as described below:
{"status": "OK","results": [ {{
"name": "Greenpoint","vicinity": "New York","types": [ "neighborhood", "political" ],"icon": "http://maps.gstatic.com/mapfiles/place_api/i
cons/geocode-71.png","reference": "CkQ_AAAAhd...MF45fwr44Ek"
}],
"html_attributions": [ ]}
Data Mining - Encontrando Produtos Preferidos Pelo Usuário Em Oferta
The analysis from Sales fact table makes it possible to find relationships among the products bought (for example, who buys coal, also takes beef). To reach this, it is used the technique called Market basket through the algorithm A priori as described in (Han, Jiawei, Kamber, Micheline, 2006, cap. 6). This data mining analysis may help in the elaboration from attractive promotions for the customers.
Moreover, according to Oracle documentation (Charlie, 2007), that is one of the databases that could be used in the implementation for the solution, it is possible to make use of Enhanced K-Means algorithm to reach Text mining, a technique enabling to cross preferences from social network (such as Facebook ones) with products and related promotions.
Another interesting data mining technique that can be employed in the proposed solution is the segmentation from store customers to find groups with common preferences. For example, if a great number of the customers prefer rock to pop music, the store can make more efficient promotions/advertising.
Mobile Phone and Store – Crossing Information from Geolocalization to Detect Proximity
In the mobile device (Android), the application needs to receive a copy from Store dimension table to know the location from each one of them. With this information it is possible (by the algorithm below) to access a web service asking for advertisements from a store nearby.
LocationManager locationManager = (LocationManager) getSystemService(Context.LOCATION_SERVICE);
LocationListener locationListener = new LocationListener() { public void onLocationChanged(Location location) {
LocationListener locationListener = new LocationListener() {public void onLocationChanged(Location location) {
//call method below from location to check if there is a near store according to the available items into the internal database from mobile device (Store dimension table), and if there is, ask for advertisements
//public void addProximityAlert (double latitude, double longitude, float radius, long expiration, PendingIntent intent)
}};
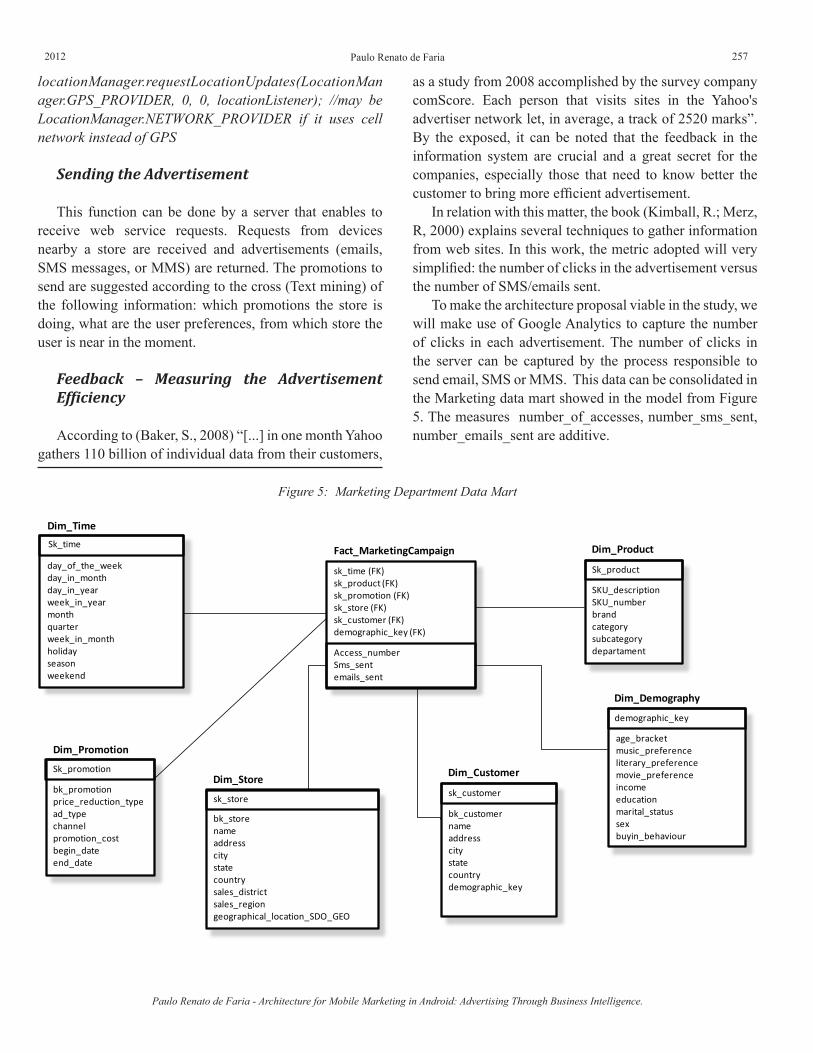
2012 257
locationManager.requestLocationUpdates(LocationManager.GPS_PROVIDER, 0, 0, locationListener); //may be LocationManager.NETWORK_PROVIDER if it uses cell network instead of GPS
Sending the Advertisement
This function can be done by a server that enables to receive web service requests. Requests from devices nearby a store are received and advertisements (emails, SMS messages, or MMS) are returned. The promotions to send are suggested according to the cross (Text mining) of the following information: which promotions the store is doing, what are the user preferences, from which store the user is near in the moment.
Feedback – Measuring the Advertisement Efficiency
According to (Baker, S., 2008) “[...] in one month Yahoo gathers 110 billion of individual data from their customers,
as a study from 2008 accomplished by the survey company comScore. Each person that visits sites in the Yahoo's advertiser network let, in average, a track of 2520 marks”. By the exposed, it can be noted that the feedback in the information system are crucial and a great secret for the companies, especially those that need to know better the customer to bring more efficient advertisement.
In relation with this matter, the book (Kimball, R.; Merz, R, 2000) explains several techniques to gather information from web sites. In this work, the metric adopted will very simplified: the number of clicks in the advertisement versus the number of SMS/emails sent.
To make the architecture proposal viable in the study, we will make use of Google Analytics to capture the number of clicks in each advertisement. The number of clicks in the server can be captured by the process responsible to send email, SMS or MMS. This data can be consolidated in the Marketing data mart showed in the model from Figure 5. The measures number_of_accesses, number_sms_sent, number_emails_sent are additive.
Figure 5: Marketing Department Data Mart
Sk_time
day_of_the_weekday_in_monthday_in_yearweek_in_yearmonthquarterweek_in_monthholidayseasonweekend
Dim_Time
sk_time (FK)sk_product (FK)sk_promotion (FK)sk_store (FK)sk_customer (FK)demographic_key (FK)
Access_numberSms_sentemails_sent
Fact_MarketingCampaign
Sk_product
SKU_descriptionSKU_numberbrandcategorysubcategorydepartament
Dim_Product
Sk_promotion
bk_promotionprice_reduction_typead_typechannelpromotion_costbegin_dateend_date
Dim_Promotion
sk_store
bk_storenameaddresscitystatecountrysales_districtsales_regiongeographical_location_SDO_GEO
Dim_Storesk_customer
bk_customernameaddresscitystatecountrydemographic_key
Dim_Customer
demographic_key
age_bracketmusic_preferenceliterary_preferencemovie_preferenceincomeeducationmarital_statussexbuyin_behaviour
Dim_Demography
Paulo Renato de Faria - Architecture for Mobile Marketing in Android: Advertising Through Business Intelligence.
Paulo Renato de Faria
Business Intelligence Journal - July, 2012 Vol.5 No.2
258 Business Intelligence Journal July
Analysing the results from advertisement
The Promotion dimension from Figure 5 is called causal because it describes factors that cause changes in the product sales. Some important factors that is worthwhile to analyse (Kimball, 1996, p. 41):a. Lift: if products in promotion experienced gains in sales
during the promotional period. To measure is necessary to establish for the store a pattern (baseline) for the sales, something that can be estimated by the sales historic from previous periods (preferably in moments when there was not any promotion).
b. Time shifting: if the products in promotion suffered a reduction in sales after finished the promotion, thus, cancelling the effects during the promotional period.
c. Cannibalization: if the products showed increase in sales, but other similar products had decrease in sales.
d. Growing the market: if all products in a given category experienced a gain in sales taking into account the periods before, during and after promotion.
With these concepts above it is possible to measure if the promotion was profitable. Normally, the metric used is the rise in the profit of a category in promotion in relationship with the sales baseline, considering time shifting, cannibalization, besides the promotion cost (price reduction, advertisements, IT costs, displays e coupons).
Conclusions
Based in the mobile marketing architecture proposed in Figure 3 and the explanation of the main components, it was possible to demonstrate the solution viability. First, because the Android devices can get information from social networks (through OAuth authentication and JSON parsing), as well as they can gather and cross information from geographical location between the store and the customer (by GPS or cell phone radio stations). Secondly, because dimensional models from sales and marketing data marts can be consolidated through ETL using data sources normally found in the company: ERPs and spreadsheets. Thirdly, due to data mining make it possible to find hidden patterns between sales and social networks information, being a selection filter for advertisements more likely to be consumed. Least but not less important, the feedback which comes from what the customers buy or the simple click in the advertisement allow the administrator to monitor promotional campaigns , verifying if the custom content really increase store sale.
Besides, according to the research, no matter if theoretical or empirical from the companies currently in the market (Velti, Greystripe; Jumptap; Millennial Media) demonstrate that the proposed model fulfils the main requirements from announcers, TI company that manages the advertisements, as well as the customers: 1) allow custom advertisement when they have greater potential to be consumed, 2) accomplish the collection of results to analyse the efficiency of the promotion.
Future Work
As the next work, it would be extremely interesting to implement the proposed architecture, to deploy and collect performance data, customer satisfaction level with the advertisement received and the changes in sales in real companies.
Limitations
Several aspects were not taken into consideration, such as:• inclusion of measures in marketing data mart to capture
the number of advertisements user liked or not to receive (satisfaction level)
• user data security• discussion about users' right not to disclosure their data
into social network• mobile phone application settings to configure
advertisement reception (SMS/email/MMS) for specified hours or types of stores (for example, receive promotions from restaurants only from 11:00 am till 12:00)
• analyse hardware requirements• analyse resources such as parallelism, redundancy and
fault tolerance• Theory recommends the use of filtered, transformed
and consolidated data. It was noticed that this becomes crucial when analyzing data typed by user without any validation (like the fields into social networks). Finding patterns inside these semi-structured data is on the toughest challenges for BI solutions and current data mining techniques, something that was not deeply explored in the article.
Acknowledgements
Google+ API still does not offer so many resources to collect user data as Facebook API does, such as customer
2012 259
preferences; it brings only simple data (marriage status, birthday, and sex). We hope that over the time Google+ API grows, but it is necessary to point that its use is not so interesting in the proposed architecture.
Recommendations
It was not found companies in Brazil which created dedicated frameworks for mobile advertising, emphasising data gathering from social networks, and passing by the suggestion from product using data mining and feedback to collect advertisement indicators.
Hence, the national scientific community may contribute with advances in data mining dedicated to the mobile marketing subject.
For the advertisement Brazilian companies it is possible to identify the opening of a new market niche still to be explored. For companies in other areas, there is a huge potential as a new advertisement channel in extraordinary expansion.
For the IT and marketing professionals mobile advertisement is a new challenging branch that will require education both in business as technical skills.
From educational perspective, it is relevant to point that there are not many available courses related to the theme, despite the quick expansion and the great market share that the area will reach in the next 5 years.
References
Baker, Stephen. The numerati. Houghton Mifflin Company. 2008.
Charlie, Berger. White Paper Oracle Data Mining , Jul 2007
Abbey, M.; Corey, M.; Taub, B. Oracle 8i Datawarehouse. Oracle, 2001.
Han, Jiawei, Kamber, Micheline. Data Mining: Concepts and Techniques. Elsevier, 2006
Kimball, R.; Merz, R. Data Webhouse : Construindo o data warehouse para a web. Rio de Janeiro: Campus, 2000
Kimball, Ralph. The data warehouse toolkit John Wiley & Sons, Inc. USA, 1996.
Kotler, Philip, 2007. Available in http://www.cbm.rn.gov.br/contentproducao/aplicacao/sesed_cbm/arquivos/artigos/artigo%20de%20management%20-%20marketing.pdf , accessed in: 3 Out 2011
Machado, Felipe Nery Rodrigues. Tecnologia e Projeto de Data Warehouse: uma visão multidimensional. Ed. Érica, 2007.
Oracle Corporation, Empowering Applications with Spatial Analysis and Mining, October 2010
Serra, Laércio. A essência do Business Intelligence. São Paulo: Berkeley Brazil, 2002
Available in: http://www.anatel.gov.br , accessed in Sept 23rd 2011
Available in: http://www.oracle.com/technetwork/database/enterprise-edition/odm-techniques-algorithms-097163.html, accessed in Sept 30th 2011
Available in: http://developers.facebook.com/docs/reference/api/ , accessed in Oct 2nd 2011
Available in: http://www.velti.com , accessed in Oct 3rd 2011
Available in: http://developer.android.com , accessed in Oct 3rd 2011
Available in: http://www.gartner.com , accessed in Oct 3rd 2011
Available in: https://developers.google.com/+/api/ , accessed in Oct 6th 2011
Available in: http://code.google.com/p/google-plus-java-starter/ , accessed in Oct 6th 2011
Available in: https://code.google.com/apis/console , accessed in Oct 6th 2011
Paulo Renato de Faria - Architecture for Mobile Marketing in Android: Advertising Through Business Intelligence.
Paulo Renato de Faria
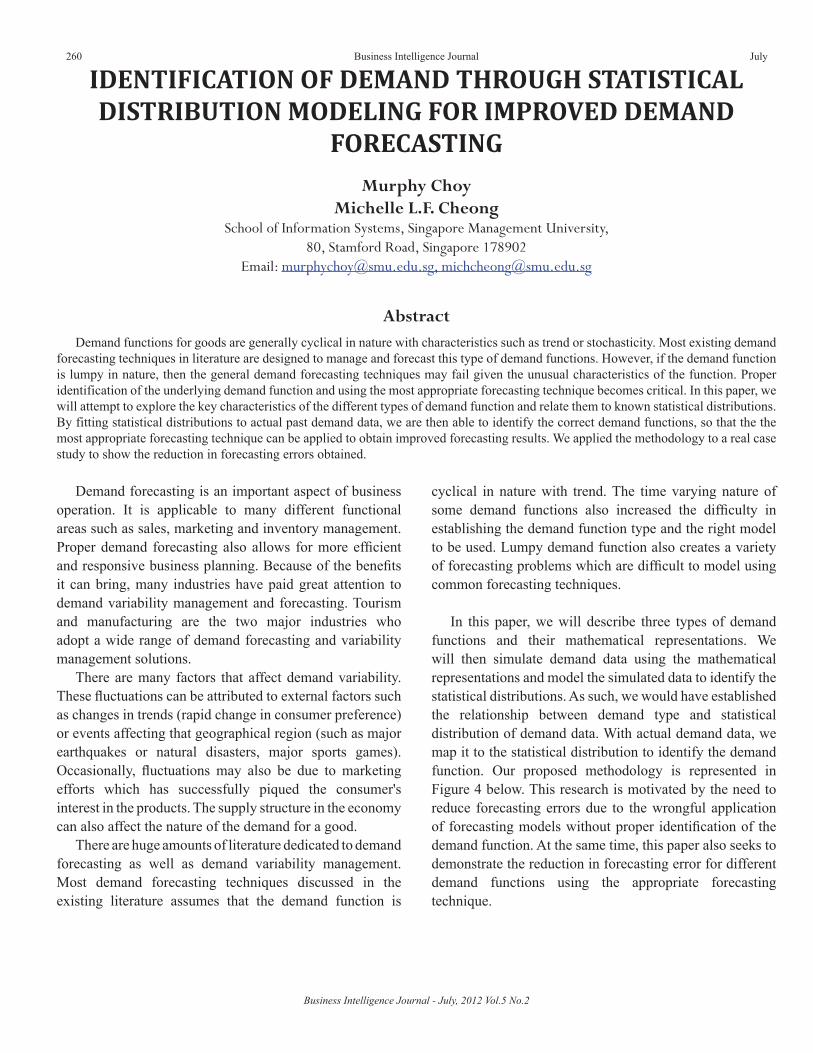
Business Intelligence Journal - July, 2012 Vol.5 No.2
260 Business Intelligence Journal July
IDENTIFICATION OF DEMAND THROUGH STATISTICAL DISTRIBUTION MODELING FOR IMPROVED DEMAND
FORECASTING
Murphy ChoyMichelle L.F. Cheong
School of Information Systems, Singapore Management University,80, Stamford Road, Singapore 178902
Email: [email protected], [email protected]
AbstractDemand functions for goods are generally cyclical in nature with characteristics such as trend or stochasticity. Most existing demand
forecasting techniques in literature are designed to manage and forecast this type of demand functions. However, if the demand function is lumpy in nature, then the general demand forecasting techniques may fail given the unusual characteristics of the function. Proper identification of the underlying demand function and using the most appropriate forecasting technique becomes critical. In this paper, we will attempt to explore the key characteristics of the different types of demand function and relate them to known statistical distributions. By fitting statistical distributions to actual past demand data, we are then able to identify the correct demand functions, so that the the most appropriate forecasting technique can be applied to obtain improved forecasting results. We applied the methodology to a real case study to show the reduction in forecasting errors obtained.
Demand forecasting is an important aspect of business operation. It is applicable to many different functional areas such as sales, marketing and inventory management. Proper demand forecasting also allows for more efficient and responsive business planning. Because of the benefits it can bring, many industries have paid great attention to demand variability management and forecasting. Tourism and manufacturing are the two major industries who adopt a wide range of demand forecasting and variability management solutions.
There are many factors that affect demand variability. These fluctuations can be attributed to external factors such as changes in trends (rapid change in consumer preference) or events affecting that geographical region (such as major earthquakes or natural disasters, major sports games). Occasionally, fluctuations may also be due to marketing efforts which has successfully piqued the consumer's interest in the products. The supply structure in the economy can also affect the nature of the demand for a good.
There are huge amounts of literature dedicated to demand forecasting as well as demand variability management. Most demand forecasting techniques discussed in the existing literature assumes that the demand function is
cyclical in nature with trend. The time varying nature of some demand functions also increased the difficulty in establishing the demand function type and the right model to be used. Lumpy demand function also creates a variety of forecasting problems which are difficult to model using common forecasting techniques.
In this paper, we will describe three types of demand functions and their mathematical representations. We will then simulate demand data using the mathematical representations and model the simulated data to identify the statistical distributions. As such, we would have established the relationship between demand type and statistical distribution of demand data. With actual demand data, we map it to the statistical distribution to identify the demand function. Our proposed methodology is represented in Figure 4 below. This research is motivated by the need to reduce forecasting errors due to the wrongful application of forecasting models without proper identification of the demand function. At the same time, this paper also seeks to demonstrate the reduction in forecasting error for different demand functions using the appropriate forecasting technique.
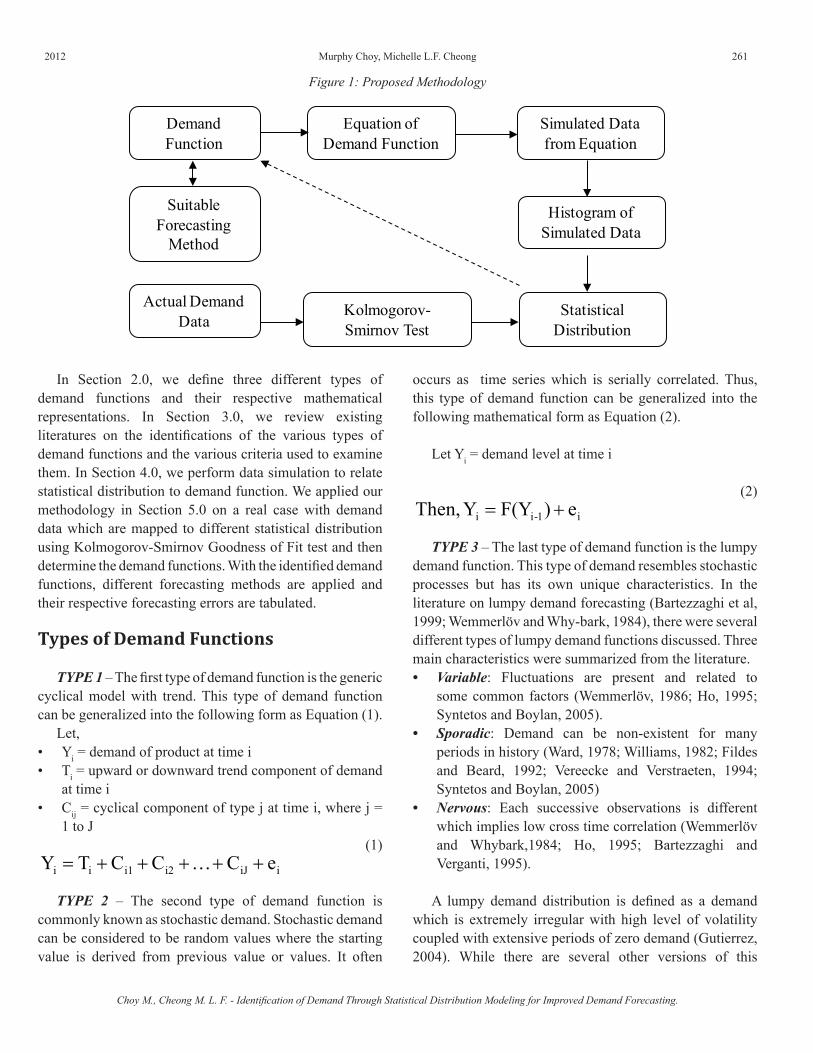
2012 261
Choy M., Cheong M. L. F. - Identification of Demand Through Statistical Distribution Modeling for Improved Demand Forecasting.
Murphy Choy, Michelle L.F. Cheong
Figure 1: Proposed Methodology
Demand Function
Equation of Demand Function
Simulated Data from Equation
Histogram of Simulated Data
Statistical Distribution
Actual Demand Data
Kolmogorov-Smirnov Test
Suitable Forecasting
Method
In Section 2.0, we define three different types of demand functions and their respective mathematical representations. In Section 3.0, we review existing literatures on the identifications of the various types of demand functions and the various criteria used to examine them. In Section 4.0, we perform data simulation to relate statistical distribution to demand function. We applied our methodology in Section 5.0 on a real case with demand data which are mapped to different statistical distribution using Kolmogorov-Smirnov Goodness of Fit test and then determine the demand functions. With the identified demand functions, different forecasting methods are applied and their respective forecasting errors are tabulated.
Types of Demand Functions
TYPE 1 – The first type of demand function is the generic cyclical model with trend. This type of demand function can be generalized into the following form as Equation (1).
Let,• Yi = demand of product at time i• Ti = upward or downward trend component of demand
at time i• Cij = cyclical component of type j at time i, where j =
1 to J
iiJi2i1ii eCCCTY +++++= (1)
TYPE 2 – The second type of demand function is commonly known as stochastic demand. Stochastic demand can be considered to be random values where the starting value is derived from previous value or values. It often
occurs as time series which is serially correlated. Thus, this type of demand function can be generalized into the following mathematical form as Equation (2).
Let Yi = demand level at time i
i1-ii e)F(YYThen, +=(2)
TYPE 3 – The last type of demand function is the lumpy demand function. This type of demand resembles stochastic processes but has its own unique characteristics. In the literature on lumpy demand forecasting (Bartezzaghi et al, 1999; Wemmerlöv and Why-bark, 1984), there were several different types of lumpy demand functions discussed. Three main characteristics were summarized from the literature.• Variable: Fluctuations are present and related to
some common factors (Wemmerlöv, 1986; Ho, 1995; Syntetos and Boylan, 2005).
• Sporadic: Demand can be non-existent for many periods in history (Ward, 1978; Williams, 1982; Fildes and Beard, 1992; Vereecke and Verstraeten, 1994; Syntetos and Boylan, 2005)
• Nervous: Each successive observations is different which implies low cross time correlation (Wemmerlöv and Whybark,1984; Ho, 1995; Bartezzaghi and Verganti, 1995).
A lumpy demand distribution is defined as a demand which is extremely irregular with high level of volatility coupled with extensive periods of zero demand (Gutierrez, 2004). While there are several other versions of this
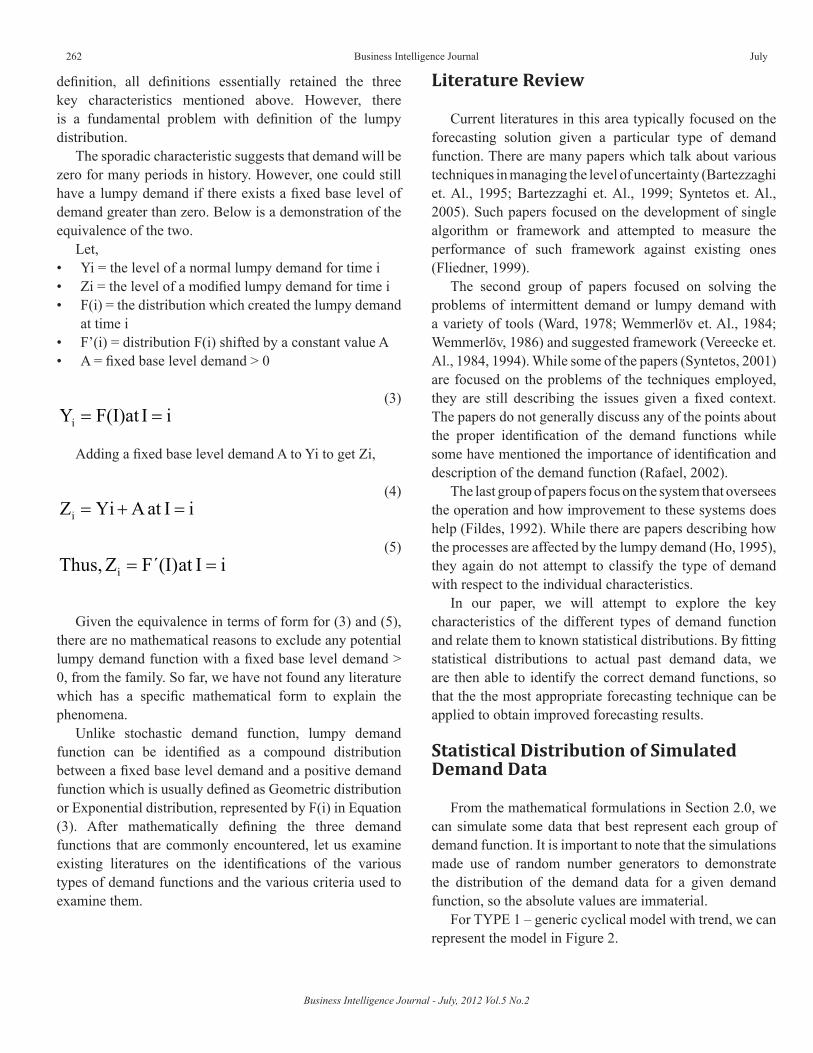
Business Intelligence Journal - July, 2012 Vol.5 No.2
262 Business Intelligence Journal July
definition, all definitions essentially retained the three key characteristics mentioned above. However, there is a fundamental problem with definition of the lumpy distribution.
The sporadic characteristic suggests that demand will be zero for many periods in history. However, one could still have a lumpy demand if there exists a fixed base level of demand greater than zero. Below is a demonstration of the equivalence of the two.
Let,• Yi = the level of a normal lumpy demand for time i• Zi = the level of a modified lumpy demand for time i• F(i) = the distribution which created the lumpy demand
at time i• F’(i) = distribution F(i) shifted by a constant value A• A = fixed base level demand > 0
(3)iIF(I)atYi ==
Adding a fixed base level demand A to Yi to get Zi,
iIatAYiZi =+=(4)
(5)iIatF´(I)ZThus, i ==
Given the equivalence in terms of form for (3) and (5), there are no mathematical reasons to exclude any potential lumpy demand function with a fixed base level demand > 0, from the family. So far, we have not found any literature which has a specific mathematical form to explain the phenomena.
Unlike stochastic demand function, lumpy demand function can be identified as a compound distribution between a fixed base level demand and a positive demand function which is usually defined as Geometric distribution or Exponential distribution, represented by F(i) in Equation (3). After mathematically defining the three demand functions that are commonly encountered, let us examine existing literatures on the identifications of the various types of demand functions and the various criteria used to examine them.
Literature Review
Current literatures in this area typically focused on the forecasting solution given a particular type of demand function. There are many papers which talk about various techniques in managing the level of uncertainty (Bartezzaghi et. Al., 1995; Bartezzaghi et. Al., 1999; Syntetos et. Al., 2005). Such papers focused on the development of single algorithm or framework and attempted to measure the performance of such framework against existing ones (Fliedner, 1999).
The second group of papers focused on solving the problems of intermittent demand or lumpy demand with a variety of tools (Ward, 1978; Wemmerlöv et. Al., 1984; Wemmerlöv, 1986) and suggested framework (Vereecke et. Al., 1984, 1994). While some of the papers (Syntetos, 2001) are focused on the problems of the techniques employed, they are still describing the issues given a fixed context. The papers do not generally discuss any of the points about the proper identification of the demand functions while some have mentioned the importance of identification and description of the demand function (Rafael, 2002).
The last group of papers focus on the system that oversees the operation and how improvement to these systems does help (Fildes, 1992). While there are papers describing how the processes are affected by the lumpy demand (Ho, 1995), they again do not attempt to classify the type of demand with respect to the individual characteristics.
In our paper, we will attempt to explore the key characteristics of the different types of demand function and relate them to known statistical distributions. By fitting statistical distributions to actual past demand data, we are then able to identify the correct demand functions, so that the the most appropriate forecasting technique can be applied to obtain improved forecasting results.
Statistical Distribution of Simulated Demand Data
From the mathematical formulations in Section 2.0, we can simulate some data that best represent each group of demand function. It is important to note that the simulations made use of random number generators to demonstrate the distribution of the demand data for a given demand function, so the absolute values are immaterial.
For TYPE 1 – generic cyclical model with trend, we can represent the model in Figure 2.
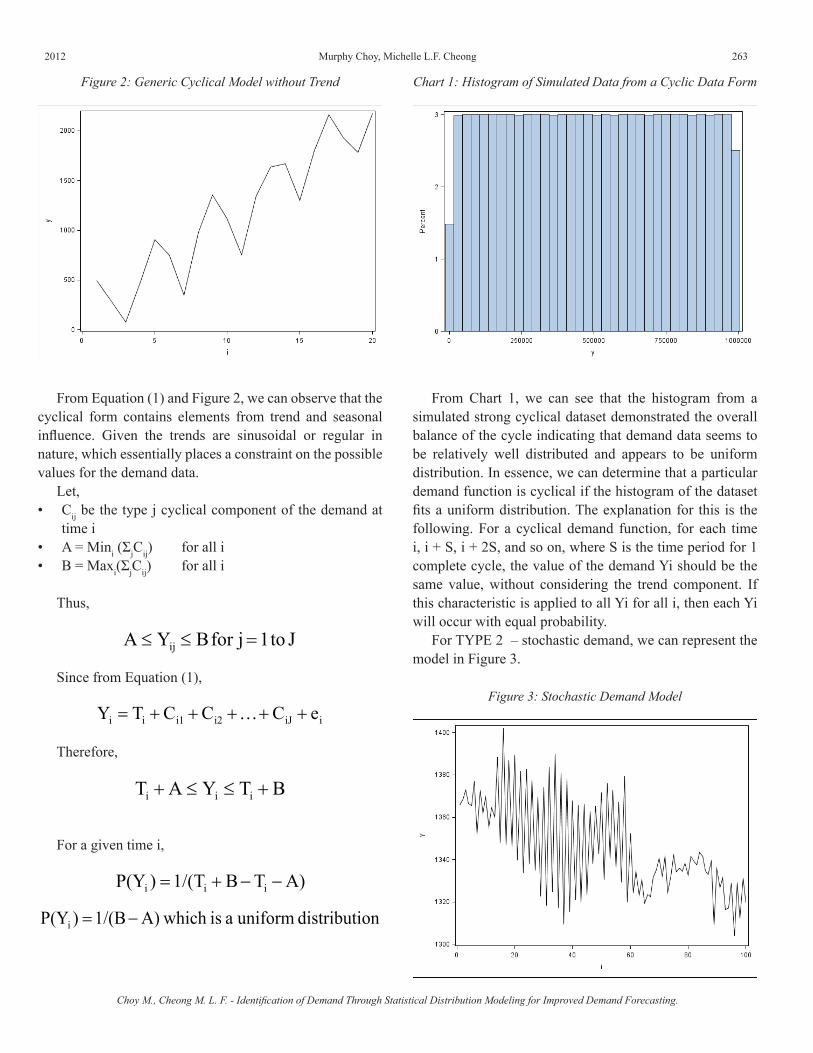
2012 263
Figure 2: Generic Cyclical Model without Trend
From Equation (1) and Figure 2, we can observe that the cyclical form contains elements from trend and seasonal influence. Given the trends are sinusoidal or regular in nature, which essentially places a constraint on the possible values for the demand data.
Let,• Cij be the type j cyclical component of the demand at
time i• A = Mini (ΣjCij) for all i• B = Maxi(ΣjCij) for all i
Thus,
Jto1jforBYA ij =≤≤
Since from Equation (1),
iiJi2i1ii eCCCTY +++++=
Therefore,
BTYAT iii +≤≤+
For a given time i,
A)TB1/(T)P(Y iii −−+=
Chart 1: Histogram of Simulated Data from a Cyclic Data Form
From Chart 1, we can see that the histogram from a simulated strong cyclical dataset demonstrated the overall balance of the cycle indicating that demand data seems to be relatively well distributed and appears to be uniform distribution. In essence, we can determine that a particular demand function is cyclical if the histogram of the dataset fits a uniform distribution. The explanation for this is the following. For a cyclical demand function, for each time i, i + S, i + 2S, and so on, where S is the time period for 1 complete cycle, the value of the demand Yi should be the same value, without considering the trend component. If this characteristic is applied to all Yi for all i, then each Yi will occur with equal probability.
For TYPE 2 – stochastic demand, we can represent the model in Figure 3.
ondistributi uniform a is which A)1/(B)P(Yi −=
Figure 3: Stochastic Demand Model
Choy M., Cheong M. L. F. - Identification of Demand Through Statistical Distribution Modeling for Improved Demand Forecasting.
Murphy Choy, Michelle L.F. Cheong
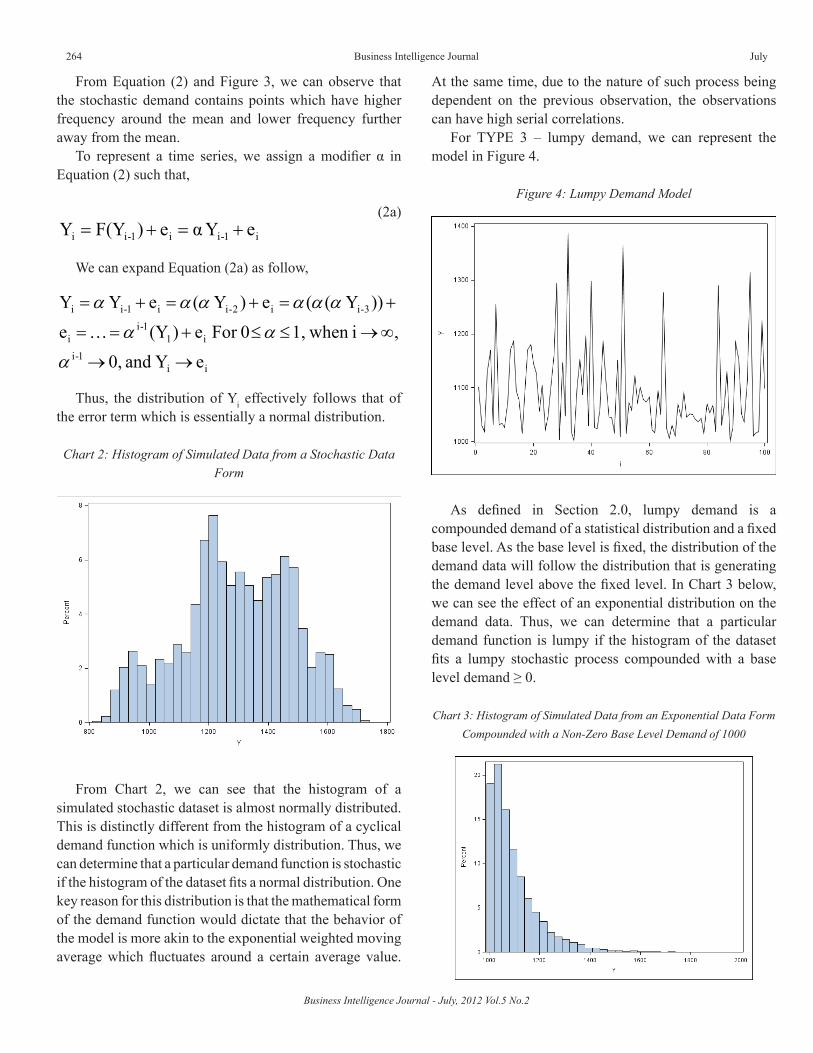
Business Intelligence Journal - July, 2012 Vol.5 No.2
264 Business Intelligence Journal July
From Equation (2) and Figure 3, we can observe that the stochastic demand contains points which have higher frequency around the mean and lower frequency further away from the mean.
To represent a time series, we assign a modifier α in Equation (2) such that,
i1-ii1-ii eYαe)F(YY +=+=(2a)
We can expand Equation (2a) as follow,
ii1-i
i11-i
i
3-ii2-ii1-ii
e Y and 0,
, i when 1, 0For e)(Ye
))Y((e)Y(eYY
→→
∞→≤≤+==
+=+=+=
α
αα
αααααα
Thus, the distribution of Yi effectively follows that of the error term which is essentially a normal distribution.
Chart 2: Histogram of Simulated Data from a Stochastic Data Form
From Chart 2, we can see that the histogram of a simulated stochastic dataset is almost normally distributed. This is distinctly different from the histogram of a cyclical demand function which is uniformly distribution. Thus, we can determine that a particular demand function is stochastic if the histogram of the dataset fits a normal distribution. One key reason for this distribution is that the mathematical form of the demand function would dictate that the behavior of the model is more akin to the exponential weighted moving average which fluctuates around a certain average value.
At the same time, due to the nature of such process being dependent on the previous observation, the observations can have high serial correlations.
For TYPE 3 – lumpy demand, we can represent the model in Figure 4.
Figure 4: Lumpy Demand Model
As defined in Section 2.0, lumpy demand is a compounded demand of a statistical distribution and a fixed base level. As the base level is fixed, the distribution of the demand data will follow the distribution that is generating the demand level above the fixed level. In Chart 3 below, we can see the effect of an exponential distribution on the demand data. Thus, we can determine that a particular demand function is lumpy if the histogram of the dataset fits a lumpy stochastic process compounded with a base level demand ≥ 0.
Chart 3: Histogram of Simulated Data from an Exponential Data Form Compounded with a Non-Zero Base Level Demand of 1000
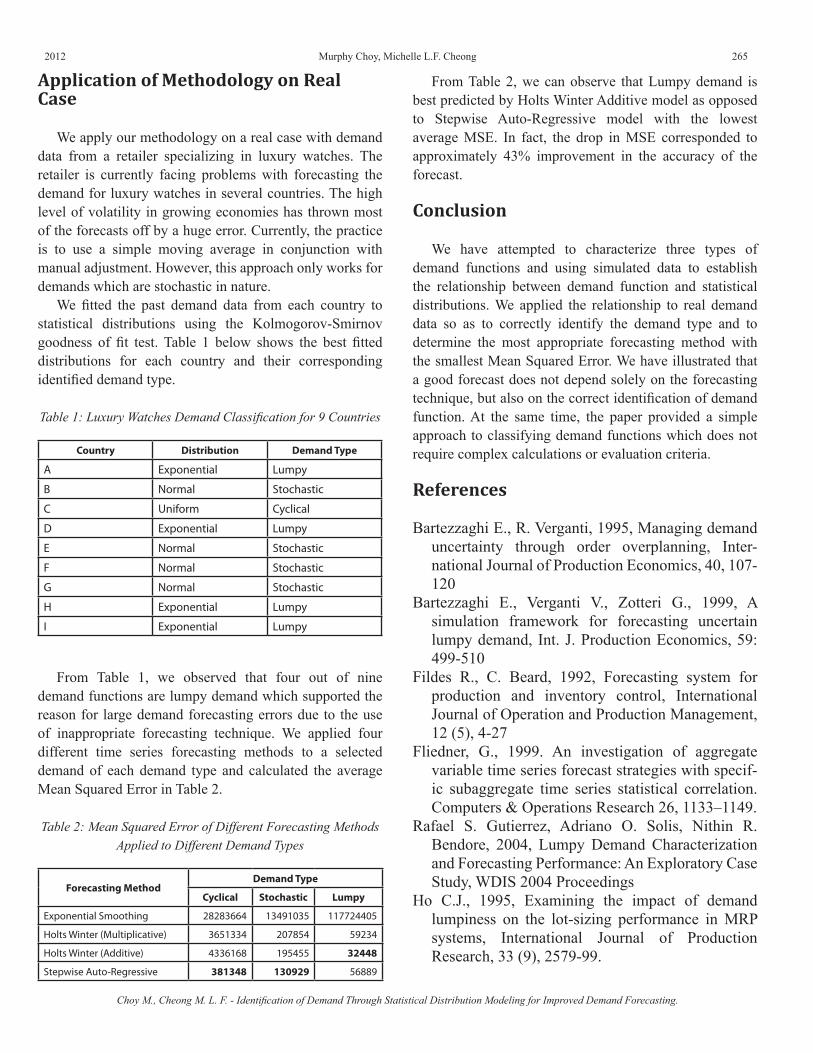
2012 265
Application of Methodology on Real Case
We apply our methodology on a real case with demand data from a retailer specializing in luxury watches. The retailer is currently facing problems with forecasting the demand for luxury watches in several countries. The high level of volatility in growing economies has thrown most of the forecasts off by a huge error. Currently, the practice is to use a simple moving average in conjunction with manual adjustment. However, this approach only works for demands which are stochastic in nature.
We fitted the past demand data from each country to statistical distributions using the Kolmogorov-Smirnov goodness of fit test. Table 1 below shows the best fitted distributions for each country and their corresponding identified demand type.
Table 1: Luxury Watches Demand Classification for 9 Countries
Country Distribution Demand Type
A Exponential Lumpy
B Normal Stochastic
C Uniform Cyclical
D Exponential Lumpy
E Normal Stochastic
F Normal Stochastic
G Normal Stochastic
H Exponential Lumpy
I Exponential Lumpy
From Table 1, we observed that four out of nine demand functions are lumpy demand which supported the reason for large demand forecasting errors due to the use of inappropriate forecasting technique. We applied four different time series forecasting methods to a selected demand of each demand type and calculated the average Mean Squared Error in Table 2.
Forecasting MethodDemand Type
Cyclical Stochastic Lumpy
Exponential Smoothing 28283664 13491035 117724405
Holts Winter (Multiplicative) 3651334 207854 59234
Holts Winter (Additive) 4336168 195455 32448
Stepwise Auto-Regressive 381348 130929 56889
Table 2: Mean Squared Error of Different Forecasting Methods Applied to Different Demand Types
From Table 2, we can observe that Lumpy demand is best predicted by Holts Winter Additive model as opposed to Stepwise Auto-Regressive model with the lowest average MSE. In fact, the drop in MSE corresponded to approximately 43% improvement in the accuracy of the forecast.
Conclusion
We have attempted to characterize three types of demand functions and using simulated data to establish the relationship between demand function and statistical distributions. We applied the relationship to real demand data so as to correctly identify the demand type and to determine the most appropriate forecasting method with the smallest Mean Squared Error. We have illustrated that a good forecast does not depend solely on the forecasting technique, but also on the correct identification of demand function. At the same time, the paper provided a simple approach to classifying demand functions which does not require complex calculations or evaluation criteria.
References
Bartezzaghi E., R. Verganti, 1995, Managing demand uncertainty through order overplanning, Inter-national Journal of Production Economics, 40, 107-120
Bartezzaghi E., Verganti V., Zotteri G., 1999, A simulation framework for forecasting uncertain lumpy demand, Int. J. Production Economics, 59: 499-510
Fildes R., C. Beard, 1992, Forecasting system for production and inventory control, International Journal of Operation and Production Management, 12 (5), 4-27
Fliedner, G., 1999. An investigation of aggregate variable time series forecast strategies with specif-ic subaggregate time series statistical correlation.Computers & Operations Research 26, 1133–1149.
Rafael S. Gutierrez, Adriano O. Solis, Nithin R. Bendore, 2004, Lumpy Demand Characterization and Forecasting Performance: An Exploratory Case Study, WDIS 2004 Proceedings
Ho C.J., 1995, Examining the impact of demand lumpiness on the lot-sizing performance in MRP systems, International Journal of Production Research, 33 (9), 2579-99.
Choy M., Cheong M. L. F. - Identification of Demand Through Statistical Distribution Modeling for Improved Demand Forecasting.
Murphy Choy, Michelle L.F. Cheong

Business Intelligence Journal - July, 2012 Vol.5 No.2
266 Business Intelligence Journal July
Syntetos A.A., Boylan J.E., 2001, On the bias of intermittent demand estimates, International Jour-nal of Production Economics, 71: 457-466
Syntetos A.A., Boylan J.E., 2005, The accuracy of intermittent demand estimates, International Journal of Forecasting, 21: 303-314
Vereecke A., P. Verstraeten, 1994, An inventory model for an inventory consisting of lumpy items, slow movers and fast movers, International Journal of Production Economics 35, 379-389
Ward J.B., 1978, Determining reorder points when demand is lumpy, Management Science, 24 (6), 623-632.
Wemmerlöv U., D.C. Whybark, 1984, Lot-sizing under uncertainty in a rolling schedule environ-ment, International Journal of Production Research, 22 (3), 467-484.
Wemmerlöv U., 1986, A time phased order-point system in environments with and without demand uncertainty: A comparative analysis of no-monetary performance variables, International Journal of Production Research, 24 (2), 343-358.
Williams T.M., 1982, Reorder levels for lumpy demand, Journal of the Operational Research Socie-ty, 33, 185-189.
2012 267
THE IMPACT OF INTELLECTUAL CAPITAL DISCLOSURE ON CAPITAL MARKETS: AN OVERVIEW
Zahra MousaviDepartment of Accounting ,Andimshk Branch , Islamic Azad University , Andimeshk , Iran.
Nasrollah TakhtaeiDepartment of Accounting ,Dezfoul Branch , Islamic Azad University , Dezfoul , Iran.
Email: [email protected]
Intellectual Capital Disclosure
The failure of financial statement in informating the ability of creating value of intangible asset (Lev and Zarowin, 1999), increasing the information asymmetry between the firms and the users of the financial accounting (Healy and Palepu, 2001). This information asymmentry creates inefficiency on the resources allocation process on the capital market (Li, Pike and Hainffa, 2008). Rylander et al. (2000) reviewed the major issues of intellectual capital disclosure and summarized them as follows:
1. The information asymmentry gap is growing as the proportion of company value attributable to intangible assets increases.
2. Long term information, particularly on strategic intent and execution, was laking from company reporting but was considered to be of particular importance to external stkeholeders, especially the investors.
3. Standards and comparability relating to the disclosure of intellectual capital would remain a major issue.
4. Value creation models could provide information to complement traditional reporting required by law
AbstractAccording to GAAP , intellectual capital is the value of firms intangible assets that aren’t reflected on the balance
sheet. Intellectual capital is defined in different ways: The OECD describes intellectual capital as the economic value of two categories of intangible assets of a company: (a) organizsational (structural) capital and (b) human capital. Structural capital can be further disaggregated into internal and external capital (Schneider and samkin, 2007). Roos et al (2005) define intellectual capital as all non – monetary and non – physical resources that are fully or partly controlled by the organization and that contribute to the organizations value creation (Peng et al. 2007). Intellectual capital can be described as structureal capital , relational capital and human capital. sveiby (2004) first proposed a classification for ic into three broad areas of intangibles viz, human capital, structural capital and customer capital a classification that was later modified and externded by replacing customer capital by relational capital (bhasin, 2008). According to davis (2001) structural capital encompasses the hardware, software, database, systems, work processes, businessmodels, organizational structure, patents, trademarks, trade secrets and all other codified knowledge. Relational capital is defined as all resources linked to the external relationships of the firm, with customers, suppliers, or partners in research and development. it comprises that part of human and structural capital involved with the companys rwlations with stockholders (investors, creditors, customers, suppliers), plus the preceptions that they hold about the company (starvoic and marr ). it also includes the image of the image of the organization in the market, its social identity and brand equity (mageza, 2004). Schultz (1993) define the term human capital as a key element in improving a firm assets and employee in order to increase productivity as well as to sustain competitive advantage. Human capital is the combined capabilities, knowledge, skills, experience, innovativeness and problem – solving abilities of each individuls knowledge (davis and Harrison, 2001). human capital involves processes that relate to training, education and other inverventions in order to increase the levels of knowledge, skills, abilities, values and social assets of an employee which will lead to the employees satisfaction and performance and eventually on a firm performance (Rizvi, 2010).
Mousavi Z., Takhtaei N. - The Impact of Intellectual Capital Disclosure on Capital Markets: An Overview.
Zahra Mousavi, Nasrollah Takhtaei
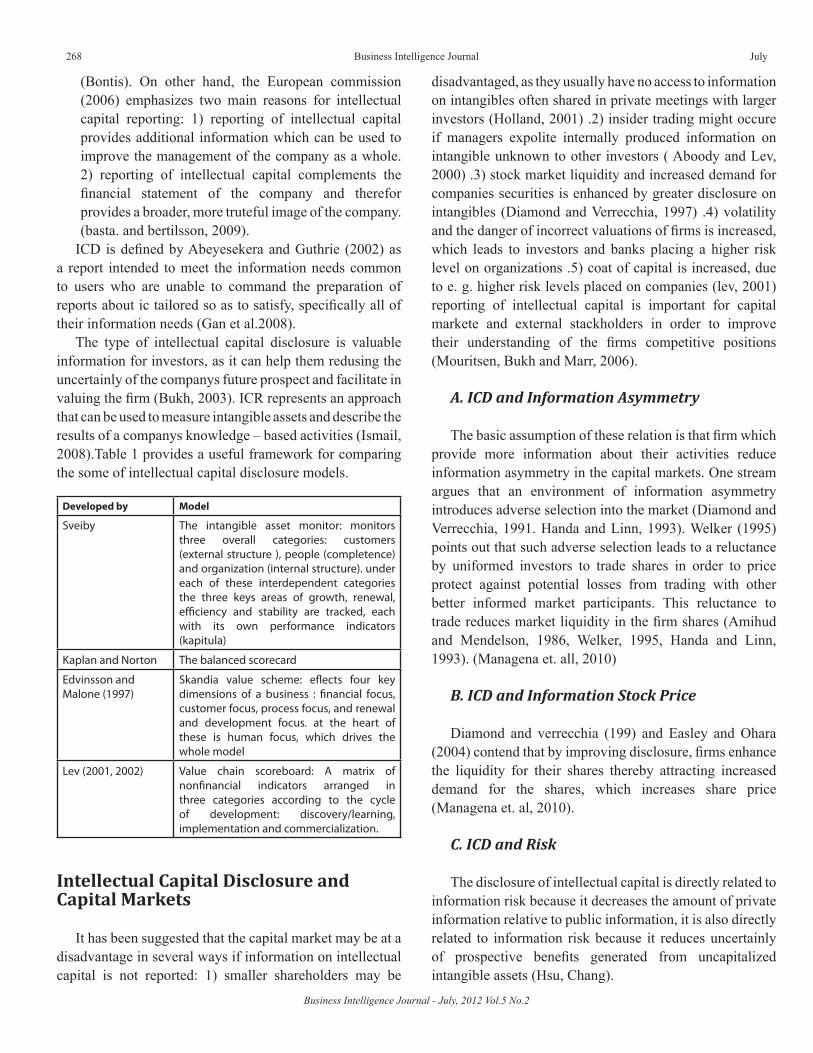
Business Intelligence Journal - July, 2012 Vol.5 No.2
268 Business Intelligence Journal July
(Bontis). On other hand, the European commission (2006) emphasizes two main reasons for intellectual capital reporting: 1) reporting of intellectual capital provides additional information which can be used to improve the management of the company as a whole. 2) reporting of intellectual capital complements the financial statement of the company and therefor provides a broader, more truteful image of the company. (basta. and bertilsson, 2009).
ICD is defined by Abeyesekera and Guthrie (2002) as a report intended to meet the information needs common to users who are unable to command the preparation of reports about ic tailored so as to satisfy, specifically all of their information needs (Gan et al.2008).
The type of intellectual capital disclosure is valuable information for investors, as it can help them redusing the uncertainly of the companys future prospect and facilitate in valuing the firm (Bukh, 2003). ICR represents an approach that can be used to measure intangible assets and describe the results of a companys knowledge – based activities (Ismail, 2008).Table 1 provides a useful framework for comparing the some of intellectual capital disclosure models.
Developed by Model
Sveiby The intangible asset monitor: monitors three overall categories: customers (external structure ), people (completence) and organization (internal structure). under each of these interdependent categories the three keys areas of growth, renewal, efficiency and stability are tracked, each with its own performance indicators (kapitula)
Kaplan and Norton The balanced scorecard
Edvinsson and Malone (1997)
Skandia value scheme: eflects four key dimensions of a business : financial focus, customer focus, process focus, and renewal and development focus. at the heart of these is human focus, which drives the whole model
Lev (2001, 2002) Value chain scoreboard: A matrix of nonfinancial indicators arranged in three categories according to the cycle of development: discovery/learning, implementation and commercialization.
Intellectual Capital Disclosure and Capital Markets
It has been suggested that the capital market may be at a disadvantage in several ways if information on intellectual capital is not reported: 1) smaller shareholders may be
disadvantaged, as they usually have no access to information on intangibles often shared in private meetings with larger investors (Holland, 2001) .2) insider trading might occure if managers expolite internally produced information on intangible unknown to other investors ( Aboody and Lev, 2000) .3) stock market liquidity and increased demand for companies securities is enhanced by greater disclosure on intangibles (Diamond and Verrecchia, 1997) .4) volatility and the danger of incorrect valuations of firms is increased, which leads to investors and banks placing a higher risk level on organizations .5) coat of capital is increased, due to e. g. higher risk levels placed on companies (lev, 2001) reporting of intellectual capital is important for capital markete and external stackholders in order to improve their understanding of the firms competitive positions (Mouritsen, Bukh and Marr, 2006).
A. ICD and Information Asymmetry
The basic assumption of these relation is that firm which provide more information about their activities reduce information asymmetry in the capital markets. One stream argues that an environment of information asymmetry introduces adverse selection into the market (Diamond and Verrecchia, 1991. Handa and Linn, 1993). Welker (1995) points out that such adverse selection leads to a reluctance by uniformed investors to trade shares in order to price protect against potential losses from trading with other better informed market participants. This reluctance to trade reduces market liquidity in the firm shares (Amihud and Mendelson, 1986, Welker, 1995, Handa and Linn, 1993). (Managena et. all, 2010)
B. ICD and Information Stock Price
Diamond and verrecchia (199) and Easley and Ohara (2004) contend that by improving disclosure, firms enhance the liquidity for their shares thereby attracting increased demand for the shares, which increases share price (Managena et. al, 2010).
C. ICD and Risk
The disclosure of intellectual capital is directly related to information risk because it decreases the amount of private information relative to public information, it is also directly related to information risk because it reduces uncertainly of prospective benefits generated from uncapitalized intangible assets (Hsu, Chang).
2012 269
D. ICD and Efficiency
The disclosure of intellectual capital make capital markets more efficient and reduce the cost of firm capital (lev, 2001). Disclosing information about intellectual capital investments provides investors with more forward – looking view of the firm (Williams, 2001, Beattie and Thomason, 2007, Guthrie et al. 2007). This improves the markets understanding of a firms value creating processes and activities as well as the economic risks attached to the firms shares. Such understanding leads to improvement in capital market efficiency. Grojer and Johanson (1999) suggest that IC disclosure should improve capital market efficiency and contribute to better corporate governance (Abeyesekera, 2008).
E. ICD and Sock Volatility
Intellectual capital reports increase the awareness and confidence of investors in the core capabilities of the company and enables them to study invested during moments of crisis. This in turn leads to reduced volatility in the companys stock and aggregate in the overall capital market (Talukdar, 2008). Aysuso (2002) states that understanding of intellectual capital investments by capital markets to reduce stock price volatility.
F. ICD and Liquidity
Since the decrease in information asymmetry increases the market liquidity, therefor intellectual capital disclosure causes the increase in market liquidity by decrease in the information asymmetry.
ICD increase the transparency. Transparency reduce the cost of capital and thereby increase the market liquidity (Hearly and Palepu, 2001). Also Bloomfield and Wilks (200) document that greater disclosure of information about the firm leads investors to trade shares at relatively higher prices, hence providing greater liquidity of the firms shares (Managena et. al, 2010).
G. ICD and Cost of Capital
Botsoan (2006) point out that greater disclosure results in a reduction of the estimation risk associated with investors assements of a shares return of pay off distribution (Managena et. al, 2010) the logic is that because investors estimate the parameters of return on a firms share on the basis of available information, an increase in disclosure
allows investors to better estimate share returns. According to lev (2001) the reporting of intellectual capital should reduce the cost of capital. Overall, firms improving their disclosure of intellectual capital information can lower their costs of capital by reducing informating asymmetry and lowering information risk (Managena et. al, 2010). Finally, ICD increase the transparency that decrease the cost of capital in capital markets.
References
Abeyesekera, Indra. (2008). Intellectual capital disclosure treads: singapore and Sri Lanka Journal of intellectual capital, vol. 9. No. 4, pp 723-737.
Amihud, Y. Mendelson, H. (1986). Asset pricing and the bid – ask spread. Journal of financial economics, 17 (2), pp. 223 – 249.
Basta, Mikael., Brestilsson, Robert (2009). Innovation and internal reporting of intellectual capital. An empirical study. University of Gothenburg.
Beattie, V., Thomason, S. J. (2007). Lifting the lid on the use of content analysis to investigate intellectual capital disclosure, Accounting Fourm, 31, pp. 129 – 163.
Bhasin, Madan Lal. Intellectual capital reporting study of it – sector corporations in India. Austrlian Journal of Business and Management Research ( AJBMR ). No 1, Vol 1. pp. 16 – 28.
Bloomfield, R. J. wilks, T. J. (2000). Disclosure effects in the laboratory: Liquidity, depth and the cost of capital. Accounting Review, 75 (1), pp. 13 - 42.
Bontis, Nick (2002). Intellectual capital disclosure in Canadian corporation. www.ssrn.com
Botosan, C. A. (2006). Disclosure and the cost of equity capital: what do we know ? Accounting and Business Research (Internation Accounting Fourm), pp 31 - 40.
Davis, J. L., harisson, S. S. (2001) Edison in the boardroom: how leading companies realize value from their intellectual assets. John Wiley and Sons, inc. Canada.
Diamond, D. and Verrecchia, R. (199). Disclosure, liquidity and the cost of equity capital. Journal of Finance, September, pp. 1325 – 1360.
European Commission. (2006). Reporting intellectual capital to augment research, development and innovation in smes. Brussels: directorate – general for research.
Mousavi Z., Takhtaei N. - The Impact of Intellectual Capital Disclosure on Capital Markets: An Overview.
Zahra Mousavi, Nasrollah Takhtaei

Business Intelligence Journal - July, 2012 Vol.5 No.2
270 Business Intelligence Journal July
Falikhatun, Y. Aryani, Anni., and Prabowo, Ananto. The Effects of Corporate Governance on the Intellectual Capital Disclosure: A Empirical Study from Banking Sector in Indonesia.
Garsia – Aysuso, M. (2003). Factors explaining the inefficient valuation of intangiblers accounting, Auditing and accountability, no. 16, pp. 57 - 69.
Grojer, J. E., Johanson, U. (1999). Voluntary guidelines on the disclosure of intangibles: a bridge over troubled water ? paper presented at the international symposium measuring and reporting intellectual capital: experiences, issues and prospects, Amsterdam, inc.
Guthrie, J., Petty, R. and Ricceri, f. (2007). Intellectual capital reporting investigations into Australia and Hong Kong, Edinburgh: institute of charetered accontants of Scotland.
Guthrie, James. (2000). The management, measurement and the reporting of intellectual capital.
Handa, p. and Linn, s. (1993). Arbitrage pricing with estimation risk. Journal of financial and Quantitative analysis, 28 (1), pp. 81 – 100.
Hsu, Audrey wen – Hsin., Chang, Yao – Lin. Can the disclosure of intellectual capital reduce information risk: Evidence from the high – tech industry in Taiwan ?
Ismail , Tarig H . ( 2008 ). Intellectual capital reporting in knowledge economy: evidence from Egypt. international conference on economic directions III: the College of Business Administration, Kuwait university.
Kapitalu, Intelektualniho. Intellectual capital reporting.Lev, 13., Zarowin, P. (1999). The Boundaries of
Financial Reporting and how to extend them. Journal of Accounting Research, 37 (2) pp. 353 – 386.
Lev, B. (2001). Intangibles – management, measuring and reporting. Brooking institution press.
Lev, B. (2001). Intangibles: management, measurement and reporting. The Brooking institution, Washington, DC.
Li, Jing., Pik, R., and Haniffa, R. (2008). Intellectual Capital Disclosure and corporate governance structure in UK firms. Accounting and Business Research. 38 (2) pp. 137 – 159.
Mageza. (2004). Intellectual capital as a creator of wealth and shareholder value for an organization.
Falculty of economic and management sciences, Rand Afrikaans university.
Managena, Musa., Pike, Richard., and Li, Jing. (2010). Intellectual capital disclosure practices and effects on the cost of equity capital: UK evidence. published by: the institute of chartered accountants of Scotland. firdt published 2010.
Peng, Tzu – Ju., Pike, Stephen., Roos, Goran. (2007). Intellectual capital and performance indicators: Taiwanese healthcare sector. Journal of intellectual capital, vol 8, no. 3, pp. 538 – 556.
Rizvi, Yasmeen. (2010). Human capital development role of human resource (hr) during mergers and acquisitions. African Journal of Business Management. vol 5 (z) pp. 261 – 268.
Roos, G., Pike, S. and Fernstorm, L. (2005). Managing intellectual capital in practice, Elsevier, oxford.
Rylander, a., Jacobsen, k., and Roos, G. (2000). Towards improved information disclosure of intellectual capital. International Journal of Technology Management, 20, pp. 715 – 741.
Rylander, a., Jacobsen, K., and Roos., G. (2000). Towards improved information disclosure of intellectual capital. International Journal of Technology Management , 20, pp. 715 – 714.
Schneider, Annika., Samkin, Grant (2007). Intellectual capital reporting by the new Zealand local governance sector. Working paper series, No, 95. Department of accounting, university of Waikato.
Schultz, T. W. (1993). The economic importance of human capital in modernization. educ. econ. no. 1. pp. 13 – 19.
Strarovic, D., Marr, B. Understanding corporate value: managing and reporting intellectual capital cima. Cranfied university school of management.
Sveiby, K. E. (2004). Methods for measuring intangibles, available at www.Sveiby.com
Talukder, Abhiji It. (2008). The benefits of ic reporting. www.Attainix.com
Welker, M. (1995). Disclosure policy, information asymmetry and liquidity market contemoracy accounting review, 11 (2), pp. 153 – 174.
Williams, S. M. (2001). Is intellectual capital performance and disclosure practicers related ? Journal of Intellectual capital, vol. 2 (b), pp. 192 – 203.

2012 271
ISLAMIC–BANK SELECTION CRITERIA IN MALAYSIA: AN AHP APPROACH
Muhamad AbduhIIUM Institute of Islamic Banking and Finance, International Islamic University Malaysia
205A Jalan Damansara, Damansara Heights, 50480 Kuala Lumpur, Malaysia.Email: [email protected]
Mohd Azmi OmarIIUM Institute of Islamic Banking and Finance, International Islamic University Malaysia
205A Jalan Damansara, Damansara Heights, 50480 Kuala Lumpur, Malaysia.
AbstractThe study of bank selection criteria has received attention from many bank marketing researchers. However, from its inception
in three decades ago, this kind of study is still scanty for Islamic banking industry. The purpose of this study was to investigate the Islamic-bank selection criteria, particularly in Malaysia. To accomplish this purpose, information collected from 279 respondents within the Klang-valley area was incorporated in the analysis. The Analytic Hierarchy Process was used to rank the criteria based on the respondents’ preferences. The result has shown that shariah-compliant attribute is the highest priority before an individual decides to patronize an Islamic bank. The next priorities are given to profitability, bank’s reputation, bank’s status, facilities and services, and friendly personnel respectively. Thus, one of the implications of this study is that Islamic banks cannot be too liberal by following all the footprints of conventional bank without giving attention to shariah principles and objectives of shariah. Key words: AHP, Islamic Banking, Selection Criteria.
Islamic banking is now a promising business in the financial services industry. It has experienced a tremendous growth just after three decades of its inception. There are now over 300 Islamic financial institutions worldwide across 75 countries. According to the Asian Banker Research Group, The World’s 100 largest Islamic banks have set an annual asset growth rate of 26.7% and the global Islamic Finance industry is experiencing average growth of 15-20% annually (McKinsey, 2008).
However, similar to its conventional counterpart, Islamic banks also depend on depositors’ money as a major source of funds. In fact, since interest is forbidden in Islam, the flexibility of Islamic bank in collecting inflow money for expenses and financing is limited. For that reason, deposits are even more important in Islamic bank compared to conventional bank. The more the number of depositors the more money received to enhance the main functions of the institutions. Thus, it is very important for Islamic banks to be able to recognize the factors influence people to patronize Islamic banks, in order to increase the number of their depositors, which in the end is to enhance the performance of the bank.
This study is aimed at analyzing bank selection criteria in the Islamic banking framework through direct interview
with Islamic bank customers, particularly in Malaysia. This study uses the analytic hierarchy process approach in order to get an accurate picture on how people rank the criteria before they have decided to patronize an Islamic bank.
Review of Related Literature
The study of bank selection criteria and bank patronize behavior has been done in a large number of studies. Kennington et al., (1996), Almossawi (2001) and Şafakli (2007), for instance, find that the bank’s reputation is the main factor in determining customers’ decision in using conventional banks’ services, while Owusu-Frimpong (1999), Ta and Har (2000), Kaynak and Harcar (2005) and Şafakli (2007) find that profitability factors and service quality, such as low service charges and high interest rates, are the major reasons why customers chose a particular bank.
The other factors that also reported to be significant affecting customers’ decision are convenience, competence, recommendation by peers, and free banking charges (Hinson et al., 2009; Blankson et al., 2007; Laroche et al., 1993; Ardic and Yuzereroglu, 2009; Yavas and Kaynak, 1993; Babakus et al., 2004). Saunders et al., (2007), for an
Muhamad A., Mohd A. O. - Islamic–Bank Selection Criteria in Malaysia: An AHP Approach.
Muhamad Abduh, Mohd Azmi Omar
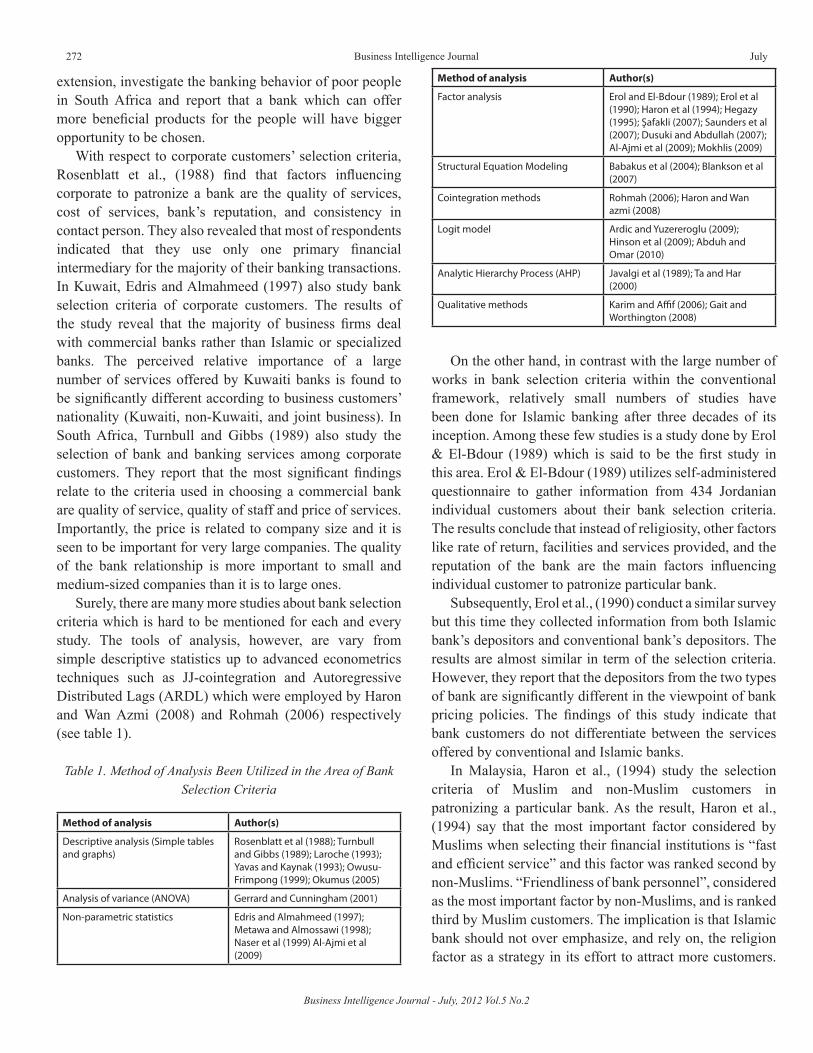
Business Intelligence Journal - July, 2012 Vol.5 No.2
272 Business Intelligence Journal July
extension, investigate the banking behavior of poor people in South Africa and report that a bank which can offer more beneficial products for the people will have bigger opportunity to be chosen.
With respect to corporate customers’ selection criteria, Rosenblatt et al., (1988) find that factors influencing corporate to patronize a bank are the quality of services, cost of services, bank’s reputation, and consistency in contact person. They also revealed that most of respondents indicated that they use only one primary financial intermediary for the majority of their banking transactions. In Kuwait, Edris and Almahmeed (1997) also study bank selection criteria of corporate customers. The results of the study reveal that the majority of business firms deal with commercial banks rather than Islamic or specialized banks. The perceived relative importance of a large number of services offered by Kuwaiti banks is found to be significantly different according to business customers’ nationality (Kuwaiti, non-Kuwaiti, and joint business). In South Africa, Turnbull and Gibbs (1989) also study the selection of bank and banking services among corporate customers. They report that the most significant findings relate to the criteria used in choosing a commercial bank are quality of service, quality of staff and price of services. Importantly, the price is related to company size and it is seen to be important for very large companies. The quality of the bank relationship is more important to small and medium-sized companies than it is to large ones.
Surely, there are many more studies about bank selection criteria which is hard to be mentioned for each and every study. The tools of analysis, however, are vary from simple descriptive statistics up to advanced econometrics techniques such as JJ-cointegration and Autoregressive Distributed Lags (ARDL) which were employed by Haron and Wan Azmi (2008) and Rohmah (2006) respectively (see table 1).
Table 1. Method of Analysis Been Utilized in the Area of Bank Selection Criteria
Method of analysis Author(s)
Descriptive analysis (Simple tables and graphs)
Rosenblatt et al (1988); Turnbull and Gibbs (1989); Laroche (1993); Yavas and Kaynak (1993); Owusu-Frimpong (1999); Okumus (2005)
Analysis of variance (ANOVA) Gerrard and Cunningham (2001)
Non-parametric statistics Edris and Almahmeed (1997); Metawa and Almossawi (1998); Naser et al (1999) Al-Ajmi et al (2009)
Method of analysis Author(s)
Factor analysis Erol and El-Bdour (1989); Erol et al (1990); Haron et al (1994); Hegazy (1995); Şafakli (2007); Saunders et al (2007); Dusuki and Abdullah (2007); Al-Ajmi et al (2009); Mokhlis (2009)
Structural Equation Modeling Babakus et al (2004); Blankson et al (2007)
Cointegration methods Rohmah (2006); Haron and Wan azmi (2008)
Logit model Ardic and Yuzereroglu (2009); Hinson et al (2009); Abduh and Omar (2010)
Analytic Hierarchy Process (AHP) Javalgi et al (1989); Ta and Har (2000)
Qualitative methods Karim and Affif (2006); Gait and Worthington (2008)
On the other hand, in contrast with the large number of works in bank selection criteria within the conventional framework, relatively small numbers of studies have been done for Islamic banking after three decades of its inception. Among these few studies is a study done by Erol & El-Bdour (1989) which is said to be the first study in this area. Erol & El-Bdour (1989) utilizes self-administered questionnaire to gather information from 434 Jordanian individual customers about their bank selection criteria. The results conclude that instead of religiosity, other factors like rate of return, facilities and services provided, and the reputation of the bank are the main factors influencing individual customer to patronize particular bank.
Subsequently, Erol et al., (1990) conduct a similar survey but this time they collected information from both Islamic bank’s depositors and conventional bank’s depositors. The results are almost similar in term of the selection criteria. However, they report that the depositors from the two types of bank are significantly different in the viewpoint of bank pricing policies. The findings of this study indicate that bank customers do not differentiate between the services offered by conventional and Islamic banks.
In Malaysia, Haron et al., (1994) study the selection criteria of Muslim and non-Muslim customers in patronizing a particular bank. As the result, Haron et al., (1994) say that the most important factor considered by Muslims when selecting their financial institutions is “fast and efficient service” and this factor was ranked second by non-Muslims. “Friendliness of bank personnel”, considered as the most important factor by non-Muslims, and is ranked third by Muslim customers. The implication is that Islamic bank should not over emphasize, and rely on, the religion factor as a strategy in its effort to attract more customers.
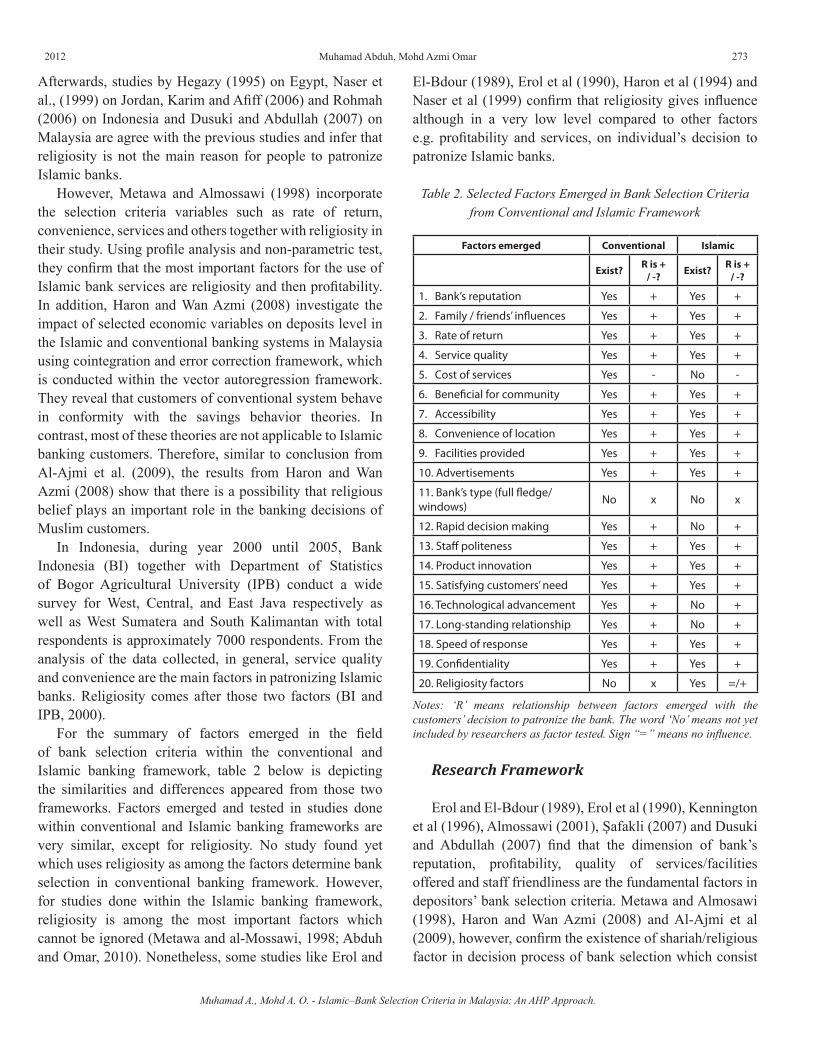
2012 273
Afterwards, studies by Hegazy (1995) on Egypt, Naser et al., (1999) on Jordan, Karim and Afiff (2006) and Rohmah (2006) on Indonesia and Dusuki and Abdullah (2007) on Malaysia are agree with the previous studies and infer that religiosity is not the main reason for people to patronize Islamic banks.
However, Metawa and Almossawi (1998) incorporate the selection criteria variables such as rate of return, convenience, services and others together with religiosity in their study. Using profile analysis and non-parametric test, they confirm that the most important factors for the use of Islamic bank services are religiosity and then profitability. In addition, Haron and Wan Azmi (2008) investigate the impact of selected economic variables on deposits level in the Islamic and conventional banking systems in Malaysia using cointegration and error correction framework, which is conducted within the vector autoregression framework. They reveal that customers of conventional system behave in conformity with the savings behavior theories. In contrast, most of these theories are not applicable to Islamic banking customers. Therefore, similar to conclusion from Al-Ajmi et al. (2009), the results from Haron and Wan Azmi (2008) show that there is a possibility that religious belief plays an important role in the banking decisions of Muslim customers.
In Indonesia, during year 2000 until 2005, Bank Indonesia (BI) together with Department of Statistics of Bogor Agricultural University (IPB) conduct a wide survey for West, Central, and East Java respectively as well as West Sumatera and South Kalimantan with total respondents is approximately 7000 respondents. From the analysis of the data collected, in general, service quality and convenience are the main factors in patronizing Islamic banks. Religiosity comes after those two factors (BI and IPB, 2000).
For the summary of factors emerged in the field of bank selection criteria within the conventional and Islamic banking framework, table 2 below is depicting the similarities and differences appeared from those two frameworks. Factors emerged and tested in studies done within conventional and Islamic banking frameworks are very similar, except for religiosity. No study found yet which uses religiosity as among the factors determine bank selection in conventional banking framework. However, for studies done within the Islamic banking framework, religiosity is among the most important factors which cannot be ignored (Metawa and al-Mossawi, 1998; Abduh and Omar, 2010). Nonetheless, some studies like Erol and
El-Bdour (1989), Erol et al (1990), Haron et al (1994) and Naser et al (1999) confirm that religiosity gives influence although in a very low level compared to other factors e.g. profitability and services, on individual’s decision to patronize Islamic banks.
Table 2. Selected Factors Emerged in Bank Selection Criteria from Conventional and Islamic Framework
Factors emerged Conventional Islamic
Exist? R is + / -? Exist? R is +
/ -?
1. Bank’s reputation Yes + Yes +
2. Family / friends’ influences Yes + Yes +
3. Rate of return Yes + Yes +
4. Service quality Yes + Yes +
5. Cost of services Yes - No -
6. Beneficial for community Yes + Yes +
7. Accessibility Yes + Yes +
8. Convenience of location Yes + Yes +
9. Facilities provided Yes + Yes +
10. Advertisements Yes + Yes +
11. Bank’s type (full fledge/windows) No x No x
12. Rapid decision making Yes + No +
13. Staff politeness Yes + Yes +
14. Product innovation Yes + Yes +
15. Satisfying customers’ need Yes + Yes +
16. Technological advancement Yes + No +
17. Long-standing relationship Yes + No +
18. Speed of response Yes + Yes +
19. Confidentiality Yes + Yes +
20. Religiosity factors No x Yes =/+
Notes: ‘R’ means relationship between factors emerged with the customers’ decision to patronize the bank. The word ‘No’ means not yet included by researchers as factor tested. Sign “=” means no influence.
Research Framework
Erol and El-Bdour (1989), Erol et al (1990), Kennington et al (1996), Almossawi (2001), Şafakli (2007) and Dusuki and Abdullah (2007) find that the dimension of bank’s reputation, profitability, quality of services/facilities offered and staff friendliness are the fundamental factors in depositors’ bank selection criteria. Metawa and Almosawi (1998), Haron and Wan Azmi (2008) and Al-Ajmi et al (2009), however, confirm the existence of shariah/religious factor in decision process of bank selection which consist
Muhamad A., Mohd A. O. - Islamic–Bank Selection Criteria in Malaysia: An AHP Approach.
Muhamad Abduh, Mohd Azmi Omar
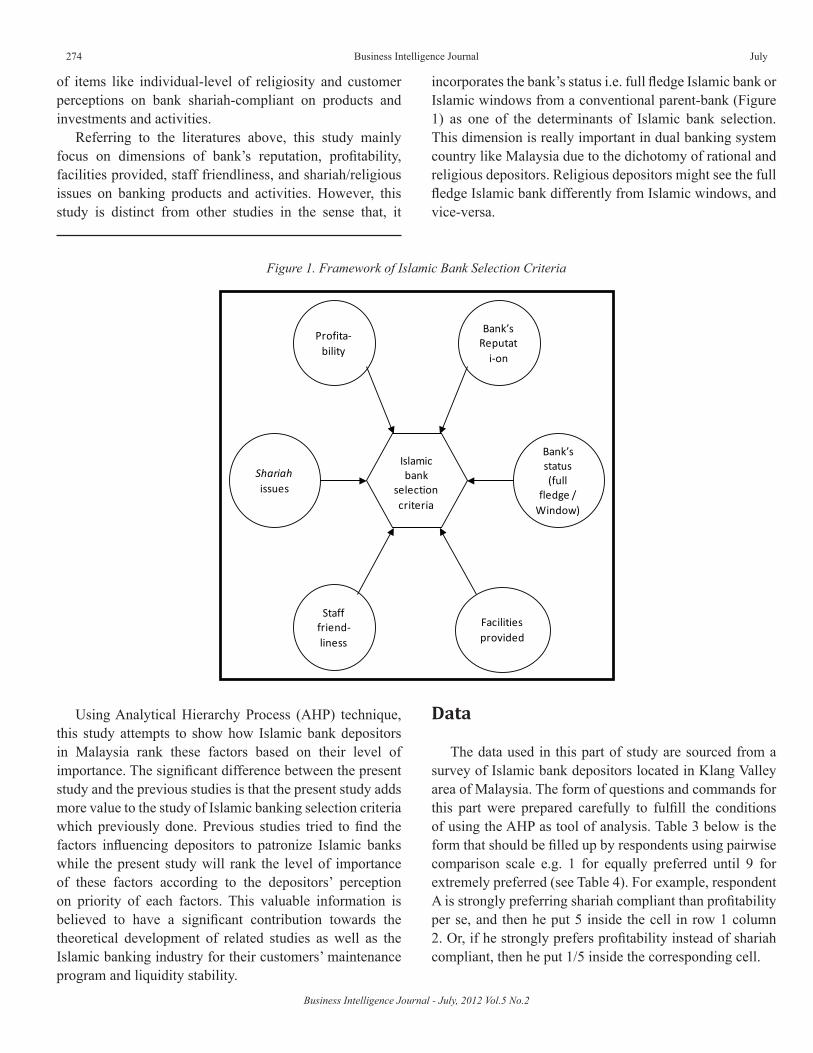
Business Intelligence Journal - July, 2012 Vol.5 No.2
274 Business Intelligence Journal July
of items like individual-level of religiosity and customer perceptions on bank shariah-compliant on products and investments and activities.
Referring to the literatures above, this study mainly focus on dimensions of bank’s reputation, profitability, facilities provided, staff friendliness, and shariah/religious issues on banking products and activities. However, this study is distinct from other studies in the sense that, it
incorporates the bank’s status i.e. full fledge Islamic bank or Islamic windows from a conventional parent-bank (Figure 1) as one of the determinants of Islamic bank selection. This dimension is really important in dual banking system country like Malaysia due to the dichotomy of rational and religious depositors. Religious depositors might see the full fledge Islamic bank differently from Islamic windows, and vice-versa.
Figure 1. Framework of Islamic Bank Selection Criteria
Islamicbank
selectioncriteria
Stafffriend-liness
Facilitiesprovided
Shariahissues
Bank’sstatus (full
fledge / Window)
Profita-bility
Bank’sReputat
i-on
Using Analytical Hierarchy Process (AHP) technique, this study attempts to show how Islamic bank depositors in Malaysia rank these factors based on their level of importance. The significant difference between the present study and the previous studies is that the present study adds more value to the study of Islamic banking selection criteria which previously done. Previous studies tried to find the factors influencing depositors to patronize Islamic banks while the present study will rank the level of importance of these factors according to the depositors’ perception on priority of each factors. This valuable information is believed to have a significant contribution towards the theoretical development of related studies as well as the Islamic banking industry for their customers’ maintenance program and liquidity stability.
Data
The data used in this part of study are sourced from a survey of Islamic bank depositors located in Klang Valley area of Malaysia. The form of questions and commands for this part were prepared carefully to fulfill the conditions of using the AHP as tool of analysis. Table 3 below is the form that should be filled up by respondents using pairwise comparison scale e.g. 1 for equally preferred until 9 for extremely preferred (see Table 4). For example, respondent A is strongly preferring shariah compliant than profitability per se, and then he put 5 inside the cell in row 1 column 2. Or, if he strongly prefers profitability instead of shariah compliant, then he put 1/5 inside the corresponding cell.
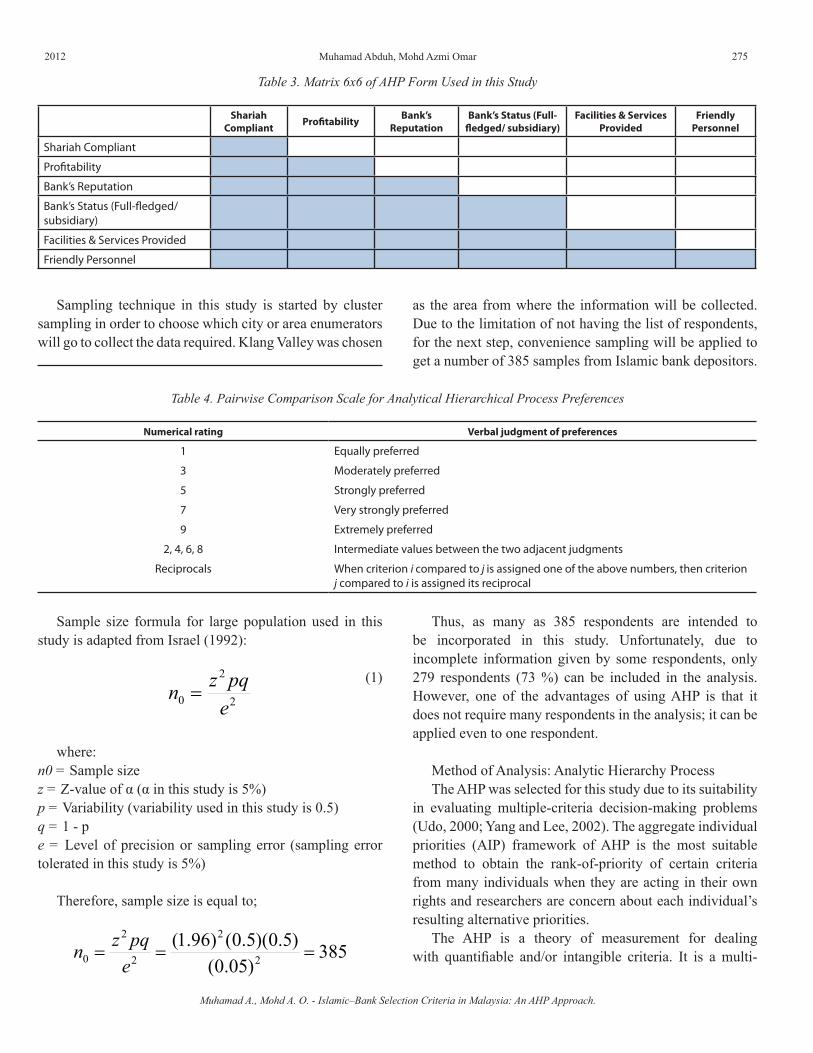
2012 275
Table 3. Matrix 6x6 of AHP Form Used in this Study
Shariah Compliant Profitability Bank’s
ReputationBank’s Status (Full-
fledged/ subsidiary)Facilities & Services
ProvidedFriendly
Personnel
Shariah Compliant
Profitability
Bank’s Reputation
Bank’s Status (Full-fledged/ subsidiary)
Facilities & Services Provided
Friendly Personnel
Sampling technique in this study is started by cluster sampling in order to choose which city or area enumerators will go to collect the data required. Klang Valley was chosen
as the area from where the information will be collected. Due to the limitation of not having the list of respondents, for the next step, convenience sampling will be applied to get a number of 385 samples from Islamic bank depositors.
Table 4. Pairwise Comparison Scale for Analytical Hierarchical Process Preferences
Numerical rating Verbal judgment of preferences
1 Equally preferred
3 Moderately preferred
5 Strongly preferred
7 Very strongly preferred
9 Extremely preferred
2, 4, 6, 8 Intermediate values between the two adjacent judgments
Reciprocals When criterion i compared to j is assigned one of the above numbers, then criterion j compared to i is assigned its reciprocal
Sample size formula for large population used in this study is adapted from Israel (1992):
2
2
0 epqzn =
(1)
where:n0 = Sample sizez = Z-value of α (α in this study is 5%)p = Variability (variability used in this study is 0.5)q = 1 - pe = Level of precision or sampling error (sampling error tolerated in this study is 5%)
Therefore, sample size is equal to;
385)05.0(
)5.0)(5.0()96.1(2
2
2
2
0 ===epqzn
Thus, as many as 385 respondents are intended to be incorporated in this study. Unfortunately, due to incomplete information given by some respondents, only 279 respondents (73 %) can be included in the analysis. However, one of the advantages of using AHP is that it does not require many respondents in the analysis; it can be applied even to one respondent.
Method of Analysis: Analytic Hierarchy ProcessThe AHP was selected for this study due to its suitability
in evaluating multiple-criteria decision-making problems (Udo, 2000; Yang and Lee, 2002). The aggregate individual priorities (AIP) framework of AHP is the most suitable method to obtain the rank-of-priority of certain criteria from many individuals when they are acting in their own rights and researchers are concern about each individual’s resulting alternative priorities.
The AHP is a theory of measurement for dealing with quantifiable and/or intangible criteria. It is a multi-
Muhamad A., Mohd A. O. - Islamic–Bank Selection Criteria in Malaysia: An AHP Approach.
Muhamad Abduh, Mohd Azmi Omar
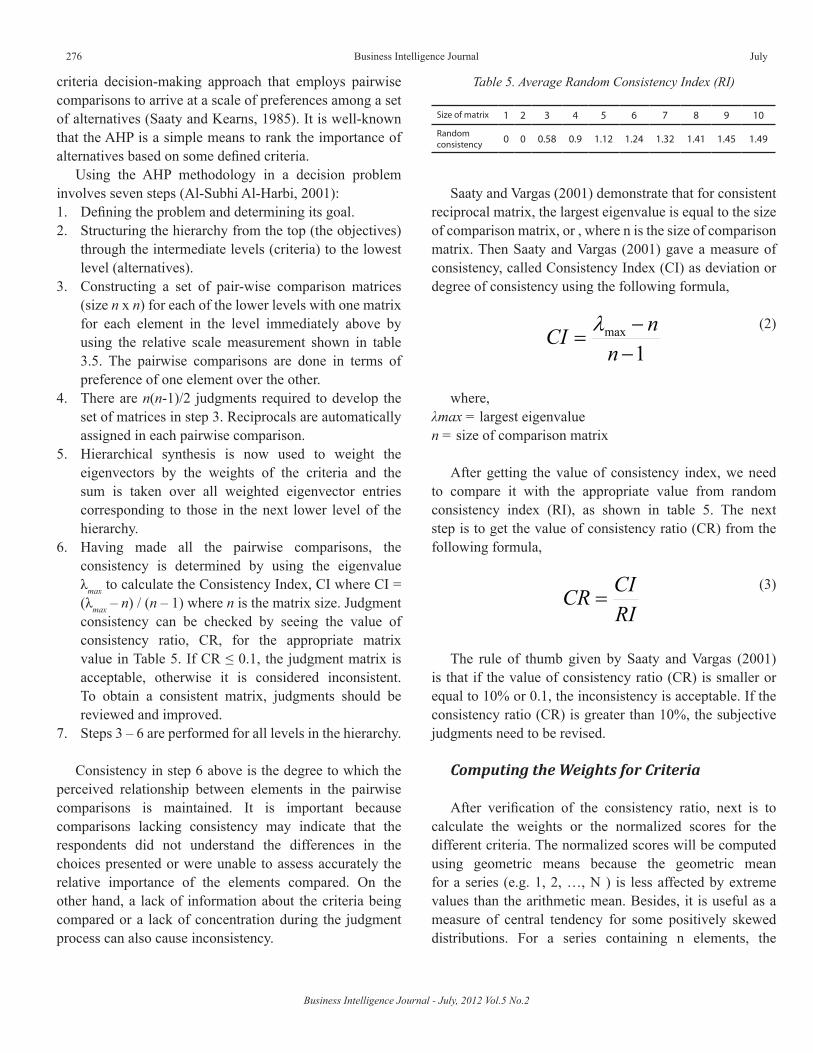
Business Intelligence Journal - July, 2012 Vol.5 No.2
276 Business Intelligence Journal July
criteria decision-making approach that employs pairwise comparisons to arrive at a scale of preferences among a set of alternatives (Saaty and Kearns, 1985). It is well-known that the AHP is a simple means to rank the importance of alternatives based on some defined criteria.
Using the AHP methodology in a decision problem involves seven steps (Al-Subhi Al-Harbi, 2001):1. Defining the problem and determining its goal. 2. Structuring the hierarchy from the top (the objectives)
through the intermediate levels (criteria) to the lowest level (alternatives).
3. Constructing a set of pair-wise comparison matrices (size n x n) for each of the lower levels with one matrix for each element in the level immediately above by using the relative scale measurement shown in table 3.5. The pairwise comparisons are done in terms of preference of one element over the other.
4. There are n(n-1)/2 judgments required to develop the set of matrices in step 3. Reciprocals are automatically assigned in each pairwise comparison.
5. Hierarchical synthesis is now used to weight the eigenvectors by the weights of the criteria and the sum is taken over all weighted eigenvector entries corresponding to those in the next lower level of the hierarchy.
6. Having made all the pairwise comparisons, the consistency is determined by using the eigenvalue λmax to calculate the Consistency Index, CI where CI = (λmax – n) / (n – 1) where n is the matrix size. Judgment consistency can be checked by seeing the value of consistency ratio, CR, for the appropriate matrix value in Table 5. If CR ≤ 0.1, the judgment matrix is acceptable, otherwise it is considered inconsistent. To obtain a consistent matrix, judgments should be reviewed and improved.
7. Steps 3 – 6 are performed for all levels in the hierarchy.
Consistency in step 6 above is the degree to which the perceived relationship between elements in the pairwise comparisons is maintained. It is important because comparisons lacking consistency may indicate that the respondents did not understand the differences in the choices presented or were unable to assess accurately the relative importance of the elements compared. On the other hand, a lack of information about the criteria being compared or a lack of concentration during the judgment process can also cause inconsistency.
Table 5. Average Random Consistency Index (RI)
Size of matrix 1 2 3 4 5 6 7 8 9 10
Random consistency 0 0 0.58 0.9 1.12 1.24 1.32 1.41 1.45 1.49
Saaty and Vargas (2001) demonstrate that for consistent reciprocal matrix, the largest eigenvalue is equal to the size of comparison matrix, or , where n is the size of comparison matrix. Then Saaty and Vargas (2001) gave a measure of consistency, called Consistency Index (CI) as deviation or degree of consistency using the following formula,
1max
−−
=n
nCI λ (2)
where,λmax = largest eigenvaluen = size of comparison matrix
After getting the value of consistency index, we need to compare it with the appropriate value from random consistency index (RI), as shown in table 5. The next step is to get the value of consistency ratio (CR) from the following formula,
RICICR =
(3)
The rule of thumb given by Saaty and Vargas (2001) is that if the value of consistency ratio (CR) is smaller or equal to 10% or 0.1, the inconsistency is acceptable. If the consistency ratio (CR) is greater than 10%, the subjective judgments need to be revised.
Computing the Weights for Criteria
After verification of the consistency ratio, next is to calculate the weights or the normalized scores for the different criteria. The normalized scores will be computed using geometric means because the geometric mean for a series (e.g. 1, 2, …, N ) is less affected by extreme values than the arithmetic mean. Besides, it is useful as a measure of central tendency for some positively skewed distributions. For a series containing n elements, the
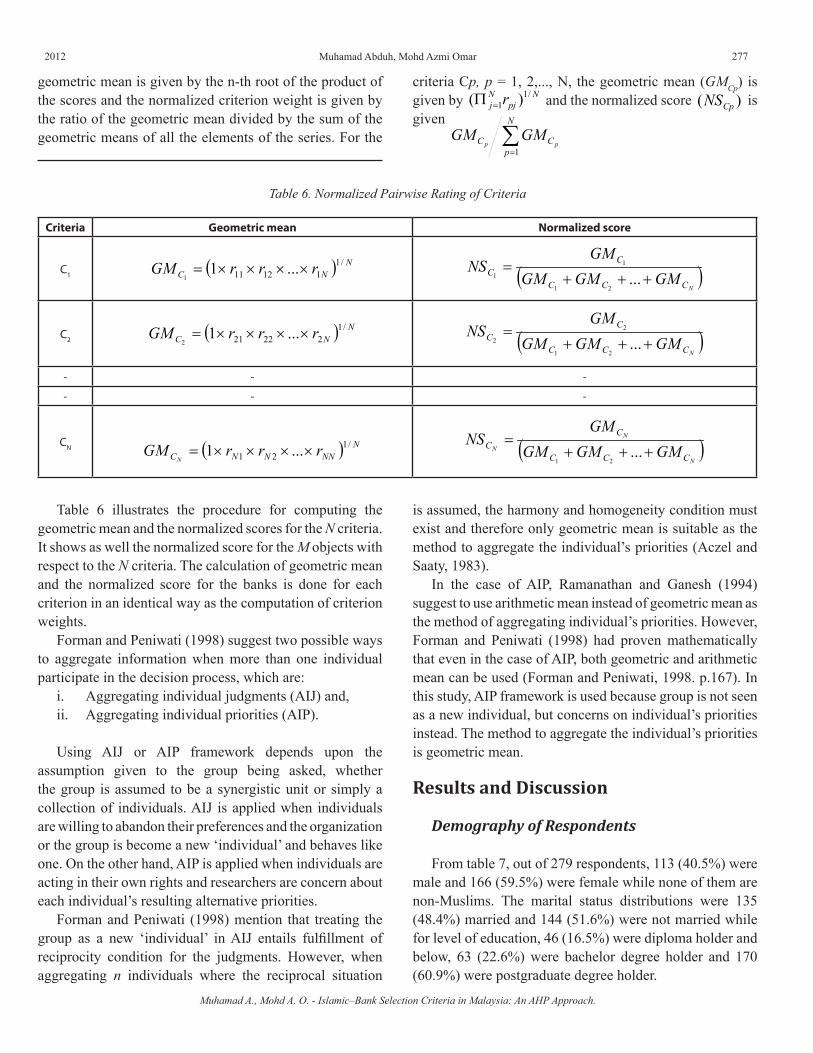
2012 277
geometric mean is given by the n-th root of the product of the scores and the normalized criterion weight is given by the ratio of the geometric mean divided by the sum of the geometric means of all the elements of the series. For the
criteria Cp, p = 1, 2,..., N, the geometric mean (GMCp) is given by N
pjNj r /1
1 )( =Π and the normalized score )( CpNS is given
∑=
N
pCC pp
GMGM1
Table 6. Normalized Pairwise Rating of Criteria
Criteria Geometric mean Normalized score
C1 ( ) NNC rrrGM /1
11211 ...11
××××= ( )NCCC
CC GMGMGM
GMNS
+++=
...21
1
1
C2 ( ) NNC rrrGM /1
22221 ...12
××××= ( )NCCC
CC GMGMGM
GMNS
+++=
...21
2
2
- - -
- - -
CN ( ) NNNNNC rrrGM
N
/121 ...1 ××××= ( )
N
N
NCCC
CC GMGMGM
GMNS
+++=
...21
Table 6 illustrates the procedure for computing the geometric mean and the normalized scores for the N criteria. It shows as well the normalized score for the M objects with respect to the N criteria. The calculation of geometric mean and the normalized score for the banks is done for each criterion in an identical way as the computation of criterion weights.
Forman and Peniwati (1998) suggest two possible ways to aggregate information when more than one individual participate in the decision process, which are:
i. Aggregating individual judgments (AIJ) and,ii. Aggregating individual priorities (AIP).
Using AIJ or AIP framework depends upon the assumption given to the group being asked, whether the group is assumed to be a synergistic unit or simply a collection of individuals. AIJ is applied when individuals are willing to abandon their preferences and the organization or the group is become a new ‘individual’ and behaves like one. On the other hand, AIP is applied when individuals are acting in their own rights and researchers are concern about each individual’s resulting alternative priorities.
Forman and Peniwati (1998) mention that treating the group as a new ‘individual’ in AIJ entails fulfillment of reciprocity condition for the judgments. However, when aggregating n individuals where the reciprocal situation
is assumed, the harmony and homogeneity condition must exist and therefore only geometric mean is suitable as the method to aggregate the individual’s priorities (Aczel and Saaty, 1983).
In the case of AIP, Ramanathan and Ganesh (1994) suggest to use arithmetic mean instead of geometric mean as the method of aggregating individual’s priorities. However, Forman and Peniwati (1998) had proven mathematically that even in the case of AIP, both geometric and arithmetic mean can be used (Forman and Peniwati, 1998. p.167). In this study, AIP framework is used because group is not seen as a new individual, but concerns on individual’s priorities instead. The method to aggregate the individual’s priorities is geometric mean.
Results and Discussion
Demography of Respondents
From table 7, out of 279 respondents, 113 (40.5%) were male and 166 (59.5%) were female while none of them are non-Muslims. The marital status distributions were 135 (48.4%) married and 144 (51.6%) were not married while for level of education, 46 (16.5%) were diploma holder and below, 63 (22.6%) were bachelor degree holder and 170 (60.9%) were postgraduate degree holder.
Muhamad A., Mohd A. O. - Islamic–Bank Selection Criteria in Malaysia: An AHP Approach.
Muhamad Abduh, Mohd Azmi Omar
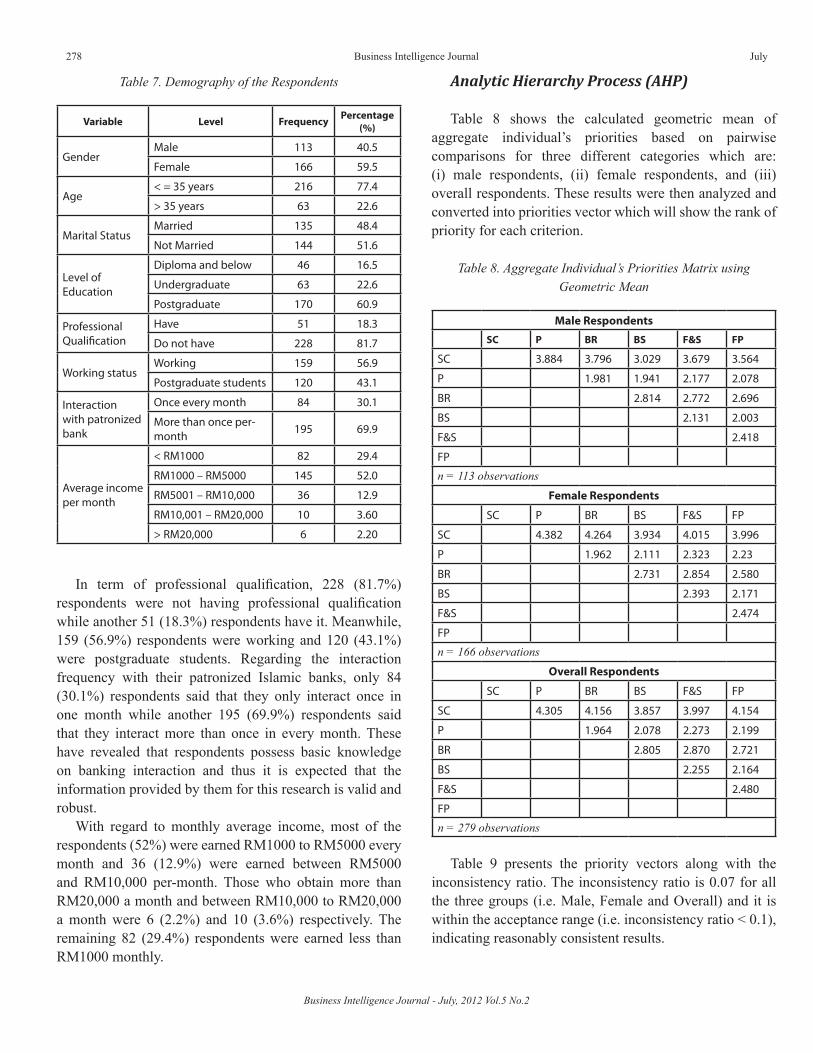
Business Intelligence Journal - July, 2012 Vol.5 No.2
278 Business Intelligence Journal July
Table 7. Demography of the Respondents
Variable Level Frequency Percentage (%)
GenderMale 113 40.5
Female 166 59.5
Age< = 35 years 216 77.4
> 35 years 63 22.6
Marital StatusMarried 135 48.4
Not Married 144 51.6
Level of Education
Diploma and below 46 16.5
Undergraduate 63 22.6
Postgraduate 170 60.9
Professional Qualification
Have 51 18.3
Do not have 228 81.7
Working statusWorking 159 56.9
Postgraduate students 120 43.1
Interaction with patronized bank
Once every month 84 30.1
More than once per-month 195 69.9
Average income per month
< RM1000 82 29.4
RM1000 – RM5000 145 52.0
RM5001 – RM10,000 36 12.9
RM10,001 – RM20,000 10 3.60
> RM20,000 6 2.20
In term of professional qualification, 228 (81.7%) respondents were not having professional qualification while another 51 (18.3%) respondents have it. Meanwhile, 159 (56.9%) respondents were working and 120 (43.1%) were postgraduate students. Regarding the interaction frequency with their patronized Islamic banks, only 84 (30.1%) respondents said that they only interact once in one month while another 195 (69.9%) respondents said that they interact more than once in every month. These have revealed that respondents possess basic knowledge on banking interaction and thus it is expected that the information provided by them for this research is valid and robust.
With regard to monthly average income, most of the respondents (52%) were earned RM1000 to RM5000 every month and 36 (12.9%) were earned between RM5000 and RM10,000 per-month. Those who obtain more than RM20,000 a month and between RM10,000 to RM20,000 a month were 6 (2.2%) and 10 (3.6%) respectively. The remaining 82 (29.4%) respondents were earned less than RM1000 monthly.
Analytic Hierarchy Process (AHP)
Table 8 shows the calculated geometric mean of aggregate individual’s priorities based on pairwise comparisons for three different categories which are: (i) male respondents, (ii) female respondents, and (iii) overall respondents. These results were then analyzed and converted into priorities vector which will show the rank of priority for each criterion.
Table 8. Aggregate Individual’s Priorities Matrix using Geometric Mean
Male Respondents
SC P BR BS F&S FP
SC 3.884 3.796 3.029 3.679 3.564
P 1.981 1.941 2.177 2.078
BR 2.814 2.772 2.696
BS 2.131 2.003
F&S 2.418
FP
n = 113 observationsFemale Respondents
SC P BR BS F&S FP
SC 4.382 4.264 3.934 4.015 3.996
P 1.962 2.111 2.323 2.23
BR 2.731 2.854 2.580
BS 2.393 2.171
F&S 2.474
FP
n = 166 observationsOverall Respondents
SC P BR BS F&S FP
SC 4.305 4.156 3.857 3.997 4.154
P 1.964 2.078 2.273 2.199
BR 2.805 2.870 2.721
BS 2.255 2.164
F&S 2.480
FP
n = 279 observations
Table 9 presents the priority vectors along with the inconsistency ratio. The inconsistency ratio is 0.07 for all the three groups (i.e. Male, Female and Overall) and it is within the acceptance range (i.e. inconsistency ratio < 0.1), indicating reasonably consistent results.
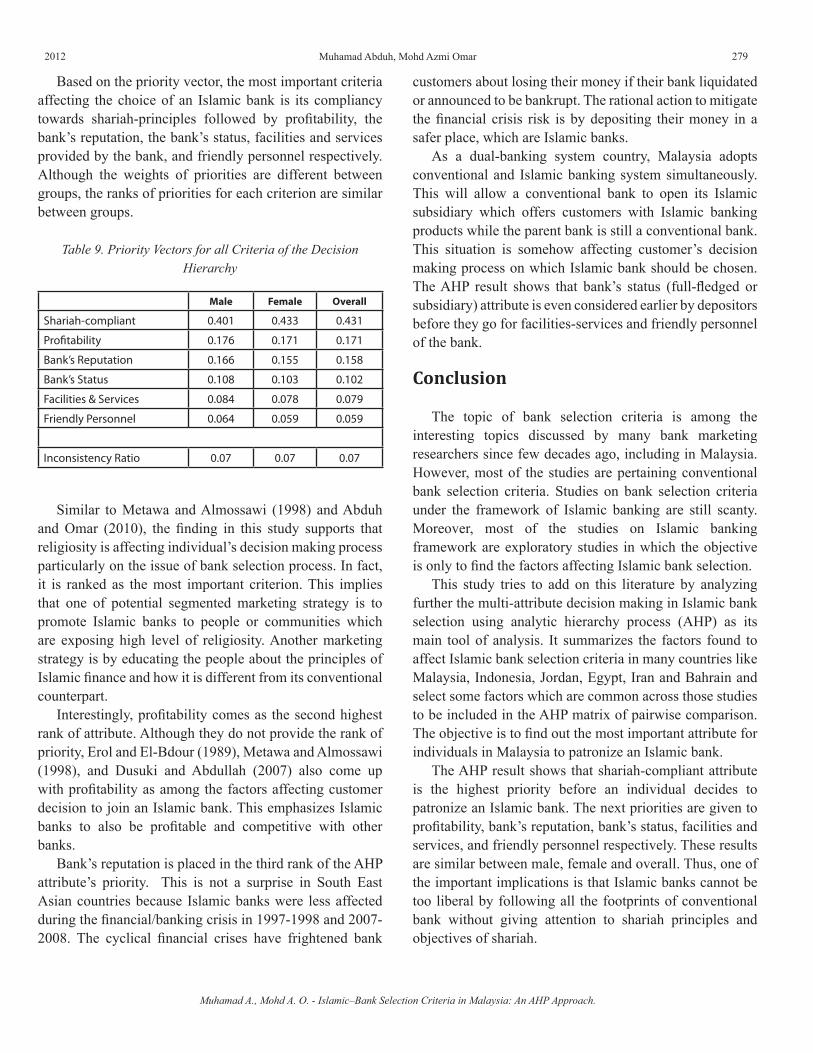
2012 279
Based on the priority vector, the most important criteria affecting the choice of an Islamic bank is its compliancy towards shariah-principles followed by profitability, the bank’s reputation, the bank’s status, facilities and services provided by the bank, and friendly personnel respectively. Although the weights of priorities are different between groups, the ranks of priorities for each criterion are similar between groups.
Table 9. Priority Vectors for all Criteria of the Decision Hierarchy
Male Female Overall
Shariah-compliant 0.401 0.433 0.431
Profitability 0.176 0.171 0.171
Bank’s Reputation 0.166 0.155 0.158
Bank’s Status 0.108 0.103 0.102
Facilities & Services 0.084 0.078 0.079
Friendly Personnel 0.064 0.059 0.059
Inconsistency Ratio 0.07 0.07 0.07
Similar to Metawa and Almossawi (1998) and Abduh and Omar (2010), the finding in this study supports that religiosity is affecting individual’s decision making process particularly on the issue of bank selection process. In fact, it is ranked as the most important criterion. This implies that one of potential segmented marketing strategy is to promote Islamic banks to people or communities which are exposing high level of religiosity. Another marketing strategy is by educating the people about the principles of Islamic finance and how it is different from its conventional counterpart.
Interestingly, profitability comes as the second highest rank of attribute. Although they do not provide the rank of priority, Erol and El-Bdour (1989), Metawa and Almossawi (1998), and Dusuki and Abdullah (2007) also come up with profitability as among the factors affecting customer decision to join an Islamic bank. This emphasizes Islamic banks to also be profitable and competitive with other banks.
Bank’s reputation is placed in the third rank of the AHP attribute’s priority. This is not a surprise in South East Asian countries because Islamic banks were less affected during the financial/banking crisis in 1997-1998 and 2007-2008. The cyclical financial crises have frightened bank
customers about losing their money if their bank liquidated or announced to be bankrupt. The rational action to mitigate the financial crisis risk is by depositing their money in a safer place, which are Islamic banks.
As a dual-banking system country, Malaysia adopts conventional and Islamic banking system simultaneously. This will allow a conventional bank to open its Islamic subsidiary which offers customers with Islamic banking products while the parent bank is still a conventional bank. This situation is somehow affecting customer’s decision making process on which Islamic bank should be chosen. The AHP result shows that bank’s status (full-fledged or subsidiary) attribute is even considered earlier by depositors before they go for facilities-services and friendly personnel of the bank.
Conclusion
The topic of bank selection criteria is among the interesting topics discussed by many bank marketing researchers since few decades ago, including in Malaysia. However, most of the studies are pertaining conventional bank selection criteria. Studies on bank selection criteria under the framework of Islamic banking are still scanty. Moreover, most of the studies on Islamic banking framework are exploratory studies in which the objective is only to find the factors affecting Islamic bank selection.
This study tries to add on this literature by analyzing further the multi-attribute decision making in Islamic bank selection using analytic hierarchy process (AHP) as its main tool of analysis. It summarizes the factors found to affect Islamic bank selection criteria in many countries like Malaysia, Indonesia, Jordan, Egypt, Iran and Bahrain and select some factors which are common across those studies to be included in the AHP matrix of pairwise comparison. The objective is to find out the most important attribute for individuals in Malaysia to patronize an Islamic bank.
The AHP result shows that shariah-compliant attribute is the highest priority before an individual decides to patronize an Islamic bank. The next priorities are given to profitability, bank’s reputation, bank’s status, facilities and services, and friendly personnel respectively. These results are similar between male, female and overall. Thus, one of the important implications is that Islamic banks cannot be too liberal by following all the footprints of conventional bank without giving attention to shariah principles and objectives of shariah.
Muhamad A., Mohd A. O. - Islamic–Bank Selection Criteria in Malaysia: An AHP Approach.
Muhamad Abduh, Mohd Azmi Omar
Business Intelligence Journal - July, 2012 Vol.5 No.2
280 Business Intelligence Journal July
Limitations and Suggestions
This study has at least one limitation which is focusing only to the individual depositors and without incorporating the corporate depositors. Since the vision and mission of these two types of depositors are different, it is believed that the resulted rank will also be different. Thus, among the suggestions for future study are: (i) to include the corporate depositors in the analysis and (ii) to use different method of analysis to test the robustness of the results.
References
Abduh M, Omar, MA (2010). Who Patronises Islamic Banks in Indonesia. Australian J. of Islamic Law, Mgt and Fin. 1(1): 48-63.
Aczel L, Saaty TL (1983). Procedures for synthesizing ratio judgments. J. of Math. Psyc. 27: 93-102.
Al-Ajmi J, Abo H, Hameeda, Al-Saleh N (2009). Clients of conventional and Islamic banks in Bahrain: How they choose which bank to patronize. Intl. J. of Social Econ. 36(11): 1086-1112.
Almossawi M (2001). Bank selection criteria employed by college students in Bahrain: An empirical analysis. Intl. J. of Bank Marketing. 19(3): 115-125.
Al-Subhi Al-Harbi KM (2001). Application of the AHP in project management. Intl. J. Project Mgt. 19: 19-27.
Ardic OP, Yuzereroglu U (2009). How do individuals choose banks? An application to household level data from Turkey. The B.E. J. of Econ. Analysis & Policy. 9(1), Article No.22.
Babakus E, Eroglu S, Yavas U (2004). Modeling consumers’ choice behavior: an application in banking. J. of Services Marketing. 18(6): 462-470.
Bank Indonesia, IPB, (2000). Pemetaan Hasil Penelitian Potensi, Preferensi, dan Perilaku Masyarakat Terhadap Bank Syariah di Pulau Jawa [Potency, Preference, and People’s Behaviour Toward Islamic Bank in Jawa Island: A Compilation]. Jakarta: Author.
Blankson C, Cheng JMS, Spears N (2007). Determinants of banks selection in USA, Taiwan, and Ghana. Intl. J. of Bank Marketing. 25(7): 469-489.
Dusuki AW, Abdullah NI (2007). Why do Malaysian customers patronize Islamic banks? Intl. J. of Bank Marketing. 25(3): 142-160.
Edris TA, Almahmeed MA (1997). Services considered important to business customers and determinants of bank selection in Kuwait: a segmentation analysis. Intl. J. of Bank Marketing, 15(4): 126-133.
Erol C, El-Bdour R (1989). Attitude, behavior and patronage factors of bank customers towards Islamic banks. Intl. J. of Bank Marketing. 7(6): 31-37.
Erol C, Kaynak E, El-Bdour R (1990). Conventional and Islamic bank: Patronage behavior of Jordanian customers. Intl. J. of Bank Marketing. 8(5): 25-35.
Forman E, Peniwati K (1998). Aggregating individual judgments and priorities with the analytical hierarchy process. Euro. J. of Operational. Res. 108: 165-169.
Gait A, Worthington A (2008). An empirical survey of individual consumer, business firm, and financial institution attitudes towards Islamic methods of finance. Intl. J. of Soc. Econ. 35(11): 783-808.
Gerard P, Cunningham JB (2001). Singapore undergraduates: How they choose which bank to patronize. Intl. J. of Bank Marketing. 19(3): 104-114.
Haron S, Ahmad N, Planisek SL (1994). Bank Patronage Factors of Muslim and Non-Muslim Customers. Intl. J. of Bank Marketing. 12(1): 32-40.
Haron S, Wan Azmi WS (2008). Determinants of Islamic and conventional deposits in the Malaysian banking system. Man. Finance. 34(9): 618-643.
Hegazy IA (1995). An empirical comparative study between Islamic and commercial banks’ selection criteria in Egypt. Intl. J. of Bank Marketing. 5(3): 46-61.
Hinson R, Frimpong NO, Dasah J (2009). Key motivations for bank patronage in Ghana. Intl. J. of Bank Marketing. 27(5): 381-399.
Israel GD (1992). Determining sample size. Agricultural Education and Communication Department Series. Institute of Food and Agricultural Sciences, University of Florida.
Javalgi R, Armacost RL, Hosseini JC (1989). Using the analytical hierarchical process for bank management: Analysis of consumer bank selection decisions. J. of Bus. Research. 19: 33-49.
Karim AA, Affif AZ (2006). Islamic banking consumer behavior in Indonesia: A qualitative approach.
2012 281
Paper presented at the 7th International Conference on Islamic Economics, 1-3 April 2008, King Abdul Aziz University, Jeddah, Saudi Arabia.
Kaynak E, Harcar T (2005). American consumers’ attitudes towards commercial banks. Intl. J. of Bank Marketing. 23(1): 73-89.
Kennington C, Hill J, Rakowska A (1996). Consumer selection criteria for banks in Poland. Intl. J. of Bank Marketing. 17(5): 12-21.
Laroche M, Rosenblatt JA, Manning T (1993). Services used and factors considered important in selecting a bank: An investigation across diverse demographic segments. Intl. J. of Bank Marketing. 4(1): 35-55.
Mckinsey (2008). The World Islamic Banking Competitiveness Report 2007-08, “Capturing The Trillion Dollar Opportunity”. Mckinsey and Company.
Metawa SA, Almossawi M (1998). Banking behavior of Islamic bank customers: perspectives and implications. Intl. J. of Bank Marketing. 16(7): 299-313.
Mokhlis S (2009). Determinants of choice criteria in Malaysia’s Retail Banking: An analysis of gender-based choice decisions. Euro. J. of Econ., Fin. and Adm. Sciences. 16: 18-30.
Naser K, Jamal A, Al-Khatib K (1999). Islamic banking: a study of customer satisfaction and preference in Jordan. Intl. J. of Bank Marketing. 17(3): 135-150.
Okumuş SH (2005). Interest free banking in Turkey: A study of customer satisfaction and bank selection criteria. J. of Econ. Coop. 26(4): 51-86.
Owusu-Frimpong N (1999). Patronage behavior of Ghanaian bank customers. Intl. J. of Bank Marketing. 17(7): 335-341.
Ramanathan R, Ganesh LS (1994). Group preference aggregation methods employed in AHP: an evaluation and intrinsic process for deriving members’ weightages. Euro. J. of Operation. Res. 79: 249-265.
Rohmah N (2006). Deposits determinants of Islamic bank in Indonesia: An ARDL modeling approach. Unpublished Master Thesis, Kulliyah of Economics and Management Sciences of IIUM.
Rosenblatt J, Laroche M, Hochstein A, McTavish R, Sheahan M (1988). Commercial banking in Canada: A study of the selection criteria and service expectations of treasury officers. Intl. J. of Bank Marketing. 6(4): 19-30.
Saaty TL, KearnsKP (1985). Analytic Planning: The organization of systems. Pergamon, Oxford.
Saaty TL, Vargas LG (2001). Models, Methods, Concepts & Applications of the Analytic Hierarchy Process. Kluwer Academic Publishers, The Netherlands.
Şafakli OV (2007). A research on the basic motivational factors in consumer bank selection: evidence from Northern Cyprus. Banks and Banks System. 2 (4): 93-100.
Saunders SG, Bendixen M, Abratt R (2007). Banking patronage motives of the urban informal poor. J. of Serv. Marketing. 21(1): 52-63.
Ta HP, Har KY (2000). A study of bank selection decisions in Singapore using the analytical hierarchical process. Intl. J. of Bank Marketing. 18(4): 170-180.
Turnbull PW, GibbsMJ (1989). The selection of banks and banking services among corporate customers in South Africa. Intl. J. of Bank Marketing. 7(5): 36-39.
Udo GG (2000). Using analytical hierarchy process to analyze the information technology outsourcing decision. Indust. Mgt. and Data Syst. 100(9): 421-429.
Yang J, Lee H (2002). Identifying key factors for successful joint venture in China. Indust. Mgt. and Data Syst. 102(2): 98-109.
Yavas U, Kaynak E (1993). Key dimensions of the bank patronage decision. Mgt. Res. News. 5(2): 22-24.
Muhamad A., Mohd A. O. - Islamic–Bank Selection Criteria in Malaysia: An AHP Approach.
Muhamad Abduh, Mohd Azmi Omar
Business Intelligence Journal - July, 2012 Vol.5 No.2
282 Business Intelligence Journal July
APPRAISING THE ROLE OF STRATEGY IMPLEMENTATION IN EXPORT PERFORMANCE: A CASE FROM MIDDLE EAST
Seyed Hossein JalaliMA of International Business, Faculty of Management & Accounting,
Allameh Tabatabai University, Tehran, IranEmail: [email protected]
AbstractThis paper aims to explore the influence of strategy implementation on export performance. The main question addressed in this
paper relates to how the strategy implementation is linked to the firm’s export performance with respect to diverse dimensions of performance in international activities. Data were gathered from food exporter firms in Iran and partial least squares method was used to test the proposed conceptual framework. The finding from this study support the conceptual framework; so it was concluded that strategy implementation influences export performance, both directly, and as a mediating variable between organizational characteristics, export commitment and environmental characteristics with export performance. Key words: Strategy Implementation, Export Performance, Developing Countries.
The growing internationalization of markets and increased participation of organizations in the global arena has resulted in export performance attracting considerable interest in many researches (Leonidou, 2003; Matanda & Freeman, 2009). Since the 1970s, an extensive body of literature has been developed on the determinants of export performance (Sousa et al., 2008; Parhizkar et al., 2010). The majority of studies about export performance have focused on a set of very diverse variables. However, while export performance is a widely researched, it is one of the least understood constructs in international marketing (Katsikeas et al., 2000). Most of researches focus on the relationships between performance and organizational or environmental factors; less has been done about the strategy and performance linkage and especially the importance of strategy implementation.
While most research focusing on export performance has been undertaken in the United States and Europe, limited work has been conducted in developing countries, especially in Middle East countries (Matanda & Freeman, 2009). A growing body of work indicates the numerous problems faced by exporters from developing countries in maintaining a competitive edge (Etemad, 2004). It is generally accepted that an increase in the exports of a country has a positive effect on the growth of a country's economy, as well as the prosperity of the individual firms involved. Enhancing export performance is crucial for companies based in developing countries that view the
global marketplace as a means to ensure growth, survival or competitiveness (Matanda & Freeman, 2009). As such, it is important for Iran as a country to better understand the determinants of export performance success in order to substantially improve its poor export performance.
This study focuses on examining the relationship between organizational characteristics, environmental characteristics, commitment, strategy implementation and export performance through a conceptual framework that can guide export policy makers in their decision making and strategic planning. To achieve the objective of this study, the work is organized as follows: The first section presents a theoretical review of the variables included in the study; organizational characteristics, environmental characteristics, commitment, strategy implementation and export performance. This review provides the basis for the formulation of research framework and hypotheses, which are tested using a sample of 137 Iranian food exporter firms. The paper then presents the conceptual model, with the various relations proposed between the constructs analyzed, describes the methodological aspects of the study, and presents the results obtained through Structural Equation Modeling (SEM) that was done by partial least squares (PLS) method. The final section includes the most important conclusions that can be drawn from the results obtained. The work ends with recommendations to policy makers and managers and future lines of research to complete the result of such studies.
2012 283
S.H. Jalali - Appraising the Role of Strategy Implementation in Export Performance: a Case from Middle East.
Seyed Hossein Jalali
Literature Review and Formulation of Hypotheses
Export Performance
Export performance is a fundamental aspect for decision making in international trade. Researchers do not agree on its conceptual or operational definition (Navarro et al., 2010). Research in the field of export performance has focused on two dimensions; first, conceptualizing this construct and second, the identification of its determinants. There is now broad consensus that performance is multidimensional and broad understanding that its main components are economic and strategic, but also broad disagreement as to its specific measurement and how its dimensions work. Therefore, the construct itself does not yet have a generally accepted conceptualization and operationalization (Katsikeas et al., 2000; Papadopoulos & Martin Martin, 2010).
Export performance can be defined as the outcomes from the firm's international activities. From this perspective, export performance is the extent to which the firm achieves its objectives when exporting a product to a foreign market (Navarro et al., 2010). Export Performance measurement is a complex issue for numerous reasons. Since firms typically do not report the financial details of their exporting activities, it is difficult to access readily available and valid archival data. On the other hand; company officials may be reluctant to disclose confidential information to outsiders, particularly regarding a single segment of their business (Leonidou et al., 2002). Katsikeas criticized more than 100 empirical studies on export performance measures; identified 42 individual measures and concluded that measurement of this construct suffers from serious conceptual, methodological and practical limitations, hindering theory advancement in the field (Katsikeas et al., 2000).
It's worthy to mention that the importance of various export performance measures may differ depending on a firm's level of international development, with sales objectives perhaps being more relevant in early stages but profit measures in later ones (Papadopoulos & Martin Martin, 2010).
Strategy Implementation
There is no universally accepted definition of strategy implementation. Different viewpoints are used to define strategy implementation term. Strategy implementation
may be viewed as a process inducing various forms of organizational learning, because both environmental threats and strategic responses are a prime trigger for organizational learning processes (Lehner, 2004). Strategy implementation is an iterative process of implementing strategies, policies, programs and action plans that allows a firm to utilize its resources to take advantage of opportunities in the competitive environment (Harrington, 2006). Strategy implementation is also portrayed as a lively process by which companies identify future opportunities (Schaap, 2006). So in a comprehensive statement, we can define the term as a dynamic, iterative and complex process, which is comprised of a series of decisions and activities by managers and employees that affected by a number of interrelated internal and external factors to turn strategic plans into reality in order to achieve strategic objectives.
Some studies on the field of strategy implementation were done with the international perspective. Roth, Schweiger and Morrison indicated six factors that should be designed specifically in order to implement multi domestic strategies; coordination, managerial philosophy, configuration, formalization, centralization and integrating mechanism. They concluded that multi domestic strategies need different implementation requirements (Okumus, 2001). Hrebiniak in his conceptual framework also suggested leadership, facilitating global learning, developing global managers, having a matrix structure and working with external companies as a key factor for strategy implementation in international environment. Other significant framework proposed by Yip, which included organizational structure, culture, people and managerial process (Okumus, 2003). In this study strategy implementation was measured by two groups of variables; operational (structure, budgeting) and managerial (leadership, culture). Hence, the following hypothesis of the relationship between strategy implementation and export performance is proposed:
H1: Strategy implementation has a positive effect on export performance
Organizational Characteristics
Various firm's characteristics have been identified in the literature as direct determinants of export performance, most of them, however, provided rather contradictory results. Most of researchers indicated that the organizational resources determine firm's export performance. Firm size has frequently been used as a proxy for organizational

Business Intelligence Journal - July, 2012 Vol.5 No.2
284 Business Intelligence Journal July
resources availability (Stoian, 2011). A larger firm size provides more scale economies, easier access to capital needed for exporting, and a greater ability to absorb the risks associated with exporting (Singh, 2009). Larger firms can deploy more resources for gathering information about foreign markets and cover the inconsistencies of foreign markets than the smaller firms (Lee & Habte-Giorgis, 2004). So, firm size is one of the most cited organizational characteristics factors.
Apart from firm size, business experience either assessed as firm age or its international experience has emerged as a key determinant of export performance (Stoian, 2011). Experiential knowledge is the prime driver as it decreases perceived uncertainty and helps the firm to recognize new opportunities abroad (Papadopoulos & Martin Martin, 2010). While most of scholars identified a positive relationship between firm experience and export performance, there are some studies that observed negative association (Baldauf et al., 2000; Brouthers & Nakos, 2005). Technological and marketing capabilities beside capital intensity are the other important organizational characteristics that enhance competitiveness of a firm for a long term (Singh, 2009). On the other hand, these factors influence the strategy implementation capability through resource allocation. Capital intensity is an important determinant of profitability, so it is positively associated with the firm's economic performance (Lee & Habte-Giorgis, 2004). Financial resources enable firms to invest in technological advancement and marketing expenditure. Technological capabilities translate tangible and intangible resources of the firm into new innovative products and technologies, many firms invest in R&D with the specific purpose of innovating for the foreign markets (Alvarez, 2004). Most of studies points that firms advertise in order to stimulate demand, establish a unique position for their products by differentiation and brand building that resulted in overcoming to the entry barriers. Based on the above explanations, the following hypotheses are formulated:
H2: Organizational characteristics has a positive effect on export performanceH3: Organizational characteristics has a positive effect on strategy implementation
Export Commitment
Commitment was first introduced as a critical concept in the social sciences during the early 1960s, and it
has since been researched extensively in various other contexts in a number of diverse disciplines (Papadopoulos & Martin Martin, 2010). Commitment considered as an organizational characteristics in many studies focusing on export performance (Lado et al., 2004; Navarro et al., 2010) Several studies have also discussed how export commitment impacts the firm's level of internationalization (Papadopoulos & Martin Martin, 2010); in other studies commitment is discussed as a inter-organizational factors that enhances export performance (Matanda & Freeman, 2009). Styles et al indicated that commitment to future exchanges influences export performance, and is itself driven by the reciprocal cycle of each partner's perception of the other's commitment (Styles et al., 2008). It is considered that if a firm is committed to exporting it dedicates special efforts and allocates important resources to the export activities, thus, higher export performance results are likely to be attained (Stoian et al., 2011). Moreover, as Lages and Montgomery point out, export commitment will increase managers' willingness to make efforts to achieve the international objectives they have set for their firm, offering strategic guidelines that will orientate their decision making in the foreign markets (Lages & Montgomery, 2004). All this will improve the efficiency and effectiveness of the resource allocation, providing an essential stimulus to boost both international sales and managers' satisfaction with the firm's export performance (Navarro et al., 2010).
In this study, commitment is used as an independent factor from organizational characteristics, because commitment play a critical role in success or failure of strategy implementation and it's noted as an effective factor in implementation process in many studies (Heracleous, 2000; Rapert et al., 2002). The following hypotheses are intended to capture the relationship between commitment with export performance and strategy implementation.
H4: Commitment has a positive effect on export performanceH5: Commitment has a positive effect on strategy implementation
Environmental Characteristics
Export performance may also be influenced by several environmental factors. Despite their relevance for export activity these factors have received rather limited research attention in the international business literature (Wheeler et al., 2008). Export performance tends to be conditioned by environmental characteristics such as the extent of
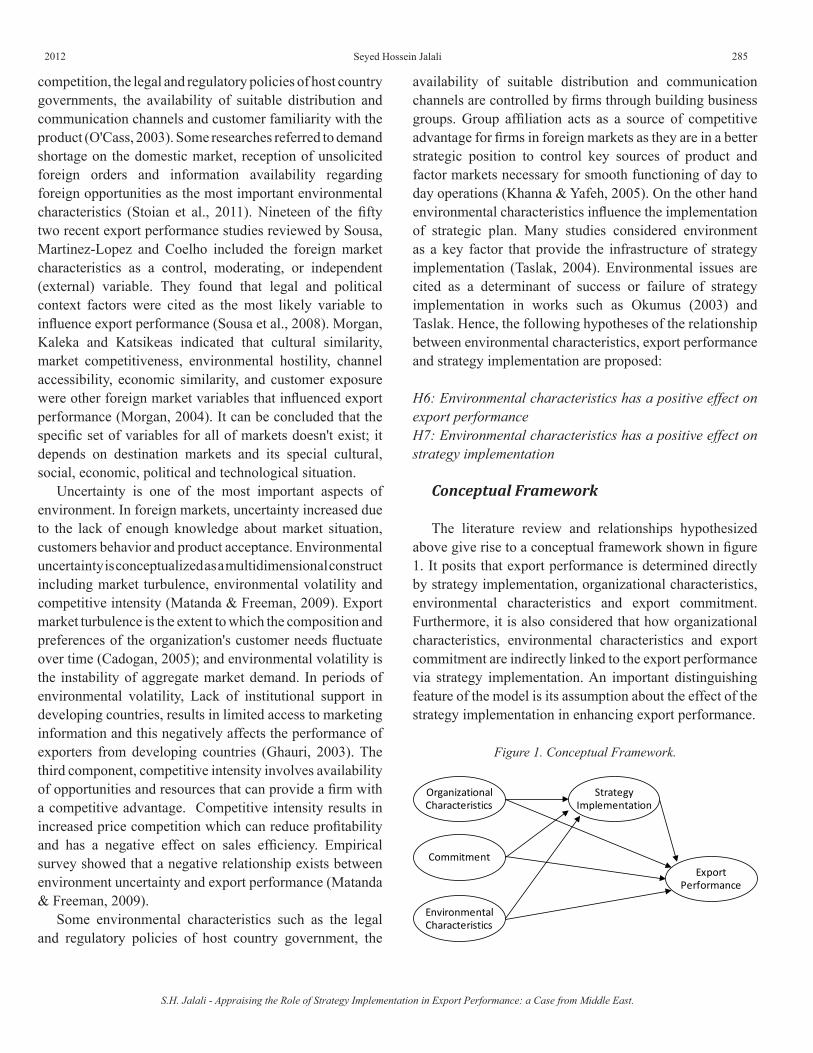
2012 285
competition, the legal and regulatory policies of host country governments, the availability of suitable distribution and communication channels and customer familiarity with the product (O'Cass, 2003). Some researches referred to demand shortage on the domestic market, reception of unsolicited foreign orders and information availability regarding foreign opportunities as the most important environmental characteristics (Stoian et al., 2011). Nineteen of the fifty two recent export performance studies reviewed by Sousa, Martinez-Lopez and Coelho included the foreign market characteristics as a control, moderating, or independent (external) variable. They found that legal and political context factors were cited as the most likely variable to influence export performance (Sousa et al., 2008). Morgan, Kaleka and Katsikeas indicated that cultural similarity, market competitiveness, environmental hostility, channel accessibility, economic similarity, and customer exposure were other foreign market variables that influenced export performance (Morgan, 2004). It can be concluded that the specific set of variables for all of markets doesn't exist; it depends on destination markets and its special cultural, social, economic, political and technological situation.
Uncertainty is one of the most important aspects of environment. In foreign markets, uncertainty increased due to the lack of enough knowledge about market situation, customers behavior and product acceptance. Environmental uncertainty is conceptualized as a multidimensional construct including market turbulence, environmental volatility and competitive intensity (Matanda & Freeman, 2009). Export market turbulence is the extent to which the composition and preferences of the organization's customer needs fluctuate over time (Cadogan, 2005); and environmental volatility is the instability of aggregate market demand. In periods of environmental volatility, Lack of institutional support in developing countries, results in limited access to marketing information and this negatively affects the performance of exporters from developing countries (Ghauri, 2003). The third component, competitive intensity involves availability of opportunities and resources that can provide a firm with a competitive advantage. Competitive intensity results in increased price competition which can reduce profitability and has a negative effect on sales efficiency. Empirical survey showed that a negative relationship exists between environment uncertainty and export performance (Matanda & Freeman, 2009).
Some environmental characteristics such as the legal and regulatory policies of host country government, the
availability of suitable distribution and communication channels are controlled by firms through building business groups. Group affiliation acts as a source of competitive advantage for firms in foreign markets as they are in a better strategic position to control key sources of product and factor markets necessary for smooth functioning of day to day operations (Khanna & Yafeh, 2005). On the other hand environmental characteristics influence the implementation of strategic plan. Many studies considered environment as a key factor that provide the infrastructure of strategy implementation (Taslak, 2004). Environmental issues are cited as a determinant of success or failure of strategy implementation in works such as Okumus (2003) and Taslak. Hence, the following hypotheses of the relationship between environmental characteristics, export performance and strategy implementation are proposed:
H6: Environmental characteristics has a positive effect on export performanceH7: Environmental characteristics has a positive effect on strategy implementation
Conceptual Framework
The literature review and relationships hypothesized above give rise to a conceptual framework shown in figure 1. It posits that export performance is determined directly by strategy implementation, organizational characteristics, environmental characteristics and export commitment. Furthermore, it is also considered that how organizational characteristics, environmental characteristics and export commitment are indirectly linked to the export performance via strategy implementation. An important distinguishing feature of the model is its assumption about the effect of the strategy implementation in enhancing export performance.
Figure 1. Conceptual Framework.
OrganizationalCharacteristics
Commitment
EnvironmentalCharacteristics
StrategyImplementation
ExportPerformance
S.H. Jalali - Appraising the Role of Strategy Implementation in Export Performance: a Case from Middle East.
Seyed Hossein Jalali
Business Intelligence Journal - July, 2012 Vol.5 No.2
286 Business Intelligence Journal July
Research Method
Variable Measurement
As being mentioned in the literature review, export performance conceptualized as being the result of two dimensions, strategic and economic, so export performance considered as a formative construct. In order to measure this construct, export sales (economic effectiveness) and perceived profitability of export sales (economic efficiency) were used. The strategic dimension of export performance was formed by market share, brand position; competitiveness and international expansion of firm. Respondents were asked to rate their performance on these dimensions, in comparison with their main competitors in the specific market.
Organizational characteristics measured by size, experience, technological capability, marketing capability and capital intensity. Export commitment was analyzed from a behavioral perspective. Thus, a set of five items was used to measure export commitment, based on Bello, Chelariu, and Zhang (2003). Strategy implementation was formed by two variables group, operational and managerial those were mentioned in the literature review and market turbulence, environmental volatility, competitive intensity, legal-political environment and cultural similarity were considered as indicators of environmental characteristics.
Sample
The current work involves an empirical study of export firms to test the proposed conceptual framework and its hypotheses. For selecting the firms to which the questionnaire was aimed, the Iran Ministry of Industries and Business database was used; all the firms in the list filtered by their industries and food exporters are chosen. At the first step, firms were selected who had been active in food exporting for at least three years. Then, simple random sampling was used and a sample of 200 decision makers in charge of exports in their respective companies was identified and selected to participate in the survey. Of the 200 questionnaire dispatched, 137 usable responses were received which representing an effective response rate of 68.5%.
Questionnaire
The data were collected using a structured questionnaire that included sections on export performance, strategy implementation, organizational characteristics, export commitment and environmental characteristics. To ensure that the questionnaire content and design would be easily and unambiguously understood by the respondents, it was pre-tested by 12 experts (Four academic professors in international business field, four consultants of exporting and foreign business and four managers of respected exporting firms) and the questionnaire revised in according of their comments.
Data analysis
The conceptual framework of this study was estimated by the partial least squares (PLS) technique; a variance based structural equation modelling (SEM) method. PLS is a technique for estimating path models involving latent constructs indirectly observed by multiple indicators such as is shown in conceptual framework of this study. PLS was used for two main reasons: this tool can be used on small samples, which is the case here (137 responses); and the tool is suitable for analyzing and evaluating models containing both formative and reflective latent variables. The use of PLS is consistent with the recommendation in the literature; some respected researches in the field of export performance in current years use PLS method for analyzing structural equations (O'Cass, 2003; Navarro et al., 2010; Papadopoulos & Martin Martin, 2010).
In this study export performance and strategy implementation considered as a formative construct and organizational characteristics, environmental characteristics and export commitment regarded as reflective ones, this is consistent with prior studies.
Results
The results from the estimation of the conceptual framework are presented in this section, starting with the measurement model, analysis of reliability and validity of constructs and continuing with the hypothesized structural relationships.
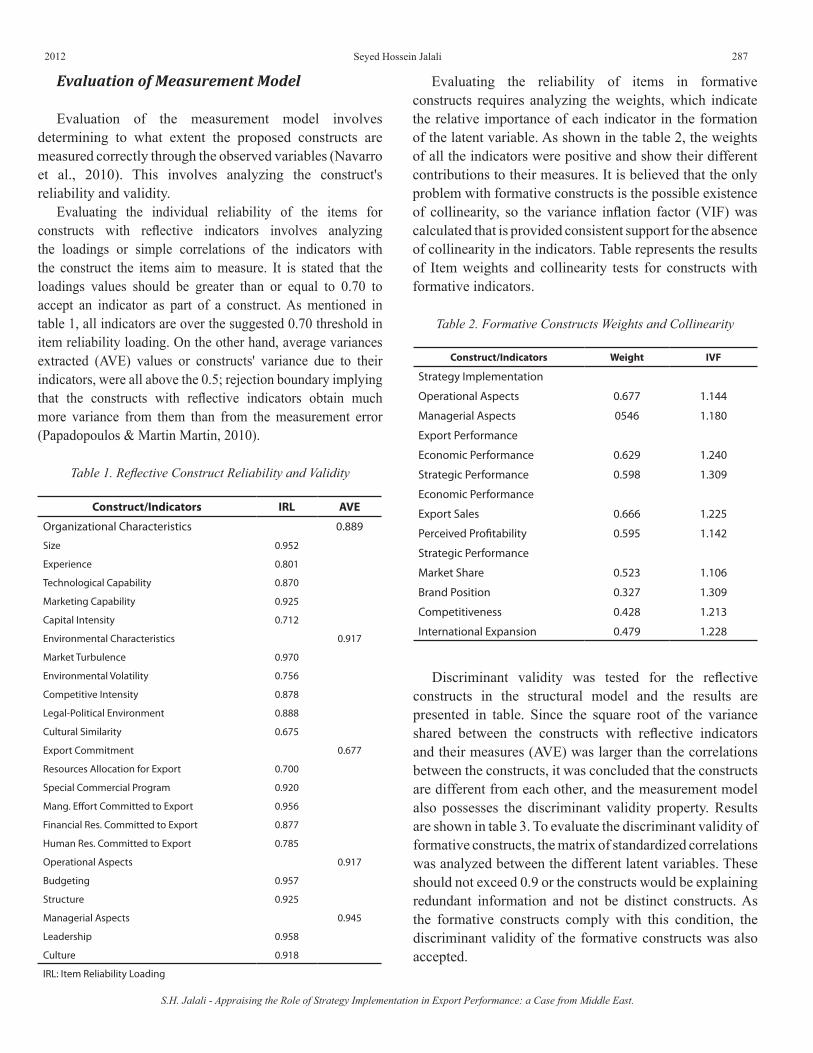
2012 287
Table 1. Reflective Construct Reliability and Validity
Construct/Indicators IRL AVE
Organizational Characteristics 0.889
Size 0.952
Experience 0.801
Technological Capability 0.870
Marketing Capability 0.925
Capital Intensity 0.712
Environmental Characteristics 0.917
Market Turbulence 0.970
Environmental Volatility 0.756
Competitive Intensity 0.878
Legal-Political Environment 0.888
Cultural Similarity 0.675
Export Commitment 0.677
Resources Allocation for Export 0.700
Special Commercial Program 0.920
Mang. Effort Committed to Export 0.956
Financial Res. Committed to Export 0.877
Human Res. Committed to Export 0.785
Operational Aspects 0.917
Budgeting 0.957
Structure 0.925
Managerial Aspects 0.945
Leadership 0.958
Culture 0.918
IRL: Item Reliability Loading
Table 2. Formative Constructs Weights and Collinearity
Construct/Indicators Weight IVF
Strategy Implementation
Operational Aspects 0.677 1.144
Managerial Aspects 0546 1.180
Export Performance
Economic Performance 0.629 1.240
Strategic Performance 0.598 1.309
Economic Performance
Export Sales 0.666 1.225
Perceived Profitability 0.595 1.142
Strategic Performance
Market Share 0.523 1.106
Brand Position 0.327 1.309
Competitiveness 0.428 1.213
International Expansion 0.479 1.228
Discriminant validity was tested for the reflective constructs in the structural model and the results are presented in table. Since the square root of the variance shared between the constructs with reflective indicators and their measures (AVE) was larger than the correlations between the constructs, it was concluded that the constructs are different from each other, and the measurement model also possesses the discriminant validity property. Results are shown in table 3. To evaluate the discriminant validity of formative constructs, the matrix of standardized correlations was analyzed between the different latent variables. These should not exceed 0.9 or the constructs would be explaining redundant information and not be distinct constructs. As the formative constructs comply with this condition, the discriminant validity of the formative constructs was also accepted.
Evaluation of Measurement Model
Evaluation of the measurement model involves determining to what extent the proposed constructs are measured correctly through the observed variables (Navarro et al., 2010). This involves analyzing the construct's reliability and validity.
Evaluating the individual reliability of the items for constructs with reflective indicators involves analyzing the loadings or simple correlations of the indicators with the construct the items aim to measure. It is stated that the loadings values should be greater than or equal to 0.70 to accept an indicator as part of a construct. As mentioned in table 1, all indicators are over the suggested 0.70 threshold in item reliability loading. On the other hand, average variances extracted (AVE) values or constructs' variance due to their indicators, were all above the 0.5; rejection boundary implying that the constructs with reflective indicators obtain much more variance from them than from the measurement error (Papadopoulos & Martin Martin, 2010).
Evaluating the reliability of items in formative constructs requires analyzing the weights, which indicate the relative importance of each indicator in the formation of the latent variable. As shown in the table 2, the weights of all the indicators were positive and show their different contributions to their measures. It is believed that the only problem with formative constructs is the possible existence of collinearity, so the variance inflation factor (VIF) was calculated that is provided consistent support for the absence of collinearity in the indicators. Table represents the results of Item weights and collinearity tests for constructs with formative indicators.
S.H. Jalali - Appraising the Role of Strategy Implementation in Export Performance: a Case from Middle East.
Seyed Hossein Jalali
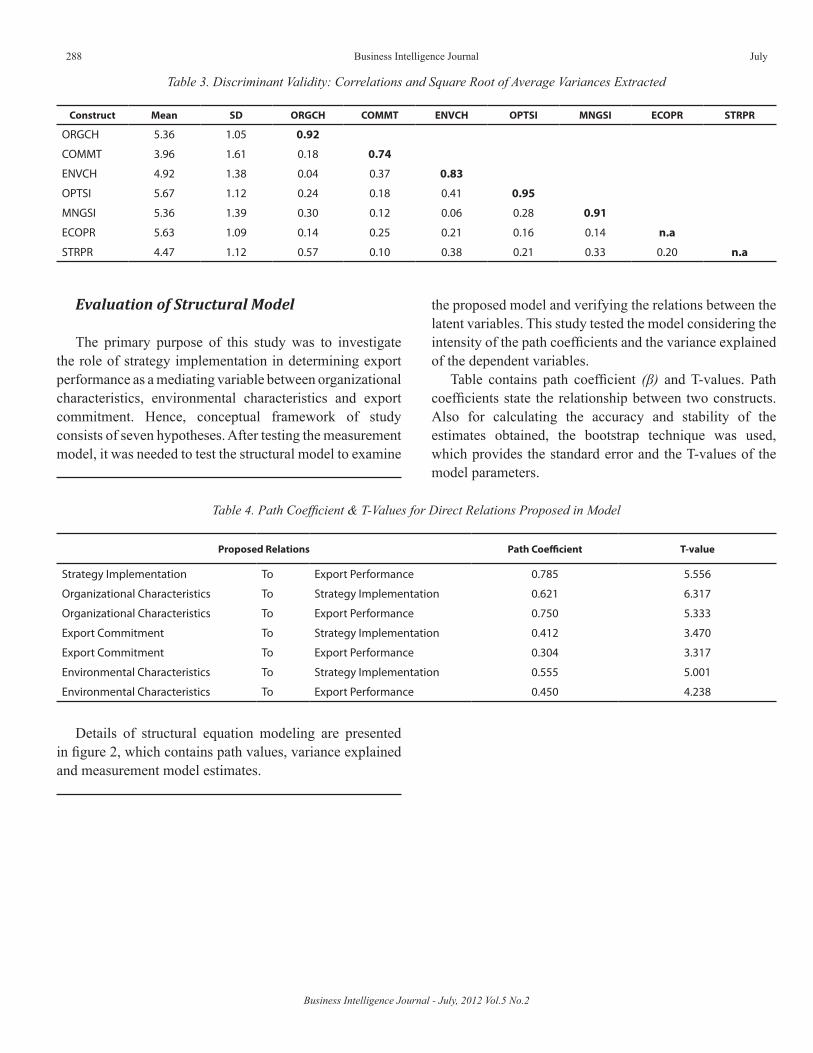
Business Intelligence Journal - July, 2012 Vol.5 No.2
288 Business Intelligence Journal July
Table 3. Discriminant Validity: Correlations and Square Root of Average Variances Extracted
Evaluation of Structural Model
The primary purpose of this study was to investigate the role of strategy implementation in determining export performance as a mediating variable between organizational characteristics, environmental characteristics and export commitment. Hence, conceptual framework of study consists of seven hypotheses. After testing the measurement model, it was needed to test the structural model to examine
Table 4. Path Coefficient & T-Values for Direct Relations Proposed in Model
Proposed Relations Path Coefficient T-value
Strategy Implementation To Export Performance 0.785 5.556
Organizational Characteristics To Strategy Implementation 0.621 6.317
Organizational Characteristics To Export Performance 0.750 5.333
Export Commitment To Strategy Implementation 0.412 3.470
Export Commitment To Export Performance 0.304 3.317
Environmental Characteristics To Strategy Implementation 0.555 5.001
Environmental Characteristics To Export Performance 0.450 4.238
the proposed model and verifying the relations between the latent variables. This study tested the model considering the intensity of the path coefficients and the variance explained of the dependent variables.
Table contains path coefficient (β) and T-values. Path coefficients state the relationship between two constructs. Also for calculating the accuracy and stability of the estimates obtained, the bootstrap technique was used, which provides the standard error and the T-values of the model parameters.
Details of structural equation modeling are presented in figure 2, which contains path values, variance explained and measurement model estimates.
Construct Mean SD ORGCH COMMT ENVCH OPTSI MNGSI ECOPR STRPR
ORGCH 5.36 1.05 0.92
COMMT 3.96 1.61 0.18 0.74
ENVCH 4.92 1.38 0.04 0.37 0.83
OPTSI 5.67 1.12 0.24 0.18 0.41 0.95
MNGSI 5.36 1.39 0.30 0.12 0.06 0.28 0.91
ECOPR 5.63 1.09 0.14 0.25 0.21 0.16 0.14 n.a
STRPR 4.47 1.12 0.57 0.10 0.38 0.21 0.33 0.20 n.a
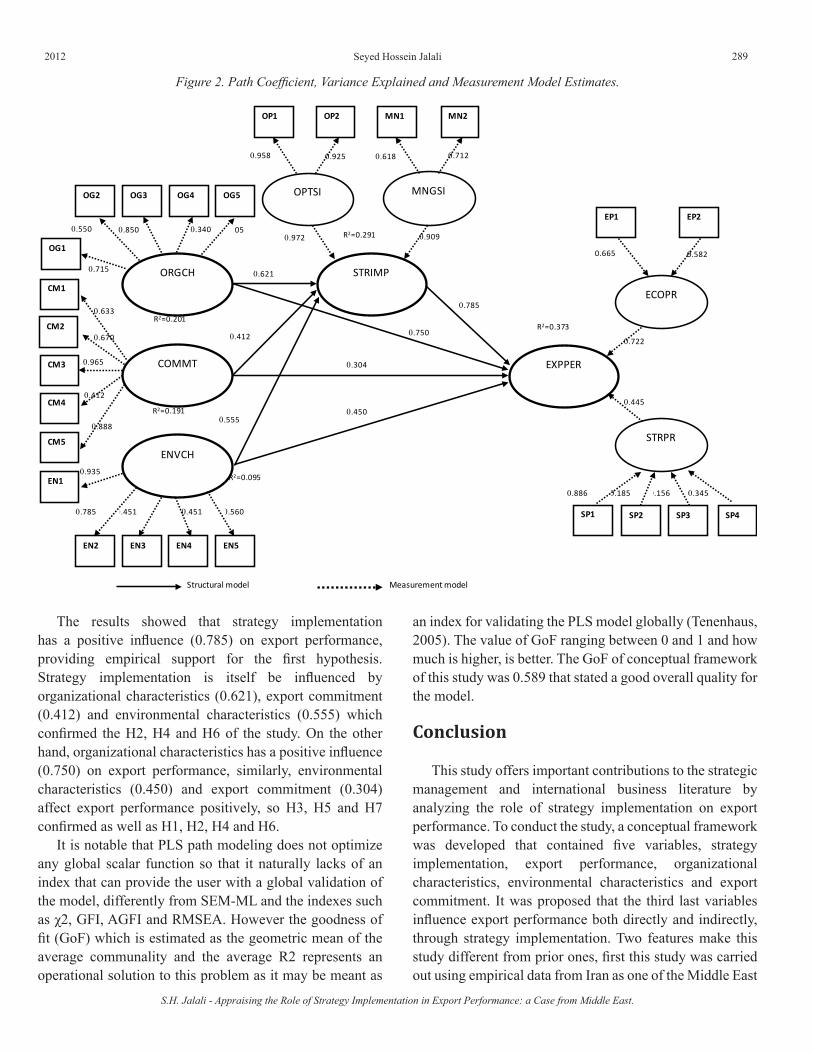
2012 289
Figure 2. Path Coefficient, Variance Explained and Measurement Model Estimates.
R2=0.201
R2=0.191
R2=0.095
0.750
0.555
0.412
0.621
0.450
0.304
0.785
0.670
0.965
0.412
0.888
0.935
0.560
0.205
0.4510.4510.785
0.633
0.715
0.550 0.3400.8500.9090.972
0.958 0.925 0.618 0.712
0.1560.185 0.3450.886
0.445
0.722
0.5820.665
R2=0.373
R2=0.291
EXPPER
STRIMP
ENVCH
COMMT
ORGCH
EP1 EP2
SP2SP1 SP3 SP4
MN2MN1OP1 OP2
CM1
CM5
CM2
CM3
OG1
OG2 OG3 OG4
EN1
EN2 EN3 EN4
CM4
EN5
OG5
STRPR
MNGSI
ECOPR
OPTSI
Structural model Measurement model
The results showed that strategy implementation has a positive influence (0.785) on export performance, providing empirical support for the first hypothesis. Strategy implementation is itself be influenced by organizational characteristics (0.621), export commitment (0.412) and environmental characteristics (0.555) which confirmed the H2, H4 and H6 of the study. On the other hand, organizational characteristics has a positive influence (0.750) on export performance, similarly, environmental characteristics (0.450) and export commitment (0.304) affect export performance positively, so H3, H5 and H7 confirmed as well as H1, H2, H4 and H6.
It is notable that PLS path modeling does not optimize any global scalar function so that it naturally lacks of an index that can provide the user with a global validation of the model, differently from SEM-ML and the indexes such as χ2, GFI, AGFI and RMSEA. However the goodness of fit (GoF) which is estimated as the geometric mean of the average communality and the average R2 represents an operational solution to this problem as it may be meant as
an index for validating the PLS model globally (Tenenhaus, 2005). The value of GoF ranging between 0 and 1 and how much is higher, is better. The GoF of conceptual framework of this study was 0.589 that stated a good overall quality for the model.
Conclusion
This study offers important contributions to the strategic management and international business literature by analyzing the role of strategy implementation on export performance. To conduct the study, a conceptual framework was developed that contained five variables, strategy implementation, export performance, organizational characteristics, environmental characteristics and export commitment. It was proposed that the third last variables influence export performance both directly and indirectly, through strategy implementation. Two features make this study different from prior ones, first this study was carried out using empirical data from Iran as one of the Middle East
S.H. Jalali - Appraising the Role of Strategy Implementation in Export Performance: a Case from Middle East.
Seyed Hossein Jalali
Business Intelligence Journal - July, 2012 Vol.5 No.2
290 Business Intelligence Journal July
countries, where export performance related topics have not been widely investigated, since of huge export of oil in comparison to other goods. Second, this study considered strategy implementation as a key variable and tried to explain its role in export performance of organizations. This study also differentiated by prior studies in methodological aspects such as using PLS method.
The conceptual framework of the study and its hypotheses get full empirical support. The results confirmed the positive influence of organizational characteristics (0.621), environmental characteristics (0.555) and export commitment (0.412) on strategy implementation in international field. Many studies investigate the role of these constructs on export performance without regarding the role of strategy implementation. The path coefficient for the relationship between strategy implementation and export performance was 0.758, providing empirical support for the relationship between these construct and it could be said that strategy implementation has a positive effect on export performance and also play a mediating role between organizational characteristics, environmental characteristics and export commitment with export performance. On the other hand PLS analysis resulted in confirmation of direct and positive influence of organizational characteristics (0.750), environmental characteristics (0.450) and export commitment (0.304) on export performance.
Examination of the empirical findings leads important observations concerning export performance. The first is that export performance can be defined as a formative first- and second-order construct that is consistent with some prior researches. Evaluations of measurement models support this conclusion. On the other hand, export performance was considered as being the result of two dimensions, strategic and economic that the contribution of economic dimension was larger than that of the strategic dimension. Some studies such as Papadopoulos & Martin Martin (2010) reported this result before. One possible reason is the tendency of manager to use quantitative criteria for evaluating export performance such as sales volume, export costs, profitability per sales and other indexes. It is notable that in developing countries quantitative criteria have more popularity and are used in policy making, however, decision makers should understand which are the significant determinants associated with their selected indicator of export performance; thus assuring a correct evaluation of organization export success. The correct selection of export performance indicator could also help managers to improve their export performance.
According to the results, decision makers should be conscious that a central role in improving export performance is played by strategy implementation. So decision makers should control the process of implementation and identify the possible obstacles that hider the proper implementation of strategic plans. It means that they should employ managers with experience in international business; allocating specific resources for implementing the strategies; modifying organizational culture and structure according to international markets and establish contacts with public or private institutions that can facilitate operations in international context. It is also important to refer to export commitment as a determinant factor of strategy implementation in international context; export commitment has a decisive influence on the success of international strategic actions, because commitment to export resulted in more resource allocation to international activities that facilitate strategy implementation.
The most limitation of this study relates to it sample. The study was based on a single country, Iran. Despite the fact that the majority of the empirical studies in the field of export performance were performed with single country samples, future studies based on samples from various countries would be able to generalize the findings of the current research by replicating the model using samples elsewhere.
References
Alvarez RE (2004). Sources of export success in small-and medium-sized enterprises: The impact of public programs. Int. Bus. Rev. 13(3): 383-402.
Baldauf A, Cravens DW, & Wagner U (2000). Examining determinants of export performance in small open economies. J. World. Bus. 35(1): 61-79.
Bello DC, Chelariu D, & Zhang L. (2003). The effect of output controls, process controls and flexibility on export channel performance. J. Mark. 61(1): 22-38.
Brouthers LE, & Nakos G (2005). The role of systematic international market selection of small firms' export performance. J. Small. Bus. Manage. 43(4): 363-381.
Cadogan J, Sandqvist W, Salmineni S, & Puumalainen RTK (2005). Export marketing, interfunctional interactions, and performance consequences. J. Acad. Mark. Sci. 33(4): 520-535.
Etemad H (2004). Internationalization of small and medium-sized enterprises: A grounded theoretical framework. Can. J. Adm. Sci. 21: 1-21.
2012 291
Ghauri PN, Lutz CH, & Tesform, G (2003). Using business networks to solve export marketing problems of small and medium-sized manufacturing firms from developing countries. Euro. J. Mark. 37(5/6): 728-752.
Harrington RJ (2006). The moderating effects of size, manager tactics and involvement on strategy implementation in food service. Hosp. Manage. 25: 373-397.
Heracleous L (2000). The role of strategy implementation in organization development. Organ. Dev. J. 18: 75-86.
Katsikeas CS, Leonidou LC, & Morgan NA (2000). Firm level export performance assessment: Review, evaluation, and development. J. Acad. Mark. Sci. 28(4): 493-511.
Khanna T, & Yafeh Y (2005). Business groups and risk sharing around the world. J. Bus. 78(1): 301-340.
Lado N, Martinez-Ros E, & Valenzuela A (2004). Identifying successful marketing strategies by export regional destination. Int. Mark. Rev. 21(6): 573-597.
Lages LF, & Montgomery DB (2004). Export performance as an antecedent of export commitment and marketing strategy adaptation, Evidence from small and medium- sized exporters. Euro. J. Mark. 38(9/10): 1186-1214.
Lee J, & Habte-Giorgis, B (2004). Empirical approach to the sequential relationships between firm strategy, export activity, and performance in U.S. manufacturing firms. Int. Bus. Rev. 13: 101-129.
Lehner J (2004). Strategy implementation tactics as response to organizational, strategic, and environmental imperatives. Manage. Rev. 15: 460-480.
Leonidou LC (2003). Overcoming the limits of exporting research using the relational paradigm. Int. Mark. Rev. 20(2): 129-141.
Leonidou LC, Katsikeas CS, & Samiee S (2002). Marketing strategy determinants of export performance: a meta-analysis. J. Bus. Res. 55: 51-67.
Matanda MJ & Freeman S (2009). Effect of perceived environmental uncertainty on exporter–importer inter-organisational relationships and export performance improvement. Int. Bus. Rev. 18: 89-107.
Morgan N, Kaleka A, & Katsikeas C (2004). Antecedents of export venture performance: a theoretical model and empirical assessment. J. Mark. 68(1): 90-108.
Navarro A, Losada F, Ruzo E, & Diez JA (2010). Implications of perceived competitive advantages, adaptation of marketing tactics and export commitment on export performance. J. World. Bus. 45: 49-58.
O'Cass A (2003). Examining firm and environmental influences on export marketing mix strategy and export performance of Australian exporters. Euro. J. Mark. 37(3/4): 366-384.
Okumus F (2003). A framework to implement strategies in organizations. Manage. Decis. 41(9): 871-882.
Okumus F (2001). Towards a strategy implementation framework. Int. J. Contemp. Hosp. Manage. 13: 327-338.
Papadopoulos N, & Martin Martin O (2010). Toward a model of the relationship between internationalization and export performance. Int. Bus. Rev. 19: 388-406.
Parhizkar O, Miller CR, & Smith RL (2010). Private sector development implications of the export performance determinants of U.S. small–medium forest enterprises to Mexico, Europe, and Asia. Forest. Policy. Econ. 12: 387-396.
Rapert MI, Velliquette A, & Garretson JA (2002). The strategic implementation process evoking strategic consensus through communication. J. Bus. Res. 55: 301-310.
Schaap JI. (2006). Toward strategy implementation success: An empirical study of the role of senior-level leaders in the Nevada gaming industry. UNLV Game. Res. Rev. J. 10: 13-37.
Singh DA (2009). Export performance of emerging market firms. Int. Bus. Rev. 18: 321-330.
Sousa CMP, Martínez-López FJ, & Coelho F (2008). The determinants of export performance: a review of the research in the literature between 1998 and 2005. Int. J. Manage. Rev. 10(4): 343–374.
Stoian MC , Rialp A, & Rialp J (2011). Export performance under the microscope: A glance through Spanish lenses. Int. Bus. Rev. 20: 117-135.
Styles C, Patterson PG, & Ahmed F (2008). A relational model of export performance. J. Int. Bus. Stud. 39: 890-900.
Taslak S (2004). Factors restricting success of strategic decisions: evidence from the Turkish textile industry, Euro. Bus. Rev. 16(2): 152-164.
Tenenhaus M, Esposito-Vinzi V, Chatelin YM, & Lauro C (2005). PLS path modeling. Comput. Stat. Data. Anal. 48: 159-205.
Wheeler C, Ibeh K, & Dimitratos P (2008). UK export performance research: Review and implications. Int. Small. Bus. J. 26(2): 207-239.
S.H. Jalali - Appraising the Role of Strategy Implementation in Export Performance: a Case from Middle East.
Seyed Hossein Jalali

Business Intelligence Journal - July, 2012 Vol.5 No.2
292 Business Intelligence Journal July
FACTORS AFFECTING THE END-USER COMPUTING SATISFACTION
Mohsen DastgirProfessor in Accounting & Finance, Islamic Azad University-Science
and Research Branch-Esfahan, IranEmail: [email protected]
Ahmad S. MortezaieMA in Accounting, Shahid Chamran University-Iran
Email: [email protected]
AbstractIn this study we investigate factors that are affecting the end-user computing of accounting information system satisfaction from
financial managers’ point of view. Our sample is selected from companies listed on Tehran Stock Exchange. This research is a descriptive – empirical field study. The required data is collected by sending out questionnaires to the financial managers of the sampled companies.Our findings indicate that, the information content, ease of using accounting information system, accuracy and correctness of information, format of the reports and timeliness of information have an impact on the end-user computing satisfaction. Key words: Accounting Information Systems, End-User, Satisfaction.
Accounting information systems (AIS) fulfill the role of gathering, processing, classifying and reporting financial transactions with the aim of recording, attention seeking and decision-making by end-user of such information.
Simon (1987) explains the main role of AIS as providing information in the form of daily or weekly reports for decision-making and performance evaluation. Gelderman (1998) argues that the success of an organization is due to the decisions that are taken and the level of reliability of such decisions is related to the quality of information provided for decision-making. The quality of the information is also related to the success of the information system.
The success of information system (IS) is important to organizations because they are making huge investment in information systems. Srinivasan (1985) argues that measuring IS success is important for organizations and researchers. Powers and Dickson (1973), Ives et al (1983), Igbaria, and Nachman (1990), Chen et al. (2000), Lin, and Shao (2000), Al-Adwani (2003), Zviran and Erlich (2003) argue that one measure of IS success is end-user computing satisfaction.
The success of an IS can be viewed from three dimensions, information content, information timeliness, information collection and classification. Information content consists of financial and non-financial information
for predicting future events. Timeliness is related to ability of IS to provide systematic and periodic reports. Collection and classification of information is related to different types of collecting and classifying information in a specific time period.
Mahmood et al. (2000) suggests that studying the user satisfaction because of the ease of study is one of most appropriate and common ways of assessing IS, and that is why researchers focus of the definition of end-users and their satisfaction. Davis and Olson (1985) pointing out to the primary and secondary users of IS. Primary users are responsible of entering data to the IS and working with software, but secondary users are those who make decision based on the reports provide by IS.
Lefkovits (1979) by pointing to direct and indirect users of IS, believes that indirect users, use IS via other people and direct users are interacting with IS. Doll and Torkzadeh (1988) define users of IS as those who are interacting with information systems, using the information provided by them to make decisions. They believe user satisfaction is an important criterion for measuring the success of IS.
Bailey and Pearson (1983) argue that user satisfaction is related to different dimensions of an IS and they believe that an information system can provide them with required information anytime they need it. Rahat (2005) argues that
2012 293
Dastgir M., Mortezaie A. S. - Factors Affecting the End-User Computing Satisfaction
Mohsen Dastgir, Ahmad S. Mortezaie
satisfaction depends on technology that supports financial managers’ decision making. In this definition technology is referred to the computer systems (soft ware and hardware) and customer support (training and helping users). He believes that user satisfaction is a positive perspective influenced of using information systems by people who one way another interact with these systems, and because of complex interrelationship that exists in the duties of information systems users, separate analysis of the factors having impact on user satisfaction is difficult.
Previous Studies
User satisfaction is an important criterion for measuring the success of IS. Though indirect, it is the most prevalent measure of IS success due to its applicability and ease of use (Melone, 1990; Mahmood et al., 2000).
With regard to the information discrepancies, information systems are designed for providing important and usefull information for the users and also for the uniformity of data provided. Somers et al. (2003), argue that behavioural aspects of user computing are the best measure of evaluating satisfaction. On the other hand user satisfaction tends to improve their behaviour and function and lends to the success of information systems. Success cannot be attributed to a single factor. Complex relations of interdependence exist between the Information System and its environment, organization, users, and management. Thus, for example, improvements in organizational performance (such as reduced costs and increased income) cannot be attributed solely to the information system. Improvements may also result from other organizational changes, such as a modification of work processes, introduction of new work procedures, or personnel training (Gallagher, 1974; Goodhue, 1986).
Powers and Dickson (1973) studied factors affecting IS success, and identified user satisfaction as one of the key factors affecting it. They assumed that if users are satisfied with an information system, they use it. Therefore, satisfaction is a good measure of IS success. On the other hand, if the users are not satisfied with the information system, they are unlikely to use it. Therefore, to improve an information system, it is important to know how the opinion of the users about it, and where its weak points lie. Ives et. al., (1983) suggest that user satisfaction to be used as the degree to which users believe that the information system at their disposal fulfils their needs. User satisfaction provides a significant surrogate for the critical product
of the information system – which cannot be measured – namely, changes in organizational effectiveness.
Baroudi, et. al. (1986), conclude that user satisfaction lead to system use, and thus, should be considered as a measure of the success of an information system.
Igbaria and Nachman (1990) studied 104 end users in six large companies. They found a positive relationship between user satisfaction and hardware/software accessibility and availability, and system utilization.
Gelderman (1998) studies the validity and the mutual relations of the two commonly used measures for the success of IS: usage and user satisfaction. The results of the study indicate that user satisfaction is significantly related to IS performance. The study provides empirical evidence for the popular assumption that user satisfaction is the most appropriate measure of IS success. He argues that EUCS is a good predictor of an application’s impact on organizational performance and, thus, a useful surrogate for system success.
The concept of IS user satisfaction can be traced to the work of Cyert and March (1963) who proposed that an information system which met the needs of its users would reinforce satisfaction with the system (Ives et al., 1983). After this initial study, IS user satisfaction was the subject of lively research that reached its peak in the late 1980s (Iivari, 1997).
Mahmood et al. (2000) focused their study on IS user satisfaction. Their research synthesized and validated the construct of IS user satisfaction using a meta-analysis. They analyzed the empirical results of 45 user-satisfaction studies published between 1986 and 1998, focusing on the relationship between user satisfaction and nine variables identified in these studies. They found positive support for the influence of all nine variables on information system user satisfaction.
Chen et al. (2000) studied the measurement of user satisfaction with data warehouses. They identified the underlying factors of end-user satisfaction with data warehouses and developed an instrument to measure these factors. Their study demonstrated that most items in classic end user satisfaction measures were also valid in a data warehouse environment.
Tools for Measuring User Satisfaction
Appropriate tools for measuring user satisfaction and for identifying weak points or failures are imperative for accurate assessment of IS success. To meet this need,
Business Intelligence Journal - July, 2012 Vol.5 No.2
294 Business Intelligence Journal July
a number of tools were developed. Gallagher (1974) developed a method for measuring perceptions of the value of a Management Information System. He constructed a questionnaire focusing on users’ perceptions of the value of the information included in reports produced by the information system, and tested it by examining the answers of 75 managers who used an information system in a specific organization.
Jenkins and Ricketts (1979) developed an instrument for measuring user satisfaction based on literature reviews and interviews, and tested it in five laboratory experiments with 197 participants. The instrument consisted of 20 items presented as features of five factors: input procedure, system processing, report content, report format, and report value. Ives et al. (1983) and Conrath and Mignen (1990) argued that the instrument focused on information system products, and did not cover the services of information system departments. Joshi (1990) noted that the measure developed by Jenkins and Ricketts was suitable for a specific decision support system (DSS) environment, but, again, might not be applicable to a general information system environment.
Larcker and Lessig (1980) developed a measure based on their interviews, and tested it in a decision-making study with 29 graduate students. Ives et al. (1983) criticized the reliability and validity of this tool, arguing that it was created and tested in an artificial environment, and therefore was not applied to real-life information system environments or to typical information system problems.
Bailey and Pearson (1983) launched a 39-question tool for measuring user satisfaction, and tested it on 32 managers from eight organizations. Bailey and Pearson’s work is considered the most important contribution to the development of a tool for measuring and analyzing user satisfaction (Conrath and Mignen, 1990). DeLone and McLean (1992) affirmed that Bailey and Pearson’s tool is a reliable instrument for measuring satisfaction and for conducting comparison studies. Klenke (1992) found that Bailey and Pearson was the most widely used instrument for measuring users’ satisfaction with information system.
Ives et al. (1983) duplicated and expanded Bailey and Pearson’s findings, and developed a short, 13-question tool based on their questionnaire. Initially, to reinforce the reliability and validity of the Bailey and Pearson questionnaire (as Bailey and Pearson’s sample was too small statistically, 29 respondents for a 39-item questionnaire), Baroudi and Orlikowski (1988) performed a psychometric evaluation of this short questionnaire. They collected
questionnaires from 358 users of transactions processing systems in 26 organizations, and performed a reliability and validity tests of the short questionnaire. The short questionnaire was shown to be valid and reliable.
Olson and Baroudi (1983), who reviewed and critically analyzed pervious studies, argued convincingly for the adoption of the instrument designed by Bailey and Pearson (1983) on the basis of reliability, content, and predictive and construct validity. They also tested and recommended adoption of Ives and al.’s (1983) shorter and enhanced questionnaire. A long list of studies using either Bailey and Pearson’s tool or Ives et al.’s short questionnaire can be found in the literature. Some studies used only parts of Bailey and Pearson’s questionnaire.
Etezadi-Amoli and Farhoomand (1991) criticized the manner in which the questionnaire was composed. They questioned the fact that respondents were asked to rate the frequency of satisfaction with features of the system, rather than their degree of satisfaction. They further claimed that the importance of each question was not measured, that reducing the number of questions from 40 to 12 was not carried out properly, and claimed that the tool had validity problems. Doll et al. (1994) performed a confirmatory factor analysis based on a sample of 409 respondents from 18 organizations to test alternative models of underlying factor structure and assess the reliability and validity of factors and items. The results provided some support for the Doll and Torkzadeh tool. McHaney et al. (2002) administered the Doll and Torkzadeh tool to Taiwanese end-users of typical business software applications. Their research provided evidence that the instrument was a valid and reliable measure in Taiwanese applications. Their findings strengthen the argument that the tool remains valid outside of the United States.
Etrzadi-Amoli and Farhoomand (1996) developed a questionnaire for measuring end-user satisfaction. The questionnaire consisted of 27 items measuring the satisfaction of end-users with a specific application, and 4 items measuring the implications of the application for the user and his or her work environment. The questionnaire was administered to 341 respondents in 22 organizations. Etezadi-Amoli and Farhoomand performed an explorative factor analysis, correlated the items with the seven derived factors, and deleted two items from the questionnaire. They later defined a model which correlated between the six satisfaction factors and the factor of user performance and examined the quality of the model through confirmatory factor analysis. They found a relation between end-user
2012 295
satisfaction and user performance, but concluded that further research was needed to determine the nature of this relation.
However, no single measure is widely accepted and no group of measures is used by all organizations. Most tools were developed following a review of the existing literature and tested using interviews, surveys, or a combination of the two. After reviewing the above literature in this study we have adapted an instrument developed by Doll and Torkzadeh (1991) and Bailey and Pearson (1983). Originally developed by Doll and Torkzadeh (1988), five factors (i.e., information content, format, accuracy, ease of use, and timeliness) are considered to have influence on end-user computing satisfaction (EUCS). The EUCS instrument developed by Doll and Torkzadeh (1991) has been widely used (Chin and Newsted (1990), Essex and Magal (1998), Etezadi-Amoli and Farhoomand (1996), Gatian (1994), Gelderman (1998), Igbaria and Zaviran (1991), McHaney and Cronan (1998, 2000)) to measure a user’s satisfaction with a specific application.
Based on the above studies five variables namely, information content, format, accuracy, ease of use, and timeliness was selected as research variables which can affect the end user satisfaction of accounting information system.
Hypotheses
After reviewing relevant literature and theories, for studying factors affecting the end user satisfaction of accounting information system following research hypotheses are set up.1. Information content of accounting information system
affect end user satisfaction2. Accuracy of information provided by accounting
information system affect end user satisfaction3. Format of the reports of accounting information system
affect end user satisfaction4. Ease of use of accounting information system affect
end user satisfaction5. Timeliness of information provided by accounting
information system affect end user satisfaction
Moderator Variables
Hypotheses based on moderator variables are set up to see whether such variables have any impact on the respondents' responses to the research questions. One
expects that such variables do not influence the way that respondents reply to the questions in the questionnaire.
Since the questionnaires were sent to the financial managers of the sampled companies, therefore, respondents' level of education, respondents' field of education and respondents’ job experience are the variables that one expects to affect respondents’ reply to the questions in the questionnaire.
Hypothesis 1: Levels of respondents' education have no impact on evaluation of the effectiveness of accounting information system.
Hypothesis 2: Field of respondents' education has no impact on evaluation of the effectiveness of accounting information system.
Hypothesis 3: Job experience of the respondents has no impact on evaluation of the effectiveness of accounting information system.
Research Method
Sample and Data Collection
The sample of this study consists of all financial managers of the companies listed on Tehran's stock exchange. Up to April 2010 there were 337 companies listed in Tehran's stock exchange. Companies are divided into different industries and 80 companies randomly selected using sampling with no replacement process.
Based on the studies by Doll and Torkzadeh (1991) and Bailey and Pearson (1983) a questionnaire is designed. The questions are on the five point Likert type questions, with a choice of very little to very much. The questionnaire consists of twenty two questions, which were carefully designed to collect relevant data. The revised instrument and a cover letter were mailed to the specific individual who was listed as financial managers of the sampled firms. A reminder was sent and non-respondents were followed up with two additional mailings. Finally 72 usable questionnaires are received.
Validity and Reliability
The data collection instrument of this study is designed based on previous studies namely, Doll and Torkzadeh (1991) and Bailey and Pearson (1983) in addition to
Dastgir M., Mortezaie A. S. - Factors Affecting the End-User Computing Satisfaction
Mohsen Dastgir, Ahmad S. Mortezaie
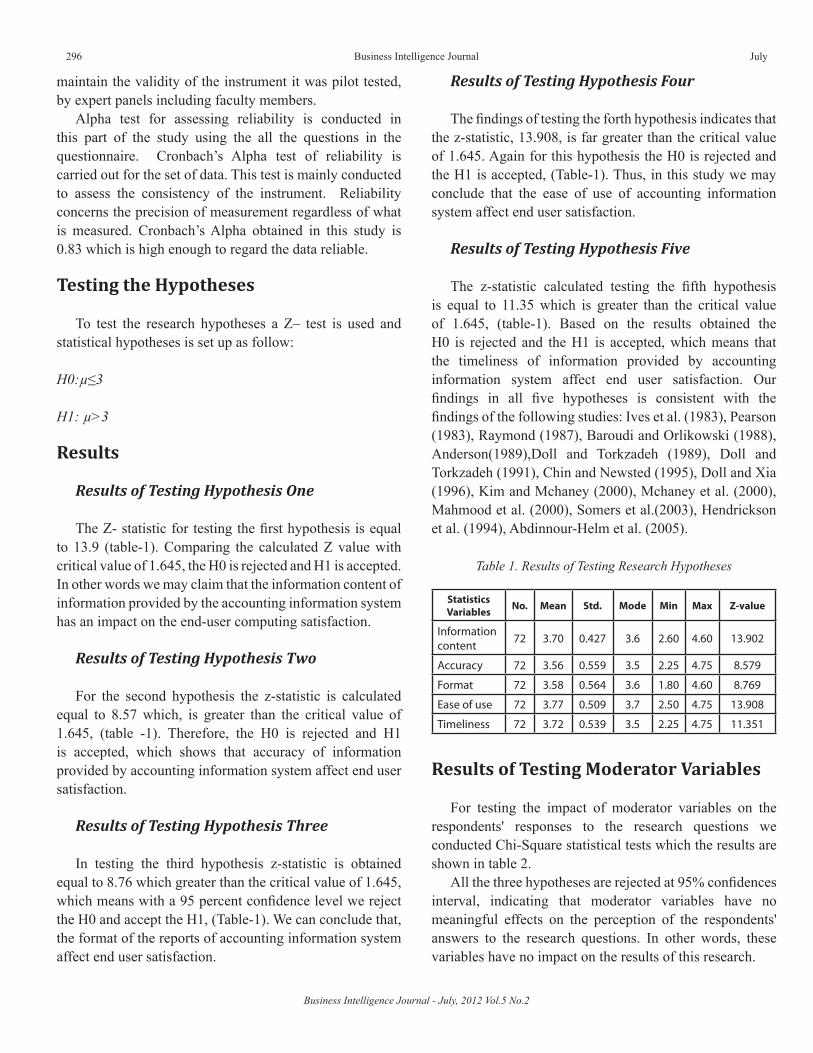
Business Intelligence Journal - July, 2012 Vol.5 No.2
296 Business Intelligence Journal July
maintain the validity of the instrument it was pilot tested, by expert panels including faculty members.
Alpha test for assessing reliability is conducted in this part of the study using the all the questions in the questionnaire. Cronbach’s Alpha test of reliability is carried out for the set of data. This test is mainly conducted to assess the consistency of the instrument. Reliability concerns the precision of measurement regardless of what is measured. Cronbach’s Alpha obtained in this study is 0.83 which is high enough to regard the data reliable.
Testing the Hypotheses
To test the research hypotheses a Z– test is used and statistical hypotheses is set up as follow:
H0:µ≤3
H1: µ>3
Results
Results of Testing Hypothesis One
The Z- statistic for testing the first hypothesis is equal to 13.9 (table-1). Comparing the calculated Z value with critical value of 1.645, the H0 is rejected and H1 is accepted. In other words we may claim that the information content of information provided by the accounting information system has an impact on the end-user computing satisfaction.
Results of Testing Hypothesis Two
For the second hypothesis the z-statistic is calculated equal to 8.57 which, is greater than the critical value of 1.645, (table -1). Therefore, the H0 is rejected and H1 is accepted, which shows that accuracy of information provided by accounting information system affect end user satisfaction.
Results of Testing Hypothesis Three
In testing the third hypothesis z-statistic is obtained equal to 8.76 which greater than the critical value of 1.645, which means with a 95 percent confidence level we reject the H0 and accept the H1, (Table-1). We can conclude that, the format of the reports of accounting information system affect end user satisfaction.
Results of Testing Hypothesis Four
The findings of testing the forth hypothesis indicates that the z-statistic, 13.908, is far greater than the critical value of 1.645. Again for this hypothesis the H0 is rejected and the H1 is accepted, (Table-1). Thus, in this study we may conclude that the ease of use of accounting information system affect end user satisfaction.
Results of Testing Hypothesis Five
The z-statistic calculated testing the fifth hypothesis is equal to 11.35 which is greater than the critical value of 1.645, (table-1). Based on the results obtained the H0 is rejected and the H1 is accepted, which means that the timeliness of information provided by accounting information system affect end user satisfaction. Our findings in all five hypotheses is consistent with the findings of the following studies: Ives et al. (1983), Pearson (1983), Raymond (1987), Baroudi and Orlikowski (1988), Anderson(1989),Doll and Torkzadeh (1989), Doll and Torkzadeh (1991), Chin and Newsted (1995), Doll and Xia (1996), Kim and Mchaney (2000), Mchaney et al. (2000), Mahmood et al. (2000), Somers et al.(2003), Hendrickson et al. (1994), Abdinnour-Helm et al. (2005).
StatisticsVariables No. Mean Std. Mode Min Max Z-value
Information content 72 3.70 0.427 3.6 2.60 4.60 13.902
Accuracy 72 3.56 0.559 3.5 2.25 4.75 8.579
Format 72 3.58 0.564 3.6 1.80 4.60 8.769
Ease of use 72 3.77 0.509 3.7 2.50 4.75 13.908
Timeliness 72 3.72 0.539 3.5 2.25 4.75 11.351
Table 1. Results of Testing Research Hypotheses
Results of Testing Moderator Variables
For testing the impact of moderator variables on the respondents' responses to the research questions we conducted Chi-Square statistical tests which the results are shown in table 2.
All the three hypotheses are rejected at 95% confidences interval, indicating that moderator variables have no meaningful effects on the perception of the respondents' answers to the research questions. In other words, these variables have no impact on the results of this research.
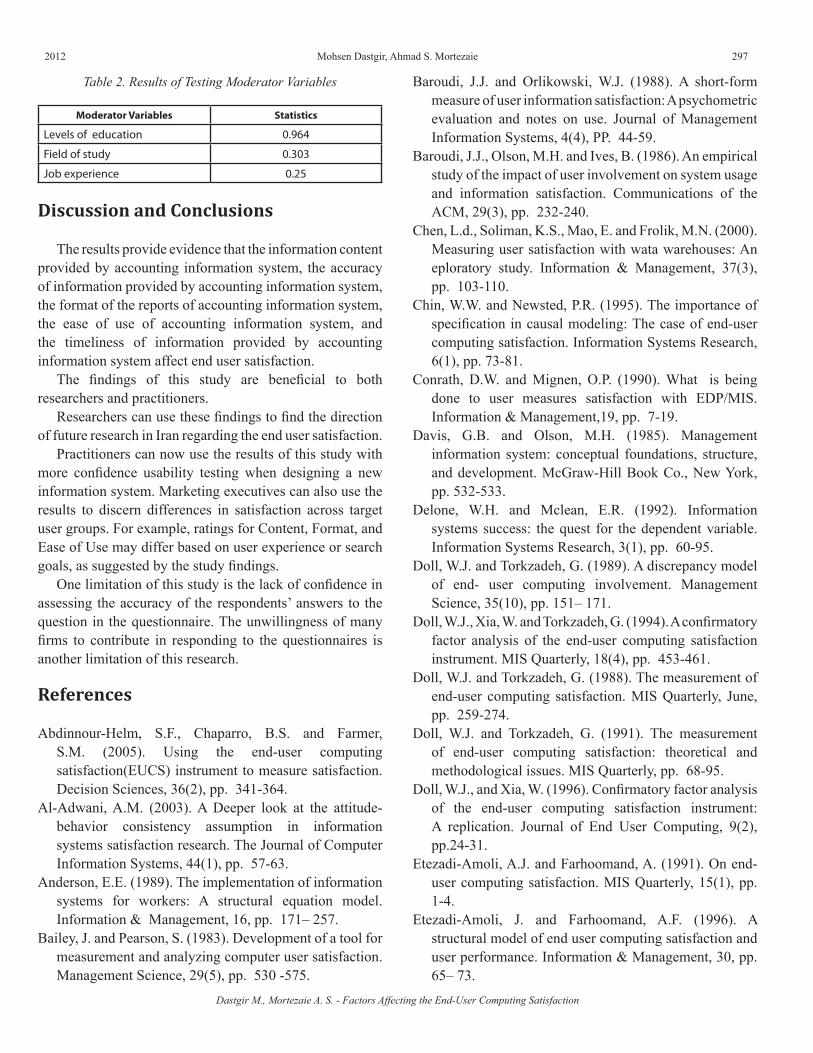
2012 297
Table 2. Results of Testing Moderator Variables
Moderator Variables Statistics
Levels of education 0.964
Field of study 0.303
Job experience 0.25
Discussion and Conclusions
The results provide evidence that the information content provided by accounting information system, the accuracy of information provided by accounting information system, the format of the reports of accounting information system, the ease of use of accounting information system, and the timeliness of information provided by accounting information system affect end user satisfaction.
The findings of this study are beneficial to both researchers and practitioners.
Researchers can use these findings to find the direction of future research in Iran regarding the end user satisfaction.
Practitioners can now use the results of this study with more confidence usability testing when designing a new information system. Marketing executives can also use the results to discern differences in satisfaction across target user groups. For example, ratings for Content, Format, and Ease of Use may differ based on user experience or search goals, as suggested by the study findings.
One limitation of this study is the lack of confidence in assessing the accuracy of the respondents’ answers to the question in the questionnaire. The unwillingness of many firms to contribute in responding to the questionnaires is another limitation of this research.
References
Abdinnour-Helm, S.F., Chaparro, B.S. and Farmer, S.M. (2005). Using the end-user computing satisfaction(EUCS) instrument to measure satisfaction. Decision Sciences, 36(2), pp. 341-364.
Al-Adwani, A.M. (2003). A Deeper look at the attitude-behavior consistency assumption in information systems satisfaction research. The Journal of Computer Information Systems, 44(1), pp. 57-63.
Anderson, E.E. (1989). The implementation of information systems for workers: A structural equation model. Information & Management, 16, pp. 171– 257.
Bailey, J. and Pearson, S. (1983). Development of a tool for measurement and analyzing computer user satisfaction. Management Science, 29(5), pp. 530 -575.
Baroudi, J.J. and Orlikowski, W.J. (1988). A short-form measure of user information satisfaction: A psychometric evaluation and notes on use. Journal of Management Information Systems, 4(4), PP. 44-59.
Baroudi, J.J., Olson, M.H. and Ives, B. (1986). An empirical study of the impact of user involvement on system usage and information satisfaction. Communications of the ACM, 29(3), pp. 232-240.
Chen, L.d., Soliman, K.S., Mao, E. and Frolik, M.N. (2000). Measuring user satisfaction with wata warehouses: An eploratory study. Information & Management, 37(3), pp. 103-110.
Chin, W.W. and Newsted, P.R. (1995). The importance of specification in causal modeling: The case of end-user computing satisfaction. Information Systems Research, 6(1), pp. 73-81.
Conrath, D.W. and Mignen, O.P. (1990). What is being done to user measures satisfaction with EDP/MIS. Information & Management,19, pp. 7-19.
Davis, G.B. and Olson, M.H. (1985). Management information system: conceptual foundations, structure, and development. McGraw-Hill Book Co., New York, pp. 532-533.
Delone, W.H. and Mclean, E.R. (1992). Information systems success: the quest for the dependent variable. Information Systems Research, 3(1), pp. 60-95.
Doll, W.J. and Torkzadeh, G. (1989). A discrepancy model of end- user computing involvement. Management Science, 35(10), pp. 151– 171.
Doll, W.J., Xia, W. and Torkzadeh, G. (1994). A confirmatory factor analysis of the end-user computing satisfaction instrument. MIS Quarterly, 18(4), pp. 453-461.
Doll, W.J. and Torkzadeh, G. (1988). The measurement of end-user computing satisfaction. MIS Quarterly, June, pp. 259-274.
Doll, W.J. and Torkzadeh, G. (1991). The measurement of end-user computing satisfaction: theoretical and methodological issues. MIS Quarterly, pp. 68-95.
Doll, W.J., and Xia, W. (1996). Confirmatory factor analysis of the end-user computing satisfaction instrument: A replication. Journal of End User Computing, 9(2), pp.24-31.
Etezadi-Amoli, A.J. and Farhoomand, A. (1991). On end-user computing satisfaction. MIS Quarterly, 15(1), pp. 1-4.
Etezadi-Amoli, J. and Farhoomand, A.F. (1996). A structural model of end user computing satisfaction and user performance. Information & Management, 30, pp. 65– 73.
Dastgir M., Mortezaie A. S. - Factors Affecting the End-User Computing Satisfaction
Mohsen Dastgir, Ahmad S. Mortezaie
Business Intelligence Journal - July, 2012 Vol.5 No.2
298 Business Intelligence Journal July
Essex, P.A., and S.R. Magal, (1998) Determinants of information center success. Journal of Management Information Systems, 15, 2, 95–117.
Gatian, A.W. (1994)Is user satisfaction a valid measure of system effectiveness? Information & Management, 26, 3, 119–131.
Gelderman, M. (1998) The relation between user satisfaction, usage of information systems and performance. Information & Management, 34(1), pp. 11-18.
Goodhue, D. (1986) “IS Attitudes: Toward Theoretical and Definition Clarity” in L. Maggi, R. Zmud, and J. Wetherbe (eds.) Proceedings of the Seventh International Conference on Information Systems, San Diego, CA, pp. 181-194.
Hendrickson, A., Glorfeld, K. and Cronan, T.P. (1994). On the repeated test-retest reliability of the end-user computing satisfaction instrument: A Comment. Decision Sciences, 25(4), pp. 613-655.
Igbaria, M. and Nachman, S. A. (1990). Correlates of user satisfaction with end user computing. Information & Management, 19(2), pp. 73-82.
Igbaria, M., and Zviran, M. End-user effectiveness: A cross-cultural examination. Omega, 19, 5 (1991), 369–379.
Ives, B., Olson, M. and Baroudi, S. (1983). The measurement of user information satisfaction. Communications of the ACM, 26(10), pp. 785–793.
Kim, S. and Mchaney, R. (2000). Validation of the end-user computing satisfaction instrument in case tool environments. Journal of Computer Information Systems, 41(1), pp. 49-56.
Lefkovits, H.C. (1979). A status report on the activities of codasyl end-user facilities committee(EUFC). Information and Management, 2, pp. 137-163.
Lin, W.T. and Shao, B.B.M. (2000). The relationship between user participation and system success: A simultaneous contingency approach. Information & Management, 37(6), pp. 283-295.
Mahmood, M.A., Burn, J.M., Gemoets, L. and Jacquez, C. (2000). Variables affecting information technology
end-user satisfaction: A meta-analysis of the empirical literature. International Journal of Human-Computer Studies, 52(5), pp. 751-771.
Mchaney, R., Hightower, R. and Pearson, J. (2002). A validation of the end-user computing satisfaction instrument in Taiwan. Information & Management, 39(6), pp. 503-511.
McHaney, R., and Cronan, T.P. Computer simulation success: On the use of the end-user computing satisfaction instrument: A comment. Decision Sciences, 29, 2 (Spring 1998), 525–536.
McHaney, R., and Cronan, T.P. Toward an empirical understanding of computer simulation implementation success. Information & Management, 37, 3 (April 2000), 135–151.
Melone, N.P. (1990). A theoretical assessment of the user-satisfaction construct in information systems research. Management Science, pp. 76-91.
Powers, R.F. and. Dickson, G.W (1973) MIS project management: myths, opinions and reality. California Management Review, 15(3), pp. 147-156.
Rahat, H.B. (2005). The relationship between system usage and user satisfaction: A meta-analysis. The Journal of Enterprise Information Management, 18(2), pp. 211-234.
Raymond, L. (1987). Validating and applying user satisfaction as a measure of MIS success in small organizations. Information & Management, 12, pp. 173– 179.
Srinivasan, A. (1985) “Alternative Measures of System Effectiveness: Associations and Implications”, MIS Quarterly, 9(3), pp. 243-253.
Somers, T.M., Nelson, K. and Karimi, J. (2003). Confirmatory factor analysis of the end-user computing satisfaction instrument. Decision Sciences, 34(3), pp. 595-621.
Zviran, M. and Erlich, Z. (2003). Measuring IS user satisfaction: review and implications, Communication of the AIS, 12, pp. 81-103.
2012 299
INTERNATIONAL FINANCIAL REPORTING STANDARD (IFRS): BENEFITS, OBSTACLES AND INTRIGUES FOR
IMPLEMENTATION IN NIGERIA
Ikpefan, Ochei AilemenPh.D (Banking & Finance), ACA, ACIB
Department of Banking & Finance, Covenant University, Ota, Ogun StateEmail: [email protected]
Akande, A.OB.Sc (Business Administration), MBA
Department of Business Studies, Covenant University, OtaEmail: [email protected]
AbstractIFRS is International Financial Reporting System and International Accounting Standard Board – (IASB) provided the framework
for its working. IFRS adopted by IASB has gained worldwide acceptance amongst many countries and some listed companies in European nations have embraced it. IFRS employs a uniform, single consistent accounting framework that is gravitating towards General Accepted Accounting Practice (GAPP) in the future. IFRS since its introduction in 2001 had provided uniform accounting in financial reporting which would enable investors to interpreted financial statements with minimum effort. Other countries, including Canada and India are expected to transit to IFRS by 2011. The Nigerian Accounting Standard Board (NASB) is not expected to lag behind in the implementation. This paper looks at the benefits of adopting IFRS, obstacles and intrigues expected from the implementation of IFRS. The article also analyzed the requirements that would assists in the implementation of IFRS in Nigeria. Using content analysis method, the paper amongst others recommended a continuous research in order to harmonize and converge with the international standards through mutual international understanding of corporate objectives and the building of human capacity that will support the preparation of financial statements in organization. Key words: IFRS, Convergence, Adopted, IASB, NASB, GAPP.
Accounting is the language of business while financial reporting is the medium through which the language is communicated. Accounting and financial reporting are regulated by Generally Accepted Accounting Principles (GAAP) comprising of accounting standards, company law, stock market regulations, and so on. GAAP for accounting and financial reporting gives answers to differences in business communication between countries. The global GAAP that is seeking to unify accounting and financial reporting world is the International Financial Reporting Standards (IFRS) issued by the International Accounting Standards (IASs; International Financial Reporting Standards (IFRSs); Standing Interpretations Committee (SICs) pronouncements; and International Financial Reporting Interpretations Committee (IFRICs) guidelines.
Accounting Framework has been shaped by International Financial Reporting Standards (IFRS) to provide for recognition, measurement, presentation and disclosure
requirements relating to transactions and events that are reflected in the financial statements. IFRS was developed in the year 2001 by the International Accounting Standard Board (IASB) in the public interest to provide a single set of high quality, understandable and uniform accounting standards. Users of financial statement world require sound understanding of financial statement but this can only be made possible if there is General Accepted Accounting Practice (GAPP). With globalization of finance gaining ground, it will enable the world to exchange financial information in a meaningful and trustworthy manner. Investors from all over the world rely upon financial statements before taking decisions and different countries adopt accounting treatments and disclosure patterns with respect of the same economic event. And as such, it will surely create confusion among the users while interpreting financial statements. In the light of the backdrops, this paper presents an overview of the IFRS with emphasis on
Ikpefan O. A., Akande A. O. - International Financial Reporting Standard (IFRS): Benefits, Obstacles and Intrigues for Implementation in Nigeria
Ikpefan, Ochei Ailemen and Akande, A.O
Business Intelligence Journal - July, 2012 Vol.5 No.2
300 Business Intelligence Journal July
the benefits, obstacles/challenges, risks and requirements associated with the implementation.
The Nigerian Accounting Standards Board (NASB) sets local accounting standards under the Nigerian Accounting Standards Board Act of 2003. Originally established in 1982 as a private sector initiative housed in the Institute of Chartered Accountant of Nigeria (ICAN), NASB became a government agency in 1992 and reports to the Federal Minister of Commerce. Its membership includes representatives of government and relevant interests groups. An adequate due process is followed in standard setting. Although the NASB-issued standards have statutory backing, the body itself operated without an enabling legal authority until the 2003 enactment of the NASB Act. The primary role of the Board is to ensure that published financial statements are uniform in content and in format and communicate precisely what they purport to convey. Other specific reasons for setting up the NASB are to:
i. Narrow areas of differences in practices so that financial statements presented to users are structurally inform and meaningful;
ii. Produce accounting information that reflects our economic environment but at the same time satisfies the anticipated needs of the users of the information;
iii. Introduce measures which will enhance the reliability and validity of information reported in financial statements.
Regulations governing the financial reporting process include: under statute (Companies and Allied Matters Act 1990, Sarbanes-Oxley Act 2002); Relevant Accounting Standards (Statements of Accounting Standards, International Financial Reporting Standards, and International Public Sector Accounting Standards- IPASAS); Other regulatory guidelines are – Central Bank of Nigeria (CBN), Securities and Exchange Commission (SEC), Nigeria Deposit Insurance Corporation (NDIC), National Insurance Commission (NAICOM) and National Pension Commission (PENCOM). NASB lacks adequate resources to fulfill its mandate. As a government agency, NASB has relied mainly on government subventions and has been exposed to serious budgetary constraints that prevented it from discharging its statutory role and this has affected its effectiveness. Legislation now allows NASB to earn income outside the government. There is a dire need to hire additional staff, retrain existing staff, offer attractive remuneration packages, and procure equipment.
No effective mechanism exists to monitor and enforce requirements for accounting and financial reporting provided
for in the Companies and Allied Matters Act (1990). The CAMA empowers the Registrar of Companies at the Corporate Affairs Commission to regulate compliance with its financial reporting presentation requirements. There is however no capacity at the Corporate Affairs Commission to effectively fulfill this function. It is a legal requirement to file a copy of the audited financial statements and directors’ report with the Commission. There is however no rigorous enforcement of timely filing. The use of International Financial Reporting Standards (IFRS) as a universal financial reporting language is gaining momentum across the globe. Several countries have implemented IFRS and converged their General Accepted Accounting Policies (GAAP) to IFRS. According to Bansal and Bansal (2010):
“more than 100 countries throughout the world, including 27 European Union member states, require or permit the use of International Financial Reporting Standards (IFRSs), developed by the IASB. The number of countries adopting IFRS is expected to increase to 150 by the end of 2011. Countries such as China and Canada have announced their intention to adopt. The Securities and Exchange Commission in India has issued a roadmap whereby a few big US corporations would begin reporting according to IFRS by 2014. Such conversion would be done by 2016 depending upon the size of the entity”.
Nigeria has joined the League of Nations that approved IFRS conversion. Nigeria has joined the over 100 countries that require, permit, or is converging with the goal of adopting IFRS. The IFRS implementation roadmap was unveiled by the Minister for Commerce and Industry on Thursday 2 September 2010. The roadmap, which is in three phases, mandates publicly listed and significant public interest entities to prepare their financial statements based on IFRS by 1 January 2012 (i.e. full IFRS financial statements are required for accounting period to 31 December 2012) while other public interest entities are required to adopt IFRS for statutory purposes by 1 January 2013. The third phase requires Small and Medium Sized Entities (SMEs) to adopt IFRS by 1 January 2014.
Precisely the statement of problem of this paper lies in management adoption of IFRS in the conversion process for Nigerian entities. Different countries adopt different accounting treatments and disclosure patterns with respect to the same economic event. There are differences of GAPP, existing law, taxation reporting systems etc. But this cannot be done without leveraging the knowledge and experience gained from IFRS conversion in other countries

2012 301
and incorporating IFRS into the curriculum for professional accounting courses. The methodology of the paper is the content analysis. Although it is defined in various ways, in this research, content analysis will be seen as “a research technique for the objective, systematic and quantitative description of the manifest content of communication” (Selltize, 1977). To this end the research will involve a review of existing secondary sources in books, journals, magazines and Newspapers. The paper is divided into sections. Next to the introduction is the Present Status of Nigerian Accounting Standards and IFRS. Section 3 covers the major differences in Nigeria GAPP and IFRS and Concept of Convergence. Section 4 discuses the Obstacles/intrigues to Implementation of IFRS in Nigeria. The paper ends with recommendations conclusion.
Present Status of Nigerian Accounting Standards and IFRS
The Nigerian Accounting Standard Board (NASB) formulates Accounting Standards (ASs) based on the IFRSs keeping in view the local conditions including legal and economic environment, which have recently been notified by the Companies and Allied and Matters Act 1990. In some cases, departures are made on account of conceptual differences with the treatments prescribed in the IFRSs. The term IFRS consists of IFRS issued by IASB; International Accounting Standard (IAS) issued by International Accounting Standard Committee (IASC); and interpretations issued by the standard interpretations Committee (SIC) and the International Financial Reporting Interpretation Committee. IFRS is issued by the International Accounting Standard Board. The International Accounting Standard states how particular types of transactions and other events should be reported in financial statements. The standards issued by IASC were known as IAS. In 2000, IASC Members bodies approved the restructuring of IASC’s foundation and in March 2001, the new IASB took over the responsibility of setting the international Accounting Standards from IASC. IASB adopted the standards set by IASC and continued to develop new standards and called the new standards – IFRS. Both IFRS and IAS are equally enforceable because there is no difference between the two.
Accounting Standards as Designed and as Practiced
There are many areas of accounting issues covered by IAS/IFRS that are yet to be address by NASB. Also,
some current IAS- based national standards were effective at the time of their issuance; but some IAS have since either been revised or withdrawn. The Nigerian Statements of Accounting Standards (SAS) seem incomplete as an authoritative guide to the preparation of financial statements. The NASB does not have a work plan to harmonize its SAS with IAS. For instance, IAS where no equivalent SAS exists are framework for preparation of financial statements; IAS 14, Segment Reporting; IAS 18, Revenue; IAS 20, Accounting for Government Grants and Disclosure of Government Assistance; IAS 22, Business Combinations; IAS 23, Borrowing Costs; IAS 24, Related Party Disclosures; IAS 27, Consolidated Financial Statements and Accounting for Investment in Subsidiaries; IAS 32, IFRS 7, Financial Instruments: Disclosure And Presentation; IAS 39, Financial instruments: Recognition and Measurement, IAS 36 Impairment of Assets etc.
There is no local standard based on agriculture (i.e., an equivalent of IAS 41), despite the prominence of agriculture sector in Nigeria. The omission of a Framework for Preparation and Presentation of Financial Statements is especially detrimental as there are several areas where no local standards exist, and the framework should guide the setting of relevant and reliable accounting policies in such circumstances. Local standards where no international equivalents exist include SAS 14, Accounting in the Petroleum industry Upstream Activities; SAS 17, Accounting in the Petroleum Industry – Downstream Activities; SAS 16, Accounting for insurance Business; and SAS 20, Abridge Financial Statements.
Reasons for IFRS
Listed companies have a lot of benefits to derive from conversion to IFRS. Companies do not operate in isolation. Therefore, in the present global environment, compliance with foreign reporting requirements will help streamline their financial reporting. This will help minimize reporting costs as a result of common reporting systems and consistency in statutory reporting. Secondly, it will enable comparison/benchmarking with foreign competitors possible. Besides, adoption of IFRS may offer companies an edge over competitors in the eyes of users. Thirdly, since the adoption of IFRS will transcend national boundaries/cross border, acquisitions and joint venture will be made possible and there will also be easy access to foreign capital. Fourthly, companies can trade their shares and securities on stock exchanges world-wide. For instance, present and emerging stock exchanges
Ikpefan O. A., Akande A. O. - International Financial Reporting Standard (IFRS): Benefits, Obstacles and Intrigues for Implementation in Nigeria
Ikpefan, Ochei Ailemen and Akande, A.O

Business Intelligence Journal - July, 2012 Vol.5 No.2
302 Business Intelligence Journal July
would require financial statements prepared under IFRS. Globally, investors would be able to make rationale and informed decisions. Fifthly, convergence of financial statements would provide a platform for management to view all companies in a group on a common platform. Thus time and efforts will reduce to adjust the accounts in order to comply with the requirements of the national GAPP. Business acquisition would be reflected at fair value than at the carrying values. There will be more objectivity and transparency in financial statements. For companies to key into these benefits mentioned above, a single set of accounting standards worldwide would ensure that auditing firms standardize their training and quality of work that they maintain globally. In summary, implementation of IFRS would give rise to the following benefits:
i. Uniform application of principles – same languageii. Cross border investments leading to economic
growth and development. It will also lead to increase globalization of commerce and trade.
iii. Easy comparability of financial statements of two or more companies’ worldwide.
iv. Tax authorities will find it easy to assess tax payers for payment and collection.
v. Administrative cost of accessing the capital markets would be reduced for companies globally. In addition time and money will be saved by international accounting firms in planning of accounting and audits
vi. Multinational companies will find it easy to carry out mergers and acquisition, easy access to multinational capital, the cumbersome task of consolidation of group financial statements would be simplified and accounting and audit functions will also be made easy.
Major Differences in Nigeria Gapp and IFRS
The major difference between IFRS and the local statement of Accounting Standards (SAS) is that the former is a more robust and principle based set of accounting standards with detailed disclosure requirements. For instance, the IASB Framework states that the objective of financial statements is to provide information about the financial position, performance and changes in financial position of an entity that is useful to a wide range of users in making economic decisions. In order to meet the objective, the framework requires financial statements to possess certain qualities which are understandability,
relevance, reliability, and comparability. Other key areas of differences include extensive use of fair values for financial instruments, more prescriptive and comprehensive guide for revenue recognition, a more rigorous process for determining goodwill in a business combination, change in format, components and nomenclature of certain items of financial statements. Highlights of a few of the major differences are given below in table 1:
Table 1: Major Differences Between IFRS and Nigerian GAP
Subject IFRS Nigerian GAAP
Components of Financial Statement
Comprises of Statements ofFinancial Position: -Statement of Comprehensive Income (e.g revaluation gains, foreign exchange etc),-Statement of Cash flow and -Notes to Accounts.
Comprises of
• Balance sheet
• Profit and loss
• Cash flows
statement
• Notes to Accounts
Format of Income Statement
IAS 1 prescribes the format of income statement
According to the format prescribed in the CAMA 1990, Banking Regulation Actfor Banks etc
Statement of Cash Flows
Mandatory for all entities Not applicable for Non-listed companies
Presentation of ExtraordinaryItems
IFRS prohibits the presentation of extraordinary items in statement of comprehensive income or in the notes
Nigerian GAAP requires extraordinary items to be presented in the profit and loss statement of the entity distinct from the ordinary income and expenses for the period. They are considered in determining the profit and loss for the period
Dividends Proposed After the end of the Reporting Period
Dividends declared after the end of the reporting period but before the financial statements are authorized for issue are not recorded as liability in the financial statements.
Dividends declared after the end of the reporting period but before the financial statements are approved and recorded as liabilities in the financial statements.
Depreciation Rates
Allocated on a systematic basis to each accounting period during the useful life of the asset.
Depreciation is based on the higher estimate of useful life of the asset.
Change in the Depreciation Method
Treated as a change in the accounting estimate and hence is accounted for prospectively.
Treated as a change in the accounting policy and is accounted for retrospectively (i. for all the relevant previous years).Any excess/deficit in the case of this kind of recalculation must be adjusted in the period in which the change is effected.
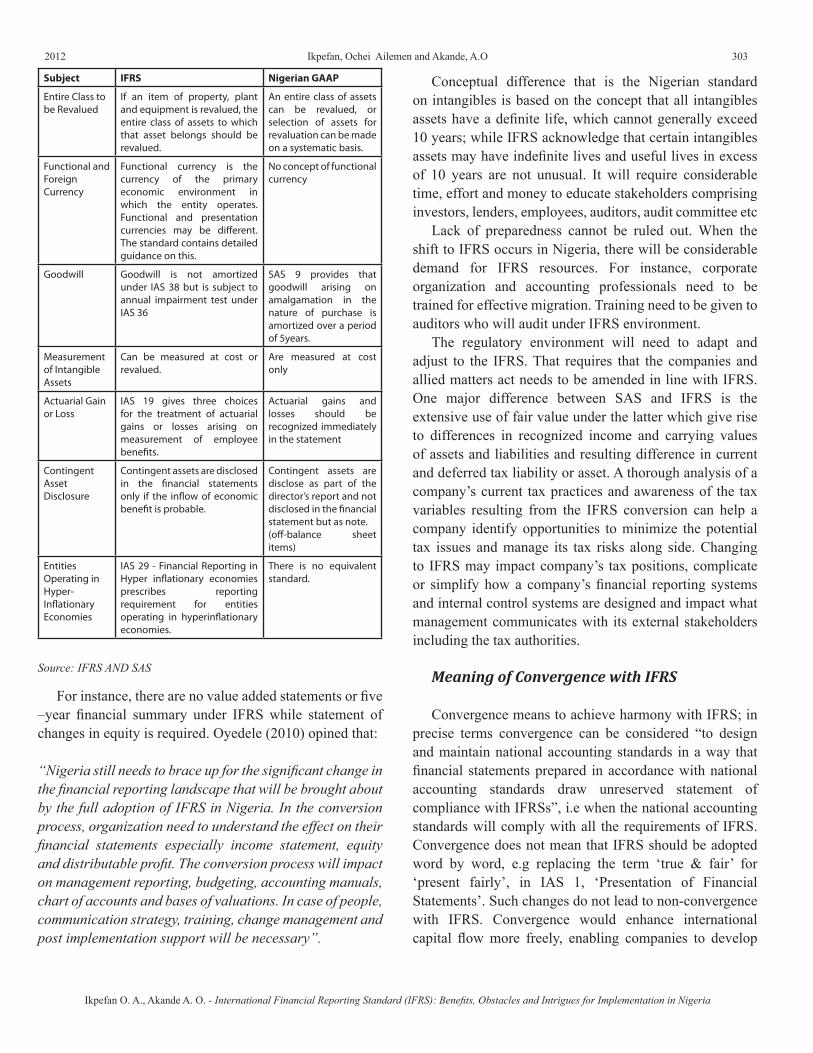
2012 303
Subject IFRS Nigerian GAAP
Entire Class to be Revalued
If an item of property, plant and equipment is revalued, the entire class of assets to which that asset belongs should be revalued.
An entire class of assets can be revalued, or selection of assets for revaluation can be made on a systematic basis.
Functional and Foreign Currency
Functional currency is the currency of the primary economic environment in which the entity operates. Functional and presentation currencies may be different. The standard contains detailed guidance on this.
No concept of functional currency
Goodwill Goodwill is not amortized under IAS 38 but is subject to annual impairment test under IAS 36
SAS 9 provides that goodwill arising on amalgamation in the nature of purchase is amortized over a period of 5years.
Measurement of Intangible Assets
Can be measured at cost or revalued.
Are measured at cost only
Actuarial Gain or Loss
IAS 19 gives three choices for the treatment of actuarial gains or losses arising on measurement of employee benefits.
Actuarial gains and losses should be recognized immediately in the statement
Contingent Asset Disclosure
Contingent assets are disclosed in the financial statements only if the inflow of economic benefit is probable.
Contingent assets are disclose as part of the director’s report and not disclosed in the financial statement but as note.(off-balance sheet items)
Entities Operating in Hyper-Inflationary Economies
IAS 29 - Financial Reporting in Hyper inflationary economies prescribes reporting requirement for entities operating in hyperinflationary economies.
There is no equivalent standard.
Source: IFRS AND SAS
For instance, there are no value added statements or five –year financial summary under IFRS while statement of changes in equity is required. Oyedele (2010) opined that:
“Nigeria still needs to brace up for the significant change in the financial reporting landscape that will be brought about by the full adoption of IFRS in Nigeria. In the conversion process, organization need to understand the effect on their financial statements especially income statement, equity and distributable profit. The conversion process will impact on management reporting, budgeting, accounting manuals, chart of accounts and bases of valuations. In case of people, communication strategy, training, change management and post implementation support will be necessary”.
Conceptual difference that is the Nigerian standard on intangibles is based on the concept that all intangibles assets have a definite life, which cannot generally exceed 10 years; while IFRS acknowledge that certain intangibles assets may have indefinite lives and useful lives in excess of 10 years are not unusual. It will require considerable time, effort and money to educate stakeholders comprising investors, lenders, employees, auditors, audit committee etc
Lack of preparedness cannot be ruled out. When the shift to IFRS occurs in Nigeria, there will be considerable demand for IFRS resources. For instance, corporate organization and accounting professionals need to be trained for effective migration. Training need to be given to auditors who will audit under IFRS environment.
The regulatory environment will need to adapt and adjust to the IFRS. That requires that the companies and allied matters act needs to be amended in line with IFRS. One major difference between SAS and IFRS is the extensive use of fair value under the latter which give rise to differences in recognized income and carrying values of assets and liabilities and resulting difference in current and deferred tax liability or asset. A thorough analysis of a company’s current tax practices and awareness of the tax variables resulting from the IFRS conversion can help a company identify opportunities to minimize the potential tax issues and manage its tax risks along side. Changing to IFRS may impact company’s tax positions, complicate or simplify how a company’s financial reporting systems and internal control systems are designed and impact what management communicates with its external stakeholders including the tax authorities.
Meaning of Convergence with IFRS
Convergence means to achieve harmony with IFRS; in precise terms convergence can be considered “to design and maintain national accounting standards in a way that financial statements prepared in accordance with national accounting standards draw unreserved statement of compliance with IFRSs”, i.e when the national accounting standards will comply with all the requirements of IFRS. Convergence does not mean that IFRS should be adopted word by word, e.g replacing the term ‘true & fair’ for ‘present fairly’, in IAS 1, ‘Presentation of Financial Statements’. Such changes do not lead to non-convergence with IFRS. Convergence would enhance international capital flow more freely, enabling companies to develop
Ikpefan O. A., Akande A. O. - International Financial Reporting Standard (IFRS): Benefits, Obstacles and Intrigues for Implementation in Nigeria
Ikpefan, Ochei Ailemen and Akande, A.O

Business Intelligence Journal - July, 2012 Vol.5 No.2
304 Business Intelligence Journal July
consistent global practices on accounting problems. It will help standardize training and assure better quality on international accounting standard
Benefits of Convergence to IFRS
Globalization has prompted more and more countries to open their doors to foreign investment and as business themselves expand across borders, both the public and private sectors are expected to recognize the benefits of having a commonly understood financial reporting framework supported by strong globally accepted auditing standards. But suffice to say that some of the benefits include:
i. Single Reporting – Convergence with IFRS eliminates multiple reporting such as Nigeria GAAP, IFRS, and Nigeria GAAP
ii. Greater comparability of financial information for investors as a result of transparent financial reporting of company’s activities; among sectors, countries and companies
iii. Greater willingness on the part of investors to invest across borders will enable entities to have access to global capital markets and eliminates barriers to cross-border listing. It will also bring in foreign capital flows to the country. Common accounting standards help investors to understand available investment opportunities as opposed to financial statements prepared under different set of national accounting standards.
iv. Lower cost of capital; more efficient allocation of resources;
v. Higher economic growth. vi. Convergence to IFRS gives Nigerian professionals
opportunities to sell their services as experts in different parts of the world.
vii. IFRS balance sheet will be closer to economic value because historical cost will be substituted by fair values for several balance sheet items, which enable a corporate to know its true worth.
viii. Convergence will place better quality of financial reporting due to consistent application of accounting principles and reliability of financial statements. Trust and reliance can be place by investors, analysts and other stakeholders in a company’s financial statements.
Global convergence is best explained by the objective as enunciated in the International Accounting Standards
Committee Foundation (IASCF) constitution, which states that the ultimate aims of the IASB and other accounting standard setters are: to develop, in the public interest, a single set of high quality, understandable and enforceable global accountings that require quality, transparent and comparable information in financial statements and other financial reporting to help participants in the world’s capital markets and other users make economic decisions; to promote the use and rigorous application of those standards; in fulfilling the objectives with (a) and (b) above, to take account of, as appropriate, the special needs of small and medium-sized entities and emerging economies; and to bring about unison of national accounting standards and international Financial Reporting (IFRSs) to high quality level.
There are two schools of thoughts to convergence. There is the one that promotes adoption (a complete replacement of national accounting standards with IASB’s standards) and the other, which tends to adaptation (modification of IASB’s standards to suit peculiarities of local market, culture and economy without compromising the accounting standards and disclosure requirements of the IASBs standards and basis of conclusions. The adoption and implementation of the international standards in a country takes place in an environment that is affected by factors unique to that country, for example, the economy, politics, laws and regulations, and culture. A reason that seems to cut across countries for not fully incorporating IFRSs and ISAs is the irresistible urge to amend the international standards to provide for national specifities.
Juan (2005) identified two barriers to convergence. The first is the translation of the standards to the different languages and the reduction of the complexity and structure of the international accounting standards, without losing quality. However, to have a common language as soon as possible cannot be overemphasized. Wong (2004) in his study of those issues that affect the adoption and implementation of IFRSs and ISAs, opined that time lag in adopting the international standards is due mainly to translation of the standards. For example, in one country a five-year time lag was experienced due to the need for translation of the ISAs. Adoption refers to “harmonization”, “transformation”. The World Bank, in Wong (2004) noted that there can be full adoption of IFRSs, but with time lag; selective adoption of IFRSs; and national standards “based on” IFRSs.
2012 305
Requirements that will Assist Implementation of IFRS in Nigeria
To achieve international convergence, requires consensus by countries especially in respect of international standards that will serve as the foundation for financial reporting and auditing globally and taking steps to encourage implementation. If there are any impediments to our ability to follow professional standards, the Institute of Chartered Accountants of Nigeria, the Nigeria Accounting Standards Board, together with international and other standard setters, regulators, governments, and others must work together. Companies, auditors, user and regulators would need to get familiar with fair measurement techniques in the preparation of financial statements.
We need accounting standards that are consistent, comprehensive and based on clear principles that communicate economic reality and, in the global world which we are living, homogenous enough so as to allow their use and facilitate understanding by everyone. Adequate corporate governance practices are required, which among other things, should ensure appropriate internal controls and effective implementation of these accounting standards. There is need for the existence of efficient and effective audits which should grant external reliability to the information prepared by the companies following the referred standards. Besides there should be a supervision or quality control mechanism accompanied by a disciplinary system, which should ensure the effective compliance with the earlier mentioned conditions. In addition, companies need to explain the impact of IFRS convergence to their investors to enable them readily accept the shift from Nigeria GAAP to IFRS.
Obstacles/Intrigues to Implementation of IFRS in Nigeria
The Oxford English Dictionary explains intrigue as a secret plan or something that will arouse the interest or curiosity. In this context, intrigue is referred to as obstacles/ challenges that could stall the implementation of IFRS. Some of the likely obstacles envisaged during adoption and implementation of IFRS are:
i. Awareness about international Practices: with the new system where we have GAAP for different countries users will view financial statements from different perspective. It is therefore important that awareness needs to be created among the users of financial statement.
ii. Training - One of the obstacles to full implementation of IFRS is absence of training facilities and academic curriculum in Nigeria. Have we trained IFRS resource persons on ground? If not between now and 2014, stakeholders should train IFRS personnel and introduce IFRS in universities accounting curriculum.
iii. Taxation- IFRS convergence will create problem. How do taxation laws address the treatment of tax liabilities arising from on convergence from Nigeria GAAP to IFRS. Where this is not taken care of, it would duplicate administrative work for the organization.
iv. Fair Value – In IFRS format, Fair value is used in measurement of most items of financial statements and this lead to volatility and subjectivity in financial statements in arriving at the fair value. Where this adjustment is reflected in income statements as gain or losses, it remains a contentious issue if it should be applied in computing distributable profit
v. Management Compensation Plan: Because of the new financial statements reporting format envisaged under IFRS which is quite different from Nigeria GAAP, the terms and conditions relating to management compensation plans would have to be change. Therefore, contracts terms and conditions of management staff will be re-negotiated.
vi. Reporting Systems- Companies will need to ensure that existing business reporting model is amended to suit the disclosure and reporting requirements of IFRS which is distinct from Nigeria reporting requirements. To correct this anomaly, information systems should be put in place to capture new requirements relating to fixed assets, segment disclosures, related party transaction, etc. Good internal control would help minimize the risk of business disruptions
vii. Amendments to the Existing law: IFRS will lead to inconsistencies with existing laws such Companies and Allied Matters Act 1990, Securities and Exchange Commission laws, banking laws and regulations and Insurance laws and regulations. Presently, the reporting requirements are governed by various regulators in Nigeria and their provisions override other laws. Whereas IFRS does not recognize such overriding laws, steps to amend these laws must be taken to ensure that the laws are amended well in time.
The dimension of cultural settings of nations and regulations are issues that need to be addressed in the adoption of IFRS. Presently, Islamic banking which is being practiced in many countries of the world, including the advanced capitalist countries of Great Britain and
Ikpefan O. A., Akande A. O. - International Financial Reporting Standard (IFRS): Benefits, Obstacles and Intrigues for Implementation in Nigeria
Ikpefan, Ochei Ailemen and Akande, A.O
Business Intelligence Journal - July, 2012 Vol.5 No.2
306 Business Intelligence Journal July
the United States of America, under Non-interest/Profit Sharing Banking in Banking eliminate interest in all banking operations. This is in addition to the compulsory requirement for all Islamic banks to contribute a certain amount of their wealth yearly by way of an alms tax for the less privileged members of the society. Has IFRS taken cognizance of these? Wong (2004), with the assistance of senior International Federation of Accountants (IFAC) staff members, engaged in discussion regarding the potential challenges in adopting and implementing the international standards and came up with the following:
i. Issues of incentives – the various factors which might encourage or discourage national decision makers from their adoption;
ii. Issues of regulation – regulatory challenges in their adoption;
iii. Issues of culture – challenges arising from cultural barriers in their adoption and implementation.
iv. Issues of scale – implementation barriers associated with the relative costs of compliance for small and medium-sized entities and accounting firms;
v. Issues of understandability – their complexity and structure;
vi. Issues of translation – the ease of their translation and the resources available to undertake the translation;
vii. Issues of education – the education and training of students and professional accountants in the international standards.
Recommendations and Conclusion
Abstracting from the above, the paper makes the following recommendations:
i. In keeping with international best practices, IFRS under the auspices of IASB should take cognizance of the GAAP of different countries in its subsequent review so that users can benefit globally.
ii. IFRS should be included in universities, polythenic and Institute of Chartered Accountant of Nigeria (ICAN) curriculum so as to build human capacity that will support the preparation of financial statements in organization.
iii. A continuous research is in fact needed to harmonize and converge with the international standards through mutual international understanding of corporate objectives.
iv. Since tax laws of different nations gives rise to varied tax liabilities, IFRS under the auspices of IASB should also resolve the question of tax liabilities as a result of convergence.
v. Steps should be taken of existing laws such as CAMA 1990, SEC, banking laws and regulation and Islamic banking/Non-interest banking that conflict with the reporting requirements of IFRS.
vi. In IFRS and other nations reporting requirements, the differences between fair value and carrying value need to resolve in measurement of most financial statements
Conclusion
Financial report is authenticated by auditor for reliance to be placed on it by users of the report. Auditor report is the culmination of all the work done by the auditor. In reporting under statute, the auditor must ensure full compliance with statutory requirements. Majority of our auditor reports in Nigeria will be under the Companies and Allied Matters Act, 1990 in conjunction with relevant ancillary legislation e.g Banks and Other Financial Institutions Act, the Insurance Act, etc. Just as we crave for IFRS, there should be International Auditor Reporting Standard (IARS) by auditors in respect of financial statements. The harmonization of International Auditing Report Standard should be clear, concise and unambiguous expression of opinion (or disclaimer of opinion) on the financial statement that will also facilitate the interpretation of financial reports by users globally. The Institute of Chartered Accountant of Nigeria (ICAN) has expressed its opinion of adopting IFRS which was considered and supported by the Nigerian Accounting Standard Board. With a view to set up a road map for convergence and provide the necessary approach for convergence, NASB need to set up an IFRS task Force. Based on the recommendations/ submission of the Task force, the council of the institute should adopt and decide on the accounting period - date, month and year of convergence with IFRS that will form the basis of compliance for listed companies in Nigeria.
References
Bansal Atul and Bansal Shweta (2010): “Challenges for IFRS Implementations in India –An Accounting Revolution”, International Journal of Research in Commerce and Management, Vol. No: 1 Issue No.4 pp. 113-126.
Ball, Ray (2005): “International Financial Reporting Standards (IFRS): Pros and Cons for investors”, Accounting and Business Research, Forthcoming.
Callao Susana, Ferrer Cristina, Jarne Jose I. and Lainez, Jose A. (2009): “The impact of IFRS on the

2012 307
European: Is it related to the Accounting Tradition of the Countries” ? Journal of Applied Accounting Research, 10 (1), pp 33-55
Juan Jose Fermin Del Valle (2005): “International Convergence and Implementation of International Financial Reporting Standard”, Vill Annual Assembly of the Association of Supervisors of Banks of the Americas, Oaxaca, September 9, pp. 3-10.
Obazee, Jim Osayande (2009): “Enhancing Enforcement of Accounting Standards in Nigeria and Efforts at Aligning with International Standards”, “Seminar for Lecturers of Accounting and Related By Nigerian Accounting Standards Board, pp 74-79.
Oyedele, Taiwo (2010): “Taxation Implications of IFRS Conversion for Companies Operating
in Nigeria”, BusinessDay, September 6, www.businessdayonline.com
Samuel A. Dipiazza Jr. (2006): “IFRS – A View from A big 4 firm”, Speech at the IASB Meeting with World Standard Setters, 25 September.
Selltize, C (1977): Research Methods in Social Relations, Methuen, London, p. 335.
Shuaib A. Ahmed (2002): “Accounting and Auditing Standards for the Operations of Non-Interest/Profit Sharing Banking in Banking”, The Nigerian Banker, July-December, pp. 22-23.
The Concise Oxford English DictionaryWong Peter (2004): “Challenges and Successes in
Implementing International Standards: Achieving Convergence to IFRS and ISAs, Report submitted to International Federation of Accountants (IFAC), pp 5- 7.
Ikpefan O. A., Akande A. O. - International Financial Reporting Standard (IFRS): Benefits, Obstacles and Intrigues for Implementation in Nigeria
Ikpefan, Ochei Ailemen and Akande, A.O
Business Intelligence Journal - July, 2012 Vol.5 No.2
308 Business Intelligence Journal July
ASSESSING THE IMPACT OF NON-DISCRETIONARY VARIABLES ON THE PERFORMANCE OF PHARMACY RETAIL
STORES USING DEA APPROACH
Smriti PandeSenior Research Fellow Birla Institute of Management Technology
Plot No. 5, Knowledge Park- II, Institutional Area Greater Noida (U.P) – 201306Email: [email protected]
Dr. G.N. PatelProfessor Birla Institute of Management Technology
Plot No. 5, Knowledge Park- II, Institutional Area Greater Noida (U.P) – 201306Email: [email protected]
AbstractPurpose: The purpose of this paper was to measure the performance of intra-chain pharmacy retail stores and to analyze the impact
of non-discretionary variables on the efficiency of the stores. Design/methodology/approach: Charnes-Cooper-Rhodes model (1978) and CCR model for discretionary and non-discretionary variables (Banker and Morey, 1986) of DEA technique were used for analyzing the efficiency of stores using different set of inputs and outputs. The efficiency scores obtained through these models were further validated using ANOVA. Findings: Major finding was that there is no significant difference between the efficiencies calculated using different models. Two of the input variables namely age and location of the store turn out to be ambiguous as their inclusion as non-discretionary input variables do not make much difference in the efficiency scores calculated. The efficiency level was mainly attained through the controllable operations taking place in the stores. Research limitations/implications: More financial and controllable inputs can be taken into consideration for a better analysis. Originality/value: This study provides us with a framework for performance measures along with useful managerial insights. Focusing upon the right areas of operations, may help out the management in improving their overall performance. Paper Type: Research Paper. Abbreviations: CCR model – Charnes Cooper Rhodes model, BCC model – Banker Charnes Cooper model, DEA – Data Envelopment Analysis, DMU - Decision Making Unit. Key words: IFRS, Convergence, Adopted, IASB, NASB, GAPP.
Over the past few years, the retail sector of India has observed a gradual shift from unorganized to organized retailing practices. The concept of retailing is no more restricted to buying and selling of products. The ever escalating consumers’ demands have resulted in rise of globalize and competitive market where it is extremely difficult for the companies to survive. Managing retail operations has also become a challenging task with the growing number of retailers in the market, varied consumer behaviour, replication of products etc. There have been many researches in retailing that have focused upon the examination of retail trade areas, retail sites, customer satisfaction, supply chain management, productivity etc. But, with the growing importance of services and the lack of productivity in this sector, area of retail performance has gained the interest of number of researchers. Barros and Alves (2004) highlight efficiency evaluation to be a vital
activity in retailing. According to Anderson et al. (1998), performance evaluation is an imperative issue because, efficient usage and allocation of resources not only benefits the organization but also the consumers as they may get lower prices and more professional service. Moreover, efficiency evaluation is an important step for a retail store because the efficiency of individual store is a major concern in retailers’ competitiveness, since the global profitability of any chain venture depends on the profitability of its elementary parts (Barros and Alves, 2003).
In the field of organized retailing, pharmacy which was more of a product-oriented business is one of the emerging areas. In the recent years the profession has noticed a shift towards a service-oriented business with many well known players entering into the pharmacy retailing market. India Retail Report by Taneja et al. (2009) highlights that in the organized retail segment, the tiny health and beauty care
2012 309
Pande S., Patel G.N. - Assessing the Impact of Non-Discretionary Variables on the Performance of Pharmacy Retail Stores Using DEA Approach.
Smriti Pande, Dr. G.N. Patel
services grew rapidly with a growth rate of 65% in 2007 over the previous year. A Business Monitor International report on India Pharmaceuticals & Healthcare (Q4, 2010), forecasts a compound annual growth rate of 13.2% with an increase in combined sales of over-the-counter (OTC) medicines and prescription drugs from US$15.7bn in 2009 to US$54.2bn in 2019. It also mentions about frequent takeover of domestic firms by multinational drug makers. According to the report, India has maintained its position as the eighth most attractive pharmaceuticals market in Asia.
Presently, Indian pharmacy retailing sector is largely dominated by unorganized players, constituting primarily of the neighbourhood chemist stores which are owned by small families. The challenge that organized sector faces is to provide customers with a superior and different experience from what unorganized sector offers.
The willingness to spend, rising affordability and increased consciousness has not only resulted in rising the health business of the society but has also demanded for a big transformation. Currently, there exists no differentiation in the offerings of organized pharmacy players. In such a scenario, the challenge for the organized sector is to position itself differently so as to compete with the small or unorganized retailers of pharmacy sector. They may aim at becoming a one stop solution with synergies of health and beauty care services. At present, Apollo, Guardian, Religare, MedPlus, Medicine Shoppe, Frank Ross (Emami Group), Himalaya, Subhiksha Pharmacy, Reliance Wellness are the major organized players in the field of pharmacy retailing.
The most imperative task in any service oriented business is to develop a long lasting relationship with the customers. Thus, with the move of pharmacy sector into service-oriented business there are several other things to be taken under consideration than just financial performance. Retailing does not focus solely on profits. It is a mix of product, place, price, promotion, presentation, process and people, altogether. Broadly, retailing activities can be divided into two operational areas; back end and front end. Back end focuses on planning whereas, front end on execution. Front end is the touch-point for the customers and acts as an interface between the company and customers, therefore, is given more importance. This elucidates why examining and measuring the success of a retail store is an important exercise.
Several studies are being carried out in the area of pharmacy and also pharmacy retailing. Beliveau and Bernstein (1997) examined the case of independent pharmacies that are struggling to survive in a hostile environment caused by sociological and technological
changes. McGee and Peterson (2000) provided an insight into the multidimensional character of distinctive competencies by measuring the resources and capabilities possessed by a sample of 255 drug stores. Pioch and Schmidt (2004) did a comparative analysis of community pharmacies and highlighted the tensions that are faced by healthcare providers and retailers. Saranga and Phani (2004) used both the CCR and BCC models of DEA technique along with assurance region model to study the performance of 44 pharmaceutical companies in order to determine the best practices in the Indian Pharmaceutical Industry. This study considers cost of production and selling, cost of material and cost of manpower as inputs and; profit margin, net sales and exports as outputs. Schofield and Breen (2004) focused specifically on supplier/customer relationship, to investigate the customer’s perception of service quality within the context of the pharmaceutical supply chain. Brooks et al. (2008) studied about the retail pharmacy market structure and their performance in U.S. The study provides a background on the retail pharmacy and its position within the pharmaceutical supply chain, discusses about the availability of data to address various issues and the measures that can be developed using the available data and also identifies the gaps in knowledge by reviewing the existing researches. Hamilton (2009) studied the pathways that can enhance pharmacy-to-customer engagements, and give capacity to build closely aligned customer interface systems. Jambulingam et al. (2009) focused on pharmaceutical wholesaler-pharmacy relationship. Alijani et al. (2010) investigated methods and constraints of drug supply and delivery in the greater New Orleans area by analyzing the data collected from sixty-seven drug stores on how these drug stores operate and respond to disaster and critical times. Jing et al. (2011) addressed a vital gap by investigating the relationship between organizational climate and performance in retail pharmacies. Wherein, the organizational climate comprises of financial performance, staff satisfaction and customer satisfaction with the pharmacy. Researches have catered to varied areas of pharmaceutical industry. However, we failed to find literature related to the area of efficiency evaluation or benchmarking of pharmacy retail store which is going to be one of the most important dimension with the rise in the pharmacy retailing industry.
Therefore, the objectives of the study are: First, to evaluate the efficiency of 46 pharmacy retail stores using different models of DEA. The motivation behind this objective is the fact that, for effectiveness in the functioning of retail stores, effective deployment of the available
Business Intelligence Journal - July, 2012 Vol.5 No.2
310 Business Intelligence Journal July
resources is a vital issue. Second, is to study the impact of non-discretionary variables on the efficiency of retail stores. The empirical application is carried out on all 46 pharmacy retail stores that are associated with a pharmacy retailer and are located in National Capital region till date. The next section discusses about Data Envelopment Analysis in detail.
Data Envelopment Analysis
With the growing importance of services in retailing, stores act as a critical touch point between the company and customers thus are an important constituent of manager’s consideration. Any wrong move in the store operations can lead to adverse circumstances. Therefore, performance or efficiency evaluation of the stores is the major issue in retailing because it is an element of overall productivity (Barros and Alves, 2003). There have been several researches conducted in this area using input- output ratios but, these are now being supplanted by enhanced approaches such as Data Envelopment Analysis (DEA).
Donthu and Yoo (1998) rightly pointed out the two advantages of relative-to-best measure as compared to the absolute measurement, they were- First, relative-to-best measures are consistent with quality control movements such as benchmarking therefore, the best performing units can be treated as role models and secondly, it takes into account performances of other comparable units and environmental factors. Looking at the above advantages DEA became a very popular technique to evaluate the relative performance with the help of decision making units.
DEA is being applied to various areas such as supplier’s selection, banking, insurance industry, financial companies, hospitals, schools, airports, hotels, and nations. As the focus of the study is to evaluate intra-chain retail stores considering non-discretionary and discretionary variables, this section discusses a few related studies. Balakrishnan et al. (1994) applied DEA to evaluate the relative spatial efficiency of locations of a network of retail outlets and how the imposition of threshold requirements alters their spatial efficiency. Donthu and Yoo (1998) analyzed 24 outlets of a fast food restaurant chain for internal benchmarking considering store location, store manager experience, store size, Promotion/give-away expenses as inputs and; customer satisfaction and sales as outputs. Here, location was considered to be an uncontrollable input variable. Barros and Alves (2003) examined the efficiency of individual retail stores belonging to a Portuguese multi-market hypermarket retailing chain using operational
results and sales as outputs and part time employees, full time employees, absenteeism, cost of labours, number of point of sales, area of outlets, inventory, age of outlet and other costs as inputs. Joo et al. (2009) measured and benchmarked the retail operations of eight coffee stores, four being located in a typical business district area and the other four located in an affluent residential area, owned by a specialty coffee company. This paper again, considers retail location as an uncontrollable input.
DEA is a non-parametric method of measuring efficiency of any Decision Making Unit (DMU) such as public sector agency, firms, retail stores, etc. Charnes, Cooper and Rhodes introduced DEA into operation research in 1978 and this model is named as CCR model. The CCR model has an assumption of constant returns to scale. Later in 1984, Banker, Charnes and Cooper introduced another model, known as BCC model which was an extension of the CCR model to accommodate the variable return to scale while evaluating the performance of any DMU. In consequent years, there have been several advancements taken place in this technique.
The paramount attribute of DEA is that it brings in relative comparison rather than giving absolute values for the evaluation. Efficiency of any DMU is calculated as maximum of the ratio of weighted outputs to weighted inputs, subject to conditions that similar ratios, using similar weights, for all other outlets under consideration are less than or equal to one.
In DEA, the weights are estimated separately for each DMU. DEA estimates weights for any DMU in such a way that its efficiency is the maximum as compared to the rest of the DMUs. The other DMUs efficiency should remain either equal to or less than 1.
The general purpose DEA, developed by Charnes et al. (1978) and known as CCR model, takes n DMUs into consideration, using m inputs to secure s outputs. The notations which are used in the model are as follows:
m: number of inputs (i =1,2,…m)
s: number of outputs (r =1,2,…s)
n: number of DMUs (j =1,2,…n)
xij: ith input of jth DMU
yrj: rth output of jth DMU

2012 311
=Υ
=Χ
snss
n
n
mnmm
n
n
yyy
yyyyyy
xxx
xxxxxx
.........
...
...
,
.........
...
...
21
22221
11211
21
22221
11211
).v,v,(v v).u,u,(u u m21s21 …=…=
The efficiency of each DMU is measured once and therefore we need n optimization problems to be solved, one for each DMUj. Let the DMUj to be evaluated on any trial be designated as DMUo, where “O” ranges over 1,2,….,n. We solve the following LP to obtain values for the input weights v1,v2,….vm and output weight u1,u2,….us as variables.
s.t.
0.u…,u,u0.v…,v,v
n)1,2,...., = (j x v+......+x v+x vyu +....+yu+yu1 =xv+......+x v+ xv
yu+…… +yu yumax
s21
m21
mjm2j21j1sjs2j21j1
mom2o21o1
sos2o21o1
≥≥
≤
+
In vector matrix the above LP can be written as:
s.t.
0vu,0vXuY
1 = vxuymax
o
o
≥≤−
(1)
The dual of LP helps in recognizing the reference set for the inefficient DMUs. These reference sets then help us in identifying the inadequacies existing in the inefficient units. The dual of the above model can be given in the following form:
s.t.
0xX
yYmin
o
o
≥≤≥
λθλ
λθ
(2)
DEA is a technique that can accommodate both discretionary and non-discretionary variables together while assessing the efficiency or performance of any DMU.
The competitive or environmental variables that are beyond the control of organization are known as non-discretionary variables. Albeit, these variables are uncontrollable still it is important to take them into consideration because these inputs along with discretionary inputs lead to estimation of the actual measure of efficiency. The formulation of CCR model in case of discretionary and non-discretionary variables is given as (Cooper et. al.2007):
sruNDivDiv
xv
njxvxvyuts
xvyu
r
i
i
Diioi
Diiji
NDiiji
s
rrjr
NDiioi
s
rror
....,2,1,,0,
1
,....,2,1,0..
max
1
1
=≥∈≥∈≥
=
=≤−−
−
∑
∑∑∑
∑∑
∈
∈∈=
∈=
ε
ε
(3)
As can be noticed, the non-discretionary values enter into the objective function; this is because the multiplier values associated with these non-discretionary inputs may be zero as we have vi ≥ 0 for i ∈ ND however, the other values must always be positive.
The dual of the above equation can be in the following form:
∑
∑
∑
∑∑
=
+
=
−
=
−
=
+
∈
−
=−=
∈+=
∈+=
+−
n
jrjrjro
n
jijijio
n
jijijio
s
rr
Dii
srsyy
NDisxx
Disxxts
ss
1
1
1
1
,....,2,1,
,
,..
min
λ
λ
λθ
εθ
(4)
In the above model it can be noticed that variable θ is not applied to the non-discretionary inputs this is because these are the uncontrollable values which are fixed exogenously and therefore it is not possible to vary them at the discretion of the management. ε is a very small value which depends on the discretion of the researcher. It is applied in the objective function to show that the slack variables will be handled at a later stage without disturbing the first stage of minimization of θ to achieve θ = θ*.
Pande S., Patel G.N. - Assessing the Impact of Non-Discretionary Variables on the Performance of Pharmacy Retail Stores Using DEA Approach.
Smriti Pande, Dr. G.N. Patel
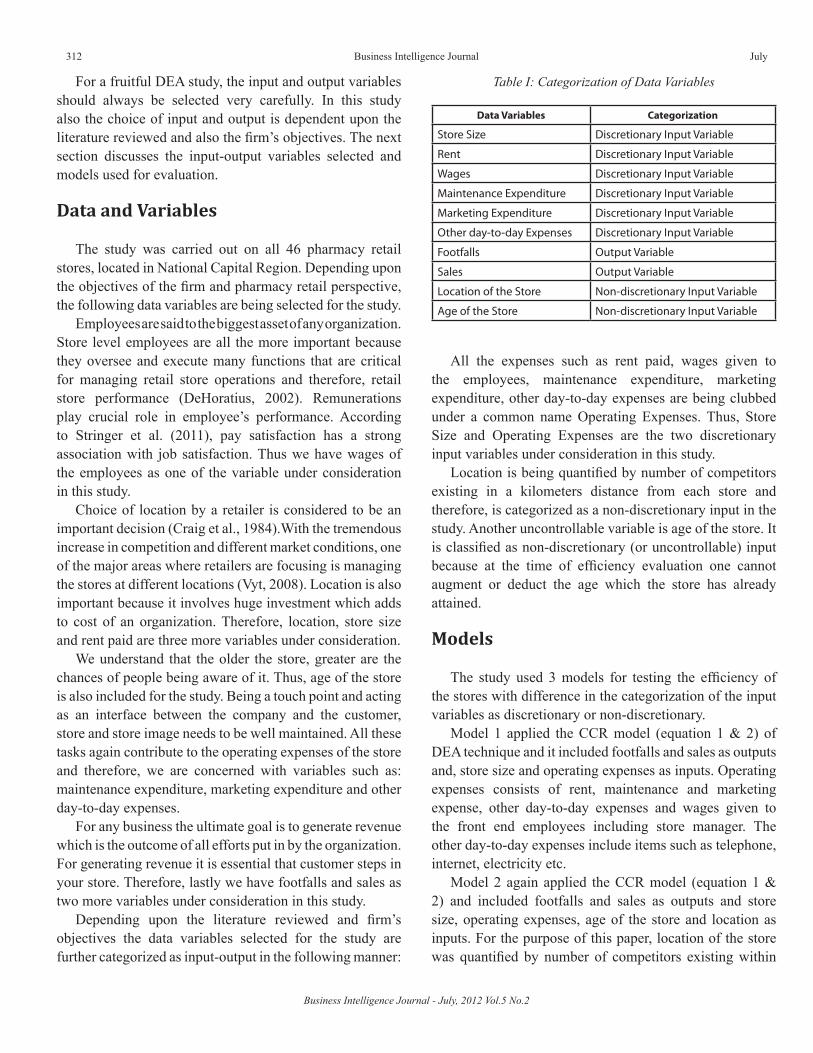
Business Intelligence Journal - July, 2012 Vol.5 No.2
312 Business Intelligence Journal July
For a fruitful DEA study, the input and output variables should always be selected very carefully. In this study also the choice of input and output is dependent upon the literature reviewed and also the firm’s objectives. The next section discusses the input-output variables selected and models used for evaluation.
Data and Variables
The study was carried out on all 46 pharmacy retail stores, located in National Capital Region. Depending upon the objectives of the firm and pharmacy retail perspective, the following data variables are being selected for the study.
Employees are said to the biggest asset of any organization. Store level employees are all the more important because they oversee and execute many functions that are critical for managing retail store operations and therefore, retail store performance (DeHoratius, 2002). Remunerations play crucial role in employee’s performance. According to Stringer et al. (2011), pay satisfaction has a strong association with job satisfaction. Thus we have wages of the employees as one of the variable under consideration in this study.
Choice of location by a retailer is considered to be an important decision (Craig et al., 1984).With the tremendous increase in competition and different market conditions, one of the major areas where retailers are focusing is managing the stores at different locations (Vyt, 2008). Location is also important because it involves huge investment which adds to cost of an organization. Therefore, location, store size and rent paid are three more variables under consideration.
We understand that the older the store, greater are the chances of people being aware of it. Thus, age of the store is also included for the study. Being a touch point and acting as an interface between the company and the customer, store and store image needs to be well maintained. All these tasks again contribute to the operating expenses of the store and therefore, we are concerned with variables such as: maintenance expenditure, marketing expenditure and other day-to-day expenses.
For any business the ultimate goal is to generate revenue which is the outcome of all efforts put in by the organization. For generating revenue it is essential that customer steps in your store. Therefore, lastly we have footfalls and sales as two more variables under consideration in this study.
Depending upon the literature reviewed and firm’s objectives the data variables selected for the study are further categorized as input-output in the following manner:
Table I: Categorization of Data Variables
Data Variables Categorization
Store Size Discretionary Input Variable
Rent Discretionary Input Variable
Wages Discretionary Input Variable
Maintenance Expenditure Discretionary Input Variable
Marketing Expenditure Discretionary Input Variable
Other day-to-day Expenses Discretionary Input Variable
Footfalls Output Variable
Sales Output Variable
Location of the Store Non-discretionary Input Variable
Age of the Store Non-discretionary Input Variable
All the expenses such as rent paid, wages given to the employees, maintenance expenditure, marketing expenditure, other day-to-day expenses are being clubbed under a common name Operating Expenses. Thus, Store Size and Operating Expenses are the two discretionary input variables under consideration in this study.
Location is being quantified by number of competitors existing in a kilometers distance from each store and therefore, is categorized as a non-discretionary input in the study. Another uncontrollable variable is age of the store. It is classified as non-discretionary (or uncontrollable) input because at the time of efficiency evaluation one cannot augment or deduct the age which the store has already attained.
Models
The study used 3 models for testing the efficiency of the stores with difference in the categorization of the input variables as discretionary or non-discretionary.
Model 1 applied the CCR model (equation 1 & 2) of DEA technique and it included footfalls and sales as outputs and, store size and operating expenses as inputs. Operating expenses consists of rent, maintenance and marketing expense, other day-to-day expenses and wages given to the front end employees including store manager. The other day-to-day expenses include items such as telephone, internet, electricity etc.
Model 2 again applied the CCR model (equation 1 & 2) and included footfalls and sales as outputs and store size, operating expenses, age of the store and location as inputs. For the purpose of this paper, location of the store was quantified by number of competitors existing within
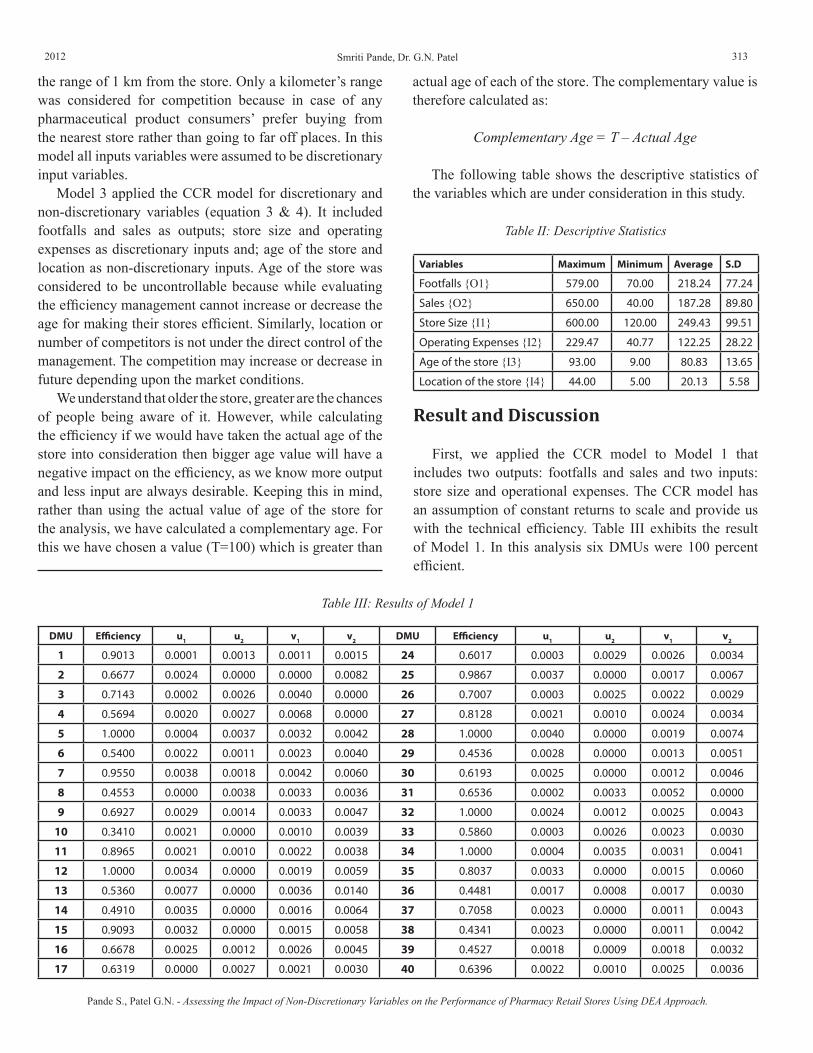
2012 313
the range of 1 km from the store. Only a kilometer’s range was considered for competition because in case of any pharmaceutical product consumers’ prefer buying from the nearest store rather than going to far off places. In this model all inputs variables were assumed to be discretionary input variables.
Model 3 applied the CCR model for discretionary and non-discretionary variables (equation 3 & 4). It included footfalls and sales as outputs; store size and operating expenses as discretionary inputs and; age of the store and location as non-discretionary inputs. Age of the store was considered to be uncontrollable because while evaluating the efficiency management cannot increase or decrease the age for making their stores efficient. Similarly, location or number of competitors is not under the direct control of the management. The competition may increase or decrease in future depending upon the market conditions.
We understand that older the store, greater are the chances of people being aware of it. However, while calculating the efficiency if we would have taken the actual age of the store into consideration then bigger age value will have a negative impact on the efficiency, as we know more output and less input are always desirable. Keeping this in mind, rather than using the actual value of age of the store for the analysis, we have calculated a complementary age. For this we have chosen a value (T=100) which is greater than
Table II: Descriptive Statistics
Variables Maximum Minimum Average S.D
Footfalls {O1} 579.00 70.00 218.24 77.24
Sales {O2} 650.00 40.00 187.28 89.80
Store Size {I1} 600.00 120.00 249.43 99.51
Operating Expenses {I2} 229.47 40.77 122.25 28.22
Age of the store {I3} 93.00 9.00 80.83 13.65
Location of the store {I4} 44.00 5.00 20.13 5.58
Result and Discussion
First, we applied the CCR model to Model 1 that includes two outputs: footfalls and sales and two inputs: store size and operational expenses. The CCR model has an assumption of constant returns to scale and provide us with the technical efficiency. Table III exhibits the result of Model 1. In this analysis six DMUs were 100 percent efficient.
Table III: Results of Model 1
DMU Efficiency u1 u2 v1 v2 DMU Efficiency u1 u2 v1 v2
1 0.9013 0.0001 0.0013 0.0011 0.0015 24 0.6017 0.0003 0.0029 0.0026 0.0034
2 0.6677 0.0024 0.0000 0.0000 0.0082 25 0.9867 0.0037 0.0000 0.0017 0.0067
3 0.7143 0.0002 0.0026 0.0040 0.0000 26 0.7007 0.0003 0.0025 0.0022 0.0029
4 0.5694 0.0020 0.0027 0.0068 0.0000 27 0.8128 0.0021 0.0010 0.0024 0.0034
5 1.0000 0.0004 0.0037 0.0032 0.0042 28 1.0000 0.0040 0.0000 0.0019 0.0074
6 0.5400 0.0022 0.0011 0.0023 0.0040 29 0.4536 0.0028 0.0000 0.0013 0.0051
7 0.9550 0.0038 0.0018 0.0042 0.0060 30 0.6193 0.0025 0.0000 0.0012 0.0046
8 0.4553 0.0000 0.0038 0.0033 0.0036 31 0.6536 0.0002 0.0033 0.0052 0.0000
9 0.6927 0.0029 0.0014 0.0033 0.0047 32 1.0000 0.0024 0.0012 0.0025 0.0043
10 0.3410 0.0021 0.0000 0.0010 0.0039 33 0.5860 0.0003 0.0026 0.0023 0.0030
11 0.8965 0.0021 0.0010 0.0022 0.0038 34 1.0000 0.0004 0.0035 0.0031 0.0041
12 1.0000 0.0034 0.0000 0.0019 0.0059 35 0.8037 0.0033 0.0000 0.0015 0.0060
13 0.5360 0.0077 0.0000 0.0036 0.0140 36 0.4481 0.0017 0.0008 0.0017 0.0030
14 0.4910 0.0035 0.0000 0.0016 0.0064 37 0.7058 0.0023 0.0000 0.0011 0.0043
15 0.9093 0.0032 0.0000 0.0015 0.0058 38 0.4341 0.0023 0.0000 0.0011 0.0042
16 0.6678 0.0025 0.0012 0.0026 0.0045 39 0.4527 0.0018 0.0009 0.0018 0.0032
17 0.6319 0.0000 0.0027 0.0021 0.0030 40 0.6396 0.0022 0.0010 0.0025 0.0036
actual age of each of the store. The complementary value is therefore calculated as:
Complementary Age = T – Actual Age
The following table shows the descriptive statistics of the variables which are under consideration in this study.
Pande S., Patel G.N. - Assessing the Impact of Non-Discretionary Variables on the Performance of Pharmacy Retail Stores Using DEA Approach.
Smriti Pande, Dr. G.N. Patel

Business Intelligence Journal - July, 2012 Vol.5 No.2
314 Business Intelligence Journal July
DMU Efficiency u1 u2 v1 v2 DMU Efficiency u1 u2 v1 v2
18 0.6789 0.0024 0.0000 0.0011 0.0044 41 0.8706 0.0024 0.0012 0.0025 0.0043
19 0.539 0.0030 0.0000 0.0016 0.0050 42 0.7332 0.0002 0.0035 0.0055 0.0000
20 1.0000 0.0000 0.0036 0.0042 0.0018 43 0.6470 0.0003 0.0030 0.0026 0.0035
21 0.5980 0.0002 0.0038 0.0060 0.0000 44 0.5060 0.0028 0.0000 0.0013 0.0052
22 0.7186 0.0000 0.0027 0.0023 0.0026 45 0.8668 0.0026 0.0012 0.0028 0.0041
23 0.8276 0.0027 0.0013 0.0027 0.0047 46 0.7718 0.0026 0.0000 0.0012 0.0047
Second, we again applied the basic CCR model to Model 2 that included two outputs: footfalls and sales and four inputs: store size, operational expenses, age of the store and location. All these input variables were assumed to be discretionary variables. The results of Model 2 are summarized in Table IV, here seven DMUs were found to be efficient.
Third, we applied the CCR model for discretionary and non-discretionary variables to Model 3 that included same set of input-output variables as used in model 2. The only difference was that age and location of the store were being categorized as non-discretionary variables. Table V exhibits the efficiency scores of Model 3. Again, the same set of DMUs as in Model 2 turns out to be efficient ones in this analysis.
Table IV: Result of Model 2 (considering all Inputs as Discretionary Variables)
DMU Efficiency u1 u2 v1 v2 v3 v4 DMU Efficiency u1 u2 v1 v2 v3 v4
1 1.0000 0.0006 0.0010 0.0015 0.0000 0.0005 0.0050 24 0.6108 0.0000 0.0032 0.0025 0.0028 0.0012 0.0000
2 0.7151 0.0026 0.0000 0.0000 0.0063 0.0024 0.0000 25 0.9939 0.0037 0.0000 0.0015 0.0055 0.0022 0.0000
3 0.7463 0.0003 0.0026 0.0031 0.0000 0.0026 0.0000 26 0.7443 0.0007 0.0023 0.0028 0.0000 0.0008 0.0092
4 0.5694 0.0020 0.0027 0.0068 0.0000 0.0000 0.0000 27 0.8527 0.0013 0.0024 0.0034 0.0000 0.0010 0.0115
5 1.0000 0.0029 0.0014 0.0029 0.0034 0.0017 0.0028 28 1.0000 0.0040 0.0000 0.0016 0.0060 0.0025 0.0000
6 0.5442 0.0022 0.0011 0.0023 0.0027 0.0014 0.0022 29 0.4682 0.0029 0.0000 0.0011 0.0043 0.0018 0.0000
7 0.9550 0.0038 0.0018 0.0042 0.0060 0.0000 0.0000 30 0.6548 0.0027 0.0000 0.0013 0.0033 0.0019 0.0000
8 0.4766 0.0010 0.0031 0.0041 0.0000 0.0000 0.0140 31 0.7094 0.0010 0.0030 0.0039 0.0000 0.0000 0.0135
9 0.6927 0.0029 0.0014 0.0033 0.0047 0.0000 0.0000 32 1.0000 0.0024 0.0012 0.0024 0.0029 0.0015 0.0024
10 0.3649 0.0023 0.0000 0.0009 0.0034 0.0014 0.0000 33 0.5993 0.0000 0.0029 0.0022 0.0025 0.0011 0.0000
11 0.9416 0.0012 0.0023 0.0032 0.0000 0.0010 0.0110 34 1.0000 0.0000 0.0038 0.0030 0.0037 0.0006 0.0000
12 1.0000 0.0034 0.0000 0.0015 0.0046 0.0021 0.0023 35 0.8349 0.0034 0.0000 0.0013 0.0050 0.0021 0.0000
13 0.5360 0.0077 0.0000 0.0036 0.0140 0.0000 0.0000 36 0.4684 0.0018 0.0008 0.0016 0.0026 0.0011 0.0000
14 0.4914 0.0035 0.0000 0.0016 0.0064 0.0000 0.0000 37 0.7634 0.0025 0.0000 0.0010 0.0037 0.0015 0.0000
15 0.9139 0.0032 0.0000 0.0013 0.0047 0.0019 0.0000 38 0.4744 0.0025 0.0000 0.0011 0.0034 0.0015 0.0017
16 0.6782 0.0035 0.0000 0.0014 0.0052 0.0021 0.0000 39 0.4684 0.0019 0.0008 0.0017 0.0027 0.0012 0.0000
17 0.6421 0.0000 0.0027 0.0020 0.0023 0.0010 0.0000 40 0.6684 0.0031 0.0000 0.0015 0.0039 0.0022 0.0000
18 0.7143 0.0025 0.0000 0.0011 0.0034 0.0015 0.0017 41 0.8822 0.0026 0.0011 0.0022 0.0037 0.0016 0.0000
19 0.5706 0.0031 0.0000 0.0015 0.0039 0.0022 0.0000 42 0.7332 0.0002 0.0035 0.0055 0.0000 0.0000 0.0000
20 1.0000 0.0009 0.0030 0.0037 0.0000 0.0011 0.0120 43 0.6709 0.0012 0.0023 0.0032 0.0000 0.0010 0.0109
21 0.6202 0.0010 0.0032 0.0043 0.0000 0.0000 0.0148 44 0.5253 0.0029 0.0000 0.0014 0.0037 0.0021 0.0000
22 0.7622 0.0007 0.0022 0.0027 0.0000 0.0008 0.0089 45 0.8715 0.0024 0.0014 0.0028 0.0038 0.0000 0.0021
23 0.8276 0.0027 0.0013 0.0027 0.0047 0.0000 0.0000 46 0.8268 0.0028 0.0000 0.0011 0.0041 0.0017 0.0000
DMU Efficiency u1 u2 v1 v2 v3 v4 DMU Efficiency u1 u2 v1 v2 v3 v4
1 1.0000 0.0017 0.0000 0.0007 0.0026 0.0010 0.0000 24 0.6017 0.0003 0.0029 0.0026 0.0034 0.0000 0.0000
2 0.6656 0.0024 0.0000 0.0000 0.0081 0.0000 0.0000 25 0.9923 0.0045 0.0000 0.0018 0.0066 0.0027 0.0000
Table V: Result of Model 3 (using Discretionary and Non-Discretionary Variables)

2012 315
On analyzing the results of all the three models together we noticed that the average efficiency scores obtained in Model 2 were the highest as compared to the other two models. This implied that increase in number of discretionary input variables does impact the efficiency scores. As can be noticed, the efficiency scores of the model with more number of discretionary input variables i.e. Model 2, were greater than or equal to the efficiency scores calculated with lesser number of discretionary input variables i.e.
(Model2)(Model3)
(Model2)Model1)( and
θθ
θθ
≤
≤
Furthermore, it was observed that ten DMUs have attained equal efficiency scores in all the three models. These DMUs were: 5, 7, 9, 12, 20, 23, 28, 32, 34 and 42. Out of these ten DMUs, six DMUs i.e. store 5, 12, 20, 28, 32 and 34 were the efficient ones. The other four DMUs 7, 9, 23, and 42 were as shown in Table VI.
Table VI: Inefficient DMUs with Equal Efficiency in all the Models
DMU MODEL u1 u2 v1 v2 v3 v4
7
1 0.0038 0.0018 0.0042 0.0060
2 0.0038 0.0018 0.0042 0.0060 0.0000 0.0000
3 0.0038 0.0018 0.0042 0.0060 0.0000 0.0000
9
1 0.0029 0.0014 0.0033 0.0047
2 0.0029 0.0014 0.0033 0.0047 0.0000 0.0000
3 0.0029 0.0014 0.0033 0.0047 0.0000 0.0000
23
1 0.0027 0.0013 0.0027 0.0047
2 0.0027 0.0013 0.0027 0.0047 0.0000 0.0000
3 0.0027 0.0013 0.0027 0.0047 0.0000 0.0000
42
1 0.0002 0.0035 0.0055 0.0000
2 0.0002 0.0035 0.0055 0.0000 0.0000 0.0000
3 0.0002 0.0035 0.0055 0.0000 0.0000 0.0000
From the above table, it can be observed that equal weights were assigned to the output variables: footfalls (u1) and sales (u2) and; discretionary input variables i.e. store size (v1) and operating expenses (v2) with the other two input variables i.e. age (v3) and location of the store (v4), assigned zero weightage. This further showed that these units have attained their efficiency on the basis of their controllable operations and were not impacted by the uncontrollable variables.
DMU Efficiency u1 u2 v1 v2 v3 v4 DMU Efficiency u1 u2 v1 v2 v3 v4
3 0.7143 0.0002 0.0026 0.0040 0.0000 0.0000 0.0000 26 0.7018 0.0000 0.0029 0.0024 0.0026 0.0000 0.0012
4 0.5693 0.0020 0.0027 0.0067 0.0000 0.0000 0.0000 27 0.8247 0.0026 0.0013 0.0026 0.0031 0.0016 0.0025
5 1.0000 0.0035 0.0014 0.0030 0.0049 0.0021 0.0000 28 1.0000 0.0037 0.0015 0.0032 0.0052 0.0023 0.0000
6 0.5400 0.0022 0.0011 0.0023 0.0040 0.0000 0.0000 29 0.4535 0.0028 0.0000 0.0013 0.0051 0.0000 0.0000
7 0.9550 0.0038 0.0018 0.0042 0.0060 0.0000 0.0000 30 0.6187 0.0025 0.0000 0.0012 0.0046 0.0000 0.0000
8 0.4553 0.0000 0.0038 0.0032 0.0036 0.0000 0.0000 31 0.6536 0.0002 0.0033 0.0052 0.0000 0.0000 0.0000
9 0.6927 0.0029 0.0014 0.0033 0.0047 0.0000 0.0000 32 1.0000 0.0025 0.0014 0.0028 0.0039 0.0000 0.0022
10 0.3410 0.0021 0.0000 0.0010 0.0039 0.0000 0.0000 33 0.5860 0.0003 0.0026 0.0023 0.0030 0.0000 0.0000
11 0.9239 0.0016 0.0030 0.0042 0.0000 0.0013 0.0143 34 1.0000 0.0000 0.0040 0.0032 0.0039 0.0006 0.0000
12 1.0000 0.0034 0.0017 0.0034 0.0041 0.0021 0.0033 35 0.8058 0.0040 0.0000 0.0016 0.0059 0.0024 0.0000
13 0.5357 0.0076 0.0000 0.0036 0.0140 0.0000 0.0000 36 0.4482 0.0017 0.0008 0.0017 0.0030 0.0000 0.0000
14 0.4913 0.0035 0.0000 0.0016 0.0064 0.0000 0.0000 37 0.7326 0.0028 0.0000 0.0011 0.0042 0.0017 0.0000
15 0.9084 0.0032 0.0000 0.0015 0.0058 0.0000 0.0000 38 0.4336 0.0023 0.0000 0.0011 0.0042 0.0000 0.0000
16 0.6678 0.0025 0.0012 0.0026 0.0045 0.0000 0.0000 39 0.4527 0.0018 0.0009 0.0018 0.0032 0.0000 0.0000
17 0.6314 0.0000 0.0026 0.0021 0.0030 0.0000 0.0000 40 0.6396 0.0022 0.0010 0.0025 0.0036 0.0000 0.0000
18 0.6786 0.0024 0.0000 0.0011 0.0044 0.0000 0.0000 41 0.8706 0.0024 0.0012 0.0025 0.0043 0.0000 0.0000
19 0.5392 0.0030 0.0000 0.0016 0.0050 0.0000 0.0000 42 0.7332 0.0002 0.0035 0.0055 0.0000 0.0000 0.0000
20 1.0000 0.0013 0.0041 0.0054 0.0000 0.0000 0.0186 43 0.6470 0.0003 0.0030 0.0026 0.0035 0.0000 0.0000
21 0.5980 0.0002 0.0038 0.0060 0.0000 0.0000 0.0000 44 0.5060 0.0028 0.0000 0.0013 0.0052 0.0000 0.0000
22 0.7273 0.0000 0.0030 0.0023 0.0026 0.0011 0.0000 45 0.8668 0.0026 0.0012 0.0028 0.0041 0.0000 0.0000
23 0.8276 0.0027 0.0013 0.0027 0.0047 0.0000 0.0000 46 0.8015 0.0031 0.0000 0.0012 0.0046 0.0019 0.0000
Pande S., Patel G.N. - Assessing the Impact of Non-Discretionary Variables on the Performance of Pharmacy Retail Stores Using DEA Approach.
Smriti Pande, Dr. G.N. Patel

Business Intelligence Journal - July, 2012 Vol.5 No.2
316 Business Intelligence Journal July
However, on comparing Model 1 and Model 3, we observed that efficiency scores obtained for twenty-five of the DMUs were exactly equal. In these twenty-five cases where efficiency obtained through Model 1 is equal to the efficiency obtained in Model 3, there was an equal distribution of weights among all the variables except, non-discretionary input variables which were assigned zero weightage. For example, DMU 3, 6, 8 10, 16, 21, 23, 24, 31, 33 etc. were the ones which have exactly equal efficiency scores with non-discretionary input variables having zero weightage. Some of them are as shown in Table VII. This implies that insertion of non-discretionary variables has not impacted the efficiency of DMUs.
Table VII: DMUs with Equal Efficiency in Model 1 and Model 3
DMU MODEL u1 u2 v1 v2 v3 v4
31 0.0002 0.0026 0.0040 0.0000
3 0.0002 0.0026 0.0040 0.0000 0.0000 0.0000
101 0.0021 0.0000 0.0010 0.0039
3 0.0021 0.0000 0.0010 0.0039 0.0000 0.0000
231 0.0027 0.0013 0.0027 0.0047
3 0.0027 0.0013 0.0027 0.0047 0.0000 0.0000
331 0.0003 0.0026 0.0023 0.0030
3 0.0003 0.0026 0.0023 0.0030 0.0000 0.0000
Apart from these twenty-five cases of equal efficiency, in rest of the cases the efficiency of a DMU in Model 1 was either less than or greater than its efficiency in Model 3 i.e.
)3()1(
)3()1(,
ModelModel
ModelModel
oreither
θθ
θθ
<
>
The DMUs where θ(Model 1) > θ(Model 3) were: 2, 13, 15, 17, 30 and 38. In all these DMUs it can be observed that the non-discretionary variables again have a zero weightage (Table VIII). This further implies that the non-discretionary variables have no impact on the performance of all such DMUs.
Table VIII: Cases where θ(Model 1) > θ(Model 3)
DM
U
MO
DEL
Effici
ency
u1 u2 v1 v2 v3 v4
21 0.6677 0.0024 0.0000 0.0000 0.0082
3 0.6656 0.0024 0.0000 0.0000 0.0081 0.0000 0.0000
In case of other DMUs such as: 1, 11, 22, 25, 26, 27, 35, 37 and 46 where θ(Model 1) < θ(Model 3), it was observed that the non-discretionary variables were assigned weights which further implied that they have impacted the efficiency of these DMUs which resulted in improved efficiency scores. Some of these cases are as shown in Table IX.
Table IX: Cases where θ(Model 1) < θ(Model 3)
DM
U
MO
DEL
Effici
ency
u1 u2 v1 v2 v3 v4
11 0.9013 0.0001 0.0013 0.0011 0.0015
3 1.0000 0.0017 0.0000 0.0007 0.0026 0.0010 0.0000
111 0.8965 0.0021 0.0010 0.0022 0.0038
3 0.9239 0.0016 0.0030 0.0042 0.0000 0.0013 0.0143
271 0.8128 0.0021 0.0010 0.0024 0.0034
3 0.8247 0.0026 0.0013 0.0026 0.0031 0.0016 0.0025
461 0.7718 0.0026 0.0000 0.0012 0.0047
0.8015 0.0031 0.0000 0.0012 0.0046 0.0019 0.0000
The above discussed cases of Model 1 and Model 3 do not helped us in arriving at any conclusion. In some of the cases the inclusion of non-discretionary input variables has an impact on the efficiency of the store whereas in others it has no impact. In order to validate the observations, ANOVA was applied to test the significance of results obtained through the two different models i.e. Model 1 and Model 3. The hypotheses formulated were:
H0: There is no significant difference between the means of the efficiencies obtained through the two different models and;
H1: There exists a significant difference between the means of the efficiencies obtained through the two different models.
DM
U
MO
DEL
Effici
ency
u1 u2 v1 v2 v3 v4
131 0.5360 0.0077 0.0000 0.0036 0.0140
3 0.5357 0.0076 0.0000 0.0036 0.0140 0.0000 0.0000
151 0.9093 0.0032 0.0000 0.0015 0.0058
3 0.9084 0.0032 0.0000 0.0015 0.0058 0.0000 0.0000
171 0.6319 0.0000 0.0027 0.0021 0.0030
3 0.6314 0.0000 0.0026 0.0021 0.0030 0.0000 0.0000
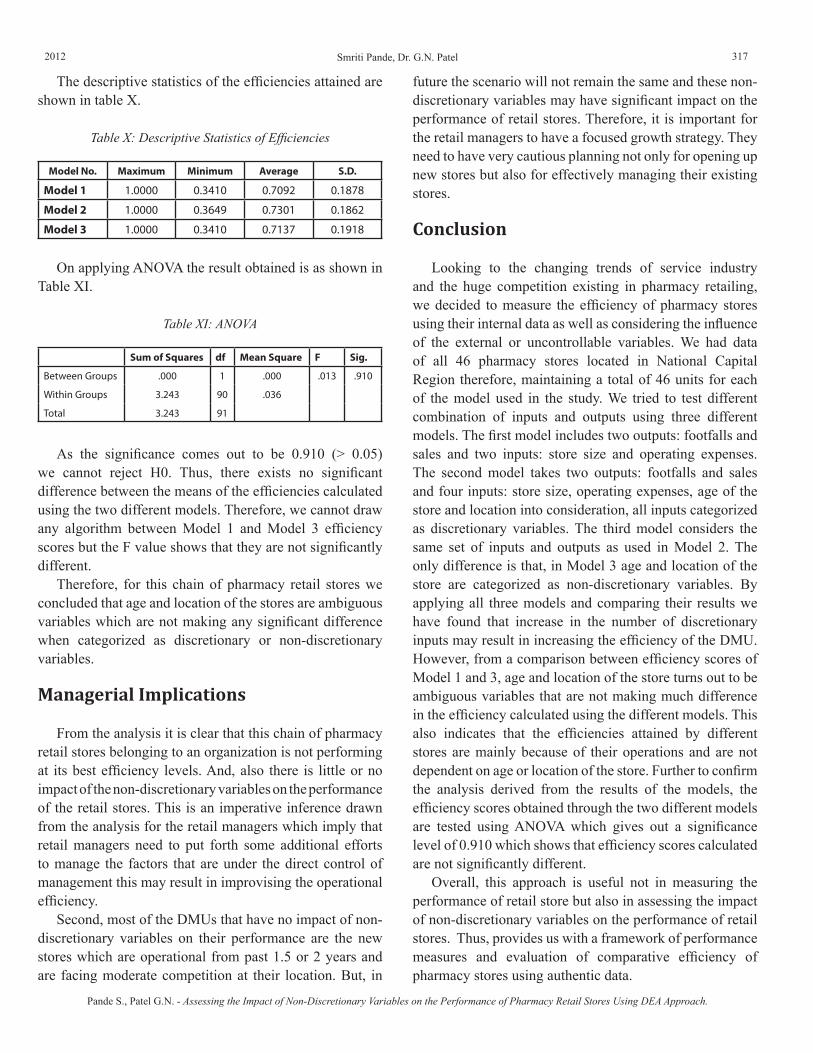
2012 317
The descriptive statistics of the efficiencies attained are shown in table X.
Table X: Descriptive Statistics of Efficiencies
Model No. Maximum Minimum Average S.D.
Model 1 1.0000 0.3410 0.7092 0.1878
Model 2 1.0000 0.3649 0.7301 0.1862
Model 3 1.0000 0.3410 0.7137 0.1918
On applying ANOVA the result obtained is as shown in Table XI.
Table XI: ANOVA
Sum of Squares df Mean Square F Sig.
Between Groups .000 1 .000 .013 .910
Within Groups 3.243 90 .036
Total 3.243 91
As the significance comes out to be 0.910 (> 0.05) we cannot reject H0. Thus, there exists no significant difference between the means of the efficiencies calculated using the two different models. Therefore, we cannot draw any algorithm between Model 1 and Model 3 efficiency scores but the F value shows that they are not significantly different.
Therefore, for this chain of pharmacy retail stores we concluded that age and location of the stores are ambiguous variables which are not making any significant difference when categorized as discretionary or non-discretionary variables.
Managerial Implications
From the analysis it is clear that this chain of pharmacy retail stores belonging to an organization is not performing at its best efficiency levels. And, also there is little or no impact of the non-discretionary variables on the performance of the retail stores. This is an imperative inference drawn from the analysis for the retail managers which imply that retail managers need to put forth some additional efforts to manage the factors that are under the direct control of management this may result in improvising the operational efficiency.
Second, most of the DMUs that have no impact of non-discretionary variables on their performance are the new stores which are operational from past 1.5 or 2 years and are facing moderate competition at their location. But, in
future the scenario will not remain the same and these non-discretionary variables may have significant impact on the performance of retail stores. Therefore, it is important for the retail managers to have a focused growth strategy. They need to have very cautious planning not only for opening up new stores but also for effectively managing their existing stores.
Conclusion
Looking to the changing trends of service industry and the huge competition existing in pharmacy retailing, we decided to measure the efficiency of pharmacy stores using their internal data as well as considering the influence of the external or uncontrollable variables. We had data of all 46 pharmacy stores located in National Capital Region therefore, maintaining a total of 46 units for each of the model used in the study. We tried to test different combination of inputs and outputs using three different models. The first model includes two outputs: footfalls and sales and two inputs: store size and operating expenses. The second model takes two outputs: footfalls and sales and four inputs: store size, operating expenses, age of the store and location into consideration, all inputs categorized as discretionary variables. The third model considers the same set of inputs and outputs as used in Model 2. The only difference is that, in Model 3 age and location of the store are categorized as non-discretionary variables. By applying all three models and comparing their results we have found that increase in the number of discretionary inputs may result in increasing the efficiency of the DMU. However, from a comparison between efficiency scores of Model 1 and 3, age and location of the store turns out to be ambiguous variables that are not making much difference in the efficiency calculated using the different models. This also indicates that the efficiencies attained by different stores are mainly because of their operations and are not dependent on age or location of the store. Further to confirm the analysis derived from the results of the models, the efficiency scores obtained through the two different models are tested using ANOVA which gives out a significance level of 0.910 which shows that efficiency scores calculated are not significantly different.
Overall, this approach is useful not in measuring the performance of retail store but also in assessing the impact of non-discretionary variables on the performance of retail stores. Thus, provides us with a framework of performance measures and evaluation of comparative efficiency of pharmacy stores using authentic data.
Pande S., Patel G.N. - Assessing the Impact of Non-Discretionary Variables on the Performance of Pharmacy Retail Stores Using DEA Approach.
Smriti Pande, Dr. G.N. Patel
Business Intelligence Journal - July, 2012 Vol.5 No.2
318 Business Intelligence Journal July
References
Alijani GS, Mancuso LC, Kwun O, Barika EI (2010). Enhancing Drugs Access in Normal and Critical Circumstances. Academy of Health Care Management Journal. 6(2): 75-86.
Anderson R, Fok R, Zumpano L, Elder H (1998). The efficiency of franchising in the residential real estate brokerage market. Journal of Consumer Marketing. 15: 386-96.
Balakrishnan P, Desai A, Storbeck J (1994). Efficiency evaluation of retail outlet networks. Environment and Planning B. 21(4): 477-88.
Banker RD, Charnes A, Cooper WW (1984). Some Models for Estimating Technical and Scale Inefficiencies in Data Envelopment Analysis. Management Science. 30: 1078-1092.
Banker RD, Morey RC (1986). Efficiency Analysis for Exogenously Fixed Inputs and Outputs. Operations Research. 34: 513-521.
Barros CP, Alves CA (2003). Hypermarket retail store efficiency in Portugal. International Journal of Retail & Distribution Management. 31(11): 549-560.
Barros CP, Alves C (2004). An empirical analysis of productivity growth in a Portuguese retail chain using Malmquist productivity index. Journal of Retailing and Consumer Services. 11(5): 269-78.
Beliveau BC, Bernstein EH (1997). Struggling to Survive: The case of independent pharmacies. Journal of Business and Entrepreneurship. 9(2): 36- 49.
Brooks JM, Doucette WR, Wan S, Klepser DG (2008). Retail pharmacy market structure and performance. Inquiry-Excellus Health Plan. 45(1): 75-88.
Charnes A, Cooper WW, Rhodes E (1978). Measuring the Efficiency of Decision Making Units. European Journal of Operational Research. 2: 429-444.
Cooper WW, Seiford LM, Tone K (2007). Data Envelopment Analysis: A comprehensive text with models, applications, references and DEA-Solver Software. Springer Science + Business Media, LLC.
Craig CS, Ghosh A, McLafferty S (1984). Models of the retail location process: a review. Journal of Retailing. 60 (Spring): 5-36.
DeHoratius N (2002). Critical determinants of retail execution. Harvard University, Graduate School of Business, George F. Baker Foundation, Ph.D.
Donthu N, Yoo B (1998). Retail Productivity Assessment Using Data Envelopment Analysis. Journal of Retailing. 74(1): 89-105.
Hamilton J (2009). Building a targeted pharmacy customer engagement approach. International Journal of Pharmaceutical and Healthcare Marketing. 3(4): 381-396.
India Pharmaceuticals & Healthcare (Q4, 2010). Business Monitor Intelligence.
Jambulingam T, Kathuria R, Nevin JR (2009). How fairness garners loyalty in the pharmaceutical supply chain: Role of trust in the wholesaler-pharmacy relationship. International Journal of Pharmaceutical and Healthcare Marketing. 3(4): 305-322.
Jing FF, Avery GC, Bergsteiner H (2011). Organizational climate and performance in retail pharmacies. Leadership and Organization Development Journal. 32(3): 224-242.
Joo SJ, Stoeberl PA, Fitzer K (2009). Measuring and benchmarking the performance of coffee stores for retail operations. Benchmarking: An International Journal. 16(6): 741-753
McGee JE, Peterson M (2000). Toward the development of measures of distinctive competencies among small independent retailers. Journal of Small Business Management. 38(2): 19-33.
Pioch EA, Schmidt RA (2004). “Community pharmacies as good neighbours?” A comparative study of Germany and the UK. International Journal of Retail & Distribution Management. 32(11): 532-544.
Saranga H, Phani BV (2004). The Indian Pharmaceutical Industry - An Overview of Internal Efficiencies using Data Envelopment Analysis. Social Science Research Network, Working Paper Series, Rochester.
Schofield RA, Breen L (2006). Suppliers, do you know your customers?. International Journal of Quality & Reliability Management. 23(4): 390-408.
Stringer C, Didham J, Theivananthampillai P (2011). Motivation, pay satisfaction, and job satisfaction of front-line employees. Qualitative Research in Accounting & Management. 8(2): 161-179.
Taneja A, Roy RS, Taneja SP, Sondhi A (2009). India Retail Report. Images Multimedia Pvt. Ltd.
Vyt D (2008). Retail Network Performance Evaluation: A DEA approach considering retailers’ geomarketing. The International Review of Retail, Distribution and Consumer Research. 18(2): 235–253.

2012 319
BUYER SUPPLIER RELATIONSHIP IN MANUFACTURING INDUSTRY - FINDINGS FROM INDIAN MANUFACTURING
SECTOR
Manoj Kumar MohantyAsst. Manager-Projects,
Larsen & Toubro Limited, Kansbahal, Sundargarh, Orissa, India – 770034Email: [email protected]
Prof. (Dr.) P. Gahan, Co-AuthorProfessor – Business Administration Department,
Sambalpur University, Burla, Orissa, India – 768019Email: [email protected]
AbstractCurrent era of business demands a stable and long lasting partnership with supply chain partners. A relationship is called a successful
one in which mutual economic gain, understanding of individual requirements and respect to each other exists. The role of the large scale manufacturing buyers becomes more crucial in building relationship where the suppliers are belongs to micro small and medium enterprises (MSME). Most of the large scale manufacturing industry is having supply base as MSME manufacturing units. The contribution of MSME sector to the country’s GDP, employment, production and export is quite remarkable and under special focus of state governments as well as central government of India. It is more over important to understand the situations of that sector and to design the expectations as a buyer. The relationship building process only will be effective if the buyers will have clarity between expectations and available offerings. The objective of the paper is in three folds. Firstly to understand the buyer supplier relationship attributes considered by the Indian large scale manufacturing organisations, secondly the expectations of large scale buyers from the MSME sector suppliers and finally the ranking of the factors affecting the buyer supplier relationship. Paper Type: Research paper. Key words: Supply Chain Management, Buyer Supplier Relationship, Manufacturing Industry, MSME Sector, RIDIT Analysis.
Globalisation and fast changing business practices putting organisations under tremendous pressure to constantly improve product or process quality, delivery index, performance, and responsiveness along with reducing costs. Organisations also increasingly exploring ways to leverage their supply chains and giving more focus on the role of suppliers in their chain. In other wards firms are now more trying to utilize their resources and increasing the value of the supply chain and in return they are experiencing more flexibility and responsive to the demands and customers. Outsourcing allows firms to exploit the capabilities, expertise, technologies, and efficiencies of their suppliers. Increased outsourcing, however, implies greater reliance on suppliers and commensurate need to manage the supplier base (Kannan & Tan, 2006).
Development and maintenance of long-term relationships between buyers and sellers is the key to
industrial buying success. Existing supplier relationships are a powerful competitive advantage for a company (Ford, 1980). Relational exchanges can contribute to product differentiation and create barriers to switching for suppliers and buyers (Day and Wensley, 1988). Today, large and small companies are making partnerships with suppliers a foundation of their supply strategies (Minahan, 1998). At an operational level, the benefit to a buyer of developing close relationships with key suppliers comes in the form of improved quality or delivery service, reduced cost, or some combination thereof. At a strategic level, it should lead to sustainable improvements in product quality and innovation, enhanced competitiveness, and increased market share (Kannan & Tan, 2006).
In Indian manufacturing set-up the micro small and medium enterprises (MSME) plays a very vital role. The outsourcing in manufacturing varies largely starting from
Mohanty M. K., Gahan P. - Buyer Supplier Relationship in Manufacturing Industry - Findings from Indian Manufacturing Sector.
Manoj Kumar Mohanty, Dr. P. Gahan
Business Intelligence Journal - July, 2012 Vol.5 No.2
320 Business Intelligence Journal July
20% to 90%. This sector’s contribution to the Indian GDP, employment, domestic consumption and social balance is remarkable. Moreover the focus from the government agencies has increased tremendously in recent pasts. As large manufacturing companies largely dependent on this MSME sector it is vital for them to build long lasting relationship with MSME sector as well as understand their problems and act as a strategic partner. The moral duty of large scale manufacturers are also to be a guide and developer to this MSME sector, from the perspective of the country’s economic and industrial growth. The brief description along with fact and figures described latter part of this paper.
Through this paper we have tried to understand the large scale manufacturing industries buyer’s expectations from the micro small medium (MSME) manufacturing sectors as suppliers. The views of the front line buyers on buyer supplier relationships and the attributes they consider for a healthy buyer supplier relationship also explored. RIDIT analysis applied to rank the attributes considered for sound relationship. The reason of such attributes also discussed in detail to give clarity on the outcomes. The recommendations were also made so that management can use the survey as a tool to strengthen the buyer supplier relationship and to close the existing loop holes.
Literature Review
Ford (1980) presents five stages in buyer seller relationship evolution. They are pre-relationship, early stage, development, long-term, and the final stage. In the early stage lack of commitment and uncertainty in the relationship prevails. In the early stage of relationship uncertainty is high, distance between supplier and buyer usually high, perceived and actual commitment is also found to be low. The time investment of management I this stage remains high. Cost saving and negotiation is found to be low and sample based. In the development stage uncertainty slowly reduces, distance between buyer and supplier also reduces, commitment level from both the parties started increasing. Contract signing, large scale ordering and formal adaptations becomes a part of relationship. In the long term relationship stage uncertainty becomes, minimum and institutionalization development takes place. Perceived commitment reduces and actual commitment becomes, maximum. Major purchasing and large scale delivery takes place along with cost saving measures. In the final stage of relationship extensive institutionalization takes place.
Business practice becomes based on code of practice and ethics. It indicates long-established stable markets.
Most of the existing literature on supplier management sees the buyer as principal and the supplier as agent (Eisenhardt, 1989), with a focus on how supplier resources and competencies can be leveraged in order to increase the buyer's expected value. With few exceptions (Dyer & Singh, 1998), value is therefore seen as largely pre-existing the buyer–supplier relationship, with the major managerial concern centred on how value can be transferred from the supplier to the buyer. Value can be defined as output/input, but this does not count for the highly individual perceptions that the individual organisation gain from working with another. It is a comparison between “what you get” or expect to get and “what you give” or expect to give (Zeithaml, 1988). The first component, “cost reduction”, seeks to leverage the supplier's ability to reduce their joint total cost, enabling the buyer to compete on selling price. Walter et al. (2003) describes what they call “the cost reduction function” from a buyer perspective. The second component, “time compression”, seeks to leverage the supplier's ability to achieve higher market responsiveness, both in product development and in supply chain execution (Mason-Jones & Towill, 1999). The third component, “innovation”, seeks to leverage the supplier's ability to improve their product portfolios. A supplier's proactive ability to develop new or improve existing products, is seen as valuable by buyers (Ulaga, 2003, Walter et al., 2001). The fourth component, “access to new buyers/suppliers”, seeks to leverage the supplier's ability to act as a bridge to new and potentially valuable supply chain associations. This allows the buyer to increase the number of customers — and perhaps to work with new suppliers as well. Walter et al. (2001) and Walter et al. (2003) describe what they call “the market function”. The fifth component of buyer perceived expected value derived from supplier associations is “competency development”. A buyer might learn from the competencies of its best suppliers, learning and leveraging this learning with other suppliers. However, learning applies equally to the supplier's value perceptions (Dyer & Hatch, 2004).
Customer-responsive supply chain management demands going beyond technological capability. Collaborative and long term partnership with few suppliers are become a practice in recent days. There is said to be ‘growing evidence that to be competitive firms are moving away from the traditional approach of adversarial relationships with a multitude of suppliers to one of forging longer term relationships with a selected few suppliers’ (Kalwani and
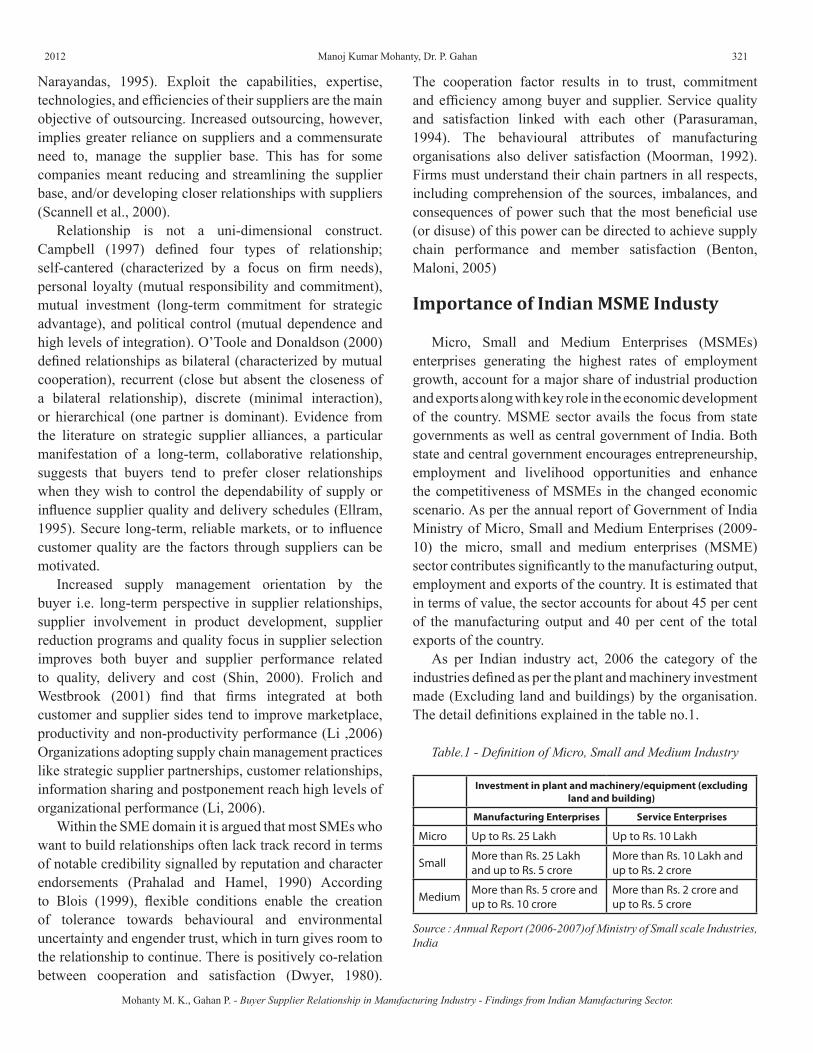
2012 321
Narayandas, 1995). Exploit the capabilities, expertise, technologies, and efficiencies of their suppliers are the main objective of outsourcing. Increased outsourcing, however, implies greater reliance on suppliers and a commensurate need to, manage the supplier base. This has for some companies meant reducing and streamlining the supplier base, and/or developing closer relationships with suppliers (Scannell et al., 2000).
Relationship is not a uni-dimensional construct. Campbell (1997) defined four types of relationship; self-cantered (characterized by a focus on firm needs), personal loyalty (mutual responsibility and commitment), mutual investment (long-term commitment for strategic advantage), and political control (mutual dependence and high levels of integration). O’Toole and Donaldson (2000) defined relationships as bilateral (characterized by mutual cooperation), recurrent (close but absent the closeness of a bilateral relationship), discrete (minimal interaction), or hierarchical (one partner is dominant). Evidence from the literature on strategic supplier alliances, a particular manifestation of a long-term, collaborative relationship, suggests that buyers tend to prefer closer relationships when they wish to control the dependability of supply or influence supplier quality and delivery schedules (Ellram, 1995). Secure long-term, reliable markets, or to influence customer quality are the factors through suppliers can be motivated.
Increased supply management orientation by the buyer i.e. long-term perspective in supplier relationships, supplier involvement in product development, supplier reduction programs and quality focus in supplier selection improves both buyer and supplier performance related to quality, delivery and cost (Shin, 2000). Frolich and Westbrook (2001) find that firms integrated at both customer and supplier sides tend to improve marketplace, productivity and non-productivity performance (Li ,2006) Organizations adopting supply chain management practices like strategic supplier partnerships, customer relationships, information sharing and postponement reach high levels of organizational performance (Li, 2006).
Within the SME domain it is argued that most SMEs who want to build relationships often lack track record in terms of notable credibility signalled by reputation and character endorsements (Prahalad and Hamel, 1990) According to Blois (1999), flexible conditions enable the creation of tolerance towards behavioural and environmental uncertainty and engender trust, which in turn gives room to the relationship to continue. There is positively co-relation between cooperation and satisfaction (Dwyer, 1980).
The cooperation factor results in to trust, commitment and efficiency among buyer and supplier. Service quality and satisfaction linked with each other (Parasuraman, 1994). The behavioural attributes of manufacturing organisations also deliver satisfaction (Moorman, 1992). Firms must understand their chain partners in all respects, including comprehension of the sources, imbalances, and consequences of power such that the most beneficial use (or disuse) of this power can be directed to achieve supply chain performance and member satisfaction (Benton, Maloni, 2005)
Importance of Indian MSME Industy
Micro, Small and Medium Enterprises (MSMEs) enterprises generating the highest rates of employment growth, account for a major share of industrial production and exports along with key role in the economic development of the country. MSME sector avails the focus from state governments as well as central government of India. Both state and central government encourages entrepreneurship, employment and livelihood opportunities and enhance the competitiveness of MSMEs in the changed economic scenario. As per the annual report of Government of India Ministry of Micro, Small and Medium Enterprises (2009-10) the micro, small and medium enterprises (MSME) sector contributes significantly to the manufacturing output, employment and exports of the country. It is estimated that in terms of value, the sector accounts for about 45 per cent of the manufacturing output and 40 per cent of the total exports of the country.
As per Indian industry act, 2006 the category of the industries defined as per the plant and machinery investment made (Excluding land and buildings) by the organisation. The detail definitions explained in the table no.1.
Investment in plant and machinery/equipment (excluding land and building)
Manufacturing Enterprises Service Enterprises
Micro Up to Rs. 25 Lakh Up to Rs. 10 Lakh
Small More than Rs. 25 Lakh and up to Rs. 5 crore
More than Rs. 10 Lakh and up to Rs. 2 crore
Medium More than Rs. 5 crore and up to Rs. 10 crore
More than Rs. 2 crore and up to Rs. 5 crore
Source : Annual Report (2006-2007)of Ministry of Small scale Industries, India
Table.1 - Definition of Micro, Small and Medium Industry
Mohanty M. K., Gahan P. - Buyer Supplier Relationship in Manufacturing Industry - Findings from Indian Manufacturing Sector.
Manoj Kumar Mohanty, Dr. P. Gahan

Business Intelligence Journal - July, 2012 Vol.5 No.2
322 Business Intelligence Journal July
MSME sector provides employment about 59 million persons in over 26 million units throughout the country. Further, this sector has consistently registered a higher growth rate than the rest of the industrial sector. There are over 6000 products ranging from traditional to high-tech items, which are being manufactured by the MSMEs in India. It is well known that the MSME sector provides the maximum opportunities for both self-employment and jobs after agriculture sector.
Table.2 - Growth Rate of MSME Units Based on Index of Industrial Production (IIP)
Year Growth rates of 1970 base IIP
Growth rates of 2001-02 base IIP
IPP(Overall Industrial Growth
Rate of Sector) (%)
2002-2003 7.68% 8.68% 5.7
2003-2004 8.59% 9.64% 7.0
2004-2005 9.96% 10.88% 8.4
2005-2006 10.40% 12.32% 8.1
2006-2007 NA 12.60% 11.5
2007-2008 NA 13.00% 8.0
Source : Annual Report ( 2009-10), Government of India Ministry of Micro, Small and Medium Enterprises, # - Source : http//www.mospi.gov.in
Table.3 - Contribution of MSME Sector in Country’s GDP
YearContribution of MSME (%) at 1999 - 2000 price
Total Industrial Production Gross Domestic Product (GDP)
1999-2000 39.74 5.86
2000-2001 39.71 6.04
2001-2002 39.12 5.77
2002-2003 38.89 5.91
2003-2004 38.74 5.79
2004-2005 38.62 5.84
2005-2006 38.56 5.83
2006-2007 44.12 7.44
2007-2008 45.00 8.00
Source: Annual Report (2009-10), Government of India Ministry of Micro, Small and Medium Enterprises. Note: Up to 2005-06 data are only for Small scale units.
The data on MSME sector clearly demonstrate the importance of this sector in Indian economy. The major opportunities in this sector are less capital requirement, extensive government support both by state government as
well as central government, easy funding by national and state level financial institutes, liberal tax systems in material procurement, machinery procurement, Export promotions and training programs by government. This aspect helps in creating entrepreneurs, creates opportunity for engagement of Indian manpower, export opportunity and more over creates social balance.
Therefore it is more important for managers and the buyers of the buying organisations to look very carefully to this segment of business. Most of the supplier segment belongs to this MSME sector. So the buyer and supplier relationship has to be very strong between large scale manufacturing industry and MSME manufacturing industry.
Expectations of Buyers from MSME Sector Suppliers
During the exploration of buyer supplier relationship attributes from the 14 buyer heads of large scale organisations the expectations of buyers towards MSME sector suppliers are also derived. We strongly believe the relationship becomes strong only when the mutual expectations of the organisations meet. It is more important to know the expectations of the buying organisation as they are the most influencer of the relationship building process. During the interview the questions were asked to the buyer heads are (1) what are the characteristics you want to see among the MSME sector suppliers (2) What are the major contributions of MSME sector suppliers to your Organisation (3) What are the major contributions your organisation has made to the suppliers (4) What are the advantages of long term relationship with those suppliers (5) Which are the reasons for which you would like to terminate relationship with suppliers (If at all needed) (6) Which are the factors the suppliers expect from your buyers. This 6 open ended question answers collected from the subject experts and their expectations are summarized as below.
MSME sector suppliers are the most contributors to the manufacturing outsourcing activities for large scale suppliers. This sector chosen based on their specific resources and how effectively they are utilizing their resources. The relationship largely driven by cost advantage to the buying organisation, flexibility in order management, technical skill they acquire, local cultural factors and interpersonal relationship with buyers. This statement also validated by Pfeffer and Salancik (1978) by stating “ Three elements constitute the dependence that
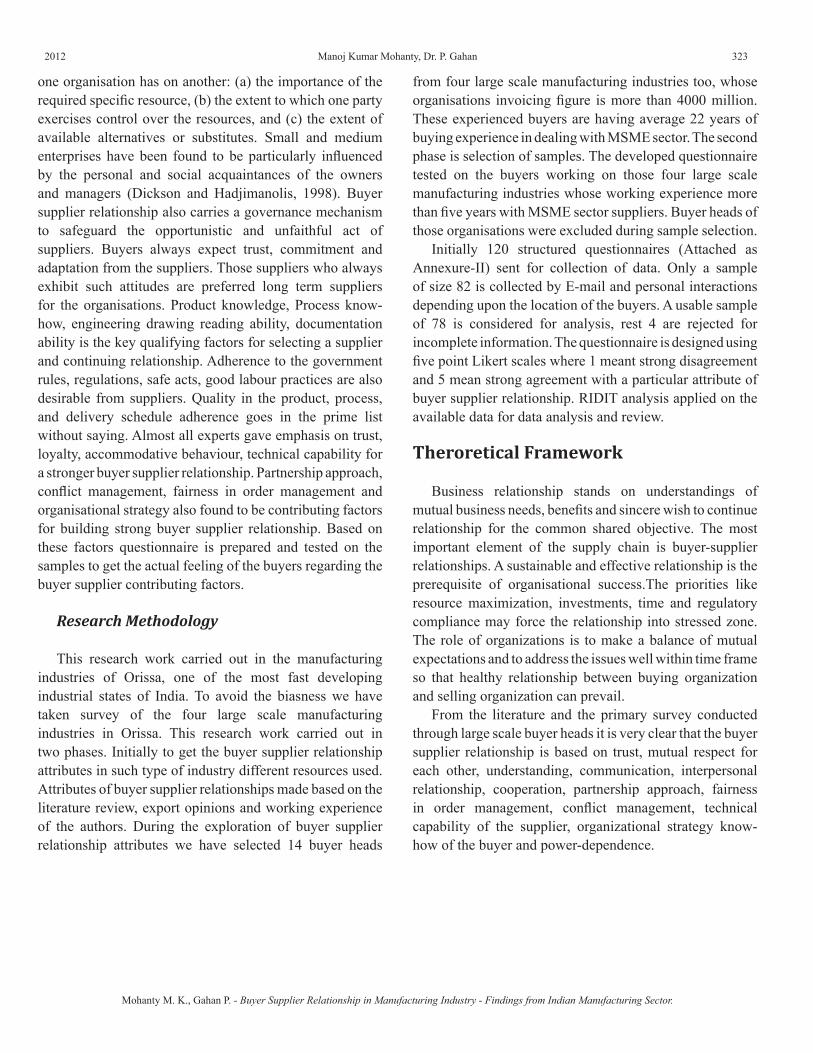
2012 323
one organisation has on another: (a) the importance of the required specific resource, (b) the extent to which one party exercises control over the resources, and (c) the extent of available alternatives or substitutes. Small and medium enterprises have been found to be particularly influenced by the personal and social acquaintances of the owners and managers (Dickson and Hadjimanolis, 1998). Buyer supplier relationship also carries a governance mechanism to safeguard the opportunistic and unfaithful act of suppliers. Buyers always expect trust, commitment and adaptation from the suppliers. Those suppliers who always exhibit such attitudes are preferred long term suppliers for the organisations. Product knowledge, Process know-how, engineering drawing reading ability, documentation ability is the key qualifying factors for selecting a supplier and continuing relationship. Adherence to the government rules, regulations, safe acts, good labour practices are also desirable from suppliers. Quality in the product, process, and delivery schedule adherence goes in the prime list without saying. Almost all experts gave emphasis on trust, loyalty, accommodative behaviour, technical capability for a stronger buyer supplier relationship. Partnership approach, conflict management, fairness in order management and organisational strategy also found to be contributing factors for building strong buyer supplier relationship. Based on these factors questionnaire is prepared and tested on the samples to get the actual feeling of the buyers regarding the buyer supplier contributing factors.
Research Methodology
This research work carried out in the manufacturing industries of Orissa, one of the most fast developing industrial states of India. To avoid the biasness we have taken survey of the four large scale manufacturing industries in Orissa. This research work carried out in two phases. Initially to get the buyer supplier relationship attributes in such type of industry different resources used. Attributes of buyer supplier relationships made based on the literature review, export opinions and working experience of the authors. During the exploration of buyer supplier relationship attributes we have selected 14 buyer heads
from four large scale manufacturing industries too, whose organisations invoicing figure is more than 4000 million. These experienced buyers are having average 22 years of buying experience in dealing with MSME sector. The second phase is selection of samples. The developed questionnaire tested on the buyers working on those four large scale manufacturing industries whose working experience more than five years with MSME sector suppliers. Buyer heads of those organisations were excluded during sample selection.
Initially 120 structured questionnaires (Attached as Annexure-II) sent for collection of data. Only a sample of size 82 is collected by E-mail and personal interactions depending upon the location of the buyers. A usable sample of 78 is considered for analysis, rest 4 are rejected for incomplete information. The questionnaire is designed using five point Likert scales where 1 meant strong disagreement and 5 mean strong agreement with a particular attribute of buyer supplier relationship. RIDIT analysis applied on the available data for data analysis and review.
Theroretical Framework
Business relationship stands on understandings of mutual business needs, benefits and sincere wish to continue relationship for the common shared objective. The most important element of the supply chain is buyer-supplier relationships. A sustainable and effective relationship is the prerequisite of organisational success.The priorities like resource maximization, investments, time and regulatory compliance may force the relationship into stressed zone. The role of organizations is to make a balance of mutual expectations and to address the issues well within time frame so that healthy relationship between buying organization and selling organization can prevail.
From the literature and the primary survey conducted through large scale buyer heads it is very clear that the buyer supplier relationship is based on trust, mutual respect for each other, understanding, communication, interpersonal relationship, cooperation, partnership approach, fairness in order management, conflict management, technical capability of the supplier, organizational strategy know-how of the buyer and power-dependence.
Mohanty M. K., Gahan P. - Buyer Supplier Relationship in Manufacturing Industry - Findings from Indian Manufacturing Sector.
Manoj Kumar Mohanty, Dr. P. Gahan
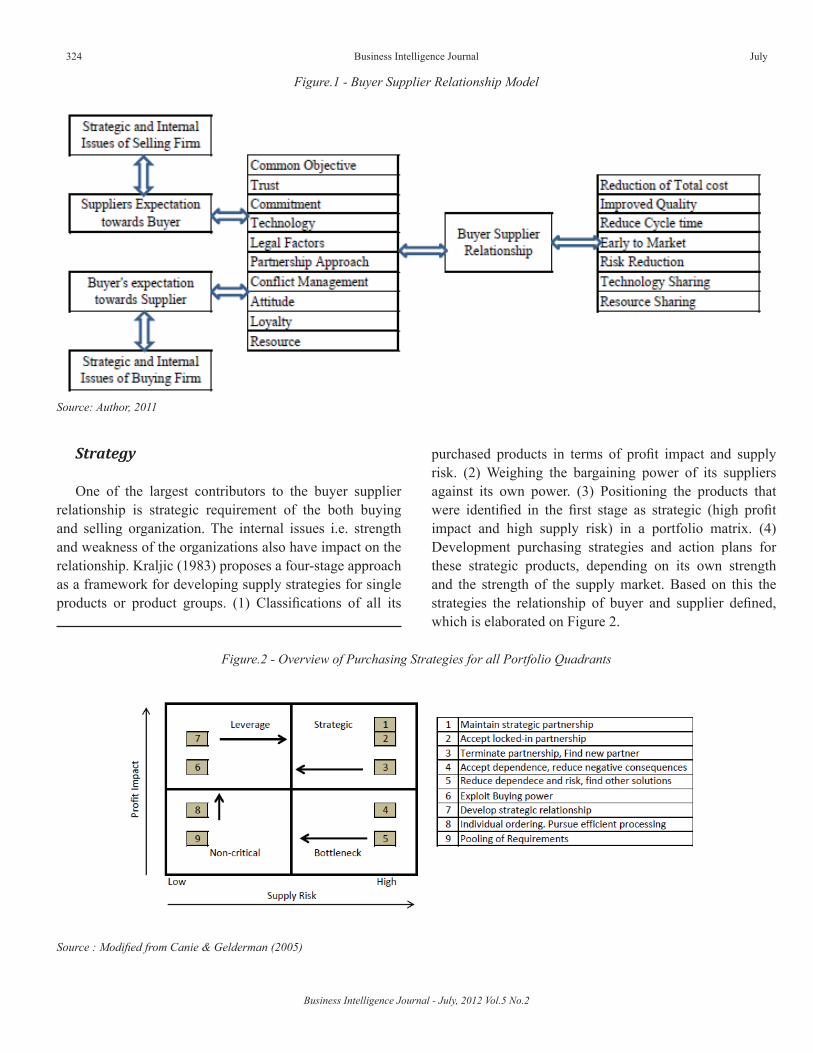
Business Intelligence Journal - July, 2012 Vol.5 No.2
324 Business Intelligence Journal July
Figure.1 - Buyer Supplier Relationship Model
Source: Author, 2011
Strategy
One of the largest contributors to the buyer supplier relationship is strategic requirement of the both buying and selling organization. The internal issues i.e. strength and weakness of the organizations also have impact on the relationship. Kraljic (1983) proposes a four-stage approach as a framework for developing supply strategies for single products or product groups. (1) Classifications of all its
purchased products in terms of profit impact and supply risk. (2) Weighing the bargaining power of its suppliers against its own power. (3) Positioning the products that were identified in the first stage as strategic (high profit impact and high supply risk) in a portfolio matrix. (4) Development purchasing strategies and action plans for these strategic products, depending on its own strength and the strength of the supply market. Based on this the strategies the relationship of buyer and supplier defined, which is elaborated on Figure 2.
Figure.2 - Overview of Purchasing Strategies for all Portfolio Quadrants
Source : Modified from Canie & Gelderman (2005)

2012 325
Trust
Trust indicates “a person’s reputation for trustworthiness on both a professional and personal
level as well as credibility in a business situation” (Woo and Phrud'homme 1999). Trust is a factor which should flow from both the sides. Based on the trust both the parties can manage the down time of business, conflicting situations, profitability issues, market management and in reality all the aspects of the business. Literatures witnessed decrease in product cost, risk reduction and sharing, long term relationships, investment opportunities and further expansion of business relationships through trust.
Power and Dependency
The fundamental assumption of all portfolio models seems to be the occurrence of differences in power and dependence between buyers and suppliers (Dubois and Pedersen, 2002). Usually power structure described as the exploit power of the buyer. Buyers go for diversification to reduce the power of supplier or to reduce the dependability. General idea of the portfolio approach is to minimize supply vulnerability and make the most of potential buying power (Kraljic, 1983). The power and dependency differs in each quarter of the purchasing portfolio. The dependency on the suppliers varies from firm to firm and situation to situation and vice versa. The dependency of buyer becomes the power source for supplier and the dependency of supplier becomes the power source for buyer. Basically power and dependency are relative terms and the magnitude varies with organization and situation.
The Buchanan (1992) conceptualized power-dependence imbalances in buyer–supplier relationships as the difference in value that buyers and sellers attach to the relationship. Independent partner dominate the exchange and vice versa. A relationship is balanced where the buyer and supplier shares a non-dominating environment. Imbalance relationship due to unbalanced power sharing can lead to stressed relationship, non-productivity and a shorter relationship life. Relationship largely depends upon the intensity of the interdependency. The positive intensity could lead to stronger relationship, long term association; mutual trust, commitment and can also open-up possibilities for further degree of business association and investment opportunities.
Capacity & Capability of Supplier
When supplier selection considered in operational terms, then these two words are the best describer of the suppliers. In real terms capacity to execute and capability to handle order and complete is the strength of the supplier. One of the very reasons of having relationship with supplier is to exploit the capacity and capability of the supplier for the organizations goal. This is one of the principal requirements. due course of the relationship the OEM can and should increase the capacity and capability like process knowledge, process improvement, special machines, tools, tackles, hands on experience of the man power at supplier end. In the manufacturing industries buyers organize special skill set improvement plan to improve the skill of the supplier's manpower. Advanced machining knowledge, advanced welding technology, molding processes, latest measuring instruments, correct assembly process, latest tools used for manufacturing also a part of building strength at supplier's end. Government rules, safety featured, environment policies implementation also taken care by OEM organization for suppliers.
Communications
Communication is one of the essential components in the buyer supplier relationship. Communication may be related to product price, contractual agreements, technical specifications, organizational strategy and may be market related know-how. Communication can only be effective if both the parties understand the requirement of each other and in the same level of thinking & understanding. According to Mohr and Nevin (1990), there are four categories of communication: content, way, feedback and frequency. These categories will shape the com¬munication intensity and the integration between supplier-buyer.
Partnership
Adversarial competitive and collaborative partnership are the two aspects of buyer supplier relationship and these two aspects represents old fashion and current fashion working style of purchasing managers. Traditional adversarial approach is to minimize the price of purchased goods and services whereas trust, commitment, long term relationship and risk sharing are the elements of
Mohanty M. K., Gahan P. - Buyer Supplier Relationship in Manufacturing Industry - Findings from Indian Manufacturing Sector.
Manoj Kumar Mohanty, Dr. P. Gahan
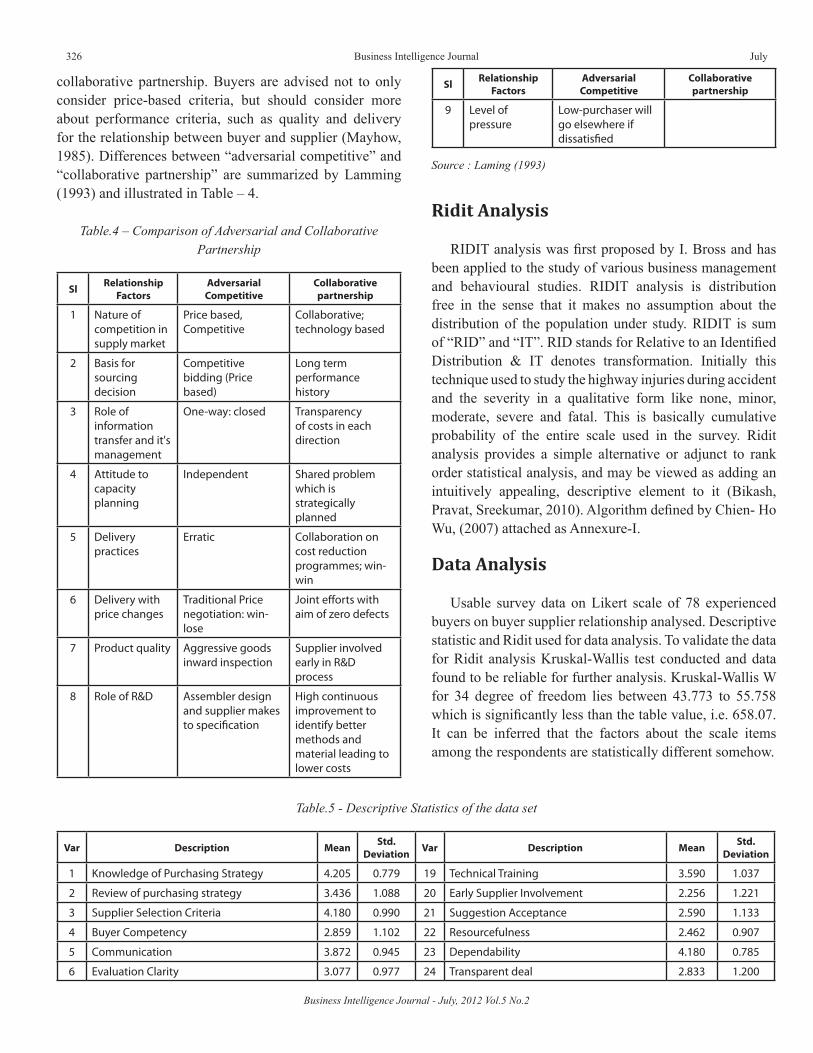
Business Intelligence Journal - July, 2012 Vol.5 No.2
326 Business Intelligence Journal July
collaborative partnership. Buyers are advised not to only consider price-based criteria, but should consider more about performance criteria, such as quality and delivery for the relationship between buyer and supplier (Mayhow, 1985). Differences between “adversarial competitive” and “collaborative partnership” are summarized by Lamming (1993) and illustrated in Table – 4.
Table.4 – Comparison of Adversarial and Collaborative Partnership
Sl Relationship Factors
Adversarial Competitive
Collaborative partnership
1 Nature of competition in supply market
Price based, Competitive
Collaborative; technology based
2 Basis for sourcing decision
Competitive bidding (Price based)
Long term performance history
3 Role of information transfer and it's management
One-way: closed Transparency of costs in each direction
4 Attitude to capacity planning
Independent Shared problem which is strategically planned
5 Delivery practices
Erratic Collaboration on cost reduction programmes; win-win
6 Delivery with price changes
Traditional Price negotiation: win-lose
Joint efforts with aim of zero defects
7 Product quality Aggressive goods inward inspection
Supplier involved early in R&D process
8 Role of R&D Assembler design and supplier makes to specification
High continuous improvement to identify better methods and material leading to lower costs
Source : Laming (1993)
Ridit Analysis
RIDIT analysis was first proposed by I. Bross and has been applied to the study of various business management and behavioural studies. RIDIT analysis is distribution free in the sense that it makes no assumption about the distribution of the population under study. RIDIT is sum of “RID” and “IT”. RID stands for Relative to an Identified Distribution & IT denotes transformation. Initially this technique used to study the highway injuries during accident and the severity in a qualitative form like none, minor, moderate, severe and fatal. This is basically cumulative probability of the entire scale used in the survey. Ridit analysis provides a simple alternative or adjunct to rank order statistical analysis, and may be viewed as adding an intuitively appealing, descriptive element to it (Bikash, Pravat, Sreekumar, 2010). Algorithm defined by Chien- Ho Wu, (2007) attached as Annexure-I.
Data Analysis
Usable survey data on Likert scale of 78 experienced buyers on buyer supplier relationship analysed. Descriptive statistic and Ridit used for data analysis. To validate the data for Ridit analysis Kruskal-Wallis test conducted and data found to be reliable for further analysis. Kruskal-Wallis W for 34 degree of freedom lies between 43.773 to 55.758 which is significantly less than the table value, i.e. 658.07. It can be inferred that the factors about the scale items among the respondents are statistically different somehow.
Sl Relationship Factors
Adversarial Competitive
Collaborative partnership
9 Level of pressure
Low-purchaser will go elsewhere if dissatisfied
Table.5 - Descriptive Statistics of the data set
Var Description Mean Std. Deviation Var Description Mean Std.
Deviation
1 Knowledge of Purchasing Strategy 4.205 0.779 19 Technical Training 3.590 1.037
2 Review of purchasing strategy 3.436 1.088 20 Early Supplier Involvement 2.256 1.221
3 Supplier Selection Criteria 4.180 0.990 21 Suggestion Acceptance 2.590 1.133
4 Buyer Competency 2.859 1.102 22 Resourcefulness 2.462 0.907
5 Communication 3.872 0.945 23 Dependability 4.180 0.785
6 Evaluation Clarity 3.077 0.977 24 Transparent deal 2.833 1.200
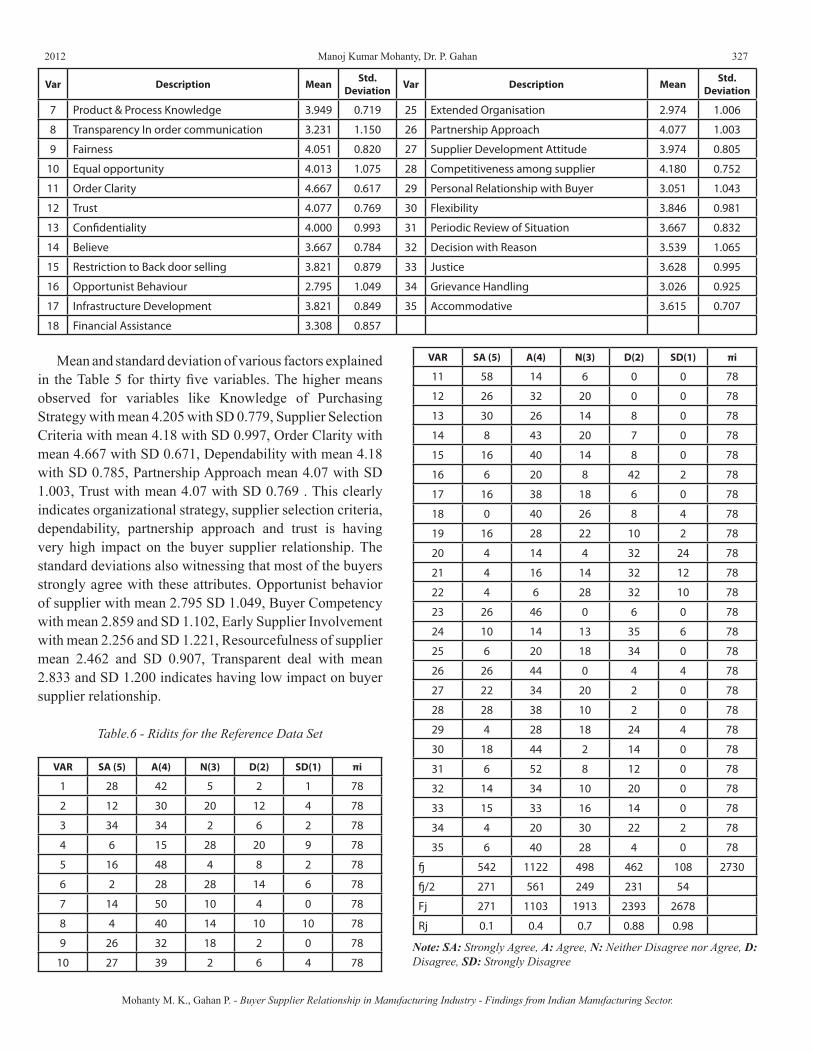
2012 327
Var Description Mean Std. Deviation Var Description Mean Std.
Deviation
7 Product & Process Knowledge 3.949 0.719 25 Extended Organisation 2.974 1.006
8 Transparency In order communication 3.231 1.150 26 Partnership Approach 4.077 1.003
9 Fairness 4.051 0.820 27 Supplier Development Attitude 3.974 0.805
10 Equal opportunity 4.013 1.075 28 Competitiveness among supplier 4.180 0.752
11 Order Clarity 4.667 0.617 29 Personal Relationship with Buyer 3.051 1.043
12 Trust 4.077 0.769 30 Flexibility 3.846 0.981
13 Confidentiality 4.000 0.993 31 Periodic Review of Situation 3.667 0.832
14 Believe 3.667 0.784 32 Decision with Reason 3.539 1.065
15 Restriction to Back door selling 3.821 0.879 33 Justice 3.628 0.995
16 Opportunist Behaviour 2.795 1.049 34 Grievance Handling 3.026 0.925
17 Infrastructure Development 3.821 0.849 35 Accommodative 3.615 0.707
18 Financial Assistance 3.308 0.857
Mean and standard deviation of various factors explained in the Table 5 for thirty five variables. The higher means observed for variables like Knowledge of Purchasing Strategy with mean 4.205 with SD 0.779, Supplier Selection Criteria with mean 4.18 with SD 0.997, Order Clarity with mean 4.667 with SD 0.671, Dependability with mean 4.18 with SD 0.785, Partnership Approach mean 4.07 with SD 1.003, Trust with mean 4.07 with SD 0.769 . This clearly indicates organizational strategy, supplier selection criteria, dependability, partnership approach and trust is having very high impact on the buyer supplier relationship. The standard deviations also witnessing that most of the buyers strongly agree with these attributes. Opportunist behavior of supplier with mean 2.795 SD 1.049, Buyer Competency with mean 2.859 and SD 1.102, Early Supplier Involvement with mean 2.256 and SD 1.221, Resourcefulness of supplier mean 2.462 and SD 0.907, Transparent deal with mean 2.833 and SD 1.200 indicates having low impact on buyer supplier relationship.
Table.6 - Ridits for the Reference Data Set
VAR SA (5) A(4) N(3) D(2) SD(1) πi
1 28 42 5 2 1 78
2 12 30 20 12 4 78
3 34 34 2 6 2 78
4 6 15 28 20 9 78
5 16 48 4 8 2 78
6 2 28 28 14 6 78
7 14 50 10 4 0 78
8 4 40 14 10 10 78
9 26 32 18 2 0 78
10 27 39 2 6 4 78
VAR SA (5) A(4) N(3) D(2) SD(1) πi
11 58 14 6 0 0 78
12 26 32 20 0 0 78
13 30 26 14 8 0 78
14 8 43 20 7 0 78
15 16 40 14 8 0 78
16 6 20 8 42 2 78
17 16 38 18 6 0 78
18 0 40 26 8 4 78
19 16 28 22 10 2 78
20 4 14 4 32 24 78
21 4 16 14 32 12 78
22 4 6 28 32 10 78
23 26 46 0 6 0 78
24 10 14 13 35 6 78
25 6 20 18 34 0 78
26 26 44 0 4 4 78
27 22 34 20 2 0 78
28 28 38 10 2 0 78
29 4 28 18 24 4 78
30 18 44 2 14 0 78
31 6 52 8 12 0 78
32 14 34 10 20 0 78
33 15 33 16 14 0 78
34 4 20 30 22 2 78
35 6 40 28 4 0 78
fj 542 1122 498 462 108 2730
fj/2 271 561 249 231 54
Fj 271 1103 1913 2393 2678
Rj 0.1 0.4 0.7 0.88 0.98
Note: SA: Strongly Agree, A: Agree, N: Neither Disagree nor Agree, D: Disagree, SD: Strongly Disagree
Mohanty M. K., Gahan P. - Buyer Supplier Relationship in Manufacturing Industry - Findings from Indian Manufacturing Sector.
Manoj Kumar Mohanty, Dr. P. Gahan

Business Intelligence Journal - July, 2012 Vol.5 No.2
328 Business Intelligence Journal July
Table-6 represents the Ridit for Reference data set. The data are tabulated according to their score in terms of the likert scale. The jiπ is 78, as the total sample taken is 78. We have calculated the fi , Fj, and Rj.
Respondents strongly agree to variables like Knowledge of Purchasing Strategy, Supplier Selection Criteria, Fairness, Order Clarity, Trust, and Confidentiality for building buyer supplier relationship. They have strongly disagree to variable like Transparency In order communication, Equal opportunity, Early Supplier Involvement in relationship building.
Table.7 - Ridits for the Comparison Data Sets
VAR SA (5) A(4) N(3) D(2) SD(1) ρi LB UB
1 0.04 0.22 0.04 0.02 0.01 0.33 0.26 0.40
2 0.02 0.15 0.18 0.14 0.05 0.53 0.46 0.60
3 0.04 0.17 0.02 0.07 0.03 0.33 0.26 0.40
4 0.01 0.08 0.25 0.23 0.11 0.67 0.60 0.74
5 0.02 0.25 0.04 0.09 0.03 0.42 0.35 0.49
6 0.00 0.14 0.25 0.16 0.08 0.63 0.56 0.70
7 0.02 0.26 0.09 0.05 0.00 0.41 0.34 0.48
8 0.01 0.21 0.13 0.11 0.13 0.57 0.50 0.64
9 0.03 0.16 0.16 0.02 0.00 0.38 0.31 0.45
10 0.03 0.20 0.02 0.07 0.05 0.37 0.30 0.44
11 0.07 0.07 0.05 0.00 0.00 0.20 0.13 0.27
12 0.03 0.16 0.18 0.00 0.00 0.38 0.31 0.45
13 0.04 0.13 0.13 0.09 0.00 0.39 0.32 0.46
14 0.01 0.22 0.18 0.08 0.00 0.49 0.42 0.56
15 0.02 0.21 0.13 0.09 0.00 0.44 0.37 0.51
16 0.01 0.10 0.07 0.47 0.03 0.68 0.61 0.75
17 0.02 0.19 0.16 0.07 0.00 0.44 0.37 0.51
18 0.00 0.21 0.23 0.09 0.05 0.58 0.51 0.65
19 0.02 0.14 0.20 0.11 0.03 0.50 0.43 0.57
20 0.01 0.07 0.04 0.36 0.30 0.78 0.71 0.85
21 0.01 0.08 0.13 0.36 0.15 0.72 0.65 0.79
22 0.01 0.03 0.25 0.36 0.13 0.77 0.70 0.84
23 0.03 0.24 0.00 0.07 0.00 0.34 0.27 0.41
24 0.01 0.07 0.12 0.39 0.08 0.67 0.60 0.74
25 0.01 0.10 0.16 0.38 0.00 0.66 0.59 0.73
26 0.03 0.23 0.00 0.05 0.05 0.35 0.28 0.42
27 0.03 0.17 0.18 0.02 0.00 0.40 0.33 0.47
28 0.04 0.19 0.09 0.02 0.00 0.34 0.27 0.41
29 0.01 0.14 0.16 0.27 0.05 0.63 0.56 0.70
30 0.02 0.23 0.02 0.16 0.00 0.42 0.35 0.49
31 0.01 0.27 0.07 0.14 0.00 0.48 0.41 0.55
32 0.02 0.17 0.09 0.23 0.00 0.51 0.44 0.58
VAR SA (5) A(4) N(3) D(2) SD(1) ρi LB UB
33 0.02 0.17 0.14 0.16 0.00 0.49 0.42 0.56
34 0.01 0.10 0.27 0.25 0.03 0.65 0.58 0.72
35 0.01 0.21 0.25 0.05 0.00 0.51 0.44 0.58
Note: SA: Strongly Agree, A: Agree, N: Neither Disagree nor Agree, D: Disagree, SD: Strongly Disagree, LB: Lower Boundary, UB: Upper Boundary.
Table.8 - Ranking of Quality Attributes in Buyer Supplier Relationship
Var Description Ridit Value Ranking
11 Order Clarity 0.20 1
1 Knowledge of Purchasing Strategy 0.33 2
3 Supplier Selection Criteria 0.33 3
23 Dependability 0.34 4
28 Competitiveness 0.34 5
26 Partnership Approach 0.35 6
10 System Driven 0.37 7
9 Fairness 0.38 8
12 Trust 0.38 9
13 Confidentiality 0.39 10
27 Supplier Development Attitude 0.40 11
7 Product & Process Knowledge 0.41 12
5 Communication 0.42 13
30 Flexibility 0.42 14
15 Restriction to Back door selling 0.44 15
17 Infrastructure Development 0.44 16
31 Periodic Review of Situation 0.48 17
14 Believe 0.49 18
33 Justice 0.49 19
19 Technical Training 0.50 20
32 Decision with Reason 0.51 21
35 Accommodative 0.51 22
2 Review of purchasing strategy 0.53 23
8 Transparency In order Management 0.57 24
18 Financial Assistance 0.58 25
6 Evaluation Clarity 0.63 26
29 Personal Relationship with Buyer 0.63 27
34 Grievance Handling 0.65 28
25 Extended Organisation 0.66 29
4 Buyer Competency 0.67 30
24 Transparent deal 0.67 31
16 Opportunist Behaviour 0.68 32
21 Suggestion Acceptance 0.72 33
22 Resourcefulness 0.77 34
20 Early Supplier Involvement 0.78 35
2012 329
Table 8 explains about the ranking of different factors. From the Ridit analysis a direct sorting of mean Ridits in terms of the probability of being in agreeing propensity gives the ranking as mentioned in Table-8, that highlights significant factors (ranking) affecting the buyer-supplier relationship according to the respondents’ opinion.
The front line factors which are contributing to the buyer supplier relationship as per the respondents are clarity in order management, knowledge of purchasing strategy by the buyers, supplier selection criteria, dependability, competitiveness, partnership approach. Factors are having low impact in buyer supplier relationship are found to be Early Supplier Involvement of the supplier, resourcefulness of supplier, suggestion acceptance, opportunist Behaviour, transparent deal, buyer competency.
Clarity in order management creates faith towards the buyer and the buying organisation. Supplier’s feel they will not be cheated in anyway by dealing with the organisation. They feel term and conditions mentioned in the order, payment terms and other contractual obligations more or less will be fair. As buyers are the common point of contact for suppliers the knowledge of purchasing strategy is very essential for the buyer. Once buyer is clear about that he/she will communicate proper massage to the suppliers, so that clarity in the thought and action will be there. Supplier selection criteria also have enough impact on the relationship. Organisations can only have a proper relationship if they can select the correct supplier base based on their strategic and functional requirement. Dependability is a word of mutual understanding and fulfilling of the individual objectives. The intensity of the relationship is also depends upon dependability. Competitive environment also helps in creating relationship. This reduces the monopoly and creates a healthy environment. No doubt partnership approach is a strong tool for maintaining relationship. Once the buying organisation and selling organisation understands each other’s position in the supply chain, then actions can be initiated to reduce the risk, sharing the process and product knowledge and market place.
Summary & Conclusion
Buyer supplier relationship largely depends upon four major aspects. They are strategic requirements of the organisation, supplier performance, mode of operation and personal factors. Strategic issues may be who to choose as a partner and for what type of product or service. Performance may be cost, quality, delivery and related issues. Mode of operation may be pricing structure, information exchange
levels, technology interchange, business area, Product or process. Personal factors will be trust, commitment, loyalty, openness, attitude, flexibility etc. out of these four factors only personal factor is qualitative and rest three are quantitative.
From the survey it is cleared that the mode of operation taking high priority in the relationship building like clarity in order management, buyer’s know-how in purchasing strategy, Supplier Selection Criteria, Competitiveness, Partnership Approach, Dependability. The role of buyer’s is considered to be more critical in making a healthy buyer supplier relationship as in operational situation only buyer becomes the interface of supplier. The survey also reveals that transparent deal, opportunist Behaviour, suggestion acceptance, resourcefulness of buyer and Early Supplier Involvement are having low impact in the relationship. These factors are additional factors in the relationship, which may add value to the relationship but not necessarily affect the relationship. Organisation must take a stock of buyer relationship status in regular intervals to know the strength of the relationship. Suppliers may be contacted individually to know the required operational flexibility. The training of the buyers on relationship making within the strategic walls can play a major role in strengthening the relationship. Buyers can be selected based on their soft skill and attitude, so that they can understand and implement suitably the meaning of term like trust, commitment, and loyalty for the relationship building.
References
A Parasuraman, Zeithaml, V. and Berry L (1994), “ Reassessment of expectationsas a comparision standard in measuring consumer perceptions of service quality : Implications for future research”, Journal of Marketing, Vol, 58, January, PP. 11-24.
Day, G.S. and Wensley, R. (1988), “Assessing advantage: a framework for diagnosing competitive superiority”, Journal of Marketing, Vol. 52 No. 1, pp. 1-20.
Ford, D. (1980), “The development of buyer-seller relationships in industrial markets”, European Journal of Marketing, Vol. 14 Nos 5/6, pp. 339-53.
Minahan, T. (1998), “Is partnering a shame?”, Purchasing, June 4, pp. 68-9.
Ford, D. (1980), “The development of buyer-seller relationships in industrial markets”, European Journal of Marketing, Vol. 14 Nos 5/6, pp. 339-53.
Vijay R. Kannan, Keah Choon Tan, Buyer-supplier relationships “The impact of supplier selection and
Mohanty M. K., Gahan P. - Buyer Supplier Relationship in Manufacturing Industry - Findings from Indian Manufacturing Sector.
Manoj Kumar Mohanty, Dr. P. Gahan
Business Intelligence Journal - July, 2012 Vol.5 No.2
330 Business Intelligence Journal July
buyer-supplier engagement on relationship and firm performance”, 2006 - International Journal of Physical Distribution & Logistics Management Vol. 36 No. 10, 2006 pp. 755-775
Eisenhardt, K. M. (1989). Agency theory: An assessment and review. Academy of Management Review, 14, 57−74.
Dyer, J. H., & Singh, H. (1998). The relational view: Cooperative strategy and sources of
interorganizational competitive advantage. Academy of Management Review, 23, 660−679.
Zeithaml, V. A. (1988). Consumer perceptions of price, quality, and value: A means-end model and synthesis of evidence. Journal of Marketing, 52, 2−22.
Walter, A., Müller, T. A., Helfert, G., & Ritter, T. (2003). Functions of industrial supplier relationships and their impact on relationship quality. Industrial Marketing Management, 32, 159−169.
Mason-Jones, R., & Towill, D. R. (1999). Total cycle time compression and the agile supply chain. International Journal of Production Economics, 62, 61−73.
Ulaga, W. (2003). Capturing value creation in business relationships: A customer perspective. Industrial Marketing Management, 32, 677−693.
Dyer, J. H., & Hatch, N. W. (2004). Using supplier networks to learn faster. MIT Sloan Management Review, 45, 57−63.
Kalwani, M.U., Narayandas, N., 1995. Long-term manufacturer-supplier relationships: do they pay off for supplier firms? Journal of Marketing 59, 1–16.
Scannell, T.V., Vickery, S.K. and Dro¨ge, C.L. (2000), “Upstream supply chain management and competitive performance the automotive supply industry”, Journal of Business Logistics, Vol. 21 No. 1, pp. 23-48.
O’Toole, T. and Donaldson, B. (2000), “Relationship governance structures and performance”,Journal of Marketing Management, Vol. 16, pp. 327-41.
O’Toole, T. and Donaldson, B. (2002), “Relationship performance dimensions of buyer-supplier exchanges”, European Journal of Purchasing & Supply Management, Vol. 8, pp. 197-207.
Ellram, L.M. (1995), “Partnering pitfalls and success factors”, International Journal of Purchasing and Materials Management, Vol. 31 No. 2, pp. 36-44.
Shin, H., Collier, D.A., Wilson, D.D., 2000. Supply management orientation and supplier/buyer performance. Journal of Operations Management 18, 317–333.
Frolich, T.M., Westbrook, R., 2001. Arcs of integration: an international study of supply chain strategies. Journal of Operations Management 19 (2), 185–200.
Li, S., Ragu-Nathan, B., Ragu-Nathan, T.S., Rao, S.S., 2006. The impact of supply chain management on competitive advantage and organizational performance. Omega 34, 107–124.
Dwyer, F. R, “Channel member satisfaction: laboratory insights”, Journal of Retailing, Vol.56, Summer (1980), PP. 59-74
Blois, K.J. (1999), “Trust in business-to-business relationships: an evaluation of its status”, Journal of Management Studies, Vol. 36 No. 2, pp. 197-215.
Moorman, C., Zaltman, G. and Deshpande, R. (1992, “Relationships between providers ans users of marketing research: the dynamics of trust within and between organisations”, Journal of Marketing Research, Vol. 29, August, pp.314-329.
Loasby, B.J. (1998) The organization of capabilities. Journal of Economic Behavior & Organization, 35:2, 139-161.
Dickson, K.E. and Hadjimanolis, A. (1998) Innovation and networking amongst small manufacturing firms in Cyprus. International Journal of Entrepreneurial Behaviour and Research, 4 :5-17.
Cunningham, M.T. (1980) International marketing and purchasing of industrial goods - Features of a European research project. European Journal of Marketing, 14:5/6, 322-338.
Pfeffer, J. and Salancik, G.R. (1978) The External Control of Organizations - A Resource Dependence Perspective. New York: Harper & Row Publishers.
Bross, I.D.J., 1981. Citation Classic, Number 24 This Week’s Citation Classic, 15 June.
M.C.J. Canie¨ls, C.J. Gelderman : Purchasing strategies in the Kraljic matrix—A power and dependence perspective/ Journal of Purchasing & Supply Management 11 (2005) 141–155
Woo, Hong Seng and Celine Phrud'homme (1999), "Culture Characteristics Prevalent in The Chinese Negotiation Process," European Business Review, 99 (5), 313-22.
Dubois, A., Pedersen, A., 2002. Why relationships do not fit into purchasing portfolio models: a comparison between the portfolio and industrial network approaches. European Journal of Purchasing & Supply Management 8, 35–42.
Buchanan, L., 1992. Vertical trade relationships: the role of dependence and symmetry in attaining organizational goals. Journal of Marketing Research 29, 65–75.
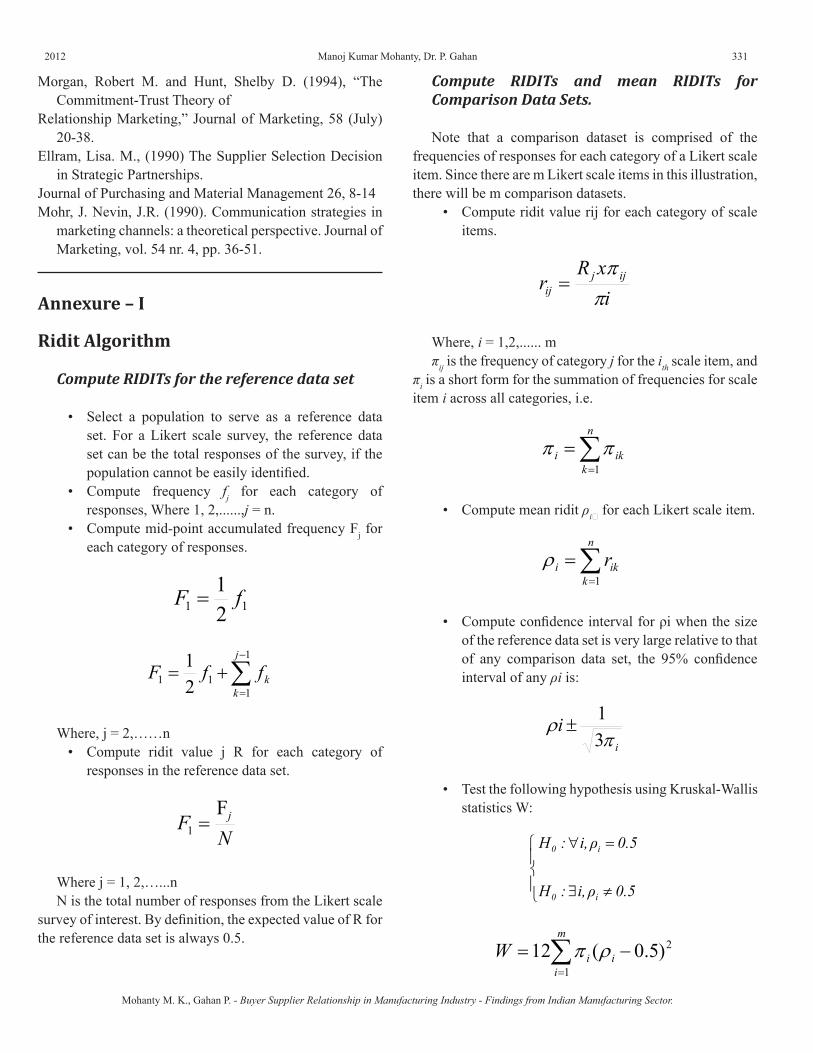
2012 331
Morgan, Robert M. and Hunt, Shelby D. (1994), “The Commitment-Trust Theory of
Relationship Marketing,” Journal of Marketing, 58 (July) 20-38.
Ellram, Lisa. M., (1990) The Supplier Selection Decision in Strategic Partnerships.
Journal of Purchasing and Material Management 26, 8-14Mohr, J. Nevin, J.R. (1990). Communication strategies in
marketing channels: a theoretical perspective. Journal of Marketing, vol. 54 nr. 4, pp. 36-51.
Annexure – I
Ridit Algorithm
Compute RIDITs for the reference data set
• Select a population to serve as a reference data set. For a Likert scale survey, the reference data set can be the total responses of the survey, if the population cannot be easily identified.
• Compute frequency fj for each category of responses, Where 1, 2,......,j = n.
• Compute mid-point accumulated frequency Fj for each category of responses.
11 21 fF =
∑−
=
+=1
111 2
1 j
kkffF
Where, j = 2,……n• Compute ridit value j R for each category of
responses in the reference data set.
NF jF
1 =
Where j = 1, 2,…...nN is the total number of responses from the Likert scale
survey of interest. By definition, the expected value of R for the reference data set is always 0.5.
Compute RIDITs and mean RIDITs for Comparison Data Sets.
Note that a comparison dataset is comprised of the frequencies of responses for each category of a Likert scale item. Since there are m Likert scale items in this illustration, there will be m comparison datasets.
• Compute ridit value rij for each category of scale items.
ixR
r ijjij π
π=
Where, i = 1,2,...... mπij is the frequency of category j for the ith scale item, and
πi is a short form for the summation of frequencies for scale item i across all categories, i.e.
∑=
=n
kiki
1ππ
• Compute mean ridit ρi for each Likert scale item.
∑=
=n
kiki r
1ρ
• Compute confidence interval for ρi when the size of the reference data set is very large relative to that of any comparison data set, the 95% confidence interval of any ρi is:
i
iπ
ρ31
±
• Test the following hypothesis using Kruskal-Wallis statistics W:
≠∃
=∀
0.5ρi,:H
0.5ρi,:H
i0
i0
∑=
−=m
iiiW
1
2)5.0(12 ρπ
Mohanty M. K., Gahan P. - Buyer Supplier Relationship in Manufacturing Industry - Findings from Indian Manufacturing Sector.
Manoj Kumar Mohanty, Dr. P. Gahan
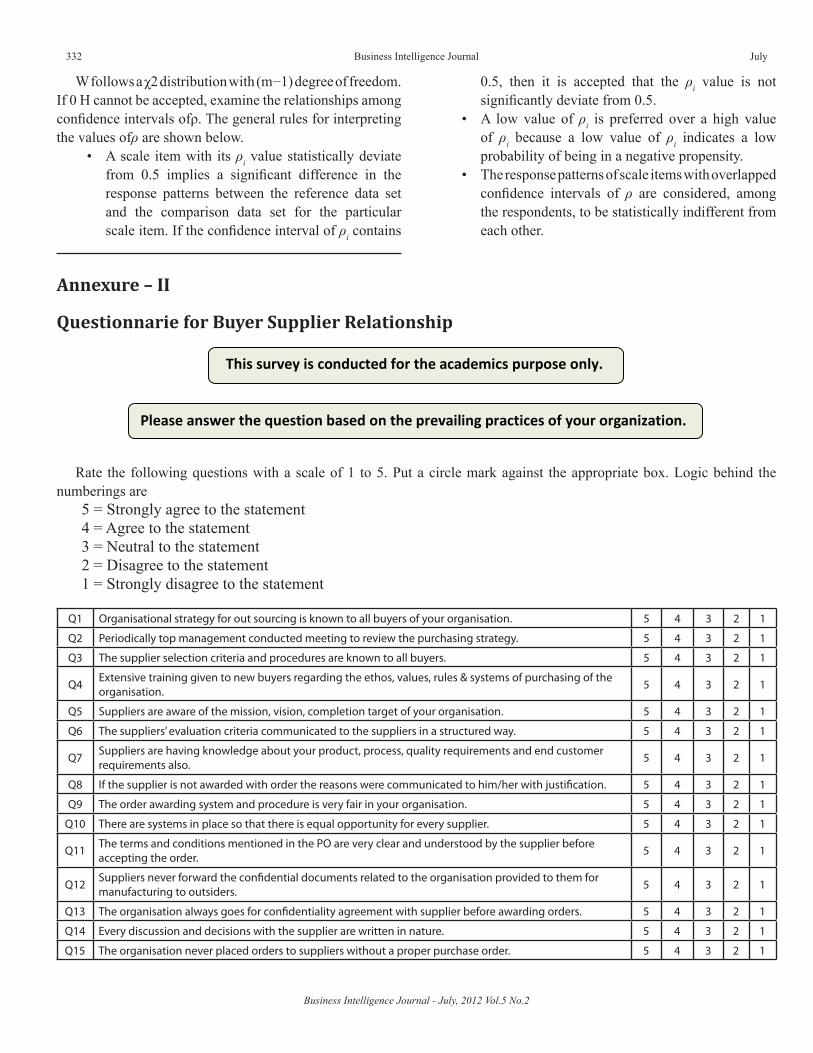
Business Intelligence Journal - July, 2012 Vol.5 No.2
332 Business Intelligence Journal July
W follows a χ2 distribution with (m−1) degree of freedom. If 0 H cannot be accepted, examine the relationships among confidence intervals ofρ. The general rules for interpreting the values ofρ are shown below.
• A scale item with its ρi value statistically deviate from 0.5 implies a significant difference in the response patterns between the reference data set and the comparison data set for the particular scale item. If the confidence interval of ρi contains
Annexure – II
0.5, then it is accepted that the ρi value is not significantly deviate from 0.5.
• A low value of ρi is preferred over a high value of ρi because a low value of ρi indicates a low probability of being in a negative propensity.
• The response patterns of scale items with overlapped confidence intervals of ρ are considered, among the respondents, to be statistically indifferent from each other.
Questionnarie for Buyer Supplier Relationship
This survey is conducted for the academics purpose only.
Please answer the question based on the prevailing practices of your organization.
Rate the following questions with a scale of 1 to 5. Put a circle mark against the appropriate box. Logic behind the numberings are
5 = Strongly agree to the statement4 = Agree to the statement3 = Neutral to the statement2 = Disagree to the statement1 = Strongly disagree to the statement
Q1 Organisational strategy for out sourcing is known to all buyers of your organisation. 5 4 3 2 1
Q2 Periodically top management conducted meeting to review the purchasing strategy. 5 4 3 2 1
Q3 The supplier selection criteria and procedures are known to all buyers. 5 4 3 2 1
Q4 Extensive training given to new buyers regarding the ethos, values, rules & systems of purchasing of the organisation. 5 4 3 2 1
Q5 Suppliers are aware of the mission, vision, completion target of your organisation. 5 4 3 2 1
Q6 The suppliers’ evaluation criteria communicated to the suppliers in a structured way. 5 4 3 2 1
Q7 Suppliers are having knowledge about your product, process, quality requirements and end customer requirements also. 5 4 3 2 1
Q8 If the supplier is not awarded with order the reasons were communicated to him/her with justification. 5 4 3 2 1
Q9 The order awarding system and procedure is very fair in your organisation. 5 4 3 2 1
Q10 There are systems in place so that there is equal opportunity for every supplier. 5 4 3 2 1
Q11 The terms and conditions mentioned in the PO are very clear and understood by the supplier before accepting the order. 5 4 3 2 1
Q12 Suppliers never forward the confidential documents related to the organisation provided to them for manufacturing to outsiders. 5 4 3 2 1
Q13 The organisation always goes for confidentiality agreement with supplier before awarding orders. 5 4 3 2 1
Q14 Every discussion and decisions with the supplier are written in nature. 5 4 3 2 1
Q15 The organisation never placed orders to suppliers without a proper purchase order. 5 4 3 2 1

2012 333
Q16 Suppliers take advantage when there is an urgent requirement of supply. 5 4 3 2 1
Q17 Organisation provides enough encouragement for infrastructure development at suppliers end. 5 4 3 2 1
Q18 Organisation provides financial assistance required by suppliers as and when they need. 5 4 3 2 1
Q19 Technical knowledge impact at supplier end is a general practice of the organisation. 5 4 3 2 1
Q20 Suppliers usually involved in design process of the end product.(Early supplier involvement) 5 4 3 2 1
Q21 Suppliers suggest design change of products for reducing cost and cycle time to the organisation. 5 4 3 2 1
Q22 Suppliers provide the source of low cost raw materials/ service/ other facilities. 5 4 3 2 1
Q23 If any mistake observed in the purchase order or manufacturing document supplier usually bring into buyers notice for clarification. 5 4 3 2 1
Q24 Suppliers share their cost structure and time record with buyer. 5 4 3 2 1
Q25 Suppliers always invited in the organisational functions. 5 4 3 2 1
Q26 Organisation always interested in long term partnership with existing suppliers. 5 4 3 2 1
Q27 Efforts given in supplier development are always a rewarding experience with the organisation. 5 4 3 2 1
Q28 Organisation keeps on searching alternative and low cost suppliers. 5 4 3 2 1
Q29 Apart from professional relationships buyers and suppliers are also shares personal relationship. 5 4 3 2 1
Q30 Existing suppliers were always given a chance to relook their price with comparison to a new low cost supplier. 5 4 3 2 1
Q31 Organisation conducted periodical meetings with suppliers to address their views / problems etc. 5 4 3 2 1
Q32 When a supplier is delisted from the vendor master it is communicated to him/her with sufficient justifications. 5 4 3 2 1
Q33 Before delisting the supplier sufficient scope given by the organisation to justify his/her action. 5 4 3 2 1
Q34 There is formal grievance handling procedures for the suppliers. 5 4 3 2 1
Q35 Delisted supplier can also be relisted if found to be worth full for the organisation with the consent of both the organisations. 5 4 3 2 1
PERSONAL DETAILS
NAME:
AGE:
NUMBER OF YEARS IN SERVICE:
Thank You for your co-operations
Mohanty M. K., Gahan P. - Buyer Supplier Relationship in Manufacturing Industry - Findings from Indian Manufacturing Sector.
Manoj Kumar Mohanty, Dr. P. Gahan
Business Intelligence Journal - July, 2012 Vol.5 No.2
334 Business Intelligence Journal July
ANALYSIS OF THE RELATIONSHIP BETWEEN EMOTIONAL INTELLIGENCE AND STRESS CAUSED BY THE
ORGANISATION: A STUDY OF NURSES
Zeynep KalyoncuHacettepe University, Faculty of Economics and Administrative Sciences,
Department of Business Administration, Ankara, TurkeyEmail: [email protected]
Semra GuneyHacettepe University, Faculty of Economics and Administrative Sciences,
Department of Business Administration, Ankara, TurkeyEmail: [email protected]
Mahmut ArslanHacettepe University, Faculty of Economics and Administrative Sciences,
Department of Business Administration, Ankara, TurkeyEmail: [email protected]
Salih GuneyIstanbul Aydin University, Faculty of Economics and Administrative Sciences,
Department of Economics and Finance, Istanbul, TurkeyEmail: [email protected]
Evren Ayranci (Corresponding Author)Istanbul Aydin University, Faculty of Economics and Administrative Sciences,
Department of Business Administration (in English), Istanbul, TurkeyEmail: [email protected]
AbstractEmotional intelligence is one of the biggest factors that contributes to the success of individuals who assume various tasks and
roles in modern life. It is also important in determining how individuals cope with the stress that can potentially limit their emotional relationships, decrease their efficiency, and reduce the pleasure of life. The main purposes of this study were to consider the concepts of emotional intelligence and stress, and to conduct an applied study of the relationship between these two variables. The nurses who worked at some of the private and governmental hospitals in the province of Ankara were studied, and this present study identified a significant relationship between emotional intelligence and stress. Key words: Emotional Intelligence, Job Stress, Nursing, Turkey.
The 21st century is a time of globalisation, information revolution, and speed (Cascio, 2001). The most important effects of these can be seen in the business world, and they can manifest themselves as changes that organisations make in their structures, strategies, activities, and technologies (Langley, 2000). Constantly changing organisations impose new roles and duties on their employees, and the employees who want to handle new roles and duties need to have a
good intelligence quotient (IQ) and a good emotional quotient (EQ) in the processes of decision making and problem solving.
The 21st century is also an era of stress. Individuals face stress in their organisational and daily lives. Although society has a set of legal regulations to help individuals live in a healthy manner, these regulations do not eliminate stress. Thus, a completely stress-free life is impossible,
2012 335
Kalyoncu Z., Guney S., Arslan M., Guney S., Ayranci E. - Analysis of the Relationship Between Emotional Intelligence and Stress Caused by the Organisation: A Study of Nurses
Zeynep Kalyoncu, Semra Guney, Mahmut Arslan, Salih Guney, Evren Ayranci
and stress becomes a characteristic of human existence. Individuals have used various methods to handle stress, including using their intelligence, especially their emotional intelligence (Sirin, 2007). Several studies have suggested that individuals with high emotional intelligence are more capable of understanding and managing their emotions, which allows them to adjust to their surroundings and become more tolerant to challenging conditions, including stress (Bar-On, 1997; Goleman, 2005; Matthews et al., 2006). Because stress is a perceived concept, emotional intelligence plays a role in the mental process of determining the source of the stress (Ucar, 2004).
The referred stress-intelligence relationship was discussed reciprocally in this study. The results obtained in the present study affirmed a negative relationship between emotional mental ability and the stress level. Studies have proposed that a certain portion of mental capacity is allocated to cope with stress, which could explain why a greater stress level reduces mental capacity (Baltas and Baltas, 2008).
Emotional Intelligence and Stress Concepts
Studies focusing on intelligence have increasingly begun to include the concept of emotion (Abaci, 2002). One reason for this trend is that researchers have observed that there was not a good correlation between the lifetime achievements of individuals with a high IQ, which is considered to be indicative of classical problem-solving ability, and their actual intelligence (Cumming, 2005). Indeed, researchers have proposed that both rational and emotional factors contribute to problem-solving ability, and emotional intelligence has recently been investigated in more detail. Some studies have suggested that emotional intelligence has different, even opposite, features from intellectual intelligence (Halicinarli and Bender, 2006; Stein and Book, 2003), whereas other studies have suggested that emotional intelligence may be the most sophisticated aspect of intelligence (Shapiro, 2004). Studies that support the idea that emotional intelligence is superior to intellectual intelligence have argued that the ability to think in the context of emotional intelligence is limited to rationality, such that cognitive resources (desire, motivation, and emotion) also need to be used as inputs in problem solving (Erdogdu, 2008; Yesilyaprak, 1990).
There are several different definitions of emotional intelligence, but emotional intelligence can be defined simply as the rational use of emotions (Weissinger, 1998).
The foundations of the emotional intelligence are based on Thorndike’s social intelligence concept, which is defined as the ability to understand and manage individuals based on their social behaviours (Dogan and Demiral, 2007). In contrast, the phrase emotional intelligence was first used by Payne (1985) and was considered to be the person’s ability to relate to fear, pain and desire. One of the prominent definitions of emotional intelligence belongs to Salovey and Mayer (1990); and this definition is related to their Four Branch Model. According to these two scholars, emotional intelligence is a type of social intelligence that includes both the ability to analyse a person’s own and others’ emotions and the ability to exploit these analyses to guide one’s own and others’ actions. The “four branches” include four factors that form emotional intelligence (Salovey and Mayer, 1990): the use of emotions, perceiving emotions, emotional management and social fitness.
Gardner has also been an important figure in the scientific research of intelligence and the scholar proposed that there is more than one type of intelligence and that individuals could have several types of intelligence at the same time (Gardner, 2004). Gardner treated social intelligence as one type of intelligence, and this intelligence depended on both intrapersonal and interpersonal communication.
Unlike Gardner, Goleman (2005) focused on emotional intelligence solely and considered it to be an individual’s analysis of own emotions, an understanding of others' emotions, and the use of these analyses and understandings to enrich one’s personal life. Goleman (1995) also expanded the Four Branch Model to include five emotional factors: managing one’s own emotional conditions; understanding and influencing other people’s emotions; identifying and distinguishing among one’s own emotional conditions; forming and sustaining successful social relationships; and using one’s current emotional state purposefully to attain specific goals.
Other than the definitions put forward by these scholars, there are many other definitions as well. For example, Martinez (1997) asserts that emotional intelligence is the ability to use accurate reasoning about one’s own and others’ emotions as well as the ability to facilitate this reasoning to enrich thinking and deciding. Chapman (2001) defines emotional intelligence by taking work environment into account: the workers’ accepting corporate values, having good feelings about themselves and others, and having the passion to sell the products.
The measurement of emotional intelligence is also a matter in the literature. A prominent instrument belongs to Mayer et al. (2002), who used the “four branch” model
Business Intelligence Journal - July, 2012 Vol.5 No.2
336 Business Intelligence Journal July
to form the Mayer-Salovey-Caruso Emotional Intelligence Test (MSCEIT). Another prominent instrument was formed by Bar-On (1997) and named as the Emotional Quotient Inventory (EQ-i), based on the assumption that emotional intelligence is actually a group of non-cognitive capabilities and competencies. It is also interesting to see that some instruments do not take emotional intelligence as a whole, but instead they try to measure only a specific factor or part of emotional intelligence. Some examples include the Diagnostic Analysis of Nonverbal Accuracy Scale (DANVA) (Nowicki and Duke, 1994), the Japanese and Caucasian Brief Effect Recognition Test (JACBART) (Matsumoto et al., 2000), the Emotional Stroop Test developed by Richards et al. (1992), and the Levels of Emotional Awareness Scale (LEAS) (Lane et al., 1990).
In addition to emotional intelligence, the present study also focused on stress. Competition, change, and hardship are widespread in today's world, and it is common for individuals to fall into stress that is hard to overcome. Stress is a concept that has been known for centuries, but only recently has it begun to be handled scientifically, and the concept of stress requires interdisciplinary studies (Ozbay and Senyuz, 1998).
The word "stress" comes from the Latin verb "estrica" and although the initial meanings of stress included misery, sorrow, and pain, in the 18th and 19th centuries, stress began to have meanings such as to pressure and to apply force (Guney, 2000). Being interdisciplinary, stress is used in many branches of science (Agma, 2007; Graham, 2002; Stora, 1992), and its widespread use has led to many definitions. For example, Selye (1985) identified stress from a physiological and psychological standpoint as the body’s reaction against any nonspecific demand loaded onto it. Similar to Selye, Cuceoglu (1999) considered stress to be both physiological and psychological, and identified stress as an individual’s struggle beyond own physical and psychological limits as a result of uncomfortable conditions coming from the environment. Schermerhorn (1989) described stress as the tension experienced by an individual when he/she encountered unusual demands, limitations, or occasions. According to another definition, stress is a situation involving tension, and it depends on factors such as inhibition, conflict, undergoing change, and unique personal elements (Rogers, 2007).
Referring to definitions of stress, it can be inferred that it is not always correct to handle the stress concept negatively. Because the human body is not able to distinguish between pleasant and unpleasant effects, the body’s stress reaction is the same against both positive and negative effects (Allen,
1983). Interestingly, research has suggested that individuals must maintain a certain level of stress to remain efficient and productive (Sahin, 2010).
Emotional Intelligence and Stress in Nursing
According to the International Council of Nurses’ definition, nursing is a profession that is aimed at protecting, improving, and rehabilitating the health of the individual, the family, and society (Boyatzis and Oosten, 2002). Because the focus of nursing is people, emotions are as important as technical information (Boyatzis and Oosten, 2002; Cowin, 2001). Similar to other people-oriented professions, nurses should respect patients' preferences and choices and fulfil patients' emotional, social, and moral needs (Journal of Nursing, 2007). Indeed, it is vital for nurses to be emotionally aware, to manage their emotions, to have empathy, and to communicate effectively (McQueen, 2004).
Many studies have expressed and/or set forth the positive effects of emotional intelligence on topics such as job satisfaction and job performance (Ayranci, 2011; Dulewicz and Higgs, 2000; Hayward, 2005; Higgs, 2004), and the positive effects of emotional intelligence have also been observed in the nursing profession. Indeed, emotional intelligence positively affects nurses and increases both job satisfaction and the ability to deal with stress (Akerjordet and Severinson, 2008; Montes-Berges and Augusto, 2007).
Nursing is a very stressful profession because the job is focused on patients’ well-being. In addition, nurses are expected to perform their work accurately and in a timely manner, and there is no room for mistakes. Moreover, nurses must take into account both the patient and the patient’s relatives (Akyar, 2009). Some of the primary causes of stress for nurses include directly dealing with pain and death, being obliged to respond to the emotional needs of patients and their relatives, long shifts, the idea that there is a huge burden of responsibility in the work environment, and physical fatigue (Landa and Lopez-Zafra, 2010).
Methods
Purpose and Importance of the Study
The purpose of this study was to investigate the relationship between the emotional intelligence of nurses and their stress caused by working in a hospital. This study is particularly relevant because the relationship
2012 337
between stress and emotional intelligence is a relatively current concept, and not many studies have examined this relationship in the nursing profession. Our study subjects were nurses from Turkish hospitals, and examining the relationship between stress and emotional intelligence in the nursing profession, which is a people-oriented profession that requires sensitivity from its practitioners, highlights the importance of this study with respect to both the Turkish and the international literature.
Hypotheses of the Study
A number of inferences from previous studies regarding the concepts of stress and emotional intelligence contributed to the hypotheses of the present study.
Hypothesis 1: There is a significant relationship between the emotional intelligence of the participating nurses and the stress caused by working in a hospital.
A study by Gohm et al. (2005) investigated how one’s stress level changes in relation to emotional intelligence. Based on this study, we decided to analyse the relationship between the stress groups and emotional intelligence, and we formed the following hypotheses:
Hypothesis 2: The relationships between the emotional intelligence of participating nurses and their stress levels will show differences.
• Hypothesis 2a: There is a significant relationship between the emotional intelligence of participating nurses and the high-stress-level group.
• Hypothesis 2b: There is a significant relationship between the emotional intelligence of the participating nurses and the medium-stress-level group.
• Hypothesis 2c: There is a significant relationship between the emotional intelligence of the participating nurses and the low-stress-level group.
Research Population and Sample
The research population was composed of nurses who worked in a number of private and government hospitals in Ankara. According to the information given by the Ministry of Health, the total number of actively working nurses in Ankara at the time the study was conducted was 10,790. The number of nurses in the hospitals where the study
was conducted was 2,070. The study sample consisted of 333 nurses from hospitals in Ankara, and the sample was statistically large enough to represent the research population within the criteria introduced by Saunders et al. (2009).
The study sample was chosen randomly in an unbiased manner from nurses at ten different health institutions. Four of the health institutions were public institutions, and the other six institutions were private. We distributed 448 questionnaires, and assumed that some participants would not respond and that some questionnaires would have missing information or erroneous answers. There were 345 returned questionnaires, but the number of questionnaires that were completed fully was 333.
Data Collection Tools
The emotional intelligence levels were measured with the Emotional Intelligence Scale, and the Job-Induced Stress Scale was used to determine the stress status of the participants. The Emotional Intelligence Scale, which was a seven-point Likert-type scale, was developed by Wong and Law (2002), and this scale with 16 items contained a total of four factors, namely self emotion appraisal, others emotion appraisal, use of emotions and regulation of emotion. Importantly, Guleryuz et al. (2008) used the Emotional Intelligence Scale in a study in Turkey and showed that the scale did not have any problems in terms of validity and reliability. The Job-Induced Stress Scale, developed by Bayram (2006), consisted of 30 items assessed by a seven-point Likert-type scale. An important feature of this scale is that it is reversed, and therefore the higher points on this scale imply lower levels of work stress. To make the questions easier to answer, we converted both scales into a five-point Likert-type scale.
Data Collection and Evaluation Method
A data collection form was prepared, which included the introduction page that had the application guidelines and the requested demographic information. The Emotional Intelligence Scale was included before the Job-Induced Stress Scale.
To determine the basic or the interaction effects of the variables, the reliability analysis of the scales was performed with t tests and one-way analysis of variance (ANOVA). We also performed simple linear regression analyses to determine the relationships amongst the variables.
Kalyoncu Z., Guney S., Arslan M., Guney S., Ayranci E. - Analysis of the Relationship Between Emotional Intelligence and Stress Caused by the Organisation: A Study of Nurses
Zeynep Kalyoncu, Semra Guney, Mahmut Arslan, Salih Guney, Evren Ayranci
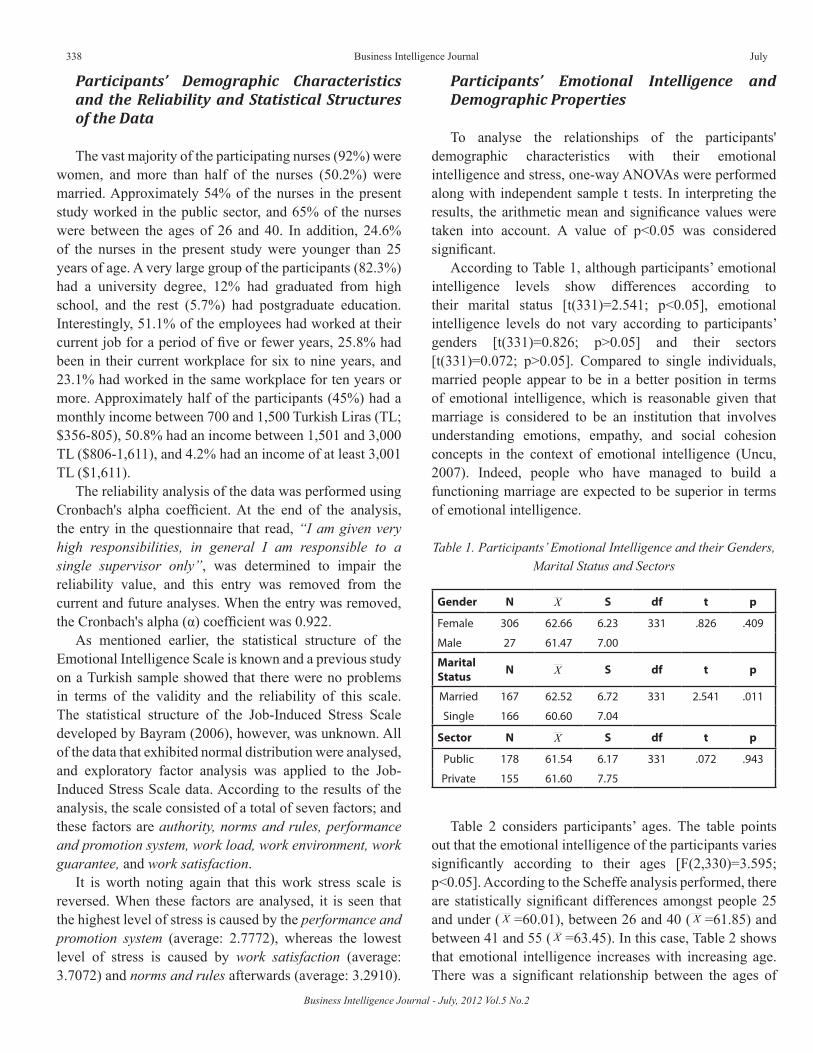
Business Intelligence Journal - July, 2012 Vol.5 No.2
338 Business Intelligence Journal July
Participants’ Demographic Characteristics and the Reliability and Statistical Structures of the Data
The vast majority of the participating nurses (92%) were women, and more than half of the nurses (50.2%) were married. Approximately 54% of the nurses in the present study worked in the public sector, and 65% of the nurses were between the ages of 26 and 40. In addition, 24.6% of the nurses in the present study were younger than 25 years of age. A very large group of the participants (82.3%) had a university degree, 12% had graduated from high school, and the rest (5.7%) had postgraduate education. Interestingly, 51.1% of the employees had worked at their current job for a period of five or fewer years, 25.8% had been in their current workplace for six to nine years, and 23.1% had worked in the same workplace for ten years or more. Approximately half of the participants (45%) had a monthly income between 700 and 1,500 Turkish Liras (TL; $356-805), 50.8% had an income between 1,501 and 3,000 TL ($806-1,611), and 4.2% had an income of at least 3,001 TL ($1,611).
The reliability analysis of the data was performed using Cronbach's alpha coefficient. At the end of the analysis, the entry in the questionnaire that read, “I am given very high responsibilities, in general I am responsible to a single supervisor only”, was determined to impair the reliability value, and this entry was removed from the current and future analyses. When the entry was removed, the Cronbach's alpha (α) coefficient was 0.922.
As mentioned earlier, the statistical structure of the Emotional Intelligence Scale is known and a previous study on a Turkish sample showed that there were no problems in terms of the validity and the reliability of this scale. The statistical structure of the Job-Induced Stress Scale developed by Bayram (2006), however, was unknown. All of the data that exhibited normal distribution were analysed, and exploratory factor analysis was applied to the Job-Induced Stress Scale data. According to the results of the analysis, the scale consisted of a total of seven factors; and these factors are authority, norms and rules, performance and promotion system, work load, work environment, work guarantee, and work satisfaction.
It is worth noting again that this work stress scale is reversed. When these factors are analysed, it is seen that the highest level of stress is caused by the performance and promotion system (average: 2.7772), whereas the lowest level of stress is caused by work satisfaction (average: 3.7072) and norms and rules afterwards (average: 3.2910).
Participants’ Emotional Intelligence and Demographic Properties
To analyse the relationships of the participants' demographic characteristics with their emotional intelligence and stress, one-way ANOVAs were performed along with independent sample t tests. In interpreting the results, the arithmetic mean and significance values were taken into account. A value of p<0.05 was considered significant.
According to Table 1, although participants’ emotional intelligence levels show differences according to their marital status [t(331)=2.541; p<0.05], emotional intelligence levels do not vary according to participants’ genders [t(331)=0.826; p>0.05] and their sectors [t(331)=0.072; p>0.05]. Compared to single individuals, married people appear to be in a better position in terms of emotional intelligence, which is reasonable given that marriage is considered to be an institution that involves understanding emotions, empathy, and social cohesion concepts in the context of emotional intelligence (Uncu, 2007). Indeed, people who have managed to build a functioning marriage are expected to be superior in terms of emotional intelligence.
Table 1. Participants’ Emotional Intelligence and their Genders, Marital Status and Sectors
Gender N X S df t p
Female 306 62.66 6.23 331 .826 .409
Male 27 61.47 7.00
Marital Status N X S df t p
Married 167 62.52 6.72 331 2.541 .011
Single 166 60.60 7.04
Sector N X S df t p
Public 178 61.54 6.17 331 .072 .943
Private 155 61.60 7.75
Table 2 considers participants’ ages. The table points out that the emotional intelligence of the participants varies significantly according to their ages [F(2,330)=3.595; p<0.05]. According to the Scheffe analysis performed, there are statistically significant differences amongst people 25 and under ( X =60.01), between 26 and 40 ( X =61.85) and between 41 and 55 ( X =63.45). In this case, Table 2 shows that emotional intelligence increases with increasing age. There was a significant relationship between the ages of
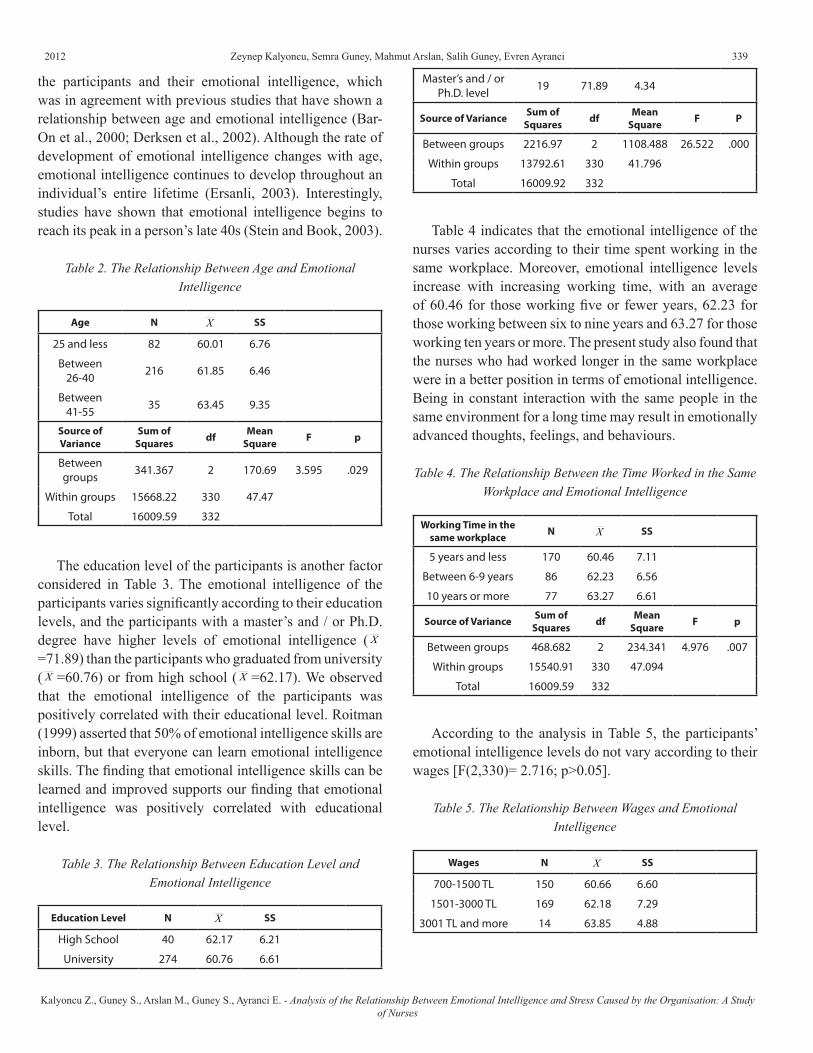
2012 339
the participants and their emotional intelligence, which was in agreement with previous studies that have shown a relationship between age and emotional intelligence (Bar-On et al., 2000; Derksen et al., 2002). Although the rate of development of emotional intelligence changes with age, emotional intelligence continues to develop throughout an individual’s entire lifetime (Ersanli, 2003). Interestingly, studies have shown that emotional intelligence begins to reach its peak in a person’s late 40s (Stein and Book, 2003).
Table 2. The Relationship Between Age and Emotional Intelligence
Age N X SS
25 and less 82 60.01 6.76
Between 26-40 216 61.85 6.46
Between 41-55 35 63.45 9.35
Source of Variance
Sum of Squares df Mean
Square F p
Between groups 341.367 2 170.69 3.595 .029
Within groups 15668.22 330 47.47
Total 16009.59 332
The education level of the participants is another factor considered in Table 3. The emotional intelligence of the participants varies significantly according to their education levels, and the participants with a master’s and / or Ph.D. degree have higher levels of emotional intelligence ( X
=71.89) than the participants who graduated from university ( X =60.76) or from high school ( X =62.17). We observed that the emotional intelligence of the participants was positively correlated with their educational level. Roitman (1999) asserted that 50% of emotional intelligence skills are inborn, but that everyone can learn emotional intelligence skills. The finding that emotional intelligence skills can be learned and improved supports our finding that emotional intelligence was positively correlated with educational level.
Education Level N X SS
High School 40 62.17 6.21
University 274 60.76 6.61
Table 3. The Relationship Between Education Level and Emotional Intelligence
Master’s and / or Ph.D. level 19 71.89 4.34
Source of Variance Sum of Squares df Mean
Square F P
Between groups 2216.97 2 1108.488 26.522 .000
Within groups 13792.61 330 41.796
Total 16009.92 332
Table 4 indicates that the emotional intelligence of the nurses varies according to their time spent working in the same workplace. Moreover, emotional intelligence levels increase with increasing working time, with an average of 60.46 for those working five or fewer years, 62.23 for those working between six to nine years and 63.27 for those working ten years or more. The present study also found that the nurses who had worked longer in the same workplace were in a better position in terms of emotional intelligence. Being in constant interaction with the same people in the same environment for a long time may result in emotionally advanced thoughts, feelings, and behaviours.
Table 4. The Relationship Between the Time Worked in the Same Workplace and Emotional Intelligence
Working Time in the same workplace N X SS
5 years and less 170 60.46 7.11
Between 6-9 years 86 62.23 6.56
10 years or more 77 63.27 6.61
Source of Variance Sum of Squares df Mean
Square F p
Between groups 468.682 2 234.341 4.976 .007
Within groups 15540.91 330 47.094
Total 16009.59 332
According to the analysis in Table 5, the participants’ emotional intelligence levels do not vary according to their wages [F(2,330)= 2.716; p>0.05].
Table 5. The Relationship Between Wages and Emotional Intelligence
Wages N X SS
700-1500 TL 150 60.66 6.60
1501-3000 TL 169 62.18 7.29
3001 TL and more 14 63.85 4.88
Kalyoncu Z., Guney S., Arslan M., Guney S., Ayranci E. - Analysis of the Relationship Between Emotional Intelligence and Stress Caused by the Organisation: A Study of Nurses
Zeynep Kalyoncu, Semra Guney, Mahmut Arslan, Salih Guney, Evren Ayranci
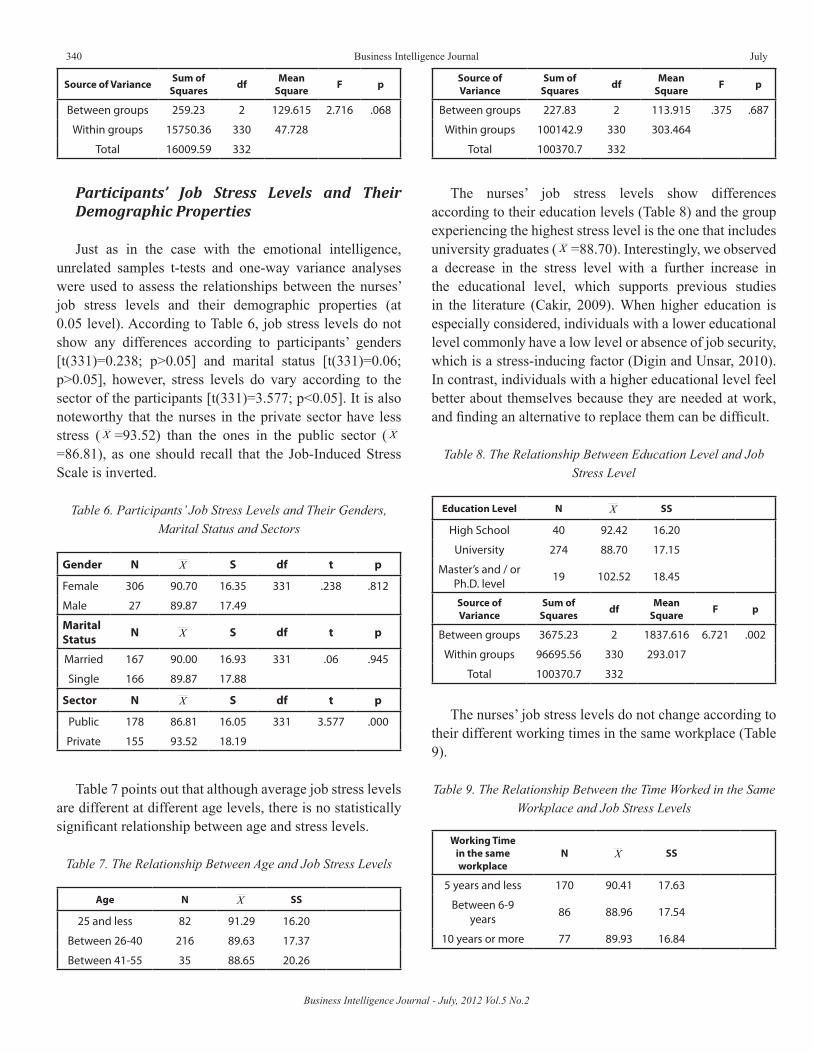
Business Intelligence Journal - July, 2012 Vol.5 No.2
340 Business Intelligence Journal July
Source of Variance Sum of Squares df Mean
Square F p
Between groups 259.23 2 129.615 2.716 .068
Within groups 15750.36 330 47.728
Total 16009.59 332
Participants’ Job Stress Levels and Their Demographic Properties
Just as in the case with the emotional intelligence, unrelated samples t-tests and one-way variance analyses were used to assess the relationships between the nurses’ job stress levels and their demographic properties (at 0.05 level). According to Table 6, job stress levels do not show any differences according to participants’ genders [t(331)=0.238; p>0.05] and marital status [t(331)=0.06; p>0.05], however, stress levels do vary according to the sector of the participants [t(331)=3.577; p<0.05]. It is also noteworthy that the nurses in the private sector have less stress ( X =93.52) than the ones in the public sector ( X
=86.81), as one should recall that the Job-Induced Stress Scale is inverted.
Table 6. Participants’ Job Stress Levels and Their Genders, Marital Status and Sectors
Gender N X S df t p
Female 306 90.70 16.35 331 .238 .812
Male 27 89.87 17.49
Marital Status N X S df t p
Married 167 90.00 16.93 331 .06 .945
Single 166 89.87 17.88
Sector N X S df t p
Public 178 86.81 16.05 331 3.577 .000
Private 155 93.52 18.19
Table 7 points out that although average job stress levels are different at different age levels, there is no statistically significant relationship between age and stress levels.
Age N X SS
25 and less 82 91.29 16.20
Between 26-40 216 89.63 17.37
Between 41-55 35 88.65 20.26
Table 7. The Relationship Between Age and Job Stress Levels
Source of Variance
Sum of Squares df Mean
Square F p
Between groups 227.83 2 113.915 .375 .687
Within groups 100142.9 330 303.464
Total 100370.7 332
The nurses’ job stress levels show differences according to their education levels (Table 8) and the group experiencing the highest stress level is the one that includes university graduates ( X =88.70). Interestingly, we observed a decrease in the stress level with a further increase in the educational level, which supports previous studies in the literature (Cakir, 2009). When higher education is especially considered, individuals with a lower educational level commonly have a low level or absence of job security, which is a stress-inducing factor (Digin and Unsar, 2010). In contrast, individuals with a higher educational level feel better about themselves because they are needed at work, and finding an alternative to replace them can be difficult.
Education Level N X SS
High School 40 92.42 16.20
University 274 88.70 17.15
Master’s and / or Ph.D. level 19 102.52 18.45
Source of Variance
Sum of Squares df Mean
Square F p
Between groups 3675.23 2 1837.616 6.721 .002
Within groups 96695.56 330 293.017
Total 100370.7 332
Table 8. The Relationship Between Education Level and Job Stress Level
The nurses’ job stress levels do not change according to their different working times in the same workplace (Table 9).
Table 9. The Relationship Between the Time Worked in the Same Workplace and Job Stress Levels
Working Time in the same workplace
N X SS
5 years and less 170 90.41 17.63
Between 6-9 years 86 88.96 17.54
10 years or more 77 89.93 16.84
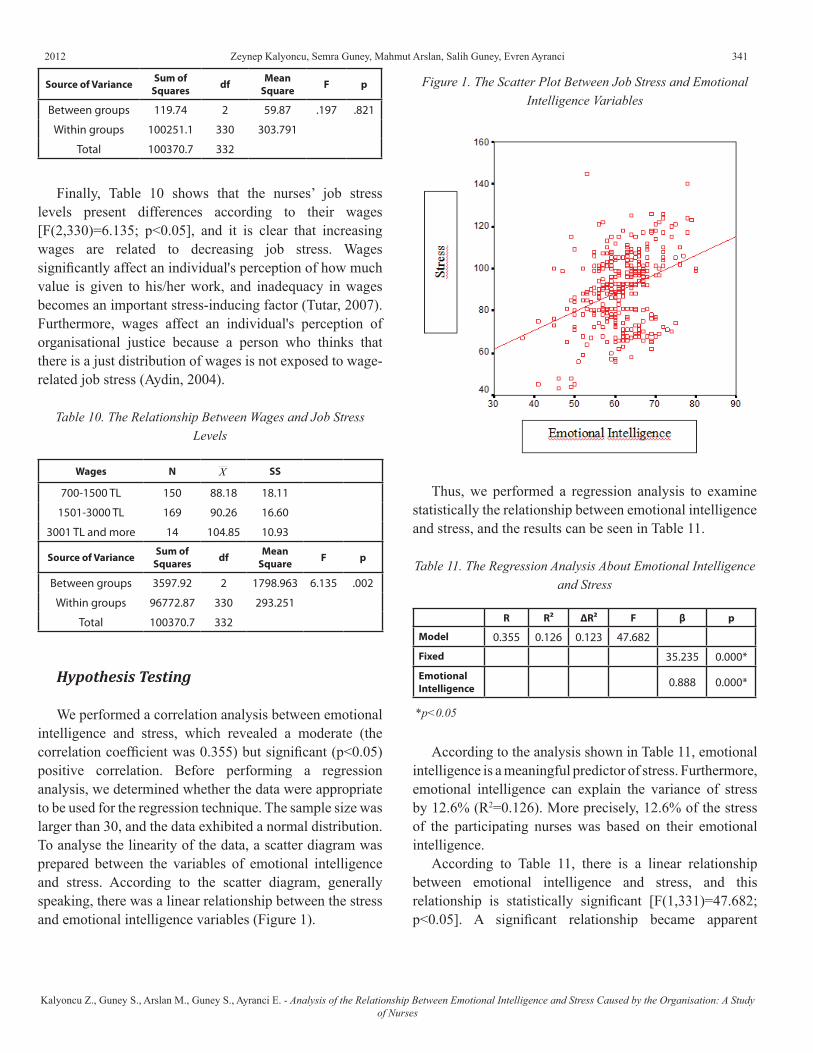
2012 341
Source of Variance Sum of Squares df Mean
Square F p
Between groups 119.74 2 59.87 .197 .821
Within groups 100251.1 330 303.791
Total 100370.7 332
Finally, Table 10 shows that the nurses’ job stress levels present differences according to their wages [F(2,330)=6.135; p<0.05], and it is clear that increasing wages are related to decreasing job stress. Wages significantly affect an individual's perception of how much value is given to his/her work, and inadequacy in wages becomes an important stress-inducing factor (Tutar, 2007). Furthermore, wages affect an individual's perception of organisational justice because a person who thinks that there is a just distribution of wages is not exposed to wage-related job stress (Aydin, 2004).
Table 10. The Relationship Between Wages and Job Stress Levels
Wages N X SS
700-1500 TL 150 88.18 18.11
1501-3000 TL 169 90.26 16.60
3001 TL and more 14 104.85 10.93
Source of Variance Sum of Squares df Mean
Square F p
Between groups 3597.92 2 1798.963 6.135 .002
Within groups 96772.87 330 293.251
Total 100370.7 332
Hypothesis Testing
We performed a correlation analysis between emotional intelligence and stress, which revealed a moderate (the correlation coefficient was 0.355) but significant (p<0.05) positive correlation. Before performing a regression analysis, we determined whether the data were appropriate to be used for the regression technique. The sample size was larger than 30, and the data exhibited a normal distribution. To analyse the linearity of the data, a scatter diagram was prepared between the variables of emotional intelligence and stress. According to the scatter diagram, generally speaking, there was a linear relationship between the stress and emotional intelligence variables (Figure 1).
Figure 1. The Scatter Plot Between Job Stress and Emotional Intelligence Variables
Thus, we performed a regression analysis to examine statistically the relationship between emotional intelligence and stress, and the results can be seen in Table 11.
Table 11. The Regression Analysis About Emotional Intelligence and Stress
R R² ΔR² F β p
Model 0.355 0.126 0.123 47.682
Fixed 35.235 0.000*
Emotional Intelligence 0.888 0.000*
*p<0.05
According to the analysis shown in Table 11, emotional intelligence is a meaningful predictor of stress. Furthermore, emotional intelligence can explain the variance of stress by 12.6% (R2=0.126). More precisely, 12.6% of the stress of the participating nurses was based on their emotional intelligence.
According to Table 11, there is a linear relationship between emotional intelligence and stress, and this relationship is statistically significant [F(1,331)=47.682; p<0.05]. A significant relationship became apparent
Kalyoncu Z., Guney S., Arslan M., Guney S., Ayranci E. - Analysis of the Relationship Between Emotional Intelligence and Stress Caused by the Organisation: A Study of Nurses
Zeynep Kalyoncu, Semra Guney, Mahmut Arslan, Salih Guney, Evren Ayranci
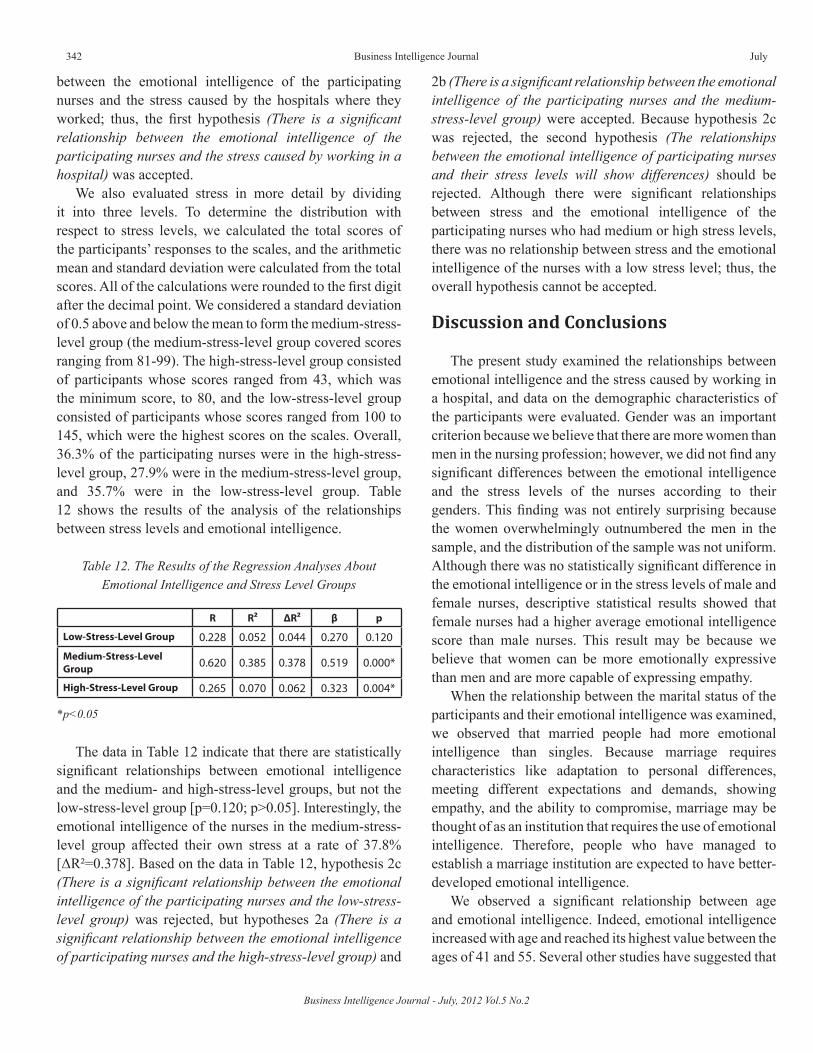
Business Intelligence Journal - July, 2012 Vol.5 No.2
342 Business Intelligence Journal July
between the emotional intelligence of the participating nurses and the stress caused by the hospitals where they worked; thus, the first hypothesis (There is a significant relationship between the emotional intelligence of the participating nurses and the stress caused by working in a hospital) was accepted.
We also evaluated stress in more detail by dividing it into three levels. To determine the distribution with respect to stress levels, we calculated the total scores of the participants’ responses to the scales, and the arithmetic mean and standard deviation were calculated from the total scores. All of the calculations were rounded to the first digit after the decimal point. We considered a standard deviation of 0.5 above and below the mean to form the medium-stress-level group (the medium-stress-level group covered scores ranging from 81-99). The high-stress-level group consisted of participants whose scores ranged from 43, which was the minimum score, to 80, and the low-stress-level group consisted of participants whose scores ranged from 100 to 145, which were the highest scores on the scales. Overall, 36.3% of the participating nurses were in the high-stress-level group, 27.9% were in the medium-stress-level group, and 35.7% were in the low-stress-level group. Table 12 shows the results of the analysis of the relationships between stress levels and emotional intelligence.
Table 12. The Results of the Regression Analyses About Emotional Intelligence and Stress Level Groups
R R² ΔR² β p
Low-Stress-Level Group 0.228 0.052 0.044 0.270 0.120
Medium-Stress-Level Group 0.620 0.385 0.378 0.519 0.000*
High-Stress-Level Group 0.265 0.070 0.062 0.323 0.004*
*p<0.05
The data in Table 12 indicate that there are statistically significant relationships between emotional intelligence and the medium- and high-stress-level groups, but not the low-stress-level group [p=0.120; p>0.05]. Interestingly, the emotional intelligence of the nurses in the medium-stress-level group affected their own stress at a rate of 37.8% [ΔR²=0.378]. Based on the data in Table 12, hypothesis 2c (There is a significant relationship between the emotional intelligence of the participating nurses and the low-stress-level group) was rejected, but hypotheses 2a (There is a significant relationship between the emotional intelligence of participating nurses and the high-stress-level group) and
2b (There is a significant relationship between the emotional intelligence of the participating nurses and the medium-stress-level group) were accepted. Because hypothesis 2c was rejected, the second hypothesis (The relationships between the emotional intelligence of participating nurses and their stress levels will show differences) should be rejected. Although there were significant relationships between stress and the emotional intelligence of the participating nurses who had medium or high stress levels, there was no relationship between stress and the emotional intelligence of the nurses with a low stress level; thus, the overall hypothesis cannot be accepted.
Discussion and Conclusions
The present study examined the relationships between emotional intelligence and the stress caused by working in a hospital, and data on the demographic characteristics of the participants were evaluated. Gender was an important criterion because we believe that there are more women than men in the nursing profession; however, we did not find any significant differences between the emotional intelligence and the stress levels of the nurses according to their genders. This finding was not entirely surprising because the women overwhelmingly outnumbered the men in the sample, and the distribution of the sample was not uniform. Although there was no statistically significant difference in the emotional intelligence or in the stress levels of male and female nurses, descriptive statistical results showed that female nurses had a higher average emotional intelligence score than male nurses. This result may be because we believe that women can be more emotionally expressive than men and are more capable of expressing empathy.
When the relationship between the marital status of the participants and their emotional intelligence was examined, we observed that married people had more emotional intelligence than singles. Because marriage requires characteristics like adaptation to personal differences, meeting different expectations and demands, showing empathy, and the ability to compromise, marriage may be thought of as an institution that requires the use of emotional intelligence. Therefore, people who have managed to establish a marriage institution are expected to have better-developed emotional intelligence.
We observed a significant relationship between age and emotional intelligence. Indeed, emotional intelligence increased with age and reached its highest value between the ages of 41 and 55. Several other studies have suggested that
2012 343
there is a relationship between emotional intelligence and age, and it has been proposed that emotional intelligence develops throughout an individual’s lifetime. Thus, we believe that the results of the present study agree with previous reports.
We also observed that increases in emotional intelligence were positively associated with increases in the educational level (especially when university and master’s or Ph.D. levels are considered). This finding supported the belief that emotional intelligence can be learned, and thus, the increasing level of education may have supported an increase in emotional intelligence.
Furthermore, we observed a positive relationship between the length of time that the participating nurses were employed at the same workplace and their emotional intelligence. This result may be because the accumulation of experience in the same hospital may have caused the nurses both to understand others efficiently and to improve their thoughts and emotions towards their surroundings easily.
With regard to the stress levels among the nurses, we observed a negative relationship between the educational level (considering university and master’s or Ph.D. degrees) of the participants and their stress levels. Highly educated individuals may have less stress because they are better prepared to handle the responsibilities of their jobs and are not as fearful of losing their jobs.
In addition, we found that job stress decreased as the nurses’ wages increased. Because wages are equivalent to earned income from work rendered, higher wages may create the perception that an individual’s work is valued. In addition, higher wages will affect the perception of the fairness of the wage distribution system. Indeed, an individual who thinks that he/she is given value and earns a deserved level of wages is expected to feel more comfortable in terms of his/her job.
Importantly, the present study found a statistically significant relationship between emotional intelligence and job stress. Indeed, a participant with a higher emotional intelligence level turned out to have a lower level of job stress. In addition, we found that emotional intelligence explained 12% of the nurses’ job stress.
The relationship between emotional intelligence and stress has been discussed in many studies and culture may also be considered for this relationship. According to Hofstede’s (2001) cultural dimensions study, Turkey has a culture that displays a high power distance, collectivism, femininity, and uncertainty-avoidance characteristics.
Because norms and rules combined to form one of the factors that caused the least amount of stress in the participants, the present stress-related results exhibited a characteristic that is well suited to Turkish culture.
Interestingly, we found that the emotional intelligence of the nurses who experienced medium stress levels significantly affected their stress level by a proportion of 37.8%. The relationship between stress and the emotional intelligence of the nurses who experienced high stress levels was significant but very weak. For the nurses who experienced low stress levels, we found that emotional intelligence did not have a significant effect on stress. The significant relationship between stress and the emotional intelligence of the participants in the medium-stress-level group compared with the other groups may have resulted because the emotional intelligence of the nurses in the medium-stress-level group allowed them to cope with the daily situations that they faced (the stress levels of the participants in the medium-stress-level group allowed them to act with their emotional intelligence). In contrast, the stress experienced by the nurses in the low- and high-stress-level groups may have had a more dominant effect on their behaviours than their emotions. For example, the stress that the nurses in the low-stress-level group experienced may have been too low to necessitate the use of their emotional intelligence, whereas the stress that the nurses in the high-stress-level group experienced may not have allowed them to use their emotional intelligence efficiently (the stress level that these nurses were experiencing may have been higher than the level at which their emotional intelligence could be effective).
References
Abaci R (2002). The qualification of life (In Turkish). Sistem Publications, İstanbul, Turkey.
Agma FŞ (2007). The negative effects and reasons of stress in work life (In Turkish). Master’s thesis, Atılım University, Ankara, Turkey.
Akerjordet K, Severinson E (2008). Emotionally intelligent nurse leadership: a literature review study. J Nurs Manag, 16(5): 565–577.
Akyar İ (2009). The over and long working and its effects (In Turkish). [online] Available at: http://www.turkhemsirelerdernegi.org.tr/menu/saglik-guncel/thd-sagliginsesiyazilari/ 91-saglikguncel.aspx (Accessed 17 March 2011).
Kalyoncu Z., Guney S., Arslan M., Guney S., Ayranci E. - Analysis of the Relationship Between Emotional Intelligence and Stress Caused by the Organisation: A Study of Nurses
Zeynep Kalyoncu, Semra Guney, Mahmut Arslan, Salih Guney, Evren Ayranci
Business Intelligence Journal - July, 2012 Vol.5 No.2
344 Business Intelligence Journal July
Allen RJ (1983). Human Stress: Its’ Nature and Control. MacMillan Publishing Company, New York.
Aydin Ş (2004). The organizational stress factors at hotels: An application regarding the 4-5 star hotels (In Turkish). Journal Of Dokuz Eylul University Graduate School Of Social Sciences. 6(4): 1–21.
Ayranci E (2011). Effects of Top Turkish Managers’ Emotional and Spiritual Intelligences on their Organizations’ Financial Performance. Bus Intell J. 4(1): 9–36.
Baltas A, Baltaş Z (2008). Stress and the ways to cope with it (In Turkish). Remzi Publications, İstanbul, Turkey.
Bar-On R (1997). BarOn Emotional Quotient Inventory Technical Manual. MHS Publications, Toronto.
Bar-On R, Brown JM, Kirkcaldy BD, Thome EP (2000). Emotional expression and implications for occupational stress: an application of the emotional quotient inventory (EQ-i). Pers Indiv Differ. 28(6): 1107–1118.
Bayram S (2006). Organizational stress factors and a research on teachers (In Turkish). Master’s thesis, Kocaeli University, Kocaeli, Turkey.
Boyatzis RE, Oosten EV (2002). Developing emotionally intelligent organizations. [online] Available at: http://www.eiconsortium.org/pdf/developing_emotionally_ intelligent_organizations.pdf (Accessed 17 March 2011).
Cakir Ö (2009). A research aimed at determining perceived hardnesses in work life and its role to cope with job stress (In Turkish). Paper presented at the 17th National Management and Organisation Congress, 21-23 May 2009, Eskişehir, Turkey.
Cascio WF (2001). Knowledge creation for practical solutions appropriate to a changing world of work. South African Journal of Industrial Psychology. 27(4): 14–16.
Chapman M (2001). The Emotional Intelligence Pocketbook. Management Pocketbooks, Arlesford.
Cowin L (2001). Measuring nurses self-concept. West J Nurs Res. 23(3): 313–325.
Cuceloglu D (1999). Human and behaviour, basic concepts of psychology (In Turkish). Remzi Publications, İstanbul.
Cumming EA (2005). An Investigation into the Relationship between Emotional Intelligence and Workplace Performance: An Exploratory Study. Master’s thesis, Lincoln University, New Zealand.
Derksen J, Kramer L, Katzko M (2002). Does a self-report measure for emotional intelligence assess something different than general intelligence? Pers Indiv Differ. 32(1): 37–48.
Digin Ö, Unsar S (2010). The determinants of workers’ social security perception and their social security contentment’s effects on organisational commitment, job stress and the intention to leave (In Turkish). Dumlupınar University Journal of Social Sciences. 26(2): 133–146.
Dogan S, Demiral Ö (2007). The role and importance of emotional intelligence on the success of organisations (In Turkish). Celal Bayar University the Faculty of Economic and Administrative Sciences Journal. 14(1): 209– 230.
Dulewicz V, Higgs M (2000). Emotional intelligence – a review and evaluation study. J Manag Psychol. 15(4): 341–372.
Erdogdu MY (2008). An analysis of emotional intelligence via some variables (In Turkish). Electronic Social Sciences Journal. 7(23): 62–76.
Ersanli E (2003). The emotional intelligence levels of university teaching staff (In Turkish). Master’s thesis, Ondokuz Mayıs University, Samsun, Turkey.
Gardner H (2004). Frames of mind: Multiple intelligence theory (In Turkish). (Trans. by Ebru Kılıç), Alfa Publications, İstanbul, Turkey.
Gohm CL, Corser GC, Dalsky DJ (2005). Emotional intelligence under stress: useful, unnecessary, or irrelevant? Pers Indiv Differ. 39(6): 1017–1028.
Goleman D (1995). Emotional Intelligence. Bantam Books, New York.
Goleman D (2005). Why is emotional intelligence more important than IQ? (In Turkish). (Trans. by Banu S. Yüksel). Varlık Publications, İstanbul, Turkey.
Graham H (2002). Use stress for your own benefit (In Turkish). (Trans. by Murat Sağlam), Alfa Publications, İstanbul, Turkey.
Guleryuz G, Guney S, Aydin EM, Asan Ö (2008). The mediating effect of job satisfaction between emotional intelligence and organizational commitment of nurses: a questionnaire survey. Int J Nurs Stud. 45(11): 1625–1635.
Guney S (2000). Behavioural sciences (In Turkish). Nobel Publications, Ankara Turkey.
Halicinarli E, Bender MT (2006). Emotional intelligence (EQ) of women and a field research (In Turkish). Paper presented at the Second

2012 345
International Conference on Women’s Studies, 27-28 April 2006, Northern Cyprus.
Hayward BA (2005). Relationship between Employee Performance, Leadership and Emotional Intelligence in a South African Parastatal Organisation. Master’s thesis, Rhodes University, Grahamstown, South Africa.
Higgs M (2004). A study of the relationship between emotional intelligence and performance in UK call centres. J Manag Psychol. 19(4): 442–454.
Hofstede G (2001). Culture's Consequences, Comparing Values, Behaviours, Institutions, and Organizations Across Nations. Sage Publications, Thousand Oaks, CA.
Journal of Nursing, 2007. Emotional intelligence in the nursing profession. [online] Available at: http://www.asrn.org/journal-nursing/202-emotional-intelligence-in-the-nursing profession.html (Accessed 17 May 2011).
Landa JMA, Lopez-Zafra E (2010). The impact of emotional intelligence on nursing: an overview. Psychology. 1(1): 50–58.
Lane RD, Quinlan, DM, Schwartz GE, Walker PA, Zeitlin SB (1990). The levels of emotional awareness scale: a cognitive-developmental measure of emotion. Journal of Personal Assessment. 55(1-2): 124–134.
Langley A (2000). Emotional intelligence – a new evaluation for management development? Career Dev Int. 5(3): 177–183.
Martinez MN (1997). The smarts that count. HR Magazine. 42 (11): 72–78.
Matsumoto D, Leroux JA, Wilson-Cohn C, Raroque J, Kooken K (2000). A new test to measure emotion recognition ability: Matsumoto and Ekman’s Japanese and Caucasian brief affect recognition test (JACBART). Journal of Nonverbal Behavior. 24(3): 179–209.
Matthews G, Emo AK, Funke G, Zeidner M, Roberts RT, Costa PT, Schulze R (2006). Emotional intelligence, personality and task-induced stress. J Exp Psychol Appl. 12(2): 96–107.
Mayer JD, Salovey P, Caruso DR (2002). Mayer-Salovey-Caruso Emotional Intelligence Test (MSCEIT) Item Booklet. MHS Publications, Toronto.
McQueen AC (2004). Emotional intelligence in nursing work. J Adv Nurs. 47(1): 101–108.
Montes-Berges J, Augusto BM (2007). Exploring the relationship between perceived emotional intelligence, coping, social support and mental health in nursing students. J Psychiatr Ment Health Nurs. 14(2): 163–171.
Nowicki SJ, Duke MP (1994). Individual differences in the nonverbal communication of affect: the diagnostic analysis of nonverbal accuracy scale. Journal of Nonverbal Behavior. 18(1): 9–35.
Ozbay Y, Senyuz A (1998). An analysis of perceived job satisfaction in different occupations and stress levels in relation to gender (In Turkish). Paper presented at The Tenth National Psychology Congress, 16-18 September 1998, Ankara, Turkey.
Payne WL (1985). A Study of Emotion: Developing Emotional Intelligence; Self-Integration; Relating to Fear, Pain and Desire (Theory, Structure of Reality, Problem-Solving, Contraction/Expansion, Tuning In/Coming Out/Letting Go). Doctoral dissertation, The Union for Experimenting Colleges and Universities (The Union Institute), Cincinnati, OH.
Richards A, French CC, Johnson W (1992). Effects of mood manipulation and anxiety on performance of an emotional Stroop task. Br J Psychol. 83(4): 479–491.
Rogers AK (2007). Stress Perceptions in Occupational Therapy Students: Traditional versus Distance Education. Master’s thesis, West Virginia University, Morgantown, WV.
Roitman JD (1999). Emotional Intelligence: The Heart is Smarter than the Brain. Master’s thesis, University of Colorado, Colorado.
Sahin NH (2010). Finding your own “positive stress” level, coping up with stress: A positive approach (In Turkish). Turkish Psychologists Association Publications, Ankara, Turkey.
Salovey P, Mayer JD (1990). Emotional intelligence. Imagination, Cognition, and Personality. 9: 185–211.
Saunders M, Lewis P, Thornhill A (2009). Research Methods for Business Students. Pearson Education, London, UK.
Schermerhorn JR (1989). Management for Productivity. John Wiley and Sons Inc., New York.
Selye H (1985). The Stress of Life. Springer-Verlag, New York.
Kalyoncu Z., Guney S., Arslan M., Guney S., Ayranci E. - Analysis of the Relationship Between Emotional Intelligence and Stress Caused by the Organisation: A Study of Nurses
Zeynep Kalyoncu, Semra Guney, Mahmut Arslan, Salih Guney, Evren Ayranci

Business Intelligence Journal - July, 2012 Vol.5 No.2
346 Business Intelligence Journal July
Shapiro LE (2004). To raise a kid with high EQ (In Turkish). (Trans. by Ümran Kartal), Varlık Publications, İstanbul.
Sirin G (2007). The relationship between teachers’ emotional intelligence levels and their ways of coping up with stress (In Turkish). Master’s thesis, Gazi University, Ankara, Turkey.
Stein SJ, Book HE (2003). EQ: The secret of emotional intelligence and success (In Turkish). Özgür Publications, İstanbul, Turkey.
Stora JB (1992). Stress (In Turkish). (Trans. by Ayşe Kalın), İletişim Publications, İstanbul, Turkey.
Tutar H (2007). Crisis and stress management (In Turkish). Seçkin Publications, Ankara, Turkey.
Ucar F (2004). The role of mind in stress, and cognitive and psychological disorders related to stress (In
Turkish). Turkish Psychology Bulletin. 10(34-35): 85–102.
Uncu S (2007). The relationship between emotional intelligence and marriage satisfaction (In Turkish). Master’s thesis, Ankara University, Ankara, Turkey.
Weissinger H (1998). Emotional intelligence at work life (In Turkish), (Trans. by Nurettin Süleymangil). MNS Publications, İstanbul, Turkey.
Wong C, Law KS (2002). The effects of leader and follower emotional intelligence on performance and attitude: an exploratory study. Leader Q. 13(3): 243–274.
Yesilyaprak B (1990). The determinants of control focus and the research related to change: A critical assessment (In Turkish). Psychology Journal. 25(7): 41–52.

2012 347
LOSSLESS DATA COMPRESSION FOR ENERGY EFFICIENT TRANSMISSION OVER WIRELESS NETWORK
Prof. Saurabh MittalArea Chairperson, Asia-Pacific Institute of Management, New Delhi
Email: [email protected], [email protected]
AbstractWireless networks are very fast replacing the traditional wired networking for the small and long distance area. With the rapid
expansion in the data generation in the digital world and need for information sharing between the different stakeholders / collaborative members for business and scientific needs, today the volume of data being transmitted is also facing exponential growth. Wireless transmission of a single bit can require over 1000 times more energy than a single 32-bit computation. It can therefore be beneficial to perform additional computation to reduce the number of bits transmitted. If the energy required to compress data is less than the energy required to send it, there is a net energy savings and an increase in battery life for portable computers. This paper proposes energy savings possible by losslessly compressing data prior to transmission. The proposed work focuses that, with several typical compression algorithms, there is actually a net energy increase when compression is applied before transmission. Reasons for this increase are explained and proposal will be to avoid it. Key words: Compression, Lossless, Transmission, Wireless, Data.
Wireless communication is an essential component of mobile computing, but the energy required for transmission of a single bit has been measured to be over 1000 times greater than for a single 32-bit computation. Thus, if 1000 computation operations can compress data by even 1 bit, energy should be saved. Compression algorithms which once seemed too resource or time-intensive might be valuable for saving energy. Implementations which made concessions in compression ratio to improve performance might be modified to provide an overall energy saving. Ideally, the effort exerted to compress data should be variable to allow a flexible tradeoff between speed and energy. Earlier work has considered lossy compression techniques which sacrifice the quality of compressed audio or video data streams to reduce the bit rate and energy required. In proposed work, we consider the challenge of reducing wireless communication energy for data that must be transmitted faithfully. We will provide detailed survey of the energy requirements of several lossless data compression schemes. Several families of compression algorithms are analyzed and characterized, and it is shown that compression prior to transmission may actually cause an overall energy increase. We will focus on behaviors and resource usage patterns which allow for energy-efficient lossless compression of data. When applied to Unix compress, these optimizations improve energy efficiency by 51%. We also explore the fact that, for many usage models,
compression and decompression need not be performed by the same algorithm. By choosing the lowest-energy compressor and decompressor on the test platform, rather than using default levels of compression, overall energy to send compressible web data can be reduced 31%. Energy to send harder-to-compress English text can be reduced 57%. Compared with a system using a single optimized application for both compression and decompression, the asymmetric scheme saves 11% or 12% of the total energy depending on the dataset. Proposed work focuses on asymmetric compression i.e. the use of one compression algorithm on the transmit side and a different algorithm for the receive path.
Compression Steps
Compression is usually broken into two steps: modeling and coding. With a perfect, concise model that describes the generation of the input source which is to be compressed, one could reproduce the data without transmitting the source data. (i.e., if the sequence 1 1 2 3 5 • • • 6765 were to be transmitted, one could express it with a “model” of Fibonacci numbers). In practice, one must approximate and construct an approximate mathematical model for the data. In English text, for example, one can model the probability of a letter occurring as a probability conditioned on letters that have already been transmitted. This probabilistic model
Mittal S. - Lossless Data Compression for Energy Efficient Transmission Over Wireless Network
Saurabh Mittal

Business Intelligence Journal - July, 2012 Vol.5 No.2
348 Business Intelligence Journal July
is transmitted with a description of how the data differs from the model.
In a coding step, information is mapped to compact code-words. Obviously, a codeword must decode to a unique value so there can be no doubt of the original message. Prefix codes are used so that no codeword is the prefix of any other codeword. It has been proved that, for any non-prefix code that may be uniquely decoded, a prefix code can be found with the same code word lengths. Often the modeling and coding steps are tightly coupled. For instance, Lempel-Ziv codes can be constructed as an input source is parsed into a “dictionary” model, when it is difficult to extricate the coding from the modeling.
Coding Methods
Coding maps symbols from the input alphabet into compact binary sequences.
1. Huffman Coding. If the probability of each source symbol is known a priori (perhaps by scanning through the source), a procedure known as static Huffman coding can be used to build an optimal code in which the most frequently occurring symbols are given the shortest code-words. Huffman codes are established by storing the symbols of the alphabet in a binary tree according to their probability. As the tree is traversed from root to leaf, the code grows in length. When visiting the right child, a 0 is appended to the code. When visiting the left child, a 1 is appended. Thus, symbols which occur frequently are stored near the root of the tree and have the shortest codes. Since data compression tools rarely have the luxury of a priori knowledge and cannot afford two passes through the data source, variants of the Huffman algorithm have been developed that work dynamically and update the tree as source symbols are encountered.
2. Arithmetic Coding. Optimal compression ratio for a data source is traditionally described with respect to Claude Shannon’s definition of source entropy: a measure of the source’s information and therefore the average number of bits required to represent it. Sometimes the most frequently occurring symbol can contain so little information that it would be ideal to represent it with less than 1 bit. Huffman codes are restricted to using an integral number of bits per symbol, increasing the coding overhead. Arithmetic codes have been designed to support a fractional number of bits per symbol to bring the average length of a codeword much closer to the optimal. Knowing the probability of occurrence for each symbol, a unique identifier can be established for
a series of symbols. This identifier is a binary fraction in the interval [0,1]. Unlikely symbols narrow this interval so that more bits are required to specify it, while highly likely symbols add little information to a message and require the addition of fewer bits as the interval refinement is coarser. As the fraction converges, the most significant bits become fixed, so the fraction can be transmitted most-significant-bit-first as soon as it is known. Arithmetic coding requires frequent division and multiplication.
3. Lempel-Ziv Codes. A Lempel-Ziv codebook is made up of fixed-length code-words in which each entry has nearly the same probability of appearing, but in which longer groups of symbols are represented in the same length as single symbols. Thus, it may require extra bits to send the coded version of a single symbol, but a string of frequently occurring symbols can be represented with a fraction of the bits ordinarily required. Since only n code-words can be represented with lg(n) bits, systems for dynamically increasing the length of code-words exist.
Lossless Compression Algorithms
The coding techniques described above are used in the algorithm families introduced below. There are two fundamental methods for constructing Lempel-Ziv codes. Introduced in the late 1970s, these methods are known by the initials of their creators and the year of introduction: LZ77 and LZ78. Prediction with Partial Match (PPM) uses Markov modeling followed by arithmetic coding. The Burrows-Wheeler Transform (BWT) reversibly permutes a block of source data so that it can easily be compressed. • Sliding Window—LZ77. LZ77 maintains a current
pointer into the source data, a search buffer, and a look-ahead buffer. The search buffer is made up of symbols encountered prior to the current symbol, and the look-ahead buffer contains symbols which appear after the current symbol. Together, the buffers comprise a “window” which specifies the section of the input source under consideration. As the current pointer advances, the window “slides” over the input. As symbols are encountered in the look-ahead buffer, the algorithm searches backward for the longest match in the search buffer. Instead of transmitting the matched symbols, they can be encoded with a triple: <offset from pointer, length of match, next codeword>. The “next codeword” is the codeword corresponding to the symbol in the look-ahead buffer following the match. It is necessary in case a match for the look-ahead buffer
2012 349
cannot be found.This scheme can be enhanced by using a variable length coder (e.g., Huffman coding) to reduce the size of the fixed-length triples. Another popular enhancement involves a more efficient way to represent a single character without an entire triple, using a flag to indicate whether a literal or match is being transmitted.
• Dictionary—LZ78. The LZ78 scheme was introduced to account for cases in which a nearby match cannot be found. Instead of the sliding search-buffer, LZ78 uses a separate dictionary, which also serves as a codebook. As each group of symbols is encountered, the dictionary is checked. An<index, code>pair is output where index corresponds to the longest prefix (if any) that matches the current input, and code is the unmatched symbol which follows. The pair is then added to the dictionary. The decompressor builds its dictionary in a corresponding fashion so that received indices refer to the same symbol as they did in the compressor. A popular improvement to LZ78 is called LZW. It seeds the dictionary with letters from the source alphabet which eliminates the need to send the second element of the pair, shortening the number of bits that must be sent for a single character. With every symbol present in the dictionary, only the index need be sent. Since each new dictionary entry contains a pointer to a previous entry, decoding occurs recursively, requiring decompression to buffer symbols in a stack and reverse them before output. Such a system results in the quick accumulation of long patterns which can be stored indefinitely, but has several drawbacks. Until the dictionary is filled with longer frequently seen patterns, “compressed” output will be larger than in its original form. Since the dictionary can grow without bound, implementations of LZ78 must erase the dictionary when it gets too large, freeze the dictionary and continue in a nonadaptive fashion, or adopt another policy to limit memory usage.
• Prediction with Partial Match—PPM. The fact that a certain string of symbols has appeared can aid in predicting which symbol will come next. For instance, if the letters compr appear in this article, there is a strong probability they will be followed by an e. The PPM scheme maintains such context information to estimate the probability of the next input symbol to appear. An arithmetic coder can use this stream of probabilities to code the source efficiently. Clearly, longer contexts will improve the probability estimation, but require more time to arise. (this is similar to the startup effect
in LZ78). To account for this, “escape symbols” exist to progressively step down to shorter context lengths. This introduces a tradeoff in which encoding a long series of escape symbols can require more space than is saved by the use of large contexts. Much effort has gone into choosing probabilities for the escape symbols to minimize their overhead. Storing and searching through each context accounts for the large memory requirements of PPM schemes. PPMd is a recent implementation of the PPM algorithm. Windows users may unknowingly be using PPMd as it is the text compression engine in the popular WinRAR program.
• Burrows-Wheeler Transform—BWT. The newest technique among those examined, the Burrows-Wheeler Transform, converts a block S of length n into a pair consisting of a permutation of S (call it L) and an integer in the interval [0...n − 1]. Though the transformation is simple to describe, it is not obvious how it may be reversed. In latency-critical single-threaded applications, the block-based processing of BWT could be a bottleneck. Several distinct operations must be performed in series (transform, move to front, run-length encode, entropy coding) and entire blocks of data must be processed before moving on to the next. Sorting is the critical operation. Although BWT-based compression could be performed in very little memory with in-place sorting, common implementations use fast sort algorithms and/or structures such as the suffix tree which require substantial memory to provide speed.
The original Lempel-Ziv-inspired methods have remained popular since their newer competitors require more time and memory to achieve compression. PPM variants have been recognized as the leader in compression ratios since their introduction in 1984, but these ratios come at a tremendous time and memory expense. BWT has grown in popularity because its implementations, based on efficient sorting, lead to greater speed than PPM implementations while giving similar excellent compression ratios. Recently, BWT has been recast as a problem similar to PPM, inspiring PPM programs to exploit advances in BWT implementations. It has taken nearly 20 years for implementations of PPM to approach the speed of the LZ77, LZ78, and BWT methods. A compression algorithm may be implemented with many different, yet reasonable, data structures (including binary tree, splay tree, trie, hash table, and list) and yield vastly different performance results.
Kalyoncu Z., Guney S., Arslan M., Guney S., Ayranci E. - Analysis of the Relationship Between Emotional Intelligence and Stress Caused by the Organisation: A Study of Nurses
Zeynep Kalyoncu, Semra Guney, Mahmut Arslan, Salih Guney, Evren Ayranci
Business Intelligence Journal - July, 2012 Vol.5 No.2
350 Business Intelligence Journal July
The quality and applicability of the implementation is as important as the underlying algorithm. We will propose lossless compression techniques for energy savings in ad-hoc network.
Future Work
The lossless compression of the data for wireless transmission for energy saving may be further achieved by developing new framework for evaluating the performance of various compression techniques. By proposing new lossless data compression technique for energy saving, the objective of energy efficient wireless transmission could be achieved. The paper suggests develop a new algorithms for future research in the area of data compression, which can provide better end results as achieve with the implementation of BWT method. The future work will help the wireless services providers and technicians to improvise the latest innovations in the fields of wireless communication based on the latest high speed networks. Future work in this area should examine sensitivity to the type of data. If one knows a priori that data is uncompressable (or can determine this fact dynamically), it is likely to change one’s choice of compression schemes. Sensitivity to the latency requirements of a given task are crucial as well. The results presented in this work are most applicable to the transfer of large files for which one may be willing to tolerate latency. Interactive work requires elimination of perceived delay, and short real-time messages are unlikely to compress well unless they are correlated to provide extensive history. Thus, algorithms which require long warm-up times or large history structures are not likely to be useful.
Conclusion
Optimizing an entire network of devices is a possible desire. Perhaps the sender is not a wall-powered server but another handheld device. Perhaps a poor or crowded communication channel limits the size or speed of a transmission. Many combinations exist for which optimal energy and performance points must be found. How collections of devices might find their desired operating point is another area for research. Most importantly, this work reminds hardware and software developers that committing to one particular compression/decompression scheme is unlikely to be wise in terms of energy. As portable, networked, battery powered computers evolve and become more popular, extended battery lives will grow in
importance. Evaluation of a platform’s relative component energy can help one choose the most energy aware lossless compression scheme.
References
A. Bhattacharya and S. K. Das. Lezi-update: An information-theoretic approach to track mobile users in PCS networks. Mobile Computing and Networking, pages 1–12, 1999.
J.-H. Chang and L. Tassiulas. Energy conserving routing in wireless ad-hoc networks. INFOCOM The Conference on Computer Communications, 1:22–31, 2000.
Barr C. Kenneth “Energy Aware Lossless Data Compression” MS Computer Science and Engineering Thesis, University of Michigan, September 2002
B. Chen, K. Jamieson, H. Balakrishnan, and R. Morris. Span: An energy-efficient coordination algorithm for topology maintenance in ad hoc wireless networks. Wireless Networks, 8(5):481–94, 2002.
P. B. Chu, N. R. Lo, E. C. Berg, and K. S. Pister.Opticall communication link using micro corner cube reflectors. Micro Electro-Mechanical Systems, pages 350–5, 1997.
J. G. Cleary and I. H. Witten. Data compression using adaptive coding and partial string matching. IEEE Transacitons on communications, 32(4):396–402, 1984.
T. H. Cormen, C. E. Leiserson, R. L. Rivest, and C. Stein. Introduciton to Algorithms. MIT Press, second edition, 2001.
J. Deng and Z. J. Haas. Dual busy tone multiple access (DBTMA): A new medium access control for packet radio networks. IEEE International Conference on Universal Personal Communications, pages 973–7, Oct. 1998.
Z. Deng and W. Zhang. Localization and dynamic tracking using wireless-networked sensors and multi-agent technology: First steps. IEICE Transactions on Fundamentals of Electronics Communications & Computer Sciences, E85-A(11):2386–95, Sept. 2002.
J. J. Garcia-Lunes-Aceves. Loop-free routing using diffusing computations. IEEE/ACM Transactions on Networking (TON), 1(1):130–41, 1993.

2012 351
Advanced RISC Machines Ltd (ARM). Writing Efficient C for ARM, Jan. 1998. Application 34.
Agilent Technologies. Agilent 34401A Multimeter: User’s Guide. Fifth edition, Apr. 2000.
R. Arnold and T. Bell. A corpus for the evaluation of lossless compression algorithms. In Data Compression Conference, 1997.
T. M. Austin and D. C. Burger. SimpleScalar version 4.0 release. Tutorial in conjunction with 34th Annual International Symposium on Microarchitecture, Dec. 2001.
T. Bell and D. Kulp. Longest match string searching for Ziv-Lempel compression. Technical Report 06/89, Department of Computer Science, University of Canterbury, New Zealand, 1989.
Kalyoncu Z., Guney S., Arslan M., Guney S., Ayranci E. - Analysis of the Relationship Between Emotional Intelligence and Stress Caused by the Organisation: A Study of Nurses
Zeynep Kalyoncu, Semra Guney, Mahmut Arslan, Salih Guney, Evren Ayranci
Business Intelligence Journal - July, 2012 Vol.5 No.2
352 Business Intelligence Journal July
MAINTAINING DATABASE: BUSINESS INTELLIGENCE TOOL FOR COMPETITIVE ADVANTAGE
Veena Tewari NandiFaculty member and the head of Centre for Corporate Citizenship in the Asia Pacific Institute of Management
Email: [email protected]
AbstractFrom the learning’s of the past we know that customer-driven marketing information is a key corporate resource. Customer information
gathered from previous purchases or inquiries enables a business to mold their marketing strategies around what the customer is currently telling them they want most from their business. As many will agree, a key ingredient of successful retail marketing today is to stay flexible and be able to adapt or change your business to meet the current needs of your customers. Those who understand the needs of their customer’s best will be capable of catering to them best. Competitive advantage has to be sustainable for the inclusive growth of any organization. Database management systems help business intelligence experts to organize, collect, and make valid predictive models. In this paper I am trying to reinforce the above idea by expressing views, know how and techniques on the effective management of data. Managing huge data volume while aligning analytical model development and deployment environments presents many challenges. Database Analytics allows organizations to be more responsive and significantly reduce costs associated with performing analysis on their data. The basic tenet of business intelligence is that one can predict the future by analyzing the past and by grouping together related groups of consumers. I have used lot of examples to define the need and modes for database management to build the company’s competitive advantage on the same. Key words: Competitive Advantage, Data Mining, Market, Tool.
Traditional Uses of the Customer Database
In the present market customer is a moving target, and the customer database allows you to reach this target. The marketing database is a key corporate asset and every customer-driven business needs to leverage this resource. The vehicle to "listen" to your customers and create a dialogue with them is the customer database. Those businesses which are able to reshape and redefine their marketing direction based on information derived from their customer database will hold a distinct competitive advantage over those who have either waited too long to build their database or those who have not been able to integrate this information into their entire marketing mix. Proper business intelligence can develop highly sophisticated and accurate predictive models that can save billions of dollars a year in advertising expenses. At the same time, consumers are provided with targeted marketing which is most appropriate to their needs.
“Businesses that "listen" to their databases like the sound of increasing sales”
The customer database is a strategic tool designed not only to attract new customers to your business, but to strengthen the relationship among existing customers who we have worked so hard to get. Traditionally, the type of consumer information retained on customer databases has evolved around transactional data such as amount of purchase, (product) type of purchase, date of purchase, frequency of purchase and method of payment. This information is retained in either a cumulative manner or by an individual purchasing event.
This historical data is used to prioritize the best customers of your business and to determine circulation policies for future direct marketing efforts. Several segmentation methods, such as RFM segmentation (recency, frequency, monetary) and predictive modeling, can be used to categorize customer groups into those which share similar purchasing characteristics. This enables the marketer to select those customer segments which will provide the maximum return on advertising investment while at the same time suppressing those groups who are not profitable to reach.
In addition to determining who does or does not receive mailings, this segmentation analysis determines
2012 353
Tewari N. V. - Maintaining Database: Business Intelligence Tool for Competitive Advantage
Veena Tewari Nandi
the frequency of communications a customer segment may warrant, for instance, an "average" performing customer segment may receive a base contact management program consisting of seasonal catalogs, whereas a higher performing customer segment may receive these same seasonal efforts along with more extensive communications geared toward special merchandise events or gift certificates for specific buying occasions.
Database Management for Business Intelligence Systems
The use of consumer data for market analysis has been used since ancient times when the Mesopotamians sold shipments of olive oil and other commodities to the Ancient Grecian empire. While the foundations of the data storage have changed dramatically from Mesopotamian clay tablets to today's modern database management systems, the goals of business intelligence and data mining remain unchanged.
Business intelligence is not limited exclusively to the area of marketing and sales. Hospitals group patients together in terms of their age and symptoms (a "cohort"), and analyze treatment regimens in order to determine the best course of treatment for their specific patient populations.
Even though the use of business intelligence saves lives, BI technology has broader social implications. First and foremost is the issue of data privacy. As consumer monitoring becomes more and more ubiquitous (note how your purchasing behavior is controlled at super markets via your buyers club card), we see that many privacy advocates do not want even our most innocuous behaviors recorded.
Fortunately, most consumers don't care whether you prefer peas to string beans and they allow point of sale systems to readily track purchases. Via the use of buyer’s club cards, the BI expert ties individual purchases to background demographic information. When consumers apply for buyer’s club cards, they provide basic demographic information which is in turn analyzed with publicly available information on major life events and income (such as the purchase of a house, a divorce, the presence or absence of children). Hence, the database has detailed information not only about what products are being purchased, but the basic demographics of the person who is purchasing the goods or services.
The issue of data storage has always been important to business intelligence because of the dynamics of changing technology. Disk prices are falling radically each and every year. Back in the 1980's, 1.2 gigabytes of disk storage could
cost a whopping $200, 000 whereas today you can purchase the same amount of disk for less than $100.
Given our ability to store large amounts of empirical information cheaply, the goal of the business intelligence manager is to somehow be able to cleanse and manipulate this data in such a way that accurate predictive models can be built.
Data as a Predictive Tool
In his book Super Crunchers, Dr. Ayres shows how data is often replacing human intuition in many areas of business intelligence. Today, we know the top CIO's and CEO's of large corporations can earn hundreds of millions of dollars a year, largely for their human intuition. It's been largely recognized that computers can only take care of the well structured part of any decision making task. We generally find that these types of information systems fall into different categories:• Expert systems - Expert systems are systems that
quantify the well structured component of a decision task and make recommendations without the input of a human expert. These systems are typified by MYCIN, a predictive tool that quantifies the questions asked when diagnosing specific blood illnesses. The same approach can be applied to just about every area of business management, including the database management system itself. In the early twenty first century, Oracle database administrators can use tools such as Oracle data mining to filter through their database metadata and performance data (using Oracle's automated workload repository), and predict in advance resource consumption trends within the database management system.
• Decision support systems (DSS) - Decisions support systems are systems where it is recognized that human intuition is an essential component of the decision making process; and DSS technology makes no claims to actually solving the problem. Rather, a decision support system provides the decision maker with information from their problem domain and leaves the actual decision process to the human expert. This is an important concept within information systems.
It is interesting to note that many systems which were first thought to be decision support systems turn out to be expert systems. In one notable case, a major soup manufacturer was about to loose a long-term employee of
Business Intelligence Journal - July, 2012 Vol.5 No.2
354 Business Intelligence Journal July
forty years, who knew every intricacy of the tricky soup vats within the company.
Initially setting out to create a DSS, the decision analyst quizzed the employee over a period of months and discovered that what was once thought to be intuition was actually the application of a large set of well structured decision rules. When this soup vat expert would say something like "I have a feeling that the problem is X", it appeared to be human intuition to those less knowledgeable observers. However in reality it was the application of a long forgotten decision rule or an experiential case for which the individual had since lost conscious knowledge. The application of the decision support system technology eventually led to an expert system. This allowed the forty year worker to retire comfortably, with the knowledge that all of his years of decision rules had in fact been quantified, helping the soup company carry on without him making even faster and better decisions as a whole.
The Application of Business Intelligence for Predictive Models
The idea of data mining allows us to do far more than predict the future behavior of a consumer. Companies such as Amazon pioneered the idea of a "recommendation engine", which analyzed patterns of behavior amongst known consumers, extrapolated them online, and made on-point recommendations for future purchases. This type of technology has also been applied to other web-type interfaces such as NetFlix and TiVo, where consumers are directed to related entertainment that people of similar interests might have in mind.
Another good example of data mining is the role of a bank loan officer. Traditionally, bank loan officers all have access to the same set of data, but it is undeniable that some people serve as better loan officers than others. This could be blamed on human intuition, whereby the loan officer recognizes someone as either having a good or a bad propensity to repay the loan based on non quantifiable characteristics.
It is largely understood now that the role of an experienced bank loan officer has more to do with the subtle nuances of the applicant; and being able to recognize them. Hence, today's bank loan officers are largely constrained by following the computer whereby an individual borrowers is compared against a cohort (the term "cohort" is the arbitrary grouping of like minded people).
In some, the rapid falling prices of disk storage technology have now made it feasible for organizations of even a modest budget to store trillions of bytes of real time information about their business processes. The immediate challenge is how to store, organize, and extrapolate from this information in order to make valuable business decisions.
The Foundation of Database Management for Business Intelligence
The storage of online data began in the 1960s as organizations began to develop the digital means to store information about stock prices, consumer trend behaviors, and so on. Unfortunately, this information had to be stored on large volumes of magnetic tape, and simple decision support queries for correlations could take days, making it difficult for a manager to follow any 'flow' of a decision process. It was only as disk storage began to become cheaper that this information was able to be brought online, so that the information could be indexed, pre-computed, and organized in such a fashion that the user of the business intelligence system could quickly get feedback on given questions. This would stimulate new questions, and provide a platform for making more informed business decisions.
An early leader in the area of decision support systems and expert systems was SAS, the Cary North Carolina based company which has been a capstone of data analysis for more than forty years. SAS had its own full programming language and rudimentary data storage platform, upon which statistical algorithms could be run to analyze just about any kind of information. But as today's corporations start collecting "raw" data from their observable world, several problems have to be undertaken:• Data cleansing - Data is only as good as the input to
that system, and common keyboarding errors from individuals can skew the quality of the information. Today we recognize that all data must be cleaned, scrubbed, and standardized in order to get meaningful information from it.
• Data summarization - In data summarization, we find the problem of pre-computing large scale aggregations from mammoth volumes of data in real time. A simple question like "how many consumers of widgets are their in New York?” might require millions of data block I/Os, and a significant amount of computing power. Even with today’s super fast computer systems and super cheap disk storage, the decision support system or expert
2012 355
system must be able to have this information available at the fingertips of the decision maker, which often requires pre-summarization and pre-aggregation of the salient data factors. Hence, today's database managers devote a significant amount of time to observing the decision patterns of their end user base, using tools such as Oracle materialized views, Oracle's star query joins; allowing the information to be accessible to the end user base in a real time fashion. We also see today's business intelligence applications supporting a drill down mechanism whereby they can take a look at the behavior of a cohort as a whole, then double click through to see the information at successive levels of usage. Today, we see tools such as the Urchin software (now called Google Analytics) which allow website referrer stats to be organized in such a way that an SEO, or search engine optimization expert, can quickly drill through and see how customers are visiting their individual websites.
Presently we have a paradigm change on the Internet whereby referrer statistics can now measure not only the number of page viewed for an individual webpage but how long an individual actually spends on that page; a far better indicator of the actual popularity of a web page. These types of technology are fostering a whole new way that we use information in order to make predictions.
Hypothesis Testing in Business Intelligence
The aircraft industry learned in the 1960s that large-scale computers could be used to simulate the flying of a new aircraft without putting pilot's lives at risk, and we are starting to see the same application of hypothesis testing being used within the business community today. Prior to launching a 100 million dollar ad campaign, the behavior of that can be simulated using sophisticated algorithms and techniques which will model the actual advertising campaign in order for the marketing executive to see what kind of an ROI (return on investment) the marketing campaign might do.
Hypothesis testing is generally a "what if" type of question, whereby the business intelligence expert can isolate individual variables within their database and manipulate them over time based on well defined preconditions. This "ceteris paribus" approach (ceteris paribus literally means
"all else being equal"), allows the decision maker to keep everything except their problem domain fixed. By fixing all but a single variable, and testing it against a well known universe, the business intelligence person can develop models which are far more sophisticated than traditional predictive analysis. For more information on this technique see Dr. Carolyn Hamm's book "Oracle Data Mining".
The Costs of Business Intelligence
It's often said in the information technology world that you 'can't afford not to have a data mining technique with in your organization'. It's not uncommon to hear stories of payback periods compressed into mere weeks even on data mining projects that cost tens of millions of dollars, because of the high value of the information that comes from these, and the end users savings for consumers.
The best example of this of course is within predicting consumer behavior, where organizations save hundreds of millions of dollars in broadcast advertising, replacing it instead with well-targeted advertising and a high probability of buying a specific product. The consumers appreciate the targeted marketing, and the reduced costs allow products to be offered more cheaply; benefiting everyone.
Let's take a close look at the shift of the costs. Back in the 1970s the major cost of any data warehousing or any data mining operation was the hardware itself which would often comprise more than 80% of the total cost. In the early twenty-first century we see a complete reversal of this, whereby the disk storage, while significant, are minimized by the amount of work required by both the database administrator and the business intelligence analyst. A highly skilled database administrator must be put in place in order to capture the real time data and organize it in such a fashion (using tools such as Oracle partitioning) so that the information can be more easily accessed by the statistical managers.
Once the data has been collected, organized, and aggregates are pre-computed and summarized, the largest expense is that of the business analyst themselves. These people must have very extensive backgrounds in multivariate statistics and understand in detail how all of the algorithms work, so that they can tear through all of this data in order to make statistically meaningful correlations between the data. In some, the lion's share of today's costs of data business analysis are in the human resources arena, propelling an experienced data mining analyst into the
Tewari N. V. - Maintaining Database: Business Intelligence Tool for Competitive Advantage
Veena Tewari Nandi

Business Intelligence Journal - July, 2012 Vol.5 No.2
356 Business Intelligence Journal July
realm of some of the most highly paid people within the information systems industry.
Database and Knowledge Management
A distinction between tacit and explicit knowledge is critical to understanding the working mechanisms of knowledge management. Lubit (2001) observes that explicit knowledge is codified and stored in the “organizational memory” and is available to employees throughout the structure. Conversely, tacit knowledge is personal knowledge possessed by an employee that may be difficult to express or communicate to others. Because a population of employees possesses a theoretically infinite number of mental models, or ways of perceiving information, tacit knowledge is often individualized and highly specific in scope. Lubit (2001) argues that it is this knowledge that is often difficult to disseminate to others in the context of the workplace, but it is also invaluable to propagate because it is a unique asset that is very hard to copy by other firms. Hence, given this premise, it can be logically understood that tacit knowledge can form the basis for competitive advantage, but to do so it must become manifest in the real world and utilized to actualize the strategic agendas of the organization. Ideally, a firm can better manage its intellectual capital base by uncovering the tacit knowledge of its employees and turning that into explicit knowledge, available to others (Erickson & Rothberg, 2000).
Capturing the Entire Shopping Experience
Whether it is traditional RFM segmentation practices or predictive modeling, today we must go one step further in identifying the most prospective audience to receive and respond to our direct marketing efforts. Through relational database systems, other significant data points surrounding the entire shopping experience can be layered onto the transactional data of each individual record. For example, have there been customer complaints or merchandise returns by the individual? Is the customer a heavy respondent to traffic-generation offers yet not a heavy buyer? Does the customer only respond when given discounts? What is the promotional responsiveness of the individual based on a specific number of contacts per year? What are the product purchasing trends of the individual and the tendency for future cross-selling opportunities? Are there special life events or occasions prompting a purchase, i.e., anniversaries, graduations, birthdays?
Having a more advanced level of marketing information available not only allows the marketer to determine who the most prospective recipient is, but what is most personally relevant to them. Due to this, the creative execution of the mail piece can be tailored to the interests of the individual. The appropriateness of the advertised message, the offer itself and the timing at which the offer is delivered can be enhanced through information extracted from the database.
Building Competitive Advantage Begins with Intelligent Marketing
Generally before looking for a competitive advantage a lot of work has already been done. Sales goals have been reviewed; target markets defined, defined problems and opportunities and prepared a thorough marketing plan. The professional knows what needs to be accomplished: Retain current customers. Increase purchases. Generate more service or product trials. Get repeat business. The question is how to go about it? How can your firm gain that elusive edge called competitive advantage? It can be done by putting together a marketing strategy, the road map that will aid in achieving your objectives.
A good foundation for building a strategy may be a careful examination of what competitors are doing. By taking a look at their activities, you may uncover areas where advantage may be gained. Secondary research — existing information found in outside sources — is an ideal starting point for this analysis.
"A good foundation for building a strategy may be a careful examination of what competitors are doing. By taking a look at their activities, you may uncover areas where advantage may be gained."
Analyzing Market Data
Marketing professionals are constantly engaged to come up with accurate, relevant, and comprehensive data for developing sales projections, market share forecasts, and market trends.
Implications for Creating Competitive Advantage
One central measure of organizational effectiveness is the creation and continuance of a measurable competitive advantage. Many broad initiatives such as efficiency, core competency advancement, actualization of customer-
2012 357
centric products and services, and limitation of the fixed costs of doing business can help to achieve a sustainable competitive advantage within the marketplace. Knowledge management is a targeted expertise designed to impact productivity and innovation in profound ways. It represents a new technology that is changing the competitive landscape of contemporary business (Sarvary, 1999). Knowledge management may exploit supply-side or demand-side economies of scale (Ofek & Sarvary, 2001). In the former case, the role is to reduce the operating costs of the firm, while in the latter case its role is to create added value to customers by appreciably increasing product quality. Thus, the effective management of knowledge understandably has the capacity to deeply impact the way a firm does business from the minor details of daily operations to the broadest strategic decision-making processes. There always exists better ways to transform inputs into outputs through the refinement of processes. Both academics and business practitioners alike are beginning to grasp the power of knowledge in helping to do so.
Conclusion: Solving Information Challenges
Whether our team is improving an existing application or constructing an entirely new data infrastructure the design techniques have to be tested for proper evaluation, documentation, and building databases that consistently meet the challenges our customers face.
In a time where information is everywhere – on your PC, on your local networks, and on the Internet - businesses need to structure their data so they can:
• Find answers easily • Share timely information • Make better business decisions • Improve productivity • Allow flexibility for future growth
By integrating your information into powerful, reliable databases, you too can have the Competitive Advantage.
References
Leveraging the customer database to your competitive advantage. Goodman John, Tuesday, December 1 1992
Journal of Knowledge Management Practice, October 2002, Creating Competitive Advantage by Effectively Managing Knowledge: A Framework for Knowledge Management.
Atul Gupta & Jason McDaniel, Lynchburg College, Quantum2 Resources : Marketing & Management Tools : Building Competitive Advantage Begins with Intelligent Marketing.
Oracle 11g Database Management for Business Intelligence, Oracle 11g Tips by Burleson Consulting.
About the Author: Presently working as a faculty member and the head of Centre for Corporate Citizenship in the Asia Pacific Institute of Management, she has a mixed experience of almost a decade in teaching, research and consultancy. She has been on the teaching assignment in East Europe and North East Africa. She has been an extensive traveler and has been to various countries by virtue of the consultancy and research projects. She has almost 60 publications both at the international and national level in various conferences, journals, book chapters and seminars. Presently she is serving as the editor in chief, board and advisory member for various journals, Marketing organizations and conferences. Areas of expertise are consumer behavior in services, corporate social responsibility and use of IT in management. She has given keynote speeches and presented papers in various tourism, marketing and innovation conferences in India and abroad.
She is a life member of CEEMAN (International Management Development Association) IEDRC (International Economics Development Centre), International Institute of marketing Professionals, IAENG, editor in chief for International journal of knowledge and research in management & ecommerce, reviewer for International journal of Management, Innovation & Technology, IJITBM International Journal of information technology & Business management, International journal of computer research and application, IJCAR, Journal of Management & Science, Journal of consumerism, Society, Anne Mary Publications, David Publishing House.
Tewari N. V. - Maintaining Database: Business Intelligence Tool for Competitive Advantage
Veena Tewari Nandi
Business Intelligence Journal - July, 2012 Vol.5 No.2
358 Business Intelligence Journal July
IMPACT OF BUSINESS INTELLIGENCE SYSTEMS IN INDIAN TELECOM INDUSTRY
Dr. Poonam Kumar (Asst. Professor)Asia Pacific Institute of Management, New Delhi (INDIA)
Email: [email protected]
AbstractGrowth of Indian Telecom Industry is a major part these days. Different software systems are used for the benefit in different areas
and segment of the industry. It is very important that the software used is really has ability to fulfill the various requirements of the industry. It is a very tough decision to take. Business Intelligence Systems are wisely used for decision-making problems. This research will investigate various business intelligence software selection decisions, awareness & benefits involved. The objective of this research is to analyze the impact of Business Intelligence Systems in Telecom Domain, rising requirements & management of different activities practiced by the Telecom Organizations in India. The aim of the research is to identify significant factors involved. The research will take both technical and managerial factors under consideration. It will also include different modes & possibilities for the growth of Telecom Industry in India using Business Intelligence Systems. This research will also check attraction of different software organizations using Business Intelligence Software’s for the growth of Indian Telecom Industry. Business intelligence technologies cover areas, like Data Warehousing & Data Mining, OLAP & Reporting, and Performance Management. Key words: Business Intelligence, Data Mining, Olap.
Business intelligence (BI) mainly refers to computer-based techniques used in identifying, extracting and analyzing business data, such as sales revenue by products and/or departments, or by associated costs and incomes. BI technologies provide historical, current and predictive views of business operations. Common functions of business intelligence technologies are reporting, online analytical processing, analytics, data mining, process mining, complex event processing, business performance management, benchmarking, text mining and predictive analytics. A Data Warehouse is one of the most valuable things for Business Intelligence System or Data warehouse rises and effective use can help decision-making intelligently that can improve the operations of Business Intelligence System or Data warehouse rises notably. It provides a collection of integrated data for on- line analytical processing (OLAP). A data warehouse is “a subject-oriented, integrated, nonvolatile, and time- variant collection of data in support of management’s decisions”.
Here Business Intelligence System or Data warehouse is:• ‘Subject-oriented’ means the data are arranged and
optimized to provide variety of analysis requirements from diverse functional departments within an organization.
• ‘Integrated’ means the data warehouse combines operational data derived from different departments & strategic business units of the organization. It is allowed to use consistent naming conventions, measurement standards, encoding structures and data attribution characteristics.
• ‘Time-variant’ means the data are periodically loaded to the data warehouse, all time-dependent aggregations need recomputed.
• ‘Non-volatile’ means Data warehouse are static. Data in the warehouse system are read-only generally; data in the database are rarely changed. Data in the warehouse database are updated or refreshed on a periodic, incremental or full refresh basis.
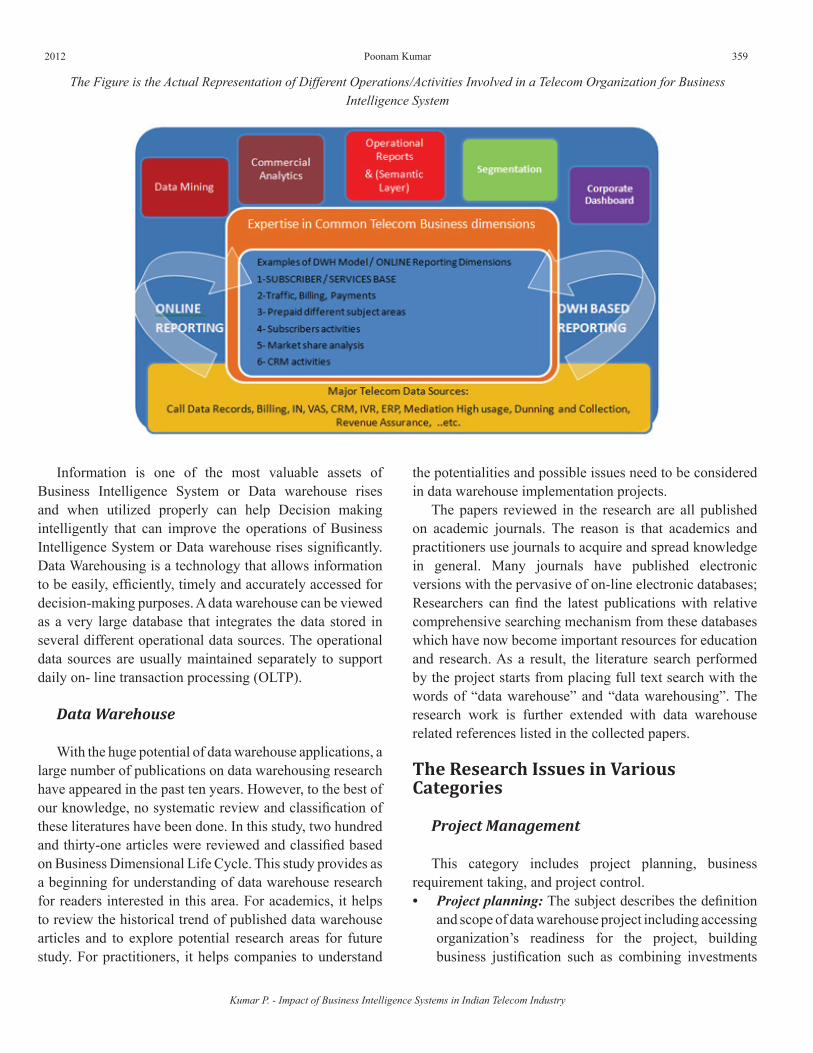
2012 359
Kumar P. - Impact of Business Intelligence Systems in Indian Telecom Industry
Poonam Kumar
The Figure is the Actual Representation of Different Operations/Activities Involved in a Telecom Organization for Business Intelligence System
Information is one of the most valuable assets of Business Intelligence System or Data warehouse rises and when utilized properly can help Decision making intelligently that can improve the operations of Business Intelligence System or Data warehouse rises significantly. Data Warehousing is a technology that allows information to be easily, efficiently, timely and accurately accessed for decision-making purposes. A data warehouse can be viewed as a very large database that integrates the data stored in several different operational data sources. The operational data sources are usually maintained separately to support daily on- line transaction processing (OLTP).
Data Warehouse
With the huge potential of data warehouse applications, a large number of publications on data warehousing research have appeared in the past ten years. However, to the best of our knowledge, no systematic review and classification of these literatures have been done. In this study, two hundred and thirty-one articles were reviewed and classified based on Business Dimensional Life Cycle. This study provides as a beginning for understanding of data warehouse research for readers interested in this area. For academics, it helps to review the historical trend of published data warehouse articles and to explore potential research areas for future study. For practitioners, it helps companies to understand
the potentialities and possible issues need to be considered in data warehouse implementation projects.
The papers reviewed in the research are all published on academic journals. The reason is that academics and practitioners use journals to acquire and spread knowledge in general. Many journals have published electronic versions with the pervasive of on-line electronic databases; Researchers can find the latest publications with relative comprehensive searching mechanism from these databases which have now become important resources for education and research. As a result, the literature search performed by the project starts from placing full text search with the words of “data warehouse” and “data warehousing”. The research work is further extended with data warehouse related references listed in the collected papers.
The Research Issues in Various Categories
Project Management
This category includes project planning, business requirement taking, and project control.• Project planning: The subject describes the definition
and scope of data warehouse project including accessing organization’s readiness for the project, building business justification such as combining investments
Business Intelligence Journal - July, 2012 Vol.5 No.2
360 Business Intelligence Journal July
and returns to calculate ROI, and focusing on resources and capable staff requirements.
• Project control: The subject focuses on keeping the data warehouse project on track by status monitoring, scope managing and ongoing communication strategy.
• Business requirement: It impacts virtually every phase of the data warehouse project lifecycle. Business requirements decide what data must be resided in data warehouse, how to organize the data, and when to update data frequently.
Data Design
The data design phase design multidimensional models to hold aggregated data for queries which is defended with the company in customize way.
Architecture
The category is dedicated to the architect design of data warehouses. It consists of five subcategories: novel architecture, DW software, the design of Meta data, security of data warehouses, and guideline of product selection.• Novel architecture: The subject includes the topics
of advanced architecture design that different from traditional data warehouse architecture such as moving the data warehouse to the Internet architecture.
• Data warehouse software: It includes commercial data warehouse systems for companies to implement and some developing systems for academic research.
• Metadata: Metadata is like an index for the warehouse contents that tracking of what data is where in the warehouse (Inmon, 2002). Metadata maintenance is an important issue, because it has influence on the entire warehouse from initial model through data extraction and load processes to the exploration and access of users.
• Security of data warehouses: The security issues are important to the data warehouse since many important data are collected in the system. The data warehouse must provide a mechanism to help user access data. The issues include data encryption, authentication, authorizations, etc.
• Product selection: Given various design and architect on the market, the subject discusses a formal procedure to decide which product fits company need better. The factors needed to be considered including price, training, and maintenance services, etc.
Realization
The realization phase transforms the logical design of a data warehouse project into physical implementation. The details of physical implementation vary according to different applications and size of projects. This phase includes five subcategories: physical design of data, data staging, query processing, data quality and applications.• Physical design: The phase converts logical data design
into physical database. One of the techniques used to improve data warehouse performance is the creation of set of materialized view. A data warehouse stores integrated information from multiple data sources in materialized views over the source data. Materialized views are used to pre-compute and store aggregated data such as sum of product sales, or are used to pre-compute joins with or without aggregations. They are employed to reduce the overhead associated with expensive joins or aggregations for complex and time-consuming queries. The research topics of materialized views include view selection, view maintenance and view synchronization.
• View selection: Normally, the data warehouse system cannot materialize all possible views due to the constraints of some resource such as disk space, computation time and maintenance cost. Accordingly, how to select an appropriate set of views to materialize under limited resources has significant effect on query processing performance.
• View maintenance: When the data in any data source changes, the materialized views in the data warehouse need to be updated consistently:
• Data staging: The process collects operational source data and integrates the data into data warehouse. It consists of three major steps: extraction, transformation and load (ETL). Extraction is the process of retrieving data from a variety of sources. By modifications, validations and conversions of the source data, transformation makes sure the data is in a consistent state. Loading data is the final step of the ETL process; it loads quality data into the warehouse.
• Query processing: Data warehouse typically involves the execution of complex queries with join, group-by, and sort operations for a large volume of data. To support these kinds of queries, a large variety of query processing techniques are used to increase the query performance.
• Data quality: Since data quality will impact on the credibility of data warehouse. To ensure quality data
2012 361
in the warehouse, the data gathering process and full lifecycle of data warehouse must be well designed.
• Applications: Data warehouse can be applied to many areas and industries for better decision making. The applications cover health care management, construction management, marketing and web data, etc. The applications of a data warehousing are seen to have considerable potential for different usage in the future.
Deployment and Maintenance
Deployment is to deliver the data warehouse related technology, data and application to end-users along with necessary education and support. End user education must match the role the users play. After successfully deploying a data warehouse, the attention should be focus on the ongoing support and education for operation of the warehouse and future growth. As data warehouse is a type of IS, the user satisfaction is applicable to measure the success of data warehouse.
Others
This category contains articles that discuss others aspects of data warehouse research. Three subcategories are related to these issues: DW implementation, introduction/overview and integration.• DW Implementation: This includes the methodology,
strategy, considered factors, critical implementation factors and organizational culture changing when implementing data warehouse.
• DW Overview: General introduction to data warehouse concepts and an overview of data warehouse related technologies, etc.
• DW Integration: As advancements are made in decision support technologies and computer based information systems, there have more opportunities to integrate data warehouse systems with others systems or technologies such as AI (artificial intelligence), KM (knowledge management) and data mining, etc.
Need of Business Intelligence for the Telecommunications Industry
This data says that till end of 2011 global cellular phone service subscribers will be doubled. Competition in the telecommunications industry is intense and several factors are forcing major changes. A continual effect worldwide on
Internet and wireless technologies will continue to advance rapidly quickly changing customer preferences, disrupting traditional communication methods and forcing prices downward. The telecommunications industry encompasses many technology-related business sectors including:
• local and long-distance telephone services• wireless communications• Internet• fiber-optic• satellites• cable TV systems
About Customer satisfaction: customers are the first step in that direction. To arrive at the overall profitability of a customer, vendors must quantify the costs associated in serving the customer over a period of time and the revenues realized from them during that period. The results of customer profitability analysis can help identify why some customers are not as profitable as others. For example, a customer might be unprofitable because the products used by them do not match their risk profile. Customer profitability analysis can significantly help in developing new offerings, customizing existing offerings and helping to target market segments for future growth.
Product Development: Under Forecasting to plan their networks, telecommunications service providers perform forecasting that helps operators to make key investment decisions. These decisions affect all aspects of the business including product development, launch, advertising, and pricing. Effective forecasting helps to ensure that the company will make a profit and that capital is invested wisely. BI solutions that use forecast data can help network planners decide how much equipment to purchase and where to place it to ensure optimum management of traffic loads.
Service Design and Delivery: In response to fierce competition, telecom service providers must develop new products in order to offer a wide range of new value-added services faster and more cost efficiently. Design of effective services is enhanced through the use of BI solutions that provide information regarding the adoption and profitability of existing products and services. Business Intelligence solutions can help telecommunications service providers improve customer retention and satisfaction through the effective analysis of service fulfillment systems. Information regarding installation, upgrades and repairs to customer’s service can help the business reduce the cost associated with service fulfillment.
Finance & Budgeting: The role of financial reporting has undergone a paradigm shift during the last decade.
Kumar P. - Impact of Business Intelligence Systems in Indian Telecom Industry
Poonam Kumar
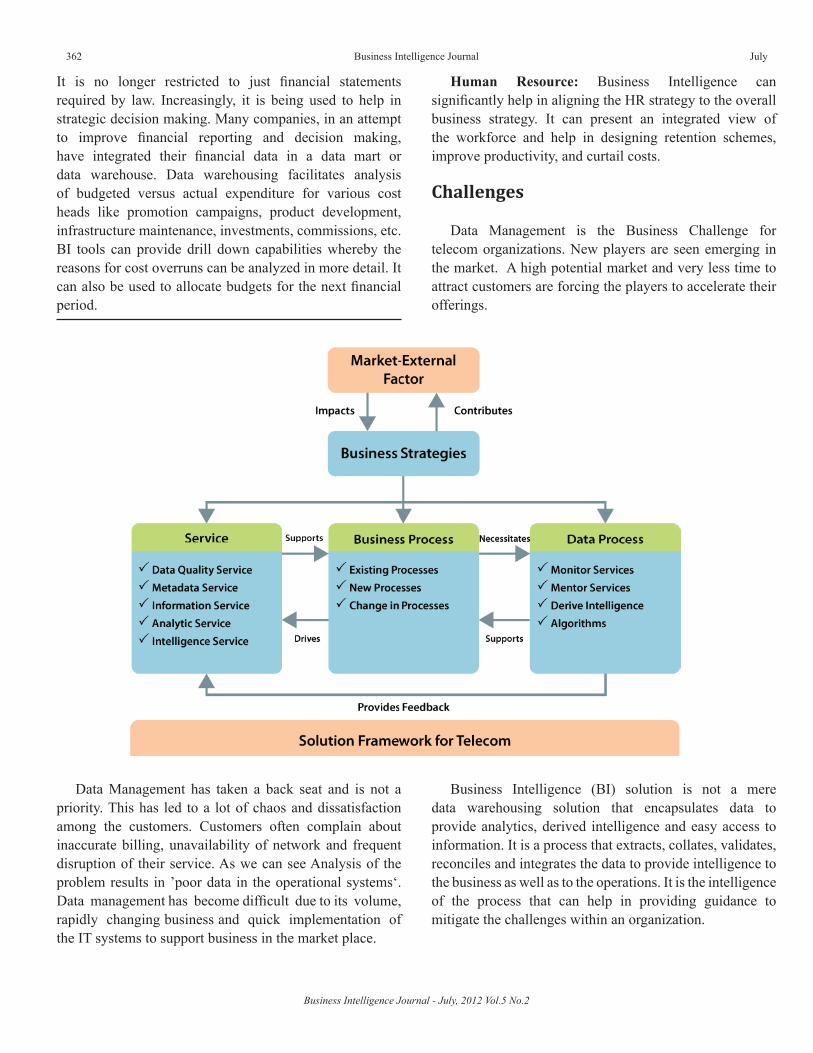
Business Intelligence Journal - July, 2012 Vol.5 No.2
362 Business Intelligence Journal July
It is no longer restricted to just financial statements required by law. Increasingly, it is being used to help in strategic decision making. Many companies, in an attempt to improve financial reporting and decision making, have integrated their financial data in a data mart or data warehouse. Data warehousing facilitates analysis of budgeted versus actual expenditure for various cost heads like promotion campaigns, product development, infrastructure maintenance, investments, commissions, etc. BI tools can provide drill down capabilities whereby the reasons for cost overruns can be analyzed in more detail. It can also be used to allocate budgets for the next financial period.
Human Resource: Business Intelligence can significantly help in aligning the HR strategy to the overall business strategy. It can present an integrated view of the workforce and help in designing retention schemes, improve productivity, and curtail costs.
Challenges
Data Management is the Business Challenge for telecom organizations. New players are seen emerging in the market. A high potential market and very less time to attract customers are forcing the players to accelerate their offerings.
Data Management has taken a back seat and is not a priority. This has led to a lot of chaos and dissatisfaction among the customers. Customers often complain about inaccurate billing, unavailability of network and frequent disruption of their service. As we can see Analysis of the problem results in ’poor data in the operational systems‘. Data management has become difficult due to its volume, rapidly changing business and quick implementation of the IT systems to support business in the market place.
Business Intelligence (BI) solution is not a mere data warehousing solution that encapsulates data to provide analytics, derived intelligence and easy access to information. It is a process that extracts, collates, validates, reconciles and integrates the data to provide intelligence to the business as well as to the operations. It is the intelligence of the process that can help in providing guidance to mitigate the challenges within an organization.
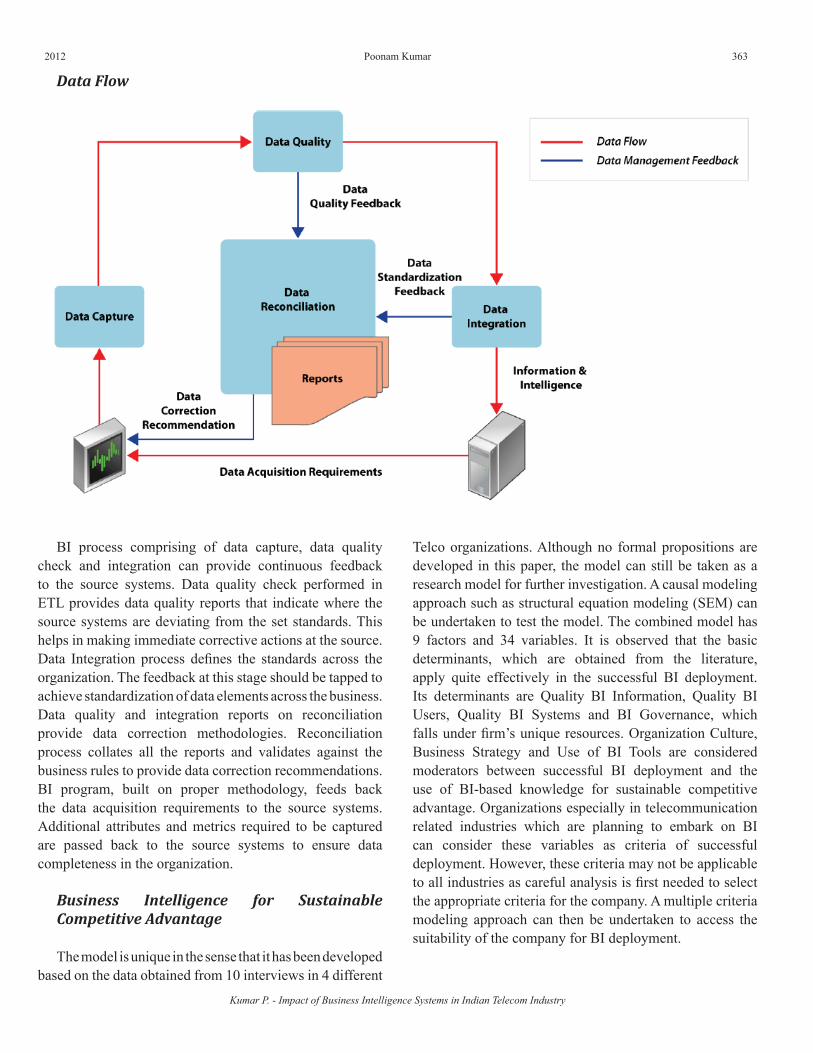
2012 363
BI process comprising of data capture, data quality check and integration can provide continuous feedback to the source systems. Data quality check performed in ETL provides data quality reports that indicate where the source systems are deviating from the set standards. This helps in making immediate corrective actions at the source. Data Integration process defines the standards across the organization. The feedback at this stage should be tapped to achieve standardization of data elements across the business. Data quality and integration reports on reconciliation provide data correction methodologies. Reconciliation process collates all the reports and validates against the business rules to provide data correction recommendations. BI program, built on proper methodology, feeds back the data acquisition requirements to the source systems. Additional attributes and metrics required to be captured are passed back to the source systems to ensure data completeness in the organization.
Business Intelligence for Sustainable Competitive Advantage
The model is unique in the sense that it has been developed based on the data obtained from 10 interviews in 4 different
Telco organizations. Although no formal propositions are developed in this paper, the model can still be taken as a research model for further investigation. A causal modeling approach such as structural equation modeling (SEM) can be undertaken to test the model. The combined model has 9 factors and 34 variables. It is observed that the basic determinants, which are obtained from the literature, apply quite effectively in the successful BI deployment. Its determinants are Quality BI Information, Quality BI Users, Quality BI Systems and BI Governance, which falls under firm’s unique resources. Organization Culture, Business Strategy and Use of BI Tools are considered moderators between successful BI deployment and the use of BI-based knowledge for sustainable competitive advantage. Organizations especially in telecommunication related industries which are planning to embark on BI can consider these variables as criteria of successful deployment. However, these criteria may not be applicable to all industries as careful analysis is first needed to select the appropriate criteria for the company. A multiple criteria modeling approach can then be undertaken to access the suitability of the company for BI deployment.
Data Flow
Kumar P. - Impact of Business Intelligence Systems in Indian Telecom Industry
Poonam Kumar
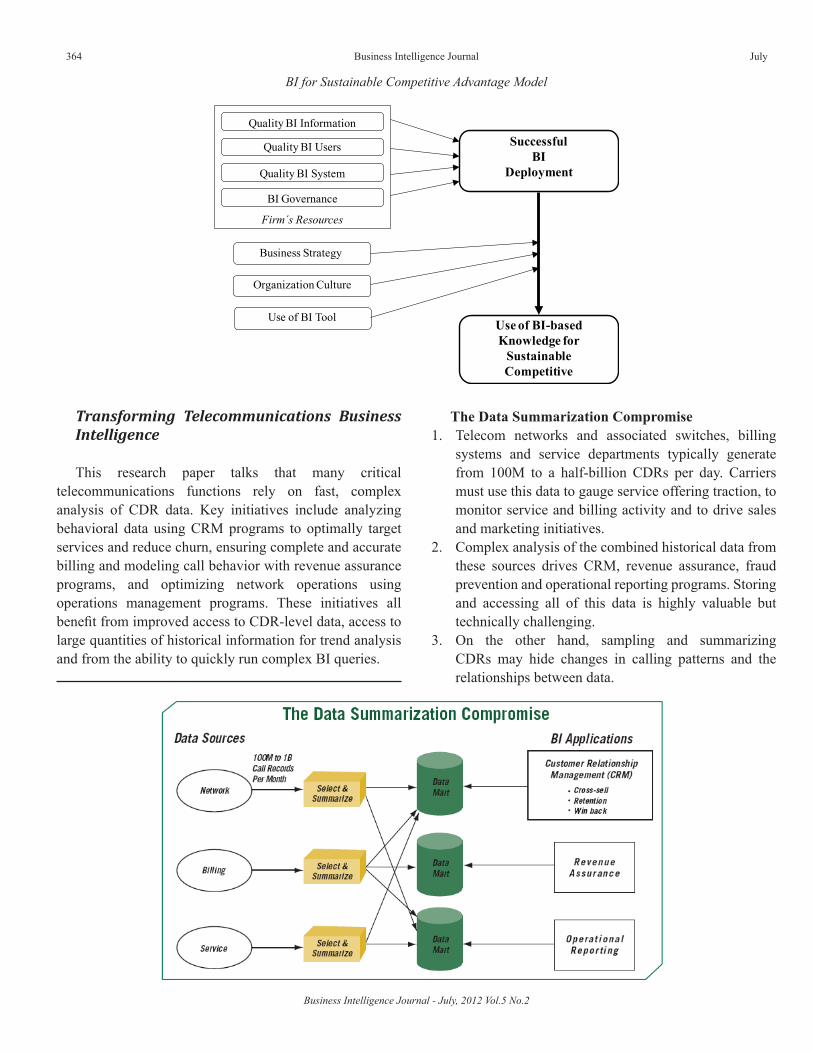
Business Intelligence Journal - July, 2012 Vol.5 No.2
364 Business Intelligence Journal July
Transforming Telecommunications Business Intelligence
This research paper talks that many critical telecommunications functions rely on fast, complex analysis of CDR data. Key initiatives include analyzing behavioral data using CRM programs to optimally target services and reduce churn, ensuring complete and accurate billing and modeling call behavior with revenue assurance programs, and optimizing network operations using operations management programs. These initiatives all benefit from improved access to CDR-level data, access to large quantities of historical information for trend analysis and from the ability to quickly run complex BI queries.
The Data Summarization Compromise1. Telecom networks and associated switches, billing
systems and service departments typically generate from 100M to a half-billion CDRs per day. Carriers must use this data to gauge service offering traction, to monitor service and billing activity and to drive sales and marketing initiatives.
2. Complex analysis of the combined historical data from these sources drives CRM, revenue assurance, fraud prevention and operational reporting programs. Storing and accessing all of this data is highly valuable but technically challenging.
3. On the other hand, sampling and summarizing CDRs may hide changes in calling patterns and the relationships between data.
BI for Sustainable Competitive Advantage Model
Quality BI Information
Quality BI Users
Quality BI System
BI Governance
Firm´s Resources
Business Strategy
Organization Culture
Use of BI Tool
SuccessfulBI
Deployment
Use of BI-basedKnowledge for
SustainableCompetitive
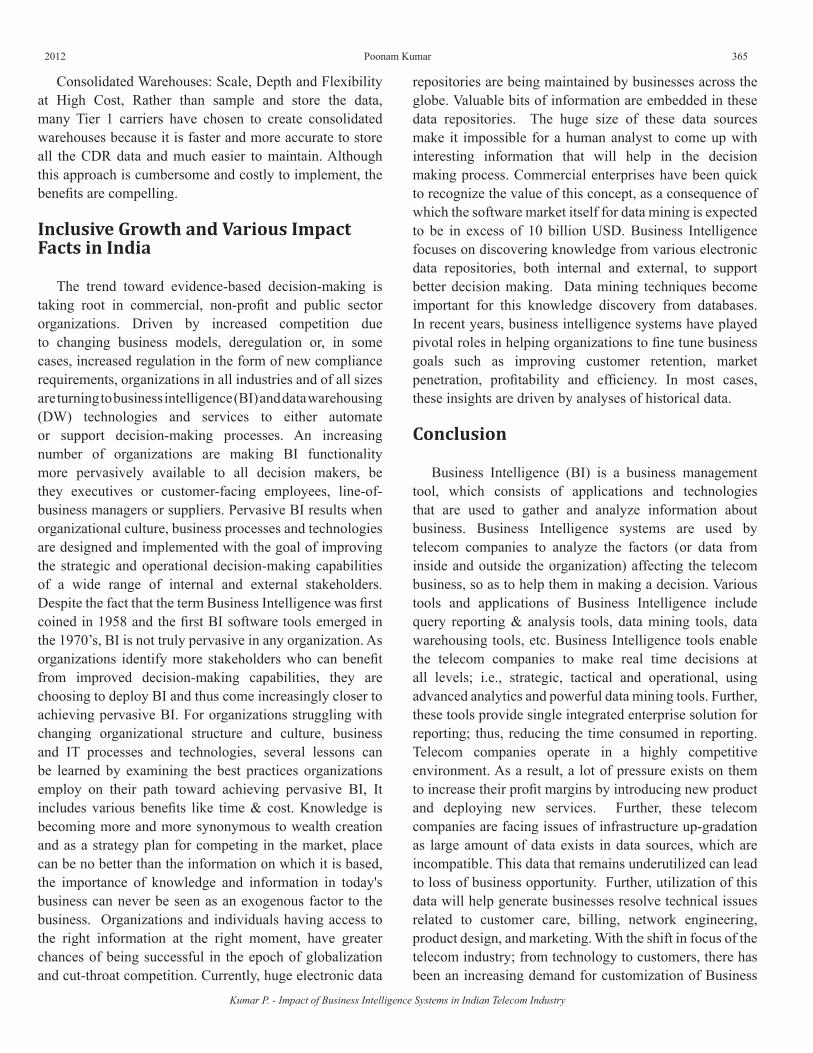
2012 365
Consolidated Warehouses: Scale, Depth and Flexibility at High Cost, Rather than sample and store the data, many Tier 1 carriers have chosen to create consolidated warehouses because it is faster and more accurate to store all the CDR data and much easier to maintain. Although this approach is cumbersome and costly to implement, the benefits are compelling.
Inclusive Growth and Various Impact Facts in India
The trend toward evidence-based decision-making is taking root in commercial, non-profit and public sector organizations. Driven by increased competition due to changing business models, deregulation or, in some cases, increased regulation in the form of new compliance requirements, organizations in all industries and of all sizes are turning to business intelligence (BI) and data warehousing (DW) technologies and services to either automate or support decision-making processes. An increasing number of organizations are making BI functionality more pervasively available to all decision makers, be they executives or customer-facing employees, line-of-business managers or suppliers. Pervasive BI results when organizational culture, business processes and technologies are designed and implemented with the goal of improving the strategic and operational decision-making capabilities of a wide range of internal and external stakeholders. Despite the fact that the term Business Intelligence was first coined in 1958 and the first BI software tools emerged in the 1970’s, BI is not truly pervasive in any organization. As organizations identify more stakeholders who can benefit from improved decision-making capabilities, they are choosing to deploy BI and thus come increasingly closer to achieving pervasive BI. For organizations struggling with changing organizational structure and culture, business and IT processes and technologies, several lessons can be learned by examining the best practices organizations employ on their path toward achieving pervasive BI, It includes various benefits like time & cost. Knowledge is becoming more and more synonymous to wealth creation and as a strategy plan for competing in the market, place can be no better than the information on which it is based, the importance of knowledge and information in today's business can never be seen as an exogenous factor to the business. Organizations and individuals having access to the right information at the right moment, have greater chances of being successful in the epoch of globalization and cut-throat competition. Currently, huge electronic data
repositories are being maintained by businesses across the globe. Valuable bits of information are embedded in these data repositories. The huge size of these data sources make it impossible for a human analyst to come up with interesting information that will help in the decision making process. Commercial enterprises have been quick to recognize the value of this concept, as a consequence of which the software market itself for data mining is expected to be in excess of 10 billion USD. Business Intelligence focuses on discovering knowledge from various electronic data repositories, both internal and external, to support better decision making. Data mining techniques become important for this knowledge discovery from databases. In recent years, business intelligence systems have played pivotal roles in helping organizations to fine tune business goals such as improving customer retention, market penetration, profitability and efficiency. In most cases, these insights are driven by analyses of historical data.
Conclusion
Business Intelligence (BI) is a business management tool, which consists of applications and technologies that are used to gather and analyze information about business. Business Intelligence systems are used by telecom companies to analyze the factors (or data from inside and outside the organization) affecting the telecom business, so as to help them in making a decision. Various tools and applications of Business Intelligence include query reporting & analysis tools, data mining tools, data warehousing tools, etc. Business Intelligence tools enable the telecom companies to make real time decisions at all levels; i.e., strategic, tactical and operational, using advanced analytics and powerful data mining tools. Further, these tools provide single integrated enterprise solution for reporting; thus, reducing the time consumed in reporting. Telecom companies operate in a highly competitive environment. As a result, a lot of pressure exists on them to increase their profit margins by introducing new product and deploying new services. Further, these telecom companies are facing issues of infrastructure up-gradation as large amount of data exists in data sources, which are incompatible. This data that remains underutilized can lead to loss of business opportunity. Further, utilization of this data will help generate businesses resolve technical issues related to customer care, billing, network engineering, product design, and marketing. With the shift in focus of the telecom industry; from technology to customers, there has been an increasing demand for customization of Business
Kumar P. - Impact of Business Intelligence Systems in Indian Telecom Industry
Poonam Kumar
Business Intelligence Journal - July, 2012 Vol.5 No.2
366 Business Intelligence Journal July
Intelligence software. These Business Intelligence solutions revolve more around customer relationship. Also, the metrics for customer satisfaction and marketing intelligence keeps on changing with the personalization of offerings. Thus, such software is marked by its flexibility to accommodate changes. Moreover, data management is the primary focus of the telecom players, which makes integration with BI applications vital for the telecom industry. The Telecommunications industry is extremely varied in its adoption of business intelligence solutions. Few companies are in the advanced stages of their business intelligence initiatives; yet there are many that are oblivious of the benefits of BI. Some companies are hesitating due to anticipated high cost and long implementation cycles that many Business intelligence solutions require. Some telecommunications service providers have gone for non scalable temporary solutions which often fail to leverage the ever-increasing volumes of data. The real challenge is to make the BI environment an integral part of the decision making process. Efficiently gathering the information requirements of all the user-groups is extremely critical for the success of any BI implementation.
References
Abascal, E., Lautre, I., Mallor, F.: Data Mining in a bicriteria clustering problem. 17. In: European Journal of Operational Research 173, pp.705-716 (2006)
Berry, M., Linoff, G.: Data Mining Techniques: For Marketing, Sales and Customer 18. Relationship Management. Wiley Publishing Inc. (2004)
D. J. Power (2007-03-10). "A Brief History of Decision Support Systems, version 4.0". DSS Resources. COM, 2008-07-10.
Pareek, D.: Business Intelligence for Telecommunications. Auerbach Publications, 1. Taylor & Francis Group LLC (2007)
Sumathi, S., Sivanandam, S.: Introduction to Data Mining and its Applications. 2. Springer-Verlag Berlin Heidelberg (2006)
Mattison, R.: Data Warehousing and Data Mining for Telecommunications. Artech 3. House Inc. (1997)
Weiss, G.: Data Mining in Telecommunications. In: Maimon, O., Rokach, L. 4. (eds.) Data Mining and Knowledge Discovery Handbook: A Complete Guide for Practitioners and Researchers, pp1189-1201. Kluwer Academic Publishers (2005)
Weiss, G.: Data Mining in the Telecommunications Industry. In Wang J. (ed.), 5. Encyclopedia of Data Warehousing and Mining, Second Edition, Information Science Publishing, Volume 1, pp.486-491 (2008)
Ngai, E., Xiu, L., Chau, D.: Application of Data Mining Techniques in Customer 6. Relationship management: A Literature Review and Classification. In: Expert Systems with Applications 36, pp.2592-2602 (2009)
Wei, C., Chiu, I.: Turning Telecommunications Call Details to Churn Prediction: 9. A Data Mining Approach. In: Expert Systems with Applications 23, pp.103-112 (2002)
Hilas, C., Mastorocostas, P.: An Application of Supervised and Unsupervised 15. Learning Approaches to Telecommunications Fraud Detection. In: Knowledge-Based Systems 21, pp.721-726 (2008)
Shortland, R., Scarfe, R.: Data Mining Applications in BI. In: BT Technology 16. Journal, Vol.25, Nos 3&4, July/October (2007)
Brief Bio-Data
Dr. Poonam Kumar is a PhD and MBA in (Information and Technology and Marketing). A Science graduate from Delhi University and Higher Diploma in Aptech she has over eleven years of extensive experience in corporate and teaching. Previously at Amity University Noida for four years , Dr. Poonam has taught across a wide range of subjects and courses in IT and Marketing, She has worked with Jaipuria Institute of management, BLS Institute of Management and OKS span tech (IT Company)Her research interests are in Information and communication Technology, quantitative methods, branding and e-commerce. She has published over dozen of research papers in International Journals in the area of Information Technology and Marketing. Her published papers are in many esteemed International and National journals and book chapters. She has conducted Management development Programme and various workshops on marketing theme and research areas at various organizations. She has been awarded as employee excellence award in OKS Span tech software Company for her best contribution in client handling and as a Project leader.
2012 367
ANTI-MONEY LAUNDERING POLICY AND ITS EFFECTS ON BANK PERFORMANCE IN NIGERIA
Idowu, AbiolaDept. of Management and Accounting Faculty of Management Sciences
Ladoke Akintola University of Technology, P.M.B. 4000, Ogbomoso.Oyo State. Nigeria.
Email: [email protected]
Obasan, Kehinde A. (corresponding author)Department of Business Administration, Faculty of Social and Management Sciences
Olabisi Onabanjo University, Ago-Iwoye, Ogun State, NigeriaEmail: [email protected]
AbstractThis study seeks to review the role of anti-money laundering policy in Nigerian banking sector with its attendance effects on
performance. Three banks in Lagos State (South Western Nigeria) were used for the study. The correlation result indicates the existence of a strong positive relationship between banks performance and adoption of sound money laundering policy with a value of 0.881. The coefficient of determination also show a value of 0.775, which implies that anti-money laundering policy actually explain and account for about 77.5% of the nature of banks performance in the economy. This result is due to the fact that banks do not need to serve as a channel for illicit monetary activities before they can post a meaningful performance in the industry. Hence, money laundering has negative consequences on the economy which include loss of revenue to the government, worsens criminal rate in the society, and threatens the political stability and internal security of a nation. Key words: Performance, Economy, Money Laundering, NBFI.
The effect of money laundering on economic development are difficult to enumerate but it is clear that such activity damages the financial-sector institutions that are critical to economic growth, reduces productivity in the economy's real sector by diverting resources and encouraging crime and corruption, which slow economic growth and distort external economic sector. Money laundering impairs the development of financial institutions for two reasons. Firstly, it erodes financial institutions themselves because there is often a correlation between money laundering and fraudulent activities undertaken by employees. At higher volumes of money-laundering activity, entire financial institutions in developing countries are vulnerable to corruption by criminal elements seeking to gain further influence over their money-laundering channels. Secondly, customer trust is fundamental to the growth of sound financial institutions, and the perceived risk to depositors and investors from institutional fraud and corruption is an obstacle to such trust especially in developing countries.
However, aside protecting such institutions from the negative effects of money laundering itself, the adoption of anti-money-laundering policies by banks supervisors
and regulators, as well as by banks, non-banks financial institutions often strengthen the required good-governance practices that are important to the development of these economically critical institutions. Indeed, several of the basic anti money-laundering policies such as know-your-customer rules and strong internal controls are also fundamental, longstanding principles of prudential banking operation, supervision, and regulation.
Although money laundering does not require the use of formal financial institutions, reviews of money-laundering arrangement consistently indicate that banks and non-bank financial institutions (NBFIs), such as insurance companies, are favoured means of laundering illicit funds both internationally and within developing countries.The reason for this preference lies in the efficiency of the financial institutions which can serve as a low-cost vehicle for relocating illicit money for the launders.
From an economic development standpoint, the adoption of anti-money-laundering policies by government financial supervisors and regulators, as well as by banks and NBFIs, often reinforce good governance practices that are important to the development of these economically
Idowu A., Obasan K. A. - Anti-Money Laundering Policy and its Effects on Bank Performance in Nigeria
Idowu, Abiola and Obasan, Kehinde A.
Business Intelligence Journal - July, 2012 Vol.5 No.2
368 Business Intelligence Journal July
critical institutions. As a result of the need to arrest this surge, the “G7” in 1989 convened the Financial Action Task Force (FATF) a team saddle with the responsibility of examining money laundering techniques, review actions taken so far and setting out measures needed to deter and defeat the menace. In the end, the committee came up with 48 recommendations on modalities to combat financial crime. It was this that gave birth to local enforcement in Nigeria with the emergence of various legislations such as the National Drug Law Enforcement Agency Act (1989); Money Laundering Act No. 7 (2003); Advance Fee Fraud Act (2004); The Economic & Financial Crimes Commission Act (2004). All agencies were charged with the responsibility of fight against money laundering and enforcement of all laws dealing with economic and financial crimes in Nigeria.
With all this concerted efforts put in place to check the activities of money laundering in Nigeria, the increasing integration of the world’s financial system through technology has reduced the barriers to free flow of capital and provide avenue to hide ill-gotten wealth with great difficulties involved in tracing the real owners of such fund outside regulation.
Literature Review
Conceptualizing money laundering has gain the attention of many scholars and agency overtime. The draft Article 1 of the European Communities Directive (1990) defines money laundering as the conversion or transfer of property, knowing that such property is derived from serious crime, for the purpose of concealing or disguising the illicit origin of the property or of assisting any person who is involved in committing such an offence or offences to evade the legal consequences of his action, and the concealment or disguise of the true nature, source, location, disposition, movement, rights with respect to, or ownership of property, knowing that such property is derived from serious crime.
Ohanyere (2003) view money laundering as the procedure by which the proceeds of illegal acts are converted into apparently legal activities, thus concealing their criminal origin. In a simple language it involves cleansing (laundering) dirty money in order to cover its dirty or illegitimate origin. It is an essential transformation process for the proceeds of crimes such as armed robbery, prostitution, gambling, arm deals, fraud, sales of hard drugs and any other act which the law and society prohibit.
Hence, money laundering is the integration of illicit funds into the main stream of legitimate finance in order to
conceal the criminal sources and nature of such funds and ultimately making the funds look clean. It is the smuggling in of funds with criminal intention into the channel of the legitimate financial system.
Historical Background of Money Laundering
Money laundering has over the years evolved from the commission of other crimes. For example, right from time robbers had always tried to conceal their acts and disguise their loots so that they could retain their respect in the society because robbery was an anti-social behaviour which is condemnable and punishable by law. The period of the 1920s and 1930s was tagged the era of “gangsterism” in the United States of America with the emergence of criminals groups which claim exclusive jurisdiction over some areas and districts for the purpose of perpetrating their criminal activities.
This practice became a fore-runner to modern day organized crime. These groups had powerful and influential leaders who channel their criminal gains secretly into the regular financial system. The injection of such fund into the normal financial transactions and business arrangements was obviously money laundering.
Gangsterism developed into Mafia and with the formation of such deep-rooted criminal organizations like the Chinese Triad, Columbian Cartels, Sicilian Mafia and the Russian Criminal Organizations, organized crime assumed international dimension. This is because the growth of organized crimes produced wealth that needed to be laundered and invested, sometimes across international boundaries.
Cases of money laundering which gave weight to the above historical foundation abound. For example in 1932, Meyer Lansky (affectionately called “The Mob’s Accountant”) one of the founding fathers of organized crime and patron saint of money launderers opened an off-shore account with a Swiss Bank. This account was used to hide the profits of Governor Huey Long of Louisiana in the United States of America. There after, Lansky & Co. were allowed to open up slot machine houses in New Orleans. Money criminally obtained, was smuggled out from the United States to a bank in Switzerland and loans were granted by the bank in Switzerland to this gang of criminals thereby permitting the return of legal money to the United State. This practice, which signaled the beginning of modern money laundering, was given further impetus by the operation of secret banking practices in countries which permitted them.
2012 369
The carting away of war loots by some German officials to secret bank accounts in Switzerland at the end of World War II brought to lime light the use of secret banking concept for money laundering. Also, the BCCI Drug Money Scandal which involved Panama, U.S. Luxembourg and London’s secret banking network as well as the money laundering activities of the off-shore banks in Cayman Island etc. lend credence to the view that secret banking greatly facilitates money laundering. In fact, the banking system had been the veritable vehicle that acted as a catalyst for money laundering. It is not surprising, therefore that any attempt to proffer solutions to the menace of money laundering without a serious focus on financial institutions globally is bound to be a fruitless exercise.
Money laundering as an expression is one of fairly recent origin. The original sighting was in newspaper reporting the Watergate Scandal in the United States in 1973. The expression first appeared in a judicial context in 1982 in America and it has been widely accepted and is in popular usage throughout the world.
The Nigerian economy did not care about the colour of monies brought in until 1989 when she could not meet up with the recommendations of FATF and was consequently listed among the Non Cooperative Countries and Territories (NCCT) and perceived to be a “Money Laundering Heaven”. This discouraged other countries from having business relationship with any country on the list. However, in the bid to shrug off this uncomplimentary position, several agencies and laws were established such as the National Drug Law Enforcement Agency (NDLEA), Money Laundering Decree (1995) (Money Laundering Act LFN 1999). Advance Fee Fraud and Other Fraud Related Offences Decree (1995) Repealed in 2006
However, money laundering techniques have become so complex and sophisticated that the operators are always steps ahead of law makers and enforcement agents. They take full advantage of the boom in communication technology such as the internet while their techniques range from the purchase and resale of any luxury item for example, car, jewel etc. to passing “dirty” money through a complex web of domestic and international legitimate business. However, the commonest type of money laundering that banks encounter on a daily basis takes the form of accumulated cash transactions which are normally deposited in the banking system or exchanged for items of value such as travelers’ cheques, money and/or postal orders, bank drafts, gold, diamond etc.
Salinger (2005) opined that money laundering takes several different forms although most methods can be
categorized into one of a few types such as bank methods, smurfing, currency exchanges, and double-invoicing."
The Money Laundering Process
Money laundering is not a solitary act but a process that is accomplished through three basic steps can be taken at the same time in the course of a single transaction, but can also appear in well separable forms.
There are also common factors regarding the wide range of methods used by
Money launderers when they attempt to launder their criminal proceeds.
Three common factors identified in laundering operations are:
• The need to conceal the origin and true ownership of the proceeds
• The need to maintain control of the proceeds• The need to change the form of the proceeds in
order to shrink the huge volumes of cash generated by the initial criminal activity.
Placement Stage involves placing or presenting the illicit money before banks or financial institutions or smuggled out of the country. The aims of the launderers are to remove the cash from the location of acquisition so as to avoid detection from the authorities and then transform it into other assets forms, e.g.Travelers’ cheques, Postal order etc. This stage is also referred to as immersion which may also be achieved by a wide variety of means depending on the opportunities available or presented to the ingenuity of the criminal, his cohorts and their network. It is the most vulnerable stage in money laundering particularly if the fund involved is raw cash. Placement of huge sums of money in most cases, attracts attention, arouses suspicion and may lead to reporting to law enforcement agencies.
Layering stage involves the creation of complex web of transactions aimed at dissociating the illegal monies from their criminal origin. Such transactions not only prevent any audit trail being left but also conceal the source and ownership of fund. It is often referred to as dilution or heavy soaping since it involved transferring of money or funds to off-shore countries and once deposited in a foreign bank, the fund can be moved through accounts of “Shell” Corporations which exist solely for laundering purpose.
Integration stage of the process involves the introduction of the funds into the legitimate economic and financial
nIntegratioLayeringPlacement ⇒⇒
Idowu A., Obasan K. A. - Anti-Money Laundering Policy and its Effects on Bank Performance in Nigeria
Idowu, Abiola and Obasan, Kehinde A.

Business Intelligence Journal - July, 2012 Vol.5 No.2
370 Business Intelligence Journal July
system. This stage provides apparent legitimacy to the criminality derived wealth as nobody would ever suspect its criminal origin. This stage is also referred to as “spinning”, “repatriation”, or “re-integration”.
A typical example is the recapitalization of an ailing public company with laundered money by buying off either all or a substantial proportion of its equity with a view to assume full control and ownership of such company. Another example is over-invoicing of imports which enables huge sums of money to be transferred abroad simply upon proof of complete but false documentation. This technique involves importing goods at deliberately
inflated prices by domestic companies owned by money launderers from off-shore companies which they also own. The difference between the inflated price and the actual price is then deposited off-shore and repatriated by choice.
Effect of Money Laundering
According to Brent (2002), when considering the effect of money laundering on developing economies like Nigeria, it is particularly useful to distinguish among five directions that the money-laundering flows may take with respect to such economies, as illustrated in Fig 1 below.
Adapted from: Brent (2002) “The Negative Effects of Money Laundering on Economic Development”a. Domestic money-laundering flows in which illegal
domestic funds are laundered within the developing country's economy and reinvested or otherwise spent within the economy.
b. Returning laundered funds originate in the developing country, are laundered (in part or in full) abroad, and returned for integration.
c. Inbound funds, for which the predicate crime occurred abroad, are either initially laundered ("placed") abroad or within the developing country, and ultimately are integrated into the developing economy.
d. Outbound funds, which typically constitute illicit capital flight from the developing economy, do not return for integration in the original economy.
e. Flow-through funds enter the developing country as part of the laundering process and largely depart for
integration elsewhere, thus playing little or no role in the economy itself (although the "fees" for money laundering activity may remain).
Despite the global approach at the eradication of money laundering all over the world, the crime continues to thrive due to the following reasons:a. The failure of countries to implement existing United
Nations anti-money laundering measures such as a resolution of the United Nations against illicit traffic in narcotic and psychotropic substance.
b. Conflict of laws due to the failure to adapt the United Nations Model Law by all nations.
c. The sophisticated nature of the crime militates against its eradication.
d. The proliferation of non-banking financial institutions all over the world has assisted the business of money laundering.
2012 371
e. The hypocritical attitude of some nations militates against this struggle.
f. When the laundered money results in the in-flow of capital to their country, they conceal it, but when they are the victims, they complain.
g. The level of corruption in many countries is a big setback for the crusade against money laundering.
This challenge is more in developing nations where for lack of facilities money laundering cannot be easily detected by law enforcement agencies and they depend on the cooperation of the banks. However, the international pressures that has recently broken the Swiss rigid secret Banking Tradition as well as the Technology that has put some law enforcement agencies in Europe and America on-line with certain banks has made information collection easy in the former and automatic in the latter. If the on-line facility is available in every nation, this certainly would go a long way in combating the global money laundering.
Although Ikpang (2011) opined that the Federal Government of Nigeria has demonstrated genuine concern and commitment in the enforcement of money laundering laws through the enacting of 2011 amendment to the previous law, which send a warning signal to the perpetrators that the country is no safe haven for them.
Methodology
This study used a descriptive survey design which is to collect detailed and factual information that describes an existing phenomenon (Ezeani 1998).The target population of the study was banks staffs in Lagos State Nigeria. A census of three banks was taken. A simple random sampling technique was used to select 200 personnel with an average of 67 staff from each bank while only 180 questionnaires were returned. Of these, 72 (40%) were females; while 108 (60%) were males with age ranges from 25-52 years, with an average age of 38.5 years. The academic qualifications of the participants are: OND, HND, B.Sc., B.Ed., B.A, M.Sc, M.A, PhD.
Instrument
A structured questionnaire was used for the collection of data on the study. The questionnaire was specifically designed to accomplish the objectives of the study. The first section collected information such as age, sex, experience,
professional status, marital status, position, etc. while the second section contained twenty (20) statements formulated to establish the level of awareness of the respondents as well as the extent of success of various anti-money laundry policies among bank staffs in Lagos State (appendix 1). A simple percentage and Pearson Product Multiple Correlation were employed to analyze the collected data.
Results
From table 2 (see appendix), the following revelations emerges:• That majority of the bank’s staffs is aware of the
Anti-Money Laundering Policy and understands its provisions. This awareness could be attributed to the massive enlightenment campaign embarked upon by the bank management and the government.
• That majority of the respondents disagreed with the statement that money laundering has no negative impact on the economy and call for a joint effort to arrest its implication on the economy.
• That bank Anti-Money Laundering Policy has a positive impact on its operations, while Government has created enough awareness about money laundering in Nigeria in order to reduce political instability which is often financed by money laundering since it affect government plans.
• That the enactment of EFCC Act reduces the incidence of money laundering through its provisions and procedures as well as regular training of banks officials on Anti-Money Laundering techniques. Similarly, applying Know Your Customer (KYC) and Know Your Business (KYB) conditions also enhance dealing with customers.
• That government has shown enough commitment in tacking money laundry while some political office holders are protected by the loop-hole in the constitution in perpetrating this fraudulent act without being checked by the EFCC Operatives.
Test of Hypothesis
In order to validate the aim of this study, the following hypothesis was subjected to test.
*Ho: That Anti-Money Laundering Policy has no significant effect on banks performance.
Idowu A., Obasan K. A. - Anti-Money Laundering Policy and its Effects on Bank Performance in Nigeria
Idowu, Abiola and Obasan, Kehinde A.
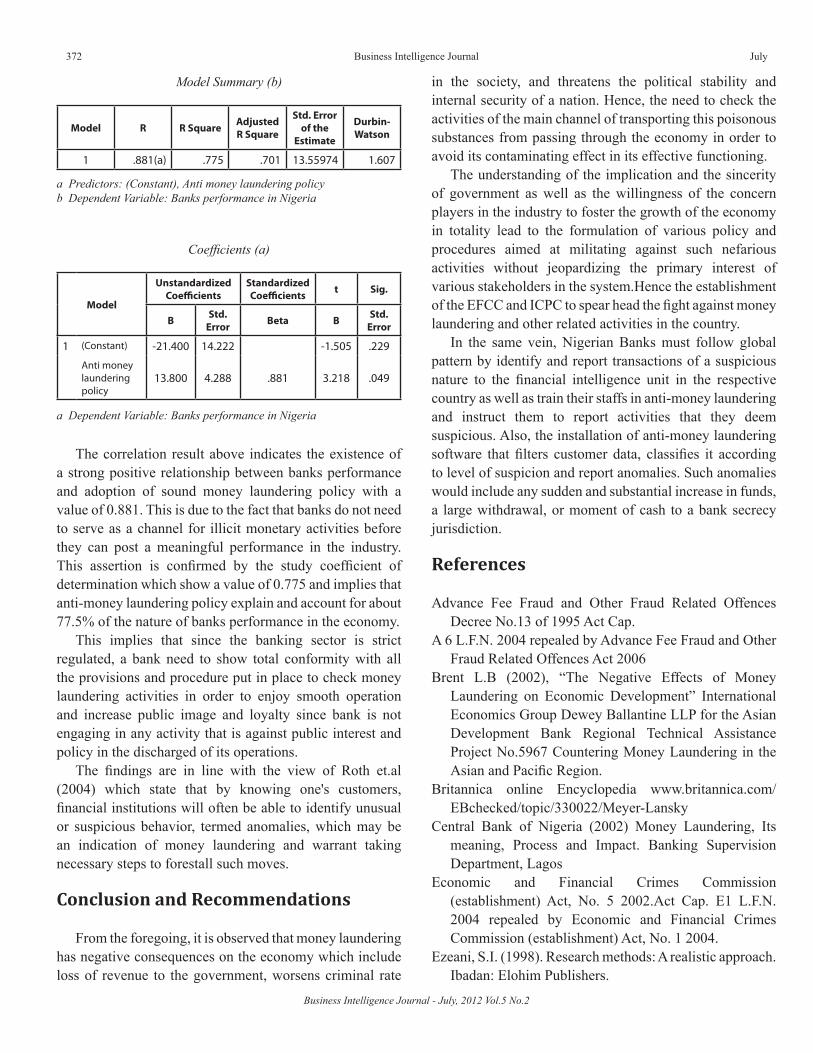
Business Intelligence Journal - July, 2012 Vol.5 No.2
372 Business Intelligence Journal July
Model Summary (b)
Model R R Square Adjusted R Square
Std. Error of the
Estimate
Durbin-Watson
1 .881(a) .775 .701 13.55974 1.607
a Predictors: (Constant), Anti money laundering policyb Dependent Variable: Banks performance in Nigeria
Coefficients (a)
Model
Unstandardized Coefficients
Standardized Coefficients t Sig.
B Std. Error Beta B Std.
Error
1 (Constant) -21.400 14.222 -1.505 .229
Anti money laundering policy
13.800 4.288 .881 3.218 .049
a Dependent Variable: Banks performance in Nigeria
The correlation result above indicates the existence of a strong positive relationship between banks performance and adoption of sound money laundering policy with a value of 0.881. This is due to the fact that banks do not need to serve as a channel for illicit monetary activities before they can post a meaningful performance in the industry. This assertion is confirmed by the study coefficient of determination which show a value of 0.775 and implies that anti-money laundering policy explain and account for about 77.5% of the nature of banks performance in the economy.
This implies that since the banking sector is strict regulated, a bank need to show total conformity with all the provisions and procedure put in place to check money laundering activities in order to enjoy smooth operation and increase public image and loyalty since bank is not engaging in any activity that is against public interest and policy in the discharged of its operations.
The findings are in line with the view of Roth et.al (2004) which state that by knowing one's customers, financial institutions will often be able to identify unusual or suspicious behavior, termed anomalies, which may be an indication of money laundering and warrant taking necessary steps to forestall such moves.
Conclusion and Recommendations
From the foregoing, it is observed that money laundering has negative consequences on the economy which include loss of revenue to the government, worsens criminal rate
in the society, and threatens the political stability and internal security of a nation. Hence, the need to check the activities of the main channel of transporting this poisonous substances from passing through the economy in order to avoid its contaminating effect in its effective functioning.
The understanding of the implication and the sincerity of government as well as the willingness of the concern players in the industry to foster the growth of the economy in totality lead to the formulation of various policy and procedures aimed at militating against such nefarious activities without jeopardizing the primary interest of various stakeholders in the system.Hence the establishment of the EFCC and ICPC to spear head the fight against money laundering and other related activities in the country.
In the same vein, Nigerian Banks must follow global pattern by identify and report transactions of a suspicious nature to the financial intelligence unit in the respective country as well as train their staffs in anti-money laundering and instruct them to report activities that they deem suspicious. Also, the installation of anti-money laundering software that filters customer data, classifies it according to level of suspicion and report anomalies. Such anomalies would include any sudden and substantial increase in funds, a large withdrawal, or moment of cash to a bank secrecy jurisdiction.
References
Advance Fee Fraud and Other Fraud Related Offences Decree No.13 of 1995 Act Cap.
A 6 L.F.N. 2004 repealed by Advance Fee Fraud and Other Fraud Related Offences Act 2006
Brent L.B (2002), “The Negative Effects of Money Laundering on Economic Development” International Economics Group Dewey Ballantine LLP for the Asian Development Bank Regional Technical Assistance Project No.5967 Countering Money Laundering in the Asian and Pacific Region.
Britannica online Encyclopedia www.britannica.com/EBchecked/topic/330022/Meyer-Lansky
Central Bank of Nigeria (2002) Money Laundering, Its meaning, Process and Impact. Banking Supervision Department, Lagos
Economic and Financial Crimes Commission (establishment) Act, No. 5 2002.Act Cap. E1 L.F.N. 2004 repealed by Economic and Financial Crimes Commission (establishment) Act, No. 1 2004.
Ezeani, S.I. (1998). Research methods: A realistic approach. Ibadan: Elohim Publishers.
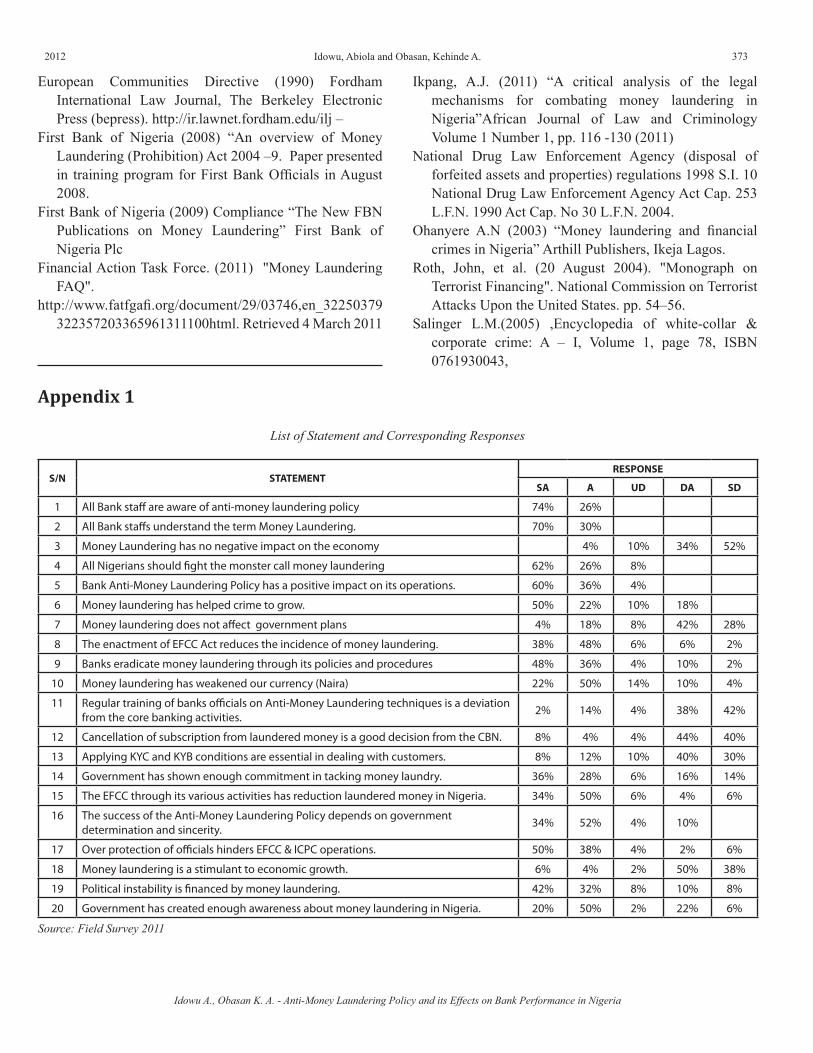
2012 373
European Communities Directive (1990) Fordham International Law Journal, The Berkeley Electronic Press (bepress). http://ir.lawnet.fordham.edu/ilj –
First Bank of Nigeria (2008) “An overview of Money Laundering (Prohibition) Act 2004 –9. Paper presented in training program for First Bank Officials in August 2008.
First Bank of Nigeria (2009) Compliance “The New FBN Publications on Money Laundering” First Bank of Nigeria Plc
Financial Action Task Force. (2011) "Money Laundering FAQ".
http://www.fatfgafi.org/document/29/03746,en_32250379322357203365961311100html. Retrieved 4 March 2011
Ikpang, A.J. (2011) “A critical analysis of the legal mechanisms for combating money laundering in Nigeria”African Journal of Law and Criminology Volume 1 Number 1, pp. 116 -130 (2011)
National Drug Law Enforcement Agency (disposal of forfeited assets and properties) regulations 1998 S.I. 10 National Drug Law Enforcement Agency Act Cap. 253 L.F.N. 1990 Act Cap. No 30 L.F.N. 2004.
Ohanyere A.N (2003) “Money laundering and financial crimes in Nigeria” Arthill Publishers, Ikeja Lagos.
Roth, John, et al. (20 August 2004). "Monograph on Terrorist Financing". National Commission on Terrorist Attacks Upon the United States. pp. 54–56.
Salinger L.M.(2005) ,Encyclopedia of white-collar & corporate crime: A – I, Volume 1, page 78, ISBN 0761930043,
List of Statement and Corresponding Responses
S/N STATEMENTRESPONSE
SA A UD DA SD
1 All Bank staff are aware of anti-money laundering policy 74% 26%
2 All Bank staffs understand the term Money Laundering. 70% 30%
3 Money Laundering has no negative impact on the economy 4% 10% 34% 52%
4 All Nigerians should fight the monster call money laundering 62% 26% 8%
5 Bank Anti-Money Laundering Policy has a positive impact on its operations. 60% 36% 4%
6 Money laundering has helped crime to grow. 50% 22% 10% 18%
7 Money laundering does not affect government plans 4% 18% 8% 42% 28%
8 The enactment of EFCC Act reduces the incidence of money laundering. 38% 48% 6% 6% 2%
9 Banks eradicate money laundering through its policies and procedures 48% 36% 4% 10% 2%
10 Money laundering has weakened our currency (Naira) 22% 50% 14% 10% 4%
11 Regular training of banks officials on Anti-Money Laundering techniques is a deviation from the core banking activities. 2% 14% 4% 38% 42%
12 Cancellation of subscription from laundered money is a good decision from the CBN. 8% 4% 4% 44% 40%
13 Applying KYC and KYB conditions are essential in dealing with customers. 8% 12% 10% 40% 30%
14 Government has shown enough commitment in tacking money laundry. 36% 28% 6% 16% 14%
15 The EFCC through its various activities has reduction laundered money in Nigeria. 34% 50% 6% 4% 6%
16 The success of the Anti-Money Laundering Policy depends on government determination and sincerity. 34% 52% 4% 10%
17 Over protection of officials hinders EFCC & ICPC operations. 50% 38% 4% 2% 6%
18 Money laundering is a stimulant to economic growth. 6% 4% 2% 50% 38%
19 Political instability is financed by money laundering. 42% 32% 8% 10% 8%
20 Government has created enough awareness about money laundering in Nigeria. 20% 50% 2% 22% 6%
Source: Field Survey 2011
Appendix 1
Idowu A., Obasan K. A. - Anti-Money Laundering Policy and its Effects on Bank Performance in Nigeria
Idowu, Abiola and Obasan, Kehinde A.
Business Intelligence Journal - July, 2012 Vol.5 No.2
374 Business Intelligence Journal July
PREDICTION OF FINANCIAL DISTRESS FOR TUNISIAN FIRMS:A COMPARATIVE STUDY BETWEEN FINANCIAL
ANALYSIS AND NEURONAL ANALYSIS
Manel HamdiInternational Finance Group Tunisia, Faculty of Management and Economic Sciences of Tunis,
Tunisia, El Manar University, Tunis cedex, C.P. 2092, El Manar TunisiaEmail: [email protected]
AbstractThis paper presents a prognosis of financial distress of Tunisian firms. For the purpose, we empirically compared the financial
analysis to artificial neural network analysis. Five multilayer perceptron are applied to improve banking-decision. Based on the results of correct classification rate, artificial neural network proved an intact predictive ability. As well, the findings of generalization test confirmed the conclusion of the classical financial analysis of a company not included in our base sample. The artificial neural network can effectively automate the granting credit decision then performed better than traditional financial analysis. Key words: Prediction; Financial Distress; Financial Analysis; Artificial Neural Network; Generalization Test.
Distress financial prediction is a binary classification task that has been widely investigated by several researches. Since long time, this kind of task is based on the traditional financial analysis that it dates back to the end of the XIXe century and it developed essentially at the XXe century. In practice, the financial analysis involves the identification of the strengths and weaknesses of companies mainly through the study of financial ratios calculated from various accounting and financial statements (Xidonas et al., 2009). In the United States, a first analysis of ratios was conducted by Wall in March 1919. His study is focused on a simultaneous analysis of seven ratios for 981 firms classified by sector and geographic regions. However, the financial analyzes suffer from subjectivity as it’s based on the human treatment of information (Hartvigsen, 1992). In order to overcome the drawback, banks have introduced new instruments based on statistical techniques to better assess the risk of loan defaults. These new instruments are the scoring models such as discriminant analysis (Beaver, 1966; Altman, 1968; Deakin, 1972), logit model (Ohlson, 1980), probit model (Zmijewski, 1984). Nevertheless, the traditional statistical tools are mainly built on linear assumptions thus the forecasting performance might be very poor if one continued using these techniques (Weigend & Gershenfeld, 1994). This leads to apply non linear tools that the most used for the financial distress prediction task is
the artificial neural networks model. In this context, a large number of studies (Odom & Sharda, 1990; Tam & Kiang, 1992; Udo, 1993; Wilson & Sharda, 1994; Fernández & Olmeda, 1995; Leshno & Spector, 1996; Witkowska , 1999; Atiya, 2001; Zurada et al., 2002; Lam, 2004; Perez, 2006; Chih-Fong & Jhen-Wei, 2008; Tsai & Wu, 2008; Chen & Du, 2009; Khashman, 2010 and 2011) have employed this model to improve decision-making of the banker.
This paper is organized as follows. Section 2 describes the methodology applied along our experiments, more precisely; we defined in detail the financial analysis of the firm requesting bank credit and their findings. Then, we presented the different steps and results of artificial neural networks analysis. Later, we concluded in section3.
Methodology Study
Sample and dataset
The sample includes 528 Tunisian firms from different sectors of activities that we have balance sheets and income statements for fiscal years 1999-2006 provided by the Central Bank of Tunisia. Based on these documents, a battery of 26 ratios was calculated and then used as input variables in our study (see Table1).
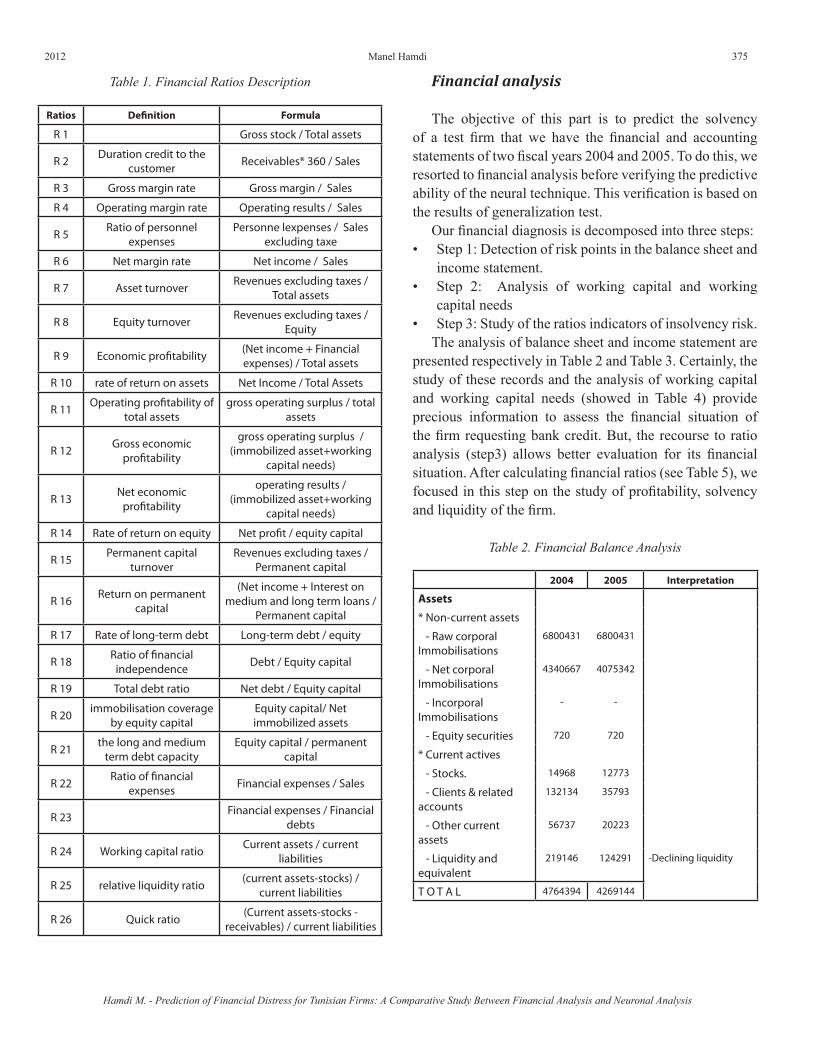
2012 375
Hamdi M. - Prediction of Financial Distress for Tunisian Firms: A Comparative Study Between Financial Analysis and Neuronal Analysis
Manel Hamdi
Ratios Definition Formula
R 1 Gross stock / Total assets
R 2 Duration credit to the customer Receivables* 360 / Sales
R 3 Gross margin rate Gross margin / Sales
R 4 Operating margin rate Operating results / Sales
R 5 Ratio of personnel expenses
Personne lexpenses / Sales excluding taxe
R 6 Net margin rate Net income / Sales
R 7 Asset turnover Revenues excluding taxes / Total assets
R 8 Equity turnover Revenues excluding taxes / Equity
R 9 Economic profitability (Net income + Financial expenses) / Total assets
R 10 rate of return on assets Net Income / Total Assets
R 11 Operating profitability of total assets
gross operating surplus / total assets
R 12 Gross economic profitability
gross operating surplus /(immobilized asset+working
capital needs)
R 13 Net economic profitability
operating results /(immobilized asset+working
capital needs)
R 14 Rate of return on equity Net profit / equity capital
R 15 Permanent capital turnover
Revenues excluding taxes /Permanent capital
R 16 Return on permanent capital
(Net income + Interest on medium and long term loans /
Permanent capital
R 17 Rate of long-term debt Long-term debt / equity
R 18 Ratio of financial independence Debt / Equity capital
R 19 Total debt ratio Net debt / Equity capital
R 20 immobilisation coverage by equity capital
Equity capital/ Net immobilized assets
R 21 the long and medium term debt capacity
Equity capital / permanent capital
R 22 Ratio of financial expenses Financial expenses / Sales
R 23 Financial expenses / Financial debts
R 24 Working capital ratio Current assets / current liabilities
R 25 relative liquidity ratio (current assets-stocks) / current liabilities
R 26 Quick ratio (Current assets-stocks - receivables) / current liabilities
Table 1. Financial Ratios Description Financial analysis
The objective of this part is to predict the solvency of a test firm that we have the financial and accounting statements of two fiscal years 2004 and 2005. To do this, we resorted to financial analysis before verifying the predictive ability of the neural technique. This verification is based on the results of generalization test.
Our financial diagnosis is decomposed into three steps:• Step 1: Detection of risk points in the balance sheet and
income statement.• Step 2: Analysis of working capital and working
capital needs• Step 3: Study of the ratios indicators of insolvency risk.
The analysis of balance sheet and income statement are presented respectively in Table 2 and Table 3. Certainly, the study of these records and the analysis of working capital and working capital needs (showed in Table 4) provide precious information to assess the financial situation of the firm requesting bank credit. But, the recourse to ratio analysis (step3) allows better evaluation for its financial situation. After calculating financial ratios (see Table 5), we focused in this step on the study of profitability, solvency and liquidity of the firm.
Table 2. Financial Balance Analysis
2004 2005 Interpretation
Assets
* Non-current assets
- Raw corporal Immobilisations
6800431 6800431
- Net corporal Immobilisations
4340667 4075342
- Incorporal Immobilisations
- -
- Equity securities 720 720
* Current actives
- Stocks. 14968 12773
- Clients & related accounts
132134 35793
- Other current assets
56737 20223
- Liquidity and equivalent
219146 124291 -Declining liquidity
T O T A L 4764394 4269144
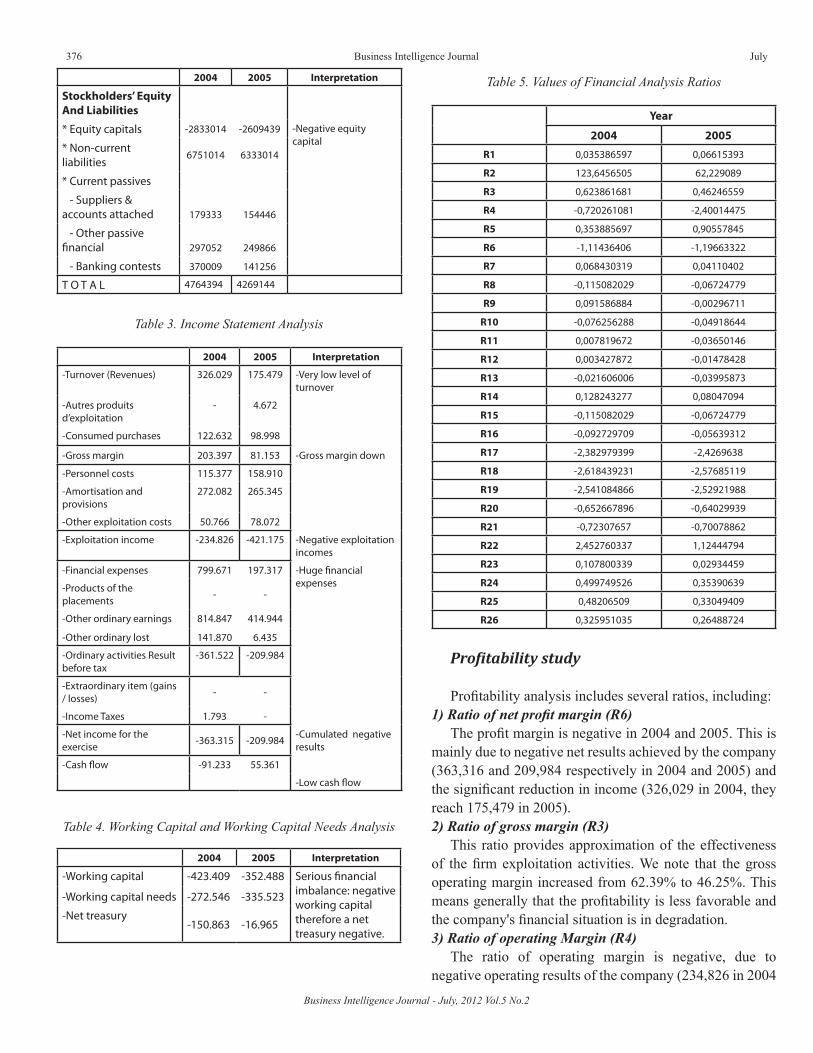
Business Intelligence Journal - July, 2012 Vol.5 No.2
376 Business Intelligence Journal July
2004 2005 Interpretation
-Turnover (Revenues) 326.029 175.479 -Very low level of turnover
-Autres produits d’exploitation
- 4.672
-Consumed purchases 122.632 98.998
-Gross margin 203.397 81.153 -Gross margin down
-Personnel costs 115.377 158.910
-Amortisation and provisions
272.082 265.345
-Other exploitation costs 50.766 78.072
-Exploitation income -234.826 -421.175 -Negative exploitation incomes
-Financial expenses 799.671 197.317 -Huge financial expenses-Products of the
placements - -
-Other ordinary earnings 814.847 414.944
-Other ordinary lost 141.870 6.435
-Ordinary activities Result before tax
-361.522 -209.984
-Extraordinary item (gains / losses) - -
-Income Taxes 1.793 -
-Net income for the exercise -363.315 -209.984 -Cumulated negative
results
-Cash flow -91.233 55.361
-Low cash flow
2004 2005 Interpretation
Stockholders’ Equity And Liabilities
* Equity capitals -2833014 -2609439 -Negative equity capital* Non-current
liabilities6751014 6333014
* Current passives
- Suppliers & accounts attached 179333 154446
- Other passive financial 297052 249866
- Banking contests 370009 141256
T O T A L 4764394 4269144
Table 3. Income Statement Analysis
2004 2005 Interpretation
-Working capital -423.409 -352.488 Serious financial imbalance: negative working capital therefore a net treasury negative.
-Working capital needs -272.546 -335.523
-Net treasury-150.863 -16.965
Table 4. Working Capital and Working Capital Needs Analysis
Table 5. Values of Financial Analysis Ratios
Year
2004 2005
R1 0,035386597 0,06615393
R2 123,6456505 62,229089
R3 0,623861681 0,46246559
R4 -0,720261081 -2,40014475
R5 0,353885697 0,90557845
R6 -1,11436406 -1,19663322
R7 0,068430319 0,04110402
R8 -0,115082029 -0,06724779
R9 0,091586884 -0,00296711
R10 -0,076256288 -0,04918644
R11 0,007819672 -0,03650146
R12 0,003427872 -0,01478428
R13 -0,021606006 -0,03995873
R14 0,128243277 0,08047094
R15 -0,115082029 -0,06724779
R16 -0,092729709 -0,05639312
R17 -2,382979399 -2,4269638
R18 -2,618439231 -2,57685119
R19 -2,541084866 -2,52921988
R20 -0,652667896 -0,64029939
R21 -0,72307657 -0,70078862
R22 2,452760337 1,12444794
R23 0,107800339 0,02934459
R24 0,499749526 0,35390639
R25 0,48206509 0,33049409
R26 0,325951035 0,26488724
Profitability study
Profitability analysis includes several ratios, including:1)Ratioofnetprofitmargin(R6)
The profit margin is negative in 2004 and 2005. This is mainly due to negative net results achieved by the company (363,316 and 209,984 respectively in 2004 and 2005) and the significant reduction in income (326,029 in 2004, they reach 175,479 in 2005). 2) Ratio of gross margin (R3)
This ratio provides approximation of the effectiveness of the firm exploitation activities. We note that the gross operating margin increased from 62.39% to 46.25%. This means generally that the profitability is less favorable and the company's financial situation is in degradation.3) Ratio of operating Margin (R4)
The ratio of operating margin is negative, due to negative operating results of the company (234,826 in 2004
2012 377
and 421,175 in 2005) and the significant drop in income is almost 50%.4) Rate of assets return (R10)
This rate of return is negative for both 2004 and 2005, indicating a very poor business performance. Numerically, total assets decreased by 10.40% and the negative cumulative results (363,316and 209,984 respectively in 2004 and 2005) may explain this poor performance.5) Turnover of assets (R7)
This ratio has risen from 0,068 in 2004 to 0,041 in 2005. This rate has deteriorated due to the decrease in assets (4764394 in 2004 to 4,269,144 in 2005). Moreover, if we look at the income statement, we find that net revenues are very low levels (326,029 in 2004 and 175,479 in 2005) that are the major reason of the decrease in ratio.6)Rateofequityprofitability(R14)
The ratio indicates the rate of return for each Dinar reinvested or invested by the shareholders. We find
that the rate decreased by 12.82% in 2004 to 8% in 2005.Even if this rate is positive, in fact, is insignificant for two major reasons: the first is that the observed results are negative (363,316 and 209,984 respectively in 2004 and 2005) and the second, especially is that capital is too low.
All profitability ratios demonstrate that the company is not profitable.
Solvency study
For the solvency analysis, we are interested to the following ratios:1) Ratio of long-term debt (R17)
This ratio indicates the degree of dependence of the company towards its long term creditors. This ratio is negative for both 2004 and 2005. This is explained by the fact that equity is negative, so the long-term creditors do not easily accept to take a risk level higher than that of shareholders. It will be almost impossible for the company to seek financing in the short term given the lack of liquidity of the company.2) Debt capacity in the long and medium term (R21)
This ratio represents the debt capacity in the long and medium term of company. If this ratio is below than 0.5, then the possibilities to borrow again for the firm are very poor.
We note that in 2004, this ratio is negative (-72.3%) and also of the same sign in 2005 (-70%). Therefore conclude that the potential for debt for the company are very weak and almost nonexistent.
3)Ratiooffinancialexpenses(R22)This ratio is another indicator of solvency; it allows
assessing the financial position of the company. Indeed, the financial costs are enormous to even higher turnover achieved (112% of revenues in 2005 and 245% in 2004). These high rates thus make the firm more vulnerable.
These ratios indicate a greater vulnerability of the company against its creditors.
Liquidity study
The liquidity of a firm measures its ability to deal with its short-term obligations. The key ratios for liquidity assessment are:1) Working Capital Ratio (R24)
This ratio shows the extent to which current assets cover current liabilities. The overall liquidity increased from 0.5 in 2004 to 0.35 in 2005. The company does not even repay its short-term short debts by its short-term assets. In fact, the short-term assets declined in proportion much greater than short-term liabilities (54.35% for short-term assets and 35.54% for short-term liabilities). Since this ratio is very low, we conclude that there is no margin of safety that can cover a decline in value of assets.2) Relative liquidity ratio (R25)
This ratio measures the liquidity of the firm. We observe deterioration in this ratio (from 0.48 in 2004 to 0.33 in 2005). As a result, the company would be able to cover 33% of short-term liabilities in 2005. This company has serious liquidity problems therefore significant difficulties to pay its short-term debts.3)Immediateliquidityratio(R26)
This ratio reflects the proportion of current liabilities may be reimbursed by the liquidity immediately available. The latter covers only 32.59% of the short-term liabilities in 2004 and26.48% of the short-term liabilities in 2005.
These ratios show that the company having serious liquidity problems and thus will be unable to pay its current liabilities.
Financial analysis conclusion
Following the financial analysis of the firm in question we found that it has several deficiencies including:
• Negative equity capital;• Brute margin down;• Negative results of the exercise;• Low cash flow;
Hamdi M. - Prediction of Financial Distress for Tunisian Firms: A Comparative Study Between Financial Analysis and Neuronal Analysis
Manel Hamdi
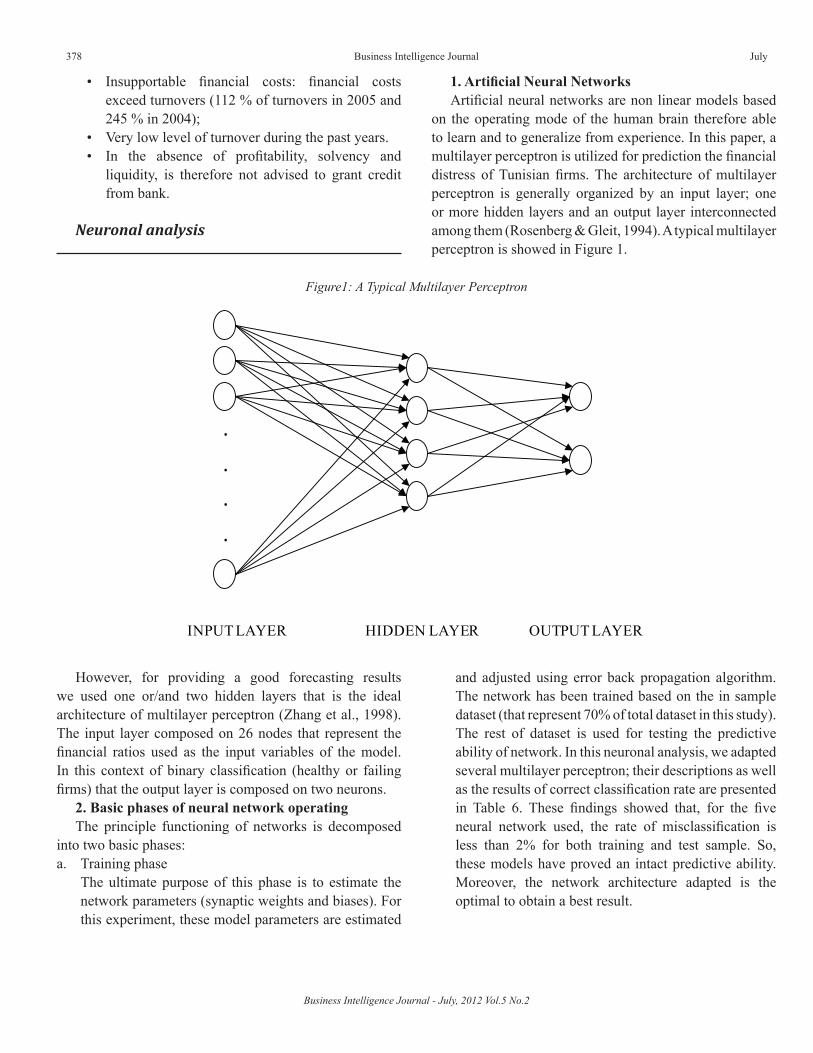
Business Intelligence Journal - July, 2012 Vol.5 No.2
378 Business Intelligence Journal July
• Insupportable financial costs: financial costs exceed turnovers (112 % of turnovers in 2005 and 245 % in 2004);
• Very low level of turnover during the past years. • In the absence of profitability, solvency and
liquidity, is therefore not advised to grant credit from bank.
Neuronal analysis
1.ArtificialNeuralNetworksArtificial neural networks are non linear models based
on the operating mode of the human brain therefore able to learn and to generalize from experience. In this paper, a multilayer perceptron is utilized for prediction the financial distress of Tunisian firms. The architecture of multilayer perceptron is generally organized by an input layer; one or more hidden layers and an output layer interconnected among them (Rosenberg & Gleit, 1994). A typical multilayer perceptron is showed in Figure 1.
.
.
.
.
INPUT LAYER HIDDEN LAYER OUTPUT LAYER
Figure1: A Typical Multilayer Perceptron
However, for providing a good forecasting results we used one or/and two hidden layers that is the ideal architecture of multilayer perceptron (Zhang et al., 1998). The input layer composed on 26 nodes that represent the financial ratios used as the input variables of the model. In this context of binary classification (healthy or failing firms) that the output layer is composed on two neurons.
2. Basic phases of neural network operatingThe principle functioning of networks is decomposed
into two basic phases:a. Training phase
The ultimate purpose of this phase is to estimate the network parameters (synaptic weights and biases). For this experiment, these model parameters are estimated
and adjusted using error back propagation algorithm. The network has been trained based on the in sample dataset (that represent 70% of total dataset in this study). The rest of dataset is used for testing the predictive ability of network. In this neuronal analysis, we adapted several multilayer perceptron; their descriptions as well as the results of correct classification rate are presented in Table 6. These findings showed that, for the five neural network used, the rate of misclassification is less than 2% for both training and test sample. So, these models have proved an intact predictive ability. Moreover, the network architecture adapted is the optimal to obtain a best result.

2012 379
Networks descriptions Correct classification (%)
training sample test sample
Network ATransfer function
Hidden layer(12 nodes)
Output layer(2 nodes)
98.9% 98.3%(One-layer
perceptron)sigmoid sigmoid
Network BTransfer function
Hidden layer(12 nodes)
Output layer(2 nodes)
98.5% 98.1%(One-layer
perceptron)tang
hyperbolictang
hyperbolic
Network CTransfer function
1st hidden layer
(4 nodes)
2sd hidden layer
(3 nodes)
Output layer(2 nodes)
98.5% 98.9%(Two-layer
perceptron)tang
hyperbolic sigmoid sigmoid
Network DTransfer function
1st hidden layer
(4 nodes)
2sd hidden layer
(3 nodes)
Output layer(2 nodes)
98.6% 98.4%(Two-layer
perceptron) sigmoid sigmoid sigmoid
Network ETransfer function
1st hidden layer
(4 nodes)
2sd hidden layer
(3 nodes)
Output layer(2 nodes)
98.3% 98.3%(Two-layer
perceptron)tang
hyperbolictang
hyperbolictang
hyperbolic
Table 6. Results of Correct Classification Rate
a. Generalization phase Generalization is the main interest of artificial neural networks approach. At this phase after have built a system of rules as a result of the learning phase, the network generalizes these rules when presented a new set of data (Boné et al., 1996). In the next section, we found the empirical results of this phase when we used the characteristics of the firm test that not included in the learning set.
( ) ( ) ( ) ( ) ( )
+
+== ∑ ∑
− =
kbiasjbiasxjiwgkjwgxkfpJ
j
I
iik 2
1 1112 ,,,
b. Predictive network ability test (generalization test) The generalization test is certainly used to verify the predictive ability of the model. Based on the characteristics of the new client (financial ratios), the network will decide if it’s a good applicant or not, by generalizing from the cases that he knows (weights matrix). The findings of the generalization tests are obtained by applying the following model:
• One multilayer perceptron model
Where;I=Number of input variables; J=Number of neurons
in the hidden layer; K = Number of neurons in the output layer; g = Transfer function; W 1 = weights matrix of the
( ) ( ) ( ) ( ) ( ) ( ) ( )
+
+
+== ∑ ∑ ∑
− = =
kseuillseuiljseuilxjiwgljwgklwgxkfpL
l
J
j
I
iik 3
1 12
11123 ,,,,
hidden layer; W 2 = weights matrix of the output layer and p = failure probability of the firm.
• Two multilayer perceptron model
Hamdi M. - Prediction of Financial Distress for Tunisian Firms: A Comparative Study Between Financial Analysis and Neuronal Analysis
Manel Hamdi
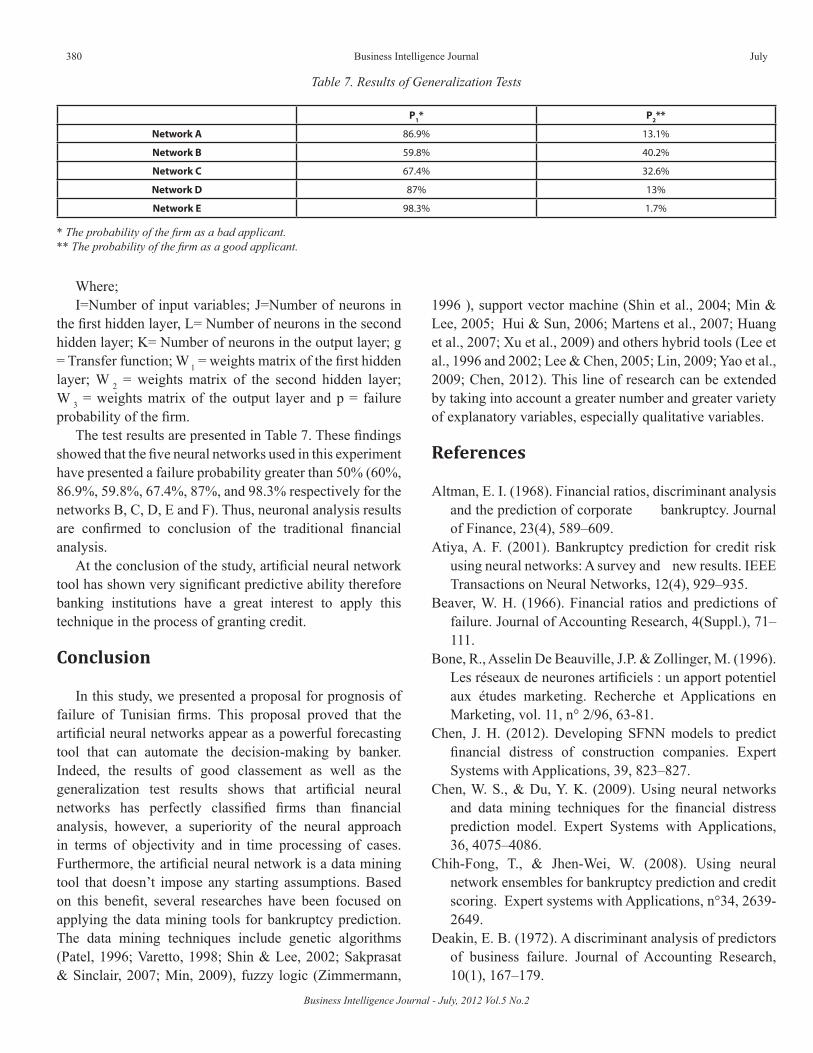
Business Intelligence Journal - July, 2012 Vol.5 No.2
380 Business Intelligence Journal July
Table 7. Results of Generalization Tests
P1* P2**
Network A 86.9% 13.1%
Network B 59.8% 40.2%
Network C 67.4% 32.6%
Network D 87% 13%
Network E 98.3% 1.7%
Where;I=Number of input variables; J=Number of neurons in
the first hidden layer, L= Number of neurons in the second hidden layer; K= Number of neurons in the output layer; g = Transfer function; W 1 = weights matrix of the first hidden layer; W 2 = weights matrix of the second hidden layer; W 3 = weights matrix of the output layer and p = failure probability of the firm.
The test results are presented in Table 7. These findings showed that the five neural networks used in this experiment have presented a failure probability greater than 50% (60%, 86.9%, 59.8%, 67.4%, 87%, and 98.3% respectively for the networks B, C, D, E and F). Thus, neuronal analysis results are confirmed to conclusion of the traditional financial analysis.
At the conclusion of the study, artificial neural network tool has shown very significant predictive ability therefore banking institutions have a great interest to apply this technique in the process of granting credit.
Conclusion
In this study, we presented a proposal for prognosis of failure of Tunisian firms. This proposal proved that the artificial neural networks appear as a powerful forecasting tool that can automate the decision-making by banker. Indeed, the results of good classement as well as the generalization test results shows that artificial neural networks has perfectly classified firms than financial analysis, however, a superiority of the neural approach in terms of objectivity and in time processing of cases. Furthermore, the artificial neural network is a data mining tool that doesn’t impose any starting assumptions. Based on this benefit, several researches have been focused on applying the data mining tools for bankruptcy prediction. The data mining techniques include genetic algorithms (Patel, 1996; Varetto, 1998; Shin & Lee, 2002; Sakprasat & Sinclair, 2007; Min, 2009), fuzzy logic (Zimmermann,
1996 ), support vector machine (Shin et al., 2004; Min & Lee, 2005; Hui & Sun, 2006; Martens et al., 2007; Huang et al., 2007; Xu et al., 2009) and others hybrid tools (Lee et al., 1996 and 2002; Lee & Chen, 2005; Lin, 2009; Yao et al., 2009; Chen, 2012). This line of research can be extended by taking into account a greater number and greater variety of explanatory variables, especially qualitative variables.
References
Altman, E. I. (1968). Financial ratios, discriminant analysis and the prediction of corporate bankruptcy. Journal of Finance, 23(4), 589–609.
Atiya, A. F. (2001). Bankruptcy prediction for credit risk using neural networks: A survey and new results. IEEE Transactions on Neural Networks, 12(4), 929–935.
Beaver, W. H. (1966). Financial ratios and predictions of failure. Journal of Accounting Research, 4(Suppl.), 71–111.
Bone, R., Asselin De Beauville, J.P. & Zollinger, M. (1996). Les réseaux de neurones artificiels : un apport potentiel aux études marketing. Recherche et Applications en Marketing, vol. 11, n° 2/96, 63-81.
Chen, J. H. (2012). Developing SFNN models to predict financial distress of construction companies. Expert Systems with Applications, 39, 823–827.
Chen, W. S., & Du, Y. K. (2009). Using neural networks and data mining techniques for the financial distress prediction model. Expert Systems with Applications, 36, 4075–4086.
Chih-Fong, T., & Jhen-Wei, W. (2008). Using neural network ensembles for bankruptcy prediction and credit scoring. Expert systems with Applications, n°34, 2639-2649.
Deakin, E. B. (1972). A discriminant analysis of predictors of business failure. Journal of Accounting Research, 10(1), 167–179.
* The probability of the firm as a bad applicant.** The probability of the firm as a good applicant.
2012 381
Fernández, E., & Olmeda, I. (1995). Bankruptcy prediction with Artificial Neural Networks. From Natural to Artificial Neural Computation, Volume 930, 1142-1146.
Hartvigsen, G. (1992). Limitations of Knowledge-Based Systems for Financial Analysis in Banking. Expert Systems with Applications, Vol. 4, 19-32.
Huang, C.L., Chen, M.C., & Wang, C.J. (2007). Credit scoring with a data mining approach based on support vector machines, Expert Systems with Applications. 33 (4), 847–856.
Hui, X. F., & Sun, J. (2006). An Application of Support Vector Machine to Companies’ Financial Distress Prediction. Modeling Decisions for Artificial Intelligence, Volume 3885/2006, 274-282.
Khashman, A. (2010). Neural networks for credit risk evaluation: Investigation of different neural models and learning schemes, Expert Systems with Applications, 37 (9), 6233–6239.
Khashman, A. (2011). Credit risk evaluation using neural networks: Emotional versus conventional models. Applied Soft Computing, 11, 5477–5484.
Lam, M. (2004). Neural networks techniques for financial performance prediction: Integrating fundamental and technical analysis. Decision Support Systems, 34(4), 567–581.
Lee, K. C., Han, I., & Kwon, Y. (1996). Hybrid neural network models for bankruptcy predictions. Decision Support Systems, 18(1), 63–72.
Lee, T.S., & Chen, I.F. (2005). A two-stage hybrid credit scoring model using artificial neural networks and multivariate adaptive regression splines. Expert Systems with Applications. 28, 743–752.
Lee, T.S., Chiu, C.C. & Lu, C.J. (2002). Credit scoring using the hybrid neural discriminant technique. Expert Systems with Applications, 23 (3). 245–254.
Leshno, M., & Spector, Y. (1996). Neural network prediction analysis: The bankruptcy case. Neurocomputing, 10(2), 125–147.
Lin, S.L. (2009). A new two-stage hybrid approach of credit risk in banking industry. Expert Systems with Applications, 36 (4), 8333–8341.
Martens, D., Baesens, B., Gestel, T.V., & Vanthienen, J. (2007). Comprehensible credit scoring models using rule extraction from support vector machines, Eur. J. Oper. Res. 183, 1466–1476.
Min, J. H., & Jeong, C. (2009). A binary classification method for bankruptcy prediction. Expert Systems with Applications, 36, 5256–5263.
Min, J.H. & Lee, Y.C. (2005). Bankruptcy prediction using support vector machine with optimal choice of kernel function parameters, Expert Systems with Applications, 28 (4), 603–614.
Odom, M., & Sharda, R. (1990). A neural network model for bankruptcy prediction. In Proceedings of the international joint conference on neural networks Vol. 2, IEEE Press, Alamitos, CA (p. 163–168).
Ohlson, J. A. (1980). Financial ratios and the probabilistic prediction of bankruptcy. Journal of Accounting Research, 18(1), 109–131.
Patel, D. (1996). Using genetic algorithms to construct a network for financial prediction. In Proceedings of SPIE – The International Society for Optical Engineering, San Jose CA (pp. 204–213).
Perez, M. (2006). Artificial neural networks and bankruptcy forecasting: a state of the art. Neural Computing & Applications, n°15, 154-163.
Rosenberg, E. & Gleit, A. (1994). Quantitative methods in credit management: a survey. Operations Research, 42 (4): 589-613.
Sakprasat, S., & Sinclair, M.C. (2007). Classification rule mining for automatic credit approval using genetic programming, in: Proceedings of the IEEE Congress on Evolutionary Computation, Singapore, September 2007, 548–555.
Shin, K. S., & Lee, Y. J. (2002). A genetic algorithm application in bankruptcy prediction modeling. Expert Systems with Applications, 23(3), 321–328.
Shin, K. S., Lee, K. J., & Kim, H. J. (2004). Support Vector Machines Approach to Pattern Detection in Bankruptcy Prediction and Its Contingency. Neural Information Processing, Volume 3316/2004, 1254-1259.
Tam, K. Y., & Kiang, M. Y. (1992). Managerial applications of neural networks: The case of bank failure predictions. Management Science, 38(7), 926–947.
Tsai, C.F., & Wu, J.W. (2008). Using neural network ensembles for bankruptcy prediction and credit scoring. Expert Systems with Applications, 34 (4), 2639–2649.
Udo, G. (1993). Neural network performance on the bankruptcy classification problem. Computers and Industrial Engineering, 25(1–3), 337–380.
Varetto, F. (1998). Genetic algorithm applications in the analysis of insolvency risk. Journal of Banking and Finance, 22(10-11), 1421–1439.
Wall, A. (1919). Study of credit barometrics. Federal Reserve Bulletin, pp. 229-243.
Hamdi M. - Prediction of Financial Distress for Tunisian Firms: A Comparative Study Between Financial Analysis and Neuronal Analysis
Manel Hamdi

Business Intelligence Journal - July, 2012 Vol.5 No.2
382 Business Intelligence Journal July
Weigend & Gershenfeld (1994). Time series predictions: Forecasting the future and understanding the past. Addison-Wesley, Reading, MA.
Wilson, R. L., & Sharda, R. (1994). Bankruptcy prediction using neural networks. Decision Support Systems, 11, 545–557.
Witkowska, D. (1999). Applying artificial neural networks to bank-decision simulations. International Advances in Economic Research, Volume 5, Number 3, 350-368.
Xidonas, P., Mavrotas, G., & Psarras, J. (2009). A multicriteria methodology for equity selection using financial analysis. Computers & Operations Research, 36, 3187 – 3203.
Xu, X., Zhou, C., & Wang, Z. (2009). Credit scoring algorithm based on link analysis ranking with support vector machine, Expert Systems with Applications, 36 (2), 2625–2632.
Yao, P., Wu, C., & Yao, M. (2009). Credit Risk Assessment Model of Commercial Banks Based on Fuzzy Neural Network. Advances in Neural Networks, Volume 5551/2009, 976-985.
Zhang, G., Patuwo, E. B., & Hu, M. Y. (1998). Forecasting with artificial neural network: The state of the art. International Journal of Forecasting, 14, 35-62.
Zimmermann, H. J. (1996). Fuzzy set theory and its applications. London: Kluwer Academic Publishers
Zmijewski, M. E. (1984). Methodological issues related to the estimation of financial distress prediction models. Journal of Accounting Research, 22(Suppl.), 59–82.
Zurada, J., Foster, B. P., & Ward, T. J. (2002). Investigation of Artificial Neural Networks for Classifying Levels of Financial Distress of Firms: The Case of an Unbalanced Training Sample. Knowledge Discovery for Business Information Systems, Volume 600, 397-424.
2012 383
USING ASSOCIATION RULES FOR EVALUATING AND PREDICTING RISK FACTORS IN BUSINESS INTELLIGENCE
SYSTEM
Mohammad JafarTarokha, Elham TeymournejadaDepartment of Industrial Engineering, K.N. Toosi University of Technology, Tehran, Iran
Email: [email protected]
AbstractDuring recent years business intelligence (BI) is being so much attention. Based on natural complication and risky of these kind
of systems, we discussion the risk factors and evaluating them in BI projects in Iran. After analyzing related studies in this scope, first risk factors identify in life cycle of BI and by distributing the questioner between individuals whom are in field of implementation and developing BI systems, relation between risk factors and probability of their occurrence define by using association rules. Key words: Business Intelligence, Risk Factors, Risk Assessment, Critical Success Factors, Bi Life Cycle.
The advent of low-cost data storage technologies and the wide availability of Internet connections have made it easier for individuals and organizations to access large amounts of data, such data are often heterogeneous in origin, content and representation, as they include commercial, financial and administrative transactions, web navigation paths, emails, texts and hypertexts, and the Results of clinical tests, to name just a few examples [1, 2].
Their accessibility opens up promising scenarios and opportunities, and raises an enticing question: is it possible to convert such data into information and knowledge that can then be used by decision makers to aid and improve the governance of enterprises and of public administration? BI may be defined as a set of mathematical models and analysis methodologies that exploit the available data to generate information and knowledge useful for complex decision-making processes[4].The main purpose of business intelligence systems is to provide knowledge workers with tools and methodologies that allow them to make effective and timely decisions. Effective decisions , the application of rigorous analytical methods allows decision makers to rely on information and knowledge which are more dependable[ 3,4].As a result, they are able to make better decisions and devise action plans that allow their objectives to be reached in a more effective way.
Timely decisions, enterprises operate in economic environments characterized by growing levels of competition and high dynamism. As a consequence, the ability to rapidly react to the actions of competitors and to
new market conditions is a critical factor in the success or even the survival of a company [2,5].
Gartner said worldwide BI platform, analytic application and performance management software revenue reached $10.5 billion in 2010 .According to Gartner that figure a 13.4 increase over revenue in 2009[6].IT projects have a high failure rate, a study of 7400 IT projects show that 34% are late or over budget, 31% are abandoned, scaled or modified, and only 24% are completed on time and in budget [7].BI as a category of software projects, suffers a failure rate of at least 80%.
The implementation of a BI system is not a conventional application-based IT project (such as an operational or transactional system), which has been the focus of many critical success factors (CSF) studies [8]. Implementing a BI system is not a simple activity ,entailing merely the purchase of a combination of software and hardware; rather, it is a complex undertaking requiring appropriate infrastructure and resources over a lengthy period [8,9,10]. Our works are focused on the importance of BI risk management through the BI life cycle .The main purposes of our work as follow:• Review and analyze key Master and PHD thesis on BI,
ERP, and DataWarhousing (DW) project from a risk management point of view.
• Review and analyze key Master and PHD thesis on BI, ERP, and DW project from a critical success / failure factors.
• Clarify risk factors in which stage of the BI life cycle.
Tarokh M. J., Teymournejad E. - Using Association Rules for Evaluating and Predicting Risk Factors in Business Intelligence System
Mohammad JafarTarokh, Elham Teymournejad
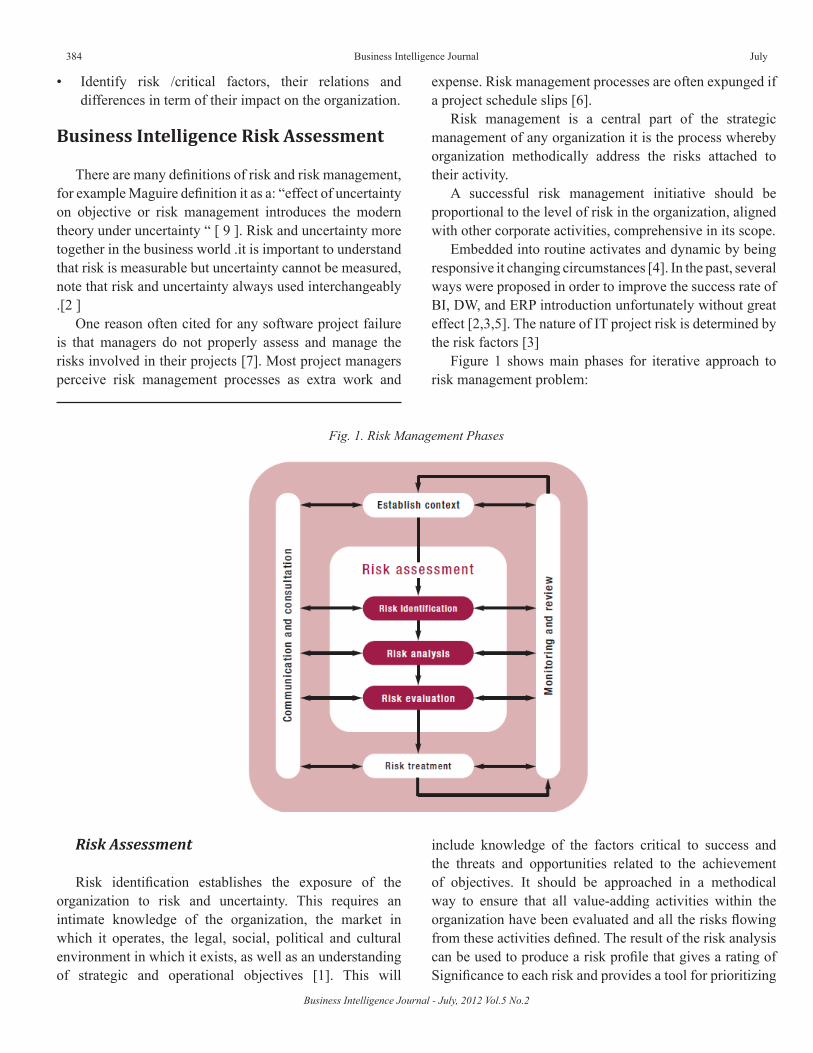
Business Intelligence Journal - July, 2012 Vol.5 No.2
384 Business Intelligence Journal July
• Identify risk /critical factors, their relations and differences in term of their impact on the organization.
Business Intelligence Risk Assessment
There are many definitions of risk and risk management, for example Maguire definition it as a: “effect of uncertainty on objective or risk management introduces the modern theory under uncertainty “ [ 9 ]. Risk and uncertainty more together in the business world .it is important to understand that risk is measurable but uncertainty cannot be measured, note that risk and uncertainty always used interchangeably .[2 ]
One reason often cited for any software project failure is that managers do not properly assess and manage the risks involved in their projects [7]. Most project managers perceive risk management processes as extra work and
expense. Risk management processes are often expunged if a project schedule slips [6].
Risk management is a central part of the strategic management of any organization it is the process whereby organization methodically address the risks attached to their activity.
A successful risk management initiative should be proportional to the level of risk in the organization, aligned with other corporate activities, comprehensive in its scope.
Embedded into routine activates and dynamic by being responsive it changing circumstances [4]. In the past, several ways were proposed in order to improve the success rate of BI, DW, and ERP introduction unfortunately without great effect [2,3,5]. The nature of IT project risk is determined by the risk factors [3]
Figure 1 shows main phases for iterative approach to risk management problem:
Fig. 1. Risk Management Phases
Risk Assessment
Risk identification establishes the exposure of the organization to risk and uncertainty. This requires an intimate knowledge of the organization, the market in which it operates, the legal, social, political and cultural environment in which it exists, as well as an understanding of strategic and operational objectives [1]. This will
include knowledge of the factors critical to success and the threats and opportunities related to the achievement of objectives. It should be approached in a methodical way to ensure that all value-adding activities within the organization have been evaluated and all the risks flowing from these activities defined. The result of the risk analysis can be used to produce a risk profile that gives a rating of Significance to each risk and provides a tool for prioritizing
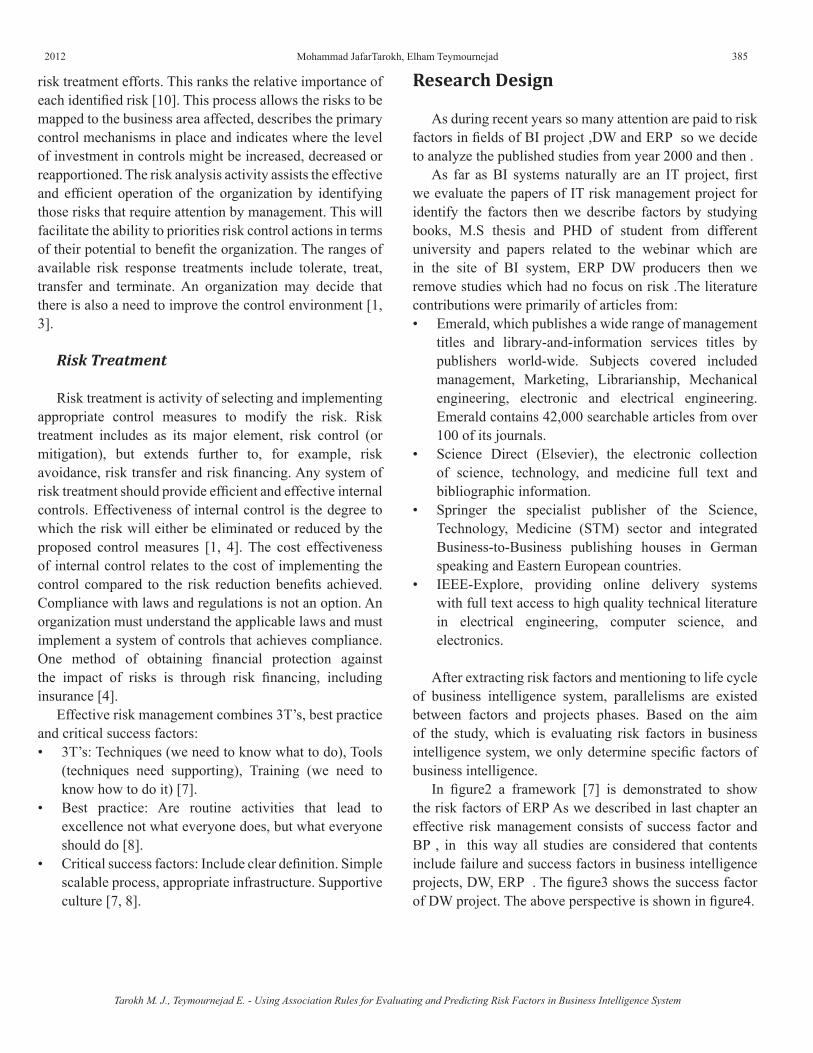
2012 385
risk treatment efforts. This ranks the relative importance of each identified risk [10]. This process allows the risks to be mapped to the business area affected, describes the primary control mechanisms in place and indicates where the level of investment in controls might be increased, decreased or reapportioned. The risk analysis activity assists the effective and efficient operation of the organization by identifying those risks that require attention by management. This will facilitate the ability to priorities risk control actions in terms of their potential to benefit the organization. The ranges of available risk response treatments include tolerate, treat, transfer and terminate. An organization may decide that there is also a need to improve the control environment [1, 3].
Risk Treatment
Risk treatment is activity of selecting and implementing appropriate control measures to modify the risk. Risk treatment includes as its major element, risk control (or mitigation), but extends further to, for example, risk avoidance, risk transfer and risk financing. Any system of risk treatment should provide efficient and effective internal controls. Effectiveness of internal control is the degree to which the risk will either be eliminated or reduced by the proposed control measures [1, 4]. The cost effectiveness of internal control relates to the cost of implementing the control compared to the risk reduction benefits achieved. Compliance with laws and regulations is not an option. An organization must understand the applicable laws and must implement a system of controls that achieves compliance. One method of obtaining financial protection against the impact of risks is through risk financing, including insurance [4].
Effective risk management combines 3T’s, best practice and critical success factors:• 3T’s: Techniques (we need to know what to do), Tools
(techniques need supporting), Training (we need to know how to do it) [7].
• Best practice: Are routine activities that lead to excellence not what everyone does, but what everyone should do [8].
• Critical success factors: Include clear definition. Simple scalable process, appropriate infrastructure. Supportive culture [7, 8].
Research Design
As during recent years so many attention are paid to risk factors in fields of BI project ,DW and ERP so we decide to analyze the published studies from year 2000 and then .
As far as BI systems naturally are an IT project, first we evaluate the papers of IT risk management project for identify the factors then we describe factors by studying books, M.S thesis and PHD of student from different university and papers related to the webinar which are in the site of BI system, ERP DW producers then we remove studies which had no focus on risk .The literature contributions were primarily of articles from:• Emerald, which publishes a wide range of management
titles and library-and-information services titles by publishers world-wide. Subjects covered included management, Marketing, Librarianship, Mechanical engineering, electronic and electrical engineering. Emerald contains 42,000 searchable articles from over 100 of its journals.
• Science Direct (Elsevier), the electronic collection of science, technology, and medicine full text and bibliographic information.
• Springer the specialist publisher of the Science, Technology, Medicine (STM) sector and integrated Business-to-Business publishing houses in German speaking and Eastern European countries.
• IEEE-Explore, providing online delivery systems with full text access to high quality technical literature in electrical engineering, computer science, and electronics.
After extracting risk factors and mentioning to life cycle of business intelligence system, parallelisms are existed between factors and projects phases. Based on the aim of the study, which is evaluating risk factors in business intelligence system, we only determine specific factors of business intelligence.
In figure2 a framework [7] is demonstrated to show the risk factors of ERP As we described in last chapter an effective risk management consists of success factor and BP , in this way all studies are considered that contents include failure and success factors in business intelligence projects, DW, ERP . The figure3 shows the success factor of DW project. The above perspective is shown in figure4.
Tarokh M. J., Teymournejad E. - Using Association Rules for Evaluating and Predicting Risk Factors in Business Intelligence System
Mohammad JafarTarokh, Elham Teymournejad
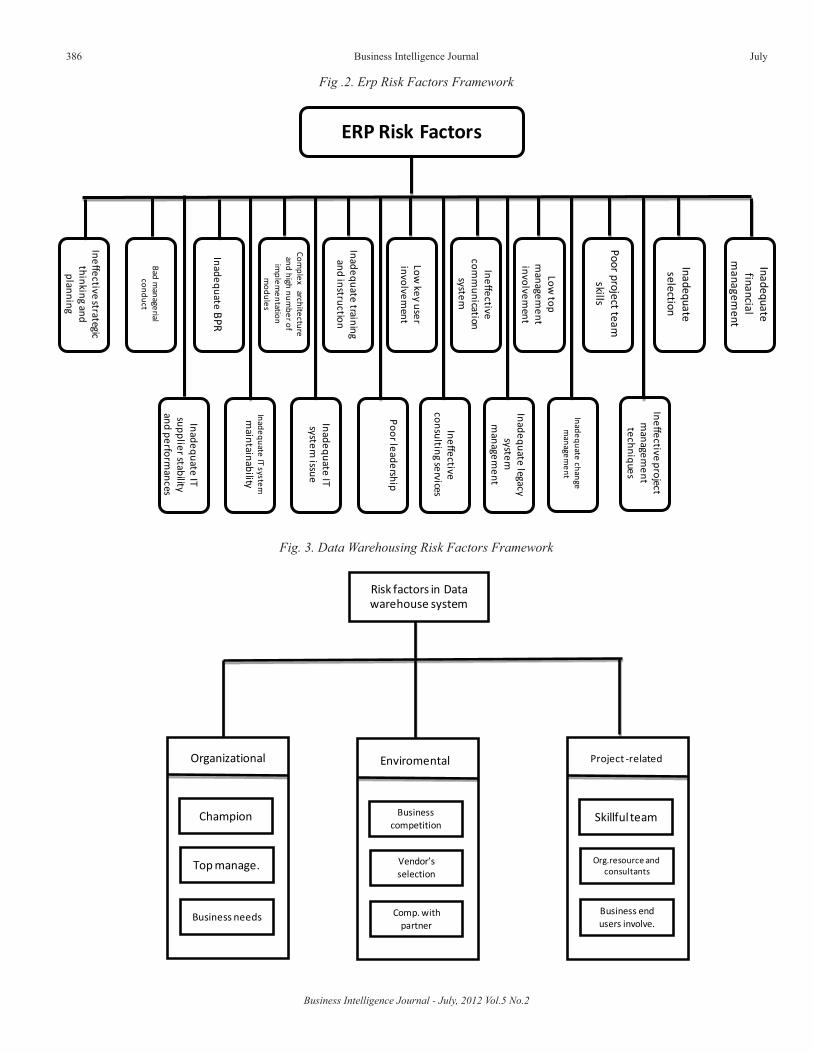
Business Intelligence Journal - July, 2012 Vol.5 No.2
386 Business Intelligence Journal July
Inadequatelegacy
systemm
anagement
Low key user
involvement
Inadequate training and instruction
Complex architecture
and high number of
implem
entation m
odules
InadequateB
PR
Bad managerial
conduct
Ineffectiveconsulting
services
Poorleadership
InadequateIT
systemissue
InadequateIT system
maintainability
Inadequate IT supplier stability
and performances
Ineffectivestrategic
thinkingand
planning
Low top
managem
ent involvem
ent
Ineffective com
munication
system
Inadequate selection
Poor project team
skills
Ineffectiveproject
managem
enttechniques
Inadequatechange
managem
ent
Inadequate financial
managem
ent
ERP Risk Factors
Fig .2. Erp Risk Factors Framework
Fig. 3. Data Warehousing Risk Factors Framework
Risk factors in Data warehouse system
Organizational
Champion
Top manage.
Business needs
Enviromental
Business competition
Vendor’s selection
Comp. with partner
Project -related
Skillful team
Org.resource and consultants
Business end users involve.
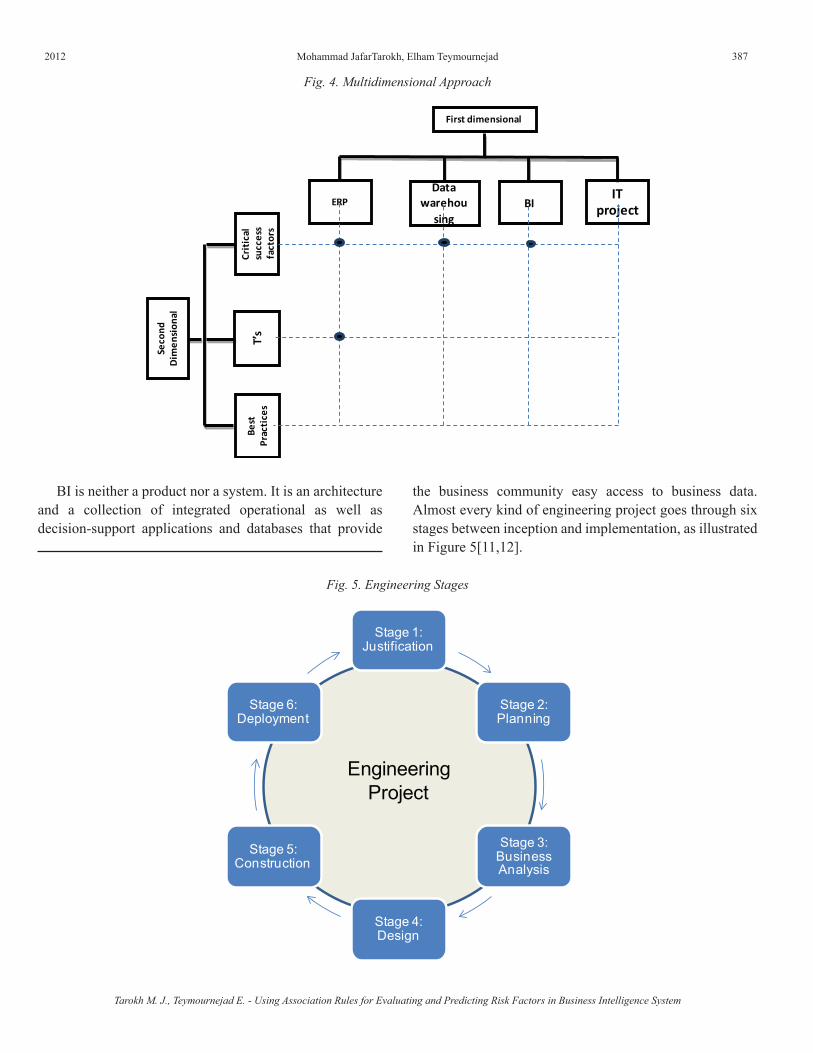
2012 387
Fig. 4. Multidimensional Approach
Seco
ndD
imen
sion
al
Best
Prac
tice
sT’
s Cr
itic
alsu
cces
sfa
ctor
s
First dimensional
ERP Data
warehousing
BI IT
project
BI is neither a product nor a system. It is an architecture and a collection of integrated operational as well as decision-support applications and databases that provide
the business community easy access to business data. Almost every kind of engineering project goes through six stages between inception and implementation, as illustrated in Figure 5[11,12].
Stage 1: Justification
Stage 2: Planning
Stage 3: Business Analysis
Stage 4: Design
Stage 5: Construction
Stage 6: Deployment
EngineeringProject
Fig. 5. Engineering Stages
Tarokh M. J., Teymournejad E. - Using Association Rules for Evaluating and Predicting Risk Factors in Business Intelligence System
Mohammad JafarTarokh, Elham Teymournejad
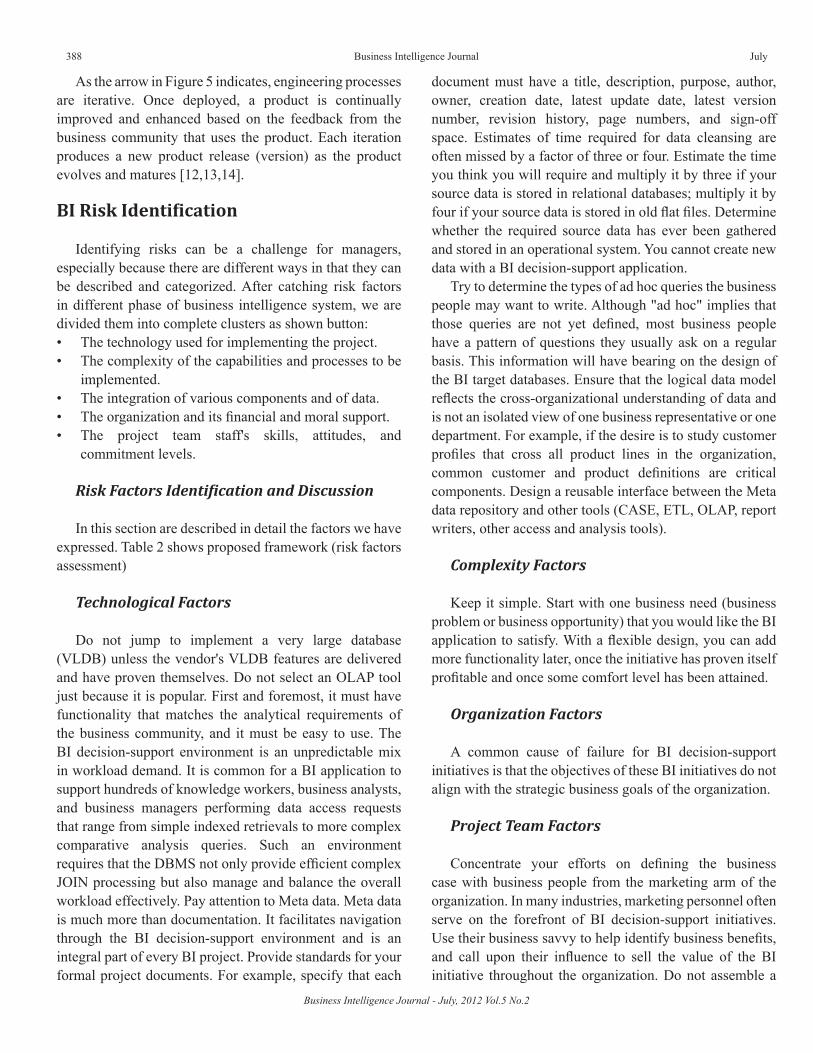
Business Intelligence Journal - July, 2012 Vol.5 No.2
388 Business Intelligence Journal July
As the arrow in Figure 5 indicates, engineering processes are iterative. Once deployed, a product is continually improved and enhanced based on the feedback from the business community that uses the product. Each iteration produces a new product release (version) as the product evolves and matures [12,13,14].
BI Risk Identification
Identifying risks can be a challenge for managers, especially because there are different ways in that they can be described and categorized. After catching risk factors in different phase of business intelligence system, we are divided them into complete clusters as shown button:• The technology used for implementing the project.• The complexity of the capabilities and processes to be
implemented.• The integration of various components and of data.• The organization and its financial and moral support.• The project team staff's skills, attitudes, and
commitment levels.
Risk Factors Identification and Discussion
In this section are described in detail the factors we have expressed. Table 2 shows proposed framework (risk factors assessment)
Technological Factors
Do not jump to implement a very large database (VLDB) unless the vendor's VLDB features are delivered and have proven themselves. Do not select an OLAP tool just because it is popular. First and foremost, it must have functionality that matches the analytical requirements of the business community, and it must be easy to use. The BI decision-support environment is an unpredictable mix in workload demand. It is common for a BI application to support hundreds of knowledge workers, business analysts, and business managers performing data access requests that range from simple indexed retrievals to more complex comparative analysis queries. Such an environment requires that the DBMS not only provide efficient complex JOIN processing but also manage and balance the overall workload effectively. Pay attention to Meta data. Meta data is much more than documentation. It facilitates navigation through the BI decision-support environment and is an integral part of every BI project. Provide standards for your formal project documents. For example, specify that each
document must have a title, description, purpose, author, owner, creation date, latest update date, latest version number, revision history, page numbers, and sign-off space. Estimates of time required for data cleansing are often missed by a factor of three or four. Estimate the time you think you will require and multiply it by three if your source data is stored in relational databases; multiply it by four if your source data is stored in old flat files. Determine whether the required source data has ever been gathered and stored in an operational system. You cannot create new data with a BI decision-support application.
Try to determine the types of ad hoc queries the business people may want to write. Although "ad hoc" implies that those queries are not yet defined, most business people have a pattern of questions they usually ask on a regular basis. This information will have bearing on the design of the BI target databases. Ensure that the logical data model reflects the cross-organizational understanding of data and is not an isolated view of one business representative or one department. For example, if the desire is to study customer profiles that cross all product lines in the organization, common customer and product definitions are critical components. Design a reusable interface between the Meta data repository and other tools (CASE, ETL, OLAP, report writers, other access and analysis tools).
Complexity Factors
Keep it simple. Start with one business need (business problem or business opportunity) that you would like the BI application to satisfy. With a flexible design, you can add more functionality later, once the initiative has proven itself profitable and once some comfort level has been attained.
Organization Factors
A common cause of failure for BI decision-support initiatives is that the objectives of these BI initiatives do not align with the strategic business goals of the organization.
Project Team Factors
Concentrate your efforts on defining the business case with business people from the marketing arm of the organization. In many industries, marketing personnel often serve on the forefront of BI decision-support initiatives. Use their business savvy to help identify business benefits, and call upon their influence to sell the value of the BI initiative throughout the organization. Do not assemble a
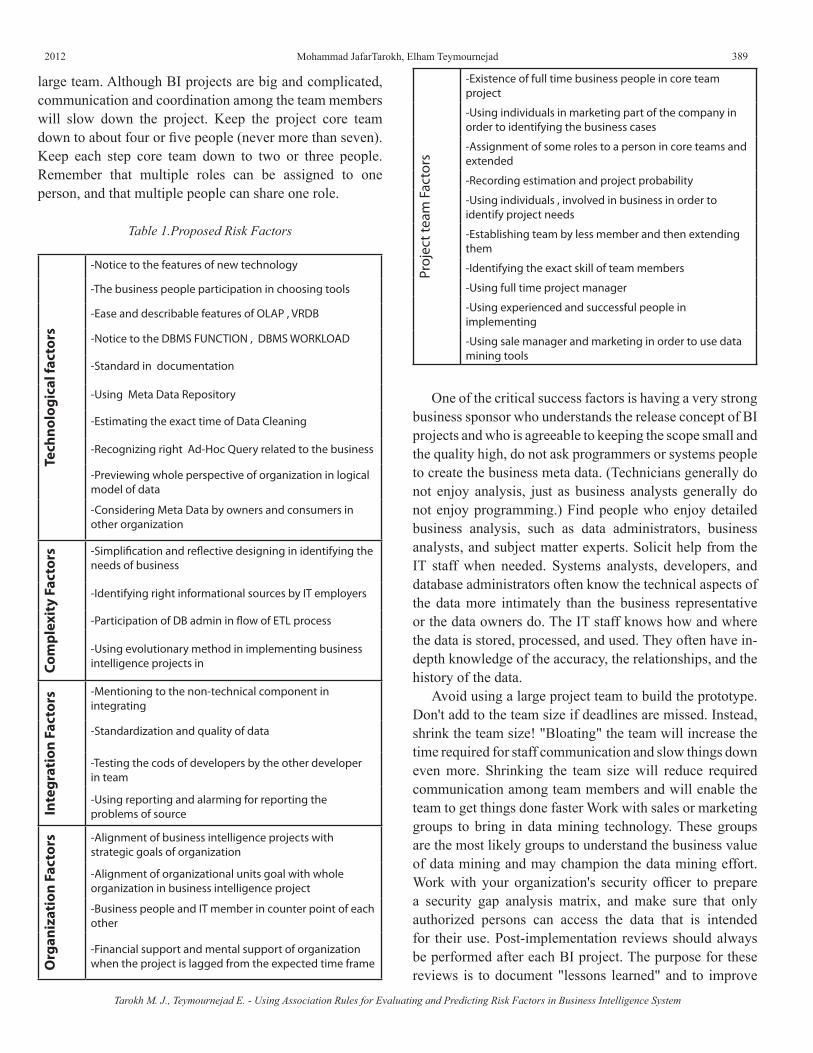
2012 389
large team. Although BI projects are big and complicated, communication and coordination among the team members will slow down the project. Keep the project core team down to about four or five people (never more than seven). Keep each step core team down to two or three people. Remember that multiple roles can be assigned to one person, and that multiple people can share one role.
Tech
nolo
gica
l fac
tors
-Notice to the features of new technology
-The business people participation in choosing tools
-Ease and describable features of OLAP , VRDB
-Notice to the DBMS FUNCTION , DBMS WORKLOAD
-Standard in documentation
-Using Meta Data Repository
-Estimating the exact time of Data Cleaning
-Recognizing right Ad-Hoc Query related to the business
-Previewing whole perspective of organization in logical model of data
-Considering Meta Data by owners and consumers in other organization
Com
plex
ity
Fact
ors -Simplification and reflective designing in identifying the
needs of business
-Identifying right informational sources by IT employers
-Participation of DB admin in flow of ETL process
-Using evolutionary method in implementing business intelligence projects in
Inte
grat
ion
Fact
ors -Mentioning to the non-technical component in
integrating
-Standardization and quality of data
-Testing the cods of developers by the other developer in team
-Using reporting and alarming for reporting the problems of source
Org
aniz
atio
n Fa
ctor
s -Alignment of business intelligence projects with strategic goals of organization
-Alignment of organizational units goal with whole organization in business intelligence project
-Business people and IT member in counter point of each other
-Financial support and mental support of organization when the project is lagged from the expected time frame
Proj
ect t
eam
Fac
tors
-Existence of full time business people in core team project
-Using individuals in marketing part of the company in order to identifying the business cases
-Assignment of some roles to a person in core teams and extended
-Recording estimation and project probability
-Using individuals , involved in business in order to identify project needs
-Establishing team by less member and then extending them
-Identifying the exact skill of team members
-Using full time project manager
-Using experienced and successful people in implementing
-Using sale manager and marketing in order to use data mining tools
Table 1.Proposed Risk Factors
One of the critical success factors is having a very strong business sponsor who understands the release concept of BI projects and who is agreeable to keeping the scope small and the quality high, do not ask programmers or systems people to create the business meta data. (Technicians generally do not enjoy analysis, just as business analysts generally do not enjoy programming.) Find people who enjoy detailed business analysis, such as data administrators, business analysts, and subject matter experts. Solicit help from the IT staff when needed. Systems analysts, developers, and database administrators often know the technical aspects of the data more intimately than the business representative or the data owners do. The IT staff knows how and where the data is stored, processed, and used. They often have in-depth knowledge of the accuracy, the relationships, and the history of the data.
Avoid using a large project team to build the prototype. Don't add to the team size if deadlines are missed. Instead, shrink the team size! "Bloating" the team will increase the time required for staff communication and slow things down even more. Shrinking the team size will reduce required communication among team members and will enable the team to get things done faster Work with sales or marketing groups to bring in data mining technology. These groups are the most likely groups to understand the business value of data mining and may champion the data mining effort. Work with your organization's security officer to prepare a security gap analysis matrix, and make sure that only authorized persons can access the data that is intended for their use. Post-implementation reviews should always be performed after each BI project. The purpose for these reviews is to document "lessons learned" and to improve
Tarokh M. J., Teymournejad E. - Using Association Rules for Evaluating and Predicting Risk Factors in Business Intelligence System
Mohammad JafarTarokh, Elham Teymournejad
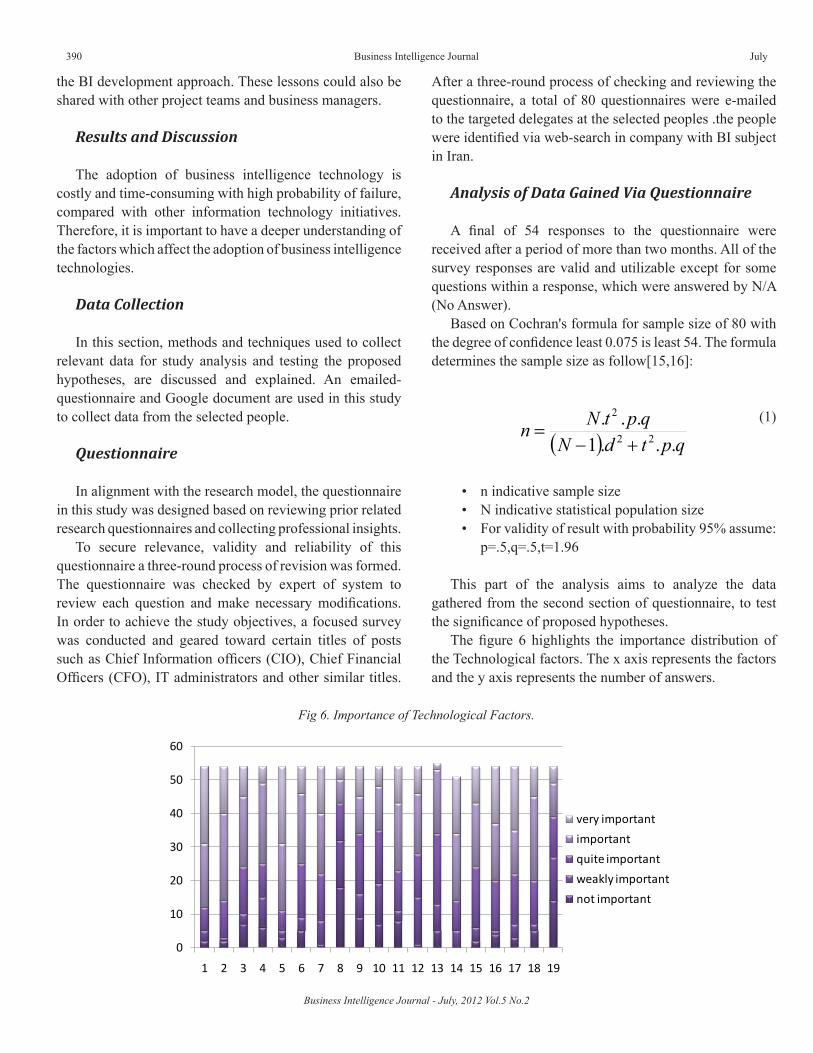
Business Intelligence Journal - July, 2012 Vol.5 No.2
390 Business Intelligence Journal July
the BI development approach. These lessons could also be shared with other project teams and business managers.
Results and Discussion
The adoption of business intelligence technology is costly and time-consuming with high probability of failure, compared with other information technology initiatives. Therefore, it is important to have a deeper understanding of the factors which affect the adoption of business intelligence technologies.
Data Collection
In this section, methods and techniques used to collect relevant data for study analysis and testing the proposed hypotheses, are discussed and explained. An emailed-questionnaire and Google document are used in this study to collect data from the selected people.
Questionnaire
In alignment with the research model, the questionnaire in this study was designed based on reviewing prior related research questionnaires and collecting professional insights.
To secure relevance, validity and reliability of this questionnaire a three-round process of revision was formed. The questionnaire was checked by expert of system to review each question and make necessary modifications. In order to achieve the study objectives, a focused survey was conducted and geared toward certain titles of posts such as Chief Information officers (CIO), Chief Financial Officers (CFO), IT administrators and other similar titles.
After a three-round process of checking and reviewing the questionnaire, a total of 80 questionnaires were e-mailed to the targeted delegates at the selected peoples .the people were identified via web-search in company with BI subject in Iran.
Analysis of Data Gained Via Questionnaire
A final of 54 responses to the questionnaire were received after a period of more than two months. All of the survey responses are valid and utilizable except for some questions within a response, which were answered by N/A (No Answer).
Based on Cochran's formula for sample size of 80 with the degree of confidence least 0.075 is least 54. The formula determines the sample size as follow[15,16]:
( ) qptdNqptNn
...1...
22
2
+−=
(1)
• n indicative sample size • N indicative statistical population size • For validity of result with probability 95% assume:
p=.5,q=.5,t=1.96
This part of the analysis aims to analyze the data gathered from the second section of questionnaire, to test the significance of proposed hypotheses.
The figure 6 highlights the importance distribution of the Technological factors. The x axis represents the factors and the y axis represents the number of answers.
Fig 6. Importance of Technological Factors.
0
10
20
30
40
50
60
1 2 3 4 5 6 7 8 9 10 11 12 13 14 15 16 17 18 19
very important
important
quite important
weakly important
not important
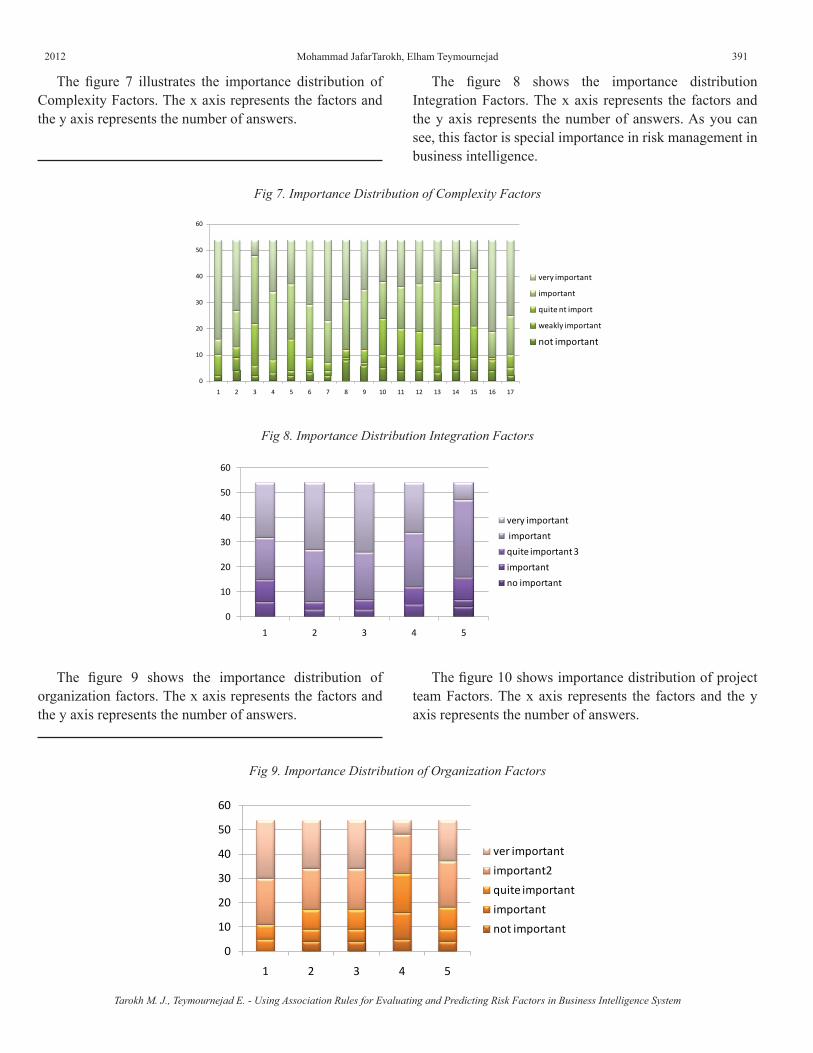
2012 391
The figure 7 illustrates the importance distribution of Complexity Factors. The x axis represents the factors and the y axis represents the number of answers.
Fig 7. Importance Distribution of Complexity Factors
0
10
20
30
40
50
60
1 2 3 4 5 6 7 8 9 10 11 12 13 14 15 16 17
very important
important
quite nt import
weakly important
not important
The figure 8 shows the importance distribution Integration Factors. The x axis represents the factors and the y axis represents the number of answers. As you can see, this factor is special importance in risk management in business intelligence.
0
10
20
30
40
50
60
1 2 3 4 5
very important
important
quite important 3
important
no important
Fig 8. Importance Distribution Integration Factors
The figure 9 shows the importance distribution of organization factors. The x axis represents the factors and the y axis represents the number of answers.
The figure 10 shows importance distribution of project team Factors. The x axis represents the factors and the y axis represents the number of answers.
0
10
20
30
40
50
60
1 2 3 4 5
ver important
important2
quite important
important
not important
Fig 9. Importance Distribution of Organization Factors
Tarokh M. J., Teymournejad E. - Using Association Rules for Evaluating and Predicting Risk Factors in Business Intelligence System
Mohammad JafarTarokh, Elham Teymournejad
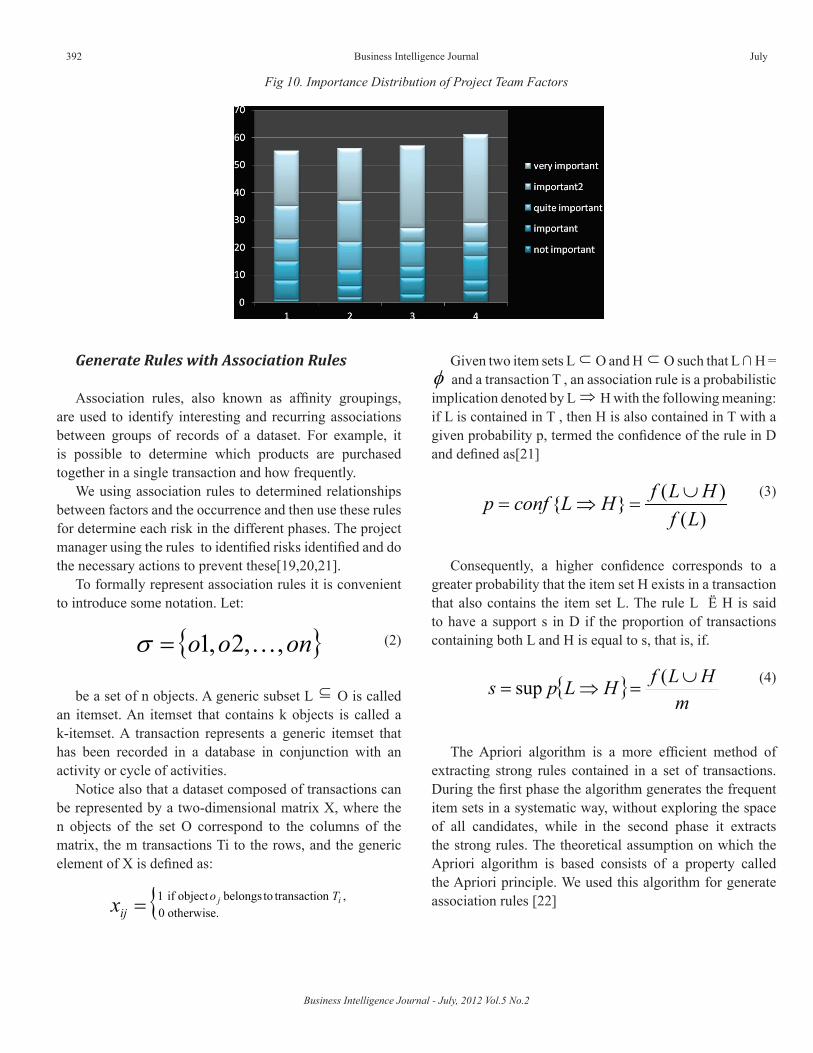
Business Intelligence Journal - July, 2012 Vol.5 No.2
392 Business Intelligence Journal July
Fig 10. Importance Distribution of Project Team Factors
Generate Rules with Association Rules
Association rules, also known as affinity groupings, are used to identify interesting and recurring associations between groups of records of a dataset. For example, it is possible to determine which products are purchased together in a single transaction and how frequently.
We using association rules to determined relationships between factors and the occurrence and then use these rules for determine each risk in the different phases. The project manager using the rules to identified risks identified and do the necessary actions to prevent these[19,20,21].
To formally represent association rules it is convenient to introduce some notation. Let:
{ }onoo ,,2,1 =σ (2)
be a set of n objects. A generic subset L ⊆ O is called an itemset. An itemset that contains k objects is called a k-itemset. A transaction represents a generic itemset that has been recorded in a database in conjunction with an activity or cycle of activities.
Notice also that a dataset composed of transactions can be represented by a two-dimensional matrix X, where the n objects of the set O correspond to the columns of the matrix, the m transactions Ti to the rows, and the generic element of X is defined as:
{ ,ntransactiotobelongsobjectif1otherwise.0
ij Toijx =
Given two item sets L ⊂ O and H ⊂ O such that L ∩ H = φ and a transaction T , an association rule is a probabilistic implication denoted by L ⇒ H with the following meaning: if L is contained in T , then H is also contained in T with a given probability p, termed the confidence of the rule in D and defined as[21]
( ){ }( )
f L Hp conf L Hf L∪
= ⇒ =(3)
Consequently, a higher confidence corresponds to a greater probability that the item set H exists in a transaction that also contains the item set L. The rule L Ë H is said to have a support s in D if the proportion of transactions containing both L and H is equal to s, that is, if.
{ }m
HLfHLps ∪=⇒=
(sup (4)
The Apriori algorithm is a more efficient method of extracting strong rules contained in a set of transactions. During the first phase the algorithm generates the frequent item sets in a systematic way, without exploring the space of all candidates, while in the second phase it extracts the strong rules. The theoretical assumption on which the Apriori algorithm is based consists of a property called the Apriori principle. We used this algorithm for generate association rules [22]
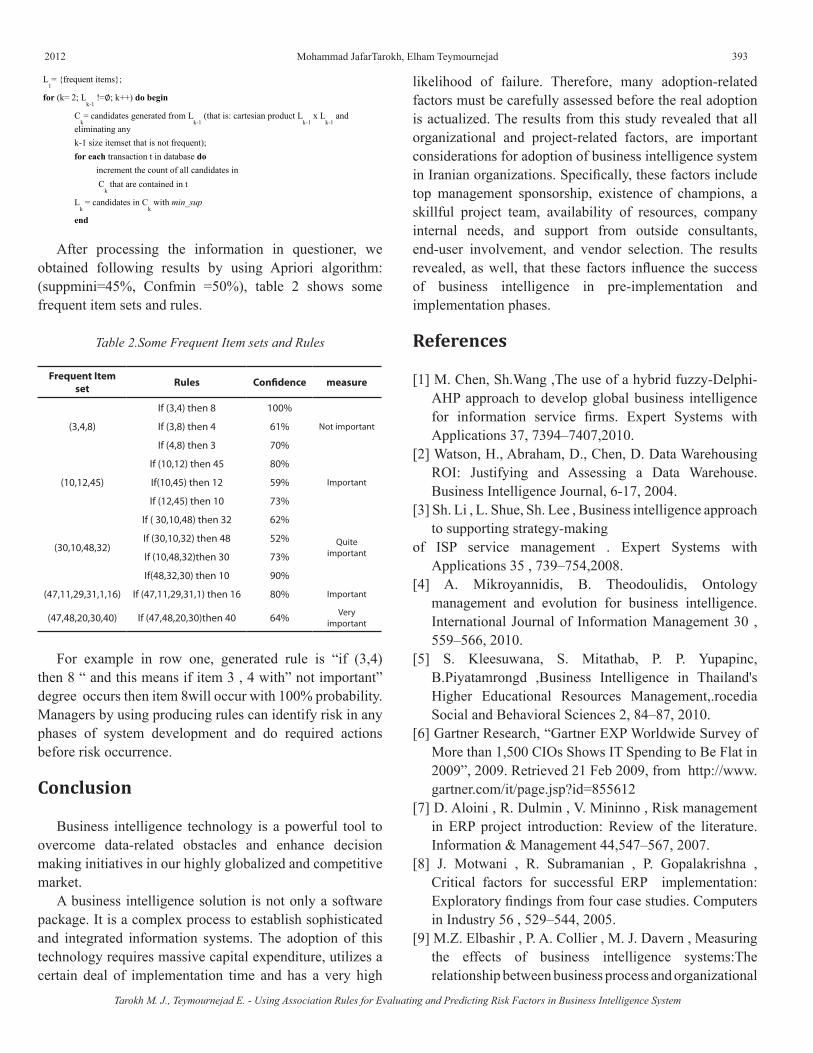
2012 393
L1= {frequent items};
for (k= 2; Lk-1
!=∅; k++) do begin
Ck= candidates generated from L
k-1 (that is: cartesian product L
k-1 x L
k-1 and
eliminating any
k-1 size itemset that is not frequent);
for each transaction t in database do
increment the count of all candidates in
Ck that are contained in t
Lk = candidates in C
k with min_sup
end
re
After processing the information in questioner, we obtained following results by using Apriori algorithm: (suppmini=45%, Confmin =50%), table 2 shows some frequent item sets and rules.
Table 2.Some Frequent Item sets and Rules
Frequent Item set Rules Confidence measure
(3,4,8)
If (3,4) then 8 100%
Not importantIf (3,8) then 4 61%
If (4,8) then 3 70%
(10,12,45)
If (10,12) then 45 80%
ImportantIf(10,45) then 12 59%
If (12,45) then 10 73%
(30,10,48,32)
If ( 30,10,48) then 32 62%
Quite important
If (30,10,32) then 48 52%
If (10,48,32)then 30 73%
If(48,32,30) then 10 90%
(47,11,29,31,1,16) If (47,11,29,31,1) then 16 80% Important
(47,48,20,30,40) If (47,48,20,30)then 40 64% Very important
For example in row one, generated rule is “if (3,4) then 8 “ and this means if item 3 , 4 with” not important” degree occurs then item 8will occur with 100% probability. Managers by using producing rules can identify risk in any phases of system development and do required actions before risk occurrence.
Conclusion
Business intelligence technology is a powerful tool to overcome data-related obstacles and enhance decision making initiatives in our highly globalized and competitive market.
A business intelligence solution is not only a software package. It is a complex process to establish sophisticated and integrated information systems. The adoption of this technology requires massive capital expenditure, utilizes a certain deal of implementation time and has a very high
likelihood of failure. Therefore, many adoption-related factors must be carefully assessed before the real adoption is actualized. The results from this study revealed that all organizational and project-related factors, are important considerations for adoption of business intelligence system in Iranian organizations. Specifically, these factors include top management sponsorship, existence of champions, a skillful project team, availability of resources, company internal needs, and support from outside consultants, end-user involvement, and vendor selection. The results revealed, as well, that these factors influence the success of business intelligence in pre-implementation and implementation phases.
References
[1] M. Chen, Sh.Wang ,The use of a hybrid fuzzy-Delphi-AHP approach to develop global business intelligence for information service firms. Expert Systems with Applications 37, 7394–7407,2010.
[2] Watson, H., Abraham, D., Chen, D. Data Warehousing ROI: Justifying and Assessing a Data Warehouse. Business Intelligence Journal, 6-17, 2004.
[3] Sh. Li , L. Shue, Sh. Lee , Business intelligence approach to supporting strategy-making
of ISP service management . Expert Systems with Applications 35 , 739–754,2008.
[4] A. Mikroyannidis, B. Theodoulidis, Ontology management and evolution for business intelligence.International Journal of Information Management 30 , 559–566, 2010.
[5] S. Kleesuwana, S. Mitathab, P. P. Yupapinc, B.Piyatamrongd ,Business Intelligence in Thailand's Higher Educational Resources Management,.rocedia Social and Behavioral Sciences 2, 84–87, 2010.
[6] Gartner Research, “Gartner EXP Worldwide Survey of More than 1,500 CIOs Shows IT Spending to Be Flat in 2009”, 2009. Retrieved 21 Feb 2009, from http://www.gartner.com/it/page.jsp?id=855612
[7] D. Aloini , R. Dulmin , V. Mininno , Risk management in ERP project introduction: Review of the literature.Information & Management 44,547–567, 2007.
[8] J. Motwani , R. Subramanian , P. Gopalakrishna , Critical factors for successful ERP implementation: Exploratory findings from four case studies. Computers in Industry 56 , 529–544, 2005.
[9] M.Z. Elbashir , P. A. Collier , M. J. Davern , Measuring the effects of business intelligence systems:The relationship between business process and organizational
Tarokh M. J., Teymournejad E. - Using Association Rules for Evaluating and Predicting Risk Factors in Business Intelligence System
Mohammad JafarTarokh, Elham Teymournejad

Business Intelligence Journal - July, 2012 Vol.5 No.2
394 Business Intelligence Journal July
performance. International Journal of Accounting Information Systems 9 ,135–153, 2008.
[10] Sh. L. P¯eeger ,Risky business: what we have yet to learn about risk management. The Journal of Systems and Software 53 ,265±273, 2000.
[11] E.Donnell ,Enterprise risk management: A systems-thinking framework for the event .
identification phase, International Journal of Accounting Information Systems 6,177– 195,2005.
[12] D.Taniar, W. Rahayu, V. Lee, O.Daly, Exception rules in association rule mining .
Applied Mathematics and Computation 2 ,735-750, 2008.[13] A .Hakim, H.Hakim, A practical model on controlling
the ERP implementation risks .,Information Systems 35 , 204–214, 2010.
[14] P. L. Bannerman , Risk and risk management in software projects: A reassessment.The Journal of Systems and Software 81 ,2118–2133,2008.
[15] Y. Li,X. Liao, Decision support for risk analysis on dynamic alliance , Decision Support Systems 42 , 2043– 2059, 2007.
[16] J.W. Lee, S.H. Kim, An integrated approach for interdependent information system project selection. International Journal of Project Management, 111–118.
[17] S. Maguire, Identifying risks during information system development: managing the process, Information Management and Computer Security, 126–134, 2002.
[18] J. Motwani, M. Madan, A. Gunasekaran, Information technology in managing global supply chain.Logistic Information Management 13 ,320–327,2000.
[19] I. Zafiropoulos, K. Metaxiotis, D. Askounis, Dynamic risk management system for the modeling, optimal adaptation and implementation of an ERP system. Information Management & Computer Security 13, 212–234, 2005.
[20] C.-C.Wei, C.-F. Chien, M.-J.J.Wang, An AHP-based approach to ERP system selection, International Journal of Production Economics 96, 47–62, 2005.
[21] Y. Xue, H. Liang, W.R. Boulton, C.A. Snyder, ERP implementation failures in China: case studies with implications for ERP vendors. International Journal of Production Economics 97 ,
[22] M.Ykhlef, A Quantum Swarm Evolutionary Algorithm for mining association rules in large databases .Journal of King Saud University - Computer and Information Sciences 1, 1-6, 2011.
2012 395
COMPARING THE INFORMATION CONTENT OF IRANIAN VS. IAS BASED OPERATING CASH FLOWS
Vali KhodadadiM.A in Accounting, Islamic Azad University, Mahshahr brunch, Khuzestan, Iran
Zahra NikbakhtDepartment of accounting, payame noor university, PO. BOX 19395-3697 Tehran, Iran
Nader NikbakhtMA in Accounting
AbstractThis study investigates and compares the value relevance of operating cash flows provided based on Iranian accounting standard#2
and international accounting standard, in Tehran Stock Exchange from 2002 to 2007. To compare the incremental and relative value relevance, the Wald test and Vuong (1989) test are used, respectively. We analyzed the results using panel data (six years) approach. The results of this research indicate that operating cash flows based on international accounting standard have significant incremental value relevance to operating cash flows based on Iranian accounting standard#2. However, the results of Vuong test show that there are no significant differences between the value relevance of operating cash flows based on international accounting standard and the value relevance of operating cash flows based on Iranian accounting standard. Key words: IAS-GAAP; IR-GAAP, Value Relevance, Operating Cash Flows.
Over the last decade numerous accounting papers investigate the empirical relation between stock market values (or changes in values) and particular accounting numbers for the purpose of assessing or providing a basis of assessing those numbers’ use or proposed use in an accounting standard (Holthausen and Watts, 2001).
Beaver (1972) in the Report of the American Accounting Association Committee on Research Methodology in Accounting, suggests that the association of accounting numbers with security returns can be used to rank order alternative accounting methods as a means of determining the accounting method that should become a standard. The report states that the “method which is more highly associated with security prices ought to be the method reported in the financial statements” (p.428), subject to considerations of competing sources of information and costs (Kothari, 2001).
Recently, Audit Organization (AO) in Iran has provided Iranian Accounting Standards (IRA-GAAP). In order to harmonize accounting standards in Iran with global standards, Audit Organization has selected the path to standard setting toward IFRS but yet, there are differences between IRA-GAAP based and IFRS based accounting
standards in several aspects. One of these differences is on how providing operating cash flows.
The second Iranian accounting standard is on cash flows statement. In this standard, cash flows are classified into these five categories: (1) Operating activities, (2) Returns on investments and servicing of finance, (3) Taxation, (4) Financing activities and (5) Investing activities, while The statement of cash flows that are prepared in accordance with International Accounting Standards (and also in accordance with US GAAP) requires classification into these three categories: (1) Operating activities, (2) Investing activities and (3) Financing activities. Operating cash flows that are provided based on IRA-GAAP includes all items of operating cash flows that are provided based on IAS-GAAP except for Taxation, Interest payable, Interest receivable and dividends. These items are in general non-recurrent. Thus, operating cash flows based on IRA-GAAP include recurring items but operating cash flows based on IAS-GAAP includes some non-recurring items , therefore,
1From this point of view, the first category of cash flows statement that are pro-vided based on IRA-GAAP, is more similar to U.K. GAAP than U.S. GAAP/IFRS operating cash flows.
Khodadadi V., Nikbakht Z., Nikbakht N. - Comparing the Information Content of Iranian Vs. IAS Based Operating Cash Flows
Vali Khodadadi, Zahra Nikbakht, Nader Nikbakht

Business Intelligence Journal - July, 2012 Vol.5 No.2
396 Business Intelligence Journal July
this paper expect that the value relevance of operating cash flows based on IRA-GAAP is higher than that of IAS-GAAP and thus, IRA-GAAP presents better way to provides cash flows from operations than IAS-GAAP.
This study compares the relative and incremental value relevance of IRA-GAAP vs. IAS-GAAP based operating cash flows and book values. The issue is investigated by regressing stock returns on the levels of operating cash flows and book values. The coefficient and explanatory power of the regression models are compared to assess the relative and incremental value relevance of operating cash flows and book values. To assess the significance of differences between the value relevance of items, the Vuong (1989) Z-statistics are used. The analysis is based on a sample of 1379 firm-years for listed Iranian firms during 2002-2007.
The rest of paper proceeds as follows. Section 2 presents the institutional background. Section 3 describes the Literature review and section 4 presents the hypothesis and research design. Section 5 reports the empirical findings and finally, conclusion remarks are presented in last section.
Institutional Background
To have a viewpoint of Tehran Stock Exchange, this paper provides a brief background about TSE and standard setting process in Iran:
The Emergence of Tehran Stock Exchange
The idea of having a well-organized stock market and accelerating the process of industrialization dates back to the 1930s in Iran when the Melli Bank undertook a study on the subject. A report completed in 1936 worked out the details for the formation of a stock market and laid the foundations for the plan. The outbreak of World War II and subsequent economic and political events delayed the establishment of the stock exchange until 1967, when the Stock Exchange Act was ratified. The TSE opened in April 1968. Initially only government bonds and certain state-backed certificates were traded on the market. During the 1970s, the demand for capital boosted the demand for stocks. At the same time, institutional changes, like the transfer of stocks of public companies and large monopolies to employees and the private sector led to the expansion of stock market activities. The restructuring of the economy which followed after the Iran Revolution, expanded public-sector control over the economy and reduced the need for private capital. At the same time, the interest-bearing
bonds were abolished. Because of these events, the TSE experienced a period of standstill.
This stagnation ended in 1989 with the revival of the private sector through the privatization of state-owned enterprises and the promotion of private-sector economic activities based on the First Five-year Development Plan of the country. Since then the TSE has expanded continuously (Mashayekhi and Mashayekh, 2008). Thus, TSE is an emerging market in the world economy.
A Brief History of Accounting Standards Setting in Iran
Prior to 1979, financial reporting in Iran was influenced heavily by Anglo-American practices (Mirshekari and Saudagaran, 2005). Following the Iranian revolution, in 1980, an amendment to the Direct Tax Law disbanded the Official Accountants Institute. During 1980–1982, the government established audit enterprises and the Budget, Planning and National Industries Organization. These new organizations recruited a large number of accountants who were previously employed with private auditing firms. In 1987, following the merger of the public-sector audit entities, the Audit Organization was established as the sole audit organization with public ownership and as the only regulatory body for setting national accounting and auditing standards. The Audit Organization is responsible for compiling and determining principles and rules of auditing and accounting in Iran.
Twenty five accounting standards were issued initially after approval by the Audit Organization’s public convention. They have become mandatory since 2001 and 2002.
After finalization, the committee assigned them to the Technical Committee. These standards were studied by the Technical Committee and sent to the board. On the basis of the Audit Organization’s public convention approval, these new standards became mandatory in 2002 (Mashayekhi and Mashayekh, 2008). On the date of writing this paper, the number of Iranian Accounting Standards was 29.
Literature Review
Prior empirical research on quality differences between accounting-standard regimes is scarce and provides mixed results. For example, Barth, Landsman, Lang and Williams (2006) compare measures of accounting quality for firms applying IAS with US firms to investigate whether IAS are
2012 397
associated with less earnings management, more timely loss recognition, and higher value relevance of accounting amounts than US GAAP. They find that IAS firms exhibit lower accounting quality relative to US firms in terms of earnings smoothing, correlation between accruals and cash flows, timely loss recognition, and the association between accounting amounts and share prices. Also, they find that IAS accounting amounts are of similar quality to reconciled US GAAP amounts. Their results suggest that although IAS accounting amounts may not be of higher quality than those of US GAAP applied comprehensively, they are of comparable quality to reconciled US GAAP amounts reported by cross-listed firms. Harris and Muller (1999) suggest that investors have realized that US-GAAP provides more investment-related information than a standard IAS.
Alford, Jones, Leftwich and Zmijewski (1993) investigate the value relevance and timelines of earnings reported under different accounting standards in their own country and then compares levels of value relevance and timelines. They conclude that earnings based on Danish, German, Italian, Singaporean and Swedish GAAP contain less information and are less timely than IAS-GAAP earnings, while earnings based on local GAAP of Australia, France, The Netherlands and the U.K. are relatively more informative and timely.
Sawabe (2005) examines the co-evolutionary relationship between accounting rules and creative accounting instruments under the rules-based approach. The case of financial instruments evolved from convertible bonds in the U.K. is used as an illustrative example to show that the co-evolutionary structure is the source of proliferation of complexity and diversity of accounting rules and creative accounting instruments. The proliferation of accounting rules and creative accounting instruments triggered initiatives to alter the accounting standard setting approach towards being more principles-based in the U.K. and with a decade lag in the U.S.
Chan and Seow (1996) examine the association between stock returns and foreign GAAP earnings versus earnings adjusted to IAS-GAAP. Using a sample of foreign firms with common stock or American Depositary Receipt (ADR) traded in U.S. exchanges, they compare the returns-earnings relations between U.S. and foreign GAAP-based earnings. Results indicate that earnings based on foreign GAAP are more closely associated with contemporaneous stock returns than earnings reconciled to IAS-GAAP. They find evidence that their results may be driven by institutional factors which are specific to foreign markets.
Leuz (2003) investigates whether firms using IAS-GAAP vis a vis IAS exhibit differences in several proxies for information asymmetry. He exploits a unique setting where the two sets of standards are put on a level playing field. Results show that at least for New Market firms, the choice between IAS and IAS-GAAP appears to be of little consequence for information asymmetry and market liquidity. These findings do not support widespread claims that IAS-GAAP produce financial statements of higher informational quality than IAS.
Bartov, Goldberg and Kim (2005) investigate comparative value relevance, measured as the slop coefficient of the return/earnings regression. They find that value relevance of IAS-GAAP based earnings is higher than that of IAS based earnings, which in turn is more value relevant than earnings produced under German GAAP.
Barth and Clinch (1996) synthesize and extend research exploring differences between U.S. and other countries’ GAAP by investigating whether differences between domestic and IAS-GAAP for U.S. listed U.K., Australian, and Canadian firms are associated with firms’ returns and prices. Their findings suggest that the SEC-required GAAP reconciliation reflects information useful to investors for U.K., Australian, and, to a more limited extent, Canadian firms.
Pope and Rees (2007) investigate the information content of two alternative accounting earnings measures constructed under U.K. and IAS-GAAP. The research design involves testing the association between U.K. stock returns and alternative accounting numbers. The evidence suggests that, for the sample examined, U.K. GAAP earnings changes have incremental information content after controlling for IAS-GAAP earnings changes, but that earnings levels measured under IAS-GAAP have some independent incremental information content after controlling for U.K. GAAP earnings. Their results are consistent with GAAP adjustments having a significant transitory component. The empirical results display explanatory power which is broadly consistent with previous work and the GAAP earnings adjustments add marginally to the ability of earnings to explain returns.
Meulen, Gaeremynck and Willekens (2007) explore attribute differences between IAS-GAAP and IFRS earnings. They test two market-based earnings attributes, i.e., value relevance and timeliness, as well as two accounting-based earnings attributes, i.e., predictability and accrual quality. These attributes are tested for German New Market firms as they are allowed to choose between IFRS and IAS-GAAP for financial reporting purposes.
Khodadadi V., Nikbakht Z., Nikbakht N. - Comparing the Information Content of Iranian Vs. IAS Based Operating Cash Flows
Vali Khodadadi, Zahra Nikbakht, Nader Nikbakht
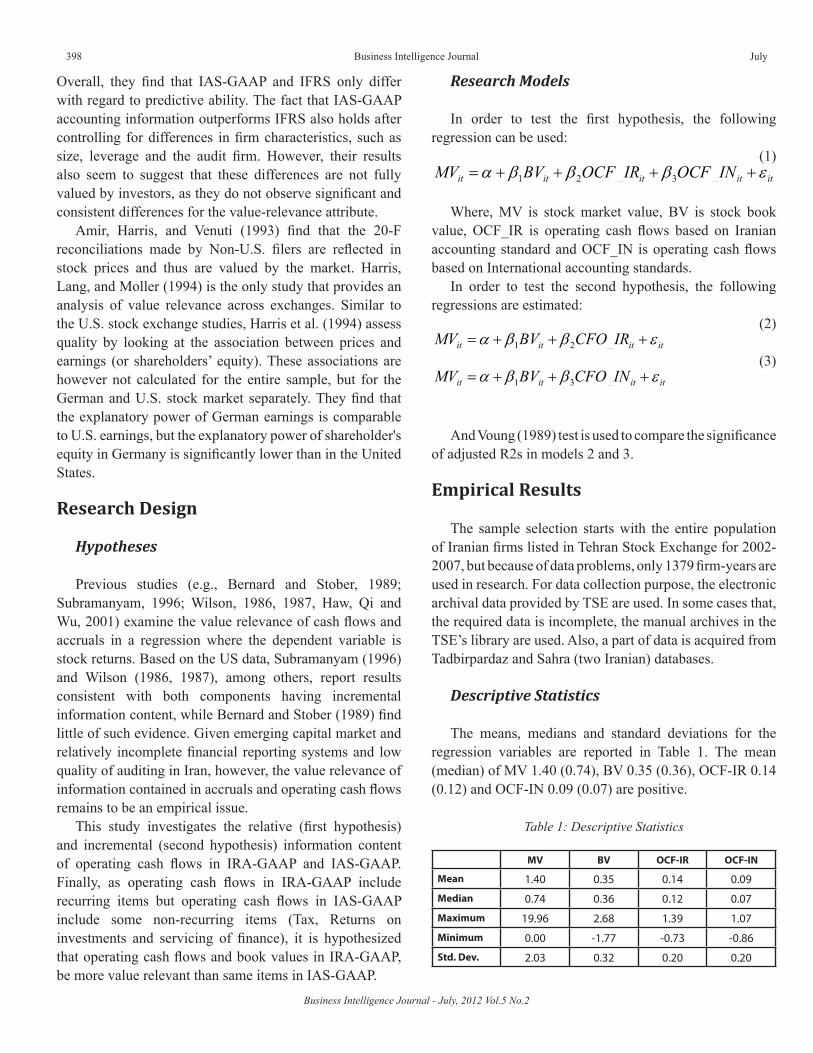
Business Intelligence Journal - July, 2012 Vol.5 No.2
398 Business Intelligence Journal July
Overall, they find that IAS-GAAP and IFRS only differ with regard to predictive ability. The fact that IAS-GAAP accounting information outperforms IFRS also holds after controlling for differences in firm characteristics, such as size, leverage and the audit firm. However, their results also seem to suggest that these differences are not fully valued by investors, as they do not observe significant and consistent differences for the value-relevance attribute.
Amir, Harris, and Venuti (1993) find that the 20-F reconciliations made by Non-U.S. filers are reflected in stock prices and thus are valued by the market. Harris, Lang, and Moller (1994) is the only study that provides an analysis of value relevance across exchanges. Similar to the U.S. stock exchange studies, Harris et al. (1994) assess quality by looking at the association between prices and earnings (or shareholders’ equity). These associations are however not calculated for the entire sample, but for the German and U.S. stock market separately. They find that the explanatory power of German earnings is comparable to U.S. earnings, but the explanatory power of shareholder's equity in Germany is significantly lower than in the United States.
Research Design
Hypotheses
Previous studies (e.g., Bernard and Stober, 1989; Subramanyam, 1996; Wilson, 1986, 1987, Haw, Qi and Wu, 2001) examine the value relevance of cash flows and accruals in a regression where the dependent variable is stock returns. Based on the US data, Subramanyam (1996) and Wilson (1986, 1987), among others, report results consistent with both components having incremental information content, while Bernard and Stober (1989) find little of such evidence. Given emerging capital market and relatively incomplete financial reporting systems and low quality of auditing in Iran, however, the value relevance of information contained in accruals and operating cash flows remains to be an empirical issue.
This study investigates the relative (first hypothesis) and incremental (second hypothesis) information content of operating cash flows in IRA-GAAP and IAS-GAAP. Finally, as operating cash flows in IRA-GAAP include recurring items but operating cash flows in IAS-GAAP include some non-recurring items (Tax, Returns on investments and servicing of finance), it is hypothesized that operating cash flows and book values in IRA-GAAP, be more value relevant than same items in IAS-GAAP.
Research Models
In order to test the first hypothesis, the following regression can be used:
ititititit INOCFIROCFBVMV εβββα ++++= 321
(1)
Where, MV is stock market value, BV is stock book value, OCF_IR is operating cash flows based on Iranian accounting standard and OCF_IN is operating cash flows based on International accounting standards.
In order to test the second hypothesis, the following regressions are estimated:
itititit IRCFOBVMV εββα +++= 21
(2)
itititit INCFOBVMV εββα +++= 31
(3)
And Voung (1989) test is used to compare the significance of adjusted R2s in models 2 and 3.
Empirical Results
The sample selection starts with the entire population of Iranian firms listed in Tehran Stock Exchange for 2002-2007, but because of data problems, only 1379 firm-years are used in research. For data collection purpose, the electronic archival data provided by TSE are used. In some cases that, the required data is incomplete, the manual archives in the TSE’s library are used. Also, a part of data is acquired from Tadbirpardaz and Sahra (two Iranian) databases.
Descriptive Statistics
The means, medians and standard deviations for the regression variables are reported in Table 1. The mean (median) of MV 1.40 (0.74), BV 0.35 (0.36), OCF-IR 0.14 (0.12) and OCF-IN 0.09 (0.07) are positive.
Table 1: Descriptive Statistics
MV BV OCF-IR OCF-IN
Mean 1.40 0.35 0.14 0.09
Median 0.74 0.36 0.12 0.07
Maximum 19.96 2.68 1.39 1.07
Minimum 0.00 -1.77 -0.73 -0.86
Std. Dev. 2.03 0.32 0.20 0.20
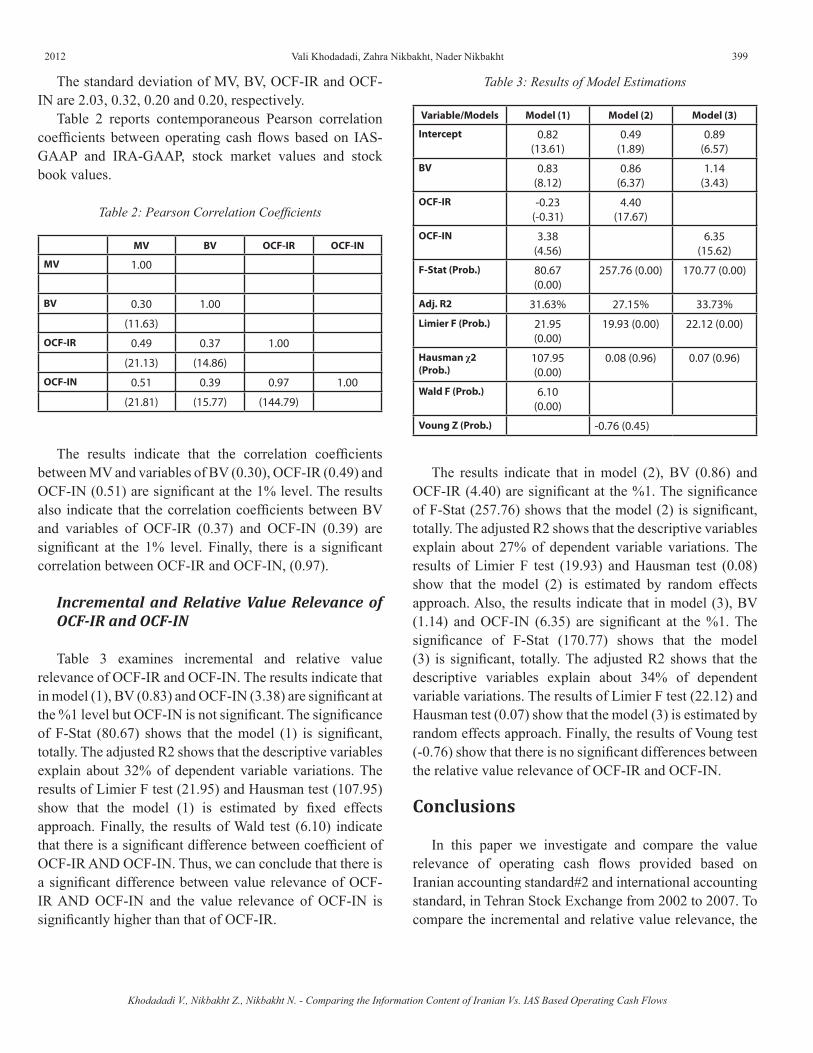
2012 399
The standard deviation of MV, BV, OCF-IR and OCF-IN are 2.03, 0.32, 0.20 and 0.20, respectively.
Table 2 reports contemporaneous Pearson correlation coefficients between operating cash flows based on IAS-GAAP and IRA-GAAP, stock market values and stock book values.
Table 2: Pearson Correlation Coefficients
MV BV OCF-IR OCF-IN
MV 1.00
BV 0.30 1.00
(11.63)
OCF-IR 0.49 0.37 1.00
(21.13) (14.86)
OCF-IN 0.51 0.39 0.97 1.00
(21.81) (15.77) (144.79)
The results indicate that the correlation coefficients between MV and variables of BV (0.30), OCF-IR (0.49) and OCF-IN (0.51) are significant at the 1% level. The results also indicate that the correlation coefficients between BV and variables of OCF-IR (0.37) and OCF-IN (0.39) are significant at the 1% level. Finally, there is a significant correlation between OCF-IR and OCF-IN, (0.97).
Incremental and Relative Value Relevance of OCF-IR and OCF-IN
Table 3 examines incremental and relative value relevance of OCF-IR and OCF-IN. The results indicate that in model (1), BV (0.83) and OCF-IN (3.38) are significant at the %1 level but OCF-IN is not significant. The significance of F-Stat (80.67) shows that the model (1) is significant, totally. The adjusted R2 shows that the descriptive variables explain about 32% of dependent variable variations. The results of Limier F test (21.95) and Hausman test (107.95) show that the model (1) is estimated by fixed effects approach. Finally, the results of Wald test (6.10) indicate that there is a significant difference between coefficient of OCF-IR AND OCF-IN. Thus, we can conclude that there is a significant difference between value relevance of OCF-IR AND OCF-IN and the value relevance of OCF-IN is significantly higher than that of OCF-IR.
Table 3: Results of Model Estimations
Variable/Models Model (1) Model (2) Model (3)
Intercept 0.82(13.61)
0.49(1.89)
0.89(6.57)
BV 0.83(8.12)
0.86(6.37)
1.14(3.43)
OCF-IR -0.23(-0.31)
4.40(17.67)
OCF-IN 3.38(4.56)
6.35(15.62)
F-Stat (Prob.) 80.67(0.00)
257.76 (0.00) 170.77 (0.00)
Adj. R2 31.63% 27.15% 33.73%
Limier F (Prob.) 21.95(0.00)
19.93 (0.00) 22.12 (0.00)
Hausman χ2 (Prob.)
107.95(0.00)
0.08 (0.96) 0.07 (0.96)
Wald F (Prob.) 6.10(0.00)
Voung Z (Prob.) -0.76 (0.45)
The results indicate that in model (2), BV (0.86) and OCF-IR (4.40) are significant at the %1. The significance of F-Stat (257.76) shows that the model (2) is significant, totally. The adjusted R2 shows that the descriptive variables explain about 27% of dependent variable variations. The results of Limier F test (19.93) and Hausman test (0.08) show that the model (2) is estimated by random effects approach. Also, the results indicate that in model (3), BV (1.14) and OCF-IN (6.35) are significant at the %1. The significance of F-Stat (170.77) shows that the model (3) is significant, totally. The adjusted R2 shows that the descriptive variables explain about 34% of dependent variable variations. The results of Limier F test (22.12) and Hausman test (0.07) show that the model (3) is estimated by random effects approach. Finally, the results of Voung test (-0.76) show that there is no significant differences between the relative value relevance of OCF-IR and OCF-IN.
Conclusions
In this paper we investigate and compare the value relevance of operating cash flows provided based on Iranian accounting standard#2 and international accounting standard, in Tehran Stock Exchange from 2002 to 2007. To compare the incremental and relative value relevance, the
Khodadadi V., Nikbakht Z., Nikbakht N. - Comparing the Information Content of Iranian Vs. IAS Based Operating Cash Flows
Vali Khodadadi, Zahra Nikbakht, Nader Nikbakht
Business Intelligence Journal - July, 2012 Vol.5 No.2
400 Business Intelligence Journal July
Wald test and Vuong (1989) test are used, respectively. The results are analyzed using panel data approach.
Our results indicate that operating cash flows based on international accounting standard have significant incremental value relevance to operating cash flows based on Iranian accounting standard#2. However, the results of Vuong test show that there are no significant differences between the value relevance of operating cash flows based on international accounting standard and the value relevance of operating cash flows based on Iranian accounting standard.
References
Amir, E., Lev, B. (1996). “Value relevance of nonfinancial information: The wireless communications industry”. Journal of Accounting and Economics, 22, 3–30.
Barth, J.R., Bartholomew, P.F., Bradley, M.G. (1990). “Determinants of thrift institution resolution costs”. Journal of Finance, 45, 731–754.
Basu, S. (1997). “The conservatism principle and the asymmetric timeliness of earnings”. Journal of Accounting and Economics, 24, 3–37.
Beaver, W.H., Lambert, R., Morse, D. (1980). “The information content of security prices”. Journal of Accounting and Economics, 2, 3–28.
Bernard, Victor, (1995). “The Feltham-Ohlson Framework: Implications for Empiricists”. Contemporary Accounting Research (Spring), 733-747.
Brief R.P., Zarowin P. (1999). “The value Relevance of Dividends, Book value and Earnings”, http://papers.ssrn.com/sol3/results.cfm
Burgstahler, D., Dichev, I. (1997). “Earnings management to avoid earnings decreases and losses”. Journal of Accounting and Economics 24, 99–126.
Collins, Daniel, Edward Maydew, and Ira Weiss., (1997). “Changes in the value-relevance of earnings and book values over the past forty years”. Journal of Accounting and Economics 24, 39-67
Dechow, P.P. Hutton and R.G. Sloan. (1999). “An empirical assessment of the residual income valuation model”. Journal of accounting and economics .26(1-3), 1-34.
Dechow, P.M., (1994). “Accounting earnings and cash flows as measures of firm performance: The role of accounting accruals”. Journal of Accounting and Economics 18, 3–42.
Elliot J., Hanna J. (1996). “Repeated accounting write-offs and the information content of earnins”. Journal of accounting research.34.135-155.
Elliot R., Jacobson P. (1991). “U.S accounting: a national emergency”. Journal of accounting research, 17, 54-58.
Eng Lili, Li sheng chun, Y.T Mak. (1999). “Trends in earning, book values and stock prices relationships: an international study”. Working paper.
Hand, John and Wayne Landsman. (1999). “The Pricing of Dividends in Equity Valuation”. Working paper, University of North Carolina.
Hayn, Carla. (1995). “The Information content of Losses”. Journal of Accounting and Economics, 20, 125-153.
Holthausen, R.W, Watts, R.L. (2001). “The relevance of the value-relevance literature for financial accounting standard setting”. Journal of Accounting and Economics, 31 3–75.
Kimberly, F. (2002) “The effect of growth on the value relevance of accounting data”, Journal of Business Research, 55, 69–78
Lambert, R.A. (1996). “Financial reporting research and standard setting”. Unpublished Working Paper, Stanford University.
Lev, Baruch and Paul Zarowin. (1999). “The Boundaries of Financial Reporting and How to Extend Them”. Journal of Accounting Research, 37, 353-385.
Lyon JD, Schroeder DA. (1992). “Firm growth and the valuation relevance of earnings levels, earnings innovations, and dividends”. Journal of Accounting, Auditing and Finance, 7(Fall): 531– 51.
Modigliani, Franco and Merton Miller. (1959). “The Cost of Capital, Corporation Finance, and the Theory of Investment: Reply”. American Economic Review (September), 655-669.
Ohlson, J.A. (1995). “Earnings, book values, and dividends in security valuation”. Contemporary Accounting Research 11, 161–182.
Skinner, D.J., (1993). “The Investment opportunity set and accounting procedure choice”. Journal of Accounting and Economics 16, 407–445.
Smith, C.W., Watts, R.L., (1982). “Incentive and tax effects of executive compensation plans”. Australian Journal of Management 7, 139–157.
Subramanyam K.R., Venkatachalam.(1998). “The role of book value in equity valuation: Does the stock variable merely proxy for relevant past flows?” Working paper.
Venkatachalam, M. (1996). “Value relevance of banks derivatives disclosures”. Journal of Accounting and Economics, 22, 327–355.
Vuong, Q.H. (1989), “Likelihood ratio tests for model selection and non-nested hypotheses”, Econometrica, 57, 307–333.
2012 401
THE RELATIONSHIPS BETWEEN GDP, EXPORT AND INVESTMENT: CASE STUDY IRAN
Mahmoud Abolpour MofradFaulty of Azad university Branch of Firouz Abad
AbstractThis study compared the long-term and short-term relationship between GDP, export and investment during the years 1991-2008.
Results show there exist a positive and significant long term relationship between investment and export with gross domestic production at 95% confidence level. But the relationship of investment and export is negative. Analysis of the vector error correction model for GDP indicates an error correction coefficient is negative which due to the high value of the GDP in the short run than long-term equilibrium value. In the short term, impact of investment and exports on GDP are positive. Effect of domestic production on investment is positive, but on export is negative. Key words: Export, Investment, Gross Domestic Production, Co integration, Error Correction.
One of the fundamental goals of each country is to achieve a high desirable economic growth rate. Planners always regarded this economic signal. Therefore, factors which impact it are important for planners and policymakers. World Bank studies show causes such as high rates of savings, investment, a large proportion of exports in GDP, based on export promotion policies and competitive markets play a key role in East Asia's economic growth (World Bank: 1993).Extra financial savings make it possible more investment in projects with high efficiency and access to updated technology. On the other hand, Expansion exports Strategy impact economic growth for several reasons in long-term economic growth as follows. A: There is ability to offer and sell goods in world markets that have potentially unlimited demand and possibility able to absorb all the products supplied by small countries in the global markets. B: Global competitive markets led to pressures of domestic enterprises. In other words, surviving exporting goods enterprises on long-term need employing permanent updating the technology and management.. And finally produce for global markets, are not only having economy scale advantages of domestic firms, but also reduce their vulnerability against variations in domestic demand. However, volatility in global markets can lead to changes in the exports of a country, and affect looking for a long-term growth rate. If this volatility is severe, then the benefits arising from producing export goods will suffer from confusion. This will reduce the investment risk on these goods. If the firm is risk aversion, This leads to reduced investment in export goods will reduce GDP. Iran is a country to achieve sustainable development and long-
term program goals, urgent need to have high growth rates. Economy dependent on oil revenues makes it vulnerable on long-term growth. Therefore, by studying causes affecting economic growth, the planners can use these variables in control and to improve economic conditions and trends to help deliver good long-term growth. And it reduced dependence of Growth rate on oil revenues.
The purpose of this study is interactions of economic growth, exports and investment. Are investment increase GDP and exports?
Export growth rate has positive effect on GDP and investment. Economic growth has Positive impact on exports and domestic investment.
Najarzadeh, R. and Maleki, M. (2005) showed the relationship of foreign direct investment and economic growth of Indonesia, Malaysia, Venezuela, Saudi Arabia and Iran are positive. This impact is through of human capital.
Mahdavi, A. and Javadi, S. (2005) examined the causal relationship between foreign trade and economic growth. Their use of econometric models of Granger and Haysao showed that Iran simultaneously needs both import substitution and export promotion methods. Owing to both strategies is the positive effect on Iranian economic growth.
Increase in tariff rates also reduces productivity growth may lead to factors.
Azerbaijani, K. and Shirani Fakhr, Z. (2009) is using regression to examine the effect of economic liberalization on economic growth. Results show that trade and market size are not strong effects on economic growth.
Mofrad M. A. - The Relationships Between GDP, Export and Investment: Case Study Iran
Mahmoud Abolpour Mofrad
Business Intelligence Journal - July, 2012 Vol.5 No.2
402 Business Intelligence Journal July
Basat (2002) showed that exports in countries that is in the middle of development, has a positive effect on economic growth. But in countries where are at the low or above levels of development, significant relationship between increased exports and economic growth is not observed.
Sarkar (2002) indicated only for countries with a medium level of development. A significant positive relationship between exports and economic growth established.
DrytSakys (2004) analyzed the relationship between economic growth, investment and exports in the case of Romania and Bulgaria. Results show a cointegration relationship is between three variables. Also, exports and investment are a positive effect on real GDP.
Marynas (2005) studied the relationship between investment, exports and economic growth in Romania. Using his analysis showed a cointegration relationship set up between of these three variables. Granger's causality test suggests that investment, and export will change the steady state of GDP. Nicholas Herman (2008) studied cause between export, industrial and agricultural production in Tanzania using time-series data during 1970 to 2005. Results show that agricultural growth, increased export. Export is also Granger's cause of industrial production and agriculture. However, increased industrial production was not increasing exports and agricultural production.
Methodology
To study the interaction correlated of variable in question, we use the vector Autoregressive.
To employ this technique is variables must be stationary. So first Augment Dickey Fuller and Philip Peron tests are using to examine the stationary of variables.
Unit root test
Many macroeconomic variables in time series are non-stationary (Hill and others: 2001). If a series is stationary, then the shock imposed on is elimination and variable returns to its long-term equilibrium. On the other hand, if the time series is nonstationary, the mean or variance or both are a function of time. And if the time is infinite, varying the variables will be infinite. Therefore, the variable will be divergent away from its path equilibrium (Stereo and Hall: 2006). First Augment Dickey Fuller and Philip Peron tests are using to examine the stationary of variables in question.
In these tests, the hypothesis is the existence of unit root for time series. In case of stationary variables, using ordinary least squares estimation is desirable.
Johansson Cointegration Test
If two or more time series are integrated, but a linear combination of them may have a lower rank of integration, the series are called Cointegration. Specially, if the variables are integratedof order one and a linear combination of them is stationary, the linear combination shows long-term equilibrium relationship between the time series. Clive Granger(1980) showed that linear regression on nonstationary time series data was inappropriate and can lead to pseudo-egression.
Hewith Robert Ayvgle(1987) in a paper presented the Cointegration vector method. Unlike pseudo-Regression which means there is not the actual relationship between variables, Cointegration indicates that it is true. This test used for long term relationship between the studied variables. The relationship between variables based on the following models.
∑+=
−− +Π+∆Γ+=∆k
jitktjtit xxAx
10 ε
Where
jΓ is matrix of adjusted short-term parameters.Elements of Matrix Π represent long term equilibrium
relation between variables of X vector. Π can break up to two matrices β and α with dimensions n.r such that Π = α. β
β includes the r vector Cointegration and elements of α are the speed adjustment (Johnson: 1988). Johnson extends the Likelihood ratio test to determine the number of Cointegration vectors, and represented 2 extended test of the trace test and maximum Eigen value. In trace test, the zero hypothesis is the series are non cointegrated (r = 0). And against the hypothesis is, there exist one or more cointegrated vectors(r > 1). In maximum Eigen value test, the zero hypotheses are cointegrated vectors equal to r and against the hypothesis are vectors equal to r + 1.
∑ ∑+= +=
+−=−=Γk
ji
k
jijjj AIandA
1 1

2012 403
Research Findings
Definition Variables
Gross Domestic production GDP
investment INV
EXPORT EX
Source: research findings
Unit root test resultspresentedinTable4-2 and Table 4-3.These tests revealed that all variables are non stationary in levels and stationery at first difference. So the variables are integrated of order one. Accordingly, it is suitable to use the Johnson - Jusilius (1990) technique to extract the long-term relationship between variables.
Table4-2: Unit Root Test Results at the Level
Vriables Augmented Dickey-Fuller Test Phillips-Perron Test
test statistic
Test critical values:
Prob.* test statistic Test critical values:
Prob.*
GDP -0.285535 -2.926622 0.9190 0.161221 -2.923780 0.9672
INV -0.745410 -2.925169 0.8249 -0.202566 -2.923780 0.9672
EX -0.231883 -1.947975 0.5974 0.003214 -1.947816 0.6788
*MacKinnon (1996) one-sided p-values.Source: research findings
Table 4-3: Unit Root Test Results at First Differences
Vriables Augmented Dickey-Fuller Test Phillips-Perron Test
test statistic
Test critical values:
Prob.* test statistic Test critical values:
Prob.*
GDP -5.430595 -2.925169 0.0000 -5.430595 -2.925169 0.0000
INV -4.363407 -2.925169 0.0011 -4.059764 -2.925169 0.0026
EX -4.323878 -1.947975 0.0001 -4.327986 -4.327986 0.0001
*MacKinnon (1996) one-sided p-values.Source: research findings
The first step in cointegrated analyze is selecting an appropriate lag for variables. To do, in this study used Akaike Information Criteria (AIC) and Schwarz Bayesian Criteria (SBC). As shown in table 4-4 both criteria selected lag length of 1.
Table 4-4: Select the Optimal Lag Length According to Schwartz Bayesian and Akaike Information Criteria
Length Lag Statistic AIC Statistic SBC
1* 64.48179 65.19036
2 64.60325 65.67659
3 64.59506 66.04039
*lag lengthSource: research findings
To find the number of cointegrationvectors, we use Trace and maximum eigenvalue test. Results are in tables 4-5 and 4-6.
Table 4-5 Unrestricted Cointegration Rank Test (Trace)
Hypothesized No.of CE(s) Eigen value Trace
statistic0.05 critical
value Prob.**
None * 0.387392 31.11462 24.27596 0.0059
At most 1 0.157416 8.083198 12.32090 0.2303
At most 2 0.000700 0.032923 4.129906 0.8820
*Trace test shows the hypothesis reject at 5% level.Source: research findings
Tables 4-6 Unrestricted Cointegration Rank Test (Maximum Eigen Value)
Hypothesized No.of CE(s) Eigen value Max-Eigen
statistic 0.05 critical
value Prob.**
None * 0.387392 23.03142 17.79730 0.0074
At most 1 0.157416 8.050276 11.22480 0.1712
At most 2 0.000700 0.032923 4.129906 0.8820
*Trace test shows the hypothesis reject at 5% level.Source: research findings
The results of above tests show there exist one cointegration relationship between time series. Normalized cointegration vectors on GDP are in Table 4-7.
Variable GDP INV EX
Coefficient 1.000000 -2.682116 -1.614244
Standard error (0.21367) (0.42889)
Standard error [-12.5529] [-3.76373]
Source: research findings
Table 4-7: The Cointegration Vector of Variables.
Mofrad M. A. - The Relationships Between GDP, Export and Investment: Case Study Iran
Mahmoud Abolpour Mofrad

Business Intelligence Journal - July, 2012 Vol.5 No.2
404 Business Intelligence Journal July
The cointegration relationship that indicates the long-run equilibrium equation between variables, estimated as follows.
GDP=2.682116 INV +1.614244 EX
According to the above normalized equation, there exist a positive and significant long term relationship between investment and export with gross domestic production at 95% confidence level. But the relationship of investment and export is negative. This could be due to investment has been done in non-export sector.
Vector Error Correction Model
To achieve the short-term dynamic relationship between variables, the study applies the error correction mechanism. Results are in Table 4-8.
Table4-8: Estimation Results of Error Correction
Variable D(GDP) D(INV) D(EXPORT)
Vec(-1) -0.170440 0.096582 0.039408
(0.09175) (0.03959) (0.02631)
[-1.85763] [ 2.43954] [ 1.49787]
D(GDP(-1)) -0.080242 0.209056 -0.119124
(0.18208) (0.07857) (0.05221)
[-0.44070] [ 2.66092] [-2.28163]
D(INV(-1)) 0.464109 0.372837 0.324390
(0.36906) (0.15925) (0.10583)
[ 1.25753] [ 2.34122] [ 3.06526]
D(EXPORT(-1)) 0.499476 -0.059552 0.499394
(0.52939) (0.22843) (0.15180)
[ 0.94349] [-0.26070] [ 3.28980]
c 8145.965 562.9247 595.2544
(3834.99) (1654.78) (1099.67)
[ 2.12412] [ 0.34018] [ 0.54130]
R2 0.231626 0.353467 0.347323
F-statistic 3.165217 5.740476 5.587579
Source: research findings
Standard error values are within parentheses and numbers written in brackets show the calculated t- value. The coefficients of vec1 (–1) showed the speed of adjustment of disequilibrium in the period of study. The coefficient for GDP is negative but positive for investment and exports.
These results indicate that adjustments in production, exports and investment in each year than the long-run equilibrium are 17, 9 and 3 percent respectively. Production in the short term is over the long-run equilibrium value, while the value of exports and investment is less than of their long-term equilibrium. Equation of error correction model for GDP is as follows.
−=∆ 965.8145GDP499476.0)1(080242.0 +−∆GDP
1704.0)1(464109.0)1( −−+−∆ invEPORT)1(40 −vec
All coefficients are significant at the 95% level of confidence. Changes in investment and export in the short term have positive impact on GDP in the next period. This equation can be written for the other variables.
Variance Decomposition
Variance decomposition shows the influence of variables in the prediction error of avariable. In other words, it studies the relative importance of each variable in the volatility of other variables.
Results are in Table 4-9. Relative importance of random shocks on each variable on other variables presented for the early years, fifth and tenth. In the first column, the variables which their variance decomposition was applied, the second column for years and the third column present forecast standard error variables.
Table4-9: Analysis of Variance Decomposition
Variance Decomposition year S.E. GDP EXPORT INV
GDP 1 24761.76 100.0000 0.000000 0.000000
5 83378.30 87.07793 7.312482 5.609587
10 134176.4 85.45807 9.008413 5.533520
EXPORT 1 7136.708 36.45124 63.54876 0.000000
5 21368.93 37.98535 59.70051 2.314139
10 26205.98 27.72206 65.17235 7.105589
INV 1 10290.29 39.99062 0.306982 59.70240
5 36778.04 81.33309 0.672821 17.99409
10 53938.44 83.01427 1.298345 15.68739
Source: research findings
2012 405
Evidence suggests that 85% of the volatility GDP after ten years due to shocks entered upon to the variable. It fluctuates by 6% of private consumption and 47% by investment as is described. On the other hand, after ten years GDP explains over 83% of the forecast error of export and investment.
After ten years, 65% of export volatility is due to shocks entered upon to it. 28% and 7% of fluctuation are due to GDP and investment respectively. Finally, 16%, 1% and 83% of investment volatility is due to investment, export and GDP respectively.
Conclusion
This study compared the long-term and short-term relationship between GDP, export and investment during the years 1991-2008. All variables in studied were non stationary, but the differences were stationary. To study the long term relationship between variables, the Johnson's cointegrating test was used. Results show there exist a positive and significant long term relationship between investment and export with gross domestic production at 95% confidence level. But the relationship of investment and export is negative. Analysis of the vector error correction model for GDP indicates an error correction coefficient is negative which due to the high value of the GDP in the short run than long-term equilibrium value. The coefficient for exports and investment is positive. This suggests that the amount of these two variables in the short term is over the long-term equilibrium values. In the short term, impact of investment and exports on GDP are positive. Effect of domestic production on investment is positive, but on export is negative. In the short term, exports havea negative effect on investment, while investment may lead to increased exports. Analysis of variance shows that fluctuations created in the GDP resulting from changes in its value. Most fluctuations in investment is also due to
GDP. Interactions between exports and investment over another prediction error are not strong.
References
Azarbayjani, K. and Shirani fakhr, Z(2009)" The Impact Of trade and market development on economic growth: case studies Iran and their business partners in the years 1995-2005" Journal of Economic Research of Iran, the Ninth year, No.1
Dritsakis, N. (2004) "Exports, investments and economic development of pre-accession countries of the European Union: an empiricalinvestigation of Bulgaria and Romania", Applied Economics,Taylor and Francis Journals, vol. 36(16), 2004
Herman, N. (2008) " Causality Relationships between Total Exports with Agricultural and Manufacturing GDP in Tanzania" Id DISCUSSION PAPER No. 136
Mahdavi,A. and Javadi,S.(2005)" Empirically test the relationship between foreign trade and economic growth in Iran" Journal of Economic Research of Iran, the Fifth year, No.23
Najar zade,R and Maleki,M(2005)" The effect of FDI on economic growth with emphasis on exporting countries" Journal of Economic Research of Iran, the seventh year, No.23
Sarkar, A.( 2000) "A Model of Brokers’ Trading, with Applications to Order Flow Internalization", Review of Financial Economics, 11, nr. 1
Serhan Çiftçioğlu, Cömert Karaaslan and M. Hulusi Demir (2004) "Savings, Investment, Exports and Economic Growth in Turkey" Review of Social, Economic & Business Studies, Vol.3/4, 20-30
Subasat, T. (2002) "Does Export Promotion Increase Economic Growth?Some Cross- Section Evidence", Development Policy Review, vol. 20
Mofrad M. A. - The Relationships Between GDP, Export and Investment: Case Study Iran
Mahmoud Abolpour Mofrad
Business Intelligence Journal - July, 2012 Vol.5 No.2
406 Business Intelligence Journal July
ANALYSIS OF USING A BUSINESS INTELLIGENCE TOOL (COGNOS) IN A COMPANY TO RESULT IN MORE EFFICIENT
AND INTUITIVE COMPANY IN THE CURRENT ERA
Kirankumar GollapudiM. BA Student, University of Northern Virginia, USA
900 Mickley Road, Apt k2-2, Whitehall, PA – 18052, USAEmail: [email protected]
Sunil Kumar JangetiM.S Student, University of Northern Virginia, USA
Email: [email protected]
Avinash Reddy KotapatiM.S Student, University of Northern Virginia, USA
Email: [email protected]
AbstractIn current economy, every organization wants to cut down on costs and invest wisely on their investments. Due to the fact that
businesses have become very competitive in current market, every company is forced to focus on improving their efficiencies by doing analysis on their historical data as well as current data pertaining to their company and then make decisions regarding their strategies. Over the years, it has become a challenge to the IT departments to meet the business needs as they have many kinds of report requirements from their stake holders. Most of the companies implement Business Intelligence solutions to help their reporting, analysis needs but many of them either fail or they end up not using them due to lack of requirements from their stake holders and they all end up in manual process. This paper will be focused on Architectural aspects of BI Tool that an Organization must focus in order to implement successful BI solution and discuss on challenges faced by Companies without having BI solution available for Business Community and finally discuss the benefits of using Cognos as BI tool to result in the more efficient and intuitive company in current economy and gain market growth. Key words: Business Intelligence (BI), IT (Information Technology).
Business Intelligence (BI) is defined as “computer based techniques used in identifying, extracting, and analyzing business data”. In a 1958 article, IBM researcher Hans Peter Luhn used the term business intelligence. He defined intelligence as: "the ability to apprehend the interrelationships of presented facts in such a way as to guide action towards a desired goal. BI is used by management, business users which help them in decision making to support business growth and stay on the top of the competitive market. Most common functions of BI solutions are: Reporting, analytics, dash boarding, collaboration, real-time monitoring, querying, etc. Many companies are facing challenges to make BI functions available to their business users due to lack of proper BI solutions in their companies.
IBM’s Business Analytics software actually helps companies to get the BI capabilities they need such as Reporting, Analysis and score carding with planning, scenario modeling, real-time monitoring and predictive analysis. Analytics-driven organizations not only seize opportunities: they outperform. IBM’s annual CFO study (involving more than 1,900 CFOs and senior finance leaders worldwide) showed that analytics-driven organizations had 33 percent more revenue growth and 32 percent more return on capital invested. Hence, it is very important for companies to think about investing in BI tool for their companies along with identifying which is right tool for their company needs. In order to identify which BI tool is right, first companies should study what are their needs and how easily they can implement the software in the company with out modifying their existing applications.

2012 407
Kirankumar G., Sunil K. J., Avinash R. K. - Analysis of Using a Business Intelligence Tool (COGNOS) in a Company to Result in More Efficient and Intuitive Company in the Current Era
Kirankumar Gollapudi, Sunil Kumar Jangeti, Avinash Reddy Kotapati
Architecture
Generally, BI applications get data that is gathered from a data warehouse or data marts. It’s not a requirement to have data warehouse for BI applications but its most common practice. In order to distinguish between concepts of business intelligence and data warehouses, Forrester Research often defines business intelligence in one of two ways: using a broad definition: "Business Intelligence is a set of methodologies, processes, architectures, and technologies that transform raw data into meaningful and useful information used to enable more effective strategic, tactical, and operational insights and decision-making." When using this definition, business intelligence also includes technologies such as data integration, data quality, data warehousing, master data management, text and content analytics, and many others that the market sometimes lumps into the Information Management segment. Therefore, Forrester refers to data preparation and data usage as two separate, but closely linked segments of the business intelligence architectural stack. Forrester defines the latter, narrower business intelligence market as "referring to just the top layers of the BI architectural stack such as reporting, analytics and dashboards."
For an effective BI architecture, below are set of attributes that needs to be considered before a BI solution is implemented in an Organization. These attributes are fundamental to business intelligence systems that will be deployed broadly across the organization.
Usability – This is one of the most important attribute as BI Tool has to reach to the maximum possible audience in a company. So Usability plays a vital role for a BI tool. If usage of the tool is not easy, user-friendly it’s hard for business users to use the tool for their purposes.
Interoperability - A BI tool must have a single interface for all BI functions with the ability to navigate from one function to other. IT must be able to enable & disable these functions based on groups and roles in the company.
Common business view - For companies with large data assets, applications and users, it’s very important that a BI solution delivers a common view of the business to all users in the company. This will make sure that every user is looking at the same numbers and there is no difference in interpretation of data. The single view must be based on all the data, and the quality of the data must be maintained to ensure user confidence. Data modelers must be able to create an effective business model quickly and readily modify it as the needs of business change over time.
Agility – Based on market situations, companies change their strategies and bring in new ideas to their business growth. So it’s important that BI solution will adapt the changes quickly as per new ideas.
Scalability – BI tools should be in a position to scale to tens of thousands of users across a global organization.
Reliability - For most organizations, business intelligence is core to the business and must be available on a 24x7 basis with redundancy for all capabilities and services.
Openness – BI tool must be open - in terms of the data that can be accessed and should be open for integration with existing and new applications.
Manageability - IT should be able to manage and support the BI tool efficiently and proactively ensuring that potential problems are identified early and avoided, thus keeping the system operating effectively.
Leverage existing infrastructure – Most of the times many BI applications enforce to implement a new infrastructure which makes the cost of the solution to go high. So IT has to look into this aspect very closely and make sure a BI solution works within existing environments and leverage everything that is re-usable to meet BI solution and save cost.
Security – Every company has their own security applications based on organization needs. Hence a BI solution should work with existing security applications in the organization to ensure that access to both the BI system and the information in that system is always secured as required.
The key challenges in businesses without BI solution are:• Data availability for analysis - Many organizations
have accounting software’s and order processing software’s that hold data in proprietary format. But for any business for having reporting done at an aggregate level for analysis, companies should have a data warehouse or data mart as a backup of data at offsite. This is one of the biggest challenges for organizations to keep the data in sync (real-time) with data marts and hence make them available for reporting.
• Rapid change in market – In current economy things are changing very fast in the market space. So a business owner should be able to keep up with the market with data analysis to be able to make decisions using data and indicators available based on data. If there is massive data available in the company it would take lot of time to make them in proper understanding
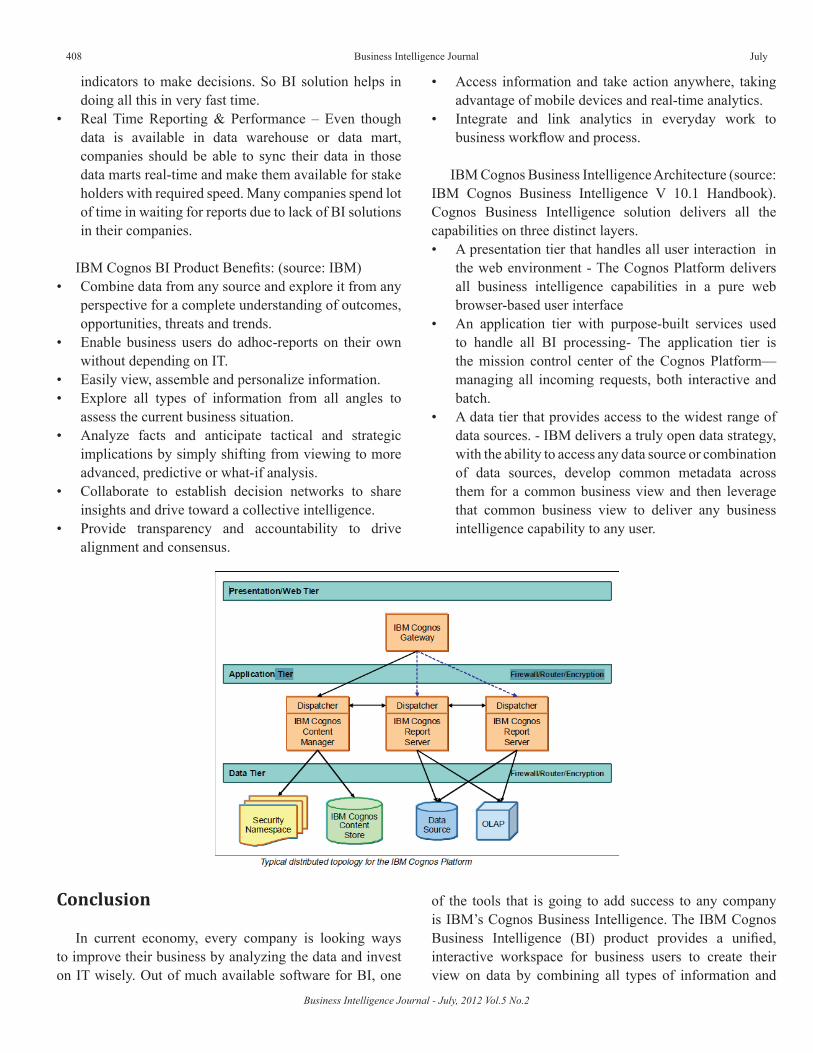
Business Intelligence Journal - July, 2012 Vol.5 No.2
408 Business Intelligence Journal July
indicators to make decisions. So BI solution helps in doing all this in very fast time.
• Real Time Reporting & Performance – Even though data is available in data warehouse or data mart, companies should be able to sync their data in those data marts real-time and make them available for stake holders with required speed. Many companies spend lot of time in waiting for reports due to lack of BI solutions in their companies.
IBM Cognos BI Product Benefits: (source: IBM) • Combine data from any source and explore it from any
perspective for a complete understanding of outcomes, opportunities, threats and trends.
• Enable business users do adhoc-reports on their own without depending on IT.
• Easily view, assemble and personalize information.• Explore all types of information from all angles to
assess the current business situation.• Analyze facts and anticipate tactical and strategic
implications by simply shifting from viewing to more advanced, predictive or what-if analysis.
• Collaborate to establish decision networks to share insights and drive toward a collective intelligence.
• Provide transparency and accountability to drive alignment and consensus.
• Access information and take action anywhere, taking advantage of mobile devices and real-time analytics.
• Integrate and link analytics in everyday work to business workflow and process.
IBM Cognos Business Intelligence Architecture (source: IBM Cognos Business Intelligence V 10.1 Handbook). Cognos Business Intelligence solution delivers all the capabilities on three distinct layers. • A presentation tier that handles all user interaction in
the web environment - The Cognos Platform delivers all business intelligence capabilities in a pure web browser-based user interface
• An application tier with purpose-built services used to handle all BI processing- The application tier is the mission control center of the Cognos Platform—managing all incoming requests, both interactive and batch.
• A data tier that provides access to the widest range of data sources. - IBM delivers a truly open data strategy, with the ability to access any data source or combination of data sources, develop common metadata across them for a common business view and then leverage that common business view to deliver any business intelligence capability to any user.
Conclusion
In current economy, every company is looking ways to improve their business by analyzing the data and invest on IT wisely. Out of much available software for BI, one
of the tools that is going to add success to any company is IBM’s Cognos Business Intelligence. The IBM Cognos Business Intelligence (BI) product provides a unified, interactive workspace for business users to create their view on data by combining all types of information and

2012 409
to personalize content to provide unique insights and to deliver faster business decisions. Stake holders can use this product to create flexible dashboards and reports. Trends in BI are changing drastically in BI world and one of the most upcoming trends is mobility. Having ability to use Smart phones is one of the features available in IBM Cognos BI product. And another important trend that is upcoming now is that Business users are willing to take ownership of BI instead of having IT support their needs. This is going to put IT in the spot to provide software which is robust enough to support all the needs of business users without depending on IT including Real-time BI. IBM Cognos has all those features to fulfill the needs to current trends of BI and to
make a company as successful and intuitive company in current Era.
References
Cindi Howson (2008). Successful Business Intelligence: Secrets to Making BI a Killer App.
Mike Biere (2010). The New era of enterprise business intelligence: Using analytics to achieve a Global Competitive Advantage.
International Technical Support Organization (2010). IBM Cognos Business Intelligence V 10.1 Handbook
Kirankumar G., Sunil K. J., Avinash R. K. - Analysis of Using a Business Intelligence Tool (COGNOS) in a Company to Result in More Efficient and Intuitive Company in the Current Era
Kirankumar Gollapudi, Sunil Kumar Jangeti, Avinash Reddy Kotapati

2012Business Intelligence JournalJuly
Business Intelligence Journal - July, 2012 Vol.5 No.2
Academic quality assurance at the EUASC Committee is enforced by the Academic Quality Assurance Board, according
to the Standards and Guidelines for Quality Assurance in the European Higher Education Area, established by the European
Association for Quality Assurance in Higher Education in 2005 at Helsinki, Finland (ENQA) Basically, the Academic
Quality Assurance Board’s work focuses on providing and permanently updating policy, methodology, and procedures to
count on a proper normative framework within which tuition institutions’ performance and studies programmes’ design and
development can become certified and/or validated by correspondent Boards at the Committee.
As cases analysis are permanently conducted on tuition institutions and studies programmes all over the world, a wide range of processes to be taken into
consideration by the Academic Quality Assurance Board may include a number of unexpected different situations, which would not necessarily arise if this work
should be performed only within the EU area.
Therefore, AQA Board must run permanent revision on a number of specific details on the normative framework to keep this “tool” in the best possible
conditions, as creating, classifying, evaluating and qualifying different local indicators to match with EU Standards.
AQA Board performs its work through three Panels:
The European Higher Education Specialists’ Bodies Panel, which integrates the work of one representative from the EU-Education and Training on Higher
Education, one representative from the EU-Education and Training on Adults Training, a representative from the IFTD of the UK, and a representative from
Högskolevernet from Sweden; The Partner Institutions for Higher Education Panel, which integrates the work of one representative from the European Business
School (Cambridge, UK), one representative from The International Management Institute of Brussels, Belgium, one representative from the European Business
School of Singapore, and one representative from the Oxford Association of Management; and
The School of Doctoral Studies (European Union) Intercollegiate Panel, which integrates the work of one representative from the Business Management
and Economics Department, one representative from the Engineering and Technology Department, one representative from the Science Department and one
representative from the Social Science Department.
Call for Papers The School of Doctoral Studies (European Union) Journal (SDSJ) publishes research analysis
and inquiry into issues of importance to the academic and scientific community. Articles in SDSJ examine emerging trends and concerns in the areas of business management, economics, engineering,
technology, natural and social science. The goal of SDSJ is to broaden the knowledge of students, academicians and society in general by promoting free access and provide valuable insight to human knowledge related information, research and ideas, presenting what the School of Doctoral Studies of the European Union’s Faculty Members may consider as relevant contributions to human knowledge. SDSJ is an annual publication and all articles are peer-reviewed. SDSJ will be published annually (one volume per year) by the IIU Press and Research Centre, A.C. for the School of Doctoral Studies of the European Union in Brussels, Belgium.
Types of paper:• Regular Articles: These should describe new and carefully confirmed findings, and research methods should be given in sufficient detail
for others to verify the work. The length of a full paper should be the minimum required to describe and interpret the work clearly.• Short Communications: A Short Communication is suitable for recording the results of complete small investigations or giving details
of new models, innovative methods or techniques. The style of main sections need not conform to that of full-length papers. Short communications are 2 to 4 printed pages (about 6 to 12 manuscript pages) in length.
• Reviews: Submissions of reviews and perspectives covering topics of current interest are welcome and encouraged. Reviews should be concise and no longer than 4to 6 printed pages (about 12 to 18 manuscript pages). Reviews manuscripts are also peer-reviewed
Please read Instructions for Authors before submitting your manuscript at http://www.iiuedu.eu/press/journals/sds/SDS_2010/Information%20
for%20Contributors.pdf The manuscript files should be given the last name of the first author.Submit manuscripts as e-mail attachment to the Editorial Office: [email protected] SDSJ will only accept manuscripts submitted as Microsoft Word archives attachments within an e-mail communication forwarded to the
above mentioned e-mail address.

July Business Intelligence Journal 2012
Business Intelligence Journal - July, 2012 Vol.5 No.2
THE OXFORD ASSOCIATION OF MANAGEMENT
The Oxford Association of Management was established by a group of professional and specialist in the United Kingdom. Those holding recognised postgraduate qualifications are admitted as certified masters and doctorates members of the association.
Special category of Postgraduate Degree in Business Administration is designed for those not hold sufficient qualifications but with extensive senior management experience that by portfolio submission be assessed and admitted to the association.
www.oxim.org
Certified Doctorate of Business AdministrationCertified Master of Business AdministrationPostgraduate Degree in Business Administration
The Oxford Association of Management is listed as professional bodies by the UK Government responsible for further and higher education in England & Wales.
THE CAMBRIDGE ASSOCIATION OF MANAGERS
The Cambridge Association of Managers was established by a group of managers and consultants in the United Kingdom. Those hold recognised professional qualifications are admitted as fellows and associates of the assocaition.
Special category of Graduate Degree in Business Administration is designed for those not holding sufficient qualifications butwith extensive management experience that by portfoliosubmission be assessed and admitted to the association.
www.cam-uk.org
Graduate Degree in Business AdministrationCertified Business Manager- FellowCertified Business Manager- Associate
The Cambridge Association of Managers is listed as professional bodies by the UK Government responsible for further and higher education in England & Wales.

2012Business Intelligence JournalJuly
Business Intelligence Journal - July, 2012 Vol.5 No.2
ISLES INTERNATIONAL UNIVERSITYEst.2000
The Isles International University was established by a group from academia, at the dawn of the millennium. The university promotes learning, research and journal publications.
The Journals are licenced and published in Brussels, the European Union and Massachusetts, USA.
Based upon research work and publishing, special categories of professional doctorates have been designed for those with extensive professional experience, which are assessed by written & oral thesis submission and defence to a selected panel.
www.iiuedu.ac
Doctor of Philosophy (PhD)Doctor of Business Administration (DBA)
The Isles International University is incorporated and registered in the Republic of Ireland and the United Kingdom.
EUROPEAN BUINESS SCHOOL- CAMBRIDGE (UK)Est.2004
The European Business School was established by a group of professionals in Cam-bridge. The EBSC offer residential programmes catering for adult learners at senior management levels.
Special categories of professional and executive masters have been designed for those not holding sufficient qualifications, yet having extensive management experience. Assessment is by written and oral portfolio sub-mission to a panel.
www.ebscambridge-ac
Master of Business Administration (MBA)Professional MBA/Executive MBA/Euro MBA
The European Business School is the business school of the Isles International University and is registered on ACTOR UK Government authority for funding in the United Kingdom.


