Embed Size (px)
Citation preview
sustainability
Article
Parametric Design Structures in Low Rise Buildings in Relationto the Urban Context in UAE
Lindita Bande *, Abeer Alshamsi, Anoud Alhefeiti, Sarah Alderei, Sebah Shaban, Mohammed Albattahand Martin D. Scoppa
�����������������
Citation: Bande, L.; Alshamsi, A.;
Alhefeiti, A.; Alderei, S.; Shaban, S.;
Albattah, M.; Scoppa, M.D.
Parametric Design Structures in Low
Rise Buildings in Relation to the
Urban Context in UAE. Sustainability
2021, 13, 8595. https://doi.org/
10.3390/su13158595
Academic Editor: Chi-Ming Lai
Received: 17 June 2021
Accepted: 26 July 2021
Published: 1 August 2021
Publisher’s Note: MDPI stays neutral
with regard to jurisdictional claims in
published maps and institutional affil-
iations.
Copyright: © 2021 by the authors.
Licensee MDPI, Basel, Switzerland.
This article is an open access article
distributed under the terms and
conditions of the Creative Commons
Attribution (CC BY) license (https://
creativecommons.org/licenses/by/
4.0/).
Department of Architectural Engineering, Al Ain Campus, College of Engineering,United Arab Emirates University, AL Ain 15551, United Arab Emirates; [email protected] (A.A.);[email protected] (A.A.); [email protected] (S.A.); [email protected] (S.S.);[email protected] (M.A.); [email protected] (M.D.S.)* Correspondence: [email protected]
Abstract: The city of Al Ain (Abu Dhabi, UAE) has a mainly low rise residential buildings. Villasas part of a compound or separate units represent the majority of the residential areas in the city.Due to the harsh hot arid climate of Al Ain, the energy demand for the cooling load is quite high.Therefore, it is relevant finding new retrofit strategies that are efficient in reducing the cooling load ofthe villas. The aim of this study is to analyze one particular strategy (parametric shading structure)in terms of design, construction, cost, energy impact on the selected villa. The main data for thisstudy is taken from the local sources. There are six steps followed in this analysis: case study analysis;climate analysis; parametric structure and PV panels; building energy consumption and outdoorthermal comfort; modelling, simulation, and validation; materials, construction, and cost evaluation.The model of the villa was validated for the full year 2020 based on the electricity bills obtained.After adding the parametric design structure, the reduction after shading is approximately 10%.Meanwhile the UTCI (Universal Thermal Climate Index) dropped from extreme heat stress to strongheat stress (average for the month of March and September). These findings are promising in theretrofit industry due to the advanced calculations used to optimize the parametric design structure.
Keywords: energy in buildings; parametric structure; BIPV (building integrated photovoltaics); ROI(return of investment); OTC (outdoor thermal comfort)
1. Introduction
Based on a study done in the city of Abu Dhabi, the residential building stock is thesector that has the highest demand in energy consumption. The energy used for the coolingload of the buildings is higher than the other cities in UAE. Moreover, the OTC values areimpacted by the harsh hot arid climate. Although UAE has regulations and codes, there arestill residential areas that have a lack of shading structures and do not follow regulationsthat could improve the indoor and outdoor environment [1].
UAE has several cities but the biggest in terms of population are: Dubai, Abu Dhabi,Sharjah, Al Ain. The urban development of Dubai is linear where the buildings are locatedon the side of two main highways in parallel to the coast. Meanwhile Abu Dhabi has thefinancial center in the downtown area of the main island and the residential zones developaround it. Al Ain has also a central area with low-rise buildings (5–6 floors) and the restof the city is made of villas as part of compound or individual units. Studying retrofitstrategies for villas is relevant for the city of AL Ain [2].
There is growth in residential electricity bills for both expats and nationals from2011 to 2017, and this data includes both the Abu Dhabi Distribution Company and AlAin Distribution Company Statistics; it shows that Abu Dhabi has the highest electricityconsumption in the domestic sector in 2018 [3].
Sustainability 2021, 13, 8595. https://doi.org/10.3390/su13158595 https://www.mdpi.com/journal/sustainability
Sustainability 2021, 13, 8595 2 of 23
Referring to a study based on existing residential buildings stock, buildings con-structed before 2003 did not follow any such regulations in both of the emirates of Dubaiand Sharjah. In Abu Dhabi, the city of Al Ain’s thermal insulation requirement was onlyestablished in 2011. The data show that all buildings in UAE built before 2003 did not haveto satisfy any thermal insulation requirements [4].
The cooling load of buildings can be mitigated only by improving the current condi-tions of the building stock. Therefore, finding retrofit strategies is crucial. These strategiesare efficient in application, maintenance, and cost. Based on a study done in a villa inAbu Dhabi, it is shown that several retrofit strategies such as window louvres, cool paint,efficient glazing, external shading devices can reduce the annual energy consumption by43% [5,6].
There is a study in Abu Dhabi that is related to the project target; it is allegedly mostlikely to reduce 10% of residential projects’ electricity bills in UAE by adopting simplepassive strategies such as shading devices; it could be valid for retrofitting existing projects.A recent study proved that a 6% reduction in the houses’ annual energy consumption couldbe achieved. Therefore, based on a simple calculation, it would result in a 2.7% reductionin the annual energy consumption of UAE. Green design principles can be uncomplicatedand efficient at the same time without adding much extra cost and complexity to thearchitecture, as shown in the figure below [7].
Based on a conducted study, buildings’ energy consumption is 80% of the total amountof electricity consumption in Abu Dhabi. The cooling load comprises 70% of this energy.Some of the useful retrofit strategies that can go along with the parametric shading structureare stated below [8].
To find a solution to these problems and to accomplish the research, case studies weredone in a residential stock low-rise building in the city of Al Ain for the developmentof a sustainable solution for adaptive parametric facades. It involves expanding theparametric shading structures into the neighborhood, creating an innovative approach forthe connection to current buildings, and expansion into parking areas [9,10].
The Abu Dhabi Media Zone is a mixed-use development that integrates three cityblocks, and it is an important landmark in Abu Dhabi. The project buildings are designed toresemble a large-scale display frame. The frame façades are asymmetrically proportionedand designed with folded smooth claddings. The TwoFour54 towers with the double-skinfacade reach levels of performance rarely attained on a project of this scale and are highprofile in the Middle East. The double-skin facade (DSF) was an important feature for thedesign. It achieved three key goals: high environmental quality, an extraordinary glasssurface, and the implementation of media lighting. DSF offers a healthy and productiveworkplace by providing a desirable environment in terms of comfort, quality, and thequantity of light. It consumes between 13 and 16% less energy than a high-performancesingle skin system [11].
The facade was built by combining five different types of precast pieces in the shapeof a propeller. It rotates about 180◦ on its axis, and the heights vary between 16 to 20 m,depending on their position. The light changes that occur during the day and the artificiallighting at night provide an interesting mix of colors, reflections, and shades, resulting inan ever-changing and unstable image of the facade [12].
This project is mainly designed to maintain residents’ visual privacy, and green designtechniques are in place to provide convenience and improve the residents’ standard ofliving. Furthermore, the residents did not want the strong east and west facade sunlightto penetrate deep into the rooms, particularly in the early mornings and late afternoonswhen the sea breeze passes through the neighborhood. Therefore, when constructing theexterior, these requirements were the parametric considerations. It consisted of a perforatedaluminum screen, where specifics were created and calculated through the use of the Igeoand Grasshopper software programs for various times of the day and weather conditions.The technique of urban camouflage was introduced, in which the double skin facade
Sustainability 2021, 13, 8595 3 of 23
inspired by the foliage blends with its surroundings. It was based on the pattern derivedfrom a photographic montage of the surrounding trees and street-scape [13].
The ability to circulate fresh air throughout the building without any reliance onair conditioning and mechanical equipment is the thermal switch’s major performancesupport. By applying dynamic action to create isolated standard flows, the facade canbring in air passively through the facade and cool building residents.
This system contains an inherent chemical property that turns it proportionally darkto the intensity of UV light, and it allows shading every time it is necessary, but this systemis impractically expensive. The material must be efficiently distributed and allocated whereneeded. Moreover, the design features curved glazing, combining photochromic pigmentswithin protective films. This strategy can be applied to buildings with different climateconditions. It is used mainly to reduce the cooling load. An experiment was made onthe UAE region, specifically on the rooftop of the University of Sharjah. This was alsoconnected to the Solar Decathlon Middle East 2018 Dubai, for a housing project. After theexperiment was performed, the results showed an improvement of 5–10% when applyingthe cool roof. This is what made it a great strategy to be used to reduce the cooling load andthe building’s generation of electricity. Cool walls are used in different climates and theyare not very common in the UAE region; the research and analysis on cool walls indicatedthat if they were combined with proper indoor ventilation, they would have a huge impacton the reduction of heat gain in the buildings [14–16].
Applying the shading devices in many areas can sometimes lead to a higher amount ofenergy consumption due to the use of artificial lighting in the building. So, when installinga shading device on a building, it is important to choose the best elevation and direction inorder to have enough natural lighting entering the building to reduce the electricity use.Shading devices are the best choice regarding the retrofit strategies. It is recommendedto use a centralized automated system, which is more beneficial for the reduction of thecooling load [1,17].
The local standards have clear retrofit strategies on low-rise buildings. The UrbanPlanning Council (UPC), which is an Abu Dhabi local authority, have developed differentprograms and regulations since 2010, for example, the Abu Dhabi 2030 plan. Based on thenew and updated regulations that are related to the Estidama sustainability rating system,neighborhood areas must follow at least the minimum standard rates of Estidama codesand regulations, and government buildings are required to target a higher level of rating.The main target in this project and the focus of this research is applying the developedretrofit strategies in the low-rise residential villas without exceeding a high retrofit costand in a reasonable amount of time [18,19].
Based on the above literature analysis, there is a large space for improvement inretrofit strategies for low-rise buildings. Shading devices are an efficient strategy (amongothers), however multiple parameters must be taken into consideration in order to find theoptimized structure [20].
The goal of this research is to design a parametric shading structure that will be addedto a residential villa to reduce the excessive heat gains on the villa façade (decreasing theinternal cooling load) and improve the walkability for the compound inhabitants. The aimof this structure is to improve both the indoor and outdoor conditions. Instead of adding amulti-shading device for each area separately, this research project suggests to have oneparametric shading device structure that connects all areas and the urban context (buildingfacade, parking area, sidewalks) under the same shading structure without any disturbanceof the surrounding environment (architecturally and structurally).
The novelty in this research is using advanced software (such as Rhino and Grasshop-per) to add parameters that automatically adjust the optimized shape of the structurefrom the architecture and construction perspective (while reducing cooling load and im-proving OTC). In addition, the production method brings advanced technology into themass production.
Sustainability 2021, 13, 8595 4 of 23
2. Methodology
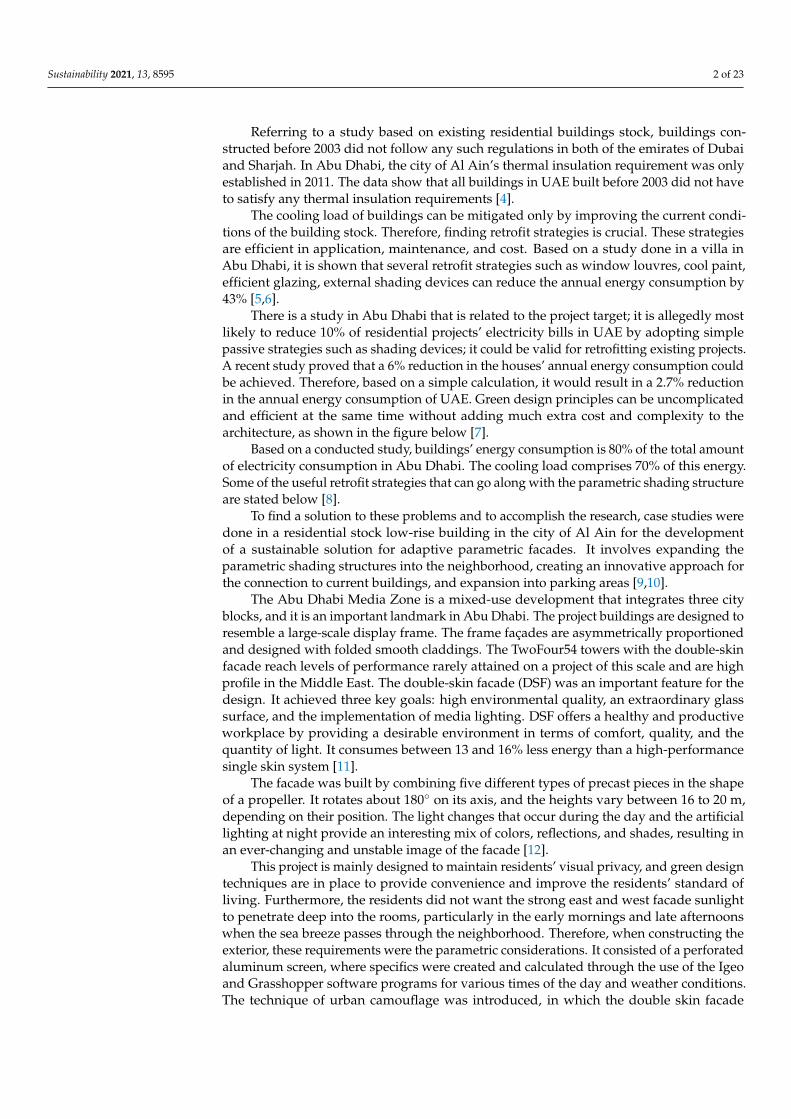
The methodology followed in this study is linear. The city was selected because of itsrapid urban development and the relevance of the city in the region. Al Ain has a hot aridclimate with low levels of humidity, unlike cities on the coast such as Dubai or Abu Dhabi.The data used for the modeling, validation, and cost evaluation model are taken from localsources. The modelling follows two main directions based on the tools used, the basemodel, and the retrofitted model. The results are compared and adjusted in accordancewith the specified method. The results are then compared and analyzed (Figure 1).
Sustainability 2021, 13, x FOR PEER REVIEW 4 of 24
2. Methodology The methodology followed in this study is linear. The city was selected because of its
rapid urban development and the relevance of the city in the region. Al Ain has a hot arid climate with low levels of humidity, unlike cities on the coast such as Dubai or Abu Dhabi. The data used for the modeling, validation, and cost evaluation model are taken from local sources. The modelling follows two main directions based on the tools used, the base model, and the retrofitted model. The results are compared and adjusted in accordance with the specified method. The results are then compared and analyzed (Figure 1).
The methodology of this research follows the main points below: - Case study analysis; - Climate analysis; - Parametric structure and PV panels; - Building energy consumption and outdoor thermal comfort; - Modelling, simulation, and validation; - Materials, construction, and cost evaluation.
Figure 1. Schematic view of the methodology followed in this study.
2.1. Case Study Analysis Based on the research, the MREIFA villa compound is chosen to be the unit to retrofit,
located in Alain. This is because we found more problems in this unit. Moreover, a site visit of the compound was performed to investigate and the results showed that the com-pound has excessive heat gain. As investigated, the heat was very uncomfortable when walking around there. This will cause a high electricity bill due to the overuse of air con-ditioning. In addition to that, the units are very old, and they do not follow the sustaina-bility standards. So, the aim is to have higher outdoor thermal comfort by adding a para-metric shading structure, which will result in less usage of air conditioning and lower the electricity bill. Moreover, one of the reasons to select the Al Ain units (MREIFA VILLAS) is the availability of information and documentation in these units specifically.
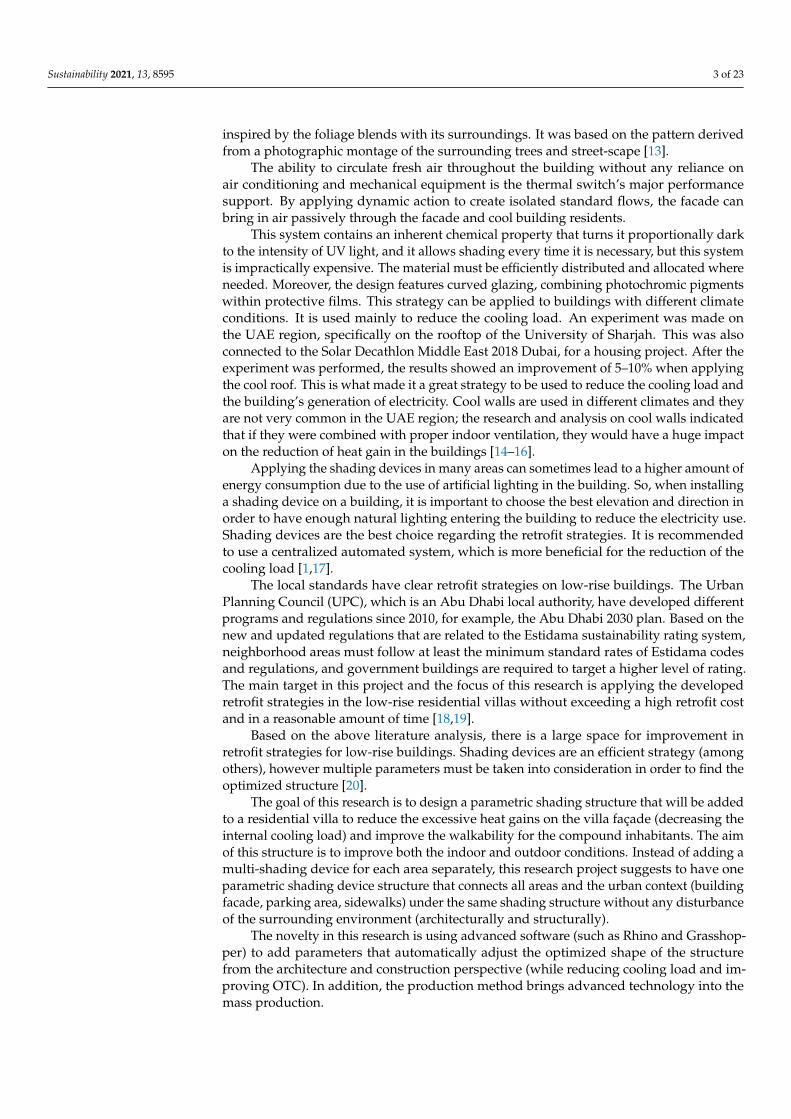
The complex is located in Asharej Alain, as illustrated in Figure 2, with a complex area of 131,302.69 m2. It consists of 114 units, and the units’ areas range from 420.75 to 608.75 m2. Moreover, each unit is a two-story villa that includes a balcony, gym, two bed-rooms, maid’s room, parking lots, and a big living room. The villa has many weaknesses that will cause high energy consumption. The first problem is having poor shading, and not only in the unit; even the outdoor area is not shaded and the parking lots in front of the units are unshaded as well, as illustrated in Figures 3 and 4, which lets lots of heat inside the units and in the neighborhood; additionally, it caused cracks on the walls. More-over, there are no water bodies that can help improve the air quality and evaporative cooling. Moreover, there is no green surrounding the units, as seen in Figure 5, and there is also no green in the neighborhood that could help to reduce heat. On the other hand, the strengths and opportunities we found in the units are the small openings in the units
Figure 1. Schematic view of the methodology followed in this study.
The methodology of this research follows the main points below:
- Case study analysis;- Climate analysis;- Parametric structure and PV panels;- Building energy consumption and outdoor thermal comfort;- Modelling, simulation, and validation;- Materials, construction, and cost evaluation.
2.1. Case Study Analysis
Based on the research, the MREIFA villa compound is chosen to be the unit to retrofit,located in Alain. This is because we found more problems in this unit. Moreover, a site visitof the compound was performed to investigate and the results showed that the compoundhas excessive heat gain. As investigated, the heat was very uncomfortable when walkingaround there. This will cause a high electricity bill due to the overuse of air conditioning. Inaddition to that, the units are very old, and they do not follow the sustainability standards.So, the aim is to have higher outdoor thermal comfort by adding a parametric shadingstructure, which will result in less usage of air conditioning and lower the electricity bill.Moreover, one of the reasons to select the Al Ain units (MREIFA VILLAS) is the availabilityof information and documentation in these units specifically.
The complex is located in Asharej Alain, as illustrated in Figure 2, with a complex areaof 131,302.69 m2. It consists of 114 units, and the units’ areas range from 420.75 to 608.75m2. Moreover, each unit is a two-story villa that includes a balcony, gym, two bedrooms,maid’s room, parking lots, and a big living room. The villa has many weaknesses that willcause high energy consumption. The first problem is having poor shading, and not only inthe unit; even the outdoor area is not shaded and the parking lots in front of the units areunshaded as well, as illustrated in Figures 3 and 4, which lets lots of heat inside the unitsand in the neighborhood; additionally, it caused cracks on the walls. Moreover, there areno water bodies that can help improve the air quality and evaporative cooling. Moreover,there is no green surrounding the units, as seen in Figure 5, and there is also no green inthe neighborhood that could help to reduce heat. On the other hand, the strengths and
Sustainability 2021, 13, 8595 5 of 23
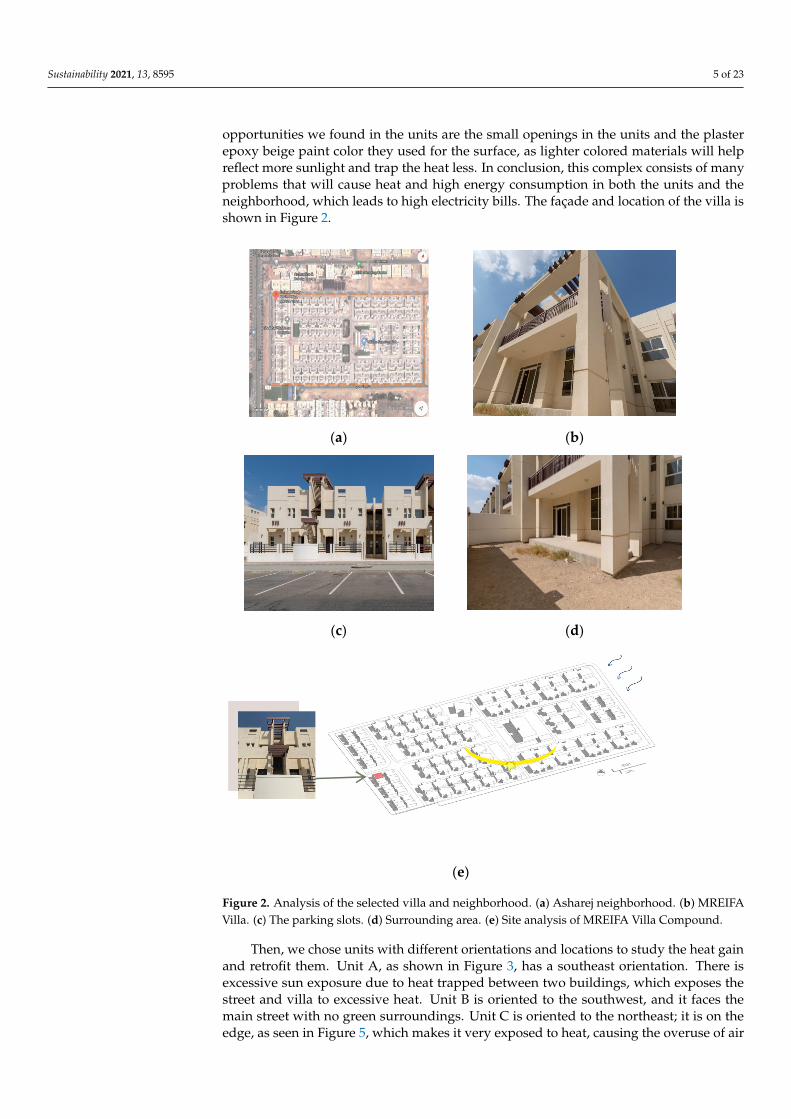
opportunities we found in the units are the small openings in the units and the plasterepoxy beige paint color they used for the surface, as lighter colored materials will helpreflect more sunlight and trap the heat less. In conclusion, this complex consists of manyproblems that will cause heat and high energy consumption in both the units and theneighborhood, which leads to high electricity bills. The façade and location of the villa isshown in Figure 2.
Sustainability 2021, 13, x FOR PEER REVIEW 5 of 24
and the plaster epoxy beige paint color they used for the surface, as lighter colored mate-rials will help reflect more sunlight and trap the heat less. In conclusion, this complex consists of many problems that will cause heat and high energy consumption in both the units and the neighborhood, which leads to high electricity bills. The façade and location of the villa is shown in Figure 2.
(a) (b)
(c) (d)
(e)
Figure 2. Analysis of the selected villa and neighborhood. (a) Asharej neighborhood. (b) MREIFA Villa. (c) The parking slots. (d) Surrounding area. (e) Site analysis of MREIFA Villa Compound.
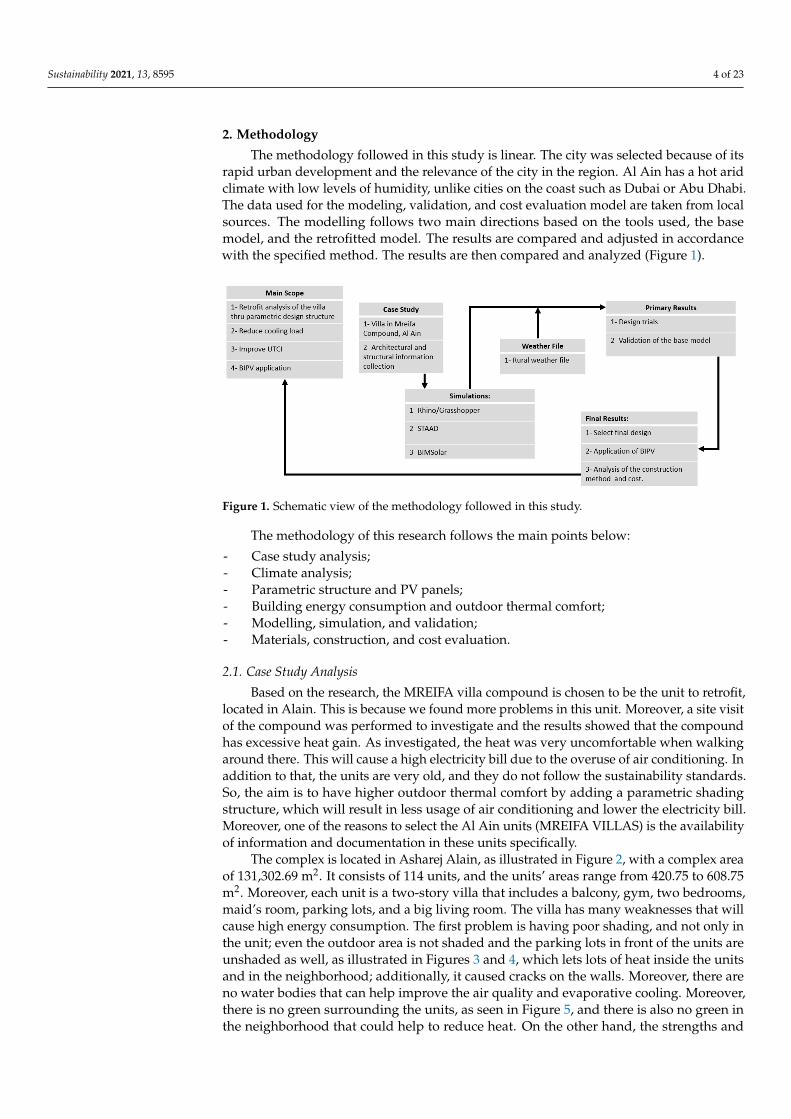
Then, we chose units with different orientations and locations to study the heat gain and retrofit them. Unit A, as shown in Figure 3, has a southeast orientation. There is ex-cessive sun exposure due to heat trapped between two buildings, which exposes the street and villa to excessive heat. Unit B is oriented to the southwest, and it faces the main street with no green surroundings. Unit C is oriented to the northeast; it is on the edge, as seen in Figure 5, which makes it very exposed to heat, causing the overuse of air conditioning. Finally, unit D is oriented to the southeast with nothing in front of it. In the end, unit B was chosen for this research because it has excessive heat gain since it is located to the southwest and facing the main street.
Figure 2. Analysis of the selected villa and neighborhood. (a) Asharej neighborhood. (b) MREIFAVilla. (c) The parking slots. (d) Surrounding area. (e) Site analysis of MREIFA Villa Compound.
Then, we chose units with different orientations and locations to study the heat gainand retrofit them. Unit A, as shown in Figure 3, has a southeast orientation. There isexcessive sun exposure due to heat trapped between two buildings, which exposes thestreet and villa to excessive heat. Unit B is oriented to the southwest, and it faces themain street with no green surroundings. Unit C is oriented to the northeast; it is on theedge, as seen in Figure 5, which makes it very exposed to heat, causing the overuse of air
Sustainability 2021, 13, 8595 6 of 23
conditioning. Finally, unit D is oriented to the southeast with nothing in front of it. In theend, unit B was chosen for this research because it has excessive heat gain since it is locatedto the southwest and facing the main street.
Based on the site study analysis of the MREIFA villa compound in Alain, it is foundthat it has no green area surroundings. The sun is mainly directed to the south. The windcomes from the northeast. The compound has the following units: unit A, unit B, unit C, andunit D. Each unit has a different area. Unit A has an area of 420.75 m2, unit B is 497.112 m2,unit C is 608.75 m2, and unit D is 420.75 m2. Regarding the study performed, unit B ischosen to work with (Figure 2).
2.2. Climate Analysis
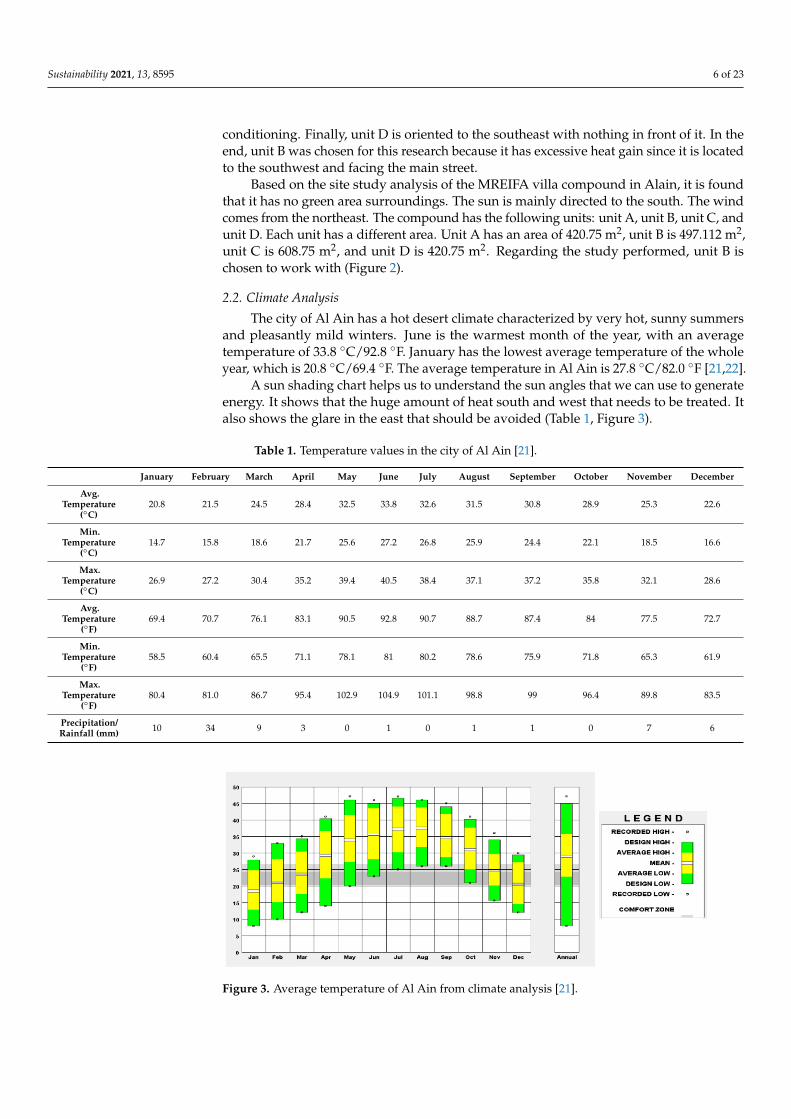
The city of Al Ain has a hot desert climate characterized by very hot, sunny summersand pleasantly mild winters. June is the warmest month of the year, with an averagetemperature of 33.8 ◦C/92.8 ◦F. January has the lowest average temperature of the wholeyear, which is 20.8 ◦C/69.4 ◦F. The average temperature in Al Ain is 27.8 ◦C/82.0 ◦F [21,22].
A sun shading chart helps us to understand the sun angles that we can use to generateenergy. It shows that the huge amount of heat south and west that needs to be treated. Italso shows the glare in the east that should be avoided (Table 1, Figure 3).
Table 1. Temperature values in the city of Al Ain [21].
January February March April May June July August September October November December
Avg.Temperature
(◦C)20.8 21.5 24.5 28.4 32.5 33.8 32.6 31.5 30.8 28.9 25.3 22.6
Min.Temperature
(◦C)14.7 15.8 18.6 21.7 25.6 27.2 26.8 25.9 24.4 22.1 18.5 16.6
Max.Temperature
(◦C)26.9 27.2 30.4 35.2 39.4 40.5 38.4 37.1 37.2 35.8 32.1 28.6
Avg.Temperature
(◦F)69.4 70.7 76.1 83.1 90.5 92.8 90.7 88.7 87.4 84 77.5 72.7
Min.Temperature
(◦F)58.5 60.4 65.5 71.1 78.1 81 80.2 78.6 75.9 71.8 65.3 61.9
Max.Temperature
(◦F)80.4 81.0 86.7 95.4 102.9 104.9 101.1 98.8 99 96.4 89.8 83.5
Precipitation/Rainfall (mm) 10 34 9 3 0 1 0 1 1 0 7 6
Sustainability 2021, 13, x FOR PEER REVIEW 6 of 24
Based on the site study analysis of the MREIFA villa compound in Alain, it is found that it has no green area surroundings. The sun is mainly directed to the south. The wind comes from the northeast. The compound has the following units: unit A, unit B, unit C, and unit D. Each unit has a different area. Unit A has an area of 420.75 m2, unit B is 497.112 m2, unit C is 608.75 m2, and unit D is 420.75 m2. Regarding the study performed, unit B is chosen to work with (Figures 2).
2.2. Climate Analysis The city of Al Ain has a hot desert climate characterized by very hot, sunny summers
and pleasantly mild winters. June is the warmest month of the year, with an average tem-perature of 33.8 °C/92.8 °F. January has the lowest average temperature of the whole year, which is 20.8 °C/69.4 °F. The average temperature in Al Ain is 27.8 °C/82.0 °F [21,22].
A sun shading chart helps us to understand the sun angles that we can use to gener-ate energy. It shows that the huge amount of heat south and west that needs to be treated. It also shows the glare in the east that should be avoided (Table 1, Figure 3).
Table 1. Temperature values in the city of Al Ain [21].
Figure 3. Average temperature of Al Ain from climate analysis [21].
Janu-ary
February March April May June July August Septem-ber
October Novem-ber
Decem-ber
Avg. Temper-
ature (°C)
20.8 21.5 24.5 28.4 32.5 33.8 32.6 31.5 30.8 28.9 25.3 22.6
Min. Temperature (°C)
14.7 15.8 18.6 21.7 25.6 27.2 26.8 25.9 24.4 22.1 18.5 16.6
Max. Temperature (°C)
26.9 27.2 30.4 35.2 39.4 40.5 38.4 37.1 37.2 35.8 32.1 28.6
Avg. Temperature (°F)
69.4 70.7 76.1 83.1 90.5 92.8 90.7 88.7 87.4 84 77.5 72.7
Min. Temperature (°F)
58.5 60.4 65.5 71.1 78.1 81 80.2 78.6 75.9 71.8 65.3 61.9
Max. Temperature (°F)
80.4 81.0 86.7 95.4 102.9 104.9 101.1 98.8 99 96.4 89.8 83.5
Precipitation/
Rainfall (mm)
10 34 9 3 0 1 0 1 1 0 7 6
Figure 3. Average temperature of Al Ain from climate analysis [21].
Sustainability 2021, 13, 8595 7 of 23
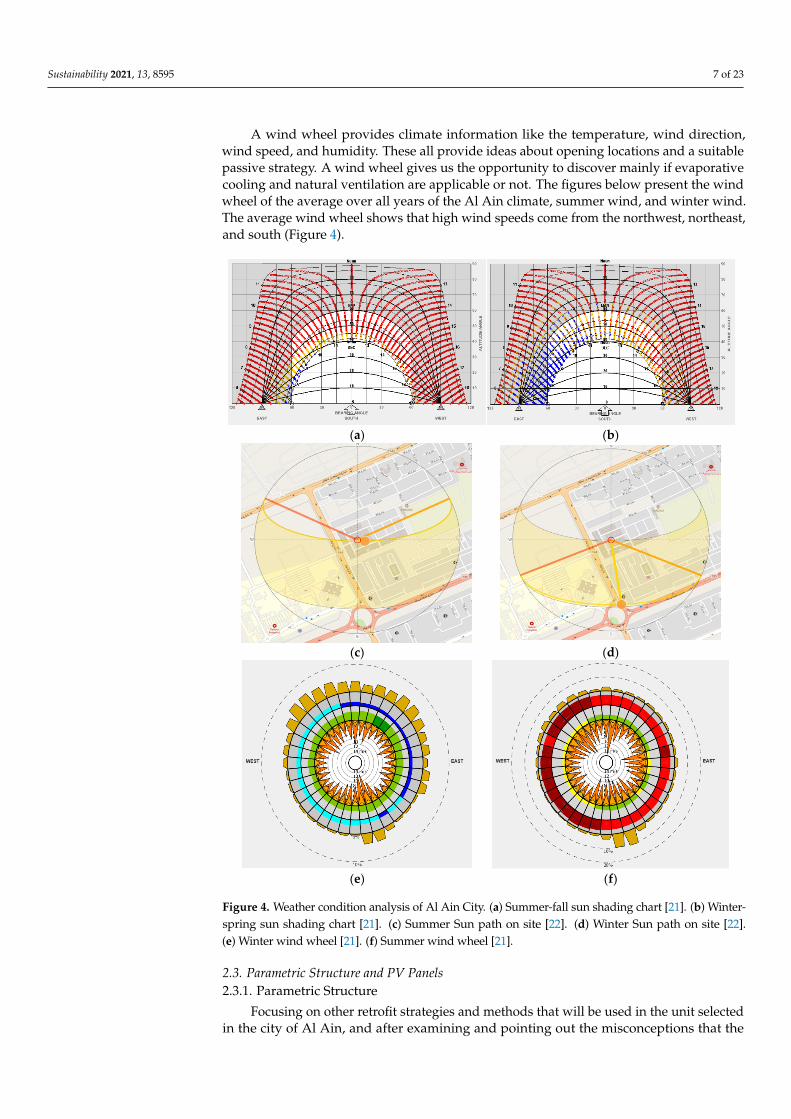
A wind wheel provides climate information like the temperature, wind direction,wind speed, and humidity. These all provide ideas about opening locations and a suitablepassive strategy. A wind wheel gives us the opportunity to discover mainly if evaporativecooling and natural ventilation are applicable or not. The figures below present the windwheel of the average over all years of the Al Ain climate, summer wind, and winter wind.The average wind wheel shows that high wind speeds come from the northwest, northeast,and south (Figure 4).
Sustainability 2021, 13, x FOR PEER REVIEW 7 of 24
A wind wheel provides climate information like the temperature, wind direction, wind speed, and humidity. These all provide ideas about opening locations and a suitable passive strategy. A wind wheel gives us the opportunity to discover mainly if evaporative cooling and natural ventilation are applicable or not. The figures below present the wind wheel of the average over all years of the Al Ain climate, summer wind, and winter wind. The average wind wheel shows that high wind speeds come from the northwest, north-east, and south (Figure 4).
(a) (b)
(c) (d)
(e) (f)
Figure 4. Weather condition analysis of Al Ain City. (a) Summer-fall sun shading chart [21]. (b) Winter-spring sun shading chart [21]. (c) Summer Sun path on site [22]. (d) Winter Sun path on site [22]. (e) Winter wind wheel [21]. (f) Summer wind wheel [21].
2.3. Parametric Structure and PV Panels
Figure 4. Weather condition analysis of Al Ain City. (a) Summer-fall sun shading chart [21]. (b) Winter-spring sun shading chart [21]. (c) Summer Sun path on site [22]. (d) Winter Sun path on site [22].(e) Winter wind wheel [21]. (f) Summer wind wheel [21].
2.3. Parametric Structure and PV Panels2.3.1. Parametric Structure
Focusing on other retrofit strategies and methods that will be used in the unit selectedin the city of Al Ain, and after examining and pointing out the misconceptions that the

Sustainability 2021, 13, 8595 8 of 23
villa is facing in regard to the correct use and suitable function of the efficient Mashrabiyadesign, research is found that illustrates and provides the traditional use and heritage ofMashrabiya, how is it applied today in contemporary architecture, and what standardsare not used correctly in the modern Mashrabiya design. Referring to the history, heritage,and culture, the use of Mashrabiya in the design of old building façades was one of themost important shading strategies. Mashrabyia was previously handmade, and it wasmade up of wooden materials. The Mashrabiya in the past was the place that is coveredwith wood, and they used to put the water jar to cool there; it provided a passive coolingstrategy. The factor that most helped in the growth of Mashrabiya is the privacy concernthat was in the Islamic religion. Mashrabiya was mostly famous in Egypt, but it waswidespread throughout Syria, Iraq, the Arabian Gulf, Sudan, Lebanon, and the Maghrebcountries. This strategy was used not only in houses but also in mosques, tombs, anddifferent organizations.
Functions that the Mashrabiya strategy provides follow: Daylight Control, Air FlowRegulation, Humidity Control, Temperature Regulation, Visual Privacy, and Air Circulation.
The research that we took the information from as a reference and evidence of ourmain concern stated that the old Mashrabiya design had more functions than just beingdecorative. The research also stated that modern architecture has changed and modified thedesign of Mashrabiya in a more efficient way, such as in the city of Masdar in Abu Dhabi;it is the most popular building technique in terms of sustainable and efficient buildings.It also kept the tradition of Mashrabiya and did not change its function but added in amodern touch and sense to enhance the use of it. Returning to the roots of traditional UAEelements in building Mashrabiya and modernizing it has been studied, as seen in Figure 5.The concept of desert dunes is added to create the final design of the parametric shadingstructure, as illustrated in Figure 6.
In this part, we studied the different structures and made a decision matrix to help usto choose the best structure to hold the parametric structure to be extended to the parkinglots and street. The first structure is the Beam Structure, which acts as a cantilever. It carriesa vertical load and shear load. The second structure is the Space Truss, which is a long-spanning three-dimensional plate structure based on the rigidity of the triangle. The thirdstructure is the Cable Structure, which utilizes tensioned cables to support or transmit themajor loads of the structure. The fourth structure is the Tree Structure, which has the shapesof trees: they are complex and fractal-like. A decision was made based on several criteria:the cost, span, durability, efficiency/quality, and weight. After testing and examining thestructures based on the given criteria using the decision matrix, the best structure with thehighest total was the Tree Structure, which carries the whole shading element.
Sustainability 2021, 13, x FOR PEER REVIEW 8 of 24
2.3.1. Parametric Structure Focusing on other retrofit strategies and methods that will be used in the unit selected
in the city of Al Ain, and after examining and pointing out the misconceptions that the villa is facing in regard to the correct use and suitable function of the efficient Mashrabiya design, research is found that illustrates and provides the traditional use and heritage of Mashrabiya, how is it applied today in contemporary architecture, and what standards are not used correctly in the modern Mashrabiya design. Referring to the history, heritage, and culture, the use of Mashrabiya in the design of old building façades was one of the most important shading strategies. Mashrabyia was previously handmade, and it was made up of wooden materials. The Mashrabiya in the past was the place that is covered with wood, and they used to put the water jar to cool there; it provided a passive cooling strategy. The factor that most helped in the growth of Mashrabiya is the privacy concern that was in the Islamic religion. Mashrabiya was mostly famous in Egypt, but it was wide-spread throughout Syria, Iraq, the Arabian Gulf, Sudan, Lebanon, and the Maghreb coun-tries. This strategy was used not only in houses but also in mosques, tombs, and different organizations.
Functions that the Mashrabiya strategy provides follow: Daylight Control, Air Flow Regulation, Humidity Control, Temperature Regulation, Visual Privacy, and Air Circula-tion.
The research that we took the information from as a reference and evidence of our main concern stated that the old Mashrabiya design had more functions than just being decorative. The research also stated that modern architecture has changed and modified the design of Mashrabiya in a more efficient way, such as in the city of Masdar in Abu Dhabi; it is the most popular building technique in terms of sustainable and efficient buildings. It also kept the tradition of Mashrabiya and did not change its function but added in a modern touch and sense to enhance the use of it. Returning to the roots of traditional UAE elements in building Mashrabiya and modernizing it has been studied, as seen in Figure 5. The concept of desert dunes is added to create the final design of the parametric shading structure, as illustrated in Figure 6.
Figure 5. Final design of parametric shading structure. Figure 5. Final design of parametric shading structure.
Sustainability 2021, 13, 8595 9 of 23Sustainability 2021, 13, x FOR PEER REVIEW 9 of 24
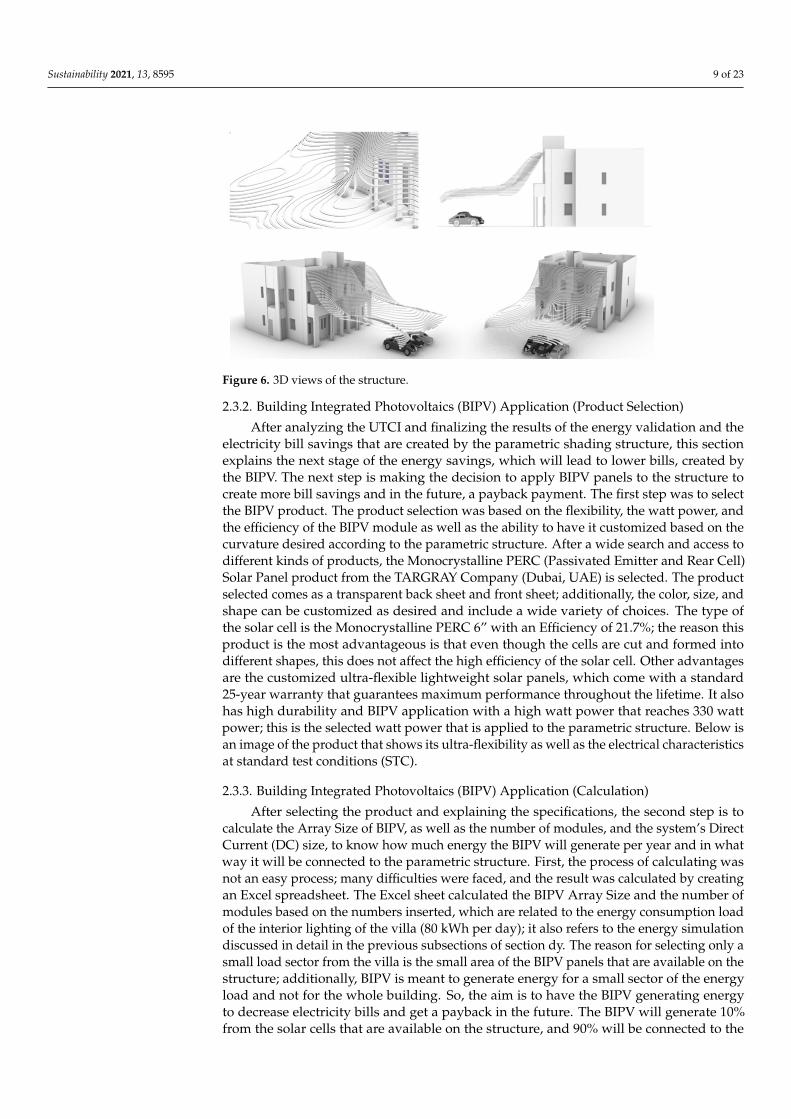
Figure 6. 3D views of the structure.
In this part, we studied the different structures and made a decision matrix to help us to choose the best structure to hold the parametric structure to be extended to the park-ing lots and street. The first structure is the Beam Structure, which acts as a cantilever. It carries a vertical load and shear load. The second structure is the Space Truss, which is a long-spanning three-dimensional plate structure based on the rigidity of the triangle. The third structure is the Cable Structure, which utilizes tensioned cables to support or trans-mit the major loads of the structure. The fourth structure is the Tree Structure, which has the shapes of trees: they are complex and fractal-like. A decision was made based on sev-eral criteria: the cost, span, durability, efficiency/quality, and weight. After testing and examining the structures based on the given criteria using the decision matrix, the best structure with the highest total was the Tree Structure, which carries the whole shading element.
2.3.2. Building Integrated Photovoltaics (BIPV) Application (Product Selection) After analyzing the UTCI and finalizing the results of the energy validation and the
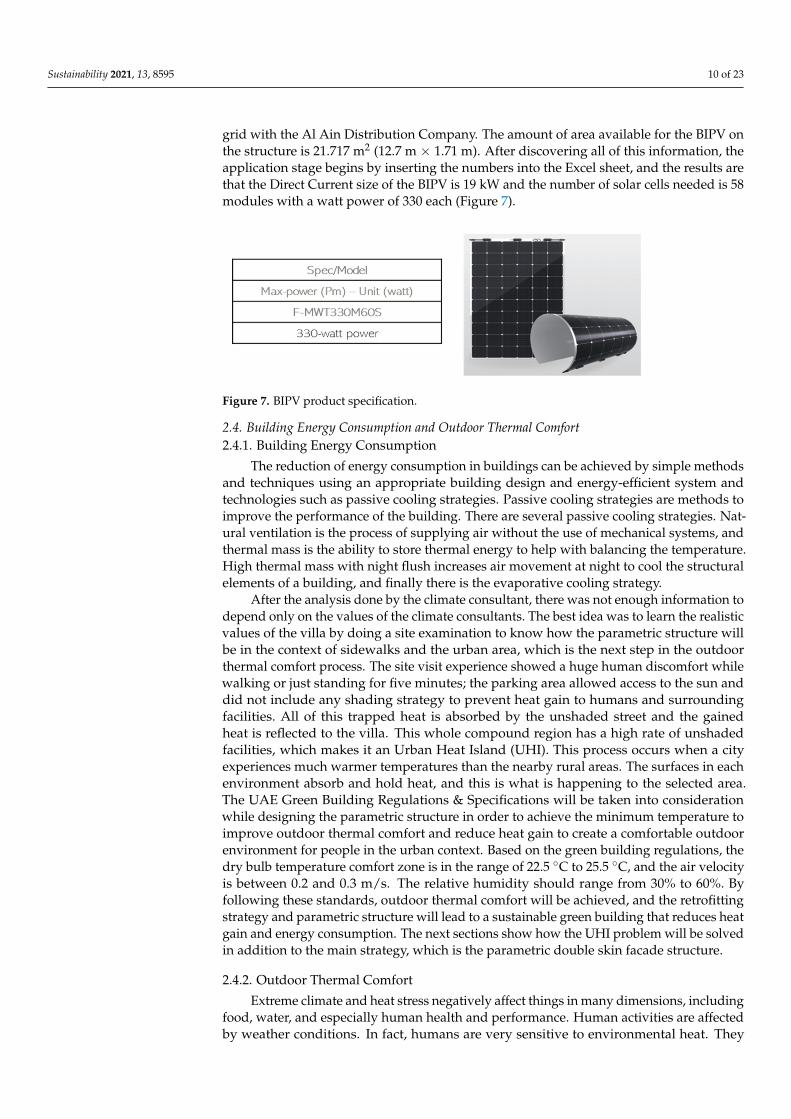
electricity bill savings that are created by the parametric shading structure, this section explains the next stage of the energy savings, which will lead to lower bills, created by the BIPV. The next step is making the decision to apply BIPV panels to the structure to create more bill savings and in the future, a payback payment. The first step was to select the BIPV product. The product selection was based on the flexibility, the watt power, and the efficiency of the BIPV module as well as the ability to have it customized based on the curvature desired according to the parametric structure. After a wide search and access to different kinds of products, the Monocrystalline PERC (Passivated Emitter and Rear Cell) Solar Panel product from the TARGRAY Company (Dubai, UAE) is selected. The product selected comes as a transparent back sheet and front sheet; additionally, the color, size, and shape can be customized as desired and include a wide variety of choices. The type of the solar cell is the Monocrystalline PERC 6″ with an Efficiency of 21.7%; the reason this product is the most advantageous is that even though the cells are cut and formed into different shapes, this does not affect the high efficiency of the solar cell. Other advantages are the customized ultra-flexible lightweight solar panels, which come with a standard 25-year warranty that guarantees maximum performance throughout the lifetime. It also has high durability and BIPV application with a high watt power that reaches 330 watt power; this is the selected watt power that is applied to the parametric structure. Below is an image of the product that shows its ultra-flexibility as well as the electrical characteristics at standard test conditions (STC).
2.3.3. Building Integrated Photovoltaics (BIPV) Application (Calculation)
Figure 6. 3D views of the structure.
2.3.2. Building Integrated Photovoltaics (BIPV) Application (Product Selection)
After analyzing the UTCI and finalizing the results of the energy validation and theelectricity bill savings that are created by the parametric shading structure, this sectionexplains the next stage of the energy savings, which will lead to lower bills, created bythe BIPV. The next step is making the decision to apply BIPV panels to the structure tocreate more bill savings and in the future, a payback payment. The first step was to selectthe BIPV product. The product selection was based on the flexibility, the watt power, andthe efficiency of the BIPV module as well as the ability to have it customized based on thecurvature desired according to the parametric structure. After a wide search and access todifferent kinds of products, the Monocrystalline PERC (Passivated Emitter and Rear Cell)Solar Panel product from the TARGRAY Company (Dubai, UAE) is selected. The productselected comes as a transparent back sheet and front sheet; additionally, the color, size, andshape can be customized as desired and include a wide variety of choices. The type ofthe solar cell is the Monocrystalline PERC 6” with an Efficiency of 21.7%; the reason thisproduct is the most advantageous is that even though the cells are cut and formed intodifferent shapes, this does not affect the high efficiency of the solar cell. Other advantagesare the customized ultra-flexible lightweight solar panels, which come with a standard25-year warranty that guarantees maximum performance throughout the lifetime. It alsohas high durability and BIPV application with a high watt power that reaches 330 wattpower; this is the selected watt power that is applied to the parametric structure. Below isan image of the product that shows its ultra-flexibility as well as the electrical characteristicsat standard test conditions (STC).
2.3.3. Building Integrated Photovoltaics (BIPV) Application (Calculation)
After selecting the product and explaining the specifications, the second step is tocalculate the Array Size of BIPV, as well as the number of modules, and the system’s DirectCurrent (DC) size, to know how much energy the BIPV will generate per year and in whatway it will be connected to the parametric structure. First, the process of calculating wasnot an easy process; many difficulties were faced, and the result was calculated by creatingan Excel spreadsheet. The Excel sheet calculated the BIPV Array Size and the number ofmodules based on the numbers inserted, which are related to the energy consumption loadof the interior lighting of the villa (80 kWh per day); it also refers to the energy simulationdiscussed in detail in the previous subsections of section dy. The reason for selecting only asmall load sector from the villa is the small area of the BIPV panels that are available on thestructure; additionally, BIPV is meant to generate energy for a small sector of the energyload and not for the whole building. So, the aim is to have the BIPV generating energyto decrease electricity bills and get a payback in the future. The BIPV will generate 10%from the solar cells that are available on the structure, and 90% will be connected to the
Sustainability 2021, 13, 8595 10 of 23
grid with the Al Ain Distribution Company. The amount of area available for the BIPV onthe structure is 21.717 m2 (12.7 m × 1.71 m). After discovering all of this information, theapplication stage begins by inserting the numbers into the Excel sheet, and the results arethat the Direct Current size of the BIPV is 19 kW and the number of solar cells needed is 58modules with a watt power of 330 each (Figure 7).
Sustainability 2021, 13, x FOR PEER REVIEW 10 of 24
After selecting the product and explaining the specifications, the second step is to calculate the Array Size of BIPV, as well as the number of modules, and the system’s Direct Current (DC) size, to know how much energy the BIPV will generate per year and in what way it will be connected to the parametric structure. First, the process of calculating was not an easy process; many difficulties were faced, and the result was calculated by creating an Excel spreadsheet. The Excel sheet calculated the BIPV Array Size and the number of modules based on the numbers inserted, which are related to the energy consumption load of the interior lighting of the villa (80 kWh per day); it also refers to the energy sim-ulation discussed in detail in the previous subsections of section dy. The reason for select-ing only a small load sector from the villa is the small area of the BIPV panels that are available on the structure; additionally, BIPV is meant to generate energy for a small sector of the energy load and not for the whole building. So, the aim is to have the BIPV gener-ating energy to decrease electricity bills and get a payback in the future. The BIPV will generate 10% from the solar cells that are available on the structure, and 90% will be con-nected to the grid with the Al Ain Distribution Company. The amount of area available for the BIPV on the structure is 21.717 m2 (12.7 m × 1.71 m). After discovering all of this information, the application stage begins by inserting the numbers into the Excel sheet, and the results are that the Direct Current size of the BIPV is 19 kW and the number of solar cells needed is 58 modules with a watt power of 330 each (Figure 7).
Figure 7. BIPV product specification.
2.4. Building Energy Consumption and Outdoor Thermal Comfort 2.4.1. Building Energy Consumption
The reduction of energy consumption in buildings can be achieved by simple meth-ods and techniques using an appropriate building design and energy-efficient system and technologies such as passive cooling strategies. Passive cooling strategies are methods to improve the performance of the building. There are several passive cooling strategies. Natural ventilation is the process of supplying air without the use of mechanical systems, and thermal mass is the ability to store thermal energy to help with balancing the temper-ature. High thermal mass with night flush increases air movement at night to cool the structural elements of a building, and finally there is the evaporative cooling strategy.
After the analysis done by the climate consultant, there was not enough information to depend only on the values of the climate consultants. The best idea was to learn the realistic values of the villa by doing a site examination to know how the parametric struc-ture will be in the context of sidewalks and the urban area, which is the next step in the outdoor thermal comfort process. The site visit experience showed a huge human discom-fort while walking or just standing for five minutes; the parking area allowed access to the sun and did not include any shading strategy to prevent heat gain to humans and surrounding facilities. All of this trapped heat is absorbed by the unshaded street and the gained heat is reflected to the villa. This whole compound region has a high rate of un-shaded facilities, which makes it an Urban Heat Island (UHI). This process occurs when a city experiences much warmer temperatures than the nearby rural areas. The surfaces in each environment absorb and hold heat, and this is what is happening to the selected area. The UAE Green Building Regulations & Specifications will be taken into consideration
Figure 7. BIPV product specification.
2.4. Building Energy Consumption and Outdoor Thermal Comfort2.4.1. Building Energy Consumption
The reduction of energy consumption in buildings can be achieved by simple methodsand techniques using an appropriate building design and energy-efficient system andtechnologies such as passive cooling strategies. Passive cooling strategies are methods toimprove the performance of the building. There are several passive cooling strategies. Nat-ural ventilation is the process of supplying air without the use of mechanical systems, andthermal mass is the ability to store thermal energy to help with balancing the temperature.High thermal mass with night flush increases air movement at night to cool the structuralelements of a building, and finally there is the evaporative cooling strategy.
After the analysis done by the climate consultant, there was not enough information todepend only on the values of the climate consultants. The best idea was to learn the realisticvalues of the villa by doing a site examination to know how the parametric structure willbe in the context of sidewalks and the urban area, which is the next step in the outdoorthermal comfort process. The site visit experience showed a huge human discomfort whilewalking or just standing for five minutes; the parking area allowed access to the sun anddid not include any shading strategy to prevent heat gain to humans and surroundingfacilities. All of this trapped heat is absorbed by the unshaded street and the gainedheat is reflected to the villa. This whole compound region has a high rate of unshadedfacilities, which makes it an Urban Heat Island (UHI). This process occurs when a cityexperiences much warmer temperatures than the nearby rural areas. The surfaces in eachenvironment absorb and hold heat, and this is what is happening to the selected area.The UAE Green Building Regulations & Specifications will be taken into considerationwhile designing the parametric structure in order to achieve the minimum temperature toimprove outdoor thermal comfort and reduce heat gain to create a comfortable outdoorenvironment for people in the urban context. Based on the green building regulations, thedry bulb temperature comfort zone is in the range of 22.5 ◦C to 25.5 ◦C, and the air velocityis between 0.2 and 0.3 m/s. The relative humidity should range from 30% to 60%. Byfollowing these standards, outdoor thermal comfort will be achieved, and the retrofittingstrategy and parametric structure will lead to a sustainable green building that reduces heatgain and energy consumption. The next sections show how the UHI problem will be solvedin addition to the main strategy, which is the parametric double skin facade structure.
2.4.2. Outdoor Thermal Comfort
Extreme climate and heat stress negatively affect things in many dimensions, includingfood, water, and especially human health and performance. Human activities are affectedby weather conditions. In fact, humans are very sensitive to environmental heat. They
Sustainability 2021, 13, 8595 11 of 23
may suffer from severe consequences because of high temperature environments. Forexample, heatstroke can damage major body organs or even cause sudden death. It canalso increase the likelihood of work-related accidents. Human thermal comfort in indoorand outdoor environments is measured by various indicators. Over 60 thermal stressindicators have been proposed to assess high temperature environments and predict thepotential for the heat stress of the body. Each of these indicators has its own advantagesand disadvantages [23,24].
The universal thermal climate index (UTCI) is the equivalent temperature for theenvironment derived from a reference environment. It is one of the most used indices formeasuring heat stress in outdoor spaces. Calculating the UTCI considers many parameters,like the dry temperature, relative humidity, solar radiation, and wind speed. It is regardedas the reference environmental temperature causing strain. The UTCI is divided into tengroups ranging from extreme cold stress to extreme heat stress, as shown in Table 2 [25].
Table 2. UCTI classification [26].
Class of Thermal Stress UTCI (◦C) Range Stress Category
−5 below −40 Extreme Cold Stress
−4 −27 to −40 Very Strong Cold Stress
−3 −13 to −27 Strong Cold Stress
−2 0 to −13 Moderate Cold Stress
−1 +9 to 0 Slight Cold Stress
0 +9 to +26 No Thermal Stress
+1 +26 to +32 Moderate Heat Stress
+2 +32 to +38 Strong Heat Stress
+3 +38 to +46 Very Strong Heat Stress
+4 above +46 Extreme Heat Stress
2.5. Modelling, Simulations, and Validation2.5.1. Modelling and Simulation
The modelling of the unit used for this study was conducted in Rhino software.Rhino is designed to work on complex structures. Grasshopper is a plugin that enablesthe parametrization to happen. For each stage of this research, different software pro-grams are used, and the alignment of this software proved to be challenging and timeconsuming [27,28].
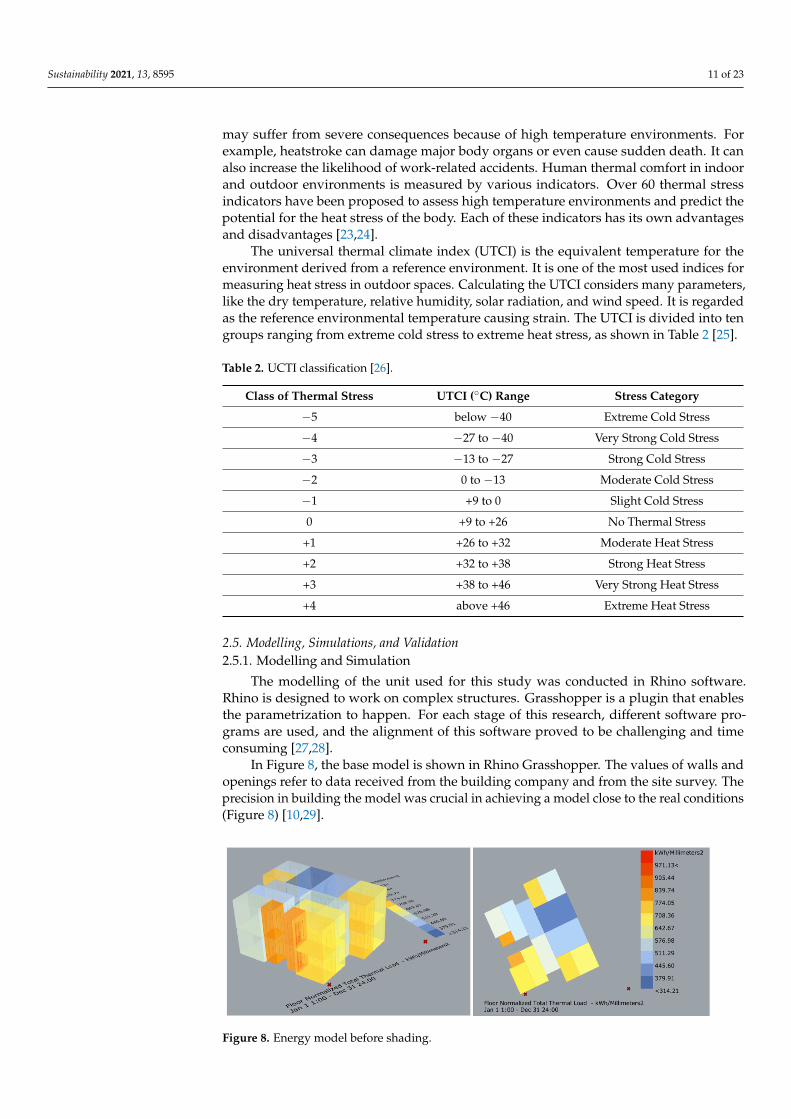
In Figure 8, the base model is shown in Rhino Grasshopper. The values of walls andopenings refer to data received from the building company and from the site survey. Theprecision in building the model was crucial in achieving a model close to the real conditions(Figure 8) [10,29].
Sustainability 2021, 13, x FOR PEER REVIEW 12 of 24
precision in building the model was crucial in achieving a model close to the real condi-tions (Figure 8) [10,29].
Figure 8. Energy model before shading.
2.5.2. Validation for 1-Bedroom Apartment A study conducted in UAE by Taleb and Al Saleh focused on the energy consumption
rate in the residential sector for every property. From their research, we can understand how much energy is normally used in UAE houses and apartments: in an expat villa, the energy use ranges between 32,100 and 97,000 kW and for an expat apartment, from 7200 to 12,400 kW. The focus will be mainly on expats because the selected compound is only for expat residents. We must study the energy consumption for the whole villa and reduce it, but there is a lack of information regarding the electricity bills for the whole villa; the only electricity bill data available are for 1-bedroom apartments within the villa. Electric-ity data for a 1st floor expat apartment in the northeast-facing unit are available. This data will be used only for validation purposes in order to make sure the energy model is correct [30].
Referring to the energy bills, it is noticed that the occupant is using less energy in some months, such as January to April; this means that the occupant is either using less electricity or is not available during the day. Because of this observation, as we are using Honeybee in Grasshopper plugins within Rhino software, we use a plugin called the Oc-cupancy Activity Schedule, as shown in Figure 9 below. The top chart shows the months in the year with respect to this and the activity of this occupant. The holidays and the weekends are added into the schedule so that we can reach the same energy consumption: this person uses 5781.10 kWh per year, and the energy use is calculated from the electricity bills from the data given. The purpose of doing this is to make the Rhino energy model close to reality as possible. After we added the occupancy schedule into the energy calcu-lation, we ran the energy model in Rhino as shown below, and the Rhino model energy consumption for the whole year is 5932.50 kWh. The goal here is to make the Rhino model as close as possible to the validation energy use. They are close, at 5932.50 kWh per year and 5781.10 kWh per year, respectively. Lastly, after doing the energy use calculation for Rhino, we start calculating the electricity bills provided by the Al Ain Distribution Com-pany website. The following information was added with 5932.50 kWh per year, and it calculated the electricity bill, which is 1589.91 AED per year for the expat apartment. This bill is closer to the validation bill, which is 1549.32 AED per year. This means that the Rhino energy model is close to reality and correct (Figure 9).
Figure 8. Energy model before shading.
Sustainability 2021, 13, 8595 12 of 23
2.5.2. Validation for 1-Bedroom Apartment
A study conducted in UAE by Taleb and Al Saleh focused on the energy consumptionrate in the residential sector for every property. From their research, we can understandhow much energy is normally used in UAE houses and apartments: in an expat villa, theenergy use ranges between 32,100 and 97,000 kW and for an expat apartment, from 7200 to12,400 kW. The focus will be mainly on expats because the selected compound is only forexpat residents. We must study the energy consumption for the whole villa and reduce it,but there is a lack of information regarding the electricity bills for the whole villa; the onlyelectricity bill data available are for 1-bedroom apartments within the villa. Electricity datafor a 1st floor expat apartment in the northeast-facing unit are available. This data will beused only for validation purposes in order to make sure the energy model is correct [30].
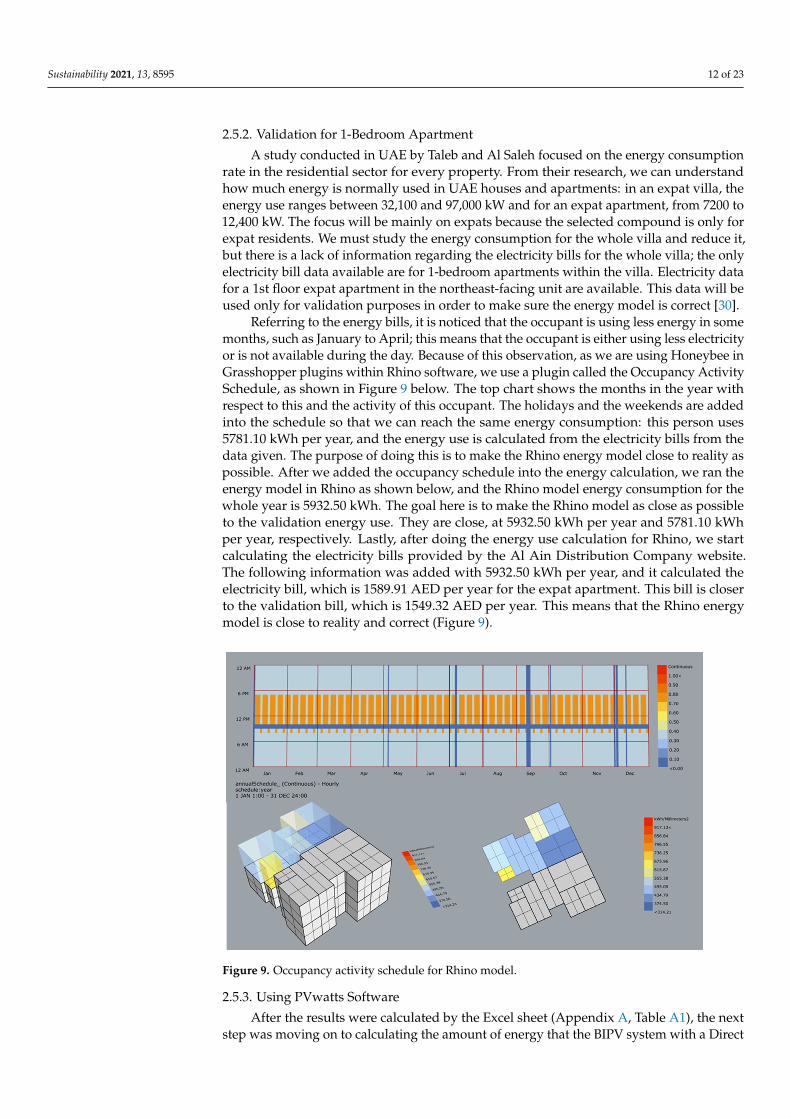
Referring to the energy bills, it is noticed that the occupant is using less energy in somemonths, such as January to April; this means that the occupant is either using less electricityor is not available during the day. Because of this observation, as we are using Honeybee inGrasshopper plugins within Rhino software, we use a plugin called the Occupancy ActivitySchedule, as shown in Figure 9 below. The top chart shows the months in the year withrespect to this and the activity of this occupant. The holidays and the weekends are addedinto the schedule so that we can reach the same energy consumption: this person uses5781.10 kWh per year, and the energy use is calculated from the electricity bills from thedata given. The purpose of doing this is to make the Rhino energy model close to reality aspossible. After we added the occupancy schedule into the energy calculation, we ran theenergy model in Rhino as shown below, and the Rhino model energy consumption for thewhole year is 5932.50 kWh. The goal here is to make the Rhino model as close as possibleto the validation energy use. They are close, at 5932.50 kWh per year and 5781.10 kWhper year, respectively. Lastly, after doing the energy use calculation for Rhino, we startcalculating the electricity bills provided by the Al Ain Distribution Company website.The following information was added with 5932.50 kWh per year, and it calculated theelectricity bill, which is 1589.91 AED per year for the expat apartment. This bill is closerto the validation bill, which is 1549.32 AED per year. This means that the Rhino energymodel is close to reality and correct (Figure 9).
Sustainability 2021, 13, x FOR PEER REVIEW 13 of 24
Figure 9. Occupancy activity schedule for Rhino model.
2.5.3. Using PVwatts Software After the results were calculated by the Excel sheet (Appendix A, Table A1), the next
step was moving on to calculating the amount of energy that the BIPV system with a Di-rect Current of 19 kW will generate per year. The next approach started with the selection of software that gives us a rough estimation of how much energy this BIPV will generate per year and the annual savings as well. The best selection to perform this action was the PVwatts software. The numbers from the Excel Sheet were next inserted into the software to get the results according to the BIPV DC size, which is 19 kW; the energy generated will be 30,640 kWh/year, with a total of 2480 dollars per year of electricity bill savings as a rough estimation from PVwatts. After that, the calculation of the bill savings started; they are based on the amount of energy consumption and the energy simulation of the shading structure before adding the BIPV to it. The amount of electricity bill savings before adding the BIPV was 84,587.34 kWh, and after adding the BIPV on top of the shading structure, the final electricity bill savings was 53,947.34 kWh after the BIPV energy simulation for the villa. So, the amount of the electricity bill that will be paid by the consumer of the villa after the BIPV is 14,457.89 kW per year, but in the future, the payback period will reach zero, and the consumer will not pay anything for the utility or the electricity bill. By this, the aim of installing the BIPV has been reached, and it will also benefit the people living in the villa.
To add, the process did not end up going smoothly, and all of the numbers were calculated with the help of an Excel sheet that performs a simple rough calculation. This is because the software that we planned to use for the project did not work even with the help of the instructor because the servers of the company itself were facing problems. The figure below shows the trial of using the BIMSolar software, which calculated an effi-ciency of the BIPV modules when applied to the shading structure of 77% (Figure 10) [31].
Figure 9. Occupancy activity schedule for Rhino model.
2.5.3. Using PVwatts Software
After the results were calculated by the Excel sheet (Appendix A, Table A1), the nextstep was moving on to calculating the amount of energy that the BIPV system with a Direct
Sustainability 2021, 13, 8595 13 of 23
Current of 19 kW will generate per year. The next approach started with the selection ofsoftware that gives us a rough estimation of how much energy this BIPV will generateper year and the annual savings as well. The best selection to perform this action was thePVwatts software. The numbers from the Excel Sheet were next inserted into the softwareto get the results according to the BIPV DC size, which is 19 kW; the energy generated willbe 30,640 kWh/year, with a total of 2480 dollars per year of electricity bill savings as arough estimation from PVwatts. After that, the calculation of the bill savings started; theyare based on the amount of energy consumption and the energy simulation of the shadingstructure before adding the BIPV to it. The amount of electricity bill savings before addingthe BIPV was 84,587.34 kWh, and after adding the BIPV on top of the shading structure,the final electricity bill savings was 53,947.34 kWh after the BIPV energy simulation forthe villa. So, the amount of the electricity bill that will be paid by the consumer of the villaafter the BIPV is 14,457.89 kW per year, but in the future, the payback period will reachzero, and the consumer will not pay anything for the utility or the electricity bill. By this,the aim of installing the BIPV has been reached, and it will also benefit the people living inthe villa.
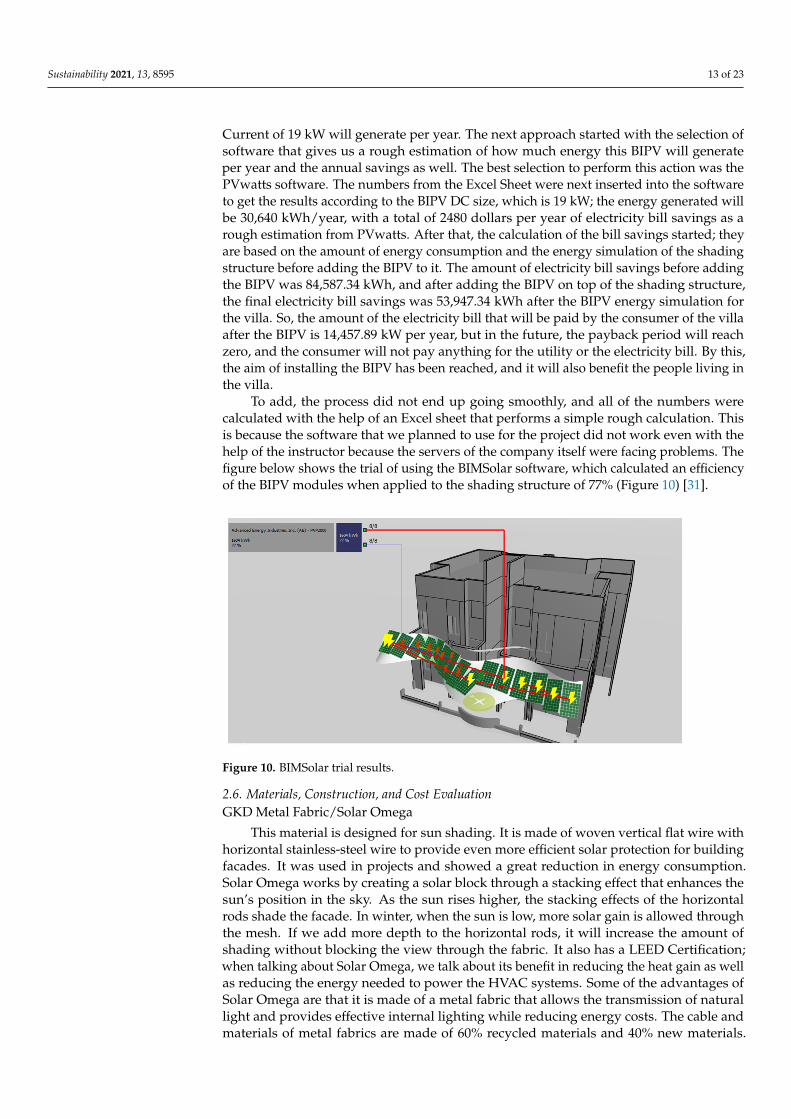
To add, the process did not end up going smoothly, and all of the numbers werecalculated with the help of an Excel sheet that performs a simple rough calculation. Thisis because the software that we planned to use for the project did not work even with thehelp of the instructor because the servers of the company itself were facing problems. Thefigure below shows the trial of using the BIMSolar software, which calculated an efficiencyof the BIPV modules when applied to the shading structure of 77% (Figure 10) [31].
Sustainability 2021, 13, x FOR PEER REVIEW 14 of 24
Figure 10. BIMSolar trial results.
2.6. Materials, Construction, and Cost Evaluation GKD Metal Fabric/Solar Omega
This material is designed for sun shading. It is made of woven vertical flat wire with horizontal stainless-steel wire to provide even more efficient solar protection for building facades. It was used in projects and showed a great reduction in energy consumption. Solar Omega works by creating a solar block through a stacking effect that enhances the sun’s position in the sky. As the sun rises higher, the stacking effects of the horizontal rods shade the facade. In winter, when the sun is low, more solar gain is allowed through the mesh. If we add more depth to the horizontal rods, it will increase the amount of shading without blocking the view through the fabric. It also has a LEED Certification; when talk-ing about Solar Omega, we talk about its benefit in reducing the heat gain as well as re-ducing the energy needed to power the HVAC systems. Some of the advantages of Solar Omega are that it is made of a metal fabric that allows the transmission of natural light and provides effective internal lighting while reducing energy costs. The cable and mate-rials of metal fabrics are made of 60% recycled materials and 40% new materials. During manufacturing, 100% of the leftover or unused material is recycled. The material is 100% recyclable whenever it reaches the end of its life. So, it can be used repeatedly and will not cost as much as new material; the only cost is the recycling process [32].
After a detailed study was made of the design and schematics for the looked-for shape and function of the facade and the structure type, as well as the materials that were based on certain criteria, the next step in this section is to choose the most beneficial fab-rication method to accomplish the target. Moreover, having the shading structure com-pleted for the desired form and time and cost, we must choose a suitable fabrication method. The first step was to look and search for similar project installation and fabrica-tion methods, and due to the uniqueness and complexity of the parametric shading struc-ture, it was found that the best solution is to use the 3D-printing fabrication method. The reasons behind choosing this process are its great benefits and the successful results it show in many parametric design projects, as well as the time it takes to complete the pro-ject compared to many other construction methods. 3D printing is a process that trans-forms a digital drawing into the final desired design by the method of layering the mate-rials until the object is created. The materials that are used in 3D printing come in many kinds, and they are formed in thin strings that are called filaments; they are placed inside the 3D printer for the selected size and material type, and the desired structure is made by layering them. The 3D-printing process goes through three important stages: model-ing, printing, and then finalization. A detailed design is prepared to describe these stages (Figure 11).
Figure 10. BIMSolar trial results.
2.6. Materials, Construction, and Cost EvaluationGKD Metal Fabric/Solar Omega
This material is designed for sun shading. It is made of woven vertical flat wire withhorizontal stainless-steel wire to provide even more efficient solar protection for buildingfacades. It was used in projects and showed a great reduction in energy consumption.Solar Omega works by creating a solar block through a stacking effect that enhances thesun’s position in the sky. As the sun rises higher, the stacking effects of the horizontalrods shade the facade. In winter, when the sun is low, more solar gain is allowed throughthe mesh. If we add more depth to the horizontal rods, it will increase the amount ofshading without blocking the view through the fabric. It also has a LEED Certification;when talking about Solar Omega, we talk about its benefit in reducing the heat gain as wellas reducing the energy needed to power the HVAC systems. Some of the advantages ofSolar Omega are that it is made of a metal fabric that allows the transmission of naturallight and provides effective internal lighting while reducing energy costs. The cable andmaterials of metal fabrics are made of 60% recycled materials and 40% new materials.
Sustainability 2021, 13, 8595 14 of 23
During manufacturing, 100% of the leftover or unused material is recycled. The material is100% recyclable whenever it reaches the end of its life. So, it can be used repeatedly andwill not cost as much as new material; the only cost is the recycling process [32].
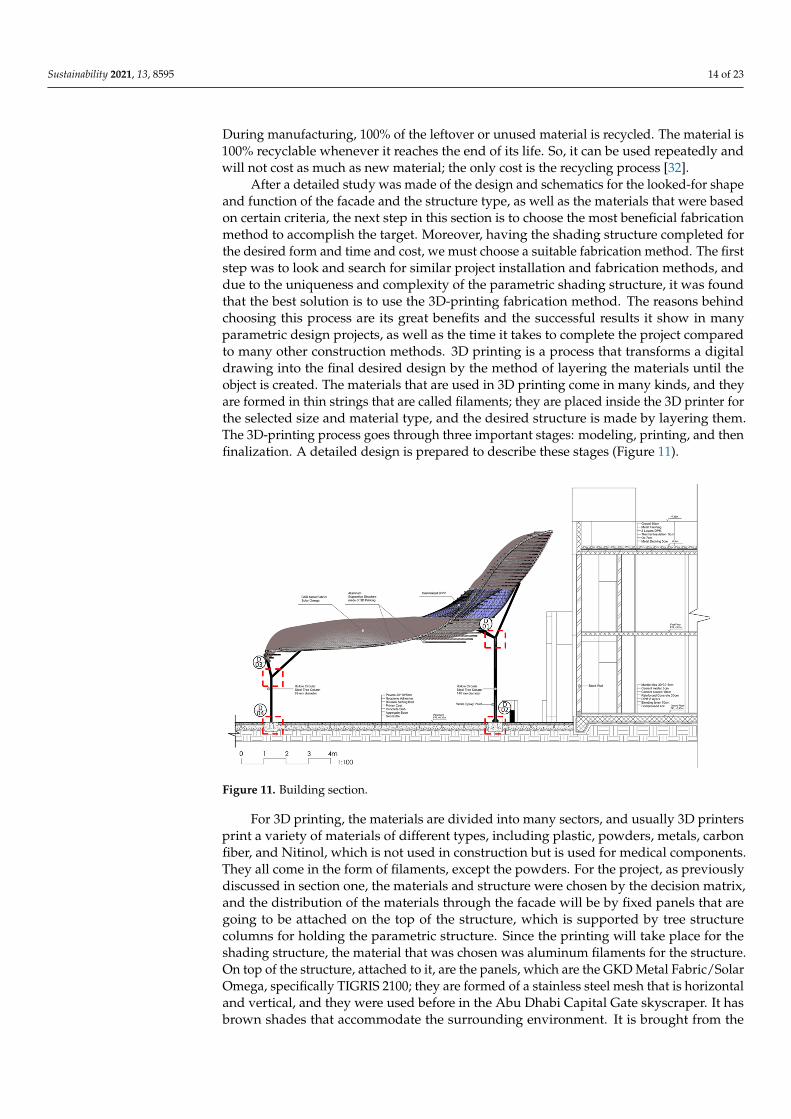
After a detailed study was made of the design and schematics for the looked-for shapeand function of the facade and the structure type, as well as the materials that were basedon certain criteria, the next step in this section is to choose the most beneficial fabricationmethod to accomplish the target. Moreover, having the shading structure completed forthe desired form and time and cost, we must choose a suitable fabrication method. The firststep was to look and search for similar project installation and fabrication methods, anddue to the uniqueness and complexity of the parametric shading structure, it was foundthat the best solution is to use the 3D-printing fabrication method. The reasons behindchoosing this process are its great benefits and the successful results it show in manyparametric design projects, as well as the time it takes to complete the project comparedto many other construction methods. 3D printing is a process that transforms a digitaldrawing into the final desired design by the method of layering the materials until theobject is created. The materials that are used in 3D printing come in many kinds, and theyare formed in thin strings that are called filaments; they are placed inside the 3D printer forthe selected size and material type, and the desired structure is made by layering them.The 3D-printing process goes through three important stages: modeling, printing, and thenfinalization. A detailed design is prepared to describe these stages (Figure 11).
Sustainability 2021, 13, x FOR PEER REVIEW 15 of 24
Figure 11. Building section.
For 3D printing, the materials are divided into many sectors, and usually 3D printers print a variety of materials of different types, including plastic, powders, metals, carbon fiber, and Nitinol, which is not used in construction but is used for medical components. They all come in the form of filaments, except the powders. For the project, as previously discussed in section one, the materials and structure were chosen by the decision matrix, and the distribution of the materials through the facade will be by fixed panels that are going to be attached on the top of the structure, which is supported by tree structure col-umns for holding the parametric structure. Since the printing will take place for the shad-ing structure, the material that was chosen was aluminum filaments for the structure. On top of the structure, attached to it, are the panels, which are the GKD Metal Fabric/Solar Omega, specifically TIGRIS 2100; they are formed of a stainless steel mesh that is horizon-tal and vertical, and they were used before in the Abu Dhabi Capital Gate skyscraper. It has brown shades that accommodate the surrounding environment. It is brought from the factory. Figures 12 and 13 show a detailed design of the different layers of the structure reflecting the fabrication and application complexity of the design shading structure [33].
Figure 11. Building section.
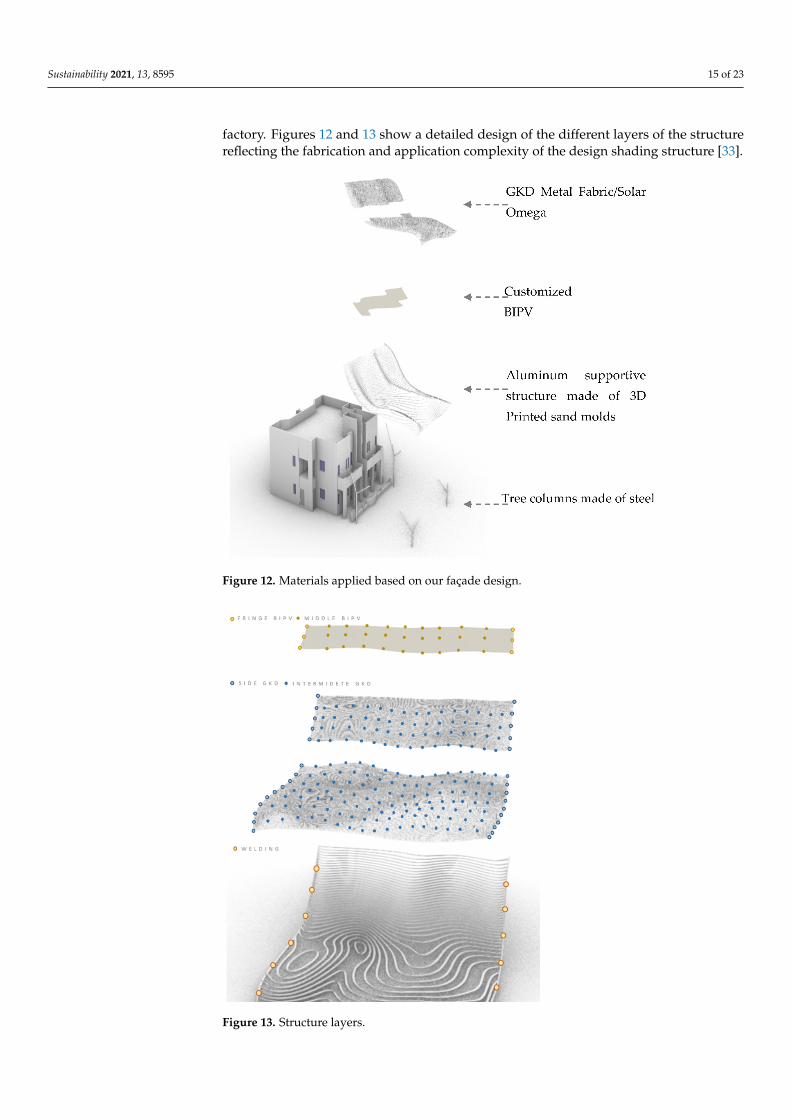
For 3D printing, the materials are divided into many sectors, and usually 3D printersprint a variety of materials of different types, including plastic, powders, metals, carbonfiber, and Nitinol, which is not used in construction but is used for medical components.They all come in the form of filaments, except the powders. For the project, as previouslydiscussed in section one, the materials and structure were chosen by the decision matrix,and the distribution of the materials through the facade will be by fixed panels that aregoing to be attached on the top of the structure, which is supported by tree structurecolumns for holding the parametric structure. Since the printing will take place for theshading structure, the material that was chosen was aluminum filaments for the structure.On top of the structure, attached to it, are the panels, which are the GKD Metal Fabric/SolarOmega, specifically TIGRIS 2100; they are formed of a stainless steel mesh that is horizontaland vertical, and they were used before in the Abu Dhabi Capital Gate skyscraper. It hasbrown shades that accommodate the surrounding environment. It is brought from the
Sustainability 2021, 13, 8595 15 of 23
factory. Figures 12 and 13 show a detailed design of the different layers of the structurereflecting the fabrication and application complexity of the design shading structure [33].
Sustainability 2021, 13, x FOR PEER REVIEW 16 of 24
Figure 12. Materials applied based on our façade design.
Figure 13. Structure layers.
Figure 12. Materials applied based on our façade design.
Sustainability 2021, 13, x FOR PEER REVIEW 16 of 24
Figure 12. Materials applied based on our façade design.
Figure 13. Structure layers. Figure 13. Structure layers.
Sustainability 2021, 13, 8595 16 of 23
3. Results
The results of this research refer to three main points analyzed in the paragraphsabove. Each section shows decreased values as expected. The results refer to
- Energy consumption;- Outdoor thermal comfort;- Cost evaluation.
3.1. Energy Consumption Reduction
In this section are shown the results of the energy calculations for the whole villabefore and after shading was added. Referring to a study, the expat villa energy use is inthe range from 32,100 to 97,000 kWh per year. Another study was conducted that estimatedhousehold energy usage in UAE; in this study, the most energy is used for cooling inhouses, and this is because of the hot weather in UAE [24].
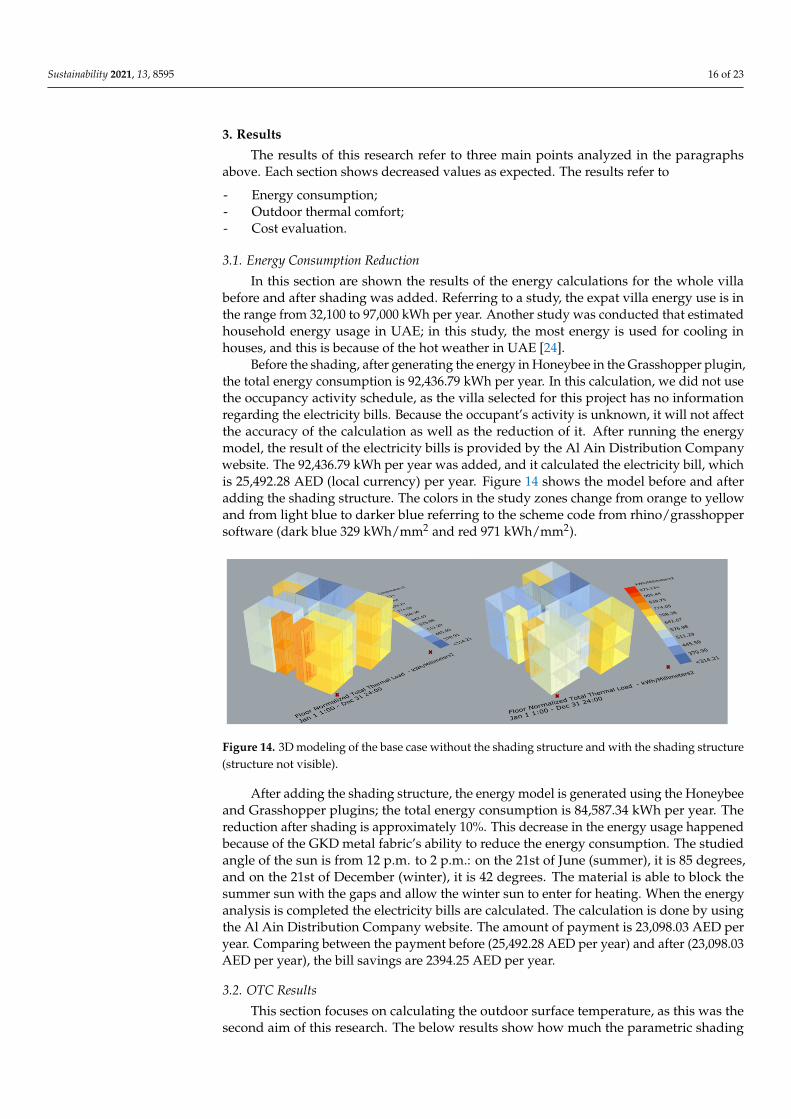
Before the shading, after generating the energy in Honeybee in the Grasshopper plugin,the total energy consumption is 92,436.79 kWh per year. In this calculation, we did not usethe occupancy activity schedule, as the villa selected for this project has no informationregarding the electricity bills. Because the occupant’s activity is unknown, it will not affectthe accuracy of the calculation as well as the reduction of it. After running the energymodel, the result of the electricity bills is provided by the Al Ain Distribution Companywebsite. The 92,436.79 kWh per year was added, and it calculated the electricity bill, whichis 25,492.28 AED (local currency) per year. Figure 14 shows the model before and afteradding the shading structure. The colors in the study zones change from orange to yellowand from light blue to darker blue referring to the scheme code from rhino/grasshoppersoftware (dark blue 329 kWh/mm2 and red 971 kWh/mm2).
Sustainability 2021, 13, x FOR PEER REVIEW 17 of 24
3. Results The results of this research refer to three main points analyzed in the paragraphs
above. Each section shows decreased values as expected. The results refer to - Energy consumption; - Outdoor thermal comfort; - Cost evaluation.
3.1. Energy Consumption Reduction In this section are shown the results of the energy calculations for the whole villa
before and after shading was added. Referring to a study, the expat villa energy use is in the range from 32,100 to 97,000 kWh per year. Another study was conducted that esti-mated household energy usage in UAE; in this study, the most energy is used for cooling in houses, and this is because of the hot weather in UAE [24].
Before the shading, after generating the energy in Honeybee in the Grasshopper plugin, the total energy consumption is 92,436.79 kWh per year. In this calculation, we did not use the occupancy activity schedule, as the villa selected for this project has no infor-mation regarding the electricity bills. Because the occupant’s activity is unknown, it will not affect the accuracy of the calculation as well as the reduction of it. After running the energy model, the result of the electricity bills is provided by the Al Ain Distribution Com-pany website. The 92,436.79 kWh per year was added, and it calculated the electricity bill, which is 25,492.28 AED (local currency) per year. Figure 14 shows the model before and after adding the shading structure. The colors in the study zones change from orange to yellow and from light blue to darker blue referring to the scheme code from rhino/grass-hopper software (dark blue 329 kWh/mm2 and red 971 kWh/mm2).
Figure 14. 3D modeling of the base case without the shading structure and with the shading structure (structure not visible).
After adding the shading structure, the energy model is generated using the Honey-bee and Grasshopper plugins; the total energy consumption is 84,587.34 kWh per year. The reduction after shading is approximately 10%. This decrease in the energy usage hap-pened because of the GKD metal fabric’s ability to reduce the energy consumption. The studied angle of the sun is from 12 pm to 2 pm: on the 21st of June (summer), it is 85 degrees, and on the 21st of December (winter), it is 42 degrees. The material is able to block the summer sun with the gaps and allow the winter sun to enter for heating. When the energy analysis is completed the electricity bills are calculated. The calculation is done by using the Al Ain Distribution Company website. The amount of payment is 23,098.03 AED per year. Comparing between the payment before (25,492.28 AED per year) and after (23,098.03 AED per year), the bill savings are 2394.25 AED per year.
Figure 14. 3D modeling of the base case without the shading structure and with the shading structure(structure not visible).
After adding the shading structure, the energy model is generated using the Honeybeeand Grasshopper plugins; the total energy consumption is 84,587.34 kWh per year. Thereduction after shading is approximately 10%. This decrease in the energy usage happenedbecause of the GKD metal fabric’s ability to reduce the energy consumption. The studiedangle of the sun is from 12 p.m. to 2 p.m.: on the 21st of June (summer), it is 85 degrees,and on the 21st of December (winter), it is 42 degrees. The material is able to block thesummer sun with the gaps and allow the winter sun to enter for heating. When the energyanalysis is completed the electricity bills are calculated. The calculation is done by usingthe Al Ain Distribution Company website. The amount of payment is 23,098.03 AED peryear. Comparing between the payment before (25,492.28 AED per year) and after (23,098.03AED per year), the bill savings are 2394.25 AED per year.
3.2. OTC Results
This section focuses on calculating the outdoor surface temperature, as this was thesecond aim of this research. The below results show how much the parametric shading
Sustainability 2021, 13, 8595 17 of 23
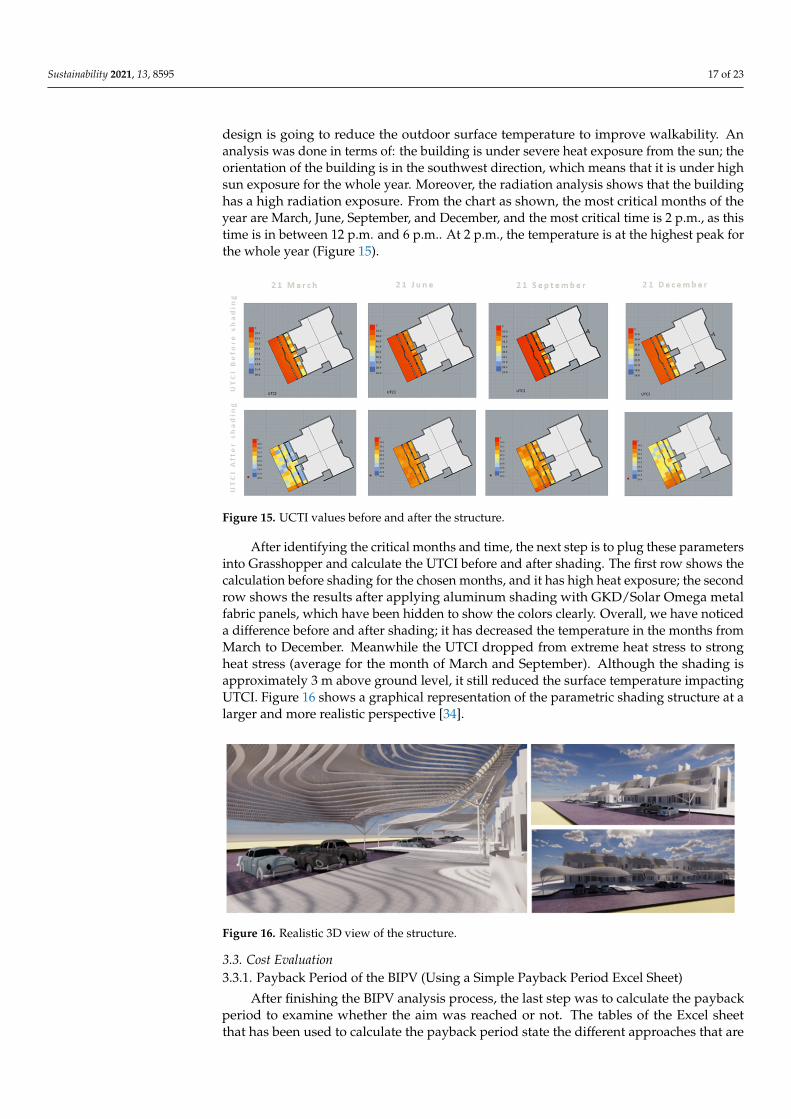
design is going to reduce the outdoor surface temperature to improve walkability. Ananalysis was done in terms of: the building is under severe heat exposure from the sun; theorientation of the building is in the southwest direction, which means that it is under highsun exposure for the whole year. Moreover, the radiation analysis shows that the buildinghas a high radiation exposure. From the chart as shown, the most critical months of theyear are March, June, September, and December, and the most critical time is 2 p.m., as thistime is in between 12 p.m. and 6 p.m.. At 2 p.m., the temperature is at the highest peak forthe whole year (Figure 15).
Sustainability 2021, 13, x FOR PEER REVIEW 18 of 24
3.2. OTC Results This section focuses on calculating the outdoor surface temperature, as this was the
second aim of this research. The below results show how much the parametric shading design is going to reduce the outdoor surface temperature to improve walkability. An analysis was done in terms of: the building is under severe heat exposure from the sun; the orientation of the building is in the southwest direction, which means that it is under high sun exposure for the whole year. Moreover, the radiation analysis shows that the building has a high radiation exposure. From the chart as shown, the most critical months of the year are March, June, September, and December, and the most critical time is 2 pm, as this time is in between 12 pm and 6 pm. At 2 pm, the temperature is at the highest peak for the whole year (Figure 15).
Figure 15. UCTI values before and after the structure.
After identifying the critical months and time, the next step is to plug these parame-ters into Grasshopper and calculate the UTCI before and after shading. The first row shows the calculation before shading for the chosen months, and it has high heat expo-sure; the second row shows the results after applying aluminum shading with GKD/Solar Omega metal fabric panels, which have been hidden to show the colors clearly. Overall, we have noticed a difference before and after shading; it has decreased the temperature in the months from March to December. Meanwhile the UTCI dropped from extreme heat stress to strong heat stress (average for the month of March and September). Although the shading is approximately 3 m above ground level, it still reduced the surface temperature impacting UTCI. Figure 16 shows a graphical representation of the parametric shading structure at a larger and more realistic perspective [34].
Figure 16. Realistic 3D view of the structure.
Figure 15. UCTI values before and after the structure.
After identifying the critical months and time, the next step is to plug these parametersinto Grasshopper and calculate the UTCI before and after shading. The first row shows thecalculation before shading for the chosen months, and it has high heat exposure; the secondrow shows the results after applying aluminum shading with GKD/Solar Omega metalfabric panels, which have been hidden to show the colors clearly. Overall, we have noticeda difference before and after shading; it has decreased the temperature in the months fromMarch to December. Meanwhile the UTCI dropped from extreme heat stress to strongheat stress (average for the month of March and September). Although the shading isapproximately 3 m above ground level, it still reduced the surface temperature impactingUTCI. Figure 16 shows a graphical representation of the parametric shading structure at alarger and more realistic perspective [34].
Sustainability 2021, 13, x FOR PEER REVIEW 18 of 24
3.2. OTC Results This section focuses on calculating the outdoor surface temperature, as this was the
second aim of this research. The below results show how much the parametric shading design is going to reduce the outdoor surface temperature to improve walkability. An analysis was done in terms of: the building is under severe heat exposure from the sun; the orientation of the building is in the southwest direction, which means that it is under high sun exposure for the whole year. Moreover, the radiation analysis shows that the building has a high radiation exposure. From the chart as shown, the most critical months of the year are March, June, September, and December, and the most critical time is 2 pm, as this time is in between 12 pm and 6 pm. At 2 pm, the temperature is at the highest peak for the whole year (Figure 15).
Figure 15. UCTI values before and after the structure.
After identifying the critical months and time, the next step is to plug these parame-ters into Grasshopper and calculate the UTCI before and after shading. The first row shows the calculation before shading for the chosen months, and it has high heat expo-sure; the second row shows the results after applying aluminum shading with GKD/Solar Omega metal fabric panels, which have been hidden to show the colors clearly. Overall, we have noticed a difference before and after shading; it has decreased the temperature in the months from March to December. Meanwhile the UTCI dropped from extreme heat stress to strong heat stress (average for the month of March and September). Although the shading is approximately 3 m above ground level, it still reduced the surface temperature impacting UTCI. Figure 16 shows a graphical representation of the parametric shading structure at a larger and more realistic perspective [34].
Figure 16. Realistic 3D view of the structure. Figure 16. Realistic 3D view of the structure.
3.3. Cost Evaluation3.3.1. Payback Period of the BIPV (Using a Simple Payback Period Excel Sheet)
After finishing the BIPV analysis process, the last step was to calculate the paybackperiod to examine whether the aim was reached or not. The tables of the Excel sheetthat has been used to calculate the payback period state the different approaches that are
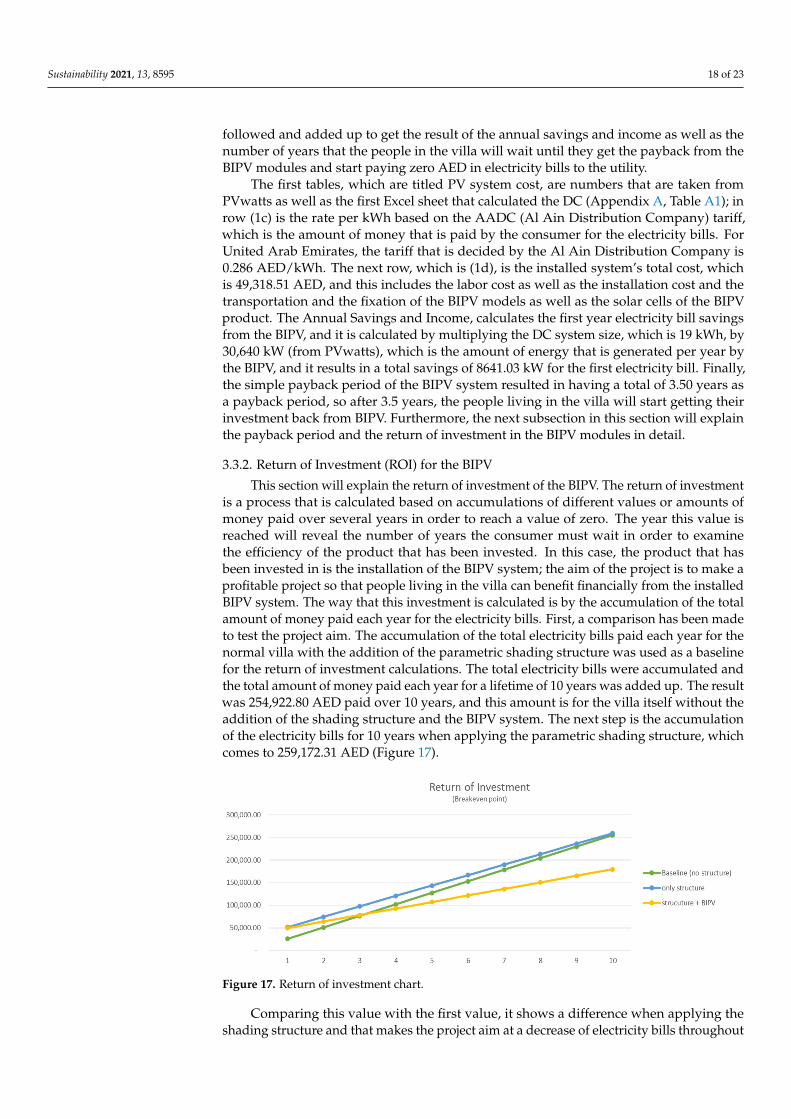
Sustainability 2021, 13, 8595 18 of 23
followed and added up to get the result of the annual savings and income as well as thenumber of years that the people in the villa will wait until they get the payback from theBIPV modules and start paying zero AED in electricity bills to the utility.
The first tables, which are titled PV system cost, are numbers that are taken fromPVwatts as well as the first Excel sheet that calculated the DC (Appendix A, Table A1); inrow (1c) is the rate per kWh based on the AADC (Al Ain Distribution Company) tariff,which is the amount of money that is paid by the consumer for the electricity bills. ForUnited Arab Emirates, the tariff that is decided by the Al Ain Distribution Company is0.286 AED/kWh. The next row, which is (1d), is the installed system’s total cost, whichis 49,318.51 AED, and this includes the labor cost as well as the installation cost and thetransportation and the fixation of the BIPV models as well as the solar cells of the BIPVproduct. The Annual Savings and Income, calculates the first year electricity bill savingsfrom the BIPV, and it is calculated by multiplying the DC system size, which is 19 kWh, by30,640 kW (from PVwatts), which is the amount of energy that is generated per year bythe BIPV, and it results in a total savings of 8641.03 kW for the first electricity bill. Finally,the simple payback period of the BIPV system resulted in having a total of 3.50 years asa payback period, so after 3.5 years, the people living in the villa will start getting theirinvestment back from BIPV. Furthermore, the next subsection in this section will explainthe payback period and the return of investment in the BIPV modules in detail.
3.3.2. Return of Investment (ROI) for the BIPV
This section will explain the return of investment of the BIPV. The return of investmentis a process that is calculated based on accumulations of different values or amounts ofmoney paid over several years in order to reach a value of zero. The year this value isreached will reveal the number of years the consumer must wait in order to examinethe efficiency of the product that has been invested. In this case, the product that hasbeen invested in is the installation of the BIPV system; the aim of the project is to make aprofitable project so that people living in the villa can benefit financially from the installedBIPV system. The way that this investment is calculated is by the accumulation of the totalamount of money paid each year for the electricity bills. First, a comparison has been madeto test the project aim. The accumulation of the total electricity bills paid each year for thenormal villa with the addition of the parametric shading structure was used as a baselinefor the return of investment calculations. The total electricity bills were accumulated andthe total amount of money paid each year for a lifetime of 10 years was added up. The resultwas 254,922.80 AED paid over 10 years, and this amount is for the villa itself without theaddition of the shading structure and the BIPV system. The next step is the accumulationof the electricity bills for 10 years when applying the parametric shading structure, whichcomes to 259,172.31 AED (Figure 17).
Sustainability 2021, 13, x FOR PEER REVIEW 20 of 24
Figure 17. Return of investment chart.
Comparing this value with the first value, it shows a difference when applying the shading structure and that makes the project aim at a decrease of electricity bills through-out the years achieved. The next step is examining the amount paid for 10 years after the addition of the BIPV for more efficiency and financial income for residents in addition to the shading structure. This amount is 179,439.52 kW. This means that the aim has been achieved, and in terms of the return of investment, zero is reached. The number below zero that is achieved by the BIPV in addition to the parametric structure is the amount of money that will start returning to the people living in the villa after 4 years. The calcula-tions of the BIPV and Shading structure are shown in the Appendix A, Table A2.
4. Discussion This study is an attempt to investigate the impact of parametric structures in building
facades and the surrounding environment. The results showed a significant improvement in the reduction of the energy consumption and improvement in outdoor thermal comfort. However, difficulties were encountered related to software: - Aligning the design software Rhino and the structure calculation software STAAD.
Rhino is an architectural software that has a large field of application. The base of the files in Rhino were proven difficult to be converted in STAAD. After several trials the converted file did not read all the structural elements. Therefore, they had to be re-designed and adjusted (Figure 18).
- The integration of the BIPV proved to be challenging in the software adaptation. In the Rhino software there are many plug-in software that can be connected (such as grasshopper and honeybee), however in order to have the estimation of the energy production from the BIPV thru BIMSolar the files needed additional work in adapt-ing.
Figure 18. Structural analysis of the parametric design structure.
Figure 17. Return of investment chart.
Comparing this value with the first value, it shows a difference when applying theshading structure and that makes the project aim at a decrease of electricity bills throughout
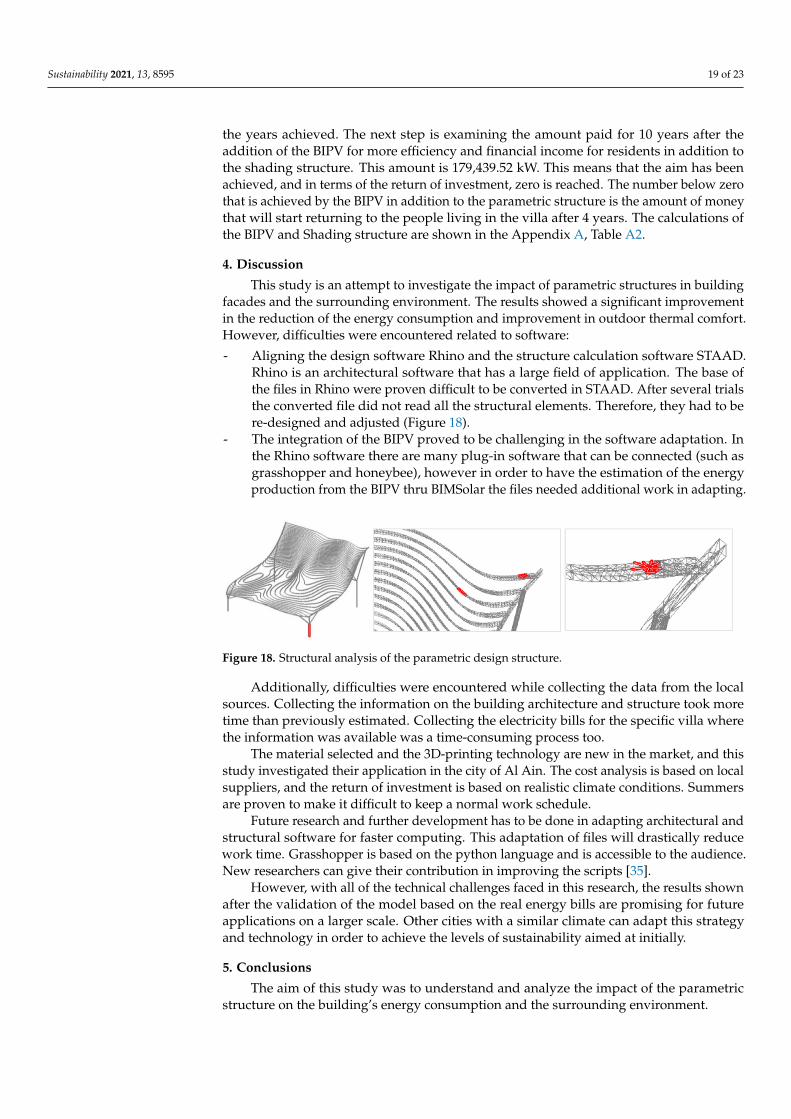
Sustainability 2021, 13, 8595 19 of 23
the years achieved. The next step is examining the amount paid for 10 years after theaddition of the BIPV for more efficiency and financial income for residents in addition tothe shading structure. This amount is 179,439.52 kW. This means that the aim has beenachieved, and in terms of the return of investment, zero is reached. The number below zerothat is achieved by the BIPV in addition to the parametric structure is the amount of moneythat will start returning to the people living in the villa after 4 years. The calculations ofthe BIPV and Shading structure are shown in the Appendix A, Table A2.
4. Discussion
This study is an attempt to investigate the impact of parametric structures in buildingfacades and the surrounding environment. The results showed a significant improvementin the reduction of the energy consumption and improvement in outdoor thermal comfort.However, difficulties were encountered related to software:
- Aligning the design software Rhino and the structure calculation software STAAD.Rhino is an architectural software that has a large field of application. The base ofthe files in Rhino were proven difficult to be converted in STAAD. After several trialsthe converted file did not read all the structural elements. Therefore, they had to bere-designed and adjusted (Figure 18).
- The integration of the BIPV proved to be challenging in the software adaptation. Inthe Rhino software there are many plug-in software that can be connected (such asgrasshopper and honeybee), however in order to have the estimation of the energyproduction from the BIPV thru BIMSolar the files needed additional work in adapting.
Sustainability 2021, 13, x FOR PEER REVIEW 20 of 24
Figure 17. Return of investment chart.
Comparing this value with the first value, it shows a difference when applying the shading structure and that makes the project aim at a decrease of electricity bills through-out the years achieved. The next step is examining the amount paid for 10 years after the addition of the BIPV for more efficiency and financial income for residents in addition to the shading structure. This amount is 179,439.52 kW. This means that the aim has been achieved, and in terms of the return of investment, zero is reached. The number below zero that is achieved by the BIPV in addition to the parametric structure is the amount of money that will start returning to the people living in the villa after 4 years. The calcula-tions of the BIPV and Shading structure are shown in the Appendix A, Table A2.
4. Discussion This study is an attempt to investigate the impact of parametric structures in building
facades and the surrounding environment. The results showed a significant improvement in the reduction of the energy consumption and improvement in outdoor thermal comfort. However, difficulties were encountered related to software: - Aligning the design software Rhino and the structure calculation software STAAD.
Rhino is an architectural software that has a large field of application. The base of the files in Rhino were proven difficult to be converted in STAAD. After several trials the converted file did not read all the structural elements. Therefore, they had to be re-designed and adjusted (Figure 18).
- The integration of the BIPV proved to be challenging in the software adaptation. In the Rhino software there are many plug-in software that can be connected (such as grasshopper and honeybee), however in order to have the estimation of the energy production from the BIPV thru BIMSolar the files needed additional work in adapt-ing.
Figure 18. Structural analysis of the parametric design structure.
Figure 18. Structural analysis of the parametric design structure.
Additionally, difficulties were encountered while collecting the data from the localsources. Collecting the information on the building architecture and structure took moretime than previously estimated. Collecting the electricity bills for the specific villa wherethe information was available was a time-consuming process too.
The material selected and the 3D-printing technology are new in the market, and thisstudy investigated their application in the city of Al Ain. The cost analysis is based on localsuppliers, and the return of investment is based on realistic climate conditions. Summersare proven to make it difficult to keep a normal work schedule.
Future research and further development has to be done in adapting architectural andstructural software for faster computing. This adaptation of files will drastically reducework time. Grasshopper is based on the python language and is accessible to the audience.New researchers can give their contribution in improving the scripts [35].
However, with all of the technical challenges faced in this research, the results shownafter the validation of the model based on the real energy bills are promising for futureapplications on a larger scale. Other cities with a similar climate can adapt this strategyand technology in order to achieve the levels of sustainability aimed at initially.
5. Conclusions
The aim of this study was to understand and analyze the impact of the parametricstructure on the building’s energy consumption and the surrounding environment.
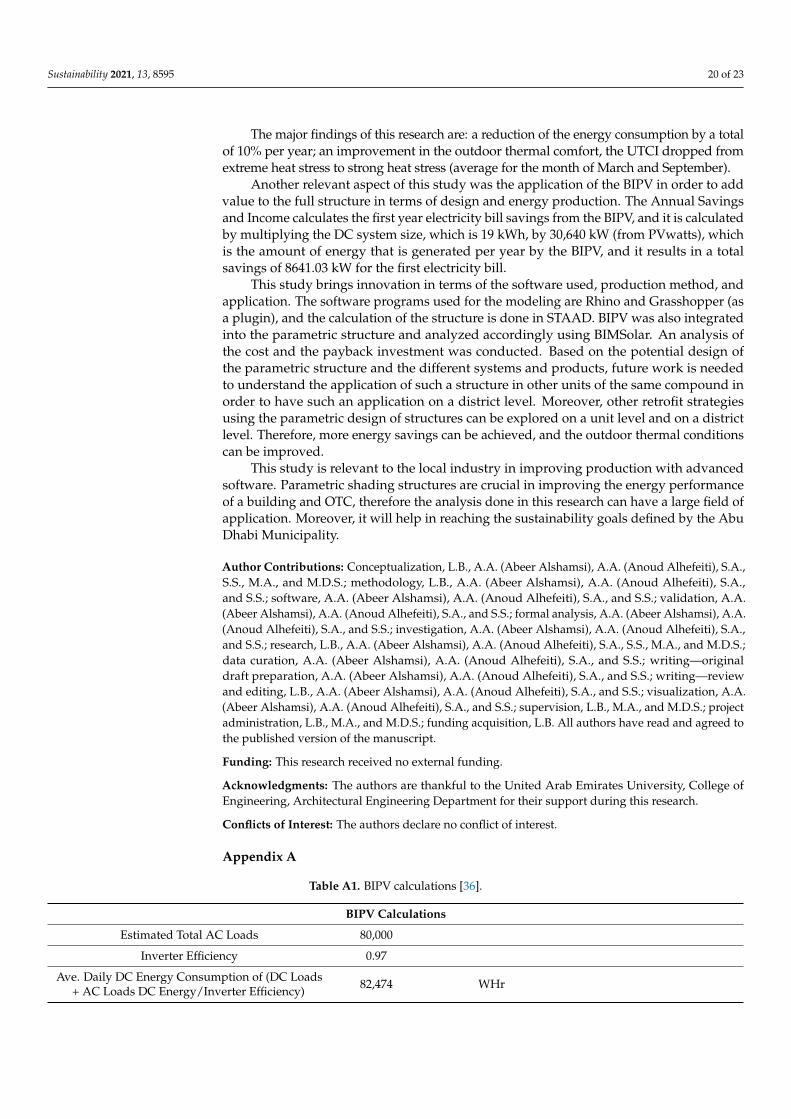
Sustainability 2021, 13, 8595 20 of 23
The major findings of this research are: a reduction of the energy consumption by a totalof 10% per year; an improvement in the outdoor thermal comfort, the UTCI dropped fromextreme heat stress to strong heat stress (average for the month of March and September).
Another relevant aspect of this study was the application of the BIPV in order to addvalue to the full structure in terms of design and energy production. The Annual Savingsand Income calculates the first year electricity bill savings from the BIPV, and it is calculatedby multiplying the DC system size, which is 19 kWh, by 30,640 kW (from PVwatts), whichis the amount of energy that is generated per year by the BIPV, and it results in a totalsavings of 8641.03 kW for the first electricity bill.
This study brings innovation in terms of the software used, production method, andapplication. The software programs used for the modeling are Rhino and Grasshopper (asa plugin), and the calculation of the structure is done in STAAD. BIPV was also integratedinto the parametric structure and analyzed accordingly using BIMSolar. An analysis ofthe cost and the payback investment was conducted. Based on the potential design ofthe parametric structure and the different systems and products, future work is neededto understand the application of such a structure in other units of the same compound inorder to have such an application on a district level. Moreover, other retrofit strategiesusing the parametric design of structures can be explored on a unit level and on a districtlevel. Therefore, more energy savings can be achieved, and the outdoor thermal conditionscan be improved.
This study is relevant to the local industry in improving production with advancedsoftware. Parametric shading structures are crucial in improving the energy performanceof a building and OTC, therefore the analysis done in this research can have a large field ofapplication. Moreover, it will help in reaching the sustainability goals defined by the AbuDhabi Municipality.
Author Contributions: Conceptualization, L.B., A.A. (Abeer Alshamsi), A.A. (Anoud Alhefeiti), S.A.,S.S., M.A., and M.D.S.; methodology, L.B., A.A. (Abeer Alshamsi), A.A. (Anoud Alhefeiti), S.A.,and S.S.; software, A.A. (Abeer Alshamsi), A.A. (Anoud Alhefeiti), S.A., and S.S.; validation, A.A.(Abeer Alshamsi), A.A. (Anoud Alhefeiti), S.A., and S.S.; formal analysis, A.A. (Abeer Alshamsi), A.A.(Anoud Alhefeiti), S.A., and S.S.; investigation, A.A. (Abeer Alshamsi), A.A. (Anoud Alhefeiti), S.A.,and S.S.; research, L.B., A.A. (Abeer Alshamsi), A.A. (Anoud Alhefeiti), S.A., S.S., M.A., and M.D.S.;data curation, A.A. (Abeer Alshamsi), A.A. (Anoud Alhefeiti), S.A., and S.S.; writing—originaldraft preparation, A.A. (Abeer Alshamsi), A.A. (Anoud Alhefeiti), S.A., and S.S.; writing—reviewand editing, L.B., A.A. (Abeer Alshamsi), A.A. (Anoud Alhefeiti), S.A., and S.S.; visualization, A.A.(Abeer Alshamsi), A.A. (Anoud Alhefeiti), S.A., and S.S.; supervision, L.B., M.A., and M.D.S.; projectadministration, L.B., M.A., and M.D.S.; funding acquisition, L.B. All authors have read and agreed tothe published version of the manuscript.
Funding: This research received no external funding.
Acknowledgments: The authors are thankful to the United Arab Emirates University, College ofEngineering, Architectural Engineering Department for their support during this research.
Conflicts of Interest: The authors declare no conflict of interest.
Appendix A
Table A1. BIPV calculations [36].
BIPV Calculations
Estimated Total AC Loads 80,000
Inverter Efficiency 0.97
Ave. Daily DC Energy Consumption of (DC Loads+ AC Loads DC Energy/Inverter Efficiency) 82,474 WHr
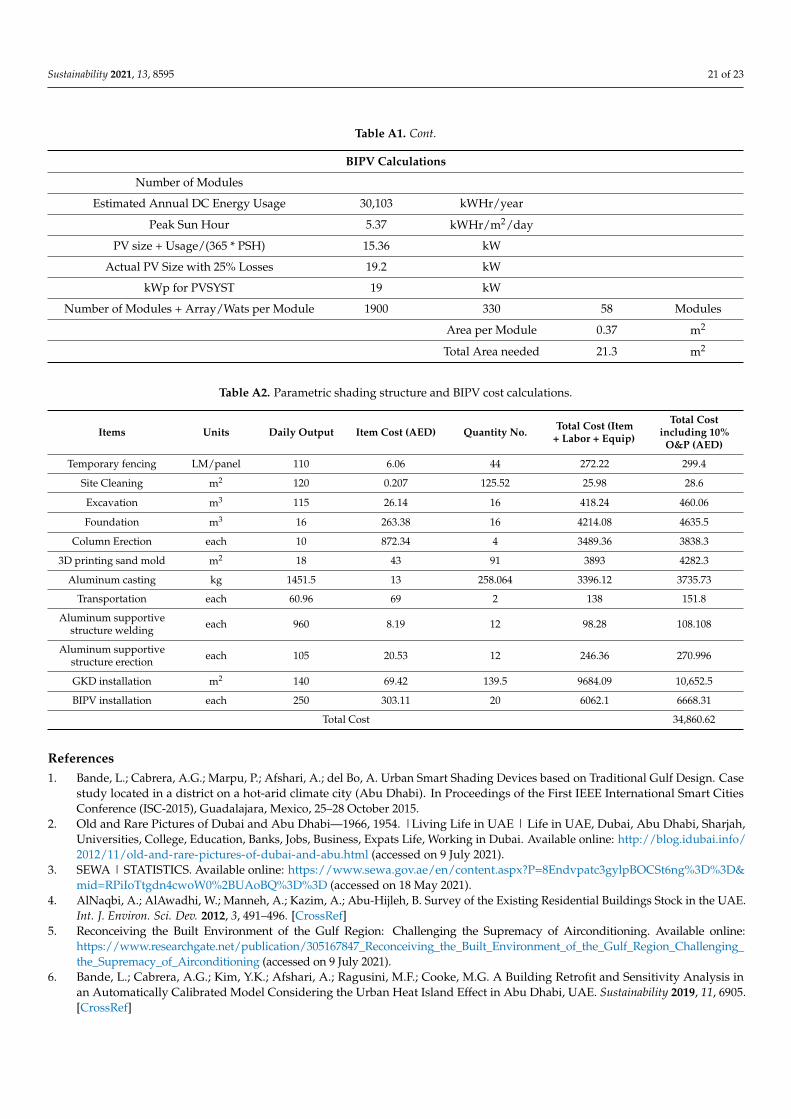
Sustainability 2021, 13, 8595 21 of 23
Table A1. Cont.
BIPV Calculations
Number of Modules
Estimated Annual DC Energy Usage 30,103 kWHr/year
Peak Sun Hour 5.37 kWHr/m2/day
PV size + Usage/(365 * PSH) 15.36 kW
Actual PV Size with 25% Losses 19.2 kW
kWp for PVSYST 19 kW
Number of Modules + Array/Wats per Module 1900 330 58 Modules
Area per Module 0.37 m2
Total Area needed 21.3 m2
Table A2. Parametric shading structure and BIPV cost calculations.
Items Units Daily Output Item Cost (AED) Quantity No. Total Cost (Item+ Labor + Equip)
Total Costincluding 10%
O&P (AED)
Temporary fencing LM/panel 110 6.06 44 272.22 299.4
Site Cleaning m2 120 0.207 125.52 25.98 28.6
Excavation m3 115 26.14 16 418.24 460.06
Foundation m3 16 263.38 16 4214.08 4635.5
Column Erection each 10 872.34 4 3489.36 3838.3
3D printing sand mold m2 18 43 91 3893 4282.3
Aluminum casting kg 1451.5 13 258.064 3396.12 3735.73
Transportation each 60.96 69 2 138 151.8
Aluminum supportivestructure welding each 960 8.19 12 98.28 108.108
Aluminum supportivestructure erection each 105 20.53 12 246.36 270.996
GKD installation m2 140 69.42 139.5 9684.09 10,652.5
BIPV installation each 250 303.11 20 6062.1 6668.31
Total Cost 34,860.62
References1. Bande, L.; Cabrera, A.G.; Marpu, P.; Afshari, A.; del Bo, A. Urban Smart Shading Devices based on Traditional Gulf Design. Case
study located in a district on a hot-arid climate city (Abu Dhabi). In Proceedings of the First IEEE International Smart CitiesConference (ISC-2015), Guadalajara, Mexico, 25–28 October 2015.
2. Old and Rare Pictures of Dubai and Abu Dhabi—1966, 1954. |Living Life in UAE | Life in UAE, Dubai, Abu Dhabi, Sharjah,Universities, College, Education, Banks, Jobs, Business, Expats Life, Working in Dubai. Available online: http://blog.idubai.info/2012/11/old-and-rare-pictures-of-dubai-and-abu.html (accessed on 9 July 2021).
3. SEWA | STATISTICS. Available online: https://www.sewa.gov.ae/en/content.aspx?P=8Endvpatc3gylpBOCSt6ng%3D%3D&mid=RPiIoTtgdn4cwoW0%2BUAoBQ%3D%3D (accessed on 18 May 2021).
4. AlNaqbi, A.; AlAwadhi, W.; Manneh, A.; Kazim, A.; Abu-Hijleh, B. Survey of the Existing Residential Buildings Stock in the UAE.Int. J. Environ. Sci. Dev. 2012, 3, 491–496. [CrossRef]
5. Reconceiving the Built Environment of the Gulf Region: Challenging the Supremacy of Airconditioning. Available online:https://www.researchgate.net/publication/305167847_Reconceiving_the_Built_Environment_of_the_Gulf_Region_Challenging_the_Supremacy_of_Airconditioning (accessed on 9 July 2021).
6. Bande, L.; Cabrera, A.G.; Kim, Y.K.; Afshari, A.; Ragusini, M.F.; Cooke, M.G. A Building Retrofit and Sensitivity Analysis inan Automatically Calibrated Model Considering the Urban Heat Island Effect in Abu Dhabi, UAE. Sustainability 2019, 11, 6905.[CrossRef]
Sustainability 2021, 13, 8595 22 of 23
7. Awadh, O.; Abuhijleh, B. The Impact of External Shading, Windows Glazing and Frame on Thermal Performance of ResidentialHouse in Abu-Dhabi. In Proceedings of the World Sustainable Building Conference, Barcelona, Spain, 28–30 October 2014.
8. Energy and Water Statistics Content List. 2017. Available online: https://www.scad.gov.ae/Release%20Documents/Energy%20and%20Water%202017%20EN.pdf (accessed on 31 July 2021).
9. Weather Spark. Average Weather in Al Ain United Arab Emirates. Available online: https://weatherspark.com/y/105466/Average-Weather-in-Al-Ain-United-Arab-Emirates-Year-Round (accessed on 31 July 2021).
10. Hamdan, D.M.A.; de Oliveira, F.L. The impact of urban design elements on microclimate in hot arid climatic conditions: Al AinCity, UAE. Energy Build. 2019, 200, 86–103. [CrossRef]
11. Camo House / WOW Architects | ArchDaily. Available online: https://www.archdaily.com/943769/camo-house-wow-architects(accessed on 18 May 2021).
12. From Design to Data: 12 Examples of Parametric Façades | ArchDaily. Available online: https://www.archdaily.com/938486/from-design-to-data-12-examples-of-parametric-facades?ad_source=search&ad_medium=search_result_all (accessed on 21July 2020).
13. Abdelfattah, M.A. Integrated Suitability Assessment: A Way Forward for Land Use Planning and Sustainable Development inAbu Dhabi, United Arab Emirates. Arid L. Res. Manag. 2013, 27, 41–64. [CrossRef]
14. Potential for Retrofitting a Federal Building in the UAE to Net Zero Electricity Building (nZEB). Heliyon 2019, 5, e01971. Availableonline: https://www.sciencedirect.com/science/article/pii/S2405844019355914 (accessed on 18 May 2021). [CrossRef] [PubMed]
15. Opoku, R.; Adjei, E.A.; Ahadzie, D.K.; Agyarko, K.A. Energy efficiency, solar energy and cost saving opportunities in publictertiary institutions in developing countries: The case of KNUST, Ghana. Alex. Eng. J. 2020, 59, 417–428. [CrossRef]
16. Solar Decathlon Middle East—Dubai Electricity & Water Authority, Dubai, UAE. Available online: https://www.solardecathlonme.com (accessed on 19 May 2021).
17. Bande, L.; Afshari, A.; Al Masri, D.; Jha, M.; Norford, L.; Tsoupos, A.; Marpu, P.; Pasha, Y.; Armstrong, P. Validation of UWG andENVI-Met Models in an Abu Dhabi District, Based on Site Measurements. Sustainability 2019, 11, 4378. [CrossRef]
18. Abu Dhabi Urban Planning Council (UPC). The Pearl Rating System for Estidama Community Rating System; Abu Dhabi UrbanPlanning Council (UPC): Abu Dhabi, UAE, 2010.
19. Abu-Hijleh, B.; Manneh, A.; AlNaqbi, A.; AlAwadhi, W.; Kazim, A. Refurbishment of public housing villas in the United ArabEmirates (UAE): Energy and economic impact. Energy Effic. 2017, 10, 249–264. [CrossRef]
20. Chi, D.A.; Gonzalez, E.G.; Valdivia, R.; Gutierrez, E.J. Parametric Design and Comfort Optimization of Dynamic ShadingStructures. Sustainability 2021, 13, 7670. [CrossRef]
21. Climate-Data.org. Al Ain Climate: Average Temperature, Weather by Month. Al Ain Weather Averages. Available online:https://en.climate-data.org/asia/united-arab-emirates/abu-dhabi/al-ain-1210/ (accessed on 18 May 2021).
22. SunCalc. Sunrise, Sunset, Shadow Length, Solar Eclipse, Sun Position, Sun Phase, Sun Height, Sun Calculator, Sun Movement,Map, Sunlight Phases, Elevation, Photovoltaic System, Photovoltaic. Available online: https://www.suncalc.org/#/40.1789,-3.5156,6.785369886966569/2021.07.10/08:46/1/3 (accessed on 10 July 2021).
23. Zare, S.; Hasheminejad, N.; Shirvan, H.E.; Hemmatjo, R.; Sarebanzadeh, K.; Ahmadi, S. Comparing Universal Thermal ClimateIndex (UTCI) with selected thermal indices/environmental parameters during 12 months of the year. Weather Clim. Extrem. 2018,19, 49–57. [CrossRef]
24. Taleb, D.; Taleb, H. Urbanizing the deserts of Dubai: An outdoor thermal comfort case study of Dubai International AcademicCity, UAE. In The Sustainable City VII; WIT Press: Southampton, UK, 2012; Volume 1, pp. 85–95.
25. Rosso, F.; Pisello, A.L.; Pignatta, G.; Castaldo, V.L.; Piselli, C.; Cotana, F.; Ferrero, M. Outdoor thermal and visual perception ofnatural cool materials for roof and urban paving. Procedia Eng. 2015, 118, 1325–1332. [CrossRef]
26. Shawesh, R.; Mohamed, M. Post-occupancy evaluation of outdoor thermal comfort in hot arid zone. Int. J. Low-Carbon Technol.2020, 107, 2411–2502. [CrossRef]
27. AlFaris, F.; Abu-Hijleh, B.; Abdul-Ameer, A. Using integrated control methodology to optimize energy performance for the guestrooms in UAE hospitality sector. Appl. Therm. Eng. 2016, 100, 1085–1094. [CrossRef]
28. Sargent, J.; Niemasz, J.; Reinhart, C.F. Shaderade: Combining RHINOCEROS and ENERGYPLUS for the design of staticexterior shading device. In Proceedings of the Building Simulation 2011: 12th Conference of International Building PerformanceSimulation Association, Sydney, Australia, 14–16 November 2011; pp. 1–9.
29. Lagios, K.; Niemasz, J.; Reinhart, C.F. Animated Building Performance Simulation (Abps)—Linking Rhinoceros / GrasshopperWith Radiance / Daysim. In Proceedings of the Fourth National Conference of IBPSA, New York, NY, USA, 11–13 August 2010;pp. 321–327.
30. Taleb, H.M. Using passive cooling strategies to improve thermal performance and reduce energy consumption of residentialbuildings in UAE. buildings. Front. Archit. Res. 2014, 3, 154–165. [CrossRef]
31. BIMsolar Features—BIMsolar. Available online: https://www.bim-solar.com/en/bimsolar-features (accessed on 19 May 2021).32. GKDMETALFABRICS | Harness the Potential of Solar Management with GKD Solar Omega Metal Fabric. Available online: https:
//www.gkdmetalfabrics.com/blog/harness_the_potential_of_solar_management_with_gkd_solar_omega_metal_fabric.html (ac-cessed on 18 May 2021).
33. Structural Engineering, Analysis, and Design Software—STAAD.Pro. Available online: https://www.bentley.com/en/products/product-line/structural-analysis-software/staadpro (accessed on 19 May 2021).

Sustainability 2021, 13, 8595 23 of 23
34. Ridha, S.; Ginestet, S.; Lorente, S. Effect of the Shadings Pattern and Greenery Strategies on the Outdoor Thermal Comfort. Int. J.Eng. Technol. 2018, 10, 108–114. [CrossRef]
35. Rhino–Grasshopper—New in Rhino 6. Available online: https://www.rhino3d.com/6/new/grasshopper/ (accessed on 10July 2021).
36. Gelani, H.E.; Dastgeer, F.; Siraj, K.; Nasir, M.; Niazi, K.A.K.; Yang, Y. Efficiency Comparison of AC and DC Distribution Networksfor Modern Residential Localities. Appl. Sci. 2019, 9, 582. [CrossRef]


