Embed Size (px)
Citation preview


Crime in High-Rise Buildings:Planning for Vertical Commu-nity Safety (CRG29/11-12)
Final Report to the Criminology Research Council
Michael Townsley, Sacha Reid,Danielle Reynald, John Rynne andBenjamin Hutchins
June 2013
Griffith University


Contents
List of Figures iii
List of Tables iv
1 Executive Summary 31.1 Understanding the Role of Place Management and Guardianship
in the Production of Crime in High-Rise Buildings . . . . . . . . . 31.2 Research Objectives . . . . . . . . . . . . . . . . . . . . . . . . . . 31.3 Methodology . . . . . . . . . . . . . . . . . . . . . . . . . . . . . 31.4 Results . . . . . . . . . . . . . . . . . . . . . . . . . . . . . . . . . 31.5 Research and Policy Implications . . . . . . . . . . . . . . . . . . 4
2 Background 72.1 Introduction . . . . . . . . . . . . . . . . . . . . . . . . . . . . . . 72.2 Aims and Objectives of the Current Research . . . . . . . . . . . 82.3 Study Region . . . . . . . . . . . . . . . . . . . . . . . . . . . . . 82.4 Structure of the Report . . . . . . . . . . . . . . . . . . . . . . . . 9
3 Literature 113.1 Environmental Criminology & Situational Crime Prevention . . . 113.2 The Rational Choice Perspective . . . . . . . . . . . . . . . . . . 123.3 Routine Activity Approach . . . . . . . . . . . . . . . . . . . . . . 143.4 Crime Pattern Theory . . . . . . . . . . . . . . . . . . . . . . . . 183.5 Defensible Space and CPTED . . . . . . . . . . . . . . . . . . . . 193.6 Risky Facilities . . . . . . . . . . . . . . . . . . . . . . . . . . . . 233.7 Strata Title Housing . . . . . . . . . . . . . . . . . . . . . . . . . 263.8 The Present Study . . . . . . . . . . . . . . . . . . . . . . . . . . 28
4 Study 1: Recorded Crime and Risky Facilities 314.1 Data . . . . . . . . . . . . . . . . . . . . . . . . . . . . . . . . . . 31
4.1.1 Data Processing and Cleaning . . . . . . . . . . . . . . . . 324.2 Analysis . . . . . . . . . . . . . . . . . . . . . . . . . . . . . . . . 33
4.2.1 Characteristics of Buildings of Interest . . . . . . . . . . . 334.2.2 Major Crime Types . . . . . . . . . . . . . . . . . . . . . . 354.2.3 Risky Facilities – All Offences . . . . . . . . . . . . . . . . 354.2.4 Risky Facilities – Top 10 Offence Types . . . . . . . . . . . 354.2.5 Risky Facilities – Building Characteristics . . . . . . . . . 36
i

4.2.6 Risky Facilities – Seasonal Trends . . . . . . . . . . . . . . 434.3 Summary . . . . . . . . . . . . . . . . . . . . . . . . . . . . . . . 43
5 Study 2: Observations of Risky Facilities 475.1 Data & Method . . . . . . . . . . . . . . . . . . . . . . . . . . . . 475.2 Inter-Rater Reliability . . . . . . . . . . . . . . . . . . . . . . . . 475.3 Concurrent Validity . . . . . . . . . . . . . . . . . . . . . . . . . . 485.4 Study 2 Results . . . . . . . . . . . . . . . . . . . . . . . . . . . . 48
5.4.1 Crime Controllers at Apartment Buildings . . . . . . . . . 485.4.2 Place Management & the Physical Environment of Apart-
ment Buildings . . . . . . . . . . . . . . . . . . . . . . . . 515.4.3 Place Management & Opportunities for Surveillance . . . . 545.4.4 Crime Control at Apartment Complexes: Examining the
Relationship Between Place Management, Guardianship,Image/Maintenance, Territoriality & Surveillance . . . . . 57
5.4.5 Guardianship, Tenure & Crime . . . . . . . . . . . . . . . 585.4.6 Place Management, Tenure & Crime . . . . . . . . . . . . 58
5.5 Summary . . . . . . . . . . . . . . . . . . . . . . . . . . . . . . . 59
6 Study 3: Discussing Risky Facilities 616.1 Data and Method . . . . . . . . . . . . . . . . . . . . . . . . . . . 61
6.1.1 Resident Questionnaire . . . . . . . . . . . . . . . . . . . . 616.1.2 In-Depth Semi-Structured Interviews . . . . . . . . . . . . 62
6.2 Results . . . . . . . . . . . . . . . . . . . . . . . . . . . . . . . . . 626.2.1 Difference Between Perceptions and Actual Rates of Crime 626.2.2 Location of Buildings/Apartments . . . . . . . . . . . . . . 646.2.3 Size of Community . . . . . . . . . . . . . . . . . . . . . . 656.2.4 Owner Occupied Buildings . . . . . . . . . . . . . . . . . . 666.2.5 Building Design Considerations . . . . . . . . . . . . . . . 676.2.6 Management of Risks . . . . . . . . . . . . . . . . . . . . . 706.2.7 Communication Portals . . . . . . . . . . . . . . . . . . . 746.2.8 Individuals Taking Responsibility . . . . . . . . . . . . . . 76
6.3 Summary . . . . . . . . . . . . . . . . . . . . . . . . . . . . . . . 78
7 Discussion And Conclusions 817.1 Significance of the Research . . . . . . . . . . . . . . . . . . . . . 817.2 Limitations and Future Directions . . . . . . . . . . . . . . . . . . 827.3 Policy Implications . . . . . . . . . . . . . . . . . . . . . . . . . . 847.4 Conclusion . . . . . . . . . . . . . . . . . . . . . . . . . . . . . . . 85
Appendix A Supplementary Results from Study 1 87A.1 J Curves for Building Tenure . . . . . . . . . . . . . . . . . . . . . 87A.2 J Curves for Building Height . . . . . . . . . . . . . . . . . . . . . 87A.3 J Curves for Temporal Patterns . . . . . . . . . . . . . . . . . . . 87
Appendix B Observational Protocol 116
Appendix C Apartment Complex Crime Control Indicator Scores 123
ii

References 131
List of Figures
2.1 Study Region. All Properties Greater than 3 Storeys Shaded Green . 10
4.1 Number of Buildings of Interest by Floors of Residential Living Space 344.2 J Curve of All Offences and All Buildings . . . . . . . . . . . . . . . 374.3 J Curves for Top 10 Offences . . . . . . . . . . . . . . . . . . . . . . 384.4 J Curves of Other Theft (excl. Unlawful Entry) Offences Conditioned
by Tenure . . . . . . . . . . . . . . . . . . . . . . . . . . . . . . . . . 404.5 J Curves of Other Theft (excl. Unlawful Entry) Offences Conditioned
by Building Height . . . . . . . . . . . . . . . . . . . . . . . . . . . . 424.6 J Curves for Peak and Off-Peak Months for Five Offence Types . . . 444.7 J Curves for Peak and Off-Peak Months for Five Offence Types . . . 45
5.1 Active Guardianship Score Items . . . . . . . . . . . . . . . . . . . . 495.2 Active Guardianship Score Frequencies . . . . . . . . . . . . . . . . . 505.3 Actively Available Place Management Score Items . . . . . . . . . . . 505.4 Actively Available Place Management Score Frequencies . . . . . . . 515.5 Image/Maintenance Score Items . . . . . . . . . . . . . . . . . . . . . 525.6 Image/Maintenance Score Frequencies . . . . . . . . . . . . . . . . . 525.7 Territorial Definition – Barriers Score Items . . . . . . . . . . . . . . 535.8 Territorial Definition – Signage Score Items . . . . . . . . . . . . . . 535.9 Territorial Definition – Barriers Score Frequencies . . . . . . . . . . . 545.10 Territorial Definition – Signage Score Frequencies . . . . . . . . . . . 545.11 CCTV Score Items . . . . . . . . . . . . . . . . . . . . . . . . . . . . 555.12 CCTV Score Frequencies . . . . . . . . . . . . . . . . . . . . . . . . . 555.13 Lighting Score Items . . . . . . . . . . . . . . . . . . . . . . . . . . . 565.14 Lighting Score Frequencies . . . . . . . . . . . . . . . . . . . . . . . . 565.15 Relationship Between Guardianship and Other Theft Crimes Condi-
tioned by Building Tenure . . . . . . . . . . . . . . . . . . . . . . . . 595.16 Relationship Between Place Management and Other Theft Crimes
Conditioned by Building Tenure . . . . . . . . . . . . . . . . . . . . . 60
A.1 J Curves of Drug Offences Offences Conditioned by Tenure . . . . . . 88A.2 J Curves of Good Order Offences Conditioned by Tenure . . . . . . . 89A.3 J Curves of Unlawful Entry Offences Conditioned by Tenure . . . . . 90A.4 J Curves of Other Property Damage Offences Conditioned by Tenure 91A.5 J Curves of Unlawful Entry With Intent - Dwelling Offences Condi-
tioned by Tenure . . . . . . . . . . . . . . . . . . . . . . . . . . . . . 92
iii
A.6 J Curves of Assault Offences Conditioned by Tenure . . . . . . . . . 93A.7 J Curves of Liquor (excl. Drunkenness) Offences Conditioned by Tenure 94A.8 J Curves of Unlawful Use of Motor Vehicle Offences Conditioned by
Tenure . . . . . . . . . . . . . . . . . . . . . . . . . . . . . . . . . . . 95A.9 J Curves of Unlawful Entry With Intent - Other Offences Conditioned
by Tenure . . . . . . . . . . . . . . . . . . . . . . . . . . . . . . . . . 96A.10 J Curves of Drug Offences Offences Conditioned by Building Height . 97A.11 J Curves of Good Order Offences Conditioned by Building Height . . 98A.12 J Curves of Unlawful Entry Offences Conditioned by Building Height 99A.13 J Curves of Other Property Damage Offences Conditioned by Building
Height . . . . . . . . . . . . . . . . . . . . . . . . . . . . . . . . . . . 100A.14 J Curves of Unlawful Entry With Intent - Dwelling Offences Condi-
tioned by Building Height . . . . . . . . . . . . . . . . . . . . . . . . 101A.15 J Curves of Assault Offences Conditioned by Building Height . . . . 102A.16 J Curves of Liquor (excl. Drunkenness) Offences Conditioned by
Building Height . . . . . . . . . . . . . . . . . . . . . . . . . . . . . . 103A.17 J Curves of Unlawful Use of Motor Vehicle Offences Conditioned by
Building Height . . . . . . . . . . . . . . . . . . . . . . . . . . . . . . 104A.18 J Curves of Unlawful Entry With Intent - Other Offences Conditioned
by Building Height . . . . . . . . . . . . . . . . . . . . . . . . . . . . 105A.19 J Curves of Drug Offences Offences Conditioned by Year . . . . . . . 106A.20 J Curves of Good Order Offences Conditioned by Year . . . . . . . . 107A.21 J Curves of Unlawful Entry Offences Conditioned by Year . . . . . . 108A.22 J Curves of Other Property Damage Offences Conditioned by Year . 109A.23 J Curves of Unlawful Entry With Intent - Dwelling Offences Condi-
tioned by Year . . . . . . . . . . . . . . . . . . . . . . . . . . . . . . 110A.24 J Curves of Assault Offences Conditioned by Year . . . . . . . . . . . 111A.25 J Curves of Liquor (excl. Drunkenness) Offences Conditioned by Year 112A.26 J Curves of Unlawful Use of Motor Vehicle Offences Conditioned by
Year . . . . . . . . . . . . . . . . . . . . . . . . . . . . . . . . . . . . 113A.27 J Curves of Unlawful Entry With Intent - Other Offences Conditioned
by Year . . . . . . . . . . . . . . . . . . . . . . . . . . . . . . . . . . 114
List of Tables
4.1 Number of Buildings by Number of Storeys Dedicated to ResidentialLiving . . . . . . . . . . . . . . . . . . . . . . . . . . . . . . . . . . . 33
4.2 Number of Buildings by Tenure Type . . . . . . . . . . . . . . . . . . 354.3 Frequency of Major Offence Categories . . . . . . . . . . . . . . . . . 36
iv

4.4 Top 12 Buildings with respect to Reported Crime and Building Char-acteristics . . . . . . . . . . . . . . . . . . . . . . . . . . . . . . . . . 37
4.5 Number of Times the Same Buildings Feature in the Highest RankingDozen Buildings per Offence Classification . . . . . . . . . . . . . . . 39
4.6 Differences In Average Number of Recorded Offences Conditioned onBuilding Tenure per Building . . . . . . . . . . . . . . . . . . . . . . 41
4.7 Level and Concentration of Other Theft (excluding Unlawful Entry)Offences by Building Height . . . . . . . . . . . . . . . . . . . . . . . 41
4.8 Differences in Average Number of Recorded Offences Conditioned onBuilding Height per Building . . . . . . . . . . . . . . . . . . . . . . 43
5.1 Inter-Correlations of Observed Apartment Complex Features . . . . . 485.2 Descriptives of Crime Control and related Environmental Variables . 575.3 Inter-Correlations between Place Management, Guardianship, Image/
Maintenance and Territoriality . . . . . . . . . . . . . . . . . . . . . 58
6.1 Sample of Interviewees . . . . . . . . . . . . . . . . . . . . . . . . . . 62
C.1 Apartment Complex Crime Control Indicator Scores . . . . . . . . . 124
1


1 Executive Summary
1.1 Understanding the Role of Place Management andGuardianship in the Production of Crime in High-RiseBuildings
1.2 Research ObjectivesThe aim of this research is to inform housing and planning policy developmentby exploring the variation in types and volumes of crime in a range of existinghigh-density communities. By analysing actual rates and types of crime, buildingmanagement styles and perceptions of fear of crime, the research will reveal howpolicing and high-rise building management styles can coalesce to create safervertical communities.
1.3 MethodologyThe methodological approach was multi-method, comprising quantitative anal-ysis, in depth interviews, a systematic observational instrument and residentsurveys.
1.4 ResultsThe research was partitioned into three separate studies, each differentiated bythe corresponding data sources and methodological approach. Qualitative anal-yses of police recorded crime incidents (Study 1) showed a high degree of con-centration of crimes in a small proportion of high-rise buildings. This patternwas observed regardless of crime type or time of year. Building characteristicswere examined and it was found that residential tenure appeared to have a rela-tionship with the amount of crime recorded at the building level. Buildings withlong-term residents recorded the lowest levels of crime, on average. Buildingswith short-term tenancies (holiday apartments, hotels) had the next highest, andbuildings with mixed tenure (both long and short term tenancies) recording thehighest levels of crime.
The second study took a subsample of high-rise buildings and used an obser-vational protocol to make ratings about place management, guardianship, and
3

physical security. The most notable finding was that unlike findings internation-ally, place management and active guardianship did not appear to be positivelycorrelated. That is, theory would suggest that locations with high levels of activeguardianship should also have high levels of place management, but we did notobserve this at the buildings in our sample. Strong positive correlations betweenplace management and territoriality, image and physical security were observed.
The third study involved interviewing residents, police officers, and buildingmanagers with a focus on the relationship between perceptions of safety andhigh-rise living. The findings indicated that the tenure and design aspects of thebuildings had a significant influence upon perceived safety and security. Buildingsof mixed tenures (short term or holiday letting and longer term residential) weremost vocal in discussing the challenges of security and safety. Importantly, designand building management alone are not the sole panacea and individuals also hadto take responsibility for considering their safety and security within high densityenvironments.
1.5 Research and Policy ImplicationsThe research reported in this project makes a substantial contribution to thecriminological literature. In the criminological literature, place management andguardianship (two core concepts in routine activity theory) are rarely measuredconcurrently in the same locations. The results of this research suggest the rela-tionship appears to be less than straightforward, with some buildings displayinga relationship consistent with theoretical expectation, whereas in others therewas none. This observation, if generalisable, may require scholars to rethink therelationship between these two important and central constructs of routine ac-tivity theory. In addition, the strata title literature rarely makes reference tocrime, favouring a focus on governance, an ostensibly obvious omission. Thecriminological literature has considerable empirical evidence attesting to the crit-ical role that place managers play in limiting crime levels, suggesting potentialcross-fertilisation of knowledge would be worthwhile.
The research findings have direct policy implications for future urban plan-ning and property development agenda. The research demonstrated that thestyle of internal management styles in high-rise residences in tourist and othersimilar residences influences the volume of crime and disorder. The Body Cor-porate and Community Management Act 1997 (BCCM) provides the legislativeguidelines for the legal ownership of strata and community title schemes, as wellas operational and management governance. However, the emphasis within theAct is for these schemes to self-govern regardless of the capacity and capabilitiesof individuals within these schemes to govern and operationalise buildings and fi-nances. The Building Codes of Australia (BCA) also provide nationally consistentstandards for structural and building safety, health, amenity and sustainability.These regulations contain technical provisions for the design and construction ofbuildings. However, developers and architects ultimately create buildings thatare commercially viable. In many instances, the regulations and legislation failto acknowledge the social and human factors involved in high density residential
4

environments.The research has larger national implications than the Gold Coast alone as
many Australian State and Local governments adopt a compact city planningapproach (Costley, 2006; Gillen, 2006). Increases in community density, throughinfill and high-rise developments, require policies that detail best practice ininternal management and its interaction with policing for safer environments.
The research findings can also help inform crime prevention practice in twoways: (i) to guide Body Corporates in how best to implement supervisory prac-tices for on-site building management in order to improve internal security andensure safer residences; and (ii) the development of policing policies around riskyfacilities, like high-rise residences, and how policing approaches can best interactwith internal high-rise management styles to lower crime.
5


2 Background
2.1 Introduction
Governments at varying levels have forecast significant changes in populationlevels and distribution over the coming decades. Australia’s population is esti-mated to rise from 22.4 million in August 2010 to 35.5 million people by 2056(Australian Bureau of Statistics, 2008). Local and state governments have imple-mented changes to planning legislation and regulations with a shift towards highdensity housing, or vertical communities, in order to ease the strain of maintain-ing a sprawling infrastructure base (Healy et al., 2006; Newman and Kenworthy,1989). The changing social environment, including shifting demographics andhousing tenure patterns, will ensure that over the next 20 years a larger portionof Australians will be living in high density residential developments. However,little consideration has been given to how these policies might impact on levelsof crime and perceptions or fear of crime within these vertical communities.
There is considerable empirical evidence that the aggregate influences of trans-port networks, land use, population and their interconnections contribute a greatdeal to explaining the crime potential at certain places and times. In theoreticalterms, crime pattern theory (Brantingham and Brantingham, 2008) and routineactivity theory (Felson, 2008) posit a relationship between human movement,routine non-criminal activities and the production of crime rates. One importantprinciple of crime prevention is that crime is highly concentrated in particularplaces and among particular people, suggesting that focusing resources on theseconcentrations is likely to yield the greatest preventive benefits.
In summary, current town planning and housing policies suggest that in thevery near future housing density will be much higher than current levels andto date little attention has been paid to how levels of crime and fear of crimemay be impacted. In order to establish evidence-based housing and planningpolicies this project explored the influence of physical building characteristicsand management practices on the volume and mix of crimes occurring in existinghigh-rise apartment buildings. This research is motivated by a desire for stateand local governments in Australia to avoid repeating the housing policy mistakesexperienced by other countries.
7
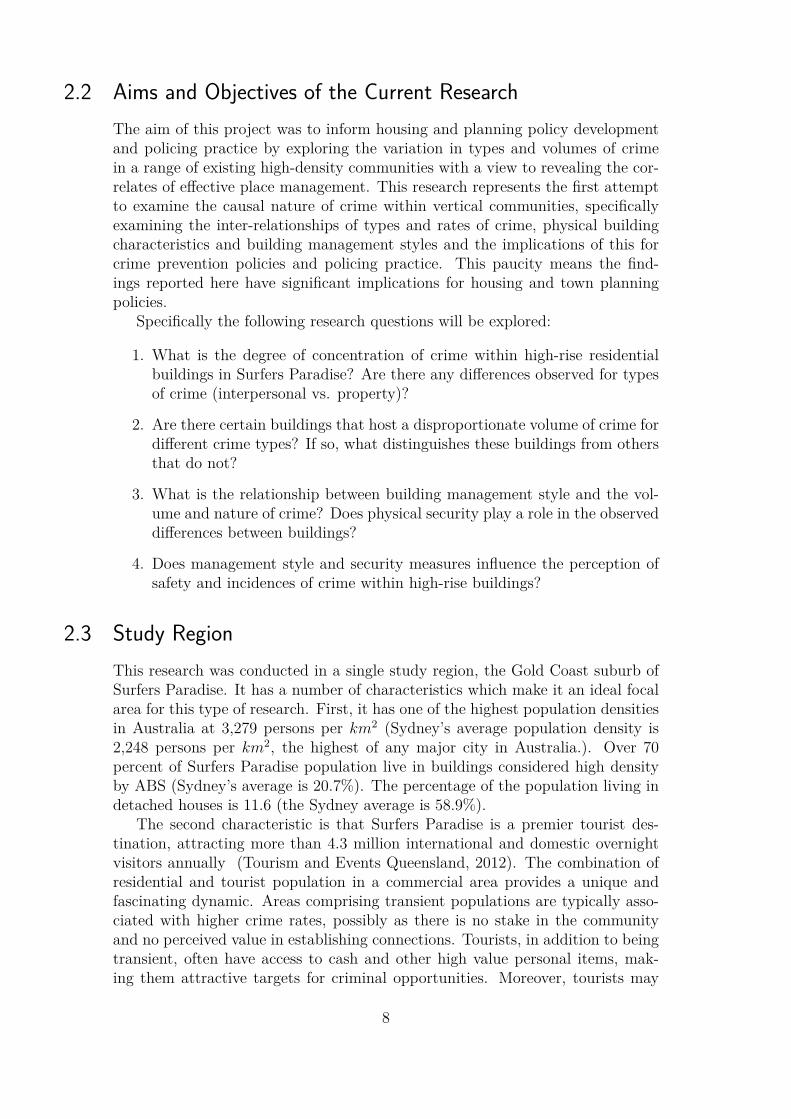
2.2 Aims and Objectives of the Current ResearchThe aim of this project was to inform housing and planning policy developmentand policing practice by exploring the variation in types and volumes of crimein a range of existing high-density communities with a view to revealing the cor-relates of effective place management. This research represents the first attemptto examine the causal nature of crime within vertical communities, specificallyexamining the inter-relationships of types and rates of crime, physical buildingcharacteristics and building management styles and the implications of this forcrime prevention policies and policing practice. This paucity means the find-ings reported here have significant implications for housing and town planningpolicies.
Specifically the following research questions will be explored:
1. What is the degree of concentration of crime within high-rise residentialbuildings in Surfers Paradise? Are there any differences observed for typesof crime (interpersonal vs. property)?
2. Are there certain buildings that host a disproportionate volume of crime fordifferent crime types? If so, what distinguishes these buildings from othersthat do not?
3. What is the relationship between building management style and the vol-ume and nature of crime? Does physical security play a role in the observeddifferences between buildings?
4. Does management style and security measures influence the perception ofsafety and incidences of crime within high-rise buildings?
2.3 Study RegionThis research was conducted in a single study region, the Gold Coast suburb ofSurfers Paradise. It has a number of characteristics which make it an ideal focalarea for this type of research. First, it has one of the highest population densitiesin Australia at 3,279 persons per km2 (Sydney’s average population density is2,248 persons per km2, the highest of any major city in Australia.). Over 70percent of Surfers Paradise population live in buildings considered high densityby ABS (Sydney’s average is 20.7%). The percentage of the population living indetached houses is 11.6 (the Sydney average is 58.9%).
The second characteristic is that Surfers Paradise is a premier tourist des-tination, attracting more than 4.3 million international and domestic overnightvisitors annually (Tourism and Events Queensland, 2012). The combination ofresidential and tourist population in a commercial area provides a unique andfascinating dynamic. Areas comprising transient populations are typically asso-ciated with higher crime rates, possibly as there is no stake in the communityand no perceived value in establishing connections. Tourists, in addition to beingtransient, often have access to cash and other high value personal items, mak-ing them attractive targets for criminal opportunities. Moreover, tourists may
8

be “holiday mode” and not as vigilant with personal safety and security as theywould be in their everyday lifestyle.
These two factors, high density living and the transient nature of local pop-ulations, mean that Surfers Paradise is a highly appropriate location to explorethe relationships between high density living, place management, guardianshipand the volume and distribution of crime. The analysis focused on buildings withat least three storeys, in order to avoid information privacy concerns. Figure 2.1displays the suburb of Surfers Paradise with all property parcels included in theanalysis shaded green.
2.4 Structure of the ReportThe remainder of the report is structured as follows: in Chapter 3 we review theprevious criminological and housing research describing empirical studies of build-ing design, crime prevention and housing management with theoretical explana-tions drawn from environmental criminology that can be employed to explainobserved concentrations of crime. This literature is used to inform the subse-quent research, which is then described across three studies. The first (Chapter4) uses police recorded crime data to conduct exploratory and descriptive anal-ysis on the volume and distribution of crimes in high-rise buildings in the studyregion. The second (Chapter 5) contains observations of different high-rise build-ings to obtain systematic measures of place management and guardianship. Thefinal study (Chapter 6) describes interviews with a range of professionals (policeofficers, crime prevention officers and building managers) and residents relating toperceptions of safety, incidences of crime and social connectedness or cohesion ofthose living in vertical communities. In Chapter 7 the results are summarised be-fore outlining the policy significance of the findings. We conclude by highlightinga number of potential avenues for further investigation.
9
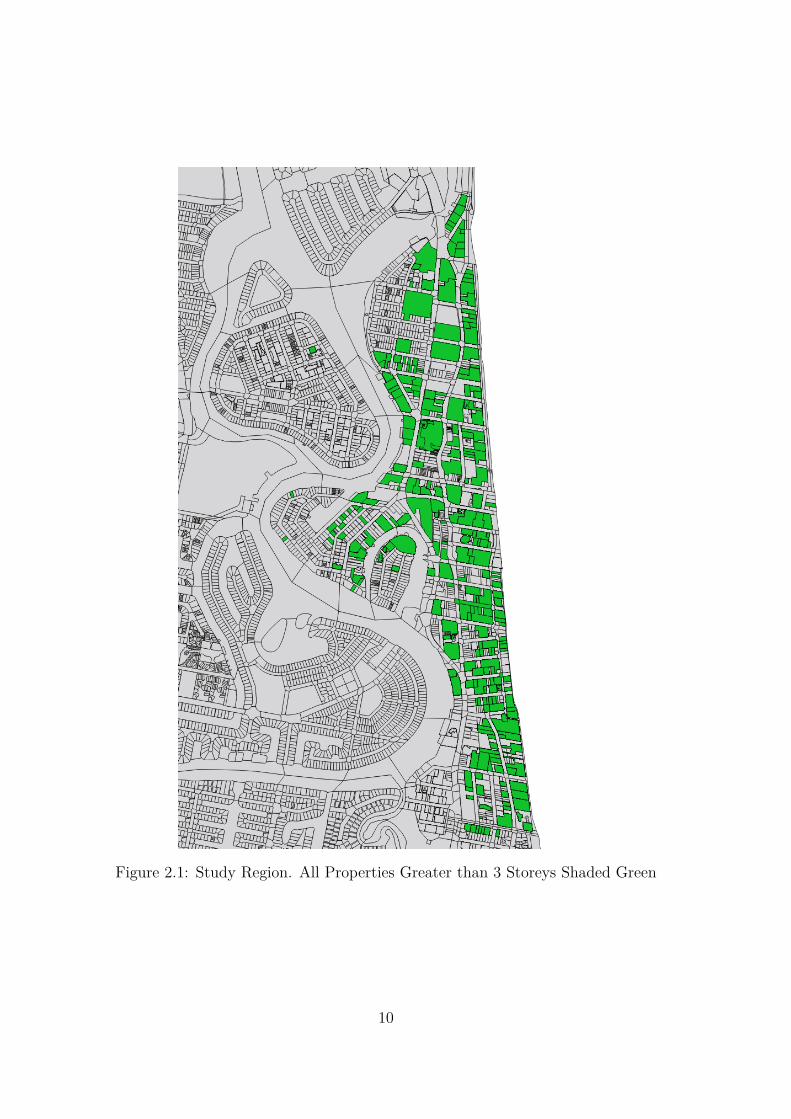
Figure 2.1: Study Region. All Properties Greater than 3 Storeys Shaded Green
10

3 Literature
3.1 Environmental Criminology & Situational Crime PreventionEnvironmental criminology differs from other schools of criminological thoughtby focusing on the opportunistic nature of crimes. Traditional criminological ap-proaches have tended to focus on the offender and the major factors that promoteor retard pro-social development (Farrington, 2003). In contrast, environmentalcriminology focuses on crimes as events arising from person-situation interac-tions and seeks to understand what factors contribute to the occurrence of theseevents and what environmental factors cause crime to be more likely or frequent(Wortley and Mazerolle, 2008). Put simply, environmental criminology seeks tounderstand the immediate setting in which crime occurs and what can be changedabout that environment to prevent crime.
There are three core propositions of environmental criminology. First, theimmediate environment plays a major role in criminal behaviour, following theperspective that behaviour arises from an interaction between person and situa-tion (Wortley and Mazerolle, 2008). This idea implies that crime is the resultof motivation and opportunity. Historically, environmental criminology studieshave assumed criminal motivation is the result of a range of distal forces (andthus, have not attempted to explain nor control it), but more recent research sug-gests it is possible to induce criminal motivation through situational factors (e.g.peer pressure) (Wortley, 1998, 2008). Once motivation is present (either inducedby the immediate environment or pre-existing), crime events become possible ifcriminal opportunities are present.
The second proposition is that crime is not evenly distributed in time or lo-cation, nor is it randomly distributed. Rather, it clusters in particular locationsand may peak at certain times (Brantingham and Brantingham, 2008; Felson,2008). This is an extension of the first proposition, that criminal behaviour isinfluenced by the surrounding environment. If environments influence opportuni-ties for crime, and by extension the occurrence of crime, it follows that crime willoccur more frequently in environments that provide a greater number of oppor-tunities. Similarly, crime will occur more frequently at certain times of the day,week, month and year corresponding with the opportunity structure and supply.
The third premise relates to Situational Crime Prevention (Clarke, 1983,1997, 2008). Understanding what makes an environment conducive to criminalbehaviour and identifying the patterns of crime and criminal opportunities isimportant in developing effective crime prevention methods. If police and crimeprevention practitioners know where crimes cluster, then prevention strategies can
11
be targeted to that particular area to have the largest, and most cost-effective,impact. Similarly if the features of an environment conducive to crime can beidentified, then they can be manipulated to reduce crime. Situational CrimePrevention is the application of environmental criminology principles, and re-volves around changing the environmental features of a place so that the person-situation interaction no longer provides opportunities for crime to occur (Clarke,1983, 1997, 2008).
A common argument against Situational Crime Prevention and place-basedinterventions is displacement. Crime displacement refers to when the location,time, crime, target, offender or method changes as a result of a situational crimeintervention (Guerette and Bowers, 2009). For example, if an intervention im-proves door security of houses in a high burglary area, offenders may change theirmethod of entry to windows (method) or target nearby housing estates withoutimproved security (spatial). Underpinning the displacement criticism is the impli-cation that situational interventions induce a change in the distribution of crimebut not the level.
Not all displacement is negative. Displacement can be benign in a number ofways such as offence displacement, where a less serious crime such as burglaryreplaces a more serious crime like armed robbery, or crime is displaced and spreadacross a greater number of victims, or when crime is directed away from morevulnerable populations such as children (Barr and Pease, 1990; Guerette andBowers, 2009). Diffusion of benefits occurs when when the reduction impact ofan intervention is observed in areas not directly targeted by the intervention. Forexample an intervention targeting assaults at bars might also cause a reductionin robberies and muggings in the surrounding area (Guerette and Bowers, 2009).
In a review of 102 situational crime prevention studies, Guerette and Bowers(2009) found that displacement occurred in 26 percent of studies, while diffusionof benefits was found in 27 percent. It was also found that on average, whendisplacement did occur, the benefits of the intervention still outweighed the cost ofdisplacement, i.e. there was still a net reduction in the presence of displacement.
There are three main theoretical approaches – the rational choice perspective,crime pattern theory and routine activity approach – that provide the foundationfor environmental criminology and situational crime prevention. These will beoutlined in turn.
3.2 The Rational Choice PerspectiveThe rational choice perspective posits that crime is a result of potential offendersweighing up the risks, potential rewards, and the effort involved in offending(Cornish and Clarke, 2008). If the risks and effort are relatively low, while thepotential rewards are high, then offending is more likely to occur. The coreconcepts of the rational choice perspective are:
• criminal behaviour is purposive. Offenders commit crimes to fulfil someneed or goal. These may not always be understood by others, but for theoffender, there is some benefit or need met by offending (Cornish and
12

Clarke, 2008). These benefits can include fulfilling a need for excitement,sexual gratification or achieving a sense of control, in addition to the typicalmonetary gain (Cornish and Clarke, 2008).
• criminal behaviour is rational. Potential offenders attempt to select thebest method of achieving their goals available to them (Cornish and Clarke,2008). This does not mean perfect rationality. Given the inherent illegal-ity of criminal behaviour, opportunities for offending are rarely going tobe ideal. The risks and rewards cannot always be objectively quantifiedprior to offending, which when combined with the additional constraints oftime frame, skill level and possible intoxication of the offender, leads to anuncertain situation in which decisions are not always going to be perfect(Cornish and Clarke, 2008). This results in satisficing, making decisions oninformation that is just satisfactory and sufficient, but not ideal (Cornishand Clarke, 2008).
• criminal decision making is crime specific. Different crimes types are carriedout to satisfy different needs, and offenders’ motives influence this decisionmaking process. Even ostensibly similar crime types can be the product ofvery different opportunity structures. A prime example is different typesof car theft, which can include temporary transport, theft for sale or theftfor components/parts. Each of these will likely have some different decisionmaking processes relating to a number of aspects of crime commission suchas target selection and gaining access (Clarke and Harris, 1992).
• criminal decision making is a process. Crime commission can be parti-tioned into decisions and actions related to different stages of the crimeevent: planning, doing it, and completion. Even impulsive crimes involvesome degree of preparation or at least some pre-existing conditions for theirsuccessful completion. Using burglary as an example, an offender can makethe necessary preparations (selecting the tools required, identifying a targetarea), a target must then be selected which relies on identifying signs so asto estimate the risks and rewards of each potential target. Once a target isselected, the offender must approach the target while remaining inconspic-uous, identify possible methods of entry and select one, identify and stealvaluable items, leave the premise and (if necessary) load stolen items intoa vehicle and finally leave the area. Viewing crimes as a process offers pre-vention opportunities beyond the narrow time window of the crime eventitself.
The rational choice perspective suggests a crime will occur when a motivatedoffender comes across an opportunity to fulfil their needs in which the rewardsoutweigh the risks, and the offender has the skills and means necessary to committhe crime. As evidenced by the overall premise and the core concepts, the ra-tional choice perspective is predominantly based around understanding the stepsinvolved in criminal behaviour for the purpose of identifying effective preventativestrategies.
13
The rational choice perspective assumes an offender’s perspective in the deci-sion making process of evaluating opportunities for crime and suggests that thefeatures of a good opportunity are low effort, low risk and high reward (Cornishand Clarke, 2008). Situational crime prevention aims to reverse this – increasingthe risk and effort and reducing the reward so criminal opportunities become lessviable.
The rational choice perspective is not without criticism, including claims thatoffenders’ decision making rarely exhibits rationality, some crimes are inherentlyirrational and that it represents a mundane approach, focusing on common crimessuch as robbery, rather than high impact crimes such as homicide (Cornish andClarke, 2008). The first criticism regarding offenders’ rationality fails to take intoaccount a number of factors. Criminals’ decision-making is often made underconsiderable time pressures or the influence of alcohol or illicit drugs, situationsthat are far from ideal for objective decision making. Cornish and Clarke (2008)argue that rational behaviour does not necessarily mean complete rationality,merely that the best possible decision is being made based on the circumstancesand information available.
The argument that some crimes are inherently irrational fails to account forthe multitude of possible motivations for criminal behaviour. While financial gainis a common motivation for much criminal behaviour, it is often not applicableto violent crimes or sexual crimes. For interpersonal crimes other desires, suchas sexual gratification, a sense of power and control, revenge or even to impresspeers, are likely to be present (Cornish and Clarke, 2008). By understanding themotivating factor behind a crime, and the situational background of the offender,seemingly irrational crimes can appear rational (Cornish and Clarke, 2008).
The criticism that the rational choice perspective focuses on the commoncrimes and not high impact crimes fails to grasp one of the fundamental pointsof the rational choice perspective: it was never designed as a theory of criminaldecision making and behaviour, it was designed to inform strategies of crimeprevention and policy (Cornish and Clarke, 2008). In this light, the decision tofocus on frequent crimes rather than rarer, high impact crimes is a pragmaticchoice in order to have a greater impact on reducing crime. In spite of this, asCornish and Clarke (2008) noted, the rational choice perspective has in fact beenapplied to high impact crimes such as rape and murder, and recently organisedcrime (Bullock et al., 2010).
3.3 Routine Activity ApproachThe routine activity approach seeks to understand the causes of criminal eventsby looking at the crime event and its core elements: the offender, the victim ortarget, and the place or location of the crime event (Felson, 2008). The approachis based on the premise that the risk of victimisation for people and property isdetermined by routine, non-criminal patterns of activity.
In its original form, the routine activity approach argued that in order fora crime to occur, three situational factors were required to converge in timeand space: a motivated offender, a suitable target/victim, and the absence of
14
a capable guardian (Cohen and Felson, 1979). A motivated offender is anyindividual with the skills and desire to commit an offence while a suitable targetcould be a valuable, easily accessed object or a distracted, vulnerable person,depending on the type of crime. A guardian is any person who merely by theirpresence discourages crimes from occurring (Felson and Clarke, 1998).
This initial version of routine activities has since been extended with theconcept of guardians now split into three types referred to as controllers, oneeach for the offender, target/victim, and the place (Felson, 1995, 2008; Tillyerand Eck, 2010). This extension of routine activities is often represented by adouble triangle, one inside the other (Felson, 2008; Tillyer and Eck, 2010). Theinnermost triangle represents the necessary components for a crime, a motivatedoffender, a suitable target or victim, and a place in which the crime can occur(Felson, 2008; Tillyer and Eck, 2010). The outer triangle is comprised of thethree controllers whose presence (or absence/ineffectiveness) deters (or facilitates)crime. The victim or target is still supervised by a guardian, while a handlersupervises the offender, and a manager controls the place (Felson, 2008; Tillyerand Eck, 2010). In order for a crime to occur, the offender must be free of handlersand identify a target not protected by guardians in a place that is not controlledby managers (Felson, 2008).
At its core, the concept of the guardian is quite clear, referring to anyonewhose presence deters offenders. Some examples of this include pedestrians whocan act as guardians for other pedestrians or for nearby properties as well ashomeowners who, when they are present, can act not only as guardians of theirown home and belongings, but also as guardians for neighbouring properties(Felson, 1995; Felson and Clarke, 1998; Sampson et al., 2009). The conceptbecomes more complex when one starts to consider that some inanimate objectscan also be considered guardians, such as security cameras or security lights, sinceby their presence, they can deter offenders. This also relates to some preventativestrategies that are suggested by the routine activity approach, in particular whendealing with property crimes such as occupancy indicators. For example, internallights set to a timer make it appear as though a dwelling is occupied.
As guardianship can come from such a wide range of sources, and as such, canbe manipulated more readily than other controllers, it is not surprising that anumber of studies have examined the effectiveness of guardianship in preventingcrime. Overall guardianship shows evidence of having a significant impact onthe occurrence of crime (Hollis-Peel et al., 2011). In their review, Hollis-Peelet al. (2011) identified 11 studies that measured some form of guardianship andfound that guardianship was found to influence crime in eight. However, it wasfound that less formal forms of guardianship, such as nearby individuals whounintentionally act as guardians, have been neglected in the research, with moststudies focusing on organised patrols or security, place managers and activelymonitored CCTV cameras (Hollis-Peel et al., 2011). One criticism Hollis-Peelet al. (2011) identified was a lack of observational and experimental measures ofguardianship.
A recently developed measure of guardianship for residential houses, knownas Guardianship In Action, uses observational data to assess not only the po-tential for guardianship as influenced by the physical environment, but also the
15

actual levels of guardianship demonstrated by residents (Hollis-Peel et al., 2011;Reynald, 2009). Reynald’s (2009) measure utilises a four-tier model of guardian-ship consisting of, from lowest to highest level: invisible, available, capable, andintervening. Invisible means no guardians were available/identifiable. Available,as it suggests, means that guardians are present and available, but not capableof monitoring the area or intervening (Reynald, 2009). A capable guardian isone who is available and has the capacity to supervise the area, but does notintervene, while intervening guardianship involves individuals who are availableand capable of supervision, but will also intervene and actively deter inappropri-ate behaviour (Reynald, 2009). In addition to this, Guardianship In Action alsoassesses and identifies factors related to Newman’s ideas of territoriality and im-age as a secondary means of determining guardianship, based on the premises ofdefensible space theory (Reynald, 2009). Using these measures, and crime statis-tics for the area, Reynald (2009) found that guardianship and crime levels wereinversely related, that is, as guardianship increased, crime levels demonstrated asignificant decrease.
Handlers have been explored the least in the literature and have never beendescribed as clearly as guardians or place managers (Tillyer and Eck, 2010).The most readily available examples of handlers are parents, principals and otherschool staff, as well as adult strangers in public locations (Felson, 1995; Tillyerand Eck, 2010). These examples predominantly only apply to younger offenders,possibly up to young adults, and become less effective as the offender becomesolder (Tillyer and Eck, 2010). However, as the handler is based on social bondsto the offender, some potential handlers for adult offenders could include siblings,partners, friends or work colleagues, as well as a boss or supervisor (Sampsonet al., 2009). Anyone that has a social bond with the offender can have somelevel of influence as a handler, though obviously if the social bond is stronger,the level of influence the handler has over the offender will be greater (Felson,1995).
Place managers are individuals who have a responsibility for controlling andmonitoring places, and through their management techniques and practices, canprevent or discourage crime from occurring at that location (Felson, 1995; Samp-son et al., 2009; Tillyer and Eck, 2010). Some examples of common place man-agers are the homeowner, building or facility manager, receptionist, security staffand bus or taxi drivers (Felson, 1995). As with handlers and guardians, there arealso different levels of responsibility for place managers. The owner of a place willobviously have the highest level of responsibility for preventing crimes occurring,while employees will have varying levels of responsibility depending on their role(Felson, 1995).
A number of studies have highlighted the importance of the place managerin preventing crime (Clarke and Bichler-Robertson, 1998; Eck et al., 2007, 2010;Homel and Clark, 1994; Madensen and Eck, 2008). Research on place manage-ment usually focuses on violent crime in bars and pubs as place managers in thesefacilities are usually highly visible and available and management strategies areoften quite hands-on, although studies of place management in apartments doexist in the literature (Clarke and Bichler-Robertson, 1998; Eck et al., 2010).
Through interviews and observations Madensen and Eck (2008) identified six
16
categories of management decisions for bars that influenced the type of patronsattracted to the bar and how the bar was used, which in turn influence therisk of violent crimes occurring: bar theme, property characteristics, bar loca-tion, entertainment and activities, marketing, and security and staff training(Madensen and Eck, 2008). Of these, the type of activities, security and stafftraining and marketing strategies have demonstrated the most influence on riskof crime (Homel and Clark, 1994; Madensen and Eck, 2008).
In terms of activities, it has been found that bars that encourage dancing,competitive activities such as pool or darts, or provide poor entertainment havea higher risk of violent behaviour occurring (Homel and Clark, 1994; Madensenand Eck, 2008).
The risk of violent crime has been found to increase when there is a low ratioof staff to customers, the staff are poorly trained or aggressive, or when the staffare mostly male (Homel and Clark, 1994; Madensen and Eck, 2008). These stafffactors were particularly significant when dealing with intoxicated customers,though intoxication itself is more related to verbal and non-physical aggressionthan physical violence (Homel and Clark, 1994).
Marketing strategies were found to influence violence predominantly throughthe type of customers that they targeted (Madensen and Eck, 2008). For in-stance, a large number of managers report using a strategy of charging higherprices for drinks in order to attract older customers and decrease instances ofheavy intoxication.
The remaining decision categories (theme, location and property character-istics) influence the risk of crime by influencing the categories discussed above.The theme of the bar often influences the location and property characteristicsthrough the physical and environmental requirements, such as a stage for livemusic venues or a dance floor for clubs (Madensen and Eck, 2008). Additionally,noise restrictions influence the location of loud clubs, while the target audiencecan influence the type of neighbourhood that a bar will be located in. For exam-ple, a pool hall that offers cheap beer will likely reside near a university or college,rather than in a wealthier neighbourhood (Madensen and Eck, 2008). In turn,the property characteristics (e.g. large open space for dancing) and location willinfluence the activities offered, and the marketing strategies used (Madensen andEck, 2008).
Studies of place management in apartment complexes are less common than inbars as the managers are often located off-site and interactions with tenants canoften be done over the phone, making it difficult to observe management practices(Eck et al., 2010). Despite this, studies by Clarke and Bichler-Robertson (1998)and Eck et al. (2010)1 have both suggested place management plays an importantrole in crime prevention in apartment complexes.
Clarke and Bichler-Robertson (1998) conducted two case studies, one of alandlord who acquired apartment complexes in Santa Barbara, and the otherof a landlord who owned apartment complexes in San Diego. These landlordspurchased rental properties in lower class neighbourhoods and spent as little
1The Eck et al. (2010) study is discussed in detail in Section 3.6 due to its relevance to thecurrent project which focuses on residential buildings.
17

as possible on maintenance and management (Clarke and Bichler-Robertson,1998). Due to the lack of management of these properties, they often attractedindividuals engaged in criminal activities such as drug dealers and prostitutes,who were unlikely to complain about living conditions. Analysis of police callsfor service in Santa Barbara discovered that a large number of calls were comingfrom a small number of properties, all owned by one individual. Further analysisshowed that yearly arrest rates had increased at nearly all of these propertiesafter being purchased by this individual. These increases were often substantiallyhigher than any increases observed in neighbouring control properties, suggestingthat the changes were not due to neighbourhood-wide increases in crime (Clarkeand Bichler-Robertson, 1998).
A similar situation was identified in San Diego but, after mounting pressure,the landlord agreed to work with a property management company which tookover responsibility for the apartments (Clarke and Bichler-Robertson, 1998).The new property management company introduced a wide range of strategiesto improve the properties including visiting tenants, substantial cleaning up ofthe grounds and any graffiti, screening applicants, restricting access and hiringresident managers for the larger apartment complexes. In the year following thesechanges, arrests at these apartments were reduced from 52 down to 6, while inthe year following this, arrests were still low, at just 12 (Clarke and Bichler-Robertson, 1998). Unfortunately, since all the changes were implemented at thesame time, it is impossible to determine which strategies were most effective andmost responsible for the reductions observed. Despite this limitation, the findingssupport the importance of place management in the occurrence of crime.
3.4 Crime Pattern TheoryCrime pattern theory is a broad approach which incorporates the ideas of rou-tine activities and the rational choice perspective in understanding the patternsand locations of offences (Eck and Weisburd, 1995). At its core is the idea thatoffenders, like everyone else, have routine activities such as work, shopping, recre-ational activities and time spent at home (Brantingham and Brantingham, 2008;Eck and Weisburd, 1995). Each of these locations is deemed an activity node andrepeated travel to these locations will result in a routine path that is commonlyfollowed, though alternative routes may be used or explored during heavy trafficor road works (Brantingham and Brantingham, 2008). The set of an individ-ual’s frequent nodes and paths form their activity space in which they frequentlymove. A related concept is an awareness space which is the subset of the activityspace conditioned by the individual’s location in space and time2 (Brantinghamand Brantingham, 2008). Crime pattern theory argues that it is within theseawareness spaces that offenders identify opportunities to commit crime, so whilethere may be numerous opportunities for crime, it is only the opportunities whichfall within offender awareness spaces that will have a higher risk of victimisation(Brantingham and Brantingham, 2008; Eck and Weisburd, 1995). Crimes most
2An offender may be aware of an easy criminal opportunity within their activity space, butcannot exploit it if it is located outside their awareness space.
18

commonly occur in the awareness space surrounding potential offenders activitynodes, and rely on the overlap between an offender’s activity space and a victim’sactivity space (Brantingham and Brantingham, 2008; Kinney et al., 2008).
Some areas are more or less crime prone than others for various reasons. Forexample, hot spots, small areas with a disproportionate amount of crime (Sher-man et al., 1989), can be labelled as crime attractors, crime generators, crimedetractors or crime neutral areas (Brantingham and Brantingham, 2008; Kinneyet al., 2008). Crime attractors are areas that become known to local and outsideoffenders as having characteristics that create ample opportunities for criminalbehaviour (Brantingham and Brantingham, 2008; Kinney et al., 2008). As aresult, motivated offenders will often travel to these areas with the intention ofcommitting offences; bar and nightclub districts, unsecured car parks and largeshopping centres are examples of crime attractors. Crime generators are placesthat do not specifically attract people intending to commit crimes, rather theygenerate a situation in which there is a large number of potential victims ortargets that provide criminal opportunities that a potential offender may takeadvantage of (Brantingham and Brantingham, 2008; Kinney et al., 2008). Anylocation that attracts a large number of people can be classed as a crime genera-tor, so similar to crime attractors, this could include shopping centres or nightlifedistricts as well as sporting events and other activity nodes.
Where crime attractors and crime generators are the result of an abundanceof offenders and targets respectively, crime enablers are locations without placemanagement (Brantingham and Brantingham, 2008). Examples include derelicthousing and vacant car parks.
3.5 Defensible Space and CPTEDDefensible space and CPTED are two research literatures that were conceivedindependently but over time have merged. Both emphasise the importance ofreducing opportunities for crime at the design stage of new buildings, spaces orenvironments.
Jacobs (1961) put forward a number of suggestions regarding physical designand how it could prevent crime, including the idea that buildings should be ori-ented inwards toward the street for better surveillance (Cozens et al., 2001b;Taylor et al., 1984). However, it was not until Newman introduced defensiblespace theory that these ideas became popular, particularly as a policy and guide-line for the construction of safe housing (Reynald and Elffers, 2009; Taylor et al.,1984).
Defensible space is a result of Newman’s observations of two housing com-plexes on opposite sides of the street, one a newly constructed high-rise complexemphasising community interaction, and the other an older, and slightly smallerrow housing complex. While both complexes had similar population demograph-ics, the older, smaller complex had few problems with crime and consistently highlevels of occupancy. The new complex however, had high levels of property crimeand violence, never passed 60 percent occupancy and was demolished after 10years (Newman, 1996). Given the similar populations, this prompted Newman
19
to ask what physical design features allowed crime to thrive in one and not theother. Newman concluded that the communal areas of the new complex, suchas the lobby, stairwells and corridors, did not provide any sense of ownershipor control. This made it impossible to enforce norms for acceptable behaviourand to differentiate intruders from other residents, in other words, they lackeddefensible space (Newman, 1996).
Newman tested his theory in New York by comparing the Brownsville socialhousing project and the Van Dyke project. These were again considered similar insocial structure, but Van Dyke was a fourteen story high-rise, while Brownsvillewas a six story mid-rise. Van Dyke was found to have almost double the crimerate of Brownsville (Cozens, 2008, 51.4 and 28.2 crimes per 1000 population re-spectively). Newman claimed this supported his theory, arguing that the differingenvironmental designs of the two building were the principle reason explainingthe different crime rates (Cozens, 2008).
The primary idea behind defensible space theory is that the physical designof residential environments can be manipulated to be less vulnerable to crime byproviding residents with greater opportunity to control and defend their space ifnecessary (Reynald and Elffers, 2009). Three main concepts underpin defensiblespace theory: territoriality, natural surveillance and image and milieu (Newman,1996). Territoriality is based on the premise of clearly defining areas as eitherpublic, semi-public, semi-private, and private spaces through the use of literaland figurative barriers (Reynald and Elffers, 2009). A literal barrier is anyform of physical object that obstructs entry, such as fences, gates and locks,while a figurative barrier conveys that the area is private through signage, orthrough the use of gardens and other signs of maintenance and ownership. Thisdifferentiation between what is private or public space results in an increasedsense of ownership and responsibility over an individual’s area, which in turncauses greater enforcement of norms and accepted forms of behaviour (Newman,1996).
In order to enforce the norms of an area, residents/owners need to be ableto observe and survey the area. This idea suggests that the physical design ofresidences should allow for easy, natural surveillance of the property and sur-rounding public spaces by residents (Reynald and Elffers, 2009). In order tomaximise these opportunities, Newman supported Jacobs (1961) suggestion thathouses should face the street and therefore each other, and that windows anddoors should also face out across the street (Newman, 1996). In addition to this,the view from buildings should be as unobstructed as possible. However, thisleads to the need to strike a balance between territoriality and natural surveil-lance. If physical barriers such as fences are too high, or symbolic barriers such asgardens are too dense, then natural surveillance becomes limited (Cozens et al.,2001a). If natural surveillance is maximised, and good line of sight is establishedbetween properties, there is a greater likelihood that any potential offenders willbe caught in the act, or crimes may be prevented from occurring (Reynald andElffers, 2009).
Image and milieu refers to the overall appearance of the area and influencespeople’s perception of vulnerability. An area with a positive image will appearwell maintained and cared for, suggesting to potential offenders that residents
20
control the area and are more likely to be vigilant and intervene if suspiciousbehaviour is observed, increasing the risk of offending (Reynald and Elffers,2009). An area with a negative image would signify the converse to offenders,that residents have little control or stake in the area and surveillance is likely lessfrequent (Reynald and Elffers, 2009).
These ideas became highly influential politically due to rising crime levelsand a lack of success of traditional theories of crime in providing effective crimeprevention strategies. In contrast, defensible space provided a relatively straight-forward strategy for reducing crime by designing safe structures and neighbour-hoods. Indeed, a number of initiatives based on defensible space, such as CrimePrevention Through Environmental Design (CPTED), have resulted in decreasesin crime, though due to these being large scale re-designs, it is unclear exactlywhat processes cause these reductions (Reynald and Elffers, 2009).
Defensible space theory has had a number of critics over the years, addressingissues such as a lack of scientific methodology in identifying concepts, vague, con-tradictory definitions, and disregard for the wider psychosocial factors influenc-ing defensible space (Reynald and Elffers, 2009). Newman attempted to addressthese issues, identifying factors such as the percentage of families receiving wel-fare and the percentage of one parent households that were correlated with crimerates (Newman, 1996). However, these factors still do not identify psychosocialprocesses that may influence territoriality and whether or not defensible space isactually defended.
The definitions provided by Newman allow for a variety of interpretationsof what defensible space is and how the components are conceptualised, whichhas led to a wide range of studies with conflicting results that all claim to havemeasured defensible space (Eck and Weisburd, 1995; Reynald and Elffers, 2009).Some examples include Taylor et al. (1984) who found some support for defensi-ble space, but neglected to measure any features relating to image, while Booth(1981) found no support for defensible space theory but conceptualised territo-riality and image into one construct, accessibility (Reynald and Elffers, 2009).The cumulative effect of these criticisms has been to weaken the causal claimsabout the influence of housing design on crime, placing much more emphasis onsocial factors and other features (Taylor et al., 1984).
There has been relatively little Australian research on the relationship be-tween crime and housing design. Matka (1997) and Weatherburn et al. (1999)measured associations between police recorded crime and socio-demographic andhousing statistics at the suburb level in Sydney. They found the amount of crimeexplained by volume and type of public housing was greatly reduced in magni-tude after controlling for socio-demographic status. This led Weatherburn et al.(1999) to find more evidence in favour of an “allocation” hypothesis (crime is highin public housing because it is disproportionally allocated to crime-prone indi-viduals) compared to the prevailing “design” hypothesis (crime is high in publichousing due to poor design).
A number of methodological issues in these studies need to be acknowledged,notwithstanding the extant criticisms of defensible space. First, the operational-isation of housing type is really a measure of housing stock. Matka (1997) cate-gorise buildings as either high-rise, walk-up, non-detached or detached buildings.
21
No attempt is made to measure design features at the building level. Newman’swork required extensive observational methods to measure key constructs such asterritoriality, at the building level. Extending on this point, the unit of analysisis the suburb, not buildings so the results can only reflect the average impactof different housing stock at the (aggregate) suburb level. There is likely to bevariation at the building level (high-rise buildings with different levels of crime)that has not been captured in this analysis.
Crime Prevention through Environmental Design (CPTED) developed fromNewman’s defensible space theory and as such, the core ideas of territoriality,natural surveillance and image are present (Cozens, 2008; Cozens et al., 2005).These ideas comprise three of the six broad preventative strategies incorporated inCPTED as territorial reinforcement3, natural surveillance and image maintenance(Cozens, 2008; Cozens et al., 2005). The remaining three preventative strategiesare access control, activity support, and target hardening (Cozens, 2008; Cozenset al., 2005).
Natural surveillance refers to the presence of opportunities for residents orother users of a space to observe an area, or for potential offenders to perceive thatthey are or can be observed (Cozens, 2008; Cozens et al., 2005). This can takeseveral forms such as informal surveillance which includes unobstructed sightlinesbetween houses and streets, formal surveillance such as police or neighbourhoodwatch patrols, or mechanical surveillance such as the presence of CCTV camerasor adequate street lighting (Cozens, 2008; Cozens et al., 2005).
Image maintenance relates to maintaining positive perceptions of the physicalenvironment to assist in the prevention of crime (Cozens, 2008; Cozens et al.,2005). This strategy is similar to aspects of territoriality in that it conveys theextent of monitoring and maintenance of an area (Cozens, 2008; Cozens et al.,2005). A more positive image suggests to potential offenders that the area isclosely monitored and any inappropriate behaviour will likely attract a response.
Access control seeks to prevent or restrict potential offenders access to likelytargets (Cozens, 2008; Cozens et al., 2005). This technique includes a numberof methods and can be applied to a range of crime types. Some examples includesecurity personnel at building entrances, alley gates to prevent access to the rearof houses, and changes to traffic flow such as road closures or one way streets(Cozens et al., 2005).
Activity support relates to the usage of spaces and how these activities arelocated in an area (Cozens, 2008; Cozens et al., 2005). For example, unsafeactivities such as withdrawing money from an ATM should be located in safelocations that afford surveillance opportunities and a large number of potentialobservers or bystanders (Cozens, 2008). Alternatively, safe activities attractmore people, potentially discouraging some crimes from occurring and makingthe area as a whole safer (Cozens, 2008; Cozens et al., 2005). Some other formsof crime, such as pickpocketing, could however become more common as a resultof the greater concentration of potential targets (Cozens, 2008; Cozens et al.,2005).
3Territorial reinforcement is indistinguishable from (the defensible space construct) territo-riality (Cozens, 2008; Cozens et al., 2005).
22

Target hardening seeks to increase the effort required for an offender to com-mit a crime through techniques such as improved locks or security systems, orbarriers such as gates and walls/fences (Cozens, 2008; Cozens et al., 2005). Tar-get hardening does run the risk of hindering surveillance however, so preventionmeasures need to strike a balance between improved security while maintainingadequate levels of visibility (Cozens, 2008; Cozens et al., 2005).
There are clear similarities between situational crime prevention and CPTEDprinciples, with several of the preventative measures of CPTED fitting into thecategories of increasing effort and increasing risks to the offender. Indeed, targethardening is a technique shared by both, and the goals of the two strategiesare virtually identical, reducing crime and fear of crime through the design/modification of the physical environment.
The concept of guardianship from routine activity theory is closely related tothat of defensible space and CPTED since the level of guardianship provided byresidents is determined by opportunities provided by the physical environment.In particular, the level of effective guardianship that residents provide is heavilyinfluenced by opportunities for natural surveillance that are facilitated by thebuilt environment. Similarly, the concept of place management is also intimatelylinked to the defensible space and CPTED concepts of image/maintenance, terri-toriality, access control and target hardening. With the designated responsibilityfor the management and maintenance of places, place managers have control overthe image of places as well as the level of accessibility and security available atplaces. The failure of place managers to exercise these powers in the control ofcrime at places often results in the fostering of risky facilities.
3.6 Risky FacilitiesRisky facilities is a relatively new concept of crime distribution/concentrationthat follows the environmental criminology focus on place in the occurrence ofcrime. The term was first used in the literature by Eck et al. (2007) to describethe uneven distribution of offences across facilities of the same type. One sur-prising finding is that even within a set of homogenous locations (hotels, trainstations, licensed venues) only a small number of locations often account for adisproportionately large number of crimes.
While Eck et al. (2007) were the first to use the term risky facilities, the ideathat crime is not evenly distributed across facilities of the same type is certainlynot new. The earliest study identified by Eck et al. (2007) that provided datademonstrating risky facilities was a study in 1982 by Hope which showed thatapproximately 33 percent of a random sample of schools in London accountedfor 75 percent of recorded burglaries. This is commonly referred to as the 80–20rule4, where 80 percent of outcomes are caused by only 20 percent of a population.This type of distribution is found throughout nature (Newman, 2005). Forexample, a small percentage of the land in Australia contains the majority of thepopulation, or a small number of people in an office will drink the majority of the
4The 80–20 rule is more formally known by various names: power law, Zipf’s law, paretodistribution (Newman, 2005).
23

coffee. This pattern has been evidenced widely in criminology, demonstrated inschools, banks, bars and clubs, bus stop shelters, various types of small businesses,construction sites, convenience stores, petrol stations, hotels and motels and afew other facility types (Eck et al., 2007). It is also worth noting that this patternholds when looking at specific crime types or aggregates of multiple crime types,as well as when sub-dividing facility types, such as chain hotels or independent,privately owned hotels (Eck et al., 2007).
The concentration at the facility can be visually depicted through a J curve, abar chart showing the frequencies of crime across all facilities in descending order(Eck et al., 2007). If risky facilities are present the majority of outcomes will belocated at the left hand side of the graph and then rapidly drop off to zero at theother.
The risky facilities concept has been heavily influenced by the routine ac-tivity approach, and places a great deal of emphasis on the role of place man-agers in particular and how their practices influence the differences observedbetween facilities (Homel and Clark, 1994; Madensen and Eck, 2008). It followsthen that risky facilities has clear implications for prevention strategies and tech-niques. Through identifying the locations responsible for the greatest proportionof crimes, resources can be allocated effectively to realise maximum preventionbenefit while focusing on relatively few locations (Eck et al., 2007; Eck and Eck,2012; Madensen and Eck, 2008; Wilcox and Eck, 2011). In addition to this, iden-tifying locations that account for the most and least crime, researchers are ableto identify some of the key factors influencing this and what management prac-tices are the most effective at preventing crime. This information can be used toreduce crime at other locations, as well as informing best practice.
A recent study of particular relevance to the current project examined theeffects of place management and environmental influences on violence in barsand apartments (Eck et al., 2010). On-site observational surveys and apartmentmanager surveys were conducted at a sample of apartment complexes in Cincin-nati. The results demonstrated clear evidence that place management practicesplay an important role in the presence of violent crimes in apartment complexes.However, the effectiveness of these practices was sometimes helped or hinderedby broader neighbourhood characteristics.
In terms of location, it was found that apartment complexes located on a cor-ner block or close to bus or public transport stops had higher incidence of violentoffences (Eck et al., 2010). The authors postulated that this may be due to theincreased accessibility and traffic associated with an additional street facing andmore people congregating at public transport stops (Eck et al., 2010). In addi-tion to this, it was found that the presence of people loitering was also associatedwith a higher rate of violent crimes, suggesting that management supervisionand monitoring is important in minimising violent behaviour (Eck et al., 2010).Resident finances were also found to be an important factor, with the numberof residents failing to pay rent, or paying with Section 8 vouchers (housing as-sistance vouchers) demonstrating a positive association with the occurrence ofviolent crime (Eck et al., 2010).
As mentioned above, neighbourhood characteristics were found to moderatethe effects of some management practices. The influence of level of traffic flow on
24
violent crime was moderated by the level of concentrated disadvantage. The riskof violent crimes occurring was greater when the apartment was located on a hightraffic street only in areas that also had high concentrated disadvantage, whereasthis was not the case in areas with lower concentrated disadvantage (Eck et al.,2010).
Similarly, maintenance of physical incivilities such as graffiti/vandalism orproperty damage were found to have different levels of effectiveness based onthe overall level of crime and disadvantage in the neighbourhood. In areas withlow disadvantage and less overall crime the presence of these types of propertyoffences tended to place apartment complexes at greater risk of violent crime (Ecket al., 2010). A possible explanation for this is in an area with little crime and lessdisadvantage a building with physical incivilities present will stand out comparedto surrounding buildings. By not fixing these problems, the manager signals topotential offenders that this building is not well supervised or monitored, andthat it may be an easier target than other properties in the area.
The study’s findings of different risk factors and the influence of managementpractices is consistent with the risky facilities concept that a certain facility type isnot inherently crime prone, rather the features of each facility and the differencesbetween these is what influences the presence or absence of crime.
Finally there were a number of important place-based prevention implicationsidentified by the authors that fit with risky facilities concept. First, place-basedcrime policies should target the worst locations rather than a more general policyfor all locations, which has the advantage of being more cost effective (Eck et al.,2010). Second, neighbourhood-wide policies need to also include strategies forspecific places following the finding that neighbourhood variables usually interactwith the specific features of the property to influence crime, rather than having adirect influence (Eck et al., 2010). Third, place-based strategies need to take intoaccount contextual factors related to the wider neighbourhood for the same rea-son, what might be a good preventative strategy at a bar in one neighbourhood,may facilitate crime when implemented at a bar in a different neighbourhood(Eck et al., 2010). Fourth, place managers play an integral role in controllingand preventing crime and they should be held accountable for ongoing problemswith crime at their property (Eck et al., 2010). Contextual and environmentallydesigned place-based interventions are only going to work if the place manageris willing to implement them fully, which may be a costly endeavour, so holdingthe manager accountable can provide incentives to assist with this (Eck et al.,2010). An alternative to specific place-based strategies that may be more effectiveis to provide place managers with a maximum allowable amount of crime (Ecket al., 2010). To enforce this, regulating bodies could provide rewards for stayingbelow a certain level of crime, or alternatively introduce penalties or sanctionsto premises that exceed these maximum levels (Eck and Eck, 2012; Eck et al.,2010). This approach allows managers to come up with creative strategies withintheir budget that are tailored specifically to their premise in order to stay belowthis threshold level (Eck et al., 2010).
25

3.7 Strata Title HousingIncreasing pressure on governments to facilitate population growth and containurban sprawl has seen many jurisdictions adopting higher density urban forms(Burton, 2000; Randolph, 2006; Thomas and Cousins, 1996). A consequence ofhigher population density, particularly in areas with strong transport and em-ployment nodes, will likely result in substantial changes to the character of manyAustralian suburbs. Based on medium Australian population growth forecastsover the next 20 years there will be a need for an additional 2.9 million dwellingsbut a shortfall in housing supply close to 640,200 dwellings (National HousingSupply Council, 2011). Therefore, more dwellings are required to house our grow-ing population, however not enough are being built or developed to satisfy thisgrowth. Additionally, many individuals are being priced out of the market due togrowing housing affordability issues (Australian Government, 2010). This con-text has resulted in governments and private developers increasingly approvingand building higher density developments to house multiple households.
Whilst there have been small scale, low-rise apartment living in Australiasince the 1930s (Lewis, 2000; Randolph, 2006; Spearritt, 2000), the introduc-tion of strata title legislation in Australia during the 1960s resulted in significantgrowth of high density residential housing in Australia. Strata title legislationallowed for the vertical subdivision of buildings, providing property rights in theform of ownership of individual lots (i.e. units, apartments, flats). As Johnstonand Reid (2013) identified, this type of legal titling structure ties individual lotsto communally owned property with a separate entity created to manage andenforce the rules of the entity (i.e. a body corporate, homeowners associationor owners corporation). Strata title living implies physically close living condi-tions within confined environments, regular interaction amongst residents andimposed social norms and responsibilities governed by body corporate rules andregulations (Bugden, 2005).
In Australia just over one million individuals reside within an apartment, flator unit, approximately 14 percent of the total population (Australian Bureau ofStatistics, 2012). The Gold Coast, and particularly Surfers Paradise, is one of themost highly dense residential areas outside of Sydney, Melbourne and BrisbaneCentral Business Districts (Department of Infrastructure and Transport, 2012).Approximately 75 percent of residents within the suburb of Surfers Paradise,nearly 6,500 individuals, live in a flat, unit or apartment (Australian Bureauof Statistics, 2011). The majority of these residents (64%) live in building 4storeys or higher (Australian Bureau of Statistics, 2011). Surfers Paradise res-idents living in high-rise buildings are typically lone person households, coupleswith no children or two people living together not in a relationship (AustralianBureau of Statistics, 2011). Furthermore, in line with previous research into thetenure structure of apartments, approximately 60% of these residents are renting(Australian Bureau of Statistics, 2011).
Despite the growing shift towards strata titled dwellings within Australian so-ciety, research into this area has been scant. In a recent review of the strata titlehousing literature less than 100 peer-reviewed, empirical research articles wereidentified (Johnston and Reid, 2013). Dredge and Coiacetto (2011) reviewed
26

common underpinnings of strata title research and summarised that governance,socio-cultural, economic and environmental literature themes have been preva-lent. Strata title developments are governed by a myriad of legislation, planningcontrols and operational outcomes. Registration of a strata plan for a strata titlescheme results in the legal existence of a body corporate that is responsible forthe management of the scheme (Gration, 2009). This has resulted in a growingbody of literature incorporating aspects such as legal rights and responsibilitiesof stakeholders (Bugden, 2005; Easthope et al., 2012; Randolph and Easthope,2007; Sherry, 2010), relationships between stakeholder groups (Blandy et al.,2006; Cassidy et al., 2008; Guilding and Whiteoak, 2008) and participation (Al-lon, 2006; Gration, 2009; Woolcock, 2007).
Economic considerations of managing a strata scheme and property assetsis another key tenet of the literature (Cassidy and Guilding, 2007; Warnkenand Guilding, 2009; Warnken et al., 2003). However, research within the socio-cultural field of residents and users of strata title apartments have largely beenoverlooked (Dredge and Coiacetto, 2011). Stone and Hulse (2007), in an oth-erwise comprehensive scoping study of links between social connectedness andAustralian housing, also failed to examine the context specific nature of residentswithin high density housing. The paucity of research into the sociological aspectsof high-rise strata complexes is a concern as governments and planners prescribea compact city planning approach. The lack of research in the socio-cultural fieldis concerning if future forecasts about the structure and shape of how Australianswill live prove accurate.
Interestingly, Gifford (2007, p. 2) concluded that in fact “high-rises are lesssatisfactory than other housing forms for most people, that they are not optimalfor children, that social relations are more impersonal, and helping behaviour isless than in other housing forms, that crime and fear of crime are greater, and thatthey may independently account for some suicides”. Larger numbers of peopleresiding within confined and shared space has resulted in a sense of sharing yourdwelling with strangers, particularly in common use areas. “This fear of strangersleads to fear of crime, a felt lack of social support and the absence of communityin the midst of many” (Gifford, 2007, p. 2). These factors have been theorized tohave a negative effect on the level of guardianship provided by residents in theseliving contexts. Residents are much more likely to keep an eye out and act indefence or protection of their wider residential context and those within it if theyare familiar with neighbours and feel a strong sense of community (see Reynald,2011). In a study of high-rise living in Hong Kong researchers found that living inapartments constrains personal freedom and forces the need for cooperation (Yipand Forrest, 2002). As strata titling suggests individual ownership of a lot anda share in the common property of a building, lot owners form a body corporateto govern, manage and maintain these multi-owned developments. Therefore,there is an obligation to participate in the self-governance and body corporateactivities as it has direct cost and lifestyle implications.
Places like Surfers Paradise have the added burden of a mix of uses (i.e.residential, touristic, retail, commercial, entertainment). A high proportion ofrental and holiday letting in Surfers Paradise leads to high turnover rates and anumber of social consequences for residents. The potential for conflict between
27

residents and tourists is high (Guilding et al., 2005). However, mixed-use multi-owned developments continue to proliferate as financing for these developmentsis more readily available (Warnken and Guilding, 2009). Developers are able tosell “off the plan” to individual investors rather than relying on traditional debtequity financing arrangements. The multitude of owners buying into these high-rise apartments is dominated by investors. Approximately 67% of all apartmentssold in Australia are sold to investors, which enter either the private long termresidential rental market or short term holiday letting (Easthope and Randolph,2009). This supports the traditionally held perception that residential apartmentliving is considered a temporary housing option, something more attractive toinvestors than residential owners (Yates, 2001).
However, “neighbourhoods in which there is a high degree of population churn-ing may be less likely to develop a strong sense of community or contain largenumbers of residents with a strong sense of place and local belonging” (Forrestet al., 2002, p. 217). These aspects of belonging which tie an individual to placeor connect them to community have beneficial outcomes. Developing a senseof community can be beneficial in creating a shared experience, an impetus forparticipation, social bonding, strengthening interpersonal relationships and per-ceptions of safety. It may encourage individuals to be aware of and look out forothers that belong to their “group”. However, there is a paucity of literature andresearch examining the role of community within high density environments.
A significant component of all apartments are held by investors who may ab-sentee or disinterested in the liveability, functionality and maintenance of thesebuildings, which has ramifications for residents, building upkeep and manage-ment. The high degree of temporary or transient residents residing in apart-ments may limit an individual’s willingness to become involved in and supportestablishment of community. Combined, these factors influence the functionality,social connectedness and perceptions of safety within many high-rise apartmentcomplexes.
3.8 The Present StudyThe preceding literature review indicates that crime concentrates with respectto a number of dimensions. While spatial and temporal dimensions are typicallyexamined, the risky facilities concept suggests that crime can concentrate evenwithin classes of places (such as railway stations, bars, and apartment complexesto name a few). The existence of risky facilities is useful from a crime preventionperspective as it not only highlights where resources should be focused to havethe largest impact on crime problems, but it also allows researchers to explorethe underlying causes of the differences in crime rates. Theory would suggestthe most germane factors that explain the varying concentrations relate to placemanagement, guardianship, and physical design.
Local councils in Australia have indicated that housing policies will need tomove towards higher density housing in coming decades. This is noteworthyas housing density and physical design are thought to be strong determinants
28

of neighbourhood crime rates. But the nature of this relationship is not wellunderstood and is highly contextually dependent.
The motivation for this research study was to use an existing suburb with highdensity housing as a case study to look at the likely consequences of changedhousing policy in the immediate future. The study region of Surfers Paradisewas selected as tourism provides a useful analog to communities with a highproportion of public housing and high resident turnover.
The approach taken in this research study extends previous research in a num-ber of important ways. First, a mixed methods approach is used. Three studiesare conducted each with different datasets and methodological approaches. Usedin conjunction, we are able to provide a rich depiction of the primary causal fac-tors contributing to the distribution of crime in high-rise residential buildings.Second, the different tenure types present in the study region (from long-termowner occupiers to short-term holiday lets) provides the ability to make compar-isons between different building types and management style that can shed lighton the underlying causes of riskiness of separate facilities.
Drawing on individual level recorded crime data over a seven year period,observations and interviews with building managers, we address the researchquestions posted in Section 2.2 in subsequent chapters.
29


4 Study 1: Recorded Crime and RiskyFacilities
The purpose of this first study was to provide a description of the concentra-tion and distribution of recorded crime among high density dwellings in SurfersParadise. This study provides the most extensive coverage of the study regionin that all buildings in the study region are included in the analysis. By thenature of the data, the analysis can only be exploratory so there is a limit to thedepth of the analysis. Further insight is possible using the richer data sourcesand approaches in Studies 2 and 3.
4.1 DataThree datasets were used to complete the first study of this research project.
Recorded crime All criminal matters recorded by the Queensland Police Ser-vice located in the Surfers Paradise Police Division, between 2005 and 2012were extracted from the QPRIME database. Fields included the unique oc-currence number (relating to the administrative reference number used bythe Queensland Police Service to distinguish individual criminal matters),the date and time of the offence, the offence code classifying the offenceand the physical location of the criminal matter. With respect to this lastcategory the Queensland Police Service record both the street address ofthe location and feature name (usually corresponding to the building orbusiness name). Post processing of recorded crime data involves geocodesthe incident to provide latitude/longitude attributes.
Property parcel map A digitised geographic representation of property parcelsin South East Queensland was used to perform spatial analysis of crimedata. Property parcel (or cadastral) maps depict property parcels that arelegally defined and recognised by the Department of Natural Resources andMines, Queensland Government.
Buildings of Interest A research assistant made manual checks of Cityscope,which contains a map of the Surfers Paradise region by building, and GoogleEarth Street View Maps and collected all records relating to buildings inSurfers Paradise with a height greater than three storeys or more. Theinformation collected from this database included street address, buildingname, building height, and use. Regarding the latter category, buildings
31

were categorised by their typical use. These included commercial, holidayapartments, hotel/resort, motel, retail, residential or any combination ofthe above.
4.1.1 Data Processing and CleaningData cleaning was performed before data processing and analysis could com-mence. The street address in the recorded crime database contained numerousspelling mistakes and inconsistencies in coding (e.g. “Breaka” for “Breaker”).Text string searches were used to correct spelling mistakes based on the streetnames featured in google maps1. Trailing white space at the end of fields wassearched for and removed.
There were a small number of anomalous values for the latitude/longitudevalues provided by the Queensland Police Service. Seven records had latitudevalues placing them in the wrong hemisphere (rectified by multiplying values by –1). Three records had latitude values placing them well outside the police division,yet all other information in the record corresponded to buildings of interest.These coordinates were manually recoded. There were another three recordswith coordinates well outside the division, but with insufficient information tomake a judgment about their inclusion nor any connection to any buildings ofinterest. They were omitted from further analysis. 559 records had no spatialinformation (these observation were retained for the most part, but were omittedin the spatial analysis.)
The street address for the buildings of interest dataset required minimal clean-ing, but they were transformed to all upper case text (i.e. “allcaps”) to ensuretext string matching would occur accurately. In addition, trailing white space atthe end of fields was searched for and removed.
There were 290 properties in the buildings of interest database. This wasused to create a copy of the property parcel map containing only the buildingsof interest.
The recorded crime data contained all offences taking place between 2005 andNovember 2012 in Surfers Paradise police division, amounting to 72,952 records.This total was reduced to criminal matters relating to the buildings of interestusing two methods2:
1. point-in-polygon matching: using a Geographical Information System, therecorded crime data set was displayed on a map and the buildings of interestmap were overlaid. A point-in-polygon operation was used to select anypoint (crime) falling within any polygon (building of interest).
2. street address matching: the street address of the recorded crime datasetwere matched against the street address of the buildings of interest dataset.This was performed using string matching.
1maps.google.com2A third matching method was used, building name matching. Similar to the street address
matching, this method used the building name text rather than the street address as thecriterion for matching. No new records were identified using this technique.
32
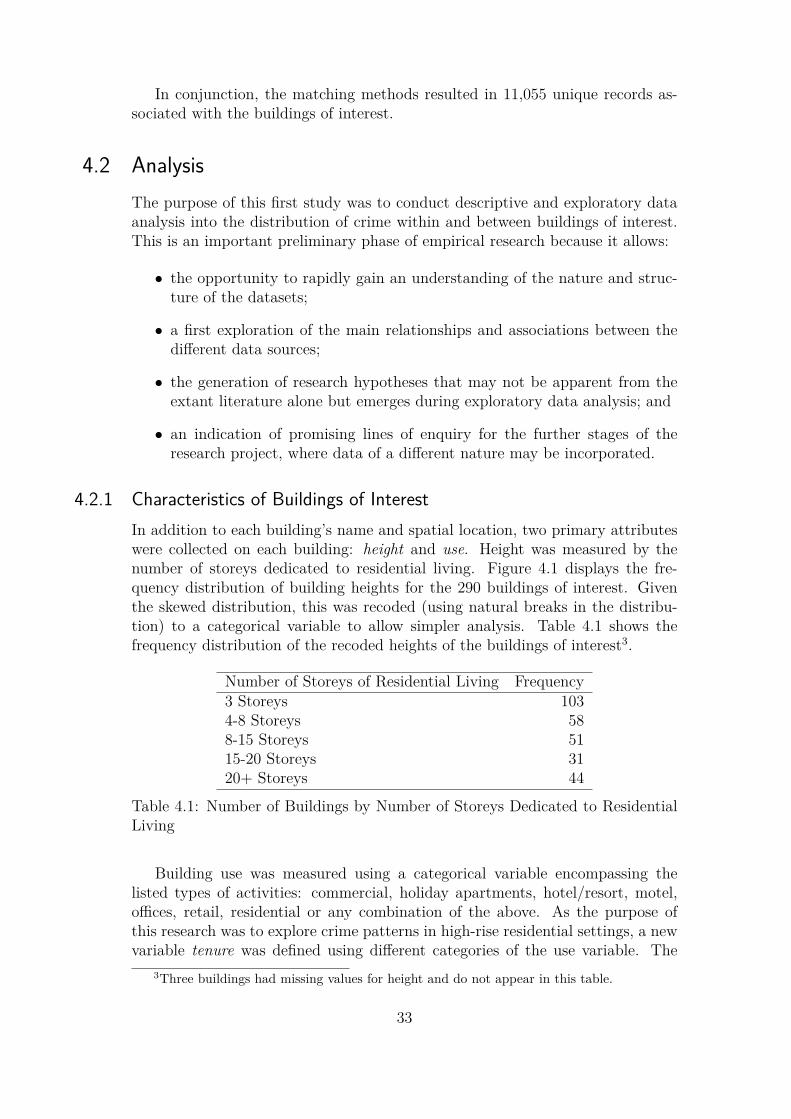
In conjunction, the matching methods resulted in 11,055 unique records as-sociated with the buildings of interest.
4.2 AnalysisThe purpose of this first study was to conduct descriptive and exploratory dataanalysis into the distribution of crime within and between buildings of interest.This is an important preliminary phase of empirical research because it allows:
• the opportunity to rapidly gain an understanding of the nature and struc-ture of the datasets;
• a first exploration of the main relationships and associations between thedifferent data sources;
• the generation of research hypotheses that may not be apparent from theextant literature alone but emerges during exploratory data analysis; and
• an indication of promising lines of enquiry for the further stages of theresearch project, where data of a different nature may be incorporated.
4.2.1 Characteristics of Buildings of InterestIn addition to each building’s name and spatial location, two primary attributeswere collected on each building: height and use. Height was measured by thenumber of storeys dedicated to residential living. Figure 4.1 displays the fre-quency distribution of building heights for the 290 buildings of interest. Giventhe skewed distribution, this was recoded (using natural breaks in the distribu-tion) to a categorical variable to allow simpler analysis. Table 4.1 shows thefrequency distribution of the recoded heights of the buildings of interest3.
Number of Storeys of Residential Living Frequency3 Storeys 1034-8 Storeys 588-15 Storeys 5115-20 Storeys 3120+ Storeys 44
Table 4.1: Number of Buildings by Number of Storeys Dedicated to ResidentialLiving
Building use was measured using a categorical variable encompassing thelisted types of activities: commercial, holiday apartments, hotel/resort, motel,offices, retail, residential or any combination of the above. As the purpose ofthis research was to explore crime patterns in high-rise residential settings, a newvariable tenure was defined using different categories of the use variable. The
3Three buildings had missing values for height and do not appear in this table.
33

0
20
40
60
80
100
Number of Storeys of Residential Living
Fre
quen
cy
3 6 9 13 17 21 25 29 33 39 58 70 80
Figure 4.1: Number of Buildings of Interest by Floors of Residential Living Space
intent of the tenure variable was to capture the nature of building occupancy anduse, and had five levels:
• Long-term residential. This category refers to buildings that are inhabitedonly by owner-occupiers or long term renters.
• Short-term residential. This category includes all buildings that house ex-clusively short-term occupants, typically holiday makers or inhabitants ofa transient nature. The types of buildings included in this category includehotels, resorts, motels and holiday lets.
• Mixed residential. Buildings that contain a mix of both long and shortterm residents. Some buildings are primarily owner-occupied but reserve anumber of units for short term holiday letting, or hotels that have severalfloors dedicated to long term residents.
• Non-residential. Buildings containing no residential units. This includedpure retail, office or commercial buildings.
• Unknown. A small number of buildings contained no information aboutuse.
34

Tenure FrequencyLong Term Residential 87Mixed Residential 87Short Term Residential 99Non-residential 9Unknown 8
Table 4.2: Number of Buildings by Tenure Type
4.2.2 Major Crime TypesCrime events are initially recorded by police offices consistent with the Queens-land Police Service offence codes. These are coded again to conform to the Aus-tralian and New Zealand Standard Offence Classification (ANZSOC). ANZSOCis a framework developed by the Australian Bureau of Statistics that stipulatesnational and uniform standards of classifying offences across jurisdictions andcriminal justice agencies. For these reasons all analysis in this research was con-ducted using ANZSOC codes. Table 4.3 shows the frequencies of the major crimecategories for the entire sample.
The top 10 offences account for 91 percent of all offences in the buildings ofinterest.
4.2.3 Risky Facilities – All OffencesFigure 4.2 shows the distributions of crime between all buildings of interest.There is an obvious concentration of crime among a small number of buildings.Frequency tables indicate the top 12 buildings (5% of the sample) host over 50percent of the recorded crime in the buildings of interest.
Table 4.4 show the top 12 buildings hosting crimes in the data set. Buildingsare referenced by an alphabetical code to prevent identifying individual addresses.The top two buildings have non-residential tenure, which is striking given thisgroup makes up about three percent of the sample. Buildings with mixed- andshort-term tenure make up the majority of the top 12 buildings hosting recordedcrime. Long term residential building only feature once in the dozen buildingswith the most recorded crime (at 12th place).
4.2.4 Risky Facilities – Top 10 Offence TypesGiven the skewed frequency distribution shown in Table 4.3, we now restrict at-tention to the top 10 most prevalent offence categories. Note the y axes in Figure4.3 have been rescaled for each panel. Each offence displays a concentration ofcrimes in a small number of buildings.
To appreciate the concentration of crime among the highest ranked buildings,Table 4.5 shows how many different buildings appear in the top dozen ranks foreach of the 10 most prevalent offence classifications. If crimes were distributedrandomly we would expect 120 different buildings to be represented (top 12 build-ings multiplied by 10 offence classifications). We observed 35 buildings. Of these,
35
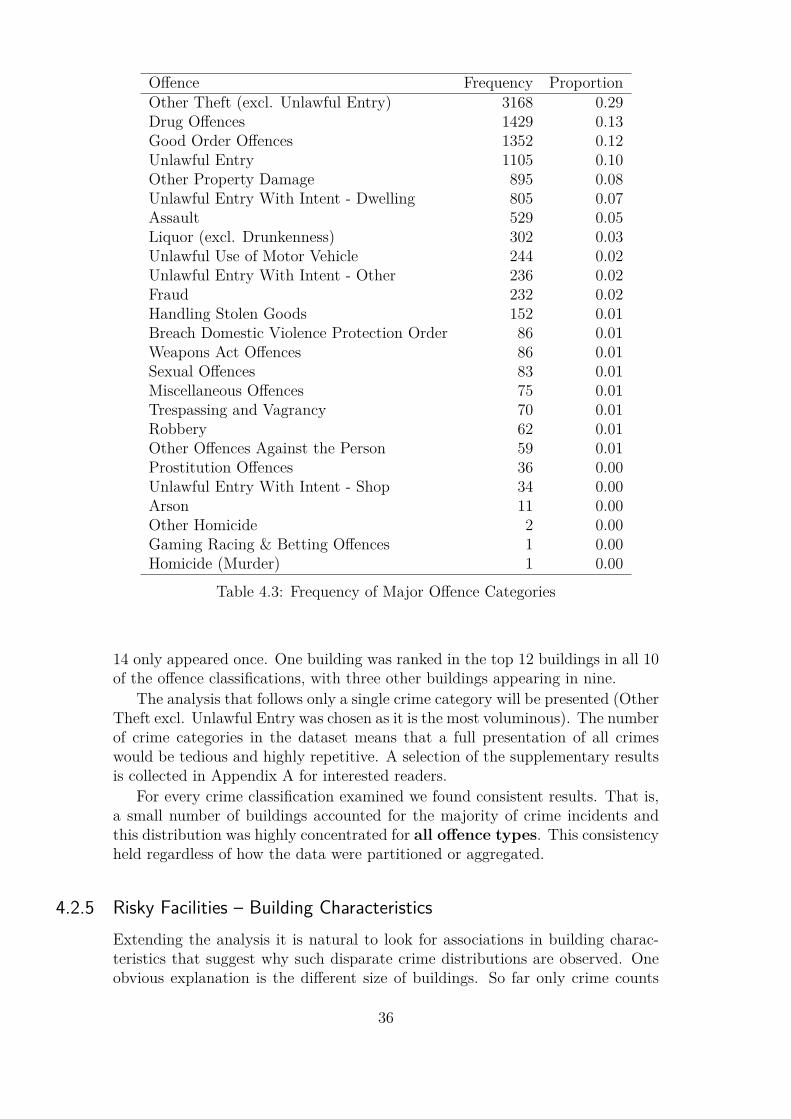
Offence Frequency ProportionOther Theft (excl. Unlawful Entry) 3168 0.29Drug Offences 1429 0.13Good Order Offences 1352 0.12Unlawful Entry 1105 0.10Other Property Damage 895 0.08Unlawful Entry With Intent - Dwelling 805 0.07Assault 529 0.05Liquor (excl. Drunkenness) 302 0.03Unlawful Use of Motor Vehicle 244 0.02Unlawful Entry With Intent - Other 236 0.02Fraud 232 0.02Handling Stolen Goods 152 0.01Breach Domestic Violence Protection Order 86 0.01Weapons Act Offences 86 0.01Sexual Offences 83 0.01Miscellaneous Offences 75 0.01Trespassing and Vagrancy 70 0.01Robbery 62 0.01Other Offences Against the Person 59 0.01Prostitution Offences 36 0.00Unlawful Entry With Intent - Shop 34 0.00Arson 11 0.00Other Homicide 2 0.00Gaming Racing & Betting Offences 1 0.00Homicide (Murder) 1 0.00
Table 4.3: Frequency of Major Offence Categories
14 only appeared once. One building was ranked in the top 12 buildings in all 10of the offence classifications, with three other buildings appearing in nine.
The analysis that follows only a single crime category will be presented (OtherTheft excl. Unlawful Entry was chosen as it is the most voluminous). The numberof crime categories in the dataset means that a full presentation of all crimeswould be tedious and highly repetitive. A selection of the supplementary resultsis collected in Appendix A for interested readers.
For every crime classification examined we found consistent results. That is,a small number of buildings accounted for the majority of crime incidents andthis distribution was highly concentrated for all offence types. This consistencyheld regardless of how the data were partitioned or aggregated.
4.2.5 Risky Facilities – Building CharacteristicsExtending the analysis it is natural to look for associations in building charac-teristics that suggest why such disparate crime distributions are observed. Oneobvious explanation is the different size of buildings. So far only crime counts
36
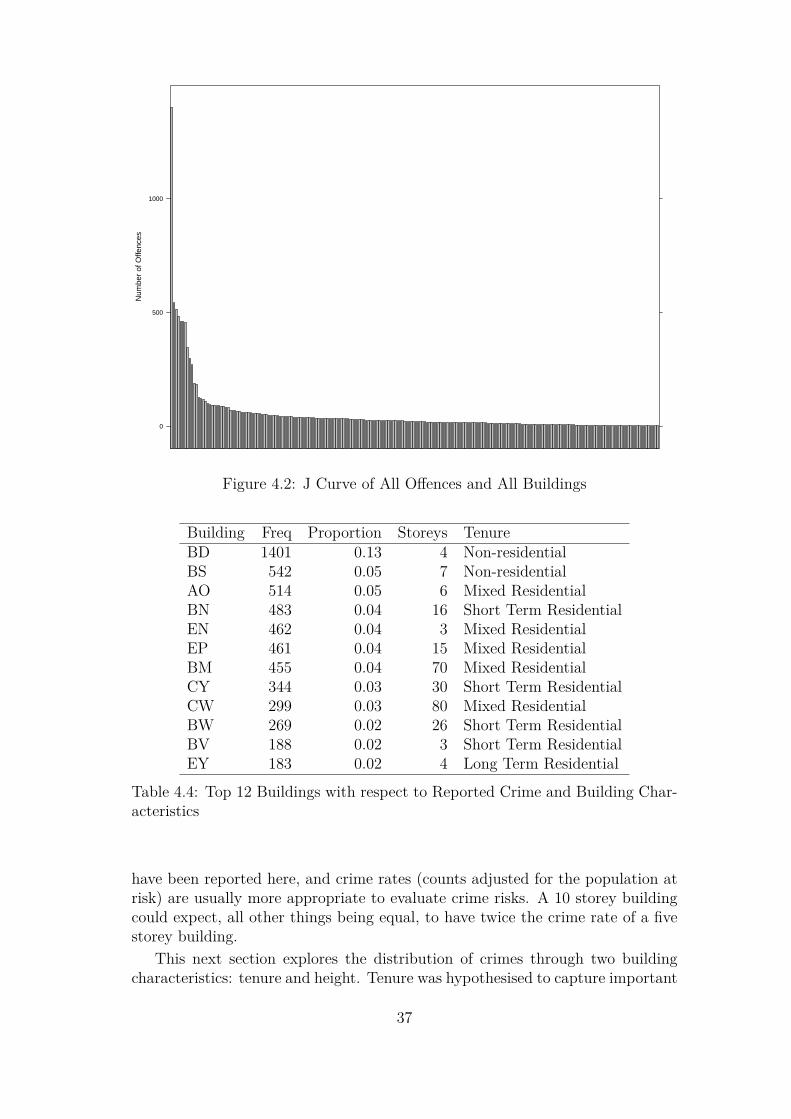
Num
ber
of O
ffenc
es
0
500
1000
Figure 4.2: J Curve of All Offences and All Buildings
Building Freq Proportion Storeys TenureBD 1401 0.13 4 Non-residentialBS 542 0.05 7 Non-residentialAO 514 0.05 6 Mixed ResidentialBN 483 0.04 16 Short Term ResidentialEN 462 0.04 3 Mixed ResidentialEP 461 0.04 15 Mixed ResidentialBM 455 0.04 70 Mixed ResidentialCY 344 0.03 30 Short Term ResidentialCW 299 0.03 80 Mixed ResidentialBW 269 0.02 26 Short Term ResidentialBV 188 0.02 3 Short Term ResidentialEY 183 0.02 4 Long Term Residential
Table 4.4: Top 12 Buildings with respect to Reported Crime and Building Char-acteristics
have been reported here, and crime rates (counts adjusted for the population atrisk) are usually more appropriate to evaluate crime risks. A 10 storey buildingcould expect, all other things being equal, to have twice the crime rate of a fivestorey building.
This next section explores the distribution of crimes through two buildingcharacteristics: tenure and height. Tenure was hypothesised to capture important
37

Assault
0
10
20
30
40
50
60
70
Drug Offences
0
20
40
60
80
100
120
140
Good Order Offences
0
200
400
600
Liquor (excl. Drunkenness)
010203040506070
Other Property Damage
0
10
20
30
40
50Other Theft (excl. Unlawful Entry)
0
50
100
150
200
250
300
350
Unlawful Entry
0
10
20
30
40
50
60
Unlawful Entry With Intent − Dwelling
0
10
20
30
40
50
Unlawful Entry With Intent − Other
0
2
4
6
8
10
12Unlawful Use of Motor Vehicle
0
2
4
6
8
10
Figure 4.3: J Curves for Top 10 Offences
38

Number of Buildings Frequency1 142 73 24 25 16 28 39 310 1
Table 4.5: Number of Times the Same Buildings Feature in the Highest RankingDozen Buildings per Offence Classification
attributes of the building environment, resident routine activities and use (stakein community, ability to distinguish legitimate from illegitimate users). Height isa proxy for the size of building, acting here as a control variable. Larger buildingsshould produce more crime, all things being equal.
Tenure
Section 4.2.1 outlined how tenure was operationalised. As the purpose of thisstudy was to explore the nature and distribution of crime, place managementand guardianship in high density residential communities, the buildings of interestwith non-residential and unknown tenure were omitted from this next phase.
Figure 4.4 shows the risky facilities of crimes classified as Other Theft (exclud-ing Unlawful Entry) among long term, short term and mixed tenure residentialbuildings. There is considerably more Other Theft offences recorded at buildingswith a mixed tenure (N=1743) compared to buildings with short-term tenure(N=875). Buildings with long-term residential tenures had much lower recordedoffence counts for Other Theft (N=214). Despite this difference in volume, thedegree of concentration was very similar. The top 10 buildings for each tenuretype host 62.5 (short-term), 68.2 (long-term) and 71.1 (mixed) percent of OtherTheft offences.
Patterns for other crime types are not shown here due to space consider-ations, but for every crime examined similar differences between tenure typeswere observed, but with very similar levels of concentration across tenure types.In other words, a small proportion of buildings account for most of the crimes,regardless of tenure type and offence classification. Overall, buildings with long-term tenure had the lowest volumes of crime, followed by short-term, with mixedtenure building hosting the most recorded crimes.
In order to establish generalizable relationships, for each of the top 10 crimecategories, the average number of crimes recorded per building for each tenuretype was computed. Using a negative binomial regression model allowed an esti-mate of the average difference in crimes for the typical building by tenure type.Table 4.6 shows the results. Long term residential tenure used as reference cate-gory, so estimated differences reflect the average increase or decrease in recorded
39

Other Theft (excl. Unlawful Entry) − Long Term Residential
0
50
100
150
200
250
300
350
Other Theft (excl. Unlawful Entry) − Mixed Residential
0
50
100
150
200
250
300
350
Other Theft (excl. Unlawful Entry) − Short Term Residential
0
50
100
150
200
250
300
350
Figure 4.4: J Curves of Other Theft (excl. Unlawful Entry) Offences Conditionedby Tenure
40

offences from the long term tenure buildings. For example, a building with mixedtenure has an average 2.09 extra recorded Other Theft offences compared a build-ing with long term tenure, all other things being equal. A building with shortterm tenure would have on average an extra 1.4 Other Theft offences compareda building with long term tenure, all other things being equal.
Mixed Tenure Short Term TenureOther Theft (excl. Unlawful Entry) 2.09 1.40
Drug Offences 0.98 0.76Good Order Offences 0.08 -0.60
Unlawful Entry 0.58 0.79Other Property Damage 0.59 0.30
Unlawful Entry With Intent - Dwelling 0.16 0.52Assault 0.27 -0.77
Liquor (excl. Drunkenness) -0.04 -1.79Unlawful Use of Motor Vehicle -0.92 -0.88
Unlawful Entry With Intent - Other -0.90 -0.85
Table 4.6: Differences In Average Number of Recorded Offences Conditioned onBuilding Tenure per Building
Height
Figure 4.5 show the distribution of Other Theft (excluding Unlawful Entry) of-fences for buildings of interest at different heights. It is difficult to assess fromthe figure which building height is associated with more recorded crime, but theconcentration of crime within buildings is clear. Table 4.7 presents some sum-mary statistics. Regardless of height, the majority of Other Theft offences areconcentrated in a small group of buildings.
Building Height Total Other Theft offences Proportion in Top 10 Buildings1 3 Storeys 565 0.772 4-8 Storeys 944 0.893 8-15 Storeys 590 0.744 15-20 Storeys 313 0.895 20+ Storeys 721 0.76
Table 4.7: Level and Concentration of Other Theft (excluding Unlawful Entry)Offences by Building Height
In order to establish generalizable relationships, for each of the top 10 crimecategories, a average number of crimes recorded per building for each buildingheight was computed. Using a negative binomial regression model allowed anestimate of the average difference in crimes for the typical building at each height.Table 4.8 shows the results. 3 Storey buildings were used as reference category,so differences reflect the average increase or decrease in recorded offences from 3storey buildings. There is not a clear relationship between building height and
41

Other Theft (excl. Unlawful Entry) − 3 Storeys
0
50
100
150
200
250
300
350
Other Theft (excl. Unlawful Entry) − 4−8 Storeys
0
50
100
150
200
250
300
350
Other Theft (excl. Unlawful Entry) − 8−15 Storeys
0
50
100
150
200
250
300
350
Other Theft (excl. Unlawful Entry) − 15−20 Storeys
0
50
100
150
200
250
300
350
Other Theft (excl. Unlawful Entry) − 20+ Storeys
0
50
100
150
200
250
300
350
Figure 4.5: J Curves of Other Theft (excl. Unlawful Entry) Offences Conditionedby Building Height
42

expected number of recorded crimes. Indeed, for none of the crime types in Table4.8 is there a positive correlation between building height and crime levels.
Building Height (Storeys)4–8 Storey 8–15 15–20 20+
Other Theft (excl. Unlawful Entry) 1.47 1.00 0.37 1.21Drug Offences 0.56 -0.03 -0.11 0.80
Good Order Offences 1.58 -0.98 -1.39 -0.63Unlawful Entry -0.03 -0.30 -0.52 0.26
Other Property Damage -0.12 -0.23 -0.75 0.27Unlawful Entry With Intent - Dwelling -0.37 -0.71 -0.91 -0.15
Assault -0.08 -0.68 -1.88 -0.64Liquor (excl. Drunkenness) -0.49 -0.74 -4.28 -3.18
Unlawful Use of Motor Vehicle -1.55 -1.85 -1.79 -1.16Unlawful Entry With Intent - Other -1.37 -2.08 -1.85 -1.04
Table 4.8: Differences in Average Number of Recorded Offences Conditioned onBuilding Height per Building
4.2.6 Risky Facilities – Seasonal TrendsSurfers Paradise is one of Australia’s premier tourist destinations and experiencesdramatic fluctuations in its residential population throughout the year. Theconsequence of this is the population at risk can be dramatically different atcertain times of the year. This has the potential to undermine any analysis, suchas the one presented here, which is based on counts of crime.
To guard against this issue, we designated an off-peak and at peak time periodwith a view to comparing whether the presence of risky facilities was restrictedto certain times of the year. The peak period related to the months of November,December and January, which corresponded to school holidays and Schoolies. Allother months were considered to be off-peak.
Figures 4.6 and 4.7 show the distribution of recorded crime among buildingsfor the top 10 crime types condition by peak and off-peak periods. We found nodifference in the kind of relationships observed for the risky facilities. In otherwords, a small number of buildings host the majority of offences in peak andoff-peak periods.
4.3 SummaryThe analysis presented in this study used descriptive statistics and exploratorydata analysis to depict the volume and distribution of recorded crime in high-risebuildings in the suburb of Surfers Paradise. We found high levels of concentrationof recorded crime regardless of offence type, building tenure, building height andtime of year.
43
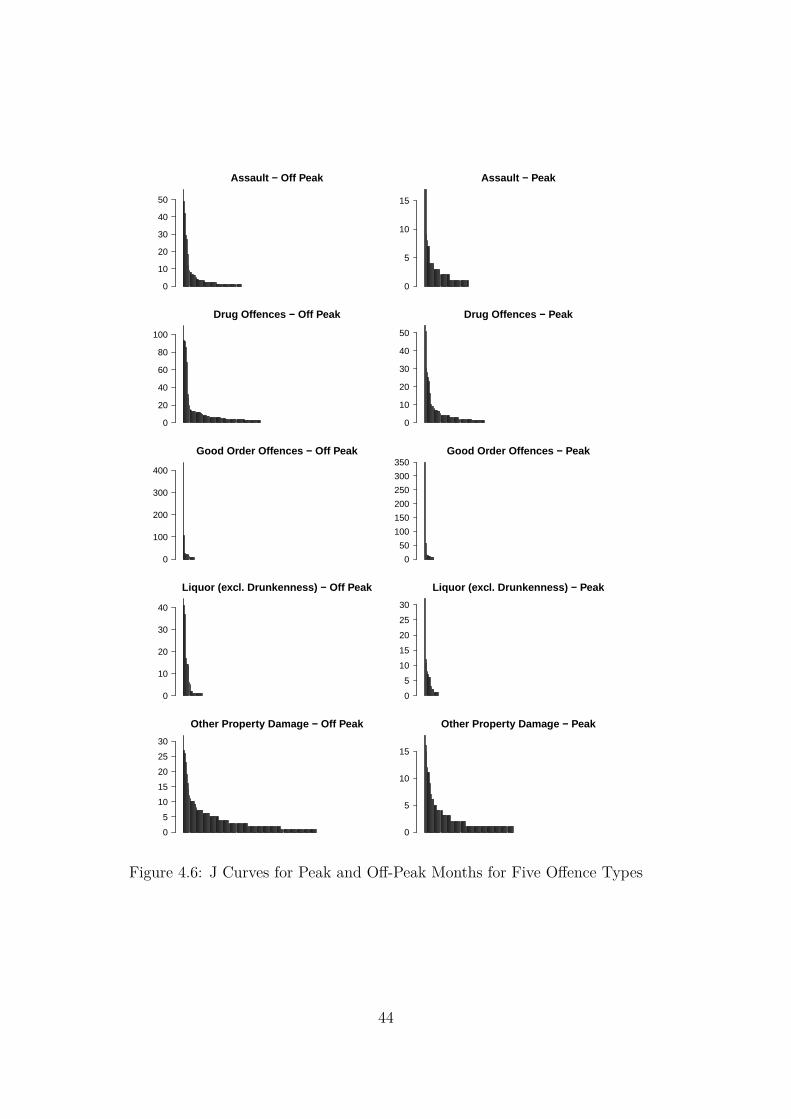
Assault − Off Peak
0
10
20
30
40
50
Assault − Peak
0
5
10
15
Drug Offences − Off Peak
0
20
40
60
80
100
Drug Offences − Peak
0
10
20
30
40
50
Good Order Offences − Off Peak
0
100
200
300
400
Good Order Offences − Peak
0
50
100
150
200
250
300
350
Liquor (excl. Drunkenness) − Off Peak
0
10
20
30
40
Liquor (excl. Drunkenness) − Peak
0
5
10
15
20
25
30
Other Property Damage − Off Peak
0
5
10
15
20
25
30
Other Property Damage − Peak
0
5
10
15
Figure 4.6: J Curves for Peak and Off-Peak Months for Five Offence Types
44

Other Theft (excl. Unlawful Entry) − Off Peak
0
50
100
150
200
250
Other Theft (excl. Unlawful Entry) − Peak
0
20
40
60
80
Unlawful Entry − Off Peak
0
10
20
30
40
Unlawful Entry − Peak
0
5
10
15
20
Unlawful Entry With Intent − Dwelling − Off Peak
0
10
20
30
Unlawful Entry With Intent − Dwelling − Peak
0
5
10
15
20
Unlawful Entry With Intent − Other − Off Peak
0
2
4
6
8
10Unlawful Entry With Intent − Other − Peak
0
1
2
3
4
Unlawful Use of Motor Vehicle − Off Peak
0
2
4
6
8
Unlawful Use of Motor Vehicle − Peak
0
1
2
3
4
Figure 4.7: J Curves for Peak and Off-Peak Months for Five Offence Types
45


5 Study 2: Observations of Risky Facilities
The purpose of this study was to concentrate on a subsample of high rise buildingsand conduct systematic observations using two existing observational protocols.Observers rated the observable social, physical and spatial characteristics of res-idential properties, facilities and their surrounding environments. This allowedmeasurement of place management, guardianship intensity, environmental designfeatures, such as: territoriality, image/maintenance, surveillance opportunitiesand target hardening at each property.
5.1 Data & Method
Observations were conducted at 125 high rise apartment buildings on the GoldCoast suburb of Surfers Paradise in November, 2012. Observational data wereacquired as a means of obtaining ecologically valid data about the physical envi-ronment in and around high rise apartment complexes, as well as the intensity ofplace management and guardianship available at these micro-places. The obser-vational instrument used for this study was derived by combining various mea-sures from two existing instruments that have been validated in previous studies– the Guardianship In Action instrument (Hollis-Peel et al., 2011; Hollis-Peeland Welsh, 2013; Reynald, 2009, 2011), and the place management at apart-ment building instrument (Eck et al., 2010). See Appendix B for the adaptedobservational instrument designed for the purposes of this study.
5.2 Inter-Rater Reliability
The team of observers consisted of six people who underwent observational train-ing for two days before the field observations were conducted. Thirty-six percentof the observation locations were rated by pairs of observers (independently) inorder to test the reliability of the observational instrument. Inter-rater reliabilitywas assessed using Cohen’s κ and results revealed strong reliability of the ob-servational measures, with κ greater than .70 recorded for all variables used inthe analyses. These results indicate that the observational instrument yieldedconsistent ratings across various observers.
47

5.3 Concurrent ValidityHaving established the reliability of the observational instrument, our next goalwas to test its concurrent validity by examining whether the variables measuredwere significantly correlated with those we would expect. For example, if the ob-servational data was validly recorded, one would expect that the number of floorsin each apartment building would have a significant positive correlation with thenumber of windows recorded for each apartment building, since both variables areindicators of the overall size of the building. Table 5.1 presents the Spearman’scorrelation coefficients, and reveals that all variables are significantly correlatedin the direction we would expect, thus confirming the concurrent validity of ourobservational instrument.
Table 5.1: Inter-Correlations of Observed Apartment Complex Features
1 2 3 4 5 6 7 8
1. Num. Floors 1.002. Num. Units .71** 1.003. Num. Windows .81** .83** 1.004. Num. Lights Complex Perimeter .33** .33** .37** 1.005. Num. Lights Complex Entrance .35** .39** .34** .37** 1.006. Num. Lights Building Exterior .29** .23** .26** .22** .17* 1.007. Num. Lights Building Entrance .53** .56** .56** .30** .50** .44** 1.008. Num. Lights in Parking Bays .50** .72** .53** .31** .31* .27* .31* 1.00
Notes: ** p< 0.01,* p < 0.05
5.4 Study 2 Results5.4.1 Crime Controllers at Apartment Buildings
Residents as Guardians – Active Availability
The first dimension of crime control observed at the selected sites was guardian-ship provided by residents of apartment building. Active guardianship, or theextent to which residents were actively available to supervise and guard theirresidential surroundings, was measured by observing (1) whether there were res-idents in apartment units who were visibly available to observers, (2) whetheravailable residents were monitoring their surroundings by looking out of theirwindows or over their balconies, and (3) whether, upon seeing observers conduct-ing observations of the apartment sites, residents intervened to enquire after theirpresence. Taken together, these three indicators were used as a measure of thelevel of actively available guardianship by residents at the sites (see Figure 5.1).
Scores for active guardianship were attributed based on each of the three di-mensions identified in Figure 5.1. A score of 0 represented a low score, indicatingthat none of the dimensions of active guardianship were observed at the site.
48
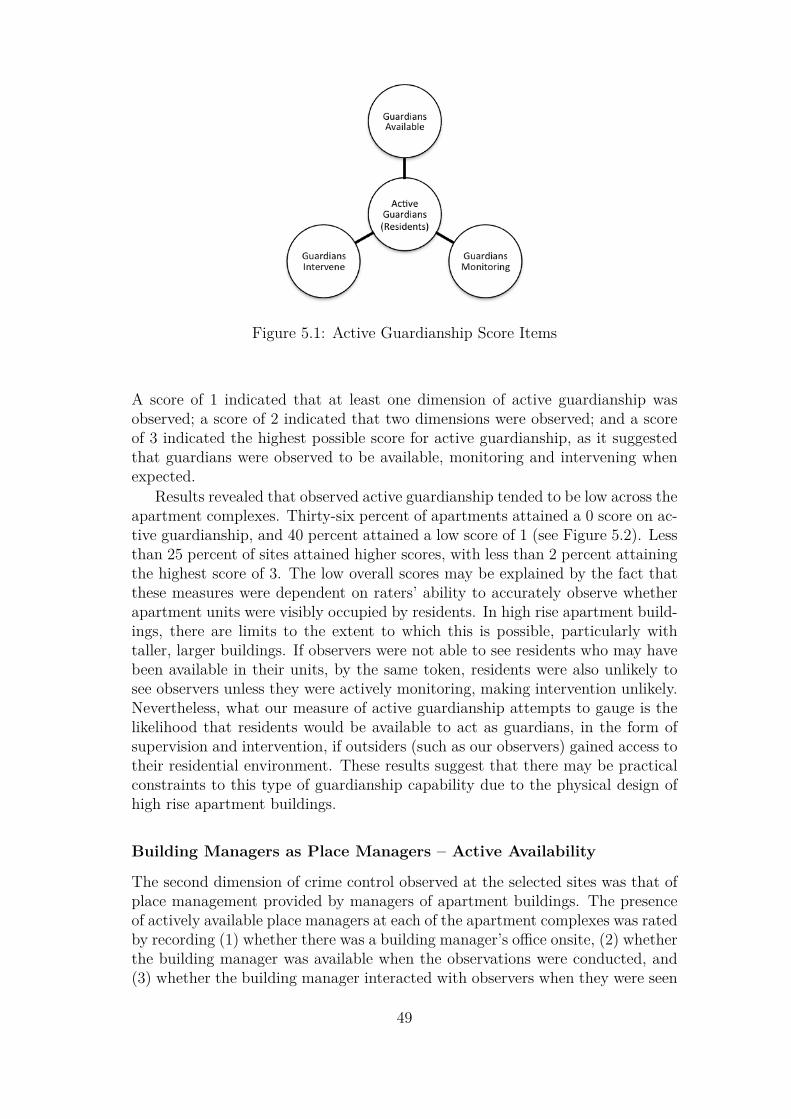
Figure 5.1: Active Guardianship Score Items
A score of 1 indicated that at least one dimension of active guardianship wasobserved; a score of 2 indicated that two dimensions were observed; and a scoreof 3 indicated the highest possible score for active guardianship, as it suggestedthat guardians were observed to be available, monitoring and intervening whenexpected.
Results revealed that observed active guardianship tended to be low across theapartment complexes. Thirty-six percent of apartments attained a 0 score on ac-tive guardianship, and 40 percent attained a low score of 1 (see Figure 5.2). Lessthan 25 percent of sites attained higher scores, with less than 2 percent attainingthe highest score of 3. The low overall scores may be explained by the fact thatthese measures were dependent on raters’ ability to accurately observe whetherapartment units were visibly occupied by residents. In high rise apartment build-ings, there are limits to the extent to which this is possible, particularly withtaller, larger buildings. If observers were not able to see residents who may havebeen available in their units, by the same token, residents were also unlikely tosee observers unless they were actively monitoring, making intervention unlikely.Nevertheless, what our measure of active guardianship attempts to gauge is thelikelihood that residents would be available to act as guardians, in the form ofsupervision and intervention, if outsiders (such as our observers) gained access totheir residential environment. These results suggest that there may be practicalconstraints to this type of guardianship capability due to the physical design ofhigh rise apartment buildings.
Building Managers as Place Managers – Active Availability
The second dimension of crime control observed at the selected sites was that ofplace management provided by managers of apartment buildings. The presenceof actively available place managers at each of the apartment complexes was ratedby recording (1) whether there was a building manager’s office onsite, (2) whetherthe building manager was available when the observations were conducted, and(3) whether the building manager interacted with observers when they were seen
49

Figure 5.2: Active Guardianship Score Frequencies
conducting their onsite observations (see Figure 5.3).
Figure 5.3: Actively Available Place Management Score Items
The presence of an onsite office for building managers was taken as an indica-tor of the potential for place management available at the apartment complexes.The actual physical presence of building managers onsite was taken as a measureof the immediate availability of place managers at the sites. Finally, the buildingmanager’s interaction with observers was taken as a measure of active availabilityof place managers, since this was interpreted as their active response to seeingour observers (as outsiders) at the apartment complexes. Taken together, thesethree indicators can be combined to provide an overall measure of the level orintensity of actively available place managers at these complexes.
Of the 125 apartment buildings rated, 61 percent were observed to have abuilding manager’s office onsite. A building manager was observed to be physi-cally available at 48 percent of the apartment buildings, and building managersinteracted with observers at 33 percent of the sites. Active Place Manager Scoreswere attributed to each apartment building based on these three dimensions ofactively available place management, with 0 indicating the lowest score (no ob-served place manager) and 3 representing the highest score (demonstrating that
50

all three dimensions were observed in the affirmative at the site). Based onthese overall active place manager scores, Figure 5.4 shows that 38 percent ofthe apartment complexes in our sample attained a low score of 0 suggesting thatthere were no observable indicators of active place managers at these sites. Incontrast, at least one indicator of actively available place managers was observedat 62 percent of the apartment complexes, with 32 percent attaining a perfectscore of 3 for their observed level of place management.
Figure 5.4: Actively Available Place Management Score Frequencies
5.4.2 Place Management & the Physical Environment of ApartmentBuildingsPlace Management – Image & Maintenance of Apartment Complexes
In addition to the availability of place managers, the level at which apartmentcomplexes were maintained and the effect this had on the overall image of thesefacilities was deemed an important indicator of the level of place management.Each apartment building received an overall Image/Maintenance Score basedon observation ratings on the presence of litter on the complex, graffiti on thecomplex and apartment buildings, junk items discarded on the complex, as wellas chipped paint on apartment buildings, broken decorations on buildings andstructural building problems (see Figure 5.5).
Scores were reverse coded so that high image scores represented well main-tained apartment complexes. Scores of 5, therefore, indicated a high level ofmaintenance since it suggests that none of these maintenance issues were recordedat the sites. A score of 0 indicated a low image/maintenance score suggesting themajority of negative image/maintenance indicators were observed onsite. Figure5.6 shows that the level of image/maintenance of the apartment complexes wasquite high overall, as over 70 percent of sites received a high image score of 5,with very few complexes observed with low levels of maintenance. These resultssuggest that the sites in our sample tended to be well managed and maintainedby place managers.
51

Figure 5.5: Image/Maintenance Score Items
Figure 5.6: Image/Maintenance Score Frequencies
Place Management – Territorial Definition of Apartment Complexes
Alongside the image/maintenance of apartment complexes, the extent of theirterritoriality or territorial definition is also deemed to be an important indicatorof the level of place management available. Each apartment building receivedtwo Territorial Definition Scores; one for physical and symbolic barriers aroundthe complex, and one for signage on the complex. As discussed in the literaturereview, both of these scores represent dimensions of the territorial definition ofproperties that indicate signs of ownership and territorial control.
The Territorial Definition – Barriers score was created by observing the pres-ence of physical or symbolic barriers on the properties, including walls, fences,gates and landscaping (see Figure 5.7). Apartment complexes received a scoreof 1 for each of these barrier items observed on the property. These were thenadded together to form the total Barriers score. A score of 4 indicated the highestpossible Barriers score, while a score of 0 was the lowest.
The Territorial Definition – Signage score was derived from observed signsaround the apartment complexes including apartment names, no loitering/solicitingsigns, no trespassing signs, surveillance warning signs, signs for parking rules and
52

signs for other behavioural restrictions (see Figure 5.8). Apartment complexesreceived a score of 1 for each of these signage items observed. These were thenadded together to form the total Signage score. A score of 6 indicated the highestpossible Signage score, while a score of 0 indicated the lowest.
Figure 5.7: Territorial Definition – Barriers Score Items
Figure 5.8: Territorial Definition – Signage Score Items
Figure 5.9 shows that the scores for Territorial Barriers were normally dis-tributed, as expected, with most apartment complexes rated as having at leasttwo (42%) or three (27%) physical/symbolic barriers around the perimeter ofthe property. These scores suggest that the majority of apartment complexeshad good territorial definition by way of barriers that demarcated it as privateproperty.
Similar to the Barriers score, Figure 5.10 shows that the Signage score wasapproximately normally distributed, with most sites (89%) observed as havingbetween one and three signs posted on their property. These results reinforcethe suggestion that the majority of apartment complexes reveal good territorialdefinition in terms of possessing signs of ownership and control.
53
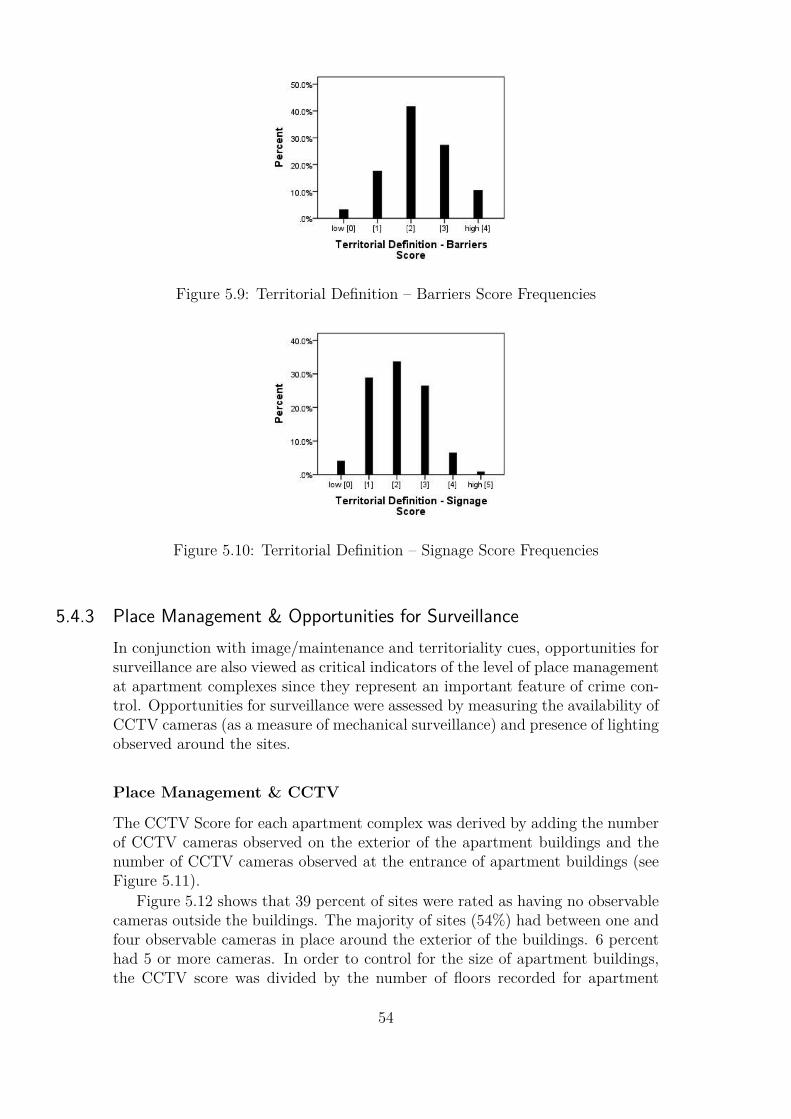
Figure 5.9: Territorial Definition – Barriers Score Frequencies
Figure 5.10: Territorial Definition – Signage Score Frequencies
5.4.3 Place Management & Opportunities for SurveillanceIn conjunction with image/maintenance and territoriality cues, opportunities forsurveillance are also viewed as critical indicators of the level of place managementat apartment complexes since they represent an important feature of crime con-trol. Opportunities for surveillance were assessed by measuring the availability ofCCTV cameras (as a measure of mechanical surveillance) and presence of lightingobserved around the sites.
Place Management & CCTV
The CCTV Score for each apartment complex was derived by adding the numberof CCTV cameras observed on the exterior of the apartment buildings and thenumber of CCTV cameras observed at the entrance of apartment buildings (seeFigure 5.11).
Figure 5.12 shows that 39 percent of sites were rated as having no observablecameras outside the buildings. The majority of sites (54%) had between one andfour observable cameras in place around the exterior of the buildings. 6 percenthad 5 or more cameras. In order to control for the size of apartment buildings,the CCTV score was divided by the number of floors recorded for apartment
54

Figure 5.11: CCTV Score Items
buildings. This CCTV score proportionate to the size of apartment buildingswas used for subsequent bivariate analyses.
Figure 5.12: CCTV Score Frequencies
Place Management & Lighting
The Lighting Score for each apartment building was derived by adding togetherthe observed number of lights around the perimeter of the apartment complex,at the entrance of the complex, on the exterior of the apartment building and atthe building entrance (see Figure 5.13).
Figure 5.14 shows that few sites had no observed lighting around apartmentbuildings (just under 8%), with the vast majority recorded as having more thanfour lights around the buildings and entrance. In order to control for the size ofapartment buildings, the lighting score total was divided by the number of floorsrecorded for apartment buildings. This lighting score proportionate to the sizeof apartment buildings was used for subsequent bivariate analyses.
55

Figure 5.13: Lighting Score Items
Figure 5.14: Lighting Score Frequencies
Table 5.2 provides some basic descriptive statistics of all aforementioned vari-ables, including the minimum and maximum scores, as well as the mean andstandard deviation. Table 5.2 shows that mean level of place manager availabil-ity was in the middle of the range of possible values, whereas the average level ofactive guardianship provided by residents was quite low. Both were quite vari-able, however, indicated by the magnitude of the standard deviation relative tothe mean. Of particular significance is that the mean level of image/maintenancewas generally very high. The mean score for territorial barriers was slightly aboveaverage across the sites, while the mean score for territorial signage was slightlybelow average. Both external CCTV and lighting scores relative to the size ofapartment buildings was also quite low across all sites.
56
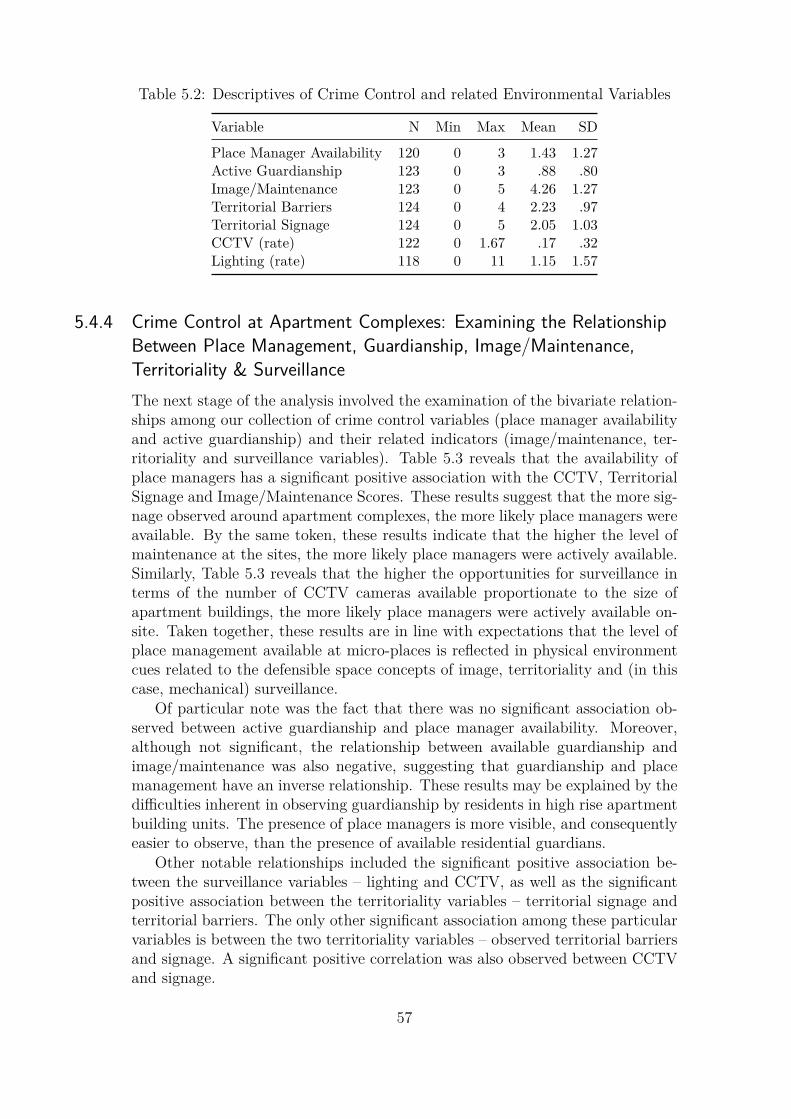
Table 5.2: Descriptives of Crime Control and related Environmental Variables
Variable N Min Max Mean SD
Place Manager Availability 120 0 3 1.43 1.27Active Guardianship 123 0 3 .88 .80Image/Maintenance 123 0 5 4.26 1.27Territorial Barriers 124 0 4 2.23 .97Territorial Signage 124 0 5 2.05 1.03CCTV (rate) 122 0 1.67 .17 .32Lighting (rate) 118 0 11 1.15 1.57
5.4.4 Crime Control at Apartment Complexes: Examining the RelationshipBetween Place Management, Guardianship, Image/Maintenance,Territoriality & SurveillanceThe next stage of the analysis involved the examination of the bivariate relation-ships among our collection of crime control variables (place manager availabilityand active guardianship) and their related indicators (image/maintenance, ter-ritoriality and surveillance variables). Table 5.3 reveals that the availability ofplace managers has a significant positive association with the CCTV, TerritorialSignage and Image/Maintenance Scores. These results suggest that the more sig-nage observed around apartment complexes, the more likely place managers wereavailable. By the same token, these results indicate that the higher the level ofmaintenance at the sites, the more likely place managers were actively available.Similarly, Table 5.3 reveals that the higher the opportunities for surveillance interms of the number of CCTV cameras available proportionate to the size ofapartment buildings, the more likely place managers were actively available on-site. Taken together, these results are in line with expectations that the level ofplace management available at micro-places is reflected in physical environmentcues related to the defensible space concepts of image, territoriality and (in thiscase, mechanical) surveillance.
Of particular note was the fact that there was no significant association ob-served between active guardianship and place manager availability. Moreover,although not significant, the relationship between available guardianship andimage/maintenance was also negative, suggesting that guardianship and placemanagement have an inverse relationship. These results may be explained by thedifficulties inherent in observing guardianship by residents in high rise apartmentbuilding units. The presence of place managers is more visible, and consequentlyeasier to observe, than the presence of available residential guardians.
Other notable relationships included the significant positive association be-tween the surveillance variables – lighting and CCTV, as well as the significantpositive association between the territoriality variables – territorial signage andterritorial barriers. The only other significant association among these particularvariables is between the two territoriality variables – observed territorial barriersand signage. A significant positive correlation was also observed between CCTVand signage.
57

Table 5.3: Inter-Correlations between Place Management, Guardianship,Image/Maintenance and Territoriality
1 2 3 4 5 6 7
1. Place Manager Availability 1.002. Active Guardianship -.01 1.003. Image/Maintenance .20* -.12 1.004. Territoriality - Barriers .05 .08 -.04 1.005. Territoriality - Signage .34** .16* -.09 .18* 1.006. CCTV (rate) .33** .05 .03 -.05 .33** 1.007. Lighting (rate) .05 .06 -.05 .05 .08 .23** 1.00
Notes: *** p < 0.001, ** p< 0.01,* p < 0.05
Appendix C provides the full list of apartments along with their correspondingscores for active place management, guardianship, image/maintenance, territorialbarriers, territorial signage, CCTV and lighting.
5.4.5 Guardianship, Tenure & CrimeHaving established in Chapter 4 that Theft excl. Unlawful Entry as the mostvoluminous crime category, the analysis that follows will focus on examining therelationship between tenure and levels of guardianship with this type of crime.Recall from the analyses presented in Chapter 4 of this report that buildingswith long-term tenure had the lowest volume of crime, followed by short-termtenure, with the highest volume recorded at mixed tenure buildings. When weexamine the distribution of Theft excl. Unlawful Entry in high density residentialcommunities among long term residential buildings, Figure 5.15 shows that thistype of crime is lowest when guardianship intensity is high, i.e., theft was lowest atthose long term residential buildings where residents were observed to be activelyavailable guardians. When we look at mixed residential buildings, we see in Figure5.15 that theft is much higher at those mixed residential buildings where no activeguardianship was recorded. At short term residential buildings, we also observethat average theft is highest at those buildings where no active guardianship wasobserved.
5.4.6 Place Management, Tenure & CrimeWhen we examine the distribution of Theft excl. Unlawful Entry in high den-sity residential communities among long term residential buildings, Figure 5.16shows that while this type of crime tends to be very slightly lower when placemanagement is high compared to when place management at these facilities islow, the level of theft tends to be similarly low regardless of the intensity of placemanagement. When we turn our attention to mixed residential buildings, Figure5.16 reveals that theft is highest when place management is low, and theft islowest when the availability of place management is highest. What we observe
58

guardianship
aver
age
othe
r th
eft o
ffenc
es
0
10
20
30
40
0 1 2 3
Long Term Residential
0 1 2 3
Mixed Residential
0 1 2 3
Short Term Residential
Figure 5.15: Relationship Between Guardianship and Other Theft Crimes Con-ditioned by Building Tenure
at these buildings of mixed residential tenure is that theft is lowest when a build-ing manager’s office is onsite and when building managers are actively availableonsite. Finally, when we examine place management at short term residentialbuildings, Figure 5.16 shows that, in contrast, theft is lowest when place man-agement is low, i.e., when no place manager is available onsite, or when a placemanager’s office is available onsite. When a place manager is actively availableonsite, average theft is revealed to be higher in comparison.
5.5 SummaryTaken together, results from direct site observations reveal that the level of ac-tively available guardianship provided by residents at high rise apartment build-ings in our sample tended to be low overall. In contrast, the level of place man-agement at these sites tended to be comparatively higher. Moreover, indicatorsof place management – in the form of image/maintenance, territoriality and op-portunities for surveillance – also tended to be quite strong across these sites asthe majority of apartments reflected high levels of management, maintenance andterritorial control, and very good levels of surveillance opportunities. When wecompared crime levels with tenure and levels of actively available guardianship,average recorded theft was lower at long term, mixed and short term residentialbuildings when guardianship intensity was lowest. Interestingly, in comparison,
59

place management
aver
age
othe
r th
eft o
ffenc
es
0
10
20
30
40
50
0 1 2 3
Long Term Residential
0 1 2 3
Mixed Residential
0 1 2 3
Short Term Residential
Figure 5.16: Relationship Between Place Management and Other Theft CrimesConditioned by Building Tenure
we observed that theft was (approximately) equally low at long term residentialbuildings when place management was low and when it was high. At mixedresidential buildings, theft was highest when place management was lowest andwas lowest when place managers’ office was located onsite and when place man-agers were actively available onsite. In short term residential buildings, theft waslowest when actively available place management was lowest.
60

6 Study 3: Discussing Risky Facilities
The focus of this study was perceptions of safety, incidences of crime and socialconnectedness or cohesion of those living in vertical communities. In-depth semi-structured interviews were conducted with residents, Queensland Police officers,building managers and body corporate managers.
6.1 Data and MethodTwo datasets were developed to complete the third phase of this research project.
6.1.1 Resident QuestionnaireA questionnaire was designed to capture demographic, tenure and householdtype and residents’ perceptions of and actual rates of crime in Surfers Paradise.Questions were asked of gender, what type of household structure (living alone,as a couple, family, group household), whether they were owner/in the processof owning or renting, on which floor level based on categories (levels 1–3, 4–8,9+). Based on the British Crime Survey residents’ perceptions of and actualrates of crime were categorised (from extremely unlikely to extremely likely).The categories included; robbed, assaulted, property damage or unlawful entrywithin their building and within their unit.
The questionnaire was randomly distributed to 1,000 letterboxes of residentswithin high-rise buildings in Surfers Paradise, representing an approximate sam-ple of 1:3.5. To encourage residents to complete the self-adhesive reply paid ques-tionnaire all respondents who returned their questionnaire went into the draw towin a $100 JB Hi Fi voucher. However, there was an extremely low response rate(N = 44 or 4.4%). Of the responses that were returned, many residents reportedfeeling safe in their unit and building generally. However, during peak touristseasons and specific event periods (e.g. Schoolies or V8 Supercars) there wereheightened feelings of fear.
The low response rate is concerning for a two reasons. First, not too muchcan be made of these findings from such a low sample size: it is highly likelythere are selection effects operating, the completely expected results notwith-standing. Second, the extremely low response rate underscores the difficulty thatthe Queensland Police Service and building managers have in fostering commu-nity investment within transient residential populations. This will be a factor inany crime prevention policy developed in high density residential community.
61

6.1.2 In-Depth Semi-Structured InterviewsIn total, 19 in-depth semi-structured interviews were conducted with police, bodycorporate managers, residents and an industry expert (see Table 6.1).
Table 6.1: Sample of Interviewees
Number Respondent
10 Residents (in-depth case of one building)5 Police3 Body Corporate Managers1 Industry Expert (specialising lawyer)
A semi-structured interview guide was developed with questions derived fromthe review of the literature. Four key themes guided the interview questions;general, building design, socio-demographic and management strategies. Generalquestions opened the interview to build rapport and trust between the interviewerand interviewee. These included: perceptions of safety and fear of crime, whatmakes high-rises susceptible etc. Building design questions were framed around:effective building design features to enhance safety and security, number of apart-ments per floor, height of the apartment within the building and mix of tenureand type of facilities. Socio-demographic questions revolved around: price pointof apartments, cost of living, mix of tourists and residents within the buildingsetc. Management strategies explored the range of prevention strategies that haveor could be implemented to enhance perceptions of safety and mitigating crime.
All interviews were digitally recorded and verbatim transcribed. Qualitativein-depth interviews provide a richness of data that builds theory through threelevels of coding (Glaser, 1998; Glaser and Strauss, 1967; Neuman, 2005; Strauss,1990). First, open coding of the interview transcripts ensured that the data waslabelled, analysed, compared and categorised. Second, an axial coding processsought to identify relationships between the categories and subcategories. Third,the analysis underwent a selective coding process to identify core themes andtheir relationship to the categories. Throughout, and as a consequence of this re-search approach, there was constant comparison between emerging categories andconsequent respondents for trustworthiness and theoretical saturation (Decrop,2004).
6.2 Results6.2.1 Difference Between Perceptions and Actual Rates of Crime
The subjective nature of perceptions of and fear of crime led many respondents toexpress views about the disparity between perceptions and actual rates of crime.As one respondent acknowledged, “Crimes tend to get publicity, and people canoverlook the fact that they’re pretty rare” [I5]. The effect of media on perceptionsof crime were also widely discussed. One respondent commented,
62

“. . . it’s the bloody Gold Coast Bulletin. It’s the worst paper in Aus-tralia! So all of a sudden you’ve got three buildings living in bloodyfear. So it’s perception. The reality is that most of them don’t gettouched by crime” [I6].
The continual exposure of residents to media reports, whether sensationalisedor not, has led to increased perceptions of rates of crime in Surfers Paradise. An-other respondent identified that this may also be aligned with the demographicsof the region. He noted:
“Given that large numbers of people retire here, I suggest that thosepeople, the level between reality and perception is far removed, be-cause those elderly people are potentially bombarded with informa-tion about crime” [I8].
However, a number of respondents also acknowledged that high-rise livingprovided a unique context and “A false sense of security” [I6 and I5]. As arespondent indicated,
“I think they feel secure because they’re high, perhaps. I think there’sa perception by guests and perhaps owners alike that they feel safer,as I said, being a little higher. But I don’t think it’s a big deterrentfor the would-be thief” [I3].
There was an element that suggested that the higher up an individual livedor resided the more heightened their perceptions of safety. It was commonlycommented that being removed from the ground floor or easy access led to thisfalse sense of security, even though incidences of crime occur at all levels ofbuildings.
One respondent also commented that it is not until an individual became avictim of crime that the gap between perceptions and actual rates reduced. Hestated,
“So you’ll tend to find, and I’m sure the research will show, thatanyone who is a victim of this type of crime, that being some sortof property crime from a high-rise, from that point on will be quitefamiliar and quite aware of the risks and from that point on generallywill take appropriate precautions. However, those that have not reallyhad contact directly or even indirectly will tend to be a little bit moreblasé until they’re actually a victim of that and I guess that’s acrossthe board, irrespective of what crime areas you’re looking at” [I7].
Therefore, it became evident that perceptions of safety and fear of crime inthe Surfers Paradise area were heightened as a consequence of ongoing mediareporting. However, as individuals retreated into high-rise buildings and apart-ments they were often lulled into a false sense of security. The disconnect withthe ground and being above ‘the others’ led to these perceptions.
63

6.2.2 Location of Buildings/ApartmentsThe location of dwellings and their surrounds also strongly influenced perceptionsof safety and fear of crime. The commercial and recreational nature of the SurfersParadise precinct is dominated by entertainment, leading to heightened risks ofunruly social behaviour.
“Even walking through parts of Surfers Paradise of a daytime, lateafternoon or early morning, you just – it doesn’t feel safe. It feels asthough it’s – that’s what it is at night, and that is it’s a party – aparty place. Then you’re dealing with people who are drunk and outof control. So – the few times I’ve been to Surfers in recent years I’vehad that feeling that it’s deteriorated a bit” [I5].
Apartment complexes in close proximity to risky facilities such as nightclubs,bars, convenience stores and fast food outlets had heightened risks.
“. . . particularly the ones closest to nightclubs, like the Hilton andCircle on Cavill, where they have the inherent problems with craziesgoing through their buildings or trying to go through their buildings”[I1].
These risky facilities have been located in these areas well before many ofthese high-rise developments, which should indicate a buyer beware mentality.However, it did not deter some owners of apartments trying to have these venuesclosed. As one respondent discussed,
“Those that might have bought on that side of the building overlook-ing Melba’s as an example, and until whatever time in the morningthey’re doing their music and the talking and the screaming and thingsthat have happened, and they have to close all their doors, they haveto put air-conditioners on. . . . basically people move in because allthey’ve bought is just the environment of that building itself” [I1].
Unit owners are attracted to the location of Surfers Paradise due in part toproximity to facilities and amenities, but when faced with living in close proximityare confronted by the challenges.
As you radiated out from the core of the Surfers Paradise entertainmentprecinct this also presented challenges to perceptions of safety and fear of crime.
“For example, if you’ve got a high-rise down off Old Burleigh Road– there is it? You know that backs onto where the river is here,where there are some derelict buildings. So next thing you get theheightened risk of entering into buildings because you’ve got derelictbuildings where vagrants tend to hang out. So suddenly they’ve gotto review their security” [I9].“If you’re bringing together people of a lower socio-economic group inlarge numbers and there’s the potential there for conflict and there’s
64

potential there for offences to be committed probably on a broaderand wider scale than what there is if they’re intermingled amongstthe community. You know so yeah I think that would have a prettydecisive impact on what crime is being committed in the local envi-ronment” [I10].
Furthermore, as individuals transit through these spaces on their way homeit presents opportunity for social amenity disorder, discarded waste, and oppor-tunistic property crime.
6.2.3 Size of CommunitySurfers Paradise is one of the most densely populated suburbs in Australia withover 75% of individuals residing in an apartment. The increased density presentsopportunity for more individuals to be in the area on a permanent and semi-permanent basis. As a respondent commented,
“So in a footprint in a residential area that might only be four or fivehouses, in a high-rise sort of area you might have 100 or 200. So Iguess simple geography means that the person doesn’t have to travelso far to reap the benefits of his criminal activity” [I7].
The size of many of these high-rise apartment towers also does not facilitatethe opportunity to know who should be or should not be there. “. . . the smaller,older ones at least you get to know people and know who’s supposed to be thereand who’s not supposed to be there. I often wonder when there are 600 apart-ments in a tower . . . ” [I4]. Another respondent notes, “You can walk in, justwalk into these places and just join in the whole crowd and the community” [I2].Nobody can really distinguish whether you have a legitimate right to be there ornot.
Further compounding this, is the high proportion of holiday letting. As onerespondent noted,
“I think the fact that a high-rise building brings with it, potentially,significant numbers of people in a small location that – where there’snot a – where there are not solely permanent residents. Where there’sa turnover of people does, so that it – what I mean by that is an extraface in – coming and going. The fact that they may only be here –some may only stay one night. They may only be an overnight person,through to a short-term stay and those sort of things. So an extraface doesn’t seem out of place. Another body walking around in thecar park doesn’t seem unusual. Another person [even on a] floor, thesame floor – no one would potentially notice that” [I8].
Respondents also commented on how the layout of many of these high-risebuildings did not facilitate the building of social interactions amongst residents.One respondent acknowledged,
65

“. . . the design or layout of a high-rise building doesn’t lend itselfparticularly well to interaction with your neighbours. What I meanis the three of us could live on the same floor in three different unitsand we may not know each other. We could live there for years andnot meet each other and not know each other” [I9].
As discussed in Section 6.2.5, the security features that have been installedin many of these high-rise apartments further limits opportunity for social in-teractions. As one respondent indicated “They only way they socialise is in thebasement or in the lift, which is not ideal locations for perceptions of crime orfear of safety” [I1]. The common areas that often provide these opportunities arenot ideal locations, often being in the basement car park, lift, lobby areas whereindividuals are often in heightened states of awareness about their safety.
6.2.4 Owner Occupied BuildingsIt was clear that there was a difference in terms of respondents perceptions aboutthe effect of owner occupied residential high-rise buildings compared with mixedtenure. As one respondent discussed “. . . by and large the higher the numberof rentals in a high-rise is usually the higher the number of incidents” [I10].The degree of transience of occupants influences their social connectedness to abuilding and its occupants (Forrest et al., 2002). Social connectedness influencesbehaviours and attitudes towards others and also property. Therefore, an owneroccupiers and tenants, particularly short term or holiday tenants will interactwith each other and the property differently. One respondent noted,
“I think the full residential buildings they were pretty good becausegenerally people talked to other people in the building and they havetheir probably body corporate meetings and because they all live therethere’s an onus on them all to understand the risks so they all arebetter educated” [I7].
Owners interact through a legislative obligation to self-govern and manage thebuilding that they have brought into. Owner occupiers meet each other throughbody corporate meetings and through regular interactions and acknowledgementas they go about their daily lives.
These owner occupied buildings had a greater ability for guardianship andsurveillance as they “will tend to know who should and shouldn’t be in the build-ing” [I7]. Another respondent commented,
“. . . if it was an exclusive permanent, the people would get to know,even just by sight, the people that are on their floor, for example. Sothat the extra body on the floor would potentially look [out of place/displaced]. Every person usually has a dedicated car spot, and peoplewould walk past and see that there’s constantly a red Commodore inthat spot, so they know that a red Commodore owns that spot. . . . asopposed to more touristy or overnight-y, or whatever you want to callit, focused – that other user group” [I8].
66

Therefore, the tenure type and mix of occupiers has a direct influence onperceptions of safety and fear of crime within many high-rise buildings.
6.2.5 Building Design ConsiderationsAs noted in Section 6.2.3, the design of high-rise buildings has an influence uponoccupants and residents perception of safety and fear of crime. Focusing onspecifics of design respondents discussed the location of the apartment withinthe building, crime prevention through environmental design principles such asdesign, lighting, closed circuit television surveillance, and specific security inclu-sions such as access.
First, it was perceived that ground and lower floor apartments were at height-ened crime risk due to ease of access. As one respondent discussed,
“I think it’s easier for somebody to access, illegally access, a lowerlevel unit than it is an upper level unit. Even if you’re on the firstfloor or the second floor, sometimes because of the way the balconiesare configured, it’s possible for an energetic person to quite easily getaccess to the first or second balcony, because I guess you can climbfrom one to the other. The further up you get, the more difficult thatis I think” [I5].
However, as noted in Section 6.2.1 this can often lead to a false sense ofsecurity for those living at higher levels. As a number of respondents highlightedthere have been numerous incidences of illegal entry through balconies even atthese higher levels.
Second, a number of respondents specifically discussed principles of crimeprevention through environmental design (CPTED).
“Things like entry points being just clear and easy to access. Linesof sight from both ends, both externally and internally within thepremises. Yes, just general maintenance of the facility itself, so itlooks clean. It looks tidy. It gives the impression that it’s cared forand looked after and someone obviously is responsible for that” [I8].
The ground level was considered particularly important as it facilitated accessinto the building.
“. . . it’s the design of the ground level that makes all the difference.Whether you walk up there with your three metre solid walls thatpeople can’t penetrate unless they’ve got iris recognition or fingerprint recognition, et cetera, or whether the building’s just generallyopen so that people can jump fences and go and swim in pools andhave these dark corners and basements are easy to get into to sleep incars, knock off cars, damage cars. The design is a big issue I think”[I1].
67

However, architects and developers’ aesthetic objectives sometimes overruleimplementing CPTED principles. A number of respondents noted “the develop-ers say, no, no, don’t ruin the aesthetics of the perimeter of the building” [I1].As a consequence, many of the newer high-rise apartment developments are re-configuring the common recreational areas. “That’s why you see more and moreof these rec centres going higher in the building, because basically they’re seeingit’s making more private, people more comfortable” [I1].
Important changes are also being made to the design of high-rise buildings toovercome issues with illegal balcony access.
“. . . some of the buildings will have a better design in terms of justnot allowing people to be able to climb the balconies, just purely theway that the balconies are designed and that could mean – I’m not anengineer, so I don’t know, the distance between the floors. Sometimesbuildings will be – will have a bit more distance between each balconywhereby the offender hasn’t got the ability to reach up and get thenext one . . . ” [I7].
Or as another respondent acknowledged, utilising materials and design tolimit climbing.
“. . . there’s the building and there’s the balcony – it should be likethat . . . offset . . . You can’t reach out. That’s never going to happen.It could happen as part of a CPTED principle of stopping balconytheft. It may be just be something simple, like, it’s like that but it’sgot a curve on it – an anti-climbing device” [I6].
Clear visuals and lighting enhance an individual’s perception of safety asthey are aware of who is around. One respondent commented “Dark little areaswhere they can sneak up and climb up balconies, if you can eliminate that” [I7].However, a number of respondents discussed the cost implications of lightingand particularly in reference to electricity charges and visual pollution. Onerespondent stated,
“. . . people are reluctant to with the charges. With the electricitypower supply now and the cost, there’s going to be more blackness.People are going to start flicking bloody switches. Where a bodycorporate is running it and people are trying to save money theycreate a problem if they just flick all the lights off. But that’s whatsome of them are doing” [I6].
Modifications or retrofitting lighting with sustainable technology such as LEDor sensor lighting could assist body corporates in reducing long term energyconsumption cost, however these changes will incur initial set up levies and costsfor owners and bodies corporate.
The installation of CCTV or visual recording devices was commonly discussedby respondents as a tool to enhance perception of safety and rates of crime inhigh-rise buildings. As one respondent acknowledged “Most people do crime
68

because they think they get away with it, but if they know that they can’t getaway with it because there are these mechanisms, video cameras. . . they’re alldeterrents I think” [I1]. Individuals can no longer be anonymous. “. . . it actuallytakes a record of an incident and insurance companies and police like that, sothat they can make sure they get the facts” [I1].
However, a number of respondents acknowledged that “cameras will catchan offence happening but it won’t necessarily deter it . . . " [I9]. The challengebeing that they may be inappropriately located, not in operation or not beingmonitored. One respondent stated “we’ve got security cameras but nobody looksat them. The security guards we hire look at them in the evening. They’re notthere all the time” [I11]. Another detailed,
“I could take you to any high-rise now and do an evaluation of thecameras in the building and you’ll see that 98 per cent of them aretotally ineffective for what you want. Why’s that? They’re ceilingmounted. Instead of – like, as you walk up to a door in a high-risebuilding where there’s a keypad or a security pad, there should be acamera straight in your face. Because nobody thinks of that. Theyleave it to the security and security come in and say we need cameras.Yes, fine, we’ll put one up there. So when you walk in it’s lookingdown at the top of your head and your baseball cap – hoodie – no onesees it. But as you come to the door it should be sitting there goingclick, click, click – every time you move click, click, click. It could goto card. It doesn’t have to go to digital video recording” [I6].
Therefore, the ineffective placement and location of cameras limits the successof cameras. As one respondent commented,
“There’s nothing worse for us if we go and have to respond to 10 or15 vehicles that have been broken into in a basement carpark andwe get there and the building manager says, – we’ve got CCTV butwe haven’t used it for years and it hasn’t worked or – that’s notuncommon for that to occur” [I7].
Others indicated that whilst cameras are good to have in operation it will notstop everyone. “Anybody that knows what they’re doing won’t get caught on asecurity camera” [I2].
Third, site specific security measures were also discussed as factors that facili-tated enhanced perceptions of safety amongst high-rise residents. One respondentindicated that separation of uses and access may assist. He stated “Ideally a sep-arate drive way for residential and a separate drive way for non-residential. Allowthe public to use that, but the private one comes through here” [I1]. Overwhelm-ingly access into a building was a key factor facilitating perceptions of safety. Asone respondent noted,
“It starts off with some sort of ability to vet who’s coming into thebuilding. Whether that’s just through the main foyer area or whetherthat’s through delivery doors down in the basement. Who’s accessing
69

your car parks? It sort of needs to start off at that level at a reallyhigh vetting level” [I9].
Electronic access cards or fob systems are commonplace. These systems limitwho can open the front door, car park gate and lift access depending upon howthey are programmed.
“Quite a lot of them are fob activated so it’s not a matter of justwalking through the front door; you need a fob to get into the frontdoor in quite a lot of those buildings. So you just can’t walk off thestreet. Also fob activated to get into lifts, on the floors and that, sothey try to put security measures in place so that it keeps out peoplewho really shouldn’t be in the building. But of course, if people wantto get in they can still get in” [I4].
Therefore, many times these access cards limit where an individual can gowithin the building to the carpark, lobby, and their floor of occupation. This hasthe potential of further limiting opportunity for casual social interactions anddevelopment of sense of community within some high-rise apartments.
However, problems can occur with these systems. Tailgating is a major con-cern, whereby an individual swipes to gain entry to a carpark and enters the gatewith another car following at close proximity. One respondent commented,
“. . . cars drive in and out and you’ve just got to walk in behind a caror follow a car in. The gates open and shut with the car, but theydon’t close on the next car. So if you tailgate it will just stay open.It’s all well and good – the only way that you can have – is to controlthe security of access is to have a static guard at the front. It becomestoo costly” [I2].
A similar concern exists with front door entry access. Therefore, site specificmeasures provide another layer of security to enhance perceptions of safety butmay not necessary be the panacea. Active management of risks also needs tooccur.
6.2.6 Management of RisksIn discussing management of risks respondents identified a number of opportu-nities beyond those discussed in Section 6.2.5. They indicated the advantageof onsite managers for guardianship, hiring of dedicated security and buildinglockdowns. A number of respondents also identified challenges to management ofrisks in the lack of police resourcing and issues with strata title legislation. Thesethemes are discussed below.
First, it was perceived that having onsite managers enhanced the perceptionof safety through guardianship and visual presence.
“. . .my view is it probably does, purely because an onsite managerhas a much better awareness of who lives there and who doesn’t and
70

who should be coming and going and they just take a real ownershipin the place rather than – an offsite manager only gets a phone callwhen something’s not working or something has gone wrong” [I7].
Their awareness of legitimate users and enforcement of body corporate rulesand regulations ensures they act as casual monitors of property. “Generally withonsite managers. . . they will keep the building reasonably secure during the dayand you don’t often need security” [I1]. Another respondent stated,
“I think because the onsite manager is very familiar with the build-ing. He or she is here generally 24/7 and can usually attend to mostmatters very quickly if needed and has usually a finger on the pulseand – both good and bad – can attend to certain aspects of life inthe building. It would be a deterrent as such but the thief doesn’tknow that there’s a resident manager in place. I guess, from a comfortpoint of view, the owner of the unit or even the guest may feel somecomfort in knowing that there’s a resident manager there – not thathe or she is going to go out and chase the culprit or do the securityrounds like some of them think the managers should” [I3].
Onsite management can take three distinct forms in strata title buildings;caretaker, resident manager or offsite manager. Caretakers are hired by thebody corporate on shorter term contracts, usually three year terms, to undertakemaintenance, repairs and general upkeep of a property. The other forms, residentand offsite managers, often have purchased the management rights to a building,for a period of up to 25 years. Management rights is a business that enablescontract holders to undertake the roles of caretaker and letting agent for unitsin the rental pool. Management rights businesses often include the purchase ofa unit within the complex, usually on the first or ground floor, which they canchoose to reside in or not. As one respondent indicated,
“. . . an onsite manager has a much better awareness of who lives thereand who doesn’t and who should be coming and going and they justtake a real ownership in the place rather than – an offsite manageronly gets a phone call when something’s not working or somethinghas gone wrong” [I7].
However, contrary to some beliefs, a manager of a building is not responsiblefor the security of the building. They have the ability to consult with the bodycorporate or to engage security through a contract.
Second, hiring of security personnel was a distinct management strategy thatrespondents identified. As mentioned previously, if there was an onsite managerit was considered that dedicated security may only be required at night or duringpeak periods such as weekends and special events. As one respondent discussed, “Iwould make it mandatory to have a certain level of security within the complex.Such as, either regular security patrols or full time security depending on thecomplex” [I2]. However, once again hiring of dedicated security incurs costs.This respondent went on to note,
71

“. . . security’s the last thing that people worry about within the com-plex, they spend the whole money – the whole heap of money on care-taking, lawns, gardens, grounds, pools, repairs, fixing things. Thensecurity budget’s another $40,000 or $50,000 – that’s [unclear] take 10here or 20 there. That’s always the first thing to suffer, which affectsthe complex” I2].
Another respondent indicated that these costs factors could be overcome byworking in collaboration with neighbouring high-rise buildings. He stated,
“. . . it’s very cost prohibitive to have substantial security services perbuilding. So the idea is, we have buildings side by side, why don’tthey have a large service and we’re not actually paying 100 per centof the cost. We’re paying a portion of the cost” [I1].
The apportionment of costs and co-utilising of security services may enhanceresponse times, and provide an added perception that there is a dedicated fulltime security team in that location.
Third, a number of respondents identified the necessity for buildings to gointo lockdown at a certain time, usually of an evening. In discussing this, onerespondent highlighted,
“Like Circle on Cavill, it gets locked down at seven o’clock. It’salmost impossible as a visitor to get into that building, okay. Intercomsystems basically aren’t as effective if you’re not right next to theintercom system. Getting to the intercom system sometimes can behard if you’ve got a group of people hanging around a door and they’rereally struggling with trying to keep their building safe” [I1].
The problematic nature of mixed uses, residential and touristic, within the onebuilding provides challenges to locking down buildings. However, some buildingsduring major events have had to outlay additional costs on security personnel tomonitor and manage building lockdowns. They indicated that it was the onlyway they could ensure the safety of residents, occupants and the property itself.
Despite the management tools and techniques for security of high-rise build-ings in Surfers Paradise a number of challenges limit their effectiveness. First,police resourcing and powers are limited. As one body corporate manager indi-cated,
“. . . the police basically said our problem is that we don’t have the re-sources to look after this. When the special events on, you’re [buildingis] just going to be in the middle of it and we’re not going to respondany quicker to you. You get more security and look after yourself”[I1].
Queensland State budgetary pressures have further constrained police re-sources, with one respondent acknowledging,
72

“In Roma Street, in police headquarters, you used to have a commu-nity safety crime prevention branch but now they’ve chopped themdown. They’ve come down – they’ve got rid of the civilians andthey’ve now got three senior sergeants. One is in charge of Neigh-bourhood Watch, one is in charge of Crime Stoppers and the otherone is in charge of school-based police constables” [I6].
The positions and roles of the civilians working or consulting to the Queens-land Police Service through the Community Safety Crime Prevention Branchwere not renewed, placing further pressure on police officers and communities,particularly in attempting to proactively address high-rise safety and security.
“Then there’s the powers of the officers and then there’s the conve-nience of you have one arrested. You take three or four officers awayto go and process them, and then all of a sudden it’s open slatherbecause there’s less presence there. [I1]
One strategy that police use to overcome these resourcing issues has beenthrough education and external communication. One respondent discussed acommunity meeting, he stated
“We sent out as many as we could and said look, we’re going tohave this meeting. Come along, we’ll talk about high-rise security –because we haven’t got the scope to go into every building and dothe whole lot. So I did a high-rise crime prevention factsheet and wetalked just generally about building security, from cameras to lightingto control of access – checking tenants” [I6].
Embracing media technology also has potential, with another respondent in-dicating that going building to building, or door to door can be “. . . a bit of atime consuming process”. He went on to note “the police service only in the last12 months has got into the blogging world" [I8]. While the Queensland PoliceService has been lauded for its use of social media in disaster recovery, opportu-nity exists to enhance these forms of communication and education channels inthe future.
The second factor limiting the effectiveness of management practices is thestrata title legislation. Discussion abounded about the need for changes to stratatitle legislation, the Body Corporate and Community Management Act (BC-CMA) in Queensland. The Attorney General is currently reviewing a numberof aspects of the BCCMA. One recent change, which may influence perceptionsof safety within strata title buildings relates to pet ownership. Previously, manybodies corporate had specific bylaws in place that limited or banned pets in apart-ments. However, the Body Corporate Commissioner through the AdjudicatorsOffice has indicated that within reason a body corporate does not have the rightto limit an individual’s ownership of pets. As one respondent highlighted,
“I still say to senior citizens anytime – they’re the greatest safety assetyou’ll ever have – is a yapping little dog. I say to any senior – any
73

veteran – go and get yourself a little bloody dog. A little Jack Russell,a little foxie, a little bloody Chihuahua. It’s the best mate you’ll everhave. You’ve got the companionship and it will always tell you whensomeone is around. They bark” [I6].
Another respondent went on to state “. . . in insurance reports they say that thegreatest deterrent of criminals is the fact that there’s an animal on the property.Because they can’t sneak in and sneak out, because a pet’s got better hearingthan all of us” [I1].
The BCCMA currently legislates on the activities, roles and responsibilitiesof lot owners, bodies corporates, and committee members. However, as noted bya number of respondents there is no security obligations within the Act.
“You have mandatory obligations as a body corporate committee nowto provide indemnity insurance and having fire insurance and havingbuilding insurance and having – looking after pest control. You haveto do that, you can’t just not do it. As a committee it’s part of yourobligation. Why don’t you do the same with security? You need toprovide a certain level of community within these gated communitiesbased on a certain parameters, I would have thought” [I2].
Increasing jurisdictions throughout Australia are dealing within increasingdensities. Over the next 30 years the proportion of Australians living in stratatitle accommodation will dramatically increase (Easthope and Randolph, 2009).Therefore, many respondents indicated there was a need for improvements to thelegislation to cater for these responsibilities of keeping residents safe. Furtheropportunities exist for “. . . probably an industry body or an industry standardthat they could refer to, to bring themselves up to a standard” [I9].
6.2.7 Communication PortalsAnother strategy that was extensively discussed involved the need for greater,more transparent and honest communication. This communication was bothinternally within a building, between residents and managers, and externallywith other stakeholders. Opportunity exists for bodies corporates to take a lead.As one respondent noted,
“. . . communication portals have to be a part of the structure of thebody corporate. There’s a few programs that are running around atthe moment where basically you have this internal [notice board] thisportal, and people get to express their concerns and kind of it getssorted out and the real issues come out of that. I think it’s somethingthat we’re looking at to see whether that makes any difference” [I1].
Body corporate meetings can also provide an opportunity for owners to ex-change information. However, body corporates only includes lot owners and doesnot encompass tenants and particularly tourists. As one respondent acknowl-edged “some of them even potentially give out a little pack to the people, when
74
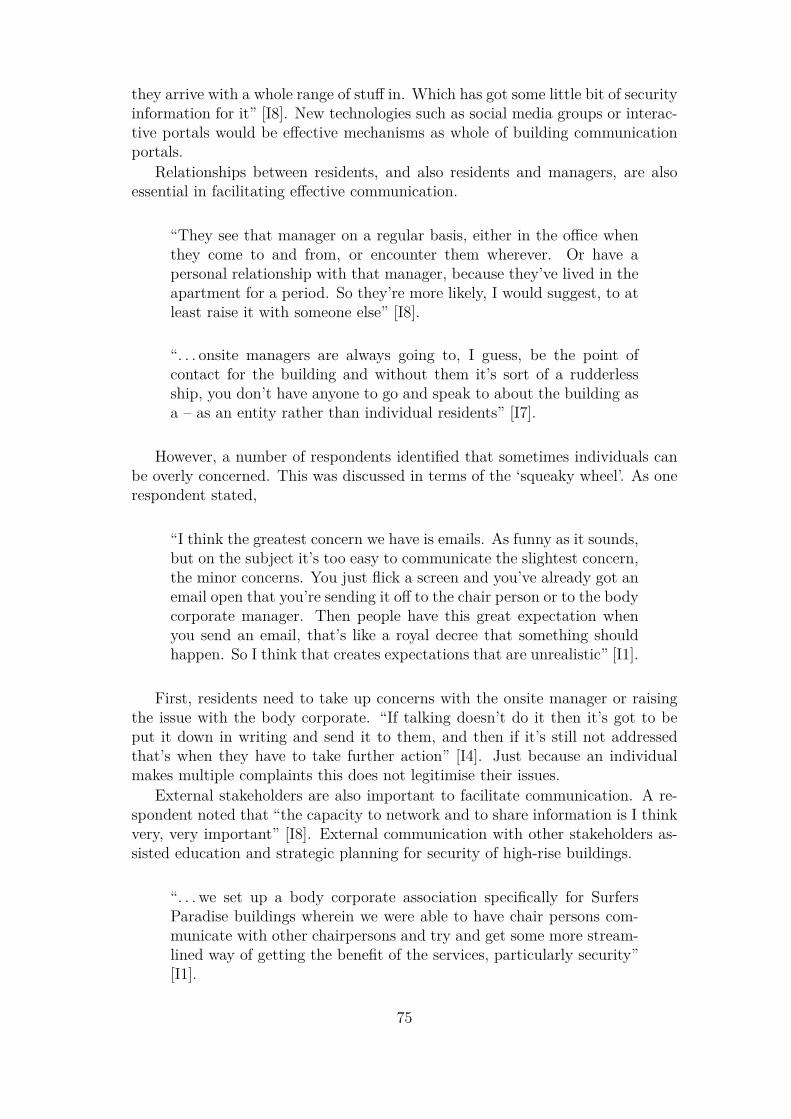
they arrive with a whole range of stuff in. Which has got some little bit of securityinformation for it” [I8]. New technologies such as social media groups or interac-tive portals would be effective mechanisms as whole of building communicationportals.
Relationships between residents, and also residents and managers, are alsoessential in facilitating effective communication.
“They see that manager on a regular basis, either in the office whenthey come to and from, or encounter them wherever. Or have apersonal relationship with that manager, because they’ve lived in theapartment for a period. So they’re more likely, I would suggest, to atleast raise it with someone else” [I8].
“. . . onsite managers are always going to, I guess, be the point ofcontact for the building and without them it’s sort of a rudderlessship, you don’t have anyone to go and speak to about the building asa – as an entity rather than individual residents” [I7].
However, a number of respondents identified that sometimes individuals canbe overly concerned. This was discussed in terms of the ‘squeaky wheel’. As onerespondent stated,
“I think the greatest concern we have is emails. As funny as it sounds,but on the subject it’s too easy to communicate the slightest concern,the minor concerns. You just flick a screen and you’ve already got anemail open that you’re sending it off to the chair person or to the bodycorporate manager. Then people have this great expectation whenyou send an email, that’s like a royal decree that something shouldhappen. So I think that creates expectations that are unrealistic” [I1].
First, residents need to take up concerns with the onsite manager or raisingthe issue with the body corporate. “If talking doesn’t do it then it’s got to beput it down in writing and send it to them, and then if it’s still not addressedthat’s when they have to take further action” [I4]. Just because an individualmakes multiple complaints this does not legitimise their issues.
External stakeholders are also important to facilitate communication. A re-spondent noted that “the capacity to network and to share information is I thinkvery, very important” [I8]. External communication with other stakeholders as-sisted education and strategic planning for security of high-rise buildings.
“. . . we set up a body corporate association specifically for SurfersParadise buildings wherein we were able to have chair persons com-municate with other chairpersons and try and get some more stream-lined way of getting the benefit of the services, particularly security”[I1].
75

“. . . it’s important that they do maintain a network between otherbuildings, because one building may become the victim to a partic-ular type of crime which is new or a method of gaining entry whichhasn’t really been used before and if they’ve got a network they canall. . . . . . identify that issue and then proactively start trying to miti-gate the risks of them being attacked. So if they all operate indepen-dently that’s not going to work very well” [I7].
However, it is challenging and time consuming “to distribute information be-cause it’s hard work, and because they turnover. The rights get sold or whatever”[I8]. As noted earlier, new technologies will be key to the future of external com-munication.
“I think there’s tremendous capability in terms of social networkingor social media to get our message out there. Where traditionally inthe old days, you had to walk door to door to door to door to door.That’s probably still a little bit of the thinking probably from some ofthe unit managers and some of the police. Whereas maybe technologycan get us around some of these issues or whatever” [I8].
Therefore, communication within and externally of buildings ensures thatresidents are aware of the actual risks to their safety and security. Communi-cating about effective strategies to mitigate these risks can reduce the need forthese communities to have to experience some of these issues first hand. How-ever, communication alone will not overcome these issues. Residents need to beeducated, with one respondent identifying,
“. . . it’s a difficult one because even if a resident is aware of it some-times they’ll be unwilling to do anything because it puts themselves– it compromises their own safety. So education is probably the key”[I7].
6.2.8 Individuals Taking ResponsibilityThe diversity of crime, as identified in Chapter 4, makes planning for and mit-igating a challenge. However, many of the respondents interviewed discussedopportunistic crime and noted that there was a need for individuals also to takeresponsibility and not rely solely on managers, bodies corporates, developers,security and police.
First, respondents identified that residents getting to know each other anddeveloping social bonds and ties facilitates a sense of community. A strong senseof community builds a shared responsibility to each other. As one respondentstated,
“. . . the fact that people have got to know each other in this buildingis very helpful. As I was saying, we have had for the last three yearswe have a monthly social, sometimes two monthly, and through thatpeople have formed friendships and bonded and know each other and
76
will look after each other and each other’s properties when necessaryand I think it’s very successful” [I11].
Developing those mutual bonds and social ties can be important to enhancingindividual’s perceptions of safety and security. However, in transient populationswith high turnover and individualistic societies this is extremely challenging todevelop. One respondent commented,
“you’d know this building has got a problem – the one that peopleare complaining about it. The rest of the people don’t even give ashit. What’s going on? As long as it doesn’t affect them – that’s theproblem. The reality is that one or two people have been affected ina building of 400 people so the rest of them don’t care” [I6].
Furthermore, the responsibility for personal safety and responsibility needsto be considered at an individual level. “We can’t go around and close yourdoors for you, you have to take responsibility for your own actions” [I3]. As onerespondent concluded,
“You can design things and do things so far, but ultimately it’s peopleinvolved. So you need to motivate those people to utilise any preven-tative aspects that are there, motivate them to use whatever thosepreventative aspects are” [I8].
Second, bodies corporates also must acknowledge the overall safety and secu-rity of the communities that they govern. Many bodies corporates have investedsignificantly in security systems and management strategies to represent theirduty of care to occupants within their buildings.
“The owners create the environment that they want within their high-rise. So it’s just not about structure it’s about people and it’s aboutthe mechanisms that they put in place. The strategies they put inplace to manage the clientele they decide to attract” [I9].
However, this is at a cost to lot owners. With such a high proportion ofabsentee or investor owners this is often a challenge to convince them that theyneed to invest in these systems. “I guess, all of this is coming back to how muchmoney they’re prepared to spend to create the environment that they want tohave surrounding that building” [I9].
Compounding this is, is the body corporate system generally. As one respon-dent acknowledged,
“Body corporates, just from our own experience here in this building,body corporates seem to be a very slow moving mechanism. Very slowto respond to anything. Very political. Yeah they’re not the way tomanage a building” [I10].
The political nature of governing strata title communities places a lot of pres-sure on lot owners and body corporate committees.
77

“We often get complaints about body corp committees and intrusionsor invasion of privacy, of stealing, of misappropriation and all thesesorts of things. So it’s just a minefield. It’s a complete minefield.I wouldn’t want to live in a unit complex purely because of beinggoverned by a body corp” [I10].
In an increasingly litigious society the role and responsibilities of bodies cor-porate in governing and managing large vertical communities may be beyond thescope and capabilities of existing lot owners. Greater transparency and inclusionof professional body corporate committee members may ease some of this burden.However, it is the responsibility of the body corporate “to provide a duty of carefor us. . . Otherwise they’ll be end up liable” [I2].
Third, in developing new high-rise apartment product the developer has aresponsibility to ensure the safety and security of future occupants. However,“developers will consider whatever the market considers important. If the marketis looking for something that is safe and secure, the developers will respond” [I5].Property developers are cost sensitive and market driven. That is developerswill create a visually appealing product at a price point that is demanded bythe market. If the market does not put a value on the additional features ofsafety and security, then it is unlikely a developer would include these in theirdevelopments. As one respondent stated,
“. . . a lot of buildings are built without those features in it, if anyfeatures at all. So we’ve got – on the Coast here – we’ve got a com-bination of, and no doubt other places, of reasonably old buildingsthat have been done. . . Some would be almost, I would suggest, notcost effective to upgrade to the standard that some of the most recentbuildings are. Because I imagine, at the end of the day, it comes downto a commercial decision. So I suppose the ultimate thing would beeffective planning in the design phase, which includes some of thosecrime prevention through environmental design principles” [I8].
The market purchasing these apartment products needs to drive the demandfor inclusion of these security features to enhance the perceptions of safety andsecurity for occupants.
6.3 SummaryPerceptions of safety and fear of crime are highly subjective. In Surfers Paradise, adisparity of views exists depending on the individual and also on their occupancytype. Permanent residents are more likely to have been exposed to ongoing mediareport of crime in the newspaper and through television. The demographics ofresidents also play a significant role, particularly due to the ageing nature ofresidents in the region. However, some residents may be lulled into a ‘false senseof security’ as a consequence of living in high-rise apartments.
Whilst a range of security features and management techniques have beenincorporated into vertical communities in Surfers Paradise, this does not always
78

correspond with decreasing levels of crime. Social amenity and opportunisticcrime abound. It is unlikely that these will be mitigated due to the nature ofSurfers Paradise, particularly the range of risky facilities present. Compoundingthis is the touristic nature of the region and the mix of resident and tourists withdiffering objectives residing within the same building. However, individuals needto take on some of the responsibility for their safety and security.
79


7 Discussion And Conclusions
7.1 Significance of the ResearchThe research reported in this project makes a unique contribution to criminologyand housing policy by adding to knowledge of crime in high-density strata-titlevertical communities. The value of this research is its analytical approach thatcombined five normally disparate focus areas. This research increases academicknowledge in the following ways:
1. this is the only study conducted in Australia focussing on high-rise residen-tial apartment complexes;
2. this study incorporates a multi-method approach to avoid privileging onemethod or data source;
3. this study focus on residential crime in a tourist destination; and
4. this study measured place management and guardianship in the same loca-tions concurrently.
The research project had three studies. Study One examined nearly sevenyears of recorded crime data and used quantitative methods to explore relation-ships between building type, housing tenure and distributions, and type of crimes.Study Two applied observational methods to investigate the relationship betweenplace management, active guardianship, territoriality and actual and perceivedcrime rates. Study Three adopted a qualitative approach in which primary stake-holders were interviewed to elicit information about crime and perceptions ofsafety. The mixture of these methods uncovered remarkable consistencies. For in-stance, Study Two established that locations with high place management and/orhigh guardianship were associated with the lower levels amounts of crime. Thesefindings were qualitatively confirmed in Study Three through the interviews withbuilding managers, police officers and residents. The perception of these stake-holders was that buildings with low territoriality experienced more crime thanother buildings was quantitatively supported.
While previous research has investigated high density public-housing in anAustralian context (Matka, 1997; Weatherburn et al., 1999), the unique blend ofresidents, tourists and businesses in this research sample provides fresh insightsinto a housing type predicted to experience rapid change over the next decade.The focus on residential crime in a tourist destination is unique. Crime preven-tion studies typically focus on crimes against tourists in public spaces (Brunt
81

et al., 2000; Lemieux and Felson, 2011). The contribution of this research addssubstantially to extant findings with its supplementary focus on a broader rangeof crimes. This feature of the research allows long-term residents greater capacityto consider real crime risks in a tourist hotspot. Not only does the current studyexamine crime risks, but it also takes a unique look at the inter-related dimen-sion of crime control at tourist destinations in the form of direct observations ofresidential guardianship and place management. In doing so, it allows for thefirst-time comparison of crime risk, residential tenure and directly observed placemanagement and residential guardianship.
The study blending place management and guardianship in the same locationscontributes to the previous literature by extending the usual unidimensional ap-proach. Accordingly, the findings reported here cast light on the previously un-explored relationship between these two controlling factors of routine activitytheory. Moreover, the relationship appears to be less than straightforward. Insome buildings there is a relationship between place management and guardian-ship, whereas in others there is no relationship. This observation, if generalisable,may require scholars to rethink the relationship between these two important andcentral constructs of routine activity theory.
A particular strength of this is research is the combination of strata-title in-quiry and criminology. Strata title literature rarely makes reference to crime,favouring a focus on governance. The criminological literature has considerableempirical evidence suggesting the volume of crime at locations is directly corre-lated with the effectiveness of place managers. The absence of crime preventionin the strata title literature seems an obvious and necessary gap to complete.
7.2 Limitations and Future DirectionsIt is important to highlight some of the limitations of the research. The con-straints of the project necessitated a cross-sectional design. The cross-sectionalapproach is good at establishing relationships between constructs provided theyremain stable over time. Should the value of variables change over time, longitu-dinal designs are consider more appropriate. Madensen (2007) outlines a dynamicmodel of place management in the context of licenced premises, whereby man-agement decisions are a result of previous crime and disorder problem, whichin turn impact future crime and disorder problems. While residential buildingmanagement is an under explored topic compared to bar management, Eck et al.(2010) notwithstanding, it seems likely a similar dynamic model of residentialplace management could operate. Place management decisions made today area response to yesterday’s crime problems. Extrapolating this view, then is thatideal place management is never a static set of processes and procedures.
In addition, the cross-sectional nature of the research means that the directionof causality is difficult to establish for the relationships examined. For example,place management and crime may display a positive correlation (i.e., high placemanagement for buildings with a high crime). Of itself, this may appear to becounterintuitive because it would be expected high levels of place managementto diminish opportunities for crime, all things being equal. However, this pre-
82

supposes the direction of the relationship, that management practices producelevels of crime. It is more likely that the level of crime instigates levels of placemanagement.
Similarly, apart from the duplicate measures to establish inter-rater reliabil-ity, each building was only visited once in Study Two. Conventionally, locationswould be visited on multiple occasions in order to purposively sample from therange of management and guardianship activities. In this research, it was de-termined that to gain a more representative sample of buildings in Surfers Par-adise more buildings should be included, but only visited once. It may be thatplace management and active guardianship are different on weekends comparedto weekdays, during daylight hours compared to nighttime hours
Measures of crime used in this report are from administrative data from QPS.It is acknowledged that these data are subject to a number of filters that skews thetrue measure of crime, something this research shares with the vast bulk of studiesthat examine the spatial distribution of crime. Nevertheless, this is an inevitablecompromise in research of this type given that victimisation surveys, generallyregarded as providing a more valid depiction of crime, would not be feasible inthis context. Regarding the survey in this research, the very low response ratefor the resident questionnaire suggests a massive degree of oversampling wouldbe required to achieve statistical power using a victimisation survey. In addition,this low response rate to the resident survey is disappointing, however, it doeshighlight the folly of trying to engage highly transient residential populations incommunity safety agenda.
The environmental variables captured in this report have been limited to theproperty parcel of the buildings. Eck et al. (2010) looked at the immediate envi-ronment of buildings (such as nearest public transport node, licensed premises).These variables were not included in the analysis due to restrictions in time avail-able.
While providing highly useful findings, this research could be extended andenhanced in four ways. First, taking account of the dynamic and responsivenature of place management, it seems further analysis of facility management isan appropriate extension to this research. While the current findings represent asnapshot of vertical communities and crime, building management practices andresidents’ attitudes are more likely in response to the history of victimisation andare likely to change over time. A different research design would be required toexplore this aspect of place management and guardianship.
Second, due to the restrictions on the recorded crime data, the distributionof crime within buildings has not been explored. Further, it will be useful tounpack why mixed tenure buildings had higher crime rates than short-term andlong-term tenure buildings. Is it that long-term residents in mixed tenure build-ings experience higher victimisation then their counterparts in long-term tenuredbuildings? Or do residents in mixed tenure buildings experience the elevated riskuniformly? If so, what explains the increased crime at these locations?
Third, Study Two revealed a curious and hitherto unexpected relationshipbetween place management and active guardianship. Given that these two con-structs have never been measured at the same location in the extant literature,it is difficult to speculate on the nature of their interaction, but this is an area
83

ripe for further research. Study Three provides some clues, namely that residentsliving on upper floors feel safer from crime than residents on lower, more physi-cally accessible, floors. It was expressed by some that residents feel that in thepresence of a place manager their personal responsibility for their protection iswaived.
Fourth, the research literature on strata title is conspicuously silent regard-ing crime. Building management generally have no obligations/responsibilitiesaround security. Body corporates are responsible for commissioning security pro-vision. From a criminological point of view this is a dangerous disconnect. Rou-tine activity theory suggests that place managers play a vital role in deterringcriminal opportunities, even without formal security responsibilities. The upkeepand image of buildings can play a role in reinforcing territoriality and naturalsurveillance opportunities for residents and building managers. This seems afruitful direction for development for strata title research.
7.3 Policy ImplicationsThe findings from this research inform policy development in the key areas ofcrime and tourism, and housing policy over the coming decade.
There are some obvious implications with respect to crime prevention arisingfrom this research. A surprising finding is that for the major crime types exploredwe found highly consistent patterns of concentration, whereby a small group ofbuildings were responsible for the majority of crimes. While rational choice theorysuggests analysis and prevention efforts should be highly crime specific (giventhe opportunity structure for crime is highly crime specific), our results imply abuildings-based approach to prevention might be more effective. It appears thatbuilding managers of short term and mixed tenure building are best placed toimpact the opportunity structure of crimes.
The obvious disconnect between responses to responsibility for safety withinbuildings needs to be addressed. To date, all lot owners on settlement of theirproperty become a member of the body corporate. The body corporate is re-sponsible for the day-to-day management and operation of a strata title scheme,making decisions and entering into contracts on behalf of lot owners to ensurethis occurs. While place management is one such contract, the terms and lengthof these contracts varies considerably depending on bodies’ corporate experienceand knowledge. The voluntary nature of self-governance and owner apathy ordisconnect to rental properties leads to identifying cost cutting measures, whichmay have longer term consequences on opportunities for crime to occur. BodyCorporate and Community Management Act legislation in Queensland needs tobe opened up to consultation regarding the responsibilities of managers and bod-ies corporate in providing suitable duty of care to residents. Specifically, clarityin terms of responsibility for security and crime needs to be addressed.
As many locations around Australia, and internationally, move towards acompact city approach with more people living in vertical communities, it isimportant that planners and developers are aware of this research. The perceivedsafety of “living the high life” needs to align with an individual’s ability to interact
84

socially and with a sense of security. Developing private enclaves that disconnectindividuals from each other will have negative social and communal consequences.Traditional policy approaches to communities need to adapt away from suburbansprawl and infrastructure provision so as to acknowledge the new communitiesthat millions of individuals are choosing to reside within.
While not the focus of this study, there are implications for the tourism indus-try arising from these findings. Surfers Paradise and the Gold Coast are interna-tionally recognised as tourist destinations. Mainstream media coverage of crimeproblems can have a drastic effect on local economies underpinned by tourism.The record high Australian dollar has made Australia an expensive destinationfor holidaymakers. Improving place management at locations likely to host crime(short-term and mixed term tenure buildings) will have a significant impact onthe reputation and enjoyment of tourists visiting Surfers Paradise. Tourism in-dustry stakeholders need to work in collaboration with crime prevention and localcouncil to assist in this endeavour.
Compounding this challenge is the legal obligation on place managers to ed-ucate short-term tenants about the building and potential safety and security.However, due to the nature of their tenure and their “holiday mode” many indi-viduals may be less conscious of their personal safety whilst in touristic locations,providing crime opportunities. Tourism industry, building managers and policeneed to work collaboratively in identifying solutions to educate and make shortterm tourists aware.
7.4 ConclusionThis research showed that a small number of buildings were responsible for host-ing the bulk of crimes, regardless of crime type or time of year. The relationshipbetween place management and active guardianship appears to be opaque in high-rise buildings, with some residents eschewing their guardianship responsibilitiesin the presence of building managers. Compounding this, there is a disconnectbetween the responsibilities of building manager and crime prevention/security.
Reform of strata title legislation is required in order to bridge the gap (betweenbuilding managers and body corporate), but also more research conducted intothe dynamics of effective and ineffective management.
85


A Supplementary Results from Study 1
A.1 J Curves for Building Tenure
A.2 J Curves for Building Height
A.3 J Curves for Temporal Patterns
87

Drug Offences − Long Term Residential
0
20
40
60
80
100
120
140
Drug Offences − Mixed Residential
0
20
40
60
80
100
120
140
Drug Offences − Short Term Residential
0
20
40
60
80
100
120
140
Figure A.1: J Curves of Drug Offences Offences Conditioned by Tenure
88
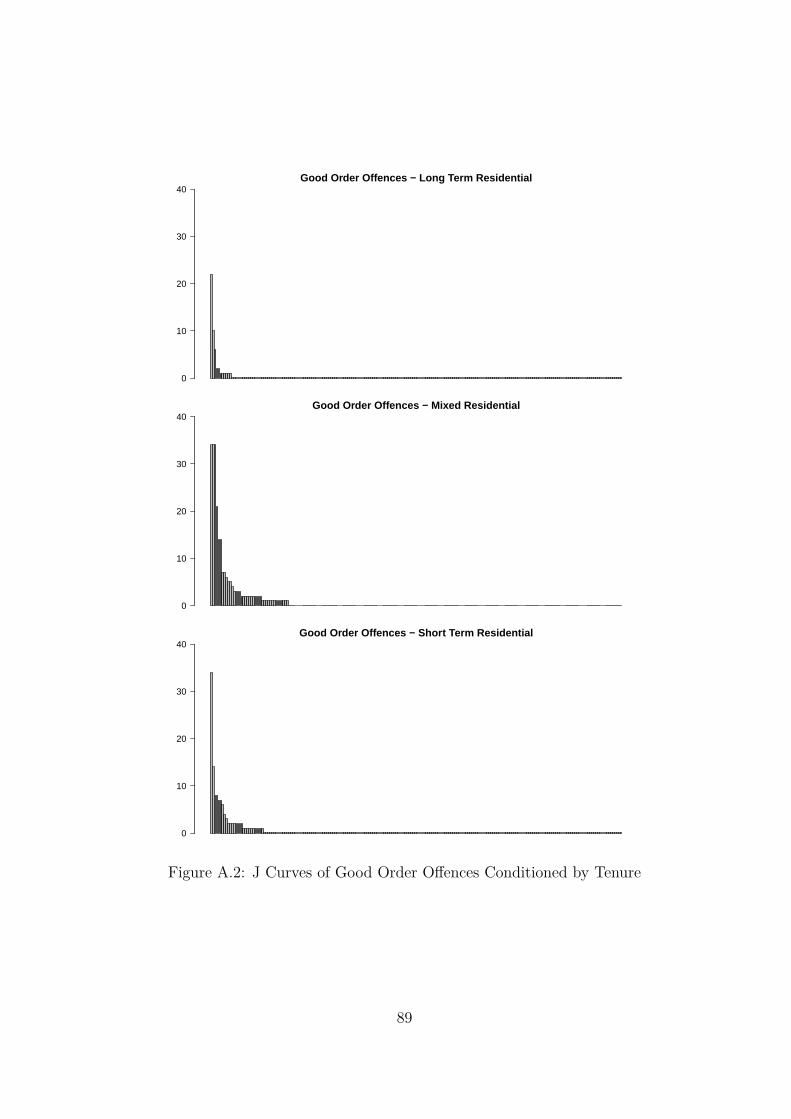
Good Order Offences − Long Term Residential
0
10
20
30
40
Good Order Offences − Mixed Residential
0
10
20
30
40
Good Order Offences − Short Term Residential
0
10
20
30
40
Figure A.2: J Curves of Good Order Offences Conditioned by Tenure
89

Unlawful Entry − Long Term Residential
0
20
40
60
80
Unlawful Entry − Mixed Residential
0
20
40
60
80
Unlawful Entry − Short Term Residential
0
20
40
60
80
Figure A.3: J Curves of Unlawful Entry Offences Conditioned by Tenure
90
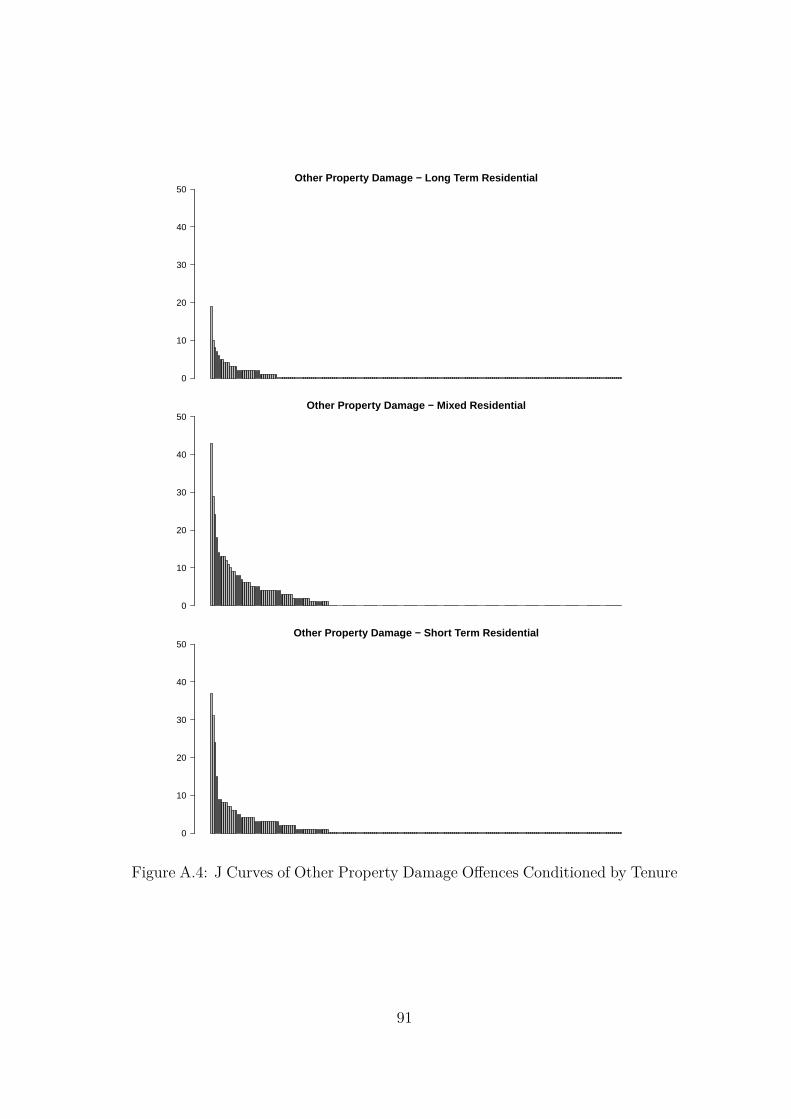
Other Property Damage − Long Term Residential
0
10
20
30
40
50
Other Property Damage − Mixed Residential
0
10
20
30
40
50
Other Property Damage − Short Term Residential
0
10
20
30
40
50
Figure A.4: J Curves of Other Property Damage Offences Conditioned by Tenure
91

Unlawful Entry With Intent − Dwelling − Long Term Residential
0
10
20
30
40
50
60
Unlawful Entry With Intent − Dwelling − Mixed Residential
0
10
20
30
40
50
60
Unlawful Entry With Intent − Dwelling − Short Term Residential
0
10
20
30
40
50
60
Figure A.5: J Curves of Unlawful Entry With Intent - Dwelling Offences Condi-tioned by Tenure
92

Assault − Long Term Residential
0
10
20
30
40
50
60
70
Assault − Mixed Residential
0
10
20
30
40
50
60
70
Assault − Short Term Residential
0
10
20
30
40
50
60
70
Figure A.6: J Curves of Assault Offences Conditioned by Tenure
93

Liquor (excl. Drunkenness) − Long Term Residential
0
20
40
60
80
Liquor (excl. Drunkenness) − Mixed Residential
0
20
40
60
80
Liquor (excl. Drunkenness) − Short Term Residential
0
20
40
60
80
Figure A.7: J Curves of Liquor (excl. Drunkenness) Offences Conditioned byTenure
94

Unlawful Use of Motor Vehicle − Long Term Residential
0
2
4
6
8
10
12
Unlawful Use of Motor Vehicle − Mixed Residential
0
2
4
6
8
10
12
Unlawful Use of Motor Vehicle − Short Term Residential
0
2
4
6
8
10
12
Figure A.8: J Curves of Unlawful Use of Motor Vehicle Offences Conditioned byTenure
95

Unlawful Entry With Intent − Other − Long Term Residential
0
2
4
6
8
10
12
Unlawful Entry With Intent − Other − Mixed Residential
0
2
4
6
8
10
12
Unlawful Entry With Intent − Other − Short Term Residential
0
2
4
6
8
10
12
Figure A.9: J Curves of Unlawful Entry With Intent - Other Offences Conditionedby Tenure
96
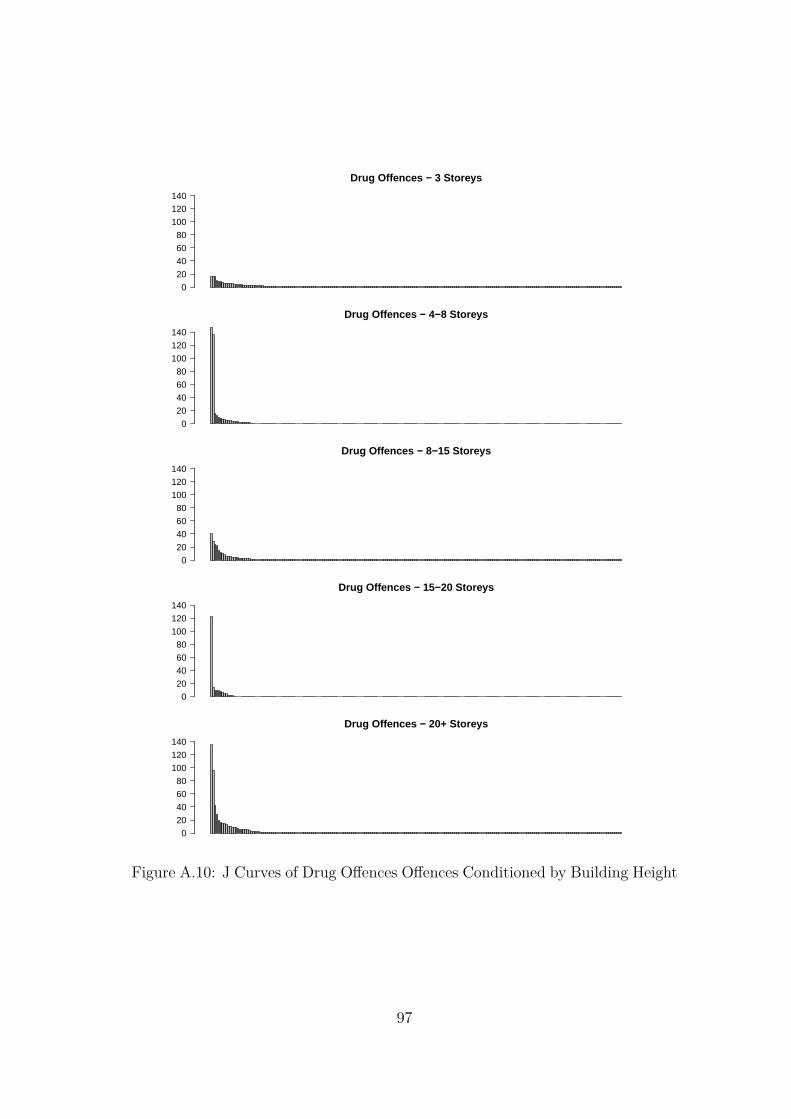
Drug Offences − 3 Storeys
0
20
40
60
80
100
120
140
Drug Offences − 4−8 Storeys
0
20
40
60
80
100
120
140
Drug Offences − 8−15 Storeys
0
20
40
60
80
100
120
140
Drug Offences − 15−20 Storeys
0
20
40
60
80
100
120
140
Drug Offences − 20+ Storeys
0
20
40
60
80
100
120
140
Figure A.10: J Curves of Drug Offences Offences Conditioned by Building Height
97

Good Order Offences − 3 Storeys
0
10
20
30
40
50
Good Order Offences − 4−8 Storeys
0
100
200
300
400
500
600
Good Order Offences − 8−15 Storeys
0
10
20
30
40
50
Good Order Offences − 15−20 Storeys
0
10
20
30
40
50
Good Order Offences − 20+ Storeys
0
10
20
30
40
50
Figure A.11: J Curves of Good Order Offences Conditioned by Building Height
98

Unlawful Entry − 3 Storeys
0
20
40
60
80
Unlawful Entry − 4−8 Storeys
0
20
40
60
80
Unlawful Entry − 8−15 Storeys
0
20
40
60
80
Unlawful Entry − 15−20 Storeys
0
20
40
60
80
Unlawful Entry − 20+ Storeys
0
20
40
60
80
Figure A.12: J Curves of Unlawful Entry Offences Conditioned by BuildingHeight
99

Other Property Damage − 3 Storeys
0
10
20
30
40
50
Other Property Damage − 4−8 Storeys
0
10
20
30
40
50
Other Property Damage − 8−15 Storeys
0
10
20
30
40
50
Other Property Damage − 15−20 Storeys
0
10
20
30
40
50
Other Property Damage − 20+ Storeys
0
10
20
30
40
50
Figure A.13: J Curves of Other Property Damage Offences Conditioned by Build-ing Height
100

Unlawful Entry With Intent − Dwelling − 3 Storeys
0
10
20
30
40
50
60
Unlawful Entry With Intent − Dwelling − 4−8 Storeys
0
10
20
30
40
50
60
Unlawful Entry With Intent − Dwelling − 8−15 Storeys
0
10
20
30
40
50
60
Unlawful Entry With Intent − Dwelling − 15−20 Storeys
0
10
20
30
40
50
60
Unlawful Entry With Intent − Dwelling − 20+ Storeys
0
10
20
30
40
50
60
Figure A.14: J Curves of Unlawful Entry With Intent - Dwelling Offences Con-ditioned by Building Height
101

Assault − 3 Storeys
0
20
40
60
80
Assault − 4−8 Storeys
0
20
40
60
80
Assault − 8−15 Storeys
0
20
40
60
80
Assault − 15−20 Storeys
0
20
40
60
80
Assault − 20+ Storeys
0
20
40
60
80
Figure A.15: J Curves of Assault Offences Conditioned by Building Height
102

Liquor (excl. Drunkenness) − 3 Storeys
0
20
40
60
80
Liquor (excl. Drunkenness) − 4−8 Storeys
0
20
40
60
80
Liquor (excl. Drunkenness) − 8−15 Storeys
0
20
40
60
80
Liquor (excl. Drunkenness) − 15−20 Storeys
0
20
40
60
80
Liquor (excl. Drunkenness) − 20+ Storeys
0
20
40
60
80
Figure A.16: J Curves of Liquor (excl. Drunkenness) Offences Conditioned byBuilding Height
103
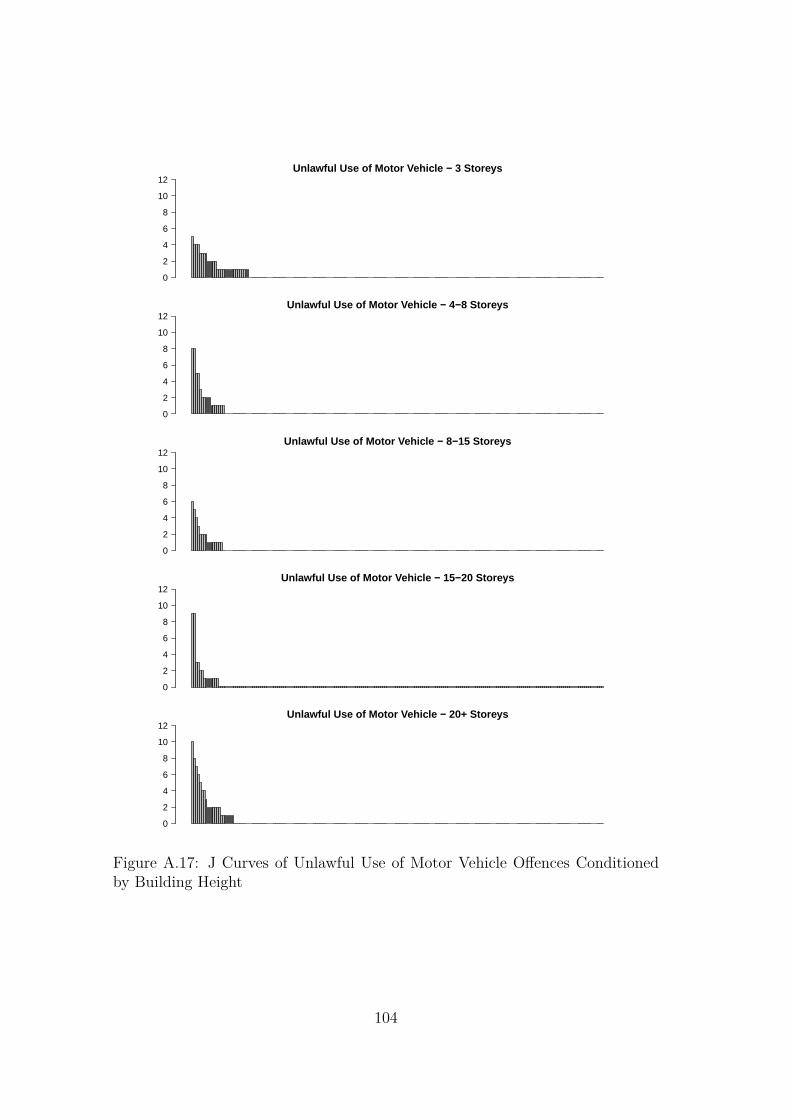
Unlawful Use of Motor Vehicle − 3 Storeys
0
2
4
6
8
10
12
Unlawful Use of Motor Vehicle − 4−8 Storeys
0
2
4
6
8
10
12
Unlawful Use of Motor Vehicle − 8−15 Storeys
0
2
4
6
8
10
12
Unlawful Use of Motor Vehicle − 15−20 Storeys
0
2
4
6
8
10
12
Unlawful Use of Motor Vehicle − 20+ Storeys
0
2
4
6
8
10
12
Figure A.17: J Curves of Unlawful Use of Motor Vehicle Offences Conditionedby Building Height
104

Unlawful Entry With Intent − Other − 3 Storeys
0
2
4
6
8
10
12
Unlawful Entry With Intent − Other − 4−8 Storeys
0
2
4
6
8
10
12
Unlawful Entry With Intent − Other − 8−15 Storeys
0
2
4
6
8
10
12
Unlawful Entry With Intent − Other − 15−20 Storeys
0
2
4
6
8
10
12
Unlawful Entry With Intent − Other − 20+ Storeys
0
2
4
6
8
10
12
Figure A.18: J Curves of Unlawful Entry With Intent - Other Offences Condi-tioned by Building Height
105

Drug Offences − 2005
0
2
4
6
8
10
12Drug Offences − 2006
0
1
2
3
4
5
6
7
Drug Offences − 2007
0
5
10
15
20
Drug Offences − 2008
0
5
10
15
20
25
30
Drug Offences − 2009
0
10
20
30
40
Drug Offences − 2010
0
5
10
15
20
25
30
Drug Offences − 2011
0
10
20
30
40
50
Drug Offences − 2012
0
5
10
15
20
25
30
Figure A.19: J Curves of Drug Offences Offences Conditioned by Year
106

Good Order Offences − 2005
0
5
10
15
20
25
30
Good Order Offences − 2006
0
10
20
30
40
50
Good Order Offences − 2007
0
20
40
60
80
100
120
Good Order Offences − 2008
0
20
40
60
80
100
120
140
Good Order Offences − 2009
0
20
40
60
80
100
120
Good Order Offences − 2010
0
20
40
60
80
100
120
Good Order Offences − 2011
0
20
40
60
80
100
Good Order Offences − 2012
0
10
20
30
40
50
60
70
Figure A.20: J Curves of Good Order Offences Conditioned by Year
107
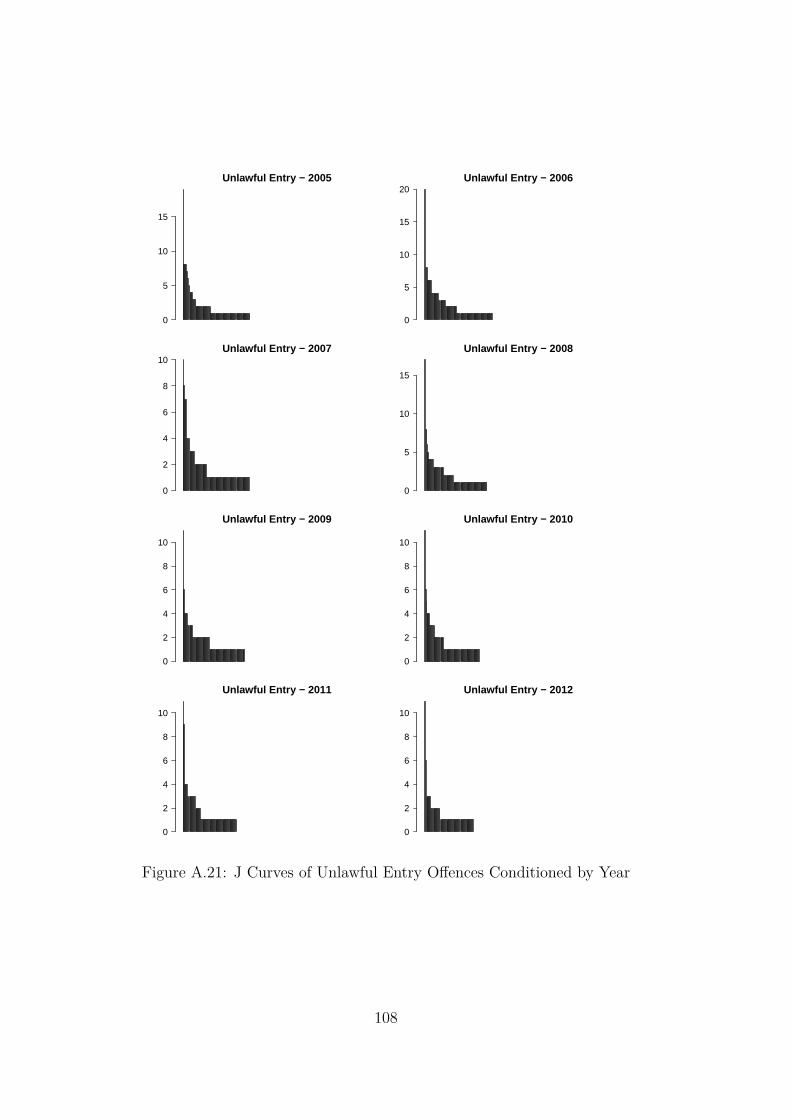
Unlawful Entry − 2005
0
5
10
15
Unlawful Entry − 2006
0
5
10
15
20
Unlawful Entry − 2007
0
2
4
6
8
10Unlawful Entry − 2008
0
5
10
15
Unlawful Entry − 2009
0
2
4
6
8
10
Unlawful Entry − 2010
0
2
4
6
8
10
Unlawful Entry − 2011
0
2
4
6
8
10
Unlawful Entry − 2012
0
2
4
6
8
10
Figure A.21: J Curves of Unlawful Entry Offences Conditioned by Year
108
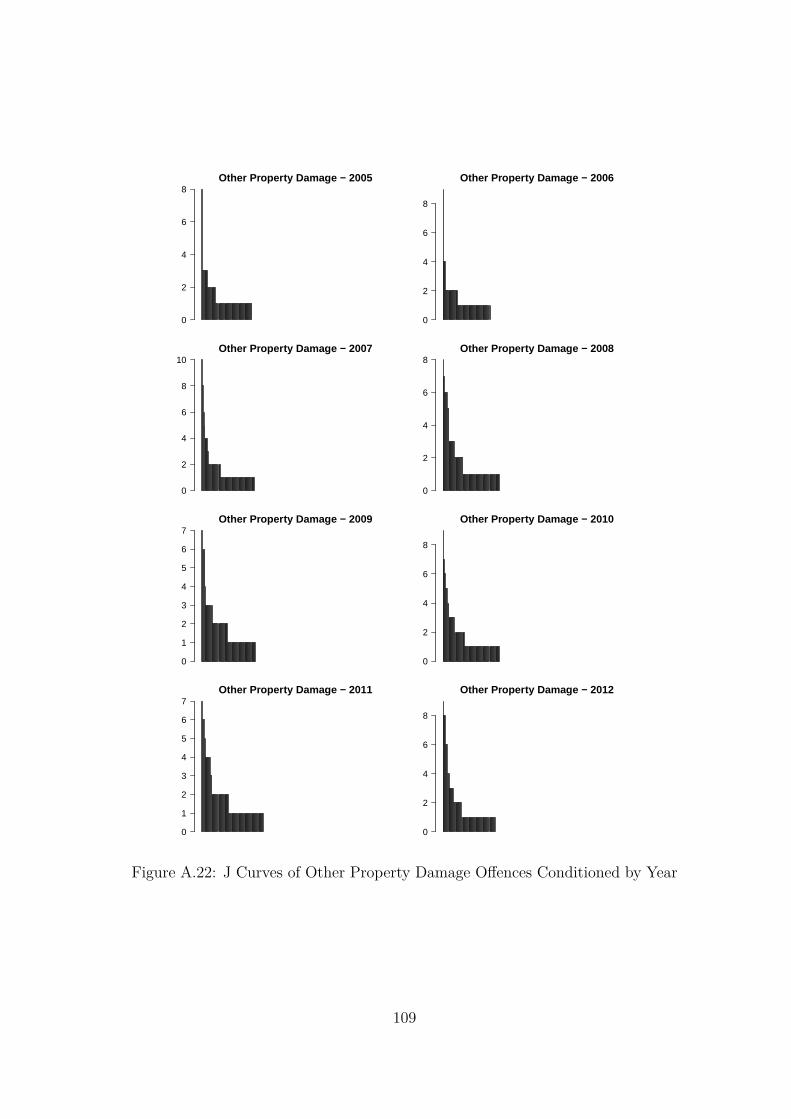
Other Property Damage − 2005
0
2
4
6
8Other Property Damage − 2006
0
2
4
6
8
Other Property Damage − 2007
0
2
4
6
8
10Other Property Damage − 2008
0
2
4
6
8
Other Property Damage − 2009
0
1
2
3
4
5
6
7Other Property Damage − 2010
0
2
4
6
8
Other Property Damage − 2011
0
1
2
3
4
5
6
7Other Property Damage − 2012
0
2
4
6
8
Figure A.22: J Curves of Other Property Damage Offences Conditioned by Year
109

Unlawful Entry With Intent − Dwelling − 2005
0
5
10
15
Unlawful Entry With Intent − Dwelling − 2006
0
5
10
15
Unlawful Entry With Intent − Dwelling − 2007
0
2
4
6
8
Unlawful Entry With Intent − Dwelling − 2008
0
2
4
6
8
10
12
Unlawful Entry With Intent − Dwelling − 2009
0
1
2
3
4
5
6
7Unlawful Entry With Intent − Dwelling − 2010
0
1
2
3
4
5
6
Unlawful Entry With Intent − Dwelling − 2011
0
2
4
6
8
Unlawful Entry With Intent − Dwelling − 2012
0
2
4
6
8
Figure A.23: J Curves of Unlawful Entry With Intent - Dwelling Offences Con-ditioned by Year
110
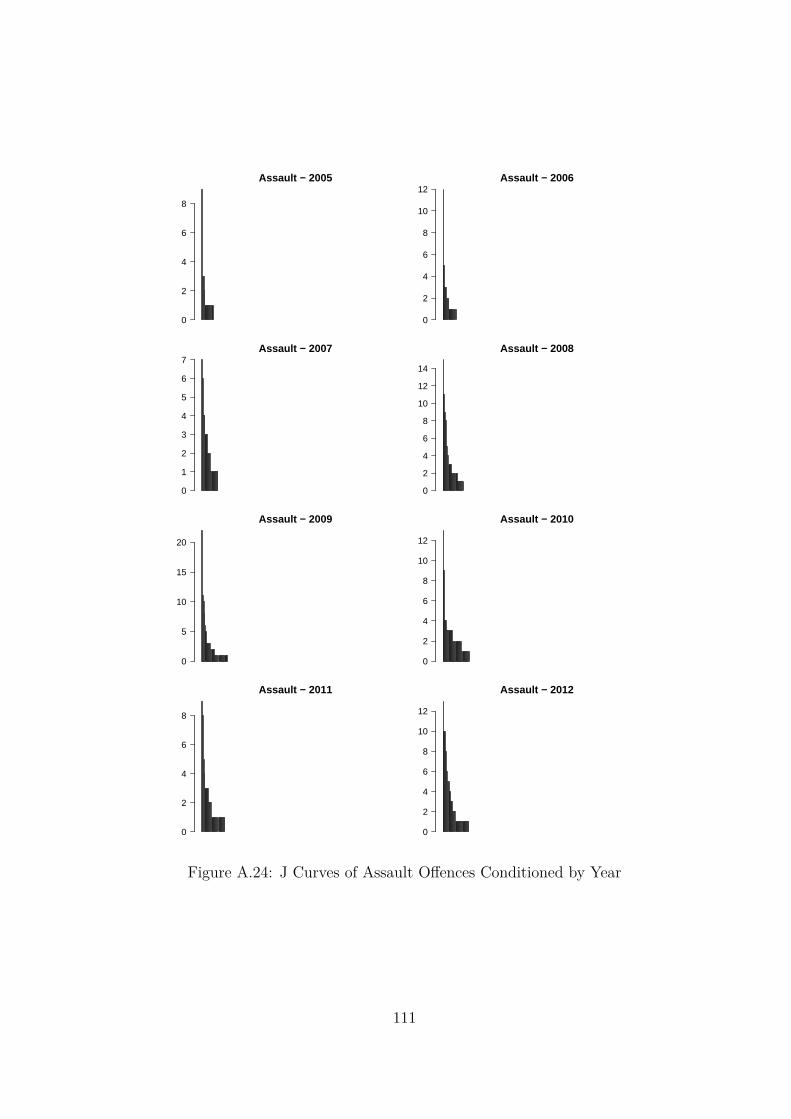
Assault − 2005
0
2
4
6
8
Assault − 2006
0
2
4
6
8
10
12
Assault − 2007
0
1
2
3
4
5
6
7Assault − 2008
0
2
4
6
8
10
12
14
Assault − 2009
0
5
10
15
20
Assault − 2010
0
2
4
6
8
10
12
Assault − 2011
0
2
4
6
8
Assault − 2012
0
2
4
6
8
10
12
Figure A.24: J Curves of Assault Offences Conditioned by Year
111

Liquor (excl. Drunkenness) − 2005
0.0
0.5
1.0
1.5
2.0Liquor (excl. Drunkenness) − 2006
0.0
0.2
0.4
0.6
0.8
1.0
Liquor (excl. Drunkenness) − 2007
0
2
4
6
8Liquor (excl. Drunkenness) − 2008
0
10
20
30
40
Liquor (excl. Drunkenness) − 2009
0
5
10
15
Liquor (excl. Drunkenness) − 2010
0
1
2
3
4
5
6
7
Liquor (excl. Drunkenness) − 2011
0
1
2
3
4
5Liquor (excl. Drunkenness) − 2012
0
2
4
6
8
10
Figure A.25: J Curves of Liquor (excl. Drunkenness) Offences Conditioned byYear
112

Unlawful Use of Motor Vehicle − 2005
0.0
0.5
1.0
1.5
2.0Unlawful Use of Motor Vehicle − 2006
0
1
2
3
4
Unlawful Use of Motor Vehicle − 2007
0.0
0.5
1.0
1.5
2.0
2.5
3.0Unlawful Use of Motor Vehicle − 2008
0.0
0.5
1.0
1.5
2.0
Unlawful Use of Motor Vehicle − 2009
0.0
0.5
1.0
1.5
2.0
2.5
3.0Unlawful Use of Motor Vehicle − 2010
0.0
0.5
1.0
1.5
2.0
2.5
3.0
Unlawful Use of Motor Vehicle − 2011
0.0
0.5
1.0
1.5
2.0
2.5
3.0Unlawful Use of Motor Vehicle − 2012
0.0
0.5
1.0
1.5
2.0
2.5
3.0
Figure A.26: J Curves of Unlawful Use of Motor Vehicle Offences Conditionedby Year
113

Unlawful Entry With Intent − Other − 2005
0.0
0.5
1.0
1.5
2.0Unlawful Entry With Intent − Other − 2006
0
1
2
3
4
Unlawful Entry With Intent − Other − 2007
0
1
2
3
4Unlawful Entry With Intent − Other − 2008
0
1
2
3
4
5
Unlawful Entry With Intent − Other − 2009
0.0
0.5
1.0
1.5
2.0Unlawful Entry With Intent − Other − 2010
0
1
2
3
4
5
Unlawful Entry With Intent − Other − 2011
0
1
2
3
4
5Unlawful Entry With Intent − Other − 2012
0.0
0.5
1.0
1.5
2.0
2.5
3.0
Figure A.27: J Curves of Unlawful Entry With Intent - Other Offences Condi-tioned by Year
114

115

B Observational Protocol
Crime in High rise Buildings on GC - Apartment Observation Checklist
2012
1
Apartment Name: _________________________________________ Apartment Address: _________________________________________ Date: ___________________ Time – Beginning: __________ Time – Ending: ________ Street Block on which Apartment Complex Located Street Block Facilities: Apartment Complex Single Family Home Duplex (2 family) (check all that apply) Retail Shop Store (convenience, grocery) Gas Station
Restaurant Bar Nightclub Public Transportation Node Church Hospital School Warehouse/Industrial Offices Park/Green Space Parking Lot Empty Lot Abandoned Building Police Building Other_____________________________________________ Activity Level Pedestrian flow (per 3 minutes): ________________________________ Flow of cyclists (per minutes): _______________________________ Traffic flow (per minutes): __________________________________ Apartment Complex Territoriality: # of Apartment Buildings Onsite_____________ Retail Establishments below Complex: Yes No Offices below Complex: Yes No People loitering outside Complex: Yes No Complex Access: Inaccessible (no openings) Partially Enclosed (check all that apply) Resident Only Completely Accessible Complex Barrier: No Barrier Wall Fence (check all that apply)
Shrubbery Gate Other _____________ Barrier Height No barrier Low (comfortable sitting height, 2-3 ft.) Moderate (easy to see over, 4-5 feet) High (5-6 ft.) Fortressing (over 7 feet)
116

Crime in High rise Buildings on GC - Apartment Observation Checklist
2012
2
Odour: Neutral Unpleasant Outdoor Seating: Yes No # Broken Seats_______ Landscaping: Yes No (incl. flowerbeds/neat hedges) Overgrown Grass/Weeds: Yes No No Green Space Decorations: Yes No Property signs/ Nameplates: Yes No Type of Signage: Apartment Name Vacancy No Soliciting/Loitering No Trespassing (check all that apply) Surveillance Warning Parking Rules Other__________________ Belongings Left Outside: Yes No #_______ (eg. Bikes, towels etc) Swimming Pool/Jacuzzi: Yes No Secured Entrance: Yes No Don’t Know/NA
In Need of Maintenance: Yes No Don’t Know/NA Number of Units Overlooking:____________
Gym/Sauna: Yes No Secured Entrance: Yes No Don’t Know/NA
In Need of Maintenance: Yes No Don’t Know/NA Number of Units Overlooking:____________
Picnic Area: Yes No Secured Entrance: Yes No Don’t Know/NA (incl. grills, picnic tables) In Need of Maintenance: Yes No Don’t Know/NA
Number of Units Overlooking:____________ Communal Trash Areas: Neat Overflowing/Untidy Don’t Know/NA
Number of Units Overlooking:____________ Image/Maintenance: Litter: Yes No # items_______ (size: palm of hand +) Alcohol Containers: Yes No # items_______ Large Junk Items: Yes No # items_______ (eg. old tires, appliances) Graffiti: Yes No (size: palm of hand +) Drug Paraphernalia: Yes No (eg. syringes) #Lighting Fixtures around Complex Perimeter:_______ #Broken_______ #Lighting Fixtures at Complex Entrance(s):_______ #Broken________ #Potholes in Complex:________
117
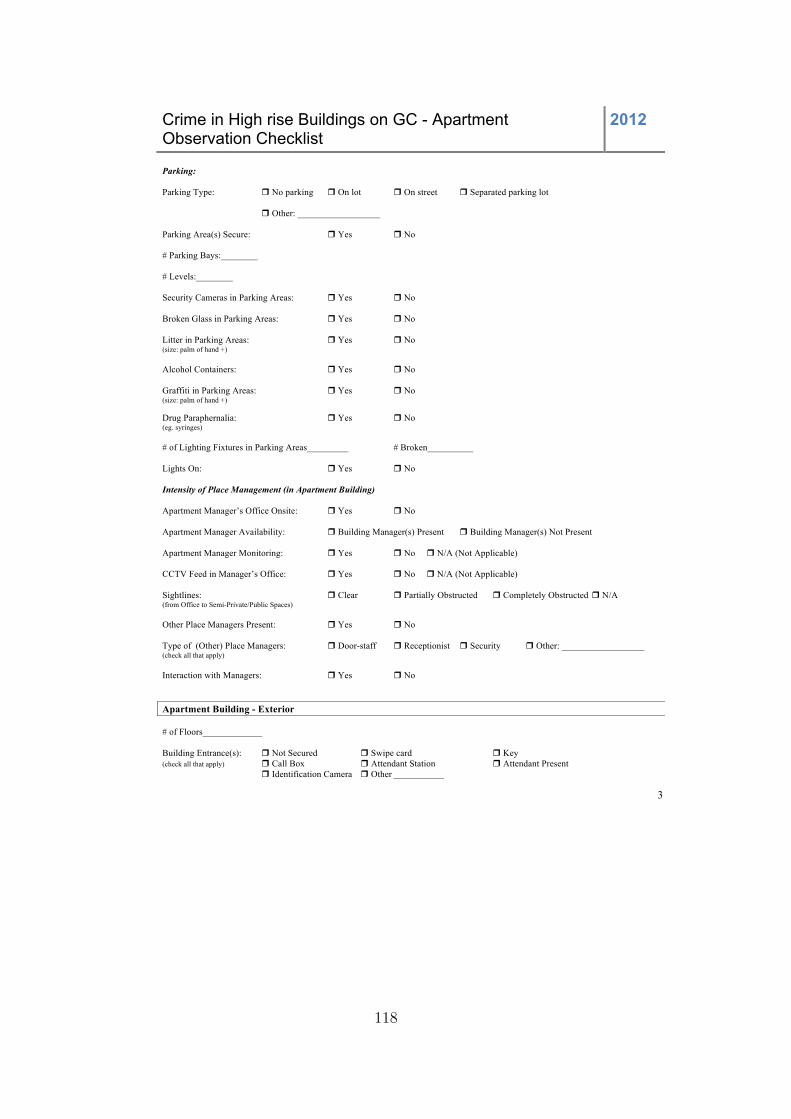
Crime in High rise Buildings on GC - Apartment Observation Checklist
2012
3
Parking: Parking Type: No parking On lot On street Separated parking lot Other: __________________ Parking Area(s) Secure: Yes No # Parking Bays:________ # Levels:________ Security Cameras in Parking Areas: Yes No Broken Glass in Parking Areas: Yes No Litter in Parking Areas: Yes No (size: palm of hand +) Alcohol Containers: Yes No Graffiti in Parking Areas: Yes No (size: palm of hand +) Drug Paraphernalia: Yes No (eg. syringes) # of Lighting Fixtures in Parking Areas_________ # Broken__________ Lights On: Yes No Intensity of Place Management (in Apartment Building) Apartment Manager’s Office Onsite: Yes No Apartment Manager Availability: Building Manager(s) Present Building Manager(s) Not Present Apartment Manager Monitoring: Yes No N/A (Not Applicable) CCTV Feed in Manager’s Office: Yes No N/A (Not Applicable) Sightlines: Clear Partially Obstructed Completely Obstructed N/A (from Office to Semi-Private/Public Spaces) Other Place Managers Present: Yes No Type of (Other) Place Managers: Door-staff Receptionist Security Other: __________________ (check all that apply) Interaction with Managers: Yes No Apartment Building - Exterior # of Floors_____________ Building Entrance(s): Not Secured Swipe card Key (check all that apply) Call Box Attendant Station Attendant Present
Identification Camera Other ___________
118
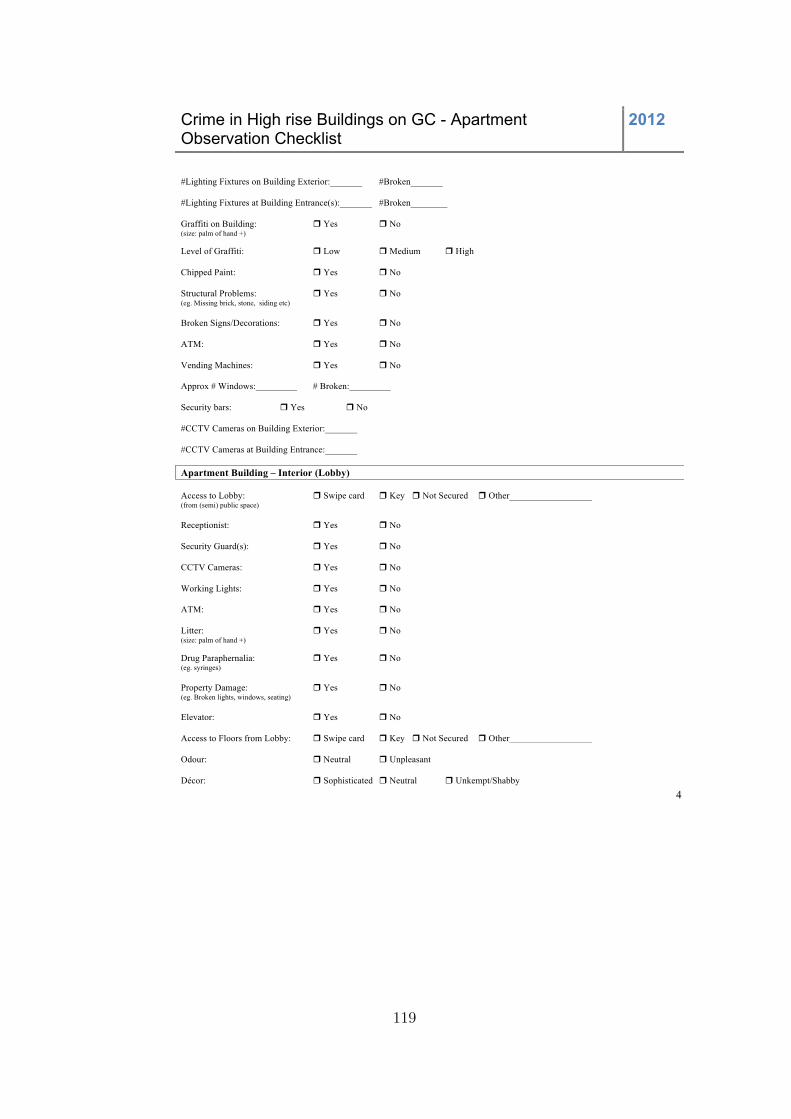
Crime in High rise Buildings on GC - Apartment Observation Checklist
2012
4
#Lighting Fixtures on Building Exterior:_______ #Broken_______ #Lighting Fixtures at Building Entrance(s):_______ #Broken________ Graffiti on Building: Yes No (size: palm of hand +) Level of Graffiti: Low Medium High Chipped Paint: Yes No Structural Problems: Yes No (eg. Missing brick, stone, siding etc) Broken Signs/Decorations: Yes No ATM: Yes No Vending Machines: Yes No Approx # Windows:_________ # Broken:_________ Security bars: Yes No #CCTV Cameras on Building Exterior:_______ #CCTV Cameras at Building Entrance:_______ Apartment Building – Interior (Lobby) Access to Lobby: Swipe card Key Not Secured Other__________________ (from (semi) public space) Receptionist: Yes No Security Guard(s): Yes No CCTV Cameras: Yes No Working Lights: Yes No ATM: Yes No Litter: Yes No (size: palm of hand +) Drug Paraphernalia: Yes No (eg. syringes) Property Damage: Yes No (eg. Broken lights, windows, seating) Elevator: Yes No Access to Floors from Lobby: Swipe card Key Not Secured Other__________________ Odour: Neutral Unpleasant Décor: Sophisticated Neutral Unkempt/Shabby
119
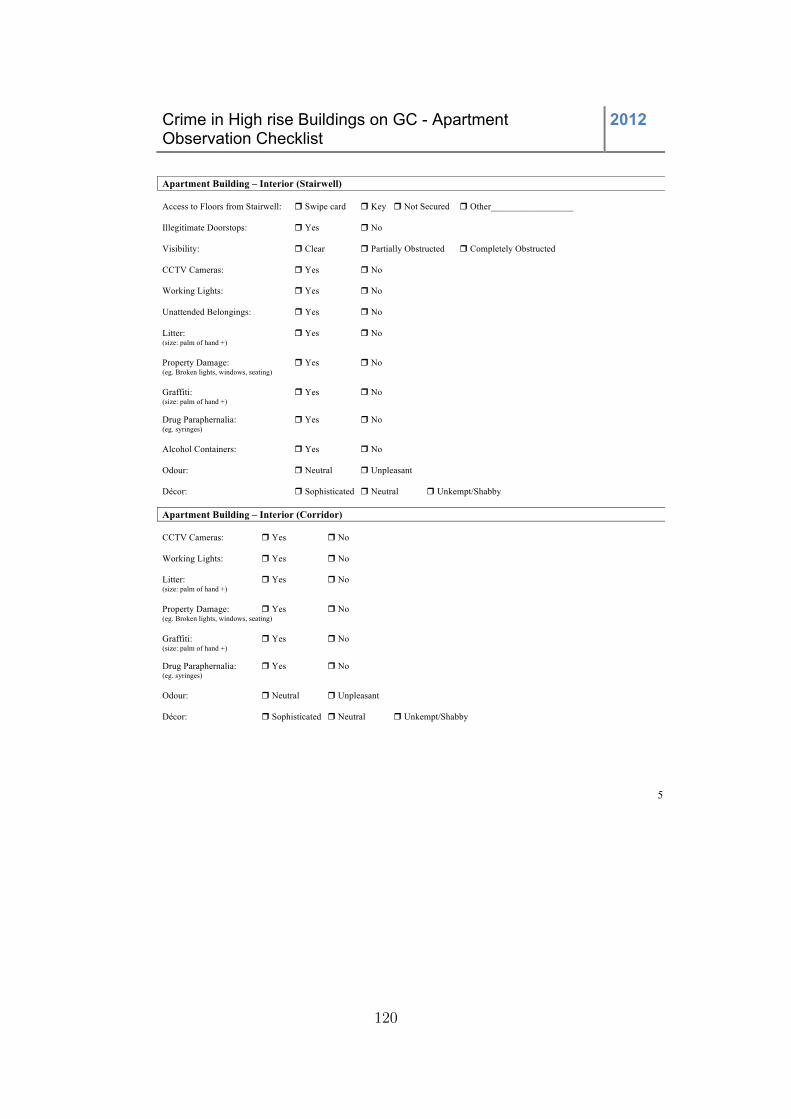
Crime in High rise Buildings on GC - Apartment Observation Checklist
2012
5
Apartment Building – Interior (Stairwell) Access to Floors from Stairwell: Swipe card Key Not Secured Other__________________ Illegitimate Doorstops: Yes No Visibility: Clear Partially Obstructed Completely Obstructed CCTV Cameras: Yes No Working Lights: Yes No Unattended Belongings: Yes No Litter: Yes No (size: palm of hand +) Property Damage: Yes No (eg. Broken lights, windows, seating) Graffiti: Yes No (size: palm of hand +) Drug Paraphernalia: Yes No (eg. syringes) Alcohol Containers: Yes No Odour: Neutral Unpleasant Décor: Sophisticated Neutral Unkempt/Shabby Apartment Building – Interior (Corridor) CCTV Cameras: Yes No Working Lights: Yes No Litter: Yes No (size: palm of hand +) Property Damage: Yes No (eg. Broken lights, windows, seating) Graffiti: Yes No (size: palm of hand +) Drug Paraphernalia: Yes No (eg. syringes) Odour: Neutral Unpleasant Décor: Sophisticated Neutral Unkempt/Shabby
120

Crime in High rise Buildings on GC - Apartment Observation Checklist
2012
6
Apartment Units # of Units____________ # front door locks on each unit___________ Type of front door locks: Electronic/key Knob/key Deadbolt Other_________ Don’t Know (check all that apply) Strike Guard # windows per unit_________ Consistent: Yes No Broken Windows: Yes No Boarded up Windows: Yes No Sightlines: Clear Partially Obstructed Completely Obstructed N/A (from Units to Semi-Private/Public Spaces) Units have: Peepholes Individual patios/balconies (check all that apply) Guardianship Intensity # Visibly Occupied Units_________ # Units with Occupants Monitoring________ # Units with Occupants who Intervene_________ Other Comments _________________________________________________________________________________________________________________________________________________________________________________________________________________________________________________________________________________________________________________________________________________________________________________________________________________________________________________________________________________________________________________________________________________________________
121


C Apartment Complex Crime ControlIndicator Scores
123

TableC.1:Apa
rtmentCom
plex
Crim
eCon
trol
IndicatorSc
ores
Apa
rtmentNam
eMan
agem
ent
Gua
rdianship
Imag
eBarrie
rsSign
age
CCTV
Ligh
ting
Mad
isonPo
int
33
52
2.27
.67
Seacrest
32
53
3.71
1.57
Surf
Regen
cy3
25
22
.14
.21
Trilo
gy3
25
22
.10
.5The
Dorchester
32
54
3.06
.47
SurfersPa
radise
Beach
Units
32
52
2.00
.17
Break
Free
Impe
rialS
urfR
esort
32
32
4.05
1.15
Sunset
Island
ResortApa
rtments
32
23
2.33
2.00
Tikiv
illag
e3
21
22
.44
4.11
The
Beaches
31
51
3.18
.46
Zenith
Apa
rtments
31
52
3.14
.23
The
EmeraldSu
rfersPa
radise
31
53
2.13
.63
Cap
ricornOne
31
52
2.13
.21
Internationa
lBeach
Resort
31
52
2.09
.55
One
Beachfron
tHoliday
Apa
rt-
ments
31
52
2.06
.94
Peninsula
31
53
3.04
1.53
Kup
ariB
outiq
ueApa
rtments
31
53
3.00
1.00
Ancho
rDow
nApa
rtments
31
52
3.00
1.33
Carlto
nHoliday
Apa
rtments
31
52
1.00
2.14
Edgewater
Garde
ns3
13
33
.24
1.06
Grosven
orApa
rtments
31
32
3.07
.33
Trickett
Garde
ns3
05
21
.67
3.00
The
ShoreHoliday
Apa
rtments
30
52
2.27
.60
WatermarkHotel
30
53
3.10
1.95
Con
tinue
don
next
page
124

Tab
leC.1
–continue
dfrom
pre-
viou
spa
geApa
rtmentNam
eMan
agem
ent
Gua
rdianship
Imag
eBarrie
rsSign
age
CCTV
Ligh
ting
Soul
30
51
1.09
.34
Q2
30
51
3.09
.96
Mon
teCarlo
30
50
1.08
1.50
SurfersCentury
30
52
1.07
.21
SurfersPlazaResort
30
52
3.07
3.87
The
Grand
Cha
ncellor
30
51
1.06
.91
Q1
30
52
4.03
.10
The
MoroccanView
Tower
Resort
30
54
2.02
.53
SurfersMay
fair
30
53
1.00
Vibe
30
33
3.20
.25
SurfersInternationa
l3
03
21
.05
.00
Prom
enad
eApa
rtments
30
31
1.00
Pacific
Plaza
30
34
2.
9.00
Beach
Lodg
eBeachfron
tApa
rt-
ments
22
53
41.00
1.00
SunTo
wer
Holiday
Apa
rtments
22
53
3.50
.50
Island
erResortHotel
22
53
4.08
1.58
Beachcombe
rResort
22
52
3.06
1.29
LeChe
lsea
22
52
1.00
.67
StTr
opez
22
31
31.67
1.67
Bay
Lodg
eApa
rtments
21
52
31.33
1.00
KResort
21
54
3.33
.33
Durha
mCou
rt2
15
21
.17
.83
Australis
Sovereign
21
52
2.11
1.67
Bah
ia2
15
32
.08
.23
Con
tinue
don
next
page
125
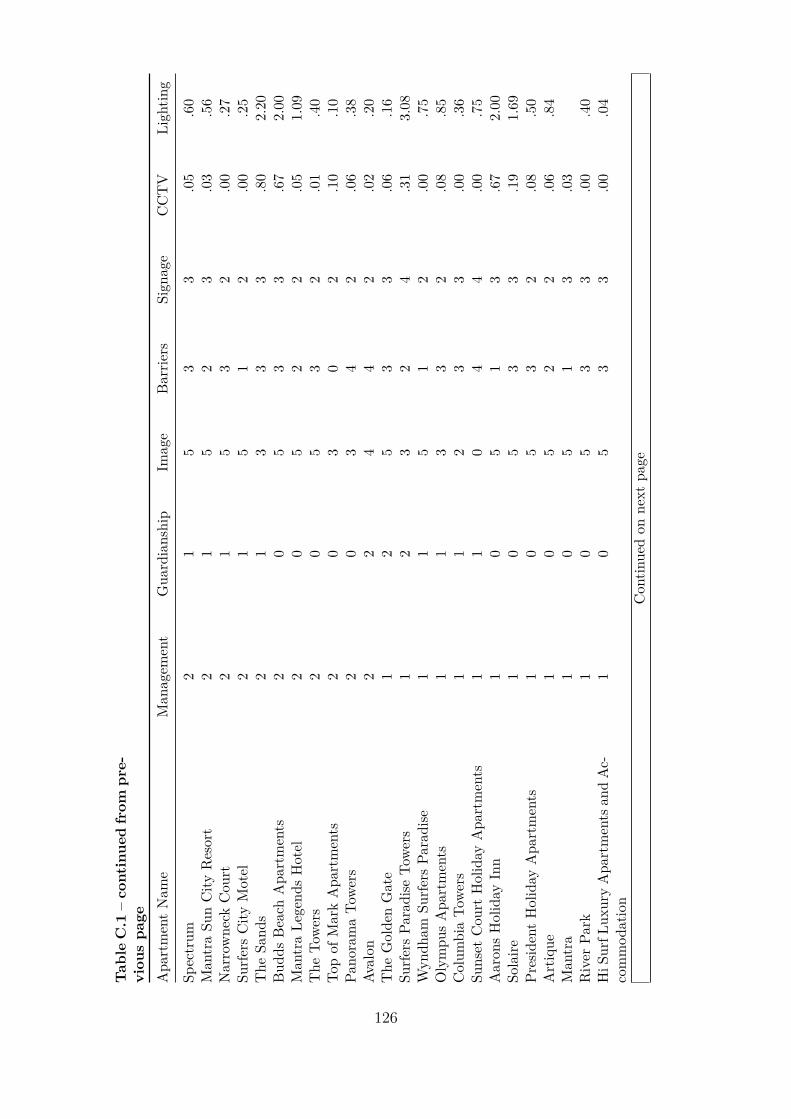
Tab
leC.1
–continue
dfrom
pre-
viou
spa
geApa
rtmentNam
eMan
agem
ent
Gua
rdianship
Imag
eBarrie
rsSign
age
CCTV
Ligh
ting
Spectrum
21
53
3.05
.60
Man
traSu
nCity
Resort
21
52
3.03
.56
Narrowne
ckCou
rt2
15
32
.00
.27
SurfersCity
Motel
21
51
2.00
.25
The
Sand
s2
13
33
.80
2.20
Bud
dsBeach
Apa
rtments
20
53
3.67
2.00
Man
traLe
gend
sHotel
20
52
2.05
1.09
The
Towers
20
53
2.01
.40
Topof
MarkApa
rtments
20
30
2.10
.10
Pano
ramaTo
wers
20
34
2.06
.38
Avalon
22
44
2.02
.20
The
Golde
nGate
12
53
3.06
.16
SurfersPa
radise
Towers
12
32
4.31
3.08
Wyn
dham
SurfersPa
radise
11
51
2.00
.75
Olympu
sApa
rtments
11
33
2.08
.85
Colum
biaTo
wers
11
23
3.00
.36
Sunset
Cou
rtHoliday
Apa
rtments
11
04
4.00
.75
Aaron
sHoliday
Inn
10
51
3.67
2.00
Solaire
10
53
3.19
1.69
PresidentHoliday
Apa
rtments
10
53
2.08
.50
Artique
10
52
2.06
.84
Man
tra
10
51
3.03
River
Park
10
53
3.00
.40
HiS
urfL
uxuryApa
rtments
andAc-
commod
ation
10
53
3.00
.04
Con
tinue
don
next
page
126

Tab
leC.1
–continue
dfrom
pre-
viou
spa
geApa
rtmentNam
eMan
agem
ent
Gua
rdianship
Imag
eBarrie
rsSign
age
CCTV
Ligh
ting
Qua
rterde
ckHoliday
Apa
rtments
10
52
2.00
.46
Pacific
Point
10
52
1.00
.00
Cop
acab
anaApa
rtments
10
51
1.00
2.00
Hilton
1.
51
0.09
.33
Martin
ique
03
53
1.00
1.00
PointBen
nelong
02
53
1.17
1.33
The
Dolph
ins
02
53
3.00
1.00
Narrowne
ckLo
dge
02
52
1.00
2.67
Mariner
View
02
51
1.00
.28
Mab
rouk
a0
25
20
.00
.75
Kinka
bool
02
30
3.11
.22
Impa
la0
21
12
.00
.75
Cyp
ress
Avenue
Apa
rtments
01
52
11.67
3.00
The
Lodg
e0
15
22
.33
.33
Ang
leseaCou
rtBeachfron
t0
15
21
.33
.33
Aloha
Holiday
Apa
rtments
01
52
3.06
.81
Kurrawon
g0
15
41
.00
.67
Holbo
row
Place
01
53
1.00
.50
Mon
aco
01
52
1.00
.00
38Cav
ill0
15
11
.00
4.20
Riverbe
ndApa
rtments
01
51
1.00
.33
Reema
01
52
0.00
.00
SurfersDel
Ray
01
34
2.33
2.33
Lima
01
32
2.00
1.67
Majorca
01
31
1.00
.25
Con
tinue
don
next
page
127
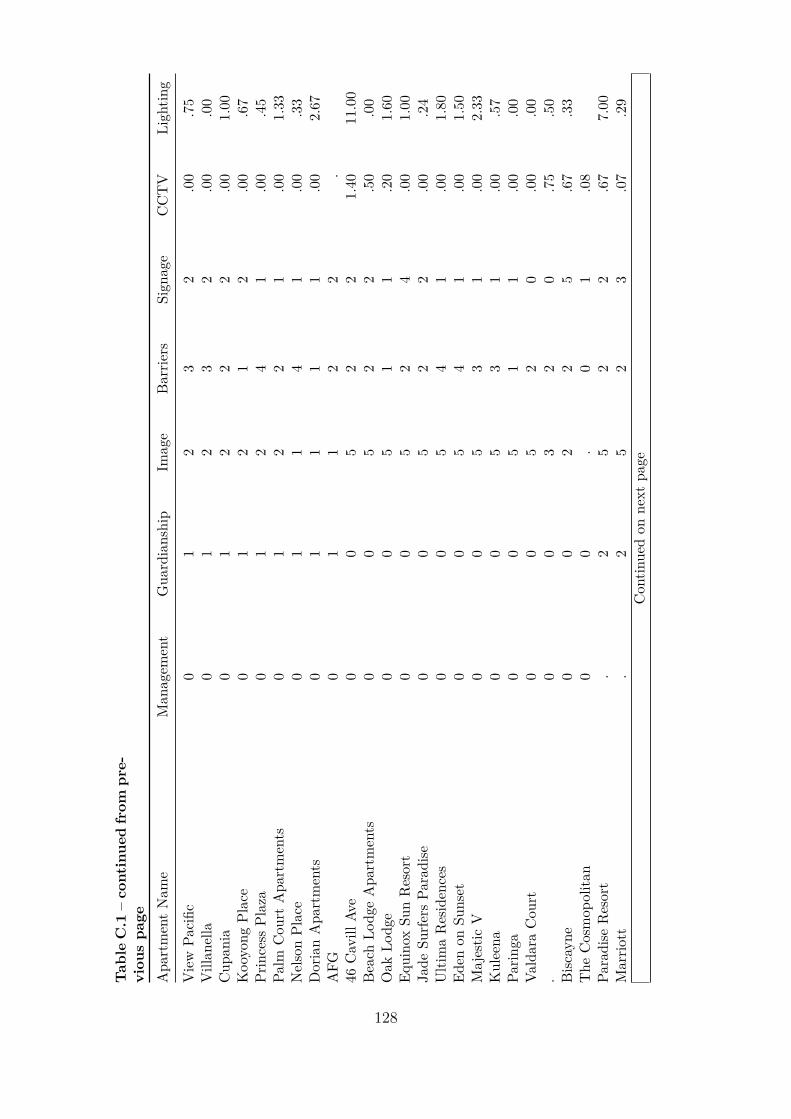
Tab
leC.1
–continue
dfrom
pre-
viou
spa
geApa
rtmentNam
eMan
agem
ent
Gua
rdianship
Imag
eBarrie
rsSign
age
CCTV
Ligh
ting
View
Pacific
01
23
2.00
.75
Villan
ella
01
23
2.00
.00
Cup
ania
01
22
2.00
1.00
Koo
yong
Place
01
21
2.00
.67
Princess
Plaza
01
24
1.00
.45
Palm
Cou
rtApa
rtments
01
22
1.00
1.33
NelsonPlace
01
14
1.00
.33
DorianApa
rtments
01
11
1.00
2.67
AFG
01
12
2.
46Cav
illAv
e0
05
22
1.40
11.00
Beach
Lodg
eApa
rtments
00
52
2.50
.00
Oak
Lodg
e0
05
11
.20
1.60
Equino
xSu
nResort
00
52
4.00
1.00
Jade
SurfersPa
radise
00
52
2.00
.24
UltimaResiden
ces
00
54
1.00
1.80
Eden
onSu
nset
00
54
1.00
1.50
Majestic
V0
05
31
.00
2.33
Kuleena
00
53
1.00
.57
Parin
ga0
05
11
.00
.00
ValdaraCou
rt0
05
20
.00
.00
.0
03
20
.75
.50
Bisc
ayne
00
22
5.67
.33
The
Cosmop
olita
n0
0.
01
.08
Paradise
Resort
.2
52
2.67
7.00
Marrio
tt.
25
23
.07
.29
Con
tinue
don
next
page
128
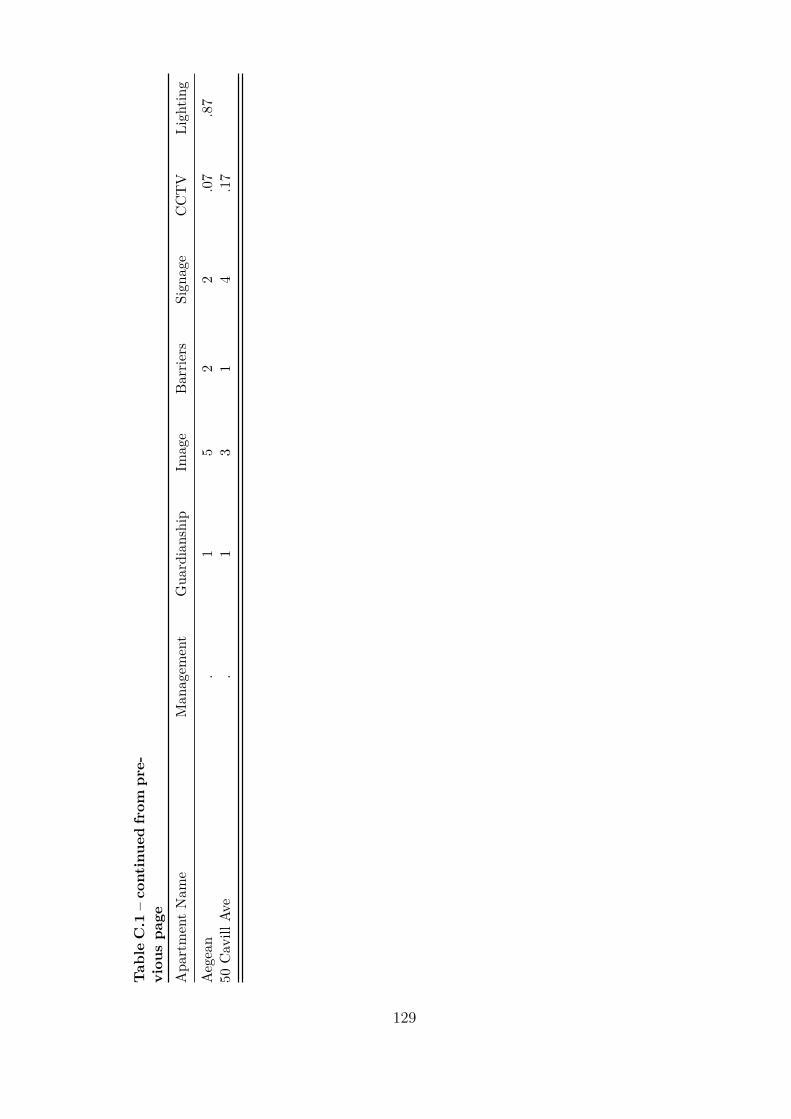
Tab
leC.1
–continue
dfrom
pre-
viou
spa
geApa
rtmentNam
eMan
agem
ent
Gua
rdianship
Imag
eBarrie
rsSign
age
CCTV
Ligh
ting
Aegean
.1
52
2.07
.87
50Cav
illAv
e.
13
14
.17
129


References
Allon, F. (2006). Suburbs for Sale: Buying and Selling the Great Australian Dream.In Post-Suburban Sydney: The City in Transformation Conference, Sydney.
Australian Bureau of Statistics (2008). Population Projections 2006 to 2101. TechnicalReport Catalogue 3222, Australian Bureau of Statistics, Canberra.
Australian Bureau of Statistics (2011). Surfers Paradise Suburb. Basic CommunityProfile, Australian Bureau of Statistics, Canberra.
Australian Bureau of Statistics (2012). 2011 Census of Population and Housing. Tech-nical report, Australian Bureau of Statistics, Canberra.
Australian Government (2010). Our Cities: Building A Productive, Sustainable AndLiveable Future. Technical report, Canberra.
Barr, R. and Pease, K. (1990). Crime Placement, Displacement, And Deflection. Crimeand justice, pages 277–318.
Blandy, S., Dixon, J., and Dupuis, A. (2006). Theorising Power Relationships In Multi-Owned Residential Developments: Unpacking The Bundle Of Rights. Urban Studies,43(13):2365–2383.
Booth, A. (1981). The Built Environment As A Crime Deterrent. Criminology,18(4):557–570.
Brantingham, P. and Brantingham, P. (2008). Crime Pattern Theory. In Wortley, R.and Mazerolle, L., editors, Environmental Criminology and Crime Analysis, pages78–93. Willan Publishing, Devon, UK.
Brunt, P., Mawby, R., and Hambly, Z. (2000). Tourist Victimisation And The Fear OfCrime On Holiday. Tourism Management, 21(4):417–424.
Bugden, G. (2005). Strata and community title in Australia–Issues 1 current challenges.In Strata and Community Title in Australia for the 21st Century Conference, 31stAug-3rd Sept, Surfers Paradise, Queensland.
Bullock, K., Clarke, R. V., and Tilley, N. (2010). Situational Prevention Of OrganisedCrimes. Taylor & Francis US.
Burton, E. (2000). The Compact City: Just Or Just Compact? A Preliminary Analysis.Urban studies, 37(11):1969–2006.
Cassidy, K. and Guilding, C. (2007). Tourist Accommodation Price Setting In Aus-tralian Strata Titled Properties. International Journal of Hospitality Management,26(2):277–292.
131

Cassidy, K., Guilding, C., and Warnken, J. (2008). Identifying Effective Strata TitleGovernance And Management Models For The Provision Of Tourism Accommoda-tion. Sustainable Tourism CRC, Gold Coast.
Clarke, R. (1983). Situational Crime Prevention: Its Theoretical Basis and PracticalScope. In Crime and Justice: A Review of Research, volume 4, pages 225–256.University of Chicago Press, Chicago.
Clarke, R. (1997). Introduction. In Clarke, R., editor, Situational Crime Prevention:Successful Case Studies, chapter 1, pages 2–43. Criminal Justice Press, Monsey, NY,2nd edition.
Clarke, R. V. (2008). Situational Crime Prevention. In Wortley, R. and Mazerolle,L., editors, Environmental Criminology and Crime Analysis, pages 178–194. WillanPublishing, Devon, UK.
Clarke, R. V. and Bichler-Robertson, G. (1998). Place Managers, Slumlords, AndCrime In Low Rent Apartment Buildings. Security Journal, 11:11–19.
Clarke, R. V. and Harris, P. M. (1992). Auto Theft And Its Prevention. In Tonry, M.,editor, Crime and Justice: A Review of Research, volume 16, pages 1–54. Universityof Chicago Press, Chicago.
Cohen, L. E. and Felson, M. (1979). Social Change And Crime Rate Trends: A RoutineActivity Approach. American sociological review, pages 588–608.
Cornish, D. and Clarke, R. (2008). The Rational Choice Perspective. In Wortley, R.and Mazerolle, L., editors, Environmental Criminology and Crime Analysis, pages21–47. Willan Publishing, Devon, UK.
Costley, D. (2006). Master Planned Communities: Do They Offer A Solution To UrbanSprawl Or A Vehicle For Seclusion Of The More Affluent Consumers In Australia?Housing, theory and society, 23(3):157–175.
Cozens, P. (2008). Crime Prevention Through Environmental Design. In Wortley, R.and Mazerolle, L., editors, Environmental Criminology and Crime Analysis, pages153–177. Willan Publishing, Devon, UK.
Cozens, P., Hillier, D., and Prescott, G. (2001a). Crime And The Design Of Residen-tial Property – Exploring The Perceptions Of Planning Professionals, Burglars AndOther Users: Part 2. Property Management, 19(4):222–248.
Cozens, P., Hillier, D., and Prescott, G. (2001b). Crime And The Design Of ResidentialProperty – Exploring The Theoretical Background - Part 1. Property Management,19(2):136–164.
Cozens, P., Saville, G., and Hillier, D. (2005). Crime prevention through environmentaldesign (CPTED): a review and modern bibliography. 23(5):328–356.
Decrop, A. (2004). Trustworthiness In Qualitative Tourism Research. In Phillimore, J.and Goodson, L., editors, Qualitative Research in Tourism: Ontologies, Epistemolo-gies and Methodologies, pages 156–69. Routledge, London.
132

Department of Infrastructure and Transport (2012). State Of Australian Cities. Tech-nical report, Department of Infrastructure and Transport, Canberra.
Dredge, D. and Coiacetto, E. (2011). Strata Title: Towards A Research Agenda ForInformed Planning Practice. Planning Practice and Research, 26(4):417–433.
Easthope, H. and Randolph, B. (2009). Governing The Compact City: The ChallengesOf Apartment Living In Sydney, Australia. Housing Studies, 24(2):243–259.
Easthope, H., Randolph, B., and Judd, S. (2012). Governing The Compact City: TheRole And Effectiveness Of Strata Management. Final report, University of NSW,Sydney.
Eck, J. E., Clarke, R. V., and Guerette, R. T. (2007). Risky Facilities: Crime Concen-tration In Homogeneous Sets Of Establishments And Facilities. Crime preventionstudies, 21:225.
Eck, J. E. and Eck, E. B. (2012). Crime Place And Pollution. Criminology & PublicPolicy, 11(2):281–316.
Eck, J. E., Madensen, T., Payne, T., Wilcox, P., Fisher, B. S., and Scherer, H. (2010).Situational Crime Prevention At Specific Locations In Community Context: PlaceAnd Neighborhood Effects. US Department of Justice, National Institute of Justice.
Eck, J. E. and Weisburd, D. (1995). Crime Places In Crime Theory. Crime and place,crime prevention studies, 4:1–33.
Farrington, D. P. (2003). Developmental And Life-Course Criminology: Key Theoret-ical And Empirical Issues. Criminology, 41(2):221–255.
Felson, M. (1995). Those Who Discourage Crime. In Eck, J. E. and Weisburd, D.,editors, Crime and Place, volume 4 of Crime Prevention Studies, chapter 3, pages53–66. Criminal Justice Press, Monsey, NY.
Felson, M. (2008). Routine Activity Approach. In Wortley, R. and Mazerolle, L.,editors, Environmental Criminology and Crime Analysis, pages 70–77. Willan Pub-lishing, Devon, UK.
Felson, M. and Clarke, R. V. (1998). Opportunity Makes The Thief. Technical Re-port 98, Home Office, London.
Forrest, R., Grange, A., and Ngai-Ming, Y. (2002). Neighbourhood In A High Rise,High Density City: Some Observations On Contemporary Hong Kong. The Socio-logical Review, 50(2):215–240.
Gifford, R. (2007). The Consequences Of Living In High-Rise Buildings. ArchitecturalScience Review, 50(1):2–17.
Gillen, M. (2006). The Challenge Of Attaining A Sustainable Urban Morphology ForSouth East Queensland. Planning, Practice & Research, 21(3):291–308.
Glaser, B. G. (1998). Doing Grounded Theory: Issues And Discussions. SociologyPress, Mill Valley, CA.
133

Glaser, B. G. and Strauss, A. L. (1967). The Discovery Of Grounded Theory: StrategiesFor Qualitative Research. Aldine, Chicago.
Gration, R. (2009). Fighting Owner Apathy: Planning For Community Cohesion. InStrata and Community Title in Australia for the 21st Century III Conference, GoldCoast.
Guerette, R. T. and Bowers, K. J. (2009). Assessing The Extent Of Crime DisplacementAnd Diffusion Of Benefits: A Review Of Crime Prevention Evaluations. Criminology,47(4):1331–1368.
Guilding, C., Warnken, J., Ardill, A., and Fredline, L. (2005). An Agency TheoryPerspective On The Owner/Manager Relationship In Tourism-Based Condominiums.Tourism Management, 26(3):409–420.
Guilding, C. and Whiteoak, J. (2008). An Examination Of Management And Gover-nance Issues Arising In Residential Golf Complexes. Pacific Rim Property ResearchJournal, 14(1):44–65.
Healy, E., Birrell, R., Housing, A., and Housing, A. (2006). Housing And CommunityIn The Compact City. Australian Housing and Urban Research Institute.
Hollis-Peel, M. E., Reynald, D. M., Bavel, M., Elffers, H., and Welsh, B. C. (2011).Guardianship For Crime Prevention: A Critical Review Of The Literature. Crime,Law and Social Change, 56(1):53–70.
Hollis-Peel, M. E. and Welsh, B. C. (2013). What Makes A Guardian Capable? A TestOf Guardianship In Action. Security Journal. in press.
Homel, R. and Clark, J. (1994). The Prediction And Prevention Of Violence In PubsAnd Clubs. volume 3 of Crime Prevention Studies, chapter 1, pages 1–46. CriminalJustice Press, Monsey, NY.
Jacobs, J. (1961). The Death And Life Of Great American Cities. Vintage.
Johnston, N. and Reid, S. (2013). Multi-Owned Developments: A Life Cycle ReviewOf A Developing Research Area. Property Management. forthcoming.
Kinney, J. B., Brantingham, P. L., Wuschke, K., Kirk, M. G., and Brantingham, P. J.(2008). Crime Attractors, Generators And Detractors: Land Use And Urban CrimeOpportunities. Built environment, 34(1):62–74.
Lemieux, A. and Felson, M. (2011). Tourist and Visitor Crime. In Natarajan, M., editor,International Crime and Justice, pages 223–228. Cambridge University Press, NewYork, NY.
Lewis, M. (2000). Suburban Backlash: The Battle For Melbourne, The World’s MostLiveable City. Blooming Books, Melbourne.
Madensen, T. D. (2007). Bar Management And Crime: Toward A Dynamic Theory OfPlace Management And Crime Hotspots. PhD thesis, University of Cincinnati.
Madensen, T. D. and Eck, J. E. (2008). Violence In Bars: Exploring The ImpactOf Place Manager Decision-Making. Crime Prevention and Community Safety,10(2):111–125.
134

Matka, E. (1997). Public Housing and Crime in Sydney. Technical report, New SouthWales Bureau of Crime Statistics and Research, Sydney.
National Housing Supply Council (2011). Key Findings Of The 2011 State Of SupplyReport. Technical report, National Housing Supply Council, Canberra.
Neuman, W. L. (2005). Social Research Methods: Quantitative And Qualitative Ap-proaches. Allyn and Bacon, Boston, 5th edition.
Newman, M. (2005). Power Laws, Pareto Distributions and Zipf S Law. Contemporaryphysics, 46(5):323–351.
Newman, O. (1996). Creating Defensible Space. Department of Housing and UrbanDevelopment, Office of Policy Development and Research, Washington, DC.
Newman, P. G. and Kenworthy, J. R. (1989). Cities And Automobile Dependence: AnInternational Sourcebook. Gower Technical, Brookfield.
Randolph, B. (2006). Delivering The Compact City In Australia: Current Trends AndFuture Implications. Urban policy and research, 24(4):473–490.
Randolph, B. and Easthope, H. (2007). Governing The Compact City: The GovernanceOf Strata Title Developments In Sydney. In 2007 ENHR International Conference,Sustainable Areas, Rotterdam.
Reynald, D. M. (2009). Guardianship In Action: Developing A New Tool For Mea-surement. Crime Prevention and Community Safety: An International Journal,11(1):1–20.
Reynald, D. M. (2011). Factors Associated With The Guardianship Of Places: Assess-ing The Relative Importance Of The Spatio-Physical And Sociodemographic Con-texts In Generating Opportunities For Capable Guardianship. Journal of Researchin Crime and Delinquency, 48(1):110–142.
Reynald, D. M. and Elffers, H. (2009). The Future Of Newman’s Defensible SpaceTheory Linking Defensible Space And The Routine Activities Of Place. EuropeanJournal of Criminology, 6(1):25–46.
Sampson, R., Eck, J. E., and Dunham, J. (2009). Super Controllers And Crime Pre-vention: A Routine Activity Explanation Of Crime Prevention Success And Failure.Security Journal, 23(1):37–51.
Sherman, L. W., Gartin, P. R., and Buerger, M. E. (1989). Hot Spots Of PredatoryCrime: Routine Activities And The Criminology Of Place. Criminology, 27(1):27–56.
Sherry, C. (2010). How Indefeasible Is Your Strata Title? Unresolved Problems InStrata And Community Title. Bond Law Review, 21(2):159–181.
Spearritt, P. (2000). Sydney’s Century: A History. University of NSW Press, Sydney.
Stone, W. and Hulse, K. (2007). Housing and Social Cohesion: An Empirical Explo-ration. Final Report No. 100, Australian Housing and Urban Research Institute,Swinburn-Monash Reseatch Centre.
135

Strauss, Anselm amd Corbin, J. (1990). Basics Of Qualitative Research: GroundedTheory Procedures And Techniques. Sage, Newbury Park.
Taylor, R. B., Gottfredson, S. D., and Brower, S. (1984). Block Crime And Fear:Defensible Space, Local Social Ties, And Territorial Functioning. Journal of Researchin Crime and Delinquency, 21(4):303–331.
Thomas, L. and Cousins, W. (1996). The Compact City: A Successful, Desirable AndAchievable Urban Form. In Jenks, M, Burton, E, and Williams, K, editors, Thecompact city: A sustainable urban form, pages 53–65. E and FN Spon, Abingdon,UK.
Tillyer, M. S. and Eck, J. E. (2010). Getting A Handle On Crime: A Further ExtensionOf Routine Activities Theory. Security Journal, 24(2):179–193.
Tourism and Events Queensland (2012). Gold Coast Regional Snapshot. Available athttp://www.tq.com.au/research.
Warnken, J. and Guilding, C. (2009). Multi-Ownership Of Tourism AccommodationComplexes: A Critique Of Types, Relative Merits, And Challenges Arising. TourismManagement, 30(5):704–714.
Warnken, J., Russell, R., and Faulkner, B. (2003). Condominium Developments In Ma-turing Destinations: Potentials And Problems Of Long-Term Sustainability. TourismManagement, 24(2):155–168.
Weatherburn, D., Lind, B., and Ku, S. (1999). Hotbeds Of Crime? Crime And PublicHousing In Urban Sydney. Crime & delinquency, 45(2):256–271.
Wilcox, P. and Eck, J. E. (2011). Criminology Of The Unpopular. Criminology &Public Policy, 10(2):473–482.
Woolcock, G. (2007). Social Infrastructure To Cope With Higher Density Living. InStrata and Community Title in Australia for the 21st Century II Conference, GoldCoast.
Wortley, R. (1998). A Two-Stage Model of Situational Crime Prevention. Studies onCrime and Crime Prevention, 7(2):173–188.
Wortley, R. (2008). Situational Precipitators of Crime. In Wortley and Mazerolle(2008), chapter 3, pages 48–69.
Wortley, R. and Mazerolle, L. (2008). Environmental Criminology And Crime Analysis:Situating The Theory, Analytic Approach And Application. In Wortley, R. andMazerolle, L., editors, Environmental Criminology and Crime Analysis, pages 1–18.Willan Publishing, Devon, UK.
Yates, J. (2001). The Rhetoric And Reality Of Housing Choice: The Role Of UrbanConsolidation. Urban Policy and Research, 19(4):491–527.
Yip, N. M. and Forrest, R. (2002). Property Owning Democracies? Home OwnerCorporations In Hong Kong. Housing Studies, 17(5):703–720.
136