Embed Size (px)
Citation preview

Vol.14, No.2 EARTHQUAKE ENGINEERING AND ENGINEERING VIBRATION June, 2015
Earthq Eng & Eng Vib (2015) 14: 275-293 DOI:10.1007/s11803-015-0023-4
Rapid assessment for seismic vulnerability of low and medium rise infi lled RC frame buildings
Hanan Al-Nimry†, Musa Resheidat‡ and Saddam Qeran§
Civil Engineering Department, Jordan University of Science and Technology, P.O. Box 3030, Irbid 22110, Jordan
Abstract: An indexing method for rapid evaluation of the seismic vulnerability of infi lled RC frame buildings in Jordan is proposed. The method aims at identifying low and medium rise residential buildings as safe or in need of further detailed evaluation. Following a rapid visual screening, the building is assigned a Basic Capacity Index (BCI); fi ve performance modifi ers are identifi ed and multiplied by the BCI to arrive at the Capacity Index (CI) of the building. A Capacity Index lower than a limit CI value indicates that the screened building could experience moderate earthquake damage whereas a higher value implies that minor damage, if any, would take place. To establish the basic evaluation parameters; forty RC frame buildings were selected, designed and analyzed using static nonlinear analysis and incorporating the effect of infi ll walls. Effects of seismicity, local site conditions, horizontal irregularities (setbacks and re-entrant corners), vertical irregularities (soft story at ground fl oor level) and overhangs on the seismic performance of local buildings were examined. Assessment forms were designed and used to evaluate and rank 112 sample buildings. About 40% of the surveyed buildings were found to be in need of detailed evaluation to better defi ne their seismic vulnerabilities.
Keywords: seismic vulnerability; rapid assessment; capacity index; infi lled frames; pushover analysis
Correspondence to: Hanan Al-Nimry, Civil Engineering Department, Jordan University of Science and Technology, P.O. Box 3030, Irbid 22110, JordanTel: +962 777 492841; Fax: +962 2 7201074 E-mail: [email protected]
†Associate Professor; ‡Professor; §Graduate StudentSupported by: Deanship of Scientifi c Research at Jordan
University of Science and Technology under Grant No. 143/2011
Received January 17, 2014; Accepted December 11, 2014
1 Introduction
Gravity load-designed RC frames with non-ductile reinforcement detailing constitute ninety percent of the existing residential building stock in Jordan. The exterior frames are typically infi lled with stiff stone-concrete walls of cross sectional details shown in Fig. 1, w hereas the interior frames bound concrete masonry walls constructed using hollow blocks of 100 or 200 mm thickness. In order to reduce the construction cost, building owners tend to use the cheaper concrete masonry walls along one or more of the exterior building facades. Yet, more than one-third of the existing residential buildings in the country use stone-concrete infi lls along the four building facades. This type of construction is also common to neighboring countries of the Middle East including Syria and Lebanon.
Proximity of the active Dead Sea transform faulting system to major cities in the country is the motivation to identify seismically inadequate structures within the
context of reducing the associated earthquake risk. While the seismic vulnerability of RC frames infi lled with typical clay or concrete brick panels is well established in the literature (FEMA-256, 1999; Risk-UE project, 2001-2004; and other programs), the effect of the local stone-concrete infi lls requires further investigation, especially in view of the lack of actual earthquake damage data. Al-Nimry (2010 and 2012) investigated the seismic vulnerability of low-rise and mid-rise gravity load-designed RC frames infi lled with stone-concrete panels of the type shown in Fig. 1.
The study reported herein is concerned with primary
,

276 EARTHQUAKE ENGINEERING AND ENGINEERING VIBRATION Vol.14
evaluation of the potential of seismic vulnerability of RC frame buildings comprising stone-concrete infi lls in their exterior facades. An indexing method for rapid evaluation of the seismic vulnerability of existing residential stone-concrete buildings in Jordan is proposed. The methodology is limited to engineered construction spanning the time period between the early nineties and the year 2005, which marks the release of the fi rst seismic code in Jordan. Yet, as most of the residential buildings constructed after the year 2005 have evaded compliance to the seismic code regulations, this method can also be applied to more recent construction.
2 Rapid visual screening methods
Recognized assessment methods of the seismic vulnerability of buildings generally stipulate a three-tiered procedure of increasing detail and sophistication: rapid visual screening (RVS) methods that are based on minimal data collected through sidewalk surveys (e.g., the rapid visual screening method of FEMA-154 and Tier 1 screening phase of FEMA-310); a more detailed evaluation instigating simplifi ed calculations of the structural capacities and demands based on information of the structural layout, orientation and size of the structural components and material properties (e.g., Tier 2 evaluation phase of FEMA-310); and the most detailed evaluation (e.g., Tier 3 detailed evaluation phase of FEMA-310) which requires the acquisition of extensive data on building materials, site conditions, structural systems and details and involves vast analytical efforts.
RVS methods are typically designed to be used, without any calculations, to classify buildings as suitable for human life protection or those that may be at risk during earthquakes and need further detailed evaluation. The method proposed by FEMA-154 (1988) uses a scoring technique that requires the evaluator to identify the major lateral load-resisting system of the structure, and building parameters or features that might affect the seismic performance of the structural system. The evaluation, data collection and decision-making process usually occurs at the building site. The evaluation method uses numerical seismic hazard and vulnerability scores that are based on the predictable ground shaking levels in the region as well as the seismic design and construction techniques for the area. The method utilizes a scoring system for the structure, which consists of a set of structural scores and performance modifi cation factors. The performance modifi cation factors are used to refl ect the effect of the building defi ciencies on its response during ground motion, such as poor quality of materials and bad construction practices, presence of openings, short columns, plan and elevation irregularities, etc. The fi nal score for the building is computed by subtracting scores obtained for the above performance modifi cation factors from the basic score. The fi nal score is compared with a cut-off score which identifi es the building to be acceptable for life safety or
in need for further detailed evaluation. When the fi nal score exceeds the cut-off value, the building is accepted for life safety. Final score values lower than the cut-off value designate seismically hazardous buildings requiring detailed evaluation.
In FEMA-310 (1998), the evaluation phase is used to identify weaknesses in the building, which could cause its collapse under earthquake excitation, using simple analyses. Building capacity to resist lateral loads can be evaluated by computing the applied shear force and the maximum induced lateral drift. Check of shear should be performed by computing the shear capacities of shear walls and columns, whereas the drift check is based on the determination of story drifts using the stiffness of frame elements. Additional information needed for the detailed evaluation is obtained from the answers to a pre-defi ned set of questions (dependent on the building type) that are concerned with the vertical and horizontal systems and the structural connections.
If the assessment based on the detailed evaluation level, Tier 3 of FEMA-310 (1998), resulted in a negative decision, the fi nal decision about the building performance requires further detailed and elaborate evaluation. A professional engineer experienced in seismic design must be included for analyses and evaluation at this stage wherein nonlinear static and dynamic analyses are to be performed. The design and construction details are compared with the latest code provisions intended for seismic design. FEMA-273 (1997) provides an assessment guideline for this evaluation phase.
Detailed inspection and analysis of the seismic performance of existing structures requires enormous time and effort. The need for quick visual screening methods still prevails in developing countries wherein the scarcity of human and fi nancial resources instigates their proper allocation. Such methods are vital tools for identifying seismically safe buildings and for prioritizing the retrofi tting and rehabilitation of defi cient structures. This section presents a brief summary of the international expertise in this area.
The National Research Council of Canada (NRCC, 1993) proposed a rapid screening procedure for ranking existing buildings for more detailed seismic evaluation. This method uses a Seismic Priority Index, comprising structural and nonstructural indices, to identify buildings that might pose a risk of loss of life or injury or even affecting community services in the event of a damaging earthquake. The method takes into consideration structural factors affecting the seismic performance of buildings: level of seismicity, soil conditions, construction type, building irregularities, building importance and occupancy; in addition to nonstructural hazards. According to the score value, screened buildings are classifi ed into three categories: low, medium and high priority, for further detailed evaluation.
Hassan and Sozen (1997) proposed a simplifi ed ranking procedure to identify low-rise RC buildings with

No.2 Hanan Al-Nimry et al.: Rapid assessment for seismic vulnerability of low and medium rise infi lled RC frame buildings 277
a high seismic vulnerability within a given region. Using the dimensions of the structure, the wall and column indices are computed as the ratio of the effective wall or column area at the base of the building to the total fl oor area above base. Both indices are used to position the building on a two-dimensional plot; the closer the building position is to the origin, the more vulnerable is the building. Gulkan and Sozen (1999) developed a simple method to estimate the seismic vulnerability of RC frame buildings with masonry infi ll walls. Using this method, the building under consideration is identifi ed with a score computed as the sum of column and wall ratios. The ratio of total column areas, in a given direction at the base level of the structure, to the total fl oor area identifi es the column ratio for the building. Whereas the ratio of the effective masonry wall area, in a given direction at the base level, to the total fl oor area defi nes the wall ratio. If the building score exceeds 0.3%, the building is designated to be safe.
The Japanese seismic evaluation methods (Otani, 2000a; Otani, 2000b; and Kaminosono, 2002) consist of three levels of screening that can be used for low to medium height RC buildings with or without shear walls. A structural index (Is) is defi ned for each screening level in a different manner, with three sub-indices: basic structural performance sub-index, Eo, structural design or confi guration sub-index, SD, and sub-index on time dependent deterioration of the building, T. The required seismic performance index, Iso, is also defi ned at each screening level, with four sub-indices: Seismic sub-index of basic structural performance, Es, seismicity zone sub-index, Z, soil or ground sub-index, G, and importance sub-index, U. The index Is is compared with the required seismic performance index, Iso, based on the evaluation of equivalent static earthquake forces. If the structural index exceeds the required seismic performance index, the building is considered acceptable for life safety when subjected to strong ground motion. Lower values of the structural index indicate the need for further detailed evaluation.
Ozcebe et al. (2003) and Yakut et al. (2003) developed a statistical model for the preliminary assessment of the seismic vulnerability of low to medium height existing RC buildings using discriminant analyses. Parameters of the proposed model included the number of stories, minimum normalized lateral stiffness index (an indication of the lateral rigidity of the ground story), minimum normalized lateral strength index (an indication of the base shear capacity of the critical story), normalized redundancy score, soft story index and overhang ratio. The variability of ground motion with respect to soil properties and the distance to source was also incorporated. Yakut (2004) developed a procedure for rapid evaluation of the seismic performance of existing RC buildings with moderate ductility. Considering the orientation, size and material properties of the members that constitute the lateral load-resisting system, the Basic Capacity Index for the
building is determined. This index is then modifi ed by a number of coeffi cients that refl ect the negative infl uence of plan and vertical irregularities and the substandard construction quality and workmanship. The method identifi es evaluated buildings as safe or failing to meet the life safety performance level.
Sinha and Goyal (2004) designed a rapid visual screening evaluation method for 10 different types of buildings including timber, steel, reinforced concrete and unreinforced masonry buildings. The method uses a scoring system based on identifi cation of the primary lateral load-resisting system and the factors that can modify the seismic performance of the structural system. Based on the fi nal structural score, one of fi ve damage states is predicted as the likely building performance.
Ozdemir and Taskin (2006) proposed the Seismic Safety Screening Method for evaluation of the seismic capacity of medium rise RC buildings in Turkey. This method, which is an adaptation of the Japanese Seismic Index Method, evaluates the seismic performance of a structure using a seismic capacity index. This capacity index is computed based on the strength and ductility of the structure and modifi ed to take into account the effect of structural irregularities and time deterioration. On the other hand, a seismic demand index is determined taking into account the effect of regional seismicity, local soil conditions and usage. Comparing the two indices, the building is expected to suffer serious damage or collapse if the capacity index is found to be lower than the demand index. Nonlinear static or dynamic analyses were performed for several existing buildings to identify the basic seismic indices and the different factors affecting the building performance.
Agrawal and Chourasia (2007) developed a rapid screening procedure to estimate the seismic vulnerability of Indian cities based on as-built information, common construction practices, construction materials and quality, building type, geological and geotechnical parameters including soil conditions and the effect of soil amplifi cation. The procedure identifi es potentially hazardous buildings based on visual inspection of the building. Each building type is assigned a basic structural hazard (BSH) score refl ecting the estimated likelihood of the building sustaining major earthquake damage. A number of performance modifi cation factors are then subtracted from the BSH score to arrive at the fi nal structural score which approximates the possibility of major damage.
Lang et al. (2010) developed a fast and cost-effective procedure to evaluate the structural and nonstructural seismic vulnerability of hospitals and schools allowing priority ranking and identifi cation of the most vulnerable structures. Separate structural and nonstructural vulnerability indices are derived for the building. While the structural vulnerability index is computed taking into consideration the effect of design failures as well as the building age and its general state of maintenance, the nonstructural vulnerability index accounts for the impact

278 EARTHQUAKE ENGINEERING AND ENGINEERING VIBRATION Vol.14
of installations and secondary structural elements on the functionality of the building.
Jain et al. (2010) proposed a rapid visual screening method for RC frame buildings in India based on earthquake damage data of 270 RC frame buildings affected by the 2001 Bhuj earthquake. Statistical analysis of the damage database was performed to predict an expected performance score. Based on the seismic zone and soil type, the proposed method assigns a basic performance score. Six vulnerability parameters/scores are then applied to obtain the expected performance score. The vulnerability parameters take into account the presence of basements, number of stories, quality of maintenance, re-entrant corners, open stories and short columns.
The proposed indexing method developed in this study adopts a similar concept to other RVS methods found in the literature in that it assigns a Basic Capacity Index (BCI) that signifi es the yield overstrength ratio for a regular building with specifi c characteristics or attributes and then identifi es features that might adversely affect its seismic performance. Those adverse effects are interpreted as seismic performance modifi ers that are applied to the basic index to obtain a fi nal capacity index characterizing the structure’s performance. This latter index has a cutoff value that is used to identify if the screened building needs further evaluation in order to reach a more informed decision regarding its seismic vulnerability. The novelty in the proposed RVS method is that the values for the basic index and the seismic performance modifi ers are determined based on an extensive analytical effort rather than using the usual statistical analysis of actual earthquake damage data. Another unique feature of the proposed methodology is that it accounts for the seismicity level and local site effects through the base shear value computed using code equations. Thus, any future modifi cations to the local seismic code can be directly adapted into the proposed method.
3 Development of the basic capacity index
3.1 Representative buildings
The proposed indexing method is only concerned with the low- and mid-rise residential RC buildings comprising stone-concrete walls as exterior infi ll panels. The number of capacity-related parameters and the associated uncertainties in their values might have a great effect on the building capacity and thereof vulnerability. However, it should be noted that structural characteristics-related parameters were found to have no signifi cant effect on the structural response of low ductility RC buildings at the lowest level of damage, i.e., slight damage (D’Ayala and Meslem, 2013). The sensitivity analysis carried out by D’Ayala and Meslem included the effect of material properties, transverse reinforcement spacing, story height, thickness of infi ll
panel, number of stories and number of bays in both building directions in addition to the uncertainties in mathematical modeling. Keeping in mind that the RVS method proposed in this study aims at assessing the potential of exceeding the level of slight damage in non-ductile RC frame buildings; it would be expected that the structural capacity at this stage will not be sensitive to the variation in the building capacity-related parameters. To this end, forty buildings representing the local RC frame buildings constructed in Jordan before the release of the local seismic code (JCERB, 2005) are selected. The buildings are classifi ed into two area groups: Group G1 with a fl oor area of 230–350 m2 and Group G2 with a fl oor area of 350–500 m2. This method does not apply to buildings with fl oor areas exceeding 500 m2. Large apartment buildings are expected to house a large number of residents thus posing high risk potential in a strong seismic event. It is suggested to evaluate these buildings based on suffi cient and accurate data.
Buildings in each of the two area groups are further classifi ed into two height categories: low-rise (LR) with 1-3 stories and mid-rise (MR) with 4–6 stories. The typical story height is fi xed at 3.25 m as the variation in story height in this type of residential construction is negligible. Effects of the locally dominant horizontal irregularities (setbacks and re-entrant corners), vertical irregularities (soft story at the ground fl oor) and heavily loaded overhangs on the seismic performance of these buildings are analyzed and quantifi ed.
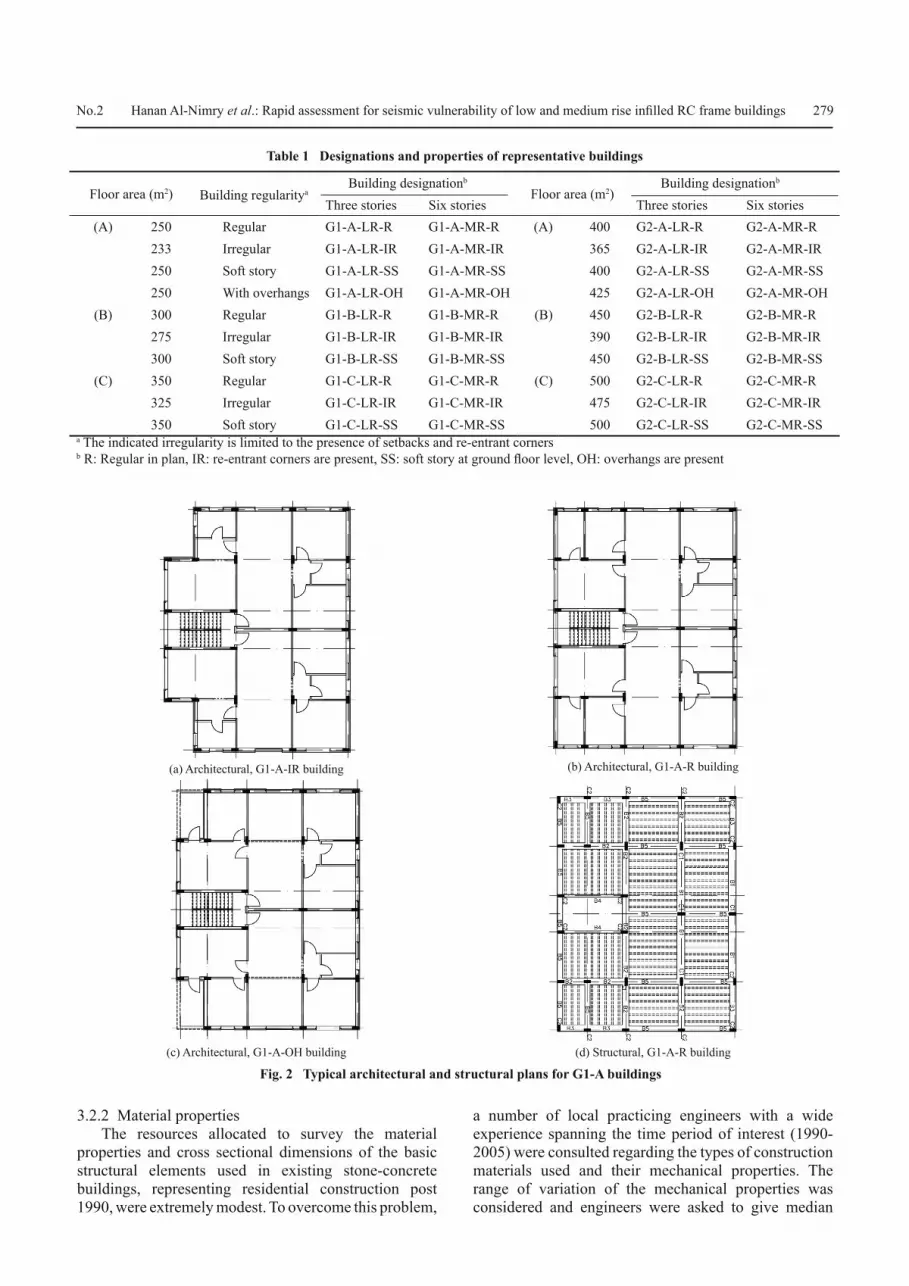
Designations and geometric properties of the forty representative buildings are summarized in Table 1. The representative buildings were designed to resist gravity loads following guidance of local design codes governing the design of RC buildings between 1990 and 2005 (JCLF, 1985; and JCPRC, 1993). The fl oor ribbed slabs were designed using 140 mm wide joists (ribs); 540 mm on centers with a total depth of 250 mm. Column cross sections were designed for the minimum reinforcement ratio of 1%. Figure 2 displays a typical structural plan for the G1-A-R building in addition to typical architectural plans for the G1-A-R, G1-A-IR and G1-A-OH buildings. Note that the soft story irregularity is accounted for in the structural model by omitting the infi ll walls at the ground fl oor level.
3.2 Structural modeling
3.2.1 GeneralThe analysis carried out in this study basically
aims at evaluating the yield base shear capacity of the building, Vy. In view of the limited height of the investigated buildings, the nonlinear static procedure of ATC-40 (1996) is adopted to assess their response to lateral loading. Three-dimensional structural models are built for each of the representative buildings. The fi nite element analysis software SAP2000 v14 (Computers and Structures Inc., 2009), which has the capability to account for both geometric and material nonlinearities, is used to perform the nonlinear static (pushover) analysis.
No.2 Hanan Al-Nimry et al.: Rapid assessment for seismic vulnerability of low and medium rise infi lled RC frame buildings 279
Table 1 Designations and properties of representative buildings
Floor area (m2) Building regularityaBuilding designationb
Floor area (m2)Building designationb
Three stories Six stories Three stories Six stories(A) 250 Regular G1-A-LR-R G1-A-MR-R (A) 400 G2-A-LR-R G2-A-MR-R
233 Irregular G1-A-LR-IR G1-A-MR-IR 365 G2-A-LR-IR G2-A-MR-IR250 Soft story G1-A-LR-SS G1-A-MR-SS 400 G2-A-LR-SS G2-A-MR-SS250 With overhangs G1-A-LR-OH G1-A-MR-OH 425 G2-A-LR-OH G2-A-MR-OH
(B) 300 Regular G1-B-LR-R G1-B-MR-R (B) 450 G2-B-LR-R G2-B-MR-R275 Irregular G1-B-LR-IR G1-B-MR-IR 390 G2-B-LR-IR G2-B-MR-IR300 Soft story G1-B-LR-SS G1-B-MR-SS 450 G2-B-LR-SS G2-B-MR-SS
(C) 350 Regular G1-C-LR-R G1-C-MR-R (C) 500 G2-C-LR-R G2-C-MR-R325 Irregular G1-C-LR-IR G1-C-MR-IR 475 G2-C-LR-IR G2-C-MR-IR350 Soft story G1-C-LR-SS G1-C-MR-SS 500 G2-C-LR-SS G2-C-MR-SS
a The indicated irregularity is limited to the presence of setbacks and re-entrant cornersb R: Regular in plan, IR: re-entrant corners are present, SS: soft story at ground fl oor level, OH: overhangs are present
Fig. 2 Typical architectural and structural plans for G1-A buildings
(a) Architectural, G1-A-IR building (b) Architectural, G1-A-R building
(c) Architectural, G1-A-OH building (d) Structural, G1-A-R building
3.2.2 Material propertiesThe resources allocated to survey the material
properties and cross sectional dimensions of the basic structural elements used in existing stone-concrete buildings, representing residential construction post 1990, were extremely modest. To overcome this problem,
a number of local practicing engineers with a wide experience spanning the time period of interest (1990-2005) were consulted regarding the types of construction materials used and their mechanical properties. The range of variation of the mechanical properties was considered and engineers were asked to give median

280 EARTHQUAKE ENGINEERING AND ENGINEERING VIBRATION Vol.14
values that were also checked against engineering material properties dictated by the requirements of design codes and regulations governing residential construction between 1990 and 2005. In fact, the use of default material properties is permitted in FEMA-356 (2000) in the absence of suffi cient data. Thence, the following assumptions are made for the representative building materials and their mechanical properties:
Normal weight concrete with an average 28-day compressive strength fc’ = 25 MPa is assumed for the structural elements. The stress-strain model proposed by Mander et al. (1988) for confi ned and unconfi ned concrete is used.
Normal weight concrete with an average 28-day compressive strength fc’ = 18 MPa is assumed for the backing concrete used in construction of the exterior stone-concrete walls.
High tensile steel with a yield stress fy of 420 MPa is used for the main reinforcement.
Mild steel with a yield stress fyv of 280 MPa is used for the transverse (secondary) reinforcement.
The complete stress-strain curve with strain hardening is used to model the main and secondary reinforcement.
Hollow concrete blocks with a single unit compressive strength of 3.0 MPa are used for the masonry walls.
Cement mortar with mix proportions of 1: 0.5: 4 (cement: lime: aggregate) by volume is assumed for construction of masonry walls.3.2.3 Modeling of beams and columns
Beam and column elements are modeled as frame elements with lumped plastic hinges, controlling the nonlinear behavior of the element, at both ends. The P-M2-M3 plastic hinges are used to model the nonlinear behavior in the columns whereas fl exural hinges (M3) are used to model the nonlinear behavior in the beam elements. The possibility of shear failure, and thus shear hinging, was not considered. As the main aim of the analysis is preliminary evaluation, the moment-curvature relations for the beam and column plastic hinges are assigned automatically in SAP2000 (Computers and Structures Inc., 2009). The built-in default hinge properties for concrete members are based on Tables 9.6, 9.7 and 9.12 in FEMA-356 (2000) depending on the level of transverse reinforcement used in the section. The location of the plastic hinges is set to be within the plastic hinge length in the direction of loading wherein the length of the plastic hinge is taken equal to the depth of the cross section.
Initial stiffness properties of the frame members are based on the effective moments of inertia of the cross-section taken as 0.7Ig for columns and 0.35Ig for beams in accordance with ATC-40 (1996). All fl oor slabs, including the roof, were assumed to act as rigid diaphragms. Full fi xity was assumed at the base of the ground fl oor columns neglecting the effects of soil-structure interaction.
3.2.4 Modeling of infi ll wallsInfi ll walls can be represented using either micro
or macro models. Micro modeling is time consuming and complicated and hence its use can be justifi ed in a detailed evaluation of the seismic performance of buildings wherein accurate results are needed. In this study, where the aim is preliminary evaluation, infi ll walls are modeled using the equivalent diagonal strut. The compressive strut is assumed to be pin-connected to the beam-column joints with no shear or moment resistance and thereby resisting compressive forces only. 3.2.4.1 Modeling of the interior concrete masonry infi lls
The interior infi ll walls are usually constructed of 100 or 200 mm thick concrete masonry (blocks). According to the local building specifi cations (MPWH, 1996), the typical concrete masonry used in Jordan is produced with a unit compressive strength of about 3.0 MPa. Typically, the local mortar mix proportions are 1: 0.5: 4 (cement: lime: aggregates) by volume and thus can be classifi ed as type (ii) mortar in accordance with the mix proportions given by BS 5628 (1992).
In view of the absence of local experimental data or empirical expressions, the characteristic compressive strength (fk) of the masonry walls is determined following BS 5628 (1992) guidance. The value is computed accordingly as 3.0 MPa. The modulus of elasticity for this type of concrete masonry is computed using E = 1000 fk (in MPa), which is recommended by Eurocode 6 (2004) resulting in a value of E = 3000 MPa. The cracking strength of the infi ll panel, ftp, is approximated at 0.25 MPa.
The macro model proposed by Fajfar et al. (2001) for clay brick infi ll panels is adopted in this study to model the strut action of the interior infi ll panels. Using this model, the nonlinear behavior of the infi ll panel is approximated by a tri-linear force-deformation relationship for an equivalent diagonal compressive strut as shown in Fig. 3 where Fc and Fu correspond to the force initiating bed joint sliding and corner crushing, respectively. The initial stiffness (Ki) of the compressive strut is calculated using Eq. (1).
p ef pi
E w tK
r
(1)
Fig. 3 Fajfar et al. (2001) tri-linear force-deformation relationship for masonry infi ll walls
No.2 Hanan Al-Nimry et al.: Rapid assessment for seismic vulnerability of low and medium rise infi lled RC frame buildings 281
where Ep and tp are the modulus of elasticity and thickness of the infi ll panel; wef is the effective width of the diagonal compressive strut; and r is the length of the strut. The effective width of the strut is given by Eq. (2) which is adopted by FEMA-356 (2000):
0.4
ef h0.175w h r (2)
The dimensionless relative stiffness parameter λh, which determines the degree of frame-infi ll interaction, is given by:
p p d4h
f f p
sin 24
E tE I h
(3)
d arctan hl
(4)
where Φd in Eq. (4) is the angle describing the inclination of the diagonal strut with the horizontal as shown in Fig. 4; Ef and If are Young’s modulus and moment of inertia of the bounding column; hp and lp are the clear height and length of the infi ll wall; h is the height of the frame measured between the centerlines of beams; and Ɩ is the beam length measured between the centerlines of columns. The fracture force, Fu, of the strut is determined using Eq. (5):
p p tp 2u 1
1 d
10.818 1 1cos
l t fF C
C
(5)
where
p1
p
1.925l
Ch
(6)
The deformation corresponding to the cracking force
of the brace is determined using Eq. (7):
cc
i
FuK
(7)
The corresponding strut shortening value, uu, which identifi es the deformation at the initial stage of compression failure, is set equal to uu;horizontal/cosΦd and assuming 0.005 h < uu;horizontal < 0.006 h. The strut cracking force, Fc, ranges between 0.45 Fu and 0.55 Fu. The softening stiffness of the infi ll wall, Ku, can be assumed in the range of -0.10 Ki < Ku < -0.05 Ki.
To refl ect the adverse effect of the presence of openings within the infi ll panel on the strength and stiffness of infi lled frames; the stiffness reduction factor λ introduced by Asteris (2003) is used to modify the effective width of an infi ll wall comprising an opening. The effective width of the equivalent diagonal compression strut given by Eq. (2) is multiplied by the stiffness reduction factor, λ given by Eq. (8):
0.54 1.141 2 w w (8)
where αw is the infi ll wall opening percentage computed as the ratio of opening area to the infi ll wall area.3.2.4.2 Modeling of exterior stone-concrete infi ll walls
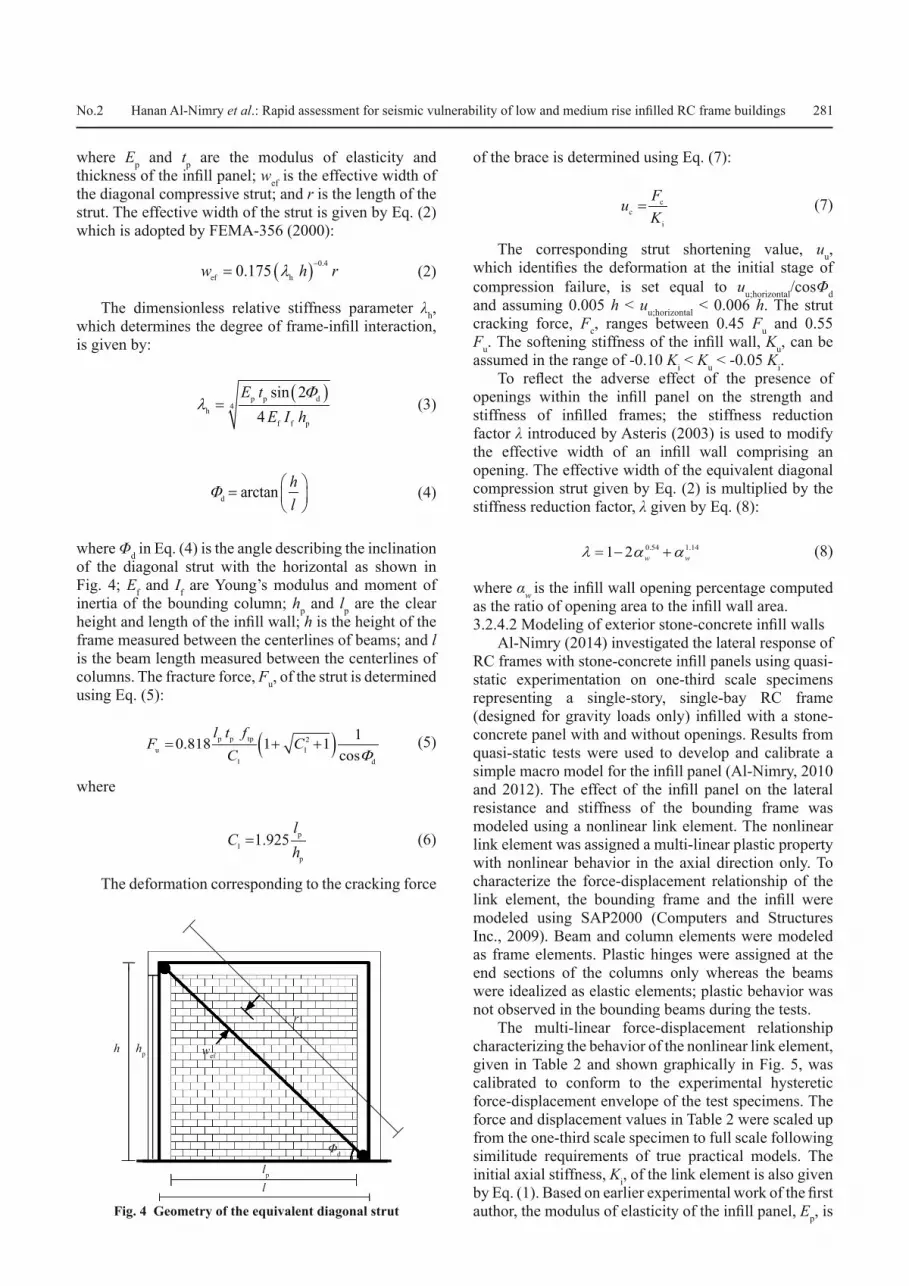
Al-Nimry (2014) investigated the lateral response of RC frames with stone-concrete infi ll panels using quasi-static experimentation on one-third scale specimens representing a single-story, single-bay RC frame (designed for gravity loads only) infi lled with a stone-concrete panel with and without openings. Results from quasi-static tests were used to develop and calibrate a simple macro model for the infi ll panel (Al-Nimry, 2010 and 2012). The effect of the infi ll panel on the lateral resistance and stiffness of the bounding frame was modeled using a nonlinear link element. The nonlinear link element was assigned a multi-linear plastic property with nonlinear behavior in the axial direction only. To characterize the force-displacement relationship of the link element, the bounding frame and the infi ll were modeled using SAP2000 (Computers and Structures Inc., 2009). Beam and column elements were modeled as frame elements. Plastic hinges were assigned at the end sections of the columns only whereas the beams were idealized as elastic elements; plastic behavior was not observed in the bounding beams during the tests.
The multi-linear force-displacement relationship characterizing the behavior of the nonlinear link element, given in Table 2 and shown graphically in Fig. 5, was calibrated to conform to the experimental hysteretic force-displacement envelope of the test specimens. The force and displacement values in Table 2 were scaled up from the one-third scale specimen to full scale following similitude requirements of true practical models. The initial axial stiffness, Ki, of the link element is also given by Eq. (1). Based on earlier experimental work of the fi rst author, the modulus of elasticity of the infi ll panel, Ep, is Fig. 4 Geometry of the equivalent diagonal strut
h hp wef
r
Φd
lp
l

282 EARTHQUAKE ENGINEERING AND ENGINEERING VIBRATION Vol.14
set equal to 14000 MPa. Using experimental evidence and test measurements of the contact length between the infi ll panel and the bounding frame, after separation, the effective width of the equivalent strut is approximated at one tenth the length of the panel’s diagonal, i.e., length of the equivalent strut.
3.3 Pushover analysis
3.3.1 Loads and load casesAs mentioned in Section 3.2.1, a three-dimensional
structural model was built for each of the forty representative buildings. The buildings were subjected to gravity loads comprising self weight in addition to 2.5 kN/m2 fl oor fi nish and a uniformly distributed live load of 2 kN/m2. These were determined in conformance with the Jordanian Code for Loads and Forces (JCLF, 1985) that governed the minimum design loads during the period of interest.
To determine the yield base shear capacity of the building under consideration, static nonlinear analysis is performed for the two principal directions (x and y) of the building. In fact, ATC-40 (1996) suggests the use of dead loads (DL) and likely live loads (LL) for gravity loading that should be applied and maintained as the lateral deformations are imposed. To defi ne the “likely” live loads ATC-40 (1996) suggests carrying out a number of analyses to cover the range of possible live load levels acting on the structure during an earthquake, and then deciding on the most critical value. Mahdi and Darehshiri (2009) developed capacity curves for reinforced concrete buildings subjected to three gravity
load cases: 1.1DL+1.1LL, 0.9DL and DL+0.2LL. The resulting capacity curves showed minor differences thereby indicating low signifi cance of the variation in live loads within the range of interest. Based on the above argument, 25% of the minimum live loads given by the pertinent local code (JCLF, 1985) are considered for pushover analysis of the representative buildings.
Different lateral load patterns are usually suggested in ATC-40 (1996). It is well established in the literature that sensitivity of the seismic demand predictions to different load patterns used in pushover analysis becomes signifi cant as the height of a structure increases (Ghaffarzadeh et al., 2013). In fact, the use of the simplest load pattern, ‘Elastic First Mode’ or ‘Code’ was recommended for the pushover analyses of low- to mid-rise frame structures by Oguz (2005). A recent investigation into the use of the multi-modal or the Square Root of Sum of Squares (SRSS) lateral load pattern, which accounts for higher mode effects, and the inverted triangular pattern for irregular low- to mid-rise RC infi lled frames indicated that the observed variations in base shear capacity did not exceed 4.7% (Altous, 2013). Note that the pushover analysis carried out in this study is only intended to estimate the yield base shear capacity of the building which, in the case of low- to mid-rise frames, has been shown to be slightly affected by the choice of the lateral load pattern. Hence, it was decided to use the inverted triangular pattern, which corresponds to the fundamental mode of vibration of the building, in accordance with the stipulations of the equivalent static force method in the Jordanian Code for Earthquake-Resistant Buildings (JCERB, 2005). 3.3.2 Capacity curves
Nonlinear static analysis is performed in the two principal directions of the building. Following the recommendations of ATC-40 (1996), gravity loading is applied fi rst using a load-controlled procedure, after which the inverted triangular lateral loads are applied using a displacement-controlled procedure. The lateral load is increased monotonically until the roof control node (located at the roof center of mass) reaches the target displacement in accordance with ATC-40 (1996). For illustration purposes, Fig. 6(a) shows the resulting capacity curves of the G1-A-LR-R building in both x and y directions. Differences between the two capacity curves were noted as a result of the non-uniform stiffness provided in the two orthogonal directions.
The capacity curve with lower resistance to lateral loads, which defi nes a lower bound for the building capacity, is selected. The pushover curve is further reduced by 25% to take into account the uncertainties associated with the as-built information, material properties and reinforcement detailing. Similar values were suggested for the uncertainty associated with structural capacity in the literature (FEMA, 2003 and Kappos et al., 2006 among others). Moreover, FEMA-356 (2000) uses a knowledge factor (Kappa) to reduce component strength based on the level of knowledge obtained for individual
Table 2 Multi-linear force-displacement defi nition for the nonlinear link element (after Al-Nimry, 2010)
Point Axial deformation (mm) Axial force (kN)( F1 , u1 ) 1.290 540( F2 , u2) 10.50 639( F3 , u3) 20.79 639( F4 , u4) 52.50 360( F5 , u5) 65.00 350
Fig. 5 Force-deformation relationship for stone-concrete infi ll walls

No.2 Hanan Al-Nimry et al.: Rapid assessment for seismic vulnerability of low and medium rise infi lled RC frame buildings 283
components during data collection and assigns a value of 75% for this Kappa factor in the absence of suffi cient data.
The reduced pushover curve is then approximated by a bilinear curve according to ATC-40 (1996) considerations for the displacement coeffi cient method as shown in Fig. 6(b). Two points are identifi ed on the idealized capacity curve of the building signifying the global yielding and ultimate states. The global yielding point corresponds to the displacement on the capacity curve where the structural system starts to soften or yield and identifi es the yield base shear capacity of the building with infi ll walls (Vy). While the ultimate point corresponds to the displacement at which a 20% reduction in the lateral load capacity of the structure occurs.
4 Basic capacity index
As described earlier, the yield base shear capacity of the building (Vy) is based on the bilinear representation of the pushover curve rather than the actual base shear-roof displacement relation obtained through analysis. The Basic Capacity Index, BCI, for a specifi c building is obtained by normalizing the yield base shear capacity of the structure (Vy) to the elastic design base shear of the associated design code (Vcode) as given by Eq. (9).
y
code
BCIV
V
(9)
The elastic design base shear (Vcode) of the building under consideration is to be calculated using Eq. (10) in accordance with the stipulations of the Jordanian Code for Earthquake-Resistant Buildings (JCERB, 2005). In fact, the Uniform Building Code (International Council of Building Offi cials, 1997), which has been adopted by the local authorities as a model code, uses the same expressions for the design base shear.
vD
C IV W
RT
(10a)
aD
2.5 C IV W
R
(10b)
a D0.11V C I W (10c) In these expressions, Ca and Cv are the acceleration-
controlled and velocity-controlled seismic coeffi cients, respectively. Ca and Cv account for soil amplifi cation of the basic ground acceleration or velocity. These coeffi cients are determined as a function of the seismic zone and underlying soil conditions (site classifi cation) using Table 3. I is an importance factor set equal to 1.25 for essential and hazardous facilities and 1 for all other facilities including residential buildings. R is the response modifi cation coeffi cient representing the combined overstrength and global ductility capacity of the lateral force-resisting system and is equivalent to the behavior factor, q, in Eurocode 8 (2004). The local seismic code assigns an R value of 3.5 for the building typology under consideration. WD is the total seismic dead load.
For the building typology considered in this study, Eq. (10b) which represents the constant acceleration cap affecting short period structures, governs the design base shear value. The base shear value computed using Eq. (10) neglects the stiffness and lateral resistance of all infi ll walls, both interior and exterior, in the building.
To compute Vcode for the 12 regular buildings, they are assumed to be located in Seismic Zone 1 which is characterized by a seismic zone factor, Z, of 0.075 in accordance with the offi cial seismic zoning map of Jordan that divides the country into 4 Seismic Zones: 1, 2A, 2B and 3 with increasing seismicity from 1 to 3. Furthermore, these buildings are assumed to be
Fig. 6 Example capacity curves of building G1-A-LR-R

284 EARTHQUAKE ENGINEERING AND ENGINEERING VIBRATION Vol.14
constructed on rock soil with a shear wave velocity, vs = 750 m/s which is classifi ed as soil type SB in accordance with the soil classifi cation of JCERB (2005) presented in Table 4.
The BCI values obtained for the 12 regular buildings are summarized in Table 5 and displayed graphically in Fig. 7. The fi gure presents the relation between the basic capacity indices of low- and mid-rise buildings and their fl oor areas. This relation is expressed, in a mathematical form, by Eq. (11).
BCI 5.7 0.002A for low-rise buildings (11a)
BCI 3.0 0.001A for mid-rise buildings (11b)
where BCI is the basic capacity index and A is the typical fl oor area of the building in m2.
For an existing building with a specifi c fl oor area, the basic capacity index value, BCI, obtained from Eq. (11a) for low-rise buildings or Eq. (11b) for mid-rise buildings can be used to assess its expected seismic performance if the building is located in Seismic Zone 1 with SB soil conditions and has no architectural or structural features that would adversely affect its seismic performance. A value of one for the BCI indicates that the actual yield base shear capacity (including the effect of infi ll walls) of the building equals the design base shear, computed according to the local seismic code, which defi nes the seismic demand according to the level
Table 3 Seismic coeffi cients Ca and Cv
Soil profi le type
Seismic zone factor (Z)a
Seismic Zone 1 Z = 0.075
Seismic Zone 2A Z = 0.15
Seismic Zone 2B Z = 0.20
Seismic Zone 3 Z = 0.30
Ca Cv Ca Cv Ca Cv Ca Cv
SA 0.06 0.06 0.12 0.12 0.16 0.16 0.24 0.24SB 0.08 0.08 0.15 0.15 0.20 0.20 0.30 0.30SC 0.09 0.13 0.18 0.25 0.24 0.32 0.33 0.45SD 0.12 0.18 0.22 0.32 0.28 0.40 0.36 0.54SE 0.19 0.26 0.30 0.50 0.34 0.64 0.36 0.84
SFSite specifi c geotechnical investigations and dynamic site response analysis shall be
performed to determine appropriate values a Z: Seismic zone factor that represents the effective peak ground acceleration (in g’s) on soft rock with 10% probability of being exceeded in 50 years
Table 4 Soil classifi cation in accordance to Jordanian code for earthquake-resistant buildings
Soil type Shear wave velocity (m/s) Soil description
SA > 1500 Hard rockSB 670–1500 RockSC 360–670 Soft rock and very dense soilSD 180–360 Stiff soilSE < 180 Soft soil
SF Requiring site-specifi c evaluations Poor soil
Table 5 Basic capacity index calculations for regular buildings (Seismic Zone 1, Soil Type SB)
Building Vy (kN) Vcode (kN) BCI (Vy / Vcode) Building Vy (kN) Vcode (kN) BCI (Vy / Vcode)
G1-A-LR-R 3797 732 5.18 G1-A-MR-R 3905 1492 2.62G1-B-LR-R 3948 780 5.06 G1-B-MR-R 4147 1596 2.60G1-C-LR-R 4287 879 4.88 G1-C-MR-R 4714 1971 2.39G2-A-LR-R 5547 1083 5.12 G2-A-MR-R 5306 2229 2.38G2-B-LR-R 6116 1194 5.12 G2-B-MR-R 6151 2452 2.51G2-C-LR-R 5430 1233 4.40 G2-C-MR-R 7724 2574.7 3.00

No.2 Hanan Al-Nimry et al.: Rapid assessment for seismic vulnerability of low and medium rise infi lled RC frame buildings 285
of seismicity and site effects. BCI values above unity would indicate shear resistance capacities exceeding the seismic demand specifi ed by the code for an earthquake-resistant building. In this case, the gravity load-designed frame building may be looked upon as having some reserve strength (overstrength) that will allow for better performance and the BCI value may be considered as the yield overstrength ratio for the building. Accordingly, BCI values can be used to assess seismic performance if the building is not affected by mass or stiffness irregularities. For a regular building, the BCI value should be at least equal to one in order to classify the building as safe. BCI values less than unity would imply that the actual building resistance is lower than the seismic demand and hence it might experience serious damage and fail to meet the life safety performance criteria in case of a strong earthquake.
5 Seismic performance modifi ers
5.1 General
Seismic vulnerability assessment of existing buildings is not an exact science and is highly affected by uncertainties regarding the materials used, actual reinforcement details and construction quality. In addition, the number of architectural features or structural irregularities that could affect the seismic vulnerability is enormous.
The effect of fl oor area, which could refl ect the wall-to-area ratio for the building, is already taken into consideration in the computations of the Basic Capacity Index value for the building. The building area signifi es the probable number of inhabitants (occupancy size) and the number of potential causalities in case a major earthquake causing extensive structural damage or complete failure takes place. For buildings with fl oor areas exceeding 500 m2, detailed evaluation is necessary in view of the expected high level of occupancy and the associated seismic risk.
The substandard design and construction practices commonly encountered in Jordan and the architectural demands imposed on structural engineers manifest
the adverse effects of higher levels of seismicity, site conditions and architectural features resulting in horizontal and vertical irregularities. Hence, an improved Capacity Index (CI) that gives the actual yield overstrength ratio and incorporates the infl uence of the seismicity level, local site conditions and specifi c irregularities on the seismic performance of buildings is introduced.
To arrive at the fi nal CI value, the Basic Capacity Index is modifi ed by introducing fi ve performance modifi er factors as shown in Eq. (12).
CI BCI ZF SF HIF SSF OHF (12)
where ZF is the zone factor quantifying the effect of variation in seismicity level; SF is the soil factor quantifying the effect of local soil conditions; HIF is the horizontal irregularity factor quantifying the effect of specifi c horizontal irregularities (setbacks and re-entrant corners), SSF is the soft story factor quantifying the effect of having a soft story at the ground fl oor, and OHF is the overhangs factor accounting for the effect of heavily loaded overhangs on the building performance during earthquakes.
5.2 Level of seismicity or seismic zone
Seismic performance of buildings is greatly associated with the level of expected seismicity at the building site which is mainly dependent on its proximity to active faulting systems. In design codes, the level of seismicity is usually determined in conjunction with seismic zoning maps, wherein a seismic zone is an area in which the rate of seismicity remains fairly constant. The main source of seismicity in Jordan is the Dead Sea Transform Fault which is clearly refl ected in the offi cial seismic zoning map for Jordan. Accordingly, the country is divided into four Seismic Zones: 3, 2B, 2A and 1 with decreasing level of seismicity from 3 to 1 as the distance to the main fault increases.
To quantify the effect of seismicity level or building location and arrive at the corresponding performance modifi cation factor or zone factor (ZF), BCI values are
Fig. 7 Relation between fl oor area and basic capacity index for regular buildings

286 EARTHQUAKE ENGINEERING AND ENGINEERING VIBRATION Vol.14
computed for the same regular building being located in each of the four seismic zones on similar soil conditions (soil type SB). Considering Seismic Zone 1 as the reference zone, the different BCI values are normalized to the value obtained for the reference zone, i.e., Zone 1. For illustration purposes, Table 6 summarizes the BCI values for buildings G1-A-LR-R and G1-A-MR-R in the four seismic zones. In addition, the table presents the BCI values normalized to the value obtained for the same building in Seismic Zone 1. In fact, as Vcode is governed by Eq. (10b) for the investigated building typology, the seismic zone modifi er is simply the ratio between the seismic coeffi cients (Ca) in seismic zone 1 to that in any of the other seismic zones. For soil type SB, the Ca values as determined from Table 3 are 0.08, 0.15, 0.2 and 0.3 for Seismic Zones 1, 2A, 2B and 3, respectively. This results in ZF values of 1, 0.53, 0.4 and 0.27 for the four seismic zones as shown in Table 6. Thus, the normalized BCI values in Table 6 actually represent the performance modifi cation factor for the level of seismicity for low- and mid-rise buildings rather than specifi c values for buildings G1-A-LR-R and G1-A-MR-R. Table 6 indicates that the seismic zone modifi cation factor (ZF) is equal for the two categories of building heights considered herein.
5.3 Local site effects-soil conditions
Local soil conditions have a major effect on the seismic performance of buildings as soft soils have a tendency to amplify the input ground motions. Using the shear wave velocity of the top 30 meters of soil, the Jordanian Code for Earthquake-Resistant Buildings (JCERB, 2005) classifi es soil conditions into six categories as shown in Table 4.
To arrive at the performance modifi cation factor associated with the soil condition, SF, the basic capacity index value BCI is computed for the same regular building considering the six different Soil Types SA to SF. The resulting BCI values are normalized to the BCI value for the building constructed on soil type SB which is considered to be the reference soil. Table 7 presents BCI values for the typical low- and mid-rise regular buildings G1-A-LR-R and G1-A-MR-R considering the
six different soil conditions. The tabulated normalized BCI values give the soil modifi cation factor which seems to be unaffected by the building height. Again, due to the fact that Vcode is governed by Eq. (10b), the soil modifi cation factor (SF) for buildings in Seismic Zone 1 is equal to the ratio of the seismic coeffi cient (Ca) value for Soil Type SB to the Ca value for other soil types. Assuming the building under consideration is located in Seismic Zone 1, the Ca values as determined from Table 3 are 0.06, 0.08, 0.09, 0.12 and 0.19 for Soil Types SA, SB, SC, SD and SE, respectively. This results in SF values of 1.33, 1, 0.89, 0.67 and 0.42 for the fi ve soil types as shown in Table 7.
For buildings constructed at a site where soil conditions are poor (Soil Type SF), this indexing method does not apply and the building should be evaluated in detail in accordance with the Jordanian Code for Earthquake-Resistant Buildings (JCERB, 2005). Moreover, this evaluation method does not take into account the potential of liquefaction at the building site.
5.4 Vertical and horizontal irregularities
5.4.1 Vertical irregularities (soft story) According to international and local standards (e.g.,
ASCE/SEI 7-05, 2006 and JCERB, 2005) a stiffness-soft story irregularity is defi ned to exist where there is a story in which the lateral stiffness is less than 70% of that in the story above or less than 80% of the average stiffness of the three stories above. The major problem that appears in this story is associated with high inter-story drift levels which could lead to damage of both structural and nonstructural elements and instability of the structural system under strong earthquake motions.
The presence of a soft story is common in the existing building stock in Jordan as a result of omitting infi ll walls at the ground fl oor level to provide for parking space. The performance modifi er factor (SSF) accounting for the effect of this common type of vertical irregularity is derived by comparing pushover analysis results for the regular building with infi ll walls at the ground fl oor with analysis results for the same building but with infi ll walls omitted from the ground fl oor. Tables 8
Table 7 Soil condition performance modifi cation factor for low- and medium-rise regular buildings
Soil conditionLow-rise buildings Medium-rise buildings
BCI SF BCI SFSA 6.91 1.33 3.49 1.33SB 5.18 1.00 2.62 1.00SC 4.61 0.89 2.33 0.89SD 3.46 0.67 1.74 0.67SE 2.18 0.42 1.10 0.42SF Requires detailed evaluation
Table 6 Seismic zone performance modifi cation factor (ZF) for low- and mid-rise buildings
Seismic zone
Building G1-A-LR-R “Low-rise buildings”
Building G1-A-MR-R“Mid-rise buildings”
BCI Normalized BCI values BCI Normalized
BCI values
1 5.18 1.00 2.62 1.002A 2.76 0.53 1.40 0.532B 2.07 0.40 1.05 0.403 1.38 0.27 0.70 0.27

No.2 Hanan Al-Nimry et al.: Rapid assessment for seismic vulnerability of low and medium rise infi lled RC frame buildings 287
Table 8 Vertical irregularity modifi cation factor (SSF) for low-rise buildings
(1) (2) (3) (4) (5) Building BCI Building BCI SSFG1-A-LR-R 5.18 G1-A-LR-SS 4.08 0.79G1-B-LR-R 5.06 G1-B-LR-SS 3.76 0.74G1-C-LR-R 4.88 G1-C-LR-SS 3.51 0.72G2-A-LR-R 5.12 G2-A-LR-SS 3.87 0.76G2-B-LR-R 5.12 G2-B-LR-SS 3.99 0.78G2-C-LR-R 4.40 G2-C-LR-SS 3.28 0.75Performance modifi cation factor (SSF) 0.75
Table 9 Vertical irregularity modifi cation factor (SSF) for mid-rise buildings
(1) (2) (3) (4) (5)Building BCI Building BCI SSF
G1-A-MR-R 2.62 G1-A-MR-SS 2.29 0.87G1-B-MR-R 2.60 G1-B-MR-SS 2.26 0.87G1-C-MR-R 2.39 G1-C-MR-SS 2.01 0.84G2-A-MR-R 2.38 G2-A-MR-SS 2.02 0.85G2-B-MR-R 2.51 G2-B-MR-SS 2.18 0.87G2-C-MR-R 2.16 G2-C-MR-SS 1.90 0.88Performance modifi cation factor (SSF) 0.85
and 9 summarize the BCI values for six regular buildings in each height category along with the corresponding BCI values of their counterpart irregular buildings. The normalized BCI values tabulated in Column (5) in each of these tables represent the ratio of the BCI value for the irregular building to the BCI value for its counterpart regular building (i.e., ratio of value in Column 4 to that in Column 2), thereby refl ecting the effect of the soft story on the shear capacity of the building.
The fi nal value of the performance modifi cation factor due to the presence of a soft story is taken as the average calculated modifi er value for each category of building heights. Computations of the average performance modifi ers in Tables 8 and 9 indicate that an SSF value of 0.75 and 0.85 can be used for low- and mid-rise buildings, respectively.
This indicates that presence of a soft story in the ground fl oor reduces the building capacity by 25% and 15% for low- and mid-rise stone-concrete buildings. Similar observations are present in the literature: Al-Ali and Krawinkler (1998) found that the seismic demand (in terms of base shear) for a building with a soft story is 7% higher than the corresponding value for a regular building. Gulkan and Yakut (1994) approximated, based on engineering judgment, the infl uence of a soft story to be about 13.5%. Sucuoglu and Yazgan (2003) arrived at the same value of 13.5% based on fi eld observations of actual earthquake damage. Magliulo et al. (2002) concluded that a soft story (in the ground fl oor) can
Table 10 Horizontal irregularity performance modifi cation factor (HIF) for low-rise buildings
(1) (2) (3) (4) (5) (6)Floor area (m2) Irregular building BCI Counterpart regular building BCI HIF
233.5 G1-A-LR-IR 4.95 G1-LR-R 5.24 0.94275.3 G1-B-LR-IR 4.99 G1-LR-R 5.15 0.97325.3 G1-C-LR-IR 4.84 G1-LR-R 5.05 0.96365.5 G2-A-LR-IR 4.99 G2-LR-R 5.12 0.98390 G2-B-LR-IR 4.98 G2-LR-R 5.12 0.97475 G2-C-LR-IR 4.33 G2-LR-R 4.75 0.91
Performance modifi cation factor (HIF) 0.95
magnify the response of the building as much as 20% compared with regular buildings. 5.4.2 Horizontal irregularities (re-entrant corners and setbacks)
The presence of large re-entrant corners induces torsion in the building under earthquake loading. The dynamic response of the building wings or blocks (multi-mass building) in general differs from that of the building as a total. Multi-mass buildings are extremely vulnerable at connections between the different wings. In this study, values for the performance modifi cation factor associated with horizontal irregularities are derived using pushover analysis results of the representative buildings with and without horizontal irregularities. Using pushover analysis results, the basic capacity index value (BCI) is computed for twelve buildings with horizontal irregularities as shown in Tables 10 and 11 for the two height categories (low-rise and mid-rise). Those values are summarized in Column 3 in each of the two tables whereas the BCI values presented in Column 5 are computed for regular counterpart buildings with equal fl oor areas using Eq. (11a) for low-rise buildings and Eq. (11b) for mid-rise buildings. The modifi er factor tabulated in Column 6, i.e., the ratio of the BCI value in Column 3 to that computed in Column 5, refl ects the effect of the horizontal irregularity on the building capacity. The average of the normalized BCI values (presented in Column 6) is taken as the performance modifi cation factor for horizontal irregularities (HIF).

288 EARTHQUAKE ENGINEERING AND ENGINEERING VIBRATION Vol.14
Computations of the average performance modifi ers in Tables 10 and 11 indicate that an HIF value of 0.95 and 0.90 can be used for low- and mid-rise buildings, respectively.5.4.3 Overhangs
Overhangs create mass concentrations over the building’s height and affect its dynamic structural response. Earthquake damage surveys have confi rmed that buildings with heavily loaded overhangs and heavy balconies sustained more damage compared to similar buildings without overhangs.
The performance modifi cation factor accounting for heavily loaded overhangs is derived using pushover analysis results of representative buildings with and without overhangs. Table 12 summarizes the BCI values for two area categories of low-rise buildings. Buildings G1-A-LR-R and G2-A-LR-R are fi rst analyzed to obtain their basic capacity indices (given in Column 2). The two buildings are then modifi ed to incorporate overhangs (the fl oor area is slightly modifi ed) and reanalyzed to arrive at new BCI values (given in Column 4). Column 5 in the table gives the normalized BCI value, i.e., the ratio of BCI value in Column 4 to that in Column 2, which represents the effect of the overhangs that is the overhang modifi cation factor. The value of the performance modifi cation factor (OHF) due to the presence of overhangs is taken as the average of normalized BCI values presented in Table 12. An OHF value of 0.94 is adopted for low-rise buildings.
A similar argument is used to arrive at the BCI values presented in Table 13 for mid-rise buildings with overhangs. A value of 0.98 is adopted for the OHF in mid-rise buildings.
This indicates that heavily loaded overhangs have an adverse effect on the building capacity of about 6% and 2% for low- and mid-rise buildings, respectively. On the other hand, the presence of setbacks and re-entrant corners was found to reduce the building capacity, compared to similar regular buildings, by about 5% and 10% for low- and mid-rise buildings, respectively (see Section 5.4.2). Similar observations are present in the literature: Al-Ali and Krawinkler (1998) found that the seismic demand (in terms of base shear) for a
building with horizontal irregularities is 4% higher than the corresponding value for a regular building. Ozmen and Gulay (2003) concluded that the overall infl uences of horizontal irregularities are less than 10% compared with regular buildings. Based on engineering judgment, Gulkan and Yakut (1994) approximated the infl uence of horizontal irregularities at about 6%. Sucuoglu and Yazgan (2003) arrived at the same value of 6% based on fi eld observations of actual earthquake damage.
6 Capacity index
The Capacity Index, CI, for a given building is determined by multiplying the fi ve performance modifi cation factors for that building by the Basic Capacity Index value, BCI, using Eq. (12). This CI value is then compared with a limit value to decide if the building needs detailed evaluation for a more reliable assessment of its seismic vulnerability or it could be ranked as being safe based on results of the proposed
Table 12 Overhangs performance modifi cation factor (OHF) for low-rise buildings (1) (2) (3) (4) (5)Building BCI Building BCI OHFG1-A-LR-R 5.18 G1-A-LR -OH 5.08 0.98G2-A-LR-R 5.12 G2-A-LR -OH 4.64 0.90Performance modifi cation factor (OHF) 0.94
Table 13 Overhangs performance modifi cation factor (OHF) for mid-rise buildings
(1) (2) (3) (4) (5)Building BCI Building BCI OHFG1-A-MR-R 2.62 G1-A-MR -OH 2.55 0.97G2-A-MR-R 2.38 G2-A-MR -OH 2.33 0.98Performance modifi cation factor (OHF) 0.98
Table 11 Horizontal irregularity performance modifi cation factor (HIF) for mid-rise buildings
(1) (2) (3) (4) (5) (6)
Floor area (m2) Irregular building BCI Counterpart regular building BCI HIF
233.5 G1-A-MR-IR 2.59 G1-MR-R 2.76 0.94275.3 G1-B-MR-IR 2.44 G1-MR-R 2.72 0.90325.3 G1-C-MR-IR 2.33 G1-MR-R 2.67 0.87365.5 G2-A-MR-IR 2.37 G2-MR-R 2.63 0.90390 G2-B-MR-IR 2.37 G2-MR-R 2.61 0.91475 G2-C-MR-IR 2.14 G2-MR-R 2.52 0.85
Performance modifi cation factor (HIF) 0.90
No.2 Hanan Al-Nimry et al.: Rapid assessment for seismic vulnerability of low and medium rise infi lled RC frame buildings 289
Table 14 Irregularities in screened buildings (building count)
Screened buildings Soft story Re-entrant corners OverhangsLow-rise (69) None 42 33Mid-rise (43) 12 15 30
RVS method. An index value above or below the limit value would identify the building under consideration as safe or in need for further detailed evaluation.
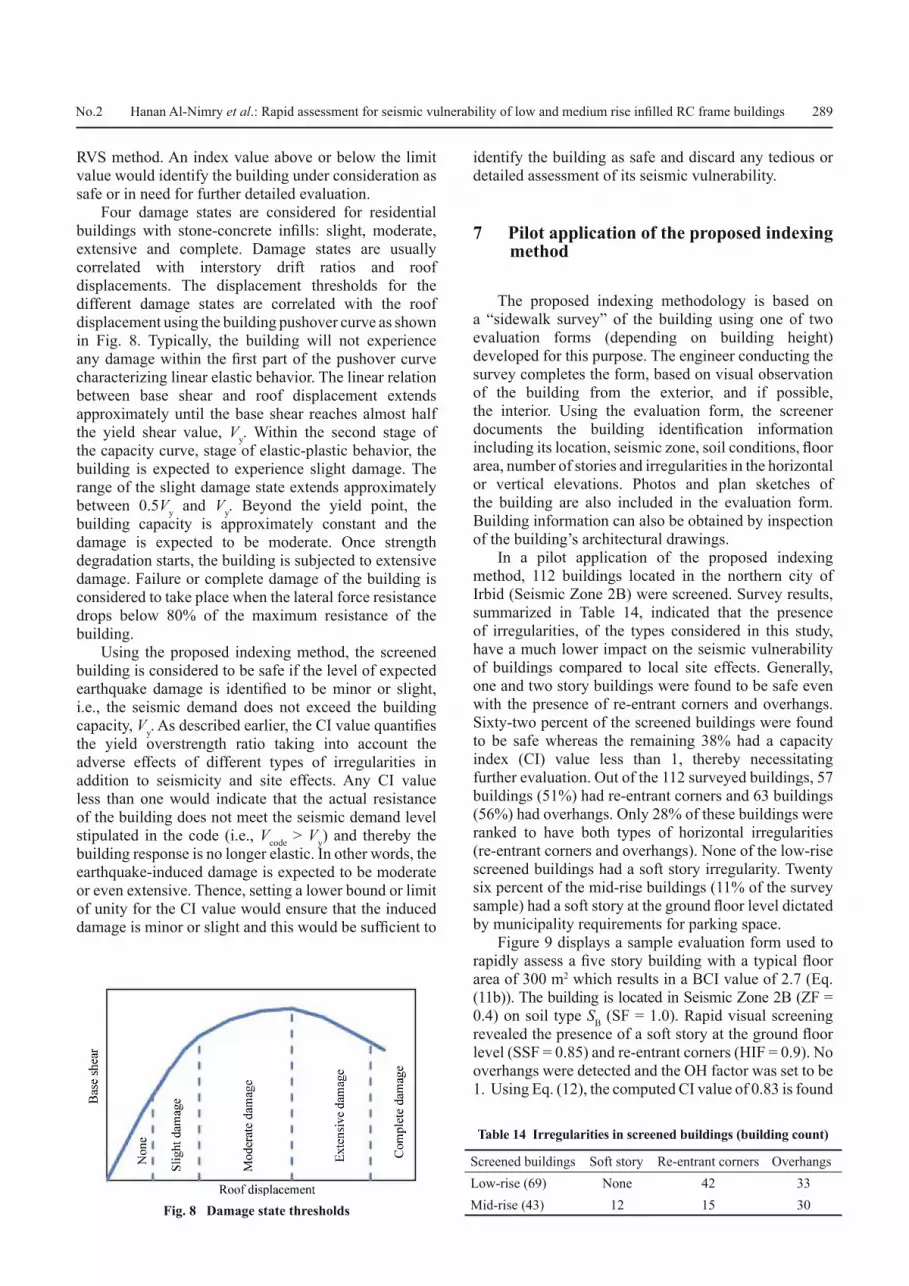
Four damage states are considered for residential buildings with stone-concrete infi lls: slight, moderate, extensive and complete. Damage states are usually correlated with interstory drift ratios and roof displacements. The displacement thresholds for the different damage states are correlated with the roof displacement using the building pushover curve as shown in Fig. 8. Typically, the building will not experience any damage within the fi rst part of the pushover curve characterizing linear elastic behavior. The linear relation between base shear and roof displacement extends approximately until the base shear reaches almost half the yield shear value, Vy. Within the second stage of the capacity curve, stage of elastic-plastic behavior, the building is expected to experience slight damage. The range of the slight damage state extends approximately between 0.5Vy and Vy. Beyond the yield point, the building capacity is approximately constant and the damage is expected to be moderate. Once strength degradation starts, the building is subjected to extensive damage. Failure or complete damage of the building is considered to take place when the lateral force resistance drops below 80% of the maximum resistance of the building.
Using the proposed indexing method, the screened building is considered to be safe if the level of expected earthquake damage is identifi ed to be minor or slight, i.e., the seismic demand does not exceed the building capacity, Vy. As described earlier, the CI value quantifi es the yield overstrength ratio taking into account the adverse effects of different types of irregularities in addition to seismicity and site effects. Any CI value less than one would indicate that the actual resistance of the building does not meet the seismic demand level stipulated in the code (i.e., Vcode > Vy) and thereby the building response is no longer elastic. In other words, the earthquake-induced damage is expected to be moderate or even extensive. Thence, setting a lower bound or limit of unity for the CI value would ensure that the induced damage is minor or slight and this would be suffi cient to
Fig. 8 Damage state thresholds
identify the building as safe and discard any tedious or detailed assessment of its seismic vulnerability.
7 Pilot application of the proposed indexing method
The proposed indexing methodology is based on a “sidewalk survey” of the building using one of two evaluation forms (depending on building height) developed for this purpose. The engineer conducting the survey completes the form, based on visual observation of the building from the exterior, and if possible, the interior. Using the evaluation form, the screener documents the building identifi cation information including its location, seismic zone, soil conditions, fl oor area, number of stories and irregularities in the horizontal or vertical elevations. Photos and plan sketches of the building are also included in the evaluation form. Building information can also be obtained by inspection of the building’s architectural drawings.
In a pilot application of the proposed indexing method, 112 buildings located in the northern city of Irbid (Seismic Zone 2B) were screened. Survey results, summarized in Table 14, indicated that the presence of irregularities, of the types considered in this study, have a much lower impact on the seismic vulnerability of buildings compared to local site effects. Generally, one and two story buildings were found to be safe even with the presence of re-entrant corners and overhangs. Sixty-two percent of the screened buildings were found to be safe whereas the remaining 38% had a capacity index (CI) value less than 1, thereby necessitating further evaluation. Out of the 112 surveyed buildings, 57 buildings (51%) had re-entrant corners and 63 buildings (56%) had overhangs. Only 28% of these buildings were ranked to have both types of horizontal irregularities (re-entrant corners and overhangs). None of the low-rise screened buildings had a soft story irregularity. Twenty six percent of the mid-rise buildings (11% of the survey sample) had a soft story at the ground fl oor level dictated by municipality requirements for parking space.
Figure 9 displays a sample evaluation form used to rapidly assess a fi ve story building with a typical fl oor area of 300 m2 which results in a BCI value of 2.7 (Eq. (11b)). The building is located in Seismic Zone 2B (ZF = 0.4) on soil type SB (SF = 1.0). Rapid visual screening revealed the presence of a soft story at the ground fl oor level (SSF = 0.85) and re-entrant corners (HIF = 0.9). No overhangs were detected and the OH factor was set to be 1. Using Eq. (12), the computed CI value of 0.83 is found

to be below the cutoff value for the Capacity Index (CI = 1). In this case, a better-informed decision regarding the seismic vulnerability of the building should be based on detailed assessment methods requiring further collection of data. Hence, the bottom-right cell in the evaluation form shows that further evaluation is needed to assess the actual seismic vulnerability of the building.
Fig. 9 Sample evaluation form for a fi ve story building
8 Conclusions
A rapid indexing method is proposed to assess the seismic vulnerability of low- and mid-rise infi lled RC frame buildings in Jordan. This rapid visual screening method is intended to identify buildings that need detailed evaluation for a more reliable assessment
290 EARTHQUAKE ENGINEERING AND ENGINEERING VIBRATION Vol.14

of their seismic vulnerability. The method takes into consideration the effect of common types of infi ll walls on the lateral resistance of RC frames designed to resist gravity loads only. The proposed RVS procedure accounts for the effects of seismicity level at the site, soil conditions, presence of vertical stiffness irregularities (soft story at ground fl oor level), plan irregularities (re-entrant corners and setbacks) and overhangs. Extensive static nonlinear analytical verifi cations have been performed, using 40 representative buildings, to defi ne the Basic Capacity Index and performance modifi ers to be identifi ed by the screener. A unique feature of the proposed methodology is that it accounts for the seismicity level and local site effects through the base shear value computed using the code equations. Any future modifi cations to the local seismic code can be directly adapted into the proposed method. The method is limited to buildings with footprints not exceeding 500 m2 and does not cover the effects of short columns, weak stories, material deterioration, pounding potential, landslides, liquefaction and very weak soils (soil type SF).
Application of the proposed method is simple and does not require the acquisition of as-built drawings and material properties. Due to the qualitative nature of rapid assessment procedures, it should be expected that in some cases two or more experienced engineers will assess the same building in a different way. However, if the uncertainties associated with soil classifi cation are set aside through the use of readily available soil maps the results of the rapid visual assessment proposed herein are no longer expected to be screener-dependent. Yet, the method was developed using generic building models with default values for the material properties, cross sections and reinforcement ratios; and thus the method is not exact.
Analysis results of representative stone-concrete buildings indicated that the presence of a soft story at ground fl oor level reduces lateral resistance capacity by 25% and 15% for low- and mid-rise buildings, respectively. Compared to counterpart regular buildings, the presence of setbacks and re-entrant corners was found to reduce the resistance capacity by about 5% and 10% for low- and mid-rise buildings, respectively. On the other hand, a 6% reduction in capacity was observed in low-rise buildings with overhangs. A lower effect (2% reduction in capacity) was noted in mid-rise buildings with overhangs.
A pilot application of the rapid indexing method, including 112 buildings located in the northern city of Irbid (Seismic Zone 2B), indicated that the presence of irregularities, of the types considered in this study, have a much lower impact on the seismic vulnerability of buildings compared to local site effects. Out of the 112 surveyed buildings, 38% were found to be in need of detailed evaluation to better defi ne their seismic vulnerabilities. In general, one and two story buildings were found to be safe even with the presence
of horizontal irregularities (re-entrant corners and overhangs). The screened buildings were found to be mostly dominated by the presence of re-entrant corners (51%) and overhangs (56%). Providing for parking space at the ground fl oor level of mid-rise buildings created a soft story irregularity in 11% of the screened buildings.
Acknowledgement
The work presented herein was funded by the Deanship of Scientifi c Research at Jordan University of Science and Technology under grant No. 143/2011.
References
Agrawal S and Chourasia A (2007), Methodology for Seismic Vulnerability Assessment of Building Stock in Mega Cities, In T. G. Sitharam and B. K. Bansal (Eds.), Microzonation, Banglore: Interline Publishing, pp. 182–190.Al-Ali A and Krawinkler H (1998), “Effects of Vertical Irregularities on Seismic Behavior of Building Structures,” Report No. 130, Department of Civil and Environmental Engineering, Stanford University.Al-Nimry H (2010), “Evaluation of Seismic Performance of Stone-concrete Residential Buildings in Jordan,” Final Report, Royal Scientifi c Society, Amman-Jordan.Al-Nimry H (2012), “Seismic Vulnerability of Residential Buildings in Jordan and its Locality,” Proceedings of the 15th World Conference on Earthquake Engineering, Lisbon, Portugal, Paper 5007.Al-Nimry H (2014), “Quasi-static Testing of RC Infi lled Frames and Confi ned Stone-concrete Bearing Walls,” Journal of Earthquake Engineering, 18(1):1–23, DOI: 10.1080/13632469.2013.835292.Altous N (2013), “An Investigation into the Effect of Concrete Masonry Infi lls on the Seismic Performance of Typical Residential Buildings in Jordan,” M.Sc. thesis, Jordan University of Science and Technology.ASCE Standard, ASCE/SEI 7–05 (2006), Minimum Design Loads for Buildings and other Structures, American Society of Civil Engineers, Reston, Virginia.Asteris PG (2003), “Lateral Stiffness of Brick Masonry Infi lled Plane Frames,” Journal of Structural Engineering, ASCE, 129(8): 1071–1079.ATC-40 (1996), Seismic Evaluation and Retrofi t of Concrete Buildings, Applied Technology Council, Redwood City (CA).BS 5628-1:1992 Code of Practice for Use of Masonry: Part 1: Structural Use of Unreinforced Masonry, London, U.K: British Standards Institution.Computers and Structures, Inc. (2009), SAP2000 v14 Integrated Solution for Structural Analysis and Design, Berkeley, CA.
No.2 Hanan Al-Nimry et al.: Rapid assessment for seismic vulnerability of low and medium rise infi lled RC frame buildings 291

D’Ayala D and Meslem A (2013), “Sensitivity of Analaytical Fragility Functions to Capacity-related Parameters,” GEM Technical Report 2013-X, GEM Foundation, Pavia, Italy.European Committee for Standardization CEN 2004, Eurocode 6: Design of Masonry Structures, Part 1-1: General Rules for Reinforced and Unreinforced Masonry Structures, prEN 1996–1–1:2004: E.European Committee for Standardization CEN 2004, Eurocode 8: Design of Structures for Earthquake Resistance, Part 1: General Rules, Seismic Actions and Rules for Buildings, EN 1998–1–2004.Fajfar P, Dolsek M, Zarnic R and Gostic S (2001), “Development of Numerical Methodologies for Infi lled Frames, Towards European Integration in Seismic Design and Upgrading of Building Structures Project,” Euroquake-Project, Final Report.FEMA (2003), HAZUS-MH Technical and User’s Manual, Federal Emergency Management Agency, Washington, D.C.FEMA-154 (1988), Rapid Visual Screening of Buildings for Potential Seismic Hazards: A Handbook, 2nd ed, Federal Emergency Management Agency, Washington, D.C.FEMA-256 (1999) HAZUS99 Technical Manual. Federal Emergency Management Agency, Washington, D.C.FEMA-273 (1997), NEHRP Guidelines for the Seismic Rehabilitation of Buildings, Federal Emergency Management Agency, Washington, D.C.FEMA-310 (1998), Handbook for the Seismic Evaluation of Buildings-A Prestandard, Federal Emergency Management Agency, Washington, D.C.FEMA-356 (2000), Prestandard and Commentary for the Seismic Rehabilitation of Buildings, Federal Emergency Management Agency, Washington DC.Ghaffarzadeh H, Talebian N and Kohandel R (2013), “Seismic Demand Evaluation of Medium Ductility RC Moment Frames Using Nonlinear Procedures,” Earthquake Engineering and Engineering Vibration, 12(3): 399–409.Gulkan P and Sozen MA (1999), “Procedure for Determining Seismic Vulnerability of Building Structures,” ACI Structural Journal, 96(3): 336–342.Gulkan P and Yakut A (1994), “An Expert System for Reinforced Concrete Structural Damage Quantifi cation,” ACI Structural Journal, SP–162: 53–71.Hassan AF and Sozen MA (1997), “Seismic Vulnerability Assessment of Low-rise Buildings in Regions with Infrequent Earthquakes,” ACI Structural Journal, 94(1): 31–39. International Council of Building Offi cials (1997), Uniform Building Code, Whittier, CA.Jain S, Mitra K, Kumar M and Shah M (2010), “A Proposed Rapid Visual Screening Procedure for Seismic Evaluation of RC-frame Buildings in India,” Earthquake
Spectra, 26(3): 709–729.JCERB (2005), Jordanian Code for Earthquake-Resistant Buildings, Jordanian National Building Council, Ministry of Public Works and Housing, Amman, Jordan.JCLF (1985), Jordanian Code for Loads and Forces, Jordanian National Building Council, Ministry of Public Works and Housing, Amman, Jordan.JCPRC (1993), Jordanian Code for Plain and Reinforced Concrete, Jordanian National Building Council, Ministry of Public Works and Housing, Amman, Jordan.Kaminosono T (2002), “Evaluation Method for Seismic Capacity of Existing Reinforced Concrete Buildings in Japan,” Proceedings of Int. Conf. on Earthquake Loss Estimation and Risk Reduction, Bucharest, Romania.Kappos A, Panagopoulos G and Penelis G (2006), “A Hybrid Method for the Vulnerability Assessment of R/C and URM Buildings,” Bulletin of Earthquake Engineering, 4: 391–413.Lang DH, Verbicaro MI, Singh Y, Prasad JSR, Wong Diaz D and Gutiérrez M (2010), “Structural and Nonstructural Seismic Vulnerability Assessment for Schools and Hospitals Based on Questionnaire Surveys: Case Studies in Central America and India,” Proceedings of the 9th U.S. National and 10th Canadian Conference on Earthquake Engineering, Toronto, Canada, Paper No. 978. Magliulo G, Ramasco R and Realfonzo R (2002), “Seismic Behavior of Irregular in Elevation Plane Frames,” Proceedings of the 12th European Conference on Earthquake Engineering, London, UK, Paper No. 219.Mahdi T and Darehshiri H (2009), “Pushover Analysis of Asymmetric Ordinary Moment RC Frames Designed According the Iranian Code,” Proceedings of the 3rd International Conference on Concrete and Development, Tehran, Iran.Mander J, Priestley M and Park R (1988), “Theoretical Stress-strain Model for Confi ned Concrete,” Journal of Structural Engineering, ASCE, 114(8): 1804–1826.Ministry of Public Works and Housing, MPWH (1996), General Building Specifi cations Vol. 1, Architectural and Civil Works, Amman, Jordan.National Research Council of Canada, NRCC (1993), Manual for Screening of Buildings for Seismic Investigation, Institute for Research in Construction, Ottawa, Canada. ISBN 0–660–15381–5.Oguz S (2005), “Evaluation of Pushover Analysis Procedures for Frame Structures,” M.Sc. thesis, Middle East Technical University.Otani S (2000a), “Seismic Vulnerability Assessment Methods for Buildings in Japan,” Earthquake Engineering and Engineering Seismology, 2(2): 47–56.Otani S (2000b), “Seismic Vulnerability Assessment of Reinforced Concrete Buildings,” Faculty of Engineering
292 EARTHQUAKE ENGINEERING AND ENGINEERING VIBRATION Vol.14
Journal, University of Tokyo, Series B (XLVII): 5–28.Ozcebe G, Yucemen MS, Aydogan V and Yakut A (2003), Preliminary Seismic Vulnerability Assessment of Existing Reinforced Concrete Buildings in Turkey-Part I: Statistical Model Based on Structural Characteristics, S.T. Wasti and G. Ozcebe (eds.), Seismic Assessment and Rehabilitation of Existing Buildings, NATO Science Series, 29: 29–42.Ozdemir P and Taskin B (2006), “Seismic Safety Screening Method for Istanbul Metropolitan City,” Proceedings of the 10th East Asia Pacifi c Conference on Structural Engineering and Construction; Wind and Earthquake Engineering (EASEC), Bangkok, Thailand, pp. 255–260.Ozmen G and Gulay F (2003), “An Investigation of Torsional Irregular Multi-story Buildings under Earthquake Loading,” Structural Engineering and Mechanics, 14(2): 237–43.Risk-UE (2001-2004), “An Advanced Approach to Earthquake Risk Scenarios, with Applications to Different European Cities,” Website: http://www.risk-ue.net.
Sinha R and Goyal A (2004), “A National Policy for Seismic Vulnerability Assessment of Buildings and Procedure for Rapid Visual Screening of Buildings for Potential Seismic Vulnerability,” Department of Civil Engineering, Indian Institute of Technology, Bombay, India.Sucuoglu H and Yazgan U (2003), “Simple Survey Procedures for Seismic Risk Assessment in Urban Building Stocks,” in Seismic Assessment and Rehabilitation of Existing Buildings (DOI: 10.1007/978-94-010-0021-5-7), NATO Science Series, London: Kluwer Academic Publishers, 29: 97–118.Yakut A (2004), “Preliminary Seismic Performance Assessment Procedure for Existing RC Buildings,” Engineering Structures, 26: 1447–1461. DOI:10.1016/j.engstruct.2004.05.011.Yakut A, Aydogan V, Ozcebe G and Yucemen MS (2003), Preliminary Seismic Vulnerability Assessment of Existing Reinforced Concrete Buildings in Turkey–Part II: Inclusion of Site Characteristics, S.T. Wasti and G. Ozcebe (eds.), Seismic Assessment and Rehabilitation of Existing Buildings, NATO Science Series, 29: 43–58.
No.2 Hanan Al-Nimry et al.: Rapid assessment for seismic vulnerability of low and medium rise infi lled RC frame buildings 293


