Embed Size (px)
Citation preview

Mitigation of airspace congestion impact on airline networks
Bo Vaaben a, b, *, Jesper Larsen b
a Jeppesen, Koebmagergade 53-3, 1150 Copenhagen, Denmarkb DTU Management Engineering, Technical University of Denmark, Produktionstorvet, Bygning 424, 2800 Kgs. Lyngby, Denmark
a r t i c l e i n f o
Article history:
Received 6 May 2013
Received in revised form
14 March 2015
Accepted 2 April 2015
Available online
Keywords:
Disruption management
Congested airspace
Aircraft recovery
Flight delays
Flight cancellations
Aircraft swaps
Airline industry
a b s t r a c t
In recent years European airspace has become increasingly congested and airlines can now observe that
en-route capacity constraints are the fastest growing source of flight delays. In 2010 this source of delay
accounted for 19% of all flight delays in Europe and has been increasing with an average yearly rate of 17%
from 2005 to 2010. This paper suggests and evaluates an approach to how disruption management can
be combined with flight planning in order to create more proactive handling of the kind of disruptions,
which are caused by congested airspace. The approach is evaluated using data from a medium size
European carrier and estimates a lower bound saving of several million USD.
© 2015 The Authors. Published by Elsevier Ltd. This is an open access article under the CC BY-NC-ND
license (http://creativecommons.org/licenses/by-nc-nd/4.0/).
1. Introduction
Running an airline is a complex business where hundreds of
aircraft need to be scheduled and maintained. Thousands of flights
need to be dispatched every day. Tens of thousands of crew
members need to be rostered and millions of passengers need to be
transported from one location to another every year. To accomplish
this enormous task airlines have for several decades relied on Op-
erations Research (OR) to stay competitive and conduct careful and
efficient planning of every single activity in their operation. Un-
fortunately these efficient plans are hardly ever being executed as
originally intended.
In 2010 24% of all flights in Europe and 18% of all flights in the US
were delayed more than 15 min and consequently experienced
some sort of disruption (Eurocontrol and FAA, 2012). Bad weather,
technical problems, crew reporting sick and in recent years to an
increasing extent also airspace being congested are all examples of
uncertainty elements.
To manage these deviations there has during the last couple of
decades been a move in airline related OR research to an increased
focus on the real-time execution of the airline. In this paper we take
OR based disruption management one step further in the direction
toward the actual flight operation as we combine disruption
management and flight planning.
The paper initially gives a short introduction to disruption
management and the main work processes, which exists in an
Operational Control Center (OCC) in an airline. The paper provides a
literature review on disruption management with a special focus
on integrated disruption management as well as flight planning.
The paper goes into further detail with Air Traffic Flow Manage-
ment (ATFM). In this paper we suggest a network representation
and a model, which handles integrated recovery decisions with
flexible flight trajectories. We describe a framework for using the
integrated decision approach and use this to evaluate our suggested
approach. Finally we present our findings in terms of a lower bound
for the annual saving, which can be obtained by using the approach.
A contribution of this paper is to suggest and evaluate an
approach to how disruption management can be combined with
flight planning in order to create more proactive handling of the
kind of disruptions, which are caused by congested airspace.
The paper suggests a method for increased interaction between
Ops Controllers and flight planners in order to make sure that the
network effects of any trajectory selection is properly incorporated
in the decisions.
The paper introduces a flight planning based aircraft recovery
model, which takes into account both passenger misconnections
* Corresponding author.
E-mail addresses: [email protected], [email protected] (B. Vaaben),
[email protected] (J. Larsen).
Contents lists available at ScienceDirect
Journal of Air Transport Management
journal homepage: www.elsevier .com/locate / ja ir t raman
http://dx.doi.org/10.1016/j.jairtraman.2015.04.002
0969-6997/© 2015 The Authors. Published by Elsevier Ltd. This is an open access article under the CC BY-NC-ND license (http://creativecommons.org/licenses/by-nc-nd/4.0/).
Journal of Air Transport Management 47 (2015) 54e65
and congested airspace constraints.
2. Disruption management
Whenever an event occurs, which makes an airline deviate from
its planned schedule or its planned crew rosters, the airline is
disrupted. Most larger airlines operate a hub and spoke network,
where efficient use of aircraft and crews are causing the airline not
to have crew following the aircraft. This is due to the fact that crew
work rules are much more restrictive than the rules which can be
applied to aircraft. The tight planning of aircraft and crew is causing
an airline to become very vulnerable to disruptions, as a delay of a
single inbound flight to a hub quickly can propagate to other flights.
Most airlines have an Operational Control Center (OCC). In the
OCC Ops Controllers monitor the operation of the airline and
manage disruptions to the schedule and are responsible for a well-
functioning network of flights, crew and passengers on the day of
operation.
The organizational setup of an OCC varies from airline to airline
and does to a large extent depend on the size of the airline. There
are, however, some typical organizational entities, which are pre-
sent in virtually any OCC. These are:
� Airline Operations Controllers: These are responsible for the
overall operation of the airline's schedule on the day of
operation.
� Aircraft Controllers: This group of people are responsible for
maintaining a feasible schedule and aircraft routing, including
that each aircraft is routed back to their scheduled and un-
scheduled maintenance activities at one of the maintenance
stations.
� Crew Controllers: When the recovery of the schedule and
aircraft routings inflict changes to the schedule, these changes
need to be verified for feasibility with the Crew Controllers.
� Customer Service Representatives: The Customer Service Rep-
resentatives in the OCC are responsible for maintaining a proper
level of service to the airline's passengers, which is especially
important to keep in focus during times of irregular operations.
� Maintenance Controllers: This group of people are in contact
with the maintenance department of the airline and commu-
nicates to the Aircraft Controllers in case a maintenance activity
will not be finished on time.
� Flight Dispatchers: A dispatcher is responsible for a number of
individual flights and does on a flight-by-flight basis take care of
everything from collecting relevant weather information for a
flight to calculating the flight plan andmonitoring the status and
potential risks related to the flight while it is en-route.
2.1. Previous work on disruption management
In order to find good recovery solutions in a limited amount of
time OR techniques have been applied to the problem. The full
problem of recovering all 3 resource areas of aircraft, crew and
passengers is, however, so complex that no work has been pub-
lished so far, which cover all 3 areas in one single integrated model.
The published models are typically inspired by how the airlines do
their manual problem solving, and the models usually address one
single resource area each. A good introduction to disruption man-
agement in the airline industry can be found in Belobaba et al.
(2009). Kohl et al. (2007) describes a large scale EU-funded proj-
ect, called Descartes, which addresses various aspects of disruption
management. The reader is also referred to an extensive survey of
operations research used for disruption management in the airline
industry by Clausen et al. (2010).
Of the 3 resource areas mentioned above, aircraft recovery was
the first area to be addressed through the application of OR by
Teodorovi�c and Guberini�c (1984). This work was merely academic
in its scope and only considered flight delays. Jarrah et al. (1993)
were the first to publish 2 models, which in combination were
capable of producing solutions, which were useful in practice. The
drawback of Jarrah et al. (1993) was that cancellations and delays
could not be traded off against each other within one single model.
This drawback was later on resolved in the work by Yan and Yang
(1996). Thengvall et al. (2001) later on extended this model to
also include so-called protection arcs, which serve the purpose of
keeping the proposed solutions somewhat similar to the original
schedule. Rosenberger et al. (2003) present a model based on the
set packing problem. Andersson (2006) proposes two meta-
heuristics based on simulated annealing and tabu search. Results
show that the tabu search heuristic is best and can find high quality
solutions in less than a minute. Recently Eggenberg et al. (2010)
proposed a generalized recovery framework using a timeband
network, where the same model can be used to solve either an
aircraft recovery problem, a passenger recovery problem or a crew
recovery problem.
The second problem, which has been addressed by the OR
community is the crew recovery problem, which was initially
addressed in the work by Johnson et al. (1994). Later work include
Wei et al. (1997), Stojkovi�c et al. (1998), Lettovsky (2000) and
Medard and Sawhney (2007).
The third area, passenger recovery, has only been addressed by a
very limited amount of published research. The main contribution
in this area is done by Bratu and Barnhart (2006), who present a
Passenger Delay Model. Vaaben and Alves (2009) does a compari-
son of sequential passenger re-accommodation with re-
accommodation based on an IP model.
3. Air Traffic Control (ATC) and flight planning
The airspace of a country is regulated by the authorities of the
country. In the US it is the Federal Aviation Administration (FAA).
While the different countries in Europe regulate their own airspace,
they have to a large extent agreed on common rules and have also
established a common control entity called Eurocontrol. Both
Europe and the US have established an overarching control layer for
their Flight Information Regions (FIRs) called Air Traffic Flow
Management (ATFM). In Eurocontrol ATFM is performed by the
Central Flow Management Unit (CFMU).
To coordinate traffic and ensure safety a number of additional
elements are defined for the airspace. Among these are waypoints
and airways. Together with waypoints the airways create a directed
graph, where waypoints represent nodes and airways represent
arcs.
In order to fly from one airport to another it is necessary to
calculate a path through the airspace graph. This process is called
Flight Planning. For further reading regarding airspace and ATC, the
reader is referred to Belobaba et al. (2009) and Cook (2007).
A flight plan describes how the aircraft is going to fly from a
Point Of Departure (POD) to a Point Of Arrival (POA) and has to be
filed with Air Traffic Control (ATC) before the flight is allowed to
take off. The route is specified as a sequence of waypoints and
altitudes.
Calculating a flight plan is a complex optimization problem in
itself. It has, however only been addressed by academia to a rather
limited extent compared to other airline related problems. Altus
(2012) gives an overview of flight planning related literature and
the complexities associated to the problem.
B. Vaaben, J. Larsen / Journal of Air Transport Management 47 (2015) 54e65 55

3.1. Cost index
An important concept to decide about speed is the cost index. All
modern aircraft in commercial aviation use cost index as an input to
their on-board computer, which is also know as a Flight Manage-
ment System (FMS). The pilot enters a cost index into the FMS,
which basically tells the computer what the value of time is
compared to the value of fuel as given in the following definition of
Cost Index, where fuel in this definition is measured in kilograms.
Cost Index ¼dollars=min
dollars=kg(3.1)
The definition of the Cost Index consequently expresses the
number of kilos of fuel, which the FMS should be willing to burn, in
order to save one minute of time. As seen from the definition, a cost
index of 0 will minimize the fuel burn by indicating that cost of
time is seen as having zero value. The problem with the cost index
definition is that it assumes that the cost of time is linear, which is
far from the case in normal airline operation. A number of factors
contribute to the fact that cost of time is not linear. In Altus (2010)
sources like subsequent flights, operational flexibility, crew con-
nections, passenger connections and goodwill are listed as exam-
ples that make cost not linear but rather piecewise linear in time.
4. Air Traffic Flow Management (ATFM)
As previouslymentioned the airspace is divided into FIRs, where
each FIR has a control center for the area, ACC. In regions with a
high density of air traffic an additional coordination layer on top of
the ACCs have been established to coordinate the flow of traffic
between the FIRs and in this way ensure that air traffic in specific
areas do not exceed capacity. The practice of coordinating air traffic
across various FIRs from a system perspective is referred to as Air
Traffic Flow Management (ATFM). ATFM is not carried out in the
same way in the US and in Europe.
ATFM in the US is taken care of by the Air Traffic Control Systems
Command Center (ATCSCC) located in Northern Virginia. Under
nominal operating conditions the ATCSCC does not put special
regulation in place in order to restrict the flowof air traffic as the US
National Airspace System (NAS) can handle the demand under
these conditions. However, when the NAS becomes disrupted due
to adverse weather, equipment outages, runway closures or de-
mand surges, the ATCSCC applies special regulations in order to
restrict the flow of traffic through the system. One such type of
regulation is the Ground Delay Program (GDP) which was initiated
in 1998.
The GDP initiative has been very successful and has according to
Metron Aviation avoided 50,000 h of assigned ground holding since
it was initiated (Vossen et al., 2012). Building on this success FAA
did in the summer of 2006 implement the Airspace Flow Program
(AFP) initiative, which extends the GDP procedures to the en-route
environment. With the AFP the ATCSCC can enforce a flow re-
striction across a predefined borderline referred to as a Flow Con-
strained Area (FCA) and thus restrict the flow of flights in one
direction across the FCA. Each airline is granted a number of slot
times according to the Ration By Schedule scheme also used for
GDPs. An AFP related slot time is a small time window where the
airline is granted the right to pass through the FCA with one flight.
The airline is allowed to decidewhich flight should use the slot time
and also which time to depart. In order to help dispatchers find
good candidates for slot swaps in case of an AFP, Abdelghany et al.
(2007) presented a heuristic to do this. For some flights the carrier
may choose to completely avoid this constraint by filing a flight
plan, which takes the flight around the FCA.
While the present paper addresses how the OCC of an airline can
respond to ATFM restrictions in a way which affects the network of
the airline to the least extent, the paper of Bertsimas et al. (2011)
proposes how ATFM with rerouting possibilities should be
handled from a central ATM point of view. This paper has its off-set
in the seminal paper of Bertsimas and Patterson (Bertsimas et al.,
2000).
Cook and Tanner (2012) explore flight prioritization principles
and argues that trajectories and departure times should increas-
ingly be decided through Collaborative Decision Making (CDM) in
order for the aircraft operators to achieve the “best business
outcome”. The present paper contributes by providing the aircraft
operator's perspective of this interaction given specific airspace
congestion constraints. This includes the evaluation of trade-offs
between passenger delays, fuel burn costs and trajectory selection
when providing the aircraft operator's suggestion to the “best
business outcome”.
ATFM in Europe is taken care of by the Central Flow Manage-
ment Unit (CFMU), which is a part of Eurocontrol and located in
Brussels. When a flight in Europe flies from point A to point B the
pilote or dispatcher, if the flight belongs to an airlinee files a flight
planwith the local airspace authorities of point of departure (POD).
CFMU receives the flight plan and calculates when the flight will
pass through a number of different air sectors on its way. In case
any of these sectors have reached their capacity limit, CFMU will
issue a Calculated Take-Off Time (CTOT), which is later than the
originally intended departure time in the flight plan filed by the
carrier. CFMU grants access through the congested air sector on a
first-come-first-serve basis in the order of time when flight plans
were filed. Based on this policy CFMU issues CTOT-delays to the
flights, which have filed flight plans through the congested sector.
In case the dispatcher of an airline determines that the CTOT-
delay is too large, he may choose to cancel the flight plan and file
another flight plan, which takes the flight around the congested
airspace. By doing so he frees up a bit of capacity in the congested
air sector.
When looking to the sky, airspace may seem plentiful compared
to the amount of aircraft manoeuvring in it. Airspace does, how-
ever, get congested in areas with a high flight density such as some
parts of Europe and the US. Combined with flight density there are
two main reasons why airspace gets congested. Both are due to
safety regulations (Belobaba et al., 2009) as ATC needs to keep a
large separation between aircraft in their area, and because ATC is
currently based on human controllers, which implies a limitation to
howmany aircraft a controller can safelymonitor at any given point
in time.
Congested areas over Europe can be followed using CFMU's
Network Operations Portal (NOP). Not a day passes by without the
NOP portal showing various areas in Europe, where en-route and
airport delays must be expected.
Whenever a disruption occurs it typically results in some form
of flight delay. A flight delay could for instance be caused by one or
more checked-in passengers not boarding the flight and their bags
will consequently have to be off-loaded for security reasons, which
often results in a delay. This is referred to as a primary delay. This
delay may have a knock-on effect on a subsequent flight in which
case this second flight delay is reported as a reactionary delay. The
International Airline Travel Association (IATA) have defined a set of
delay codes for both primary and reactionary delays. Airlines use
these codes for reporting their delays to Eurocontrol and the delay
causes among all airlines are roughly split fiftyefifty between pri-
mary and reactionary delays (Eurocontrol, 2010).
It is especially interesting to look at primary delay causes due to
the fact that if these are reduced the corresponding reactionary
delays will also be reduced. In their yearly reports Eurocontrol has
B. Vaaben, J. Larsen / Journal of Air Transport Management 47 (2015) 54e6556

published the distribution of primary delays causes for flights in
Europe. For 2010 the distribution is shown in Fig. 1.
In Fig.1 it is noted that themajority of the primary delays (41.8%)
are caused by factors related to the airline itself, such as technical
problems, baggage delays, checked-in passengers not showing up,
etc. The second largest portion (32.5%) of primary delays are caused
by factors related to Air Traffic Flow Control Management (ATFCM),
which is basically the part of Eurocontrol taking care of the flow of
flights through different sectors in Europe. The largest subset of the
ATFCM-delays are so-called en-route delays and correspond to
19.09% of all flight delays.
While en-route delays is not the biggest source of primary de-
lays, it is, however, the fastest growing source of delays (Network
Operations Report, 2010). This source of delays in Europe has
increased with an average yearly rate of 17% from 2005 to 2010,
which is a good reason to address exactly this kind of delays. That
en-route delays have been rising so sharply in recent years is due to
the fact that European airspace is close to reaching its capacity
limit. A similar development has also been seen in some areas of
the US, especially in the densely populated North East. This is the
main reason why both the US and Europe have initiated huge
programs called Next Generation Air Traffic Control (NextGen) in
the US and SESAR in Europe. Both programs aim at increasing
airspace capacity by e.g. enabling more direct flight paths and
reduced aircraft separation requirements.
5. Combining flight planning and disruption management
In the work flow in the OCC there is a high degree of interaction
between Ops Controllers and people in the related areas of aircraft,
crew and customer service. Based on the experience of the first
author and his 15 years in the airline industry, there is little inter-
action between Ops Controllers and dispatchers, who at some air-
lines are not even located in the same room.
Ops Controllers take care of the overall network of flights and
use a combination of swaps, delays and cancellations in order to
recover from a disruption. Dispatchers on the other hand, look at
individual flights and make local decisions about trajectory and
speed.
There is little focus on the flexibility, which flight planning can
provide when searching for good recovery solutions. The proposal
of this paper is a model, which can do exactly this. It includes
various flight trajectories in disruption management decisions in
order to change flight planning decisions from being local decisions
for individual flights to being decisions, which serve the entire
airline network in the best possible way in terms of both fuel burn
and passenger connections. The model formulation allows for both
rerouting trajectories and speed change trajectories to be handled.
The computational experiments do, however, only consider
rerouting trajectories as only these are relevant for the short haul
European flight schedule, which are used for the experiments.
6. Modelling
In this section we describe the network representation of the
problem as well as the mathematical model, which is based on the
network. The model is based on a time-space network representa-
tion of the airline's schedule and planned maintenance activities.
The nodes in a time-space network represent both time and loca-
tion. In the current application the locations are airports.
6.1. Network representation
In the aircraft recovery literature the modelling is generally
based on different variants of three network representations as
surveyed in Clausen et al. (2010). 1) A connection network, where
the flight activities are represented by nodes in the network. 2) A
time-line networkwhere each node represents a point in time and a
location, while flights are represented as arcs in the network. 3)
Finally a time-band network has been used as a variant hereof,
where points in time are aggregated into so-called time-bands. The
latter two representations both belong to the time-space class of
representations, where nodes represent both a point in time and
space. As the purpose of this paper is to alleviate the problems of
congested airspace by combining flight planning and disruption
management, we havemade the choice of a time-line network. This
representation has the advantage of an exact representation of time
and location at an airport together with an intuitive and logical way
of representing flight plans as arcs in this network.
The basic layout of the network is shown in Fig. 2. In this
network time is increasing from left to right and each horizontal
line represents an airport location. A white square node represents
a source node for a specific aircraft. This is the current location of
this aircraft at the start of the recovery window. The recovery win-
dow is a time window where the algorithm is allowed to make
changes to the aircraft schedule. A black square node is a sink node
for a specific aircraft and represents a time where this aircraft must
be present at the specified airport.
The small network example in Fig. 2 could be operated by two
aircraft. One starting in airport A, visiting airport B and C before
returning back to airport A; and another aircraft starting in airport
B, travelling to airport D and back to B before ending at airport D.
Fig. 1. Primary delay causes in 2010.
Source: Network Operations Report for 2010, Eurocontrol. Fig. 2. Basic layout of time-space network.
B. Vaaben, J. Larsen / Journal of Air Transport Management 47 (2015) 54e65 57
The network also contains ground arcs (not shown) that represent
the time spend on the ground, in-between flights. As an example,
the network in Fig. 2 would contain four ground arcs for airport B
(an arc between node 1 and 2, one between 2 and 3 and so on). The
network also contains maintenance arcs which, like ground arcs,
connect two nodes associated with the same airport. However,
maintenance arcs represent planned repairs and/or inspections and
are usually mandatory, where ground arcs are optional.
In order to produce a valid recovery solution where no addi-
tional post-processing is required it is important to have complete
control over which specific aircraft will perform each activity. This
is obvious for maintenance activities, where a mandatory mainte-
nance of an aircraft requires that this specific aircraft arrives at the
maintenance hangar.
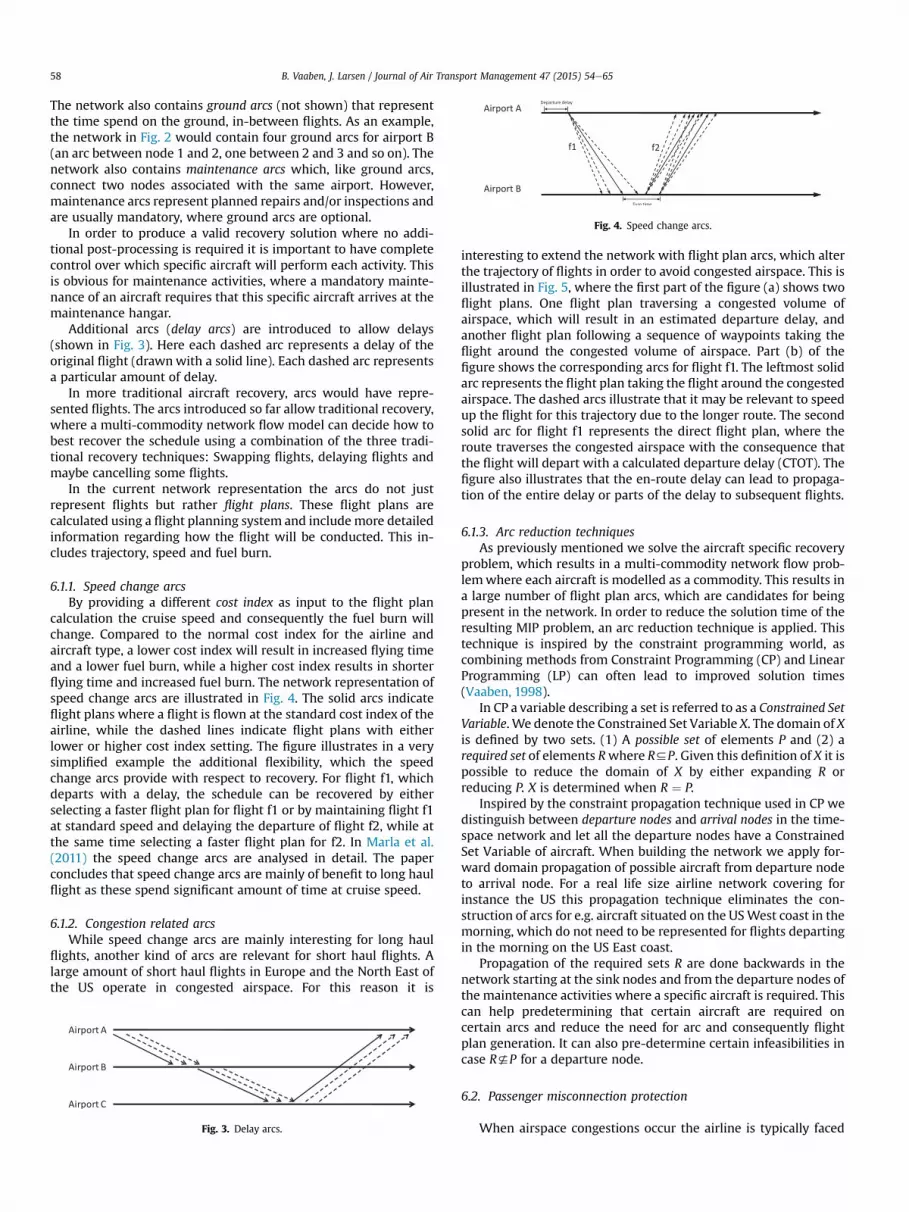
Additional arcs (delay arcs) are introduced to allow delays
(shown in Fig. 3). Here each dashed arc represents a delay of the
original flight (drawnwith a solid line). Each dashed arc represents
a particular amount of delay.
In more traditional aircraft recovery, arcs would have repre-
sented flights. The arcs introduced so far allow traditional recovery,
where a multi-commodity network flow model can decide how to
best recover the schedule using a combination of the three tradi-
tional recovery techniques: Swapping flights, delaying flights and
maybe cancelling some flights.
In the current network representation the arcs do not just
represent flights but rather flight plans. These flight plans are
calculated using a flight planning system and includemore detailed
information regarding how the flight will be conducted. This in-
cludes trajectory, speed and fuel burn.
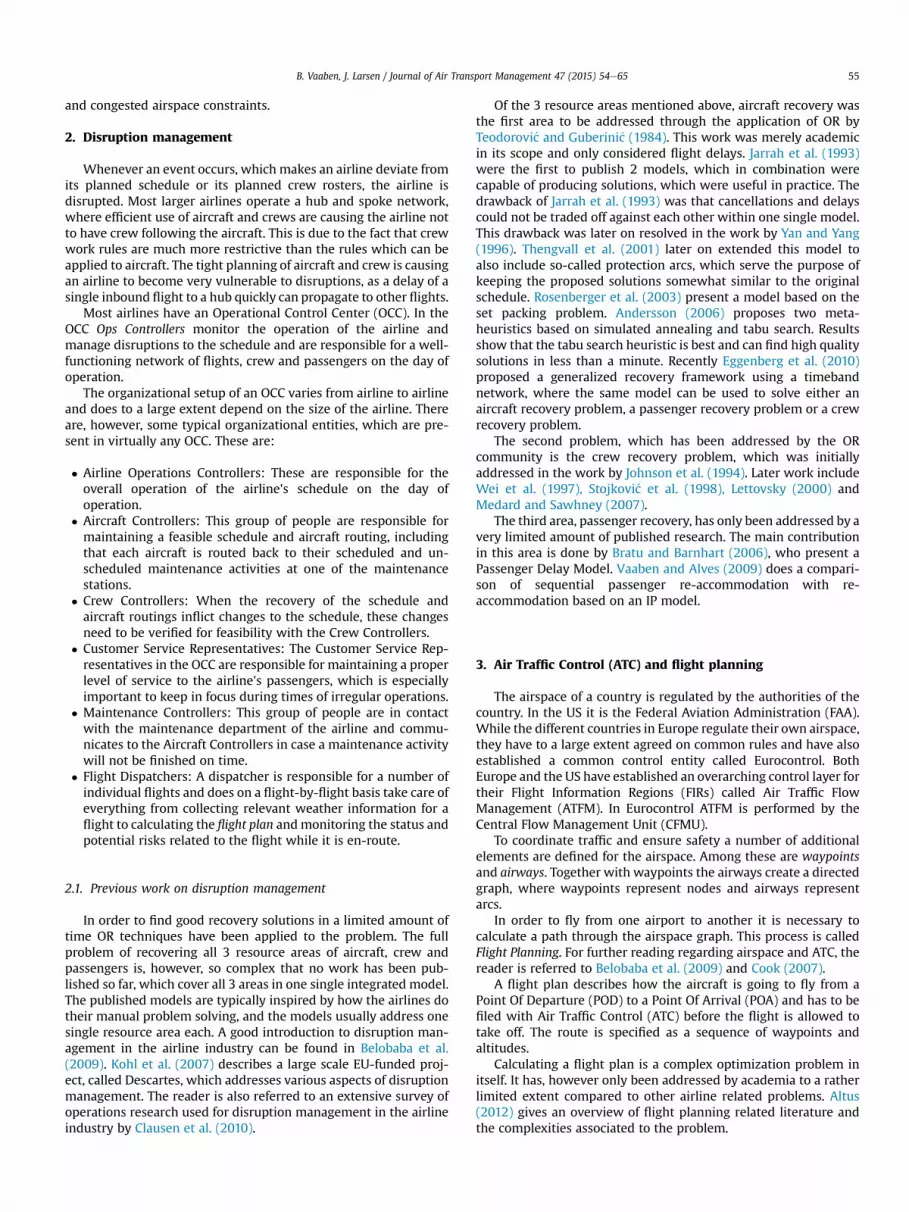
6.1.1. Speed change arcs
By providing a different cost index as input to the flight plan
calculation the cruise speed and consequently the fuel burn will
change. Compared to the normal cost index for the airline and
aircraft type, a lower cost index will result in increased flying time
and a lower fuel burn, while a higher cost index results in shorter
flying time and increased fuel burn. The network representation of
speed change arcs are illustrated in Fig. 4. The solid arcs indicate
flight plans where a flight is flown at the standard cost index of the
airline, while the dashed lines indicate flight plans with either
lower or higher cost index setting. The figure illustrates in a very
simplified example the additional flexibility, which the speed
change arcs provide with respect to recovery. For flight f1, which
departs with a delay, the schedule can be recovered by either
selecting a faster flight plan for flight f1 or by maintaining flight f1
at standard speed and delaying the departure of flight f2, while at
the same time selecting a faster flight plan for f2. In Marla et al.
(2011) the speed change arcs are analysed in detail. The paper
concludes that speed change arcs are mainly of benefit to long haul
flight as these spend significant amount of time at cruise speed.
6.1.2. Congestion related arcs
While speed change arcs are mainly interesting for long haul
flights, another kind of arcs are relevant for short haul flights. A
large amount of short haul flights in Europe and the North East of
the US operate in congested airspace. For this reason it is
interesting to extend the network with flight plan arcs, which alter
the trajectory of flights in order to avoid congested airspace. This is
illustrated in Fig. 5, where the first part of the figure (a) shows two
flight plans. One flight plan traversing a congested volume of
airspace, which will result in an estimated departure delay, and
another flight plan following a sequence of waypoints taking the
flight around the congested volume of airspace. Part (b) of the
figure shows the corresponding arcs for flight f1. The leftmost solid
arc represents the flight plan taking the flight around the congested
airspace. The dashed arcs illustrate that it may be relevant to speed
up the flight for this trajectory due to the longer route. The second
solid arc for flight f1 represents the direct flight plan, where the
route traverses the congested airspace with the consequence that
the flight will depart with a calculated departure delay (CTOT). The
figure also illustrates that the en-route delay can lead to propaga-
tion of the entire delay or parts of the delay to subsequent flights.
6.1.3. Arc reduction techniques
As previously mentioned we solve the aircraft specific recovery
problem, which results in a multi-commodity network flow prob-
lemwhere each aircraft is modelled as a commodity. This results in
a large number of flight plan arcs, which are candidates for being
present in the network. In order to reduce the solution time of the
resulting MIP problem, an arc reduction technique is applied. This
technique is inspired by the constraint programming world, as
combining methods from Constraint Programming (CP) and Linear
Programming (LP) can often lead to improved solution times
(Vaaben, 1998).
In CP a variable describing a set is referred to as a Constrained Set
Variable. We denote the Constrained Set Variable X. The domain of X
is defined by two sets. (1) A possible set of elements P and (2) a
required set of elements Rwhere R4P. Given this definition of X it is
possible to reduce the domain of X by either expanding R or
reducing P. X is determined when R ¼ P.
Inspired by the constraint propagation technique used in CP we
distinguish between departure nodes and arrival nodes in the time-
space network and let all the departure nodes have a Constrained
Set Variable of aircraft. When building the network we apply for-
ward domain propagation of possible aircraft from departure node
to arrival node. For a real life size airline network covering for
instance the US this propagation technique eliminates the con-
struction of arcs for e.g. aircraft situated on the USWest coast in the
morning, which do not need to be represented for flights departing
in the morning on the US East coast.
Propagation of the required sets R are done backwards in the
network starting at the sink nodes and from the departure nodes of
the maintenance activities where a specific aircraft is required. This
can help predetermining that certain aircraft are required on
certain arcs and reduce the need for arc and consequently flight
plan generation. It can also pre-determine certain infeasibilities in
case R?P for a departure node.
6.2. Passenger misconnection protection
When airspace congestions occur the airline is typically facedFig. 3. Delay arcs.
Fig. 4. Speed change arcs.
B. Vaaben, J. Larsen / Journal of Air Transport Management 47 (2015) 54e6558

with the decisionwhether it should accept a departure delay or file
a flight plan with a trajectory, which takes a flight around the
volume of congested airspace. In order to have the airline make the
right trade-off between the additional fuel burn cost, which the
longer route incurs, and the cost of having some passengers loose
their connection due to the delayed departure we introduce pas-
sengermisconnection constraints as also used in the work byMarla
et al. (2011). It is noted that equivalent misconnection constraints
can be used for crew connections, which would be introduced with
a higher violation penalty.
6.3. AFP slot constraints
When an AFP is imposed, airlines will receive a number of slot
times where they are allowed to pass through an FCA. The airlines
decide themselves, which flights will make use of these slot times.
This gives the US airlines increased control over their flights in a
congestion situation compared to their European counterparts, but
does also introduce some additional complexity as they need to
prioritize, which flights should use which time slots through the
FCA. To help with this prioritization we propose the AFP Slot con-
straints as illustrated in Fig. 6.
Consider an example with possible trajectories for two flights to
Newark airport (EWR) departing from Chicago (ORD) and Detroit
(DTW) respectively. Before the departure of these flights ATCSCC
has issued an AFP. When the AFP is issued, the airline in question is
granted a number of time slots for passing through the FCA. In this
example we assume that two such time slots are granted. So the
trajectories through the FCA need to respect the time slots granted
by ATCSCC. Alternative trajectories, which are taking flights around
the FCA are, however, not restricted by the time slots for passing
through the FCA.
Fig. 6 shows the corresponding flight plan representation as arcs
in the time-space network. The FCA area is here represented as a
wave line to indicate that the FCA is not one single point in space
but rather a borderline or an area. The two time slots granted for
passing through the FCA are marked as grey shades on the FCA. The
solid trajectories from the Fig. 6 are represented as solid arcs. It is
noted that the same direct trajectory taking a flight through the
Fig. 5. Network representation of congested airspace arcs.
Fig. 6. Illustration of AFP constraint.
B. Vaaben, J. Larsen / Journal of Air Transport Management 47 (2015) 54e65 59

first time slot can also be used in a later flight plan taking the flight
through the second time slot. The dashed arcs on the graph indicate
flight plans using trajectories taking the flight around the FCA. The
dashed arcs are consequently not restricted by the FCA.
With the example provided above it is noted that there are 3
possible decisions for each flight, which is affected by an AFP on its
most direct trajectory:
� Direct trajectory. Choose a direct trajectory through the FCA at
one of time slots provided. The usage of these trajectories will
typically also result in a departure delay. Combined with the
possibility of changing speed it can result in some additional
speed change arcs through the time slots. These speed change
arcs are not shown on the figure.
� Alternate trajectory. Choose a trajectory around the FCA. This is
represented by a single dashed arc for each affected flight. Again,
combined with the speed change possibility it can result in
some additional speed change arcs, which are not depicted on
the figure.
� Flight cancellation. Choose to cancel a flight. This would typically
also result in another flight cancellation in order to cancel a
complete round trip from the hub to a destination and back
again.
7. Mathematical model
Let G ¼ ðN ;AÞ be a graph representing the network described in
section 6. LetN be the set of nodes in the network, where these are
divided into departure nodesNd2N and arrival nodesNa2N . Let A
be the set of available aircraft and F the set of flights to be carried
out in the recovery period T.
Arcs in the network are either flight plan arcs C2A or ground
arcs G2A. Every flight f has a set of possible flight plans denoted
Cf2C. Each flight plan k2Cf connects a possible departure node
n2Nd with an arrival node in Na. From each arrival node a ground
arc is created to the first subsequent departure node respecting the
turn time between the two corresponding flights. From each de-
parture node for a flight plan there exists additional outgoing
ground arcs to the subsequent departure node on that airport
location in order to ensure cancellation capability of the model.
To control the creation of feasible aircraft paths through the
network we define N�n as the set of incoming arcs to each node
n2N and Nþn is the set of outgoing arcs from each node n2N . For
each aircraft a2A, a supply sn ¼ 1 is associated with the node n
where the aircraft is known to start at the beginning of time win-
dow T, and a demand of sn ¼ �1, where it starts the next flight just
outside the time window T.
Let xkfbe a binary variable, which takes the value 1 if flight plan
k2Cf of flight f2F is used in the recovery solution and 0 otherwise.
Similarly the binary variable yg takes on the value 1 if ground arc
g2G is present in the solution and 0 otherwise. We let the binary
variable zf denote if flight f2F is cancelled. In that case it takes the
value 1 and 0 otherwise.
Let P be the set of passenger itineraries operated within the
recovery period, and np represent the number of passengers on
itinerary p2P. Let ITðpÞ be the set of flight legs in itinerary p, ITðp; lÞ
the lth flight leg in itinerary p. Let MCðp; f ; kÞ denote the set of on-
ward flight plans following flight f in passenger itinerary p to which
there is insufficient time to connect from flight plan k of flight f. This
set consequently corresponds to the set of flight plans, which in
combination with the selection of flight plan k will cause a
misconnection for the passengers on itinerary p. Let lp be a binary
variable, which takes the value 1 if the passengers on itinerary p are
disrupted and 0 otherwise.
To control the usage of flight plans traversing an AFP and
consequently consuming the slot time resource in the AFP we
define the binary constant dkfb, which takes the value 1 if flight plan
k of flight f makes use of time slot b and 0 otherwise. In case the
airline network is affected by various AFPs we let the enumeration
sequence of AFP2 continue from the end of the enumeration
sequence of AFP1 etc.
The problem can now be formulated as follows:
Minimize:
X
f2F
X
k2Cf
ckf xkc þ
X
f2F
cf zf þX
p2P
~cpnplp (7.1)
Subject to:
X
k2Cf
xkf þ zf ¼ 1 cf2F (7.2)
X
g2N�n
yg þX
ðf ;kÞ2N�n
xkf þ sn ¼X
g2Nþn
yg þX
ðf ;kÞ2Nþn
xkf cn2N ;ca2A
(7.3)
xkITðp;lÞ þX
m2MCðp;ITðp;lÞ;kÞ
xmITðp;lþ1Þ � lp � 1 ck2CITðp;lÞ;
cl21;…; jITðpÞj � 1; cp2P (7.4)
lp � zf cf2ITðpÞ;cp2P (7.5)
X
f2F
X
k2Cf
dkfbxkf � 1 cb2B (7.6)
xkf 20;1 ck2Cf ;cf2F (7.7)
zf20;1 cf2F (7.8)
lp20;1 cp2P (7.9)
yg � 0 cg2G (7.10)
Here constraints (7.2) ensure that every flight is either carried
out and thus assigned a flight plan or cancelled.
Constraints (7.3) are referred to as either flow conservation
constraints or aircraft balance constraints. It requires that if an
aircraft flows into a node, it must also leave it again except for the
source and sink nodes in the network where we in the source node
have a supply of the aircraft, sn ¼ 1, while the sink node has a de-
mand of an aircraft sn ¼ �1. For all other nodes we have sn ¼ 0. The
constraints thus ensures that for every aircraft a path is found from
source to sink in the network.
Constraints (7.4) enforce lp to be 1 for every combination of
flight plan arcs, which will result in one or more passenger itiner-
aries misconnecting. l is penalized in the objective function pro-
portionally to the number of passengers on this itinerary, who will
lose their connection when this combination of arcs are in basis.
Constraints (7.5) ensure that if a flight is cancelled then pas-
sengers onboard that flight will also be counted and penalized as
misconnecting.
Constraints (7.6) ensure for every AFP time slot that only a single
flight plan is allowed to traverse the corresponding FCA in the time
slot.
Constraints (7.7)e(7.10) are all integrality constraints for
respectively: Flight plan selection, flight cancellations, passenger
B. Vaaben, J. Larsen / Journal of Air Transport Management 47 (2015) 54e6560

misconnections and the usage of ground arcs.
To respect maintenance activities, which are aircraft specific, we
model these as special “flights” where the possible set of aircraft,
which can carry out this activity, is only one single aircraft.
Regarding the objective function (7.1) this is divided into 3 parts:
� Flight plan cost. The cost parameter ckfis a sum of the following
cost elements: Incremental fuel cost, flight delay cost and
aircraft swap cost.
� Cancellation cost. The cost parameter cf specifies the cost penalty
for cancelling a flight or a maintenance activity, which is
modelled as a special kind of “flight”. The cost for cancelling a
flight is also penalized as the passengers on that flight will be
counted as misconnecting. The flight cancellation cost is
consequently set rather low. The cancellation cost for mainte-
nance activities is set very high to make the cancellation of a
maintenance activity correspond to an infeasible solution. We
refer to this practice as a soft constraint.
� Passenger misconnection cost. The parameter ~cp is an approxi-
mate cost of re-accommodation for each disrupted itinerary
p2P, because we assume that if a passenger itinerary p is dis-
rupted, the passengers are re-accommodated on the next
available itinerary to the destination in the next flight bank.
As we do not include a complete passenger re-accommodation
in this model, but only an approximation of the passenger
impact, we measure the full impact of the flight plan selection by
subsequently running the resulting solutions from this model
through a commercially available re-accommodation tool called the
Jeppesen Passenger Re-accommodation Solver (Vaaben and Alves,
2009), which takes the full passenger itineraries and aircraft ca-
pacities into account and calculates the passenger re-
accommodation cost.
8. Experimental framework
In this section we describe the data and experimental frame-
work used to evaluate the proposed solution approach. The airline
data, which is used for the experiments, have generously been
made available to us by a medium sized European carrier. The
carrier operates a hub-and-spoke network with approximately 250
daily flights serving 60 cities on multiple continents. The airline is
consequently severely impacted by airspace congestions in the
European region. In our experiments we focus on fleets covering
short haul flying within Europe, which are the flights mainly
exposed to airspace congestions. The data received from the airline
contains its historic flight schedule covering 3 months and
including both planned and actual times. Along with this we have
also received matching passenger reservations with complete
itineraries for a period of 2 weeks. Data concerning airspace con-
gestions are collected from the Eurocontrol Network Operations
Portal (NOP).
The framework of software modules and data used for the
experiments is illustrated in Fig. 7. The Flight Plan Manager reads
the planned schedule and disrupted state from a database along
with passenger loads for each flight. Based on this information the
Flight Plan Manager calls the flight planning engine, which is a
commercial software tool from Jeppesen and ensures that flight
plans are continuously updated for all flights in the time period
observed. For flight plans, which are affected by congested
airspace, an alternative flight plan avoiding the congestion is also
calculated. All flight plans are stored and continuously updated in
the flight plan cache to enable fast retrieval, when a disruption
needs to be solved.
The Integrated Flight Planning and Disruption Management
module, contains the implementation of the optimization model
formulated in section 6. When a disruption needs to be solved, this
module retrieves schedule, disruption state, fleet information and
passenger itineraries along with relevant and updated flight plans
from the Flight Plan Cache. The optimization run leads to a simul-
taneous decision on: Delays, Swaps, Cancellations, Trajectory and
fuel burn.
The recovery solution from this process is subsequently eval-
uated by a commercially available passenger re-accommodation
solver, which calculates the actual passenger re-accommodation
cost. This final evaluation step is carried out due to the fact the
proposed recovery model in section 6 does not take the full
passenger itineraries into account, but only passenger
connections.
8.1. Parameter assumptions
For input parameters in the model we assume the following
values. The airline's own cost for a delayed passenger is assumed to
be $1.09 per minute. This input is based on the airline's own in-
ternal calculations of this cost for year 2008 and includes passenger
re-accommodation and loss of goodwill.
Fuel is assumed to be $0.478 per lb, which is equivalent to $3.65
per gallon. This is based on the airlines own reported cost of
approximately 750V per metric ton in February 2010. This price
has been converted to 2008 numbers using a conversion rate of
1V ¼ $1.27 in November 2008 according to the European central
bank and according to IATA charts indicating that the fuel cost in
February 2010 was 0.903 times the cost in November 2008.
The normal Cost Index for the airline is assumed to be 30. All
flight plans are calculated at this speed since no speed changes are
considered in this experiment. The cost per disrupted passenger cpis based on the assumption that misconnecting passengers will be
re-accommodated in the next bank of flights, which gives an
average delay of 7 h for the flight schedule of this airline. Using the
cost per passenger delay minute of $1.09, this gives a misconnec-
tion cost of $457.8. A swap cost of $500 is assumed for swaps within
the same fleet. Swaps between fleets are not used in these exper-
iments. The cost is based on parameter calibration with airline Ops
Controllers.
A flight cancellation cost cf of $20,000 is assumed and is also
based on parameter calibration with Ops Controllers. For the pur-
pose of flight plan calculations an average passenger weight,
including luggage, of 100 kg has been used.
9. Computational experiments
Our models are implemented in Cþþ with a direct interface to
the MIP solver Xpress version 19.00. The experiments are con-
ducted on a server running Linux and equipped with a 64 bit Intel
Xeon E5440 processor with 4 cores and 16 GB of RAM.
The cases used to evaluate the model are based on 3 months of
historical disruption data combined with a subset of airspace
congestions. It has unfortunately not been possible to replicate all
airspace congestion to the flight planning engine for the purpose of
the evaluation. For this reason the results should be seen as a
conservative lower bound for the savings which can be achieved by
applying the approach.
The evaluation is based on 28 scenarios distributed over the
seven days of the week in order to capture the varying flight
schedule and passenger flows during the course of a week. The
seven days have, however not been selected from the same week,
but have been evenly distributed over the three months in order to
even out some of the traffic variations from month to month.
B. Vaaben, J. Larsen / Journal of Air Transport Management 47 (2015) 54e65 61

9.1. Example: heavy fog over the Netherlands
In this example heavy fog over the Netherlands is causing
increased separation requirements, which reduces the ATC capacity
in the area. This is resulting in a volume of airspace experiencing
congestions during a course of 5 h. The area has an extension of
approximately 15,400 square nautical miles (nm2), where the
congestion in average have caused a 15 min estimated departure
delay for flights traversing the congested area. The recovery time
window has been set to 48 h, which leaves 93 flights belonging to
the Airbus 320 fleet, consisting of 12 aircraft, in the window. Of the
93 flights, 14 pass through the congested airspace during the
presence of the congestion. Fig. 8 shows the recovery solution for
the example. It is noted that flights marked with a blue dot in the
lower left corner have been assigned a flight plan, which takes the
flight around the congested area, which would otherwise have
caused a departure delay of approximately 15 min. These are the 5
flights: 875, 876, 892, 891 and 811. These flights have been assigned
a flight plan, which deviates from the lowest cost flight plan, in
order to avoid the congested area.
Fig. 9 shows a trajectory view of the same solution as displayed
in the Gantt view in Fig. 8. It is notable that the flights going to and
from Amsterdam (AMS) airport are forced to enter the congested
area and depart with a 15 min delay. For the flights to and from
London it is less obvious that it is cheapest to select a trajectory
through the congested area and accept the departure delay. For the
flight to Brussels (BRU) a trajectory around the congestion is
selected, while the flight back from Brussels should go through the
congestion. It is worth noting that the hub of the airline is located in
the periphery of Europe and in spite the fact that the congestion
occurs far from the hub, it does have a significant impact on the
network operation of the airline.
Table 1 shows the variations in results over the different days of
the week, where the week day selection has been distributed
evenly over the course of the 3 months of schedule data, which has
been available. It can be observed that the same congestion results
in a large difference in the number of congestion-affected flights,
which are diverted around the congestion. This is due to three
factors:
� Day-to-day variations in the schedule
� Differences in passenger flows
� Differences in historical disruptions
The day to day variations in the schedule is estimated to have
less impact on the variations as there is a rather high re-occurrence
Fig. 7. Framework for integrated flight planning and disruption management.
Fig. 8. Gantt display showing recovery solution for the example.
B. Vaaben, J. Larsen / Journal of Air Transport Management 47 (2015) 54e6562

of the same flights each day. The majority of the variation stems
from the differences in passenger flows from day to day and the
differences in level and type of disruption each day. The differences
in passenger flows affect the extent to which passenger connec-
tions influence the solution due to constraints (7.9). Similarly, an
input disruption with various larger flight delays will already have
used up the aircraft turn time and passenger Minimum Connection
Time (MCT) buffers in the schedule. These disruptions are conse-
quently more likely to render solutions, where flights are diverted
around congested airspace as an additional departure delay will
immediately lead to delay propagation through constraints (7.3)
and (7.9).
The interesting observation from Table 1 is the large variation in
the percentage of flights, for which it is cost beneficial to select a
trajectory around a congested area. There is furthermore an even
larger variation in how cost beneficial it is to divert these flights
around the congestion. This emphasizes the fact that it is difficult
for a dispatcher, who does not have the entire network overview
and does not have individual passenger connection information, to
decide when he should select a trajectory around a congested area
of airspace and when he should rather accept a departure delay and
take the most fuel efficient trajectory.
On the day of operation fast decisions are one of the key factors
to avoiding that a disruption propagates to other parts of the
network. Solution times for a disruption management system
should consequently be kept low and ideally below 2 min in
running time as various reruns may need to be carried out by the
ops controller (Marla et al., 2011). The solutions presented for a
single Airbus 320 fleet of a medium size European carrier do in
average involve 89 flights in the recovery time window and solves
to optimality in less than a second. The average problem sizes
contain 38,000 constraints and 59,000 variables. The fast runtimes
are mainly due to the fact that additional flight plan arcs only need
to the generated for the few of the 89 trajectories, which are
actually affected by the congested airspace.
Table 1 shows an average saving of $11,260 per day when this
airspace congestion occurs. In order to obtain a lower bound esti-
mate of a yearly saving by applying the approach, the statistics
department of Eurocontrol were kind to provide us with a list of
their most frequently congested areas in year 2008, combined with
Fig. 9. Trajectory view showing recovery solution for case 1.
Table 1
Result of approach for same congestion on different days.
Weekday Flights in
recovery window
Congestion
affected flights (%)
Congestion affected flights diverting
around congestion (%)
Additional fuel pr.
diverted flight (%)
Re-accommodation
cost saving (%)
Total cost
saving (%)
Total cost
saving (USD)
Monday 93 15.1 35.7 3.87 23.61 22.90 30,135
Tuesday 100 17.0 64.7 3.89 2.94 1.89 3131
Wednesday 102 14.7 40.0 3.96 12.35 10.41 5251
Thursday 78 16.7 46.2 4.15 1.24 0.56 853
Friday 79 17.7 42.9 4.33 3.12 1.79 1297
Saturday 64 14.1 55.6 3.48 20.72 19.11 8493
Sunday 82 19.5 56.3 3.32 23.61 22.54 29,662
Average 85.4 16.4 48.7 3.86 12.51 11.31 11,260
B. Vaaben, J. Larsen / Journal of Air Transport Management 47 (2015) 54e65 63

the number of days where each of these locations were imposed an
en-route regulationwithmore than 15min of departure delays. The
approach has been evaluated on a selection of some of the most
frequently congested areas in Northern Europe, which provides a
lower bound for the saving, which can be achieved by applying the
approach of using flexible flight plans in the recovery decisions,
when congested areas of airspace are involved. Each of the four
evaluated areas have been evaluated over seven days as for the case
with the Netherlands in the previous Table 1. The lower bound
estimate is consequently based on 28 scenarios, which all solve to
optimality in less than 1 s.
As mentioned previously, the airline, which has contributed
data to this research, does not have its hub in a central part of
Europe and is somewhat retracted from the main congested areas
of the continent. Despite that fact, it is notable that airspace con-
gestions over the Netherlands are one of the most contributing
areas to the savings potential of the approach. Based on that
observation it is assumed that airlines, which are more centrally
located in Europe, would be able to benefit considerably more from
the approach.
The results in Table 2 show an estimated lower bound of yearly
savings of 5.1 million USD for the airline's Airbus 320 fleet con-
sisting of 12 aircraft.
10. Conclusions and future work
The main conclusion from this work is that it is possible to
integrate dispatch decisions regarding flight trajectories in the re-
covery decisions. An optimization based recovery system, which
integrates traditional recovery with flexible flight trajectories, can
in an environment, which is severely impacted by airspace con-
gestions, contribute with a yearly saving of several million USD. For
a medium size European carrier, with a hub located outside of
central Europe, a lower bound yearly savings potential of 5.1 million
USD is estimated compared to traditional recovery without flexible
trajectories.
For future work it would be relevant to apply the method to a
larger fleet in order to evaluate the feasibility of the approach for a
larger scale operation. Here it should bementioned that the current
results already show quite some room for scaling up the problem
size, as the tested problems currently solve to optimality in less
than a second.
For additional future work it would be relevant to apply the
approach to a US-based airline, preferable one with a significant
part of its operation in the North East of the US, where most US
airspace congestions occur.
Acknowledgements
The authors gratefully acknowledge the Eurocontrol depart-
ment of Operational Monitoring and Reporting for having provided
statistics regarding congestion frequencies for areas of European
airspace. We are also grateful to Jeppesen for having provided ac-
cess to their flight planning engine JetPlan. Finally, the authors
would like to thank the reviewers and especially the editor-in-chief
for the positive dialogue and contributions to increase the quality of
the paper.
References
Abdelghany, K., Abdelghany, A., Niznik, T., 2007. Managing severe airspace flowprograms: the airlines side of the problem. J. Air Transp. Manag. 13 (6),329e337.
Altus, S., 2010. Dynamic Cost Index Management in Flight Planning and Re-plan-ning. AGIFORS Airline Operations Study Group Meeting, Brisbane.
Altus, S., 2012. Quantitative Problem Solving Methods in the Airline Industry.Springer, pp. 295e315. Ch. 6.
Andersson, T., 2006. Solving the flight perturbation problem with meta heuristics.J. Heuristics 12 (1e2), 37e53.
Belobaba, P., Odini, A., Barnhart, C. (Eds.), 2009. The Global Airline Industry. Wiley.Bertsimas, D., Patterson, S., AUG, 2000. The traffic flow management rerouting
problem in air traffic control: a dynamic network flow approach. Transp. Sci. 34(3), 239e255.
Bertsimas, D., Lulli, G., Odoni, A., Jan. 2011. An integer optimization approach tolarge-scale air traffic flow management. Oper. Res. 59 (1), 211e227.
Bratu, S., Barnhart, C., 2006. Flight operations recovery: new approaches consid-ering passenger recovery. J. Sched. 9 (3), 279e298.
Clausen, J., Larsen, A., Larsen, J., Rezanova, N.J., 2010. Disruption management in theairline industry-concepts, models and methods. Comput. Oper. Res. 37 (5),809e821.
Cook, A. (Ed.), 2007. European Air Traffic Management: Principles, Practice andResearch. Ashgate Publishing Limited, Hampshire, England.
Cook, A., Tanner, G., 2012. A quantitative exploration of flight prioritisation prin-ciples, using new delay costs. J. Aerosp. Oper. 1 (3), 195e211.
Eggenberg, N., Salani, M., Bierlaire, M., 2010. Constraint-specific recovery networkfor solving airline recovery problems. Comput. Oper. Res. 37 (6), 1014e1026.
Eurocontrol, 2010. Coda Digest Annual 2010. URL: http://www.eurocontrol.int/sites/default/files/content/documents/official-documents/facts-and-figures/coda-reports/CODA%20Digests%202010/coda-digest-annual-2010.pdf.
Eurocontrol, FAA, March 2012. 2010-u.s./europe Comparison of Atm-related Oper-ational Performance. URL: http://www.faa.gov/air_traffic/publications/media/us_eu_comparison_2010.pdf.
Jarrah, A., Yu, G., Krishnamurthy, N., Rakshit, A., 1993. A decision support frameworkfor airline flight cancellations and delays. Transp. Sci. 27 (3), 266e280.
Johnson, E.L., Lettovsky, L., Nemhauser, G., Pandit, R., Q., S., 1994. Final Report toNorthwest Airlines on the Crew Recovery Problem. Tech. rep.. The LogisticsInstitute, Georgia Institute of Technology.
Kohl, N., Larsen, A., Larsen, J., Ross, A., Tiourine, S., 2007. Airline disruption man-agement - perspectives, experiences and outlook. J. Air Transp. Manag. 13 (3),149e162.
Lettovsky, Johnson, Nemhauser, 2000. Airline crew recovery. Transp. Sci. USA 34 (4),337e348.
Marla, L., Vaaben, B., Barnhart, C., 2011. Integrated Disruption Management andFlight Planning to Trade off Delays and Fuel Burn. Tech. rep.. DTU ManagementEngineering.
Medard, C.P., Sawhney, N., 2007. Airline crew scheduling from planning to opera-tions. Eur. J. Oper. Res. 183 (3), 1013e1027.
Network Operations Report, 2010. Eurocontrol.Rosenberger, J., Johnson, E., Nemhauser, G., 2003. Rerouting aircraft for airline re-
covery. Transp. Sci. 37 (4), 408e421.Stojkovi�c, M., Soumis, F., Desrosiers, J., 1998. The operational airline crew scheduling
problem. Transp. Sci. 32 (3), 232e245.Teodorovi�c, D., Guberini�c, S., 1984. Optimal dispatching strategy on an airline
network after a schedule perturbation. Eur. J. Oper. Res. 15 (2), 178e182.Thengvall, B.G., Yu, G., Bard, J.F., 2001. Multiple fleet aircraft schedule recovery
following hub closures. Transp. Res. A Policy Pract. 35 (4), 289e308.Vaaben, B., 1998. Constraint Programming Based Column Generation for Crew
Assignment. Master’s thesis. Technical University of Denmark.
Table 2
Selection of en-route congested areas of Northern European airspace with savings estimate for flexible trajectories.
Airspace area Average regulation duration
(minutes)
Number of days with en-route regulation
above 15 min
Average daily saving with flexible
trajectories (USD)
Yearly saving with flexible
trajectories (kUSD)
North West of
Poland
235 333 2309 769
Holland 301 318 11,260 3581
South Baltic Sea 106 81 6254 507
East of Denmark 247 79 3109 246
Lower bound
saving
e e e 5103
B. Vaaben, J. Larsen / Journal of Air Transport Management 47 (2015) 54e6564

Vaaben, B., Alves, A., 2009. Disruption Management - Passenger Re-accommodationStrategies. Presented at AGIFORS Airline Operations. URL: http://www.agifors.org/studygrp/opsctl/2009.
Vossen, T.W.M., Hoffman, R., Mukherjee, A., 2012. Quantitative Problem SolvingMethods in the Airline Industry. Springer, pp. 385e447. Ch. 7.
Wei, G., Yu, G., Song, M., 1997. Optimization model and algorithm for crew man-agement during airline irregular operations. J. Comb. Optim. 1 (3), 305e321.
Yan, S., Yang, D.-H., 1996. A decision support framework for handling scheduleperturbation. Transp. Res. B Methodol. 30 (6), 405e419.
B. Vaaben, J. Larsen / Journal of Air Transport Management 47 (2015) 54e65 65