Embed Size (px)
Citation preview
Turkish Journal of Computer and Mathematics Education Vol.12 No.6 (2021), 5390-5403
Research Article
5390
Transmission Congestion Management through Optimal Placement and Sizing of TCSC Devices in a Deregulated Power Network
A.Vengadesan a, Dr. R.Ashok Bakkiyaraj b , Dr. S.Sakthivel c
a Research Scholar, b Associate Professor a, b Department of Electrical Engineering, Annamalai University, Chidambaram, TN, India c Professor, Department of Electrical and Electronics Engineering, Nehru Institute of Engineering and Technology,
Coimbatore, TN, India a [email protected], b [email protected], c [email protected]
Article History: Received: 10 November 2020; Revised 12 January 2021 Accepted: 27 January 2021; Published online: 5
April 2021
_____________________________________________________________________________________________________
Abstract: Transmission congestion is mainly caused by agreed transactions between generating companies and distributing
companies in deregulated power system networks across the world. Secured and economic operation of power system networks in the deregulated scenario can be ensured by managing the congestion in the transmission lines. FACTS devices are used for changing the power flow through the lines so that all the lines are carrying power flow below their respective limit. In this work, series connected Thyristor Controlled Switched Capacitor(TCSC) devices are installed in suitable lines for relieving congestion in the over loaded lines of the system. The size and location of TCSC devices greatly affect their efficiency in congestion management problem. To maximize the benefits of TCSC in congestion management problem, the site and size of
the TCSC devices are optimized by using an optimization technique. The recent bio inspired Whale Optimization Algorithm (WOA) is employed in this proposed work for the optimization of the objective value through identifying the position and size of FACTS devices. This algorithm involves low number of parameters to be tuned for attaining global best results and can be easily coded in Matlab platform. The proposed WOA based method for optimal position and sizing of TCSC is implemented on the IEEE 30 bus test system. The results obtained are compared against the results reported by Particle Swarm Optimization algorithm (PSO), Firefly algorithm(FFA)and are found to be outperforming.
Keywords: Deregulation, Congestion management, Whale optimization algorithm, FACTS, TCSC, FFA, PSO
1. Introduction
Competitive markets are introduced for all commodities including electricity for economic benefits.
Monopolistic electricity market has been restructured into three separate entities, viz, generation companies
(GENCOS), transmission companies (TRANSCOS) and distribution companies (DISCOS) [1]-[2]. Competition is
being introduced to GENCOS and DISCOS to achieve higher efficiency in electricity generation and utilization.
Transmission network is operated by a system operator (SO) which may be a private or government entity.
Transmission infrastructure is generally owned by one entity for benefits of economy and of proper control of
power flow. Power demand is increasing at a faster rate as compared to the expansion in transmission networks. In
addition, the large numbers of bilateral and multilateral contracts cause intense transmission line utilization [3].
When all the contracted transactions are not accommodated in a controlled manner, some lines in certain areas
may get overloaded; this is referred to as congestion [4]. It forces for the enhancement of transmission capability
or expansion of transmission networks. Congestion management may be defined as actions taken to remove
overloading of lines. Acquiring of right-of-way and cost of installations are the key limitations in transmission
network expansion. Moreover, depending on the transactions, higher capacity of lines may be temporary only
during the transaction period which justifies the capacity enhancement as best alternative to expansion.
Transaction contracts leading to heavy flows results in increased line losses, threaten stability, security and
reliability of the system. Therefore, maximizing the utilization of already installed transmission capability is
required. This can be easily achieved by installing flexible AC transmission systems (FACTS) devices [5]-[7].
The increased use of these FACTS devices is because of two reasons. Firstly, the recent advancements in high
power electronic switches made these devices cost less and involve low loss [8] and secondly, their use in power
flow control for dispatching specified power transactions. It is crucial to identify the location and size of these
devices for optimal performance and considerable costs. There are many different ways available for determining
the optimal location and sizing of FACTS devices in power systems [9]-[11].
In [12] sensitivity-based approaches are used for finding the best location of TCSC to relieve congestion from
overloaded lines. TCSC parameters are optimized to reduce the line overloading under contingency conditions in
[13]. Reference [14] discusses congestion relief and voltage stability enhancement in deregulated electricity
market using multiple FACTS devices. Total congestion cost minimization by placing FACTS devices at suitable
locations has been discussed in [15]. Differential Evolution algorithm is applied for improving power system
security under single line outage condition for reducing congestion [16]. Management of congestion and cost
Turkish Journal of Computer and Mathematics Education Vol.12 No.6 (2021), 5390-5403
Research Article
5391
minimization is done through Bee Colony Optimization in [17]. TCSC is placed at best locations for optimizing
social benefit and congestion [18]. Genetic algorithm is used for finding optimal location of TCSC to solve
transmission line congestion problem [19].
A new method based on WOA is proposed here to find the optimal location of TCSC devices. In Section 2,
static power injection modeling of TCSC is presented. In Section 3, the objective function of minimizing
congestion, loss and voltage deviation is discussed. InSection 4, the whale algorithm technique is explained.In
section 5 the results and discussions are presented and finally in section 6, the work is concluded. The proposed
method is tested on IEEE 30 bus system under three different scenarios.
2. Modelling Of Tcsc Device
The series connected TCSC is capable of operating both in lagging and leading power factor modes. It is
connected in series with a line to adjust its effective reactance [20].Its simplicity in implementation and low cost
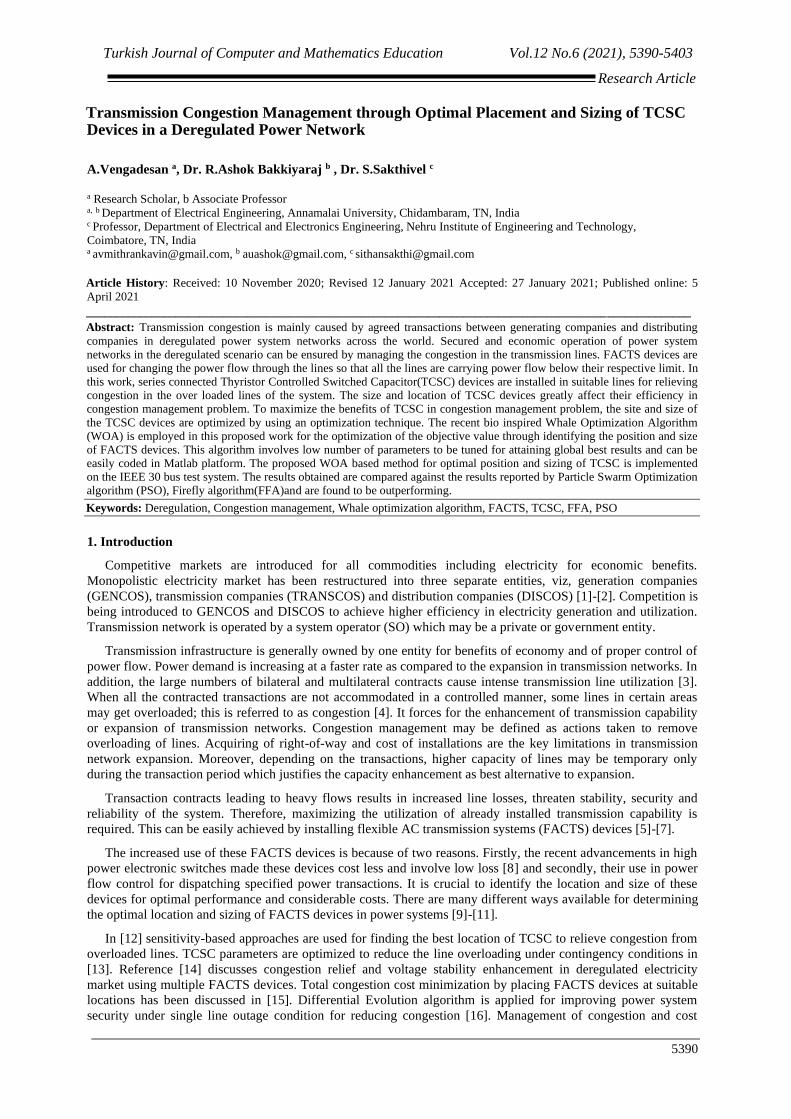
when compared to other types of FACTS devices is the principal reason for its widespread use. Figure 1 shows the
π-equivalent model of the line connected between buses ‘i’ and ‘j’.
Figure 1. π-model of a line
If 𝑉𝑖∠𝛿𝑖 and 𝑉𝑗∠𝛿𝑗 are the voltages at bus-i and bus-j respectively, the equations representing active and
reactive power flow through the line connected between buses ‘i’ and ‘j’can be given by equations (1) and (2)
respectively.
𝑃𝑖𝑗 = 𝑉𝑖2𝐺𝑖𝑗 − 𝑉𝑖𝑉𝑗(𝐺𝑖𝑗𝑐𝑜𝑠𝛿𝑖𝑗 + 𝐵𝑖𝑗𝑠𝑖𝑛𝛿𝑖𝑗) (1)
𝑄𝑖𝑗 = −𝑉𝑖2(𝐵𝑖𝑗 + 𝐵𝑠ℎ) − 𝑉𝑖𝑉𝑗(𝐺𝑖𝑗𝑠𝑖𝑛𝛿𝑖𝑗 + 𝐵𝑖𝑗𝑐𝑜𝑠𝛿𝑖𝑗) (2)
The equations for real and reactive power flow from bus-j to bus-i are represented by equations (3) and (4)
respectively.
𝑃𝑗𝑖 = 𝑉𝑗2𝐺𝑖𝑗 − 𝑉𝑖𝑉𝑗(𝐺𝑖𝑗𝑐𝑜𝑠𝛿𝑖𝑗 + 𝐵𝑖𝑗𝑠𝑖𝑛𝛿𝑖𝑗) (3)
𝑄𝑗𝑖 = −𝑉𝑗2(𝐵𝑖𝑗 + 𝐵𝑠ℎ) − 𝑉𝑖𝑉𝑗(𝐺𝑖𝑗𝑠𝑖𝑛𝛿𝑖𝑗 + 𝐵𝑖𝑗𝑐𝑜𝑠𝛿𝑖𝑗) (4)
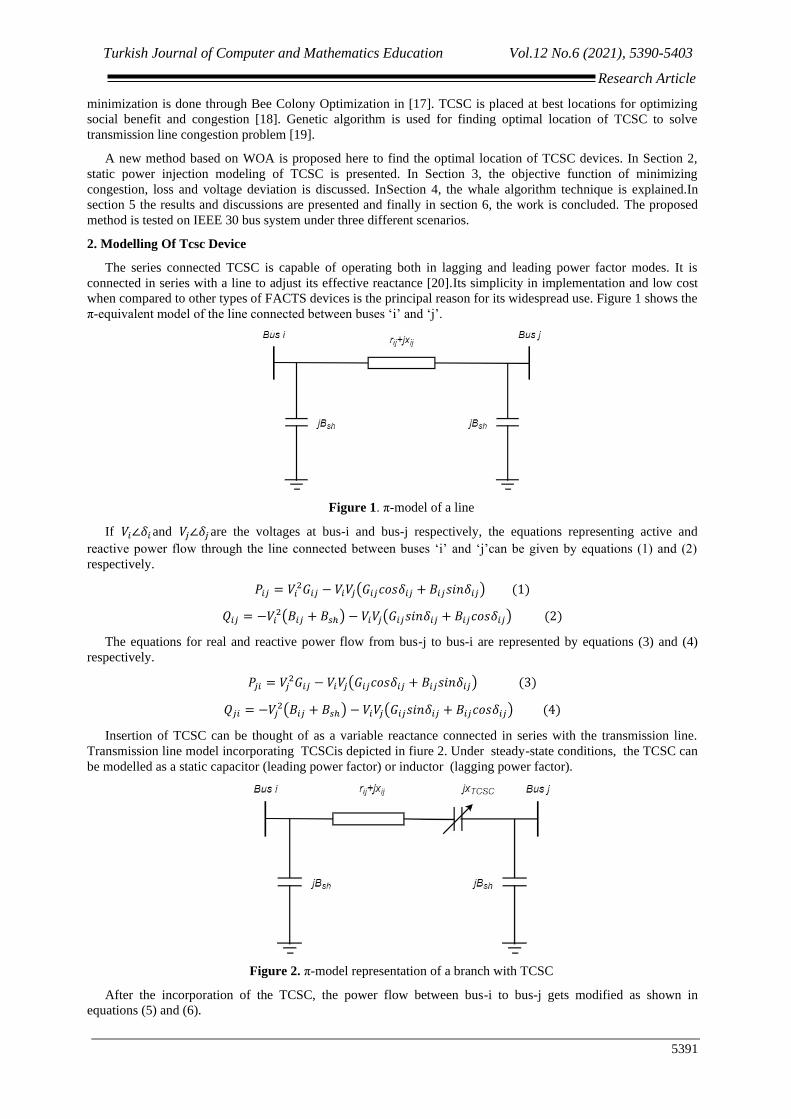
Insertion of TCSC can be thought of as a variable reactance connected in series with the transmission line.
Transmission line model incorporating TCSCis depicted in fiure 2. Under steady-state conditions, the TCSC can
be modelled as a static capacitor (leading power factor) or inductor (lagging power factor).
Figure 2. π-model representation of a branch with TCSC
After the incorporation of the TCSC, the power flow between bus-i to bus-j gets modified as shown in
equations (5) and (6).
Turkish Journal of Computer and Mathematics Education Vol.12 No.6 (2021), 5390-5403
Research Article
5392
𝑃𝑖𝑗′ = 𝑉𝑖
2𝐺𝑖𝑗′ − 𝑉𝑖𝑉𝑗(𝐺𝑖𝑗
′ 𝑐𝑜𝑠𝛿𝑖𝑗 + 𝐵𝑖𝑗′ 𝑠𝑖𝑛𝛿𝑖𝑗) (5)
𝑄𝑖𝑗′ = −𝑉𝑖
2(𝐵𝑖𝑗′ + 𝐵𝑠ℎ
′ ) − 𝑉𝑖𝑉𝑗(𝐺𝑖𝑗′ 𝑠𝑖𝑛𝛿𝑖𝑗 + 𝐵𝑖𝑗
′ 𝑐𝑜𝑠𝛿𝑖𝑗) (6)
Where,
𝐺𝑖𝑗′ =
𝑟𝑖𝑗
𝑟𝑖𝑗2 + (𝑥𝑖𝑗 − 𝑥𝑇𝐶𝑆𝐶)
2
𝐵𝑖𝑗′ =
−(𝑥𝑖𝑗 − 𝑥𝑇𝐶𝑆𝐶)
𝑟𝑖𝑗2 + (𝑥𝑖𝑗 − 𝑥𝑇𝐶𝑆𝐶)
2
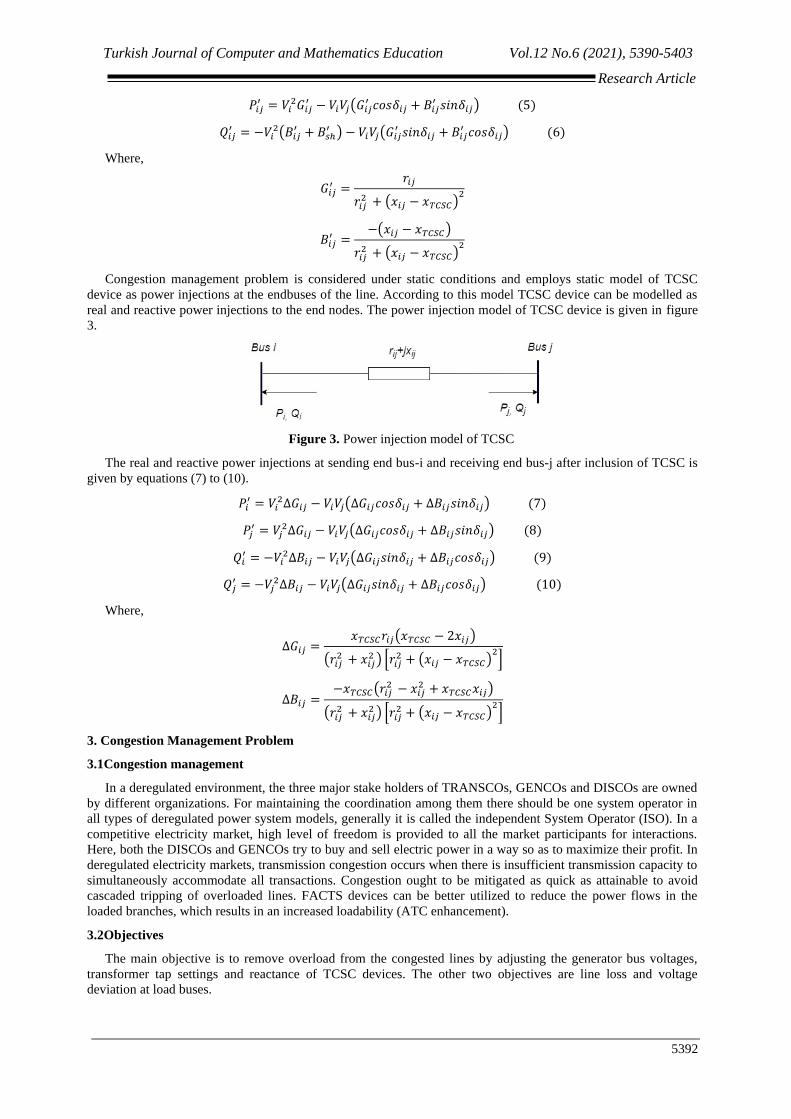
Congestion management problem is considered under static conditions and employs static model of TCSC
device as power injections at the endbuses of the line. According to this model TCSC device can be modelled as
real and reactive power injections to the end nodes. The power injection model of TCSC device is given in figure
3.
Figure 3. Power injection model of TCSC
The real and reactive power injections at sending end bus-i and receiving end bus-j after inclusion of TCSC is
given by equations (7) to (10).
𝑃𝑖′ = 𝑉𝑖
2∆𝐺𝑖𝑗 − 𝑉𝑖𝑉𝑗(∆𝐺𝑖𝑗𝑐𝑜𝑠𝛿𝑖𝑗 + ∆𝐵𝑖𝑗𝑠𝑖𝑛𝛿𝑖𝑗) (7)
𝑃𝑗′ = 𝑉𝑗
2∆𝐺𝑖𝑗 − 𝑉𝑖𝑉𝑗(∆𝐺𝑖𝑗𝑐𝑜𝑠𝛿𝑖𝑗 + ∆𝐵𝑖𝑗𝑠𝑖𝑛𝛿𝑖𝑗) (8)
𝑄𝑖′ = −𝑉𝑖
2∆𝐵𝑖𝑗 − 𝑉𝑖𝑉𝑗(∆𝐺𝑖𝑗𝑠𝑖𝑛𝛿𝑖𝑗 + ∆𝐵𝑖𝑗𝑐𝑜𝑠𝛿𝑖𝑗) (9)
𝑄𝑗′ = −𝑉𝑗
2∆𝐵𝑖𝑗 − 𝑉𝑖𝑉𝑗(∆𝐺𝑖𝑗𝑠𝑖𝑛𝛿𝑖𝑗 + ∆𝐵𝑖𝑗𝑐𝑜𝑠𝛿𝑖𝑗) (10)
Where,
∆𝐺𝑖𝑗 =𝑥𝑇𝐶𝑆𝐶𝑟𝑖𝑗(𝑥𝑇𝐶𝑆𝐶 − 2𝑥𝑖𝑗)
(𝑟𝑖𝑗2 + 𝑥𝑖𝑗
2 ) [𝑟𝑖𝑗2 + (𝑥𝑖𝑗 − 𝑥𝑇𝐶𝑆𝐶)
2]
∆𝐵𝑖𝑗 =−𝑥𝑇𝐶𝑆𝐶(𝑟𝑖𝑗
2 − 𝑥𝑖𝑗2 + 𝑥𝑇𝐶𝑆𝐶𝑥𝑖𝑗)
(𝑟𝑖𝑗2 + 𝑥𝑖𝑗
2 ) [𝑟𝑖𝑗2 + (𝑥𝑖𝑗 − 𝑥𝑇𝐶𝑆𝐶)
2]
3. Congestion Management Problem
3.1Congestion management
In a deregulated environment, the three major stake holders of TRANSCOs, GENCOs and DISCOs are owned
by different organizations. For maintaining the coordination among them there should be one system operator in
all types of deregulated power system models, generally it is called the independent System Operator (ISO). In a
competitive electricity market, high level of freedom is provided to all the market participants for interactions.
Here, both the DISCOs and GENCOs try to buy and sell electric power in a way so as to maximize their profit. In
deregulated electricity markets, transmission congestion occurs when there is insufficient transmission capacity to
simultaneously accommodate all transactions. Congestion ought to be mitigated as quick as attainable to avoid
cascaded tripping of overloaded lines. FACTS devices can be better utilized to reduce the power flows in the
loaded branches, which results in an increased loadability (ATC enhancement).
3.2Objectives
The main objective is to remove overload from the congested lines by adjusting the generator bus voltages,
transformer tap settings and reactance of TCSC devices. The other two objectives are line loss and voltage
deviation at load buses.
Turkish Journal of Computer and Mathematics Education Vol.12 No.6 (2021), 5390-5403
Research Article
5393
The transmission lines are designed to carry power within their thermal limits. Congestion management
removes these violations by minimizing the real power violation which is taken as first objective here.
f1 = ∑|Pk − Pk rat|
Nl
k=1
(11)
Where Pk is the power flow at kth line and Pk rat is the maximum power flow limit of the line.
For economical and efficient operation, the ISO should ensure minimum transmission loss which is considered
as the second objective.
f2 = ∑Gk[Vi2 +
Nl
k=1
Vj2 − 2|Vi||Vj|cosδi − δj] (12)
Where Gk is the conductance of kth line. Vi and Vj are the sending end and receiving end voltage magnitudes
of the kth line. δi and δj are the sending end and receiving end voltage angles of the kth line.
The objective of ensuring quality power at consumer end by eliminating voltage variations at load buses is
done by minimizing voltage deviation and that is the third objective.
f3 = ∑ |(Vk − Vk ref)|
Npq
k=1
(13)
Where Vk is the voltage of kth bus. Vk ref is the reference voltage at bus k. it is taken as 1.0 p.u. in this work.
The congestion management problem has been formulated as anaugmented multi-objective optimization
problem of minimizing the overloads, reducing the transmission losses and minimizing the voltage deviation at
load buses.
F = min(f1, f2, f3)
Weighted aggregated method is employed to convert the multi-objective model in to single objective model as
[21].
F = w1f1 + w2f2 + w3f3 (14)
For determining the weight factors for the augmentation of the objectives, weight factor for voltage deviation
is set as the highest value (0.6). The other two objectives are given equal weights of 0.2.
since,w1 = 0.2, w2 = 0.2, w3 = 0.6 for the optimization work.
3.3 Constraints
3.3.1 Equality constraints
The power system must satisfy the real and reactive power flow constraints which are given by power flow
equations as equality constraints.
PGi − PDi − ∑ViVjYijcos(δij
NB
j=1
+ γj − γi) = 0 (15)
QGi − QDi − ∑ViVjYijsin(δij
NB
j=1
+ γi − γj) = 0 (16)
Where, PGi, QGi are the active and reactive power of ith generator, PDi, QDithe active and reactive power of
ithload bus.
3.3.2 Inequality constraints
Generator constraints:
Generator voltage and reactive power of ith bus lies between their upper and lower limits as given below:
VGimin ≤ VGi ≤ VGi
maxi = 1,2, . . . . NG (17)
Turkish Journal of Computer and Mathematics Education Vol.12 No.6 (2021), 5390-5403
Research Article
5394
QGimin ≤ QGi ≤ QGi
maxi = 1,2, . . . . NG (18)
Where, VGimin , VGi
max are the minimum and maximum voltage of ith generating unit and QGimin , QGi
max are the
minimum and maximum reactive power of ith generating unit.
Load bus voltage constraints:
The upper and lower bound of load bus voltages are given by
Vimin ≤ Vi ≤ Vi
maxi = 1,2, . . . . NPQ(19)
Where, Vimin, Vi
max are the minimum and maximum value voltage of load bus ‘i’.
Transmission line constraints:
Pi ≤ Pimaxi = 1,2, . . . , NL (20)
Where, Pi is the apparent power flow of ith branch and Pimax is the maximum apparent power flow limit of ith
branch.
Transformer taps constraints:
Transformer tap settings are bounded between upper and lower limit as given below:
Timin ≤ Ti ≤ Ti
maxi = 1,2, . . . , NT(21)
Where, Timin, Ti
max are the minimum and maximum tap setting limits of ith transformer.
4. Whale Optimization Algorithm
4.1 Overview
Whales do not sleep as they need to come to the surface of water for breathing. Whales are alert of all the times
that helps a whale to think, learn, judge and communicate emotional by its spindle cells [22]. Most of the whale
species are living in a family during their life time. Humpback whale is one of the biggest spices that has a special
prey hunting behavior called bubble net feeding. Bubble-net feeding is a unique behavior that can only be seen in
humpback whale is mathematically modeled for searching optimal solution in the search space. Nature inspired
algorithms are mimicked from the food searching mechanism, survival mechanism etc. of the living beings. WOA
is developed based on the survival mechanism of whale in deep ocean.
4.1.1Encircling of the Prey
WOA algorithm takes the current best candidate close to the optimum solution. Once the best solution is
identified, the other candidates try to update their positions.
This updating action is expressed by the following equations:
D⃗⃗ = |C⃗ . X∗⃗⃗⃗⃗ (t) − X⃗⃗ (t)| (22)
X⃗⃗ (t + 1) = X∗⃗⃗⃗⃗ (t) − A⃗⃗ ∙ D⃗⃗ (23)
Where‘t’ refers the current iteration number, A and C are coefficient vectors, X*is the best solution obtained so
far, X is the current solution. | | is for absolute value, and dot (·) is for element level multiplication operator.
Equation (24) is used for calculating coefficients A and C.
A⃗⃗ = 2a⃗ ∙ r − a⃗ (24)
C⃗⃗⃗ = 2 ∙ r (25)
‘a’is linearly decreased from 2 to 0 over the course of iterations,‘r’is a random number in the range[0,1].
The position (X,Y) of a search agent can be updated according to the position of the current best
history(X*,Y*).New solutions around the current best one can be generated with respect to the current position
through changing the value of A and C vectors.
4.1.2Bubble-net attacking (exploitation phase)
Two approaches can be followed for modeling the bubble-net behavior of humpback whales viz, shrinking
encircling mechanism and spiral updating position. Shrinking encircling mechanism is used here.

Turkish Journal of Computer and Mathematics Education Vol.12 No.6 (2021), 5390-5403
Research Article
5395
This behaviour is satisfied by decreasing the value of ‘a’, it may be noted that the fluctuation range of A is also
decreased by ‘a’ in other words A is a random value in the interval [ −a , a ] where a is decreased from 1 to 0over
the course of iterations.
4.1.3 Search for Prey (exploration phase)
The same approach based on the variation of the A vector can be utilized to search for prey
(exploration).Infact, humpback whales search randomly according to the position of each other. Therefore, we use
A with the random values greater than1or less than −1 to force search agent to move far away from a reference
whale.
This mechanism and |A|>1emphasize exploration and allow the WOA algorithm to perform a global search.
The mathematical model is as follows:
D⃗⃗ = |C⃗ . Xrand⃗⃗ ⃗⃗ ⃗⃗ ⃗⃗ ⃗⃗ − X⃗⃗ | (26)
X⃗⃗ (t + 1) = Xrand⃗⃗ ⃗⃗ ⃗⃗ ⃗⃗ ⃗⃗ − A⃗⃗ ∙ D⃗⃗ (27)
where Xrand⃗⃗ ⃗⃗ ⃗⃗ ⃗⃗ ⃗⃗ ⃗is a random position vector (a random whale) chosen from the current population.
The WOA algorithm begins with a set of random initial solutions. At each iteration, search agents update their
positions with a randomly generated search agent or search agent generated around the best solution. Random
search process is chosen when |A|>1, while the current best solution is selected for updating the agent when |A|<1.
Implementation of WOA for congestion management
The steps followed in the implementation of the algorithm are as given below:
Step 1: Read line data and bus data of the test system and solve for line flow problem of the
system using NR load flow method for the present system state.
Step 2: Initialize the whales, population size NP as 30 and iteration counter as 300. Each whale is a set of
control variable values taken within their limits.
Step3: Set the control variables with randomly selected values.
Step4: Randomly generate whale population and initialize the iteration counter.
Step5:Run the load flow and for each whale (different value for control variables) calculate the objective
function value. Repeat this procedure for all the 30 whales and this completes one iteration.
Step 6: Once the objective function value of all the search agent are found, sort the whales in the ascending or
their objective function. The current best solution is the whale with minimum objective value (first whale).
Step 7: Based on Eqns. (23) – (28) update the position of search agents.
Step 8: For the new updated population of whales, determine objective function values by performing
Newton-Rapson load flow.
Step 9:Identify the best whale in this iteration. Compare this best whale with the best whale obtained so far. If
this current best is better than the best so far replaces the best solution with current best or else go back to step 7.
Step 10:If the stopping is met, then print the results.
5. Simulation Resuls And Analysis
The proposed WOA based method for congestion management approach by placing suitable sized TCSC
devices is tested on IEEE 30 bus test system. This system is with 6 generator nodes24 load nodes and 41
lines[23].Three different reasons of transmission congestion are taken for this study viz, Increased load, bilateral
transactions and multilateral transactions. The three cases of congestion are given along with amount of
transactions in table 1. The decision variables of this optimization work are generator node voltages, transformer
tap changer settings and reactance of TCSC devices. The lower and upper bounds for generator node voltages and
transformers tap setter positions are within 0.9 p.u. and 1.1 p.u. TCSC reactance is allowed between 20 %
inductance to 70 % capacitance.
Table 1. Different operating conditions
Case Operating condition
Case 1 35 % overload at all the load buses.

Turkish Journal of Computer and Mathematics Education Vol.12 No.6 (2021), 5390-5403
Research Article
5396
Case 2 11.5 MW of bilateral power transaction between GENCO 13 and DISCO 26
Case 3 GENCOS
Generator 8-11MW
Generator 11-10 MW
Total 21 MW
DISCOS
Load bus 21-8 MW
Load bus 29-13 MW
Total 21 MW
Case 1- 1.35p.u.load
System load is increased by 35 percent causing overload in line 1 which is carrying a load of131.267 MW. The
capacity of this line is 130 MW only while it carries an excess power of 1.267 MW. This line connects the
reference bus to the rest of the network and crucial for security of the system. Congestion is to be relieved
otherwise severe security problems will takes place in the system.
To remove the line flow violation, line flow patterns of the other lines are adjusted by inserting TCSC devices
at suitable lines connecting load buses. The TCSC devices change the reactance of the line in which they are
located and thereby the line flows are changed. Power flow through all the lines of the system during and after
congestion management are presented in table 2 for comparison. It is clear from the power flows that the
congested line is relieved and the flows of all the lines are so adjusted that they carrying power below their
capacity.
Table 2. Power flow comparison in case 1
Line
number
MW flow
before CM
MW flow after CM
PSO FFA WOA
1 131.267 128.839 128.725 128.670
2 77.7204 78.3058 77.2428 77.1170
3 45.1248 46.2526 44.4892 44.8157
4 72.8314 72.3697 71.4094 70.9269
5 74.1643 77.4879 74.4018 74.8208
6 59.3274 54.5948 58.6516 59.1426
7 63.3811 67.5346 62.9974 64.6010
8 7.93120 4.36360 11.3948 13.3623
9 37.5064 36.5524 36.4299 35.9749
10 22.1891 31.1238 22.7541 22.8529
11 25.4170 22.8614 25.4740 22.9542
12 18.3791 16.9454 13.4256 18.2134
13 47.4478 22.2079 37.3714 38.6959
14 46.4785 44.2980 53.4742 43.6413
15 42.8541 40.0214 42.4660 40.2370
16 53.8331 46.5975 28.5627 22.0865
17 12.0257 11.0097 11.0211 10.7795
18 29.0165 25.4560 25.8492 24.8155
19 13.6922 11.1082 11.3856 10.5187
20 3.2679 2.1607 2.2005 1.9462
21 8.1316 5.6265 6.1768 5.2901
22 9.8363 8.8524 8.9907 8.5715
23 5.2405 4.2391 4.4335 4.0150
24 8.5512 9.4177 9.4490 9.8111
25 11.9157 12.8395 12.8647 13.2507
26 6.6694 9.1849 9.8320 10.3443
27 28.9593 28.9398 29.3731 30.3810
28 10.8002 8.1141 8.4442 8.3159
29 1.7056 1.2725 0.7449 1.7154
30 10.5278 6.6038 6.9033 6.0511
31 10.6332 8.0416 8.3692 8.2246
32 5.6166 2.5022 3.2057 2.9218
33 4.2880 3.1879 3.6502 2.0369
34 5.8192 5.7934 5.7922 5.7441
35 3.5019 8.8219 8.7931 7.7395
Turkish Journal of Computer and Mathematics Education Vol.12 No.6 (2021), 5390-5403
Research Article
5397
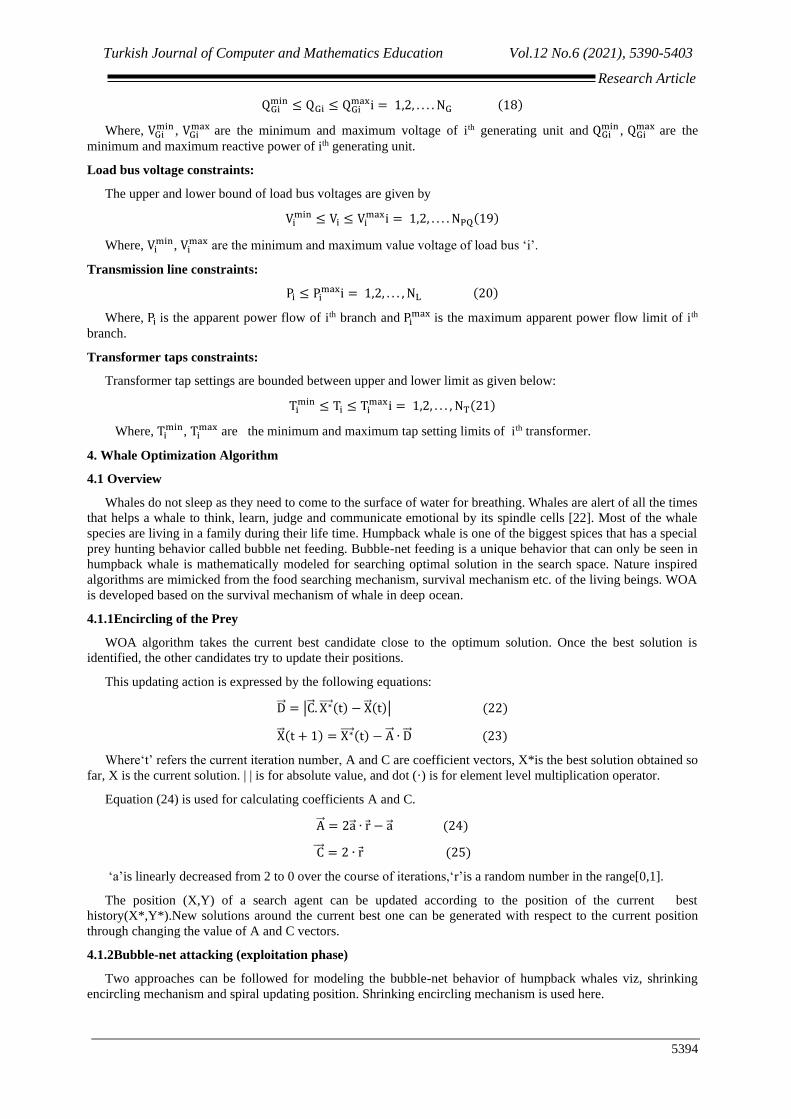
36 30.9965 24.6938 23.7233 25.0278
37 8.8276 8.7463 8.7427 8.7514
38 10.0438 9.9450 9.9406 9.9512
39 5.1140 5.0916 5.0906 5.0930
40 1.7674 4.9394 2.5793 1.9606
41 20.3357 22.5722 22.1440 22.6412
Optimization of power flow pattern by locating TCSC devices relieved the congestion and also achieves
minimization of line loss and total voltage deviation of load nodes. These benefits are given in table 3. During
congestion, line loss was 15.2375 MW, in post congestion management loss is reduced to 13.3062 MW. There is a
reduction of 1.9313 MW of loss reduction is achieved. For proving the strength of the proposed WOA based
method, the loss and voltage deviation reported by FFA and PSO are also given in table 3.
Table 3.Power loss and voltage deviation with TCSC in case 1
Parameter During
congestion
After congestion is relieved
PSO FFA WOA
Total power loss
(MW)
15.2375 13.5592
13.4278
13.3062
Voltage deviation
(p.u.)
0.9000 0.4526
0.4456
0.4150
The design variables are adjusted during the optimization process for reaching the best results. The best set of
control variables corresponding to global best results are shown in table 4. These values are ensured to be lying
within their maximum and minimum limits.
Table 4. Optimal control variables in case 1
Parameter Best value
PSO
Best value
FFA
Best value
WOA
V1 (p.u.) 1.0913 1.0890 1.1000
V2(p.u.) 1.0694 1.0642 1.0785
V5(p.u.) 1.0172 1.0384 1.0456
V8(p.u.) 1.0398 1.0401 1.0397
V11(p.u.) 1.0105 1.1000 1.1000
V13(p.u.) 1.0932 1.0615 1.0456
T11(p.u.) 0.9629 1.0099 1.0551
T12(p.u.) 1.0010 1.0834 0.9765
T15(p.u.) 1.0419 1.0043 0.9782
T36(p.u.) 0.9594 0.9578 0.9782
TCSC1(p.u.) 0.2000 -0.2924 0.2000
TCSC2 (p.u.) 0.2000 -0.4998 -0.7000
Two TCSCs are suggested at different line locations by the three algorithms as shown in the table5.The
locations are the most suitable ones for congestion management in case 1.
Table.5 Optimal locations ofTCSCs in case 1
Label of
TCSC
Location of TCSC
PSO FFA WOA
TCSC1 6 15 28
TCSC2 7 14 34
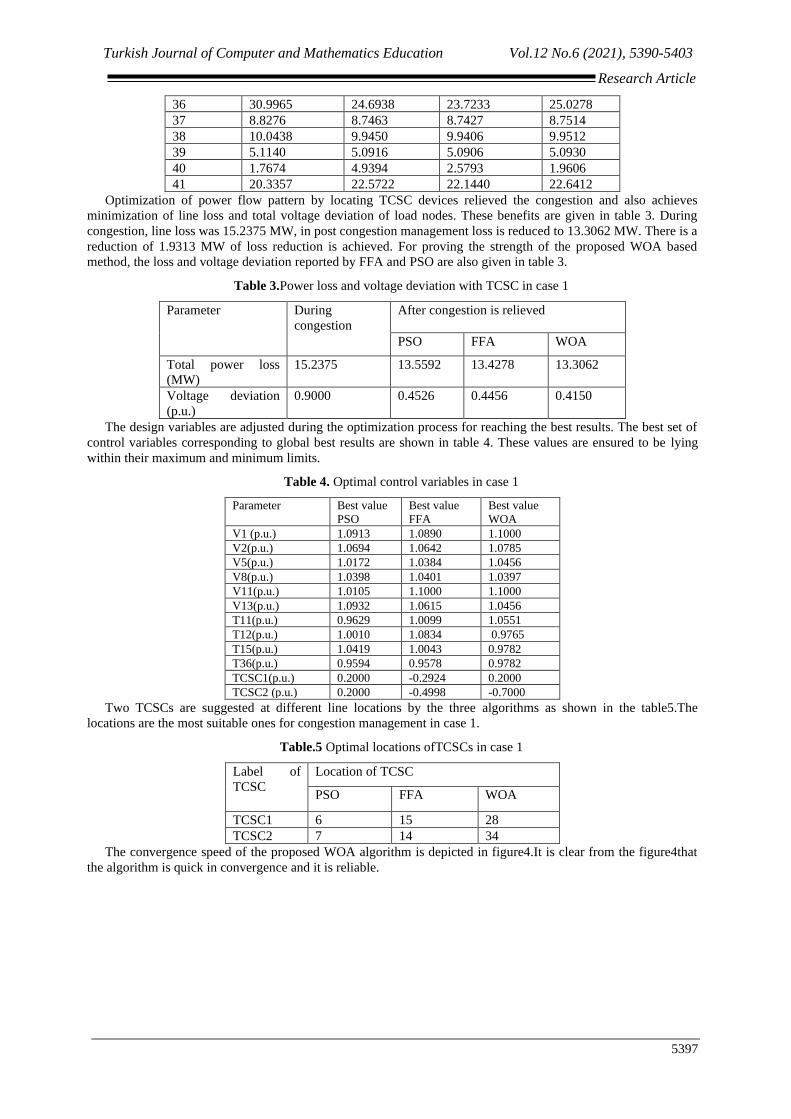
The convergence speed of the proposed WOA algorithm is depicted in figure4.It is clear from the figure4that
the algorithm is quick in convergence and it is reliable.
Turkish Journal of Computer and Mathematics Education Vol.12 No.6 (2021), 5390-5403
Research Article
5398
Figure 4. Convergence of PSO, FFA and WOA in case 1
Case2- Bilateral transaction
In this case, a bilateral transaction between buses 13 and 26 is taken. This transaction is with bus 13 as the
Genco and bus 26 as the Disco bus for power transaction. The agreement is for a power transaction of 11.5 MW
and this result in congestion in line number 34 whose capacity is 16 MW. Power flow during this transaction
period is 16.1233 MW. The proposed WOA based method is exploited for removing congestion caused in line 34.
Overload of the line is relieved and the post line flows obtained by the PSO, FFA and WOA algorithms are shown
in table 6.
Table 6. Power flow comparison in case 2
Line
number
MW flow
before CM
MW flow after CM
PSO FFA WOA
1 57.0233 58.4314 57.3960 52.6136
2 43.6815 43.4656 42.7549 48.5362
3 31.0181 29.9513 29.6274 27.3848
4 40.6146 39.9488 39.5946 45.0083
5 45.4808 46.9800 46.1995 45.3741
6 39.6320 39.4394 39.1706 37.5486
7 39.8581 47.4073 42.5602 46.1712
8 2.3672 4.3525 8.9289 9.7721
9 25.7829 22.1727 21.9447 22.7289
10 24.7471 15.6223 14.3421 15.7805
11 15.7261 25.2807 17.2836 16.5637
12 12.4440 13.8421 11.4780 10.4672
13 43.3236 40.5165 26.4023 20.8236
14 34.9827 34.9306 36.2057 35.1271
15 22.6015 18.9676 18.3901 17.7028
16 51.3706 39.9473 34.2877 32.0608
17 9.7744 7.9772 8.2759 8.2357
18 25.0675 20.0735 20.4327 20.2776
19 12.4633 9.7548 10.1261 9.5679
20 3.2225 2.3522 2.1288 2.0930
Turkish Journal of Computer and Mathematics Education Vol.12 No.6 (2021), 5390-5403
Research Article
5399
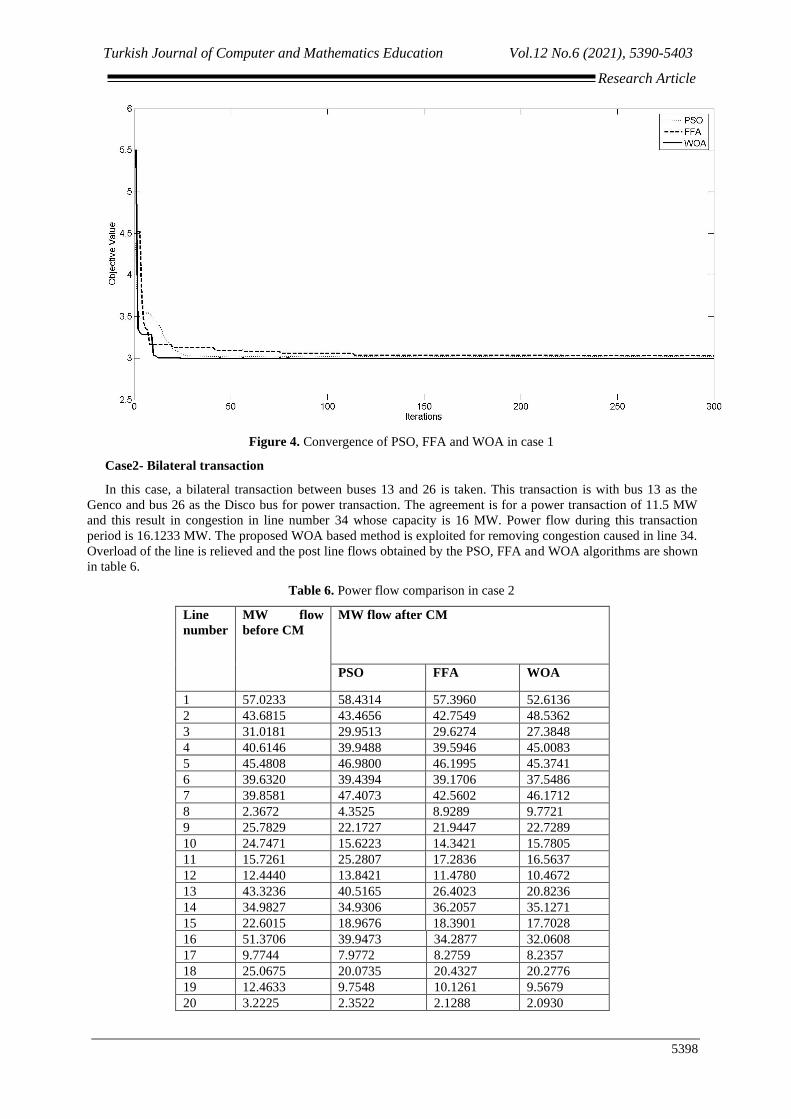
21 8.2686 7.6230 7.1481 6.5617
22 8.3147 6.8927 6.9395 7.0524
23 4.8852 4.2027 3.8600 3.9848
24 5.2431 8.2852 7.3984 7.3568
25 7.6561 10.6815 9.8130 9.7613
26 2.6326 11.6590 9.3616 9.2550
27 21.9695 25.1072 23.9413 23.1646
28 11.3091 8.6022 8.9394 7.4266
29 1.5164 4.5179 2.9527 2.9400
30 10.8513 8.2901 7.3584 7.0640
31 11.1538 8.5404 8.8692 7.3691
32 8.0211 5.7142 5.6746 3.9511
33 9.8490 6.6007 6.3325 2.9282
34 16.1233 15.2770 15.1496 15.0929
35 7.0327 13.7128 12.2870 14.5605
36 29.2238 28.8556 24.2614 29.0848
37 6.4457 6.4066 6.4111 6.4108
38 7.3265 7.2791 7.2845 7.2841
39 3.7625 3.7518 3.7530 3.7529
40 5.0213 4.4228 3.3212 4.3069
41 17.9584 21.4768 21.0286 23.1701
In table7 the additional benefits of loss level and voltage deviation minimization reported by the algorithms are
given. The real power loss achieved by WOA algorithm in this bilateral transaction period is 6.5223MW which is
less than the loss levels shown by the other two algorithms. It is clear that the proposed algorithm relieves the
congestion and also minimizes the line loss is considerable. Total voltage deviation during congestion was 0.7370
that is reduced to 0.2154 by WOA algorithm. 0.2392 and 0.2227 are the voltage deviation achieved by PSO and
FFA algorithms.
Table 7. Power loss and voltage deviation with TCSC in case 2
Parameter During
congestion
After congestion is relieved
PSO FFA WOA
Total power loss
(MW)
7.1254 6.8444
6.5810
6.5223
Voltage deviation
(p.u.)
0.7370
0.2392
0.2227
0.2154
Magnitudes of generator bus voltages, transformer tap changer positions and TCSC parameters are all
optimized by PSO, FFA and WOA algorithms. The control variables are adjusted respecting the upper and lower
limits during optimization process. The well tunes control variables corresponding to best results are presented in
table 8.
Table 8. Optimal control variables in case 2
Parameter Best value
PSO
Best value
FFA
Best value
WOA
V1(p.u.) 1.0185 1.0354 1.0442
V2(p.u.) 1.0039 1.0275 1.0305
V5(p.u.) 0.9763 1.0126 1.0117
V8(p.u.) 0.9836 1.0044 1.0075
V11(p.u.) 1.1000 1.0663 1.0420
V13(p.u.) 0.9710 1.0346 1.0052
Turkish Journal of Computer and Mathematics Education Vol.12 No.6 (2021), 5390-5403
Research Article
5400
T11(p.u.) 1.0042 0.9839 0.9598
T7(p.u.) 0.9211 0.9901 0.9908
T21(p.u.) 0.9000 1.0099 0.9598
T36(p.u.) 0.9000 0.9395 0.9602
TCSC1(p.u.) 0.1878 -0.1916 -0.4873
TCSC2(p.u.) 0.2000 -0.1991 -0.2494
Table 9 shows the best locations(lines) identified for TCSCs in relieving congestion in this case that are
different for different algorithms.
Table. 9 Optimal locations of TCSCs in case 2
Label of
TCSC
Location of TCSC
PSO FFA WOA
TCSC1 15 19 36
TCSC2 9 34 2
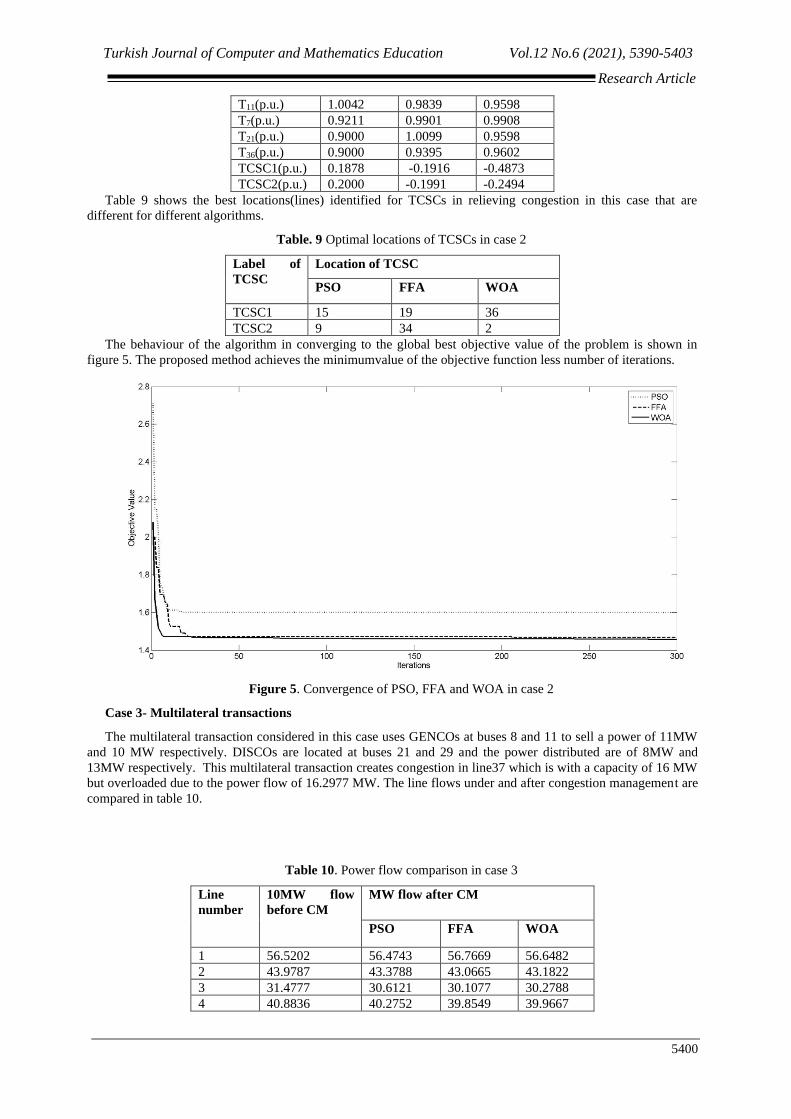
The behaviour of the algorithm in converging to the global best objective value of the problem is shown in
figure 5. The proposed method achieves the minimumvalue of the objective function less number of iterations.
Figure 5. Convergence of PSO, FFA and WOA in case 2
Case 3- Multilateral transactions
The multilateral transaction considered in this case uses GENCOs at buses 8 and 11 to sell a power of 11MW
and 10 MW respectively. DISCOs are located at buses 21 and 29 and the power distributed are of 8MW and
13MW respectively. This multilateral transaction creates congestion in line37 which is with a capacity of 16 MW
but overloaded due to the power flow of 16.2977 MW. The line flows under and after congestion management are
compared in table 10.
Table 10. Power flow comparison in case 3
Line
number
10MW flow
before CM
MW flow after CM
PSO FFA WOA
1 56.5202 56.4743 56.7669 56.6482
2 43.9787 43.3788 43.0665 43.1822
3 31.4777 30.6121 30.1077 30.2788
4 40.8836 40.2752 39.8549 39.9667
Turkish Journal of Computer and Mathematics Education Vol.12 No.6 (2021), 5390-5403
Research Article
5401
5 45.1716 45.7809 46.0863 45.5694
6 38.7853 38.6383 38.3788 38.6127
7 34.0998 44.8264 37.3898 37.6653
8 1.9086 3.0802 5.2124 5.1066
9 25.8442 23.7029 22.4531 22.9466
10 22.4069 5.1680 8.5747 8.5181
11 14.6906 11.9075 13.0179 12.9590
12 13.5454 12.7228 12.1663 12.1279
13 48.4644 35.3254 44.5386 44.5492
14 43.4359 41.5148 43.4333 43.3733
15 29.2591 24.6584 24.9520 24.9595
16 46.5368 59.9930 21.2579 21.2617
17 9.3830 8.1738 7.8773 7.8817
18 23.4450 19.4377 18.6234 18.6432
19 10.7910 7.9691 7.3910 7.3736
20 2.9020 1.6528 1.6218 1.6273
21 6.7331 3.9317 4.2374 4.2150
22 7.2961 6.2035 5.8816 5.8658
23 3.9619 2.8221 2.7007 2.6816
24 6.3395 7.2789 7.9589 7.9663
25 8.7636 9.7640 10.4583 10.4667
26 4.3122 6.9103 9.2921 9.2887
27 28.1567 27.1291 28.3994 28.5217
28 10.8685 7.6385 7.6684 7.3192
29 1.4134 2.9810 0.2454 0.1759
30 10.1178 5.9379 6.0292 6.0763
31 10.7265 7.6123 7.6340 7.2860
32 5.9264 3.8309 4.1200 4.3916
33 7.4464 6.9832 6.6871 6.6513
34 4.2746 4.2618 4.2621 4.2621
35 2.9917 9.7618 9.3894 9.3940
36 33.0062 31.1674 30.7529 30.8615
37 16.2977 15.4582 15.3689 15.2735
38 11.2768 11.8489 11.8450 11.6249
39 0.5275 1.0344 1.0279 0.8388
40 6.4117 6.4680 6.0354 6.0526
41 19.7638 24.8623 25.1007 25.1459
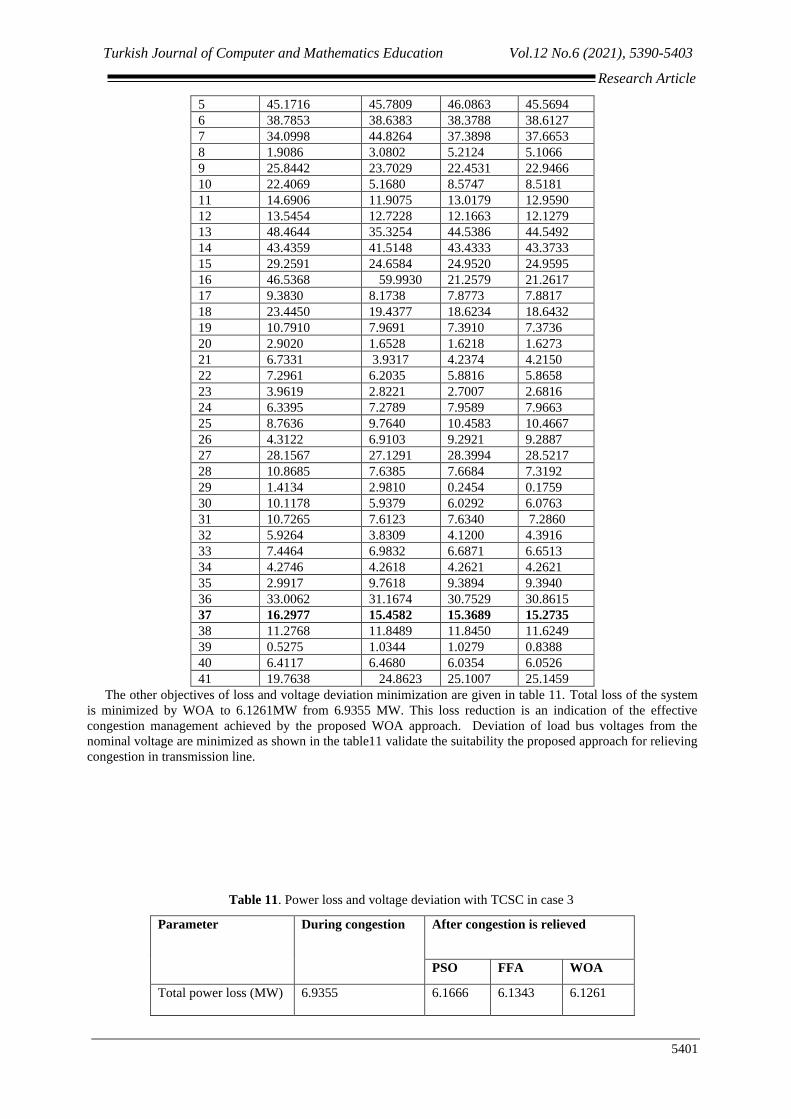
The other objectives of loss and voltage deviation minimization are given in table 11. Total loss of the system
is minimized by WOA to 6.1261MW from 6.9355 MW. This loss reduction is an indication of the effective
congestion management achieved by the proposed WOA approach. Deviation of load bus voltages from the
nominal voltage are minimized as shown in the table11 validate the suitability the proposed approach for relieving
congestion in transmission line.
Table 11. Power loss and voltage deviation with TCSC in case 3
Parameter During congestion After congestion is relieved
PSO FFA WOA
Total power loss (MW) 6.9355 6.1666
6.1343
6.1261
Turkish Journal of Computer and Mathematics Education Vol.12 No.6 (2021), 5390-5403
Research Article
5402
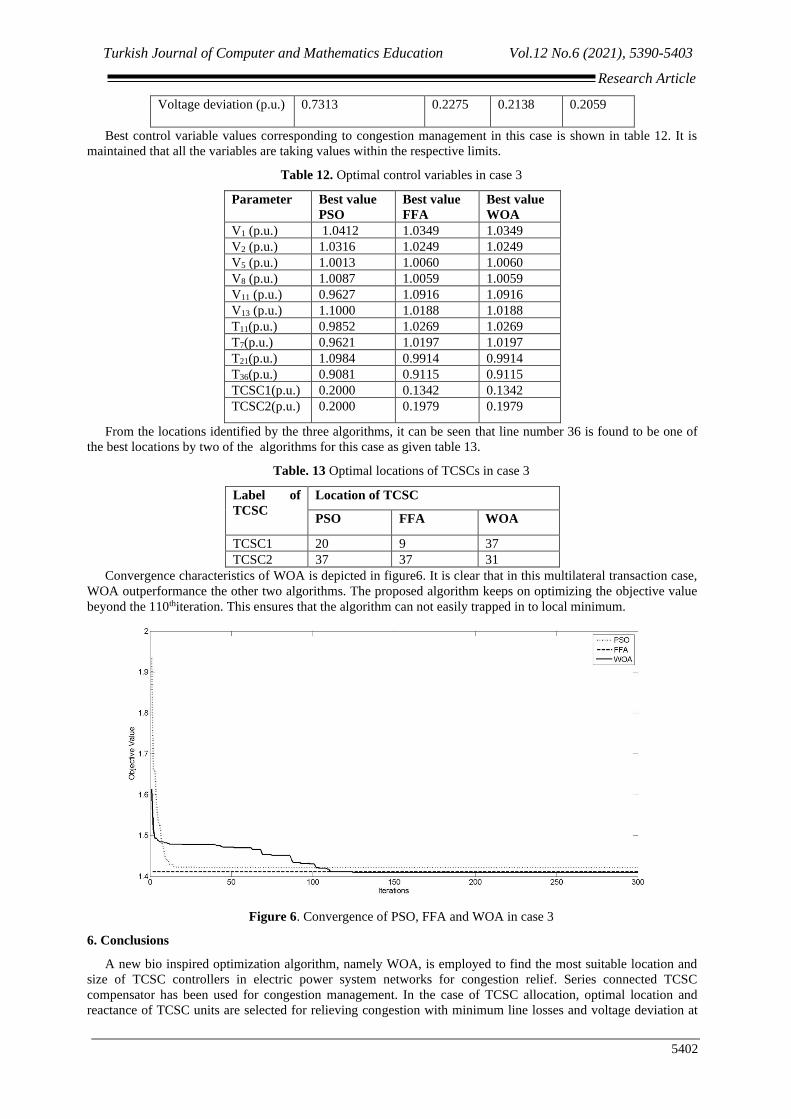
Voltage deviation (p.u.) 0.7313 0.2275
0.2138
0.2059
Best control variable values corresponding to congestion management in this case is shown in table 12. It is
maintained that all the variables are taking values within the respective limits.
Table 12. Optimal control variables in case 3
Parameter Best value
PSO
Best value
FFA
Best value
WOA
V1 (p.u.) 1.0412 1.0349 1.0349
V2 (p.u.) 1.0316 1.0249 1.0249
V5 (p.u.) 1.0013 1.0060 1.0060
V8 (p.u.) 1.0087 1.0059 1.0059
V11 (p.u.) 0.9627 1.0916 1.0916
V13 (p.u.) 1.1000 1.0188 1.0188
T11(p.u.) 0.9852 1.0269 1.0269
T7(p.u.) 0.9621 1.0197 1.0197
T21(p.u.) 1.0984 0.9914 0.9914
T36(p.u.) 0.9081 0.9115 0.9115
TCSC1(p.u.) 0.2000 0.1342 0.1342
TCSC2(p.u.) 0.2000 0.1979 0.1979
From the locations identified by the three algorithms, it can be seen that line number 36 is found to be one of
the best locations by two of the algorithms for this case as given table 13.
Table. 13 Optimal locations of TCSCs in case 3
Label of
TCSC
Location of TCSC
PSO FFA WOA
TCSC1 20 9 37
TCSC2 37 37 31
Convergence characteristics of WOA is depicted in figure6. It is clear that in this multilateral transaction case,
WOA outperformance the other two algorithms. The proposed algorithm keeps on optimizing the objective value
beyond the 110thiteration. This ensures that the algorithm can not easily trapped in to local minimum.
Figure 6. Convergence of PSO, FFA and WOA in case 3
6. Conclusions
A new bio inspired optimization algorithm, namely WOA, is employed to find the most suitable location and
size of TCSC controllers in electric power system networks for congestion relief. Series connected TCSC
compensator has been used for congestion management. In the case of TCSC allocation, optimal location and
reactance of TCSC units are selected for relieving congestion with minimum line losses and voltage deviation at
Turkish Journal of Computer and Mathematics Education Vol.12 No.6 (2021), 5390-5403
Research Article
5403
load buses. The results show that for TCSC position and sizing, WOA produces minimum values for the
objectives. Therefore, WOA can be used as an efficient algorithm for solving optimal allocation of TCSC devices
in congestion management problem. From the comparison of results obtained from the other algorithms, PSO and
FFA algorithms, and their convergence characteristics it is clear that WOA performs better in relieving
congestion...
References
1. R. S. Fang and A. K. David, “Optimal Dispatch under transmission contracts,” IEEE Transactions on
Power Systems, vol. 14, No.2, pp.732-737, May 1999.
2. R. D. Christie, B. Wollenberg, I. Wangensteen, “Transmission management in the deregulated
environment,” Proc. IEEE, vol. 88, no.2, pp. 170–195, Feb. 2000.
3. M. Shahidehpour, H. Yamin, Z. Li, Market Operations in Electric Power Systems, Wiley, New York,
2002.
4. Gad M, Shinde P, Kulkarni SU (2012) Optimal location of TCSC by sensitivity methods. Int J
ComputEng Res 2(6):162–168.
5. H. C. Leung and T. S. Chung, “Optimal power flow with a versatile FACTS controller by genetic
algorithm approach”, in Proc. Power engineering society winter meeting, 2000, vol.4, pp. 2806-2811,
Jan. 2000.
6. N. G. Hingorani and L. Gyugyi, Understanding FACTS, The Institution of Electrical and Electronics
Engineers, 1998.
7. L. Gyugyi, T. R. Rietman, A. Edris, C. D.S Chauder, D. R. Torgerson, and S. L. Williams, “The unified
power flow controller: a new approach to power transmission control,” IEEE Transactions on Power
Delivery, vol. 10, No.2, pp. 1085-1097.
8. Larsen E, Millers N, Nilsson S, Lindgren S. Benefits of GTO-based compensation systems for electric
utility applications. IEEE Trans Power Deliv 1992;7(4): 2056–64.
9. Preedavinchit P, Srivastava SC. Optimal reactive power dispatch considering FACTS devices. Electric
Power Syst Res 1998;46(3):251–7.
10. Momoh JA, Zhu JZ. A new approach to optimal power flow with phase shifter. In: IEEE international
conference on systems, vol. 5; 1998. p. 4794–9.
11. Liu JY, Song YH. Comparison studies of unified power flow controller with static var compensators and
phase shifters. Electric Machines Power Syst 1999;27:237–51.
12. Besharat, H. and Taher, S.A., 2008. Congestion management by determining optimal location of TCSC
in deregulated power systems. International Journal of Electrical Power & Energy Systems, 30(10),
pp.563-568.
13. S. N. Singh and a. K. David, “Optimal location of FACTS devices for congestion management,” Electr.
Power Syst. Res., vol. 58, no. 2, pp. 71–79, 2001.
14. N. Amjady and M. Hakimi, “Dynamic voltage stability constrained congestion management framework
for deregulated electricity markets,” Energy Convers. Manag., vol. 58, pp. 66–75, 2012.
15. D.Sharmila, Dr.R.Medeswaran, “optimal location of tcsc and svc devices to enhance power system
security” in International Journal Of Engineering Sciences & Research Technology, pp.649-652, 2016.
16. G. I. Rashed and Y. Sun, “Optimal placement of Thyristor controlled series compensation for enhancing
power system security based on computational intelligence techniques,” in Procedia Engineering, vol. 15,
pp. 908–914, 2011.
17. . A. I. Z. . c O. M. M. . Rahim M.N.A.eMusirin, “Contingency based congestion management and cost
minimization using bee colony optimization technique,” in PECon2010 - 2010 IEEE International
Conference on Power and Energy, pp. 891–896, 2010.
18. G. B. Shrestha and W. Feng, “Effects of series compensation on spot price power markets,” Int. J. Electr.
Power Energy Syst., vol. 27, no. 5– 6, pp. 428–436, 2005.
19. N. Hosseinipoor and S. M. H. Nabavi, “Optimal locating and sizing of TCSC using genetic Algorithm for
congestion management in deregualted power markets,” in 2010 9th Conference on Environment and
Electrical Engineering, EEEIC 2010, pp. 136–139,2010.
20. Verma KS, Singh SN, Gupta HO. FACTS devices location for enhancement of total transfer capability.
In: Power engineering society winter meeting, IEEE, vol. 2; 2001. p. 522–7
21. Jordehi, A.R., 2015. Brainstorm optimisation algorithm (BSOA): An efficient algorithm for finding
optimal location and setting of FACTS devices in electric power systems. International Journal of
Electrical Power & Energy Systems, 69, pp.48-57.
22. Mirjalili, S., & Lewis, A. (2016). The whale optimization algorithm. Advances in Engineering Software,
95, 51-67.
23. The IEEE 30-Bus Test System. <http://www.ee.washington.edu/research/pstca/
24. pf30/pg_tca30bus.htm>..


