Embed Size (px)
Citation preview

Metabolomics Analysis Identifies Intestinal Microbiota-Derived Biomarkers of Colonization Resistance inClindamycin-Treated MiceRobin L. P. Jump1,2*, Alex Polinkovsky3, Kelly Hurless3, Brett Sitzlar3, Kevin Eckart3, Myreen Tomas2,
Abhishek Deshpande3, Michelle M. Nerandzic3, Curtis J. Donskey1,2,3
1 Geriatric Research Education and Clinical Center, Cleveland Veterans Affairs Medical Center, Cleveland, Ohio, United States of America, 2 Division of Infectious Diseases
and HIV Medicine, Department of Medicine, Case Western Reserve University, Cleveland, Ohio, United States of America, 3 Research Service, Cleveland Veterans Affairs
Medical Center, Cleveland, Ohio, United States of America
Abstract
Background: The intestinal microbiota protect the host against enteric pathogens through a defense mechanism termedcolonization resistance. Antibiotics excreted into the intestinal tract may disrupt colonization resistance and alter normalmetabolic functions of the microbiota. We used a mouse model to test the hypothesis that alterations in levels of bacterialmetabolites in fecal specimens could provide useful biomarkers indicating disrupted or intact colonization resistance afterantibiotic treatment.
Methods: To assess in vivo colonization resistance, mice were challenged with oral vancomycin-resistant Enterococcus orClostridium difficile spores at varying time points after treatment with the lincosamide antibiotic clindamycin. For concurrentgroups of antibiotic-treated mice, stool samples were analyzed using quantitative real-time polymerase chain reaction toassess changes in the microbiota and using non-targeted metabolic profiling. To assess whether the findings wereapplicable to another antibiotic class that suppresses intestinal anaerobes, similar experiments were conducted withpiperacillin/tazobactam.
Results: Colonization resistance began to recover within 5 days and was intact by 12 days after clindamycin treatment,coinciding with the recovery bacteria from the families Lachnospiraceae and Ruminococcaceae, both part of the phylumFirmicutes. Clindamycin treatment caused marked changes in metabolites present in fecal specimens. Of 484 compoundsanalyzed, 146 (30%) exhibited a significant increase or decrease in concentration during clindamycin treatment followed byrecovery to baseline that coincided with restoration of in vivo colonization resistance. Identified as potential biomarkers ofcolonization resistance, these compounds included intermediates in carbohydrate or protein metabolism that increased(pentitols, gamma-glutamyl amino acids and inositol metabolites) or decreased (pentoses, dipeptides) with clindamycintreatment. Piperacillin/tazobactam treatment caused similar alterations in the intestinal microbiota and fecal metabolites.
Conclusions: Recovery of colonization resistance after antibiotic treatment coincided with restoration of several fecalbacterial metabolites. These metabolites could provide useful biomarkers indicating intact or disrupted colonizationresistance during and after antibiotic treatment.
Citation: Jump RLP, Polinkovsky A, Hurless K, Sitzlar B, Eckart K, et al. (2014) Metabolomics Analysis Identifies Intestinal Microbiota-Derived Biomarkers ofColonization Resistance in Clindamycin-Treated Mice. PLoS ONE 9(7): e101267. doi:10.1371/journal.pone.0101267
Editor: Daniel Paredes-Sabja, Universidad Andres Bello, Chile
Received November 19, 2013; Accepted June 4, 2014; Published July 2, 2014
This is an open-access article, free of all copyright, and may be freely reproduced, distributed, transmitted, modified, built upon, or otherwise used by anyone forany lawful purpose. The work is made available under the Creative Commons CC0 public domain dedication.
Funding: RLPJ gratefully acknowledges the T. Franklin Williams Scholarship with funding provided by Atlantic Philanthropies, Inc.; the John A. HartfordFoundation, the Association of Specialty Professors, the Infectious Diseases Society of America and the National Foundation for Infectious Diseases. This work wassupported by the National Institutes of Health (R03-AG040722 to RLPJ), by the Veterans Affairs Merit Review Program (CJD), by an unrestricted grant from theSTERIS Corporation for Infectious Diseases Research Support for Investigators (RLPJ) and the Veterans Integrated Service Network 10 Geriatric Research Educationand Clinical Center (VISN 10 GRECC; RLPJ, BS, CJD). The funders had no role in study design, data collection and analysis, decision to publish, or preparation of themanuscript.
Competing Interests: Atlantic Philanthropies, Inc., and STERIS Corporation provided funding towards this study. There are no patents, products in developmentor marketed products to declare. This does not alter the authors’ adherence to all the PLOS ONE policies on sharing data and materials.
* Email: [email protected]
Introduction
The gastrointestinal tract of adult mammals is inhabited by a
complex microbial community that includes hundreds of distinct
bacterial species [1–3]. The intestinal microbiota can be classified
into 4 principal phyla: Firmicutes and Actinobacteria (Gram-positive)
and Bacteroidetes and Proteobacteria (Gram-negative), with Firmucutes
and Bacteroidetes typically being dominant in healthy mammals [4].
The microbiota complement host physiology by providing a rich
array of metabolic functions that benefit the host [5]. Key
functions provided by intestinal microorganisms include bile salt
metabolism, synthesis of vitamins, digestion and fermentation of
otherwise non-digestible polysaccharides and proteins, and stim-
ulation of immune function [1,5].
PLOS ONE | www.plosone.org 1 July 2014 | Volume 9 | Issue 7 | e101267

The indigenous microbiota of the colon also provide a critical
host defense by inhibiting growth of potentially pathogenic
microorganisms. This defense mechanism, termed colonization
resistance, can be applied to prevention of colonization by
exogenously introduced organisms and to prevention of over-
growth of resident bacteria usually present in low numbers [5,6].
Antibiotics excreted into the intestinal tract may disrupt coloni-
zation resistance, leaving the host vulnerable to infection with
pathogens such as Clostridium difficile and vancomycin-resistant
enterococci (VRE) [7,8]. Although the organisms that establish
and maintain colonization resistance are not known, several recent
studies have identified specific bacterial species or combinations of
species that may be involved. In antibiotic-treated mice, partial
restoration of colonization resistance to Clostridium difficile and VRE
was attained through administration of isolates from the bacterial
families Lachnospiraceae (phylum Firmucutes, clostridial cluster XIVa)
[9] and Barnsiella (phylum Bacteroidetes) [10], respectively. Lawley et
al. demonstrated that a mixture of six phylogenetically diverse
intestinal bacteria restored colonization resistance to C. difficile in
mice, suggesting that synergistic action of multiple organisms
might be required [11].
Although many studies have examined antibiotic-induced
changes in the intestinal microbiota, limited information is
available on the effect of antibiotic treatment on bacterial
metabolites. Some studies have suggested that levels of short
chain fatty acids produced by bacterial metabolism could be an
indicator or mediator of colonization resistance [11,12]. However,
it is not known if specific profiles of bacterial metabolites are
associated with intact colonization resistance. Here, we used a
mouse model to test the hypothesis alterations in levels of bacterial
metabolites in fecal specimens could provide useful biomarkers
indicating disrupted or intact colonization resistance after antibi-
Table 1. 16S Ribosomal RNA probes used for quantitative real-time polymerase chain reaction to quantify changes in componentsof the fecal microbiota during and after treatment with clindamycin.
Bacterial TargetFamilya
Bacterial Target Genus &Speciesa Primer Name Sequence (59 R 39) Standard Reference
Bacteroidaceae,Prevotellaceae
Bacteroides spp. Uni331F TCCTACGGGAGGCAGCAGT Bacteroides fragilis [17]
Bac708R CAATCGGAGTTCTTCGTG [18]
Enterobacteriaceae Enterobacter spp. Eco1457F CATTGACGTTACCCGCAGAAGAAGC
Escherichia coli [19]
Eco1652R CTCTACGAGACTCAAGCTTGC [19]
Ruminococcaceae Ruminococcus,Faecalibacterium,Ethanoligenes spp. andClostridiales leptum subgroup
sg-Clept-F GCACAAGCAGTGGAGT Clotridium leptum [20]
sg-Clept-R CTTCCTCCGTTTTGTCAA [20]
Lachnospiraceae Blautia, Pseudobutyrivibrio,Roseburia spp. andClostridiales coccoides group
Erec482R GCTTCTTAGTCARGTACCG Ruminoccus torques probeBasepB-00963 [22]
Eub338F ACTCCTACGGGAGGCAGC probeBasepB-00159 [22]
Desulfovibrio-naeceae Desulfovibro spp. g-desulf-F GGTACCTTCAAAGGAAGCAC Desulfovibriodesulfuricans
[16]
g-desulf-R GGGATTTCACCCCTGACTTA [16]
Enterococcaceae Enterococcus spp. g-enter-F CCCTTATTGTTAGTTGCCATCATT Enterococcus faecium [16]
g-enter-R ACTCGTTGTACTTCCCATTGT [16]
Veillonellaceae Veillonella spp. g-veill-F A(C/T)CAACCTGCCCTTCAGA Veillonella parvula [16]
g-veill-R CGTCCCGATTAACAGAGCTT [16]
Prevotellaceae Prevotella spp. CFB286F GTAGGGGTTCTGAGAGGA Prevotella oris probeBasepB-00045 [22]
CFB719R AGCTGCCTTCGCAATCGG probeBasepB-00047 [22]
Lactobacillaceae,Planococcaceae
Lactobacillus spp. Uni331F TCCTACGGGAGGCAGCAGT Lactobacillusacidophilus
[17]
Lacto371R TGGAAGATTCCCTACTGC probeBasepB-00195 [22]
Bifidobacteriaceae Bifidobacterium spp. Bif551F CGCGTCYGGTGTGAAAG Bifidobacterium spp [21]
Bif794R CCCCACATCCAGCATCCA [21]
Eubacteria Total bacteria 515F GTGCCAGCAGCCGCGGTAA B. fragilis &E. coli
[50]
685R TCTACGCATTTCACCGCTAC
aas determined using TestProbe from SILVA-ARB (www.silva-arb.de) [23].doi:10.1371/journal.pone.0101267.t001
Biomarkers of Colonization Resistance
PLOS ONE | www.plosone.org 2 July 2014 | Volume 9 | Issue 7 | e101267

otic treatment. After treatment with the lincosamide antibiotic
clindamycin, the timing of recovery of in vivo colonization
resistance was determined by challenging mice with C. difficile
spores or VRE. Non-targeted metabolic profiling by gas
chromatograph (GC)/mass spectrometry (MS) and ultra-high
performance liquid chromatography-tandem MS (UPLC-MS/
MS) to identify fecal metabolites associated with disrupted versus
intact colonization resistance and quantitative real-time PCR
(qPCR) was performed to evaluate concurrent changes in the
microbiota. To assess whether the findings were applicable to
another antibiotic class that suppresses intestinal anaerobes,
similar experiments were conducted with the beta-lactam/beta-
lactamase inhibitor antibiotic piperacillin/tazobactam.
Materials and Methods
Ethics StatementThe Animal Care Committee of the Cleveland Veterans Affairs
Medical Center approved the study protocol. The VRE test strain
was isolated from a patient at the Cleveland VA Medical Center.
The Institutional Review Board of the Cleveland VA Medical
Center approved the study protocol for collection of the isolate.
Informed consent was not obtained because the isolate was
cultured from clinical samples with no collection of patient
identifiers or interaction with the subject.
Bacterial StrainsE. faecium C68 is a clinical VanB VRE isolate that has been used
in previous mouse colonization studies [7]. For C68, the minimum
inhibitory concentrations (MICs) of clindamycin and piperacillin/
tazobactam are .10,000 mg/mL and 1,250 mg/mL, respectively
[7]. VA17 is an epidemic North American pulsed-field gel
electrophoresis type 1 (NAP1) C. difficile strain. For VA17, the
MICs of clindamycin and piperacillin/tazobactam are 128 mg/mL
and 2 mg/mL, respectively [8]. C. difficile spores were prepared as
previously described [13].
In vivo Mouse Model of Colonization ResistanceWe used a mouse model we described previously to evaluate
recovery of colonization resistance after antibacterial treatment
[7]; in this model, mice do not develop weight loss or other overt
evidence of illness due to antibiotic treatment or colonization by
pathogens, including toxigenic C. difficile. Female CF-1 mice
weighing 25 to 30 g (Harlan Sprague-Dawley, Indianapolis, IN)
were housed in individual micro-isolator cages. Mice received
daily subcutaneous injections (0.2-mL total volume) of saline,
clindamycin (1.4 mg/day) for 3 days. The antibiotic dose was
equal to the usual human doses administered over a 24-hour
period (milligrams of antibiotic per gram of body weight). To
assess in vivo colonization resistance, mice were challenged with 104
colony-forming units (CFU) of VRE C68 or C. difficile VA17 spores
by orogastric gavage before and 1, 5, and 12 days after completion
of antibiotic treatment (3 saline controls and 6 clindamycin-treated
mice per group were included for each time point). Fresh stool
specimens were collected 2 and 4 days after gavage and the
concentration of pathogens was measured by plating serially
diluted samples on selective agar as previously described [7]. Pre-
reduced cycloserine-cefoxitin-brucella agar containing 0.1%
taurocholic acid and lysozyme 5 mg/mL (CDBA) [13] and
Enterococcosel agar (Becton Dickinson, Sparks, MD) containing
20 mg/mL of vancomycin were used as selective media for C.
difficile and VRE, respectively. Colonization resistance was deemed
intact at a given time point if there was no significant increase in
concentrations of the pathogens in the stool of antibiotic-treated
mice at 4 days post-challenge in comparison to the control mice.
The experiments were performed in duplicate.
Measurement of Antibiotic Concentrations in FecesMice were given clindamycin as described above. The
concentration of the antibiotics in stool specimens collected on
day 3 of antibiotic treatment was measured using an agar well
diffusion assay with Clostridium perfringens as the indicator strain
[14].
Microbiota AnalysisFecal specimens were collected from mice given clindamycin
(n = 6) or saline (n = 3), as described above, at 1, 5, 8, 12 and 21
days after the final antibiotic dose for analysis of the intestinal
microbiota and stool metabolites. qPCR was performed using the
methods of Louie et al. [15]. The primers used and their bacterial
targets are shown in Table 1 [15–22]. Fecal specimens were frozen
at 280uC prior to analysis. Fecal bacterial DNA was extracted
from 100 mg of feces using the QIAmp DNA Stool Mini Kit
(Qiagen, Hilden, Germany) according to the manufacturer’s
instructions. DNA was eluted from the columns with 200 mL of
Figure 1. Recovery of in vivo colonization resistance over timein clindamycin treated animals. Mice (6 per group at each timepoint) were challenged with 104 colony-forming units of toxigenicClostridium difficile spores (A) or vancomycin-resistant Enterococci (VRE)(B) by orogastric gavage either before treatment or 1, 5, or 12 daysfollowing treatment with 3 days of daily subcutaneous clindamycin.Concentrations of the pathogens in feces were measured byquantitative cultures 2 days (black bars) and 4 days (white bars)following pathogen challenge. ** p,0.01 compared to other timepoints. Error bars represent standard error. Results are shown for 1 of 2duplicate experiments.doi:10.1371/journal.pone.0101267.g001
Biomarkers of Colonization Resistance
PLOS ONE | www.plosone.org 3 July 2014 | Volume 9 | Issue 7 | e101267
Biomarkers of Colonization Resistance
PLOS ONE | www.plosone.org 4 July 2014 | Volume 9 | Issue 7 | e101267

nuclease-free ultrapure molecular biology grade water. The
concentration of bacterial DNA in nanograms per mL was
measured using the Qubit 2.0 Fluorometer (Life Technologies,
Carlsbad, CA).
Bacterial targets for each primer set were determined in silico
using using TestProbe from SILVA-ARB (www.silva-arb.de) [23].
The results for each primer set were concatenated using R to
identify amplicons from known bacterial species [24]. Sequences
representing 1% or more of the amplicons are in shown in Table
S1 and form the basis for the Bacterial Target columns in Table 1.
The specificity of the primers for DNA obtained from bacteria
used for standards was assessed using the methods of Louie et al.
[15]. Reference strains are shown in Table 1. Purified template
DNA from the reference strains was used for melting curve
analysis and to generate standard curves for each primer set using
10-fold serial dilutions of DNA ranging from 10 to 1026 ng. The
optimum annealing temperature and specificity of each primer set
was determined using a Mastercycler pro (Eppendorf, Hamburg,
Germany) and 2X PCR Master Mix (Promega, Fitchburg, WI)
with gradient. qPCR was performed using the CFX96 detection
system (Biorad, Hercules, CA). Amplification and detection were
conducted in 96-well plates with SYBR Green 26 qPCR Master
Mix (BioRad). Each sample was run in triplicate in a final volume
of 20 ml containing a final concentration of 0.3 mM of each primer
and 5 mL of template DNA using the following parameters: 1 cycle
at 94uC for 5 minutes, followed by 49 cycles at 94uC for 20
seconds, 56uC–58uC for 20 seconds, and 72uC for 20 seconds.
To evaluate the correlation between qPCR and culture, fresh
fecal specimens collected at the same time points were used for
quantitative culture of enterococci. The specimens were emulsified
in 5-fold (weight/volume) pre-reduced phosphate buffered saline.
Serially diluted aliquots were inoculated onto Enterococcosel agar.
Plates were incubated at 37uC for 48 hours and CFU per gram of
stool were calculated.
Fecal Metabolite AnalysisAnalysis of metabolic compounds in fecal specimens was
conducted by Metabolon (Durham, NC) using methods described
previously [25–27]. Fecal samples underwent a methanol extrac-
tion under vigorous shaking for 2 min (Glen Mills Genogrinder
2000) to remove the protein fraction while maximizing recovery of
small molecules. The resulting extract was divided into fractions
for analysis using GC/MS, UPLC-MS/MS (positive mode), and
UPLC-MS/MS (negative mode).
The UPLC-MS/MS platform utilized an Acquity UPLC
(Waters, Milford, CA) with Waters UPLC BEH C18-
2.16100 mm, 1.7 mm columns and a ThermoFisher LTQ mass
spectrometer, which included an electrospray ionization source
and a linear ion-trap mass analyzer. The instrumentation was set
to monitor for positive ions in acidic extracts or negative ions in
basic extracts through independent injections. The instrument was
set to scan 99–1000 m/z and alternated between MS and MS/MS
scans. Samples destined for analysis by GC-MS were dried under
vacuum desiccation for a minimum of 18 hours prior to being
derivatized using bis(trimethylsilyl)trifluoroacetamide. Derivatized
samples were separated on a 5% phenyldimethyl silicone column
with helium as carrier gas and a temperature ramp from 60u to
340uC within a 17-min period. All samples were analyzed on a
Thermo-Finnigan Trace DSQ fast-scanning single-quadrupole
MS operated at unit mass resolving power with electron impact
ionization and a 50–750 atomic mass unit scan range.
Metabolites were identified by automated comparison of the ion
features in the experimental samples to a reference library of
chemical standard entries that included retention time, molecular
weight (m/z), preferred adducts, and in-source fragments as well as
associated MS spectra and curated by visual inspection for quality
control using software developed at Metabolon [26]. Identification
of known chemical entities was based on comparison to
metabolomic library entries of more than 2,400 purified standards.
Peaks were quantified using area-under-the-curve. Raw area
counts for each metabolite in each sample were normalized to
correct for variation resulting from instrument inter-day tuning
differences by the median value for each run-day, therefore,
setting the medians to 1.0 for each run. This preserved variation
between samples but allowed metabolites of widely different raw
peak areas to be compared on a similar graphical scale. Missing
values were imputed with the observed minimum after normal-
ization.
Evaluation of Colonization Resistance, Fecal Microbiota,and Fecal Metabolites in Mice Treated with Piperacillin/Tazobactam
To assess the applicability of the findings for clindamycin to
another antibiotic class, similar experiments were conducted with
the beta-lactam/beta-lactamase inhibitor antibiotic piperacillin/
tazobactam. Piperacillin/tazobactam suppresses anaerobic intesti-
nal microbiota in a manner similar to clindamycin with disruption
of colonization resistance, but also suppresses indigenous entero-
cocci and facultative gram-negative bacilli [7–8]. The in vivo
colonization resistance experiments were identical to the clinda-
mycin experiments with the following exceptions: 3 mice were
used for the experimental and control groups at each time point
testing recovery of colonization resistance and 4 mice for testing
changes in the fecal microbiota and metabolites. The dose of
piperacillin/tazobactam was 8 mg/day daily for 3 days. The fecal
microbiota analysis and the fecal metabolite analysis conducted by
Metabolon was the same as previously described for the
clindamycin-treated mice. The library used by Metabolon for
the analysis of pipericilln/tazobactam-treated animals differed
slightly from the one used for the clindamycin-treated mice and
did not include N-acetyl-isoleucine or gamma-glutamylglutmate.
Data AnalysisAnalysis of variance (ANOVA) with repeated measures was
used to compare quantities of exogenous bacteria recovered from
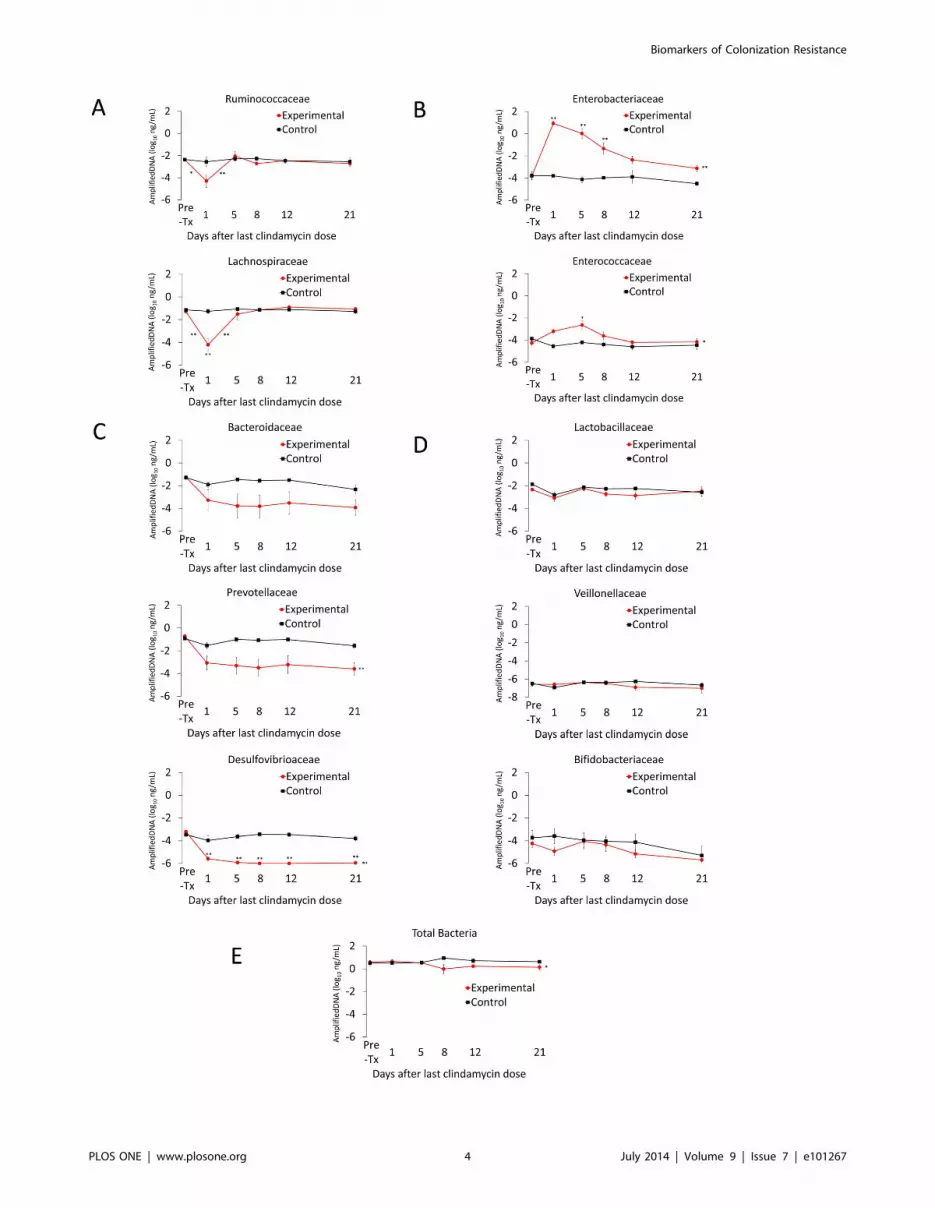
Figure 2. Recovery of the fecal microbiota over time in clindamycin treated animals. Microbiota analysis was performed in conjunctionwith 1 of the 2 colonization resistance experiments. Mice received subcutaneous clindamycin (n = 6) or normal saline (n = 3) for 3 days. Quantitativereal-time PCR was used to measure fecal bacterial DNA in fecal specimens collected either before treatment or 1, 5, 8, 12, or 21 days followingtreatment. The y-axis shows the quantity of amplified DNA detected per 1 ng of template DNA. The bacterial families with mouse fecal microbiotashowed 4 distinct response patterns following clindamycin exposure: (A) decrease followed by a rapid normalization, (B) increase with slownormalization, (C) sustained decrease and (D) no difference compared to controls. Red circles, mean values for clindamycin-treated mice. Blacksquares, mean values for control mice. * p,0.05 and ** p,0.001. Symbols adjacent to the line indicate statistically significant differences betweenconsecutive time points. Symbols adjacent to circles indicate statistically significant differences between the experimental and control groups for thatindividual time point. Symbols after the terminal point of the lines on a graph indicate statistically significant differences between experimental andcontrol groups independent of individual time points. Error bars represent standard error.doi:10.1371/journal.pone.0101267.g002
Biomarkers of Colonization Resistance
PLOS ONE | www.plosone.org 5 July 2014 | Volume 9 | Issue 7 | e101267

Biomarkers of Colonization Resistance
PLOS ONE | www.plosone.org 6 July 2014 | Volume 9 | Issue 7 | e101267

stool and quantities of DNA from bacterial families for control
versus antibiotic-treated mice. For the metabolite analysis,
ANOVA with repeated measures was performed after log
transformation to identify compounds that differed significantly
between control and antibiotic groups. Welch’s two-sample t-test
was used for comparison of the pretreatment groups.
Compounds that differed between antibiotic-treated and control
mice were identified as potential biomarkers of colonization
resistance if the timing of recovery of the compound to baseline
levels correlated closely with the timing of recovery of in vivo
colonization resistance (i.e., normalization or substantial return
toward baseline within 8 days after the final clindamycin dose).
Given the large number of comparisons performed in metabo-
lomic discovery studies, it is anticipated that some compounds will
show significant differences by random chance. Accordingly, a q-
value was used to estimate the false discovery rate [28].
Furthermore, compounds identified as potential biomarkers of
colonization resistance were selected for more detailed analysis in
the context of other lines of evidence including the Kyoto
Encyclopedia of Genes and Genomes (KEGG) database [29] or
the Human Metabolome Database [30]. The fold change in the
concentrations of the compounds determined to be of importance
in distinguishing antibiotic-treated versus control mice in compar-
ison to the baseline levels were graphed over time. Statistical
analyses were performed using R [24].
Results
Restoration of in vivo Colonization Resistance AfterClindamycin Treatment
Figure 1 shows the results of the assessment of in vivo
colonization resistance for 1 of the 2 sets of experiments (similar
results were obtained for each set of experiments). In the absence
of clindamycin treatment, all baseline and untreated control mice
demonstrated intact colonization resistance with either undetect-
able or only low levels of the pathogens in stool. Clindamycin-
treated mice challenged with the pathogens 1 day after the final
antibiotic dose developed high-density colonization that remained
Figure 3. Changes in levels of fecal metabolites of clindamycin-treated mice compared to saline controls for selected compoundsthat exhibited a sustained increase or decrease after clindamycin treatment. Compounds from pathways related to metabolism of (A)creatinine, (B) bile salts, (C) phytoestrogens, (D) N-acetylated amino acids and (E) short-chain fatty acids. Results from experimental mice are shownon the left and from control animals on the right. Metabolites measured in the experimental group are the significantly different (p#0.05) from thepre-treatment levels at least through day 8 after the final clindamycin dose for all compounds except N-acetyl-aspartate (p#0.10 at days 5, 8; p#0.5all other times). Error bars represent standard error.doi:10.1371/journal.pone.0101267.g003
Figure 4. Changes in levels of fecal metabolites of 4- and 5-carbon sugars and alcohols in clindamycin-treated mice compared tosaline controls. Compounds from pathways related to metabolism of 4- and 5-carbon (A) alcohols and (B) sugars. Results from experimental miceare shown on the left and from control animals on the right. Metabolites measured in the experimental group are the significantly different (p#0.05)from the pre-treatment levels through day 1 (arabitol, xylulose), day 5 (ribitol, xylitol, arabinose, ribulose, xylose) day 8 (erythirol) or day 12 (threitol,ribose). Error bars represent standard error.doi:10.1371/journal.pone.0101267.g004
Biomarkers of Colonization Resistance
PLOS ONE | www.plosone.org 7 July 2014 | Volume 9 | Issue 7 | e101267

elevated 4 days later. By 5 days after the final clindamycin dose,
mice demonstrated partially restored colonization resistance to
both pathogens. By 12 days following clindamycin exposure, the
concentrations of C. difficile and VRE in stool did not differ from
the concentrations in untreated mice, indicating restored coloni-
zation resistance. The mean concentration of clindamycin in fecal
specimens on day 3 of treatment was 55.9 mg/g (range, 21.2 to
132.2).
Figure 5. Changes in levels of fecal metabolites of clindamycin-treated mice compared to saline controls for selected compoundsthat increased or decreased in concentration during clindamycin treatment followed by normalization or substantial return towardbaseline within 8 days. Compounds from pathways related to metabolism of (A) dipeptides, (B) inositol isomers and metabolites and (C) gamma-glutamyl amino acids. Results from experimental mice are shown on the left and from control animals on the right. Methyl-chiro-inositol uses theright axis. Metabolites measured in the experimental group are the significantly different (p#0.05) from the pre-treatment levels through day 1(pyroglutamylglutamine, gamma-glutamylleucine, gamma-glutamylvaline, gamma-glutamylphenylalanine, gamma-glutamyltyrosine), day 5 (proline-hydroxy-proline, myo-inositol, gamma-glutamylglutamate), and day 8 (chiro-inositol, methyl-chiro-inositol, gamma-glutamylmethionine) exceptgamma-glutamylisoleucine (p#0.10 through day 8). Error bars represent standard error.doi:10.1371/journal.pone.0101267.g005
Biomarkers of Colonization Resistance
PLOS ONE | www.plosone.org 8 July 2014 | Volume 9 | Issue 7 | e101267

Correlation of Changes in the Intestinal Microbiota within vivo Colonization Resistance
Figure 2 shows the results of qPCR analysis of changes in the
microbiota during and after clindamycin treatment. Four distinct
response patterns were demonstrated. First, fecal bacterial DNA
from the families Ruminococcaceae and Lachnospiraceae decreased by
1.5 to 3 logs during clindamycin administration with a prompt
return to baseline concentrations by 5 days following completion
of antibiotics, coinciding with partical recovery of in vivo
colonization resistance. Second, fecal bacterial DNA from the
families Enterobacteriaceae and Enterococcaceae increased significantly
during clindamycin treatment and decreased to or approached the
pre-treatment baseline by days 8 to 12 following the final dose of
clindamycin, corresponding with recovery of in vivo colonization
resistance. Third, fecal bacterial DNA from the families Bacteroi-
daceae, Prevotellaceae, and Desulfovibrioaceae decreased by $ 2 logs
during clindamycin administration and failed to recover during
the course of the experiment. Finally, concentrations of fecal
bacterial DNA from the families Lactobacilliaceae, Veionellaceae and
Figure 6. Changes in fecal levels of compounds related to tryptophan metabolism in clindamycin-treated mice compared to controlanimals. (A) A schematic representation of mammalian metabolism of dietary tryptophan. Biochemical pathways specific to the host are indicated indashed lines and to the microbiota in solid lines. Fecal levels of compounds with metabolic pathways dependent, at least in part, on the gutmicrobiota (B) or solely on the host (C). Results from experimental mice are shown on the left and from control animals on the right. Metabolitesmeasured in the experimental group are the significantly different (p#0.05) from the pre-treatment levels through day 1 (indolepropionate,kyurenate), at day 5 (indolelactate) or days 5 – 21 (N-acetyletryptophan). Error bars represent standard error.doi:10.1371/journal.pone.0101267.g006
Biomarkers of Colonization Resistance
PLOS ONE | www.plosone.org 9 July 2014 | Volume 9 | Issue 7 | e101267

Bifidobacteriaceae were largely unaffected by clindamycin. Quanti-
tative cultures for enterococci correlated well with the qPCR
results. The fecal concentration of enterococci increased during
clindamycin treatment, decreased by day 8 after the last dose of
clindamycin and approached the pre-treatment baseline by day 19
(data not shown).
Correlation of Fecal Metabolites with in vivo ColonizationResistance
Four hundred-eighty four compounds were identified in the
fecal samples. Table S2 shows the metabolites analyzed and the
effect of clindamycin treatment expressed as a ratio the
metabolites detected in the fecal material of treated animals vs.
control animals at each time point. Three patterns of response to
clindamycin treatment were observed. First, 144 (30%) com-
pounds did not change in concentration in comparison to controls.
Second, in clindamycin-treated mice, 24 (5%) compounds
exhibited a sustained change compared to controls. Third, 146
(30%) of the compounds demonstrated an initial change during
clindamycin treatment followed by a substantial return toward
baseline within 8 days after the final clindamycin dose. The
remaining compounds showed a variable response to clindamycin
treatment (146; 30%) or were different from controls at baseline
(24; 5%).
For the second response pattern, 14 (3%) compounds showed a
sustained increase and 10 (2%) showed a sustained decrease in
experimental vs. control animals. Specifically, increases in creatine
and creatinine levels following clindamycin treatment persisted
throughout the study period (Figure 3A), consistent with findings
that several members of the gut microbiota metabolize these
compounds [31]. Furthermore, clindamycin-treatment corre-
sponded with an increase taurocholate and tauroursodeoxycho-
late, primary bile acids formed in the liver, and with a decrease in
6-beta-hydroxylithocholate, a secondary bile acid produced
through bacterial metabolism of primary bile acids (Figure 3B).
The levels of these compounds did not return to their respective
baseline levels during the study period. Similarly, enterolactone
and equol, both products of intestinal bacterial metabolism of
phytoestrogens [32], declined following clindamycin treatment;
these changes persisted until after recovery of in vivo colonization
resistance (Figure 3C). Furthermore, while three N-acetylated
amino acids (methionine, leucine, and isoleucine) increased, N-
acetyl-aspartate decreased significantly with clindamycin treat-
ment. None of these amino acids returned to baseline by the end of
the study period (Figure 3D). Finally, we also examined changes
in the short-chain fatty acids (SCFAs) which are produced in the
colon through bacterial fermentation of dietary fiber. Fecal levels
of valerate and isolvalerate decreased during clindaymycin
treatment and failed to normalize during the study period
(Figure 3E). These compounds were not identified as potential
biomarkers or mediators of colonization resistance based upon the
absence of correlation with recovery of in vivo colonization
resistance.
In the third pattern of response, 146 (30%) compounds
increased or decreased in concentration during clindamycin
treatment followed by normalization or substantial return toward
baseline within 8 days after the final clindamycin dose. These
compounds, of which 100 (21%) increased and 46 (10%)
decreased, are potential biomarkers of colonization resistance
based upon the correlation between their recovery and the
recovery of in vitro colonization resistance. The magnitude of the
change or the ability to group compounds into metabolic sub-
pathways in which multiple compounds demonstrated similar
changes determined which potential biomarkers were selected for
further description below.
4- and 5-Carbon Sugar Alcohols and CorrespondingSugars
Pentitols (i.e., ribitol, arabitol, xylitol) are 5-carbon sugar
alcohols present in many fruits and vegetables. Pentitols and other
sugar alcohols are not well absorbed in the small intestine and are
metabolized to pentoses by the intestinal microbiota [33]. In
addition, mammalian metabolic pathways may convert pentoses to
pentitols [34]. The concentration of both 5-carbon (arabitol,
ribitol, xylitol) and 4-carbon sugar alcohols (erythritol, threitol)
increased significantly during clindamycin treatment, while the
concentration of the corresponding pentoses (arabinose, xylose,
xylulose, ribose and ribulose) decreased (Figure 4). The
concentrations of pentitols decreased to baseline by 8-12 days
after the final dose of clindamycin, whereas the concentrations of
pentoses remained lower than baseline levels for the duration of
the experiment.
DipeptidesOf 124 dipeptides analyzed, 79 (64%) had significantly
increased concentrations in clindamycin-treated mice versus
Figure 7. Recovery of in vivo colonization resistance over timein piperacillin/tazobactam treated animals. Mice (3–6 per groupat each time point) were challenged with 104 colony-forming units oftoxigenic Clostridium difficile spores (A) or vancomycin-resistantEnterococci (VRE) (B) by orogastric gavage either before treatment or1, 5, or 12 days following treatment with 3 days of daily subcutaneouspiperacillin/tazobactam. Concentrations of the pathogens in feces weremeasured by quantitative cultures 2 days (black bars) and 4 days (whitebars) following pathogen challenge. Error bars represent standard error.doi:10.1371/journal.pone.0101267.g007
Biomarkers of Colonization Resistance
PLOS ONE | www.plosone.org 10 July 2014 | Volume 9 | Issue 7 | e101267

Biomarkers of Colonization Resistance
PLOS ONE | www.plosone.org 11 July 2014 | Volume 9 | Issue 7 | e101267

controls at one or more time points. However, many of the
dipeptides exhibited either persistent or transient increases that did
not coincide with the timing of disruption of colonization
resistance. Two dipeptides (proline-hydroxy-proline and pyroglu-
tamylglutamine) were identified as potential biomarkers of
colonization resistance to be evaluated in future studies based on
the magnitude (9–12 fold increase over pre-clindamycin treatment
concentrations) and timing of the increase associated with
clindamycin treatment (Figure 5A). Proline-hydroxy-proline is a
dipeptide present in collagen and other connective tissue proteins.
Inositol MetabolitesInositol is a cyclohexane with several isomers, including myo-
inositol and chiro-inositol, present in a variety of foods including
fruits, grains, and nuts. Myo-inositol is a carbohydrate component
of the structural lipids phosphatidylinositol phosphates (PIPs) and,
in mammals, may be synthesized from glucose. Myo-inositol, chiro-
inositol and especially methyl-chiro-inositol (D-pinitol) levels
increased markedly during clindamycin treatment, peaking at 5
days after the final clindamycin dose with a rapid decline that
coincided with recovery of in vivo colonization resistance
(Figure 5B).
Gamma-Glutamyl Amino AcidsThe gamma-glutamyl amino acids are produced when gamma-
glutamyl transpeptidase (GGT) catalyzes the transfer of the
gamma-glutamyl moiety of glutathione to amino acids. GGT is
present in several mammalian tissues, most notably the liver, and
in several bacterial species, as determined using inhibition assays
or searches for gene homologes [29,35]. Several gamma-glutamyl
amino acids increased 5 to 19 fold during clindamycin treatment
and rapidly declined approaching baseline by day 5 to 8 after the
final dose of clindamycin (Figure 5C).
Tryptophan MetabolismThe intestinal microbiota synthesize several compounds from
tryptophan, an essential amino acid that mammals must absorb
from their diet [36]. Tryptophanase produced by enteric bacteria
metabolizes tryptophan to indole, with subsequent conversion by
other bacterial enzymes to indole-3-proprionic acid (IPA)
(Figure 6A) [36]. Enteric bacteria also metabolize tryptophan to
L-kynurenine which host enzymes convert to xanthurenate and
kynurenate. Intestinal anaerobes also convert indole to indole
acetate [37]. In germ-free mice, a number of tryptophan
metabolites have been shown to be significantly reduced in serum
in comparison to conventional control mice [36]. As shown in
Figure 6B, indole-3-propionate, indole acetate, xanthurenate,
and kynurenate, all indole metabolites produced by bacteria,
decreased during clindamycin treatment and normalized 5–8 days
after the final dose of clindamycin. Synthesis of indole lactate and
N-acetyltryptophan from tryptophan relies upon host enzymes for
which there are no known bacterial counterparts among the gut
microbiome. Levels of these compounds rose 2–3 fold in
experimental versus control mice on day 5 following completion
of clindamycin exposure (Figure 6C), suggesting that in the
absence of a robust gut microbiome, tryptophan metabolism may
be shunted towards pathways that exist only in the host cellular
machinery.
Correlation of Changes in Intestinal Microbiota and FecalMetabolites with Restoration of in vivo ColonizationResistance after Piperacillin/Tazobactam Treatment
Figure 7 shows the results of the assessment of in vivo
colonization resistance following exposure to piperacillin/tazo-
bactam. The mean concentration of piperacillin/tazobactam in
fecal specimens on day 3 of treatment was 31.4 mg/g (range, 2.0 to
90.2). Mice challenged with C. difficile 1 day following completion
of piperacillin/tazobactam did not develop colonization, consis-
tent with the fact that the C. difficile test strain is susceptible to this
agent and low concentrations of piperacillin/tazobactam persist in
cecal contents for up to 3 days after treatment [8]. Challenge with
C. difficile 5 days following treatment resulted in high-density
colonization while challenge 12 days later was consistent with
restored colonization resistance. Mice challenged with VRE 1 or 5
days after discontinuation of treatment developed high-density
colonization, whereas colonization resistance was restored by 12
days after treatment.
Figure 8 shows the results of qPCR analysis of changes in the
microbiota during and after piperacillin/tazobactam treatment.
Total bacterial DNA levels declined during treatment with
piperacillin/tazobactam, consistent with its broad effect on the
gut microbiota (i.e., suppression of indigenous enterococci and
facultative gram-negative bacilli in addition to anaerobes).
Compared to control mice, piperacillin/tazobactam suppressed
fecal bacterial DNA from the family Lachnospiraceae with a return to
baseline concentrations coinciding with recovery of in vivo
colonization resistance. Similar to clindamycin-treated animals,
bacteria from the Families Lactobacillaceae, Veillonellaceae and
Bifidobacteriaceae were largely unaffected by piperacillin/tazobac-
tam treatment.
Piperacillin/tazobactam treatment resulted in patterns of
alteration in fecal metabolites similar to the changes associated
with clindamycin. Figure 9 shows data for several metabolic
compounds that were not considered potential biomarkers of
colonization resistance based upon a sustained increase or
decrease in experimental versus control mice. Figure 10 shows
data for several metabolic compounds that increased or decreased
in concentration during piperacillin/tazobactam treatment fol-
lowed by normalization or substantial return toward baseline
within 6 days after the final antibiotic dose. These compounds
were considered potential biomarkers of colonization resistance
based upon the correlation between their recovery and the
recovery of in vivo colonization resistance to both piperacillin/
tazobactam and clindamycin.
Discussion
Although essential for treatment of infections, antibiotics often
result in unintended adverse consequences due to disruption of the
indigenous microbiota of the host. Consistent with previous studies
[7,8,10], we demonstrated that clindamycin and piperacillin/
tazobactam treatment causes profound alteration of the intestinal
microbiota, with some anaerobic bacterial families failing to
Figure 8. Recovery of the fecal microbiota over time in piperacillin/tazobactam treated animals. Mice received subcutaneouspiperacillin/tazobactam (n = 4) or normal saline (n = 4) for 3 days. Quantitative real-time PCR was used to measure fecal bacterial DNA in fecalspecimens collected either before treatment or 1, 7 or 14 days following treatment. The y-axis shows the quantity of amplified DNA detected per1 ng of template DNA. Red circles, mean values for clindamycin-treated mice. Black squares, mean values for control mice. * p,0.05. Symbols indicatedifferences between the experimental and control groups for individual time points. Error bars represent standard error.doi:10.1371/journal.pone.0101267.g008
Biomarkers of Colonization Resistance
PLOS ONE | www.plosone.org 12 July 2014 | Volume 9 | Issue 7 | e101267

Biomarkers of Colonization Resistance
PLOS ONE | www.plosone.org 13 July 2014 | Volume 9 | Issue 7 | e101267

recover to baseline levels by 21 days after treatment. However, the
rapid restoration of colonization resistance against C. difficile and
VRE by 5 to 12 days after treatment also highlights the resilience
of the microbiota. By correlating the timing of functional recovery
of colonization resistance with changes in concentrations of fecal
metabolites, we identified a number of potential biomarkers that
could provide useful indicators of intact or disrupted colonization
resistance during and after antibiotic treatment. Such biomarkers
could be used to determine the susceptibility of patients to
intestinal colonization by healthcare-associated pathogens includ-
ing C. difficile. This information could be useful to guide infection
prevention efforts and to evaluate the impact of antimicrobials and
probiotics on colonization resistance.
Our findings are consistent with recent evidence that bacteria
from the phylum Firmucutes may play an important role in
colonization resistance. As noted previously, administration of
isolates from the bacterial family Lachnospiraceae (clostridial cluster
XIVa) and a mixture of bacteria including Anaerostipes sp. nov.
(clostridial cluster XIVa) have been shown to be effective in
partially or completely restoring colonization resistance to C.
difficile in mice [9,11]. In hospitalized patients, a reduction in the
abundance of the family Clostridiales (clostridial cluster XI) was
independently associated with increased risk of nosocomial C.
difficile infection [38]. Another study found that patients with C.
difficile infection or nosocomial diarrhea had significant depletion
of bacteria from the Lachnospiraceae and Ruminococcaceae families and
butyrate-producing anaerobic fermenters [39]. Here, we demon-
strated that recovery bacteria from the families Lachnospiraceae and
Ruminococcaceae (phylum Firmicutes, order Clostridiales) corresponded
directly with the timing of recovery of in vivo colonization
resistance. In contrast, bacteria from the families Bacteroidaceae,
Prevotellaceae and Desulfovirionaceae were suppressed by clindamycin
but did not recover to baseline levels within 21 days after the final
clindamycin dose. As has been described previously, concentra-
tions of bacteria from the families Enterococcaceae and Enterobacte-
riaceae increased during clindamycin treatment and decreased to
near baseline levels by 8–12 days after the final day of treatment,
providing potential indicators of colonization resistance recovery
that can be easily measured using standard culture methods [6–
8,10,11,39].
Clindamycin treatment caused marked changes in metabolites
present in fecal specimens. Of 484 compounds measured, 35%
changed significantly in concentration during clindamycin treat-
ment, confirming the involvement of anaerobic intestinal bacteria
in their metabolism. However, many of these compounds
remained significantly higher or lower than their baseline levels
well beyond the recovery of in vivo colonization resistance. For
example, concentrations of the phyotoestrogen metabolites en-
terolactone and equol, the secondary bile salt 6-beta-hydroxy-
lithocholate, the minor SCFAs valerate and isovalerate as well as
an N-acetylated amino acid, aspartate, were suppressed during
clindamycin treatment and remained low. In contrast, the
concentrations of 3 other N-acetylated amino acids, isoleucine,
methionine and valine, increased and remained high for 21 days
after clindamycin treatment. A likely explanation for the
prolonged alteration of these compounds is that their metabolism
is dependent on bacterial species whose levels are altered for a
prolonged period after clindamycin treatment. None of these
compounds were identified as potential biomarkers of mediators of
colonization resistance because changes in their relative concen-
trations did not change with recovery of in vivo colonization
resistance.
We also identified several compounds with marked increase or
decrease in concentration during clindamycin treatment followed
by normalization or substantial return toward baseline within 8
days. The recovery of these compounds and those in closely
related metabolic pathways correlated with recovery of
colonization resistance, identifying them as potential biomarkers
and/or mediators of colonization resistance. Several of these
potential biomarkers were intermediates in carbohydrate or
protein metabolism that increased during clindamycin treatment
(pentitols, gamma-glutamyl amino acids, urea, cadaverine, sac-
charapine, and inositol metabolites or isomers), presumably due to
loss of metabolic digestion by anaerobic microbiota. The increase
in the dipeptides (proline-hydroxy-proline and pyroglutamylgluta-
mine) during clindamycin treatment is notable because previous
studies identified the dipeptide beta-aspartylglycine as a potential
indicator of colonization resistance (i.e., present in feces of germ-
free or antibiotic-treated mice but not in the presence of intact
indigenous microbiota) [40].
Tryptophan metabolites containing indole are a final potential
group of compounds identified as potential biomarkers of
colonization resistance. Indole-3-propionate and kynurenate
decreased significantly during clindamycin treatment with nor-
malization by 5–8 days after treatment. These data are consistent
with recent studies demonstrating that indole-containing metab-
olites derived from tryptophan are significantly reduced in blood of
germ-free mice [36].
The similarity of findings for piperacillin/tazobactam and
clindamycin suggest that the potential biomarkers of colonization
resistance identified will be applicable to multiple classes of
antibiotics. Piperacillin/tazobactam and clindamycin both sup-
presses anaerobic intestinal microbiota and disrupt colonization
resistance [7–8]. Piperacillin/tazobactam also suppresses indige-
nous enterococci and facultative gram-negative bacilli, but these
organisms make up a minor proportion of the total microbiota of
healthy adults and have not been identified as important for
colonization resistance [7–8].
Our finding that antibiotic treatment dramatically alters fecal
metabolites is consistent with other recent studies that examined
the effect of antibiotics on fecal or urinary metabolites using high
resolution 1H nuclear magnetic resonance (NMR) spectroscopic
based profiling [41–44,11,45]. Yap et al. demonstrated that oral
vancomycin treatment resulted in reduced fecal excretion of
amino acids, SCFAs and uracil as well as increased levels of
choline and oligosaccharides [41]. Romick-Rosendale et al.
demonstrated that 8 metabolites changed significantly in fecal
extracts of mice treated with enrofloxacin, including reductions in
SCFAs, decreased amino acids, and increased urea [42]. Swann et
al. demonstrated that penicillin and streptomycin-induced alter-
ation of the intestinal microbiota of rats was associated with
reduced fecal levels of SCFAs, alanine, lactate, methionine, and
Figure 9. Changes in levels of fecal metabolites of piperacillin/tazobactam-treated mice compared to saline controls for selectedcompounds that exhibited a sustained increase or decrease after clindamycin treatment. Compounds from pathways related tometabolism of (A) creatinine, (B) bile salts; (C) phytoestrogens (D) N-acetylated amino acids and (E) short-chain fatty acids. Results from experimentalmice are shown on the left and from control animals on the right. Metabolites measured in the experimental group are the significantly different (p#0.05) from the pre-treatment levels through day 0 (N-acety-valine, N-acetyl-aspartate), day 2 (creatine, creatinine, equol, N-acetyl-methionine, N-acetyl-aspartate), at day 2 (taurocholate,) and days 6 and 12 (6-beta-hydroxylithocholate, valerate). Error bars represent standard error.doi:10.1371/journal.pone.0101267.g009
Biomarkers of Colonization Resistance
PLOS ONE | www.plosone.org 14 July 2014 | Volume 9 | Issue 7 | e101267

Biomarkers of Colonization Resistance
PLOS ONE | www.plosone.org 15 July 2014 | Volume 9 | Issue 7 | e101267

succinate and increased fecal levels of taurine, tryptophan,
asparagine, choline, and oligosaccharides [43]. Using a method-
ology comparable to ours, Theriot et al. reported very similar
metabolite changes associated with the broad-spectrum antibiotic
cefoperazone, including elevation of sugar alcohols and primary
bile acids, and decreases in secondary bile acids and short chain
fatty acids [44]. Moreover, it was demonstrated that C. difficile was
able to exploit these antibiotic-induced metabolic changes to
colonize the intestinal tract, including use of the primary bile acid
taurocholate for germination and sugar alcohols and other carbon
sources for growth [44]. Similarly, Ng et al. demonstrated that
antibiotic treatment increased levels of free sialic acid in mice,
providing a potential source of nutritional support for C. difficile
[45]. Finally, Lawley et al. have also demonstrated that clindamy-
cin-induced disruption of colonization resistance was associated
with reduction in SCFAs [11].
Our study has some limitations. First, the in vivo colonization
resistance assessment included only one strain each of VRE and C.
difficile. However, our findings are consistent with previous studies
in which it was demonstrated that recovery of colonization
resistance occurred within days after discontinuation of clindamy-
cin or other antibiotics, including for toxigenic C. difficile strains
[7,8,10]. Second, in our mouse model of colonization resistance,
mice become colonized with high concentrations of toxigenic C.
difficile without developing signs of illness or mortality. Thus, we
cannot exclude the possibility that the metabolic changes do not
reflect changes associated with more prolonged or profound
disruption of the microbiota which has been associated with
development of C. difficile disease in mice [11,44,46,47]. However,
the metabolic changes associated with colonization in our model
were very similar to the changes associated with susceptibility to
disease in the model of Theriot et al. [44]. In addition, the levels of
bacteria detected per gram of stool in mice is typical of levels
measured in humans infected with C. difficile or colonized with
VRE [48,49]. Third, because our analysis of the microbiota
included only a limited number of bacterial groups, further studies
are needed that include more extensive analysis of the microbiota.
Additional studies are also needed to determine which bacterial
species are responsible for production of specific metabolites.
Given the degree of functional redundancy of the intestinal
microbiota, it is likely that multiple families of bacteria may be
able to carry out the metabolic conversions required to produce
the metabolites identified here. Fourth, mice and humans differ in
metabolism and elimination of antibiotics. However, the measured
concentrations of both antibiotics in feces of mice were consistent
with levels measured in previous studies in humans. Fifth,
antibiotics that alter the anaerobic microbiota result in a change
in the consistency of feces (i.e., softer and larger pellets) in the mice
used in these experiments without causing overt diarrhea. Thus,
we cannot rule out the possibility that a wash out or dilution effect
caused some reduction in the concentrations of microbiota and
fecal metabolites. However, the fact that some bacterial groups
and metabolites increased while others decreased during antibiotic
treatment is not consistent with a significant wash out effect. Sixth,
although many compounds were analyzed in the current study, it
is possible that the methods used might miss some important
potential biomarkers or mediators of colonization resistance. For
example, it has been proposed that the predominant SCFAs
(acetate, butyrate, and propionate) may contribute to colonization
resistance [11,12], but they were not measured here because they
were below the molecular weight cutoff of the methods used or
were lost during extraction. Seventh, the conclusions that can be
drawn from the piperacillin/tazobactam experiments are limited
by the small numbers of mice included in each group. However,
the findings for time to recovery of colonization resistance are
consistent with a previous study [7]. Finally, the non-targeted
metabolic profiling analyses conducted in the current study
provide a relative measure of changes in fecal metabolites.
Although the consistency of the changes in fecal metabolites
associated with 2 antibiotic classes provides support for their
potential utility as biomarkers, additional studies that include
quantitative measurements of the potential biomarkers will be
needed.
Supporting Information
Table S1 Amplicons specific to each primer set. Bacterial
targets for each primer set were determined in silico using
TestProbe from SILVA-ARB (www.silva-arb.de) [23]. The results
for each primer set were concatenated to identify amplicons from
known bacterial species. Sequences representing 1% or more of
the amplicons are shown.
(XLSX)
Table S2 Changes in mouse fecal metabolites followingclindamycin exposure. Column C lists the metabolites
analyzed, along with their pathway and links to databases
(columns A-B & F-G, respectively). The effect of clindamycin
treatment is expressed as a ratio the metabolites detected in the
fecal material of treated animals vs. control animals at each time
point (columns K-O). Column H describes patterns observed
include no change in treated mice compared to controls (1), a
sustained change compared to controls (2), an initial changes with
a substantial return to baseline within 8 days (3) or a variable
response (4). Metabolites with a significant difference at baseline
(prior to initiation of treatment) are coded a as 0. For patterns 2 &
3, an increase in the proportion of metabolites from the treated vs.
control group is coded as 0 and a decrease as 1 (Column I). Results
from statistical analysis are included in the second worksheet.
(XLSX)
Acknowledgments
We thank Tom Louie for assistance in development of the methods for
qPCR microbiota analysis and Ed Karoly and Jacob Wulff from
Metabolon for contributions to the metabolite data analysis and
interpretation.
Author Contributions
Conceived and designed the experiments: RLPJ CJD. Performed the
experiments: AP KH BS KE MT MMN. Analyzed the data: RLPJ AP AD
CJD. Wrote the paper: RLPJ AD CJD.
Figure 10. Changes in levels of fecal metabolites of piperacillin/tazobactam-treated mice compared to saline controls for selectedcompounds that increased or decreased in concentration during treatment followed by normalization or substantial return tobaseline within 8 days. Compounds from pathways related to metabolism of (A) 4- and 5-carbon alcohols and (B) sugars, (C) dipeptides, (D)inositol isomers and metabolites and (E) gamma-glutamyl amino acids. Results from experimental mice are shown on the left and from controlanimals on the right. Metabolites measured in the experimental group are the significantly different (p#0.05) from the pre-treatment levels throughday 0 (ribitol, xylulose, pyroglutamylglutamine, gamma-glutamylvaline, day 6 (arabitol, erythritol, chiro-inositol, gamma-glutamylisoleucine, gamma-glutamylmethionine), at day 6 (threitol) or through day 2 (all other metabolites). Error bars represent standard error.doi:10.1371/journal.pone.0101267.g010
Biomarkers of Colonization Resistance
PLOS ONE | www.plosone.org 16 July 2014 | Volume 9 | Issue 7 | e101267

References
1. Blaut M, Clavel T (2007) Metabolic Diversity of the Intestinal Microbiota:
Implications for Health and Disease. J Nutr 137: 751S–755S.
2. Backhed F, Ley RE, Sonnenburg JL, Peterson DA, Gordon JI (2005) Host-bacterial mutualism in the human intestine. Science 307: 1915–1920.
doi:10.1126/science.1104816.
3. Eckburg PB, Bik EM, Bernstein CN, Purdom E, Dethlefsen L, et al. (2005)Diversity of the Human Intestinal Microbial Flora. Science 308: 1635–1638.
doi:10.1126/science.1110591.
4. Holmes E, Li JV, Athanasiou T, Ashrafian H, Nicholson JK (2011)
Understanding the role of gut microbiome-host metabolic signal disruption inhealth and disease. Trends Microbiol 19: 349–359. doi:10.1016/
j.tim.2011.05.006.
5. Lawley TD, Walker AW (2013) Intestinal colonization resistance. Immunology138: 1–11. doi:10.1111/j.1365–2567.2012.03616.x.
6. Van der Waaij D, Vries JMB, der Wees JECL (1971) Colonization resistance of
the digestive tract in conventional and antibiotic-treated mice. J Hyg (Lond) 69:405–411.
7. Stiefel U, Pultz NJ, Marion S. Helfand M, Donskey CJ (2004) Increased
Susceptibility to Vancomycin-Resistant Enterococcus Intestinal ColonizationPersists After Completion of Anti-Anaerobic Antibiotic Treatment In Mice.
Infect Control Hosp Epidemiol 25: 373–379.
8. Pultz NJ, Donskey CJ (2005) Effect of Antibiotic Treatment on Growth of and
Toxin Production by Clostridium difficile in the Cecal Contents of Mice.Antimicrob Agents Chemother 49: 3529–3532. doi:,p.10.1128/
AAC.49.8.3529–3532.2005,/p..
9. Reeves AE, Koenigsknecht MJ, Bergin IL, Young VB (2012) Suppression ofClostridium difficile in the gastrointestinal tracts of germfree mice inoculated with a
murine isolate from the family Lachnospiraceae. Infect Immun 80: 3786–3794.doi:10.1128/IAI.00647-12.
10. Buffie CG, Jarchum I, Equinda M, Lipuma L, Gobourne A, et al. (2012)
Profound Alterations of Intestinal Microbiota following a Single Dose of
Clindamycin Results in Sustained Susceptibility to Clostridium difficile-InducedColitis. Infect Immun 80: 62–73. doi:10.1128/IAI.05496-11.
11. Lawley TD, Clare S, Walker AW, Stares MD, Connor TR, et al. (2012)
Targeted Restoration of the Intestinal Microbiota with a Simple, DefinedBacteriotherapy Resolves Relapsing Clostridium difficile Disease in Mice. PLoS
Pathog 8: e1002995. doi:10.1371/journal.ppat.1002995.
12. Rolfe RD (1984) Role of volatile fatty acids in colonization resistance toClostridium difficile. Infect Immun 45: 185–191.
13. Nerandzic MM, Donskey CJ (2009) Effective and Reduced-Cost Modified
Selective Medium for Isolation of Clostridium difficile. J Clin Microbiol 47: 397–400. doi:,p.10.1128/JCM.01591-08,/p..
14. Rolfe RD, Finegold SM (1983) Intestinal b-Lactamase Activity in Ampicillin-
Induced, Clostridium difficile-Associated Ileocecitis. J Infect Dis 147: 227–235.
doi:10.1093/infdis/147.2.227.
15. Louie TJ, Cannon K, Byrne B, Emery J, Ward L, et al. (2012) Fidaxomicin
Preserves the Intestinal Microbiome During and After Treatment of Clostridium
difficile Infection (CDI) and Reduces Both Toxin Reexpression and Recurrenceof CDI. Clin Infect Dis 55: S132–S142. doi:10.1093/cid/cis338.
16. Rinttila T, Kassinen A, Malinen E, Krogius L, Palva A (2004) Development of
an extensive set of 16S rDNA-targeted primers for quantification of pathogenicand indigenous bacteria in faecal samples by real-time PCR. J Appl Microbiol
97: 1166–1177. doi:10.1111/j.1365-2672.2004.02409.x.
17. Nadkarni MA, Martin FE, Jacques NA, Hunter N (2002) Determination ofbacterial load by real-time PCR using a broad-range (universal) probe and
primers set. Microbiology 148: 257–266.
18. Bernhard AE, Field KG (2000) A PCR Assay To Discriminate Human and
Ruminant Feces on the Basis of Host Differences in Bacteroides-PrevotellaGenes Encoding 16S rRNA. Appl Environ Microbiol 66: 4571–4574.
doi:10.1128/AEM.66.10.4571–4574.2000.
19. Bartosch S, Fite A, Macfarlane GT, McMurdo MET (2004) Characterization ofBacterial Communities in Feces from Healthy Elderly Volunteers and
Hospitalized Elderly Patients by Using Real-Time PCR and Effects of AntibioticTreatment on the Fecal Microbiota. Appl Environ Microbiol 70: 3575–3581.
doi:10.1128/AEM.70.6.3575–3581.2004.
20. Matsuki T, Watanabe K, Fujimoto J, Miyamoto Y, Takada T, et al. (2002)
Development of 16S rRNA-Gene-Targeted Group-Specific Primers for theDetection and Identification of Predominant Bacteria in Human Feces. Appl
Environ Microbiol 68: 5445–5451. doi:10.1128/AEM.68.11.5445–5451.2002.
21. Delroisse J-M, Boulvin A-L, Parmentier I, Dauphin RD, Vandenbol M, et al.(2008) Quantification of Bifidobacterium spp. and Lactobacillus spp. in rat fecal
samples by real-time PCR. Microbiol Res 163: 663–670.
22. Loy A, Horn M, Wagner M (2003) probeBase: an online resource for rRNA-targeted oligonucleotide probes. Nucleic Acids Res 31: 514–516.
23. Quast C, Pruesse E, Yilmaz P, Gerken J, Schweer T, et al. (2013) The SILVA
ribosomal RNA gene database project: improved data processing and web-basedtools. Nucleic Acids Res 41: D590–596. doi:10.1093/nar/gks1219.
24. R Development Core Team (2012) R: A language and environment for
statistical computing. Vienna, Austria: R Foundation for Statistical Computing.
Available: URL http://www.R-project.org/.
25. Evans AM, DeHaven CD, Barrett T, Mitchell M, Milgram E (2009) Integrated,
nontargeted ultrahigh performance liquid chromatography/electrospray ioniza-tion tandem mass spectrometry platform for the identification and relative
quantification of the small-molecule complement of biological systems. Anal
Chem 81: 6656–6667. doi:10.1021/ac901536h.
26. Dehaven CD, Evans AM, Dai H, Lawton KA (2010) Organization of GC/MSand LC/MS metabolomics data into chemical libraries. J Cheminformatics 2: 9.
doi:10.1186/1758-2946-2-9.
27. M. Evans A (2012) Categorizing Ion –Features in Liquid Chromatography/Mass Spectrometry Metobolomics Data. J Postgenomics Drug Biomark Dev 02.
Available: http://www.omicsonline.org/2153-0769/2153-0769-2-110.php?aid = 5372. Accessed 23 June 2013.
28. Storey JD, Tibshirani R (2003) Statistical significance for genomewide studies.
Proc Natl Acad Sci U S A 100: 9440–9445. doi:10.1073/pnas.1530509100.
29. Kanehisa M, Goto S, Furumichi M, Tanabe M, Hirakawa M (2010) KEGG for
representation and analysis of molecular networks involving diseases and drugs.Nucleic Acids Res 38: D355–360. doi:10.1093/nar/gkp896.
30. Wishart DS, Jewison T, Guo AC, Wilson M, Knox C, et al. (2013) HMDB 3.0—
The Human Metabolome Database in 2013. Nucleic Acids Res 41: D801–807.doi:10.1093/nar/gks1065.
31. Wyss M, Kaddurah-Daouk R (2000) Creatine and Creatinine Metabolism.
Physiol Rev 80: 1107–1213.
32. Rowland IR, Wiseman H, Sanders TAB, Adlercreutz H, Bowey EA (2000)Interindividual Variation in Metabolism of Soy Isoflavones and Lignans:
Influence of Habitual Diet on Equol Production by the Gut Microflora. NutrCancer 36: 27–32. doi:10.1207/S15327914NC3601_5.
33. Macfarlane GT, Macfarlane S (2012) Bacteria, colonic fermentation, and
gastrointestinal health. J AOAC Int 95: 50–60.
34. SEGAL S, FOLEY J (1958) The metabolism of D-ribose in man. J Clin Invest
37: 719–735. doi:10.1172/JCI103658.
35. Tronick SR, Ciardi JE, Stadtman ER (1973) Comparative Biochemical andImmunological Studies of Bacterial Glutamine Synthetases. J Bacteriol 115:
858–868.
36. Wikoff WR, Anfora AT, Liu J, Schultz PG, Lesley SA, et al. (2009)Metabolomics analysis reveals large effects of gut microflora on mammalian
blood metabolites. Proc Natl Acad Sci 106: 3698–3703. doi:10.1073/pnas.0812874106.
37. Chung KT, Anderson GM, Fulk GE (1975) Formation of indoleacetic acid by
intestinal anaerobes. J Bacteriol 124: 573–575.
38. Vincent C, Stephens DA, Loo VG, Edens TJ, Behr MA, et al. (2013) Reductionsin intestinal Clostridiales precede the development of nosocomial Clostridium
difficile infection. Microbiome 1: 18. doi:10.1186/2049-2618-1-18.
39. Antharam VC, Li EC, Ishmael A, Sharma A, Mai V, et al. (2013) Intestinal
dysbiosis and depletion of butyrogenic bacteria in Clostridium difficile infection andnosocomial diarrhea. J Clin Microbiol 51: 2884–2892. doi:10.1128/JCM.00845-
13.
40. Welling GW, Groen G, Tuinte JH, Koopman JP, Kennis HM (1980)Biochemical effects on germ-free mice of association with several strains of
anaerobic bacteria. J Gen Microbiol 117: 57–63.
41. Yap IKS, Li JV, Saric J, Martin F-P, Davies H, et al. (2008) Metabonomic andmicrobiological analysis of the dynamic effect of vancomycin-induced gut
microbiota modification in the mouse. J Proteome Res 7: 3718–3728.
doi:10.1021/pr700864x.
42. Romick-Rosendale LE, Goodpaster AM, Hanwright PJ, Patel NB, Wheeler ET,et al. (2009) NMR-based metabonomics analysis of mouse urine and fecal
extracts following oral treatment with the broad-spectrum antibiotic enroflox-acin (Baytril). Magn Reson Chem MRC 47 Suppl 1: S36–46. doi:10.1002/
mrc.2511.
43. Swann JR, Tuohy KM, Lindfors P, Brown DT, Gibson GR, et al. (2011)Variation in antibiotic-induced microbial recolonization impacts on the host
metabolic phenotypes of rats. J Proteome Res 10: 3590–3603. doi:10.1021/
pr200243t.
44. Theriot CM, Koenigsknecht MJ, Carlson Jr PE, Hatton GE, Nelson AM, et al.(2014) Antibiotic-induced shifts in the mouse gut microbiome and metabolome
increase susceptibility to Clostridium difficile infection. Nat Commun 5. Available:http://www.nature.com/ncomms/2014/140120/ncomms4114/full/
ncomms4114.html. Accessed 6 May 2014.
45. Ng KM, Ferreyra JA, Higginbottom SK, Lynch JB, Kashyap PC, et al. (2013)Microbiota-liberated host sugars facilitate post-antibiotic expansion of enteric
pathogens. Nature 502. Available: http://www.ncbi.nlm.nih.gov/pmc/articles/
PMC3825626/. Accessed 6 May 2014.
46. Abujamel T, Cadnum JL, Jury LA, Sunkesula VCK, Kundrapu S, et al. (2013)Defining the Vulnerable Period for Re-Establishment of Clostridium difficile
Colonization after Treatment of C. difficile Infection with Oral Vancomycin orMetronidazole. PloS One 8: e76269. doi:10.1371/journal.pone.0076269.
47. Reeves AE, Theriot CM, Bergin IL, Huffnagle GB, Schloss PD, et al. (2011) The
interplay between microbiome dynamics and pathogen dynamics in a murinemodel of Clostridium difficile Infection. Gut Microbes 2: 145–158.
48. Jump RLP, Pultz MJ, Donskey CJ (2007) Vegetative Clostridium difficile Survives
in Room Air on Moist Surfaces and in Gastric Contents with Reduced Acidity: a
Potential Mechanism To Explain the Association between Proton Pump
Biomarkers of Colonization Resistance
PLOS ONE | www.plosone.org 17 July 2014 | Volume 9 | Issue 7 | e101267

Inhibitors and C. difficile-Associated Diarrhea? Antimicrob Agents Chemother
51: 2883–2887. doi:,p.10.1128/AAC.01443-06,/p..49. Donskey CJ, Chowdhry TK, Hecker MT, Hoyen CK, Hanrahan JA, et al.
(2000) Effect of antibiotic therapy on the density of vancomycin-resistant
enterococci in the stool of colonized patients. N Engl J Med 343: 1925–1932.doi:10.1056/NEJM200012283432604.
50. Lerner A, Romano J, Chmelnitsky I, Navon-Venezia S, Edgar R, et al. (2013)
Rectal swabs are suitable for quantifying the carriage load of KPC-producing
carbapenem-resistant Enterobacteriaceae. Antimicrob Agents Chemother 57: 1474–
1479. doi:10.1128/AAC.01275-12.
Biomarkers of Colonization Resistance
PLOS ONE | www.plosone.org 18 July 2014 | Volume 9 | Issue 7 | e101267


