Embed Size (px)
Citation preview
Stable isotope-resolved metabolomics and applications for drugdevelopment
Teresa W-M. Fan1,2,4, Pawel Lorkiewicz1,4, Katherine Sellers1, Hunter N.B. Moseley1,4,Richard M. Higashi1,4, and Andrew N. Lane2,3,4
1 Department of Chemistry, University of Louisville.2 J.G. Brown Cancer Center, University of Louisville.3 Department of Medicine, University of Louisville.4Center for Regulatory and Environmental Analytical Metabolomics (CREAM), University ofLouisville.
AbstractAdvances in analytical methodologies, principally nuclear magnetic resonance spectroscopy(NMR) and mass spectrometry (MS), during the last decade have made large-scale analysis of thehuman metabolome a reality. This is leading to the reawakening of the importance of metabolismin human diseases, particularly cancer. The metabolome is the functional readout of the genome,functional genome, and proteome; it is also an integral partner in molecular regulations forhomeostasis. The interrogation of the metabolome, or metabolomics, is now being applied tonumerous diseases, largely by metabolite profiling for biomarker discovery, but also inpharmacology and therapeutics. Recent advances in stable isotope tracer-based metabolomicapproaches enable unambiguous tracking of individual atoms through compartmentalizedmetabolic networks directly in human subjects, which promises to decipher the complexity of thehuman metabolome at an unprecedented pace. This knowledge will revolutionize ourunderstanding of complex human diseases, clinical diagnostics, as well as individualizedtherapeutics and drug response.
In this review, we focus on the use of stable isotope tracers with metabolomics technologies forunderstanding metabolic network dynamics in both model systems and in clinical applications.Atom-resolved isotope tracing via the two major analytical platforms, NMR and MS, has thepower to determine novel metabolic reprogramming in diseases, discover new drug targets, andfacilitates ADME studies. We also illustrate new metabolic tracer-based imaging technologies,which enable direct visualization of metabolic processes in vivo. We further outline currentpractices and future requirements for biochemoinformatics development, which is an integral partof translating stable isotope-resolved metabolomics into clinical reality.
© 2011 Elsevier Inc. All rights reserved.
Correspondence to: Dr. Teresa W-M. Fan, Department of Chemistry, University of Louisville, 2210 S. Brook St, Rm. 348 John W.Shumaker Research Building, Louisville, KY 40292, USA [email protected] Tel: 502-852-6448.
Publisher's Disclaimer: This is a PDF file of an unedited manuscript that has been accepted for publication. As a service to ourcustomers we are providing this early version of the manuscript. The manuscript will undergo copyediting, typesetting, and review ofthe resulting proof before it is published in its final citable form. Please note that during the production process errors may bediscovered which could affect the content, and all legal disclaimers that apply to the journal pertain.
NIH Public AccessAuthor ManuscriptPharmacol Ther. Author manuscript; available in PMC 2013 March 01.
Published in final edited form as:Pharmacol Ther. 2012 March ; 133(3): 366–391. doi:10.1016/j.pharmthera.2011.12.007.
NIH
-PA Author Manuscript
NIH
-PA Author Manuscript
NIH
-PA Author Manuscript
KeywordsMetabolomics; systems biochemistry; stable isotope tracing; drug discovery; metaboliccompartmentation and regulation; pathway reconstruction
I. IntroductionI.1. Systems biochemistry and drug development
Drug development from the early stage of target identification and validation throughclinical trials to clinical practice is a long, tortuous, and extremely costly process. The netyield of such process has also been poor and often comes from incremental advances onexisting therapeutic agents (Adams and Brantner 2006; Adams and Brantner 2010;Arrowsmith 2011; Light and Warburton 2011; Subbaraman 2011).
The current paradigm for drug development calls for uncovering specific molecular targets,against which highly selective and potent inhibitors can be developed, with minimal off-target effects. Such agents can be synthetic small molecules that may require optimizationby medicinal chemistry, or natural products and their synthetic derivatives. From targetdiscovery, through target validation, to clinical testing and eventual clinical adoption, thewhole process would logically require a systems biochemical understanding of the diseaseitself, pharmacological properties (i.e. absorption, distribution, metabolism, excretion, andtoxicity or ADMET) of the therapeutic agents, and their functional impact on the humanbody both on-target and off-target. Systems biochemistry can be viewed as “globalbiochemical networks and molecular regulations”. As with all systems approaches, thisrepresents a tall order for drug discovery, development, and deployment using conventionalapproaches. The lack of systems biochemical approaches and thus functional understandingin the past presents a fundamental barrier to efficient and successful commercialization ofpotential therapeutic agents.
Beginning with the development of genomics, followed by functional genomics, proteomics,and now metabolomics, it is for the first time that a systems biochemical understanding ofthe human body may be envisioned. Once developed, this will accelerate the understandingof disease mechanisms and therapeutic development at an unprecedented pace. In thisreview, we will provide an overview of the metabolomics approach with the focus on theuse of stable isotope tracer technologies for drug discovery and development processes fromtarget identification and validation to pharmacodynamics and ADMET.
I.2. Overview of metabolomics approachesWhat is the metabolome?—The metabolome, the intersecting systems chemistry of lifeprocesses, is the functional outcome of the activity of the genome, functional genome, andthe proteome. Metabolic processes are the ultimate expression of gene and protein activitiesto meet the physiological demands for growth and survival, including responses toenvironmental factors such as nutrient availability, xenobiotics, and therapeutic agents.Metabolic products are often indispensible players in maintaining metabolic homeostasis viaregulating enzyme activities, as well as protein and gene expression events in a feedbackloop (Figure 1). This is simply illustrated by the well-known insulin production in responseto blood glucose levels to maintain glucose homeostasis (Lienhard, Slot et al. 1992). Thus,the metabolome is an integral part of the systems biology and a holistic understanding ofmetabolic processes is essential to advancing our knowledge on the molecular regulations ordysregulations as a result of disease development or therapeutic interventions, which mayoccur at all ‘omics levels. However, metabolomics, i.e. the study of the metabolome,
Fan et al. Page 2
Pharmacol Ther. Author manuscript; available in PMC 2013 March 01.
NIH
-PA Author Manuscript
NIH
-PA Author Manuscript
NIH
-PA Author Manuscript
remains to be the least explored and is currently the most technologically challenged amongthe ‘omics.
A common misconception in the past has been that the human metabolome involves only afew thousand endogenous metabolites, unlike the human genome and proteome, whichconsists of tens of thousands of genes and perhaps millions of different proteins (James2000). Consequently, the metabolome seems relatively “simple” and much appears to bealready known as summarized in the biochemistry textbooks. This misconception clearlydoes not reflect the unknown number of nutrients, xenobiotics, and anthropogenicpollutants, or therapeutic agents that human bodies need to interact with. Nor does itconsider the complex dynamics, redundancy of metabolites in functionally differentpathways, compartmentation including intra- and inter-organ interactions, and metabolicreprogramming that occur in the human body, particularly under stress or disease states.Metabolic reprogramming is a common feature of cancers and other metabolic diseases,which can be caused by genetic mutations. This is exemplified by the long-known aerobicglycolysis or “Warburg effect” (Warburg 1924) in many cancer types and the recentdiscovery of a defective mitochondrial Krebs cycle associated with a loss of functionfumarate hydratase mutation (Gottlieb and Tomlinson 2005; King, Selak et al. 2006) orisocitrate dehydrogenase 1 (IDH1) mutation diverting isocitrate to 2-hydroxyglutarate(Dang, White et al. 2009). Note that this is more than an 80-year gap between discoveries.The recent findings merely represent the “tip of the iceberg” for the “undiscovered country”of the human metabolome.
Metabolomic analyses is technically challenging—Due to the diverse nature of thechemicals, metabolites, and molecular interactions that we need to cope with, the analyticaldemands pose extremely difficult challenges distinct from genomic and proteomic analyses.The last decade has seen unprecedented critical advances in nuclear magnetic resonancespectroscopy (NMR) and mass spectrometry (MS) such that it is now practical to meet manyof the technical challenges faced by metabolomics investigations. These include therequisite task of large-scale detection of a wide range of structurally diverse chemicals, theirstructure elucidation without a priori knowledge, and quantification across a wideconcentration range, to name just a few of the major challenges. It is not surprising thatstudies involving both unbiased and targeted metabolite profiling have been growingexponentially since the early 2000's, many of which touched upon drug discovery anddiagnostics (Fan, Lane et al. 2004; Fernie, Trethewey et al. 2004; Verhoeckx, Bijlsma et al.2004; Whitfield, German et al. 2004; Fan, Bandura et al. 2005; Harrigan, Brackett et al.2005; Lee and Go 2005; Lutz 2005; Rochfort 2005; Andrew Clayton, Lindon et al. 2006;Griffin 2006; Schlotterbeck, Ross et al. 2006; Beger, Hansen et al. 2009; Fan, Lane et al.2009; Wikoff, Anfora et al. 2009; Fan 2010; Kim, Wilson et al. 2010; William J. Griffithsand Deigner 2010; Fan and Lane 2011; Psychogios, Hau et al. 2011).
Why are stable isotopic tracer approaches required for deciphering themetabolome?—Steady-state concentration-based metabolite profiling is only part of thestory in the quest for deciphering the human metabolome. It is well known that manypathways intersect to form a dense network with the same chemical species participating inmany interweaved pathways. Glutamate represents a good example, which can be involvedin up to 55 known pathways and some 200 reactions (M. Arita, personal communication).From examining metabolic charts (such as the Metabolic Pathway Charts of D. Nicholson,http://www.sigmaaldrich.com/life-science/metabolomics/learning-center/metabolic-pathways.html), this is common to many compounds in central metabolism. Thus, it ismathematically impossible to discern the contributions of each pathway segment based onoverall metabolite concentrations alone (Figure 2).
Fan et al. Page 3
Pharmacol Ther. Author manuscript; available in PMC 2013 March 01.
NIH
-PA Author Manuscript
NIH
-PA Author Manuscript
NIH
-PA Author Manuscript
What complicates the matters even more is the largely unknown compartmentation anddynamic exchange between compartments, such as the distribution and exchange of citrate,OAA, Asp, and malate between the mitochondrion and the cytoplasm, which is essential forshuttling reducing equivalents (NADH) and acetyl CoA (for lipid biosynthesis) between thetwo compartments (cf. Figure 4). In fact, compartmentation of metabolites via membranebound organelles, intracellular pools separated by diffusion limits, or between organs is oneof the universal means for homeostatic regulation. This critical information, as well as thepathway/network information, simply does not exist in concentration-based datasets, thus itis futile to attempt to extract it from mining the datasets. Both types of information must bespecifically acquired in order to decipher the human metabolome. This is also valuable toexploit from the standpoint of therapeutic targets and pharmacological efficacy. The stableisotope tracer-based metabolomics approach illustrated in Figures 3 and 4 can revealdynamic information on molecular-level compartmentation, which spatial discrimination-based imaging techniques have yet to achieve.
Figure 3 outlines a typical path for the stable isotope-resolved metabolomics (SIRM)approach that we have developed and applied to cell cultures, excised tissues, wholeanimals, and human subjects (Fan, Lane et al. 2003; Fan, Bandura et al. 2005; Fan, Kucia etal. 2008; Lane, Fan et al. 2008; Fan, Lane et al. 2009; Fan, Yuan et al. 2010; Fan, Lane et al.2011; Lane, Fan et al. 2011; Moseley, Lane et al. 2011). The utility of this approach inexploring the toxic action of widely disparate anticancer agents such as cisplatin and sodiumselenite is also illustrated. It is interesting to note that based on the 13C-positionalisotopomer (cf. Figure 6) analysis by NMR, cisplatin treatment of lung cancer A549 cellsled to inhibition of 13C label incorporation from uniformly 13C-lableled glucose (13C6-Glc)into lactate (glycolytic end product), Glu, citrate, Asp, glutathione (GSH) (derived from theKrebs cycle), Gly, and adenine (AXP) and uracil nucleotides (UXP) (T.W-M Fan and M.Capece, unpublished data). These data suggest that cisplatin may block multiple pathwaysincluding glycolysis, Krebs cycle, GSH synthesis, one-carbon metabolism, and nucleotidesynthesis, which may or may not be related to its ability to cross-link DNA (Poklar, Pilch etal. 1996). The ability of selenite to inhibit fatty acyl chain biosynthesis but not glycerolbackbone incorporation into lipids in A549 cells is revealed by high-resolution Fouriertransform-ion cyclotron resonance-MS (FT-ICR-MS) analysis of 13C-mass isotopologues(cf. Figure 6) of lipids (Figure 3). This result points to one possible mechanism of seleniteaction, i.e. inhibition of de novo fatty acid biosynthesis, which involves two enzymes acetylCoA carboxylase and fatty acid synthase.
In addition to mapping intersecting pathways to reveal specific site(s) of pathwayperturbations, the SIRM or analogous approaches (Lu, Mulder et al. 2002; Jin, Jones et al.2004; Ronnebaum, Ilkayeva et al. 2006) can help deduce pathways and their fluxesoccurring in different cellular compartments or organs without having to maintain thephysical integrity of cells or tissues during the measurement. Such large-scale molecular-level compartmentation and dynamics is still impractical to achieve by imaging-basedtechnologies (cf. section IV).
Figure 4 illustrates how tracking the fate of 13C6-Glc delineates pathways occurring in thecytoplasm (glycolysis and lipid biosynthesis), mitochondria (Krebs cycle), and extracellularspace (excretion of 13C3-lactate). In particular, two separate pools of pyruvate aredistinguished based on the cytoplasmic production of 13C3-lactate via LDH andmitochondrial synthesis of 13C3-citrate via the anaplerotic PC reaction. A 3rd pool ofpyruvate can be rationalized based on the differential effect of selenite on the time courseexcretion of 13C-lactate and 13C-Ala by A549 cells (Figure 5). Both metabolites are derivedfrom pyruvate and yet their excretion to the medium shows opposite behavior in response to
Fan et al. Page 4
Pharmacol Ther. Author manuscript; available in PMC 2013 March 01.
NIH
-PA Author Manuscript
NIH
-PA Author Manuscript
NIH
-PA Author Manuscript
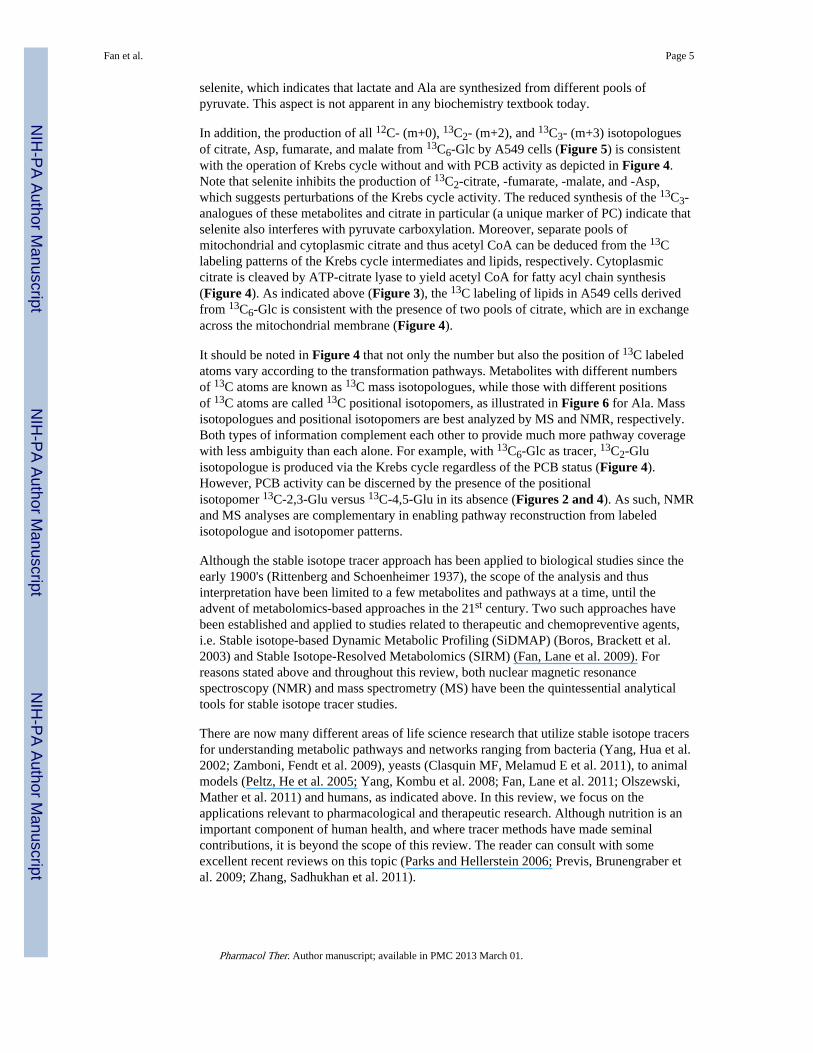
selenite, which indicates that lactate and Ala are synthesized from different pools ofpyruvate. This aspect is not apparent in any biochemistry textbook today.
In addition, the production of all 12C- (m+0), 13C2- (m+2), and 13C3- (m+3) isotopologuesof citrate, Asp, fumarate, and malate from 13C6-Glc by A549 cells (Figure 5) is consistentwith the operation of Krebs cycle without and with PCB activity as depicted in Figure 4.Note that selenite inhibits the production of 13C2-citrate, -fumarate, -malate, and -Asp,which suggests perturbations of the Krebs cycle activity. The reduced synthesis of the 13C3-analogues of these metabolites and citrate in particular (a unique marker of PC) indicate thatselenite also interferes with pyruvate carboxylation. Moreover, separate pools ofmitochondrial and cytoplasmic citrate and thus acetyl CoA can be deduced from the 13Clabeling patterns of the Krebs cycle intermediates and lipids, respectively. Cytoplasmiccitrate is cleaved by ATP-citrate lyase to yield acetyl CoA for fatty acyl chain synthesis(Figure 4). As indicated above (Figure 3), the 13C labeling of lipids in A549 cells derivedfrom 13C6-Glc is consistent with the presence of two pools of citrate, which are in exchangeacross the mitochondrial membrane (Figure 4).
It should be noted in Figure 4 that not only the number but also the position of 13C labeledatoms vary according to the transformation pathways. Metabolites with different numbersof 13C atoms are known as 13C mass isotopologues, while those with different positionsof 13C atoms are called 13C positional isotopomers, as illustrated in Figure 6 for Ala. Massisotopologues and positional isotopomers are best analyzed by MS and NMR, respectively.Both types of information complement each other to provide much more pathway coveragewith less ambiguity than each alone. For example, with 13C6-Glc as tracer, 13C2-Gluisotopologue is produced via the Krebs cycle regardless of the PCB status (Figure 4).However, PCB activity can be discerned by the presence of the positionalisotopomer 13C-2,3-Glu versus 13C-4,5-Glu in its absence (Figures 2 and 4). As such, NMRand MS analyses are complementary in enabling pathway reconstruction from labeledisotopologue and isotopomer patterns.
Although the stable isotope tracer approach has been applied to biological studies since theearly 1900's (Rittenberg and Schoenheimer 1937), the scope of the analysis and thusinterpretation have been limited to a few metabolites and pathways at a time, until theadvent of metabolomics-based approaches in the 21st century. Two such approaches havebeen established and applied to studies related to therapeutic and chemopreventive agents,i.e. Stable isotope-based Dynamic Metabolic Profiling (SiDMAP) (Boros, Brackett et al.2003) and Stable Isotope-Resolved Metabolomics (SIRM) (Fan, Lane et al. 2009). Forreasons stated above and throughout this review, both nuclear magnetic resonancespectroscopy (NMR) and mass spectrometry (MS) have been the quintessential analyticaltools for stable isotope tracer studies.
There are now many different areas of life science research that utilize stable isotope tracersfor understanding metabolic pathways and networks ranging from bacteria (Yang, Hua et al.2002; Zamboni, Fendt et al. 2009), yeasts (Clasquin MF, Melamud E et al. 2011), to animalmodels (Peltz, He et al. 2005; Yang, Kombu et al. 2008; Fan, Lane et al. 2011; Olszewski,Mather et al. 2011) and humans, as indicated above. In this review, we focus on theapplications relevant to pharmacological and therapeutic research. Although nutrition is animportant component of human health, and where tracer methods have made seminalcontributions, it is beyond the scope of this review. The reader can consult with someexcellent recent reviews on this topic (Parks and Hellerstein 2006; Previs, Brunengraber etal. 2009; Zhang, Sadhukhan et al. 2011).
Fan et al. Page 5
Pharmacol Ther. Author manuscript; available in PMC 2013 March 01.
NIH
-PA Author Manuscript
NIH
-PA Author Manuscript
NIH
-PA Author Manuscript
II. Major Analytical Platforms for Stable Isotope Tracer-Based MetabolicStudies
In some studies on stable isotope tracing of metabolism, particularly those involving humansubjects, isotope ratio MS (IRMS) has been a popular tool for its ability to detect andquantify a minute level of isotopic enrichment in the parent tracers such as 13C-glucose, 13C-cholesterol, 13C,15N-amino acids and/or their labeled metabolites (Kalhan, Bieret al. 1980; Storch, Wagner et al. 1990; Yu, Wagner et al. 1990; Ostlund and Matthews1993; Chen, Collins et al. 2005). However, this technique requires extensive isolation andsometimes even chemical degradation of the labeled metabolites before analysis can beperformed (Zhang, Trierweiler et al. 1999), which precludes its application for simultaneoustracking of a large number of specifically labeled metabolites in metabolomics-based tracerstudies.
Meanwhile, the isotopic ratio precision of structure-specific NMR has been shown to rivalor exceed that of the structure-blind IRMS (Zhang, Trierweiler et al. 1999), and themolecular formula-specific, high-resolution accurate mass MS (e.g. Fourier transformioncyclotron resonance-MS or FT-ICR-MS) also appears to have outstanding isotopic ratiocapabilities (Lane, Fan et al. 2009). Thus, NMR, chromatography-based MS, and morerecently direct infusion FT-ICR-MS, can be excellent tools for isotope ratio determination.
NMR is an extremely powerful tool for elucidating organic structures at the atom position-specific level. The versatility of multi-nuclear and multi-dimensional NMR techniquesdeveloped over the past few decades have enabled reliable and rigorous metabolite profilingof crude biological extracts without the need for sample fractionation (Fan 1996; Fan 1996;Fan and Lane 2008). Since many stable isotopes of biological importance(e.g. 2H, 11B 13C, 15N, 77Se) are NMR-observable and have low background of naturalabundance, metabolites enriched in these isotopes can be readily tracked by NMR both interms of their molecular structures and the positional isotopomers (Figure 6). Moreover,NMR measurement is non-invasive, which makes it a unique modality for in vivo or in situmetabolic analysis, particularly for pathway dynamics and real-time imaging (cf. sectionIV).
In addition to NMR, spectral MS (which excludes IRMS because it is a non-spectraltechnique) analysis is frequently used to achieve comprehensive metabolite profiling (Fan,Lane et al. 2004; Lane, Fan et al. 2008; Lane, Fan et al. 2008). NMR and MS are bothcomplementary and confirmatory in terms of metabolomics investigations. While NMR isby far the most powerful tool in providing structural identity and positional labelinginformation, it is limited by sensitivity (e.g. >1-2 nmol metabolite for 1H-NMR detection),structural resolution in case of certain structures (such as highly redundant methylene groupsin a long fatty acyl chain), insensitivity to NMR-inactive nuclei (e.g., 16O and 32S) orparamagnetically influenced nuclei (Lane, Fan et al. 2008). These limitations can beovercome by the complementary use of MS in confirming the metabolite identity andquantification by NMR, while extending the metabolite coverage beyond NMR analysisalone. Equally important is the ability of MS to supply mass isotopologue distribution, withhigh sensitivity and resolving power. Together with the positional isotopomer informationfrom NMR, such capability enables a global reconstruction of metabolic pathways (Fan,Yuan et al. 2010) and quantification of pathway fluxes using flux modeling approaches(Moseley, Lane et al. 2011)
However, SIRM studies ideally require global metabolite coverage of all possibleisotopomers and isotopologues. This, means that, for example, the 13C mass spectral peaksmust be free of all other elemental isotopologues (e.g. 2H, 15N, 18O) in order to accurately
Fan et al. Page 6
Pharmacol Ther. Author manuscript; available in PMC 2013 March 01.
NIH
-PA Author Manuscript
NIH
-PA Author Manuscript
NIH
-PA Author Manuscript
remove 13C natural abundance contributions for net enrichment determination (Moseley2010). Until recently, this basic premise has not been emphasized because of the lack of MSinstrument resolution and mass accuracy, which cannot be circumvented by other meanssuch as chromatography. The advent of “user friendly”, modern Fourier-transform (FT) MSinstruments has delivered the necessary performance to globally measure such isotopicallypure peaks (Pingitore, Tang et al. 2007; Lane, Fan et al. 2009; Moseley 2010). These FT-MSinstruments, principally FT-ICR-MS, are capable of achieving ultra-high resolving power of400,000 or more (at 400 m/z, 10% valley) and mass accuracies better than 0.2 ppm (i.e.0.00008 Da @ 400 m/z). This level of performance enables unambiguous detection andquantification of thousands of metabolites and all their isotopologue species simultaneouslyin a high throughput fashion (e.g. < 5 min per sample) (Pingitore, Tang et al. 2007; Lane,Fan et al. 2009) (cf. Figure 7). As of this writing, another major type of FT-MS, Kingdon-Makarov trap MS (Orbitrap™), are not yet available with resolutions sufficient to meet thisneed.
Recently, the biochemoinformatics potential of such high level performance by FT-ICR-MSwas revealed for quantitatively tracking multiple convergent pathways by analyzing the 13Cisotopologue distribution of just a single metabolite, UDP-GlcNAc (Moseley, Lane et al.2011). It is reasonable to expect that since hundreds of other metabolites and theirisotopologues are also measured simultaneously, the information density from FT-MSanalysis of stable isotope tracer-based experiments is immense, and appears sufficient tointerpret multiple intersecting events at the network level.
II.1. Separation-based MSInsufficient mass resolution of conventional MS instruments is a major impetus for couplingMS to separations technology to improve compound resolution (Watson 1985). Today,separation-based MS techniques are commonly used in stable-isotope tracer experiments.Coupling chromatographic separation with MS allows for highly sensitive (pM) detection(Shimizu and Matsuoka 2010; Psychogios, Hau et al. 2011) with added resolvingdimensions that significantly exceed the performance of standalone MS instruments (Lane,Fan et al. 2008).
The oldest of the separation-based instruments, GC-MS, is a well-established technique formetabolite structure confirmation and quantification(Fan, Higashi et al. 1986; Lane, Fan etal. 2008), and it has been utilized in SIRM extensively (Boros, Brackett et al. 2003; DesRosiers, Lloyd et al. 2004; Fan, Lane et al. 2009). This is in large part due to the highlymature derivatization technology that enhances the volatility of many polar metabolites, aprerequisite for any GC-based analysis. In addition, GC-MS such as 2-D GC-TOF (time offlight)-MS posts the highest chromatographic resolution among the different platforms ofseparation-based MS (Lidstrom and Guo 2008; Sumner and Bedair 2008), but remainsunproven for SIRM studies. Among the many GC derivatization probes available, silylatingreagents such as MTBSTFA (N-methyl-N-(tertbutyldimethylsilyl) trifluoroacetamide) arethe most useful ones due to the ability for simultaneous derivatization across multiplefunctional groups (Fan, Colmer et al. 1993).
However, it is becoming clear that GC-based techniques are of limited utility to fill theextremely wide metabolic coverage needs of metabolomics. Without prior degradation –which may destroy critical isotopologue information – major classes of metabolites cannotbe made sufficiently volatile for GC-MS analysis; these include many higher molecularmass metabolites such as polar lipids, nucleotides, oligosaccharides, peptides, etc. andmetabolites that are permanently charged such as cholines (Fan, Lane et al. 2004). Thus thefuture utility of GC-MS in metabolomics and especially for stable isotope tracer studies willmainly reside in targeted metabolic studies.
Fan et al. Page 7
Pharmacol Ther. Author manuscript; available in PMC 2013 March 01.
NIH
-PA Author Manuscript
NIH
-PA Author Manuscript
NIH
-PA Author Manuscript
In contrast, high-performance liquid chromatography (HPLC) coupled to various MSplatforms has no such limitations, and recently has become a powerful and commonlyemployed method in both “unbiased” global and targeted metabolite profiling studies (Want,O'Maille et al. 2006; Frezza, Zheng et al. 2011). HPLC-MS applications in metabolomicsstudies have been reviewed extensively elsewhere (Chen, Gonzalez et al. 2007; Metz, Zhanget al. 2007; Ceglarek, Kortz et al. 2011; Theodoridis, Gika et al. 2011).
Despite the proven values of GC-MS and HPLC-MS in metabolite profiling, there is onemajor drawback to consider for accurate stable isotope ratio analysis in SIRM studies. TheMS signals of analytes acquired from chromatographic separation are transient in nature (inmilliseconds to seconds range), which is incompatible with the need for long signalaveraging to obtain more precise isotopic profiles. This issue, together with the desire forhigh sample throughput, predicate the development of direct sample introduction inconjunction with high-resolution MS (Aharoni, Ric de Vos et al. 2002; Lane, Fan et al.2009; Lane, Fan et al. 2011), particularly for stable isotope tracer studies (Pingitore, Tang etal. 2007; Lane, Fan et al. 2009; Moseley, Lane et al. 2011).
II.2. Direct MS: Continuous Ion SourceIn lieu of the separation techniques described above, direct sample introduction MS analyseshave been successfully and preferably employed for SIRM investigation of crude extracts(Pingitore, Tang et al. 2007; Lane, Fan et al. 2009; Moseley, Lane et al. 2011). It is clear thatFT-MS is the only category of MS instruments that can achieve the need for unambiguousdistinction of molecular formulae and all possible elemental isotopologues, a problem notaddressable by chromatographic separation (Pingitore, Tang et al. 2007; Lane, Fan et al.2009; Moseley, Lane et al. 2011). By coupling with continuous infusion, FT-MS canachieve high sensitivity and greater dynamic range through signal averaging, which alsoenables far more precise isotope ratio determination (Lane, Fan et al. 2009) than is possiblefrom separation-based MS. Among continuous infusion ion sources, an excellent choice isthe nanoelectrospray source, which greatly reduces sample consumption while enhancingthe sensitivity of detection. Another added advantage of long continuous delivery of analyteions (for up to 1 h) is the enhanced performance on tandem MS experiments such as MS2 oreven MSn (n>2) for detailed structural confirmation or positional isotopomer determination(Pingitore, Tang et al. 2007).
Since direct continuous infusion demands high MS resolution for SIRM studies, the questionis how high is sufficient resolution? We have tested this with a 7 Tesla FT-ICR-MSinstrument housed in our Center for Regulatory and Environmental AnalyticalMetabolomics (CREAM). Figure 7 demonstrates that glutamate simultaneously labeledwith 13C, 15N, and 2H can be clearly distinguished from all other metabolite isotopologuespresent in a crude cancer cell extract. This spectrum was acquired with a mass resolvingpower of 1:400,000, which is routinely achieved by this instrument. Such mass resolutionalso allows practically all mammalian lipid species to be resolved in a single run (Lane, Fanet al. 2009). In addition, the high precision of FT-ICR-MS for isotope ratio analysis enablesreliable natural abundance isotopic stripping (Moseley 2010). As described above, this levelof resolving power and precision for isotope ratio is “sufficient” for deconvoluting multipleconverging biosynthetic pathways based on the isotopologue distribution of a singlemetabolite (Moseley, Lane et al. 2011). As FT-ICR-MS spectra typically contain hundredsof other metabolites with their thousands of isotopologue peaks, the reconstruction ofmultiple metabolic pathways and modeling fluxes through the metabolic network appears tobe within reach. However there are still many technical challenges in analyzing theextremely rich FT-ICR-MS spectral data, which may be overcome by futurechemoinformatic developments (cf. section V)
Fan et al. Page 8
Pharmacol Ther. Author manuscript; available in PMC 2013 March 01.
NIH
-PA Author Manuscript
NIH
-PA Author Manuscript
NIH
-PA Author Manuscript
II.3. Direct MS: Discontinuous Ion SourceIn addition to electrospray-based ion introduction techniques, Matrix Assisted LaserDesorption Ionization (MALDI) is another direct introduction technique that allows forsimultaneous detection of multiple metabolites from crude extracts. Here the metabolite ionsare generated by irradiating the MALDI matrix and sample pre-concentrated on a small areaof a conductive plate placed in high vacuum or in atmospheric pressure conditions. Thisapproach is generally more tolerant to higher salt content samples than the electrospraymethods, which makes it intrinsically compatible with complex biological mixtures.However, high chemical background from the matrix can interfere with the analysis of asignificant fraction of the metabolites (Strupat, Karas et al. 1991; Beavis and Bridson 1993;Shroff, Rulisek et al. 2009). More recently, new MALDI matrices have been developed tominimize this issue (Shroff, Rulisek et al. 2009; Miura, Fujimura et al. 2010).
There have been a few applications of MALDI-MS to stable-isotope tracer based studies.For example 13C flux analysis was performed with MALDI-TOF-MS for bacterial speciesCorynebacterium Glutamicum (Wittmann and Heinzle 2001) and other microorganisms (S.cerevisiae) (Hollemeyer, Velagapudi et al. 2007). There have also been some applications ofMALDI-MS for stable isotope studies in mammalian cells. Estrada et al. analyzedsimultaneously the incorporation of D9-choline into human lens epithelial cell lipids(Estrada, Borchman et al. 2006). The changes in the rates of label incorporation intophosphatidylcholine (PCh) and sphingomyelin (SM) headgroups were consistent with PChsynthesis preceding SM synthesis (Estrada, Borchman et al. 2006). However there are nocomparable applications in human or model animal tissues, yet there are no intrinsic barriersfor the application.
An interesting potential of the MALDI ion source has been metabolite imaging across thesurface of tissues or in cells (Hsieh, Casale et al. 2006; Cornett, Reyzer et al. 2007; Reyzerand Caprioli 2007; Signor, Varesio et al. 2007; Stoeckli, Staab et al. 2007; Caprioli, Cornettet al. 2008). Again, there are no applications shown for stable isotope labeled tissue imagingin human or model animals, but there is no known barrier to such use. Currently, the spatialresolution of imaging-MALDI lies between a few μm and ca. 100 μm depending on theinstrumental setup and the MALDI matrix (Heeren and Chughtai 2010). It is not trivial toachieve further improvements in spatial resolution because of detection limit problems ofsmall sample size ionized by very thin laser beams (Dorrestein and Watrous 2011) andwavelength limits on spot size. However, it is expected that this will improve to nmresolution in the future, so that, spatial discrimination of subcellular compartments ororganelle by MALDI-MS imaging coupled with stable-isotope tracer experiments maybecome an important tool in tracking localized changes in metabolic pathways. As discussedpreviously and shown in Figures 4 and 5, stable isotope tracer experiments can alreadyreveal compartmentation information from tissue or cell extracts without any explicit spatialresolution. In conjunction with stable isotope tracer approach, MALDI imaging standspoised to provide metabolic network information as a function of tissue heterogeneities andeven intracellular compartmentation in-situ without the need for metabolite extraction.
II.4. Tandem MSIn order to have the widest coverage of metabolite isotopologues, the main focus of MS inSIRM studies has been to obtain molecular ion data using one-dimensional MS mode ofoperation. However, there are cases where more detailed, sub-molecular structuralinformation may be desired such as for structural confirmation or determination ofpositional isotopomers. Analysis by tandem MS including two-dimensional (MS/MS =MS2) or higher dimensional (MSn, n >2) MS meets such demands, especially in conjuctionwith high-resolution FT-ICR-MS (Pingitore, Tang et al. 2007). Tandem MS accomplishes
Fan et al. Page 9
Pharmacol Ther. Author manuscript; available in PMC 2013 March 01.
NIH
-PA Author Manuscript
NIH
-PA Author Manuscript
NIH
-PA Author Manuscript
this by generating daughter mass fragments from the isolated molecular or parent ion, whichis a routine operation on all of the commercial FT-MS instruments. For example, Pingitoreet al. (Pingitore, Tang et al. 2007) utilized multiple MS2 mode of FT-ICR-MS under directcontinuous infusion to obtain the 13C isotopomer labeling pattern of amino acids from soilbacterium Desulfovibrio vulgaris growing on [1-13C] lactate. However presently there is noequivalent work on human or model animal systems. Using low resolution multiple tandemMS measurements for each observable labeled metabolite, a workflow was developed formetabolomics flux analysis in heart tissue (Antoniewicz and Choi 2011), but the approach isnot amenable for SIRM studies under non-steady state conditions (cf. Section V).
Besides utility in endogenous metabolic studies, MSn techniques have long been used instable-isotope tracer experiments for tracking drug metabolism (Watson 1985). This isexemplified by Mutlib et al. who used LC/MS2 to identify the metabolites of deuteriumlabeled benzylamine in bile and urine samples (Mutlib 2008). Since tandem MS is muchmore time-consuming than 1D MS, the MSn approach is very practical for drug metabolismstudies because of the very limited analyte list. This is diametrically opposed to theanalytical needs of endogenous metabolomic studies, which have an open-ended analyte list.
II.5. Applications of MS to Stable Isotope Tracer StudiesII.5.1. General Applications—Since the early 1980's, MS has been applied to studyingdrug metabolism (Brazier, Ribon et al. 1980) and endogenous metabolic pathways andfluxes through the use of various isotopically enriched tracers (Wolfe 1984). As outlined inFigure 3, such studies require the administration of a labeled precursor (e.g. 13C labeledglucose) to cells, tissues or whole organisms. The resulting labeled xenobiotic and/orendogenous cellular metabolites are then identified by different platforms of MS (and oftenin combination with NMR), which can also provide unique patterns of mass isotopologuesof the drug adducts and degradation products for subsequent reconstruction of relevant“metabolic fate” pathways (Fischer and Sauer 2003; Lane, Fan et al. 2008).
II.5.2. MS and SIRM applications to cancer cell metabolism—Stable isotope tracerstudies that utilize MS (frequently in conjunction with NMR) have been conducted toidentify key pathways altered by disease development, from which potential drug targets canbe uncovered for clinical intervention. The same approach is also valuable for validating on-target effect and revealing off-target toxicity. As stated in the Overview, understanding thehuman metabolome including compartmentation and dynamics are vital to gaining insightinto the pathogenesis of diseases, particularly for cancer, diabetes and other metabolicdisorders. Described below are a few examples of studies that employed stable-isotopelabeled tracers and MS to determine the distributions of labeled metabolite isotopologuesand therefore the transformation pathways of the tracers in various types of cancer cells.
Boros et al used [13C2-1,2]-glucose as a tracer and GC-MS extensively to probe fluxesthrough the pentose phosphate pathway (PPP), fatty acid synthesis, and glycolysis in tumorcells and fibroblasts, which led to the discovery on the role of thiamine deprivation instimulating cell apoptosis (Boros, Brackett et al. 2003). A similar SiDMAP study using GC-MS assessed the effect of a glycogen phosphorylase inhibitor on pancreatic tumor cells andfound that interference with glycogen mobilization led to inhibition of anabolic metabolisminto macromolecules and apoptosis (Lee, Guo et al. 2004). Perturbed fluxes through PPP aswell as synthesis of nucleic acids and fatty acids were also observed in myeloid leukemiacells treated with Gleevec and Isofenphos, which could constitute the mechanism of growthinhibition with these drugs (Boren, Cascante et al. 2001; Boros, Cascante et al. 2002; Boros,Lee et al. 2002). Harris et al used 13C glucose tracer and GC-MS to investigate the effect offatty acid synthase inhibitor C75 and a panel of flavonoids on metabolic pathways of
Fan et al. Page 10
Pharmacol Ther. Author manuscript; available in PMC 2013 March 01.
NIH
-PA Author Manuscript
NIH
-PA Author Manuscript
NIH
-PA Author Manuscript
pancreatic tumor cells MIA PaCa2. The pools of 13C labeled palmitate and cholesterol weremeasured and the authors concluded that the naturally occurring luteolin was a superiorinhibitor of fatty acid synthase than the targeted C75 drug. This study thereforedemonstrated the utility of the targeted SIRM approach to assess differential drug response(Harris, Li et al. 2011).
Sabatini's group (Possemato, Marks et al. 2011) used a RNAi knockdown screening protocolon an orthotopic xenograft mouse model with human breast cancer cells to identify theimportance of overexpression of phosphoglycerate dehydrogenase (PHGDH) forproliferation. PHGDH is the first committed step in serine biosynthesis. Using 15N2-Glnand 13C5-Gln as tracers and LC-MS analysis, it was shown that shunting 8-9% of theglycolytic flux through serine pathway contributed about 50% of the net production of 2-oxoglutarate in these tumors.
Some selenium-containing compounds have shown efficacy against cancers (Ip 1998; Hu,Jiang et al. 2005) (Clark, Combs et al. 1996; Fan, Bandura et al. 2005; Suzuki 2005). Fan etal. combined GC-MS with NMR to study the response of lung cancer cells to anti-cancerselenium compounds (Fan, Bandura et al. 2005; Fan, Higashi et al. 2006; Fan, Tan et al. inpress, 2011). NMR was used to determine the positional isotopomers, while the absoluteconcentrations of metabolites and their isotopologue distributions were determined by GC-MS. This combined approach allowed multiple pathways in lung cancer cells impacted bySe compounds to be reconstructed in an unbiased manner. They found that the toxicity ofselenite and methylseleninic acid to lung cancer cells involved multiple targets spanningacross glycolysis, PPP, the Krebs cycle, and the biosynthesis of glutathione, fatty acids(Figure 3), and nucleotides. The efficacy of different Se compounds also depends highly onthe chemical form, pointing to variations in the uptake and/or metabolism to the active formby cancer cells. The metabolic perturbations induced by Se forms were further linked togene expression changes via Metabolomics-Edited Transcriptomic Analysis (META) (Fan,Bandura et al. 2005; Fan 2010) so that metabolic dysregulations at the transcriptional levelwere revealed.
II.5.3. MS and SIRM applications to central nervous systems—Apart fromapplications for cancer drug targets, the effect of drug treatments or disorder on the centralnervous system have been a subject of many investigations involving stable isotope labeledtracers and MS (Schousboe, Waagepetersen et al. 2000; Dusick, Glenn et al. 2007; Fan,Yuan et al. 2010). For example the SIRM approach was used for probing metabolic pathwaychanges induced by lithium salt in rat astrocytes and neuronal cells (Fan, Yuan et al. 2010);Lithium is commonly used in the treatment of bipolar disorders (Yuan, Huang et al. 2001;Quiroz, Gould et al. 2004; Lan, McLoughlin et al. 2009). Both GC-MS and NMR wereemployed to follow the fate of three different 13C-labeled tracers (13C6-glucose, 13C-3-lactate or 13C-2,3-alanine). The study found that lithium enhanced carbon flow throughglycolysis and part of the Krebs cycle in both cell types. In particular, lithium stimulated theanaplerotic PC pathway in both cell types, which may facilitate neurotransmitter Glnsynthesis while maintaining energy production. Moreover, the release of fuel substrates byastrocytes and their subsequent metabolism by neurons for energy and neurotransmitterproduction were enhanced by lithium. Similar studies used 13C6-glucose tracer with MS andNMR to track the changes in the Krebs cycle in cortical neurons induced by depolarization(Schousboe, Waagepetersen et al. 2000). The differential labeling patterns of fumarate andAsp led to the hypothesis on the existence of distinct Krebs cycles with different turnoverrates (compartmentation of the Krebs cycle) in the mitochondria.
II.5.4. MS and SIRM applications to whole model animals and humans—Since 13C or 15N stable isotopes are naturally occurring, 13C or 15N labeled nutrients should
Fan et al. Page 11
Pharmacol Ther. Author manuscript; available in PMC 2013 March 01.
NIH
-PA Author Manuscript
NIH
-PA Author Manuscript
NIH
-PA Author Manuscript
pose no toxicity to whole organisms and can be administered to human subjects for trackingmetabolic pathways in vivo. Recently, Beger and colleagues (Beger, Hansen et al. 2009)introduced 13C6-glucose intraperitoneally into mice to monitor the influence of valproate (ananticonvulsant) on cholesterol, glycogen and ribose metabolism in mice. Mass isotopologueanalysis by GC-MS was carried out on blood plasma, urine, and different tissues to reveal adecreased reabsorption of glucose through the kidney, reduced synthesis of glycogen andribose RNA by the liver, and reduced carbon flux into the plasma and kidney cholesterolpools. In another recent study, Fan and co-workers intravenously infused 13C6-glucosetracer into non-small cell lung cancer (NSCLC) patients and followed the incorporationof 13C into various metabolites of cancerous versus non-cancerous (NC) lung tissues usingthe SIRM approach (Figure 3). Based on the specific 13C labeling patterns of the Krebscycle metabolites, they found that the Krebs cycle was more active in cancerous lung thanNC. They also uncovered a novel activation of pyruvate carboxylation (PC) (Figure 4) inpatient lung cancer tissues and that such activation was regulated at the gene expressionlevel (Fan, Lane et al. 2009; Lane, Fan et al. 2011). This SIRM study demonstrated thefeasibility of directly working with human subjects for pathway resolution and metabolictarget discovery, thus the promise for target validation and off-target assessment in humansubjects is self-evident.
A study by Dusick et al. infused 13C2-1,2-glucose into patients with traumatic brain injuryand control subjects. By examining the 13C labeling patterns in plasma lactate, theyuncovered an enhanced PPP flux associated with increased glucose uptake exhibited bybrain injury patients (Dusick, Glenn et al. 2007). Such investigations promise to providenew functional insights into brain disorders, thereby revealing new targets for therapeuticinterventions, particularly with studies performed on human subjects since it is difficult toemulate human brain disorders with animal models.
II.5.5. MS applications to ADMET—MS-based stable isotope tracer studies have alsobeen conducted to evaluate the metabolic fate of therapeutic agents and theirpharmacokinetics (Pons and Rey 1999; Mutlib 2008). A common approach is to introduce amixture of labeled and unlabeled drug into the system, followed by probing their metabolitesin biological fluids using appropriate MS platforms, e.g. HPLC-MS. MS detects pairs ofcompanion peaks separated by a mass difference of the labeled isotope, which enables easyassignment of the parent drugs and their metabolites (Brazier, Ribon et al. 1980; Mimuraand Baba 1980; Brazier, Salle et al. 1981; Mimura and Baba 1981; Goromaru, Matsuura etal. 1982; Goromaru, Matsuura et al. 1984; Mutlib and Nelson 1990; Mutlib and Nelson1990; Borel and Abbott 1993; Tonn, Mutlib et al. 1993; Mutlib 2008). A similar approachinvolves the use of labeled precursors to assess if a particular interaction between theprecursor and the drug occurs. An example study employed 13C labeled GSH to identifyglutathionylated drug conjugates (Mutlib, Shockcor et al. 2000; Yan and Caldwell 2004;Mutlib, Lam et al. 2005; Mutlib 2008). Another interesting approach of studying drugmetabolism involves administering the 13C labeled drug, followed by analyzing the 13Cenrichment of the expired CO2 gas. If the 13C label at specific atomic position(s) of the drugis metabolized via methylation or decarboxylation into formaldehyde, formic acid,formyltetrahydrofolate, and CO2, then the CO2 released will be enriched in 13C. Suchmeasurement in conjunction with analysis of the drug clearance from biological fluids canserve to determine the enzyme activities responsible for the demethylation/decarboxylationreactions. A more in-depth description of such applications has been reviewed elsewhere(Pons and Rey 1999).
In a recent review by Chen et al., LC-MS based metabolomics approaches (without traceruse) were outlined for ADMET studies (Chen, Gonzalez et al. 2007). The principle approachis comparative and differential metabolite profiling, and statistically linking that to drug-
Fan et al. Page 12
Pharmacol Ther. Author manuscript; available in PMC 2013 March 01.
NIH
-PA Author Manuscript
NIH
-PA Author Manuscript
NIH
-PA Author Manuscript
related events and xenobiotic metabolism, i.e. ADMET. However there is no mention of thestable isotope tracer-based metabolomic approaches to elucidating pathways and networks,although there is no technical barrier to extending the profiling workflow to SIRM studies.
From the above examples of applications, we hope to provide readers with a glimpse of thevalue and versatility of MS in stable isotope tracers-based metabolomic studies in the fieldof pharmacology and therapeutics. With continuing advances in MS technologies,particularly the high resolution, accurate mass instrumentation, coupled withbiochemoinformatic developments and complementary use of NMR (section III), there canbe quantum leaps in our understanding of human diseases and ability to develop highlyefficacious and individualized therapeutics.
III. Application of NMR to Stable Isotope Tracer StudiesIII.1. In vitro NMR approach
NMR has a long history in analytical and natural products research, and along with MS andsingle crystal x-ray diffraction it has become one of the main analytical tools for structureanalysis (Pretsch, Bühlmann et al. 2009). The general principles and approaches have beendescribed in great detail in many excellent texts (Bax, Freeman et al. 1981; Sanders andHunter 1987; Claridge 1999; Pochapsky and Pochapsky 2007). Although most such textsdiscuss analysis of pure compounds, NMR in fact can easily be applied to mixtures, whichhas a number of advantages for biological studies, particularly for the stable isotope tracerapproach, as described in the Overview (Fan and Lane 2008; Lane, Fan et al. 2008).
The majority of stable-isotope tracers applications in metabolism have used 1D methods,especially direct observation of 13C and making use of the 13C-13C coupling for isotopomeranalysis. Such approaches have been successfully applied to many different disease states(Carvalho, Babcock et al. 1999; Zwingmann, Richter-Landsberg et al. 2001; Lu, Mulder etal. 2002; Mason, Petersen et al. 2002; Burgess, Weis et al. 2003; Mason, Petersen et al.2003; Wang, Lloyd et al. 2003; Zwingmann and Leibfritz 2003; Anousis, Carvalho et al.2004; Carvalho, Rodrigues et al. 2004; Cline, LePine et al. 2004; Des Rosiers, Lloyd et al.2004; Goddard, Mason et al. 2004; Jin, Jones et al. 2004; Mason and Rothman 2004; Sherry,Jeffrey et al. 2004; Des Rosiers and Chatham 2005; Jin, Jones et al. 2005; Patel, de Graaf etal. 2005; Wang, Lloyd et al. 2005; Hausler, Browning et al. 2006; Hyder, Patel et al. 2006;DeBerardinis, Mancuso et al. 2007; Mason, Petersen et al. 2007; Fan and Lane 2008;Morrish, Neretti et al. 2008; Morrish, Noonan et al. 2010). However, the sensitivity andinformation content is significantly less than using 2D methods with proton detection (Fan1996; Fan, Higashi et al. 1997; Carvalho, Jeffrey et al. 1998; Carvalho, Zhao et al. 2001;Lloyd, Zeng et al. 2004; Lane and Fan 2007).
The identification of various components in a mixture is greatly facilitated when using 2DNMR experiments that detect interactions between atoms within a molecule through thecovalent network. These include homonuclear experiments such as 1H COSY and TOCSY,and heteronuclear correlation experiments such as 1H-13C HSQC/HMQC, HMBC andvariants that combine two or more experimental types such as HSQC-TOCSY (Fan, Higashiet al. 1986; Fan 1996; Willker, Engelmann et al. 1996; Fan and Lane 2008; Fan, Kucia M. etal. 2008; Lane, Fan et al. 2008; Fan and Lane 2011; Fan and Lane 2012; Lane 2012). 2DNMR experiments are therefore more rigorous in metabolite identification and offer superiorresolution than 1D NMR methods. The HSQC-based experiments are especially valuable foranalyzing 13C positional isotopomers of metabolites (Figures 3 and 6), because of thenuclear editing capabilities of NMR. Namely, a molecule that contains atoms enrichedwith 13C or 15N can be selectively observed in a mixture, and identified on the basis of theirchemical shifts and covalent linkages expressed as the 13C-1H (e.g. HSQC) and 13C-1H-1H
Fan et al. Page 13
Pharmacol Ther. Author manuscript; available in PMC 2013 March 01.
NIH
-PA Author Manuscript
NIH
-PA Author Manuscript
NIH
-PA Author Manuscript
(e.g. HSQC-TOCSY) covalent correlations in the 2D data (Fan, Higashi et al. 1997; Fan andLane 2011).
III.2. Target identification and verification by NMR profilingThere have been numerous SIRM-based studies that make use of NMR (and often MS) fordrug target identification and validation in cultured cells and animal models. Based on theSIRM analysis of an experiment designed to inhibit LDH-A in breast cancer cells (which isknown to be required for tumorigenesis (Fantin, St-Pierre et al. 2006; Le, Cooper et al.2010)), Chesney's group showed that the LDHA inhibitor oxamate also impacted aspartatemetabolism via the OAA/Glu transaminase, suggesting that such aminotransferases might belegitimate targets in some cancers (Thornburg, Nelson et al. 2008). These authors have alsoused SIRM to evaluate potential targets including choline kinase and phosphofructokinase 2,uncovered by both genetic and metabolic analyses with small molecule inhibitorsspecifically designed from in silico modeling (Telang, Yalcin et al. 2006; Clem, Telang etal. 2008; Dailey, Hait et al. 2009; Yalcin, Clem et al. 2009; Yalcin, Clem et al. 2010; Clem,Clem et al. 2011). In addition to target validation, the SIRM approach is excellently suitedfor assessing the off-target effects and their origin, because of the breadth in metaboliccoverage with this approach (Fan and Lane 2008; Fan and Lane 2011).
III.3. NMR profiling of genetic defects in metabolism and therapeutic effectsInborn errors of metabolism have been characterized in great detail (Wevers, Engelke et al.1994). Less known are the germline mutations in metabolic enzymes that have beenassociated with cancer. These include the familial cancers with loss-of-function mutations infumarate hydratase (FH) or succinate dehydrogenase (SDH), leading to severe defects inmitochondrial metabolism (King, Selak et al. 2006; Tennant, Duran et al. 2010), yet theresulting renal cancers grow more aggressively (Frezza, Pollard et al. 2011). Due to thisdefect, the tumor cells are presumably more dependent on glycolysis for energy. However, aglycolysis inhibitor, 2-deoxyglucose (2-DG), was tested on a patient with FH-deficientpapillary renal carcinoma, but the treatment failed (Yamasaki, Tran et al. 2011). 2-DGappears to be more effective for hypoxic tumors, and its mode of action may not bemediated through glycolysis, but rather via the unfolded protein response (Kurtoglu, Gao etal. 2007; Kurtoglu, Maher et al. 2007; Boutrid, Jockovich et al. 2008). Clearly thisdemonstrates the importance of prior SIRM-based metabolic analysis before appropriatetherapeutics may be designed. Indeed, a recent article reported that FH(-) mouse kidney cellsutilized the Gln to heme synthesis and degradation pathway to permit a partial functioningof the mitochondrial Krebs cycle and suggested that this pathway may be a potential targetfor treating FH(-) cancer (Frezza, Zheng et al. 2011).
Mutations in isoforms of isocitrate dehydrogenase (IDH) have recently been found in a fewcancers (Dang, White et al. 2009; Dang, Jin et al. 2010; Gross, Cairns et al. 2010). Themutations result in a change of function, i.e. the IDH variant now catalyzes the reduction ofα-ketoglutarate (α-KG) to 2-hydroxyglutarate (2-HG), using NADPH as the hydride donor.2-HG builds up to a very high concentration (Dang, White et al. 2009) and may act as acompetitive inhibitor of prolyl hydroxylases for which α-KG is a co-substrate (Xu, Yang etal. 2011), thus preventing VHL (von Hippel-Lindau) binding to HIF for proteasomaldegradation (Pan, Mansfield et al. 2007). Based on [U-13C]-Gln labeling studies, 2-HG wasderived mainly from Gln, although central metabolism did not appear to be perturbed (Dang,White et al. 2009). However more recently, widespread changes in central metabolism werereported by profiling steady-state levels of a wide range of metabolites, although the authorsindicated that stable isotope labeling studies are essential to define fully the metabolicconsequences of the mutations (Reitman, Jin et al. 2011). As 2-HG is derived from Gln viaglutaminase, inhibition of this enzyme should be a direct means to maintain a low
Fan et al. Page 14
Pharmacol Ther. Author manuscript; available in PMC 2013 March 01.
NIH
-PA Author Manuscript
NIH
-PA Author Manuscript
NIH
-PA Author Manuscript
intracellular concentration of 2-HG. A glutaminase inhibitor (BPTES) has indeed beenshown to inhibit the growth of glutamine-dependent IDH1 glioblastoma cells (Seltzer,Bennett et al. 2010).
It is also possible for isozymes of IDH to catalyze the reductive carboxylation (RC) of α-KGto isocitrate. This reaction is usually considered to be essentially irreversible. However, asthe equilibrium constant of the decarboxylation reaction is near 1 M (Londesborough andDalziel 1968), the reaction can be reversed, provided that the NADPH/NADP+
concentration ratio is high, the isocitrate/ α-KG ratio is low, and there is adequate dissolvedCO2 present. RC can occur in both mitochondria and the cytoplasm. In the cytoplasm, thepresence of both IDH1 isoform and aconitase can convert α-KG to citrate via isocitratewithout going through the mitochondrial Krebs cycle; citrate is the precursor of acetyl CoA(via ATP-dependent citrate lyase) for many acetylation reactions, as well as fatty acidbiosynthesis. The RC reaction has been demonstrated in several tissues, including liver(Holleran, Briscoe et al. 1995) and brown adipose tissues (Yoo, Antoniewicz et al. 2008).When coupled with glutaminase, RC could bypass defect(s) in the Krebs cycle such as FHdeficiency to supply cancer cells with citrate for acetyl CoA production and fatty acidsynthesis.
It is clear that tissue specific expression of metabolic isozymes is widespread (Aledo,Gomez-Fabre et al. 2000), as is differential compartmentation of isozymes, such asmitochondrial and cytoplasmic forms of transaminase, malic enzyme, IDH, aconitase, etc.Cancers in particular are associated with altered expression of different isoforms ofmetabolic enzymes, such as several of the glycolytic enzymes, which makes them potentialdrug targets (Pelicano, Martin et al. 2006; Mathupala, Colen et al. 2007; Vander Heiden,Christofk et al. 2010; de Atauri, Benito et al. 2011). One example is the alternatively splicedpyruvate kinase. The M1 isoform of this enzyme is usually expressed in somatic tissue butin cancers the M2 splice variant is preferentially expressed (Elbers, Vanunnik et al. 1991;Mazurek, Grimm et al. 2000). PKM2 can exist as the essentially inactive dimers, or as theactive tetramers (Mazurek, Grimm et al. 2002). It has been argued that the inactive form ofPKM2 predominates in cancers, leading to a buildup of glycolytic intermediates prior toPEP, and the lack of lactate production from glucose. Instead, glutamine oxidation andconversion to pyruvate was proposed to account for the very high yield of lactate in tumors(Mazurek and Eigenbrodt 2003). However, SIRM experiments on different cancer cell linesshow conclusively that nearly all of the lactate produced by cancers cells was derived fromglucose, not from glutamine, and the same is true for tumors (DeBerardinis, Mancuso et al.2007; Fan, Kucia M. et al. 2008; Fan, Lane et al. 2009; Fan, Tan et al. 2011; Moseley, Laneet al. 2011). Recently it was shown that a novel reaction in which PEP phosphorylates theactive site histidine residue of the preceding enzyme, phosphoglycerate mutase (PGM),thereby releasing pyruvate for lactate production. This altered glycolytic pathway occurs atthe expense of one less ATP produced per mol glucose consumed (Heiden, Locasale et al.2010) and it is unclear on the overall contribution of the PGM phosphorylation to theenormous amount of lactate production by cancer cells. Nevertheless, glutamine metabolismis critical for many tumor cell types in terms of their survival and growth (Newsholme,Crabtree et al. 1985; Neermann and Wagner 1996; Cline, LePine et al. 2004; DeBerardinis,Mancuso et al. 2007; Donadio, Lobo et al. 2008; Serres, Raffard et al. 2008; Yoo,Antoniewicz et al. 2008; Yuneva 2008; Dang 2010; Seltzer, Bennett et al. 2010; Dang,Hamaker et al. 2011) (DeBerardinis, Mancuso et al. 2007; Yuneva, Zamboni et al. 2007;DeBerardinis, Lum et al. 2008; Morrish, Neretti et al. 2008; Wise, DeBerardinis et al. 2008;Dang, Le et al. 2009; DeBerardinis and Cheng 2010). Again, SIRM studies should facilitatethe unraveling of the functions of glutamine metabolism in tumor development.
Fan et al. Page 15
Pharmacol Ther. Author manuscript; available in PMC 2013 March 01.
NIH
-PA Author Manuscript
NIH
-PA Author Manuscript
NIH
-PA Author Manuscript
Furthermore, the SIRM approach is valuable in discerning the metabolic perturbationsinduced by a synergistic interaction of different therapeutic agents. For example, we recentlyconducted a SIRM study on the combined effect of anti-cancer agents paclitaxel andmethylseleninic acid (MSA) on lung cancer cells. This combination has been reported tosynergize apoptosis in prostate cancer cells (Hu, Jiang et al. 2005). The fate of 13C6-glucosewas tracked in PC14PE6 cells treated with MSA or taxol alone, or MSA plus taxol. The 1DHSQC NMR analysis of the cell extracts indicates that the glucose to glutamate pathwaymay be synergistically inhibited by the combination treatment, as evidenced by the furtherreduction in the synthesis of different 13C isotopomers of Glu by the combination treatmentcompared with either treatment alone (13C-2-Glu and 13C-4-Glu in Figure 9) (T.W-M Fanand K. Sellers, unpublished data).
III.4. ADMET of therapeutic agents monitored by NMRAn important component of the drug development concerns the absorption, distribution,metabolism, excretion, and toxicity of drugs (ADMET). Many drugs contain naturallyabundant 19F, which improves their ADMET properties (Bachert 1998; Park, Kitteringhamet al. 2001; Mutlib 2008; Reid and Murphy 2008) and facilitates tracking of the parent drugsand their metabolites by NMR. Incorporation of stable isotopes such as 2H and 13C into theparent drugs are also frequently used to trace drug metabolism (Meese and Fischer 1990;Athersuch, Nicholson et al. 2007; Mutlib 2008). Investigating drug metabolism by NMR andMS has been reviewed extensively by Mutlib (Mutlib 2008).
Metabolism of 19F-containing drugs has been extensively studied by Nicholson's group(Wade, Wilson et al. 1990; Spraul, Hofmann et al. 1993; Corcoran, Lindon et al. 2001;Blackledge, Nicholson et al. 2002; Blackledge, Nicholson et al. 2003; Keun, Athersuch et al.2008). In these studies, the agent was introduced to an organism such as a rat, followed bythe analysis of the drug and its metabolites by 19F and 1H NMR in urine and or bloodplasma. As such, the extent of excretion of the untransformed drug as well as the actualmetabolites transformed by the organism can be quantified (Blackledge, Nicholson et al.2002; Blackledge, Nicholson et al. 2003). In a recent study of flucloxacillinbiotransformation in humans, heteronuclear 1H-(Fant, De Sloovere et al.) statisticalcorrelation spectroscopy (STOCSY) on high field NMR (18.8 T) was used to evaluate thedrug metabolism and excretion in urines collected at timed intervals after the drugadministration (Keun, Athersuch et al. 2008). This technique can be applied to any 1H-Xnucleus pair in suitable drugs enriched with stable isotopes or 19F.
13C and 15N enriched drug molecules can also be traced by similar approaches, asdemonstrated in numerous studies (Meese and Fischer 1990; Serkova and Boros 2005;Athersuch, Nicholson et al. 2007; Mutlib 2008; Blech, Ludwig-Schwellinger et al. 2010).Identification of drug metabolites can be greatly facilitated by the use of 2D heteronuclearcorrelation experiments (e.g. HSQC or HSQC-TOCSY) (Fan and Lane 2008; Fan and Lane2011) after the enriched drugs are transformed.
An important aspect of ADMET studies is the use of appropriate model system. UsingSIRM technology, substantial differences were observed in metabolite utilization betweenrat and human hepatocytes, which was traced to hormone status and fasting in the humanversus fed in the rat case (Winnike, Pediaditakis et al. 2011). As hepatocytes are the primarycells for drug metabolism, considerations for such distinction are very important in anyADMET study.
Fan et al. Page 16
Pharmacol Ther. Author manuscript; available in PMC 2013 March 01.
NIH
-PA Author Manuscript
NIH
-PA Author Manuscript
NIH
-PA Author Manuscript
III.5. NMR-based tracer studies in whole model animals and humansAnimal models of diseases are widely available (Caron, James et al. 2002; Griffin 2006;Richmond and Su 2008; Brosius, Alpers et al. 2009) (Thelwall, Simpson et al. 2011) (Chen,Gonzalez et al. 2007). As depicted in Figure 3, the isotope tracing studies can be performedon whole animals, in addition to cell cultures. The analytical approach can be sampling andextracting biofluids and tissues at different time points for analysis (Beger, Hansen et al.2009; Fan, Lane et al. 2011; Lane, Fan et al. 2011), or direct measurements in real time invivo (see below). The former has considerably better resolution analytical data, but poorertime resolution and more interference from individual variations than in vivo spectroscopy.It should be noted that NMR is one of the few and by far the most versatile technique thatcan be employed for real time stable isotope tracer studies in vivo due to its noninvasivemode of measurement. In either case, the tracer can be administered as a bolus orally(Mason, Petersen et al. 2002) or intraperitoneally, via ad libitum food or water intake, viatail vein injection, (Fan, Lane et al. 2011; Lane, Fan et al. 2011), or by continuous infusionvia a cannula (Thelwall, Yemin et al. 2005; Mason, Petersen et al. 2007; Thelwall, Simpsonet al. 2011). The continuous infusion approach has the advantage of achieving a muchhigher and constant level of the tracer. In contrast, a bolus injection leads to a timedependent concentration of the tracer in the circulating blood due to tissue absorption andmetabolism, which limits the time scale of the metabolic events that can be followed, as wellas complicating the subsequent flux analysis (see below). Oral and peritoneal administrationlie somewhere in between these two extremes, and give rise to a more complex convolutionof the tracer input function with the subsequent metabolic transformations (Fan, Lane et al.2011).
Another significant consideration with animal models is whether to work with alert oranesthetized animals. Both have disadvantages. For example, extensive animal handling isknown to cause tachycardia and release of stress hormones into the plasma of rodents(Roizen, Moss et al. 1978; Kawashima, Miwa et al. 1985), which may affect metabolicactivity of various organs, such as glycogen degradation in liver (Gruetter, Magnusson et al.1994), synaptic release of amino acids in brain (Timmerman, Cisci et al. 1999), and energymetabolism in brain (Chance, Nakase et al. 1978). Therefore, handling stress-inducedalteration of 13C-glucose metabolism may contribute to the pattern of labeled productsobserved in Figures 2, 4-8 of (Fan, Lane et al. 2011). Particularly notable is the lack of 13C-glucose and significant buildup of 13C-lactate in our mouse brain extracts (cf. Fig. 6 and S3,(Fan, Lane et al. 2011)), which is distinct from that observed in situ in human or rat brain(Gruetter, Adriany et al. 2003). In contrast, anesthetized animals are metabolically lessactive than alert animals, leading to altered drug metabolism and response; the anesthetizingagent itself can also have an effect on animal's metabolism. Inserting a cannula for infusionstudies can overcome some of the stress issues as the animals become acclimated, and pre-cannulated animals are often available from vendors (e.g. Charles River, HarlanLaboratories). Nevertheless, the infusion lines may still affect behavior patterns. The choiceof technique has to be made according to the experimental design and information to besought (Fan, Lane et al. 2011).
Fan and colleagues (Fan, Lane et al. 2011) examined glucose metabolism in SCID micebearing an orthotopic xenograft lung tumor, using [U-13C]-glucose as the traceradministered via tail vein injection. This study demonstrated that the 13C-edited metabolicprofile obtained from 1D HSQC analysis can reveal tissue-specific metabolic networks, andmany significant differences in glucose metabolism between normal and cancer-bearinglungs.
As for human applications, there have been widespread metabolomic profiling studies onhuman subjects for biomarker discovery, mainly involving biofluid analysis in response to
Fan et al. Page 17
Pharmacol Ther. Author manuscript; available in PMC 2013 March 01.
NIH
-PA Author Manuscript
NIH
-PA Author Manuscript
NIH
-PA Author Manuscript
treatments or disease states, but without using tracers (Lindon 2003; Lindon, Holmes et al.2004; Lindon, Holmes et al. 2004; Kristal BS, Shurubor YI et al. 2006; Kaddurah-Daouk,Kristal et al. 2008). As stated earlier (Figure 2), the chemometric approach and systemicbiofluid analysis alone do not readily provide unambiguous mechanism of disease etiologyor drug response. To achieve such mechanistic understanding, biofluid studies should becoupled with target tissue analysis via biopsy or surgical resection, when practical, andadopt the use of stable isotope tracers.
As described in II.3.3., Fan et al. applied 13C6-glucose tracer preoperatively, followed byresection of cancerous and adjacent non-cancerous (NC) lung tissue and collection of bloodplasma and urine pre and perioperatively as well as at follow up (Fan, Lane et al. 2009;Lane, Fan et al. 2011). In addition to the MS analysis of tissue and plasma extracts describedin II.3.3., parallel NMR analysis of the same extracts was performed. The 13C labelingprofiles of the cancerous and NC tissues were distinct, as revealed by their 1D HSQCspectra (Figure 10). Except for glucose, the 13C abundance of lactate, Krebs cyclemetabolites, non-essential amino acids, glutathiones, and nucleotides in the cancerous tissuewas in excess of its paired NC tissues. This suggests an activation of multiple centralmetabolic pathways leading to the synthesis of these metabolites. In particular, the enhancedabundance of 13C-2 and 13C-3-Glu is consistent with the up-regulation of pyruvatecarboxylase (PCB) in the cancerous tissue, as is also evidenced from the GC-MS and geneexpression data described in II.3.3 and Western blot data (Fan 2010; Fan, Tan et al. 2011).The dependence of cancer cell growth on PCB has been further examined by DeBerardinis’group using 13C NMR. They found that PCB activity was induced in glutaminase-suppressed glioblastoma cells, PCB overexpression sustained cell growth under Glndeprivation, and silencing PCB inhibited cell growth (Cheng, Sudderth et al. 2011). Thesemodel data support a requirement of PCB activation for cancer development, which was firstuncovered by SIRM profiling of human subjects (Fan, Lane et al. 2009).
In a related study, using 1H NMR and GC-MS, Fan et al. examined the in vivo metaboliteprofiles of two different lung lesions in the same patient with distinct responses to erlotinib,an inhibitor of the EGFR tyrosine kinase, (Fan, Lane et al. 2009). The profiles differedbetween the two lesions, which corresponded to different PET SUVs (standardized uptakevalues). The lesion with overexpression of EGFR and sensitivity to the drug was confirmedas bronchioloadenocarcinoma (BAC), while the other was either a very early stage of lungcancer or a benign lesion. The metabolic profile of BAC showed an enhanced accumulationof many central metabolites than the erlotinib-insensitive lesion, whose metabolite profilewas in turn elevated over the paired NC tissue.
III.6. In vivo NMR profiling of metabolismAlthough detailed information can be obtained from extract analysis, many aspects of themetabolic interactions may be lost, such as the interactions between organs via the blood andlymphatic systems, pH and ion compartmentation, influence of microenvironmentalconditions, and interactions between different cell types within a tissue. Such interactionsare clearly important from the standpoint of metabolic homeostasis (Perriello, Jorde et al.1995; Tayek and Katz 1997) and cooperation between neurons and astrocytes for example(Bouzier-Sore, Serres et al. 2003; Patel, de Graaf et al. 2005; Fan, Yuan et al. 2010).Furthermore, in vivo unidirectional rate of metabolic reactions cannot be achieved with theextract approach.
Localized 31P NMR spectroscopy has long been used to obtain tissue level bioenergetics andintracellular pH information in small animals and humans, including their responses toaltered physiological states or drugs (Gadian and Radda 1981; Gadian 1986; Gadian 1995;Brand, RichterLandsberg et al. 1996; Gillies, Raghunand et al. 2002; Wolfe, Hsu et al. 2002;
Fan et al. Page 18
Pharmacol Ther. Author manuscript; available in PMC 2013 March 01.
NIH
-PA Author Manuscript
NIH
-PA Author Manuscript
NIH
-PA Author Manuscript
McClelland, MacDonald et al. 2003; Gillies and Morse 2005; Thelwall, Yemin et al. 2005;Seagle, Christie et al. 2008). The localization is readily achieved using a small surface coilto detect NMR signals from the underlying tissue (Fan, Clifford et al. 1994; Gadian 1995;Macdonald, Schmidlin et al. 2002). Typical 31P signals of mammalian tissues arise fromphosphocreatine, ATP, inorganic phosphate (Pi), phosphomonoesters, and phosphodiesters.The intracellular and extracellular pH can be determined indirectly from the chemical shiftsof Pi. Furthermore, the 31P saturation transfer technique makes it possible to measure theunidirectional rates of ATP synthesis and utilization in vivo (Gadian and Radda 1981;Brindle and Radda 1987). Together, these measurements provide a detailed picture ofenergy metabolism, to complement stable isotope tracer studies (Mancuso, Zhu et al. 2005).In vivo 31P and tracer-based 13C NMR approaches have been applied to whole animals suchas mice or other rodents, and to excised organs maintained in an appropriate physiologicalstate (Gadian and Radda 1981; Sherry, Nunnally et al. 1985; Gadian 1986; Gadian 1995;Burgess, Babcock et al. 2001; Carvalho, Zhao et al. 2001; Macdonald, Schmidlin et al.2002; Macdonald, Xu et al. 2002; Anousis, Carvalho et al. 2004; Carvalho, Rodrigues et al.2004; Thelwall, Yemin et al. 2005; Hausler, Browning et al. 2006; Seagle, Christie et al.2008).
By coupling with 13C tracers, in vivo or ex vivo 13C NMR has been employed to obtain thekinetics or compartmentation of metabolic reactions. Sherry and Malloy's group usedmultiple 13C tracers to study the metabolism of isolated mouse hearts (Burgess, Babcock etal. 2001). 13C-2-acetate, 13C-3-lactate, 13C4-2,4,6,8-octanotae were infused into the hearts.Using proton detection of attached 13C by HMQC, a time resolution of approximately 20 swas achieved for tracking the C3 and C4 isotopomers of glutamate. The indirect detectionmethod provided a sensitivity enhancement of nearly 10 fold over the direct 13C detectionmethod. Based on the kinetics and a model of the TCA cycle including Glu/α-ketoglutarateexchange reaction, the relative contributions of the substrate to TCA entry were calculatedto be in the order acetate>octanoate>lactate, which is consistent with the known substratepreference of cardiac muscle for energy production. In another study, 13C6-glucose was usedto label glycogen in the perfused rat heart (Anousis, Carvalho et al. 2004), By chasingwith 13C-1-glucose, 13C NMR analysis of the lactate and glutamate isotopomers were usedto estimate the relative contributions of glucose-dependent glycolysis from glycogenolysis.The results were consistent with functional compartmentation of glycolytic andglycogenolytic enzymes that allows pyruvate generated by these two processes to bedistinguished at the level of lactate and acetyl-CoA. A third example utilized 13C-2-glycinetracer and 13C MRS to track glutathione and glycine metabolism in fibrosarcoma tumorsimplanted subcutaneously in rats (Thelwall, Yemin et al. 2005). After infusion of the Glytracer, its uptake and metabolism was monitored in vivo in the tumor by surface-coillocalized MRS including 13C chemical shift imaging (CSI). Gly was mainly incorporatedinto the glycyl residue of glutathione and CSI imaging revealed spatial heterogeneity inglycine and gluthathione distribution within the tumor volume.
One major disadvantage of in vivo NMR analysis is signal broadening due to tissueheterogeneity (thus variable magnetic susceptibility and chemical shifts), whichcompromises both sensitivity and resolution of NMR detection. To improve the in vivoNMR signal quality, high-resolution magic angle spinning (HR-MAS) spectroscopy oftissue samples has been developed. Part of the signal broadening can be overcome byspinning the tissue at moderate speeds at the so-called magnetic angle, which averages outspatial inhomogeneities, giving rise to much sharper (and thus more intense) and resolvedNMR spectra (Millis, Maas et al. 1997; Bathen, Sitter et al. 2010; Malet-Martino andHolzgrabe 2011). This is applicable only to tissue samples, such as from biopsy and enablesmore metabolites to be determined than in whole organisms while largely retaining the localarchitecture. If combined with 13C and/or 15N tracer applications, the approach can give
Fan et al. Page 19
Pharmacol Ther. Author manuscript; available in PMC 2013 March 01.
NIH
-PA Author Manuscript
NIH
-PA Author Manuscript
NIH
-PA Author Manuscript
detailed information on metabolic networks in tissues, albeit under non-physiologicalconditions such as low temperature and generally for relatively short periods (Martinez-Bisbal, Marti-Bonmati et al. 2004; Martinez-Granados, Monleon et al. 2006; Swanson,Zektzer et al. 2006; Levin, Albers et al. 2009; Rocha, Barros et al. 2010). HR-MAS withoutthe use of tracers has been extensively applied to several disease states, especially in variouscancers, and for assessing effects of drugs on tissue metabolism (Bathen, Sitter et al. 2010;Beckonert, Coen et al. 2010; Glunde, Artemov et al. 2010; Rocha, Barros et al. 2010;Garcia-Alvarez, Fernandez-Mayoralas et al. 2011; Malet-Martino and Holzgrabe 2011).
IV. Non-invasive imaging techniques to monitor metabolism in vivoLike in vivo NMR, non-invasive imaging techniques have the unique ability to track real-time changes of metabolism in living organisms. In addition, some of these imagingmethods, particularly magnetic resonance spectroscopy (MRS) imaging are capable ofproviding spatially resolved pictures of metabolic processes, which adds new dimensions toour understanding of in vivo metabolic perturbations caused by disease or exposure to drugs.Because many of these techniques are applicable from the cellular level to the organismallevel, they translate well from the laboratory to the clinic. The clinical applications ofimaging techniques have been extensively reviewed (Cai, Rao et al. 2006; Cai, Shin et al.2006; Wessels, Busse et al. 2007; Brindle 2008; Frangioni 2008; Weissleder and Pittet 2008;Willmann, van Bruggen et al. 2008), and this section will focus on those that providemetabolic information and with the ability to sense stable isotope tracers, i.e. MRS imaging.Radioactive isotope-based positron emission tomography (PET) and optical imaging willalso be briefly described. PET is a well-established method for clinical diagnostics andtogether with optical imaging can complement and verify information obtained from MRS.All three imaging techniques have demonstrated great utility in drug discovery process.
IV.1. PET imagingPositron Emission Tomography (PET) images radioactive tracers that emit positrons. Thepositrons collide with nearby electrons, causing the production of two gamma rays. Thegamma rays are emitted at a 180° angle from each other, which are detected by a pair ofcollinear gamma detectors. A three dimensional image can then be reconstructed usingsignals from multiple detectors. Because the spatial resolution (ca. 1 mm) of microPETimaging is limited by the mean free path of the positron and the number of gamma detectors,they are often combined with better-resolved anatomical data acquired from computedtomography (CT). Combined PET/CT scanners ensure that the two independent images areproperly registered. PET tracers are typically analogues of biological substrates containing aradionuclide such as 11C, 13N, 15O, and 18F. Because PET is highly sensitive (10-12 M),tracers can be administered in doses low enough to eliminate concerns for toxicity.
The clinical potential of PET was first realized at the end of the 1970's with the developmentof glucose analogue 18F-2-fluorodeoxy-D-glucose (2-FDG) (Reivich, Kuhl et al. 1979).Glucose-utilizing cells take up 2-FDG, which accumulates in the tissue becausephosphorylation by hexokinase prevents its export and replacement of the 2’ oxygen withfluorine prevents it from undergoing further glucose metabolism. Because cancer tissue hasa greater glucose demand (typically by an order of magnitude) than the surrounding stromaltissues, 2-FDG provides a means to highlight tumor regions. Indeed, the standardized uptakevalue (SUV) is regarded as a marker of tumor aggressiveness and is valuable in tumorstaging (Dhital, Saunders et al. 2000; Bares, Eschmann et al. 2002; Cermik, Mavi et al.2008), as it reflects the well-known property of solid tumors to take up and metabolizeglucose at an accelerated rate, even under aerobic conditions, i.e. the Warburg effect(Warburg 1923; Warburg 1956; Garber 2004). While 2-FDG continues to be the majortracer used in clinical PET (Gambhir 2002), other tracers have shown promise as
Fan et al. Page 20
Pharmacol Ther. Author manuscript; available in PMC 2013 March 01.
NIH
-PA Author Manuscript
NIH
-PA Author Manuscript
NIH
-PA Author Manuscript
proliferation markers such as amino acid, nucleotide, acetate and choline-containingradionuclides, as reviewed elsewhere (Kumar, Dhanpathi et al. 2008).
In addition to its diagnostic value, 2-FDG PET has been shown to help assess therapeuticresponse to anti-cancer treatment in lymphoma (Juweid and Cheson 2006; Juweid,Stroobants et al. 2007), breast (Smith, Welch et al. 2000), melanoma (Tseng, Stuart et al.2011), NSCLC (Weber, Petersen et al. 2003), and head and neck carcinoma (Brun, Kjellenet al. 2002) (e.g. Figure 11A). Because metabolic changes precede structural changes, PETimaging surpasses anatomical imaging techniques to assess early response to cancertreatments.
Moreover, PET has been used to identify biomarkers for disease. For instance, uptake of theamyloid-binding reagent 11C-2-(4-methylaminophenyl)-6-hydroxy-benzothiazole wasshown to be a positive predictor for patients who would develop Alzheimer disease(Forsberg, Engler et al. 2008). PET also has attractive properties for studyingpharmacokinetics. Preclinical pharmaceuticals can be labeled with radionuclei and theirtissue absorption, distribution, metabolism, and excretion can be monitored (ADME). PETtracers have been developed for cisplatin (Ginos, Cooper et al. 1987), fluorouracil (Kissel,Brix et al. 1997), tamoxifen (Inoue, Kim et al. 1996), DACA (Saleem, Harte et al. 2001),paclitaxel (Kurdziel, Kiesewetter et al. 2003), verapamil (Hoebers, Kartachova et al. 2008;Thelwall, Simpson et al. 2011), and temozolomide (Rosso, Brock et al. 2009).
However, PET has several intrinsic disadvantages in metabolomics applications. First, themetabolic information provided by PET scans is limited to a single pathway or even a singlereaction and PET scans cannot differentiate between the tracer and its metabolites. Second,the availability of the radiotracers restricts PET's clinical and laboratory applications. Theradionuclides for PET typically have very short half-lives, e.g. two minutes for 15O, 20minutes for 11C, or 2 h for 18F, requiring them to be synthesized at an on-site or regionalcyclotron (Muehllehner and Karp 2006). This is not only costly but also limit PETapplications to very fast metabolic reactions. The related imaging technique single photonemission computed tomography (SPECT) circumvents some of these limitations. SPECTtracers emit gamma rays directly with characteristic energies. These tracers have longer half-lives and can contain different radioisotopes for simultaneous imaging. Radiolabeledapoptosis marker annexin V has been used to evaluate in vivo response of paclitaxel inbreast cancer mouse model (Thelwall, Simpson et al. 2011), cisplatin in head and neckcancer patients (Hoebers, Kartachova et al. 2008), and cyclophosphamide-etoposide in alymphoma and breast cancer mouse models (Chen, Gonzalez et al. 2007). However, thespatial resolution of these techniques is low and metabolic application is still limited.
IV.2. Optical imagingUnlike PET probes, optical imaging probes are stable and relatively inexpensive.Fluorescence-based imaging relies on probes that absorb a photon at a particular wavelengthand emit a photon at a longer wavelength. In bioluminescence, the emitting molecule doesnot absorb a photon but is excited biochemically, such as using the energy of ATPhydrolysis via the luciferase reaction (Chen, Gonzalez et al. 2007). Optical imaging is alsohighly sensitive and in principle quantitative.
Fluorescence imaging has been applied extensively in cell cultures but its application intissues is limited because tissues absorb and scatter light and auto-fluoresce, limiting thedepth these techniques can penetrate (Rao, Dragulescu-Andrasi et al. 2007). Theselimitations have been somewhat abated by the development of probes that fluoresce in thenear infrared region (NIR), which is transparent to human tissues (Cai, Shin et al. 2006).
Fan et al. Page 21
Pharmacol Ther. Author manuscript; available in PMC 2013 March 01.
NIH
-PA Author Manuscript
NIH
-PA Author Manuscript
NIH
-PA Author Manuscript
NIR probes increase fluorescence imaging depths from the low mm range to the several cmrange, albeit with a concomitant loss of resolution by using longer wavelengths.
Recently, activatable fluorescent probes have been developed for imaging in vivo metaboliteconcentration or enzyme activity. These probes are more sensitive than constitutively activeprobes because they are silent until reaction with their target; thus they do not requireclearance via circulation for contrast. Activatable probes rely on fluorescence resonanceenergy transfer (FRET) from donor to acceptor fluorophores or fluorescence self-quenchingbetween two identical fluorophores. They typically have two or more fluorophores attachedby a linker and both FRET and self-quenching depend on the distance between thefluorophores. The linker is designed to bind to a metabolite or react with an enzyme, whichcauses the distance between fluorophores to change, resulting in FRET or direct energyexchange for self-quenching. In both cases, the end result is a loss or gain of fluorescenceintensity. These types of activatable molecular probes can be tuned for different metabolitesor enzymes, providing a novel mechanism to image differences in metabolite concentrationor enzyme activity as a result of disease states or in response to treatment in real-time (Elias,Thorek et al. 2008).
For example, one of the first FRET-based probes monitored calcium concentration bylinking two fluorescent proteins by calmodulin. Upon calcium binding, the calmodulinlinker undergoes a conformational change, bringing the donor and acceptor proteins closeenough to enable FRET (Miyawaki, Llopis et al. 1997). In another example, the activity ofmatrix metalloproteinases (MMPs) was monitored to track tumor development andmetastasis in model animals (Scherer, VanSaun et al. 2008). Scherer et al. developed a probewhere Cys5.5 and AF750 were attached to a polyamidoamine backbone. Cys5.5 moleculeswere attached to the polymer by a peptide with a sequence specific for MMP 7 and in closeproximity to permit self-quenching. Upon cleavage with MMP-7, the signal for Cys5.5increased while AF750 served as a reference dye for the quantification of both cleaved andnon-cleaved substrates.
More recently, quantum dots are being explored for their ability to serve as donors in FRETcouples because they display high absorptivity, high quantum yield, resistance tophotobleaching, omnidirectionality, and their emission spectra are tunable based on theirsize (Rao, Dragulescu-Andrasi et al. 2007). Such probes have been developed for a varietyof enzymes such as trypsin (Shi, Rosenzweig et al. 2007), caspase 3 (Boeneman, Mei et al.2009), lactate dehydrogenase (Ren, Yang et al. 2010), casein kinase and alkalinephosphatase (Freeman, Finder et al. 2010), type IV collagenase (Theodoridis, Gika et al.2011), and histone acetyltransferase (Ghadiali, Lowe et al. 2011).
Fluorescence imaging is not limited to the large number of synthetic probes. Endogenousfluorophores arising from differential metabolic activity within cancer tissues have beeninvestigated for tumor detection. For instance, many tumors such as melanoma, bladder,gastrointestinal, and glioma have increased capacity to synthesize and accumulatefluorescent porphyrins after administration of 5-aminolevulinic acid (5-ALA) (Stummer,Stocker et al. 1998). In an eight-year follow-up study, Denzinger and colleagues (Denzinger,Burger et al. 2007) showed that using 5-ALA-induced fluorescent-guided endoscopy, post-operative bladder carcinoma patients had significantly reduced residual tumor and increasedrecurrence-free survival.
It is also practical to genetically engineer fluorophore probes in cells and animal models. Forexample, mouse models are xenographed with cancer cells transfected with luciferase,which catalyzes the oxidation of luciferin, leading to photon emission. This allows tumorprogression and treatment response to be monitored in the same animal over time (Sim,
Fan et al. Page 22
Pharmacol Ther. Author manuscript; available in PMC 2013 March 01.
NIH
-PA Author Manuscript
NIH
-PA Author Manuscript
NIH
-PA Author Manuscript
Bibee et al. 2011). Because the luciferase reaction requires ATP, bioluminescence providesa mechanism to monitor ATP metabolism within the tumor microenvironment. Pellegattiand colleagues (Pellegatti, Raffaghello et al. 2008) engineered a plasma membrane-targetedluciferase. Using this probe, the authors quantified extracellular ATP within the tumormicroenvironment in the high μM range, while it was undetectable in the extracellularmatrix of normal tissue (Figure 11B).
As optical probes have to be developed for each reaction to be monitored, optical imaging isnot suited for assaying metabolic networks, but rather for testing specific hypotheses.
IV.3. MRS and MR imagingIV.3.1 Conventional NMR imaging—While PET and optical imaging have provenuseful for monitoring specific aspects of in vivo metabolism, both methods can only observea single target per probe. In contrast, MRS imaging has the potential to monitor spatiallyresolved flux through a large number of pathways in vivo. The principle of MRS or MRI isan extension of NMR with added spatial encoding. The spatial information arises fromapplying a magnetic field gradient across the sample to be imaged and the resonantfrequency is dependent upon a nucleus's position within the gradient or from physicallocalization using surface coils (cf. III.6). MRI is inherently insensitive, and sensitivityversus spatial resolution is always a trade-off such that the method is usually restricted toproton detection of the most abundant molecules, i.e. water and fat. Clinically, when MRI isused to image signals derived from water or fat molecules (“chemical shift imaging”), theanatomical contrast is provided by tissue-specific water concentration and intermolecularinteractions that change a proton's relaxation time.
However, MRS is intrinsically versatile for in vivo metabolic imaging due to the NMR'sability to resolve protons or other nuclei in different chemical environments and thereforedifferent metabolites (Brown 1992; Li, Negendank et al. 1996; McMillan, Rogers et al.2006). For instance, MRS analysis of breast cancer has implicated a peak at 3.2 ppm as abiomarker for malignancy (Katz-Brull, Lavin et al. 2002). Because proton peaks from invivo MRS are broader than those in typical NMR spectra of extracts, this peak is acomposite of several unresolved choline-containing compounds. The Bolan group(Meisamy, Bolan et al. 2004) was able to detect a positive correlation between changes intumor sizes and total choline concentration in locally advanced breast cancer patientsundergoing doxorubicin neoadjuvant chemotherapy. In addition, 75% of patients whoresponded to the treatment showed decreased total choline levels after one day of treatment,compared with no change or increased choline levels in 92% of non-responders (Haddadin,McIntosh et al. 2009). However, there are several obstacles for clinical applications such aspoor sensitivity, the need to suppress water and lipid signals, and difficulty for accuratequantification. Furthermore, the ratio of phosphocholine to choline is not specific to breastcancer (de Molina, Gallego-Ortega et al. 2005; Glunde and Serkova 2006; Hernando,Sarmentero-Estrada et al. 2009) but more likely a marker of proliferation (Lane, Fan. T. W-M. et al. 2008). This points to a weakness of using single metabolic markers.
IV.3.2 Hyperpolarization (DNP) NMR imaging—As described above, in vivo NMRhas the potential to measure a wide variety of metabolites noninvasively, especially whencoupled with stable isotope tracers that avoid all complications of short half-lives andhazardous radioactivity. Also referred above is that its major drawback is low sensitivity.
Recently, MRS/MRI sensitivity has been dramatically improved with the use ofhyperpolarized substrates. Such method is called dynamic nuclear polarization (DNP) MRS.NMR is intrinsically insensitive because of the very small energy difference between groundand excited nuclear states, which means that the population difference at thermal
Fan et al. Page 23
Pharmacol Ther. Author manuscript; available in PMC 2013 March 01.
NIH
-PA Author Manuscript
NIH
-PA Author Manuscript
NIH
-PA Author Manuscript
equilibrium is very small (ca. 1 part in 10,000 for protons, and 4 fold lower for 13C).However, the population difference can be radically enhanced by transferring theequilibrium magnetization from an electron spin radical at low temperature (typically 1-2K). The low temperature itself increases the population difference by more than 100 fold,and the electron polarization accounts for another 660 fold (Maly, Debelouchina et al.2008). The polarized sample must be rapidly warmed prior to injection into animals orhuman subjects, at which point the polarization is typically of the order 5000-10000 timesthat of the unpolarized sample (Hu, Balakrishnan et al. 2011; Kurhanewicz, Vigneron et al.2011). This means that very rapid data acquisition with good sensitivity is possible forsubstrates present at low concentrations (Hu, Balakrishnan et al. 2011; Kurhanewicz,Vigneron et al. 2011). However, the polarization is short lived and it persists over the periodof the spin-lattice relaxation time T1, which is about 1 second for 13C directly attached to aproton. For this reason, it is much preferred that a substrate contains a carbonyl orquaternary carbon, which may have a T1 value of 20-40 seconds or more depending on thein vivo conditions (Wilson, Keshari et al. 2010). This limits the time scale to less than 5minutes for DNP-MRS measurements. It is also not surprising that the most commonly usedsubstrate to date is 13C labeled pyruvate. Monitoring hyperpolarized 13C pyruvatemetabolism in cancer models has elucidated novel biomarkers for prostate cancer (Levin,Albers et al. 2009). In addition, hyperpolarized 13C pyruvate enabled tracking the action ofpotential anti-cancer drug dichloroacetate in vivo (Seth, Grant et al. 2011). Dichloroacetateattenuates lactate dehydrogenase activity by activating pyruvate dehydrogenase. The authorswere able to observe a significant reduction in lactate to pyruvate signal ratio in mice treatedwith dichloroacetate.
Goga and colleagues (Hu, Balakrishnan et al. 2011) used 13C pyruvate to monitor metabolicchanges in MYC-induced liver tumors in mouse models. Doxycyclin was used to suppressMYC expression. The mouse livers were histologically normal after the first four weeks ofdoxycyclin withdrawal, even though expression of MYC mRNA was detectable. After eightweeks the mice developed primary tumors. The tissues still appeared tumorous byhistological analysis after 72 hours of retreatment with doxycyclin, even though MYCexpression was completely inhibited. In parallel, the researchers administeredhyperpolarized 13C-1-pyruvate before doxycyclin withdrawal (normal liver), after fourweeks of doxycyclin withdrawal (pre-tumor liver), after eight weeks of doxycyclinwithdrawal (tumor), and 72 hours after returning doxycyclin treatment (tumor regression).They discovered that transamination of pyruvate to alanine was upregulated in pre-tumortissue, which corresponded to increased alanine transaminase mRNA expression andactivity. They also detected high levels of labeled lactate in the tumor tissues, whilesurrounding normal tissues displayed high levels of labeled pyruvate (Figure 11C).Increased lactate signals in tumor tissues correlated with enhanced lactate dehydrogenase(LDH) activity as well as mRNA and protein expression. Both LDH expression and 13Clactate signal decreased significantly in the regressed tumor tissues. Thus, the authors wereable to discover novel biomarkers for pre-MYC induced tumors and tumor regression. Thesebiomarkers were detectable before tumor development and regression were discernable byhistology. These results are consistent with reduced tumor growth elicited by LDH Aknockdown in vivo.
Hyperpolarized 13C-1-pyruvate was used to determine ex vivo rates of pyruvate uptake andturnover via LDH, PDH, ALT (Ala transaminase) reactions in isolated rat heart (Merritt,Harrison et al. 2007). With 1-second time resolution, the concentrations of 13C labeledpyruvate, lactate (LDH), alanine (ALT), CO2 and bicarbonate (PDH+carbonic anhydrase)could be measured (Figure 11D), from which metabolic fluxes could be estimated.
Fan et al. Page 24
Pharmacol Ther. Author manuscript; available in PMC 2013 March 01.
NIH
-PA Author Manuscript
NIH
-PA Author Manuscript
NIH
-PA Author Manuscript
In another recent application, Brindle and colleagues (Gallagher, Kettunen et al. 2008)developed a novel mechanism to measure pH in vivo. The authors injected a mouse modelwith hyperpolarized H13CO3
- and monitored its conversion to 13CO2 by carbonic anhydrase.pH was estimated by the Henderson-Hasselbalch equation: pH = pKa +log10(H13CO3
-/13CO2). Lymphoma-bearing mice had significantly more acidic tissue at thetumor site than the surrounding non-cancerous tissue.
Using different tracers, hyperpolarized MRI has the unique ability to monitor pathwayfluxes in vivo, which may lead to the discovery of novel targets and validate known targetssuch as LDH. A recent review discusses several hyperpolarized substrates that have beendeveloped and their subsequent metabolism as it relates to disease states (Xu, Lu et al.2008). Hyperpolarization studies of metabolism in vivo have already shown values inanimal-based preclinical studies. It is to be expected that they will be uniquely suited fortargeted and short term translational studies in human subjects as more hyperpolarizedsubstrates become available, multiplexing of several substrates is implemented (Wilson,Keshari et al. 2010), and the issues of toxicities are solved (Xu, Lu et al. 2008).
It is clear that all three in vivo imaging techniques can detect molecular markers that precedeanatomical markers and that they are valuable for real-time monitoring of treatment efficacy.Early detection of treatment response has the potential to expand the number of patientseligible for clinical trials. Currently, clinical trials are conducted in patients with advancestages of disease, after established treatment methods have failed. This is the least effectivepopulation to test new drugs because these patients may be the worst responders. Whilethese methods have serious drawbacks for comprehensive pathway analysis, they areexcellently suited for hypothesis-driven investigations of specific metabolic questions. Theprospect for real time tracking of specific metabolic reactions in human subjects in situ isexciting and will be a perfect complement to human subject-based SIRM studies.
V. Dynamic range and Sensitivity for Metabolite Detection by NMR and MSThe sensitivity of a technique depends on the ability to discriminate a signal above the noiselevel. This is not identical to the signal-to-noise ratio, which is defined as the integral of thesignal normalized to the root mean square noise figure. In spectroscopy, sharp resonancesare easier to detect above the noise than broad signals of the same integrated area or volume.The signal intensity depends on spectral resolution, in addition to the usual considerations ofthe quality of the detector, the efficiency of physical activation that is instrument andstructure-dependant, and the intrinsic sensitivity of the spectral property being measured.For example, in NMR, only 1 nucleus in about 500,000 is typically detected, owing to thevery small difference in populations between ground and excited states at room temperature,In contrast, mass spectrometry produces sub-percent to nearly 100% (for permanentlyionized compounds) of measurable ions, depending on the ion source design and chemicalstructure.
In a mixture of metabolites extracted from tissue or in a biofluid, there will be a very widedistribution of metabolite concentrations, ranging from high mM for the abundantmetabolites (e.g. lactate) to pM for some hormones. This dynamic range (>109) is extremelychallenging for any analytical technique, and currently no single platform is capable ofsimultaneously detecting all analytes present. Indeed this is a reason why multiple platformsshould be used in order to have a high coverage for metabolite analysis.
Among structure-based analytical platforms capable of isotopomer analysis, NMR is theleast sensitive technique, and does not usually detect molecules present at sub μMconcentrations. However, NMR detection is linear in response over nearly 5 orders ofmagnitude. Without any further sample manipulation, the dynamic range is determined by
Fan et al. Page 25
Pharmacol Ther. Author manuscript; available in PMC 2013 March 01.
NIH
-PA Author Manuscript
NIH
-PA Author Manuscript
NIH
-PA Author Manuscript
the digital resolution of the receiver, which in modern NMR spectrometers is at least 16 bits(range = 65,536), and may be closer to 20 bits effectively. As some of the digitization isused to represent noise, the actual dynamic range for detection is less than the number of bitsavailable. In practice the effective dynamic range is closer to 5×10³ owing to limitations inspectral resolution (defining as spectral width/peak width), which is of the order 104 andmuch worse for dilute species resonating next to very abundant ones. Some of the dynamicrange problems can be alleviated by suppressing unwanted signals via solvent exchange(e.g. D2O for H2O) and weak irradiation (“saturation”) or by targeting desired signals usingtailored excitation profiles. For isotopomer analysis, the isotope selection procedure itself(e.g. indirect proton detection of attached 13C) removes a large number of unlabeled signals(see above and (Fan and Lane 2011; Lane 2012)). Furthermore, as described above, targetedenrichment with DNP can enhance specific signals 5000-10000 fold, so that low abundancemetabolites can be selectively detected.
Relative to NMR, MS has always been considered as a more sensitive technique forisotopologue structure-based analysis and its sensitivity is highly platform-dependent. Withadvancement in novel nanomechanical MS, detection of a single protein molecule is withinreach (Naik, Hanay et al. 2009). However, it is unclear if such innovation will soon beapplicable to small molecules and how the high matrix (e.g. abundant non-targeted analytesand salts) interference (Lagerwerf, van Dongen et al. 2000; Taylor 2005; Vogeser and Seger2010) can be dealt with. As stated earlier, the latter has been a major hurdle to overcome fordirect analysis by MS without coupling to separation methods such as GC, LC, or capillaryelectrophoresis. With excellent separation such as 2D GCxGC, routine MS detection cannow reach down to sub pM (Sumner and Bedair 2008; Psychogios, Hau et al. 2011).
However, the digital dynamic range of the MS detectors is typically 212 (4096) to 214
(16384), which falls far short of the dynamic range (pM to mM) of metaboliteconcentrations in crude biological extracts. As part of the digitization is used for noisedefinition, this means that a 12-bit or a 14-bit digitizer has effective dynamic range of theorder 256 to 1024 or 1024-4096, respectively, for a single spectrum, i.e. no signal averaging.However, with signal averaging via direct infusion from a continuous ion source, thedynamic range can approach the upper values quoted, and the isotope ratio precision is alsogreatly improved (see section II.2). It must be kept in mind that this benefit of directinfusion is not practical for complex metabolomic analysis unless it is coupled with an MSof resolving power >200,000. The upshot of dynamic range limitations is that trace-levelmetabolites will need to be enriched before MS detection. Affinity chromatography or otherforms of separation methods as described above is a common but usually more timeconsuming strategy to pre-concentrate metabolites or to remove interfering matrix (Want,Smith et al. 2006; Pucci, Di Palma et al. 2009). Selective chemical derivatization is anothergood strategy, not only for metabolite enrichment but also for stabilization of labilemetabolites and increasing ionization efficiency (Fu, Li et al. 2011). We have utilized thisstrategy to enrich metabolites with carbonyl functionality for direct detection by FT-ICR-MS (e.g. pyruvate and oxaloacetate) (Mattingly et al., accepted for Metabolomics J. withminor revision). A summary of additional derivatization strategies for improving LC-MSdetection of metabolites with other functional groups can be found in the review by Santa(Santa 2011).
For the MS analysis of relative isotopologue distribution, the typical effective dynamic limitis constrained not only by the sensitivity but also by the digitization range of the MSdetector, which is at best a few % of the most abundant ions. In contrast, with the very highmass resolution techniques, such as FT-ICR-MS, the effective dynamic range can beextended to 0.05% under superior mass resolution and a 14-bit digitizer detector and signalaveraging of transients (Fan et al., unpublished data).
Fan et al. Page 26
Pharmacol Ther. Author manuscript; available in PMC 2013 March 01.
NIH
-PA Author Manuscript
NIH
-PA Author Manuscript
NIH
-PA Author Manuscript
VI. Biochemoinformatics and ModelingVI.1. Computational requirement for tracer studies
Informatics is an integral component of all ‘omics approaches from raw data reductionthrough interoperability of different data streams, standardization, statistical analysis tobiological interpretation (Sansone, Fan et al. 2007; Sumner, Amberg et al. 2007; Scalbert,Brennan et al. 2009; Redestig, Kusano et al. 2010). For metabolomics, this involvesprimarily analysis of NMR and MS raw data, reconstruction of metabolic networks, andmodeling of metabolic flux and regulations in extended networks. There has beenconsiderable effort expended on the various technical problems of MS and NMR dataanalyses, such as spectral alignment, semi-automated metabolite identification andquantification (Weljie, Newton et al. 2006) (Coulier, Bas et al. 2006; Van der Greef,Hankemeier et al. 2006; Zhao, Stoyanova et al. 2006; Schiavo, Ebbel et al. 2008; Kind,Wohlgemuth et al. 2009; Ebbel, Leymarie et al. 2010; Kumari, Stevens et al. 2011; Sands,Coen et al. 2011; Veselkov, Vingara et al. 2011). It is commonly recognized that manyfeatures in NMR and MS spectra are unassigned, and therefore difficult to quantifyrigorously and uninterpretable in the biochemical context. In SIRM studies, this problem isfurther aggravated by the need for analyzing mass isotopologues and positional isotopomersof metabolites to track the fate of individual atoms from a labeled tracer (cf. Figures 4 and6), which requires new computational resources to deconvolute. It is also non-trivial toremove natural abundance contribution when quantifying fractional label enrichment inmetabolites such as lipids, particularly for species with multiple labeled isotopes. For massisotopologue data acquired from FT-ICR-MS, natural abundance stripping for 13C isotopehas been solved algorithmically (Lane, Fan et al. 2009; Moseley 2010). However, thechemoinformatic development for automated determination of the isotopomers andisotopologues of different metabolites is at its infancy and is platform dependent, whetherthey be different types of MS (Lane, Fan et al. 2009; Moseley, Lane et al. 2011) or NMR(Fan and Lane 2008). Furthermore, to reconstruct metabolic pathways from labeledisotopomer and isotopologue profiles by computational means, in silico atom-resolveddatabases of metabolic networks are required and have been developed for E. coli by Arita(Arita 2003; Arita 2004) as well as for several organisms in the KEGG database (http://www.genome.jp/kegg/pathway.html). However, to date, there are no appropriate atom-tracking databases available for human that encompasses such essential elements ascompartmentation and interorgan interactions.
VI.2. Computational analyses of tracer dataVarious levels of computational analyses are applicable to MS and NMR data obtained fromtracer experiments. For profiling total metabolite levels, various data mining tools (e.g.principal components analysis, orthogonal partial least square-discriminant analysis) can beapplied to both assigned and unassigned MS and NMR data. These are by far the mostcommon tools for uncovering biomarkers using non-tracer types of NMR and MS data for avariety of diseases including cancers (Griffin and Shockcor 2004; Lindon and Nicholson2008; Fan, Lane et al. 2009). These methods may also be useful for initial biomarkerdiscovery with isotopomer and isotopologue data from stable isotope tracer studies.However, such purely statistical data mining approaches do not provide robustunderstanding of disease initiation and progression for drug target discovery. The next levelof data mining is required to identify stable isotope labeling patterns and to quantify theirdistribution for subsequent pathway reconstruction. This type of chemoinformatic tools isnot yet available for NMR or MS analysis, neither are the tools available for automatedreconstruction of human metabolic networks from labeled isotopomers and isotopologues ofmetabolites.
Fan et al. Page 27
Pharmacol Ther. Author manuscript; available in PMC 2013 March 01.
NIH
-PA Author Manuscript
NIH
-PA Author Manuscript
NIH
-PA Author Manuscript
However, there is a number of methodologies developed for quantitative flux modeling ofspecific pathways based on stable isotope labeling data. This is epitomized in the SiDMAP(Boros, Brackett et al. 2003) and metabolic control analysis (MCA) approaches (Fell 1992;Cascante, Boros et al. 2002). Moreover, a quantitative flux analysis of stable isotopeincorporation into metabolites of cancer cells has been pursued by a variety of relatedcomputational methodologies under the umbrella of metabolic flux analysis (MFA)(Wiechert, Mollney et al. 2001; Papin, Price et al. 2003; Blank, Kuepfer et al. 2005;Antoniewicz, Kelleher et al. 2006; Lee, Gianchandani et al. 2006; Antoniewicz, Kelleher etal. 2007). These methodologies rely on detailed human metabolic networks which areavailable from public metabolic databases such as KEGG (Kanehisa and Goto 2000; Goto,Okuno et al. 2002), HumanCyc (Romero, Wagg et al. 2004), and the human metabolomedatabase (Wishart, Tzur et al. 2007; Psychogios, Hau et al. 2011). However, none of thesedatabases are adequate in terms of compartmentalized metabolic reactions, or take intoaccount interorgan interactions.
A more comprehensive modeling of cellular metabolism also requires very complete andaccurate metabolic models, which have been developed for multiple prokaryotic species, afew eukaryotic species, but are still under heavy development for human cells (Duarte,Becker et al. 2007; Oberhardt, Palsson et al. 2009). Nevertheless, significant strides havebeen made in developing cancer-relevant models of cellular metabolism which have alreadydemonstrated the utility for identifying new drug targets for cancer (Folger, Jerby et al.2011). The majority of the model-based metabolic flux analysis (MFA) on human cells hasbeen limited to central carbon metabolism under metabolic steady-state conditions, whichrequires high concentrations of labeled tracers, typically 13C-labeled glucose and for longperiods (Maier, Hofmann et al. 2008; Meadows, Kong et al. 2008; Yang, Richardson et al.2008; Metallo, Walther et al. 2009). Even when isotopic steady state is established formetabolic end products such as lactate, there is no assurance that other metabolites in themodeled metabolic networks are in the required isotopic equilibrium. This is particularly thecase for “hub” metabolites such as glutamate, which can participate in more than 200metabolic reactions (M. Arita, personal communication); its isotopic steady-state was notreached in lung cancer A549 cells even after 96 h of growth in 13C6-glucose (Fan,unpublished data). Therefore, the early successes of 13C MFA in prokaryotic systems underchemostat conditions (Tang, Martin et al. 2009; Dauner 2010) cannot be directly applied toalmost all tissue culture experiments in complex media due to the metabolically non-steady-state (non-stationary or instationary) conditions resulting in part from batch-fed, unstirrednature of the experimental set up (Wahl, Nöh et al. 2008; Noack, Nöh et al. 2010; Zamboni2010). It is self-evident that the applicability to whole organisms such as humans is evenfurther distant.
Moreover, it may not be practical to establish isotopic steady state when cell metabolism isperturbed by drug treatments or by fluctuations of nutrient status to be expected in tissuemicroenvironment. Nutrient deficiency can dictate non-steady-state conditions because thetransporters typically have Km values in the range 1-10 mM (Shepherd and Kahn 1999).Finally, it is unrealistic to expect isotopic steady-state conditions for human tracer studiessince not only this is cost-prohibitive but also incompatible with ethical standards.
A recent development by Moseley et al. demonstrated a novel approach to non-steady statemodeling of relative flux through intersecting metabolic pathways (Moseley, Lane et al.2011; Moseley, Higashi et al. 2011). The approach involves tracing biochemical subunits(e.g. acetyl, ribosyl, uracil) through metabolic networks from the labeled tracer (e.g. 13C6-glucose) to the detected metabolite (e.g. uridine diphosphate N-acetylglucosamine or UDP-GlcNAc), which allows computational deconvolution of a set of mass isotopologue dataacquired from FT-ICR-MS into fractional labeling of these subunits in the detected
Fan et al. Page 28
Pharmacol Ther. Author manuscript; available in PMC 2013 March 01.
NIH
-PA Author Manuscript
NIH
-PA Author Manuscript
NIH
-PA Author Manuscript
metabolite. This deconvolution enables modeling of fractional labeling patterns into relativeflux through relevant metabolic pathways. This approach (Genetic Algorithm forIsotopologues in Metabolic Systems or GAIMS) was demonstrated in prostate cancer cellswhere a time series of FT-ICR-MS isotopologue data for UDP-GlcNAc were deconvolutedinto time-dependent fractional labeling of its four subunits (glucose, ribose, uracil, andacetyl). The label incorporation into the subunits was also confirmed by NMR. Themodeling outcome revealed a large relative flux (>80%) through the PPP and hexosaminebiosynthetic pathway versus half to a third of the flux through glycolysis and the Krebscycle. In addition, the robustness of this approach was tested by selecting the correctdeconvolution out of 40 alternatives (Moseley, Lane et al. 2011). These results demonstratethe promise of the GAIMS approach for non-steady state modeling of fluxes throughmetabolic networks and its value as a validation tool for models built from known metabolicnetworks (Moseley, Lane et al. 2011; Moseley, Higashi et al. 2011).
To facilitate metabolic flux modeling in mammalian systems including human, futuredevelopment should therefore focus on i) automation of isotopologue and isotopomerassignments and quantification from large MS and NMR datasets; (ii) developing robustmetabolic flux analyses that can deal with metabolically non-stationary states of thesesystems; iii) improving network models of human metabolism, particularly regardingcompartmentation for a variety of cell and tissue types; and iv) making these modelsavailable in open standards like the systems biology markup language or SBML (Hucka,Finney et al. 2003). Already there is progress in the extension and development of a varietyof methods to handle the metabolic realities of cell culture and whole organism experiments(Selivanov, Marin et al. 2006; Baxter, Liu et al. 2007; Lee, Gianchandani et al. 2008; Wahl,Nöh et al. 2008). Recently, non-stationary methods were applied to metabolic flux analysisfor cancer cells (Selivanov, Vizan et al. 2010). These approaches generally solve thedifferential equations for a set of biochemical reactions that represent a realistic model of therelevant metabolic processes (Maher, Kuchel et al. 2003; Selivanov, Puigjaner et al. 2004;Selivanov, Meshalkina et al. 2005; Possemato, Marks et al. 2011). For small networksmodels, it is possible to solve the differential equations analytically (Yuan, Bennett et al.2008; Lane, Fan et al. 2011) but such approaches are necessarily limited. This is because asthe model become more complex, the number of differential equations will expand rapidlyto render such computational approaches intractable. For larger, more biologically realisticmodels, numerical solutions are essential. Given the interrelatedness of metabolic networks(Arita 2004), it remains an art determining how large the model should encompass to berealistic, while computationally tractable. In the past, metabolic models tend to be simplisticbecause they do not account for dynamic compartmentation, even though the problem hasbeen long recognized (Wolfe 1992), and isotope tracing can detect different intracellularpools of metabolites (cf. Figure 5) (Fan and Lane 2008). Although a selected set ofcompartmentalized events have been modeled in humans, such as the glutamate cyclingbetween astrocytes and neurons (Mason and Rothman 2004; Patel, de Graaf et al. 2005;Mason, Petersen et al. 2007), dynamic compartmentation issues will remain to be the“Achilles heel” of large-scale network modeling for cells, not to say of tissues or wholeorganisms.
VII. Future DirectionsIt is clear that complementary and confirmatory structure-based tools such as NMR and MSare indispensable for resolving complex metabolic networks. Past metabolic studies havetended to utilize either tool alone, which cannot benefit from the synergism of the combinedapproaches. Facing a multitude of difficult challenges in deciphering human diseasemetabolome and its response to therapeutics, it is most efficient and reliable to integrate
Fan et al. Page 29
Pharmacol Ther. Author manuscript; available in PMC 2013 March 01.
NIH
-PA Author Manuscript
NIH
-PA Author Manuscript
NIH
-PA Author Manuscript
stable isotope tracers, MS, NMR, and any other relevant approaches (such as those outlinedin this review) in future research.
As the emerging stable isotope tracer-based metabolomic approach matures, it is foreseeablethat the full complexity of the mammalian metabolic networks may begin to unfold for thefirst time in biomedical history. For this to be of translational and clinical relevance, ourunderstanding of the metabolic networks on models must be ultimately validated by in vivostudies directly on human subjects, a trend that has already started (Fan, Lane et al. 2009).This is where one area of future tracer-based metabolomics research should be emphasized.A second area is the development of appropriate atom-tracking human metabolomedatabases and biochemoinformatic tools for analyzing metabolite labeling patterns from rawdata and for reconstructing and modeling the networks. A third area is to developcomputational tools for integrating the metabolic network functions with functionalgenomics and proteomics information into comprehensive metabolic, signaling, and generegulatory models that can be used to discern key nodes in network regulation. These nodesare crucial to realizing the full benefit of systems biochemical understanding of humandiseases in therapeutic development and validation, such as timely, cost-effective, andefficacious drug development with optimal on-target effects and minimal off-target toxicity.It is our view that the exciting technologies presented in the review will help revolutionizethe field of pharmacology and therapeutics in the 21st century.
AcknowledgmentsThis work was supported by 1R01CA118434-01A2, 1RO1CA101199-01, and 3R01CA118434-02S1 (TWMF),from the National Cancer Institute, the University of Louisville CTSPGP/ARRA grant 20044, the Kentucky LungCancer Research Program OGMB090354B1 and OGMB101380 (TWMF and ANL) and OGMB080120S1(fellowship to PL), NSF/EPSCoR grant EPS-0447479 (TWMF) for the FT-ICR-MS instrumentation, and theKentucky Challenge for Excellence. We thank our colleagues for interest and support of stable isotope resolvedmetabolomics and CREAM
Abbreviations
SIRM Stable Isotope Resolved Metabolomics
META Metabolomics Edited Transcriptomic Analysis
SiDMAP Stable isotope-based Dynamic Metabolic Profiling
FT-ICR Fourier Transform-Ion Cyclotron Resonance
IRMS isotope ratio MS
PET Positron Emission Tomography
CT computed tomography
MALDI matrix-assisted laser desorption ionization
TOCSY total correlation spectroscopy
HSQC heteronuclear single quantum coherence spectroscopy
HR-MAS high-resolution magic angle spinning
MRI magnetic resonance imaging
MRS magnetic resonance spectroscopy
CSI chemical shift imaging
DNP Dynamic Nuclear Polarization
Fan et al. Page 30
Pharmacol Ther. Author manuscript; available in PMC 2013 March 01.
NIH
-PA Author Manuscript
NIH
-PA Author Manuscript
NIH
-PA Author Manuscript
NIR near infrared region
FRET fluorescence resonance energy transfer
α-KG α-ketoglutarate
2-HG 2-hydroxyglutarate
GSH reduced glutathione
GSSG oxidized glutathione
AXP adenine nucleotides
UXP uracil nucleotides
2-DG 2-deoxyglucose
2-FDG 2-fluorodeoxy-D-glucose
MSA methylseleninic acid13C6-Glc uniformly 13C labeled glucose
PC pyruvate carboxylation
PCh phosphatidylcholines
RC reductive carboxylation
PEP phosphoenolpyruvate
OAA oxaloacetate
SM sphingomyelins
UDP-GlcNAc uridine diphosphate N-acetylglucosamine
Pi inorganic phosphate
5-ALA 5-aminolevulinic acid
MTBSTFA N-methyl-N-(tert-butyldimethylsilyl) trifluoroacetamide
BPTES bis-2-(5-phenylacetamido-1,2,4-thiadiazol-2-yl)ethyl sulfide
FH fumarate hydratase
LDH lactate dehydrogenase
PCB pyruvate carboxylase
PDH pyruvate dehydrogenase
IDH isocitrate dehydrogenase
SDH succinate dehydrogenase
PGM phosphoglycerate mutase
EGFR epithelial growth factor receptor
MMP metalloproteinase
ALT alanine transaminase
PPP pentose phosphate pathway
ADMET absorption, distribution, metabolism, excretion, and toxicity
NSCLC non-small cell lung cancer
Fan et al. Page 31
Pharmacol Ther. Author manuscript; available in PMC 2013 March 01.
NIH
-PA Author Manuscript
NIH
-PA Author Manuscript
NIH
-PA Author Manuscript
BAC bronchioloadenocarcinoma
NC non-cancerous
SUV standardized uptake values
MCA metabolic control analysis
MFA metabolic flux analysis
ReferencesAdams CP, Brantner VV. Estimating the cost of new drug development: Is it really $802 million?
Health Affairs. 2006; 25(2):420–428. [PubMed: 16522582]
Adams CP, Brantner VV. Spending on new drug development. Health Economics. 2010; 19(2):130–141. [PubMed: 19247981]
Aharoni A, Ric de Vos CH, et al. Nontargeted metabolome analysis by use of Fourier Transform IonCyclotron Mass Spectrometry. OMICS. 2002; 6(3):217–234. [PubMed: 12427274]
Aledo JC, Gomez-Fabre PM, et al. Identification of two human glutaminase loci and tissue-specificexpression of the two related genes. Mammalian Genome. 2000; 11(12):1107–1110. [PubMed:11130979]
Andrew Clayton T, Lindon JC, et al. Pharmaco-metabonomic phenotyping and personalized drugtreatment. Nature. 2006; 440(7087):1073–1077. [PubMed: 16625200]
Anousis N, Carvalho RA, et al. Compartmentation of glycolysis and glycogenolysis in the perfused ratheart. Nmr in Biomedicine. 2004; 17(2):51–59. [PubMed: 15052552]
Antoniewicz MR, Choi J. Tandem mass spectrometry: A novel approach for metabolic flux analysis.Metabolic Engineering. 2011; 13(2):225–233. [PubMed: 21134484]
Antoniewicz MR, Kelleher JK, et al. Determination of confidence intervals of metabolic fluxesestimated from stable isotope measurements. Metabolic Engineering. 2006; 8(4):324–337.[PubMed: 16631402]
Antoniewicz MR, Kelleher JK, et al. Elementary metabolite units (EMU): a novel framework formodeling isotopic distributions. Metabolic Engineering. 2007; 9(1):68–86. [PubMed: 17088092]
Arita M. In silico atomic tracing by substrate-product relationships in Escherichia coli intermediarymetabolism. Genome Research. 2003; 13(11):2455–2466. [PubMed: 14559781]
Arita M. Computational resources for metabolomics. Briefings in Functional Genomics andProteomics. 2004; 3(1):84–93. [PubMed: 15163362]
Arita M. The metabolic world of Escherichia coli is not small. Proceedings of the National Academyof Sciences of the United States of America. 2004; 101(6):1543–1547. [PubMed: 14757824]
Arrowsmith J. Biobusiness Briefs: Trial watch: Phase II failures: 2008–2010. Nature Reviews DrugDiscovery. 2011; 10:328–329.
Athersuch TJ, Nicholson JK, et al. Isotopic enrichment enhancement in metabonomic analysis ofUPLC-MS data sets. Journal of Labelled Compounds & Radiopharmaceuticals. 2007; 50(5-6):303–307.
Bachert P. Pharmacokinetics using fluorine NMR in vivo. Progress in Nuclear Magnetic ResonanceSpectroscopy. 1998; 33(1):1–56.
Bares R, Eschmann SM, et al. 18F-fluorodeoxyglucose positron emission tomography in the diagnosisof lung cancer. Acta medica Austriaca FIELD Publication Date:2002. 2002; 29(5):171–175.FIELD Reference Number:139 FIELD Journal Code:7501997 FIELD Call Number:.
Bathen TF, Sitter B, et al. Magnetic Resonance Metabolomics of Intact Tissue: A BiotechnologicalTool in Cancer Diagnostics and Treatment Evaluation. Cancer Research. 2010; 70(17):6692–6696.[PubMed: 20699363]
Bax A, Freeman R, et al. An Nmr Technique for Tracing out the Carbon Skeleton of an Organic-Molecule. Journal of the American Chemical Society. 1981; 103(8):2102–2104.
Fan et al. Page 32
Pharmacol Ther. Author manuscript; available in PMC 2013 March 01.
NIH
-PA Author Manuscript
NIH
-PA Author Manuscript
NIH
-PA Author Manuscript
Baxter C, Liu J, et al. Determination of metabolic fluxes in a non-steady-state system. Phytochemistry.2007; 68(16-18):2313–2319. [PubMed: 17582446]
Beavis RC, Bridson JN. EPITAXIAL PROTEIN INCLUSION IN SINAPIC ACID CRYSTALS.Journal of Physics D-Applied Physics. 1993; 26(3):442–447.
Beckonert O, Coen M, et al. High-resolution magic-angle-spinning NMR spectroscopy for metabolicprofiling of intact tissues. Nature Protocols. 2010; 5(6):1019–1032.
Beger R, Hansen D, et al. Single valproic acid treatment inhibits glycogen and RNA ribose turnoverwhile disrupting glucose-derived cholesterol synthesis in liver as revealed by the [U-13C6]-d-glucose tracer in mice. Metabolomics. 2009; 5(3):336–345. [PubMed: 19718458]
Blackledge CA, Nicholson JK, et al. Application of H-1- and F-19-NMR spectroscopy in theinvestigation of the urinary and biliary excretion of 3,5-, 2,4-ditrifluoromethylbenzoic andpentafluorobenzoic acids in rat. Xenobiotica. 2002; 32(7):605–613. [PubMed: 12162856]
Blackledge CA, Nicholson JK, et al. An NMR study of the metabolic fate of 2-, 3- and 4-fluorobenzylalcohols in the rat - Detection of N-acetylcysteinyl conjugates as minor metabolites in urine.Journal of Pharmaceutical and Biomedical Analysis. 2003; 32(1):133–140. [PubMed: 12852455]
Blank LM, Kuepfer L, et al. Large-scale 13C-flux analysis reveals mechanistic principles of metabolicnetwork robustness to null mutations in yeast. Genome biology. 2005; 6(6):R49. [PubMed:15960801]
Blech S, Ludwig-Schwellinger E, et al. The Metabolism and Disposition of the Oral DipeptidylPeptidase-4 Inhibitor, Linagliptin, in Humans. Drug Metabolism and Disposition. 2010; 38(4):667–678. [PubMed: 20086031]
Boeneman K, Mei BC, et al. Sensing caspase 3 activity with quantum dot-fluorescent proteinassemblies. Journal of the American Chemical Society. 2009; 131(11):3828–3829. [PubMed:19243181]
Borel AG, Abbott FS. Metabolic Profiling of Clobazam, a 1,5-Benzodiazepine, in Rats. DrugMetabolism and Disposition. 1993; 21(3):415–427. [PubMed: 8100496]
Boren J, Cascante M, et al. Gleevec (ST1571) influences metabolic enzyme activities and glucosecarbon flow toward nucleic acid and fatty acid synthesis in myeloid tumor cells. Journal ofBiological Chemistry. 2001; 276(41):37747–37753. [PubMed: 11489902]
Boros LG, Brackett DJ, et al. Metabolic biomarker and kinase drug target discovery in cancer usingstable isotope-based dynamic metabolic profiling (SIDMAP). Current cancer drug targets. 2003;3(6):445–453. [PubMed: 14683502]
Boros LG, Cascante M, et al. Metabolic profiling of cell growth and death in cancer: applications indrug discovery. Drug Discovery Today. 2002; 7(6):364–372. [PubMed: 11893545]
Boros LG, Lee WP, et al. Imatinib and chronic-phase leukemias. New England Journal of Medicine.2002; 347(1):67–68. [PubMed: 12097546]
Boutrid H, Jockovich ME, et al. Targeting hypoxia, a novel treatment for advanced retinoblastoma.Investigative Ophthalmology & Visual Science. 2008; 49(7):2799–2805. [PubMed: 18326690]
Bouzier-Sore AK, Serres S, et al. Lactate involvement in neuron-glia metabolic interaction: C-13-NMR spectroscopy contribution. Biochimie. 2003; 85(9):841–848. [PubMed: 14652173]
Brand A, RichterLandsberg C, et al. In vivo C-13 and P-31 NMR spectroscopy on primary neuronsimmobilized in basement membrane gel threads. Journal of Neurochemistry. 1996; 66:S90–S90.
Brazier JL, Ribon B, et al. Study of Theophylline Metabolism in Premature Human Newborns UsingStable Isotope Labeling. Biomedical Mass Spectrometry. 1980; 7(5):189–192. [PubMed: 7417694]
Brazier JL, Salle B, et al. Invivo N-7 Methylation of Theophylline to Caffeine in Premature-Infants -Studies with Use of Stable Isotopes. Developmental Pharmacology and Therapeutics. 1981; 2(3):137–144. [PubMed: 7227139]
Brindle K. New approaches for imaging tumour responses to treatment. Nature reviews. Cancer. 2008;8(2):94–107.
Brindle KM, Radda GK. 31P-NMR saturation transfer measurements of exchange between Pi andATP in the reactions catalysed by glyceraldehyde-3-phosphate dehydrogenase andphoshoglycerate kinase in vitro. Biochimica et biophysica acta. 1987; 928:45–55. [PubMed:3828401]
Fan et al. Page 33
Pharmacol Ther. Author manuscript; available in PMC 2013 March 01.
NIH
-PA Author Manuscript
NIH
-PA Author Manuscript
NIH
-PA Author Manuscript
Brosius FC, Alpers CE, et al. Mouse Models of Diabetic Nephropathy. Journal of the AmericanSociety of Nephrology. 2009; 20(12):2503–2512. [PubMed: 19729434]
Brown TR. PRACTICAL APPLICATIONS OF CHEMICAL-SHIFT IMAGING. Nmr inBiomedicine. 1992; 5(5):238–243. [PubMed: 1449963]
Brun E, Kjellen E, et al. FDG PET studies during treatment: prediction of therapy outcome in head andneck squamous cell carcinoma. Head & neck. 2002; 24(2):127–135. [PubMed: 11891942]
Burgess SC, Babcock EE, et al. NMR indirect detection of glutamate to measure citric acid cycle fluxin the isolated perfused mouse heart. Febs Letters. 2001; 505(1):163–167. [PubMed: 11557062]
Burgess SC, Weis B, et al. Noninvasive evaluation of liver metabolism by H-2 and C-13 NMRisotopomer analysis of human urine. Analytical Biochemistry. 2003; 312(2):228–234. [PubMed:12531210]
Cai W, Rao J, et al. How molecular imaging is speeding up antiangiogenic drug development.Molecular cancer therapeutics. 2006; 5(11):2624–2633. [PubMed: 17121909]
Cai W, Shin DW, et al. Peptide-labeled near-infrared quantum dots for imaging tumor vasculature inliving subjects. Nano letters. 2006; 6(4):669–676. [PubMed: 16608262]
Caprioli RM, Cornett DS, et al. MALDI-FTICR imaging mass spectrometry of drugs and metabolitesin tissue. Analytical Chemistry. 2008; 80(14):5648–5653. [PubMed: 18564854]
Caron KMI, James LR, et al. A genetically clamped renin transgene for the induction of hypertension.Proceedings of the National Academy of Sciences of the United States of America. 2002; 99(12):8248–8252. [PubMed: 12034874]
Carvalho RA, Babcock EE, et al. Multiple bond C-13-C-13 spin-spin coupling providescomplementary information in a C-13 NMR isotopomer analysis of glutamate. MagneticResonance in Medicine. 1999; 42(1):197–200. [PubMed: 10398967]
Carvalho RA, Jeffrey FMH, et al. C-13 isotopomer analysis of glutamate by heteronuclear multiplequantum coherence total correlation spectroscopy (HMQC-TOCSY). Febs Letters. 1998; 440(3):382–386. [PubMed: 9872407]
Carvalho RA, Rodrigues TB, et al. A C-13 isotopomer kinetic analysis of cardiac metabolism:influence of altered cytosolic redox and [Ca2+](o). American Journal of Physiology-Heart andCirculatory Physiology. 2004; 287(2):H889–H895. [PubMed: 15044195]
Carvalho RA, Zhao P, et al. TCA cycle kinetics in the rat heart by analysis of C-13 isotopomers usingindirect H-1 C-13 detection. American Journal of Physiology-Heart and Circulatory Physiology.2001; 281(3):H1413–H1421. [PubMed: 11514314]
Cascante M, Boros LG, et al. Metabolic control analysis in drug discovery and disease. NatureBiotechnology. 2002; 20(3):243–249.
Ceglarek U, Kortz L, et al. Fast liquid chromatography combined with mass spectrometry for theanalysis of metabolites and proteins in human body fluids. Analytical and BioanalyticalChemistry. 2011; 399(8):2635–2644. [PubMed: 21253711]
Cermik TF, Mavi A, et al. Impact of FDG PET on the preoperative staging of newly diagnosed breastcancer. European Journal of Nuclear Medicine and Molecular Imaging. 2008; 35(3):475–483.[PubMed: 17957366]
Chance B, Nakase Y, et al. Detection of 31P nuclear magnetic resonance signals in brain by in vivoand freeze-trapped assays. Proc Natl Acad Sci U S A. 1978; 75(10):4925–4929. [PubMed:283403]
Chen C, Gonzalez FJ, et al. LC-MS-based metabolomics in drug metabolism. Drug MetabolismReviews. 2007; 39(2-3):581–597. [PubMed: 17786640]
Chen L, Collins XH, et al. Use of a 13C tracer to investigate lutein as a ligand for plasma transthyretinin humans. Lipids. 2005; 40(10):1013–1022. [PubMed: 16382573]
Cheng T, Sudderth J, et al. Pyruvate carboxylase is required for glutamine-independent growth oftumor cells. Proceedings of the National Academy of Sciences of the United States of America.2011; 108(21):8674–8679. [PubMed: 21555572]
Claridge, TDW. High-resolution NMR techniques in organic chemistry. Elsevier; San Diego: 1999.
Clark LC, Combs GF, et al. Effects of selenium supplementation for cancer prevention in patients withcarcinoma of the skin a randomized controlled trial - A randomized controlled trial. Jama-Journalof the American Medical Association. 1996; 276(24):1957–1963.
Fan et al. Page 34
Pharmacol Ther. Author manuscript; available in PMC 2013 March 01.
NIH
-PA Author Manuscript
NIH
-PA Author Manuscript
NIH
-PA Author Manuscript
Clasquin MF, Melamud E, et al. Riboneogenesis in yeast. Cell. 2011; 145:969–980. [PubMed:21663798]
Clem BF, Clem AL, et al. A novel small molecule antagonist of choline kinase-alpha thatsimultaneously suppresses MAPK and PI3K/AKT signaling. Oncogene. 2011; 30(30):3370–3380.[PubMed: 21423211]
Clem BF, Telang S, et al. Small Molecule Inhibition of 6-Phosphofructo-2-Kinase Activity SuppressesGlycolytic Flux and Tumor Growth. Molecular Cancer Therapeutics. 2008; 7:110–120. [PubMed:18202014]
Cline GW, LePine RL, et al. C-13 NMR isotopomer analysis of anaplerotic pathways in INS-1 cells.Journal of Biological Chemistry. 2004; 279(43):44370–44375. [PubMed: 15304488]
Corcoran O, Lindon JC, et al. The potential of F-19 NMR spectroscopy for rapid screening of cellcultures for models of mammalian drug metabolism. Analyst. 2001; 126(12):2103–2106.[PubMed: 11814184]
Cornett DS, Reyzer ML, et al. MALDI imaging mass spectrometry: molecular snapshots ofbiochemical systems. Nature Methods. 2007; 4(10):828–833. [PubMed: 17901873]
Coulier L, Bas R, et al. Simultaneous quantitative analysis of metabolites using ion-pair liquidchromatography - Electrospray ionization mass spectrometry. Analytical Chemistry. 2006; 78(18):6573–6582. [PubMed: 16970336]
Dailey MD, Hait C, et al. Structure-based Drug Design: From Nucleic Acid to Membrane ProteinTargets. Exp. Molec. Pathol. 2009; 86:141–150. [PubMed: 19454265]
Dang CV. Glutaminolysis Supplying carbon or nitrogen or both for cancer cells? Cell Cycle. 2010;9(19):3884–3886. [PubMed: 20948290]
Dang CV, Hamaker M, et al. Therapeutic targeting of cancer cell metabolism. Journal of MolecularMedicine-Jmm. 2011; 89(3):205–212.
Dang CV, Le A, et al. MYC-Induced Cancer Cell Energy Metabolism and Therapeutic Opportunities.Clinical Cancer Research. 2009; 15(21):6479–6483. [PubMed: 19861459]
Dang L, Jin S, et al. IDH mutations in glioma and acute myeloid leukemia. Trends in MolecularMedicine. 2010; 16(9):387–397. [PubMed: 20692206]
Dang L, White DW, et al. Cancer-associated IDH1 mutations produce 2-hydroxyglutarate. Nature.2009; 462(7274):739–744. [PubMed: 19935646]
Dauner M. From fluxes and isotope labeling patterns towards in silico cells. Current opinion inbiotechnology. 2010; 21(1):55–62. [PubMed: 20185292]
de Atauri P, Benito A, et al. Carbon metabolism and the sign of control coefficients in metabolicadaptations underlying K-ras transformation. Biochimica Et Biophysica Acta-Bioenergetics. 2011;1807(6):746–754.
de Molina AR, Gallego-Ortega D, et al. Choline kinase is a novel oncogene that potentiates RhoA-induced carcinogenesis. Cancer Research. 2005; 65(13):5647–5653. [PubMed: 15994937]
DeBerardinis RJ, Cheng T. Q's next: the diverse functions of glutamine in metabolism, cell biologyand cancer. Oncogene. 2010; 29(3):313–324. [PubMed: 19881548]
DeBerardinis RJ, Lum JJ, et al. The biology of cancer: Metabolic reprogramming fuels cell growth andproliferation. Cell Metabolism. 2008; 7(1):11–20. [PubMed: 18177721]
DeBerardinis RJ, Mancuso A, et al. Beyond aerobic glycolysis: Transformed cells can engage inglutamine metabolism that exceeds the requirement for protein and nucleotide synthesis.Proceedings of the National Academy of Sciences of the United States of America. 2007; 104(49):19345–19350. [PubMed: 18032601]
Denzinger S, Burger M, et al. Clinically relevant reduction in risk of recurrence of superficial bladdercancer using 5-aminolevulinic acid-induced fluorescence diagnosis: 8-year results of prospectiverandomized study. Urology. 2007; 69(4):675–679. [PubMed: 17445650]
Des Rosiers C, Chatham JC. Myocardial phenotyping using isotopomer analysis of metabolic fluxes.Biochemical Society Transactions. 2005; 33:1413–1417. [PubMed: 16246133]
Des Rosiers C, Lloyd S, et al. A critical perspective of the use of C-13-isotopomer analysis by GCMSand NMR as applied to cardiac metabolism. Metabolic Engineering. 2004; 6(1):44–58. [PubMed:14734255]
Fan et al. Page 35
Pharmacol Ther. Author manuscript; available in PMC 2013 March 01.
NIH
-PA Author Manuscript
NIH
-PA Author Manuscript
NIH
-PA Author Manuscript
Dhital K, Saunders CA, et al. (18)F]Fluorodeoxyglucose positron emission tomography and itsprognostic value in lung cancer. European journal of cardiothoracic surgery. 2000; 18(4):425–428.[PubMed: 11024379]
Donadio AC, Lobo C, et al. Antisense glutaminase inhibition modifies the O-GlcNAc pattern and fluxthrough the hexosamine pathway in breast cancer cells. Journal of Cellular Biochemistry. 2008;103(3):800–811. [PubMed: 17614351]
Dorrestein PC, Watrous JD. Imaging mass spectrometry in microbiology. Nature ReviewsMicrobiology. 2011; 9(9):683–694.
Duarte NC, Becker SA, et al. Global reconstruction of the human metabolic network based on genomicand bibliomic data. PNAS. 2007; 104(6):1777–1782. [PubMed: 17267599]
Dusick JR, Glenn TC, et al. Increased pentose phosphate pathway flux after clinical traumatic braininjury: a 1,2-C-13(2) glucose labeling study in humans. Journal of Cerebral Blood Flow andMetabolism. 2007; 27(9):1593–1602. [PubMed: 17293841]
Ebbel EN, Leymarie N, et al. Identification of phenylbutyrate-generated metabolites in Huntingtondisease patients using parallel liquid chromatography/electrochemical array/mass spectrometry andoff-line tandem mass spectrometry. Analytical Biochemistry. 2010; 399(2):152–161. [PubMed:20074541]
Elbers JRJ, Vanunnik JAM, et al. Pyruvate-Kinase Activity and Isozyme Composition in NormalFibrous Tissue and Fibroblastic Proliferations. Cancer. 1991; 67(10):2552–2559. [PubMed:2015555]
Elias DR, Thorek DL, et al. In vivo imaging of cancer biomarkers using activatable molecular probes.Cancer biomarkers : section A of Disease markers. 2008; 4(6):287–305.
Estrada R, Borchman D, et al. In vitro and in situ tracking of choline-phospholipid biogenesis byMALDI TOF-MS. Anal Chem. 2006; 78(4):1174–1180. [PubMed: 16478109]
Fan T, Bandura L, et al. Metabolomics-edited transcriptomics analysis of Se anticancer action inhuman lung cancer cells. Metabolomics Journal. 2005; 1(4):325–339.
Fan T, Lane A, et al. Stable isotope resolved metabolomics of lung cancer in a SCID mouse model.Metabolomics. 2011; 7(2):257–269. [PubMed: 21666826]
Fan TW. Metabolite Profiling by One and Two-Dimensional NMR Analysis of Complex Mixtures.Progress in Nuclear Magnetic Resonance Spectroscopy. 1996; 28:161–219.
Fan TW, Kucia M, et al. Rhabdomyosarcoma cells show an energy producing anabolic metabolicphenotype compared with primary myocytes. Mol Cancer. 2008; 7:79. [PubMed: 18939998]
Fan TW, Lane AN. Structure-based profiling of Metabolites and Isotopomers by NMR. Progress inNMR Spectroscopy. 2008; 52:69–117.
Fan TW, Lane AN, et al. Metabolic profiling identifies lung tumor responsiveness to erlotinib. ExpMol Pathol. 2009; 87:83–86. [PubMed: 19409891]
Fan TW, Lane AN, et al. Altered Regulation of Metabolic Pathways in Human Lung Cancer Discernedby 13C Stable Isotope-Resolved Metabolomics (SIRM)). Molecular Cancer. 2009; 8:41. [PubMed:19558692]
Fan, TW-M. Recent Advancement in Profiling Plant Metabolites by Multi-Nuclear and Multi-dimensional NMR. American Society of Plant Physiologists; Rockville, MD: 1996.
Fan, TW-M., editor. Metabolomics-Edited Transcriptomics Analysis (Meta). Academic Press; Oxford:2010. Comprehensive Toxicology..
Fan, TW-M. Metabolomics-Edited Transcriptomics Analysis (Meta).. In: McQueen, CA., editor.Comprehensive Toxicology. Vol. 2. Academic Press; Oxford: 2010. p. 685-706.
Fan TW-M, Lane AN. NMR-based Stable Isotope Resolved Metabolomics in Systems Biochemistry.J. Biomolec. NMR. 2011; 49:267–280.
Fan, TW-M.; Lane, AN., editors. Assignment strategies for NMR resonances in metabolomicsresearch. Cambridge University Press; Cambridge: 2012. Methodologies for Metabolomics:Experimental Strategies and Techniques..
Fan TW-M, Lane AN, et al. Erlotinib-sensitive and resistant lung tumors show radically differentmetabolic profiles. Exp. Molec. Pathol. 2009; 87:83–86. [PubMed: 19409891]
Fan et al. Page 36
Pharmacol Ther. Author manuscript; available in PMC 2013 March 01.
NIH
-PA Author Manuscript
NIH
-PA Author Manuscript
NIH
-PA Author Manuscript
Fan TW-M, Lane AN, et al. The Promise of Metabolomics in Cancer Molecular Therapeutics. CurrentOpnion in Molecular Therapeutics. 2004; 6(6):584–592.
Fan TW-M, Lane AN, et al. Stable Isotope Resolved Metabolomics of Lung Cancer in a SCID MouseModel. Metabolomics. 2011; 7:257–269. [PubMed: 21666826]
Fan TW-M, Tan J, et al. Stable Isotope Resolved Metabolomics Analysis of Ribonucleotide and RNAMetabolism in Human Lung Cancer Cells. Metabolomics. 2011 doi:10.1007/s11306-011-0337-9.
Fan TW-M, Yuan P, et al. Stable Isotope-Resolved Metabolomic Analysis of Lithium Effects on Glial-Neuronal Metabolism and Interactions. Metabolomics. 2010; 6(2):165–179. [PubMed:20631920]
Fan TWM, Clifford AJ, et al. In vivo 13C NMR analysis of acyl chain composition and organizationof perirenal triacylglycerides in rats fed vegetable and fish oils. Journal of Lipid Research. 1994;35(4):678–689. [PubMed: 8006523]
Fan TWM, Colmer TD, et al. Determination of Metabolites by H-1-Nmr and Gc - Analysis forOrganic Osmolytes in Crude Tissue-Extracts. Analytical biochemistry. 1993; 214(1):260–271.[PubMed: 8250233]
Fan TWM, Higashi RM, et al. Anaerobic nitrate and ammonium metabolism in flood-tolerant ricecoleoptiles. Journal of Experimental Botany. 1997; 48(314):1655–1666.
Fan TWM, Higashi RM, et al. Application of Proton Nmr and Gas Chromatography-MassSpectroscopy To Study Metabolic Response of Chilled Tomato and Carrot Cells. PlantPhysiology (Rockville). 1986; 80(4 SUPPL):122. [PubMed: 16664565]
Fan TWM, Higashi RM, et al. Integrating metabolomics and transcriptomics for probing Se anticancermechanisms. Drug Metabolism Reviews. 2006; 38(4):707–732. [PubMed: 17145697]
Fan TWM, Higashi RM, et al. Combined use of proton NMR and gas chromatography-mass spectrafor metabolite monitoring and in vivo proton NMR assignments. Biochimica et Biophysica Acta.1986; 882(2):154–167. [PubMed: 3011112]
Fan TWM, Lane AN, et al. In vivo and in vitro metabolomic analysis of anaerobic rice coleoptilesrevealed unexpected pathways. Russian Journal of Plant Physiology. 2003; 50(6):787–793.
Fant F, De Sloovere A, et al. The use of amino compounds for binding 2,4,6-trinitrotoluene in water.Environmental Pollution. 2001; 111(3):503–507. [PubMed: 11202755]
Fantin VR, St-Pierre J, et al. Attenuation of LDH-A expression uncovers a link between glycolysis,mitochondrial physiology, and tumor maintenance. Cancer Cell. 2006; 9:435–434. [PubMed:16766263]
Fell DA. Metabolic control analysis: a survey of its theoretical and experimental development.Biochemical Journal. 1992; 286(Pt 2):313. [PubMed: 1530563]
Fernie AR, Trethewey RN, et al. Metabolite profiling: from diagnostics to systems biology. NatureReviews. Molecular Cell Biology. 2004; 5:1–7.
Fischer E, Sauer U. Metabolic flux profiling of Escherichia coli mutants in central carbon metabolismusing GC-MS. European journal of biochemistry / FEBS. 2003; 270(5):880–891. [PubMed:12603321]
Folger O, Jerby L, et al. Predicting selective drug targets in cancer through metabolic networks.Molecular Systems Biology. 2011; 7
Forsberg A, Engler H, et al. PET imaging of amyloid deposition in patients with mild cognitiveimpairment. Neurobiology of aging. 2008; 29(10):1456–1465. [PubMed: 17499392]
Frangioni JV. New technologies for human cancer imaging. Journal of clinical oncology : officialjournal of the American Society of Clinical Oncology. 2008; 26(24):4012–4021. [PubMed:18711192]
Freeman R, Finder T, et al. Probing protein kinase (CK2) and alkaline phosphatase with CdSe/ZnSquantum dots. Nano letters. 2010; 10(6):2192–2196. [PubMed: 20481436]
Frezza C, Pollard PJ, et al. Inborn and acquired metabolic defects in cancer. Journal of MolecularMedicine-Jmm. 2011; 89(3):213–220.
Frezza C, Zheng L, et al. Haem oxygenase is synthetically lethal with the tumour suppressor fumaratehydratase. Nature. 2011 advance online publication.
Fan et al. Page 37
Pharmacol Ther. Author manuscript; available in PMC 2013 March 01.
NIH
-PA Author Manuscript
NIH
-PA Author Manuscript
NIH
-PA Author Manuscript
Fu XA, Li M, et al. A novel microreactor approach for analysis of ketones and aldehydes in breath.The Analyst. 2011; (22):4662–4666. [PubMed: 21897949]
Gadian DG. In vivo NMR. Supramolecular structure and function. 1986:93–103.
Gadian, DG. NMR and its applications to living systems. Oxford University Press; Oxford, U.K.:1995.
Gadian DG, Radda GK. NMR studies of tissue metabolism. Ann. Rev. Biochem. 1981; 50:69–83.[PubMed: 7023368]
Gallagher FA, Kettunen MI, et al. Magnetic resonance imaging of pH in vivo using hyperpolarized13C-labeled bicarbonate. Nature. 2008; 453:940–943. [PubMed: 18509335]
Gambhir SS. Molecular imaging of cancer with positron emission tomography. Nature reviews.Cancer. 2002; 2(9):683–693.
Garber K. Energy boost: The Warburg effect returns in a new theory of cancer. Journal of the NationalCancer Institute. 2004; 96(24):1805–1806. [PubMed: 15601632]
Garcia-Alvarez I, Fernandez-Mayoralas A, et al. Effect of Drugs in Cells and Tissues by NMRSpectroscopy. Current Topics in Medicinal Chemistry. 2011; 11(1):27–42. [PubMed: 20809892]
Ghadiali JE, Lowe SB, et al. Quantum-dot-based FRET detection of histone acetyltransferase activity.Angewandte Chemie. 2011; 50(15):3417–3420. [PubMed: 21391297]
Gillies RJ, Morse DL. In vivo magnetic resonance spectroscopy in cancer. Annual Review ofBiomedical Engineering. 2005; 7:287–326.
Gillies RJ, Raghunand N, et al. MRI of the tumor microenvironment. Journal of Magnetic ResonanceImaging. 2002; 16(4):430–450. [PubMed: 12353258]
Ginos JZ, Cooper AJ, et al. [13N]cisplatin PET to assess pharmacokinetics of intra-arterial versusintravenous chemotherapy for malignant brain tumors. Journal of nuclear medicine : officialpublication, Society of Nuclear Medicine. 1987; 28(12):1844–1852.
Glunde K, Artemov D, et al. Magnetic Resonance Spectroscopy in Metabolic and Molecular Imagingand Diagnosis of Cancer. Chemical Reviews. 2010; 110(5):3043–3059. [PubMed: 20384323]
Glunde K, Serkova NJ. Therapeutic targets and biomarkers identified in cancer choline phospholipidmetabolism. Pharmacogenomics. 2006; 7(7):1109–1123. [PubMed: 17054420]
Goddard AW, Mason GF, et al. Impaired GABA neuronal response to acute benzodiazepineadministration in panic disorder. American Journal of Psychiatry. 2004; 161(12):2186–2193.[PubMed: 15569888]
Goromaru T, Matsuura H, et al. Identification of Isopropylantipyrine Metabolites in Rat and Man byUsing Stable Isotope Tracer Techniques. Chemical & Pharmaceutical Bulletin. 1984; 32(8):3179–3186.
Goromaru T, Matsuura H, et al. Identification of Fentanyl Metabolites in Rat Urine by GasChromatography-Mass Spectrometry with Stable-Isotope Tracers. Drug Metabolism andDisposition. 1982; 10(5):542–546. [PubMed: 6128207]
Goto S, Okuno Y, et al. LIGAND: database of chemical compounds and reactions in biologicalpathways. Nucleic Acids Res. 2002; 30(1):402–404. [PubMed: 11752349]
Gottlieb E, Tomlinson IPM. MITOCHONDRIAL TUMOUR SUPPRESSORS: A GENETIC ANDBIOCHEMICAL UPDATE. Nature Reviews Cancer. 2005; 5(11):857–866.
Griffin JL. The Cinderella story of metabolic profiling: does metabolomics get to go to the functionalgenomics ball? Philosophical Transactions of the Royal Society B-Biological Sciences. 2006;361(1465):147–161.
Griffin JL. Understanding mouse models of disease through metabolomics. Current Opinion inChemical Biology. 2006; 10(4):309–315. [PubMed: 16815732]
Griffin JL, Shockcor JP. Metabolic profiles of cancer cells. Nature reviews. Cancer. 2004; 4(7):551–561.
Gross S, Cairns RA, et al. Cancer-associated metabolite 2-hydroxyglutarate accumulates in acutemyelogenous leukemia with isocitrate dehydrogenase 1 and 2 mutations. Journal of ExperimentalMedicine. 2010; 207(2):339–344. [PubMed: 20142433]
Gruetter R, Adriany G, et al. Localized in vivo 13C NMR spectroscopy of the brain. NMR Biomed.2003; 16(6-7):313–338. [PubMed: 14679498]
Fan et al. Page 38
Pharmacol Ther. Author manuscript; available in PMC 2013 March 01.
NIH
-PA Author Manuscript
NIH
-PA Author Manuscript
NIH
-PA Author Manuscript
Gruetter R, Magnusson I, et al. Validation of 13C NMR measurements of liver glycogen in vivo. MagnReson Med. 1994; 31(6):583–588. [PubMed: 8057810]
Haddadin IS, McIntosh A, et al. Metabolite quantification and high-field MRS in breast cancer. NMRin biomedicine. 2009; 22(1):65–76. [PubMed: 17957820]
Harrigan GG, Brackett DJ, et al. Medicinal chemistry, metabolic profiling and drug target discovery: Arole for metabolic profiling in reverse pharmacology and chemical genetics. Mini-Reviews inMedicinal Chemistry. 2005; 5(1):13–20. [PubMed: 15638788]
Harris D, Li L, et al. Diverse mechanisms of growth inhibition by luteolin, resveratrol, and quercetin inMIA PaCa-2 cells: a comparative glucose tracer study with the fatty acid synthase inhibitor C75.Metabolomics. 2011:1–10. [PubMed: 21461033]
Hausler N, Browning J, et al. Effects of insulin and cytosolic redox state on glucose productionpathways in the isolated perfused mouse liver measured by integrated H-2 and C-13 NMR.Biochemical Journal. 2006; 394:465–473. [PubMed: 16288601]
Heeren RMA, Chughtai K. Mass Spectrometric Imaging for Biomedical Tissue Analysis. ChemicalReviews. 2010; 110(5):3237–3277. [PubMed: 20423155]
Heiden MGV, Locasale JW, et al. Evidence for an Alternative Glycolytic Pathway in RapidlyProliferating Cells. Science. 2010; 329(5998):1492–1499. [PubMed: 20847263]
Hernando E, Sarmentero-Estrada J, et al. A critical role for choline kinase-alpha in the aggressivenessof bladder carcinomas. Oncogene. 2009; 28(26):2425–2435. [PubMed: 19448670]
Hoebers FJ, Kartachova M, et al. 99mTc Hynic-rh-Annexin V scintigraphy for in vivo imaging ofapoptosis in patients with head and neck cancer treated with chemoradiotherapy. Europeanjournal of nuclear medicine and molecular imaging. 2008; 35(3):509–518. [PubMed: 17994297]
Hollemeyer K, Velagapudi VR, et al. Matrix-assisted laser desorption/ionization time-of-flight massspectrometry for metabolic flux analyses using isotope-labeled ethanol. Rapid Communicationsin Mass Spectrometry. 2007; 21(3):336–342. [PubMed: 17206598]
Holleran AL, Briscoe DA, et al. Glutamine metabolism in AS-30D hepatoma cells. Evidence for itsconversion into lipids via reductive carboxylation. Molecular and Cellular Biochemistry. 1995;152(2):95–101. [PubMed: 8751155]
Hsieh Y, Casale R, et al. Matrix-assisted laser desorption/ionization imaging mass spectrometry fordirect measurement of clozapine in rat brain tissue. Rapid Communications in MassSpectrometry. 2006; 20(6):965–972. [PubMed: 16470674]
Hu H, Jiang C, et al. Methylseleninic acid potentiates apoptosis induced by chemotherapeutic drugs inandrogen-independent prostate cancer cells. Clin Cancer Res. 2005; 11(6):2379–2388. [PubMed:15788689]
Hu HB, Jiang C, et al. Methylseleninic acid potentiates apoptosis induced by chemotherapeutic drugsin androgen-independent prostate cancer cells. Clinical Cancer Research. 2005; 11(6):2379–2388. [PubMed: 15788689]
Hu S, Balakrishnan A, et al. (13)C-Pyruvate Imaging Reveals Alterations in Glycolysis that Precede c-Myc-Induced Tumor Formation and Regression. Cell metabolism. 2011; 14(1):131–142.[PubMed: 21723511]
Hucka M, Finney A, et al. The systems biology markup language (SBML): a medium forrepresentation and exchange of biochemical network models. Bioinformatics. 2003; 19(4):524.[PubMed: 12611808]
Hyder F, Patel AB, et al. Neuronal-glial glucose oxidation and glutamatergic - GABAergic function.Journal of Cerebral Blood Flow and Metabolism. 2006; 26(7):865–877. [PubMed: 16407855]
Inoue T, Kim EE, et al. Positron emission tomography using [18F]fluorotamoxifen to evaluatetherapeutic responses in patients with breast cancer: preliminary study. Cancer biotherapy &radiopharmaceuticals. 1996; 11(4):235–245. [PubMed: 10851543]
Ip C. Lessons from basic research in selenium and cancer prevention. Journal of Nutrition. 1998;128(11):1845–1854. [PubMed: 9808633]
James, P., editor. Proteome Research : Mass Spectrometry (Principles and Practice). Springer Verlag;2000.
Fan et al. Page 39
Pharmacol Ther. Author manuscript; available in PMC 2013 March 01.
NIH
-PA Author Manuscript
NIH
-PA Author Manuscript
NIH
-PA Author Manuscript
Jin ES, Jones JG, et al. Comparison of [3,4-C-13(2)]glucose to [6,6-H-2(2)]glucose as a tracer forglucose turnover by nuclear magnetic resonance. Magnetic Resonance in Medicine. 2005; 53(6):1479–1483. [PubMed: 15906303]
Jin ES, Jones JG, et al. Glucose production, gluconeogenesis, and hepatic tricarboxylic acid cyclefluxes measured by nuclear magnetic resonance analysis of a single glucose derivative. AnalBiochem. 2004; 327(2):149–155. [PubMed: 15051530]
Juweid ME, Cheson BD. Positron-emission tomography and assessment of cancer therapy. The NewEngland journal of medicine. 2006; 354(5):496–507. [PubMed: 16452561]
Juweid ME, Stroobants S, et al. Use of positron emission tomography for response assessment oflymphoma: consensus of the Imaging Subcommittee of International Harmonization Project inLymphoma. Journal of clinical oncology : official journal of the American Society of ClinicalOncology. 2007; 25(5):571–578. [PubMed: 17242397]
Kaddurah-Daouk R, Kristal BS, et al. Metabolomics: A global biochemical approach to drug responseand disease. Annual Review of Pharmacology and Toxicology. 2008; 48:653–683.
Kalhan SC, Bier DM, et al. Estimation of Glucose Turnover and 13C Recycling in the HumanNewborn by Simultaneous [l-13C]Glucose and [6,6-2H2]Glucose Tracers. Journal of ClinicalEndocrinology & Metabolism. 1980; 50(3):456–460. [PubMed: 7358831]
Kanehisa M, Goto S. KEGG: Kyoto Encyclopedia of Genes and Genomes. Nucleic Acids Res. 2000;28:27–30. [PubMed: 10592173]
Katz-Brull R, Lavin PT, et al. Clinical utility of proton magnetic resonance spectroscopy incharacterizing breast lesions. Journal of the National Cancer Institute. 2002; 94(16):1197–1203.[PubMed: 12189222]
Kawashima K, Miwa Y, et al. Hypotensive effect of bunitrolol at low plasma concentrations inconscious, unrestrained spontaneously hypertensive rats. Jpn J Pharmacol. 1985; 38(3):259–265.[PubMed: 2865388]
Keun HC, Athersuch TJ, et al. Heteronuclear F-19-H-1 statistical total correlation spectroscopy as atool in drug metabolism: Study of flucloxacillin biotransformation. Analytical Chemistry. 2008;80(4):1073–1079. [PubMed: 18211034]
Kim HK, Wilson EG, et al. Metabolomics: a tool for anticancer lead-finding from natural products.Planta Med. 2010; 76(11):1094–1102. [PubMed: 20486069]
Kind T, Wohlgemuth G, et al. FiehnLib: Mass Spectral and Retention Index Libraries forMetabolomics Based on Quadrupole and Time-of-Flight Gas Chromatography/MassSpectrometry. Analytical Chemistry. 2009; 81(24):10038–10048. [PubMed: 19928838]
King A, Selak MA, et al. Succinate dehydrogenase and fumarate hydratase: linking mitochondrialdysfunction and cancer. Oncogene. 2006; 25(34):4675–4682. [PubMed: 16892081]
Kissel J, Brix G, et al. Pharmacokinetic analysis of 5-[18F]fluorouracil tissue concentrations measuredwith positron emission tomography in patients with liver metastases from colorectaladenocarcinoma. Cancer research. 1997; 57(16):3415–3423. [PubMed: 9270007]
Kristal BS, Shurubor YI, et al. High-performance liquid chromatography separations coupled withcoulometric electrode array detectors: a unique approach to metabolomics. Methods Mol. Biol.2006; 358:159–174. [PubMed: 17035686]
Kumar R, Dhanpathi H, et al. Oncologic PET tracers beyond [F-18]FDG and the novel quantitativeapproaches in PET imaging. Quarterly Journal of Nuclear Medicine and Molecular Imaging.2008; 52(1):50–65. [PubMed: 18235421]
Kumari S, Stevens D, et al. Applying In-Silico Retention Index and Mass Spectra Matching forIdentification of Unknown Metabolites in Accurate Mass GC-TOF Mass Spectrometry.Analytical Chemistry. 2011; 83(15):5895–5902. [PubMed: 21678983]
Kurdziel KA, Kiesewetter DO, et al. Biodistribution, radiation dose estimates, and in vivo Pgpmodulation studies of 18F-paclitaxel in nonhuman primates. Journal of nuclear medicine :official publication, Society of Nuclear Medicine. 2003; 44(8):1330–1339.
Kurhanewicz J, Vigneron DB, et al. Analysis of Cancer Metabolism by Imaging HyperpolarizedNuclei: Prospects for Translation to Clinical Research. Neoplasia. 2011; 13(2):81–97. [PubMed:21403835]
Fan et al. Page 40
Pharmacol Ther. Author manuscript; available in PMC 2013 March 01.
NIH
-PA Author Manuscript
NIH
-PA Author Manuscript
NIH
-PA Author Manuscript
Kurtoglu M, Gao N, et al. Under normoxia 2-deoxy-D-Glucose, but not 2-fluoro-deoxy-D-glucose,kills select tumor cells by interfering with N-linked glycosylation. Molecular CancerTherapeutics. 2007; 6:3049–3058. [PubMed: 18025288]
Kurtoglu M, Maher JC, et al. Differential toxic mechanisms of 2-deoxy-D-glucose versus 2-fluorodeoxy-D-glucose in hypoxic and normoxic tumor cells. Antioxidants & Redox Signaling.2007; 9(9):1383–1390. [PubMed: 17627467]
Lagerwerf FM, van Dongen WD, et al. Exploring the boundaries of bioanalytical quantitative LC-MS-MS. Trac-Trends in Analytical Chemistry. 2000; 19(7):418–427.
Lan MJ, McLoughlin GA, et al. Metabonomic analysis identifies molecular changes associated withthe pathophysiology and drug treatment of bipolar disorder. Molecular Psychiatry. 2009; 14(3):269–279. [PubMed: 18256615]
Lane, AN. Fan, TW-M.; Lane, AN.; Higashi, RM.; Humana, editors. NMR applications inmetabolomics. Handbook of Metabolomics. 2012. in press
Lane AN, Fan TW. Quantification and identification of isotopomer distributions of metabolites incrude cell extracts using 1H TOCSY. Metabolomics. 2007; 3:79–86.
Lane AN, Fan TW, et al. Isotopomer-based metabolomic analysis by NMR and mass spectrometry.Methods Cell Biol. 2008; 84:541–588. [PubMed: 17964943]
Lane AN, Fan TW, et al. Prospects for clinical cancer metabolomics using stable isotope tracers. J.Exp. Molec. Pathol. 2009; 86:165–173.
Lane, AN.; Fan, TW-M., et al. Amar, P.; Kepes, F.; Norris, V.; Vandenbunder, B., editors. Modelingcomplex biological systems in the context of the genome; Stable isotope tracing in metabolicpathways. 2008. p. 69-78.
Lane AN, Fan TW-M, et al. Stable isotope analysis of lipid biosynthesis by high resolution massspectrometry and NMR. Anal. Chim. Acta. 2009; 651:201–208. [PubMed: 19782812]
Lane AN, Fan TWM, et al. Stable Isotope-Resolved Metabolomics (SIRM) in Cancer Research withClinical Application to NonSmall Cell Lung Cancer. Omics-a Journal of Integrative Biology.2011; 15(3):173–182. [PubMed: 21329461]
Lane AN, Fan TWM, et al. Stable isotope-assisted metabolomics in cancer research. Iubmb Life. 2008;60(2):124–129. [PubMed: 18380001]
Le A, Cooper CR, et al. Inhibition of lactate dehydrogenase A induces oxidative stress and inhibitstumor progression. Proceedings of the National Academy of Sciences of the United States ofAmerica. 2010; 107(5):2037–2042. [PubMed: 20133848]
Lee JM, Gianchandani EP, et al. Dynamic analysis of integrated signaling, metabolic, and regulatorynetworks. PLoS computational biology. 2008; 4(5):e1000086. [PubMed: 18483615]
Lee JM, Gianchandani EP, et al. Flux balance analysis in the era of metabolomics. Briefings inBioinformatics. 2006; 7(2):140. [PubMed: 16772264]
Lee WNP, Go VLW. Nutrient-gene interaction: Tracer-based metabolomics. Journal of Nutrition.2005; 135(12):3027S–3032S. [PubMed: 16317166]
Lee WNP, Guo P, et al. Metabolic sensitivity of pancreatic tumour cell apoptosis to glycogenphosphorylase inhibitor treatment. British Journal of Cancer. 2004; 91(12):2094–2100. [PubMed:15599384]
Levin YS, Albers MJ, et al. Methods for metabolic evaluation of prostate cancer cells using proton and(13)C HR-MAS spectroscopy and [3-(13)C] pyruvate as a metabolic substrate. Magneticresonance in medicine : official journal of the Society of Magnetic Resonance in Medicine /Society of Magnetic Resonance in Medicine. 2009; 62(5):1091–1098. [PubMed: 19780158]
Li CW, Negendank WG, et al. Quantitation of 5-fluorouracil catabolism in human liver in vivo bythree-dimensional localized F-19 magnetic resonance spectroscopy. Clinical Cancer Research.1996; 2(2):339–345. [PubMed: 9816177]
Lidstrom ME, Guo XF. Metabolite profiling analysis of Methylobacterium extorquens AM1 bycomprehensive two-dimensional gas chromatography coupled with time-of-flight massspectrometry. Biotechnology and Bioengineering. 2008; 99(4):929–940. [PubMed: 17879968]
Lienhard GE, Slot JW, et al. How cells absorb glucose. Scientific American. 1992; 266(1):86–91.[PubMed: 1734513]
Fan et al. Page 41
Pharmacol Ther. Author manuscript; available in PMC 2013 March 01.
NIH
-PA Author Manuscript
NIH
-PA Author Manuscript
NIH
-PA Author Manuscript
Light DW, Warburton R. Demythologizing the high costs of pharmaceutical research. BioSocieties.2011; 6:34–50.
Lindon JC. HPLC-NMR-MS: past, present and future. Drug Discovery Today. 2003; 8(22):1021–1022. [PubMed: 14690631]
Lindon JC, Holmes E, et al. Metabonomics: Systems biology in pharmaceutical research anddevelopment. Current Opinion in Molecular Therapeutics. 2004; 6(3):265–272. [PubMed:15264428]
Lindon JC, Holmes E, et al. Toxicological applications of magnetic resonance. Progress in NuclearMagnetic Resonance Spectroscopy. 2004; 45(1-2):109–143.
Lindon JC, Nicholson JK. Spectroscopic and Statistical Techniques for Information Recovery inMetabonomics and Metabolomics. Annual Review of Analytical Chemistry. 2008; 1(1):45–69.
Lloyd SG, Zeng HD, et al. Lactate isotopomer analysis by H-1 NMR spectroscopy: Consideration oflong-range nuclear spin-spin interactions. Magnetic Resonance in Medicine. 2004; 51(6):1279–1282. [PubMed: 15170850]
Londesborough J, Dalziel KD. The Equilibrium Constant of the Isocitrate Dehydrogenase Reaction.Biochem J. 1968; 110:217–222. [PubMed: 4387224]
Lu D, Mulder H, et al. 13C NMR isotopomer analysis reveals a connection between pyruvate cyclingand glucose-stimulated insulin secretion (GSIS). Proceedings of the National Academy ofSciences of the United States of America. 2002; 99(5):2708–2713. [PubMed: 11880625]
Lu DH, Mulder H, et al. C-13 NMR isotopomer analysis reveals a connection between pyruvatecycling and glucose-stimulated insulin secretion (GSIS). Proceedings of the National Academyof Sciences of the United States of America. 2002; 99(5):2708–2713. [PubMed: 11880625]
Lutz NW. From metabolic to metabolomic NMR spectroscopy of apoptotic cells. Metabolomics.2005:1–18.
Macdonald JM, Schmidlin O, et al. In vivo monitoring of hepatic glutathione in anesthetized rats byC-13 NMR. Magnetic Resonance in Medicine. 2002; 48(3):430–439. [PubMed: 12210907]
Macdonald, JM.; Xu, A., et al. Metabolic Tissue Engineering. Academic Press; San Diego: 2002. LiverCell Culture and Lineage Biology.; p. 151-201.
Maher AD, Kuchel PW, et al. Mathematical modelling of the urea cycle - A numerical investigationinto substrate channelling. European Journal of Biochemistry. 2003; 270(19):3953–3961.[PubMed: 14511377]
Maier K, Hofmann U, et al. Identxification of metabolic fluxes in hepatic cells from transient 13Clabeling experiments: Part II. Flux estimation. Biotechnology and bioengineering. 2008; 100(2):355–370. [PubMed: 18095336]
Malet-Martino M, Holzgrabe U. NMR techniques in biomedical and pharmaceutical analysis. Journalof pharmaceutical and biomedical analysis. 2011; 55(1):1–15. [PubMed: 21237608]
Maly T, Debelouchina GT, et al. Dynamic nuclear polarization at high magnetic fields. Chem Phys.2008; 128:052211.
Mancuso A, Zhu AZ, et al. Artificial tumor model suitable for monitoring P-31 and C-13 NMRspectroscopic changes during chemotherapy-induced apoptosis in human glioma cells. MagneticResonance in Medicine. 2005; 54(1):67–78. [PubMed: 15968647]
Martinez-Bisbal MC, Marti-Bonmati L, et al. H-1 and C-13 HR-MAS spectroscopy of intact biopsysamples ex vivo and in vivo H-1 MRS study of human high grade gliomas. Nmr in Biomedicine.2004; 17(4):191–205. [PubMed: 15229932]
Martinez-Granados B, Monleon D, et al. Metabolite identification in human liver needle biopsies byhigh-resolution magic angle spinning H-1 NMR spectroscopy. Nmr in Biomedicine. 2006; 19(1):90–100. [PubMed: 16411169]
Mason GF, Petersen KF, et al. A comparison of C-13 NMR measurements of the rates of glutaminesynthesis and the tricarboxylic acid cycle during oral and intravenous administration of 1-C-13glucose. Brain Research Protocols. 2002; 10(3):181–190. [PubMed: 12565689]
Mason GF, Petersen KF, et al. A comparison of C-13 NMR measurements of the rates of glutaminesynthesis and the tricarboxylic acid cycle during oral and intravenous administration of 1-C-13glucose (vol 10, pg 181, 2003). Brain Research Protocols. 2003; 11(2):143–143.
Fan et al. Page 42
Pharmacol Ther. Author manuscript; available in PMC 2013 March 01.
NIH
-PA Author Manuscript
NIH
-PA Author Manuscript
NIH
-PA Author Manuscript

Mason GF, Petersen KF, et al. Measurements of the anaplerotic rate in the human cerebral cortex usingC-13 magnetic resonance spectroscopy and [1-C-13] and [2-C-13] glucose. Journal ofNeurochemistry. 2007; 100(1):73–86. [PubMed: 17076763]
Mason GF, Rothman DL. Basic principles of metabolic modeling of NMR C-13 isotopic turnover todetermine rates of brain metabolism in vivo. Metabolic Engineering. 2004; 6(1):75–84.[PubMed: 14734257]
Mathupala SP, Colen CB, et al. Lactate and malignant tumors: a therapeutic target at the end stage ofglycolysis. Journal of bioenergetics and biomembranes. 2007; 39(1):73–77. [PubMed: 17354062]
Mazurek S, Eigenbrodt E. The tumor metabolome. Anticancer Research. 2003; 23(2A):1149–1154.[PubMed: 12820363]
Mazurek S, Grimm H, et al. Pyruvate kinase type M2: A crossroad in the tumor metabolome. BritishJournal of Nutrition. 2002; 87(Supplement 1):S23–S29. [PubMed: 11895152]
Mazurek S, Grimm H, et al. Tumor M2-PK and glutaminolytic enzymes in the metabolic shift oftumor cells. Anticancer Research. 2000; 20(6D):5151–5154. [PubMed: 11326687]
McClelland RE, MacDonald JM, et al. Modeling O-2 transport within engineered hepatic devices.Biotechnology and Bioengineering. 2003; 82(1):12–27. [PubMed: 12569620]
McMillan KM, Rogers BP, et al. Physiologic characterisation of glioblastoma multiforme using MRI-based hypoxia mapping, chemical shift imaging, perfusion and diffusion maps. Journal ofClinical Neuroscience. 2006; 13(8):811–817. [PubMed: 16997706]
McMurry, JE.; Begley, TP. The Organic Chemistry of Biological Pathways. Roberts and CompanyPublishers; Greenwood Village, CO: 2005.
Meadows AL, Kong B, et al. Metabolic and morphological differences between rapidly proliferatingcancerous and normal breast epithelial cells. Biotechnology progress. 2008; 24(2):334–341.[PubMed: 18307352]
Meese CO, Fischer P. TRACING THE HUMAN METABOLISM OF STABLE ISOTOPE-LABELEDDRUGS BY EXVIVO NMR-SPECTROSCOPY - A REVISION OF S-CARBOXYMETHYL-L-CYSTEINE BIOTRANSFORMATION. Zeitschrift Fur Naturforschung C-a Journal ofBiosciences. 1990; 45(11-12):1171–1175.
Meisamy S, Bolan PJ, et al. Neoadjuvant chemotherapy of locally advanced breast cancer: predictingresponse with in vivo (1)H MR spectroscopy--a pilot study at 4 T. Radiology. 2004; 233(2):424–431. [PubMed: 15516615]
Merritt ME, Harrison C, et al. Hyperpolarized 13C allows a direct measure of flux through a singleenzymecatalyzed step by NMR. Proc Natl Acad Sci USA 104(50), 19773–19777. Proc Natl AcadSci USA. 2007; 104:19773–19777. [PubMed: 18056642]
Metallo CM, Walther JL, et al. Evaluation of 13C isotopic tracers for metabolic flux analysis inmammalian cells. Journal of Biotechnology. 2009; 144(3):167–174. [PubMed: 19622376]
Metz TO, Zhang Q, et al. The future of liquid chromatography-mass spectrometry (LC-MS) inmetabolic profiling and metabolomic studies for biomarker discovery. Biomarkers in Medicine.2007; 1(1):159–185. [PubMed: 19177179]
Millis KK, Maas WE, et al. Gradient, high-resolution, magic-angle spinning nuclear magneticresonance spectroscopy of human adipocyte tissue. Magnetic Resonance in Medicine. 1997;38(3):399–403. [PubMed: 9339440]
Mimura K, Baba S. Studies on the Biotransformation of Paeonol by Isotope Tracer Techniques .2.Species-Differences in Metabolism. Chemical & Pharmaceutical Bulletin. 1980; 28(6):1704–1710.
Mimura K, Baba S. Determination of Paeonol Metabolites in Man by the Use of Stable Isotopes.Chemical & Pharmaceutical Bulletin. 1981; 29(7):2043–2050.
Miura D, Fujimura Y, et al. Highly Sensitive Matrix-Assisted Laser Desorption Ionization-MassSpectrometry for High-Throughput Metabolic Profiling. Analytical Chemistry. 2010; 82(2):498–504. [PubMed: 20014780]
Miyawaki A, Llopis J, et al. Fluorescent indicators for Ca2+ based on green fluorescent proteins andcalmodulin. Nature. 1997; 388(6645):882–887. [PubMed: 9278050]
Morrish F, Neretti N, et al. The oncogene c-Myc coordinates regulation of metabolic networks toenable rapid cell cycle entry. Cell Cycle. 2008; 7(8):1054–1066. [PubMed: 18414044]
Fan et al. Page 43
Pharmacol Ther. Author manuscript; available in PMC 2013 March 01.
NIH
-PA Author Manuscript
NIH
-PA Author Manuscript
NIH
-PA Author Manuscript
Morrish F, Noonan J, et al. Myc-dependent Mitochondrial Generation of Acetyl-CoA Contributes toFatty Acid Biosynthesis and Histone Acetylation during Cell Cycle Entry. Journal of BiologicalChemistry. 2010; 285(47):36267–36274. [PubMed: 20813845]
Moseley H. Correcting for the effects of natural abundance in stable isotope resolved metabolomicsexperiments involving ultra-high resolution mass spectrometry. BMC Bioinformatics. 2010;11:139. [PubMed: 20236542]
Moseley H, Lane A, et al. A novel deconvolution method for modeling UDPGlcNAc biosyntheticpathways based on 13C mass isotopologue profiles under non steady-state conditions. BMCBiology. 2011; 9(1):37. [PubMed: 21627825]
Moseley, HNB.; Higashi, RM., et al. Analysis of Non-Steady State Stable Isotope-Resolve Metabolismof UDP-GlcNAc and UDP-GalNAc; The International Conference on Bioinformatics Models,Methods and Algorithms; Proceedings of BIOINFORMATICS. 2011; 2011.
Moseley HNB, Lane AN, et al. Non-Steady State Modeling of UDPGlcNAc Biosynthesis is Enabledby Stable Isotope Resolved Metabolomics (SIRM). BMC Biology. 2011; 9:37. [PubMed:21627825]
Muehllehner G, Karp JS. Positron emission tomography. Physics in medicine and biology. 2006;51(13):R117–137. [PubMed: 16790899]
Mutlib A, Lam W, et al. Application of stable isotope labeled glutathione and rapid scanning massspectrometers in detecting and characterizing reactive metabolites. Rapid Communications inMass Spectrometry. 2005; 19(23):3482–3492. [PubMed: 16261644]
Mutlib AE. Application of stable isotope-labeled compounds in metabolism and in metabolism-mediated toxicity studies. Chemical Research in Toxicology. 2008; 21(9):1672–1689. [PubMed:18702535]
Mutlib AE, Nelson WL. Pathways of Gallopamil Metabolism - Regiochemistry and Enantioselectivityof the N-Dealkylation Processes. Drug Metabolism and Disposition. 1990; 18(3):331–337.[PubMed: 1974195]
Mutlib AE, Nelson WL. Synthesis and Identification of the N-Glucuronides of Norgallopamil andNorverapamil, Unusual Metabolites of Gallopamil and Verapamil. Journal of Pharmacology andExperimental Therapeutics. 1990; 252(2):593–599. [PubMed: 2313589]
Mutlib AE, Shockcor J, et al. Disposition of glutathione conjugates in rats by a novel glutamic acidpathway: characterization of unique peptide conjugates by liquid chromatography/massspectrometry and liquid chromatography/NMR. Journal of Pharmacology and ExperimentalTherapeutics. 2000; 294(2):735–745. [PubMed: 10900255]
Naik AK, Hanay MS, et al. Towards single-molecule nanomechanical mass spectrometry. Naturenanotechnology. 2009; 4(7):445–450.
Neermann J, Wagner R. Comparative analysis of glucose and glutamine metabolism in transformedmammalian cell lines, insect and primary liver cells. Journal of Cellular Physiology. 1996;166(1):152–169. [PubMed: 8557765]
Newsholme EA, Crabtree B, et al. Glutamine Metabolism In Lymphocytes: Its Biochemical,Physiological And Clinical Importance. Quart. J. Exp. Physiol. 1985; 70:473–489.
Noack S, Nöh K, et al. Stationary versus non-stationary 13C-MFA: A comparison using a consistentdataset. Journal of Biotechnology. 2010
Oberhardt MA, Palsson BØ, et al. Applications of genome-scale metabolic reconstructions. Molecularsystems biology. 2009; 5(1)
Olszewski KL, Mather MW, et al. Branched tricarboxylic acid metabolism in Plasmodium falciparum(vol 466, pg 774, 2010). Nature. 2011; 469(7330):432–432.
Ostlund RE, Matthews DE. [13C]cholesterol as a tracer for studies of cholesterol metabolism inhumans. Journal of Lipid Research. 1993; 34(10):1825–1831. [PubMed: 8245729]
Pan Y, Mansfield KD, et al. Multiple factors affecting cellular redox status and energy metabolismmodulate hypoxia-inducible factor prolyl hydroxylase activity in vivo and in vitro. Mol Cell Biol.2007; 27(3):912–925. [PubMed: 17101781]
Papin JA, Price ND, et al. Metabolic pathways in the post-genome era. Trends in BiochemicalSciences. 2003; 28(5):250–258. [PubMed: 12765837]
Fan et al. Page 44
Pharmacol Ther. Author manuscript; available in PMC 2013 March 01.
NIH
-PA Author Manuscript
NIH
-PA Author Manuscript
NIH
-PA Author Manuscript
Park BK, Kitteringham NR, et al. Metabolism of fluorine-containing drugs. Annual Review ofPharmacology and Toxicology. 2001; 41:443–470.
Parks EJ, Hellerstein MK. Thematic review series: patient-oriented research. Recent advances in livertriacylglycerol and fatty acid metabolism using stable isotope labeling techniques. J Lipid Res.2006; 47(8):1651–1660. [PubMed: 16741290]
Patel AB, de Graaf RA, et al. The contribution of GABA to glutamate/glutamine cycling and energymetabolism in the rat cortex in vivo. Proceedings of the National Academy of Sciences of theUnited States of America. 2005; 102(15):5588–5593. [PubMed: 15809416]
Pelicano H, Martin DS, et al. Glycolysis inhibition for anticancer treatment. Oncogene. 2006;25:4633–4646. [PubMed: 16892078]
Pellegatti P, Raffaghello L, et al. Increased level of extracellular ATP at tumor sites: in vivo imagingwith plasma membrane luciferase. PLoS ONE. 2008; 3(7):e2599. [PubMed: 18612415]
Peltz M, He TT, et al. Characterizing lung metabolism with carbon-13 magnetic resonancespectroscopy in a small-animal model: Evidence of gluconeogenesis during hypothermic storage.Transplantation. 2005; 80(3):417–420. [PubMed: 16082340]
Perriello G, Jorde R, et al. Estimation of Glucose-Alanine-Lactate-Glutamine Cycles in PostabsorptiveHumans - Role of Skeletal-Muscle. American Journal of Physiology-Endocrinology andMetabolism. 1995; 32(3):E443–E450.
Pingitore F, Tang Y, et al. Analysis of Amino Acid Isotopomers Using FT-ICR MS. AnalyticalChemistry. 2007; 79(6):2483–2490. [PubMed: 17305312]
Pochapsky, TC.; Pochapsky, SS. NMR for Physical and Biological Scientists. Taylor & Francis; NewYork: 2007.
Poklar N, Pilch DS, et al. Influence of cisplatin intrastrand crosslinking on the conformation, thermalstability, and energetics of a 20-mer DNA duplex. Proceedings of the National Academy ofSciences. 1996; 93(15):7606–7611.
Pons G, Rey E. Stable isotopes labeling of drugs in pediatric clinical pharmacology. Pediatrics. 1999;104(3 Pt 2):633–639. [PubMed: 10469806]
Possemato R, Marks KM, et al. Functional genomics reveal that the serine synthesis pathway isessential in breast cancer. Nature. 2011 doi:10.1038/nature10350.
Pretsch, E.; Bühlmann, P., et al. Structure Determination of Organic Compounds. Springer; Berlin:2009.
Previs SF, Brunengraber DZ, et al. Is there glucose production outside of the liver and kidney? Annualreview of nutrition. 2009; 29:43–57.
Psychogios N, Hau DD, et al. The human serum metabolome. PLoS ONE. 2011; 6(2):e16957.[PubMed: 21359215]
Pucci V, Di Palma S, et al. A novel strategy for reducing phospholipids-based matrix effect in LC-ESI-MS bioanalysis by means of HybridSPE. Journal of Pharmaceutical and Biomedical Analysis.2009; 50(5):867–871. [PubMed: 19553055]
Quiroz JA, Gould TD, et al. Molecular effects of lithium. Molecular Interventions. 2004; 4(5):259–272. [PubMed: 15471909]
Rao J, Dragulescu-Andrasi A, et al. Fluorescence imaging in vivo: recent advances. Current opinion inbiotechnology. 2007; 18(1):17–25. [PubMed: 17234399]
Redestig H, Kusano M, et al. Consolidating metabolite identifiers to enable contextual and multi-platform metabolomics data analysis. Bmc Bioinformatics. 2010; 11
Reid DG, Murphy PS. Fluorine magnetic resonance in vivo: A powerful tool in the study of drugdistribution and metabolism. Drug Discovery Today. 2008; 13(11-12):473–480. [PubMed:18549972]
Reitman ZJ, Jin GL, et al. Profiling the effects of isocitrate dehydrogenase 1 and 2 mutations on thecellular metabolome. Proceedings of the National Academy of Sciences of the United States ofAmerica. 2011; 108(8):3270–3275. [PubMed: 21289278]
Reivich M, Kuhl D, et al. The [18F]fluorodeoxyglucose method for the measurement of local cerebralglucose utilization in man. Circulation research. 1979; 44(1):127–137. [PubMed: 363301]
Fan et al. Page 45
Pharmacol Ther. Author manuscript; available in PMC 2013 March 01.
NIH
-PA Author Manuscript
NIH
-PA Author Manuscript
NIH
-PA Author Manuscript
Ren X, Yang L, et al. Enzyme biosensor based on NAD-sensitive quantum dots. Biosensors &bioelectronics. 2010; 26(1):271–274. [PubMed: 20627509]
Reyzer ML, Caprioli RM. MALDI-MS-based imaging of small molecules and proteins in tissues.Current Opinion in Chemical Biology. 2007; 11(1):29–35. [PubMed: 17185024]
Richmond A, Su YJ. Mouse xenograft models vs GEM models for human cancer therapeutics. DiseaseModels & Mechanisms. 2008; 1(2-3):78–82. [PubMed: 19048064]
Rittenberg D, Schoenheimer R. Deuterium as an indicator in study of intermediatory metabolism. VIII.Hydrogenation of fatty acids in the animals organism. J. Biol. Chem. 1937; 117:485–490.
Rocha CM, Barros AS, et al. Metabolic Profiling of Human Lung Cancer Tissue by (1)H HighResolution Magic Angle Spinning (HRMAS) NMR Spectroscopy. Journal of Proteome Research.2010; 9(1):319–332. [PubMed: 19908917]
Rochfort S. Metabolomics reviewed: A new “Omics” platform technology for systems biology andimplications for natural products research. Journal of Natural Products. 2005; 68(12):1813–1820.[PubMed: 16378385]
Roizen MF, Moss J, et al. Effect of general anesthetics on handling- and decapitation-inducedincreases in sympathoadrenal discharge. J Pharmacol Exp Ther. 1978; 204(1):11–18. [PubMed:563442]
Romero P, Wagg J, et al. Computational prediction of human metabolic pathways from the completehuman genome. Genome biology. 2004; 6(1):R2. [PubMed: 15642094]
Ronnebaum SM, Ilkayeva O, et al. A pyruvate cycling pathway involving cytosolic NADP-dependentisocitrate dehydrogenase regulates glucose-stimulated insulin secretion. Journal of BiologicalChemistry. 2006; 281(41):30593–30602. [PubMed: 16912049]
Rosso L, Brock CS, et al. A new model for prediction of drug distribution in tumor and normal tissues:pharmacokinetics of temozolomide in glioma patients. Cancer research. 2009; 69(1):120–127.[PubMed: 19117994]
Saleem A, Harte RJ, et al. Pharmacokinetic evaluation of N-[2-(dimethylamino)ethyl]acridine-4-carboxamide in patients by positron emission tomography. Journal of clinical oncology : officialjournal of the American Society of Clinical Oncology. 2001; 19(5):1421–1429. [PubMed:11230487]
Sanders, JKM.; Hunter, BK. Modern NMR Spectroscopy. A guide for chemists. Oxford UniversityPress; Oxford, U.K.: 1987.
Sands CJ, Coen M, et al. Data-Driven Approach for Metabolite Relationship Recovery in Biological(1)H NMR Data Sets Using Iterative Statistical Total Correlation Spectroscopy. AnalyticalChemistry. 2011; 83(6):2075–2082. [PubMed: 21323345]
Sansone SA, Fan T, et al. The metabolomics standards initiative. Nature Biotechnology. 2007; 25(8):844–848.
Santa T. Derivatization reagents in liquid chromatography/electrospray ionization tandem massspectrometry. Biomedical Chromatography. 2011; 25(1-2):1–10. [PubMed: 21058414]
Scalbert A, Brennan L, et al. Mass-spectrometry-based metabolomics: limitations andrecommendations for future progress with particular focus on nutrition research. Metabolomics.2009; 5(4):435–458. [PubMed: 20046865]
Scherer RL, VanSaun MN, et al. Optical imaging of matrix metalloproteinase-7 activity in vivo using aproteolytic nanobeacon. Molecular imaging. 2008; 7(3):118–131. [PubMed: 19123982]
Schiavo S, Ebbel E, et al. Metabolite identification using a nanoelectrospray LC-EC-array-MSintegrated system. Analytical Chemistry. 2008; 80(15):5912–5923. [PubMed: 18576668]
Schlotterbeck G, Ross A, et al. Metabolic profiling technologies for biomarker discovery inbiomedicine and drug development. Pharmacogenomics. 2006; 7(7):1055–1075. [PubMed:17054416]
Schousboe A, Waagepetersen HS, et al. Compartmentation of TCA cycle metabolism in culturedneocortical neurons revealed by C-13 MR spectroscopy. Neurochemistry International. 2000;36(4-5):349–358. [PubMed: 10733002]
Seagle C, Christie MA, et al. High-throughput nuclear magnetic resonance metabolomic footprintingfor tissue engineering. Tissue Engineering Part C-Methods. 2008; 14(2):107–118. [PubMed:18544027]
Fan et al. Page 46
Pharmacol Ther. Author manuscript; available in PMC 2013 March 01.
NIH
-PA Author Manuscript
NIH
-PA Author Manuscript
NIH
-PA Author Manuscript
Selivanov V, Vizan P, et al. Edelfosine-induced metabolic changes in cancer cells that precede theoverproduction of reactive oxygen species and apoptosis. BMC Systems Biology. 2010; 4(1):135. [PubMed: 20925932]
Selivanov VA, Marin S, et al. Software for dynamic analysis of tracer-based metabolomic data:estimation of metabolic fluxes and their statistical analysis. Bioinformatics. 2006; 22(22):2806.[PubMed: 17000750]
Selivanov VA, Meshalkina LE, et al. Rapid simulation and analysis of isotopomer distributions usingconstraints based on enzyme mechanisms: an example from HT29 cancer cells. Bioinformatics.2005; 21(17):3558–3564. [PubMed: 16002431]
Selivanov VA, Puigjaner J, et al. An optimized algorithm for flux estimation from isotopomerdistribution in glucose metabolites. Bioinformatics. 2004; 20(18):3387–3397. [PubMed:15256408]
Seltzer MJ, Bennett BD, et al. Inhibition of Glutaminase Preferentially Slows Growth of Glioma Cellswith Mutant IDH1. Cancer Research. 2010; 70(22):8981–8987. [PubMed: 21045145]
Serkova N, Boros LG. Detection of resistance to imatinib by metabolic profiling - Clinical and drugdevelopment implications. American Journal of Pharmacogenomics. 2005; 5(5):293–302.[PubMed: 16196499]
Serres S, Raffard G, et al. Close coupling between astrocytic and neuronal metabolisms to fulfillanaplerotic and energy needs in the rat brain. Journal of Cerebral Blood Flow and Metabolism.2008; 28(4):712–724. [PubMed: 17940539]
Seth P, Grant A, et al. On-target inhibition of tumor fermentative glycolysis as visualized byhyperpolarized pyruvate. Neoplasia. 2011; 13(1):60–71. [PubMed: 21245941]
Shepherd PR, Kahn BB. Glucose Transporters and Insulin Action — Implications for InsulinResistance and Diabetes Mellitus. N Engl J Med. 1999; 341:248–257. [PubMed: 10413738]
Sherry AD, Jeffrey FMH, et al. Analytical solutions for C-13 isotopomer analysis of complexmetabolic conditions: substrate oxidation, multiple pyruvate cycles, and gluconeogenesis.Metabolic Engineering. 2004; 6(1):12–24. [PubMed: 14734252]
Sherry AD, Nunnally RL, et al. Metabolic Studies of Pyruvate-Perfused and Lactate-Perfused Guinea-Pig Hearts by C-13 Nmr - Determination of Substrate Preference by Glutamate IsotopomerDistribution. Journal of Biological Chemistry. 1985; 260(16):9272–9279. [PubMed: 4019474]
Shi L, Rosenzweig N, et al. Luminescent quantum dots fluorescence resonance energy transfer-basedprobes for enzymatic activity and enzyme inhibitors. Analytical chemistry. 2007; 79(1):208–214.[PubMed: 17194141]
Shimizu K, Matsuoka Y. Current status of (13)C-metabolic flux analysis and future perspectives.Process Biochemistry. 2010; 45(12):1873–1881.
Shroff R, Rulisek L, et al. Acid-base-driven matrix-assisted mass spectrometry for targetedmetabolomics. Proceedings of the National Academy of Sciences of the United States ofAmerica. 2009; 106(25):10092–10096. [PubMed: 19520825]
Signor L, Varesio E, et al. Analysis of erlotinib and its metabolites in rat tissue sections by MALDIquadrupole time-of-flight mass spectrometry. Journal of Mass Spectrometry. 2007; 42(7):900–909. [PubMed: 17534860]
Sim H, Bibee K, et al. Pharmacokinetic modeling of tumor bioluminescence implicates efflux, and notinflux, as the bigger hurdle in cancer drug therapy. Cancer research. 2011; 71(3):686–692.[PubMed: 21123454]
Smith IC, Welch AE, et al. Positron emission tomography using [(18)F]-fluorodeoxy-D-glucose topredict the pathologic response of breast cancer to primary chemotherapy. Journal of clinicaloncology : official journal of the American Society of Clinical Oncology. 2000; 18(8):1676–1688. [PubMed: 10764428]
Spraul M, Hofmann M, et al. COUPLING OF HPLC WITH F-19-NMR AND H-1-NMRSPECTROSCOPY TO INVESTIGATE THE HUMAN URINARY-EXCRETION OFFLURBIPROFEN METABOLITES. Journal of Pharmaceutical and Biomedical Analysis. 1993;11(10):1009–1015. [PubMed: 8305581]
Fan et al. Page 47
Pharmacol Ther. Author manuscript; available in PMC 2013 March 01.
NIH
-PA Author Manuscript
NIH
-PA Author Manuscript
NIH
-PA Author Manuscript
Stoeckli M, Staab D, et al. Compound and metabolite distribution measured by MALDI massspectrometric imaging in whole-body tissue sections. International Journal of MassSpectrometry. 2007; 260(2-3):195–202.
Storch KJ, Wagner DA, et al. [1-13C; methyl-2H3]methionine kinetics in humans: methionineconservation and cystine sparing. The American journal of physiology. 1990; 258(5 Pt 1):E790–798. [PubMed: 2185662]
Strupat K, Karas M, et al. 2,5-DIHYDROXYBENZOIC ACID - A NEW MATRIX FOR LASERDESORPTION IONIZATION MASS-SPECTROMETRY. International Journal of MassSpectrometry and Ion Processes. 1991; 111:89–102.
Stummer W, Stocker S, et al. Intraoperative detection of malignant gliomas by 5-aminolevulinic acid-induced porphyrin fluorescence. Neurosurgery. 1998; 42(3):518–525. discussion 525-516.[PubMed: 9526986]
Subbaraman N. Flawed arithmetic on drug development costs. Nature Biotechnology. 2011; 29(5):381–381.
Sumner LW, Amberg A, et al. Proposed minimum reporting standards for chemical analysis.Metabolomics. 2007; 3(3):211–221.
Sumner LW, Bedair M. Current and emerging mass-spectrometry technologies for metabolomics.Trac-Trends in Analytical Chemistry. 2008; 27(3):238–250.
Suzuki KT. Metabolomics of selenium : Se metabolites based on speciation studies. Journal of HealthScience. 2005; 51(2):107–114.
Swanson MG, Zektzer AS, et al. Quantitative analysis of prostate metabolites using H-1 HR-MASspectroscopy. Magnetic Resonance in Medicine. 2006; 55(6):1257–1264. [PubMed: 16685733]
Tang YJ, Martin HG, et al. Advances in analysis of microbial metabolic fluxes via 13C isotopiclabeling. Mass spectrometry reviews. 2009; 28(2):362–375. [PubMed: 19025966]
Tayek JA, Katz J. Glucose production, recycling, Cori cycle, and gluconeogenesis in humans:Relationship to serum cortisol. American Journal of Physiology. 1997; 272(3 PART 1):E476–E484. [PubMed: 9124555]
Taylor PJ. Matrix effects: the Achilles heel of quantitative high-performance liquid chromatography-electrospray-tandem mass spectrometry. Clinical biochemistry. 2005; 38(4):328–334. [PubMed:15766734]
Telang S, Yalcin A, et al. Ras transformation requires metabolic control by 6-phosphofructo-2-kinase.Oncogene. 2006; 25(55):7225–7234. [PubMed: 16715124]
Tennant DA, Duran RV, et al. Targeting metabolic transformation for cancer therapy. Nature Rev.Cancer. 2010; 10:267–277. [PubMed: 20300106]
Thelwall P, Simpson N, et al. In vivo MR studies of glycine and glutathione metabolism in a ratmammary tumor. NMR Biomed. 2011 doi: 10.1002/nbm.1745.
Thelwall PE, Yemin AY, et al. Noninvasive in vivo detection of glutathione metabolism in tumors.Cancer research. 2005; 65(22):10149–10153. [PubMed: 16287997]
Theodoridis G, Gika HG, et al. Mass spectrometry-based holistic analytical approaches for metaboliteprofiling in systems biology studies. Mass Spectrometry Reviews. 2011
Thornburg JM, Nelson KK, et al. Targeting Aspartate Aminotransferase in Breast Cancer. BreastCancer Research. 2008; 10:R84. [PubMed: 18922152]
Timmerman W, Cisci G, et al. Effects of handling on extracellular levels of glutamate and other aminoacids in various areas of the brain measured by microdialysis. Brain Res. 1999; 833(2):150–160.[PubMed: 10375690]
Tonn GR, Mutlib A, et al. Simultaneous Analysis of Diphenhydramine and a Stable-Isotope Analog(H-2(10) Diphenhydramine Using Capillary Gas-Chromatography with Mass-Selective Detectionin Biological-Fluids from Chronically Instrumented Pregnant Ewes. Biological MassSpectrometry. 1993; 22(11):633–642. [PubMed: 8251550]
Tseng JR, Stuart D, et al. Use of DNA microarray and small animal positron emission tomography inpreclinical drug evaluation of RAF265, a novel B-Raf/VEGFR-2 inhibitor. Neoplasia. 2011;13(3):266–275. [PubMed: 21390189]
Fan et al. Page 48
Pharmacol Ther. Author manuscript; available in PMC 2013 March 01.
NIH
-PA Author Manuscript
NIH
-PA Author Manuscript
NIH
-PA Author Manuscript
Van der Greef J, Hankemeier T, et al. Metabolomics-based systems biology and personalizedmedicine: moving towards n=1 clinical trials? Pharmacogenomics. 2006; 7(7):1087–1094.[PubMed: 17054418]
Vander Heiden MG, Christofk HR, et al. Identification of small molecule inhibitors of pyruvate kinaseM2. Biochemical Pharmacology. 2010; 79(8):1118–1124. [PubMed: 20005212]
Verhoeckx KCM, Bijlsma S, et al. Characterization of anti-inflammatory compounds usingtranscriptomics, proteomics, and metabolomics in combination with multivariate data analysis.International Immunopharmacology. 2004; 4(12):1499–1514. [PubMed: 15351319]
Veselkov KA, Vingara LK, et al. Optimized Preprocessing of Ultra-Performance LiquidChromatography/Mass Spectrometry Urinary Metabolic Profiles for Improved InformationRecovery. Analytical Chemistry. 2011; 83(15):5864–5872. [PubMed: 21526840]
Vogeser M, Seger C. Pitfalls Associated with the Use of Liquid Chromatography-Tandem MassSpectrometry in the Clinical Laboratory. Clinical Chemistry. 2010; 56(8):1234–1244. [PubMed:20511452]
Wade KE, Wilson ID, et al. F-19 AND H-1 MAGNETIC-RESONANCE STRATEGIES FORMETABOLIC STUDIES ON FLUORINATED XENOBIOTICS - APPLICATION TOFLURBIPROFEN 2-(2-FLUORO-4-BIPHENYLYL)PROPIONIC ACID. Journal ofPharmaceutical and Biomedical Analysis. 1990; 8(5):401–410. [PubMed: 2081200]
Wahl S, Nöh K, et al. 13C labeling experiments at metabolic nonstationary conditions: An exploratorystudy. Bmc Bioinformatics. 2008; 9(1):152. [PubMed: 18366666]
Wang P, Lloyd S, et al. The effect of type-2 diabetes on substrates utilization during normoxia and lowflow ischemia. FASEB Journal. 2003; 17(4-5) Abstract No.
Wang PP, Lloyd SG, et al. Impact of high glucose/high insulin and dichloroacetate treatment oncarbohydrate oxidation and functional recovery after low-flow ischemia and reperfusion in theisolated perfused rat heart. Circulation. 2005; 111(16):2066–2072. [PubMed: 15824201]
Want EJ, O'Maille G, et al. Solvent-dependent metabolite distribution, clustering, and proteinextraction for serum profiling with mass spectrometry. Analytical Chemistry. 2006; 78(3):743–752. [PubMed: 16448047]
Want EJ, Smith CA, et al. Phospholipid capture combined with non-linear chromatographic correctionfor improved serum metabolite profiling. Metabolomics. 2006; 2(3):145–154.
Warburg O. Versuche an überlebendem Carcinomgewebe (Methoden). Biochem. Zeitschr. 1923;142:317–333.
Warburg O. Is the respiration of cancer cells normal? Biochem. Zeitschr. 1924; 51
Warburg O. On the origin of cancer cells. Science. 1956; 123:309–314. [PubMed: 13298683]
Watson, JT. Introduction to Mass Spectrometry. Raven Press; New York: 1985.
Weber WA, Petersen V, et al. Positron emission tomography in non-small-cell lung cancer: predictionof response to chemotherapy by quantitative assessment of glucose use. Journal of clinicaloncology : official journal of the American Society of Clinical Oncology. 2003; 21(14):2651–2657. [PubMed: 12860940]
Weissleder R, Pittet MJ. Imaging in the era of molecular oncology. Nature. 2008; 452(7187):580–589.[PubMed: 18385732]
Weljie AM, Newton J, et al. Targeted profiling: Quantitative analysis of H-1 NMR metabolomics data.Analytical Chemistry. 2006; 78(13):4430–4442. [PubMed: 16808451]
Wessels JT, Busse AC, et al. In vivo imaging in experimental preclinical tumor research--a review.Cytometry. Part A : the journal of the International Society for Analytical Cytology. 2007; 71(8):542–549. [PubMed: 17598185]
Wevers RA, Engelke U, et al. HIGH-RESOLUTION H-1-NMR SPECTROSCOPY OF BLOOD-PLASMA FOR METABOLIC STUDIES. Clinical Chemistry. 1994; 40(7):1245–1250.[PubMed: 8013094]
Whitfield PD, German AJ, et al. Metabolomics: an emerging post-genomic tool for nutrition. BritishJournal of Nutrition. 2004; 92(4):549–555. [PubMed: 15522124]
Wiechert W, Mollney M, et al. A universal framework for 13C metabolic flux analysis. MetabolicEngineering. 2001; 3(3):265–283. [PubMed: 11461148]
Fan et al. Page 49
Pharmacol Ther. Author manuscript; available in PMC 2013 March 01.
NIH
-PA Author Manuscript
NIH
-PA Author Manuscript
NIH
-PA Author Manuscript
Wikoff WR, Anfora AT, et al. Metabolomics analysis reveals large effects of gut microflora onmammalian blood metabolites. Proc Natl Acad Sci U S A. 2009; 106(10):3698–3703. [PubMed:19234110]
Griffiths, William J.; YuqinWang, TK.; Kohl, Matthias; Enot, David P.; Deigner, H-P. TargetedMetabolomics for Biomarker Discovery. Angew. Chem. Int. Ed. 2010; 49:5426–5446.
Willker W, Engelmann J, et al. Metabolite Detection in Cell Extracts and Culture Media by Proton-detected 2D-H,C-NMR Spectroscopy. J. Magn. Res. Anal. 1996; 2:21–32.
Willmann JK, van Bruggen N, et al. Molecular imaging in drug development. Nature reviews. Drugdiscovery. 2008; 7(7):591–607.
Wilson DM, Keshari KR, et al. Multi-compound polarization by DNP allows simultaneous assessmentof multiple enzymatic activities in vivo. Journal of Magnetic Resonance. 2010; 205(1):141–147.[PubMed: 20478721]
Winnike JH, Pediaditakis P, et al. Stable isotope resolved metabolomics of primary human hepatocytesreveals a stressed phenotype. Metabolomics. 2011 DOI 10.1007/s11306-011-0284-5.
Wise DR, DeBerardinis RJ, et al. Myc regulates a transcriptional program that stimulatesmitochondrial glutaminolysis and leads to glutamine addiction. Proceedings of the NationalAcademy of Sciences of the United States of America. 2008; 105(48):18782–18787. [PubMed:19033189]
Wishart DS, Tzur D, et al. HMDB: the human metabolome database. Nucleic Acids Research. 2007;35:D521–D526. [PubMed: 17202168]
Wittmann C, Heinzle E. Application of MALDI-TOF MS to lysine-producing Corynebacteriumglutamicum - A novel approach for metabolic flux analysis. European Journal of Biochemistry.2001; 268(8):2441–2455. [PubMed: 11298764]
Wolfe RR. Tracers in metabolic research: radioisotope and stable isotope/mass spectrometry methods.Laboratory and research methods in biology and medicine. 1984; 9:1–287. [PubMed: 6427541]
Wolfe, RR. Radioactive and stable isotope tracers in biomedicine : principles and practice of kineticanalysis. Wiley-Liss; New York: 1992.
Wolfe SP, Hsu E, et al. A novel multi-coaxial hollow fiber bioreactor for adherent cell types. Part 1:Hydrodynamic studies. Biotechnology and Bioengineering. 2002; 77(1):83–90. [PubMed:11745176]
Xu GM, Lu X, et al. LC-MS-based metabonomics analysis. Journal of Chromatography B-AnalyticalTechnologies in the Biomedical and Life Sciences. 2008; 866(1-2):64–76.
Xu W, Yang H, et al. Oncometabolite 2-hydroxyglutarate is a competitive inhibitor of α-ketoglutarate-dependent dioxygenases. cancer Cell. 2011; 19:17–30. [PubMed: 21251613]
Yalcin A, Clem B, et al. Selective inhibition of choline kinase simultaneously attenuates MAPK andPI3K/AKT signaling. Oncogene. 2010; 29(1):139–149. [PubMed: 19855431]
Yalcin A, Clem BF, et al. Nuclear Targeting of 6-Phosphofructo-2-kinase (PFKFB3) IncreasesProliferation via Cyclin-dependent Kinases. Journal of Biological Chemistry. 2009; 284(36):24223–24232. [PubMed: 19473963]
Yamasaki T, Tran TAT, et al. Exploring a glycolytic inhibitor for the treatment of an FH-deficienttype-2 papillary RCC. Nature Reviews Urology. 2011; 8(3):165–171.
Yan ZY, Caldwell GW. Stable-isotope trapping and high-throughput screenings of reactivemetabolites using the isotope MS signature. Analytical Chemistry. 2004; 76(23):6835–6847.[PubMed: 15571331]
Yang C, Hua Q, et al. Quantitative analysis of intracellular metabolic fluxes using GC-MS and two-dimensional NMR spectroscopy. Journal of Bioscience and Bioengineering. 2002; 93(1):78–87.[PubMed: 16233169]
Yang C, Richardson A, et al. Profiling of central metabolism in human cancer cells by two-dimensional NMR, GC-MS analysis, and isotopomer modeling. Metabolomics. 2008
Yang L, Kombu RS, et al. Metabolomic and mass isotopomer analysis of liver gluconeogenesis andcitric acid cycle - I. Interrelation between gluconeogenesis and cataplerosis; Formation ofmethoxamates from aminooxyacetate and ketoacids. Journal of Biological Chemistry. 2008;283(32):21978–21987. [PubMed: 18544527]
Fan et al. Page 50
Pharmacol Ther. Author manuscript; available in PMC 2013 March 01.
NIH
-PA Author Manuscript
NIH
-PA Author Manuscript
NIH
-PA Author Manuscript
Yoo H, Antoniewicz MR, et al. Quantifying reductive carboxylation flux of glutamine to lipid in abrown adipocyte cell line. Journal of Biological Chemistry. 2008; 283(30):20621–20627.[PubMed: 18364355]
Yu YM, Wagner DA, et al. Quantitative role of splanchnic region in leucine metabolism: L-[1-13C,15N]leucine and substrate balance studies. The American journal of physiology. 1990; 259(1 Pt1):E36–51. [PubMed: 2372053]
Yuan J, Bennett BD, et al. Kinetic flux profiling for quantitation of cellular metabolic fluxes. NatProtoc. 2008; 3(8):1328–1340. [PubMed: 18714301]
Yuan PX, Huang LD, et al. The mood stabilizer valproic acid activates mitogen-activated proteinkinases and promotes neurite growth. Journal of Biological Chemistry. 2001; 276(34):31674–31683. [PubMed: 11418608]
Yuneva M. Finding an “Achilles’ heel” of cancer: the role of glucose and glutamine metabolism in thesurvival of transformed cells. Cell Cycle. 2008; 7:2083–2089. [PubMed: 18635953]
Yuneva M, Zamboni N, et al. Deficiency in glutamine but not glucose induces MYC-dependentapoptosis in human cells. Journal of Cell Biology. 2007; 178(1):93–105. [PubMed: 17606868]
Zamboni N. 13C metabolic flux analysis in complex systems. Current opinion in biotechnology. 2010
Zamboni N, Fendt SM, et al. (13)C-based metabolic flux analysis. Nat Protoc. 2009; 4(6):878–892.[PubMed: 19478804]
Zhang BL, Trierweiler M, et al. Consistency of NMR and mass spectrometry determinations ofnatural-abundance site-specific carbon isotope ratios. The case of glycerol. Anal Chem. 1999;71(13):2301–2306. [PubMed: 21662780]
Zhang GF, Sadhukhan S, et al. Metabolomics, pathway regulation, and pathway discovery. TheJournal of biological chemistry. 2011; 286(27):23631–23635. [PubMed: 21566142]
Zhao Q, Stoyanova R, et al. HiRes - a tool for comprehensive assessment and interpretation ofmetabolomic data. Bioinformatics. 2006; 22(20):2562–2564. [PubMed: 16895927]
Zwingmann C, Leibfritz D. Regulation of glial metabolism studied by C-13-NMR. Nmr inBiomedicine. 2003; 16(6-7):370–399. [PubMed: 14679501]
Zwingmann C, Richter-Landsberg C, et al. C-13 isotopomer analysis of glucose and alaninemetabolism reveals cytosolic pyruvate compartmentation as part of energy metabolism inastrocytes. Glia. 2001; 34(3):200–212. [PubMed: 11329182]
Fan et al. Page 51
Pharmacol Ther. Author manuscript; available in PMC 2013 March 01.
NIH
-PA Author Manuscript
NIH
-PA Author Manuscript
NIH
-PA Author Manuscript
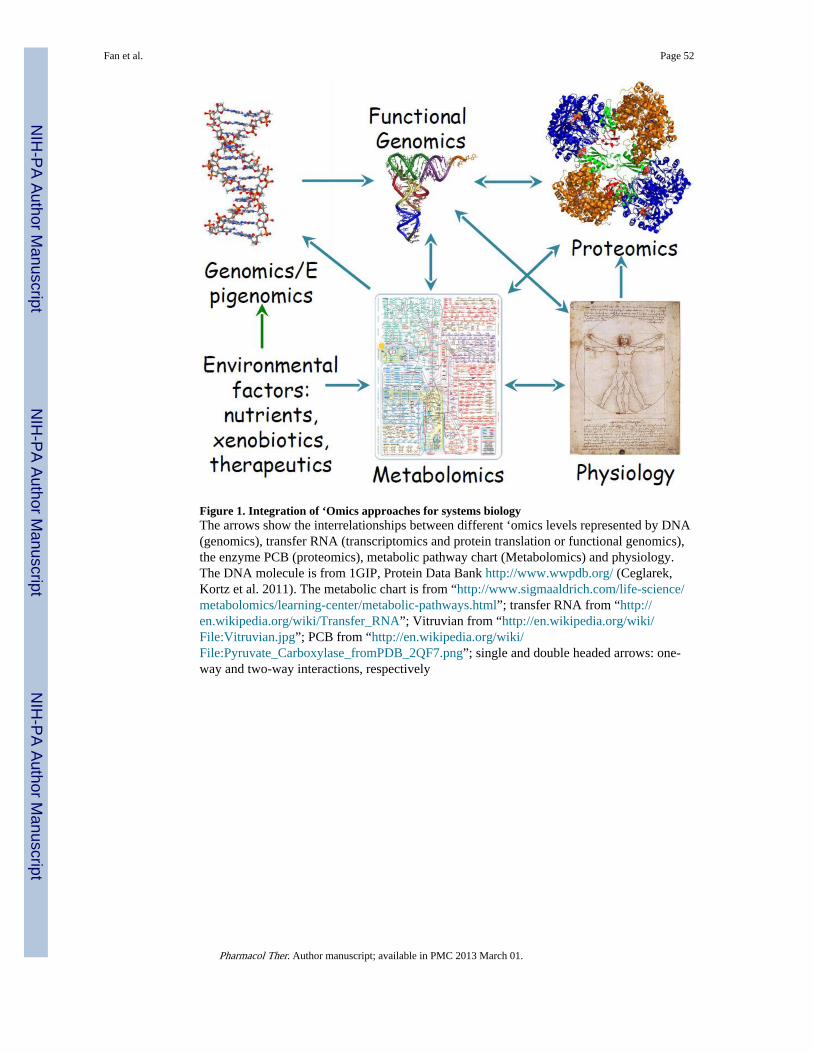
Figure 1. Integration of ‘Omics approaches for systems biologyThe arrows show the interrelationships between different ‘omics levels represented by DNA(genomics), transfer RNA (transcriptomics and protein translation or functional genomics),the enzyme PCB (proteomics), metabolic pathway chart (Metabolomics) and physiology.The DNA molecule is from 1GIP, Protein Data Bank http://www.wwpdb.org/ (Ceglarek,Kortz et al. 2011). The metabolic chart is from “http://www.sigmaaldrich.com/life-science/metabolomics/learning-center/metabolic-pathways.html”; transfer RNA from “http://en.wikipedia.org/wiki/Transfer_RNA”; Vitruvian from “http://en.wikipedia.org/wiki/File:Vitruvian.jpg”; PCB from “http://en.wikipedia.org/wiki/File:Pyruvate_Carboxylase_fromPDB_2QF7.png”; single and double headed arrows: one-way and two-way interactions, respectively
Fan et al. Page 52
Pharmacol Ther. Author manuscript; available in PMC 2013 March 01.
NIH
-PA Author Manuscript
NIH
-PA Author Manuscript
NIH
-PA Author Manuscript
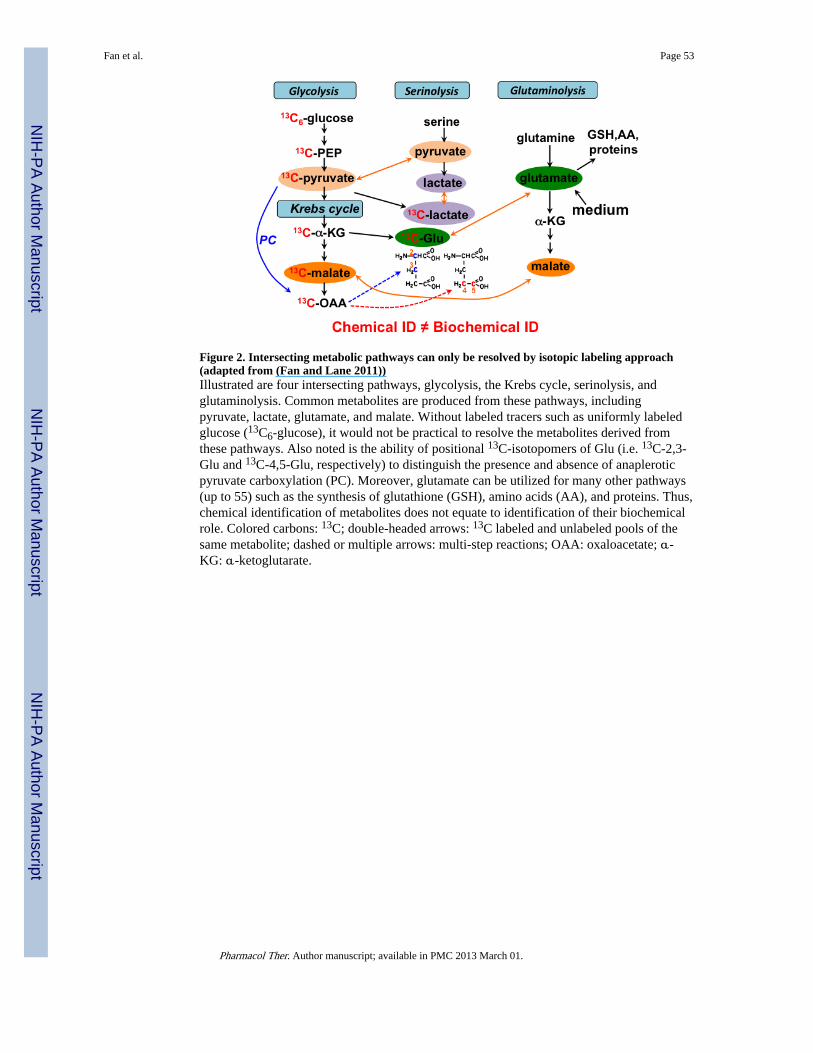
Figure 2. Intersecting metabolic pathways can only be resolved by isotopic labeling approach(adapted from (Fan and Lane 2011))Illustrated are four intersecting pathways, glycolysis, the Krebs cycle, serinolysis, andglutaminolysis. Common metabolites are produced from these pathways, includingpyruvate, lactate, glutamate, and malate. Without labeled tracers such as uniformly labeledglucose (13C6-glucose), it would not be practical to resolve the metabolites derived fromthese pathways. Also noted is the ability of positional 13C-isotopomers of Glu (i.e. 13C-2,3-Glu and 13C-4,5-Glu, respectively) to distinguish the presence and absence of anapleroticpyruvate carboxylation (PC). Moreover, glutamate can be utilized for many other pathways(up to 55) such as the synthesis of glutathione (GSH), amino acids (AA), and proteins. Thus,chemical identification of metabolites does not equate to identification of their biochemicalrole. Colored carbons: 13C; double-headed arrows: 13C labeled and unlabeled pools of thesame metabolite; dashed or multiple arrows: multi-step reactions; OAA: oxaloacetate; α-KG: α-ketoglutarate.
Fan et al. Page 53
Pharmacol Ther. Author manuscript; available in PMC 2013 March 01.
NIH
-PA Author Manuscript
NIH
-PA Author Manuscript
NIH
-PA Author Manuscript
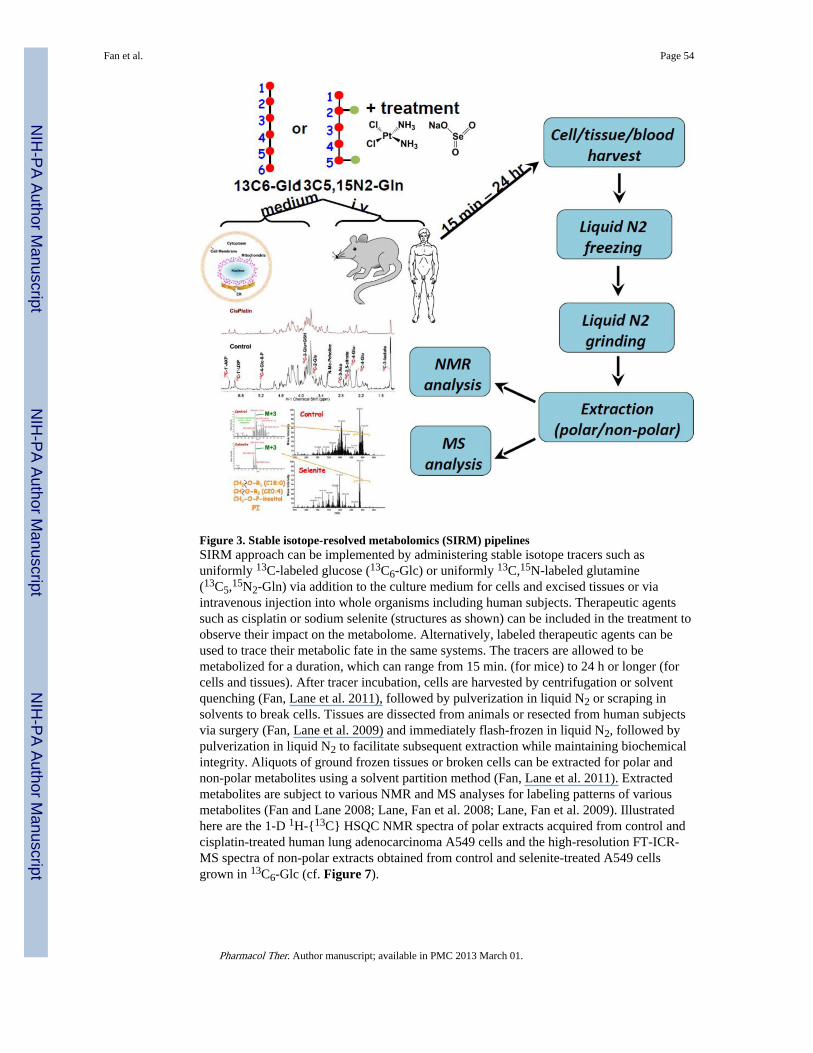
Figure 3. Stable isotope-resolved metabolomics (SIRM) pipelinesSIRM approach can be implemented by administering stable isotope tracers such asuniformly 13C-labeled glucose (13C6-Glc) or uniformly 13C,15N-labeled glutamine(13C5,15N2-Gln) via addition to the culture medium for cells and excised tissues or viaintravenous injection into whole organisms including human subjects. Therapeutic agentssuch as cisplatin or sodium selenite (structures as shown) can be included in the treatment toobserve their impact on the metabolome. Alternatively, labeled therapeutic agents can beused to trace their metabolic fate in the same systems. The tracers are allowed to bemetabolized for a duration, which can range from 15 min. (for mice) to 24 h or longer (forcells and tissues). After tracer incubation, cells are harvested by centrifugation or solventquenching (Fan, Lane et al. 2011), followed by pulverization in liquid N2 or scraping insolvents to break cells. Tissues are dissected from animals or resected from human subjectsvia surgery (Fan, Lane et al. 2009) and immediately flash-frozen in liquid N2, followed bypulverization in liquid N2 to facilitate subsequent extraction while maintaining biochemicalintegrity. Aliquots of ground frozen tissues or broken cells can be extracted for polar andnon-polar metabolites using a solvent partition method (Fan, Lane et al. 2011). Extractedmetabolites are subject to various NMR and MS analyses for labeling patterns of variousmetabolites (Fan and Lane 2008; Lane, Fan et al. 2008; Lane, Fan et al. 2009). Illustratedhere are the 1-D 1H-{13C} HSQC NMR spectra of polar extracts acquired from control andcisplatin-treated human lung adenocarcinoma A549 cells and the high-resolution FT-ICR-MS spectra of non-polar extracts obtained from control and selenite-treated A549 cellsgrown in 13C6-Glc (cf. Figure 7).
Fan et al. Page 54
Pharmacol Ther. Author manuscript; available in PMC 2013 March 01.
NIH
-PA Author Manuscript
NIH
-PA Author Manuscript
NIH
-PA Author Manuscript
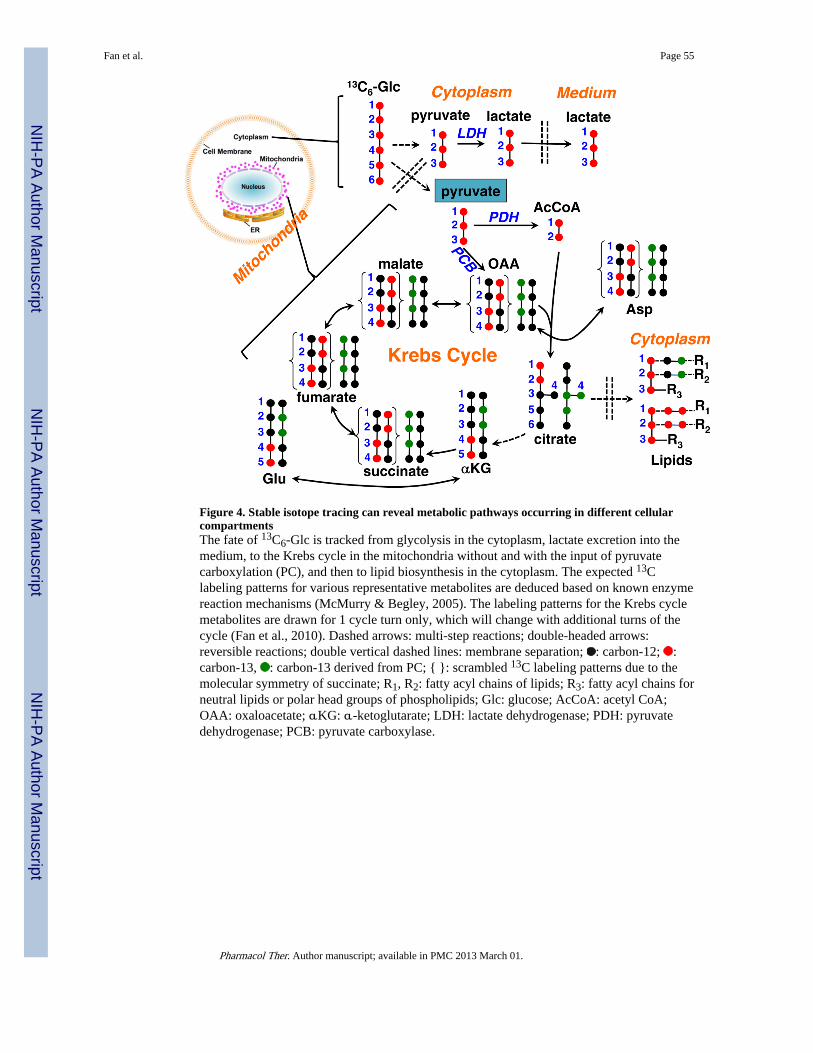
Figure 4. Stable isotope tracing can reveal metabolic pathways occurring in different cellularcompartmentsThe fate of 13C6-Glc is tracked from glycolysis in the cytoplasm, lactate excretion into themedium, to the Krebs cycle in the mitochondria without and with the input of pyruvatecarboxylation (PC), and then to lipid biosynthesis in the cytoplasm. The expected 13Clabeling patterns for various representative metabolites are deduced based on known enzymereaction mechanisms (McMurry & Begley, 2005). The labeling patterns for the Krebs cyclemetabolites are drawn for 1 cycle turn only, which will change with additional turns of thecycle (Fan et al., 2010). Dashed arrows: multi-step reactions; double-headed arrows:reversible reactions; double vertical dashed lines: membrane separation; : carbon-12; :carbon-13, : carbon-13 derived from PC; { }: scrambled 13C labeling patterns due to themolecular symmetry of succinate; R1, R2: fatty acyl chains of lipids; R3: fatty acyl chains forneutral lipids or polar head groups of phospholipids; Glc: glucose; AcCoA: acetyl CoA;OAA: oxaloacetate; αKG: α-ketoglutarate; LDH: lactate dehydrogenase; PDH: pyruvatedehydrogenase; PCB: pyruvate carboxylase.
Fan et al. Page 55
Pharmacol Ther. Author manuscript; available in PMC 2013 March 01.
NIH
-PA Author Manuscript
NIH
-PA Author Manuscript
NIH
-PA Author Manuscript
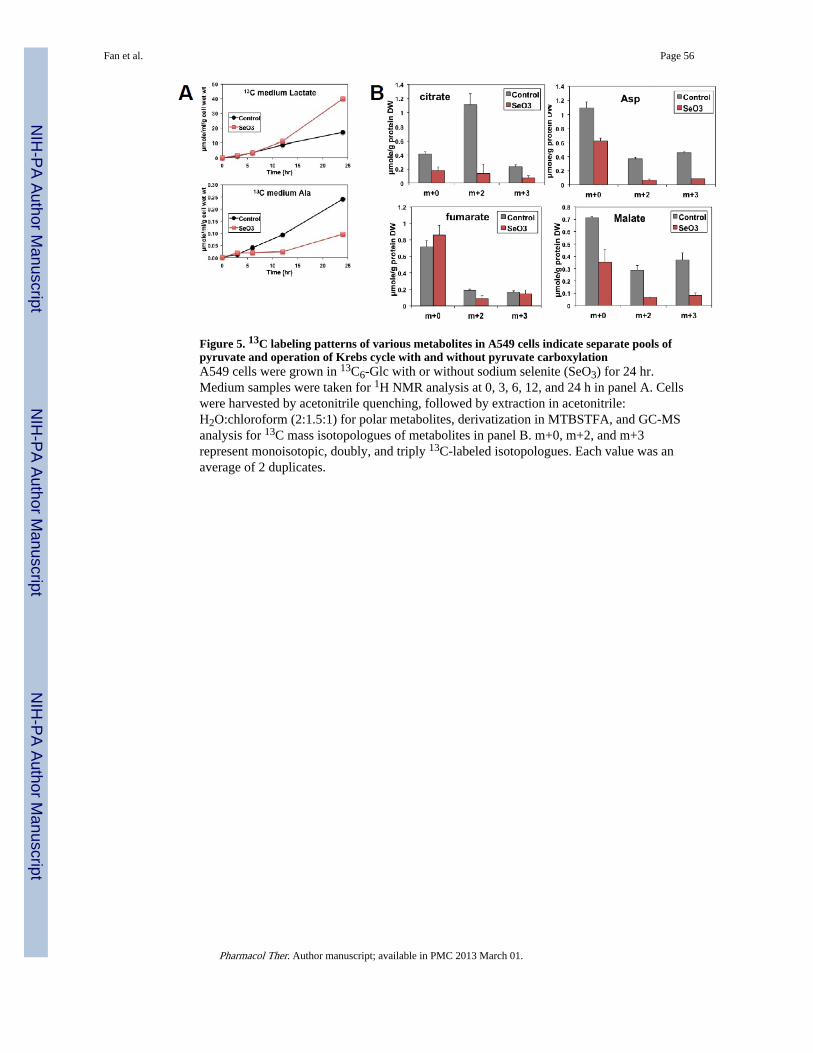
Figure 5. 13C labeling patterns of various metabolites in A549 cells indicate separate pools ofpyruvate and operation of Krebs cycle with and without pyruvate carboxylationA549 cells were grown in 13C6-Glc with or without sodium selenite (SeO3) for 24 hr.Medium samples were taken for 1H NMR analysis at 0, 3, 6, 12, and 24 h in panel A. Cellswere harvested by acetonitrile quenching, followed by extraction in acetonitrile:H2O:chloroform (2:1.5:1) for polar metabolites, derivatization in MTBSTFA, and GC-MSanalysis for 13C mass isotopologues of metabolites in panel B. m+0, m+2, and m+3represent monoisotopic, doubly, and triply 13C-labeled isotopologues. Each value was anaverage of 2 duplicates.
Fan et al. Page 56
Pharmacol Ther. Author manuscript; available in PMC 2013 March 01.
NIH
-PA Author Manuscript
NIH
-PA Author Manuscript
NIH
-PA Author Manuscript
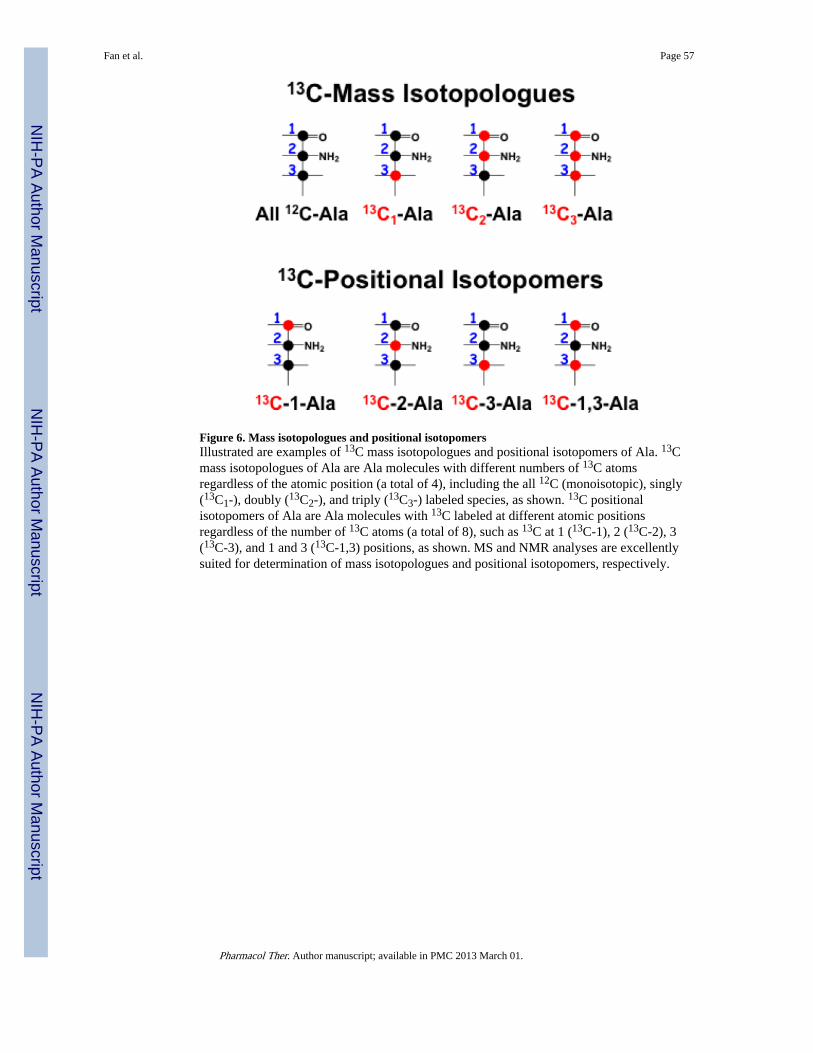
Figure 6. Mass isotopologues and positional isotopomersIllustrated are examples of 13C mass isotopologues and positional isotopomers of Ala. 13Cmass isotopologues of Ala are Ala molecules with different numbers of 13C atomsregardless of the atomic position (a total of 4), including the all 12C (monoisotopic), singly(13C1-), doubly (13C2-), and triply (13C3-) labeled species, as shown. 13C positionalisotopomers of Ala are Ala molecules with 13C labeled at different atomic positionsregardless of the number of 13C atoms (a total of 8), such as 13C at 1 (13C-1), 2 (13C-2), 3(13C-3), and 1 and 3 (13C-1,3) positions, as shown. MS and NMR analyses are excellentlysuited for determination of mass isotopologues and positional isotopomers, respectively.
Fan et al. Page 57
Pharmacol Ther. Author manuscript; available in PMC 2013 March 01.
NIH
-PA Author Manuscript
NIH
-PA Author Manuscript
NIH
-PA Author Manuscript
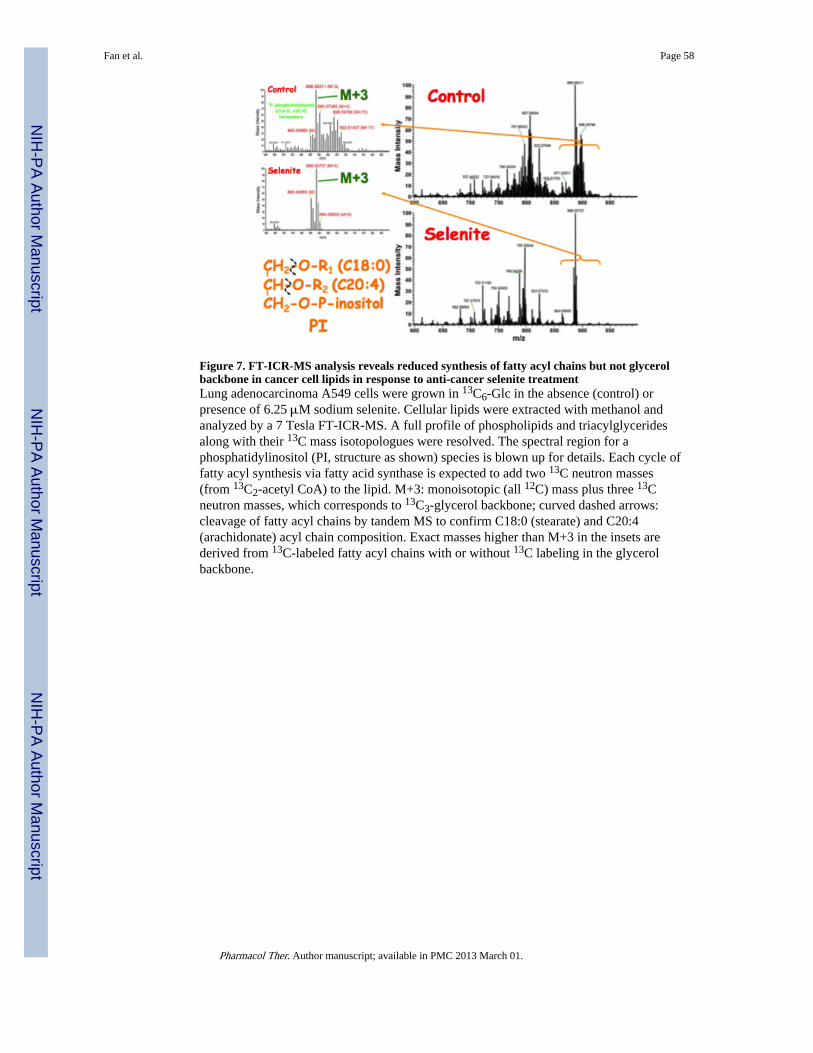
Figure 7. FT-ICR-MS analysis reveals reduced synthesis of fatty acyl chains but not glycerolbackbone in cancer cell lipids in response to anti-cancer selenite treatmentLung adenocarcinoma A549 cells were grown in 13C6-Glc in the absence (control) orpresence of 6.25 μM sodium selenite. Cellular lipids were extracted with methanol andanalyzed by a 7 Tesla FT-ICR-MS. A full profile of phospholipids and triacylglyceridesalong with their 13C mass isotopologues were resolved. The spectral region for aphosphatidylinositol (PI, structure as shown) species is blown up for details. Each cycle offatty acyl synthesis via fatty acid synthase is expected to add two 13C neutron masses(from 13C2-acetyl CoA) to the lipid. M+3: monoisotopic (all 12C) mass plus three 13Cneutron masses, which corresponds to 13C3-glycerol backbone; curved dashed arrows:cleavage of fatty acyl chains by tandem MS to confirm C18:0 (stearate) and C20:4(arachidonate) acyl chain composition. Exact masses higher than M+3 in the insets arederived from 13C-labeled fatty acyl chains with or without 13C labeling in the glycerolbackbone.
Fan et al. Page 58
Pharmacol Ther. Author manuscript; available in PMC 2013 March 01.
NIH
-PA Author Manuscript
NIH
-PA Author Manuscript
NIH
-PA Author Manuscript
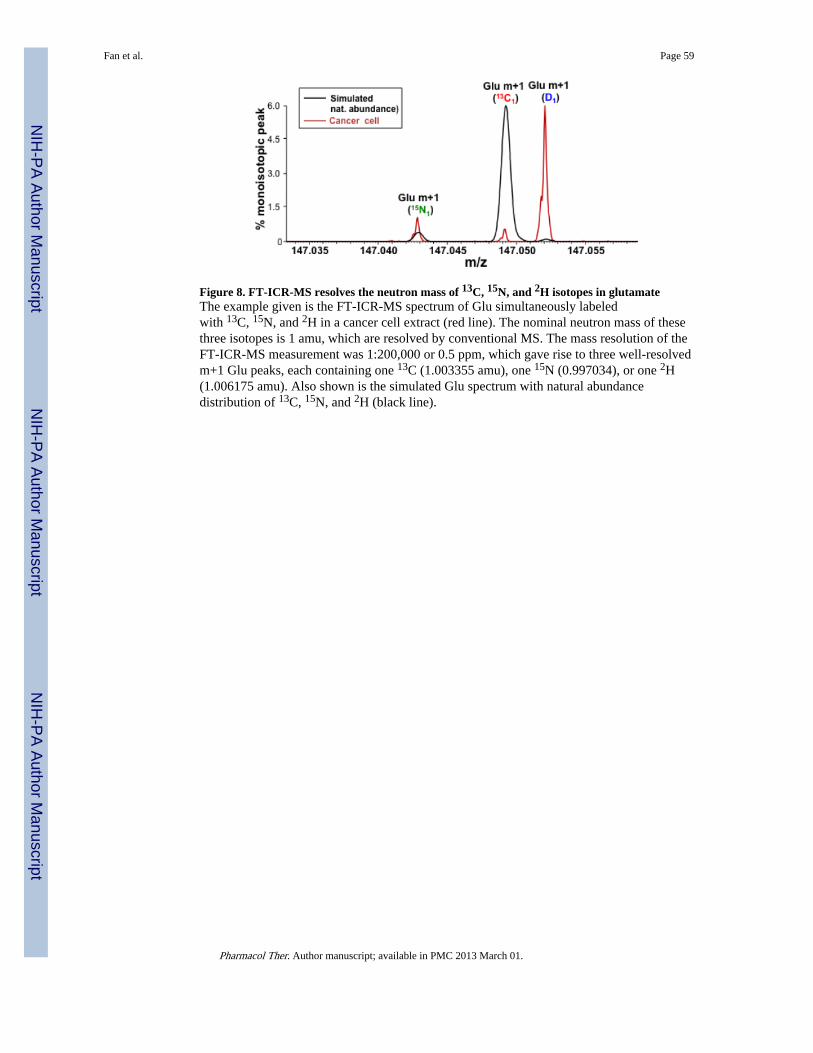
Figure 8. FT-ICR-MS resolves the neutron mass of 13C, 15N, and 2H isotopes in glutamateThe example given is the FT-ICR-MS spectrum of Glu simultaneously labeledwith 13C, 15N, and 2H in a cancer cell extract (red line). The nominal neutron mass of thesethree isotopes is 1 amu, which are resolved by conventional MS. The mass resolution of theFT-ICR-MS measurement was 1:200,000 or 0.5 ppm, which gave rise to three well-resolvedm+1 Glu peaks, each containing one 13C (1.003355 amu), one 15N (0.997034), or one 2H(1.006175 amu). Also shown is the simulated Glu spectrum with natural abundancedistribution of 13C, 15N, and 2H (black line).
Fan et al. Page 59
Pharmacol Ther. Author manuscript; available in PMC 2013 March 01.
NIH
-PA Author Manuscript
NIH
-PA Author Manuscript
NIH
-PA Author Manuscript
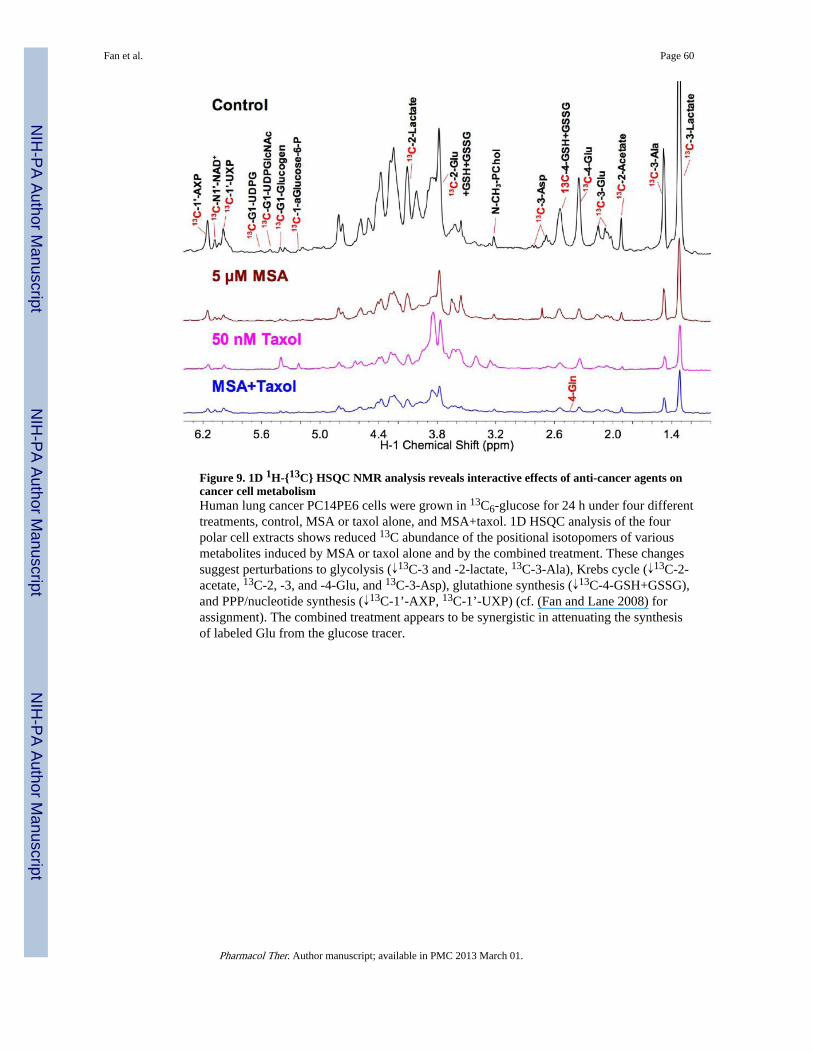
Figure 9. 1D 1H-{13C} HSQC NMR analysis reveals interactive effects of anti-cancer agents oncancer cell metabolismHuman lung cancer PC14PE6 cells were grown in 13C6-glucose for 24 h under four differenttreatments, control, MSA or taxol alone, and MSA+taxol. 1D HSQC analysis of the fourpolar cell extracts shows reduced 13C abundance of the positional isotopomers of variousmetabolites induced by MSA or taxol alone and by the combined treatment. These changessuggest perturbations to glycolysis (↓13C-3 and -2-lactate, 13C-3-Ala), Krebs cycle (↓13C-2-acetate, 13C-2, -3, and -4-Glu, and 13C-3-Asp), glutathione synthesis (↓13C-4-GSH+GSSG),and PPP/nucleotide synthesis (↓13C-1’-AXP, 13C-1’-UXP) (cf. (Fan and Lane 2008) forassignment). The combined treatment appears to be synergistic in attenuating the synthesisof labeled Glu from the glucose tracer.
Fan et al. Page 60
Pharmacol Ther. Author manuscript; available in PMC 2013 March 01.
NIH
-PA Author Manuscript
NIH
-PA Author Manuscript
NIH
-PA Author Manuscript
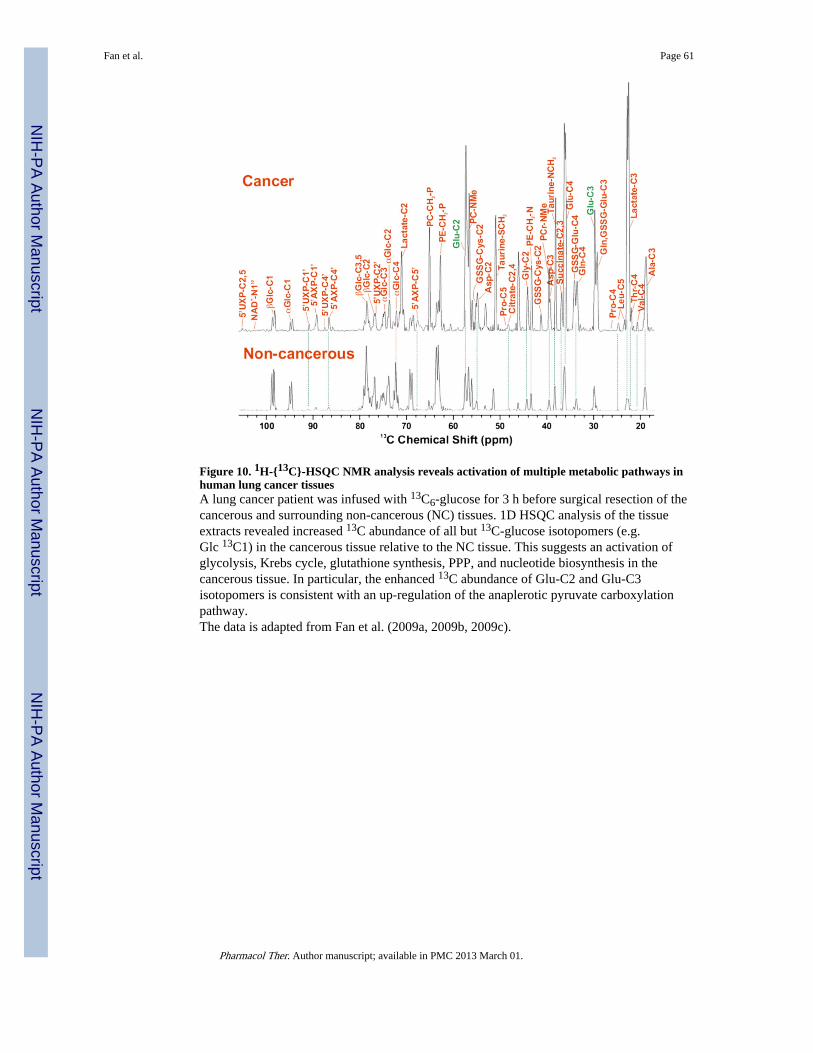
Figure 10. 1H-{13C}-HSQC NMR analysis reveals activation of multiple metabolic pathways inhuman lung cancer tissuesA lung cancer patient was infused with 13C6-glucose for 3 h before surgical resection of thecancerous and surrounding non-cancerous (NC) tissues. 1D HSQC analysis of the tissueextracts revealed increased 13C abundance of all but 13C-glucose isotopomers (e.g.Glc 13C1) in the cancerous tissue relative to the NC tissue. This suggests an activation ofglycolysis, Krebs cycle, glutathione synthesis, PPP, and nucleotide biosynthesis in thecancerous tissue. In particular, the enhanced 13C abundance of Glu-C2 and Glu-C3isotopomers is consistent with an up-regulation of the anaplerotic pyruvate carboxylationpathway.The data is adapted from Fan et al. (2009a, 2009b, 2009c).
Fan et al. Page 61
Pharmacol Ther. Author manuscript; available in PMC 2013 March 01.
NIH
-PA Author Manuscript
NIH
-PA Author Manuscript
NIH
-PA Author Manuscript
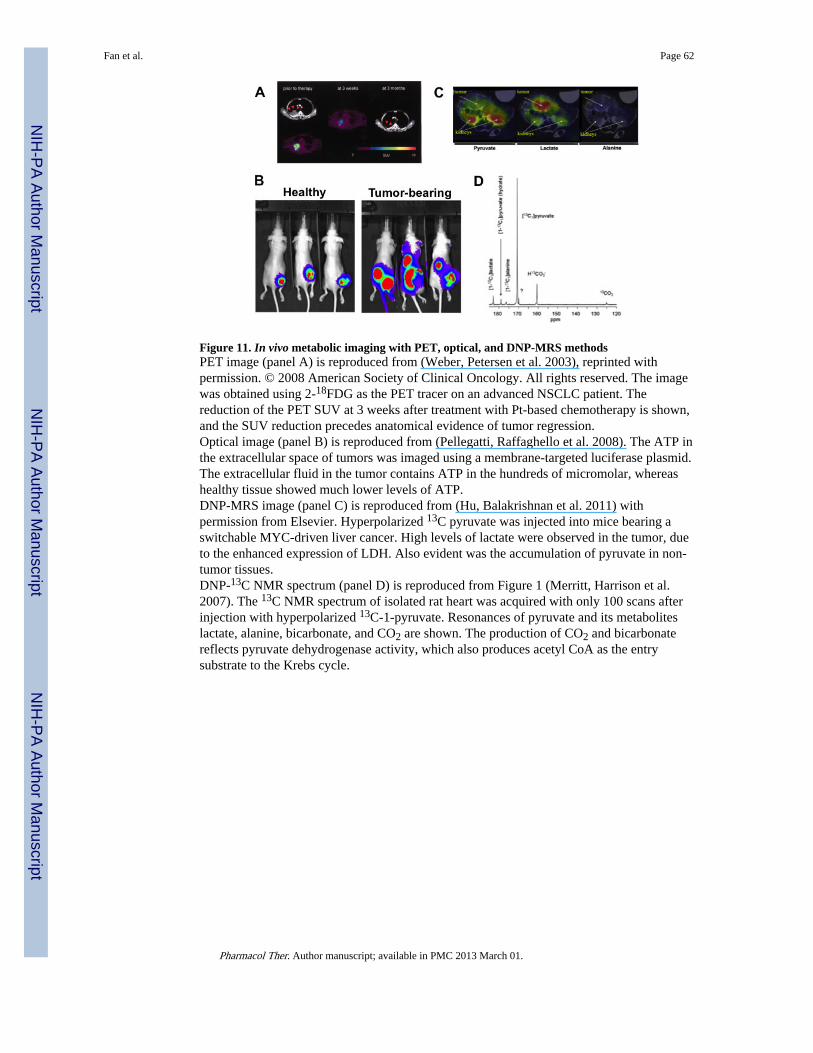
Figure 11. In vivo metabolic imaging with PET, optical, and DNP-MRS methodsPET image (panel A) is reproduced from (Weber, Petersen et al. 2003), reprinted withpermission. © 2008 American Society of Clinical Oncology. All rights reserved. The imagewas obtained using 2-18FDG as the PET tracer on an advanced NSCLC patient. Thereduction of the PET SUV at 3 weeks after treatment with Pt-based chemotherapy is shown,and the SUV reduction precedes anatomical evidence of tumor regression.Optical image (panel B) is reproduced from (Pellegatti, Raffaghello et al. 2008). The ATP inthe extracellular space of tumors was imaged using a membrane-targeted luciferase plasmid.The extracellular fluid in the tumor contains ATP in the hundreds of micromolar, whereashealthy tissue showed much lower levels of ATP.DNP-MRS image (panel C) is reproduced from (Hu, Balakrishnan et al. 2011) withpermission from Elsevier. Hyperpolarized 13C pyruvate was injected into mice bearing aswitchable MYC-driven liver cancer. High levels of lactate were observed in the tumor, dueto the enhanced expression of LDH. Also evident was the accumulation of pyruvate in non-tumor tissues.DNP-13C NMR spectrum (panel D) is reproduced from Figure 1 (Merritt, Harrison et al.2007). The 13C NMR spectrum of isolated rat heart was acquired with only 100 scans afterinjection with hyperpolarized 13C-1-pyruvate. Resonances of pyruvate and its metaboliteslactate, alanine, bicarbonate, and CO2 are shown. The production of CO2 and bicarbonatereflects pyruvate dehydrogenase activity, which also produces acetyl CoA as the entrysubstrate to the Krebs cycle.
Fan et al. Page 62
Pharmacol Ther. Author manuscript; available in PMC 2013 March 01.
NIH
-PA Author Manuscript
NIH
-PA Author Manuscript
NIH
-PA Author Manuscript


