Embed Size (px)
Citation preview
Food Research International 54 (2013) 1131–1145
Contents lists available at ScienceDirect
Food Research International
j ourna l homepage: www.e lsev ie r .com/ locate / foodres
A primer to nutritional metabolomics by NMR spectroscopyand chemometricsFrancesco Savorani, Morten Arendt Rasmussen, Mette Skau Mikkelsen, Søren Balling Engelsen ⁎Department of Food Science, Quality & Technology, Faculty of Life Sciences, University of Copenhagen, Rolighedsvej 30, 1958 Frederiksberg C, Denmark
⁎ Corresponding author. Tel.: +45 20 20 00 64.E-mail address: [email protected] (S.B. Engelsen).
0963-9969/$ – see front matter © 2013 Elsevier Ltd. Allhttp://dx.doi.org/10.1016/j.foodres.2012.12.025
a b s t r a c t
a r t i c l e i n f oArticle history:Received 17 September 2012Accepted 14 December 2012
Keywords:ChemometricsNMRMetabolomicsMetabonomicsNutritionNutri-metabolomics
This paper outlines the advantages and disadvantages of using high throughput NMRmetabolomics for nutri-tional studies with emphasis on the workflow and data analytical methods for generation of new knowledge.The paper describes one-by-one the major research activities in the interdisciplinary metabolomics platformand highlights the opportunities that NMR spectra can provide in future nutrition studies. Three areasare emphasized: (1) NMR as an unbiased and non-destructive platform for providing an overview of themetabolome under investigation, (2) NMR for providing versatile information and data structures for multi-variate pattern recognition methods and (3) NMR for providing a unique fingerprint of the lipoprotein statusof the subject. For the first time in history, by combining NMR spectroscopy and chemometrics we are ableto perform inductive nutritional research as a complement to the deductive approach.
© 2013 Elsevier Ltd. All rights reserved.
1. Introduction
The interplay between dietary intake and health/disease has beeninvestigated for many years with gradually more refined measuringmethods. Consumption of nutrients and other bioactive compoundsfrom food interacts with numerous targets, metabolic pathways andfunctions in the organism and hereby potentially reduce or increasethe risk of disease. Methods that can handle multiple responses maytherefore be particularly beneficial compared to the classical univari-ate approaches most often used in nutrition research. Many lifestylerelated problems are in reality metabolic issues: a mismatch betweenwhat is ingested and the needs of the organism. Food health and safe-ty are areas reaping the benefits of metabolomics. Food is eaten as awhole and therefore the combined effect of components has to betaken into account when assessing the health and safety aspect offood and food processes. Nutritional metabolomics has the potentialto deal effectively with complex nutritional problems as it allows toexplore the metabolic effect of, for example, a specific food challengein a more global way than with traditional nutritional methods(Scalbert et al., 2009). While genomics concerns the analysis of indi-vidual genes and thus the inherited potential of what can happenin a given biological system, metabolomics concerns the analysis ofsmall molecule intermediates and products of metabolism presentin biofluids, tissues and cellular extracts and thus represent its actualstate (Giovane, Balestrieri, & Napoli, 2008).
The word metabolome was introduced for the first time in 1998 byOliver, Winson, Kell, and Baganz (1998) as the set of low-molecular-mass compounds synthesized by an organism (metabolites). The term
rights reserved.
metabonomics was shortly thereafter introduced by Nicholson, Lindon,and Holmes (1999) and describes the analysis of changes in the meta-bolic status of an organism, as a consequence of drug treatment,environmental influences, nutrition, lifestyle, genetic effects, toxicexposure, diseases, etc. A fewyears later the termmetabolomicswas in-troduced, as the identification and quantification of every singlemetab-olite in a biological system (Fiehn, 2002). The two terms metabolomicsand metabonomics are nowadays often used intertwined and the wordmetabolomics is now more widely accepted. The human metabolomedoes not only include metabolites produced by cells or tissues in thehost or foreign metabolites derived from e.g. drugs, but it also includesmetabolites derived from digestion of food and metabolites producedby the gut microbiota (Martin, Collino, & Rezzi, 2011). Altogether, thisleaves a complex metabolome signature depending on genetics andon diet as well as environmental variations that the host has been ex-posed to. The exact number of small metabolites (b1,500 Da) fromhumans is unknown, but has been estimated to be around 20,000with wide concentration ranges spreading over nine orders of magni-tude (Giovane et al., 2008). Together these numbers makes analysis ofthe complete human metabolome a nearly insurmountable challenge.The driving force behind the development of metabolomics was signif-icant developments in analytical platforms such as nuclear magneticresonance spectroscopy (NMR) and mass spectrometry (MS). Today,the situation is turned upside down and it is now the quest to unravelthe metabolome that is the driving force behind development of newinstrumentation.
Nutritional metabolomics is metabolomics applied to the study ofthe human (or animal) metabolome as a function of nutritional statusor as a function of a nutritional challenge. Metabolomic analysesis normally conducted on biofluids, such as blood, urine or faecessamples. The prospects of nutritional metabolomics are immense as
1132 F. Savorani et al. / Food Research International 54 (2013) 1131–1145
it provides an effective tool for objectively monitoring the humanmetabolic response to dietary interventions and lifestyle habits. Func-tional foods are expected to play a major role in preventing lifestylerelated problems in the future (Katan & De Roos, 2004) and researchon the relation between the human metabolome, nutrition, andhealth holds great promise for investigating and understanding bio-markers for food intake and lifestyle diseases (Rezzi et al., 2007).The first published study, in which the metabolomics approach wasused in a nutritional experiment, applied NMR technology to measurethe effect of dietary soy supplementation (Solanky et al., 2003), andafter this several other NMR-based nutritional metabolomic studieshave been conducted, e.g. Holmes et al. (2008), Lenz et al. (2004),Stella et al. (2006). MS-based nutritional metabolomics had its begin-ning a little later with one of the first studies investigating polyphenolconcentrations in human urine after intake of polyphenol-rich bever-ages (Ito et al., 2005), andmore studies have followed (Fardet, Llorach,Martin, et al., 2008; Fardet, Llorach, Orsoni, et al., 2008; Shen et al.,2008). This paper aims at providing a quick introduction to the nutri-tional metabolomics work flow, studying the fate and mechanisms ofbioactive components in food with particular focus on strengths andweaknesses of using the NMR analytical platform.
2. The nutritional metabolomics platform
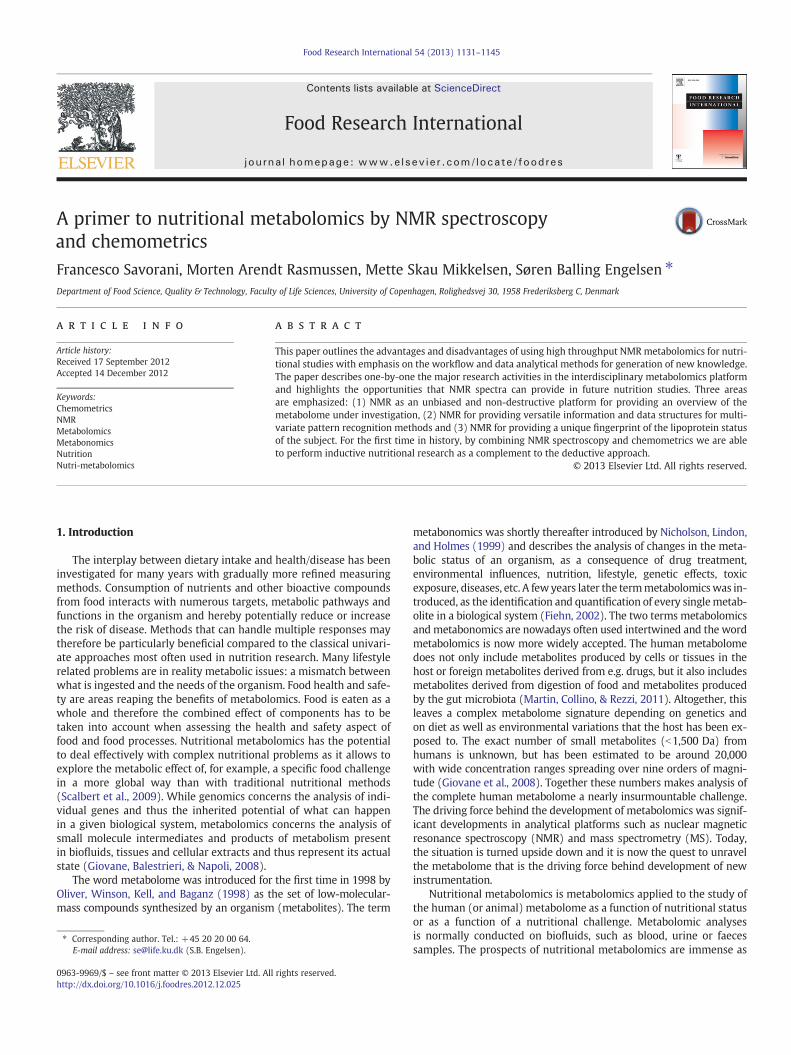
The increasing interest towards metabolomics and metabonomicstakes advantage from the nuclear magnetic resonance (NMR) spec-troscopy that in many cases is able to replace laborious and timeconsuming chemical analysis, providing a comprehensive overviewover the gross chemical (and physical) features of the samples. To ob-tain fruitful and reliable results from metabolomic studies, numerousfactors have to be carefully considered. These aspects are summarizedin Fig. 1, which illustrates the workflow of a metabolomic study.
3. Hypothesis
In society there is a massive quest towards healthy diets: (1) peo-ple want to eat healthy to increase their well-being, (2) society wantspeople to eat healthy to reduce cost for the public health sector,(3) doctors would like to be able to give diet recommendationsbased on scientific evidence and (4) the food industry wants to beable to give health claims on their products in order to maximizetheir profits. The study and refinement of human nutrition will thuscontinue to have strong push from society and industry. In nutritionalmetabolomics the aim is usually to investigate the perturbationof the human metabolome by a certain diet or a certain bioactivecompound. For the industry the prospects of using metabolomics forestablishing nutritional benefits and health claims is considerable,
Fig. 1. The workflow of a nutritional metabolomics study: hypothesis, experimental design,analysis and the biological interpretation.
but serious challenges remain ahead. For example: How do we definehealth in the absence of disease? (Huber et al., 2011). Measuring(more) metabolites in a more sensitive manner in healthy subjectsdoes not alwaysmean providingmore information and, for nutritionalmetabolomics, an important driver is the lack of success to observeeffects of dietary interventions on profiles obtained in homeostasisin healthy subjects. Interestingly, health has recently been redefinedto be the body's ability to recover after a given (nutritional) challengeand the way out for nutritional metabolomics is to assess dynamicsupon perturbations, which might help metabolomics to develop newbiomarkers beyond the well-established blood pressure and choles-terol numbers (Holmes et al., 2008; Llorach, Garcia-Aloy, Tulipani,Vazquez-Fresno, & Andres-Lacueva, 2012).
4. Experimental design
Metabolomic profiling seeks to determine as many chemical (andphysical) features as possible and to identify metabolites or patternsof metabolites that discriminate samples from treated individualsand controls (Fiehn, 2002). Experimental design is about maximizingthe possibilities of obtaining significant results in relation to the hy-pothesis investigated. There is in principle no difference betweena nutri-metabolomic study and a more traditional nutrition study ex-cept that the data output will be multivariate. This is unambiguouslyto be considered as a huge advantage because biological systems arecomplex multivariate systems and because multivariate responseswill allow much more rigorous result validation.
The human organism can be considered as a multivalent sink ca-pable of converting about all biological materials to energy. However,on the detailed chemical and kinetic level there is a great intra- andinter-individual variation in efficiency and specificity. In order todeal with this a number of key-issues deserve particular attentionbefore conducting an intervention study. Firstly, it is particularly im-portant to control the dietary intake due to the large diversity of com-pounds present in different food items. Metabolomics studies haveshown that already after 24 h, the subjects remain in their metabolicspace and that the remaining intra-and intersubject variations appearto be influenced by variables such as genetics, age, and lifestyle(Winnike, Busby, Watkins, & O'Connell, 2009), while experimentswith urine samples have shown that diet standardization during3 days reduce inter- and intra-individual variation and that effectsof diet culture and cohabitation were significantly attenuated afterdiet standardization (Rasmussen et al., 2011). Secondly, because ofthe high inter-individual variation, a full cross-over design shouldbe preferred to parallel studies (Scalbert et al., 2009) as it gives thepossibility to observe and compare the individual with and withoutintervention. And thirdly, different metabolomes display different
sampling of biofluids, the analytical platform, the sample spectra, the multivariate data
1133F. Savorani et al. / Food Research International 54 (2013) 1131–1145
kinetics upon a given challenge. The most commonly used biologicalsamples for obtaining metabolic snapshots are the easy accessiblesamples such as urine, saliva, faeces and blood/plasma/serum(Giovane et al., 2008), and their metabolite and sampling dynamicsis an important issue to consider in the study design. In urine thereexists a high diurnal variation (Maher, Zirah, Holmes, & Nicholson,2007) but it has been shown that postprandial urines had a stablechemical composition over a period of 2–4 h after eating a stan-dardized breakfast, suggesting that there is a flexible time windowfor urine collection (Fave et al., 2011). In serum the efficient humanhomeostasis will effectively restore the status quo and in faecesthere is a significant pooling effect and samples thus represent a sum-mary of the previous 24 h (or so) solid state waste. Recently, partlybecause of the change in the health definition and partly becauseof new measurement and data analysis opportunities, the responsekinetics of the metabolome upon a nutritional challenge has beenfavoured from the previous more static approaches based on a singleor a few samples along the time line of the intervention (van Ommen,Keijer, Heil, & Kaput, 2009).
In any case, experimental design should be thoroughly discussedby all the stake-holders in the nutri-metabolomics work flow. Bythe clinical nutritionalists, what is the expected level of intra- andinter-individual variation? By the analytical chemists, what is theuncertainty of the measurements? By the data analysts, what is thepower of the investigation? By the ethical experts, what is acceptableto investigate? By the legislators, what are the requirements forobtaining health claims?
5. Sampling
In humans and animals, biologically relevant samples can routine-ly be obtained from blood, small tissue biopsies, saliva, urine andfaeces. Nutritional metabolomic experiments are most often designedto capture one or more time snapshots of the metabolome, andthe primary concern of sampling is to inhibit or stop metabolic fluxto preserve the original information and variance in the biologicalsample and to ensure appropriate quantification and reproducibilityamong samples (Beckonert et al., 2007). Standard operational proce-dures (SOP) must be developed for the sampling which takes intoconsideration all critical sampling issues that may introduce additionalunwanted variation. From a sampling perspective the three main bodyfluids represent different challenges and metabolic snapshots. For bothurine and plasma samples the time between collection and processingshould not exceed 2 h and during this time delay samples should bekept at 4 °C. Longer term storage such as in a biobanking environment
5.56.06.57.07.58.08.59.09.5ppm
tyro
sine
form
ate
phen
ylal
anin
e
hypp
urat
e
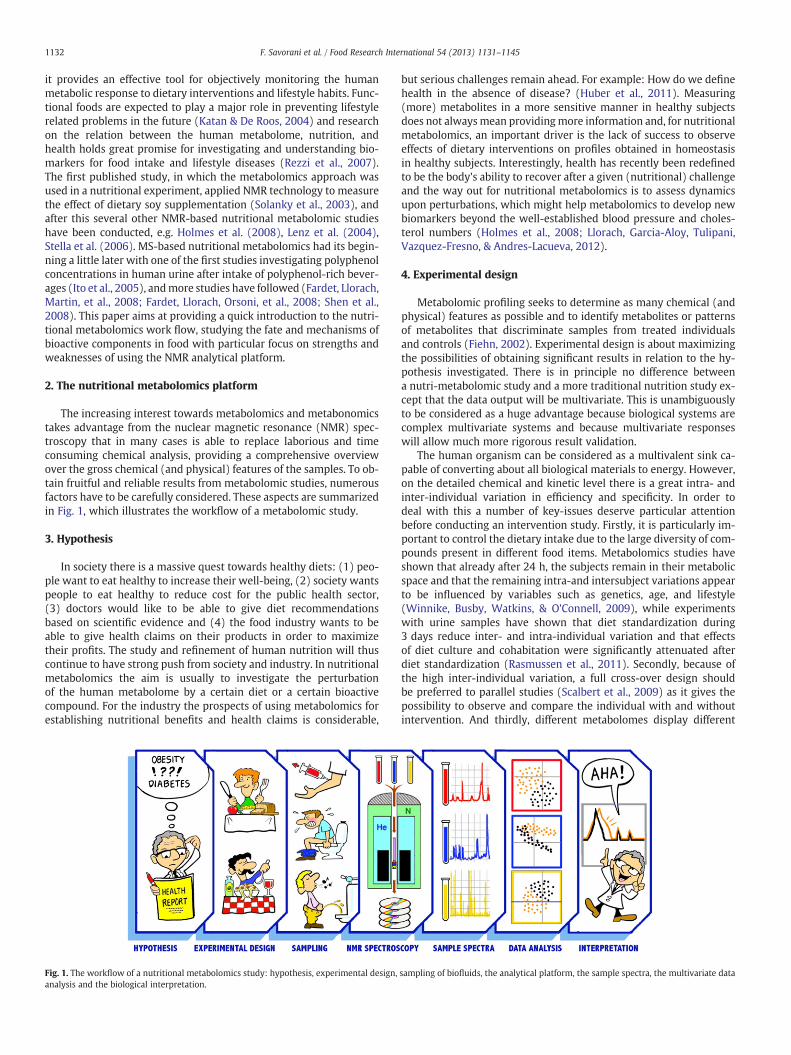
Fig. 2. A typical NMR spectrum of human urine acquired at 600 MHz with TCI cryoprobe,4.05(s)), creatine (3.04(s), 3.93(s)), trimethylamide N-oxide (3.27(s)), dimethylamide (4.16(q)).
should be done at −80 °C (Bernini et al., 2011; Gika, Theodoridis, &Wilson, 2008).
5.1. Urine samples
Urine can be considered as a hydrophilic human waste streamgenerated in the kidneys and containing numerous metabolites. Theurine contains undesirablemetabolites and especially nitrogen richme-tabolites which have been eliminated from the blood stream. One of thefirst 1H NMR studies of human urine was performed by Holmes et al.(1994). A representative spectrum is shown in Fig. 2 including a list ofthe major metabolites observed. The most prominent metabolites inthe 1H NMR spectrum of urine are creatinine, creatine, trimethylamideN-oxide, dimethylamide, citrate and lactate.
Sampling of urine is non-invasive and can be performed eitheras spot urine or as a 24 h pooled sample. Irrespective of the collectionmethod, a urinary preservative and cooled storage conditions (below5 °C) is recommended (Maher et al., 2007; Rasmussen et al., 2011) asurine most often will be contaminated with microorganisms. This willminimise the microbial conversion of metabolites and in this waykeep them representative for the biological situation they originallyderived from. In NMR investigations a proton-free preservative ispreferred to limit interference with 1H NMR spectra, and addition ofNaN3 has been recommended by Lauridsen, Hansen, Jaroszewski,and Cornett (2007) and Saude and Sykes (2007), who showed thatNaN3 reduced the changes in metabolite concentration when urinewas kept at room temperature. Addition of NaN3 to the sample collec-tion devices prior to collection is only possible in animal studiesand not in human studies, due to safety issues of this highly toxicchemical. In 1H NMR analysis of urine samples, special concerns haveto be focused onminimising the sample to sample variation in chemicalshift due to tiny variations in temperature, ionic strength and, above all,pH. In order tominimize the latter variation a phosphate buffer is some-times added to the sample.
It must not be forgotten that urine consists mostly of water andthat the dry matter content per volume can severely change amongindividuals, but also within the same individual, according to a multi-plicity of factors that may be summarized into drinking habits, physicalactivity, food intake and health status. This represents a challengingissue that has to be taken into consideration when comparing NMRmetabolomics urine data, since the absolute intensity of themetaboliteswill strongly differ among samples (Dieterle, Ross, Schlotterbeck, &Senn, 2006). Data normalisation tools (see later), but also the adoptionof a standardized regime of the subject habits before sampling, arecommon ways for coping with this issue (Rasmussen et al., 2011).
1.01.52.02.53.03.54.04.5
crea
tine
citr
ate
lact
ate
lact
ate
creatinine
TM
AO
dim
ethy
lam
ine
glyc
ine
using a 1D NOESY_presat experiment. The main metabolites are creatinine (3.05(s),2.73(s)), citrate (2.53–2.56, 2.66–2.71 (AB)), glycine (3.57(s)) and lactate (1.34(d),
1134 F. Savorani et al. / Food Research International 54 (2013) 1131–1145
5.2. Blood samples
Whole blood is composed of blood cells and the liquid mediumfluid: blood plasma. Plasma samples are prepared by removing theblood cells by spinning with a centrifuge and subsequently add an an-ticoagulant. The choice of the anticoagulant must be made in order toavoid unwanted peaks in the 1H NMR spectrum and additionally toreduce the oxidation of plasma as much as possible. EDTA, heparinand citrate are the most commonly used anticoagulants. Heparin,a polysaccharide, has been recommended as the preferred plasmaanticoagulant for NMR metabolomic studies due to low introductionof interfering peaks (Barton et al., 2010). Serum samples differ fromplasma samples in that they do not contain the protein fibrin whichis responsible for the bloods capability to clot. Blood serum samples,which are most abundantly used in nutritional metabolomics studies,are prepared by allowing the blood to clot and subsequently removingthe clot using a centrifuge. A third promising option for collectingvaluable information from blood is to sample erythrocytes or RBC(red blood cells) which may be suitable for nutritional metabolomicsstudies (Darghouth, Koehl, Junot, & Romeo, 2010; Jenab, Slimani,Bictash, Ferrari, & Bingham, 2009).
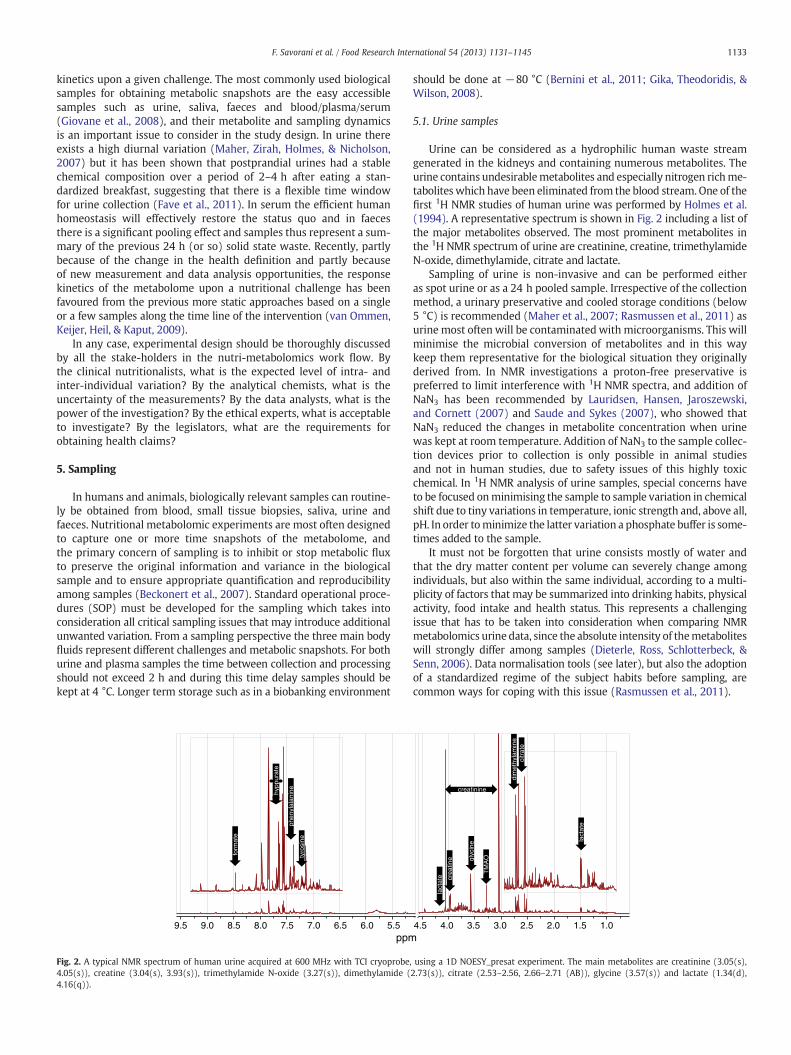
Plasma is highly aqueous (92% v/v) and circulates dissolved nutri-ents, such as glucose, amino acids, and fatty acids (dissolved in theblood or embedded in the lipoproteins), and removes waste products,such as carbon dioxide, urea, and lactic acid. The first 1H NMR study ofhuman blood was performed by Bock (1982) on her own blood beforeand after ingestion of alcohol (the first NMR nutritional metabolomicsstudy). A representative human blood spectrum (plasma) is shownin Fig. 3 including assignments of the major metabolites observed.The most prominent metabolites in the NMR spectrum of blood arefat (methylene- and methyl-moieties from the lipoproteins), lactateand glucose. A comprehensive list of metabolites in the human serummetabolome is given by Nicholson, Foxall, Spraul, Farrant, and Lindon(1995) and by Psychogios et al. (2011).
Sampling of blood is invasive but can be performed with regularintervals with a simple drop and will, in contrast to urine, alwayshave approximately the same dry matter content. When consideringblood sample collection, the microbial aspect is less important thanin urine, but instead enzymatic metabolite degradation can be pro-nounced. Blood samples should therefore be handled as cold as possi-ble to preserve themetabolic snapshot in themost optimalway and ananticoagulant must be added in order to prevent clotting. An excep-tion to this protocol may be when optimal lipoprotein fractionationis desired as it has been shown that a single freeze–thaw cycle canintroduce 37% variability in HDL and LDL cholesterol determinationsbased on density fractionation (Zivkovic et al., 2009).
33.23.43.63.84.04.24.44.64.85.05.25.4ppm
α-gl
ucos
e
residual water
lact
ate
glucose
unsa
tura
tedl
ipid
s
*
Fig. 3. NMR spectrum of human plasma acquired at 600 MHz with TCI cryoprobe, using amethyl: 0.75–0.86; unsaturated chain protons: 5.27–5.40; as well as many others in the r4.14(q)), alanine (1.49(d)), valine (1.02(d), 1.07(d)) and glucose (3.20–4.00(m), 5.27(d)).
Addition of the reference compound 3-trimethylsilylpropionicacid (TSP), which is normally used in 1H NMR experiments, is notrecommended in plasma or other samples with high protein contentdue to protein binding (Cavanagh, Fairbrother, Palmer, & Skelton,1996) and in turn much reduced signals (Beckonert et al., 2007), be-sides TSP is also pH dependent (De Marco, 1977). Instead the naturaloccurrence of α-glucose can be used as reference compound assuggested by Pearce et al. (2008). Another solution is to use a quan-titative reference signal in an electronic manner as provided by theERETIC experiment (Akoka, Barantin, & Trierweiler, 1999) whichhave become wide spread in quantitative NMR applications. Finally,it should be mentioned that ultrafiltration can be used to remove thebroad signals from high-molecular weight species of serum (Tiziani etal., 2008) and the spectral quality that can be obtained has been provensuperior to other separation methods and spectral editing techniques(Stolzenburg, Lauridsen, Toft, Zalloua, & Baunsgaard, 2011).
5.3. Face samples
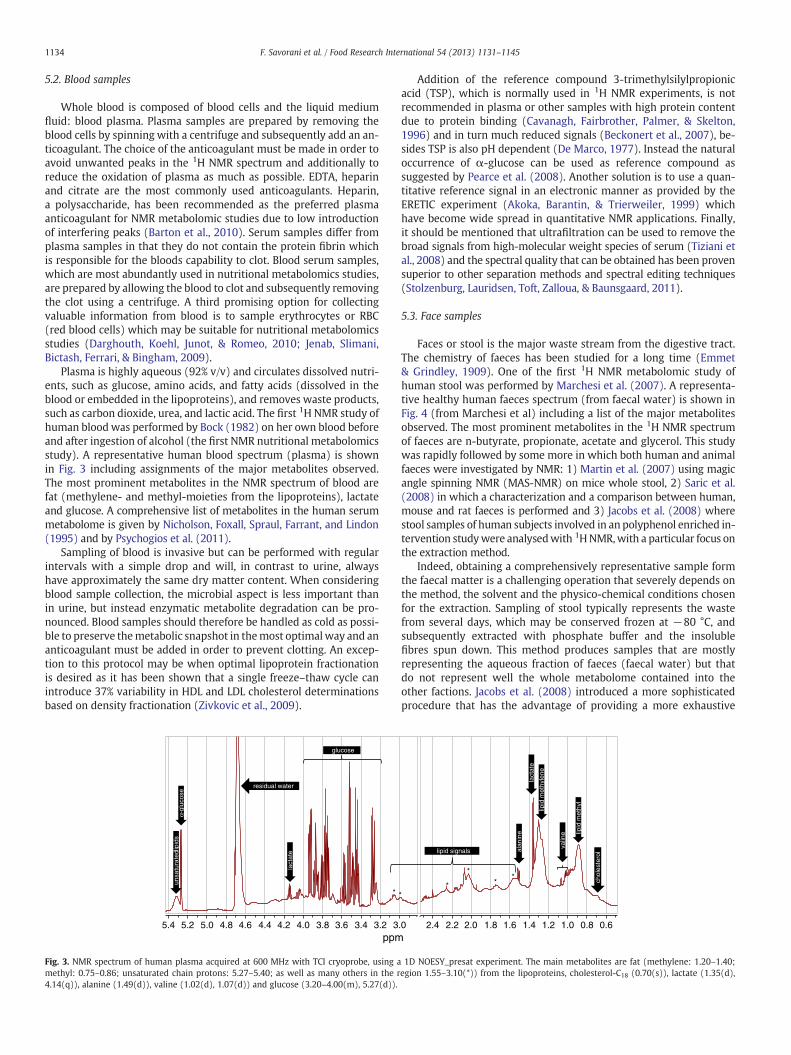
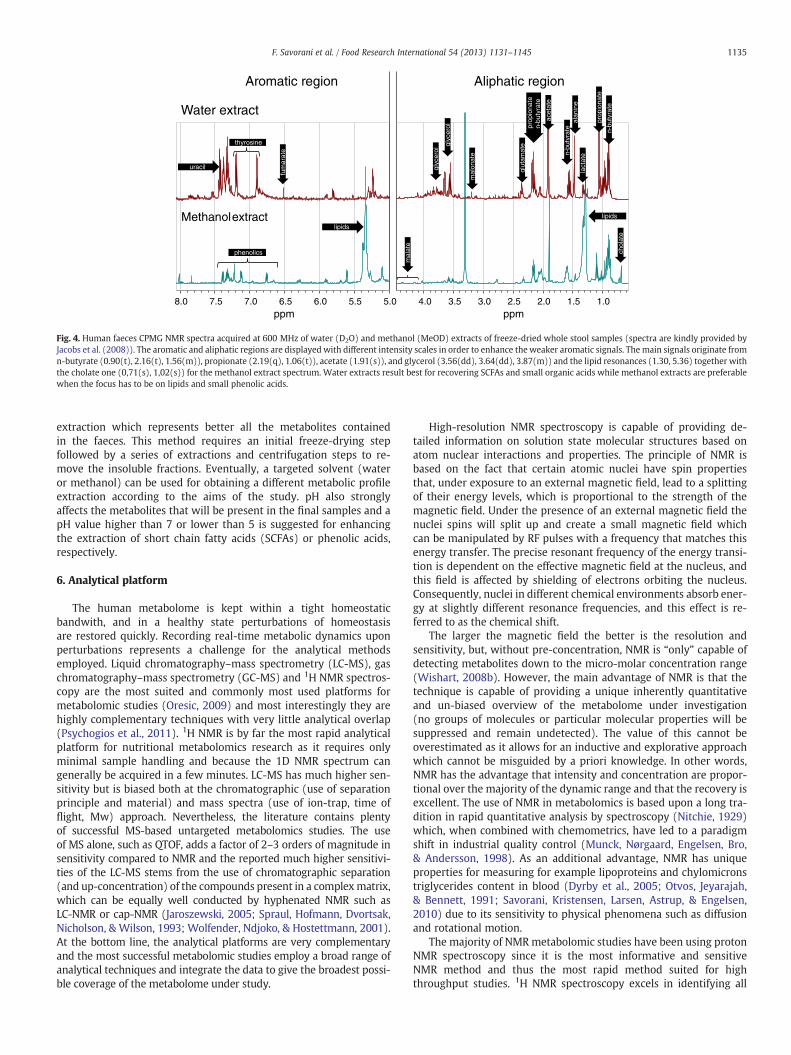
Faces or stool is the major waste stream from the digestive tract.The chemistry of faeces has been studied for a long time (Emmet& Grindley, 1909). One of the first 1H NMR metabolomic study ofhuman stool was performed by Marchesi et al. (2007). A representa-tive healthy human faeces spectrum (from faecal water) is shown inFig. 4 (from Marchesi et al) including a list of the major metabolitesobserved. The most prominent metabolites in the 1H NMR spectrumof faeces are n-butyrate, propionate, acetate and glycerol. This studywas rapidly followed by some more in which both human and animalfaeces were investigated by NMR: 1) Martin et al. (2007) using magicangle spinning NMR (MAS-NMR) on mice whole stool, 2) Saric et al.(2008) in which a characterization and a comparison between human,mouse and rat faeces is performed and 3) Jacobs et al. (2008) wherestool samples of human subjects involved in an polyphenol enriched in-tervention studywere analysedwith 1HNMR,with a particular focus onthe extraction method.
Indeed, obtaining a comprehensively representative sample formthe faecal matter is a challenging operation that severely depends onthe method, the solvent and the physico-chemical conditions chosenfor the extraction. Sampling of stool typically represents the wastefrom several days, which may be conserved frozen at −80 °C, andsubsequently extracted with phosphate buffer and the insolublefibres spun down. This method produces samples that are mostlyrepresenting the aqueous fraction of faeces (faecal water) but thatdo not represent well the whole metabolome contained into theother factions. Jacobs et al. (2008) introduced a more sophisticatedprocedure that has the advantage of providing a more exhaustive
0.60.81.01.21.41.61.82.02.22.4.0
alan
ine
chol
este
rol
lact
ate
lipid
met
hyle
ne
lipid
met
hyl
valin
e
lipid signals
**
*
**
1D NOESY_presat experiment. The main metabolites are fat (methylene: 1.20–1.40;egion 1.55–3.10(*)) from the lipoproteins, cholesterol-C18 (0.70(s)), lactate (1.35(d),
1.01.52.02.53.03.54.0ppm
5.05.56.06.57.07.58.0ppm
Methanolextract
Water extract
glut
amat
e
prop
iona
te
prop
iona
ten-
buty
rate
acet
ate
glyc
erol
lipids
lipids
n-bu
tyra
te
n-bu
tyra
te
glyc
erol
uracil
mal
ate
chol
ate
lact
ate
mal
onat
e
alan
ine
fum
arat
e
thyrosine
phenolics
Aromatic region Aliphatic region
Fig. 4. Human faeces CPMG NMR spectra acquired at 600 MHz of water (D2O) and methanol (MeOD) extracts of freeze-dried whole stool samples (spectra are kindly provided byJacobs et al. (2008)). The aromatic and aliphatic regions are displayed with different intensity scales in order to enhance the weaker aromatic signals. The main signals originate fromn-butyrate (0.90(t), 2.16(t), 1.56(m)), propionate (2.19(q), 1.06(t)), acetate (1.91(s)), and glycerol (3.56(dd), 3.64(dd), 3.87(m)) and the lipid resonances (1.30, 5.36) together withthe cholate one (0,71(s), 1,02(s)) for the methanol extract spectrum. Water extracts result best for recovering SCFAs and small organic acids while methanol extracts are preferablewhen the focus has to be on lipids and small phenolic acids.
1135F. Savorani et al. / Food Research International 54 (2013) 1131–1145
extraction which represents better all the metabolites containedin the faeces. This method requires an initial freeze-drying stepfollowed by a series of extractions and centrifugation steps to re-move the insoluble fractions. Eventually, a targeted solvent (wateror methanol) can be used for obtaining a different metabolic profileextraction according to the aims of the study. pH also stronglyaffects the metabolites that will be present in the final samples and apH value higher than 7 or lower than 5 is suggested for enhancingthe extraction of short chain fatty acids (SCFAs) or phenolic acids,respectively.
6. Analytical platform
The human metabolome is kept within a tight homeostaticbandwith, and in a healthy state perturbations of homeostasisare restored quickly. Recording real-time metabolic dynamics uponperturbations represents a challenge for the analytical methodsemployed. Liquid chromatography–mass spectrometry (LC-MS), gaschromatography–mass spectrometry (GC-MS) and 1H NMR spectros-copy are the most suited and commonly most used platforms formetabolomic studies (Oresic, 2009) and most interestingly they arehighly complementary techniques with very little analytical overlap(Psychogios et al., 2011). 1H NMR is by far the most rapid analyticalplatform for nutritional metabolomics research as it requires onlyminimal sample handling and because the 1D NMR spectrum cangenerally be acquired in a few minutes. LC-MS has much higher sen-sitivity but is biased both at the chromatographic (use of separationprinciple and material) and mass spectra (use of ion-trap, time offlight, Mw) approach. Nevertheless, the literature contains plentyof successful MS-based untargeted metabolomics studies. The useof MS alone, such as QTOF, adds a factor of 2–3 orders of magnitude insensitivity compared to NMR and the reported much higher sensitivi-ties of the LC-MS stems from the use of chromatographic separation(and up-concentration) of the compounds present in a complexmatrix,which can be equally well conducted by hyphenated NMR such asLC-NMR or cap-NMR (Jaroszewski, 2005; Spraul, Hofmann, Dvortsak,Nicholson, & Wilson, 1993; Wolfender, Ndjoko, & Hostettmann, 2001).At the bottom line, the analytical platforms are very complementaryand the most successful metabolomic studies employ a broad range ofanalytical techniques and integrate the data to give the broadest possi-ble coverage of the metabolome under study.
High-resolution NMR spectroscopy is capable of providing de-tailed information on solution state molecular structures based onatom nuclear interactions and properties. The principle of NMR isbased on the fact that certain atomic nuclei have spin propertiesthat, under exposure to an external magnetic field, lead to a splittingof their energy levels, which is proportional to the strength of themagnetic field. Under the presence of an external magnetic field thenuclei spins will split up and create a small magnetic field whichcan be manipulated by RF pulses with a frequency that matches thisenergy transfer. The precise resonant frequency of the energy transi-tion is dependent on the effective magnetic field at the nucleus, andthis field is affected by shielding of electrons orbiting the nucleus.Consequently, nuclei in different chemical environments absorb ener-gy at slightly different resonance frequencies, and this effect is re-ferred to as the chemical shift.
The larger the magnetic field the better is the resolution andsensitivity, but, without pre-concentration, NMR is “only” capable ofdetecting metabolites down to the micro-molar concentration range(Wishart, 2008b). However, the main advantage of NMR is that thetechnique is capable of providing a unique inherently quantitativeand un-biased overview of the metabolome under investigation(no groups of molecules or particular molecular properties will besuppressed and remain undetected). The value of this cannot beoverestimated as it allows for an inductive and explorative approachwhich cannot be misguided by a priori knowledge. In other words,NMR has the advantage that intensity and concentration are propor-tional over the majority of the dynamic range and that the recovery isexcellent. The use of NMR in metabolomics is based upon a long tra-dition in rapid quantitative analysis by spectroscopy (Nitchie, 1929)which, when combined with chemometrics, have led to a paradigmshift in industrial quality control (Munck, Nørgaard, Engelsen, Bro,& Andersson, 1998). As an additional advantage, NMR has uniqueproperties for measuring for example lipoproteins and chylomicronstriglycerides content in blood (Dyrby et al., 2005; Otvos, Jeyarajah,& Bennett, 1991; Savorani, Kristensen, Larsen, Astrup, & Engelsen,2010) due to its sensitivity to physical phenomena such as diffusionand rotational motion.
The majority of NMRmetabolomic studies have been using protonNMR spectroscopy since it is the most informative and sensitiveNMR method and thus the most rapid method suited for highthroughput studies. 1H NMR spectroscopy excels in identifying all

1136 F. Savorani et al. / Food Research International 54 (2013) 1131–1145
proton containing compounds in a sample. Because of the high naturalabundance of 1H (~99.985%), its high gyromagnetic ratio and its preva-lence inmetabolites, this nucleus is themost used for metabolomics ex-periments in NMR measurements (Beckonert et al., 2007; Moco, Bino,DeVos, & Vervoort, 2007). The development of instrumentswith highermagnetic field strength and cryogenically cooled probes has pushed thelimits of detection (Keun, 2006), improving their use in non-targetedmetabolomics. In this case, the consequent spectral comparison de-mands that the spectrum acquisition and control of conditions shouldbe very precise. Generally, NMR metabolomic studies of biofluids haveshown high reproducibility (Keun et al., 2002) and in most cases onlyone analytical replicate is sufficient per time point (Beckonert et al.,2007). However, small changes in pH, ionic strength, temperature andpresence of precipitate, impurities or degradation of sample materialshould be minimised, since these factors may lead to detection offalse metabolic changes and hereby incorrect selection of potentialbiomarkers (Moco et al., 2007).
Despite the superiority in information and sensitivity of the basic1H NMR spectrum other NMR methods have also been investigatedfor use in metabolomics. In enriched studies 13C NMR can providevaluable and complementary information (Keun et al., 2002), but13C NMR will never become a competitive high throughput methoddue to the low abundancy of the 13C isotope. Other trends in NMRmethods go towards pure shift (Aguilar, Faulkner, Nilsson, & Morris,2010) and J-resolved methods (Yilmaz, Nyberg, & Jaroszewski,2011) for the enhanced resolution and towards diffusion edited spec-troscopy (DOSY) (Johnson, 1999) for contrasting close metabolitesin a second dimension (Dyrby et al., 2005; Nilsson, Khajeh, Botana,Bernstein, & Morris, 2009). In particular the 2D J-resolved (JRES)NMR experiment has great potential for quantification since it re-quires only a short measurement time and still reduces signal overlapby separating effects of chemical shift and J-coupling in two dimen-sions (Ludwig & Viant, 2010). The JRES experiment can be recordedin an ultrafast (UF) acquisition mode by making use of spatialencoding instead of conventional time-incrementing in which thesecond dimension can be sampled in a single shot, and it is thusof great interest for compound quantification of short time scalephenomena in concentrated mixtures. Ultra-sensitive and ultra-fastNMR can also be performed by dynamic nuclear polarization (DNP)which has great potential for elucidating metabolic reactions inthe picosecond scale, but unfortunately this method is not likelyto be developed as a quantitative high-throughput method (Meier,Karlsson, Jensen, Lerche, & Duus, 2011). A proof-of-principle thatDNP can indeed be used for quantitative single scan 13C NMR detec-tion of a drug metabolite in plasma has recently been given (Lercheet al., 2011).
7. Spectral preprocessing of NMR data
NMR signals are collected as a function of time. The decaying sig-nal that follows a pulse is called the free induction decay (FID). Thechemical shift can be derived from the FID by utilising a Fourier trans-formation, whereby the time domain is converted into the frequencydomain. Spectral processing of single NMR spectra will not be con-sidered here, but the quality of the spectra and thus the quantitativeinformation in the spectra will depend on the quality and homoge-neity of the external magnetic field (shimming) and on precise andaccurate tuning and matching of the nuclei magnetic resonance fre-quency (Goodacre et al., 2007). Prior to Fourier transformation thedata is typically zerofilled and apodised to a certain line broadening.Hereafter, NMR spectra needs to be corrected for deviations froma flat horisontal baseline and phase errors (Wishart, 2008a). Theemployed NMR software can usually do this automatically and it istempting to state that current metabolomics research is “beyond thechildren diseases” in spectral preprocessing such as (1) zero fillingand line broadening; (2) chemical-shift referencing; (3) phasing; (4)
baseline correction; (5) line-shape correction; (6) pH determination;and (7) notch/water filtering (Wishart, 2008b).
One of the most valuable features of 1H NMR spectroscopy is thatthe observed resonance frequencies are extremely sensitive to thelocal chemical environment of the nucleus. It is this property thatcauses dispersion of the resonances from the various nuclei in amolecule across the spectrum, facilitating structural characterizationand the differentiation between various compounds in a mixture.However, this shift sensitivity also means that resonance frequenciescan be affected by even minor fluctuations in temperature, pH, andthe external magnetic field (Pearce et al., 2008), which in turn maycreate difficulties for the subsequent data analysis and interpretation.To solve this problem a number of different peak (signal) alignmentmethods have been developed (see below).
Moreover, magnet shimming, which is a critical NMR procedure(automatic or manual) to generate an ideally perfect homogeneousmagnetic field over a restricted region of the sample volume in orderto obtain pure lorentzian line shapes, in reality often produces tinydifferences in shim quality between samples which are normallyneglectable. However, if such inhomogeneities are pronounced, refer-ence deconvolution (Metz, Lam, & Webb, 2000) can significantly im-prove quantitative performance of non-optimal recorded NMR spectra.
8. Multivariate data analysis of NMR metabolomics data
The performance of the combination of NMR spectroscopy withmultivariate data analysis (chemometrics) was already demonstratedin the early 1980s (Johnels et al., 1983) and has proven to have a tre-mendous potential for metabonomics (Nicholson et al., 1999; Trygg,Holmes, & Lundstedt, 2007). In this approach themultivariate analyticalresults are compared across large cohorts, for example in interventionstudies, for metabolites and/or patterns of metabolites that are able toisolate the effect of the intervention.
When collecting large scale NMR metabolomics data basically twopossibilities exist for the subsequent multivariate data analysis:
Metabolic profiling: NMR is inherently quantitative and the signalintegrals are directly related to the concentration of the metabo-lites. For this reason metabolic profiling is an obvious choice forthe analysis of large scale metabolomics data sets. In this approach,as many signals as possible are identified (not necessary assigned)and their peaks integrated for each sample. This approach willgenerate a data set of the size (number of samples)×(number ofpeaks) where the number of peaks usually is in the order of hun-dred to a few hundreds. An important development in metabolicprofiling is targeted profiling in which the mixture spectrum iscompared to a library of reference spectra derived from pure com-pounds of known concentrations and the metabolites thus directlyquantified (Wishart, 2008b).Metabolic fingerprinting: In this slightly more explorative approach,the NMR signals (metabolites) are not initially identified and allthe spectral features are utilized in the multivariate data analysis.This approach is often referred to as metabolic fingerprinting, sincethe intention is not to identify each observedmetabolite, but insteadto compare ‘fingerprints’ or patterns of changes in response toe.g. dietary intake or disease status (Dettmer, Aronov, & Hammock,2007). Subsequently, model interpretation and identification ofthe selected metabolites is necessary in order to provide biologicalinsight and understanding of underlying mechanism of action. Asmetabolic fingerprinting promotes new and unexpected findingsand as computational power has increased, there is an increasingtendency to perform analyses at the maximum spectral resolutionpossible (Cloarec et al., 2005b). Metabolic fingerprinting will gen-erate a data set of the size (number of samples) × (number of spec-tral variables). The number of spectral variables is usually manythousands.

1137F. Savorani et al. / Food Research International 54 (2013) 1131–1145
9. Preparing for multivariate data analysis of NMRmetabolomics data
9.1. Data preprocessing
Typically, large scale metabolomics data sets are analysed bypattern recognition methods such as principal component analysis(PCA) (Hotelling, 1933) in which many sample spectra are analysedsimultaneously. Irrespective of the chosen data strategy modernmultivariate data analytical strategies will challenge the care and pre-cision by which the metabolomics NMR data have been generatedand preprocessed. For this reason, chemometrics has been useful infinding solutions to imperfect analytical methodology that are proneto alignment, normalization and other standardization problems aswell as for advanced analysis aimed at exploiting the experimentaldesign and the data structure (Bro et al., 2010; van Velzen et al., 2008).
Since there is an increasing tendency to perform metabolic pro-filing at the maximum spectral resolution possible, it is crucial thatshift errors are removed and the spectra accurately calibrated to pre-vent such variation deteriorating the pattern recognition. In contrastto normalization, which represents a vertical change to the NMRdata, alignment is a horizontal change to the data. Sometimes spectralalignment can be avoided by binning (Spraul et al., 1994) in whichmany spectral variables are summed to represent only one averagevariable. There exist in scientific literature two commonly usedmethods for alignment: compression/expansion (C/E) or insertion/deletion (I/D). The former implicitly assumes that peak widths canbe correlated to the spectral axis. The latter, on the contrary, assumesthe peak width to be invariant within limited ranges of the spectralaxis and remains unchanged in case of shift. Therefore, the C/Emodel is most commonly used in the alignment of chromatographicsignals with methods such as correlation optimised warping (COW)(Nielsen, Carstensen, & Smedsgaard, 1998) whereas the I/D modelwith methods such as recursive segment-wise peak alignment (RSPA(Veselkov et al., 2009)) and interval correlation optimised shifting(icoshift) (Savorani, Tomasi, & Engelsen, 2010). Fig. 5 shows an exampleof the performance of modern alignment methods which efficientlycan eliminate horizontal scaling problems in NMR data.
succ
inat
e
Fig. 5. Interval alignment of NMR data using the icoshift tool. The three spectral inter-vals with gray background are shown before and after the alignment correction.Having different peak multiplicity, they present very different peak misalignmentseverity but are all correctly amended by the algorithm at once as clearly shown espe-cially for the succinate singlet.
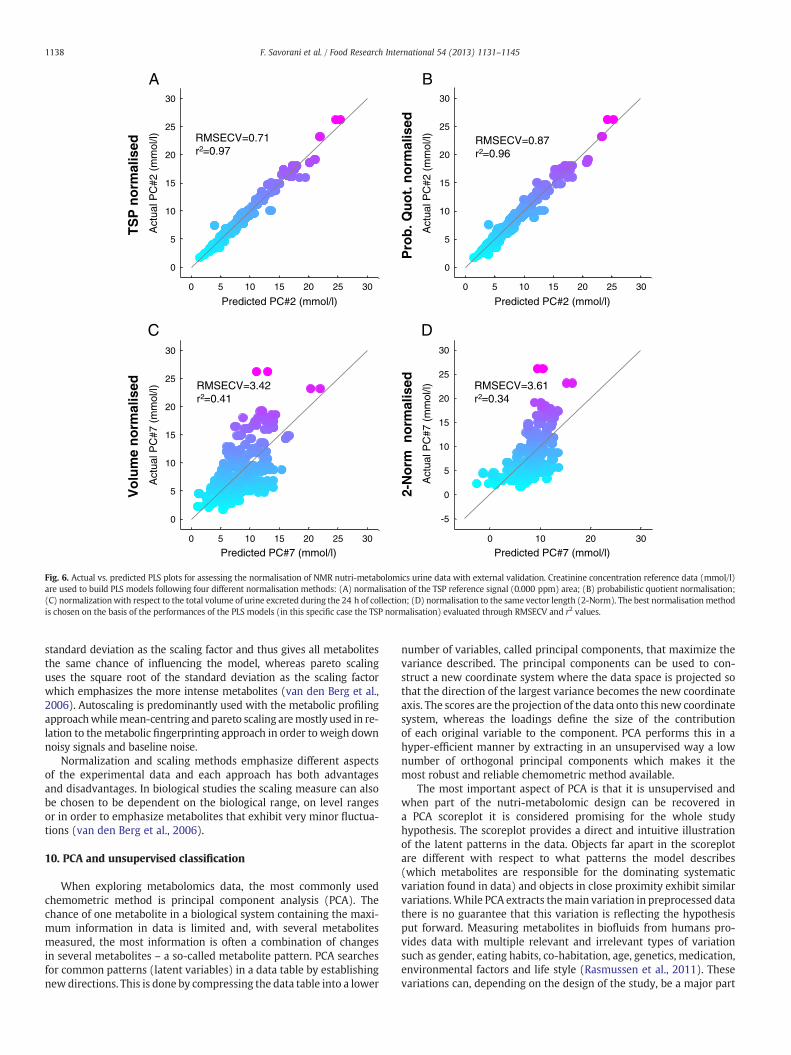
Recorded metabolite profiles, measured from biofluid data, areoften subject to systematic variations in intensity across all measuredvariables in a sample which can mask the biologically-relevant differ-ences between profiles. The sources of obscuring variation may arisefrom inhomogeneity of samples, minor differences in sample prepara-tion, instrumental perturbation and also data extraction steps may in-troduce an additional error (Sysi-Aho, Katajamaa, Yetukuri, & Oresic,2007). Data normalisation (vertical scaling between samples) andscaling between variables is typically applied to remove unwantedsystematic bias in ion- or signal- intensity measurements whileretaining the interesting biological information. The normalisation ofmetabolite profiles is therefore a process of row-wise standardisation,intended to remove this spurious between-sample variation fromthe data. Paradoxically the risk of any normalisation method is thepossibility of introducing spurious correlations to the data (Capozzi,Ciampa, Picone, Placucci, & Savorani, 2011), and obviously the chosennormalisation method can have a decisive effect on the outcomeof subsequent application of pattern-recognition methods. There area great number of established methods for normalising metaboliteprofiles and every method of normalisation is based on certainassumptions to the nature of the data. Some of the most commonnormalisations methods are: (1) unit sample intensity sum; (2) unitsample vector length (Euclidian norm); (3) probabilistic quotient/median fold-change (Dieterle et al., 2006); (4) a reference featurepresent in all samples at a constant level. The referencing standardsTSP and DSS often provide this, along with chemical-shift referencingfor NMR. However, for the protein rich samples like those derivatingfrom blood, the TSP protein binding capacity makes it a non-suitablechoice for the normalization purpose. In some cases a good under-standing of the underlying biology allows the selection of a compoundexpected to be stable across the data-set. For example, as far backas Rose (1933), creatinine has been used as a reference compound inurine clinical-chemistry, under the assumption that it scales wellwith muscle mass; (5) histogram matching (Torgrip, Aberg, Alm,Schuppe-Koistinen, & Lindberg, 2008) which seek to match the histo-gram of intensities in a spectrum as closely as possible to that of areference spectrum; and (6) entropy related methods. Since any nor-malizationmethodmay be destructive to the quantitative informationburied in the metabolomics data, it is always recommended to use anexternal validation of the normalization method used. This can be op-timally done if external quantitative knowledge from clinical analysisis available to the sample set. Then, a simple multivariate regression(see later) to a given metabolite can evaluate whether the normaliza-tion deteriorates or improves the correlation. This is for exampleshown in the case of creatinine in urine (Rasmussen et al., 2012).Fig. 6 shows how the regression performance between the NMRspectra and the externally measured creatinine concentration can beinfluenced by different normalisation methods. The best normalisationmethod can then be selected as the one which conserve the creatinineinformation best.
9.2. Data pretreatment
Before multivariate data analysis the spectral data is normallymean-centred in order to focus the analysis on the difference be-tween the samples rather than the direction of the overall variance.Mean-centring converts all the signal intensities (metabolite concen-trations) to fluctuations around zero instead of around the meanof the signal intensities (metabolite concentrations) and herebyadjusts for offset variation between the high and low abundantmetabolites (van den Berg, Hoefsloot, Westerhuis, Smilde, & van derWerf, 2006). Besides this, the addition of a column-wise vertical scalingmethod should also be considered in order to adjust for the fold dif-ference between the detected metabolites. The most commonly usedscaling methods for metabolomics data are autoscaling (scaling to unitvariance) and pareto scaling. The autoscaling method employs the
0 5 10 15 20 25 30
0
5
10
15
20
25
30
Predicted PC#2 (mmol/l)
Act
ual P
C#2
(m
mol
/l)
0 10 20 30
-5
0
5
10
15
20
25
30
Predicted PC#7 (mmol/l)
Act
ual P
C#7
(m
mol
/l)
B
D
0 5 10 15 20 25 30
0
5
10
15
20
25
30
Predicted PC#2 (mmol/l)
Act
ual P
C#2
(m
mol
/l)
Vo
lum
e n
orm
alis
ed
TS
P n
orm
alis
ed
0 5 10 15 20 25 30
0
5
10
15
20
25
30
Predicted PC#7 (mmol/l)
Act
ual P
C#7
(m
mol
/l)
A
C
Pro
b. Q
uo
t. n
orm
alis
ed
2-N
orm
no
rmal
ised
RMSECV=0.71r2=0.97
RMSECV=0.87r2=0.96
RMSECV=3.42r2=0.41
RMSECV=3.61r2=0.34
Fig. 6. Actual vs. predicted PLS plots for assessing the normalisation of NMR nutri-metabolomics urine data with external validation. Creatinine concentration reference data (mmol/l)are used to build PLS models following four different normalisation methods: (A) normalisation of the TSP reference signal (0.000 ppm) area; (B) probabilistic quotient normalisation;(C) normalizationwith respect to the total volume of urine excreted during the 24 h of collection; (D) normalisation to the same vector length (2-Norm). The best normalisationmethodis chosen on the basis of the performances of the PLS models (in this specific case the TSP normalisation) evaluated through RMSECV and r2 values.
1138 F. Savorani et al. / Food Research International 54 (2013) 1131–1145
standard deviation as the scaling factor and thus gives all metabolitesthe same chance of influencing the model, whereas pareto scalinguses the square root of the standard deviation as the scaling factorwhich emphasizes the more intense metabolites (van den Berg et al.,2006). Autoscaling is predominantly used with the metabolic profilingapproachwhilemean-centring and pareto scaling aremostly used in re-lation to themetabolic fingerprinting approach in order to weigh downnoisy signals and baseline noise.
Normalization and scaling methods emphasize different aspectsof the experimental data and each approach has both advantagesand disadvantages. In biological studies the scaling measure can alsobe chosen to be dependent on the biological range, on level rangesor in order to emphasize metabolites that exhibit very minor fluctua-tions (van den Berg et al., 2006).
10. PCA and unsupervised classification
When exploring metabolomics data, the most commonly usedchemometric method is principal component analysis (PCA). Thechance of one metabolite in a biological system containing the maxi-mum information in data is limited and, with several metabolitesmeasured, the most information is often a combination of changesin several metabolites – a so-called metabolite pattern. PCA searchesfor common patterns (latent variables) in a data table by establishingnewdirections. This is done by compressing the data table into a lower
number of variables, called principal components, that maximize thevariance described. The principal components can be used to con-struct a new coordinate system where the data space is projected sothat the direction of the largest variance becomes the new coordinateaxis. The scores are the projection of the data onto this new coordinatesystem, whereas the loadings define the size of the contributionof each original variable to the component. PCA performs this in ahyper-efficient manner by extracting in an unsupervised way a lownumber of orthogonal principal components which makes it themost robust and reliable chemometric method available.
The most important aspect of PCA is that it is unsupervised andwhen part of the nutri-metabolomic design can be recovered ina PCA scoreplot it is considered promising for the whole studyhypothesis. The scoreplot provides a direct and intuitive illustrationof the latent patterns in the data. Objects far apart in the scoreplotare different with respect to what patterns the model describes(which metabolites are responsible for the dominating systematicvariation found in data) and objects in close proximity exhibit similarvariations.While PCA extracts themain variation in preprocessed datathere is no guarantee that this variation is reflecting the hypothesisput forward. Measuring metabolites in biofluids from humans pro-vides data with multiple relevant and irrelevant types of variationsuch as gender, eating habits, co-habitation, age, genetics, medication,environmental factors and life style (Rasmussen et al., 2011). Thesevariations can, depending on the design of the study, be a major part

1139F. Savorani et al. / Food Research International 54 (2013) 1131–1145
of the total variation and thus, be extracted by the PCA model in thefirst components. Being able to minimize these effects using a properexperimental design, balanced data, randomized samples and opti-mized instrumental conditions is of prime importance in nutritionalmetabolomic studies where the sought information can otherwise behidden.
Fig. 7 shows a typical example of a PCA scoreplot based on theNMR data from a nutritional metabolomics study. In a PCA model,the a priori knowledge can be used to colour objects in the scoreplotthereby emphasizing potential patterns and/or quantitative gradientsfound in data. In this case, the scoreplot is coloured by design infor-mation, i.e. the subject is male or female, and apparently the genderinformation dominates the PC2 variation which describes more than20% of the total systematic variation in the data set. If the hypothesisis to scrutinize the data for very minor effect it might thus be useful todivide the data up into two. It is normally not critical to validate a PCAmodel since the important scoreplots remain relatively unperturbedby different validation methods, while the described variance bythe principal components will be influenced by the validation methodemployed.
While a discriminative PCA result is the most important indicatorof whether the design of the study has been effective in revealingeffects, it has a weakness in relation to the interpretation of the result.Variable (fingerprinting) or metabolite (profiling) interpretation hasto be performed through the loading plot, which is the backboneof the PCA model. However, due to the orthogonality constrain inthe PCA, spectral loadings are typically not easy to interpret. Thereare other unsupervised classification alternatives to PCA that donot have this orthogonality constraint. This is for example the casewith multivariate curve resolution (MCR) (de Juan & Tauler, 2006;Lawton & Sylvestre, 1971) which is similar to PCA, but without theconstraint that the PC must be orthogonal. In simple mixtures MCRhas proven able to recover the real underlying NMR spectra of the in-dividual components (Winning, Larsen, Bro, & Engelsen, 2008). In thecase of higher order dimension NMR data, such as diffusion orderedspectroscopy (DOSY), parallel factor analysis (PARAFAC) (Harshman,1970) can be used to recover the experimental design including thespectral profiles of the metabolites (Bro et al., 2010). The PARAFACmodel has for example been demonstrated useful to resolve the 2Ddiffusion-edited 1H NMR spectra of human plasma samples (samples ×spectral variables × diffusion gradient). In particular PARAFAC was ableto resolve the lipoprotein main fractions due to the different densities
PC 1 (74%)
PC
2 (
21%
)
Female
Male
Fig. 7. PCA scoreplot based on NMR data from a typical human intervention study.In this case the scores are coloured by design information (male and female). PC1describe 74% and PC2 21% of the total variation in the data set.
of the lipoproteins. Subsequent inspection of the PARAFAC loadingsshows a remarkable resemblance with the pure fraction methyl spectrameasured by Otvos and co-workers (Otvos et al., 1991), and the diffu-sion profiles give excellent agreement with hydrodynamic diametersof the main lipoprotein fractions calculated using the Stokes-Einsteinrelation for diffusion of a spherical particle (Dyrby et al., 2005). In thecase of recording NMR metabolite profiles as a function of time, theTucker3 multiwaymodel (Tucker, 1966) has been demonstrated usefulin maintaining more of the structure inherent in the data than PCA byexplicitly model the time as an axis of the development of a toxicologi-cal response (Dyrby, Baunsgaard, Bro, & Engelsen, 2005). One drawbackof using MCR and PARAFAC in contrast to Tucker3 and PCA is that thenumber of components needs to be correctly specified, which makesthem less suitable for providing an initial overview of data.
11. PLS-DA and supervised classification
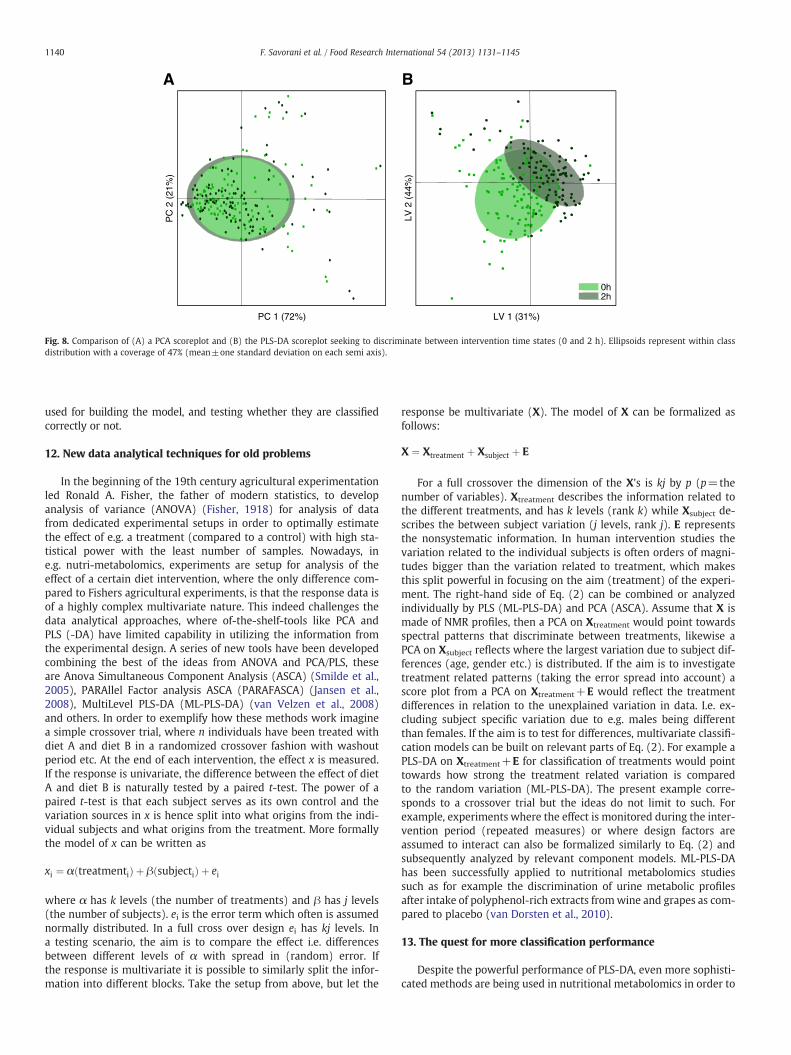
While PCA is a very powerful explorative method, researchers areoften not satisfied by the discrimination that the unsupervised PCAcan provide, for which reason supervised classification methods areemployed. In supervised classification chemometric methods, thea priori knowledge is actively used in the classification model. Manydifferent supervised classification methods exist, but the archetypeis the so-called partial least squares regression discriminant analysis(PLS-DA) method (Ståhle & Wold, 1987). The PLS-DA method is aclassification method where a classifier variable (typically a vectorwith zero's and one's describing the subjects relation to one out oftwo classes) is predicted in the best possible way using the informa-tion found in the metabolite table or the NMR spectral data set. Thedesired result of this classification exercise is to find the best possiblediscrimination between two (or more) groups and, in turn, the me-tabolite pattern that is responsible for the discrimination betweenthe two groups, for example intervention and control. The PLS-DAis closely related to a normal partial least squares regression (PLS)model (Wold, Martens, &Wold, 1983) where, instead, a continuous pa-rameter (e.g. cholesterol level) is predicted from e.g. a NMR spectrum.While a normal PLS model is optimized according to the predictionerror (e.g. root-mean-square-error-of-cross-validation: RMSECV), aPLS-DAmodel should be optimized on the basis of classification perfor-mance (e.g. rate or percentage of misclassified samples). The use ofPLS-DA models are dominating nutritional metabolomic studies be-cause of its very strong classification performance. This is exemplifiedin Fig. 8 which shows a comparison between a PCA score classificationand a PLS-DA score classification on the same data. In case of the PCAthe design parameter which is metabolome dynamics (0 h or 2 h)cannot be differentiated in the first two PCs describing more than 90%of the variation in the NMR data. In contrast the PLS-DA scoreplotshows a clear albeit not perfect classification of the time parameter.
While PCA represents an unbiased, untargeted and unsuperviseddata exploration, PLS-DA represents the opposite. It is a supervisedmethodwhere patterns are extracted so that they discriminate betweenclasses in the best possible way. “When you ask for discrimination - youwill get it!” and for PLS-DA spurious correlations often can lead to excel-lent but false classifications. In fact it can be shown that a non-validatedPLS-DA on sound metabolite data containing no information about agiven class relationship is able to show a clear separation of the classesin the scoreplot (Westerhuis et al., 2008). Regardless of validationor not, the score- and loading- plots would be similar and thus, theseplots should not be blindly used to access the classification performanceof a PLS-DAmodel. The only acceptable approach is to include a rigorousvalidation step to confirm or refute the class separation. The applicationof more advanced validationmethods like double cross-validation, per-mutation and Monte Carlo testing often add complementary insight ofthe model performance (Westerhuis et al., 2008). The ultimate classifi-cation test/validation is the use of an independent test set; i.e. applica-tion of the developed classification model on some new samples, not
LV 1 (31%)
LV 2
(44
%)
PC 1 (72%)
PC
2 (
21%
)
0h2h
A B
Fig. 8. Comparison of (A) a PCA scoreplot and (B) the PLS-DA scoreplot seeking to discriminate between intervention time states (0 and 2 h). Ellipsoids represent within classdistribution with a coverage of 47% (mean±one standard deviation on each semi axis).
1140 F. Savorani et al. / Food Research International 54 (2013) 1131–1145
used for building the model, and testing whether they are classifiedcorrectly or not.
12. New data analytical techniques for old problems
In the beginning of the 19th century agricultural experimentationled Ronald A. Fisher, the father of modern statistics, to developanalysis of variance (ANOVA) (Fisher, 1918) for analysis of datafrom dedicated experimental setups in order to optimally estimatethe effect of e.g. a treatment (compared to a control) with high sta-tistical power with the least number of samples. Nowadays, ine.g. nutri-metabolomics, experiments are setup for analysis of theeffect of a certain diet intervention, where the only difference com-pared to Fishers agricultural experiments, is that the response data isof a highly complex multivariate nature. This indeed challenges thedata analytical approaches, where of-the-shelf-tools like PCA andPLS (-DA) have limited capability in utilizing the information fromthe experimental design. A series of new tools have been developedcombining the best of the ideas from ANOVA and PCA/PLS, theseare Anova Simultaneous Component Analysis (ASCA) (Smilde et al.,2005), PARAllel Factor analysis ASCA (PARAFASCA) (Jansen et al.,2008), MultiLevel PLS-DA (ML-PLS-DA) (van Velzen et al., 2008)and others. In order to exemplify how these methods work imaginea simple crossover trial, where n individuals have been treated withdiet A and diet B in a randomized crossover fashion with washoutperiod etc. At the end of each intervention, the effect x is measured.If the response is univariate, the difference between the effect of dietA and diet B is naturally tested by a paired t-test. The power of apaired t-test is that each subject serves as its own control and thevariation sources in x is hence split into what origins from the indi-vidual subjects and what origins from the treatment. More formallythe model of x can be written as
xi ¼ α treatmentið Þ þ β subjectið Þ þ ei
where α has k levels (the number of treatments) and β has j levels(the number of subjects). ei is the error term which often is assumednormally distributed. In a full cross over design ei has kj levels. Ina testing scenario, the aim is to compare the effect i.e. differencesbetween different levels of α with spread in (random) error. Ifthe response is multivariate it is possible to similarly split the infor-mation into different blocks. Take the setup from above, but let the
response be multivariate (X). The model of X can be formalized asfollows:
X ¼ Xtreatment þ Xsubject þ E
For a full crossover the dimension of the X's is kj by p (p=thenumber of variables). Xtreatment describes the information related tothe different treatments, and has k levels (rank k) while Xsubject de-scribes the between subject variation (j levels, rank j). E representsthe nonsystematic information. In human intervention studies thevariation related to the individual subjects is often orders of magni-tudes bigger than the variation related to treatment, which makesthis split powerful in focusing on the aim (treatment) of the experi-ment. The right-hand side of Eq. (2) can be combined or analyzedindividually by PLS (ML-PLS-DA) and PCA (ASCA). Assume that X ismade of NMR profiles, then a PCA on Xtreatment would point towardsspectral patterns that discriminate between treatments, likewise aPCA on Xsubject reflects where the largest variation due to subject dif-ferences (age, gender etc.) is distributed. If the aim is to investigatetreatment related patterns (taking the error spread into account) ascore plot from a PCA on Xtreatment+E would reflect the treatmentdifferences in relation to the unexplained variation in data. I.e. ex-cluding subject specific variation due to e.g. males being differentthan females. If the aim is to test for differences, multivariate classifi-cation models can be built on relevant parts of Eq. (2). For example aPLS-DA on Xtreatment+E for classification of treatments would pointtowards how strong the treatment related variation is comparedto the random variation (ML-PLS-DA). The present example corre-sponds to a crossover trial but the ideas do not limit to such. Forexample, experiments where the effect is monitored during the inter-vention period (repeated measures) or where design factors areassumed to interact can also be formalized similarly to Eq. (2) andsubsequently analyzed by relevant component models. ML-PLS-DAhas been successfully applied to nutritional metabolomics studiessuch as for example the discrimination of urine metabolic profilesafter intake of polyphenol-rich extracts fromwine and grapes as com-pared to placebo (van Dorsten et al., 2010).
13. The quest for more classification performance
Despite the powerful performance of PLS-DA, even more sophisti-cated methods are being used in nutritional metabolomics in order to

1141F. Savorani et al. / Food Research International 54 (2013) 1131–1145
exploit any possible significance in the experimental design of the in-terventions. In order to improve the interpretation of the classificationresults, some classificationmethods include an orthogonalisation stepas an integral part of themodelling. Themost commonly usedmethodin metabolomics within this category is orthogonal PLS-DA (Cloarecet al., 2005). While the ML-PLS-DA approach described above extractsvariation uncorrelated to the class information, but uses externalinformation in doing so, the O-PLS-DA seeks to extract orthogonalcomponents of unknown, but irrelevant information in the data-set(i.e. information that is uncorrelated to the classifier that is beingpredicted). While O-PLS-DA sometimes result in an easier and moreintuitive interpretation, it will never provide a better classificationof the samples (Tapp & Kemsley, 2009). If an improved classificationperformance is required other classification strategies such as forexample canonical variates analysis (CVA) and its extension thatis able to handle datasets with more variables than objects: extendedcanonical variates analysis (ECVA) (Nørgaard, Bro, Westad, & Engelsen,2006) can be investigated. However, it should be noticed that therewill not necessarily be a large difference in the misclassification ratebetween different methods as they all have their advantages anddisadvantages.
Another obvious approach to improve classification performanceand interpretation is to use variable selection. Due to the vast amountof variables or metabolites included in nutri-metabolomic studiesmany of them will be irrelevant (unsystematic, noisy or metabolitescontaining different information than the one explored) and removalof those variable can often lead to improved classification models.Variable selection is a whole branch of chemometrics and outsidethe scope of this paper but can give, in relation to nutritionalmetabolomic studies, considerable advantages in interpretation andperformance. However, when combining a supervised model such asPLS-DAwith a “hard core” variable selectionmethodmodel validationbecomes critical. In this contextwewill onlymention the “light” inter-val PLS-DA (iPLS-DA)methodwhich has proven efficient in improvingand simplifying classification models of NMR data by breaking thevariable space (ppm scale) up into smaller intervals (either consistingof a spectral region with many metabolites or one metabolite perinterval) of data (Di Anibal, Callao, & Ruisanchez, 2011; Ferrari, Foca,Vignali, Tassi, & Ulrici, 2011; Nørgaard et al., 2000; Savorani,Kristensen, et al., 2010; Savorani, Picone, et al., 2010; Savorani,Tomasi, et al., 2010; Winning et al., 2009). Fig. 9 shows an exampleof a so-called iPLS plot in which a continuous reference parameter isto be predicted from a set of NMR spectra – in this case the chylomi-cron concentration but it could also be a classifier variable. The plot
33.544.555.50
0.1
0.2
0.3
0.4
0.5
RM
SE
CV
33333333
3 LV’s
p
Fig. 9. The application of interval PLS to a large NMR data set for the prediction of the chylommodels (RMSECV as bars). Certain intervals beat the performance of a global 3 component
shows that some intervals improve the global prediction (horizontalline) in terms of a lower RMSECV and the best one is not surprisinglythe complex lipoprotein methylene peak, here coloured in greenbetween 1.0 and 1.5 ppm. Consistently, another interval still relatedto lipoprotein triglyceride protons and located between 2.0 and2.5 ppm performs similarly. The principle behind this strategy is to re-duce the variable space (the intervals can as one extreme be sized onevariable) and thus the number of possible interferences resulting in amore parsimonious and often improved model. The interval modelsare generally a healthy principle in NMR fingerprinting splitting updifferent region of the NMR spectrum into logical and more homoge-nous regions such as the aromatic, carbohydrate and aliphatic regions.When few intervals and/or fewermetabolites are found to provide thesame or better classification as the complete metabolite profile, thisalso makes the subsequent biological interpretation simpler.
14. Misclassifications and the receiver operating characteristics
Despite application of the most powerful classification models, theclassification performance in a nutritional metabolomic investigationis rarely complete and there is no doubt that we have to improve ourcapability to accept that our metabolomics study failed to show theeffect that we were looking for. Unfortunately, is it seen much toooften that a O-PLS-DA score plot provides the final proof of a highlydesired relation, but this is not a valid approach. In order to validatethe performance of a binary classifier, one can use the receiver-operating characteristic (ROC) which is a common tool within medi-cine for judging the quality of a metric used to separate two groups ina population (Zweig & Campbell, 1993). Especially in discriminationproblems with unbalanced numbers in each class, the ROC givesa more refined description of the performance compared to e.g. asingle metric as the overall miss classification rate. In a two grouppopulation, any continuous (numeric) observation, x, may show asignificantly different distribution between the groups. It could forexample be the PLS-DA prediction of the intervention kinetics of thesame data as in Fig. 8B. In this case 0 represent 0 h and 1 represent2 h. Based on the value of x a sample is then classified into one of thetwo groups by comparison with a certain threshold (y). Observationswhere xby will be assigned to one group (0 h) and the remainder tothe other (2 h). In this situation, the classification of any observationmay be sorted into one of four categories, those correctly assignedto their group, known as true-positives and -negatives, and thoseerroneously assigned to the incorrect group, known as false-positivesand -negatives. Depending on the threshold value and the overlap and
0.511.522.5
33333333
pm
icron concentration. The iPLS plot shows the performance of the local interval based PLSmodel based on the entire spectrum (horizontal line).

1142 F. Savorani et al. / Food Research International 54 (2013) 1131–1145
shape of the distributions, the proportion of these errors will shift. Thefour categories are often summarised as sensitivity: the proportion oftrue positives to true positives plus false negatives; and specificity:the proportion of true negatives to true negatives plus false positives.The ROC can be used to summarise this intrinsic trade-off betweensensitivity and specificity by plotting the sensitivity vs. specificity forthe entire range of possible threshold values.
Fig. 10 shows the ROC curve for the intervention study representedby the PLS-DA model in Fig. 8B. A ROC curve that runs along thediagonal of the plot classifies the samples randomly, while any curvethat extends into the upper left half improves on this. In the examplewe want to predict if the samples belong to 0 or the 2 h class. ThePLS-DA predictions give rise to two profiles (coloured in green andgrey-green) which are overlapped and thus no selection of thresholdvalue y is possible for perfect classification. If we select a very low ywe obtain a very high sensitivity but a low specificity (situation A)and vice versawhenwe select a high ywe obtain a very low sensitivitybut a high specificity (situation B). The optimal threshold value issituation C which has both high sensitivity and high specificity.
15. Biological interpretation
Metabolite identification is an essential part of most metabolomicstudies, but since this task is difficult and a time consuming stepat the end of the metabolomics pipeline, it is sometimes ignoredor left unfinished (Scalbert et al., 2009). However, since NMR is ofrelative low sensitivity, most NMR nutritional metabolomic studiesinclude full or near full assignments of metabolite signals. A valuableaid in metabolite identification is the development of humanmetabolome databases such as the Biological Magnetic ResonanceData Bank (Wishart et al., 2009) and in hyphenated NMR techniquessuch as LC-NMR which is capable of isolating single compounds andobtaining pure metabolite spectra (Jaroszewski, 2005). The NMRtechnique can elucidate chemical structures and provide highly spe-cific evidence for the identification of an unknown molecule, if theyare at a high enough quantity (Moco et al., 2007). When a metaboliteor pattern of metabolites has been identified, a relevant biological in-terpretation should be drawn related to the research question. This isstill the major challenge in the nutritional metabolomics chain sincethe extracted important metabolite patterns responsible for the clas-sification may not have direct (causal) relations to the experimental
10
1
Sen
sitiv
ity
A
C
B
Fig. 10. Receiver operator characteristics (ROC) from a PLS-DA model for two class discriminspecificity and classification threshold boundary. (A) Low threshold boundary leading to highbut low sensitivity. (C) Optimal threshold boundary balancing focus on both specificity and
design, but merely be part of the inherent biological pleiothrophywheremanymetabolites are influenced by the perturbation introduced.If comprehensive biological knowledge is available for the investigatedsubjects, the so-called statistical total correlation spectroscopy (STOCSY)autocorrelation matrices (Cloarec et al., 2005; Eads & Noda, 2002)and statistical hetero spectroscopy (SHY) for a generalized correlationapproach (Crockford et al., 2006; Noda, 1993) can also be described astools for unravelling molecules connected in a metabolic pathway. Inany case it is necessary to validate the found correlations with evidencefrom other sources as statistical methods cannot discriminate betweencausal effects and indirect correlations (Capozzi et al., 2011).
Nutritional metabolomics is still a relative new technology andfew thorough investigations and successful intervention studieshave reached the scientific literature. The major advantage of NMRmetabolomics is it inherent quantitative nature and its ability ofproviding an unbiased overview over the study design. This is notpossible with the other analytical platform used in nutritionalmetabolomics. NMR nutri-metabolomics can in a snapshot providean overview over a few hundred metabolites which will enhancethe value of future nutritional intervention studies since it readilycan detect compliance status in relation to: medicine (Loo et al.,2012), alcohol (Bock, 1982), protein intake (Rasmussen et al., 2012),fasting status (Nicholson et al., 1984; Rubio-Aliaga et al., 2011), fatboosting (Cheng et al., 2010), and fruit intake (Heinzmann et al.,2010). Alone the fact that NMR, in contrast to the other analyticalmetabolomics platforms, contains information about the lipoproteinprofile (Otvos et al., 1991; Petersen et al., 2005) and chylomicroncontent (Savorani, Kristensen, et al., 2010; Savorani, Picone, et al.,2010; Savorani, Tomasi, et al., 2010), justifies its relevance. Thesemolecules are of outmost importance to future obesity and diabetesresearch. Many other biomarkers for different food ingestion havebeen discovered, but the breakthrough for metabolomics in relationto describing the mechanisms of functional foods is unfortunatelystill missing and therefore the target of forthcoming research studiesin the field of nutritional-metabolomics.
16. Conclusion
Nutritional metabolomic studies are complex and studies dealingwith metabolomics data are concerned with multifactorial problemsand as these are analysed with multifactorial sensors and separation
0Specificity
CalibratedCV
ation of a typical dietary intervention. Depicted are three relations between sensitivity/sensitivity, but low specificity. (B) High threshold boundary leading to a high specificitysensitivity.

0.711.31.6ppm
Female
Male
1.41.5 1.11.2 0.80.9
Fig. 11. Superimposed NMR spectra of human blood showing the lipid region of a typical nutri-metabolomic intervention study. Male and female profiles are highlighted in differentcolours showing a distinct difference in their lipoprotein response to the intervention study.
1143F. Savorani et al. / Food Research International 54 (2013) 1131–1145
methods, multivariate data handling methods are required to extractand describe the data. The modern analytical platforms generatevast amount of data in a very short time and the analyst risks thechallenge to be flooded with non-informative data. There are multipleways to analyse nutritional metabolomics data and many choiceshave to be made. Data recording, cleaning, preprocessing, modelingand validation are all essential parts of the informatics flow in any nu-tritional metabolomic study (Fig. 1). More research along this direc-tion will facilitate data fusion between different nutri-metabolomicstudies which in turn will increase the information level in nutritionalmetabolomics.
The NMR analytical platform has several advantages comparedto the other metabolomics analytical platforms. In particular it is in-herently quantitative which makes it able to provide an unbiasedoverview of the metabolome in which hundreds of metabolitescan be simultaneously quantified in future nutritional metabolomicstudies. Another important aspect of NMR nutri-metabolomics is itsspeed of analysis. This property facilitates closely spaced “real-time”nutritional metabolomics studies (van Ommen et al., 2009) whichwill provide much more information related to the new health defi-nition i.e. the ability to recover after a given perturbation. Last butnot least the non-destructive analysis and the sensitivity of NMRto physical phenomena such as the rotational diffusion (size) of thelipoproteins which makes it able to determine the lipoprotein profilein human blood and in turn to determine the health status (Otvoset al., 1991; Petersen et al., 2005). Fig. 11 shows the NMR spectrafrom a typical human intervention study which reveals not only largevariations in the lipoprotein signals but also major differences in theaverage female and male lipoprotein profile.
Technically the NMR analytical platform can still improve and theexpanding number of qNMR applications over the last years can for amajor part be attributed to the introduction of cryoprobes. This allowedfor a cost-effective leap in sensitivity which could previously onlybe obtained by investing in very expensive strong superconductingmagnets. The next leaps in sensitivity can be achieved by advancesin probe-design (Grimes & O'Connell, 2011) and introduction of cost-effective solutions for dynamic nuclear polarisation (DNP).
While nutritional metabolomics canmeasure what has happened tothe human metabolome when ingesting a given diet, nutri-genomicscontains information about the potential of what can happen with thehuman metabolome when exposed to a given diet. Hopefully the com-bined research efforts in nutri-metabolomics will pave the way to theultimate challenge of integrating the different -omics technologies:genomics, transcriptomics, proteomics, and metabolomics, to obtaina more complete picture of health status and in this way to unravel
links between disease prevention and dietary intake. The new develop-ments in nutritional metabolomics such as improved analytical toolsand databases combined with bioinformatics, pathway mapping,and computational modeling, are now used for nutrition researchon diet, metabolism, microbiome, and health associations. Thesenew developments enable metabolome-wide association studies(MWAS) (Holmes et al., 2008) and provide a foundation for nutri-tional metabolomics, along with genomics, epigenomics, and healthphenotyping, to support the integrated models required for person-alized diet and nutrition forecasting (Jones, Park, & Ziegler, 2012).Indeed, recent nutritional metabolomic research has shown that anunderstanding of metabolic phenotypes and individual differences inthe response to food challenges is a prerequisite for guiding nutritionand health programmes (Heinzmann et al., 2012).
Acknowledgments
John van Duynhoven and Doris Jacobs are acknowledged forinspiring discussion and for providing the spectra for Fig. 4. TheDanish Ministry of Food, Agriculture and Fisheries is acknowledgedfor sponsoring the project “Urinary biomarkers for eating patterns usingNMR spectroscopy and Chemometrics” (3304-FVFP-060706-01) andthe Faculty of Science interdisciplinary project UNIK-Food, Fitness andPharma is acknowledged for support to the NMR nutri-metabolomicsplatform. The European Union is acknowledged for the support underthe FP7 programme to the CHANCE project (KBBE-4-266331).
This paper is dedicated to our friend and college Jerzy Jaroszewskifrom the pharmaceutical faculty of University of Copenhagen whodedicated his professional life to increase the scientific level of researchin bioactive natural compounds by primarily NMR and hyphenatedNMR techniques.
References
Aguilar, J. A., Faulkner, S., Nilsson, M., & Morris, G. A. (2010). Pure shift H-1 NMR: Aresolution of the resolution problem? Angewandte Chemie International Edition,49(23), 3901–3903.
Akoka, S., Barantin, L., & Trierweiler, M. (1999). Concentration measurement by protonNMR using the ERETIC method. Analytical Chemistry, 71(13), 2554–2557.
Barton, R. H., Waterman, D., Bonner, F. W., Holmes, E., Clarke, R., Nicholson, J. K., et al.(2010). The influence of EDTA and citrate anticoagulant addition to human plasmaon information recovery from NMR-based metabolic profiling studies. MolecularBioSystems, 6(1), 215–224.
Beckonert, O., Keun, H. C., Ebbels, T. M. D., Bundy, J. G., Holmes, E., Lindon, J. C., et al.(2007). Metabolic profiling, metabolomic and metabonomic procedures for NMRspectroscopy of urine, plasma, serum and tissue extracts. Nature Protocols, 2(11),2692–2703.

1144 F. Savorani et al. / Food Research International 54 (2013) 1131–1145
Bernini, P., Bertini, I., Luchinat, C., Nincheri, P., Staderini, S., & Turano, P. (2011).Standard operating procedures for pre-analytical handling of blood and urine formetabolomic studies and biobanks. Journal of Biomolecular NMR, 49(3–4), 231–243.
Bock, J. L. (1982). Analysis of serum by high-field proton nuclear magnetic-resonance.Clinical Chemistry, 28(9), 1873–1877.
Bro, R., Viereck, N., Toft, M., Toft, H., Hansen, P. I., & Engelsen, S. B. (2010). Mathematicalchromatography solves the cocktail party effect in mixtures using 2D spectra andPARAFAC. TrAC Trends in Analytical Chemistry, 29(4), 281–284.
Capozzi, F., Ciampa, A., Picone, G., Placucci, G., & Savorani, F. (2011). Normalizationis a necessary step in NMR data processing: Finding the right scaling factors.In J. -P. Renou, G. Webb, & P. S. Belton (Eds.), Magnetic Resonance in Food Science(pp. 147–160). The Royal Society of Chemistry.
Cavanagh, J., Fairbrother, W. J., Palmer, A. G., III, & Skelton, N. J. (1996). Protein NMRspectroscopy: Principles and practice. London: Academic Press.
Cheng, K. K., Benson, G. M., Grimsditch, D. C., Reid, D. G., Connor, S. C., & Griffin, J. L.(2010). Metabolomic study of the LDL receptor null mouse fed a high-fat dietreveals profound perturbations in choline metabolism that are shared with ApoEnull mice. Physiological Genomics, 41(3), 224–231.
Cloarec, O., Dumas, M. E., Craig, A., Barton, R. H., Trygg, J., Hudson, J., et al. (2005a).Statistical total correlation spectroscopy: An exploratory approach for latent bio-marker identification from metabolic H-1 NMR data sets. Analytical Chemistry,77(5), 1282–1289.
Cloarec, O., Dumas, M. E., Trygg, J., Craig, A., Barton, R. H., Lindon, J. C., et al. (2005b).Evaluation of the orthogonal projection on latent structure model limitationscaused by chemical shift variability and improved visualization of biomarkerchanges in H-1 NMR spectroscopic metabonomic studies. Analytical Chemistry,77(2), 517–526.
Crockford, D. J., Holmes, E., Lindon, J. C., Plumb, R. S., Zirah, S., Bruce, S. J., et al. (2006).Statistical heterospectroscopy, an approach to the integrated analysis of NMR andUPLC-MS data sets: Application in metabonomic toxicology studies. AnalyticalChemistry, 78(2), 363–371.
Darghouth, D., Koehl, B., Junot, C., & Romeo, P. H. (2010). Metabolomic analysis of nor-mal and sickle cell erythrocytes. Transfusion Clinique Et Biologique, 17(3), 148–150.
de Juan, A., & Tauler, R. (2006). Multivariate curve resolution (MCR) from 2000:Progress in concepts and applications. Critical Reviews in Analytical Chemistry,36(3–4), 163–176.
De Marco, A. (1977). pH Dependence of Internal References. Journal of MagneticResonance, 26, 527–528.
Dettmer, K., Aronov, P. A., & Hammock, B. D. (2007). Mass spectrometry-basedmetabolomics. Mass Spectrometry Reviews, 26(1), 51–78.
Di Anibal, C. V., Callao, M. P., & Ruisanchez, I. (2011). (1)H NMR variable selectionapproaches for classification. A case study: The determination of adulteratedfoodstuffs. Talanta, 86, 316–323.
Dieterle, F., Ross, A., Schlotterbeck, G., & Senn, H. (2006). Probabilistic quotient normal-ization as robust method to account for dilution of complex biological mixtures.Application in H-1 NMR metabonomics. Analytical Chemistry, 78(13), 4281–4290.
Dyrby, M., Baunsgaard, D., Bro, R., & Engelsen, S. B. (2005a). Multiway chemometricanalysis of the metabolic response to toxins monitored by NMR. Chemometricsand Intelligent Laboratory Systems, 76(1), 79–89.
Dyrby, M., Petersen, M., Whittaker, A. K., Lambert, L., N›rgaard, L., Bro, R., et al. (2005b).Analysis of lipoproteins using 2D diffusion-edited NMR spectroscopy and multi-way chemometrics. Analytica Chimica Acta, 531(2), 209–216.
Eads, C. D., & Noda, I. (2002). Generalized correlation NMR spectroscopy. Journal of theAmerican Chemical Society, 124(6), 1111–1118.
Emmet, A. D., & Grindley, A. D. (1909). The chemistry of animal feces. First paper - Acomparison of the analysis of fresh and air-dried feces. Journal of the AmericanChemical Society, 31(5), 569–579.
Fardet, A., Llorach, R., Martin, J. F., Besson, C., Lyan, B., Pujos-Guillot, E., et al. (2008a). Aliquid chromatography-quadrupole time-of-flight (LC-QTOF)-based metabolomicapproach reveals newmetabolic effects of catechin in rats fed high-fat diets. Journalof Proteome Research, 7(6), 2388–2398.
Fardet, A., Llorach, R., Orsoni, A., Martin, C. F., Pujos-Guillot, E., Lapierre, C., et al.(2008b). Metabolomics provide new insight on the metabolism of dietary phyto-chemicals in rats. Journal of Nutrition, 138(7), 1282–1287.
Fave, G., Beckmann, M., Lloyd, A. J., Zhou, S. B., Harold, G., Lin, W. C., et al. (2011). Develop-ment and validation of a standardized protocol to monitor human dietary exposureby metabolite fingerprinting of urine samples. Metabolomics, 7(4), 469–484.
Ferrari, E., Foca, G., Vignali, M., Tassi, L., & Ulrici, A. (2011). Adulteration of the anthocya-nin content of red wines: Perspectives for authentication by Fourier Transform-NearInfraRed and (1)H NMR spectroscopies. Analytica Chimica Acta, 701(2), 139–151.
Fiehn, O. (2002). Metabolomics - the link between genotypes and phenotypes. PlantMolecular Biology, 48(1–2), 155–171.
Fisher, R. A. (1918). The correlation between relatives on the supposition of Mendelianinheritance. Transactions of the Royal Society of Edinburgh, 52, 399–433.
Gika, H. G., Theodoridis, G. A., & Wilson, I. D. (2008). Liquid chromatography andultra-performance liquid chromatography-mass spectrometry fingerprinting ofhuman urine - Sample stability under different handling and storage conditionsfor metabonomics studies. Journal of Chromatography. A, 1189(1–2), 314–322.
Giovane, A., Balestrieri, A., & Napoli, C. (2008). New Insights Into Cardiovascular andLipid Metabolomics. Journal of Cellular Biochemistry, 105(3), 648–654.
Goodacre, R., Broadhurst, D., Smilde, A. K., Kristal, B. S., Baker, J. D., Beger, R., et al.(2007). Proposed minimum reporting standards for data analysis in metabolomics.Metabolomics, 3(3), 231–241.
Grimes, J. H., & O'Connell, T. M. (2011). The application of micro-coil NMR probe tech-nology to metabolomics of urine and serum. Journal of Biomolecular NMR, 49(3–4),297–305.
Harshman, R. A. (1970). Foundations of the PARAFAC procedure: Models and conditionsfor an 'explanatory' multi-modal factor analysis. UCLA Working Papers in Phonetics,16, 1–84.
Heinzmann, S. S., Brown, I. J., Chan, Q., Bictash, M., Dumas, M. E., Kochhar, S., et al. (2010).Metabolic profiling strategy for discovery of nutritional biomarkers: Proline betaine asa marker of citrus consumption. American Journal of Clinical Nutrition, 92(2), 436–443.
Heinzmann, S. S., Merrifield, C. A., Rezzi, S., Kochhar, S., Lindon, J. C., Holmes, E., et al.(2012). Stability and Robustness of Human Metabolic Phenotypes in Responseto Sequential Food Challenges. Journal of Proteome Research, 11(2), 643–655.
Holmes, E., Foxall, P. J. D., Nicholson, J. K., Neild, G. H., Brown, S. M., Beddell, C. R., et al.(1994). Automatic data reduction and pattern-recognition methods for analysis ofH-1 nuclear magnetic resonance spectra of human urine from normal and patho-logical states. Analytical Biochemistry, 220(2), 284–296.
Holmes, E., Loo, R. L., Stamler, J., Bictash, M., Yap, I. K. S., Chan, Q., et al. (2008). Humanmetabolic phenotype diversity and its association with diet and blood pressure.Nature, 453(7193), 396–400.
Hotelling, H. (1933). Analysis of a complex of statistical variables into principal compo-nents. Journal of Educational Psychology, 24, 417–441.
Huber, M., Knottnerus, J. A., Green, L., van der Horst, H., Jadad, A. R., Kromhout, D., et al.(2011). How should we define health? British Medical Journal, 343.
Ito, H., Gonthier, M. P., Manach, C., Morand, C., Mennen, L., Remesy, C., et al. (2005). Poly-phenol levels in human urine after intake of six different polyphenol-rich beverages.British Journal of Nutrition, 94(4), 500–509.
Jacobs, D. M., Deltimple, N., van Velzen, E., van Dorsten, F. A., Bingham, M., Vaughan, E.E., et al. (2008). H-1 NMRmetabolite profiling of feces as a tool to assess the impactof nutrition on the human microbiome. NMR in Biomedicine, 21(6), 615–626.
Jansen, J. J., Bro, R., Hoefsloot, H. C. J., van den Berg, F. W. J., Westerhuis, J. A., & Smilde,A. K. (2008). PARAFASCA: ASCA combined with PARAFAC for the analysis of meta-bolic fingerprinting data. Journal of Chemometrics, 22(1–2), 114–121.
Jaroszewski, J. W. (2005). Hyphenated NMR methods in natural products research,Part 2: HPLC-SPE-NMR and other new trends in NMR hyphenation. Planta Medica,71(9), 795–802.
Jenab, M., Slimani, N., Bictash, M., Ferrari, P., & Bingham, S. A. (2009). Biomarkers innutritional epidemiology: Applications, needs and new horizons. Human Genetics,125(5–6), 507–525.
Johnels, D., Edlund, U., Grahn, H., Hellberg, S., Sjostrom, M., Wold, S., et al. (1983). Clus-tering of aryl C-13 nuclear magnetic-resonance substituent chemical-shifts - amultivariate data-analysis using principal components. Journal of the ChemicalSociety - Perkin Transactions, 2(6), 863–871.
Johnson, C. S. (1999). Diffusion ordered nuclear magnetic resonance spectroscopy:Principles and applications. Progress in Nuclear Magnetic Resonance Spectroscopy,34(3–4), 203–256.
Jones, D. P., Park, Y., & Ziegler, T. R. (2012). Nutritional metabolomics: Progress inaddressing complexity in diet and health. In R. J. Cousins (Ed.), Annual Review ofNutrition, Vol. 32. (pp. 183–203). Palo Alto: Annual Reviews.
Katan, M. B., & De Roos, N. M. (2004). Promises and problems of functional foods.Critical Reviews in Food Science and Nutrition, 44(5), 369–377.
Keun, H. C. (2006). Metabonomicmodeling of drug toxicity. Pharmacology & Therapeutics,109(1–2), 92–106.
Keun, H. C., Beckonert, O., Griffin, J. L., Richter, C., Moskau, D., Lindon, J. C., et al. (2002a).Cryogenic probe C-13NMR spectroscopy of urine for metabonomic studies. AnalyticalChemistry, 74(17), 4588–4593.
Keun, H. C., Ebbels, T. M. D., Antti, H., Bollard, M. E., Beckonert, O., Schlotterbeck, G.,et al. (2002b). Analytical reproducibility in H-1 NMR-based metabonomic urinalysis.Chemical Research in Toxicology, 15(11), 1380–1386.
Lauridsen, M., Hansen, S. H., Jaroszewski, J. W., & Cornett, C. (2007). Human urineas test material in H-1 NMR-based metabonomics: Recommendations for samplepreparation and storage. Analytical Chemistry, 79(3), 1181–1186.
Lawton, W. H., & Sylvestre, E. A. (1971). Self Modeling Curve Resolution. Technometrics,13(3), 617–633.
Lenz, E. M., Bright, J., Wilson, I. D., Hughes, A., Morrisson, J., Lindberg, H., et al. (2004).Metabonomics, dietary influences and cultural differences: A H-1 NMR-basedstudy of urine samples obtained from healthy British and Swedish subjects. Journalof Pharmaceutical and Biomedical Analysis, 36(4), 841–849.
Lerche, M. H., Meier, S., Jensen, P. R., Hustvedt, S. O., Karlsson, M., Duus, J. O., et al.(2011). Quantitative dynamic nuclear polarization-NMR on blood plasma forassays of drug metabolism. NMR in Biomedicine, 24(1), 96–103.
Llorach, R., Garcia-Aloy, M., Tulipani, S., Vazquez-Fresno, R., & Andres-Lacueva, C.(2012). Nutrimetabolomic Strategies To Develop New Biomarkers of Intake andHealth Effects. Journal of Agricultural and Food Chemistry, 60(36), 8797–8808.
Loo, R. L., Chan, Q., Brown, I. J., Robertson, C. E., Stamler, J., Nicholson, J. K., et al. (2012).A Comparison of Self-Reported Analgesic Use and Detection of Urinary Ibuprofenand Acetaminophen Metabolites by Means of Metabonomics The INTERMAPStudy. American Journal of Epidemiology, 175(4), 348–358.
Ludwig, C., & Viant, M. R. (2010). Two-dimensional J-resolved NMR spectroscopy:Review of a key methodology in the metabolomics toolbox. Phytochemical Analysis,21(1), 22–32.
Maher, A. D., Zirah, S. F. M., Holmes, E., & Nicholson, J. K. (2007). Experimental andanalytical variation in human urine in H-1 NMR spectroscopy-based metabolicphenotyping studies. Analytical Chemistry, 79(14), 5204–5211.
Marchesi, J. R., Holmes, E., Khan, F., Kochhar, S., Scanlan, P., Shanahan, F., et al. (2007).Rapid and noninvasive metabonomic characterization of inflammatory boweldisease. Journal of Proteome Research, 6(2), 546–551.
Martin, F. P. J., Collino, S., & Rezzi, S. (2011). 1H NMR-based metabonomic applicationsto decipher gut microbial metabolic influence on mammalian health. MagneticResonance in Chemistry, 49, S47–S54.
1145F. Savorani et al. / Food Research International 54 (2013) 1131–1145
Martin, F. P. J., Wang, Y. L., Sprenger, N., Holmes, E., Lindon, J. C., Kochhar, S., et al.(2007). Effects of probiotic Lactobacillus Paracasei treatment on the host gut tissuemetabolic profiles probed via magic-angle-spinning NMR spectroscopy. Journal ofProteome Research, 6(4), 1471–1481.
Meier, S., Karlsson, M., Jensen, P. R., Lerche, M. H., & Duus, J. O. (2011). Metabolic pathwayvisualization in living yeast by DNP-NMR. Molecular BioSystems, 7(10), 2834–2836.
Metz, K. R., Lam, M. M., & Webb, A. G. (2000). Reference deconvolution: A simpleand effective method for resolution enhancement in nuclear magnetic-resonancespectroscopy. Concepts in Magnetic Resonance, 12(1), 21–42.
Moco, S., Bino, R. J., De Vos, R. C. H., & Vervoort, J. (2007). Metabolomics technologiesand metabolite identification. TrAC Trends in Analytical Chemistry, 26(9), 855–866.
Munck, L., Nørgaard, L., Engelsen, S. B., Bro, R., & Andersson, C. A. (1998). Chemometricsin food science - a demonstration of the feasibility of a highly exploratory, induc-tive evaluation strategy of fundamental scientific significance. Chemometrics andIntelligent Laboratory Systems, 44(1), 31–60.
Nicholson, J. K., Foxall, P. J. D., Spraul, M., Farrant, R. D., & Lindon, J. C. (1995). 750 MHzH-1 and H-1-C-13 NMR spectroscopy of human blood plasma. Analytical Chemistry,67(5), 793–811.
Nicholson, J. K., Lindon, J. C., & Holmes, E. (1999). ‘Metabonomics’: Understanding themet-abolic responses of living systems to pathophysiological stimuli via multivariate statis-tical analysis of biological NMR spectroscopic data. Xenobiotica, 29(11), 1181–1189.
Nicholson, J. K., Oflynn, M. P., Sadler, P. J., Macleod, A. F., Juul, S. M., & Sonksen, P. H.(1984). Proton-nuclear-magnetic-resonance studies of serum, plasma and urinefrom fasting normal and diabetic subjects. Biochemical Journal, 217(2), 365–375.
Nielsen, N. P. V., Carstensen, J. M., & Smedsgaard, J. (1998). Aligning of single andmultiple wavelength chromatographic profiles for chemometric data analysis usingcorrelation optimised warping. Journal of Chromatography. A, 805(1–2), 17–35.
Nilsson, M., Khajeh, M., Botana, A., Bernstein, M. A., & Morris, G. A. (2009). Diffusion NMRand trilinear analysis in the study of reaction kinetics. Chemical Communications, 10,1252–1254.
Nitchie, C. C. (1929). Quantitative analysis with the spectrograph. Journal of Industrialand Engineering Chemistry, 1(1), 1–18.
Noda, I. (1993). Generalized 2-dimensional correlation method applicable to infrared,Raman and other types of spectroscopy. Applied Spectroscopy, 47(9), 1329–1336.
Nørgaard, L., Bro, R., Westad, F., & Engelsen, S. B. (2006). A modification of canonicalvariates analysis to handle highly collinear multivariate data. Journal of Chemometrics,20(8–10), 425–435.
Nørgaard, L., Saudland, A., Wagner, J., Nielsen, J. P., Munck, L., & Engelsen, S. B. (2000).Interval partial least-squares regression (iPLS): A comparative chemometric studywith an example from near-infrared spectroscopy. Applied Spectroscopy, 54(3),413–419.
Oliver, S. G., Winson, M. K., Kell, D. B., & Baganz, F. (1998). Systematic functional analysisof the yeast genome. Trends in Biotechnology, 16(9), 373–378.
Oresic, M. (2009). Metabolomics, a novel tool for studies of nutrition, metabolism andlipid dysfunction. Nutrition, Metabolism, and Cardiovascular Diseases, 19(11), 816–824.
Otvos, J. D., Jeyarajah, E. J., & Bennett, D. W. (1991). Quantification of plasma-lipoproteins by proton nuclear-magnetic-resonance spectroscopy. Clinical Chemistry,37(3), 377–386.
Pearce, J. T. M., Athersuch, T. J., Ebbels, T. M. D., Lindon, J. C., Nicholson, J. K., & Keun, H.C. (2008). Robust algorithms for automated chemical shift calibration of 1D H-1NMR spectra of blood serum. Analytical Chemistry, 80(18), 7158–7162.
Petersen, M., Dyrby, M., Toubro, S., Engelsen, S. B., Nørgaard, L., Pedersen, H. T., et al.(2005). Quantification of lipoprotein subclasses by proton nuclear magneticresonance-based partial least-squares regression models. Clinical Chemistry, 51(8),1457–1461.
Psychogios, N., Hau, D. D., Peng, J., Guo, A. C., Mandal, R., Bouatra, S., et al. (2011). TheHuman Serum Metabolome. PloS One, 6(2).
Rasmussen, L. G., Savorani, F., Larsen, T. M., Dragsted, L. O., Astrup, A., & Engelsen, S. B.(2011). Standardization of factors that influence human urine metabolomics.Metabolomics, 7(1), 71–83.
Rasmussen, L. G., Winning, H., Savorani, F., Toft, H., Larsen, T. M., Dragsted, L. O., et al.(2012). Assessment of the Effect of High or Low Protein Diet on the HumanUrine Metabolome as Measured by NMR. Nutrients, 4(2), 112–131.
Rezzi, S., Ramadan, Z., Martin, F. P. J., Fay, L. B., van Bladeren, P., Lindon, J. C., et al.(2007). Human metabolic phenotypes link directly to specific dietary preferencesin healthy individuals. Journal of Proteome Research, 6(11), 4469–4477.
Rose, W. C. (1933). The Metabolism of Creatine and Creatinine. Annual Review ofBiochemistry, 2(1), 187–206.
Rubio-Aliaga, I., de Roos, B., Duthie, S. J., Crosley, L. K., Mayer, C., Horgan, G., et al. (2011).Metabolomics of prolonged fasting in humans reveals new catabolic markers.Metabolomics, 7(3), 375–387.
Saric, J., Wang, Y., Li, J., Coen, M., Utzinger, J., Marchesi, J. R., et al. (2008). Speciesvariation in the fecal metabolome gives insight into differential gastrointestinalfunction. Journal of Proteome Research, 7(1), 352–360.
Saude, E. J., & Sykes, B. D. (2007). Urine stability for metabolomic studies: Effects ofpreparation and storage. Metabolomics, 3(1), 19–27.
Savorani, F., Kristensen, M., Larsen, F. H., Astrup, A., & Engelsen, S. B. (2010a). Highthroughput prediction of chylomicron triglycerides in human plasma by nuclearmagnetic resonance and chemometrics. Nutrition and Metabolism, 7.
Savorani, F., Picone, G., Badiani, A., Fagioli, P., Capozzi, F., & Engelsen, S. B. (2010b).Metabolic profiling and aquaculture differentiation of gilthead sea bream by 1HNMR metabonomics. Food Chemistry, 120(3), 907–914.
Savorani, F., Tomasi, G., & Engelsen, S. B. (2010c). icoshift: A versatile tool for the rapidalignment of 1D NMR spectra. Journal of Magnetic Resonance, 202(2), 190–202.
Scalbert, A., Brennan, L., Fiehn, O., Hankemeier, T., Kristal, B. S., van Ommen, B., et al.(2009). Mass-spectrometry-based metabolomics: Limitations and recommendations
for future progress with particular focus on nutrition research. Metabolomics, 5(4),435–458.
Shen, Q., Li, X., Qiu, Y. P., Su, M. M., Liu, Y. M., Li, H. K., et al. (2008). Metabonomic andmetallomic profiling in the amniotic fluid of malnourished pregnant rats. Journal ofProteome Research, 7(5), 2151–2157.
Smilde, A. K., Jansen, J. J., Hoefsloot, H. C. J., Lamers, R., van der Greef, J., & Timmerman,M. E. (2005). ANOVA-simultaneous component analysis (ASCA): A new tool foranalyzing designed metabolomics data. Bioinformatics, 21(13), 3043–3048.
Solanky, K. S., Bailey, N. J. C., Beckwith-Hall, B. M., Davis, A., Bingham, S., Holmes, E.,et al. (2003). Application of biofluid H-1 nuclear magnetic resonance-basedmetabonomic techniques for the analysis of the biochemical effects of dietaryisoflavones on human plasma profile. Analytical Biochemistry, 323(2), 197–204.
Spraul, M., Hofmann, M., Dvortsak, P., Nicholson, J. K., & Wilson, I. D. (1993).High-Performance Liquid-Chromatography coupled to high-field proton nuclear-magnetic-resonance spectroscopy - Application to the urinary metabolites ofibuprofen. Analytical Chemistry, 65(4), 327–330.
Spraul, M., Neidig, P., Klauck, U., Kessler, P., Holmes, E., Nicholson, J. K., et al. (1994).Automatic reduction of NMR spectroscopic data for statistical and pattern-recognition classification of samples. Journal of Pharmaceutical and BiomedicalAnalysis, 12(10), 1215–1225.
Ståhle, L., & Wold, S. (1987). Partial least squares analysis with cross-validation for thetwo-class problem: A Monte Carlo study. Journal of Chemometrics, 1, 185–196.
Stella, C., Beckwith-Hall, B., Cloarec, O., Holmes, E., Lindon, J. C., Powell, J., et al. (2006).Susceptibility of human metabolic phenotypes to dietary modulation. Journal ofProteome Research, 5(10), 2780–2788.
Stolzenburg, S., Lauridsen, M. B., Toft, H., Zalloua, P. A., & Baunsgaard, D. (2011).Improved quality of H-1 NMR spectroscopic data for enhanced metabolic profilingof low molecular weight metabolites in human serum. Metabolomics, 7(2), 270–277.
Sysi-Aho, M., Katajamaa, M., Yetukuri, L., & Oresic, M. (2007). Normalization methodfor metabolomics data using optimal selection of multiple internal standards.BMC Bioinformatics, 8.
Tapp, H. S., & Kemsley, E. K. (2009). Notes on the practical utility of OPLS. TrAC Trends inAnalytical Chemistry, 28(11), 1322–1327.
Tiziani, S., Einwas, A. H., Lodi, A., Ludwig, C., Bunce, C. M., Viant, M. R., et al. (2008).Optimized metabolite extraction from blood serum for H-1 nuclear magnetic reso-nance spectroscopy. Analytical Biochemistry, 377(1), 16–23.
Torgrip, R. J. O., Aberg, K. M., Alm, E., Schuppe-Koistinen, I., & Lindberg, J. (2008). A noteon normalization of biofluid 1D H-1-NMR data. Metabolomics, 4(2), 114–121.
Trygg, J., Holmes, E., & Lundstedt, T. (2007). Chemometrics in metabonomics. Journal ofProteome Research, 6(2), 469–479.
Tucker, L. H. (1966). Some mathematical notes on three-mode factor analysis.Psychometrika, 31, 279–311.
van den Berg, R. A., Hoefsloot, H. C. J., Westerhuis, J. A., Smilde, A. K., & van der Werf, M. J.(2006). Centering, scaling, and transformations: Improving the biological informa-tion content of metabolomics data. BMC Genomics, 7.
van Dorsten, F. A., Grun, C. H., van Velzen, E. J. J., Jacobs, D. M., Draijer, R., & van Duynhoven,J. P. M. (2010). Themetabolic fate of red wine and grape juice polyphenols in humansassessed by metabolomics. Molecular Nutrition & Food Research, 54(7), 897–908.
van Ommen, B., Keijer, J., Heil, S. G., & Kaput, J. (2009). Challenging homeostasis todefine biomarkers for nutrition related health.Molecular Nutrition & Food Research,53(7), 795–804.
van Velzen, E. J. J., Westerhuis, J. A., van Duynhoven, J. P. M., van Dorsten, F. A., Hoefsloot,H. C. J., Jacobs, D. M., et al. (2008). Multilevel data analysis of a crossover designedhuman nutritional intervention study. Journal of Proteome Research, 7(10), 4483–4491.
Veselkov, K. A., Lindon, J. C., Ebbels, T. M. D., Crockford, D., Volynkin, V. V., Holmes, E., et al.(2009). Recursive Segment-Wise Peak Alignment of Biological H-1 NMR Spectra forImproved Metabolic Biomarker Recovery. Analytical Chemistry, 81(1), 56–66.
Westerhuis, J. A., Hoefsloot, H. C. J., Smit, S., Vis, D. J., Smilde, A. K., van Velzen, E. J. J.,et al. (2008). Assessment of PLSDA cross validation. Metabolomics, 4(1), 81–89.
Winnike, J. H., Busby, M. G., Watkins, P. B., & O'Connell, T. M. (2009). Effects of aprolonged standardized diet on normalizing the human metabolome. AmericanJournal of Clinical Nutrition, 90(6), 1496–1501.
Winning, H., Larsen, F. H., Bro, R., & Engelsen, S. B. (2008). Quantitative analysis of NMRspectra with chemometrics. Journal of Magnetic Resonance, 190(1), 26–32.
Winning, H., Roldán-Marín, E., Dragsted, L. O., Viereck, N., Poulsen, M., Sánchez-Moreno,C., et al. (2009). An exploratory NMR nutri-metabonomic investigation revealsdimethylsulfone as a dietary biomarker for onion intake. Analyst, 134(11), 2344–2351.
Wishart, D. S. (2008a). Metabolomics: Applications to food science and nutritionresearch. Trends in Food Science & Technology, 19(9), 482–493.
Wishart, D. S. (2008b). Quantitative metabolomics using NMR. TrAC Trends in AnalyticalChemistry, 27(3), 228–237.
Wishart, D. S., Knox, C., Guo, A. C., Eisner, R., Young, N., Gautam, B., et al. (2009). HMDB: Aknowledgebase for the human metabolome. Nucleic Acids Research, 37, D603–D610.
Wold, S., Martens, H., & Wold, H. (1983). The multivariate calibration problem inchemistry solved by the PLS methods. In A. Ruhe, & B. Kågstrøm (Eds.), Heidelberg:Springer Verlag.
Wolfender, J. L., Ndjoko, K., & Hostettmann, K. (2001). The potential of LC-NMR inphytochemical analysis. Phytochemical Analysis, 12(1), 2–22.
Yilmaz, A., Nyberg, N. T., & Jaroszewski, J. W. (2011). Metabolic Profiling Based onTwo-Dimensional J-Resolved H-1 NMR Data and Parallel Factor Analysis. AnalyticalChemistry, 83(21), 8278–8285.
Zivkovic, A. M., Wiest, M. M., Nguyen, U. T., Davis, R., Watkins, S. M., & German, J. B.(2009). Effects of sample handling and storage on quantitative lipid analysis inhuman serum. Metabolomics, 5(4), 507–516.
Zweig, M. H., & Campbell, G. (1993). Receiver-Operating Characteristic (ROC) plots - Afundamental evaluation tool in clinical medicine. Clinical Chemistry, 39(4), 561–577.