Embed Size (px)
Citation preview

Measuring Semantic Distanceusing Distributional Profiles of Concepts
Saif Mohammad!
Institute of Advanced ComputerStudies, University of Maryland
Graeme Hirst!!Department of Computer Science,University of Toronto
Automatic measures of semantic distance can be classified into two kinds: (1) those, such asWordNet, that rely on the structure of manually created lexical resources and (2) those thatrely only on co-occurrence statistics from large corpora. Each kind has inherent strengths andlimitations. Here we present a hybrid approach that combines corpus statistics with the structureof a Roget-like thesaurus to gain the strengths of each while avoiding many of their limitations.We create distributional profiles (co-occurrence vectors) of coarse thesaurus concepts, ratherthan words. This allows us to estimate the distributional similarity between concepts, ratherthan words. We show that this approach can be ported to a cross-lingual framework, so as toestimate semantic distance in a resource-poor language by combining its text with a thesaurusin a resource-rich language. Extensive experiments, both monolingually and cross-lingually,on ranking word pairs in order of semantic distance, correcting real-word spelling errors,and solving word-choice problems show that these distributional measures of concept distancemarkedly outperform traditional distributional word-distance measures and are competitive withthe best WordNet-based measures.
1. Introduction
Semantic distance is a measure of how close or distant two units of language are,in terms of their meaning. The units of language may be words, phrases, sentences,paragraphs, or documents. For example, the nouns dance and choreography are closer inmeaning than the nouns clown and bridge. These units of language, especially words,may have more than one possible meaning. However, their context may be used todetermine the intended senses. For example, star can mean both CELESTIAL BODY andCELEBRITY; however, star in the sentence below refers only to CELESTIAL BODY and ismuch closer to sun than to famous:
(1) Stars are powered by nuclear fusion.
Thus, semantic distance between words in context is in fact the distance between wordsenses or concepts. (We use the terms word senses and concepts interchangeably here,although later on we will make a distinction. Throughout this paper, example wordswill be written in italics, as in the example sentence above, whereas example senses orconcepts will be written in small capitals.)
! E-mail: [email protected]!! Email: [email protected]
© 2006 Association for Computational Linguistics

Computational Linguistics Volume 1, Number 1
Two classes of automatic semantic distance measures exist. Lexical-resource-basedmeasures of concept-distance, such as those of Jiang and Conrath (1997), Leacock andChodorow (1998), and Resnik (1995), rely on the structure of a knowledge source, suchas WordNet, to determine the distance between two concepts defined in it. Distribu-tional measures of word-distance, such as cosine and !-skew divergence (Lee 2001),rely on the distributional hypothesis, which states that two words are semanticallyclose if they tend to occur in similar contexts (Firth 1957; Harris 1968). These measuresrely simply on text and can give the distance between any two words that occur at leasta few times.
However, both these approaches have significant limitations (described in detailin Section 3). In this paper (Section 4), we present a new hybrid approach that com-bines the co-occurrence statistics of a distributional approach with the informationin a lexical resource. We will refer to this new class of measures as distributionalmeasures of concept-distance. We also show how this approach can be ported to across-lingual framework (Section 6), which has two additional benefits: (1) Semanticdistance problems in a resource-poor language can be solved by combining its texts witha lexical resource from a resource-rich language; (2) Cross-lingual semantic distanceis useful when working on natural language problems that inherently involve two ormore languages, such as machine translation and multilingual information retrieval.We perform extensive experiments, both monolingually (Section 5) and cross-lingually(Section 7), and show that this new method is markedly better than others.
2. Background
2.1 When are two terms considered semantically close?
Humans consider two concepts to be semantically close if there is a sharing of somemeaning. More formally, two concepts are semantically close if there is a lexical seman-tic relation between the concepts. According to Cruse (1986), a lexical semantic relationis the relation between lexical units—a surface form along with a sense. As Crusepoints out, the number of semantic relations that bind concepts is innumerable butcertain relations, such as hyponymy, meronymy, antonymy, and troponymy, are moresystematic and have enjoyed more attention in the linguistics community. However,as Morris and Hirst (2004) point out, these relations are far out-numbered by otherswhich they call non-classical relations. A few of the kinds of non-classical relationsthey observed included positive qualities (BRILLIANT, KIND), commonly co-occurringwords (locations such as HOMELESS, SHELTER; problem–solution pairs such as DRUGS,REHABILITATION).
2.2 Semantic relatedness and semantic similarity
Semantic distance is of two kinds: semantic similarity and semantic relatedness. Theformer is a subset of the latter, but the two may be used interchangeably in certain con-texts, making it even more important to be aware of their distinction. Two concepts areconsidered to be semantically similar if there is a hyponymy (hypernymy), antonymy,or troponymy relation between them. Two concepts are considered to be semanticallyrelated if there is any lexical semantic relation between them—classical or non-classical.
Semantically similar concepts tend to share a number of common properties. Forexample, consider APPLES and BANANAS. They are both hyponyms of FRUIT. They areboth edible, they grow on trees, they have seeds, etc. Another example of a semantically
2

Mohammad and Hirst Measuring Semantic Distance using Distributional Profiles of Concepts
Table 1Word-pair datasets that have been manually annotated with distance values. Pearson’scorrelation was used to determine inter-annotator correlation (last column). Those used forexperiments reported in this paper are marked in bold. “n.r.” stands for “not reported”.Dataset Year Language # pairs PoS # subjects CorrelationRubenstein and Goodenough 1965 English 65 N 51 n.r.Miller and Charles 1991 English 30 N n.r. .90Resnik and Diab 2000 English 27 V n.r. .76 and .79Finkelstein 2002 English 153 N 13 n.r.Finkelstein 2002 English 200 N 16 n.r.Gurevych 2005 German 65 N 24 .81Zesch and Gurevych 2006 German 350 N, V, A 8 .69
similar pair is DOCTOR and SURGEON. The concept of a DOCTOR is a hypernym ofSURGEON. Therefore, they share the properties associated with a DOCTOR.
On the other hand, semantically related concepts may not have many properties incommon, but have at least one classical or non-classical lexical relation between themwhich lends them the property of being semantically close. For example, DOOR andKNOB are semantically related as one is the meronym of the other (i.e., stands in thepart-of relation). The concept pair, DOCTOR and SURGEON is in addition to semanticallyrelated (as well as being semantically similar) as one is the hyponym of the other.Example pairs considered semantically related due to non-classical relations includeSURGEON–SCALPEL and TREE–SHADE. Note that semantic similarity entails semanticrelatedness but the converse need not be true.
2.3 Can humans estimate semantic distance?
Many will agree that humans are adept at estimating semantic distance, but considerthe following questions. How strongly will two people agree or disagree on distanceestimates? Will the agreement vary over different sets of concepts? In our minds, isthere a clear distinction between related and unrelated concepts or are concept-pairsspread across the whole range from synonymous to unrelated?
Some of the earliest work that begins to answer these questions is by Rubensteinand Goodenough (1965a). They conducted quantitative experiments with human sub-jects (51 in all) who were asked to rate 65 English word pairs on a scale from 0.0 to 4.0as per their semantic distance. The word pairs chosen ranged from almost synonymousto unrelated. However, they were all noun pairs and those that were semantically closewere semantically similar; the dataset did not contain word pairs that were semanticallyrelated but not semantically similar. The subjects repeated the annotation after twoweeks and the new distance values had a Pearson’s correlation r of 0.85 with theold ones. Miller and Charles (1991) also conducted a similar study on 30 word pairstaken from the Rubenstein-Goodenough pairs. These annotations had a high correlation(r = 0.97) with the mean annotations of Rubenstein and Goodenough (1965a). Resnik(1999) repeated these experiments and found the inter-annotator correlation (r) to be0.90. Finkelstein (2002) asked human judges to rank two sets of noun pairs (153 pairsand 200 pairs) in order of semantic distance. However, this dataset has certain polit-ically biased word pairs, such as Arafat–peace, Arafat–terror, Jerusalem–Israel, Jerusalem–Palestinian, and so there might be less human agreement on ranking this data.
3

Computational Linguistics Volume 1, Number 1
Resnik and Diab (2000) conducted annotations of 48 verb pairs and found inter-annotator correlation (r) to be 0.76 when the verbs were presented without context and0.79 when presented in context. Gurevych (2005) and Zesch et al. (2007) asked nativeGerman speakers to mark two different sets of German word pairs with distance values.Set 1 was a German translation of the Rubenstein and Goodenough (1965a) dataset. Ithad 65 noun–noun word pairs. Set 2 was a larger dataset containing 350 word pairsmade up of nouns, verbs, and adjectives. The semantically close word pairs in the 65-word set were mostly synonyms or hypernyms (hyponyms) of each other, whereasthose in the 350-word set had both classical and non-classical relations with each other.Details of these semantic distance benchmarks are summarized in Table 1. Inter-subjectcorrelations (last column in Table 1) are indicative of the degree of ease in annotatingthe datasets.
The high correlation values suggest that humans are quite good and consistent atestimating semantic distance of noun-pairs; however, annotating verbs and adjectivesand combinations of parts of speech is harder. This also means that estimating semanticrelatedness is harder than estimating semantic similarity. It should be noted here thateven though the annotators were presented with word-pairs and not concept-pairs, it isreasonable to assume that they were annotated as per their closest senses. For example,given the noun pair bank and interest, most if not all will identify it as semanticallyrelated even though both words have more than one sense andmany of the sense–sensecombinations are unrelated (for example, the RIVER BANK sense of bank and the SPECIALATTENTION sense of interest).
Apart from proving that humans can indeed estimate semantic distance, thesedatasets act as “gold standards” to evaluate automatic distance measures. However,lack of large amounts of data from human subject experimentation limits the reliabilityof this mode of evaluation. Therefore automatic distance measures are also evaluatedby their usefulness in natural language tasks such as correcting real-word spellingerrors (Budanitsky and Hirst 2006) and solving word-choice problems (Turney 2001).We evaluate our distributional concept-distance measures both intrinsically throughranking human-judged word pairs in order of semantic distance as well as extrinsicallythrough natural language tasks such as correcting spelling errors and solving word-choice problems.
2.4 The anatomy of a distributional measure of semantic distance
Even though there are numerous distributional measures, many of which may seemdramatically different from each other, all of them do the following: (1) choose a unitof co-occurrence (e.g., word, word–syntactic-relation combination); (2) choose a mea-sure of strength of association (SoA) of the co-occurrence unit with the target word(e.g., conditional probability, pointwise mutual information); (3) represent the targetwords by vectors or points in the co-occurrence space (and possibly apply dimensionreduction);1 and (4) calculate the distance between the target vectors using a suitabledistributional measure (e.g., cosine, Euclidean distance). While any of the measures ofvector distance may be used with any of the measures of strength of association, inpractice only certain combinations are used (see Table 2) and certain other combinations
1 The co-occurrence space is a hyper-dimensional space where each dimension is a unique co-occurrenceunit. If words are used as co-occurrence units, then this space has |V| dimensions, where V is thevocabulary.
4

Mohammad and Hirst Measuring Semantic Distance using Distributional Profiles of Concepts
Table 2Measures of vector distance, measures of strength of association, and standard combinations.Those used for experiments reported in this paper are marked in bold.Measures of DP distance Measures of strength of association (SoA)!-skew divergence (ASD) " coefficient (Phi)cosine (Cos) conditional probability (CP)Dice coefficient (Dice) cosine (Cos)Euclidean distance (L2 norm) Dice coefficient (Dice)Hindle’s measure (Hin) log likelihood ration (LLR)Kullback-Leibler divergence (KLD) odds ratio (Odds)Manhattan distance (L1 norm) pointwise mutual information (PMI)Jensen–Shannon divergence (JSD) Yule’s coefficient (Yule)Lin’s measure (Lin)
Standard combinations!-skew divergence—" coefficient (ASD–CP)cosine—conditional probability (Cos–CP)Dice coefficient—conditional probability (Dice–CP)Euclidean distance—conditional probability (L2 norm–CP)Hindle’s measure—pointwise mutual information (Hin–PMI)Kullback-Leibler divergence—conditional probability (KLD–CP)Manhattan distance—conditional probability (L1 norm–CP)Jensen–Shannon divergence—conditional probability (JSD–CP)Lin’s measure—pointwisemutual information (Lin–PMI)
may not bemeaningful, for example, Kullback-Leibler divergencewith " coefficient. Wewill refer to these co-occurrence vectors as the distributional profile (DP) of the targetwords. Below is a contrived, but plausible, example DP of the target word fusion:
FUSION: heat 0.16, hydrogen 0.16, energy 0.13, bomb 0.09, light 0.09, space 0.04, . . .
It shows that fusion has a strong tendency to co-occur with words such as heat, hydrogen,and energy. The values are the pointwise mutual information between the target andco-occurring words.
All experiments in this paper use simple word co-occurrences, and standard com-binations of vector distance and measure of association. To avoid clutter, instead ofreferring to a distributional measure by its measure of vector distance and measureof association (for example, !-skew divergence—conditional probability), we will referto it simply by the measure of vector distance (in this case, !-skew divergence). Themeasures used in our experiments are !-skew divergence (ASD) (Lee 2001) , cosine(Cos) (Schütze and Pedersen 1997), Jensen-Shannon divergence (JSD) (Manning andSchütze 2008), and that proposed by Lin (1998a) (Lin). Jensen–Shannon divergenceand !-skew divergence calculate the difference in distributions of words that co-occurwith the targets. Lin’s distributional measure follows from his information-theoreticdefinition of similarity (Lin 1998b).
5

Computational Linguistics Volume 1, Number 1
3. Limitations of semantic distance measures
Lexical-resource-based concept-distance measures and distributional word-distancemeasures each have certain uniquely attractive features: resource-based measures cancapitalize on manually encoded lexical semantic relations, whereas distributional ap-proaches are widely applicable because they need only raw text (and maybe someshallow syntactic processing). However, they both also have certain limitations.
3.1 Limitations of lexical-resource-based concept-distancemeasures
Resource-based measures are only as good as the lexical resource on which they rely.
3.1.1 Lack of high-quality WordNet-like knowledge sources. Ontologies, wordnets,and semantic networks are available for a few languages such as English, German,and Hindi. Creating them requires human experts and it is time intensive. Thus, formost languages, we cannot use resource-based measures simply due to the lack ofhigh-quality large-coverage wordnet-like resources. Further, updating a resource isagain expensive and there is usually a lag between the current state of language us-age/comprehension and the lexical resource representing it.
On the other hand, distributional measures require only text. Large corpora, billionsof words in size, may now be collected by a simple web crawler. Large corpora of more-formal writing are also available (for example, the Wall Street Journal or the AmericanPrinting House for the Blind (APHB) corpus). This makes distributional measures veryattractive.
3.1.2 Poor estimation of semantic relatedness. The most widely used WordNet-basedmeasures rely only on its extensive #is-a hierarchy. This is because networks of otherlexical-relations such as meronymy are much less developed. Further, the networksfor different parts of speech are not well connected. Thus, even though resource-basedmeasures are successful at estimating semantic similarity between nouns, they are poorat estimating semantic relatedness—especially in pairs other than noun–noun. Also,as Morris and Hirst (2004) pointed out, a large number of terms have a non-classicalrelation between them and are semantically related (not semantically similar). On theother hand, distributional measures can be used to determine both semantic relatednessand semantic similarity (Mohammad and Hirst 2007).
3.1.3 Inability to cater to specific domains.Given a concept pair,measures that rely onlyon a network and no text, such as Rada et al. (1989), give just one distance value. How-ever, two concepts may be very close in a certain domain but not so much in another.For example, SPACE and TIME are close in the domain of quantum mechanics but notso much in most others. Resources created for specific domains do exist; however, theyare rare. Some of the more successful WordNet-based measures, such as that of Jiangand Conrath (1997), rely on text as well, and do indeed capture domain-specificity tosome extent, but the distance values are still largely affected by the underlying network,which is not domain-specific. On the other hand, distributional measures rely primarily(if not completely) on text and large amounts of corpora specific to particular domainscan easily be collected.
6

Mohammad and Hirst Measuring Semantic Distance using Distributional Profiles of Concepts
3.2 Limitations of corpus-based word-distance measures3.2.1 Conflation of word senses. The distributional hypothesis (Firth 1957) states thatwords that occur in similar contexts tend to be semantically close. But most frequentlyused words have more than one sense; and a word in each of its senses is likely to co-occur with different sets of words. For example, bank in the FINANCIAL INSTITUTIONsense is likely to co-occur with interest, money, accounts, and so on, whereas when usedin the RIVER BANK sense will co-occur with such as river, erosion, and silt. Thus, adistributional measurewill give a score that is some form of a dominance-based averageof the distances between their senses.
However, in most natural language applications, including spelling correction,information retrieval, and text summarization, one requires the semantic distance be-tween the intended senses of the target words. Since words that occur together in texttend to refer to senses that are closest in meaning to one another, this often tends tobe the distance between the closest senses of the two target words. Thus, distributionalword-distance measures are expected to perform poorly in the face of word sense am-biguity. WordNet-based measures do not suffer from this problem as they give distancebetween concepts, not words.
3.2.2 Data sparseness. Since Zipf’s law seems to hold even for the largest of corpora,there will always be words that occur too few times for distributional measures toaccurately estimate their distance with other words. On the other hand, a large numberof relatively obscure words may be listed in high-coverage resources such as WordNet(WordNet has more than 155,000 unique tokens). Of course, manually created resourcesare also lacking in a number of word-types. However, they tend to have groupings ofwords into coarse concepts. This allows even corpus-based approaches to determineproperties of these coarse concepts through occurrences of the more frequent membersof a concept. In Section 4, we will propose a hybrid method of semantic distance thatdoes exactly that using the categories in a published thesaurus.
3.3 Space requirements
As applications for linguistic distance become more sophisticated and demanding, itbecomes attractive to pre-compute and store the distance values between all possiblepairs of words or senses. However both WordNet-based and distributional measureshave large space requirements to do this, requiring matrices of size N " N , where N isvery large. In case of distributional measures, N is the size of the vocabulary (at least100,000 for most languages). In case of WordNet-based measures, N is the number ofsenses (81,000 just for nouns). Given that these matrices tend to be sparse2 and thatcomputational capabilities are continuing to improve, this limitation may not seemhugely problematic, but as we see more and more natural language applications inembedded systems and hand-held devices, such as cell phones, iPods, and medicalequipment, available memory becomes a serious constraints.
2 Even thoughWordNet-based and distributional measures give non-zero similarity and relatednessvalues to a large number of term pairs (concept pairs and word pairs), values below a suitable thresholdcan be reset to 0.
7
Computational Linguistics Volume 1, Number 1
apply pmi or conditional probabilitycreate contingency tables
published thesaurustext corpus
distributional profiles of concepts
distributionalmeasure target concept 2
target concept 1calculate distributional distance
count word–category co-occurrences
distributional distance between target concepts
word–category co-occurrence matrix bootstrapping andsense disambiguation
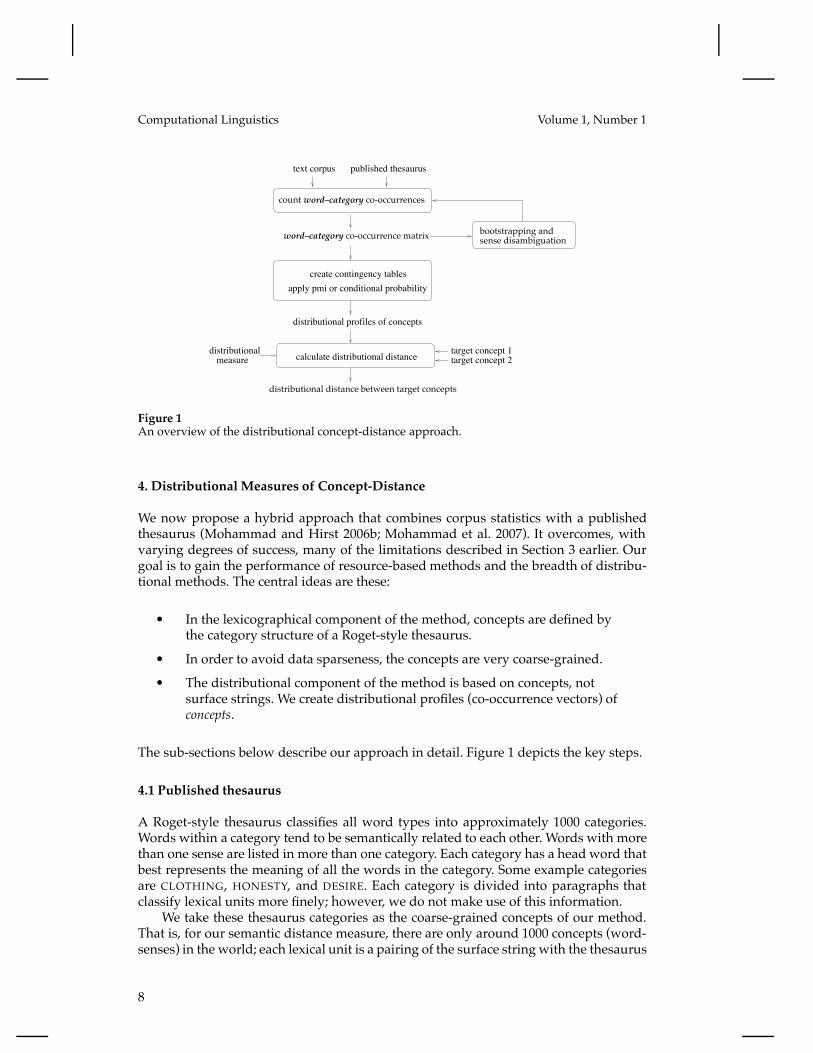
Figure 1An overview of the distributional concept-distance approach.
4. Distributional Measures of Concept-Distance
We now propose a hybrid approach that combines corpus statistics with a publishedthesaurus (Mohammad and Hirst 2006b; Mohammad et al. 2007). It overcomes, withvarying degrees of success, many of the limitations described in Section 3 earlier. Ourgoal is to gain the performance of resource-based methods and the breadth of distribu-tional methods. The central ideas are these:
! In the lexicographical component of the method, concepts are defined bythe category structure of a Roget-style thesaurus.! In order to avoid data sparseness, the concepts are very coarse-grained.! The distributional component of the method is based on concepts, notsurface strings. We create distributional profiles (co-occurrence vectors) ofconcepts.
The sub-sections below describe our approach in detail. Figure 1 depicts the key steps.
4.1 Published thesaurus
A Roget-style thesaurus classifies all word types into approximately 1000 categories.Words within a category tend to be semantically related to each other. Words with morethan one sense are listed in more than one category. Each category has a head word thatbest represents the meaning of all the words in the category. Some example categoriesare CLOTHING, HONESTY, and DESIRE. Each category is divided into paragraphs thatclassify lexical units more finely; however, we do not make use of this information.
We take these thesaurus categories as the coarse-grained concepts of our method.That is, for our semantic distance measure, there are only around 1000 concepts (word-senses) in the world; each lexical unit is a pairing of the surface string with the thesaurus
8

Mohammad and Hirst Measuring Semantic Distance using Distributional Profiles of Concepts
category in which it appears. This is in stark contrast to using WordNet synsets assenses, which sometimes has been criticized to be much too fine-grained.3
Representing the complete vocabulary with only about 1000 concepts helps counterdata sparseness issues (limitation described in Section 3.2.2) at the cost of losing the abil-ity to make fine-grained distinctions. This also means that pre-computing a completeconcept–concept distance matrix now involves the creation of a matrix approximatelyonly 1000 " 1000 in size—much smaller and roughly .01% the size of matrices requiredby existing measures)—thereby mitigating storage limitations in memory-scarce de-vices (limitation of Section 3.3).
In our experiments, we use the categories from the Macquarie Thesaurus (Bernard1986). It has 812 categories with around 176,000 word-tokens and 98,000 word-types.
4.2 The distributional hypothesis for concepts
If we apply the distributional hypothesis (Firth 1957; Harris 1968) to word senses (in-stead of words), then the hypothesis states that wordswhen used in different senses tendto keep different “company" (co-occurringwords). Therefore,we propose the creation ofdistributional profiles (DPs) of word senses or concepts, rather than those of words. Thecloser the distributional profiles of two concepts, the smaller is their semantic distance.Below are example distributional profiles of two senses of STAR:
CELESTIAL BODY: space 0.36, light 0.27, constellation 0.11, hydrogen 0.07, . . .CELEBRITY: famous 0.24, movie 0.14, rich 0.14, fan 0.10, . . .
It should be noted that creating such distributional profiles of concepts is much morechallenging than creating distributional profiles of words, which involve simple word–word co-occurrence counts. (In the next sub-section, we show how these profiles may beestimated without the use of any sense-annotated data). However, once created, any ofthe many measures of vector distance can be used to estimate the distance between theDPs of two target concepts (just as in the case of traditional word-distance measures,measures of vector distance are used to estimate the distance between the DPs oftwo target words). For example, here is how cosine is traditionally used to estimatedistributional distance between two words.
Coscp(w1, w2) =
!w#C(w1)$C(w2)
(P (w|w1) " P (w|w2))"!w#C(w1)
P (w|w1)2 ""!
w#C(w2)P (w|w2)2
(1)
C(t) is the set of words that co-occur (within a certain window) with the word t ina corpus. The conditional probabilities in the formula are taken from the distributionalprofiles of words.We adapt the formula to estimate distributional distance between twoconcepts as shown below:
Coscp(c1, c2) =
!w#C(c1)$C(c2)
(P (w|c1) " P (w|c2))"!w#C(c1)
P (w|c1)2 ""!
w#C(c2)P (w|c2)2
(2)
3 WordNet has more than 117,000 synsets. To counter this fine-grainedness, methods to group synsets intocoarser senses have been proposed (Agirre and Lopez de Lacalle Lekuona 2003; Navigli 2006).
9

Computational Linguistics Volume 1, Number 1
C(x) is now the set of words that co-occur with concept x within a pre-determinedwindow. The conditional probabilities in the formula are taken from the distributionalprofiles of concepts.
If the distance between two words is required, and their intended senses are notknown, then the distance between all relevant sense pairs is determined and the min-imum is chosen. (This is the heuristic described earlier in Section 3.2.1, and is exactlyhow WordNet-based measures of concept-distance are used too (Budanitsky and Hirst2006).) For example, if star has the two senses mentioned above and fusion has one (let’scall it FUSION), then the distance between them is determined by first applying cosine(or any vector distance measure) to the DPs of CELESTIAL BODY and FUSION:
CELESTIAL BODY: space 0.36, light 0.27, constellation 0.11, hydrogen 0.07, . . .FUSION: heat 0.16, hydrogen 0.16, energy 0.13, bomb 0.09, light 0.09, space 0.04, . . .
and then applying cosine to the DPs of CELEBRITY and FUSION:
CELEBRITY: space 0.36, light 0.27, constellation 0.11, hydrogen 0.07, . . .FUSION: heat 0.16, hydrogen 0.16, energy 0.13, bomb 0.09, light 0.09, space 0.04, . . .
Finally the scores which imply the greatest closeness (least distance) is chosen:
distance(star, fusion) = max(Cos(CELEBRITY, FUSION),Cos(CELESTIAL BODY, FUSION))(3)
Note that the maximum value is chosen above because cosine is a closeness measure(greater values imply smaller distances). In the case of distance measures, such as !-skew divergence, the lower of the two values will be chosen.
4.3 Generating distributional profiles of concepts
Determining distributional profiles of concepts requires information about which wordsco-occur with which concepts. A direct approach for this requires the text, from whichcounts are made, to be sense annotated. Since existing labeled data is minimal andmanual annotation is far too expensive, indirect means must be used. Below, we presenta way to estimate distributional profiles of concepts from raw text, using a publishedthesaurus (the concept inventory) and a bootstrapping algorithm.
4.3.1 Creating a word–category co-occurrence matrix. A word–category co-occurrencematrix (WCCM) is created having word types w as one dimension and thesauruscategories c as another.
c1 c2 . . . cj . . .w1 m11 m12 . . . m1j . . .w2 m21 m22 . . . m2j . . ....
...... . . . ...
...wi mi1 mi2 . . . mij . . ....
...... . . .
... . . .
The matrix is populated with co-occurrence counts from a large corpus. A particularcell mij , corresponding to word wi and category or concept cj , is populated with the
10
Mohammad and Hirst Measuring Semantic Distance using Distributional Profiles of Concepts
number of times wi co-occurs (in a window of ±5 words) with any word that has cj
as one of its senses (i.e., wi co-occurs with any word listed under concept cj in thethesaurus). For example, assume that the concept of CELESTIAL BODY is represented byfour words in the thesaurus: constellation, planet, star, and sun. If the word space co-occurswith constellation (15 times), planet (50 times), star (40 times), and sun (65 times) in thegiven text corpus, then the cell for space and CELESTIAL BODY in theWCCM is populatedwith 170 (15 + 50 + 40 + 65). This matrix, created after a first pass of the corpus, is calledthe base word–category co-occurrence matrix (base WCCM).
The choice of ±5 words as window size is somewhat arbitrary and hinges on theintuition that words close to a target word are more indicative of its semantic propertiesthan those more distant. Church andHanks (1990), in their seminal work onword–wordco-occurrence association, also use a window size of ±5 words and argue that this sizeis large enough to capture many verb–argument dependencies and yet small enoughthat adjacency information is not diluted too much.
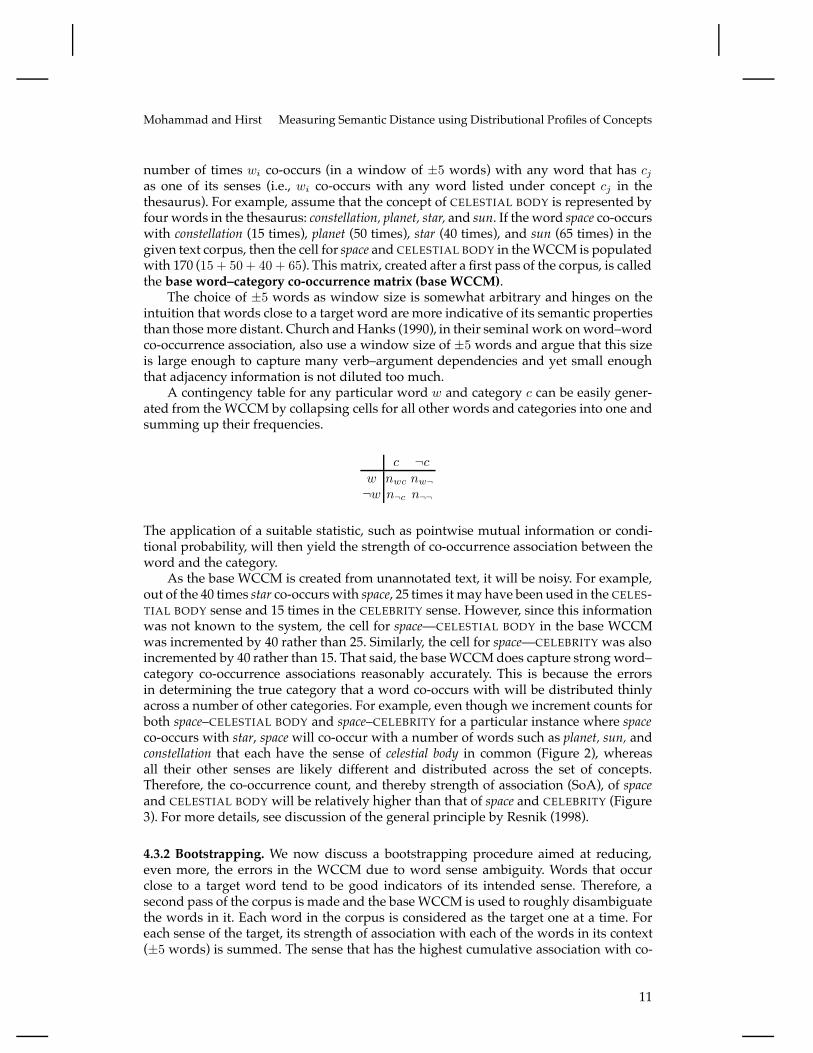
A contingency table for any particular word w and category c can be easily gener-ated from the WCCM by collapsing cells for all other words and categories into one andsumming up their frequencies.
c ¬cw nwc nw¬¬w n¬c n¬¬
The application of a suitable statistic, such as pointwise mutual information or condi-tional probability, will then yield the strength of co-occurrence association between theword and the category.
As the base WCCM is created from unannotated text, it will be noisy. For example,out of the 40 times star co-occurs with space, 25 times it may have been used in the CELES-TIAL BODY sense and 15 times in the CELEBRITY sense. However, since this informationwas not known to the system, the cell for space—CELESTIAL BODY in the base WCCMwas incremented by 40 rather than 25. Similarly, the cell for space—CELEBRITY was alsoincremented by 40 rather than 15. That said, the baseWCCMdoes capture strong word–category co-occurrence associations reasonably accurately. This is because the errorsin determining the true category that a word co-occurs with will be distributed thinlyacross a number of other categories. For example, even though we increment counts forboth space–CELESTIAL BODY and space–CELEBRITY for a particular instance where spaceco-occurs with star, space will co-occur with a number of words such as planet, sun, andconstellation that each have the sense of celestial body in common (Figure 2), whereasall their other senses are likely different and distributed across the set of concepts.Therefore, the co-occurrence count, and thereby strength of association (SoA), of spaceand CELESTIAL BODY will be relatively higher than that of space and CELEBRITY (Figure3). For more details, see discussion of the general principle by Resnik (1998).
4.3.2 Bootstrapping. We now discuss a bootstrapping procedure aimed at reducing,even more, the errors in the WCCM due to word sense ambiguity. Words that occurclose to a target word tend to be good indicators of its intended sense. Therefore, asecond pass of the corpus is made and the baseWCCM is used to roughly disambiguatethe words in it. Each word in the corpus is considered as the target one at a time. Foreach sense of the target, its strength of association with each of the words in its context(±5 words) is summed. The sense that has the highest cumulative association with co-
11

Computational Linguistics Volume 1, Number 1
........
w
CELESTIAL BODY
spacea fragment of text
one sense of w
other sense(s) of ww # {constellation, planet, star, sun}
Figure 2The word space will co-occur with a number of wordsX that each have one sense of CELESTIALBODY in common.
CELESTIAL BODY
CELEBRITY
SoA
SoAa fragment of text
starspace
sense of star
sense of star
Figure 3The base WCCM captures strong word–category co-occurrence strength of association (SoA).
occurring words is chosen as the intended sense of the target word. In this second pass,a new bootstrapped WCCM is created such that each cell mij , corresponding to wordwi and concept cj , is populated with the number of times wi co-occurs with any wordused in sense cj . For example, consider again the 40 times star co-occurs with space. Ifthe contexts of 25 of these instances have higher cumulative strength of associationwith CELESTIAL BODY than CELEBRITY, suggesting that in only these 25 of those 40occurrences star was used in CELESTIAL BODY sense, then the cell for space–CELESTIALBODY is incremented by 25 rather than 40 (as was the case in the base WCCM). Thisbootstrapped WCCM, created after simple and fast word sense disambiguation, willbetter capture word–concept co-occurrence values, and hence strengths of associationvalues, than the base WCCM.4
The bootstrapping step can be repeated; however, further iterations do not improveresults significantly. This is not surprising because the baseWCCMwas createdwithoutanyword sense disambiguation and so the first bootstrapping iteration with word sensedisambiguation will markedly improve the matrix. The same is not true for subsequentiterations.
5. Evaluation: monolingual tasks
We evaluated the distributional concept-distance measures on two monolingual tasks:ranking word pairs in order of their semantic distance and correcting real-word spellingerrors. Each of these experiments is described in the subsections below. We also used
4 Speed of disambiguation is important here as all words in the corpus are to be disambiguated. Afterdetermining co-occurrence counts from the BNC (a 100 million word corpus), creating the bootstrappedWCCM from the base WCCM took only about 4 hours on a 1.3GHz machine with 16GB memory.
12

Mohammad and Hirst Measuring Semantic Distance using Distributional Profiles of Concepts
distributional profiles of concepts to determine word sense dominance and obtainednear-upper-bound results (not described here; see Mohammad and Hirst (2006a)).
We conducted experiments with four vector distance measures: !-skew divergence(ASD) (! = 0.99), cosine (Cos), Jensen–Shannon divergence (JSD), and Lin’s distribu-tional measure (Lindist). All four vector distancemeasures were used to solve the word-pair ranking and spelling correction tasks in two different ways: (1) by calculating tra-ditional distributional word-distance, that is, distance between distributional profiles ofwords; (2) by calculating distributional concept-distance, that is, distance between dis-tributional profiles of concepts. This allows for a fair comparison of the two approaches.However, comparison with WordNet-based measures is not so straightforward. Both ofthe above-mentioned semantic distance tasks have traditionally been performed usingWordNet-based measures—which are good at estimating semantic similarity betweennouns but particularly poor at estimating semantic relatedness between concept pairsother than noun–noun. This has resulted in the creation of “gold-standard" data onlyfor nouns. As creating new gold-standard data is arduous, we perform experiments onexisting noun data.
The distributional profiles of concepts were created from the British National Corpus(BNC) and the Macquarie Thesaurus. In the base WCCM, 22.85% of the 98, 000" 812cells had non-zero values whereas the statistic in the bootstrapped WCCM was 9.1%.5The word-distance measures used a word–word co-occurrence matrix created from theBNC alone. The BNC was not lemmatized, part-of-speech tagged, nor chunked. Thevocabulary was restricted to the words present in the thesaurus (about 98,000 wordtypes) both to provide a level evaluation platform and to filter out named entities andtokens that are not actually words (for example, the BNC has Hahahahahahahahaaaaa,perampam, and Owzeeeyaaaah). Also, in order to overcome large computation times ofdistributional word-distance measures, co-occurrence counts less than five were resetto zero, and words that co-occurred with more than 2000 other words were stoplisted(543 in all). This resulted in a word–word co-occurrence matrix having non-zero valuesin 0.02% of its 98, 000" 98, 000 cells.
5.1 Ranking word pairs
A direct approach to evaluate semantic distance measures is to determine how closethey are to human judgment and intuition. Given a set of word-pairs, humans can rankthem in order of their distance—placing near-synonyms on one end of the rankingand unrelated pairs on the other. As described earlier in Section 2.3, Rubenstein andGoodenough (1965a) provide a “gold-standard” list of 65 human-ranked word-pairs(based on the responses of 51 subjects). An automatic distance measure is deemedto be more accurate than another if its ranking of word-pairs correlates more closelywith the human ranking. The concept distance measures were used to determine word-pair distance by two different methods: (1) calculating the concept-distance between allpairs of senses of the two words, and then choosing the shortest distance; (2) taking theaverage of the distance between each of the relevant pairs of senses.
Table 3 lists correlations of human rankings with those created using the word–word co-occurrence matrix–based traditional distributional word-distance measuresand the correlations using the proposed word–concept co-occurrence matrix–based dis-tributional concept-distance measures. Observe that the distributional concept-distance
5 Recall that theMacquarie Thesaurus has 98,000 word types and 812 categories.
13

Computational Linguistics Volume 1, Number 1
Table 3Correlations with human ranking of Rubenstein and Goodenough word pairs of automaticrankings using traditional word–word co-occurrence–based distributional word-distancemeasures and the word–concept co-occurrence–based distributional concept-distance measures.Best results for each measure-type are shown in boldface.
Measure-typeWord-distance Concept-distance
Distributional measure closest average!-skew divergence 0.45 0.60 –cosine 0.54 0.69 0.42Jensen–Shannon divergence 0.48 0.61 –Lin’s distributional measure 0.52 0.71 0.59
Figure 4Correlations with human ranking of Rubenstein and Goodenough word pairs of automaticrankings using traditional word–word co-occurrence–based distributional word-distancemeasures and the word–concept co-occurrence–based distributional concept-distance measures.
measures give markedly higher correlation values than distributional word-distancemeasures. (Figure 4 depicts the results in a graph.) These results are also better than thebest reported results (0.64) using latent semantic analysis (Landauer, Foltz, and Laham1998). Also, using the distance of the closest sense pair (for Cos and Lindist) gives muchbetter results than using the average distance of all relevant sense pairs. (We do notreport average distance for ASD and JSD because they give very large distance valueswhen sense-pairs are unrelated; these values dominate the averages, overwhelm theothers, and make the results meaningless.) These correlations are, however, notablylower than those obtained by the best WordNet-based measures (not shown in thetable), which fall in the range 0.78 to 0.84 (Budanitsky and Hirst 2006).
5.2 Correcting real-word spelling errors
The set of Rubenstein and Goodenough word pairs is much too small to safely assumethat measures that work well on them do so for the entire English vocabulary. Conse-quently, semantic measures have traditionally been evaluated through more extensiveapplications such as the work by Hirst and Budanitsky (2005) on correcting real-word
14

Mohammad and Hirst Measuring Semantic Distance using Distributional Profiles of Concepts
spelling errors (or malapropisms). If a word in a text is not semantically close to anyother word in its context, then it is considered a suspect. If the suspect has a spelling-variant that is semantically close to a word in its context, then the suspect is declared aprobable real-word spelling error and an alarm is raised; the semantically close spelling-variant is considered its correction. Hirst and Budanitsky tested the method on 500articles from the 1987–89Wall Street Journal corpus for their experiments, replacing onenoun in every 200th word by a spelling-variant and looking at whether the methodcould restore the original word. This resulted in text with 1408 real-word spellingerrors out of a total of 107,233 noun tokens. we adopt this method and this test data,but whereas Hirst and Budanitsky used WordNet-based semantic measures, we usedistributional concept- and word-distance measures.
In order to determine whether two words are “semantically close” or not as perany measure of distance, a threshold must be set. If the distance between two wordsis less than the threshold, then they will be considered semantically close. Hirst andBudanitsky (2005) pointed out that there is a notably wide band in the human ratingsof the Rubenstein and Goodenough word pairs such that no word-pair was assigneda distance value between 1.83 and 2.36 (on a scale of 0–4). They argue that somewherewithin this band is a suitable threshold between semantically close and semanticallydistant, and therefore set thresholds for the WordNet-based measures such that therewas maximum overlap in what the automatic measures and human judgments consid-ered semantically close and distant. Following this idea, we use an automatic methodto determine thresholds for the various distributional concept- and word-distance mea-sures. Given a list of Rubenstein and Goodenough word pairs ordered according toa distance measure, we repeatedly consider the mean of all adjacent distance values ascandidate thresholds. Then we determine the number of word-pairs correctly classifiedas semantically close or semantically distant for each candidate threshold, consideringwhich side of the band they lie as per human judgments. The candidate threshold withhighest accuracy is chosen as the threshold.
We follow the Hirst and St. Onge (1998) metrics to evaluate real-word spellingcorrection. Suspect ratio and alarm ratio evaluate the processes of identifying suspectsand raising alarms, respectively.
suspect ratio =(number of true-suspects)/(number of malapropisms )
(number of false-suspects)/(number of non-malapropisms) (4)
alarm ratio =(number of true-alarms)(number of true-suspects)
(number of false-alarms)/(number of false-suspects) (5)
Detection ratio is the product of the two, andmeasures overall performance in detectingthe errors.
detection ratio =(number of true-alarms)/(number of malapropisms)
(number of false-alarms)/(number of non-malapropisms) (6)
15
Computational Linguistics Volume 1, Number 1
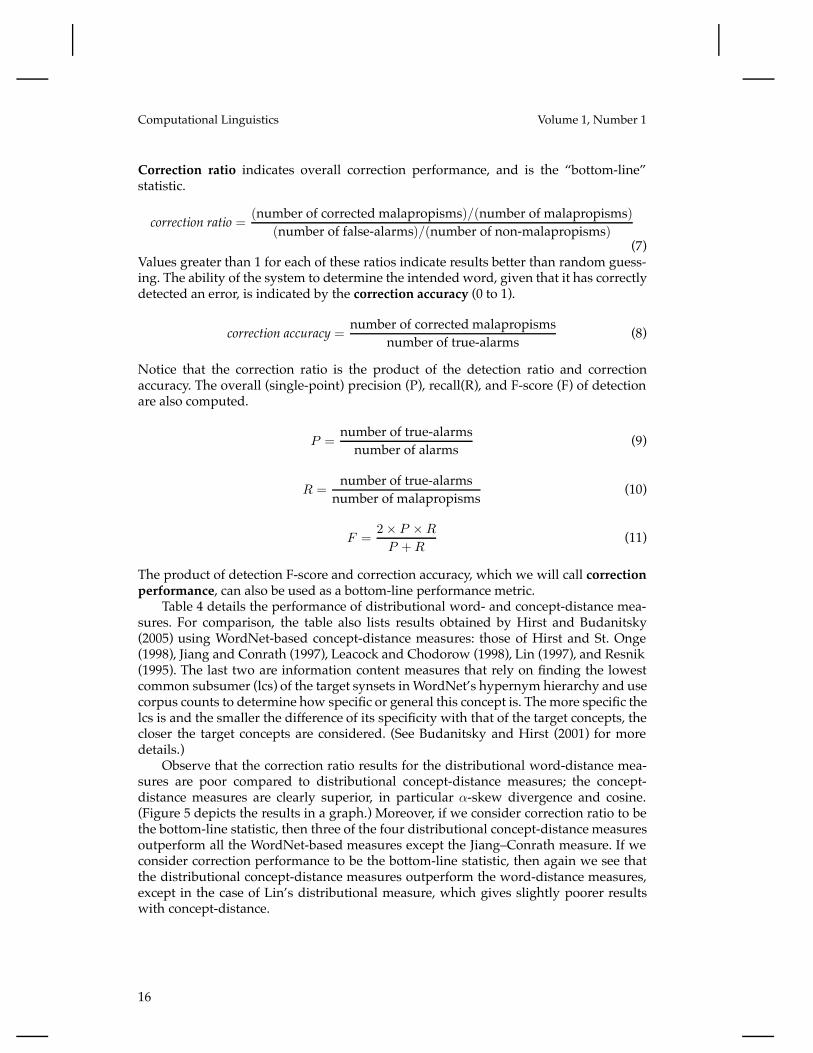
Correction ratio indicates overall correction performance, and is the “bottom-line”statistic.
correction ratio =(number of corrected malapropisms)/(number of malapropisms)
(number of false-alarms)/(number of non-malapropisms)(7)
Values greater than 1 for each of these ratios indicate results better than random guess-ing. The ability of the system to determine the intended word, given that it has correctlydetected an error, is indicated by the correction accuracy (0 to 1).
correction accuracy =number of corrected malapropisms
number of true-alarms (8)
Notice that the correction ratio is the product of the detection ratio and correctionaccuracy. The overall (single-point) precision (P), recall(R), and F-score (F) of detectionare also computed.
P =number of true-alarmsnumber of alarms (9)
R =number of true-alarmsnumber of malapropisms (10)
F =2 " P " R
P + R(11)
The product of detection F-score and correction accuracy, which we will call correctionperformance, can also be used as a bottom-line performance metric.
Table 4 details the performance of distributional word- and concept-distance mea-sures. For comparison, the table also lists results obtained by Hirst and Budanitsky(2005) using WordNet-based concept-distance measures: those of Hirst and St. Onge(1998), Jiang and Conrath (1997), Leacock and Chodorow (1998), Lin (1997), and Resnik(1995). The last two are information content measures that rely on finding the lowestcommon subsumer (lcs) of the target synsets inWordNet’s hypernym hierarchy and usecorpus counts to determine how specific or general this concept is. Themore specific thelcs is and the smaller the difference of its specificity with that of the target concepts, thecloser the target concepts are considered. (See Budanitsky and Hirst (2001) for moredetails.)
Observe that the correction ratio results for the distributional word-distance mea-sures are poor compared to distributional concept-distance measures; the concept-distance measures are clearly superior, in particular !-skew divergence and cosine.(Figure 5 depicts the results in a graph.) Moreover, if we consider correction ratio to bethe bottom-line statistic, then three of the four distributional concept-distance measuresoutperform all the WordNet-based measures except the Jiang–Conrath measure. If weconsider correction performance to be the bottom-line statistic, then again we see thatthe distributional concept-distance measures outperform the word-distance measures,except in the case of Lin’s distributional measure, which gives slightly poorer resultswith concept-distance.
16

Mohammad and Hirst Measuring Semantic Distance using Distributional Profiles of Concepts
Table4
Real-wordspellingerrorcorrection.Thebestresultsasperthetwobottom-linestatistics,correctionratioandcorrectionperformance,areshownin
boldface.
suspect
alarm
detection
correction
correction
detection
correction
Measure
ratio
ratio
ratio
accuracy
ratio
PR
Fperformance
Distributional word
!-skewdivergence
3.36
1.78
5.98
0.84
5.03
7.37
45.53
12.69
10.66
cosine
2.91
1.64
4.77
0.85
4.06
5.97
37.15
10.28
8.74
Jensen–Shannondivergence
3.29
1.77
5.82
0.83
4.88
7.19
44.32
12.37
10.27
Lin’sdistributionalmeasure
3.63
2.15
7.78
0.84
6.52
9.38
58.38
16.16
13.57
Distributional concept
!-skewdivergence
4.11
2.54
10.43
0.91
9.49
12.19
25.28
16.44
14.96
cosine
4.00
2.51
10.03
0.90
9.05
11.77
26.99
16.38
14.74
Jensen–Shannondivergence
3.58
2.46
8.79
0.90
7.87
10.47
34.66
16.08
14.47
Lin’sdistributionalmeasure
3.02
2.60
7.84
0.88
6.87
9.45
36.86
15.04
13.24
WNetconcept
Hirst–St-Onge
4.24
1.95
8.27
0.93
7.70
9.67
26.33
14.15
13.16
Jiang–Conrath
4.73
2.97
14.02
0.92
12.91
14.33
46.22
21.88
20.13
Leacock–Chodrow
3.23
2.72
8.80
0.83
7.30
11.56
60.33
19.40
16.10
Lin’sW
ordNet-basedmeasure
3.57
2.71
9.70
0.87
8.48
9.56
51.56
16.13
14.03
Resnik
2.58
2.75
7.10
0.78
5.55
9.00
55.00
15.47
12.07
17

Computational Linguistics Volume 1, Number 1
Figure 5Correction ratio obtained on the real-word spelling correction task using traditional word–wordco-occurrence–based distributional word-distance measures and the word–conceptco-occurrence–based distributional concept-distance measures.
Also, in contrast to correction ratio values, using the Leacock–Chodorow measureresults in relatively higher correction performance values than the best distributionalconcept-distance measures. While it is clear that the Leacock–Chodorow measure isrelatively less accurate in choosing the right spelling-variant for an alarm (correctionaccuracy), detection ratio and detection F -score present contrary pictures of relativeperformance in detection.
As the correction ratio is determined by the product of a number of ratios, eachevaluating the various stages of malapropism correction (identifying suspects, raisingalarms, and applying the correction), we believe it is a better indicator of overallperformance than correction performance, which is a not-so-elegant product of an F -score and accuracy. However, no matter which of the two is chosen as the bottom-lineperformance statistic, the results show that the distributional concept-distancemeasuresare clearly superior to word-distance measures. Further, of all the WordNet-basedmeasures, only that proposed by Jiang and Conrath outperforms the best distributionalconcept-distance measures consistently with respect to both bottom-line statistics.
6. Cross-lingual Semantic Distance
The application of semantic distance algorithms in most languages is hindered by thelack of high-quality linguistic resources.WordNet-basedmeasures of semantic distance,such as those of Jiang and Conrath (1997) and Resnik (1995), require a WordNet.Distributional measures of word-distance, as shown in Section 4 earlier, are markedlyless accurate because they conflate the many senses of a word. Also as shown there,distributional measures of concept-distance avoid sense conflation and achieve resultsbetter than the traditional word-distance measures. However, the high-quality thesauriand WordNet-like resources that the concept-distance methods require do not exist formost of the 3000–6000 languages in existence today and they are costly to create.
Here we show how distributional measures of concept-distance can be ported to across-lingual framework to overcome this knowledge bottleneck. We describe cross-lingual distributional measures of concept-distance, or simply cross-lingual mea-sures, that determine the distance between a word pair in resource-poor language L1
using a knowledge source in a resource-rich language L2. We use a bilingual lexicon toconnect the words in L1 with the words in L2. We will compare this approach with the
18

Mohammad and Hirst Measuring Semantic Distance using Distributional Profiles of Concepts
star
Stern Bank
bank bench
}
}
}CELEBRITY BODY INSTITUTIONCELESTIAL
BANKRIVER
FURNITURE JUDICIARYFINANCIAL
wen
wde
cen
Figure 6The cross-lingual candidate senses of German words Stern and Bank. In red are concepts that arenot really senses of the German words, but simply artifacts of the translation step.
best monolingual approaches, which usually require high-quality knowledge sources inthe same language (L1); the smaller the loss in performance, the more capable the cross-lingual algorithm is of overcoming ambiguities in word translation. An evaluation,therefore, requires an L1 that in actuality has adequate knowledge sources. Thereforewe chose German to stand in as the resource-poor language L1 and English as theresource-rich L2. The evaluation tasks will involve estimating the semantic distancebetween German words. Both monolingual and cross-lingual approaches will use thesame German corpus, but while the monolingual approach will use a knowledge sourcein the same language, the German GermaNet, the cross-lingual approach (which we de-scribe below)will use a knowledge source from another language, the EnglishMacquarieThesaurus. The remainder of this section describes our approach in terms of German andEnglish, but the algorithm itself is language independent.
6.1 Cross-lingual senses, cross-lingual distributional profiles, and cross-lingual dis-tributional distance
Given a German word wde in context, we use a German–English bilingual lexicon todetermine its different possible English translations. Each English translation wen mayhave one or more possible coarse senses, as listed in an English thesaurus. These Englishthesaurus concepts (cen) will be referred to as the cross-lingual candidate senses ofthe German word wde. Figure 6 depicts examples. They are called “candidate" becausesome of the senses of wen might not really be senses of wde. For example, CELESTIALBODY and CELEBRITY are both senses of the English word star, but the German wordStern can mean only CELESTIAL BODY and not CELEBRITY. Similarly, the German Bankcan mean FINANCIAL INSTITUTION or FURNITURE, but not RIVER BANK or JUDICIARY.An automated system has no straightforward method of teasing out the actual cross-lingual senses of wde from those that are an artifact of the translation step. So wetreat them all as its senses. Now, we proceed to determine semantic distance just asin the monolingual case, except that the words are German and their senses are Englishthesaurus categories. Table 5 presents a mini vocabulary of German words needed tounderstand the discussion below.
As in the monolingual estimation of distributional concept-distance, the distancebetween two concepts is calculated by first determining their DPs (co-occurrence vec-tors). Recall the example monolingual DPs of the two senses of star:
CELESTIAL BODY (celestial body, sun, . . . ): space 0.36, light 0.27, constellation 0.11, hydrogen0.07, . . .
CELEBRITY (celebrity, hero, . . . ): famous 0.24, movie 0.14, rich 0.14, fan 0.10, . . .
19

Computational Linguistics Volume 1, Number 1
Table 5Vocabulary of German words needed to understand this discussion.German word Meaning(s) German word Meaning(s)Bank 1. financial institution Licht light
2. bench (furniture) Morgensonne morning sunberühmt famous Raum spaceBombe bomb reich richErwärmung heat Sonne sunFilm movie (motion picture) Star star (celebrity)Himmelskörper heavenly body Stern star (celestial body)Konstellation constellation Verschmelzung fusion
In the cross-lingual approach, a concept is now glossed by near-synonymous words inan English thesaurus, whereas its profile is made up of the strengths of association withco-occurring German words. We will call them cross-lingual distributional profiles ofconcepts or just cross-lingual DPCs. Here are constructed examples for the two cross-lingual candidate senses of the German word Stern:
CELESTIAL BODY (celestial body, sun, . . . ): Raum 0.36, Licht 0.27, Konstellation 0.11, . . .CELEBRITY (celebrity, hero, . . . ): berühmt 0.24, Film 0.14, reich 0.14, . . .
The values are the strength of association (usually pointwise mutual information orconditional probability) of the target concept with co-occurring words. In order to cal-culate the strength of association, we must first determine individual word and conceptcounts, as well as their co-occurrence counts. The next section describes how these canbe estimated without the use of any word-aligned parallel corpora and without anysense-annotated data. The closer the cross-lingual DPs of two concepts, the smalleris their semantic distance. Just as in the case of monolingual distributional concept-distance measures (described in Section 4.2 earlier), distributional measures can be usedto estimate the distance between the cross-lingual DPs of two target concepts. For ex-ample, recall how cosine is used in a monolingual framework to estimate distributionaldistance between two concepts:
Coscp(c1, c2) =
!w#C(c1)$C(c2)
(P (w|c1) " P (w|c2))"!w#C(c1)
P (w|c1)2 ""!
w#C(c2)P (w|c2)2
(12)
C(x) is the set of English words that co-occur with English concept x within a pre-determined window. The conditional probabilities in the formula are taken from themonolingual distributional profiles of concepts. We can adapt the formula to estimatecross-lingual distributional distance between two concepts as shown below:
Coscp(cen1 , cen2 ) =
!wde#C(cen1 )$C(cen2 )
#P (wde|cen1 ) " P (wde|cen2 )
$"!
wde#C(cen1 ) P (wde|cen1 )2 ""!
wde#C(cen2 ) P (wde|cen2 )2(13)
20

Mohammad and Hirst Measuring Semantic Distance using Distributional Profiles of Concepts
C(x) is now the set of German words that co-occur with English concept x within apre-determined window. The conditional probabilities in the formula are taken fromthe cross-lingual DPCs.
If the distance between two German words is required, then the distance betweenall relevant English cross-lingual candidate sense pairs is determined and the minimumis chosen. For example, if Stern has the two cross-lingual candidate senses mentionedabove and Verschmelzung has one (FUSION), then the distance between them is deter-mined by first applying cosine (or any distributional measure) to the cross-lingual DPsof CELESTIAL BODY and FUSION:
CELESTIAL BODY (celestial body, sun, . . . ): Raum 0.36, Licht 0.27, Konstellation 0.11, . . .FUSION (thermonuclear reaction, atomic reaction, . . . ): Erwärmung 0.16, Bombe 0.09, Licht0.09, Raum 0.04, . . .
Then applying cosine to the cross-lingual DPs of CELEBRITY and FUSION:
CELEBRITY (celebrity, hero, . . . ): berühmt 0.24, Film 0.14, reich 0.14, . . .FUSION (thermonuclear reaction, atomic reaction, . . . ): Erwärmung 0.16, Bombe 0.09, Licht0.09, Raum 0.04, . . .
And finally choosing the one with minimum semantic distance, that is, maximumsimilarity/relatedness:
distance(Stern,Verschmelzung) = max(Coscp(CELEBRITY, FUSION),Coscp(CELESTIAL BODY, FUSION))(14)
Maximum is chosen because cosine is a similarity/relatedness measure. In case ofdistance measures, such as ! Skew Divergence, the minimum will be chosen.
6.2 Estimating cross-lingual DPCs by creating cross-lingual word–category co-occurrence matrix
Determining cross-lingual distributional profiles of concepts requires information aboutwhich words in one language L1 co-occur with which concepts as defined in anotherlanguage L2. This means that a direct approach requires the text in L1, from whichcounts are made, to have a word-aligned parallel corpus in L2. Further, the L2 text mustbe sense annotated. Such data exists rarely, if at all, and it is expensive to create. Herewe present a way to estimate cross-lingual distributional profiles of concepts from rawtext (in one language, L1) and a published thesaurus (in another language, L2) using anL1–L2 bilingual lexicon and a bootstrapping algorithm.
We create a cross-lingual word–category co-occurrence matrix with German wordtypes wde as one dimension and English thesaurus concepts cen as the other.
cen1 cen2 . . . cenj . . .wde1 m11 m12 . . . m1j . . .wde2 m21 m22 . . . m2j . . ....
...... . . . ...
...wdei mi1 mi2 . . . mij . . ....
...... . . .
... . . .
21

Computational Linguistics Volume 1, Number 1
celestial body star
Star SternSonne Morgensonne
sun ... }
... }
}
Himmelskörper
wen
wde
CELESTIAL BODY cen
Figure 7Words having CELESTIAL BODY as one of their cross-lingual candidate senses.
The matrix is populated with co-occurrence counts from a large German corpus.A particular cellmij , corresponding to word wdei and concept cenj , is populated with
the number of times the German word wdei co-occurs (in a window of ±5 words) withany German word having cenj as one of its cross-lingual candidate senses. For example,the Raum–CELESTIAL BODY cell will have the sum of the number of times Raum co-occurs withHimmelskörper, Sonne, Morgensonne, Star, Stern, and so on (see Figure 7). Thismatrix, created after a first pass of the corpus, is called the cross-lingual baseWCCM. Acontingency table for any particular German word wde and English category cen can beeasily generated from the WCCM by collapsing cells for all other words and categoriesinto one and summing up their frequencies.
cen ¬cen
wde nwdecen nwde¬¬wde n¬cen n¬¬
The application of a suitable statistic, such as PMI or conditional probability, will thenyield the strength of association between the German word and the English category.
As the cross-lingual base WCCM is created from unannotated text, it will be noisy(for the same word-sense-ambiguity reasons as to why the monolingual base WCCMis noisy—explained in Section 4.3.1 earlier). Yet, again, the cross-lingual base WCCMdoes capture strong associations between a category (concept) and co-occurring words(just like the monolingual baseWCCM). For example, even though we increment countsfor both Raum–CELESTIAL BODY and Raum–CELEBRITY for a particular instance whereRaum co-occurs with Star, Raum will co-occur with a number of words such as Himmel-skörper, Sonne, andMorgensonne that each have the sense of CELESTIAL BODY in common(see Figures 7 and 8), whereas all their other senses are likely different and distributedacross the set of concepts. Therefore, the co-occurrence count of Raum and CELESTIALBODY, and thereby their strength of association, will be relatively higher than those ofRaum and CELEBRITY (Figure 9). Therefore, we bootstrap the matrix just as describedbefore in the monolingual case (Section 4.3.2).
7. Evaluation: cross-lingual, word-distance tasks
We evaluated German–English cross-lingual distributional measures of concept-distance on the tasks of (1) measuring semantic distance between German words andranking German word pairs according to semantic distance, and (2) solving German‘nearest-synonym’ questions from Reader’s Digest. Each of these is described in thesubsections below.We also used Chinese–English cross-lingual distributional profiles ofconcepts in SemEval-2007’s Chinese–English word-translation task (not described here;see Mohammad et al. (2007)).
22

Mohammad and Hirst Measuring Semantic Distance using Distributional Profiles of Concepts
Raum
........
CELESTIAL BODY
xa fragment of text
other sense(s) of xx # {Stern, Sonne, Himmelskörper, Morgensonne, Konstellation}
one sense of x
Figure 8The word Raum will also co-occur with a number of other words x that each have one sense ofCELESTIAL BODY in common.
Raum Stern
CELESTIAL BODY
CELEBRITY
SoA
SoAa fragment of text
sense of Stern
sense of Stern
Figure 9The base WCCM captures strong word–category co-occurrence strength of association (SoA).
The German-English distributional profiles were created using the following re-sources: the German newspaper corpus taz6 (Sep 1986 to May 1999; 240 million words),the English Macquarie Thesaurus (Bernard 1986) (about 98,000 word types), and theGerman–English bilingual lexicon BEOLINGUS7 (about 265,000 entries). Multi-wordexpressions in the thesaurus and the bilingual lexicon were ignored. We used a contextof ±5 words on either side of the target word for creating the base and bootstrappedWCCMs. No syntactic pre-processing was done, nor were the words stemmed, lemma-tized, or part-of-speech tagged.
In order to compare results with state-of-the-art monolingual approaches we con-ducted experiments using GermaNet measures as well. The specific distributional mea-sures andGermaNet-basedmeasures used are listed in Table 6. The GermaNetmeasuresused are of two kinds: (1) information content measures, and (2) Lesk-like measuresthat rely on n-gram overlaps in the glosses of the target senses, proposed by Gurevych(2005). As GermaNet does not have glosses for synsets, Gurevych (2005) proposed away of creating a bag-of-words-type pseudo-gloss for a synset by including the wordsin the synset and in synsets close to it in the network. The information content measuresrely on finding the lowest common subsumer (lcs) of the target synsets in a hypernymhierarchy and using corpus counts to determine how specific or general this concept is.The more specific the lcs is and the smaller the difference of its specificity with that ofthe target concepts, the closer the target concepts are.
6 http://www.taz.de7 http://dict.tu-chemnitz.de
23

Computational Linguistics Volume 1, Number 1
Table 6Distance measures used in the experiments.(Cross-lingual) DistributionalMeasures (Monolingual) GermaNet Measures
Information Content–based Lesk-like!-skew divergence (Lee 2001) Jiang and Conrath (1997) hypernym pseudo-glosscosine (Schütze and Pedersen 1997) Lin (1998b) (Gurevych 2005)Jensen-Shannon divergence Resnik (1995) radial pseudo-gloss(Dagan, Lee, and Pereira 1994) (Gurevych 2005)
Lin (1998a)
7.1 Ranking word pairs7.1.1 Data. Gurevych (2005) and Zesch et al. (2007) asked native German speakers tomark two different sets of German word pairs with distance values. Set 1 (Gur65) isthe German translation of the English (Rubenstein and Goodenough 1965b) dataset. Ithas 65 noun–noun word pairs. Set 2 (Gur350) is a larger dataset containing 350 wordpairs made up of nouns, verbs, and adjectives. The semantically close word pairs inGur65 are mostly synonyms or hypernyms (hyponyms) of each other, whereas those inGur350 have both classical and non-classical relations (Morris and Hirst 2004)with eachother. Details of these semantic distance benchmarks8 were listed earlier in Table 1.
7.1.2 Results and Discussion.Word-pair distances determined using different distancemeasures are compared in twoways with the two human-created benchmarks. The rankordering of the pairs from closest to most distant is evaluated with Spearman’s rankorder correlation $; the distance judgments themselves are evaluated with Pearson’scorrelation coefficient r. The higher the correlation, the more accurate the measure is.Spearman’s correlation ignores actual distance values after a list is ranked—only theranks of the two sets of word pairs are compared to determine correlation. On the otherhand, Pearson’s coefficient takes into account actual distance values. So even if two listsare ranked the same, but one has distances between consecutively-ranked word-pairsmore in line with human-annotations of distance than the other, then Pearson’s coef-ficient will capture this difference. However, this makes Pearson’s coefficient sensitiveto outlier data points, and so one must interpret it with caution. Therefore, Spearman’srank correlation is more common in the semantic distance literature. However, many ofthe experiments on German data report Pearson’s correlation. We report both correla-tions in Table 7.
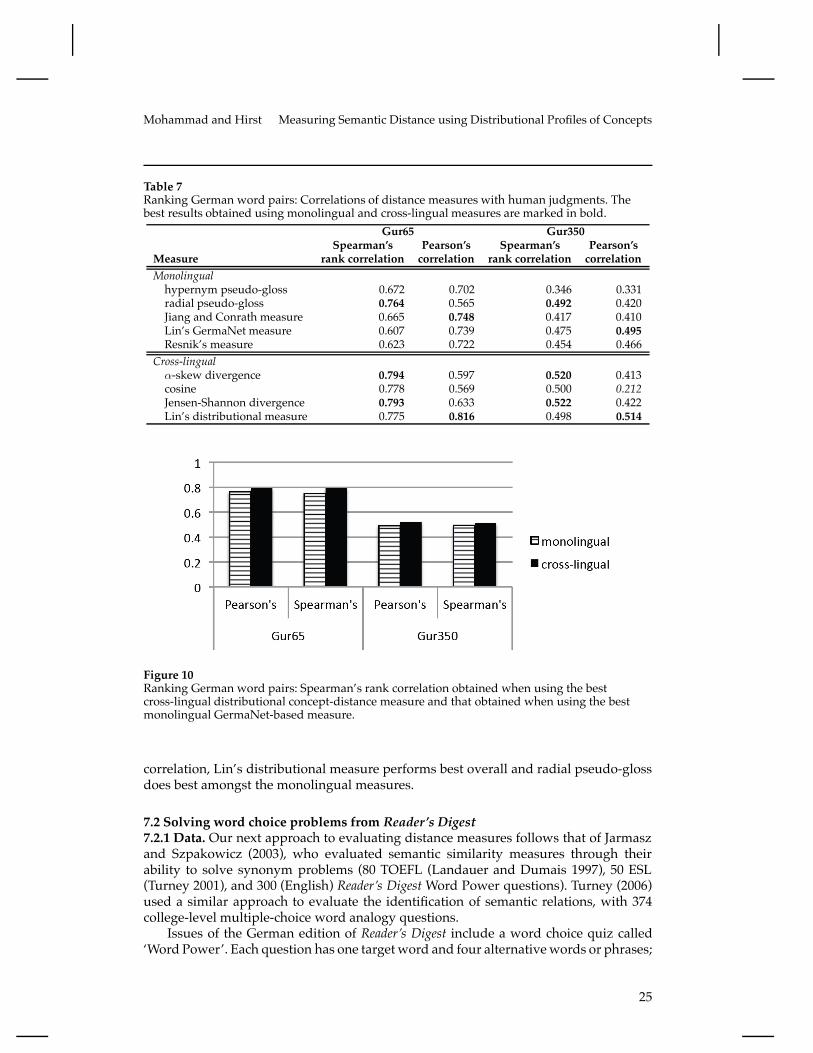
Observe that on both datasets and by both measures of correlation, the cross-lingual measures of concept-distance perform not just as well as the best monolingualmeasures, but in fact slightly better. (Figure 10 depicts the results in a graph.) In general,the correlations are lower for Gur350 as it contains cross-PoS word pairs and non-classical relations, making it harder to judge even by humans (as shown by the inter-annotator correlations for the datasets in Table 1). As per Spearman’s rank correlation,!-skew divergence and Jensen-Shannon divergence perform best on both datasets. Thecorrelations of cosine and Lin’s distributional measure are not far behind. Amongst themonolingual GermaNet measures, radial pseudo-gloss performs best. As per Pearson’s
8 The datasets are publicly available athttp://www.ukp.tu-darmstadt.de/data/semRelDatasets.
24
Mohammad and Hirst Measuring Semantic Distance using Distributional Profiles of Concepts
Table 7Ranking German word pairs: Correlations of distance measures with human judgments. Thebest results obtained using monolingual and cross-lingual measures are marked in bold.
Gur65 Gur350Spearman’s Pearson’s Spearman’s Pearson’s
Measure rank correlation correlation rank correlation correlationMonolingualhypernym pseudo-gloss 0.672 0.702 0.346 0.331radial pseudo-gloss 0.764 0.565 0.492 0.420Jiang and Conrath measure 0.665 0.748 0.417 0.410Lin’s GermaNet measure 0.607 0.739 0.475 0.495Resnik’s measure 0.623 0.722 0.454 0.466
Cross-lingual!-skew divergence 0.794 0.597 0.520 0.413cosine 0.778 0.569 0.500 0.212Jensen-Shannon divergence 0.793 0.633 0.522 0.422Lin’s distributional measure 0.775 0.816 0.498 0.514
Figure 10Ranking German word pairs: Spearman’s rank correlation obtained when using the bestcross-lingual distributional concept-distance measure and that obtained when using the bestmonolingual GermaNet-based measure.
correlation, Lin’s distributional measure performs best overall and radial pseudo-glossdoes best amongst the monolingual measures.
7.2 Solving word choice problems from Reader’s Digest7.2.1 Data. Our next approach to evaluating distance measures follows that of Jarmaszand Szpakowicz (2003), who evaluated semantic similarity measures through theirability to solve synonym problems (80 TOEFL (Landauer and Dumais 1997), 50 ESL(Turney 2001), and 300 (English) Reader’s DigestWord Power questions). Turney (2006)used a similar approach to evaluate the identification of semantic relations, with 374college-level multiple-choice word analogy questions.
Issues of the German edition of Reader’s Digest include a word choice quiz called‘Word Power’. Each question has one targetword and four alternativewords or phrases;
25

Computational Linguistics Volume 1, Number 1
the objective is to pick the alternative that is most closely related to the target. Forexample:9
Duplikat (duplicate)a. Einzelstück (single copy) b. Doppelkinn (double chin)c. Nachbildung (replica) d. Zweitschrift (copy)
Torsten Zesch compiled the Reader’s Digest Word Power (RDWP) benchmark for Ger-man, which consists of 1072 of these word-choice problems collected from the January2001 to December 2005 issues of the German-language edition (Wallace and Wallace2005). Forty-four problems that had more than one correct answer and twenty problemsthat used a phrase instead of a single term as the target were discarded. The remaining1008 problems form our evaluation dataset, which is significantly larger than any of theprevious datasets employed in a similar evaluation.
We evaluate the various cross-lingual and monolingual distance measures by theirability to choose the correct answer. The distance between the target and each of thealternatives is computed by a measure, and the alternative that is closest is chosen. Iftwo or more alternatives are equally close to the target, then the alternatives are said tobe tied. If one of the tied alternatives is the correct answer, then the problem is countedas correctly solved, but the corresponding score is reduced. The system assigns a scoreof 0.5, 0.33, and 0.25 for 2, 3, and 4 tied alternatives, respectively (in effect approximatingthe score obtained by randomly guessing one of the tied alternatives). If more thanone alternative has a sense in common with the target, then the thesaurus-based cross-lingual measures will mark them each as the closest sense. However, if one or more ofthese tied alternatives is in the same semicolon group of the thesaurus as the target, thenonly these are chosen as the closest senses.10
Even though we discard questions from the German RDWP dataset that containeda phrasal target, we did not discard questions that had phrasal alternatives simplybecause of the large number of such questions. Many of these phrases cannot be foundin the knowledge sources (GermaNet or Macquarie Thesaurus via translation list). Inthese cases, we remove stopwords (prepositions, articles, etc.) and split the phraseinto component words. As German words in a phrase can be highly inflected, allcomponents are lemmatized. For example, the target imaginär (imaginary) has nur inder Vorstellung vorhanden (exists only in the imagination) as one of its alternatives. Thephrase is split into its component words nur, Vorstellung, and vorhanden. The systemcomputes semantic distance between the target and each phrasal component and selectsthe minimum value as the distance between target and potential answer.
7.2.2 Results and Discussion. Table 8 presents the results obtained on the GermanRDWP benchmark for both monolingual and cross-lingual measures. Only those ques-tions for which themeasures have some distance information are attempted; the column‘# attempted’ shows the number of questions attempted by each measure, which is themaximum score that the measure can hope to get. Observe that the thesaurus-basedcross-lingual measures have a much larger coverage than the GermaNet-based mono-lingual measures. The cross-lingual measures have a much larger number of correct
9 English translations are in parentheses.10 Words in a thesaurus category are further partitioned into different paragraphs and each paragraph into
semicolon groups. Words within a semicolon group are more closely related than those in semicolongroups of the same paragraph or category.
26

Mohammad and Hirst Measuring Semantic Distance using Distributional Profiles of Concepts
Table 8Solving word choice questions: Performance of monolingual and cross-lingual distancemeasures. The best results for each class of measures are marked in bold.
Reader’s Digest Word Power benchmarkMeasure # attempted # correct # ties Score P R FMonolingualhypernym pseudo-gloss 222 174 11 171.5 .77 .17 .28radial pseudo-gloss 266 188 15 184.7 .69 .18 .29Jiang and Conrath 357 157 1 156.0 .44 .16 .23Lin’s GermaNet measure 298 153 1 152.5 .51 .15 .23Resnik’s measure 299 154 33 148.3 .50 .15 .23
Cross-lingual!-skew divergence 438 185 81 151.6 .35 .15 .21cosine 438 276 90 223.1 .51 .22 .31Jensen-Shannon divergence 438 276 90 229.6 .52 .23 .32Lin’s distributional measure 438 274 90 228.7 .52 .23 .32
answers too (column ‘# correct’), but this number is bloated due to the large numberof ties. We see more ties when using the cross-lingual measures because they rely ontheMacquarie Thesaurus, a very coarse-grained sense inventory (around 800 categories),whereas the monolingual measures operate on the fine-grained GermaNet. ‘Score’ isthe score each measure gets after it is penalized for the ties. The cross-lingual measurescosine, Jensen-Shannon divergence, and Lin’s distributional measure obtain the highestscores. But ‘Score’ by itself does not present the complete picture either as, given thescoring scheme, a measure that attempts more questions may get a higher score justfrom random guessing. We therefore present precision (P), recall (R), and F measure(F):
P = Score# attempted (15)
R = Score1008 (16)
F = 2"P"RP+R (17)
Figure 11 depicts the results in a graph. Observe that the cross-lingual measures havea higher coverage (recall) than the monolingual measures but lower precision. The Fmeasures show that the best cross-lingual measures do slightly better than the bestmonolingual ones, despite the large number of ties. The measures of cosine, Jensen-Shannon divergence, and Lin’s distributional measure remain the best cross-lingualmeasures, whereas hypernym pseudo-gloss and radial pseudo-gloss are the best mono-lingual ones.
8. Related work
A detailed survey of WordNet-based semantic distance measures is given by Budanit-sky and Hirst (2006). Patwardhan et al. (2003) also compare the performance of various
27

Computational Linguistics Volume 1, Number 1
Figure 11Solving word choice questions: Performance of the best monolingual and cross-lingual distancemeasures.
WordNet-based measures. See Curran (2004), Weeds et al. (2004), and Mohammad andHirst (2007) for comprehensive surveys of distributional measures of word-distance.
Yarowsky (1992) proposed a model for unsupervised word sense disambiguationusing Roget’s Thesaurus. A mutual information–like measure was used to identify wordsthat best represent each category in the thesaurus, which he calls the salient words. Thepresence of a salient word in the context of a target word is evidence that the wordis used in a sense corresponding to the salient word. The evidence is incorporated ina Bayesian model. The word-category co-occurrence matrix (WCCM) we created canbe seen as a means of determining the degree of salience of any word co-occurringwith a concept. We further improved the accuracy of the WCCM using a bootstrappingtechnique.
Jarmasz and Szpakowicz (2003) use the taxonomic structure of the Roget’s Thesaurusto determine semantic similarity. Two words are considered maximally similar if theyoccur in the same semicolon group in the thesaurus. Then on, decreasing in similarityare word pairs in the same paragraph, words pairs in different paragraphs belonging tothe same part of speech andwithin the same category, word pairs in the category, and soon until word pairs which have nothing in common except that they are in the thesaurus(maximally distant). However, a large number of words that are in different thesauruscategories may be semantically related. Thus, this approach is better suited for estimat-ing semantic similarity than semantic relatedness. Our approach is specifically intendedto determine the semantic relatedness between word pairs across thesaurus categories.
Pantel and Lin (2002) proposed a method to discover word senses from text usingword co-occurrence information. The approach produces clusters of words that aresemantically similar and there is a numeric score representing the distance of eachword in a cluster with the centroid of that cluster. Note that these clusters do nothave information of which words co-occur with the clusters (concepts) and so these arenot distributional profiles of concepts (DPCs). Rather, the output of the Pantel and Linsystem is more like a Roget’s or Macquaries Thesaurus, except that it is automaticallygenerated. One can create DPCs using our method and the Pantel and Lin thesaurus(instead of Macquarie) and it will be interesting to determine its usefulness. However,we suspect that there will be more complementarity between information encoded in ahuman created lexical resource and the co-occurrence information in text.
28

Mohammad and Hirst Measuring Semantic Distance using Distributional Profiles of Concepts
Pantel (2005) also provides a way to create co-occurrence vectors for WordNetsenses. The lexical co-occurrence vectors of words in a leaf node are propagated upthe WordNet hierarchy. A parent node inherits those co-occurrences that are sharedby its children. Lastly, co-occurrences not pertaining to the leaf nodes are removedfrom its vector. Even though the methodology attempts to associate a WordNet node orsense with only those co-occurrences that pertain to it, no attempt is made at correctingthe frequency counts. After all, word1–word2 co-occurrence frequency (or association) islikely not the same as SENSE1–word2 co-occurrence frequency (or association), simplybecause word1may have senses other than SENSE1, as well. Further, in Pantel’s system,the co-occurrence frequency associated with a parent node is the weighted sum of co-occurrence frequencies of its children. The frequencies of the child nodes are used asweights. Sense ambiguity issues apart, this is still problematic because a parent concept(say, BIRD) may co-occur much more frequently (or infrequently) with a word than itschildren do. In contrast, the bootstrapped WCCM not only identifies which words co-occur with which concepts, but also has more accurate estimates of the co-occurrencefrequencies.
Patwardhan and Pedersen (2006) create aggregate co-occurrence vectors for aWordNet sense by adding the co-occurrence vectors of the words in its WordNet gloss.The distance between two senses is then determined by the cosine of the angle betweentheir aggregate vectors. However, such aggregate co-occurrence vectors are expected tobe noisy because they are created from data that is not sense-annotated. The bootstrap-ping procedure introduced in Section 4.3.2 minimizes such errors and, as we showed inMohammad and Hirst (2006a),markedly improves accuracies of natural language tasksthat use these co-occurrence vectors.
Véronis (2004) presents a graph theory–based approach to identify the varioussenses of a word in a text corpus without the use of a dictionary. For each target word,a graph of inter-connected nodes is created. Every word that co-occurs with the targetword is a node. Two nodes are connected with an edge if they are found to co-occurwith each other. Highly interconnected components of the graph represent the differentsenses of the target word. The node (word) with the most connections in a componentis representative of that sense and its associations with words that occur in a testinstance are used to quantify evidence that the target word is used in the correspondingsense. However, these strengths of association are at best only rough estimates of theassociations between the sense and co-occurring words, since a sense in his system isrepresented by a single (possibly ambiguous) word.
Erk and Padó (2008) proposed a way of determining the distributional profile ofa word in context. They use dependency relations and selectional preferences of thetarget words and combine multiple co-occurrence vectors in a manners so as to givemore weight to co-occurring words pertaining to the intended senses of the targetwords. This approach effectively assumes that each occurrence of a word in a differentcontext has a unique meaning. In contrast, our approach explores the use of only about athousand very coarse concepts to represent the meaning of all words in the vocabulary.By choosing to work with much coarser concepts, the approach foregoes the abilityto make fine-grained distinctions in meaning, but is able to better estimate semanticdistance between the coarser concepts as there is much more information pertaining tothem.
29

Computational Linguistics Volume 1, Number 1
9. Conclusion
We proposed an approach that allows distributional measures to estimate semanticdistance between concepts using a published thesaurus and raw text. Additionally, weshowed how this approach can be ported into a cross-lingual framework to determinesemantic distance in a resource-poor language by combining its text with a knowledgesource in a different, preferably resource-rich, language. We evaluated the approachboth monolingually and cross-lingually in comparison with traditional word-distancemeasures and WordNet-like resource-based concept-distance measures.
The monolingual evaluation required the automatic measures to (1) rank word-pairs in order of their human-judged linguistic distance, and (2) correct real-wordspelling errors. The distributional concept-distance measures outperformed word-distance measures in both tasks. They do not perform aswell as the bestWordNet-basedmeasures in ranking a small set of word pairs, but in the task of correcting real-wordspelling errors, they beat all WordNet-based measures except for Jiang–Conrath (whichis markedly better) and Leacock–Chodorow (which is slightly better if we considercorrection performance as the bottom-line statistic, but slightly worse if we rely oncorrection ratio). It should be noted that the Rubenstein and Goodenough word-pairsused in the ranking task, as well as all the real-word spelling errors in the correction task,are nouns. We expect that theWordNet-basedmeasures will perform poorly when otherparts of speech are involved, as those hierarchies of WordNet are not as extensivelydeveloped. Further, the various hierarchies are not well connected, nor is it clear howto use these interconnections across parts of speech for calculating semantic distance.On the other hand, the distributional concept-distance measures do not rely on anyhierarchies (even if they exist in a thesaurus) but on sets of words that unambiguouslyrepresent each sense. Further, because our measures are tied closely to the corpus fromwhich co-occurrence counts are made, we expect the use of domain-specific corpora togive even better results.
We evaluated the cross-lingual measures against the best monolingual ones oper-ating on a WordNet-like resource, GermaNet, through an extensive set of experimentson two different tasks: (1) rank German word-pairs in order of their human-judgedlinguistic distance, and (2) solve German ‘Word Power’ questions from Reader’s Digest.Even with the added ambiguity of translating words from one language to another, thecross-lingual measures performed slightly better than the best monolingual measureson both the word-pair task and the Reader’s Digest word-choice task. Further, in theword-choice task, the cross-lingual measures obtained a significantly higher coveragethan the monolingual measure. The richness of English resources seems to have a majorimpact, even though German, with GermaNet, a well-established resource, is in a betterposition than most other languages. This is indeed promising, because obtaining broadcoverage for resource-poor languages remains an important goal as we integrate state-of-the-art approaches in natural language processing into real-life applications. Theseresults show that the proposed algorithm can successfully combine German text withan English thesaurus using a bilingual German–English lexicon to obtain state-of-the-art results in measuring semantic distance. These results also support the broader claimthat natural language problems in a resource-poor language can be solved using aknowledge source in a resource-rich language (for example the cross-lingual PoS taggerof Cucerzan and Yarowsky (2002)). Cross-lingual DPCs also have tremendous potentialin tasks inherently involving more than one language. We believe that the future ofnatural language processing lies not in standalone monolingual systems but in thosethat are powered by automatically created multilingual networks of information.
30

Mohammad and Hirst Measuring Semantic Distance using Distributional Profiles of Concepts
Thus distributional measures of concept-distance have most of the attractive fea-tures of a distributional measure, and yet avoid to some extent the problems associatedwith word-distance measures. They do not conflate sense information (mitigating thelimitation described in Section 3.2.1). They need a matrix of size only about 1000 by1000 to store all pre-computed distances (mitigating limitation of Section 3.3). As theycalculate distance between coarse senses, each represented bymanywords, even if somewords are not seen often in a text corpus, all concepts have sufficient representation evenin small corpora, they avoid the data sparseness problem (limitation of Section 3.2.2).And lastly, they can be used cross-lingually so that a high-quality knowledge sourcein a resource-rich language can be leveraged to solve semantic distance problems in aresource-poor language (mitigating the limitation described in 3.1.1).
Acknowledgments
This paper incorporates research that was first reported in Mohammad and Hirst(2006a), Mohammad and Hirst (2006b), and Mohammad et al. (2007). The work de-scribed in section 7 was carried out in collaboration with Iryna Gurevych and TorstenZesch, Technische Universität Darmstadt. The research was supported by the NaturalSciences and Engineering Research Council of Canada, the University of Toronto, theU.S. National Science Foundation, and the Human Language Technology Center ofExcellence. Any opinions, findings, and conclusions or recommendations expressed inthis material are those of the authors and do not necessarily reflect the views of the spon-sor. We thank Afra Alishahi, Alex Budanitsky, Michael Demko, Afsaneh Fazly, DianaMcCarthy, Rada Mihalcea, Siddharth Patwardhan, Gerald Penn, Philip Resnik, FrankRudicz, Suzanne Stevenson, Vivian Tsang, and Xinglong Wang for helpful discussions.
ReferencesAgirre, Eneko and Oier Lopez de Lacalle Lekuona. 2003. Clustering WordNet word senses. InProceedings of the 1st International Conference on Recent Advances in Natural Language Processing(RANLP-2003), Borovets, Bulgaria.
Bernard, John R. L., editor. 1986. The Macquarie Thesaurus. Macquarie Library, Sydney, Australia.Budanitsky, Alexander and Graeme Hirst. 2001. Semantic distance in WordNet: Anexperimental, application-oriented evaluation of five measures. InWorkshop on WordNet andOther Lexical Resources, in the North American Chapter of the Association for ComputationalLinguistics (NAACL-2000), Pittsburgh, Pennsylvania.
Budanitsky, Alexander and Graeme Hirst. 2006. Evaluating WordNet-based measures ofsemantic distance. Computational Linguistics, 32(1):13–47.
Church, Kenneth W. and Patrick Hanks. 1990. Word association norms, mutual information andlexicography. Computational Linguistics, 16(1):22–29.
Cruse, D. Allen. 1986. Lexical semantics. Cambridge University Press, Cambridge, UK.Cucerzan, Silviu and David Yarowsky. 2002. Bootstrapping a multilingual part-of-speech taggerin one person-day. In Proceedings of the 6th Conference on Computational Natural LanguageLearning, pages 132–138, Taipei, Taiwan.
Curran, James R. 2004. From Distributional to Semantic Similarity. Ph.D. thesis, School ofInformatics, University of Edinburgh, Edinburgh, UK.
Dagan, Ido, Lillian Lee, and Fernando Pereira. 1994. Similarity-based estimation of wordcooccurrence probabilities. In Proceedings of the 32nd Annual Meeting of the Association ofComputational Linguistics (ACL-1994), pages 272–278, Las Cruces, New Mexico.
Erk, Katrin and Sebastian Padó. 2008. A structured vector space model for word meaning incontext. In Proceedings of the Conference on Empirical Methods in Natural Language Processing(EMNLP-2086), pages 897–906, Honolulu, HI.
Finkelstein, Lev, Evgeniy Gabrilovich, Yossi Matias, Ehud Rivlin, Zach Solan, Gadi Wolfman,and Eytan Ruppin. 2002. Placing search in context: The concept revisited. ACM Transactions onInformation Systems, 20(1):116–131.
31

Computational Linguistics Volume 1, Number 1
Firth, John R. 1957. A synopsis of linguistic theory 1930–55. In Studies in Linguistic Analysis(special volume of the Philological Society), pages 1–32, Oxford, England. The Philological Society.
Gurevych, Iryna. 2005. Using the structure of a conceptual network in computing semanticrelatedness. In Proceedings of the 2nd International Joint Conference on Natural Language Processing(IJCNLP-2005), pages 767–778, Jeju Island, Republic of Korea.
Harris, Zellig. 1968.Mathematical Structures of Language. Interscience Publishers, New York, NY.Hirst, Graeme and Alexander Budanitsky. 2005. Correcting real-word spelling errors byrestoring lexical cohesion. Natural Language Engineering, 11(1):87–111.
Hirst, Graeme and David St-Onge. 1998. Lexical chains as representations of context for thedetection and correction of malapropisms. In Christiane Fellbaum, editor,WordNet: AnElectronic Lexical Database. The MIT Press, Cambridge, MA, chapter 13, pages 305–332.
Jarmasz, Mario and Stan Szpakowicz. 2003. Roget’s Thesaurus and semantic similarity. InProceedings of the International Conference on Recent Advances in Natural Language Processing(RANLP-2003), pages 212–219, Borovets, Bulgaria.
Jiang, Jay J. and David W. Conrath. 1997. Semantic similarity based on corpus statistics andlexical taxonomy. In Proceedings of International Conference on Research on ComputationalLinguistics (ROCLING X), Taipei, Taiwan.
Landauer, Thomas K. and Susan T. Dumais. 1997. A solution to Plato’s problem: The latentsemantic analysis theory of acquisition, induction, and representation of knowledge.Psychological Review, 104:211–240.
Landauer, Thomas K., Peter W. Foltz, and Darrell Laham. 1998. Introduction to latent semanticanalysis. Discourse Processes, 25(2–3):259–284.
Leacock, Claudia and Martin Chodorow. 1998. Combining local context and WordNet similarityfor word sense identification. In Christiane Fellbaum, editor,WordNet: An Electronic LexicalDatabase. The MIT Press, Cambridge, MA, chapter 11, pages 265–283.
Lee, Lillian. 2001. On the effectiveness of the skew divergence for statistical language analysis. InProceedings of the Eigth International Workshop on Artificial Intelligence and Statistics(AISTATS-2001), pages 65–72, Key West, Florida.
Lin, Dekang. 1997. Using syntactic dependency as local context to resolve word sense ambiguity.In Proceedings of the 8th Conference of the European Chapter of the Association for ComputationalLinguistics (ACL,EACL-1997), pages 64–71, Madrid, Spain.
Lin, Dekang. 1998a. Automatic retreival and clustering of similar words. In Proceedings of the 17thInternational Conference on Computational Linguistics (COLING-1998), pages 768–773, Montreal,Canada.
Lin, Dekang. 1998b. An information-theoretic definition of similarity. In Proceedings of the 15thInternational Conference on Machine Learning, pages 296–304, San Francisco, CA. MorganKaufmann.
Manning, Christopher D. and Hinrich Schütze. 2008. Foundations of Statistical Natural LanguageProcessing. MIT Press, Cambridge, Massachusetts.
Miller, George A. and Walter G. Charles. 1991. Contextual correlates of semantic similarity.Language and Cognitive Processes, 6(1):1–28.
Mohammad, Saif, Iryna Gurevych, Graeme Hirst, and Torsten Zesch. 2007. Cross-lingualdistributional profiles of concepts for measuring semantic distance. In Proceedings of the JointConference on Empirical Methods in Natural Language Processing and Computational NaturalLanguage Learning (EMNLP/CoNLL-2007), pages 571–580, Prague, Czech Republic.
Mohammad, Saif and Graeme Hirst. 2006a. Determining word sense dominance using athesaurus. In Proceedings of the 11th Conference of the European Chapter of the Association forComputational Linguistics (EACL), pages 121–128, Trento, Italy.
Mohammad, Saif and Graeme Hirst. 2006b. Distributional measures of concept-distance: Atask-oriented evaluation. In Proceedings of the Conference on Empirical Methods in NaturalLanguage Processing (EMNLP-2006), pages 35–43, Sydney, Australia.
Mohammad, Saif and Graeme Hirst. 2007. Distributional measures of semantic distance: Asurvey. http://www.cs.toronto.edu/compling/Publications.
Mohammad, Saif, Graeme Hirst, and Philip Resnik. 2007. Tor, tormd: Distributional profiles ofconcepts for unsupervised word sense disambigution. In Proceedings of the Fourth InternationalWorkshop on Semantic Evaluations (SemEval-07), pages 326–333, Prague, Czech Republic.
Morris, Jane and Graeme Hirst. 2004. Non-classical lexical semantic relations. In Proceedings of theWorkshop on Computational Lexical Semantics, Human Language Technology Conference of the NorthAmerican Chapter of the Association for Computational Linguistics, pages 46–51, Boston,
32

Mohammad and Hirst Measuring Semantic Distance using Distributional Profiles of Concepts
Massachusetts.Navigli, Roberto. 2006. Meaningful clustering of senses helps boost word sense disambiguationperformance. In Proceedings of the 21st International Conference on Computational Linguistics andthe 44th annual meeting of the Association for Computational Linguistics (COLING-ACL 2006),pages 105–112, Sydney, Australia.
Pantel, Patrick. 2005. Inducing ontological co-occurrence vectors. In Proceedings of the 43rdAnnual Meeting of the Association for Computational Linguistics (ACL-05), pages 125–132, AnnArbor, Michigan.
Pantel, Patrick and Dekang Lin. 2002. Discovering word senses from text. In Proceedings of the 8thAssociation of Computing Machinery SIGKDD International Conference On Knowledge Discoveryand Data Mining, pages 613–619, Edmonton, Canada.
Patwardhan, Siddharth, Satanjeev Banerjee, and Ted Pedersen. 2003. Using measures of semanticrelatedness for word sense disambiguation. In Proceedings of the Fourth International Conferenceon Intelligent Text Processing and Computational Linguistics (CICLING-03), pages 17–21, MexicoCity, Mexico.
Patwardhan, Siddharth and Ted Pedersen. 2006. Using WordNet based context vectors toestimate the semantic relatedness of concepts. In Proceedings of the European Chapter of theAssociation for Computational Linguistics Workshop Making Sense of Sense—BringingComputational Linguistics and Psycholinguistics Together, pages 1–8, Trento, Italy.
Rada, Roy, Hafedh Mili, Ellen Bicknell, and Maria Blettner. 1989. Development and applicationof a metric on semantic nets. IEEE Transactions on Systems, Man, and Cybernetics, 19(1):17–30.
Resnik, Philip. 1995. Using information content to evaluate semantic similarity. In Proceedings ofthe 14th International Joint Conference on Artificial Intelligence (IJCAI-95), pages 448–453,Montreal, Canada.
Resnik, Philip. 1998. Wordnet and class-based probabilities. In Christiane Fellbaum, editor,WordNet: An Electronic Lexical Database. The MIT Press, Cambridge, Massachusetts, pages239–263.
Resnik, Philip. 1999. Semantic similarity in a taxonomy: An information-based measure and itsapplication to problems of ambiguity in natural language. Communications of the Association ofComputing Machinery, 11:95–130.
Resnik, Philip and Mona Diab. 2000. Measuring verb similarity. In Proceedings of the 22nd AnnualMeeting of the Cognitive Science Society (CogSci 2000), pages 399–404, Philadelphia,Pennsylvania.
Rubenstein, Herbert and John B. Goodenough. 1965a. Contextual correlates of synonymy.Communications of the Association of Computing Machinery, 8(10):627–633.
Rubenstein, Herbert and John B. Goodenough. 1965b. Contextual Correlates of Synonymy.Communications of the ACM, 8(10):627–633.
Schütze, Hinrich and Jan O. Pedersen. 1997. A cooccurrence-based thesaurus and twoapplications to information retreival. Information Processing and Management, 33(3):307–318.
Turney, Peter. 2001. Mining the Web for synonyms: PMI-IR versus LSA on TOEFL. In Proceedingsof the Twelfth European Conference on Machine Learning (ECML-2001), pages 491–502, Freiburg,Germany.
Turney, Peter. 2006. Expressing implicit semantic relations without supervision. In Proceedings ofthe 21st International Conference on Computational Linguistics and the 44th annual meeting of theAssociation for Computational Linguistics, pages 313–320, Sydney, Australia.
Véronis, Jean. 2004. Hyperlex: Lexical cartography for information retrieval. Computer Speech andLanguage. Special Issue on Word Sense Disambiguation, 18(3):223–252.
Wallace, DeWitt and Lila Acheson Wallace. 2005. Reader’s Digest, das Beste für Deutschland. Jan2001–Dec 2005. Verlag Das Beste, Stuttgart.
Weeds, Julie, David Weir, and Diana McCarthy. 2004. Characterising measures of lexicaldistributional similarity. In Proceedings of the 20th International Conference on ComputationalLinguistics (COLING-04), pages 1015–1021, Geneva, Switzerland.
Yarowsky, David. 1992. Word-sense disambiguation using statistical models of Roget’scategories trained on large corpora. In Proceedings of the 14th International Conference onComputational Linguistics (COLING-1992), pages 454–460, Nantes, France.
Zesch, Torsten, Iryna Gurevych, and Max Mühlhäuser. 2007. Comparing Wikipedia and GermanWordNet by evaluating semantic relatedness on multiple datasets. In Proceedings of HumanLanguage Technologies: The Annual Conference of the North American Chapter of the Association forComputational Linguistics (NAACL,HLT-2007), pages 205–208, Rochester, New York.
33

34


