Embed Size (px)
Citation preview
The Australian Economic Review, vol. 35, no. 4, pp. 363–79
The University of Melbourne, Melbourne Institute of Applied Economic and Social Research 2002Published by Blackwell Publishing Ltd
Abstract
While there have been many studies of the an-nual redistributional impact of governmenthealth outlays, there do not appear to havebeen any lifetime studies in Australia. Thisstudy uses a dynamic cohort microsimulationmodel to examine the redistributive impact ofgovernment health outlays over the lifetime.The results suggest that government healthoutlays lead to redistribution over the entirelifetime from the affluent to the poorer, fromthose who have relatively short lives to thosewho have longer lives, from those without chil-dren to those with larger families, and frommen to women.
1. Introduction
There have been many studies in Australia ofthe
annual
distributional impact of all healthoutlays (for example, Australian Bureau of Sta-tistics (ABS) 1996a; Landt et al. 1995; Raskalland Urquhart 1994). Health outlays have alsobeen included in many studies examining theannual impact of a range of non-cash benefits,typically comprising health, housing and edu-cation (for example, Johnson, Manning andHellwig 1995; Harding 1995b). A number offiscal incidence studies have also examined theannual distributional impact of just one type ofhealth expenditure, such as hospital outlays(Schofield 1998a; Thurect et al. 2002) and thePharmaceutical Benefits Scheme (Schofield1998b).
However, there appears to have been noanalysis of the likely distributional impact ofhealth outlays in Australia
over the lifetime
.The annual studies of health expenditure inci-dence typically find that health outlays are pro-gressive, amounting to a higher proportion ofthe income of low income groups than of highincome groups (ABS 1996a, p. 11; Landt et al.1995, p. 14). But these findings emerge fromanalyses of cross-sectional data where house-holds are ranked by income—that is, snapshotsof the population
at a single point in time
. It ispossible that the pattern over the lifetimes ofindividuals might be rather different, as otherstudies contrasting the lifetime and annual inci-dence of taxes and cash transfers have sug-gested (Harding 1995c).
One issue, for example, is that many of thepeople shown as poor in cross-sectional studies
The Lifetime Distributional Impact of Government Health Outlays
Ann Harding
†
, Richard Percival
†
, Deborah Schofield
‡
and Agnes Walker
†
†
National Centre for Social and Economic Modelling, University of Canberra
‡
Retirement and Income Modelling Unit, The Treasury
364 The Australian Economic Review December 2002
The University of Melbourne, Melbourne Institute of Applied Economic and Social Research
might be students who go on to earn higher in-comes in the future, or the retired who mighthave earned high incomes in the past. Accord-ingly, when a longer period is considered, it isconceivable that the wide-ranging governmentprograms of health expenditure and accompa-nying taxation simply redistribute resources
across the life cycles
of individuals, fundingthe net health benefits received by individualswhen they are studying or retired from thetaxes collected from the same individuals dur-ing their peak working years. It is thus possiblethat government health outlays do not redis-tribute income from rich to poor at all, as an-nual net fiscal incidence studies conclude, butmerely reallocate resources from one period ofan individual’s life to another. In other words,it may be that all of the redistribution achievedby taxation and health expenditure programs is,in effect,
intrapersonal
rather than
interper-sonal
. There are also other possibilities. For exam-
ple, some groups may receive more healthcare while they are alive but die at a youngerage, thus receiving less than those who live toan old age. There may be substantial cross-subsidisation between those who never havechildren and those who have large families.
It is not possible to examine these issuesusing any existing Australian longitudinaldata. Although a range of options exists forestablishing synthetic longitudinal data, per-haps the most sophisticated possible approachis to use a dynamic microsimulation model.Microsimulation models were pioneered byOrcutt, and the defining characteristic of suchmodels is that they attempt to simulate thecharacteristics and behaviour of individualsand families (Orcutt 1957; Orcutt, Merz andQuinke 1986).
This study uses a dynamic cohort microsim-ulation model, which tracks 4000 simulatedAustralians year by year from their birth totheir death. The cohort is ‘born’ in 1986 andlives for up to 95 years in a world which re-mains exactly as it was in their birth year. Theprocesses simulated in the original model foreach individual for each year of life are de-scribed in detail in Harding (1993a) and in-clude mortality, marriage, divorce and fertility;
disability; preschool usage and attendance at arange of primary, secondary and tertiary educa-tion sectors; paid labour force participation,including hours in employment and unemploy-ment each year; and earnings, investment in-come, social security receipts and incometaxes.
1
In each case, the probabilities of partic-ular life events happening to the pseudo-cohortindividuals were estimated from data abouthow often those particular events happened toreal Australians.
Given the uncertainty surrounding futurechanges in marriage and birth rates, labourforce participation rates, health service utilisa-tion rates and so on, this means that a
steady-state
world has been assumed in the model.The model does not attempt to estimate whatthe actual experience of the cohort born in Aus-tralia in 1986 will be. Instead it seeks to answerthe following question in this analysis: if thedemographic, labour force, income and healthservice utilisation patterns of the populationand all government policies existing in 1986remained unchanged for 95 years, what pat-terns of lifetime and life cycle redistributionwould public provision and subsidisation ofhealth services produce?
Although the steady-state assumption mightappear unrealistic at first glance, it is probablythe most useful benchmark against which toevaluate government policies and changes tothose policies. As Summers pointed out in1956, the instability of the size distribution ofincome makes data about the lifetime incomedistribution in the past of little help in analys-ing the lifetime income distribution of today,while the distribution of lifetime income inthe future is unknown. Summers saw great po-tential in the construction of steady-state or‘latent’ income distributions, which wouldallow one to answer questions about lifetimeincome distribution given existing socio-economic conditions and government policies(1956, p. 4). Similarly, both the Canadian DE-MOGEN and West German SFB3 dynamiccohort models assume a steady-state worldwhen evaluating the impact of both existingand possible government policies (Wolfson1988, p. 233; Hain and Helberger 1986, p.63).
Harding et al.: Lifetime Distributional Impact of Government Health Outlays 365
The University of Melbourne, Melbourne Institute of Applied Economic and Social Research
2. Simulating Health Service Usage and Cost
The extension of the model described in this ar-ticle involved imputing the annual usage ofhealth services to each individual within themodel, and calculating the average cost of suchusage to government in 1985–86 dollars.
The usage and costs of four types of healthservice were imputed within the model:
• hospitals and other institutional services andbenefits;
• clinics and other non-institutional servicesand benefits, including GP and specialist vis-its;
• pharmaceuticals, medical aids and appli-ances; and
• public health, health research and health ser-vices and benefits not elsewhere classified.
Our methodology closely followed that usedby the ABS in constructing its 1988–89 fiscalincidence study (ABS 1992). However, whilethe ABS imputed the usage of hospital andmedical services by age and gender, we also al-lowed usage and cost to vary with income.
2
This reflects a range of new research suggest-ing that there are marked differences in theusage of such services by income level andsocio-economic status (Schofield 1998a;Walker and Abello 2000; Harding et al. 2000,p. 10; Thurect et al. 2002).
For imputing the value of
hospital usage
toindividuals, we first estimated the averagenumber of days spent in public hospitals forAustralians by age and gender, using the 1989–90 National Health Survey, and then multipliedthis by the estimated average costs of each bedday in 1985–86. However, we then departedfrom this ‘standard’ ABS fiscal incidencemethodology, because of concerns that it bi-ased the results. This was because ofSchofield’s (1998a) findings, based on 1995data, that members of higher income groupswere younger and healthier than those fromlower income groups and, accordingly, were
less likely to be admitted to hospital. If theywere hospitalised, they were admitted less fre-quently and for a shorter length of stay. Theywere also more likely to have private health in-surance and therefore to be admitted to a pri-vate hospital or as a private patient in a publichospital than were members of lower incomegroups. Those admitted as private patients inpublic hospitals cost less per separation thanpublic patients in public hospitals (Schofield1998a, p. 8). Taken together, these factors re-sulted in lower income groups receiving ahigher proportion of total public hospitalspending than suggested by the standard ABSmethodology (Schofield 1998a, p. 22).
3
Inother words, we felt that the standard ABS ap-proach understated the extent to which benefitsfrom public hospital expenditure were incidentupon lower income groups.
It was not easy to take these findings for1995 into account in our analysis, given thatthe world that we were modelling was for 1986and no comparable data existed to estimate thedistribution of public hospital expenditure in1986. To incorporate Schofield’s results, wefirst divided the pseudo-cohort into age, genderand age-specific quintiles of gross family in-come. Next, we scaled the average results foreach age–gender grouping in line with the esti-mated hospital expenditure in 1995 for personsclassified by their age, gender and age-specificquintile of gross family income. To give an ex-ample, the Schofield results suggested that theestimated public hospital cost for males aged35–49 years who were in the bottom incomequintile of all males aged 35–49 was $551 ayear in 1995. This was 2.05 times the averagecost for all males aged 35–49 of $268 in 1995.The standard ABS-type methodology sug-gested that the average cost in 1985–86 for amale aged 35–49 years was $193 (that is, thebed day cost of $417.42 multiplied by the esti-mated 0.46 days spent in hospital by males ofthis age). In our model, we assumed that thebottom quintile of males aged 35–49 yearsused $396 a year of hospital services ($193 *2.05).
In the case of
medical services
, doctor visitswere used as an indicator of the use of all non-institutional benefits and services, such as
366 The Australian Economic Review December 2002
The University of Melbourne, Melbourne Institute of Applied Economic and Social Research
dentists, specialists, chiropractors and pathol-ogy services. Usage rates for doctors by agerange, gender and age-specific quintile of grossfamily income were obtained from the 1989–90 National Health Survey, with the utilisationrates then being multiplied by the estimated av-erage cost per doctor visit.
The allocation of government outlays on
pharmaceuticals
, medical aids and appliancesagain followed the ABS fiscal incidence studymethodology. The allocation was based on theeligibility by the pseudo-cohort individuals forpharmaceutical concessions, allied with the es-timated usage of prescribed medicines by ageand gender, calculated using the 1989–90 Na-tional Health Survey (ABS 1996b, p. 58).
In 1985–86 three types of pharmaceuticalconcessions were available:
•
Pensioner
—free pharmaceuticals for thoseentitled to a Pensioner Health Benefit Cardor a Health Benefit Card (for sickness bene-ficiaries) and their dependants;
•
Concessional
—a concessional $2 contribu-tion rate for low income persons entitled toan income-tested Health Care Card; and
•
General
—a $7.50 contribution rate per med-ication for the remainder of the population.
The estimated value of government pharma-ceutical concessions was the estimated subsidyper prescription (which varied for each of thethree categories) multiplied by the age–genderspecific usage rates for prescribed medicines.
Finally, in allocating the benefits of
publichealth
, health research and health not else-where classified, the ABS methodology wasagain followed, with such government outlayssimply being allocated equally to all persons.
Of the four types of health outlays simulated,hospitals are by far the most important, ac-counting for three-fifths of total health outlays(ABS 1992, pp. 57–8), with medical servicesbeing the next most significant at 28 per cent oftotal outlays. Pharmaceutical benefits ac-counted for 7 per cent of total health outlays,while public health took the remaining 5 percent.
3. Lifetime Value of Health Services Used
The lifetime value of health services used canbe determined for every member of the pseudo-cohort by simply summing the value of thehealth services that they received in every yearof life.
It should be noted that the consumption ofhospital and other health services was calcu-lated for only the pseudo-cohort individualswhen they were aged 20 or more years. How-ever, those individuals in the model who hadchildren aged less than 20 years still living withthem were also assigned the value of the healthbenefits accruing to their children. The value ofthe health services used by the children wassplit equally between the parents if a couple orattributed entirely to the sole parent. (For ex-ample, if a married woman had a baby in hos-pital, the costs to government of this hospitalstay were split equally between the mother andthe father.)
These assumptions were made to stop doublecounting in the model and to allow the differ-ential lifetime impact for those who did and didnot have children to be assessed. In essence,this approach roughly replicates a world wherechildren aged less than 20 years and still livingat home are assumed to be the financial respon-sibility of their parents, while all individualsaged 20 or more are assumed to look afterthemselves. The imputation of health benefitsreflects this assumption, with parents of youngchildren being the ones assumed to benefit fi-nancially from the existence of public healthcare for their children (rather than the benefitsof public health care for 2 year olds being im-puted to the lifetime account of those 2 yearolds).
4
Perceptions of the redistributive effect of
health outlays can be distorted if the value ofhealth services received is simply summedover the lifetime. This is because those wholive the longest will appear to receive the high-est health benefits because they have moreyears of life in which to use health services. Forexample, someone who lives to be 100 yearsold is likely to receive more than twice as muchbenefit from government health outlays assomeone who dies at the age of 50 years.
Harding et al.: Lifetime Distributional Impact of Government Health Outlays 367
The University of Melbourne, Melbourne Institute of Applied Economic and Social Research
To eliminate this factor, the
annualised
valueof health services used was calculated. Thismeans that the total value of health services re-ceived after the age of 20 by each member ofthe pseudo-cohort was divided by their years oflife minus 20 years. The annualised lifetimevalue of health services used can thus bereadily interpreted as the average value of thehealth services received by each individualduring each year of their adult life.
5
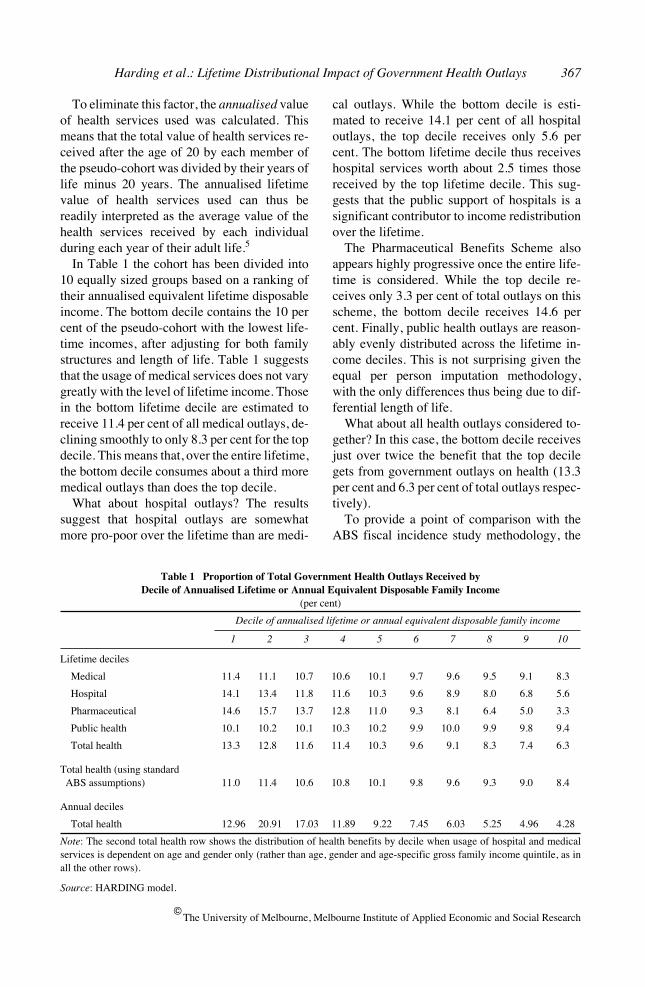
In Table 1 the cohort has been divided into
10 equally sized groups based on a ranking oftheir annualised equivalent lifetime disposableincome. The bottom decile contains the 10 percent of the pseudo-cohort with the lowest life-time incomes, after adjusting for both familystructures and length of life. Table 1 suggeststhat the usage of medical services does not varygreatly with the level of lifetime income. Thosein the bottom lifetime decile are estimated toreceive 11.4 per cent of all medical outlays, de-clining smoothly to only 8.3 per cent for the topdecile. This means that, over the entire lifetime,the bottom decile consumes about a third moremedical outlays than does the top decile.
What about hospital outlays? The resultssuggest that hospital outlays are somewhatmore pro-poor over the lifetime than are medi-
cal outlays. While the bottom decile is esti-mated to receive 14.1 per cent of all hospitaloutlays, the top decile receives only 5.6 percent. The bottom lifetime decile thus receiveshospital services worth about 2.5 times thosereceived by the top lifetime decile. This sug-gests that the public support of hospitals is asignificant contributor to income redistributionover the lifetime.
The Pharmaceutical Benefits Scheme alsoappears highly progressive once the entire life-time is considered. While the top decile re-ceives only 3.3 per cent of total outlays on thisscheme, the bottom decile receives 14.6 percent. Finally, public health outlays are reason-ably evenly distributed across the lifetime in-come deciles. This is not surprising given theequal per person imputation methodology,with the only differences thus being due to dif-ferential length of life.
What about all health outlays considered to-gether? In this case, the bottom decile receivesjust over twice the benefit that the top decilegets from government outlays on health (13.3per cent and 6.3 per cent of total outlays respec-tively).
To provide a point of comparison with theABS fiscal incidence study methodology, the
Table 1 Proportion of Total Government Health Outlays Received by Decile of Annualised Lifetime or Annual Equivalent Disposable Family Income
(per cent)
Decile of annualised lifetime or annual equivalent disposable family income
1 2 3 4 5 6 7 8 9 10
Lifetime deciles
Medical 11.4 11.1 10.7 10.6 10.1 9.7 9.6 9.5 9.1 8.3
Hospital 14.1 13.4 11.8 11.6 10.3 9.6 8.9 8.0 6.8 5.6
Pharmaceutical 14.6 15.7 13.7 12.8 11.0 9.3 8.1 6.4 5.0 3.3
Public health 10.1 10.2 10.1 10.3 10.2 9.9 10.0 9.9 9.8 9.4
Total health 13.3 12.8 11.6 11.4 10.3 9.6 9.1 8.3 7.4 6.3
Total health (using standard ABS assumptions) 11.0 11.4 10.6 10.8 10.1 9.8 9.6 9.3 9.0 8.4
Annual deciles
Total health 12.96 20.91 17.03 11.89 9.22 7.45 6.03 5.25 4.96 4.28
Note
: The second total health row shows the distribution of health benefits by decile when usage of hospital and medicalservices is dependent on age and gender only (rather than age, gender and age-specific gross family income quintile, as inall the other rows).
Source
: HARDING model.
368 The Australian Economic Review December 2002
The University of Melbourne, Melbourne Institute of Applied Economic and Social Research
second ‘total health’ row shows the estimateddistribution of lifetime health outlays when theusage of hospital and medical services is basedon utilisation rates by age and gender only(rather than age, gender and income, as in thisstudy). The results indicate that, even underthese more restrictive assumptions, the lifetimedistribution of health benefits is markedly pro-poor, with the poorest lifetime income decilereceiving 11 per cent of all government healthoutlays, compared with just 8.4 per cent for themost affluent decile.
How do these lifetime results compare withthose of the more traditional
annual
incidencestudies? To find out, it is possible to use thelifetime model to provide a simulated cross-sectional sample, by simply taking every ob-servation for every year of life for cohort mem-bers aged 20 years or more. The thousands ofrecords in the model can therefore be treated asseparate observations rather than as simply an-other year in the life path of a particular indi-vidual. The synthetic cross-sectional samplethus created has records for adults of every age,just as a snapshot cross-sectional survey ofAustralia does.
6
Excluding the bottom decile, whose compo-
sition is unusual in comparison to the otherdeciles (for example, relatively large numbersof students on low incomes),
7
the annual healthincidence results look much more pro-poorthan the lifetime results. For example, individ-uals in decile 2 of
annual
income are estimatedto receive about five times as much in healthbenefits as those in decile 10. This suggeststhat the cross-sectional studies of the incidenceof government health outlays overstate thelonger term redistributive effect of such out-lays. Over the lifetime, some of the differencesbetween individuals are smoothed out, so thatthe lifetime distribution of government healthoutlays is more even than that suggested bycross-sectional snapshots. Nevertheless, thelifetime health outlays distribution is stillmarkedly pro-poor in effect in Australia.
Although there are some differences inmethodology, a comparison of the results withthose achieved by Propper (1992, p. 189) forthe United Kingdom suggests that the Austra-lian public health care system is more redistrib-
utive over the lifetime than the UK nationalhealth service. This may be driven by a greaterlikelihood in Australia of higher income fami-lies using private hospitals or entering publichospitals as a private patient, as well as by ourhighly progressive Pharmaceutical BenefitsScheme. Although Propper also found thatover the lifetime the poor in the United King-dom are both sicker and receive a higher shareof health care outlays, the differences in theproportion of health care outlays received bylifetime income decile are less marked than inAustralia.
4. The Financing of Health Care
Our model can also be used to examine the netincidence of health care outlays and receiptsover the lifetime. Net incidence is defined hereas the difference between
what individuals re-ceive and what they pay
. Given that govern-ment health outlays are financed from taxation,it is appropriate to take both the receipts andoutlays into account when assessing the extentto which lifetime health outlays are pro-poor.
But how are government health care outlaysfinanced? One possibility is to assume thattotal health outlays are fully financed from di-rect taxes—namely, income taxes and theMedicare levy. But this assumption can be crit-icised, because less than half of Australian taxrevenue is from direct taxes, with indirect andcompany taxes making up the balance. How-ever, there are no fully comprehensive studiesof tax incidence in Australia in 1985–86. Theprecise incidence of all taxes in 1985–86 is thusopen to some conjecture. Warren’s estimatesfor 1984–85 and 1988–89 suggest that theoverall incidence of the taxation system is rea-sonably close to being proportional to gross in-come for the most affluent 70 per cent of thepopulation (Warren 1997).
Consequently, for the purposes of this studywe have assumed that the net incidence of alltaxes in Australia in 1985–86 was propor-tional—that is, that taxes amounted to the samepercentage of gross income for all families.
8
This assumption probably errs slightly on theconservative side. Nonetheless, it can be seenas providing a useful worst-case estimate. On
Harding et al.: Lifetime Distributional Impact of Government Health Outlays 369
The University of Melbourne, Melbourne Institute of Applied Economic and Social Research
this basis, a proportional tax amounting to 7 percent of gross income for the pseudo-cohortwould fully finance the government health out-lays received by the pseudo-cohort. Under thisproportional tax assumption, therefore, the av-erage net gain for the entire cohort was zero (ashealth taxes collected equalled health outlays).
4.1 Net Incidence of Health Care Transfers
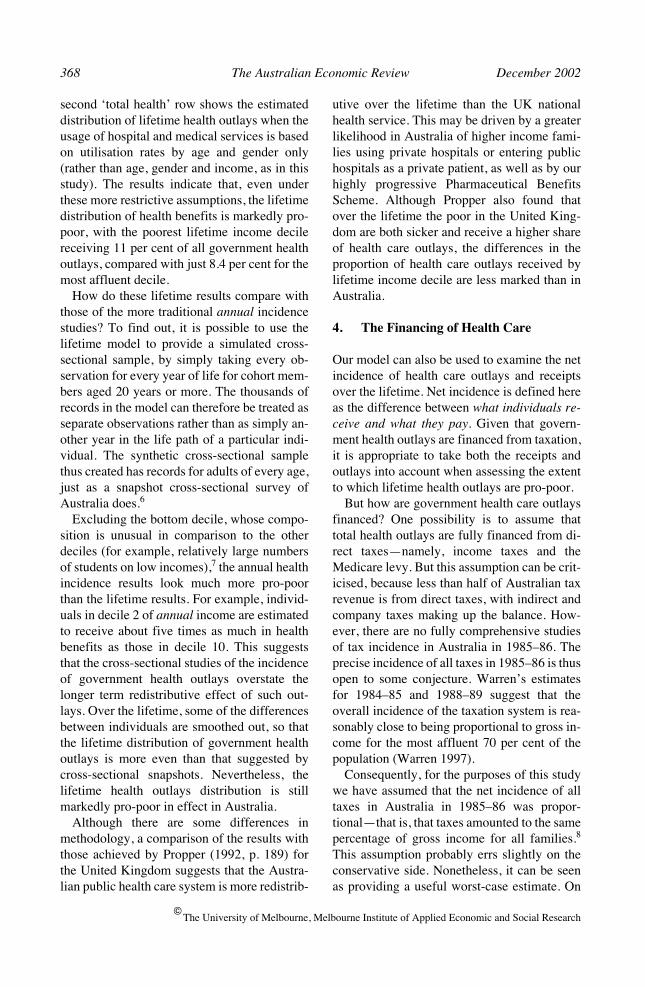
Our estimates suggest that people in the poorestlifetime income decile receive $57000 morehealth care services during their lives than theypay for in tax, while those in the top decile pay$83000 more in health tax than they receive inhealth care services (Figure 1). This suggeststhat, even over a lifetime and with a very con-servative assumption about how health careoutlays are financed, the redistributive effect ofnet health care transfers should not be underes-timated. It therefore appears that governmentprovision and financing of health care is a pow-erful weapon for redistributing resources fromthe lifetime rich to the lifetime poor.
Although Figure 1 shows how much individ-uals gain or lose throughout their lifetimesfrom net health care transfers, it does not giveus the full picture about the extent to which in-dividuals finance their own health care fromtaxes paid at other points during their life cycle.
One of the interesting questions is: what is theextent of intrapersonal redistribution (acrossone’s own life cycle) compared with interper-sonal redistribution (from one person to an-other)? Each member of the cohort on averagereceives $62000 in health benefits financed bygovernment during their lifetime. By construc-tion this exactly matches the $62000 of healthtaxes paid to finance those health benefits. Ofthe total health benefits of $62000 received, onaverage $45000 are paid for by the same indi-vidual at some point during their lifetime,while the remaining $17000 represents trans-fers from one person to another. Overall, there-fore, 73 per cent of the value of the healthservices received by individuals is paid for bythemselves at some stage of their life cycle.Thus, only about one-quarter of total net healthcare transfers received are not paid for by therecipient at some other point in their lifetime.However, it should be noted that, given ourconservative financing assumption, it is likelythat the extent of interpersonal redistribution issomewhat understated.
4.2 Transfers to Different Family Types
Another interesting issue that can be examinedwith the model is the extent of any transfersfrom those who never have children to those
1 (bottom) 2 3 4 5 6 7 8 9 10 (top)-100
-80
-60
-40
-20
0
20
40
60
80
Figure 1 Net Incidence of Lifetime Health Care Transfers
Source
: HARDING model.
Lifetime netgain ($’000)
Decile of annualised lifetime equivalent family income
370 The Australian Economic Review December 2002
The University of Melbourne, Melbourne Institute of Applied Economic and Social Research
Table 2 Annualised Lifetime Net Health Care Benefits by Lifetime Family Status
(dollars)
Never married Ever married
No children 1+ children No children 1–2 children 3+ children
Medical 210 347 243 275 313
Hospital 540 735 606 636 737
Pharmaceuticals 68 131 74 81 91
Public health 35 53 35 45 57
Total health care services 852 1266 958 1037 1198
minus
Health taxes 1187 1010 1164 1120 1096
Net health care benefits –335 257 –206 –83 102
Source
: HARDING model.
who do have children. Marriage can also havean impact, resulting in higher lifetime incomesfor women and thus affecting health servicesused. The pseudo-cohort was divided into fivegroups to examine these issues:
• those who never married and never had chil-dren;
• those who never married but had children;
• those who married but had no children;
• those who married and had one or two chil-dren; and
• those who married and had three or morechildren.
The results suggest that those who remainedsingle for all of their lives and never had chil-dren were the greatest losers, paying far morein health care taxes than they used in health ser-vice benefits (Table 2). Similarly, those whomarried but did not have children were also netlosers. This is because they did not have chil-dren who used subsidised or government-funded health services, but they were still as-sumed to contribute to health taxes in propor-tion to their gross income.
Those who married at some point in theirlives but had only one or two children werealso net losers. The net beneficiaries were soleparents and those who married and had three ormore children. Sole parents who never married
gained from government-funded health care—in part because their lower incomes resulted inhigher eligibility rates for pharmaceutical ben-efits, and also because their lower incomes re-sulted in higher usage of public hospital andmedical services. Their lower incomes also re-sulted in lower health care taxes, leading to anet gain of $257 in every year of adult life.Those who married and had three or more chil-dren were also net gainers, but their higher in-comes resulted in them facing higher healthtaxes than did sole parents. This was one of thereasons why their net gain was lower than thegain by sole parents, at just over $100 a year ineach year of adult life.
5. Impacts across the Life Cycle
5.1 Value of Health Care Services Used
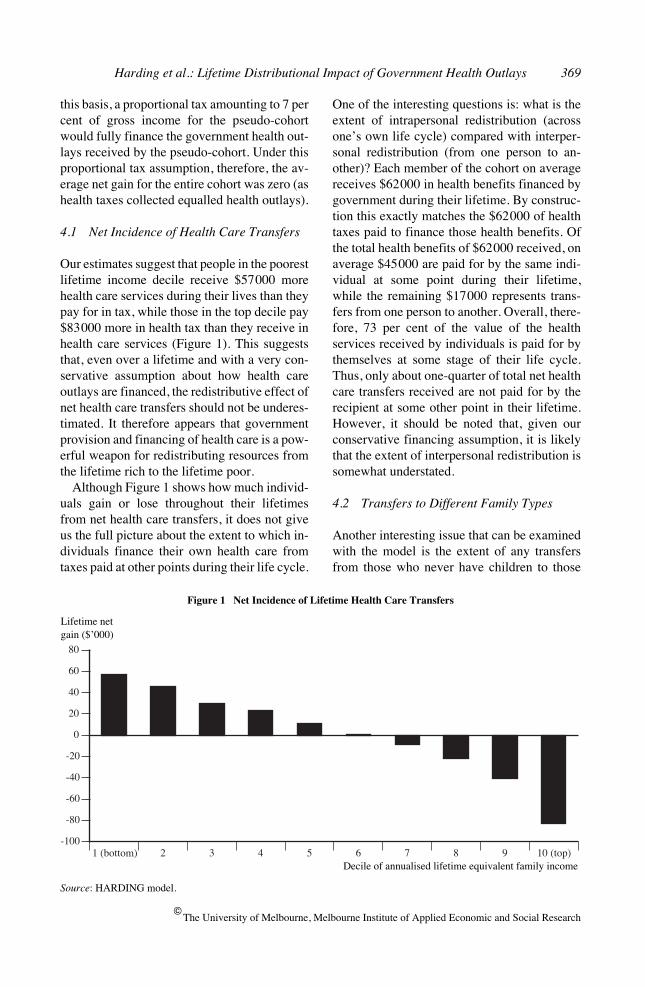
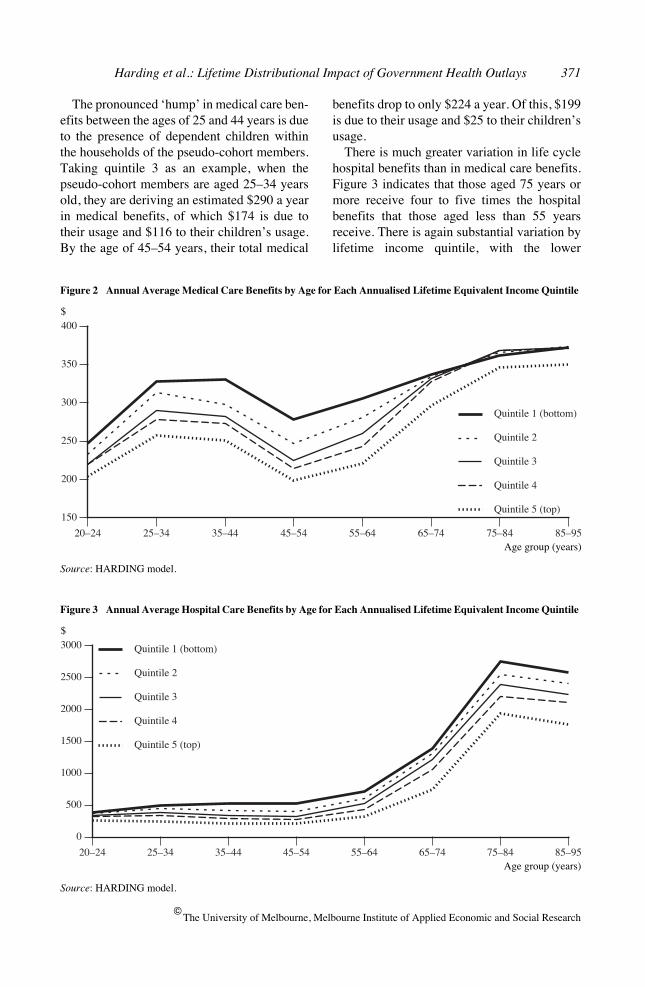
The model is also valuable for examining thelifetime profile of health care services used.Figure 2 shows the estimated value of medicalservices consumed by those in each of the fivelifetime income quintiles at different stages ofthe life cycle. The figure suggests that those inquintiles 1–4 and aged 85–95 consume on av-erage about $375 a year in medical services.Only the top quintile is expected to remainhealthier than the average at this age, with pro-jected medical care benefits of only $350 ayear. At earlier stages of the life cycle there isgreater variation in medical service usage byquintile, with the bottom lifetime quintile expe-riencing the greatest benefits.
Harding et al.: Lifetime Distributional Impact of Government Health Outlays 371
The University of Melbourne, Melbourne Institute of Applied Economic and Social Research
20–24 25–34 35–44 45–54 55–64 65–74 75–84 85–95
150
200
250
300
350
400
Quintile 1 (bottom)
Quintile 2
Quintile 3
Quintile 4
Quintile 5 (top)
Figure 2 Annual Average Medical Care Benefits by Age for Each Annualised Lifetime Equivalent Income Quintile
Source
: HARDING model.
$
Age group (years)
20–24 25–34 35–44 45–54 55–64 65–74 75–84 85–95
0
500
1000
1500
2000
2500
3000 Quintile 1 (bottom)
Quintile 2
Quintile 3
Quintile 4
Quintile 5 (top)
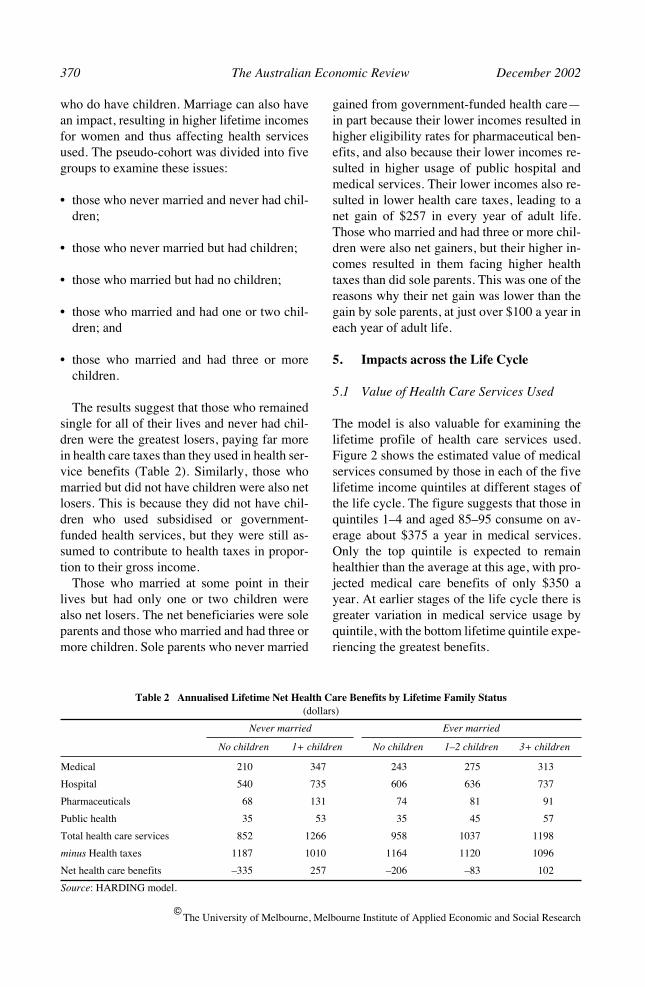
Figure 3 Annual Average Hospital Care Benefits by Age for Each Annualised Lifetime Equivalent Income Quintile
Source
: HARDING model.
$
Age group (years)
The pronounced ‘hump’ in medical care ben-efits between the ages of 25 and 44 years is dueto the presence of dependent children withinthe households of the pseudo-cohort members.Taking quintile 3 as an example, when thepseudo-cohort members are aged 25–34 yearsold, they are deriving an estimated $290 a yearin medical benefits, of which $174 is due totheir usage and $116 to their children’s usage.By the age of 45–54 years, their total medical
benefits drop to only $224 a year. Of this, $199is due to their usage and $25 to their children’susage.
There is much greater variation in life cyclehospital benefits than in medical care benefits.Figure 3 indicates that those aged 75 years ormore receive four to five times the hospitalbenefits that those aged less than 55 yearsreceive. There is again substantial variation bylifetime income quintile, with the lower
372 The Australian Economic Review December 2002
The University of Melbourne, Melbourne Institute of Applied Economic and Social Research
quintiles benefiting more from public hospitalprovision—but the extent of the difference isdwarfed in the graph by the huge increase ap-parent for the aged. Those aged 85–95 yearsexperience lower average benefits than thoseaged 75–84 years. This reflects the data used toconstruct the model, which suggest a lower av-erage cost for females aged over 75 years thanfor those aged 65–74 years and for females rel-ative to males. As the cohort males in themodel die earlier than the cohort females, theaverage cost for the oldest age group shown inFigure 3 is lower than that for 75–84 year olds.
For most quintiles, the dependent child in-duced ‘hump’ in total benefits is again appar-ent, but in the case of hospital benefits it ismore difficult to discern this trend because ofthe difference in scale on the vertical axis dueto the very high hospital costs of the aged.However, taking quintile 3 as an exampleagain, total hospital benefits amount to $387 ayear at ages 25–34 years, of which $252 is dueto the parent or adults and the remaining $135to children. At the ages of 45–54 years, thechildren’s usage amounts to only $34 out of atotal hospital benefit of $328 a year.
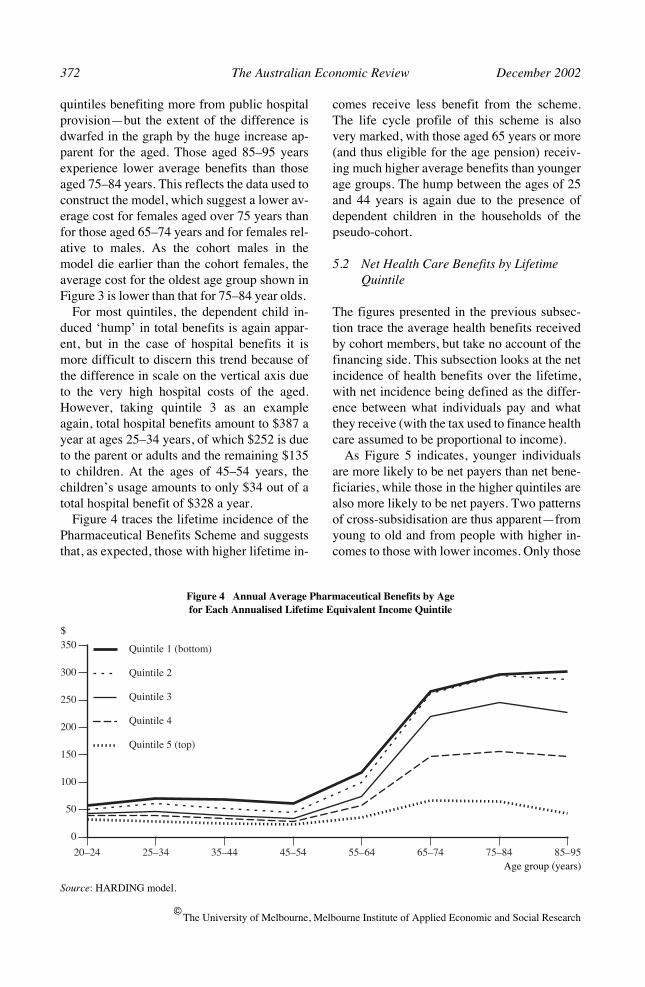
Figure 4 traces the lifetime incidence of thePharmaceutical Benefits Scheme and suggeststhat, as expected, those with higher lifetime in-
comes receive less benefit from the scheme.The life cycle profile of this scheme is alsovery marked, with those aged 65 years or more(and thus eligible for the age pension) receiv-ing much higher average benefits than youngerage groups. The hump between the ages of 25and 44 years is again due to the presence ofdependent children in the households of thepseudo-cohort.
5.2 Net Health Care Benefits by Lifetime Quintile
The figures presented in the previous subsec-tion trace the average health benefits receivedby cohort members, but take no account of thefinancing side. This subsection looks at the netincidence of health benefits over the lifetime,with net incidence being defined as the differ-ence between what individuals pay and whatthey receive (with the tax used to finance healthcare assumed to be proportional to income).
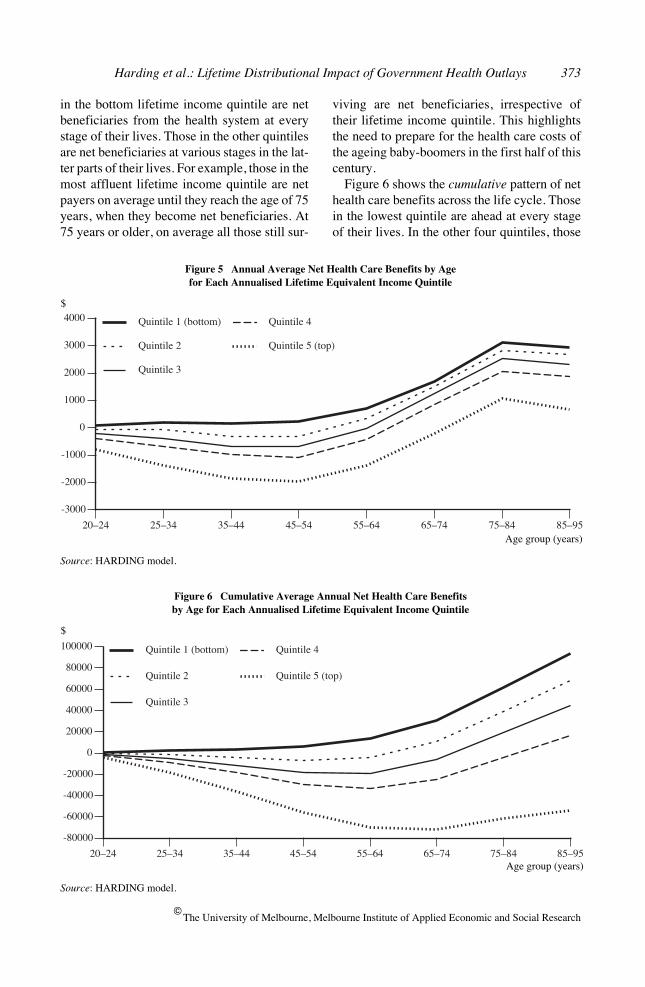
As Figure 5 indicates, younger individualsare more likely to be net payers than net bene-ficiaries, while those in the higher quintiles arealso more likely to be net payers. Two patternsof cross-subsidisation are thus apparent—fromyoung to old and from people with higher in-comes to those with lower incomes. Only those
20–24 25–34 35–44 45–54 55–64 65–74 75–84 85–95
0
50
100
150
200
250
300
350 Quintile 1 (bottom)
Quintile 2
Quintile 3
Quintile 4
Quintile 5 (top)
Figure 4 Annual Average Pharmaceutical Benefits by Agefor Each Annualised Lifetime Equivalent Income Quintile
Source
: HARDING model.
$
Age group (years)
Harding et al.: Lifetime Distributional Impact of Government Health Outlays 373
The University of Melbourne, Melbourne Institute of Applied Economic and Social Research
in the bottom lifetime income quintile are netbeneficiaries from the health system at everystage of their lives. Those in the other quintilesare net beneficiaries at various stages in the lat-ter parts of their lives. For example, those in themost affluent lifetime income quintile are netpayers on average until they reach the age of 75years, when they become net beneficiaries. At75 years or older, on average all those still sur-
viving are net beneficiaries, irrespective oftheir lifetime income quintile. This highlightsthe need to prepare for the health care costs ofthe ageing baby-boomers in the first half of thiscentury.
Figure 6 shows the
cumulative
pattern of nethealth care benefits across the life cycle. Thosein the lowest quintile are ahead at every stageof their lives. In the other four quintiles, those
20–24 25–34 35–44 45–54 55–64 65–74 75–84 85–95
-3000
-2000
-1000
0
1000
2000
3000
4000 Quintile 1 (bottom)
Quintile 2
Quintile 3
Quintile 4
Quintile 5 (top)
Figure 5 Annual Average Net Health Care Benefits by Age for Each Annualised Lifetime Equivalent Income Quintile
Source
: HARDING model.
$
Age group (years)
20–24 25–34 35–44 45–54 55–64 65–74 75–84 85–95
-80000
-60000
-40000
-20000
0
20000
40000
60000
80000
100000 Quintile 1 (bottom)
Quintile 2
Quintile 3
Quintile 4
Quintile 5 (top)
Figure 6 Cumulative Average Annual Net Health Care Benefits by Age for Each Annualised Lifetime Equivalent Income Quintile
Source
: HARDING model.
$
Age group (years)
374 The Australian Economic Review December 2002
The University of Melbourne, Melbourne Institute of Applied Economic and Social Research
20–24 25–34 35–44 45–54 55–64 65–74 75–84 85–95
-1500
-1000
-500
0
500
1000
1500
2000
2500
3000
Men
Women
Figure 7 Annual Average Net Health Care Benefits by Gender
Source
: HARDING model.
$
Age group (years)
Table 3 Lifetime Health Care Transfers by Gender
(dollars)
Lifetime health services used
Lifetime net health care benefits
Annualised lifetime health services used
Annualised lifetime net health care benefits
Men 54283 –8537 944 –243
Women 71534 10729 1178 125
Source
: HARDING model.
who die before the age of 65 years are net life-time health care losers, paying more in healthtaxes than they receive in health care benefits.Those who live past the age of 65 years becomeincreasingly likely to be net winners, withthose who survive to the age of 95 being nethealth care beneficiaries if they belong to thelowest four quintiles. However, those in the topquintile never become net lifetime beneficia-ries, paying on average far more in health taxesthan they receive in health care benefits duringtheir lifetime. The results suggest that the nethealth care transfers in Australia are more pro-gressive than in the United Kingdom.
9
5.3 Net Health Care Transfers by Gender
Do women do better out of health care transfersthan men do? Despite our assumption of equalsharing of income within marriage, women re-ceive lower earnings than men do during the
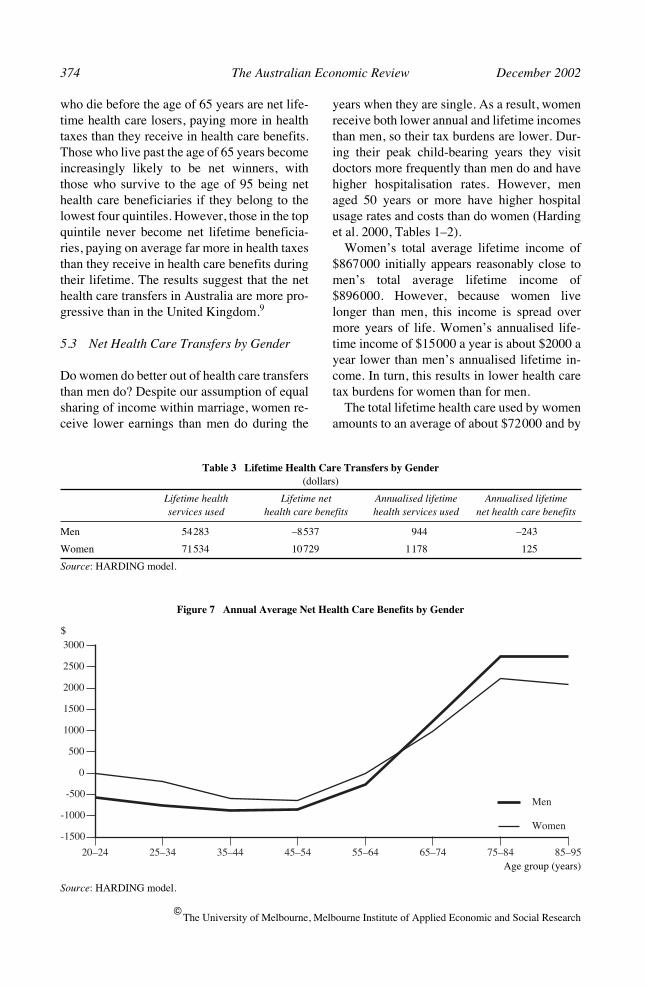
years when they are single. As a result, womenreceive both lower annual and lifetime incomesthan men, so their tax burdens are lower. Dur-ing their peak child-bearing years they visitdoctors more frequently than men do and havehigher hospitalisation rates. However, menaged 50 years or more have higher hospitalusage rates and costs than do women (Hardinget al. 2000, Tables 1–2).
Women’s total average lifetime income of$867000 initially appears reasonably close tomen’s total average lifetime income of$896000. However, because women livelonger than men, this income is spread overmore years of life. Women’s annualised life-time income of $15000 a year is about $2000 ayear lower than men’s annualised lifetime in-come. In turn, this results in lower health caretax burdens for women than for men.
The total lifetime health care used by womenamounts to an average of about $72000 and by
Harding et al.: Lifetime Distributional Impact of Government Health Outlays 375
The University of Melbourne, Melbourne Institute of Applied Economic and Social Research
20–24 25–34 35–44 45–54 55–64 65–74 75–84 85–95
-40000
-30000
-20000
-10000
0
10000
20000
30000
40000
50000
Men
Women
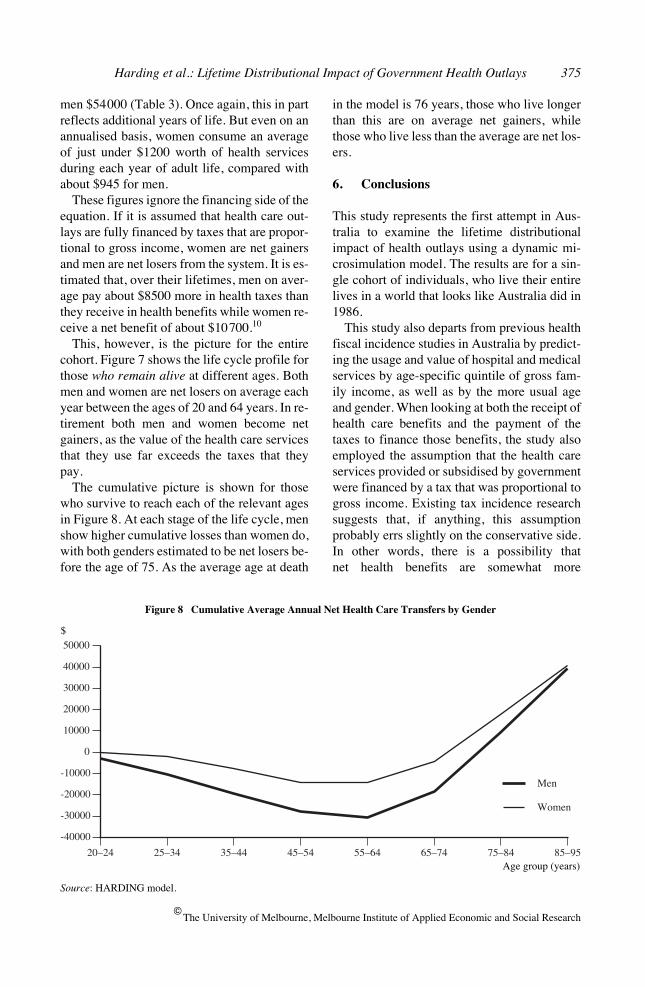
Figure 8 Cumulative Average Annual Net Health Care Transfers by Gender
Source
: HARDING model.
$
Age group (years)
men $54000 (Table 3). Once again, this in partreflects additional years of life. But even on anannualised basis, women consume an averageof just under $1200 worth of health servicesduring each year of adult life, compared withabout $945 for men.
These figures ignore the financing side of theequation. If it is assumed that health care out-lays are fully financed by taxes that are propor-tional to gross income, women are net gainersand men are net losers from the system. It is es-timated that, over their lifetimes, men on aver-age pay about $8500 more in health taxes thanthey receive in health benefits while women re-ceive a net benefit of about $10700.
10
This, however, is the picture for the entirecohort. Figure 7 shows the life cycle profile forthose
who remain alive
at different ages. Bothmen and women are net losers on average eachyear between the ages of 20 and 64 years. In re-tirement both men and women become netgainers, as the value of the health care servicesthat they use far exceeds the taxes that theypay.
The cumulative picture is shown for thosewho survive to reach each of the relevant agesin Figure 8. At each stage of the life cycle, menshow higher cumulative losses than women do,with both genders estimated to be net losers be-fore the age of 75. As the average age at death
in the model is 76 years, those who live longerthan this are on average net gainers, whilethose who live less than the average are net los-ers.
6. Conclusions
This study represents the first attempt in Aus-tralia to examine the lifetime distributionalimpact of health outlays using a dynamic mi-crosimulation model. The results are for a sin-gle cohort of individuals, who live their entirelives in a world that looks like Australia did in1986.
This study also departs from previous healthfiscal incidence studies in Australia by predict-ing the usage and value of hospital and medicalservices by age-specific quintile of gross fam-ily income, as well as by the more usual ageand gender. When looking at both the receipt ofhealth care benefits and the payment of thetaxes to finance those benefits, the study alsoemployed the assumption that the health careservices provided or subsidised by governmentwere financed by a tax that was proportional togross income. Existing tax incidence researchsuggests that, if anything, this assumptionprobably errs slightly on the conservative side.In other words, there is a possibility thatnet health benefits are somewhat more
376 The Australian Economic Review December 2002
The University of Melbourne, Melbourne Institute of Applied Economic and Social Research
redistributive over the lifetime than suggestedin this study.
However, even recognising that more redis-tribution may actually be taking place than sug-gested by the slightly conservative health taxassumption employed, the study still suggestedthat publicly financed and subsidised healthcare did have a major redistributive impactover the lifetime.
The study suggested that government-financed health care in Australia leads to fourmajor types of lifetime redistribution:
• from those who have relatively short lives tothose who have relatively long lives;
• from the affluent to the poorer, with the 40per cent of individuals in the top four lifetimeincome deciles being net losers and the bot-tom 60 per cent being net winners fromhealth transfers;
• from those without children to those withlarger families, with those who remain singleand never having children being the greatestlosers; and
• from men to women.
Interestingly, the results underline the impor-tance of the Australian public health system asa mechanism for reallocating resources acrossthe life cycles of individuals, using taxes leviedduring the peak working years to fund benefitsreceived in old age. Thus, despite the extensivepatterns of redistribution occurring, on averagethree-quarters of all health care services re-ceived during the lifetime were funded by taxesincident upon the same individual at some stageof their life cycle. In other words, about three-quarters of all redistribution achieved via thehealth system was intrapersonal, funding healthbenefits received from taxes levied in the sameor other years of that individual’s life. The re-sidual one-quarter represented interpersonal re-distribution, from one individual to another.
The most progressive health service over thelifetime appeared to be the provision of phar-maceutical benefits, followed by public hospi-tal subsidies. Medical outlays appeared less
progressive over the lifetime than hospital sub-sidies.
The study also suggests that the numerouscross-sectional studies of the incidence of gov-ernment health outlays overstate the longerterm redistributive effect of such outlays. Overthe lifetime, some of the differences betweenindividuals are smoothed out, so that the life-time distribution of government health outlaysis more even than that suggested by cross-sectional snapshots. Nevertheless, the lifetimehealth outlays distribution is still markedlypro-poor in effect in Australia.
One of the drawbacks with dynamic micro-simulation models is that they are very ex-pensive to construct, with development coststypically ranging from hundreds of thousandsto millions of dollars. Accordingly, it was notpossible for us to update the model used to pro-duce all the above results to take account ofchanges in Australian society since 1986.However, it is possible to summarise some ofthe major health changes since then and pointto their likely impact upon the findings. Duringthe past decade there has been a particularlyrapid rise in Pharmaceutical Benefits Schemeexpenditures, resulting from the listing of anumber of expensive new medications, an in-crease in the number of Pharmaceutical Bene-fits Scheme prescriptions per person per yearand an extension of health concession cardcoverage of the aged. Given the progressivityof the scheme’s outlays, this may have resultedin greater targeting of health outlays towardslower income groups.
There has also been a marked rise in privatehealth insurance coverage, following the intro-duction of the private health insurance rebate, apenalty for uninsured higher income earnersand the introduction of lifetime health insur-ance. There is some uncertainty about whetherthe newly insured are continuing to enter pub-lic hospitals as public patients, rather than de-claring their private insurance status or,alternatively, entering private hospitals. To theextent that this is occurring, this may againhave resulted in greater targeting of health out-lays towards lower income groups.
A third factor has been the continuing in-creases in government expenditure on health,
Harding et al.: Lifetime Distributional Impact of Government Health Outlays 377
The University of Melbourne, Melbourne Institute of Applied Economic and Social Research
after taking out the impact of inflation. How-ever, in all three of the examples mentionedabove, any impact is likely to have been greaterupon cross-sectional estimates of the incidenceof health outlays, rather than upon the lifetimeincidence estimated in this study. This is be-cause, over the lifetime, individuals generallymove between periods of higher and lower in-come—so that health reforms that may appearvery progressive at a single point in time areless progressive over the entire lifetime.
First version received September 2001;final version accepted May 2002 (Eds).
Endnotes
1. Extensions to the original model have com-prised the imputation of wholesale sales taxand excises (Harding 1993b) and the evalua-tion of income-contingent student loans (Chap-man and Harding 1993; Harding 1995a).
2. The imputation methodology is described indetail in Harding et al. (2000).
3. The modelling includes funding from publicsources only and does not include private pay-ments for public or private hospital care eitheras direct payments from patients or throughtheir insurers (Schofield 1998a, p. 7).
4. This approach differs from that followed in asimilar dynamic cohort microsimulation mod-elling exercise by Propper (1992), as Propperattributed health benefits to individuals fromtheir birth to their death and did not attributebenefits to parents on behalf of their children.However, such a methodology does not capturethe differential benefits received from publichealth outlays by those who do and do not havechildren.
5. See Harding (1993a, pp. 46–8) for a moreextensive account of the problems created bydifferential length of life and the annualisingprocedure.
6. This technique is frequently employed bymicrosimulation and other modellers (see, for
example, Harding 1993a; Propper 1992;Davies, St-Hilaire and Whalley 1984).
7. This phenomenon is also apparent in otherstudies of the annual incidence of health out-lays. For example, in the 1988–89 ABS fiscalincidence study the estimated health benefitsconsumed by decile 1 are lower than those con-sumed by deciles 2 and 3, and this seems to belargely because the bottom decile householdsare much smaller on average than householdsin all other deciles (ABS 1992, pp. 10–11).
8. For couples, tax burdens were assumed to besplit equally between the partners. Thus, in acouple where the husband worked in the paidlabour force and the wife was a homemaker,the husband was not assumed to bear all of theincidence of tax. Instead, it was assumed thattax burdens affected the living standards of thewhole family rather than just the nominalpayer, so tax burdens were assumed to beequally shared between couples. This appearsto differ from the tax incidence assumptionsmade by Propper, which may explain why herhealth incidence results by gender are differentfrom our results.
9. At first glance, Figure 6 seems reasonablysimilar to Propper’s results for the UnitedKingdom (1992, p. 194). However, it should benoted that Propper assumes that UK health out-lays are financed by only direct (income) taxes,whereas we have assumed that Australianhealth outlays are financed by a tax propor-tional to gross income. The more progressivehealth outlays in Australia combined with amore regressive tax assumption than used byPropper cancel each other out to some extent,resulting in a fairly similar net lifetime inci-dence pattern for the two countries. Even so,the Australian health system appears to bemore redistributive than the UK national healthsystem over the lifetime.
10. The average losses of men do not exactlymatch the average gains of women. This is be-cause, among other reasons, there are slightlymore women than men in the cohort due towomen’s lower death rates.
378 The Australian Economic Review December 2002
The University of Melbourne, Melbourne Institute of Applied Economic and Social Research
References
Australian Bureau of Statistics 1992,
1988–89Household Expenditure Survey, Australia:The Effects of Government Benefits andTaxes on Household Income
, Cat. no.6537.0, ABS, Canberra.
Australian Bureau of Statistics 1996a,
1993–94Household Expenditure Survey, Australia:The Effects of Government Benefits andTaxes on Household Income
, Cat. no.6537.0, ABS, Canberra.
Australian Bureau of Statistics 1996b,
The Ef-fects of Government Benefits and Taxes onHousehold Income: Methods and Assump-tions
, Household Income and ExpenditureSection Working Paper 96/1, ABS, Can-berra.
Chapman, B. and Harding, A. 1993, ‘Austra-lian student loans’,
Australian Economic Re-view
, 1st quarter, pp. 61–75.Davies, J., St-Hilaire, F. and Whalley, J. 1984,
‘Some calculations of lifetime tax inci-dence’,
American Economic Review
, vol. 74,pp. 633–49.
Hain, W. and Helberger, C. 1986, ‘Longitudi-nal microsimulation of lifetime income’, in
Microanalytic Simulation Models to SupportSocial and Financial Policy
, eds G. Orcutt, J.Merz and H. Quinke, North Holland, NewYork.
Harding, A. 1993a,
Lifetime Income Distribu-tion and Redistribution
, North Holland, Am-sterdam.
Harding, A. 1993b, ‘Lifetime vs annual inci-dence of indirect taxes: Wholesale sales taxand excises’, in
Fightback: An Economic As-sessment
, Conference Series no. 12, ed. J.Head, Australian Tax Research Foundation,Melbourne.
Harding, A. 1995a, ‘Financing higher educa-tion: An assessment of income-contingentloan options and repayment patterns over thelifecycle’,
Education Economics
, vol. 3, pp.173–203.
Harding, A. 1995b, ‘The impact of health, edu-cation and housing outlays upon incomedistribution in Australia in the 1990s’,
Aus-tralian Economic Review
, 3rd quarter, pp.71–86.
Harding, A. 1995c, ‘Lifetime vs annual tax-transfer incidence: How much less progres-sive?’,
Economic Record
, vol. 69, pp. 179–91.
Harding, A., Percival, R., Schofield, D. andWalker, A. 2000, ‘The lifetime impact ofgovernmental health outlays’, DiscussionPaper no. 47, National Centre for Social andEconomic Modelling, University of Can-berra.
Johnson, D., Manning, I. and Hellwig, O. 1995,
Trends in the Distribution of Cash and Non-Cash Benefits
, Report to the Department ofPrime Minister and Cabinet, AGPS, Can-berra.
Landt, J., Percival, P., Schofield, D. and Wil-son, D. 1995, ‘Income inequality in Austra-lia: The impact of non-cash subsidies forhealth and housing’, Discussion Paper no. 5,National Centre for Social and EconomicModelling, University of Canberra.
Orcutt, G. 1957, ‘A new type of socio-economic system’,
Review of Economics andStatistics
, vol. 58, pp. 773–97.Orcutt, G., Merz, J. and Quinke, H. 1986,
Mi-croanalytic Simulation Models to SupportSocial and Financial Policy
, North Holland,New York.
Propper, C. 1992, ‘For richer, for poorer, insickness and in health: The lifetime distribu-tion of NHS health care’, in
The Dynamic ofWelfare—The Welfare State and the Life Cy-cle
, eds J. Falkingham and J. Hills, Har-vester, Hemel Hempstead.
Raskall, P. and Urquhart, R. 1994,
Inequality,Living Standards and the Social Wage dur-ing the 1980s
, Study of Social and EconomicInequalities Monograph no. 3, University ofNew South Wales, Sydney.
Schofield, D. 1998a, ‘Public expenditure onhospitals: Measuring the distributional im-pact’, Discussion Paper no. 37, NationalCentre for Social and Economic Modelling,University of Canberra.
Schofield, D. 1998b, ‘Re-examining the distri-bution of health benefits in Australia: Whobenefits from the Pharmaceutical BenefitsScheme?’, Discussion Paper no. 36, NationalCentre for Social and Economic Modelling,University of Canberra.
Harding et al.: Lifetime Distributional Impact of Government Health Outlays 379
The University of Melbourne, Melbourne Institute of Applied Economic and Social Research
Summers, R. 1956, ‘An econometric investiga-tion of the size distribution of lifetime aver-age annual income’, Technical Report no.31, Department of Economics, Stanford Uni-versity.
Thurect, L., Walker, A., Bill, A., Harding, A.,Gibbs, A. and Pearse, J. 2002, ‘Socioeco-nomic characteristics of NSW hospital usersin 1998–99’, paper presented to Health Out-comes Conference, Canberra, 18 July.
Walker, A. and Abello, A. 2000, ‘Changes inthe health status of low income groups in
Australia, 1977–78 to 1995’, DiscussionPaper no. 52, National Centre for Social andEconomic Modelling, University of Can-berra.
Warren, N. 1997, ‘Recent trends in Australiantaxation and their impact on tax incidence’,in
Taxation towards 2000
, ed. J. Head,Australian Tax Research Foundation, Syd-ney.
Wolfson, M. 1988, ‘Homemaker pensions andlifetime redistribution’, Review of Incomeand Wealth, vol. 34, pp. 221–50.