Embed Size (px)
Citation preview
THE WORLD BANK
EDITED BY
Aline Coudouel
Stefano Paternostro
V O L U M E T W O
Analyzing theDistributionalImpact of Reforms A practitioner’s guide to pension, health,
labor markets, public sector downsizing,
taxation, decentralization, and
macroeconomic modeling
Pub
lic D
iscl
osur
e A
utho
rized
Pub
lic D
iscl
osur
e A
utho
rized
Pub
lic D
iscl
osur
e A
utho
rized
Pub
lic D
iscl
osur
e A
utho
rized

Analyzing the Distributional Impact of Reforms

THE WORLD BANKWashington, D.C.
EDITED BY
Aline Coudouel
Stefano Paternostro
Analyzing theDistributionalImpact of ReformsA practitioner’s guide to pension, health,
labor markets, public sector downsizing,
taxation, decentralization, and
macroeconomic modeling
V O L U M E T W O
©2006 The International Bank for Reconstruction and Development / The WorldBank1818 H Street NWWashington DC 20433Telephone: 202-473-1000Internet: www.worldbank.orgE-mail: [email protected]
All rights reserved
1 2 3 4 5 10 09 08 07 06
This volume is a product of the staff of the International Bank for Reconstructionand Development / The World Bank. The findings, interpretations, and conclusionsexpressed in this volume do not necessarily reflect the views of the Executive Direc-tors of The World Bank or the governments they represent.
The World Bank does not guarantee the accuracy of the data included in this work.The boundaries, colors, denominations, and other information shown on any map inthis work do not imply any judgement on the part of The World Bank concerning thelegal status of any territory or the endorsement or acceptance of such boundaries.
Rights and PermissionsThe material in this publication is copyrighted. Copying and/or transmitting por-
tions or all of this work without permission may be a violation of applicable law. TheInternational Bank for Reconstruction and Development / The World Bank encour-ages dissemination of its work and will normally grant permission to reproduceportions of the work promptly.
For permission to photocopy or reprint any part of this work, please send a requestwith complete information to the Copyright Clearance Center Inc., 222 RosewoodDrive, Danvers, MA 01923, USA; telephone: 978-750-8400; fax: 978-750-4470;Internet: www.copyright.com.
All other queries on rights and licenses, including subsidiary rights, should beaddressed to the Office of the Publisher, The World Bank, 1818 H Street NW, Wash-ington, DC 20433, USA; fax: 202-522-2422; e-mail: [email protected].
Cover design and typesetting by Circle Graphics
ISBN-10: 0821363484ISBN-13: 978-0-8213-6348-5eISBN: 978-0-8213-6349-2DOI: 10.1596/978-0-8213-6348-5
Library of Congress Cataloging-in-Publication Data has been applied for
V O L U M E T W O C O N T E N T S
v
A C K N O W L E D G M E N T S xi
A B O U T T H E A U T H O R S xiii
I N T R O D U C T I O N xix
1 Pension System Reforms 1
Anita M. Schwarz
2 Health Sector Reforms 43
Mattias Lundberg and Limin Wang
3 Selected Labor Market Reforms 111
Aline Coudouel and Pierella Paci
4 Public Sector Downsizing 213
Juan Jose Diaz
5 Indirect Tax and Public Pricing Reforms 255
David Coady
6 Decentralization Reforms 313
Kai Kaiser
7 Macroeconomic Shocks and Policies 355
B. Essama-Nssah
B O X E S
2.1. Econometric Research on User Charges 86
3.1. Labor Market Reforms Do Not Happen in a Vacuum 116
3.2. Examples of Types of Market Failures in the Market for Labor 125
4.1. Labor Market Characteristics of State-Owned Enterprises 217
4.2. Retrenchment and Rehiring in Peru 226
4.3. Unconsolidated Budgets and Downsizing in Brazil 232
6.1. Assessing Fiscal Equalization: The Case of Indonesia 324
6.2. Checklist for Distributional Impact Analysis of Decentralization 338
7.1. Lorenz Curve Approach, POVCAL: Assessing Poverty Dynamics in Madagascar 365
7.2. Lorenz Curve Approach, SimSIP Poverty: Predicting the Effect of Aggregate Growth on Poverty in Paraguay 366
7.3. Unit Record Approach, PovStat: Growth, Inequality,and Simulated Poverty Paths for Tanzania 369
7.4. Unit Record Approach: The Envelope Model Gainers and Losers in Trade Reform in Morocco 372
7.5. Unit Record Approach, Household Income and OccupationalChoice Model: A Microsimulation Study on Côte d’Ivoire 376
7.6. CGE Model: The Impact of Trade Policies on Income Distribution in a Planning Model for Colombia 384
7.7. The 123PRSP Model: Distributional Effects ofMacropolicies and Shocks in Zambia 393
7.8. PAMS II: A Reduced-Form Application of PAMS to Indonesia 401
7.9. The IMMPA Model: Adjustment Policies and the Poor in Brazil 405
F I G U R E S
1.1. Comparison of Internal Rates of Return in a Social Security System over Time, United States, 1960 and 2005 12
1.2. Deficits in the Turkish Pension System 29
1.3. Pension Equity within a Cohort of Women 34
1.4. APEX Models of Pension Systems 36
2.1. The Determinants of Health Outcomes 47
3.1. Selected Indexes of Labor Market Rigidities across Regions 113
3.2. An International Comparison of Selected Indicators of Employment Protection Legislation 119
4.1. A Downsizing Decision Tree 219
Contents
vi
6.1. Subnational Expenditure and Revenue Shares 321
6.2. Levels of Fiscal-Distributional Impacts 323
6.3. DAU 2006: Actual versus Formula-Based Distribution 325
6.4. Ratio of Actual to Formula-Based DAU, 2006 326
6.5. The Accountability Triangle 331
T A B L E S
1.1. Distribution of the Beneficiaries of Federal Public Expenditures on Pensions, Mexico, 2002 38
2.1. Definition of Equity in Health Policy 49
2.2. Typology of Selected Health Sector Reforms 54
2.3. Health Sector Reforms in Selected Countries 61
2.4. Archetypal Community-Based Health Financing in Africa and Asia 63
2.5. Stakeholders in the Health Reform Process 67
2.6. Health Reform Transmission Channels 71
2.7. Indicators of Health Sector Reforms 77
2.8. Qualitative Analysis of Health Sector Reforms 84
2.9. Quantitative (Econometric) Studies of Health Sector Reforms 88
2.10. Experimental and Quasi-Experimental Evaluations in Health 91
3.1. Average Size of the Informal Economy in Terms ofValue Added, by Region, 2000 114
3.2. Employment Protection Legislation Reforms in Europe since 1985 122
3.3. Cumulative Employment Response of Firms in the GreaterJohannesburg Metropolitan Area to the Stricter Labor Policies of 1995–9, 1999 150
3A.1. Characteristics of the Minimum Wage in Selected Countries 176
3A.2. International Comparisons of Alternative Indicators of the Stringency of Employment Protection Legislation 208
4.1. Distribution of Employment Reduction Methods in Retrenchment Programs, 1990s 215
4.2. Determinants of Losses from Job Separations 235
5.1. Alternative Approaches for Evaluating the Welfare Impacts of Tax and Price Reforms 259
6.1. Potential Links between Decentralization and the Poor 315
6.2. Types of Decentralization 318
6.3. Core World Bank Instruments for Impact Analysis on Decentralization 339
Contents
vii
7.1. Modeling the Poverty and Distributional Impacts of Macroeconomic Shocks and Policies 358
7.2. Poverty Measures and the Decomposition of Poverty Outcomes, Madagascar, 1962–80 365
7.3. Simulations of the Impact of Growth Patterns on Poverty in Paraguay: Some Examples 366
7.4. Sectoral Decomposition of the Change in Poverty 370
7.5. Gainers and Losers in Four Trade Reform Scenarios 372
7.6. Decomposition by Microsimulation of the Change in the Distribution 376
7.7. Structure of a SAM for an Open Economy 380
7.8. Income Distribution Measures for a Model of Colombia 384
7.9. Impact of Shocks in Government Expenditures and Copper Prices 394
7.10. Poverty Implications of an Improvement in the Terms of Trade 401
7.11. Brazil Simulation Results: Impact of a 10 Percentage PointIncrease in the Interest Rate 405
C H A P T E R A N N E X E S
C H A P T E R 3
1. Characteristics of the Minimum Wage in Selected Countries 173
2. International Comparisons of Alternative Indicators of theStringency of Employment Protection Legislation 207
C H A P T E R 5
1. Theoretical Approach to Evaluating the Social WelfareImpact of Price Reforms 293
2. Alternative Price-Shifting Models 301
3. General Lessons from Tax Theory 308
C H A P T E R 7
1. Selected Tools for the Poverty and Social Impact Analysis ofMacroeconomic Shocks and Policies 419
Contents
viii
Published in 2005 by the World BankISBN 0-8213-6181-3
EDITED BY
Aline Coudouel
Stefano Paternostro
Analyzing theDistributionalImpact of ReformsA practitioner’s guide to trade, monetary
and exchange rate policy, utility provision,
agricultural markets, land policy, and
education
V O L U M E O N E
x
V O L U M E O N E C O N T E N T S
1 Trade Policy Reforms 1
Maurizio Bussolo and Alessandro Nicita
2 Monetary and Exchange Rate Policy Reforms 39
Patrick Conway
3 Utility Reforms 73
Vivien Foster, Erwin R. Tiongson,and Caterina Ruggeri Laderchi
4 Agricultural Market Reforms 145
Mattias Lundberg
5 Land Policy Reforms 213
Klaus Deininger
6 Education Policy Reforms 261
Erwin R. Tiongson

AC K N OW L E D G M E N T S
xi
The preparation of this volume has benefited from invaluable contri-butions from many colleagues. We would like to acknowledge bothwritten inputs and helpful comments provided for the entire project
or for individual chapters from Luca Barbone, Mark Camden Bassett,Gordon Betcherman, Shiyan Chao, David Coady, Shanta Devarajan,Daniel Dulitzky, David Evans, Deon Filmer, Emanuela Galasso, Delfin S.Go, Markus Goldstein, Dave Gwatkin, Oleksiy Ivaschenko, MoatazMostafa Kamel El Said,Vijdan Korman, Silvana Kostenbaum, Philippe LeHouerou, Jennie Litvack, Hans Löfgren, Antonio Nucifora, Martin Rama,Ana Revenga, George Schieber, Sudhir Shetty, Yvonne Sin, QuentinWodon. Many chapters also benefited from comments received at vari-ous seminars held both inside and outside the World Bank. Cecile Wodonand Robert Zimmermann provided invaluable technical and editorialassistance.

V O L U M E S O N E A N D T W O
A B O U T T H E AU T H O R S
xiii
Maurizio Bussolo, at the World Bank since 2003, works on quantitativeanalyses of economic policy and development, including studies of thelinks among trade, growth, and poverty. He has previously worked at theOrganisation for Economic Co-Operation and Development, the Over-seas Development Institute (London), and Fedesarrollo and the Univer-sity of Los Andes (Bogotá). He holds a PhD in economics from theUniversity of Warwick. He has published in international journals. Hisrecent publications include Globalization and Poverty: Channels and Poli-cies (Routledge, London 2005), which he jointly edited with Jeff Round,and Structural Change and Poverty Reduction in Brazil: The Impact of theDoha Round, with Jann Lay and Dominique van der Mensbrugghe.
David Coady is a technical assistance advisor to the Poverty and SocialImpact Analysis Group in the Fiscal Affairs Department of the Interna-tional Monetary Fund. His research interests include public economicsand development economics. Recently, his research has focused on theevaluation of the targeting, financing, and impact of conditional cash-transfer programs. He has coauthored (with Margaret Grosh and JohnHoddinott) Targeting of Transfers in Developing Countries: Review ofLessons and Experience (World Bank and International Food PolicyResearch Institute, Washington, DC 2004), which reviews the design andimplementation of targeted transfer programs. Prior to joining the Fund,he was a research fellow at the International Food Policy Research Insti-tute between 1998 and 2004 and a lecturer in economics at the Universityof London between 1992 and 1998.
Patrick J. Conway is professor of economics at the University of NorthCarolina at Chapel Hill. He has been on the faculty there since 1983. His
research has focused on the international aspects of trade and financewith developing countries. He is the author of three books and many ref-ereed journal articles. His current research interests include the impact ofInternational Monetary Fund lending programs on developing-countrywelfare, the development of financial markets in transition economies,the welfare impact of exchange-rate depreciation in developing countries,and the impact on United States workers of U.S. textile and apparelimports.
Aline Coudouel is a senior economist with the Poverty Group at the WorldBank. She leads the team working on poverty analysis, monitoring, andimpact evaluation. She has been involved in the Poverty and SocialImpact Analysis agenda in the World Bank since its inception, definingthe approach and advising teams on its implementation for selectedcountries and reforms. She is one of the contributors to A User’s Guide toPoverty and Social Impact Analysis (World Bank 2003). She is the coeditor(with Stefano Paternostro) of Analyzing the Distributional Impact ofReforms, volume one, on guidance for the PSIA in selected sectors (WorldBank 2005), and coeditor (with Anis A. Dani and Stefano Paternostro) ofPoverty and Social Impact Analysis of Reforms: Lessons and Examples fromImplementation (World Bank 2006), a volume on operational experiencesin implementing PSIA.
Klaus W. Deininger is a lead economist in the World Bank’s DevelopmentResearch Group. His main areas of interest are income and asset inequal-ity and its relationship to poverty reduction and growth; access to land,land markets, and land reform, and their impact on household welfareand agricultural productivity; land tenure and the design and economicand social impact of measures aimed at increasing tenure security; andcapacity building (including the use of quantitative and qualitative meth-ods) for policy analysis and program evaluation.
Juan Jose Diaz is an associate researcher at the Group for the Analysis ofDevelopment, a Peruvian think-tank. His areas of interest include laboreconomics, the evaluation of social programs, and development. He hasrecently been working on research projects related to the effectiveness ofnonexperimental evaluation methods of social programs, the evaluationof job-training programs in Peru, and the relationship between healthcare use and access to social security and private health insurance among
About the Authors
xiv
the elderly in Mexico. He has served as consultant for the World Bank andthe Inter-American Development Bank. He holds a PhD in economicsfrom the University of Maryland.
B. Essama-Nssah is a senior economist with the Poverty Reduction Groupat the World Bank, where he has been working on the development and application of simulation models for the study of the impact of eco-nomic shocks and policies on poverty and income distribution. He is theauthor of Inégalité, pauvreté et bien-être social: Fondements analytiques etnormatifs (Inequality, Poverty, and Social Well-Being: The Analytical andNormative Underpinnings, De Boeck Université, Brussels 2000). He was a senior research associate with the Food and Nutrition Policy Programat Cornell University from 1990 to 1992. From 1984 to 1989, he was vicedean of the Faculty of Law and Economics and head of the EconomicsDepartment at the University of Yaoundé (Cameroon). He holds a PhDin economics from the University of Michigan.
Vivien Foster is a senior economist in the Infrastructure Economics andFinance unit at the World Bank. She specializes in infrastructure issues,including pricing, subsidies, regulation, private sector participation, andsector reform. She has more than 10 years’ experience advising govern-ments in Latin America on various aspects of infrastructure reform, par-ticularly with regard to the water sector, and has also contributed toprojects in Africa, Asia, and Eastern Europe. Her research has focused onthe social impacts of infrastructure reform and the design of infrastruc-ture subsidies. Before joining the Bank, she worked as an economic con-sultant with Oxford Economic Research Associates Ltd in the UnitedKingdom. She holds a Bachelor’s degree from the University of Oxford, aMaster’s from Stanford University, and a PhD from University CollegeLondon.
Kai Kaiser is an economist with the Public Sector Group at the WorldBank. His current work focuses on public finance, decentralization, andthe governance of service delivery. He was previously based in Jakartaduring the unfolding of a major decentralization reform. He is nowengaged in a research project to assess the impact of decentralization inIndonesia, including a series of governance and decentralization surveysmeant to assess decentralized outcomes in public service delivery andaccountability. He has also recently worked on decentralization reformsin Africa and South Asia.
About the Authors
xv
Mattias K. A. Lundberg is an agricultural economist by training, but hasfocused more recently on issues of income distribution, impact evalua-tion, and health sector reforms. He is one of the contributors to A User’sGuide to Poverty and Social Impact Analysis (World Bank 2003) and hasrecently completed a toolkit on “Public Expenditure Reviews in HumanDevelopment” for the World Bank. His published research includespapers on the impact on households of crises such as HIV/AIDS andflood exposure and on the relationship between income distribution andgrowth. He is currently on the staff of World Development Report 2007.
Alessandro Nicita is a consultant in the Development and EconomicResearch Group at the World Bank. His research focuses on issues relatedto international trade and development. His work has included the analy-sis of the effect of international trade policies on the exports of low-income countries, as well as the effect of trade policies on poverty andinequality. Most recently, he has been working extensively on the impactof World Trade Organization agreements and of the Doha DevelopmentAgenda on Least Developed Countries. He has authored several publica-tions in the field of trade and development and collaborated on a numberof World Bank reports. He holds a PhD in economics from the Universitéde Genève.
Pierella Paci is a lead economist in the Poverty Reduction Group at theWorld Bank. A labor economist by training, she has, since her arrival atthe Bank, worked extensively in the area of poverty, the labor market, andgender. Before joining the Bank, she taught labor economics, economet-rics, and public economics at a number of universities in the United King-dom and published widely in the areas of labor economics, the economicsof inequality and poverty, and the economics of gender. She has a Laureain economics from the University of Rome and a PhD from the Univer-sity of Manchester. Her regional experience is predominantly on Europe,the former Soviet Union and other transition economies, and LatinAmerica.
Stefano Paternostro is a lead economist in the World Bank’s Africa RegionHuman Development Group. From 2002 to 2005, he coordinated theWorld Bank Poverty Group’s work on poverty and social impact analysis,developing and disseminating methodologies to assess impacts of policyreforms, producing A User’s Guide to Poverty and Social Impact Analysis(World Bank 2003) and “Good Practice Note: Using Poverty and Social
About the Authors
xvi
Impact Analysis to Support Development Policy Operations” (WorldBank 2004) and coordinating with external partners on operationalissues. He is the coeditor (with Aline Coudouel) of the first volume onguidance for the PSIA in selected sectors, Analyzing the DistributionalImpact of Reforms (World Bank 2005), and coeditor (with Aline Coudoueland Anis A. Dani) of Poverty and Social Impact Analysis of Reforms:Lessons and Examples from Implementation (World Bank 2006), a volumeon operational experiences in implementing PSIA.
Caterina Ruggeri Laderchi is an economist in the Poverty Reduction andEconomic Management unit for Eastern Africa at the World Bank, whereshe has been working on issues involving Ethiopia and Sudan. Her cur-rent efforts are focused on the integration of Millennium DevelopmentGoal strategies in government plans and Poverty Reduction StrategyPapers, poverty and distributional analysis, particularly in urban con-texts, and impact evaluation and labor markets. Before joining the WorldBank in 2003, she worked on poverty for the Human DevelopmentReport Office of the United Nations Development Program and on labormarkets for the Directorate-General for Employment, Social Affairs, andEqual Opportunities, European Commission.
Anita M. Schwarz is a lead economist in the Human DevelopmentDepartment in the World Bank’s Europe and Central Asia Region. Shefocuses on pensions. Previous to her current appointment, she was leadeconomist in the Bank’s Social Protection Department, where she wasteam leader for the pensions work throughout the Bank. She was part ofthe research department team that produced Averting the Old Age Crisis:Policies to Protect the Old and Promote Growth (Oxford University Press1994), the Bank’s seminal initiation into the world of pension reform. Sheholds a doctorate in economics from the University of Chicago and wasan assistant professor at the University of Delaware and at the ForeignService Institute before joining the World Bank.
Erwin H. R. Tiongson is an economist in the Poverty Reduction and Eco-nomic Management unit of the World Bank Europe and Central AsiaRegion, where he currently works on issues related to poverty, labor mar-kets, and public finance. Between 2003 and 2004, he was a member of theWorld Bank Poverty Group’s PSIA team and provided technical contri-butions to various PSIA-related initiatives. Prior to joining the Bank, hewas at the International Monetary Fund’s Expenditure Policy Division,
About the Authors
xvii

where he was involved in work on the efficiency and equity of publicspending on education and health care in developing countries and tran-sition economies.
Limin Wang is an economist on secondment to the World Bank from theDepartment for International Development (United Kingdom). Sheholds a PhD in economics from the University of Southampton, UnitedKingdom. Her research focuses on impact analysis of policy reforms,income inequality, labor market reforms, and determinants of health out-comes in developing countries. She has contributed to a series of aca-demic publications and policy reports for the World Bank. Before joiningthe Bank in 1999, she was lecturer at King’s College London and aresearch officer at the Suntory and Toyota International Centres for Eco-nomics and Related Disciplines, London School of Economics.
About the Authors
xviii
I N T R O D U C T I O N
xix
The analysis of the distributional impact of policy reforms1 on the well-being and welfare of various stakeholder groups, particularly the poorand vulnerable, has an important role in the elaboration and imple-
mentation of poverty reduction strategies in developing countries. Inrecent years, this type of work has been labeled Poverty and Social Im-pact Analysis (PSIA), and, increasingly, it is being applied to promoteevidence-based policy choices and foster debate on the options in policyreform.
PSIA helps to realize the following tasks:
� analyze the link between policy reforms and the related poverty andsocial impacts
� consider trade-offs among reforms on the basis of the distributionalimpacts
� enhance the positive impacts of reforms and minimize the adverseimpacts
� assess the risks involved in policy reform� design mitigating measures and risk management systems� build country ownership and capacity for analysis
PSIA is not a product in itself. Rather, it is an approach that may beused and prove useful in guiding the analysis of distributional impacts.The process begins with an ex ante analysis of the expected poverty andsocial impacts of policy reforms. This helps in the design of the reforms.Ideally, the approach then involves monitoring the results during theimplementation of the reforms. Finally, where possible, ex post evalua-tions of the poverty and social impacts of the reforms are carried out.PSIA can be an especially important ingredient in the design and imple-
mentation of reforms that are expected to have large distributionalimpacts, are prominent in the policy agenda of governments, and arelikely to provoke significant debate.
AVAILABLE RESOURCES
The World Bank has developed a series of resources over the past fewyears to help practitioners analyze the poverty and social impacts ofreforms.2
First, A User’s Guide to Poverty and Social Impact Analysis3 introducesthe main concepts underlying PSIA, presents major elements of goodpractice in PSIA, and highlights significant constraints on and opera-tional principles of PSIA. The guide highlights key tools that practitionersmay find useful in undertaking a PSIA of policy reforms. It does not aimto be comprehensive in coverage.
Second, as a complement to the user’s guide, the World Bank hasdeveloped assistance through the identification of appropriate tools andtechniques. A first volume, The Impact of Economic Policies on Poverty andIncome Distribution: Evaluation Techniques and Tools,4 is a compendiumof existing techniques, the principles on which they are built, and illus-trative applications. The techniques range from incidence analysis totools linking microeconomic distribution to macroeconomic frame-works or models. A second volume, Evaluating the Impact of Macro-economic Policies on Poverty and Income Distribution using Micro-MacroLinkage Models, is currently being prepared. This volume will present fiveapproaches through which macro-counterfactual experiments can bemodeled and linked to microeconomic data. The World Bank has alsoreleased a sourcebook of Tools for Institutional, Political, and Social Anal-ysis (TIPS) in Poverty and Social Impact Analysis,5 which has beenproduced in partnership with the Department for International Devel-opment (United Kingdom) and draws on a range of multidisciplinarytools to complement econometric analysis.
Third, the World Bank has produced the short “Good Practice Note:Using Poverty and Social Impact Analysis to Support Development Pol-icy Operations,”6 which provides advice to World Bank staff and theircounterparts on promoting PSIA in countries and integrating it withindevelopment policy support operations as envisaged by the World Bank’sOperational Policy on Development Policy Lending (OP 8.60).
Fourth, a book of case studies, Poverty and Social Impact Analysis ofReforms: Lessons and Examples from Implementation,7 provides a detailedaccount of country experiences to date in implementing the PSIA
Introduction
xx
approach, with a view to highlighting the spectrum of sectors and policyreforms to which PSIA can be applied and the range of analytical toolsand techniques that have been used for PSIA, as well as the challengesbeing faced and the lessons being learned in carrying out this work on theground. Each case largely deals with policy reforms in a single sector, suchas agriculture, energy, utilities, education, social welfare, or taxation, butalso includes practical guidelines on macroeconomic modeling.
WHY THE NEED FOR SECTOR-SPECIFIC GUIDANCE
While information is available on general approaches, techniques, andtools for distributional analysis, each sector displays particular charac-teristics. These have implications for the analysis of distributionalimpacts, including the types of impacts and transmission channels thatwarrant particular attention, the tools and techniques most appropriate,the data sources typically required, and the range of political economyfactors most likely to affect the reform process.
Hence, as a complement to the resources listed above, each chapterin this volume provides an overview of the specific issues arising in theanalysis of the distributional impacts of selected categories of policy andinstitutional reform. Each chapter also offers guidance on the selection oftools and techniques most appropriate for the reforms under scrutiny andsupplies examples of applications of these approaches.
The individual chapters are meant to be indicative only; they do notattempt to cover issues for each selected type of reform in an exhaustivefashion. In addition, the chapters mainly focus on economic analysis.8
This is the second volume in a series. The first volume covers six keyareas of policy reforms that are likely to have significant effects on dis-tribution and poverty: trade, monetary and exchange rate policy, utilityprovision, agricultural markets, land policy, and education.9
OUTLINE OF THE VOLUME
Each chapter is organized around the transmission channels throughwhich policy reforms may be expected to have an impact on populations.It provides an overview of the typical direction and magnitude of theexpected impacts, the implementation mechanisms through whichreforms are usually carried out, the stakeholders who are likely to affector be affected by the reforms positively or negatively, and the meth-odologies normally used to analyze the distributional impacts. Eachchapter describes and illustrates these points with examples of tools,
Introduction
xxi
methods, and applications, highlighting key theoretical and practicalsource materials. Each chapter also includes a bibliography.
This volume covers six crucial areas in which policy reform is likelyto have significant effects on distribution and poverty: pensions, healthcare, the labor market, public sector downsizing, indirect taxation andpublic pricing, and decentralization. The final chapter supplies anoverview of approaches to the modeling of macroeconomic shocks andpolicies.
A short synopsis of the most salient features of the individual chap-ters is presented below.10
Pension System Reforms
Anita M. Schwarz, the author of the first chapter, highlights that pensionsystems are designed to provide an income to those individuals who suf-fer a loss in earnings capacity through advanced age, the experience of adisability, or the death of a wage earner in the family. While, in some cases,the systems are designed to facilitate direct transfers from the governmentto particular target groups, the emphasis is, in most cases, on establishinga viable mechanism whereby the individual might insure himself nowagainst the loss of earnings in the future.
The chapter begins with a review of mechanisms for supplying sup-port for the elderly and disabled—namely, contributory versus non-contributory pension systems—and considers redistributive and socialelements within these mechanisms.
The author notes that, while the primary goal of a pension systemshould be to ensure adequate, affordable, sustainable, and robust retire-ment incomes, most of the reforms are motivated by fiscal concerns. Thisarises partly because systems are rarely actuarially designed from the out-set. Hence, the aging of populations, changes in the contributing laborforce, poor system design, and poor administration often lead to systemsthat run deficits.
The chapter discusses the various types of pension system reformsand the distributional and social consequences of each type. Pensionreforms may be grouped into at least four categories: parametric reformsthat involve changes in the parameters of current pension systems, sys-temic reforms that involve the introduction of a new sort of pensionsystem to replace or complement the existing system, regulatory reformsthat involve changes in the investment regulations of funds havinginvestible assets, and, finally, administrative reforms.
Introduction
xxii
Since countries have very different systems, one should consider afew questions before analyzing the poverty and social impact of pensionreforms: Are the elderly poor? What are the living arrangements of theelderly? How much income do the elderly need? What are the coveragerates of the systems? What is the fiscal status of the pension system now,and what will it be in the near future? Is the contribution rate affordable?The author also suggests that the benefit structure should be analyzed toassess the fairness of and the redistribution involved in the system. Threequestions can be used as guidelines in the process, as follows: Are thebenefits adequate? Are the pensions fairly provided? How redistributiveis the pension system?
An important specificity is the fact that the distributional benefits ofpension reforms will not be obvious in the short run since pensionreforms usually take 30 to 40 years to unfold fully, given that acquiredrights must be legally and, in some cases, constitutionally respected.
Health Sector Reforms
In the second chapter, Mattias Lundberg and Limin Wang aim to providea guide for policy practitioners who wish to conduct an analysis of theimpact of health reform or health policy changes on the welfare of house-holds, especially poor households.
The authors discuss the rationale for and the types of reforms thatare common in the health sector and highlight issues that are specific tothe analysis of the sector. The scope of the health reforms implementedin developing countries varies substantially. It is useful, albeit rough andimprecise, to distinguish the reforms into those affecting the supply sideand those affecting the demand side of the health sector, that is, thoseinvolving the financing, management, and provision of services on theone hand and, on the other hand, those involving the demand for andconsumption of services. The vast majority of reforms have focused onthe supply side.
In practice, reforms are generally not implemented independently orpiece by piece. They are often ambitious and far reaching, comprising abroad range of different actions. This has implications for the analysis,since it is difficult convincingly to identify the impact of components ofreform programs. There are also important factors outside the reformsthemselves through which the impact of the reforms is experienced by thepoor. In particular, the demand for services will greatly influence both thelevel and the efficiency of supply, and the perceived quality of services isa major determinant of the consumption of services.
Introduction
xxiii
Health reforms commonly include changes in health financing andchanges in health system organization and management. Changes infinancing may involve cost recovery and user charges for publicly pro-vided services, community-based financing schemes, insurance schemes(social and private), and changes in public expenditure and allocation.Changes in system organization and management may entail decentrali-zation (authority, responsibilities, and functions) and changes in the ownership of service provision and delivery (privatization or a public-private mix). The authors highlight two types of more commonlyimplemented reforms: community-based health financing and thedecentralization of health services.
The authors also discuss the stakeholders in reforms, the trans-mission channels for the impact of reforms, and ways to choose the ap-propriate tools and methods in impact analysis. They focus on twoquantitative tools in particular: conventional econometric welfare analy-sis (derived from a model of household welfare in which welfare or utilityis determined by health status and the consumption of other goods andservices) and the experimental method of randomized controlled trials.
Selected Labor Market Reforms
Employment is widely perceived as one of the most important channelsthrough which the poor can move out of poverty. In making decisions onthe implementation of labor market reforms, policymakers should there-fore be fully aware of the potential direct and indirect impacts on the dis-tribution of incomes of both individuals and households so that the fullsignificance of the policies and reforms in terms of efficiency, equality,and poverty reduction may be adequately evaluated.
The goal of the chapter by Aline Coudouel and Pierella Paci is to pro-vide policymakers with the tools they need to conduct such an assess-ment. The chapter focuses on three labor market policies: the minimumwage, employment protection legislation, and unemployment benefits. Itdescribes possible reforms in these policies and the rationale behind thereforms. The authors also illustrate the channels through which thereforms may impact income distribution and poverty.
Labor market reforms have important potential impacts on incomedistribution and poverty via their effects on the level and distribution ofwages and employment. In any examination of key transmission mecha-nisms, it is crucial to consider explicitly the dual dimensions of the econ-omy and distinguish between the formal or covered sector, where thepolicies apply, and the informal or uncovered sector, where they either do
Introduction
xxiv
not apply or are not enforced. On the whole, stricter, more binding poli-cies result in higher wages for covered workers at the expense of employ-ment in general and covered employment in particular. Thus, the overallimpact of a reform depends on its combined effect on both the demandand the supply of labor in the covered sector and in other sectors of theeconomy. This effect differs according to the policies in place and currentlabor market conditions.
The authors then identify the stakeholders involved in each of thereforms analyzed and outline the tools of analysis and the main impactsof the reforms as identified in the empirical literature. Assessing thepotential distributional impacts of labor market interventions andreforms in labor market institutions is not a simple task. This is due to anumber of factors. Thus, in evaluating the potential impact of interven-tions and reforms on income distribution, one must distinguish betweenthe distribution of earnings and the distribution of income. The formeris defined at the level of individuals and by focusing only on employedworkers. The latter is usually defined at the level of households anddepends on the total labor income of all household members, plusincome from other sources. Another element complicating the analysis isthe fact that impacts are transmitted through both employment andearnings. Changes in policies will also typically affect not only the par-ticular segment of the labor market to which the policy applies, but alsothe rest of the labor market outside these boundaries. Resolving the rele-vant issues therefore calls for broad analysis.
Public Sector Downsizing
This chapter provides an economic analysis of public sector downsizingoperations and illustrates the analysis with examples of reforms duringthe 1980s and 1990s. Juan Jose Diaz presents the most common types of reforms: voluntary departure schemes, involuntary retrenchmentschemes, contracting-out schemes, employee ownership, and privatiza-tion. The rationale for this sort of reform is to address the problem of apublic sector characterized by public agencies and state-owned enter-prises that are overstaffed, bureaucracies that are bloated, and public ser-vices that are inefficient.
One of the most recurrent challenges linked to this type of reform isthe problem of adverse selection in voluntary separation schemes, whichleads to the rehiring of essential staff, overcompensation, externalities ofdownsizing, and difficulties in the appraisal of financial and economicreturns.
Introduction
xxv
The author identifies key stakeholders in these reforms, their likelyresponses, and the dissemination channels of the impacts of the reforms.The financial costs of separation packages designed to compensate dis-placed workers may be substantial, and mass layoffs may generate signif-icant social and political costs. Downsizing operations directly affectstakeholders other than separated workers, such as entire communities inthe case of one-company towns, caterers and providers of services tostate-owned enterprises, and final consumers and taxpayers.
The author concentrates on assessing the welfare losses among dis-missed workers. These consist of the present value of the resulting changein earnings, the present value of the losses in nonwage benefits, and otherintangible losses from separation. Downsizing may generate differentialdistributional impacts. Traditional rules of thumb used to compute sever-ance compensations take into account only current wages and years oftenure in the public sector. Changes in welfare after dismissal are relatedto other observable characteristics that may serve as the basis for thedesign of a “just right” compensation package. In particular, the authorsuggests that a well-tailored downsizing operation may consider the edu-cation, geographic location, and gender of workers. Various studies alsoshow that the just right severance compensation package outperformsmore traditional rules of thumb on the grounds of both costs and fairness.
To help assess the consequences of various downsizing strategies onthe computation of severance packages, the author refers to a computerapplication called the Downsizing Options Simulation Exercise that hasbeen developed by the World Bank.
Indirect Tax and Public Pricing Reforms
It is common for governments in developing countries to influence theprices of goods and services using a range of policy instruments and insti-tutional arrangements. These manipulations typically arise from the needto raise revenue, the desire to redistribute incomes toward the poor ortoward politically important groups, the desire to provide protection fordomestic producers, or the desire to affect the levels of supply or demandin related markets where prices cannot be readily controlled.
David Coady discusses three methodologies for addressing theseissues: the general equilibrium approach, the limited general equilibriumapproach, and the partial equilibrium approach. The general equilibriumapproach allows for all commodity-demand and factor-supply responsesand thus incorporates both the direct and the indirect welfare effects of
Introduction
xxvi
reforms. The use of such models is particularly valuable in analyzing thedistributional impact of reforms that involve significant changes in pro-ducer prices, for instance, trade liberalization. The limited general equi-librium approach typically focuses on a subset of price reforms or allowsfor only a subset of household responses, thereby incorporating only asubset of the indirect effects. The partial equilibrium approach focusesonly on the direct effect of reforms on prices and household real incomes.Simple partial equilibrium analyses may provide valuable information onthe likely magnitude of the impacts of tax and price reforms on house-hold real incomes, as well as the distribution across households. Theyhave relatively low resource costs in terms of data, time, and modelingrequirements and may therefore be undertaken on a routine basis.
The chapter draws lessons from the empirical literature in categor-izing reforms into three groups: tax reforms, trade liberalization, andreforms of public sector prices. Indirect tax reforms include the intro-duction of value-added tax systems in place of existing sales or excisetaxes. Trade liberalization refers to reforms that replace taxes on interna-tional trade with taxes on domestic consumption (including the con-sumption of imported goods). Public sector pricing reforms includereforms that adjust prices controlled by the government.
The author points out that, typically, the introduction of a relativelybroadbased value-added tax in place of a sales tax reduces the progres-sivity of a tax system. It does this by enlarging the tax base to include pre-viously exempt goods and services that are usually relatively moreimportant in the budgets of the poor or by reducing taxes on goods that are relatively more important in the budgets of higher-incomehouseholds. He suggests that, given the substantial leakage of benefits tohigher-income households and the potentially large efficiency costs,manipulating commodity taxes to soften the impact on poor householdsis a very blunt second-best approach to protecting the real incomes of thepoor. In cases where price manipulations provide an effective approachto distribution (for example, low prices for agricultural goods that areboth produced and consumed by rural households), a high efficiency costis usually involved.
Decentralization Reforms
Decentralization may refer to a wide range of reforms, but it is possibleto identify three principal types: deconcentration, delegation, and devo-lution. Kai Kaiser outlines three levels of analysis for a PSIA on decen-tralization depending on the institutional characteristics, the probable
Introduction
xxvii
mechanisms of impact, and the likely available sources of information. Atthe first level, the focus is on the amount and distribution of publicresources across places. At the second level, the analysis concerns the dis-tribution of public resources across people, such as the poor and non-poor, given the prevailing institutional and governance arrangementswithin places. At the third level, the analysis investigates impacts on localgovernance and public service delivery. Assessing the distributionalimpacts of decentralization will typically require a considerable amountof subnational data.
Kaiser describes instruments and methodologies that offer valuableentry points for the analysis. Public expenditure reviews have helped inanalyses of the aggregate level, composition, and operational efficiency ofpublic expenditures. Through public expenditure tracking surveys, onestrives to produce detailed analyses of the extent to which public re-sources actually reach localities and front-line service delivery points.Poverty mapping, using subnational fiscal data and other socioeconomicdata, may be usefully combined to assess incidence across places. Front-line service delivery surveys may provide important insights into decen-tralized outcomes. Specialized surveys, including household and facilitysurveys, may also target dimensions of service delivery not usually foundin standard household socioeconomic surveys, which normally supplyevidence on basic service use and access, but not service quality. Institu-tional and governance reviews may serve as venues for describing thepolitical economy of decentralization reforms.
Inherent in decentralization is the expectation that the outcomes arediverse across subnational jurisdictions. Hence, studies should attempt togather evidence from a sufficiently large number of localities to be repre-sentative and at least indicative of national patterns. The author suggeststhat even the short-run evidence on decentralization is quite fragmented.One explanatory factor may be that decentralization efforts are, by designand manner of implementation, diverse and difficult to compare.Another issue is that the methodologies for establishing the direction andmagnitude of distributional impacts have been idiosyncratic.
Macroeconomic Shocks and Policies
The importance of distributional issues in policymaking creates a needfor empirical tools that can help assess the impact of economic shocksand policies, such as terms-of-trade shocks, fiscal adjustment, monetarypolicy, and trade liberalization, on the living standards of relevant indi-viduals. B. Essama-Nssah reviews some of the modeling approaches that
Introduction
xxviii
are currently available for the analysis of the impact of macroeconomicshocks and policies on poverty and income distribution. These ap-proaches provide a framework that links a macroeconomic model to amodel of the distribution of economic welfare at the individual or house-hold level.
The approaches or specific models described in the chapter vary inthe ways they specify the macroeconomy, the distribution of welfare, andmacro-micro linkages. A first series of models focus only on income dis-tribution, while the macromodel remains implicit. These models can beused in conjunction with assumptions about the response of the macro-economy to shocks and policies. The models in this family include POVCAL and SimSIP, which are purely statistical, and PovStat, themaximum value or envelope model, and the household income andoccupational choice model.
A second series involves embedding distributional mechanismswithin a general equilibrium framework. While the standard representa-tive household approach limits the analysis of the distributional impactof shocks and policies to their effects on representative socioeconomicgroups, the extended representative household approach considers vari-ous socioeconomic groups as representative households. Within a gen-eral equilibrium framework, it is possible to account for various marketand household behavioral adjustments induced by shocks or policies.
The third series adopts a modular approach in linking poverty anddistributional outcomes to macroeconomic shocks and policies. Thesemodels have been influenced by an emerging approach known as Top-Down/Bottom-Up; they try to account for the feedback effects from themicrolevel to the macrolevel and back until convergence is achieved.Within this class, the author focuses on the 123PRSP model (one coun-try, two sectors, and three commodities); the poverty analysis macro-economic simulator; a macro-micro simulation model that uses theinvestment savings–liquidity money framework for macroeconomicanalysis; and the integrated macroeconomic model for poverty analysisframework, which links a dynamic computable general equilibriummodel to unit record data.
The best approach to adopt depends on the problem at hand, thedata, and other resource constraints.
NOTES
1. Here and throughout this book, the word reform is meant to encompass bothpolicy and institutional changes.
Introduction
xxix
2. Refer to http://www.worldbank.org/psia for further information. An elec-tronic learning program (providing a self-paced introduction to PSIAapproaches, tools, and methods) and a series of case studies that illustrategood practice are also available online and are included in the CD ROM inthe case attached to the inside back cover of this volume.
3. Published by the Poverty Reduction Group and Social Development Depart-ment of the World Bank in 2003, the guide is available for download athttp://www.worldbank.org/psia and included in the CD ROM attached to theinside back cover of this volume.
4. Edited by François Bourguignon and Luiz A. Pereira da Silva, the book waspublished by Oxford University Press in 2003. Visit http://www1.worldbank.org/prem/poverty/psia/tools.htm for information. See also http://www.worldbank.org/psia for details about other tools and training materials.
5. More information is available at http://www.worldbank.org/tips.6. Downloadable at http://www.worldbank.org/psia.7. Edited by Aline Coudouel, Anis A. Dani, and Stefano Paternostro and pub-
lished by the World Bank in 2006.8. For more details on institutional, political, and social analyses, see http://
www.worldbank.org/tips.9. Analyzing the Distributional Impact of Reforms: A Practitioner’s Guide to
Trade, Monetary and Exchange Rate Policy, Utility Provision, AgriculturalMarkets, Land Policy, and Education (World Bank, 2005), edited by AlineCoudouel and Stefano Paternostro and available at http://www.worldbank.org/psia.
10. These chapters, updates, and further reference material are available at http://www.worldbank.org/psia.
Introduction
xxx
Pension System Reforms
Anita M. Schwarz
1
1
Pension systems are designed to provide an income to those individu-als who suffer a loss in earnings capacity through advanced age, theexperience of a disability, or the death of a wage earner in the family.
The systems are designed in some cases to facilitate direct transfers fromthe government to these particular target groups and may be evaluatedas such, but, in most cases, the emphasis is on providing a mechanismwhereby the individual might insure himself against the loss of futureearnings.
Why are pension systems needed? In most traditional societies, fami-lies or communities care for individuals who reach old age, become dis-abled, or suffer the death of a wage earner. However, even in theseinstances, there are always individuals who do not have children to carefor them or whose communities and families are too poor to supply ade-quate care or are otherwise unable or unwilling to do so. As societiesmodernize and people move from the communities in which they havebeen raised, community and family ties weaken and leave the elderly anddisabled without an adequate safety net. Individuals may try to save, but,in the absence of secure financial markets, savings often take the form ofreal estate, livestock, or jewelry, all of which suffer from fluctuations inprice and potential misfortunes due to disease, theft, or war. For thesereasons, governments often take on the role of making some type of pen-sion system available.
Even in developed countries, in which reasonably secure financialmarkets exist, governments frequently either support pensions directly ormandate the participation in pension plans furnished by employers or pri-vate pension providers. Two reasons are commonly cited for government
involvement in old-age pension systems either as direct provider or asregulator and mandator. First, workers may suffer from “myopia” andnot think about old age when they are young and healthy. By the timethey begin to worry about old age, it may be too late for them to take ade-quate steps to provide for themselves. Second, workers may incur “moralhazard” by consuming as much as possible when young, with the expec-tation that society will care for them when they are old. The only way thatgovernments can limit the costs of caring for the elderly is to require par-ticipation in a pension plan for those individuals who can afford it andthen limit direct government transfers so that these go only to people whowere too poor to be able to save during their working years.
What are the objectives of a pension system? First, a pension systemtries to reduce poverty among the elderly. Second, a pension system triesto smooth consumption between the working years and the retirementyears so that an individual does not suffer a huge drop in living standardswhen old age or disability reduces his or her earning ability.1 While thefirst objective can be evaluated much like the objective of any other socialprogram, the second is considerably different. In order for the secondobjective to be met, those people who earn more and consume more dur-ing their working years should continue to receive more and consumemore during their retirement years. This feature makes pension systemsunlike virtually all other forms of government expenditure. In the case ofeducation spending, for example, ideally, there should not be a disparityin spending per pupil based on the income level of the pupil, or, if thereis, the government should focus its spending on poorer pupils, with therationale that government spending is meant to complement privatespending on goods such as education. A similar argument could be madefor health spending or spending on roads or electricity. Ideally, thegovernment’s spending should benefit all members of society equally orbe targeted toward lower-income individuals.2
While the first pension-system objective, that of poverty reduction,may be financed through general revenues, consumption smoothing istypically financed by contributions from workers. Usually, workers makecontributions based on their incomes and expect to receive pensions thatare also based on their incomes.
However, the financing of pension systems through contributionsthat are calculated based on wages introduces a new set of problems fromthe point of view of poverty and social impact. It becomes close to impos-sible to collect and record contributions from workers who are not partof the formal sector. Determining income for groups such as farmers andthe self-employed is difficult. Even in the United States, where the highly
Analyzing the Distributional Impact of Reforms
2
feared tax authorities collect social security contributions, complianceamong the self-employed, excluding household employees, is estimatedat less than 50 percent, while it stands at 96 percent for the rest of thepopulation. The “informalization” of workers allows employers to avoidnot only employment-related contributions and income taxes, but alsocompliance with unduly difficult labor regulations and standards. As aresult, many workers in World Bank client countries are not coveredunder contributory pension systems.
Neither one of the two pension-system objectives—neither povertyreduction nor consumption smoothing—is necessarily to be preferredover the other; they simply represent separate societal priorities; coun-tries place different emphases on these two objectives. Some countries,such as Australia, New Zealand, and, to a lesser extent, the United States,focus on poverty reduction more than consumption smoothing. NewZealand offers all individuals of a certain age a flat pension that is unre-lated to previous income, while Australia offers a means-tested pensionthat provides some level of benefit to more than 75 percent of the elderly.But, even within contributory schemes, such as the one in the UnitedStates, a progressive benefit formula can result in a greater focus onpoverty reduction relative to consumption smoothing. The average pen-sion paid is around 40 percent of the relevant wages in the United States,but high-income individuals receive as little as 20 percent of their wagelevels, while low-income individuals receive 100 percent of their previ-ous wages. By contrast, countries such as Austria and Sweden stronglylink contributions and benefits and achieve much higher rates of con-sumption smoothing.
Moreover, some countries choose to distinguish between these objec-tives by pursuing them using separate instruments. Social assistance pro-grams, as part either of overall programs or of programs especially targetedat the elderly, may account for the bulk of poverty reduction, while thecontributory system focuses on consumption smoothing. The Frenchand German systems would fall in this category: the pension systemsthemselves are not expected to redistribute toward the poor, and old-agepoverty relief is provided by other instruments. Other countries try toachieve both objectives using only one instrument. But trying to achieveboth objectives through one instrument may create conflicts. Consump-tion smoothing implies that benefits should be tightly linked to contri-butions and therefore to income, with redistribution occurring across anindividual’s lifetime, but not among individuals. On the other hand,poverty reduction among the elderly clearly involves providing resourcesfor the elderly poor. Within a contributory system, this usually implies
Pension System Reforms
3
that the resources come from the other contributors. But redistributingwithin the program weakens the link between contributions and benefitsand can have a severely negative impact on the incentives for contribu-tion compliance. Of course, mandating participation in a pension planoriented toward consumption smoothing may prevent some myopicindividuals from finding themselves in poverty in old age; so, the twoobjectives are interrelated up to a certain income level.
Given the possibility that more than one instrument may be used forold-age support, the pension system should not be viewed in isolation.The pension system may be merely one of many elements comprising thesocial safety net for elderly individuals. Each individual element need notincorporate the same level of redistribution since the pension system’sobjectives extend beyond redistribution. Therefore, it might be sensibleto review all programs affecting the elderly population jointly rather thanreviewing each individually. However, the task of this chapter is to lookspecifically at these issues with respect to pension programs and not atoverall programs for the elderly even in the cases where social assistanceprograms are applicable to the elderly.
The remainder of the chapter is organized as follows. The next sectionreviews mechanisms for providing support for the elderly and disabled.The subsequent section considers redistributive and social elementswithin these mechanisms. The rationale for pension system reforms isexamined thereafter. The types of pension system reform and the distri-butional and social consequences of each type are then explored. Theimpact of pension reform on stakeholders is assessed in the penultimatesection. Finally, a checklist and toolbox for analyzing the poverty andsocial impacts of pension reforms are presented.
SUPPORT MECHANISMS FOR THE ELDERLY AND DISABLED
Contributory systems
The primary method for providing old-age support is contributory pen-sion systems. Contributory pension systems are frequently describedaccording to either the relevant financing mechanism or the benefitstructure. Financing mechanisms are generally of two types: pay as yougo or fully funded mechanisms. In pay as you go, current workers makecontributions based on their current earnings. These contributions areimmediately used to pay benefits for current recipients; the worker whois making the contribution only receives a promise from the governmentthat it will pay benefits related to these contributions when the worker
Analyzing the Distributional Impact of Reforms
4
becomes eligible for a pension.3 In what is known as fully funded pensionsystems, worker contributions are invested, rather than spent, and theinvestment earnings are an integral part of the benefits eventually paid.These investments can be managed by a monopolistic public agency orcompetitively, with participation by the private sector.
Benefit mechanisms are also of two types: defined-benefit mecha-nisms and defined-contribution mechanisms. Under the defined-benefitmechanism, the pension received is usually a function of income expressedas a percentage of income per year of contribution; it may also be definedin some other manner. The distinction is that the benefit provided isspecified in some way. Should financing fall short, someone, typicallyeither the government in a public plan or the employer in an employer-based plan, has the responsibility to provide the pension. Alternatively,under the defined-contribution mechanism, the contribution is specifiedas a percentage of wages, and rates are specified for employees, employ-ers, and, potentially, the government, but the final pension is determinedby the amount in one’s pension account at the time of retirement, whichincludes both the contributions and the investment earnings on thosecontributions. Under this system, no specific benefit is promised; thepension is completely dependent on the money in the account, andthere is no need for a guarantor of last resort.4 Financial assets fully backthe promise made in this case, which is simply a return of the money in theaccount.
In a strictly stylized world, the risk characteristics of these two typesof pension systems would be considerably different, with governments oremployers bearing the risk in defined-benefit systems, and workers bear-ing the risk in defined-contribution systems. However, in practice, thesedistinctions are quite blurred. The parameters in defined-benefit systemscan change, substantially altering the nature of the benefit promised.Many Bank client countries find themselves unable to pay pensions on atimely basis, which imposes considerable risks on retirees during theirmost vulnerable years. Most defined-contribution systems, on the otherhand, carry government guarantees of minimum pensions or are onlyone component in a broader pension strategy, whereby the other com-ponents mitigate the risks to the worker that are attributable to thedefined-contribution arrangement.
Typically, defined-benefit systems are of the pay as you go sort, anddefined-contribution systems are of the fully funded sort. It is possiblefor a defined-benefit system to be fully funded because the guarantormaintains sufficient financial assets to cover the liabilities in the plan.However, should investment returns fall in any particular year, the
Pension System Reforms
5
employer has the obligation to offset the lower returns by increasing hiscontribution. A hybrid defined-contribution, pay as you go system thatis called notional accounts has been pioneered in the last decade. Thekey feature is that contributions are recorded and earn “notional” inter-est rates. The combination of contributions and notional interest earn-ings determine the pension benefit, much as in conventional defined-contribution systems. However, because the system is financed on a payas you go basis and because there are no financial assets behind theaccounts, the government must define the interest rate it will pay on thecontributions. The system may run deficits, unlike in the case of a truedefined-contribution system, and, if it does, the government is obligedto cover the deficits. As a result, the notional account system is not a truedefined-contribution system, since, by defining both the contributionand the interest rate paid, the government has implicitly defined thebenefits.
Noncontributory pension systems
Even where a contributory system exists, there will always be people whodo not participate in the labor markets covered by the social security sys-tem, who do not participate sufficiently regularly to qualify for benefits,or whose low lifetime earnings leave them with even lower pension bene-fits. This is particularly true for the many informal sector workers innumerous Bank client countries. And, in many cases, groups of workers,such as the self-employed or farmers, are not covered by the nationalpension system because it is considered too difficult to assess income andcollect contributions from these groups.
All of these groups are at risk of poverty in old age if they do not qual-ify for a contributory pension or if they qualify only for a small pension.As a result, most high- and middle-income countries with contributorysystems also offer minimal benefits for those people who do not qualify.This benefit can take the form of a demogrant, whereby everyone above acertain age receives the benefit on the basis of a residency or citizenshiprequirement, as in countries as varied as Nepal and New Zealand, or it canbe means tested, such that only those elderly with incomes below a certainlevel are eligible to receive the benefit. A few countries, such as NewZealand and, until 15 years ago, Australia, choose to offer only this type ofdemogrant or means-tested benefit in lieu of a contributory system.
The benefit in most cases is financed directly through general tax rev-enues. Both types of noncontributory systems tend to reduce povertyamong the elderly. Obviously, the means-tested benefit is more well tar-
Analyzing the Distributional Impact of Reforms
6
geted toward the poor elderly, but, given the costs and complicationsinvolved with means testing, the potential changes to incentives, and thebehavior of individuals trying to meet the qualifications, the demograntapproach may be a better solution in some countries. Some countriesinstitute a demogrant, but then use other mechanisms to target resourcesmore effectively away from higher-income individuals and toward lower-income individuals. New Zealand, for example, uses its progressiveincome tax to reduce the value of the demogrant to higher-income indi-viduals. Similarly, some lower-income countries, such as Georgia andNepal, ostensibly offer a demogrant, but the amount is so low thathigher-income individuals are not interested in collecting it, and the sys-tems are, to this extent, engaging in affluence testing rather than meanstesting.
Since the purpose of the noncontributory pension is clearly povertyreduction, with no attempt at consumption smoothing, some countrieschoose to integrate this social assistance for the elderly with the socialassistance systems for the nonelderly, resulting in one national social assis-tance system. From a targeting perspective, such integration is ideal sinceresources flow to those most in need, regardless of age. However, from anadministrative and social point of view, there may be arguments for separ-ating the programs. Goals such as inducing working-age individuals toreenter the workforce are clearly not an issue in terms of the elderly;annual means testing may be necessary for working-age individuals whosesituation can change dramatically from one year to the next, but less neces-sary for elderly individuals living alone or as part of a couple since theirincome situation is unlikely to improve in the future. Finally, elderly peo-ple who were not poor during their working lifetimes may feel especiallystigmatized because they now must seek social assistance.
THE REDISTRIBUTIVE AND SOCIAL IMPACT OF PENSION SYSTEMS
Any social program that may involve expenditures in double-digit per-centages of gross domestic product will have substantial impact on theeconomy in which it exists. Pension systems can affect poverty among theelderly. They can affect relationships between younger and elder cohorts,as well as family living arrangements. They also have a substantial impacton labor markets and employment, particularly if they are financedthrough contributory systems. They can impact national savings and thedevelopment of financial markets. They can affect the composition ofgovernment spending by squeezing out other types of spending. They can
Pension System Reforms
7
even affect the overall level of government spending. A huge body of lit-erature exists on each one of these issues and would be impossible tosummarize here.5 However, it should be noted that much of this litera-ture is derived from case studies and data on the United States and othercountries of the Organisation for Economic Co-operation and Develop-ment. It is questionable whether all these results will apply equally acrossthe board in the Bank’s client countries.
This chapter focuses on the direct distributive impact of the pensionsystem, ignoring secondary impacts arising through the economy. Thedistributive impact will depend on the type of pension system existing inthe country.
The defined-benefit, pay as you go system
While the goal of a defined-benefit, pay as you go system is ostensibly tobase benefits on contributions, thereby creating an institution that willallow individuals to smooth consumption over their lifetimes in theabsence of a secure market institution, this type of pension schemealways has distributional implications within generations and acrossgenerations, some intentional, and others unintentional. Countries fre-quently try both to redistribute toward the poor and to provide a savingsmechanism within these systems. However, there is a natural tensionbetween redistribution in a contributory system and the provision toindividuals of incentives to contribute by tying the benefits to contri-butions. There are also limits to how much true redistribution can beaccomplished within a contributory system since the majority of re-distribution occurs from one group of contributors to another. If cov-erage is low, both groups may already be receiving relatively similarincomes since they are more likely to belong to a narrow segment of theworking population.
Intentional redistribution
Intentional redistribution in a defined-benefit scheme across a cohorttakes place through at least three mechanisms. Most defined-benefit sys-tems have a minimum pension, but individuals must contribute for a setperiod of time before they may receive this minimum pension. Theminimum pension almost always involves some redistribution. Becauseof the minimum pension, workers at minimum wage who contribute forthe minimum contribution period almost always receive higher pensionsthan the pensions they would have earned based on the formula. This, ofcourse, leaves open the option that workers may game the system by con-
Analyzing the Distributional Impact of Reforms
8
tributing only enough to qualify for the minimum pension, but thepoverty reduction objectives of pension systems have usually overriddenthese concerns. The higher the level of the minimum pension, the morethe incentive issue begins to override the poverty reduction issue.
A second mechanism for redistribution results from a possibly pro-gressive benefits formula. The United States is one of a few countriesexplicitly offering a benefits formula that provides a declining replace-ment rate as income goes up. Related to this approach, but usually lessprogressive, are schemes offering separate replacement rates for differentgroups of workers, usually by crediting more years of service per year ofcontribution. In Serbia, for example, women are given 15 percent moreyears of service credit over and above their years of contribution. In othercountries, this special credit is given to particular occupations such asteachers or miners.
A third mechanism for explicit redistribution, more common thanthe second, is the front-loaded benefit formula, whereby the first 10–15 years of service are awarded higher benefit rates than are subsequentyears. The thinking is that lower-income workers are more likely tointerrupt their working careers, particularly in the formal sector, andare therefore unlikely to accumulate significant amounts of time in for-mal sector service. If the early years of contribution are rewarded moreheavily, these workers will still be able to retire with reasonable pen-sions. As with minimum pensions, this design feature raises incentiveissues; if people can earn reasonable pensions with only 10–15 years ofcontribution, why should they contribute throughout their careers?Nevertheless, countries continue to use this mechanism in the name ofredistribution.
Unintentional redistribution
In addition to intentional redistribution, there are common design fea-tures within defined-benefit systems that have unintentional distributiveconsequences. One of the primary features is the averaging period forwages used to calculate the pensions. Pensions are expressed as a per-centage of wages, but the wages may be defined as the last salary earned,as the average salary over the last five years, or as average wages over anyperiod up to the lifetime average wage. If the averaging period is anyperiod less than full career, then there is a redistribution involved. Indi-viduals pay contributions on wages throughout their careers; if the pen-sions are not linked to the average career wage, then the pensions are notlinked to the average contributions either. In addition, there is a system-atic income-based bias to the extent that higher-income and more well
Pension System Reforms
9
educated workers generally experience more rapid wage growth, particu-larly toward the ends of their careers. Thus, the shorter the averagingperiod, the more redistribution there is in the system from future work-ers to current pensioners and the greater the redistribution towardhigher-income pensioners who earn the highest wages at the ends of theircareers.
A second issue is the life-expectancy differential between incomeclasses. Higher-income individuals tend to live longer. This differentialtends to make the defined-benefit scheme regressive, given that higher-income individuals will receive benefits for a longer period because oftheir longer life expectancy, resulting in a higher total benefit paid evenif the monthly pension is identical.
A final issue is the life-expectancy differential between men andwomen. Defined-benefit schemes do not distinguish between the benefitrates paid to men and those paid to women even though women tend toreceive the benefits for more years because of their longer life expectancy.As a result, there is an automatic redistribution from men to womenimplicit in the defined-benefit scheme. The common practice of allow-ing women to retire earlier with the same benefits only intensifies thisredistribution.6
Intergenerational distribution
While the distributional consequences usually involve intracohort redis-tributions, the redistribution impact in defined-benefit schemes is largerbetween cohorts. Rarely are the schemes costed out in such a way thatthey are actuarially fair. Usually, a contribution rate is chosen, a benefitrate is chosen, and eligibility conditions are chosen. These parameters arealmost never actuarially consistent. Since the schemes are normally setup when the countries are young, the parameters are often selected tomaintain a balance between revenues and expenditures in the first years,with perhaps a small accumulated surplus. Because, at the start, manycontributors are young, and few elderly are collecting benefits, contribu-tion rates usually start low, and benefits are fairly generous. As a result,from the beginning, contributions rarely cover the future benefits to bepaid out to these same contributors; the expectation is that the contribu-tions of future generations will be used to pay the benefits of currentworkers. As long as population continues to grow rapidly, the scheme isviable, as all pyramid schemes would be. But, when the population ofpaying cohorts starts to stabilize in size or when it falls, huge deficitsappear. Attempts to fix the fiscal deficits by raising contribution rates andreducing benefits exacerbate the intercohort redistribution problems.
Analyzing the Distributional Impact of Reforms
10
Younger cohorts are asked to pay higher and higher contributions andreceive fewer benefits; they are often required to postpone retirement,which also results in fewer benefits paid in total.
While there may be some justification for transferring income fromone cohort to another, especially when particular cohorts are hard hit bywars, recessions, or a transition to a market economy, the redistributionsystem initiated under defined-benefit systems does not involve only aone-time transfer, but will result in undesirable and unexpected redistri-butions over time.
Even if the system were actuarially balanced at its introduction,changes in life expectancy and fertility will require continuous adjust-ments to maintain actuarial balance.7 In countries where analyses havebeen carried out, the intercohort redistributions substantially overwhelmthe intracohort redistribution, as shown in Figure 1.1 for the UnitedStates. Both panels in the figure show the internal rate of return in thesocial security system, the implicit rate of return that contributions madeto the system would receive given the benefits that are provided by thesystem for two different cohorts, those retiring in 1960 and those retiringin 2005. While internal rates of return are higher for lower-income earn-ers than they are for higher-income earners, the differences are not hugewithin the cohort of retirees in any particular year. The differencesbetween those retiring in 1960, shown in the left-hand panel, and thoseretiring in 2005, shown in the right-hand panel, are far more pronouncedthan the differences within the cohort. Furthermore, the analysis repre-sented in the figure does not take into account the mortality differencesbetween low-income and high-income individuals and assumes that allindividuals have the same life expectancy. When mortality differentialsare included, the intracohort distribution almost disappears. And theseresults apply to the U.S. system, which is designed to be highly redistrib-utive, with marginal benefit rates declining with income. Most defined-benefit systems do not incorporate even this element of redistributionand thus are unlikely to be positively redistributive. A more completeanalysis of the U.S. system can be found in Steuerle and Bakija (1994).
The defined-contribution system
Little redistribution takes place in a pure defined-contribution system. Atretirement, individuals get back their own contributions with the invest-ment interest that these contributions have earned.
However, most systems are not pure defined-contribution systems;they contain an element of redistribution. Many systems, such as those
Pension System Reforms
11
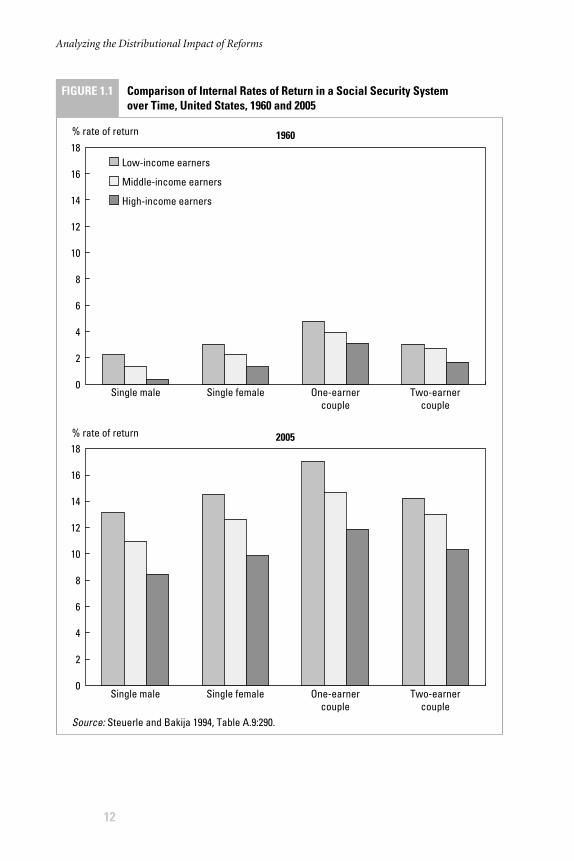
Analyzing the Distributional Impact of Reforms
12
FIGURE 1.1 Comparison of Internal Rates of Return in a Social Security System over Time, United States, 1960 and 2005
in Chile and Mexico, offer a minimum pension guarantee to workers, suchthat, after a given period of contribution, a minimum pension will beprovided by the government. Other systems, such as those in Malaysiaand Singapore, provide a guaranteed minimum rate of return, which canbe redistributive depending on the level. If the minimum rate of returnis high, it obviously redistributes from the guarantor, usually the govern-ment, to pensioners, but without regard to the income level of the pen-sioner. On the other hand, there are a few cases where the rate of returnis virtually fixed ex ante, and, if the fund can earn better rates of return,then individuals lose by belonging to the fund, but, again, the loss is notdependent on income level.
A second redistributive element arises through the provision ofannuities. An annuity is a mechanism for converting an account balanceinto a stream of periodic payments. Usually, an individual purchases anannuity from a life insurance company, which guarantees monthly pay-ments as long as the individual or spouse lives. The payments can beadjusted upward periodically, often with inflation. As with defined-benefit pensions, if individuals are forced to buy annuities, higher-income individuals, who are typically longer-lived, gain at the expense oflower-income, shorter-lived individuals since the annuities are not priceddifferently for different income groups. Most countries (aside from thosein Latin America) also require the use of unisex annuities when annuitiesare chosen. In unisex annuities, both men and women are in the sameannuity pool, and there is no price differential. As with defined-benefitplans, unisex annuities result in a transfer toward women, who are, onaverage, longer lived than men.
Many countries do not require annuitization and set up programmedwithdrawals as a benefit option, whereby an individual withdraws anamount from his account each month that is specified on an annual basisdepending on the rate of return that the fund received on its investmentearnings and the expected duration of the retirement. Upon the death ofthe individual, the balance in the individual’s account is inheritable bywhomsoever the individual specified. Under this approach, individualstake a risk that they will outlive the money in their accounts since theyare not guaranteed payments for life, as under an annuity, but shorter-lived individuals have the option of leaving an inheritance rather thanallowing the account to revert to the insurance company, which uses themoney to cross-subsidize longer-lived individuals. Since lower-incomeindividuals tend to die sooner than do higher-income individuals, theoption of programmed withdrawals reduces the redistribution towardthe rich.
Pension System Reforms
13
A third, more indirect potential distributive element is linked to theinvestment policy of the pension fund. In some countries, assets, particu-larly when they are publicly managed, are invested largely in housing orin programs perceived to be socially beneficial (at the expense of lowerrates of return to workers). In this case, there is a transfer from workersto the beneficiaries of the investment, and it is usually not a progressivetransfer since it rewards those who are politically powerful and not thosewho are poor.
Voluntary or supplemental pensions
In defined-benefit and defined-contribution pensions, governments typi-cally impose ceilings on the income that is subject to contributions, and thesame ceiling is typically used in calculating benefits. The thinking is that,while governments want to promote poverty reduction and consumptionsmoothing among the elderly, they are generally not concerned withwhether the super rich of the world have sufficiently smoothed theirincomes. Since all requirements reduce individual freedom, a ceiling on thecontribution requirement limits the impact to what is necessary to preventold-age poverty and overcome myopia. The ceiling is often set at three tofive times the average wage. Thus, the mandatory systems do not providesubstantial consumption smoothing among higher-income individuals.
But governments would still like to provide incentives so that higher-income individuals save for consumption smoothing purposes. Govern-ments do this by offering tax advantages for voluntary or supplementalsavings. Typically, governments do not tax contributions made to volun-tary pension systems or the returns the contributions earn; they tax onlythe benefits when these are received.8 The policy represents an attemptby the governments to encourage long-term savings, which can then beinvested and help stimulate growth in the economy. By and large, thosepeople who take advantage of these schemes are higher-income individ-uals, resulting in tax reductions for these individuals. From a distribu-tional standpoint, the policy can be worthwhile if the growth arising from the increased long-term savings helps the poor. However, the evi-dence generally suggests that higher-income individuals do not increasetheir savings in order to access these tax-advantaged retirement funds,but merely shift their savings from one instrument to another. In thiscase, the policy merely lowers the taxes on the rich without substantialimprovements in growth or in lowering poverty. Thus, some countriesimpose limits on the amount of income that can earn tax advantageseven if the income is saved through the pension system.
Analyzing the Distributional Impact of Reforms
14
RATIONALE FOR PENSION SYSTEM REFORM
The primary goal of a pension system should be to provide adequate,affordable, sustainable, and robust retirement income.9 Most Bank-sponsored reforms attempt to achieve all these goals.
However, the overwhelming reason for the Bank’s involvement inpension reform issues is the fiscal implications, largely of defined-benefitsystems, although sometimes also of social assistance benefits for theelderly. Since the systems are rarely actuarially designed from the outset,it is not surprising that, with the aging of populations, changes in the con-tributing labor force, poor system design, and poor administration, thesystems begin to run deficits. Deficits within the pension system can behuge relative to overall gross domestic product and the overall deficits ofa country. For example, in Brazil in the late 1990s, three-fourths of thegovernment fiscal deficit of 8 percent of gross domestic product wasdirectly attributable to social security, and, in Serbia, the fiscal deficit ofthe pension funds runs to 7 percent of gross domestic product. Such largedeficits clearly create a drag on the entire economy.
These large deficits have huge distributional implications, particu-larly in countries with low labor force coverage. If only 5–10 percent ofthe labor force is part of the pension system, and the system is runningdeficits that need to be financed from general revenue, then money fromall individuals who contribute to the general revenue is being transferredto the 5–10 percent of the population that is covered by the pension sys-tem, making even a progressively designed system potentially regressive.In the majority of Bank-client countries, coverage among the working-age population is below 50 percent; deficits in these pension systemsclearly lead to regressive outcomes. Given the already huge intergenera-tional transfers that occur in these defined-benefit systems, the low cov-erage, combined with the financing of deficits from general revenue,pushes the cost of providing pensions not only on to younger cohortscovered under the system, but on to younger cohorts who are not evencovered by the system, making the impact more regressive. As a result,much of the focus of the World Bank in pension reform is on reducingthe fiscal deficits so that the pension system, if limited in coverage, isfinanced through contributions from that same limited populationrather than through transfers from the broader population.10
Pension reform efforts have also attempted to increase coverage asa means of providing old-age security to a broader segment of the pop-ulation, but most attempts at increasing coverage have not been suc-cessful. The one positive preliminary result has occurred in Mexico,
Pension System Reforms
15
where the government provides a flat contribution per day of workercontribution to the defined-contribution system, which amounts toapproximately 5.5 percent of the minimum wage. The government con-tribution doubles the contributions going to the pension funds for low-income workers, which increases the incentive for low-income workersto contribute. Since this flat government contribution has been imple-mented, coverage among the lower three deciles of the income distri-bution has expanded.
But, because there are few successful examples, governments areturning to social assistance pensions as a means of providing support toelderly people who are not covered under contributory social securityprograms, rather than seeking to expand coverage. These social assistanceprograms are, in some cases, embedded within general social assistance,while, in other cases, they exist as stand-alone programs or are tied to thecontributory pension system.
Countries running defined-contribution systems that might be earn-ing poor investment returns also encounter trouble if substantial num-bers of the elderly fall below the poverty line. Appropriate supervisionand regulation of this type of pension fund and of voluntary pension sys-tems need to be provided, along with flexibility in the investment ofassets, so that the investment funds supply sufficient returns to workersmaking contributions. In some cases, governments see the pension fundreserves as a ready source of financing for whatever politically motivatedinvestments they might desire. However, there is a trade-off between pro-viding workers reasonable returns on their contributions and gettingcheap financing for what might be socially laudable investment projects.Improvements in the functioning of capital markets may also be requiredbefore pension funds can provide adequate old-age support.
TYPES OF REFORM AND THE DISTRIBUTIONAL CONSEQUENCES
Since the primary reason, by far, for pension reforms has been to addressthe fiscal impact, the reforms have focused largely on improving fiscaldeficits first. From a distributional standpoint, this is an appropriatefocus given the incomplete coverage and the potential for regressive dis-tribution from noncovered lower-income groups to covered higher-income groups. Any reform that lowers the fiscal deficit will be beneficialfrom a distributive perspective.
Pension reforms can be grouped into at least four different cate-gories: parametric reforms, which involve changes in the parameters ofcurrent pension systems; systemic reforms, which involve introducing a
Analyzing the Distributional Impact of Reforms
16
new type of pension system to replace or complement the existing sys-tem; regulatory reforms, which involve changes in the investment regu-lations on funds having assets that can be invested; and administrativereforms.
Parametric reforms
Pension systems rely on three subgroups of parameters: contributionparameters, benefit parameters, and eligibility conditions for receivingpensions. Many parametric reforms involve changes in all three sub-groups. Each of these parameter subgroups has a distributive impactamong contributors and beneficiaries, and so do the reforms. The reformsalso affect the fiscal sustainability of the pension system, and the fiscal sus-tainability affects the redistribution from outside the pension system tothe contributors and beneficiaries of the pension system.
Contribution-revenue parameters apply both to the defined-benefitsystem and to the defined-contribution system, as well as voluntary sys-tems. However, the impact on fiscal sustainability primarily occurs indefined-benefit systems. The parameters include the following:
� Contribution rates. Raising contribution rates clearly lowers the take-home salaries of workers and the net benefits that workers receivefrom the pension system. Rising labor costs may reduce or causestagnation in the level of employment in the formal sector. Thesehave a negative impact on workers, but may be necessary to main-tain fiscal balance. Contribution rates above 15 percent are likely tohave negative labor market impact.
� Wages that are subject to contributions. Raising the ceiling of thewages that are subject to contributions, another common measure,tends to be positively distributive in that higher-salaried workerspay more of their incomes into the pension fund, although, in thelonger run, they will usually receive higher benefits, too. Thus,while there may be a positive redistributive effect in the short run,there will be little impact in the long run as the benefits for higher-income individuals rise, particularly if the higher, long-run bene-fits are not fiscally sustainable.
Benefit parameters include the following:
� Accrual rate (the rate of benefit per year of service). Lowering theaccrual rate clearly makes pensioners worse off and lowers their net
Pension System Reforms
17
rate of return from the system, but, when the system runs deficits, ithelps avoid transfers from younger cohorts and those people who arenot covered by the system.
� Averaging period for wages. The averaging period for wages shouldideally be the full career, which best aligns the average contributionspaid with the average benefits received. A shift toward full-careerwages tends to be progressive since high-income workers gain if pen-sions are based on the final full year of salary.
� Revalorization of wages. Wages should be revalued according to average wage growth in order to provide incentives for workers to con-tribute during their early years. This may be thought of as a means ofproviding a rate of return on contributions. The revalorization ofwages to average wage growth is equivalent to giving workers a rateof return on their contributions that is equal to the wage growth.Lower revalorization could, theoretically, lead to greater fiscal sus-tainability, but usually results in more evasion since workers earn lowrates of return on early contributions, and this undermines fiscal sus-tainability. This is among the variables that are least understood byindividuals who are not pension professionals, but it has a hugeimpact on the actual benefits delivered by the pension system.
� Postretirement indexation of pensions. The postretirement indexa-tion of pensions should ideally be undertaken relative to inflationto protect the purchasing power of pensions during the retire-ment years. Lack of indexation results in the older elderly receivingsubstantially lower pensions and less protection than the youngerelderly who might be able to work. Women, who generally livelonger than men, are also disproportionately disadvantaged by alack of indexation since their real pensions will fall over a greaternumber of years. Indexation to wage growth is essentially unafford-able for most countries and not justifiable from the perspective thatthe retiree does not need to increase his consumption over thecourse of his retirement, assuming that health expenditures areotherwise covered, regardless of how average wages change withrespect to the pension. The postretirement indexation of pensionsis an issue both in defined-benefit systems and in defined-contributionsystems, as well as for noncontributory benefits.
� Minimum pension. The level of the minimum pension is set too high inmost countries, sometimes as high as or higher than the minimumwage. Given that workers at minimum wage make contributions fromtheir wages, have families to support, and pay income taxes, while pen-sioners do not make contributions, have fewer family members to sup-
Analyzing the Distributional Impact of Reforms
18
port, and usually pay no or fewer income taxes, it does not make senseto give pensioners more than the net wage they earned while they wereworking. Lowering the minimum pension might put some pensionersinto poverty, but this has to be balanced against the goal of limiting out-of-system transfers and the goal of tying contributions to benefits inorder to encourage individuals to contribute. The minimum pensionaffects both defined-benefit and defined-contribution systems, as wellas noncontributory benefits, which are a form of minimum pension.
Eligibility conditions include the following:
� Retirement age. Ideally, the age of retirement should rise as lifeexpectancy and the ability of the older population to work increase,restricting pension benefits to those people who are considered tooold to work. An average of 15 years in retirement should be the goalof the pension system. In most cases, raising the age of retirementmay reduce the number of lower-income individuals who collectpensions since their life expectancy is generally lower. However, ben-efits would be available to the survivors, who may be more numerousamong lower-income individuals than the survivors of higher-incomeindividuals, and the difference in life expectancy within the coveredpopulation, which is, itself, often only the higher-income classes inthe country, may not be that great. Equalizing the retirement ages formen and women tends to be pro-women as it substantially raises thepension levels for most women. Changes in the retirement age affectboth defined-benefit and defined-contribution systems, as well asnoncontributory benefits and voluntary pension systems. In defined-benefit systems and for noncontributory pensions, changes in theretirement age improve fiscal sustainability, while, in the case ofdefined-contribution systems and voluntary systems, they raise thelevel of pensions.
� Years of service required before receiving a pension. Raising the years ofservice required before an individual may receive a full pension maysimilarly discriminate against lower-income individuals, who gener-ally have shorter eligible working careers, but, again, the differenceswithin the covered population may not be that great, and providingprorated pensions for shorter working careers may address this issuesufficiently.
� Means testing. In the case of noncontributory benefits, countriessometimes introduce means testing in order to reduce the fiscal costsor change the threshold for pension eligibility. Both these measures
Pension System Reforms
19
reduce the numbers of people eligible for pensions, but balances thiswith lower fiscal costs, requiring fewer transfers from the workinggenerations to the elderly.
A special note is warranted about reforms that represent a steptoward a system of notional accounts or a point system. In some respects,these systems represent a new paradigm and therefore should be dealtwith through systemic reforms. However, in other respects, they stillinvolve liabilities for the government and can be mimicked through acombination of parametric reforms. In both systems, contributions arecollected and recorded. In notional accounts, the actual contribution isrecorded, and a notional interest rate is earned on the contributions. Inthe point system, individuals receive pension points each year dependingon how long they have contributed and on the basis of the relevant wage;the points are then converted into a financial value at retirement. Animplicit notional interest rate will equate the two, as will some combina-tion of conventional defined-benefit parameters. Both systems tend tofavor lifetime average income as the basis for determining pensions andclosely link benefits and contributions, with the same distributional con-sequences as noted above. Notional accounts have the added feature thatpensions are automatically reduced as life expectancy rises, suggestingthat, as life expectancy increases, a larger and larger share of pensionerswill receive only the minimum pensions if they do not postpone retire-ment. Most other parameters of these systems are identical to those ofconventional defined-benefit systems, and their distributional impact isprecisely the same.
In almost all cases, parametric reforms, particularly those in defined-benefit systems, will reduce the level of pensions and thus potentially putmore elderly in poverty or require greater contributions from workers,also putting people at risk of poverty. These measures are nonethelessessential for maintaining the affordability and sustainability of the pen-sion system. Without these measures, the pension system will pass its fis-cal stress on to other sectors (squeezing out spending in other areas),encourage the use of inflation to cover deficit spending, or begin to accu-mulate arrears. None of these possibilities has positive social conse-quences. The accumulation of arrears is particularly detrimental sinceindividuals who have reached old age and suddenly find themselves with-out pension benefits have few alternative means of support. Sustainabilitybecomes even more of a social issue when coverage under the pensionsystem is not complete and fiscal resources must be drawn from a broaderpopulation to cover pensions for the few, usually the higher-income few.
Analyzing the Distributional Impact of Reforms
20
Furthermore, many common reform measures improve the distrib-utional consequences of pension systems and often remedy unintentionalnegative effects. They may make pension systems fairer by more directlylinking pensions to the contributions paid, and the perception of greaterfairness can improve contribution compliance.
Systemic reforms
Many countries in the past 15 years have shifted from reliance on puredefined-benefit systems to defined-contribution systems or to mixed sys-tems with both defined-benefit components and defined-contributioncomponents. In the long run, the defined-contribution systems involve lessredistribution, both positive and negative, than was inherent in thedefined-benefit systems. They are also more able to contain the costs of thepension system, so that those individuals who pay will ultimately be bene-ficiaries of the system, and they are more able to reinstate the initial aim ofsmoothing consumption among individuals during their lifetimes. Sincemuch of the redistribution within defined-benefit systems was often regres-sive, these changes should be positive. However, pure defined-contributionsystems that are not accompanied by a safety net do not prevent the elderly,even those elderly who were middle income during their working years,from falling into poverty. Governments must provide a safety net, such asa minimum-pension guarantee, to protect workers against excessive fluc-tuations in capital markets. Governments that use both a defined-benefitcomponent and a defined-contribution component normally allow thedefined-benefit component to function as the safety net. However, theminimum-pension guarantee reintroduces an element of redistributioninto the system, usually from the whole population to the covered minor-ity, and breaks the link between contributions and benefits. Therefore, itneeds to be designed to provide protection for workers, but not to be sogenerous that it distorts incentives or causes large-scale redistribution.
It should be noted, nonetheless, that a shift to a funded systeminvolves transition costs since the government must continue to pay pen-sions to current pensioners and acquired rights to current workers whenthey retire even as workers begin to put part or all of their contributionsinto individual defined-contribution accounts. During this transitionperiod, there is an increase in the regressiveness of the system because thegovernment, through general revenue drawn from the whole population,pays pensions for the covered minority. However, this increase in regres-siveness needs to be viewed as a temporary cost required to eliminateregressiveness in the system over the medium and longer term.
Pension System Reforms
21
Other systemic changes include the introduction of a noncontribu-tory benefit that tends to be positively redistributive as people who pre-viously had no access to pensions are now provided with some benefits.The introduction of a voluntary pension system has redistributive con-sequences only through tax treatment (as noted elsewhere above).
Regulatory reforms to investment guidelines
Regulatory reforms rarely have direct distributional implications. How-ever, improvements in regulation and supervision are positive steps inensuring that the contributions that workers and their employers makewill be available to them during retirement. Regulation and supervisioncan insure that less financially sophisticated consumers, typically withlower incomes, are treated as fairly as those with more financial knowl-edge. The demand for assets from pension funds can also spur develop-ment in capital markets, and this may add stability and depth to otherfinancial-market transactions.
Administrative reforms
Administrative reforms focus on unifying multiple systems within acountry, improving collection compliance, improving benefit service,individualizing databases, improving record keeping, and strengtheningthe eligibility criteria for disability, as well as aggregating contributioncollection with tax collection.
The unification of systems involves a great deal more than the admin-istrative process. Countries that have fragmented systems usually haveseparate benefit and contribution structures. During a unification, somegroups clearly lose benefits. In a few cases, there are groups that gain ben-efits, but, to be affordable, the unification typically occurs at the level ofthe least generous scheme. Despite the presence of losing groups, not onlydoes the unification improve the overall fiscal picture, but the defrag-mentation of the labor market results in a better allocation of labor andless uncertainty for all groups, which no longer have to fear the loss of pen-sion benefits when faced with voluntary or involuntary job changes.
Improving benefit service usually not only improves service, but alsoreduces the ability of corrupt officials to take bribes to expedite payment,which the poor cannot afford, making benefits more equitably availableto all income groups.
While all these improvements tend to enhance fiscal sustainabilityand the functioning of the pension system, it should be noted that many
Analyzing the Distributional Impact of Reforms
22
pension systems effectively function as quasi-social-assistance agenciesso that anyone bold enough to present a pension claim will eventuallybe paid because the pension fund does not maintain sufficient recordsto check whether the individual has paid contributions. To the extentthat these pensions reduce poverty and are being paid to individualswho have not contributed, poverty may temporarily increase. However,in the longer run, as contribution collections rise, the pension fund maybe able to reduce the contribution rate, which would be an improve-ment for all workers. The government can then determine where tofocus its poverty reduction efforts most effectively rather than payingout pensions only to individuals bold enough to present false docu-ments to the authorities.
IMPACT OF PENSION REFORM ON STAKEHOLDERS
Stakeholders for pension reform include, of course, pensioners them-selves, workers and their union representatives, and employers, as wellas government agencies administering pensions and the Ministry ofFinance. Pension reform typically takes place in the context of a defici-tary pension system. The remedy for the deficit invariably involves reduc-ing benefits. Clearly, pensioners and unions are not going to be in favorof these changes. Workers also frequently oppose reforms, but this is lessunderstandable. In many cases, the pensions they have been promised arenot going to materialize or are at risk if no changes are made. The changesmight cut future benefits, but they generally increase the probability thatbenefits will be received, such that the expected value of the benefits mayeven be higher than before. But persuading workers and pensioners of theadvantages of reforms that will be undertaken at a future time is a toughjob and requires a politically powerful reform champion within govern-ment. For both pensioners and workers, reforms are usually phased ingradually so that no cohort faces an abrupt loss of benefits.
One issue that makes the reform of pension systems more difficultthan the reform of other programs is the acquired rights of workers. Work-ers make contributions to the pension system in return for the promise offuture benefits. Politically, it may be difficult to tell these same workersthat the benefits they have already paid for are now going to be reduced.As a result, pension reforms usually have to be phased in slowly, withsome grandfathering of existing contributors. The legal and constitu-tional status of these rights varies considerably. A few countries haveruled that workers who have begun work under a particular pension sys-tem with particular parameters have the right to continue working under
Pension System Reforms
23
the same parameters even if the pension regulations are changed. Othercountries dictate that accumulated rights cannot be touched, but that allbenefits earned after the enactment of reform will fall under the new sys-tem. Still other countries have ruled that the government can change anyparameter of the pension system at any time. Specific details of workerrights are also sometimes written into a country’s constitution, such asretirement age provisions in Brazil or the method of pension indexationin Uruguay.
Pension agencies may be either supportive of reforms or unsupport-ive, depending on how the reforms affect them. The unification of systemsgenerally results in the shutting down of some administrative systems,with a potential loss of jobs or prestige. Similarly, transferring responsi-bility for contribution collection to tax authorities may result in a loss orreallocation of jobs. Breaking the monopoly power of public pension sys-tems by introducing private pension funds may also be viewed negatively.Even at the ministerial level, since pension reforms are frequently under-taken to improve fiscal sustainability and involve collaboration with theMinistry of Finance, turf issues between the ministry in charge of pensionprograms, usually Labor or Social Affairs, and the Ministry of Financemay also surface. On the other hand, administrative reforms, whichinvolve additional investment financing for the pension agency, are usu-ally viewed quite positively.
Generally, Ministries of Finance view pension reforms quite posi-tively and are very supportive. However, since the introduction of amandatory, funded system usually involves spending fiscal resources inthe short run, this particular type of reform may be problematic from theperspective of the Ministry of Finance. It is possible to adjust the designof the funded scheme in order to reduce costs. For example, the defini-tion of the eligibility criteria for the new scheme—whether it is only opento new entrants, to people under the age of 30, under 40, under 50, orwhatever age—will affect the number of people who join the new schemeand the extent of the loss of pension revenue as people put all or part oftheir contributions in their own individual accounts instead of con-tributing to the public pension system. Countries can also choose theportion of the contribution that goes to the individual accounts amongthose people eligible to join the new scheme; some countries have man-dated that only 2 percentage points of a much larger contribution rate areallocated to the individual accounts, but allow the share to grow overtime. The benefits offered to those who switch to the funded system fromthe public system may also be designed in a generous manner, whichwould encourage heavy switching, or in a less generous manner, which
Analyzing the Distributional Impact of Reforms
24
would discourage switching. Even the default option—what happenswhen people do not make choices—has an impact on who switches andto what. Finally, public information on the options available may makea big difference in managing switching decisions so that the result is fis-cally feasible.
CHECKLIST AND TOOLS FOR ANALYSIS
Before analyzing the poverty and social impact of pension reforms, oneought to answer a few basic questions. Countries have made very differ-ent choices about the design of their pension systems, and coveragewithin the systems varies substantially as well. So, an initial stocktakingof the choices that a country has made will produce a more well-informedanalysis.
Taking stock of the current system
1. Are the elderly poor? The first step is to determine how poor the elderlyare. Several recent analyses suggest that the elderly are not uniformlypoor in many Bank-client countries.11 Pockets of poverty exist, but theelderly often live within extended families, which frequently meansthat poverty rates are no higher among them than the rates existingamong the rest of the population. In countries where such cohabita-tion is common, the elderly who do live alone or as couples fall intoone of two categories: (a) those elderly who have sufficient means andchoose to live on their own,12 and (b) those elderly who have no oneto care for them. It is the latter group that is clearly at greater risk ofpoverty. The other case in which the elderly may become particularlyvulnerable occurs when the adult children on whom the elderly weredepending for old-age support disappear because of illness (such asAIDS), civil wars, or even extensive migration. These elderly are thenleft with few means of support. These results are very different fromthose in developed countries where the elderly depend for assistancein their old age more on public pension support than on the supportof their own families.
While it is useful to look at the pre- and posttransfer poverty posi-tions of the elderly, it is important to recognize that pension arrange-ments have an impact on living arrangements. While many elderlywould face poverty if their pensions were suddenly taken away, livingarrangements might have changed in a way to accommodate theelderly if a pension system had not existed or had deteriorated over
Pension System Reforms
25
time. There are significant numbers of multigenerational householdsin countries in the Europe and Central Asia Region where the pensionsystem no longer offers meaningful pensions. The extent of povertyamong the elderly and the identification of pockets of poverty amongthe elderly will provide insights into whether scarce fiscal resourcesshould be transferred to the elderly and also help identify the groupsat which the resources should be targeted, particularly if thoroughmeans testing is not feasible. This analysis needs to take place throughexamination of household surveys during a poverty assessment.Potential target groups that should be considered include widows,rural workers, the eldest of the elderly, and people with substantialhealth problems, but not all these groups are at risk of poverty in allcountries.
2. What are the living arrangements of the elderly? How much income dothe elderly need? In countries where cohabitation is common, theelderly who are part of larger households need far less income to avoidpoverty than do the elderly who are living alone. However, the oneconsumption category that may require significant increases in expen-diture for the elderly is health care. If the elderly are responsible foreven a portion of their own health care expenses, the income require-ments of the elderly go up significantly.
3. What are coverage rates? The third step in taking stock is to deter-mine the percentage of the labor force that is actually covered andcontributing to the pension system. Coverage rates as a percentageof the labor force vary from as low as 5 percent to as high as 95 per-cent. Coverage tends to vary by region and by income, with low cov-erage in poorer countries and in countries with newer systems.Coverage is thus typically lower in parts of Africa and Asia, thoughthere are many exceptions. Uruguay, for example, which does nothave a particularly high income, has a relatively high coverage rateof 80 percent.
Coverage is important in terms of the degree of redistributionwithin a pension system. If coverage is high, redistribution within thepension system implies that overall redistribution occurs from therich to the poor. If coverage is low, redistribution within the pensionsystem may have little impact on overall redistribution, since what-ever redistribution may be occurring is taking place between relativelyhigh-income groups of individuals. The bigger concern in this case isthe redistribution from outside the pension system to the coveredelderly when the system runs deficits. Similarly, government contri-butions to a system may be positive if the coverage is high, particularly
Analyzing the Distributional Impact of Reforms
26
if these contributions are targeted, but may be highly regressive if cov-erage is low. While information on coverage can be gleaned fromhousehold surveys, there seems to be a systematic underreporting ofcoverage in such surveys. It is not clear whether this is a sampling issueor whether there is some other bias causing underreporting. Mostpension agencies tend to have reasonable records of the number ofcontributors. A comparison of age- and gender-specific data with age-and gender-specific labor force data ought to provide a better pictureof labor force coverage.
However, labor force coverage is only part of the picture. In manycountries, coverage among the labor force is completely mismatchedwith the percentage of the elderly collecting pensions. In some cases, asin many countries in the Europe and Central Asia Region prior to tran-sition, labor force participation was close to 100 percent, and everyonewas covered. As a result, virtually all elderly qualify for a pension. Butthe high rates of unemployment that have accompanied the transitionto a market economy and the privatization, downsizing, and closing ofmany state-run enterprises have led to declining formal labor forceparticipation rates, and this will mean lower rates of coverage amongthe elderly in the future. By contrast, in parts of Africa, Asia, and LatinAmerica, coverage among the elderly is much lower than is coverageamong the labor force simply because many of today’s elderly wererural farmers not working in covered occupations. Not only has cov-erage expanded over the last 30 years to include more groups of work-ers, but also changes in labor force composition have meant that moreworkers have entered covered categories relative to 30 years ago.Finally, poor system design can result in low coverage among the laborforce, but high rates of coverage among the elderly. If people becomeeligible for benefits after only five years of contributions, as in Georgia,for example, individuals may choose to contribute for only five yearsand evade after that. As a result, labor force coverage of only one-ninthof the working-age population may result in complete coverage amongthe elderly, suggesting a fiscal issue, but not necessarily a lack of socialprotection for the elderly. The data on elderly coverage can be obtaineddirectly from pension agencies. These agencies sometimes lack full dataon contributors, but they usually have reasonable statistics on the per-sons to whom they pay benefits.
4. What is the fiscal status of the pension system now, and what will it be inthe near future? If the pension system is running deficits, and coverageis low, then there are clearly transfers from outside the pension systemto people within the system. These transfers are likely to be regressive
Pension System Reforms
27
since the revenue collected at large by the government may includerevenue from sources such as value-added taxes, which affect a segmentof the population that is broader than the population share repre-sented by persons who are beneficiaries of the pension system. Even ifcoverage is high, fiscal unsustainability suggests that the pension sys-tem will be squeezing fiscal resources. Governments respond very dif-ferently to fiscal deficits. Most governments, such as those in Brazil,Mexico, and Turkey, have responded to fiscal pressures in social secu-rity by running less-prudent macroeconomic policies and by squeez-ing other expenditures. Other governments, such as those in Argentina,Georgia, and Nigeria, have responded to fiscal pressures by not pay-ing pensions and allowing arrears to pensioners to build up. While thefirst response has implications for other social expenditures, the secondis perhaps worse in that pensioners who no longer have the capacityto work are suddenly denied pensions. Future payment of arrears isuseless to the pensioner who dies before the payments are made. Fis-cal deficits or prospective fiscal deficits also invariably lead to policychanges, since deficits are only sustainable for a limited time. Aware-ness of such deficits thus leads to uncertainty among pensioners andworkers. The main idea of a pension system is to provide securitywhen people are unable to work. Introducing a high degree of uncer-tainty to the benefit structure reduces the value of the pension systemto workers.
One difficulty that arises in evaluating the financial results of thepension system pre- and postreform involves the increase in short-term deficits caused by the shift to a funded system. Deficits increasein the short term since the government has to cover pensions for thecurrent elderly and the soon-to-be elderly, while younger workers puttheir contributions in their own individual accounts. Thus, taking ashort-run view, it might appear that the reforms have made the situ-ation worse. Even without a shift to a funded system, pension reformsare enacted so slowly that a major policy change may result in little fis-cal change during the first five years.
The implicit pension debt in the pension system provides a truerpicture of the impact of reform than do the short-run deficits becauseimplicit pension debt measures the present value of the liabilities inthe pension system. These alter immediately after the reform has beenenacted, however long the pension reform takes to unfold, althoughchanges that impact only new entrants will not affect the currentimplicit pension debt since there are no current liabilities with respectto people who have not yet entered the system.
Analyzing the Distributional Impact of Reforms
28
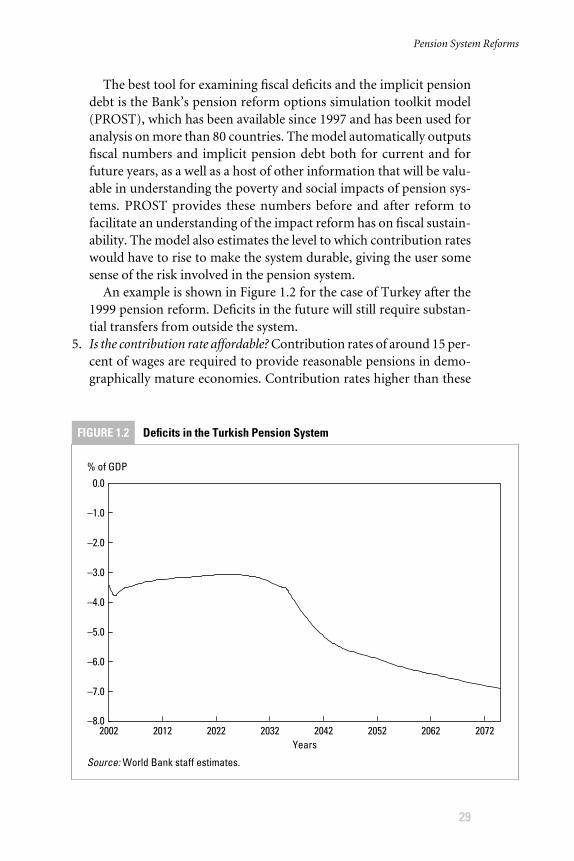
The best tool for examining fiscal deficits and the implicit pensiondebt is the Bank’s pension reform options simulation toolkit model(PROST), which has been available since 1997 and has been used foranalysis on more than 80 countries. The model automatically outputsfiscal numbers and implicit pension debt both for current and forfuture years, as a well as a host of other information that will be valu-able in understanding the poverty and social impacts of pension sys-tems. PROST provides these numbers before and after reform tofacilitate an understanding of the impact reform has on fiscal sustain-ability. The model also estimates the level to which contribution rateswould have to rise to make the system durable, giving the user somesense of the risk involved in the pension system.
An example is shown in Figure 1.2 for the case of Turkey after the1999 pension reform. Deficits in the future will still require substan-tial transfers from outside the system.
5. Is the contribution rate affordable? Contribution rates of around 15 per-cent of wages are required to provide reasonable pensions in demo-graphically mature economies. Contribution rates higher than these
Pension System Reforms
29
FIGURE 1.2 Deficits in the Turkish Pension System
impose high labor costs on the economy, encouraging informalizationof the labor market and discouraging labor-intensive activities. In ageographically competitive world, high labor taxes also affect laborcompetitiveness, which, in turn, has an impact on employment.
Benefit structure: fairness and redistribution
1. Are the benefits adequate? The adequacy of benefits can be judgedaccording to at least two very different criteria, each stemming fromthe two separate goals of the pension system. First, the level of the ben-efit should be compared with the poverty level to determine whetherthe benefit is sufficient to reduce poverty in old age. This needs to beevaluated both for new retirees and for individuals already in retire-ment since the absence of indexation can drive pension levels belowthe poverty line. The poverty evaluation should also be carried out formen and for women and over time. Particular attention should bepaid to the level of the minimum benefit because many lower-incomeindividuals will receive the minimum benefit, not the average benefit.However, it should be noted that pension benefits below the povertyline are not necessarily bad, especially if the pension is only one sourceof retirement income. If elders live with younger generations, even apension below the poverty level may have significant poverty reduc-tion impact.
A similar analysis should be carried out relative to the average wageto determine how well the pension benefit performs relative to wagegrowth in the economy. Since pensions are typically indexed to infla-tion and not wage growth, the benefit usually falls relative to the aver-age wage during a person’s retirement period. A pension indexed toinflation may still be consumption smoothing since a person needs tosmooth consumption over his own lifetime. Thus, inflation indexa-tion will maintain the level of real pension benefits over the retirementperiod relative to real income during an individual’s working years.Similarly, the analysis can be carried out for men and for women ineach income group, taking into account the minimum pension, ceil-ings on benefits, and survivor benefits.
The Bank’s PROST model is also an excellent instrument for thisanalysis. Once the system characteristics have been entered for the fis-cal analysis, all these measures of adequacy are automatically produced.There is also a module that allows the user to specify characteristics ofindividuals at one time with respect to gender, age at first employment,age at retirement, starting wage relative to the average for the cohort,
Analyzing the Distributional Impact of Reforms
30
wage growth relative to the average for the cohort, mortality rate rela-tive to the average for the cohort, and work history. All these charac-teristics have an impact on the adequacy of the pension.
One issue that the Bank’s model does not fully cover is the impactof taxation. At the very least, the adequacy analysis should comparenet pension benefits with net wages. Typically, workers or unions con-sider gross replacement rates and complain that a 60 percent replace-ment rate of preretirement income is not adequate for pension benefits.But, if the contribution rate for a pension by the employee is 10 per-cent, the health-insurance contribution is 5 percent of wages, andincome tax rates are 25 percent of wages, the 60 percent replacementrate for pension benefits represents 100 percent of net salary. Giventhe lower nutrition requirements and fewer number of dependents ofthe elderly, 100 percent of net salary represents an overly generousbenefit. The output of PROST provides the overall information, butdoes not calculate the net salary since the tax structure may vary byindividual, but this calculation can be easily performed in a separatespreadsheet.
2. Are the pensions fairly provided? Adequacy is not the only dimensionupon which a particular benefit structure should be evaluated. Indi-viduals and their employers make decisions about whether to join thepension system or not partly based on whether the system is perceivedto be fair. Since people are being asked to make contributions in orderto receive benefits, people need to feel that they are getting a reason-able deal from the pension system; otherwise, they will not want toparticipate, choosing to self-insure instead.
For example, pensions among men and women relative to the aver-age wage in the economy will generally reflect the wage differences andwork-history differences between men and women. Given the poten-tially large disparity between men’s and women’s wages, there can bea fairly large disparity in pensions as well. However, fixing the pensiondisparity through policy will weaken the link between contributionsand benefits. If women receive relatively high benefits regardless ofhow much they contribute, they will contribute as little as possible. If,in order to redistribute toward women, men receive less relative to theamounts they have contributed, they will perceive the pension systemas unfair and will tend to withdraw from the system as much as pos-sible. Neither group will want to contribute, resulting in negative fis-cal consequences for the system overall.
Fairness can be measured in at least two ways. One approachtoward analyzing the fairness of a pension system involves calculating
Pension System Reforms
31
the internal rate of return inherent in the pension system for people indifferent income groups, cohorts, and genders. (The internal rate ofreturn is the rate of return that will equalize the net present value ofthe benefits received with the net present value of the contributionspaid.) This analysis may be carried out for a variety of people in dif-ferent income groups, age groups, and gender groups, taking intoaccount differences in the average age at first employment, differencesin ages at retirement, differences in the growth path of wages experi-enced by different individuals, differences in the continuity of labormarket participation, and differences in mortality across incomegroups.13 The individuals should be representative of their income,age, and gender groups, but their careers may be either simulated orbased on actual work histories. The goal would be to have a systembased on either equal internal rates of return for different incomegroups, age groups, or gender groups or rates of return that are slightlyhigher for lower-income groups. The analysis can be carried out priorto reform and after reform to determine whether the internal rates ofreturn have become more equitable or whether the inequality hasincreased.
A second, related tool takes the present value of the stream of ben-efits a person receives and subtracts the present value of the stream ofcontributions the person made, including an interest payment on thecontributions, to determine the net transfer the individual receivesfrom the pension system. This net transfer is usually normalized bydividing it by some variable such as the average wage. The resultingcalculation can be interpreted as the equivalent of the person receiv-ing or paying x additional average wages because of the person’s par-ticipation in the pension system. As in the calculation of the internalrate of return, this approach takes into account contributions an indi-vidual makes, as well as the benefits received, but, unlike the calcula-tion of the internal rate of return, it requires the user to define anappropriate interest rate. Since predetermining an interest rate maybe difficult, many users prefer to rely on the similarly calculated inter-nal rate of return. Furthermore, the tool can make interpretation dif-ficult. If all pensioners receive benefits that are twice as high as theircontributions, higher-income individuals will receive a net transferthat is higher in absolute monetary amounts since the pension bene-fits for higher-income individuals are higher than those for lower-income individuals. Do higher net transfers indicate a policy that ismisaligned across income groups? Not necessarily, since consumptionsmoothing is one of the primary goals of pension systems. If the net
Analyzing the Distributional Impact of Reforms
32
transfer were to be normalized by the level of contributions for eachgroup analyzed rather than by the average economy-wide wage (thetypical normalization method), this tool could be useful for intra-cohort comparisons. The net transfer figure turns from positive tonegative for the same cohorts for which the internal rate of returnmoves from above the market interest rate to below the market inter-est rate. The preference for one over the other largely reflects howcomfortable a user is in defining an appropriate market interest rate.
Figure 1.3 provides an example of how analyses of adequacy andfairness may yield different results. Pre-reform, the Slovak Republichad an extremely redistributive system with relatively low ceilings onboth contributions and benefits. As a result, the pension relative to thepreretirement wage, shown in the right-hand panel, was extremelylow for high-income women, but reasonable for average- and low-income women. The succession of reforms—first, a pay as you goreform, then the addition of a funded pillar, and then future reformsthat will bring the pay as you go part to full sustainability—has man-aged to raise the benefit levels for high-income women, while main-taining or increasing the benefit levels for middle- and low-incomewomen. However, while individuals might measure their pensionsrelative to their preretirement incomes as one indication of the ade-quacy of the pension, other measures of equity might gauge theamounts individuals pay relative to the benefits they receive, as shownin the left-hand panel. Even though high-income women were receiv-ing pensions that were low relative to the women’s preretirementwages, they were receiving rates of return on their contributions thatwere higher than those received by lower-income women, partlybecause of the longer life expectancy of higher-income women andpartly because the pensions were based on wages earned toward theend of the career, where high-income individuals experience the mostwage growth. The reforms have brought down rates of return amongall income groups from the previous unsustainable levels and havetended to increase equality in the rates of return across incomegroups. Since funded systems tend to be more equitable in terms ofrates of return than are unfunded systems, the heavier reliance onfunded systems tends to produce more equality. However, the differ-ence in life expectancy remains and still generates differences in theinternal rates of return.
3. How redistributive is the pension system? Another tool looks at the extentto which a pension system is redistributive. Pension systems try both toredistribute income and to provide a mechanism for consumption
Pension System Reforms
33
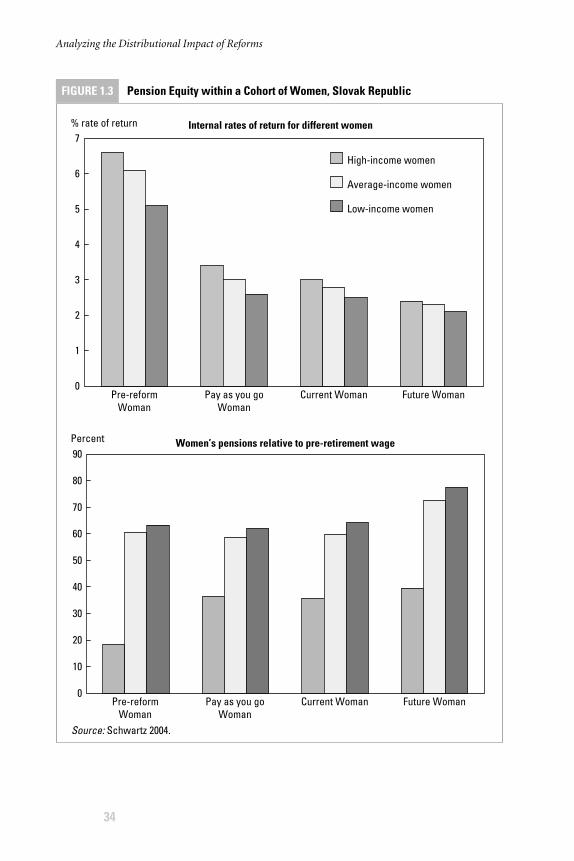
Analyzing the Distributional Impact of Reforms
34
0
10
20
30
40
50
60
70
80
90
FIGURE 1.3 Pension Equity within a Cohort of Women, Slovak Republic
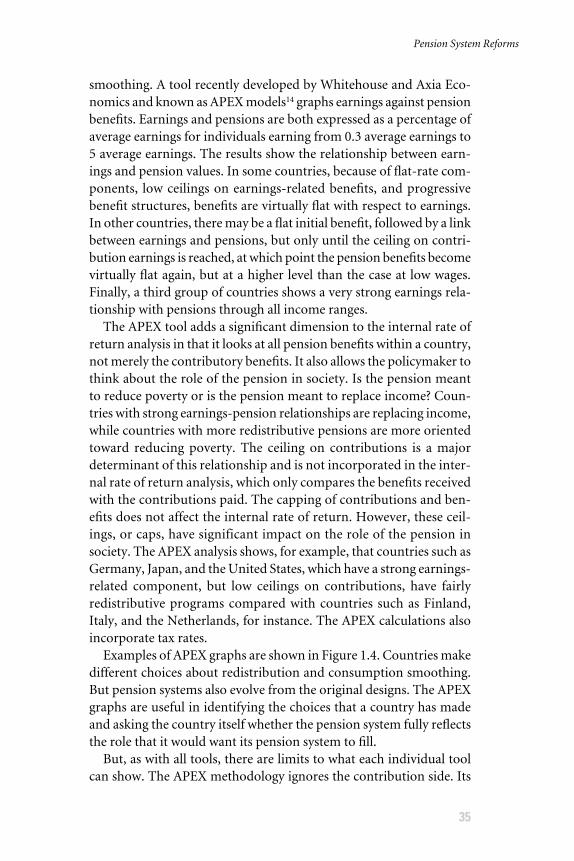
smoothing. A tool recently developed by Whitehouse and Axia Eco-nomics and known as APEX models14 graphs earnings against pensionbenefits. Earnings and pensions are both expressed as a percentage ofaverage earnings for individuals earning from 0.3 average earnings to5 average earnings. The results show the relationship between earn-ings and pension values. In some countries, because of flat-rate com-ponents, low ceilings on earnings-related benefits, and progressivebenefit structures, benefits are virtually flat with respect to earnings.In other countries, there may be a flat initial benefit, followed by a linkbetween earnings and pensions, but only until the ceiling on contri-bution earnings is reached, at which point the pension benefits becomevirtually flat again, but at a higher level than the case at low wages.Finally, a third group of countries shows a very strong earnings rela-tionship with pensions through all income ranges.
The APEX tool adds a significant dimension to the internal rate ofreturn analysis in that it looks at all pension benefits within a country,not merely the contributory benefits. It also allows the policymaker tothink about the role of the pension in society. Is the pension meant to reduce poverty or is the pension meant to replace income? Coun-tries with strong earnings-pension relationships are replacing income,while countries with more redistributive pensions are more orientedtoward reducing poverty. The ceiling on contributions is a majordeterminant of this relationship and is not incorporated in the inter-nal rate of return analysis, which only compares the benefits receivedwith the contributions paid. The capping of contributions and ben-efits does not affect the internal rate of return. However, these ceil-ings, or caps, have significant impact on the role of the pension insociety. The APEX analysis shows, for example, that countries such asGermany, Japan, and the United States, which have a strong earnings-related component, but low ceilings on contributions, have fairlyredistributive programs compared with countries such as Finland,Italy, and the Netherlands, for instance. The APEX calculations alsoincorporate tax rates.
Examples of APEX graphs are shown in Figure 1.4. Countries makedifferent choices about redistribution and consumption smoothing.But pension systems also evolve from the original designs. The APEXgraphs are useful in identifying the choices that a country has madeand asking the country itself whether the pension system fully reflectsthe role that it would want its pension system to fill.
But, as with all tools, there are limits to what each individual toolcan show. The APEX methodology ignores the contribution side. Its
Pension System Reforms
35
Analyzing the Distributional Impact of Reforms
36
FIGURE 1.4 APEX Models of Pension Systems
focus is on relating pensions to earnings, not to contributions. To theextent that contributions are not directly linked to earnings, theresults may differ from those shown by the internal rate of returnanalysis. For example, if contributions must be paid on a minimumwage, the extent of redistribution toward a worker earning less thanthe minimum wage is much lower according to the calculation of theinternal rate of return than it is according to the APEX methodology.Similarly, if the maximum pension provided by the system is notstrictly related to the contribution ceiling on earnings, the two toolswill give different results. Finally, while the APEX tool shows the redis-tributive intent within the system, it does not specify the source of theredistributed funds. Internal rates of return can specify groups of con-tributors who are losing through the system and others who are gain-ing, but only if the system is fully self-financing. To the extent that thesystem runs a deficit and funds are injected from outside the system,neither internal rates of return nor APEX specifies who loses in theredistribution process. The APEX analysis has been completed forall countries in the Organisation for Economic Co-operation andDevelopment and many countries in the Europe and Central Asia,Latin America and the Caribbean, and Middle East and North AfricaRegions of the World Bank.
Benefit incidence analysis
Another tool frequently used to analyze expenditure items is benefit inci-dence analysis. The presence of consumption smoothing as a primaryobjective of many pension system designs suggests that traditional bene-fit incidence analysis is not an appropriate instrument for examiningpension systems and pension system reforms. By design, people who earnmore and contribute more should expect to receive higher benefits.Design issues, combined with the often low compliance among low-income earners, mean that pension expenditures are focused on higher-income individuals. But, unlike in other types of expenditures, this typeof incidence inequality is not a negative in pension systems; it is anexpected feature of pension system objectives. As long as the pension sys-tem is self-financing, expenditures skewed toward high-income individ-uals are fine.15
A second issue that complicates analysis of pensions systems is thetypically contributory nature of systems. If one were to engage in ben-efit incidence analysis, the analysis would only be correct if it is carriedout net of contributions, because contributions, unlike other taxes
Pension System Reforms
37
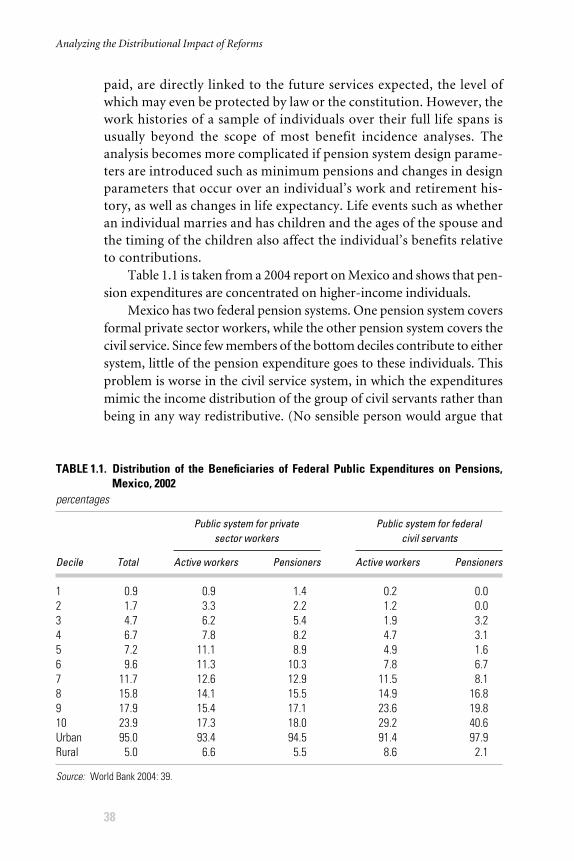
paid, are directly linked to the future services expected, the level ofwhich may even be protected by law or the constitution. However, thework histories of a sample of individuals over their full life spans isusually beyond the scope of most benefit incidence analyses. Theanalysis becomes more complicated if pension system design parame-ters are introduced such as minimum pensions and changes in designparameters that occur over an individual’s work and retirement his-tory, as well as changes in life expectancy. Life events such as whetheran individual marries and has children and the ages of the spouse andthe timing of the children also affect the individual’s benefits relativeto contributions.
Table 1.1 is taken from a 2004 report on Mexico and shows that pen-sion expenditures are concentrated on higher-income individuals.
Mexico has two federal pension systems. One pension system coversformal private sector workers, while the other pension system covers thecivil service. Since few members of the bottom deciles contribute to eithersystem, little of the pension expenditure goes to these individuals. Thisproblem is worse in the civil service system, in which the expendituresmimic the income distribution of the group of civil servants rather thanbeing in any way redistributive. (No sensible person would argue that
Analyzing the Distributional Impact of Reforms
38
TABLE 1.1. Distribution of the Beneficiaries of Federal Public Expenditures on Pensions,Mexico, 2002
percentages
Public system for private Public system for federalsector workers civil servants
Decile Total Active workers Pensioners Active workers Pensioners
1 0.9 0.9 1.4 0.2 0.02 1.7 3.3 2.2 1.2 0.03 4.7 6.2 5.4 1.9 3.24 6.7 7.8 8.2 4.7 3.15 7.2 11.1 8.9 4.9 1.66 9.6 11.3 10.3 7.8 6.77 11.7 12.6 12.9 11.5 8.18 15.8 14.1 15.5 14.9 16.89 17.9 15.4 17.1 23.6 19.810 23.9 17.3 18.0 29.2 40.6Urban 95.0 93.4 94.5 91.4 97.9Rural 5.0 6.6 5.5 8.6 2.1
Source: World Bank 2004: 39.
doctors and teachers should be drawn from the least-educated, lowest-income groups in order to equalize the distribution of pensions andwages within the civil servant system.) One could even contend that, inthe case of civil servants, these pensions are not expenditures per se, butpart of the compensation packages of teachers and health workers andthus should be included in the cost of education or health services ratherthan as a separate expenditure category.
CONCLUSIONS
Several critical points emerge in undertaking poverty and social impactanalysis on pension systems and pension system reforms.
1. Pension systems are not a direct expenditure of the government, butprovide a mechanism by which contributions can be made duringworking years and benefits can be received during retirement years.Thus, by nature, they are not transfer programs.
2. Benefit incidence analysis is not appropriate for the study of pensionsystems because it typically does not net out the contributions madeover the employment careers of workers.
3. Pension systems attempt to reduce poverty during old age, but also tryto smooth consumption between the working years and the retire-ment years. For this reason, it is anticipated that individuals who con-sume more during their working years will continue to consume moreduring their retirement years.
4. Many worthwhile pension reforms may result in poor distributionalconsequences in the short run. This is clearly the case when a shift isundertaken to a funded system, in which the government pays pen-sion benefits to covered pensioners, while workers deposit theirmoney into their individual accounts. However, this is a transition toa system in which the government will have limited liability for pen-sion expenditures, freeing up future resources for more targetedassistance. Even in the case of parametric reforms that tie contribu-tions more closely to benefits, those individuals who have not con-tributed will lose in the short run, though the fiscal improvementswill free resources to cover those individuals who cannot contributein the long run.
5. The distributional benefits of pension reform will not be obvious inthe short run since pension reform usually takes 30 to 40 years tounfold fully, given that acquired rights must be legally and, in somecases, constitutionally respected.
Pension System Reforms
39
6. Ideally, analysts should take a holistic approach to the welfare of theelderly in a particular country and should not focus solely on the dis-tributional impact of a single instrument, the pension system.
NOTES
1. In fact, the International Labour Organization endorses a minimum stan-dard of 40 percent of an individual’s wage for 30 years of work. While thedefinition of an individual’s wage is somewhat vague, it is clear that the stan-dard is relative to some measure of one’s own wage, not a minimum povertylevel.
2. Unemployment insurance can have similar features in that the target bene-fit is related to one’s income.
3. The pension agency may have reserve funds, in which case the system maybe considered partially funded.
4. Typically, governments offer a minimum pension guarantee under a defined-contribution plan, but this design feature is similar to the role of a minimumpension in a defined-benefit plan and is only available to those who have ful-filled certain conditions.
5. The literature is extensive and includes Corsetti and Schmidt-Hebbel (1997),Diamond and Hausman (1984), Disney (1996), Gruber and Wise (1999),and Koitz (1988), among many others.
6. One might argue that this redistribution is corrected by the fact that men fre-quently leave widows and other survivors, while women do not. The pensionto the man and his survivor is roughly equivalent in duration or may even belarger than the pension given to the longer-lived woman, who typically doesnot leave a survivor.
7. It should be noted that younger cohorts can be expected to live longer andtherefore receive more benefits than their parents’ generation, which mightprovide some compensation for having to pay higher contribution rates orfor receiving lower benefits, but there is usually a lag between the change inthe underlying demographics and the change in the policies, so that there isno automatic linkage to maintaining actuarial balance. Some cohorts receivenet transfers; others lose.
8. Sometimes, governments tax contributions and make the pensions nontax-able. In a few cases, both contributions and benefits are exempt from tax. A systematic review of tax treatment can be found in Whitehouse (1999).
9. See Holzmann and Hinz et al. (2005).10. It is certainly possible that the group of people covered by the pension sys-
tem is identical to the group of people paying taxes, suggesting no increasedregressivity from pension deficits. However, with the introduction of broad-ranging value-added taxes in a large number of countries, it is more likelythat the tax base is broader than the coverage of the pension system.
11. Schwarz (2005); Kakwani and Subbarao (2005); Whitehouse (2000).
Analyzing the Distributional Impact of Reforms
40
12. Evidence from developed countries suggests that independent living is a pre-ferred state among the elderly, and, when income permits, the elderly chooseto live alone. However, there may be a cultural element to these preferences.
13. The Bank’s PROST model provides an automatic tool that can perform thisanalysis both before and after reform, but this analysis can be performedusing simple spreadsheets as well.
14. See Whitehouse (2005).15. The International Labour Organization and trade unions frequently argue in
favor of tripartite financing, which is financing by employees, employers, andthe government. This may be a reasonable policy in countries in which cov-erage is high, such as in the developed world, but, in countries with low coverage, this policy should be carefully evaluated, since it usually involvestransferring general revenue only to those individuals who contribute, andthese tend to be high-income individuals.
BIBLIOGRAPHY
Corsetti, G., and K. Schmidt-Hebbel. 1997. “Pension Reform and Growth.” InThe Economics of Pensions: Principles, Policies and International Experience, ed.S. Valdés-Prieto. Cambridge: Cambridge University Press.
Diamond, P., and J. Hausman. 1984. “Individual Retirement and Savings Behav-ior.” Journal of Public Economics, 23 (1/2): 81–114.
Disney, R. 1996. Can We Afford to Grow Older? Cambridge, MA: The MIT Press.Gruber, J., and D. A. Wise, eds. 1999. Social Security and Retirement around the
World. Chicago: University of Chicago Press.Holzmann, R., and R. Hinz et al. 2005. Old-Age Income Support in the 21st Cen-
tury: An International Perspective on Pension Systems and Reform. Washington,DC: World Bank.
Kakwani, N., and K. Subbarao. 2005. “Aging and Poverty in Africa and the Roleof Social Pensions.” Sector Report, Human Development Department, AfricaRegion, World Bank, Washington, DC.
Koitz, D. 1988. Social Security: Its Funding Outlook and Significance for Govern-ment Finance. Washington, DC: Congressional Research Service.
Schwarz, A. M. 2004. “Slovak Republic: Pension Policy Reform Note.” SectorReport, Human Development Department, Europe and Central Asia Region,World Bank, Washington, DC.
———. 2005. “Old Age Security and Social Pensions.” Working Paper, SocialProtection Department, Human Development Network, World Bank,Washington, DC.
Steuerle, C. E., and J. M. Bakija. 1994. Retooling Social Security for the 21st Century:Right and Wrong Approaches to Reform. Washington, DC: Urban Institute Press.
Whitehouse, E. 1999. “The Tax Treatment of Funded Pensions.” Social Protec-tion Discussion Paper 9910, Social Protection Department, Human Develop-ment Network, World Bank, Washington, DC.
Pension System Reforms
41
———. 2000. “How Poor are the Old?: A Survey of Evidence from 44 Coun-tries.” Social Protection Discussion Paper 0017, Social Protection Depart-ment, Human Development Network, World Bank, Washington, DC.
———. 2005. Pensions at a Glance: Public Policies across OECD Countries. Paris:Organisation for Economic Co-operation and Development.
World Bank. 2004. “Mexico: Public Expenditure Review.” Report 27894-MX,Latin America Economic Policy Sector, World Bank, Washington, DC.
Analyzing the Distributional Impact of Reforms
42
Health Sector Reforms
Mattias Lundberg and Limin Wang
43
2
THE FUNCTION OF A PUBLIC HEALTH SYSTEM
The purpose of Poverty and Social Impact Analysis (PSIA) is to exam-ine the distributional consequences of sectoral reforms. It is not areview of the impact of reforms on overall sectoral performance. How-
ever, the effect of health sector reforms on welfare among the poor andother groups is inextricably linked to the effect of reforms on sectoral per-formance. Reforms are intended to address a wide variety of problemsand constraints in the sector and to achieve myriad and often conflictingobjectives. Not all of these are explicitly intended to enhance equity, butthey will all have distributional consequences.
As a prerequisite to examining health sector reforms, understand-ing what the health system is designed to do, how it can achieve its goals,and the context in which it operates is important. Although improvedhealth is a goal in itself and is a requirement for economic growth, toexpect that the health system can, on its own, achieve broader welfare orgrowth objectives is unreasonable. The health system should focus onimproving health.
According to World Health Report 2000 (WHO 2000a), national healthsystems have three fundamental objectives: (1) improving the health ofthe population they serve, (2) responding to people’s expectations, and(3) providing financial protection against the costs of ill health. World
The authors gratefully acknowledge the comments and suggestions of Mark CamdenBassett, Shiyan Chao, Shanta Devarajan, David Evans, Deon Filmer, Dave Gwatkin, andGeorge Schieber on this chapter.
Health Report 2000 goes on to suggest that the second and third goals arepartly instrumental, that is, they contribute to the first goal.
Note that this list says nothing about how these objectives are to beachieved. There is nothing about health or public health that requires a par-ticular mode of organization or delivery. This is distinct from the acknowl-edgment that certain components of health and health care are public goods,which (it is assumed) must be provided or at least encouraged by collectiveaction.
To achieve these goals, health systems perform a number of generalfunctions. Paraphrasing the World Health Report, these can be classifiedas: (1) governance and oversight, (2) investment and training, (3) financeand risk-pooling, and (4) service provision.
One can imagine many hundreds of things that health systems actu-ally do, but they can reasonably be subsumed into these comprehensive cat-egories of activities. This requires a broader view of health systems, such asdescribed in both World Health Report 2000 and World Development Report2004 (World Bank 2003a). Public health is not merely medical care, orhuman resources, or social insurance; similarly, it consists of more thanvertical public campaigns targeted at specific diseases.
To understand the impact of health sector reforms, especially onpoverty and welfare, one must ask how the proposed actions will influencethe performance of the system and the system’s ability to achieve itsfundamental objectives. To make this a bit more concrete, it is importantto ask, for example, not only whether a particular program (say, a programon insecticide-treated bed-nets) is achieving its objectives and not merelywhether the program is pro-poor. It is important also to ask about theopportunity costs of the program: can the objectives of better public healthand better health among the poor be achieved by other means? We can thenask whether the program is best designed to achieve its own objectives. Inthe current jargon, we must first ask whether we are “doing the rightthings” and then whether we are “doing them right.”1 It is also essential tohave some idea of the counterfactual: what is likely to happen in the absenceof any changes or intervention?
We must keep in mind that health is an input to human well-being, andhuman well-being is the goal of public policy. Health is instrumental, even(pace Amartya Sen) fundamental, but it is conceivable that, under certainconditions, welfare will be more enhanced by investments in items otherthan health. The concept of the counterfactual should therefore be broad-ened to encompass nonhealth alternatives. Even if one particular investmentor policy is found to dominate others within the sector, it is possible thatanother nonhealth investment will increase living standards even more.
Analyzing the Distributional Impact of Reforms
44
These alternative investments can cover items that also improve health, suchas food, shelter, water, sanitation, and transport, but these are usually out-side the purview of health ministries.
Thus, it is important to understand the broader context of health sec-tor reforms. However, it is equally important to maintain the analyticalfocus on the distributional consequences of reforms. This chapter specifi-cally aims to provide a guide for policy practitioners who wish to conductan analysis of the impact of health reform or health policy changes on thewelfare of households, especially poor households (thus, “poverty andsocial impact analysis”).
At a minimum, analysis of proposed reforms in health must addressthe following questions:
� What is needed to enable the health sector to achieve its broaderobjectives?
� What is the potential welfare impact of the proposed reforms acrosssocioeconomic groups?
� What can be done to avoid or minimize possibly adverse consequencesof reforms?
The first of these questions addresses the design and context ofreforms. Understanding the welfare consequences requires that we con-sider the main intended purpose of the reforms. What goals are the reformsintended to achieve, and how can the health system be organized to bestachieve the goals? These questions are addressed in World DevelopmentReport 2004. The third question addresses the design of compensationmechanisms to mitigate the unintended adverse effects of policy changes.While there is little experience with designing mitigation mechanismsspecifically for health reforms, more general guidance is provided in ASourcebook for Poverty Reduction Strategies (Klugman 2002), especiallyPart 5, “Human Development” (pages 163–231) and “Technical Note”(pages 543–76), as well as in A User’s Guide to Poverty and Social ImpactAnalysis (World Bank 2003b).
This chapter focuses on the second issue: the identification of the con-sequences of reforms for the poor and other groups. This information isclearly required for the design of mitigation programs, but mitigationshould be considered a last-best alternative to designing reforms in orderto achieve the best outcomes for all. The identification of impacts is alsoessential for designing effective reforms that enable the sector to achieve itsoverarching goal of enhancing public health.
This chapter proceeds as follows. First, we discuss the rationale for andthe types of reforms that are common in the health sector. We then discuss
Health Sector Reforms
45

the stakeholders and transmission channels for the impact of reforms.Finally, we turn to the technical aspects: analytical methods, assumptions,data requirements, and so on.
ISSUES SPECIFIC TO THE ANALYSIS OF HEALTH REFORMS
Before we begin, we must deal with a few aspects of reforms that are uniqueto the health sector. Some of these issues arise in other reforms, especiallythose dealing with public or quasi-public goods, such as education. But theyare arguably more complex and more confounding in health reforms thanin reforms in other sectors, and they are all vital to the analysis of the impactof reforms on welfare. These include the definition of equity, moral hazardand agency, asymmetric information and adverse selection, and other con-founding factors.
Health care is not the same as health
One feature of health care that distinguishes it from other public goodsand services is that the consumption of health care is only one input, albeitan important one, in the production of health. As Filmer, Hammer, andPritchett (2000) demonstrate, the connection between public health spend-ing and public health outcomes is rather tenuous. Health is produced inthe household as a function of health care, nutrition, behavior, water, andmyriad other factors. Wagstaff (1999) provides a figure to illustrate theselinks. He points out that not only do health outcomes vary across groups,but there is enormous inequality in the determinants of health outcomesas well (Figure 2.1).
When examining the impact of health reforms on health and welfare,one should understand that these other characteristics will inevitably getin the way of the path from policies to outcomes. It is equally importantthat we understand the interactions between the sectoral reforms andthese confounding factors. Three main questions must be addressed, asfollows:
� What effect will the reforms have on these other confounding factors?� How will these confounding factors influence the impact of reforms
on health?� How will these confounding factors shape the process of reform?
The first of these questions is not intuitive. Reforms may have signi-ficant external (to the health sector) effects, positive and negative. For
Analyzing the Distributional Impact of Reforms
46
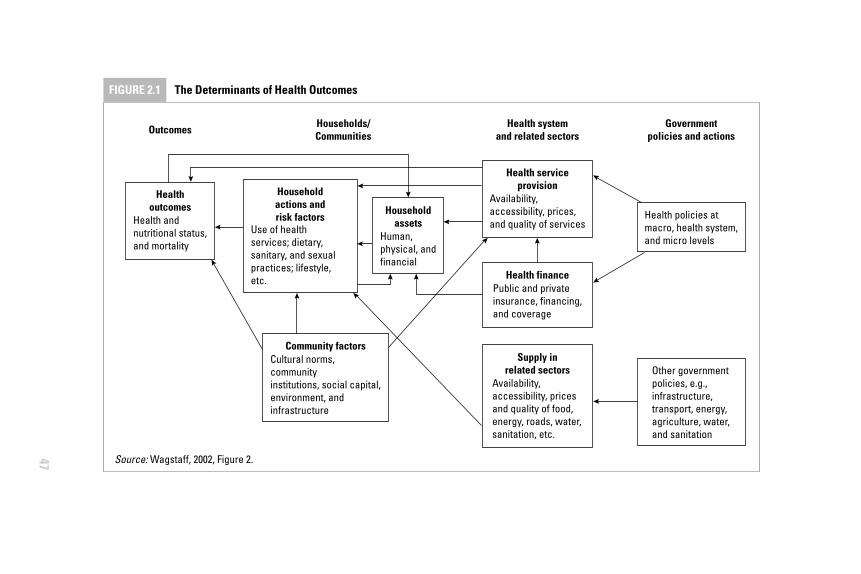
47
Outcomes
Healthoutcomes
Health andnutritional status,and mortality
Households/Communities
Health systemand related sectors
Health serviceprovision
Availability,accessibility, prices,and quality of services
Health financePublic and privateinsurance, financing,and coverage
Supply inrelated sectors
Availability,accessibility, pricesand quality of food,energy, roads, water,sanitation, etc.
Governmentpolicies and actions
Health policies atmacro, health system,and micro levels
Other governmentpolicies, e.g.,infrastructure,transport, energy,agriculture, water,and sanitation
Community factorsCultural norms,communityinstitutions, social capital,environment, andinfrastructure
Householdactions andrisk factors
Use of healthservices; dietary,sanitary, and sexualpractices; lifestyle,etc.
Householdassets
Human,physical, andfinancial
Source: Wagstaff, 2002, Figure 2.
FIGURE 2.1 The Determinants of Health Outcomes
example, reforms in the health sector may influence community institu-tions. There have been numerous experiments recently to harness com-munity groups to monitor the performance of local public services (see,for example, Loewenson 2000). This may have the added effect of strength-ening local capital and local institutions, which may then collectively bar-gain for (or informally provide) other services that incidentally enhancehealth, such as water and sewage connections.
The second question—on the influence of confounding factors on theoutcomes of the reforms—is related to the issue of transmission channels.In this case, however, the transmission channels are primarily external tothe sector and to the reforms. Clearly, enhanced access to health serviceswill affect health care consumption and possibly health outcomes. Thatis the direct and intended impact. But this impact will differ across areasbecause of, for example, differing access to clean water. Health is not nec-essarily enhanced by the construction of clinics if the local drinking wateris contaminated by sewage. There may be more subtle consequences aswell: for example, the physiological impact of medical treatment may beaffected by illnesses caused by pathogens in drinking water.
Finally, many nonhealth institutions, both private and public, willinfluence the implementation of reforms in the sector. These are externalto the health sector proper, but will shape the process and impact of re-forms. In Mozambique, for example, eight ministries are involved in healthcare finance and policy, six of which are actually providing health services.These include the ministries of public works, education, justice, and inte-rior, as well as health.
Equity
Equity in health has been the subject of enormous discussion and litera-ture. Here, some of the issues are mentioned that will arise in the contextof any health reform. These can be crudely distinguished as equity of what?and what equity? These questions are not trivial: World Health Report 2000placed great emphasis on creating indexes of the equity of health financeand services (see the Statistical Annexes in the report), and these indexeshave been remarkably controversial (for example, see Asada and Hede-mann 2002; Wagstaff 1999). Here, the various concepts of equity are brieflydescribed that are commonly used in health.
Equity in health care can be conceived in terms of access, finance, expen-diture, and outcomes, and health policy has usually distinguished betweenhorizontal and vertical equity, which have specific meanings in each case.Table 2.1 briefly describes these different terms as they are commonly used.
Analyzing the Distributional Impact of Reforms
48
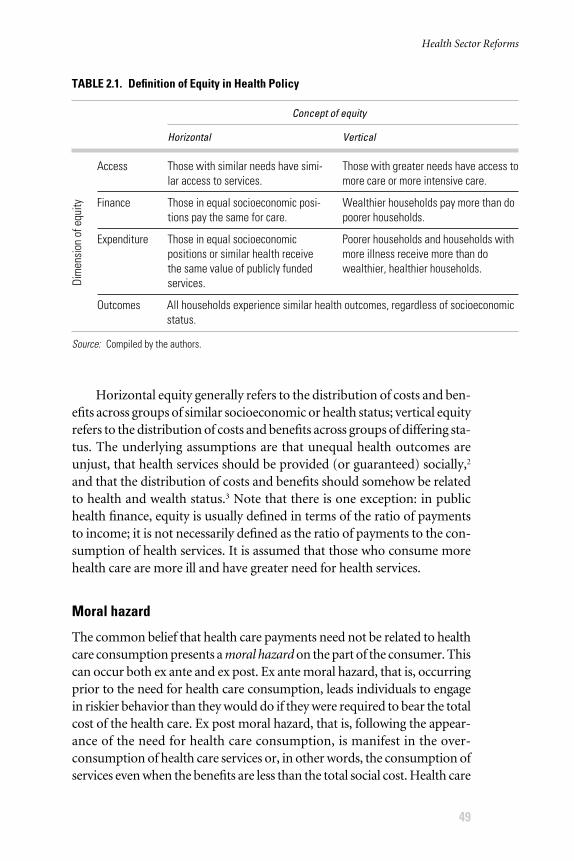
Horizontal equity generally refers to the distribution of costs and ben-efits across groups of similar socioeconomic or health status; vertical equityrefers to the distribution of costs and benefits across groups of differing sta-tus. The underlying assumptions are that unequal health outcomes areunjust, that health services should be provided (or guaranteed) socially,2
and that the distribution of costs and benefits should somehow be relatedto health and wealth status.3 Note that there is one exception: in publichealth finance, equity is usually defined in terms of the ratio of paymentsto income; it is not necessarily defined as the ratio of payments to the con-sumption of health services. It is assumed that those who consume morehealth care are more ill and have greater need for health services.
Moral hazard
The common belief that health care payments need not be related to healthcare consumption presents a moral hazard on the part of the consumer. Thiscan occur both ex ante and ex post. Ex ante moral hazard, that is, occurringprior to the need for health care consumption, leads individuals to engagein riskier behavior than they would do if they were required to bear the totalcost of the health care. Ex post moral hazard, that is, following the appear-ance of the need for health care consumption, is manifest in the over-consumption of health care services or, in other words, the consumption ofservices even when the benefits are less than the total social cost. Health care
Health Sector Reforms
49
TABLE 2.1. Definition of Equity in Health Policy
Concept of equity
Horizontal Vertical
Access
Finance
Expenditure
Outcomes
Source: Compiled by the authors.
Dim
ensi
on o
f equ
ity
Those with similar needs have simi-lar access to services.
Those in equal socioeconomic posi-tions pay the same for care.
Those in equal socioeconomic positions or similar health receivethe same value of publicly fundedservices.
Those with greater needs have access tomore care or more intensive care.
Wealthier households pay more than dopoorer households.
Poorer households and households withmore illness receive more than dowealthier, healthier households.
All households experience similar health outcomes, regardless of socioeconomicstatus.
is different from other public goods and services, such as education, sincegreater consumption is not always beneficial. There exists a point beyondwhich the net social returns to more use of health services are negative.4 Thisis of greater concern in former socialist countries, in which overconsump-tion was common, but it may be troublesome also where publicly providedservices are captured by a (presumably wealthier) minority.
Moral hazard can cause problems on the supply side as well, since doc-tors have no incentive to control costs. For instance, doctors working undera fee-for-service regime have an incentive to provide more services than thepatients would choose to receive if they had complete information. This isalso known as supplier-induced demand. It is not merely a theoretical con-cern, although the evidence is primarily from developed countries. Studieson China (Bumgarner 1992), France (Chiappori, Durand, and Geoffard1998), the Netherlands (Hurst 1992), Taiwan (Cheng and Chiang 1997),and the United Kingdom (Dusheiko et al. 2003) find that fee-for-servicereimbursement leads providers to increase the volume of services.
ASYMMETRIC INFORMATION
Moral hazard arises from the asymmetric distribution of information.Ex ante moral hazard occurs because an insurer (for example) cannotmonitor the behavior of the people he insures. Asymmetric informationcauses, in addition to moral hazard, further problems in health care pro-vision since the quality of care is generally unobservable. Moreover, thecharacteristics valued by the consumer of care are not necessarily relatedto the efficacy or medical quality of care. For instance, a patient mightprefer a pleasant, but ineffectual doctor to an impolite, but effective one.In that case, the preferences of the patient and the public health author-ities conflict.
The quality of care is unobservable partly because we cannot see clearlythe effort that physicians and other providers expend in producing healthcare. Even if they show up for work (which is not always the case; seeChaudhury and Hammer 2003), it is difficult to monitor the attention pro-viders give to patients. To use the economics jargon, the interests of theprincipals (the patients and the public health authorities) differ from thoseof the agent (the provider) who is hired to supply the services. The princi-pals want greater health; the agents may want that, too, but they also wantto avoid working long hours for low pay. This leads to lower levels andquality of service than the principals would like.
A good deal of research has gone into the design of incentives and pay-ment schemes to minimize the difference between the interests of princi-
Analyzing the Distributional Impact of Reforms
50
pals and agents, or, at least, to reduce the cost of controlling the agencyproblem. Since the agent’s behavior is expensive to monitor, the principalmust design a contract such that the provision of the services the principalwants is in the interest of the agent (Eggleston and Hsieh 2004; Hammerand Jack 2001; Jack 2001a; McGuire 2000).
This is not merely of academic interest, but has great impact on the dis-tribution of services, since physicians may neglect poorer patients in favorof those who can pay, or may direct patients away from public services toalternative, fee-paying services. This issue of “dual practice” is rather con-troversial and has received considerable attention from reformers. On theone hand, dual-practice doctors can induce demand, reduce effort and qual-ity in their public sector jobs, and steal other resources from public facilitiesto benefit their private practices. On the other hand, dual practice can be away for the public sector to retain skilled doctors at low wages and for thedoctors to target public services more effectively to those who cannot payprivately (Bir and Eggleston 2003; Ferrinho et al. 2004; Gruen et al. 2002).
The provision of health insurance and prepayment systems may be ren-dered inefficient or unsustainable by the problem of adverse selection. Thisrefers to the observation that those who expect to have high health costs aremore likely to seek insurance. The problem for insurance arises because theinsurer cannot sort (and price-discriminate among) consumers accordingto health risks (or rather, that screening and monitoring are expensive), andhigh-risk consumers drive up the costs of care insurance.
HEALTH SECTOR REFORMS: MOTIVATION AND TYPOLOGY
Motivation
Health sector reforms have been a focus of policy debates in both devel-oped and developing countries at least since the 1970s. In response toplainly deteriorating morbidity and mortality (for instance, see Bennett1979), the Alma Ata Declaration of September 1978 established, amongother points, that health is a fundamental human right and that peopleare entitled to take part in health care planning and implementation.
In principle, health sector policies in developing countries haveemphasized equity and focused on delivering services to the poor, but, inpractice, the basic goals of the Alma Ata Declaration have not beenachieved in the intervening 25 years. According to some, the ideals havebeen abandoned; according to others, the ideals were unrealistic andunattainable in the first place (for example, see Hall and Taylor 2003).
In addition, recent research has demonstrated the weak links betweenpublic health policies and expenditures on the one hand and health services
Health Sector Reforms
51
and outcomes on the other (see Filmer, Hammer, and Pritchett 2000 andWorld Development Report 2004). More money is clearly not sufficientand may not even be necessary to achieve better health outcomes. Sur-veys and case studies in low-income countries reveal a rather disappointingpicture. Wagstaff (2000a) and Wang (2003) present data from more than40 low-income countries in the 1990s showing that children in poor house-holds had a much higher probability of dying before age 5 and that survivalrates improved much less among these children than they did among chil-dren in more well off households.
Some of the reasons for continuing inequities and poor health out-comes are external to health policy. Thus, civil wars, natural disasters, andthe AIDS crisis have overwhelmed public health services, and political com-mitment to the rhetoric of the Alma Ata Declaration has proven easier thancommitting the resources required to achieve the declaration’s goals.
But some of the reasons for poor outcomes involve governance, cap-ture, and mismanagement in the sector itself. Public spending intendedfor services to poor households has been captured by the non-poor (seeCastro-Leal et al. 2000); large shares of limited public spending on health(about 1 percent of gross domestic product) have been devoted to curativeservices, which mainly benefit the more well off. Griffin (1992) found thatthe distribution of central government health resources to the provincesin many Asian countries was often inversely correlated with need as mea-sured by infant mortality. Health programs that are designed specificallyto benefit the poor (such as the expansion of primary health care) were notreaching the poor effectively. Poor children are much less likely to receivesimple curative care such as oral rehydration salts, and they are muchless likely to be immunized than are children from wealthier households(Gwatkin et al. 2000).
In a comprehensive review, the World Health Organization (WHO2000a) categorized three generations of health sector reforms. As inmany other areas, the first generation of reforms concentrated on cut-ting bloated budgets and encouraging the private sector.5 The secondwave of reforms emphasized public sector efficiency, human resourcemanagement, and decentralization. More recently, the approach hasbeen to take a broader, “sectorwide” view to improve both service deliv-ery and outcomes (see World Development Report 2004). This has meantthat the aims of health reform have become—in principle, at least—more clearly defined and openly shared among policymakers and donorcommunities. The reforms reflect changes in thinking about health sys-tems and their links to health outcomes, as well as to broader develop-ment objectives.
Analyzing the Distributional Impact of Reforms
52
Very often, health system reforms are imposed from the outside. Forexample, in response to structural adjustment programs and imposed pub-lic sector reform, many African countries engineered partial changes inhealth system financing, such as the introduction of user fees. In CentralAmerica, the devolution of some management functions to district orregional health offices was a direct response to macroeconomic reformsbecause of fiscal crisis and government decentralization (Bossert 1998).These imposed reforms included the promotion of the private sector deliv-ery of health services (mainly by nongovernmental organizations), whichwas often part of a nationwide privatization movement (McPake 1997).
Recent years have seen popular reaction against health sector reforms,with the common perception that reforms have adversely affected the pro-vision of services, particularly for the vulnerable. The list of perceived fail-ures associated with reforms has included inequity due to the introductionof user fees, the damage done to vertical immunization and family plan-ning programs by decentralization, and the reduction of access to qualityservices by the poor caused by inadequately designed insurance schemes(Berman and Bossert 2000). In spite of this backlash, it is clear that contin-ued reforms are essential both to enhance the performance of the sectorand to expand coverage to poor and vulnerable groups (for example, seeWorld Development Report 2004).
Typology of reforms
The scope of the health reforms implemented in developing countriesvaries substantially. It is useful, albeit crude and imprecise, to distinguishthe reforms into those affecting the supply side and those affecting thedemand side of the health sector, that is, those involving the financing, man-agement, and provision of services on the one hand and, on the other hand,those involving the demand for and consumption of services. The vastmajority of reforms have focused on the supply side. Table 2.2 presents ahighly stylized selection of reforms and their potential consequences forwelfare and poverty. These are not necessarily comparable: some are ambi-tious and comprehensive, and some are relatively minor.
The list is not exhaustive, nor is the taxonomy perfect, but it shows themajority of issues that will come up during health sector reforms. In thetable, supply-side reforms include governance, organization, management,provider payments, human resources, and such issues. Primarily for con-venience, the table combines demand-side issues with those dealing withsources of funds for the health sector. This chapter cannot deal with all thesereforms in great detail, but the table does present a fairly representative
Health Sector Reforms
53
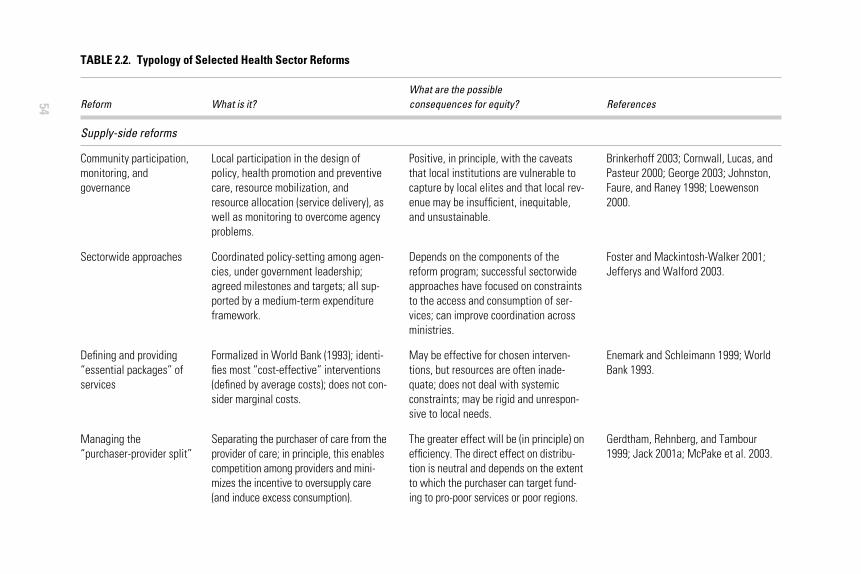
54
TABLE 2.2. Typology of Selected Health Sector Reforms
What are the possible Reform What is it? consequences for equity? References
Supply-side reforms
Community participation, monitoring, and governance
Sectorwide approaches
Defining and providing “essential packages” of services
Managing the “purchaser-provider split”
Local participation in the design of policy, health promotion and preventivecare, resource mobilization, andresource allocation (service delivery), aswell as monitoring to overcome agencyproblems.
Coordinated policy-setting among agen-cies, under government leadership;agreed milestones and targets; all sup-ported by a medium-term expenditureframework.
Formalized in World Bank (1993); identi-fies most “cost-effective” interventions(defined by average costs); does not con-sider marginal costs.
Separating the purchaser of care from theprovider of care; in principle, this enablescompetition among providers and mini-mizes the incentive to oversupply care(and induce excess consumption).
Positive, in principle, with the caveatsthat local institutions are vulnerable tocapture by local elites and that local rev-enue may be insufficient, inequitable,and unsustainable.
Depends on the components of thereform program; successful sectorwideapproaches have focused on constraintsto the access and consumption of ser-vices; can improve coordination acrossministries.
May be effective for chosen interven-tions, but resources are often inade-quate; does not deal with systemicconstraints; may be rigid and unrespon-sive to local needs.
The greater effect will be (in principle) onefficiency. The direct effect on distribu-tion is neutral and depends on the extentto which the purchaser can target fund-ing to pro-poor services or poor regions.
Brinkerhoff 2003; Cornwall, Lucas, andPasteur 2000; George 2003; Johnston,Faure, and Raney 1998; Loewenson2000.
Foster and Mackintosh-Walker 2001;Jefferys and Walford 2003.
Enemark and Schleimann 1999; WorldBank 1993.
Gerdtham, Rehnberg, and Tambour1999; Jack 2001a; McPake et al. 2003.
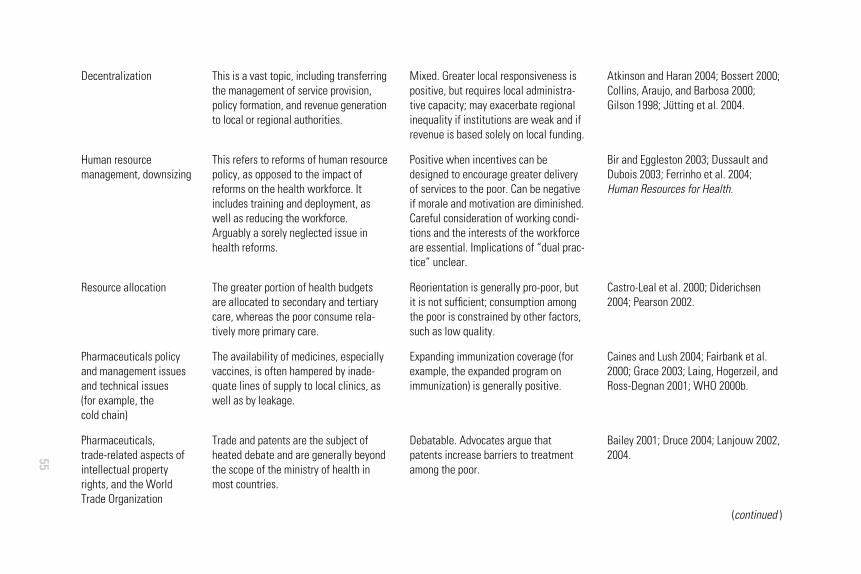
55
Decentralization
Human resource management, downsizing
Resource allocation
Pharmaceuticals policy and management issues and technical issues (for example, the cold chain)
Pharmaceuticals,trade-related aspects of intellectual property rights, and the World Trade Organization
This is a vast topic, including transferringthe management of service provision,policy formation, and revenue generationto local or regional authorities.
This refers to reforms of human resourcepolicy, as opposed to the impact ofreforms on the health workforce. Itincludes training and deployment, aswell as reducing the workforce.Arguably a sorely neglected issue inhealth reforms.
The greater portion of health budgetsare allocated to secondary and tertiarycare, whereas the poor consume rela-tively more primary care.
The availability of medicines, especiallyvaccines, is often hampered by inade-quate lines of supply to local clinics, aswell as by leakage.
Trade and patents are the subject ofheated debate and are generally beyondthe scope of the ministry of health inmost countries.
Mixed. Greater local responsiveness ispositive, but requires local administra-tive capacity; may exacerbate regionalinequality if institutions are weak and ifrevenue is based solely on local funding.
Positive when incentives can bedesigned to encourage greater deliveryof services to the poor. Can be negativeif morale and motivation are diminished.Careful consideration of working condi-tions and the interests of the workforceare essential. Implications of “dual prac-tice” unclear.
Reorientation is generally pro-poor, butit is not sufficient; consumption amongthe poor is constrained by other factors,such as low quality.
Expanding immunization coverage (forexample, the expanded program onimmunization) is generally positive.
Debatable. Advocates argue thatpatents increase barriers to treatmentamong the poor.
Atkinson and Haran 2004; Bossert 2000;Collins, Araujo, and Barbosa 2000;Gilson 1998; Jütting et al. 2004.
Bir and Eggleston 2003; Dussault andDubois 2003; Ferrinho et al. 2004;Human Resources for Health.
Castro-Leal et al. 2000; Diderichsen2004; Pearson 2002.
Caines and Lush 2004; Fairbank et al.2000; Grace 2003; Laing, Hogerzeil, andRoss-Degnan 2001; WHO 2000b.
Bailey 2001; Druce 2004; Lanjouw 2002,2004.
(continued )

56
Regulation and support of private sector providers
Quality monitoring, control, enhancement
Public-privatepartnerships
Payments to providers: incentive- and performance-basedcontracts
Payments to providers: capitation
TABLE 2.2. Typology of Selected Health Sector Reforms (Continued )
What are the possible Reform What is it? consequences for equity? References
The majority of care is provided by theprivate sector; most of the care con-sumed by the poor is private.
Poor consumers are affected at least asmuch by the quality of care as by theprice.
Engaging the private sector to providethe right mix of services to the targetpopulation; can include clinical care, as well as nonclinical services.
Using contingent contracts to payproviders; these are becoming popular,especially since the appearance ofWorld Development Report 2003(World Bank 2002).
Population-based payments to providers;may be weighted by demographic char-acteristics and may specify the servicesto be provided.
Monitoring is vital, but expensive, espe-cially among unorganized individualproviders. The poor often use informal oreven illegal providers, who may playimportant roles, but require training.
There is considerable evidence that thepoor will respond to quality enhance-ments even if prices also rise.
Can be positive if incentives are man-aged carefully.
Can be positive if incentives aredesigned and managed carefully; can beused to deliver targeted or subsidizedservices.
Can increase access to services amongthe poor; must account for variationsacross communities; there is an incen-tive for cream-skimming and cost-cutting, since the provider’s profit is theresidual between his costs and the capi-tation grant.
Bennett, McPake, and Mills 1997;Kumaranayake et al. 2000; Mills et al.2002; Smith, Brugha, and Zwi 2001.
Collier, Dercon, and Mackinnon 2002;Montagu 2003; Mwabu, Ainsworth,Nyamete 1993; QAP and PAHO 2003.
Caines and Lush 2004; England 2002,2004; Liu et al. 2004; Nieves, La Forgia,and Ribera 2000.
Barnum, Kutzin, and Saxenian 1995;Bitrán and Yip 1998; Eggleston and Hsieh2004; Jack 2001a; Lavadenz, Schwab,and Straatman 2001; Leonard 2000;Loevinsohn 2001, 2002; Maceira 1998.
Bitrán 2001; Bitrán and Yip 1998;Maceira 1998; Telyukov 2001.
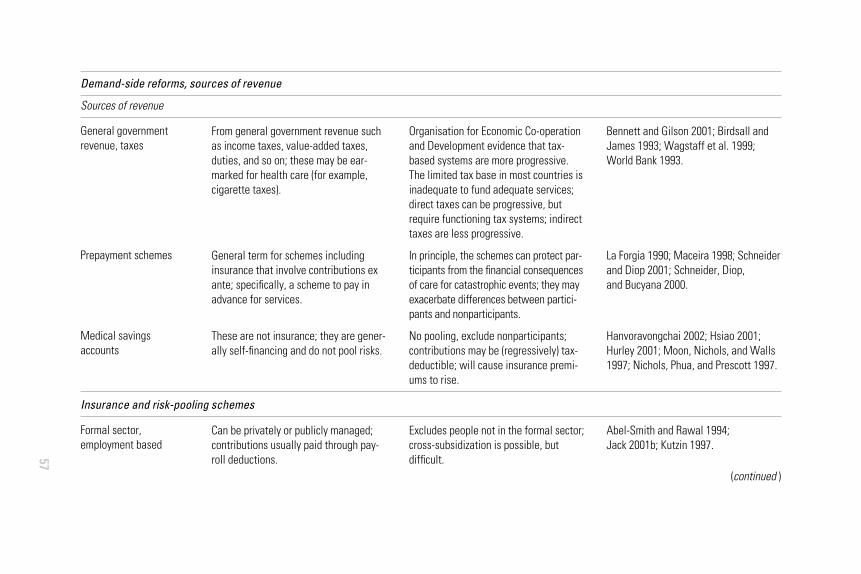
57
Demand-side reforms, sources of revenue
Sources of revenue
General government revenue, taxes
Prepayment schemes
Medical savings accounts
Insurance and risk-pooling schemes
Formal sector, employment based
From general government revenue suchas income taxes, value-added taxes,duties, and so on; these may be ear-marked for health care (for example, cigarette taxes).
General term for schemes includinginsurance that involve contributions exante; specifically, a scheme to pay inadvance for services.
These are not insurance; they are gener-ally self-financing and do not pool risks.
Can be privately or publicly managed;contributions usually paid through pay-roll deductions.
Organisation for Economic Co-operationand Development evidence that tax-based systems are more progressive.The limited tax base in most countries isinadequate to fund adequate services;direct taxes can be progressive, butrequire functioning tax systems; indirecttaxes are less progressive.
In principle, the schemes can protect par-ticipants from the financial consequencesof care for catastrophic events; they mayexacerbate differences between partici-pants and nonparticipants.
No pooling, exclude nonparticipants;contributions may be (regressively) tax-deductible; will cause insurance premi-ums to rise.
Excludes people not in the formal sector;cross-subsidization is possible, but difficult.
Bennett and Gilson 2001; Birdsall andJames 1993; Wagstaff et al. 1999;World Bank 1993.
La Forgia 1990; Maceira 1998; Schneiderand Diop 2001; Schneider, Diop, and Bucyana 2000.
Hanvoravongchai 2002; Hsiao 2001;Hurley 2001; Moon, Nichols, and Walls1997; Nichols, Phua, and Prescott 1997.
Abel-Smith and Rawal 1994; Jack 2001b; Kutzin 1997.
(continued )
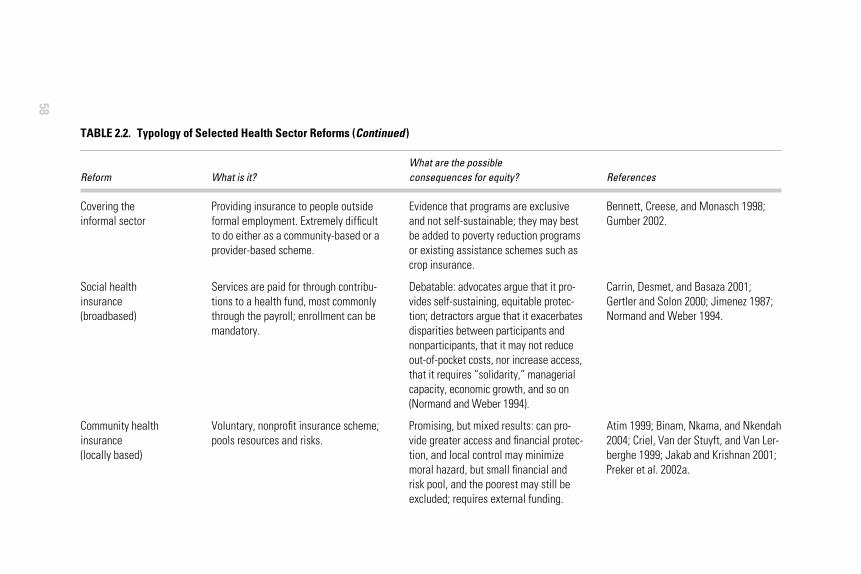
58
Covering the informal sector
Social health insurance(broadbased)
Community health insurance(locally based)
TABLE 2.2. Typology of Selected Health Sector Reforms (Continued )
What are the possible Reform What is it? consequences for equity? References
Providing insurance to people outsideformal employment. Extremely difficultto do either as a community-based or aprovider-based scheme.
Services are paid for through contribu-tions to a health fund, most commonlythrough the payroll; enrollment can bemandatory.
Voluntary, nonprofit insurance scheme;pools resources and risks.
Evidence that programs are exclusiveand not self-sustainable; they may bestbe added to poverty reduction programsor existing assistance schemes such ascrop insurance.
Debatable: advocates argue that it pro-vides self-sustaining, equitable protec-tion; detractors argue that it exacerbatesdisparities between participants andnonparticipants, that it may not reduceout-of-pocket costs, nor increase access,that it requires “solidarity,” managerialcapacity, economic growth, and so on(Normand and Weber 1994).
Promising, but mixed results: can pro-vide greater access and financial protec-tion, and local control may minimizemoral hazard, but small financial andrisk pool, and the poorest may still beexcluded; requires external funding.
Bennett, Creese, and Monasch 1998;Gumber 2002.
Carrin, Desmet, and Basaza 2001;Gertler and Solon 2000; Jimenez 1987;Normand and Weber 1994.
Atim 1999; Binam, Nkama, and Nkendah2004; Criel, Van der Stuyft, and Van Ler-berghe 1999; Jakab and Krishnan 2001;Preker et al. 2002a.
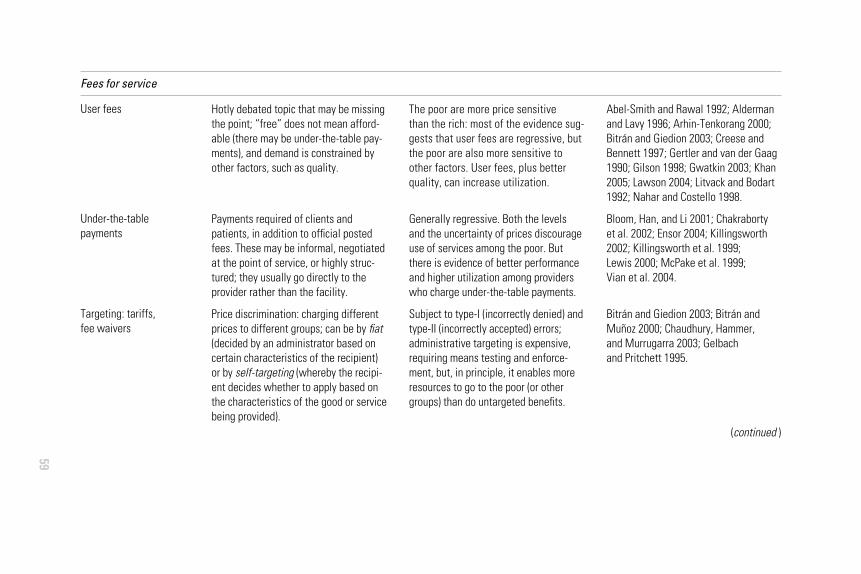
59
Fees for service
User fees
Under-the-tablepayments
Targeting: tariffs, fee waivers
Hotly debated topic that may be missingthe point; “free” does not mean afford-able (there may be under-the-table pay-ments), and demand is constrained byother factors, such as quality.
Payments required of clients andpatients, in addition to official postedfees. These may be informal, negotiatedat the point of service, or highly struc-tured; they usually go directly to theprovider rather than the facility.
Price discrimination: charging differentprices to different groups; can be by fiat(decided by an administrator based oncertain characteristics of the recipient)or by self-targeting (whereby the recipi-ent decides whether to apply based onthe characteristics of the good or servicebeing provided).
The poor are more price sensitive than the rich: most of the evidence sug-gests that user fees are regressive, butthe poor are also more sensitive toother factors. User fees, plus betterquality, can increase utilization.
Generally regressive. Both the levelsand the uncertainty of prices discourageuse of services among the poor. Butthere is evidence of better performanceand higher utilization among providerswho charge under-the-table payments.
Subject to type-I (incorrectly denied) andtype-II (incorrectly accepted) errors;administrative targeting is expensive,requiring means testing and enforce-ment, but, in principle, it enables moreresources to go to the poor (or othergroups) than do untargeted benefits.
Abel-Smith and Rawal 1992; Aldermanand Lavy 1996; Arhin-Tenkorang 2000;Bitrán and Giedion 2003; Creese andBennett 1997; Gertler and van der Gaag1990; Gilson 1998; Gwatkin 2003; Khan2005; Lawson 2004; Litvack and Bodart1992; Nahar and Costello 1998.
Bloom, Han, and Li 2001; Chakraborty et al. 2002; Ensor 2004; Killingsworth2002; Killingsworth et al. 1999; Lewis 2000; McPake et al. 1999; Vian et al. 2004.
Bitrán and Giedion 2003; Bitrán andMuñoz 2000; Chaudhury, Hammer, and Murrugarra 2003; Gelbach and Pritchett 1995.
(continued )
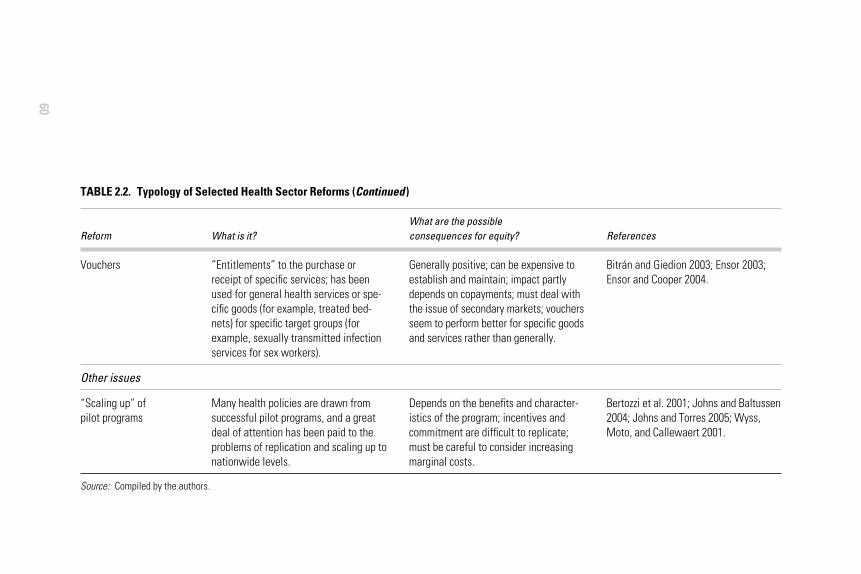
60
Vouchers
Other issues
“Scaling up” of pilot programs
Source: Compiled by the authors.
TABLE 2.2. Typology of Selected Health Sector Reforms (Continued )
What are the possible Reform What is it? consequences for equity? References
“Entitlements” to the purchase orreceipt of specific services; has beenused for general health services or spe-cific goods (for example, treated bed-nets) for specific target groups (forexample, sexually transmitted infectionservices for sex workers).
Many health policies are drawn fromsuccessful pilot programs, and a greatdeal of attention has been paid to theproblems of replication and scaling up tonationwide levels.
Generally positive; can be expensive toestablish and maintain; impact partlydepends on copayments; must deal withthe issue of secondary markets; vouchersseem to perform better for specific goodsand services rather than generally.
Depends on the benefits and character-istics of the program; incentives andcommitment are difficult to replicate;must be careful to consider increasingmarginal costs.
Bitrán and Giedion 2003; Ensor 2003;Ensor and Cooper 2004.
Bertozzi et al. 2001; Johns and Baltussen2004; Johns and Torres 2005; Wyss,Moto, and Callewaert 2001.
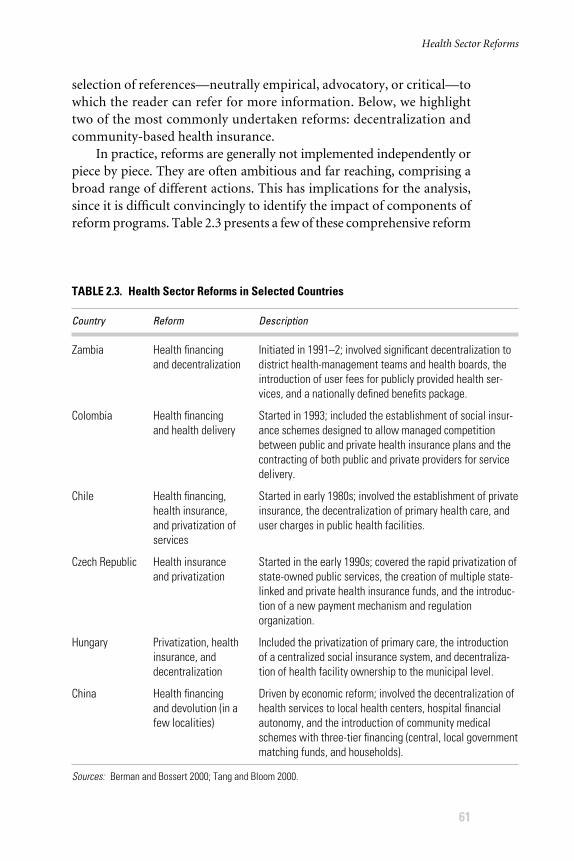
selection of references—neutrally empirical, advocatory, or critical—towhich the reader can refer for more information. Below, we highlighttwo of the most commonly undertaken reforms: decentralization andcommunity-based health insurance.
In practice, reforms are generally not implemented independently orpiece by piece. They are often ambitious and far reaching, comprising abroad range of different actions. This has implications for the analysis,since it is difficult convincingly to identify the impact of components ofreform programs. Table 2.3 presents a few of these comprehensive reform
Health Sector Reforms
61
TABLE 2.3. Health Sector Reforms in Selected Countries
Country Reform Description
Zambia
Colombia
Chile
Czech Republic
Hungary
China
Sources: Berman and Bossert 2000; Tang and Bloom 2000.
Health financingand decentralization
Health financingand health delivery
Health financing,health insurance,and privatization ofservices
Health insuranceand privatization
Privatization, healthinsurance, anddecentralization
Health financingand devolution (in afew localities)
Initiated in 1991–2; involved significant decentralization todistrict health-management teams and health boards, theintroduction of user fees for publicly provided health ser-vices, and a nationally defined benefits package.
Started in 1993; included the establishment of social insur-ance schemes designed to allow managed competitionbetween public and private health insurance plans and thecontracting of both public and private providers for servicedelivery.
Started in early 1980s; involved the establishment of privateinsurance, the decentralization of primary health care, anduser charges in public health facilities.
Started in the early 1990s; covered the rapid privatization ofstate-owned public services, the creation of multiple state-linked and private health insurance funds, and the introduc-tion of a new payment mechanism and regulationorganization.
Included the privatization of primary care, the introductionof a centralized social insurance system, and decentraliza-tion of health facility ownership to the municipal level.
Driven by economic reform; involved the decentralization ofhealth services to local health centers, hospital financialautonomy, and the introduction of community medicalschemes with three-tier financing (central, local governmentmatching funds, and households).
programs. The reforms in Chile, begun in the early 1980s, are typical ofsuch ambitious and comprehensive restructuring efforts (de la Jara andBossert 1995). This involved all the principal “control knobs” discussed byHsiao (2000): the creation of a private insurance system funded largelythrough social insurance contributions, the decentralization of primarycare facilities, the introduction of user charges and per capita payments,and new regulation regimes and new programs to alter health behavior andhelp address preventable conditions.6
Health reforms commonly include changes in health financing andchanges in health system organization and management. Changes in healthfinancing may involve cost recovery and user charges for publicly providedservices, community-based financing schemes, insurance schemes (socialand private), and changes in public expenditure and allocation. Changes inhealth system organization and management may entail decentralization(authority, responsibilities, and functions) and changes in the ownershipof service provision and delivery (privatization or a public-private mix).Here, two types of the more commonly implemented reforms are high-lighted: community-based health financing and the decentralization ofhealth services.
Community-based health financing
Community-based health financing broadly covers financing schemes thathave three key features: community control, voluntary membership, andprepayment for health care by community members (Hsiao 2004). It doesnot include compulsory regional or national social insurance plans.Community-based schemes have been implemented with increasing fre-quency since the early 1990s as a means to raise resources for health care,to overcome insurance market failures, and to promote the inclusion of thepoor (Table 2.4).
In most low-income countries, the scope for raising public revenue tofinance health services through general taxation is narrow.7 The amountthat can be allocated from the government budget to public health activ-ities is limited, and providing primary health care to all is not sustainablethrough general government revenue alone. Other avenues, such as fees forservice or some sort of prepayment, are required to raise the funds neededto provide care.
As noted in the section on issues specific to the analysis of healthreforms, information problems lead to insurance market failures in bothdeveloped and developing countries so that health insurance is insuffi-cient or even absent. Community-based health financing is seen by many
Analyzing the Distributional Impact of Reforms
62
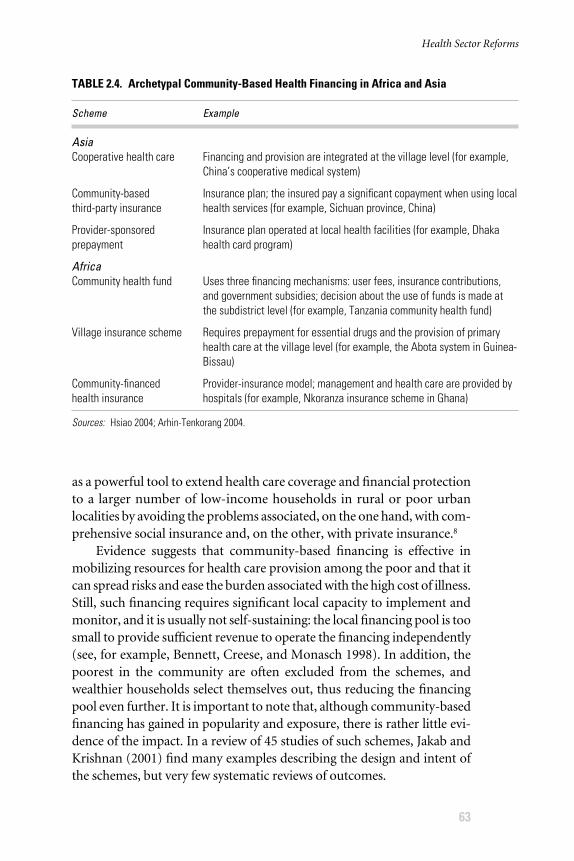
as a powerful tool to extend health care coverage and financial protectionto a larger number of low-income households in rural or poor urbanlocalities by avoiding the problems associated, on the one hand, with com-prehensive social insurance and, on the other, with private insurance.8
Evidence suggests that community-based financing is effective inmobilizing resources for health care provision among the poor and that itcan spread risks and ease the burden associated with the high cost of illness.Still, such financing requires significant local capacity to implement andmonitor, and it is usually not self-sustaining: the local financing pool is toosmall to provide sufficient revenue to operate the financing independently(see, for example, Bennett, Creese, and Monasch 1998). In addition, thepoorest in the community are often excluded from the schemes, andwealthier households select themselves out, thus reducing the financingpool even further. It is important to note that, although community-basedfinancing has gained in popularity and exposure, there is rather little evi-dence of the impact. In a review of 45 studies of such schemes, Jakab andKrishnan (2001) find many examples describing the design and intent ofthe schemes, but very few systematic reviews of outcomes.
Health Sector Reforms
63
TABLE 2.4. Archetypal Community-Based Health Financing in Africa and Asia
Scheme Example
AsiaCooperative health care
Community-basedthird-party insurance
Provider-sponsoredprepayment
AfricaCommunity health fund
Village insurance scheme
Community-financedhealth insurance
Sources: Hsiao 2004; Arhin-Tenkorang 2004.
Financing and provision are integrated at the village level (for example,China’s cooperative medical system)
Insurance plan; the insured pay a significant copayment when using localhealth services (for example, Sichuan province, China)
Insurance plan operated at local health facilities (for example, Dhakahealth card program)
Uses three financing mechanisms: user fees, insurance contributions,and government subsidies; decision about the use of funds is made atthe subdistrict level (for example, Tanzania community health fund)
Requires prepayment for essential drugs and the provision of primaryhealth care at the village level (for example, the Abota system in Guinea-Bissau)
Provider-insurance model; management and health care are provided byhospitals (for example, Nkoranza insurance scheme in Ghana)
Despite the limited amount of rigorous evidence of beneficial outcomes,there is no shortage of suggestions for the design of community-basedfinancing schemes. Advocates have proposed numerous modifications toenhance sustainability and performance. These include (1) targeted sub-sidies for the poorest, (2) reinsurance to enlarge the effective size of therisk pool, (3) improved prevention interventions, (4) technical supportto strengthen management capacity, and (5) strengthening links with for-mal financing and provider networks (Preker et al. 2002a, 2002b). Inaddition, community-based financing must take care to deal with (1) thelevels of the insurance premium, (2) moral hazard and adverse selection,(3) “covariant risks” (the phenomenon that health problems are corre-lated within a population), (4) community participation, (5) the qualityof care, (6) the referral system, and (7) cultural concepts of illness,among many other factors (Wiesmann and Jütting 2000). In addition,Jakab and Krishnan (2001) find that successful schemes take into accountthe nature of the incomes of the membership population, allowing mem-bers to pay premiums at irregular intervals and even through in-kindarrangements.
Community-based health financing is not a panacea. But broadbasedsocial insurance is not a viable option for a typical poor country with a lim-ited tax base and a small formal sector workforce, and private insurance isinsufficient to provide for poor and vulnerable groups. Expanding healthcare to underserved populations will most likely require community par-ticipation in resource mobilization and in the management of care.
Decentralization of health services
Like community financing, decentralization comes in many forms. Theterm is applied to myriad diverse policies, from increasing hospital auton-omy to local revenue generation. The impact of decentralization on thepoor depends to a large extent on what is being devolved, to whom, andunder which circumstances. The consequences of the decentralization of ser-vices are quite different from the consequences of the decentralization ofrevenues; empowering a local community group to monitor performanceis different from entrusting medical training to a regional government; alarge city will have a different set of management skills than a small ruralcouncil. It is also important to pay attention to the consequences of devo-lution for the management of the health system and the coordination ofhealth policy, and it is important to be concerned about the people who arenot in areas involved in the decentralization, as well as those who are insuch areas.
Analyzing the Distributional Impact of Reforms
64
Decentralization in health systems is justified on the basis that it willcorrect the information-related problems of agency and moral hazard dis-cussed in the section on issues specific to the analysis of health reforms. Inprinciple, local communities have better knowledge of local needs and con-ditions and can make better decisions if they are granted the authority tomanage resources and organize and supply health services. Decentraliza-tion promotes accountability and participation among the local popula-tion, makes health service providers accountable to the local community,and boosts the responsiveness of the providers to the local demand for ser-vices. Decentralization is expected to improve the efficiency, equity, andquality of health service delivery and management.
Decentralization has been widely implemented in Latin America sincethe 1980s, in Africa since the 1990s, and elsewhere (China, Eastern Europeand Central Asia) more recently, but the ambitious goals presented abovehave only rarely been realized. A recent study of 19 country cases (Jüttinget al. 2004) found that decentralization had “somewhat negative” or“negative” consequences for poverty and that all but one of the positiveperformers were middle-income countries.9 The study concluded that“one has to be very cautious in promoting decentralisation for povertyreduction.”
Decentralization will improve service delivery for the poor if the healthsystem and other services and infrastructure are already performing well.When conditions are favorable, local participation and control may well beused to improve both the performance and targeting of services. But if thereare problems with coordination and performance at the national level,decentralization may merely make things worse. Studies of the experienceof rural China (Tang and Bloom 2000) and Nigeria (Khemani 2004) foundthat there is little enforcement or accountability at the local level. Decen-tralization will not, by itself, solve problems of governance. It is unlikely thatlocal governments will function any better than national governments. Ifthe national health system is performing poorly, local health systems areprobably no better. Decentralization may simply reinforce local patronagesystems (Brinkerhoff 2000).
In their review of country experiences, Jütting et al. (2004) present alist of the factors they found to be correlated with successful, pro-poordecentralization. These include:
� sufficient and stable local finances� sufficient local human capital and managerial capacity� political commitment at the national level
Health Sector Reforms
65
� donor support� the free flow of information� participation and accountability� policy coherence, especially between the national government and
donors
There is broad agreement that the constraints of poor governance andpoor performance must be dealt with before attempting decentralization.Atkinson and Haran (2004) found that, in Ceará, Brazil, good managementpractices led to successful decentralization rather than vice versa.
Any apparent association between decentralization and performance seems to bean artifact of the informal management, and the wider political culture in which alocal health system is embedded strongly influences the performance of local healthsystems (Atkinson and Haran 2004: 822).
STAKEHOLDERS
One of the primary obligations of the health sector in any country and amajor justification for reforms is that the system must be responsive tothe needs of citizens. This is generally taken to mean the clients—actualand potential—of health services. A quick review of the literature, on theother hand, suggests that most of the focus has been on the “humanresource” aspects of reform, that is, the impact of reform on health sec-tor workers. There is even a professional journal devoted exclusively tothis topic.10
Any policy change will affect different groups in different ways de-pending on their relationship to the sector, and reforms often reflectcompromise among various stakeholders. It is important to understandthat different stakeholders exercise different degrees of control and influ-ence over the reforms.
Table 2.5 presents a list of stakeholders, distinguishing between thoseon the supply side and those on the demand side of health care. Again, thedistinction is not perfect. Individuals can be both providers and consumersof services: employees of the local health ministry have children who needvaccinations and become ill. But it makes sense heuristically to considerthese as two separate groups. The doctor who is ill becomes a patient. Thehousehold that consumes health services is concerned with efficiency whenthe time comes to pay taxes. Below, two categories of stakeholders arediscussed in detail: health workers on the supply side and women on thedemand side.
Analyzing the Distributional Impact of Reforms
66
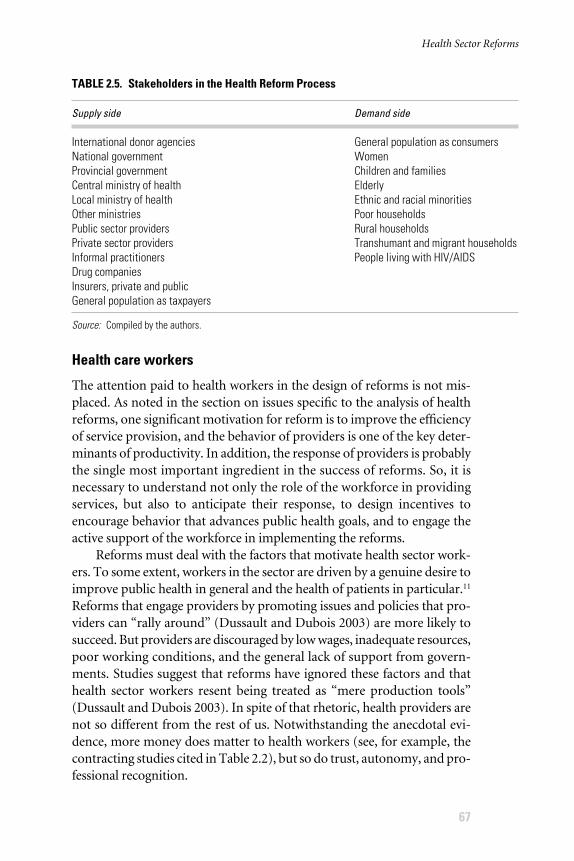
Health care workers
The attention paid to health workers in the design of reforms is not mis-placed. As noted in the section on issues specific to the analysis of healthreforms, one significant motivation for reform is to improve the efficiencyof service provision, and the behavior of providers is one of the key deter-minants of productivity. In addition, the response of providers is probablythe single most important ingredient in the success of reforms. So, it isnecessary to understand not only the role of the workforce in providingservices, but also to anticipate their response, to design incentives toencourage behavior that advances public health goals, and to engage theactive support of the workforce in implementing the reforms.
Reforms must deal with the factors that motivate health sector work-ers. To some extent, workers in the sector are driven by a genuine desire toimprove public health in general and the health of patients in particular.11
Reforms that engage providers by promoting issues and policies that pro-viders can “rally around” (Dussault and Dubois 2003) are more likely tosucceed. But providers are discouraged by low wages, inadequate resources,poor working conditions, and the general lack of support from govern-ments. Studies suggest that reforms have ignored these factors and thathealth sector workers resent being treated as “mere production tools”(Dussault and Dubois 2003). In spite of that rhetoric, health providers arenot so different from the rest of us. Notwithstanding the anecdotal evi-dence, more money does matter to health workers (see, for example, thecontracting studies cited in Table 2.2), but so do trust, autonomy, and pro-fessional recognition.
Health Sector Reforms
67
TABLE 2.5. Stakeholders in the Health Reform Process
Supply side Demand side
International donor agencies General population as consumersNational government WomenProvincial government Children and familiesCentral ministry of health ElderlyLocal ministry of health Ethnic and racial minoritiesOther ministries Poor householdsPublic sector providers Rural householdsPrivate sector providers Transhumant and migrant householdsInformal practitioners People living with HIV/AIDSDrug companiesInsurers, private and publicGeneral population as taxpayers
Source: Compiled by the authors.

The unfortunate consequences for the poor of these human resourceissues are well known, but difficult to resolve. There are few incentives inplace to enhance service provision to poor, rural, or otherwise underservedcommunities. To improve the distribution of services, governments gen-erally combine the carrot and the stick, that is, incentives and compulsion.The health system can provide supplements to wages or other financialincentives, funding for travel, or assistance to families. The government canalso make certain services compulsory for medical graduates, as well aspaying them more, as is the case in China, India, and Indonesia (Chomitzet al. 1997; Hindu April 7, 2005).
Reforms, especially those that introduce competition, tighten moni-toring, or change payment regimes, will inevitably produce winners andlosers. Successful reforms will require political strategies to address the con-cerns of different groups of providers. Reforms that threaten job securityand incomes may lead—as they did in Zimbabwe—to strikes, theft, highturnover, and low morale among workers (Mutizwa-Mangiza 1998).
Finally, the AIDS epidemic is taking its toll among health workers.The perceived risk of contracting HIV is quite high among health work-ers, the demand for and complexity of care continue to outstrip the avail-able resources, and workers are confronted daily with wards full of dyingpatients.12 These factors contribute to stress and “burnout,” leading toincreased absenteeism and attrition (Aitken and Kemp 2003; Marchal, DeBrouwere, and Kegels 2005; Tawfik and Kinoti 2003; World Bank 1997b).The human and financial demands of the AIDS crisis reduce the resourcesthat might be otherwise available for expanded care for the poor.
Women as consumers of care
To some extent, treating women as a distinct and coherent categoryamong consumers is to obscure enormous differences among women.Clearly, women can be disaggregated by health status, geography, casteand ethnicity, wealth, and myriad other factors. However, even if they donot always speak with one voice, they arguably share concerns and con-straints in health care that are often neglected (Cornwall 2000). Men andwomen are often not treated equally even when they have commonhealth needs, and, when their health needs are different, these differencesare not addressed equitably (Mensch 1993; see also the papers cited inLakshminarayanan 2003a).
There are few empirical studies of the impact of reform on women,especially poor women, and this section derives primarily from anecdo-tal evidence and advocacy. But there are some regularities, even among
Analyzing the Distributional Impact of Reforms
68
the anecdotes. One common concern is the effect of user charges on poorwomen. Although there is little robust evidence on the impact of userfees, women may have less disposable income and less control over pur-chasing decisions within households (Nanda 2002). Reforms that pur-port to increase access to care by poor women must take into accountgender inequalities in purchasing power and decisionmaking.
Financial constraints are exacerbated where women do not havethe right to travel alone or to be in the company of men, includinghealth care providers, outside their immediate family. Where femalehealth workers are not available, women may be forced to go withoutcare. The opportunity costs of medical treatment may also be greaterfor a woman. If she becomes ill at harvest time, for example, there maybe no one who will take her place in the fields or at home. The visit toa health worker might thus impose unacceptable burdens on the house-hold (WHO 1998).
Women are the main health caregivers in the household. The firstoption for the treatment of children’s diseases such as malaria is hometreatment by the mother. The mother will buy over-the-counter med-ication, possibly on the advice of the shopkeeper, but lack of informationcan lead to ineffective treatment and accelerated drug resistance. A pilotstudy in Kenya found that training shopkeepers in appropriate drug usehad a large impact on both the use and the adequate dosing of chloro-quine (Marsh et al. 2004).
Women’s health services have focused on the reproductive needs ofwomen, especially contraception and safe childbearing, and the majorityof studies on the impact of reforms on women have also focused on theconsequences of reforms for reproductive health. These studies empha-size the importance of participation, openness, and flexibility in thereform process and in the management of health care, especially at thelocal level. They also emphasize the need to understand the constraintsfacing women and their consumption of health services (Futures GroupInternational 2000; Lakshminarayanan 2003b; Langer, Nigenda, andCatino 2000).
TRANSMISSION CHANNELS
In this section, we examine the way households are connected to thehealth sector and the mechanisms through which the impact of reformsis felt by stakeholders. The PSIA guidebook (World Bank 2003b) lists fivemain transmission channels: labor markets, prices, assets, access to goodsand services, and transfers and taxes. In health, there are a number of
Health Sector Reforms
69
other factors through which the impact of reforms is experienced by thepoor. First, because health is often publicly provided, some decision mustbe made on which services the public health system will supply. Thisincludes determination of the “basic package” of services. Second, thedemand for services will greatly influence both the level and the efficiencyof supply. Third, the perceived quality of services is a major determinantof the consumption of services.
Table 2.6 presents a description of the major transmission channels.They are mostly supply side in that they transmit signals from producers toconsumers. However, the links from those paying for services to those whoproduce services may be thought of as a demand-side transmission, and, inaddition, the supply of services certainly responds to demand. The ultimatewelfare impact of a reform depends also on how households and con-sumers respond to changes in policy, supply, prices, and so on. Thesechannels do not operate in isolation: the effects of one (say, public-privateinteractions) will have an effect on others (for example, prices), and the dis-tributional impact of reform can be transmitted through all of them.
Defining the service package is a major task for policymakers. Thisinvolves setting priorities based on information about the current bur-den of disease of the population and choosing the most cost-effectivesolutions. It depends on changes in available health financing, whetherthrough fees for service, public health spending allocations, or insuranceschemes. Changes in health financing, meanwhile, also have a directimpact on the incentives offered to service providers and on consumerbehavior, which determines the level and distribution of health serviceprovision and use. The ownership structure of service provision anddelivery (private versus public, for instance) also has implications forhealth financing, as well as for the quality and equity of health services.
The health financing reform in Jamaica that involved a government-supported expansion of private insurance to the urban formal sector pro-vides a useful illustration of these transmission channels (Gertler andSturm 1997). The expansion of private insurance coverage can lead to areduction in public health expenditure by inducing those who are betteroff to switch to private providers. The insurance scheme will lower the out-of-pocket price of health care at the point of use by smoothing paymentsacross individuals and time, and it will reduce cost differentials betweenpublic and private providers. Both factors will encourage those covered bythe insurance to opt out of public care in favor of private care. Indeed,Besley and Coate (1991) demonstrate theoretically that, in a quality-based separating equilibrium, individuals above some income level chooseto purchase services from a higher-quality, higher-priced private sector,
Analyzing the Distributional Impact of Reforms
70
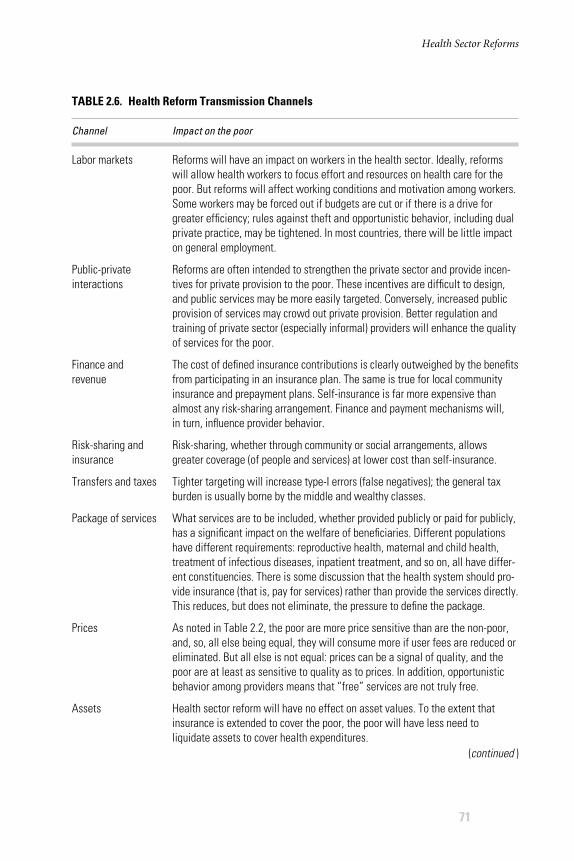
Health Sector Reforms
71
TABLE 2.6. Health Reform Transmission Channels
Channel Impact on the poor
Labor markets
Public-privateinteractions
Finance and revenue
Risk-sharing and insurance
Transfers and taxes
Package of services
Prices
Assets
Reforms will have an impact on workers in the health sector. Ideally, reformswill allow health workers to focus effort and resources on health care for thepoor. But reforms will affect working conditions and motivation among workers.Some workers may be forced out if budgets are cut or if there is a drive forgreater efficiency; rules against theft and opportunistic behavior, including dualprivate practice, may be tightened. In most countries, there will be little impacton general employment.
Reforms are often intended to strengthen the private sector and provide incen-tives for private provision to the poor. These incentives are difficult to design,and public services may be more easily targeted. Conversely, increased publicprovision of services may crowd out private provision. Better regulation andtraining of private sector (especially informal) providers will enhance the qualityof services for the poor.
The cost of defined insurance contributions is clearly outweighed by the benefitsfrom participating in an insurance plan. The same is true for local communityinsurance and prepayment plans. Self-insurance is far more expensive thanalmost any risk-sharing arrangement. Finance and payment mechanisms will, in turn, influence provider behavior.
Risk-sharing, whether through community or social arrangements, allowsgreater coverage (of people and services) at lower cost than self-insurance.
Tighter targeting will increase type-I errors (false negatives); the general taxburden is usually borne by the middle and wealthy classes.
What services are to be included, whether provided publicly or paid for publicly,has a significant impact on the welfare of beneficiaries. Different populationshave different requirements: reproductive health, maternal and child health,treatment of infectious diseases, inpatient treatment, and so on, all have differ-ent constituencies. There is some discussion that the health system should pro-vide insurance (that is, pay for services) rather than provide the services directly.This reduces, but does not eliminate, the pressure to define the package.
As noted in Table 2.2, the poor are more price sensitive than are the non-poor,and, so, all else being equal, they will consume more if user fees are reduced oreliminated. But all else is not equal: prices can be a signal of quality, and thepoor are at least as sensitive to quality as to prices. In addition, opportunisticbehavior among providers means that “free” services are not truly free.
Health sector reform will have no effect on asset values. To the extent thatinsurance is extended to cover the poor, the poor will have less need toliquidate assets to cover health expenditures.
(continued )
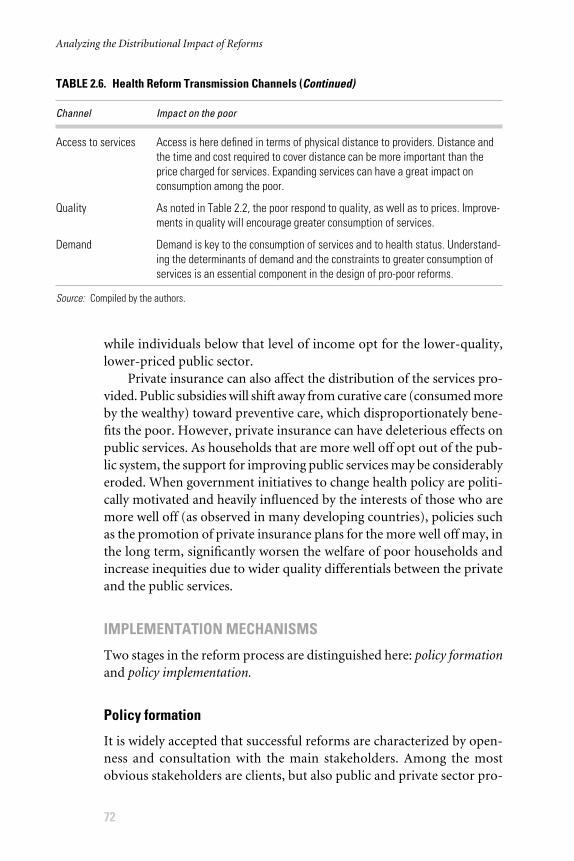
Access to services
Quality
Demand
Source: Compiled by the authors.
while individuals below that level of income opt for the lower-quality,lower-priced public sector.
Private insurance can also affect the distribution of the services pro-vided. Public subsidies will shift away from curative care (consumed moreby the wealthy) toward preventive care, which disproportionately bene-fits the poor. However, private insurance can have deleterious effects onpublic services. As households that are more well off opt out of the pub-lic system, the support for improving public services may be considerablyeroded. When government initiatives to change health policy are politi-cally motivated and heavily influenced by the interests of those who aremore well off (as observed in many developing countries), policies suchas the promotion of private insurance plans for the more well off may, inthe long term, significantly worsen the welfare of poor households andincrease inequities due to wider quality differentials between the privateand the public services.
IMPLEMENTATION MECHANISMS
Two stages in the reform process are distinguished here: policy formationand policy implementation.
Policy formation
It is widely accepted that successful reforms are characterized by open-ness and consultation with the main stakeholders. Among the mostobvious stakeholders are clients, but also public and private sector pro-
Analyzing the Distributional Impact of Reforms
72
Access is here defined in terms of physical distance to providers. Distance andthe time and cost required to cover distance can be more important than theprice charged for services. Expanding services can have a great impact onconsumption among the poor.
As noted in Table 2.2, the poor respond to quality, as well as to prices. Improve-ments in quality will encourage greater consumption of services.
Demand is key to the consumption of services and to health status. Understand-ing the determinants of demand and the constraints to greater consumption ofservices is an essential component in the design of pro-poor reforms.
TABLE 2.6. Health Reform Transmission Channels (Continued)
Channel Impact on the poor
viders, including for-profit and nonprofit, charity, and nongovernmental-organization providers. This is because reforms are not merely technicalblueprints, but are value laden and frequently conflict ridden (Gilson1997). In other words, it is necessary to build collegial support for thereforms and to anticipate and deal with disagreements that might derailthe reform process.
There must be coordination among international and bilateraldonors and funders, as well as other ministries within the national govern-ment. This ensures that policies are consistent with medium-term plans,sectorwide approaches, the Poverty Reduction Strategy Paper, and thePoverty Reduction and Growth Facility.
There is often more talk about openness and consultation than there isactual openness, especially in the planning stage. In his study of participa-tion in Tanzanian reforms, Semali (2003) found that, although the processof policy formation was supposed to follow the guidelines for consultationestablished in World Development Report 1993 (World Bank 1993), theactual consultation consisted of meetings of Ministry of Health officials inWashington, a meeting of the “consultative group” of donors in Paris, andtwo workshops comprising ministry officials, donors, and the World Bank.13
Policies must also be internally consistent. For example, it is importantthat one set of policies does not encourage private sector providers toexpand services, while another set of policies simultaneously discouragesthem from expanding. While this seems obvious on paper, sectoral policiescan, in principle, be quite complex; to coordinate sectoral policies withthose of, for instance, the tax authorities or policies regulating small busi-nesses is even more difficult. In addition, the stated objectives of policyreform and the instruments proposed to achieve these objectives canappear to conflict, for instance, expanding private sector provision by tight-ening licensing restrictions (Gilson 1997).
Policy implementation
Successful reforms require a functioning and capable public sector at boththe national and local levels. This again raises the unfortunate point thatreforms—such as decentralization—cannot, in principle, be expected tosolve problems of governance and stewardship.
Similarly, the reforms must define the responsibilities of all partici-pants in the process. The government must have a clear conception of itsrole in the sector. This may simultaneously include the roles of policy-maker, regulator, purchaser, and, possibly, provider of health services.On the other hand, the public sector need not actually supply the services.
Health Sector Reforms
73
The private sector dominates primary care provision in many countries,and many health ministries contract with private providers to deliver ser-vices to the poor (for example, Bangladesh, Mozambique, and Uganda).
The government must also have a firm commitment to achieving thegoals set out by the reform process. This includes the will and ability toprovide adequate funding. Policy statements and intentions are meaning-less unless sufficient resources are allocated to fulfill the required tasks.Similarly, public expenditures and, more importantly, changes in sectoralinstitutions and structures must be supported by an appropriate legal andregulatory framework. For example, if the reforms are intended to encour-age the participation of the private sector, the appropriate legal institu-tions should be established to define and protect both the rights and theresponsibilities of private providers in health (Kumaranayake et al. 2000;Mills et al. 2002).
A number of studies have highlighted the importance of paying atten-tion to the process of reforms and not merely the goals (Gilson 1997; Waltand Gilson 1994). It is not simply a matter of “knowing which directionto move in, but paying attention to how to get there: in essence, recog-nizing that policy implementation is as much a process as it is content”(Brinkerhoff 1996: 1395). Thus, it is important to develop a commonunderstanding, to build consensus for the reforms, and to obtain input andsupport from a wide and inclusive selection of government people (includ-ing politicians), health providers, and civil society (Aga Khan Health Ser-vices 2004). This requires openness and consultation not only during theimplementation, but during the process of policy formation as well.
TOOLS AND DATA FOR ANALYSIS
Once a potential set of reforms has been proposed to advance nationalhealth goals, a PSIA should aim to provide evidence to address the basicquestion posed at the beginning of this chapter: what is the potential wel-fare impact of the identified reforms across socioeconomic groups? Inparticular, how are disadvantaged households affected? As a requirementof PSIA, the identification of reform options is absolutely essential. In thissection, we discuss how distributional analysis can be conducted on anidentified policy change.
The choice of tools for analyzing the distributional impact on house-hold welfare of health sector policy changes is determined by four basicconsiderations:
� the nature of the policy change� the type of questions to be addressed
Analyzing the Distributional Impact of Reforms
74
� the available data� the constraints on time, resources, and analytical capacity
While the last two considerations are straightforward, the first tworequire some explanation. The policy itself will have an influence on thechoice of analytical method. In general, health is not a tradable good, so itis usually not necessary to resort to economy-wide models with externalaccounts (such as computable general equilibrium models). On the otherhand, if the reforms are broadly based, if they involve not only the healthsector, but also other sections of the economy, some understanding of thelink between health and (for instance) labor markets will be required. Inaddition, reforms will always have general equilibrium or multiplier effects,that is, any policy change will induce behavioral responses on both the sup-ply side and the demand side. These responses, in turn, will affect eachother: a change in finance policies will affect the demand for services, whichwill affect the supply of services, which will have further demand effects,and so on.
Second, the nature of the question to be asked will have an effect on themethods used. On one level, a policy analyst would like to examine the long-run consequences of reforms through all possible transmission channels andfor all groups. But this will clearly not be possible in practice, nor is it neces-sarily desirable in all cases. In practice, the policy analyst may be interestedin only one particular aspect of the reforms. For example, what are the directeffects of subsidized antiretroviral treatment on food consumption amonghouseholds in which someone is infected with HIV? This very narrow ques-tion can be examined through econometric analysis of household expendi-tures. Nonetheless, the analyst must be aware that an approach that is toonarrow might miss some important effects. In the case of antiretroviralmedication, treatment may improve the health of the person with HIV tothe extent that he can continue working or resume working, so that house-hold income increases. Or the burden of caring for the ill household mem-ber will be diminished, so that other members of the household can increasethe time they spend at school or in work. These factors might be missed bya narrowly defined and static econometric approach.
One can crudely distinguish the available analytical methods asquantitative and qualitative. A clear distinction between the two is noteasy to draw, although Bamberger (2000) provides a useful summary ofthe methods in terms of the selection of units of analysis, the researchprotocol, and data collection. When time and data permit, a combina-tion of the two methods (that is, “mixed” methods) is preferable. Quali-tative methods can provide hypotheses to be tested by the quantitative
Health Sector Reforms
75
methods, and the qualitative methods also supply a way of validating theresults of the rather more abstract quantitative methods.
The following discussion centers on four topics: the choice of out-come indicators, data and sources, qualitative methods, and quantitativemethods.
Choice of indicators
There are two factors to consider in the choice of indicators. Recalling thediscussion in the section on issues specific to the analysis of healthreforms, these can be thought of as “the distribution of what?” and “whatdistribution?” First, what dimension of outcomes are we interested in?Do we care about the distribution of health status or about the distribu-tion of the financial burden of illness? Second, how do we measure thedistribution of this outcome? The two issues are discussed here in turn.
The distribution of what?
How do we define and measure the changes in welfare among householdsor individuals because of health policy changes? Sen’s (1984) capabilityapproach has led to the recognition that welfare is multidimensional, sothat human capital outcomes, such as those in health and education, arevalid measures of welfare, as much as consumption and income. In thehealth literature, indicators such as child mortality, morbidity, life ex-pectancy (often adjusted for disability), and self-reported health statusare the most widely used.
Understanding the impact of health policy changes is complicated bya number of factors. First, as noted in the section on issues, health out-comes are determined by factors both inside and outside the health sector.14
Second, health status is a lagging indicator of health investments and poli-cies. The impact of health policy changes on health outcomes will only bemanifest after some time even in the case of major policy changes. Third,self-reported health status indicators are often not independently reliable:they are determined partly by expectations and sensitivity to illness, whichvary systematically with factors such as income. The poor are less likelythan the more well off to report sickness. The poor are not healthier thanthe rich, but they are more likely to underreport, partly because they areless able to do anything about it (Schultz and Tansel 1997; Strauss andThomas 1998).
These complications leave two options for analysis. The first is tochoose a set of “proximate determinants” of health outcomes, that is, nothealth outcomes per se, but the factors that are closely (preferably causally)
Analyzing the Distributional Impact of Reforms
76
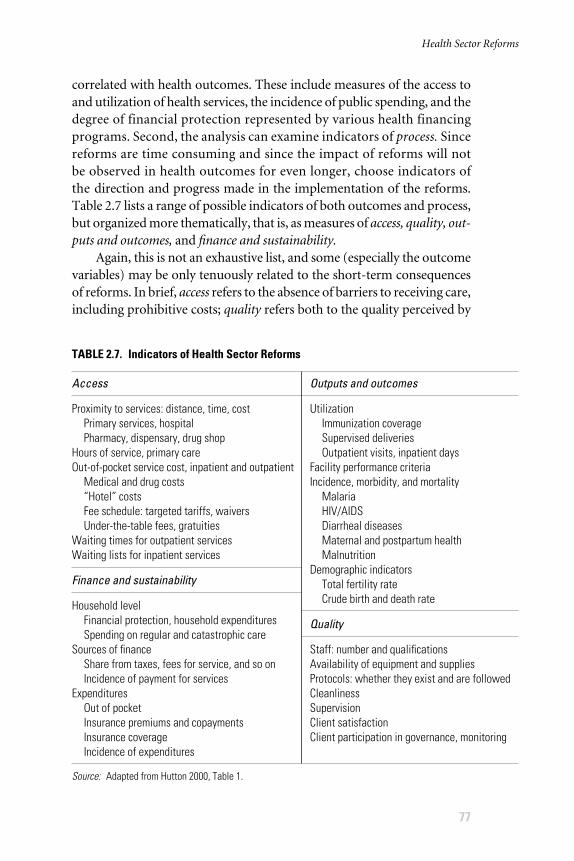
correlated with health outcomes. These include measures of the access toand utilization of health services, the incidence of public spending, and thedegree of financial protection represented by various health financingprograms. Second, the analysis can examine indicators of process. Sincereforms are time consuming and since the impact of reforms will notbe observed in health outcomes for even longer, choose indicators ofthe direction and progress made in the implementation of the reforms.Table 2.7 lists a range of possible indicators of both outcomes and process,but organized more thematically, that is, as measures of access, quality, out-puts and outcomes, and finance and sustainability.
Again, this is not an exhaustive list, and some (especially the outcomevariables) may be only tenuously related to the short-term consequencesof reforms. In brief, access refers to the absence of barriers to receiving care,including prohibitive costs; quality refers both to the quality perceived by
Health Sector Reforms
77
TABLE 2.7. Indicators of Health Sector Reforms
Access Outputs and outcomes
Proximity to services: distance, time, costPrimary services, hospitalPharmacy, dispensary, drug shop
Hours of service, primary careOut-of-pocket service cost, inpatient and outpatient
Medical and drug costs“Hotel” costsFee schedule: targeted tariffs, waiversUnder-the-table fees, gratuities
Waiting times for outpatient servicesWaiting lists for inpatient services
Finance and sustainability
Household levelFinancial protection, household expendituresSpending on regular and catastrophic care
Sources of financeShare from taxes, fees for service, and so onIncidence of payment for services
ExpendituresOut of pocketInsurance premiums and copaymentsInsurance coverageIncidence of expenditures
Source: Adapted from Hutton 2000, Table 1.
UtilizationImmunization coverageSupervised deliveriesOutpatient visits, inpatient days
Facility performance criteriaIncidence, morbidity, and mortality
MalariaHIV/AIDSDiarrheal diseasesMaternal and postpartum healthMalnutrition
Demographic indicatorsTotal fertility rateCrude birth and death rate
Quality
Staff: number and qualificationsAvailability of equipment and suppliesProtocols: whether they exist and are followedCleanlinessSupervisionClient satisfactionClient participation in governance, monitoring
the clients and to the technical, medical quality of the care provided; out-puts and outcomes are combined here and include the volumes of servicesprovided (from the supply side) and population-level and household-levelindicators; finance and sustainability also encompass both systemwide andhousehold-level variables, including financial protection among house-holds and sources of finance for the system.
What distribution?
The most commonly used measure of equity in public services is benefitincidence, that is, how much of a given benefit (or cost) accrues to whichfraction or group within the population.15 The usual practice is to rank thepopulation by some welfare measure, such as income, and then ascertainthe value of public benefit that each member of the population receives.Evaluation of the incidence of health care finance requires examination ofall sources of health sector funding, not only the direct payments that aremade exclusively for health care. In addition to out-of-pocket payments,health insurance contributions, and earmarked health taxes, the distribu-tional burden of all direct and indirect taxes may be examined where thesecomprise a significant part of total health sector revenue.
Alternatively, one can calculate the concentration index, which is asummary measure describing benefit incidence. The advantage of theindex is that one can also easily compute standard errors, which permitrobust comparisons of statistically significant differences across classes ofindividuals or households.
One important advance is the computation of marginal benefit inci-dence analysis.16 This is used to examine the distribution of the marginalcosts and benefits of program expansion across different incomegroups. This is a more informative measure than average benefit inci-dence, since policy changes often involve the scaling up of existing pro-grams. Recent research indicates that the benefits of public programscan be initially captured by the non-poor, but that the poor will bene-fit more as a program is expanded. For example, the rich may demandpayoffs in return for their taxes to cover a social program’s start-upcosts, and only once the program has expanded (and the marginal costsof program expansion have been lowered) will it be politically feasiblefor the government to concentrate services in poor, remote areas (seeLanjouw and Ravallion 1999).
Data
The data required for the distributional analysis of health reform dependmainly on the nature and scale of the policy change, the question to be
Analyzing the Distributional Impact of Reforms
78
addressed, and the choice of methods. Lindelöw and Wagstaff (2003)offer a comprehensive review of the data sources commonly used inhealth analysis. Only a selection of the more widely available data are dis-cussed here.
Demographic and Health Survey (DHS)
These surveys are among the most widespread sources for data on healthstatus and policy. Funded by the U.S. Agency for International Develop-ment, nearly 200 of these household-level surveys have been collectedsince 1985 (see http://www.measuredhs.com). The DHS attempts to becomparable across countries and over time and includes a wide range ofindicators, such as basic household characteristics, fertility, child nutritionand health status, access to environmental services (safe water, sanitation,and electricity), and utilization of basic health and education services. Atypical DHS collects detailed information on reproductive history, edu-cational attainment, knowledge about common childhood illnesses, HIV/AIDS, and sexually transmitted infections, as well as knowledge about thetreatment of these illnesses. The DHS is useful for assessing health knowl-edge and practices, health status, and the consumption of health services.
One of the limitations of the DHS data is that they include only verylittle information on wealth and generally no information on income andexpenditure. This information is traditionally used for measuring livingstandards and is essential for distributional analysis. A number of recentstudies using DHS data have constructed a wealth index as a proxy measureof living standards in order to address distributional issues (see, for exam-ple, Filmer and Pritchett 1998).
The surveys and the methods are being continually updated andexpanded; for example, surveys of providers are now being conducted.These facility-based provider surveys gather information on health servicedelivery, including quality, infrastructure, utilization, and availability, andcan be linked to household surveys in order to identify relationshipsbetween behavior and outcomes on the household side and the supply ofhealth services.
Living Standards Measurement Study (LSMS)
More than 50 LSMS surveys have been conducted in low-income coun-tries to measure levels and changes in living standards. These are largeand comprehensive household surveys that collect rich information onsocioeconomic characteristics, especially on household consumption andincome. They frequently include health modules to gather information on
Health Sector Reforms
79
the health status of household members, service utilization, and accesscosts. The LSMS surveys that have an added health module are useful datasources for analyzing the impact of health policy changes (for example, usercharges, health financing programs, or publicly financed health projects)on health demand, as well as for the distributional impact analysis of pub-lic spending.
For some, the LSMS and DHS datasets (which are narrow, but deep)can be combined with census data (which are broad, but shallow) to pro-duce maps of poverty, health status, and access to services and infrastruc-ture. The availability of such tools at the disaggregated level can be valuablein helping policymakers target poor localities accurately. Elbers, Lanjouw,and Lanjouw (2003) have developed a methodology to combine census andhousehold-survey data to create reliable district-level poverty maps. Anongoing research project at Macro International (http://www.orcmacro.com) is exploring the possibility of replicating the methodology to producemaps on key health indicators. Similar work is being conducted elsewhere.Fujii (2003), for example, has developed anthropometric maps using DHSand census data on Cambodia.
Other household-level data sources
Other agencies conduct internationally comparable and valuable surveys,sometimes with a health focus. For example, the Multiple Indicator Clus-ter Surveys sponsored by the United Nations Children’s Fund focus onwomen and children; about 50 country reports are available. Hundredsof other household surveys are conducted throughout the world everyyear, usually in an ad hoc fashion. There are periodic attempts to stan-dardize and codify survey methods. The Paris 21 Initiative, for instance,was established by the United Nations to develop survey techniques andto build a “culture of evidence-based policymaking” (see http://www.paris21.org). The World Bank’s Africa Household Survey Databank con-tains more than 400 surveys, and surveys are available for other regionsas well.
Quantitative service delivery surveys and Public Expenditure Tracking Surveys
Quantitative service delivery surveys focus on the service facility and fac-tors affecting quality of services. It is a technique for surveying serviceproviders, resource availability, and performance. Public ExpenditureTracking Surveys measure problems in the budget execution process, suchas leakage, delays, and the reallocation of resources, but they can also be
Analyzing the Distributional Impact of Reforms
80
used to examine incentives for service providers and the quality and quan-tity of services. These two are often linked, and the distinction betweenthem is becoming smaller. About 30 of these two types of surveys had beencarried out by the Bank and its clients as of early 2005 (see Dehn, Reinikka,and Svensson 2003).
Experimental and quasi-experimental data
Rigorous evaluation of the impact of a specific health intervention mayrequire data collected from a policy experiment. This is because theimpact of an intervention can be affected by factors that are impossibleto disentangle exclusively through ex post evaluation. For example, a pro-gram may be put in a particular place for reasons that also affect the pro-gram’s outcomes. If we were only to look at outcomes, we would beunable to determine the impact of the program and the impact of theseother factors.17
Experimental analysis is complex and generally expensive; it requiresboth baseline and follow-up data, preferably including supply-side (healthfacility) and demand-side (household) surveys. However, surveys to ana-lyze policy experiments generally use simpler instruments on smaller sam-ples relative to the DHS or LSMS, especially if the intervention is a pilotprogram. See the section on quantitative methods hereafter for a morecomplete description of the method.
Qualitative data
Qualitative data differ from survey or experiment data because of the for-mat of the data and the process through which the data are generated (see,for example, Chung 2000). For instance, focus-group interviews are oftenconducted during small meetings using open-ended questions about a spe-cific topic. The information collected is often contextual and providesinsights about the process and implementation of the reform program thatare particularly valuable for confirming an evaluation based on experimentor survey data. See the section on analytical methods below for a morecomplete description.
National health accounts
National health accounts describe in great detail all the sources and usesof funds and other resources within the health system, private and pub-lic. These are an excellent source of information on the functional classi-fication of the sources and the allocation of expenditures; they less often
Health Sector Reforms
81
disaggregate the information by income or other household categories.National health accounts have so far been prepared for about 75 countries.Since 1999, the World Health Organization has been undertaking a sys-tematic exercise to develop health expenditure data for all its 191 memberstates, based on the United Nations System of National Accounts (seeWHO 2003).
Analytical methods
The methods used to examine the consequences of health reforms (or anyreforms) are often distinguished as either qualitative or quantitative. Inmany ways, this is a false and unproductive dichotomy. Faute de mieux, wemaintain this distinction and discuss a few of the methods in detail.
Qualitative methods
“Qualitative methods” generally refers to the use of case studies and in-depth, open-ended interviews and discussions to analyze the distribu-tional impact of health reforms. The methods most commonly mentionedin the literature include social impact analysis, participatory beneficiaryassessments, and stakeholder analysis. Each of these methods is de-scribed in A User’s Guide to Poverty and Social Impact Analysis (WorldBank 2003b).
One major strength of qualitative methods is that they provide a muchdeeper understanding of the processes underlying policy implementation,including the interactions among the various stakeholders, than can beelicited in a structured, impersonal questionnaire. This information is crucial for gauging the benefits and costs of a reform for different stake-holders. It can offer valuable insights into the reasons for the failure or success of a reform program in reaching the intended objectives. Findingsfrom studies using this approach can also supply information that can beapplied to improve the design of household surveys and interpret theresults of quantitative analyses. It can also be employed to validate the out-comes of quantitative analysis.
For the analysis of the distributional impact of policy reform, thesequalitative methods have a few limitations. First, they cannot quantify thewelfare gains or losses due to a health policy change. Thus, they are notvaluable as guides in the design of explicit compensation measures to mit-igate any adverse impact (that is, the “willingness to pay” or “willingness toaccept” a sum as equivalent to the welfare change caused by the policy).Indeed, very few empirical studies that use the qualitative method havetouched upon the distributional aspect of reform. Two empirical examples
Analyzing the Distributional Impact of Reforms
82
of attempts to use qualitative methods to address equity issues are Bossert(2000), on the decentralization of health system organization in Bolivia,Chile, and Colombia, and Tang and Bloom (2000), on health servicedecentralization in rural China.18 Second, findings from the qualitativeapproach are not usually generalizable; they are strongly dependent onlocal conditions (indeed, that is a strength of the method). This means thatit is more difficult to apply the lessons learned in one case to another caseand that any attempt to do so must carefully account for these differencesin local conditions.
Table 2.8 summarizes several studies that have used qualitative toolsto evaluate health reforms.
Quantitative methods
The majority of PSIA cases will involve some quantitative analysis. Thisis not to say that the information produced by these tools is always prefer-able to the information derived from the qualitative methods discussedabove. In fact, the richest and most robust story will derive from mixedmethods.19 In this section, two of the quantitative methods are describedthat are commonly used to examine the distributional impact of healthreforms. These are conventional econometric welfare analysis and experi-mental evaluation. These are illustrated in greater detail in A User’s Guideto Poverty and Social Impact Analysis (World Bank 2003b).
The first method, econometrics, derives from a model of householdwelfare in which welfare (utility) is determined by health status and theconsumption of other goods and services. Health outcomes, in turn, aremodeled through a “production function,” with individual, household,community, and other characteristics as inputs. Households maximizeutility, subject to a budget constraint, by choosing the optimal combina-tion of health services and other goods. From this solution can be deriveda (“reduced-form”) health-demand equation that can be estimated empiri-cally as a function of prices and individual, household, and communitycharacteristics.
A regression of the health-demand function using information com-monly collected through household surveys and health-facility surveysprovides an estimation of the marginal impact of policy changes. For ex-ample, the demand equation can be used to examine the impact of changesin user fees, improved access to health facilities, changes in quality, or anyother quantitatively measurable policy change.
There are three main advantages to the econometric welfare ap-proach. First, this method has a strong theoretical foundation, including
Health Sector Reforms
83
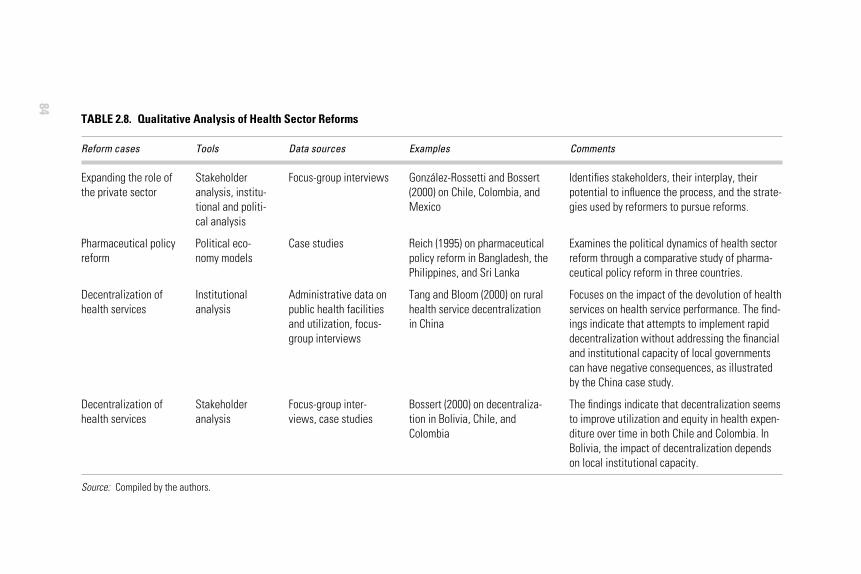
84
TABLE 2.8. Qualitative Analysis of Health Sector Reforms
Reform cases Tools Data sources Examples Comments
Expanding the role of the private sector
Pharmaceutical policy reform
Decentralization of health services
Decentralization of health services
Source: Compiled by the authors.
Stakeholderanalysis, institu-tional and politi-cal analysis
Political eco-nomy models
Institutionalanalysis
Stakeholderanalysis
Focus-group interviews
Case studies
Administrative data onpublic health facilitiesand utilization, focus-group interviews
Focus-group inter-views, case studies
González-Rossetti and Bossert(2000) on Chile, Colombia, andMexico
Reich (1995) on pharmaceuticalpolicy reform in Bangladesh, thePhilippines, and Sri Lanka
Tang and Bloom (2000) on ruralhealth service decentralization in China
Bossert (2000) on decentraliza-tion in Bolivia, Chile, andColombia
Identifies stakeholders, their interplay, theirpotential to influence the process, and the strate-gies used by reformers to pursue reforms.
Examines the political dynamics of health sectorreform through a comparative study of pharma-ceutical policy reform in three countries.
Focuses on the impact of the devolution of healthservices on health service performance. The find-ings indicate that attempts to implement rapiddecentralization without addressing the financialand institutional capacity of local governmentscan have negative consequences, as illustratedby the China case study.
The findings indicate that decentralization seemsto improve utilization and equity in health expen-diture over time in both Chile and Colombia. InBolivia, the impact of decentralization dependson local institutional capacity.
a clearly defined concept of welfare, which provides an analytical base forconducting distributional impact analysis. It is generally agreed whatthese methods measure, and the results are therefore comparable acrossstudies and settings. Second, the method allows us to examine the mar-ginal impact rather than the average impact of a policy change, that is, wecan see the incremental value of the next dollar spent on a particular pol-icy, rather than of the average dollar spent. This is important becausethere is no reason to believe that the impact of the next dollar will resem-ble the impact of an average dollar.20 Third, this method can provide abasis for policy simulations of various reform scenarios. In other words,we can use these results to ask “what if?” for any number of changes topolicy or social and environmental conditions. This can be extremelyuseful in designing policies and projecting the consequences of reforms.
The disadvantages to this approach revolve mainly around the fact thatthe reliability of the empirical results depends crucially on data quality andthe correct specification of the health-demand function. Unfortunately,obtaining good data is difficult, and perfect data may be impossible to col-lect. Microbehavior is driven partly by nonmonetary costs and benefits,which are very hard to measure (Das and Hammer 2004). Analysis of themicrolevel impact of health reforms therefore requires data that we cannothave or for which we must rely on imperfect proxies. In addition, the resultsare often driven by methods rather than by the data or by the question thatneeds to be answered. Different methods can yield different results. Pleasenote that this does not mean that all econometric methods are equallysuspect: differences may reflect problems in one method that can be cor-rected by another.
Addressing the misspecification of the health-demand function posesother formidable challenges to the analysis. The econometric evaluationof program impact suffers from the problems of omitted variables gen-erally and endogeneity and sample selection problems specifically. Forexample, the impact of a child health intervention will depend on themotivation and behavior of the household in which the child lives. Chil-dren whose mothers are more able and willing to seek public health ser-vices and follow advice on the prevention of illness and disease are morelikely to experience better child health outcomes. These households arealso more likely to participate in government-promoted health programs.A naive evaluation runs the risk of ascribing to the intervention the bene-fits to the child of having a motivated mother. This problem would beminimized if we could measure the mother’s motivation, but these vari-ables (ability, knowledge, and willingness of mothers) are not directlyobservable.
Health Sector Reforms
85
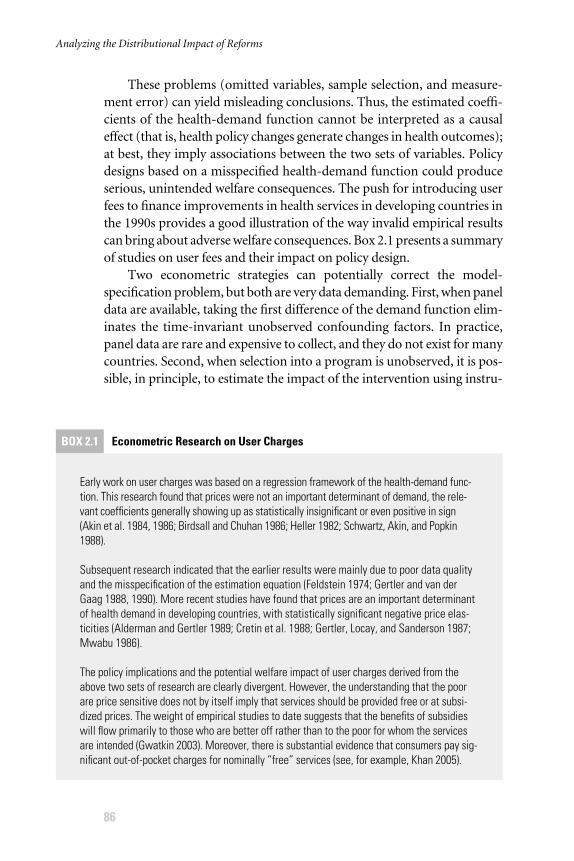
These problems (omitted variables, sample selection, and measure-ment error) can yield misleading conclusions. Thus, the estimated coeffi-cients of the health-demand function cannot be interpreted as a causaleffect (that is, health policy changes generate changes in health outcomes);at best, they imply associations between the two sets of variables. Policydesigns based on a misspecified health-demand function could produceserious, unintended welfare consequences. The push for introducing userfees to finance improvements in health services in developing countries inthe 1990s provides a good illustration of the way invalid empirical resultscan bring about adverse welfare consequences. Box 2.1 presents a summaryof studies on user fees and their impact on policy design.
Two econometric strategies can potentially correct the model-specification problem, but both are very data demanding. First, when paneldata are available, taking the first difference of the demand function elim-inates the time-invariant unobserved confounding factors. In practice,panel data are rare and expensive to collect, and they do not exist for manycountries. Second, when selection into a program is unobserved, it is pos-sible, in principle, to estimate the impact of the intervention using instru-
Analyzing the Distributional Impact of Reforms
86
BOX 2.1 Econometric Research on User Charges
Early work on user charges was based on a regression framework of the health-demand func-tion. This research found that prices were not an important determinant of demand, the rele-vant coefficients generally showing up as statistically insignificant or even positive in sign(Akin et al. 1984, 1986; Birdsall and Chuhan 1986; Heller 1982; Schwartz, Akin, and Popkin1988).
Subsequent research indicated that the earlier results were mainly due to poor data qualityand the misspecification of the estimation equation (Feldstein 1974; Gertler and van derGaag 1988, 1990). More recent studies have found that prices are an important determinantof health demand in developing countries, with statistically significant negative price elas-ticities (Alderman and Gertler 1989; Cretin et al. 1988; Gertler, Locay, and Sanderson 1987;Mwabu 1986).
The policy implications and the potential welfare impact of user charges derived from theabove two sets of research are clearly divergent. However, the understanding that the poorare price sensitive does not by itself imply that services should be provided free or at subsi-dized prices. The weight of empirical studies to date suggests that the benefits of subsidieswill flow primarily to those who are better off rather than to the poor for whom the servicesare intended (Gwatkin 2003). Moreover, there is substantial evidence that consumers pay sig-nificant out-of-pocket charges for nominally “free” services (see, for example, Khan 2005).
mental variables. This requires the identification of a variable that deter-mines the household’s decision to participate in the program, but is notindependently correlated with health outcomes. Valid instrumental vari-ables are difficult to find. To some extent, good knowledge about programplacement and implementation can help in identifying potential instru-mental variables (see Baker 2000).
Table 2.9 presents a few examples of the use of quantitative econo-metric methods to simulate the impact of policies on health outcomes. Thisis clearly only suggestive: the list of references to this chapter and, indeed,most of the citations in Table 2.2 provide many examples of the use ofquantitative econometric methods. Some of the studies presented inTable 2.9 are conducted ex ante, that is, prior to the introduction of policychanges, and some are conducted ex post, that is, following the policychanges. But they all share the same basic method, whereby demand param-eters are derived econometrically, and then these are used to simulate theimpact of the proposed policy change on behavior.
The search for solutions to the problems associated with cross-sectional econometric evaluation methods has led to the increased use ofexperimental and quasi-experimental techniques, especially to control forbias caused by nonrandom sample selection. These techniques are basedon a simple comparison of differences between (usually two) subsamplesdrawn from the same population, one of which has received an interven-tion, while the other has not. In the scientific jargon, the first group is thetreatment group, and the second is the control. The control group playsthe role of counterfactual, permitting policy analysts to see what would havehappened if the reform had not taken place.
There are two main strands to this literature, which can be distin-guished by the underlying basis for the comparison between the treatmentand control groups. In the first, the control group is selected ex post; in thesecond, the control and treatment groups are selected ex ante. Each isbriefly described hereafter, and a few examples are presented.
The first method is often referred to as “quasi-experimental” evalua-tion and consists primarily of variants of matching methods. This involvescreating the control group ex post, that is, from a sample that contains bothtreatment and control individuals (or households); one then selects thesubsample of untreated individuals who most closely resemble the treatedindividuals. This is most commonly done by the method of propensity-scorematching (see Cochrane and Rubin 1973; Rosenbaum and Rubin 1983).The propensity score is an estimate of the probability that any individual(treated or untreated) will receive the treatment, as a function of the indi-vidual’s observed characteristics. Each treated individual is then matched
Health Sector Reforms
87
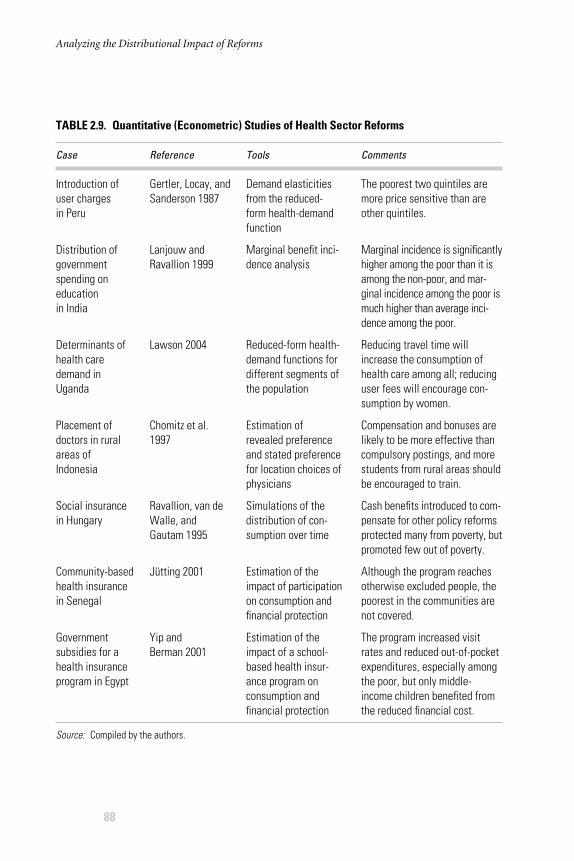
Analyzing the Distributional Impact of Reforms
88
TABLE 2.9. Quantitative (Econometric) Studies of Health Sector Reforms
Case Reference Tools Comments
Introduction of user charges in Peru
Distribution of governmentspending on educationin India
Determinants of health care demand in Uganda
Placement of doctors in rural areas of Indonesia
Social insurance in Hungary
Community-basedhealth insurance in Senegal
Governmentsubsidies for a health insurance program in Egypt
Source: Compiled by the authors.
Gertler, Locay, andSanderson 1987
Lanjouw and Ravallion 1999
Lawson 2004
Chomitz et al. 1997
Ravallion, van deWalle, and Gautam 1995
Jütting 2001
Yip and Berman 2001
Demand elasticitiesfrom the reduced-form health-demandfunction
Marginal benefit inci-dence analysis
Reduced-form health-demand functions fordifferent segments ofthe population
Estimation ofrevealed preferenceand stated preferencefor location choices ofphysicians
Simulations of thedistribution of con-sumption over time
Estimation of theimpact of participationon consumption andfinancial protection
Estimation of theimpact of a school-based health insur-ance program onconsumption andfinancial protection
The poorest two quintiles aremore price sensitive than areother quintiles.
Marginal incidence is significantlyhigher among the poor than it isamong the non-poor, and mar-ginal incidence among the poor ismuch higher than average inci-dence among the poor.
Reducing travel time willincrease the consumption ofhealth care among all; reducinguser fees will encourage con-sumption by women.
Compensation and bonuses arelikely to be more effective thancompulsory postings, and morestudents from rural areas shouldbe encouraged to train.
Cash benefits introduced to com-pensate for other policy reformsprotected many from poverty, butpromoted few out of poverty.
Although the program reachesotherwise excluded people, thepoorest in the communities arenot covered.
The program increased visitrates and reduced out-of-pocketexpenditures, especially amongthe poor, but only middle-income children benefited fromthe reduced financial cost.
with one or more untreated individuals who are most closely similar basedon the estimated propensity score. The control group is then the subsam-ple of untreated individuals who are otherwise nearly identical (that is,“matched”) to the treated individuals. The impact of the treatment can beseen as the difference in mean outcomes between the treated group and thematched, untreated control group.21
The main advantage of matching methods is that they can draw onexisting datasets and are often more rapid and less expensive to implement.22
The principal disadvantage of this method is that it may not completelysolve the problem of selection bias: selection into the treatment group maybe a function of unobserved characteristics. In addition, matching methodscan be statistically complex, requiring considerable expertise in the designof the evaluation and in the analysis and interpretation of the results.
The second method involves experimental, randomized controlledtrials. These studies require a sample of individuals equally eligible andwilling to receive treatment. One subsample is randomly assigned to thetreatment group, and the remainder is assigned to the control group,which does not receive the treatment. This is generally considered themost robust evaluation method. The random assignment process createscomparable treatment and control groups that are statistically equivalentto one another, given appropriate sample sizes. In principle, control groupsgenerated through random assignment serve as a perfect counterfactual,free from the problems of selection bias that plague evaluations.
The benefits of this technique are the robustness and simplicity of theresults: the impact of the intervention can be measured simply as the dif-ference between the mean measured outcomes of the samples of the treat-ment group and the control group. Although experimental designs areconsidered the ideal approach to estimating project impact, there are sev-eral problems in practice:
� Randomization may be unethical or may be perceived as unethical.� It can be politically difficult to provide an intervention for one group
and not another.� Nationwide programs or policy changes leave no room for a control
group.� Circumstances and the behavior of participants may change during
the experiment: people move or may seek alternative treatment.� Assignment may not be truly random: program administrators may
exclude high-risk applicants to achieve better results.� Experimental designs can be expensive and time consuming in cer-
tain situations, particularly in the collection of new data.
Health Sector Reforms
89
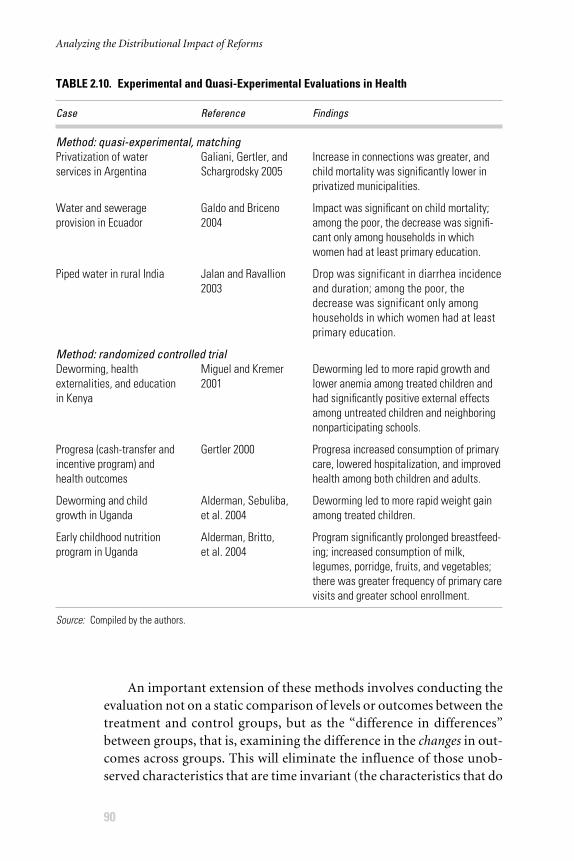
Analyzing the Distributional Impact of Reforms
90
TABLE 2.10. Experimental and Quasi-Experimental Evaluations in Health
Case Reference Findings
Method: quasi-experimental, matchingPrivatization of water services in Argentina
Water and sewerage provision in Ecuador
Piped water in rural India
Method: randomized controlled trialDeworming, health externalities, and education in Kenya
Progresa (cash-transfer and incentive program) and health outcomes
Deworming and child growth in Uganda
Early childhood nutrition program in Uganda
Source: Compiled by the authors.
Galiani, Gertler, andSchargrodsky 2005
Galdo and Briceno2004
Jalan and Ravallion2003
Miguel and Kremer2001
Gertler 2000
Alderman, Sebuliba,et al. 2004
Alderman, Britto, et al. 2004
Increase in connections was greater, andchild mortality was significantly lower in privatized municipalities.
Impact was significant on child mortality;among the poor, the decrease was signifi-cant only among households in whichwomen had at least primary education.
Drop was significant in diarrhea incidenceand duration; among the poor, thedecrease was significant only amonghouseholds in which women had at leastprimary education.
Deworming led to more rapid growth andlower anemia among treated children andhad significantly positive external effectsamong untreated children and neighboringnonparticipating schools.
Progresa increased consumption of primarycare, lowered hospitalization, and improvedhealth among both children and adults.
Deworming led to more rapid weight gainamong treated children.
Program significantly prolonged breastfeed-ing; increased consumption of milk,legumes, porridge, fruits, and vegetables;there was greater frequency of primary carevisits and greater school enrollment.
An important extension of these methods involves conducting theevaluation not on a static comparison of levels or outcomes between thetreatment and control groups, but as the “difference in differences”between groups, that is, examining the difference in the changes in out-comes across groups. This will eliminate the influence of those unob-served characteristics that are time invariant (the characteristics that do
not change during the period of the study).23 This requires a baselineand follow-up surveys (panel data for comparisons across individuals).
Table 2.10 presents some examples of both experimental and quasi-experimental (matching) evaluations. They are primarily evaluations ofspecific interventions rather than large-scale multifaceted programs. Thatis not to say that these methods are not applicable to larger programs.Rigorous evaluation was key to the design of the Progresa program inMexico and has been ongoing since before the program’s launch in 1997.Fundamental to these types of evaluations, however, is the existence of acontrol group. Without external controls, it is only possible with thesemethods to conduct a “before and after” comparison within the treat-ment group itself. While some confounding unobservable characteristicsmay be controlled through instrumental variables, it is likely that theresults will be biased by selection problems.
NOTES
1. In the literature on health sector reforms, it is common to equate these withallocative and technical efficiency, respectively.
2. Health care is seen as a merit good, that is, a good that we have decided isbeneficial for people to consume, regardless of their own feelings in the matter. Health has external effects, that is, one person’s health behavior andstatus affect the health and welfare of others.
3. See, for example, Wagstaff (2002) for a summary of inequality in the healthsector.
4. The RAND health care experiment in the United States found that highercopayments reduced health care consumption, but had little impact onhealth, implying that people seek unnecessary care when the cost per visit islow (Newhouse and the Insurance Experiment Group 1993).
5. See, for instance, World Development Report 1997 (World Bank 1997a).6. Hsiao (2000) specifies a set of “control knobs”—financing, payment, orga-
nization, regulation, and consumer behavior—that capture the full range ofhealth reforms.
7. Developing-country tax revenue is about 18 percent of gross domestic prod-uct, compared to 38 percent among countries of the Organisation for Eco-nomic Co-operation and Development (Tanzi and Zee 2001).
8. In addition to the references cited in Table 2.2, see Atim (1998) and Stinson(1982).
9. The exception was West Bengal.10. Human Resources for Health, http://www.human-resources-health.com/.11. It must be noted that these two goals are sometimes in conflict: what is good
for any one particular patient may not be in the best public interest.
Health Sector Reforms
91
12. There is little evidence that the actual risk of HIV infection is higher amonghealth workers. See Marchal, De Brouwere, and Kegels (2005).
13. Once this group had decided on a package of reforms, these were pilot tested,partly to gauge the reaction of communities to the proposed reforms.
14. The factors include better nutrition, mother’s education, access to safe waterand sanitation, access to electricity, and so on, in addition to health sectoroutputs such as immunization and basic health services.
15. For excellent introductions and instructions for these measures, see the tech-nical notes, especially 7, 12, and 16, at http://web.worldbank.org/WBSITE/EXTERNAL/TOPICS/EXTHEALTHNUTRITIONANDPOPULATION/EXTPAH/0,,contentMDK:20216933~menuPK:460204~pagePK:148956~piPK:216618~theSitePK:400476,00.html.
16. See Lanjouw et al. (2002); Lanjouw and Ravallion (1999); Younger (2003).17. To make this a bit more concrete, imagine that a group of highly motivated
parents lobby successfully for a child health intervention. Comparing thechildren who had received this intervention to a group of other childrenwould conflate the beneficial consequences of the motivation of the par-ents on their children with the benefits of the intervention. The benefits ofmotivation are likely to be high, perhaps even higher than the benefits ofthe intervention itself. See Newman et al. (2002); Newman, Rawlings, andGertler (1994).
18. Tang and Bloom (2000) indicate that rapid decentralization that does notaddress weaknesses in the financial and institutional capacity of local govern-ments can have an adverse impact on the quality of health services, andpoor areas are likely to be disproportionately affected. However, distribu-tional issues are not explicitly analyzed. According to Bossert (2000), localstakeholders perceive that decentralization has improved service quality;but Bossert acknowledges that these findings are based on rather limitedinformation.
19. See, for example, Bamberger (2000); Hentschel (1999); Rao and Ibanez(2003); and Woolcock (2001).
20. This is most clearly illustrated by the universal phenomenon of nonlinear costs.In a program to vaccinate 1 million children, for instance, the marginal cost ofreaching the millionth child is likely to be much higher than the cost of reach-ing the thousandth child. Also see the discussion on marginal benefit incidenceanalysis in the section titled “What distribution?”.
21. Becker and Ichino (1999) and Ravallion (2003) provide excellent explana-tions of the steps involved in the propensity-score-matching method.
22. This and the following three paragraphs draw on Baker 2000.23. This includes factors such as the education of the parents of the included
adults, ethnicity, religion, and place of birth, and other unobserved character-istics that might influence health behavior. However, the influence of un-observed individual characteristics that change during the study may beincreased by differencing.
Analyzing the Distributional Impact of Reforms
92
BIBLIOGRAPHY
Abel-Smith, B., and P. Rawal. 1992. “Can the Poor Afford ‘Free’ Health Services?:A Case Study of Tanzania.” Health Policy and Planning 7 (4): 329–41.
———. 1994. “Employers’ Willingness to Pay: The Case for Compulsory HealthInsurance in Tanzania.” Health Policy and Planning 9 (4): 409–18.
Aga Khan Health Services. 2004. “Health Facility Committees: The GovernanceIssue.” Policy Brief 4, Best Practices in Community-Based Health Initiatives,Community Health Department, Aga Khan Health Services in Kenya, Nairobi.
Aitken, J.-M., and J. Kemp. 2003. “HIV/AIDS, Equity, and Health Sector Per-sonnel in Southern Africa.” Equinet Discussion Paper 12, Network for Equityin Health in Southern Africa, Harare, Zimbabwe.
Akin, J., S. C. Griffin, D. K. Guilkey, and B. M. Popkin. 1984. The Demand forPrimary Health Care in Developing Countries. Totowa, NJ: Littlefield, Adams.
———. 1986. “The Demand for Primary Health Care Services in the Bicol Regionof the Philippines.” Economic Development and Cultural Change 34 (4): 755–82.
Alderman, H., P. Britto, P. Engle, and A. Siddiqi. 2004. “Longitudinal Evaluationof Uganda Nutrition and Early Child Development Program.” Unpublishedmanuscript, World Bank, Washington, DC.
Alderman, H., and P. J. Gertler. 1989. “The Substitutability of Public and PrivateHealth Care for the Treatment of Children in Pakistan.” Living StandardsMeasurement Study Working Paper 57. World Bank, Washington, DC.
Alderman, H., and V. Lavy. 1996. “Household Responses to Public Health Services:Cost and Quality Trade-Offs.” World Bank Research Observer 11 (1): 3–22.
Alderman, H., I. Sebuliba, J. Konde-Lule, and A. Hall. 2004. “Increased WeightGain with Mass Deworming Given during Child Health Days in Uganda.”Unpublished manuscript, World Bank, Washington, DC.
Arhin-Tenkorang, D. 2000. “Mobilizing Resources for Health: The Case for UserFees Revisited.” CMH Working Paper Series WG3: 6, Commission on Macro-economics and Health, World Health Organization, Geneva.
———. 2004. “Experience of Community Health Financing in the African Re-gion.” In Health Financing for Poor People: Resource Mobilization and Risk Shar-ing, ed. A. S. Preker and G. Carrin. Washington, DC: World Bank; Geneva:World Health Organization; Geneva: International Labour Office.
Asada, Y., and T. Hedemann. 2002. “A Problem with the Individual Approach inthe WHO Health Inequality Measurement.” International Journal for Equityin Health 1 (2). http://www.equityhealthj.com/content/1/1/2.
Asenso-Okyere, W. K., A. Anum, I. Osei-Akoto, and A. Adukonu. 1998. “CostRecovery in Ghana: Are There Any Changes in Health Care Seeking Behav-ior?” Health Policy and Planning 13 (2): 181–88.
Atim, C. 1998. “Contribution of Mutual Health to Financing, Delivery, and Accessto Health Care: Synthesis of Research in Nine West and Central African Coun-tries.” Technical Report 18, Partnerships for Health Reform Project, Abt Asso-ciates Inc., Bethesda, MD.
Health Sector Reforms
93
———. 1999. “Social Movements and Health Insurance: A Critical Evaluationof Voluntary, Non-Profit Insurance Schemes with Case Studies from Ghanaand Cameroon.” Social Science and Medicine 48: 881–96.
Atkinson, S., and D. Haran. 2004. “Back to Basics: Does DecentralizationImprove Health System Performance?: Evidence from Ceará in North-EastBrazil.” Bulletin of the World Health Organization 82 (11): 822–32.
Bailey, M. 2001. “Priced Out of Reach.” Briefing Paper 4, Oxfam International,Washington, DC.
Baker, J. L. 2000. Evaluating the Impact of Development Projects on Poverty: AHandbook for Practitioners. Directions in Development. Washington, DC:World Bank.
Bamberger, M. 2000. “Opportunities and Challenges for Integrating Quantitativeand Qualitative Research.” In Integrating Quantitative and Qualitative Researchin Development Projects, ed. M. Bamberger, 3–36. Washington, DC: WorldBank.
Barnum, H., J. Kutzin, and H. Saxenian. 1995. “Incentives and Provider PaymentMethods.” Human Resources Development and Operations Policy WorkingPaper 51, World Bank, Washington, DC.
Bassi, L. 1983. “Estimating the Effects of Training Programs with NonrandomSelection.” Review of Economics and Statistics 66: 36–43.
Becker, S. O., and A. Ichino. 1999. “Estimation of Average Treatment EffectsBased on Propensity Scores.” The Stata Journal 2 (4): 358–77.
Beegle, K. 1995. “The Quality and Availability of Family Planning Services andContraceptive Use in Tanzania.” Living Standards Measurement StudyWorking Paper 114, World Bank, Washington, DC.
Bennett, F. 1979. “Primary Health Care and Developing Countries.” Social Scienceand Medicine 13A (5): 505–14.
Bennett, S., A. Creese, and R. Monasch. 1998. “Health Insurance Schemes forPeople Outside Formal Sector Employment.” ARA Paper 16, Division ofAnalysis, Research, and Assessment, World Health Organization, Geneva.
Bennett, S., and L. Gilson. 2001. Health Financing: Designing and ImplementingPro-Poor Policies. London: Health Systems Resource Centre, Department forInternational Development.
Bennett, S., B. McPake, and A. Mills, eds. 1997. Private Health Providers in Devel-oping Countries: Serving the Public Interest? London: Zed Books.
Berman, P. A., ed. 1995. Health Sector Reform in Developing Countries: MakingHealth Development Sustainable. Cambridge, MA: Harvard University Press;Health Policy 32 (1–3).
———. 1997. “National Health Accounts in Developing Countries: AppropriateMethods and Recent Applications.” Health Economics 6 (1): 11–30.
Berman, P. A., and T. J. Bossert. 2000. “A Decade of Health Sector Reform inDeveloping Countries: What Have We Learned?” Paper prepared for the Datafor Decision Making Project Symposium, “Appraising a Decade of Health Sec-tor Reform in Developing Countries,” Washington, DC, March 15.
Analyzing the Distributional Impact of Reforms
94
Bertozzi, S. M., B. Aracena, L. Cahuana, A. Corcho, K. Rely, and V. Zurita. 2001.“Study on Costs of Scaling-Up Health Interventions for the Poor in Latin-American Settings: Final Report.” Working Group 5, Commission on Macro-economics and Health, World Health Organization, Geneva.
Besley, T., and S. Coate. 1991. “Public Provision of Private Goods and the Re-distribution of Income.” American Economic Review 81 (4): 979–84.
Bhushan, I., S. Keller, and B. Schwartz. 2002. “Achieving the Twin Objectives ofEfficiency and Equity: Contracting Health Services in Cambodia.” ERD Pol-icy Brief 6, Economics and Research Department, Asian Development Bank,Manila.
Binam, J. N., A. Nkama, and R. Nkendah. (2004). “Estimating the Willingnessto Pay for Community Health Prepayment Schemes in Rural Areas: A CaseStudy of the Use of Contingent Valuation Surveys in Central Cameroon.”Unpublished manuscript, Institute of Agricultural Research for Develop-ment, Farming Systems, Economy and Rural Sociology Division, Yaoundé,Cameroon. http://www.csae.ox.ac.uk/conferences/2004-GPRaHDiA/papers/4h-Binam-CSAE2004.pdf.
Bir, A., and K. Eggleston. 2003. “Physician Dual Practice: Access Enhancementor Demand Inducement?” Working Paper 2003-11, Department of Econom-ics, Tufts University, Boston.
Birdsall, N., and P. Chuhan. 1986. “Client Choice of Health Treatment in RuralMali.” Unpublished manuscript, Population and Rural Resources Depart-ment, World Bank, Washington, DC.
Birdsall, N., and E. James. 1993. “Health, Government, and the Poor: The Casefor the Private Sector.” In The Epidemiological Transition: Policy and PlanningImplications for Developing Countries, ed. J. N. Gribble and S. H. Preston.Washington, DC: National Academy Press.
Bitrán, R. 2001. “Paying Healthcare Providers through Capitation in Argentina,Nicaragua, and Thailand: Output, Spending, Organizational Impact, and Mar-ket Structure.” Major Applied Research 2, Technical Paper, Partnerships forHealth Reform Project, Abt Associates Inc., Bethesda, MD.
Bitrán, R., and U. Giedion. 2003. “Waivers and Exemptions for Health Services inDeveloping Countries.” Social Protection Discussion Paper 0308, Social Pro-tection Unit, Human Development Network, World Bank, Washington, DC.
Bitrán, R., and C. Muñoz. 2000. “Targeting Methodologies: Conceptual Approachand Analysis of Experiences.” Partnerships for Health Reform Project, LatinAmerica and Caribbean Regional Health Sector Reform Initiative. http://www.lachsr.org/documents/targetingmethodologiesconceptualapproachandanaly-sisofexperiences-EN.pdf.
Bitrán, R., and W. C. Yip. 1998. “A Review of Health Care Provider PaymentReform in Selected Countries in Asia and Latin America.” Major AppliedResearch 2 Working Paper 1, Abt Associates Inc., Bethesda, MD.
Bloom, G., L. Han, and Xiang Li. 2001. “How Health Workers Earn a Living inChina.” Human Resources for Health Development Journal 5 (1–3): 25–38.
Health Sector Reforms
95
Blundell, R., and M. Costa-Dias. 2000. “Evaluation Methods for Non-Experimental Data.” Fiscal Studies 21 (4): 427–68.
Blundell, R., M. Costa-Dias, C. Meghir, and J. van Reenen. 2000. “Evaluatingthe Employment Impact of Mandatory Job-Search Assistance: The UKNew Deal Gateway.” Unpublished manuscript, Institute for Fiscal Studies,London.
Bossert, T. J. 1998. “Analyzing the Decentralization of Health Systems in Devel-oping Countries: Decision Space, Innovation, and Performance.” Social Sci-ence and Medicine 47 (10): 1513–27.
———. 2000. “Decentralization of Health Systems in Latin America: A Com-parative Analysis of Chile, Colombia, and Bolivia.” Latin America and theCaribbean Health Sector Reform Initiative Working Paper, Harvard Schoolof Public Health, Boston.
Brenzel, L. 1993. “Selecting an Essential Package of Health Services Using Cost-Effectiveness Analysis: A Manual for Professionals in Developing Countries.”Population and Human Resources Sector, Population, Health, and NutritionDepartment, World Bank, Washington, DC; Data for Decision Making Proj-ect, Department of Population Studies and International Health, HarvardSchool of Public Health, Boston.
Brinkerhoff, D. 1996. “Process Perspectives on Policy Change: HighlightingImplementation.” World Development 24: 1395–401. Quoted in Gilson (1997).
———. 2000. “Democratic Governance and Sectoral Policy Reform: TracingLinkages and Exploring Synergies.” World Development 28 (4): 601–15.
———. 2003. Accountability and Health Systems: Overview, Framework, andStrategies. Bethesda, MD: Abt Associates Inc.
Bumgarner, J. R., ed. 1992. China: Long-Term Issues and Options in the HealthTransition. World Bank Country Study. Washington, DC: World Bank.
Caines, K., and L. Lush. 2004. “Impact of Public-Private Partnerships Address-ing Access to Pharmaceuticals in Selected Low- and Middle-Income Coun-tries: A Synthesis Report from Studies in Botswana, Sri Lanka, Uganda, andZambia.” Initiative on Public-Private Partnerships for Health, Global Forumfor Health Research, Geneva.
Carrin, G., M. Desmet, and R. Basaza. 2001. “Social Health Insurance Develop-ment in Low-Income Developing Countries: New Roles for Government andNon-Profit Health Insurance Organizations.” In Building Social Security: TheChallenge of Privatization. International Social Security Series, vol. 6, ed. X.Scheil-Adlung, 125–53. London: Transaction Publishers.
Cassels, A., and K. Janovsky. 1996. “Reform of the Health Sector in Ghana andZambia: Commonalities and Contrasts.” SHS Paper 11, WHO/SHS/CC/96.1,Division of Strengthening of Health Services, World Health Organization,Geneva.
Castro-Leal, F., J. Dayton, L. Demery, and K. Mehra. 2000. “Public Spending onHealth Care in Africa: Do the Poor Benefit?” Bulletin of the World HealthOrganization 78 (1): 66–74.
Analyzing the Distributional Impact of Reforms
96
Chakraborty, S., R. Gatti, J. Klugman, and G. Gray-Molina. 2002. “When is ‘Free’Not So Free?: Informal Payments for Basic Health Services in Bolivia.”Unpublished manuscript, World Bank, Washington, DC.
Chaudhury, N., and J. S. Hammer. 2003. “Ghost Doctors: Absenteeism inBangladeshi Health Facilities.” Policy Research Working Paper 3065, WorldBank, Washington, DC.
Chaudhury, N., J. S. Hammer, and E. Murrugarra. 2003. “The Effects of a Fee-Waiver Program on Health Care Utilization among the Poor: Evidencefrom Armenia.” Policy Research Working Paper 2952, World Bank, Washington, DC.
Cheng, S., and T. Chiang. 1997. “The Effect of Universal Health Insurance onHealth Care Utilization in Taiwan.” Journal of the American Medical Associa-tion 278: 89–93.
Chiappori, P. A., F. Durand, and P. Y. Geoffard. 1998. “Moral Hazard and theDemand for Physician Services: First Lessons from a French Natural Experi-ment.” European Economic Review 42 (3–5): 499–511.
Chomitz, K. M., G. Setiadi, A. Azwar, N. Ismail, and Widiyarti. 1997. “What DoDoctors Want?: Developing Incentives for Doctors to Serve in Indonesia’sRural and Remote Areas.” Policy Research Working Paper 1888, World Bank,Washington, DC.
Chung, K. 2000. “Issues and Approaches in the Use of Integrated Methods.” InIntegrating Quantitative and Qualitative Research in Development Projects, ed.M. Bamberger, 37–46. Washington, DC: World Bank.
Cochrane, W., and D. Rubin. 1973. “Controlling Bias in Observational Studies.”Sankyha 35: 417–46.
Collier, P., S. Dercon, and J. Mackinnon. 2002. “Density versus Quality in HealthCare Provision: Using Household Data to Make Budgetary Choices inEthiopia.” CSAE Working Paper 2002-17, Centre for the Study of AfricanEconomies, Oxford University, Oxford.
Collins, C., J. Araujo, and J. Barbosa. 2000. “Decentralizing the Health Sector:Issues in Brazil.” Health Policy 52: 113–27.
Cornwall, A. 2000. “Beneficiary, Consumer, Citizen: Perspectives on Participa-tion for Poverty Reduction.” SIDA Studies 2, Swedish International Devel-opment Cooperation Agency, Stockholm.
Cornwall, A., H. Lucas, and K. Pasteur, eds. 2000. “Accountability through Par-ticipation: Developing Workable Partnership Models in the Health Sector.”Institute of Development Studies Bulletin 31 (1).
Creese, A., and S. Bennett. 1997. “Rural Risk-Sharing Strategies.” In Innovationsin Health Care Financing. Proceedings of a World Bank Conference, March10–11, 1997, ed. G. Schieber. Washington, DC: World Bank.
Cretin, S., E. Keeler, A. Williams, and Y. Shi. 1988. “Factors Affecting TwoTown-Countryside Differences in the Use of Health Services in Two RuralCounties in Sichuan.” Unpublished manuscript, Rand Corporation, SantaMonica, CA.
Health Sector Reforms
97
Criel, B., P. Van der Stuyft, and W. Van Lerberghe. 1999. “The Bwamanda Hospi-tal Insurance Scheme: Effective for Whom?, A Study of Its Impact on Hospital-isation and Utilisation Patterns.” Social Science and Medicine 48 (7): 879–911.
Das, J., and J. S. Hammer. 2004. “Which Doctor?: Combining Vignettes and ItemResponse to Measure Doctor Quality.” Policy Research Working Paper 3301,Public Services, Development Research Group, World Bank, Washington, DC.
Deaton, A., and J. Muellbauer. 1980. Economics and Consumer Behavior.Cambridge: Cambridge University Press.
Dehn, J., R. Reinikka, and J. Svensson. 2003. “Survey Tools for Assessing Perfor-mance in Service Delivery.” Unpublished manuscript, World Bank, Washington, DC.
Deininger, K., and P. Mpuga. 2004. “Economic and Welfare Effects of theAbolition of Health User Fees: Evidence from Uganda.” Policy ResearchWorking Paper 3276, Rural Development, Development Research Group,World Bank, Washington, DC.
de la Jara, J. J., and T. J. Bossert. 1995. “Chile’s Health Sector Reform: Lessonsfrom Four Reform Periods.” Health Policy 32 (1–3): 155–66.
Demery, L. 2003. “Analyzing the Incidence of Public Spending.” In The Impactof Economic Policies on Poverty and Income Distribution: Evaluation Techniquesand Tools, ed. F. Bourguignon and L. Pereira da Silva, 41–68. Washington,DC: World Bank; New York: Oxford University Press.
Demery, L., S. Y. Chao, R. Bernier, and K. Mehra. 1995. “The Incidence of SocialSpending in Ghana.” PSP Discussion Papers 82, Poverty and Social PolicyDepartment, World Bank, Washington, DC.
Diderichsen, F. 2004. “Resource Allocation for Health Equity: Issues and Meth-ods.” Health, Nutrition, and Population Discussion Paper, World Bank,Washington, DC.
Diop, F., A. Yazbeck, and R. Bitrán. 1995. “The Impact of Alternative CostRecovery Schemes on Access and Equity in Niger.” Health Policy and Plan-ning 10: 223–40.
Druce, N. 2004. “Access to Medicines in Under-Served Markets.” OverviewPaper, Health Systems Resource Centre, Department for International Devel-opment, London.
Dusheiko, M., H. Gravelle, R. Jacobs, and P. Smith. 2003. “The Effects of Bud-gets on Doctor Behaviour: Evidence from a Natural Experiment.” DiscussionPaper 2003/04, Department of Economics, University of York, York, UnitedKingdom.
Dussault, G., and C.-A. Dubois. 2003. “Human Resources for Health Policies: ACritical Component in Health Policies.” Human Resources for Health 1 (1).http://www.human-resources-health.com/content/1/1/1.
Eggleston, K., and C.-R. Hsieh. 2004. “Health Care Payment Incentives: A Com-parative Analysis of Reforms in Taiwan, Korea and China.” Working Paper2004-2, Department of Economics, Tufts University, Boston.
Egypt, Ministry of Health and Population, Department of Planning. 1995.“National Health Accounts for Egypt.” Data for Decision Making Project,
Analyzing the Distributional Impact of Reforms
98
Department of Population Studies and International Health, Harvard Schoolof Public Health, Boston.
Elbers, C., J. Lanjouw, and P. Lanjouw. 2003. “Micro-Level Estimation of Povertyand Inequality.” Econometrica 71 (1): 355–64.
Enemark, U., and F. Schleimann. 1999. “Financing Health Services in PoorCountries: Feeding a White Elephant?” Discussion Paper 1, Danish Inter-national Development Agency, Copenhagen.
England, R. 2002. Contracting and Performance Management in the Health Sector:Some Pointers on How to Do It. London: Health Systems Resource Centre,Department for International Development.
———. 2004. Experiences of Contracting with the Private Sector: A Selective Review.London: Health Systems Resource Centre, Department for InternationalDevelopment.
Ensor, T. 2003. Consumer-Led Demand Side Financing for Health and Education: AnInternational Review. Oxford, United Kingdom: Oxford Policy Management.
———. 2004. “Informal Payments for Health Care in Transition Economies.”Social Science and Medicine 58 (2): 237–46.
Ensor, T., and S. Cooper. 2004. “Overcoming Barriers to Health Service Access:Influencing the Demand Side.” Health Policy and Planning 19 (2): 69–79.
Fairbank, A., M. Makinen, W. Schott, and B. Sakagawa. 2000. “Poverty Reduc-tion and Immunizations: Considering Immunizations in the Context of DebtRelief for Poor Countries.” Abt Associates Inc., Bethesda, MD. http://www.gaviftf.info/forum/bb2/7-21_hipc.pdf.
Feldstein, M. 1974. “Econometric Studies of Health.” In Four Frontiers ofQuantitative Economics, vol. 2, ed. M. Intriligator and D. Kendrick, 377–442.Amsterdam: North-Holland.
Feng, X. S., S. L. Tang, G. Bloom, M. Segall, and X. Y. Gu. 1995. “Cooperative Med-ical Schemes in Contemporary Rural China.” Social Science and Medicine 41 (8):1111–18.
Ferrinho, P., W. Van Lerberghe, I. Fronteira, F. Hipólito, and A. Biscaia. 2004.“Dual Practice in the Health Sector: Review of the Evidence.” Human Resourcesfor Health 2 (14). http://www.human-resources-health.com/content/2/1/14.
Filmer, D., J. S. Hammer, and L. Pritchett. 2000. “Weak Links in the Chain: A Diagnosis of Health Policy in Poor Countries.” World Bank Research Observer15 (2): 199–224.
———. 2002. “Weak Links in the Chain II: A Prescription for Health Policy inPoor Countries.” World Bank Research Observer 17 (1): 47–66.
Filmer, D., and L. Pritchett. 1998. “Estimating Wealth Effects without ExpenditureData or Tears: With an Application to Educational Enrollments in States ofIndia.” Policy Research Working Paper 1944, Development Research Group,Poverty and Human Resources, World Bank, Washington, DC.
Foster, M., and S. Mackintosh-Walker. 2001. “Sector Wide Programmes andPoverty Reduction.” Centre for Aid and Public Expenditure Working Paper157, Overseas Development Institute, London.
Health Sector Reforms
99
Fujii, T. 2003. “Maps of Anthropometric Indicators: Using Cambodia DHS andCensus.” Unpublished manuscript, Agricultural and Resource Economics,University of California, Berkeley, CA.
Futures Group International. 2000. “Health Reform, Decentralization, and Partici-pation in Latin America: Protecting Sexual and Reproductive Health.” PolicyProject, Futures Group International, Washington, DC.
Galdo, V., and B. Briceno. 2004. “Evaluating the Impact on Child Mortality of aWater Supply Project and Sewerage Expansion in Quito, Ecuador.” Unpub-lished manuscript, Office of Evaluation and Oversight, Inter-American Devel-opment Bank, Washington, DC.
Galiani, S., P. J. Gertler, and E. Schargrodsky. 2005. “Water for Life: The Impactof the Privatization of Water Services on Child Mortality.” Journal of PoliticalEconomy 113 (1): 83–120.
Gelbach, J. B., and L. H. Pritchett. 1995. “Does More for the Poor Mean Less forthe Poor?: The Politics of Tagging.” Policy Research Working Paper 1523,World Bank, Washington, DC.
George, A. 2003. “Accountability in Health Services: Transforming Relationshipsand Contexts.” HCPDS Working Paper Series 13 (1), Harvard Center for Popu-lation and Development Studies, Cambridge, MA.
Gerdtham, U.-G., C. Rehnberg, and M. Tambour. 1999. “The Impact of InternalMarkets on Health Care Efficiency: Evidence from Health Care Reforms inSweden.” Applied Economics 31 (8): 935–45.
Gertler, P. J. 1998. “On the Road to Social Health Insurance: The Asian Experi-ence.” World Development 26 (4): 717–32.
———. 2000. “Final Report: The Impact of Progresa on Health.” Unpublishedmanuscript, International Food Policy Research Institute, Washington, DC.
Gertler, P. J., L. Locay, and W. C. Sanderson. 1987. “Are User Fees Regressive?:The Welfare Implications of Health Care Financing Proposals in Peru.” Jour-nal of Econometrics 36 (1–2) (supplement): 67–88.
Gertler, P. J., and O. Solon. 2000. “Who Benefits from Social Health Insurance?:Evidence from the Philippines.” NBER Working Paper XXX, Haas School ofBusiness, University of California at Berkeley, Berkeley, CA.
Gertler, P. J., and R. Sturm. 1997. “Private Health Insurance and Public Expen-ditures in Jamaica.” Journal of Econometrics 77 (1): 237–57.
Gertler, P. J., and J. van der Gaag. 1988. “The Willingness to Pay for Social Ser-vices in Developing Countries.” Living Standards Measurement Study Work-ing Paper 45, World Bank, Washington, DC.
———. 1990. The Willingness to Pay for Medical Care: Evidence from Two Devel-oping Countries. Baltimore: Johns Hopkins University Press.
Gilson, L. 1997. “Implementing and Evaluating Health Reform Processes: Lessonsfrom the Literature.” Major Applied Research 1 Working Paper 1, Partnershipsfor Health Reform Project, Abt Associates Inc., Bethesda, MD.
———. 1998. “In Defense and Pursuit of Equity.” Social Science and Medicine 47(12): 1891–96.
Analyzing the Distributional Impact of Reforms
100
González-Rossetti, A., and T. J. Bossert. 2000. “Enhancing the Political Feasibility ofHealth Reform: A Comparative Analysis of Chile, Colombia, and Mexico.” Datafor Decision Making Project and the Latin American and Caribbean Health Sec-tor Reform Initiative, Department of Population Studies and InternationalHealth, Harvard School of Public Health, Boston.
Gorter, A. 2003. “Competitive Vouchers for Health.” Background paper, Insti-tuto CentroAmericano de la Salud, Managua, Nicaragua; World Bank, Washington, DC.
Grace, C. 2003. “Equitable Pricing of Newer Essential Medicines for DevelopingCountries: Evidence for the Potential of Different Mechanisms.” Unpublishedmanuscript, London Business School, London.
Griffin, C. C. 1992. Health Care in Asia: A Comparative Study of Cost and Financing.World Bank Regional and Sectoral Studies. Washington, DC: World Bank.
Gruen, R., R. Anwar, T. Begum, J. R. Killingsworth, and C. Normand. 2002. “DualJob Holding Practitioners in Bangladesh: An Exploration.” Social Science andMedicine 54 (2): 267–79.
Gumber, A. 2002. “Health Insurance for the Informal Sector: Problems andProspects.” Working Paper 90, Indian Council for Research on InternationalEconomic Relations, New Delhi.
Gumber, A., and V. Kulkarni. 2000. “Health Insurance for the Informal Sector:Case Study of Gujarat.” Economic and Political Weekly, September 30: 3607–13.
Gwatkin, D. R. 2003. “Free Government Health Services: Are They the Best Way to Reach the Poor?” Unpublished manuscript, World Bank, Washington, DC.
Gwatkin, D. R., S. Rutstein, K. Johnson, R. P. Poande, and A. Wagstaff. 2000.“Socioeconomic Differences in Health, Nutrition, and Population.” Health,Nutrition, and Population Discussion Paper, Health, Nutrition, and Popula-tion Family, Human Development Network, World Bank, Washington, DC.
Hall, J. J., and R. Taylor. 2003. “Health for All Beyond 2000: The Demise of theAlma-Ata Declaration and Primary Health Care in Developing Countries.”Medical Journal of Australia 178 (1): 17–20.
Hammer, J. S. 1993. “The Economics of Malaria Control.” World Bank ResearchObserver 8 (1): 1–22.
Hammer, J. S., and W. Jack. 2001. “The Design of Incentives for Health CareProviders in Developing Countries: Contracts, Competition, and Cost Con-trol.” Policy Research Working Paper 2547, World Bank, Washington, DC.
Hanvoravongchai, P. 2002. “Medical Savings Accounts: Lessons Learned fromInternational Experience.” EIP/HFS/PHF Discussion Paper 52, World HealthOrganization, Geneva.
Heller, P. 1982. “A Model of Demand for Medical and Health Services in Penin-sular Malaysia.” Social Science and Medicine 16: 267–84.
Hentschel, J. 1999. “Contextuality and Data Collection Methods: A Frameworkand Application to Health Service Utilisation.” Journal of Development Studies35 (4): 64–94.
Health Sector Reforms
101
Hindu (Chennai, Madras, India). 2005. “Law on Service in Rural Areas forDoctors Likely,” April 7. http://www.hindu.com/2005/04/07/stories/2005040708310400.htm.
Hope, R. L. 2003. “Paying in Potatoes: Community-Based Health Insurance forthe Rural and Informal Sector.” The Lancet 362 (938): 827–29.
Hsiao, W. C. 2000. “Inside the Black Box of Health Systems.” Program on HealthCare Financing, Harvard School of Public Health, Boston.
———. 2001. “Commentary: Behind the Ideology and Theory, What is theEmpirical Evidence for Medical Savings Accounts?” Journal of Health Politics,Policy and Law 26 (4): 733–37.
———. 2004. “Experience of Community Health Financing in the Asian Region.”In Health Financing for Poor People: Resource Mobilization and Risk Sharing, ed.A. S. Preker and G. Carrin. Washington, DC: World Bank; Geneva: WorldHealth Organization; Geneva: International Labour Office.
Human Resources for Health (various). http://www.human-resources-health.com/.
Hurley, J. 2001. “Medical Savings Accounts in Publicly Financed Health Care Sys-tems: What Do We Know?” Research Working Paper 01–12, Centre for HealthEconomics and Policy Analysis, McMaster University, Hamilton, Ontario,Canada.
Hurst, J. W. 1992. “The Reform of Health Care: A Comparative Analysis of SevenOECD Countries.” OECD Health Policy Studies 2, Organisation for Eco-nomic Co-operation and Development, Paris.
Hutton, G. 2000. “Indicators for Monitoring Health Sector Reform and theSector-Wide Approach.” Presentation at Sector-Wide Approach in HealthConference, “Moving from Policy to Practice,” Royal Tropical Institute, Ams-terdam, November 27–28.
INEI (Instituto Nacional de Estadística e Informática). 1986. “Encuesta nacionalde nutrición y salud, ENNSA” (Survey of Nutrition and Health), NationalStatistics Institute, Lima.
Jack, W. 2001a. “Purchasing Medical Care: A Conceptual Framework.” Unpub-lished manuscript, Georgetown University, Washington, DC.
———. 2001b. “Health Insurance Reform in Four Latin American Countries:Theory and Practice.” Policy Research Working Paper 2492, World Bank,Washington, DC.
Jakab, M., and C. Krishnan. 2001. “Community Involvement in Health CareFinancing: A Survey of the Literature on the Impacts, Strengths, and Weak-nesses.” Health, Nutrition, and Population Discussion Paper, September,Health, Nutrition, and Population Family, Human Development Network,World Bank, Washington, DC.
Jalan, J., and M. Ravallion. 2003. “Does Piped Water Reduce Diarrhea for Chil-dren in Rural India?” Journal of Econometrics 112 (1): 153–73.
Jefferys, E., and V. Walford. 2003. “Mapping of Sector Wide Approaches inHealth.” Institute for Health Sector Development, London.
Analyzing the Distributional Impact of Reforms
102
Jimenez, E. 1987. Pricing Policies in the Social Sectors: Cost Recovery for Educationand Health in Developing Countries. Baltimore: Johns Hopkins University Press.
Johannesson, M. 1995. “The Relationship between Cost-Effectiveness Analysisand Cost-Benefit Analysis.” Social Science and Medicine 41 (4): 483–89.
Johannesson, M., and M. Meltzer. 1998. “Some Reflections on Cost-EffectivenessAnalysis.” Health Economics 7 (1): 1–7.
Johns, B., and R. Baltussen. 2004. “Accounting for the Cost of Scaling-Up HealthInterventions.” Health Economics 13 (11): 1117–24.
Johns, B., and T. T. Torres. 2005. “Costs of Scaling-Up Health Interventions:A Systematic Review.” Health Policy and Planning 20 (1): 1–13.
Johnston, T., S. D. Faure, and L. Raney. 1998. “The World Bank and the HealthSector in Mali.” Report 18112, World Bank, Washington, DC.
Jütting, J. 2001. “The Impact of Community-Based Health Financing on Finan-cial Protection in Africa: Case Study Senegal.” Unpublished manuscript,Health, Nutrition, and Population Family, Human Development Network,World Bank, Washington, DC.
Jütting, J., C. Kauffmann, I. McDonnell, H. Osterrieder, N. Pinaud, and L. Wegne.2004. “Decentralisation and Poverty in Developing Countries: Exploring theImpact.” Working Paper 236, Development Centre, Organisation for EconomicCo-operation and Development, Paris.
Khan, S. H. 2005. “Free Does Not Mean Affordable: Maternity Patient Expendi-tures in a Public Hospital in Bangladesh.” Cost Effectiveness and Resource Allo-cation 3 (1). http://www.resource-allocation.com/content/3/1/1.
Khemani, S. 2004. “Local Government Accountability for Service Delivery inNigeria.” Development Research Group, World Bank, Washington, DC.
Killingsworth, J. R. 2002. “Official, Unofficial, and Informal Fees for HealthCare.” Draft Discussion Note 13, Third Health Sector Development Techni-cal Advisory Group Meeting, “Health Care Financing in the Western PacificRegion,” Manila, February 17–19.
Killingsworth, J. R., N. Hossain, Y. Hedrick-Wong, S. Thomas, A. Rahman, andT. Begum. 1999. “Unofficial Fees in Bangladesh: Price, Equity, and Institu-tional Issues.” Health Policy and Planning 14 (2): 152–63.
Klugman, J., ed. 2002. A Sourcebook for Poverty Reduction Strategies. 2 vols. Washington, DC: World Bank.
Kremer, M. 1995. “Research on Schooling: What We Know and What We Don’t(A Comment on Hanushek).” World Bank Research Observer 10 (2): 247–54.
Kumaranayake, L., S. Lake, P. Mujinja, C. Hongoro, and R. Mpembeni. 2000.“How Do Countries Regulate the Health Sector?: Evidence from Tanzaniaand Zimbabwe.” Health Policy and Planning 15 (4): 357–67.
Kutzin, J. 1997. “Health Insurance for the Formal Sector in Africa: ‘Yes but . . .’.”Current Concerns ARA Paper 14, Division of Analysis, Research, and Assess-ment, World Health Organization, Geneva.
La Forgia, G. M. 1990. Health Services for Low-Income Families: Extending Cov-erage through Prepayment Plans in the Dominican Republic. Bethesda, MD:Health Financing and Sustainability Project, Abt Associates Inc.
Health Sector Reforms
103
Laing, R. O., H. V. Hogerzeil, and D. Ross-Degnan. 2001. “Ten Recommenda-tions to Improve Use of Medicines in Developing Countries.” Health Policyand Planning 16 (1): 13–20.
Lakshminarayanan, R. 2003a. “Gender and Health Sector Reform: An AnnotatedBibliography.” Unpublished manuscript, International Women’s HealthCoalition, New York.
———. 2003b. “Decentralisation and its Implications for Reproductive Health:The Philippines Experience.” Reproductive Health Matters 11 (21): 96–107.
Langer, A., G. Nigenda, and J. Catino. 2000. “Health Sector Reform and Repro-ductive Health in Latin America and the Caribbean: Strengthening the Links.”Bulletin of the World Health Organization 78 (5): 667–76.
Lanjouw, J. O. 2002. “Intellectual Property and the Availability of Pharmaceuti-cals in Poor Countries.” Working Paper 5, Center for Global Development,Washington, DC.
———. (2004). “Drug Patents: Taking the Poorest Out of the Fight.” MilkenInstitute Quarterly Review. http://are.berkeley.edu/∼lanjouw/milken.pdf.
Lanjouw, P., M. Pradhan, F. Saadah, H. Sayed, and R. Sparrow. 2002. “Poverty,Education, and Health in Indonesia: Who Benefits from Public Spend-ing?, Volume 1.” Policy Research Working Paper 2739, World Bank, Washington, DC.
Lanjouw, P., and M. Ravallion. 1999. “Benefit Incidence, Public Spending Reforms,and the Timing of Program Capture.” World Bank Economic Review 13 (2):257–73.
Lavadenz, F., N. Schwab, and H. Straatman. 2001. “Decentralized and Commu-nity Health Networks in Bolivia.” Pan-American Journal of Public Health 9 (3):182–89. (In Spanish).
Lawson, D. 2004. “Determinants of Health-Seeking Behaviour in Uganda: Is itJust Income and User Fees that are Important?” Unpublished manuscript,University of Manchester, Manchester, United Kingdom.
Leonard, K. L. 2000. “Moral Hazard in Health Care: An Empirical Investigationin Rural Cameroon.” Unpublished manuscript, Department of Economics,Columbia University, New York.
Lewis, M. 2000. “Who Is Paying for Health Care in Eastern Europe and CentralAsia?” Europe and Central Asia Region, Human Development Sector Unit,World Bank, Washington, DC.
Lindelöw, M., and A. Wagstaff. 2003. “Health Facility Surveys: An Introduction.”Policy Research Working Paper 2953, Public Services, Development ResearchGroup, World Bank, Washington, DC.
Litvack, J. I., and C. I. Bodart. 1992. “User Fees Plus Quality Equals ImprovedAccess to Health Care: Results of a Field Experiment in Cameroon.” SocialScience and Medicine 37 (3): 369–83.
Liu, X., D. R. Hotchkiss, S. Bose, R. Bitrán, and U. Giedion. 2004. Contracting forPrimary Health Services: Evidence on Its Effects and Framework for Evaluation.Bethesda, MD: Partners for Health Reformplus Project, Abt Associates Inc.
Analyzing the Distributional Impact of Reforms
104
Loevinsohn, B. 2001. “Contracting for the Delivery of Primary Health Care inCambodia: Design and Initial Experience of a Large Pilot Test.” Manuscript,World Bank, Washington, DC.
———. 2002. “Practical Issues in Contracting for Primary Health Care Delivery:Lessons from Two Large Projects in Bangladesh.” World Bank, Washington, DC.
Loewenson, R. 2000. “Participation and Accountability in Health Systems: TheMissing Factor in Equity?” Equinet Discussion Paper 1, Network for Equityin Health in Southern Africa, Harare, Zimbabwe.
Maceira, D. 1998. “Provider Payment Mechanisms in Health Care: Incentives,Outcomes, and Organizational Impact in Developing Countries.” MajorApplied Research 2 Working Paper 2, Partnerships for Health Reform Project, Abt Associates Inc., Bethesda, MD.
Marchal, B., V. De Brouwere, and G. Kegels. 2005. “Viewpoint: HIV/AIDS andthe Health Workforce Crisis, What are the Next Steps?” Tropical Medicine andInternational Health 10 (4): 300–4.
Marsh, V. M., W. M. Mutemi, A. Willetts, K. Bayah, S. Were, A. Ross, and K. Marsh. 2004. “Improving Malaria Home Treatment by Training DrugRetailers in Rural Kenya.” Tropical Medicine and International Health 9 (4):451–60.
McFadden, D. 1981. “Econometric Models of Probabilistic Choice.” In StructuralAnalysis of Discrete Data with Econometrics Applications, ed. C. Manski andD. McFadden, 114–78. Cambridge, MA: The MIT Press.
McGuire, T. G. 2000. “Physician Agency.” In Handbook of Health Economics, ed.A. J. Culyer and J. P. Newhouse, 461–536. Amsterdam: Elsevier Science.
McPake, B. 1997. “The Role of the Private Sector in Health Care Provision.” InPrivate Health Providers in Developing Countries: Servicing the Public Interest?,ed. S. Bennett, B. McPake, and A. Mills. London: Zed Books.
McPake, B., D. Asiimwe, F. Mwesigye, M. Ofumbi, L. Ortemblad, P. Streefland,and D. Turinde. 1999. “Informal Economic Activities of Public HealthWorkers in Uganda: Implication for Quality and Accessibility of Care.” SocialScience and Medicine 49: 849–65.
McPake, B., F. J. Yepes, S. Lake, and L. H. Sanchez. 2003. “Is the ColombianHealth System Reform Improving the Performance of Public Hospitals inBogotá?” Health Policy and Planning 118: 182–94.
Mensch, B. 1993. “Quality of Care: A Neglected Dimension.” In The Health ofWomen: A Global Perspective, ed. M. Koblinsky, J. Timyan, and J. Gay. Boulder,CO: Westview Press. Cited in WHO (1998).
Miguel, E., and M. Kremer. 2001. “Worms: Education and Health Externalitiesin Kenya.” Econometrica 72 (1): 159–217.
Miller, K., R. Miller, I. Askew, M. C. Horn, and L. Ndlovu, eds. 1998. “Clinic-Based Family Planning and Reproductive Health Services in Africa: Findingsfrom Situation Analysis Studies.” Population Council, New York.
Mills, A., R. Brugha, K. Hanson, and B. McPake. 2002. “What Can Be Done aboutthe Private Health Sector in Low-Income Countries?” Bulletin of the WorldHealth Organization 80 (4): 325–30.
Health Sector Reforms
105
Montagu, D. 2003. “Accreditation and Other External Quality Assessment Sys-tems for Healthcare: Review of Experience and Lessons Learned.” Health Sys-tems Resource Centre, Department for International Development, London.
Moon, M., L. M. Nichols, and S. Walls. 1997. “Winners and Losers under Medical Savings Accounts.” Spectrum 70 (1): 26–29.
Murray, C. J. L., A. D. Lopez, C. D. Mathers, and C. Stein. 2001. “The Global Bur-den of Disease 2000 Project: Aims, Methods and Data Sources.” ResearchPaper 01.1, Harvard Burden of Disease Unit, Center for Population and Development Studies, Cambridge, MA.
Mutizwa-Mangiza, D. 1998. “The Impact of Health Sector Reform on Public Sec-tor Health Worker Motivation in Zimbabwe.” Major Applied Research 5Working Paper 4, Partnerships for Health Reform Project, Abt Associates Inc.,Bethesda, MD.
Mwabu, G. 1986. “Health Care Decisions at the Household Level: Results of aRural Health Survey in Kenya.” Social Science and Medicine 22 (3): 315–19.
Mwabu, G., M. Ainsworth, and A. Nyamete. 1993. “Quality of Medical Care andChoice of Medical Treatment in Kenya: An Empirical Analysis.” Journal ofHuman Resources 28 (4): 838–62.
Nahar, S., and A. Costello. 1998. “The Hidden Cost of ‘Free’ Maternity Care inDhaka, Bangladesh.” Health Policy and Planning 13 (4): 417–22.
Nanda, P. 2002. “Gender Dimensions of User Fees: Implications for Women’sUtilization of Health Care.” Reproductive Health Matters 10 (20): 127–34.
Newhouse, J. P., and the Insurance Experiment Group. 1993. Free for All? Lessonsfrom the RAND Health Insurance Experiment. Cambridge, MA: Harvard Uni-versity Press.
Newman, J. L., M. Pradhan, L. B. Rawlings, G. Ridder, R. Coa, and J. L. Evia.2002. “An Impact Evaluation of Education, Health, and Water Supply Invest-ments by the Bolivian Social Investment Fund.” World Bank Economic Review16 (2): 241–74.
Newman, J. L., L. B. Rawlings, and P. J. Gertler. 1994. “Using Randomized Con-trol Designs in Evaluating Social Sector Programs in Developing Countries.”World Bank Research Observer 9 (2): 181–201.
Nichols, L. M., K. H. Phua, and N. M. Prescott. 1997. “Medical Savings Accountsfor Developing Countries.” In Innovations in Health Care Financing. Pro-ceedings of a World Bank Conference, March 10–11, 1997, ed. G. Schieber.Washington, DC: World Bank.
Nieves, I., G. M. La Forgia, and J. Ribera. 2000. “Large-Scale Government Con-tracting of NGOs to Extend Basic Health Services to Poor Populations inGuatemala.” World Bank, Washington, DC.
Normand, C., and A. Weber. 1994. Social Health Insurance: A Guidebook for Plan-ning. Geneva: World Health Organization.
Pearson, M. 2001. “Demand Side Financing for Healthcare.” Unpublished manuscript, Health Systems Resource Centre, Department for InternationalDevelopment, London.
Analyzing the Distributional Impact of Reforms
106
———. 2002. “Allocating Public Resources for Health: Developing Pro-PoorApproaches.” Health Systems Resource Centre, Department for InternationalDevelopment, London.
Preker, A. S., G. Carrin, D. Dror, M. Jakab, W. C. Hsiao, and D. Arhin-Tenkorang.2002a. “Health Care Financing for Rural and Low-Income Populations: TheRole of Communities in Resource Mobilization and Risk Sharing.” Backgroundreport, Commission on Macroeconomics and Health, World Health Organi-zation, Geneva.
———. 2002b. “Effectiveness of Community Health Financing in Meeting theCost of Illness.” Bulletin of the World Health Organization 80 (2): 143–50.
QAP (Quality Assurance Project) and PAHO (Pan American Health Organiza-tion). 2003. “Maximizing Quality of Care through Health Sector Reform: TheRole of Quality Assurance Strategies.” Working draft, Quality AssuranceProject, Bethesda, MD. http://www.qaproject.org/pubs/PDFs/PAHO.pdf.
Rannan-Eliya, R. P., C. Blanco-Vidal, and A. K. Nandakumar. 1999. “The Dis-tribution of Health Care Resources in Egypt: Implications for Equity, AnAnalysis Using a National Health Accounts Framework.” Data for DecisionMaking Project, Department of Population Studies and International Health,Harvard School of Public Health, Boston.
Rao, V., and A. M. Ibanez. 2003. “The Social Impact of Social Funds in Jamaica:A Mixed-Methods Analysis of Participation, Targeting, and Collective Actionin Community-Driven Development.” Policy Research Working Paper 2970,World Bank, Washington, DC.
Ravallion, M. 2003. “Assessing the Poverty Impact of an Assigned Program.” InThe Impact of Economic Policies on Poverty and Income Distribution: Evalua-tion Techniques and Tools, ed. F. Bourguignon and L. Pereira da Silva, 103–22.New York: Oxford University Press.
Ravallion, M., D. van de Walle, and M. Gautam. 1995. “Testing a Social SafetyNet.” Journal of Public Economics 57 (2): 175–99.
Reich, M. R. 1995. “The Politics of Health Sector Reform in Developing Coun-tries: Three Cases of Pharmaceutical Policy.” Health Policy 32 (1–3): 47–77.
Rosenbaum, P. R., and D. B. Rubin. 1983. “The Central Role of the PropensityScore in Observational Studies for Causal Effects.” Biometrika 70 (1): 41–55.
Sandiford, P., A. Gorter, and M. Salvetto. 2002. “Vouchers for Health: UsingVoucher Schemes for Output-Based Aid.” Public Policy for the Private Sec-tor, Viewpoint 243, World Bank, Washington, DC.
Schmeer, K. 2000. “Stakeholder Analysis Guidelines.” In Policy Toolkit forStrengthening Health Sector Reform, ed. S. Scribner and D. Brinkerhoff, 2:1–43. Bethesda, MD: Abt Associates Inc., Bethesda, MD.
Schneider, P., and F. Diop. 2001. Impact of Prepayment Pilot on Health Care Uti-lization and Financing in Rwanda: Findings from Final Household Survey.Bethesda, MD: Partners for Health Reformplus Project, Abt Associates Inc.
Schneider, P., F. Diop, and S. Bucyana. 2000. “Development and Implementa-tion of Prepayment Schemes in Rwanda.” Technical Report 45, Partnershipsfor Health Reform Project, Abt Associates Inc., Bethesda, MD.
Health Sector Reforms
107
Schultz, T. P., and A. Tansel. 1997. “Wage and Labor Supply Effects of Illness inCôte d’Ivoire and Ghana.” Journal of Development Economics 53 (2): 251–86.
Schwartz, J., J. Akin, and B. M. Popkin. 1988. “Price and Income Elasticities ofDemand for Modern Health Care: The Case of Infant Delivery in the Philip-pines.” World Bank Economic Review 2 (1): 49–76.
Semali, I. A. J. 2003. “Understanding Stakeholders’ Roles in the Health SectorReform Process in Tanzania: The Case of Decentralizing the ImmunizationProgram.” PhD dissertation, University of Basel, Basel, Switzerland.http://pages.unibas.ch/diss/2003/DabsB_6803.pdf.
Sen, A. 1984. “Poor, Relatively Speaking.” In Resources, Values, and Development,ed. A. Sen. New York: Basil Blackwell.
Smith, E., R. Brugha, and A. Zwi. 2001. “Working with Private Sector Providersfor Better Health Care: An Introductory Guide.” Options and London Schoolof Hygiene and Tropical Medicine, London.
Stinson, W. 1982. Community Financing of Primary Health Care. Washington,DC: American Public Health Association.
Strauss, J., and D. Thomas. 1998. “Health, Nutrition, and Economic Develop-ment.” Journal of Economic Literature 36 (2):766–817.
Tang, S., and G. Bloom. 2000, “Decentralizing Rural Health Services: A Case Studyin China.” International Journal of Health Planning and Management 15 (3):189–200.
Tanzi, V., and H. Zee. 2001. “Tax Policy for Developing Countries.” EconomicIssues 27, International Monetary Fund, Washington, DC.
Tawfik, L., and S. N. Kinoti. 2003. “The Impact of HIV/AIDS on Health Systemsand the Health Workforce in Sub-Saharan Africa.” Unpublished manuscript,Support for Analysis and Research in Africa Project, Office of SustainableDevelopment, Bureau for Africa, U.S. Agency for International Development,Washington, DC.
Telyukov, A. 2001. “Guide to Prospective Capitation with Illustrations fromLatin America.” Abt Associates Inc., Bethesda, MD.
Thomason, J. A., W. C. Newbrander, and R.-L. Kolehmainen-Aitken, eds. 1991.“Decentralization in a Developing Country: The Experience of Papua NewGuinea and Its Health Service.” Pacific Research Monograph 25, NationalCentre for Development Studies, Australian National University, Canberra.
van de Walle, D. 2002. “The Static and Dynamic Incidence of Vietnam’s PublicSafety Net.” Policy Research Working Paper 2791, Public Services, Develop-ment Research Group, World Bank, Washington, DC.
van de Walle, D., and K. Nead, eds. 1995. Public Spending and the Poor: Theoryand Evidence. Baltimore: Johns Hopkins University Press.
Vian, T., K. Gryboski, Z. Sinoimeri, and R. Hall Clifford. 2004. “Informal Pay-ments in the Public Health Sector in Albania: A Qualitative Study.” Partnersfor Health Reformplus Project, Abt Associates Inc., Bethesda, MD.
Wagstaff, A. 1999. “Measuring Equity in Health Care Financing: Reflections on(and Alternatives to) the World Health Organization’s Fairness of FinancingIndex.” Policy Research Working Paper 2550, World Bank, Washington, DC.
Analyzing the Distributional Impact of Reforms
108
———. 2000a. Presentation to London Meeting on Health and Equity, Departmentfor International Development, London. Cited in Bennett and Gilson (2001).
———. 2000b. “Socioeconomic Inequalities in Child Mortality: Comparisonsacross Nine Developing Countries.” Bulletin of the World Health Organization78 (1): 19–29.
———. 2002. “Poverty and Health Sector Inequalities.” Bulletin of the WorldHealth Organization 80 (2): 97–105.
Wagstaff, A., and E. van Doorslaer. 2002. “Catastrophe and Impoverishment inPaying for Health Care: With Applications to Vietnam, 1993–98.” Unpub-lished manuscript, World Bank, Washington, DC.
Wagstaff, A., E. van Doorslaer, H. van der Burg, et al. 1999. “Equity in theFinance of Health Care: Some Further International Comparisons.” Journalof Health Economics 18 (3): 263–90.
Walsh, J. A., and K. S. Warren. 1979. “Selective Primary Health Care: An InterimStrategy for Disease Control in Developing Countries.” New England Journalof Medicine 301 (18): 967–74.
Walt, G., and L. Gilson. 1994. “Reforming the Health Sector in DevelopingCountries: The Central Role of Policy Analysis.” Health Policy and Planning9 (4): 353–70.
Wang, L. 2003. “Determinants of Child Mortality in LDCs: Empirical Findingsfrom Demographic and Health Surveys.” Health Policy 65 (3): 277–99.
Whitehead, M., G. Dahlgren, and T. Evans. 2001. “Equity and Health SectorReforms: Can Low-Income Countries Escape the Medical Poverty Trap?” TheLancet 358 (9284): 833–36.
WHO (World Health Organization). 1998. “Gender and Health: A TechnicalPaper.” World Health Organization, Geneva. http://www.who.int/docstore/frh-whd/GandH/GHreport/gendertech.htm.
———. 2000a. The World Health Report 2000: Health Systems, Improving Per-formance. Geneva: World Health Organization.
———. 2000b. How to Develop and Implement a National Drug Policy. 2nd ed.Geneva: World Health Organization.
———. 2003. Guide to Producing National Health Accounts. Geneva: World HealthOrganization.
Wiesmann, D., and J. Jütting. 2000. “The Emerging Movement of CommunityBased Health Insurance in Sub-Saharan Africa: Experiences and LessonsLearned.” Afrika Spectrum 2/2000: 193–210.
Woolcock, M. 2001. “Social Assessments and Program Evaluation with LimitedFormal Data: Thinking Quantitatively, Acting Qualitatively.” Social Develop-ment Briefing Note 68, World Bank, Washington, DC.
World Bank. 1993. World Development Report 1993: Investing in Health. NewYork: Oxford University Press.
———. 1997a. World Development Report 1997: The State in a Changing World.New York: Oxford University Press.
———. 1997b. Confronting AIDS. Baltimore: Johns Hopkins University Press.
Health Sector Reforms
109
———. 2002. World Development Report 2003: Sustainable Development in aDynamic World. New York: Oxford University Press.
———. 2003a. World Development Report 2004: Making Services Work for PoorPeople. New York: Oxford University Press.
———. 2003b. A User’s Guide to Poverty and Social Impact Analysis. Washington,DC: Poverty Reduction Group and Social Development Department, WorldBank.
Wyss, K., D. D. Moto, and B. Callewaert. 2001. “Improving Health Outcomes ofthe Poor: Constraints to Scaling Up Health Interventions, Country CaseStudy, Chad.” Working Group 5, Commission on Macroeconomics andHealth, World Health Organization, Geneva. (In French).
Xu, K., D. Evans, K. Kawabata, R. Zeramdini, J. Klavus, and C. Murray. 2003.“Household Catastrophic Health Expenditure: A Multicountry Analysis.” TheLancet 362 (9378): 111–17.
Yazbeck, A. S., and M. Wenner. 1994. “Social Financing in Niger.” MajorApplied Research Working Paper 15. Health Financing and SustainabilityProject, Abt Associates Inc., Bethesda, MD.
Yip, W., and P. A. Berman. 2001. “Targeted Health Insurance in a Low-IncomeCountry and Its Impact on Access and Equity in Access: Egypt’s School HealthInsurance.” Health Economics 10 (3): 207–20.
Younger, S. D. 2003. “Benefits on the Margin: Observations on Marginal Bene-fit Incidence.” World Bank Economic Review 17 (1): 89–106.
Analyzing the Distributional Impact of Reforms
110
Selected Labor Market Reforms
Aline Coudouel and Pierella Paci
111
3
Overall, in recent years, the policy advice of bilateral and multilateraldonors to policymakers in developing countries has been centered on reducing the degree of government intervention in the function-
ing of the labor market and on increasing the liberalization of labor mar-ket institutions. Underpinning this advice is the traditional neo-classicalassumption that the laissez-faire approach ensures the highest social wel-fare by promoting labor market efficiency and job creation.
However, this view has long been challenged by those who see in themany market failures in the labor markets of developing countries theneed for a more active role for labor market policies. A number of non-competitive theoretical frameworks question the efficiency of unregu-lated markets, provide a rationale for different types of labor marketinterventions, and, in combination with the Theorem of Second Best,1
challenge the view that liberalization always leads to increased efficiency.In addition, the strongest criticism of the laissez-faire approach is basedon considerations of equity and on poverty reduction objectives on thegrounds that the outcomes of unregulated, competitive labor markets arenot necessarily consistent with the social justice objective. The differentdefinitions of social justice or equity preclude any simple answer to thisquestion (Barr 1993). However, the claim becomes much easier to assesswhen the focus is on poverty and on income distribution. The argumenthere is that labor market interventions reduce inequality in labor incomesby (1) maintaining earnings at the lower end of the income distributionabove the level at which they would have been in an unregulated market,and (2) reducing the vulnerability of earnings.
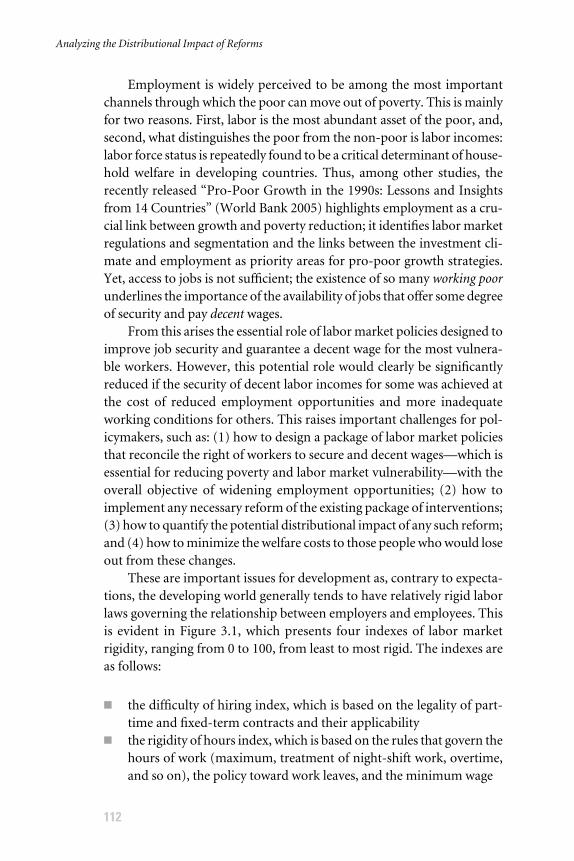
Employment is widely perceived to be among the most importantchannels through which the poor can move out of poverty. This is mainlyfor two reasons. First, labor is the most abundant asset of the poor, and,second, what distinguishes the poor from the non-poor is labor incomes:labor force status is repeatedly found to be a critical determinant of house-hold welfare in developing countries. Thus, among other studies, therecently released “Pro-Poor Growth in the 1990s: Lessons and Insightsfrom 14 Countries” (World Bank 2005) highlights employment as a cru-cial link between growth and poverty reduction; it identifies labor marketregulations and segmentation and the links between the investment cli-mate and employment as priority areas for pro-poor growth strategies.Yet, access to jobs is not sufficient; the existence of so many working poorunderlines the importance of the availability of jobs that offer some degreeof security and pay decent wages.
From this arises the essential role of labor market policies designed toimprove job security and guarantee a decent wage for the most vulnera-ble workers. However, this potential role would clearly be significantlyreduced if the security of decent labor incomes for some was achieved atthe cost of reduced employment opportunities and more inadequateworking conditions for others. This raises important challenges for pol-icymakers, such as: (1) how to design a package of labor market policiesthat reconcile the right of workers to secure and decent wages—which isessential for reducing poverty and labor market vulnerability—with theoverall objective of widening employment opportunities; (2) how toimplement any necessary reform of the existing package of interventions;(3) how to quantify the potential distributional impact of any such reform;and (4) how to minimize the welfare costs to those people who would loseout from these changes.
These are important issues for development as, contrary to expecta-tions, the developing world generally tends to have relatively rigid laborlaws governing the relationship between employers and employees. Thisis evident in Figure 3.1, which presents four indexes of labor marketrigidity, ranging from 0 to 100, from least to most rigid. The indexes areas follows:
� the difficulty of hiring index, which is based on the legality of part-time and fixed-term contracts and their applicability
� the rigidity of hours index, which is based on the rules that govern thehours of work (maximum, treatment of night-shift work, overtime,and so on), the policy toward work leaves, and the minimum wage
Analyzing the Distributional Impact of Reforms
112
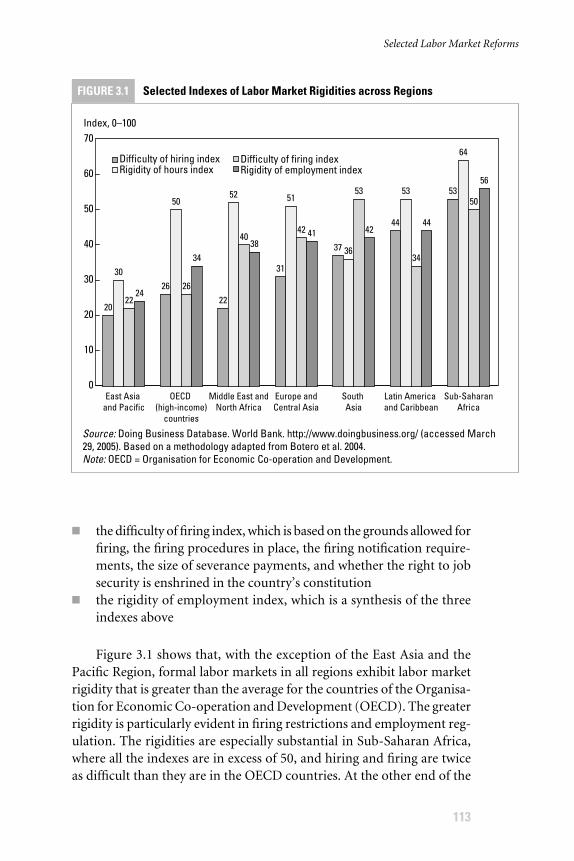
FIGURE 3.1 Selected Indexes of Labor Market Rigidities across Regions
Selected Labor Market Reforms
113
� the difficulty of firing index, which is based on the grounds allowed forfiring, the firing procedures in place, the firing notification require-ments, the size of severance payments, and whether the right to jobsecurity is enshrined in the country’s constitution
� the rigidity of employment index, which is a synthesis of the threeindexes above
Figure 3.1 shows that, with the exception of the East Asia and thePacific Region, formal labor markets in all regions exhibit labor marketrigidity that is greater than the average for the countries of the Organisa-tion for Economic Co-operation and Development (OECD). The greaterrigidity is particularly evident in firing restrictions and employment reg-ulation. The rigidities are especially substantial in Sub-Saharan Africa,where all the indexes are in excess of 50, and hiring and firing are twiceas difficult than they are in the OECD countries. At the other end of the
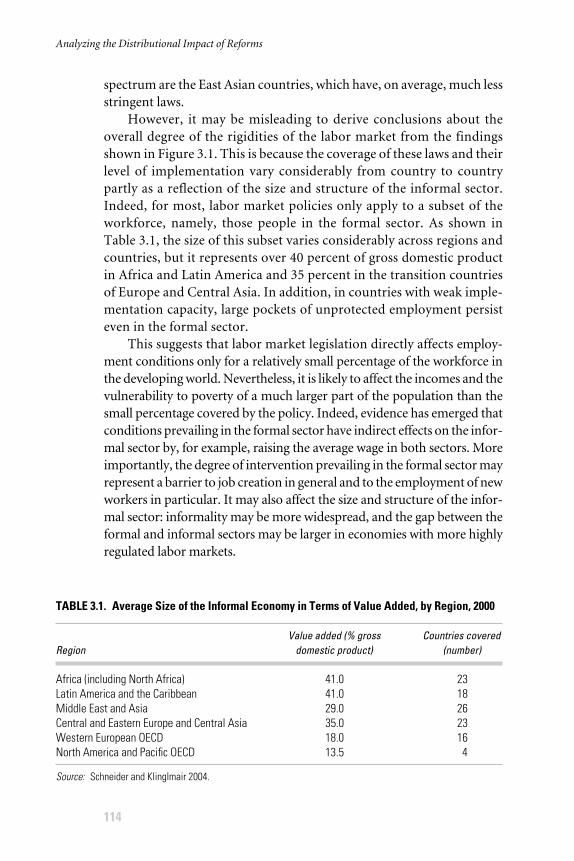
spectrum are the East Asian countries, which have, on average, much lessstringent laws.
However, it may be misleading to derive conclusions about theoverall degree of the rigidities of the labor market from the findingsshown in Figure 3.1. This is because the coverage of these laws and theirlevel of implementation vary considerably from country to countrypartly as a reflection of the size and structure of the informal sector.Indeed, for most, labor market policies only apply to a subset of theworkforce, namely, those people in the formal sector. As shown inTable 3.1, the size of this subset varies considerably across regions andcountries, but it represents over 40 percent of gross domestic productin Africa and Latin America and 35 percent in the transition countriesof Europe and Central Asia. In addition, in countries with weak imple-mentation capacity, large pockets of unprotected employment persisteven in the formal sector.
This suggests that labor market legislation directly affects employ-ment conditions only for a relatively small percentage of the workforce inthe developing world. Nevertheless, it is likely to affect the incomes and thevulnerability to poverty of a much larger part of the population than thesmall percentage covered by the policy. Indeed, evidence has emerged thatconditions prevailing in the formal sector have indirect effects on the infor-mal sector by, for example, raising the average wage in both sectors. Moreimportantly, the degree of intervention prevailing in the formal sector mayrepresent a barrier to job creation in general and to the employment of newworkers in particular. It may also affect the size and structure of the infor-mal sector: informality may be more widespread, and the gap between theformal and informal sectors may be larger in economies with more highlyregulated labor markets.
Analyzing the Distributional Impact of Reforms
114
TABLE 3.1. Average Size of the Informal Economy in Terms of Value Added, by Region, 2000
Value added (% gross Countries covered Region domestic product) (number)
Africa (including North Africa) 41.0 23Latin America and the Caribbean 41.0 18Middle East and Asia 29.0 26Central and Eastern Europe and Central Asia 35.0 23Western European OECD 18.0 16North America and Pacific OECD 13.5 4
Source: Schneider and Klinglmair 2004.
Thus, labor market policies and policy reforms are an importantdeterminant of income distribution and poverty incidence even incountries where the relative importance of the covered sector in theoverall labor market is small. This is because of the indirect effect of the policies and the reforms on the rest of the economy. Indeed, whenthe focus is on improving overall social welfare and reducing poverty,labor market interventions may act as a double-edged sword by pro-tecting the income levels and security of those covered by the policies,the insiders, while increasing the vulnerability of the rest of the popula-tion, the outsiders, who may face increasing barriers to employment andhave access only to jobs in the uncovered sector of a typically dual labormarket.2 For this reason, any reform of the prevailing labor market is unlikely to be Pareto neutral. It will leave some members of societyworse off, while improving the living standards of others and will there-fore have an important distributional impact. Who the winners andlosers will be will depend on a number of factors, ranging from the type and direction of the reforms—that is, more intervention versusincreased liberalization—to the characteristics of the labor and outputmarkets.
In deciding on the implementation of these policies and reforms,policymakers should thus be fully aware of the potential direct and indi-rect impacts on the distribution of income at both the individual and thehousehold levels so that the full significance of the policies and reformsin terms of efficiency, equality, and poverty reduction can be adequatelyevaluated.
The objective of this chapter is to provide policymakers with thetools they need to conduct such an evaluation. The chapter first describesa variety of labor market policies, focusing on three of these policies. Itthen describes possible reforms of these policies and the rationale behindthe reforms. The subsequent section illustrates the channels by which thereforms may impact income distribution and poverty. The following sec-tion identifies the stakeholders involved in each of the reforms analyzed.Finally, the tools of analysis and the main impacts of the reforms as iden-tified in the empirical literature are outlined.
The chapter is not intended as a full-scale analysis of the pros andcons of particular labor market policies and reforms, but more simplyas a guide to the comprehensive evaluation of potential distributionalimpacts. Thus, the attention is on the possible effects on income inequal-ity and the incidence of poverty rather than on the efficiency of the system or the existence of a trade-off between efficiency and equityconsiderations.3
Selected Labor Market Reforms
115
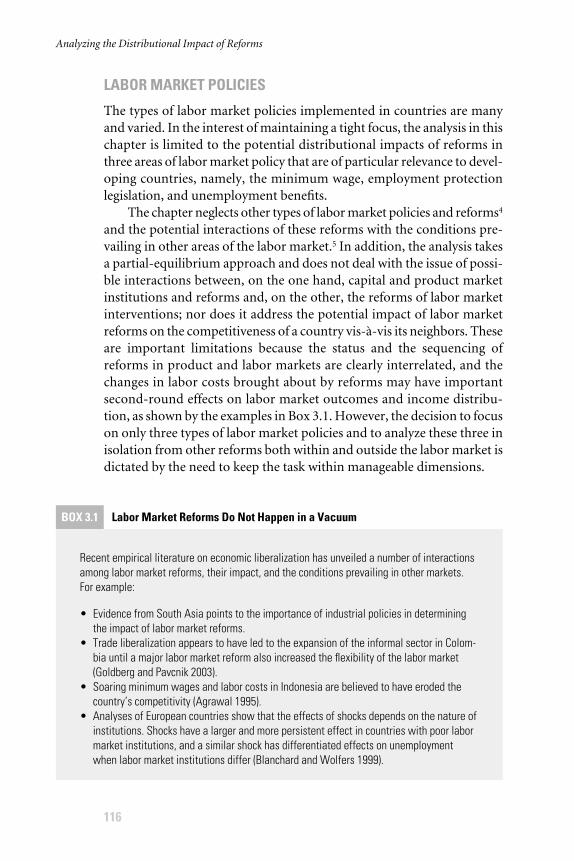
LABOR MARKET POLICIES
The types of labor market policies implemented in countries are manyand varied. In the interest of maintaining a tight focus, the analysis in thischapter is limited to the potential distributional impacts of reforms inthree areas of labor market policy that are of particular relevance to devel-oping countries, namely, the minimum wage, employment protectionlegislation, and unemployment benefits.
The chapter neglects other types of labor market policies and reforms4
and the potential interactions of these reforms with the conditions pre-vailing in other areas of the labor market.5 In addition, the analysis takesa partial-equilibrium approach and does not deal with the issue of possi-ble interactions between, on the one hand, capital and product marketinstitutions and reforms and, on the other, the reforms of labor marketinterventions; nor does it address the potential impact of labor marketreforms on the competitiveness of a country vis-à-vis its neighbors. Theseare important limitations because the status and the sequencing ofreforms in product and labor markets are clearly interrelated, and thechanges in labor costs brought about by reforms may have importantsecond-round effects on labor market outcomes and income distribu-tion, as shown by the examples in Box 3.1. However, the decision to focuson only three types of labor market policies and to analyze these three inisolation from other reforms both within and outside the labor market isdictated by the need to keep the task within manageable dimensions.
Analyzing the Distributional Impact of Reforms
116
BOX 3.1 Labor Market Reforms Do Not Happen in a Vacuum
Recent empirical literature on economic liberalization has unveiled a number of interactionsamong labor market reforms, their impact, and the conditions prevailing in other markets.For example:
• Evidence from South Asia points to the importance of industrial policies in determiningthe impact of labor market reforms.
• Trade liberalization appears to have led to the expansion of the informal sector in Colom-bia until a major labor market reform also increased the flexibility of the labor market(Goldberg and Pavcnik 2003).
• Soaring minimum wages and labor costs in Indonesia are believed to have eroded thecountry’s competitivity (Agrawal 1995).
• Analyses of European countries show that the effects of shocks depends on the nature ofinstitutions. Shocks have a larger and more persistent effect in countries with poor labormarket institutions, and a similar shock has differentiated effects on unemploymentwhen labor market institutions differ (Blanchard and Wolfers 1999).
The minimum wage
Minimum wage legislation sets a lower bound to the wages paid to indi-vidual workers. The conceptual definition is very simple, but the scale,eligibility, and policy design differ considerably from country to country.The majority of countries opt for a single national minimum rate set onan hourly, daily, weekly, or monthly basis. Beyond the single nationalwage, a reduced or subminimum rate is sometimes applied for somegroups of workers, notably, youth, the unskilled, or the long-term un-employed; for most workers, subminimum rates sometimes exist defacto, because special employment programs allow employers to paylower wages for young workers. In other countries, minimum wage pre-miums are sometimes used that are related to worker characteristics. Forexample, the minimum wage may rise according to worker experience,worker qualifications, or worker family status.
In addition, different minima may be set for different regions,occupations, or industries. This is particularly common in Latin Amer-ica. For example, in Argentina, there are dozens of minimum wages setfor agricultural workers, while one minimum wage is set for all othereconomic activities (World Bank 2006), and, in Mexico, wages are setseparately for three regions and 88 occupations (Gindling and Terrell2004a). Countries also vary in the process they adopt to set the mini-mum wage. The government sets it unilaterally in some countries. In others, it is the result of negotiations between representatives ofworkers and firms. In a number of countries, it is indexed to priceinflation. The available information on selective features of minimumwage policies across countries is summarized in Table 3A.1 in theannex to this chapter.
Such diverse approaches make international comparisons of mini-mum wages difficult. Nevertheless, cross-country comparisons can bemade by measuring the value of the minimum wage relative to somemeasure of average wage (the Kaitz index). Maloney and Mendez (2003)provide estimates for the Kaitz index for most Latin American countries.They find a large variance across countries. Argentina, Bolivia, Brazil,Chile, Mexico, and Uruguay represent the lower bound (with a Kaitzindex around 20–25 percent), while El Salvador, Honduras, Paraguay,and Venezuela are among the countries with the largest values (with esti-mates around 50–60 percent). The evidence for African countries is lessreadily available. Jones (1998) finds that, in Ghana, the Kaitz index formanufacturing workers fell from 50 percent in the early 1970s to around20 percent in the early 1990s.
Selected Labor Market Reforms
117
Employment protection legislation
Employment protection legislation refers to the set of norms and proce-dures to be followed when hiring or dismissing workers. The legislationtypically obliges employers to give workers a monetary compensation incase of early termination of permanent contracts and imposes proceduresto be followed in case of individual or collective layoffs.6 It also imposesconstraints on the type and length of the available contracts, for exampleby limiting the use of temporary contracts.
Typically, the legislation governs severance payments and advancenotice. A severance payment is a monetary transfer to a worker in case offirm-initiated layoff. The payment may include compensation for unjus-tified dismissal, seniority premiums, and compensation for wages for-gone during any legal process if the worker brings an action against thefirm,7 and so on. An advance notice is a specific period of time allowed tothe worker before a layoff can be implemented. Firms typically eitherprovide notice and keep the workers during the notice period or providea compensation equivalent to the wages that would have been earnedduring the notice period. When workers continue on the job during thenotice period, their level of effort is likely to be reduced, which translatesinto an extra cost for the employer. In addition to mandatory payments,some firms and sectors also have collective agreements that specify otherrequirements. These components of the legislation can be conceived ofas monetary transfers similar in nature to wages.
Another aspect of the legislation is the administrative procedures thatmust be followed. In most countries, the employer is required to discusslayoff decisions with the representatives of the workers. In some coun-tries, dismissals must be approved by authorities (for example, India),and, in most countries, the legislation distinguishes between individualand collective dismissals. Within individual dismissals, a distinction is usu-ally made between economic dismissals and disciplinary dismissals (oftennot covered by the legislation). The procedures for collective dismissalsapply to large-scale restructuring and typically impose tighter adminis-trative burdens in the form of prolonged consultations with worker rep-resentatives. The legislation may also govern the distribution of legalcosts if workers contest dismissals by initiating court proceedings.These components of the legislation can be conceived of as “taxes” sincethey correspond to payments to third parties.
The multifaceted character of the legislation throughout the worldmakes international comparisons of the nature and comprehensivenessof the legislation difficult. However, several synthetic measures of therigidity of the legislation exist. International comparisons of two of these
Analyzing the Distributional Impact of Reforms
118
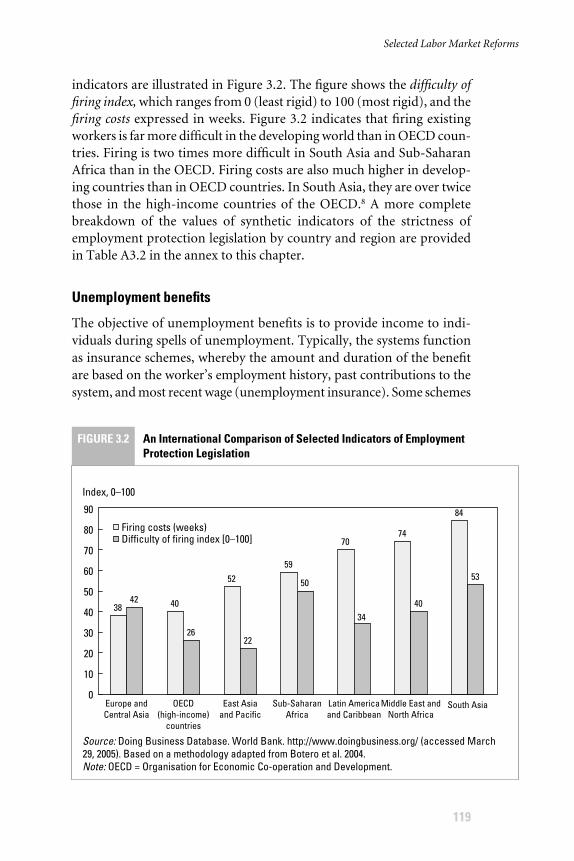
FIGURE 3.2 An International Comparison of Selected Indicators of Employment Protection Legislation
indicators are illustrated in Figure 3.2. The figure shows the difficulty offiring index, which ranges from 0 (least rigid) to 100 (most rigid), and thefiring costs expressed in weeks. Figure 3.2 indicates that firing existingworkers is far more difficult in the developing world than in OECD coun-tries. Firing is two times more difficult in South Asia and Sub-SaharanAfrica than in the OECD. Firing costs are also much higher in develop-ing countries than in OECD countries. In South Asia, they are over twicethose in the high-income countries of the OECD.8 A more completebreakdown of the values of synthetic indicators of the strictness ofemployment protection legislation by country and region are providedin Table A3.2 in the annex to this chapter.
Unemployment benefits
The objective of unemployment benefits is to provide income to indi-viduals during spells of unemployment. Typically, the systems functionas insurance schemes, whereby the amount and duration of the benefitare based on the worker’s employment history, past contributions to thesystem, and most recent wage (unemployment insurance). Some schemes
Selected Labor Market Reforms
119
also include a component that is independent of the worker’s profile and(usually) provides flat benefits to individuals with long unemploymentspells or who are below a certain income level (unemployment assistance).In most developed economies, unemployment benefits are combined withother transfers designed to supplement income for individuals who areout of work, such as early retirement schemes, invalidity pensions, andsocial assistance benefits. In addition, alternative ways of supporting theincome levels of the unemployed while increasing their reemploymentopportunities have recently been tried by a number of countries. Thesepolicies, commonly referred to as active labor market policies, vary sub-stantially in their characteristics and in the degree of their success both assafety nets and as a means of reemployment. Vodopivec and Raju (2002)offer an extensive review of alternative systems of income support for theunemployed and an evaluation of the relative merits.
Several key features characterize an unemployment benefit system.Among these are the level of payments, the duration of the payments, andthe eligibility requirements. To deal with the size of the benefit and thelength of time during which the benefit is provided, the OECD tabulatesa “summary measure of benefit generosity,” defined as the average replace-ment rate during the first two years of unemployment for an “average pro-duction worker” having sufficiently long seniority to be offered the benefitsup to their maximum duration. Another useful indicator is the coveragerate, that is, the fraction of the unemployed population receiving benefits.This measure depends on the duration of the benefits and the character-istics of unemployment (in particular, the share in unemployment repre-sented by those individuals who typically do not benefit from the systembecause of a lack of work experience).
The potential interaction between different policies
The three policies highlighted in this chapter interact in interesting ways.This is particularly true of the unemployment benefit and employmentprotection legislation because the effects of the benefit are likely to differdepending on how flexible the legislation is, and, to a degree, the legisla-tion and the benefit can substitute one for the other. However, in orderto maintain a tight focus, this chapter does not address the topic.
TYPES OF REFORMS AND THE RATIONALE OF REFORM
The rationale for labor market intervention has traditionally been basedon the argument that the market for labor is a very special type of mar-
Analyzing the Distributional Impact of Reforms
120

ket because of its nature and the fact that it deals in people rather thangoods. This makes issues of equity particularly important and also makesthe occurrence of market failures more likely and worrisome. In the viewof many, this implies that an unregulated labor market would lead to out-comes that are inequitable and inefficient and that some form of inter-vention is required to increase the efficiency of the labor market andenhance the equity of its outcomes. However, many other people believethat the acceptance of this argument has caused labor markets to becomeexcessively regulated in numerous wealthy and less wealthy countries andthat this has led to outcomes that are neither efficient nor equitable.Based on these two competing views, calls for reform have focused onthe implementation or strengthening of interventionist policies or ontheir weakening. For the most part, this has led only to marginal changesdesigned to alter the coverage or the generosity of systems.
Reforms of the minimum wage
In addition to the setting or elimination of a minimum wage, reforms inthe area of the minimum wage are typically of two types: those that eitherincrease or decrease the average value of the wage threshold and thosedesigned to introduce subminimal wage floors for particular groups ofworkers (such as the unskilled, youth, or the long-term unemployed) orlocations or regions (areas of high unemployment or poor areas). Themain rationale for a generalized increase in the minimum wage is the needto ensure a living wage to all workers and concerns about excessive wageinequalities. In such a context, the introduction or increase of a mini-mum wage acts as an instrument for redistributing income within a for-mal labor market characterized by large numbers of “working poor.”9
On the other hand, a reduction in the average minimum wage or inthe minimum wage of specific types of workers is advocated when theexisting level of the relevant minimum wage appears to act as a barrier toemployment either across the board or among workers characterized byparticularly low productivity, typically youth, the unskilled, or the long-term unemployed. The introduction of regional variations in the mini-mum wage may also be advocated in a context of differences in the costof living across regions or systematic differences in labor demand or skilllevels across parts of a country.
Thus, these contrasting proposals reflect two different views of theimpact of the minimum wage and of minimum wage reforms. One viewstresses the redistribution dimension of the minimum wage, while the otherview stresses the quantity crowding out dimension. These two different
Selected Labor Market Reforms
121
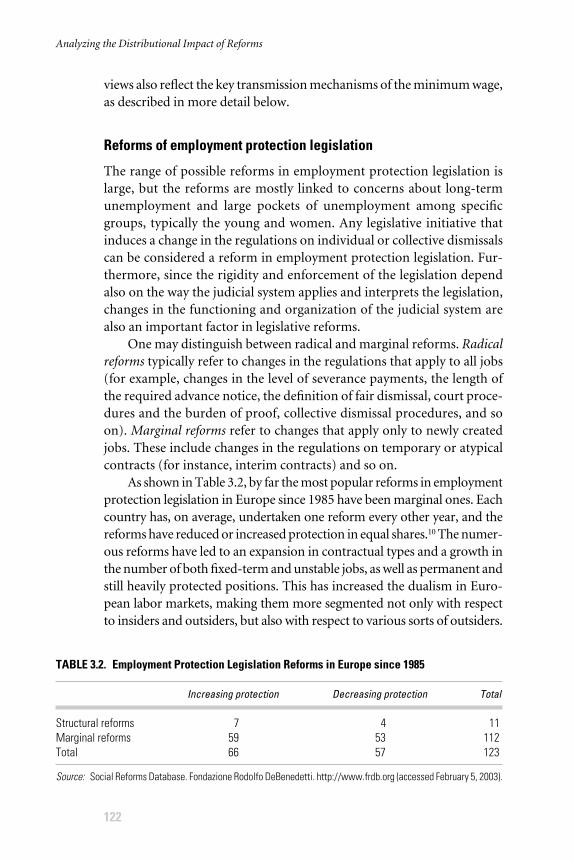
views also reflect the key transmission mechanisms of the minimum wage,as described in more detail below.
Reforms of employment protection legislation
The range of possible reforms in employment protection legislation islarge, but the reforms are mostly linked to concerns about long-termunemployment and large pockets of unemployment among specificgroups, typically the young and women. Any legislative initiative thatinduces a change in the regulations on individual or collective dismissalscan be considered a reform in employment protection legislation. Fur-thermore, since the rigidity and enforcement of the legislation dependalso on the way the judicial system applies and interprets the legislation,changes in the functioning and organization of the judicial system arealso an important factor in legislative reforms.
One may distinguish between radical and marginal reforms. Radicalreforms typically refer to changes in the regulations that apply to all jobs(for example, changes in the level of severance payments, the length ofthe required advance notice, the definition of fair dismissal, court proce-dures and the burden of proof, collective dismissal procedures, and soon). Marginal reforms refer to changes that apply only to newly createdjobs. These include changes in the regulations on temporary or atypicalcontracts (for instance, interim contracts) and so on.
As shown in Table 3.2, by far the most popular reforms in employmentprotection legislation in Europe since 1985 have been marginal ones. Eachcountry has, on average, undertaken one reform every other year, and thereforms have reduced or increased protection in equal shares.10 The numer-ous reforms have led to an expansion in contractual types and a growth inthe number of both fixed-term and unstable jobs, as well as permanent andstill heavily protected positions. This has increased the dualism in Euro-pean labor markets, making them more segmented not only with respectto insiders and outsiders, but also with respect to various sorts of outsiders.
Analyzing the Distributional Impact of Reforms
122
TABLE 3.2. Employment Protection Legislation Reforms in Europe since 1985
Increasing protection Decreasing protection Total
Structural reforms 7 4 11Marginal reforms 59 53 112Total 66 57 123
Source: Social Reforms Database. Fondazione Rodolfo DeBenedetti. http://www.frdb.org (accessed February 5, 2003).
Reforms in unemployment benefits
The main reforms in unemployment benefits consist of changes in theduration of benefits, in entitlements, and in replacement rates. The reformsare often designed to realize policies to encourage labor market activity andlabor force participation or to increase the incentives for unemployedindividuals to take up jobs. In addition, a number of countries have alsorecently been experimenting with alternative ways to support the incomelevels of the unemployed, while increasing their reemployment opportu-nities. These policies, commonly referred to as active labor market policies,vary substantially in their features and in the degree of their success as safetynets and as a means to boost reemployment.
An analysis of reforms in unemployment benefits in the EuropeanUnion since 1987 shows that reforms in basic benefit systems are numer-ous, with an average of two reforms in each country every three years.Most of these reforms have aimed at augmenting benefits, but have onlyentailed marginal changes (that is, phasing in new beneficiaries rather thanchanges in existing entitlements) or have increased the rewards for labormarket participation by altering the incentive structure. Finally, reformshave typically taken place during phases of economic growth and haveoften involved simple changes in administrative rules, for example, requir-ing more frequent visits to an employment office before one is eligible toreceive benefits or rewriting the definition of “suitable job offer.” Thisreflects the fact that the implementation of administrative reforms duringeconomic growth is often less controversial than changes in benefit levels.
To avoid the opposition of people already covered by the system, moreradical reforms to benefit systems are typically implemented little by littlevia marginal adjustments in benefits and a gradual narrowing of entitle-ments. Benefit reforms therefore usually “grandfather” existing entitle-ments by exempting those individuals who are receiving benefits at the timeof the reform and allowing for the new rules to be phased in. An importantexception is represented by the case of the former planned economies ofCentral and Eastern Europe, where fiscal constraints and the need to setright the perverse incentive structure that prevailed before the transitionled to dramatic reforms, which, in some instances, severely reduced bene-fits and halved the maximum duration of benefits (Boeri 2000).
There are three main reasons for carrying out reforms in unemploy-ment benefits. The first relates to the observed positive correlationbetween the duration of a benefit and the duration of unemployment. Exitsfrom unemployment are found to respond strongly to the benefit-entitlement period (the exit rate increases as workers near the end of their
Selected Labor Market Reforms
123
entitlements). A second reason relates to the effects of benefits on un-employment levels. More generous benefit systems tend to be associatedwith higher unemployment rates because of longer unemployment andbecause of a dampening effect on entries into the workforce. A third rea-son for benefit reforms is the fiscal cost of the benefit system that, in con-junction with other nonemployment benefits, may account for a significantproportion of social spending.
The argument for implementation and strengthening of labor market interventions
From an efficiency perspective, the arguments for significant interven-tion in the labor market focus on the existence of different causes of mar-ket failure. First, the efficient working of a market under laissez-faireconditions requires full information flows. However, the substantialdegree of heterogeneity among workers and jobs makes informationflows highly complex and the costs of acquiring and updating informa-tion extremely high, leading to the use of infrequently updated stereo-types that distort decisionmaking and may put some groups systematicallyat a disadvantage, that is, either by being discriminated against in employ-ment decisions or by being paid less than their marginal value product.Second, the presence of externalities may distort the relationship betweenindividual utility-maximizing objectives and the overall objective of maxi-mizing social welfare. A third potential source of market failure may arisewhen product market monopolies, trade unions, or a labor marketmonopsony cause the relationship among productivity, real wages, andemployment to be distorted, leading to inefficiency in resource alloca-tions.11 Finally, the failure of markets for goods, services, and resourcesto perform efficiently may distort the operation of demand and supply.
Box 3.2 provides examples of the different categories of labor mar-ket failures discussed above. It is important to note that these are notmutually exclusive. On the contrary, they may interact to generatewidespread market failures. This is particularly evident in the case ofunemployment insurance.
An additional argument for labor market intervention derives fromthe fact that contracts for employment are more likely to be incompletethan are contracts prevailing in goods and output markets because of the“idiosyncratic” character of labor as a factor of production. Indeed, con-tracts involving the exchange of labor have dimensions other than dura-tion and terms of employment that cannot be easily quantified orcommunicated, such as attentiveness, effort, and creativeness. Since these
Analyzing the Distributional Impact of Reforms
124

Selected Labor Market Reforms
125
BOX 3.2 Examples of Types of Market Failures in the Market for Labor
The following are examples of the four prevailing types of failures of the market for labor indeveloping countries.
1. Asymmetric information. In many situations, information is available asymmetrically inthe labor market. This is a particular problem in markets with less effective reputationeffects, that is, markets characterized by small firms, mobile workers, and informal con-tractual arrangements.� Firms may find that it is expensive to discover the true characteristics of applicants, and
job-seekers may find that it is difficult to discover the true characteristics of job offers.• Off-the-job search is inefficient.
� Employees may be unable to obtain full information on job-security arrangements intheir current jobs.• They may make inefficient decisions about training and job-seeking.
� Firms may conceal their difficult financial situations in order to prevent new job-seekingand departures by their most valuable workers.
2. Externalities. There are many examples of externalities in this area.� In deciding whether or not to close a branch, firms are unlikely to internalize the costs
to local workers or to the government in the form of lost tax revenues and increasedbenefit payments.
� In deciding whether or not to accept jobs, unemployed job-seekers are unlikely to takeinto account the costs of their refusal for firms or for the government.
� If firms or workers are prepared to internalize these costs, free-riders who have failedto do so may nevertheless share in the resulting benefits.• Private decisionmaking in the unregulated labor market is inefficient because it
does not internalize these costs.
3. Monopoly power may result from a number of factors both in the labor market and theproduct market and affect both demand and supply.� The existence of technologies idiosyncratic to a particular firm means that skills
obtained through on-the-job training cannot be transferred to other employers. Thismakes labor turnover costly.• Virtually all employees and firms possess some degree of monopoly power.• Labor mobility is restricted; the labor market is not competitive, and wages may
not clear.� Trade unions or monopolistic behavior may lead to similar distortions in the wage and
employment equilibrium.
4. Absence of markets for goods and services may distort the operation of both the demandside and the supply side of the labor market.� The investment decisions of individuals may be distorted by the inability of workers to
realize the value of their human capital in the same way they sell their financial assets.• There will be underinvestment in education and training.
� The inability to obtain full insurance against redundancy because of the risk of moralhazard may distort interfirm mobility.
Analyzing the Distributional Impact of Reforms
126
dimensions are not specified in the contract, they cannot be enforced,and the agency problem results. Thus, contracts need to be designed toincrease the incentives for workers to behave in a manner that is consis-tent with the interest of employers, that is, supply-acceptable levels ofeffort and so on, or, more technically, “no shirking.” These incentivemechanisms may involve piece-rate systems of pay or internal promotionthat may distort the operation of market forces, leading to the develop-ment of internal labor markets and requiring intervention.
Finally, Keynes argued that, in the context of a more aggregateapproach toward labor contracts, competitive labor markets are prone tocoordination problems, resulting in aggregate market failures and per-sistent aggregate unemployment. These difficulties derive from the factthat contracts are negotiated at regular, but potentially long intervals andin terms of money wages. Meanwhile, worker demands are motivated interms of real wages, and the offers of firms are motivated by labor costs.This means that any adjustments will be achieved through employmentrather than wages. More recently, the “new growth theory” has expressedconcerns about the ability of unregulated labor markets to produce opti-mal growth performance because of the failure of private employers tointernalize the full development benefits of the existence of a trained andeducated labor force.
However, the argument most often used to justify labor market inter-ventions is the one based on equity. Many question the capacity of anunregulated labor market to produce an outcome that is socially accept-able given the fact that the trade in individual labor is involved. The var-ious definitions of social justice or equity preclude any simple response(Barr 1993). Nonetheless, calls for equity become much easier to addresswhen the focus is on poverty reduction since employment at a “decent”wage is widely perceived as the most important channel through whichthe poor can move out of poverty. It is also somewhat easier to evaluatethe impact of policies on earning distribution and on earnings variability.This is because labor market policies, for the most part, are designed toreduce inequalities in labor incomes by maintaining earnings at the lowerend of the income distribution above the level at which they would havebeen in an unregulated market, as well as to minimize income vulnerabilityin the light of possible dismissal, unemployment, and so on.
The argument for less labor market intervention
In recent years, the policy advice of bilateral and multilateral donors topolicymakers in developing countries has been centered on reducing
government intervention in the labor market and increasing the liberal-ization of labor market institutions. Underpinning this advice is the con-viction that, despite the clear potential for market failures and the activerole labor market policies can play in promoting a more equitable distri-bution of incomes and in reducing poverty, labor markets across theworld tend to be overregulated. This overintervention may result in sig-nificant efficiency costs that lead to a trade-off between efficiency andequity. Furthermore, some have argued that, in the name of equity andfairness, excessive intervention may ultimately hurt those very groups itis designed to protect: the vulnerable and the poor. This can happen in anumber of ways.
At the simplest level, overintervention may result in excessive govern-ment expenditure, and the imposition of taxes to finance this expendi-ture will reduce efficiency. Taxes will distort key relative prices, such asthose between work and leisure on the supply side and those betweenlabor and capital on the demand side. These distortions cause labor mar-ket behavior to deviate from that consistent with economic efficiency by,for example, discouraging formal employment, reducing employmentpotential, or generating growth in the uncovered, untaxed informal sec-tor at the expense of the formal one. Similarly, interventions in the mini-mum wage or through employment protection legislation, by prohibitingemployment under certain conditions, reduce the freedom of choice ofworkers and employers. When excessive, they may prevent the signing ofmutually beneficial labor contracts, which would have important impli-cations for the overall level and distribution of welfare. In addition,enforcement of these policies requires resources that could be used moredirectly for wealth creation.
STAKEHOLDERS AND THE POLITICAL ECONOMY OF REFORM
It is clear that any type of reform is likely to have important distributionaleffects because of the differential impact on the welfare of various groupsin society; some groups may benefit, while others will likely lose out.However, the losers and the winners will be specifically determined by thetype of policy and the nature of the reform.
The minimum wage
One important difference between reforms of the minimum wage andreforms of other labor market institutions is that the former mostly affectthe bottom of the income distribution in contrast to, for example, changes
Selected Labor Market Reforms
127
in the structure of unemployment benefits, which directly affect all work-ers. Indeed, the main winners from a rise in the minimum wage are thoseworkers who thereby enjoy a wage increase. Meanwhile, the losers arethose people who lose their formal jobs because of the related reductionin employment. Typically, both groups are unskilled workers in the formalsector. The opposite is true for a reduction in the minimum wage. Finally,the expectation is that the introduction of differentiated minima forgroups or regions facing particularly high risks of unemployment willbenefit workers from these groups or regions. In the case of the intro-duction of subminimal wages for selected groups, the policy may dis-advantage other workers at the same level of productivity becauseemployers would tend to replace more expensive workers with those atthe subminimal wage.
In addition, workers slightly above the minimum wage are also likelyto be (or to be afraid of being) affected by reforms because they risk beingreplaced by workers at the minimum wage. Indeed, they would benefitfrom a rise in the minimum wage if this reform results in the eliminationof the least skilled (the employment effect) since it would increase theirmarginal value and hence their wages. On the other hand, they would suf-fer from a reduction in the minimum wage, since it might bring less-skilled workers into the market, and they might lose their jobs. Hence,semiskilled workers might support an increase in the minimum wage,although they do not benefit directly from such an increase.
Workers in the informal sector are also likely to be indirectly affectedbecause the minimum wage may come to represent a “fair wage” andhence a binding constraint on employers in the informal sector who needto attract labor and minimize labor turnover. Some employers are likelyto lose from reforms that increase the minimum wage, but the extent ofthe loss will partly also depend on their ability to elude the increase via anincrease in shadow activity or other subtle methods to lower the effectivehourly wage without violating the statutory minimum (for example, byextending working hours or reducing training schemes).
Reforms that decrease or increase the minimum wage are relativelysimple to implement and have no direct fiscal implications. The adminis-tration of the minimum wage is also rather simple, and this limits theneed for a sizable enforcement agency.
Employment protection legislation
Insider workers hired under permanent contract in the covered sector arethose for whom the bulk of employment protection legislation applies
Analyzing the Distributional Impact of Reforms
128
directly. They are likely to suffer from radical reforms that soften the leg-islation since this might increase the chance they will lose their jobs. Thus,radical reductions in the scope of the legislation are generally difficultto implement because successful reforms typically need the approval ofthe median voter, who is likely to be an insider worker protected by thelegislation. This might explain part of the resilience of job-security pro-visions and the difficulty of implementing radical reform once the insti-tutions are in place. In such a context, marginal reforms seem to be theonly politically viable option since they do not affect the median voter. Atoughening of the legislation reduces the probability of exiting employ-ment for those currently employed, but also increases the difficulty offinding a new job if one is lost. This produces a sense of insecurity amongprotected workers, who tend to exert pressure to maintain a high level ofprotection. Since protected workers tend to have greater political powerthan outsiders, they will typically oppose any diminution in the legislation.
The outsiders, on the other hand, include workers in the informal,uncovered sectors, the unemployed, and workers with fixed-term con-tracts. For them, a relaxing of the legislation usually has a positive impactin that it increases the hiring rate and, hence, the chance of these peopleto enter employment as insiders. However, these groups are unlikely tohave sufficient political power to bring about the required reforms, andpoorer, marginalized workers (youth, women, the unemployed, the dis-couraged) will tend to become more marginalized.
Finally, capital owners and shareholders are likely to benefit from arelaxing of the legislation, both marginal and structural, because strictlegislation is akin to a tax on capital since it forces capital to be allocatedto low-productivity jobs.
Unemployment benefits
More generous unemployment benefit systems tend to redistribute fromless exposed workers to more exposed workers and from the employedto the unemployed. However, the extent to which different groups willgain or lose depends on the strength of the various effects.
Under strong wage effects (when adjustments in the labor marketoccur through wage compression rather than through employmentreduction), insider workers are more likely to suffer from reductions inbenefits. Consequently, employed workers oppose reforms and may ben-efit from strong support from unions. Conversely, currently unemployedindividuals may be more prone to accept benefit cuts because they mayrealize potential increases in job-finding rates. The progressivity of
Selected Labor Market Reforms
129
unemployment benefits is also important. Skilled workers may supportreductions in strongly progressive systems (or oppose the extension ofprogressive systems) since they do not benefit so much from these sys-tems. For instance, they might oppose the introduction of a flat rate.Finally, when reforms have a strong active labor market policy content,both employed and unemployed individuals might be winners. Indeed,these policies increase the welfare of outsiders (by increasing expected job-finding rates), while reducing payroll taxes earmarked for unemploymentbenefits. They may also increase the wages of insiders. Overall, surveys inEurope eliciting the preferences of individuals for benefits (Boeri, Börsch-Supan, and Tabellini 2001) find that the demand for benefits is strongeramong unemployed individuals than it is among all employees.
Unions often oppose reforms that reduce the generosity of benefit sys-tems. This is partly because unions typically represent a relatively unskilledsegment of the workforce and because unions are sometimes directlyinvolved in the management of benefit systems.
The political economy of reform
Since both intervention and the lack of it have the potential of leading toinefficient and inequitable outcomes, the desirability of labor marketintervention depends crucially on the nature and characteristics of thepolicy. Some policies and intervention designs lead to improvements inefficiency and equity, while others result in a trade-off between the twodimensions, and still others represent a definite worsening in both dimen-sions. Consequently, it is not possible to evaluate the need for a reformand the potential impact of a reform on poverty and growth without acareful evaluation of the impact on labor market efficiency and incomedistribution.
Moreover, even in cases in which such an evaluation dictates a par-ticular reform, the actual implementation of the change is never simplefor reasons of political economy. This is because the reform is unlikely to be “Pareto neutral” due to its differential impact on the welfare ofvarious groups in society; some groups will benefit, and others are likelyto lose out. The magnitude and direction of these benefits and losses willdepend crucially on the type of policy under revision and on the detailsof the reform.
One concern derives from the consideration that a government’sdecisions on these and other matters may reflect more its overwhelmingdesire to be reelected rather than the objective of maximizing social wel-fare. This has two important negative implications. The first might be
Analyzing the Distributional Impact of Reforms
130
called short-“termism,” whereby policies aiming at long-term social wel-fare gains that take more than one election cycle to become fully realizedare less likely to be implemented than those aiming at a more immediateimpact. An example of policies that risk being neglected would be a policydesigned to match school education, skill training, and labor marketemployment.
On the other hand, governments will tend to favor policies that,while suboptimal in terms of welfare impact, may produce tangible gains,but generate costs that are so widely diffused that they are not perceivedas costs or are so perceived only by groups or individuals who have littlevoice and limited political power. Examples of this type of interventionare provided by minimum wage legislation and employment protectionlegislation.
An example of a highly popular policy with insubstantial or nega-tive welfare impact is the practice of subsidizing the purchase of sharesin newly privatized companies. Meanwhile, depending on the prevail-ing political economy conditions, interventions that have great poten-tial impact, such as improving information flows in the labor market,may be neglected by governments since the benefits are widely dis-persed and unlikely to have an important influence on the popularityof the government.
A final rationale for the introduction of and support for interven-tions that are inefficient is provided by the theory of regulation. Theanalysis of Peltzman (1976) emphasizes that: (1) regulation confers ben-efits on certain market participants by providing subsidies or restrictingcompetition; (2) in a static model, by doing this, regulation redistributeswealth toward particular groups; and (3) these groups try to retain orstrengthen the regulation by providing political or financial support tosympathetic politicians. Excessively high levels of minimum wage or overlystrict employment protection legislation provide good examples of poli-cies that can be introduced and retained despite their potentially negativeimpact on social welfare.
IMPACT PATHWAYS
Reforms of the labor market have important potential impacts on incomedistribution and poverty via their impacts on the level and distributionof wages and employment. On the whole, more binding and stricter poli-cies result in higher wages for covered workers at the expense of employ-ment in general and covered employment in particular. Thus, the overalleffect of a reform depends on its combined effect on the demand and the
Selected Labor Market Reforms
131
supply of labor in the covered sector and in other sectors of the economy.This effect differs across policies and labor market conditions. In anyexamination of key transmission mechanisms, it is crucial explicitly toconsider the dual dimension of the economy and distinguish between theformal or covered sector, where the policies apply, and the informal oruncovered sector, where they either do not apply or are not enforced.12
The minimum wage
The overall effects of changes in the minimum wage on income distri-bution and poverty depend on the characteristics of the labor market.
Effects on the level and the distribution of wages in the covered sector
Minimum wage legislation involves establishing a floor for wages so thatthe equilibrium wage cannot drop below this floor. The expectation isthat the introduction of minimum wage legislation or an increase in theminimum wage will, ceteris paribus, result in a compression in wage dis-tribution and a reduction in wage inequality in the formal sector since itboosts the wages of the lowest-paid workers above the unregulated mar-ket equilibrium. Conversely, a reform designed to reduce the minimumwage across the board or among selected groups of workers is expectedto increase earnings inequality.
However, evidence suggests that the effect of changes in the mini-mum wage are not limited only to workers at the lower end of the wagedistribution. Indeed, a rise in the minimum wage may lead to a shift inthe wage distribution and an increase in average wages, and part of thisincrease may be enjoyed by workers with earnings higher than the mini-mum wage. If this is the case, any reduction in wage inequality may beconsiderably less than anticipated.
Effects on the level of employment in the covered sector
In a perfectly competitive labor market, the imposition of a minimumwage above the equilibrium wage—or an increase in the value of the mini-mum wage—would generally reduce employment through a reductionin labor demand along an upward-sloping labor supply. Workers whosemarginal value product is below the minimum wage are forced out ofemployment; classical unemployment arises and can only be reabsorbedby lowering the minimum wage. If, in addition, the increase in the mini-mum wage results in an overall increase in wages, the reform will lead toa generalized reduction in employment across the earnings distribution.The extent of this reduction and the overall change in labor incomes
Analyzing the Distributional Impact of Reforms
132

received by workers in the covered sector depend on the elasticity of labordemand (at constant output). Across the world, this typically variesbetween −0.15 and −0.75, with an average of −0.45 (Hamermesh 1993).
On the other hand, if a labor market or any of its segments are dom-inated by a single employer, the monopsonist, then the impact of anincrease in the minimum wage may be very different. The reason for thisconclusion is that the monopsonist can affect the equilibrium wage bydeciding on the volume of hiring. If labor supply grows with wages, themonopsonist will have an incentive to restrict hiring in order to benefitfrom low wages. In this context, a rise in the minimum wage is perfectlyconsistent with a rise in employment. Thus, for a sufficiently low level ofstarting wage, an increase in the minimum wage could be accompaniedby an increase in employment. However, above some specific threshold,the traditional negative relationship sets in. This result is very important.However, three caveats are in order:
� Pure monopsony situations are very uncommon; they may occur inspecific geographic areas where labor mobility is low and the num-ber of firms is small.
� An increase in the minimum wage acts positively on employmentonly when the initial level of wages is low (below the competitivewage); this is not common in most real-life markets.
� The impact on employment of a rise in the minimum wage dependson the elasticity of labor supply; labor supply has little elasticity onaverage.
Over the last 10 years, a number of papers have studied variousimperfect models in which an upward-sloping supply curve at the firmlevel may arise, implying that the basic monopsony model may becomerelevant. When imperfect information is pervasive, workers may have aninterest in refusing job offers when the wage is too low, since they mayget better offers later on. A firm must then choose a wage level that willallow it to attract a sufficient number of workers to meet its needs (Burdettand Mortensen 1998; Masters 1999). This mechanism ensures a mono-tonic relationship between the wage and the size of firms. Other scholarshave proposed variants of the monopsony model grounded in the theoryof “efficiency wages.” Manning (2004) summarizes and reviews thisresearch in detail.
The introduction of a subminimal wage among categories of work-ers characterized by particularly low average productivity (youth) or ahigh variation in productivity levels (women) has an impact on these
Selected Labor Market Reforms
133
workers that is equivalent to that of a generalized reduction in the mini-mum wage, that is, it will increase employment among them unless themonopsonist model applies. However, the increase in employmentamong these workers may be achieved at the expense of a reduction inemployment among other workers, and the overall effect on aggregateemployment is uncertain.
It appears that no systematic evaluation of the impact of reductionsin the minimum wage exists. However, experimental evidence suggeststhat the effects of changes in opposing directions in the minimum wageare not symmetrical and that the positive effect of a reduction in the min-imum wage on employment may be much smaller than the negative effectof an increase of equal proportion in the minimum wage. This is becausethe existence of the minimum wage results in a permanent increase inreservation wages that does not fully adjust downward when the level ofthe minimum wage is reduced (Falk, Fehr, and Zehnder 2005).
The impact on wages and employment in the uncovered sector
In most developing countries, there is a substantial informal sector, and,in large pockets of the formal sector, minimum wage legislation is notapplied. This does not mean that these sectors are unaffected by mini-mum wage reforms since there are important spillover effects betweenthe two sectors. The standard theoretical argument is that, following anincrease in the minimum wage, sector wages that are not covered will fallbecause redundant workers will move into employment in the uncoveredsector, and employment in this sector will rise (Gramlich 1976; Mincer1976; Welch 1976).13 However, if an increase in the minimum wage in theformal sector leads firms in the informal sector to raise their average wageto keep attracting good workers or because of “fair remuneration con-siderations,” an increase in the minimum wage can lead to an increase ininformal sector wages (the lighthouse effect) or a drop in employment.
The effect on participation, job-seeking, and unemployment
In the context of a labor market that is supply constrained, the expectedimpact of the minimum wage may be somewhat different given the exis-tence of endogenous labor market participation and endogenous searcheffort on the part of the unemployed. One can think of the decision toparticipate in the labor market as the solution to the trade-off betweenthe value of being an unemployed job-seeker and the value of beingengaged full time in home production. In this situation, the increase inthe potential benefits of employment generated by the increase in theminimum wage may lead to an increase in labor force participation and
Analyzing the Distributional Impact of Reforms
134
a shift in labor supply that increases employment among the low paid. Inaddition, if the new minimum wage exceeds the reservation wage, theintensity of the job search by the unemployed and their exit rate fromunemployment may rise. Thus, the supply-side effects of the introduc-tion of a new, higher minimum wage may combine to increase employ-ment and reduce unemployment.
The effect of minimum wage reforms on income distribution and poverty
In evaluating the potential impact of minimum wage reforms on incomedistribution, it is important to distinguish between earnings distributionand income distribution. The former is defined at the level of the indi-vidual and by focusing only on employed workers. The latter is usuallydefined at the level of households and is calculated according to the totallabor income of all household members, plus income from other sources.
An increase in the minimum wage can have both a positive and anegative effect on inequality in household incomes. First, a rise in incomesat the lower end of the income range among the formally employed typi-cally reduces inequality in individual earnings. However, it might alsoresult in less employment among the low-paid workers for whom theminimum wage is binding or in the transfer of some of these workers tothe uncovered, less-well-paid informal sector. This could increase inequal-ity in labor incomes both at the individual level and at the householdlevel, especially if workers on the minimum wage live in households witha high proportion of low-skilled, potentially low-paid individuals. Theoverall direct effect on income inequality depends on labor market con-ditions, demographics, and household composition.
These effects are compounded by the indirect changes in the sectornot covered. If labor is mobile across sectors, then the standard covered-uncovered adjustment mechanisms operate, and an increase in the min-imum wage leads to an increase in earnings inequality. Yet, the impact isreduced if the lighthouse effect comes into play, since a higher minimumwage leads to an increase in wages in both the covered market and theuncovered market. In this case, the overall impact on the distribution ofhousehold income will depend on the employment dynamics betweenthe covered sector and the uncovered sector, as well as the impact of thereform on the two segments of the labor market.
Reforms of the minimum wage are also expected to have a typicallyambiguous impact on the poverty rate.14 An increase in the minimumwage, for example, will typically raise the earnings of low-paid workerswho maintain their jobs, and, ceteris paribus, this will bring the povertyrate down if these individuals are the lone earners within their households
Selected Labor Market Reforms
135
and if all low-paid earners within households maintain their employmentat the prereform level. However, the increase is also likely to reduceemployment in the covered sector, and this will result in lower laborincome at the household level if any wage earners lose their jobs becauseof the policy or are forced to transfer to the lower-paying, uncovered sec-tor. This may increase the vulnerability to poverty of households that areclose to the poverty line (Brown 1999). However, evidence in developedcountries suggests that a large proportion of earners on the minimumwage are second or third earners in households that are well above thepoverty line. This substantially reduces the potential impact of minimumwage reforms on the incidence of poverty.
Employment protection legislation
There are four transmission mechanisms through which reforms inemployment protection legislation can affect the distribution of incomesand the incidence of poverty.
Impact of reforms on hiring, firing, and employment levels
Hiring and, especially, firing are the key standard mechanisms of anyreform in employment protection legislation because such legislationtends to increase the cost to firms of initiating a worker separation. Thus,the most direct effect of legislative reform is a change in the rate of firingssince the reform affects the tendency of firms to hoard labor—to holdonto marginal jobs—and delay the timing of labor adjustments. How-ever, legislative reform also has an obvious indirect effect on hiringbecause firms, at the hiring stage, will attempt to anticipate future costlyadjustments because of adverse shocks. Strict legislation will thereforereduce the incentive for firms to hire additional workers. The combina-tion of direct and indirect effects suggests that strict legislation will reduceturnover (hiring and firing), while any reform that reduces the stringencyof the legislation will lead to an increase in turnover among firms. Theeffects on the stock of employment are more ambiguous. In equilibrium,hiring and firing among firms offset each other. In this case, the existenceof legislation has no clear effect on the average employment level. The keytransmission mechanism of employment protection legislation does notimply a reduction in average employment, but rather an effect on theflows of employment.15
The transmission mechanism described above can be easily appliedto the case of radical reforms, but, when reforms are marginal, the situa-tion is more complicated. This is illustrated by a reform that increases the
Analyzing the Distributional Impact of Reforms
136
availability of fixed-term contracts, a typical marginal reform in OECDcountries during the 1990s.16 The availability of temporary contracts willcertainly raise the incentive for firms to hire new workers on a temporarybasis. In addition, it will increase the incentive for firms to wait until theexpiration of temporary contracts before implementing reductions inpersonnel. This suggests that a marginal reform in the labor market canlead to the formation of a dual labor market, wherein a stock of protectedworkers hired under a complete legislative regime of employment pro-tection exists alongside a fringe of workers hired under temporary con-tracts, and that this dual labor market acts as a buffer against labor marketshocks (Blanchard and Landier 2002).
The workings of the key transmission mechanism depend cruciallyon the behavior of wages and on the use of taxes versus transfers. Thebaseline transmission mechanism functions smoothly if wages do notadjust in response to changes in employment protection legislation andif a reform relates to a tax component of the legislation. The situationbecomes more complicated if wages can adjust, especially in the case oflegislation involving transfers.
Wage-bargaining
Another important transmission mechanism involves the effect of employ-ment protection legislation on the threat point of wage-bargaining forinsider workers. The existence of such legislation reduces a firm’s threatpoint in the bargaining over the wages of insiders because insiders areprotected by the legislation against dismissal in case a wage agreement isnot reached. As a result, the existence of the legislation leads to higherwages for insider workers.
The key issue is what happens to the wages of outsiders. Most wage-bargaining models predict the emergence of a two-tier regime, wherebythe wages of outsiders are reduced because of the legislation. In otherwords, workers on temporary contracts partly prepay, in the form oflower wages, the future cost of employment protection legislation. Thesize of the prepayment will depend on whether the legislation providesfor a firing tax or a severance payment.
In the case of severance payments, the prepayment is full, so that theexpected cumulative wage bill obtained by hiring an outsider is constant.This is the well-known neutrality result of the existence of severance pay-ments and wage flexibility, originally identified by Lazear (1990). It is animportant benchmark result, since it suggests that, when employmentprotection legislation takes the form of a transfer and wages are suffi-ciently flexible, the legislation is neutral. In the case of firing taxes, the
Selected Labor Market Reforms
137
prepayment is never full, so that the predictions obtained by the standardmechanism apply. To sum up this transmission mechanism: employ-ment protection legislation induces a reduction in the wages of outsidersand an increase in the wages of insiders. In addition, when the legislationprovides for a transfer, the effect of wage-bargaining is so important thatthe legislation is neutralized. The neutrality disappears, however, as soonas wages become rigid or if the legislation provides for a tax rather thana transfer.17
The effort of workers and labor productivity
Another transmission mechanism revolves around the impact of employ-ment protection legislation on worker productivity. Since such legisla-tion increases job security, it automatically reduces the incentive of workersto make any extra effort and, thus, in turn, reduces labor productivity.While it is true that an increase in job security can certainly lead to anincrease in the propensity of workers to shirk, one needs to bear in mindthe difference between economic dismissal and disciplinary dismissal;legislative provisions typically govern only economic dismissals, that is,dismissals that are not caused by a shortcoming of the workers (Ichinoand Riphahn 2005). If a clear distinction exists between economic anddisciplinary dismissals, the potential for an increase in shirking is sub-stantially reduced. In addition, many have argued that the greater jobtenure that derives from employment protection legislation may in factfoster an increase in productivity via the higher incidence of job-specifictraining and greater company loyalty among workers.
Capital-labor substitution and capital allocation
Employment protection legislation may also have an impact on the pre-vailing technology. This mechanism was originally discussed by Caballeroand Hammour (1998), and it is best understood from the perspective ofa sort of putty-clay technology.18 In the short run, capital is largely fixedand installed, and capital-labor substitution is low. In the long run, how-ever, firms have a much more flexible technological menu at their dis-posal and can select different capital-labor ratios. This suggests that moreencompassing employment protection legislation may have differenteffects in the short and long run. In the short run, an increase in legisla-tive coverage may result in a tax on existing capital in ways that cause agreater share of the surplus to be captured by labor. The situation is dif-ferent in the long run. Since employment protection legislation acts partlyas a tax on labor, firms have an incentive to invest in labor-saving tech-nologies, leading to an increase in the capital-labor ratio.
Analyzing the Distributional Impact of Reforms
138
Finally, the passage of stricter legislation tends to reduce the reallo-cation of capital from ailing sectors to expanding sectors. In a sense, thisis in the nature of a sclerotic market; it suggests that, in a country withstrict legislation, capital is not allocated efficiently. This may have anobvious impact on the average productivity of the economy and may alsoaffect the growth process.
Unemployment benefits
Reforms of the system of unemployment benefits can impact labor mar-ket outcomes through various channels.
Impact on unemployment duration and incentives for job-seeking
Generous, long-term benefit entitlements may provide an incentive forlonger spells of unemployment; cross-country evidence demonstrates theexistence of this positive association (Boeri, Layard, and Nickell 2001).Thus, a reduction in unemployment benefits is advocated as a way of reduc-ing the duration of spells of unemployment. However, some studies suggestthat causality might work the other way: in cases of high long-term unem-ployment, governments might be pressed to increase the duration of bene-fits. For instance, changes in the duration of unemployment benefits insome parts of the United States tend to follow upon increases in the dura-tion of unemployment (Card and Levine 2000). This means that the nega-tive effects of benefits on the duration of unemployment may be overstated.
Thus, most benefit systems are designed to discourage recipientsfrom using the system for the maximum duration. For instance, unem-ployment insurance benefits typically decrease in value over time, andthere may be limits on the maximum duration of unemployment assis-tance benefits or conditions may be imposed in terms of the time oreffort spent job-seeking. New policies also provide incentives to increasesearch efforts by imposing restrictions and conditions on the receipt ofunemployment benefits. Finally, assistance in job-seeking is often pro-vided to encourage more active searches. On the other hand, eligibilityfor unemployment assistance that is based on means-testing at thehousehold level can create strong incentives for other members of the household to leave employment or limit their searches (because theirincomes may increase the average household income above the eligibil-ity income threshold).
Reforms reducing the generosity of unemployment benefits (or rais-ing the rewards of labor market participation) provide incentives for theunemployed to increase the intensity of their job searches. Furthermore,
Selected Labor Market Reforms
139

evidence supports the positive effect on employment and on earnings ofthe provision of assistance in job hunting. Evidence also points to the costsavings arising from the increased flows of people from unemploymentto employment generated by the imposition of job-seeking requirements.Finally, penalties on individuals refusing to take up suitable job offersseem to be rather effective in a few selected countries (the Netherlandsfor example).
Impact on the level and type of employment
The implementation of an increase in wage subsidies through variablecontribution rates among employers for different types of workers mayalso affect employment and wages, depending on the elasticity of labordemand and supply.19 A reduction by 21 percent in employer contribu-tions in Belgium for the wages of unskilled workers is expected to increaseemployment among low-skilled workers by almost 7 percent. Estimatesfor France and the Netherlands point to similar increases.20
Linking benefits to past contributions reduces the incentive to evadepayroll contributions and provides an incentive for workers to stay in theformal sector. Since these workers would likely require a higher wage inthe informal sector, this also provides an incentive to firms to remainactive in the formal sector to avoid paying higher wages.
TOOLS OF ANALYSIS AND THE FINDINGS
Natural experiment is the best empirical methodology for assessing thedistributional effects of labor market reforms. This methodology consistsof exploiting exogenous changes in the economic environment of certainagents to compare their reactions to those of otherwise similar agentswho have not undergone the changes. The influential work of Card andKrueger (1994) on the effect of the minimum wage represents a key illus-tration of this methodology. However, the opportunity for carrying outstudies based on this technique is rarely at hand, and, for the most part,researchers have to find other ways of assessing the impact of labor mar-ket reforms.
Computable general equilibrium models can also be useful, but theyhave to depend on an underlying structure of the labor market in a waythat is consistent with the complex effects of the regulation in question.There are two key features that should be kept in mind, particularly if oneis dealing with a complex dual labor market in a developing country.First, the analyst should pay special attention during the modeling ofboth the formal-covered sector and the informal-uncovered sector of the
Analyzing the Distributional Impact of Reforms
140
economy. Second, a model based on a simple two-sector conception of per-fect competition is hardly appropriate for assessing the effects of reformsthat may have considerably different impacts under different labor mar-ket conditions, say, the impact of a reform of the minimum wage in acontext of monopsonistic price setting. The literature does not yet seemto provide a good example of complex labor markets that could be usedas reference points.
For the most part, the empirical literature focuses on
� evaluating the impact on one particular link in the chain of reactionsdescribed above (that is, employment or the wage level), withoutmuch consideration of the transmission channels of the impact (thatis, the full distributional impact)
� the impact of the implementation of a particular policy rather thanthe potential effects of reforms in the current system
The review that has been undertaken of methodologies and findingsfor this chapter covers the existing evidence and treats the implementa-tion or removal of a policy as a type of reform that causes a labor marketto become more regulated or less regulated. The findings on each of thetransmission channels and on the overall impact on income distributionand poverty are summarized below.
Minimum wage
Over the last 10 years, an extensive amount of research on the employ-ment effect of the minimum wage has emerged, mainly in response to theresults of the empirical studies carried out by Card and Krueger (1995).Furthermore, the growing availability of microdata for developing coun-tries has permitted a deepening understanding of the minimum wage indual markets. Most of the empirical literature analyzes total employmentfrom the perspective of the effects of the introduction of or increase inthe minimum wage. Some also focuses on the impact of changes in thesubminimal wage on the employment of youth. On the basis of the avail-able evidence, it is not clear that an increase in the minimum wage leads,on average, to substantial job losses. However, the increase may con-tribute to a shift from formal to informal employment.21
Effects on the level of employment
Card and Krueger (1994, 1995) studied the impact of increases in theminimum wage in New Jersey in 1992 and in California in 1988, taking
Selected Labor Market Reforms
141
Pennsylvania, a state where the minimum wage did not change, as a con-trol. Using a difference-in-difference estimator, they found that, after theminimum wage was raised from $4.25 to $5.05 in New Jersey, the level ofemployment in fast-food establishments rose more quickly in New Jerseythan it did in Pennsylvania. They concluded that an increase in the min-imum wage may lead to a rise in employment if the wage is sufficientlylow at the outset, as it was in New Jersey. (In the literature on develop-ment, no evidence derived from natural experiments has been discoveredon changes in the minimum wage.)
The research by Card and Krueger generated a vivid debate along twodimensions. The first dimension was the interpretation of the results, forexample, whether consumers of fast food can be considered representa-tive of the population as a whole, since it may well be that persons earn-ing minimum wages are typical consumers of fast food. The seconddimension of the debate revolved around the fact that the original Cardand Krueger study was based on data gathered through telephone inter-views and not on administrative data. However, despite the argumentsand counterarguments exchanged between Neumark and Wascher (2000)and Card and Krueger (1994), the results of the earlier study seem to havebeen confirmed.
In the absence of access to the natural experiment methodology, thelarge majority of empirical studies adopt a methodology that consists ofhighlighting the aggregate correlation between variations in employmentand the minimum wage, while controlling for the other factors that mightaffect employment. These studies make use of the evolution over time ofthe minimum wage, as well as differences in the level of the minimumwage across industries and geographic regions. The estimates vary fromcountry to country. Large negative effects are found in Colombia (Bell1997), Ghana (Jones 1998), Morocco (Agenor and El Aynaoui 2003), andPuerto Rico (Castillo-Freeman and Freeman 1992), while the impactappears to be insignificant in Indonesia and Mexico (Bell 1997; Rama1996). Carneiro (2004) also finds evidence of a significant reduction informal sector employment and a shift toward employment in the low-paying informal sector. It is clear that, in this type of study, too manyvariables are often left out of the analysis, and the coefficients shouldnot be interpreted as robust evidence, but simply as important country-specific correlations.
Data at the level of firms are becoming available in developing coun-tries and are often used to estimate the impact of the minimum wage onlabor demand. Studies typically use these data on the formal manufac-turing sector and regress employment at the level of firms on a set of con-
Analyzing the Distributional Impact of Reforms
142
trols (such as the prices for other factors and value added, if available),a minimum wage dummy, and employment lags to allow for dynamicadjustment.22 The estimates of the impact vary across countries. Theeffect of the minimum wage appears large and negative in Colombia (Bell1997; Maloney and Mendez 2003), but small or negligible in Costa Ricaand Mexico. In Indonesia, the sharp increase in the minimum wage regis-tered between 1990 and 1996 appears to have reduced employment insmall domestic firms, but not in larger ones, foreign or domestic. Mean-while, the impact on total employment was found to be positive in Brazil,but was the result of a composition effect between hours and jobs; thetotal number of hours increased, but the number of jobs fell.
Estimates of the impact also vary across groups of workers. The joblosses resulting from an increase in the minimum wage in Brazil andMexico seem to have particularly affected marginal groups such as women,youth, and low-skilled workers. It is supposed that this impact dependson the level of the minimum wage relative to the wages of these groups(World Bank 2006). In Chile, an increase in the minimum wage appears tohave reduced employment opportunities among youth and the unskilledand, thus, especially unskilled youth, while promoting the employmentof skilled and older workers (Montenegro and Pagés 2003). The minimumwage also appears to be responsible for much of the increase in long-term unemployment among the unskilled population in Bulgaria andLithuania (Rutkowski 2003a, 2003b). Similarly, experience in Mexicosuggests that the erosion of the minimum wage in the 1990s boostedemployment among women (Feliciano 1998). Some countries alsoexperimented with subminimal wages for apprenticeship, which seemsto have improved employment opportunities for young graduates inChile (Gill, Montenegro, and Domeland 2002).
While most of these studies use data on the formal sector, there areat least three studies that use the same methodology to look at the employ-ment effects of changes in the minimum wage in the informal sector(Lemos 2004a for Brazil; Gindling and Terrell 2004a for Costa Rica; Jones1998 for Ghana). Using microdata for Brazil, Lemos finds evidence ofadverse employment effects in both the formal sector and the informalsector, challenging standard two-sector models. Her results are consis-tent with a sizable lighthouse effect. Similar effects are also found byGindling and Terrell for Costa Rica who, perhaps surprisingly, also dis-covered evidence that the minimum wage compresses wage distributionin the informal sector more than in the formal sector. Yet, no wage effectof the minimum wage was found for the self-employed. In contrast, Jones(1998) found that the effects of the minimum wage in the informal sector
Selected Labor Market Reforms
143
in Ghana appear consistent with the standard mechanism of the tradi-tional two-sector model.
Individual longitudinal data make it possible to follow the labor mar-ket histories of persons whose wages are at or close to the minimum wage.Recent studies in this area find that changes in the minimum wage havea significant impact on employment among these workers. Nevertheless,there is no agreement over the direction of these changes. Abowd et al.(1999) found that, in France, an increase of 1 percent in the minimumwage reduces the employment probability of workers on minimum wageby 1.3 percent among men and 1.0 percent among women. In the UnitedStates, a reduction by 1 percent in the minimum wage increases theemployment probability of affected workers by 0.4 percent among menand 1.6 percent among women. Portugal and Cardoso (2001) found dif-ferent results using the same type of methodology. They exploited leg-islative changes in the minimum wage in Portugal in 1987. The minimumwage was raised by 50 percent for adolescents aged 16 to 18 and 33 per-cent for youths 18 and 19. They found that the hikes had a dampeningeffect on hiring, but that those young people who found jobs had a greatertendency to keep them. In other words, Portugal and Cardoso observedfewer departures from employment, and this partly offset the fall inhiring.23 Using longitudinal data from three contrasting individual datasets, Stewart (2004) found that the introduction of the minimum wagein the United Kingdom had an insignificant effect on the employmentprobability of low-wage workers.24 Indeed, overall, the minimum wageappeared to have potentially significant effects on the probability of beinghired or of losing a job. However, it does not invariably have a positiveeffect on the probability of job loss among the population affected by theminimum wage.
Effects on the wage level, the average wage, and wage distribution
Empirical evidence suggests that the introduction of or increase in theminimum wage has considerable spillover effects on the level of wages ofworkers further up the earning distribution. For instance, studies inBrazil, Colombia, and Mexico show that a 10 percent increase in the mini-mum wage results in a 1–6 percent increase in average wages (WorldBank 2006). This appears to be caused by the fact that the minimum wageseems to be used as a more general unit of account or “numeraire,” forinstance in quoting wages or monetary contracts in general, and, hence,the minimum wage influences wages throughout the earnings distribu-tion. For example, in Bolivia, the effects of a change in the minimumwage have echoed up the wage distribution; 60 percent of the rise has
Analyzing the Distributional Impact of Reforms
144
been transferred to wages around the minimum wage, and 38 percent towages around four times the minimum wage (Maloney and Mendez2003). In Indonesia, a doubling of the minimum wage led to an estimated10 percent increase in average wages (Rama 1996).
However, empirical evidence from Latin America suggests that somegroups of workers benefit disproportionately from increases in the min-imum wage and that this has important distributional implications. Forexample, analyses in Brazil and Mexico suggest that minimum wageincreases benefit men more than women throughout the wage distribu-tion. A 10 percent increase in the Mexican minimum wage led to a10–36 percent increase in men’s wages, but only to a 0–10 percent increasefor women (World Bank 2006). Similarly, in Mexico, adults with wagesaround the minimum wage are found to benefit more from minimumwage increases than do the young in the same earnings category.
The minimum wage appears also to operate somewhat in the informalsector in many countries of Latin America, including Brazil, Chile, Colom-bia, Ecuador, El Salvador, Guyana, Mexico, Nicaragua, Panama, Paraguay,Peru, Venezuela, and Uruguay (World Bank 2006). In Brazil, there is evi-dence that the minimum wage has a strong influence on the informallabor market and acts as a “voluntary” reference wage. Over 20 percentof wage adjustments in the informal sector were exactly equal to the mini-mum wage adjustment after the launching of the Real Plan, September1994 to May 1995 (Amadeo, Gill, and Neri 2002). In Costa Rica, the mini-mum wage compresses the wage distribution in the informal sector morethan in the formal sector, but does not have wage effects among the self-employed (Gindling and Terrell 2004a). Similarly, there does not seemto be evidence of a strong lighthouse effect among the self-employed inBolivia; this might be related to the fact that the self-employed mayadjust their earnings frequently to avoid inflation erosion (Maloneyand Mendez 2003).
The effect of minimum wage reforms on income distribution and poverty
One way of assessing whether the minimum wage is actually enforced isto plot the earnings of individuals as a histogram. The position and shapeof the histogram provide information on the extent of compliance withthe minimum wage. If there had been no government intervention in thelabor market, one would expect the wage distribution to be relativelysmooth, reflecting the underlying distribution of skills among workers.On the other hand, if employers actually enforce the minimum wage,workers who would have earned less than the minimum are no longeremployed, and the distribution is truncated. The fact that some workers
Selected Labor Market Reforms
145
have lost their jobs should create a spike in the wage distribution that isrelatively close to the legally imposed minimum. If there is no spike or ifthe spike lies significantly to the right or the left of the minimum wage,the data indicate that the minimum wage is having little “bite.” Thisempirical methodology is often used to provide a first assessment of theimpact of a minimum wage. Most studies on developing countries findevidence of a spike in the wage distribution that corresponds to the mini-mum wage. This is a first, visual effect of the ability of the minimum wageto compress the earnings distribution. This effect appears to occur in mostdeveloping countries in Latin America and in some transition economies.25
Particularly interesting is the search for a wage spike in the informalsector. Since the minimum wage is not binding in that sector, one wouldexpect to find no spike, but, if the lighthouse effect is relevant, one mayfind a spike in the wage distribution also in the informal sector. The light-house effect is precisely what Lemos (2004a) finds in her study of theimpact of the minimum wage in the formal and informal sectors of theBrazilian economy. Similar results have also been found in other LatinAmerican countries (World Bank 2006).
The overall impact of a reform on earnings inequality seems to dependon the initial level of the minimum wage. In Latin America, increases in ahigh minimum wage have been found to boost inequality, while increasesin a relatively low minimum wage reduce inequality (World Bank 2006).The decrease in the real minimum wage in Brazil and Mexico in the 1990shas been blamed for a large share of the increase in overall inequality.Thus, the decrease was responsible for 4.8 percent of the increase ininequality in the formal sector and 18.4 percent in the informal sectorin Brazil (Rodrigues and Menezes-Filho 2004). Similarly, a study of121 countries over the period 1970–2000 shows that the minimumwage (relative to per capita income) tends to worsen income inequality(Calderón, Chong, and Valdés 2004).
On the other hand, empirical research in the United States generallyconcludes that the minimum wage reduces wage inequality (Brown 1999)and that an increase in the minimum wage also reduces wage inequality.DiNardo, Fortin, and Lemieux (1996) and Lee (1999) suggest that the fallin the real value of the minimum wage contributed significantly to risingwage inequality in the United States in the 1980s. DiNardo, Fortin, andLemieux (1996) look at the evolution of the distribution of wages between1979 and 1988 and find that the fall in the minimum wage explains one-quarter of the rise in the standard deviation in the distribution of men’swages and 30 percent of the standard deviation for women. Lee (1999),for his part, estimates that the shrinking minimum wage over this period
Analyzing the Distributional Impact of Reforms
146
explains 70 percent of the increase in the ratio of average fifth-decilewages to average first-decile wages.
Evidence from the United States suggests that the net effect of a mini-mum wage increase on poverty is very small; only 4.1 percent of the group was lifted out of poverty, while 3.9 percent of the previously non-poor fell into poverty as a result of the policy (Neumark and Wascher1997). One possible explanation lies in the fact that earners of the mini-mum wage are typically distributed across the broader population (includ-ing in middle-income households) rather than only in low-incomehouseholds. Hence, some of those who lose their jobs might live in house-holds that have other substantial sources of income that can help maintainthe newly unemployed individuals within the non-poor household. Simi-lar results have also been obtained through a simulation exercise in theUnited Kingdom that used data from the family-expenditure survey andPolimod, a tax-benefit microsimulation model (Sutherland 2001). Find-ings from this simulation suggest that the minimum wage is not an efficientmethod for targeting poverty in the United Kingdom because it benefits thesame proportions of the poor and the non-poor. In addition, poverty ratesappear not to be very sensitive to the level of the minimum wage, and theintroduction of the minimum wage appears to have only a small impact onthe overall poverty rate, a potential reduction of only 1.2 percent.
For the minimum wage to have a significant impact on poverty, itneeds to be higher than the subsistence minimum for wage earners andtheir dependents. However, the minimum wage provides for the basicneeds of one worker, plus one dependent in only 7 of the 17 countries ina study on Latin America and the Caribbean (World Bank 2006). A lookat both the increased wages among those household members who kepttheir jobs and the fall in earnings among those who lost theirs reveals thatthe increase in the minimum wage had some impact on wage povertyrates in Colombia, but not in Brazil (Arango and Pachon 2003). A disag-gregation among the poor, who represent a large share of the populationin these countries, shows, however, that the poorest do not benefit. Rather,the main beneficiaries are households near the poverty line. The poorest25 percent in Colombia are not helped at all, which might be because thewage and unemployment effects cancel each other out or because theminimum wage laws do not have effects on this part of the population.In Brazil, the bottom 30 percent of the income distribution actually expe-riences wage losses, while poor households in higher brackets do not ben-efit. These results are confirmed by Carneiro (2004), who suggests thatthe shift of employment from the formal sector to the informal sector fol-lowing the increases in the minimum wage in Brazil from 1982 to 2002
Selected Labor Market Reforms
147
was largely responsible for the rise in poverty over that period. Similarly,evidence from Indonesia suggests that increases in the minimum wagemay have worsened the poverty situation there (Mason and Baptist 1996).
In contrast, an analysis in four African, five Asian, and thirteen LatinAmerican countries shows that the minimum wage does reduce povertyas measured by headcount, the poverty gap, or calorie intake. Theseeffects are similar in the various regions, though they are more markedfor urban poverty relative to rural poverty. However, since the minimumwage is also associated with higher unemployment, the reduction inpoverty may be offset by losses in efficiency over the long term (Lustigand McLeod 1996).
Employment protection legislation
Assessing the impact of a specific reform in employment protection legis-lation is not easy. In the absence of evaluations using natural experiments,most empirical regularities are revealed through cross-country compari-sons rather than through full-fledged policy evaluation. Researchers haveused statistical methods to compare the effects of a reform on treatmentgroups of workers, as well as control groups. This is always done usingmicrodata on firms and workers. A good example is the work of Kugler(2000, 2004) on the Colombian reform. The identification strategy of thistype of analysis consists of exploiting the change over time in labor mar-ket legislation, together with the variability in coverage across groups.While such studies broadly confirm the empirical regularities, they pro-vide much sounder economic analyses. Another example of this type ofstudy is Acemoglu and Angrist (2001).
Effect on employment levels
According to the theoretical wisdom, the overall effect of employmentprotection legislation on employment should be limited. Indeed, stricterlegislation is expected to reduce labor turnover, which would translateinto higher employment rates during periods of recession (since firmscannot adjust their labor force downward) and lower employment ratesduring periods of expansion (since firms do not adjust for fear of sub-sequent recessions). Hence, the net impact of reforms is likely to varyaccording to economic cycles.
Evidence from cross-country time-series data on OECD countriestends to find that stricter employment protection legislation has either anegative or an insignificant impact on employment. Similarly, the effecton unemployment is ambiguous. However, evidence based on disaggre-
Analyzing the Distributional Impact of Reforms
148
gated data for single countries, which permit the capture of more varia-tions in regulatory policies, suggests that job-security regulations have anegative effect on employment.26
In Peru, the use of severance payments is found to have a negativeeffect on the level of employment, and labor demand appears to adjustmore slowly to economic cycles. Between 1987 and 1990, a 10 percentincrease in dismissal costs reduced long-run employment rates by anestimated 11 percent, keeping wages constant (Saavedra and Torero 2000,2003). Evidence from Argentina also points to a negative relationshipbetween employment protection legislation and employment, with a 10 percent increase in dismissal costs, leading to a 3 to 6 percent decreasein employment rates (Mondino and Montoya 2003). Overall, thecountry-specific evidence from Latin America consistently points to anegative impact on average employment rates by employment protectionlegislation, although a cross-sectional analysis of time-series data on apool of countries does not yield robust results (Heckman and Pagés2003). Similarly, in South Africa, 39 percent of large manufacturingfirms reacted to stricter legislation by reducing the level of hiring or sub-stituting capital for workers, which suggests that the legislation had anegative impact on employment levels.27 An equally strong negative rela-tion emerges in Croatia, where excessive legislative controls have beenidentified as the only major reason for high levels of unemployment(Rutkowski 2003c).
In the longer term, legislation may have an impact on the type oftechnology that firms select. An increase in legislative controls could, inthe long run, lead firms to invest in labor-saving technologies, therebyraising the capital-labor ratio and lowering employment. This phenom-enon seems to be confirmed by a comparison of France and the UnitedStates in the 1980s and 1990s (Caballero and Hammour 1998). Capital-labor ratios are larger in France than they are in the United States, andthe evolution of profit shares is consistent with this finding (Blanchard1997). The evidence from South Africa presented in Table 3.3 also pointsto substitution, with 39 percent of large manufacturing firms respondingto stricter legislation by replacing workers by capital.
Effects on employment flows
Overall, radical reforms in employment protection legislation affect thecost for firms of the worker separations the firm may initiate. A first directeffect is that strict legislation pushes the firms to hold on to marginal jobsand delay labor adjustment (that is, they hoard labor). Stricter legislationalso leads firms to anticipate more costly labor adjustments in the future
Selected Labor Market Reforms
149
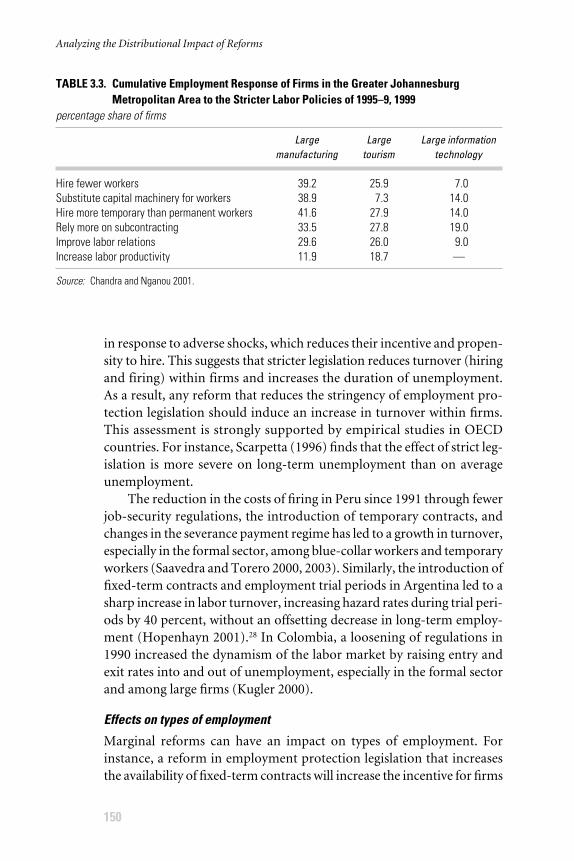
in response to adverse shocks, which reduces their incentive and propen-sity to hire. This suggests that stricter legislation reduces turnover (hiringand firing) within firms and increases the duration of unemployment.As a result, any reform that reduces the stringency of employment pro-tection legislation should induce an increase in turnover within firms.This assessment is strongly supported by empirical studies in OECDcountries. For instance, Scarpetta (1996) finds that the effect of strict leg-islation is more severe on long-term unemployment than on averageunemployment.
The reduction in the costs of firing in Peru since 1991 through fewerjob-security regulations, the introduction of temporary contracts, andchanges in the severance payment regime has led to a growth in turnover,especially in the formal sector, among blue-collar workers and temporaryworkers (Saavedra and Torero 2000, 2003). Similarly, the introduction offixed-term contracts and employment trial periods in Argentina led to asharp increase in labor turnover, increasing hazard rates during trial peri-ods by 40 percent, without an offsetting decrease in long-term employ-ment (Hopenhayn 2001).28 In Colombia, a loosening of regulations in1990 increased the dynamism of the labor market by raising entry andexit rates into and out of unemployment, especially in the formal sectorand among large firms (Kugler 2000).
Effects on types of employment
Marginal reforms can have an impact on types of employment. Forinstance, a reform in employment protection legislation that increasesthe availability of fixed-term contracts will increase the incentive for firms
Analyzing the Distributional Impact of Reforms
150
TABLE 3.3. Cumulative Employment Response of Firms in the Greater Johannesburg Metropolitan Area to the Stricter Labor Policies of 1995–9, 1999
percentage share of firms
Large Large Large informationmanufacturing tourism technology
Hire fewer workers 39.2 25.9 7.0Substitute capital machinery for workers 38.9 7.3 14.0Hire more temporary than permanent workers 41.6 27.9 14.0Rely more on subcontracting 33.5 27.8 19.0Improve labor relations 29.6 26.0 9.0Increase labor productivity 11.9 18.7 —
Source: Chandra and Nganou 2001.
to hire new workers on temporary contracts and wait to lay off employeesuntil the expiration of temporary contracts. Hence, such marginal reformscan lead to the establishment of a dual labor market wherein a stock ofprotected workers hired under a full employment protection regime isaccompanied by a fringe of flexible workers hired on temporary con-tracts. These temporary contracts thus act as a sort of buffer to shocks inthe output market (Blanchard and Landier 2002).
The use of temporary contracts varies across countries, but it is sub-stantial in some cases. For instance, in Spain, the share of workers hiredon temporary contracts is now as high as 30 percent (Dolado, García-Serrano, and Jimeno 2002). The share of temporary contracts in formalsalaried employment in Lima rose from under 20 percent in 1991 to 44 percent in 1997 after the red tape and restrictions on temporary con-tracts were reduced (Saavedra and Torero 2000). In Argentina, the rise inhiring on temporary contracts was associated with a substitution awayfrom longer-term employment (Hopenhayn 2001). In Colombia, grow-ing employment turnover following a relaxation of employment protec-tion legislation resulted in greater reliance on temporary contracts, aswell as less job security for permanent workers (Kugler 2000). Evidenceon large firms, especially manufacturing firms, in the metropolitan areaof Johannesburg also points to a shift to temporary contracts as a resultof the passage of stricter legislation in 1995–9, as shown in Table 3.3. Moregenerally, the introduction of strict legislation in India and Zimbabweappears to have been followed by a substantial decline in the demand foremployees, with a clear causality relation, at least in the case of India(Fallon and Lucas 1991).
Effect on the demographic structure of employment
Similarly, stricter legislative regimes can increase the marginalization ofoutsiders. While average employment is not necessarily directly affectedby strict legislation, stricter employment protection legislation tends tobe associated with fewer jobs for newcomers to the labor market (youth,low-skilled workers, women, and so on). This can be explained partly bythe fact that the value of severance payments rises with wages and withseniority, making it more expensive for firms to dismiss older or morewell paid workers. For instance, in the OECD and in Latin America, morestringent legislation is found to increase youth unemployment more thanaverage unemployment (Heckman and Pagés 2000 and Scarpetta 1996).The evidence for differentiated impacts on men and women is less uni-form. Heckman and Pagés (2000) find that stricter legislation is associ-ated with lower employment rates among women in the OECD, but with
Selected Labor Market Reforms
151
higher employment rates among women in Latin America. Evidence fromChile suggests that stricter regulations reduce the employment opportu-nities of the young and the unskilled (thus, especially unskilled youth).It also finds that stricter regulations may force some workers, particu-larly women and the unskilled, out of wage employment and into self-employment (Montenegro and Pagés 2003).
Effect on formal employment
To the extent that different employers are subject to different rules (eitherbecause of their formal or informal status, or because of their sector),reforms in employment protection legislation can influence the sectoraldistribution of employment. In India, stricter employment protection (infavor of workers) is found to decrease registered manufacturing outputand employment (firms are registered in the formal sector once they reacha certain size) and increase unregistered (informal) manufacturing out-put, with no net effect on total output (Besley and Burgess 2004). Mar-quez (1998) finds that, in Latin America, more stringent protection isassociated with a larger percentage of self-employed workers. Overall,however, the evidence is still mixed on this effect both in the OECD andin Latin America (Heckman and Pagés 2000).
Effects on unemployment
While the evidence suggests that stricter protection legislation has a neg-ative effect on employment, the evidence concerning unemployment isambiguous. Some workers appear to leave the labor market altogetherbecause of reduced employment opportunities.29 For example, theincreased flexibility in hiring and firing introduced in Colombia is esti-mated to have decreased the unemployment rate by between 1.4 and 1.7 percent from the late 1980s to the early 1990s, a period of economicexpansion. However, in contrast, the greater flexibility may also explainpart of the surge in the unemployment rate during the late 1990s, a periodof economic recession (Kugler 2000). A study of the effect of the 1990Bolivian reform shows that the duration of unemployment decreased asa result of more relaxed legislation and that exit rates from unemploy-ment into formal employment (especially into large firms) rose morethan exit rates into informal employment (Kugler 2004).
Effects on wages
While it is difficult to isolate the effect of employment protection legisla-tion on wages, most of the empirical work on wage determinants amongtemporary workers finds unexplained wage differentials. In other words,
Analyzing the Distributional Impact of Reforms
152
for a given tenure, education, gender, occupation, and experience, tem-porary workers receive lower wages. Such residual differentials are con-sistent with the prepayment effect outlined above (OECD 2002).
Effect on productivity
Employment protection legislation increases job security and can there-fore be expected to reduce the incentive for workers to take extra effort,which, in turn, reduces labor productivity. This applies as long as the costof supervision is excessive so that the risk of disciplinary dismissal is lim-ited. The effect of reforms also ultimately depends on the actual enforce-ment of the reform. For instance, the effectiveness of legislation dependspartly on how the norms are interpreted by the courts.
In an indirect way, stricter legislation reduces the reallocation ofhuman capital from ailing sectors to expanding sectors, resulting in aninefficient allocation of labor. More relaxed legislation may allow for abetter allocation of workers among firms since the cost of experimenta-tion with new, potentially better matched workers is lower. This mayhave an impact on average productivity in the economy and on growth.
Strict legislation will also likely hamper the speed at which economiesadjust to shocks. Estimates based on 60 countries for the 1980s and 1990sshow that, in countries where the rule of law is well established (that is,better enforcement), a shift from a low level of job security (20th per-centile of the distribution in the 60 countries) to a high level of job secu-rity (80th percentile) cuts the speed of adjustment to shocks by one-thirdand reduces annual productivity growth by about 1 percent. In contrast,such a shift in countries with poorer enforcement does not have muchimpact on productivity growth (Caballero et al. 2004).
Effect on poverty
To the extent that reforms in employment protection legislation havean impact on types of employment and relative wages, they can beexpected to have an impact on poverty if the people who are affectedare living near the poverty line. The evidence is scarce on this type ofimpact. Besley and Burgess (2004) find that, in India, stricter legislationtends to reduce the size of the formal or registered manufacturing sec-tor, which affects the urban poor. They estimate that poverty wouldhave been 11 percent lower (that is, 520,000 fewer poor) in the state ofWest Bengal if the state had not passed stricter legislation. Conversely,poverty would have been 12 percent higher (that is, 640,000 more poorindividuals) in the state of Andhra Pradesh if the state had not relaxedthe relevant legislation.
Selected Labor Market Reforms
153
Unemployment benefits
In the absence of evaluations of the impact of unemployment benefitsbased on natural experiments, the most solid empirical evaluations of theimpact of the benefits and the relevant reforms have been producedthrough microeconometric studies. An alternative method of assessingbenefit reform at the aggregate level is to use difference-in-differencestechniques to compare labor market performance in reforming and non-reforming countries before and after the policy changes.
Effects of increasing the length and generosity of unemployment benefits
A key predictor related to the baseline transmission mechanism revolvesaround the links between the generosity of unemployment benefits andlong-term unemployment, which is measured as the share in all the un-employed of those who have been unemployed for more than one year.Cross-country tabulations display a positive association between the maxi-mum duration of unemployment benefits and long-term unemployment(Boeri, Layard, and Nickell 2001).30 However, several recent studies sug-gest that the causality may run the other way: governments in countrieswith a higher incidence of long-term unemployment are subject to pres-sure to increase the maximum duration of benefits. Indeed, in the UnitedStates, regional variations in the maximum duration of benefits tend tooccur in parallel with increases in the duration of unemployment in somestates (Card and Levine 2000). Indeed, Lalive, van Ours, and Zweimueller(2002) show that this policy endogeneity may lead one significantly tooverstate the negative effects of benefits on the duration of unemploy-ment. The microeconomic literature can deal more effectively with these“policy endogeneity” problems. It suggests that the duration of un-employment benefits has a strong effect on the flows from unemploymentto employment. The literature draws on so-called duration analysis(Kiefer 1988) and points to the negative effects of the duration of bene-fits on unemployment outflows even when controlling for regional char-acteristics and cyclical conditions (Atkinson and Micklewright 1991;Krueger and Meyer 2002). Similarly, the reduction in the possible dura-tion of unemployment benefits undertaken in Slovenia in 1998 appearsto have had a significant positive effect on the exit rate out of unemploy-ment to employment and to other categories of activity (Van Ours andVodopivec 2005a, 2005b).
Overall, there is little doubt that generous unemployment benefitsincrease the duration of unemployment. Nonetheless, estimates of theeffects of benefit generosity on unemployment duration should be viewed
Analyzing the Distributional Impact of Reforms
154
with caution. The role played by policy endogeneity suggests that theseestimates may be more fruitfully viewed merely as upper bounds to theelasticity of unemployment outflows with respect to benefit generosity.
The argument centered on the key transmission mechanism holdsthat greater benefit generosity is correlated with potential reductions inthe employment rate of groups exhibiting elastic labor supply (via the effectson the incentives for job-seeking) and groups represented by unions (viathe effects of unions on labor demand). In accordance with these predic-tions based on the key transmission mechanism, estimates of aggregateemployment and unemployment equations (Nickell 1997; Blanchard andWolfers 1999; Scarpetta 1999) point to the existence of a mild, but statis-tically significant and positive effect of the generosity of unemploymentbenefits on unemployment. This conclusion seems also to apply to thetransition countries of Europe and Central Asia (Alam et al. 2005).
Evidence supplied through surveys of individuals and householdssuggests that the reservation wage of job-seekers is positively affectedby unemployment benefit receipts (as predicted by the above argumentbased on the transmission mechanism), and this puts upward pressure onwages.31 Estimates of earnings functions also find that the effect of un-employment benefits on wages is positive, although many different chan-nels could generate this result.
Effects of employment on conditional incentives
Evidence related to both the earned income tax credit in the United States(Eissa and Hoynes 1998) and the working family tax credit in the UnitedKingdom (Blundell and Hoynes 2001) indicates that the programs havelowered employment rates among married women with working spouses.The most relevant example in Europe—at least in terms of take-up rates—is the Dutch SPAK measure (see Doudeijns, Einerhand, and Van deMeerendonk 2000), which allows employers to reduce their contribu-tions on low wages.32 The amount of the reduction declines as the wagerises, and the reduction ceases to be available at 115 percent of the statu-tory minimum wage. Evaluations based on general equilibrium modelsof the Dutch economy (De Mooij, Graafland, and Bovenberg 1998) havepredicted a total increase in employment of between 1 and 5 percentamong the low skilled. Evaluations of similar programs in Belgium and France report significant effects on employment. On the basis of indi-vidual data on firms, Crépon and Deplatz (2001) estimate the number ofjobs created at between 255,000 and 670,000. Sneessens and Shadman-Metha (2001) estimate that, in Belgium, a cut of 21 percent in employercontributions for unskilled jobs may increase total employment of the
Selected Labor Market Reforms
155
unskilled by 6.7 percent. All these estimates are based on different esti-mates of demand and supply elasticities.
Effects of employment activation policies
The jury is still out on which employment activation policies work andwhich do not. However, there is a consensus that different categories ofindividuals—youth, married women returning to the labor market, thelong-term unemployed—respond more readily to different activationpolicies. The experimental evidence on activation policies is confined,regrettably, mostly to the United States, and nonexperimental evidenceexists for the United States and some European countries. Nevertheless,for the most part, the picture that emerges is quite consistent and, at a minimum, allows some policies to be ruled out because they are noteffective.33
A key result is that employment activation policies should be differentfor people receiving unemployment insurance and people receiving unem-ployment assistance. This is partially caused by differences in the averagecharacteristics of the two groups of recipients.34 Recipients of unemploy-ment assistance include many older individuals with long unemploymentspells whose employability is questionable. The evidence on how theseindividuals might be helped is disappointing because no strategy seemseffective. To avoid wasting human and financial resources, it is thereforeimportant to test the willingness of these individuals actively to seek work.Hence, the best strategy for recipients of unemployment assistance maybe to promote slots in active labor market programs, such as training programs, and, if necessary, subsidized jobs or job-creation schemes;however, expectations should not be boosted. The strategy should beunderstood mainly as a screening device. A job-seeker’s refusal to partici-pate might be discouraged by providing for reductions in the duration ofunemployment assistance or outright elimination of the benefit.
Australia has experimented the most with policies aimed at helpingthe long-term unemployed. The Australian New Start allowance for thelong-term unemployed emphasized “activity agreements,” which fundedpaid work experience or unpaid volunteer work proposed by the recipient.This was part of a “case management” approach involving greater admini-strative oversight of the long-term unemployed and more frequentinterviews with the public employment service. The strategy provedcostly, and the results were far from encouraging. In 1996, the approachwas scaled back by the new Labor government, and the intervention wasincreasingly decentralized to private and not-for-profit organizations,with premiums for the placement of older workers.
Analyzing the Distributional Impact of Reforms
156
Empirically, activation policies for women returning to the labormarket have been found to be the most successful, especially when theytake the form of assistance in job-seeking, counseling, and trainingdirected at facilitating an immediate return to employment. Successfulpolicies for other groups of unemployment assistance beneficiaries withlimited labor market experience, such as unemployed youth, have provedelusive. In particular, there is evidence that training per se has very littleeffect on this group; constant monitoring and testing of employmentactivity are crucial.
For the young unemployed, the most effective scheme would seemto be the British New Deal, which is the most articulated effort to dealwith this problem to date. Key features of the New Deal are (1) the com-bination of lump-sum wage employment subsidies and assistance in job-seeking and on-the-job training; (2) the screening during the initialfour-month gateway period to separate out individuals who tend to beunemployable and minimize deadweight costs; and (3) a division of theyoung unemployed into two groups according to age and the duration ofthe unemployment spell.
Unemployment insurance recipients are individuals who experiencerelatively short unemployment spells and whose employability (or lackthereof) must generally still be assessed. Activation strategies aimed atthese individuals therefore rely less heavily on employment activationand more on assistance in job-seeking and testing, which have proved tobe among the most effective instruments.
Effects of job-seeking requirements
Evidence demonstrates the usefulness of job-seeking assistance amongwomen and recipients of benefits who have recently become un-employed. Over and above the effects of financial incentives, the Cana-dian Self-Sufficiency Project and the Minnesota Family InvestmentProject in the United States (both targeted at welfare recipients) weredesigned specifically to test the incremental effects of policies aimed atan early reintegration into employment, primarily assistance in job-seeking, then short-term training and job counseling. The incrementaleffects of these policies on employment seem large: up to a 7 percent-age point increase in employment rates in the case of the Self-Sufficiency Project and nearly a 10 percentage point increase in the caseof the Minnesota Family Investment Project. There are also positiveeffects on earnings. Although these estimates should be interpreted asupper bounds, assistance in job-seeking and related activities are start-ing to be regarded as cost effective.
Selected Labor Market Reforms
157
Other experiments conducted in cooperation between several statesand employment services in the United States have achieved considerablecost savings by augmenting job-seeking requirements. Thus, in Switzer-land, the United Kingdom, and the United States, individuals must nowfill out a minimum number of job applications in a given period (usuallydetermined case-by-case by the public employment service). Experimen-tal evidence (mainly from the state of Maryland) shows that job counsel-ing has a substantial effect on outflows from unemployment to jobs.Significantly, most of the increase in exits from unemployment occurredshortly before a compulsory four-day training workshop on job hunting,which represented a rise in the opportunity costs of drawing unemploy-ment benefits. Attendance at the workshop itself did not have a signifi-cant effect on outflow rates. In other words, it was the “help and hassle”approach involved in the initiative that stimulated exits from unemploy-ment, rather than the job-hunting training scheme per se.
CONCLUSIONS
Assessing the potential distributional impacts of labor market interven-tions and reforms in labor market institutions is not a simple task. Thisis due to a number of factors.
First, in evaluating the potential impact of interventions and reformson income distribution, one must distinguish between the distributionof earnings and the distribution of income. The former is defined at thelevel of individuals and by focusing only on employed workers. The lat-ter is usually defined at the level of households and depends on the totallabor income of all household members, plus income from other sources.
At least in the case of the policies described in this chapter, the diffi-culty arises from the fact that the empirical evidence suggests that labormarket policies protect the prospective earnings of workers in the sectorsthat are covered at the expense of employment opportunities in that sec-tor and earning levels in the rest of the economy, that is, the sectors thatare not covered, whether formal or informal. As long as such an imbal-ance exists between earnings and employment opportunities in the cov-ered sector, the risk is that labor market policies may lead to greaterinequality and more poverty. This is particularly true in the case of labormarket policies that are not directly targeted at low-income earners, butit also applies to policies designed to protect the most vulnerable workers,such as workers at minimum wage.
An increase in the minimum wage can have both a positive and anegative effect on inequality in household incomes. First, an increase in
Analyzing the Distributional Impact of Reforms
158
the incomes at the lower end of the range of the formally employed typi-cally tends to reduce inequality in individual earnings. However, it mightalso result in a reduction in employment among low-paid workers, forwhom the minimum wage is binding, or in the transfer of some of theseworkers to the uncovered, lower-pay informal sector. This could increaseinequality in labor incomes both among individuals and at the householdlevel, especially if workers at the minimum wage live in households witha high proportion of low-skilled, potentially low-pay individuals. Theoverall direct effect on income inequality depends on labor market con-ditions, demographics, and household composition. The effects are alsocompounded by indirect changes in the uncovered sector. If labor ismobile across sectors, then the standard covered-uncovered adjustmentmechanisms will come into play, and an increase in the minimum wagewill lead to an increase in earnings inequality.35 In this situation, the over-all impact on the distribution of household incomes will depend on theemployment dynamics operating between the covered and uncoveredsectors, as well as on the impact of the reform on the two segments of thelabor market.
Similarly, reforms of the minimum wage are also expected to have atypically ambiguous impact on the poverty rate. An increase in the mini-mum wage, for example, will usually boost the earnings of low-paidworkers who maintain their jobs, and, ceteris paribus, this will bring thepoverty rate down if the individuals are the only income earners withintheir households or if all low-paid earners within households maintaintheir employment at the prereform level. However, the increase in theminimum wage is also likely to reduce employment in the covered sec-tor, and this will result in lower labor incomes among households if anywage earners in the households lose their jobs as a result of the policy orare forced to transfer to the lower-paying uncovered sector. This mayincrease the vulnerability to poverty of households that are close to thepoverty line.
Thus, the impact of labor market policies and reforms of these poli-cies on the distribution of household incomes and on poverty dependscrucially on the existence of a trade-off between labor market protectionand employment, that is, a trade-off between intervention and efficiency.This is not as clear cut as the advocates of liberalization would like one tobelieve. The arguments presented in this chapter show that both interven-tion and the lack of intervention may lead to inefficient and inequitableoutcomes.
The desirability of a particular sort of labor market interventiontherefore depends crucially on the type and characteristics of the policy.
Selected Labor Market Reforms
159
Some policies and intervention designs generate improvements on bothefficiency and equity grounds; others result in a trade-off between effi-ciency and equity, and still others lead to a definite worsening in bothareas. Similarly, it is unwise to argue in favor of or against a particularreform without careful evaluation of the potential impact of the newpolicy on labor market efficiency, income distribution, and poverty.
This chapter has provided the tools required to conduct such anevaluation by (1) identifying the main channels through which the re-distributive and poverty impacts of three labor market policies—the mini-mum wage, employment protection legislation, and the unemploymentbenefit—affect earnings and household incomes and (2) reviewing theexisting empirical evidence on the magnitude and direction of theimpacts of these policies on each link in the chain. The evidence pointsto a number of cases in which the labor market interventions analyzedhere may have negative effects on income equality and may increasepoverty rather than reducing it. However, this is clearly not the caseacross the board. This leaves policymakers faced with the challenge ofdesigning interventions that strike the right balance between reducingincome inequality and curbing poverty on the one hand, while continu-ing to protect the living standards of workers. This can only be doneeffectively by mastering the factors that lead to the existence of tensionsbetween labor market interventions and employment. It requires policiesthat are at once pro-growth and pro-equity. Some of the innovative poli-cies introduced recently by a number of countries in Central Europe andLatin America to maintain the incomes of the unemployed seem toanswer this challenge. Among these are conditional transfer programsand employment activation programs.
NOTES
1. The theory of the second best assumes that, if one of the conditions neces-sary to achieve Pareto optimality is missing, then the “second best” positioncan only be reached by departing from all the other Paretian conditions.Pareto efficiency is defined as the efficiency of a market that is unable to pro-duce more from the same level of inputs without reducing the output ofanother product.
2. The insider-outsider theory, developed by Lindbeck and Snower (1989),argues that existing workers, insiders, enjoy a relatively advantageous posi-tion and expropriate rents from their employers thanks to the high barriersto employment faced by unemployed and entrant workers, the outsiders.However, in this chapter, “insiders” is used to refer to the workers covered bylabor market regulations, and “outsiders” is used to refer to the unemployed
Analyzing the Distributional Impact of Reforms
160
or to those people working in uncovered jobs in the formal or the informalsectors. This distinction is somewhat better defined than that between for-mal and informal employment.
3. The focus of the chapter is on statutory regulations and interventions. Thisis so despite the fact that, in many countries, these types of policies have beenreplaced through voluntary negotiations and agreements between labor andmanagers; these act in a way very similar to the mandatory steps described.The voluntary agreements are not explicitly analyzed here.
4. Other types of labor market institutions and regulations that are not analyzedhere include labor unions, labor standards, wage-setting laws (other thanminimum wages), collective bargaining, the constraints imposed in the con-text of privatization (for example, no retrenchment), pensions, active labormarket programs (such as public works), the public sector’s role in the labormarket, training and retraining programs, microfinance and unemploymentlending, and payroll taxes.
5. For instance, Scarpetta (1996) finds that the size of the impact of strictemployment protection legislation on unemployment depends on the wage-bargaining system. Such interactions are not systematically reviewed here.
6. For an extensive review of different types of employment protection legislationand the relative advantages, see Betcherman, Luinstra, and Ogawa (2001).
7. This can represent a substantial cost when the period is long. For instance,prior to the 1999 reforms in Brazil, more than 6 percent of all salaried workers(about 2 million workers) filed lawsuits every year, and the average disputetook almost three years. (This was cut in half by the reforms; see World Bank2002.) The number of cases and the length of court hearings vary greatly inthe OECD. Up to 20 percent of layoffs become subjects of court proceedingsin France, with an average dispute lasting over a year (OECD 2004).
8. Of course, these laws only formally apply to workers in the formal economy,which often represents a very small share of the total number of workers.
9. The working poor are those workers who are employed full time and, never-theless, appear to be living close to the poverty line.
10. Fondazione Rodolfo DeBenedetti, http://www.frdb.org.11. Labor market monopsony refers to the situation wherein a dominant employer
is, in essence, a single “buyer” of labor services in a particular segment ofthe labor market. Under this condition of demand-side monopoly, themonopsonist employer pays lower wages and employs less labor than wouldemployers in the case of perfect competition.
12. This distinction is somewhat sharper than that between formal and informallabor markets as highlighted by the theory of labor market duality.
13. This prediction requires that labor mobility be perfect between the two sectors.14. The poverty rate is usually measured as the proportion of individuals whose
incomes are less than a threshold value referred to as the poverty line.15. The best description of this mechanism is contained in the work of
Bentolila and Bertola (1990) and Bertola (1999). Ljungqvist (2002) studies
Selected Labor Market Reforms
161
this transition mechanism through a variety of models and finds that it isquite robust.
16. Spain is the most prominent example in this respect. There, the share ofworkers hired on temporary contracts is now as high as 30 percent (Dolado,García-Serrano, and Jimeno 2002).
17. See Garibaldi and Violante (2002).18. So called from the properties of putty and clay. Putty can be molded as one
might wish before it is baked, but, through baking, putty becomes hardenedclay, and the shape can no longer be altered.
19. When the elasticity of labor demand is larger than that of labor supply, theemployment effect will be larger than the earnings effect.
20. Crépon and Deplatz (2001); De Mooij, Graafland, and Bovenberg (1998);Doudeijns, Einerhand, and Van de Meerendonk (2000); European Com-mission 1999; Sneessens and Shadman-Metha (2001).
21. See, for example, Carneiro (2004) on Brazil.22. Note that this type of equation is econometrically identified only if the firm
is a price-taker in the labor market, so that the monopsonistic model doesnot apply. To insure proper identification, these studies often use a laggedvalue for the minimum wage.
23. Note that this result is coherent with the prediction of the monopsonymodel, since it confirms the greater attachment of youth to their jobs whenwages improve.
24. The three data sets used were the labor force surveys, the British householdpanel survey, and the matched new earning surveys for the period after 1999.
25. See Maloney and Mendez (2004) and Eriksson and Pytlikova (2004).26. For a summary and discussion, see Addison and Teixeira (2003) and Heckman
and Pagés (2003).27. Firms in service industries, particularly in tourism, also reduced their hiring,
as is evident in Table 3.3.28. Additional examples are summarized in Heckman and Pagés (2000).29. See Heckman and Pagés (2003) for a summary of the evidence.30. The best example is probably offered by transatlantic differences in un-
employment rates. These differences can be almost entirely explained bythe differences in long-term unemployment rates. Meanwhile, unemploymentbenefits in Europe are significantly more generous than those in the UnitedStates.
31. The reservation wage is the lowest wage at which a job-seeker would considera job offer.
32. SPAK is short for Specifieke Afdrachtskorting (specific tax rebate).33. For a detailed review of the evidence on this issue, see Betcherman, Olivas,
and Dar (2004).34. Unemployment assistance covers workers who have been unemployed for a
long time and the other individuals without occupation, such as youths withno or limited labor market experience, mothers returning to the labor mar-
Analyzing the Distributional Impact of Reforms
162
ket after exhausting maternity protection, disabled individuals, and older,long-term unemployed who have exhausted unemployment assistance.Unemployment insurance covers other unemployed workers who haveaccumulated enough contributions to be eligible for unemployment bene-fits.
35. The potential negative impact is reduced if there is a lighthouse effect, sincea higher minimum wage leads to an increase in wages in the market, whethercovered or uncovered.
BIBLIOGRAPHY
Abowd, J., F. Framarz, T. Lemieux, and D. Margolis. 1999. “Minimum Wage andYouth Employment in France and the United States.” In Youth Employmentand the Labor Market, ed. D. Blanchflower and R. Freeman, 427–72. Chicago:University of Chicago Press.
Acemoglu, D., and J. Angrist. 2001. “The Consequence of EPL: The Case of theEmployment Disability Act.” Journal of Political Economy 109 (5): 915–57.
Addison, J., and P. Teixeira. 2003. “The Economics of Employment Protection.”Journal of Labor Research 24 (1): 85–129.
Agenor, P. R., and K. El Aynaoui. 2003. “Labor Market Policies and Unemploy-ment in Morocco: A Quantitative Analysis.” Policy Research Working Paper3091, World Bank, Washington, DC.
Aghion, P., and B. Hermalin. 1990. “Legal Restrictions on Private ContractsCan Enhance Efficiency?” Journal of Law, Economics, and Organization 6 (2):381–409.
Agrawal, N. 1995. “Indonesia: Labor Market Policies and International Com-petitiveness.” Policy Research Working Paper 1515, World Bank, Wash-ington, DC.
Alam, A., M. Murthi, R. Yemtsov, E. Murrugarra, N. Dudwick, E. Hamilton, andE. Tiongson. 2005. “Growth, Poverty, and Inequality: Eastern Europe and theFormer Soviet Union.” Washington, DC: Europe and Central Asia Region,World Bank.
Amadeo, E. J., I. S. Gill, and M. C. Neri. 2002. “Assessing the Impact of Regula-tions on Informal Workers in Brazil.” In Crafting Labor Policy: Techniques andLessons from Latin America, ed. I. S. Gill, C. E. Montenegro, and D. Domeland,67–95. New York: Oxford University Press.
Arango, C., and A. Pachon. 2003. “Distributive Effects of Minimum Wages onHousehold Incomes: Colombia 1997–2002.” Unpublished manuscript. Bancode la Republica (Colombia) and World Bank. Cited in World Bank (2006).
Atkinson, A. B., and J. Micklewright. 1991. “Unemployment Compensation andLabor Market Transitions: A Critical Review.” Journal of Economic Literature29 (4): 1679–1727.
Barr, N. 1993. The Economics of the Welfare State. Oxford: Oxford University Press.
Selected Labor Market Reforms
163
Bell, L. A. 1997. “The Impact of Minimum Wages in Mexico and Columbia.”Journal of Labor Economics 15 (3): S102–35.
Bentolila, S., and G. Bertola. 1990. “How Bad is Eurosclerosis.” Review of Eco-nomic Studies 57 (3): 381–402.
Bertola, G. 1999. “Microeconomic Perspectives on Aggregate Labor Markets.” InHandbook of Labor Economics, ed. O. Ashenfelter and D. Card, Vol. 3C, Part 12,Chapter 45, 2985–3028. Amsterdam: Elsevier Science, North-Holland.
Besley, T., and R. Burgess. 2004. “Can Labor Market Regulations Hinder Eco-nomic Performance?: Evidence from India.” Quarterly Journal of Economics119 (1): 91–134.
Betcherman, G., A. Luinstra, and M. Ogawa. 2001. “Labor Market Regulation:International Experience in Promoting Employment and Social Protection.”Social Protection Discussion Paper 0128, Social Protection Department,Human Development Network, World Bank, Washington, DC.
Betcherman, G., K. Olivas, and A. Dar. 2004. “Impacts of Active Labor MarketPrograms: New Evidence from Evaluations with Particular Attention to Devel-oping and Transition Countries.” Social Protection Discussion Paper 0402,Social Protection Department, Human Development Network, World Bank,Washington, DC.
Blanchard, O. 1997. “The Medium Run.” Brookings Papers on Economic Activity1997 (2): 89–158, The Brookings Institution, Washington, DC.
Blanchard, O., and A. Landier. 2002. “The Perverse Effects of Partial Deregu-lation: Fixed Duration Contracts in France.” Economic Journal 112 (480):F214–44.
Blanchard, O., and P. Portugal. 2001. “What Lies behind the UnemploymentRate: Comparison of U.S. and Portugal.” American Economic Review 91 (1):993–1008.
Blanchard, O., and J. Tirole. 2003. “Contours of Employment Protection Reform.”Working Paper Series 03-35, Department of Economics, MassachusettsInstitute of Technology, Cambridge, MA.
Blanchard, O., and J. Wolfers. 1999. “The Role of Shocks and Institutions in theRise of European Unemployment: The Aggregate Evidence.” NBER WorkingPaper 7282, National Bureau of Economic Research, Cambridge, MA.
———. 2000. “The Role of Shocks and Institutions in the Rise of EuropeanUnemployment: The Aggregate Evidence.” Economic Journal 110 (462): 1–33.
Blundell, R., and H. Hoynes. 2001. “Has In-Work Benefit Reform Helped theLabor Market?” NBER Working Paper 8546, National Bureau of EconomicResearch, Cambridge, MA.
Boeri, T. 2000. Structural Change, Welfare Systems, and Labor Reallocation.Oxford: Oxford University Press.
Boeri, T., A. Börsch-Supan, and G. Tabellini. 2001. “Would You Like to Shrinkthe Welfare State?: The Opinions of European Citizens.” Economic Policy16 (32): 7–50.
Analyzing the Distributional Impact of Reforms
164
Boeri, T., J. I. Conde-Ruiz, and V. Galasso. 2003. “Protecting against Labor Mar-ket Risk: Employment Protection or Unemployment Benefits?” CEPR Dis-cussion Paper 3990, Centre for Economic Policy Research, London.
Boeri, T., R. Layard, and S. Nickell. 2001. “Welfare-to-Work and the Fightagainst Long-Term Unemployment.” Research Report 206, Department forEducation and Skills, London.
Boeri, T., and K. Terrell. 2002. “Institutional Determinants of Labor Realloca-tion in Transition.” Journal of Economic Perspectives 16 (1): 51–76.
Botero, J., S. Djankov, R. La Porta, F. Lopez-de-Silanes, and A. Shleifer. 2004.“The Regulation of Labor.” Quarterly Journal of Economics 119 (4): 1339–82.
Brown, C. 1999. “Minimum Wages, Employment, and the Distribution ofIncome.” In Handbook of Labor Economics, ed. O. Ashenfelter and D. Card,Vol. 3B, Part 8, Chapter 32, 2101–63. Amsterdam: Elsevier Science, North-Holland.
Burdett, K., and D. Mortensen. 1998. “Wage Differentials, Employer Size, andUnemployment.” International Economic Review 39 (2): 257–73.
Caballero, R., K. Cowan, E. Engel, and A. Micco. 2004. “Effective Labor Regula-tion and Microeconomic Flexibility.” NBER Working Paper 10744, NationalBureau of Economic Research, Cambridge, MA.
Caballero, R., and M. Hammour. 1998. “Jobless Growth: Appropriability, FactorSubstitution, and Unemployment.” Carnegie-Rochester Conference Series onPublic Policy 48: 51–94, Elsevier, New York.
Calderón, C., A. Chong, and R. Valdés. 2004. “Labor Market Regulations andIncome Inequality: Evidence for a Panel of Countries.” Research DepartmentWorking Paper 514, Inter-American Development Bank, Washington, DC.
Cameron, L. A., and V. Alatas. 2003. “The Impact of Minimum Wages onEmployment in a Low-Income Country: An Evaluation Using the Difference-in Differences Approach.” Policy Research Working Paper 2985, World Bank,Washington, DC.
Card, D., and A. Krueger. 1994. “Minimum Wage and Employment: A CaseStudy of the Fast-Food Industry in New Jersey and Pennsylvania.” AmericanEconomic Review 84 (4): 772–93.
———. 1995. Myth and Measurement: The New Economics of Minimum Wage.Princeton, NJ: Princeton University Press.
Card, D., and P. Levine. 2000. “Extended Benefits and the Duration of UI Spells:Evidence from the New Jersey Extended Benefit Program.” Journal of PublicEconomics 78 (1–2): 107–38.
Carneiro, F. G. 2004. “Are Minimum Wages to Blame for Informality in theLabour Market?” Empirica 31 (4): 295–306.
Castillo-Freeman, A. J., and R. B. Freeman. 1992. “When the Minimum WageReally Bites: The Effects of the U.S.-Level Minimum Wage on Puerto Rico.”In Immigration and the Work Force: Economic Consequences for the UnitedStates and Source Areas, ed. G. J. Borjas and R. B. Freeman, 177–211. Chicago:University of Chicago Press.
Selected Labor Market Reforms
165
Chandra, V., and J. P. Nganou. 2001. “Obstacles to Formal Employment Cre-ation in South Africa: Evidence from Recent Firm Surveys.” Paper presentedat the Development Policy Research Unit and Friedrich Ebert FoundationConference, “Labor Markets and Poverty in South Africa,” Johannesburg,November 15–16.
Crépon, B., and R. Deplatz. 2001. “Une nouvelle évaluation des effets des allége-ments des charges sociales sur les bas salaires.” Economie et Statistique 348 (8):2001–8.
Daveri, F., and G. Tabellini. 2000. “Unemployment, Growth, and Taxation inIndustrial Countries.” Economic Policy 15 (30): 47–104.
De Mooij, R. A., J. Graafland, and A. L. Bovenberg. 1998. “Tax Reform and theDutch Labor Market in the 21st Century.” CPB Report 1998 (2): 19–24, Bureaufor Economic Policy Analysis, The Hague.
DiNardo, J., N. M. Fortin, and T. Lemieux. 1996. “Labor Market Institutions andthe Distribution of Wages, 1973–1992: A Semi-Parametric Approach.” Econo-metrica 64 (5): 1001–44.
Dolado, J. J., C. García-Serrano, and J. F. Jimeno. 2002. “Drawing Lessons fromthe Boom of Temporary Jobs in Spain.” Economic Journal 112 (480): 270–95.
Doudeijns, M., M. Einerhand, and A. van de Meerendonk. 2000. “FinancialIncentives to Take Up Low-Paid Work: An International Comparison of theRole of Tax and Benefit Systems.” In Policy Measures for Low Wage Employ-ment in Europe, ed. W. Salverda, C. Lucifora, and B. Nolan, 43–66. Cheltenham,United Kingdom: Edward Elgar.
Eissa, N., and J. B. Hoynes. 1998. “The Earned Income Tax Credit and the LaborSupply of Married Couples.” NBER Working Paper 6856, National Bureau ofEconomic Research, Cambridge, MA.
Eriksson, T., and M. Pytlikova. 2004. “Firm-Level Consequences of LargeMinimum-Wage Increases in the Czech and Slovak Republic.” Labor 18 (1):75–103.
European Commission. 1999. “Energy in Europe: Economic Foundations forEnergy Policy.” The Shared Analysis Project, European Commission, Brussels.
Falk, A., E. Fehr, and C. Zehnder. 2005. “The Behavioral Effect of MinimumWages.” CEPR Discussion Paper 5115, Centre for Economic Policy Research,London.
Fallon, P. R., and R. E. B. Lucas. 1991. “The Impact of Changes in Job SecurityRegulations in India and Zimbabwe.” World Bank Economic Review 5 (3):395–413.
Feliciano, Z. M. 1998. “Does Minimum Wage Affect Employment in Mexico?”Eastern Economic Journal 24 (2): 165–80.
Fields, G. S. 2005. “A Guide to Multisector Labor Market Models.” Social Pro-tection Discussion Paper 0505, Social Protection Department, HumanDevelopment Network, World Bank, Washington, DC.
Forteza, A., and M. Rama. 2000. “Labor Market Rigidity and the Success of Eco-nomic Reforms across More than a Hundred Countries.” Policy ResearchWorking Paper 2521, World Bank, Washington, DC.
Analyzing the Distributional Impact of Reforms
166
Freeman, R. B. 1996. “The Minimum Wage as a Redistributive Tool.” EconomicJournal 106 (436): 639–49.
Garibaldi, P., and G. L. Violante. 2002. “Firing Tax and Severance Payment inSearch Economies: A Comparison.” CEPR Discussion Paper 3636, Centre forEconomic Policy Research, London.
Gill, I. S., C. E. Montenegro, and D. Domeland, eds. 2002. Crafting Labor Policy:Techniques and Lessons from Latin America. New York: Oxford UniversityPress.
Gindling, T. H., and K. Terrell. 2004a. “Minimum Wages and the Wages of For-mal and Informal Sector Workers in Costa Rica.” William Davidson InstituteWorking Papers Series 2004–647, William Davidson Institute, Stephen M.Ross Business School, University of Michigan, Ann Arbor, MI.
———. 2004b. “Minimum Wages, Inequality, and Globalization.” IZA DiscussionPaper 1160, Institute for the Study of Labor, Bonn.
Goldberg, P. K., and N. Pavcnik. 2003. “The Response of the Informal Sector toTrade Liberalization.” Journal of Development Economics 72 (2): 463–96.
Gramlich, E. 1976. “Impact of Minimum Wages on other Wages, Employment,and Family Incomes.” Brookings Papers on Economic Activity 1976 (2): 409–51,The Brookings Institution, Washington, DC.
Hamermesh, D. S. 1993. Labor Demand. Princeton, NJ: Princeton UniversityPress.
Heckman, J., and C. Pagés. 2000. “The Cost of Job Security Regulation: Evidencefrom Latin American Labor Markets.” NBER Working Paper 7773, NationalBureau of Economic Research, Cambridge, MA.
———. 2003. “Law and Employment: Lessons from Latin America and theCaribbean.” NBER Working Paper 10129, National Bureau of EconomicResearch, Cambridge, MA.
Hopenhayn, H. 2001. “Labor Market Policies and Employment Duration: TheEffects of Labor Market Reform in Argentina.” Research Network WorkingPaper R–407, Inter-American Development Bank, Washington, DC.
Ichino, A., and R. T. Riphahn. 2005. “The Effect of Employment Protection onWorker Effort: A Comparison of Absenteeism during and after Probation.”Journal of the European Economic Association 3 (1): 120–43.
Jones, P. 1998. “The Impact of the Minimum Wage Legislation in DevelopingCountries where Coverage is Incomplete.” Working Paper 98–2, Institute ofEconomics and Statistics, Oxford, United Kingdom.
Kiefer, N. M. 1988. “Economic Duration Data and Hazard Functions.” Journalof Economic Literature 26 (2): 646–79.
Krueger, A., and B. Meyer. 2002. “Labor Supply Effects of Social Insurance.” NBERWorking Paper 9014, National Bureau of Economic Research, Cambridge, MA.
Kugler, A. 2000. “The Incidence of Job Security Regulations on Labor MarketFlexibility and Compliance in Colombia: Evidence from the 1990 Reform.”Research Network Working Paper R–393, Inter-American Development Bank,Washington, DC.
Selected Labor Market Reforms
167
———. 2004. “The Effect of Job Security Regulations on Labor Market Flexibil-ity: Evidence from the Colombian Labor Market.” In Law and Employment:Lessons from Latin America and the Caribbean, ed. J. Heckman and C. Pagés,183–228. Chicago: University of Chicago Press.
Lalive, R., J. C. van Ours, and J. Zweimueller. 2002. “The Effect of Benefit Sanc-tions on the Duration of Unemployment.” IEW Working Paper 110, Insti-tute for Empirical Research in Economics, University of Zurich, Zurich,Switzerland.
Lazear, E. 1990. “Job Security Provisions and Employment.” Quarterly Journal ofEconomics 105 (3): 699–726.
Lee, D. 1999. “Wage Inequality in the United States during the 1980s: RisingDispersion or Falling Minimum Wage?” Quarterly Journal of Economics114 (3): 977–1023.
Lemos, S. 2004a. “The Effects of the Minimum Wage across the Formal andInformal Sectors in Brazil.” IZA Discussion Paper 1089, Institute for theStudy of Labor (IZA), Bonn.
———. 2004b. “Are Wage and Employment Effects Robust to AlternativeMinimum Wage Variables?” IZA Discussion Paper 1079, Institute for theStudy of Labor, Bonn.
Lindbeck, A., and D. Snower. 1989. The Insider-Outsider Theory of Unemploy-ment. Cambridge, MA: The MIT Press.
Ljungqvist, L. 2002. “How Do Lay-Off Costs Affect Employment?” EconomicJournal 112 (482): 829–53.
Lustig, N., and D. McLeod. 1996. “Minimum Wages and Poverty in DevelopingCountries: Some Empirical Evidence.” Brookings Discussion Papers in Inter-national Economics 125, The Brookings Institution, Washington, DC.
Maloney, W. F., and J. N. Mendez. 2003. “Measuring the Impact of MinimumWages: Evidence from Latin America.” NBER Working Paper 9800, NationalBureau of Economic Research, Cambridge MA.
———. 2004. “Measuring the Impact of Minimum Wages: Evidence from LatinAmerica.” In Law and Employment: Lessons from Latin American and theCaribbean, ed. J. Heckman and C. Pagés, 109–30. Chicago: University ofChicago Press.
Manning, A. 2004. Monopsony in Motion: Imperfect Competition in Labor Markets.Princeton, NJ: Princeton University Press.
Marquez, G. 1998. “Proteccion al empleo y funcionamiento del Mercado detrabajo: una aproximacion comparative.” Unpublished manuscript, Inter-American Development Bank, Washington, DC. Cited in Heckman andPagés (2000).
Mason, A. D., and J. Baptist. 1996. “How Important are Labor Markets to theWelfare of the Poor in Indonesia?” Policy Research Working Paper 1665,World Bank, Washington, DC.
Masters, A. 1999. “Wage Posting in Two-Sided Search and the Minimum Wage.”International Economic Review 40 (4): 809–26.
Analyzing the Distributional Impact of Reforms
168
Mincer, J. 1976. “Unemployment Effects of Minimum Wages.” Journal of PoliticalEconomy 84 (4): 87–104.
Mondino, G., and S. Montoya. 2004. “The Effect of Labor Market Regulationson Employment Decisions by Firms: Empirical Evidence for Argentina.” InLaw and Employment: Lessons from Latin America and the Caribbean,ed. J. Heckman and C. Pagés, 351–99. Chicago: University of Chicago Press.
Montenegro, C. E., and C. Pagés. 2003. “Who Benefits from Labor Market Reg-ulations?: Chile 1960–1998.” NBER Working Paper 9850, National Bureau ofEconomic Research, Cambridge, MA.
Neumark, D., and W. Wascher. 1997. “Do Minimum Wages Fight Poverty?”NBER Working Paper 6127, National Bureau of Economic Research,Cambridge, MA.
———. 2000. “Minimum Wages: A Case Study of the Fast Foods Industry inNew Jersey and Pennsylvania; Comment.” American Economic Review 90 (5):1362–96.
Nickell, S. 1997. “Unemployment and Labor Market Rigidities: Europe versusNorth America.” Journal of Economic Perspectives 11 (3): 55–74.
Nickell, S., and R. Layard. 1999. “Labor Market Institutions and EconomicPerformance.” In Handbook of Labor Economics, ed. O. Ashenfelter and D. Card, Vol. 3C, Part 12, Chapter 46, 3029–84. Amsterdam: Elsevier Science,North-Holland.
OECD (Organisation for Economic Co-operation and Development). 1998.“Making the Most of the Minimum: Statutory Minimum Wages, Employ-ment, and Poverty.” OECD Employment Outlook 1998, Chapter 2, 31–77,Organisation for Economic Co-operation and Development, Paris.
———. 2002. OECD Employment Outlook 2002, Organisation for EconomicCo-operation and Development, Paris.
———. 2004. OECD Employment Outlook 2004, Organisation for EconomicCo-operation and Development, Paris.
Peltzman, S. 1976. “Toward a More General Theory of Regulation.” Journal ofLaw and Economics 19 (2): 211–40.
Portugal, P., and A. R. Cardoso. 2001. “Disentangling the Minimum Wage Puzzle:An Analysis of Job Accession and Separation from a Longitudinal MatchedEmployer-Employee Data Set.” CEPR Discussion Paper 2844, Centre for Eco-nomic Policy Research, London.
Rama, P. 1996. “The Consequences of Doubling the Minimum Wage: The Case of Indonesia.” Policy Research Working Paper 1643, World Bank,Washington, DC.
Riboud, M., C. Sánchez-Parámo, and C. Silva-Jáuregui. 2002. “Does Eurosclero-sis Matter?: Institutional Reform and Labor Market Performance in Centraland Eastern European Countries in the 1990s.” Social Protection DiscussionPaper 0202, Social Protection Department, Human Development Network,World Bank, Washington, DC.
Selected Labor Market Reforms
169
Rodrigues, E. A. S., and N. A. Menezes-Filho. 2004. “Minimum Wage andInequality in Brazil and Mexico, 1981–2000: A Semiparametric Approach.”Research Department, Banco Central do Brasil, and Department of Economics,University of São Paulo. http://www.bcu.gub.uy/autoriza/peiees/jor/2004/iees03j3290804.pdf.
Rutkowski, J. 2003a. “Rapid Labor Reallocation with a Stagnant UnemploymentPoor: The Puzzle of the Labor Market in Lithuania.” Labor and EmploymentWorking Paper 2946, World Bank, Washington, DC.
———. 2003b. “Why is Unemployment so High in Bulgaria?” Labor andEmployment Working Paper 3017, World Bank, Washington, DC.
———. 2003c. “Does Strict Employment Protection Discourage Job Creation?:Evidence from Croatia.” Labor and Employment Working Paper 3104, WorldBank, Washington, DC.
Saavedra, J., and M. Torero. 2000. “Labor Market Reforms and Their Impacton Formal Labor Demand and Job Market Turnover: The Case of Peru.”Research Network Working Paper R-394, Inter-American DevelopmentBank, Washington, DC.
———. 2004. “Labor Market Reforms and their Impact over Formal LaborDemand.” In Law and Employment: Lessons from Latin America and theCaribbean, ed. J. Heckman and C. Pagés, 131–82. Chicago: University ofChicago Press.
Saint Paul, G. 2000. The Political Economy of Labor Market Institutions. Oxford:Oxford University Press.
Scarpetta, S. 1996. “Assessing the Role of Labor Market Policies and Institu-tional Settings on Unemployment: A Cross-Country Study.” OECD Eco-nomic Studies 26 (1): 43–98, Organisation for Economic Co-operation andDevelopment, Paris.
———. 1999. “Labor Market Reforms and Unemployment: Lessons from the Experience of the OECD Countries.” Research Department WorkingPaper 382, Inter-American Development Bank, Washington, DC.
Schneider, F., and R. Klinglmair. 2004. “Shadow Economies around the World:What Do We Know?” Working Paper 0403, Department of Economics,Johannes Kepler University of Linz, Linz, Austria.
Sneessens, H., and F. Shadman-Metha. 2001. “Chocs asymétriques et persistancedu chômage: Wallonie et Flandre comparées.” IRES Discussion Paper 2001–024,Institut de Recherches Economiques et Sociales, Université Catholique deLouvain, Louvain, Belgium.
Stewart, M. B. 2004. “The Impact of the Introduction of the UK Minimum Wageon the Employment Probabilities of Low-Wage Workers.” Journal of theEuropean Economic Association 2 (1): 67–97.
Stigler, G. J. 1946. “The Economics of Minimum Wage Legislation.” AmericanEconomic Review 36 (3): 358–65.
Sutherland, H. 2001. “The National Minimum Wage and In-Work Poverty.”Microsimulation Unit Discussion Paper MU0102, Department of AppliedEconomics, University of Cambridge, Cambridge.
Analyzing the Distributional Impact of Reforms
170
Van Ours, J. C., and M. Vodopivec. 2005a. “How Changes in Benefits EntitlementAffect the Duration of Unemployment.” Center Discussion Paper 2005–30,Tilburg University, Tilburg, The Netherlands.
Van Ours, J. C., and M. Vodopivec. 2005b. “Changes in Benefit Entitlementand Job Finding: The Slovenian Experiment.” http://europa.eu.int/comm/economy_finance/events/2005/bxlworkshop0305/doc11en.pdf.
Vodopivec, M., and D. Raju. 2002. “Income Support Systems for the Un-employed: Issues and Options.” Social Protection Discussion Paper 0214,Social Protection Department, Human Development Network, WorldBank, Washington, DC.
Welch, F. 1976. “Minimum Wage Legislation in the United States.” In Evaluat-ing the Labor Market Effects of Social Programs, ed. O. Ashenfelter and J. Blum,1–38. Princeton, NJ: Princeton University Press.
World Bank. 2002. “Brazil Jobs Report.” Sector Report 24480-BR, Latin Americaand the Caribbean Region, World Bank, Washington, DC.
———. 2005. “Pro-Poor Growth in the 1990s: Lessons and Insights from14 Countries.” Report, Operationalizing Pro-Poor Growth Research Program,World Bank, Washington, DC.
———. 2006. “Minimum Wages in Latin America and the Caribbean: TheImpact on Employment, Inequality, and Poverty.” Draft manuscript, LatinAmerica and the Caribbean Region, World Bank, Washington, DC.
Selected Labor Market Reforms
171


Characteristics of the Minimum Wagein Selected Countries
173
1A N N E X

TABLE 3A.1. Characteristics of the Minimum Wage in Selected Countries
Country Minimum wage–setting procedure Coverage: scope
Europe and Central AsiaAlbania
Bulgaria
Cyprus
Czech Republic
Estonia
Hungary
Latvia
Lithuania
Analyzing the Distributional Impact of Reforms
174
The national minimum wage rate is set inan order of the government.
The government sets the national minimumwage rate by decree.
There is no national minimum wage. Thegovernment sets minimum wage rates forselected low-wage occupations. Theseminimum rates are adjusted yearly.
The government stipulates the nationalminimum wage rate in an official decree. Italso sets 12 minimum tariff rates for differ-ent grades. The minimum wage is adjustedyearly.
The minimum wage and the procedures toamend it are set by the government basedon a bipartite agreement between workerand employer organizations.
The minimum wage rate is determined bythe government. The National Labor Coun-cil is consulted during the process, and min-imum wage rates are subject to itsagreement.
Minimum wage rates are determined by thegovernment.
The government determines minimumwage levels according to the recommenda-tions of a tripartite council.
The national minimum wagerate applies to all workers.
The national minimum wagerate applies to all workersand employees.
Only workers in the occu-pations specified by thegovernment.
The Labor Code applies to allemployees except those whowork for a company regis-tered in the Czech Republic,but work and reside in a for-eign country. Employees of acompany with foreign capitalinterest may be excluded ifthe government specifies aregulatory framework thatgoverns them.
The minimum wage rateapplies to all workersemployed under an employ-ment contract.
Minimum wage regulationsapply to all, including publicservice officials otherwiseexempt from the Labor Code.They apply also to employeesof Hungarian employers work-ing abroad, but not to foreignemployers and their employ-ees working in Hungary.
The Labor Law of 2001 covers all employees andemployers.
Regulations apply to all work-ers employed in Lithuania orposted abroad by theiremployers. They do not applyto foreign employers whopost employees to Lithuania.

Annex 1: Characteristics of the Minimum Wage in Selected Countries
175
Coverage: variations in minimum wage, by categories Level(s) a
• The government may establish a lower minimum wage rate for youngworkers to facilitate their entry into the workforce.
• During an apprentice’s training period, which cannot exceed sixmonths, the wage may not be less than 90% of the minimum wage.
• Piece-rate workers.
• The minimum wage order applies to shop assistants, clerks, nursingaids, and child-care workers.
• A minimum wage rate that is slightly lower than the regular rateapplies during the first six months of employment with a newemployer.
• When employers do not sign a collective agreement with trade unions,they must pay their employees at least the minimum tariffs for thegrade of the employees.
• Employees between 18 and 21 years of age are entitled to 90% of theminimum wage for a six-month period. Employees under 18 are enti-tled to 80% of the minimum wage.
• Employees with partial disability pensions are entitled to 75% of theminimum wage. Employees with full disability pensions and disabledjuveniles without pensions are entitled to 50% of the minimum wage.
• The Labor Code provides that separate rates may be set for a specificfield or area. In fact, no separate rates have been set.
• Minors, disabled employees, and part-time employees may receiveless than the minimum wage only if a derogation is issued by theNational Labor Council. No such derogation has been issued.
• A separate minimum hourly rate is established for workers under 18 years of age.
• The legislation provides that specific wage rates may be set for cate-gories of employees and different branches of the economy. In fact, nospecific rates have been set.
PPP$195.27 per month.
PPP$213.02 per month.
US$618.00 per monthfor the first six months.US$657.60 per monthafter the first sixmonths.
PPP$466.48 per month.
PPP$384.75 per month.
PPP$420.80 per month.
PPP$335.61 per month.
PPP$313.73 per month.
(continued )
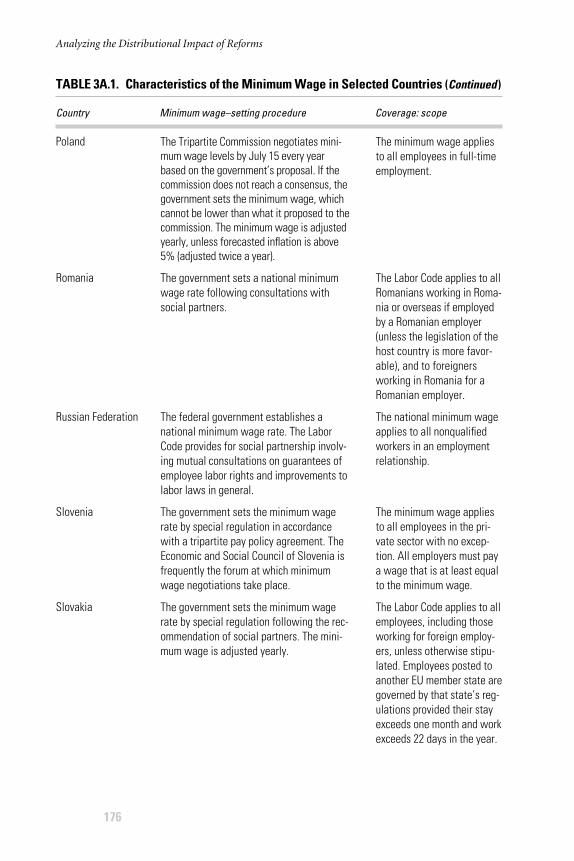
Analyzing the Distributional Impact of Reforms
176
Poland
Romania
Russian Federation
Slovenia
Slovakia
The Tripartite Commission negotiates mini-mum wage levels by July 15 every yearbased on the government’s proposal. If thecommission does not reach a consensus, thegovernment sets the minimum wage, whichcannot be lower than what it proposed to thecommission. The minimum wage is adjustedyearly, unless forecasted inflation is above5% (adjusted twice a year).
The government sets a national minimumwage rate following consultations withsocial partners.
The federal government establishes anational minimum wage rate. The LaborCode provides for social partnership involv-ing mutual consultations on guarantees ofemployee labor rights and improvements tolabor laws in general.
The government sets the minimum wagerate by special regulation in accordancewith a tripartite pay policy agreement. TheEconomic and Social Council of Slovenia isfrequently the forum at which minimumwage negotiations take place.
The government sets the minimum wagerate by special regulation following the rec-ommendation of social partners. The mini-mum wage is adjusted yearly.
The minimum wage appliesto all employees in full-timeemployment.
The Labor Code applies to allRomanians working in Roma-nia or overseas if employedby a Romanian employer(unless the legislation of thehost country is more favor-able), and to foreignersworking in Romania for aRomanian employer.
The national minimum wageapplies to all nonqualifiedworkers in an employmentrelationship.
The minimum wage appliesto all employees in the pri-vate sector with no excep-tion. All employers must paya wage that is at least equalto the minimum wage.
The Labor Code applies to allemployees, including thoseworking for foreign employ-ers, unless otherwise stipu-lated. Employees posted toanother EU member state aregoverned by that state’s reg-ulations provided their stayexceeds one month and workexceeds 22 days in the year.
TABLE 3A.1. Characteristics of the Minimum Wage in Selected Countries (Continued )
Country Minimum wage–setting procedure Coverage: scope
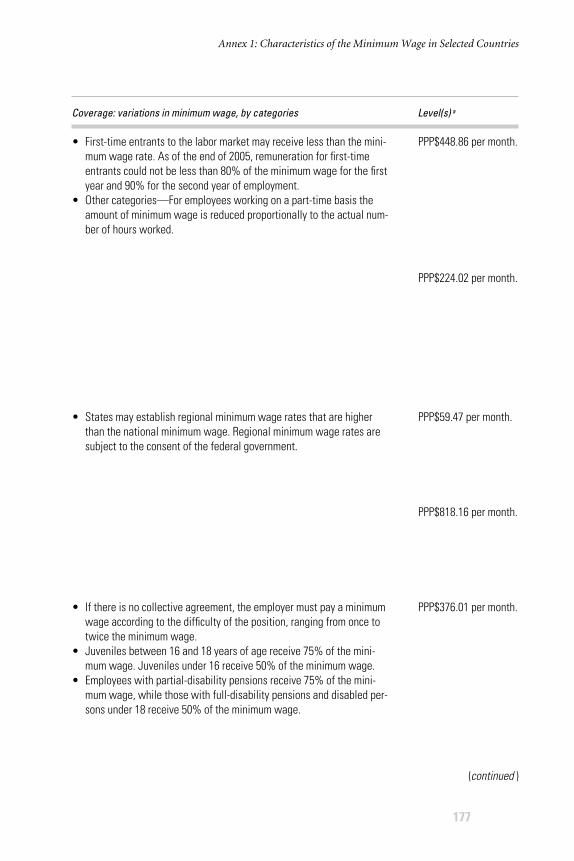
Annex 1: Characteristics of the Minimum Wage in Selected Countries
177
Coverage: variations in minimum wage, by categories Level(s) a
• First-time entrants to the labor market may receive less than the mini-mum wage rate. As of the end of 2005, remuneration for first-timeentrants could not be less than 80% of the minimum wage for the firstyear and 90% for the second year of employment.
• Other categories—For employees working on a part-time basis theamount of minimum wage is reduced proportionally to the actual num-ber of hours worked.
• States may establish regional minimum wage rates that are higherthan the national minimum wage. Regional minimum wage rates aresubject to the consent of the federal government.
• If there is no collective agreement, the employer must pay a minimumwage according to the difficulty of the position, ranging from once totwice the minimum wage.
• Juveniles between 16 and 18 years of age receive 75% of the mini-mum wage. Juveniles under 16 receive 50% of the minimum wage.
• Employees with partial-disability pensions receive 75% of the mini-mum wage, while those with full-disability pensions and disabled per-sons under 18 receive 50% of the minimum wage.
PPP$448.86 per month.
PPP$224.02 per month.
PPP$59.47 per month.
PPP$818.16 per month.
PPP$376.01 per month.
(continued )

Analyzing the Distributional Impact of Reforms
178
Turkey
AfricaAngola
Botswana
Burkina Faso
Cape Verde
Chad
Minimum wage rates are set by the Mini-mum Wage–Setting Board. The rate is sup-posed to be adjusted every two years. Inpractice, rates have been adjusted every 6 to 12 months.
The minimum wage is set by decree of theCouncil of Ministers based upon the pro-posal made by the minister of protection,labor, and finance.
Minimum wage rates are set by sector. Theminister of labor must consult the MinimumWage Advisory Board when adjusting orsetting rates for trade or industry that mayrequire a statutory minimum wage rate, butis not obliged to accept the board’s recom-mendations. Additionally, the minister mustpublish a notice in the Official Gazetteannouncing the intention to alter ratesbefore any adjustment is made. In practice,the rates are adjusted each year.
The government determines one minimumwage rate for nonagricultural workers andone minimum wage rate for agriculturalworkers after receiving the opinion of theLabor Advisory Commission.
There is currently no minimum wage inCape Verde.
The 1996 Labor Code provides for minimumwages to be determined in agreement withorganizations representing employers andworkers. In practice, minimum wage rateshave not been adjusted since 1994.
The provisions of the LaborAct concerning the minimumwage apply to all employees.
All workers are covered byminimum wage regulations.The government may excludeworkers covered by a collec-tive agreement signed withinsix months preceding theissue of the decree settingthe minimum wage.
Minimum wage rates applyonly to workers in the sectorsset forth in the EmploymentAct, 1982. Unless the minis-ter of labor issues a specificregulation, government offi-cials are not covered by anyminimum wage rate order.
Minimum wage provisionsapply to all workers except those employed in public administration and apprentices.
The minimum wage appliesto all workers.
TABLE 3A.1. Characteristics of the Minimum Wage in Selected Countries (Continued )
Country Minimum wage–setting procedure Coverage: scope

Annex 1: Characteristics of the Minimum Wage in Selected Countries
179
Coverage: variations in minimum wage, by categories Level(s) a
• There is a lower minimum wage rate for workers younger than 16 yearsof age. The minimum wage rate is currently TL378,000,000 per month(US$251.85) for employees younger than 16.
• The legislation provides that the minimum wage rates may be set bysector or by territorial region. However, as of 2003, only one nationalminimum wage rate had been established.
• The minister of labor sets minimum wage rates for night watchmen.• The minister of labor may establish minimum wage rates for building
and construction; exploration and quarrying industry; garage and motortrade; road transport industry; hotel, catering, and entertainment trade;manufacturing, service, and repair trade; and wholesale and retail dis-tribution trade.
• Disabled persons to whom a wage order applies or their prospectiveemployers may apply for a permit authorizing them to be paid less thanthe minimum wage rate.
• Piece-rate workers must receive wages that are proportional to thosethat would be received by a full-time worker.
• Minimum wage rates vary according to occupation and seniority.• Separate minimum wage rates have been established for agricultural
workers and nonagricultural workers.• Workers between 14 and 18 years of age who are not working under a
contract of apprenticeship may not receive less than 80% of the rele-vant minimum wage rate.
• The amount paid to a piece-rate worker must be proportional to what aworker paid per hour would receive for the same work.
PPP$590.93 per monthfor employees 16 yearsof age and above.
US$50 per month.
PPP$0.86 per hour fornight watchmen.PPP$1.02 per hour forworkers in trades setforth in the Employ-ment Act other thanthe retail distributiontrade.
PPP$0.89 per hour foragricultural workers.PPP$0.97 per hour for nonagriculturalworkers.
PPP$171.45 per monthfor nonagriculturalworkers.PPP$173.06 per monthfor agricultural workers.
(continued )
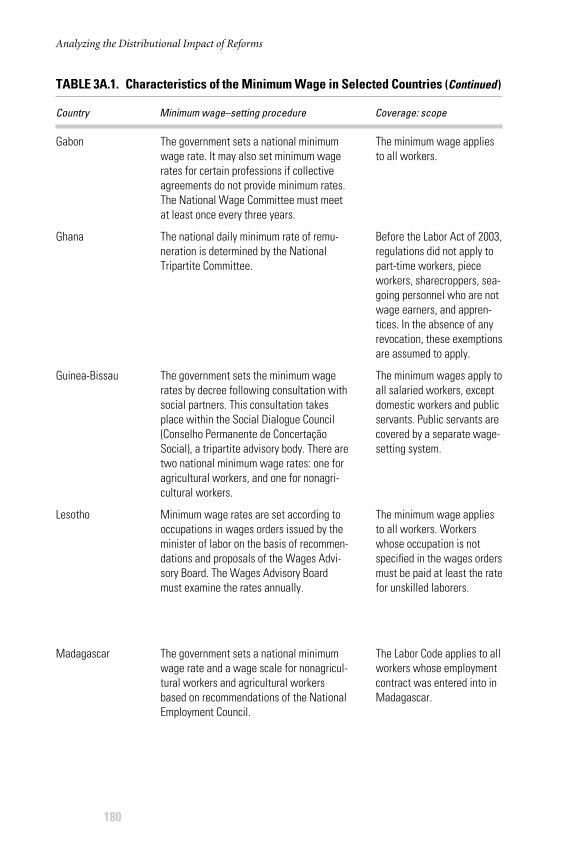
Analyzing the Distributional Impact of Reforms
180
Gabon
Ghana
Guinea-Bissau
Lesotho
Madagascar
The government sets a national minimumwage rate. It may also set minimum wagerates for certain professions if collectiveagreements do not provide minimum rates.The National Wage Committee must meetat least once every three years.
The national daily minimum rate of remu-neration is determined by the National Tripartite Committee.
The government sets the minimum wagerates by decree following consultation withsocial partners. This consultation takesplace within the Social Dialogue Council(Conselho Permanente de ConcertaçãoSocial), a tripartite advisory body. There aretwo national minimum wage rates: one foragricultural workers, and one for nonagri-cultural workers.
Minimum wage rates are set according tooccupations in wages orders issued by theminister of labor on the basis of recommen-dations and proposals of the Wages Advi-sory Board. The Wages Advisory Boardmust examine the rates annually.
The government sets a national minimumwage rate and a wage scale for nonagricul-tural workers and agricultural workersbased on recommendations of the NationalEmployment Council.
The minimum wage appliesto all workers.
Before the Labor Act of 2003,regulations did not apply topart-time workers, pieceworkers, sharecroppers, sea-going personnel who are notwage earners, and appren-tices. In the absence of anyrevocation, these exemptionsare assumed to apply.
The minimum wages apply toall salaried workers, exceptdomestic workers and publicservants. Public servants arecovered by a separate wage-setting system.
The minimum wage appliesto all workers. Workerswhose occupation is notspecified in the wages ordersmust be paid at least the ratefor unskilled laborers.
The Labor Code applies to allworkers whose employmentcontract was entered into inMadagascar.
TABLE 3A.1. Characteristics of the Minimum Wage in Selected Countries (Continued )
Country Minimum wage–setting procedure Coverage: scope

Annex 1: Characteristics of the Minimum Wage in Selected Countries
181
Coverage: Variations in minimum wage, by categories Level(s) a
• Workers paid on a piece-rate basis must be paid at a rate that aworker of average capabilities working normally would be paid.
• The minister of labor may issue a permit excluding a person affectedby some type of infirmity, physical injury, or disability from the legislative provisions concerning minimum wage.
• The law provides that different national minimum wages can be set bysector.
• An employee under the age of 16 shall be paid no less than 60% of thenational minimum rate. An employee between the age of 16 and 18shall be paid a rate not less than 80% of the national minimum rate. Aminor with more than six months of employment in the same activityshall be paid the full minimum rate.
• Minimum wage rates have been established for the following occupa-tions: drivers; hammer mill operators; junior clerks; machine operators;machine attendants; messengers; receptionists; shop assistants; telephone operators; ungraded artisans; unskilled laborers; waiters;trainee weavers and sewing machine workers; watchmen; domesticworkers; and copy-typists.
• Workers employed by small businesses whose occupation is not speci-fied in a wages order must be paid at least the minimum wage rate forsmall businesses, which is lower than the rate for unskilled laborers.
• Wage rates are set on a wage scale that allows for rates to vary inaccordance with level of seniority and professional category.
• Rates paid to piece workers must be such that an average workerworking at a normal rate receives the same wage as workers beingpaid according to the time worked.
PPP$111.35 per month.
PPP$7.69 per day.
PPP$25.00, plus onebag of rice per month.
PPP$105 per month fordomestic workers.PPP$210.5 per monthfor workers in smallbusinesses.PPP$310.50 per monthfor unskilled laborers.PPP$595.50 per monthfor drivers.
PPP$70.4 per monthfor nonagriculturalworkers.PPP$80.63 per monthfor agriculturalworkers.
(continued )
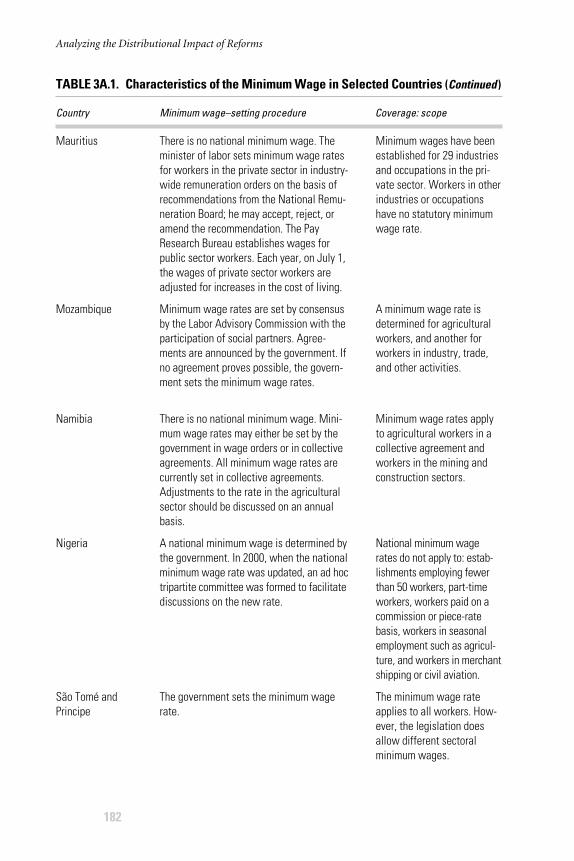
Analyzing the Distributional Impact of Reforms
182
Mauritius
Mozambique
Namibia
Nigeria
São Tomé and Principe
There is no national minimum wage. Theminister of labor sets minimum wage ratesfor workers in the private sector in industry-wide remuneration orders on the basis ofrecommendations from the National Remu-neration Board; he may accept, reject, oramend the recommendation. The PayResearch Bureau establishes wages forpublic sector workers. Each year, on July 1,the wages of private sector workers areadjusted for increases in the cost of living.
Minimum wage rates are set by consensusby the Labor Advisory Commission with theparticipation of social partners. Agree-ments are announced by the government. Ifno agreement proves possible, the govern-ment sets the minimum wage rates.
There is no national minimum wage. Mini-mum wage rates may either be set by thegovernment in wage orders or in collectiveagreements. All minimum wage rates arecurrently set in collective agreements.Adjustments to the rate in the agriculturalsector should be discussed on an annualbasis.
A national minimum wage is determined bythe government. In 2000, when the nationalminimum wage rate was updated, an ad hoctripartite committee was formed to facilitatediscussions on the new rate.
The government sets the minimum wagerate.
Minimum wages have beenestablished for 29 industriesand occupations in the pri-vate sector. Workers in otherindustries or occupationshave no statutory minimumwage rate.
A minimum wage rate isdetermined for agriculturalworkers, and another forworkers in industry, trade,and other activities.
Minimum wage rates applyto agricultural workers in acollective agreement andworkers in the mining andconstruction sectors.
National minimum wagerates do not apply to: estab-lishments employing fewerthan 50 workers, part-timeworkers, workers paid on acommission or piece-ratebasis, workers in seasonalemployment such as agricul-ture, and workers in merchantshipping or civil aviation.
The minimum wage rateapplies to all workers. How-ever, the legislation doesallow different sectoral minimum wages.
TABLE 3A.1. Characteristics of the Minimum Wage in Selected Countries (Continued )
Country Minimum wage–setting procedure Coverage: scope
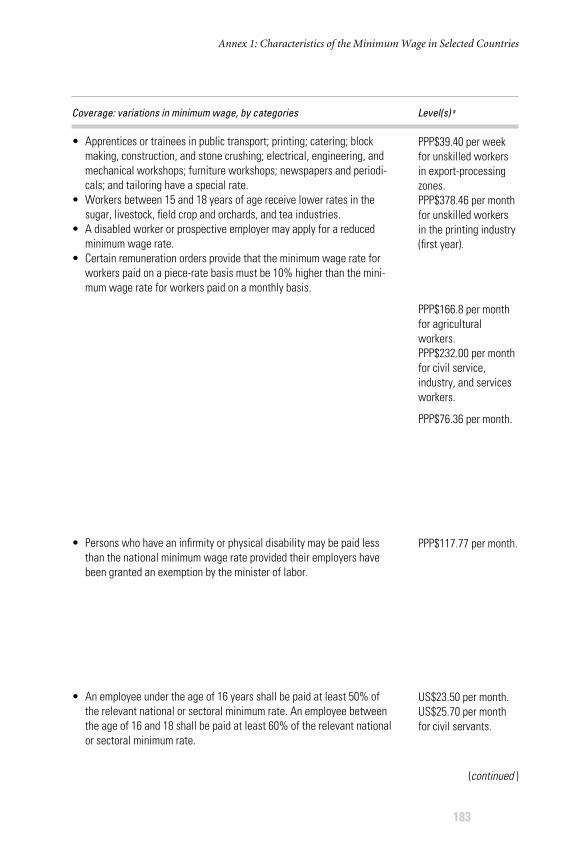
Annex 1: Characteristics of the Minimum Wage in Selected Countries
183
• Apprentices or trainees in public transport; printing; catering; blockmaking, construction, and stone crushing; electrical, engineering, andmechanical workshops; furniture workshops; newspapers and periodi-cals; and tailoring have a special rate.
• Workers between 15 and 18 years of age receive lower rates in thesugar, livestock, field crop and orchards, and tea industries.
• A disabled worker or prospective employer may apply for a reducedminimum wage rate.
• Certain remuneration orders provide that the minimum wage rate forworkers paid on a piece-rate basis must be 10% higher than the mini-mum wage rate for workers paid on a monthly basis.
• Persons who have an infirmity or physical disability may be paid lessthan the national minimum wage rate provided their employers havebeen granted an exemption by the minister of labor.
• An employee under the age of 16 years shall be paid at least 50% ofthe relevant national or sectoral minimum rate. An employee betweenthe age of 16 and 18 shall be paid at least 60% of the relevant nationalor sectoral minimum rate.
PPP$39.40 per weekfor unskilled workersin export-processingzones.PPP$378.46 per monthfor unskilled workersin the printing industry(first year).
PPP$166.8 per monthfor agriculturalworkers.PPP$232.00 per monthfor civil service,industry, and servicesworkers.
PPP$76.36 per month.
PPP$117.77 per month.
US$23.50 per month.US$25.70 per monthfor civil servants.
Coverage: variations in minimum wage, by categories Level(s) a
(continued )

Analyzing the Distributional Impact of Reforms
184
Senegal
South Africa
East Asia and the PacificCambodia
China
There are national minimum wage rates fornonagricultural workers and agriculturalworkers. In addition, minimum wage rateshigher than these rates can be set by jointcommittees for sectors covered by collec-tive agreements.
A dual system of minimum wage–settinghas been established. The government mayset rates for certain sectors in sectoraldeterminations, following recommenda-tions of the Employment Conditions Com-mission. In addition, minimum wage ratesmay be determined in collective agree-ments. Most of the sectoral determinationspredetermine increases (or link them to theconsumer price index) for the subsequentthree years.
The Ministry of Labor sets a guaranteedminimum wage based on recommendationsmade by the Labor Advisory Committee.
The government is responsible for imple-menting a system of regional minimumwage rates; there is no national minimumwage rate. Standards are stipulated byprovincial, regional, and municipal govern-ments and reported to the State Council forconsent. They are adjusted at least onceevery two years.
The minimum wage rates foragricultural and nonagricul-tural workers apply to allworkers.
The Basic Conditions ofEmployment Act applies to allemployees and employers,except members of theNational Defense Force, theNational Intelligence Agency,and the Secret Service,unpaid volunteers working forcharitable organizations, andpersons employed on seavessels. Sectoral determina-tions may not apply to work-ers already bound bycollective agreements.
The Labor Code applies to allprofessional, charitable, andeducational enterprises. Itdoes not apply to judges;permanent public servants;members of the police, army,military forces, air and mar-itime transportation person-nel (governed by a separatestatute); and domesticworkers.
The provisions concerningminimum wages apply toenterprises, private nonen-terprise entities, individualindustrial and commercialhouseholds, and the laborerswho have formed a laborrelationship with them.
TABLE 3A.1. Characteristics of the Minimum Wage in Selected Countries (Continued )
Country Minimum wage–setting procedure Coverage: scope
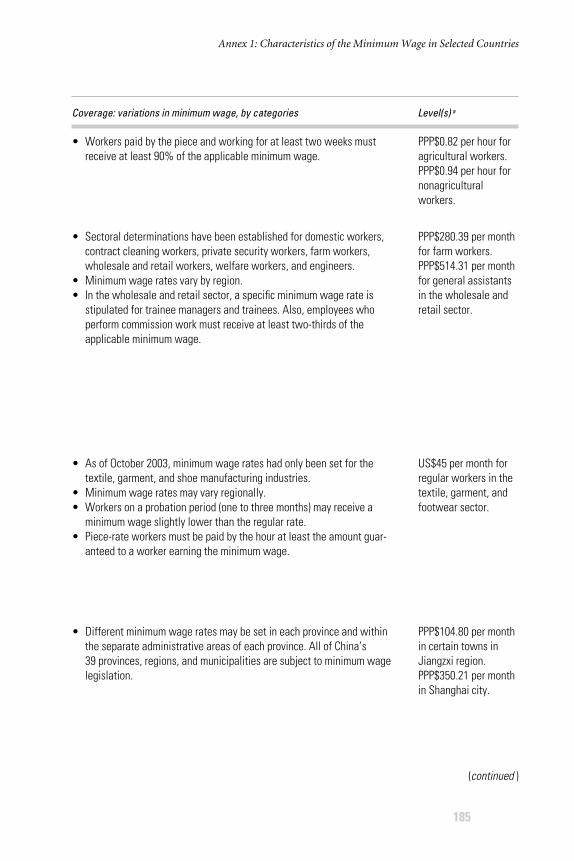
Annex 1: Characteristics of the Minimum Wage in Selected Countries
185
• Workers paid by the piece and working for at least two weeks mustreceive at least 90% of the applicable minimum wage.
• Sectoral determinations have been established for domestic workers,contract cleaning workers, private security workers, farm workers,wholesale and retail workers, welfare workers, and engineers.
• Minimum wage rates vary by region.• In the wholesale and retail sector, a specific minimum wage rate is
stipulated for trainee managers and trainees. Also, employees whoperform commission work must receive at least two-thirds of theapplicable minimum wage.
• As of October 2003, minimum wage rates had only been set for thetextile, garment, and shoe manufacturing industries.
• Minimum wage rates may vary regionally.• Workers on a probation period (one to three months) may receive a
minimum wage slightly lower than the regular rate.• Piece-rate workers must be paid by the hour at least the amount guar-
anteed to a worker earning the minimum wage.
• Different minimum wage rates may be set in each province and withinthe separate administrative areas of each province. All of China’s 39 provinces, regions, and municipalities are subject to minimum wagelegislation.
PPP$0.82 per hour foragricultural workers.PPP$0.94 per hour fornonagriculturalworkers.
PPP$280.39 per monthfor farm workers.PPP$514.31 per monthfor general assistantsin the wholesale andretail sector.
US$45 per month forregular workers in thetextile, garment, andfootwear sector.
PPP$104.80 per monthin certain towns inJiangzxi region.PPP$350.21 per monthin Shanghai city.
Coverage: variations in minimum wage, by categories Level(s) a
(continued )

Analyzing the Distributional Impact of Reforms
186
Fiji
Indonesia
Korea, Republic of
Lao PDR
There is no national minimum wage in Fiji.The government may establish WagesCouncils for groups of workers if no collec-tive bargaining mechanism is in place.Wages Councils make wage regulation pro-posals to the minister of labor who mayenact the proposal as an order. Minimumwages for sectors of the workforce not cov-ered by Wages Councils are determined incollective agreements.
The governor of each province sets mini-mum wage rates for the respective provinceor regency. The Law on Manpower Affairsprovided that a National Wage Council,Provincial Wage Councils, and District/CityWage Councils should be established todevelop a national wage system. Minimumwages are reviewed by each province on ayearly basis.
The minister of labor sets the national mini-mum wage each year, following the Mini-mum Wage Council’s proposal. If theminister of labor does not agree with thewage proposal, but two-thirds of the Coun-cil support it, the minister must adopt theproposal. The minister of labor publishesthe rate proposals, and representatives ofworkers or employers may raise objectionswithin 10 days of publication.
The Labor Act of 1994 states that the govern-ment or other relevant body will establishminimum wage rates for each region.
Only workers in sectors cov-ered by Wages Councils areentitled to statutory mini-mum wage rates.
All workers are covered byminimum wage regulationsexcept for domestic workers.The legislation provides forexceptions for companiesunable to pay minimumwage rates.
The minimum wage appliesto all workers, exceptdomestic workers and busi-nesses using only relativesliving together. An employermay obtain permission toexclude certain workers fromminimum wage provisions incases of disability, probation(a maximum of threemonths), training, or forworkers engaged in surveil-lance or intermittent work.
The Labor Act applies onlyto workers in the formalsector. The Act does notapply to civil servantsemployed in state adminis-trative and technical ser-vices, national defense, orpublic order.
TABLE 3A.1. Characteristics of the Minimum Wage in Selected Countries (Continued )
Country Minimum wage–setting procedure Coverage: scope

Annex 1: Characteristics of the Minimum Wage in Selected Countries
187
• Rates are set for the building, civil, and engineering trade; wholesaleand retail trade; hotel and catering trade; road transport; mining andquarrying industries; saw milling and logging industry; printing trades;garment industry; and manufacturing industry.
• All apprentices are entitled to minimum hourly rates in accordancewith the number of years of apprenticeship completed.
• A few industries have set separate rates for workers under 18.• A disabled worker, employer, or prospective employer may apply for a
reduced minimum wage rate to apply to the worker.• The minimum wage is increased by 25% for casual workers.
• Many provinces have set a basic minimum wage that applies to allsectors. However, provinces are entitled to set separate minimumwages for each sector on the basis of agreements between corporateorganizations and worker unions or labor federations.
• Workers on probation must be paid the minimum wage.• Piece-rate workers, contractors, and freelancing daily workers are cov-
ered if they are employed for one month or more.
• Separate minimum wage rates may be set for seamen.• Workers under the age of 18 employed for less than six months should
receive 90% of the applicable minimum wage rate.• Workers with a disability may be excluded from minimum wage
protection.• Piece-rate workers must receive hourly wage rates equivalent to the
minimum wage rate. The Minimum Wage Act stipulates that a sepa-rate minimum wage rate may be determined for piece workers. Nodecrees in this regard have yet been made.
• The legislation also applies to contractors, for whom the minimumwage rate shall be determined according to a certain unit of output orachievement.
• Workers on a probationary period must receive at least 90% of theapplicable minimum wage (for a maximum of one or two months).
• Workers may only be paid on a piece-rate basis if the government orrelevant body has not established a minimum wage rate for a specificregion, or if the employer allows workers to bring and do supplemen-tary work outside their labor unit.
PPP$1.31 per hour forlearners in the gar-ment industry.PPP$2.16 per hour forworkers in printingtrades.
PPP$113.88 per monthin East Java.PPP$255.06 per monthin the province ofJakarta.
PPP$674.74 per month.
PPP$46.19 per month.
Coverage: variations in minimum wage, by categories Level(s) a
(continued )
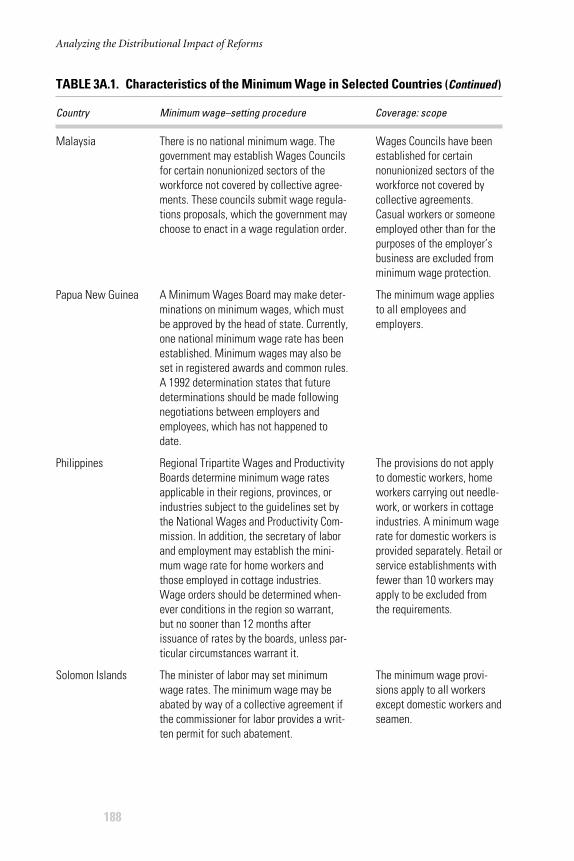
Analyzing the Distributional Impact of Reforms
188
Malaysia
Papua New Guinea
Philippines
Solomon Islands
There is no national minimum wage. Thegovernment may establish Wages Councilsfor certain nonunionized sectors of theworkforce not covered by collective agree-ments. These councils submit wage regula-tions proposals, which the government maychoose to enact in a wage regulation order.
A Minimum Wages Board may make deter-minations on minimum wages, which mustbe approved by the head of state. Currently,one national minimum wage rate has beenestablished. Minimum wages may also beset in registered awards and common rules.A 1992 determination states that futuredeterminations should be made followingnegotiations between employers andemployees, which has not happened todate.
Regional Tripartite Wages and ProductivityBoards determine minimum wage ratesapplicable in their regions, provinces, orindustries subject to the guidelines set bythe National Wages and Productivity Com-mission. In addition, the secretary of laborand employment may establish the mini-mum wage rate for home workers andthose employed in cottage industries.Wage orders should be determined when-ever conditions in the region so warrant,but no sooner than 12 months afterissuance of rates by the boards, unless par-ticular circumstances warrant it.
The minister of labor may set minimumwage rates. The minimum wage may beabated by way of a collective agreement ifthe commissioner for labor provides a writ-ten permit for such abatement.
Wages Councils have beenestablished for certainnonunionized sectors of theworkforce not covered bycollective agreements.Casual workers or someoneemployed other than for thepurposes of the employer’sbusiness are excluded fromminimum wage protection.
The minimum wage appliesto all employees andemployers.
The provisions do not applyto domestic workers, homeworkers carrying out needle-work, or workers in cottageindustries. A minimum wagerate for domestic workers isprovided separately. Retail orservice establishments withfewer than 10 workers mayapply to be excluded fromthe requirements.
The minimum wage provi-sions apply to all workersexcept domestic workers andseamen.
TABLE 3A.1. Characteristics of the Minimum Wage in Selected Countries (Continued )
Country Minimum wage–setting procedure Coverage: scope

Annex 1: Characteristics of the Minimum Wage in Selected Countries
189
• Minimum wage rates are set for workers in the catering and hotel sec-tor and for stevedores, cinema workers, and shop assistants.
• For shop assistants, two regions have been identified with differentrates, and specific minimum wages rates have been set for apprentices.
• Workers in the catering and hotel sector and shop assistants receivedifferent minimum wage rates if between 14 and 16 or 16 and 18.
• An employer or prospective employer of a disabled person may applyfor a reduced minimum wage to the relevant Wages Council.
• New entrants to the workforce between 16 and 21 years of age areentitled to 75% of the national minimum wage rate.
• Domestic workers are covered by specific wage rates.• The regional boards set minimum wage rates for at least two categories:
agricultural and nonagricultural workers. There are also specific rates forhospital workers in 7 regions; retail/service workers in 12 regions; cottageworkers in 10 regions; and school workers in 3 regions.
• Apprentices receive at least 75% of the applicable minimum wage forthe first six months.
• Disabled workers receive at least 75% of the minimum wage.• Workers paid by output must not receive less than the applicable
minimum wage.
• A separate rate is set for the fishing and agriculture sectors.• Disabled workers may apply for an exemption from minimum wage pro-
visions, and this would lead to the setting of the applicable wage rate.
PPP$94.98 per monthfor cinema workers.PPP$153.19 per monthfor shop assistants incertain urban districts.
PPP$28.12 per week.
PPP$8.24 per day forretail and service work-ers in selected areas.PPP$21.41 per day fornonagricultural work-ers in the NationalCapital Region.
PPP$0.47 per hour forthe fishing and agricul-tural plantation sector.PPP$0.58 per hour forall other sectors.
Coverage: variations in minimum wage, by categories Level(s) a
(continued )
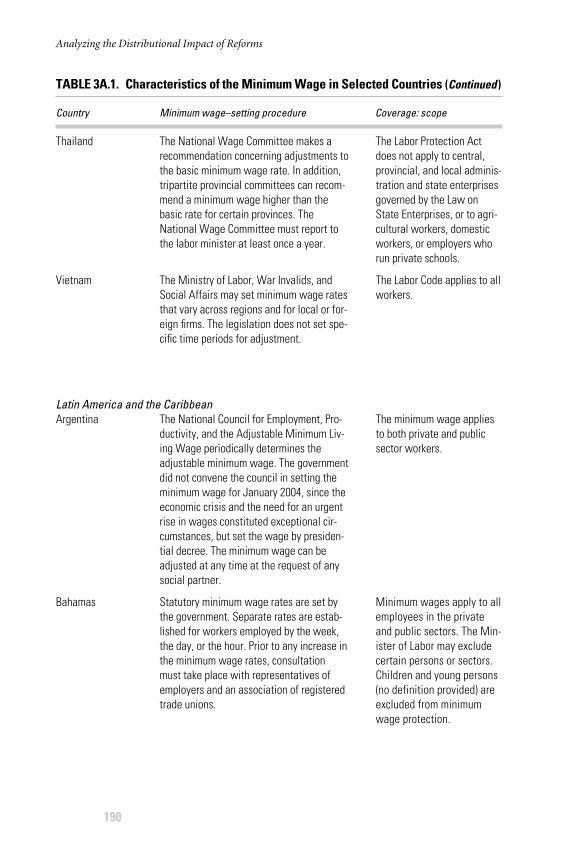
Analyzing the Distributional Impact of Reforms
190
Thailand
Vietnam
Latin America and the CaribbeanArgentina
Bahamas
The National Wage Committee makes arecommendation concerning adjustments tothe basic minimum wage rate. In addition,tripartite provincial committees can recom-mend a minimum wage higher than thebasic rate for certain provinces. TheNational Wage Committee must report tothe labor minister at least once a year.
The Ministry of Labor, War Invalids, andSocial Affairs may set minimum wage ratesthat vary across regions and for local or for-eign firms. The legislation does not set spe-cific time periods for adjustment.
The National Council for Employment, Pro-ductivity, and the Adjustable Minimum Liv-ing Wage periodically determines theadjustable minimum wage. The governmentdid not convene the council in setting theminimum wage for January 2004, since theeconomic crisis and the need for an urgentrise in wages constituted exceptional cir-cumstances, but set the wage by presiden-tial decree. The minimum wage can beadjusted at any time at the request of anysocial partner.
Statutory minimum wage rates are set bythe government. Separate rates are estab-lished for workers employed by the week,the day, or the hour. Prior to any increase inthe minimum wage rates, consultationmust take place with representatives ofemployers and an association of registeredtrade unions.
The Labor Protection Actdoes not apply to central,provincial, and local adminis-tration and state enterprisesgoverned by the Law onState Enterprises, or to agri-cultural workers, domesticworkers, or employers whorun private schools.
The Labor Code applies to allworkers.
The minimum wage appliesto both private and publicsector workers.
Minimum wages apply to allemployees in the privateand public sectors. The Min-ister of Labor may excludecertain persons or sectors.Children and young persons(no definition provided) areexcluded from minimumwage protection.
TABLE 3A.1. Characteristics of the Minimum Wage in Selected Countries (Continued )
Country Minimum wage–setting procedure Coverage: scope

Annex 1: Characteristics of the Minimum Wage in Selected Countries
191
• Minimum wage rates have been established for certain provinces thatare higher than the basic minimum wage rate.
• Two rates are set, for local and foreign-invested enterprises.• Apprentices and trainees must receive at least 70% of the applicable
wage rate for an employee performing the same job.• Employees on a trial period must receive at least 70% of the applicable
wage rate for the relevant rank of the job.• Piece-rate workers may be paid wages according to the number of
items produced.
• The remuneration of home workers is determined by parity commission.• Minimum wages for domestic workers are set by the Ministry of Labor
and Social Security Resolution.• A specific minimum wage rate, which may not be lower than the
national minimum wage rate, may be set for agricultural workers bythe executive.
• Apprentices, minors, and disabled workers may receive a minimumwage lower than the national rate for adult workers.
From PPP$10.53 perday to PPP$13.38 per day.
PPP$96.97 per monthfor workers in localenterprises.PPP$209.32 per monthfor workers in foreign-invested enterprises inHanoi City and Ho ChiMinh City.
PPP$531.81 per month.
PPP$157.89 per week.
Coverage: variations in minimum wage, by categories Level(s) a
(continued )
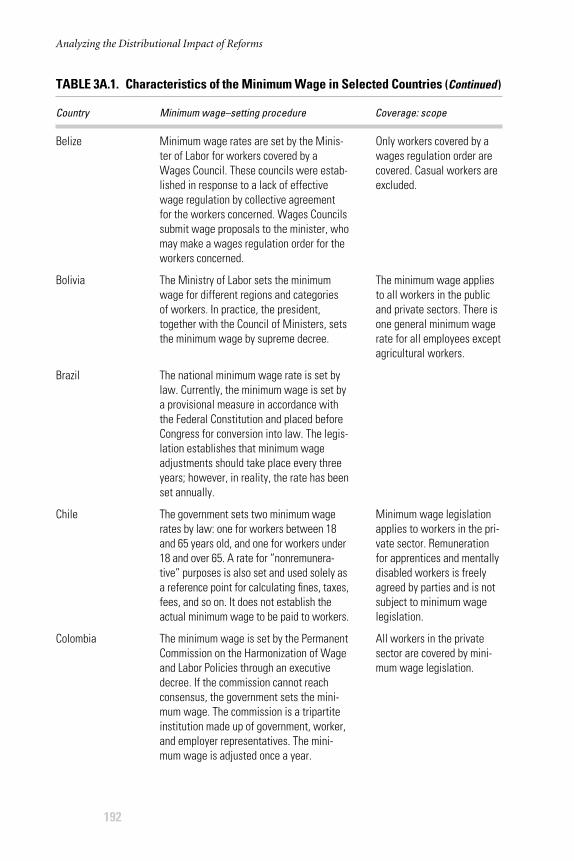
Analyzing the Distributional Impact of Reforms
192
Belize
Bolivia
Brazil
Chile
Colombia
Minimum wage rates are set by the Minis-ter of Labor for workers covered by aWages Council. These councils were estab-lished in response to a lack of effectivewage regulation by collective agreementfor the workers concerned. Wages Councilssubmit wage proposals to the minister, whomay make a wages regulation order for theworkers concerned.
The Ministry of Labor sets the minimumwage for different regions and categoriesof workers. In practice, the president,together with the Council of Ministers, setsthe minimum wage by supreme decree.
The national minimum wage rate is set bylaw. Currently, the minimum wage is set bya provisional measure in accordance withthe Federal Constitution and placed beforeCongress for conversion into law. The legis-lation establishes that minimum wageadjustments should take place every threeyears; however, in reality, the rate has beenset annually.
The government sets two minimum wagerates by law: one for workers between 18and 65 years old, and one for workers under18 and over 65. A rate for “nonremunera-tive” purposes is also set and used solely asa reference point for calculating fines, taxes,fees, and so on. It does not establish theactual minimum wage to be paid to workers.
The minimum wage is set by the PermanentCommission on the Harmonization of Wageand Labor Policies through an executivedecree. If the commission cannot reachconsensus, the government sets the mini-mum wage. The commission is a tripartiteinstitution made up of government, worker,and employer representatives. The mini-mum wage is adjusted once a year.
Only workers covered by awages regulation order arecovered. Casual workers areexcluded.
The minimum wage appliesto all workers in the publicand private sectors. There isone general minimum wagerate for all employees exceptagricultural workers.
Minimum wage legislationapplies to workers in the pri-vate sector. Remunerationfor apprentices and mentallydisabled workers is freelyagreed by parties and is notsubject to minimum wagelegislation.
All workers in the privatesector are covered by mini-mum wage legislation.
TABLE 3A.1. Characteristics of the Minimum Wage in Selected Countries (Continued )
Country Minimum wage–setting procedure Coverage: scope
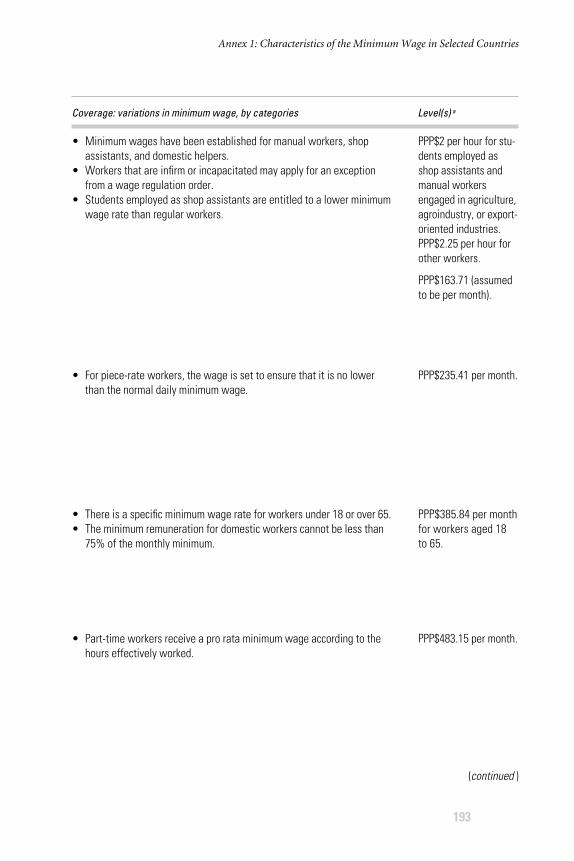
Annex 1: Characteristics of the Minimum Wage in Selected Countries
193
• Minimum wages have been established for manual workers, shopassistants, and domestic helpers.
• Workers that are infirm or incapacitated may apply for an exceptionfrom a wage regulation order.
• Students employed as shop assistants are entitled to a lower minimumwage rate than regular workers.
• For piece-rate workers, the wage is set to ensure that it is no lowerthan the normal daily minimum wage.
• There is a specific minimum wage rate for workers under 18 or over 65.• The minimum remuneration for domestic workers cannot be less than
75% of the monthly minimum.
• Part-time workers receive a pro rata minimum wage according to thehours effectively worked.
PPP$2 per hour for stu-dents employed asshop assistants andmanual workersengaged in agriculture,agroindustry, or export-oriented industries.PPP$2.25 per hour forother workers.
PPP$163.71 (assumedto be per month).
PPP$235.41 per month.
PPP$385.84 per monthfor workers aged 18 to 65.
PPP$483.15 per month.
Coverage: variations in minimum wage, by categories Level(s) a
(continued )

Analyzing the Distributional Impact of Reforms
194
Costa Rica
Cuba
Dominican Republic
Ecuador
The National Wage Council sets minimumwages by sector and occupation for work-ers in the private sector through executivedecrees. The council’s proposal for adjust-ments is sent every year to the Ministry ofLabor for comment, and the final decision ismade by the council. In addition, minimumwages can be revised at any time duringthe year at the request of 5 employers or15 workers.
Minimum wages are set by the Council ofMinisters in consultation with the centralunion of workers.
Minimum wages for private sector workersare set by occupation and sector by theNational Salary Committee, which adjustsminimum wages at least every two years.In principle, the minimum wages cannot bechanged within the first year of validity.However, if the employers or the workersprove that a certain minimum wage rateimpairs one of the social partners andcauses detriment to the national economy,the committee may adjust the rate. Theminimum wage for public sector workers isset directly by executive decree.
The government, through the NationalWage Council, sets minimum wages forworkers in the private sector and the gen-eral “vital” minimum wage rate, which isused as a reference point for calculatingfines, taxes, fees, and so on. The NationalWage Council is a tripartite institutionmade up of three representatives: one eachfrom government, employers, and workers.In case the National Wage Council cannotreach a consensus, the Ministry of Laborsets the minimum wage rates. Minimumwages are updated yearly.
General rates tend to applyto workers in occupationsrequiring a professional qual-ification and vary accordingto qualification. Sectoralrates are set for nonqualified,partially qualified, and spe-cialist workers. Occupationalrates are defined by theNational Wage Council in its“Occupational Profiles.”
All workers are covered byminimum wage legislation.
Minimum wages are set byoccupation and sector.
Minimum wage rates applyto all workers in the privatesector and are set by sectorand occupation.
TABLE 3A.1. Characteristics of the Minimum Wage in Selected Countries (Continued )
Country Minimum wage–setting procedure Coverage: scope

Annex 1: Characteristics of the Minimum Wage in Selected Countries
195
• Rates vary by sector and occupation.• Minimum wage rates for youth are no less than 50% of the relevant
minimum wage rate during the first year of employment and no lessthan 75% during the second year.
• Workers carrying out dangerous or unhealthy work are entitled to anhourly minimum wage equivalent to one-sixth of the daily minimumwage for nonqualified workers set by sector.
• Piece-rate workers cannot be paid less than what a worker would havereceived if working an ordinary working day.
• Minimum wage rates vary by sector and by occupation. They are set forlaborers, administrative and service workers, technicians, and managers.
• The minimum wage for part-time workers is proportional to the timeworked.
• A minimum wage rate is set for the agricultural sector.
• Minimum wages are set for workers operating heavy machinery, elec-tricians, painters, carpenters, and plumbers.
• Minimum wages are set for agriculture; hotels, restaurants, bars, cafesand other food service establishments; the construction industry; thesugar industry; and sectors that do not have a specific rate. In certainsectors, minimum wage rates depend on the size of a company and thenature of the business.
• Minimum wage rates are set in accordance with production for the fol-lowing occupations: carpenters, electricians, plumbers, painters, brick-layers, and heavy-machine operators in agriculture.
• Minimum wages for part-time workers shall be calculated on a prorata basis.
• The remuneration for apprentices cannot be less than the minimumwage and should be calculated according to the hours of training.
• Minimum wage rates are determined for the industry, agriculture, andtextile sectors. The minimum wage rate for the industry and agriculturesectors is also applicable for other workers. The rate set for the textilesector is slightly lower.
• Remuneration for apprentices cannot be less than 80% of the remuner-ation paid to an adult performing a similar work.
• Part-time workers are paid the equivalent of the applicable minimumwage rate on a pro rata basis.
PPP$345.35 per monthfor domestic workers.PPP$19.92 per day fornonqualified workersin the agricultural, fish-ing, forestry, and min-ing industries, or theelectricity, commerce,tourism, services,transport, and ware-housing sectors.
PPP$7.40 per day forworkers in the sugarindustry.PPP$587.38 per monthfor workers in largeindustrial, commercial,or service companies.
PPP$90.79 per monthfor domestic workers.PPP$256.11 per monthfor workers in thesmall-scale industrysector, agriculturalsector, and other general workers.
Coverage: variations in minimum wage, by categories Level(s) a
(continued )

Analyzing the Distributional Impact of Reforms
196
El Salvador
Guatemala
Haiti
Honduras
Minimum wage rates are set by the govern-ment for certain sectors following propos-als of the National Minimum Wage Council.The executive has the discretion to acceptthe proposals and set the rates by decree ordirect the council to reconsider. The wagesare adjusted at least every three years.
Minimum wage rates for private sectorworkers are set as follows. Joint minimumwage boards in each region and economiczone make recommendations to the NationalWage Commission, a technical and advisorybody attached to the Ministry of Labor andSocial Welfare. The commission issues areport harmonizing all the proposed rates.Finally, the executive sets the rates (whichapply nationwide with no regional variation)with the Ministry of Labor and Social Wel-fare. Rates are adjusted every year.
The minimum wage is set by the govern-ment. In 1995, the Committee for Consulta-tion and Arbitration was established tomake recommendations concerning theminimum wage. The minimum wage is sup-posed to be adjusted for changes in thecost of living and must be increased whenthe annual inflation rate is more than 10%.
The National Minimum Wage Commissionsets minimum wages by sector. This tripar-tite institution comprises government,employer, and employee representatives. Ifit does not reach a consensus, the execu-tive has the authority to increase the mini-mum wage. Minimum wages are adjustedeach year. At the request of employers orworkers, they can also be revised every sixmonths if inflation is more than 12%.
Minimum wage rates applyto selected sectors.
Minimum wage rates are setby sector and occupation,and rates apply to all work-ers except those employedby the state.
The national statutory mini-mum wage applies to allworkers in commercial,industrial, and agriculturalestablishments. Domesticworkers are not covered.
All workers in the privatesector are covered by mini-mum wage legislation exceptfor apprentices. Minimumwages vary according to sec-tor, the type of business con-cerned, and the number ofemployees.
TABLE 3A.1. Characteristics of the Minimum Wage in Selected Countries (Continued )
Country Minimum wage–setting procedure Coverage: scope

Annex 1: Characteristics of the Minimum Wage in Selected Countries
197
• Minimum wages are set for the commerce, services, industry, textile,clothing, agriculture, coffee, cotton, and sugar sectors.
• Piece-rate workers must receive wages equal to at least the daily mini-mum wage.
• Apprentices are entitled to at least 50% of the relevant minimum wageduring the first year and 75% during the second year.
• Employers must pay the full daily minimum wage to workers on the jobfive to eight hours a day. In any other case, the minimum wage must beproportional to the number of hours worked.
• Minimum wage rates are set for the agricultural and nonagriculturalsectors. In the nonagricultural sector, special minimum wage rates areset for bakers and pastry workers.
• Minimum wage rates for all part-time workers in the nonagriculturalsector and workers in the media who are not paid on a daily basis are16% higher than the standard rates.
• Remuneration for piece-rate workers cannot be lower than the applica-ble minimum wage rates.
• Apprentices may be paid less than the minimum wage.
• Minimum wage rates are set for (1) agriculture, fishing, hunting, andforestry; (2) manufacturing, construction, commerce, hotels and restau-rants, and social and personal services; (3) warehousing, transporta-tion, communications, real estate, and other services; and (4) generalservices. Within certain sectors, rates also vary according to the num-ber of workers employed.
• A permit may be issued for a disabled worker stating the percentage ofthe minimum wage the worker is entitled to receive.
PPP$5.59 per day forworkers in the agricul-tural sector.PPP$11.69 per day forworkers in the industrysector.
PPP$9.97 per day foragricultural workers.PPP$10.25 per day fornonagriculturalworkers.
PPP$8.30 per day.
PPP$8.33 per day forworkers in general ser-vices companies with1–15 workers.
PPP$13.70 per day forworkers in companiesin the temporaryimport regime.
Coverage: variations in minimum wage, by categories Level(s) a
(continued )
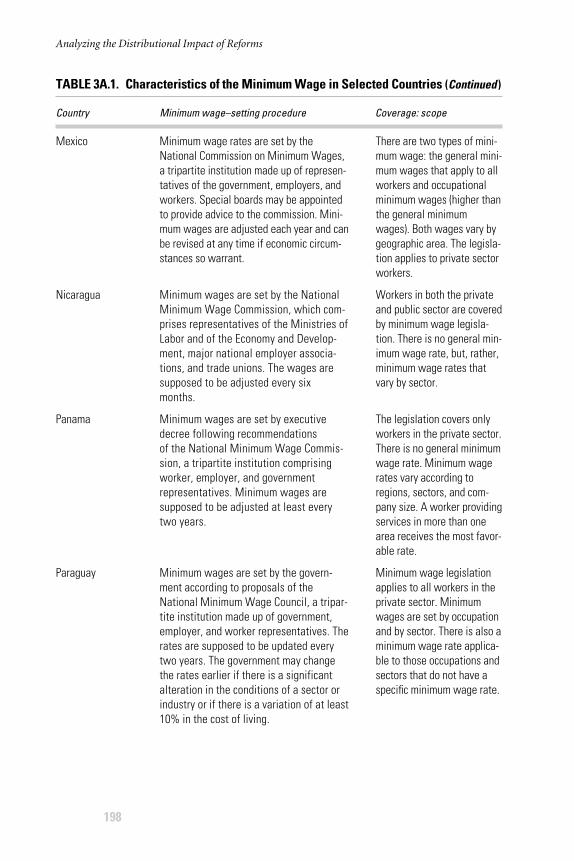
Analyzing the Distributional Impact of Reforms
198
Mexico
Nicaragua
Panama
Paraguay
Minimum wage rates are set by theNational Commission on Minimum Wages,a tripartite institution made up of represen-tatives of the government, employers, andworkers. Special boards may be appointedto provide advice to the commission. Mini-mum wages are adjusted each year and canbe revised at any time if economic circum-stances so warrant.
Minimum wages are set by the NationalMinimum Wage Commission, which com-prises representatives of the Ministries ofLabor and of the Economy and Develop-ment, major national employer associa-tions, and trade unions. The wages aresupposed to be adjusted every sixmonths.
Minimum wages are set by executivedecree following recommendations of the National Minimum Wage Commis-sion, a tripartite institution comprisingworker, employer, and government representatives. Minimum wages are supposed to be adjusted at least everytwo years.
Minimum wages are set by the govern-ment according to proposals of theNational Minimum Wage Council, a tripar-tite institution made up of government,employer, and worker representatives. Therates are supposed to be updated everytwo years. The government may changethe rates earlier if there is a significantalteration in the conditions of a sector orindustry or if there is a variation of at least10% in the cost of living.
There are two types of mini-mum wage: the general mini-mum wages that apply to allworkers and occupationalminimum wages (higher thanthe general minimumwages). Both wages vary bygeographic area. The legisla-tion applies to private sectorworkers.
Workers in both the privateand public sector are coveredby minimum wage legisla-tion. There is no general min-imum wage rate, but, rather,minimum wage rates thatvary by sector.
The legislation covers onlyworkers in the private sector.There is no general minimumwage rate. Minimum wagerates vary according toregions, sectors, and com-pany size. A worker providingservices in more than onearea receives the most favor-able rate.
Minimum wage legislationapplies to all workers in theprivate sector. Minimumwages are set by occupationand by sector. There is also aminimum wage rate applica-ble to those occupations andsectors that do not have aspecific minimum wage rate.
TABLE 3A.1. Characteristics of the Minimum Wage in Selected Countries (Continued )
Country Minimum wage–setting procedure Coverage: scope
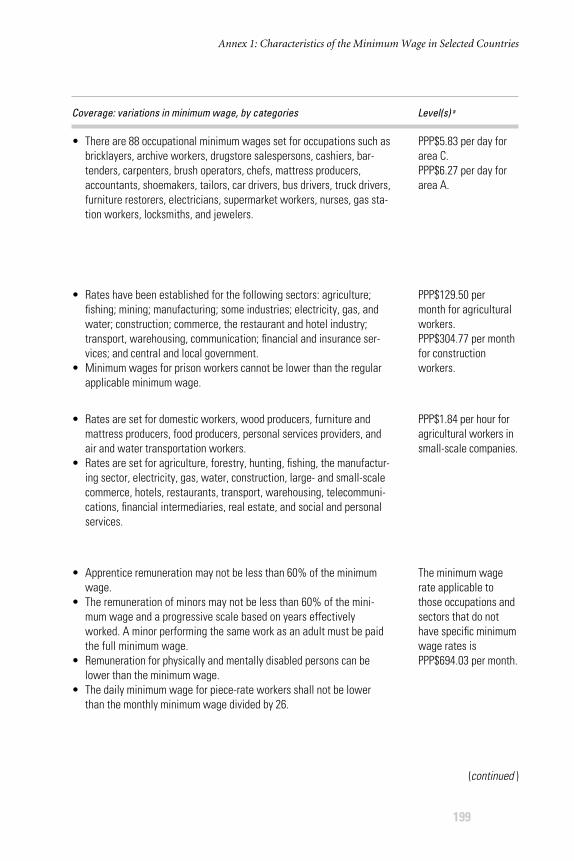
Annex 1: Characteristics of the Minimum Wage in Selected Countries
199
• There are 88 occupational minimum wages set for occupations such asbricklayers, archive workers, drugstore salespersons, cashiers, bar-tenders, carpenters, brush operators, chefs, mattress producers,accountants, shoemakers, tailors, car drivers, bus drivers, truck drivers,furniture restorers, electricians, supermarket workers, nurses, gas sta-tion workers, locksmiths, and jewelers.
• Rates have been established for the following sectors: agriculture;fishing; mining; manufacturing; some industries; electricity, gas, andwater; construction; commerce, the restaurant and hotel industry;transport, warehousing, communication; financial and insurance ser-vices; and central and local government.
• Minimum wages for prison workers cannot be lower than the regularapplicable minimum wage.
• Rates are set for domestic workers, wood producers, furniture andmattress producers, food producers, personal services providers, andair and water transportation workers.
• Rates are set for agriculture, forestry, hunting, fishing, the manufactur-ing sector, electricity, gas, water, construction, large- and small-scalecommerce, hotels, restaurants, transport, warehousing, telecommuni-cations, financial intermediaries, real estate, and social and personalservices.
• Apprentice remuneration may not be less than 60% of the minimumwage.
• The remuneration of minors may not be less than 60% of the mini-mum wage and a progressive scale based on years effectivelyworked. A minor performing the same work as an adult must be paidthe full minimum wage.
• Remuneration for physically and mentally disabled persons can belower than the minimum wage.
• The daily minimum wage for piece-rate workers shall not be lowerthan the monthly minimum wage divided by 26.
PPP$5.83 per day forarea C.PPP$6.27 per day forarea A.
PPP$129.50 per month for agriculturalworkers.PPP$304.77 per monthfor constructionworkers.
PPP$1.84 per hour foragricultural workers insmall-scale companies.
The minimum wagerate applicable tothose occupations andsectors that do nothave specific minimumwage rates isPPP$694.03 per month.
Coverage: variations in minimum wage, by categories Level(s) a
(continued )

Analyzing the Distributional Impact of Reforms
200
Peru
Trinidad and Tobago
Uruguay
Venezuela
Middle East and North AfricaAlgeria
The minimum wage is set by the NationalLabor and Employment Promotion Council,a tripartite institution made up of govern-ment, worker, and employer representa-tives. If there is no agreement on aminimum wage rate within the council, thepresident sets the minimum wage throughemergency decree.
The government sets the minimum wage inan order based on the recommendation ofthe Minimum Wages Board.
The government sets the national minimumwage by decree.
The Ministry of Labor sets minimum wagesbased on recommendations by the Tripar-tite Commission for the Revision of theMinimum Wage. In the absence of a recom-mendation, the executive may unilaterallyset the rates. In case of large increases inthe cost of living, the executive may setrates by decree, taking into account com-ments of worker and employer representa-tives, the National Economic Council, andthe Central Bank. Rates are adjusted yearly.
In accordance with the law on labor rela-tions, the government sets a national mini-mum wage following consultation withsocial partners.
All workers in the privatesector are covered by mini-mum wage legislation. Thereis one general minimumwage rate applicable to allworkers in the private sector.
The order does not apply totrainees in government-approved training schools,registered apprentices, work-ers in certain government-approved schemes, studentson vacation jobs, and volun-teers in registered charities.
The national minimum wageapplies to the public and pri-vate sectors. There are threeminimum wage rates: gen-eral, for rural workers, andfor domestic workers.
Minimum wages apply toboth private and public sec-tor workers. There is no gen-eral minimum wage rate.There are different minimumwage rates for: urban work-ers, workers in companieswith fewer than 20 workers,rural workers, and youth andapprentices.
All workers, except nationaldefense personnel, magis-trates, state officials, andpersonnel of selected publicestablishments. Legislationmay be enacted for man-agers, journalists, pilots,captains, seafarers, homeworkers, artists, commercialrepresentatives, athletes,and domestic workers.
TABLE 3A.1. Characteristics of the Minimum Wage in Selected Countries (Continued )
Country Minimum wage–setting procedure Coverage: scope

Annex 1: Characteristics of the Minimum Wage in Selected Countries
201
• Remuneration for youth, trainees, and apprentices cannot be lowerthan the minimum wage. If they work less than a full working day, theremuneration should be set on a pro rata basis.
• Piece-rate workers and offsite workers must be paid an agreed piece-rate or an hourly rate based on a fair estimate of the equivalent num-ber of hours and on the minimum wage.
• Minimum wage rates for domestic workers vary by region.• Minimum wage rates for agricultural laborers vary by occupation.
• The minimum wage rate applicable to workers in companies withfewer than 20 workers is also applicable to domestic workers.
• If apprentices and youth render services under the same conditions asurban or rural workers, the regular minimum wage rates apply.
• Apprentices receive a presalary equivalent to 15% of the national ratefor six months (if the apprenticeship stays less than 24 months) or for12 months (if the apprenticeship stays more than 24 months).
• Wages for home workers may not be lower than the national minimumwage rate.
PPP$309.94 per month.
PPP$282.62 per month.
PPP$110.19 per month.
PPP$265.84 per monthfor rural workers.PPP$295.37 per monthfor urban workers.
PPP$389.41 per month.
Coverage: variations in minimum wage, by categories Level(s) a
(continued )
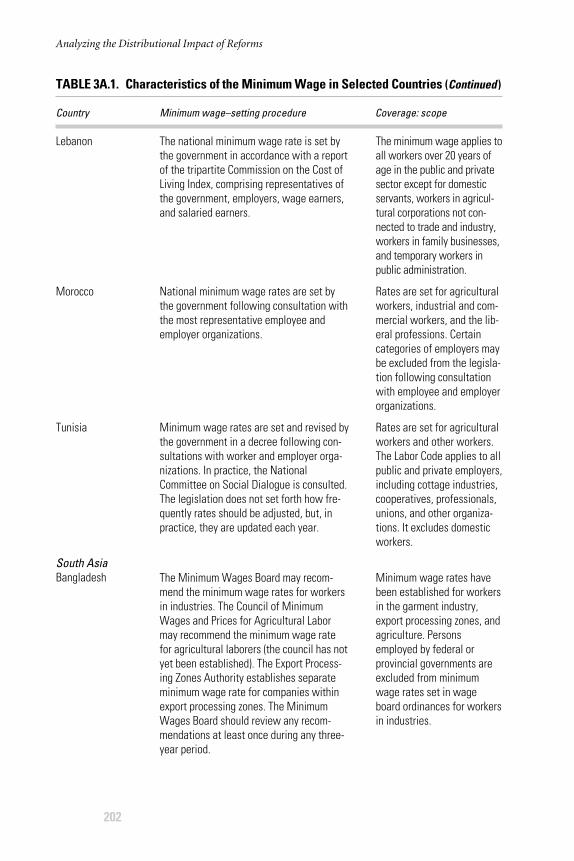
Analyzing the Distributional Impact of Reforms
202
Lebanon
Morocco
Tunisia
South AsiaBangladesh
The national minimum wage rate is set bythe government in accordance with a reportof the tripartite Commission on the Cost ofLiving Index, comprising representatives ofthe government, employers, wage earners,and salaried earners.
National minimum wage rates are set bythe government following consultation withthe most representative employee andemployer organizations.
Minimum wage rates are set and revised bythe government in a decree following con-sultations with worker and employer orga-nizations. In practice, the NationalCommittee on Social Dialogue is consulted.The legislation does not set forth how fre-quently rates should be adjusted, but, inpractice, they are updated each year.
The Minimum Wages Board may recom-mend the minimum wage rates for workersin industries. The Council of MinimumWages and Prices for Agricultural Labormay recommend the minimum wage ratefor agricultural laborers (the council has notyet been established). The Export Process-ing Zones Authority establishes separateminimum wage rate for companies withinexport processing zones. The MinimumWages Board should review any recom-mendations at least once during any three-year period.
The minimum wage applies toall workers over 20 years ofage in the public and privatesector except for domesticservants, workers in agricul-tural corporations not con-nected to trade and industry,workers in family businesses,and temporary workers inpublic administration.
Rates are set for agriculturalworkers, industrial and com-mercial workers, and the lib-eral professions. Certaincategories of employers maybe excluded from the legisla-tion following consultationwith employee and employerorganizations.
Rates are set for agriculturalworkers and other workers.The Labor Code applies to allpublic and private employers,including cottage industries,cooperatives, professionals,unions, and other organiza-tions. It excludes domesticworkers.
Minimum wage rates havebeen established for workersin the garment industry,export processing zones, andagriculture. Personsemployed by federal orprovincial governments areexcluded from minimumwage rates set in wageboard ordinances for workersin industries.
TABLE 3A.1. Characteristics of the Minimum Wage in Selected Countries (Continued )
Country Minimum wage–setting procedure Coverage: scope

Annex 1: Characteristics of the Minimum Wage in Selected Countries
203
• Apprentices may be paid wages lower than the minimum rates.• Employees paid by the piece, output, or production must receive a
salary equivalent to the minimum rate unless output is reduced as aresult of factors within the control of the employee concerned.
• Employees whose salaries are made up entirely of tips or tips and abase salary are entitled to receive at least the minimum wage rate. Ifthe tips are not sufficient, the employer must pay the difference.
• A minimum wage rate is set for workers under 18 years of age; this iscurrently at 85% of the relevant adult rate.
• Wage rates for workers paid per piece produced must be set at theequivalent of the minimum wage rate.
• Apprentices have a slightly lower minimum wage rate than regularworkers in export processing zones. Separate wage rates are also setfor trainees or apprentices in the garment industry.
PPP$239.00 per month.
PPP$14.18 per day foragricultural workers.
PPP$14.58 per day foragricultural workers.PPP$411.97 per weekfor nonagriculturalworkers.
PPP$49.23 per monthfor helpers in the garment industry.PPP$73.84 per monthfor machine operatorsin the garment industry.PPP$148.91 per monthfor helpers in exportprocessing zones.PPP$248.18 per monthfor ordinary operatorsin electronics indus-tries in export process-ing zones.
Coverage: variations in minimum wage, by categories Level(s) a
(continued )
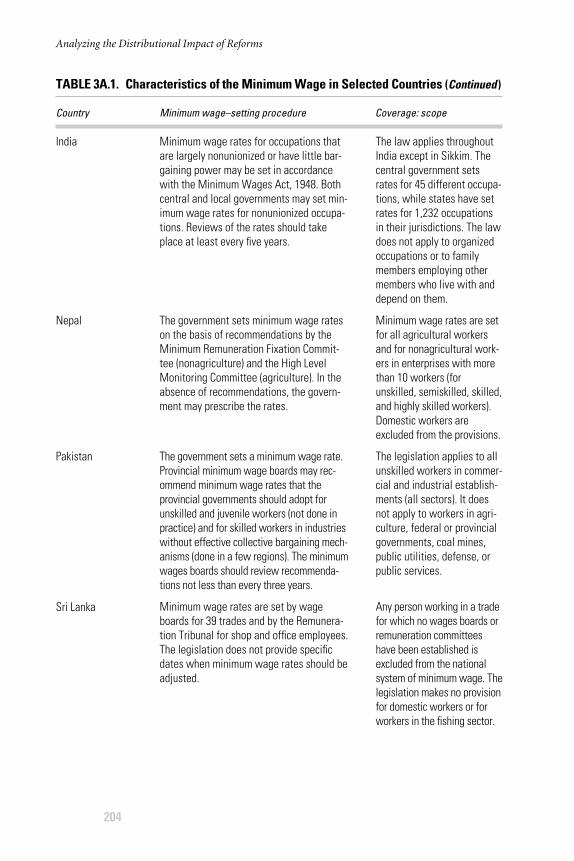
Analyzing the Distributional Impact of Reforms
204
India
Nepal
Pakistan
Sri Lanka
Minimum wage rates for occupations thatare largely nonunionized or have little bar-gaining power may be set in accordancewith the Minimum Wages Act, 1948. Bothcentral and local governments may set min-imum wage rates for nonunionized occupa-tions. Reviews of the rates should takeplace at least every five years.
The government sets minimum wage rateson the basis of recommendations by theMinimum Remuneration Fixation Commit-tee (nonagriculture) and the High LevelMonitoring Committee (agriculture). In theabsence of recommendations, the govern-ment may prescribe the rates.
The government sets a minimum wage rate.Provincial minimum wage boards may rec-ommend minimum wage rates that theprovincial governments should adopt forunskilled and juvenile workers (not done inpractice) and for skilled workers in industrieswithout effective collective bargaining mech-anisms (done in a few regions). The minimumwages boards should review recommenda-tions not less than every three years.
Minimum wage rates are set by wageboards for 39 trades and by the Remunera-tion Tribunal for shop and office employees.The legislation does not provide specificdates when minimum wage rates should beadjusted.
The law applies throughoutIndia except in Sikkim. Thecentral government setsrates for 45 different occupa-tions, while states have setrates for 1,232 occupationsin their jurisdictions. The lawdoes not apply to organizedoccupations or to familymembers employing othermembers who live with anddepend on them.
Minimum wage rates are setfor all agricultural workersand for nonagricultural work-ers in enterprises with morethan 10 workers (forunskilled, semiskilled, skilled,and highly skilled workers).Domestic workers areexcluded from the provisions.
The legislation applies to allunskilled workers in commer-cial and industrial establish-ments (all sectors). It doesnot apply to workers in agri-culture, federal or provincialgovernments, coal mines,public utilities, defense, orpublic services.
Any person working in a tradefor which no wages boards orremuneration committeeshave been established isexcluded from the national system of minimum wage. The legislation makes no provisionfor domestic workers or forworkers in the fishing sector.
TABLE 3A.1. Characteristics of the Minimum Wage in Selected Countries (Continued )
Country Minimum wage–setting procedure Coverage: scope

Source: Conditions of Work and Employment Database. International Labor Organization. http://www.ilo.org/travaildatabase/servlet/minimumwages (accessed November 23, 2005).a Most minimum wage rates are expressed here in terms of purchasing power using the purchasing power parity(PPP) factors elaborated by the World Bank for 2003. Where values in PPP dollars (PPP$) are not available, minimumwage rates have been converted to United States dollars (US$) using the average exchange rate for 2003 (Source:Economic Intelligence Unit). When there are multiple rates, the table typically presents the lowest and highest rates.
Annex 1: Characteristics of the Minimum Wage in Selected Countries
• The regional minimum wage rates should not be less than the mini-mum floor wage set by the minister of labor.
• Specific minimum wage rates may be established for apprentices, adolescents (14 to 18 years of age), and children under 14.
• The appropriate government may exclude disabled employees fromcertain provisions of the legislation.
• A lower rate is set for workers between 14 and 16 years of age.
• Apprentices are excluded from the legislation, but the apprenticeshiprules provide that apprentices receive a guaranteed rate that starts at50% of the regular rate in the first year and increases up to the regularrate after three years.
• Minimum wage rates may vary in accordance with a worker’s skill level.• Lower minimum wage rates than those set for adults have been estab-
lished for apprentices, trainees, and learners in selected trades.• Many wage boards set lower minimum wage rates for children.• Disabled workers may be granted reduced minimum rates.• Wage boards may determine minimum wage rates for piece work.
PPP$5.85 per day forunskilled constructionworkers in most ruralareas.PPP$10.43 per day forunskilled agriculturalworkers in some areas.
PPP$133.94 per monthfor unskilled workerson tea estates.PPP$197.3 per monthfor workers andemployees not workingon tea estates.
PPP$182.08 per month.
PPP$3.85 per day forrubber workers.PPP$50.70 per monthfor preschoolassistants.PPP$128.98 per monthfor textile workers.
Coverage: variations in minimum wage, by categories Level(s) a

207
2A N N E X
International Comparisons ofAlternative Indicators of theStringency of Employment
Protection Legislation
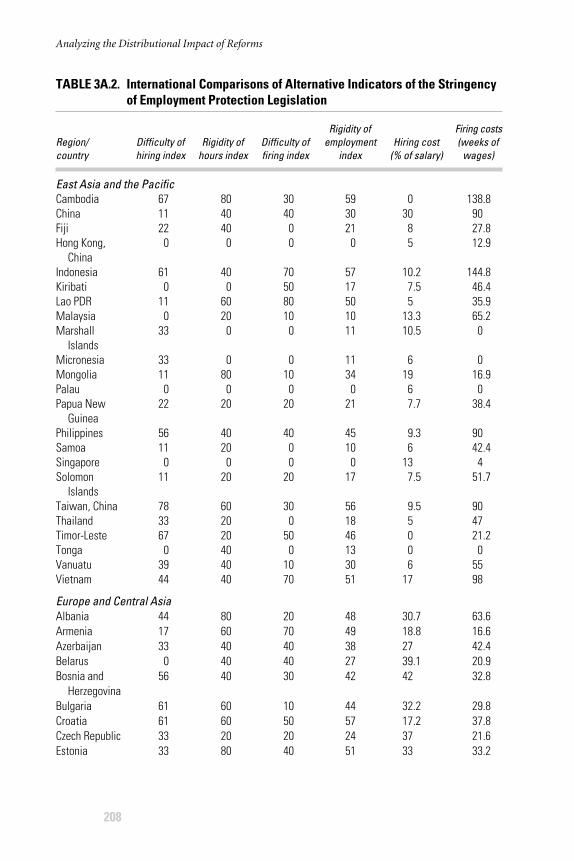
Analyzing the Distributional Impact of Reforms
208
TABLE 3A.2. International Comparisons of Alternative Indicators of the Stringencyof Employment Protection Legislation
Rigidity of Firing costsRegion/ Difficulty of Rigidity of Difficulty of employment Hiring cost (weeks of country hiring index hours index firing index index (% of salary) wages)
East Asia and the PacificCambodia 67 80 30 59 0 138.8China 11 40 40 30 30 90Fiji 22 40 0 21 8 27.8Hong Kong, 0 0 0 0 5 12.9
ChinaIndonesia 61 40 70 57 10.2 144.8Kiribati 0 0 50 17 7.5 46.4Lao PDR 11 60 80 50 5 35.9Malaysia 0 20 10 10 13.3 65.2Marshall 33 0 0 11 10.5 0
IslandsMicronesia 33 0 0 11 6 0Mongolia 11 80 10 34 19 16.9Palau 0 0 0 0 6 0Papua New 22 20 20 21 7.7 38.4
GuineaPhilippines 56 40 40 45 9.3 90Samoa 11 20 0 10 6 42.4Singapore 0 0 0 0 13 4Solomon 11 20 20 17 7.5 51.7
IslandsTaiwan, China 78 60 30 56 9.5 90Thailand 33 20 0 18 5 47Timor-Leste 67 20 50 46 0 21.2Tonga 0 40 0 13 0 0Vanuatu 39 40 10 30 6 55Vietnam 44 40 70 51 17 98
Europe and Central Asia Albania 44 80 20 48 30.7 63.6Armenia 17 60 70 49 18.8 16.6Azerbaijan 33 40 40 38 27 42.4Belarus 0 40 40 27 39.1 20.9Bosnia and 56 40 30 42 42 32.8
HerzegovinaBulgaria 61 60 10 44 32.2 29.8Croatia 61 60 50 57 17.2 37.8Czech Republic 33 20 20 24 37 21.6Estonia 33 80 40 51 33 33.2
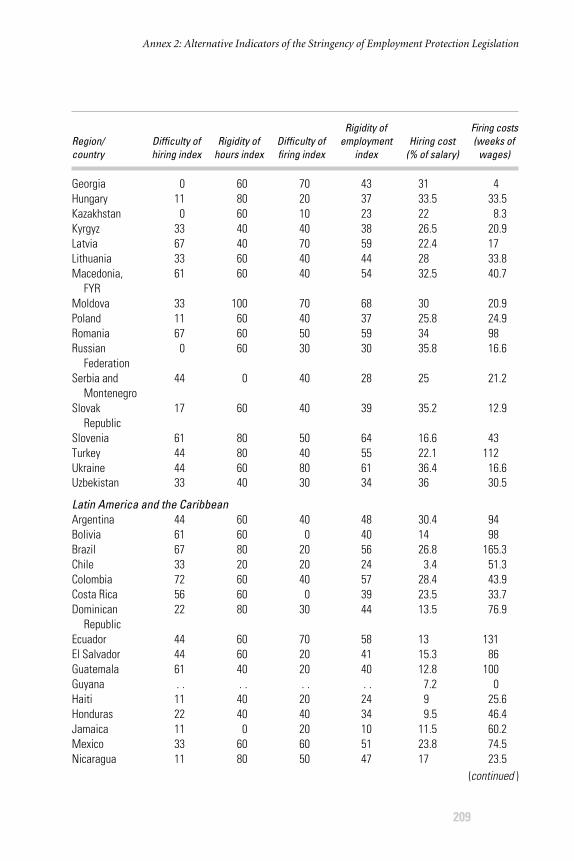
Georgia 0 60 70 43 31 4Hungary 11 80 20 37 33.5 33.5Kazakhstan 0 60 10 23 22 8.3Kyrgyz 33 40 40 38 26.5 20.9Latvia 67 40 70 59 22.4 17Lithuania 33 60 40 44 28 33.8Macedonia, 61 60 40 54 32.5 40.7
FYRMoldova 33 100 70 68 30 20.9Poland 11 60 40 37 25.8 24.9Romania 67 60 50 59 34 98Russian 0 60 30 30 35.8 16.6
FederationSerbia and 44 0 40 28 25 21.2
MontenegroSlovak 17 60 40 39 35.2 12.9
RepublicSlovenia 61 80 50 64 16.6 43Turkey 44 80 40 55 22.1 112Ukraine 44 60 80 61 36.4 16.6Uzbekistan 33 40 30 34 36 30.5
Latin America and the CaribbeanArgentina 44 60 40 48 30.4 94Bolivia 61 60 0 40 14 98Brazil 67 80 20 56 26.8 165.3Chile 33 20 20 24 3.4 51.3Colombia 72 60 40 57 28.4 43.9Costa Rica 56 60 0 39 23.5 33.7Dominican 22 80 30 44 13.5 76.9
RepublicEcuador 44 60 70 58 13 131El Salvador 44 60 20 41 15.3 86Guatemala 61 40 20 40 12.8 100Guyana . . . . . . . . 7.2 0Haiti 11 40 20 24 9 25.6Honduras 22 40 40 34 9.5 46.4Jamaica 11 0 20 10 11.5 60.2Mexico 33 60 60 51 23.8 74.5Nicaragua 11 80 50 47 17 23.5
Rigidity of Firing costsRegion/ Difficulty of Rigidity of Difficulty of employment Hiring cost (weeks of country hiring index hours index firing index index (% of salary) wages)
Annex 2: Alternative Indicators of the Stringency of Employment Protection Legislation
209
(continued )
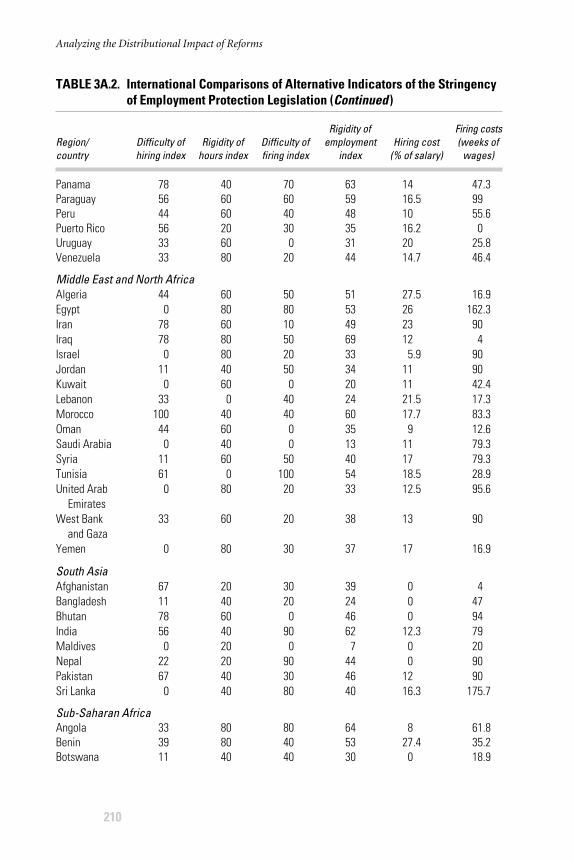
Analyzing the Distributional Impact of Reforms
210
Panama 78 40 70 63 14 47.3Paraguay 56 60 60 59 16.5 99Peru 44 60 40 48 10 55.6Puerto Rico 56 20 30 35 16.2 0Uruguay 33 60 0 31 20 25.8Venezuela 33 80 20 44 14.7 46.4
Middle East and North Africa Algeria 44 60 50 51 27.5 16.9Egypt 0 80 80 53 26 162.3Iran 78 60 10 49 23 90Iraq 78 80 50 69 12 4Israel 0 80 20 33 5.9 90Jordan 11 40 50 34 11 90Kuwait 0 60 0 20 11 42.4Lebanon 33 0 40 24 21.5 17.3Morocco 100 40 40 60 17.7 83.3Oman 44 60 0 35 9 12.6Saudi Arabia 0 40 0 13 11 79.3Syria 11 60 50 40 17 79.3Tunisia 61 0 100 54 18.5 28.9United Arab 0 80 20 33 12.5 95.6
EmiratesWest Bank 33 60 20 38 13 90
and GazaYemen 0 80 30 37 17 16.9
South AsiaAfghanistan 67 20 30 39 0 4Bangladesh 11 40 20 24 0 47Bhutan 78 60 0 46 0 94India 56 40 90 62 12.3 79Maldives 0 20 0 7 0 20Nepal 22 20 90 44 0 90Pakistan 67 40 30 46 12 90Sri Lanka 0 40 80 40 16.3 175.7
Sub-Saharan AfricaAngola 33 80 80 64 8 61.8Benin 39 80 40 53 27.4 35.2Botswana 11 40 40 30 0 18.9
TABLE 3A.2. International Comparisons of Alternative Indicators of the Stringencyof Employment Protection Legislation (Continued )
Rigidity of Firing costsRegion/ Difficulty of Rigidity of Difficulty of employment Hiring cost (weeks of country hiring index hours index firing index index (% of salary) wages)
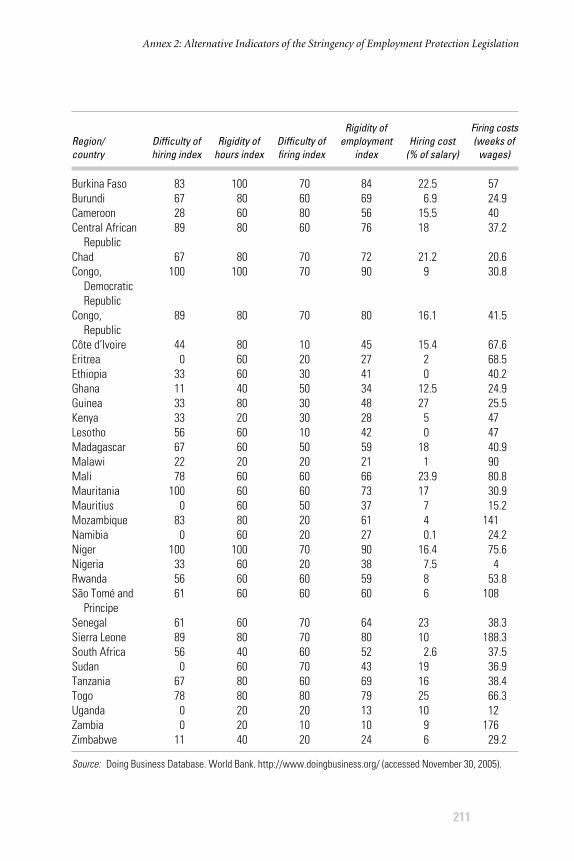
Burkina Faso 83 100 70 84 22.5 57Burundi 67 80 60 69 6.9 24.9Cameroon 28 60 80 56 15.5 40Central African 89 80 60 76 18 37.2
RepublicChad 67 80 70 72 21.2 20.6Congo, 100 100 70 90 9 30.8
DemocraticRepublic
Congo, 89 80 70 80 16.1 41.5Republic
Côte d’Ivoire 44 80 10 45 15.4 67.6Eritrea 0 60 20 27 2 68.5Ethiopia 33 60 30 41 0 40.2Ghana 11 40 50 34 12.5 24.9Guinea 33 80 30 48 27 25.5Kenya 33 20 30 28 5 47Lesotho 56 60 10 42 0 47Madagascar 67 60 50 59 18 40.9Malawi 22 20 20 21 1 90Mali 78 60 60 66 23.9 80.8Mauritania 100 60 60 73 17 30.9Mauritius 0 60 50 37 7 15.2Mozambique 83 80 20 61 4 141Namibia 0 60 20 27 0.1 24.2Niger 100 100 70 90 16.4 75.6Nigeria 33 60 20 38 7.5 4Rwanda 56 60 60 59 8 53.8São Tomé and 61 60 60 60 6 108
PrincipeSenegal 61 60 70 64 23 38.3Sierra Leone 89 80 70 80 10 188.3South Africa 56 40 60 52 2.6 37.5Sudan 0 60 70 43 19 36.9Tanzania 67 80 60 69 16 38.4Togo 78 80 80 79 25 66.3Uganda 0 20 20 13 10 12Zambia 0 20 10 10 9 176Zimbabwe 11 40 20 24 6 29.2
Source: Doing Business Database. World Bank. http://www.doingbusiness.org/ (accessed November 30, 2005).
Rigidity of Firing costsRegion/ Difficulty of Rigidity of Difficulty of employment Hiring cost (weeks of country hiring index hours index firing index index (% of salary) wages)
Annex 2: Alternative Indicators of the Stringency of Employment Protection Legislation
211

Public Sector Downsizing
Juan Jose Diaz
213
4
Many governments face the difficult task of reducing the size andimproving the efficiency of an overstaffed public sector as part ofa general endeavor to increase economic growth and cut fiscal
deficits. These retrenchment efforts often face considerable politicalopposition. To overcome opposition and to treat public employeeswho lose their jobs fairly, governments often provide severance pay-ments to workers who leave public employment. However, problemsin the design and implementation of these compensation schemes fre-quently reduce their efficiency and may result in the failure of theretrenchment.
This chapter provides an economic analysis of downsizing opera-tions, illustrated by examples of operations implemented during the1980s and 1990s. It discusses the rationale for this sort of reform andaddresses the problem of adverse selection in voluntary separationschemes and the difficulties in appraisals of financial and economicreturns. The analysis also identifies key stakeholders in the reform, theirlikely responses, and the dissemination channels of reform impacts.The chapter examines the consequences for households and the econ-omy at large, the ways downsizing may affect displaced public sectorworkers, and the distributional impacts of downsizing for differentgroups of these workers. In order to advise policymakers, the chapterpresents a simple tool for designing compensation packages that canoutperform typical rules of thumb on the grounds of both financialreturns and fairness. Finally, some threats and risks to these reforms arediscussed.
CONTEXT OF REFORM: TYPES OF DOWNSIZING OPERATIONS
During the 1980s and 1990s, public sector downsizing and retrenchmentoperations were implemented around the world, particularly in Africa,Latin America, and the transition economies.1 These operations targetedgovernment agencies, state-owned enterprises, and the military. Some ofthe options governments used to downsize overstaffed civil services andstate-owned enterprises are as follows:
� Voluntary departure schemes. This mechanism uses an arbitraryrule typically based on seniority and current earnings so that theworkers to be let go are offered higher compensation packages thelonger their tenure in the firm. For instance, separated workersreceive two years of salary, or one month of salary per year of ser-vice, or some other combination of these seniority and currentearnings variables. This mechanism helps bypass the legal obstaclesin countries where outright layoffs are not allowed. This “buyingout” scheme greatly minimizes political costs. However, two com-mon problems diminish the effectiveness of this mechanism: (1)targeting errors, because sometimes only the best public sectorworkers leave; and (2) overcompensation or undercompensation,because the compensation may bear little relation with the lossesexperienced by the workers as a result of separation.
� Involuntary retrenchment schemes. This option may entail involun-tary “soft” separations involving the strict enforcement of manda-tory retirement rules, as well as the removal of workers from thepayroll who are not working (ghost workers), or “hard” separations,such as layoffs. Depending on the outcome of the voluntary programand on the political leverage of workers, redundant staff may stillneed to be laid off against their will. Similar to the voluntary case, arule of thumb involving salary and perhaps seniority in the publicsector is used to calculate the compensation package.
� Contracting-out schemes. One way to minimize labor redundancies isto contract out activities previously executed within the enterprise toprivate cooperatives established by former enterprise employees.
� Employee ownership. To build support for privatization, some gov-ernments have reserved shares for employees in the to-be-privatizedenterprises. This mechanism has been used in several sectors inArgentina, Bangladesh, Bolivia, Chile, Ghana, Mexico, Morocco,Pakistan, Peru, Turkey, and other countries. In addition to the finan-cial gains, employee ownership gives employees a direct stake in theperformance of the companies.
Analyzing the Distributional Impact of Reforms
214
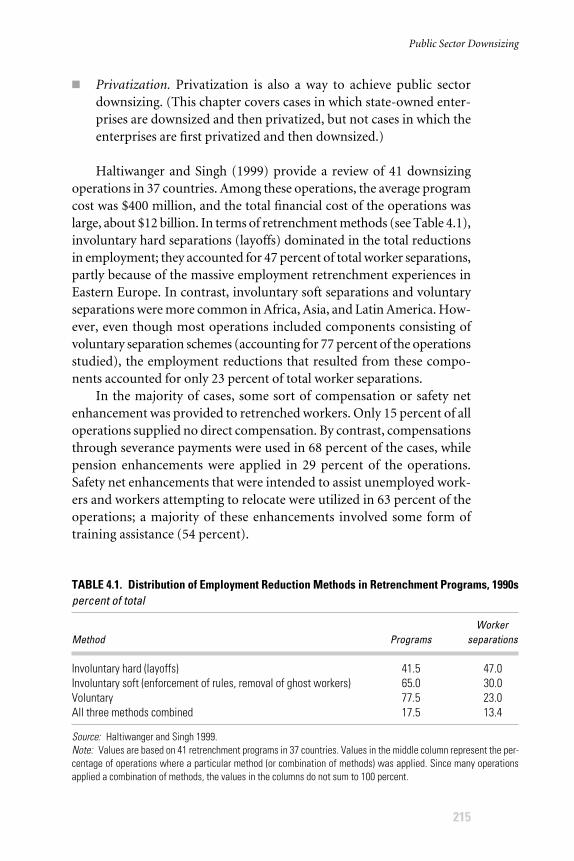
� Privatization. Privatization is also a way to achieve public sectordownsizing. (This chapter covers cases in which state-owned enter-prises are downsized and then privatized, but not cases in which theenterprises are first privatized and then downsized.)
Haltiwanger and Singh (1999) provide a review of 41 downsizingoperations in 37 countries. Among these operations, the average programcost was $400 million, and the total financial cost of the operations waslarge, about $12 billion. In terms of retrenchment methods (see Table 4.1),involuntary hard separations (layoffs) dominated in the total reductionsin employment; they accounted for 47 percent of total worker separations,partly because of the massive employment retrenchment experiences inEastern Europe. In contrast, involuntary soft separations and voluntaryseparations were more common in Africa, Asia, and Latin America. How-ever, even though most operations included components consisting ofvoluntary separation schemes (accounting for 77 percent of the operationsstudied), the employment reductions that resulted from these compo-nents accounted for only 23 percent of total worker separations.
In the majority of cases, some sort of compensation or safety netenhancement was provided to retrenched workers. Only 15 percent of alloperations supplied no direct compensation. By contrast, compensationsthrough severance payments were used in 68 percent of the cases, whilepension enhancements were applied in 29 percent of the operations.Safety net enhancements that were intended to assist unemployed work-ers and workers attempting to relocate were utilized in 63 percent of theoperations; a majority of these enhancements involved some form oftraining assistance (54 percent).
Public Sector Downsizing
215
TABLE 4.1. Distribution of Employment Reduction Methods in Retrenchment Programs, 1990spercent of total
WorkerMethod Programs separations
Involuntary hard (layoffs) 41.5 47.0Involuntary soft (enforcement of rules, removal of ghost workers) 65.0 30.0Voluntary 77.5 23.0All three methods combined 17.5 13.4
Source: Haltiwanger and Singh 1999.Note: Values are based on 41 retrenchment programs in 37 countries. Values in the middle column represent the per-centage of operations where a particular method (or combination of methods) was applied. Since many operationsapplied a combination of methods, the values in the columns do not sum to 100 percent.
The extent of labor redundancies may be such that any serious down-sizing is politically unfeasible, at least if it were to rely on involuntary dis-missals. This explains the increasing popularity among developing-countrygovernments, multilateral organizations, and donor countries of a volun-tary approach to downsizing a public sector workforce. Specifically, thisapproach involves offering severance payments to encourage redundantworkers to quit, thus overcoming their resistance to downsizing, restruc-turing, and privatization. In many developing countries, such buying outof redundant workers is, in fact, the only way to bypass the legal obsta-cles to the dismissal of public sector employees.
Voluntary separations, contracting-out schemes, and employeeownership alternatives help reduce political opposition to a downsiz-ing operation. However, the risks of incurring errors in targeting andsetting the wrong payment compensation need to be addressed. The evi-dence reported by Haltiwanger and Singh (1999) shows that the numberof total separations is greater than the total reduction in employment,indicating that there is rehiring and new hires. Rehiring is a particularlyacute problem in that it implies targeting errors in a retrenchment pro-gram. The need for rehiring makes evident that some workers essentialto the running of the downsized agency or state-owned enterprise wereincorrectly separated. Significant rehiring was found in about 20 per-cent of all operations studied by Haltiwanger and Singh. This is oneamong several risks in retrenchment programs, and it has implicationsfor the economic returns to the operations. In addition, public sectorretrenchment may entail fiscal, productive, and other forms of exter-nalities that go beyond the pervasive effects of overstaffing. These exter-nalities may also contribute to unexpected divergence in the financialand economic returns to a downsizing operation. In particular, exter-nalities create additional economic costs that may not be taken intoaccount in financial appraisals of downsizing, such as the diminishedearnings and other economic loses experienced by private sector workersin activities linked to state-owned enterprises that are the focus of down-sizing operations.
RATIONALE FOR UNDERTAKING PUBLIC SECTOR DOWNSIZING
The rationale for downsizing the public sector is to reduce the size (work-force) of public agencies and state-owned enterprises in an attempt toimprove efficiency, while reallocating workers where they might be moreproductive. It may be part of an effort to move toward a more market-oriented economy. The operations are usually part of an overall effort to
Analyzing the Distributional Impact of Reforms
216
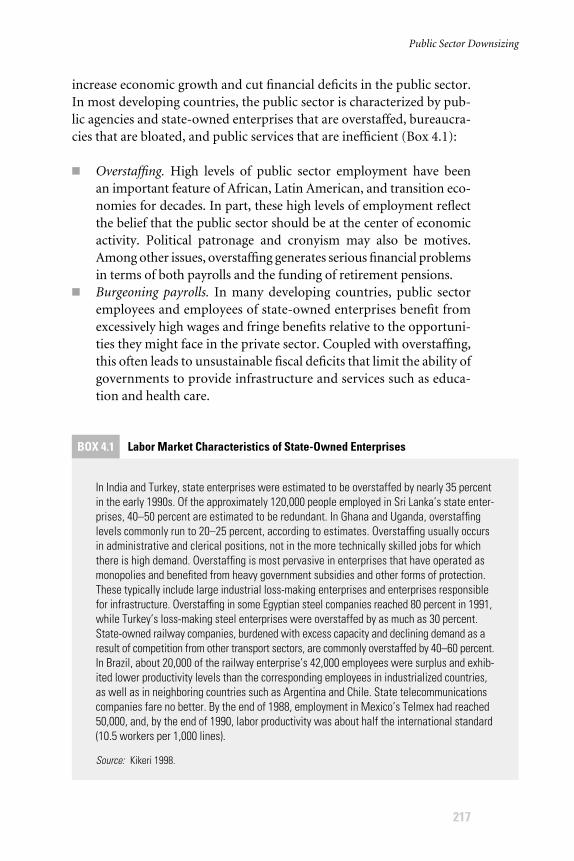
increase economic growth and cut financial deficits in the public sector.In most developing countries, the public sector is characterized by pub-lic agencies and state-owned enterprises that are overstaffed, bureaucra-cies that are bloated, and public services that are inefficient (Box 4.1):
� Overstaffing. High levels of public sector employment have been an important feature of African, Latin American, and transition eco-nomies for decades. In part, these high levels of employment reflectthe belief that the public sector should be at the center of economicactivity. Political patronage and cronyism may also be motives.Among other issues, overstaffing generates serious financial problemsin terms of both payrolls and the funding of retirement pensions.
� Burgeoning payrolls. In many developing countries, public sectoremployees and employees of state-owned enterprises benefit fromexcessively high wages and fringe benefits relative to the opportuni-ties they might face in the private sector. Coupled with overstaffing,this often leads to unsustainable fiscal deficits that limit the ability ofgovernments to provide infrastructure and services such as educa-tion and health care.
Public Sector Downsizing
217
BOX 4.1 Labor Market Characteristics of State-Owned Enterprises
In India and Turkey, state enterprises were estimated to be overstaffed by nearly 35 percentin the early 1990s. Of the approximately 120,000 people employed in Sri Lanka’s state enter-prises, 40–50 percent are estimated to be redundant. In Ghana and Uganda, overstaffinglevels commonly run to 20–25 percent, according to estimates. Overstaffing usually occursin administrative and clerical positions, not in the more technically skilled jobs for whichthere is high demand. Overstaffing is most pervasive in enterprises that have operated asmonopolies and benefited from heavy government subsidies and other forms of protection.These typically include large industrial loss-making enterprises and enterprises responsiblefor infrastructure. Overstaffing in some Egyptian steel companies reached 80 percent in 1991,while Turkey’s loss-making steel enterprises were overstaffed by as much as 30 percent.State-owned railway companies, burdened with excess capacity and declining demand as aresult of competition from other transport sectors, are commonly overstaffed by 40–60 percent.In Brazil, about 20,000 of the railway enterprise’s 42,000 employees were surplus and exhib-ited lower productivity levels than the corresponding employees in industrialized countries,as well as in neighboring countries such as Argentina and Chile. State telecommunicationscompanies fare no better. By the end of 1988, employment in Mexico’s Telmex had reached50,000, and, by the end of 1990, labor productivity was about half the international standard(10.5 workers per 1,000 lines).
Source: Kikeri 1998.
� Inefficiency. Attempts to reduce payrolls through wage compres-sion and declining real wages frequently lead to absenteeism andthe departure of more skilled staff, and this contributes to publicsector inefficiency.
� Technological progress. The pace of technological progress aroundthe world is causing natural monopolies to disappear, thus obligingformerly somnolent state-owned enterprises to face competition.
The specific motives triggering downsizing decisions vary acrosscountries and agencies, as Haltiwanger and Singh point out:
The most prominent factors leading to retrenchment were fiscal crises and a gen-eral effort to reduce the size of government in the economy. However, in somecases, the compelling factors appeared to be structural problems with the type andmix of government workers. Wage compression among public sector workersleading to morale and staffing problems was a common complaint. Overstaffing,including the problem of ghost workers, was another common complaint. Finally,the downsizing of the military played a prominent role as well. (Haltiwanger andSingh 1999, 34)
The decision to downsize
Rama (1999) provides a decision tree intended to assist policymakers inanalyzing the possibility of downsizing. This decision tree is organizedaround critical questions on downsizing. It is reproduced in Figure 4.1.
The first question in the decision tree refers to the appropriate pri-vate sector counterfactual: is privatization advisable? In some cases, thechoice is not between downsizing or not downsizing, but rather betweendownsizing by the government or downsizing by the private sector. Thischoice involves efficiency considerations and public interest issues thatneed to be carefully evaluated in each case. But whether downsizing shouldprecede privatization when the latter is advisable is an issue that needs tobe addressed.
The second question in the decision tree refers to the overstaffingproblem: is overstaffing an obstacle to privatization? One reason down-sizing may be justified prior to privatization is the credibility of thereform process.2 The ability to overcome labor resistance and trimemployment may, indeed, be seen as a signal that the government iscommitted to privatization. This signal, in turn, would reduce theuncertainty faced by potential investors, thereby making privatizationpossible. If no action is taken to overcome the opposition of those whostand to lose from privatization, chances are there will be no bids for
Analyzing the Distributional Impact of Reforms
218
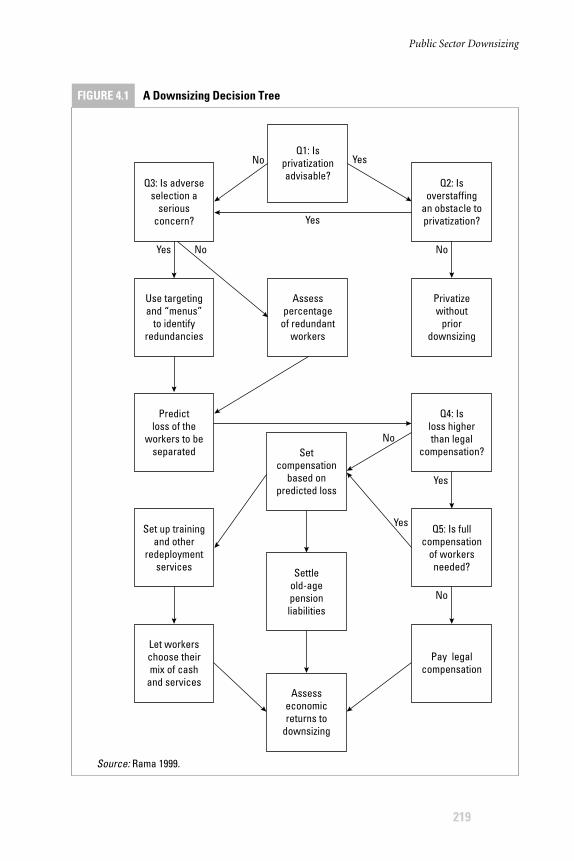
Public Sector Downsizing
219
Q1: Isprivatizationadvisable?
Q3: Is adverseselection a
seriousconcern?
Set up trainingand other
redeploymentservices
Predictloss of the
workers to beseparated
Use targetingand “menus”
to identifyredundancies
Assesspercentage
of redundantworkers
Privatizewithout
priordownsizing
Pay legalcompensation
Setcompensation
based onpredicted loss
Settleold-agepensionliabilities
Assesseconomicreturns to
downsizing
Let workerschoose theirmix of cash
and services
Q2: Isoverstaffing
an obstacle toprivatization?
Q4: Isloss higherthan legal
compensation?
Q5: Is fullcompensation
of workersneeded?
No
No No
No
No
Yes
Yes
Yes
Yes
Yes
Source: Rama 1999.
FIGURE 4.1 A Downsizing Decision Tree
the privatization of the enterprise. The irreversibility of investmentdecisions thus provides a rationale to buy out the workers as part of thepreparation for privatization.
If downsizing has not been carried out by the government prior toprivatization, the new private owners will have to deal with labor redun-dancies. The amount and composition of labor shedding would proba-bly differ in both cases, and the average compensation per worker wouldbe different, too. Moreover, the price the potential buyers would be will-ing to pay for a state-owned enterprise would vary depending on theextent to which the enterprise is overstaffed. Because of the ensuing dif-ferences in the extent of labor shedding, in the amount of the compen-sation offered, and in the price of the privatization of the enterprise,assessing the net gains from downsizing prior to privatization may be dif-ficult. But a net loss is likely.
To begin with, if downsizing has been managed by the governmentbefore privatization rather than left to the new private owners, the totalnumber of displaced workers is probably larger. There are examples invarious countries in which the new owners have kept the labor force moreor less intact, tending to confirm the claim that net reductions in employ-ment have been generally small in privatized firms. Based on a systematiccomparison of employment patterns across Polish firms during the tran-sition to a market economy, Frydman et al. (1997) show that employ-ment cuts were larger in state-owned enterprises than in otherwisesimilar privatized firms. It thus seems that the government may get rid ofworkers the new owners would prefer to keep. Furthermore, when thegovernment is in charge of downsizing, the “wrong” workers may be separ-ated from their jobs at an excessively high cost. A “wrong” compositionof separations is possible because governments are usually not particu-larly good at managing human resources. If governments could make theright decisions regarding whom to retain and whom to lay off and wereable to deliver on these decisions, the rationale for privatization wouldbe seriously weakened. An excessively high cost of separation is likelybecause governments can shift part of the downsizing costs to the tax-payer, for instance, in the form of early retirement programs, while, inprinciple, the new owners cannot do this. The temptation to resort togolden handshakes is therefore likely to be stronger if downsizing takesplace prior to privatization. Case studies suggest that this has happenedin practice.3
Unnecessary downsizing costs cannot be recovered through a higherprice for the state-owned enterprise during privatization. In theory, theprivatization price would, of course, increase every time a redundant
Analyzing the Distributional Impact of Reforms
220
worker is separated from his or her job. But getting rid of workers whoare not redundant would not increase the price. And, even for the gen-uinely redundant workers, the increase would be equal to the amount ofresources the new owners would have spent to secure their separation,not to the amount of resources actually spent (directly and indirectly) bythe government. Having studied 236 privatization experiences in Mexicoduring the 1980s and early 1990s, López (1997) concludes that employ-ment reductions through downsizing prior to privatization have a mar-ginal impact on privatization prices. Given the substantial cost ofprior-restructuring policies, the key lesson from López is “do not do toomuch; simply sell.”
The third important question concerns the adverse selection prob-lem: is adverse selection a serious concern? Adverse selection arises whenworkers decide whether to accept or reject a severance payment offerbased upon information only observable by them, such as the true pro-ductivity of the workers. Buying out the workers is a simple and conve-nient way to defuse the opposition to public sector reform. But severancepayments create an incentive for the most productive workers to leave thepublic sector and for the least productive ones to stay. This is generallythe case because workers who are more productive usually have betteroutside opportunities than do their less productive peers, and, so, whenthe compensation package is profitable, the workers who are more pro-ductive are the first to leave. This may not be socially desirable in the caseof public sector units producing valuable services. In this case, it is betterto target separations based on the observable characteristics of the work-ers and to use a more appropriate method to deal with the unobservabledifferences among workers.
The fourth and fifth questions concern the assistance to be providedto the separated workers: Is the loss among separated workers greater thanthe legal compensation? And is full compensation among workers needed?No matter the combination of cash, retraining, and redeployment ser-vices offered, there is no justification for spending more than would beneeded to buy out the redundant workers. The expected losses from separ-ation thus offer a benchmark against which to judge both the existinglaws on compensation and the ad hoc packages that may be proposed inthe context of downsizing. Labor market data can be used to predict theselosses according to observable characteristics of the workers, such as edu-cation, seniority, or gender.
Retraining and other redeployment programs deserve special atten-tion in assessing the cost of the assistance to be provided to separatedworkers. More resources may be spent on this component than on direct
Public Sector Downsizing
221
compensation. However, the evidence on the effectiveness of retrainingand other redeployment programs is mixed at best. If these programs areto be part of the downsizing operation, a safeguard should be introducedso as to minimize resource waste. Basically, separated workers should beallowed to choose between enrolling in any of the programs offered andcashing in on the equivalent of the cost of these programs per individual.This demand-driven approach would make it more difficult for voca-tional training and (often ailing) government agencies to divert excessiveresources from the downsizing operation.
The adverse selection problem
In a retrenchment program, the goal is to dismiss redundant workers, inparticular to trim low effort and unproductive workers. However, in sev-eral cases, especially in government administration and state agencies, theeffort levels or productivity of workers are not always observable or aredifficult to measure. It is expected that workers will decide whether toaccept or reject a severance payment offer using this private informationstrategically. This is the adverse selection problem.
Standard voluntary separation programs usually lead to the depar-ture of workers who show high productivity because these workers havethe best prospects outside the public sector. It follows from this that stan-dard voluntary separation programs are not appropriate in all circum-stances. For instance, these programs would lead to the wrong compositionof layoffs if they were applied to public sector units that produce valu-able services (such as health care) and operate in a tight labor market(where unemployment is low, and there are many vacancies). The factthat these programs have been used systematically in the past could beone of the reasons so many separated workers have been rehired in theaftermath of downsizing operations.
Several alternatives to standard voluntary separation programs havebeen proposed in cases where adverse selection is a serious concern.These include randomization, the menu approach to induce workers toreveal their productivity, and targeting mechanisms. These are now dis-cussed in turn.
In the randomization of job separations (Diwan 1994), the proba-bility that a public sector worker would be dismissed from his or her jobwould be equal to the estimated percentage of redundant workers. Theadvantage of this alternative is that the composition of separated work-ers resembles the composition of the workers who remain in the publicsector (thus, “randomization”). For units producing socially valuable ser-
Analyzing the Distributional Impact of Reforms
222
vices in a tight labor market, the alternative therefore represents an un-ambiguous improvement compared with standard voluntary separationprograms. However, Levy and McLean (1997) argue that, in general, ran-domization is not an efficient mechanism for downsizing the public sec-tor. This is so because, in terms of profit maximization, closing downthese units or leaving them untouched could be preferable to a random-ized downsizing. Levy and McLean show that the same argument appliesto standard voluntary separation programs as well.
In the presence of unobservable information, an efficient mechanismfor downsizing must lead workers to reveal their productivity. Jeon andLaffont (1999) show how to implement such a mechanism by means ofa menu of combinations of wages and severance payments. Each combi-nation, called a pair, is associated with a different probability of separation.If the probability of separation is equal to 1, the pair can be interpreted asa standard severance payment offer. If it is equal to 0, it can be viewed asa typical open-ended public sector contract. All the workers choosing thefirst pair are retrenched, whereas all those choosing the second pair areretained. For pairs in between these two extremes, some of the workersare retrenched, whereas others keep their jobs. If the menu is appropri-ately designed, workers should choose the pairs associated with theirsocially optimal probability of separation. For instance, if the overstaffedpublic sector unit produces a valuable service and operates in a tight labormarket, workers with low productivity should choose a pair associatedwith a strictly positive probability of separation.
However, setting up the right menu might be difficult in practice, sothat other, simpler devices for identifying workers with low productivityin the public sector should be used as well. In their cross-country surveyof downsizing operations, Haltiwanger and Singh (1999) find that thetargeting of separations significantly reduces the probability of subse-quent rehiring. The targeting mechanism can include such simple devicesas chasing out ghost workers. The experience of the Central Bank ofEcuador, analyzed by Rama and MacIsaac (1999), is also interesting inthis respect. After a first, disastrous attempt to downsize using voluntaryseparation programs, the bank decided to classify all its personnel in threecategories: those who were essential for the bank’s functioning, those whowere clearly redundant, and those who were difficult to place in either ofthe first two categories. The classification was based on the nature of eachworker’s unit and on each worker’s occupation and educational attain-ment. Essential workers did not have the option to leave; workers whowere clearly redundant did not have the option to stay; and the rest of theworkers were offered a voluntary separation program.
Public Sector Downsizing
223
Financial and economic returns to downsizing
As in any investment project, it is useful to distinguish between the finan-cial returns and the economic returns to a downsizing operation. Thefinancial returns result from a reduction in public sector expenditures,particularly the public sector wage bill. When the present value of thisreduction is higher than the upfront cost in terms of severance payments,safety nets, and the like, downsizing has positive financial returns. Eco-nomic returns, in contrast, result from a better allocation of labor acrosssectors. If the contribution of displaced workers to aggregate welfare ishigher when the workers are outside rather than inside the public sector,downsizing is likely to yield positive economic returns. The failure toidentify labor redundancies correctly in specific government agencies andstate-owned enterprises explains the disappointing results of some down-sizing operations.4
In the general case, however, assessing the returns to downsizing oper-ations is a difficult task. The typical evaluation compares the savings interms of public sector wages with the costs in terms of severance paymentpackages, retraining, and redeployment programs. But this comparison ismisleading. Overstaffing is only one among several distortions character-izing the public sector. Another example of a distortion is the fact thatpublic sector wages usually differ from private sector wages, and wages inthe public sector are therefore not a good indicator of the opportunity costof labor. Furthermore, the externalities from mass retrenchment shouldnot be ignored. The most obvious externalities arise in the context of one-company towns, which may easily become ghost towns after downsizinghas taken place. But public sector downsizing leads to fiscal externalities,too, because it reduces the equilibrium level of government expendituresand, hence, the burden of distortionary taxes. Because of all these distor-tions, the economic returns to public sector downsizing can be either higheror lower than might be suggested by the financial returns, and financialreturns may thus be a poor indicator of economic returns.
The contrast between remarkably high financial returns and rela-tively low economic returns should be a warning for policymakers. Theinability to distinguish between these two types of returns may give riseto an excessively upbeat assessment of the potential gains from downsiz-ing. The problem is that economic returns are much harder to measurein downsizing projects than in standard investment projects. In the lattersort of projects, the difference between financial and economic returnsarises from the different valuation of output prices and input costs in thepresence of market distortions.5 For instance, investing in an activity pro-tected by import tariffs may yield high financial returns, but low or even
Analyzing the Distributional Impact of Reforms
224
negative economic returns. The gap between the two assessments stemsfrom the use of different prices to value the output flow created by theinvestment project. The tariff-inclusive price is appropriate for the finan-cial appraisal, while the international price needs to be used for the eco-nomic appraisal. But, apart from this difference in valuation, the itemsinvolved in the two appraisals are basically the same in standard invest-ment projects. This is not true in the case of downsizing projects.
Haltiwanger and Singh (1999) evaluate the financial returns to selectedoperations based on the number of years it takes to recover the directfinancial costs in the form of lower expenditures. This indicator is calledthe break-even period. In 15 downsizing operations for which therequired information was available, the performance of downsizing opera-tions was remarkably good. The average break-even period was twoyears and four months, and it exceeded four years in less than 10 percentof the cases. Few investment projects display such high financial returns.However, these results should come as no surprise. If, say, a couple ofyears of salary are offered to whoever is willing to leave the public sector,as is often the case in practice, the upfront spending is recovered in theform of a lower wage bill in a mere two years. However, this calculationdoes not indicate whether the workers who took the offer and left thepublic sector were redundant.
Haltiwanger and Singh provide an indirect measure of the economicreturns to downsizing by examining the percentage of the displacedworkers who were subsequently rehired by the restructuring agencies orstate-owned enterprises. (Box 4.2 supplies the example of Peru.) Notethat rehires are different from new hires. The latter are not necessarily anindication of failure because the new recruits may have skills that weremissing among the displaced workers. Rehires, in contrast, indicate apoorly handled downsizing process. In the best case, they imply thatworkers who were essential to the operation of the restructured agenciesor state-owned enterprises were mistakenly considered redundant. In theworst case, they suggest that workers who had no intention of leaving thepublic sector were able to cash in through golden handshakes. It is diffi-cult to believe that downsizing projects characterized by incompetence(in the best case) or corruption (in the worst case) may have performedwell at reallocating workers based on their productivity inside and out-side the public sector. Other things being equal, a high percentage of dis-placed workers rehired can therefore be seen as an indication of loweconomic returns to downsizing.
Workers were subsequently rehired in 40 percent of the down-sizing operations surveyed by Haltiwanger and Singh, and rehiring was
Public Sector Downsizing
225
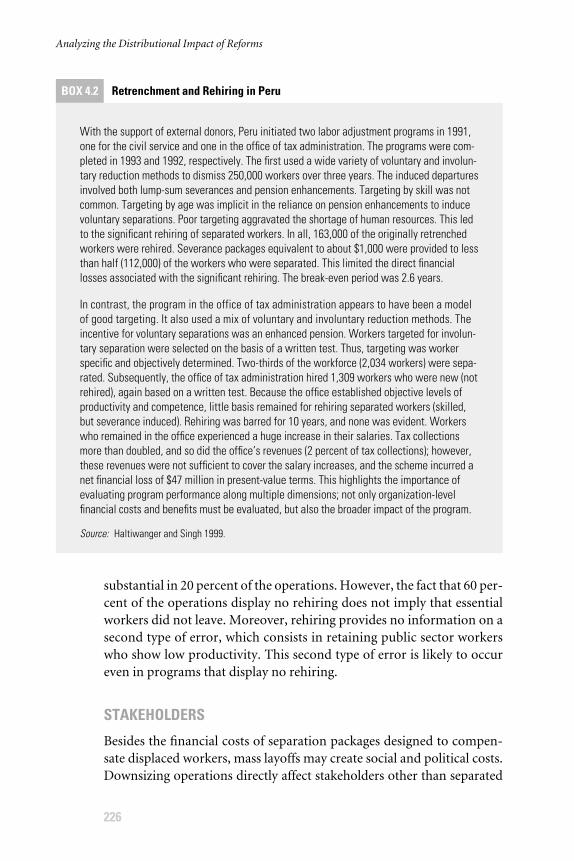
substantial in 20 percent of the operations. However, the fact that 60 per-cent of the operations display no rehiring does not imply that essentialworkers did not leave. Moreover, rehiring provides no information on asecond type of error, which consists in retaining public sector workerswho show low productivity. This second type of error is likely to occureven in programs that display no rehiring.
STAKEHOLDERS
Besides the financial costs of separation packages designed to compen-sate displaced workers, mass layoffs may create social and political costs.Downsizing operations directly affect stakeholders other than separated
Analyzing the Distributional Impact of Reforms
226
BOX 4.2 Retrenchment and Rehiring in Peru
With the support of external donors, Peru initiated two labor adjustment programs in 1991,one for the civil service and one in the office of tax administration. The programs were com-pleted in 1993 and 1992, respectively. The first used a wide variety of voluntary and involun-tary reduction methods to dismiss 250,000 workers over three years. The induced departuresinvolved both lump-sum severances and pension enhancements. Targeting by skill was notcommon. Targeting by age was implicit in the reliance on pension enhancements to inducevoluntary separations. Poor targeting aggravated the shortage of human resources. This ledto the significant rehiring of separated workers. In all, 163,000 of the originally retrenchedworkers were rehired. Severance packages equivalent to about $1,000 were provided to lessthan half (112,000) of the workers who were separated. This limited the direct financiallosses associated with the significant rehiring. The break-even period was 2.6 years.
In contrast, the program in the office of tax administration appears to have been a modelof good targeting. It also used a mix of voluntary and involuntary reduction methods. Theincentive for voluntary separations was an enhanced pension. Workers targeted for involun-tary separation were selected on the basis of a written test. Thus, targeting was workerspecific and objectively determined. Two-thirds of the workforce (2,034 workers) were sepa-rated. Subsequently, the office of tax administration hired 1,309 workers who were new (notrehired), again based on a written test. Because the office established objective levels ofproductivity and competence, little basis remained for rehiring separated workers (skilled,but severance induced). Rehiring was barred for 10 years, and none was evident. Workerswho remained in the office experienced a huge increase in their salaries. Tax collectionsmore than doubled, and so did the office’s revenues (2 percent of tax collections); however,these revenues were not sufficient to cover the salary increases, and the scheme incurred anet financial loss of $47 million in present-value terms. This highlights the importance ofevaluating program performance along multiple dimensions; not only organization-levelfinancial costs and benefits must be evaluated, but also the broader impact of the program.
Source: Haltiwanger and Singh 1999.
workers, such as entire communities in the case of one-company towns,caterers and providers of services to state-owned enterprises, and final con-sumers and taxpayers. The fiscal flows and political burdens of downsizingmay affect central and local tiers of government differently. In some cases,this type of reform may also generate “signals” in the sense that multilateralorganizations and donor countries supporting a structural reform processin progress might view the downsizing as a commitment to the overallprocess. A Poverty and Social Impact Analysis (PSIA) of downsizing opera-tions must identify and take into account the interests and potentialresponses of these different and likely heterogeneous stakeholders.
Workers
Workers in state agencies or state-owned enterprises constitute themost visible stakeholders in this kind of reform. The welfare of sepa-rated workers is directly affected by a downsizing operation. Retrenchedworkers stand to lose in terms of earnings and benefits, but also in termsof forgone intangible benefits such as the lower levels of effort that maycharacterize jobs in the public sector, acquired job security, or maternityleave benefits for women. At the same time, even if public sector workersdo not represent the poorest sector in a society, the families and otherpeople who depend on the earnings of these workers may also experiencewelfare loses as a result of downsizing operations.
In preparation for a downsizing operation, the political power ofpublic sector workers and the unions with which they are affiliated mustbe assessed. Public workers are usually the most vocal group in a society;they are usually affiliated with strong unions, and, as a group, have moreeducation than the rest of society. In most countries, they represent awell-organized political force and form a contingent of hundreds of thou-sands of voters. Involuntary separation schemes that imply mass layoffsor voluntary departure schemes that cause workers to perceive that theyare being coerced to volunteer would face strong political oppositionsince public sector workers can readily catch the attention of the mediaand mobilize large pools of citizens; this opposition can bring the opera-tion to a halt and may even bring it to an end.
One-company towns and communities
Other directly affected groups may consist of entire towns or communi-ties in which public companies have settled. Many developing countriesand, especially, transition economies have numerous one-company towns,
Public Sector Downsizing
227
the distinctive feature of which is the presence of single, large employerswithin local labor markets. The term one-company towns applies to min-ing towns and to the communities growing up next to large manufactur-ing plants, such as steel mills or armament factories. In all cases, thecompany accounts for a substantial share of the jobs in the town, but aparticular characteristic is that even those people who do not work for thecompany depend on it somehow to make a living. If the company were tocease operations, the one-company town could easily become a ghosttown. Decisions affecting state-owned enterprises in one-company townsshould therefore not be based solely on considerations of profitability, but,rather, they should incorporate the costs to the surrounding populationin terms of employment and earnings. In some cases, it may be desirablefrom a social standpoint to keep a state-owned enterprise open instead oftransforming the one-company town into a ghost town.6
Caterers and providers of services to state-owned enterprises
Another group of stakeholders directly affected by a downsizing opera-tion is comprised of smaller businesses that cater for or provide servicesto public agencies or state-owned enterprises and their employees. As aresult of retrenchment efforts, caterers and providers of services to state-owned enterprises may incur welfare losses or even abandon their meansof livelihood. Thus, the reduction of public employment in overstaffedagencies may generate negative earnings and employment externalitiesfor these people.
The state
Central government agencies such as a ministry of finance, a tax collec-tion administration, or a social security administration will likely favordownsizing operations as long as these operations are perceived as help-ing to control fiscal imbalances by reducing the state wage bill, pensionobligations, and other liabilities. Ministries of finance in developingcountries are usually in charge of reform processes aimed at reducing thesize of the public sector and making the public sector more efficient, andthese will try to show off the advantages of the reforms for the sake of gen-eral opinion and potential private buyers of state-owned enterprises. Incontrast, sector ministries will probably have more ambiguous responses.They stand to gain if a reform is seen to remove from the state the directresponsibility for the provision and the quality of the services providedby privatized state agencies and state-owned enterprises. By contrast, they
Analyzing the Distributional Impact of Reforms
228
may stand to lose if the reform is perceived to reduce their political powerrelative to other ministries or authorities.
Local government agencies will probably respond negatively to down-sizing operations, particularly if the magnitude of the layoffs is consider-able or if entire communities are affected, which is likely the case forone-company towns. Both scenarios represent extremely heavy politicalburdens at the local level. Local governments are generally on the front-line in facing increased unemployment rates and political protests andopposition to reform processes as a result of downsizing. Additionally,local bureaucracies will probably lose political power because they nolonger have credible control over employment allocations in public com-panies or state agencies. Finally, local governments may also be concernedabout the allocation of assets, asset ownership, and liabilities, especially ifdownsizing is an intermediate step toward privatization. Thus, as a resultof downsizing operations, fiscal flows may not favor local governmentsat all; it is likely that the proceeds from privatizations will flow directly tothe central government.
Multilateral organizations and donors
Multilateral organizations, such as the World Bank or the InternationalMonetary Fund, and other donors are interested in the overall public sec-tor reform processes undertaken by developing countries. Many of theloans made by these organizations and donors are conditioned by theprogress of reforms. In the case of downsizing, these institutions may lendmoney to finance severance payments and compensation packages andmay also be involved in advising governments on the processes.
Taxpayers
Consumers are the largest single class of stakeholders. However, con-sumers are usually less organized than are public sector workers. In part,this is because there are several distinct groups within this class, each withdifferent, potentially conflicting interests (such as current versus poten-tial consumers) and different relative levels of political power (such asurban versus rural consumers). As taxpayers, consumers may respondpositively to downsizing operations if they perceive their taxes being usedin more cost-effective ways and if inefficiencies are eliminated or at leastreduced by the reforms. Supporting overstaffed state agencies and state-owned enterprises entails a double burden for society. A key direct costis represented by the amount of resources that are transferred to public
Public Sector Downsizing
229
companies and that thus cannot be used for consumption or investmentpurposes. A more subtle burden results from the use of distortionary taxesto collect these resources because distortionary taxes may affect householddecisions regarding labor force participation, the effort to be exerted onjob productivity, savings, and so on. In other words, transferring one dol-lar to a public sector company may cost the rest of society more than onedollar because the distortionary taxes may reduce private sector produc-tivity or the efficient allocation of resources.
IMPACT CHANNELS
This section explores the channels of the direct and indirect impacts of downsizing. These channels include employment and wages, fiscalflows, productive externalities, and the access to and quality and priceof services.
Employment and wages
Changes in employment and wages both among affected workers and insociety as a whole can be expected to occur because of downsizing. Forsome of the separated public workers and workers in state-owned enter-prises, the immediate employment and wage effects may be negative. Formost of these workers, the transition and relocation costs can be partic-ularly burdensome. Some public sector employees will have spent a largeportion if not all of their working lives in public agencies or state-ownedenterprises. It is likely that their skills do not match those required by pri-vate companies. Moreover, some of these workers will be too old to findjobs in private companies at the wage levels commiserate with their expe-rience. Some of them may never find other jobs, and, even if they do, theywill probably spend time in unemployment. Meanwhile, some of themore productive workers who may choose to leave their public jobs willbe able to perform well in the private sector. High-productivity workerswith superior prospects in the private sector usually stay in the public sec-tor only because they value intangible benefits that cannot be acquired inprivate companies. If they are offered compensation packages that offsetthe loss in such intangibles, these workers will likely leave. Likewise, whenprivatization occurs, employment conditions and wages may also changeamong the workers who remain at the state-owned enterprises, and theymay obtain more flexible contracts and more favorable wage dispersion.
For society as a whole, however, downsizing operations may increaseaggregate output in the medium run through the reallocation of workers
Analyzing the Distributional Impact of Reforms
230
to activities in which they can, presumably, be more productive andthrough a reduction in the equilibrium level of taxes. This scenario mayoccur if productivity in the public sector was very low before the reformsand if the potential earnings in the private sector are high.
Externalities
Public sector downsizing may affect the rest of an economy not onlythrough its impact on the budget and the allocation of labor, but alsothrough its direct impact on private sector output. An obvious illustra-tion of this productive externality is provided by the one-company town.In such a case, many of the other jobs in the town depend on the employ-ment and wage levels in the state-owned enterprise. The company’semployees are probably the most important customers at the town’s pri-vate shops. In the extreme case of a mining town, all the activities of thesurrounding population may revolve around the mining company. Adrastic employment reduction at the company is therefore likely todepress private sector activity in the town or even transform the towninto a ghost town.
Productive externalities involved in downsizing may also occur at anationwide level. Mass retrenchment programs that affect a substantialfraction of the urban labor force may increase unemployment rates overlong periods of time. In some Sub-Saharan African countries where thepublic sector represents a large share of the modern economy, downsiz-ing may depress economic activity in the short run. Productive external-ities of this sort cannot be ruled out in more developed economies either,as suggested by the substantial increase in unemployment rates that fol-lowed the massive public sector downsizing program in Argentina.
Externalities like those arising in a one-company town may providea justification for retaining some redundant workers. Limiting the extentof downsizing certainly entails a cost to the rest of society, which mustpay for the redundancies in the form of higher taxes or lower socialexpenditures. Retrenching redundant workers also entails a cost to thepopulation that surrounds the company and depends on it to sustain eco-nomic activity. The optimal extent of downsizing involves a trade-offbetween these two costs.
Fiscal flows
Downsizing operations generate financial gains and costs for the publicsector. The first and most obvious financial gain is the cut in the wage bill.
Public Sector Downsizing
231
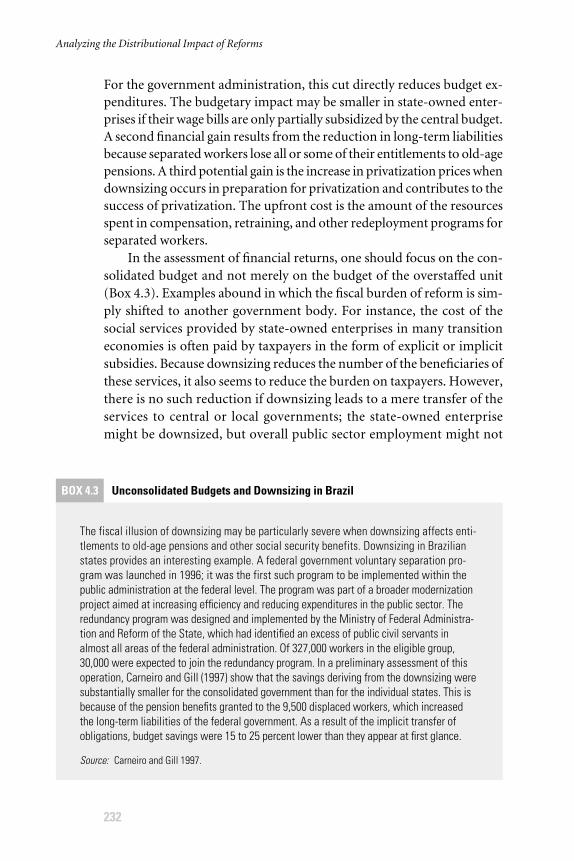
For the government administration, this cut directly reduces budget ex-penditures. The budgetary impact may be smaller in state-owned enter-prises if their wage bills are only partially subsidized by the central budget.A second financial gain results from the reduction in long-term liabilitiesbecause separated workers lose all or some of their entitlements to old-agepensions. A third potential gain is the increase in privatization prices whendownsizing occurs in preparation for privatization and contributes to thesuccess of privatization. The upfront cost is the amount of the resourcesspent in compensation, retraining, and other redeployment programs forseparated workers.
In the assessment of financial returns, one should focus on the con-solidated budget and not merely on the budget of the overstaffed unit(Box 4.3). Examples abound in which the fiscal burden of reform is sim-ply shifted to another government body. For instance, the cost of thesocial services provided by state-owned enterprises in many transitioneconomies is often paid by taxpayers in the form of explicit or implicitsubsidies. Because downsizing reduces the number of the beneficiaries ofthese services, it also seems to reduce the burden on taxpayers. However,there is no such reduction if downsizing leads to a mere transfer of theservices to central or local governments; the state-owned enterprisemight be downsized, but overall public sector employment might not
Analyzing the Distributional Impact of Reforms
232
BOX 4.3 Unconsolidated Budgets and Downsizing in Brazil
The fiscal illusion of downsizing may be particularly severe when downsizing affects enti-tlements to old-age pensions and other social security benefits. Downsizing in Brazilianstates provides an interesting example. A federal government voluntary separation pro-gram was launched in 1996; it was the first such program to be implemented within thepublic administration at the federal level. The program was part of a broader modernizationproject aimed at increasing efficiency and reducing expenditures in the public sector. Theredundancy program was designed and implemented by the Ministry of Federal Administra-tion and Reform of the State, which had identified an excess of public civil servants inalmost all areas of the federal administration. Of 327,000 workers in the eligible group,30,000 were expected to join the redundancy program. In a preliminary assessment of thisoperation, Carneiro and Gill (1997) show that the savings deriving from the downsizing weresubstantially smaller for the consolidated government than for the individual states. This isbecause of the pension benefits granted to the 9,500 displaced workers, which increasedthe long-term liabilities of the federal government. As a result of the implicit transfer ofobligations, budget savings were 15 to 25 percent lower than they appear at first glance.
Source: Carneiro and Gill 1997.
be, and the need for funds therefore does not disappear. Another exam-ple is provided by redeployment programs allowing redundant work-ers to take other public sector jobs. In this case, the payroll is cut in therestructured public sector unit, but wage bills are inflated elsewhere inthe public sector.
DETERMINANTS AND DISTRIBUTIONAL IMPACTS OF WELFARE LOSSES
Downsizing may affect the welfare of other stakeholders in the reformprocess besides displaced public sector employees. Caterers and providersof services to state agencies and state-owned enterprises, as well as thecommunities surrounding the enterprises in one-company towns, willlikely be affected by public sector retrenchment programs. Impacts amongagents providing services to the enterprises are expected to be similar indirection (employment and wages losses) to those experienced by sepa-rated workers.
The following concentrates only on welfare impacts among separatedworkers. The welfare loss a separated public sector worker experiencesmay be disaggregated into three components. The first is the present valueof the resulting change in earnings, including bonuses and other cashbenefits. In general, the wage structure in the public sector is differentfrom that in the private sector; wage differentials between public and pri-vate unskilled (blue-collar) workers is usually higher than that betweenpublic and private skilled (white-collar) workers. Moreover, it may takea long time for some of the separated workers to find new jobs, and earn-ings may be close to zero during that period. The second component isthe present value of the loss in nonwage benefits. Public sector jobs usu-ally provide health coverage and old-age pensions, among other benefits.In most developing countries, the jobs available to separated public sec-tor workers do not carry such benefits. The third component is com-prised by other, more intangible losses from separation. For instance,effort and productivity levels on the job tend to be lower in the public sec-tor than in the private sector, whereas job security is almost invariablygreater. In particular, intangible benefits such as flexible working hoursand maternity leaves are highly valuable for women. The possibility oftaking bribes or using government facilities also falls into this category.Formally, the total welfare loss is:
WL EL BL OL= + + ( . )4 1
Public Sector Downsizing
233
where WL measures the welfare loss, EL is the present value of the earn-ings loss, BL is the present value of the loss in nonwage benefits such asold-age pensions, and OL is the loss in other, more intangible benefits.
In preparation for a downsizing operation, it is important to assessthe welfare loss separated workers might experience. This assessmentmay help predict the cost of the downsizing operation in terms of sever-ance payments, and it may also provide a cost benchmark. The welfareloss experienced by retrenched workers will depend on the observablecharacteristics the workers possess. These characteristics include salariesand seniority in the public sector, the two variables most commonlyused when designing severance compensation (the most common ruleof thumb). But they also include gender, age, education, job level, geo-graphic location, and other characteristics.
Table 4.2, taken from Rama (1999), summarizes findings of severalstudies on the determinants of welfare losses and earnings losses from jobdisplacements in developing countries and transition economies. Itreports the signs of the impact of worker characteristics on the welfareand earnings losses among the workers. In the table, a “+” sign denotes astatistically significant positive association between the losses and specificworker characteristics; the opposite holds for the “−” sign, while “0”denotes nonsignificant relationships, and a “?” denotes changes in signacross specifications.
Several regularities emerge from the table. First, it appears that thewage level in the public sector is a poor predictor of welfare losses, at leastas long as other observable characteristics of workers are taken intoaccount. Second, with the exception of Egypt, where government hiringand compensation policies strongly distort the payoffs for schooling, theloss from displacement is usually smaller as the level of educational attain-ment of a worker rises. Third, while higher seniority in a public sector jobmay lead to larger losses from displacement, there is no clear link betweentotal work experience and displacement losses. Fourth, women workersand workers with bigger families may suffer more from displacement.These distributional impacts are now discussed in more detail.
Education and specific skills
Traditional rules of thumb for compensation do not consider educationin setting the amount of severance payments. However, education is animportant predictor of earnings. In fact, it is an empirical regularity that,in most developing countries, the more educated the individual, the morehe or she will be able to earn. If this is the case, the welfare losses of the
Analyzing the Distributional Impact of Reforms
234
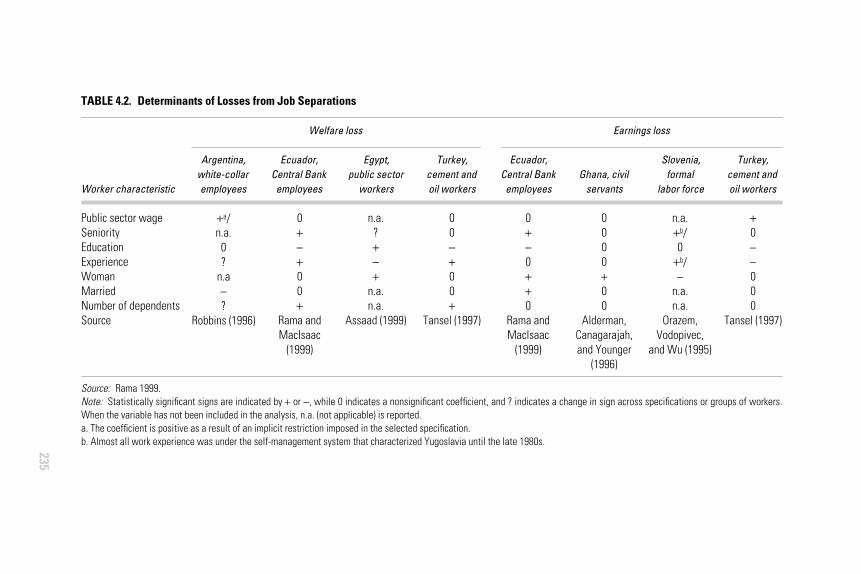
235
TABLE 4.2. Determinants of Losses from Job Separations
Welfare loss Earnings loss
Argentina, Ecuador, Egypt, Turkey, Ecuador, Slovenia, Turkey, white-collar Central Bank public sector cement and Central Bank Ghana, civil formal cement and
Worker characteristic employees employees workers oil workers employees servants labor force oil workers
Public sector wageSeniorityEducationExperienceWomanMarriedNumber of dependentsSource
+a/n.a.0?
n.a−?
Robbins (1996)
0+−+00+
Rama andMacIsaac
(1999)
n.a.?+−+
n.a.n.a.
Assaad (1999)
00−+00+
Tansel (1997)
0+−0++0
Rama andMacIsaac
(1999)
n.a.+b/0
+b/−
n.a.n.a.
Orazem,Vodopivec,
and Wu (1995)
+0−−000
Tansel (1997)
0000+00
Alderman,Canagarajah,and Younger
(1996)
Source: Rama 1999.Note: Statistically significant signs are indicated by + or −, while 0 indicates a nonsignificant coefficient, and ? indicates a change in sign across specifications or groups of workers.When the variable has not been included in the analysis, n.a. (not applicable) is reported.a. The coefficient is positive as a result of an implicit restriction imposed in the selected specification.b. Almost all work experience was under the self-management system that characterized Yugoslavia until the late 1980s.
more educated will typically be lower than the welfare losses of the lesseducated. Evidence provided by several studies suggests that, indeed,welfare losses are higher among less educated workers; this has been thecase in Ecuador, Guinea-Bissau, and Turkey. Assessing the welfareimpacts of downsizing in the cement and oil sectors in Turkey, Tansel(1997) reports that the probability of a similar or better current situationwith respect to a predismissal status—a self-rated welfare measure—increased significantly with the level of education. Additionally, Tanselfinds that earnings losses were smaller among the better educated; inparticular, general high school graduates experienced the smallest losses,while the largest losses were experienced by middle school graduates. Inthe case of Ecuador, Rama and MacIsaac (1999) use an implicit welfaremeasure of the losses among workers after dismissal from the CentralBank. They find that more well educated employees fared better thandid other retrenched bank employees; if their estimates are interpretedliterally, the implicit welfare loss decreased by roughly 15 percent foreach additional year of schooling. Chong and Rama (1998) also findthat welfare losses are higher among less educated public sector work-ers in Guinea-Bissau. In the case of Egypt, in contrast, Assaad (1999)reports that welfare losses among dismissed workers at state-ownedenterprises tend to be significantly higher among individuals with second-ary and postsecondary education than among workers with lower levelsof education.
Despite the specific relationship between education and welfarelosses by country, it is clear that variations in welfare across educationgroups might be important, but that this is not considered in traditionalrules of thumb. As Assaad points out:
The significant difference in displacement losses among workers at different levelsof education has important implications for the design of severance pay programs.If the same package of benefits is offered to all workers to achieve a certain rate ofexit, the likely outcome is that all level-one workers, who tend to have lower losses,will exit first, leading to a highly distorted occupational structure. Some control canbe achieved over the composition of the exiting workers by setting up separate pro-grams for each level of education. (Assaad 1999, 133)
Besides education, other skills may be important, too. Public sectorworkers and workers in state-owned enterprises accumulate specific skillsthat may not be easily transferable to the private sector, where these skillsmay show low returns or are not rewarded at all. Workers may acquireand develop highly specific skills to perform tasks in the public sectorthat may not be standard elsewhere. Thus, after dismissal, workers with
Analyzing the Distributional Impact of Reforms
236
highly specific skills stand to lose more than do other workers. Anexample is production-line workers versus managers of state-ownedenterprises. The technologies used in the private sector may not be thesame as those used in state enterprises; thus, individuals who onceworked on a state enterprise production line and acquired specific skillsnontransferable to the private sector would likely experience longerunemployment spells after dismissal or may not be able even to find simi-lar jobs in the private sector. In any of these situations, an earnings lossmay be expected. On the other hand, managerial skills are generalenough, and white-collar employees are likely to find similar jobs in theprivate sector even if the job level is lower or if the dismissed individualsare obliged to spend time among the unemployed before obtaining pri-vate sector jobs. Some evidence on these issues is reported by Tansel(1997) for workers in state-owned enterprises in the cement and oil sec-tors in Turkey. Tansel finds that, in postdismissal earnings regressions,years of experience at the enterprises are only marginally statistically sig-nificant or not statistically significant at all. This may suggest that the skillsacquired in the public sector were not easily transferable to the privatesector. More evidence on this issue is provided by Rama and MacIsaac(1999) on workers dismissed from the Central Bank in Ecuador, where theearnings losses after dismissal increased with years of tenure at the bank,but did not increase with work experience outside the bank. Rama andMacIsaac argue that longer careers at the Central Bank may be associatedwith higher investments in specific skills that have low returns in the pri-vate sector.
Geographic location
Geographic location and place of residence may also play an importantrole in terms of the differential distributional impacts of retrenchmentprograms. In particular, dismissed public sector workers and workers instate-owned enterprises in small towns or in rural areas are expected tolose more after separation than other workers. Local labor market con-ditions could be tighter—a situation involving low unemployment andmany vacancies—in small towns than in capital cities or other medium-to-large cities, where more employment opportunities may be availablefor both blue- and white-collar workers. In several developing countries,private firms—good examples are manufacturing plants and seaportfacilities—are concentrated in medium-to-large cities and especially incapital cities. Given that the typical rule of thumb would equally com-pensate dismissed workers from large cities and small or rural towns,
Public Sector Downsizing
237
retrenched workers in the latter group stand to lose more. However, thismight not always be the case since, in smaller towns, the cost of living isprobably much lower. In any case, both aspects, the prospects of gettinga paid job and the costs of living, should be taken into consideration.
Analyzing the case of Guinea-Bissau, Chong and Rama (1998) findthat potential earnings in the private sector are higher in Bissau than out-side the city. They suggest that a well-tailored severance package shouldbe more generous in remote areas, where job alternatives might be limi-ted, than in the capital city. Similar differential distributional impacts interms of geographic location are reported by Assaad (1999) in the case ofEgypt. Assaad simulates severance packages that could be offered toworkers in state-owned enterprises using alternative indexation schemesrather than the traditional rule of thumb. He finds that simulated accep-tance rates would be higher in the Alexandria and Suez Canal regionsand, to a lesser extent, rural Lower Egypt. In contrast, simulated accep-tance rates would be disproportionately low in Upper Egypt, a regionwith poor private sector prospects.
Gender
Studies of public sector downsizing impacts summarized in Table 4.2present direct evidence of the relative loss in incomes for women versusmen. In both Ecuador and Ghana, women were shown to suffer greaterearnings losses even after controlling for worker characteristics in aregression analysis. In Ecuador, a woman’s loss in earnings was 30 per-centage points higher than the loss of a comparable male colleague. Incontrast, in Slovenia, women suffered a smaller loss than men, and, inTurkey, women’s losses were the same as men’s. As Table 4.2 illustrates,the total welfare loss, including loss of benefits, is greater among womenthan among men in Egypt (as the “+” sign in the third column in the“Woman” row indicates) and about the same in Ecuador and Turkey (asthe “0” sign in the second and fourth columns in the “Woman” rowshows). In Egypt, the total welfare loss among women was 85 percenthigher than the loss among men.
There are at least three reasons one should care whether women aremore negatively affected than men by public sector downsizing programs.First, the income of women workers is important to the welfare of house-holds. Men workers tend to contribute more to total household incomesthan do women workers, but the relevant issue is the incomes lost. Asshown by Appleton, Hoddinott, and Krishnan (1999), Assaad (1999), andRama (2001), laid-off women public sector employees will, on average,
Analyzing the Distributional Impact of Reforms
238
spend more time unemployed, and the gap between the wages they earnedin their public sector jobs versus the wages in their private sector jobs willbe greater. Additionally, studies from a wide set of countries indicate thatwomen’s and men’s relative contributions to household incomes affectspending patterns. These studies show that increasing a woman’s share ofincome in the household (controlling for total household income) signifi-cantly increases the share of the household budget allocated to children’seducation, health care, and nutrition-related expenditures.
Second, disproportionate layoffs of women, coupled with privatesector discrimination, may result in an inefficient use of the labor forcein the economy as a whole. In Egypt, economic reforms eliminatingguaranteed civil service employment for graduates of secondary andhigher education institutions have been found to have such an effect.While the educated men who were eligible for guaranteed public sectoremployment were generally able to find jobs in the private sector, theirwomen counterparts were obliged to move into very low-productivitysubsistence agriculture or otherwise leave the labor market.7
Third, disproportionate layoffs of women employees may exacerbateexisting shortages of women in certain departments. In the case of agricul-tural extension agents or health care professionals, for example, it may bethat women are needed to provide services to women farmers or womenpatients. Conversely, there may be few men in positions (for example,elementary school teachers) where it may be socially desirable to main-tain a balance between men and women.
METHODS TO ASSESS DOWNSIZING IMPACTS ON WORKER WELFARE
As a result of downsizing, some displaced workers may face losses in earn-ings and welfare (losses in earnings, plus losses in nonwage and intangiblebenefits) following separation, while others may receive gains. This posesthe problem of determining a severance payment to help compensatethose who stand to lose, while avoiding overcompensation. This sectiondiscusses three approaches for assessing and measuring worker losses orgains, the data requirements for performing this sort of analysis, and aprocedure for tailoring a separation compensation package.
Methods
In what follows, a list of three approaches is presented that may help inassessing the impacts of downsizing on worker welfare losses and in
Public Sector Downsizing
239
measuring these losses. For practical purposes, the first two approachescannot be used in preparation for downsizing operations, but are none-theless useful tools for analyzing ex post welfare impacts among dis-missed workers and for generating insights on prospective operations.
� The “before and after” methodology. The first strategy consists of inter-viewing former public sector workers one year after separation (forexample) and asking them to evaluate any changes in their well-being.The interviews may be carried out according to subjective or objec-tive criteria. In the subjective evaluation of well-being, the separatedworkers would be asked to assess their current well-being with respectto the predismissal situation. The change in well-being might be mea-sured using a discrete variable indicating whether postdismissal well-being is much better, better, about the same, less, or much less thanpredismissal well-being. In the objective evaluation of well-being, theworkers would be asked to report pre- and postdismissal earnings.The change in well-being could then be computed as the percent dif-ference between pre- and postdismissal earnings. In both cases, theseindicators are regressed against predismissal earnings and tenure inthe public sector, as well as other observable worker characteristics,such as age, education, gender, marital status, and the like. Thismethodology has been used by Rama and MacIsaac (1999) to studywelfare losses among dismissed civil servants at the Central Bank ofEcuador and by Tansel (1997) to assess welfare losses among dis-missed workers in state-owned enterprises in Turkey.
� The “stayers and leavers” methodology. A second empirical strategyrelies on the welfare losses predicted by public sector workers beforethe downsizing. The idea is to compare the workers who acceptedseparation offers with those who rejected them. Those who acceptedthe offers expected that there would be a net welfare gain from sep-aration, whereas those who rejected the offers expected that therewould be a net welfare loss from separation. The probability ofacceptance may therefore be estimated as a function of all the indi-vidual characteristics of the workers and the severance payments theworkers were offered. This is then used to infer the amount of sever-ance payments that would have made each worker indifferent aboutaccepting or rejecting an offer. That amount is an indicator of thewelfare loss or gain expected by each worker. The “stayers andleavers” methodology has been used by Robbins, Gonzales, andMenendez (1996) to assess the welfare change after dismissal amongworkers in seven state-owned enterprises in Argentina.
Analyzing the Distributional Impact of Reforms
240
� The “in versus out” methodology. This strategy compares the presentvalue of earnings among workers inside and outside the public sector.Typically, the comparison shows that some public sector workers earnless over their working lives than similar workers in the private sec-tor. If the public sector workers do not quit voluntarily, it is probablybecause they derive other benefits from their jobs. The gap in earningsobserved for the most disadvantaged group of public sector workersmay thus be used to infer the value of nonwage and other intangiblebenefits involved in public sector jobs, such as job security, healthinsurance coverage, in-kind payments, and other fringe benefits, oreven low job-effort (productivity) requirements. For less disadvan-taged workers, it is assumed that the loss of nonwage and intangiblebenefits is proportional to the public sector salary. Relying on thehypothesis that a stable relationship exists between the welfare lossesand the earnings losses related to displacement, studies addressing thelatter can be expected to provide information on the former. Fromthe previous discussion, it may be inferred that, if a separated workerearns less in the private sector or the informal sector once nonwageand intangible benefits are accounted for, the resulting net presentvalue of the difference between public sector and private sector (“inand out”) earnings and benefits will be positive, and a welfare losswill have occurred. Similarly, if the separated worker earns more inthe private or the informal sector, the resulting “in and out” net pres-ent value of the difference in earnings and benefits will be negative,and, in this case, a net welfare gain will have occurred. The “in ver-sus out” method was initially proposed by Fiszbein (1994), who usesa forward-looking formula to assess the “just right” severance pack-age to compensate dismissed workers for potential earnings losses.Assaad (1999) refined the forward-looking approach by taking intoaccount both tangible and intangible losses. Many workers in pub-lic or state-owned enterprises might be able to earn more in the pri-vate sector, but, despite this, they prefer to stay at their public sectorjobs; this means that these other, intangible benefits are highly val-ued. Chong and Rama (1998) build upon the work of Fiszbein andAssaad to propose additional methodological refinements, includingthe appropriate time spans that should be considered in computingpresent discounted values and the significance of measurement errorproblems in the calculation of intangible benefits. The “in versus out”methodology has been used by Assaad (1999) on Egypt, Chong andRama (1998) on Guinea-Bissau, Fiszbein (1994) on Sri Lanka, andRama (2001) on Vietnam.
Public Sector Downsizing
241
Data sources
Before a downsizing operation is implemented, the “in versus out”methodology may be applied. After the operation, the “before and after”or the “stayers versus leavers” methodologies may be applied. Most of theinformation required is similar, and several sources of information maybe used. The analysis will require data on earnings; it is important to useannual earnings instead of daily or weekly earnings, especially in devel-oping countries, because many jobs in the private sector are casual or sea-sonal, such as in the case of self-employed or informal workers. Thus,total earnings during a year may be low despite occasionally high daily orweekly totals. In addition, annual earnings figures should include earn-ings from primary and secondary jobs where applicable because privatesector workers frequently hold secondary occupations as additional sourcesof income. Other welfare measures could be useful as well, such as house-hold consumption levels or the amount of the old-age pensions to whichworkers are entitled. Information on the individual characteristics ofworkers will also be required, such as age, education, gender, tenure oryears of work experience, region of residence (urban versus rural, cityversus town), and marital status, among others.
A first source of information useful for an assessment of the welfareimplications of downsizing is administrative data on the public sector,such as public employment censuses or payrolls. Ad hoc household sur-veys may be particularly relevant as a supplement to these data given thatthe surveys may be specifically designed to assess the welfare impacts of downsizing on dismissed workers. Other individual or household sur-veys typically carried out in most countries, such as labor force surveys, household-expenditure surveys, or Living Standards Measurement Stud-ies, might also serve as good sources of information.
Designing a separation package
Tailoring a separation compensation package may help minimize thewelfare losses of dismissed workers and reduce the distributional impactsthrough education, gender, region of residence, or other worker charac-teristics and may also help reduce the total cost associated with a volun-tary separation scheme. In a typical downsizing operation, the amountof compensation displaced workers receive is based on a rule of thumbinvolving their salaries and perhaps their seniority in the public sector.The implicit assumption is that their welfare losses from displacementcan be accurately predicted based only on these two observable charac-
Analyzing the Distributional Impact of Reforms
242
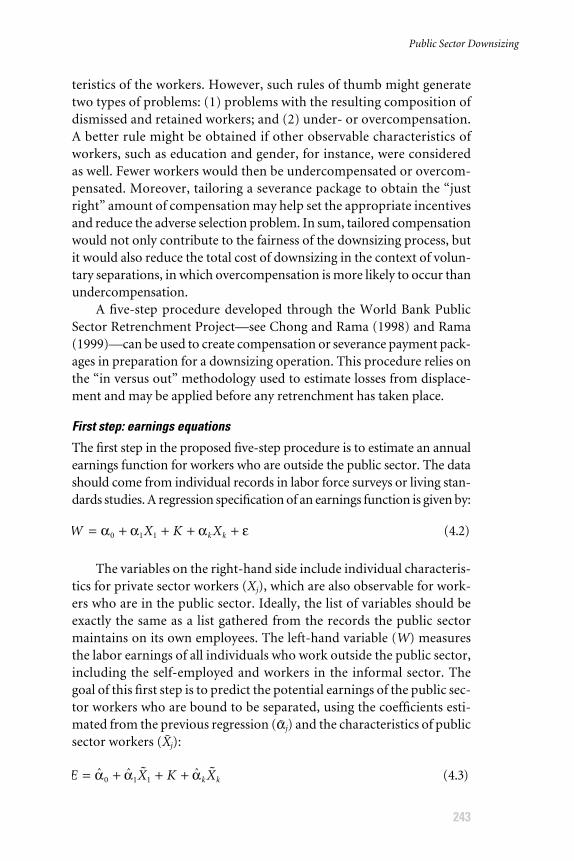
teristics of the workers. However, such rules of thumb might generatetwo types of problems: (1) problems with the resulting composition ofdismissed and retained workers; and (2) under- or overcompensation.A better rule might be obtained if other observable characteristics ofworkers, such as education and gender, for instance, were consideredas well. Fewer workers would then be undercompensated or overcom-pensated. Moreover, tailoring a severance package to obtain the “justright” amount of compensation may help set the appropriate incentivesand reduce the adverse selection problem. In sum, tailored compensationwould not only contribute to the fairness of the downsizing process, butit would also reduce the total cost of downsizing in the context of volun-tary separations, in which overcompensation is more likely to occur thanundercompensation.
A five-step procedure developed through the World Bank PublicSector Retrenchment Project—see Chong and Rama (1998) and Rama(1999)—can be used to create compensation or severance payment pack-ages in preparation for a downsizing operation. This procedure relies onthe “in versus out” methodology used to estimate losses from displace-ment and may be applied before any retrenchment has taken place.
First step: earnings equations
The first step in the proposed five-step procedure is to estimate an annualearnings function for workers who are outside the public sector. The datashould come from individual records in labor force surveys or living stan-dards studies. A regression specification of an earnings function is given by:
The variables on the right-hand side include individual characteris-tics for private sector workers (Xj), which are also observable for work-ers who are in the public sector. Ideally, the list of variables should beexactly the same as a list gathered from the records the public sectormaintains on its own employees. The left-hand variable (W) measuresthe labor earnings of all individuals who work outside the public sector,including the self-employed and workers in the informal sector. Thegoal of this first step is to predict the potential earnings of the public sec-tor workers who are bound to be separated, using the coefficients esti-mated from the previous regression (αj) and the characteristics of publicsector workers (Xj):
E X K Xk k= + + +ˆ ˆ ˆ ( . )α α α0 1 1 4 3� �
W X K Xk k= + + + +α α α ε0 1 1 4 2( . )
Public Sector Downsizing
243
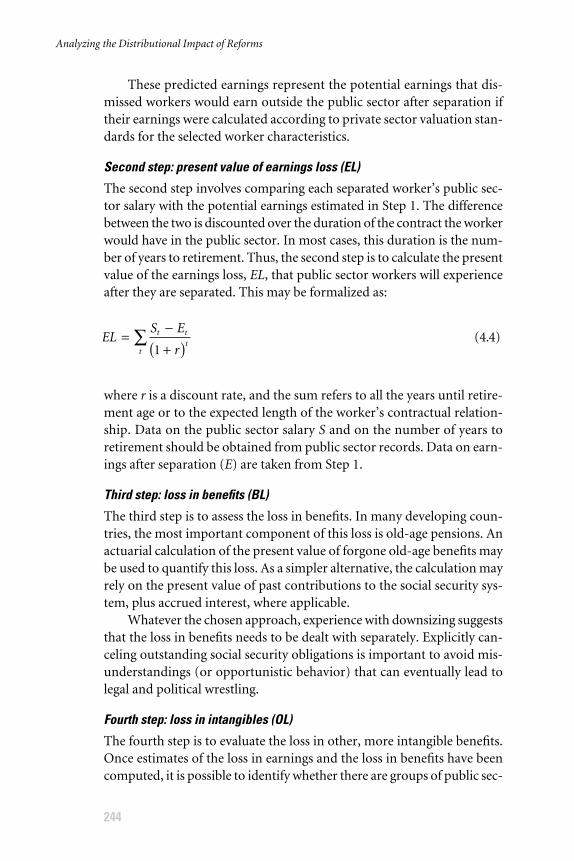
These predicted earnings represent the potential earnings that dis-missed workers would earn outside the public sector after separation iftheir earnings were calculated according to private sector valuation stan-dards for the selected worker characteristics.
Second step: present value of earnings loss (EL)
The second step involves comparing each separated worker’s public sec-tor salary with the potential earnings estimated in Step 1. The differencebetween the two is discounted over the duration of the contract the workerwould have in the public sector. In most cases, this duration is the num-ber of years to retirement. Thus, the second step is to calculate the presentvalue of the earnings loss, EL, that public sector workers will experienceafter they are separated. This may be formalized as:
where r is a discount rate, and the sum refers to all the years until retire-ment age or to the expected length of the worker’s contractual relation-ship. Data on the public sector salary S and on the number of years toretirement should be obtained from public sector records. Data on earn-ings after separation (E) are taken from Step 1.
Third step: loss in benefits (BL)
The third step is to assess the loss in benefits. In many developing coun-tries, the most important component of this loss is old-age pensions. Anactuarial calculation of the present value of forgone old-age benefits maybe used to quantify this loss. As a simpler alternative, the calculation mayrely on the present value of past contributions to the social security sys-tem, plus accrued interest, where applicable.
Whatever the chosen approach, experience with downsizing suggeststhat the loss in benefits needs to be dealt with separately. Explicitly can-celing outstanding social security obligations is important to avoid mis-understandings (or opportunistic behavior) that can eventually lead tolegal and political wrestling.
Fourth step: loss in intangibles (OL)
The fourth step is to evaluate the loss in other, more intangible benefits.Once estimates of the loss in earnings and the loss in benefits have beencomputed, it is possible to identify whether there are groups of public sec-
ELS E
r
t t
tt
= −+( )∑
14 4( . )
Analyzing the Distributional Impact of Reforms
244
tor workers for whom the average sum of the earnings and benefits lossesis substantial. If these workers stay in the public sector, it is because theyderive some other benefits from their jobs. These other benefits may beestimated based on the absolute value of the earnings loss, plus the ben-efits loss. The monetary value of these other benefits is at least equal tothe sum of the earnings and benefits losses. The ratio between this mon-etary value and the public sector salaries of the workers may be used toinfer the intangible benefits enjoyed by other, less disadvantaged publicsector workers.
Fifth step: a compensation formula
Step 5 involves the development of a simple formula to calculate compen-sation based on a few observable characteristics of public sector workers. Itis assumed that losses related to old-age pensions will be settled separately.The problem thus becomes the identification of the minimum informationnecessary to allow one to predict the losses in earnings and intangiblebenefits in a convenient and noncontroversial way. This is importantbecause making compensations contingent on individual characteristicssuch as gender or ethnicity would not be legally or socially admissible insome countries and because other characteristics, such as marital statusor the number of dependents, may be subject to manipulation.
The compensation formula developed in Step 5 differs from the typi-cal rules of thumb used to design severance payment packages in twoimportant ways. First, the information required may or may not includedata on salaries and seniority in the public sector, depending on how use-ful these two variables are in predicting the losses in earnings and intangi-ble benefits. Second, the coefficients used to multiply these two variables,as well as the other variables in the relevant data set, are not arbitrary, butare the coefficients of a regression explaining the predicted losses in earn-ings and intangible benefits as a function of the observable characteris-tics of public sector workers.
The downsizing options simulation exercise
The Downsizing Options Simulation Exercise is an Excel application forassessing the consequences of various downsizing strategies.8 It uses thefive steps discussed above to estimate the value of a compensation packagethat would make some of the workers in state-owned enterprises accepta voluntary departure scheme. The tool has been used in preparation fordownsizing operations in countries such as Guinea-Bissau, Guyana, andVietnam, among others.
Public Sector Downsizing
245
The tool relies on individual records from official databases andhousehold surveys to construct a small-scale public sector, including allworkers whose main jobs are in government administration or state-owned enterprises, depending on the focus of the operations. It estimatesthe value of the total loss from separations (earnings and intangiblebenefits) and uses this information to classify each public sector workerinto one of two groups: those who would accept the offers (potentialleavers) and those who would not accept the offers (potential stayers),depending on the combination of early retirement and voluntary sepa-ration offers made. This classification helps to identify the “right” volun-tary separation package that could serve as a cost benchmark fordownsizing options involving involuntary separations. The tool also cal-culates the financial and economic returns to the operations based onvarious assumptions.
Given that men and women employees may experience differen-tiated welfare impacts from job separations, a gender-sensitive version ofthe tool that has been designed for Vietnam is also publicly available.9 Themodified tool emphasizes the gender dimension. Specifically, it uses sep-arate earnings functions for men and women in estimating the alterna-tive earnings of separated public sector workers. Thus, the tool does notassume the same returns to skills and other observable characteristics formen and women workers. It also estimates the value of intangible bene-fits separately for men and women and produces summary statistics dis-aggregated by gender.
THREATS AND RISKS
There are several potential threats and risks that may prevent financialand economic returns to downsizing from materializing.
Overcompensation
Overcompensation is a potential bias of downsizing operations. To someextent, this bias is inevitable if the downsizing is based on voluntary separ-ations. Workers who are offered compensations lower than the welfarelosses they may experience will tend to prefer to stay in the public sector.Meanwhile, workers who are offered compensations that are greater thanwhat they stand to lose will tend to accept the offers and leave. Thus,errors involving excessively low compensations have no serious practicalimplications for the public sector (though the compensations may beineffective), whereas errors involving excessively high compensations
Analyzing the Distributional Impact of Reforms
246
may have serious financial and economic implications. Ill-designed com-pensation mechanisms exacerbate this second type of error. The mosttypical rule of thumb used to compensate workers is actually one such ill-designed mechanism.10 Usually, severance payments are set as a multipleof the last public sector wages. Applying this rule of thumb to compen-sate displaced public sector workers frequently creates problems. Thoseat the top of the hierarchy (say, professionals) are offered much betterdeals than those at the bottom (say, janitors). But those at the top haveless to lose in relative terms if they leave. Because of the egalitarian natureof the public sector, their wages are usually below the corresponding pri-vate sector wages, while the opposite is true for those at the bottom of thehierarchy. A severance payment offer based on public sector wages wouldtherefore overcompensate those at the top of the hierarchy, but fail toencourage the departure of those at the bottom although redundanciestend to be more prevalent at the bottom. Studies show that a better tailor-ing of severance payment offers could reduce the total cost of downsizingby 20 percent or more.11
In addition, compensation offers may contradict the broader objec-tives of economic policy reform in developing countries. Many reformefforts supported by multilateral organizations and donor countries areaimed at reorienting public expenditures toward the neediest. Somewould claim that there is a conflict between supporting such efforts to tiltthe budgetary process in favor of the poor and lending generous amountsof money to finance severance payment packages for public sector work-ers, who usually are not poor.12 Although the decision to offer severancepayments should be made on a case-by-case basis, there is clearly no jus-tification for overcompensating displaced workers.
Adverse selection and rehiring
Adverse selection can dramatically affect the economic returns to down-sizing without modifying the financial returns very much. If the retrenchedworkers are genuinely redundant, their productivity in the public sectoris probably low. However, if the retrenched workers are essential for theoperation of a unit producing a socially valuable service, productivity inthe public sector may actually be quite large. The contributions of goodcivil servants to society may be much greater than the cost in wages. If theyleave, public sector downsizing may show negative economic returns inspite of any positive (and possibly high) financial returns. Poorly tailoreddownsizing operations may result in substantial rehiring of previously dis-placed civil servants and public workers, as reported by Haltiwanger and
Public Sector Downsizing
247
Singh (1999). As a consequence the financial gains from the operationdisappear; compensation packages become “golden handshakes,” andoverstaffing is not corrected.
Externalities
When confronted with productive externalities and other externalitiessuch as those arising in the case of one-company towns, the optimal pol-icy decision might involve a trade-off between two costs. First, there is thefinancial cost of keeping these companies in operation, which entails a costfor the rest of society because any company deficits translate into highertaxes or lower social expenditures. Second, shutting down or significantlydownsizing the operations of such companies entails a cost for nearbypopulations that depend on the companies to sustain local economicactivity. Unfortunately, relatively little is known about the magnitude ofthe costs to surrounding populations. As in other areas of public policy,externalities are more difficult to quantify than deficits. In the absence ofinformation about the impact of the company’s size on the town’s earn-ings, decisions regarding labor retrenchment could be misguided.
Other distortions and imperfections
The initial situation of a public sector unit that is to be downsized is typi-cally characterized by distortions and imperfections. Overstaffing is onlyone among these problems. Public sector agencies and state-owned enter-prises are likely to use pay scales that are distorted relative to those in theprivate sector. They are also financed through taxes (at least partially inthe case of enterprises), and this creates distortions and reduces aggregateoutput. Downsizing operations usually tackle only the overstaffing dis-tortions. If other distortions remain after the downsizing, the downsizingoperations may not succeed in improving economic efficiency.
CONCLUSIONS
Public sector downsizing operations are designed to reduce the size(workforce) of public agencies or state-owned enterprises in an attemptto improve the efficiency of the public sector. The operations are usuallypart of an overall effort to increase economic growth and cut financialdeficits in the public sector. Overstaffing, burgeoning payrolls, and inef-ficiencies are still evident in the public sector and in state-owned enter-
Analyzing the Distributional Impact of Reforms
248
prises in many developing countries. Downsizing operations thereforerepresent tangible policy alternatives. However, downsizing should becarefully assessed before implementation to avoid unexpected problems.
A PSIA assessment of downsizing operations must identify the stake-holders involved in the reform. Usually, these stakeholders have hetero-geneous interests in and reactions to a reform process and, depending ontheir political power, may interfere with the process and compromise theoutcome. The welfare of dismissed employees in the public sector and instate-owned enterprises is directly affected by retrenchment programs.These workers constitute the most visible and most well organized groupof stakeholders in this kind of reform; they represent hundreds of thou-sands of votes and can easily attract the attention of the media and mobi-lize large numbers of citizens. The state is also an important stakeholder,with direct control over the operations. However, its stake in and responsesto the reform will depend on the specific central or local tier of governmentinvolved. Other stakeholders whose welfare might be directly affected,but whose political power is likely weaker than that of the public sectoremployees include people in communities surrounding state-ownedenterprises and caterers and providers of services to public agencies andstate-owned enterprises. Taxpayers, taken as a group, multilateral orga-nizations, and donor countries are also among the stakeholders in adownsizing operation.
This chapter concentrates on assessing the welfare losses among dis-missed workers. These welfare losses consist of the present value of theresulting change in earnings (including bonuses and other cash benefits),the present value of the losses in nonwage benefits (such as health coverageand old-age pensions), and other intangible losses from separation (suchas reduced job security or less effort or productivity on the job). Down-sizing may generate differential distributional impacts. Traditional rules ofthumb used to compute severance compensations take into account onlycurrent wages and years of tenure in the public sector. Changes in welfareafter dismissal are related to other observable characteristics that may serveas the basis for the design of a “just right” compensation package. In par-ticular, evidence suggests that a well-tailored downsizing operation mayconsider the education, geographic location, and gender of workers. Vari-ous studies also show that the “just right” severance compensation pack-age outperforms more traditional rules of thumb on the grounds of bothcosts and fairness. To help assess the consequences of using various down-sizing strategies to compute a severance package, the chapter refers thereader to the Downsizing Options Simulation Exercise, an Excel-basedapplication that can be found on the “Shrinking Smartly” Web page of the
Public Sector Downsizing
249
World Bank. This analytical tool has been used in preparation for down-sizing operations in Guinea-Bissau, Guyana, and Vietnam, among othercountries.
A PSIA assessment should also consider the differences between thefinancial and economic returns to downsizing operations. Financial re-turns are calculated according to the present value of the difference be-tween the payroll savings and the direct costs of the operations, such as thetotal amount of severance payments, the administrative costs, and othercosts associated with safety net services provided to retrenched workers.In most cases, financial returns should be positive; however, even if this isso, the economic returns may be negative. Economic returns are muchharder to assess. An indirect measure is the percentage of rehired workers.Rehires indicate that downsizing operations have been poorly handledand may indicate that some employees essential to the public agencies orstate-owned enterprises were incorrectly dismissed or, worse, that someworkers who had no intention of leaving in the first place were able to cashin through golden handshakes. Other factors may also cause differencesin financial and economic returns, such as distorted public sector payscales, distortionary taxes, or the presence of externalities as in the case ofone-company towns.
A last word on the risks and threats involved in this type of operation.Retrenchment programs usually face political opposition. For this reason,voluntary or similar separation schemes are often preferred to involuntaryschemes. However, the risks of ill-designed operations may cause the re-form process to derail. In a PSIA, these risks should also be addressed. Someimportant risk factors that should be taken into account in the design ofdownsizing operations are the problems of overcompensation and adverseselection and externalities and distortions other than overstaffing.
NOTES
1. See Haltiwanger and Singh (1999) and Rama (1997, 1999).2. See, for example, Vickers and Yarrow (1991) and World Bank (1995).3. See Galal et al. (1994).4. Haltiwanger and Singh (1999).5. See Squire (1989); see also Devarajan, Squire, and Suthiwart-Narueput (1995).6. See the discussion in Rama and Scott (1999).7. See Assaad and Arntz (2000), Mahdi (2000), Said (2000), Wahba (2000).8. The tool can be downloaded from the “Shrinking Smartly” Web page of the
World Bank. (At http://www.worldbank.org/, insert “Shrinking Smartly”into the search cell and click “GO.”)
Analyzing the Distributional Impact of Reforms
250
9. Gender-sensitive versions of the tool have also been designed for Peru andYemen.
10. For surveys of typical rules of thumb, see Nunberg (1994) and Kikeri (1997).11. Assaad (1999).12. See London Economics (1996).
BIBLIOGRAPHY
Alderman, H., S. Canagarajah, and S. D. Younger. 1996. “A Comparison ofGhanaian Civil Servants’ Earnings before and after Retrenchment.” Journal ofAfrican Economies 4 (2): 259–88.
Appleton, S., J. Hoddinott, and P. Krishnan. 1999. “The Gender Wage Gap inThree African Countries.” Economic Development and Cultural Change 47 (2):289–312.
Assaad, R. 1999. “Matching Severance Payments with Worker Losses in theEgyptian Public Sector.” World Bank Economic Review 13 (1): 117–54.
Assaad, R., and M. Arntz. 2000. “Does Structural Adjustment Contribute to aGrowing Gender Gap in the Labor Market?: Evidence from Egypt.” ERFResearch Project ERF 99-US-1003, Economic Research Forum for the ArabCountries, Iran, and Turkey. Cairo.
Carneiro, F. G., and I. Gill. 1997. “Effectiveness and Financial Costs of VoluntarySeparation Programs in Brazil: 1995–1997.” Economic Notes 25, CountryDepartment I, Latin America and the Caribbean Regional Office, World Bank,Washington, DC.
Chong, A., and M. Rama. 1998. “A Compensation Package for Separated PublicSector Workers in Guinea-Bissau.” Unpublished manuscript, DevelopmentEconomics Department, World Bank, Washington, DC.
Devarajan, S., L. Squire, and S. Suthiwart-Narueput. 1995. “Reviving ProjectAppraisal at the World Bank.” Policy Research Working Paper 1496, PolicyResearch Department, World Bank, Washington, DC.
Diwan, I. 1994. “Public Sector Retrenchment and Severance Pay: Nine Proposi-tions.” In “Civil Service Reform in Latin America and the Caribbean: Pro-ceedings of a Conference,” ed. S. A. Chaudhry, G. J. Reid, and W. H. Malik,97–108. World Bank Technical Paper 259, World Bank, Washington, DC.
Fiszbein, A. 1994. “An Opportunity Cost Approach to Redundancy Compensa-tion: An Application to Sri Lanka.” In “Labor Economics in Less DevelopedCountries,” special issue, Estudios de Economía 21 (1): 115–26.
Frydman, R., C. W. Gray, M. Hessel, and A. Rapaczynski. 1997. “Private Owner-ship and Corporate Performance: Some Lessons from Transition Economies.”Policy Research Working Paper 1830, Policy Research Department, WorldBank, Washington, DC.
Galal, A., L. Jones, P. Tandoon, and I. Vogelsang. 1994. Welfare Consequences ofSelling Public Enterprises: An Empirical Analysis. New York: Oxford Univer-sity Press.
Public Sector Downsizing
251
Haltiwanger, J., and M. Singh. 1999. “Cross-Country Evidence on Public SectorRetrenchment.” World Bank Economic Review 13 (1): 23–66.
Jeon, D.-S., and J.-J. Laffont. 1999. “The Efficient Mechanism for Downsizing thePublic Sector.” World Bank Economic Review 13 (1): 67–88.
Kikeri, S. 1998. “Privatization and Labor: What Happens to Workers When Gov-ernments Divest?” World Bank Technical Paper 396, Washington, DC.
Levy, A., and R. McLean. 1997. “Optimal and Sub-Optimal Retrenchment Schemes:An Analytical Framework.” Unpublished manuscript, Policy Research Depart-ment, Rutgers University, New Brunswick, NJ.
London Economics. 1996. “The Impact of Privatisation on Labour in Africa.”Report prepared for the Africa Regional Office, World Bank, Washington, DC.
López, F. 1997. “Determinants of Privatization Prices.” Quarterly Journal of Eco-nomics 112 (4): 965–1025.
Mahdi, A. 2000. “The Labor Absorption Capacity of the Informal Sector inEgypt.” Report, Economic Research Forum for the Arab Countries, Iran, andTurkey. Cairo.
Nunberg, B. 1994. “Experience with Civil Service Pay and Employment Reform:An Overview.” In Rehabilitating Government: Pay and Employment Reform inAfrica. Regional and Sectoral Study, ed. D. L. Lindauer and B. Nunberg,119–59. Washington, DC: World Bank.
Orazem, P. F., M. Vodopivec, and R. Wu. 1995. “Worker Displacement duringthe Transition: Experience from Slovenia.” Policy Research Working Paper1449, Policy Research Department, World Bank, Washington, DC.
Rama, M. 1997. “Efficient Public Sector Downsizing.” Policy Research WorkingPaper 1840, Policy Research Department, World Bank, Washington, DC.
———. 1999. “Public Sector Downsizing: An Introduction.” World Bank Eco-nomic Review 13 (1): 1–22.
———. 2001. “The Gender Implications of Public Sector Downsizing: TheReform Program of Vietnam.” Policy Research Working Paper 2573, WorldBank, Washington, DC.
Rama, M., and D. MacIsaac. 1999. “Earnings and Welfare after Retrenchment: Cen-tral Bank Employees in Ecuador.” World Bank Economic Review 13 (1): 89–116.
Rama, M., and K. Scott. 1999. “Labor Earnings in One-Company Towns: Theory and Evidence from Kazakhstan.” World Bank Economic Review 13 (1):185–209.
Robbins, D. 1996. “Public Sector Retrenchment: A Case Study of Argentina.”Paper presented at the World Bank conference, “Public Sector Retrench-ment and Efficient Compensation Schemes,” World Bank, Washington, DC,November 6–7.
Robbins, D., M. Gonzales, and A. Menendez. 1996. “Public Sector Retrenchmentand Efficient Severance Pay Schemes: A Case Study of Argentina.” HarvardInstitute for International Development, Cambridge, MA.
Ruppert, E. 1999. “The Algerian Retrenchment System: A Financial and Eco-nomic Evaluation.” World Bank Economic Review 13 (1): 155–83.
Analyzing the Distributional Impact of Reforms
252
Said, M. 2000. “A Decade of Rising Inequality?: Gender, Occupation, and Public-Private Issues in the Egyptian Wage Structure, 1988–1998.” Report, Eco-nomic Research Forum for the Arab Countries, Iran, and Turkey. Cairo.
Squire, L. 1989. “Project Evaluation in Theory and in Practice.” In Handbookof Development Economics, ed. H. Chenery and T. N. Srinivasan, Vol. II,1153–86. Amsterdam: Elsevier Science.
Tansel, A. 1997. “Public Sector Retrenchment and the Impact of Labor SheddingPrograms on Workers in Turkey.” Unpublished manuscript, Department ofEconomics, Middle East Technical University, Ankara.
Vickers, J., and G. Yarrow. 1991. “Economic Perspectives on Privatization.” Jour-nal of Economic Perspectives 5 (Spring): 111–32.
Wahba, J. 2000. “Labour Mobility in Egypt: Are the 90s Any Different fromthe 80s?” Report, Economic Research Forum for the Arab Countries, Iran,and Turkey. Cairo.
World Bank. 1995. Bureaucrats in Business: The Economics and Politics of Gov-ernment Ownership. World Bank Policy Research Report. New York: OxfordUniversity Press.
Public Sector Downsizing
253

Indirect Tax and Public Pricing Reforms
David Coady
255
5
It is common for governments in developing countries to manipulate theprices of goods and services using a range of policy instruments andinstitutional arrangements. The motivations behind these price manipu-
lations reflect varying objectives, such as the need to raise revenue, thedesire to redistribute income toward the poor or toward politically im-portant groups, the desire to provide protection to domestic producers,or the desire to influence the levels of supply or demand in related mar-kets in which prices cannot easily be influenced.1 For example, the majorsource of revenue in most developing countries is commodity taxationsuch as domestic sales and excise taxes and taxes on international trade(Burgess and Stern 1993; Keen and Simone 2004); food prices are oftenkept artificially low for consumers in order to increase the real incomes ofpoor households (Pinstrup-Andersen 1988a; Gupta et al. 2000); and pub-lic sector prices (for example, for electricity, gas, petroleum, coal, otherfuels, fertilizers) are also often controlled by governments, reflectingeither the perceived strategic importance of these inputs for developmentor the need to provide these sectors with an independent source of rev-enue and thus greater financial autonomy (Julius and Alicbusan 1989).
Reform of these indirect tax systems and publicly controlled prices isoften an important component of many structural adjustment programs.
The views expressed in this chapter are those of the author and do not necessarily repre-sent the views of the International Monetary Fund (IMF), nor do they necessarily reflectIMF policy. The author is grateful for the comments of participants at World Bank semi-nars on Poverty and Social Impact Analysis (PSIA) and IMF seminars and for detailed dis-cussion with staff at the IMF PSIA Group.
The reform of indirect tax systems can involve various approaches such asreducing high trade taxes and replacing lost revenue through other indi-rect taxes, replacing trade and sales taxes with a value-added tax, broaden-ing the value-added tax base to include previously exempt goods andservices, or simply raising existing tax rates (Barbone et al. 1999; Abed et al.1998). The reform of publicly controlled prices typically involves raisingsubsidized prices so that they are closer to world or cost recovery prices,or, possibly, the replacement of government price controls by market-determined prices (Gupta et al. 2000).
Governments and other stakeholders commonly express concernsregarding the potential adverse impact of these reforms on poverty. Thedesirability of these reforms is usually motivated primarily by efficiency andfiscal considerations, that is, the desire to raise revenue, but limit the dis-tortion of economic activity. However, the associated price changes canpotentially decrease the real incomes of households and thus, possibly,increase poverty. This potential for adverse effects on poverty may under-lie the reluctance on the part of governments and other stakeholders to sup-port such reforms. A credible reform strategy therefore requires an analysisof the likely impacts of proposed reforms on household real incomes andthe distribution of the impacts across households, with a particular empha-sis on the impact on the poorest households. The insights from these analy-ses should influence program design (that is, the structure of tax reforms,as well as the speed and sequencing of the introduction of the reforms) andinform the choice of alternative approaches for mitigating the adverseeffects.2
The objective in this chapter is to set out the various methodologicalapproaches that can be used to analyze the impact of tax and price reformson household real incomes, to explain how these are related and comparetheir resource requirements, and to identify general policy lessons fromexisting empirical studies. The next section describes the various method-ological approaches used in the literature and identifies their time, data,and skill-resource requirements. This is followed by a review of the find-ings of the empirical literature using these various approaches and the iden-tification of general lessons for policy reform. The final section concludeswith a summary of the methodological and policy lessons suggested by thereview.
Throughout the chapter, the alternative approaches to modeling thewelfare implications of tax and price reforms are separated into three cat-egories: general equilibrium, limited general equilibrium, and partialequilibrium approaches. This classification is motivated as follows. Thetotal impact on household welfare can be separated into the direct effect
Analyzing the Distributional Impact of Reforms
256
on households arising from the price effects of the reforms and the indi-rect effect that results once households and firms respond by changingtheir demand for and supply of goods and services and factors of pro-duction (resulting in efficiency and revenue impacts). The net distribu-tional effect will depend on the magnitude of these indirect effects andhow these indirect effects are distributed across households, for example,how the extra revenue is spent. General equilibrium approaches allow forall commodity-demand and factor-supply responses and thus incorpo-rate both the direct and the indirect welfare effects of the reforms. Lim-ited general equilibrium approaches typically focus on a subset of pricereforms (such as agricultural price reforms) or allow for only a subset ofhousehold responses (for instance, responses in closely related marketsor demand responses alone), thus incorporating only a subset of the indi-rect effects. Partial equilibrium approaches focus only on the direct effectof reforms on prices and household real incomes.
A more comprehensive analysis of tax and price reforms would needto address other important determinants of successful reform strategies, inparticular, the administrative and political constraints on reforms. The factthat such issues are not addressed in this chapter should not be interpretedas an implicit assessment as to their relative importance for policy advice,but rather as a desire to keep the review manageable and focused. Suchissues are only addressed indirectly in so far as they influence the set of taxand price reforms under consideration. Note also that the equity and effi-ciency implications of reforms can be expected to influence both the needfor administrative reforms and the likely political economy of reforms.
ALTERNATIVE METHODOLOGICAL APPROACHES
As indicated in the introduction, one can distinguish three methodologi-cal approaches to the analysis of tax and price reforms: general equili-brium, limited general equilibrium, and partial equilibrium approaches.The total impact of a reform can be separated into the direct effect and theindirect effect on household welfare.3 The direct effect captures the impactarising from the change in consumer prices that is due to the reform andthat affects household real incomes. The indirect effect captures the wel-fare impacts that result from demand- and supply-side responses to thereforms with associated implications for efficiency and revenue. The netdistributional effect of a reform will therefore depend on the magnitudeof these indirect effects and how they are distributed across households,for example, how the extra revenue is spent. The three methodologicalalternatives differ according to the extent to which the indirect welfare
Indirect Tax and Public Pricing Reforms
257
effects are incorporated into the analysis. In addition, the data, time, andmodeling-resource requirements differ substantially across these methodo-logical alternatives (see Table 5.1 below).4
Partial equilibrium approach
The partial equilibrium approaches focus solely on the direct effect ofreforms on consumer prices and household real incomes. These studiestherefore ignore all household and producer responses and focus on thefirst-order effect on the real incomes of households (or, equivalently, theeffect on household cost of living). It is common to interpret these effectsas the short-run impact of reforms prior to household and producer re-sponses. Household responses such as switching consumption away fromtaxed goods or toward subsidized goods tend to decrease adverse welfareimpacts and increase beneficial welfare impacts. First-order effects arethus often interpreted as an upper bound on longer-term adverse impactsand a lower bound on beneficial impacts. Producer responses can affectthe degree to which the incidence of taxes is pushed onto final-goodsprices or factor prices and thus also the overall distribution of the welfareimpact.
Estimation of these first-order impacts requires household-surveyinformation on the consumption of the relevant goods and services. Suchsurveys, which are now available for many developing countries, can beused to calculate the budget shares for goods and services. By multiplyingbudget shares by the proportional increase in the corresponding pricesattributable to the reforms, one obtains an estimate of the proportionalchange in household real incomes. For example, if a household allocates10 percent of its total expenditures to food and the price of food increasesby 10 percent, this results in a 1 percent decrease in household real income.If the prices of many goods are affected, this procedure can be carried outfor each good and summed to get the total real-income effect. One can thenanalyze the pattern of these real-income changes across households at dif-ferent levels of income, for example, by income deciles.5 If the percentagedecrease in income that is due to taxes is higher (lower) for higher-incomedeciles, then the incidence of the tax burden is said to be progressive(regressive).
If reforms involve a change in the prices of intermediate goods (suchas energy products), one needs to model the pass-through of these pricechanges to final-goods prices. This requires information on the input-output structure of the economy, as well as information regarding the sec-tors that are internationally traded or nontraded or for which the prices are
Analyzing the Distributional Impact of Reforms
258
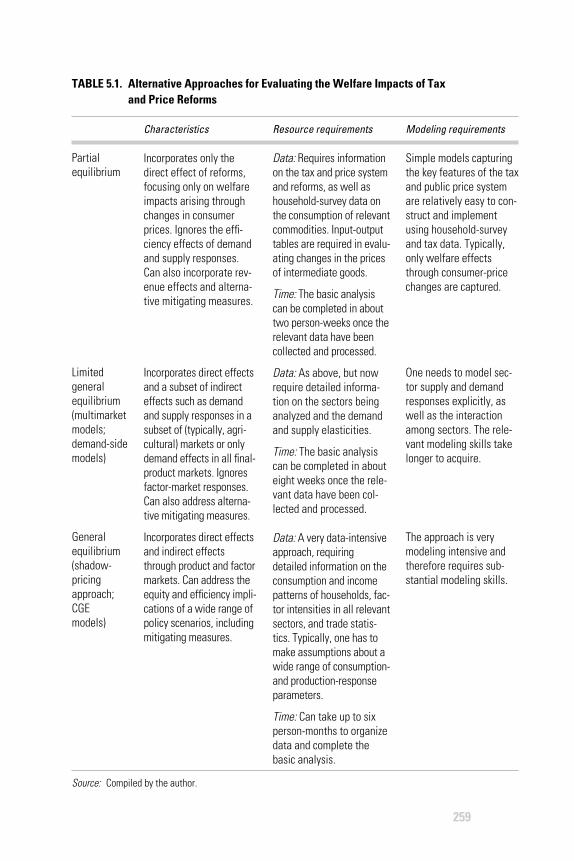
259
TABLE 5.1. Alternative Approaches for Evaluating the Welfare Impacts of Tax and Price Reforms
Characteristics Resource requirements Modeling requirements
Partialequilibrium
Limitedgeneralequilibrium(multimarketmodels;demand-sidemodels)
Generalequilibrium(shadow-pricingapproach;CGEmodels)
Source: Compiled by the author.
Incorporates only thedirect effect of reforms,focusing only on welfareimpacts arising throughchanges in consumerprices. Ignores the effi-ciency effects of demandand supply responses.Can also incorporate rev-enue effects and alterna-tive mitigating measures.
Incorporates direct effectsand a subset of indirecteffects such as demandand supply responses in asubset of (typically, agri-cultural) markets or onlydemand effects in all final-product markets. Ignoresfactor-market responses.Can also address alterna-tive mitigating measures.
Incorporates direct effectsand indirect effectsthrough product and factormarkets. Can address theequity and efficiency impli-cations of a wide range ofpolicy scenarios, includingmitigating measures.
Data: Requires informationon the tax and price systemand reforms, as well ashousehold-survey data onthe consumption of relevantcommodities. Input-outputtables are required in evalu-ating changes in the pricesof intermediate goods.
Time: The basic analysiscan be completed in abouttwo person-weeks once therelevant data have beencollected and processed.
Data: As above, but nowrequire detailed informa-tion on the sectors beinganalyzed and the demandand supply elasticities.
Time: The basic analysiscan be completed in abouteight weeks once the rele-vant data have been col-lected and processed.
Data: A very data-intensiveapproach, requiringdetailed information on theconsumption and incomepatterns of households, fac-tor intensities in all relevantsectors, and trade statis-tics. Typically, one has tomake assumptions about awide range of consumption-and production-responseparameters.
Time: Can take up to sixperson-months to organizedata and complete thebasic analysis.
Simple models capturingthe key features of the taxand public price systemare relatively easy to con-struct and implementusing household-surveyand tax data. Typically,only welfare effectsthrough consumer-pricechanges are captured.
One needs to model sec-tor supply and demandresponses explicitly, aswell as the interactionamong sectors. The rele-vant modeling skills takelonger to acquire.
The approach is verymodeling intensive andtherefore requires sub-stantial modeling skills.
directly controlled by the government. One typically assumes that suchprice increases are pushed forward onto the output prices for nontradedgoods, but backward onto factor prices or quasi-fiscal deficits for traded orprice-controlled sectors. Since the modeling of price shifting is relativelystraightforward (subject to data availability), so too is the simulation ofprice-shifting outcomes.6
Partial equilibrium analyses can provide a valuable input into policydialogue and reform, especially when combined with a qualitative dis-cussion of the likely efficiency effects of reforms. For example, switchingtaxes to products with inelastic demands or negative social externalities(such as petroleum products, tobacco, and alcohol) when these are ini-tially small can be expected to increase the overall efficiency of the tax sys-tem. Similarly, broadening the tax base to include previously exemptfinal-consumption goods and services is also generally expected to im-prove the overall efficiency of the tax system. Such gains can then be jux-taposed against the distributional implications of these reforms in orderto identify possible welfare gains from reforms or any trade-offs betweenefficiency and distributional considerations.
The policy relevance of such analyses can be strengthened even fur-ther by using household-survey data to simulate the likely effectivenessof existing or potential safety net expenditures in mitigating any adverseeffects of reforms on poor households. Household-survey data, com-bined with knowledge of the design of any existing safety net programs,can be used to simulate the potential for such programs to protect the poor-est households during the reform process and the implications for the netrevenue effects of the reforms. If information on existing safety net pro-grams is weak, one can construct the likely impact of (well-implemented)hypothetical programs as a way of focusing attention on the need forcost-effective programs. The aggregate first-order income effects alsoprovide an estimate of the first-order revenue impacts of the reforms.Similarly, using household data, one can simulate the likely incidence ofalternative social expenditures (such as increased education and healthexpenditures) that may be financed by the revenue gains from reforms.Such analyses help highlight the motivation behind and potential bene-fits from reforms.7
Limited general equilibrium approach
Limited general equilibrium approaches can be separated into two cate-gories: multimarket models and demand-side models. Multimarket mod-els typically focus on a limited set of price reforms (usually agricultural
Analyzing the Distributional Impact of Reforms
260
price reforms) and allow for only a subset of demand and supply responses(for example, in closely related agricultural output markets). Demand-sidemodels focus on demand-side responses only and implicitly assume fixedproducer prices so that all tax and price reforms are shifted fully forwardonto final-goods prices. Both these approaches thus incorporate only asubset of the indirect welfare effects.
Multimarket models are useful when one is interested in price reformsin what are perceived as important markets, for example, the rice market.These markets are often directly controlled by governments through arange of policy instruments (such as trade taxes or direct price controls)and institutional arrangements (such as marketing boards). These modelsattempt to identify important demand and supply responses in a subset ofclosely related markets, for instance, in rice and maize markets, that canhave important implications for the efficiency and distributional implica-tions of reforms. This, in turn, requires the estimation of a system ofdemand and supply elasticities for well-defined sectors using a combina-tion of household-survey information on the pattern of consumption, pro-duction, and prices across households and, possibly, time-series data onproduction and prices for important crops.
Demand-side models usually cover a broader range of goods andexplicitly incorporate the efficiency implications of reforms by allowingfor demand-side responses. The basic approach is to calculate the welfare(that is, combined efficiency and distributional) impact of raising oneunit of revenue via different indirect taxes. These welfare impacts canthen be compared across commodities to identify revenue-neutral andwelfare-improving reforms of the current system, that is, by switchingrevenue-raising from commodities with relatively high welfare costs perunit of revenue to those with relatively low welfare costs. Alternatively,such an analysis can be used to determine how to raise extra revenue atthe lowest welfare cost.
Incorporating the efficiency implications of taxation into the modelessentially allows for the fact that the magnitude of the aggregate welfareloss will increase when households respond by reducing consumption, forexample, by switching away from a taxed good.8 Partial equilibriummodels assume away efficiency effects. They do this by assuming thatdemand is fixed, so that a household’s share of the tax burden resultingfrom taxing any commodity is given by the household’s share in the totalconsumption of that commodity. If, to take an extreme example, one onlycares about the impact on poor households, then one should increase taxeson goods for which the poor have a relatively low share of total consump-tion such as luxuries. However, the fact that households respond to a tax
Indirect Tax and Public Pricing Reforms
261
increase by decreasing their consumption of the taxed commodity meansthat taxes have to be higher to raise a given amount of revenue, thusincreasing the total tax burden on households.9 The tax burden on poorhouseholds is calculated as the share of these households in the tax burden(that is, the share of these households in total consumption), times the totaltax burden. For example, if luxuries have high price elasticities, then rais-ing revenue by taxing luxuries as opposed to taxing necessities may actu-ally result in a higher tax burden for the poor even though the share of thepoor in the total burden is lower. Therefore, when elasticities differ suf-ficiently across commodities, partial equilibrium analyses can give amisleading picture regarding the best way to raise revenue.
Introducing efficiency implications into the analysis requires the addi-tional estimation of a system of price elasticities. The data requirements forcalculating the distributional effects are the same as they are under partialequilibrium approaches, that is, the availability of household-level data,with consumption matched to tax categories and rates, as well as an input-output table when tax cascading is an issue. On the efficiency side, oneneeds to estimate the price elasticities of demand or supply, which can bedone using information in the household survey. Typically, there is a trade-off between simplifying assumptions regarding the structure of householddemand or supply and the ease of the calculation of the elasticities.10 But auseful approach in practice is to start off with a simple model, run throughthe analysis, and then increase the sophistication of the analysis overtime. The calculation of elasticities within the standard utility and profit-maximizing framework also facilitates the estimation of so-called exact(as opposed to first-order) measures of the welfare impact of tax reforms,for example, through the use of “equivalent variation” measures of the real-income impact on households. These measures allow for the fact thathouseholds can avoid some of the tax burden by substituting away fromhighly taxed goods.
General equilibrium approach
General equilibrium approaches incorporate indirect effects arising fromdemand and supply responses in all commodity and factor markets.Implicit in the demand-side general equilibrium models discussed aboveis the assumption that producer prices and, thus, production-technologycoefficients are fixed. This is then consistent with the incidence of all taxesbeing fully pushed forward onto consumers.11 However, in general, pro-ducer and factor prices cannot be assumed to be fixed, so that some of theburden of taxation is pushed backward onto factor prices.
Analyzing the Distributional Impact of Reforms
262
In the literature, one can find two approaches to capturing these widergeneral equilibrium effects of taxes. One approach is to use a computablegeneral equilibrium (CGE) model, which involves setting out a fully articu-lated system of demand and supply functions for each of the various sec-tors of the economy. An alternative approach uses shadow prices (which areinterpreted as summary statistics from a model that is not fully articulated)in place of producer prices, and the standard welfare analysis goes throughas above, except that “shadow taxes” (that is, consumer prices, minusshadow prices) are used in place of actual taxes.
Building CGE models is time, data, and modeling intensive.12 However,once constructed, a model can be used to simulate a wide variety of reformsand market structures. One first sets out a system of equations on the sup-ply and demand of commodities and factors for each sector in the economyand specifies market-clearing and macroeconomic closure rules. The vari-ous model parameters are either specified exogenously or calibrated withexisting data on consumption, production, and trade flows, leading to a setof equilibrium-relative prices. Most of these models tend to be Walrasian inthat all commodity and factor markets clear through adjustments in prices,although straightforward extensions are possible to allow for simple factor-market distortions.13 Demand functions are typically some modified ver-sion of the linear expenditure system, while production functions aretypically of the constant elasticity of substitution variety. The domestic pro-duction of traded goods can also be differentiated according to the degreeof substitutability in consumption between imported and domestically pro-duced goods so that domestic prices for traded goods do not necessarilymove together with world prices one for one. Factor markets are often sep-arated into skilled and unskilled labor, irrigated and nonirrigated land, andcapital. Total factor supplies are usually fixed, but can be reallocated amongsectors and even segmented by regions within a country. Note that,although the model uses country-specific data on consumption, produc-tion, and international trade (such as from household surveys, manufac-turing surveys, and input-output tables), the production parameters areoften “guesstimates” based on parameters available in the literature. In thissense, the models are part empirical and part analytical, and sensitivityanalyses using different parameters are important.14
Once in place, the model is “shocked” by a tax reform, and a new setof equilibrium commodity and factor prices is calculated. These are usedto calculate either “first-order” or “exact” welfare changes as above byapplying the price changes to household-level data. One can then decom-pose the total welfare impacts across households into the impact caused bychanges in consumer prices and in factor prices. One can also separately
Indirect Tax and Public Pricing Reforms
263
identify both the efficiency and the distributional implications of the taxreform. Welfare-improving tax-reform packages can be constructed byfirst examining the welfare cost of raising a fixed amount of extra revenuethrough the manipulation of individual tax rates and using the insightsprovided by such an analysis to construct “reform packages.” Given thesophistication and complexity of the models, with many commodity andfactor markets interacting simultaneously in the presence of numerous dis-tortions, it is important to decompose the source of the welfare changes foran initial set of “narrow” reforms to develop a clear understanding of thechannels through which the welfare effects are operating.
The use of shadow prices provides a less resource-intensive approachfor incorporating the general equilibrium welfare effects of tax reforms.The parameters of the models underlying the calculation of shadow pricesare smaller in number than are those for a typical CGE model. However,this is traded off against a greater level of sectoral detail than is typical in aCGE model and the greater flexibility in incorporating the sensitivity of theresults to alternative market structures and government policies. For exam-ple, the most widely used approach for specifying shadow prices is that ofLittle and Mirrlees (1974), which uses world prices as the basis for shadowprices for traded goods and the marginal social cost of production as theshadow price for nontraded goods. These shadow prices depend on under-lying government policies, as well as underlying market structure. Forexample, binding trade quotas are captured by treating the relevant goodsas nontraded. Shadow wages are calculated based on a simple model of thelabor market that adjusts for the fact that producer prices are not equatedwith shadow prices, that labor markets may not clear through wage adjust-ments, but through some form of (often poorly understood) rationingprocess across sectors, and that the underlying distribution of income is notsocially optimal. Other factor markets can similarly be adjusted to allow forprice distortions (for example, in agricultural output and input prices forland, or import prices, or the interest rate for capital). These simple shadowpricing rules are consistent with a wide class of second-best analytical mod-els. The calculation of shadow prices is relatively straightforward, usingdata available in input-output tables and household surveys.
A limitation of the shadow-pricing approach from the perspective ofdistributional analysis is the fact that the distribution of the indirect wel-fare effects is not typically analyzed in detail. This reflects, in part, the factthat the main channel through which indirect distributional effects areincorporated is the shadow wage rate. This compares with the CGEapproach, wherein the change in factor prices is modeled explicitly, andthese changes can be imposed on household-survey data to analyze the
Analyzing the Distributional Impact of Reforms
264
distribution of factor-income changes across households in different partsof the income distribution.
LESSONS FROM THE EMPIRICAL LITERATURE
The discussion below of the empirical tax-reform literature distinguishesthe literature in terms of both the modeling approach used and the typeof tax or price reform considered. The first distinction is drawn, as above,in terms of the modeling approach used in the analysis, that is, amongpartial equilibrium, limited general equilibrium, and full general equi-librium models. Within each of these categories, a distinction is madeamong three categories of reforms: tax reform, trade liberalization, andthe reform of public sector prices.15
Indirect tax reforms include reforms such as the introduction of avalue-added tax (VAT) system in place of existing sales or excise taxes. VATis often seen as superior to sales taxes since intermediate inputs are not taxed(thus avoiding the distortion of production techniques) and is often appliedto a broader consumption base. Sales taxes are typically levied on both finaland intermediate goods, resulting in “tax cascading,” as tax rates are leviedon output prices that have already been adjusted upward in response tohigher production costs, reflecting taxes on intermediate inputs. Otherissues that arise include the inability to tax the “informal sector” (includinghousehold agriculture), the existence of tax-exempt and zero-rated goodsand services, and the choice of differential or uniform VAT rates.
Trade liberalization refers to reforms that replace taxes on interna-tional trade with taxes levied on domestic consumption (including the con-sumption of imported goods). Such reforms are often motivated by a desireto reduce the distortion in the domestic production and consumption oftraded goods. Any revenue losses can be recouped by replacing such taxesby taxes levied on a broader base that does not differentiate between tradedand nontraded goods.16 Since these reforms can be anticipated to result inrelatively large changes in relative producer prices (such as between trada-bles and nontradables), one expects that modeling factor-price changes isespecially important for this set of reforms.
Public sector pricing reform includes reforms that adjust prices con-trolled by the government. Developing-country governments often controlthe prices of a range of goods. This might involve the use of marketingboards, combined with domestic trade and government procurementrestrictions, to control the price of agricultural food production. Thesereforms may be motivated by revenue concerns (such as in the case ofimportant agricultural exports) and distributional concerns (such as in the
Indirect Tax and Public Pricing Reforms
265
case of subsidized agriculture). In some instances, governments also sellprocessed foods at subsidized prices, subject to quantity rationing. Govern-ments also often control energy prices, for example, petroleum products orelectricity, especially in the face of rapidly increasing world oil prices.
Before one reviews the literature, it is useful to distinguish between twodistributional concepts: relative progressivity and absolute progressivity.17
The concept of relative progressivity is commonly used in studies evaluat-ing tax incidence, whereas the concept of absolute progressivity is morecommonly used in studies evaluating the incidence of public expenditures.A tax system is relatively progressive if the percentage decrease in incomeis lower for low-income households. This will be the case if the share of low-income households in the tax burden is less than the share of these house-holds in total income. In this case, then, a neutral (or reference) tax systemis one in which the percentage decrease in income attributable to the taxburden is equal for all households. A tax system is absolutely progressive ifthe share of low-income households in the aggregate tax burden is lessthan the population share of these households, for example, if the bottom20 percent of the population pays less than 20 percent of the tax burden.The reference for neutrality here is thus a uniform absolute tax burdenacross all groups. It should be fairly obvious that, in the context of taxes,relative progressivity is a stricter definition of progressivity compared withabsolute progressivity, since the former implies the latter, but not viceversa. In the context of price subsidies or direct transfers, the oppositeholds, that is, absolute progressivity implies relative progressivity, but notvice versa. Below, unless specifically stated, the terms regressive and pro-gressive will be used to refer to the relative concept.
Partial equilibrium studies
Distributional studies based on the consumption patterns in household-level data suggest that reforms emphasizing VAT and excise taxes are pro-gressive. For example, Sahn and Younger (1999) examine the likelyincidence of various taxes in six African countries: Côte d’Ivoire, Ghana,Madagascar, South Africa, Tanzania, and Uganda. Their analysis of con-sumption patterns suggests that gasoline and diesel excise taxes are rela-tively progressive, followed by the VAT system. Kerosene excise taxes arefound to be the most regressive, and export taxes also often appear to beregressive. Since excise taxes are typically levied on products that arethought to have relatively low price elasticities and are associated with nega-tive consumption externalities (such as petroleum products, tobacco, andalcohol) and since VAT is intended to be levied on a broader tax base, tax
Analyzing the Distributional Impact of Reforms
266
reforms that shift revenue raising to these tax instruments are typicallyassumed to improve both the equity and the efficiency impacts of the taxsystem. Reforms that switch tax revenue from trade taxes (which distortboth production and consumption) to VAT (which, in principle, taxes onlyconsumption) are similarly attractive.
The perception that excise taxes on petroleum products are attractivefrom a distributional perspective is not altered in studies that allow for thecascading effect of these taxes and the indirect effect on householdsthrough changes in other prices.18 The progressiveness of petroleum excisetaxes indicated above is based on the fact that low-income householdsdirectly consume relatively small amounts of petroleum products. How-ever, a substantial proportion (sometimes over 50 percent) of petroleum-product consumption is typically used as an intermediate input intotransport and other production activities. Therefore, the net effect onhouseholds will depend on how these higher costs are passed on in con-sumer prices. Studies that use input-output techniques to model these indi-rect impacts find that, although these taxes appear less progressive (becauseof the indirect consumption by lower-income groups of petroleum prod-ucts), they are still more progressive than other taxes.19 Import taxes aresimilarly found to be more progressive (or less regressive), which is consis-tent with the more intensive consumption of imported intermediate inputsby higher-income groups.
VAT often appears to be an even more progressive tax once one adjustsfor the fact that agriculture and small-scale economic activities are typicallyVAT exempt. For example, low-income households often consume fooddirectly from their own production or from small outlets that fall outsidethe VAT system. This feature tends to make VAT more progressive. Inprinciple, these households may still pay some tax since the VAT on theinputs in these sectors is not rebated and is thus pushed onto consumerprices. However, the level of this taxation tends to be relatively low, and, inany case, many agricultural inputs are often zero rated.
A number of studies have found that replacing a sales tax with VAThas made the tax system more regressive (or less progressive). AlthoughVAT is typically progressive, it is often less progressive than the sales taxesit has replaced, mainly because sales taxes have not been imposed on basicfoods.
� Muñoz and Cho (2004) evaluate the impact of replacing a system ofsales taxes with a VAT in Ethiopia.20 Although the VAT was progres-sive, partly reflecting the importance of own-consumption among thepoorest households (and in spite of the disproportionate consumption
Indirect Tax and Public Pricing Reforms
267
of exempt goods by the non-poor), it was less progressive than the salestaxes it replaced.
� Hossain (1995, 2003) undertakes a similar analysis for Bangladesh,which introduced a VAT in 1991 to replace a system of excise taxeson domestic producers, import duties, and sales taxes levied on bothimports and domestically produced goods. The analysis shows thata uniform, revenue-neutral VAT would be substantially more regres-sive; the reform would result in a more than 2–3.5 percent decreasein the real incomes of the lowest-income households compared witha 4.5–8.1 percent increase for the highest-income households.21 Thisreflected the inclusion of basic cereals and other food within the VATsystem.
� More recently, Tareq et al. (2005) analyze the distributional impact ofintroducing a VAT in Bosnia and Herzegovina. The existing sales taxhad a standard rate of 20 percent, a preferential rate of 10 percent, anda zero rate for exports and a number of basic food items and certainservices. The sales tax was collected at the retail stage, except for excis-able products (alcohol and alcoholic beverages, soft drinks, coffee, oiland derivatives, and tobacco and tobacco products), for which it wascollected at the importer or manufacturer stages. The proposed VATwas expected to involve a single rate of 17 percent, and the inclusion ofpreviously exempt goods at this higher rate gave rise to concerns withinthe government regarding the impact of the reform on low-incomehouseholds. The analysis found that the VAT was slightly less progres-sive than sales taxes. It was estimated that the tax reform would resultin an increase in the average tax burden in the range of 1.9 to 2.6 per-cent across deciles and would be highest for the lower-income deciles.
The progressiveness of VAT can be improved by zero-rating basicfoods. For example, Hossain (1995, 2003) examined how the zero-ratingof food in Bangladesh would affect the distribution of the tax burden. Theexisting system (which taxed food) was compared with a system that zero-rated foodgrains and vegetables, applied a uniform rate on other goods andservices, and levied excise taxes on tobacco, energy goods, and sugar. Thelatter system was found to be less regressive; it was estimated that a switchto the latter system would result in gains for lower-income households inthe range of 1.2 to 2.7 percent and losses for higher-income households inthe range of 0.8 to 6.6 percent.22 Note, however, that, although VAT can berestructured to enhance its progressivity, the substantial leakage of benefitsto higher-income households makes such an approach much less attractivethan, say, a well-designed and well-targeted direct transfer program.
Analyzing the Distributional Impact of Reforms
268
In many cases, the direct effect of agricultural trade liberalization thatincreases prices appears to be to decrease overall poverty, but increaseextreme poverty.23 For example, Ravallion and Lokshin (2004) examine thelikely distributional consequences of agricultural trade reform in Morocco.The authors take the output price changes generated by a CGE analysisof the removal of cereal-import tariffs and apply them to a householdsurvey to identify the first-order welfare effects, taking into account thatsome households are net producers, and others are net consumers ofcereals.24 They find that the consequent price decreases in cereals resultin an increase in the rural poverty headcount index and that this reflectsthe fact that the rural poor are, on average, net producers of cereals. Note,however, that this could also be consistent with the extremely poor ben-efiting if they were net consumers. For example, in their analysis of anincrease in rice prices in Indonesia, Ravallion and van de Walle (1991)found that the rural extreme poor, who tend to be landless and net con-sumers of rice, suffered decreases in income, whereas the moderatelypoor tended to be net producers and to gain from the reform. In addition,as shown below, the impact of the reforms on factor markets tends toreverse these effects so that the output-price effects may be interpreted asshort-run impacts prior to adjustments on factor markets (for example,adjustments in unskilled wages).25
Limited general equilibrium models
One of the central findings of early empirical work on tax reform was thestrong trade-off between efficiency and distributional concerns (Ahmadand Stern 1984, 1987, 1991). Commodities that were very attractive sourcesof revenue from the perspective of efficiency (such as food, which typicallyhas a low price elasticity and thus a low “deadweight loss” associated withthe relevant taxation) were very unattractive from the perspective of dis-tributional impact (for example, food is relatively more important in thebudgets of the poor). In other words, taxing commodities for which low-income households have a relatively small share of the commodity-taxburden will not necessarily lead to a smaller welfare loss for these house-holds. This finding has two important implications for tax-reform policy.First, ignoring the efficiency implications of taxes can give a misleadingindication of the commodities on which taxes should be increased if onewants to minimize the welfare impact on poor households. Second,improved distributional outcomes via commodity taxation are typicallybought at the expense of substantial inefficiency. Therefore, using theindirect tax system should generally be viewed as a short-term measure
Indirect Tax and Public Pricing Reforms
269
until more cost-effective redistributional policy instruments are devel-oped, for instance, a well-designed and well-implemented social protectionprogram.26
However, it may be possible to identify commodities that are rela-tively attractive sources of tax revenue even when both equity and effi-ciency considerations are taken into account. For example, in the Ahmadand Stern (1991) studies of tax reform in Pakistan, the marginal socialcosts of raising revenue via taxes on rice; edible oils; housing, fuel, andlight; and clothing were always below the median cost. The attraction oftaxation on cereals, on the other hand, depended sensitively on how con-cerned one was about distribution when setting tax levels. If effectivedirect redistribution instruments do not exist, then the taxation of cerealsis not desirable, even though the distributional gains come at a highefficiency cost.
The ranking of commodities may, however, be sensitive to the initialstructure of taxes in a country. The marginal social cost of raising revenuethrough increasing a tax on a specific commodity depends on the existinglevel of taxes on commodities, as well as on the patterns of own- and cross-price elasticities and consumption across income groups. Therefore, evenif one expects that the latter patterns are similar across “similar” countries,the former may differ greatly. One should thus be cautious when trans-porting policy lessons across countries.
Studies of agricultural price reforms (for example, as part of tradeliberalization) using multimarket models reinforce the partial equilibriumfinding that the rural extreme poor and the urban poor lose from priceincreases, while the rural moderate poor gain. Minot and Goletti (2000)evaluate the distributional impact of the removal of rice export-quota con-trols in Vietnam using a multimarket model. Their model simulates thedemand and supply responses in the markets for four staple foods in sevenregions of the country (that is, rice, maize, sweet potatoes, and cassava).The resulting welfare impacts thus take account of important demand andsupply responses of households. The model also allows for the impact ofhigher rice production in terms of lower world prices. The results of theanalysis of the welfare impact of rice price changes indicate that the poor-est rural farmers lose from the higher domestic rice prices, as do the urbanpoor, reflecting the fact that both groups are net consumers. Non-poorrural households gain, which reflects the net producer status of thesehouseholds. A similar, but less pronounced pattern was observed througha simple first-order partial equilibrium analysis, reflecting the fact that thehigher rice production reduces world prices so that domestic rice prices donot increase by as much.27
Analyzing the Distributional Impact of Reforms
270
General equilibrium models
The results produced by tax-reform analysis can differ substantially if oneuses shadow taxes in place of effective taxes. For example, Ahmad and Stern(1990, 1991) look at the implications of this in the context of tax reform inPakistan.28 As one would expect given the implicit assumption in the cal-culation of effective taxes that all goods are nontraded, both sets of taxesdiffer substantially when goods are traded and are subject to trade taxes orprice controls. For example, when wheat and rice were treated as non-traded, their revenue collections were applied to the total consumptionbase, implying tax rates of −1.8 percent and 1.7 percent, respectively. Whentreated as traded, these revenues were applied to the smaller trade base togive substantially higher rates of −30.3 percent (reflecting import subsidies)and −10.8 percent (reflecting export taxes). But note that effective andshadow taxes can also differ for nontraded goods when factor markets aredistorted or the prices of important traded inputs are distorted.
Not surprisingly, since existing tax rates enter into the efficiency sideof the analysis, the differences that arise do so with regard to the efficiencyimplications of tax reform. For example, the large initial subsidy on wheatwhen shadow prices are used now makes wheat a much more attractivesource of revenue (that is, by reducing the subsidy) from an efficiency per-spective. But such an increase remains as unattractive as before from a dis-tributional perspective. The result is that the trade-off between efficiencyand distributional concerns is increased, indicating a potential efficiencygain deriving from access to an effective transfer system that would enableefficiency considerations to be more prominent in the setting of tax rates.
The empirical shadow-pricing literature also highlight the fact that,when one evaluates reforms that liberalize agricultural prices, it is ex-tremely important to capture the nature of and the constraints on the policy instruments used, as well as the precise consumption and produc-tion relationship among alternative agricultural commodities. Coady(1997a) extends the above results for Pakistan to allow for a more realisticand broader set of policy instruments, including the fact that householdsare both producers and consumers of agricultural commodities, so thatonly net market trades (or marketed surplus) can be taxed. In this con-text, what matters for efficiency is the net trade (as opposed to total-consumption) elasticities. When one allows for the fact that net trade isonly a small proportion of total consumption and that some commoditiesmay be substitutes in consumption, but complements in production, notonly are the own- and cross-price net trade elasticities substantially higherthan the consumption elasticities, but their sign may also be different.
Indirect Tax and Public Pricing Reforms
271
For example, in Pakistan in the early 1980s, about 60 percent of wheatand 20 percent of rice were consumed on farms. Reflecting this and thefact that wheat and rice are sown in rotation on the same land and arethus production complements, the own- and cross-price net trade elas-ticities were very high and positive.
The constraint of being able to tax only net trades can therefore havesubstantial implications for both the distributional and the efficiencyimplications of taxes. For example, in Coady (1997a), although ruralhouseholds were, in aggregate, net producers of wheat, poor households inrural areas tended to be net consumers, while non-poor households werenet producers. As a result, low wheat prices (reflecting low procurementprices) acted as a subsidy for low-income households that was financed bya tax on high-income households, so that low prices were an extremelypowerful redistributive instrument. However, net trade elasticities werealso very high, so that the efficiency costs of low prices were very large.Therefore, the constraint of being able only to tax net trade magnifies thetrade-off between efficiency and distribution when setting taxes.
The corollary of this is that the efficiency gains obtained by reformingthe existing system of tax and price controls were also very substantial; infact, the direct revenue-reducing effect of higher procurement prices forwheat were swamped by the positive indirect revenue effects throughhigher government procurement, which replaced more expensive wheatimports, as well as the increased production and export of rice, whichresulted in higher export-tax revenue. In other words, existing taxes wereon the wrong side of the Laffer curve.29 This finding also reinforces theargument implicit in multimarket modeling, whereby focusing on the pricereform for one agricultural commodity in isolation may give misleadingresults. For example, the welfare impacts of lowering wheat prices werestrongly influenced by the indirect revenue effects through rice markets.Note also that the presence of this indirect revenue effect through rice sug-gests that low wheat prices may be less inefficient if rice prices are higher.In other words, higher rice prices enable the distributional gains from lowwheat prices to be achieved at a lower efficiency cost. This sequentialapproach to price reform could help mitigate the adverse distributionaleffects of a move to a more efficient price and tax system until an effectivesocial protection system can be developed.
Analyses of tax systems using CGE models have supported the par-tial equilibrium findings that energy taxes are progressive and that thedistributional effect of VAT depends on how basic foods are treated.30 Forexample, Go et al. (2005) test the partial equilibrium findings of Fourieand Owen (1993) that VAT in South Africa was mildly regressive. Apply-
Analyzing the Distributional Impact of Reforms
272
ing the same partial equilibrium method for 2001, they found similarresults, with low-income households paying over 5 percent of theirincomes in VAT compared with only 3.5 percent among high-incomegroups. This occurred in spite of the fact that certain food items (such asbrown bread, maize meal, milk and milk powder, rice, and unprocessedvegetables and fruits) were zero rated, and small-scale firms were notrequired to register for VAT.
To evaluate the welfare impact of the current VAT, the models removeVAT completely and replace it with a proportional income tax to balancethe government budget and not influence the overall incidence of indirecttaxes. Whereas the overall tax system (including direct taxes, fuel and excisetaxes, tariffs, and VAT) is progressive, VAT is found to be mildly regressive.Overall, the high-income groups pay over 20 percent of their income intaxes, while low-income groups pay less than 10 percent. With VAT, high-income groups pay less than 4 percent, while low-income groups pay over5 percent. When VAT is removed and revenue is replaced by scaling upsales taxes (which are levied on petroleum, beverages, and transport equip-ment) by 262 percent, the overall tax burden becomes slightly more pro-gressive, indicating that VAT is more regressive than sales taxes. This partlyreflects the fact that there was a relatively high VAT rate on food, which isparticularly important for poor households, and sales taxes are higheron goods disproportionately consumed by high-income households.Removing the VAT on food and increasing the base rate on other goodsto 16.4 percent to keep VAT revenue constant transforms VAT from a regressive to a progressive tax; low-income households pay less than2 percent in VAT, whereas high-income households pay more than 3 per-cent (compared with more than 5 percent and less than 4 percent, respec-tively, under the previous VAT structure).31
Analyses of the distributional impacts of trade liberalization usingCGE models completely overturn the findings of studies using partialequilibrium and limited general equilibrium models. The distributionalimpacts through factor markets are likely to be particularly important inthe context of trade liberalization, which results in substantial changes inrelative producer prices, that is, the relative prices of traded and nontradedcommodities. Hertel and Reimer (2004) and Reimer (2002) provide sur-veys of the empirical findings from analyses of the distributional impact oftrade liberalization. They find that a key channel for these impacts is theeffect of reforms on factor markets, particularly labor markets. This is to beexpected in so far as: (1) classical trade theory shows that changes in out-put prices brought about by trade reforms lead to magnified changes in fac-tor prices for intensively used factors; the degree of magnification is higher
Indirect Tax and Public Pricing Reforms
273
in the short run when some sector-specific factors exist; and (2) householdsare typically more specialized in terms of sources of income rather thanconsumption patterns. For example, the removal of an export subsidy onrice will lead to an increase in domestic prices. If rice is relatively intensivein unskilled labor compared with other sectors, then the unskilled wage ratecan be expected to increase proportionally more than do rice prices. If thepoor are net consumers of rice and receive most of their income from theirunskilled labor, then the positive wage effect can be expected to dominatethe negative effect of higher rice prices. Therefore, evaluations of the dis-tributional effects of trade liberalization need to incorporate these factor-price effects through general equilibrium analysis.32
There is also evidence from CGE analysis that the use of optimal exporttaxes on agricultural exports can have adverse effects on poverty, besidesany adverse effects on market share in the long run. Warr (2001) providesa very interesting and rigorous example of the use of CGE modeling to eval-uate the distributional implications of controlling the domestic price ofrice in Thailand using export taxes. Thailand is perceived to have somemonopoly power in international rice markets, so that, based on first-bestefficiency arguments, a positive export tax is optimal. Based on an export-demand elasticity for rice of 0.25, the optimal tax from this perspectiveturns out to be about 42 percent, and the net welfare gain is 0.63 of a per-centage point of gross domestic product relative to a situation with a zeroexport tax. However, the tax decreases the domestic price of rice, so thatthis aggregate gain comes at the expense of both the rural and the urbanpoor, reflecting lower prices for poor producers and lower unskilled wagesfor poor consumers. Incorporating even relatively modest distributionalconcerns into the analysis substantially changes this outcome; the optimalsituation quickly switches to a subsidy of 20 percent. The results highlightthat: (1) the main distributional effects come through factor-market prices,(2) higher rice prices are distributionally powerful in the long run even ifpoor net consumers lose in the short run before unskilled wages increase,and (3) any short-term efficiency gains from export taxes may come at thecost of higher poverty.
The results from CGE analysis also reinforce the finding that there maybe substantial welfare gains from using more direct policy instruments toprotect the incomes of low-income households instead of adjusting taxrates. For example, Coady and Harris (2004) look at the welfare impacts ofusing the revenue generated by efficiency-improving tax reforms to financea (perfectly targeted) direct transfer program in Mexico. The initial indi-rect tax system was characterized by large agricultural food subsidiesand a differentiated VAT structure with a low rate (zero) applied to raw
Analyzing the Distributional Impact of Reforms
274
and processed food. The tax reforms considered are aimed essentiallyat (1) removing agricultural subsidies; (2) keeping the current VAT struc-ture, but scaling up the rates; and (3) increasing the VAT rate on food.When the revenue is raised by removing food subsidies, the cost to house-holds is only 62 percent of the revenue raised (that is, the cost of a unit ofpublic funds is 0.62). Similarly, when revenue is raised through a single VATapplied to all sectors, the cost of public funds is only 0.95, so that the gainsfrom reforming the VAT structure outweigh the losses from the higher aver-age rate required to finance the introduction of the transfer program. Theother tax reforms considered all showed the costs of public funds in therange of 1.05 to 1.07. Although low-income and high-income householdsbore a disproportionate amount of this higher tax burden, the existence ofa well-targeted transfer program more than offset this negative effect on thepoorest households. The gains from introducing such a program are thustwofold. First, the transfers are targeted better than the subsidies implicit inthe differentiated tax structure. Second, the presence of the program enablesone to focus on efficiency considerations when setting VAT rates. Thesefindings were found to be very robust to alternative parameter values for theunderlying consumption, production, and trade functions.
When using CGE models to evaluate tax reforms, it is important topresent the sources of the welfare impacts in a transparent manner both tohave a clear understanding of the channels at work and to enhance thecredibility of the findings. For example, in Go et al. (2005), the nominalwages of semiskilled and unskilled labor are fixed, reflecting unemploy-ment among these types of labor. Therefore, tax reforms that increasedemand in domestic sectors that are intensive in relatively unskilled laborwill tend to increase welfare. For example, reducing taxes on a nontradedsector that is intensive in unskilled labor can be expected to result in asubstantial efficiency gain arising from the conventional decrease in dead-weight loss, but also the reduction in unemployment. In the language ofthe shadow-pricing model discussed earlier, the shadow tax (for example,the consumer price, minus the social marginal cost of production) is highfor these sectors; decreasing them can thus lead to large welfare gainsbecause of the elimination of this “shadow deadweight loss.” It wouldtherefore be useful to identify the various sources of the overall welfareimpact, for example, changes in output prices, changes in factor prices, andchanges in unemployment. In the Walrasian model, with markets clearingthrough price adjustment, welfare impacts can be expressed solely in termsof price changes, but, in models in which commodities or factors arerationed (such as with unemployment), welfare impacts depend on bothprice and quantity changes. Note also that results may, in general, be very
Indirect Tax and Public Pricing Reforms
275
sensitive to the mechanisms used to allocate rationed quantities acrosshouseholds with different socioeconomic characteristics, and the relativelysimple allocation process used in a CGE model may give results that arevery different form those produced by a more sophisticated allocation pro-cess, say, similar to those being used in recent CGE-cum-microsimulationmodels.
CONCLUSIONS
In this section, the main issues and findings discussed in the chapter aresummarized. Lessons regarding the use of the alternative methodolo-gies are dealt with first. Findings from the empirical literature are thensummarized.
Methodological lessons
1. Simple partial equilibrium analyses can provide valuable informationon the likely magnitude of the impacts of tax and price reforms onhousehold real incomes, as well as the distribution across households.These studies have relatively low resource costs in terms of data, time,and modeling requirements and can therefore be undertaken on a rou-tine basis. When combined with a qualitative discussion of the likelyefficiency and fiscal implications of reforms and a quantitative analysisof the potential uses of revenue (for example, mitigating measures orthe financing of other social expenditures), these studies can be a veryeffective input into policy dialogue and the development of credible andacceptable reform strategies. As with all studies of tax reforms in devel-oping countries, it is important that one incorporate the constraints ontax instruments into the analysis (for example, the inability to tax theconsumption of own-production in rural areas or informal sector trans-actions) since these can greatly affect the distributional impacts ofreforms.
2. General equilibrium models are necessary when one wishes to evaluateand highlight the magnitude of the efficiency implications of reformsand the trade-off with distributional impacts. These studies can helpemphasize the fact that using indirect taxes to mitigate the adverseeffects of taxation on the real incomes of poor households can be a veryinefficient approach relative to more a direct approach to social protec-tion through well-designed and well-implemented social safety net pro-grams. While the “shadow-pricing” approach can provide a flexible andrelatively low resource-cost approach to explicitly incorporating themagnitude of the efficiency impacts, it is less useful when one wishes to
Analyzing the Distributional Impact of Reforms
276
disaggregate the distribution of these indirect effects. For this, a CGEmodel is required. Building such a model from scratch is a resource-intensive activity. However, if a model is available, the cost of adaptingit for the analysis at hand is much lower.
3. The use of a CGE model is particularly valuable in analyzing the distri-butional impact of reforms that involve significant changes in producerprices, for instance, trade liberalization. This reflects the fact that the dis-tributional impacts of such reforms arise mainly through changes in fac-tor prices as opposed to changes in consumer prices, and the relativedistributional impacts can differ substantially across these two channels.The consumer-price effects are often interpreted as short-run impactsuntil factor prices can adjust.
Empirical lessons
1. Typically, the introduction of a relatively broadbased VAT in place ofsales taxes has reduced the progressivity of the tax system by enlargingthe tax base to include previously exempt goods and services that areusually relatively more important in the budgets of the poor or byreducing taxes on goods that are relatively more important in the bud-gets of higher-income households. Therefore, revenue-neutral reformswill generally lead to gains by upper-income groups at the expense oflower-income groups.
2. Excise taxes on petroleum products (except kerosene), tobacco, andalcohol are highly progressive, even after allowing for their indirecteffects, which tend to be less progressively distributed compared withthe direct effects.
3. Since both these tax instruments are often associated with a more effi-cient collection of tax revenue (reflecting their broader base, lower priceelasticities, and negative consumption externalities), opportunities existfor improving both the efficiency and the equity effects of tax reform.The introduction of VAT and the use of excise taxes on petroleumproducts and tobacco play an important role in realizing these welfaregains. For example, the use of excise taxes can help generate sufficientlylarge revenues, thereby enabling VAT to be introduced at a lower rate.The introduction of differential rates, with lower rates on goods con-sumed disproportionately by the poor, would improve the progressiv-ity of VAT.
4. In practice, distributional gains from tax reform often come at theexpense of efficiency, and this efficiency cost may be particularly largein the context of agricultural commodities if households are both
Indirect Tax and Public Pricing Reforms
277
consumers and producers and the tax base is limited to the net markettrades of these commodities. It is therefore useful to have some indica-tion of the relative magnitude of these trade-offs across commodities.
5. Similarly, although differentiating excise taxes within aggregate com-modity groups—for example, low taxes on kerosene, combined withhigher taxes on gasoline and diesel—may help mitigate the impact onthe real incomes of the poor, this is likely to come at a high efficiencyand revenue cost given the relatively high degree of substitutabilityamong these different commodities, especially over the long term.
6. In general, manipulating commodity taxes to mitigate the impact onpoor households is a very blunt second-best approach to protecting thereal incomes of the poor given the substantial leakage of benefits tohigher-income households and the potentially large efficiency costs. Incases in which price manipulations provide a very effective approach todistribution (for example, low prices for agricultural goods both pro-duced and consumed by rural households), this usually comes at a veryhigh efficiency cost. The introduction of a well-designed and well-implemented social safety net offers a more effective way of protectingthe poor and can generate substantial gains by allowing taxes to beraised more efficiently. In this regard, the paucity of the informationoften available on the design, implementation, and performance of tar-geted social programs is a major constraint on policy advice in this area.If an effective safety net system is not in place, then knowledge of themagnitude and pattern of the equity-efficiency trade-off can guide thechoice of the tax mitigating mechanism that should be used as a short-term social protection measure.
NOTES
1. On the structure of taxation and tax reform in developing countries, seeBevan et al. (2000), Bird (1992), Burgess and Stern (1993), Coady (1997b),Gemmell (1987), Gemmell and Morrissey (2003, 2005), Gillis (1989), Heady(2001), Keen and Simone (2004), Tanzi (1987, 2000), and Thirsk (1997).
2. Indeed, there is a clear expectation that the design of IMF programs in low-income developing countries under the so-called Poverty Reduction andGrowth Facility should explicitly recognize these distributional issues (Guptaet al. 2002).
3. A more formal discussion of the welfare impact of tax and price reforms is pre-sented in Annex 1. A similar categorization is used by Hertel and Reimer(2004) in the context of trade liberalization. Some of the issues discussed inthe text are discussed in more detail in Ahmad and Stern (1984, 1991); Coadyand Drèze (2002); Coady and Harris (2004); Deaton (1997); Drèze and Stern
Analyzing the Distributional Impact of Reforms
278
(1987); Dervis, de Melo, and Robinson (1982); Gunning and Keyser (1995);Newbery and Stern (1987); and Sadoulet and de Janvry (1992). An alternativeapproach to the “simulation approaches” discussed in this chapter wouldinvolve using the price data available in household surveys to estimate areduced-form impact of price changes on household real incomes. However,because no such empirical studies have been found, this approach is not dis-cussed here. The lack of empirical studies in this area may reflect econometricproblems related to identifying price effects and separating these from, say,location-fixed effects.
4. Note that, with all these methodologies, one can also distinguish between first-order welfare measures (in which household net demand is assumed to be fixed)and “exact” welfare measures (those that incorporate demand changes). Forexample, in the case of increases in the consumer prices of final goods, first-order measures will, in general, overestimate the adverse welfare impact sincethey ignore the potential for households to switch demand away from goodsfor which prices increase (Banks, Blundell, and Lewbel 1996). Similarly, theywill underestimate the benefits from consumer price decreases. The analysis of“marginal reforms” essentially assumes that price changes are sufficiently smalland that second- and higher-order welfare effects are also relatively small, sothat first-order measures are accurate approximations. Note that, although onefocuses here on welfare impacts for “marginal reforms,” one simply needs toreplace first-order welfare effects with “exact” welfare measures (for example,equivalent variations) for large changes, and then the discussion goes throughmore or less as in the text.
5. Typically, total household consumption (for instance, in per capita or percapita adult equivalent form) is used to categorize households by welfarelevel since this is perceived to be a more accurate reflection of household“permanent income” (Deaton 1997).
6. Annex 2 presents two examples of the types of price-shifting models that canbe used for reforms of indirect taxes and price subsidies.
7. Note that such simulations of alternative expenditures can also be motivatedby a desire to identify the relative distributional implications of alternativeways of, say, reducing a budget deficit.
8. In practice, the aggregate welfare loss can either increase or decrease depend-ing on the existing structure of taxes. For example, it could decrease if ahigher tax leads to a switch in demand to other, relatively highly taxed goods.
9. Note that this example implicitly assumes that the efficiency losses are“returned” to households via changes in the tax under consideration.
10. See Deaton (1995, 1997) for a discussion of alternative approaches to esti-mating elasticities and the inherent trade-offs among different approaches interms of data and the restrictiveness of the underlying assumptions.
11. To the extent that producer prices (including commodity and factor prices)are truly fixed, for instance, because of the existence of perfectly competitiveimports or government price controls, this assumption is obviously valid.
Indirect Tax and Public Pricing Reforms
279
More generally, this assumption would be valid if production technologywere characterized by constant returns to scale with a single nonproducedfactor of production and no joint products; under these assumptions, the so-called nonsubstitution theorem holds, and producer prices are unaffected bythe pattern of demand. See, for example, Mas-Colell, Whinston, and Green(1995, 157–60) for further details on this issue.
12. For a discussion of the various resource costs for developing empirical CGEmodels, see Dahl and Mitra (1991). For examples of the importance of mod-eling assumptions, see Clarete (1991) and Shah and Whalley (1991).
13. For example, rationing in the labor market (through unemployment, forinstance) can be relatively easily incorporated by allowing increased produc-tion to draw on unemployed labor at a fixed wage, or imperfect competitioncan be captured through simple price-markup rules. How appealing theseextensions are will depend on the policy context. Note also that the presenceof rationing means that welfare effects occur not only through price changes,but also through changes in quantity allocations (for example, the reallocationof labor between segmented markets with differential labor returns and wagerates for otherwise identical labor types). This possibility has generated arelated “microsimulation” literature, which projects the new equilibrium (thatis, prices and quantities) from the CGE to household data and supplements thestandard CGE analysis with an empirical reduced-form rationing model thatallocates household labor to different sectors and generates a new distributionof income. For more detailed discussion on these issues, see Bourguignon andPereira da Silva (2005) and Kehoe, Srinivasan, and Whalley (2005).
14. See Warr (2001), which evaluates a reform of Thailand’s rice-export taxes, foran example of a CGE model that incorporates substantial country-specificestimates of the various parameters.
15. Annex 2 provides basic models that can be used to represent the partial equi-librium effects of tax and price reforms. Annex 3 provides a brief summaryof the theoretical tax literature, the insights from which are often the moti-vating factors behind these reforms.
16. See Ebrill, Stotsky, and Gropp (1999) for empirical evidence on the revenueimplications of trade tax reforms.
17. See Besley and Preston (1988), Coady and Skoufias (2004), Pfahler (1987),and Pfingsten (1986) for more detailed discussion.
18. Many developing-country governments directly control the price of petro-leum and other energy products. For example, the determination of petro-leum prices is fully liberalized (that is, the private sector determines priceswithout having to seek government permission) in only a few countries inSub-Saharan Africa (Chad, Kenya, Lesotho, South Africa, and Tanzania). Inthe majority of countries, prices are either fully controlled by the governmentwithout a functioning formula (11 countries) or are government determinedthrough a functioning price formula (17 countries). In a smaller group ofcountries, governments negotiate prices with the private sector based on a
Analyzing the Distributional Impact of Reforms
280
formula (7 countries) or the private sector determines prices using a formula(4 countries). For a discussion of the welfare and fiscal implications of alter-native price-smoothing rules, see Federico, Daniel, and Bingham (2001).
19. See, for example, Chen, Matovu, and Reinikka (2001), on Uganda; Coadyand Newhouse (2005), on Ghana; Gillingham and El-Said (2005), on Jordan;Gillingham and Medas (2005), on Bolivia; Hughes (1986, 1987), on Indone-sia, Thailand, and Tunisia; and Rajemison, Haggblade, and Younger (2003),on Madagascar.
20. Their analysis adjusts for the fact that many households consume from theirhome production, especially food, and are not normally covered by the VATsystem, so that they only pay VAT on their purchases from the market. In com-mon with much of the earlier literature, the analysis also allows for the exis-tence of tax evasion through the use of “implicit tax rates,” that is, actual taxrevenue divided by the tax base, as opposed to statutory rates, which assumeperfect implementation. Because of data constraints, an input-output table forTanzania for 1992 was used as a substitute. Note that there are two dimensionsin which this is unsatisfactory: using Tanzania data for Ethiopia and using 1992data when the reforms took place in 2003. Still, what matters here is not reallythat the economic structure of these countries may differ (for example, greaterreliance on agriculture or industry), but that the input-output coefficients,which capture technologies and relative prices, may differ. However, given theimportance of taxation on intermediate goods, the alternative would be tofocus only on the impact arising from direct consumption by households,which would be even more unsatisfactory given that the impact through theindirect consumption by households can dominate. (For example, over 50 per-cent of petroleum products are often consumed in the production and distri-bution of goods and services.) Although results based on imperfect data needto be qualified, they can still provide a valuable input into the policy debate.
21. Real-income effects were calculated using estimates of equivalent variationbased on estimated demand elasticities. Note also that the analysis focusedon total consumption and did not distinguish between households that werenet producers and households that were net consumers of foodgrains.Refaqat (2003) uses household-survey data for 2001 to evaluate the distrib-utional impact of the VAT in Pakistan and finds that it is very slightly pro-gressive. Chen, Matovu, and Reinikka (2001) find that the VAT introducedin Uganda in 1996 was no less progressive than the sales taxes it replaced.
22. For other examples of the distributional gains resulting from introducing dif-ferential VAT rates, see Ahmad and Ludlow (1989) and Ahmad and Stern(1991, ch. 7), in the context of Pakistan, and Gibson (1998), in the context ofPapua New Guinea. The first two papers also find that the general distribu-tional picture is unchanged when one uses equivalent variation measures ofwelfare impacts to adjust for the fact that tax changes are not marginal.
23. There are many partial equilibrium studies evaluating such impacts; see, forexample, Barrett and Dorosh (1996), on Madagascar; Budd (1993), on Côte
Indirect Tax and Public Pricing Reforms
281
d’Ivoire; Case (2000), on South Africa; Chen and Ravallion (2003), on China;Deaton (1989), on Thailand; Fletcher (2005); Chia, Wahba, and Whalley(2000); Krueger, Schiff, and Valdès (1988); and Trairatvorakul (1984), onThailand. Hertel and Reimer (2004) and Reimer (2002) provide very goodsurveys of different trade-reform studies and should be consulted for a moredetailed and exhaustive summary of this literature. See Cornia, Jolly, andStewart (1987) and Pinstrup-Andersen (1988a) for a discussion of the moti-vation behind these policies. For an overview of alternative approaches toaccessing the welfare impacts of trade policies, see McCulloch, Winters, andCirera (2001).
24. Note that, although a CGE model generated the price changes, factor-pricechanges are not incorporated into the analysis. The likely implications of thisare discussed in later sections. But note that Löfgren (2000) found that, inthe short run, although domestic trade liberalization produced aggregategains for the country, the rural poor lost out.
25. Ravallion (1990) discusses the importance of wage effects when evaluatingreforms in rice pricing in Bangladesh and indicates that wage effects are likelyto dominate commodity-price effects over the long term, as would beexpected from the well-known Stolper-Samuelson theorem. See also Porto(2003a, 2003b) and Nicita (2004a) on trade liberalization in Argentina andMexico, respectively. In the former case, trade liberalization was found tobenefit the poor more than it did the rich. In the latter, although trade liberali-zation was found to decrease poverty, inequality increased.
26. A recent paper by Nicita (2004b) is indicative of the detail that can be intro-duced on the efficiency side of the analysis. The paper evaluates the potentialfor welfare-improving marginal price reforms across different food groupsin Mexico—the paper abstracts from the issue of effective versus nominaltaxation—and makes three interesting innovations. First, using a modeldeveloped by Deaton (1987, 1988, 1990) and Deaton and Grimard (1992), itestimates demand elasticities with a model that allows for quality differencesin commodities. Second, it estimates separate sets of elasticities for incomequintiles and rural and urban areas. Third, it estimates these elasticities usinga series of six household surveys covering a period of 12 years, from 1989 to2000. The results show that income and price elasticities vary substantiallyacross households and that lower-income households tend to have signifi-cantly larger income and price elasticities. The results also indicate that, evenwithin this smaller subgroup of consumption, there is potential for welfare-improving price reforms and that there is a trade-off between efficiency anddistributional concerns. An interesting extension of this work would be toevaluate separately the importance of calculating “exact” welfare impacts, asopposed to “first-order” impacts, for the distributional and efficiency impli-cations of tax reforms.
27. See also Sadoulet and de Janvry (1992) for an analysis of the likely short- andlong-run effects on the poor in different African and Asian economies. These
Analyzing the Distributional Impact of Reforms
282
authors also examine the potential for social protection programs to offsetthe short-run adverse welfare effects on the poor.
28. See also various chapters in Newbery and Stern (1987) for further discussionof the theory and application of the shadow-pricing approach.
29. For a similar result in the context of factor-market distortions, see Devarajan,Thierfelder, and Suthiwart-Narueput (2001). Using CGE analysis forBangladesh, Cameroon, and Indonesia, these authors find that some taxincreases have a “negative deadweight loss,” reflecting reallocation of factorsacross sectors with differential factor productivities. Their analysis shows thatthe results can be very sensitive to the underlying assumptions about factor-market functioning and that the potential for efficiency-improving tax re-forms are great.
30. Using a CGE model for Mexico, Sobarzo (2000) found that increasing VATrates did not lead to substantial changes in producer prices. This is not sur-prising given the openness of the economy since, for traded sectors, pro-ducer prices are determined by world prices. The incidence of VAT increaseswas found to be progressive, while the pattern of the incidence of higherenergy prices was found to have an inverted “J” shape, with welfare decreaseshigher among the middle-income group, followed by the “poor” and the“rich” ordered by magnitude. Reducing VAT, combined with higher energyprices, had a progressive incidence. The poor gained least from the removalof tariffs.
31. Similar results are produced by the Devarajan and Hossain (1995) analysis oftaxes in the Philippines, which finds that indirect taxes as a whole are near neu-tral. Energy taxes are found to be progressive, reflecting the relatively highenergy-intensity of goods consumed by higher-income households, whileimport and VAT were found to be neutral in incidence. When combined withthe substantial progressive incidence of expenditures, the overall tax-cum-expenditure incidence is strongly progressive. The effect of taxes is virtuallyidentical across income deciles, leading to a 20 percent decrease in realincomes. But there are substantial differences among the incidences of expen-ditures; the bottom decile experienced a 47 percent increase in income, thisfalling to about 11 percent for the middle two deciles and to less than 7 percentfor the top three deciles. The net effect of the tax-expenditure system led to a26 percent increase in income for the lowest decile, a decrease of about 8 per-cent in income for the middle two deciles, and close to a 20 percent decrease inincome for the top decile.
32. See Clarete (1991), on the Philippines; Harrison, Rutherford, and Tarr (1993),on Turkey; and Shah and Whalley (1991), on Pakistan, for analyses of theimpacts of trade liberalization in specific countries.
33. The model discussed in this section draws heavily on the works of Drèze andStern (1987) and Guesnerie (1979).
34. Note also that, subject to regularity conditions, the constrained demand func-tions xh(.) also have the standard properties with respect to q and mh. For
Indirect Tax and Public Pricing Reforms
283
instance, Roy’s identity and the Slutsky equations continue to apply. Simi-larly, the Slutsky matrix S is symmetric and negative semi-definite, and q�S = 0. The main difference is that the matrix S has columns of zero entriesfor commodities such that the quantity constraint is binding (because asmall change in the price of such a commodity works like a change in lump-sum income).
35. Strictly speaking, one only needs convexity in the space of commodities forwhich the quantity constraints are not binding.
36. Note also that the quantity constraints enable us to treat the net supply vec-tors of firms operating under constant returns to scale as functions ratherthan as correspondences.
37. This does not require the assumption that producer prices are actually con-stant. If producer prices are among the “control variables,” then the derivationremains valid by the envelope theorem. Furthermore, it should be rememberedthat the “control variables” formally include the market-clearing variables, thatis, the variables that implicitly adjust to clear the scarcity constraints. Seen inthis light, the device of holding producer prices constant is much more generalthan appears at first sight. More precisely, the derivation is valid if any of thefollowing hold: (1) producer prices are actually fixed (as in Diamond andMirrlees 1975), (2) producer prices adjust endogenously to clear the scarcityconstraints, or (3) producer prices are directly controlled by the planner.
38. See, also, Newbery and Stern (1987) and Sadoulet and de Janvry (1992) forfurther details on these approaches.
39. Note the slight difference regarding the definition of partial equilibriumcompared with definitions in standard introductory text books, which ofteninclude responses in the market under analysis.
40. See Coady (1997a) and Newbery and Stern (1987) for further discussion andapplications.
41. Ignoring income-distribution issues and assuming that government revenueis optimal (that is, λ=β=1), if the gain in revenue is less than the aggregatedirect income effect (so that η<1), then the difference captures the welfare lossfrom the price increase. This is analogous to the partial equilibrium Harbergerwelfare-loss triangle from taxes. See Coady and Drèze (2002) for more detaileddiscussion.
42. For a discussion of price-shifting within a broader class of models (for exam-ple, incorporating different degrees of competition), see Stern (1987).
43. Throughout the chapter, lowercase in equations refers to row vectors, anduppercase to matrices.
44. This would not be the case in vatable sectors for the VAT component in taxeson traded sectors.
45. The solution vector of prices is a (1×n) vector in which the elements are inter-preted, in general, as the “weighted average prices” for aggregate sectors.Alternatively, one could treat each component of p as a separate (1×n) vec-tor and solve out for each vector simultaneously.
Analyzing the Distributional Impact of Reforms
284
46. Note also that, if taxes are imposed at the wholesale stage, then these rateswill need to be adjusted to reflect the (lower) tax proportion of retail prices.
47. In this case, for t>0, then dq<0.48. See Coady and Drèze (2002) for a recent survey of the literature in the con-
text of these three roles.49. Note that a proportional reduction in tariffs “financed” by a proportional
increase in any existing consumption taxes will not be unambiguously welfareimproving; see Anderson (1999).
50. Note that the “radial” and “concertina” reforms are now only unambiguouslywelfare improving in the space of “shadow taxes.”
BIBLIOGRAPHY
Abed, G., L. Ebrill, S. Gupta, B. Clements, R. McMorran, A. Pellechio, J. Schiff,and M. Verhoeven. 1998. “Fiscal Reforms in Low-Income Countries: Experi-ence under IMF-Supported Programs.” IMF Occasional Paper 160, Inter-national Monetary Fund, Washington, DC.
Ahmad, E., and S. Ludlow. 1989. “The Distributional Consequences of TaxReform: On a VAT for Pakistan.” PPR Working Paper 238, World Bank,Washington, DC.
Ahmad, E., and N. Stern. 1984. “Theory of Reform and Indian Indirect Taxes.”Journal of Public Economics 25 (3): 259–98.
———. 1987. “Alternative Sources of Government Revenue: Illustrations fromIndia, 1979–80.” In The Theory of Taxation for Developing Countries, ed.D. Newbery and N. Stern, 281–332. Oxford: Oxford University Press.
———. 1990. “Tax Reform and Shadow Prices for Pakistan.” Oxford EconomicPapers 42: 135–59.
———. 1991. The Theory and Practice of Tax Reform in Developing Countries.Cambridge: Cambridge University Press.
Anderson, J. 1999. “Trade Reform with a Government Budget Constraint.” InInternational Trade Policy and the Pacific Rim, ed. J. Piggott and A. Woodland.London: Macmillan.
Banks, J., R. Blundell, and A. Lewbel. 1996. “Tax Reform and Welfare Measure-ment: Do We Need Demand System Estimation?” Economic Journal 106 (438):1227–41.
Barbone, L., A. Das-Gupta, L. De Wulf, and A. Hannson. 1999. “Reforming TaxSystems: The World Bank Record in the 1990s.” Tax Policy and Administra-tion Thematic Group, World Bank Institute, World Bank, Washington, DC.
Barrett, S., and P. Dorosh. 1996. “Farmers’ Welfare and Changing Food Prices:Nonparametric Evidence from Rice in Madagascar.” American Journal ofAgricultural Economics 78 (3): 656–69.
Besley, T., and I. Preston. 1988. “Invariance and the Axiomatics of Income TaxProgression: A Comment.” Bulletin of Economic Research 40 (1): 159–63.
Bevan, D., P. Collier, N. Gemmell, and D. Greenway, eds. 2000. Trade and FiscalAdjustment in Africa. London: Macmillan.
Indirect Tax and Public Pricing Reforms
285
Bird, R. 1992. Tax Policy and Economic Development. Baltimore: Johns HopkinsUniversity Press.
Bourguignon, F., and L. Pereira da Silva, eds. 2005. The Impact of Economic Poli-cies on Poverty and Income Distribution: Evaluation Techniques and Tools. NewYork: Oxford University Press.
Budd, J. 1993. “Changing Food Prices and Rural Welfare: A Non-ParametricExamination of the Côte d’Ivoire.” Economic Development and CulturalChange 41 (3): 587–603.
Burgess, R., and N. Stern. 1993. “Taxation and Development.” Journal of Eco-nomic Literature 31 (June): 762–830.
Case, A. 2000. “Implications of Policy Reform Given Income Distribution andExpenditure Patterns in South Africa.” Paper presented at “Conference onPoverty and the International Economy,” Stockholm, October 20–21.
Chen, D., J. Matovu, and R. Reinikka. 2001. “A Quest for Revenue and Tax Inci-dence in Uganda.” IMF Working Paper 01/24, International Monetary Fund,Washington, DC.
Chen, S., and M. Ravallion. 2003. “Household Welfare Impacts of China’s Acces-sion to the World Trade Organization.” Policy Research Working Paper 3040,World Bank, Washington, DC.
Chia, N.-C., S. Wahba, and J. Whalley. 2000. “Analyzing the Incidence of Taxesin the Côte d’Ivoire.” In Trade and Fiscal Adjustment in Africa, ed. D. Bevan,P. Collier, N. Gemmell, and D. Greenway, 149–75. London: Macmillan.
Clarete, R. L. 1991. “A General Equilibrium Analysis of the Tax Burden and Insti-tutional Distortions in the Philippines.” In Tax Policy in Developing Countries,ed. J. Khalilzadeh-Shirazi and A. Shah, 188–200. Washington, DC: WorldBank.
Coady, D. 1997a. “Agricultural Pricing Policies in Developing Countries: AnApplication to Pakistan.” International Tax and Public Finance 4 (1): 39–57.
———. 1997b. “Fiscal Reform in Developing Countries.” In Fiscal Reforms in theLeast Developed Countries, ed. C. Patel, 18–46. Cheltenham, United Kingdom:Edward Elgar.
Coady, D., and J. Drèze. 2002. “Commodity Taxation and Social Welfare: The Gen-eralized Ramsey Rule.” International Tax and Public Finance 9 (3): 295–316.
Coady, D., and R. Harris. 2004. “Evaluating Transfer Programs within a GeneralEquilibrium Framework.” Economic Journal 114 (October): 778–99.
Coady, D., and D. Newhouse. 2005. “Ghana: Evaluation of the DistributionalImpacts of Petroleum Price Reforms.” Technical Assistance Report, FiscalAffairs Department, International Monetary Fund, Washington, DC.
Coady, D., and E. Skoufias. 2004. “On the Targeting and Redistributive Efficien-cies of Alternative Transfer Programs.” Review of Income and Wealth 50 (1):11–27.
Cornia, G. A., R. Jolly, and F. Stewart, eds. 1987. Adjustment with a Human Face:Protecting the Vulnerable and Promoting Growth. Vol. 1. Oxford: ClarendonPress.
Analyzing the Distributional Impact of Reforms
286
Dahl, H., and P. Mitra. 1991. “Applying Tax Policy Models in Country EconomicWork: Bangladesh, China, and India.” In Tax Policy in Developing Countries,ed. J. Khalilzadeh-Shirazi and A. Shah, Washington, DC: World Bank.
Deaton, A. 1987. “Econometric Issues for Tax Design in Developing Coun-tries.” In The Theory of Taxation for Developing Countries, ed. D. Newberyand N. Stern, 92–113. New York: Oxford University Press.
———. 1988. “Quality, Quantity, and Spatial Variation in Price.” American Eco-nomic Review 78 (3): 418–30.
———. 1989. “Rice Prices and Income Distribution in Thailand: A Non-Parametric Analysis.” Economic Journal 99 (395), Conference Supplement,1–37.
———. 1990. “Price Elasticities from Survey Data: Extensions and IndonesianResults.” Journal of Econometrics 44 (3): 281–309.
———. 1995. “Data and Econometric Tools for Development Analysis.” In Hand-book of Development Economics. Vol. IIIa, ed. J. Behrman and T. Srinivasan,1785–1882. Amsterdam: Elsevier.
———. 1997. The Analysis of Household Surveys: A Microeconomic Approach toDevelopment Policy. Baltimore: Johns Hopkins University Press.
Deaton, A., and F. Grimard. 1992. “Demand Analysis for Tax Reform in Pakistan.”LSMS Working Paper 85, World Bank, Washington, DC.
Deaton, A., and N. Stern. 1986. “Optimally Uniform Commodity Taxes, TasteDifferences, and Lump-Sum Grants.” Economic Letters 20: 263–66.
Dervis, K., J. de Melo, and S. Robinson. 1982. General Equilibrium Models forDevelopment Policy. New York: Cambridge University Press.
Devarajan, S., and S. Hossain. 1995. “The Combined Incidence of Taxes andPublic Expenditures in the Philippines.” Policy Research Working Paper 1543,World Bank, Washington, DC.
Devarajan, S., K. Thierfelder, and S. Suthiwart-Narueput. 2001. “The MarginalCost of Public Funds in Developing Countries.” In Policy Evaluations withComputable General Equilibrium Models, ed. A. Fossati and W. Weigard,39–55. London: Routledge.
Diamond, P. 1975. “A Many-Person Ramsey Rule.” Journal of Public Economics4: 335–42.
Diamond, P., and J. Mirrlees. 1971a. “Optimal Taxation and Public ProductionI: Production Efficiency.” American Economic Review 61 (1): 8–27.
———. 1971b. “Optimal Taxation and Public Production II: Tax Rules.”American Economic Review 61 (3): 261–78.
———. 1975. “Private Constant Returns and Public Shadow Prices.” Review ofEconomic Studies 43 (1): 41–47.
Dixit, A. K. 1975. “Welfare Effects of Tax and Price Changes.” Journal of PublicEconomics 4 (2): 103–23.
———. 1985. “Tax Policy in Open Economies.” In Handbook of Public Economics,ed. A. Auerbach and M. Feldstein, Vol. 1, Chap. 6, 313–74. Amsterdam:North-Holland.
Indirect Tax and Public Pricing Reforms
287
Drèze, J., and N. Stern. 1987. “The Theory of Cost-Benefit Analysis.” In Hand-book of Public Economics, ed. A. Auerbach and M. Feldstein, Vol. 2, Chap. 14,909–89. Amsterdam: North-Holland.
Ebrill, L., J. Stotsky, and R. Gropp. 1999. “Revenue Implications of Trade Liberalization.” IMF Occasional Paper 180, International Monetary Fund,Washington, DC.
Emran, M. S., and J. E. Stiglitz. 2005. “On Selective Indirect Tax Reform inDeveloping Countries.” Journal of Public Economics 89 (4): 599–623.
Federico, G., J. Daniel, and B. Bingham. 2001. “Domestic Petroleum PriceSmoothing in Developing and Transition Countries.” IMF Working Paper 75,International Monetary Fund, Washington, DC.
Fletcher, K. 2005. “Increasing Public Sector Revenue in the Philippines: Equityand Efficiency Considerations.” IMF Working Paper 22, International Mon-etary Fund, Washington, DC.
Fourie, F., and A. Owen. 1993. “Value-Added Tax and Regressivity in SouthAfrica.” South African Journal of Economics 61 (4): 281.
Gemmell, N. 1987. “Taxation and Development: A Survey.” In Surveys in Devel-opment Economics, ed. N. Gemmell, 269–306. Oxford: Basil Blackwell.
Gemmell, N., and O. Morrissey. 2003. “Tax Structure and the Incidence on thePoor in Developing Countries.” CREDIT Research Paper 03/18, University ofNottingham, Nottingham, United Kingdom.
———. 2005. “Distributional and Poverty Impacts of Tax Structure Reform inDeveloping Countries: How Little We Know.” Development Policy Review 23(2): 131–44.
Gibson, J. 1998. “Indirect Tax Reform and the Poor in Papua New Guinea.”Pacific Economic Bulletin 13 (20): 29–39.
Gillingham, R., and M. El-Said. 2005. “Jordan: Distributional Effects of Elimi-nating Subsidies for Petroleum Products.” Technical Assistance Report,Fiscal Affairs Department, International Monetary Fund, Washington, DC.
Gillingham, R., and P. Medas. 2005. “Bolivia: Distributional Effects of ReducingSubsidies to Hydrocarbon Products.” Report, Fiscal Affairs Department,International Monetary Fund, Washington, DC.
Gillis, M., ed. 1989. Tax Reform in Developing Countries. Durham, NC: DukeUniversity Press.
Go, D., M. Kearney, S. Robinson, and K. Thierfelder. 2005. “An Analysis ofSouth Africa’s Value-Added Tax.” Unpublished manuscript, World Bank,Washington, DC.
Guesnerie, R. 1979. “General Statements of Second-Best Pareto Optimality.”Journal of Mathematical Economics 6: 169–94.
Gunning, J. W., and M. Keyser. 1995. “Applied General Equilibrium Models forPolicy Analysis.” In Handbook of Development Economics, ed. J. Behrman andT. Srinivasan, Vol. III, Chap. 35, 2025–2107. Amsterdam: Elsevier.
Gupta, S., M. Verhoeven, R. Gillingham, C. Schiller, A. Mansoor, and J. P. Cor-doba. 2000. “Equity and Efficiency in the Reform of Price Subsidies.” Report,International Monetary Fund, Washington, DC.
Analyzing the Distributional Impact of Reforms
288
Gupta, S., M. Plant, B. Clements, T. Dorsey, E. Baldacci, G. Inchauste, S. Tareq,and N. Thacker. 2002. “Is the PRGF Living Up to Expectations?: An Assess-ment of Program Design.” IMF Occasional Paper 216, International Mone-tary Fund, Washington, DC.
Harrison, G. W., T. F. Rutherford, and D. G. Tarr. 1993. “Piecemeal TradeReform in the Partially Liberalized Economy of Turkey.” World Bank Eco-nomic Review, 7 (May): 191–217.
Heady, C. 2001. “Taxation Policy in Low-Income Countries.” WIDER Discus-sion Paper 2001/81, United Nations University–World Institute for Develop-ment Economics Research, Helsinki.
Heady, C., and P. Mitra. 1982. “Restricted Redistributive Taxation, ShadowPrices, and Trade Policy.” Journal of Public Economics 17 (1): 1–22.
———. 1987. “Optimal Taxation and Shadow Prices in a Developing Eco-nomy.” In The Theory of Taxation for Developing Countries, ed. D. Newberyand N. Stern, 407–25. New York: Oxford University Press.
Hertel, T., and J. Reimer. 2004. “Predicting the Poverty Impacts of Trade Liberalization: A Survey.” Unpublished manuscript, World Bank, Washington, DC.
Hossain, S. 1995. “The Equity Impact of the Value-Added Tax in Bangladesh.”IMF Staff Papers 42 (June): 411–32.
———. 2003. “Poverty and Social Impact Analysis: A Suggested Framework.”IMF Working Paper 03/195, International Monetary Fund, Washington, DC.
Hughes, G. 1986. “A New Method for Estimating the Effects of Fuel Taxes: AnApplication to Thailand.” World Bank Economic Review 1 (1): 65–101.
———. 1987. “The Incidence of Fuel Taxes: A Comparative Study of Three Coun-tries.” In The Theory of Taxation for Developing Countries, ed. D. Newbery andN. Stern, 533–59. New York: Oxford University Press.
Julius, D., and A. Alicbusan. 1989. “Public Sector Pricing Policies: A Review ofBank Policy and Practice.” Policy Planning and Research Working Paper 49,World Bank, Washington, DC.
Keen, M., and J. Ligthart. 2002. “Coordinating Tariff Reduction and DomesticTax Reform.” Journal of International Economics 56 (2): 489–507.
Keen, M., and A. Simone. 2004. “Tax Policy in Developing Countries: SomeLessons from the 1990s and Some Challenges Ahead.” In Helping CountriesDevelop: The Role of Fiscal Policy, ed. S. Gupta, B. Clements, and G. Inchauste,302–52. Washington, DC: International Monetary Fund.
Kehoe, T., T. Srinivasan, and J. Whalley, eds. 2005. Frontiers in Applied GeneralEquilibrium Models. Cambridge: Cambridge University Press.
Khalilzadeh-Shirazi, J., and A. Shah, eds. 1991. Tax Policy in Developing Countries.Washington, DC: World Bank.
Krueger, A. O., M. Schiff, and A. Valdès. 1988. “Agricultural Incentives in Devel-oping Countries: Measuring the Effect of Sectoral and Economy-Wide Poli-cies.” World Bank Economic Review 2 (3): 255–71.
———. 1991. The Political Economy of Agricultural Pricing Policy. 5 vols.Baltimore: Johns Hopkins University Press.
Indirect Tax and Public Pricing Reforms
289
Little, I., and J. Mirrlees. 1974. Project Appraisal and Planning in DevelopingCountries. London: Heinemann.
Löfgren, H. 2000. “Trade Reform and the Poor in Morocco: A Rural-Urban Gen-eral Equilibrium Analysis of Reduced Protection.” In Earnings Inequality,Unemployment, and Poverty in the Middle East and North Africa, ed. W. Shahinand G. Dibeh, Chap. 4. Westport, CT: Greenwood Press.
Mas-Colell, A., M. Whinston, and J. Green. 1995. Microeconomic Theory. NewYork: Oxford University Press.
McCulloch, N., A. Winters, and X. Cirera. 2001. Trade Liberalization and Poverty:A Handbook. London: Centre for Economic Policy Research and Departmentfor International Development.
Minot, N., and F. Goletti. 2000. “Rice Market Liberalization and Poverty inVietnam.” Research Report 114, International Food Policy Research Institute,Washington, DC.
Muñoz, S., and S. Cho. 2004. “Social Impact of a Tax Reform: The Case ofEthiopia.” In Helping Countries Develop: The Role of Fiscal Policy, ed. S. Gupta,B. Clements, and G. Inchauste. Washington, DC: International MonetaryFund.
Newbery, D. 1986. “On the Desirability of Input Taxes.” Economic Letters 20:267–70.
Newbery, D., and N. Stern, eds. 1987. The Theory of Taxation for DevelopingCountries. New York: Oxford University Press.
Nicita, A. 2004a. “Who Benefited from Trade Liberalization in Mexico: Measur-ing the Effects on Household Welfare.” Policy Research Working Paper 3265,World Bank, Washington, DC.
———. 2004b. “Efficiency and Equity of a Marginal Tax Reform: Income, Qual-ity, and Price Elasticities for Mexico.” Policy Research Working Paper 3266,World Bank, Washington, DC.
Patel, C., ed. 1997. Fiscal Reforms in the Least Developed Countries. Cheltenham,United Kingdom: Edward Elgar.
Perry, G., J. Whalley, and G. McMahon, eds. 2000. Fiscal Reform and StructuralChange in Developing Countries. 2 vols. London: Macmillan.
Pfahler, W. 1987. “Redistributive Effects of Tax Progressivity: Evaluating aGeneral Class of Aggregate Measures.” Public Finance 42 (3): 1–31.
Pfingsten, A. 1986. “The Measurement of Tax Progression.” Studies in Contem-porary Economics, 20. Berlin: Springer Verlag.
Pinstrup-Andersen, P., ed. 1988a. Food Subsidies in Developing Countries: Costs,Benefits, and Policy Options. Baltimore: Johns Hopkins University Press.
———. 1988b. “Macroeconomic Adjustment and Human Nutrition.” FoodPolicy 13 (1): 37–46.
Porto, G. 2003a. “Trade Reforms, Market Access, and Poverty in Argentina.”Policy Research Working Paper 3135, World Bank, Washington, DC.
———. 2003b. “Using Survey Data to Access the Distributional Effects of TradePolicy.” Unpublished manuscript, Development Research Group, WorldBank, Washington, DC.
Analyzing the Distributional Impact of Reforms
290
Rajemison, H., S. Haggblade, and S. Younger. 2003. “Indirect Tax Incidence inMadagascar: Updated Estimates Using the Input-Output Table.” WorkingPaper 147, Cornell Food and Nutrition Policy Program, Cornell University,Ithaca, NY.
Ramsey, F. 1927. “A Contribution to the Theory of Taxation.” Economic Journal37 (March): 47–61.
Ravallion, M. 1990. “Rural Welfare Effects of Food Price Changes under InducedWage Responses: Theory and Evidence for Bangladesh.” Oxford EconomicPapers 42: 574–85.
Ravallion, M., and M. Lokshin. 2004. “Gainers and Losers from Trade Reform inMorocco.” Policy Research Working Paper 3368, World Bank, Washington, DC.
Ravallion, M., and D. van de Walle. 1991. “The Impact on Poverty of Food PriceReforms: A Welfare Analysis for Indonesia.” Journal of Policy Modeling 13 (2):281–99.
Refaqat, S. 2003. “Social Incidence of the General Sales Tax in Pakistan.” IMFWorking Paper 216, International Monetary Fund, Washington, DC.
Reimer, J. 2002. “Estimating the Poverty Impacts of Trade Liberalization.” PolicyResearch Working Paper 2790, World Bank, Washington, DC.
Sadoulet, E., and A. de Janvry. 1992. “Agricultural Trade Liberalization and theLow-Income Countries: A General Equilibrium-Multimarket Approach.”American Journal of Agricultural Economics 74 (2): 268–80.
Sahn, D., and S. Younger. 1999. “Fiscal Incidence in Africa: Microeconomic Evi-dence.” Working Paper 91, Cornell Food and Nutrition Policy Program,Cornell University, Ithaca, NY.
Shah, A., and J. Whalley. 1991. “The Redistributive Impact of Taxation in Develop-ing Countries.” In Tax Policy in Developing Countries, ed. J. Khalilzadeh-Shiraziand A. Shah, 166–87. Washington, DC: World Bank.
Sobarzo, H. 2000. “Interactions between Trade and Tax Reform in Mexico: SomeGeneral Equilibrium Results.” In Fiscal Reform and Structural Change in Devel-oping Countries, ed. G. Perry, J. Whalley, and G. McMahon, Vol. 1. London:Macmillan.
Stern, N. 1987. “The Effects of Taxation, Price Control, and Government Con-tracts in Oligopoly and Monopolistic Competition.” Journal of Public Eco-nomics 32: 133–58.
Stiglitz, J. E., and P. S. Dasgupta. 1971. “Differential Taxation, Public Goods, andEconomic Efficiency.” Review of Economic Studies 38 (114): 151–74.
Tanzi, V. 1987. “Quantitative Characteristics of the Tax Systems of DevelopingCountries.” In The Theory of Taxation for Developing Countries, ed. D. Newberyand N. Stern, Vol. 2, 205–41. New York: Oxford University Press.
———. 2000. “Taxation and Economic Structure.” In Fiscal Reform and StructuralChange in Developing Countries, ed. G. Perry, J. Whalley, and G. McMahon,Vol. 2, Chap. 8. London: Macmillan.
Tareq, S., J. Ligthart, A. Segura-Ubiergo, N. Wandwasi, and I. Izvorski. 2005.“Bosnia and Herzegovina: Assessing the Distributional Impact of a VAT.”
Indirect Tax and Public Pricing Reforms
291
Technical Assistance Report, Fiscal Affairs Department, InternationalMonetary Fund, Washington, DC.
Thirsk, W., ed. 1997. Tax Reform in Developing Countries. Washington, DC:World Bank.
Trairatvorakul, P. 1984. “The Effects on Income Distribution and Nutrition ofAlternative Rice Price Policies in Thailand.” Research Report 46, Inter-national Food Policy Research Institute, Washington, DC.
Triest, R. 1990. “The Relationship between the Marginal Cost of Public Fundsand Marginal Excess Burden.” American Economic Review 80 (3): 557–66.
Warr, P. 2001. “Welfare and Distributional Effects of an Export Tax: Thailand’sRice Premium.” American Journal of Agricultural Economics 83 (4): 903–20.
Analyzing the Distributional Impact of Reforms
292
Theoretical Approach to Evaluating the Social Welfare
Impact of Price Reforms
293
The empirical literature evaluating the welfare impact of changes (or“reforms”) in commodity taxes or prices covers a broad range of method-ological approaches, which can be usefully classified according to whetherthey are general equilibrium, partial equilibrium, or somewhere in between(often referred to as limited general equilibrium or multimarket models).In this annex, a general equilibrium model is set out that captures the keyingredients of any analysis of the welfare impacts of reforms in commod-ity taxes or prices. The model helps to clarify the three different roles playedby commodity taxation and price controls, namely, resource mobilization(that is, government revenue), resource reallocation (or efficiency), andresource redistribution (or equity). Although the primary concern will bethe distributional consequences of price changes, a comprehensive evalu-ation of such reforms must recognize the other dimensions of thesereforms since these may be the main factors motivating the reforms in thefirst place and can be expected to have important implications for house-hold welfare. For example, price changes may reflect the desire to reformthe structure of commodity taxes to raise either the same or greater revenuemore efficiently. Or the price changes may reflect a desire to make publicsector prices better reflect the true cost of meeting demand. If revenuesincrease, these may be used to enhance the coverage of social safety netsamong the poorest households or to expand access to valuable publiclysupplied services such as education, health-nutrition, or various types ofphysical infrastructure. A comprehensive evaluation of price effects there-fore needs to take all these implications into account.
The next section describes the model and derives the analytical equa-tions used to identify the main ingredients in a general equilibrium analysis
1A N N E X
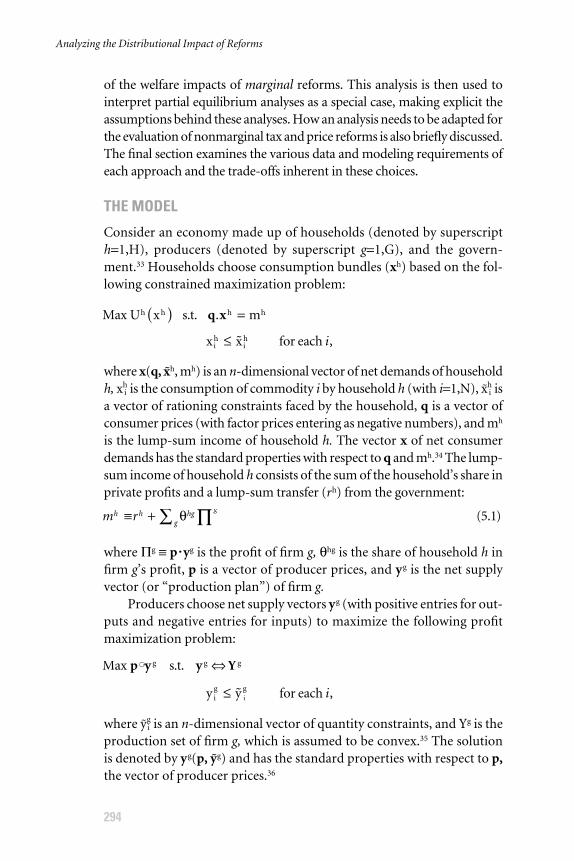
of the welfare impacts of marginal reforms. This analysis is then used tointerpret partial equilibrium analyses as a special case, making explicit theassumptions behind these analyses. How an analysis needs to be adapted forthe evaluation of nonmarginal tax and price reforms is also briefly discussed.The final section examines the various data and modeling requirements ofeach approach and the trade-offs inherent in these choices.
THE MODEL
Consider an economy made up of households (denoted by superscripth=1,H), producers (denoted by superscript g=1,G), and the govern-ment.33 Households choose consumption bundles (xh) based on the fol-lowing constrained maximization problem:
where x(q, xh, mh) is an n-dimensional vector of net demands of householdh, xi
h is the consumption of commodity i by household h (with i=1,N), x ih is
a vector of rationing constraints faced by the household, q is a vector ofconsumer prices (with factor prices entering as negative numbers), and mh
is the lump-sum income of household h. The vector x of net consumerdemands has the standard properties with respect to q and mh.34 The lump-sum income of household h consists of the sum of the household’s share inprivate profits and a lump-sum transfer (rh) from the government:
where Πg ≡ p �yg is the profit of firm g, θhg is the share of household h infirm g’s profit, p is a vector of producer prices, and yg is the net supplyvector (or “production plan”) of firm g.
Producers choose net supply vectors yg (with positive entries for out-puts and negative entries for inputs) to maximize the following profitmaximization problem:
where yig is an n-dimensional vector of quantity constraints, and Yg is the
production set of firm g, which is assumed to be convex.35 The solutionis denoted by yg(p, yg) and has the standard properties with respect to p,the vector of producer prices.36
Max s.t.
y y for each
g g g
ig g
i
p y y Y�
�
⇔
≤ i,
m rh h hgg
g≡ + ∑ ∏θ ( . )5 1
Max U x s.t. . m
x x for each
h h h h
ih
ih
( ) =
≤
q x
� i,
Analyzing the Distributional Impact of Reforms
294
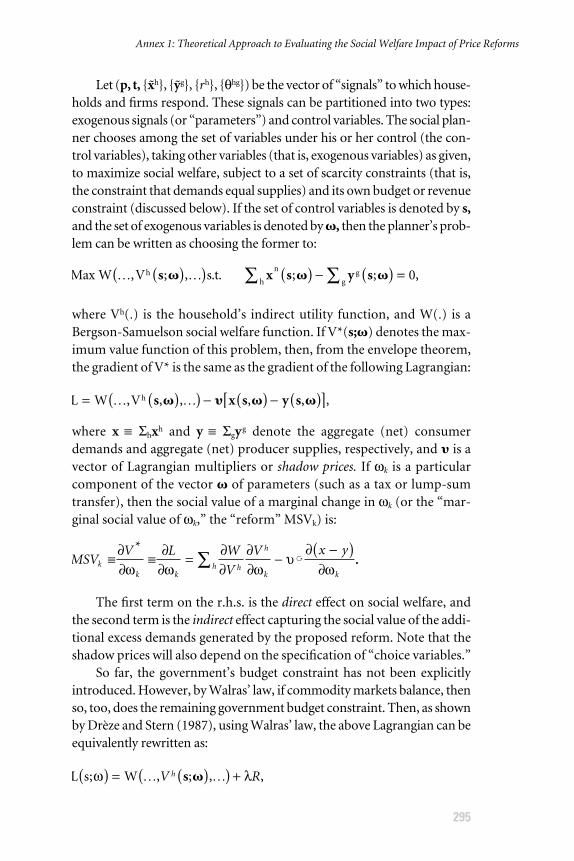
Let (p, t, {xh}, {yg}, {rh}, {θhg}) be the vector of “signals” to which house-holds and firms respond. These signals can be partitioned into two types:exogenous signals (or “parameters”) and control variables. The social plan-ner chooses among the set of variables under his or her control (the con-trol variables), taking other variables (that is, exogenous variables) as given,to maximize social welfare, subject to a set of scarcity constraints (that is,the constraint that demands equal supplies) and its own budget or revenueconstraint (discussed below). If the set of control variables is denoted by s,and the set of exogenous variables is denoted by �, then the planner’s prob-lem can be written as choosing the former to:
where Vh(.) is the household’s indirect utility function, and W(.) is aBergson-Samuelson social welfare function. If V*(s;�) denotes the max-imum value function of this problem, then, from the envelope theorem,the gradient of V* is the same as the gradient of the following Lagrangian:
where x ≡ Σhxh and y ≡ Σgyg denote the aggregate (net) consumerdemands and aggregate (net) producer supplies, respectively, and � is avector of Lagrangian multipliers or shadow prices. If ωk is a particularcomponent of the vector � of parameters (such as a tax or lump-sumtransfer), then the social value of a marginal change in ωk (or the “mar-ginal social value of ωk,” the “reform” MSVk) is:
The first term on the r.h.s. is the direct effect on social welfare, andthe second term is the indirect effect capturing the social value of the addi-tional excess demands generated by the proposed reform. Note that theshadow prices will also depend on the specification of “choice variables.”
So far, the government’s budget constraint has not been explicitlyintroduced. However, by Walras’ law, if commodity markets balance, thenso, too, does the remaining government budget constraint. Then, as shownby Drèze and Stern (1987), using Walras’ law, the above Lagrangian can beequivalently rewritten as:
L s W; , ; , ,ω λ( ) = ( )( ) +… …V Rh s �
MSVV L W
V
V x yk
k khh
h
k k
≡ ∂∂
≡ ∂∂
= ∂∂
∂∂
−∂ −( )
∂∑*
ω ω ωυ
ω� ..
L W Vh= ( )( ) − ( ) − ( )[ ]… …, , , , , ,s x s y s� � � �
Max W V s.t.hh
h gg
… …, ; , ; ; ,s x s y s� � �( )( ) ( ) − ( ) =∑ ∑ 0
Annex 1: Theoretical Approach to Evaluating the Social Welfare Impact of Price Reforms
295
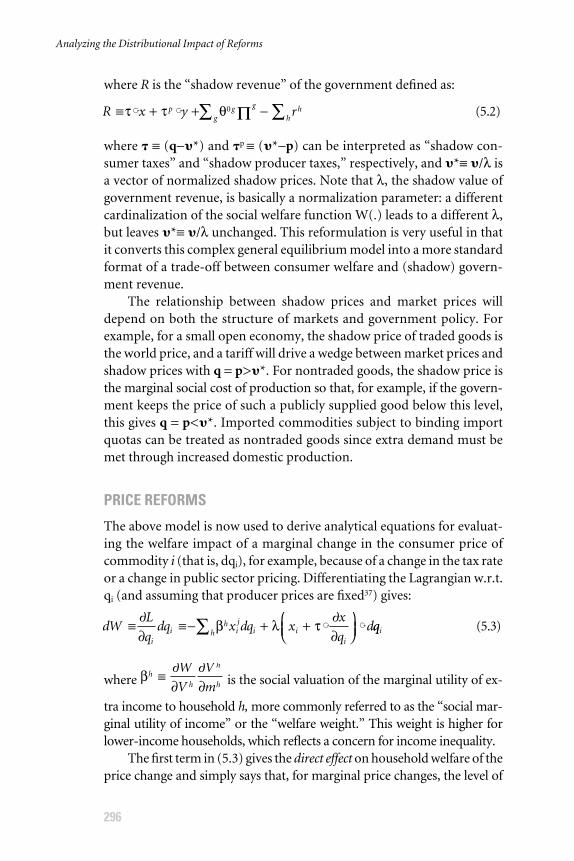
where R is the “shadow revenue” of the government defined as:
where � ≡ (q−�*) and �p ≡ (�*−p) can be interpreted as “shadow con-sumer taxes” and “shadow producer taxes,” respectively, and �*≡ �/λ isa vector of normalized shadow prices. Note that λ, the shadow value ofgovernment revenue, is basically a normalization parameter: a differentcardinalization of the social welfare function W(.) leads to a different λ,but leaves �*≡ �/λ unchanged. This reformulation is very useful in thatit converts this complex general equilibrium model into a more standardformat of a trade-off between consumer welfare and (shadow) govern-ment revenue.
The relationship between shadow prices and market prices willdepend on both the structure of markets and government policy. Forexample, for a small open economy, the shadow price of traded goods isthe world price, and a tariff will drive a wedge between market prices andshadow prices with q = p>�*. For nontraded goods, the shadow price isthe marginal social cost of production so that, for example, if the govern-ment keeps the price of such a publicly supplied good below this level,this gives q = p<�*. Imported commodities subject to binding importquotas can be treated as nontraded goods since extra demand must bemet through increased domestic production.
PRICE REFORMS
The above model is now used to derive analytical equations for evaluat-ing the welfare impact of a marginal change in the consumer price ofcommodity i (that is, dqi), for example, because of a change in the tax rateor a change in public sector pricing. Differentiating the Lagrangian w.r.t.qi (and assuming that producer prices are fixed37) gives:
where is the social valuation of the marginal utility of ex-
tra income to household h, more commonly referred to as the “social mar-ginal utility of income” or the “welfare weight.” This weight is higher forlower-income households, which reflects a concern for income inequality.
The first term in (5.3) gives the direct effect on household welfare of theprice change and simply says that, for marginal price changes, the level of
βhh
h
h
W
V
V
m≡ ∂
∂∂∂
dWL
qdq x dq x
x
qd
ii
hij
h i ii
≡ ∂∂
≡− + + ∂∂
∑ β λ τ � � qqi ( . )5 3
R x y rp g g hhg
≡ + + − ∑∑τ τ θ� � 0 5 2Π ( . )
Analyzing the Distributional Impact of Reforms
296
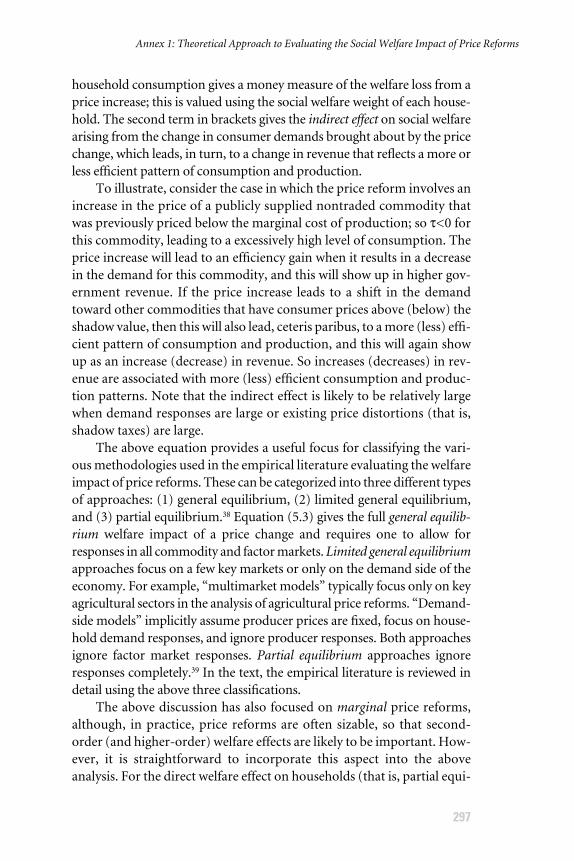
household consumption gives a money measure of the welfare loss from aprice increase; this is valued using the social welfare weight of each house-hold. The second term in brackets gives the indirect effect on social welfarearising from the change in consumer demands brought about by the pricechange, which leads, in turn, to a change in revenue that reflects a more orless efficient pattern of consumption and production.
To illustrate, consider the case in which the price reform involves anincrease in the price of a publicly supplied nontraded commodity thatwas previously priced below the marginal cost of production; so τ<0 forthis commodity, leading to a excessively high level of consumption. Theprice increase will lead to an efficiency gain when it results in a decreasein the demand for this commodity, and this will show up in higher gov-ernment revenue. If the price increase leads to a shift in the demandtoward other commodities that have consumer prices above (below) theshadow value, then this will also lead, ceteris paribus, to a more (less) effi-cient pattern of consumption and production, and this will again showup as an increase (decrease) in revenue. So increases (decreases) in rev-enue are associated with more (less) efficient consumption and produc-tion patterns. Note that the indirect effect is likely to be relatively largewhen demand responses are large or existing price distortions (that is,shadow taxes) are large.
The above equation provides a useful focus for classifying the vari-ous methodologies used in the empirical literature evaluating the welfareimpact of price reforms. These can be categorized into three different typesof approaches: (1) general equilibrium, (2) limited general equilibrium,and (3) partial equilibrium.38 Equation (5.3) gives the full general equilib-rium welfare impact of a price change and requires one to allow forresponses in all commodity and factor markets. Limited general equilibriumapproaches focus on a few key markets or only on the demand side of theeconomy. For example, “multimarket models” typically focus only on keyagricultural sectors in the analysis of agricultural price reforms. “Demand-side models” implicitly assume producer prices are fixed, focus on house-hold demand responses, and ignore producer responses. Both approachesignore factor market responses. Partial equilibrium approaches ignoreresponses completely.39 In the text, the empirical literature is reviewed indetail using the above three classifications.
The above discussion has also focused on marginal price reforms,although, in practice, price reforms are often sizable, so that second-order (and higher-order) welfare effects are likely to be important. How-ever, it is straightforward to incorporate this aspect into the aboveanalysis. For the direct welfare effect on households (that is, partial equi-
Annex 1: Theoretical Approach to Evaluating the Social Welfare Impact of Price Reforms
297
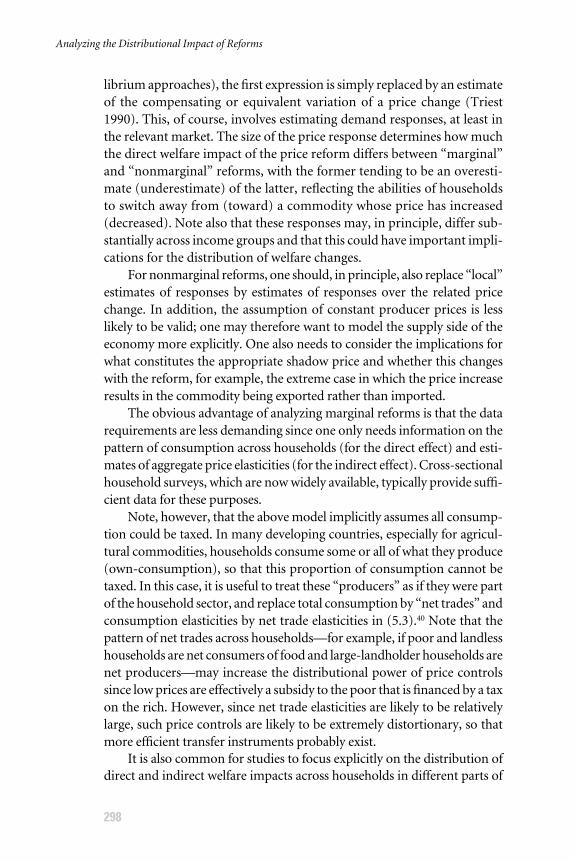
librium approaches), the first expression is simply replaced by an estimateof the compensating or equivalent variation of a price change (Triest1990). This, of course, involves estimating demand responses, at least inthe relevant market. The size of the price response determines how muchthe direct welfare impact of the price reform differs between “marginal”and “nonmarginal” reforms, with the former tending to be an overesti-mate (underestimate) of the latter, reflecting the abilities of householdsto switch away from (toward) a commodity whose price has increased(decreased). Note also that these responses may, in principle, differ sub-stantially across income groups and that this could have important impli-cations for the distribution of welfare changes.
For nonmarginal reforms, one should, in principle, also replace “local”estimates of responses by estimates of responses over the related pricechange. In addition, the assumption of constant producer prices is lesslikely to be valid; one may therefore want to model the supply side of theeconomy more explicitly. One also needs to consider the implications forwhat constitutes the appropriate shadow price and whether this changeswith the reform, for example, the extreme case in which the price increaseresults in the commodity being exported rather than imported.
The obvious advantage of analyzing marginal reforms is that the datarequirements are less demanding since one only needs information on thepattern of consumption across households (for the direct effect) and esti-mates of aggregate price elasticities (for the indirect effect). Cross-sectionalhousehold surveys, which are now widely available, typically provide suffi-cient data for these purposes.
Note, however, that the above model implicitly assumes all consump-tion could be taxed. In many developing countries, especially for agricul-tural commodities, households consume some or all of what they produce(own-consumption), so that this proportion of consumption cannot betaxed. In this case, it is useful to treat these “producers” as if they were partof the household sector, and replace total consumption by “net trades” andconsumption elasticities by net trade elasticities in (5.3).40 Note that thepattern of net trades across households—for example, if poor and landlesshouseholds are net consumers of food and large-landholder households arenet producers—may increase the distributional power of price controlssince low prices are effectively a subsidy to the poor that is financed by a taxon the rich. However, since net trade elasticities are likely to be relativelylarge, such price controls are likely to be extremely distortionary, so thatmore efficient transfer instruments probably exist.
It is also common for studies to focus explicitly on the distribution ofdirect and indirect welfare impacts across households in different parts of
Analyzing the Distributional Impact of Reforms
298
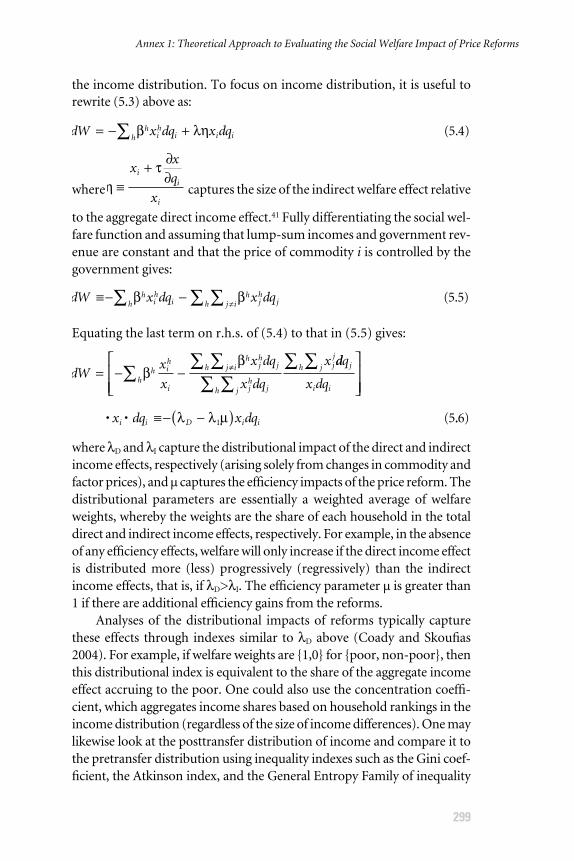
the income distribution. To focus on income distribution, it is useful torewrite (5.3) above as:
where captures the size of the indirect welfare effect relative
to the aggregate direct income effect.41 Fully differentiating the social wel-fare function and assuming that lump-sum incomes and government rev-enue are constant and that the price of commodity i is controlled by thegovernment gives:
Equating the last term on r.h.s. of (5.4) to that in (5.5) gives:
where λD and λI capture the distributional impact of the direct and indirectincome effects, respectively (arising solely from changes in commodity andfactor prices), and µ captures the efficiency impacts of the price reform. Thedistributional parameters are essentially a weighted average of welfareweights, whereby the weights are the share of each household in the totaldirect and indirect income effects, respectively. For example, in the absenceof any efficiency effects, welfare will only increase if the direct income effectis distributed more (less) progressively (regressively) than the indirectincome effects, that is, if λD>λI. The efficiency parameter µ is greater than1 if there are additional efficiency gains from the reforms.
Analyses of the distributional impacts of reforms typically capturethese effects through indexes similar to λD above (Coady and Skoufias2004). For example, if welfare weights are {1,0} for {poor, non-poor}, thenthis distributional index is equivalent to the share of the aggregate incomeeffect accruing to the poor. One could also use the concentration coeffi-cient, which aggregates income shares based on household rankings in theincome distribution (regardless of the size of income differences). One maylikewise look at the posttransfer distribution of income and compare it tothe pretransfer distribution using inequality indexes such as the Gini coef-ficient, the Atkinson index, and the General Entropy Family of inequality
dWx
x
x dq
x dq
xh i
h
i
hjh
jj ih
jh
jh j
jj
jh= − − ≠∑∑∑∑
∑∑β
β ddq
x dq
x dq x dq
j
i ih
i i D i i
∑
≡− −( )• • λ λ µ1 5( .. )6
dW x dq x dqhih
h ih
jh
j ih j≡− −∑ ∑∑ ≠β β ( . )5 5
ητ
≡+ ∂
∂x
x
q
x
ii
i
dW x dq x dqhih
h i i i= − +∑ β λη ( . )5 4
Annex 1: Theoretical Approach to Evaluating the Social Welfare Impact of Price Reforms
299
indexes. Since these indexes either explicitly or implicitly assume someunderlying welfare weights, it is therefore important to undertake sensi-tivity analyses. Alternatively, one could simply present numbers on theshares accruing to households in the various income deciles or plot therelated concentration curves.
One may wish to focus on the size of the income effects (and notmerely the distribution) to understand the proportionate change in house-hold incomes and the resulting effects on income poverty and to inform apolicy discussion on the design of appropriate compensating policy mea-sures. One may also wish to understand the distributional effects acrosssocioeconomic groupings (for example, by region or ethnic group) tounderstand the implications for horizontal (as opposed to vertical) equityor for political economy.
Analyzing the Distributional Impact of Reforms
300
Alternative Price-Shifting Models
301
In general, tax and price reforms will involve changes in the prices of inter-mediate goods. The extent to which these price changes are passed forwardonto output prices or backward onto factor prices will depend on, forexample, the structure of the economy (how substitutable different com-modities are with internationally traded goods) and the degree of controlthe government has over prices in general. To the extent that taxes arepushed forward onto output prices, the actual tax content of the final equi-librium price, that is, the “effective tax” (te), will exceed the nominal orstatutory tax on the sector (t). Obviously, subsidies on intermediate goodsmay mean that te<t.
In addition, in practice, existing tax systems in developing countriesinclude a range of different tax components (such as excise taxes, tradetaxes, and VAT), and some sectors fall outside the tax sector (for instance,agriculture, the informal sector, and sectors “exempt” from VAT). It istherefore important, in modeling the price effects of tax reforms, to cap-ture these important features of the tax system, which can be expected tohave significant implications for the equity and efficiency effects of taxreforms.
In this annex, a simple price-shifting model is set out that can be usedto capture these different features of a tax system and that simply requiresthe use of the available data on the input-output structure of the economy.The model allows for different degrees of tradedness within each aggregatesector of the input-output table. Note that, to the extent that price changesare not pushed forward onto output prices, the changes must be pushedbackward onto factor prices. The model presented does not follow throughthe implications of these factor-price changes or the changes in output
2A N N E X
prices. The model is very similar in spirit to that presented in Hughes(1986) and also has much in common with the effective tax model ofAhmad and Stern (1984, 1991).42 Once price changes have been calculated,one can apply these to household-level consumption data (as discussed inthe main chapter) to evaluate the household real-income effect of the equi-librium output-price changes.
A PRICE-SHIFTING MODEL FOR ENERGY TAXATION
The implications of the higher costs for output or factor prices will, ofcourse, depend on the structure of the economy (for example, whether com-modities are traded internationally or nontraded), the nature of commod-ity taxes, and the extent to which prices are controlled by the government.Commodities are therefore first grouped into three broad classifications,reflecting the assumed relationships between higher production costs andoutput prices:
� Cost-push sectors: These are sectors in which higher input costs arepushed fully onto output prices. One can therefore (loosely) think ofthese as nontraded commodities.
� Traded sectors: These are sectors that compete with internationallytraded goods and for which the output prices are determined by worldprices and the import or export tax regime. Therefore, higher inputcosts are not pushed forward onto output prices; the brunt of thesehigher costs is thus borne through lower factor prices or lower profits.
� Controlled sectors: These are sectors in which output prices are con-trolled by the government. Therefore, the relationship between out-put prices and production costs depends on whether and how thegovernment adjusts the controlled prices. If the controlled prices arenot adjusted, then the burden of the higher costs will be borne by fac-tor prices, profits, or government revenue.
In modeling price changes, it is useful to think of “aggregate” com-modity categories (for example, the aggregate categories available from aninput-output table) as made up of a certain proportion of cost-push,traded, and controlled commodities; these proportions can be given by α,β, and γ, respectively. These proportions should obviously sum to unityand never be negative, that is:
0 1
1
≤ ( ) ≤
+ + =
α β γ
α β γ
, ,
Analyzing the Distributional Impact of Reforms
302
Alternatively, one could interpret these proportions as capturing thedegree of tradedness of a single commodity.
The technology of domestic firms is captured by a standard input-output coefficient matrix, A, with the typical aij denoting the cost ofinput i in producing one unit of output j; one might think of units ofoutput defined such that they have a user price of unity, so that pricechanges can be interpreted as percentage changes. Consistent with theinterpretation that A captures an underlying Leontief (that is, fixed-coefficient) production technology, one can interpret aij’s as the changein the cost of producing a unit of j caused by a unit change in the priceof input i.
For traded sectors, user prices, q*, are determined by world prices,pw, and by trade taxes (including tariffs and sales taxes), t*:
and q* = p* − t*, since taxes on domestic production alone (as opposedto international trade) do not affect user prices, but are, instead, pushedbackward onto lower producer prices and, in turn, lower factor paymentsand profits. In this sense, foreign goods are deemed to be perfectly com-petitive with domestically produced traded goods. Changes in the userprices for traded sectors are then given by:
and both terms on the r.h.s. will be specified exogenously by the reformpackage under consideration.
For controlled sectors, producer prices are determined by pricingcontrols (say, p), and one can think of domestic taxes as zero for conve-nience, so that:
Alternatively, one could think of the difference between user prices andaverage unit production costs as an implicit tax, with the revenue accruingto the public sector enterprise and thus entering government revenuethrough the quasi-fiscal side of the budget. The formula for price changesis then given simply as:
where the r.h.s. is specified exogenously in the reform package.
∆ ∆� �q p= ′( . )5 8
� �q p= ( . )5 8
∆ ∆ ∆q p tw* * ( . )= + ′5 7
q p tw* * ( . )= + 5 7
Annex 2: Alternative Price-Shifting Models
303
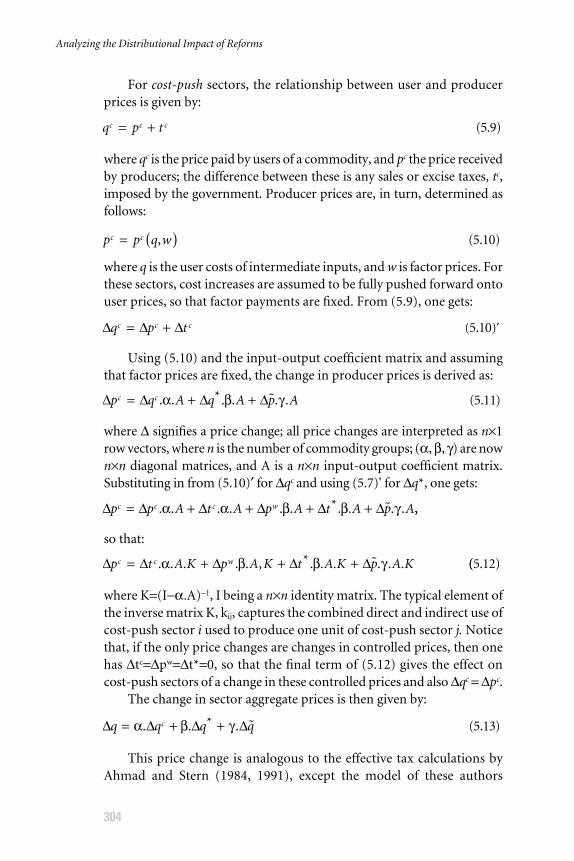
For cost-push sectors, the relationship between user and producerprices is given by:
where qc is the price paid by users of a commodity, and pc the price receivedby producers; the difference between these is any sales or excise taxes, tc,imposed by the government. Producer prices are, in turn, determined asfollows:
where q is the user costs of intermediate inputs, and w is factor prices. Forthese sectors, cost increases are assumed to be fully pushed forward ontouser prices, so that factor payments are fixed. From (5.9), one gets:
Using (5.10) and the input-output coefficient matrix and assumingthat factor prices are fixed, the change in producer prices is derived as:
where ∆ signifies a price change; all price changes are interpreted as n×1row vectors, where n is the number of commodity groups; (α, β, γ) are nown×n diagonal matrices, and A is a n×n input-output coefficient matrix.Substituting in from (5.10)′ for ∆qc and using (5.7)' for ∆q*, one gets:
so that:
where K=(I−α.A)−1, I being a n×n identity matrix. The typical element ofthe inverse matrix K, kij, captures the combined direct and indirect use ofcost-push sector i used to produce one unit of cost-push sector j. Noticethat, if the only price changes are changes in controlled prices, then onehas ∆tc=∆pw=∆t*=0, so that the final term of (5.12) gives the effect oncost-push sectors of a change in these controlled prices and also ∆qc = ∆pc.
The change in sector aggregate prices is then given by:
This price change is analogous to the effective tax calculations byAhmad and Stern (1984, 1991), except the model of these authors
∆ ∆ ∆ ∆q q q qc= + +α β γ. . * . ( . )� 5 13
∆ ∆ ∆ ∆ ∆p t A K p A K t A K p A Kc c w= + + +. . . . . , *. . . . . .α β β γ� (( . )5 12
∆ ∆ ∆ ∆ ∆ ∆p p A t A p A t A p Ac c c w= + + + +. . . . . . *. . . .α α β β γ� ,,
∆ ∆ ∆ ∆p q A q A p Ac c= + +. . *. . . . ( . )α β γ� 5 11
∆ ∆ ∆q p tc c c= + ′( . )5 10
p p q wc c= ( ), ( . )5 10
q p tc c c= + ( . )5 9
Analyzing the Distributional Impact of Reforms
304
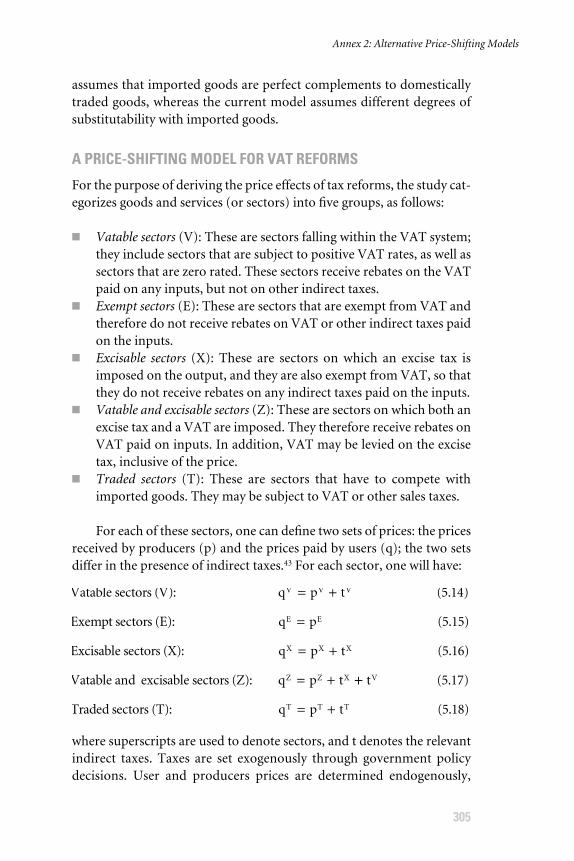
assumes that imported goods are perfect complements to domesticallytraded goods, whereas the current model assumes different degrees ofsubstitutability with imported goods.
A PRICE-SHIFTING MODEL FOR VAT REFORMS
For the purpose of deriving the price effects of tax reforms, the study cat-egorizes goods and services (or sectors) into five groups, as follows:
� Vatable sectors (V): These are sectors falling within the VAT system;they include sectors that are subject to positive VAT rates, as well assectors that are zero rated. These sectors receive rebates on the VATpaid on any inputs, but not on other indirect taxes.
� Exempt sectors (E): These are sectors that are exempt from VAT andtherefore do not receive rebates on VAT or other indirect taxes paidon the inputs.
� Excisable sectors (X): These are sectors on which an excise tax isimposed on the output, and they are also exempt from VAT, so thatthey do not receive rebates on any indirect taxes paid on the inputs.
� Vatable and excisable sectors (Z): These are sectors on which both anexcise tax and a VAT are imposed. They therefore receive rebates onVAT paid on inputs. In addition, VAT may be levied on the excisetax, inclusive of the price.
� Traded sectors (T): These are sectors that have to compete withimported goods. They may be subject to VAT or other sales taxes.
For each of these sectors, one can define two sets of prices: the pricesreceived by producers (p) and the prices paid by users (q); the two setsdiffer in the presence of indirect taxes.43 For each sector, one will have:
where superscripts are used to denote sectors, and t denotes the relevantindirect taxes. Taxes are set exogenously through government policydecisions. User and producers prices are determined endogenously,
Traded sectors (T): q p tT T T= + ( . )5 18
Vatable and excisable sectors (Z): q p tZ Z X= + ++ tV ( . )5 17
Excisable sectors (X): q p tX X X= + ( . )5 16
Exempt sectors (E): q pE E= ( . )5 15
Vatable sectors (V): q p tV V V= + ( . )5 14
Annex 2: Alternative Price-Shifting Models
305
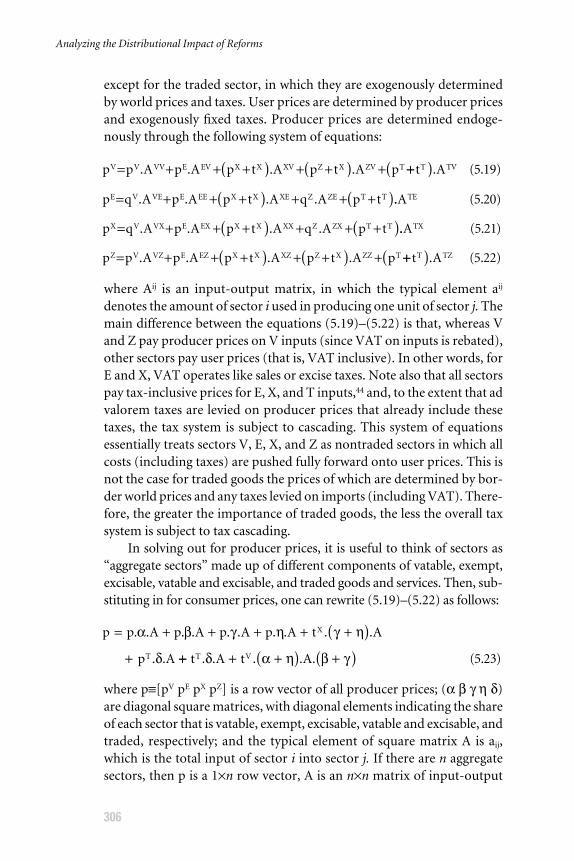
except for the traded sector, in which they are exogenously determinedby world prices and taxes. User prices are determined by producer pricesand exogenously fixed taxes. Producer prices are determined endoge-nously through the following system of equations:
where Aij is an input-output matrix, in which the typical element aij
denotes the amount of sector i used in producing one unit of sector j. Themain difference between the equations (5.19)–(5.22) is that, whereas Vand Z pay producer prices on V inputs (since VAT on inputs is rebated),other sectors pay user prices (that is, VAT inclusive). In other words, forE and X, VAT operates like sales or excise taxes. Note also that all sectorspay tax-inclusive prices for E, X, and T inputs,44 and, to the extent that advalorem taxes are levied on producer prices that already include thesetaxes, the tax system is subject to cascading. This system of equationsessentially treats sectors V, E, X, and Z as nontraded sectors in which allcosts (including taxes) are pushed fully forward onto user prices. This isnot the case for traded goods the prices of which are determined by bor-der world prices and any taxes levied on imports (including VAT). There-fore, the greater the importance of traded goods, the less the overall taxsystem is subject to tax cascading.
In solving out for producer prices, it is useful to think of sectors as“aggregate sectors” made up of different components of vatable, exempt,excisable, vatable and excisable, and traded goods and services. Then, sub-stituting in for consumer prices, one can rewrite (5.19)–(5.22) as follows:
where p≡[pV pE pX pZ] is a row vector of all producer prices; (α β γ η δ)are diagonal square matrices, with diagonal elements indicating the shareof each sector that is vatable, exempt, excisable, vatable and excisable, andtraded, respectively; and the typical element of square matrix A is aij,which is the total input of sector i into sector j. If there are n aggregatesectors, then p is a 1×n row vector, A is an n×n matrix of input-output
p p A p A p A p A t A
p A
X
T
= + + + + +( )+
. . . . . . . . . .
. .
α β γ η γ η
δ ++ + +( ) +( )t A t AT V. . . . . ( . )δ α η β γ 5 23
p p A p A p t A p t A pZ V VZ E EZ X X XZ Z X ZZ T= + + +( ) + +( ) +. . . . ++( )t AT TZ. ( . )5 22
p q A p A p t A q A p tX V VX E EX X X XX Z ZX T T= + + +( ) + + +( ). . . . .. ( . )ATX 5 21
p q A p A p t A q A p tE V VE E EE X X XE Z ZE T T= + + +( ) + + +( ). . . . .. ( . )ATE 5 20
p p A p A p t A p t A pV V VV E EV X X XV Z X ZV T= + + +( ) + +( ) +. . . . ++( )t AT TV. ( . )5 19
Analyzing the Distributional Impact of Reforms
306
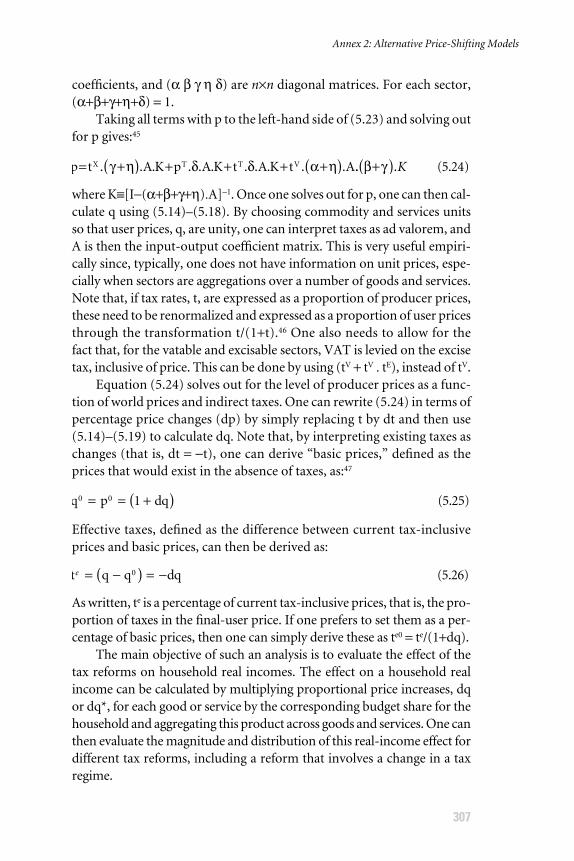
coefficients, and (α β γ η δ) are n×n diagonal matrices. For each sector,(α+β+γ+η+δ) = 1.
Taking all terms with p to the left-hand side of (5.23) and solving outfor p gives:45
where K≡[I−(α+β+γ+η).A]−1. Once one solves out for p, one can then cal-culate q using (5.14)–(5.18). By choosing commodity and services unitsso that user prices, q, are unity, one can interpret taxes as ad valorem, andA is then the input-output coefficient matrix. This is very useful empiri-cally since, typically, one does not have information on unit prices, espe-cially when sectors are aggregations over a number of goods and services.Note that, if tax rates, t, are expressed as a proportion of producer prices,these need to be renormalized and expressed as a proportion of user pricesthrough the transformation t/(1+t).46 One also needs to allow for thefact that, for the vatable and excisable sectors, VAT is levied on the excisetax, inclusive of price. This can be done by using (tV + tV . tE), instead of tV.
Equation (5.24) solves out for the level of producer prices as a func-tion of world prices and indirect taxes. One can rewrite (5.24) in terms ofpercentage price changes (dp) by simply replacing t by dt and then use(5.14)–(5.19) to calculate dq. Note that, by interpreting existing taxes aschanges (that is, dt = −t), one can derive “basic prices,” defined as theprices that would exist in the absence of taxes, as:47
Effective taxes, defined as the difference between current tax-inclusiveprices and basic prices, can then be derived as:
As written, te is a percentage of current tax-inclusive prices, that is, the pro-portion of taxes in the final-user price. If one prefers to set them as a per-centage of basic prices, then one can simply derive these as te0 = te/(1+dq).
The main objective of such an analysis is to evaluate the effect of thetax reforms on household real incomes. The effect on a household realincome can be calculated by multiplying proportional price increases, dqor dq*, for each good or service by the corresponding budget share for thehousehold and aggregating this product across goods and services. One canthen evaluate the magnitude and distribution of this real-income effect fordifferent tax reforms, including a reform that involves a change in a taxregime.
t q q dqe = −( ) = −0 5 26( . )
q p dq0 0 1 5 25= = +( ) ( . )
p t A.K p A.K t A.K t AX T T V= +( ) + + + +( ). . . . . . . .γ η δ δ α η .. . ( . )β γ+( ) K 5 24
Annex 2: Alternative Price-Shifting Models
307
General Lessons from Tax Theory
308
This annex briefly identifies key insights provided by the theoretical litera-ture addressing the issue of how to design or reform a structure of com-modity taxes. One can find three potential roles for commodity taxation inthe literature:48 (1) raising revenue to finance government activities whenlump-sum taxation is not available to the government; (2) reallocatingresources to bring about more efficient allocation, for example, Pigouviantaxes; and (3) redistributing income when lump-sum taxes and transfersare not available to the government. The evolution of the theoretical litera-ture will be very briefly discussed below in terms of the extension of taxrules to incorporate each of these roles. One will also distinguish betweenthe “theory of optimum taxation” and the “theory of tax reform,” wherethe former focuses on what a system of optimum taxes would look like,while the latter focuses on the identification of welfare-improving reforms.There is obviously an intimate link between these two strands of the litera-ture since an optimum tax system is one in which no welfare-improvingreforms are possible.
OPTIMUM COMMODITY TAXATION
One of the earliest contributions to the formal literature on the structureof optimum commodity taxes was Ramsey (1927). The paper examinedthe optimum structure of commodity taxes when the government had afixed revenue requirement that could not be financed through lump-sumtaxation. The main insight from the paper is captured by the so-calledRamsey Inverse-Elasticity Rule, which indicates that taxes should behigher on commodities with low price elasticities of demand. The basic
3 A N N E X
intuition behind this result is straightforward: optimum taxes requirethat the reduction in (compensated) demand be the same for all com-modities, and this means that tax rates must be relatively high on com-modities with relatively low price elasticities.
The seminal papers in the area of optimum commodity taxationare Diamond and Mirrlees (1971a, 1971b), which also focused on therevenue-raising role of commodity taxes. These papers developed thebasic analytical framework used in the modern optimum commodity-taxliterature. A key contribution of this work was the identification of theconditions under which “production efficiency” was desirable, implyingthat the taxation of intermediate goods was undesirable. In particular,intermediate-goods taxation is only potentially desirable when somefinal-consumption goods cannot be optimally taxed (for example,because of the presence of consumption from own-production in ruralareas or the existence of an untaxable informal sector), but can be taxedindirectly via taxes on inputs. Similarly, input taxes may be desirable as away of taxing economic profits if these cannot be taxed directly via anoptimum profits tax. If all consumption by households can be taxed, andan optimal profits tax exists, then all revenue should be raised via taxeson final consumption (such as a VAT) without distinguishing amongcommodities according to whether they are traded or nontraded. Thisalso implies that trade taxes are not desirable.
Diamond (1975) extended the above model to allow for the re-distributive role of commodity taxes. The paper showed that, relative tothe efficient tax structure identified above, taxes should be lower on com-modities that are relatively more important in the budgets of low-incomehouseholds. Since these commodities (necessities, for instance) are oftenthose with relatively low price elasticities, this suggests the existence of atrade-off between equity and efficiency when setting taxes, that is, reduc-ing the burden of taxation on lower-income households is likely to comeat the cost of a higher aggregate burden.
Drèze and Stern (1987), building on an earlier model by Guesnerie(1979), developed a fairly general model that captures a wide range of sec-ond-best worlds and incorporates a resource reallocation role for com-modity taxes, in addition to the revenue-raising and redistributionalroles. They derived a “Generalized Ramsey Rule,” which showed that theprevious rules go through as before, but now actual taxes are replaced by“shadow taxes,” defined as the difference between consumer prices andshadow prices. This rule incorporates, for example, the standard Pigou-vian argument for commodity taxation, as well as other second-bestdepartures from the standard Ramsey Rule.
Annex 3: General Lessons from Tax Theory
309
REFORM OF COMMODITY TAXES
The earliest work in the area of tax reform was undertaken in the contextof trade taxation, whereby revenue requirements were not considered, andoptimal lump-sum taxes and transfers were implicitly assumed to be avail-able to the government to raise and redistribute revenue. Therefore, thisliterature was primarily concerned with efficient resource reallocation.Dixit (1975, 1985), which played an important role in integrating a sepa-rate body of theory on trade taxation into the standard analytical approachused in public finance theory, examined the conditions under which“radial reforms” (an equi-proportionate reduction of commodity taxes)and “concertina reforms” (reducing only the highest taxes) are welfareimproving. Such reforms are obviously less interesting in the context of agovernment-revenue requirement.
Ahmad and Stern (1984) introduced the general theory of tax reformin the context of a government-revenue requirement and a redistributiverole for commodity taxes. This was extended by Drèze and Stern (1987)to incorporate a resource-allocation role. Their approach involved iden-tifying the marginal social cost of raising a unit of revenue using alterna-tive commodity taxes, while keeping all other taxes fixed. Revenue-neutraland welfare-improving tax reforms can then be identified by decreasingthe tax rates on commodities with high marginal social cost and replacingthe lost revenue by raising taxes on commodities with low marginal socialcost. While this approach helps to identify potentially welfare-improvingand revenue-neutral reform strategies, the focus on single tax rates andkeeping all other rates fixed introduces limitations on this approach froma policy perspective.
Another, related strand of the tax-reform literature identifies theconditions under which specific (and commonly discussed) tax-reform“packages” are welfare improving. A corollary of the Diamond-Mirrleesproduction efficiency theorem is simply that replacing trade taxes withoptimal commodity taxes and keeping revenue constant will always bewelfare improving under the conditions discussed above (that is, that allconsumption can be taxed, and production exhibits constant returns toscale or, if not, that optimal profit taxes are available to the govern-ment).49 Keen and Ligthart (2002) examine the conditions under whichreplacing any trade taxes with consumption-tax reforms that keep con-sumer prices constant and increase production efficiency are unambigu-ously welfare improving (that is, improve production efficiency, increaserevenue, and keep household welfare unchanged). A corollary of this isthat eliminating all tariffs and adjusting domestic consumption taxes to
Analyzing the Distributional Impact of Reforms
310
keep consumer prices unchanged will unambiguously increase bothhousehold welfare and government revenue. Note that the Diamond-Mirrlees result keeps revenue unchanged and requires optimal com-modity taxes.
A key assumption in the above literature is that all the consumptionbase can be taxed. However, this is an implausible assumption for devel-oping countries where many agricultural households consume out of theirown food production and the informal sector (including small-scale ruraland urban enterprises) is a substantial proportion of the economy. Animportant finding in Diamond and Mirrlees (1971a, 1971b) is that, if thetotal consumption of a given commodity cannot be taxed, then produc-tion efficiency is only desirable among the fully taxed sectors. The infor-mal sector can then be incorporated as part of the household sector, withproduction inputs treated the same as any household purchases. In addi-tion, the efficiency implications of taxation will then depend on net tradeelasticities (Newbery and Stern 1987). Note that, under these conditions,there is no presumption that the taxation of inputs is undesirable, andsuch taxes may be a desirable way of taxing the informal sector indirectly(Heady and Mitra 1982; Newbery 1986; Stiglitz and Dasgupta 1971). Thisis essentially the issue addressed in Emran and Stiglitz (2005), who showthat, in the presence of an informal sector not subject to VAT, replacingtrade taxes with revenue-neutral VAT reforms is not necessarily welfareimproving.
TAX REFORM AND REDISTRIBUTION
A key assumption in all of the above literature is that the government hasaccess to optimal lump-sum transfers. Once one introduces a distributionalrole for indirect taxes, for example, because direct transfer systems areunavailable or ineffective, then one can say very little regarding the welfareimpacts of the tax-reform packages conventionally discussed in the litera-ture (Coady and Drèze 2002).50 These welfare impacts will depend on thespecific patterns of production and consumption found in a country, par-ticularly the patterns across income groups, as well as the range of policyinstruments available for redistributing income (for example, see Deatonand Stern 1986). However, a common finding in the empirical literature isthat using indirect taxes (including price controls) is a very ineffectiveinstrument for protecting poor households from the adverse effects of tax-ation (for example, reflecting the fact that these households account for asmall proportion of the consumption base of most commodities), or, whenthey are distributionally attractive, they come at very high efficiency costs
Annex 3: General Lessons from Tax Theory
311

(Coady 1997a). One therefore expects substantial gains from developingeffective direct transfer programs, that is, the gains from having more well-targeted transfers, plus those from not having them incur the standardtrade-off between equity and efficiency when using taxes to redistributeincome (Coady and Harris 2004).
Analyzing the Distributional Impact of Reforms
312
Decentralization Reforms
Kai Kaiser
313
6
Three levels of analysis are outlined in this chapter that offer a potentiallytractable means of mapping out Poverty and Social Impact Analysis(PSIA) for decentralization given the institutional characteristics of
decentralization, the probable mechanisms of impact, and the likely avail-able sources of information. In the first instance, the level and distributionof public resources across places is a focus. At the second stage, the analy-sis concerns the distribution of public resources across people, such as thepoor and non-poor, given the prevailing institutional and governancearrangements within places. Finally, the chapter highlights attempts toinvestigate impacts on local governance and public service delivery, thatis, how effectively public resources are translated into public services.
OVERVIEW
The distributional impact of decentralization, notably on the poor, ulti-mately depends on the specific design and implementation in a givencountry context. The decentralization of public resources, officials, politi-cal power, and accountability affects both places and people. In theoryand practice, the changes in the benefit incidence of public expenditures,services, and local governance that are associated with decentralizationcan make a specific group or even the majority better or worse off in aggre-gate. Given the ambiguity in the potential impacts, the application of PSIA
Special thanks to Emanuela Galasso, Markus Goldstein, and Jennie Litvack for comments.All errors are due to the author.
is especially pertinent for the variety of forms of decentralization likely tobe encountered at the country level. Those pursuing distributional analy-ses of decentralization reforms will therefore have to determine an assess-ment methodology that identifies probable impact channels and tacklesthe typical data constraints confronted in quantitatively capturing effectson places and people at the subnational level.
There is an extensive theoretical literature on the potential advan-tages and disadvantages of decentralization. Decentralized decisionmak-ing can bring governments closer to the people; overcome informationasymmetries; enhance transparency and accountability; allow for a bet-ter matching of local preferences, especially when these are heteroge-neous across places; make for more responsive government throughinterjurisdictional competition for investment and the hearts and mindsof inhabitants and taxpayers by, for example, allowing for “voting withyour feet”; take into account local innovation; and increase the legitimacyof the state, while incorporating previously marginalized stakeholderssuch as the poor, women, ethnic groups, or castes.
Decentralization may also be associated with significant risks. Localentities may underprovide particular services, immunizations, for exam-ple, because of the presence of externalities. Disparities in local revenuecapacity may constrain public services, especially in poorer areas. Localcapacity constraints may deteriorate the provision of public goods in needyareas; a lack of clarity concerning the roles and responsibilities of centraland subnational entities may do likewise. Weak bottom-up accountabilityand political economy factors such as elite capture may marginalize par-ticular stakeholders and make local expenditure decisions less pro-poor(see, for instance, Bardhan 2000, Bardhan and Mookherjee 2002).
The impact of decentralization on poverty may be direct by flowingfrom the targeting of fiscal transfers and expenditure disparities, forinstance, or indirect, such as the impacts that decentralization may haveon the quality of public services or economic growth (von Braun andGrote 2000). Despite the expanding literature assessing the general linksbetween decentralization and poverty reduction (Bossuyt and Gould2000), the overall results are mixed and inconclusive (Jütting, Corsi, andStockmayer 2005; Jütting et al. 2004).1
Table 6.1 speculates on a number of benefits and risks of decentrali-zation, grouping these by potential time horizons, for example, withinthree to five years or beyond. The actual importance and direction ofthese considerations will depend on the country context, design, moti-vations, and phasing in of the decentralization. Given the significant lagswith which some of these potential developments are associated, this
Analyzing the Distributional Impact of Reforms
314
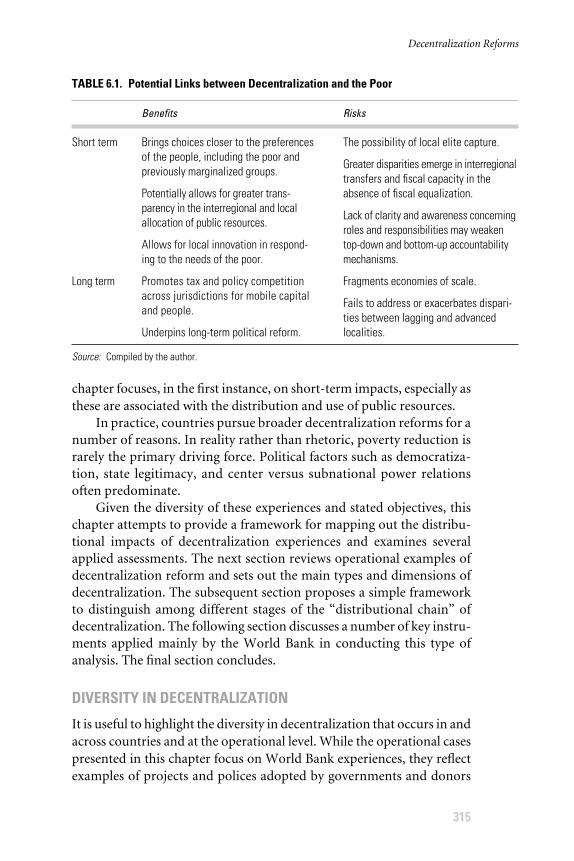
chapter focuses, in the first instance, on short-term impacts, especially asthese are associated with the distribution and use of public resources.
In practice, countries pursue broader decentralization reforms for anumber of reasons. In reality rather than rhetoric, poverty reduction israrely the primary driving force. Political factors such as democratiza-tion, state legitimacy, and center versus subnational power relationsoften predominate.
Given the diversity of these experiences and stated objectives, thischapter attempts to provide a framework for mapping out the distribu-tional impacts of decentralization experiences and examines severalapplied assessments. The next section reviews operational examples ofdecentralization reform and sets out the main types and dimensions ofdecentralization. The subsequent section proposes a simple frameworkto distinguish among different stages of the “distributional chain” ofdecentralization. The following section discusses a number of key instru-ments applied mainly by the World Bank in conducting this type ofanalysis. The final section concludes.
DIVERSITY IN DECENTRALIZATION
It is useful to highlight the diversity in decentralization that occurs in andacross countries and at the operational level. While the operational casespresented in this chapter focus on World Bank experiences, they reflectexamples of projects and polices adopted by governments and donors
Decentralization Reforms
315
TABLE 6.1. Potential Links between Decentralization and the Poor
Benefits Risks
Short term
Long term
Source: Compiled by the author.
Brings choices closer to the preferencesof the people, including the poor andpreviously marginalized groups.
Potentially allows for greater trans-parency in the interregional and localallocation of public resources.
Allows for local innovation in respond-ing to the needs of the poor.
Promotes tax and policy competitionacross jurisdictions for mobile capitaland people.
Underpins long-term political reform.
The possibility of local elite capture.
Greater disparities emerge in interregionaltransfers and fiscal capacity in theabsence of fiscal equalization.
Lack of clarity and awareness concerningroles and responsibilities may weakentop-down and bottom-up accountabilitymechanisms.
Fragments economies of scale.
Fails to address or exacerbates dispari-ties between lagging and advancedlocalities.
across the world equally well. Clarifying the types, dimensions, and extentof decentralization evident in a given country and operational contextserves as a starting point for mapping the potential distributional channelsof proposed or ongoing reforms.
Decentralization: operational perspectives
Within World Bank operational experience, decentralization reformsare widespread, but diverse. Over one-quarter of development policyoperations—135 of 511 approved in fiscal years 1995–2005—listed atleast one condition with a decentralization theme. During that decade,task managers explicitly chose decentralization as a theme in almost 5 per-cent of cases of development policy lending and 9 percent of cases ofinvestment lending (or 249 of 2,927 projects in the latter case).2
Closer inspection of World Bank development policy conditionalityhighlights the range of reforms embraced under decentralization. In fiscalyear 2005, development policy conditionality was utilized in 18 countries.3
For the cases of Ghana and Mozambique, these focused on the adoption ofa general legal framework for decentralization. In Pakistan, conditions calledfor passing on additional fiscal space to provinces and local governments.Conditionality in Mozambique argues for the implementation of partici-patory planning programs in a specific number of districts. Measures in Peruwere designed to promote a more participatory, transparent, and resultsoriented decentralized monitoring and evaluation process. The first Sene-gal Poverty Reduction Support Credit called more specifically for resourceallocation mechanisms to decentralized units based on poverty, health needs,and performance. A sectoral focus in Timor-Leste saw decentralizationreforms centered on decentralized management at the school level. In con-trast, proposed reforms in Burkina Faso and Mali focused on deconcen-trated entities, that is, decentralized offices of the central government.
Investment lending relies on a variety of decentralized mechanisms tomeet project objectives focused on different institutional levels and sectors.In fiscal year 2005, these included large-scale examples of community-driven development such as Indonesia’s Subdistricts (Kecamatan) Develop-ment Program and an operation in Benin; district-level capacity-buildingand good governance promotion, for example, Tanzania and Indonesia’sGovernance Reform Initiative Programs; education projects such asthose in Afghanistan, Bangladesh, and Democratic Republic of Congo;or health, for instance, in India, Lesotho, Malawi, and Vietnam.
Decentralization projects frequently only intervene in a subset oflocalities. For example, Rwanda’s Decentralization and Community
Analyzing the Distributional Impact of Reforms
316
Development Program is directly engaged in about one-third of thecountry’s 106 districts with assistance for strengthened planning andimplementation.4 As is common in many countries, Rwanda’s decen-tralization framework was nonetheless implemented on a nationwidebasis. Project impact analysis would clearly not only be concerned withthe extent to which additional financial resources benefit the covereddistricts, for example, relative to the existing fiscal resources or relativepoverty rate of the localities in a national context. Another importantissue would be whether improved outcomes such as the greater incidenceof priority services for the poor are more evident over time in these local-ities relative to other, initially comparable districts.
The foregoing examples underscore the range of approaches requiredto assess this diverse set of reforms falling under the rubric of decentraliza-tion. In the first instance, the analysis must seek to specify the mechanismsthrough which decentralization might have distributional implications.Common examples include new interregional allocation criteria forresources, greater decentralized autonomy over front-line resource allo-cation and public investment or service delivery decisions, or changes inthe institutions or groups participating in decisions made at the locallevel, such as the mandated representation of women and previouslymarginalized groups, newly selected or elected bodies, or facility-leveldecisionmaking bodies such as parent-teacher associations.
Types of decentralization
At the heart of all decentralization reforms lies the extension of somedegree of autonomy for decisionmaking over public resources, staff,and regulations that was previously centralized. Table 6.2 presents threeprincipal types of decentralization: deconcentration, delegation, anddevolution (Litvack, Ahmad, and Bird 1998).5 Deconcentration entailsgranting increased responsibilities to decentralized agencies. These maybe decentralized agencies within a ministry, such as regional educationoffices, or territorial entities, such as provinces and provincial heads.Delegation entails the assignment of a particular function or program toa decentralized entity, for example, a poverty targeting program. Devolu-tion is often considered the most far-reaching form of decentralization inthat it assigns a degree of political autonomy and taxing powers to sub-national governments.
These types of decentralization also differ along fiscal, administra-tive, and political dimensions. The fiscal dimension encompasses thedegree to which revenue-raising and spending authority is decentralized.Administrative decentralization pertains to civil servants and may influ-
Decentralization Reforms
317
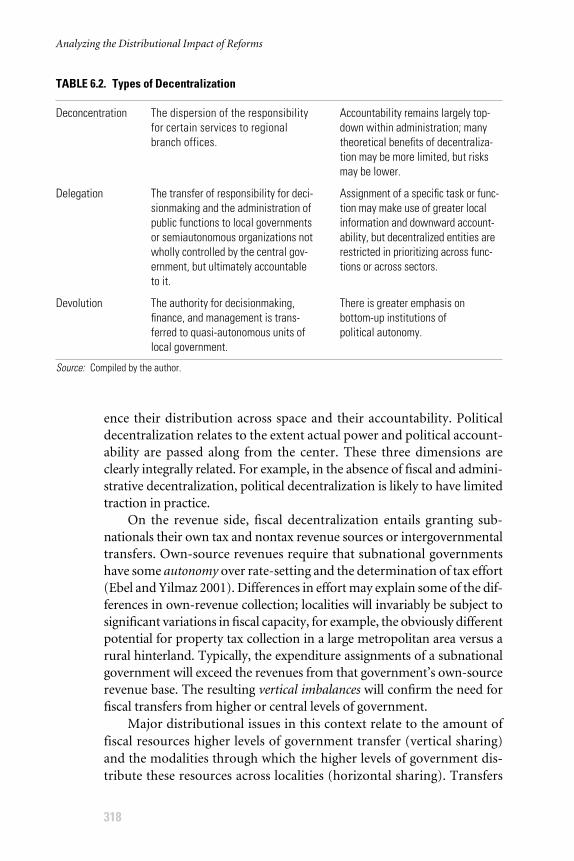
ence their distribution across space and their accountability. Politicaldecentralization relates to the extent actual power and political account-ability are passed along from the center. These three dimensions areclearly integrally related. For example, in the absence of fiscal and admini-strative decentralization, political decentralization is likely to have limitedtraction in practice.
On the revenue side, fiscal decentralization entails granting sub-nationals their own tax and nontax revenue sources or intergovernmentaltransfers. Own-source revenues require that subnational governmentshave some autonomy over rate-setting and the determination of tax effort(Ebel and Yilmaz 2001). Differences in effort may explain some of the dif-ferences in own-revenue collection; localities will invariably be subject tosignificant variations in fiscal capacity, for example, the obviously differentpotential for property tax collection in a large metropolitan area versus arural hinterland. Typically, the expenditure assignments of a subnationalgovernment will exceed the revenues from that government’s own-sourcerevenue base. The resulting vertical imbalances will confirm the need forfiscal transfers from higher or central levels of government.
Major distributional issues in this context relate to the amount offiscal resources higher levels of government transfer (vertical sharing)and the modalities through which the higher levels of government dis-tribute these resources across localities (horizontal sharing). Transfers
Analyzing the Distributional Impact of Reforms
318
TABLE 6.2. Types of Decentralization
Deconcentration
Delegation
Devolution
The dispersion of the responsibilityfor certain services to regionalbranch offices.
The transfer of responsibility for deci-sionmaking and the administration ofpublic functions to local governmentsor semiautonomous organizations notwholly controlled by the central gov-ernment, but ultimately accountableto it.
The authority for decisionmaking,finance, and management is trans-ferred to quasi-autonomous units oflocal government.
Accountability remains largely top-down within administration; manytheoretical benefits of decentraliza-tion may be more limited, but risksmay be lower.
Assignment of a specific task or func-tion may make use of greater localinformation and downward account-ability, but decentralized entities arerestricted in prioritizing across func-tions or across sectors.
There is greater emphasis on bottom-up institutions of political autonomy.
Source: Compiled by the author.
may be based on the origin of the resource collection, for example, sharednatural-resource revenues; they may be formula based; or they may bediscretionary and ad hoc. Impact analysis in this context needs to assesswhether needy areas receive more or fewer resources in absolute and rela-tive terms. While needy might be defined based on criteria such as povertyas measured by a poverty headcount ratio, need would ideally incorpo-rate some concept of the difference between expenditure needs and fiscalcapacity, or the capacity to raise revenues at similar effort levels given aparticular revenue base such as property. Subnational expenditure needswill, in turn, depend on prevailing expenditure assignments. For exam-ple, primary education is typically a prominent expenditure assignmentin many countries. The literature provides substantial guidance on theoptimal design of intergovernmental transfers (Bahl 1999; Bird and Smart2002), including the design of allocation formulas. At the operationallevel, the challenge typically lies in providing workable measures of fiscalcapacity and expenditure needs.
Administrative decentralization refers to arrangements concerningcivil servants (Evans 2004). Along with fiscal resources, this may impactthe spatial distribution of staff such as teachers and doctors and, hence,the access to staff by various groups, for example, urban or rural, remoteor nonremote groups. In practice, attracting good civil servants and teach-ers to poor and remote regions is often a challenge in developing coun-tries in any case (World Bank 2005b). The incentives provided may beaffected by decentralization. The accountability relationship involved inthe management of civil servants, for instance, the right by local govern-ments to hire and fire or the right of central agencies to reassign acrosslocalities, may also be important not only in determining the ultimatedistribution of civil servants, but also the effectiveness of the provision ofservices by civil servants.
Political decentralization involves the granting of decisionmakingautonomy to lower levels of government such as for resource allocationsacross sectoral priorities. This autonomy implies some form of localaccountability mechanism. Electoral institutions and local representa-tion are typically at the heart of the relevant decisionmaking processes.Beyond periodic voting, a range of other processes may be embraced,such as efforts to enhance citizen participation, including that of thepoor, in the local budgeting process (Blair 2000). Often, important ques-tions about the impact of decentralization will focus on how changes inpolitical decentralization have affected local accountability given the fis-cal and administrative decentralization arrangements, for example, byallowing a voice for a previously marginalized constituency.
Decentralization Reforms
319
While these various forms of decentralization often coexist in a singlecountry or even in a single sector, the distinctions entail important dif-ferences in the nature of decentralized decisionmaking and, by exten-sion, the distributional impacts. Devolution is often understood as themost pronounced form of decentralization. It entails some sort of locallyaccountable entity, generally an elected one; the emphasis is on a greaterdegree of autonomy and accountability at a more local level. Such enti-ties will be able to set priorities across a greater range of alternatives, forexample, sectoral preferences between infrastructure and social expendi-tures, while, at the margin, depending on taxes from their own con-stituencies. In contrast, deconcentration and delegation imply a greaterpredominance of top-down accountability and, potentially, a more lim-ited set of decentralized choices, such as delegation over a very narrowfunction. Devolution may guarantee (but not necessarily) greater scopefor realizing some of the broader gains from more full-fledged decen-tralization. At the same time, devolution may be subject to greater risksfrom factors such as local capture owing to less stringent forms of top-down accountability.
The nature of decentralization may also be subject to important dif-ferences within a country, including urban and rural differences. Federalcountries such as India manifest important differences in the degree ofdecentralization to local governments and communities across states.Asymmetric decentralization arrangements are important features insome countries, for example, Indonesia’s special autonomy provisionsfor the provinces of Aceh and Papua. Ladder approaches, whereby in-creased resourcing and autonomy are granted over time depending onthe demonstrated development of capacity, may also generate differencesin decentralization across localities. Examples include Cambodia’s earlyimplementation of the Seila Commune Decentralization Program. Whilethese types of asymmetrically phased decentralization approaches mayhave attractive features from the perspective of dealing with capacity dif-ferences across what are often very heterogeneous subnational entities,they may be difficult to sustain politically. Thus, in the context of politi-cal decentralization, it would be very difficult for a national governmentto withhold elections from some localities, but not others.
Extent of decentralization
International comparisons of decentralization have typically focused onthe extent to which fiscal resources are managed by subnational entities.The International Monetary Fund’s Government Finance Statistics pro-
Analyzing the Distributional Impact of Reforms
320
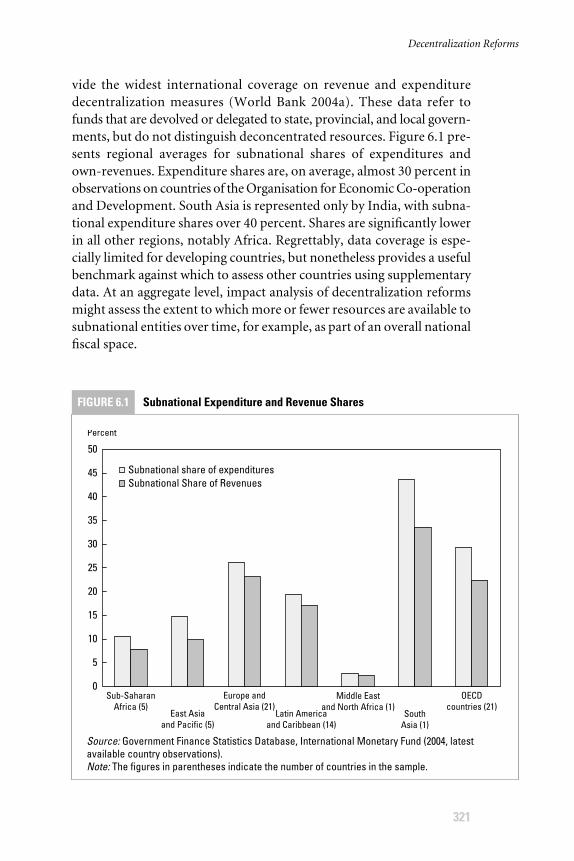
vide the widest international coverage on revenue and expendituredecentralization measures (World Bank 2004a). These data refer tofunds that are devolved or delegated to state, provincial, and local govern-ments, but do not distinguish deconcentrated resources. Figure 6.1 pre-sents regional averages for subnational shares of expenditures andown-revenues. Expenditure shares are, on average, almost 30 percent inobservations on countries of the Organisation for Economic Co-operationand Development. South Asia is represented only by India, with subna-tional expenditure shares over 40 percent. Shares are significantly lowerin all other regions, notably Africa. Regrettably, data coverage is espe-cially limited for developing countries, but nonetheless provides a usefulbenchmark against which to assess other countries using supplementarydata. At an aggregate level, impact analysis of decentralization reformsmight assess the extent to which more or fewer resources are available tosubnational entities over time, for example, as part of an overall nationalfiscal space.
Decentralization Reforms
321
FIGURE 6.1 Subnational Expenditure and Revenue Shares
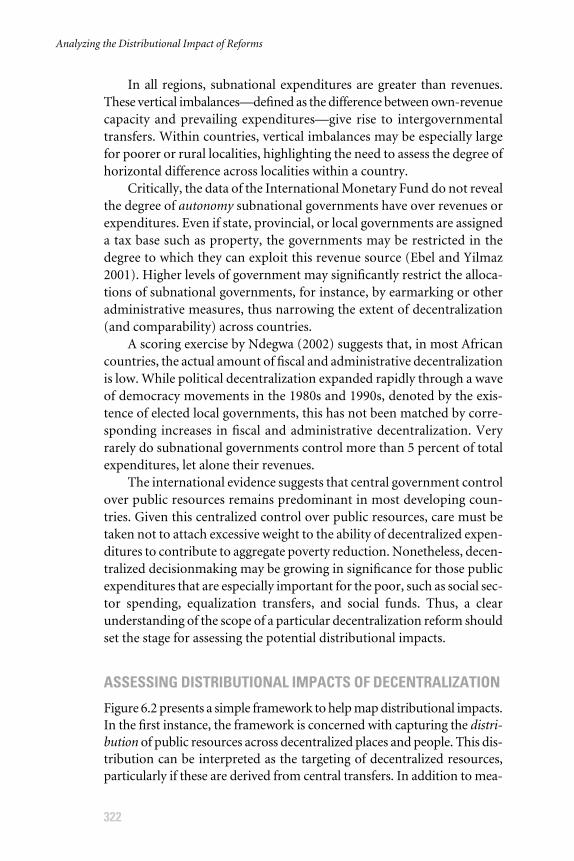
In all regions, subnational expenditures are greater than revenues.These vertical imbalances—defined as the difference between own-revenuecapacity and prevailing expenditures—give rise to intergovernmentaltransfers. Within countries, vertical imbalances may be especially largefor poorer or rural localities, highlighting the need to assess the degree ofhorizontal difference across localities within a country.
Critically, the data of the International Monetary Fund do not revealthe degree of autonomy subnational governments have over revenues orexpenditures. Even if state, provincial, or local governments are assigneda tax base such as property, the governments may be restricted in thedegree to which they can exploit this revenue source (Ebel and Yilmaz2001). Higher levels of government may significantly restrict the alloca-tions of subnational governments, for instance, by earmarking or otheradministrative measures, thus narrowing the extent of decentralization(and comparability) across countries.
A scoring exercise by Ndegwa (2002) suggests that, in most Africancountries, the actual amount of fiscal and administrative decentralizationis low. While political decentralization expanded rapidly through a waveof democracy movements in the 1980s and 1990s, denoted by the exis-tence of elected local governments, this has not been matched by corre-sponding increases in fiscal and administrative decentralization. Veryrarely do subnational governments control more than 5 percent of totalexpenditures, let alone their revenues.
The international evidence suggests that central government controlover public resources remains predominant in most developing coun-tries. Given this centralized control over public resources, care must betaken not to attach excessive weight to the ability of decentralized expen-ditures to contribute to aggregate poverty reduction. Nonetheless, decen-tralized decisionmaking may be growing in significance for those publicexpenditures that are especially important for the poor, such as social sec-tor spending, equalization transfers, and social funds. Thus, a clearunderstanding of the scope of a particular decentralization reform shouldset the stage for assessing the potential distributional impacts.
ASSESSING DISTRIBUTIONAL IMPACTS OF DECENTRALIZATION
Figure 6.2 presents a simple framework to help map distributional impacts.In the first instance, the framework is concerned with capturing the distri-bution of public resources across decentralized places and people. This dis-tribution can be interpreted as the targeting of decentralized resources,particularly if these are derived from central transfers. In addition to mea-
Analyzing the Distributional Impact of Reforms
322
suring the ultimate distributional patterns quantitatively at these levels,such an analysis typically seeks to understand the factors that appear to bedriving progressive or regressive distributions, for example, the identifica-tion of the characteristics of individual localities, including the use of prox-ies to gauge factors that would increase the likelihood of capture.
The fiscal analysis of people and places is primarily concerned withpublic resources as an input that may or may not translate into better ser-vice delivery. Another level of analysis involves trying to assess changes inthe quality of public services owing to decentralization. Do poor peopleget more of the services they want or need at a higher standard because ofthe decentralization reform such as in basic health or education servicedelivery? Better local governance can be seen as an intermediate input forservice delivery outcomes. Within given fiscal resources, are accountabil-ity arrangements so established that services are properly provided? How-ever, improvements in local governance may also themselves be a focus ofanalysis. Thus, decentralization may increase or decrease the sorts of cor-ruption that have a disproportionate impact on poor households or smallfirms. The empowerment effects of decentralization, such as those result-ing from the existence of reformed or new political institutions, may beespecially promising for the poor.
Distributional impacts across places
Decentralization reforms may alter the level and distribution of trans-fers from central or other higher levels of government. In the case ofdevolution, changes in the local own-source revenue base may also be
Decentralization Reforms
323
FIGURE 6.2 Levels of Fiscal-Distributional Impacts
important, especially if the fiscal capacity to raise resources differs signif-icantly across localities. For example, the assignment of a property taxwill have different implications for urban and for rural areas.6 In manydeveloping countries, donor flows to subnational governments may bequite substantial. These flows are often not captured by central transfersand may even be off budget. The distributional analysis of decentralizedresources may therefore be faced with serious obstacles to comprehen-siveness. In the case of Rwanda, for instance, differences in direct donorallocations across districts can dwarf the corresponding differences informal channels of allocation.
An important element in fiscal analysis across places is the focus onactual allocations to localities versus budgeted or notional allocations.The introduction of more transparent, formula-based criteria mayreduce the use of fiscal transfers for political patronage (see, for example,Diaz-Cayeros, Magaloni, and Weingast 2003 on the historical case ofMexico). Indonesia’s 2001 “big bang” decentralization affected the crite-ria by which intragovernmental fiscal transfers were allocated. While thereforms introduced a new formula, legacy allocations and existing civilservice salaries remained important driving forces behind the actual fis-cal distributions, leading to significant errors in targeting, depending onwhich benchmark formula one believes to be “ideal” (see Box 6.1).
Analyzing the Distributional Impact of Reforms
324
BOX 6.1 Assessing Fiscal Equalization: The Case of Indonesia
Starting in 2001, Indonesia devolved almost a third of public expenditure to subnational govern-ments, notably its 434 districts (kabupaten, kota) and, to a lesser degree, 32 provinces. Regionsdepend heavily on central government transfers to finance the gap between their limited own-source revenue base and prevailing expenditure levels. Transfers consist of a general-purposetransfer or general block grant (dana alokasi umum, DAU); natural-resource revenue sharing(sumber daya alam), for example, from oil and gas; property taxes; income; a special autonomygrant for the easternmost province of Papua; and a minor special-grant facility. Disparities inown-source revenues and revenue sharing mean that Indonesia’s districts enjoy significantly dif-ferent levels of fiscal resources on a per capita basis (Hofman et al. 2005; World Bank 2003a).
At the start of devolution in 2001, DAU allocations were made based largely on existingestablishment costs. These were estimated using the sum of the previous transfers for thedeconcentrated structures and staff that had been handed over to local governments, aswell as the prevailing capital transfers to local governments. Over time, policymakers envi-sioned moving more steadily toward a transparent, formula-based allocation system throughthe decentralization reforms. A new formula sought to distribute a national pool of DAUresources (now 26.5 percent of national resources) based on a fiscal-gap formula. Thisformula incorporates indicators of fiscal capacity and expenditure needs as measured by
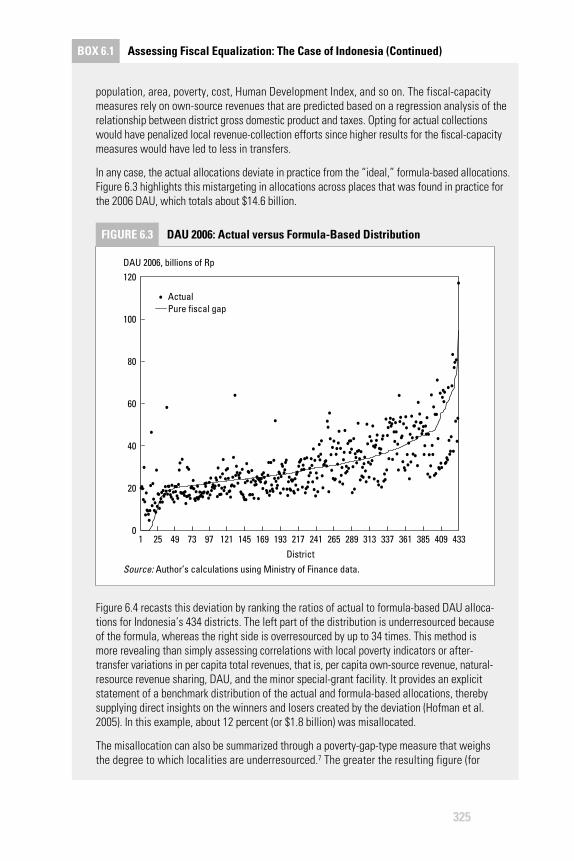
325
BOX 6.1 Assessing Fiscal Equalization: The Case of Indonesia (Continued)
FIGURE 6.3 DAU 2006: Actual versus Formula-Based Distribution
population, area, poverty, cost, Human Development Index, and so on. The fiscal-capacitymeasures rely on own-source revenues that are predicted based on a regression analysis of therelationship between district gross domestic product and taxes. Opting for actual collectionswould have penalized local revenue-collection efforts since higher results for the fiscal-capacitymeasures would have led to less in transfers.
In any case, the actual allocations deviate in practice from the “ideal,” formula-based allocations.Figure 6.3 highlights this mistargeting in allocations across places that was found in practice forthe 2006 DAU, which totals about $14.6 billion.
Figure 6.4 recasts this deviation by ranking the ratios of actual to formula-based DAU alloca-tions for Indonesia’s 434 districts. The left part of the distribution is underresourced becauseof the formula, whereas the right side is overresourced by up to 34 times. This method ismore revealing than simply assessing correlations with local poverty indicators or after-transfer variations in per capita total revenues, that is, per capita own-source revenue, natural-resource revenue sharing, DAU, and the minor special-grant facility. It provides an explicitstatement of a benchmark distribution of the actual and formula-based allocations, therebysupplying direct insights on the winners and losers created by the deviation (Hofman et al.2005). In this example, about 12 percent (or $1.8 billion) was misallocated.
The misallocation can also be summarized through a poverty-gap-type measure that weighsthe degree to which localities are underresourced.7 The greater the resulting figure (for
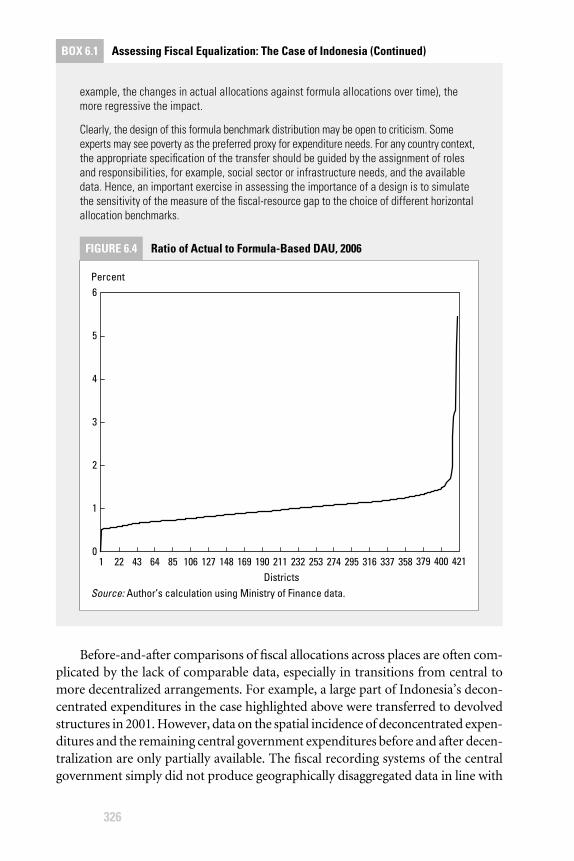
326
BOX 6.1 Assessing Fiscal Equalization: The Case of Indonesia (Continued)
FIGURE 6.4 Ratio of Actual to Formula-Based DAU, 2006
example, the changes in actual allocations against formula allocations over time), themore regressive the impact.
Clearly, the design of this formula benchmark distribution may be open to criticism. Someexperts may see poverty as the preferred proxy for expenditure needs. For any country context,the appropriate specification of the transfer should be guided by the assignment of rolesand responsibilities, for example, social sector or infrastructure needs, and the availabledata. Hence, an important exercise in assessing the importance of a design is to simulatethe sensitivity of the measure of the fiscal-resource gap to the choice of different horizontalallocation benchmarks.
Before-and-after comparisons of fiscal allocations across places are often com-plicated by the lack of comparable data, especially in transitions from central tomore decentralized arrangements. For example, a large part of Indonesia’s decon-centrated expenditures in the case highlighted above were transferred to devolvedstructures in 2001. However, data on the spatial incidence of deconcentrated expen-ditures and the remaining central government expenditures before and after decen-tralization are only partially available. The fiscal recording systems of the centralgovernment simply did not produce geographically disaggregated data in line with
the new subnational jurisdictions. From this perspective, one of the bene-fits of a decentralized system may be that it increases transparency con-cerning the spatial incidence of fiscal resources (assuming all subnationalgovernments provide reports for national-level comparisons).
A review of the evolution of intragovernmental fiscal systems for eightcountries in the process of accession to the European Union finds that mosthave moved to more transparent formula-based allocations. This representsan advance over the predominance of nontransparent and discretionaryallocations during the communist era. Beyond the apparent redistributionalaspects of intergovernmental transfers, it is important to bear in mind thepotential incentive effects for economic growth and revenue mobilization.While the European Union–8’s new allocations significantly reduce dispari-ties across localities relative to the extent to which revenues are collected inan area, the equalization may actually be excessive from the perspective ofeconomic efficiency (Dillinger 2005). Poor design in intragovernmental fis-cal transfers may also have very detrimental effects on own-source revenuemobilization. Thus, Russia’s system of ad hoc grants penalized regions thatraised more own-resources (Zhuravskaya 2000).
Understanding the amount of resources that actually arrives at thelocal level is an often neglected element of distributional analysis. Rwanda’scommon development fund provides, in principle, each of the country’s106 districts with an equal allocation for infrastructure projects such as inmarkets. The disbursement of these funds, however, relies on the prepara-tion of an adequate proposal and on progress in project implementation,including processes such as procurement. Data for 2004 suggest that actualdisbursements ranged from no disbursement to full disbursement againstthe basic allocation. This has raised concerns that poorer, lower-capacitydistricts may be experiencing regressive allocations.
There may be any number of reasons why allocated fiscal resourcesmay not actually arrive at the decentralized level. Reinikka and Svensson(2004) examined variations in the degree of leakage in fiscal transfers toschools in Uganda. Leakages were defined as the difference between theamounts schools were supposed to receive, that is, capitation grants, andthe amounts they actually received. The authors found that poorerschools suffered from greater leakages, potentially because of their morelimited bargaining power vis-à-vis districts.
Distributional impacts across places and people
The distributional incidence of public resources within places dependson the way lower-level institutions such as local governments allocate
Decentralization Reforms
327
these resources in terms of types of programs and services, for example,and what this implies for the ultimate distributional incidence across dif-ferent beneficiaries such as poor and non-poor households or persons bygender, by ethnicity, by caste, and so on.
Distributional outcomes based on the way fiscal resources are allo-cated at the local level in a decentralized context will depend on the degreeof autonomy and accountability and the associated capacity at the vari-ous institutional tiers. The amount of autonomy will determine theamount of discretion a given level of the state will have in targeting pub-lic resources. Are local decisionmakers only able to select from a limitedmenu of projects? Can they make broad choices concerning activities andimplicit or explicit beneficiaries given available resources? The capacityand accountability to allocate effectively decentralized resources may dif-fer not only vertically across levels of government, for example, betweencentral and local governments, but also horizontally (urban or rural,small or large, and so on);8 that is, are agents at any given tier both will-ing and able to make choices that benefit the poor? Do local governmentshave the capacity, including sufficient information, to identify poor ben-eficiaries effectively and implement activities to help them?
The theoretical literature suggests that the degree and impact of cen-tral versus local capture are ambiguous (Bardhan and Mookherjee 2000,2005). A key challenge facing distributional analysis therefore is to assesswhether prevailing institutional arrangements tend to favor or threatendesirable distribution outcomes such as pro-poor allocations acrosslocalities. For any given context, it will be important to provide a morestylized assessment of the local governance mechanisms and characteris-tics that might affect distributional outcomes. Are decisionmakingprocesses sufficiently inclusive of stakeholders at the local level such asthe rich or poor, landed or landless, literate or illiterate, women or men,minorities, particular ethnic and caste groups? Are the incentives suchthat decisionmakers would act in accordance with broadbased or narrowdistributional outcomes (for example, elite capture)?
An increasing number of quantitative analyses of decentralized deci-sionmaking seek to link observed outcomes with local characteristics interms of poverty targeting or the choice of certain projects. To varyingdegrees, these characteristics serve as either indirect or direct proxies forlocal arrangements mediating distributional decisions. Thus, high degreesof inequality or ethnic polarization could undermine more broadbased orpro-poor distributional outcomes at the decentralized level. Consequently,distributional analysis should, ideally, provide an inventory of the risks ofcapture in a given context. The analysis should also seek to encapsulate the
Analyzing the Distributional Impact of Reforms
328
salient differences across places in a given context such as the compositionof the population and its characteristics, resource endowments, and socialtraditions vis-à-vis stakeholders such as women. These differences are notstatic, and decentralization will not simply affect fiscal allocations; at oneand the same time, decentralization may transform underlying decision-making processes, institutions, and the behavior of key stakeholders. Anydecentralization analysis will therefore confront a number of simul-taneous, overlapping processes. Nonetheless, an important dimension ofthe assessment of first-order effects would be the focus on how given decen-tralized mechanisms or reforms impact the targeting of fiscal resources.
Galasso and Ravallion (2005) provide a good example of two-stagetargeting analysis in the context of Bangladesh’s Food for Education Pro-gram. The central government delegated to communities the responsi-bility for allocating program transfers across people. It was assumed thatthese levels would have better information for identifying the poor.Whether actual allocations might be undermined by inadequate accounta-bility, for example, program capture by local elites, is an open question.The central program office allocates across the communities. Its infor-mation partly relies on national statistical sources for aggregate povertyindicators on given localities, but the accountability is also open to doubtbecause of, for instance, the political pressure to favor particular consti-tuencies in allocations.
The study finds that decentralized targeting within villages is pro-poor, but that targeting can be more or less effective given particularcommunity characteristics such as inequalities in land holdings. In com-parison, the central level performs comparatively badly in its allocationsacross communities when its contributions targeting the poor aredecomposed. This suggests that, at least in this case, the accountability forpro-poor targeting appears to be more effective at the local level ratherthan the central level.
Findings from Bolivia indicate not only that previously marginalizedlocalities have received more resources under decentralization, but thatthe structure of expenditures has tended to be more reflective of local pri-orities. The approach has relied on linking the sectoral structure ofexpenditures to the performance of proxies for expenditure needs basedon a number of socioeconomic indicators across localities (Faguet 2004).
Evidence from decentralized social investment funds in Ecuadorsuggests that inequality—a proxy for local capture—both reduces thelikelihood that places will receive funds, but also affects the types of invest-ment priorities of localities (Arauja et al. 2005). A simple choice seems toinfluence more general distinctions in the types of projects selected by
Decentralization Reforms
329
localities, notably, private goods benefiting primarily the poor, such aslatrines, versus public goods benefiting also the more well off, such as schools and community infrastructure. Higher inequality tends toreduce the likelihood that communities will chose the pro-poor latrines.Whereas the evidence does not offer a fuller account of the way inequal-ity may act as a proxy for less progressive forms of local governance, suchanalytical distinctions among types of goods according to their distribu-tional incidence and the local conditions may be useful for analyses inother contexts.
Studies of fiscal equalization are typically concerned with the alloca-tion of transfers across places. Since own-source revenue assignments aretypically insufficient to meet all assigned expenditure needs even amongthe wealthiest, such as in urban localities, central transfers will usually berequired. Fiscal equalization is often analyzed on the basis of whethermore central government resources are destined for poorer localities. Acommon question is: do transfers reduce the per capita disparities in thecombined revenues available to local governments? However, per capitaequalization is often not the best benchmark for equalization (see Box6.1, Hofman et al. 2005).
The nature of center-subnational relations can be highly instructiveregarding the potential outcomes of decentralization. Evidence that anational government is strongly disposed toward encouraging better out-comes at the subnational level is often an important sign of potential suc-cess (for instance, as revealed by a proactive commitment to monitoringand evaluation). The choice of types of intragovernmental transfers andpoverty targeting designs, whether based on poverty or political patron-age, for instance, is also often indicative. Institutionally, the incentives setby particular sorts of decentralization act to discipline subnational andcentral governments in very different ways (Blanchard and Shleifer 2000;Quian and Weingast 1995). Such comparative conclusions are naturallysubject to debate, but do hint at the value of mapping out the apparentmotivations of central government and the principal incentives a decen-tralized system offers to subnational entities.
A better understanding of the political economy of decentralizeddecisionmaking can help map out the likely dynamics for ensuring distri-butional outcomes. Efforts to arrive at a stylized model of decisionmakingcan bring more focus on those interest groups that would be key in dri-ving local decisionmaking and those that may be marginalized. Forexample, in Indian villages, relevant groups might emerge around landedand landless constituencies (Foster and Rosenzweig 2002). Even in theabsence of more detailed expenditure benefit-incidence data, these types
Analyzing the Distributional Impact of Reforms
330
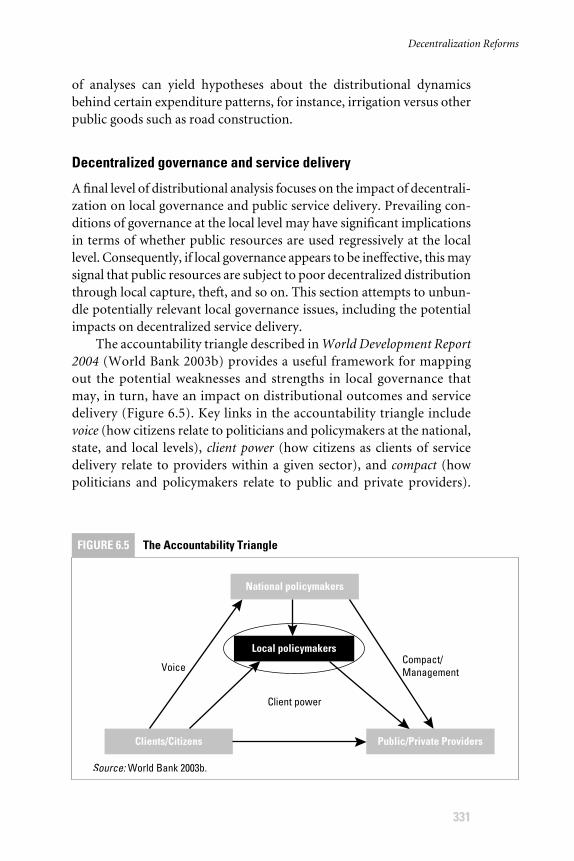
of analyses can yield hypotheses about the distributional dynamicsbehind certain expenditure patterns, for instance, irrigation versus otherpublic goods such as road construction.
Decentralized governance and service delivery
A final level of distributional analysis focuses on the impact of decentrali-zation on local governance and public service delivery. Prevailing con-ditions of governance at the local level may have significant implicationsin terms of whether public resources are used regressively at the locallevel. Consequently, if local governance appears to be ineffective, this maysignal that public resources are subject to poor decentralized distributionthrough local capture, theft, and so on. This section attempts to unbun-dle potentially relevant local governance issues, including the potentialimpacts on decentralized service delivery.
The accountability triangle described in World Development Report2004 (World Bank 2003b) provides a useful framework for mappingout the potential weaknesses and strengths in local governance thatmay, in turn, have an impact on distributional outcomes and servicedelivery (Figure 6.5). Key links in the accountability triangle includevoice (how citizens relate to politicians and policymakers at the national,state, and local levels), client power (how citizens as clients of servicedelivery relate to providers within a given sector), and compact (howpoliticians and policymakers relate to public and private providers).
Decentralization Reforms
331
FIGURE 6.5 The Accountability Triangle
These drive the effectiveness of public service delivery (see Ahmad et al.2005; World Bank 2003b).
Decentralization is likely to shift the onus of accountability in termsof voice between citizens and local policymakers and change the com-pact between central and subnational governments (such as throughgreater fiscal decentralization in the case of devolution and delegation)and decentralized providers (in the case of deconcentration, for instance).Compacts will be strongly affected by the nature of fiscal and administra-tive decentralization, for example, how localities are financed and staffed.Decentralization, including greater autonomy for front-line providers,will also have the potential of strengthening client power if citizens holdlocal providers more directly accountable, such as by targeting their feed-back at specific providers or choosing alternative providers. While a rangeof accountability mechanisms may be formally established, differentconstellations of these mechanisms may actually exist in a given context(Blair 2000). Hence, attention also needs to be paid to the functioning ofinformal institutions.
A variety of voice mechanisms may influence the actions of local policy-makers, including taxing and spending priorities, and the extent to whichthese policymakers are compelled to transform public resources intooutcomes that benefit local households. Key questions concerning thequality of voice mechanisms might include the following: Can the selec-tion of local policymakers be made to hinge on the responsiveness of thepolicymakers to broadbased political demands? Are decisionmakingbodies representative of all local groups? Are more direct forms of over-sight, such as participatory budgeting, established and effective?
Distributional impacts depend on the scope of decentralized deci-sionmaking. Following wide-ranging devolutions, local policymakersmay be able to sway the preferences of stakeholders across a broad set ofpriorities, including education versus infrastructure, hiring more staffversus spending more on buildings, fewer versus more taxes, and so on.In the context of delegated programs, the choices may be more limited,for example, the identification of the individual beneficiaries of a cash-transfer poverty program. Decisionmaking about local facilities will belimited to a specific sector or function, such as the rates or opening hoursfor particular services. The nature of the compacts between central andlocal officials and between officials and providers, public or private, atvarious levels will determine the spectrum of the choices.
The inability of voters to hold local leaders to account through theballot box undermines the effectiveness of electoral voice mechanisms inensuring the delivery of goods to meet broadbased needs. If politicians
Analyzing the Distributional Impact of Reforms
332
cannot or do not fulfill promises and if they cannot be made to do so, if,for instance, they will not pursue measures that strengthen local educa-tion to benefit all residents, then elections may merely breed patronageand clientelism, and politicians may secure control over the public sec-tor by providing narrow spoils to limited constituencies, such as theirown tribes (Keefer and Khemani 2003). The contrasts in the Indian statesof Kerala and Uttar Pradesh highlight the importance of differences inpublic action. While they share similar income levels, Kerala achieves sig-nificantly better results in health and education indicators because publicchoices support spending substantially larger amounts of public resourcesto attain this outcome.
A comparative study of decentralization in the Philippines and inUganda suggests that apparent bottom-up accountability may be quiteweak in practice (Azfar, Kähkönen, and Meagher 2001). Survey evidenceindicates that citizens in both countries relied heavily on communityleaders rather than on the media for information on local politics andon corruption, potentially heightening the risk of local capture. A seriesof governance and decentralization surveys in Indonesia combined sur-veys and studies on households, facilities, and governance with the spe-cific objective of revealing community- and district-level disparities inautonomy, accountability, and service delivery. The surveys found sig-nificant differences in how well informed citizens were about leaders atvarious levels of government, as well as in the perceptions of citizensconcerning local corruption and capture (Hofman and Kaiser 2005;World Bank 2005c).
Informal accountability arrangements may act as a substitute for for-mal mechanisms of electoral voice. Tsai (2005) examines the conditionsthat might make local governments in China more responsive to localcommunity needs. She finds some support for the notion that the pres-ence of encompassing social groups, temple groups, for example, com-bined with the participation of embedded local officials, is associated withbetter outcomes on such issues as the quality of local infrastructure. Shefinds that, under current circumstances, these informal arrangements inparticular localities are a passable substitute for the sort of accountabilitythat might be expected from elections. Her paper cautions, however, thatthese informal arrangements may not represent a sustainable, broad-based institutional foundation for local accountability in China. More-over, she found such arrangements effective in less than a fifth of thevillages she surveyed.
Recent contributions have focused on designing decentralized insti-tutions to enhance policy responsiveness to marginalized groups. The
Decentralization Reforms
333
designs include the mandated representation of women and the castesoften found in South Asia. Evidence from India suggests that mandatedrepresentation does increase spending on goods and initiatives likely tobenefit the targeted groups, such as special programs or reserved employ-ment. Besley et al. (2004) find some evidence that the mandated represen-tation of a pradhan (village head) in India impacts the types of expendituresthat are prioritized in local decisionmaking.
The greater participation engendered by decentralization throughthe empowerment of local institutions or the specifically mandated rep-resentation of previously uninvolved or marginalized groups may notalways translate into more equitable resource allocations and more re-sponsive service delivery. The opportunity of increased participation mayinitially raise expectations, but prove difficult to sustain over time espe-cially because the opportunity costs are high and the apparent returnslow. Consequently, greater participation may give a boost to voice andclient-power mechanisms, but, for these to be sustainable and producetangible outcomes, the corresponding compact arrangements, includingsufficient financing and staffing at the local and front-line levels, must beestablished.
No matter what the nature of the prevailing relationships are be-tween key actors in a decentralization process, it is important to bear inmind that these are likely to evolve over time. Decentralization may ini-tially be largely a top-down affair, with the central government determin-ing the new fiscal targeting mechanisms. Gradually, however, subnationalgovernments may strengthen their bargaining positions vis-à-vis the cen-tral government, for example, through subnational government organi-zations. Subnational governments may thus begin to play a far greaterrole in the way national fiscal resources are distributed.
Local revenue collection can contribute to the generation of publicresources, but, potentially more importantly, it can help enhance localaccountability (Raich 2005). While a greater reliance on the local tax basemay increase interregional disparities in fiscal capacity, linking the spend-ing choices of local officials more directly to the local tax effort throughrate setting, for instance, may strengthen the voice relationships. Citizenswho are taxed or charged fees for general or specific services may be moreattentive to how and how well resources are used. A fundamental prob-lem in many developing countries, however, is that the local revenue baseis often quite limited, and higher levels of government are reluctant toyield a larger revenue base to subnational governments.
The effectiveness of different local accountability mechanisms inreducing corruption is often doubtful. An investigation of community
Analyzing the Distributional Impact of Reforms
334
projects in Indonesia sought to assess the impact on corruption of athreat of stricter auditing and compare this to the impact of measuresdesigned to stimulate greater community participation (Olken 2004).Audits can be interpreted in this context as a form of top-down compactaccountability, whereas participation puts the emphasis on bottom-upvoice accountability. The study sought to generate a hard measure of cor-ruption based on engineering assessments of community road projects.The analysis suggested that audits were more effective at reducing cor-ruption, while greater participation merely shifted the expenditure com-position to areas where leakages could be more readily masked. This typeof analysis does not assess decentralization per se, but it is indicative ofthe type of institutional mechanisms that may influence outcomes in adecentralized context.
A study in Cambodia showed that changes in the compact withrespect to health facilities improve performance. The study found thatdistricts that had contracted out to nongovernmental organizations per-formed better than those retaining traditional compacts relying on gov-ernment facilities (Bhushan, Keller, and Schwartz 2002).
Citizen score cards provide one mechanism for enhancing clientfeedback on schools and clinics (World Bank 2004b). Randomized exper-iments gauging the impact of this feedback on facility-level performancecan be used to assess this accountability mechanism.
An outcome-focused distributional analysis of decentralizationneeds to be clear about the dimensions of service delivery that are ofinterest and relevant. Public service delivery is, by its very nature, multi-dimensional in terms of quantity, quality, structure, cost, and so on. Doesdecentralization enhance access by improving, for example, proximity toa school or providing clean water? Does it enhance dimensions such asresponsiveness? Are the “right” services being provided? Is service deliv-ery conditioned on informal payments? Has decentralization affected thestandard of service delivery? How well are teachers now teaching? Distri-butional analysis will also need to be concerned with the benefit incidenceof these various dimensions. Does decentralization mean the poor arereceiving more goods that are important for their welfare, such as basicinfrastructure or vaccines, and at a lower price? Does it mean the poor aregetting more of the goods that are important to them such as latrines ver-sus sports facilities?
Given that trends in service delivery are subject to a number of con-current developments, including changes in fiscal allocations and insti-tutional reforms that alter the prevailing accountability constellation forservice delivery, it is difficult to establish the causal relationships that are
Decentralization Reforms
335
due to decentralization. Formal impact evaluation typically requires theidentification of a treatment group and a control group (Minkel 2005).Decentralization is generally national in scope. Politically, it is very diffi-cult to devolve voting rights and resources to one set of localities, but notothers. Projects often face substantial hurdles in randomizing interventiondistricts. In practice, formal impact evaluation within decentralization pro-jects is complicated by the fact that the selection criteria for interventionlocations are typically not random or clear cut. Regional clustering toeconomize coordination costs, a history of previous interventions, or anindividual locality’s proven success or willingness to participate in reformtend to predominate. Moreover, the impacts of such projects may onlyemerge over time.
Using test scores as an outcome variable in a study on education inArgentina, Galiani, Gertler, and Schargrodsky (2005) find that richer andbetter administered schools benefit from decentralization, while the im-pact on poorer schools with less administrative capacity is negative. Thefact that not all schools were decentralized at the same time provided anidentification strategy in the study that was unique in many ways.9 Whiledecentralization may increase the overall performance of service deliveryin terms of access and quality, it may also exacerbate geographic inequal-ities. The Argentina education study suggests that, in the absence ofcountervailing policy measures, decentralization may widen disparitiesbetween more advanced and less advanced regions. Granting greaterautonomy over own-source fiscal resources will likely increase fiscal dis-parities in the absence of equalization measures. Increased autonomymay allow high-capacity, well-governed localities to forge ahead, whilelow-capacity and poorly governed districts risk falling behind. Conse-quently, decentralization may initially trigger some divergence in out-comes relative to initial conditions across key socioeconomic indicators(Kaiser, Pattinasarany, and Schulze 2006).
Decentralization may also have effects on interregional growth andinvestment patterns and on firms. Granting greater policy leverage to sub-national governments may induce them to pursue policies aimed at attract-ing mobile investment, including in the area of taxation. Alternatively,because of local conditions, subnational governments may initially veertoward predatory behavior against incumbent firms. If bureaucrats at thecentral and decentralized levels are engaged in corruption in, for example,the issuance of licenses, then, if no effective disciplining mechanisms areinstituted, this may significantly raise the costs of doing business for firmsand negatively impact investment, such as during Russia’s post-communisttransition and decentralization (Shleifer and Vishny 1993).
Analyzing the Distributional Impact of Reforms
336
If it is well designed, decentralization can generate incentives forinnovation and better subnational performance. Policy design needs tofoster these developments, while mitigating some of the risks, includingthrough equalizing measures. Local outcomes are likely to be subject tosignificant lags. Hence, applied distributional analysis of decentralizationwill need to focus equally on ex post assessments. Providing an appraisalof distributional mechanisms and priority indicators is critical to settingout a forward-looking monitoring and evaluation strategy that can thenfeed back into policy design.
Finally, ongoing power or bureaucratic struggles between centraland decentralized actors may compromise the quality of the compact anderode the efficacy of potential voice and client power. In situations wherethe roles and responsibilities of local officials and politicians are poorlydefined, accountability may be blurred, and officials may be unwilling orunable to respond effectively. Overcoming these institutional constraintsmay therefore also represent an important ingredient in improving thedistributional impact of decentralization.10
APPLIED METHODS AND INSTRUMENTS
Practitioners of the distributional analysis of decentralization will typi-cally be confronted with significant information, data, time, and resourceconstraints. Box 6.2 presents a checklist of key sets of questions and typesof evidence that are critical in setting out such analysis. Obviously, themore well defined a decentralization reform and the more focused theassociated analysis, the more likely it is that the analysis will yield the direc-tion and magnitude of the distributional impacts.
A number of instruments and methodologies offer valuable entrypoints for applied analysis (Table 6.3). Existing analytical reports oftenyield a significant stock of information to inform a prospective distribu-tional analysis of decentralization. However, targeted primary qualitativeand quantitative information collection and analysis will still frequentlybe necessary. Given that the impacts of decentralization are frequentlysubject to significant lags or are indirect, an important facet of the analy-sis should also be the identification of prospective baseline data for futurerounds of impact assessment.
Public expenditure reviews have helped analyze the aggregate level,composition, and operational efficiency of public expenditures (Pradhan1996). Country public expenditure reviews can help set the context fordecentralized expenditures, including those derived from local own-source revenues, which are typically not covered in central government
Decentralization Reforms
337
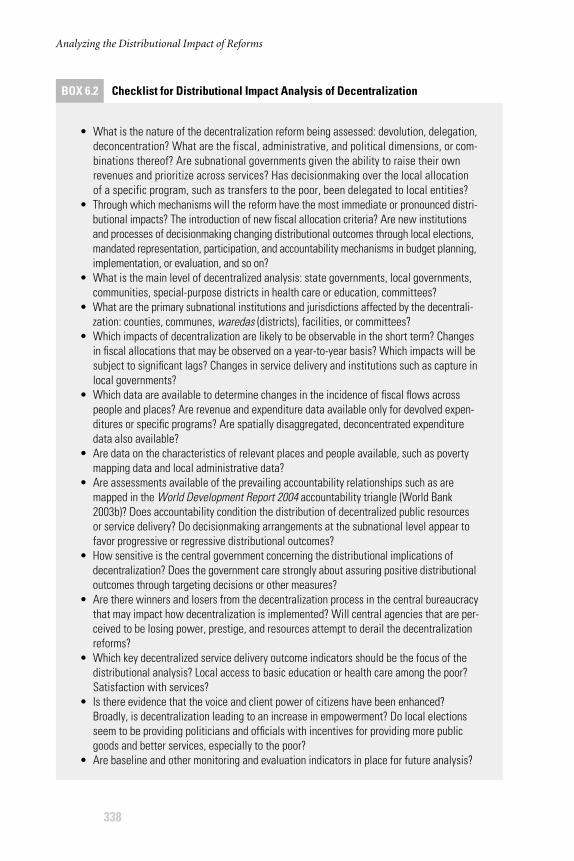
Analyzing the Distributional Impact of Reforms
338
BOX 6.2 Checklist for Distributional Impact Analysis of Decentralization
• What is the nature of the decentralization reform being assessed: devolution, delegation,deconcentration? What are the fiscal, administrative, and political dimensions, or com-binations thereof? Are subnational governments given the ability to raise their ownrevenues and prioritize across services? Has decisionmaking over the local allocationof a specific program, such as transfers to the poor, been delegated to local entities?
• Through which mechanisms will the reform have the most immediate or pronounced distri-butional impacts? The introduction of new fiscal allocation criteria? Are new institutionsand processes of decisionmaking changing distributional outcomes through local elections,mandated representation, participation, and accountability mechanisms in budget planning,implementation, or evaluation, and so on?
• What is the main level of decentralized analysis: state governments, local governments,communities, special-purpose districts in health care or education, committees?
• What are the primary subnational institutions and jurisdictions affected by the decentrali-zation: counties, communes, waredas (districts), facilities, or committees?
• Which impacts of decentralization are likely to be observable in the short term? Changesin fiscal allocations that may be observed on a year-to-year basis? Which impacts will besubject to significant lags? Changes in service delivery and institutions such as capture inlocal governments?
• Which data are available to determine changes in the incidence of fiscal flows acrosspeople and places? Are revenue and expenditure data available only for devolved expen-ditures or specific programs? Are spatially disaggregated, deconcentrated expendituredata also available?
• Are data on the characteristics of relevant places and people available, such as povertymapping data and local administrative data?
• Are assessments available of the prevailing accountability relationships such as aremapped in the World Development Report 2004 accountability triangle (World Bank2003b)? Does accountability condition the distribution of decentralized public resourcesor service delivery? Do decisionmaking arrangements at the subnational level appear tofavor progressive or regressive distributional outcomes?
• How sensitive is the central government concerning the distributional implications ofdecentralization? Does the government care strongly about assuring positive distributionaloutcomes through targeting decisions or other measures?
• Are there winners and losers from the decentralization process in the central bureaucracythat may impact how decentralization is implemented? Will central agencies that are per-ceived to be losing power, prestige, and resources attempt to derail the decentralizationreforms?
• Which key decentralized service delivery outcome indicators should be the focus of thedistributional analysis? Local access to basic education or health care among the poor?Satisfaction with services?
• Is there evidence that the voice and client power of citizens have been enhanced?Broadly, is decentralization leading to an increase in empowerment? Do local electionsseem to be providing politicians and officials with incentives for providing more publicgoods and better services, especially to the poor?
• Are baseline and other monitoring and evaluation indicators in place for future analysis?
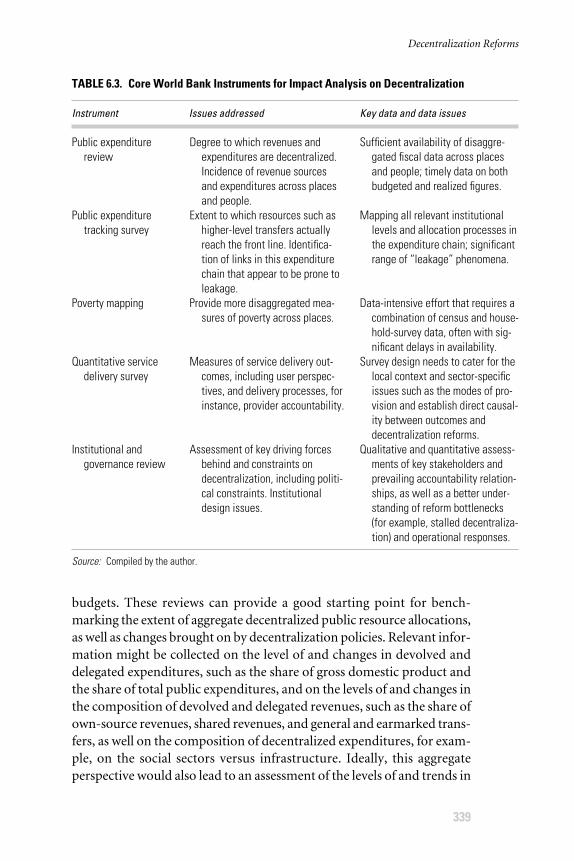
budgets. These reviews can provide a good starting point for bench-marking the extent of aggregate decentralized public resource allocations,as well as changes brought on by decentralization policies. Relevant infor-mation might be collected on the level of and changes in devolved anddelegated expenditures, such as the share of gross domestic product andthe share of total public expenditures, and on the levels of and changes inthe composition of devolved and delegated revenues, such as the share ofown-source revenues, shared revenues, and general and earmarked trans-fers, as well on the composition of decentralized expenditures, for exam-ple, on the social sectors versus infrastructure. Ideally, this aggregateperspective would also lead to an assessment of the levels of and trends in
Decentralization Reforms
339
TABLE 6.3. Core World Bank Instruments for Impact Analysis on Decentralization
Instrument Issues addressed Key data and data issues
Public expenditure review
Public expenditure tracking survey
Poverty mapping
Quantitative service delivery survey
Institutional and governance review
Degree to which revenues andexpenditures are decentralized.Incidence of revenue sourcesand expenditures across placesand people.
Extent to which resources such ashigher-level transfers actuallyreach the front line. Identifica-tion of links in this expenditurechain that appear to be prone toleakage.
Provide more disaggregated mea-sures of poverty across places.
Measures of service delivery out-comes, including user perspec-tives, and delivery processes, forinstance, provider accountability.
Assessment of key driving forcesbehind and constraints ondecentralization, including politi-cal constraints. Institutionaldesign issues.
Sufficient availability of disaggre-gated fiscal data across placesand people; timely data on bothbudgeted and realized figures.
Mapping all relevant institutionallevels and allocation processes inthe expenditure chain; significantrange of “leakage” phenomena.
Data-intensive effort that requires acombination of census and house-hold-survey data, often with sig-nificant delays in availability.
Survey design needs to cater for thelocal context and sector-specificissues such as the modes of pro-vision and establish direct causal-ity between outcomes anddecentralization reforms.
Qualitative and quantitative assess-ments of key stakeholders andprevailing accountability relation-ships, as well as a better under-standing of reform bottlenecks(for example, stalled decentraliza-tion) and operational responses.
Source: Compiled by the author.
interregional disparities. Similar information on the level and structureof and interregional variations and changes in deconcentrated expendi-tures may supply important distributional insights into decentralization.In many cases, however, these figures may be subsumed in the centralgovernment fiscal accounts and may therefore be difficult to disaggregate.
A number of public expenditure reviews have focused on decentrali-zation and related subnational issues. The analysis of fiscal disparitiesacross subnational jurisdictions, including local governments, will requirenationally representative data on local own-source revenues and transfersfrom the central level. During Indonesia’s 2001 big bang decentralization,transfers and an expanded revenue base, including shares in natural-resource revenue, were granted to district governments (kabupaten, kota).There were significant fiscal disparities in these 336 places in the wake ofthe decentralization (World Bank 2003a).11 It was not possible to assesschanges in the incidence of public expenditures or the impacts of thesechanges in terms of service delivery at the local level following decen-tralization owing to the absence of predecentralization data on decon-centrated and central government expenditures across places. However, aselection of provincial case studies has provided insights into interre-gional differences in capacity and the prevailing disparities arising inpractice during the implementation of decentralization.
The impact of special autonomy status and the fiscal windfallsderiving from special autonomy status and natural-resource revenuesin Indonesia’s remote Papua province were the focus of a subsequentprovincial public expenditure review (World Bank 2005d). The analysisfound that, while the province was generally well treated and well endowedin fiscal terms, there were substantial differences across districts. More-over, a relative abundance of fiscal resources did not appear to translateinto better outcomes everywhere. Especially in remote districts, the effec-tiveness of service delivery was undermined because localities could notattract and retain key personnel such as doctors and trained teachers.This highlights the fact that decentralized distributional impacts dependon the level of resources available to localities, but also on the account-ability and capacity constraints affecting resource use.
Public expenditure tracking surveys strive to produce detailed analy-ses of the extent to which public resources actually reach localities andfront-line service delivery points. The methodology consists of mappingfiscal flows all the way to the front line, for example, to schools, and com-paring actual receipts to planned receipts. By measuring flows across alllevels of government, such analyses help identify key breaks in the pub-lic expenditure chain (Dehn, Reinikka, and Svensson 2003). An impor-
Analyzing the Distributional Impact of Reforms
340
tant component of these surveys is often the simple measures of horizon-tal differences in the resources reaching front-line facilities across majorareas of public finance, including wages, nonwage recurrent expenditure,and capital investment.
The first-ever public expenditure tracking survey conducted inUganda (Reinikka and Svensson 2004) remains the most successfulexample of diagnosis and subsequent improvements in the expenditurechain for capitation grants aimed at schools. Surveys in more than twodozen countries following decentralization have typically confrontedmore complex and ambiguous fiscal flows in the health and educationsectors (Kaiser and Kushnarova 2005). In a decentralized context, thismethod can be especially useful in clarifying the de facto institutionaland structural origins, methods, and impacts of expenditure decisionsat the intermediate levels and the extent to which these detract from ben-efit incidence at other levels.
The distribution of centrally allocated resources is administered viatwo mechanisms: deconcentrated branch offices of the central govern-ment, such as education sector offices, or local municipalities throughtransfers and other delegated financing pathways. An example of thelatter is the Glass of Milk program in Peru. In that case, an expendituretracking exercise found that funds were quickly being dissipated bylower-level decisionmaking about onward disbursement and procure-ment. Using household-level survey data, the exercise was also able toestimate the extent of leakage attributable to beneficiary dilution (WorldBank 2002a). Each expenditure channel manifested particular challengesin terms of fiscal leakage. The case highlights an issue running throughthe vast majority of public expenditure tracking surveys: decentralizedleakage cannot always be attributed simply to theft. In many instances,resources may actually be reallocated at the local level for other purposesof unknown merit. Such reallocations may often be a symptom of chronicunderfunding among local governments.
Data on the characteristics of poverty and the needs in expenditureboth in places and among people are a key ingredient of the distributionalanalysis of decentralization. However, even if decentralized fiscal dataacross places are available, detailed socioeconomic data on localities areoften not available. The sampling design of national surveys is typicallysuch that they are not representative at the decentralized level. Thismakes it difficult to assess whether the poorest or richest places are ben-efiting from decentralization. Periodic census data provide one means ofgenerating indicators for low levels of geographic disaggregation. Thus,poverty map approaches are being applied to leverage household-welfare
Decentralization Reforms
341
surveys and census data so that indicators can be generated at very lowlevels of spatial disaggregation, for example, communes in Madagascar(Demombynes et al. 2002). Such approaches are being used for geographictargeting in poverty programs or the ex post assessment of decentralizedrevenues.
Subnational fiscal data, poverty mapping data, and other socioeco-nomic data can be usefully combined to assess incidence across places. Adistributional analysis might begin with poverty indicators and simplecorrelation analysis, including, for instance, per capita transfers and totalrevenues. More systematic analysis might specify an ideal benchmarkallocation based on multiple criteria such as projected fiscal capacity andpoverty and compare this to actual allocation (see Box 6.1). Special careshould be taken to ensure that data reflect actual allocation and are notsubject to leakages relative to notional allocation assessed, for instance,by public expenditure tracking surveys.
Front-line service delivery surveys can provide important insightsinto decentralized outcomes. These have typically focused on basic healthand education facilities, that is, schools and clinics. Absenteeism surveys,which usually consist of surprise visits to schools and clinics, may shedlight on interregional differences in teacher and health worker attendanceand the extent to which poor places and people are prone to this sourceof erosion in public service delivery. Facility surveys have found that, onaverage, 19 percent of teachers and 35 percent of health workers areabsent at any given time in developing countries (Chaudhury et al. 2006).Evidence from India suggests that poorer states are more prone to absen-teeism. Empirical studies have relied on a variety of methodologies,including specialized surveys. Ideally, the analysis would cover a suffi-ciently large sample of localities to provide some sense of the diversity ofoutcomes across localities.
Specialized surveys, including household and facility surveys, mayalso target dimensions of service delivery not usually found in standardhousehold socioeconomic surveys, which normally provide evidence onbasic service use and access, but not service quality. Such surveys mightprovide an indicative or even representative assessment of the strength ofthe various forms of accountability (voice, client power, and compact).Given the diversity in the dimensions of decentralized service delivery,distributional analysis that focuses on service delivery should strive toarticulate the key variables of interest. These might include intermediatevariables such as teacher absenteeism, local rates of access and enroll-ment, or outcome indicators on, for example, household-level incidenceor satisfaction with service delivery.
Analyzing the Distributional Impact of Reforms
342
A key decision in any distributional analysis of decentralizationwill revolve around whether to initiate a bespoke survey (an ad hoc sur-vey tailored to specific needs) or whether data from, for instance, exist-ing household surveys are sufficient. Given that subnational diversityis an important lens through which decentralized impacts might be assessed, surveys often face a small-area estimation problem. Tocover a sufficient number of regions, the actual sample size of surveyswithin localities may be quite constrained to avoid prohibitive costsand long survey schedules. Thus, a sufficient number of poor peopleand poor households must be sampled within each locality if the dif-ferences in impacts across places (as defined in the checklist in Box 6.2)are to be adequately measured. Trade-offs stemming from this prob-lem can typically be managed in a number of ways, must notably bytrying to make national inferences based on a more limited subset oflocalities. Other methods may involve selecting localities based onsome ex ante hypothesis about distributional impacts according totypes of localities, such as by degree of ethnic diversity, rural-urbancomposition, and so on.
Institutional and governance reviews can serve as venues for describ-ing the political economy of decentralization reforms (World Bank2002b). An assessment of Pakistan’s 2000 devolution was focused onascertaining the scope for action and incentives among nazims, or districtleaders (ADB, DfID, and World Bank 2004). The assessment highlighteda number of areas for improvement, including the excesses of clientelismand the provision of narrow private goods by local councilors because ofthe prevailing political economy of the devolution. It relied on detailedcase studies in six of more than 100 districts across Pakistan’s fourprovinces, as well as the collection of a national fiscal database on dis-tricts. A variant of the accountability triangle served as a useful founda-tion for structuring the discussion (see Figure 6.5). However, the primaryobjective of the assessment was not to pursue a distributional analysis,but rather to provide a broader analysis for the early implementation ofa newly instituted decentralization framework.
A range of quantitative and qualitative methods may be used tofathom local institutions and the way they function both formally andinformally (DfID and World Bank 2005). Focus groups and more struc-tured surveys are helpful in identifying key actors and groups and theirrespective accountability and power relationships. Thus, stakeholderanalysis of a certain aspect of decentralized decisionmaking can informthe way distributional decisions are made in a given context or, morebroadly, the forces shaping an evolving decentralization project.
Decentralization Reforms
343
At one level, these methods may shed light on the relations amongvarious central and subnational actors and determine how they are posi-tioned vis-à-vis the decentralization reform. While certain agencies mayact as champions for the reform, others, especially those central bureau-cracies that may lose prestige or resources owing to the decentralization,may see few benefits. At the subnational level, this type of stakeholderanalysis can provide a more nuanced assessment of the conditions underwhich local capture might endanger distributional outcomes, and it cansuggest potential approaches for mitigating these risks by, for example,strengthening the transparency of particular decisionmaking processes.
The accountability triangle presented in Figure 6.5 is a useful guideon the types of indicators collected for distributional analysis. One classof indicators aims at assessing the actual degree of autonomy and respon-sibility of subnational entities within a particular area. While the functionsof these entities may be formally decentralized in terms of, for instance,control over staffing decisions or local-level targeting, this may not alwaysbe the case in practice. Thus, a survey of health providers and local offi-cials in Nigeria found that local governments rather than states were per-ceived to be responsible for basic health service delivery (Das Gupta,Gauri, and Khemani 2004; Khemani 2005). These sorts of measures canbe especially valuable in contexts in which decentralized autonomy mayvary both formally and informally within a country, as in the case oflocal government autonomy across states in India and Nigeria. TheIndonesian governance and decentralization surveys asked about theprimary responsibility across a set of functions, including hiring andfiring, disciplinary actions, budgetary allocations, and drug purchases,to construct measures of decentralized responsibility and autonomy(World Bank 2005c). Measurement of these types of issues from multi-ple perspectives provides a useful cross-check on the validity of the state-ments of officials. Inconsistencies in the responses of various actors,such as central versus local government officials, can also supply usefulinsights into problems, including the lack of clarity in roles and respon-sibilities, that may be undermining accountability. Additional questionsmight focus on the apparent quality of compact and management. Thus,public expenditure tracking surveys can offer an indication of the extentto which financial allocations to decentralized entities are transparentand predictable.
Similarly, household surveys, citizen report cards, and user-groupsurveys between parent-teacher associations and other community groupscan provide measures of the degree to which client power and voice mech-anisms function at the local level. Questions might focus on the degree to
Analyzing the Distributional Impact of Reforms
344
which local constituents are informed about the identity and actions oflocal decisionmakers and how local budgets are allocated and imple-mented. Additional questions might probe the degree to which citizens,including the poor, feel they actually influence decentralized decision-making processes.
While administrative data can supply useful information on suchmatters as local budget allocations, care must be taken that these are notsubject to misreporting or bias. Thus, if local governments are compen-sated for enrollment numbers under a new decentralization reform, theremay be clear incentives to overreport outcomes. Measures focused on theeducation or training of local staff may also provide proxies for localcapacity, although such formal input measures may not necessarily begauging actual capacity, especially if local absenteeism among the mostskilled is a significant problem.
The geographic variation in distributional outcomes and the variouspotential constellations in the accountability and capacities underlyingany given decentralization mean that a special effort should be made toleverage many sources of data for analysis. The combination of fiscal andpoverty mapping data provides one promising avenue. The critical roleplayed by differences in local accountability and capacity in shapingdistributional outcomes suggests that pertinent information on bothdimensions may prove especially fruitful. For example, the analysis onUganda was able to link local-level information on leakages with thecharacteristics of poverty to show that, while the formal distribution ofcapitation grants was quite egalitarian, outcomes in practice were moreregressive (Reinikka and Svensson 2004).
Since decentralization processes typically encompass a number ofsimultaneous changes, it is often quite difficult to make strong claimsconcerning causality. However, some proximate indicators of the factorsassociated with poor distributional outcomes can help identify potentialareas for policy reform within a given context by, for instance, increasingthe amount of transparency and information associated with the process.In the context of more overarching decentralization reforms through,say, devolution, understanding which agencies stand to win or lose interms of power, prestige, resources, and so on may also help clarify thelikely proponents or opponents of the proposed measures.
This chapter has highlighted that a growing number of analyses haveattempted to gain a better empirical understanding of the distributionalimpacts of decentralization and the underlying driving forces as theyemerged, for example, from the formal and informal functioning of localinstitutions and governance processes.
Decentralization Reforms
345
In fact, an assessment of 10 local governments in Ghana (ClayDordConsultancy Services 2004) appears to be the only formal PSIA of decen-tralization. The assessment finds that local governments were gener-ally underresourced and characterized by low capacity. As is typical ofmany decentralization projects, the relationship between absorptivecapacity and the additional fiscal resources actually granted by the cen-tral level was entangled in a chicken-and-egg type debate. The assessmentalso finds that the reliance on and knowledge about district-level gov-ernments by the public were often quite limited, though this conclusionwas based on a limited number of respondents (250). The PSIA on Ghanarepresents a useful perspective on the state of devolution there. However,the assessment does not spell out the scope of Ghana’s decentralization,noting only that, in a major reform, the common fund of the districtassemblies will receive or has already received 7.5 percent of national rev-enues. Ultimately, it is a more general assessment of the country’s decen-tralization reform, rather than an explicit distributional analysis.
Examples like this demonstrate that the distributional impacts ofdecentralization tend to be quite context specific. Greater clarity aboutthe main dimensions and mechanisms being assessed under a PSIA aspart of a decentralization reform might help strengthen internationalinsights into comparable decentralization experiences and potentialpolicy responses.
CONCLUSIONS
Decentralization can refer to a wide range of reforms. Examples spanmajor changes in a country’s intragovernmental fiscal, administrative,and political arrangements, or they may be focused more simply on theintroduction or reform of a cash-transfer program. In any case, it isimportant to determine the principal mechanisms through which thedistributional impacts of the reforms occur. Building on such an appliedframework, the analysis would ideally muster a realistic base of infor-mation to enable an empirical assessment. Inherent in decentralizationis the expectation that the outcomes are diverse across subnationaljurisdictions. Hence, studies should attempt to gather evidence from asufficiently large number of localities to be representative and at leastindicative of national patterns.
The limited record on PSIAs on decentralization suggests that futureefforts need to provide a more explicit statement of the type of decen-tralization being assessed, the general magnitude of the public resourcesinvolved relative to overall public resources, and the effect of institutions
Analyzing the Distributional Impact of Reforms
346
in mediating distributional impacts. A range of complementary quanti-tative and qualitative methodologies is available to address these issues.The accountability triangle presented in Figure 6.5 can provide a usefulorganizing framework. Such an approach should help sharpen the under-standing of the ways local governance arrangements across countries andlocalities shape distributional outcomes.
The objective of this chapter is to examine approaches that focus onidentifying and assessing the short-term distributional impacts of decen-tralization reforms, primarily through the channel of public expendi-tures. A growing literature has been concentrating on the medium- tolong-term, direct, and indirect impacts of decentralization, including thebroader effects on democratic decentralization and empowerment. Someof the work has speculated on the impacts of decentralization on sub-national growth, although the evidence is largely inconclusive (Martinezand McNab 2003). This chapter suggests that even the short-run evidenceon decentralization is quite fragmented. One explanatory factor may bethat decentralization projects are, by design and manner of implementa-tion, quite diverse and difficult to compare. Another issue is that themethodologies for establishing the direction and magnitude of distribu-tional impacts have been idiosyncratic. One research agenda might there-fore involve promoting a more coherent understanding of the nature ofdecentralization and the application of consistent methodologies. At aminimum, this would contribute to more systematic insights into theimpact of decentralization and a more compelling body of evidence onthe first-order direction of the distributional implications.
Whereas changes in the allocation of fiscal inputs across peoplesand places may be fairly rapid, the impacts in terms of local governance andpublic service delivery are likely to be subject to more significant lags andmay even be negative. Consequently, it may be necessary to determinethe proper timing for the assessment of particular impacts. In the case ofmany reforms, it may be simply “too early to tell.” Especially with a pro-cess as wide-ranging and complex as decentralization, special care mustbe taken not to arrive at hasty or incomplete judgments. Nonetheless,assessments should attempt to identify early trends (and warnings) anddevelop indicators on emerging benefits and risks. The systematic cata-loging of best and worst practices—say, across a representative sample ofdistricts, councils, or waredas—would provide a very useful complementto a distributional analysis focused on short-term factors.
Assessing the distributional impacts of decentralization will typicallyrequire a threshold level of subnational data. Even if these data are avail-able at the start of the decentralization, reporting systems often run the
Decentralization Reforms
347
risk of deteriorating or even collapsing in the wake of decentralization.This may be aggravated by the fact that many central governments (anddonors) are wont to demand more reporting by local entities. Such infor-mation is rarely used and, moreover, can overwhelm the capacity if notthe willingness of localities to report. Agreement on a set of core decen-tralization monitoring and evaluation indicators, including, for example,a poverty reduction strategy that brings together government, donors,and other key stakeholders, will be an important step in moving fromshort-run assessments to sustainable, ongoing assessments. Consequently,the analysis of trends over time should be accompanied by critical invest-ments in the collection of key baseline data and the tracking of indicators.Information does not flow only from the local level to the center, but use-ful information is also conveyed back to local governments, allowing forbenchmarking across localities. This would enhance the incentives forquality reporting.
NOTES
1. For example, Bird et al. (1995) suggest that decentralization was associatedwith a deterioration of public services during the initial stages of transitionin Eastern and Central Europe. In China, decentralization was associatedwith increased regional disparities in the provision of health and educationservices (Wong and West 1995). In contrast, Faguet (2004) finds that decen-tralization in Bolivia benefited marginalized regions and made service deliv-ery more responsive.
2. Data on World Bank operations have been compiled from the BusinessWarehouse, and complementary data on conditionality for developmentpolicy have been drawn from the Adjustment Lending Conditionality Imple-mentation Database (World Bank 2005a).
3. Albania, Brazil, Burkina Faso, Cape Verde, Chad, Ethiopia, Ghana, India,Mali, Mozambique, Pakistan, Peru, Romania, Rwanda, Senegal, Sierra Leone,Timor-Leste, and Vietnam.
4. Rwanda embarked on a territorial reform in late 2005, consolidating existingdistricts to one-third the original number.
5. Privatization, not discussed here, could also be considered a form of market-based decentralization.
6. Another example would be in the case of greater facility autonomy, such asthrough the retention of user fees.
7. The measure is akin to a Foster-Greer-Thorbecke poverty-gap index in sum-marizing the deviations from ideal allocations (the Figure 6.3 ratio is 1) bythose below 1 (Deaton 1997):
fiscal resource gap* = −( )1 1 6 12
N XiΣ ( . )
Analyzing the Distributional Impact of Reforms
348
where Xi ≤ 1, (i) is the district, X the ratio, and N the total number of locali-ties. The square implies a greater weight for outliers, but can be suitably in-creased or decreased.
8. The concepts of accountability and capacity are often overlapping in thesense that effective accountability (World Bank 2003b) implies capacity, forinstance, the ability effectively to muster and utilize information. In practice,it is important to highlight the points where key capacity bottlenecks may beconstraining more favorable distributional allocations and the transforma-tion of resources into public services.
9. The study was able to leverage a unique set of circumstances. Any examina-tion of the short-run distributional impacts of decentralization in a projector more general reform should exploit such fortuitous or intended variationsacross localities, for example, as part of a baseline with a two- to five-yearforward-looking time horizon. When there are clear-cut rules that qualifyone set of localities rather than another for a decentralization initiative, suchas a poverty threshold or the receipt of a grant, one approach might be to iden-tify comparable intervention and control localities along this demarcation.
10. At the operational level, the challenge is not simply to avoid creating unneces-sary structures, but to leverage decentralized decisionmaking into strengthened,more general voice, client power, and compact-management accountability inpublic sector institutions (Bhatia 2003).
11. The number of local governments was subsequently increased to 434.
BIBLIOGRAPHY
ADB (Asian Development Bank), DfID (U.K. Department for International Devel-opment), and World Bank. 2004. “Devolution in Pakistan: An Assessmentand Recommendations for Action.” Report, Islamabad, Asian DevelopmentBank, U.K. Department for International Development, and World Bank.
Ahmad, J., S. Devarajan, S. Khemani, and S. Shah. 2005. “Decentralizationand Service Delivery.” Policy Research Working Paper 3603, World Bank,Washington, DC.
Arauja, M. C., F. H. G. Ferreira, P. Lanjouw, and B. Özler. 2005. “Local Inequal-ity and Project Choice in a Social Investment Fund.” First draft of a work inprogress, World Bank, Washington, DC.
Azfar, O., S. Kähkönen, and P. Meagher. 2001. “Conditions for Effective Decen-tralized Governance.” IRIS Center, University of Maryland, College Park, MD.
Bahl, R. 1999. “Implementation Rules for Fiscal Decentralization.” InternationalStudies Program Working Paper 30, Georgia State University, Atlanta.
Bardhan, P. 2002. “Decentralization of Governance and Development.” Journalof Economic Perspectives 16 (4): 185–205.
Bardhan, P., and D. Mookherjee. 2000. “Capture and Governance at Local andNational Level.” American Economic Review 90 (2): 135–39.
———. 2005. “Decentralizing Anti-Poverty Program Delivery in DevelopingCountries.” Journal of Public Economics 89 (4): 675–704.
Decentralization Reforms
349
Besley, T., L. Rahman, R. Pande, and V. Rao. 2004. “The Politics of Public GoodProvision: Evidence from Indian Local Governments.” Journal of the Euro-pean Economic Association 2 (2): 416–26.
Bhatia, M. 2003. “Public Sector Management and Institutional Issues in SocialFunds.” Draft report, Social Protection Unit, Human Development Network,World Bank, Washington, DC.
Bhushan, I., S. Keller, and B. Schwartz. 2002. “Achieving the Twin Objectives ofEfficiency and Equity: Contracting Out Health Services in Cambodia.” Brief 6,Economics and Research Department, Asian Development Bank, Manila.
Bird, R. M., R. Ebel, and C. Wallich, eds. 1995. Decentralization of the SocialistState. Washington, DC: World Bank.
Bird, R. M., and M. Smart. 2002. “Intergovernmental Fiscal Transfers: SomeLessons from International Experience.” World Development 30 (6): 899–912.
Blair, H. 2000. “Participation and Accountability at the Periphery: Democraticand Local Governance in Six Countries.” World Development 28 (1): 21–39.
Blanchard, O., and A. Shleifer. 2000. “Federalism With and Without PoliticalDecentralization: China Versus Russia.” Paper 1889, Harvard Institute ofEconomics Research, Harvard University, Cambridge, MA.
Bossuyt, J., and J. Gould. 2000. “Decentralisation and Poverty Reduction: Elab-orating the Linkages.” Policy Management Brief, European Centre for Devel-opment Policy Management, Maastricht, the Netherlands.
Chaudhury, N., J. Hammer, M. Kremer, K. Mularidharan, and H. Rogers. 2006.“Missing in Action: Teacher and Health Worker Absence in DevelopingCountries.” Journal of Economic Perspectives (forthcoming).
ClayDord Consultancy Services. 2004. “Poverty and Social Impact Analysis (PSIA)on Resource Allocation, Mobilization, Management, and Capacity Building atDistrict Level in Ghana.” Report, ClayDord Enterprises Limited, Accra, Ghana.
Das Gupta, M., V. Gauri, and S. Khemani. 2004. “Decentralized Delivery of Pri-mary Health Services in Nigeria: Survey Evidence from the States of Lagos andKogi.” Africa Region Human Development Working Paper 32815, WorldBank, Washington, DC.
Deaton, A. 1997. The Analysis of Household Surveys: A MicroeconometricApproach to Development Policy. Baltimore: Johns Hopkins University Press.
Dehn, J., R. Reinikka, and J. Svensson. 2003. “Survey Tools for Assessing Perfor-mance in Service Delivery.” In The Impact of Economic Policies on Poverty andIncome Distribution: Evaluation Techniques and Tools, ed. François Bourguignonand Luiz A. Pereira da Silva, Chapter 9. New York: Oxford University Press.
Demombynes, G., C. Elbers, J. Lanjouw, P. Lanjouw, J. Mistiaen, and B. Özler.2002. “Producing an Improved Geographic Profile of Poverty.” DiscussionPaper 39, United Nations University–World Institute for Development Eco-nomics Research, Helsinki.
DfID (U.K. Department for International Development) and World Bank. 2005.Tools for Institutional, Social and Political Analysis (TIPS): Sourcebook for PSIA.London: Poverty Analysis and Monitoring Team, Department for Inter-national Development.
Analyzing the Distributional Impact of Reforms
350
Diaz-Cayeros, A., B. Magaloni, and B. R. Weingast. 2003. “Tragic Brilliance:Equilibrium Hegemony and Democratization in Mexico.” Unpublishedmanuscript, Hoover Institution, Stanford University, Stanford, CA.
Dillinger, W. 2005. “Intergovernmental Fiscal Relations (in the EU 8 Countries).”Report, Poverty Reduction, and Economic Management Unit, Europe andCentral Asia Region, World Bank, Washington, DC.
Ebel, R. D., and S. Yilmaz. 2001. “Fiscal Decentralization: Is It Happening?, HowDo We Know?” Paper presented to “Public Finance in Developing and Tran-sition Countries: A Conference in Honor of Richard Bird,” Georgia State Uni-versity, Atlanta, April 5–6.
Evans, A. 2004. “Administrative Decentralization: A Review of Staffing Prac-tices during Decentralization in Eight Countries.” Report, World Bank,Washington, DC.
Faguet, J.-P. 2004. “Does Decentralization Increase Responsiveness to LocalNeeds?: Evidence from Bolivia.” Journal of Public Economics 88 (3–4): 867–94.
Foster, A. D., and M. R. Rosenzweig. 2002. “Democratization, Decentralization,and the Distribution of Public Goods in a Poor Rural Economy.” WorkingPaper 010, Bureau for Research and Economic Analysis of Development,Berkeley, CA.
Galasso, E., and M. Ravallion. 2005. “Decentralized Targeting of an Anti-PovertyProgram.” Journal of Public Economics 89 (4): 705–22.
Galiani, S., P. Gertler, and E. Schargrodsky. 2005. “School Decentralization:Helping the Good Get Better, but Leaving the Poor Behind.” Unpublishedworking paper, Universidad de San Andres, Buenos Aires.
Hofman, B., Kadjatmiko, K. Kaiser, and B. Suharnoko. 2005. “EvaluatingIndonesia’s Fiscal Equalization.” Unpublished working paper, World Bank,Washington, DC.
Hofman, B., and K. Kaiser. 2005. “Decentralization, Democratic Transition,and Local Governance in Indonesia.” In Decentralization and Local Gover-nance in Developing Countries: A Comparative Perspective, ed. P. Bardhanand D. Mookherjee, 81–124. Cambridge, MA: The MIT Press.
Jütting, J., E. Corsi, and A. Stockmayer. 2005. “Decentralization and PovertyReduction.” Development Centre Policy Insights 56, Organisation for Eco-nomic Co-operation and Development, Paris.
Jütting, J., C. Kaufman, I. McDonnel, H. Osterrieder, N. Pinaud, and L. Wegner.2004. “Decentralization and Poverty in Developing Countries: Exploring theImpact.” Development Centre Working Paper 236, Organisation for EconomicCo-operation and Development, Paris.
Kaiser, K., and I. Kushnarova. 2005. “Public Expenditure Tracking Surveys (PETS):International Stocktaking.” Presentation to the Public Sector GovernanceBoard, World Bank, Washington, DC, July 14.
Kaiser, K., D. Pattinasarany, and G. G. Schulze. 2006. “Decentralization, Gover-nance, and Public Services in Indonesia.” In Decentralization in Latin Americaand Asia: An Inter-Disciplinary Perspective, ed. G. Peterson, P. Smoke, andE. J. Gómez. Cheltenham, United Kingdom: Edward Elgar.
Decentralization Reforms
351
Keefer, P., and S. Khemani. 2003. “Democracy, Public Expenditures, and thePoor.” Policy Research Working Paper 3164, World Bank, Washington, DC.
Khemani, S. 2005. “Local Government Accountability for Service Delivery inNigeria.” Journal of African Economies 14 (October).
Litvack, J., J. Ahmad, and R. Bird. 1998. “Rethinking Decentralization in Devel-oping Countries.” PREM Network Sector Studies, Poverty Reduction andEconomic Management Network, World Bank, Washington, DC.
Martinez, J., and R. M. McNab. 2003. “Fiscal Decentralization and EconomicGrowth.” World Development 31 (9): 1597–1616.
Minkel, J. R. 2005. “Trials for the Poor: Rise of Randomized Trials to StudyAntipoverty Programs.” Scientific American December.
Ndegwa, S. N. 2002. “Decentralization in Africa: A Stocktaking Survey.” AfricaRegion Working Paper Series 40, World Bank, Washington, DC.
Olken, B. 2004. “Corruption and the Costs of Redistribution: Micro-evidencefrom Indonesia.” Paper prepared for National Bureau of Economic Research,Cambridge, MA.
Pradhan, S. 1996. “Evaluating Public Spending: A Framework for Public Expen-diture Reviews.” Discussion Paper 323, World Bank, Washington, DC.
Quian, Y., and B. R. Weingast. 1995. “China’s Transition to Markets: Market-Preserving Federalism, Chinese Style.” Unpublished report, Hoover Institution,Stanford, CA.
Raich, U. 2005. “Fiscal Determinants of Empowerment.” Policy Research Work-ing Paper 3705, World Bank, Washington, DC.
Reinikka, R., and J. Svensson. 2004. “Local Capture: Evidence from a CentralGovernment Transfer Program in Uganda.” Quarterly Journal of Economics119 (2): 679–705.
Shleifer, A., and R. W. Vishny. 1993. “Corruption.” Quarterly Journal of Eco-nomics 108 (3): 599–617.
Tsai, L. 2005. “Accountability without Democracy: How Solidarity Groups Pro-vide Public Goods Provision in Rural China.” Paper presented at the PublicSector and Anticorruption Brown Bag Series, Poverty Reduction and Eco-nomic Management Network, World Bank, Washington, DC, November.
von Braun, J., and U. Grote. 2000. “Does Decentralization Serve the Poor?” Paperpresented at the Conference, “Fiscal Decentralization,” International Mone-tary Fund, Washington, DC, November.
Wong, C., and L. West. 1995. “Fiscal Decentralization and Growing RegionalDisparities in Rural China: Some Evidence in the Provision of Social Ser-vices.” Oxford Review of Economic Policy 2 (4): 70–84.
World Bank. 2002a. “Peru: Restoring Fiscal Discipline for Poverty Reduction,Public Expenditure Review.” Economic Report, Latin America and theCaribbean Region, World Bank, Washington, DC.
———. 2002b. “Institutional and Governance Reviews: A New Type of Eco-nomic and Sector Work.” PREMnotes 75, Poverty Reduction and EconomicManagement Network, World Bank, Washington, DC.
Analyzing the Distributional Impact of Reforms
352
———. 2003a. “Decentralizing Indonesia: A Regional Public Expenditure Over-view Report.” East Asia Poverty Reduction and Economic Management Unit,World Bank, Washington, DC.
———. 2003b. World Development Report 2004: Making Services Work for PoorPeople. New York: Oxford University Press.
———. 2004a. “Measuring Fiscal Decentralization.” Data Note, Decentraliza-tion and Subnational Regional Economics Thematic Group, World Bank,Washington, DC.
———. 2004b. “Citizen Report Card Surveys: A Note on the Concept andMethodology.” Social Development Notes: Participation and Civic Engage-ment 91, World Bank, Washington, DC.
———. 2005a. “Public Sector Governance (PSG) in Operations.” Internalbackground document, Public Sector Group, World Bank, Washington, DC.
———. 2005b. “Examples of Effective Incentives and Mechanisms to Attractand Retain Personnel in Disadvantaged Areas.” Public Sector Group, WorldBank, Washington, DC.
———. 2005c. “Decentralization, Service Delivery, and Governance in Indonesia:Findings from the Governance and Decentralization Survey.” World Bank,Jakarta.
———. 2005d. “Papua Public Expenditure Analysis: Regional Finance andService Delivery in Indonesia’s Most Remote Region.” Report, ProvincialGovernment of Papua, Support Office for Eastern Indonesia, World Bank,Makassar, Jakarta.
Zhuravskaya, E. V. 2000. “Incentives to Provide Local Public Goods: FiscalFederalism, Russian Style.” Journal of Public Economics 76 (3): 337–68.
Decentralization Reforms
353

Macroeconomic Shocks and Policies
B. Essama-Nssah
355
7
The importance of distributional issues in policymaking creates a needfor empirical tools that can help assess the impact of economic shocksand policies on the living standards of relevant individuals. The purpose
of this chapter is therefore to review some of the modeling approaches thatare currently in use at the World Bank and other international financialinstitutions in the evaluation of the impact of macroeconomic shocksand policies on poverty and income distribution. The hope is that theinterested reader might then be able to make an informed choice amongthe reviewed approaches.1
Developing countries face a host of macroeconomic challenges in thedesign and implementation of development strategies and policies. Someof the recurrent issues include (1) fiscal adjustment, (2) monetary policyreforms, (3) trade liberalization, and (4) the impact of terms-of-tradeshocks. Fiscal adjustment involves a modification of government tax,spending, and borrowing policies to achieve a sustainable macroeconomicframework consistent with the objectives of economic growth and povertyreduction. Monetary policy reforms entail control of foreign capital flowsand adjustments in the money supply and in the exchange rate. Tradeliberalization implies a reduction or removal of trade barriers such asquantitative restrictions and tariffs. In fact, trade liberalization has
The author is grateful to Stefano Paternostro, Aline Coudouel, Vijdan Korman, MoatazMostafa Kamel El Said, Hans Löfgren, Delfin S. Go, Oleksiy Ivaschenko, David P. Coady,Limin Wang, and Philippe H. Le Houerou for useful suggestions and insightful commentson an earlier draft. Vijdan Korman also provided excellent support during the preparationof this chapter.
become a prerequisite for participation in the World Trade Organization.Finally, terms-of-trade shocks are important determinants of the perfor-mance of open economies. Many developing countries are, indeed, pri-mary commodity exporters or net oil importers and hence vulnerable tovolatility in the world prices of these commodities.
The need to consider the distributional implications of such macro-economic events stems from at least two basic considerations related tothe goal of development and the heterogeneity of the stakeholders. In thecontext of the Millennium Declaration (United Nations 2000), the inter-national community has included poverty and hunger eradication amongthe basic objectives of development and has thus made poverty reductiona benchmark measure of the performance of socioeconomic systems.This vision is consistent with the notion of development as empower-ment, meaning a process that entails the expansion of the ability of par-ticipants to achieve their freely chosen life plans. In this perspective,poverty is seen as the deprivation of basic capabilities to live the kind oflife that one has reason to value (Sen 1999).
Furthermore, political factors are essential determinants of eco-nomic outcomes, and distributional issues underpin the political dimen-sion of policymaking (understood to include implementation) becauseof the heterogeneity of interests. Heterogeneity may stem from differ-ences in tastes, in resource endowments, or in views of the world. Therecould be conflicts of interest even in situations where the socioeconomicagents are identical ex ante. They may value a good equally, yet be in con-flict over the distribution of the good (Drazen 2000). Approaches to pol-icymaking may be characterized according to whether they account forpolitical constraints arising from a heterogeneity of interests. With noconflict of interest, optimal policies could be found by maximizing theutility of a representative agent. This is essentially the normative approachto policymaking (Dixit 1996). In the positive approach, policymaking isconsidered a political process involving strategic interactions among var-ious socioeconomic agents subject to potential conflict over distribution.
Two basic dimensions define the desirable properties of a policy model:relevance and reliability (Quade 1982). A relevant model focuses on issues ofconcern and on politically significant socioeconomic groups and the inter-actions among them. A reliable model is based on sound analytical linkagesbetween available policy instruments (part of the exogenous variables) andrelevant outcomes such as poverty or inequality (part of the endogenousvariables) to ensure a high degree of confidence in the model’s predictions.Modeling the poverty and distributional impacts of macroeconomicshocks and policies therefore requires a clear understanding of the transmis-
Analyzing the Distributional Impact of Reforms
356
sion channels. This relates to the specification of the linkages among macro-economic shocks and policies, as well as the fundamental determinants ofthe distribution of economic welfare. In the terminology of Bourguignon,Ferreira, and Lustig (2005), macroeconomic events may have three types ofeffects on income distribution: (1) endowment effects represent changes inthe amounts of the resources available to individuals or households; (2) priceeffects translate changes in the remuneration of these resources; (3) finally,occupational effects represent changes in resource allocation.
The outline of the chapter is as follows. The following section focuseson simulation models of the size distribution of an indicator of economicwelfare. In the section, two types of approaches to modeling the size dis-tribution of economic welfare across a population are reviewed. The firstincludes purely statistical models such as POVCAL (Chen, Datt, andRavallion 1991) and SimSIP Poverty (Wodon, Ramadas, and Van derMensbrugghe 2003). These two tools rely on a parameterization of theLorenz curve and, arguably, offer the simplest way of simulating the povertyeffect of macroeconomic shocks and policies. The second approach relieson unit record data and includes (1) PovStat (Datt and Walker 2002), (2) themaximum value or envelope model2 (Chen and Ravallion 2004; Ravallionand Lokshin 2004), and (3) the household income and occupational choicemodel (Bourguignon and Ferreira 2005).
The subsequent section discusses poverty and distributional analysiswithin a general equilibrium framework (Dervis, de Melo, and Robinson1982; Decaluwé et al. 1999).
The penultimate section examines modular approaches to linkingmacroeconomic models to models of income distribution. The sectionfocuses on the 123PRSP model—the name stands for one country, twosectors, and three commodities, and the model is built to feed into themacroeconomic framework for Poverty Reduction Strategy Papers—(Devarajan and Go 2003); the Poverty Analysis Macroeconomic Simu-lator I (PAMS I) (Pereira da Silva, Essama-Nssah, and Samaké 2003);PAMS II (Essama-Nssah 2004, 2005); a macro-micro simulation modelfor Brazil that uses the investment savings–liquidity money (IS-LM)framework for macroeconomic analysis (Ferreira et al. 2004); and theintegrated macroeconomic model for poverty analysis (IMMPA) frame-work, which links a dynamic computable general equilibrium (CGE)model to unit record data (Agénor, Izquierdo, and Jensen 2006).
Concluding remarks are presented in the last section. Table A7.1 in theannex provides a summary description of the tools reviewed in this chapter.
Table 7.1 presents a synoptic view of the modeling approachesdescribed in this chapter, with a focus on three elements: the treatment
Macroeconomic Shocks and Policies
357
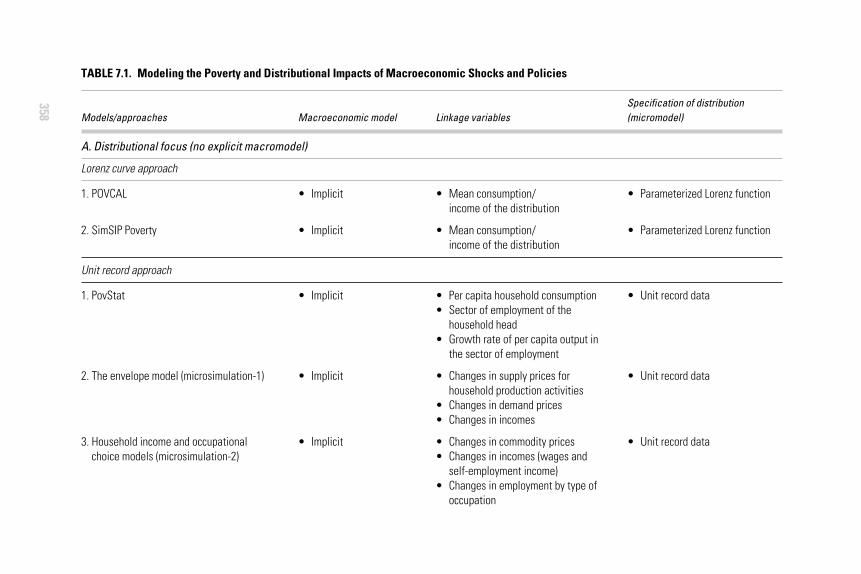
358
TABLE 7.1. Modeling the Poverty and Distributional Impacts of Macroeconomic Shocks and Policies
Specification of distribution Models/approaches Macroeconomic model Linkage variables (micromodel)
A. Distributional focus (no explicit macromodel)
Lorenz curve approach
1. POVCAL
2. SimSIP Poverty
Unit record approach
1. PovStat
2. The envelope model (microsimulation-1)
3. Household income and occupational choice models (microsimulation-2)
• Implicit
• Implicit
• Implicit
• Implicit
• Implicit
• Mean consumption/income of the distribution
• Mean consumption/income of the distribution
• Per capita household consumption• Sector of employment of the
household head• Growth rate of per capita output in
the sector of employment
• Changes in supply prices forhousehold production activities
• Changes in demand prices• Changes in incomes
• Changes in commodity prices• Changes in incomes (wages and
self-employment income)• Changes in employment by type of
occupation
• Parameterized Lorenz function
• Parameterized Lorenz function
• Unit record data
• Unit record data
• Unit record data
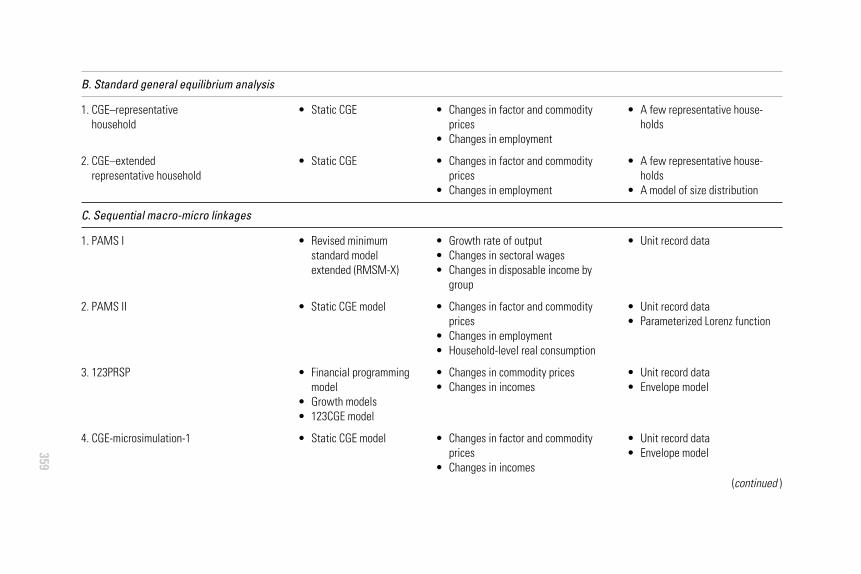
359
B. Standard general equilibrium analysis
1. CGE–representative household
2. CGE–extended representative household
C. Sequential macro-micro linkages
1. PAMS I
2. PAMS II
3. 123PRSP
4. CGE-microsimulation-1
• Static CGE
• Static CGE
• Revised minimumstandard modelextended (RMSM-X)
• Static CGE model
• Financial programmingmodel
• Growth models• 123CGE model
• Static CGE model
• Changes in factor and commodityprices
• Changes in employment
• Changes in factor and commodityprices
• Changes in employment
• Growth rate of output• Changes in sectoral wages• Changes in disposable income by
group
• Changes in factor and commodityprices
• Changes in employment• Household-level real consumption
• Changes in commodity prices• Changes in incomes
• Changes in factor and commodityprices
• Changes in incomes
• A few representative house-holds
• A few representative house-holds
• A model of size distribution
• Unit record data
• Unit record data• Parameterized Lorenz function
• Unit record data• Envelope model
• Unit record data• Envelope model
(continued )
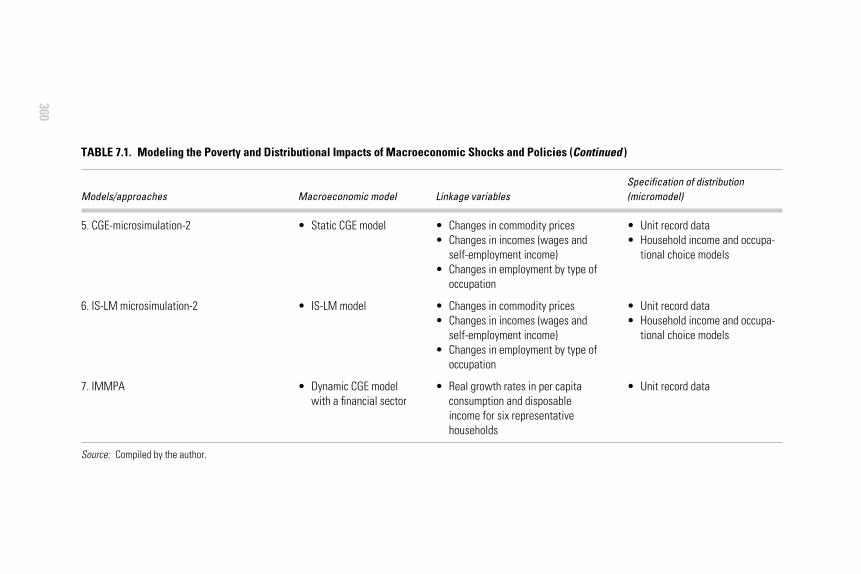
360
5. CGE-microsimulation-2
6. IS-LM microsimulation-2
7. IMMPA
Source: Compiled by the author.
TABLE 7.1. Modeling the Poverty and Distributional Impacts of Macroeconomic Shocks and Policies (Continued )
Specification of distribution Models/approaches Macroeconomic model Linkage variables (micromodel)
• Static CGE model
• IS-LM model
• Dynamic CGE modelwith a financial sector
• Changes in commodity prices• Changes in incomes (wages and
self-employment income)• Changes in employment by type of
occupation
• Changes in commodity prices• Changes in incomes (wages and
self-employment income)• Changes in employment by type of
occupation
• Real growth rates in per capitaconsumption and disposableincome for six representativehouseholds
• Unit record data• Household income and occupa-
tional choice models
• Unit record data• Household income and occupa-
tional choice models
• Unit record data
of the macroeconomic framework, the modeling of the size distribution,and the variables linking the macroeconomic framework to the model ofdistribution. The first category has no explicit macromodel. The secondembeds distributional mechanisms in a general equilibrium model.
The last approach links a macroeconomic model to a distributionmodel in a top-down fashion. All the models reviewed fall within the classof policy models. The specification of such models is dictated by theissues at stake, the knowledge about the nature of the process involved,and the availability and reliability of relevant data. It is impossible to pro-vide, in the context of an overview like this one, enough implementationdetails for each model under consideration. However, an effort has beenmade to include a long list of relevant references, as well as boxes describ-ing examples of the approaches. In addition, the annex to this chaptersupplies a description of many of the tools considered. It also includes anestimation of the cost of implementation and information on appropriatesoftware for some of the tools.
SIMULATION MODELS OF THE SIZE DISTRIBUTION OF INCOME
The idea of simulating the distribution of income among individuals orhouseholds originated in the field of public finance because of the needto have reliable models for the detailed analysis of the incidence of atax-benefit system. The basic idea is to model the distribution of house-hold income and consumption taking household behavior as exogenous,but fully accounting for applicable taxes and transfers (Davies 2004). Toreflect the diversity of the characteristics in a population adequately, thesesimulation models require a nationally representative microdata set. Thefact that household behavior is exogenous means that these accountingmodels can predict only the first-round effects of a tax-benefit policy oninequality and poverty.
All the approaches reviewed in this section are various interpreta-tions of the basic idea underlying tax-benefit simulation models. POV-CAL and SimSIP Poverty illustrate the use of the Lorenz curve for povertyand distributional impact analysis. These two tools are particularly use-ful when only aggregate or grouped data are available. The second classof simulation tools considered under this heading relies on unit recorddata on the distribution of some money-metric measure of economicwelfare at the individual or household level. Three approaches are exam-ined. PovStat uses per capita consumption as a measure of welfare. Thesecond approach relies on the envelope theorem and employs the maximumvalue function to model the determinants of individual welfare (Chen and
Macroeconomic Shocks and Policies
361
Ravallion 2004; Ravallion and Lokshin 2004). The last approach is basedon a reduced-form model of household income generation (Bourguignonand Ferreira 2005). Even though the envelope model and the income-generation models include some aspects of household behavior, thesemicrosimulation models must be viewed as statistical devices to the extentthat they fail to account fully for market adjustment through endogenousprices or the adjustment of the behavior of agents from one equilibriumstate to another (Ferreira and Leite 2003).
The Lorenz curve approach
Given that poverty indexes are computed on the basis of a distribution ofliving standards that is entirely characterized by the mean and by thedegree of inequality, it is reasonable to think of a poverty indicator as afunction of these two factors. In fact, procedures have been developed forthe decomposition of poverty changes into growth and inequality com-ponents (Datt and Ravallion 1992; Kakwani 1993, 1997; Shorrocks 1999).The growth component is associated with a variation in the mean of thedistribution, while the inequality component is linked to a change in aninequality indicator. The Lorenz-based approach to simulating povertyand inequality relies on this basic idea and the fact that most commonpoverty and inequality measures can be recovered from the mean of thedistribution and a fully specified Lorenz function. Indeed, given these twopieces of information about an income distribution, the level of incomeat a given percentile can be recovered from the mean and the first-orderderivative, while the corresponding density can be calculated from themean and the second-order derivative.
Generally speaking, at the most aggregate level, the poverty implicationsof any policy affecting aggregate output (or consumption) can be analyzedwithin this framework. The conclusions from such an analysis hinge onthe assumption maintained about the behavior of inequality. One fre-quently used assumption is distributional neutrality, whereby inequalityis assumed to be constant. Another possibility is to specify a pattern ofchange in inequality. For instance, one can assume a Lorenz-convex trans-formation that entails a distribution-neutral change in everyone’s incomelevel, coupled with a redistribution process that taxes every income at agiven percentage and redistributes the proceeds equally over the entirepopulation (Ferreira and Leite 2003).
Two basic tools are reviewed that are grounded on this framework:POVCAL and SimSIP Poverty. These simulation tools are most conve-nient if distributional data are available only in aggregate form.
Analyzing the Distributional Impact of Reforms
362
POVCAL
The following types of simulations can be performed using POVCAL(Datt 1992, 1998): (1) sensitivity analysis with respect to the poverty line,(2) analysis of the poverty implications of distributionally neutral growth,(3) decomposition of poverty changes into growth and redistributioncomponents, plus a residual, and (4) the contribution to overall povertyof regional or sectoral disparities in mean consumption. As far as policyanalysis is concerned, POVCAL can be used to trace the poverty and dis-tributional implications of any policy that affects the overall mean or thesectoral means.
This tool presents two major limitations for the analysis of the dis-tributional impact of macroeconomic shocks and policies: the modelingof the macroeconomic framework remains implicit, and the level ofaggregation of the household level limits the ability of the tool to accountfor heterogeneity.
For POVCAL, data are expected to be structured in “records” and“subgroups.”3 The number of records is determined by the number ofclass intervals or quantiles in the data. A data set presented in deciles con-tains 10 records. The number of subgroups corresponds to the number ofexhaustive and mutually exclusive socioeconomic groups, for example,rural and urban households.4
Eight data configurations are possible: (1) the cumulative proportionof individuals and the corresponding cumulative proportion of income;(2) the proportion of the population and the associated proportion ofincome; (3) the cumulative proportion of the population and the pro-portion of income; (4) the proportion of the population and the cumu-lative proportion of income; (5) the percentage of people in a given classinterval and the class mean income; (6) the upper bound of the class inter-val, the percentage of the population in the class, and the class meanincome; (7) the upper bound of the class interval, the cumulative propor-tion of the population in the class, and the class mean income; and (8) theupper bound of the class interval and the percentage of the populationin the class.
When the class mean income is unknown, the following rule of thumbis recommended (Chen, Datt, and Ravallion 1991): (1) set the mean forthe poorest class at 80 percent of the upper bound of that class interval;(2) set the mean of the highest class at 30 percent above the lower boundof that class; and (3) use the midpoint for all other classes.
POVCAL will prompt the user for five key inputs: (1) the name ofthe ASCII input data file, (2) the number of subgroups, (3) the numberof records, (4) the type of data configuration (codes 1 through 8), and
Macroeconomic Shocks and Policies
363
(5) the DOS name for the output file. Once this input has been receivedfor each of the two specifications of the Lorenz curve underlying the simu-lation tool, the program provides an estimate of the Lorenz curve, alongwith relevant statistical summary measures. It prompts the user to sup-ply a poverty line and a different estimate of the mean of the distribution(if he/she does not want to use the estimate based on the data).
An application of POVCAL is illustrated in Box 7.1.It is important to make sure that the poverty line is expressed in the
same units as the mean of the distribution. The program then computesthe Gini index of inequality, poverty measures of the Foster-Greer-Thorbecke (1984) family, and the associated elasticities with respect to themean and the Gini index. The computation of the elasticities with respectto the Gini index assumes a Lorenz-convex transformation whereby theLorenz curve shifts proportionately up or down at all points. Finally, theprogram plots the fitted Lorenz curves and the corresponding first andsecond derivatives and provides an assessment of the Lorenz curve thatseems to fit the data most closely.
SimSIP Poverty
SimSIP Poverty is a member of the SimSIP family of simulation tools, acollection of Excel-based modules designed to simulate social indicatorsand poverty. The following inputs are expected for the tool: (1) incomeor consumption distribution by groups (deciles or quintiles), (2) the meanincome or consumption for each group, (3) the population shares for eachgroup, and (4) the relevant poverty lines. Depending on data availability,the analysis can be performed at the national level and for socioeconomicgroups classified by place of residence (urban or rural) or by sector ofemployment (agriculture, manufacturing, and services).
The key limitation on SimSIP Poverty arises because changes in per capita income (or expenditure) and the linkages between macro-economic shocks and policies are exogenous. The tool thus imposes aminimal structure upon the complex relationship between policy instru-ments and poverty outcomes. No behavioral or market adjustment ismodeled explicitly. The reliability of the predictions of the simulator thusdepends on the modeling of the process that engendered the changes inthe means and the accuracy of the population shares that are fed into thesimulator. Another limitation is due to the requirement that the inputdata be aggregated. This implies a loss of information with respect to theheterogeneity of households. In fact, SimSIP Poverty shares these limita-tions with POVCAL.
The use of SimSIP Poverty is illustrated in Box 7.2.
Analyzing the Distributional Impact of Reforms
364
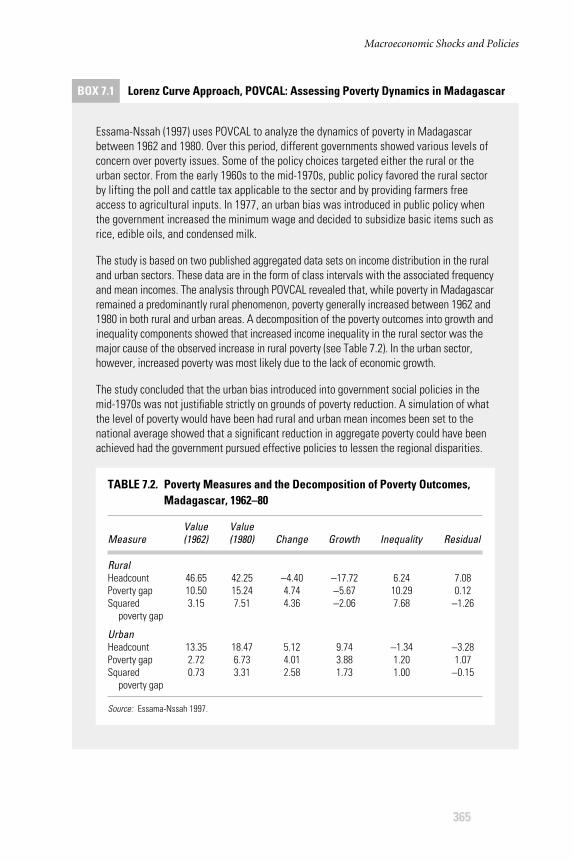
Macroeconomic Shocks and Policies
365
BOX 7.1 Lorenz Curve Approach, POVCAL: Assessing Poverty Dynamics in Madagascar
Essama-Nssah (1997) uses POVCAL to analyze the dynamics of poverty in Madagascarbetween 1962 and 1980. Over this period, different governments showed various levels ofconcern over poverty issues. Some of the policy choices targeted either the rural or theurban sector. From the early 1960s to the mid-1970s, public policy favored the rural sectorby lifting the poll and cattle tax applicable to the sector and by providing farmers freeaccess to agricultural inputs. In 1977, an urban bias was introduced in public policy whenthe government increased the minimum wage and decided to subsidize basic items such asrice, edible oils, and condensed milk.
The study is based on two published aggregated data sets on income distribution in the ruraland urban sectors. These data are in the form of class intervals with the associated frequencyand mean incomes. The analysis through POVCAL revealed that, while poverty in Madagascarremained a predominantly rural phenomenon, poverty generally increased between 1962 and1980 in both rural and urban areas. A decomposition of the poverty outcomes into growth andinequality components showed that increased income inequality in the rural sector was themajor cause of the observed increase in rural poverty (see Table 7.2). In the urban sector,however, increased poverty was most likely due to the lack of economic growth.
The study concluded that the urban bias introduced into government social policies in themid-1970s was not justifiable strictly on grounds of poverty reduction. A simulation of whatthe level of poverty would have been had rural and urban mean incomes been set to thenational average showed that a significant reduction in aggregate poverty could have beenachieved had the government pursued effective policies to lessen the regional disparities.
TABLE 7.2. Poverty Measures and the Decomposition of Poverty Outcomes, Madagascar, 1962–80
Value Value Measure (1962) (1980) Change Growth Inequality Residual
RuralHeadcount 46.65 42.25 −4.40 −17.72 6.24 7.08Poverty gap 10.50 15.24 4.74 −5.67 10.29 0.12Squared 3.15 7.51 4.36 −2.06 7.68 −1.26
poverty gap
UrbanHeadcount 13.35 18.47 5.12 9.74 −1.34 −3.28Poverty gap 2.72 6.73 4.01 3.88 1.20 1.07Squared 0.73 3.31 2.58 1.73 1.00 −0.15
poverty gap
Source: Essama-Nssah 1997.
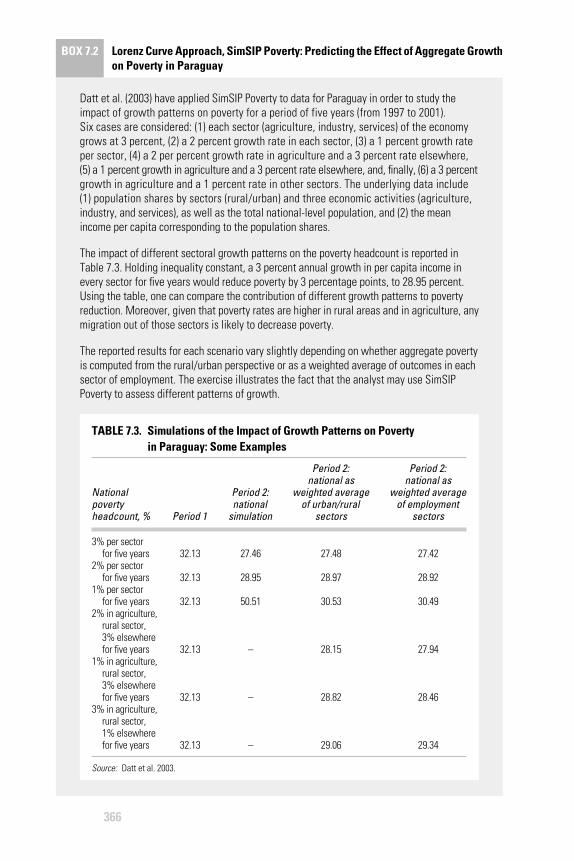
BOX 7.2 Lorenz Curve Approach, SimSIP Poverty: Predicting the Effect of Aggregate Growthon Poverty in Paraguay
366
Datt et al. (2003) have applied SimSIP Poverty to data for Paraguay in order to study theimpact of growth patterns on poverty for a period of five years (from 1997 to 2001). Six cases are considered: (1) each sector (agriculture, industry, services) of the economygrows at 3 percent, (2) a 2 percent growth rate in each sector, (3) a 1 percent growth rateper sector, (4) a 2 per percent growth rate in agriculture and a 3 percent rate elsewhere,(5) a 1 percent growth in agriculture and a 3 percent rate elsewhere, and, finally, (6) a 3 percentgrowth in agriculture and a 1 percent rate in other sectors. The underlying data include(1) population shares by sectors (rural/urban) and three economic activities (agriculture,industry, and services), as well as the total national-level population, and (2) the meanincome per capita corresponding to the population shares.
The impact of different sectoral growth patterns on the poverty headcount is reported inTable 7.3. Holding inequality constant, a 3 percent annual growth in per capita income inevery sector for five years would reduce poverty by 3 percentage points, to 28.95 percent.Using the table, one can compare the contribution of different growth patterns to povertyreduction. Moreover, given that poverty rates are higher in rural areas and in agriculture, anymigration out of those sectors is likely to decrease poverty.
The reported results for each scenario vary slightly depending on whether aggregate povertyis computed from the rural/urban perspective or as a weighted average of outcomes in eachsector of employment. The exercise illustrates the fact that the analyst may use SimSIPPoverty to assess different patterns of growth.
TABLE 7.3. Simulations of the Impact of Growth Patterns on Poverty in Paraguay: Some Examples
Period 2: Period 2: national as national as
National Period 2: weighted average weighted average poverty national of urban/rural of employment headcount, % Period 1 simulation sectors sectors
3% per sector for five years 32.13 27.46 27.48 27.42
2% per sector for five years 32.13 28.95 28.97 28.92
1% per sector for five years 32.13 50.51 30.53 30.49
2% in agriculture, rural sector, 3% elsewhere for five years 32.13 – 28.15 27.94
1% in agriculture, rural sector, 3% elsewhere for five years 32.13 – 28.82 28.46
3% in agriculture, rural sector, 1% elsewhere for five years 32.13 – 29.06 29.34
Source: Datt et al. 2003.
Computations are based on a parameterization of the Lorenzcurve. Two parameterizations are provided by the general quadraticand the Beta models. For robust poverty comparisons over time andamong sectors, the simulator produces poverty dominance and Lorenzcurves. It also computes the Gini coefficient, poverty measures of theFoster-Greer-Thorbecke family, and the associated elasticities withrespect to growth and inequality. Any member of this family for a givengroup can be written as a weighted sum of poverty within all the sub-groups. The weights are equal to the population shares. Based on thisfact, SimSIP Poverty provides decompositions of poverty outcomes inthree components. The first component represents change in within-group poverty. The second term measures the effects of populationshifts among groups. The last component captures the interactionbetween inter- and within-group effects (see Ravallion and Huppi 1991for details). It is also possible to decompose changes in poverty overtime into the following contributing factors: growth, inequality, and aresidual. These decompositions require two sets of observations on thedistribution of income or expenditure. This is the same approach dis-cussed above in the case of POVCAL.
Unit-record-based approaches
PovStat
PovStat is an Excel-based tool primarily designed to simulate thepoverty implications of alternative growth paths. This simulation toolarose out of the basic idea that the rate and pattern of economicgrowth determine the evolution of poverty over time. In particular, itis assumed that per capita consumption for a household grows at the samerate as per capita output in the sector of employment of the head of thehousehold. Households are classified into four sectors on the basis ofthe employment status of the head: (1) agriculture, (2) industry, (3)services, and (4) residual. The residual sector amalgamates householdswith unemployed or inactive heads and those with unknown occupa-tional status.
A major advantage of PovStat over SimSIP Poverty stems from theuse of unit-level data. This has the potential to improve the precisionof the estimates of the poverty and inequality measures. Otherwise, thetool shares in the major limitations that have been flagged for POV-CAL and SimSIP Poverty: (1) there is no explicit modeling of themacroeconomic framework, and (2) there is a loss of informationabout the heterogeneity of households because the sectoral classifica-tion of households is based on the status of the heads of household.
Macroeconomic Shocks and Policies
367
Finally, the flexibility provided in setting assumptions about changesin inequality comes at the price of an increased uncertainty in theresults.
The two key inputs are country-specific unit record household-leveldata representing the distribution of living standards for a base year anda set of user-supplied projection parameters characterizing the paths ofgrowth. Household-level data involve six variables that must be submit-ted to the simulator in the following order: (1) a household identifier, (2)monthly per capita consumption in local currency units for the base year,(3) household weight (or a population expansion factor), (4) an urbandummy, (5) household size, and (6) sector of employment of the house-hold head.
For each year within the projection horizon, the per capita consump-tion for each household is computed recursively using a growth rate that isequal to the rate of per capita output. The latter is calculated as the realgrowth in gross domestic product (GDP) in the sector of employment of thehead of household, minus the rate of population growth in that sector. Forthe first three sectors, the sectoral population growth rate is computed fromthe overall population growth rate and an adjustment factor that dependson the share of each sector in total employment and sector-specific growthrates of employment. The population in the residual sector is assumed togrow at the same rate as the overall population. Household weights are alsoadjusted recursively using sectoral rates of population growth.
Assuming that inequality within sectors remains constant, PovStatcomputes the following indicators for the forecast horizon: (1) povertymeasures of the Foster-Greer-Thorbecke family, (2) the number of peo-ple below the poverty line, (3) mean monthly per capita consumption,(4) Gini coefficients, (5) two inequality measures of the generalizedentropy family, and (6) the variance of log consumption per person.
In general, the simulation framework offers the user the opportunityto control the simulation process by setting the following parameters: (1)the forecast horizon, (2) the poverty line, (3) the base and survey years,(4) the survey-year population, (5) the country’s purchasing power par-ity exchange rate, (6) the base and survey-year consumer price indexes(CPIs), (7) the sectoral output growth rates for each projection year, (8)the population growth rates and employment growth rates for each pro-jection year, (9) the survey-year sectoral GDP and employment shares,(10) the GDP deflator and the CPI for each projection year, (11) changesin the relative price of food by year, (12) the share of food in the bundledefining the poverty line, (13) the share of food in the CPI, (14) thechange in the Gini within each sector for each projection year, (15)
Analyzing the Distributional Impact of Reforms
368
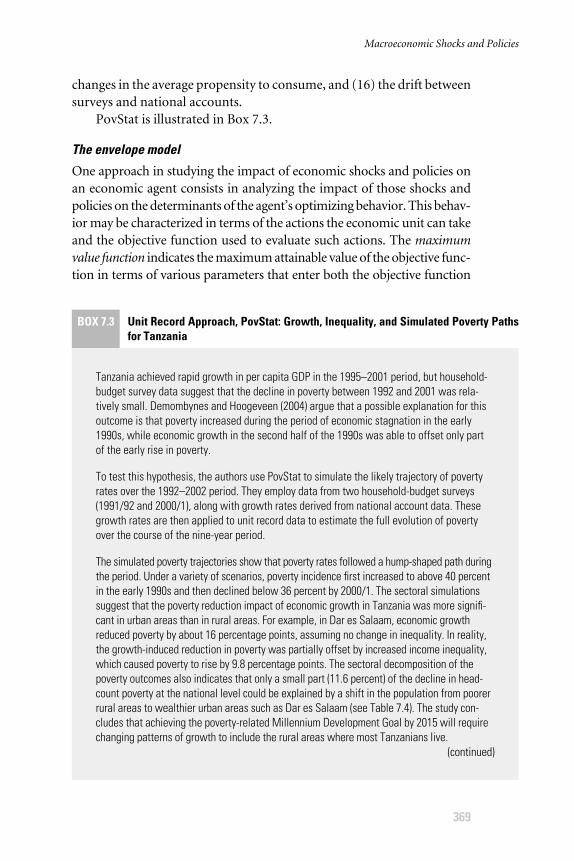
Macroeconomic Shocks and Policies
369
BOX 7.3 Unit Record Approach, PovStat: Growth, Inequality, and Simulated Poverty Pathsfor Tanzania
Tanzania achieved rapid growth in per capita GDP in the 1995–2001 period, but household-budget survey data suggest that the decline in poverty between 1992 and 2001 was rela-tively small. Demombynes and Hoogeveen (2004) argue that a possible explanation for thisoutcome is that poverty increased during the period of economic stagnation in the early1990s, while economic growth in the second half of the 1990s was able to offset only partof the early rise in poverty.
To test this hypothesis, the authors use PovStat to simulate the likely trajectory of povertyrates over the 1992–2002 period. They employ data from two household-budget surveys(1991/92 and 2000/1), along with growth rates derived from national account data. Thesegrowth rates are then applied to unit record data to estimate the full evolution of povertyover the course of the nine-year period.
The simulated poverty trajectories show that poverty rates followed a hump-shaped path duringthe period. Under a variety of scenarios, poverty incidence first increased to above 40 percentin the early 1990s and then declined below 36 percent by 2000/1. The sectoral simulationssuggest that the poverty reduction impact of economic growth in Tanzania was more signifi-cant in urban areas than in rural areas. For example, in Dar es Salaam, economic growthreduced poverty by about 16 percentage points, assuming no change in inequality. In reality,the growth-induced reduction in poverty was partially offset by increased income inequality,which caused poverty to rise by 9.8 percentage points. The sectoral decomposition of thepoverty outcomes also indicates that only a small part (11.6 percent) of the decline in head-count poverty at the national level could be explained by a shift in the population from poorerrural areas to wealthier urban areas such as Dar es Salaam (see Table 7.4). The study con-cludes that achieving the poverty-related Millennium Development Goal by 2015 will requirechanging patterns of growth to include the rural areas where most Tanzanians live.
changes in the average propensity to consume, and (16) the drift betweensurveys and national accounts.
PovStat is illustrated in Box 7.3.
The envelope model
One approach in studying the impact of economic shocks and policies onan economic agent consists in analyzing the impact of those shocks andpolicies on the determinants of the agent’s optimizing behavior. This behav-ior may be characterized in terms of the actions the economic unit can takeand the objective function used to evaluate such actions. The maximumvalue function indicates the maximum attainable value of the objective func-tion in terms of various parameters that enter both the objective function
(continued)
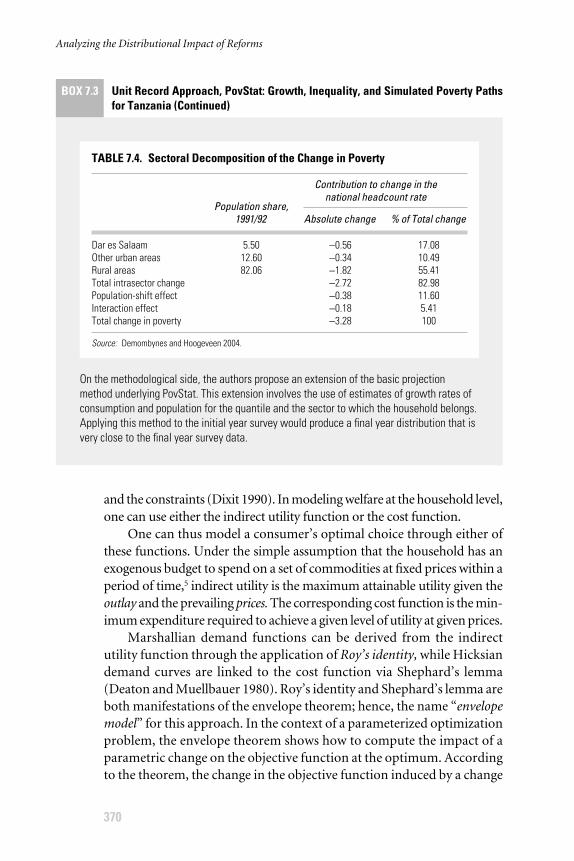
and the constraints (Dixit 1990). In modeling welfare at the household level,one can use either the indirect utility function or the cost function.
One can thus model a consumer’s optimal choice through either ofthese functions. Under the simple assumption that the household has anexogenous budget to spend on a set of commodities at fixed prices within aperiod of time,5 indirect utility is the maximum attainable utility given theoutlay and the prevailing prices. The corresponding cost function is the min-imum expenditure required to achieve a given level of utility at given prices.
Marshallian demand functions can be derived from the indirectutility function through the application of Roy’s identity, while Hicksiandemand curves are linked to the cost function via Shephard’s lemma(Deaton and Muellbauer 1980). Roy’s identity and Shephard’s lemma areboth manifestations of the envelope theorem; hence, the name “envelopemodel” for this approach. In the context of a parameterized optimizationproblem, the envelope theorem shows how to compute the impact of aparametric change on the objective function at the optimum. Accordingto the theorem, the change in the objective function induced by a change
Analyzing the Distributional Impact of Reforms
370
BOX 7.3 Unit Record Approach, PovStat: Growth, Inequality, and Simulated Poverty Pathsfor Tanzania (Continued)
On the methodological side, the authors propose an extension of the basic projectionmethod underlying PovStat. This extension involves the use of estimates of growth rates ofconsumption and population for the quantile and the sector to which the household belongs.Applying this method to the initial year survey would produce a final year distribution that isvery close to the final year survey data.
TABLE 7.4. Sectoral Decomposition of the Change in Poverty
Contribution to change in the
Population share,national headcount rate
1991/92 Absolute change % of Total change
Dar es Salaam 5.50 −0.56 17.08Other urban areas 12.60 −0.34 10.49Rural areas 82.06 −1.82 55.41Total intrasector change −2.72 82.98Population-shift effect −0.38 11.60Interaction effect −0.18 5.41Total change in poverty −3.28 100
Source: Demombynes and Hoogeveen 2004.
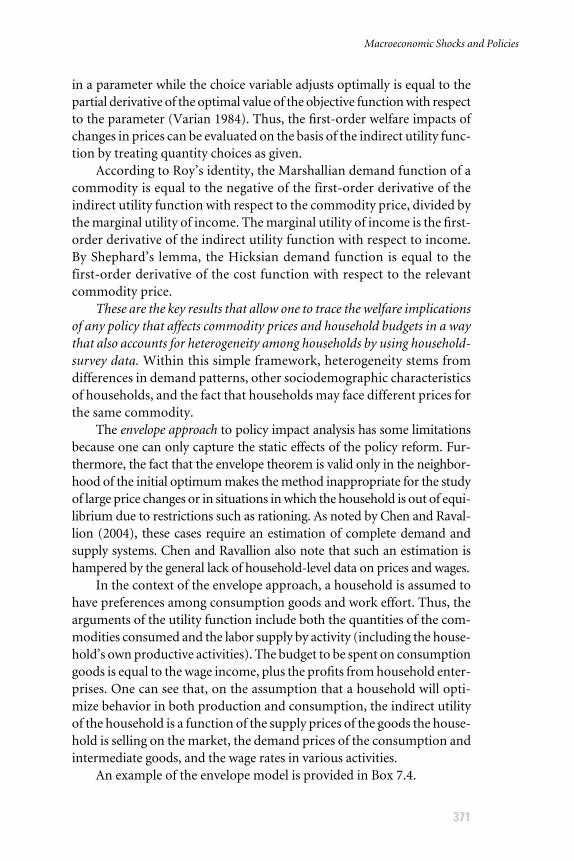
in a parameter while the choice variable adjusts optimally is equal to thepartial derivative of the optimal value of the objective function with respectto the parameter (Varian 1984). Thus, the first-order welfare impacts ofchanges in prices can be evaluated on the basis of the indirect utility func-tion by treating quantity choices as given.
According to Roy’s identity, the Marshallian demand function of acommodity is equal to the negative of the first-order derivative of theindirect utility function with respect to the commodity price, divided bythe marginal utility of income. The marginal utility of income is the first-order derivative of the indirect utility function with respect to income.By Shephard’s lemma, the Hicksian demand function is equal to thefirst-order derivative of the cost function with respect to the relevantcommodity price.
These are the key results that allow one to trace the welfare implicationsof any policy that affects commodity prices and household budgets in a waythat also accounts for heterogeneity among households by using household-survey data. Within this simple framework, heterogeneity stems fromdifferences in demand patterns, other sociodemographic characteristicsof households, and the fact that households may face different prices forthe same commodity.
The envelope approach to policy impact analysis has some limitationsbecause one can only capture the static effects of the policy reform. Fur-thermore, the fact that the envelope theorem is valid only in the neighbor-hood of the initial optimum makes the method inappropriate for the studyof large price changes or in situations in which the household is out of equi-librium due to restrictions such as rationing. As noted by Chen and Raval-lion (2004), these cases require an estimation of complete demand andsupply systems. Chen and Ravallion also note that such an estimation ishampered by the general lack of household-level data on prices and wages.
In the context of the envelope approach, a household is assumed tohave preferences among consumption goods and work effort. Thus, thearguments of the utility function include both the quantities of the com-modities consumed and the labor supply by activity (including the house-hold’s own productive activities). The budget to be spent on consumptiongoods is equal to the wage income, plus the profits from household enter-prises. One can see that, on the assumption that a household will opti-mize behavior in both production and consumption, the indirect utilityof the household is a function of the supply prices of the goods the house-hold is selling on the market, the demand prices of the consumption andintermediate goods, and the wage rates in various activities.
An example of the envelope model is provided in Box 7.4.
Macroeconomic Shocks and Policies
371
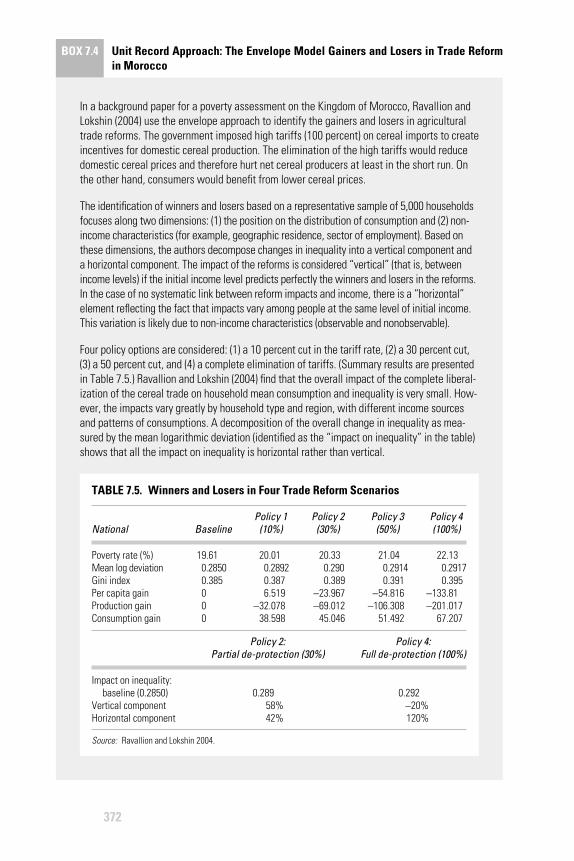
372
BOX 7.4 Unit Record Approach: The Envelope Model Gainers and Losers in Trade Reformin Morocco
In a background paper for a poverty assessment on the Kingdom of Morocco, Ravallion andLokshin (2004) use the envelope approach to identify the gainers and losers in agriculturaltrade reforms. The government imposed high tariffs (100 percent) on cereal imports to createincentives for domestic cereal production. The elimination of the high tariffs would reducedomestic cereal prices and therefore hurt net cereal producers at least in the short run. Onthe other hand, consumers would benefit from lower cereal prices.
The identification of winners and losers based on a representative sample of 5,000 householdsfocuses along two dimensions: (1) the position on the distribution of consumption and (2) non-income characteristics (for example, geographic residence, sector of employment). Based onthese dimensions, the authors decompose changes in inequality into a vertical component anda horizontal component. The impact of the reforms is considered “vertical” (that is, betweenincome levels) if the initial income level predicts perfectly the winners and losers in the reforms.In the case of no systematic link between reform impacts and income, there is a “horizontal”element reflecting the fact that impacts vary among people at the same level of initial income.This variation is likely due to non-income characteristics (observable and nonobservable).
Four policy options are considered: (1) a 10 percent cut in the tariff rate, (2) a 30 percent cut,(3) a 50 percent cut, and (4) a complete elimination of tariffs. (Summary results are presentedin Table 7.5.) Ravallion and Lokshin (2004) find that the overall impact of the complete liberal-ization of the cereal trade on household mean consumption and inequality is very small. How-ever, the impacts vary greatly by household type and region, with different income sourcesand patterns of consumptions. A decomposition of the overall change in inequality as mea-sured by the mean logarithmic deviation (identified as the “impact on inequality” in the table)shows that all the impact on inequality is horizontal rather than vertical.
TABLE 7.5. Winners and Losers in Four Trade Reform Scenarios
Policy 1 Policy 2 Policy 3 Policy 4 National Baseline (10%) (30%) (50%) (100%)
Poverty rate (%) 19.61 20.01 20.33 21.04 22.13Mean log deviation 0.2850 0.2892 0.290 0.2914 0.2917Gini index 0.385 0.387 0.389 0.391 0.395Per capita gain 0 6.519 −23.967 −54.816 −133.81Production gain 0 −32.078 −69.012 −106.308 −201.017Consumption gain 0 38.598 45.046 51.492 67.207
Policy 2: Policy 4: Partial de-protection (30%) Full de-protection (100%)
Impact on inequality: baseline (0.2850) 0.289 0.292
Vertical component 58% −20%Horizontal component 42% 120%
Source: Ravallion and Lokshin 2004.
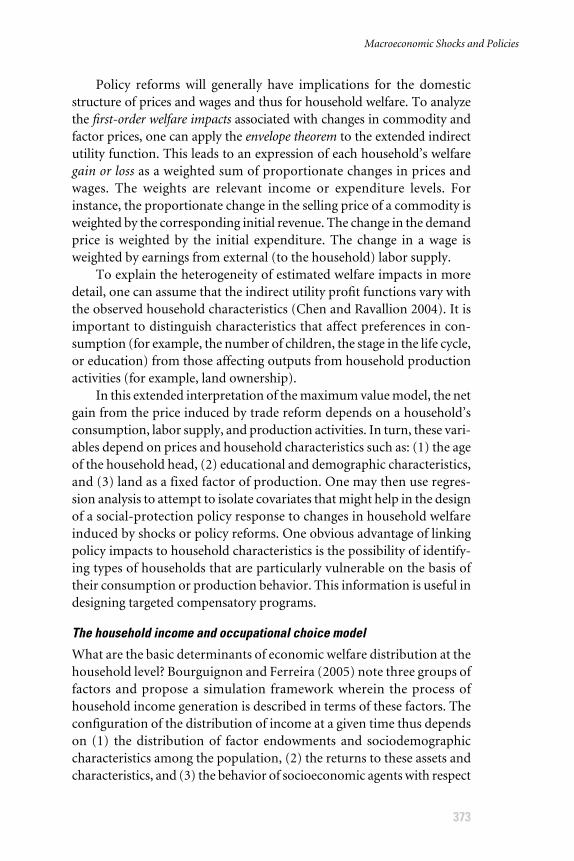
Policy reforms will generally have implications for the domesticstructure of prices and wages and thus for household welfare. To analyzethe first-order welfare impacts associated with changes in commodity andfactor prices, one can apply the envelope theorem to the extended indirectutility function. This leads to an expression of each household’s welfaregain or loss as a weighted sum of proportionate changes in prices andwages. The weights are relevant income or expenditure levels. Forinstance, the proportionate change in the selling price of a commodity isweighted by the corresponding initial revenue. The change in the demandprice is weighted by the initial expenditure. The change in a wage isweighted by earnings from external (to the household) labor supply.
To explain the heterogeneity of estimated welfare impacts in moredetail, one can assume that the indirect utility profit functions vary withthe observed household characteristics (Chen and Ravallion 2004). It isimportant to distinguish characteristics that affect preferences in con-sumption (for example, the number of children, the stage in the life cycle,or education) from those affecting outputs from household productionactivities (for example, land ownership).
In this extended interpretation of the maximum value model, the netgain from the price induced by trade reform depends on a household’sconsumption, labor supply, and production activities. In turn, these vari-ables depend on prices and household characteristics such as: (1) the ageof the household head, (2) educational and demographic characteristics,and (3) land as a fixed factor of production. One may then use regres-sion analysis to attempt to isolate covariates that might help in the designof a social-protection policy response to changes in household welfareinduced by shocks or policy reforms. One obvious advantage of linkingpolicy impacts to household characteristics is the possibility of identify-ing types of households that are particularly vulnerable on the basis oftheir consumption or production behavior. This information is useful indesigning targeted compensatory programs.
The household income and occupational choice model
What are the basic determinants of economic welfare distribution at thehousehold level? Bourguignon and Ferreira (2005) note three groups offactors and propose a simulation framework wherein the process ofhousehold income generation is described in terms of these factors. Theconfiguration of the distribution of income at a given time thus dependson (1) the distribution of factor endowments and sociodemographiccharacteristics among the population, (2) the returns to these assets andcharacteristics, and (3) the behavior of socioeconomic agents with respect
Macroeconomic Shocks and Policies
373
to resource allocation, subject to prevailing institutional constraints. Thisbehavior is reflected in labor market participation and occupationalchoice, consumption patterns, or fertility choices.
Based on this view, the household-income-generation process canbe described parametrically through a set of four equations: (1) an occu-pation equation, (2) a wage equation, (3) a self-employment income equa-tion, and (4) an equation for the computation of household per capitaincome. The occupational equation, which is based on a multinomial logitmodel, describes how household members of working age allocate theirtime among wage work, self-employment, and nonmarket activities. Theallocation of the workforce across activities depends on observed charac-teristics specific to the individual and the household to which he or shebelongs. The allocation also depends on a set of unobserved variables rep-resented by random variables that are assumed to follow the law of extremevalues and to be identically and independently distributed across individ-uals and activities. Given the discrete choice model underlying the alloca-tion of the labor force, the occupation equation determines the likelihoodthat a working-age member of a household will be a wage earner, self-employed, or a non-earner. This likelihood depends on individual char-acteristics such as education, age, and experience. It is also a function ofhousehold characteristics such as education of the household head, house-hold size, the dependency ratio, and the place of residence.
The wage equation follows the Mincerian specification, whereby thelogarithm of earnings in a given occupation is a linear function of individ-ual characteristics and random variables that are assumed to follow thestandard normal distribution and to be distributed identically and inde-pendently across individuals and occupations. Self-employment income issimilarly modeled. The wage and self-employment equations are estimatedon the basis only of individuals and households with nonzero earnings orself-employment income. There is thus a need to correct for selection bias.
One approach is to use Heckman’s two-stage estimator. Given theprevious three equations of the model, the last equation of the model com-putes the per capita household income in two steps. First, total householdincome is obtained from the aggregation, across individuals and activi-ties, of earnings and self-employment income with unearned income.Second, total household income is divided by household size.
To avoid the difficulties associated with the joint estimation of the par-ticipation and earnings equations for each household member, the modelis estimated in reduced form. Thus, results should never be regarded ascorresponding to a structural model, and no causal inference is implied.Bourguignon and Ferreira (2005) explain that the parameters generated
Analyzing the Distributional Impact of Reforms
374
by these equations are merely descriptions of conditional distributionsbased on the chosen functional forms.
The model can be used to analyze changes in household income dis-tribution in a manner analogous to the Oaxaca-Blinder decomposition ofchanges in mean income (Bourguignon and Ferreira 2005). Within theOaxaca-Blinder framework, the income of an individual is viewed as alinear function of his or her observed characteristics, say, endowments,and some unobserved characteristics represented by a random variable.The linear coefficients are interpreted as rates of return to individualendowments or the prices of the services from these endowments. If theunobserved characteristics are distributed independently of the endow-ments, then one can use ordinary least squares to estimate the rates ofreturn. If one also assumes that the expected value of the residual term isequal to zero, then the change in mean earnings can be expressed as thesum of two effects: (1) the endowment effect (associated with a change inthe mean endowment at constant prices) and (2) the price effect (associ-ated with a change in prices at constant mean endowments).
The interpretation of the above decomposition within the household-income-generation model generalizes the counterfactual simulation tech-niques from the single earnings equation model to a system of multiplenonlinear equations that is meant to represent mechanisms of householdincome generation; hence, the name “generalized Oaxaca-Blinder decom-position.” The approach entails simulating counterfactual distributions,changing market and household behavior one aspect at a time (ceterisparibus), and noting the effect of each change on the distribution of eco-nomic welfare. Three major effects may thus be identified: (1) endow-ment effects, (2) price effects, and (3) occupational effects.
The household income and occupational choice model is demon-strated in Box 7.5.
EMBEDDING DISTRIBUTIONAL MECHANISMS IN A GENERAL EQUILIBRIUM MODEL
The distributional models reviewed in the section above have only a lim-ited application to the analysis of the impacts of macroeconomic shocksand policies on poverty and income distribution. This limitation stemsmainly from the fact that these approaches fail to account fully for variousmarket and household behavioral adjustments induced by the shocks orpolicies. This is the basic reason why these frameworks are interpreted asreduced-form models. The reliability of their predictions depends on thereliability of the assumptions made about the impact of macroeconomic
Macroeconomic Shocks and Policies
375
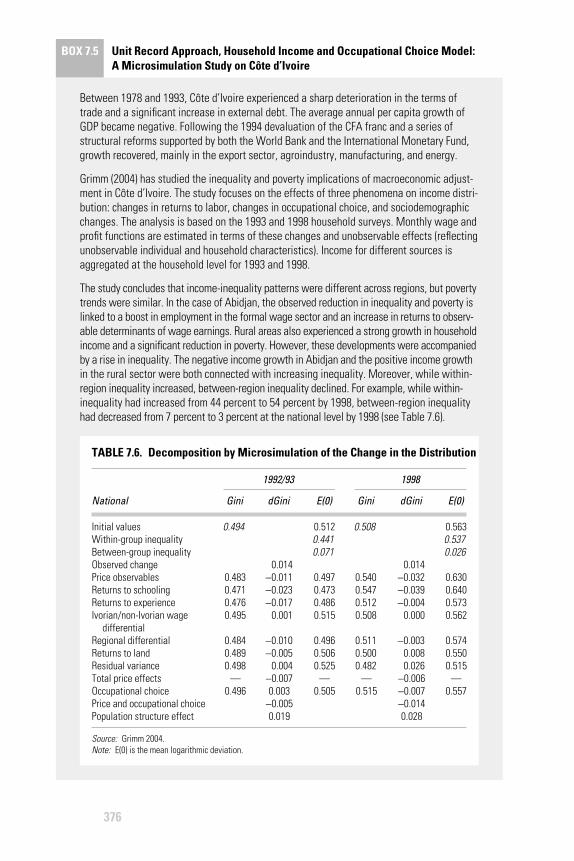
376
BOX 7.5 Unit Record Approach, Household Income and Occupational Choice Model: A Microsimulation Study on Côte d’Ivoire
Between 1978 and 1993, Côte d’Ivoire experienced a sharp deterioration in the terms oftrade and a significant increase in external debt. The average annual per capita growth ofGDP became negative. Following the 1994 devaluation of the CFA franc and a series ofstructural reforms supported by both the World Bank and the International Monetary Fund,growth recovered, mainly in the export sector, agroindustry, manufacturing, and energy.
Grimm (2004) has studied the inequality and poverty implications of macroeconomic adjust-ment in Côte d’Ivoire. The study focuses on the effects of three phenomena on income distri-bution: changes in returns to labor, changes in occupational choice, and sociodemographicchanges. The analysis is based on the 1993 and 1998 household surveys. Monthly wage andprofit functions are estimated in terms of these changes and unobservable effects (reflectingunobservable individual and household characteristics). Income for different sources isaggregated at the household level for 1993 and 1998.
The study concludes that income-inequality patterns were different across regions, but povertytrends were similar. In the case of Abidjan, the observed reduction in inequality and poverty islinked to a boost in employment in the formal wage sector and an increase in returns to observ-able determinants of wage earnings. Rural areas also experienced a strong growth in householdincome and a significant reduction in poverty. However, these developments were accompaniedby a rise in inequality. The negative income growth in Abidjan and the positive income growthin the rural sector were both connected with increasing inequality. Moreover, while within-region inequality increased, between-region inequality declined. For example, while within-inequality had increased from 44 percent to 54 percent by 1998, between-region inequalityhad decreased from 7 percent to 3 percent at the national level by 1998 (see Table 7.6).
TABLE 7.6. Decomposition by Microsimulation of the Change in the Distribution
1992/93 1998
National Gini dGini E(0) Gini dGini E(0)
Initial values 0.494 0.512 0.508 0.563Within-group inequality 0.441 0.537Between-group inequality 0.071 0.026Observed change 0.014 0.014Price observables 0.483 −0.011 0.497 0.540 −0.032 0.630Returns to schooling 0.471 −0.023 0.473 0.547 −0.039 0.640Returns to experience 0.476 −0.017 0.486 0.512 −0.004 0.573Ivorian/non-Ivorian wage 0.495 0.001 0.515 0.508 0.000 0.562
differentialRegional differential 0.484 −0.010 0.496 0.511 −0.003 0.574Returns to land 0.489 −0.005 0.506 0.500 0.008 0.550Residual variance 0.498 0.004 0.525 0.482 0.026 0.515Total price effects — −0.007 — — −0.006 —Occupational choice 0.496 0.003 0.505 0.515 −0.007 0.557Price and occupational choice −0.005 −0.014Population structure effect 0.019 0.028
Source: Grimm 2004.Note: E(0) is the mean logarithmic deviation.
shocks and policies on the key exogenous variables. General equilibriummodels can be used to introduce more structure in the analysis.
In this section, the logic of general equilibrium modeling is firstreviewed. Two ways of modeling distributional mechanisms are thenexamined based on two key sources: Dervis, de Melo, and Robinson (1982)and Decaluwé et al. (1999).
The logic of general equilibrium modeling
What is a general equilibrium model?
A general equilibrium model is a logical representation of a socioeconomicsystem wherein the behavior of all participants is compatible. The keymodeling issues thus entail the following: (1) the identification of the par-ticipants, (2) the specification of individual behavior, (3) the mode ofinteraction among socioeconomic agents, and (4) the characterization ofcompatibility.
The basic Walrasian framework serves as a template for most appliedgeneral equilibrium models. There are two basic categories of agents: con-sumers and producers, which are also referred to as households and firms.The behavior of each economic agent is supposed to conform to the opti-mization principle, which holds that the agent attempts to implement thebest feasible action. Thus, modeling optimizing behavior entails the speci-fication of (1) actions that an economic unit can undertake, (2) the con-straints it faces, and (3) the objective function used to evaluate such actions(Varian 1984). Within this framework, each household buys the bestbundle of commodities it can afford. The objective that guides householdchoice is therefore utility maximization, and the constraints are expressedin terms of budget constraints. Choices by a firm are characterized byprofit maximization, subject to technological and market constraints.
Households and firms are supposed to interact through a networkof perfectly competitive markets. Market interaction is a mode of socialcoordination through a mutual adjustment among participants based onquid pro quo (Lindblom 2001).6 Market participants are buyers andsellers whose supply and demand behavior is an observable consequenceof the optimization assumption. In this setting, behavioral compatibil-ity is described in terms of market equilibrium. General equilibrium isachieved by an incentive configuration (as represented through relativeprices) such that, for each market, the amount demanded is equal to theamount supplied. Alternatively, we can say that, when the economic sys-tem is in a state of general equilibrium, no feasible change in individualbehavior is worthwhile, and no desirable change is feasible.
Macroeconomic Shocks and Policies
377
Comparative statics entail a comparison of the equilibrium statesassociated with changes in the socioeconomic environment. Suchchanges may be induced by shocks or policy reforms. The comparisonof equilibrium states can be framed within a social evaluation. The eval-uation has two perspectives: individual and social. If one focuses onindividual objectives, then Pareto efficiency implies that no participantcan be made better off without making some other participant worseoff. A poverty-focused criterion would say that less poverty is preferableto more.
Empirical implementation
For policy analysis, one needs to move from a conceptual framework toa computable model. Applied general equilibrium models are commonlyrepresented by systems of equations. These equations fall into the fol-lowing basic categories: (1) demand equations from the optimizingbehavior of consumers, (2) supply equations from the optimizing behav-ior of firms, (3) income equations describing the income of each agentbased on prevailing prices and the quantities exchanged on goods andfactors markets, and (4) equilibrium conditions for all markets. All sup-ply and demand equations are homogeneous of degree zero. If one mul-tiplies all commodity and factor prices by a constant factor k, theequilibrium supply and demand will not change. Thus, the model ismoney neutral and can determine only relative prices. This creates theneed to normalize the price system by fixing a numéraire price. Themodel also satisfies Walras’ Law. Accordingly, if all economic agents sat-isfy their budget constraints and all but one of the markets are in equi-librium, then the last market must automatically be in equilibrium(Dinwiddy and Teal 1988).
The choice of the functional forms determines the set of structuralparameters that must be estimated to make the model computable. Thenecessary data usually come in the form of a social accounting matrix(SAM). The matrix reflects the circular flow of economic activity for thechosen year. It provides an analytically integrated data set that reflectsvarious aspects of the economy, such as production, consumption,trade, accumulation, and income distribution. A SAM is a square matrix,the dimension of which is determined by the institutional setting under-lying the economy under consideration. Each account is represented bya combination of one row and one column with the same label. Each entryrepresents a payment to a row account by a column account. Thus,all receipts into an account are read along the corresponding row, while
Analyzing the Distributional Impact of Reforms
378
payments by the same account are recorded in the corresponding column.In accordance with the principles of double-entry bookkeeping, the wholeconstruct is subject to a consistency restriction that makes the columnsums equal to the corresponding row sums. This restriction also meansthat the SAM obeys Walras’ Law in the sense that, for an n-dimensionalmatrix, if the (n−1) accounts balance, so must the last one. Table 7.7 showsthe structure of a SAM for a model of an open economy.
For the purpose of analyzing the impact of macroeconomic shocksand policies on poverty and income distribution, it is important to under-stand how shocks and policies affect key macroeconomic balances before con-sidering how the repercussions are transmitted to households. In general, themacroeconomic properties of a static general equilibrium model of a realeconomy such as the one described here depend on the closure rule cho-sen. Such a rule refers to the equilibrating mechanisms governing prod-uct and factor markets, as well as the following three basic macrobalances:the balance of trade, the government budget balance, and the savings-investment balance. The inevitable inclusion of these macrobalances inthe basic Walrasian framework requires the specification of a correspond-ing flow equilibrium condition for which a closure rule has to be stated(Robinson and Löfgren 2005).
Robinson (2003) discusses four possible closures for this class ofmodels. Two of these assume the full employment of factors of produc-tion, while the other two do not. Assuming that output is a function of twofactors of production (capital and labor), there are 10 potential closurevariables: the GDP deflator, the wage rate, the exchange rate, investmentdemand, the trade balance, labor supply, the government consumptionof goods and services, capital, the savings rate, and the income tax rate.Closure rules differ on the basis of which three (the number of macrobal-ances in the model) of these 10 variables are made endogenous, while allthe rest are exogenous.
The first full-employment closure, also known as neoclassical, con-siders the wage rate, the exchange rate, and investment demand asendogenous variables. The second full-employment closure considersthe wage rate, the exchange rate, and the balance of trade as endogenous.Closure rules that assume unemployment are known as Keynesian. Thefirst rule makes the GDP deflator, the exchange rate, and labor supplyendogenous. For the second rule, the endogenous variables are the GDPdeflator, the trade balance, and labor supply. It is worth noting that theGDP deflator is a numéraire price in the full employment case, while thewage rate plays that role in the Keynesian case.
Macroeconomic Shocks and Policies
379
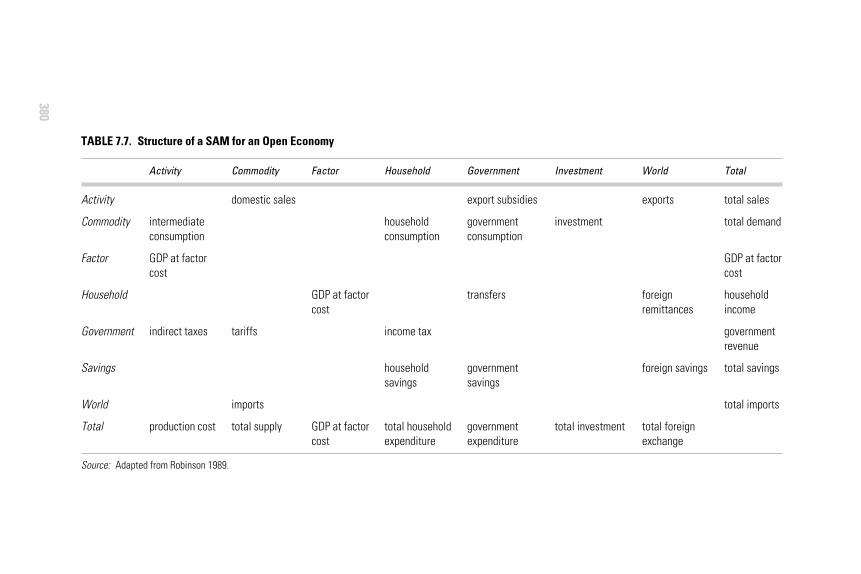
380
TABLE 7.7. Structure of a SAM for an Open Economy
Activity Commodity Factor Household Government Investment World Total
Activity
Commodity
Factor
Household
Government
Savings
World
Total
domestic sales
tariffs
imports
total supply
GDP at factorcost
GDP at factorcost
householdconsumption
income tax
householdsavings
total householdexpenditure
export subsidies
governmentconsumption
transfers
governmentsavings
governmentexpenditure
investment
total investment
exports
foreignremittances
foreign savings
total foreignexchange
total sales
total demand
GDP at factorcost
householdincome
governmentrevenue
total savings
total imports
Source: Adapted from Robinson 1989.
intermediateconsumption
GDP at factorcost
indirect taxes
production cost
A further examination of the neoclassical rule illustrates the types ofanalytical restrictions that such rules place on a general equilibriummodel for the purpose of macroeconomic analysis. This rule makes thecurrent account balance7 exogenous, along with savings rates and gov-ernment expenditure. Given that the current account balance is relatedto the functioning of the asset market, making it exogenous means thatthe corresponding flow of funds must be added to or subtracted fromthe savings-investment account (in the SAM). Equivalently, the budgetconstraint of at least one agent includes an exogenous net asset change(Robinson and Löfgren 2005). This closure rule leaves unexplained thedecision of households to save at fixed rates and the allocation by house-holds of savings across different assets.
With respect to the government account, it is commonly assumedthat government expenditure (both consumption and transfers) is fixedin real terms and that government revenue depends on fixed tax rates.The government deficit or surplus is computed residually and added tothe savings-investment account without any consideration of the specificfinancial mechanisms involved.
The above discussion clearly shows that a general equilibrium modelbased on this closure will certainly be useful in tackling the medium- tolong-term structural implications of a shock or a policy that works throughindividual markets, provided it is sufficiently disaggregated to account forpolicy-relevant sectors. The model, however, would have a limited abilityto deal with flow-of-funds issues related to the determination of aggregatesavings, the savings-investment balance, and the allocation of investmentacross the production sector. This requires the addition of financial mech-anisms to the general equilibrium model.
Robinson and Tyson (1984) offer an illustration through an exampleof a terms-of-trade shock and the interdependence between structuralissues that are essentially microeconomic in nature and aggregate flow-of-funds issues that are basically macroeconomic. They also suggest a frame-work for analyzing this interdependence and the implications for policytrade-offs and effectiveness. The basic idea is to link a proper macroeconomicmodel to a Walrasian general equilibrium model through variables that areendogenous in one, but exogenous in the other. For instance, a macromodelmay treat the price level and various macroeconomic aggregates, such asemployment, investment, and consumption, as endogenous. These vari-ables may then be specified as exogenous in the general equilibrium model.However, the closure rules for macrobalances and factor markets must bedesigned in such a way that the general equilibrium model behaves in amanner that is consistent with the outcome of the macromodel.
Macroeconomic Shocks and Policies
381
Modeling distributional mechanisms
Dervis, de Melo, and Robinson (1982) note that policymakers might beinterested in how income is distributed among the following: (1) factorsof production, (2) institutions, (3) socioeconomic groups, (4) house-holds, and (5) individuals. Distribution to factors of production is knownas functional distribution, while distribution to individuals is called sizedistribution. The choice of the Walrasian framework with a neoclassicalclosure focuses analysis on the microeconomic determinants of incomedistribution based on relative factor intensities in production and theinteraction among supply, demand, and employment.
A sufficiently disaggregated SAM provides a data framework formappings among various types of distributions of income. Referring backto Table 7.7, we note that the functional distribution of income is givenby the intersection of the factor-row and the activity-column. Depend-ing on data availability, this functional distribution can be disaggregatedby sector of production (agriculture, industry, and services) and by laborcategories if the labor market is segmented. When, in addition, factors ofproduction are disaggregated so that labor is differentiated by skill, edu-cation, or sector of employment and capital is differentiated by type, sec-tor, or region, we get what Löfgren, Robinson, and El-Said (2003) call theextended functional distribution of income.
GDP at market prices that includes indirect taxes is distributedamong various institutions such as households, enterprises, and govern-ment.8 Government revenue from all taxes is spent on export subsidies,government consumption, and transfers to households. The residual isput in the capital account. This framework does not explain various flowsof funds related to the activities of the central bank, such as money cre-ation or credit and interest rate policies. Therefore, it would be difficultto analyze the distributional implications of these macroeconomic poli-cies within this model. Both the functional and institutional distributionsclassify flows of funds according to the functional (factor employment)and institutional structure of the economy.
The household account in the SAM actually stands for all the peoplein the economy and may in fact cover all nongovernmental institutions,including enterprises. Thus, the distributions by socioeconomic groups,households, and individuals are various representations of the distribu-tion of income within this account (Dervis, de Melo, and Robinson 1982).The classification of individuals or households by socioeconomic group is dic-tated by policy issues and data availability. One simple scheme differenti-ates groups by type and source of income. Given an exhaustive andmutually exclusive partition of the entire population into socioeconomic
Analyzing the Distributional Impact of Reforms
382
groups, it is possible to derive the overall size distribution of income as aweighted sum of within-group density functions. Using the log varianceas an indicator of relative inequality, overall inequality can be decom-posed into within-group and between-group components. Thus, ceterisparibus, an increase in inequality in any one group or an increase in thedistance between one group’s average income and the overall meanincome will boost overall inequality. Given that the overall size distributionis derived empirically, one can compute any desired measure of inequalityor poverty (given a poverty line). In the simulation of the inequality impli-cations of shocks and policies, only between-group inequality can be generatedendogenously by this framework through changes in group means. This isbecause within-group distributions are exogenous.
The fact that the overall distribution of income is derived numericallyas a weighted sum of individual group distributions makes it possible toallow the functional form to vary from group to group. The lognormaldistribution that has often been used in this context is known to providea poor approximation of the distribution at the upper extreme. Onecould use the Pareto distribution for high-income groups. Employing adifferent function for every within-group distribution increases the abil-ity of the model to capture the heterogeneity of socioeconomic groups.Decaluwé et al. (1999) use the Beta distribution to this effect. This func-tion is fully characterized by the minimum income, the maximum income,and two shape parameters defining the skewness of the distribution. In amodel of an archetypical developing country, these authors allow the fourcharacteristic parameters of the Beta distribution to vary across six socio-economic groups: (1) landless rural households, (2) rural smallholders,(3) big landlords, (4) urban households with poorly educated heads,(5) urban households with highly educated heads, and (6) capitalists.9
Instead of aggregating group distributions into an overall distribution, theauthors compute, for each group, poverty measures of the Foster-Greer-Thorbecke family. Overall poverty can then be inferred as a weighted sumof within-group poverty whereby the weights are given by populationshares. Decaluwé et al. (1999) allow the nominal poverty line to be deter-mined within the model. The value of the reference basket of goods is adjustedon the basis of equilibrium prices computed by the model.
An application of the CGE model is shown in Box 7.6.The basic idea underlying the approach discussed here involves link-
ing an extended functional distribution to a size distribution of income.Various socioeconomic groups are considered as representative house-holds. This approach is thus called the extended representative household(ERH) approach to distinguish it from the standard representative house-
Macroeconomic Shocks and Policies
383
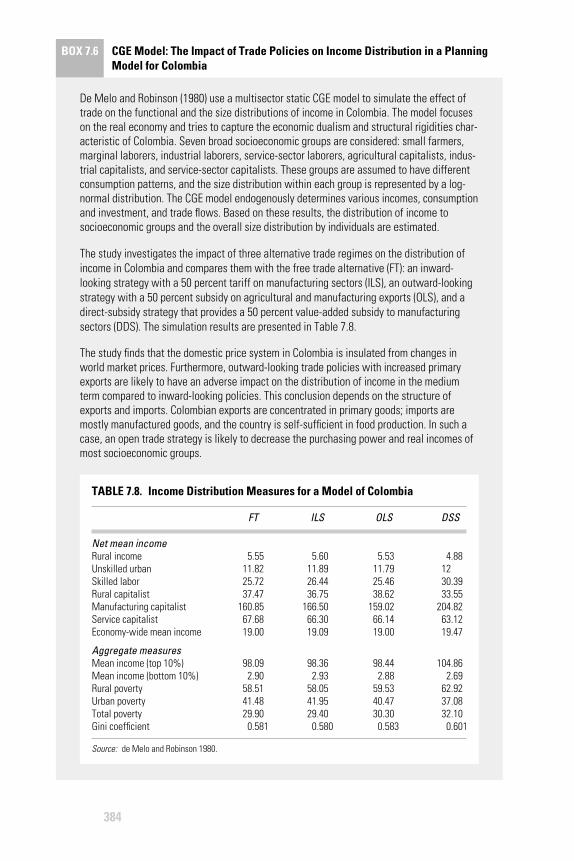
384
BOX 7.6 CGE Model: The Impact of Trade Policies on Income Distribution in a PlanningModel for Colombia
De Melo and Robinson (1980) use a multisector static CGE model to simulate the effect oftrade on the functional and the size distributions of income in Colombia. The model focuseson the real economy and tries to capture the economic dualism and structural rigidities char-acteristic of Colombia. Seven broad socioeconomic groups are considered: small farmers,marginal laborers, industrial laborers, service-sector laborers, agricultural capitalists, indus-trial capitalists, and service-sector capitalists. These groups are assumed to have differentconsumption patterns, and the size distribution within each group is represented by a log-normal distribution. The CGE model endogenously determines various incomes, consumptionand investment, and trade flows. Based on these results, the distribution of income tosocioeconomic groups and the overall size distribution by individuals are estimated.
The study investigates the impact of three alternative trade regimes on the distribution ofincome in Colombia and compares them with the free trade alternative (FT): an inward-looking strategy with a 50 percent tariff on manufacturing sectors (ILS), an outward-lookingstrategy with a 50 percent subsidy on agricultural and manufacturing exports (OLS), and adirect-subsidy strategy that provides a 50 percent value-added subsidy to manufacturingsectors (DDS). The simulation results are presented in Table 7.8.
The study finds that the domestic price system in Colombia is insulated from changes inworld market prices. Furthermore, outward-looking trade policies with increased primaryexports are likely to have an adverse impact on the distribution of income in the mediumterm compared to inward-looking policies. This conclusion depends on the structure ofexports and imports. Colombian exports are concentrated in primary goods; imports aremostly manufactured goods, and the country is self-sufficient in food production. In such acase, an open trade strategy is likely to decrease the purchasing power and real incomes ofmost socioeconomic groups.
TABLE 7.8. Income Distribution Measures for a Model of Colombia
FT ILS OLS DSS
Net mean incomeRural income 5.55 5.60 5.53 4.88Unskilled urban 11.82 11.89 11.79 12Skilled labor 25.72 26.44 25.46 30.39Rural capitalist 37.47 36.75 38.62 33.55Manufacturing capitalist 160.85 166.50 159.02 204.82Service capitalist 67.68 66.30 66.14 63.12Economy-wide mean income 19.00 19.09 19.00 19.47
Aggregate measuresMean income (top 10%) 98.09 98.36 98.44 104.86Mean income (bottom 10%) 2.90 2.93 2.88 2.69Rural poverty 58.51 58.05 59.53 62.92Urban poverty 41.48 41.95 40.47 37.08Total poverty 29.90 29.40 30.30 32.10Gini coefficient 0.581 0.580 0.583 0.601
Source: de Melo and Robinson 1980.
hold (RH) approach, which limits the analysis of the distributionalimpact of shocks and policies to their effects on representative socioeco-nomic groups. There is one other way of implementing the ERHapproach (discussed in Agénor, Chen, and Grimm 2004). The treatmentof the size distribution in this case is analogous to the approach underly-ing PovStat. Indeed, it is assumed that, following a shock or the imple-mentation of a policy, per capita consumption and disposable income fora household change at the same rate as the rate predicted by the generalequilibrium model for the socioeconomic group to which the householdbelongs.10 Thus, the size distribution is represented directly by relevantunit records from a household survey. Following a shock or the imple-mentation of a policy, a new distribution of income and consumption isgenerated by applying the predicted rates of change to the initial data.New measures of poverty and inequality can therefore be computed andcompared to baseline values.
This approach can only predict changes in between-group inequalitybecause the income and consumption of all the households belonging toa single socioeconomic group are scaled (up or down) by the same factor.Another limitation noted by the authors is the fact that the approach doesnot account for changes in the structure of employment. Therefore, theypropose an extension of the approach based on a reweighing procedurethat reassigns population weights to households in a manner that is con-sistent with predicted changes in the structure of employment.
LINKING A MACROECONOMIC FRAMEWORK TO A MODEL OF INCOME DISTRIBUTION
To be sure, both the standard RH and the ERH approaches reveal thebasic principles involved in linking a macroeconomic model to a repre-sentation of the distribution of economic welfare across individuals orhouseholds. This section focuses on some specific models (tools) that havebeen built more or less around these principles. The first one described isthe 123PRSP model, a three-layer and parsimonious framework designedto link macroeconomic policies to poverty outcomes via a two-sectorgeneral equilibrium model of an open economy.
Two implementations of the PAMS framework are then considered.The first interpretation of this framework uses the ERH approach basedon unit records to simulate the poverty impact of macroeconomic shocksand policies analyzed within a macroconsistency model such as the RevisedMinimum Standard Model Extended (RMSM-X). The second interpre-tation is a reduced form of the first, whereby a CGE model is linked
Macroeconomic Shocks and Policies
385
recursively (in a top-down fashion) to a poverty module built upon aparameterization of the Lorenz curve à la POVCAL.
A different macro-micro simulation model is then reviewed, whereinthe macroeconomy is represented by an IS-LM model.
Finally, the IMMPA framework is described briefly. The frameworklinks a dynamic CGE model including a financial sector to a distribu-tional module that is analogous to PovStat.
Given the distributional concerns, these models must ultimately be judgedon the basis of how well they use the wealth of available information (fromnational accounts and household surveys) to explain the interdependenceamong sectors and institutions and the heterogeneity of actors. Naturally, ina particular environment, additional criteria come into play, such as theskills required of the analyst in implementing a given approach.
The 123PRSP model
The 123PRSP model is based on the idea that the impact on poverty ofmacroeconomic shocks and policies is transmitted through two basicchannels. The first channel involves distributional-neutral changes in theaverage income, while the second is the change in the sectoral pattern ofgrowth induced by changes in relative prices (for example, shifts in the realexchange rate). The overall impact is thus equal to the pure growthimpact, plus the distributional impact.
This idea is implemented within a three-layer model. The macrolayerhas three components: (1) a financial programming model, (2) a trivariatevector autoregressive (VAR) model, and (3) a medium-term growthmodel based on cross-country regression analysis. The meso- (or inter-mediate) layer is represented by a two-sector general equilibrium modelof an open economy. Finally, the microlayer relies on the envelope theo-rem to model the distribution of welfare across households.
The financial programming module
Generally speaking, financial programming is the process of designinga consistent set of macroeconomic policies, whereby instruments (forexample, domestic credit) are set in such a way that a target variable(official reserves, for instance) follows a desired trajectory. In the contextof policy reform programs supported by the International Monetary Fund,this approach is used to set monetary and fiscal policies aimed at restrainingaggregate demand and adjusting relative prices. Financial programmingcan be described in terms of the underlying accounting framework thatimposes consistency upon data and any prediction based on assumed
Analyzing the Distributional Impact of Reforms
386
behavioral relationships or projection rules.11 The approach emphasizesthe monetary dimension of the balance of payments and relates themonetary and fiscal accounts to the balance of payments.
The economy is divided into four institutional sectors: (1) the pri-vate sector, (2) the public (government) sector, (3) the foreign sector orthe rest of the world, and (4) the domestic banking sector. Each sectorin the economy is represented by a budget that constrains its behavior,and all variables are measured in nominal local currency. Within thisframework, financial transactions are distinguished from those arisingfrom the production or acquisition of goods and services (also knownas income/expenditure transactions). It is assumed that the private sectorowns all factors of production. The private sector gets nominal incomefrom the sale of current output. This income is used to pay taxes to thegovernment, purchase goods for consumption, and make investments.Any disposable income after expenditure is used to accumulate financialassets or liabilities in the form of money, foreign assets, and borrowingfrom the banking system.
The public sector collects taxes from the private sector and uses theproceeds for consumption. Any surplus or deficit is accounted for by theaccumulation of financial assets or liabilities in the form of foreign assetsand net borrowing from the banking system. The foreign sector gets rev-enues from the sale of imports to the domestic economy. It spends ondomestic exports. In the case of a current account deficit, the revenues ofthe foreign sector exceed its expenditures. The foreign sector can buy backits liabilities from the domestic private and public sectors and acquiresreserves from the domestic banking system. The financial sector func-tions as a financial intermediary among various actors. It obtains assetsin the form of international reserves and claims on domestic actors andissues its own liabilities in the form of money to the private sector.
These budget constraints are not independent; they represent anoverall resource constraint on the economy. This resource constraint canbe expressed as follows: the difference between gross national disposableincome and domestic absorption is equal to the current account balance.12
The linkages among these sectoral accounts imply that a deficit in anysector must be financed by savings in other sectors. For the whole econ-omy, excess spending is possible only if financing is available from therest of the world. The relationship between excess absorption and thecurrent account balance shows that an improvement in the latter may beachieved through an increase in the country’s output or a reduction inabsorption. Furthermore, the sum of the current account balance and netcapital inflows is equal to the change in net official reserves. This identity
Macroeconomic Shocks and Policies
387
connects excess absorption (over income) to two financing sources: cap-ital inflows to the nonbanking sector and official international reserves.This clearly shows that the current account balance acts as a resourceconstraint on the whole economy (IMF 1987).
The basic structure of the financial programming model can beunderstood by focusing on the case of a small open economy with a fixedexchange rate, which is known as the Polak model (Agénor 2004a; Polak1998; IMF 1987). In this context, the money supply is viewed as anendogenous variable that depends on changes in the balance of payments.
The core model contains four relationships. The first relationship isan accounting identity based on the balance sheet of the banking system.13
Accordingly, the change in the money supply (a liability for the bankingsystem) equals the sum of the change in net official reserves and thechange in net domestic credit (that is, the sum of changes in the foreignand domestic assets held by the banking system). The second relationshipdefines the change in the nominal demand for money as the change in thenominal income multiplied by the inverse of the income velocity ofmoney, which is assumed to be constant over time. The third relation-ship defines flow equilibrium in the money market. The last relationshiprestates the balance of payments identity as follows: the change in officialreserves is equal to exports, minus imports, plus the change in net capi-tal inflows to the nonbanking system. Exports are assumed to be exoge-nous, while imports are computed as national income multiplied by aconstant marginal propensity to import.
The design of a financial program involves an iterative processbased on the following five steps (IMF 1987): (1) Set the target for thechange in the official reserves. (2) Use the last relationship (the balanceof payments identity) to compute residually a value for imports that isconsistent with the reserve target and the assumed level of the exoge-nous variables (exports and the change in net capital flows to the non-banking sector). (3) Project nominal income and use the projection,along with the assumed values for the income velocity of money and themarginal propensity to import, to obtain the demands for money andimports. (4) Given a forecast of the money demand (equal to the moneysupply in equilibrium) and the target for official reserves, use the balance-sheet identity of the banking system (first equation) to infer thechange in domestic credit that is compatible with the target for officialreserves and the desired increase in nominal money balances. (5) Checkfor consistency by comparing the projected imports with the residualvalue computed from the balance of payments identity in step 2. If thetwo values are equal, stop the process; if not, make adjustments to the
Analyzing the Distributional Impact of Reforms
388
underlying assumptions and repeat the process until consistency isachieved.
Monetary and fiscal policy can be linked through the financial pro-gramming framework by distinguishing the expansion of credit to theprivate sector from that to the public sector (IMF 1987). Thus, the totalchange in the domestic assets of the banking system appearing in thebalance-sheet identity must now include two components: (1) the changein domestic credit to the government and (2) the change in domesticcredit to the private sector. Similarly, the total change in foreign capitalinflows to the nonbanking sector has two components: public and pri-vate. Finally, a relationship must be added to reflect the fact that the gov-ernment can finance its budget deficit through net borrowing either fromabroad or from the domestic banking system.
The growth module
The growth module has two components. The first is a trivariate VARmodel designed to capture an improvement or deterioration in the termsof trade or other short-run growth impact that is produced by a shock ora change in government expenditure or other short-run growth impactthat is produced by a policy reform. The VAR model is a useful tool foranalyzing interrelationships among different time series. In this frame-work, all variables are endogenous because of the assumption that the timepath of each variable affects and is affected by current and past realizationsof the other variables. A VAR model may be characterized by the numberof variables (time series) and the longest lag length (Enders 1995). Thus,a first-order bivariate VAR would involve two variables and a lag lengthof at most one. The random disturbances in the VAR framework areknown as innovations or shocks. A shock in one variable not only affectsthat variable directly, but is also transmitted to all the other variables,depending on the lag structure of the model. A VAR can be written as avector moving-average of the shocks, from which one can derive impulseresponse functions. An impulse response function represents the behaviorof time series in response to various shocks. The 123PRSP frameworkincludes the following three variables: the growth rate, the real exchangerate, and either the terms of trade or government expenditure. The param-eter estimates based on impulse response functions are interpreted as short-run growth elasticities.
The second component of the growth module is a cross-countryregression model (Easterly 2001) designed to capture the impact of macro-economic policies on long-run growth. The model involves three groupsof independent variables. The first group includes policy determinants of
Macroeconomic Shocks and Policies
389
growth: (1) a black market premium, (2) a measure of financial devel-opment (M2/GDP),14 (3) inflation, (4) the real exchange rate, (5) secon-dary education enrollment, and (6) telephone lines per 1,000 individuals(a proxy for infrastructure stock). The second group of variables capturesthe impact of shocks such as: (1) the terms of trade as a percentage of GDP,(2) the interest on external debt as a percentage of GDP, and (3) growthamong trading partners of the Organisation for Economic Co-operationand Development. Finally, variables measuring initial conditions include(1) initial income, (2) an intercept, (3) a dummy variable for the 1980s,and (4) a dummy variable for the 1990s.
The two-sector general equilibrium model
The mesolayer of the 123PRSP is represented by a two-sector generalequilibrium model of a small open economy. The model is a generaliza-tion of the Salter-Swan framework, which provides a foundation for thestudy of the impact of macroeconomic imbalances and adjustmentpolicies on the real sector of the economy. This single-country model(as opposed to a multicountry trade model) represents a significantimprovement on both the standard neoclassical trade model and theSalter-Swan model. The neoclassical model often leads to implausibleempirical results because of two basic assumptions. The first assumptionstates that all goods are tradable, while the second implies perfect substi-tutability between foreign and domestic goods. These two assumptionsimply the law of one price, according to which the domestic prices oftradable goods and services are determined by the world market.
The Salter-Swan framework makes an important distinction betweentradable and nontradable goods and services. Nontradables are goods andservices the prices of which are determined by supply and demand con-ditions within domestic markets. Prices for tradable goods are deter-mined by the world market. The fact that a good is nontradable may bedue to its nature (such as public services or construction) or to prohibi-tive transport costs that keep the good off the world market. Thus, somepolicy changes may cause some goods to switch categories. Further-more, the country under consideration is assumed to be small withrespect to international trade and therefore faces a perfectly elasticexcess supply from the rest of the world. In other words, it cannot affectthe terms at which it is trading with the rest of the world. Exportableand importable goods can therefore be aggregated into a single class ofgood, tradables, using world prices as weights. The model still main-tains the neoclassical assumption that domestic and foreign goods areperfect substitutes in consumption and focuses on the effects of external
Analyzing the Distributional Impact of Reforms
390
shocks on the real exchange rate, which ultimately directs resource allo-cation within the economy.
The extensions of this framework as implemented within the 123PRSPdrop the assumptions about aggregation and perfect substitution andexplicitly add government, savings, and investment.15 These extensionsallow the inclusion of policy instruments such as taxes, as well as the con-sideration of macroeconomic effects. These extensions are now brieflydescribed. (See Devarajan, Lewis, and Robinson 1990 for a more detailedpresentation.)
The small country assumption is maintained; thus, the country can-not affect its terms of trade with the rest of the world. There are two sec-tors of production. The first produces exports, and the second producesall other final goods, which are referred to as domestic (home) goods.Real GDP is an aggregation of exports and domestic goods based on aconstant elasticity of transformation function.16 The supply of exportsrelative to domestic goods is obtained by maximizing GDP, subject to thetechnical transformability constraint (above) and sales opportunities athome and abroad.
Consumption is expressed in terms of a composite good that is anaggregation of home goods and imports based on a constant elasticity ofsubstitution function. The demand for imports and for domestic goodsis derived by minimizing the cost of the composite good, subject to a substi-tutability constraint represented by the elasticity of substitution function.The representative household is assumed to save a constant fraction of itsdisposable income. Gross income is the sum of GDP, transfers from thepublic sector, and remittances from abroad.
The domestic prices of exports and imports are calculated from worldprices, the exchange rate, and all applicable taxes. The GDP deflator is aweighted average of the domestic price of exports and that of home goods.The weights are the shares of each commodity in GDP. Similarly, theaggregate price of the composite consumption good is a weighted averageof the domestic prices of imports and home goods.
Two types of equilibrium conditions are explicitly stated. The firstgroup concerns commodity market equilibrium: (1) the supply of homegoods equals the demand, and (2) the supply of the composite good equalsthe demand, which includes private consumption, investment, andgovernment consumption (assumed to be fixed in real terms). The othergroup of conditions pertains to macroeconomic balances: (1) the currentaccount balance is fixed; (2) total savings (the sum of private, public, andforeign savings) equals investment, and (3) government revenue fromdirect and indirect taxes is accounted for by government consumption,
Macroeconomic Shocks and Policies
391
transfers, and savings. There are also implicit equilibrium conditions asso-ciated with the use of the constant elasticity of transformation production-possibility frontier. This assumption is a cover for the operation of factormarkets (labor and capital). Indeed, it is equivalent to assuming fullemployment in a single labor market within the economy. In this staticmodel, capital is assumed to be fixed and sector specific. Thus, there isan equilibrium wage rate associated with each equilibrium price forhome goods. Returns to capital in each sector can be computed residuallyfrom the value of output.
The financial programming model and the growth module trace themacroeconomic implications of shocks and policies. In particular, thesetwo submodules produce information on the evolution of GDP that isconsistent with the underlying macroeconomic framework over the rel-evant horizon. The 1-2-3 model then takes this information and com-putes the structural implications induced by a change in relative prices.This is a key link in the chain of transmission from macroeconomicevents to poverty. Based on the distinction between tradable and non-tradable commodities, the real exchange rate is defined as the price oftradables relative to nontradable goods. An increase in domestic pricesrelative to world prices is known as an appreciation of the real exchangerate, while a decrease marks a depreciation. Real appreciation of theexchange rate, for instance, shifts incentives in favor of domestic goodsrelative to exports. The final outcome depends on the structural charac-teristics of the economy as revealed by the elasticity of transformationand of substitution.
The microlayer
The purpose of the microlayer is to translate the solution of the 1-2-3general equilibrium model into changes in household welfare. For anymacroeconomic event worked out within the macroeconomic frame-work, the general equilibrium model computes the corresponding changesin income (wages and profit) by sector (tradable and nontradable) andthe changes in commodity prices (imports and home goods). The con-struction of the household module follows the envelope approach (dis-cussed elsewhere above). Here, the indirect utility is a function of the wagerate, sectoral profits, and commodity prices. These are the linkage variablesbetween the meso- and the microlayers. Thus, the first-order approxi-mation of the welfare impact of a macroshock at the household level isequal to the sum of three components: (1) the initial level of laborincome multiplied by the relative change in the wage rate, (2) the changein profit income, and (3) the sum over commodities of the product of
Analyzing the Distributional Impact of Reforms
392
the negative of the initial consumption and the relative change in thecommodity price.17
For the empirical implementation, distributions of income and expen-diture by deciles are derived from available household-survey data. Thereare three income sources: wages, profits from the home goods sector, andprofits from the exports sector. Consumption expenditure is dividedbetween imports and domestic goods. Heterogeneity among households isthus reflected by differences in the sources of incomes and in the patterns ofconsumption. This helps capture the differential impacts among house-holds of shocks and policies.
Consider, for instance, a cut in public expenditure that falls mainly onnontradable goods. If there is sufficient structural flexibility, the inducedfall in the price of nontradables will lead to a real depreciation in theexchange rate. The production of tradable goods will increase, while thatof nontradables will decline. The welfare impact at the household levelwill depend on whether a household is a net seller or a net buyer of trad-able goods. Net sellers would gain, while net buyers would lose. Once thesedifferential impacts are computed, standard techniques can be used toderive the desired poverty and inequality measures. However, it is impor-tant to keep in mind that, even when abundant and relevant household-leveldata are available, the ability of a modular framework such as 123PRSP toaccount for heterogeneity is constrained by the degree of disaggregation atthe mesolevel. By unifying the labor market and dividing the economyinto only two sectors, the 123PRSP model achieves a great deal of trans-parency at a significant cost in terms of heterogeneity.18
The use of the 123PRSP model is illustrated in Box 7.7.
Macroeconomic Shocks and Policies
393
BOX 7.7 The 123PRSP Model: Distributional Effects of Macropolicies and Shocks in Zambia
Devarajan and Go (2003) employ the 123PRSP model to examine the distributional impact ofmacroeconomic shocks and policies in Zambia.
Zambia is a landlocked economy that depends heavily on mineral exports, particularly copper.This renders the country very vulnerable to external price shocks. Over the 2001–3 period,two risk factors threatened macroeconomic stability in Zambia. The first shock stemmed fromexpenditure pressures associated with the presidential election in late 2001, and the secondfrom the decline in the world price of copper (the major export for the economy) induced by aslowdown in world demand.
(continued)
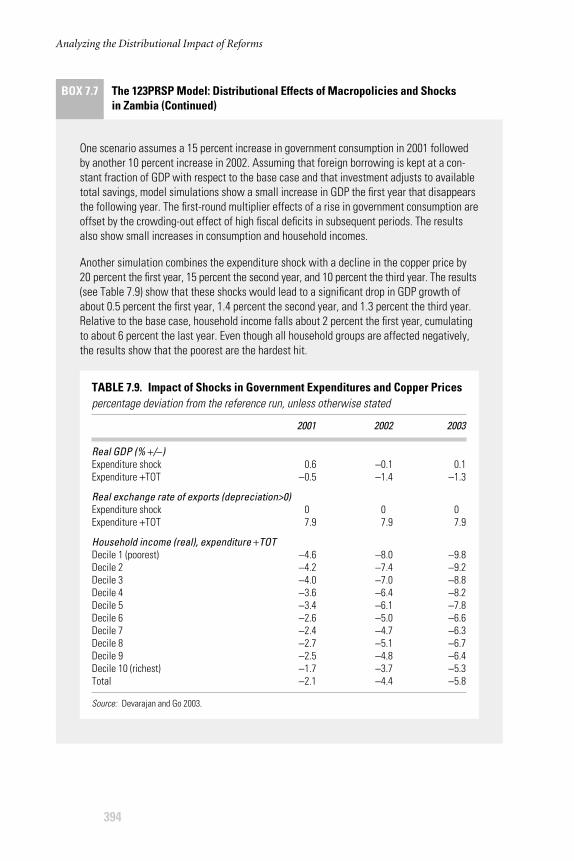
Analyzing the Distributional Impact of Reforms
394
BOX 7.7 The 123PRSP Model: Distributional Effects of Macropolicies and Shocks in Zambia (Continued)
One scenario assumes a 15 percent increase in government consumption in 2001 followedby another 10 percent increase in 2002. Assuming that foreign borrowing is kept at a con-stant fraction of GDP with respect to the base case and that investment adjusts to availabletotal savings, model simulations show a small increase in GDP the first year that disappearsthe following year. The first-round multiplier effects of a rise in government consumption areoffset by the crowding-out effect of high fiscal deficits in subsequent periods. The resultsalso show small increases in consumption and household incomes.
Another simulation combines the expenditure shock with a decline in the copper price by20 percent the first year, 15 percent the second year, and 10 percent the third year. The results(see Table 7.9) show that these shocks would lead to a significant drop in GDP growth ofabout 0.5 percent the first year, 1.4 percent the second year, and 1.3 percent the third year.Relative to the base case, household income falls about 2 percent the first year, cumulatingto about 6 percent the last year. Even though all household groups are affected negatively,the results show that the poorest are the hardest hit.
TABLE 7.9. Impact of Shocks in Government Expenditures and Copper Pricespercentage deviation from the reference run, unless otherwise stated
2001 2002 2003
Real GDP (% +/−)Expenditure shock 0.6 −0.1 0.1Expenditure +TOT −0.5 −1.4 −1.3
Real exchange rate of exports (depreciation>0)Expenditure shock 0 0 0Expenditure +TOT 7.9 7.9 7.9
Household income (real), expenditure +TOTDecile 1 (poorest) −4.6 −8.0 −9.8Decile 2 −4.2 −7.4 −9.2Decile 3 −4.0 −7.0 −8.8Decile 4 −3.6 −6.4 −8.2Decile 5 −3.4 −6.1 −7.8Decile 6 −2.6 −5.0 −6.6Decile 7 −2.4 −4.7 −6.3Decile 8 −2.7 −5.1 −6.7Decile 9 −2.5 −4.8 −6.4Decile 10 (richest) −1.7 −3.7 −5.3Total −2.1 −4.4 −5.8
Source: Devarajan and Go 2003.
The PAMS framework
PAMS is a simple simulation framework analogous to the 123PRSP to theextent that it is designed to help trace sequentially, in a top-down fashion,the poverty and distributional implications of macroeconomic shocks orpolicies. The original implementation of this framework (PAMS I) hasthree layers. The macroeconomic layer is represented by a standard macro-consistency model such as the World Bank’s RMSM-X.
The second layer, which represents the mesolevel of analysis, is basedon the idea that each household in the economy gets its means of liveli-hood both from the government (net public transfers) and from the mar-ket. The microlayer deals with household-level information organized onthe basis of policy-relevant characteristics in a way that allows easy linkageswith the mesoframework. Unit record data are used in a manner analo-gous to PovStat. The second generation of the framework is a reduced-form application that combines the macro- and mesolayers into a generalequilibrium model and employs a parameterization of the Lorenz curvefor poverty simulation.
This section first discusses the macroeconomic module within theRMSM-X framework. It then provides a brief description of the meso-module and the poverty simulator. It closes with a brief description of theessential features of the reduced-form version, which links a CGE modelto a parameterized Lorenz curve.
The RMSM-X module
In essence, the RMSM-X framework may be viewed as an extension of afinancial programming model that includes a growth model specified alongthe lines of the Harrod-Domar model.19 In the basic formulation, there arefour economic agents or sectors in the economy: (1) the central govern-ment, (2) the monetary system, (3) the private sector, and (4) the rest ofthe world (or the foreign sector). The underlying macroeconomic account-ing framework is the same as the one described in the section on financialprogramming. It obeys the principles of flow-of-funds accounting: (1) asource of funds for one sector represents a use of funds by another sector,and (2) for each sector, the total amount of funds from all sources mustequal the total disposition for all uses.
The structure of the model is characterized by (1) the budget con-straints facing each sector and the overall economy, (2) market equilibriumconditions for goods and asset markets, and (3) behavioral and projec-tion rules linking some variables to others. Consider, in particular, aneconomy with the four sectors and three assets above, including money,domestic lending by the banking system, and foreign debt.20 A basic
Macroeconomic Shocks and Policies
395
RMSM-X model could then be specified along the following lines. Thegrowth equation establishes a relationship among the growth of real out-put, investment, and the incremental capital output ratio (ICOR). Astandard assumption is that the ICOR is constant over time, whichimplies a proportional relationship between growth and investment.21
Next, one includes two equations describing changes in nominal outputand changes in the overall price index. The change in the overall priceindex can be defined as a weighted average of the changes in the index ofdomestic prices and the changes in the exchange rate.
On the financial side of the economy, one would add the followingrelationships from the financial programming framework. A money supplyequation would be derived from the balance sheet of the banking system.The equilibrium condition in the domestic lending market states that achange in domestic credit is the sum of the credit to the private sector andthe credit to the public sector. The credit to the private sector could beexpressed as a function of the change in nominal GDP. The change inofficial reserves is derived from the balance of payments identity. In thisidentity, exports are exogenous and computed on the basis of a simpleprojection rule. Imports can be computed as a function of real income andthe real exchange rate (Agénor 2004a). The flow of foreign debt is given bythe equilibrium condition on the foreign asset market, which states that thetotal flow is equal to the sum of the private and public flows. As before, thedemand for money is a function of the velocity parameter and nominalincome. Flow equilibrium prevails in the money market.
The budget constraints of both the public and private sectors canbe written in a reduced form that shows the accumulation of the assetsand liabilities associated with a surplus or deficit. In addition, to computeinvestment, the budget constraint of the private sector can be combinedwith the notion that private consumption is a linear function of dispos-able income (Agénor 2004a).
Adding up the four budget constraints in the model gives the fun-damental national income identity. The model therefore contains eightcore equations represented by the four budget constraints, the derivednational income identity, and the three flow equilibrium conditions inasset markets (money, domestic credit, and foreign debt). These coreequations are not mathematically independent due to the relationshipbetween the sectoral budgets and the overall resource constraint. The sys-tem thus obeys Walras’ Law and can be solved on the basis of only sevenof the core equations. The solution of the remaining equation can beinferred from that of the other seven. However, the solution proceduredepends on the closures chosen. There are three common closure rules
Analyzing the Distributional Impact of Reforms
396
(World Bank 1995). In the case of public closure, one seeks values of gov-ernment consumption and borrowing from both the monetary systemand abroad that are consistent with projected growth, inflation, and othervariables. In the case of private closure, one seeks a solution in terms ofprivate consumption and borrowing. With respect to the policy closure,one is interested in the likely impact of alternative macroeconomic pro-grams on target variables such as growth and inflation.
The policy closure seems more appropriate when the module isused to study the impact of macroeconomic policies on poverty and thedistribution of income. In this context, one could solve the systemrecursively as follows (World Bank 1995). Step 1: identify and fix all for-eign borrowing available to the country; then compute imports resid-ually from the balance of payments. Step 2: use the value of importsderived from step one in the national income identity to solve for pri-vate investment.22 Step 3: compute the value of the second target variable,the current price, from the money market equilibrium and the moneydemand equation.23 Step 4: derive total domestic credit residually from themoney supply equation. Step 5: given the change in government credit,compute private credit residually from the equilibrium condition of thedomestic credit market.
The mesomodule
The main element of this component is the labor and wage-incomemodule, which reconfigures the productive sector of the economy intoa number of sectors equal to the number of socioeconomic groups. Thiseffectively leads to a segmented labor market in the module. This seg-mentation is achieved as follows. First, the module divides the economyinto two basic components, rural and urban. Then, within each compo-nent, one distinguishes the formal sector from the informal sector. Withineach of these sectors, subsectors producing tradables are distinguishedfrom those producing nontradables.
GDP, which is determined at the macro level, is an important linkagevariable and must also be broken down according to the above categories.Here again, it will be necessary to determine residually the production ofcertain sectors (for example, the urban informal sector and the rural sub-sistence sector) in order to maintain overall consistency. The simplestway to model the rural economy is to represent its output as a constantelasticity function of rural labor. Within the urban economy, the produc-tion of the public sector is exogenous. Assuming that all private invest-ment in the economy occurs within the formal sector, the output in thatsector can be computed on the basis of an appropriate incremental cap-
Macroeconomic Shocks and Policies
397
ital output ratio. In such a case, the growth rate of output in the urbanformal economy would stand in a fixed-coefficient relationship with theratio of investment to output. For the sake of consistency, the output ofthe informal nontradable sector is determined residually.
Labor supply is seen as largely driven by demographic considera-tions and semi-exogenous migrations of labor and skill categories. Labordemand is broken down by socioeconomic categories, skill levels, andlocation (rural and urban) and is viewed as dependent on sectoral demand(output growth), as well as real wages. Hence, the new module determineswage income broken down by socioeconomic categories, skill levels, andlocation (rural and urban). Even though each sector in the reconfiguredeconomy may employ both skilled and unskilled labor, the module relieson a simplifying assumption according to which each sector employsonly one kind of labor. Thus, there is no substitution among types oflabor in the production process except for semi-exogenous migrationbased on the Harris-Todaro process.
The excess of the total income generated in the economy with respectto the total wage bill distributed to all labor categories represents the prof-its that are distributed to a representative class of rentiers. The currentversion of the tool does not track down financial assets and returns onthese assets. However, the interest revenue can conceivably be redistrib-uted from the macroframework to various socioeconomic groups accord-ing to some rule. Average tax and transfer rates are used to compute thedisposable income for each socioeconomic group. It is the percentagechange in this disposable income that is transmitted to the poverty sim-ulator in order to simulate the impact of shocks and policies on povertyand between-group inequality.
The poverty simulator
The poverty simulator in this version of PAMS (PAMS I) is analogous toPovStat. Intragroup distributions are represented by unit records per-taining to each socioeconomic group. To compute the impact of amacroeconomic shock or a policy on the welfare of a given household, theper capita income or expenditure of the household is multiplied by theinduced growth rate of the disposable income of the representative groupto which the household belongs. This growth rate is jointly determinedby the macro- and the mesolayers.
As with any of the frameworks examined here, there are structuraland, possibly, data constraints that can limit the reliability of the frame-work in predicting the poverty and distributional impact of macro-economic shocks and policies. In the particular case of PAMS I, there is
Analyzing the Distributional Impact of Reforms
398
a data constraint stemming from the fact that most household surveysprovide some information at the household level, such as expenditureand self-employment income, while other information, such as laborincome and employment status, is given at the individual level. Choos-ing the household as the unit of analysis means that individual-level datamust be aggregated up to the household level. Socioeconomic groups arethus created on the basis of the characteristics of heads of household. Thisobviously leads to results that are coarser than results based on relevantindividual-level data.
In addition, the poverty simulator is bound to inherit the strengthsand weaknesses of the top layers. It is well known, for instance, that thebasic RMSM-X is a simple macroeconomic accounting framework andshows no behavioral relationships in the economic sense. Also, the useof a labor demand function that is defined by sector and skill level isequivalent to assuming a homogenous labor factor with different, sector-specific remuneration.
Operational support
PAMS I has seen battle in support of the design of Poverty ReductionSupport Credits and the Poverty Assessment for Burkina Faso. Specifi-cally, the framework was used to simulate the poverty implications of nega-tive shocks to the cotton sector, as well as the impact of some patternsof growth. Assuming a permanent 20 percent decline in the price of cot-ton starting in 2004, the simulations reveal an increase of about 1.5 per-centage points above the baseline. Naturally, cotton farmers (18 percentof the population) are the most affected. This impact would be exacer-bated if it were accompanied by drop of 20 percent in output.
In the context of the analysis of the implications of different growthpatterns, the simulation framework was used to study the impact of shocksto the agriculture sector outside cotton. A 20 percent increase in the out-put of the primary sector could lead to a 3 percentage point decline inpoverty. One set of simulations concerns the implications of a pattern ofgrowth wherein the overall growth rate remains unchanged, while theprimary sector grows at a rate 2 percent higher than the baseline, alongwith a lower growth rate for the tertiary sector. In this case, poverty fallsby 1 percent up to 2007 and by 4 percentage points by 2015.
Reduced-form implementation
The purpose of the mesolayer in the original PAMS is to model an extendedfunctional distribution of the income generated by the upper-layer macro-economic model based on the selected socioeconomic groups. In practice,
Macroeconomic Shocks and Policies
399
several iterations are required in order to calibrate this module to availabledata. If a disaggregated SAM is available that is compatible with the selectedsocioeconomic groups, then it might be easier to compress the macro- andmesolayers into a general equilibrium model. As far as the poverty simula-tor is concerned, it should be noted that multiplying each observation(expenditure or income) in the unit record representation of a distributionby a scalar implies that the mean of the distribution is multiplied by thesame scalar. Given that the within-group group distribution remains con-stant from one state to another, one might as well construct the povertysimulator on the basis of group means and Lorenz functions estimatedfrom the available household data.
An example of the application of PAMS is supplied in Box 7.8.This approach increases computational efficiency in a simulation
environment. Thus, within the reduced-form version of PAMS (PAMS II)that runs in EViews (version 4.1 or later), poverty and distributionaloutcomes of shocks and policies are derived by linking recursively an appropriately disaggregated CGE model with a poverty and in-equality simulator built upon a parameterization of the Lorenz curve.The approach underlying PAMS II is analogous to the ERH approachdescribed elsewhere above. The main difference with other implemen-tations of this approach stems from the fact that, in the PAMS frame-work, the within-group size distribution of income is derived from theassumed Lorenz distribution. Many other applications assume func-tional forms for the density function characterizing the within-groupdistribution.
A macro-micro simulation model for Brazil
In the context of this review, a macro-micro simulation model stands forany simulation framework that links in some fashion a representation ofthe macroeconomy to a model of the size distribution of income. In thisfundamental sense, the 123PRSP model, PAMS, and even the ERH frame-work are members of the family of macro-micro simulation models. Twoapproaches commonly followed in the literature are to combine a CGEmodel either with an envelope model of welfare distribution or with anincome and occupational model. The first approach is analogous to theway 123PRSP links a two-sector CGE model to the corresponding house-hold module. Given this analogy and the fact that this chapter has alreadyreviewed the structure of CGE models and income-occupational models,the focus here below is only on an approach followed by Ferreira et al.(2004) in a study of the distributional impacts of macroeconomic shocks
Analyzing the Distributional Impact of Reforms
400
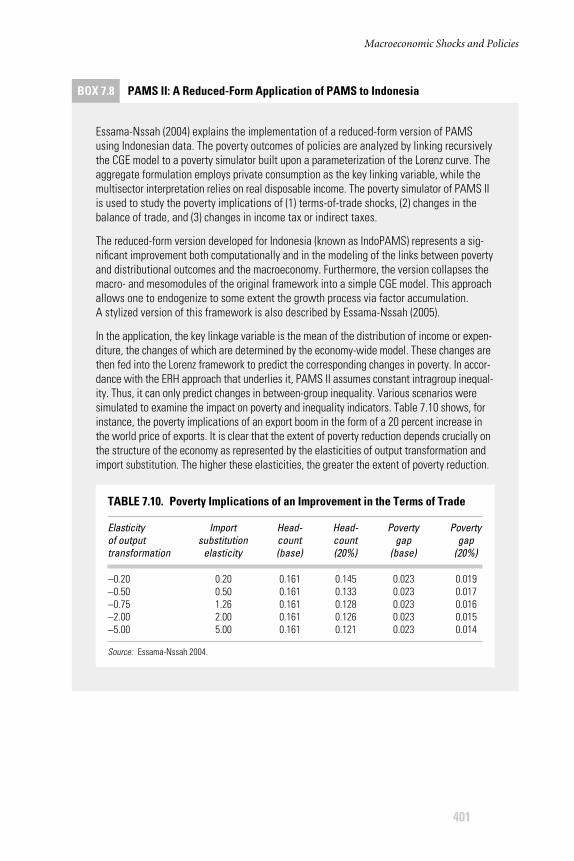
Macroeconomic Shocks and Policies
401
BOX 7.8 PAMS II: A Reduced-Form Application of PAMS to Indonesia
Essama-Nssah (2004) explains the implementation of a reduced-form version of PAMSusing Indonesian data. The poverty outcomes of policies are analyzed by linking recursivelythe CGE model to a poverty simulator built upon a parameterization of the Lorenz curve. Theaggregate formulation employs private consumption as the key linking variable, while themultisector interpretation relies on real disposable income. The poverty simulator of PAMS IIis used to study the poverty implications of (1) terms-of-trade shocks, (2) changes in thebalance of trade, and (3) changes in income tax or indirect taxes.
The reduced-form version developed for Indonesia (known as IndoPAMS) represents a sig-nificant improvement both computationally and in the modeling of the links between povertyand distributional outcomes and the macroeconomy. Furthermore, the version collapses themacro- and mesomodules of the original framework into a simple CGE model. This approachallows one to endogenize to some extent the growth process via factor accumulation. A stylized version of this framework is also described by Essama-Nssah (2005).
In the application, the key linkage variable is the mean of the distribution of income or expen-diture, the changes of which are determined by the economy-wide model. These changes arethen fed into the Lorenz framework to predict the corresponding changes in poverty. In accor-dance with the ERH approach that underlies it, PAMS II assumes constant intragroup inequal-ity. Thus, it can only predict changes in between-group inequality. Various scenarios weresimulated to examine the impact on poverty and inequality indicators. Table 7.10 shows, forinstance, the poverty implications of an export boom in the form of a 20 percent increase inthe world price of exports. It is clear that the extent of poverty reduction depends crucially onthe structure of the economy as represented by the elasticities of output transformation andimport substitution. The higher these elasticities, the greater the extent of poverty reduction.
TABLE 7.10. Poverty Implications of an Improvement in the Terms of Trade
Elasticity Import Head- Head- Poverty Poverty of output substitution count count gap gaptransformation elasticity (base) (20%) (base) (20%)
−0.20 0.20 0.161 0.145 0.023 0.019−0.50 0.50 0.161 0.133 0.023 0.017−0.75 1.26 0.161 0.128 0.023 0.016−2.00 2.00 0.161 0.126 0.023 0.015−5.00 5.00 0.161 0.121 0.023 0.014
Source: Essama-Nssah 2004.
in Brazil. They link an IS-LM model to a model of income and occupa-tional choice. In what follows, only the macroeconomic model and thelinkage variables are considered.
The IS-LM model
The basic IS-LM model is considered an expression of the Keynesianapproach to macroeconomics24 and is grounded on a key assumption:aggregate demand determines the equilibrium level of output. The modelprovides a framework for the study of the interaction between the real andthe financial sides of the economy. This interaction is governed by two keyvariables: the real economy determines the level of income, which affectsthe demand for money (a financial variable), and the financial sectordetermines the interest rate, which affects investment in the real economy.
The Brazilian model reviewed here is a neo-Keynesian extension ofthe above basic framework; it has three key elements. The real economyblock of the model determines the aggregate demand, production, andfactor demand components. The second block models the determinationof the price level and the wage rate. Finally, the interest rate is determinedin the financial block of the model. The main transmission mechanismbetween the real and the financial sides of the economy relies on thespecification of real private consumption and investment as functionsof the interest rate. Private consumption is also a function of disposableincome and the general price index. The model includes a disaggregatedrepresentation of the balance of payments.
In order to improve the ability of the model to handle the agent hetero-geneity observed in the household survey, supply is divided into six sectors:(1) urban tradable formal, (2) urban nontradable formal, (3) urban non-tradable informal, (4) rural tradable formal, (5) rural nontradable for-mal, and (6) rural nontradable informal. Production in each of thesesectors is assumed to be an elasticity of substitution function of capitaland a composite labor input with skilled and unskilled components. Labordemand by skill level (low, intermediate, and high) is determined by profitmaximization.
Linkage variables
The solution of the model affords the linkage variables needed for impactanalysis with the microsimulation module. In particular, it produces18 wage rates (for three skill levels in six sectors), and 21 occupation rates(six employment levels and one value for unemployment for six sectors).Another set of linkage variables includes changes in output prices in thesix sectors. The authors (Ferreira et al. 2004) use an algorithm to ensure
Analyzing the Distributional Impact of Reforms
402
consistency between the macroeconomic solution and the predictions ofthe microsimulation model.
The IMMPA framework
The IMMPA is a dynamic framework designed around some key charac-teristics of low-income countries. It focuses on issues relating to labormarket segmentation, informal activities, credit market imperfections,and the composition of public expenditure. The macro- and mesopartsof the economy are represented by a financial CGE model with seven dis-tinct blocks: (1) production and employment, (2) the demand side of theeconomy, (3) the price system, (4) external trade, (5) income formation,(6) the financial sector, and (7) the public sector. The specification ofeach of these blocks follows well-known principles in general equilibriummodeling. The focus is therefore the presentation here of some key, distinctive features of the IMMPA.
It should be noted at the outset that this framework is richer thanany of those described above. The framework allows the analyst to con-sider the segmentation of the labor market induced by legislation or wage-setting practices, along with the role of informal employment in thetransmission of the impact of shocks and policies to the poor. For highlyindebted countries, one can analyze the effects of foreign debt on privateincentives to invest. The integration of the real and financial sides of theeconomy in the context of credit market imperfections allows a realisticconsideration of stabilization and structural policy issues. Finally, bydistinguishing the components of public expenditure on infrastructure,health, and education, the framework permits a disaggregated impactanalysis. However, while this structural richness is desirable for a properaccounting of heterogeneity, it may also prove to be a severe constraintto implementation in a data-poor environment.
The labor market
With respect to the modeling of the labor market, the IMMPA frameworkemphasizes the idea that the structure of labor plays a crucial role in thetransmission of the impact of shocks and policies to economic activity,employment, and relative prices. This is especially important because,generally speaking, labor supply is a major source of income for the poorin many countries. The framework distinguishes between the rural and theurban sectors of the economy. The urban labor market has two compo-nents: the formal and the informal segments. Wages are assumed to be fullyflexible in the informal economy. In the formal sector, labor is heteroge-
Macroeconomic Shocks and Policies
403
neous and comprises a skilled element and an unskilled element. Wages forskilled workers in the private sector are fixed on the basis of efficiency-wageconsiderations. The government determines the wages for public sectoremployees and unskilled workers in the formal private sector.
It is assumed that unskilled workers can work in the rural and urbansectors, while skilled workers are restricted to the urban sector. The laborforce in rural areas grows at an exogenous rate equal to the populationgrowth rate, minus the net migration to urban areas. According to theHarris-Todaro model, migration is governed by the differential betweenthe expected income in the rural sector and the one prevailing in theurban sector.
The financial sector
The modeling of the financial sector is based on features of an arche-typical poor economy with a limited number of financial assets. This com-ponent of the framework seeks to determine the structure of the portfolioheld by households, the demand for credit by firms, and the behavior ofcommercial banks. Savings can be held only in the form of money or bankdeposits at home and abroad. Financial intermediation is dominated bycommercial banks. A key assumption states that firms are unable to issuetradable claims on their assets or future output. The framework also triesto capture the impact of interest rates on capital flows and the structureof agent portfolios, the real balance effects on expenditure, and the link-ages between bank credit and the supply side of the economy through thedemand for working capital by firms. In particular, the bank lending rateis incorporated in the effective price of labor faced by firms that mustfinance their working capital needs prior to the sale of output. This is one of the crucial ways in which the real and financial sides of theeconomy interact.
Public expenditure
The IMMPA framework is designed to account for the channels throughwhich various components of public investment affect the economy. Inparticular, the stock of public capital in infrastructure (roads, powerplants, and railroads) is assumed to have a direct effect on the level of pro-duction in the private sector and, hence, on the marginal productivity ofprimary factors employed in that sector.
Public expenditure on education consists of spending on items such asschool buildings and other infrastructure and is assumed to have an impactif it assists unskilled workers to acquire skills. Similarly, public assets suchas hospitals and health centers affect individual health outcomes.
Analyzing the Distributional Impact of Reforms
404
Distributional analysis
For the purpose of distributional analysis, the IMMPA framework con-siders six categories of households: (1) workers in the rural traded sector,(2) workers in the rural nontraded sector, (3) unskilled workers in theurban informal sector, (4) unskilled workers in the urban formal sector,(5) skilled workers in the urban formal sector, and (6) capitalists. Themacroeconomic model is linked to unit record data in a way that is anal-ogous to impact analysis with PovStat. Following a shock to the modeleconomy, the macromodel generates real growth rates in per capita con-sumption and disposable income for all six household categories and foreach year in the simulation horizon (up to 10 years). These growth ratesare then used to scale per capita consumption and disposable incomeappropriately in each group. New poverty and inequality indicators (theFoster-Greer-Thorbecke family, the Gini, and the Theil) are computedand compared to the baseline values. The difference is attributed to theshock. In this dynamic framework, short-term impact corresponds to thefirst two periods. Medium-term impact is supposed to occur betweenperiods 3 and 5. Long-term impact is felt beyond period 6.
The IMMPA model is demonstrated by the case described in Box 7.9.
Macroeconomic Shocks and Policies
405
BOX 7.9 The IMMPA Model: Adjustment Policies and the Poor in Brazil
Brazil has made significant progress in controlling inflation and achieving stabilization sincethe Real Plan of 1994. Despite the 1999 currency crisis, which put pressure on the exchangerate and led to the adoption of a flexible exchange rate regime, inflation remained low. Thisstabilization was achieved through a prudent fiscal policy and the active management ofshort-term interest rates by the central bank.
Agénor et al. (2006) provide an interpretation of the IMMPA framework to analyze the impactof adjustment policies on poverty and income distribution in Brazil. The interpretation involvesextensions to the prototype framework to capture important characteristics specific to theBrazilian economy. In particular, the Brazilian model allows for open unskilled urban unem-ployment, a distinction between product wage and consumption wage in the determinationof skilled worker wages, the possibility of congestion effects linked to the use of public ser-vices in urban areas, and the bond financing of public sector deficits, while excluding bor-rowing from the central bank.
The poverty and distributional implications of a 10 percent increase in the interest rate arepresented in Table 7.11. In the short run, the poverty headcount index increases only slightly
(continued)
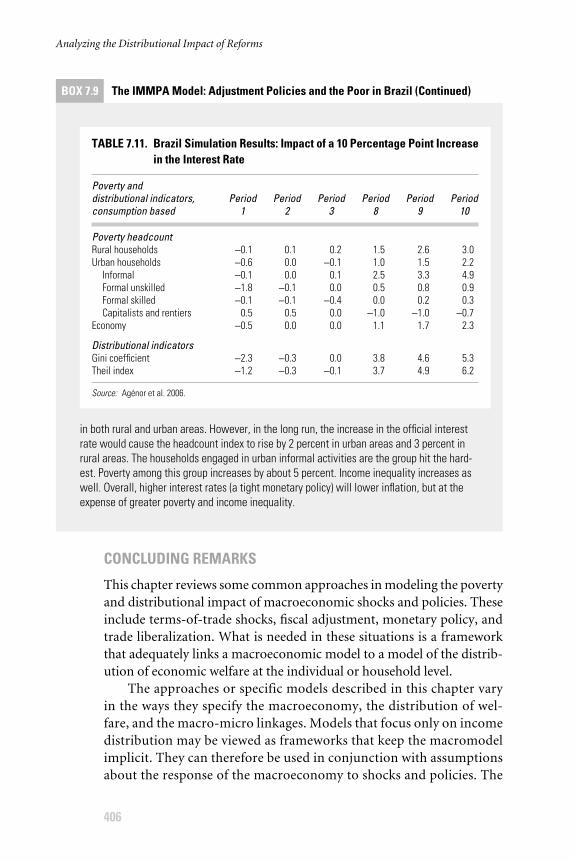
Analyzing the Distributional Impact of Reforms
406
CONCLUDING REMARKS
This chapter reviews some common approaches in modeling the povertyand distributional impact of macroeconomic shocks and policies. Theseinclude terms-of-trade shocks, fiscal adjustment, monetary policy, andtrade liberalization. What is needed in these situations is a frameworkthat adequately links a macroeconomic model to a model of the distrib-ution of economic welfare at the individual or household level.
The approaches or specific models described in this chapter varyin the ways they specify the macroeconomy, the distribution of wel-fare, and the macro-micro linkages. Models that focus only on incomedistribution may be viewed as frameworks that keep the macromodelimplicit. They can therefore be used in conjunction with assumptionsabout the response of the macroeconomy to shocks and policies. The
BOX 7.9 The IMMPA Model: Adjustment Policies and the Poor in Brazil (Continued)
TABLE 7.11. Brazil Simulation Results: Impact of a 10 Percentage Point Increase in the Interest Rate
Poverty and distributional indicators, Period Period Period Period Period Period consumption based 1 2 3 8 9 10
Poverty headcountRural households −0.1 0.1 0.2 1.5 2.6 3.0Urban households −0.6 0.0 −0.1 1.0 1.5 2.2
Informal −0.1 0.0 0.1 2.5 3.3 4.9Formal unskilled −1.8 −0.1 0.0 0.5 0.8 0.9Formal skilled −0.1 −0.1 −0.4 0.0 0.2 0.3Capitalists and rentiers 0.5 0.5 0.0 −1.0 −1.0 −0.7
Economy −0.5 0.0 0.0 1.1 1.7 2.3
Distributional indicatorsGini coefficient −2.3 −0.3 0.0 3.8 4.6 5.3Theil index −1.2 −0.3 −0.1 3.7 4.9 6.2
Source: Agénor et al. 2006.
in both rural and urban areas. However, in the long run, the increase in the official interestrate would cause the headcount index to rise by 2 percent in urban areas and 3 percent inrural areas. The households engaged in urban informal activities are the group hit the hard-est. Poverty among this group increases by about 5 percent. Income inequality increases aswell. Overall, higher interest rates (a tight monetary policy) will lower inflation, but at theexpense of greater poverty and income inequality.
second approach involves embedding distributional mechanisms withina general equilibrium framework. The third class of models adopts amodular approach in linking poverty and distributional outcomes tomacroeconomic shocks and policies. An emerging approach known asTop-Down/Bottom-Up (Savard 2005) is worth mentioning. It tries toaccount for the feedback effect from the micromodule to the macro andback until convergence is achieved. Which approach to adopt depends,of course, on the problem at hand, the data, and other constraints imposedby modeling resources, such as skills.
The reliability of a model designed to predict the poverty and distri-butional outcomes of macroeconomic shocks and policies depends onhow well the model handles three fundamentals. The first relates to theheterogeneity of socioeconomic agents in terms of endowments (assetsand personal characteristics) and behavior. The availability of reliablehousehold data is a key constraint in accounting for such heterogeneity.The second fundamental concerns the modeling of transmission chan-nels in terms of institutional arrangements that control social interaction.A realistic representation of such arrangements allows one to estimatemore accurately both the direct and the indirect effects of shocks and poli-cies. Finally, the macroeconomic model should be designed to account forthe interdependence among policy issues (stabilization, structural, anddistributional). In a modular approach, the ability of the bottom layer toaccount for heterogeneity can be severely constrained by the top layers ifthey are not disaggregated in a way that is consistent with the bottomlayer. It may therefore be said that the whole framework is only as “strong”as its “weakest” module.
NOTES
1. The review focuses on models dealing primarily with the income dimensionof poverty. The Development Economics Development Prospects Group atthe World Bank has established a framework known as MAMS or Maquettefor MDG Simulation. This framework allows an economy-wide analysis ofshocks and policies on income poverty and a set of Millennium DevelopmentGoals (MDGs) related to health, education, and infrastructure (see Löfgrenand Diaz-Bonilla 2005).
2. Most economic models of behavior are based on the principle of optimiza-tion, according to which each agent attempts to implement the best possibleaction given her/his objective and the prevailing constraints. The maximumvalue function is the maximum attainable value of the objective functionexpressed in terms of the parameters characterizing the environment of theproblem (see Dixit 1990).
Macroeconomic Shocks and Policies
407
3. POVCAL is programmed in Fortran 5.0 and uses the parametric specifica-tion of the underlying Lorenz curve. Currently, it supports the followingspecifications: (1) the general quadratic model (Villasenor and Arnold 1984)and (2) the Beta model (Kakwani 1980).
4. The ASCII data file must be in tabular form wherein each row of data corre-sponds to a record, and columns represent the variable for the subgroups.Variables must be organized according to the order of subgroups.
5. In other terms, the household is facing a linear budget constraint. The insti-tutional underpinning of this assumption consists of efficient markets withnegligible transaction costs (Deaton and Muellbauer 1980).
6. According to Lindblom (2001), social coordination aims at minimizing con-flict and promoting cooperation viewed as an exchange of help. Lindblomalso notes a fundamental distinction between the notions of market and mar-ket system. There are markets whenever people frequently pay others to dosomething. A market system is a collection of markets designed to organizeand coordinate social interaction.
7. This is a record of the foreign exchange inflows and outflows associated withtrade, factor and interest payments, and institutional transfers, includingmigrant remittances.
8. It is assumed here that indirect taxes are paid at the factory gate. That is why, inthe SAM, they appear as a payment by the activity account to the governmentaccount. However, such taxes may also be paid out of the commodity account.
9. The parameters can be estimated using household-survey data. Alternatively,group density functions can be estimated using relevant parameterized Lorenzcurves, as is done in the discussion of the PAMS framework.
10. Agénor, Chen, and Grimm (2004) consider the following categories: (1) ruralworkers, (2) urban workers in the informal sector, (3) urban unskilled work-ers in the formal sector, (4) urban skilled workers in the formal sector, and(5) capitalists-rentiers. This does not mean that any policy model should fol-low the same disaggregation. Disaggregation in terms of sectors, factor mar-kets, institutions, and socioeconomic groups is dictated by the issues at hand,the availability and reliability of relevant data, and the adequacy of the resourcesfor information processing.
11. This presentation of the accounting framework follows Khan, Montiel, andHaque (1990).
12. Absorption is taken to represent the sum of private consumption, domesticinvestment, and government expenditure (IMF 1987).
13. It is also possible to base the analysis on the balance sheet of the central bankinstead of that of the banking system as a whole. The policy variable wouldthen be changes in the net domestic assets of the central bank and notdomestic credit expansion. The balance sheet identity would be stated interms of reserve money (the currency held by the public and the reservesheld by commercial banks). The total money supply would then be a func-tion of the reserve money. See Polak (1998) and IMF (1987) for details.
Analyzing the Distributional Impact of Reforms
408
14. In calculations of the quantity of money in an economy, M1 stands for cur-rency, plus the demand deposits held by nonbank institutions. M2 is basedon a broader concept and is equal to M1, plus savings and time deposits incommercial banks.
15. This extended Salter-Swan model is commonly known as the 1-2-3 modelbecause it represents one country, two sectors of production (exports anddomestic goods), and three commodities (exports, domestic goods, andimports).
16. The use of a constant elasticity of transformation production-possibilityfrontier may be viewed as a reduced-form interpretation of the framework.Devarajan, Lewis, and Robinson (1990) show how to specify the model as astandard CGE model with the explicit use of production functions and a con-sideration of factor markets.
17. There is an inverse relationship between the demand for a commodity andthe price of the commodity.
18. It is important to keep in mind that the core model here is the 1-2-3 modelthat is used to derive the aggregate income and key relative prices. Nothingprevents the analyst from adopting a different configuration for the othercomponents. For the macroframework, a government development plancan be used, or other growth regressions such as Barro’s can be employed.For the poverty module, one could use POVCAL or PovStat or even a micro-simulation model.
19. Easterly (1999) refers to the current version of the growth model employedat the World Bank as the “financing gap model”; its most important usesinvolve determining growth prospects and the associated financing short-falls.
20. One could add a fourth asset: bonds issued by the government to borrowmoney from the general public. This addition would not alter the basic logicpresented in the text.
21. In a critique of the use of this model in short-term growth analysis, Easterly(1999) notes that, in both the neoclassical and endogenous growth models,the ICOR can be constant in a steady state. In the neoclassical framework,this steady state ICOR is equal to the ratio of the investment rate to the sumof population growth and the rate of labor-augmenting technical progress.Furthermore, this constancy does not imply a causal and proportional rela-tionship between investment and growth. Finally, he argues against viewingthe ICOR as an indicator of the quality of investment.
22. This is possible because, once imports are known, all other components of thisidentity are determined except private investment. In particular, real GDP isdetermined from the ICOR and the total investment during the previousperiod. Exports are projected exogenously. Private consumption is specified asa fraction of disposable income, and government consumption and investmentare each a fraction of GDP.
Macroeconomic Shocks and Policies
409
23. The current level of the overall price index is equal to the money supplymultiplied by the velocity of money, divided by nominal income.
24. The simplest version presented in textbooks is commonly called the Keynesian cross.
BIBLIOGRAPHY
Agénor, P.-R. 2003. “The Mini-Integrated Macroeconomic Model for PovertyAnalysis: A Framework for Analyzing the Unemployment and Poverty Effectsof Fiscal and Labor Market Reforms.” Policy Research Working Paper 3067,World Bank, Washington, DC.
———. 2004a. The Economics of Adjustment and Growth. 2nd ed. Cambridge,MA: Harvard University Press.
———. 2004b. “Macroeconomic Adjustment and the Poor: Analytical Issuesand Cross-Country Evidence.” Journal of Economic Surveys 18 (3): 351–408.
Agénor, P.-R., D. H. C. Chen, and M. Grimm. 2004. “Linking RepresentativeHousehold Models with Household Surveys for Poverty Analysis: A Com-parison of Alternative Methodologies.” Policy Research Working Paper 3343,World Bank, Washington, DC.
Agénor, P.-R., R. Fernándes, E. Haddad, and H. T. Jensen. 2006. “Adjustment Poli-cies and the Poor in Brazil.” In Adjustment Policies, Poverty, and Unemployment:The IMMPA Framework, ed. P.-R. Agénor, A. Izquierdo, and H. T. Jensen.Oxford: Blackwell Publishing.
Agénor, P.-R., A. Izquierdo, and H. Fofack. 2003. “IMMPA: A QuantitativeMacroeconomic Framework for the Analysis of Poverty Reduction Strate-gies.” Photocopy, World Bank, Washington, DC.
Agénor, P.-R., A. Izquierdo, and H. T. Jensen, eds. 2006. Adjustment Policies,Poverty, and Unemployment: The IMMPA Framework. Oxford: BlackwellPublishing.
Avitsland, T., and J. Aasness. 2004. “Combining CGE and Microsimulation Mod-els: Effects on Equality of VAT Reforms.” Discussion Paper 392, ResearchDepartment, Statistics Norway, Oslo.
Bandara, J. S. 1991. “Computable General Equilibrium Models for DevelopmentPolicy Analysis.” Journal of Economic Surveys 5 (1): 3–69.
Barja Daza, G., J. Monterrey Arce, and S. Villarroel Böhrt. 2004. “Bolivia: Impactof Shocks and Poverty Policy on Household Welfare.” Paper, Global Devel-opment Network, World Bank, Washington, DC.
Bourguignon, F, W. H. Branson, and J. de Melo. 1992. “Adjustment and IncomeDistribution: A Micro-Macro Model for Counterfactual Analysis.” Journal ofDevelopment Economics 38 (1): 17–39.
Bourguignon, F., and F. H. G. Ferreira. 2005. “Decomposing Changes in the Dis-tribution of Household Incomes: Methodological Aspects.” In The Micro-economics of Income Distribution Dynamics in East Asia and Latin America, ed.F. Bourguignon, F. H. G. Ferreira, and N. Lustig, 17–46. New York: OxfordUniversity Press.
Analyzing the Distributional Impact of Reforms
410
Bourguignon, F., F. H. G. Ferreira, and N. Lustig. 2005. “Introduction.” In TheMicroeconomics of Income Distribution Dynamics in East Asia and Latin Amer-ica, ed. F. Bourguignon, F. H. G. Ferreira, and N. Lustig, 1–15. New York:Oxford University Press.
Bourguignon, F., A.-S. Robilliard, and S. Robinson. 2003. “Representative VersusReal Households in the Macro-Economic Modeling of Inequality.” DELTAWorking Paper 2003–5, Département et Laboratoire d’Economie Théoriqueet Appliquée, Paris.
Bourguignon, F., and A. Sapadaro. 2005. “Microsimulation as a Tool for Evaluat-ing Redistribution Policies.” Working Paper 2005-02, Paris-Jourdan SciencesEconomiques, Paris.
Chen, S., G. Datt, and M. Ravallion. 1991. “POVCAL: A Program for Calcu-lating Poverty Measures from Group Data.” Photocopy, World Bank,Washington, DC.
Chen, S., and M. Ravallion. 2004. “Welfare Impacts of China’s Accession to theWorld Trade Organization.” World Bank Economic Review 18 (1): 29–57.
Coady, D., and R. Harris. 2001. “A Regional General Equilibrium Analysis ofthe Welfare Impact of Cash Transfers: An Analysis of Progresa in Mexico.”Trade and Macroeconomics Division Discussion Paper 76, InternationalFood Policy Research Institute, Washington, DC.
Cockburn, J. 2001. “Trade Liberalization and Poverty in Nepal: A ComputableGeneral Equilibrium Micro Simulation Analysis.” Photocopy, Department ofEconomics, Laval University, Montreal.
Datt, G. 1992. “Computational Tools for Poverty Measurement and Analysis.”Photocopy, World Bank, Washington, DC.
———. 1998. “Computational Tools for Poverty Measurement and Analysis.”Food Consumption and Nutrition Division Discussion Paper 50, InternationalFood Policy Research Institute, Washington, DC.
Datt, G., K. Ramadas, D. van der Mensbrugghe, T. Walker, and Q. Wodon. 2003.“Predicting the Effect of Aggregate Growth on Poverty.” In The Impact of Eco-nomic Policies on Poverty and Income Distribution: Evaluation Techniques andTools, ed. F. Bourguignon and L. A. Pereira da Silva, 215–33. New York:Oxford University Press.
Datt, G., and M. Ravallion. 1992. “Growth and Redistribution Componentsof Changes in Poverty Measures: A Decomposition with Applications toBrazil and India in the 1980s.” Journal of Development Economics 38 (2):275–95.
Datt, G., and T. Walker. 2002. “PovStat 2.12: A Poverty Projection Toolkit, User’sManual.” Photocopy, World Bank, Washington, DC.
Davies, J. B. 2004. “Microsimulation, CGE, and Macro Modelling for Transitionand Developing Economies.” Discussion Paper 2004/08, United NationsUniversity–World Institute for Development Economics Research, Helsinki.
Deaton, A., and J. Muellbauer. 1980. Economics and Consumer Behavior. Cam-bridge: Cambridge University Press.
Macroeconomic Shocks and Policies
411
Decaluwé, B., J.-C. Dumont, and L. Savard. 1999. “Measuring Poverty andInequality in a Computable General Equilibrium Model.” CREFA WorkingPaper 99–20, Research Center in Applied Economics and Finance, Depart-ment of Economics, Laval University, Montreal.
Decaluwé, B., A. Martens, and L. Savard. 2001. La politique économique dudéveloppement et les modèles d’équilibre général calculable. Montreal: Univer-sité Francophone–Presses de l’Université de Montréal.
Decaluwé, B., A. Patry, L. Savard, and E. Thorbecke. 1999. “Poverty Analysiswithin a General Equilibrium Framework.” CREFA Working Paper 99–06,Research Center in Applied Economics and Finance, Department of Eco-nomics, Laval University, Montreal.
de Melo, J., and S. Robinson. 1980. “The Impact of Trade Policies on IncomeDistribution in a Planning Model for Colombia.” Journal of Policy Modeling2 (1): 81–100.
Demombynes, G., and J. G. Hoogeveen. 2004. “Growth, Inequality, and Simu-lated Poverty Paths for Tanzania, 1992–2002.” Policy Research Working Paper3432, World Bank, Washington, DC.
Dervis, K., J. de Melo, and S. Robinson. 1982. General Equilibrium Models forDevelopment Policy. World Bank, Washington, DC.
Devarajan, S., and J. de Melo. 1987. “Adjustment with a Fixed Exchange Rate:Cameroon, Côte-d’Ivoire, and Senegal.” World Bank Economic Review 1 (3):447–87.
Devarajan, S., and S. D. Go. 2002. “A Macroeconomic Framework for PovertyReduction Strategy Papers with an Application to Zambia.” Africa RegionWorking Paper Series 38, World Bank, Washington, DC.
———. 2003. “The 123PRSP Model.” In The Impact of Economic Policies on Poverty and Income Distribution: Evaluation Techniques and Tools, ed.F. Bourguignon and L. A. Pereira da Silva, 277–99. New York: Oxford Uni-versity Press.
Devarajan, S., and J. D. Lewis. 1991. “Structural Adjustment and EconomicReform in Indonesia: Model-Based Policies vs. Rules of Thumb.” In ReformingEconomic Systems in Developing Countries, ed. D. H. Perkins and M. Roemer,159–86. Cambridge, MA: Harvard University Press.
Devarajan, S., J. D. Lewis, and S. Robinson. 1990. “Policy Lessons from Two-Sector Models.” Journal of Policy Modeling 12 (4): 625–57.
———. 1993. “External Shocks, Purchasing Power Parity, and the EquilibriumReal Exchange Rate.” World Bank Economic Review 7 (1): 45–63.
Dinwiddy, C. L., and F. J. Teal. 1988. The Two-Sector General Equilibrium Model:A New Approach. Oxford: Phillip Allan; New York: St. Martin’s Press.
Dixit, A. K. 1990. Optimization in Economic Theory. Oxford: Oxford UniversityPress.
———. 1996. The Making of Economic Policy: A Transaction Cost Politics Perspec-tive. Cambridge, MA: The MIT Press.
Analyzing the Distributional Impact of Reforms
412
Drazen, A. 2000. Political Economy in Macroeconomics. Princeton, NJ: PrincetonUniversity Press.
Duclos, J.-Y., A. Araar, and C. Fortin. 1998–2004. “DAD: A Software for Dis-tributive Analysis/Analyse Distributive.” International Development ResearchCentre, Government of Canada, Ottawa; Research Center in Applied Eco-nomics and Finance, Department of Economics, Laval University, Montreal.www.mimap.ecn.ulaval.ca.
Easterly, W. 1999. “The Ghost of Financing Gap: Testing the Growth Model Usedin the International Financial Institutions.” Journal of Development Econom-ics 60 (2): 423–38.
———. 2001. “The Lost Decades: Developing Countries’ Stagnation in Spite ofPolicy Reform 1980–1998.” Journal of Economic Growth 6 (2): 135–57.
———. 2004. “An Identity Crisis?: Examining IMF Financial Programming.”Photocopy, Department of Economics, New York University, New York.
Emini, C. A., J. Cockburn, and B. Decaluwé. 2005. “The Poverty Impacts of theDoha Round and the Role of Tax Policy: A Case Study for Cameroon.” Paper,Centre d’Etudes et de Recherches en Economie et Gestion, University ofYaounde II, Yaounde, Cameroon.
Enders, W. 1995. Applied Econometric Time Series. New York: John Wiley and Sons.Essama-Nssah, B. 1997. “Impact of Growth and Distribution on Poverty in
Madagascar.” Review of Income and Wealth 43 (2): 239–52.———. 2004. “A Reduced-Form Application of PAMS to Indonesia.” Photocopy,
World Bank, Washington, DC.———. 2005. “Simulating the Poverty Impact of Macroeconomic Shocks
and Policies.” Policy Research Working Paper 3788, World Bank, Washington, DC.
Ferreira, F. H. G., and P. G. Leite. 2003. “Policy Options for Meeting the Mil-lennium Development Goals: Can Microsimulation Help?” Policy ResearchWorking Paper 2975, World Bank, Washington, DC.
Ferreira, F. H. G., P. G. Leite, L. A. Pereira da Silva, and P. Picchetti. 2004. “Canthe Distributional Impacts of Macroeconomic Shocks be Predicted? A Com-parison of the Performance of Macro-Micro Models with Historical Data forBrazil.” Photocopy, World Bank, Washington, DC.
Fisher, S., and W. Easterly. 1990. “The Economics of the Government BudgetConstraint.” World Bank Research Observer 5 (2): 127–42.
Foster, J., J. Greer, and E. Thorbecke. 1984. “A Class of Decomposable PovertyMeasures.” Econometrica 52 (3): 761–66.
Gemmell, N., and O. Morrissey. 2005. “Distribution and Poverty Impacts of TaxStructure Reform in Developing Countries: How Little We Know.” Develop-ment Policy Review 23 (2): 131–44.
Gomes, R., and M. Lawson. 2005. “Pro-Poor Macroeconomic Policies RequirePoverty and Social Impact Analysis.” Development Policy Review 23 (3):369–84.
Macroeconomic Shocks and Policies
413
Grimm, M. 2004. “A Decomposition of Inequality and Poverty Changes in theContext of Macroeconomic Adjustment: A Microsimulation Study for Côted’Ivoire.” In Growth, Inequality, and Poverty: Prospects for Pro-Poor EconomicDevelopment, ed. A. F. Shorrocks and R. van der Hoeven, 197–221. Oxford:Oxford University Press.
Gunter, B. G., M. J. Cohen, and H. Löfgren. 2005. “Analyzing Macro-PovertyLinkages: An Overview.” Development Policy Review 23 (3): 243–65.
Gunter, B. G., L. Taylor, and E. Yeldan. 2005. “Analyzing Macro-Poverty Linkagesof External Liberalization: Gaps, Achievements, and Alternatives.” DevelopmentPolicy Review, 23 (3): 285–98.
Hertel, T. W. 1999. “Applied General Equilibrium Analysis of Agricultural andResource Policies.” Staff Paper 99-2, Department of Agricultural Economics,Purdue University, West Lafayette, IN.
Hertel, T. W., and J. J. Reimer. 2004. “Predicting the Poverty Impacts of Trade Lib-eralization.” Policy Research Working Paper 3444, Washington, DC, WorldBank.
Host-Maden, P. 1979. “Macroeconomic Accounts: An Overview.” PamphletSeries 29, International Monetary Fund, Washington, DC.
Howard, M., and N. Mamingi. 2002. “The Monetary Approach to the Balance ofPayments: An Application to Barbados.” Singapore Economic Review 47 (2):213–28.
IMF (International Monetary Fund). 1987. “Theoretical Aspects of the Design ofFund-Supported Adjustment Programs.” IMF Occasional Paper 55, Interna-tional Monetary Fund, Washington, DC.
Ianchovichina, E., A. Nicita, and I. Soloaga. 2001. “Trade Reform and HouseholdWelfare: The Case of Mexico.” Policy Research Working Paper 2667, WorldBank, Washington, DC.
Kakwani, N. 1980. Income Inequality and Poverty: Methods of Estimation andPolicy Applications. Oxford: Oxford University Press.
———. 1993. “Poverty and Economic Growth with Application to Côte d’Ivoire.”Review of Income and Wealth 39 (2): 121–39.
———. 1997. “On Measuring Growth and Inequality Components of Changesin Poverty with Application to Thailand.” Discussion Paper 97/16, School ofEconomics, University of New South Wales, Sydney.
Khan, H. A. 2004. “Using Macroeconomic Computable General EquilibriumModels for Assessing the Poverty Impact of Structural Adjustment Policies.”Discussion Paper 12, Asian Development Bank Institute, Tokyo.
Khan, M. S., P. Montiel, and N. U. Haque. 1990. “Adjustment with Growth:Relating the Analytical Approaches of the IMF and the World Bank.” Journalof Development Economics 32 (1): 155–79.
King, D., and S. Handa. 2003. “The Welfare Effects of Balance of PaymentsReform: A Macro-Micro Simulation of the Cost of Rent-Seeking.” Journal ofDevelopment Studies 39 (3): 101–28.
Analyzing the Distributional Impact of Reforms
414
Kraev, E., and B. Akolgo. 2005. “Assessing Modelling Approaches to the Distri-butional Effects of Macroeconomic Policy.” Development Policy Review 23 (3):299–312.
Lindblom, C. E. 2001. The Market System: What Is It, How It Works, and What toMake of It. New Haven, CT: Yale University Press.
Löfgren, H., and C. Diaz-Bonilla. 2005. “An Ethiopian Strategy for Achievingthe Millennium Development Goals: Simulations with the MAMS Model.”Photocopy, World Bank, Washington, DC.
Löfgren, H., R. L. Harris, and S. Robinson. 2002. A Standard Computable Gen-eral Equilibrium (CGE) Model in GAMS. With M. El-Said and M. Thomas.Vol. 5 of Microcomputers in Policy Research. Washington, DC: InternationalFood Policy Research Institute.
Löfgren, H., S. Robinson, and M. El-Said. 2003. “Poverty and Inequality Analy-sis in a General Equilibrium Framework: The Representative HouseholdApproach.” In The Impact of Economic Policies on Poverty and Income Distri-bution: Evaluation Techniques and Tools, ed. F. Bourguignon and L. A. Pereirada Silva, 325–37. New York: Oxford University Press.
Papageorgiou, D., A. M. Choksi, and M. Michaely. 1990. Liberalizing ForeignTrade in Developing Countries: The Lessons of Experience. World Bank,Washington, DC.
Pereira da Silva, L. A., B. Essama-Nssah, and I. Samaké. 2002. “Poverty Analy-sis Macro-Simulator or PAMS.” Photocopy (February), World Bank,Washington, DC.
———. 2003. “Linking Aggregate Macro-Consistency Models to HouseholdSurveys: A Poverty Analysis Macroeconomic Simulator, or PAMS.” In TheImpact of Economic Policies on Poverty and Income Distribution: EvaluationTechniques and Tools, ed. F. Bourguignon and L. A. Pereira da Silva. New York:Oxford University Press.
Polak, J. J. 1998. “The IMF Monetary Model at 40.” Economic Modelling 15 (3):395–410.
Powell, M., and J. I. Round. 2000. “Structure and Linkage in the Economy ofGhana: A SAM Approach.” In Economic Reforms in Ghana: Miracle or Mirage?,ed. E. Aryeetey, J. Harrigan, and M. Nissanke, 68–87. Oxford: James CurreyPress.
Pyatt, G., and J. I. Round, eds. 1985. Social Accounting Matrices: A Basis for Plan-ning. World Bank, Washington, DC.
Quade, E. S. 1982. Analysis for Public Decisions. New York: North-Holland.Rajcoomar, S., and M. W. Bell. 1996. Financial Programming and Policy: The Case
of Sri Lanka. With J. Karlik, M. Martin, and C. Sisson et al. Washington, DC:IMF Institute, International Monetary Fund.
Ramadas, K., D. van der Mensbrugghe, and Q. Wodon. 2002. SimSiP Poverty:Poverty and Inequality Comparisons Using Group Data. World Bank, Washington, DC.
Macroeconomic Shocks and Policies
415
Ravallion, M., and M. Huppi. 1991. “Measuring Changes in Poverty: A Method-ological Case Study of Indonesia during an Adjustment Period.” World BankEconomic Review 5 (1): 57–82.
Ravallion, M., and M. Lokshin. 2004. “Gainers and Losers from Trade Reformin Morocco.” Policy Research Working Paper 3368, World Bank, Washington, DC.
Reimer, J. J. 2002. “Estimating the Poverty Impacts of Trade Liberalization.”GTAP Working Paper 20, Center for Global Trade Analysis and Departmentof Agricultural Economics, Purdue University, West Lafayette, IN.
Reinert, K. A., and D. W. Roland-Holst. 1997. “Social Accounting Matrices.” InApplied Methods for Trade Policy Analysis: A Handbook, ed. J. F. Francois andK. A. Reinert, 94–121. Cambridge: Cambridge University Press.
Robb, C. M. 2003. “Poverty and Social Analysis, Linking Macroeconomic Poli-cies to Poverty Outcomes: Summary of Early Experiences.” IMF WorkingPaper WP/03/43, International Monetary Fund, Washington, DC.
Robilliard, A.-S., F. Bourguignon, and S. Robinson. 2001. “Crisis and Income Dis-tribution: A Micro-Macro Model for Indonesia.” Photocopy, InternationalFood Policy Research Institute, Washington, DC.
Robinson, S. 1989. “Multisector Models.” In Handbook of Development Eco-nomics, Vol. 2, ed. H. Chenery and T. N. Srinivasan, 885–947. Amsterdam:North-Holland.
———. 2003. “Macro Models and Multipliers: Leontief, Stone, Keynes, and CGEModels.” Paper, International Food Policy Research Institute, Washington, DC.
Robinson, S., and H. Löfgren. 2005. “Macro Models and Poverty Analysis:Theoretical Tensions and Empirical Practice.” Development Policy Review23 (3): 267–83.
Robinson, S., and L. D. Tyson. 1984. “Modeling Structural Adjustment: Microand Macro Elements in a General Equilibrium Framework.” In AppliedGeneral Equilibrium Analysis, ed. H. E. Scarf and J. B. Shoven, Chapter 6.Cambridge: Cambridge University Press.
Round, J. I. 2003. “Social Accounting Matrices and SAM-based MultiplierAnalysis.” In The Impact of Economic Policies on Poverty and Income Distribu-tion: Evaluation Techniques and Tools, ed. F. Bourguignon and L. A. Pereirada Silva, 301–24. New York: Oxford University Press.
Sadoulet, E., and A. de Janvry. 1995. Quantitative Development Policy Analysis.Baltimore: Johns Hopkins University Press.
Savard, L. 2005. “Poverty and Inequality Analysis within a CGE Framework: AComparative Analysis of the Representative Agent and MicrosimulationApproaches.” Development Policy Review 23 (3): 313–31.
Sen, A. 1999. Development as Freedom. New York: Alfred A. Knopf.Shorrocks, A. F. 1999. “Decomposition Procedures for Distributional Analysis:
A Unified Framework Based on the Shapley Value.” Draft, Department ofEconomics, University of Essex, Colchester, United Kingdom.
Analyzing the Distributional Impact of Reforms
416
Shoven, J., and J. Whalley. 1992. Applying General Equilibrium. New York: Cam-bridge University Press.
Tarp, F. 1993. Stabilization and Structural Adjustment: Macroeconomic Frame-works for Analysing the Crisis in Sub-Saharan Africa. London: Routledge.
Tarp, F., D. W. Roland-Holst, and J. Rand. 2002. “Trade and Income Growth inVietnam: Estimates from a New Social Accounting Matrix.” Economic SystemsResearch 14 (2): 157–84.
United Nations. 2000. United Nations Millennium Declaration. Resolutionadopted by the General Assembly, September. United Nations, New York.
Varian, H. R. 1984. Microeconomic Analysis. New York: Norton & Company.Villasenor, J., and B. C. Arnold. 1984. “The General Quadratic Lorenz Curve.”
Technical report (photocopy), Colegio de Postgraduados, Mexico City.———. 1989. “Elliptical Lorenz Curves.” Journal of Econometrics 40 (2):
327–38.Wodon, Q., K. Ramadas, and D. van der Mensbrugghe. 2003. “SimSIP Poverty
Module.” Photocopy, World Bank, Washington, DC.World Bank. 1995. “Model Building: RMSM-X Reference Guide.” Development
Data Group, Development Economics, World Bank, Washington, DC.———. 1998. “RMSM-X User’s Guide.” Development Data Group, Develop-
ment Economics, World Bank, Washington, DC.———. 2003. A User’s Guide to Poverty and Social Impact Analysis. Washington,
DC: Poverty Reduction Group and Social Development Department, WorldBank.
———. 2004. “Kingdom of Morocco Poverty Report: Strengthening Policy byIdentifying the Geographic Dimension of Poverty.” Report 28223-MOR,Social and Economic Development Group, Middle East and North AfricaRegion, World Bank, Washington, DC.
Young, H. P. 1994. Equity: In Theory and Practice. Princeton, NJ: Princeton Uni-versity Press.
Macroeconomic Shocks and Policies
417

Selected Tools for the Poverty and Social Impact Analysis of
Macroeconomic Shocks and Policies
419
1A N N E X
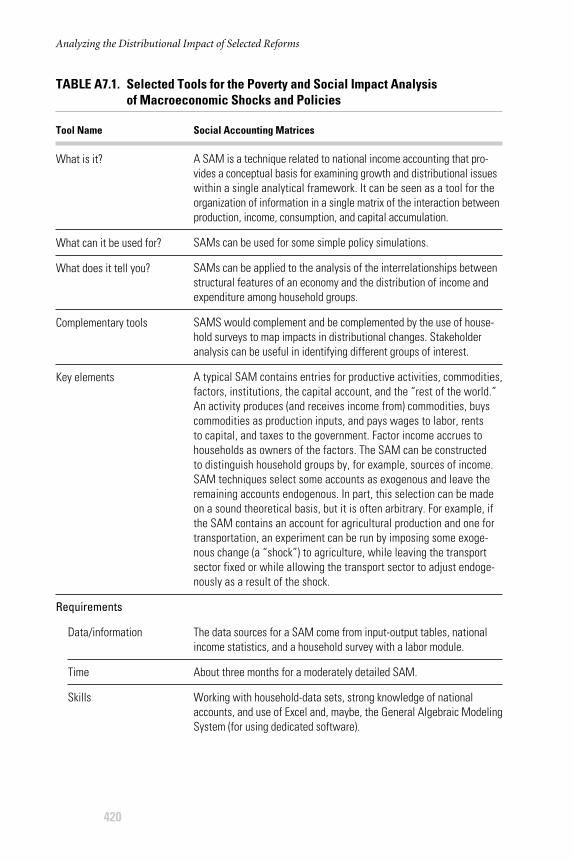
Analyzing the Distributional Impact of Selected Reforms
420
TABLE A7.1. Selected Tools for the Poverty and Social Impact Analysis of Macroeconomic Shocks and Policies
Tool Name Social Accounting Matrices
What is it?
What can it be used for?
What does it tell you?
Complementary tools
Key elements
Requirements
Data/information
Time
Skills
A SAM is a technique related to national income accounting that pro-vides a conceptual basis for examining growth and distributional issueswithin a single analytical framework. It can be seen as a tool for theorganization of information in a single matrix of the interaction betweenproduction, income, consumption, and capital accumulation.
SAMs can be used for some simple policy simulations.
SAMs can be applied to the analysis of the interrelationships betweenstructural features of an economy and the distribution of income andexpenditure among household groups.
SAMS would complement and be complemented by the use of house-hold surveys to map impacts in distributional changes. Stakeholderanalysis can be useful in identifying different groups of interest.
A typical SAM contains entries for productive activities, commodities,factors, institutions, the capital account, and the “rest of the world.”An activity produces (and receives income from) commodities, buyscommodities as production inputs, and pays wages to labor, rents to capital, and taxes to the government. Factor income accrues tohouseholds as owners of the factors. The SAM can be constructed to distinguish household groups by, for example, sources of income.SAM techniques select some accounts as exogenous and leave theremaining accounts endogenous. In part, this selection can be madeon a sound theoretical basis, but it is often arbitrary. For example, ifthe SAM contains an account for agricultural production and one fortransportation, an experiment can be run by imposing some exoge-nous change (a “shock”) to agriculture, while leaving the transportsector fixed or while allowing the transport sector to adjust endoge-nously as a result of the shock.
The data sources for a SAM come from input-output tables, nationalincome statistics, and a household survey with a labor module.
About three months for a moderately detailed SAM.
Working with household-data sets, strong knowledge of nationalaccounts, and use of Excel and, maybe, the General Algebraic ModelingSystem (for using dedicated software).
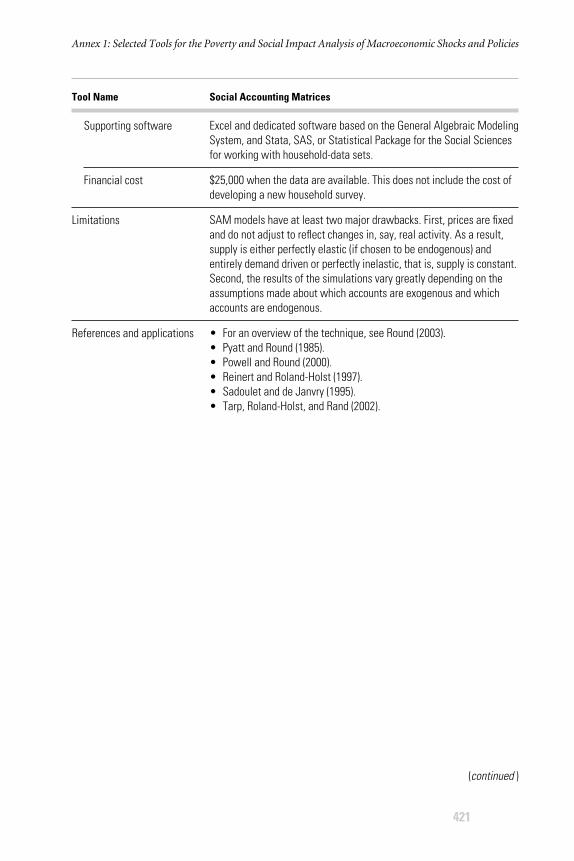
Annex 1: Selected Tools for the Poverty and Social Impact Analysis of Macroeconomic Shocks and Policies
421
Tool Name Social Accounting Matrices
Supporting software
Financial cost
Limitations
References and applications
Excel and dedicated software based on the General Algebraic ModelingSystem, and Stata, SAS, or Statistical Package for the Social Sciencesfor working with household-data sets.
$25,000 when the data are available. This does not include the cost ofdeveloping a new household survey.
SAM models have at least two major drawbacks. First, prices are fixedand do not adjust to reflect changes in, say, real activity. As a result,supply is either perfectly elastic (if chosen to be endogenous) andentirely demand driven or perfectly inelastic, that is, supply is constant.Second, the results of the simulations vary greatly depending on theassumptions made about which accounts are exogenous and whichaccounts are endogenous.
• For an overview of the technique, see Round (2003).• Pyatt and Round (1985).• Powell and Round (2000).• Reinert and Roland-Holst (1997).• Sadoulet and de Janvry (1995).• Tarp, Roland-Holst, and Rand (2002).
(continued )
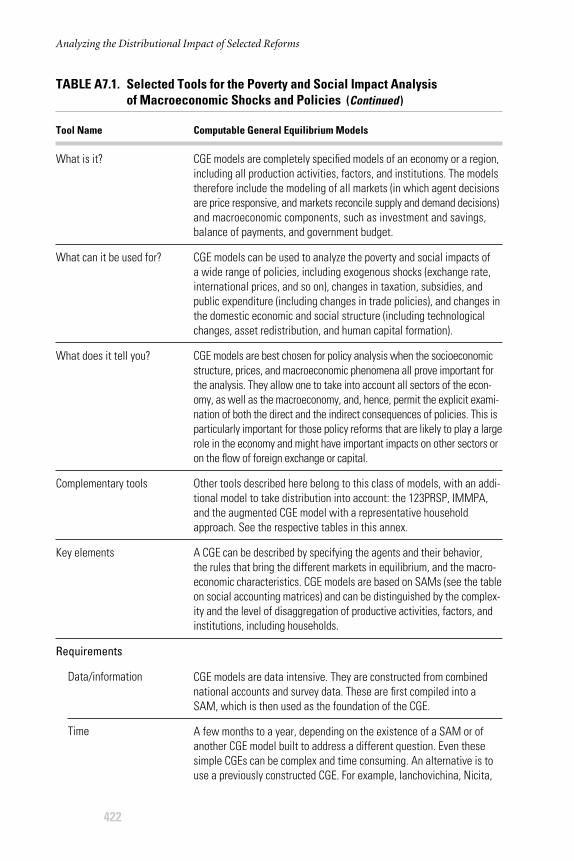
What is it?
What can it be used for?
What does it tell you?
Complementary tools
Key elements
Requirements
Data/information
Time
Analyzing the Distributional Impact of Selected Reforms
422
CGE models are completely specified models of an economy or a region,including all production activities, factors, and institutions. The modelstherefore include the modeling of all markets (in which agent decisionsare price responsive, and markets reconcile supply and demand decisions)and macroeconomic components, such as investment and savings,balance of payments, and government budget.
CGE models can be used to analyze the poverty and social impacts of a wide range of policies, including exogenous shocks (exchange rate,international prices, and so on), changes in taxation, subsidies, andpublic expenditure (including changes in trade policies), and changes inthe domestic economic and social structure (including technologicalchanges, asset redistribution, and human capital formation).
CGE models are best chosen for policy analysis when the socioeconomicstructure, prices, and macroeconomic phenomena all prove important forthe analysis. They allow one to take into account all sectors of the econ-omy, as well as the macroeconomy, and, hence, permit the explicit exami-nation of both the direct and the indirect consequences of policies. This isparticularly important for those policy reforms that are likely to play a largerole in the economy and might have important impacts on other sectors oron the flow of foreign exchange or capital.
Other tools described here belong to this class of models, with an addi-tional model to take distribution into account: the 123PRSP, IMMPA,and the augmented CGE model with a representative householdapproach. See the respective tables in this annex.
A CGE can be described by specifying the agents and their behavior, the rules that bring the different markets in equilibrium, and the macro-economic characteristics. CGE models are based on SAMs (see the tableon social accounting matrices) and can be distinguished by the complex-ity and the level of disaggregation of productive activities, factors, andinstitutions, including households.
CGE models are data intensive. They are constructed from combinednational accounts and survey data. These are first compiled into aSAM, which is then used as the foundation of the CGE.
A few months to a year, depending on the existence of a SAM or ofanother CGE model built to address a different question. Even thesesimple CGEs can be complex and time consuming. An alternative is touse a previously constructed CGE. For example, Ianchovichina, Nicita,
TABLE A7.1. Selected Tools for the Poverty and Social Impact Analysis of Macroeconomic Shocks and Policies (Continued )
Tool Name Computable General Equilibrium Models
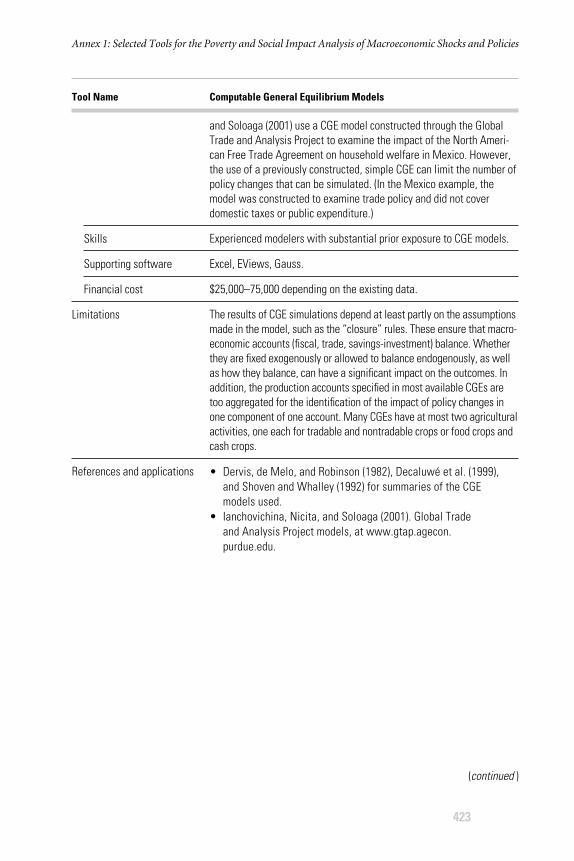
Skills
Supporting software
Financial cost
Limitations
References and applications
Annex 1: Selected Tools for the Poverty and Social Impact Analysis of Macroeconomic Shocks and Policies
423
Tool Name Computable General Equilibrium Models
and Soloaga (2001) use a CGE model constructed through the GlobalTrade and Analysis Project to examine the impact of the North Ameri-can Free Trade Agreement on household welfare in Mexico. However,the use of a previously constructed, simple CGE can limit the number ofpolicy changes that can be simulated. (In the Mexico example, themodel was constructed to examine trade policy and did not coverdomestic taxes or public expenditure.)
Experienced modelers with substantial prior exposure to CGE models.
Excel, EViews, Gauss.
$25,000–75,000 depending on the existing data.
The results of CGE simulations depend at least partly on the assumptionsmade in the model, such as the “closure” rules. These ensure that macro-economic accounts (fiscal, trade, savings-investment) balance. Whetherthey are fixed exogenously or allowed to balance endogenously, as wellas how they balance, can have a significant impact on the outcomes. Inaddition, the production accounts specified in most available CGEs aretoo aggregated for the identification of the impact of policy changes inone component of one account. Many CGEs have at most two agriculturalactivities, one each for tradable and nontradable crops or food crops andcash crops.
• Dervis, de Melo, and Robinson (1982), Decaluwé et al. (1999), and Shoven and Whalley (1992) for summaries of the CGE models used.
• Ianchovichina, Nicita, and Soloaga (2001). Global Trade and Analysis Project models, at www.gtap.agecon.purdue.edu.
(continued )
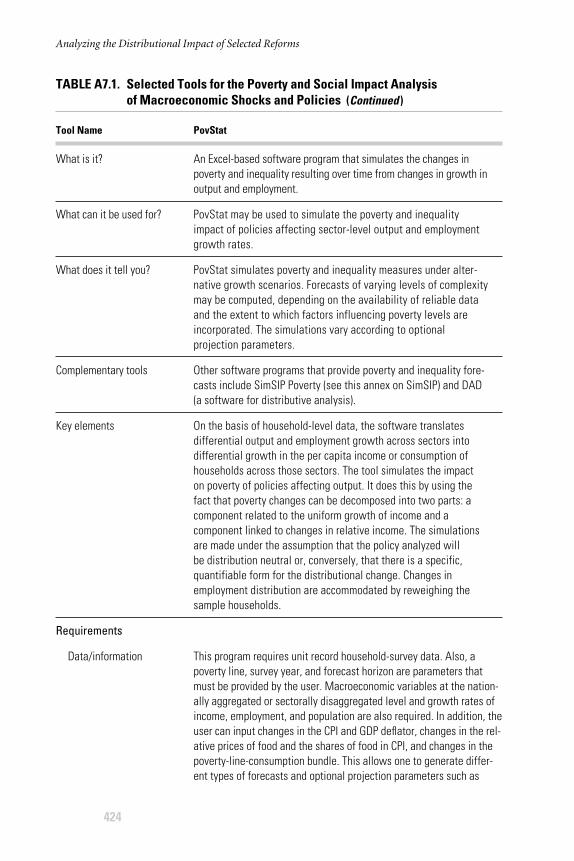
Analyzing the Distributional Impact of Selected Reforms
424
TABLE A7.1. Selected Tools for the Poverty and Social Impact Analysis of Macroeconomic Shocks and Policies (Continued )
Tool Name PovStat
What is it?
What can it be used for?
What does it tell you?
Complementary tools
Key elements
Requirements
Data/information
An Excel-based software program that simulates the changes inpoverty and inequality resulting over time from changes in growth inoutput and employment.
PovStat may be used to simulate the poverty and inequality impact of policies affecting sector-level output and employmentgrowth rates.
PovStat simulates poverty and inequality measures under alter-native growth scenarios. Forecasts of varying levels of complexitymay be computed, depending on the availability of reliable data and the extent to which factors influencing poverty levels are incorporated. The simulations vary according to optional projection parameters.
Other software programs that provide poverty and inequality fore-casts include SimSIP Poverty (see this annex on SimSIP) and DAD (a software for distributive analysis).
On the basis of household-level data, the software translates differential output and employment growth across sectors into differential growth in the per capita income or consumption of households across those sectors. The tool simulates the impact on poverty of policies affecting output. It does this by using the fact that poverty changes can be decomposed into two parts: a component related to the uniform growth of income and a component linked to changes in relative income. The simulations are made under the assumption that the policy analyzed will be distribution neutral or, conversely, that there is a specific, quantifiable form for the distributional change. Changes in employment distribution are accommodated by reweighing the sample households.
This program requires unit record household-survey data. Also, apoverty line, survey year, and forecast horizon are parameters thatmust be provided by the user. Macroeconomic variables at the nation-ally aggregated or sectorally disaggregated level and growth rates ofincome, employment, and population are also required. In addition, theuser can input changes in the CPI and GDP deflator, changes in the rel-ative prices of food and the shares of food in CPI, and changes in thepoverty-line-consumption bundle. This allows one to generate differ-ent types of forecasts and optional projection parameters such as
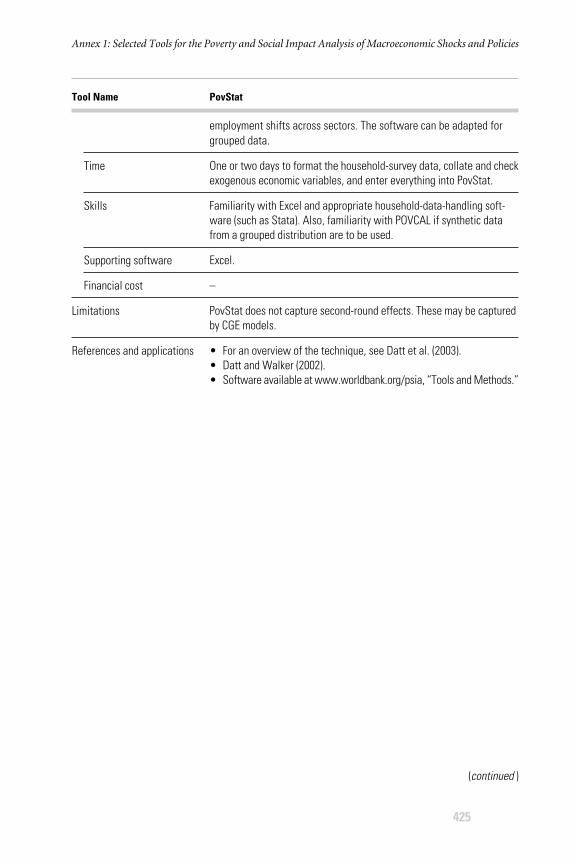
Annex 1: Selected Tools for the Poverty and Social Impact Analysis of Macroeconomic Shocks and Policies
425
Tool Name PovStat
Time
Skills
Supporting software
Financial cost
Limitations
References and applications
employment shifts across sectors. The software can be adapted forgrouped data.
One or two days to format the household-survey data, collate and checkexogenous economic variables, and enter everything into PovStat.
Familiarity with Excel and appropriate household-data-handling soft-ware (such as Stata). Also, familiarity with POVCAL if synthetic datafrom a grouped distribution are to be used.
Excel.
–
PovStat does not capture second-round effects. These may be capturedby CGE models.
• For an overview of the technique, see Datt et al. (2003).• Datt and Walker (2002).• Software available at www.worldbank.org/psia, “Tools and Methods.”
(continued )
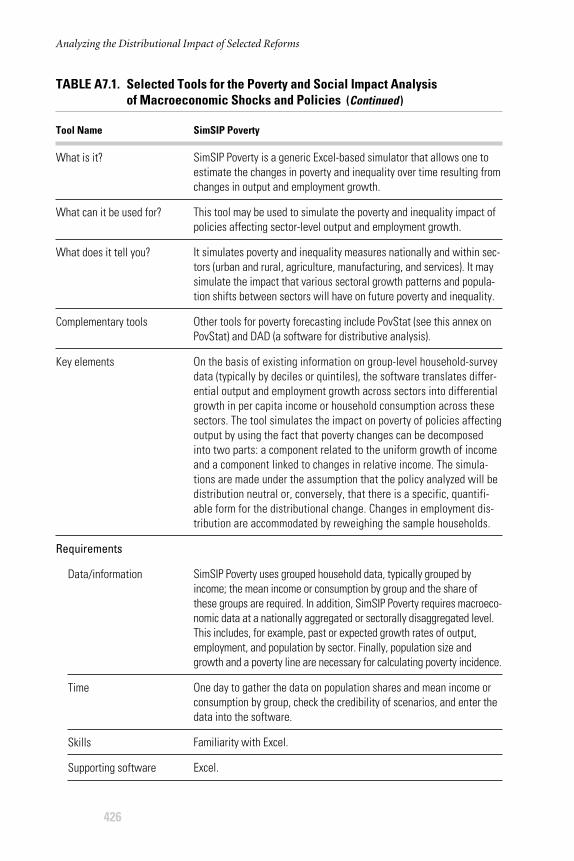
Analyzing the Distributional Impact of Selected Reforms
426
TABLE A7.1. Selected Tools for the Poverty and Social Impact Analysis of Macroeconomic Shocks and Policies (Continued )
Tool Name SimSIP Poverty
What is it?
What can it be used for?
What does it tell you?
Complementary tools
Key elements
Requirements
Data/information
Time
Skills
Supporting software
SimSIP Poverty is a generic Excel-based simulator that allows one toestimate the changes in poverty and inequality over time resulting fromchanges in output and employment growth.
This tool may be used to simulate the poverty and inequality impact ofpolicies affecting sector-level output and employment growth.
It simulates poverty and inequality measures nationally and within sec-tors (urban and rural, agriculture, manufacturing, and services). It maysimulate the impact that various sectoral growth patterns and popula-tion shifts between sectors will have on future poverty and inequality.
Other tools for poverty forecasting include PovStat (see this annex onPovStat) and DAD (a software for distributive analysis).
On the basis of existing information on group-level household-surveydata (typically by deciles or quintiles), the software translates differ-ential output and employment growth across sectors into differentialgrowth in per capita income or household consumption across thesesectors. The tool simulates the impact on poverty of policies affectingoutput by using the fact that poverty changes can be decomposedinto two parts: a component related to the uniform growth of incomeand a component linked to changes in relative income. The simula-tions are made under the assumption that the policy analyzed will bedistribution neutral or, conversely, that there is a specific, quantifi-able form for the distributional change. Changes in employment dis-tribution are accommodated by reweighing the sample households.
SimSIP Poverty uses grouped household data, typically grouped byincome; the mean income or consumption by group and the share ofthese groups are required. In addition, SimSIP Poverty requires macroeco-nomic data at a nationally aggregated or sectorally disaggregated level.This includes, for example, past or expected growth rates of output,employment, and population by sector. Finally, population size andgrowth and a poverty line are necessary for calculating poverty incidence.
One day to gather the data on population shares and mean income orconsumption by group, check the credibility of scenarios, and enter thedata into the software.
Familiarity with Excel.
Excel.

Annex 1: Selected Tools for the Poverty and Social Impact Analysis of Macroeconomic Shocks and Policies
427
Tool Name SimSIP Poverty
Financial cost
Limitations
References and applications
–
SimSIP does not capture second-round effects. These may be capturedby CGE models.
• For an overview of the technique, see Datt et al. (2003).• Wodon, Ramadas, and Van der Mensbrugghe (2003).• Ramadas, Van der Mensbrugghe, and Wodon (2002).• Software available at www.worldbank.org/simsip.
(continued )
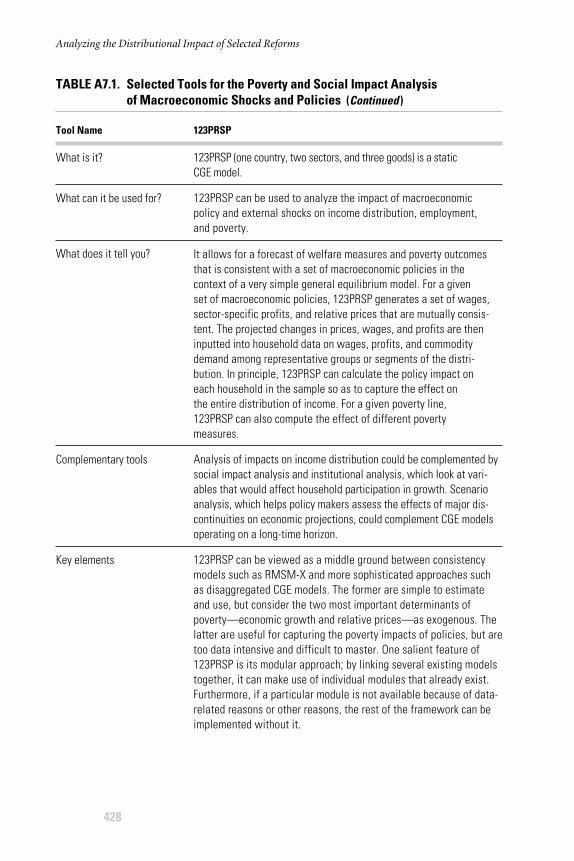
Analyzing the Distributional Impact of Selected Reforms
428
TABLE A7.1. Selected Tools for the Poverty and Social Impact Analysis of Macroeconomic Shocks and Policies (Continued )
Tool Name 123PRSP
What is it?
What can it be used for?
What does it tell you?
Complementary tools
Key elements
123PRSP (one country, two sectors, and three goods) is a static CGE model.
123PRSP can be used to analyze the impact of macroeconomic policy and external shocks on income distribution, employment, and poverty.
It allows for a forecast of welfare measures and poverty outcomesthat is consistent with a set of macroeconomic policies in the context of a very simple general equilibrium model. For a given set of macroeconomic policies, 123PRSP generates a set of wages,sector-specific profits, and relative prices that are mutually consis-tent. The projected changes in prices, wages, and profits are theninputted into household data on wages, profits, and commoditydemand among representative groups or segments of the distri-bution. In principle, 123PRSP can calculate the policy impact on each household in the sample so as to capture the effect on the entire distribution of income. For a given poverty line, 123PRSP can also compute the effect of different poverty measures.
Analysis of impacts on income distribution could be complemented bysocial impact analysis and institutional analysis, which look at vari-ables that would affect household participation in growth. Scenarioanalysis, which helps policy makers assess the effects of major dis-continuities on economic projections, could complement CGE modelsoperating on a long-time horizon.
123PRSP can be viewed as a middle ground between consistencymodels such as RMSM-X and more sophisticated approaches suchas disaggregated CGE models. The former are simple to estimateand use, but consider the two most important determinants ofpoverty—economic growth and relative prices—as exogenous. Thelatter are useful for capturing the poverty impacts of policies, but aretoo data intensive and difficult to master. One salient feature of123PRSP is its modular approach; by linking several existing modelstogether, it can make use of individual modules that already exist.Furthermore, if a particular module is not available because of data-related reasons or other reasons, the rest of the framework can beimplemented without it.
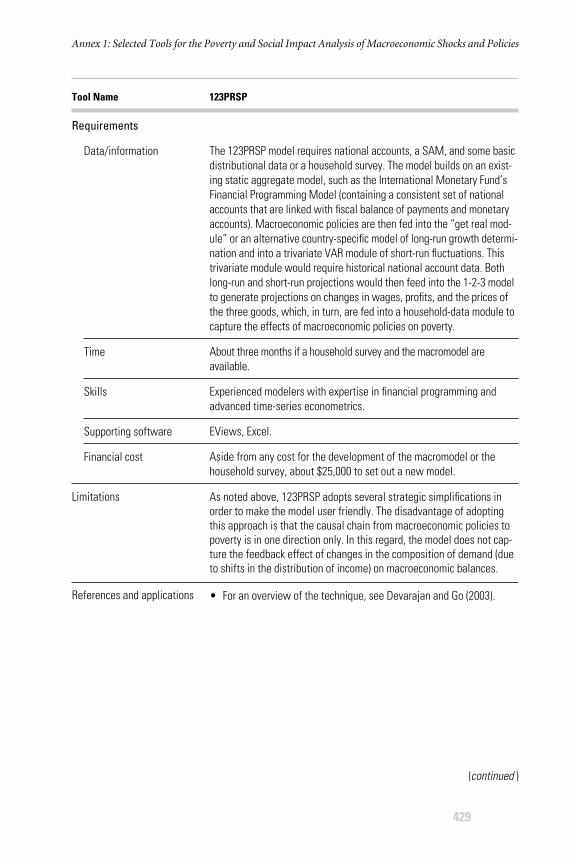
Annex 1: Selected Tools for the Poverty and Social Impact Analysis of Macroeconomic Shocks and Policies
429
Tool Name 123PRSP
Requirements
Data/information
Time
Skills
Supporting software
Financial cost
Limitations
References and applications
The 123PRSP model requires national accounts, a SAM, and some basicdistributional data or a household survey. The model builds on an exist-ing static aggregate model, such as the International Monetary Fund’sFinancial Programming Model (containing a consistent set of nationalaccounts that are linked with fiscal balance of payments and monetaryaccounts). Macroeconomic policies are then fed into the “get real mod-ule” or an alternative country-specific model of long-run growth determi-nation and into a trivariate VAR module of short-run fluctuations. Thistrivariate module would require historical national account data. Bothlong-run and short-run projections would then feed into the 1-2-3 modelto generate projections on changes in wages, profits, and the prices ofthe three goods, which, in turn, are fed into a household-data module tocapture the effects of macroeconomic policies on poverty.
About three months if a household survey and the macromodel are available.
Experienced modelers with expertise in financial programming andadvanced time-series econometrics.
EViews, Excel.
Aside from any cost for the development of the macromodel or thehousehold survey, about $25,000 to set out a new model.
As noted above, 123PRSP adopts several strategic simplifications inorder to make the model user friendly. The disadvantage of adoptingthis approach is that the causal chain from macroeconomic policies topoverty is in one direction only. In this regard, the model does not cap-ture the feedback effect of changes in the composition of demand (dueto shifts in the distribution of income) on macroeconomic balances.
• For an overview of the technique, see Devarajan and Go (2003).
(continued )
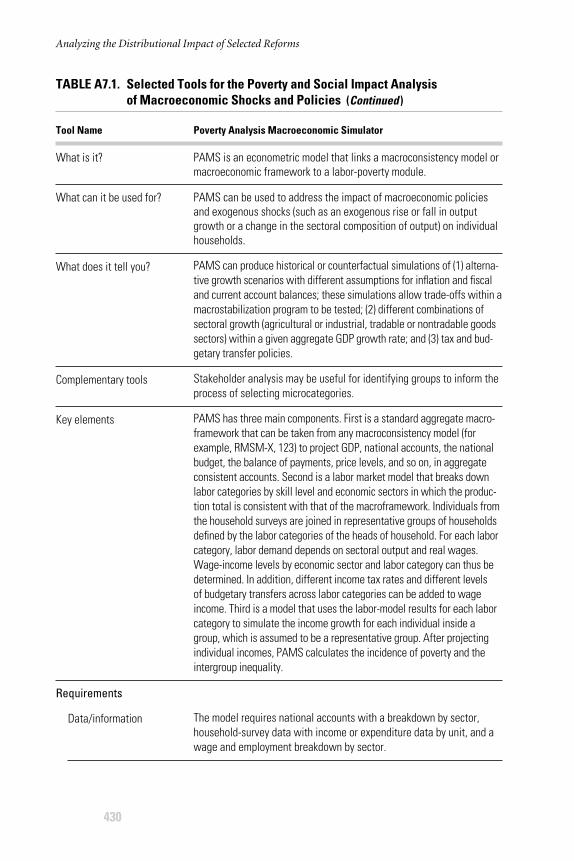
Analyzing the Distributional Impact of Selected Reforms
430
TABLE A7.1. Selected Tools for the Poverty and Social Impact Analysis of Macroeconomic Shocks and Policies (Continued )
Tool Name Poverty Analysis Macroeconomic Simulator
What is it?
What can it be used for?
What does it tell you?
Complementary tools
Key elements
Requirements
Data/information
PAMS is an econometric model that links a macroconsistency model ormacroeconomic framework to a labor-poverty module.
PAMS can be used to address the impact of macroeconomic policiesand exogenous shocks (such as an exogenous rise or fall in outputgrowth or a change in the sectoral composition of output) on individualhouseholds.
PAMS can produce historical or counterfactual simulations of (1) alterna-tive growth scenarios with different assumptions for inflation and fiscaland current account balances; these simulations allow trade-offs within amacrostabilization program to be tested; (2) different combinations ofsectoral growth (agricultural or industrial, tradable or nontradable goodssectors) within a given aggregate GDP growth rate; and (3) tax and bud-getary transfer policies.
Stakeholder analysis may be useful for identifying groups to inform theprocess of selecting microcategories.
PAMS has three main components. First is a standard aggregate macro-framework that can be taken from any macroconsistency model (forexample, RMSM-X, 123) to project GDP, national accounts, the nationalbudget, the balance of payments, price levels, and so on, in aggregateconsistent accounts. Second is a labor market model that breaks downlabor categories by skill level and economic sectors in which the produc-tion total is consistent with that of the macroframework. Individuals fromthe household surveys are joined in representative groups of householdsdefined by the labor categories of the heads of household. For each laborcategory, labor demand depends on sectoral output and real wages.Wage-income levels by economic sector and labor category can thus bedetermined. In addition, different income tax rates and different levels of budgetary transfers across labor categories can be added to wageincome. Third is a model that uses the labor-model results for each laborcategory to simulate the income growth for each individual inside agroup, which is assumed to be a representative group. After projectingindividual incomes, PAMS calculates the incidence of poverty and theintergroup inequality.
The model requires national accounts with a breakdown by sector,household-survey data with income or expenditure data by unit, and awage and employment breakdown by sector.
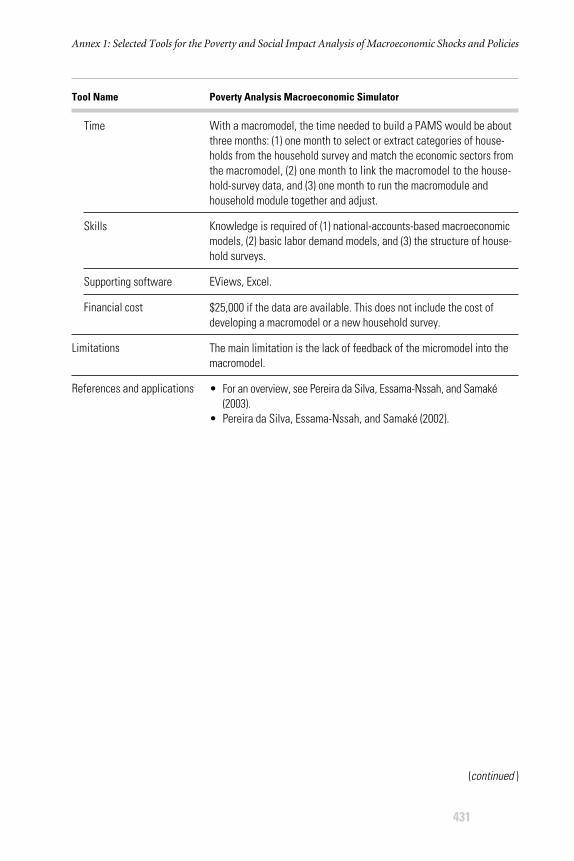
Annex 1: Selected Tools for the Poverty and Social Impact Analysis of Macroeconomic Shocks and Policies
431
Time
Skills
Supporting software
Financial cost
Limitations
References and applications
With a macromodel, the time needed to build a PAMS would be aboutthree months: (1) one month to select or extract categories of house-holds from the household survey and match the economic sectors fromthe macromodel, (2) one month to link the macromodel to the house-hold-survey data, and (3) one month to run the macromodule andhousehold module together and adjust.
Knowledge is required of (1) national-accounts-based macroeconomicmodels, (2) basic labor demand models, and (3) the structure of house-hold surveys.
EViews, Excel.
$25,000 if the data are available. This does not include the cost ofdeveloping a macromodel or a new household survey.
The main limitation is the lack of feedback of the micromodel into themacromodel.
• For an overview, see Pereira da Silva, Essama-Nssah, and Samaké(2003).
• Pereira da Silva, Essama-Nssah, and Samaké (2002).
(continued )
Tool Name Poverty Analysis Macroeconomic Simulator
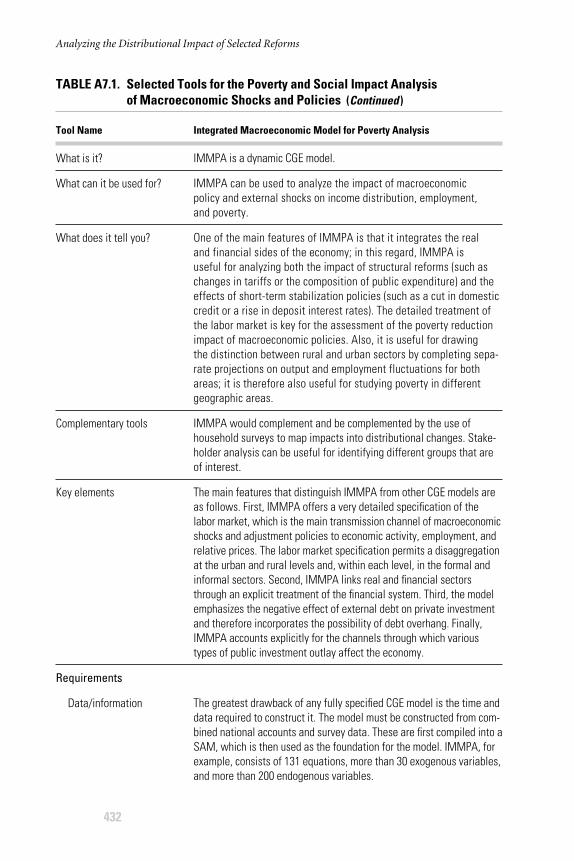
Analyzing the Distributional Impact of Selected Reforms
432
TABLE A7.1. Selected Tools for the Poverty and Social Impact Analysis of Macroeconomic Shocks and Policies (Continued )
Tool Name Integrated Macroeconomic Model for Poverty Analysis
What is it?
What can it be used for?
What does it tell you?
Complementary tools
Key elements
Requirements
Data/information
IMMPA is a dynamic CGE model.
IMMPA can be used to analyze the impact of macroeconomic policy and external shocks on income distribution, employment, and poverty.
One of the main features of IMMPA is that it integrates the real and financial sides of the economy; in this regard, IMMPA is useful for analyzing both the impact of structural reforms (such aschanges in tariffs or the composition of public expenditure) and theeffects of short-term stabilization policies (such as a cut in domesticcredit or a rise in deposit interest rates). The detailed treatment ofthe labor market is key for the assessment of the poverty reductionimpact of macroeconomic policies. Also, it is useful for drawing the distinction between rural and urban sectors by completing sepa-rate projections on output and employment fluctuations for bothareas; it is therefore also useful for studying poverty in differentgeographic areas.
IMMPA would complement and be complemented by the use ofhousehold surveys to map impacts into distributional changes. Stake-holder analysis can be useful for identifying different groups that areof interest.
The main features that distinguish IMMPA from other CGE models areas follows. First, IMMPA offers a very detailed specification of thelabor market, which is the main transmission channel of macroeconomicshocks and adjustment policies to economic activity, employment, andrelative prices. The labor market specification permits a disaggregationat the urban and rural levels and, within each level, in the formal andinformal sectors. Second, IMMPA links real and financial sectorsthrough an explicit treatment of the financial system. Third, the modelemphasizes the negative effect of external debt on private investmentand therefore incorporates the possibility of debt overhang. Finally,IMMPA accounts explicitly for the channels through which varioustypes of public investment outlay affect the economy.
The greatest drawback of any fully specified CGE model is the time anddata required to construct it. The model must be constructed from com-bined national accounts and survey data. These are first compiled into aSAM, which is then used as the foundation for the model. IMMPA, forexample, consists of 131 equations, more than 30 exogenous variables,and more than 200 endogenous variables.
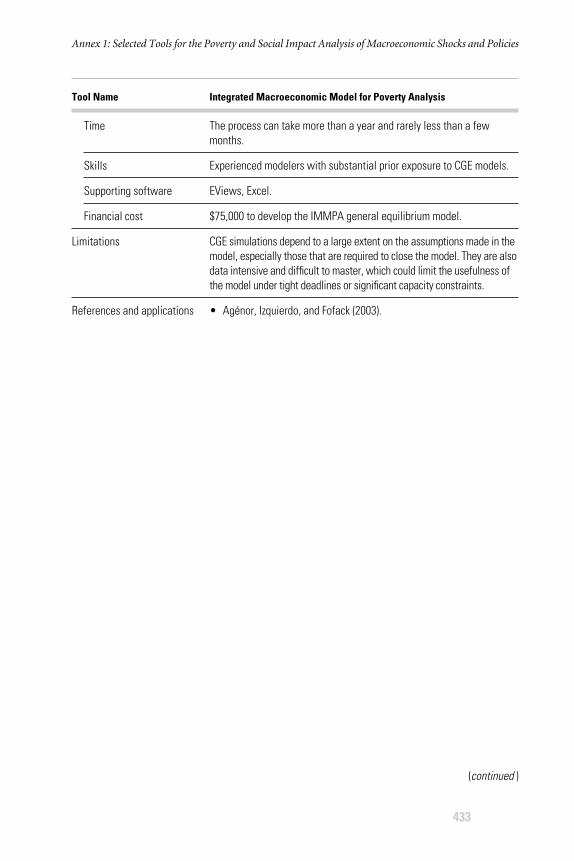
Annex 1: Selected Tools for the Poverty and Social Impact Analysis of Macroeconomic Shocks and Policies
433
Time
Skills
Supporting software
Financial cost
Limitations
References and applications
The process can take more than a year and rarely less than a fewmonths.
Experienced modelers with substantial prior exposure to CGE models.
EViews, Excel.
$75,000 to develop the IMMPA general equilibrium model.
CGE simulations depend to a large extent on the assumptions made in themodel, especially those that are required to close the model. They are alsodata intensive and difficult to master, which could limit the usefulness ofthe model under tight deadlines or significant capacity constraints.
• Agénor, Izquierdo, and Fofack (2003).
Tool Name Integrated Macroeconomic Model for Poverty Analysis
(continued )
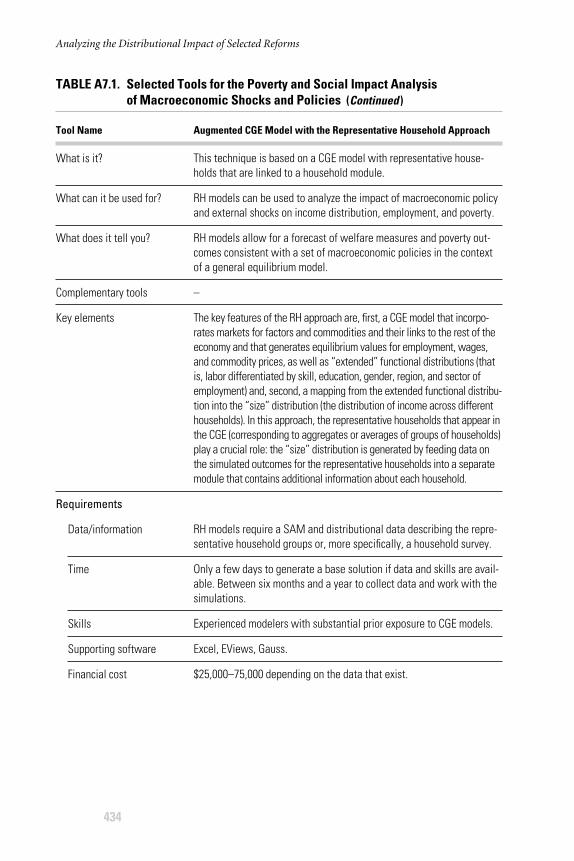
This technique is based on a CGE model with representative house-holds that are linked to a household module.
RH models can be used to analyze the impact of macroeconomic policyand external shocks on income distribution, employment, and poverty.
RH models allow for a forecast of welfare measures and poverty out-comes consistent with a set of macroeconomic policies in the contextof a general equilibrium model.
–
The key features of the RH approach are, first, a CGE model that incorpo-rates markets for factors and commodities and their links to the rest of theeconomy and that generates equilibrium values for employment, wages,and commodity prices, as well as “extended” functional distributions (thatis, labor differentiated by skill, education, gender, region, and sector ofemployment) and, second, a mapping from the extended functional distribu-tion into the “size” distribution (the distribution of income across differenthouseholds). In this approach, the representative households that appear inthe CGE (corresponding to aggregates or averages of groups of households)play a crucial role: the “size” distribution is generated by feeding data onthe simulated outcomes for the representative households into a separatemodule that contains additional information about each household.
RH models require a SAM and distributional data describing the repre-sentative household groups or, more specifically, a household survey.
Only a few days to generate a base solution if data and skills are avail-able. Between six months and a year to collect data and work with thesimulations.
Experienced modelers with substantial prior exposure to CGE models.
Excel, EViews, Gauss.
$25,000–75,000 depending on the data that exist.
Analyzing the Distributional Impact of Selected Reforms
434
TABLE A7.1. Selected Tools for the Poverty and Social Impact Analysis of Macroeconomic Shocks and Policies (Continued )
Tool Name Augmented CGE Model with the Representative Household Approach
What is it?
What can it be used for?
What does it tell you?
Complementary tools
Key elements
Requirements
Data/information
Time
Skills
Supporting software
Financial cost

Limitations
References and applications
Source: World Bank 2003.
Annex 1: Selected Tools for the Poverty and Social Impact Analysis of Macroeconomic Shocks and Policies
435
In the absence of a CGE model to feed into the RH module, the model isdata intensive and difficult to master.
• For an overview, see Löfgren, Robinson, and El-Said (2003).• Robilliard, Bourguignon, and Robinson (2001) on Indonesia.• Coady and Harris (2001) on Mexico.• Löfgren, Harris, and Robinson (2002).
Tool Name Augmented CGE Model with the Representative Household Approach


The analysis of the distributional impact of policy reforms on the well-being or wel-fare of different stakeholder groups, particularly on the poor and vulnerable, has animportant role in the elaboration and implementation of poverty reduction strategiesin developing countries. In recent years this type of work has been labeled as Povertyand Social Impact Analysis (PSIA) and is increasingly implemented to promote evi-dence-based policy choices and foster debate on policy reform options.
While information is available on the general approach, techniques, and tools for dis-tributional analysis, each sector displays a series of specific characteristics. These haveimplications for the analysis of distributional impacts, including the types of impactsand transmission channels that warrant particular attention, the tools and techniquesmost appropriate, the data sources typically utilized, and the range of political economyfactors most likely to affect the reform process.
Analyzing the Distributional Impact of Reforms is the second volume in a series, and itcovers six key areas of policy reform that are likely to have significant effects on dis-tribution and poverty: pension, health, labor markets, public sector downsizing, taxa-tion, and decentralization. It also provides a brief overview of the modeling approachesfor macroeconomic shocks and policies.
This volume is a companion to a first volume, Analyzing the Distributional Impact ofReforms, edited by Aline Coudouel and Stefano Paternostro (2005), which coveredreforms in the areas of trade, monetary and exchange rate policy, utility provision,agricultural markets, land policy, and education.
Each chapter is organized around the different transmission channels through whichpolicy reforms can be expected to affect the population. The chapters provide anoverview of the typical direction and magnitude of the expected impacts; the imple-mentation mechanisms through which reforms are typically carried out; the stake-holders who are likely to be affected by the reform, positively or negatively, or who arelikely to affect the reform; and the methodologies typically used to analyze the distri-butional impact. Each chapter illustrates these points with examples, applications,references, sources and a bibliography.
THE WORLD BANK
A practitioner’s guide to pension, health, labor markets, public sectordownsizing, taxation, decentralization, and macroeconomic modeling
Analyzing the DistributionalImpact of Reforms
ISBN 0-8213-6348-4


