Embed Size (px)
Citation preview

LASER SURFACE MODIFICATION OF BIOMEDICAL ALLOYS
A thesis submitted for the degree of
Doctor of Philosophy
by
EVANS CHIKARAKARA
(B.ENG.)
School of Mechanical and Manufacturing Engineering
Faculty of Engineering and Computing
Dublin City University
January 2012
Supervisors
Dr Sumsun Naher
Dr Dermot Brabazon
PhD 2012
ii
Preface
This thesis describes original work which has not previously been submitted for a
degree in Dublin City University or at any other University. The investigations were
carried out in the School of Mechanical and Manufacturing Engineering, Dublin City
University, during the period November 2008 to November 2011, under the supervision
of Dr Sumsun Naher and Dr Dermot Brabazon. This work has been disseminated
through the following publications.
Journal Articles:
E. Chikarakara, S. Naher and D. Brabazon, High Speed Laser Surface Modification
of Ti-6Al-4V, Accepted for publication, Surface and Coatings Technology,
03/01/2012.
E. Chikarakara, S. Naher and D. Brabazon, Analysis of Microstructural Changes
during Pulsed CO2 Laser Surface Processing of AISI 316L Stainless Steel, Advanced
Materials Research, 264-265, 1401-1408, 2011.
E. Chikarakara, S. Naher and D. Brabazon, Process Mapping of Laser Surface
Modification of AISI 316L Stainless Steel for Biomedical Applications, Applied
Physics A: Materials Science & Processing, 101, 367-371, 2010.
E. Chikarakara, S. Aqida, D. Brabazon, S. Naher, J. A. Picas, M. Punset and A.
Forn, Surface Modification of HVOF Thermal Sprayed WC-CoCr Coatings by Laser
Treatment, International Journal of Material Forming, 3, 801 – 804, 2010.
International Conference Papers:
E. Chikarakara, S. Naher and D. Brabazon, Tribological Analysis of High Speed
Laser Surface Modified Ti-6Al-4V, 11th
International Conference on Laser Ablation,
Mexico, November 14 – 18, 2011.
E. Chikarakara, A. Betts, S. Naher and D. Brabazon, Effects of High Speed Laser
Surface Modification on Microstructure and Corrosion Characteristics of Ti-6Al-4V,
25th
International Conference on Surface Modification Technologies, Sweden, June
20 – 22, 2011.

iii
E. Chikarakara, M. Punset, J.A. Picas, D. Brabazon and S. Naher, Characterisation
of Laser Modified WC-CoCr Coatings, The 14th
International ESAFORM conference
on material Forming, Queens University, Northern Ireland, April 27-29, 2011, AIP
Conference Proceedings, Volume 1353, pp. 1087-1092 (2011).
E. Chikarakara, S. Aqida, D. Brabazon, S. Naher, J.A. Picas, M. Punset and A.
Forn, Surface Modification of HVOF Thermal Sprayed WC-CoCr Coatings by Laser
Treatment, The 13th International ESAFORM Conference on Material Forming,
University of Brescia, Italy, April 7-9, 2010.
E. Chikarakara, S. Naher and D. Brabazon, Process Mapping of Laser surface
modification of AISI 316L Stainless Steel, 10th
International Conference on Laser
Ablation, Singapore, November 23 – 27, 2009.
E. Chikarakara, S. Naher and D. Brabazon, Analysis of Microstructural Changes
During Pulsed CO2 Laser Surface Processing of AISI 316L Stainless Steel,
Proceedings of the International Conference on Advances in Materials and
Processing Technologies (AMPT), Kuala Lumpur, Malaysia, October 26 – 29, 2009.
Seminars and Posters:
E. Chikarakara, S. Naher and D. Brabazon, High Speed Laser Surface Modification
of Ti-6Al-4V for Biomedical Applications, Faculty Research Day, Dublin City
University, May 12, 2011. Awarded 3st prize for the oral presentation.
E. Chikarakara, S. Naher and D. Brabazon, Laser Surface Modification of Ti-6Al-
4V alloy for biomedical applications, Surface science of biologically important
interfaces (SBII 12), Ulster University, October 27, 2010.
E. Chikarakara, S. Naher and D. Brabazon, Process Mapping of Laser Surface
Modification of AISI 316L Stainless Steel for Biomedical Applications, Faculty
Research Day, Dublin City University, May 12, 2010. Awarded 1st prize for poster
presentation.
E. Chikarakara, S. Naher and D. Brabazon, Overview of Pulsed Laser Surface
Melting of AISI 316L Stainless Steel for Biomedical Applications, Symposium for
Mechanical Engineering Research and Practice, Dublin City University, May 28,
2009.

iv
Declaration
I hereby certify that this material, which I now submit for assessment on the programme
of study leading to the award of Doctor of Philosophy is entirely my own work, that I
have exercised reasonable care to ensure that the work is original, and does not to the
best of my knowledge breach any law of copyright, and has not been taken from the
work of others save and to the extent that such work has been cited and acknowledged
within the text of my work.
Signed: …………………....
(Evans Chikarakara)
ID No. 54781457
Date: 30 January 2012

v
Dedication
To Mom
For making my life feel like a vacation

vi
Acknowledgements
First and foremost, I would like to sincerely thank my supervisors, Dr Sumsun Naher
and Dr Dermot Brabazon for their support throughout the project. I want to especially
thank them for, their encouragements, advice, ever-inspiring expertise, sourcing out
collaborations and funding of conference expenses. I am truly grateful for everything
they have done to help me get to where I am now.
Special thanks to the late Martin Johnson for his support with the CO2 laser - may his
soul Rest In Peace. Thanks to Michael May, Barry O’Connell, Alan Meehan and Liam
Domican for the technical support throughout the study. I would also like to extend my
thanks to DCU’s mechanical workshop technicians Jim Barry, Cian Merne and Eoin
Tuohy for the manufacturing and machining of the parts and materials required for the
project.
I am also grateful to all the collaborations I had in the process and would like to thank
Anthony Betts from Dublin Institute of Technology for the support in corrosion testing.
Many thanks go to Laura Grehan (Athlone Institute of Technology), Tanya Levinstone
and John Lau (Royal College of Surgeons) for their assistance in biocompatibility
experimental work. Special thanks go to Syarifah Nur Aqida Syed Ahmad and David
Moore, who were part of the laser processing group, for the regular exchange of ideas
that helped with the progress of this work.
I would like to also thank the DCU’s Office of Vice-President of Research (OVRP) and
the School of Mechanical and Manufacturing Engineering for funding the project.
Finally, thank you to my family and friends. If it wasn't for you, I'd be way closer to
insanity, ndinotenda.

vii
Abstract
This study investigated the effects of high speed laser surface modification on 316L
stainless steel and Ti-6Al-4V for biomedical implants application. Laser processing was
carried out in an inert argon environment using a 1.5 kW CO2 laser. Parameters
investigated in this work included irradiance, residence time, pulse width and sample
pre-treatments. Surface topology, microstructure and melt pool depth were characterised
using the scanning electron microscope. White light interferometry and stylus
profilometry were used to determine the surface roughness. X-ray diffractometry was
used to investigate the crystallinity and phase transformation induced by the laser
treatment. Micro-hardness was measured using a Vickers micro-hardness indentation
apparatus. Wear behaviour was investigated using a pin on disk apparatus. Corrosion
behaviour was evaluated using a potentiostat and an electrochemical cell set-up
simulating human body conditions. Biocompatibility of the samples was investigated in
vitro by monitoring NIH/3T3 fibroblast and MC3T3-E1 osteoblast cell growth via MTT
and Hoechst DNA assays.
A strong correlation between irradiance, residence time, depth of processing and
roughness was established in 316L. High depth of altered microstructure and increased
roughness were linked to higher levels of both irradiance and residence times. At fixed
energy density, increase in residence time resulted in growth of the melt pool. In the
melted region, a uniform composition in microstructure with fewer impurities was
observed. In Ti-6Al-4V alloy, laser treatment resulted in crack-free layers, twenty to
fifty microns thick. With increase in both irradiance and residence time, surface
roughness was found to decrease while melt pool depth increased. A martensite
structure formed on the laser treated region producing acicular αTi nested within the
aged βTi matrix. The βTi phase volume fraction was reduced by up to 19%.
Microhardness increased up to 760 HV0.05 which represented a 67% increase compared
to the bulk material. A homogenous chemical composition of the alloying elements was
achieved in laser modified regions. Much lower levels of wear were noted in laser
treated samples compared to untreated samples. Stable passive polarisation behaviour
and reduction in corrosion rates was noted in treated samples ranging between 86 and
239 nm yr-1
compared to 108 nm yr-1
for untreated samples and 309 nm yr-1
for grit
blast samples. Direct contact assays showed that laser treated samples had improved
cytotoxicity properties compared to their untreated counterparts.

viii
Contents
CONTENTS ............................................................................................................................................. VIII
INTRODUCTION ................................................................................................................... 1-1 CHAPTER 1
1.1 OVERVIEW ......................................................................................................................................... 1-1
1.2 STATEMENT OF INVESTIGATION .............................................................................................................. 1-3
1.3 THESIS OUTLINE .................................................................................................................................. 1-4
LITERATURE REVIEW ........................................................................................................... 2-5 CHAPTER 2
2.1 HIP REPLACEMENT PROSTHESIS .............................................................................................................. 2-5
2.1.1 Femoral head .......................................................................................................................... 2-6
2.1.2 Femoral stem .......................................................................................................................... 2-7
2.2 CONVENTIONAL BIOMATERIALS USED IN HIP REPLACEMENTS ....................................................................... 2-7
2.3 METALLIC BIOMATERIALS ...................................................................................................................... 2-9
2.3.1 316L stainless steel ............................................................................................................... 2-10
2.3.2 Ti-6Al-4V ............................................................................................................................... 2-14
2.4 SURFACE ENGINEERING ....................................................................................................................... 2-19
2.5 CORROSION ...................................................................................................................................... 2-20
2.6 WETTABILITY CHARACTERISTICS ............................................................................................................ 2-22
2.7 BIOCOMPATIBILITY ............................................................................................................................. 2-25
2.8 LASER SURFACE MODIFICATION ............................................................................................................ 2-27
2.8.1 Laser Glazing ......................................................................................................................... 2-27
2.8.2 Laser Surface Alloying ........................................................................................................... 2-30
2.8.3 Laser Surface Cladding .......................................................................................................... 2-32
2.8.4 Laser Shock Hardening .......................................................................................................... 2-33
2.8.5 Laser Surface Melting ........................................................................................................... 2-34
2.9 PARAMETERS AFFECTING LASER SURFACE MODIFICATION ......................................................................... 2-35
2.9.1 Material Properties ............................................................................................................... 2-35
2.9.2 Laser Operating Modes ......................................................................................................... 2-38
2.9.3 Laser Power and Irradiance .................................................................................................. 2-39
2.9.4 Sample Speed and Residence Time ....................................................................................... 2-41
2.9.5 Overlap percentage .............................................................................................................. 2-41
2.9.6 Pulse Energy density ............................................................................................................. 2-42
2.10 EFFECTS OF LASER SURFACE MELTING ON STAINLESS STEEL PROPERTIES ..................................................... 2-42
2.11 EFFECTS OF LASER SURFACE MELTING ON TI-6AL-4V PROPERTIES ............................................................ 2-44
2.11.1 Microstructure .................................................................................................................... 2-45
2.11.2 Melt Profile ......................................................................................................................... 2-46
2.11.3 Roughness ........................................................................................................................... 2-47
2.11.4 Hardness ............................................................................................................................. 2-48
ix
2.11.5 Wear Properties .................................................................................................................. 2-49
2.11.6 Corrosion Resistance ........................................................................................................... 2-50
2.11.7 Interfacial and Biocompatibility Properties ........................................................................ 2-51
2.12 STUDY FOCUS AND OBJECTIVES .......................................................................................................... 2-52
MATERIALS AND METHODS .............................................................................................. 3-55 CHAPTER 3
3.1 SAMPLE PREPARATION........................................................................................................................ 3-55
3.1.1 Surface Pre-treatments ......................................................................................................... 3-56
3.2 LASER INSTRUMENTATION AND EXPERIMENTAL SET-UP ............................................................................. 3-57
3.2.1 Laser Processing of Cylindrical Work-pieces ......................................................................... 3-59
3.2.2 Laser Processing of Planar Work-pieces ............................................................................... 3-60
3.3 METALLOGRAPHY .............................................................................................................................. 3-60
3.3.1 Sectioning of the Work-piece ................................................................................................ 3-60
3.3.2 Mounting of the Sectioned Sample ....................................................................................... 3-60
3.3.3 Grinding and Polishing of the Mounted Sample ................................................................... 3-61
3.3.4 Etching .................................................................................................................................. 3-61
3.4 DESIGN OF EXPERIMENTS (DOE) .......................................................................................................... 3-62
3.4.1 316L Stainless Steel .............................................................................................................. 3-63
3.4.2 Ti-6Al-4V ............................................................................................................................... 3-66
3.5 MICROSTRUCTURAL ANALYSIS .............................................................................................................. 3-67
3.6 MELT POOL PROFILE MEASUREMENT .................................................................................................... 3-68
3.7 ROUGHNESS MEASUREMENTS .............................................................................................................. 3-68
3.8 MICRO-HARDNESS MEASUREMENTS ..................................................................................................... 3-69
3.9 XRD ANALYSIS .................................................................................................................................. 3-69
3.10 CHEMICAL COMPOSITION ANALYSIS .................................................................................................... 3-70
3.11 WEAR TESTING ............................................................................................................................... 3-71
3.11.1 Reasons for parameter choice ............................................................................................ 3-73
3.11.2 Wear Testing Procedure ..................................................................................................... 3-73
3.12 CORROSION TESTING ........................................................................................................................ 3-73
3.12.1 Corrosion Testing Procedure ............................................................................................... 3-76
3.13 CONTACT ANGLE ANALYSIS ................................................................................................................ 3-77
3.14 BIOCOMPATIBILITY ANALYSIS ............................................................................................................. 3-78
3.14.1 Cell Attachment and Proliferation ...................................................................................... 3-78
3.14.2 Cytotoxicity ......................................................................................................................... 3-79
: 316L STAINLESS STEEL RESULTS & DISCUSSIONS ............................................................. 4-84 CHAPTER 4
4.1 DESIGN OF EXPERIMENTS 1 ................................................................................................................. 4-84
4.1.1 Morphology and Microstructure Analysis ............................................................................. 4-84
4.1.2 Melt Pool Size Analysis .......................................................................................................... 4-88
4.1.3 Roughness Analysis ............................................................................................................... 4-90
4.2 DESIGN OF EXPERIMENTS 2 ................................................................................................................. 4-92
x
4.2.1 Microstructure Analysis ........................................................................................................ 4-92
4.2.2 Effects of pre-treatments and residence time on meltpool depth ........................................ 4-94
4.2.3 Microhardness ...................................................................................................................... 4-95
4.2.4 EDS Analysis .......................................................................................................................... 4-96
4.3 SUMMARY ........................................................................................................................................ 4-98
RESULTS: TI-6AL-4V ........................................................................................................... 5-99 CHAPTER 5
5.1. METALLOGRAPHY ............................................................................................................................. 5-99
5.1.1 Surface Topography .............................................................................................................. 5-99
5.1.2 Cross-sectional microstructure ........................................................................................... 5-101
5.2 MELTPOOL PROFILE ......................................................................................................................... 5-105
5.3 ROUGHNESS ................................................................................................................................... 5-108
5.4 MICROHARDNESS ............................................................................................................................ 5-111
5.5 PHASE AND CHEMICAL COMPOSITION CHARACTERISATION ...................................................................... 5-114
5.5.1 X-ray diffraction .................................................................................................................. 5-114
5.5.2 Topographic chemical composition analysis....................................................................... 5-119
5.5.3 Cross-sectional chemical composition analysis................................................................... 5-122
5.6 WEAR RESISTANCE ........................................................................................................................... 5-123
5.6.1 Wear Track Micrographs .................................................................................................... 5-124
5.6.2 Effects of Laser Processing Parameters on Specific Wear rate ........................................... 5-127
5.7 CORROSION RESISTANCE ................................................................................................................... 5-130
5.8 SURFACE WETTABILITY ..................................................................................................................... 5-135
5.8.1 Contact Angles of Unpolished Samples ............................................................................... 5-136
5.8.2 Contact Angle of Polished Samples ..................................................................................... 5-140
5.9 BIOCOMPATIBILITY ........................................................................................................................... 5-141
5.9.1 Cell Attachment and Metabolic Activity ............................................................................. 5-141
5.9.2 Cytotoxicity ......................................................................................................................... 5-145
DISCUSSION: TI-AL-4V ..................................................................................................... 6-147 CHAPTER 6
6.1 METALLOGRAPHY ANALYSIS ............................................................................................................... 6-147
6.1.1 Surface Melting and Morphological Features .................................................................... 6-147
6.1.2 Cross-sectional microstructure ........................................................................................... 6-149
6.2 MELTPOOL DEPTH ANALYSIS .............................................................................................................. 6-151
6.3 ROUGHNESS ANALYSIS ...................................................................................................................... 6-152
6.4 MICROHARDNESS ............................................................................................................................ 6-154
6.5 PHASE TRANSFORMATION AND CHEMICAL ANALYSIS .............................................................................. 6-155
6.5.1 X-ray Diffraction Analysis .................................................................................................... 6-155
6.5.2 Chemical Composition ........................................................................................................ 6-157
6.6 WEAR RESISTANCE ........................................................................................................................... 6-158
6.7 CORROSION RESISTANCE ................................................................................................................... 6-160
6.8 SURFACE WETTABILITY ANALYSIS ........................................................................................................ 6-162

xi
6.8.1 Effects of roughness on contact angle ................................................................................ 6-162
6.9 BIOCOMPATIBILITY ........................................................................................................................... 6-164
CONCLUSIONS ................................................................................................................. 7-166 CHAPTER 7
7. 1 316 STAINLESS STEEL ...................................................................................................................... 7-166
7.2 TI-6AL-4V ..................................................................................................................................... 7-167
7.3 FUTURE WORK ................................................................................................................................ 7-169
REFERENCES ................................................................................................................................... 7-170
APPENDICES ........................................................................................................................................... I
A. MATERIAL CERTIFICATES FROM THE SUPPLIERS ................................................................................................ I
316L stainless steel produced by Acciaierie ......................................................................................... I
Ti-6Al-4V supplied by Supper Alloys .................................................................................................... II
B. LINEAR STAGE DISPLACEMENT OF LASER STAGE ............................................................................................... X
C. PRELIMINARY DOE FOR 316L .................................................................................................................. XII
Design of experiments ...................................................................................................................... XII
Preliminary DOE Results .................................................................................................................. XIII
D. RECOMMENDED CUT-OFF LENGTHS FOR ROUGHNESS MEASUREMENTS ............................................................. XX
E. CALCULATION OF LOAD FOR PIN ON DISK WEAR TESTING ................................................................................ XXI
F. ADDITIONAL RESULTS FOR 316L STAINLESS STEEL DOE ............................................................................... XXIII
Effects of pre-treatments on roughness ........................................................................................ XXIII
G. MELTPOOL DATA ................................................................................................................................. XXV
H. ROUGHNESS DATA .............................................................................................................................. XXVI
I. ENERGY DISPERSIVE X-RAY SPECTROSCOPY RAW DATA ............................................................................... XXVII
Cross-sectional Analysis ............................................................................................................... XXVIII
J. ABLATION EFFECTS .............................................................................................................................. XXXV
K. RAW DATA MATERIAL PROPERTIES MEASURED FOR TI-6AL-4V ................................................................. XXXVI

xii
List of Figures
FIGURE 1-1: METALLIC IMPLANTS THAT CAN BE IMPROVED VIA LASER SURFACE MODIFICATION [13, 14]. ....................... 1-2
FIGURE 2-1: HIP ANATOMY WITH PROSTHETIC IMPLANT INSERTED [24]. ................................................................... 2-5
FIGURE 2-2: A TYPICAL FEMORAL COMPONENT OF A THR INDICATING NECESSARY REQUIREMENTS. ............................... 2-6
FIGURE 2-3: PROPERTIES OF AN IDEAL HARD TISSUE REPLACEMENT BIOMATERIAL [2] ................................................ 2-10
FIGURE 2-4: 316L STAINLESS STEEL MICROSTRUCTURE CONTAINING LOW CARBON CONTENT [45]. .............................. 2-11
FIGURE 2-5: THE IRON-CARBON BINARY PHASE DIAGRAM [47]. ............................................................................ 2-12
FIGURE 2-6: METALLIC MATERIALS USED IN IMPLANTS AND THEIR SUSCEPTIBILITY TO CORROSION [57]. ........................ 2-15
FIGURE 2-7: THE TITANIUM-ALUMINIUM BINARY PHASE DIAGRAM [68, 69]. ........................................................... 2-17
FIGURE 2-8: CONTACT ANGLE (Θ) OF A LIQUID (L) ON A SOLID (S). ΓLV, IS THE INTERFACIAL ENERGY OF LIQUID–VAPOUR
INTERFACE; ΓSL, IS THE INTERFACIAL ENERGY OF THE SOLID–LIQUID INTERFACE; AND ΓSV, IS THE INTERFACIAL ENERGY OF
THE SOLID–VAPOUR INTERFACE [94]. ..................................................................................................... 2-23
FIGURE 2-9: SUPER HYDROPHILIC AND SUPER HYDROPHOBIC CONTACT ANGLES [95]. ................................................ 2-24
FIGURE 2-10: CLASSIFICATION OF DIFFERENT LASER PROCESSING TECHNIQUES [80]. ................................................. 2-27
FIGURE 2-11: COMPARISON OF PERCEIVED GLAZING PROCESS PARAMETERS IN LITERATURE [97, 99]. .......................... 2-28
FIGURE 2-12: ABSORPTION OF LASER RADIATION WAVELENGTH BY METALS [160]. ................................................... 2-36
FIGURE 2-13: EFFECTS OF ANGLE OF INCIDENCE AND ROUGHNESS ON LASER REFLECTIVITY [162]. ............................... 2-37
FIGURE 2-14: EFFECT OF OXIDE THICKNESS ON ABSORPTION OF A CO2 LASER IRRADIATION [162]. .............................. 2-38
FIGURE 2-15: GEOMETRY AND INTENSITY OF THE GAUSSIAN LASER BEAM [172]. ..................................................... 2-40
FIGURE 2-16: LASER BEAM MODES ILLUSTRATING (A) TEMOO AND (B) TEM01 MODES [97]. ...................................... 2-40
FIGURE 2-17: SCHEMATIC DIAGRAM REPRESENTING 50% SPOT OVERLAP................................................................ 2-41
FIGURE 2-18: VARIATIONS OF TREATED ZONE WIDTH AND DEPTH WITH INCREASING PULSE ENERGY FOR FIXED VALUES OF
PULSE WIDTH (5 MS), FREQUENCY (30 HZ) AND SCAN RATE [163]. .............................................................. 2-47
FIGURE 3-1: ILLUSTRATION OF THE TI-6AL-4V WORK-PIECE, SPECIMEN AND SAMPLE, AS USED IN THIS THESIS. .............. 3-56
FIGURE 3-2: ROFIN CO2 LASER SYSTEM AND GAS PUMPING UNIT, SHOWING THE PROCESSING OF A CYLINDRICAL SAMPLE 10
MM IN DIAMETER. ............................................................................................................................... 3-58
FIGURE 3-3: SCHEMATIC OF THE LASER PROCESSING SET-UP FOR A CYLINDRICAL SAMPLE. ........................................... 3-59
FIGURE 3-4: SCHEMATIC OF THE (A) CROSS SECTIONAL SIDE VIEW OF THE EQUIPMENT AND (B) THE PLANAR VIEW OF THE
RASTER SCAN PATH FOR THE LASER TREATMENT PROCESS. ........................................................................... 3-60
FIGURE 3-5: CARL-ZEISS EVO-LS15 SEM AND ITS COMPONENTS (A) EXTERIOR AND (B) INTERIOR. ............................. 3-67
FIGURE 3-6: SAMPLING AND EVALUATION LENGTHS OF A MEASURED SURFACE PROFILE. ............................................. 3-68
FIGURE 3-7: SCHEMATIC AND IMAGE OF XRD SET-UP [47]. ................................................................................. 3-69
FIGURE 3-8: (A) SCHEMATIC DEPICTION OF THE VARIATION OF INTERACTION VOLUME SHAPE WITH AVERAGE SAMPLE ATOMIC
NUMBER (Z) AND ELECTRON BEAM ACCELERATING VOLTAGE (E0); AND (B) CHART FOR CALCULATING X-RAY SPATIAL
RESOLUTION FROM THE ACCELERATING VOLTAGE [225]. ............................................................................ 3-71
FIGURE 3-9: SCHEMATIC OF THE (A) PIN ON DISC APPARATUS USED AND (B) TYPICAL WEAR TRACK ............................... 3-72
FIGURE 3-10: SCHEMATIC DIAGRAM OF POLARISATION CELL USED IN THE EXPERIMENTS [228].................................... 3-74
FIGURE 3-11: SCHEMATIC OF INSTRUMENTATION SETUP FOR ELECTROCHEMICAL POLARISATION EXPERIMENTS. ............. 3-75

xiii
FIGURE 3-12: FTA 200 ANGSTROM SESSILE DROP MEASURING MACHINE [229]. ..................................................... 3-77
FIGURE 3-13: HAEMOCYTOMETER VIEWED AT 200X MAGNIFICATION [230] ........................................................... 3-81
FIGURE 4-1: MICROSTRUCTURE OF AS-RECEIVED 316L STAINLESS STEEL (A) MORPHOLOGY STRUCTURE, AND THE CROSS-
SECTIONAL MICROSTRUCTURE OBTAINED VIA (B) SECONDARY ELECTRON (SE) DETECTOR AND (C) BACK SCATTER
ELECTRON (BSE) DETECTOR. ................................................................................................................. 4-84
FIGURE 4-2: EFFECTS OF ENERGY DENSITY ON SURFACE MELTING ........................................................................... 4-85
FIGURE 4-3: BACK SCATTER SEM IMAGES OF TRANSVERSE CROSS SECTIONAL MICROSTRUCTURE CORRESPONDING TO
PROCESSED SURFACE SHOWN IN FIGURE 4-2 (A), (B) AND (C). ..................................................................... 4-85
FIGURE 4-4: GRAIN STRUCTURE RE-ORIENTATION IN SAMPLES LASER TREATED AT ENERGY DENSITIES GREATER THAN 9 J/MM2.
....................................................................................................................................................... 4-86
FIGURE 4-5: (A) MICROSTRUCTURE VARIATION IN SAMPLES TREATED AT 20.96 J/MM2 AND CLOSE UP VIEW OF SPECIFIC
REGIONS (B), (C) AND (D). .................................................................................................................... 4-87
FIGURE 4-6: EFFECTS OF RESIDENCE TIME AND IRRADIANCE AND ON MELT POOL DEPTH. ............................................ 4-88
FIGURE 4-7: BACKSCATTER SEM CROSS SECTION MICROGRAPHS OF SAMPLES PROCESSED USING THE SAME ENERGY DENSITY
(13.1 J/MM2) WITH: (A) LOW IRRADIANCE (79 KW/MM
2) AND HIGH RESIDENCE TIME (167 µS); (B) HIGH IRRADIANCE
(157 KW/MM2) AND LOW RESIDENCE TIME (83 µS). ................................................................................ 4-89
FIGURE 4-8: RELATIONSHIP BETWEEN AVERAGE SURFACE ROUGHNESS AND IRRADIANCE AT VARYING RESIDENCE TIMES. .. 4-90
FIGURE 4-9: SAMPLE TREATED AT LOW IRRADIANCE (79 KW/MM2) AND HIGH RESIDENCE TIME (167 ΜS) ILLUSTRATING
EFFECTS OF HIGH DENSITIES ON SURFACE ROUGHNESS. ............................................................................... 4-91
FIGURE 4-10: RELATIONSHIP BETWEEN AVERAGE SURFACE ROUGHNESS AND ENERGY DENSITY FOR LASER PROCESSING OF
316L WITH DOE 1. ............................................................................................................................ 4-91
FIGURE 4-11: INFLUENCE OF LOW ENERGY DENSITY 5 J/MM2 ON MELTING OF SURFACE (A) SURFACE TOPOLOGY AND( B)
CROSS SECTIONAL MICROSTRUCTURE ...................................................................................................... 4-92
FIGURE 4-12: INFLUENCE OF HIGH ENERGY DENSITY 25 J/MM2 ON MELTING OF SURFACE (A) SURFACE TOPOLOGY AND B)
CROSS SECTIONAL MICROSTRUCTURE ...................................................................................................... 4-92
FIGURE 4-13: EFFECTS OF PROCESSING PARAMETERS AT A FIXED ENERGY DENSITY (10.48 J/MM2): (A) HIGH IRRADIANCE (157
KW/MM2) AND LOW RESIDENCE TIME (67 µS); (B) LOW IRRADIANCE (62.9 KW/MM
2) AND HIGH RESIDENCE TIME
(167 µS). .......................................................................................................................................... 4-93
FIGURE 4-14: (A) AND (B) BSE MICROGRAPHS OF TRANSVERSE CROSS SECTIONAL MICROSTRUCTURE CORRESPONDING TO
PROCESSED SURFACE SHOWN IN FIGURE 4-13 (A) AND (B) RESPECTIVELY. ...................................................... 4-94
FIGURE 4-15: EFFECTS OF PRE-TREATMENTS AND RESIDENCE TIME ON MELTPOOL DEPTH. .......................................... 4-95
FIGURE 4-16: EFFECTS OF LASER PROCESSING ON 316L HARDNESS COMPARED TO AS RECEIVED MATERIAL HARDNESS. ... 4-96
FIGURE 4-17: MICROGRAPH AND EDS SPECTRUM OF THE BULK 316L MATERIAL. .................................................... 4-97
FIGURE 4-18: MICROGRAPH AND EDS SPECTRUM OF THE LASER MELTED 316L STAINLESS STEEL. ............................... 4-97
FIGURE 5-1: SEM MICROGRAPHS SHOWING THE PLANE VIEW OF (A) AS-RECEIVED AND (B) GRIT BLASTED TI-6AL-4V ..... 5-99
FIGURE 5-2: BACK SCATTER DETECTOR (BSE) SURFACE MORPHOLOGY IMAGES OF LASER SURFACE MODIFIED TI-6AL-4V AT A
CONSTANT RESIDENCE TIME OF 1.08 MS AND THREE LEVELS OF IRRADIANCE (A) 15.72, (B) 20.4 AND (C) 26.7
KW/MM2. ....................................................................................................................................... 5-100

xiv
FIGURE 5-3: BACK SCATTER DETECTOR (BSE) SURFACE MORPHOLOGY IMAGES OF LASER SURFACE MODIFIED TI-6AL-4V AT A
CONSTANT RESIDENCE TIME OF 1.44 MS AND THREE LEVELS OF IRRADIANCE (A) 15.72, (B) 20.4 AND (C) 26.7
KW/MM2. ....................................................................................................................................... 5-100
FIGURE 5-4: BACK SCATTER DETECTOR (BSE) SURFACE MORPHOLOGY IMAGES OF LASER SURFACE MODIFIED TI-6AL-4V AT A
CONSTANT RESIDENCE TIME OF 2.16 MS AND THREE LEVELS OF IRRADIANCE (A) 15.72, (B) 20.4 AND (C) 26.7
KW/MM2. ....................................................................................................................................... 5-100
FIGURE 5-5: GRAIN DISTRIBUTION ON THE SURFACE OF A SAMPLE LASER MELTED AT AN IRRADIANCE OF 26 KW/MM2 AND A
RESIDENCE TIME OF 2.16 MS, IMAGED IN BSE MODE. .............................................................................. 5-101
FIGURE 5-6: CROSS-SECTIONAL MICROGRAPHS OF THE AS-RECEIVED TI-6AL-4V OBTAINED VIA (A) OPTICAL MICROSCOPY AND
(B) BSE. ......................................................................................................................................... 5-102
FIGURE 5-7: CROSS SECTIONAL BSE MICROGRAPH OF LASER MODIFIED TI-6AL-4V, OBTAINED VIA (A) OPTICAL MICROSCOPY
AND (B) BSE. ................................................................................................................................... 5-102
FIGURE 5-8: BACK SCATTER DETECTOR (BSE) SURFACE MORPHOLOGY IMAGES OF LASER SURFACE MODIFIED TI-6AL-4V AT A
CONSTANT LEVEL OF IRRADIANCE 15.72 KW/MM2 AND THREE LEVELS OF IRRADIANCE OF RESIDENCE TIME OF (A) 1.08
(B) 1.44 AND (C) 2.16 MS. ................................................................................................................ 5-104
FIGURE 5-9: BACK SCATTER DETECTOR (BSE) SURFACE MORPHOLOGY IMAGES OF LASER SURFACE MODIFIED TI-6AL-4V AT A
CONSTANT LEVEL OF IRRADIANCE 20.4 KW/MM2 AND THREE LEVELS OF IRRADIANCE OF RESIDENCE TIME OF (A) 1.08
(B) 1.44 AND (C) 2.16 MS. ................................................................................................................ 5-104
FIGURE 5-10: BACK SCATTER DETECTOR (BSE) SURFACE MORPHOLOGY IMAGES OF LASER SURFACE MODIFIED TI-6AL-4V AT A
CONSTANT LEVEL OF IRRADIANCE 26.72 KW/MM2 AND THREE LEVELS OF IRRADIANCE OF RESIDENCE TIME OF (A) 1.08
(B) 1.44 AND (C) 2.16 MS. ................................................................................................................ 5-104
FIGURE 5-11: EFFECTS OF LASER IRRADIANCE AND RESIDENCE TIME ON MELTPOOL DEPTH FOR THE TI-6AL-4V SAMPLES.
..................................................................................................................................................... 5-105
FIGURE 5-12: EFFECTS OF LASER IRRADIANCE AND RESIDENCE TIME ON MELTPOOL DEPTH FOR THE TI-6AL-4V SAMPLES.
..................................................................................................................................................... 5-106
FIGURE 5-13: A GRAPH OF THE ACTUAL MELTPOOL DEPTH VERSUS THE PREDICTED VALUES. ...................................... 5-107
FIGURE 5-14: EFFECTS OF IRRADIANCE AND RESIDENCE TIME ON AVERAGE ROUGHNESS OF THE TI-6AL-4V SAMPLES. ... 5-108
FIGURE 5-15: EFFECTS OF IRRADIANCE AND RESIDENCE TIME ON AVERAGE ROUGHNESS OF THE TI-6AL-4V SAMPLES. ... 5-109
FIGURE 5-16: A GRAPH OF THE ACTUAL ROUGHNESS VERSUS THE PREDICTED VALUES. ............................................. 5-110
FIGURE 5-17: EFFECTS OF IRRADIANCE AND RESIDENCE TIME ON MICROHARNESS. .................................................. 5-111
FIGURE 5-18: A GRAPH OF THE ACTUAL MICROHARDNESS VERSUS THE PREDICTED VALUES. ...................................... 5-112
FIGURE 5-19: MICROHARDNESS OF LASER SURFACE MODIFIED TI-6AL-4V WITH RESPECT TO DEPTH FROM THE SURFACE FOR
SAMPLE 9. ....................................................................................................................................... 5-113
FIGURE 5-20: X-RAY DIFFRACTION PATTERN OF UNTREATED TI-6AL-4V. .............................................................. 5-114
FIGURE 5-21: XRD PATTERN OF UNTREATED AND LSM SAMPLES. ....................................................................... 5-116
FIGURE 5-22: EFFECTS OF IRRADIANCE AND RESIDENCE TIME ON THE Β-TI PHASE. ................................................... 5-117
FIGURE 5-23: A GRAPH OF THE ACTUAL Β-TI VOLUME FRACTION VERSUS THE PREDICTED VALUES. .............................. 5-118
FIGURE 5-24: EDS ANALYSIS OF THE TI-6AL-4V TOPOGRAPHIC SURFACE (A) AREA SCAN AND (B) POINT ANALYSIS. ...... 5-119
FIGURE 5-25: ELEMENTAL COMPOSITION USING DIFFERENT SCAN METHODS AND PROCESSING TIMES. ........................ 5-119

xv
FIGURE 5-26: GRID SCAN MICROGRAPHS OF (A) UNTREATED AND (B) GRIT BLASTED TI-6AL-4V. ............................... 5-120
FIGURE 5-27: EDS SPECTRUM OF UNTREATED TI-6AL-4V. ................................................................................ 5-121
FIGURE 5-28: EDS SPECTRUM OF GRIT BLASTED TI-6AL-4V. .............................................................................. 5-121
FIGURE 5-29: EDS SPECTRUM OF LSM TI-6AL-4V. ......................................................................................... 5-121
FIGURE 5-30: TYPICAL EDS ANALYSES OF THE CROSS-SECTIONAL MICROSTRUCTURE PERPENDICULAR TO THE DIRECTION OF
THE BEAM ....................................................................................................................................... 5-122
FIGURE 5-31: EDS ANALYSIS OF TITANIUM COMPOSITION DISTRIBUTION IN SAMPLES 3, 6 AND 9. ............................. 5-122
FIGURE 5-32: EDS ANALYSIS OF ALUMINIUM COMPOSITION DISTRIBUTION IN SAMPLES 3, 6 AND 9 ........................... 5-123
FIGURE 5-33: RELATIONSHIP OF WEAR TRACK AND DISTANCE TRAVELLED BY THE PIN. .............................................. 5-124
FIGURE 5-34: 3D WEAR TRACK PROFILE OF (A) UNTREATED TI-6AL-4V TESTED FOR 150 M, (B) LSM TI-6AL-4V TESTED FOR
150 M AND (A) LSM TI-6AL-4V TESTED FOR 20 M ................................................................................ 5-124
FIGURE 5-35: MICROGRAPHS OF UNTREATED TI-6AL-4V AT VARIOUS MAGNIFICATIONS, SAMPLES TESTED FOR 20 M... 5-125
FIGURE 5-36: MICROGRAPHS OF LSM 3 (26.72KW/MM2 AND 2.16 MS) AT VARIOUS MAGNIFICATIONS, SAMPLES TESTED
FOR 20 M........................................................................................................................................ 5-125
FIGURE 5-37: MICROGRAPHS OF UNTREATED TI-6AL-4V AT VARIOUS MAGNIFICATIONS, SAMPLES TESTED FOR 150 M. 5-126
FIGURE 5-38: MICROGRAPHS OF LSM 3 (26.72 KW/MM2 AND 2.16 MS ) AT VARIOUS MAGNIFICATIONS, SAMPLES TESTED
FOR 150 M...................................................................................................................................... 5-126
FIGURE 5-39: SPECIFIC WEAR RATES OF TI-6AL-4V AT TWO SLIDING DISTANCES OF 20 AND 150 M. .......................... 5-127
FIGURE 5-40: RELATIONSHIP OF SPECIFIC WEAR RATE AND MELT-POOL DEPTH FOR SAMPLES TESTED FOR 150 M. ........ 5-127
FIGURE 5-41: EFFECTS OF LASER PROCESSING PARAMETERS ON SPECIFIC WEAR RATE OVER 20 M SLIDING DISTANCE. .... 5-128
FIGURE 5-42: ACTUAL SPECIFIC WEAR RATE VALUES VERSUS THE PREDICTED RESPONSE VALUES ................................. 5-129
FIGURE 5-43: OCP VARIATION WITH TIME OF IMMERSION FOR AS-RECEIVED, GRIT BLASTED AND LSM 3,6 AND 9 SAMPLES
DURING IMMERSION IN 0.9 % NACL AT 37°C. ....................................................................................... 5-130
FIGURE 5-44: OCP VARIATION WITH TIME OF IMMERSION FOR AS-RECEIVED, GRIT BLASTED AND LSM 1,4 AND 7 SAMPLES
DURING IMMERSION IN 0.9 % NACL AT 37°C. ....................................................................................... 5-131
FIGURE 5-45: OCP VARIATION WITH TIME OF IMMERSION FOR AS-RECEIVED, GRIT BLASTED AND LSM 2,5 AND 8 SAMPLES
DURING IMMERSION IN 0.9 % NACL AT 37°C. ....................................................................................... 5-131
FIGURE 5-46: POLARISATION CURVES OF AS-RECEIVED, GRIT BLASTED, LSM 4 AND LSM 7 TI-6AL-4V SAMPLES IN 0.9%
NACL AT 37°C. ................................................................................................................................ 5-132
FIGURE 5-47: POTENTIODYNAMIC POLARISATION CURVES OF AN UNTREATED AND LASER TREATED TI-6AL-4V ............ 5-133
FIGURE 5-48: LOCALISED CORROSION OF (A) AS-RECEIVED TI-6AL-4V, (B) LSM 8 AND (C) MAGNIFIED VIEW OF SUB-SECTION
FROM (B). ....................................................................................................................................... 5-134
FIGURE 5-49: TYPICAL CONTACT ANGLES OF (A) POLISHED AND (B) GRIT BLASTED TI-6AL-4V. .................................. 5-135
FIGURE 5-50: IMAGES OF CONTACT ANGLES ON LASER SURFACE MODIFIED TI-6AL-4V AT A CONSTANT IRRADIANCE OF
15.72KW/MM2
AND THREE LEVELS OF RESIDENCE TIME (A) 1.08, 1.44 AND 2.16MS ................................... 5-136
FIGURE 5-51: IMAGES OF CONTACT ANGLES ON LASER SURFACE MODIFIED TI-6AL-4V AT A CONSTANT IRRADIANCE OF
20.43KW/MM2
AND THREE LEVELS OF RESIDENCE TIME (A) 1.08, 1.44 AND 2.16MS ................................... 5-136
FIGURE 5-52: IMAGES OF CONTACT ANGLES ON LASER SURFACE MODIFIED TI-6AL-4V AT A CONSTANT IRRADIANCE OF
26.72KW/MM2
AND THREE LEVELS OF RESIDENCE TIME (A) 1.08, 1.44 AND 2.16MS ................................... 5-136
xvi
FIGURE 5-53: EFFECTS OF IRRADIANCE AND RESIDENCE TIME ON CONTACT ANGLE. ................................................. 5-137
FIGURE 5-54: CONTOUR PLOT HIGHLIGHTING THE EFFECTS OF IRRADIANCE AND RESIDENCE TIME ON MEASURED CONTACT
ANGLES. .......................................................................................................................................... 5-137
FIGURE 5-55: A GRAPH OF THE ACTUAL CONTACT ANGLES OF UNPOLISHED LASER TREATED SAMPLES VERSUS THE PREDICTED
VALUES. .......................................................................................................................................... 5-139
FIGURE 5-56: RELATIONSHIP BETWEEN ENERGY DENSITY AND CONTACT ANGLES ..................................................... 5-139
FIGURE 5-57: EFFECTS OF CONTACT ANGLE IRRADIANCE AND RESIDENCE TIME ON CONTACT ANGLES OF POLISHED SAMPLES .
..................................................................................................................................................... 5-140
FIGURE 5-58: CELLULAR ATTACHMENT AT 2 HOURS SHOWN AS A PERCENTAGE OF THE NUMBER OF CELLS ORIGINALLY SEEDED.
..................................................................................................................................................... 5-142
FIGURE 5-59: RELATIONSHIP BETWEEN CONTACT ANGLE OF UNPOLISHED LSM SAMPLES AND CELL ATTACHMENT ........ 5-142
FIGURE 5-60: EFFECTS OF ROUGHNESS ON CELL ATTACHMENT ............................................................................ 5-143
FIGURE 5-61: METABOLIC ACTIVITY AT 24 HR, 96 HR, AND 7 DAYS * (P<0.05). .................................................... 5-143
FIGURE 5-62: METABOLIC ACTIVITY SHOWN AS PERCENT REDUCTION. .................................................................. 5-144
FIGURE 5-63: CELL NUMBER AS MEASURED ON DAY 3 AND DAY 7 * (P<0.1). ........................................................ 5-144
FIGURE 5-64: EFFECT OF TI-6AL-4V SAMPLES IN DIRECT CONTACT WITH NIH/3T3 FIBROBLASTS FOR 24 HR USING THE MTT
CELL VIABILITY ASSAY AS A MEASURE OF TOXICITY. ................................................................................... 5-145
FIGURE 5-65: EFFECT OF VARIOUS CONCENTRATIONS OF TI-6AL-4V SAMPLE EXTRACT IN CONTACT WITH NIH/3T3
FIBROBLASTS FOR 24 HR USING THE MTT CELL VIABILITY ASSAY AS A MEASURE OF TOXICITY. ........................... 5-146
FIGURE 5-66: SCHEMATIC OF THE LASER MELTED POOL PERPENDICULAR TO THE DIRECTION OF LASER BEAM MOVEMENT [97].
..................................................................................................................................................... 6-147
FIGURE 5-67: IRRADIANCE OF THE TEM MODE AS A FUNCTION OF DISTANCE ACROSS THE LASER BEAM [234]. ............ 6-148
FIGURE 5-68: (A) CROSS SECTIONAL BSE MICROGRAPH OF LASER MODIFIED TI-6AL-4V, (B) LASER MODIFIED LAYER AND (C)
SUBSTRATE MICROSTRUCTURE. ............................................................................................................ 6-149
FIGURE 5-69: EFFECTS OF ENERGY DENSITY ON MELTPOOL DEPTH. ...................................................................... 6-152
FIGURE 5-70: RELATIONSHIP BETWEEN ENERGY DENSITY AND ROUGHNESS. ........................................................... 6-153
FIGURE 5-71: BSE MICROSTRUCTURAL IMAGES OF (A) UNTREATED AND (B) LASER TREATED TI-6AL-4V; AND (C) X-RAY
DIFFRACTION PATTERN OF UNTREATED AND LASER TREATED TI-6AL-4V. ...................................................... 6-155
FIGURE 5-72: EFFECTS OF ENERGY DENSITY ON THE VOLUME FRACTION OF THE Β-TI PHASE. ..................................... 6-156
FIGURE 5-73: EFFECTS OF ENERGY DENSITY ON SPECIFIC WEAR RATE. ................................................................... 6-158
FIGURE 5-74: POLARISATION CURVES OF AS-RECEIVED, LSM 7 AND LSM 8 TI-6AL-4V IN 0.9% NACL AT 37°C. ....... 6-160
FIGURE 5-75: RELATIONSHIP BETWEEN CONTACT ANGLE AND ROUGHNESS OF THE LSM SAMPLES. ............................ 6-163
FIGURE 5-76: RELATIONSHIP BETWEEN CONTACT ANGLE AND ROUGHNESS WITHOUT THE OUTLIER. ............................ 6-163
FIGURE 5-77: CONTACT ANGLES OF POLISHED AND UNPOLISHED SAMPLES, WHERE AR IS AS-RECEIVED, GB IS GRIT BLASTED
AND 1-9 ARE LASER MODIFIED SAMPLES. ............................................................................................... 6-164
xvii
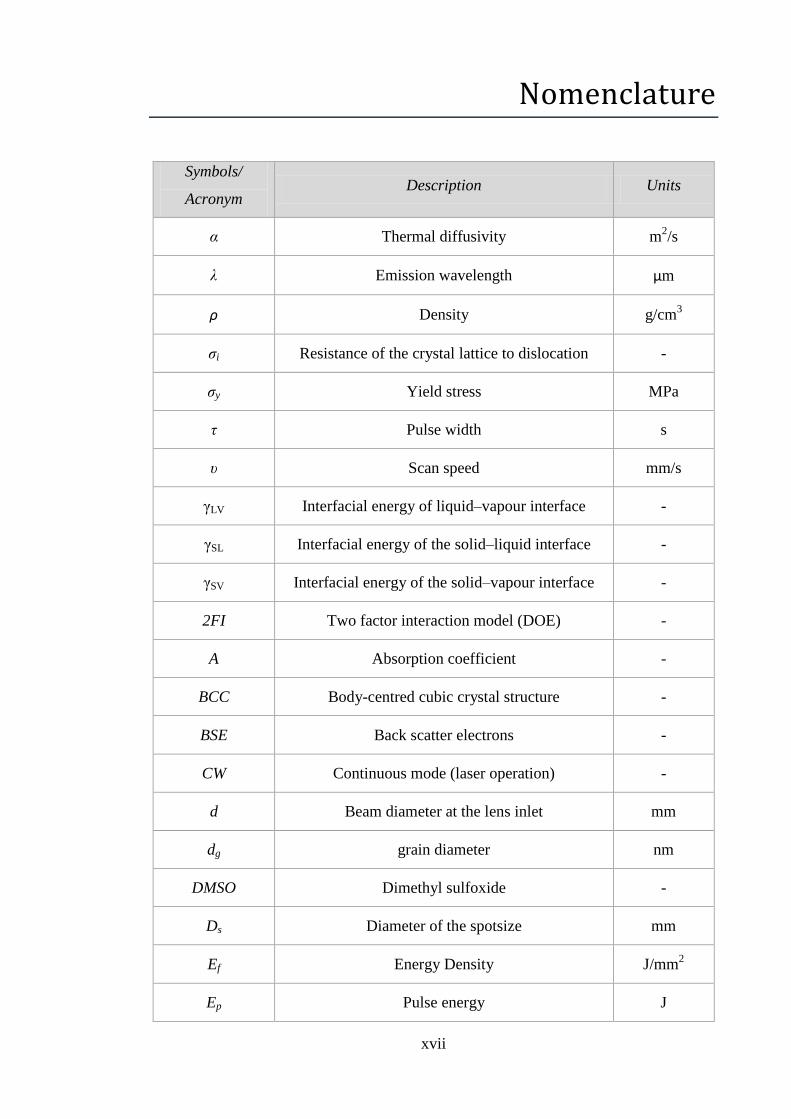
Nomenclature
Symbols/
Acronym Description Units
α Thermal diffusivity m2/s
λ Emission wavelength μm
ρ Density g/cm3
σi Resistance of the crystal lattice to dislocation -
σy Yield stress MPa
τ Pulse width s
υ Scan speed mm/s
γLV Interfacial energy of liquid–vapour interface -
γSL Interfacial energy of the solid–liquid interface -
γSV Interfacial energy of the solid–vapour interface -
2FI Two factor interaction model (DOE) -
A Absorption coefficient -
BCC Body-centred cubic crystal structure -
BSE Back scatter electrons -
CW Continuous mode (laser operation) -
d Beam diameter at the lens inlet mm
dg grain diameter nm
DMSO Dimethyl sulfoxide -
Ds Diameter of the spotsize mm
Ef Energy Density J/mm2
Ep Pulse energy J
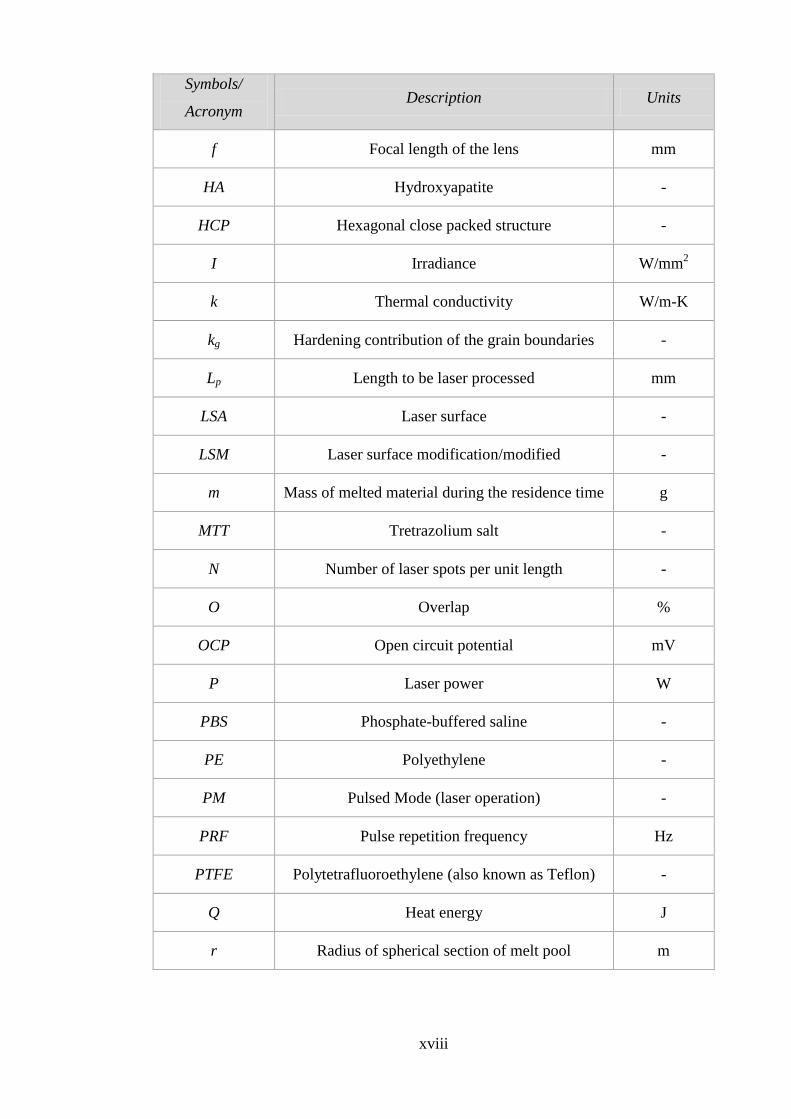
xviii
Symbols/
Acronym Description Units
f Focal length of the lens mm
HA Hydroxyapatite -
HCP Hexagonal close packed structure -
I Irradiance W/mm2
k Thermal conductivity W/m-K
kg Hardening contribution of the grain boundaries -
Lp Length to be laser processed mm
LSA Laser surface -
LSM Laser surface modification/modified -
m Mass of melted material during the residence time g
MTT Tretrazolium salt -
N Number of laser spots per unit length -
O Overlap %
OCP Open circuit potential mV
P Laser power W
PBS Phosphate-buffered saline -
PE Polyethylene -
PM Pulsed Mode (laser operation) -
PRF Pulse repetition frequency Hz
PTFE Polytetrafluoroethylene (also known as Teflon) -
Q Heat energy J
r Radius of spherical section of melt pool m

xix
Symbols/
Acronym Description Units
R Residence Time s
Ra Mean surface roughness μm
rb Radius of the beam spot m
SE Secondary electrons -
SEM Standard error of mean -
SCE Saturated calomel electrode -
t Time s
t1 Heating time s
t0
Time necessary for heat to diffuse over a distance
equal to the laser beam radius on the work-piece
surface
s
T0 Ambient temperature K
TEM Transverse mode of the laser beam (Transverse
Electro-Magnetic) -
THR Total Hip Replacements -
TiN Titanium nitride -
UHMWPE Ultra-high molecular weight polyethylene -
wo Initial beam radius at focus mm
wz Beam radius along the propagation line mm
z Distance to focus below the surface of work-piece mm
z0 Distance over which heat can diffuse during the
laser beam interaction time. mm
XRD X-ray diffraction -
1-1
Chapter 1
Introduction
1.1 Overview
Average life expectancy of humans in the developed world has seen a huge increase due
to ever improving availability of medical facilities. Human joints, especially in aged
persons, are prone to degenerative and inflammatory diseases that result in pain and
stiffness of joints [1]. Approximately 90% of the population over the age of 40 suffer
some degree of degenerative joint disease [2]. One in four hundred people receive hip
replacement surgeries in Ireland and more than 250,000 hip replacements surgeries
occur annually in the USA [3-5]. The demand of total hip arthroplasty is estimated to
grow to 572,000 in USA alone by the year 2030 [3]. Approximately 10 to 20% of hip
replacement surgeries that occur are replacements of failed implants [6]. Operation
success rate has significantly increased but the lifespan of the implant after operation is
still lower than required. Typical implant life times of ten years are common leading to
the same patient having to go through the same procedure several times in their life [5,
6]. This presents a low quality of life and proves to be costly for both the patient and the
state [7]. Developing affordable and improved lifelong biomaterial and manufacturing
technology remains a challenge for material engineers; which is the present focus of this
study.
The most common reasons for revision of hip replacement, according to the Canadian
Joint Replacement Registry (CJRR) in 2004, were loosening of implants, osteolysis,
implant wear and infection [8]. Causes of implant failure are interrelated; loosening of
implants is mainly due to infection of surrounding tissue which is caused by release of
ions and accumulation of tiny particles due to wear and corrosion of the implant [6, 9].
The interaction between the implant material and surrounding physiological
environment is of high importance. Unsatisfactory interaction may lead to either failure
of the implant to function as it was intended, or have an adverse effect on the patient
resulting in the rejection of the implant by the surrounding tissue, or both [10].
To combat the mechanical degradation leading to early removal of the implant, thus
extending the life of the implant, laser surface modification was investigated, as
presented in this thesis, to improve the microstructure, tribological, wear, corrosion and
biocompatibility properties of 316L stainless steel and Ti-6Al-4V. In this context, the

1-2
work was mainly focused on high speed laser processing for application on the femoral
stem and the prosthetic hip bearing head. For biomedical implants different properties
are required at different locations of the implant which needs to be manufactured at
reasonably high manufacturing rates. This is the case for the three parts of a typical hip
replacement, namely, the femoral stem, the femoral head and the acetabular cup. All
three components require different properties in order to have a good functional
prosthesis [11].
Manufacturing of implants involves a range of factors that are governed by regulatory
requirements, patient needs, durability cost, dimensions and weight of implants. The
current manufacturing techniques for hip implants do not allow for custom designing
for specific patient needs with a rapid turnaround; instead surgeons are forced to adapt
existing designs to fit the patients’ requirements [12]. An imperative need exists for
functionally graded hip implants representing a better balance of properties via novel
high speed laser processing techniques. Even though the work presented mainly focuses
on hip replacements, the processing technique can be applied to a wide range of
biomedical implants where improved wear and corrosion resistance are necessary.
Figure 1-1 highlights different implants in which this technology could be applied.
Figure 1-1: Metallic implants that can be improved
via laser surface modification [13, 14].

1-3
1.2 Statement of Investigation
Laser surface modification plays a dual role: minimizing the release of metal ions by
making the surface harder, wear and corrosive resistant, as well as making the surface
more bioactive and stimulating bone growth due to improvement in wettability and
lower local surface energies [15]. The aim of this study was to provide for improved
performance characteristics of biomedical implants thus improving the quality of life of
their recipients. This study investigated the effects of high speed laser surface
modification of two common biomedical alloys i.e. 316L Stainless Steel and Ti-6Al-4V.
The objective was to improve the hardness, wear resistance, corrosion behaviour, and
bio-compatibility, by transforming the surface microstructure through high speed laser
treatment.
Laser melting of material to improve their scope of application has widely been
investigated for several applications including aerospace, automotive parts and tooling.
Although this process has been applied to industrial engineering components and alloys,
very few investigations have been carried out for biomedical implants. The focus of this
study is on biomedical implants, particularly hip replacements. Previous studies on laser
processing of biomedical alloys have concentrated on combinations of lower irradiances
and higher residence times than are currently possible with newer laser systems [16-20].
Previous work has demonstrated that higher irradiances and lower residence times
provide enhanced microstructure and corrosion properties [18, 19, 21]. Most studies of
laser modification of biomedical alloys presented in the literature are based on low
speed laser processing and use of alloying elements (e.g. laser nitriding) to improve the
material properties.
The present study is not limited to the aforementioned processing parameters. The work
presented in this thesis provides new insights into the laser surface modification of
biomedical alloys. The thesis explores the results of both tried and tested methods as
well as marshalling enhanced techniques for modifying biomedical alloys. The current
work is separated from other studies due to extensive study of:
i. High speed laser treatment
ii. High power densities
iii. Extremely low exposure times
iv. Use of cylindrical samples
v. Micrometre laser spot size resulting
in high power densities
vi. Hip replacement application
vii. Pulsed laser treatment
viii. Unalloyed laser treatment
ix. Creation of crack free surfaces
x. Characterisation including
biological interactions

1-4
1.3 Thesis Outline
The thesis has been laid out in a progressive manner that initially introduces the reader
to the problem at hand. Background knowledge relating to the subject is then presented,
followed by the material and methods used in the work. The results from the study are
the elucidated followed by discussions and conclusions. The contents of each chapter
are highlighted below:
Chapter 2 – The aim of the chapter is to introduce the reader to the several subjects the
thesis encompasses. The chapter reviews the necessary background theory of hip
replacements, surface engineering, biomaterial and the reasons behind the choice of
material and processes used in this research. Chapter 2 also reveals previous work
carried out in this field, highlighting the short-comings that need improvements and
further study. The chapter focuses on the various laser surface modification techniques
implemented in literature. The chapter also elucidates a survey of processing parameters
previously implemented and their effects on surface properties.
Chapter 3 – The chapter aims on revealing the materials and methods used, and allow
for experimental repeatability by readers. The chapter outlines the material preparation,
procedures and design of experiments implemented in this research.
Chapter 4 – The chapter disseminates results obtained from laser surface melting of
316L stainless steel. The results are split into two sections Design of Experiments 1 and
2. Each section analyses the resulting microstructure, meltpool profile, roughness,
hardness and chemical composition induced by laser surface modification.
Chapter 5 – Results obtained from laser surface melting of Ti-6Al-4V are elucidated in
this chapter. The main focus of this research study was on Ti-6Al-4V; therefore each
section thoroughly investigates the effects of laser surface melting on microstructure,
melt profile, roughness, hardness, phase transformation, chemical composition, wear,
corrosion, wettability, cell attachment and cytotoxicity.
Chapter 6 – The chapter discusses the findings of Ti-6Al-4V results presented in
chapter 5.
Chapter 7 – This chapter presents an overall discussion of the study and concludes by
highlighting the most important findings and recommendations for future research
work.
2-5
Chapter 2
Literature Review
2.1 Hip Replacement Prosthesis
Total hip replacement (THR) is one of the most commonly performed orthopaedic
procedures and has been shown to improve functional status and relieve the pain often
associated with osteoarthritis, rheumatoid arthritis and traumatic arthritis [7, 22, 23].
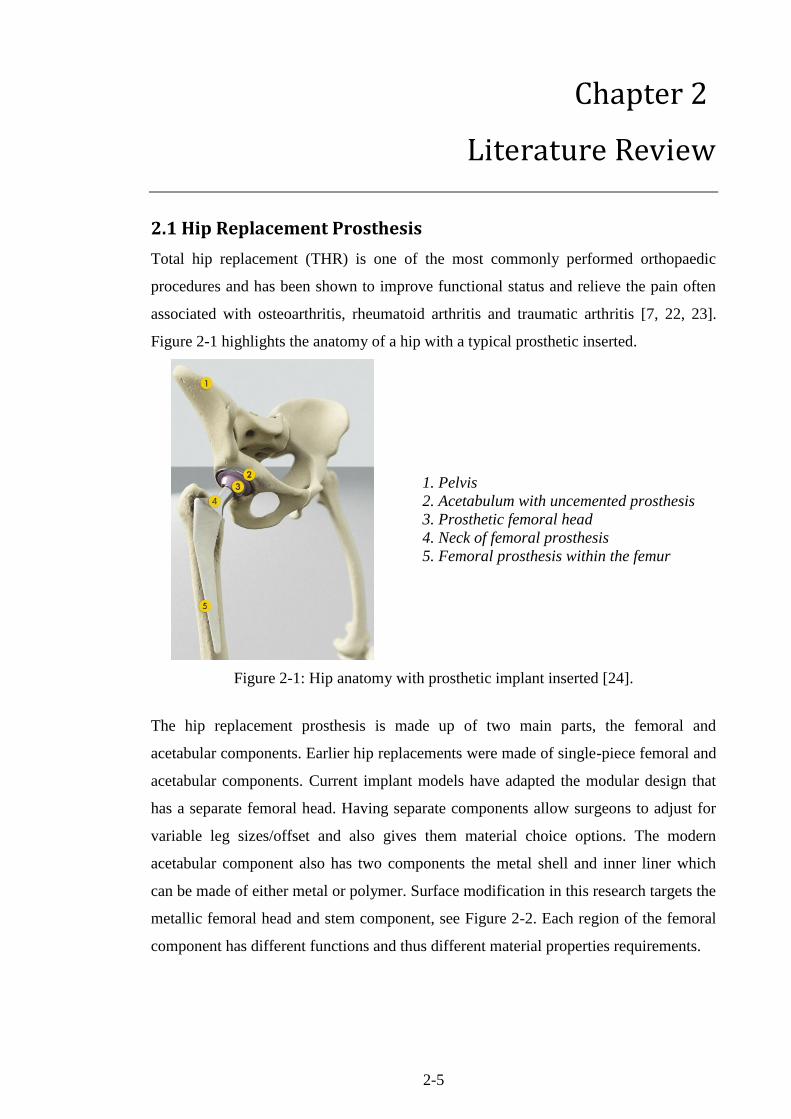
Figure 2-1 highlights the anatomy of a hip with a typical prosthetic inserted.
1. Pelvis
2. Acetabulum with uncemented prosthesis
3. Prosthetic femoral head
4. Neck of femoral prosthesis
5. Femoral prosthesis within the femur
Figure 2-1: Hip anatomy with prosthetic implant inserted [24].
The hip replacement prosthesis is made up of two main parts, the femoral and
acetabular components. Earlier hip replacements were made of single-piece femoral and
acetabular components. Current implant models have adapted the modular design that
has a separate femoral head. Having separate components allow surgeons to adjust for
variable leg sizes/offset and also gives them material choice options. The modern
acetabular component also has two components the metal shell and inner liner which
can be made of either metal or polymer. Surface modification in this research targets the
metallic femoral head and stem component, see Figure 2-2. Each region of the femoral
component has different functions and thus different material properties requirements.

2-6
Figure 2-2: A typical femoral component of a THR indicating necessary requirements.
2.1.1 Femoral head
Femoral head is the part of the femoral component that interfaces with the acetabular
cup. The modern femoral head has increased in diameter compared to previous deigns,
typically >38 mm, to increase stability and reduce risks of dislocation [25, 26]. The
femoral head is typically made of metal. The main requirements of the femoral head
component include: extremely low roughness, high hardness, high wear and corrosion
resistant, and non-cytotoxic of released ions/debris.
The femoral head has to have extremely low average roughness (Ra), typically less than
26 nm [27, 28]. Low roughness in bearing surfaces is necessary as it reduces the wear
rate of the surface. High hardness also plays a part in increasing the surfaces wear
resistance subsequently minimising metal ion release. Aseptic loosening usually occurs
when wear particles form at the bearing surfaces of the implant due to friction at the
joint, which induces biological responses and causes osteolysis. These wear particles are
composed of microscopic grains of bearing material. Wear resistance of the modified
layer will be assessed to highlight effects of laser melting. Another crucial property is
that the metal ions released should be non-toxic. Cytotoxicity of released metallic ions
can affect the surrounding tissue thus leading to the loosening of the implant. Other
necessary properties crucial in bearing surfaces include: good fracture toughness, yield
strength and density. These properties are not the focus of this study since conventional
biomedical alloys used in this research meet the minimum requirements and these
properties are insignificant contributing factors to the majority of implant removals.
Femoral head (bearing surface)
Polished to reduce wear
Must be wear and corrosive resistant
High hardness strength and toughness
Femoral stem (attaching surface)
Rough/coated to stimulate bone growth
Wear and corrosive resistant
Biocompatible and non-cytotoxic

2-7
2.1.2 Femoral stem
The femoral stem is part of the prosthesis that fits into the femur (thigh bone). Bone is
firstly removed from the femur and shaped to fit the dimensions of the stem. The
fixation can either be cemented or cementless. Cementless implants are used in younger,
more active, patients while cemented implants are used for older patients where there
will be less post-operative activity or in cases of reduced bone density. Cemented
fixations commonly use acrylic cements while cement-less fixations are held in place by
friction and aid of surface coatings that simulate bone-to-implant bonding. The stem is
made of metallic alloys mainly titanium based, cobalt chrome alloys and 316L stainless
steel [29].
The main requirements for femoral stems include: excellent osseointegration, high wear
and corrosion resistance. Osseointegration refers to the direct structural and functional
connection between living bone and the surface of a load-bearing artificial implant
without intervening connective tissue. The implant material has to permit bone cells to
attach and proliferate on the surface without imposing cytotoxic risks. This required that
the laser treated surface be tested for its ability to permit cells to attach and proliferate.
Wear accelerated by corrosion also plays a part in the mechanical degradation. This type
of corrosive degradation can progress little by little for many years on the surface of
material attaching to the surrounding tissue [13]. Thus, the factors inducing corrosion in
implants should be examined to improve corrosion resistance of femoral bearing
surfaces. Other properties necessary in femoral stem requirements include: low elastic
modulus (close to bone in order to prevent stress shielding), high strength, good fatigue
resistance and good fracture toughness.
2.2 Conventional Biomaterials Used in Hip Replacements
The three main types of material currently being used in hip replacement components
are ceramics, polymers and metals [30, 31]. Applications of non-metallic biomaterial in
load bearing systems are limited to some extent due to their inferior mechanical
properties such as lower fracture toughness in the case of ceramics and lower strength in
the case of polymers.
Ceramics are used in bearing surfaces primarily due to their superior wear resistance
that reduces metal ion release compared to metal alternatives. Ceramics also possess
high hardness, good biocompatibility, excellent corrosion resistance properties and are
less difficult to process compared to other material types. The most popular biomedical
ceramics are alumina (Al2O3) and zirconia (ZrO2) [31, 32]. Alumina is the most

2-8
common orthopaedic ceramic, usually used in femoral heads in hip replacements and
wear plates for knee replacements [33]. The main concern related to ceramic implants is
the limited lifetime due to their inferior fracture toughness and mechanical integrity
brought about by their brittle nature [31]. This has been evidenced in 2001, by the recall
of thousands of ceramic femoral heads by their manufacturer -St. Gobain Desmarquest
[34]. Salts like hydroxyapatite (HA) can be crystallised from calcium phosphate and
since the mineral phase of bone and teeth closely resemble HA, it has high
biocompatibility properties. The properties and use of HA as a biomaterial are well
established and documented [35]. The major drawback of this HA is its poor
mechanical properties. Its fracture toughness (KIC) is less than 1.2 MPa m0.5
. On the
other hand, the fracture toughness of human bone ranges from 2 to 12 MPa m0.5
.
Therefore, the application of HA is limited to low load bearing applications, coatings, or
porous implants [36].
Polymers are used as bone biomaterial due to their high corrosion resistance and
biocompatibility properties. The use of these polymers in total hip replacements is
restricted due to their insufficient mechanical properties [33]. The most common
polymers used in orthopaedics include polytetrafluoroethylene (PTFE), polyethylene
(PE), ultra-high molecular weight polyethylene (UHMWPE) and acrylic. PTFE
polymers were largely used as acetabular cups in THR until a discovery of their poor
wear resistance and distortion characteristics. PTFE acetabular cups have since been
discontinued. PE has widely been used on metallic bearing surfaces in knee and hip
total joint replacement. However, polyethylene cups created debris due to wear of
interfacial adhesion between tissues and the implant. This debris is attacked by the
immune system causing bone loss. Studies have revealed that although polyethylene is
biologically inert as a whole, microscopic particles released due to wear have a toxic
effect that may lead to osteolysis if realised in large amounts. This may also lead to
loosening of the implant. Osteolysis is mainly triggered by polyethylene wear particles
in the size range of 0.2±0.1 mm which are phagocytosed by macrophages leading to the
release of inflammatory mediators, or cytokines, which act upon other cells and also
lead to bone resorption [31, 37, 38]. Since their discovery, polymers made of lactic acid
became more popular in the medical field due to their high stable structure leading to
biodegradability.
The aforementioned concerns with ceramics and polymers have renewed an interest in
metal-on-metal bearing surfaces on implants, particularly on large contact areas [39,
40]. Tipper et al. revealed that metal wear particles isolated were an order of magnitude

2-9
smaller than polyethylene particles. Up to 100-fold more particles were produced per
unit volume of wear compared to polyethylene [41]. Lower wear rates are critical in
extending the life of the implant; especially in orthopaedics since most of the revision
surgeries are now due to wear and loosening of the implants. The primary focus was on
metals for this study due to:
i. Concerns with ceramics and polymers, primarily reduced lifetime in ceramics
and high ion release in polymers.
ii. Metals can be used in both the femoral head and stem.
iii. The most successful material combinations for total artificial hip joint
replacements have been ultra-high molecular weight polyethylene (UHMWPE)
sliding against metallic counterfaces.
iv. Laser surface modification of metallic alloys is less complicated and highly
repeatable compared to laser surface modification of polymers or ceramics.
v. Surface modification of metals produce more significant microstructural changes
compared to those seen for polymer and ceramic materials.
2.3 Metallic Biomaterials
Some of the desirable properties required in hip replacement include, high
biocompatibility, excellent mechanical properties like hardness, static and fatigue
strength, thermal conductivity, low friction and mechanical shock resistance. Metallic
implants all share these properties making them the most used material type for joint
replacements [29, 32]. Metals also provide high X-ray imaging visibility which is
crucial during inspection. Tribological properties like wear and corrosion resistance also
play a crucial part in joint replacement. The major drawback in metallic implants is that
electrochemical reactions take place on metallic surfaces in the human body. Metals are
known to corrode in contact with body fluid environments. Most cells cannot
metabolise the corroded particles therefore giving rise to harmful infection to the body.
Improved tribological properties reduce toxic ions from being released in vivo.
Contamination of ions released from joint replacements is still a major issue that needs
to be resolved for metallic biomaterials.
When designing biomedical implants two main categories of properties should be taken
into consideration; surface properties that affect bio integration and also the bulk
properties that meet the mechanical requirements. Figure 2-3 shows properties of an
ideal hard tissue replacement biomaterial. It is considerably difficult to obtain a material
that can achieve both mechanical and biological property requirements.

2-10
Figure 2-3: Properties of an ideal hard tissue replacement biomaterial [2]
The three most dominant metals used in joint replacements are AISI 316L stainless
steel, cobalt-chrome alloys (Co-Cr) and titanium alloys (Ti-6Al-4V) [29, 31]. A
comparison of properties of 316L stainless steel, Co-Cr, Ti-6Al-4V alloys and cortical
bone are listed in Table 2-1. There has also been recent interest in magnesium to be
used as an orthopaedic biomaterial due to its light weight and mechanical properties
which are similar to natural bone structure [42]. Magnesium was not examined in this
work. One drawback of magnesium is its biodegradability nature which makes it
impractical in load bearing systems. Co based alloys were also not studied in this work.
One problem that has occurred with Co based alloys is their release of toxic ions which
recently instigated a recall of the DePuy ASR ® hip replacements [43].
Table 2-1: A comparison of the properties of orthopaedic metals to cortical bone [2, 29]
316L SS Co-Cr-Mo Ti-6Al-4V Cortical bone
Modulus of elasticity (GPa) 190 240 110 10 – 16
Bending strength (MPa) 485 825 900 120
Hardness (GPa) 235 430 325 -
Ductility 40 10 12 0 - 2
2.3.1 316L stainless steel
Type 302 was the first stainless steel to be used for implant fabrication but was later
replaced by 316 stainless steel which contains a small percentage of molybdenum for
improved corrosion resistance. In 1950, 316 stainless steel was further improved by
reducing the carbon content to a maximum of 0.03 % from 0.08 % to reduce the risk of
intergranular corrosion attacks [32]. This became known as 316L stainless steel, where
the “L” stands for low carbon content. Additional molybdenum also enhances corrosion
pitting in vivo. 316L stainless steel has become the most popular stainless steel used for
In vitro property:
a) Non-cytotoxic
b) Cell adhesion (fibroblast)
c) Heamocompatibility
Property
requirements for
ideal hard tissue
replacement Biological interface
Bone apposition
Controlled degradability
E-modulus ≈ 30-80 GPa,
depending on application.
Density ≈ 3-4 gm/cc
Fracture toughness > 3 MPa
Fracture strength: > 200 MPa
Hardness: > 4GPa
Mechanical Properties Biological Properties

2-11
biomedical implants due to its improved corrosion resistance properties. The American
Society of Testing Materials (ASTM) also recommends this type of steel in implant
fabrication [32]. Nickel content in 316L is set at maximum of 17 to 20%. This
composition is suitable for stabilising the austenitic phase at room temperature and also
enhance the corrosion resistance. However, large ratios of Ni: Cr concentrations were
also found to impose allergic infections to the host body [44]. The minimum amount
required for maintaining the austenitic phase is 10% Ni. Small amounts of silicon are
present in the steel composition. Silicon increases the hardness of ferrite, oxidation
resistance and is an effective deoxidizer. Even with the detailed compositions, it should
be noted that 316L steel may corrode under certain circumstances in a highly stressed
and oxygen depleted region. It is therefore crucial to modify the surface of the metal to
improve the wear resistance, corrosion resistance and fatigue strength of 316L steel
[32].
Figure 2-4 shows the microstructure of 316L stainless steel containing about 0.1 % C by
weight, alloyed with iron. The steel has two major constituents, which are ferrite and
pearlite. The light coloured region of the microstructure is the ferrite. The dark regions
are the pearlite and the grain boundaries between the ferrite grains are visibly clear.
Pearlite is made up from a fine mixture of ferrite and iron carbide, which can be seen as
a "wormy" texture [45]. Pearlite is hard and it gives the steel strength. The ferrite is soft
and it gives the steel ductility and toughness. If the amount of carbon in the steel is
increased, this increases the amount of pearlite in the steel. This has the effect of
increasing the strength, but it also decreases the ductility and toughness [46].
Figure 2-4: 316L stainless steel microstructure containing low carbon content [45].

2-12
Small spots within the ferrite grains, visible in Figure 2-4, are inclusions or impurities
such as oxides and sulphides. The properties of the steel depend upon the
microstructure. Decreasing the size of the grains improves the strength and decreasing
the amount of pearlite, increases the ductility and the toughness of the steel [45].
Phase diagram: Some mechanical properties of 316L stainless steel are a function of its
microstructures, and consequently, its thermal history. Phase diagrams are crucial in
understanding the melting and crystallisation of the alloy. Phases in an alloy can be
described as homogeneous portions that have uniform physical and chemical
characteristics [47]. In the case of 316L a binary alloy (Iron-Carbon) phase diagram is
used to describe the characteristic phase transformations. Figure 2-5 show the iron rich
portion of the Fe-C phase diagram. Only 0.02% C is present in 316L stainless steel
therefore only the area along the left vertical axis is considered.
Figure 2-5: The iron-carbon binary phase diagram [47].
There are two crystal structure transformations that occur in iron before melting. Stable
ferrite (α iron) with a BCC crystal structure exists at room temperature. At
approximately 912 °C, a polymorphic transformation occurs; ferrite becomes an FCC
austenite (γ iron). At 1394 °C, the austenite reverts to a BCC ferrite (δ iron) structure.
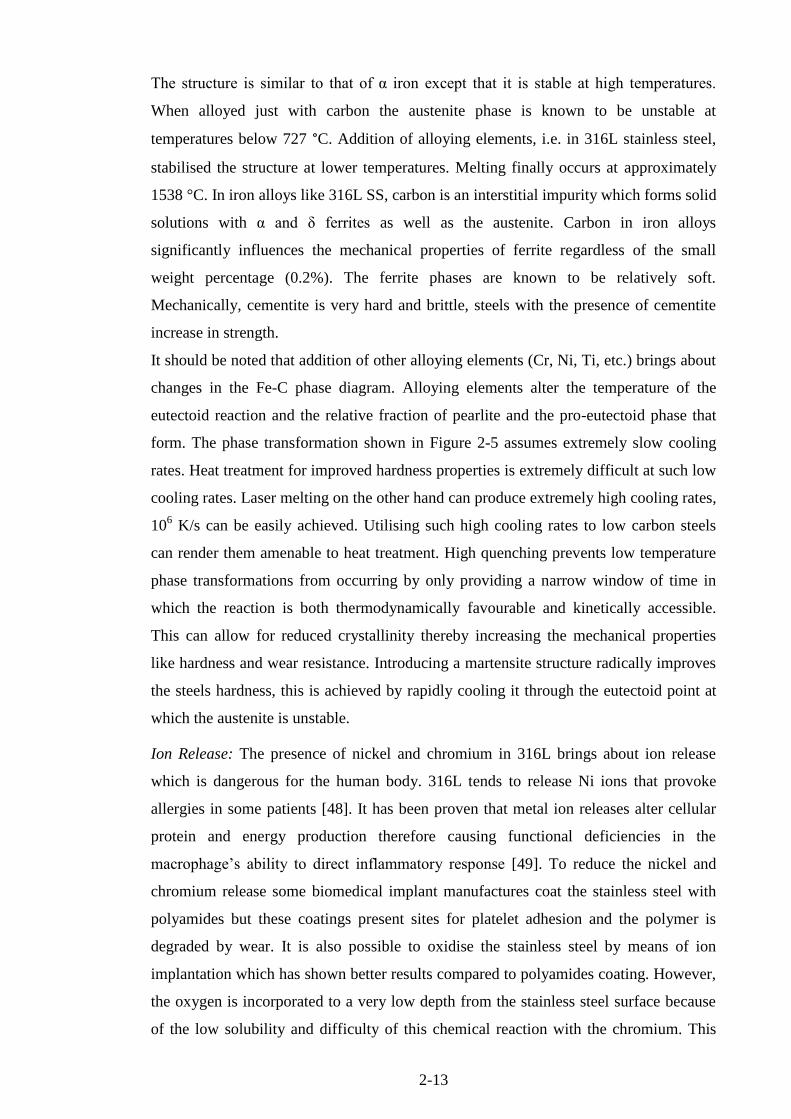
2-13
The structure is similar to that of α iron except that it is stable at high temperatures.
When alloyed just with carbon the austenite phase is known to be unstable at
temperatures below 727 °C. Addition of alloying elements, i.e. in 316L stainless steel,
stabilised the structure at lower temperatures. Melting finally occurs at approximately
1538 °C. In iron alloys like 316L SS, carbon is an interstitial impurity which forms solid
solutions with α and δ ferrites as well as the austenite. Carbon in iron alloys
significantly influences the mechanical properties of ferrite regardless of the small
weight percentage (0.2%). The ferrite phases are known to be relatively soft.
Mechanically, cementite is very hard and brittle, steels with the presence of cementite
increase in strength.
It should be noted that addition of other alloying elements (Cr, Ni, Ti, etc.) brings about
changes in the Fe-C phase diagram. Alloying elements alter the temperature of the
eutectoid reaction and the relative fraction of pearlite and the pro-eutectoid phase that
form. The phase transformation shown in Figure 2-5 assumes extremely slow cooling
rates. Heat treatment for improved hardness properties is extremely difficult at such low
cooling rates. Laser melting on the other hand can produce extremely high cooling rates,
106 K/s can be easily achieved. Utilising such high cooling rates to low carbon steels
can render them amenable to heat treatment. High quenching prevents low temperature
phase transformations from occurring by only providing a narrow window of time in
which the reaction is both thermodynamically favourable and kinetically accessible.
This can allow for reduced crystallinity thereby increasing the mechanical properties
like hardness and wear resistance. Introducing a martensite structure radically improves
the steels hardness, this is achieved by rapidly cooling it through the eutectoid point at
which the austenite is unstable.
Ion Release: The presence of nickel and chromium in 316L brings about ion release
which is dangerous for the human body. 316L tends to release Ni ions that provoke
allergies in some patients [48]. It has been proven that metal ion releases alter cellular
protein and energy production therefore causing functional deficiencies in the
macrophage’s ability to direct inflammatory response [49]. To reduce the nickel and
chromium release some biomedical implant manufactures coat the stainless steel with
polyamides but these coatings present sites for platelet adhesion and the polymer is
degraded by wear. It is also possible to oxidise the stainless steel by means of ion
implantation which has shown better results compared to polyamides coating. However,
the oxygen is incorporated to a very low depth from the stainless steel surface because
of the low solubility and difficulty of this chemical reaction with the chromium. This

2-14
provokes a slight decrease of the ion release [48]. Recent reports have found that oxide
formation plays a crucial role in ion release of metallic implants. Oxide films formed on
metallic implants protect the surface from ion release [50, 51]. Hanawa noted that low
concentrations of dissolved oxygen, the presence of inorganic ions, and the presence of
protein cells, accelerate the metal ion release. Formation and regeneration of the oxide
directly control the release rate.
Heat Treatability: Alloying provides the basis for the heat treatability of steel. While
iron is the balance element in steel, carbon is the most important alloying element in
terms of its strengthening effect on iron. The main challenge of laser modifying
stainless steel for increased hardness is a well-known characteristic that the stainless
steel does not harden through conventional heat treatment. Since CO2 laser irradiation
can be considered as a heat source, hypothetically, the same factors affecting heat
treatability may also apply. However the study of CO2 irradiation is still carried out
since the exposure time and corresponding melt cooling rate is extremely rapid. One of
the pre-requisites for hardening through heat treatment is sufficient carbon and alloy
content, since diffusion rate is based on the differential of concentration. If there is
sufficient carbon then the steel can be directly hardened through heat treatment,
typically more than 0.25% C [52, 53], otherwise the surface of the work-piece has to be
carbon enriched using some diffusion hardening treatment techniques. The carburising
process occurs by exposing the work-piece to a carbon rich atmosphere at an elevated
temperature thus allowing diffusion to transfer the carbon atoms into the steel [46].
2.3.2 Ti-6Al-4V
Titanium and its alloys have been used as implant material for various medical
applications for more than 30 years. Titanium and its alloys are favourable to
orthopaedic implants due to their high specific strength and fatigue resistance, excellent
biocompatibility properties, and good corrosion resistance [54-56]. Titanium and its
alloys are considered the most corrosion resistant of the implant metals presently
employed, see Figure 2-6. The most widely used titanium alloy is the α+β alloy, Ti-6Al-
4V, because of its high strength and low content of interstitial elements. A relatively
new α+β alloy, Ti-13Nb-13Zr, uses niobium as β-phase stabiliser, and exhibits an
interesting low elastic modulus [12].
2-15
Figure 2-6: Metallic materials used in implants and their susceptibility to corrosion [57].
The interaction between titanium and body tissues, which allow osseointegration in
contact with bone, is greatly advantageous over other metallic biomaterials. High
biocompatibility and corrosion resistance is mainly credited to the ability of titanium to
develop an oxide layer in contact with body fluids. Several authors have demonstrated
the high biocompatibility properties of titanium and its alloys [31, 58, 59]. Another
advantage of titanium is the non-ferromagnetic properties that allow for safe
examination with magnetic resonance imaging thus making them useful as long term
implants. Importantly the lower Young’s modulus of titanium alloys compared to steel
and Co-Cr alloys more closely matches that of bone thus reducing the effects of stress
shielding.
A disadvantage of Ti-6Al-4V use arises from the wear and corrosion related release of
harmful products including aluminium which is related to neurotoxin effects and
vanadium which is cytotoxic [60, 61]. Release of vanadium ions by the way of passive
dissolution or another process involving wear can cause discoloration of the
surrounding tissue or an inflammatory reaction causing pain and even leading to
loosening owing to osteolysis [62]. Corrosion fatigue triggered by body fluids is another
factor limiting use of titanium for biomedical implants [63]. Titanium’s corrosive
resistance properties are credited to a tenacious oxide layer that forms on the surface of
the metal. Improving the corrosion properties can be done by thickening the oxide,

2-16
nitriding and laser remelting. Ti-Al-V alloys exhibit very good corrosion resistance, but
are subject to fretting and wear. Particles of the alloy have been found in surrounding
tissue; rather than precipitated corrosion products due to uniform or localised corrosion
[10, 64-66].
A common way of fabricating coatings on Ti substrate is plasma spraying of
hydroxyapatite (HA). However, the long term stability of the plasma spray coated HA is
currently limited due to occasional failure at the interface between coatings and
substrate. In addition, the formation of amorphous calcium phosphate phase reduces the
crystallinity and changes the chemical composition in the coatings. Modification of
microstructure or composition of the alloy through conventional nitriding techniques
has already been explored and is known to improve hardness of the material [67].
However, this process requires high treatment temperatures and extensive hours of
processing. Ion implementation is another alternative process. Only a few micrometres
of microstructure can be altered by this process and long processing times are required
even for relatively small specimen sizes thus detracting from this option. Oxide
thickening and nitriding methods have resulted in hard and brittle surface which cracks
and flakes off easily when force is applied. These drawbacks bring about interest in
using laser surface modification techniques as an alternative to achieve the improved
tribological properties.
Phase diagram: Like most alloys, Ti-6Al-4V mechanical properties of depend on its
microstructures, and consequently, its thermal history. To show the changes in
microstructure with temperature variation a Titanium-Aluminum phase diagram is used,
see Figure 2-7. The binary phase diagram shows the expected phases at equilibrium for
different combinations of aluminium content In the Ti-Al phase diagram there are two
allotropic forms of solid titanium: HCP αTi which is stable at room temperature and up
to 882 °C and BCC βTi which is stable from 882 °C to the melting temperature. In Ti-
6Al-4V, the alloying elements aluminum and vanadium are alpha and beta phase
stabilisers, respectively. Aluminium is the only common metal that raises the beta
transus temperature. The metal is miscible in both alpha and beta phase. Vanadium is a
beta stabiliser that is completely miscible with βTi. Only 6% Al is present in Ti-6Al-4V
therefore Ti3Al and other phases are not taken into account. It should be noted that the
phase transformation shown in Figure 2-7 is only for slow cooling rates. Laser melting
on the other hand can produce extremely high cooling rates therefore the phase diagram
does not full highlight the resulting phases.

2-17
Figure 2-7: The titanium-aluminium binary phase diagram [68, 69].
Selection of Ti-6Al-4V: Titanium alloys usually have three microstructure categories: α,
α+β and β alloys. Ti-6Al-4V falls under the α+β category and is mostly widely used due
to the range of microstructural features that can be achieved via thermo mechanical and
heat treatments [70, 71]. The α phase is a low temperature phase with a hexagonal
closed packed (HCP) structure and the β phase is a high temperature phase with a body
centred cubic (BCC) structure. Heating effects such as occur in weldments, casting and
laser remelting, of the first eleven alloys listed in Table 2-2, generally result in
properties (e.g. wear and corrosion) which are similar to the untreated counterparts. This
is because these alloys contain so little alloy content and second phase that metallurgical
instability and thermal effects are not significant [72]. Ti-6Al-4V was specifically
chosen out of the remaining alloys due to its laser heat treatability and well known
biocompatibility properties.
Te
mp
era
ture
°C
Composition (wt% Al)

2-18
Table 2-2: Various commercial titanium alloys [72].
Common Alloy
Designation
Nominal Composition, wt% ASTM
Grade
Alloy Type
Grade 1 unalloyed titanium 1 α
Grade 2 unalloyed titanium 2 α
Grade 3 unalloyed titanium 3 α
Grade 4 unalloyed titanium 4 α
Ti-Pd Ti-0.15Pd 07-Nov α
Ti-0.05-Pd Ti-0.05Pd 16/17 α
Ti-Ru Ti-0.1Ru 26/27 α
Grade 12 Ti-0.3Mo-0.8Ni 12 near α
Ti-3-2.5 Ti-3Al-2.5V 9 near α
Ti-3-2.5-Pd Ti-3Al-2.5V-0.05Pd 18 near α
Ti-3-2.5-Ru Ti-3Al-2.5V-0.1Ru 28 near α
Ti-6-4 Ti-6Al-4V 5 α+β
Ti-6-4-ELI Ti-6Al-4V(0.13% O max) 23 α+β
Ti-6-4-Ru Ti-6Al-4V-0.1Ru (0.13% O max) 29 α+β
Ti-5-2.5 Ti-5Al-2Sn - α
Ti-8-1-1 Ti-8Al-1VMo - near α
Ti-6-2-4-2 Ti-6Al-2Sn-4Zr-2Mo - near α
Ti-550 Ti-4Al-2Sn-4Mo-0.5Si - α+β
SP-700 Ti-4.5Al-3V-2Fe-2Mo - α+β
Ti-6-6-2 Ti-6Al-6V-2Sn-0.6Fe-0.6Cu - α+β
Ti-6-2-4-6 Ti-6Al-2Sn-4Zr-6Mo - α+β
Ti-6-22-22 Ti-6Al-2Sn-2Zr-2Cr-2Mo-0.15Si - α+β
Ti-10-2-3 Ti-10V-2Fe-3Al - near β
Ti-15-3-3-3 Ti-15V-3Sn-3Cr-3Al - β
Beta-21S Ti-15Mo-2.7Nb-3Al-0.2Si 21 β
Ti-3-8-6-44 (Ti Beta-CTM
) Ti-3Al-8V-6Cr-4Zr-4Mo 19 β
Ti-13-11-3 Ti-3Al-13V-11Cr - β
Conventionally pure metals solidify at a single temperature. Alloys on the other hand
solidify over a temperature range during which they are in the semi-solid state.
Solidification, from the liquid, proceeds from nucleation to solid growth to a fully
solidified metal. All industrially important alloys, when solidified from a molten state
under certain conditions, form dendrites. The size, shape, and orientation of the
dendrites help determine the mechanical and tribological properties of the metal.
Solidification in alloys is important in laser surface modification as the nature in which
the melt pool solidifies influences the resultant alloy’s properties.
The first stage of solidification is nucleation. Spontaneous nucleation, known as
homogeneous nucleation, may occur when an alloy is cooled rapidly to a temperature
well below its equilibrium freezing temperature. Due to the moderate cooling rates
experienced in most metal solidification processes, a large enough under-cooling for
homogeneous nucleation does not normally occur. Instead, solidification commonly
2-19
commences by heterogeneous nucleation in which preferential nucleation sites are
irregularities such as cracks on mould walls and solid impurities in the molten metal
[73, 74]. However laser surface modification involves a beam of radiation that is
focused and has short duration energy input. This establishes a steep thermal gradient
between the liquid pool and the relatively cold substrate underneath, which acts as a
heat sink. The thermal gradient of great magnitude coupled with the conduction mode
of heat transfer can establish a cooling rate as high as 1011
K/s. Owing to this high
cooling rate (almost always >103 K/s), the surface freezes with a non-equilibrium
microstructure [36, 75]. The rapid cooling rates achieved through laser surface
engineering also open up the possibility of amorphisation, which is known for many
metals to have improved wear and corrosion properties.
In general, laser surface melting which induces extremely high cooling rates, due to low
volume melt pools and rapid workpiece movement results in a finer grain size and a
larger number of grains per unit volume. This is desirable within the solidified metal as
the larger grain boundary surface area effectively blocks the slip of crystal structure
defects, resulting in better mechanical and tribological properties. An empirical
relationship between grain size and yield stress (σy) was formalised mathematically by
Hall and Petch [76], see Equation (1)
σy = σi + kgdg -0.5
(1)
where σi represents the overall resistance of the crystal lattice to dislocation movement
(constant for a particular metal), k measures the relative hardening contribution of the
grain boundaries (constant for given metal), and dg is the grain diameter.
2.4 Surface Engineering
Biomedical implants not only rely on their bulk material properties but also on surface
characteristics. For example, wear activities that occur depend on the implants surface
properties, contact area and the environment in which they operate. Enhancement of the
surface characteristics increases lifespan of the implant. Surface engineering techniques
are suitable for biomedical implants as only the surface is hardened thus the inner
substrate remains softer for improved fatigue results. Most commonly practised
conventional surface engineering techniques like galvanising, diffusion coating and
nitriding have several disadvantages including [77-80]:
i. Long processing time,
ii. High energy and material consumption,
2-20
iii. Poor precision and flexibility,
iv. Lack in scope of automation,
v. Requirement of complex heat treatment schedules, and
vi. Easy deformation of work-piece being treated.
Another popular technique, thermal spray coating, has drawbacks mainly due to limited
bond strength between the coating and substrate and the subsequent lifetime of coating
[31]. These issues arise mainly due to low coating density, non-uniform coating
thickness and mismatch of coefficient of thermal expansion [81]. Surface engineering
methods based on application of electron, ion and laser beams are free from such
limitations. Laser treatment is more advantageous compared to electron and ion beam
based processing because electron and ion beams cause the [80]:
i. Rapid deceleration of high energy electrons generates X-rays which is a
possible health hazard, and
ii. Requirement of an expensive ionisation chamber delivery system and ultra-
high vacuum level
Laser treatment can be free of the aforementioned short-comings. Laser surface
modification provides precise control over the morphology of processed area and has
the ability to process complex parts and specific areas of the component without
affecting the bulk material. Due to the need of high irradiance and low residence times,
only high power lasers (typically Nd:YAG and CO2) can be used for metallic surface
modification [82].
2.5 Corrosion
Corrosion of human body metallic implants is critical because it can adversely affect
biocompatibility and mechanical integrity [83]. The question “Does laser surface
modification of this biomedical alloy have an effect on its corrosion properties?” is one
that material engineers need to ask when considering the use of this process with a
specific alloy for use within the human body. A brief background is discussed in this
section covering the effects of corrosion and methods used to assess rates of corrosion.
The human body is a harsh environment for implants due to its high oxygen
concentration, saline electrolyte conditions of pH 7.15 to 7.35 (it decreases down to 5.2
during an inflammation reaction [84]) and a temperature of about 37 °C. Chloride
solutions are known to be aggressive and corrosive to metals, however, ionic
composition and protein concentration in body fluids complicate the nascent
2-21
understanding of biomedical corrosion even further. Variations in alloy compositions
can lead to subtle differences in mechanical, physical, or electrochemical properties.
However, these differences are minor compared with the potential variability caused by
differences in fabrication methodology, heat treatment, cold working, and surface
finishing, where surface treatments are particularly important for corrosion and wear
properties [10].
The typical types of corrosion that occur in metallic implants are pitting, crevice,
galvanic, intergranular, stress-corrosion cracking, corrosion fatigue, and fretting
corrosion. Surface modification of implants, is considered to be the best solution to
combat corrosion and to enhance the life span of the implants and longevity of the
human beings. Tribocorrosion studies are gaining importance in relation to toxicity
because of the influence of friction or fretting on the local depassivation and release of
metallic ions [85]. To replicate the real environment as closely as possible, implants
should be tested in vivo in animal experimentation; but the possibility of monitoring
electrochemical processes is limited and very complex [57]. In vitro, titanium has been
proved to have high stability and corrosion resistance [54, 86, 87]. However, there are
studies that still show metal release and corrosion in vivo, thus requiring surface
modification of the implant material [88, 89].
To accelerate corrosion processes, electrochemical tests are used to directly amplify the
impact of corrosion processes. This is possible since electrochemical tests use some
fundamental model of the electrode kinetics associated with corrosion processes to
quantify corrosion rates. To maintain reproducibility and minimize variables, simulated
body fluids that contain some combination of amino acids, proteins and ions at the
proper temperature and pH are often used, simply due to the complexity and often non-
well controlled nature of the vivo system, and the inherent difficulty of reproducing that
system in the laboratory. This approach is known to yield significant results compared
to in vivo testing [10]. There are two types of methods used in electrochemical testing.
These are polarisation and electrochemical impendence spectroscopy (EIS). Polarisation
measures susceptibility to localized corrosion for corrosion resistant materials. EIS can
be used to follow actively corroding systems like degradable surfaces. Electrochemical
corrosion testing also allows for monitoring of the release of toxic ions in the body,
which is another major issue long before failure occurs [57].
It is worth noting that, body fluid consists of inorganic ions (Na+, Cl
-, Ca
2+, HxPO4 n-
etc.), therefore the simulated body fluids (SBF) need to be carefully considered. The
concentration of oxygen depends on the part of body: in the intercellular fluid and

2-22
arterial blood, it is 1/80 and ¼ respectively. It is two thirds of these values under
ambient conditions. The kind of cell in the surrounding tissue depends on the part of
body and varies as time proceeds after implantation. In corrosion testing metallic
biomaterials are typically evaluated in saline, phosphate buffer saline solution,
simulated body fluid containing only inorganic ions, and medium with and without the
addition of serum [13]. Because the type of cells used changes the environment and
secrete various chemical that have an effect on the corrosion processes, using the
appropriate SBF is therefore important.
Pitting corrosion: is a localized form of corrosion by which cavities or "holes" are
produced in the material. Pitting is considered to be more dangerous than uniform
corrosion damage because it is more difficult to detect, predict and design against.
Pitting corrosion of the laser treated material can be compared to the untreated by
calculating the corrosion rate derived from potentio-dynamic polarisation studies.
Potentiodynamic polarization is a technique where the potential of the electrode is
varied at a selected rate by application of a current through the electrolyte. Polarization
methods involve changing the potential of the working electrode and monitoring the
current which is produced as a function of time or potential. The three main polarisation
methods are anodic, cathodic and cyclic polarisation.
i. Anodic: involves changing the potential in the anode causing the working
electrode to become the anode and causing electrons to be withdrawn from it
ii. Cathodic: the working electrode becomes more negative and electrons are
added to the surface
iii. Cyclic: both anodic and cathodic polarisations are performed in a cyclic
manner.
2.6 Wettability Characteristics
Events leading to integration of the implant into the bone, which in turn determine the
performance of the device, take place largely at the tissue-implant interface [90]. The
ability to promote bone cell anchorage, attachment, spreading and growth is a key factor
for a successful biomaterial in orthopaedics. It is important that the interface between
the implant and host tissues do not induce any deleterious effects such as chronic
inflammatory response or formation of unusual tissue. It is therefore crucial to design
biomaterials used in implants with the best surface properties that can encourage ideal
bio-integration. The wetting of a surface to a liquid and the spreading of the liquid are
very important aspects in surface engineering for biomedical implants.

2-23
Wettability is the ability of the liquid to spread on a solid surface. Surface energy and
wetting characteristics can be used as a measure for biocompatibility [91, 92]. Wetting
measurements are only sensitive to the upper 0.5 nm or so of the surface. Measuring
surface energies at the interface is crucial for biomedical implants as these energies
drive important processes such as adsorption and adhesion. When a drop is placed on a
solid surface under gravity, it has a tendency to spread. Once the cohesion (internal
forces) of the liquid, the gravity forces and the capillary forces (related to the surface
tension) are in thermodynamic balance, the equilibrium state is reached and the specific
contact angle, θ, between the solid surface and the liquid can be measured. The triple
interface formed between solid, liquid and gas will move in response to the forces
arising from the three interfacial tensions until an equilibrium position is established
[93]. Contact angle, θ, is the angle between the solid surface and the tangent of the
liquid surface, see Figure 2-8. Spreading of the liquid over a solid depends on the
components of the interfacial tension and is given by Young’s Equation (2).
(2)
where ϒ are the surface tension coefficients of solid, gas and liquid interfaces. This
theoretical relation is true for smooth and homogeneous solid surface; it does not have
practical application for rough surfaces.
Figure 2-8: Contact angle (Θ) of a liquid (L) on a solid (S). γLV, is the interfacial energy
of liquid–vapour interface; γSL, is the interfacial energy of the solid–liquid interface; and
γSV, is the interfacial energy of the solid–vapour interface [94].
The present techniques used to alter a material’s wettability characteristics are often
complex and difficult to control. Lasers offer high control capability and flexibility.

2-24
There are numerous publications demonstrating the practicability of employing lasers
for surface wettability modification [15, 90, 92].
Hydrophilic surfaces have good affinity for water and therefore have strong adhesive
forces, high surface energies and low contact angles. On the other hand hydrophobic
surfaces are made up of non-polar groups and have large contact angles. Figure 2-9
demonstrates hydrophilic and hydrophobic surfaces. Measurements of contact angle are
thus used to gain qualitative information about the chemical nature of the surface.
Wetting can be determined from the equilibrium contact angle. If θ < 90°, the liquid is
said to wet the solid and a zero contact angle is known as complete or perfect wetting.
Figure 2-9: Super hydrophilic and super hydrophobic contact angles [95].

2-25
2.7 Biocompatibility
Biocompatibility is the fundamental requirement for choosing a metallic implant
material; the material has to exhibit nontoxic properties to the surrounding biological
system. Hip implant biocompatibility problems are most often caused by toxins that
leach out of the implant material into the surrounding tissues and body fluids. The main
cause of osteolysis in hip replacements is the release of ions due to metal on metal wear
in bearing surfaces. To identify and quantitate specific leachable moieties, analytical
extraction studies are carried out. Extracts are obtained from the material and prepared
under exaggerated conditions of time and temperature in order to allow a margin of
safety over normal physiological conditions.
The tissue culture assays examine the toxicity or irritancy potential of materials at a
cellular level through the use of isolated cells in vitro. The most important factor in
testing toxicity is the dose of chemicals delivered to each individual cell [31]. There are
three ways of performing the cytotoxicity test, namely: direct contact, agar diffusion and
elution methods. With all three assays the outcome is measured by observing changes in
the morphology of the cells. The main difference between the assays is the way the cells
are exposed to the material being tested.
Direct contact: - This assay involves placing a piece of test material directly onto
growing culture medium. The cells are incubated at normal body conditions and
subsequently stained with a cytochemical stain such as haematoxylin blue. Dead cells
lose their adherence to the culture plate while live cells adhere and are stained by the
cyto-chemical stain. Therefore toxicity is evaluated by the absence of stained cells on
the specimen. A disadvantage of this assay is that it is suited for low density materials.
Agar diffusion: - This method involves placing a contact thickness of agar over the
culture cells. The test material is then placed on top of the agar layer and subsequently
incubated at normal body conditions. The agar mixture usually contains a die that
allows for visualisation of the live healthy cells while dead cells cannot absorb the die
and therefore remains colourless allowing for toxicity evaluation. Agar diffusion is also
suitable for high density materials.
Elution: This method uses extracting media and extraction conditions to test material
according to actual conditions or to exaggerated conditions. An extract of material is
usually prepared using sodium chloride or serum free culture medium. The extract is
placed on a prepared layer of cells and the toxicity is evaluated after incubation at
normal body conditions. Live and dead cells are distinguished by using histochemical or

2-26
vital stains thus evaluating the toxicity levels. Table 2-3 lists the advantages and
disadvantages of these cell culture methods [96].
Table 2-3: Advantages and disadvantages of the cell culture methods [96].
Advantages Diadvantages
Direct contact
Eliminate extraction preparation
zone of diffusion.
Target cell contact material.
Can extend exposure time by adding
fresh media.
Cellular trauma if material moves
Cellular trauma with dense material
Decreased cell population with
highly soluble toxicants
Agar diffusion
Eliminate extraction preparation
zone of diffusion.
Better concentration gradient of
toxicant.
Can test one side of a material
independent of material density.
Require flat surfaces
Solubility of toxicants in agar
Risk of thermal shock when
preparing agars overlay
Limited exposure time
Risk of absorbing water from agar
Elusion
Separation extraction from testing
Extended exposure time.
Choice of extract condition.
Choice of solvents.
Additional time and steps

2-27
2.8 Laser Surface Modification
Laser material processing can be divided into three major classes, namely heating,
melting and vaporisation. These three classes are determined by power density
(irradiance) and exposure/interaction time (residence time) as shown by the chart in
Figure 2-10. Within these classes there are various processes that can be achieved
through careful selection of the irradiance and residence time.
Figure 2-10: Classification of different laser processing techniques [80].
This study focuses on the high power density melting regime which requires substantial
amount of energy to be induced at a very short period of time to trigger microstructure
and phase transformation. High laser power levels and reliability are crucial, thus
making CO2 and Nd–YAG lasers the only practical solutions for this type of process
[80]. Since the focus of this study was within the melting regime, some of the processes
within this class i.e. glazing, alloying and cladding will be discussed in more detail.
2.8.1 Laser Glazing
To date it is well known that decreasing grain sizes into the nanoscale increases
strength, hardness and tribological properties of both metals and ceramics [2]. An
amorphous structure has no grains and is known to increase hardness and surface
properties through elimination of crystalline anisotropy and inter-crystalline defects
[80]. The term ‘glazing’ refers to the process of being able to make ‘glassy’, to make a
solid without any crystalline structure [97]. Laser glazing occurs when a beam of

2-28
sufficient intensity, to create a molten state, is scanned rapidly across a solid. Extremely
rapid cooling caused by conduction of heat into the bulk material and shallow processed
area result in major microstructural alteration i.e. freezing of the atoms in a random state
before they can form crystals. These microstructural changes enable laser glazing to
produce higher compressive strength, hardness, wear and corrosion resistance properties
[98].
However, laser glazing and the parameters required to produce such a state of
processing is difficult to distinguish as various authors throughout literature define the
process differently [97, 99-102]. With the various formats of irradiance and exposure
time figures presented in literature, it is very difficult to predict a priory the precise
conditions which promote the formation of glazed surfaces [80, 97, 99, 103]. Figure
2-11 highlights some of the irradiance versus irradiance time graphs as published by
different authors.
Figure 2-11: Comparison of perceived glazing process parameters in literature [97, 99].
Mahank defined the glazing as a melting process used for surface modification in which
a thin layer of substrate or coating is melted to remove surface roughness or porosity
[99]. The author associated the process with a combination of irradiance ranging
between 2.5 – 7000 kW/cm2 and beam interaction time between 0.001 – 10 s. DiMelfi
et al. [104] used laser glazing to reduce the friction coefficient of rail steel with
treatments producing up to 100 µm deep glazed surfaces. In their study, a pulsed 1.6
kW Nd:YAG laser with a 1.06 µm wavelength and 0.2 mm spot size was used. The 1.06
µm wavelength was particularly used because it eliminates the need for an absorptive
coating for rail steel. Two beam shapes were exploited, circular and elliptical, with an
average of 1 kW power being used for each pass. Nitrogen was used as an assist gas
during their experiments. The laser glazing treatment used on the steel produced micro

2-29
hardness values of up to 1072 HV, 257% higher than the typical untreated steel. Static
friction experiments proved that a reduction in friction coefficient of approximately
40% occurred which corresponded with a calculated reduction in the crack propagation
rate of 79%. A drawback noted from DiMelfi’s study was that the X-ray diffraction
scans showed full crystallinity of the glazed layer, therefore the study was inconclusive
regarding the nature of the glazed layer [104]. In this respect, it can be seen that the
term laser glazing used in the literature does not generally correspond with the
production of amorphous material but rather represents a process which uses high
power density and low surface interaction times.
Laser glazing typically occurs with a partially focused beam incident on a sample
moving at high speed, for example, with the sample on a rotating turntable. Speeds of
several meters per second can be readily achieved. Cases in which such glass structures
have been confirmed in metals are often of a eutectic composition, such as for the Fe-C-
Si-B and Pd-Cu-Si alloys. However not all eutectic alloys will produce glassy
structures. Pre-treatment to homogenise the microstructure prior to the glazing pass
have been used to achieve glassy structures [97]. Most of the confirmed laser glazing
cases that highlight the presence of amorphous structure are for ceramics [100, 101,
105]. Ceramics are known to radically reduce in grain size by applying appropriate heat
treatment regimes therefore validating the possibility of achieving a glazed surface [31].
Laser glazing also has the potential to seal heat checks formed on the surface of alloys
and relax surface stresses [106].
Due to the vague definition of laser glazing process in literature, the process parameters
used in this research can be termed as being within the glazing range. If laser glazing is
defined by the processing maps given in [80, 97, 99] then the processing parameters
used in this study are within the glazing umbrella. However, for clarification purposes
the process used in this study is defined as being laser melting or laser surface
modification.
Amorphisation of the metal surface was not sought as a primary goal in this study
mainly due to the following:
i. Readily amorphised alloys require compositions, that allow rapid quenching,
that are not present in biomedical alloys [107-111]. Including these elements
would change the biocompatibility properties thus making the material usable
within the body.
ii. Uncertainty of laser glazing in titanium alloys [110]. Laser glazing of titanium
alloys is mentioned in two publications Malakondaiah et al. [112] and Ready et

2-30
al. [97]. However, as discussed in DiMelfi’s study [104], Malakondaiah et al.
did not prove the amorphous structure by means of XRD or otherwise. Ready et
al. [97], refers to creation of α martensite as laser glazing. The process of
creating α martensite was achieved in this study and several other [17, 113, 114]
and has been proven to be a crystalline structure.
iii. Metallic glasses are known to be brittle therefore limiting their performance in
load bearing applications like hip replacement application [115].
iv. The area of laser surface modification of biomedical alloy already presents a
significant large scope for optimisation and investigation.
2.8.2 Laser Surface Alloying
Laser surface alloying (LSA) is a surface modification technique which utilises high
power density available from focused laser sources to melt, externally added, alloying
elements and the underlying substrate [116, 117]. The process is similar to laser melting
except that extraneous alloying elements are added to the melt pool, thus changing the
chemical composition of the surface. The bulk of research carried out on surface
modification of titanium alloys have been focused on laser alloying. There are two main
ways used to deposit the alloying element namely: co-deposition and pre-deposition.
Co-deposition involves direct deposition of the alloying element during laser irradiation.
The alloying element is deposited mainly in the form of gas [118, 119], powder [120,
121] or wire [122]. Co-deposition of the alloying element is considered the most
attractive as it involves a single step processing. This method also offers the significant
advantage of real time control, over pre-deposition where the alloying element is
deposited prior to laser irradiation. Gas deposition has been the main technique used for
laser alloying of biomedical alloys. In previous studies laser nitriding of titanium alloys
has been thoroughly studied [123-127]. The attractiveness of LSA as compared to
alternative coating techniques is mainly due to rapid quenching from liquid phase which
allows formation of extended solid solutions and novel metastable phases with superior
mechanical and chemical properties.
Up to 500 µm thicknesses of titanium nitride (TiN) layers have been reported, with
increased hardness as well as erosion and wear resistance [128]. Laser nitriding of
titanium alloys is typically conducted with either Nd:YAG or CO2 continuous lasers
operating at power densities between 108
and 1011
W/m2 with typical cooling rates of
between 103 and 10
5 K/s [124, 129]. The type of gas is also known to affect the
resulting surface roughness, nitrogen gas results in higher average surface roughness

2-31
compared to a mixture of nitrogen and argon. Considerable roughness is desired in the
stem of biomedical hip implants because it improves the bone bonding capabilities
[130]. The thickness of the processed region greatly depends on nitrogen pressure
intensity. Smooth processing is attributed to nitrogen pressures above atmospheric
pressure, however, an increase in nitrogen pressure also results in reduced thickness due
to the cooling effect imposed by the higher pressures. Continuous wave laser processing
of energy density, beam diameter, scanning velocity and nitrogen pressure of 5×10⁴
W/cm2, 3 mm, 6 mm/s and 0.4 MPa respectively, easily forms a fine titanium nitrate
(TiN) compound [131].
TiN is extremely hard and is known to be used to improve the substrate's surface
properties. It hardens and protect surfaces, its non-toxic properties allow for it to be
used for medical implants as it meets the FDA requirements [132]. To produce the TiN,
experiments have to be conducted in a nitrogen atmosphere. Ageing treatments increase
hardness and distribute the TiN uniformly on the treated areas [113]. In laser nitriding,
up to five fold increases in hardness have been reported on Ti-6Al-4V alloy surface
compared to substrates of approximately 350 HV [113, 124, 133, 134]. TiN coatings are
most popular for corrosion resistance in machine tooling, with lifetime improvement
being increased by a factor of three or more [132, 135]. Formation of α-Ti was observed
in the heat affected zone (HAZ) with hardness values averaging 450 HV.
Jiang et al. also investigated the hardness and wear resistance of laser treated Ti-6Al-4V
alloy with a 3.3 kW continuous laser [136]. The authors reported an increase in both
parameters and related improvements to laser beam scanning rate. A lower beam scan
speed resulted in laser surface alloyed composite coating having a higher volume
fraction of TiN reinforcement due to the longer gaseous nitrogen and liquid interaction
time. Gyorgy et al. found the presence of TiN in Ti-6Al-4V alloys treated using a
pulsed Nd:YAG laser in a controlled nitrogen atmosphere [137]. The process of laser
nitriding can be achieved through the use of either pure nitrogen or a mixture with argon
or helium. The best wear resistance properties were observed by laser melting in pure
nitrogen followed by a mixture with argon. Pulsed laser systems allow for high
repetition rates to be achieved subsequently improving the depth of the processed layer
[138]. Improved cavitation erosion resistance was also observed and compared to
untreated samples [139].
The main problems still associated with this process are the formation of cracks due to
high cooling rates and lack of reproducibility. Cracks have been associated with the
laser scanning speed and nitrogen gas parameters [139]. Investigations carried out by

2-32
Mridha et al. demonstrated a reduction in number of cracks as the laser scanning speed
increased [140]. The study also established that nitriding in dilute gas environments
nitrogen-helium and nitrogen-argon produced a significant reduction of cracks. The
surface hardness after glazing was dependent on the nitrogen concentration in the
mixture and was seen to increase with increasing nitrogen content. Formation of less
dendritic TiN was cited as a contributing factor to lower crack formation. Preheat
treatment through laser glazing under argon prior to nitriding produced a more uniform
depth of treatment and reduced cracking effects [127]. In addition to production of
cracks, laser alloying also introduces foreign alloying elements therefore achieving
homogeneity and repeatability is very difficult. Homogeneity and repeatability are
crucial in achieving a quality implant and therefore crucial in the biomedical industry.
2.8.3 Laser Surface Cladding
Laser surface cladding (LSC) is a melting process where there is fusion of a substrate
material with a material of different metallurgical properties. Laser cladding is similar
to laser surface alloying except the dilution by the substrate is kept at a minimum.
Normally, processes involving less than 10% dilution are referred to as cladding while
those with dilutions exceeding 10% are termed as alloying [117]. The cladding process
offers optimum bonding, great flexibility, low distortion, and low thermal load on the
work piece together with little need for post cladding treatment [97]. Ni-based alloys are
the most commonly used material for cladding titanium and its alloys. Ni-based alloys
are often used due to their good high temperature wear and corrosion resistance
properties and they are easier to bond to the substrate than other materials [141-143].
However, nickel based alloys do not offer good biocompatibility properties due to the
toxicity of nickel within body environments [44].
High hardness coating up to 1000 HV with excellent wear resistance and very low load
sensitivity properties can be obtained by laser cladding [144]. One of the early works on
improvements of wear and oxidation properties of titanium was carried out by Hirose et
al. [145]. They investigated the effects of laser cladding aluminides on CpTi. More
work on cladding of titanium has been carried out by Guo et al. [146] and Pu et al.
[147]. Cracking was found in all the laser modified specimens, this raised a cause of
concern for this laser treatment. Harness levels up to 600 HV have been achieved
through the formation of TiC, TiB and TiB2 via laser cladding [148]. Recently studies
on the cladding of Ti-6Al-4V by cobalt to improve corrosion resistance were carried out
by Majumdar et al. [149]. A significant improvement in microhardness was achieved at
the interfacial region. Uniform corrosion resistance increases along the graded

2-33
interfaces were noted, but the pitting corrosion resistance marginally deteriorated. In
this case, the direct laser clad Co layer showed a better biocompatibility than that of as-
received Ti–6Al–4V sample.
The main drawback of cladding is that it often produces uncontrollable cracks, which
result from the very high cooling rate of the melted pool. The process also has poor
reproducibility. This is due to the complexity in dissolving the material uniformly in the
melted pool. In an effort to achieve improved coating composition laser cladding uses a
lower power density, around 102 kW/mm
2 compared to 10
3 to 10
4 kW/mm
2 for laser
surface melting. This lower power density not only reduces the relative extent of
distortion, but also ensures a closer control of the dilution. Laser cladding is also costly
compared to other laser processing techniques [97, 117].
2.8.4 Laser Shock Hardening
There are other laser processing techniques that modify the surface structure like laser
shock hardening (LSH). The principle of LSH is to use a high intensity laser and
suitable overlays to generate high pressure shock waves on the surface of the treated
material. When a material is irradiated with a Q switched pulse laser, operated at power
density greater than 0.1 GW/cm2, a shock wave can be generated on the surface. Surface
of the treated material can be coated with a black paint before LSH as a laser energy
absorbing layer. The workpiece is usually covered with a transparent layer (for example
water or glass). When the laser beam strikes the coated sample, the black paint, due to
absorption of laser beam energy, is heated and instantaneously vaporized. The vapour
absorbs the remaining laser beam radiation and produces plasma. The rapidly expanding
plasma creates a high surface pressure, which propagates into material as a shock wave.
The shock wave can induce compressive residual stress that penetrates beneath the
surface and strengthens the surface of the treated material. This effect may induce
microstructural changes, cause a high increase in dislocation density, influence
roughness surface of the material as well as introduce a compressive residual stresses
into the treated surface of the material [150, 151]. The effects of such a process would
not greatly influence the crucial wear and corrosion properties needed in a biomedical
implant. Although LSH improves the wear and corrosion properties, the improvements
are insignificant compared to other laser surface modification techniques. It is because
of this reason that LSH was not implemented in this study.
2-34
2.8.5 Laser Surface Melting
The process used in this research can be best described as laser surface melting. In this
process the alloy surface is laser melted and rapidly re-solidified without any direct
addition of other material elements to modify the chemical composition of the surface.
Vaporization is avoided during this laser treatment and the molten pool solidifies
rapidly. There is a sequence of events which initiate when the laser beam contacts the
surface. Firstly, the near surface region rapidly reaches the melting point and then a
liquid/solid interface starts to move through the alloy. Diffusion of elements follows
within this liquid phase. At this point the laser pulse is nearly terminated while the
surface has remained below the vaporization temperature. At this stage the maximum
melt depth has been attained, inter-diffusion continues, the re-solidified interface
velocity is momentarily zero. The interface then rapidly moves back to the surface from
the region of maximum melt depth. Inter-diffusion continues in the liquid, but the re-
solidified metal behind the liquid/solid interface cools so rapidly that solid state
diffusion is negligible compared to that expected from an equilibrium phase diagram.
Finally, re-solidification is completed and a surface modified layer has been created.
Due to the relatively small depth of the melted zone (10 to 1000 micrometres), very
high quench rates are achieved, in the range of 103 to 10
6 K/s, resulting in non-
equilibrium martensitic microstructure [152]. The re-solidified alloy has a titanium
oxide film on the surface, which confers good hardness, wear and corrosion resistance.
Due to the extremely high thermal gradients, residual stresses can develop which may
result in distortion of the work-piece. These effects can be overcome by applying a low
powered surface heating procedure following the laser melting process [152].
The advantages of laser melting in surface modification of biomedical implants include:
i. No foreign material is used that might cause early or stress forced failure.
ii. Elimination of alien species eliminates the complex material dispensing
procedure therefore allowing for homogenous surface treatment.
iii. Less parameters are used, therefore, compared to other laser surface
modification techniques, the results are repeatability which is crucial in
biomedical industries.
iv. Less material and energy are required compared to other laser modification
techniques resulting in a cheaper process.
v. Superior corrosion properties result compared to nitriding or cladding [17, 153].
vi. Superior biocompatibility can result due to elimination of foreign elements.
vii. Crack-free modification easily created compared to laser nitriding and cladding.
2-35
2.9 Parameters Affecting Laser Surface Modification
The main process variables in the laser surface modification operation are: laser power,
beam diameter, beam configuration, work-piece velocity, substrate condition
(roughness, temperature and absorptivity), alloy composition and thermophysical
properties of the work-piece [80]. In order to obtain the required properties it is crucial
that the selected interaction time and power density allow the material to undergo the
desired degree of heating and phase transition. Power density (irradiance) input largely
determines the maximum temperature attained. Duration of interaction (residence time)
largely determines the reaction among the phases and the cooling rates. Interfacial
properties are also strongly attributed to the temperature encountered during treatment
[36]. The control of these laser processing parameters in this study is important to
achieve repeatability and optimum microstructure changes on the surface. It should be
noted that the parameter selection process is complex. For instance, it would be more
convenient to quantify different laser processing using a singular parameter like energy
density (J/mm2) determined from power density multiplied by time. However, this
would not define the true outcome of each individual processing parameter as it is the
specific combination of power and time (rather than their product) which determines the
resulting thermal and material effect.
2.9.1 Material Properties
To achieve any level of hardening in alloys, certain types of microstructure are
favourable. For example, in steel microstructures a fine pearlitic structure and small
grain sizes typically provide optimal conditions for laser processing [154-156]. If the
structure was made up of coarse graphite with large grains of ferrous alloys it would not
respond as well to laser hardening, preventing the complete transformation from the
austenitic phase to the martensitic phase. The final hardness of the steel is directly
related to the quantity of residual austenite or martensite formed during laser hardening.
Steel alloys can be heat treated down to greater depths than plain carbon steel due to
their lower thermal conductivity. Research to date suggests that laser treating is the best
method at inducing the formation of retained martensite due to the extremely low
quenching times [157]. Laser hardening has also been found to produce surface residual
compressive stresses which can minimise crack growth leading to higher fatigue limits
and better wear resistance. Ti-6Al-4V is preferred over other titanium alloys due to its
laser treatability characteristic [70, 71].

2-36
Metals are known to reflect the infrared irradiation of the CO2 laser at its 10.6 µm
wavelength. Surface modification techniques such as sandblasting, machining, etching,
anodising and coating are known to improve the absorption of metals [80]. Absorption
of the CO2 laser beam greatly affects the thermal cycles and peak temperature therefore
all heat transfer calculations on laser material processing require knowledge of the
beam’s absorptivity. The absorption of infrared radiation by metals largely depends on
conductive absorption by free electrons and therefore the absorptivity can be calculated
from the knowledge of the electrical resistivity of the substrate. Arata et al.
demonstrated that the absorptivity of various polished metallic surfaces is a linear
function of the square root of the electrical resistivity of the respective metals [158]. Ti-
6Al-4V absorption is estimated to be approximately 0.42 or 42% [16].
Metals absorptivity to incident laser irradiation depends on the following parameters:
Wavelength: At shorter wavelength, more energetic photons can be absorbed by a
greater number of bound electrons and so the reflectivity falls at shorter wavelengths
and absorptivity of the surface increases as shown in Figure 2-12. Generally, laser
energy is absorbed by metals better when it is of a short wavelength rather than a long
wavelength. The absorptivity of (0.694 µm) ruby lasers, for example is over 15%
greater than absorptivity of (10.6 µm) CO2 lasers for irradiated mechanically polished
321 stainless steel at 294 K [159].
Figure 2-12: Absorption of laser radiation wavelength by metals [160].
Effects of angle of incidence: At certain angles the surface electrons may be constrained
from vibrating since to do so would involve leaving the surrounding surface. Thus if the
electric vector is in the plane of incidence, the vibration of the electron is inclined to
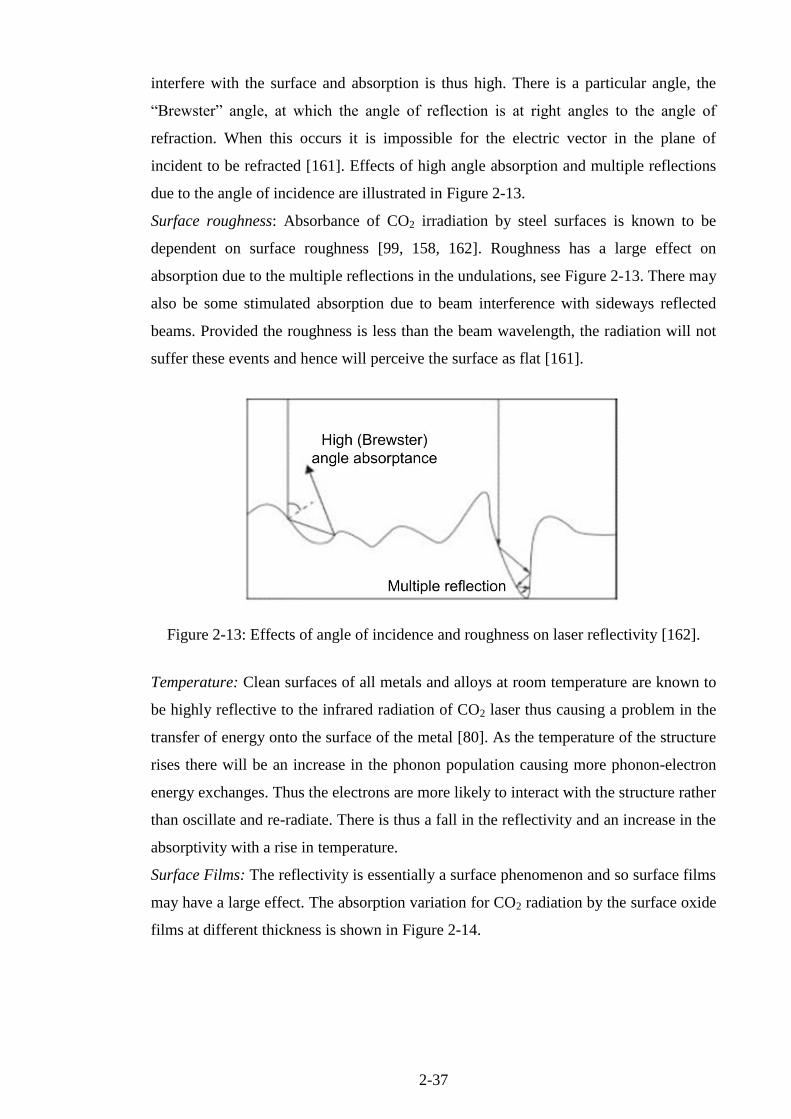
2-37
interfere with the surface and absorption is thus high. There is a particular angle, the
“Brewster” angle, at which the angle of reflection is at right angles to the angle of
refraction. When this occurs it is impossible for the electric vector in the plane of
incident to be refracted [161]. Effects of high angle absorption and multiple reflections
due to the angle of incidence are illustrated in Figure 2-13.
Surface roughness: Absorbance of CO2 irradiation by steel surfaces is known to be
dependent on surface roughness [99, 158, 162]. Roughness has a large effect on
absorption due to the multiple reflections in the undulations, see Figure 2-13. There may
also be some stimulated absorption due to beam interference with sideways reflected
beams. Provided the roughness is less than the beam wavelength, the radiation will not
suffer these events and hence will perceive the surface as flat [161].
Figure 2-13: Effects of angle of incidence and roughness on laser reflectivity [162].
Temperature: Clean surfaces of all metals and alloys at room temperature are known to
be highly reflective to the infrared radiation of CO2 laser thus causing a problem in the
transfer of energy onto the surface of the metal [80]. As the temperature of the structure
rises there will be an increase in the phonon population causing more phonon-electron
energy exchanges. Thus the electrons are more likely to interact with the structure rather
than oscillate and re-radiate. There is thus a fall in the reflectivity and an increase in the
absorptivity with a rise in temperature.
Surface Films: The reflectivity is essentially a surface phenomenon and so surface films
may have a large effect. The absorption variation for CO2 radiation by the surface oxide
films at different thickness is shown in Figure 2-14.

2-38
Figure 2-14: Effect of oxide thickness on absorption of a CO2 laser irradiation [162].
2.9.2 Laser Operating Modes
Both continuous wave (CW) and pulsed mode (PM) lasers may be employed for surface
modification. In contrast to the continuous wave operation, a pulsed beam offers several
challenges owing to the higher number of operating variables and the complexity of
optimising the process parameters. For a given melt profile, surface characteristics and
other aspects including economy, the operating parameters such as pulse energy, pulse
width, pulsing frequency, scan rate etc. have to be chosen. This calls for an excellent
knowledge of the influence of operating parameters on melt profile and an in depth
understanding of its effect on structure and properties [163]. Compared with continuous
wave lasers, the high peak power of a single pulse produced by a pulsed laser can
readily induce higher absorptivity in metals. Short duration times of pulsed lasers mean
short heating times which therefore contribute to higher cooling rates, subsequent grain
refinement, and the formation of non-equilibrium phases [164]. Since pulsed lasers
allow for adjustments of various pulse parameters, they can provide a flexible
processing window that can be tailored to suit certain microstructures and materials
[164]. CW operation on the other hand can offer higher depths of processing compared
to PM as previously seen for example in 316L stainless steel [165].
There have been very few comparative studies examining the effects of laser operational
mode on microstructure in the literature. Samant et al. studied the use of CW and PM
for the surface modification of alumina ceramics [166]. The two processing conditions
generated two different grain structures. The grains showed facets for CW mode of laser
operation while they were non-faceted for PM mode. The author observed much higher
cooling rates for PM (two orders of magnitude) compared to the cooling rates from the

2-39
CW laser processing. PM also created deeper melts depths due to higher energy
densities being supplied for shorter periods of time, thus melting more material than
CW where smaller energy densities were supplied for a longer periods of time. Thus the
melt depth was shown to be a function of the input energy and the time for which it was
supplied (residence time) without much direct bearing on the under cooling. Under
cooling in this case is defined conventionally as being the difference between the
melting point of the material and the temperature at which the temperature derivative
with respect to time is zero.
2.9.3 Laser Power and Irradiance
The average power of the laser beam, whether it is operating in the continuous mode
(CW) or pulsed mode (PM), affects the nature and scale of the resultant structures [167].
The use of pulsed power allows two more variables to be considered, namely, pulse
repetition frequency (PRF) and percentage overlap. Penetration of the laser beam is a
function of power. However, high power settings result in vaporisation and material
ejection [161]. The power density or irradiance of a laser beam is determined by the
power of the laser beam used and the diameter of its focal spot (spot size). Also known
as the laser intensity, irradiance is given by:
(3)
where, I is the irradiance (W/mm2), P is power (W), and w0 is the radius of the spot size.
Figure 2-15 illustrates the laser beam profile depending on the focusing. Most of studies
in the literature focus the beam either below or above the surface to achieve larger beam
diameters than the focused spot size and hence give the power density required [16, 110,
153, 168, 169].
The focused spot size, D, for a Gaussian beam shown in Figure 2-15, can be calculated
to a good approximation using Equation (4) [170]:
(4)
where d is the beam diameter at the lens inlet, f is the focal length of the lens, and 2wo is
the spot diameter at the focus, see Figure 2-15.
The optimal diameter of the beam which contains almost 86 % of the total laser power
is defined by 1/e2 of the peak intensity. A CO2 laser that functions in TEM00 mode
produces a Gaussian shaped spot as illustrated in Figure 2-16 (a). Generally, the
intensity along with the material properties gives an indication of the expected rise in

2-40
temperature in the focal region and consequently indicates the melting intensity of the
material [171].
Figure 2-15: Geometry and intensity of the Gaussian laser beam [172].
Figure 2-16: Laser beam modes illustrating (a) TEMoo and (b) TEM01 modes [97].
(a) (b)

2-41
2.9.4 Sample Speed and Residence Time
The speed of the sample and laser beam spot size is crucial in determining the residence
time. Residence time can be defined as the amount of time the laser beam is in contact
with material. For pulsed mode, residence time encompasses the duty cycle, tangential
speed of the sample and beam diameter. This time is equivalent of exposure time for
continuous mode lasers and can be calculated as follows [166]:
(5)
Where R is the residence time (s), τ is the pulse width, Ds is the diameter of the spot
size, PRF is the pulse repetition frequency and υ is the sample scan speed.
When continuous mode is used the pulse width and repetition frequency are ignored in
this calculation since the duty cycle is 100% and duty cycle is given be the product of
pulse width and PRF.
2.9.5 Overlap percentage
Overlap is the ratio of the distance between two consecutive laser spots and the diameter
of the spot. A homogeneous structure is achieved in pulsed laser beams by using
controlled overlap. Overlap percentage is typically calculated as:
(
) (6)
where O is the overlap percentage, Lp is the length being processed, Ds is the diameter
of the spot size and N is the number of spots within length Lp.
Figure 2-17: Schematic diagram representing 50% spot overlap.
2-42
The best results for laser processing of Ti-6Al-4V were found from 50% overlap [152,
173]. Other works found that 30% and 35% overlap produced satisfactory surfaces
[174]. Overlapping has a large effect on heat build-up on the workpiece, resulting in
preheating before subsequent tracks [175]. It is therefore crucial that the overlap
percentage is careful chosen to address these issues.
2.9.6 Pulse Energy density
Energy density is the power per unit time per unit area delivered by a single laser pulse
at the focal spot. Energy density is a more accurate parameter to compare the effect of a
laser beam with varying pulse durations. Energy density is the product of irradiance and
residence time and can be calculated as follows:
(7)
where, Ef is the energy density (J/mm2), I is the irradiance (W/mm
2) and R is the
residence time (s).
2.10 Effects of Laser Surface Melting on Stainless Steel Properties
Steels that can be heat treated are typically of high carbon content [97]. AISI 316L
stainless steel is extremely difficult to heat treat for hardness due to its low carbon
content. Carbon enrichment methods have to be implemented before heat treatment
operations. Laroudie et al. published a study on laser surface alloying of 316L stainless
steel to improve the hardness of the 316L steel surface [176]. The process consists of
melting the surface of the base alloy with known amounts of pre-deposited materials. In
particular, the two routes presented were (i) the formation of iron-chromium carbides by
carbon and SiC incorporation, and (ii) the incorporation of submicron particles of TiC
and precipitation of titanium carbides. Surface alloying was carried out on polished
samples using a 300 W continuous wave Nd:YAG laser with argon as a shielding gas to
prevent oxidation. A circular spot of 950 µm in diameter resulting in a maximum power
density of 4.11 W/m2 was implemented in their research. The quality of the coating was
noted through high hardness, reduced cracks, and improved homogeneity throughout
the sample. SiC alloying micro hardness measurements revealed mean values of
between 500 and 600 HV in the melted area and with absence of cracks on the surface.
Carbon alloying produced microstructures leading to an average micro hardness of 400
HV. TiC submicron particles alloying produced crack-free, but a heterogeneous surface
with a slight increase in micro hardness to about 280 HV. Micro hardness of the surface
alloy ranged between 350 HV and 700 HV for Ti + SiC alloying. Laurodie et al. thereby
2-43
showed that 316L austenitic stainless steel can be hardened by laser surface alloying
[176].
The average surface roughness depends on pulse width and pulse period for pulsing
mode lasers. Pinkerton and Li obtained rougher surfaces using low pulse periods of 20
ms compared to higher pulse periods of 80 ms [165]. High duty cycles were found to
produce rougher surfaces due to longer irradiation times. Pulsing mode was found to
produce better roughness properties compared to continuous mode. Average surface
roughness Ra of as low as 0.07 μm were achieved with a larger spotsize of 1.7 μm and
lower irradiance of 198 W/mm2.
Corrosion in 316L can take many forms; the most common identified forms are
intergranular, pitting, fretting and crevice corrosion. More than 30 years ago,
heterogeneous intergranular distribution of carbon was observed in surgical grade 316
to result in intergranular corrosion due to the formation of chromium carbides. This
resulted in a demand for low carbon content alloys in surgical specifications. The
introduction of austenitic stainless steel with carbon content, lower than 0.03%, saw a
reduction in the risk of corrosion attacks of this form. Pitting is the most common form
of corrosion arising from the breakdown of the passivating oxide film, which can be
enhanced by the presence of proteins in the tissue fluid and serum [10]. Corrosion
products due to fretting on 316L immersed in extracellular tissue fluid were found to be
oxides containing chromic chloride and potassium dichromate as well as variable
amounts of calcium, chloride, and phosphorous, with nickel and manganese being
absent, indicating preferential release of these metal ions into the surrounding solution.
These results indicate that for 316L implant surfaces, nickel and manganese are
depleted in the oxide film and that the surface oxide composition changes to mostly
chromium and iron oxide with a small percentage of molybdenum oxide in the human
body. 316L is highly susceptible to crevice corrosion attack as compared to the other
implant alloys. Corrosion has been identified on bone plates and screws made of 316L
at the interface between the screw heads and the countersink [177]. In cases where there
are galvanic couples arising from the combination of dissimilar metals, such as 316L
stainless steel and the Co-Cr-M alloy or Ti-6Al-4V alloy, the stainless steel will be
attacked (galvanic corrosion) therefore these combinations should be avoided. There
continues to be a debate as to whether stress corrosion cracking takes place in 316L in
the body. While fractures of this alloy have been found to exhibit the classical stress
corrosion cracking appearance, in other cases it has been determined that intergranular
corrosion had weakened the device, thus influencing the fracture.
2-44
Laser melting of sensitised 316L stainless steel showed significantly increased
resistance to pitting. This increase was attributed to the elimination of the more reactive
heterogeneous microstructure by laser melting [178]. Studies on retrieved implants
show that more than 90% of the failures of 316L stainless steel implants are due to
pitting and crevice corrosion attack [179]. Hansen et al. [10] suggested that this fact
alone deems that a better material be used for even temporary implant devices.
Passivation and pitting-resistance properties were also seen to be enhanced with
increase in δ-ferrite content in Laser Surface Modified (LSM) samples [180].
Possibilities of improving intergranular corrosion (IGC) and intergranular stress
corrosion cracking (IGSCC) resistance were successfully investigated by melting the
surface of nitrogen containing 316L stainless steel using a CW CO2 laser [181]. The
main cause of IGC and IGSCC is formation of M23C6 carbides along the grains
subsequently leading to depletion of chromium adjacent to these carbides, a process
referred to as sensitisation. When sensitised microstructure is exposed to corrosive
solution IGC and IGCC can occur. By using a CW CO2 laser, sensitised microstructure
can be eliminated. A CO2 laser at 5 kW with a traverse speed of 20 mm/s was used in
the reported work [177]. Depending upon the temperature profiles, cooling rate, and
interaction time, continuous M23C6 carbides present in the sensitized specimen
dissolved. At the interface between the heat-affected zone and the unmelted zone,
globular particles of M23C6 were discontinuously distributed. Alloy depletion around
these particles was discontinuous, thus failure due to IGC or IGSCC was seen to be less
likely [181].
2.11 Effects of Laser Surface Melting on Ti-6Al-4V Properties
Laser surface modification of Ti-6Al-4V has been widely investigated in the literature.
The bulk of modification techniques carried out are laser nitriding. This section of the
thesis focuses on the technique examined in the authors work and presented later in this
thesis, laser surface melting, where an inert gas is used to avoid alloying. Table 2-4
shows the laser processing parameters from the literature for unalloyed laser melting of
Ti-6Al-4V.
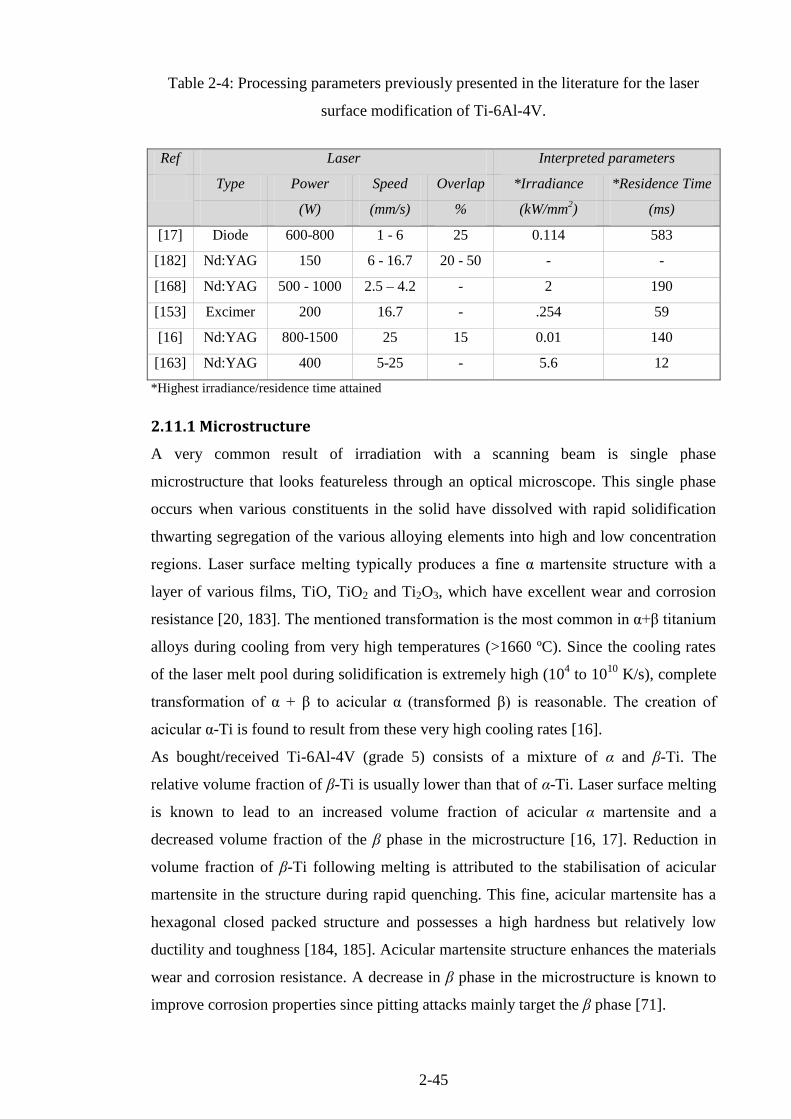
2-45
Table 2-4: Processing parameters previously presented in the literature for the laser
surface modification of Ti-6Al-4V.
Ref Laser Interpreted parameters
Type Power Speed Overlap *Irradiance *Residence Time
(W) (mm/s) % (kW/mm2) (ms)
[17] Diode 600-800 1 - 6 25 0.114 583
[182] Nd:YAG 150 6 - 16.7 20 - 50 - -
[168] Nd:YAG 500 - 1000 2.5 – 4.2 - 2 190
[153] Excimer 200 16.7 - .254 59
[16] Nd:YAG 800-1500 25 15 0.01 140
[163] Nd:YAG 400 5-25 - 5.6 12
*Highest irradiance/residence time attained
2.11.1 Microstructure
A very common result of irradiation with a scanning beam is single phase
microstructure that looks featureless through an optical microscope. This single phase
occurs when various constituents in the solid have dissolved with rapid solidification
thwarting segregation of the various alloying elements into high and low concentration
regions. Laser surface melting typically produces a fine α martensite structure with a
layer of various films, TiO, TiO2 and Ti2O3, which have excellent wear and corrosion
resistance [20, 183]. The mentioned transformation is the most common in α+β titanium
alloys during cooling from very high temperatures (>1660 ºC). Since the cooling rates
of the laser melt pool during solidification is extremely high (104 to 10
10 K/s), complete
transformation of α + β to acicular α (transformed β) is reasonable. The creation of
acicular α-Ti is found to result from these very high cooling rates [16].
As bought/received Ti-6Al-4V (grade 5) consists of a mixture of α and β-Ti. The
relative volume fraction of β-Ti is usually lower than that of α-Ti. Laser surface melting
is known to lead to an increased volume fraction of acicular α martensite and a
decreased volume fraction of the β phase in the microstructure [16, 17]. Reduction in
volume fraction of β-Ti following melting is attributed to the stabilisation of acicular
martensite in the structure during rapid quenching. This fine, acicular martensite has a
hexagonal closed packed structure and possesses a high hardness but relatively low
ductility and toughness [184, 185]. Acicular martensite structure enhances the materials
wear and corrosion resistance. A decrease in β phase in the microstructure is known to
improve corrosion properties since pitting attacks mainly target the β phase [71].

2-46
Laser surface melting has a significant effect on grain structure of Ti-6Al-4V. Extreme
cooling rates resulting from low residence time reduce the grain size and grain sizes
have been found to increase with distance from the surface of the treated zone [97].
Generally the heat affected zone has a large grain structure compared to the melted zone
[174]. Singh et al. reported grain growth from 65 µm to 89 µm for an increase in laser
power from 800 to 1500 W [16]. This grain growth was associated with high
temperatures which produced larger melt pools and subsequently a slower cool rate.
Some reports have reported defects on laser melted surfaces [182]. Defects, especially
cracks have been seen to result from lack of use of an inert assist gas. Ossowska et al. in
particular used air in their laser melting technique thus producing large cracks on the
melted surface [182]. The formation of surface cracks is likely to be due to extensive
oxidation of titanium as it is irradiated in atmospheric air [153]. When argon gas has
been used at a sufficient flow rate, laser surface melting has been shown to produce
crack-free surfaces [17, 153].
2.11.2 Melt Profile
The depth of processing can influence the service life and final application of the
component. In coating technology the depth of coating is a very important factor as
thicker coatings have a chance to delaminate while thinner coatings have a short
lifetime. The same applies for the laser processed surface where an average layer
thickness of between 40 µm and 60 µm has been reported to be ideal [2]. Meltpool
profile depends on various laser processing parameters including laser spot size, power
and scan speed. Variation of scan speed and power has previously been used to analyse
their effects on melt layer depth profile. However considering irradiance and residence
time solely does not give a complete representation of all factors affecting the meltpool
profile. The product of these two parameters (energy density) assists in gaining further
understanding of the influences on melt pool depth profile. When the process
parameters where analysed individually, treated zone depth and width was found to
decrease with increasing scan rate for Ti6Al-4V [136, 163]. This phenomenon was
concluded to be a result of a reduced interaction time between the target and the laser
beam. In samples treated in pulsed mode the width and depth of the treated zone
increased linearly with increasing pulsing frequency. This was attributed to the
increased average power deposited with increasing frequency. Kumar found that melt
pool width and depth increased with increasing pulse energy [163]. The treated depth
increased from 0.15 mm to 0.75 mm and the treated width increased from 0.85 mm to
2.35 mm for an increase in pulse energy from 2 to 12 J, see Figure 2-18. As the pulse

2-47
energy increases both the average and peak power increases, increasing the treated zone
dimensions.
Figure 2-18: Variations of treated zone width and depth with increasing pulse energy
for fixed values of pulse width (5 ms), frequency (30 Hz) and scan rate [163].
A mathematical model was developed for the 3-D melt-pool geometry and single-
crystalline melt-pool solidification in laser surface melting [186-188]. The models relate
power and scan speed to meltpool depth and width. The model was found to match the
effects mentioned earlier. The model was also found to be in good agreement between
the predicted and experimentally observed microstructures. Chan et al. also created a
thermal model to show the effects of conduction and convection on depth and width of
the meltpool [189]. It was found that the physics of the process can change from
conduction dominated to convection dominated for large melt pools. This was noted to
change the pool geometry dramatically, resulting in up to a 150% increase in the aspect
ratio (width/depth) as compared to the case with only pure conduction taken into
account. The study done by Chan also highlighted the crucial role of overlap on
meltpool dimensions and the need to consider it as a parameter. The temperature
distributions and molten flow within the meltpool were further detailed by Bamberger
[190].
2.11.3 Roughness
Effects of laser surface modification of roughness have received little interest in the
literature mainly because many applications require a finishing surface machining

2-48
operation before service. Roughness greatly depends on the variation of irradiance and
residence time. Very smooth surfaces have been previously reported in the literature
[152]. Surface roughness usually arises from the ridges and periodic structure caused by
the laser pulsing and the movement of the sample during laser treatment. Laser melting
produces smooth flat islands, surrounded by a wave-like micro-relief. Surface rippling
or roughness of laser modified Ti-6A-4V is dependent on the viscosity of the melt.
Morton et al. concluded that waviness is a function of the convectional flow of the melt
surface and also further noted that it is influenced by the percentage overlap [173].
Energy density also plays a crucial role in the resultant roughness. Li et al. showed that
increased energy density and number of pulses resulted in higher roughness [191].
Roughness has a major effect on cell attachment onto the surface.
2.11.4 Hardness
Hardness can be described as the measure of the resistance of a material to plastic
deformation and is dependent on the chemical composition and microstructure of the
alloy. Hardenability on the other hand is the depth to which the alloy can be hardened
during a heat treatment such as quenching. The microstructure, in this case, is dependent
on the severity of quenching. Achieving a rapid cooling rate with laser should produce
reduced grain size and improve hardness properties. Hardness has a significant
influence on the wear properties of a material a fact which has resulted in a significant
amount of research on this point [152, 192].
Singh et al. reported an increase in hardness from 254 HV in an untreated sample up to
297 HV from laser modified surfaces [16]. Other reports in literature have recorded
micro-hardness improvements up to 510 HV [17, 182]. Typically, hardness reduces
with distance from the surface. The heat affected region has lower hardness values
compared to the melted region [193]. Investigations by Biswas et al. revealed that
uniform hardness can be obtained within the melted region. This study showed a 490
HV hardness that was consistent throughout the 350 μm treated region [17]. The
hardness then dropped to 260 HV within the untreated bulk alloy. The improvement in
micro-hardness of the melt zone was attributed to refinement of microstructure and
formation of acicular martensite during rapid quenching. The hardness of laser surface-
treated Ti–6Al–4V decreased with increase in laser power [16]. This is in accordance
with the well-known Hall–Petch relation that defines the increase in hardness with
decreased grain size [116, 194].
2-49
Various reports have been published showing the decrease of hardness with increase in
scan speed [152, 193, 195]. However, from the literature on laser nitrided samples, the
same result cannot be guaranteed as with laser melted samples. Hamad et al. extensively
studied the effects of laser nitriding on Ti-6Al-4V and noticed a bell shaped relation
between hardness and scan speed [125]. Initially as scan speed increased the hardness
increased. Conversely, at very high speed, with laser nitriding, the hardness reduced for
further increases in scan speed. It is worth noting that laser nitriding tends to have high
hardness compared to laser melting in argon [16, 17]. This is due to the formation of the
hard TiN alloyed layer on the nitride surface.
2.11.5 Wear Properties
Titanium alloys are known to have poor fretting fatigue resistance and poor tribological
properties. Mathematical models have shown that metals with low theoretical tensile
and shear strengths exhibit higher coefficients of friction than higher strength materials.
Ti-6Al-4V has a hexagonal close packed structure and has relatively low theoretical
tensile and shear strength. Consequently, it is expected that it will have high coefficient
of friction (μ) values, which is the case for titanium sliding against titanium in air is μ =
6 [196]. Lower strength materials also show greater material transfer to non-material
counter-faces, than higher strength materials. The great affinity of titanium for oxygen
leads to the formation of oxide which is transferred and adheres to non-metallic
materials, such as polymers, resulting in severe adhesive wear. Surface modification is
therefore required to increase near surface strength, thereby reducing μ and lowering the
tendency for transfer of material and adhesive wear [197].
Yerramareddy and Bahadur were among the first to study both sliding wear and
abrasive wear of titanium alloys following laser surface modification [138]. They
assessed the wear following surface melting in an argon atmosphere with nitriding and
nickel alloying. Sliding wear tests were undertaken using a block-on-ring configuration
in dry conditions, with the titanium alloy sliding against a tool steel. The steady state
wear rate decreased from 40×10-4
mm3/m to 0.8 x 10
-4 mm
3/N m after Ni alloying, to
0.5×10⁻⁴
mm3/N m after surface melting, and to the lowest wear rate of 0.3×10
-4 mm
3/N
m, following laser nitriding. The as-received value of μ was reduced from 0.62 to 0.43
for all the laser treated specimens. The study showed that laser surface melting can be
used to enhance the wear properties of Ti-6Al-4V.
Biswas et al. [198] and Singh et al. [16] laser treated Ti-6Al-4V to improved wear and
corrosion properties for bio-implant applications. Generally the wear rate increased
with an increase in power. Singh et al. attributed the reduction in wear rate of treated
2-50
samples to the modifications in microstructure, hardness, grain size and alteration of the
electrochemical response of the modified surface.
2.11.6 Corrosion Resistance
Ti-6Al-4V is considered to be highly corrosive resistant. However, corrosion can still
occur especially when the passivation layer is damaged by fretting of a loosened
implant and/or a change in pH value occurs due to wounds or infection [199]. Gilbert, et
al. reported that approximately 16% to 35% of 148 retrieved total hip implants showed
signs of moderate to severe corrosive attack in the head-neck taper connection [200].
Improvements in corrosion potential and primary potential for pit formation compared
to the as-received Ti-6Al-4V have been observed in the literature [17]. Biswas et al.
[17] and Yue et al. [153] reported better corrosion properties in laser melting surfaces
compared laser nitrided surfaces. Corrosion potential values for laser surface modified
sample shifts significantly towards the nobler direction after treatment. Shifting of the
corrosion potential was attributed to formation of acicular martensite and a reduction in
βTi volume phase. Unlike the untreated specimen, LSM samples were not seen to
passivate over the current range of 10-6
to 10-5
A/cm2 [16, 17, 153, 168]. Pitting
potentials reduced in laser melted samples compared to the untreated samples [16].
Singh et al. reported pitting potentials of 2.4 V and <1.8 V in laser treated and untreated
samples, respectively [16]. However, when the laser treated samples were polished the
pitting potential was greater than 2.4 V and highest corrosion resistance was noted from
processing at 800 W.
Re-distribution of alloying elements within the treated titanium alloys improved pitting
corrosion resistance. Geetha et al. found improved corrosion resistance of laser nitrided
samples in a simulated body environment using potentio-dynamic polarisation [130].
These results also indicated pitting potential increase by 200 mV for the laser treated
surface. Studies carried out using excimer lasers showed significant increase in pitting
potential of the Ti alloy when the material was treated in argon gas [18]. Up to a seven-
fold reduction in corrosion current was obtained when the material was treated in
nitrogen gas. The improvements were credited to the reduction of the solute partitioning
effect of detrimental aluminium segregation from α phase [18].
Zaveri et al. studied treated Ti–6Al–4V alloy with pulsed-wave Nd:YAG laser under
various conditions to obtain a surface oxide layer for improved corrosion resistance
[168]. Corrosion resistance studies were carried out in three different simulated bio-
fluids (SBFs), namely, NaCl solution, Hank’s solution, and Cigada solution. Tafel
analysis showed that the laser-treated Ti–6Al–4V were more corrosion resistant than the
2-51
bare specimens in any of the above SBFs [168]. Langlade et al. used a Nd:YAG laser to
study the oxidising Ti-6Al-4V [20]. Stratified layers giving different coloured films
were related to oxide thicknesses and oxide compositions. It was noted that titanium
oxides may exhibit a solid lubricant effect, while the oxygen dissolved in the titanium
matrix had a hardening effect.
The reduced pitting corrosion provided by surface melting is possibly because of partial
suppression of β phase formation in the microstructure and the change in morphology
from granular to acicular [17, 153]. Yue et al. attributed corrosion enhancement to the
presence of the transformed Ti martensitic structure in the laser-modified layer [153].
The poor corrosion resistance of untreated Ti–6Al–4V can also be attributed to the local
enrichment of aluminium (α stabilizer) and the formation of a galvanic cell between the
two different phases α and β. Partitioning of aluminium from α-phase during
electrochemical corrosion is the primary mechanism of degradation of the aluminium
containing Ti-alloys, whereas, acicular α in laser treated Ti-6Al-4V lacks this portioning
effect [16].
2.11.7 Interfacial and Biocompatibility Properties
Bandyopadhyay et al. has shown that the laser processing does not have a negative
effect of inherent biocompatibility of the materials used to fabricate the structures [114].
Laser surface modification produces minimal contamination compared to conventional
surface modification techniques, thus it can help improve osseointegration [90, 201,
202]. The highest implant stability can be achieved by complete osseointegration of a
large implant surface.
Several publications have shown that roughness and wettability produced by laser
modification plays a vital role in biocompatibility properties [202-207]. Hao et al.
showed that improved surface roughness, surface oxygen content and surface energy
generated by laser treatment accounted for the better wettability characteristics of the
material and enhancement of the adhesion with the biological liquids used. Although
surface roughness played a role on the osteoblast response, the authors reported that
wettability characteristics were the chief mechanism governing the osteoblast response
[207].
An investigation of initial cell spreading and adhesion on longitudinally and
transversally oriented micro-grooves produced by the laser irradiation of Ti-6Al-4V
surfaces was carried out by J. Chen et al. [208]. Samples were polished and laser
treated. Human osteosarcoma (HOS) cells, common bone cancer cells, were cultured at
periods ranging from 15 minutes to 24 hours with immuno-fluorescence staining of
2-52
adhered proteins (actin and vinculin) being used to study the spreading and adhesion of
the cells. Enzymatic detachment tests were carried out to quantify the adhesion of cells.
Results of the experiment showed that cell spreading and adhesion were enhanced by
the longitudinally and transversally oriented micro-grooves. Contact guidance was
found to promote cell adhesion due to the increase in interactions between the focal
adhesions and the patterned extra-cellular matrix (ECM) proteins on the laser micro-
grooved surfaces [208].
Grizon et al. found that rougher titanium implants have stronger bone response
compared to smoother implants after a long term implantation [407]. A study conducted
by Wennerberg et al. reported the optimal surface for biomedical implants shows wave
structures with an average wavelength of 11.6 µm and height deviations of 1.4 µm [201,
209]. The structure of the surface of titanium implants dictates the success for the
subsequent healing process. It is primarily the microscopic structure of the implant
surface that is responsible for bone apposition to the implant [201]. Surface treatment of
implant material has been proven to influence the attachment of cells [202, 210-213].
2.12 Study Focus and Objectives
The vast majority of laser surface modifications for improved Ti-6Al-4V found in
literature are on the topic of laser surface nitriding. Nitriding is an alloying process
which has limited applications in bio-implants due to non-homogeneity of the surface
properties, crack development on the surface and difficulty in reproducibility. Laser
surface melting has a great potential as it is does not suffer from the same limitations as
alternate processes. For bio-implants, laser surface melting provides (relative to other
processes) very low contamination, easy elimination of cracks, and the ability to easily
achieve uniform and repeatable surface properties. However, the limited laser melting
studies conducted in previous work have mainly focused on low scan speeds and the use
of a large spot-size for the laser treatments. These previous works therefore have been
restricted to high residence times and low irradiance, which in essence produce lower
cooling rates than would be required to achieve finer surface structures with enhanced
properties. None of the work reviewed in the literature followed a design of experiments
approach so it is difficult to gain a full understanding of the process even within the
parameter ranges that have been investigated to date. Studies reviewed in the literature
only relate processing parameters to one individual response without cross-relating
between multiple measured properties achieved by laser melting. This makes process
mapping considerable challenging.
2-53
In this work, design of experiments was used to provide a detailed understanding of the
effects of processing parameters on resulting surface properties. This work presents a
comprehensive study of high speed laser surface melting of commercially available
316L stainless steel and Ti-6Al-4V for biomedical applications. The work in particular
investigates the possibility of implementing extremely high irradiance and low
residence times in order to improve the alloys’ microstructure, tribological and
biocompatibility properties. The aims can be summarised as follows:
i. Implementing design of experiments to study the effects of CO2 laser processing
parameters on surface properties relating to biomedical applications
ii. Investigate in particular the use of high irradiances and low residence times with a
view to producing a surface which has a combination of properties required for
biomedical implants, including a surface which is chemically homogenous, has
low corrosion potential, low wear, high hardness, high degree of biocompatibility,
good melt pool depth, roughness appropriate for various biomedical applications,
and a low induced surface stress.
iii. To provide a laser treatment process to enhance the life time of a currently used
biomaterials to avoid the need for new biomaterial development as well as process
development.
iv. Microstructure analysis – study of the resulting topography and cross-sectional
microstructures induced by laser treatment.
v. Meltpool profile – characterising the melt pool profile induced by laser treatment.
vi. Roughness – study of effects of laser process parameters on roughness.
vii. Hardness analysis – investigate the effects of laser processing on hardness and
resulting hardness distributions within the treated surface.
viii. X-ray diffraction analysis – phase distribution in treated samples and effects of
irradiance and residence time on residual strain/stress.
ix. Chemical composition analysis – variation in chemical elements within the treated
samples.
x. Wear – investigating the wear mechanism in laser treated samples and difference
compared to untreated samples.
xi. Corrosion resistance – study the corrosion behaviour and rates of the untreated
and treated samples.
xii. Biocompatibility – In this study, screening tests were used to test biocompatibility
of the laser treated samples. Since the material being used for this research is

2-54
already being used for hip replacement implants the biocompatibility tests were
used to evaluate the performance of the laser treated alloys relative to the
untreated alloy. In this research the biocompatibility of the material was
investigated using analytical chemistry (in vitro) techniques [31].
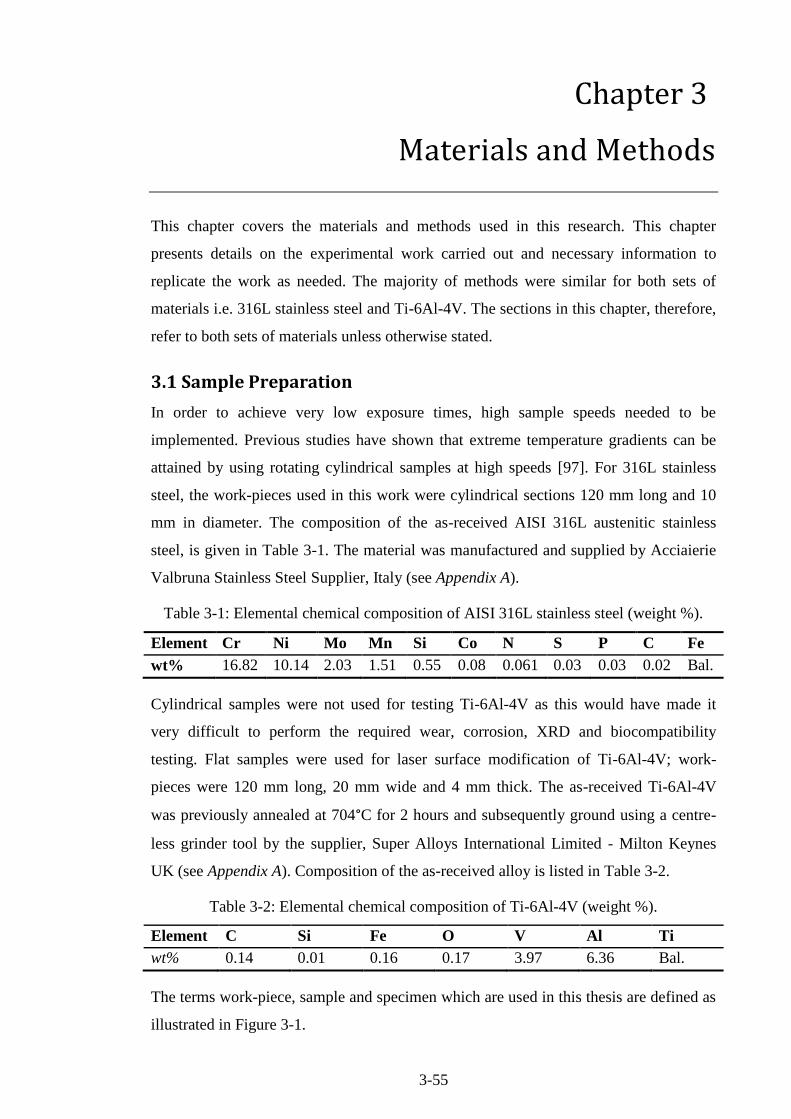
3-55
Chapter 3
Materials and Methods
This chapter covers the materials and methods used in this research. This chapter
presents details on the experimental work carried out and necessary information to
replicate the work as needed. The majority of methods were similar for both sets of
materials i.e. 316L stainless steel and Ti-6Al-4V. The sections in this chapter, therefore,
refer to both sets of materials unless otherwise stated.
3.1 Sample Preparation
In order to achieve very low exposure times, high sample speeds needed to be
implemented. Previous studies have shown that extreme temperature gradients can be
attained by using rotating cylindrical samples at high speeds [97]. For 316L stainless
steel, the work-pieces used in this work were cylindrical sections 120 mm long and 10
mm in diameter. The composition of the as-received AISI 316L austenitic stainless
steel, is given in Table 3-1. The material was manufactured and supplied by Acciaierie
Valbruna Stainless Steel Supplier, Italy (see Appendix A).
Table 3-1: Elemental chemical composition of AISI 316L stainless steel (weight %).
Element Cr Ni Mo Mn Si Co N S P C Fe
wt% 16.82 10.14 2.03 1.51 0.55 0.08 0.061 0.03 0.03 0.02 Bal.
Cylindrical samples were not used for testing Ti-6Al-4V as this would have made it
very difficult to perform the required wear, corrosion, XRD and biocompatibility
testing. Flat samples were used for laser surface modification of Ti-6Al-4V; work-
pieces were 120 mm long, 20 mm wide and 4 mm thick. The as-received Ti-6Al-4V
was previously annealed at 704°C for 2 hours and subsequently ground using a centre-
less grinder tool by the supplier, Super Alloys International Limited - Milton Keynes
UK (see Appendix A). Composition of the as-received alloy is listed in Table 3-2.
Table 3-2: Elemental chemical composition of Ti-6Al-4V (weight %).
Element C Si Fe O V Al Ti
wt% 0.14 0.01 0.16 0.17 3.97 6.36 Bal.
The terms work-piece, sample and specimen which are used in this thesis are defined as
illustrated in Figure 3-1.

3-56
Figure 3-1: Illustration of the Ti-6Al-4V work-piece,
specimen and sample, as used in this thesis.
3.1.1 Surface Pre-treatments
316L stainless steel work-pieces were machined and in some cases etched prior to laser
treatment, to improve the CO2 laser wavelength absorption. Chemical etching was
carried out by immersing the work-pieces in glyceregia for 10 minutes before laser
treatment. Glyceregia is a chemical etchant made up of 10 ml HNO3, 20-50 ml HCl and
30 ml glycerol. Etchant preparation and application was carried out under fume hood
ventilation. Glyceregia reacts with 316L stainless steel, darkening the metal for better
10.6 μm wavelength absorption. Roughening is another well-known technique for
improving laser wavelength absorption as explained in section 2.9.1. Roughening of
316L SS samples was achieved by machining the surface using a Computer Numerical
Controlled (CNC) turning machine to produce 2.90 ± 0.2 μm average surface
roughness. Ti-6Al-4V samples were grit blasted before treatment. Parameters of grit
blasting procedure are outlined in Table 3-3.
Table 3-3: Grit blasting parameters used for Ti-6Al-4V samples.
Machinery Distance Pressure Angle Type of Particles Shape Size
Guyson F
1400®
100 mm
8 bar ~45° Soda lime
glass*
Spherical
and smooth
106-212
µm
*Chemically inert Honite® Grade 13 [214]
There are two main reasons for grit blasting the samples:
i. Grit blasting removes surface contaminants from the titanium workpiece.
Imperfections on the surface are eliminated when small inert particles are
launched at high velocities. Eliminating imperfections is also desirable in laser
processing for even surface processing.
20 m
m

3-57
ii. Grit blasting is also known to improve absorption of the CO2 laser by creating a
non-reflective surface [75, 162].
After grit blasting the work-piece still had tightly adhering particles embedded onto the
surfaces. These contaminants were composed of insoluble particles loosely attached and
held in place by ionic or cohesive forces. These particles needed only be displaced
sufficiently to break the attractive forces in order to be removed. All work-pieces were
ultrasonically cleaned for 10 minutes in filtered clean de-ionised water. This ultrasonic
cleaning is less aggressive cleaning, compared to other chemical cleaning methods,
which therefore does not affect the composition of the substrate [215].
3.2 Laser Instrumentation and Experimental Set-up
Laser treatment of the samples was carried out using a, Rofin DC015 slab CO2 laser.
This CO2 laser system was utilised in this study due to its versatility, high unsaturated
gain and mostly high-power output capabilities [161, 216]. The laser has a maximum
power output of 1.5 kW in the far infrared region (10.6 µm wavelength). Both pulsing
mode and continuous wave laser operation were implemented, depending on the DOE.
All experiments were carried out with the laser beam focused on the work-piece surface
providing a Gaussian laser spot size of 90 μm. Minimal laser beam spot size was used
for high cooling rates during processing. Table 3-4 gives a summary of the CO2 laser
system implemented in this investigation.
Table 3-4: CO2 laser system specifications used in this work.
Laser system specifications
Active medium Carbon Dioxide
Output wavelength 10.6 µm
Peak power capacity 1.5 kW
Operation mode Pulsed/Continuous
PRF range 2 – 5000 Hz
Pulse width range 26 µs – 125 ms
Laser beam specification
Spatial mode TEM00
Beam quality factor, K >0.9
Beam propagation parameter, M2 1.11

3-58
Argon was used as an assist gas with three crucial functions in laser surface melting:
i. Shielding the melt pool thus avoiding oxidation during laser processing
ii. Preventing small ablated particles from back-spattering into the nozzle and
possibly damaging the laser optics
iii. Aids the cooling process thus allowing for even higher cooling rates
The laser was controlled from the main Rofin laser control unit provided. The main unit
facilitates control of laser beam peak power, duty cycle, and pulse repetition frequency.
Figure 3-2 shows the CO2 laser system used in this study.
Figure 3-2: Rofin CO2 laser system and gas pumping unit, showing
the processing of a cylindrical sample 10 mm in diameter.
The control console shown in Figure 3-2 was used to position the stage, control the
table motion during processing and gas delivery through the nozzle. The laser came
equipped with a MTI 0505 Scientific Motion System (positioning stage). This motion
system, shown in Figure 3-2, consisted of a machining table that provided XY cutting
area of 50 × 50 cm. The motion resolution provided via the optical rotary encoders was
1.25 µm. The XY positioning speed was controllable from 1 to 5000 mm/min, and the
acceleration at the beginning of the motion could be as high as 2 m/s2. The laser beam
was focused onto the moving samples via a 127 mm (5 inch) focal-length lens which
was part of the nozzle assembly. The nozzle assembly was guided by vertical linear
variable displacement transducers (LVDT) which provided 150 mm of vertical height or
focal position adjustment capability [170].

3-59
3.2.1 Laser Processing of Cylindrical Work-pieces
Cylindrical work-pieces, 10 mm in diameter, were rotated using a DC motor attached to
the positioning stage. The DC motor was capable of reaching speeds up to 2500 rpm.
Figure 3-3 shows a schematic of the laser modification process. The laser beam was
kept perpendicular to the work-piece during laser irradiation to maximise the
absorbance and ensure uniform conditions for processing [99]. Tangential and linear
velocities were varied using the control console depending on the pulse repetition
frequency being used. The tangential and linear velocities also determined the resultant
laser spot overlap. The calculation method used for overlap percentage determination is
detailed in section 2.9.5. Specimens of 10 mm length along the bar were processes with
different processing parameters according to the DOEs for subsequent characterisation
as outlined below.
Figure 3-3: Schematic of the laser processing set-up for a cylindrical sample.
Spot diameter (z) on the sample surface could be controlled through setting the sample
distance from focal plane of the Gaussian beam. Equation (8) was used to calculate the
focus distance, see section 2.9.3 for more details.
[ (
)
]
⁄
(8)
where the beam radius along the propagation line, w(z) was 45 µm, initial beam radius
at the focus, wo was 45 µm, and the wavelength of the CO2 laser, λ is 10.6 µm. All
experiments were conducted with the laser beam focused on the surface of the work-
piece.
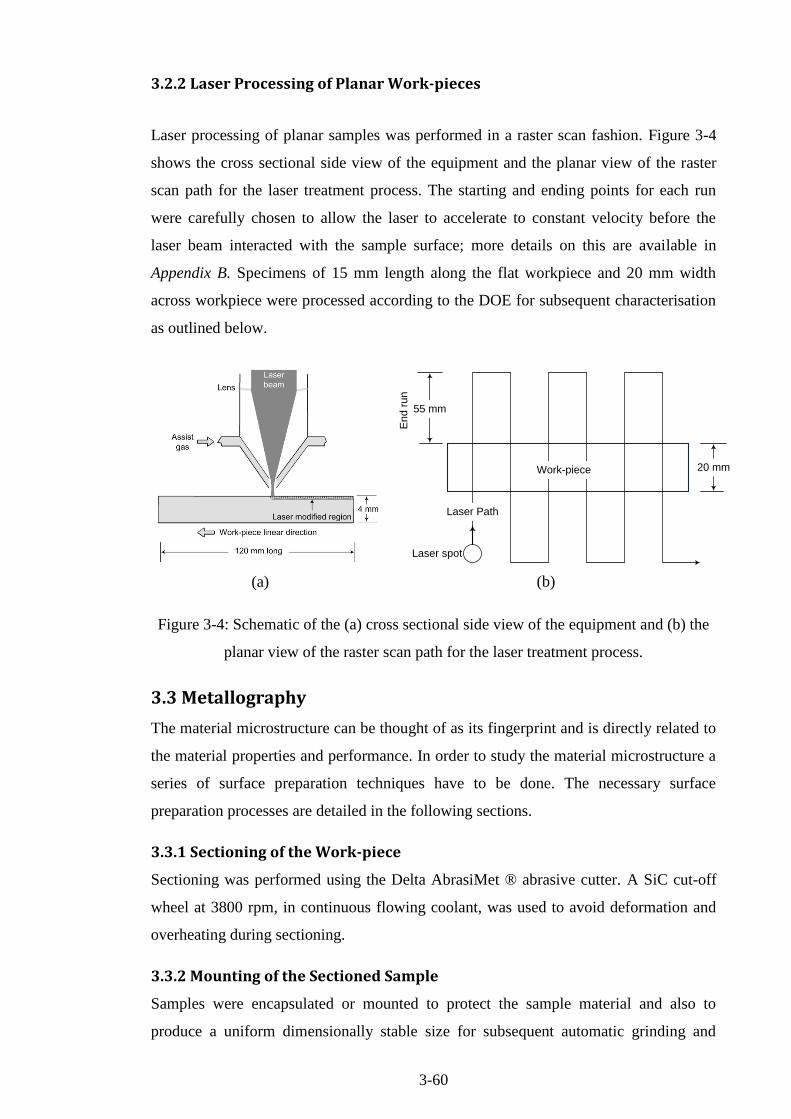
3-60
3.2.2 Laser Processing of Planar Work-pieces
Laser processing of planar samples was performed in a raster scan fashion. Figure 3-4
shows the cross sectional side view of the equipment and the planar view of the raster
scan path for the laser treatment process. The starting and ending points for each run
were carefully chosen to allow the laser to accelerate to constant velocity before the
laser beam interacted with the sample surface; more details on this are available in
Appendix B. Specimens of 15 mm length along the flat workpiece and 20 mm width
across workpiece were processed according to the DOE for subsequent characterisation
as outlined below.
Figure 3-4: Schematic of the (a) cross sectional side view of the equipment and (b) the
planar view of the raster scan path for the laser treatment process.
3.3 Metallography
The material microstructure can be thought of as its fingerprint and is directly related to
the material properties and performance. In order to study the material microstructure a
series of surface preparation techniques have to be done. The necessary surface
preparation processes are detailed in the following sections.
3.3.1 Sectioning of the Work-piece
Sectioning was performed using the Delta AbrasiMet ® abrasive cutter. A SiC cut-off
wheel at 3800 rpm, in continuous flowing coolant, was used to avoid deformation and
overheating during sectioning.
3.3.2 Mounting of the Sectioned Sample
Samples were encapsulated or mounted to protect the sample material and also to
produce a uniform dimensionally stable size for subsequent automatic grinding and
20 mm
55 mmE
nd
ru
n
Laser spot
Work-piece
Laser Path
(a) (b)
3-61
polishing operations. Compression hot mounting was implemented in this study.
Bakelite™ thermoset phenolic mounting material was used in a SimpliMet® 2000
mounting press. Thermosetting phenolic mounting material was chosen because once
set it remains rigid even when subjected to heat. Curing was carried out at 180 °C for 8
minutes. The encapsulated samples were then cooled for 4 minutes.
3.3.3 Grinding and Polishing of the Mounted Sample
During the metallographic preparation of the treated region, damage can be induced to
the sample. Sectioning of the specimen can cause localized cracking. As a result, the
plane of evaluation must be at a point beyond this induced damage. This initial step,
designed to quickly remove material, is referred to as planar grinding. The samples were
ground on successive grades of silicon carbide paper using water to keep the specimen
cool and flush away loose particles of metal and abrasive. Final polishing was carried
out using a microcloth and alumina or diamond suspension. Both grinding and polishing
were done using Buehler Motopol® 2000 automatic grinder/polisher machine. Table
3-5 highlights the grinding and polishing parameter used for both 316L SS and Ti-6Al-
4V.
3.3.4 Etching
In order to reveal information such as grain boundaries and phases of the material, the
samples where chemically etched. Grinding and polishing produces a highly deformed,
thin layer on the surface which is removed chemically during etching. Etchants attack
the surface with preference for those sites with the highest energy, leading to surface
relief which allows different crystal orientations, grain boundaries, precipitates, phases
and defects to be distinguished in reflective light. 316L stainless steel was etched by
exposing the surface to be characterised in glyceregia for approximately 1 minute [217].
The higher HCl content in glyceregia reduces pitting tendency, attacks σ phase and
outlines carbides. Glyceregia was always used while fresh and discarded when it turned
orange in colour. Micro-etching of Ti-6Al-4V was carried out by immersion in Kroll’s
reagent for one and a half minutes. Composition of the etchant being: 92 ml distilled
water H2O, 6 ml nitric acid HNO3, and 2ml hydrofluoric acid HF [218].
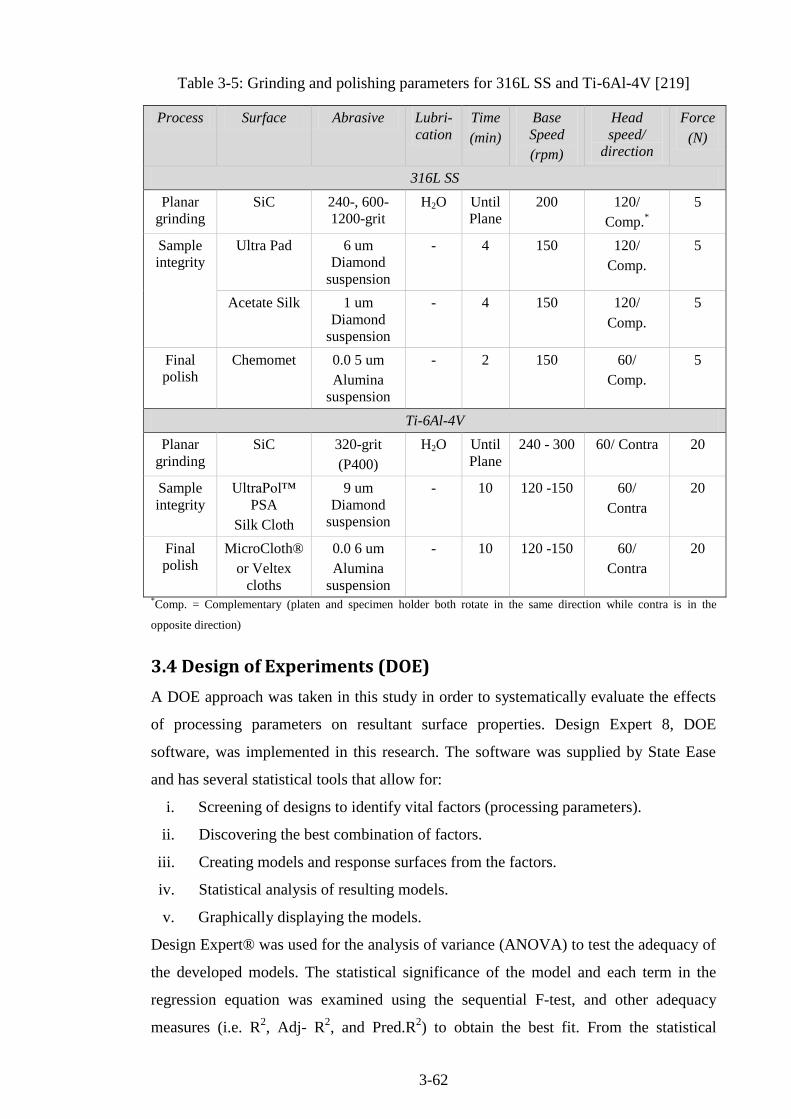
3-62
Table 3-5: Grinding and polishing parameters for 316L SS and Ti-6Al-4V [219]
Process Surface Abrasive Lubri-
cation
Time
(min)
Base
Speed
(rpm)
Head
speed/
direction
Force
(N)
316L SS
Planar
grinding
SiC
240-, 600-
1200-grit
H2O Until
Plane
200 120/
Comp.*
5
Sample
integrity
Ultra Pad 6 um
Diamond
suspension
- 4 150 120/
Comp.
5
Acetate Silk 1 um
Diamond
suspension
- 4 150 120/
Comp.
5
Final
polish
Chemomet 0.0 5 um
Alumina
suspension
- 2 150 60/
Comp.
5
Ti-6Al-4V
Planar
grinding
SiC
320-grit
(P400)
H2O Until
Plane
240 - 300 60/ Contra 20
Sample
integrity
UltraPol™
PSA
Silk Cloth
9 um
Diamond
suspension
- 10 120 -150 60/
Contra
20
Final
polish
MicroCloth®
or Veltex
cloths
0.0 6 um
Alumina
suspension
- 10 120 -150 60/
Contra
20
*Comp. = Complementary (platen and specimen holder both rotate in the same direction while contra is in the
opposite direction)
3.4 Design of Experiments (DOE)
A DOE approach was taken in this study in order to systematically evaluate the effects
of processing parameters on resultant surface properties. Design Expert 8, DOE
software, was implemented in this research. The software was supplied by State Ease
and has several statistical tools that allow for:
i. Screening of designs to identify vital factors (processing parameters).
ii. Discovering the best combination of factors.
iii. Creating models and response surfaces from the factors.
iv. Statistical analysis of resulting models.
v. Graphically displaying the models.
Design Expert® was used for the analysis of variance (ANOVA) to test the adequacy of
the developed models. The statistical significance of the model and each term in the
regression equation was examined using the sequential F-test, and other adequacy
measures (i.e. R2, Adj- R
2, and Pred.R
2) to obtain the best fit. From the statistical
3-63
models created by Design Expert, the F-values are indications of a factor’s influence,
higher F-values signify that the factor is of greater influence. Low p-values less than
0.05 indicate that the model is significant. A p-value of 0.05 indicates 95% confidence
of the model. The R-squared value is a measure of the amount of variation around the
mean explained by the model. The closer it is to 1 the less variance there is around the
mean. The adjusted R-squared value is a measure of the amount of variation around the
mean adjusted for the number of terms in the model. The adjusted R-squared value
should be in reasonable agreement with the predicted R-squared value. The Adeq
Precision value measures the signal to noise ratio. A higher ratio is desirable, and for the
terms used in this study, a ratio greater than 4 is desirable.
3.4.1 316L Stainless Steel
Three DOEs were implemented for 316L stainless steel, however, only the last two are
presented in the results section. The preliminary (screening) DOE is presented in the
Appendix C. This initial DOE was a full three level factorial design (33). This model
was chosen as it gave a more comprehensive analysis of all parameter interactions. The
results from this pilot run were used to determine the parameters that had the most
influence on the surface properties.
Design of Experiments 1
After the initial DOE, the two main parameters that had a pronounced effect on the
surface properties were found to be residence time and irradiance. From the pilot DOE
it was decided to further investigate the parameters using a 52 DOE. This DOE was
named DOE 1. Two factors irradiance and residence time were varied for five levels
from 78.6 to 235.8 kW/mm2 and 49.6 to 165.3 μs respectively. These parameters
correspond to energy densities from 3.93 to 39.3 J/mm2. Table 3-6 summarises the
parameters used. The following parameters were kept at these specified constant levels
throughout the laser treatment:
i. Cylindrical sample diameter, 10 mm
ii. Laser beam spot size, 90 μm
iii. Assist gas, Argon at 200 kPa
iv. Overlap, 0%
v. Surface tangential speed, 272 mm/s
vi. PRF, 3000 Hz
vii. Table speed, 46.8 mm/min

3-64
Table 3-6: DOE 1 processing parameters for 316L stainless steel.
ID Peak
Power
Duty
Cycle
Average
Power Irradiance
Residence
Time
Energy
Density
Est
Temp.
(W) % (kW) (kW/mm2) (μs) (J/mm
2) (°C)
1 500
15
75 78.6
49.6
3.93 483
2 800 120 125.8 6.29 773
3 1000 150 157.2 7.86 967
4 1300 195 204.4 10.22 1260
5 1500 225 235.8 11.79 1450
6 500
20
100 78.6
66.1
5.24 644
7 800 160 125.8 8.38 1031
8 1000 200 157.2 10.48 1289
9 1300 260 204.4 13.62 1676
10 1500 300 235.8 15.72 1933
11 500
25
125 78.6
82.6
6.55 806
12 800 200 125.8 10.48 1289
13 1000 250 157.2 13.10 1611
14 1300 325 204.4 17.03 2094
15 1500 375 235.8 19.65 2417
16 500
30
150 78.6
99.2
7.86 967
17 800 240 125.8 12.58 1547
18 1000 300 157.2 15.72 1933
19 1300 390 204.4 20.43 2513
20 1500 450 235.8 23.58 2900
21 500
50
250 78.6
165.3
13.10 1611
22 800 400 125.8 20.96 2578
23 1000 500 157.2 26.20 3222
24 1300 650 204.4 34.06 4189
25 1500 750 235.8 39.30 4833
The laser beam spotsize was kept constant at the lowest permissible diameter of 90 μm
as lower spotsize would result in higher cooling rates. The cylindrical sample diameter
and overlap were kept constant at optimised levels from previous studies that showed
smoother surface properties at these levels [102]. The surface tangential speed, PRF and
assist gas pressures were derived from the preliminary DOE. Surface temperatures were
predicted using Equation 12 [97, 220].
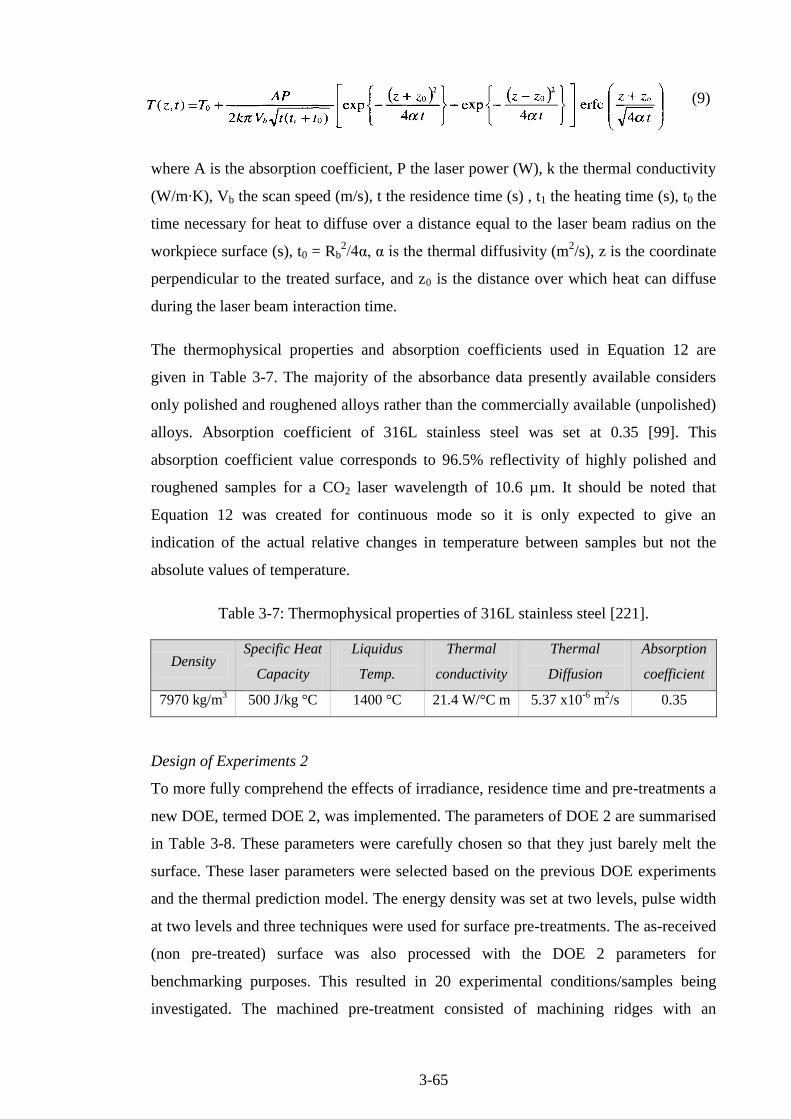
3-65
(9)
where A is the absorption coefficient, P the laser power (W), k the thermal conductivity
(W/m∙K), Vb the scan speed (m/s), t the residence time (s) , t1 the heating time (s), t0 the
time necessary for heat to diffuse over a distance equal to the laser beam radius on the
workpiece surface (s), t0 = Rb2/4α, α is the thermal diffusivity (m
2/s), z is the coordinate
perpendicular to the treated surface, and z0 is the distance over which heat can diffuse
during the laser beam interaction time.
The thermophysical properties and absorption coefficients used in Equation 12 are
given in Table 3-7. The majority of the absorbance data presently available considers
only polished and roughened alloys rather than the commercially available (unpolished)
alloys. Absorption coefficient of 316L stainless steel was set at 0.35 [99]. This
absorption coefficient value corresponds to 96.5% reflectivity of highly polished and
roughened samples for a CO2 laser wavelength of 10.6 µm. It should be noted that
Equation 12 was created for continuous mode so it is only expected to give an
indication of the actual relative changes in temperature between samples but not the
absolute values of temperature.
Table 3-7: Thermophysical properties of 316L stainless steel [221].
Density Specific Heat
Capacity
Liquidus
Temp.
Thermal
conductivity
Thermal
Diffusion
Absorption
coefficient
7970 kg/m3 500 J/kg °C 1400 °C 21.4 W/°C m 5.37 x10
-6 m
2/s 0.35
Design of Experiments 2
To more fully comprehend the effects of irradiance, residence time and pre-treatments a
new DOE, termed DOE 2, was implemented. The parameters of DOE 2 are summarised
in Table 3-8. These parameters were carefully chosen so that they just barely melt the
surface. These laser parameters were selected based on the previous DOE experiments
and the thermal prediction model. The energy density was set at two levels, pulse width
at two levels and three techniques were used for surface pre-treatments. The as-received
(non pre-treated) surface was also processed with the DOE 2 parameters for
benchmarking purposes. This resulted in 20 experimental conditions/samples being
investigated. The machined pre-treatment consisted of machining ridges with an

3-66
average roughness of approximately 3 µm. As the overlap was set to 0 % for DOE 2, the
residence time was equivalent to the pulse width.
Table 3-8: Laser processing parameters implemented in the fractional DOE.
Run* Peak Power
(W)
Duty Cycle
(%)
Irradiance
(kW/mm2)
Residence Time
(µs)
Energy density
(J/mm2)
1 1000 20 157 67 10.48
2 800 25 126 83 10.48
3 400 50 63 167 10.48
4 700 30 110 100 11.00
5 1400 15 220 50 11.00
*Each run was repeated using three surface pre-treatments etched; machined; machined+etched
3.4.2 Ti-6Al-4V
Design of Experiments 1: Planar samples
Experiments with Ti-6Al-4V were conducted with flat samples as opposed to the
cylindrical samples used for the 316L processing. A 32 design of experiment was
implemented. The two factors chosen were irradiance and residence, each time varied at
three levels. The laser was used in continuous mode to irradiate the workpiece at three
levels of irradiance: 15.72, 20.43 and 26.72 kW/mm2 and three levels of residence time:
1.08, 1.44 and 2.16 ms, see Table 3-9.
Table 3-9: DOE 1 processing parameters for Ti-6Al-4V
ID Average
Power
Sample
Speed Irradiance
Residence
Time
Energy
Density
(W) (mm/s) (kW/mm2) (ms) (J/mm
2)
LSM 1 100
41.2
15.72
2.16
34
LSM 2 130 20.44 44
LSM 3 170 26.72 58
LSM 4 100
62.5
15.72
1.44
23
LSM 5 130 20.44 29
LSM 6 170 26.72 38
LSM 7 100
83.3
15.72
1.08
17
LSM 8 130 20.44 22
LSM 9 170 26.72 29
The laser beam was focused on the work-piece surface providing a Gaussian laser spot
size of 90 μm. Since a continuous beam was used, pulse frequency and pulse width
were not taken into account for residence time calculation, see section 2.9.4 for more

3-67
details. Low workpiece velocity compared to 316L samples subsequently resulted in
much lower residence times. Due to the continuous nature of the beam the power is
expressed as average power as opposed to peak power for Ti-6Al-4V. Irradiation was
carried out using a raster scan with a partial overlap of 30% in order to provide for
microstructural and compositional homogeneity. Argon at a pressure of 200 kPa was
used as an assist gas to avoid oxidation. The laser beam was kept perpendicular to the
workpiece during laser irradiation to maximise absorbance and ensure uniform
conditions for processing.
3.5 Microstructural Analysis
The influence of the process parameters on the microstructure of the modified surface
topology and cross section were studied using optical and scanning electron microscopy
(SEM). Microstructure analysis was used to enable characterisation of the following:
i. Pits and cracks
ii. Grain structure and sizes
iii. Gas-, shrinkage-, and interfacial-voids
iv. Inclusions
A Reichart Me F2 Universal optical microscope was used for bright field examination
of polished metallographic specimens. The microscope was equipped with Buehler
Omnimet Enterprise, a software driven tool that allows for the quantitative analysis of
the sample image. A Carl-Zeiss EVO-LS15 scanning electron microscope, shown in
Figure 3-5, integrated with SmartSEM software was used for both morphological and
microstructure analysis.
Figure 3-5: Carl-Zeiss EVO-LS15 SEM and its components (a) exterior and (b) interior.
Micrographs obtained from secondary electrons were primarily used for morphological
analysis, while the backscatter detector images from the SEM were used to reveal
microstructure features. The dependence of the backscatter yield with atomic number
formed a basis for differentiating between different phases, thus providing an ideal
starting point for further microanalysis. All images were captured at a high accelerating
(a) (b)
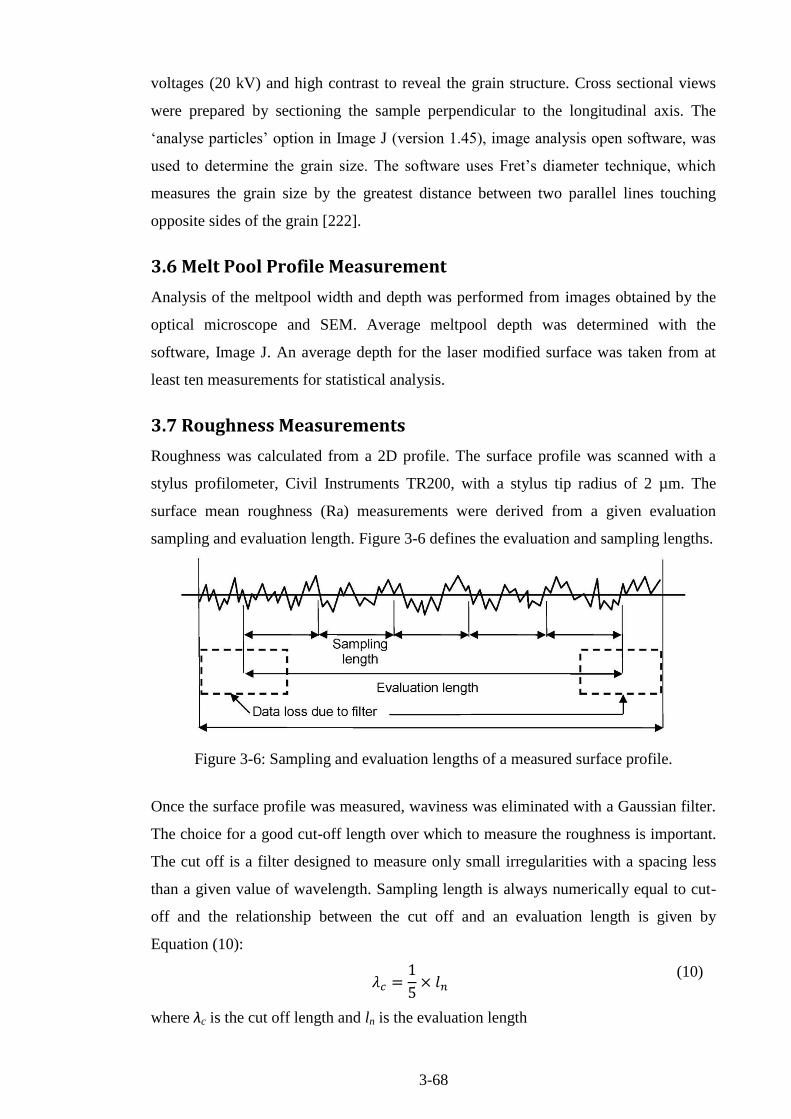
3-68
voltages (20 kV) and high contrast to reveal the grain structure. Cross sectional views
were prepared by sectioning the sample perpendicular to the longitudinal axis. The
‘analyse particles’ option in Image J (version 1.45), image analysis open software, was
used to determine the grain size. The software uses Fret’s diameter technique, which
measures the grain size by the greatest distance between two parallel lines touching
opposite sides of the grain [222].
3.6 Melt Pool Profile Measurement
Analysis of the meltpool width and depth was performed from images obtained by the
optical microscope and SEM. Average meltpool depth was determined with the
software, Image J. An average depth for the laser modified surface was taken from at
least ten measurements for statistical analysis.
3.7 Roughness Measurements
Roughness was calculated from a 2D profile. The surface profile was scanned with a
stylus profilometer, Civil Instruments TR200, with a stylus tip radius of 2 µm. The
surface mean roughness (Ra) measurements were derived from a given evaluation
sampling and evaluation length. Figure 3-6 defines the evaluation and sampling lengths.
Figure 3-6: Sampling and evaluation lengths of a measured surface profile.
Once the surface profile was measured, waviness was eliminated with a Gaussian filter.
The choice for a good cut-off length over which to measure the roughness is important.
The cut off is a filter designed to measure only small irregularities with a spacing less
than a given value of wavelength. Sampling length is always numerically equal to cut-
off and the relationship between the cut off and an evaluation length is given by
Equation (10):
(10)
where λc is the cut off length and ln is the evaluation length

3-69
Sampling and evaluation lengths used were 0.8 mm and 4 mm respectively. The
roughness was measured according to ISO 4287/4288. A table of the recommended cut-
off lengths is shown in Appendix D.
3.8 Micro-hardness Measurements
A Leitz mini-load tester was used to perform the microhardness measurements of all
samples. Vickers microhardness tests were carried out using a set load of 500 mN and
an indentation time of 30 s. The measurements were taken from the cross-sectional
surface that had been polished to a finish of 0.05 μm. Vickers microhardness was
calculated by measuring the diagonal length (d1) of square indentations. Five
measurements were taken from the middle of the modified layer, unless otherwise
stated. Measurements were taken according to the ISO 14577 standard. The indents
were kept at least three diameters (indentation diameter) away from a free surface or
interface and at least five diameters, of the largest indent, from each other to avoid
interference [223].
3.9 XRD Analysis
X-ray diffraction patterns of the samples were recorded using a Bruker D8 XRD system
with Cu Kα (λ = 1.5405 Å) radiation. The test set-up is schematically shown in Figure
3-7. Samples were cleaned with acetone and rinsed with deionised water prior to
analysis.
Figure 3-7: Schematic and image of XRD set-up [47].

3-70
A fixed detector slit size of 0.2 mm wide and 12 mm long was used for all samples. A z
scan was used to position samples at correct heights on the z drive prior to XRD
measurement. Locked coupled scans were performed at a rate of 5 sec/step, with 0.01
step increments, varying the diffraction angle between 20 and 120°. Each scan took 13
hours and 47 minutes to complete. The diffraction patterns produced were plotted with
intensity against 2 theta angles, and used for phase transformation and crystallinity
analysis. Ti-6Al-4V is not included in the Joint Committee on Powder Diffraction
Standards (JCPDS) database. Therefore, miller indices and phase determination were
derived from the hexagonal α-Ti pattern (JCPDS file #44-1294) and the cubic β-Ti
pattern (JCPDS file #44-1288). Strain and residual stress calculation induced by laser
treatment can be calculated by using the variation in interplanar spacing, derived from
shifting of the diffraction peaks, [224].
3.10 Chemical Composition Analysis
Element analysis and chemical characterisation were performed with an energy
dispersive x-ray spectrometer (EDS). The Inca X-Act and Microanalysis suit, Oxford
Instruments, integrated in the SEM was used, see Figure 3-5. The instrument is capable
of analysing composition of sample areas down to 2 µm to be analysed on conductive
samples with a relative accuracy of +/- 2%. The volume analysed, in which the primary
electrons interact with the sample is generally characterized as pear/onion shaped region
as seen in Figure 3-8 (a).
The geometry and volume of this shape is dependent on the average sample atomic
number and electron beam accelerating voltage. The accelerating voltage used in the
electron column influences both the spatial resolution of the x-ray signal and the
efficiency with which characteristic x-rays are excited from the sample atoms. Higher
voltages produce higher energy electrons, which penetrate more deeply into the sample
and spread more widely than low-energy electrons. The result is degradation in
resolution on the one hand, but more efficient excitation on the other. The relationship
between the accelerating voltage, density and spatial resolution is given in Figure 3-8
(b). The red dashed line in Figure 3-8 (b) indicates the conditions use for analysis of the
Ti-6Al-4V samples in this work.

3-71
Figure 3-8: (a) Schematic depiction of the variation of interaction volume shape with
average sample atomic number (Z) and electron beam accelerating voltage (E0); and (b)
chart for calculating x-ray spatial resolution from the accelerating voltage [225].
3.11 Wear Testing
Tribological evaluation of the modified surface was obtained using a pin on disk
tribometer (ball on disc configuration); according to ASTM wear testing standard G-99.
The apparatus used a pin pressing against the disk (sample) at a specified load. Amount
of wear was determined by measuring appropriate linear dimensions of the wear track
of the specimen after the test. The wear track shape was characterised using the SEM
and dimension measured using the white light interferometry, Veeco’s Wyko NT110
optical profiling system. The continuous recording of wear data was obtained using a
LVDT to characterise the formation of the track. The continuous wear depth data alone
cannot be used to fully characterise the wear properties due to the complicated effects of
wear debris and transfer film present in the contact gap and the low, but significant,
vibrations of the mechanism. A schematic of the pin-on-disk wear tester is shown in
Figure 3-9. The Ti-6Al-4V samples were polished to within 0.2 µm average roughness
to avoid excessive damage of the wear of the testing pin. Wear tests were carried out by
sliding a 5 mm commercial zirconia pin against the polished samples at a constant speed
of 18.9 mm/s with an applied load of 5 N.
(a) (b)
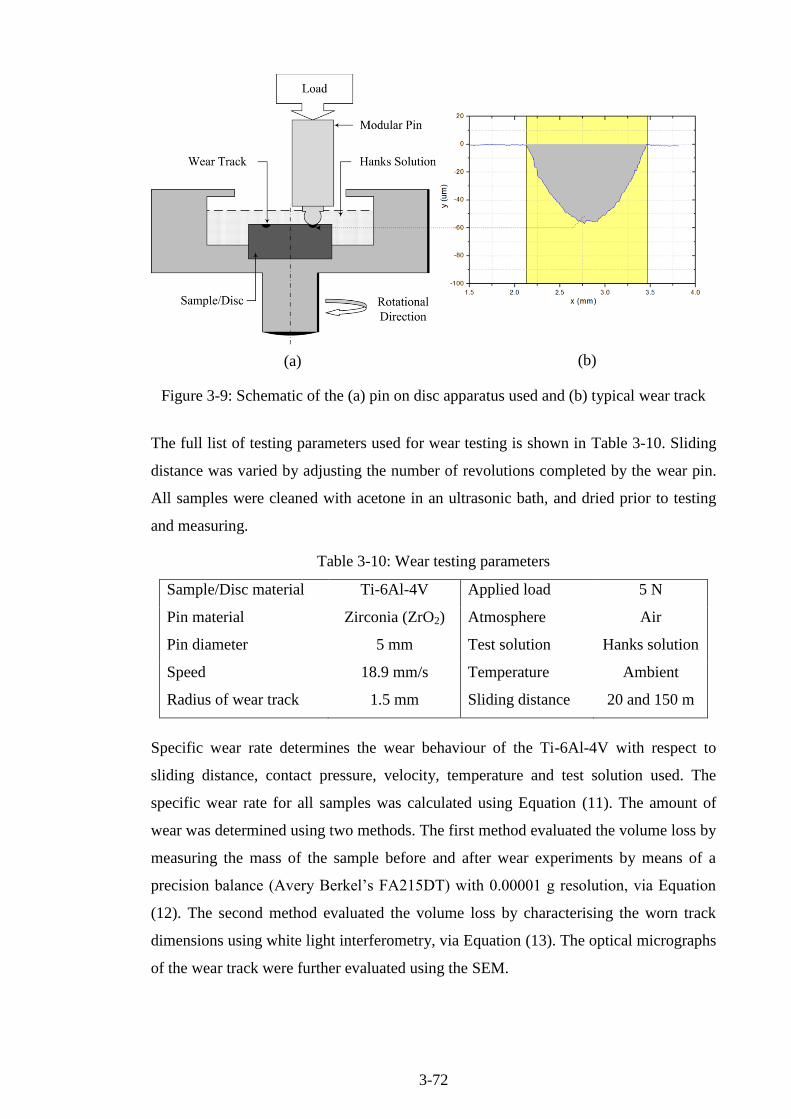
3-72
Figure 3-9: Schematic of the (a) pin on disc apparatus used and (b) typical wear track
The full list of testing parameters used for wear testing is shown in Table 3-10. Sliding
distance was varied by adjusting the number of revolutions completed by the wear pin.
All samples were cleaned with acetone in an ultrasonic bath, and dried prior to testing
and measuring.
Table 3-10: Wear testing parameters
Sample/Disc material Ti-6Al-4V Applied load 5 N
Pin material Zirconia (ZrO2) Atmosphere Air
Pin diameter 5 mm Test solution Hanks solution
Speed 18.9 mm/s Temperature Ambient
Radius of wear track 1.5 mm Sliding distance 20 and 150 m
Specific wear rate determines the wear behaviour of the Ti-6Al-4V with respect to
sliding distance, contact pressure, velocity, temperature and test solution used. The
specific wear rate for all samples was calculated using Equation (11). The amount of
wear was determined using two methods. The first method evaluated the volume loss by
measuring the mass of the sample before and after wear experiments by means of a
precision balance (Avery Berkel’s FA215DT) with 0.00001 g resolution, via Equation
(12). The second method evaluated the volume loss by characterising the worn track
dimensions using white light interferometry, via Equation (13). The optical micrographs
of the wear track were further evaluated using the SEM.
(a) (b)
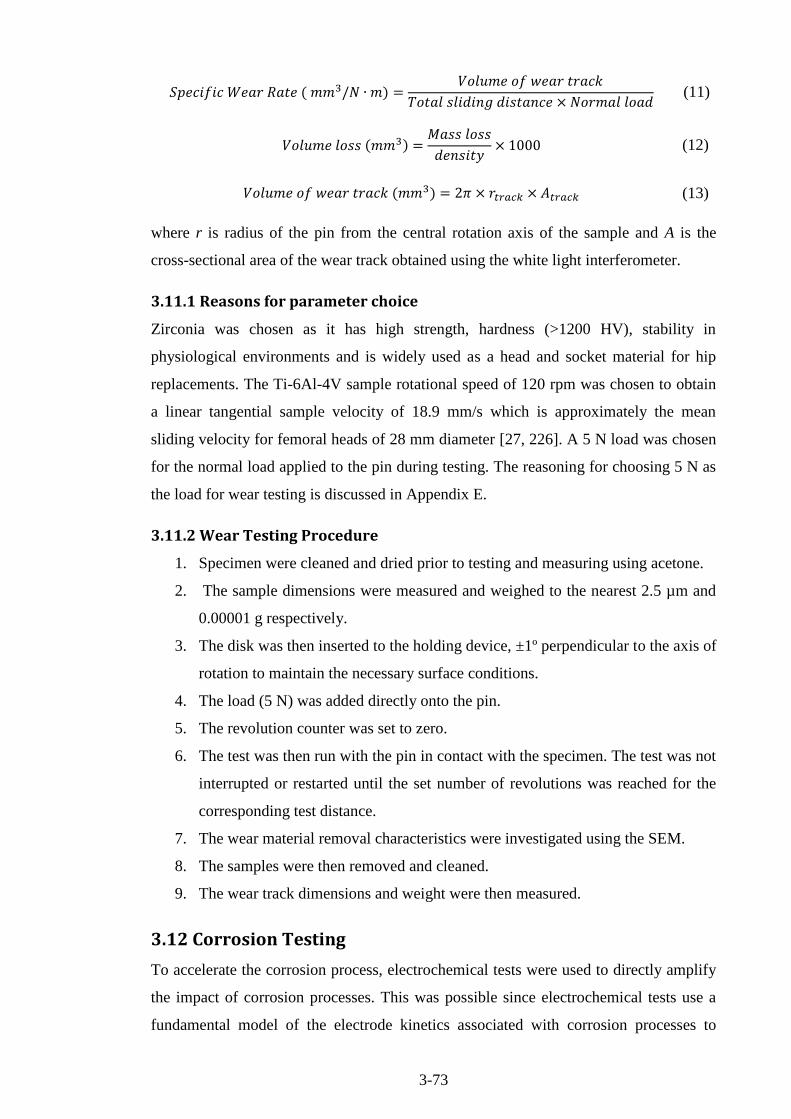
3-73
(11)
(12)
(13)
where r is radius of the pin from the central rotation axis of the sample and A is the
cross-sectional area of the wear track obtained using the white light interferometer.
3.11.1 Reasons for parameter choice
Zirconia was chosen as it has high strength, hardness (>1200 HV), stability in
physiological environments and is widely used as a head and socket material for hip
replacements. The Ti-6Al-4V sample rotational speed of 120 rpm was chosen to obtain
a linear tangential sample velocity of 18.9 mm/s which is approximately the mean
sliding velocity for femoral heads of 28 mm diameter [27, 226]. A 5 N load was chosen
for the normal load applied to the pin during testing. The reasoning for choosing 5 N as
the load for wear testing is discussed in Appendix E.
3.11.2 Wear Testing Procedure
1. Specimen were cleaned and dried prior to testing and measuring using acetone.
2. The sample dimensions were measured and weighed to the nearest 2.5 µm and
0.00001 g respectively.
3. The disk was then inserted to the holding device, ±1º perpendicular to the axis of
rotation to maintain the necessary surface conditions.
4. The load (5 N) was added directly onto the pin.
5. The revolution counter was set to zero.
6. The test was then run with the pin in contact with the specimen. The test was not
interrupted or restarted until the set number of revolutions was reached for the
corresponding test distance.
7. The wear material removal characteristics were investigated using the SEM.
8. The samples were then removed and cleaned.
9. The wear track dimensions and weight were then measured.
3.12 Corrosion Testing
To accelerate the corrosion process, electrochemical tests were used to directly amplify
the impact of corrosion processes. This was possible since electrochemical tests use a
fundamental model of the electrode kinetics associated with corrosion processes to

3-74
quantify corrosion rates [227]. Two types of electrochemical testing were employed.
The first method was the corrosion measurement at the free corrosion potential (open
circuit potential) in order to follow the active corrosion. The second was polarisation
which measured susceptibility to localized corrosion for corrosion resistant materials.
Prior to electrochemical testing, specimens were machined into square samples of 10
mm × 10 mm (+/- 1 mm) subsequent to laser treatment. The precise sample dimensions
were measured prior to each test to 0.01 mm resolution and these measurements were
input into the software before each test. The samples were embedded in epoxy resin
exposing 1 cm2 of the sample surface to the electrolyte. All samples were ultrasonically
cleaned in acetone and rinsed using deionised water. A polarisation test cell with the
following inserts was used: test, auxiliary and reference electrodes; luggin capillary; and
thermometer, see schematic in Figure 3-10. Potentiodynamic polarisation was carried
out using an ACM Gillac® potentiostat scanning unit. The potentiostat was capable of
maintaining an electrode potential within 1 mV of a pre-set value. The auxiliary
electrode supplied the current to the working electrode (test specimen) in order to
polarise it. The potential between the specimen and the reference electrode was
monitored in the test.
Figure 3-10: Schematic diagram of polarisation cell used in the experiments [228]
Figure 3-11 shows the experimental set-up used to monitor the electrochemical
corrosion. A saturated calomel electrode and a platinum electrode were utilised as the
reference and auxiliary electrode respectively.
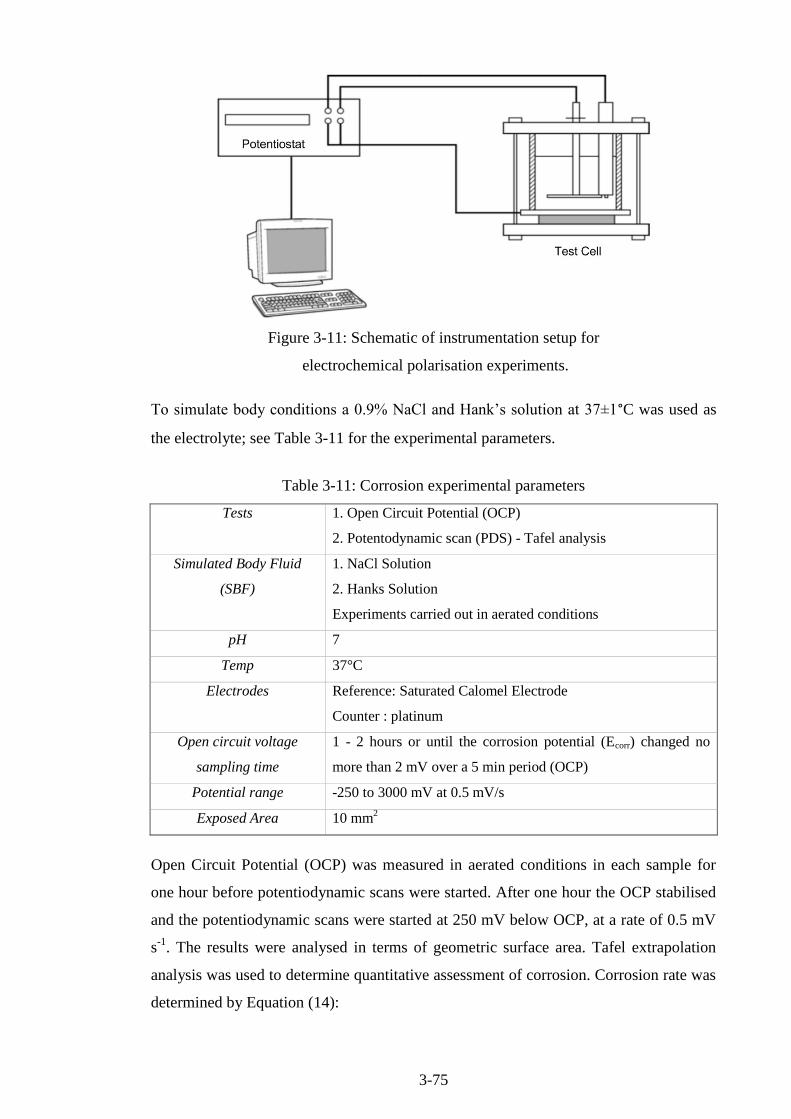
3-75
Figure 3-11: Schematic of instrumentation setup for
electrochemical polarisation experiments.
To simulate body conditions a 0.9% NaCl and Hank’s solution at 37±1°C was used as
the electrolyte; see Table 3-11 for the experimental parameters.
Table 3-11: Corrosion experimental parameters
Tests 1. Open Circuit Potential (OCP)
2. Potentodynamic scan (PDS) - Tafel analysis
Simulated Body Fluid
(SBF)
1. NaCl Solution
2. Hanks Solution
Experiments carried out in aerated conditions
pH 7
Temp 37°C
Electrodes Reference: Saturated Calomel Electrode
Counter : platinum
Open circuit voltage
sampling time
1 - 2 hours or until the corrosion potential (Ecorr) changed no
more than 2 mV over a 5 min period (OCP)
Potential range -250 to 3000 mV at 0.5 mV/s
Exposed Area 10 mm2
Open Circuit Potential (OCP) was measured in aerated conditions in each sample for
one hour before potentiodynamic scans were started. After one hour the OCP stabilised
and the potentiodynamic scans were started at 250 mV below OCP, at a rate of 0.5 mV
s-1
. The results were analysed in terms of geometric surface area. Tafel extrapolation
analysis was used to determine quantitative assessment of corrosion. Corrosion rate was
determined by Equation (14):
3-76
(mm/y) (14)
where icor is the corrosion current density (μA cm-2
), K is a constant of 3.27×10⁻³
mm g
(μA cm yr)-1
, EW is the equivalent weight (11.768 g equiv.-1
), and ρ is the density (4.42
g/cm3).
3.12.1 Corrosion Testing Procedure
Sample Preparation
1. The specimens to be used for corrosion testing were marked with a unique
designation during preparation.
2. Dimensions of the sample were recorded.
3. Samples were cleaned with acetone and dried before mounting.
4. Silver paste was applied to attach an insulted wire to the opposite of the tested
area sample and secured to the sample using tape. A requisite resistivity of less
than 1 Ω was kept for all samples.
5. Samples were cold mounted using epoxy and allowed to set for at least 6 hours.
6. For comparison purposes the control samples were polished. Grinding was
accomplished using 320 grit SiC paper and polishing was conducted using 9 µm
diamond suspension and followed by 0.06 µm alumina solution.
7. The surface structure was analysed under SEM or optical microscopy for
existing defects before corrosion testing.
Apparatus Set-up
8. The prepared NaCl/Hank’s solution was poured into a clean polarisation cell.
9. The temperature of the solution was raised to 37 ºC using a controlled water
bath.
10. Components of the test cell were placed into the cell. The sample was then
mounted on the electrode holder. Degreasing was carried out using acetone and
rinsing using distilled water, just before immersion.
11. The working electrode was transferred to the cell and the salt bridge adjusted so
that the probe tip was about 2 mm away from the surface of the specimen.
Corrosion Testing
12. Before each polarisation scan was initiated, the corrosion sample was allowed to
stabilise in the electrolyte for either 1 hour or until the corrosion potential, Ecorr,
changed by no more than 2 mV over a 5 min period.
13. Cyclic sweep scan was carried out at a sweep rate of 0.5 mV/s -

3-77
Post-test
14. Ultrasonic cleaning was carried out in reagent water to remove loose products.
15. Assessment of corrosion damage: microscopical examination for dealloying,
exfoliation, cracking or intergranular attack by metallographic examination.
16. Data analysis involved OCP variation with time analysis and comparison of
polarisation curves.
3.13 Contact Angle Analysis
The wetting characteristics of the surfaces were evaluated by measuring the contact
angle between the surface and deionised water droplets, based on the standard sessile
drop test. The contact angles, θ, of deionised water on the untreated and laser treated Ti-
6Al-4V was determined in atmospheric conditions using a sessile drop measuring
machine (goniometer). FTÅ 200 angstrom equipment was used for this which comprised
of a monochrome camera and a motor actuated 10 ml syringe, see Figure 3-12. To avoid
contamination, all samples being tested were cleaned with acetone in an ultrasonic bath
for 30 mins, rinsed with deionised water several time and allowed to dry for at least 30
minutes. A wait period of 30 seconds was used before each θ measurement was taken.
Dedicated software was used to calculate the wetting angles. Three measurements taken
at different positions were averaged to get the final contact angle value for each sample.
The mean value for the angle from both sides of each drop was used.
Figure 3-12: FTA 200 angstrom sessile drop measuring machine [229].

3-78
3.14 Biocompatibility Analysis
The biocompatibility work carried out in this research is split into two sections: (i) cell
attachment and proliferation, and (ii) cytotoxicity analysis. The methods taken for each
section are detailed in sections 3.14.1 and 3.14.2 respectively.
3.14.1 Cell Attachment and Proliferation
Cell culture
MC3T3 pre-osteoblastic cells were cultured in T175 flasks (Sarstedt) in standard media
(α-MEM media (BioSera) supplemented with 10% fetal bovine serum (BioSera), 2%
penicillin/streptomycin (Sigma Aldrich), and 1% L-glutamate (Sigma Aldrich)). Cells
were passaged using trypsin-EDTA to detach the cells after several washes with sterile
Phosphate Buffered Saline (PBS). The cells were incubated for 3 minutes then media
added to deactivate trypsin. The solution was then placed in a centrifuge and processed
at 1200 rpm for 5 minutes. The mixture of trypsin and media was then pipetted out and
the resulting pellet re-suspended and split among T175 flasks. Media was then added to
the flasks and the flasks were placed in incubators at 37° C and 5% CO2. Media was
refreshed every 3 days.
Seeding cells
Media was removed from the flasks and the cells rinsed several times with PBS. Cells
were detached from the flasks using trypsin-EDTA solution and then incubated for 3
minutes. Media was added to deactivate the trypsin. The resulting solution was then
placed in the centrifuge at 1200 rpm for 5 minutes to separate the cells and the solution.
The mixture of trypsin and media was then pipetted out and the pellet re-suspended in
10 ml of media. Cells were then counted using a haemocytometer several times and the
average used to calculate the total amount of cells in the solution. The media was again
removed and the pellet then re-suspended to yield a cell suspension containing 2.5 x 10⁵
cells per 20 µl. The titanium samples were warmed in the incubator in 24 well plates
and then seeded with 20 µl of the pre-defined cellular solution on each of the treated
surfaces. The samples were incubated for 15 minutes with 1 ml of media at 37°C and
5% CO2.
Evaluating cell attachment
At 2 hrs, the cells were removed using trypsin-EDTA solution, and digested using
papain solution to expose the DNA. Hoechst dye binds to DNA (hence the exposure of
DNA required) and fluoresces, resulting in higher levels of fluorescence with higher
3-79
amounts of DNA. Cell number was quantified using a Hoechst 33258 DNA assay.
Measurements were made using a fluorescence spectrophotometer (Varioskan Flash,
Thermo Scientific) (excitation: 355 nm; emission: 460 nm) and readings were converted
to cell numbers using a standard curve. Cell attachment was quantified using the results
from the Hoechst 33258 DNA assay.
Evaluating metabolic activity
10% alamarBlue® solution (Invitrogen, UK) was made using α-MEM media (BioSera)
and alamarBlue® dye. AlamarBlue is a compound that is reduced in cells and this
reduction results in a colour change of the solution, thereby indicating the cell metabolic
activity. The samples were then removed from the media and placed in 24 well plates
with 1 ml of 10% alamarBlue® solution in each well. The samples were then incubated
at 37°C and 5% CO2 for 4 hours. They were then transferred back to 24 well plates with
1 ml of media in each well, and the alamarBlue® solution pipetted out in 100 µl
triplicate on 96 well plates and read with a spectrophotometer at 540 and 620 nm
absorbance. This process was repeated at 24 and 96 hours and 7 days to assess cell
metabolism.
Evaluating cell number
At 3 days and 7 days, the cells were removed using trypsin-EDTA solution, and
digested using papain solution to expose the DNA. Cell number was quantified using a
Hoechst 33258 DNA assay. Measurements were made using a fluorescence
spectrophotometer (Varioskan Flash, Thermo Scientific) and readings were converted to
cell numbers using a standard curve. Cell number was quantified, again using the results
from the Hoechst 33258 DNA assay.
Statistical Analysis
One way repeated analysis of variance (ANOVA) followed by Holm-Sidak multiple
comparisons were performed on both sets to compare data. T-tests were also used to
compare the treated and untreated samples. Error is reported as standard deviation and is
represented on figures, and significance noted for cases with probability, p < 0.05.
3.14.2 Cytotoxicity
Cytotoxicity tests were performed in accordance with ISO 10993-5 (2009) guidelines
and included the direct contact, the indirect contact and elution tests with MTT as an
endpoint.
3-80
Cell culture
The in vitro cytotoxicity assessment of the titanium samples was performed on the
mouse embryo fibroblast (NIH/3T3) cell line. All culture and manipulation of cells was
performed within a class 11 laminar flow unit in a dedicated cell culture laboratory. To
ensure an adequate level of sterility, aseptic technique was strictly adhered to in
accordance with ISO 10993 standards. Tissue culture plasticware was utilised at all
times while incubators and laminar flow units were periodically cleaned with 70%
ethanol to reduce the risk of contamination. In accordance with American Type Culture
Collection (ATCC) recommendations for cell type media selection, 200 ml volumes of
media, were aseptically prepared in 75 cm2 culture flasks. Table 3-12 outlines the
preparation of NIH/3T3 complete culture medium. Complete media was stored at 4°C
for no more than 14 days. Media was heated to 37°C prior to use.
Cryovials of NIH/3T3 cells were removed from liquid nitrogen (-196°C) storage and
disinfected with 70% ethanol. Cells were placed in a 37°C water bath to thaw. Cells
were added to 10 ml of pre-warmed medium in sterile 25 ml universals and spun at
1500 rpm for 5 min in a bench top centrifuge (Mistral 1000, MSE Ltd.). Cell pellets
were re-suspended in 1 ml of complete medium. Cell suspensions were subsequently
pipetted into 25 cm2 culture flasks and cultured in a humidified atmosphere of 5% CO2:
95% air at 37°C until subconfluent.
Table 3-12: Composition of NIH/3T3 complete culture medium.
Constituent Volume/200 ml
Dulbecco's Modified Eagles Medium (DMEM) 178
Fetal Calf Serum (FCS) 20
Penicillin-Streptomycin 1
Amphotericin B 1
Upon reaching 80% confluency, anchorage dependant cells were detached from the
growth substratum. Media was aspirated off, under the laminar flow unit, cells were
washed with sterile PBS and 2 ml of 0.25% trypsin-ethylenediamine tetra-acetic acid
(EDTA) was added in order to facilitate cell removal. Cell culture flasks were incubated
at 37º C for 5 mins. The degree of detachment was then assessed under an inverted light
microscope. In order to deactivate the trypsin upon complete cellular detachment, 2 ml
fresh media was added. Cell suspensions were aseptically removed to a sterile universal
and centrifuged at 1500 rpm for 5 mins. The supernatant was discarded and the cell
pellet was re-suspended in 1 ml of complete medium. If required, a cell count was

3-81
performed; otherwise the re-suspended cell pellet was split equally between two cell
culture flasks and incubated at 37°C in a humidified CO2 incubator.
A volume of 0.1 ml of cell suspension was transferred to a sterile eppendorf tube along
with 0.15 ml PBS and 0.25 ml of 0.45% trypan blue. The suspension was inverted
several times to allow for even distribution of cells. 10 µl of cells were loaded onto a
Neubauer haemocytometer (previously washed with 70% ethanol) and covered with a
glass cover-slip. All viable cells were counted in five 1 mm2 squares (see shaded
regions in Figure 3-13), viewed under an inverted light microscope at 200x
magnification.
Figure 3-13: Haemocytometer viewed at 200x magnification [230]
The count was repeated three times for accuracy and the number of cells per ml of
suspension was calculated, Equation (15).
(15)
Cytotoxicity Assessment
Cytotoxic effects on cell growth and viability were determined by the MTT assay. This
assay determines the ability of viable cells to convert the soluble tetrazolium salt (MTT)
into a purple formazan precipitate which can be quantified spectrophotometrically. The
conversion of the tetrazolium ring to the formazan product is maintained by the
mitochondrial enzyme succinate dehydrogenase and the cofactors nicotinamide adenine
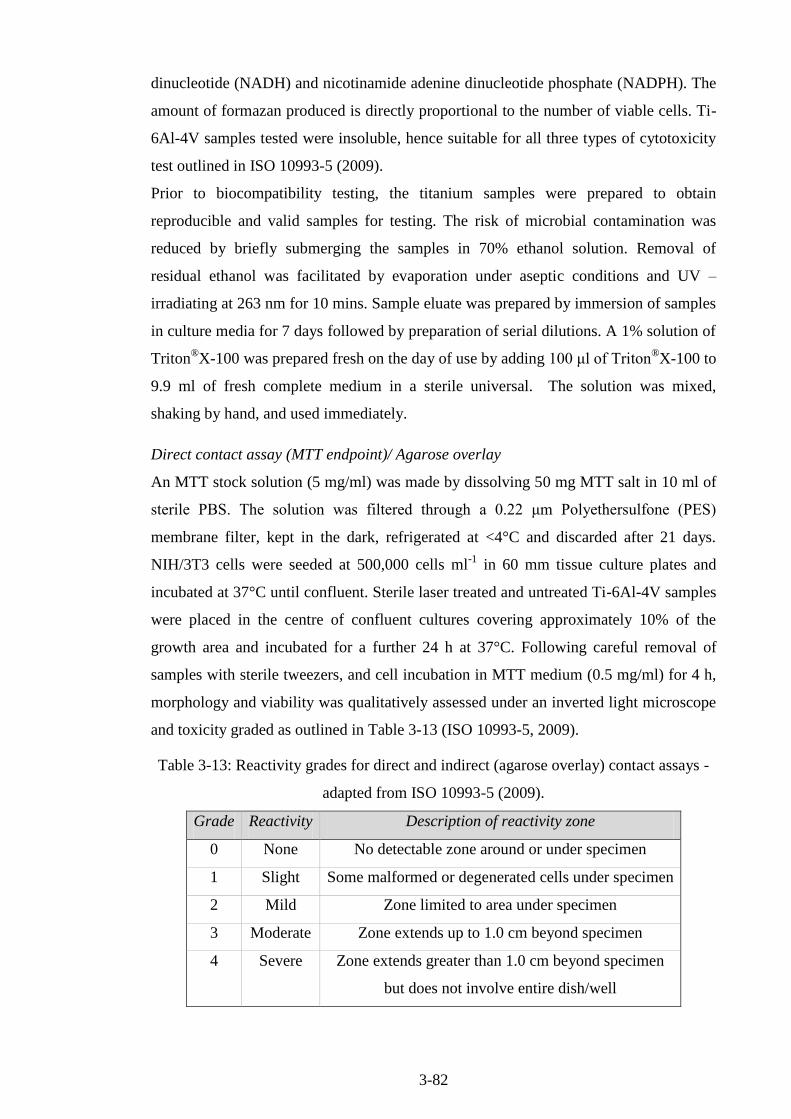
3-82
dinucleotide (NADH) and nicotinamide adenine dinucleotide phosphate (NADPH). The
amount of formazan produced is directly proportional to the number of viable cells. Ti-
6Al-4V samples tested were insoluble, hence suitable for all three types of cytotoxicity
test outlined in ISO 10993-5 (2009).
Prior to biocompatibility testing, the titanium samples were prepared to obtain
reproducible and valid samples for testing. The risk of microbial contamination was
reduced by briefly submerging the samples in 70% ethanol solution. Removal of
residual ethanol was facilitated by evaporation under aseptic conditions and UV –
irradiating at 263 nm for 10 mins. Sample eluate was prepared by immersion of samples
in culture media for 7 days followed by preparation of serial dilutions. A 1% solution of
Triton®X-100 was prepared fresh on the day of use by adding 100 μl of Triton
®X-100 to
9.9 ml of fresh complete medium in a sterile universal. The solution was mixed,
shaking by hand, and used immediately.
Direct contact assay (MTT endpoint)/ Agarose overlay
An MTT stock solution (5 mg/ml) was made by dissolving 50 mg MTT salt in 10 ml of
sterile PBS. The solution was filtered through a 0.22 μm Polyethersulfone (PES)
membrane filter, kept in the dark, refrigerated at <4°C and discarded after 21 days.
NIH/3T3 cells were seeded at 500,000 cells ml-1
in 60 mm tissue culture plates and
incubated at 37°C until confluent. Sterile laser treated and untreated Ti-6Al-4V samples
were placed in the centre of confluent cultures covering approximately 10% of the
growth area and incubated for a further 24 h at 37°C. Following careful removal of
samples with sterile tweezers, and cell incubation in MTT medium (0.5 mg/ml) for 4 h,
morphology and viability was qualitatively assessed under an inverted light microscope
and toxicity graded as outlined in Table 3-13 (ISO 10993-5, 2009).
Table 3-13: Reactivity grades for direct and indirect (agarose overlay) contact assays -
adapted from ISO 10993-5 (2009).
Grade Reactivity Description of reactivity zone
0 None No detectable zone around or under specimen
1 Slight Some malformed or degenerated cells under specimen
2 Mild Zone limited to area under specimen
3 Moderate Zone extends up to 1.0 cm beyond specimen
4 Severe Zone extends greater than 1.0 cm beyond specimen
but does not involve entire dish/well

3-83
For quantitative assessment 4 ml of fresh culture media supplemented with 0.5 mg/ml
MTT, was added to each well and incubated for a further 4 h at 37°C. The MTT media
was carefully aspirated off and 4 ml of Dimethyl Sulfoxide (DMSO) was added to each
well to aid in solubilisation of the crystals. Plates were shaken for 15 s and incubated at
room temperature for 10 min prior to recording optical densities at 540 nm, with cell
viabilities calculated as a percentage of untreated control cells ± the standard error of
the mean (SEM) using Equation (16):
(16)
Elution test (MTT endpoint)
NIH/3T3 cells were seeded at 10,000 cells per 100 μl of media in 96 well microtitre
plates and incubated in a humidified atmosphere of 5% CO2: 95% air at 37°C until the
desired degree of confluency was obtained. Subsequently cultures were exposed to pre-
warmed test media containing 100-0% eluate from Ti-6Al-4V samples or 1% Triton®X-
100 positive control for a further 24 h at 37°C. Following removal of test media cells
were washed with 100 µl of warm sterile PBS. 100 µl fresh culture media supplemented
with 0.5 mg/ml MTT was added to each well and plates were incubated for a further 4 h
at 37°C. The MTT media was carefully aspirated off and 100 μl of DMSO was added to
each well to aid in solubilisation of the crystals. Plates were shaken for 15 s and
incubated at room temperature for 10 min prior to recording optical densities at 540 nm.
Cell viabilities were calculated as a percentage of untreated control cells ± the standard
error of the mean using Equation (15).

4-84
: 316L Stainless Steel Chapter 4
Results & Discussions
4.1 Design of Experiments 1
This DOE was especially designed to study the effects of irradiance and residence time
on 316L stainless steel after reviewing of literature and preliminary results, see
Appendix C.
4.1.1 Morphology and Microstructure Analysis
Figure 4-1 shows SEM images the (a) planar and (b) cross-sectional microstructure
prior to laser surface modification. The as-received surface, Figure 4-1 (a), showed an
uneven topology with significantly large scratches and cracks. The cross sectional
micrographs, Figure 4-1 (b) and (c), clearly show the phases present in 316L stainless
steel. Small pores are visible as dark spots on the BSE micrographs. These are likely to
be caused by the pull out of inclusions in the steel during grinding and polishing.
Figure 4-1: Microstructure of as-received 316L stainless steel (a) morphology
structure, and the cross-sectional microstructure obtained via (b) secondary
electron (SE) detector and (c) back scatter electron (BSE) detector.
To demonstrate the effects of laser processing parameters on the morphology and cross-
sectional microstructure three levels of energy density have been selected, 5.24, 10.48
and 20.96 J/mm2. These three levels are important as they illustrate three different
stages that result from energy density variations. Surface morphology and cross-
sectional microstructure of the laser processed 316L stainless steel are presented in
Figure 4-2 and Figure 4-3 respectively. Figure 4-2 illustrates the surface melting
induced by the laser treatment at increasing energy density from (a) to (c). The surface
(a) (c) (b)

4-85
temperature directly under the surface was estimated, using Equation (9) to be
approximately 1190, 2001 and 3111 K for the samples in Figure 4-2/Figure 4-3 (a), (b)
and (c) respectively.
Figure 4-2: Effects of energy density on surface melting
(a) 5.24 J/mm2, (b) 10.48 J/mm
2 and (c) 20.96 J/mm
2.
Figure 4-3: Back scatter SEM images of transverse cross sectional microstructure
corresponding to processed surface shown in Figure 4-2 (a), (b) and (c).
Sample rotation parameters were set to produce 0% overlapping of the melt pool as
represented in Figure 4-2 (a) and Figure 4-3 (a). At 5.24 J/mm2, Figure 4-2 (a) and
Figure 4-3 (a), laser marking features are visible. The low energy density only produces
localized melting effects. This is more evident in Figure 4-3 (a) which shows less than
20 µm depth of processing in the cross sectional microstructure. No significant grain
structure changes are visible in Figure 4-3 (a).
At 10.48 J/mm2, Figure 4-2 (b) and Figure 4-3 (b) illustrate homogenised melting with
increased depth of processing. Using the spotsize diameter of 90 μm created on the
surface of the material, the work-piece velocity and PRF were adjusted to create an
overlap of 0%. However overlapping of the meltpool was visible at energy densities of
10.48 J/mm2. This overlapping effect is due to the production of melt pools wider than
the original spot size and subsequent flow due to the fast rotation of the specimen. High
(a)
(a)
(c) (b)
(b) (c)
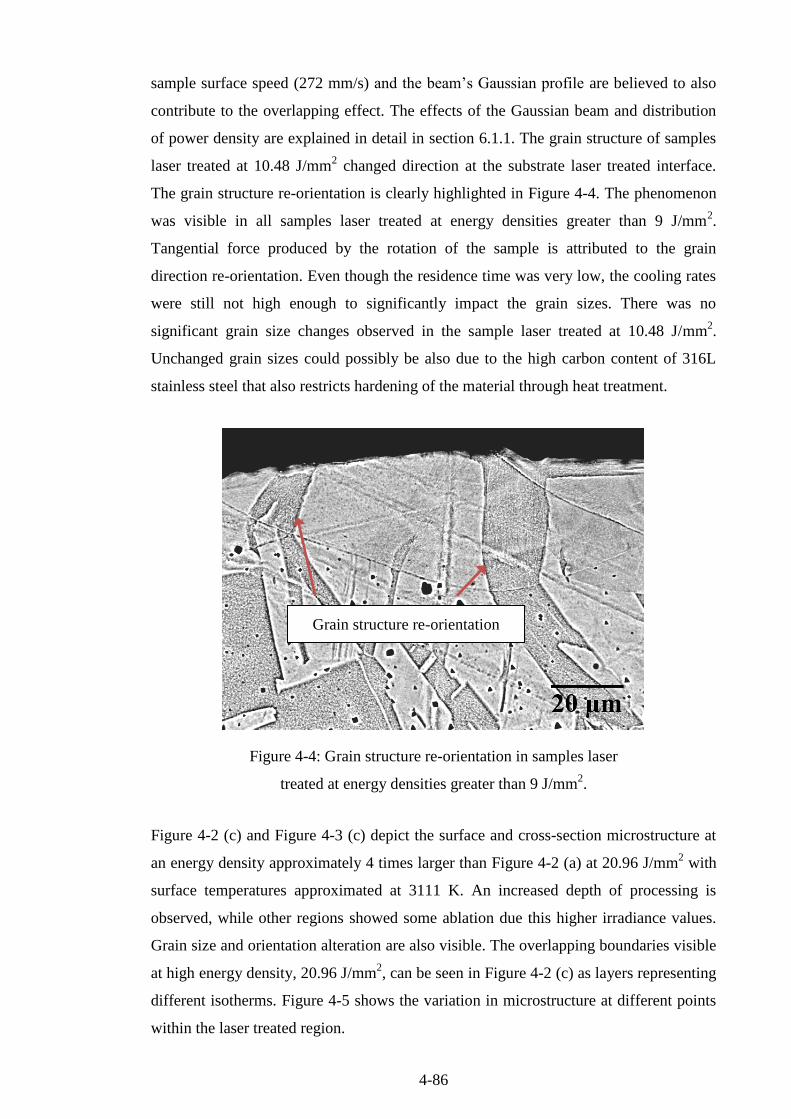
4-86
sample surface speed (272 mm/s) and the beam’s Gaussian profile are believed to also
contribute to the overlapping effect. The effects of the Gaussian beam and distribution
of power density are explained in detail in section 6.1.1. The grain structure of samples
laser treated at 10.48 J/mm2 changed direction at the substrate laser treated interface.
The grain structure re-orientation is clearly highlighted in Figure 4-4. The phenomenon
was visible in all samples laser treated at energy densities greater than 9 J/mm2.
Tangential force produced by the rotation of the sample is attributed to the grain
direction re-orientation. Even though the residence time was very low, the cooling rates
were still not high enough to significantly impact the grain sizes. There was no
significant grain size changes observed in the sample laser treated at 10.48 J/mm2.
Unchanged grain sizes could possibly be also due to the high carbon content of 316L
stainless steel that also restricts hardening of the material through heat treatment.
Figure 4-4: Grain structure re-orientation in samples laser
treated at energy densities greater than 9 J/mm2.
Figure 4-2 (c) and Figure 4-3 (c) depict the surface and cross-section microstructure at
an energy density approximately 4 times larger than Figure 4-2 (a) at 20.96 J/mm2 with
surface temperatures approximated at 3111 K. An increased depth of processing is
observed, while other regions showed some ablation due this higher irradiance values.
Grain size and orientation alteration are also visible. The overlapping boundaries visible
at high energy density, 20.96 J/mm2, can be seen in Figure 4-2 (c) as layers representing
different isotherms. Figure 4-5 shows the variation in microstructure at different points
within the laser treated region.
Grain structure re-orientation
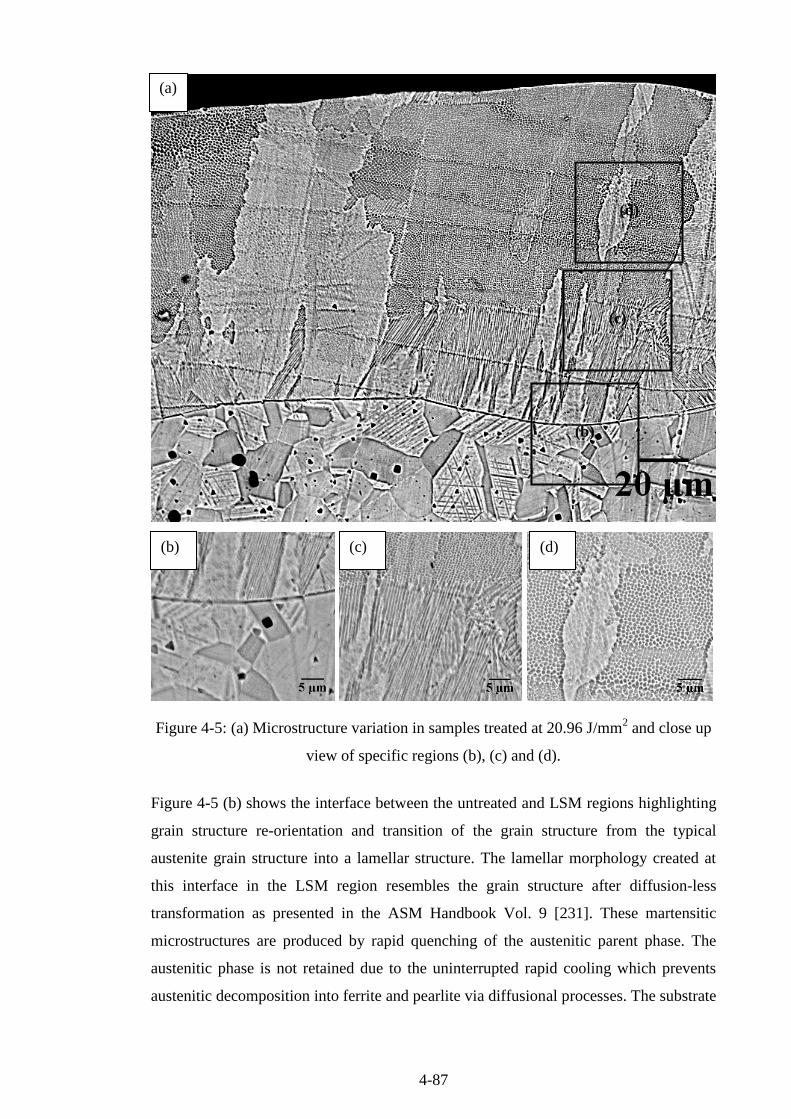
4-87
Figure 4-5: (a) Microstructure variation in samples treated at 20.96 J/mm2 and close up
view of specific regions (b), (c) and (d).
Figure 4-5 (b) shows the interface between the untreated and LSM regions highlighting
grain structure re-orientation and transition of the grain structure from the typical
austenite grain structure into a lamellar structure. The lamellar morphology created at
this interface in the LSM region resembles the grain structure after diffusion-less
transformation as presented in the ASM Handbook Vol. 9 [231]. These martensitic
microstructures are produced by rapid quenching of the austenitic parent phase. The
austenitic phase is not retained due to the uninterrupted rapid cooling which prevents
austenitic decomposition into ferrite and pearlite via diffusional processes. The substrate
(a)
(b) (c) (d)
(d)
(c)
(b)
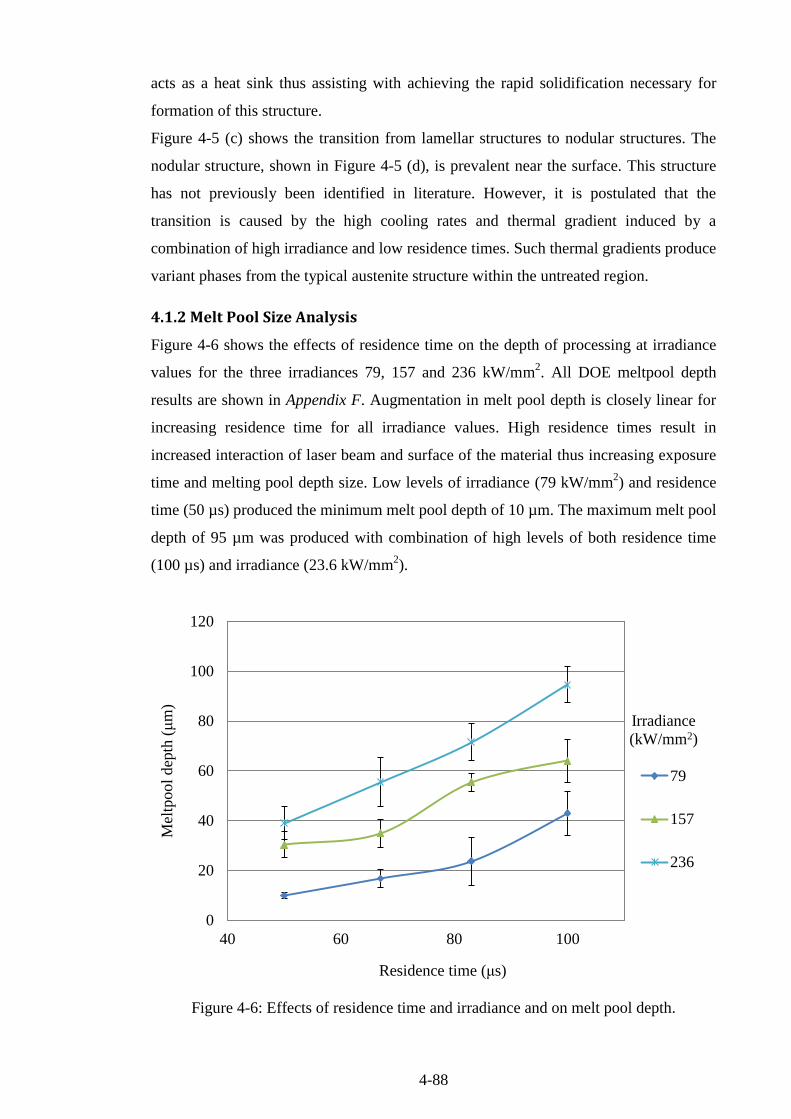
4-88
acts as a heat sink thus assisting with achieving the rapid solidification necessary for
formation of this structure.
Figure 4-5 (c) shows the transition from lamellar structures to nodular structures. The
nodular structure, shown in Figure 4-5 (d), is prevalent near the surface. This structure
has not previously been identified in literature. However, it is postulated that the
transition is caused by the high cooling rates and thermal gradient induced by a
combination of high irradiance and low residence times. Such thermal gradients produce
variant phases from the typical austenite structure within the untreated region.
4.1.2 Melt Pool Size Analysis
Figure 4-6 shows the effects of residence time on the depth of processing at irradiance
values for the three irradiances 79, 157 and 236 kW/mm2. All DOE meltpool depth
results are shown in Appendix F. Augmentation in melt pool depth is closely linear for
increasing residence time for all irradiance values. High residence times result in
increased interaction of laser beam and surface of the material thus increasing exposure
time and melting pool depth size. Low levels of irradiance (79 kW/mm2) and residence
time (50 µs) produced the minimum melt pool depth of 10 µm. The maximum melt pool
depth of 95 µm was produced with combination of high levels of both residence time
(100 µs) and irradiance (23.6 kW/mm2).
Figure 4-6: Effects of residence time and irradiance and on melt pool depth.
0
20
40
60
80
100
120
40 60 80 100
Mel
tpool
dep
th (μ
m)
Residence time (μs)
79
157
236
Irradiance
(kW/mm2)

4-89
To illustrate the effects of irradiance and residence time on the depth of processing and
roughness, energy density was fixed at 13.1 J/mm2 with two different combinations of
irradiance and residence time. The resulting micrographs are shown in Figure 4-7. A
combination of low irradiance (79 kW/mm2) and high residence time (167 µs) produced
a melt pool depth of 115 μm. The depth was approximately double that of a
combination of high irradiance (157 kW/mm2) and low residence time (83 µs) which
produced a depth of 57 μm, see Figure 4-7. An observation of the aforementioned
results show that residence time has a greater effect on depth of processing compared to
irradiance. The results prove that depth of processing cannot be related to a product
value (energy density) of irradiance and residence time. Independent values of both
parameters have to be considered in order to understand the output depth of processing.
In order to have a microstructure with low grain sizes (improved hardness), very high
cooling rates are required. The cooling rates can only be obtained at very low exposure
time with extremely high irradiance. Using the minimum permissible residence time
from the system of 27 μs, an irradiance of over 1500 W would be required which is over
the limit of the laser unit used in the presented research. One way to increase the energy
input is to improve the laser absorbance of the stainless steel surface as only 3.5%
absorption was estimated using the surface temperature prediction Equation (9) per the
literature [99].
Figure 4-7: Backscatter SEM cross section micrographs of samples processed using the
same energy density (13.1 J/mm2) with: (a) low irradiance (79 kW/mm
2) and
high residence time (167 µs); (b) high irradiance (157 kW/mm2)
and low residence time (83 µs).
(a) (b)
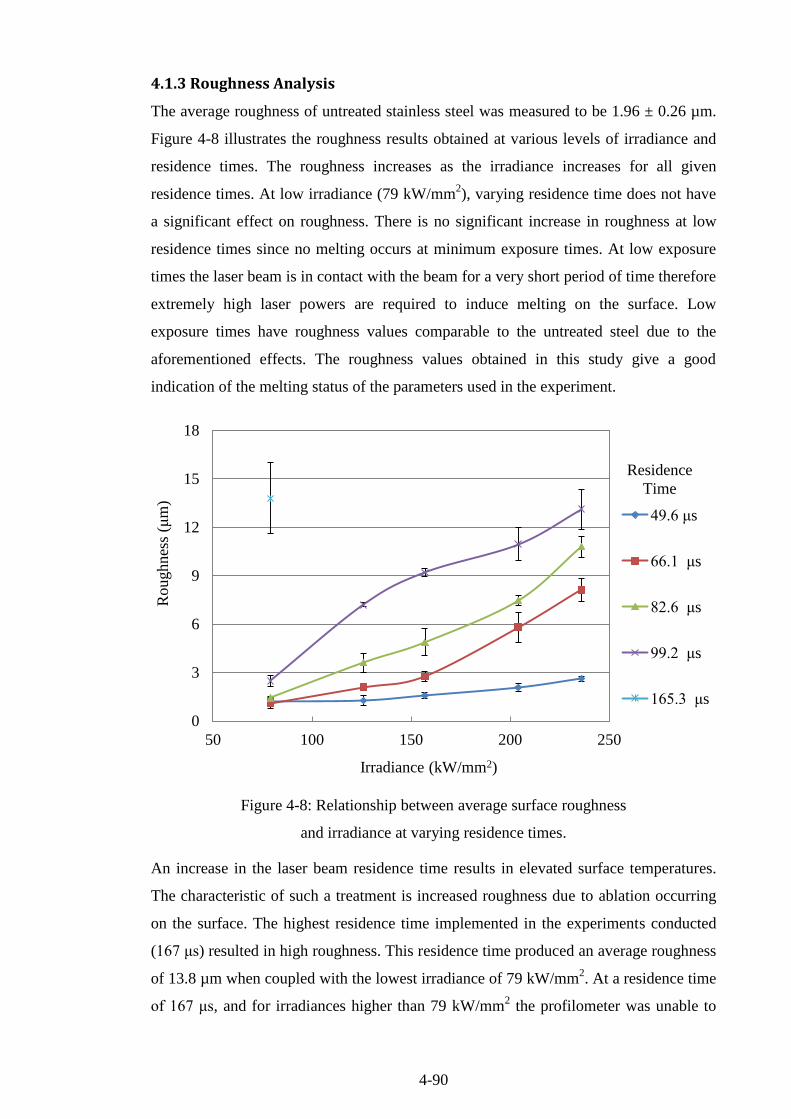
4-90
4.1.3 Roughness Analysis
The average roughness of untreated stainless steel was measured to be 1.96 ± 0.26 µm.
Figure 4-8 illustrates the roughness results obtained at various levels of irradiance and
residence times. The roughness increases as the irradiance increases for all given
residence times. At low irradiance (79 kW/mm2), varying residence time does not have
a significant effect on roughness. There is no significant increase in roughness at low
residence times since no melting occurs at minimum exposure times. At low exposure
times the laser beam is in contact with the beam for a very short period of time therefore
extremely high laser powers are required to induce melting on the surface. Low
exposure times have roughness values comparable to the untreated steel due to the
aforementioned effects. The roughness values obtained in this study give a good
indication of the melting status of the parameters used in the experiment.
Figure 4-8: Relationship between average surface roughness
and irradiance at varying residence times.
An increase in the laser beam residence time results in elevated surface temperatures.
The characteristic of such a treatment is increased roughness due to ablation occurring
on the surface. The highest residence time implemented in the experiments conducted
(167 μs) resulted in high roughness. This residence time produced an average roughness
of 13.8 µm when coupled with the lowest irradiance of 79 kW/mm2. At a residence time
of 167 μs, and for irradiances higher than 79 kW/mm2 the profilometer was unable to
0
3
6
9
12
15
18
50 100 150 200 250
Roughnes
s (μ
m)
Irradiance (kW/mm2)
49.6 μs
66.1 μs
82.6 μs
99.2 μs
165.3 μs
Residence
Time

4-91
detect resulting high sample roughness due to extensive ablation. Figure 4-9 illustrates
the effect of low irradiance and high residence time on the surface roughness.
Figure 4-9: Sample treated at low irradiance (79 kW/mm2) and high residence
time (167 μs) illustrating effects of high densities on surface roughness.
Figure 4-9 shows the typical, channel-like, ablation features that are induced at high
energy densities. A strong correlation is also visible between roughness and energy
density used in the experiment regardless to the residence time; see Figure 4-10. The
first three points (bottom left) on the graph were results from samples in which no
melting occurred due to the low energy density. A linear increase in roughness is
observed with higher energy densities.
Figure 4-10: Relationship between average surface roughness and energy density for
laser processing of 316L with DOE 1.
R² = 0.9198
0
2
4
6
8
10
12
14
0 5 10 15 20 25 30
Roughnes
s (μ
m)
Energy Density (J/mm2)
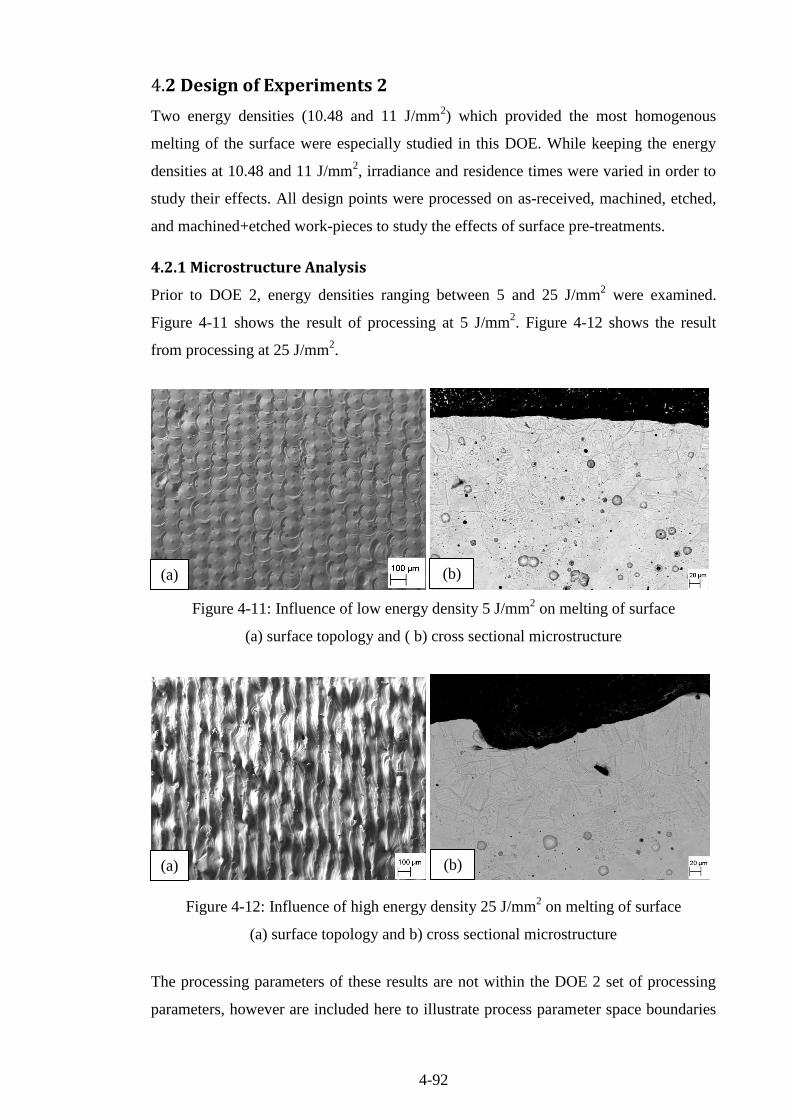
4-92
4.2 Design of Experiments 2
Two energy densities (10.48 and 11 J/mm2) which provided the most homogenous
melting of the surface were especially studied in this DOE. While keeping the energy
densities at 10.48 and 11 J/mm2, irradiance and residence times were varied in order to
study their effects. All design points were processed on as-received, machined, etched,
and machined+etched work-pieces to study the effects of surface pre-treatments.
4.2.1 Microstructure Analysis
Prior to DOE 2, energy densities ranging between 5 and 25 J/mm2 were examined.
Figure 4-11 shows the result of processing at 5 J/mm2. Figure 4-12 shows the result
from processing at 25 J/mm2.
Figure 4-11: Influence of low energy density 5 J/mm2 on melting of surface
(a) surface topology and ( b) cross sectional microstructure
Figure 4-12: Influence of high energy density 25 J/mm2 on melting of surface
(a) surface topology and b) cross sectional microstructure
The processing parameters of these results are not within the DOE 2 set of processing
parameters, however are included here to illustrate process parameter space boundaries
(a) (b)
(a) (b)
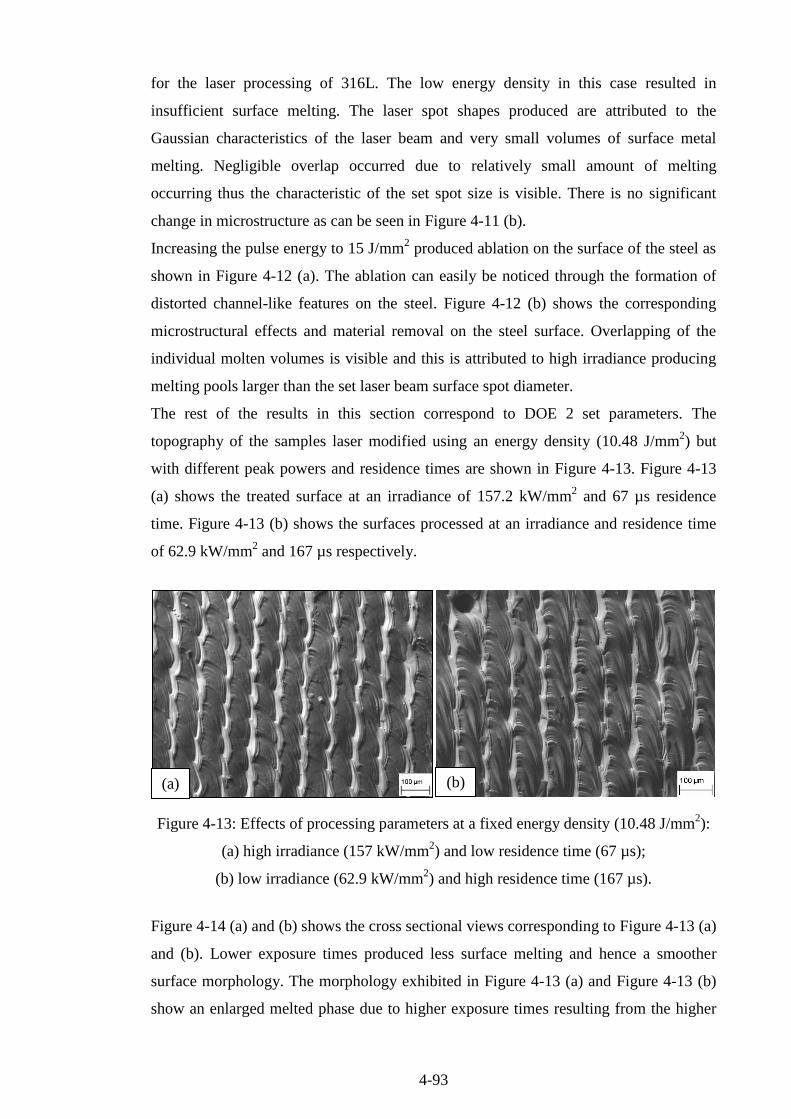
4-93
for the laser processing of 316L. The low energy density in this case resulted in
insufficient surface melting. The laser spot shapes produced are attributed to the
Gaussian characteristics of the laser beam and very small volumes of surface metal
melting. Negligible overlap occurred due to relatively small amount of melting
occurring thus the characteristic of the set spot size is visible. There is no significant
change in microstructure as can be seen in Figure 4-11 (b).
Increasing the pulse energy to 15 J/mm2 produced ablation on the surface of the steel as
shown in Figure 4-12 (a). The ablation can easily be noticed through the formation of
distorted channel-like features on the steel. Figure 4-12 (b) shows the corresponding
microstructural effects and material removal on the steel surface. Overlapping of the
individual molten volumes is visible and this is attributed to high irradiance producing
melting pools larger than the set laser beam surface spot diameter.
The rest of the results in this section correspond to DOE 2 set parameters. The
topography of the samples laser modified using an energy density (10.48 J/mm2) but
with different peak powers and residence times are shown in Figure 4-13. Figure 4-13
(a) shows the treated surface at an irradiance of 157.2 kW/mm2 and 67 µs residence
time. Figure 4-13 (b) shows the surfaces processed at an irradiance and residence time
of 62.9 kW/mm2 and 167 µs respectively.
Figure 4-13: Effects of processing parameters at a fixed energy density (10.48 J/mm2):
(a) high irradiance (157 kW/mm2) and low residence time (67 µs);
(b) low irradiance (62.9 kW/mm2) and high residence time (167 µs).
Figure 4-14 (a) and (b) shows the cross sectional views corresponding to Figure 4-13 (a)
and (b). Lower exposure times produced less surface melting and hence a smoother
surface morphology. The morphology exhibited in Figure 4-13 (a) and Figure 4-13 (b)
show an enlarged melted phase due to higher exposure times resulting from the higher
(a) (b)
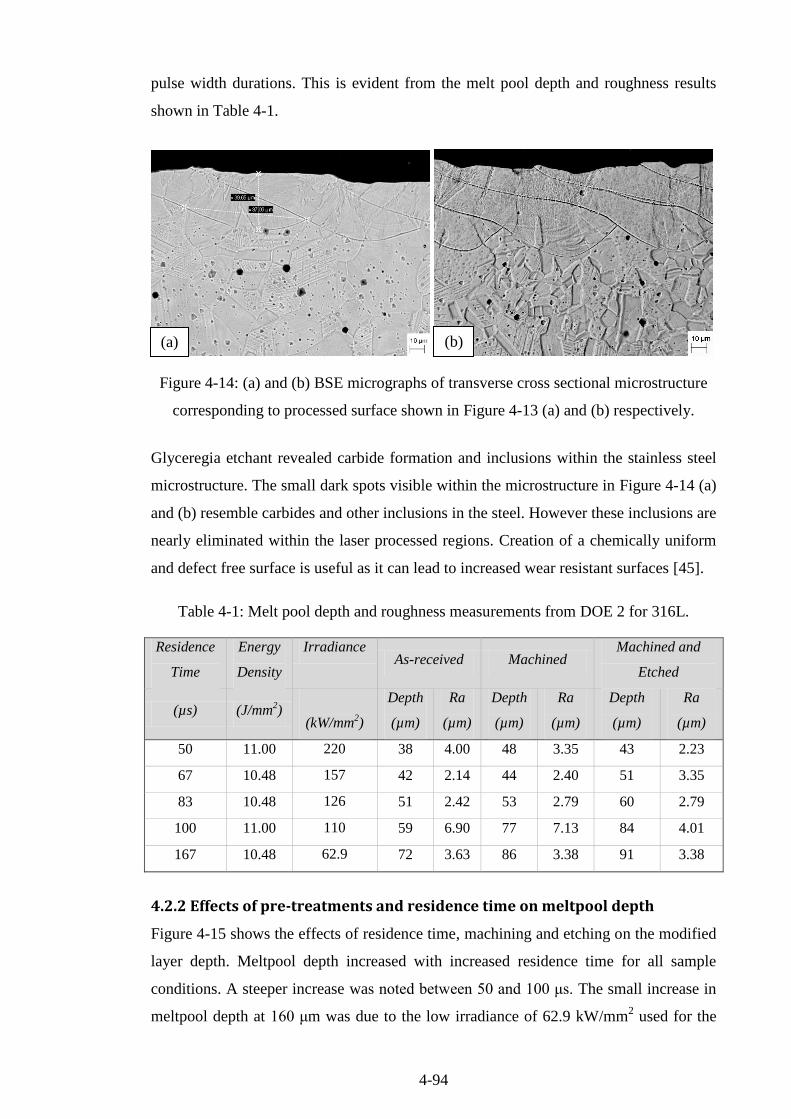
4-94
pulse width durations. This is evident from the melt pool depth and roughness results
shown in Table 4-1.
Figure 4-14: (a) and (b) BSE micrographs of transverse cross sectional microstructure
corresponding to processed surface shown in Figure 4-13 (a) and (b) respectively.
Glyceregia etchant revealed carbide formation and inclusions within the stainless steel
microstructure. The small dark spots visible within the microstructure in Figure 4-14 (a)
and (b) resemble carbides and other inclusions in the steel. However these inclusions are
nearly eliminated within the laser processed regions. Creation of a chemically uniform
and defect free surface is useful as it can lead to increased wear resistant surfaces [45].
Table 4-1: Melt pool depth and roughness measurements from DOE 2 for 316L.
Residence
Time
Energy
Density
Irradiance As-received Machined
Machined and
Etched
(µs) (J/mm2)
(kW/mm2)
Depth
(µm)
Ra
(µm)
Depth
(µm)
Ra
(µm)
Depth
(µm)
Ra
(µm)
50 11.00 220 38 4.00 48 3.35 43 2.23
67 10.48 157 42 2.14 44 2.40 51 3.35
83 10.48 126 51 2.42 53 2.79 60 2.79
100 11.00 110 59 6.90 77 7.13 84 4.01
167 10.48 62.9 72 3.63 86 3.38 91 3.38
4.2.2 Effects of pre-treatments and residence time on meltpool depth
Figure 4-15 shows the effects of residence time, machining and etching on the modified
layer depth. Meltpool depth increased with increased residence time for all sample
conditions. A steeper increase was noted between 50 and 100 μs. The small increase in
meltpool depth at 160 μm was due to the low irradiance of 62.9 kW/mm2 used for the
(a) (b)

4-95
sample processed at this point. Etched samples did not improve the meltpool depth thus
indicating that it had the least impact on improving CO2 laser absorption of 316L
stainless steel. Machined and etched samples showed the highest meltpool depths.
Machining of samples had a greater effect on meltpool depth compared to etching.
There were no significant effects of pre-treatments on roughness, see Appendix F.
Figure 4-15: Effects of pre-treatments and residence time on meltpool depth.
4.2.3 Microhardness
The average hardness of untreated 316L stainless steel was measured from the sectioned
samples to be 250 HV. Figure 4-16 shows the effects of laser surface melting on
microhardness. The dotted line represents the hardness of untreated samples. Some
samples showed slight increase in hardness. Although a significant increase in hardness
was identifiable for specific laser processing conditions, the level of increase was small
and for most samples no strong relationship was present from the effects of laser
processing parameters on resultant microhardness. In order to have significant increase
in hardness within the steel, time is needed for the carbon content to diffuse to allow the
transformation from austenite to martensite to occur [97]. When insufficient time is
provide due to rapid heating and cooling or when insufficient carbon content is present
to aid the driving of the diffusion process, then little hardening effect would be expected
to occur. Both of these situations were present in this case due to the rapid laser
processing and the low carbon content in 316L material respectively.
0
20
40
60
80
100
0 50 100 150 200
Mel
tpool
Dep
th (μ
m)
Residence Time (μs)
Machined +Etched
Machined
Etched
As-received
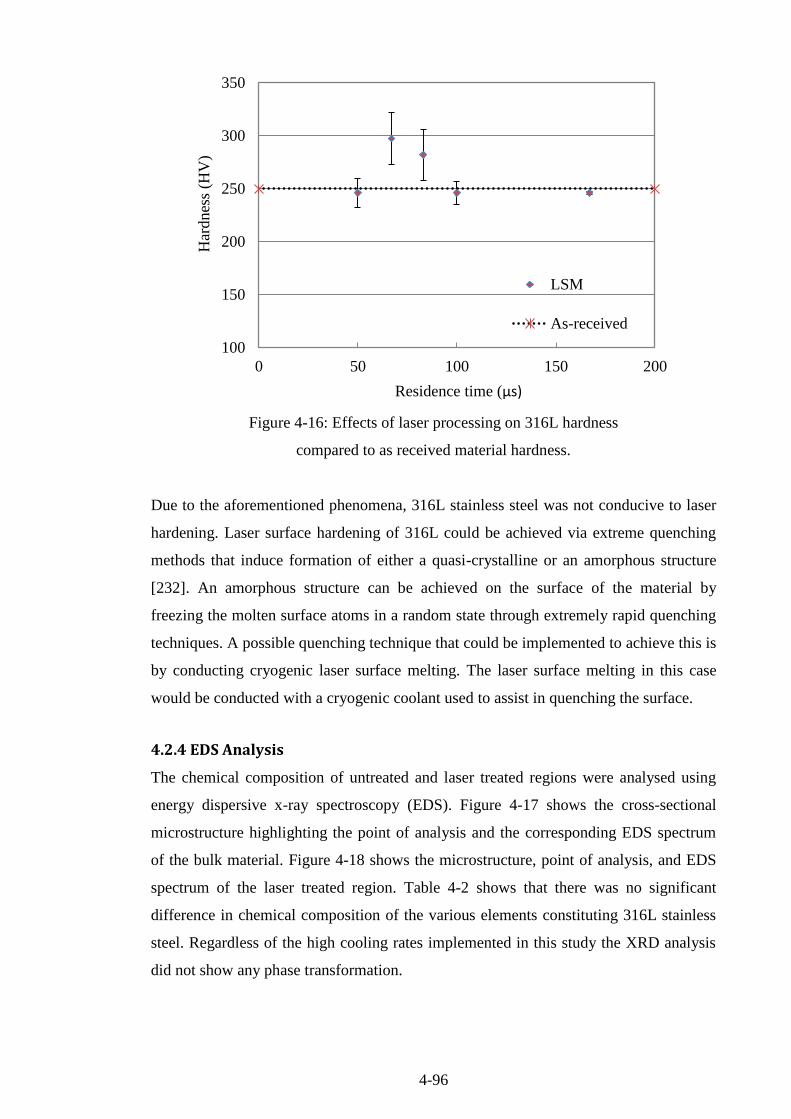
4-96
Figure 4-16: Effects of laser processing on 316L hardness
compared to as received material hardness.
Due to the aforementioned phenomena, 316L stainless steel was not conducive to laser
hardening. Laser surface hardening of 316L could be achieved via extreme quenching
methods that induce formation of either a quasi-crystalline or an amorphous structure
[232]. An amorphous structure can be achieved on the surface of the material by
freezing the molten surface atoms in a random state through extremely rapid quenching
techniques. A possible quenching technique that could be implemented to achieve this is
by conducting cryogenic laser surface melting. The laser surface melting in this case
would be conducted with a cryogenic coolant used to assist in quenching the surface.
4.2.4 EDS Analysis
The chemical composition of untreated and laser treated regions were analysed using
energy dispersive x-ray spectroscopy (EDS). Figure 4-17 shows the cross-sectional
microstructure highlighting the point of analysis and the corresponding EDS spectrum
of the bulk material. Figure 4-18 shows the microstructure, point of analysis, and EDS
spectrum of the laser treated region. Table 4-2 shows that there was no significant
difference in chemical composition of the various elements constituting 316L stainless
steel. Regardless of the high cooling rates implemented in this study the XRD analysis
did not show any phase transformation.
100
150
200
250
300
350
0 50 100 150 200
Har
dnes
s (H
V)
Residence time (μs)
LSM
As-received
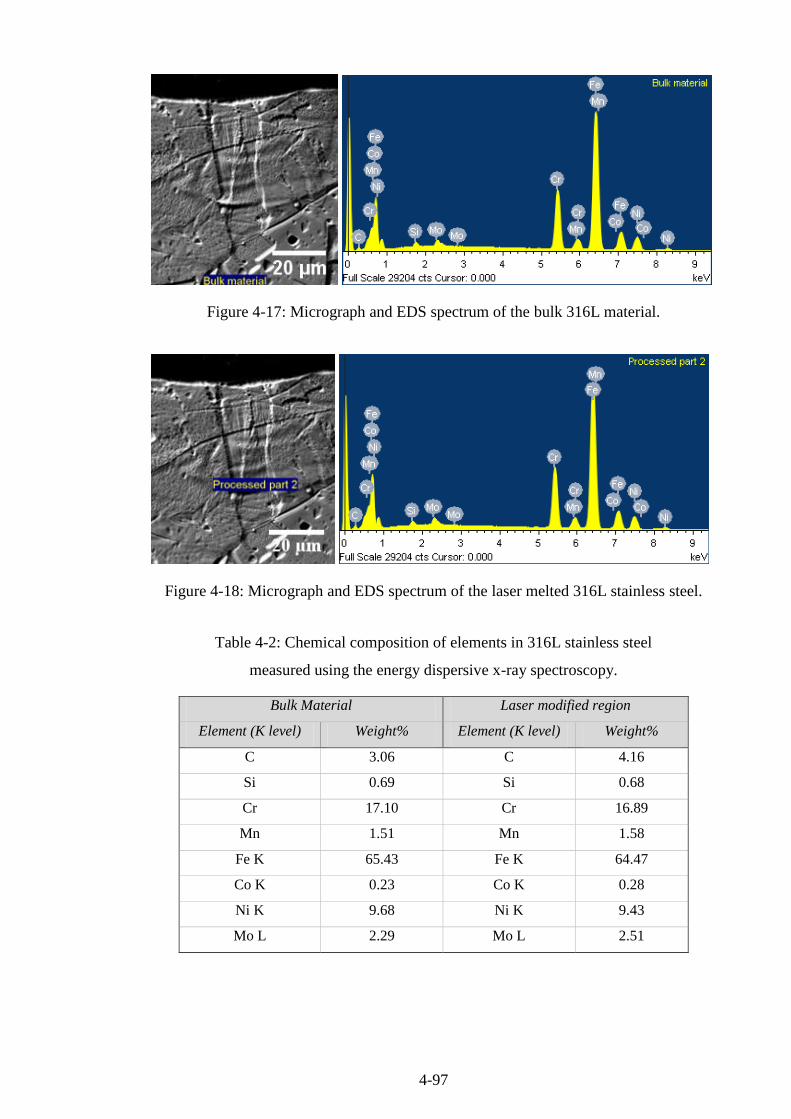
4-97
Figure 4-17: Micrograph and EDS spectrum of the bulk 316L material.
Figure 4-18: Micrograph and EDS spectrum of the laser melted 316L stainless steel.
Table 4-2: Chemical composition of elements in 316L stainless steel
measured using the energy dispersive x-ray spectroscopy.
Bulk Material Laser modified region
Element (K level) Weight% Element (K level) Weight%
C 3.06 C 4.16
Si 0.69 Si 0.68
Cr 17.10 Cr 16.89
Mn 1.51 Mn 1.58
Fe K 65.43 Fe K 64.47
Co K 0.23 Co K 0.28
Ni K 9.68 Ni K 9.43
Mo L 2.29 Mo L 2.51

4-98
4.3 Summary
This chapter presented results for the laser surface modification of 316L stainless steel.
In particular, the effects of the laser surface modification processing conditions on
meltpool profile, microstructure, roughness, hardness, and chemical composition were
presented. It was found the surface could be melted and solidified in a controlled
manner by control of the laser processing parameters. Novel microstructures have been
obtained which were not previously reported in the literature. Laser surface
modification also reduced asperities and eliminated cracks and inclusions within the
treated region. An increase in hardness was achieved for some of the laser processing
conditions relative to the untreated surface. However, the level of this increase was
typically not high and no correlation was evident between the range of processing
parameters investigated and the hardness results. Meltpool depths were found to
increase for increased residence time and for machined as well as machined and etched
surfaces.
Reduced irradiance and higher residence times resulted in lower surface roughness
values. While reduced roughness and increased melt pool depths could be seen as
beneficial for biomedical implants, other physical properties of the surface also need to
be considered, in particular, the levels of hardness. The lack of significant phase
transformation and chemical composition changes of the microstructure for the
processing parameters investigated would indicate that the possibility of significant
improvements of hardness and necessary tribological properties would not be great for
this alloy. This indicates that an alternate process that alters the material structure in a
different manner would be required if laser surface modification was to be successful
for increasing the hardness and life span for 316L hip implants. One possible method of
achieving this would be to create an amorphous structure on the surface of this implant
material. Amophous structures are known to have excellent hardness, wear and
corrision peoperties. Such a structure could potentially be achieved by cryogenic laser
surface treatment.

5-99
Chapter 5
Results: Ti-6Al-4V
This chapter presents results for high speed laser melted Ti-6Al-4V. The results include
microstructure analysis, meltpool profile, roughness, microhardness, phase and
chemical composition, wear and corrosion resistance, wettability and biocompatibility
properties. Compared to 316L stainless steel results presented in Chapter 4, much more
detailed characterisations were carried out on Ti-6Al-4V samples.
5.1. Metallography
The results presented in this section are mainly microscopic analysis of the physical
structure of the Ti-6Al-4V before and after laser melting. Surface topography results
represent the plan view analysis while the cross-section views were obtain after a
transverse sectioning and etching to highlight phase structure.
5.1.1 Surface Topography
Figure 5-1 presents the plan view of the (a) as-received and (b) grit blasted Ti-6Al-4V.
There were no visible voids, inclusions, pits or cracks on the surface of as-received
samples.
Figure 5-1: SEM micrographs showing the plane view of
(a) as-received and (b) grit blasted Ti-6Al-4V
Figure 5-2 to Figure 5-4 presents the topographical characteristics of the laser melted
region, highlighting the repetitive processing tracks created due to rapid solidification.
(a) (b)

5-100
Figure 5-2: Back scatter detector (BSE) surface morphology images of laser
surface modified Ti-6Al-4V at a constant residence time of 1.08 ms and
three levels of irradiance (a) 15.72, (b) 20.4 and (c) 26.7 kW/mm2.
Figure 5-3: Back scatter detector (BSE) surface morphology images of laser
surface modified Ti-6Al-4V at a constant residence time of 1.44 ms and
three levels of irradiance (a) 15.72, (b) 20.4 and (c) 26.7 kW/mm2.
Figure 5-4: Back scatter detector (BSE) surface morphology images of laser
surface modified Ti-6Al-4V at a constant residence time of 2.16 ms and
three levels of irradiance (a) 15.72, (b) 20.4 and (c) 26.7 kW/mm2.
(a) (b)
(c) (a)
(a) (b) (c)
(b)
(c)

5-101
Figure 5-2 shows the morphological structure at the lowest residence time of 1.08 ms
and three levels of irradiance (15.72, 20.4 and 26.7 kW/mm2). Increase in irradiance
produced a smoother treated region with a more homogeneous melting regime. A
similar trend with increased irradiance was observed for samples processed at higher
residence times of 1.44 ms (Figure 5-3) and 2.16 ms (Figure 5-4).
Evolution of roughness and rippling effect on the treated surface confirms that the
surface was heated to a liquid phase as seen in Figure 5-5. No evidence of ablation is
visible on all treated sample due to the careful selection of the laser processing
parameters. Grain structure formation is also visible on all topographic micrographs.
Figure 5-5 shows the typical grain distribution on laser melted topography. The grains
are not homogeneous in size and vary within the treated zone. In Figure 5-5 the
dimension of the grains varied from as low as 5 μm to 30 μm. It was not possible to
quantitatively determine from these images an average the grain size within a particular
treated sample. However, the grains generally increased in size and became more visible
with increasing irradiance and residence time. The largest grains are visible in Figure
5-4 (c) where the highest irradiance of 26.7 kW/mm2 and residence time of 2.16 ms was
applied.
Figure 5-5: Grain distribution on the surface of a sample laser melted at an
irradiance of 26 kW/mm2 and a residence time of 2.16 ms, imaged in BSE mode.
5.1.2 Cross-sectional microstructure
Figure 5-6 shows the etched cross-sectional microstructure images of the as-received
Ti-6Al-4V taken using an optical microscopes, see Figure 5-6 (a), and back scatter
electron detector (BSE), see Figure 5-6 (b). The as-received microstructure consists of a
fully lamellar microstructure consisting of colonies of alternating laths of α and β phase
Small grains
Large grains
Rippling
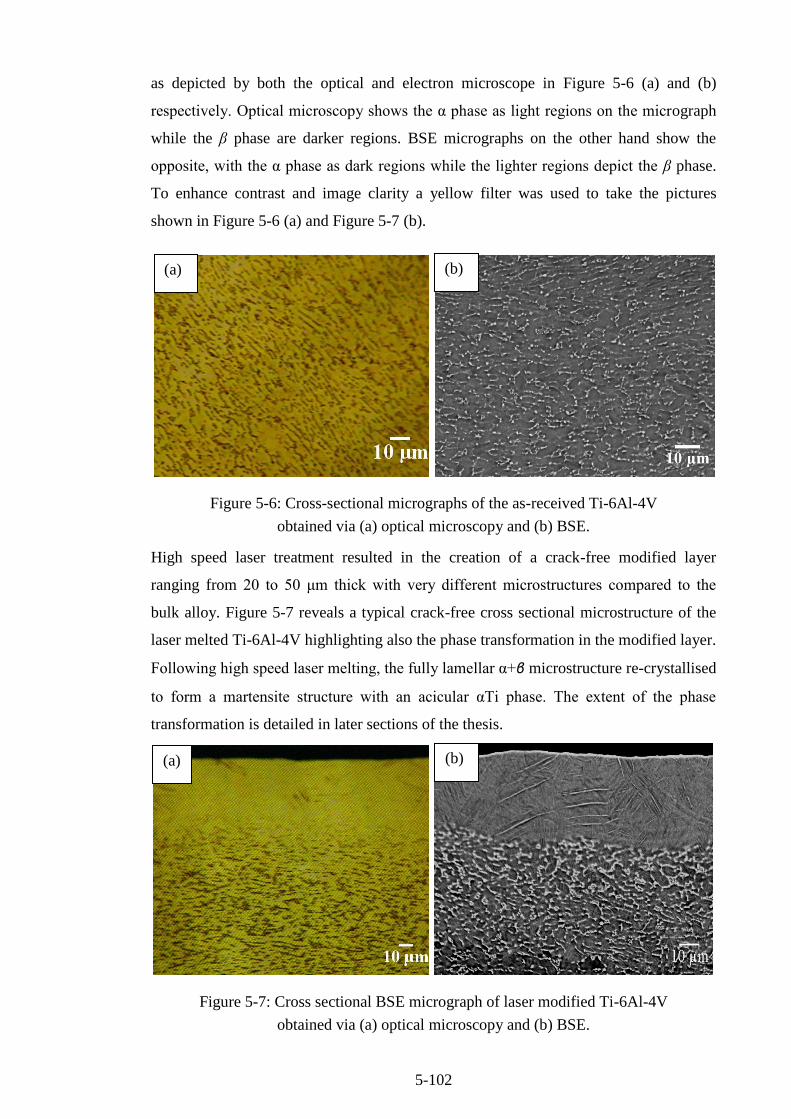
5-102
as depicted by both the optical and electron microscope in Figure 5-6 (a) and (b)
respectively. Optical microscopy shows the α phase as light regions on the micrograph
while the β phase are darker regions. BSE micrographs on the other hand show the
opposite, with the α phase as dark regions while the lighter regions depict the β phase.
To enhance contrast and image clarity a yellow filter was used to take the pictures
shown in Figure 5-6 (a) and Figure 5-7 (b).
Figure 5-6: Cross-sectional micrographs of the as-received Ti-6Al-4V
obtained via (a) optical microscopy and (b) BSE.
High speed laser treatment resulted in the creation of a crack-free modified layer
ranging from 20 to 50 μm thick with very different microstructures compared to the
bulk alloy. Figure 5-7 reveals a typical crack-free cross sectional microstructure of the
laser melted Ti-6Al-4V highlighting also the phase transformation in the modified layer.
Following high speed laser melting, the fully lamellar α+β microstructure re-crystallised
to form a martensite structure with an acicular αTi phase. The extent of the phase
transformation is detailed in later sections of the thesis.
Figure 5-7: Cross sectional BSE micrograph of laser modified Ti-6Al-4V
obtained via (a) optical microscopy and (b) BSE.
(a)
(b) (a)
(b)

5-103
Figure 5-8 to Figure 5-10 highlight the effects of irradiance and residence time on the
cross sectional microstructure of the laser surface modified Ti-6Al-4V. The samples
treated at higher irradiances showed a smoother surface finish compared to the samples
treated at lower irradiance which had a more wavy surface type. This is particularly
noticeable in Figure 5-8 shows a clear increase in depth of processing as the residence
time increased. This trend is generally the same at the higher irradiance values in Figure
5-9 and Figure 5-10. More uniform meltpool depths were also created at higher
irradiance values and for higher residence times. A relatively homogeneous treated
meltpool depth was found in the micrographs for the sample at the highest irradiance of
26.72 kW/mm2.

5-104
Figure 5-8: Back scatter detector (BSE) surface morphology images of laser surface
modified Ti-6Al-4V at a constant level of irradiance 15.72 kW/mm2 and three
levels of irradiance of residence time of (a) 1.08 (b) 1.44 and (c) 2.16 ms.
Figure 5-9: Back scatter detector (BSE) surface morphology images of laser surface
modified Ti-6Al-4V at a constant level of irradiance 20.4 kW/mm2 and three
levels of irradiance of residence time of (a) 1.08 (b) 1.44 and (c) 2.16 ms.
Figure 5-10: Back scatter detector (BSE) surface morphology images of laser surface
modified Ti-6Al-4V at a constant level of irradiance 26.72 kW/mm2 and three
levels of irradiance of residence time of (a) 1.08 (b) 1.44 and (c) 2.16 ms.
(a) (b) (c)
(a) (b) (c)
(a) (b) (c)

5-105
5.2 Meltpool Profile
Figure 5-8 to Figure 5-10 qualitatively highlighted the changes in microstructure,
roughness and meltpool depth of the laser modified regions. These micrographs show
that irradiance has an effect on the thickness uniformity of the melted area. Figure 5-11
compares the effects of the lowest and highest irradiance, 15.72 and 26.72 kW/mm2
respectively, on the meltpool depth. As the irradiance increased, a more homogeneous
meltpool depth with fewer discontinuities was observed. Increase in both irradiance and
residence times resulted in an increase in meltpool depth which is quantitatively
presented in Figure 5-11.
Figure 5-11: Effects of laser irradiance and residence time
on meltpool depth for the Ti-6Al-4V samples.
The graph shows the error bars constructed using a 95% confidence t-test from a
population of ten samples for each design point. The table in Appendix G presents the
design points and results obtained from the tests. Figure 5-12 shows a 3D graph
simultaneously displaying the effects of irradiance and residence on meltpool depth.
The 3D graph was generated, in Design Expert®, using two factor interactions model
(2FI). Table 5-1 shows the analysis of variance table generated by the model. The high
model F-value of 23.23 implied the model was significant. A p-value of 0.002
suggested that there is a low chance the F-value could occur due to noise. The predicted
R2 of 0.879 is in reasonable agreement with the adjusted R
2 of 0.893. There is only
0.014 difference in the R2 values, this is significantly smaller than the threshold of 0.2.
10
20
30
40
50
1 1.2 1.4 1.6 1.8 2 2.2
Mel
tpool
Dep
th (
µm
)
Residence time (ms)
15.72
26.72
Irradiance
(kW/mm2)

5-106
High R2 values suggest there is a statistical significant interaction between the factors.
The resulting meltpool depth can be modelled by the final equation given in Table 5-1.
Figure 5-12: Effects of laser irradiance and residence time
on meltpool depth for the Ti-6Al-4V samples.
Table 5-1: Analysis for variance (ANOVA) table for meltpool depth – 2FI model.
Source Sum of Squares Mean Square F Value p-value
Model 502.786 167.595 23.268 0.0023
A-Irradiance 135.375 135.375 18.795 0.0075
B-Residence Time 366.601 366.601 50.898 0.0008
AB 0.81 0.81 0.112 0.7510
Residual 36.013 7.202
Cor Total 538.8
Final equation obtained from the model:
R-Squared 0.933 Microhardness =
-3.93448
+0.61818 × Irradiance
+11.26016 × Residence Time
+0.15152 × Irradiance × Residence Time
Adj R-Squared 0.893
Pred R-Squared 0.879
Adeq Precision 14.047
The ANOVA results show that meltpool depth was affected by both irradiance (A) and
residence time (B). Residence time had the most significant effect on the meltpool depth
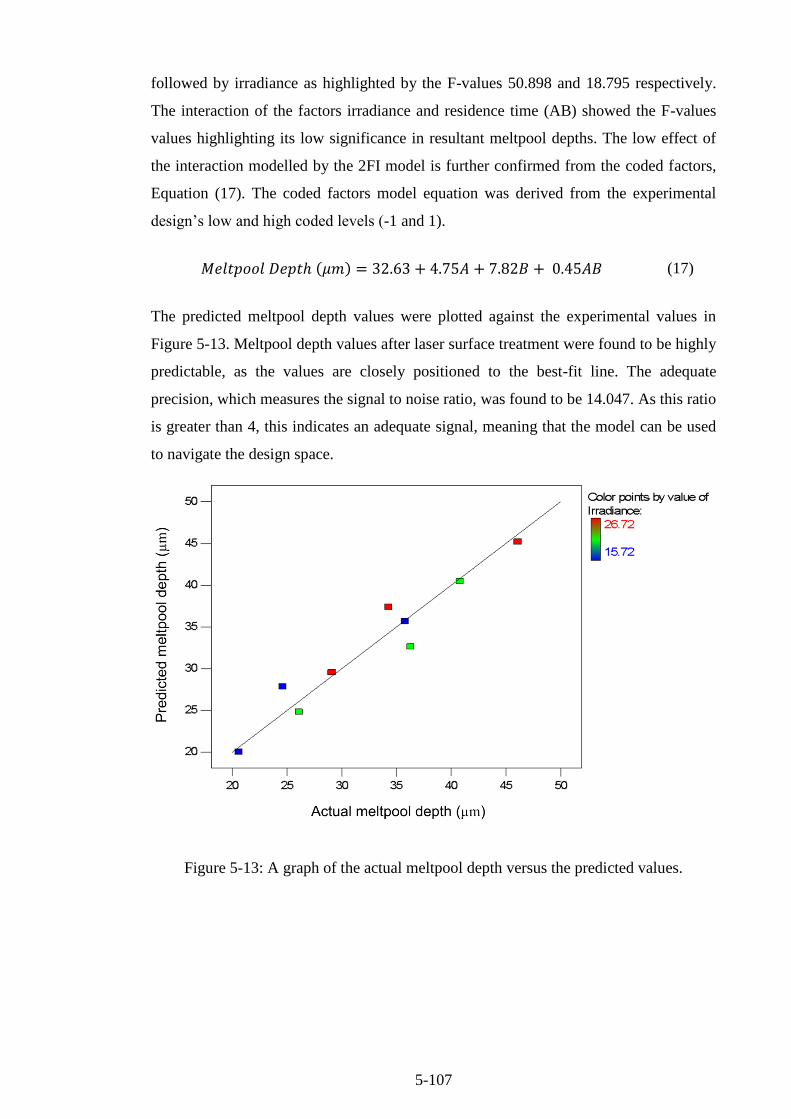
5-107
followed by irradiance as highlighted by the F-values 50.898 and 18.795 respectively.
The interaction of the factors irradiance and residence time (AB) showed the F-values
values highlighting its low significance in resultant meltpool depths. The low effect of
the interaction modelled by the 2FI model is further confirmed from the coded factors,
Equation (17). The coded factors model equation was derived from the experimental
design’s low and high coded levels (-1 and 1).
(17)
The predicted meltpool depth values were plotted against the experimental values in
Figure 5-13. Meltpool depth values after laser surface treatment were found to be highly
predictable, as the values are closely positioned to the best-fit line. The adequate
precision, which measures the signal to noise ratio, was found to be 14.047. As this ratio
is greater than 4, this indicates an adequate signal, meaning that the model can be used
to navigate the design space.
Figure 5-13: A graph of the actual meltpool depth versus the predicted values.
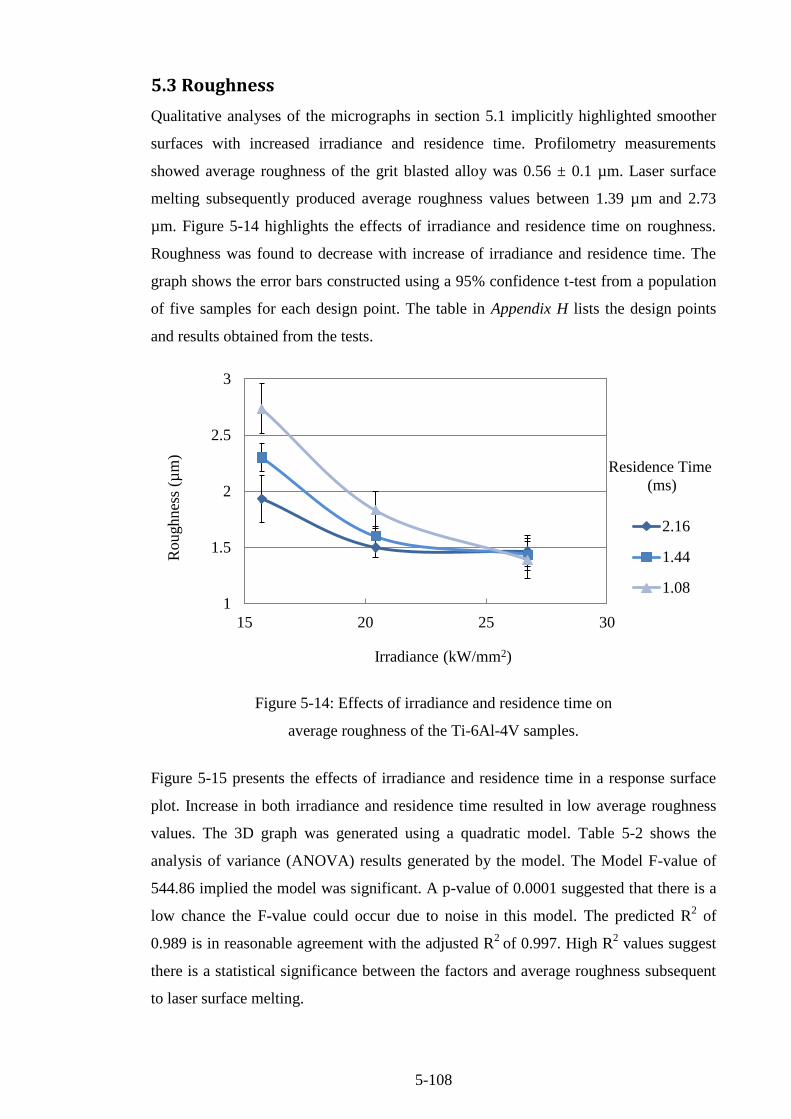
5-108
5.3 Roughness
Qualitative analyses of the micrographs in section 5.1 implicitly highlighted smoother
surfaces with increased irradiance and residence time. Profilometry measurements
showed average roughness of the grit blasted alloy was 0.56 ± 0.1 µm. Laser surface
melting subsequently produced average roughness values between 1.39 µm and 2.73
µm. Figure 5-14 highlights the effects of irradiance and residence time on roughness.
Roughness was found to decrease with increase of irradiance and residence time. The
graph shows the error bars constructed using a 95% confidence t-test from a population
of five samples for each design point. The table in Appendix H lists the design points
and results obtained from the tests.
Figure 5-14: Effects of irradiance and residence time on
average roughness of the Ti-6Al-4V samples.
Figure 5-15 presents the effects of irradiance and residence time in a response surface
plot. Increase in both irradiance and residence time resulted in low average roughness
values. The 3D graph was generated using a quadratic model. Table 5-2 shows the
analysis of variance (ANOVA) results generated by the model. The Model F-value of
544.86 implied the model was significant. A p-value of 0.0001 suggested that there is a
low chance the F-value could occur due to noise in this model. The predicted R2 of
0.989 is in reasonable agreement with the adjusted R2
of 0.997. High R2 values suggest
there is a statistical significance between the factors and average roughness subsequent
to laser surface melting.
1
1.5
2
2.5
3
15 20 25 30
Roughnes
s (µ
m)
Irradiance (kW/mm2)
2.16
1.44
1.08
Residence Time
(ms)

5-109
Figure 5-15: Effects of irradiance and residence time on
average roughness of the Ti-6Al-4V samples.
Table 5-2: Analysis for variance (ANOVA) table for roughness – quadratic model.
Source Sum of Squares Mean Square F Value p-value
Model 1.672515 0.334503 544.8589 0.0001
A-Irradiance 1.185482 1.185482 1930.985 < 0.0001
B-Residence Time 0.18375 0.18375 299.3032 0.0004
AB 0.1936 0.1936 315.3475 0.0004
A2 0.107803 0.107803 175.5957 0.0009
B2 0.001881 0.001881 3.063707 0.1784
Residual 0.001842 0.000614
Cor Total 1.674357
Final equation obtained from the model:
R-Squared 0.998 Roughness =
+ 10.14118
- 0.52654 × Irradiance
- 2.23667 × Residence time
+ 0.074074 × Irradiance ×Residence time
+ 7.67493 × 10⁻³
× Irradiance2
+ 0.10517 × Residence time2
Adj R-Squared 0.997
Pred R-Squared 0.989
Adeq Precision 65.692
The ANOVA table showed p-values less than 0.05 for all model terms except high order
residence time (B2). Such low p-values highlight the significance of such these factors
and their interactions. The F values from the ANOVA table can be used to rank the
influence of factors/interactions on the resultant average roughness. In this case,

5-110
irradiance (A) was found to be the most influencial with the highest F value of
(1930.985). Interaction AB had the second influence followed by residence time (B) and
A2 respectively. B
2 had the least influence as expected with the lowest F-value of just
3.063 – A>>AB>B>A2>>B
2. The average roughness can therefore be modelled by the
final equation produced by the model given in Table 5-2. The coded factors model is
presented by Equation (18) again highlighting the influence of each term on the model.
(18)
Average roughness values after laser surface treatment was found to be highly
predictable according to the model as seen in Figure 5-16. All roughness values lie on
the best-fit line of the predicted results. The adequate precision ratio was found to be
65.692 which is significantly higher that the threshold of 4. This means that the model
had very little noise , therefore it can be used to navigate the design space.
Figure 5-16: A graph of the actual roughness versus the predicted values.
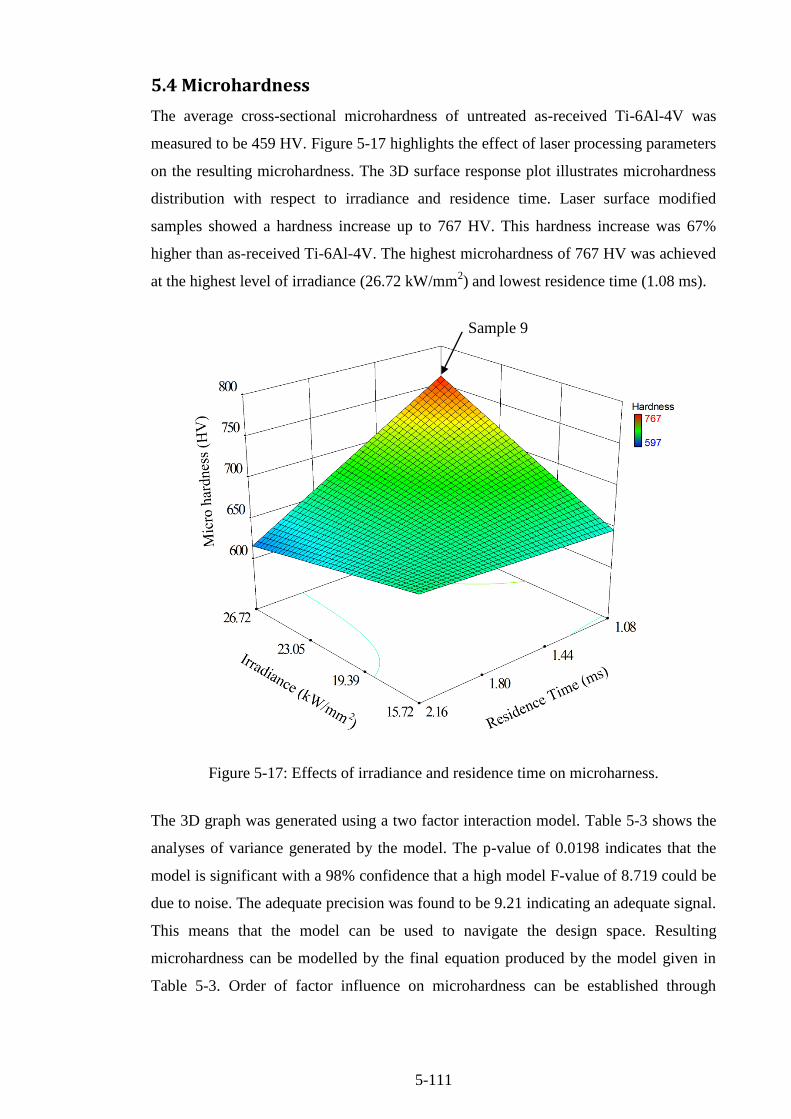
5-111
5.4 Microhardness
The average cross-sectional microhardness of untreated as-received Ti-6Al-4V was
measured to be 459 HV. Figure 5-17 highlights the effect of laser processing parameters
on the resulting microhardness. The 3D surface response plot illustrates microhardness
distribution with respect to irradiance and residence time. Laser surface modified
samples showed a hardness increase up to 767 HV. This hardness increase was 67%
higher than as-received Ti-6Al-4V. The highest microhardness of 767 HV was achieved
at the highest level of irradiance (26.72 kW/mm2) and lowest residence time (1.08 ms).
Figure 5-17: Effects of irradiance and residence time on microharness.
The 3D graph was generated using a two factor interaction model. Table 5-3 shows the
analyses of variance generated by the model. The p-value of 0.0198 indicates that the
model is significant with a 98% confidence that a high model F-value of 8.719 could be
due to noise. The adequate precision was found to be 9.21 indicating an adequate signal.
This means that the model can be used to navigate the design space. Resulting
microhardness can be modelled by the final equation produced by the model given in
Table 5-3. Order of factor influence on microhardness can be established through
Sample 9

5-112
analysis of the F-values magnitude as follows: AB>B>A. The final equation in terms of
the coded factor further confirms the influence of the factors, see Equation (19).
Table 5-3: Analysis for variance (ANOVA) table for microhardness – 2FI model
Source Sum of Squares Mean Square F Value p-value
Model 14700.39 4900.13 8.719 0.0198
A-Irradiance 1849.06 1849.06 3.290 0.1294
B-Residence Time 6424.89 6424.89 11.432 0.0196
AB 6426.42 6426.42 11.435 0.0196
Residual 2809.93 561.98
Cor Total 17510.32
Final equation obtained from the model:
R-Squared 0.84 Microhardness =
+238.0962
+25.055 × Irradiance
+225.7819 × Residence Time
-13.4958 × Irradiance × Residence Time
Adj R-Squared 0.74
Pred R-Squared 0.46
Adeq Precision 9.21
(19)
Figure 5-18 shows a graph of the actual microhardness versus the predicted values.
Figure 5-18: A graph of the actual microhardness versus the predicted values.
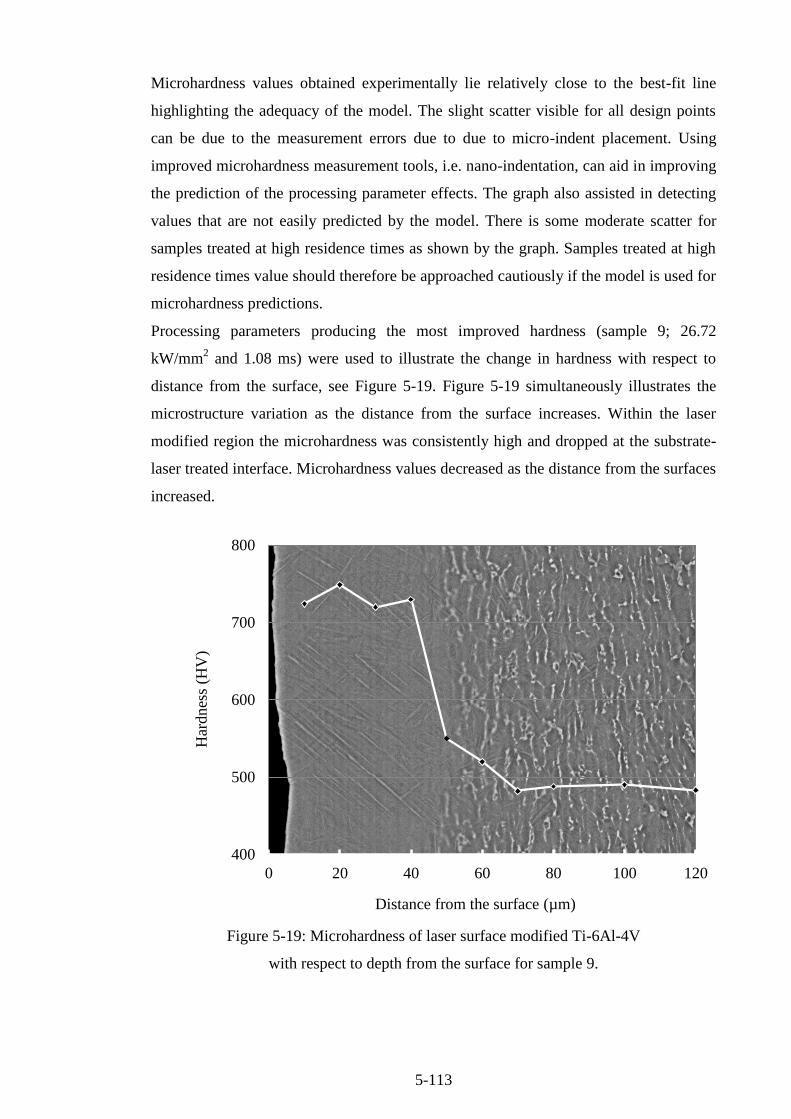
5-113
Microhardness values obtained experimentally lie relatively close to the best-fit line
highlighting the adequacy of the model. The slight scatter visible for all design points
can be due to the measurement errors due to due to micro-indent placement. Using
improved microhardness measurement tools, i.e. nano-indentation, can aid in improving
the prediction of the processing parameter effects. The graph also assisted in detecting
values that are not easily predicted by the model. There is some moderate scatter for
samples treated at high residence times as shown by the graph. Samples treated at high
residence times value should therefore be approached cautiously if the model is used for
microhardness predictions.
Processing parameters producing the most improved hardness (sample 9; 26.72
kW/mm2 and 1.08 ms) were used to illustrate the change in hardness with respect to
distance from the surface, see Figure 5-19. Figure 5-19 simultaneously illustrates the
microstructure variation as the distance from the surface increases. Within the laser
modified region the microhardness was consistently high and dropped at the substrate-
laser treated interface. Microhardness values decreased as the distance from the surfaces
increased.
Figure 5-19: Microhardness of laser surface modified Ti-6Al-4V
with respect to depth from the surface for sample 9.
400
500
600
700
800
0 20 40 60 80 100 120
Har
dnes
s (H
V)
Distance from the surface (µm)

5-114
5.5 Phase and Chemical Composition Characterisation
5.5.1 X-ray diffraction
X-ray diffraction analysis was used to evaluate the phase transformation and
crystallinity changes of Ti-6Al-4V subsequent to laser surface melting. Figure 5-20
demonstrates the x-ray diffraction pattern of untreated Ti-6Al-4V. Figure 5-20 confirms
the presents of the α+β phase observed by the cross-sectional micrographs in section
5.1.2. Table 5-4 lists the major peaks that were indexed between braggs angle (2-theta)
of 20 and 100 degrees. Untreated Ti-6Al-4V is comprised of; the majority α-Ti (100),
(101), (102), (110), (112), (201) and (104) at 35.4°, 40.2°, 53.1°, 63.2° and 70.8°
respectively; and the minority β-Ti (110) and (211) at 38.4° and 76.5° respectively. The
results were found to be in good agreement with reported XRD scans in literature [233].
Figure 5-20: X-ray diffraction pattern of untreated Ti-6Al-4V.
20 30 40 50 60 80 90 100
0
20
40
60
93.1
T
i(104
) In
ten
sity (
a.u
.)
T
i(2
01
)
Angle 2(degrees)
Untreated
76.970.963.653.3
T
i(1
12
)
T
i(2
11
)
T
i(1
10
)
T
i(1
02
)
T
i(1
01
)T
i(1
10
)
T
i(1
00
)
35.4

5-115
Table 5-4: X-ray diffraction data for untreated Ti-6Al-4V.
2θ d Intensity hkl-α hkl-β
(°) Å Max) I/I1(%)
35.407 2.53314 79.8 34.6 100
38.576 2.33198 124 53.9
110
39.375 2.28652 51.1 22.2 - -
40.471 2.22705 230 100 101
53.309 1.71709 96.8 42 102
63.577 1.46226 56.1 24.4 110
71.02 1.32617 140 60.7
211
76.86 1.23931 64.6 28.1 112
78.11 1.22257 40.5 17.6 201
93.146 1.06065 40.7 17.6 10
Figure 5-21 show the x-ray diffraction scans of untreated and laser surface modified
samples. A reduction in the β-Ti phase is evident in all treated samples. The α-Ti at the
2θ value of 39.375° visible in untreated samples is not visible in any LSM XRD scans.
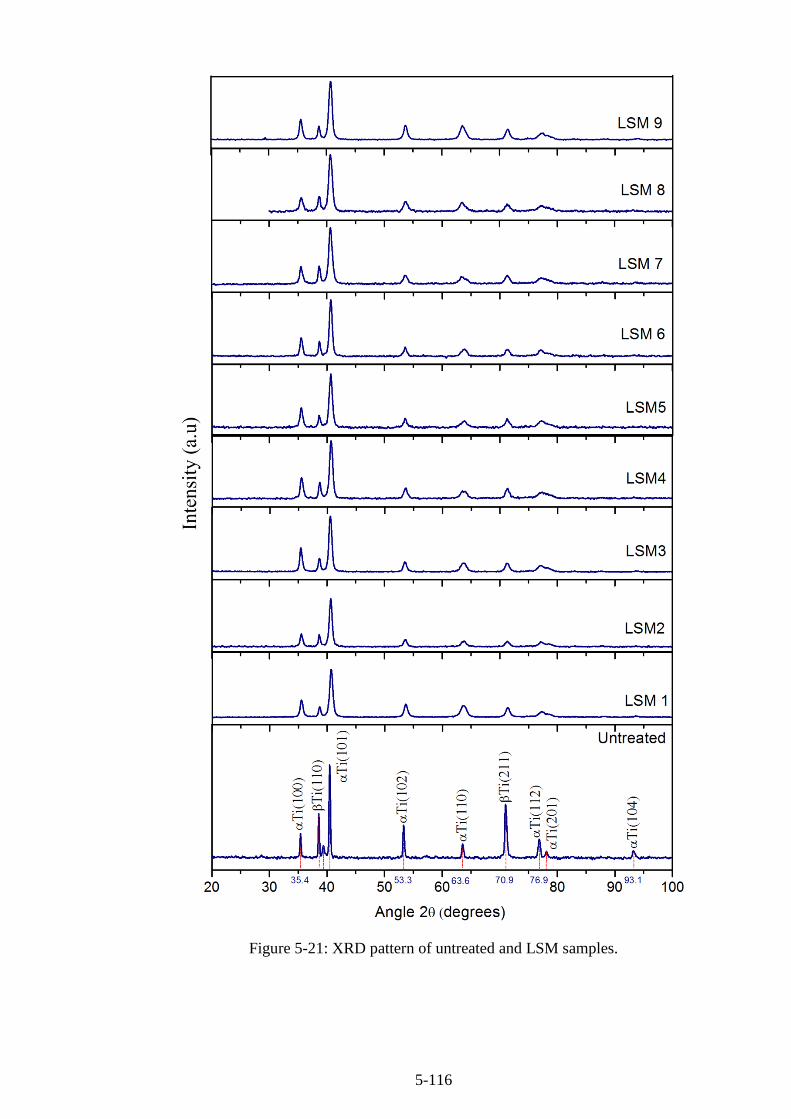
5-116
Figure 5-21: XRD pattern of untreated and LSM samples.

5-117
Untreated Ti-6Al-4V was calculated to contain 28.6% β-Ti, assuming that the remaining
composition is the α phase that means 71.4 % of the material is made up of α-Ti. Figure
5-22 highlights the change in β-Ti phase composition at various levels of irradiance and
residence time. Within the treated samples, β-Ti phase was highest at the lowest
irradiance and residence time, 15.72 kW/mm2 and 1.08 ms respectively. At the lowest
residence time (1.08 ms) β-Ti volume fraction decreased with increase in irradiance. At
the highest residence time (2.16 ms), β-Ti volume fraction slightly increased with
increase in irradiance.
Figure 5-22: Effects of irradiance and residence time on the β-Ti phase.
The 3D graph was generated, in Design Expert®, using two factor interactions model
(2FI). Table 5-5 shows the analyses of variance generated by the model. The Model F-
value of 17.5 implied the model was significant. A p-value of 0.0044 suggested that
there is was a low chance the F-value could occur due to noise. High R2 values suggest
there is a statistical significant interaction between the factors. The adequate precision
was found to be 12.73 indicating an adequate signal. This means that the model can be
used to navigate the design space. Resulting beta Ti phase volume fraction can be
modelled by the final equation produced by the model given in Table 5-5. Order of
factor influence on microhardness can be established through analysis of the F-values
magnitude as follows: A>AB>B. The final equation in terms of the coded factor further
confirms the influence of the factors, see Equation (20).

5-118
Table 5-5: Analysis for variance (ANOVA) table for βTi volume fraction– 2FI model
Source Sum of Squares Mean Square F Value p-value
Model 11.342 3.781 17.500 0.0044
A-Irradiance 6.689 6.689 30.964 0.0026
B-Residence Time 1.244 1.244 5.761 0.0616
AB 3.408 3.408 15.776 0.0106
Residual 1.080 0.216
Cor Total 12.423
Final equation obtained from the model:
R-Squared 0.913 Ti beta phase volume fraction (%) =
+ 37.870
- 0.695 × Irradiance
- 7.438 × Residence Time
+ 0.310 × Irradiance × Residence Time
Adj R-Squared 0.860
Pred R-Squared 0.584
Adeq Precision 12.773
(20)
β-Ti phase volume fraction values after laser surface treatment was found to be highly
predictable according to the model as seen in Figure 5-23. All design points are
positioned close to the best-fit line of the predicted results.
Figure 5-23: A graph of the actual βTi volume fraction versus the predicted values.

5-119
5.5.2 Topographic chemical composition analysis
A comparison of energy dispersive x-ray spectroscopy (EDS) quantitative results was
initially carried out to find the most accurate method of analysing the chemical
composition of the surface. Figure 5-24 shows the two types of scans used (a) area scan
and (b) grid scan.
Figure 5-24: EDS analysis of the Ti-6Al-4V topographic surface
(a) area scan and (b) point analysis.
Both methods resulted in relatively similar chemical compositions as illustrated by the
weight percentage of the composition in Figure 5-25. The results also suggest a
homogeneous chemical composition throughout the surface of the material.
Figure 5-25: Elemental composition using different scan methods and processing times.
0
20
40
60
80
100
Ti Al V Si
Wei
ght
(%
)
Area scan 120 s
Area scan 160 s
Grid Average 120s / spot

5-120
Figure 5-26: Grid scan micrographs of (a) untreated and (b) grit blasted Ti-6Al-4V.
Figure 5-26 shows the micrographs highlighting the scan area for untreated and grit
blasted samples. Figure 5-27 to Figure 5-29 shows the EDS spectrum obtained from the
untreated, grit blasted and LSM samples. The untreated sample spectrum in Figure 5-27
shows the typical Ti, Al and V elements at the expected electron voltages. However,
unexpected minute traces of silicon were observed in grit blasted and some laser treated
spectrums, Figure 5-28 and Figure 5-29 respectively. These traces are attributed to the
grit blasting process undertaken prior to laser treatment. The chemical composition
analysis shows that laser treatment does not result in significant changes in elemental
chemical composition of the topography. No evidence of other foreign element
contamination was found in the treated zones.
(a) (b)

5-121
Figure 5-27: EDS spectrum of untreated Ti-6Al-4V.
Figure 5-28: EDS spectrum of grit blasted Ti-6Al-4V.
Figure 5-29: EDS spectrum of LSM Ti-6Al-4V.

5-122
5.5.3 Cross-sectional chemical composition analysis
A cross-sectional EDS analysis of the laser surface modified samples was carried out at
the points as shown in Figure 5-30. Eight spectrum points were analysed beginning at 8
μm from the surface of the material. All points were separated by 8 μm thus giving an
analysis range of 64 μm covering both the untreated and laser melted regions.
Figure 5-30: Typical EDS analyses of the cross-sectional microstructure
perpendicular to the direction of the beam
Figure 5-31 shows variation in weight percent of the Ti element for sample 3, 6 and 9 as
the distance from the surface is increased.
Figure 5-31: EDS analysis of titanium composition distribution in samples 3, 6 and 9.
85
90
95
0 8 16 24 32 40 48 56 64
Wei
ght
(%)
Distance from surface (μm)
1.08 ms 1.44 ms 2.16 ms

5-123
The graph simultaneous highlight changes in microstructure of a typical laser surface
modified sample at the corresponding distances. Within the laser treated region, the
titanium element composition is uniform at approximately 90% compared to the
relatively non-homogenous titanium distribution within the bulk alloy. The same trend
was found for the aluminium alloying elements, see Figure 5-32. The actual cross-
sectional micrographs of each sample are given in Appendix I.
Figure 5-32: EDS analysis of aluminium composition distribution in samples 3, 6 and 9
5.6 Wear Resistance
Initial tests were carried out to distinguish the depth of wear tracks at specific sliding
distances. Figure 5-33 shows the relationship between wear track depth and sliding
distances of Ti-6Al-4V, characterised via white light interferometry. The wear depth of
Ti-6Al-4V was found to increase linearly from 11 to 57 μm when the distance travelled
by the pin (sliding distance) was varied between 9.7 and 150 m respectively. The
coefficient of determination (R2) of 0.9966 shows a good fit, representing a good
relationship between the depth of wear track and distance travelled by the pin. Two
sliding distances, 20 and 150 m, were selected for the remaining study of laser
processing parameters influence on the wear characteristics. Figure 5-34 shows 3D wear
profiles, of (a) untreated (UT) sample wear tested for 150 m, (b) laser surface modified
(LSM) sample wear tested for 150 m and (c) laser surface modified (LSM) samples
wear tested for 20 m. The images were obtained via white light interferometry.
4.5
5.5
6.5
0 8 16 24 32 40 48 56 64
Wei
ght
(%)
Distance from surface (μm)
Sample 3 Sample 6 Sample 9
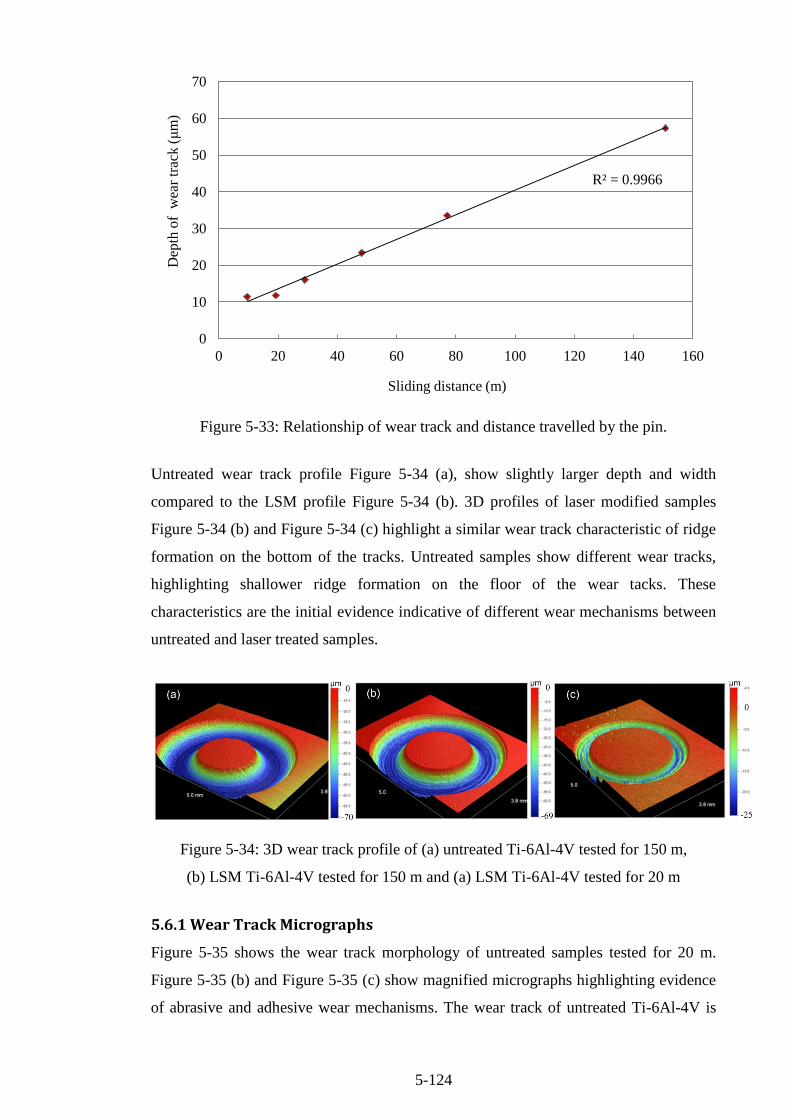
5-124
Figure 5-33: Relationship of wear track and distance travelled by the pin.
Untreated wear track profile Figure 5-34 (a), show slightly larger depth and width
compared to the LSM profile Figure 5-34 (b). 3D profiles of laser modified samples
Figure 5-34 (b) and Figure 5-34 (c) highlight a similar wear track characteristic of ridge
formation on the bottom of the tracks. Untreated samples show different wear tracks,
highlighting shallower ridge formation on the floor of the wear tacks. These
characteristics are the initial evidence indicative of different wear mechanisms between
untreated and laser treated samples.
Figure 5-34: 3D wear track profile of (a) untreated Ti-6Al-4V tested for 150 m,
(b) LSM Ti-6Al-4V tested for 150 m and (a) LSM Ti-6Al-4V tested for 20 m
5.6.1 Wear Track Micrographs
Figure 5-35 shows the wear track morphology of untreated samples tested for 20 m.
Figure 5-35 (b) and Figure 5-35 (c) show magnified micrographs highlighting evidence
of abrasive and adhesive wear mechanisms. The wear track of untreated Ti-6Al-4V is
R² = 0.9966
0
10
20
30
40
50
60
70
0 20 40 60 80 100 120 140 160
Dep
th o
f w
ear
trac
k (μ
m)
Sliding distance (m)
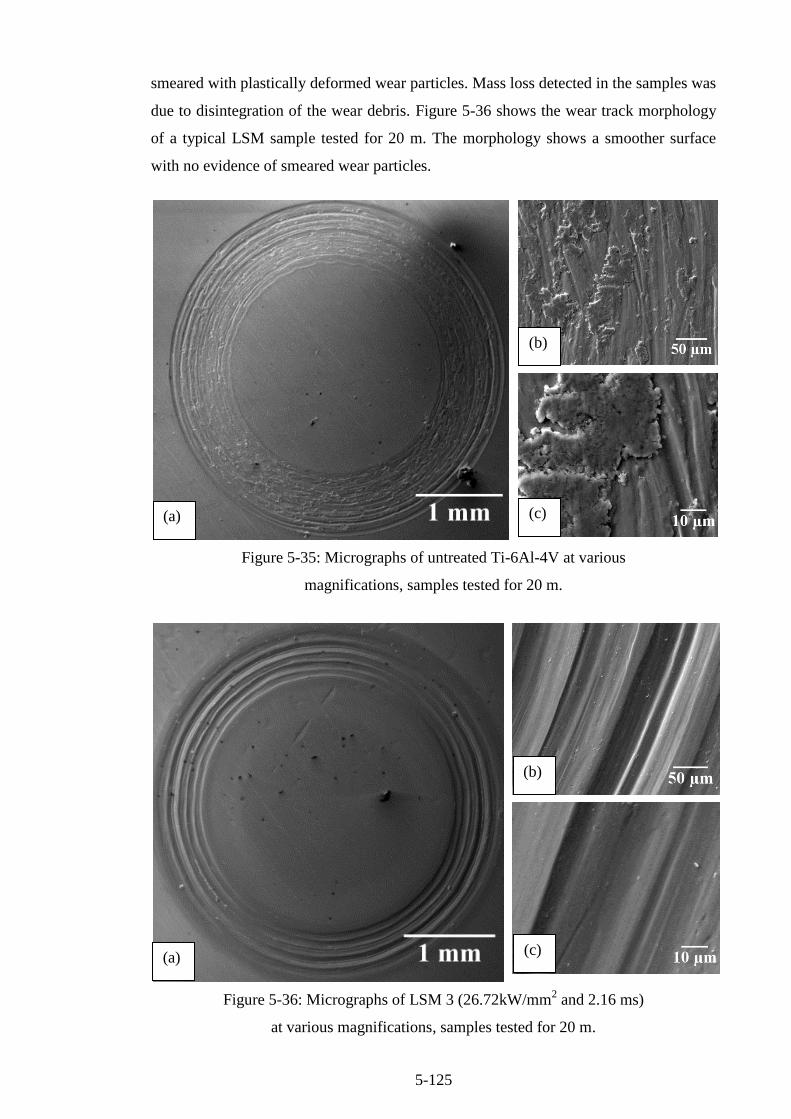
5-125
smeared with plastically deformed wear particles. Mass loss detected in the samples was
due to disintegration of the wear debris. Figure 5-36 shows the wear track morphology
of a typical LSM sample tested for 20 m. The morphology shows a smoother surface
with no evidence of smeared wear particles.
Figure 5-35: Micrographs of untreated Ti-6Al-4V at various
magnifications, samples tested for 20 m.
Figure 5-36: Micrographs of LSM 3 (26.72kW/mm2 and 2.16 ms)
at various magnifications, samples tested for 20 m.
(a)
(b)
(c)
(a)
(b)
(c)
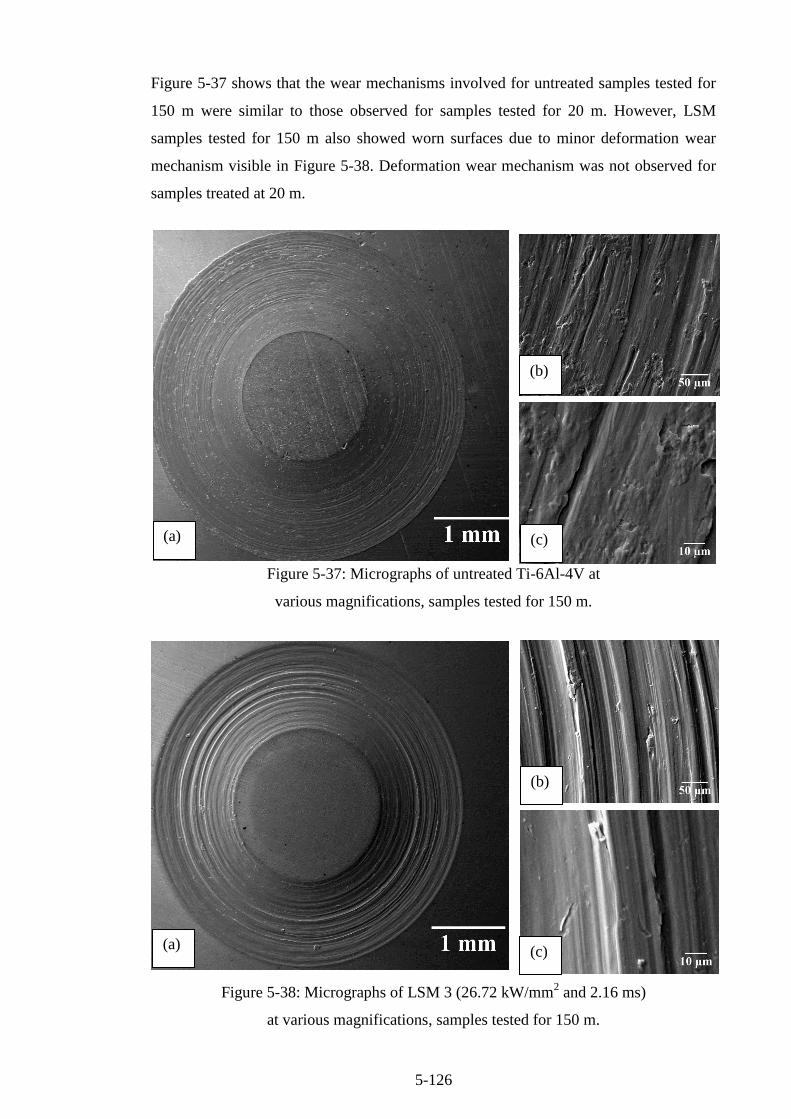
5-126
Figure 5-37 shows that the wear mechanisms involved for untreated samples tested for
150 m were similar to those observed for samples tested for 20 m. However, LSM
samples tested for 150 m also showed worn surfaces due to minor deformation wear
mechanism visible in Figure 5-38. Deformation wear mechanism was not observed for
samples treated at 20 m.
Figure 5-37: Micrographs of untreated Ti-6Al-4V at
various magnifications, samples tested for 150 m.
Figure 5-38: Micrographs of LSM 3 (26.72 kW/mm2 and 2.16 ms)
at various magnifications, samples tested for 150 m.
(a)
(b)
(c)
(a) (c)
(b)

5-127
5.6.2 Effects of Laser Processing Parameters on Specific Wear rate
Figure 5-39 shows the specific wear rate of untreated (UT) and laser modified (LSM)
samples tested for 20 and 150 m.
Figure 5-39: Specific wear rates of Ti-6Al-4V at two sliding distances of 20 and 150 m.
When wear testing was conducted for 150 m, specific wear rate of the untreated samples
were found to be closely similar to that of the treated samples. No correlation was
observed between processing parameters and specific wear rate. However, a strong
correlation was found between the specific wear rate and laser modified melt pool
depths. Figure 5-40 highlights a linear relationship, R2 value of 0.7, where samples with
higher melt-pool depth produced the least wear.
Figure 5-40: Relationship of specific wear rate and melt-pool depth
for samples tested for 150 m.
0
200
400
600
800
UT LSM1 2 3 4 5 6 7 8 9
Sp
ecif
ic W
ear
Rat
e
(×10
-6 m
m3/N
·m)
20 m 150 m
R² = 0.7013
500
550
600
650
700
750
20 25 30 35 40 45 50
Spec
ific
Wea
r R
ate
(×10
-6 m
m3/N
·m)
Meltpool Depth (μm)

5-128
This evidence suggested that the wear track being produced was significantly larger
than the melt-pool sizes therefore the tested wear rates combined with the substrate.
Samples tested for 20 m showed a relationship between laser processing parameters and
the specific wear rate. Figure 5-41 highlights the effects of irradiance time and residence
time on specific wear rate for samples tested for 20 m. Increase in both irradiance and
residence time resulted in higher specific wear rates.
Figure 5-41: Effects of laser processing parameters on
specific wear rate over 20 m sliding distance.
The lowest wear rate of 504 ×10-6
mm3/N·m (17% less than untreated samples) was
produced with the minimal irradiance and residence time of 15.7 kW/mm2 and 1.08 ms
respectively. The 3D graph was generated using a two factor interaction model. Table
5-6 shows the analyses of variance generated by the model. The Model F-value of 62.82
implies the model is significant. A p-value of 0.0002 suggests that there is a low chance
the F-value could occur due to noise. The Predicted R2 of 0.974 is in reasonable
agreement with the Adjusted R2
of 0.9586. High R2 values suggest there is a statistical
significant interaction between the factors. Resulting specific wear rate can be modelled
by the final equation produced by the model given in Table 5-6. Order of factor
influence on microhardness can be established through analysis of the F-values
magnitude as follows: A>>B>>AB. The final equation in terms of the coded factor
further confirms the influence of the factors, see Equation (21).

5-129
Table 5-6: Analysis for variance (ANOVA) table for specific wear rate – 2FI model
Source Sum of Squares Mean Square F Value p-value
Model 18726.17 6242.055 62.819 0.0002
A-Irradiance 16363.66 16363.66 164.683 < 0.0001
B-Residence Time 2347.49 2347.49 23.625 0.0046
AB 15.015 15.015 0.151 0.7135
Residual 496.821 99.36
Cor Total 19222.99 :
Final equation obtained from the model
R-Squared 0.974 Specific Wear Rate 20m =
+331.32746
+8.43833× Irradiance
+22.78662 × Residence Time
+0.65236× Irradiance × Residence Time
Adj R-Squared 0.958
Pred R-Squared 0.832
Adeq Precision 21.669
(21)
The outcome of wear treated samples has a high predictability factor as presented in
Figure 5-42. The specific wear rates values obtained experimentally are positioned close
to the best-fit line highlighting the adequacy of the model.
Figure 5-42: Actual specific wear rate values versus the predicted response values
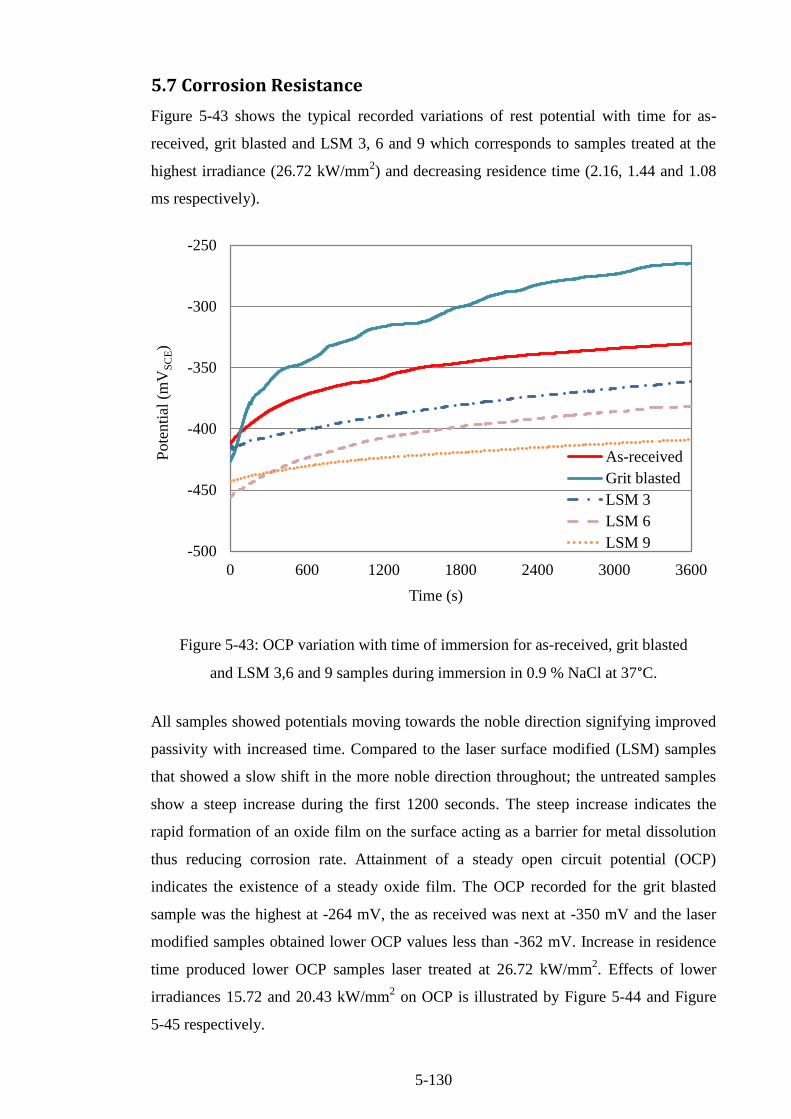
5-130
5.7 Corrosion Resistance
Figure 5-43 shows the typical recorded variations of rest potential with time for as-
received, grit blasted and LSM 3, 6 and 9 which corresponds to samples treated at the
highest irradiance (26.72 kW/mm2) and decreasing residence time (2.16, 1.44 and 1.08
ms respectively).
Figure 5-43: OCP variation with time of immersion for as-received, grit blasted
and LSM 3,6 and 9 samples during immersion in 0.9 % NaCl at 37°C.
All samples showed potentials moving towards the noble direction signifying improved
passivity with increased time. Compared to the laser surface modified (LSM) samples
that showed a slow shift in the more noble direction throughout; the untreated samples
show a steep increase during the first 1200 seconds. The steep increase indicates the
rapid formation of an oxide film on the surface acting as a barrier for metal dissolution
thus reducing corrosion rate. Attainment of a steady open circuit potential (OCP)
indicates the existence of a steady oxide film. The OCP recorded for the grit blasted
sample was the highest at -264 mV, the as received was next at -350 mV and the laser
modified samples obtained lower OCP values less than -362 mV. Increase in residence
time produced lower OCP samples laser treated at 26.72 kW/mm2. Effects of lower
irradiances 15.72 and 20.43 kW/mm2 on OCP is illustrated by Figure 5-44 and Figure
5-45 respectively.
-500
-450
-400
-350
-300
-250
0 600 1200 1800 2400 3000 3600
Pote
nti
al (
mV
SC
E)
Time (s)
As-received
Grit blasted
LSM 3
LSM 6
LSM 9
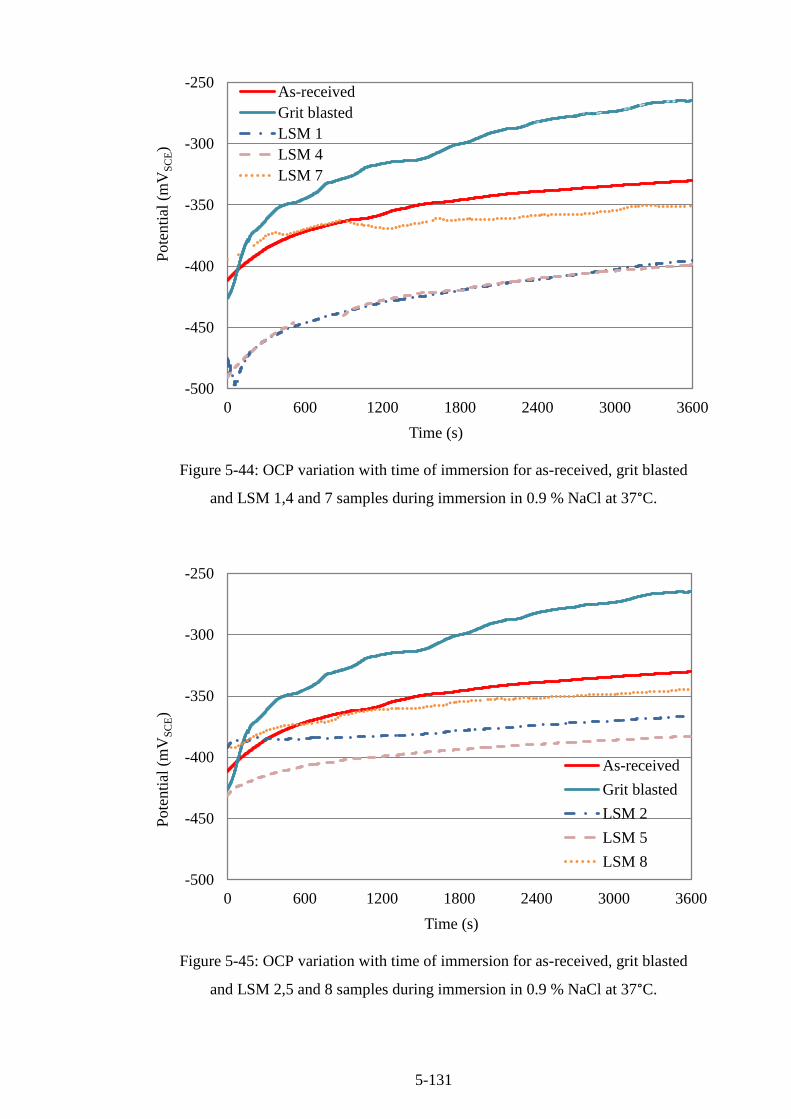
5-131
Figure 5-44: OCP variation with time of immersion for as-received, grit blasted
and LSM 1,4 and 7 samples during immersion in 0.9 % NaCl at 37°C.
Figure 5-45: OCP variation with time of immersion for as-received, grit blasted
and LSM 2,5 and 8 samples during immersion in 0.9 % NaCl at 37°C.
-500
-450
-400
-350
-300
-250
0 600 1200 1800 2400 3000 3600
Pote
nti
al (
mV
SC
E)
Time (s)
As-received
Grit blasted
LSM 1
LSM 4
LSM 7
-500
-450
-400
-350
-300
-250
0 600 1200 1800 2400 3000 3600
Pote
nti
al (
mV
SC
E)
Time (s)
As-received
Grit blasted
LSM 2
LSM 5
LSM 8
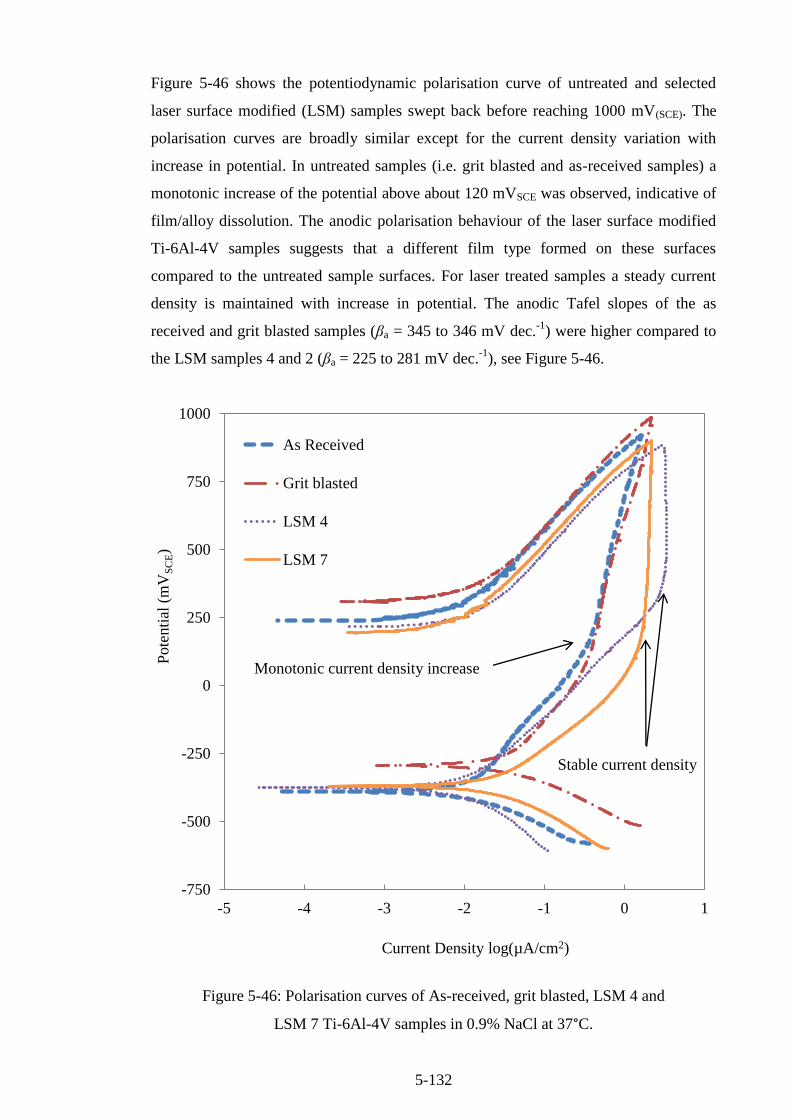
5-132
Figure 5-46 shows the potentiodynamic polarisation curve of untreated and selected
laser surface modified (LSM) samples swept back before reaching 1000 mV(SCE). The
polarisation curves are broadly similar except for the current density variation with
increase in potential. In untreated samples (i.e. grit blasted and as-received samples) a
monotonic increase of the potential above about 120 mVSCE was observed, indicative of
film/alloy dissolution. The anodic polarisation behaviour of the laser surface modified
Ti-6Al-4V samples suggests that a different film type formed on these surfaces
compared to the untreated sample surfaces. For laser treated samples a steady current
density is maintained with increase in potential. The anodic Tafel slopes of the as
received and grit blasted samples (βa = 345 to 346 mV dec.-1
) were higher compared to
the LSM samples 4 and 2 (βa = 225 to 281 mV dec.-1
), see Figure 5-46.
Figure 5-46: Polarisation curves of As-received, grit blasted, LSM 4 and
LSM 7 Ti-6Al-4V samples in 0.9% NaCl at 37°C.
-750
-500
-250
0
250
500
750
1000
-5 -4 -3 -2 -1 0 1
Pote
nti
al (
mV
SC
E)
Current Density log(µA/cm2)
As Received
Grit blasted
LSM 4
LSM 7
Monotonic current density increase
Stable current density

5-133
Figure 5-47 shows the potentiodynamic polarisation curve of untreated and laser surface
melted Ti-6Al-4V where the upscan reached the breakdown potential. Low Tafel slopes
in LSM samples are clearly visible. The monotonic increase of untreated samples
intersects LSM samples at approximately 1000 mV(SCE). LSM sample show a stable
current density resembling a superior stable passive film compared to untreated
samples. Both laser treated and untreated samples showed localised corrosion
characteristics, illustrated in Figure 5-47 as the rapid increase in current density at a
high potentials. In this case the localised corrosion was found to be pitting corrosion.
Figure 5-47: potentiodynamic polarisation curves of an untreated
and laser treated Ti-6Al-4V
Localised corrosion in the form of pitting is clearly shown for both the untreated and
LSM 8 in Figure 5-48. The pit size and shape of the LSM and as-received samples are
different highlighting different surface properties on both set of samples. Figure 5-48 (c)
shows the appearance of the laser-treated surface layer on the pit. A smoother pitting
-750
-250
250
750
1250
1750
2250
-4 -2 0 2 4
Pote
nti
al (
mV
SC
E)
Current Density log(µA/cm2)
Untreated
Laser-treated

5-134
surface is produced on the laser modified layer. No pitting was observed in any of these
samples kept below 1000 mVSCE, indicating the existence of stable passive protective
films up to approximtely1300mVSCE.
Figure 5-48: Localised corrosion of (a) as-received Ti-6Al-4V, (b) LSM 8
and (c) magnified view of sub-section from (b).
Tafel analysis results obtained using Tafel rulers of the ACM Sequencer software are
tabulated in Table 5-7. The corrosion current densities (icorr) were found to be between
10 and 28 nA cm-2
. Samples treated at the lowest residence 1.08 and highest irradiance
26.72 kW/mm2 showed the lowest average corrosion rate of 86 nm yr
-1. At a constant
residence time of 1.08 ms (lowest residence time implemented), irradiances of 15.72,
(a) (b)
(c)
Laser modified layer
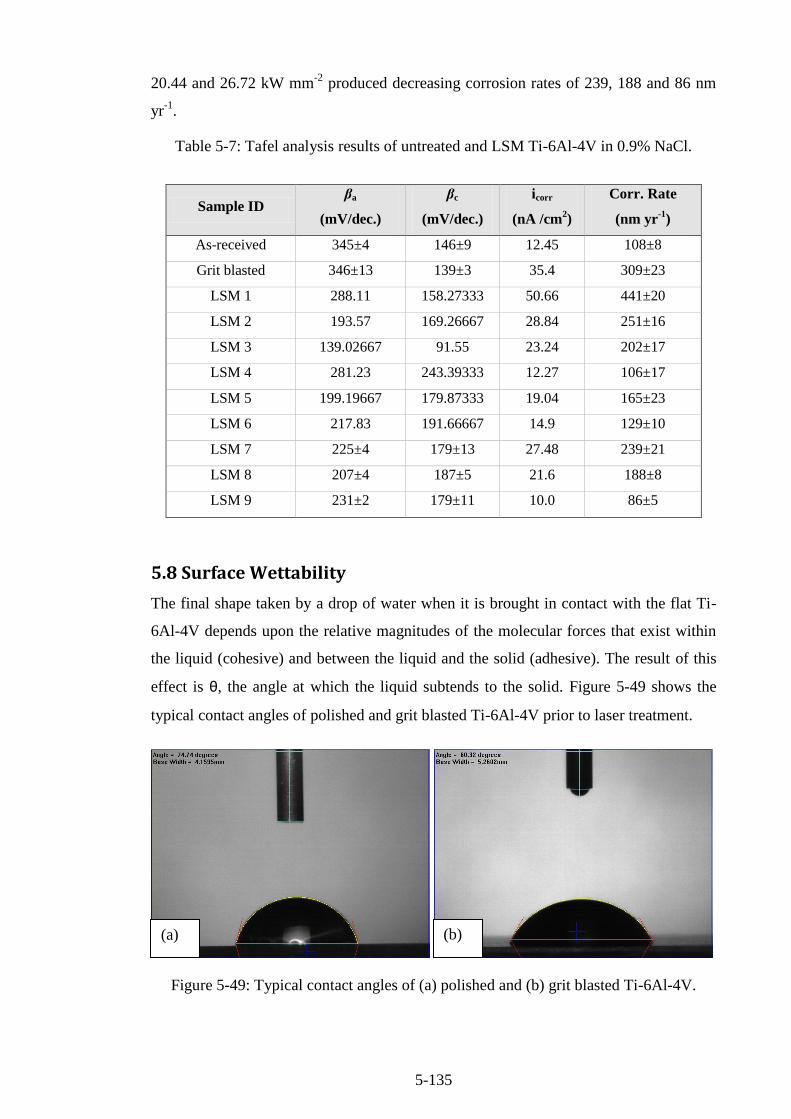
5-135
20.44 and 26.72 kW mm-2
produced decreasing corrosion rates of 239, 188 and 86 nm
yr-1
.
Table 5-7: Tafel analysis results of untreated and LSM Ti-6Al-4V in 0.9% NaCl.
Sample ID βa
(mV/dec.)
βc
(mV/dec.)
icorr
(nA /cm2)
Corr. Rate
(nm yr-1
)
As-received 345±4 146±9 12.45 108±8
Grit blasted 346±13 139±3 35.4 309±23
LSM 1 288.11 158.27333 50.66 441±20
LSM 2 193.57 169.26667 28.84 251±16
LSM 3 139.02667 91.55 23.24 202±17
LSM 4 281.23 243.39333 12.27 106±17
LSM 5 199.19667 179.87333 19.04 165±23
LSM 6 217.83 191.66667 14.9 129±10
LSM 7 225±4 179±13 27.48 239±21
LSM 8 207±4 187±5 21.6 188±8
LSM 9 231±2 179±11 10.0 86±5
5.8 Surface Wettability
The final shape taken by a drop of water when it is brought in contact with the flat Ti-
6Al-4V depends upon the relative magnitudes of the molecular forces that exist within
the liquid (cohesive) and between the liquid and the solid (adhesive). The result of this
effect is θ, the angle at which the liquid subtends to the solid. Figure 5-49 shows the
typical contact angles of polished and grit blasted Ti-6Al-4V prior to laser treatment.
Figure 5-49: Typical contact angles of (a) polished and (b) grit blasted Ti-6Al-4V.
(a) (b)
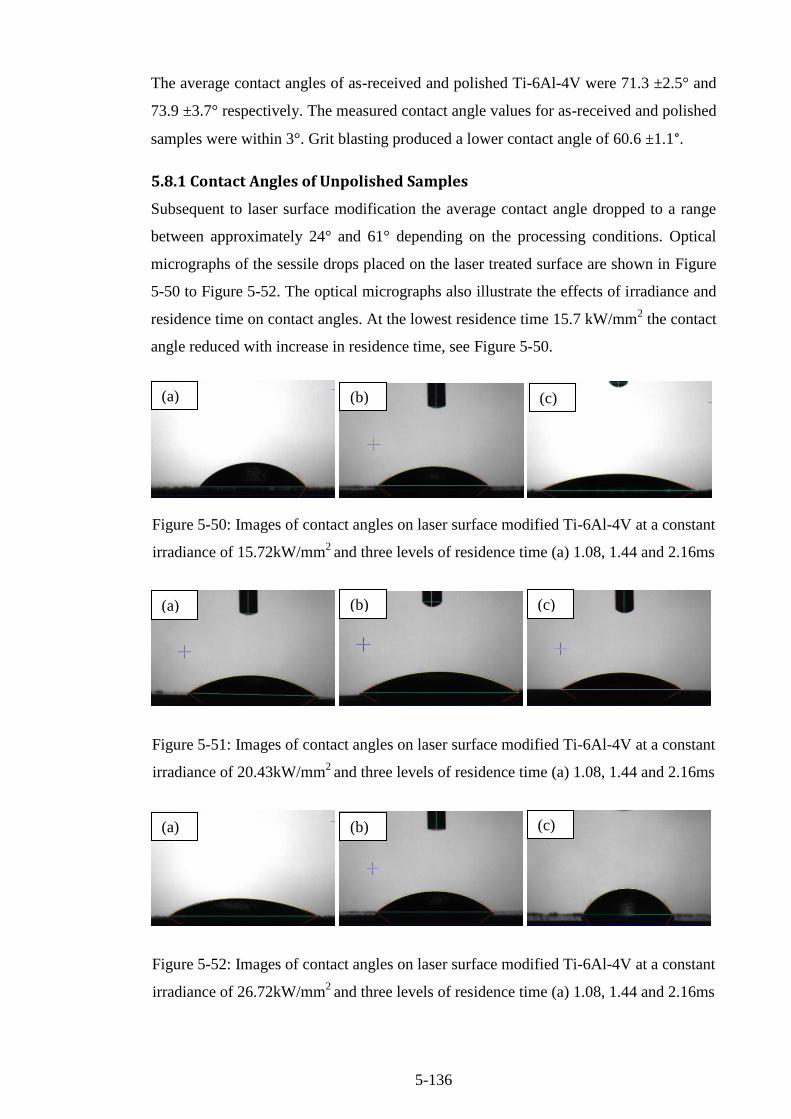
5-136
The average contact angles of as-received and polished Ti-6Al-4V were 71.3 ±2.5° and
73.9 ±3.7° respectively. The measured contact angle values for as-received and polished
samples were within 3°. Grit blasting produced a lower contact angle of 60.6 ±1.1°.
5.8.1 Contact Angles of Unpolished Samples
Subsequent to laser surface modification the average contact angle dropped to a range
between approximately 24° and 61° depending on the processing conditions. Optical
micrographs of the sessile drops placed on the laser treated surface are shown in Figure
5-50 to Figure 5-52. The optical micrographs also illustrate the effects of irradiance and
residence time on contact angles. At the lowest residence time 15.7 kW/mm2 the contact
angle reduced with increase in residence time, see Figure 5-50.
Figure 5-50: Images of contact angles on laser surface modified Ti-6Al-4V at a constant
irradiance of 15.72kW/mm2
and three levels of residence time (a) 1.08, 1.44 and 2.16ms
Figure 5-51: Images of contact angles on laser surface modified Ti-6Al-4V at a constant
irradiance of 20.43kW/mm2
and three levels of residence time (a) 1.08, 1.44 and 2.16ms
Figure 5-52: Images of contact angles on laser surface modified Ti-6Al-4V at a constant
irradiance of 26.72kW/mm2
and three levels of residence time (a) 1.08, 1.44 and 2.16ms
(a) (b) (c)
(a) (b) (c)
(a) (b) (c)

5-137
Figure 5-53 shows effects of processing parameters on contact angles. A line
representing the contact angle of untreated samples was included to highlight reduction
in contact angles induced by laser surface melting. At low residence time (1.08 ms),
contact angle decreases with increase in irradiance. This opposite happens at high
residence times (2.16 ms) where contact angles increase with increase in irradiance. At
the mid-range residence time (1.44 ms), the contact angle does not vary significantly.
The effect can easily be viewed by the contour plot presented in Figure 5-54.
Figure 5-53: Effects of irradiance and residence time on contact angle.
Figure 5-54: Contour plot highlighting the effects of irradiance
and residence time on measured contact angles.
20
30
40
50
60
70
80
15 20 25 30
Conta
ct A
ngle
(°)
Irradiance kW(mm2)
2.16
1.44
1.08
As-received
Residence Time
(ms)
Design-Expert® Software
Factor Coding: Actual
Contact Angles (unpolished)
61.24
24.0867
X1 = A: Irradiance
X2 = B: Residence Time
15.72 19.39 23.05 26.72
1.08
1.44
1.80
2.16Contact Angles (unpolished)
A: Irradiance
B:
Re
sid
en
ce
Tim
e
30
30
40
40
50
50
Design-Expert® Software
Factor Coding: Actual
Contact Angles (unpolished)
61.24
24.0867
X1 = A: Irradiance
X2 = B: Residence Time
15.72 19.39 23.05 26.72
1.08
1.44
1.80
2.16Contact Angles (unpolished)
A: Irradiance
B:
Re
sid
en
ce
Tim
e
30
30
40
40
50
50
Irradiance (kW/mm2)
Res
iden
ce t
ime
(ms)

5-138
The contour plot was generated using a quadratic model. Table 5-8 shows the analysis
of variance generated by the model. The high Model F-value of 49.348 implied the
model was significant. A p-value of 0.0044 suggested that there was a low chance such
a high F-value could occur due to noise. The predicted R2 of 0.968 is in reasonable
agreement with the adjusted R2
of 0.86. High R2 values suggest there is a statistical
significance between the factors and average contact angles subsequent to laser surface
melting. Contact angles of unpolished samples can be modelled by the final equation
produced by the model given in Table 5-8. Order of factor influence on contact angles
can be established through analysis of the F-values magnitude as follows:
AB>>A2>>B
2>A>B. The final equation in terms of the coded factor further confirms
the influence of the factors, see Equation (22).
Table 5-8: Analysis for variance (ANOVA) table for contact angles
of unpolished samples - quadratic model
Source Sum of Squares Mean Square F Value p-value
Model 1315.486 263.097 49.348 0.0044
A-Irradiance 3.3450 3.345 0.627 0.4862
B-Residence Time 0.115 0.115 0.0217 0.8922
AB 1139.288 1139.288 213.694 0.0007
A2 158.301 158.301 29.692 0.0121
B2 14.436 14.4363 2.707 0.1984
Residual 15.994 5.331
Cor Total 1331.48
Final equation obtained from the model:
R-Squared 0.988 Contact angles of unpolished sample (°)=
+ 379.649
+ 21.551× Irradiance
- 150.175 × Residence time
+ 5.683 × Irradiance ×Residence time
+ 0.294 × Irradiance2
+ 9.214 × Residence time2
Adj R-Squared 0.968
Pred R-Squared 0.866
Adeq Precision 18.696
(22)
Measured contact angles after laser surface treatment was found to be highly predictable
according to the model as seen in Figure 5-55. All design points are positioned close to
the best-fit line of the predicted results. The adequate precision was found to be 18.696
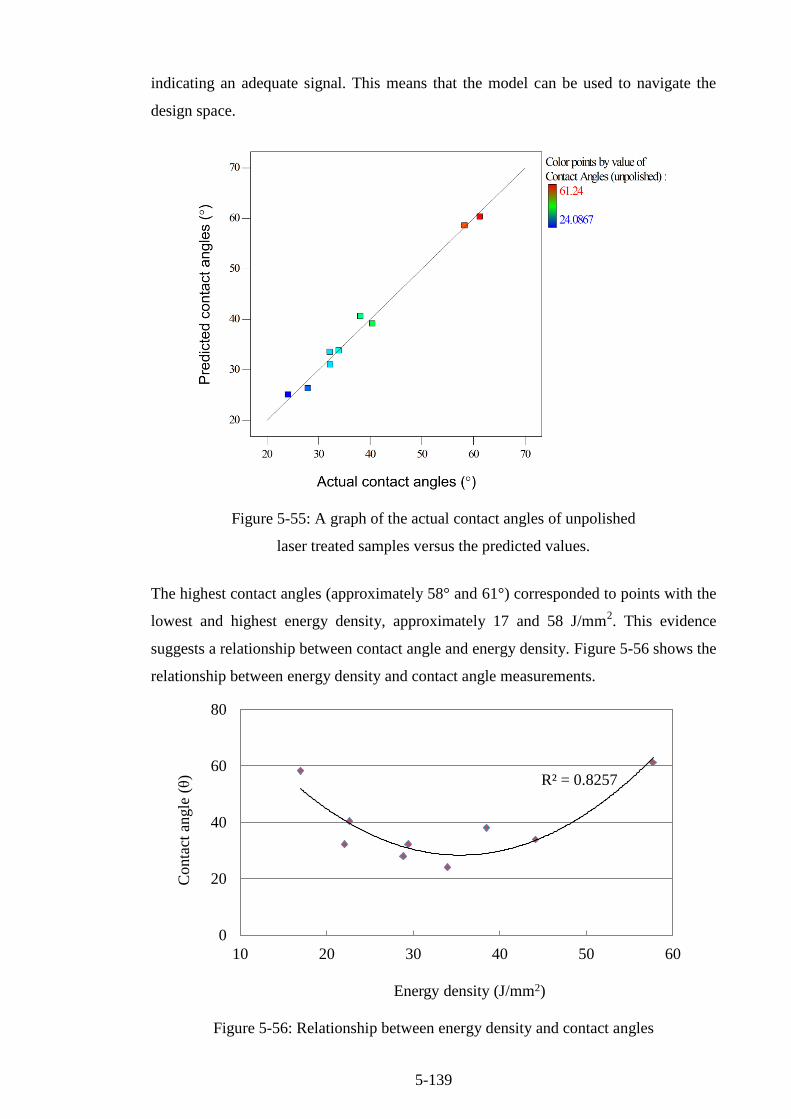
5-139
indicating an adequate signal. This means that the model can be used to navigate the
design space.
Figure 5-55: A graph of the actual contact angles of unpolished
laser treated samples versus the predicted values.
The highest contact angles (approximately 58° and 61°) corresponded to points with the
lowest and highest energy density, approximately 17 and 58 J/mm2. This evidence
suggests a relationship between contact angle and energy density. Figure 5-56 shows the
relationship between energy density and contact angle measurements.
Figure 5-56: Relationship between energy density and contact angles
R² = 0.8257
0
20
40
60
80
10 20 30 40 50 60
Conta
ct a
ngle
(θ)
Energy density (J/mm2)

5-140
The R2 value of 0.826 indicates that the second order polynomial relationship between
the parameters is significant. A saddle point was observed at mid-range energy
densities, where the lowest contact angles were measured.
5.8.2 Contact Angle of Polished Samples
Figure 5-57 shows the effects of processing parameters on contact angles measure from
samples polished subsequent to laser modification. A saddle shape relationship
highlighting stationary values at the mid-range residence time was observed. The graph
shows a different relationship of effects of processing parameters on contact angles
compared to the unpolished samples thus further suggesting significance of roughness
in contact angle measurements. The contour plot was produced using Design Expert via
a quadratic model. Table 5-9 shows the analyses variance generated by the model. The
model F-value of 15.86 implies the model is significant with a 0.0228 chance that this
model F value is due to noise. The predicted R2 of 0.7 is above the minimum threshold
and the difference between the adjusted R2 is also within the minium require 0.2. High
R2 values suggest there is a statical significant interaction between the factors. This
interaction can be modelled by the final equation produced by the model given in Table
5-9.
Figure 5-57: Effects of contact angle Irradiance and residence time on
contact angles of polished samples.
Design-Expert® Software
Factor Coding: Actual
Contact Angles (Polished)
70.2433
54.5167
X1 = A: Irradiance
X2 = B: Residence Time
15.72 19.39 23.05 26.72
1.08
1.44
1.80
2.16
Contact Angles (Polished)
A: Irra d ia n c e
B: R
esid
en
ce T
ime
58
60
60
62
62
64
64
66
66
68
Design-Expert® Software
Factor Coding: Actual
Contact Angles (Polished)
70.2433
54.5167
X1 = A: Irradiance
X2 = B: Residence Time
15.72 19.39 23.05 26.72
1.08
1.44
1.80
2.16
Contact Angles (Polished)
A: Irra d ia n c e
B: R
esid
en
ce T
ime
58
60
60
62
62
64
64
66
66
68
Irradiance (kW/mm2)
Res
iden
ce t
ime
(ms)

5-141
Table 5-9: Analysis for variance (ANOVA) table for contact angles
of polished samples - quadratic model
Source Sum of Squares Mean Square F Value p-value
Model 269.037 53.807 15.867 0.0228
A-Irradiance 11.454 11.454 3.377 0.1634
B-Residence Time 9.685 9.685 2.856 0.1896
AB 7.049 7.049 2.078 0.2450
A2 5.137 5.137 1.515 0.3061
B2 235.710 235.710 69.509 0.0036
Residual 10.173 3.391
Cor Total 279.210
Final equation obtained from the model:
R-Squared 0.963 Contact Angle (polished )=
+171.80192
- 1.77578× Irradiance
-113.4916× Residence Time
-0.44697 × Irradiance × Residence Time
+0.052987 × Irradiance2
+37.22946 × Residence Time2
Adj R-Squared 0.902
Pred R-Squared 0.701
Adeq Precision 9.243
Order of factor influence on contact angles can be established through analysis of the F-
values magnitude as follows: B2>>A>B>AB>A
2. The final equation in terms of the
coded factor further confirms the influence of the factors, see Equation (23).
(23)
5.9 Biocompatibility
5.9.1 Cell Attachment and Metabolic Activity
Figure 5-58 demonstrates the percentage cell attachment of each group with the error
bars indicating the standard deviation between groups. One way ANOVA showed that
there was no significant difference in cell attachment. This is due to large variation
between several groups, illustrated by the error bars in Figure 5-58.

5-142
Figure 5-58: Cellular attachment at 2 hours shown as a
percentage of the number of cells originally seeded.
Figure 5-59 shows the relationship between cell attachment and measured contact
angles. The graph shows that cell attachment percentage generally decreased with an
increase in measured contact angles.
Figure 5-59: Relationship between contact angle of
unpolished LSM samples and cell attachment
However, roughness did not have any effects on cell attachment percentage. Figure 5-60
demonstrates that cell attachment is independent of roughness values.
0
10
20
30
40
50
60
Control LSM 1 LSM 2 LSM 3 LSM 4 LSM 5 LSM 6 LSM 7 LSM 8 LSM 9
Cel
l A
ttac
hm
ent
(%)
10
15
20
25
30
20 30 40 50 60 70
Cel
l A
ttac
hm
ent
(%)
Contact Angle (θ)

5-143
Figure 5-60: Effects of roughness on cell attachment
Figure 5-61 demonstrates the varying levels of proliferation for different samples. One
way ANOVA for each set of data demonstrates that there is no significant difference
between cell proliferation on laser treated samples.
Figure 5-61: Metabolic activity at 24 hr, 96 hr, and 7 days * (p<0.05).
However, the difference between the control (untreated sample) and the laser treated
samples was significant (P<0.05). This demonstrates that there was more cell metabolic
activity on the laser treated samples and less on the untreated control Ti-6Al-4V
samples. Further t-tests showed that there was a significant difference between the
untreated control and the treated samples at all-time points, see Figure 5-62.
0
10
20
30
40
50
1 1.5 2 2.5 3
Cel
l A
ttac
hm
ent
(%)
Roughness (μm)
0
10
20
30
40
50
60
70
Red
uct
ion (
%)
24 hr
96 hr
7 Days
*
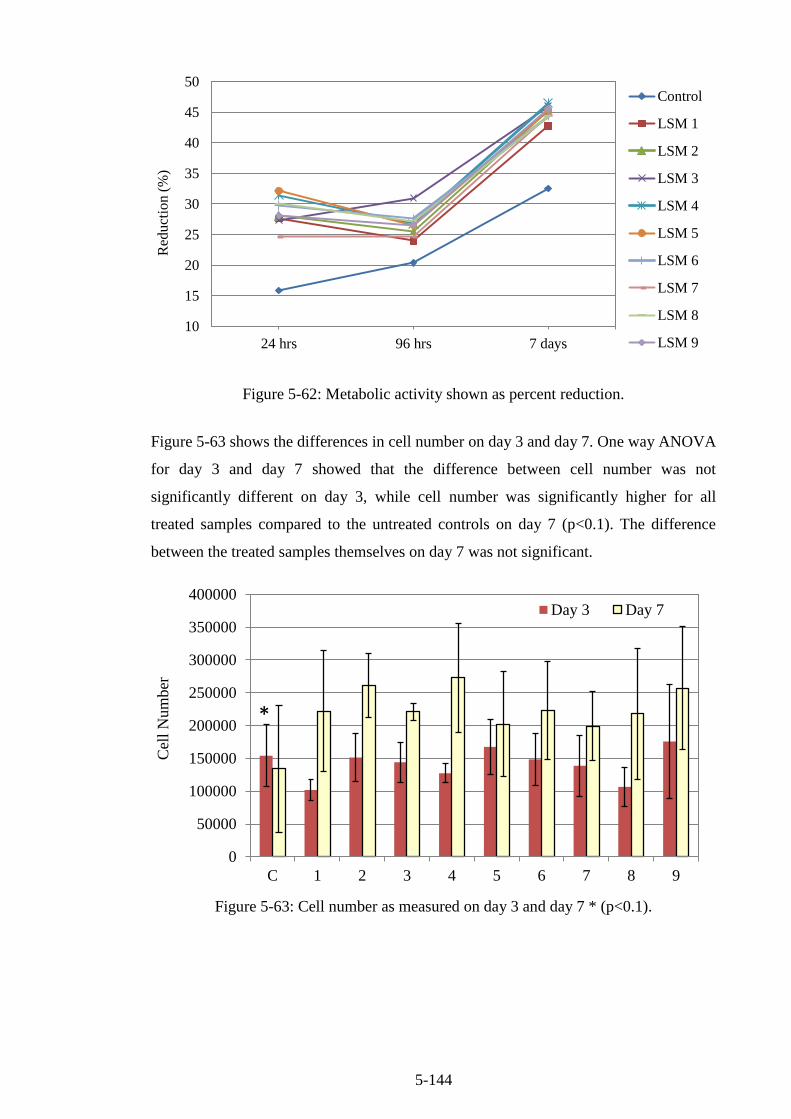
5-144
Figure 5-62: Metabolic activity shown as percent reduction.
Figure 5-63 shows the differences in cell number on day 3 and day 7. One way ANOVA
for day 3 and day 7 showed that the difference between cell number was not
significantly different on day 3, while cell number was significantly higher for all
treated samples compared to the untreated controls on day 7 (p<0.1). The difference
between the treated samples themselves on day 7 was not significant.
Figure 5-63: Cell number as measured on day 3 and day 7 * (p<0.1).
10
15
20
25
30
35
40
45
50
24 hrs 96 hrs 7 days
Red
uct
ion
(%
)
Control
LSM 1
LSM 2
LSM 3
LSM 4
LSM 5
LSM 6
LSM 7
LSM 8
LSM 9
0
50000
100000
150000
200000
250000
300000
350000
400000
C 1 2 3 4 5 6 7 8 9
Cel
l N
um
ber
Day 3 Day 7
*

5-145
5.9.2 Cytotoxicity
Direct contact
The results for the MTT viability assessment of NIH/3T3 fibroblast cells following 24
hour exposure to Ti-6A-l4V samples are shown in Figure 5-64. Each column is the
mean of three separate experiments where n = 3 ± SEM, (* denotes a significant
difference from the control *= p<0.05). A high degree of reproducibility was achieved
as indicated by the relatively small error bars. In general, all samples produced a
significant decrease in viability. Samples 6-9 showed a slight but significant (p < 0.05)
inhibition of formazan production while the untreated sample, reduced the viability
values below 50% at 24 h exposure. The results clearly indicate that the treatment
(laser) had an impact on the cytotoxic potential of the tested samples. In contrast to
results obtained from untreated samples, treated samples showed only slight cytotoxic
behaviour.
Figure 5-64: Effect of Ti-6Al-4V samples in direct contact with NIH/3T3 fibroblasts for
24 hr using the MTT cell viability assay as a measure of toxicity.
Leachate/Elusion test
Figure 5-65 shows the effect of various concentrations of untreated and laser melted Ti-
6Al-4V samples in contact with NIH/3T3 fibroblasts for 24 hr using the MTT cell
viability assay as a measure of toxicity. Each data point is the mean of three separate
experiments where n=18 ± SEM, (* denotes a significant difference from the control *=
p<0.05).
*
* * *
0
20
40
60
80
100
120
Control Untreated LSM 6 LSM 7 LSM 8 LSM 9
Via
bil
ity (
% c
ontr
ol)
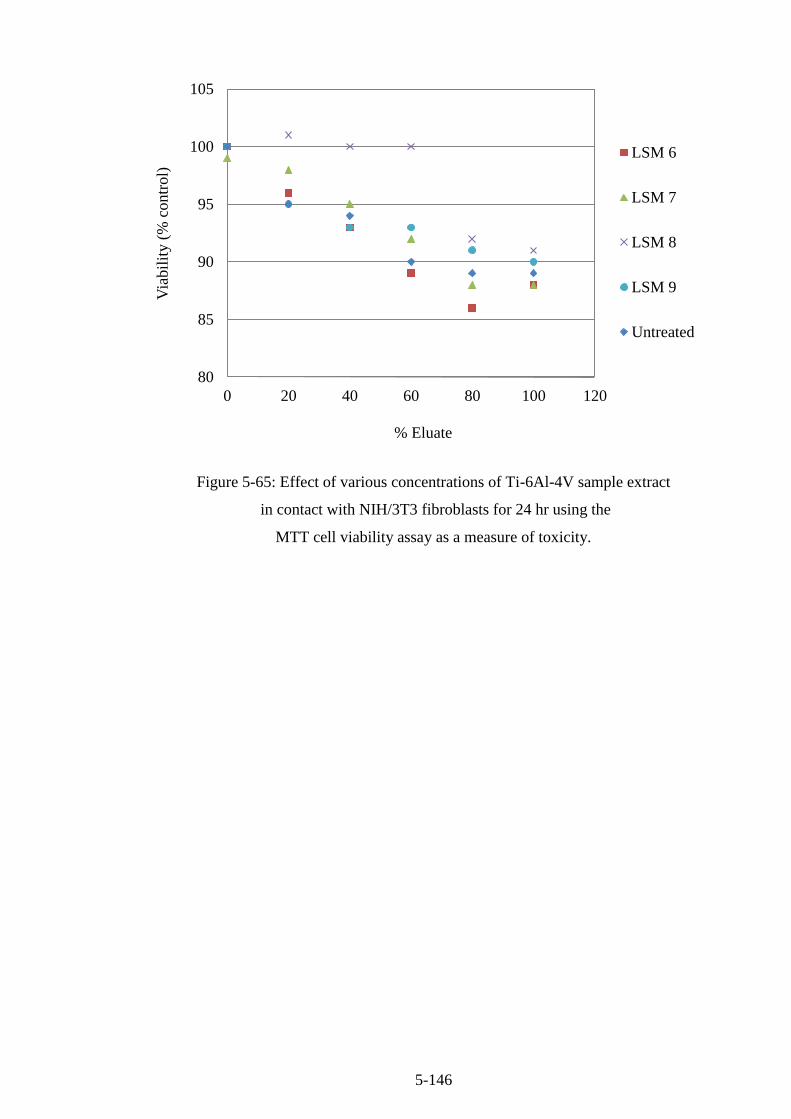
5-146
Figure 5-65: Effect of various concentrations of Ti-6Al-4V sample extract
in contact with NIH/3T3 fibroblasts for 24 hr using the
MTT cell viability assay as a measure of toxicity.
80
85
90
95
100
105
0 20 40 60 80 100 120
Via
bil
ity (
% c
ontr
ol)
% Eluate
LSM 6
LSM 7
LSM 8
LSM 9
Untreated

6-147
Chapter 6
Discussion: Ti-Al-4V
6.1 Metallography Analysis
6.1.1 Surface Melting and Morphological Features
Laser surface melting produced a typical melting morphology with no voids, inclusions,
pits or cracks. Exclusion of such asperities was crucial to establish a consistent and
analogous laser treatment of the samples. This also suggested that a non-contaminated
laser melting could be achieved at these processing conditions. Processing parameters
used in this study were carefully chosen so that energy densities do not exceed levels
that induce ablation of surface material. Appendix J highlights preliminary tests where
high energy densities were implemented resulting in material ejection from the surface.
From the preliminary studies, it was established that energy densities greater than 67
J/mm2 resulted in ablation. At this energy level sample sparking while laser processing
began to occur.
The BSE topographic micrographs from the final DOE (Figure 5-2 to Figure 5-10)
showed no evidence of ablation of the surface. Lack of ejected material or channel-like
features in the BSE images can be evidenced as absence of ablation on the surface.
Instead, the surface is melted and rapidly solidifies due to high speed processing.
Roughness and ripple-like features visible on the surface of the treated zone is evidence
that the material reached a liquid phase. A schematic representation of the formation of
the rippling effect is shown in Figure 6-1.
Figure 6-1: Schematic of the laser melted pool perpendicular
to the direction of laser beam movement [97].
1. Stagnation flow region
2. Free surface boundary layer
3. Cooled corner region
4. Solid-liquid interface
5. Isothermal inviscid core

6-148
When the surface is laser melted an immediate depression is formed directly underneath
the beam due to liquid movement. Absorbed energy by the surface is altered by the
alteration in focal distance and the newly formed liquid phase. This lead to a uniform
distribution of surface temperature and altered the driving force. When the depression
diminished the reverse occurred thus causing the cyclic nature made obvious in the
ripples characterising laser melting.
The width of the tracks, deduced from the ripple-like features, is representative of the
laser beam spot size of 90 µm. However, the set overlap of 30% is inadvertently larger,
construed to be approximately 50% in all the treated samples. The beam is skewed
towards the direction of the linear displacement therefore resulting in a slightly higher
overlap than the set 30%. Another effect of this phenomenon can be due to the Gaussian
nature of the laser beam and the beam quality of TEM00. TEM Gaussian beam drops
from the centre forming a bell shaped curve, resembling a normal distribution. The
effects of the beam effect can be demonstrated by Figure 6-2. Diameter of such laser
beam qualities is defined by the distance at which the irradiance is 1/e2 of the maximum
peak irradiance, as illustrated by Figure 6-2 [234]. This means that only 86.5% of the
total laser beam power lies within this region since 1/e2 is 0.135. The remainder of this
energy outside this point is regarded as insignificant to impact the material thus
resulting in the reduced overlap percentage.
Figure 6-2: Irradiance of the TEM mode as a function
of distance across the laser beam [234].

6-149
The dimensions of grains observed on the laser processed surface tend to increase with
increase in irradiance. This behaviour is related to the low cooling rates induced by high
power densities. When the surface is treated at high power density, a much larger
instantaneous maximum temperature could be attained thus producing a larger molten
volume which took longer to cool therefore produced larger grain sizes compared to
samples treated at low power densities. The instantaneous maximum temperature could
be calculated using thermal heat energy Equation (9) [16].
6.1.2 Cross-sectional microstructure
Laser treatment transformed the regular lamellar α+β phase of Ti-6Al-4V into one that
consists of acicular α structures. The transformation resulted in a martensite structure
that is significantly different from the substrate. The unetched modified region is
brighter than the substrate under an optical microscope and when etched the true nature
of the transformation is demonstrated again in Figure 6-3.
Figure 6-3: (a) Cross sectional BSE micrograph of laser modified Ti-6Al-4V,
(b) laser modified layer and (c) substrate microstructure.
Unlike other surface modification techniques that have three distinct regions: modified
region, heat affected zone and the bulk alloy; this type of laser treatment does not show
a discernible heat affected zone which is prevalent in other laser treatment processes in
literature [169]. Formation of this structure was due to the rapid solidification which
Laser surface modified zone
Substrate
Acicular α-Ti
Lamella α+β
(a)
(b)
(c)
6-150
thwarted the segregation of the various alloying elements into high and low
concentration. Another advantageous trait from the newly formed surface compared to
other studies in literature is the absence of cracks [195]. The exclusion of cracks and the
lack of a heat affected zone, from the experimental conditions examined in this work,
indicate a surface modification technique that can be successfully applied and is well
adjacent to the bulk metal. Crack elimination is attributed to the high speed processing,
low residence times and corresponding assist gas parameters. These processing
characteristics ensure minimal thermal stress is exerted on the surface thus avoiding
crack development. Excellent bonding was observed in the modified layers processed in
this work which is typical of laser surface processing [169].
6-151
6.2 Meltpool Depth Analysis
Meltpool depth is crucial in contact components since the depth of the modified layer is
related to the lifetime of the component. Homogeneous, deep and well bonded surface
treatments are the optimal requirements for bio-implants. Etching the surface revealed
that laser surface modification varied between 20 and 50 μm. BSE micrographs were
qualitatively used to analyse meltpool depths. The qualitative analyses showed an
increase in depth at higher irradiance and residence times. The cross sectional analysis
showed a smoother surface finish on the surface treated at high irradiance compared to
those treated at lower irradiances which were rather wavy. This effect is due to thorough
melting regime and ideal power densities matching the prescribed overlap. At low
irradiance, the beam profile becomes more perceptible in the microstructure. High
irradiances resulted in a more homogenous meltpool depth much superior to the
meltpool depth produced at low irradiances. Homogeneous treated meltpool depths are
preferred in most surface engineering applications. A homogeneous meltpool depth is
desirable in bioimplants since uniformity of mechanical properties is attained
throughout the implant. This eliminates preferential damages of weak (low depth)
points on the newly modified surface. Uniformity in meltpool depths created at high
irradiance and residence times are also attributed to thorough melting regime
phenomenon.
Figure 5-9 and Figure 5-10 also highlights that there is no significant change in depth of
processing between samples irradiated at 20.4 and 26.72 kW/mm2; this is due to
insignificant difference in energy densities, 22 and 29 J/mm2 respectively. However, the
significance can be easily demonstrated for samples treated at irradiances of 15.72 and
26.72 kW/mm2 as seen in Figure 5-11; this is due to a higher difference in energy
density. The effect of energy density on meltpool depth is further illustrated by Figure
6-4. The meltpool profile not only depends on energy density but also on the laser beam
profile used which was TEM00 (Gaussian), thermal conductivity, microstructure,
absorption mechanisms and convection of the liquid phase meltpool. Energy density
absorbed by the alloy controls the melt pool depth and thus the volume of the molten
alloy [152].

6-152
Figure 6-4: Effects of energy density on meltpool depth.
As the irradiance increased, a more homogeneous meltpool depth with fewer
discontinuities was observed. However, lower meltpool depths (between 20 and 50 μm)
were obtained in this experiment compared to other laser surface modification studies
[16, 169]. Lower meltpool depths are attributed to extremely low exposure time used in
these experiments. Lower meltpool depths can be advantageous due to their
corresponding lower induced thermal stress thus eliminating formation of cracks on the
surface.
6.3 Roughness Analysis
Function of bioimplants greatly depends on the surface rugosity. Roughness of laser
surface modified layers has received very little attention in literature mainly due to the
fact that various applications require machining of the surface before service. The
bearing component of the hip implant require polishing (i.e. to reduce friction) while the
stem require rougher surfaces (i.e. greater than 3 μm, for improved cell adhesion). It is
therefore vital that the resulting roughness can be predicted prior to surface engineering.
A combination of low residence time and low irradiance produced the highest
roughness due to a more unevenly melted surface produced by the lower energy density.
Note that the energy density is the product of irradiance and residence time. Figure 6-5
R² = 0.5203
0
10
20
30
40
50
0 10 20 30 40 50 60 70
Mel
tpool
Dep
th (μ
m)
Energy Density (J/mm2)

6-153
shows a power regression line highlighting the relationship between roughness and
energy density.
Figure 6-5: Relationship between energy density and roughness.
Effects of irradiance and residence time on surface roughness inferred from Figure 5-2
to Figure 5-4 and Figure 5-14 suggest improved homogeneity and smoothness of the
surface with an increase in both irradiance and residence time. However, it should
strongly be noted that this analogy applies to this collection of processing parameters,
where melting occurs without necessitating ablation. Once ablation initiate, at energy
densities over 67 J/mm2, an increase in entropy occurs forcing the smooth nature of the
surface to collapse. Preliminary experimental design studies found that a further
increase in irradiance (>26.72 kW/mm2) at high residence times (>2.16 ms) would
result in ablation thus an associated rise in roughness, see Appendix J. At lower energy
densities that facilitate melting; the smooth surface is replaced by waviness of partially
melted regions. The processing parameters used in this study were fully optimised to
take advantage of the region where the Ti-6Al-4V “just melts (flux)” thus aiding
extremely rapid solidification rates. The decrease in roughness is mainly attributed to a
more homogenous melting produced at high irradiance thus producing smoother
surfaces. Roughness variation thus depends on energy density. In this experiment an
energy density of approximately 29 J/mm2 (samples 9) produced preeminent
homogeneity with the lowest roughness. Development of ridges/ripples, explained in
section 6.1.1, is the another cause of roughness evolution in laser surface modified
R² = 0.57
0
0.5
1
1.5
2
2.5
3
0 10 20 30 40 50 60 70
Roughnes
s (µ
m)
Energy Density (J/mm2)
6-154
regions. The waviness observed in low energy density samples is a function of the
convectional flow of the melt influenced by the percentage overlap [173].
6.4 Microhardness
Hardness of the material plays a crucial role in the overall wear resistance of the
material. Ti-6Al-4V among biomedical alloys is known to have relatively low hardness.
By determining the effects which processing parameters have on hardness a process
map can be developed in order to predict outcome hardness after laser treatment and
also to aid future researchers. All laser melted samples produced hardness values greater
than the untreated samples. Increase of hardness in laser treated samples is attributed to
microstructure refinement, which is depended on the thermal gradient developed and
extremely high cooling rates. Thermal gradient controls the extent of plastic
deformation and cooling rates controls the nature and extent of non-equilibrium phases,
acicular martensite formation [163]. The fine, acicular martensite has a hexagonal
closed packed structure and possesses a high hardness but relatively low ductility and
toughness [184, 185].
The highest microhardness was obtained at the highest level of irradiance (26.72
kW/mm2) and the lowest residence time (1.08 ms). The combination of these
parameters gave optimal conditions for hardness improvement since irradiance
increases target temperature producing steeper gradients. Similarly low irradiance times
(high scanning rates) increase cooling rate thus encouraging transformation into the
non-equilibrium phase produced. Hardness relationship with processing parameters
obtained in this study is in good agreement with studies in literature [163]. However,
the absolute microhardness values recorded cannot be compared to all literature results
due to variation in load and loading times implemented. Increase in hardness at low
residence time can also be related to the low grain sizes observed in topography images
in section 5.1.1. This explanation is in accordance to the Hall-Petch theory which relates
increase of hardness and yield strength to reduced grain size [194].
An analysis of hardness distribution with increase in distance from the surface revealed
a relatively uniform hardness within the treated region which rapidly reduced at the
treated-substrate interface. Uniformly high hardness levels throughout the laser
modified region iterate the superiority of the modified regions compared to the bulk
alloy. High hardness and uniformity of the modified layer is crucial in biomedical Ti-
6Al-4V alloys as it has a significant influence on wear resistance properties [152, 192].

6-155
Improved hardness can therefore be beneficial on the femoral head (bearing region) of
the hip prosthesis.
6.5 Phase Transformation and Chemical Analysis
6.5.1 X-ray Diffraction Analysis
Backscatter images of the laser treated surfaces provided an ideal starting point for
further phase microanalysis by highlighting presence of two phases. The micrographs
visually presented the alternating laths of α and β phase present in as-received Ti-6Al-
4V. Presence of such phases was confirmed by the XRD patterns obtained using the X-
ray diffractometer. The relative volume fraction of β-Ti was lower than that of α-Ti. The
characterised Ti-6Al-4V alloy consisted of 28% β phase and the remaining 72% was the
α phase. Subsequent to laser processing, the α-Ti phase was transformed into an acicular
structure. The microstructure of the treated Ti-6Al-4V revealed that the transformed
acicular α-Ti was nested within the aged β matrix. Figure 6-6 is used to properly
demonstrate the microstructure and phase transformation within the alloy. Laser
treatment also resulted in detection of a new peak, at 29.4°, not observed in untreated
samples. The peak is believed to have been induced by phase transformation of the
surface. This peak in essence represents the articular phase induced within the
martensite structure.
Figure 6-6: BSE microstructural images of (a) untreated and (b) laser treated Ti-6Al-4V;
and (c) x-ray diffraction pattern of untreated and laser treated Ti-6Al-4V.
A reduction in volume fraction of β-Ti up to 19% following laser melting was
measured. Reduction in volume fraction of β-Ti phase can also be related to the energy
density. Figure 6-7 demonstrates that β -Ti volume fraction tends to diminish as the
(b)
(c) (a)
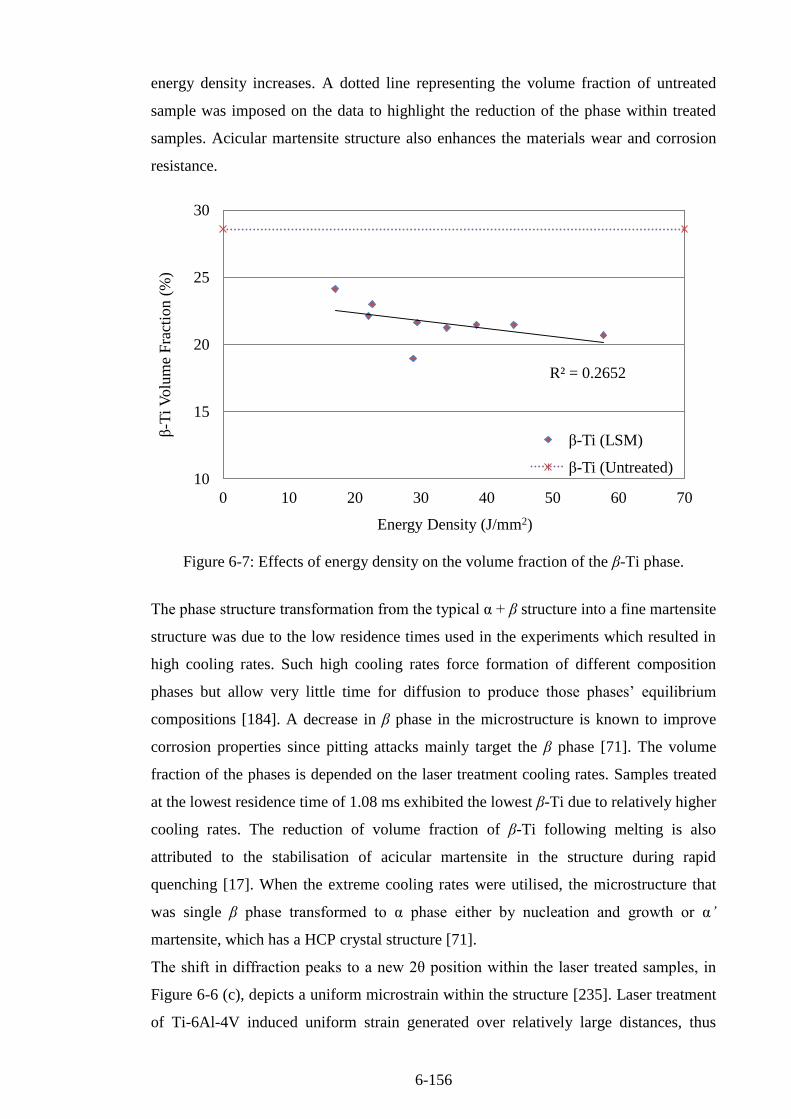
6-156
energy density increases. A dotted line representing the volume fraction of untreated
sample was imposed on the data to highlight the reduction of the phase within treated
samples. Acicular martensite structure also enhances the materials wear and corrosion
resistance.
Figure 6-7: Effects of energy density on the volume fraction of the β-Ti phase.
The phase structure transformation from the typical α + β structure into a fine martensite
structure was due to the low residence times used in the experiments which resulted in
high cooling rates. Such high cooling rates force formation of different composition
phases but allow very little time for diffusion to produce those phases’ equilibrium
compositions [184]. A decrease in β phase in the microstructure is known to improve
corrosion properties since pitting attacks mainly target the β phase [71]. The volume
fraction of the phases is depended on the laser treatment cooling rates. Samples treated
at the lowest residence time of 1.08 ms exhibited the lowest β-Ti due to relatively higher
cooling rates. The reduction of volume fraction of β-Ti following melting is also
attributed to the stabilisation of acicular martensite in the structure during rapid
quenching [17]. When the extreme cooling rates were utilised, the microstructure that
was single β phase transformed to α phase either by nucleation and growth or α’
martensite, which has a HCP crystal structure [71].
The shift in diffraction peaks to a new 2θ position within the laser treated samples, in
Figure 6-6 (c), depicts a uniform microstrain within the structure [235]. Laser treatment
of Ti-6Al-4V induced uniform strain generated over relatively large distances, thus
R² = 0.2652
10
15
20
25
30
0 10 20 30 40 50 60 70
β-T
i V
olu
me
Fra
ctio
n (
%)
Energy Density (J/mm2)
β-Ti (LSM)
β-Ti (Untreated)
6-157
changing the lattice plane spacings in the constituent grains from a stress free value to a
new value corresponding to the magnitude of stress applied. Micro-strain is induced
within the melted zone of the surface treated Ti-6Al-4V samples mainly due to a very
high thermal gradient developed and the related quench stress built thereafter.
6.5.2 Chemical Composition
The two types of scans, area and grid, used for chemical composition analysis produced
similar results. This highlighted that the topographic chemical composition was
homogeneous. Uniform distribution of chemical elements was also observed on the
cross-sectional analysis of laser modified samples. Uniform element distribution in the
modified region could be due to high speed of convection stream providing intensive
stirring of the elements inside the molten pool as well as the high cooling rates
prohibiting sufficient time for elemental diffusion and segregation typical under slower
cooling conditions. Re-distribution of alloying elements within the treated titanium
alloys is also known to improve pitting corrosion resistance due to preferential
corrosion attack prevention [130].

6-158
6.6 Wear Resistance
A linear relationship, R2=0.9966, between depth wear tracks and distance travelled by
the pin suggest good repeatability thus suggesting accurate predictions of wear depth to
be derived from known sliding distances. There was no correlation between laser
processing parameters and specific wear rates for samples wear tested for 150 m. This
was due to the high depth of wear tracks which infringed the substrate and in some
cases completely wore the laser modified region. This meant part of substrate material
was included in the analysis of specific wear rate thus there was no relationship between
processing parameters and specific wear rate. The ratio of the worn substrate and laser
modified region was different for all samples and this further impacted the statistical
significance. Results from samples tested for 20 m provided an improved insight of the
effects of laser processing parameters on specific wear rate. An improved wear rate was
achieved by LSM samples. The lowest irradiance (15.72 kW/mm2) and residence time
(1.08 ms) produced the most improved wear rate. Reduction in wear rate of treated
samples is attributed to phase transformation inducing martensite microstructure,
improved hardness properties and alteration of electrochemical responses of the
material. Samples treated with the minimal residence time and irradiance produced
highest cooling rates associated with the transformation thus resulting in the lowest
wear rates. For the processing parameters used in this study, energy density greatly
influence the resultant specific wear rates. Figure 6-8 shows a good relationship
between specific wear rate and energy density. Specific wear rate increased with
increased energy density. The highest energy density of 57.7 J/mm2 produced the
highest wear rate of 654×10-6
mm3/N·m.
Figure 6-8: Effects of energy density on specific wear rate.
R² = 0.7043
400
450
500
550
600
650
700
10 20 30 40 50 60 70
Spec
ific
Wea
r R
ate
(×10
-6 m
m3/N
·m)
Energy Density (J/mm2)
6-159
Evidence of both abrasive and adhesion wear mechanisms were visible in untreated
samples. Abrasive wear produced micro-cutting features visible on the floor of the wear
tracks. Smearing of wear particles on the bottom surface of the wear track was extensive
in untreated samples. Higher mass losses observed in untreated samples could also be
attributed to micro-fragmentation of the particles adhering to the surface from
subsequent sliding of the pin. Micro-cracking is believed to assist the fragmentation
allowing for wieldier disintegration. Micro-cracking develops due to thermal and
corrosion fatigue brought about by frictional forces of the zirconia pin and the Ti-6Al-
4V sample [16]. The evidence from the SEM images also suggests a form of scuffing
wear that is associated with local solid-state welding between rubbing surfaces.
Scuffing occurs when the boundary lubricant films breakdown due to high friction
generated by the rubbing surfaces. Other studies have also attributed features found in
untreated wear tracks to be due mild tribochemical wear during sliding caused by
tribooxidation and chemical reactions between Ti-6Al-4V, Zirconia and the
physiological solution [236-239]. The continuous wear process constantly exposes a
fresh surface thus accelerating the tribochemical reactions [239].
Plastic deformation of worn particles was not observed in LSM samples; where abrasive
micro-cutting was the prominent wear mechanism. LSM samples produced a smoother
and shiny worn track where grooves and scratches were clearly seen. The surface of
worn tracks of LSM samples appear to be polished compared to the untreated
counterparts. The aforementioned characteristics of the worn tracks are due to a harder
surface created during rapid quenching of the laser modified surfaces. LSM samples
show high resistance to scuffing due to a tenacious boundary lubricant film formed on
the surface. The formed film is crucial in maintaining a stable boundary in the
contacting area, conferring to low friction. Laser surface melting effectively results in
low adhesion between contacting surfaces thus reducing frictional forces and wear
[240].

6-160
6.7 Corrosion Resistance
The open circuit measurement produced a steady increase in potential with time. This
indicates that there was steady growth of TiO2 passive films on the surface of the
samples, known as spontaneous passivity, and as expected according to the Ti-H2O
Pourbaix diagram [241]. The thickness of the spontaneously formed protective oxide on
the surface at open circuit conditions is expected to be within the range of 1 to 4 nm for
a buffered aqueous solution at 23oC [242]. Okazaki et al. and Ask et al. have previously
noted from chemical composition analysis of the oxide films formed on Ti-6Al-4V that
they are predominantly composed of TiO2 (rutile) containing small amounts of TiO and
Ti2O3 near the metal-oxide interface [243, 244].
Untreated Ti-6Al-4V alloys had lower current densities at low potential scans. However
at high potentials, displayed in Figure 6-9, the as-received samples do not reach stable
passivity and therefore the current density continues to rise with increase in potential
and converge with LSM samples at 1000 mVSCE.
Figure 6-9: Polarisation curves of as-received, LSM 7 and
LSM 8 Ti-6Al-4V in 0.9% NaCl at 37°C.
-750
-250
250
750
1250
1750
2250
-4 -2 0 2 4
Pote
nti
al (
mV
SC
E)
Current density log (µA/cm2)
As Received
LSM 8
LSM 7
Stage 1
Stage 2
Stage 3

6-161
These characteristics displayed by the potentiodynamic scans reveals that the LSM
samples have more stable passivity and continue to maintain a constant protective film
with increase in potential. LSM samples resemble highly passive corrosive behaviour
found in pure Titanium [87]. In Figure 6-9, the potential for LSM 7 was increased up to
only 1000 mVSCE and then swept back to illustrate the influence that termination
potential have on electrochemical behaviour. When the potential was reversed at 1000
mVSCE before reaching the breakdown potential, a high repassivation potential is noted
showing that the protective passive film remains. At the potential upscan of 1350
mVSCE and 1460 mVSCE (breakdown potential, Eb), a transition occurs for both LSM
and untreated samples. The transition invokes three separate stages, a rapid increase in
current density (stage 1) followed by a decrease (stage 2) then another increase (stage 3)
initiates and remains high for the rest of the scan. The transition is caused by the
crystallisation and/or formation of new phases from the existing amorphous TiO2 which
slows the localised corrosion until at higher potentials [245]. Stage 2 could indicate
some kind of salt film deposition which slows the localised corrosion until at higher
potentials, where it accelerates markedly. Stage 3 transition behaviour signifies
localised corrosion.
The lower Tafel slopes (i.e. higher current density rate) in the LSM samples is attributed
to rougher surfaces in compared to untreated samples. This subsequently results in a
thinner oxide films in these samples due to the slower formation of the oxide film on the
laser treated surfaces or the formation of TiO2 and Ti2O3 [246, 247]. At 130 mV (1.5
µA/ cm2) and 340 mV (2.8 µA/cm
2) the current density reaches a steady state for LSM 7
and LSM 4 respectively. This passive current density is higher than that normally
reported for titanium polarised in saline solutions, but this is connected with the higher
scan rates used in this study compared to potentiostatic or slow scan rates of 0.167mVs
normally employed [87]. For potentials beyond these points, the current densities
recorded are associated with steady passive films already formed on the LSM samples.
On the other hand, the passive films can be seen (lower slope values) to be still forming
on the untreated samples at these higher potentials. The stable current densities for the
LSM samples indicate that the stable oxide layer prevents further current density
increases for increased potential. All samples showed similar response on the reverse
sweep. As the potential decreased there was a marked decrease in current until a new
steady state formed around 250 mV SCE. The reverse sweep anodic Tafel slopes are
similar to those in the forward sweep direction, indicative of the same activation
controlled oxidation process.

6-162
The lowest corrosion rate of 86 nm/yr was found in the laser surface modified sample.
An increase in irradiance produced a decrease in corrosion rates at the lowest residence
time of 1.08 ms. LSM samples had a more compact and stable passive film compared to
the untreated sample. The difference behaviour between the polarisation curves is
mainly attributed to the change in microstructure instigated by rapid melting and
solidification of the laser melted region in LSM samples and its effect on the passive
film formed on the alloy’s surface. Thus the three main factors that contributed to the
change in corrosion behaviour for LSM samples are: the martensite structure formation,
βTi phase reduction and homogeneity in elemental chemical composition.
Calculation of current density was done using sample geometric area without taking
into account the rugosity on the surface. Therefore, high corrosion rates in some laser
treated samples are due to slightly higher roughness in LSM sample.
6.8 Surface Wettability Analysis
Contact angle analysis plays a crucial part in cell adhesion in bio-implants [248].
Hydrophilicity means the fluid can wet the surface corresponding to higher surface
adhesion. All laser treated samples exhibited lower contact angles (hydrophilic)
compared to untreated sample thus suggesting improved cell adhesion and proliferation
properties. Wetting characteristics also influence the interaction characteristics of the
treated surfaces with the corrosive species [249]. The main factors that affect the
wetting characteristics of a surface are its composition, the content of oxygen, the
surface morphology, surface energy and the temperature [250]. However, laser surface
treatment by melting does not significantly change the composition and oxygen content,
compared with the untreated surface thus roughness becomes the main factor
influencing wetting properties (contact angles). The results agree to numerous
publications that detail the effects of roughness on wetting characteristics [251-253].
6.8.1 Effects of roughness on contact angle
Figure 6-10 graphs the relationship between contact angles and roughness. A second
order polynomial with a R2 value of 0.416 was achieved. This initial result hints infers
that the relationship between the two responses is present but not significant. However
when the outlier is ignored the R2 value becomes 0.8415, see Figure 6-11. This indicates
that roughness influence the resultant contact angles.

6-163
Figure 6-10: Relationship between contact angle and roughness of the LSM samples.
Figure 6-11: Relationship between contact angle and roughness without the outlier.
The effects of processing parameters on contact angles, independent of roughness, were
further explored by polishing laser surface modified sample. Polishing was carried out
using 1200 grit SiC paper, with water as a lubricant. Figure 6-12 shows the contact
angles of unpolished and polished laser surface modified samples. All polished samples
produced higher average contact angles (64.7±1.9°) compared to the unpolished samples
R² = 0.4167
0
10
20
30
40
50
60
70
1.00 1.50 2.00 2.50 3.00
Conta
ct A
ngle
(°)
Roughness (μm)
R² = 0.8415
0
10
20
30
40
50
60
70
1.00 1.50 2.00 2.50 3.00
Conta
ct A
ngle
(°)
Roughness (μm)

6-164
(38.7±3.5°). However, the contact angles are still relatively low compared to the
polished as received sample. The lowest contact angle recorded was 54.5±1.4° obtained
at a mid-range energy density of 29.4 J/mm2. Contact angles of all polished samples
showed relatively low deviation from the mean value thus suggesting more homogenous
contact angle values in polished laser surface modified samples. The relatively non
uniformity of the wetting characteristics of unpolished LSM samples is due to the
inhomogeneous morphology produced by laser surface modification.
Figure 6-12: Contact angles of polished and unpolished samples, where AR
is as-received, GB is grit blasted and 1-9 are laser modified samples.
6.9 Biocompatibility
There was no difference in initial cell attachment between the samples. Laser surface
melting did not adversely affect the initial cell attachment. The roughness difference in
previous publications that showed differences in cell attachment were much larger,
which may explain the lack of a significant difference between cell attachment of
relatively similar roughness values [254]. The surface area of the samples, which was
constant across all the samples, may have restricted the number of cells that can attach
to the surface (approximately 30%). The cells, unable to have contact with the surface
of the sample, were possibly subsequently washed away when media was added.
Metabolic activity was significantly higher for all the treated samples compared to the
untreated controls at all time points. However, there was not a significant difference
0
20
40
60
80
AR GB 1 2 3 4 5 6 7 8 9
Conta
ct A
ngle
(°)
Polished Unpolished
6-165
between the treated samples. This may have been due to the narrow range of Ra values
of the treated samples (1.32-2.72 µm). At this range the roughness may be high enough
that the cells grow in roughly the same manner on the surface. The higher metabolic
activity may be due to the higher bioactivity of the treated surfaces [90].
There was no significant difference in cell number at day 3, but there were higher
numbers of cells at day 7 for all treated samples compared to the untreated controls. At
day 3, the slight differences in surface properties may not have led to significantly
different rates of cell mitosis, but metabolic activity was higher. The difference in both
cell number and metabolism is shown on day 7, where both cell metabolism and cell
number were significantly higher. Cell number increased at a higher rate for treated
samples, and this was visible at day 7. As the differences between the properties of the
treated samples are not large enough to show significant differences in cell metabolism
and proliferation, further studies may need to be performed to evaluate cell metabolism
and proliferation over a longer time frame (i.e. greater than 7 days).
Direct contact analysis showed improved cytotoxicity behaviour in laser treated sample
compared to the untreated ones. Elusion test results showed that all samples produced a
dose dependant decrease in viability. High extract concentrations resulted in up to 20%
inhibition of formazan production while low concentrations exerted only slight
cytotoxic behaviour. Overall the viability of the NIH/3T3 monolayer did not
significantly vary from the untreated control monolayer indicating that minimal loss of
viability following treatment with extracts prepared from samples 6-8. On the other
hand, the highest tested concentration of extracts obtained from sample 9 and untreated
samples induced a slight but significant (p < 0.05) loss in cell viability which became
more pronounced with an increase in concentration indicating the presence of leachates.
The results from the biocompatibility analysis are encouraging, showing that laser
melted Ti-6Al-4V can potentially be used for bioimplants.

7-166
Chapter 7
Conclusions
7. 1 316 Stainless steel
High speed laser surface melting was successful achieved for 316L stainless steel. The
novel processing parameters used in the reseach (Irradiance up to 235 kW/mm2 and
residence times as low as 50 μs) produced extremely high cooling rates and high
thermal gradients capable of eliminating asperities, cracks and inclusions within the
treated region. The reseach successfully process mapped the melting regimes induced
by high speed laser processing. In DOE 1, at low energy densities of 5.24 J/mm2,
localised melting became visible. Low depth of processing was observed with no
physical change in grain structure detected. Medium energy density of 10.48 J/mm2
produced uniform melting on the surface. In this case, melt pool depth reached
approximately 60 μm with visible overlapping induced by increased melting areas
larger than the laser spot size and the rotational nature of the laser treatment process.
High levels of energy density, exceeding 20.96 J/mm2 were characteristic of high
meltpol depths (up to 130 μm) and also evidence of ablation became visible on the
surface. At such high energy density transformation of the microstructure grain size and
orientation and was observed, however this tranformation did not impact chemical
composition, crystallinity and hardness significantly. On the other hand, a clear
correlation between the process parameters (irradiance and residance time) and melt
pool depth and surface roughness was noted. As these input parameters were increased,
both melt pool depth and roughness increased in a linear fashion.
A similar level of influence of these input parameters on the melt pool depth and surface
roughness was found. In particular within DOE 1, going from the low level of
irradiance (79 kW/mm2) to the high level (246 kW/mm
2) at 100 µs residance time
resulted in a 52 µm increase in melt pool depth and a 10.5 µm increase in surface
roughness. The lowest roughness from this DOE was noted at 1 µm for a irradance of
79 kW/mm2
and a residance time of 50 µs. Further studies using the surface temperature
prediction model for 316L stainlees steel revealed that this can be used to aid prediction
of the energy density required to melt the surface of the steel.
In DOE 2, at fixed energy densities melt pool depth was largely influenced by surface
pre-treatment conditions, irradiance and residence time. An average increase in melt
7-167
pool depth of 40 µm was noted from inceasing residence time from the lowest (50 µs) to
the highest level (167 µs). Etching of the surface prior to laser treatment produced the
least effect on melt-pool depth, while machining produced the most pronounced effect.
Depth increases of 34, 38 and 43 µm were noted for increased irradiance from the
highest level to the lowest level (from 63 to 220 kW/mm2) for the as received, machined
and machined and etched surfaces respectively. At fixed energy densities, the highest
melt-pool depth (91 μm) was achieved for machined+etched surfaces laser melted at
lowest irradiance (63 kW/mm2) and highest residence time (167 μs). From this analysis
on laser processing of 316L, it is clear that at fixed energy density, that a combination
of low to mid levels of irradiance (such as 63, 79 and 127 kW/mm2) and low to mid
levels of residence time (such as 50 μs, 67 and 83 μs) could produce the sought
combination of homogeneous melting regime with moderate melt-pool depth (10 to 51
µm) and low roughness (1 to 2.79 µm).
The main contribution of the reseach study on 316L stainless steel for biomedical
applications was creation of a process map that could be used to determine surface
properties (i.e. roughness and meltpool depth) through variation of irradiance and
residence time.
7.2 Ti-6Al-4V
High speed laser melting was implemented on Ti-6A-4V in an inert argon environment
which resulted in a well bonded 20 to 50 μm meltpool free of cracks, inclusion, voids
and surface asperities. BSE micrographs and XRD results confirmed that the typical
α+β microstructure in Ti-6Al-4V was transformed into a martensite structure
characterised by acicular α embedded in the β matrix due to high cooling rates
experienced. Meltpool depth was found to increase with increase in both irradiance and
residence time. The study found that the resulting meltpool depth can be estimated from
energy density with reasonable accuracy. Higher irradiance levels were found to provide
for a more uniform depth of processing which reached a maximum of 50 µm. The high
speed laser treatment resulted in an average roughness ranging from 1.39 to 2.73 μm.
Roughness in laser melting was influenced by the beam profile and ripple effects due to
convection and absorption mechanism of the molten metal. A relationship between
irradiance and residence time for roughness was observed, whereby roughness
decreased with an increase in irradiance and residence time, see Figure 5-14. Roughness
characteristics were closely related to the melting energy density.

7-168
X-Ray diffraction results demonstrated an increase of α phase and corresponding
decrease of the βTi phase in Ti-6Al-4V subsequent to laser treatment. The analysis
showed that the lowest beta phase was achieved at the lowest residence time and highest
irradiance. This point resembles the highest cooling rates and steepest cooling gradients
due to extreme nature of residence time and irradiance. Topographic and cross-sectional
EDS analysis revealed homogeneous elemental composition in all laser treated samples
due to redistribution of elements as a result of rapid solidification. This phenomenon is
widely regarded as beneficial as it eliminates preferential corrosion attacks.
Unlike 316L stainless steel, microhardness examination revealed improved
microhardness in all laser treated Ti-6Al-4V. Highest irradiance (26.7kW/mm2) and the
lowest residence time (1.08 ms) resulted in a 67% increase in microhardness (767 HV)
compared to the untreated region (459 HV). The associated low residence time and
rapid cooling rates allowed for novel and apparently useful wear and corrosion
properties to be achieved. Laser surface modified samples showed improved wear
characteristics compared to untreated samples. Within the laser surface modified
samples, low irradiance (15.7 kW/mm2) and residence time (1.08 ms) produced the least
specific wear rate of 504 ×10-6
mm3/N·m. Specific wear rate increased with increase in
both irradiance and residence time. A strong relationship between energy density and
specific wear rate was observed, whereby specific wear rate increased with increases in
energy density. Both adhesive and abrasion wear mechanisms were driving forces in
material removal from the untreated samples. Micro-cracking, micro-fragmentation and
scuffing were all features involved in mass loss of untreated samples. Laser modified
samples showed smoother wear tracks with no evidence of plastically deformed debris
embedded on the wear track surfaces as was apparent for the untreated samples.
Microstructure transformation from the typical α+β Ti-6Al-4V to improved martensite
structure due to rapid quenching induced by high speed laser melting which explains the
improved wear characteristics noted.
Electrochemical polarisation tests revealed different oxide films formed on the untreated
and LSM samples. LSM samples had a more compact and stable passive film compared
to the untreated sample. A three stage transition was observed starting at breakdown
potential for untreated and LSM samples. The transition indicated crystallisation and/or
formation of new phases from amorphous TiO2 and a salt film deposition which slows
the localised corrosion until at higher potentials. The lowest corrosion rate according to
comparison of Tafel slopes, which was observed at the lowest irradiance (15.72
kW/mm2) and lowest residence time (1.08 ms) was found to be 86 nm/yr. An increase in

7-169
irradiance produced a decrease in corrosion rates at the lowest residence time of 1.08
ms. Pitting was observed in both untreated and laser modified samples with a more
uniform pitting occurring in the treated regions.
High speed laser melting produced hydrophilic surfaces compared to the untreated
samples. Contact angles as low as 23° was measured on the laser treated sample,
compared to 72° on the untreated sample. The lowest contact angles (23°) were found at
the mid energy density (30 J/mm2). Contact angle was found to be independent of
irradiance but strongly dependent on residence time in a non-linear fashion, see Figure
5-56. Roughness was also found to effect wettability in a non-linear fashion. The
unpolished laser treated sample produced lower contact angles compared to their
polished counterparts. There was no significant difference in cell attachment and
metabolic activity between untreated and laser treated samples. Direct contact tests
showed improved cytotoxicity in laser modified samples. The results proved that the
high speed laser treatments used in this work can potentially be used for bioimplants
application. This work established that Ti-6Al -4V could be successfully treated by high
speed laser for surface modification. The laser treatments resulted in an improved
asperity free surface with a martensitic microstructure which contained reduced β-Ti
phase. These treatments were shown to be capable of producing improvements in
micro-hardness, chemical composition, surface wettability, biocompatibility, wear and
corrosion resistance which are all beneficial factors for biomedical implants.
7.3 Future Work
Further detailed advanced characterisation of the surface could be carried out to study
the microstruture transformation process during laser surface modification and its
effects on biocompatibility properties. Such characterisation techqniques that could be
used include nano-indentation, transmission electron microscopy, electrochemical
impedance spectroscopy, and in vivo biocompatibility testing. Future work should also
study high speed laser processing of biomedical alloys for the possibility of achieving
semi-crystalline, quasi-crystalline or even an amorphous microstructure. Amophous
structures are known to have excellent wear and corrision peoperties. Such a structure
could potentially be achieved by cryogenic laser surface treatment. A system could be
deviced that simalteneously laser melts the surface while enabling rapidly quenching to
create such an amophous layer on the surface. Another crucial area that could be studied
is development of polishing techniques that could be used to produce the required
surface finish of approximately 25 nm for hip replacement bearings.

7-170
References
[1] M. Long and H. J. Rack, Titanium Alloys in Total Joint Replacement - A
Materials Science Perspective, Biomaterials, 19 (18), pp. 1621-1639, 1998.
Available: http://dx.doi.org/10.1016/S0142-9612(97)00146-4.
[2] B. Basu, D. S. Katti and A. Kumar, Advanced Biomaterials: Fundamentals,
Processing, and Applications, Wiley-American Ceramic Society, 2009.
[3] S. Kurtz, K. Ong, E. Lau, F. Mowat and M. Halpern, Projections of Primary and
Revision Hip and Knee Arthroplasty in the United States from 2005 to 2030,
The Journal of Bone and Joint Surgery American Volume , 89 (4), pp. 780-785,
2007.
[4] Wrong Diagnosis Website, Statistics by Country for Hip Replacement, 2010
Accessed (3/3/2010)
Available: http://www.wrongdiagnosis.com/h/hip_replacement/stats-
country.htm#extrapwarning.
[5] Frost and Sullivan Ltd, Orthopedics joint replacement markets, market
engineering research, Frost and Sullivan, 9 May 2007.
[6] Americas Academy of Orthopaedic Surgeons, Joint Revision Surgery, [online]
Accessed (06/05/2011), 2011.
Available: http://orthoinfo.aaos.org/topic.cfm?topic=A00510.
[7] M. Borstlap,J. Zant,M. Soesbergen and J. Korst, Effects of Total Hip
Replacement on Quality of Life in Patients with Osteoarthritis and in Patients
with Rheumatoid Arthritis, Clinical Rheumatology, 13 (1), pp. 45-50, 1994.
[8] A. S. Edelstein and R. C. Cammarata, Nanomaterials: Sythesis, Properties and
Applications London: Institute of Physics Publishing, 1998.
[9] H. Malchau, P. Herberts and L. Ahnfelt, Prognosis of Total Hip Replacement in
Sweden: Follow-Up of 92,675 Operations Performed 1978–1990, Acta Orthop,
64 (5), pp. 497-506, 1993.
[10] D. C. Hansen, Metal Corrosion in the Human Body: The Ultimate Bio-corrosion
Scenario, Electrochemical Society Interface, 17 (2), pp. 24-7, 2008.

7-171
[11] D. W. Hoeppner and V. Chandrasekaran, Fretting in Orthopaedic Implants: A
Review, Wear, 173 (1-2), pp. 189-197, 1994.
[12] R. Banerjee and N. Soumya, "Laser processing of orthopedic biomaterials" in
Advanced Biomaterials, 1st ed., Wiley, 2009, pp. 278.
[13] S. Hiromoto, Corrosion of Metallic Biomaterials in Cell Culture Environments,
Electrochemical Society Interface, 17 (2), pp. 41, 2008.
[14] Zimmer Website, Hip Replacement, 2011 [online] Accessed (23/08/2011).
http://www.zimmer.com/z/ctl/op/global/action/1/id/8140/template/PC/navid/68/
[15] L. Hao, J. Lawrence, Y. F. Phua, K. S. Chian, G. C. Lim and H. Y. Zheng,
Enhanced Human Osteoblast Cell Adhesion and Proliferation on 316 LS
Stainless Steel by Means of CO2 Laser Surface Treatment, Journal of
Biomedical Materials Research - Part B Applied Biomaterials, 73 (1), pp. 148-
156, 2005. Available: http://dx.doi.org/10.1002/jbm.b.30194.
[16] R. Singh, A. Kurella and N. B. Dahotre, Laser Surface Modification of Ti-6Al-
4V: Wear and Corrosion Characterization in Simulated Biofluid, Journal of
Biomaterials Applications, 21 (1), pp. 49-73, 2006. Available:
http://dx.doi.org/10.1177/0885328206055998.
[17] A. Biswas, L. Li, T. K. Maity, U. K. Chatterjee, B. L. Mordike, I. Manna and J.
Dutta Majumdar, Laser Surface Treatment of Ti-6Al-4V for Bio-Implant
Application, Lasers in Engineering , 17 (1-2), pp. 59-73, 2007.
[18] T. M. Yue, J. K. Yu, Z. Mei and H. C. Man, Excimer Laser Surface Treatment
of Ti–6Al–4V Alloy for Corrosion Resistance Enhancement, Materials Letters,
52 (3), pp. 206-212, 2002.
[19] R. Singh, M. Martin and N. B. Dahotre, Influence of Laser Surface Modification
on Corrosion Behavior of Stainless Steel 316L and Ti-6Al-4V in Simulated
Biofluid, Surface Engineering , 21 (4), pp. 297-306, 2005. Available:
http://dx.doi.org/10.1179/174329405X55320.
[20] C. Langlade, A. B. Vannes, J. M. Krafft and J. R. Martin, Surface Modification
and Tribological Behaviour of Titanium and Titanium Alloys After YAG-Laser
Treatments, Surface and Coatings Technology , 100-101 pp. 383-387, 1998.
[21] R. Singh, S. K. Tiwari, S. K. Mishra and N. B. Dahotre, Electrochemical and
Mechanical Behavior of Laser Processed Ti-6Al-4V Surface in Ringer's

7-172
Physiological Solution, pp. 1-10, 2011. Available:
http://dx.doi.org/10.1007/s10856-011-4362-z.
[22] E. W. Karlson, L. A. Mandl, G. N. Aweh, O. Sangha, M. H. Liang and F.
Grodstein, Total Hip Replacement due to Osteoarthritis: The Importance of Age,
Obesity, and Other Modifiable Risk Factors, The American Journal of Medicine,
114 (2), pp. 93-98, 2003.
[23] J. C. Schrama, B. Espehaug, G. Hallan, L. B. Engesæter, O. Furnes, L. I.
Havelin and B. S. Fevang, Risk of Revision for Infection in Primary Total Hip
and Knee Arthroplasty in Patients with Rheumatoid Arthritis Compared with
Osteoarthritis: A Prospective, Population-Based Study on 108,786 Hip and Knee
Joint Arthroplasties from the Norwegian Arthroplasty Register, Arthritis Care &
Research, 62 (4), pp. 473-479, 2010.
[24] Hip & Knee Advice Website, Total Hip Replacement, 2011 [online] Accessed
(05/08/2010), Available: http://www.hipandkneeadvice.com/index.php/hip-
procedures/hip-replacement/.
[25] C. R. Wheeless, J. A. Nunley and J. R. Urbaniak, Wheeless' Textbook of
Orthopaedics, 2011 [online] Accessed (8/16/2011), Available:
http://www.wheelessonline.com/
[26] S. L. Smith, D. Dowson and A. A. J. Goldsmith, The Effect of Femoral Head
Diameter upon Lubrication and Wear of Metal-on-Metal Total Hip
Replacements, Proceedings of the Institution of Mechanical Engineers, Part H:
Journal of Engineering in Medicine , 215 (2), pp. 161-170, 2001.
[27] Z. M. Jin, D. Dowson and J. Fisher, Analysis of Fluid Film Lubrication in
Artificial Hip Joint Replacements with Surfaces of High Elastic Modulus,
Proceedings of the Institution of Mechanical Engineers, Part H: Journal of
Engineering in Medicine , 211 (3), pp. 247-256, 1997.
[28] K. Martin, Unpublished thesis: Development of Pneumatic Percussion Tool for
Total Hip Replacement and Quality Control Measures in the Medical Device
Industry, Dublin City University, 2011.
[29] P. A. Dearnley, A Review of Metallic, Ceramic and Surface-Treated Metals used
for Bearing Surfaces in Human Joint Replacements, Proceedings of the
Institution of Mechanical Engineers -- Part H -- Journal of Engineering in
Medicine , 213 (2), pp. 107-135, 1999.

7-173
[30] A. Shimmin, P. E. Beaulé and P. Campbell, Metal-on-Metal Hip Resurfacing
Arthroplasty, The Journal of Bone and Joint Surgery , 90 (3), pp. 637, 2008.
[31] B. D. Ratner and B. D. Ratner, Biomaterials Science: An Introduction to
Materials in Medicine, 2004. Available:
http://isbndb.com/d/book/biomaterials_science_a01.
[32] J. D. Bronzino, The Biomedical Engineering Handbook Boca Raton, USA: Boca
Raton, FL: CRC Press, 2000.
[33] K. S. Katti, Biomaterials in Total Joint Replacement, Colloids and Surfaces B:
Biointerfaces, 39 (3), pp. 133-142, 2004.
[34] BrownMed Website, Saint Gobain Desmarquest Hip Implant, 2011 [online]
(05/08/2011), Available:
http://biomed.brown.edu/Courses/BI108/BI108_2007_Groups/group05/pages/sai
nt_gobain_desmarquest.html.
[35] W. Suchanek and M. Yoshimura, Processing and Properties of Hydroxyapatite-
Based Biomaterials for use as Hard Tissue Replacement Implants, Journal of
Materials Research, 13 (1), pp. 94-117, 1998.
[36] A. Kurella and N. B. Dahotre, Review Paper: Surface Modification for
Bioimplants: The Role of Laser Surface Engineering, Journal of Biomaterials
Applications, 20 (1), pp. 5-50, 2005. Available:
http://dx.doi.org/10.1177/0885328205052974.
[37] T. R. Green, J. Fisher, M. Stone, B. M. Wroblewski and E. Ingham,
Polyethylene Particles of a 'Critical Size' are Necessary for the Induction of
Cytokines by Macrophages in Vitro, Biomaterials, 19 (24), pp. 2297-2302,
1998.
[38] P. Campbell, S. Nasser, N. Kossovsky and H. C. Amstutz, Histopathological
Effects of Ultrahigh-Molecular-Weight Polyethylene and Metal Wear Debris in
Porous and Cemented Surface Replacements, Presented at: Symposium on
Biocompatibility of Particulate Implant Materials, October 31, 1990 - October
31, 1992, pp. 38-51.
[39] J. Cawley, J. E. P. Metcalf, A. H. Jones, T. J. Band and D. S. Skupien, A
Tribological Study of Cobalt Chromium Molybdenum Alloys used in Metal-on-
Metal Resurfacing Hip Arthroplasty, Wear , 255 (7-12), pp. 999-1006, 2003.

7-174
[40] W. Pospula, Total Hip Replacement: Past, Present and Future, Kuwait Medical
Journal, 36 (4), pp. 250-255, 2004.
[41] J. L. Tipper, P. J. Firkins, E. Ingham, J. Fisher, M. H. Stone and R. Farrar,
Quantitative Analysis of the Wear and Wear Debris from Low and High Carbon
Content Cobalt Chrome Alloys used in Metal on Metal Total Hip Replacements,
Journal of Materials Science: Materials in Medicine , 10 (6), pp. 353-362, 1999.
Available: http://dx.doi.org/10.1023/A:1026473723777.
[42] M. P. Staiger, A. M. Pietak, J. Huadmai and G. Dias, Magnesium and its Alloys
as Orthopedic Biomaterials: A Review, Biomaterials, 27 (9), pp. 1728-1734,
2006.
[43] Disabled-World Website, DePuy ASR Hip Replacement Recall: 12,000 Patients
Will Need Revision Surgery, 2011 [online] Accessed (29/08/2011), Available:
http://www.disabled-world.com/medical/recalls/asr-recall.php.
[44] S. Hierholzer, G. Hierholzer and K. H. Saucer, Increased Corrosion of Stainless
Steel Implants in Infected Plated Fractures, Archives of Orthopaedic and
Traumatic Surgery , 102 (3), pp. 198, 1984.
[45] Pwatlas Website, Micrographs: Low Carbon Steel, 2009 (6/22/2009), Available:
http://pwatlas.mt.umist.ac.uk/internetmicroscope//micrographs/microstructures/l
ow-carbon-steel.html.
[46] M. Meier, Heat Treatment of Steel, 2010 [online] (16/02/2010), Available:
http://ocw.kfupm.edu.sa/user062/ME2155355/HT-Steel.pdf.
[47] W. D. Callister, Materials Science and Engineering: An Introduction 2000,
Available: http://isbndb.com/d/book/materials_science_and_engineering_a09.
[48] M. Diaz, P. Sevilla, A. M. Galan, G. Escolar, E. Engel and F. J. Gil, Evaluation
of Ion Release, Cytotoxicity, and Platelet Adhesion of Electrochemical
Anodized 316 L Stainless Steel Cardiovascular Stents, Journal of Biomedical
Materials Research - Part B Applied Biomaterials , 87 (2), pp. 555-561, 2008,
Available: http://dx.doi.org/10.1002/jbm.b.31144.
[49] J. C. Wataha, C. T. Hanks and R. G. Craig, The in Vitro Effects of Metal Cations
on Eukaryotic Cell Metabolism, Journal of Biomedical Materials Research , 25
(9), pp. 1133-1149, 1991. Available: http://dx.doi.org/10.1002/jbm.820250907.

7-175
[50] T. Hanawa, Metal Ion Release from Metal Implants, pp. 745-752, 2004.
Available: http://dx.doi.org/10.1016/j.msec.2004.08.018.
[51] M. Uo, F. Watari, A. Yokoyama, H. Matsuno and T. Kawasaki, Tissue Reaction
Around Metal Implants Observed by X-Ray Scanning Analytical Microscopy,
Biomaterials, 22 (7), pp. 677-85, 2001. Available:
http://dx.doi.org/10.1016/S0142-9612(00)00230-1.
[52] Efunda Inc., Heat Treatments: Hardening: Diffusion Treatments, 2011 [online]
Accessed (1/16/2010) Available:
http://www.efunda.com/processes/heat_treat/hardening/diffusion.cfm
[53] S. H. Aldajah, O. O. Ajayi, G. R. Fenske and Z. Xu, Effect of Laser Surface
Modifications Tribological Performance of 1080 Carbon Steel, Journal of
Tribology , 127 (3), pp. 596, 2005.
[54] J. E. G. González and J. C. Mirza-Rosca, Study of the Corrosion Behavior of
Titanium and some of its Alloys for Biomedical and Dental Implant
Applications, Journal of Electroanalytical Chemistry , 471 (2), pp. 109-115,
1999.
[55] B. Grosgogeat, L. Reclaru, M. Lissac and F. Dalard, Measurement and
Evaluation of Galvanic Corrosion between titanium/Ti6Al4V Implants and
Dental Alloys by Electrochemical Techniques and Auger Spectrometry,
Biomaterials , 20 (10), pp. 933-941, 1999. Available:
http://dx.doi.org/10.1016/S0142-9612(98)00248-8.
[56] B. F. Lowenberg, S. Lugowski, M. Chipman and J. E. Davies, ASTM-F86
Passivation Increases Trace Element Release from Ti6Al4V into Culture
Medium, Journal of Materials Science: Materials in Medicine , 5 (6-7), pp. 467-
472, 1994. Available: http://dx.doi.org/10.1007/BF00058985.
[57] P. Schmutz, N. Quach-Vu and I. Gerber, Metallic Medical Implants:
Electrochemical Characterization of Corrosion Processes, Electrochemical
Society Interface, 17 (2), pp. 35-40, 2008.
[58] E. Eisenbarth, D. Velten, M. Müller, R. Thull and J. Breme, Biocompatibility of
β-Stabilizing Elements of Titanium Alloys, Biomaterials, 25 (26), pp. 5705-
5713, 2004.

7-176
[59] B. Kasemo, Biocompatibility of Titanium Implants: Surface Science Aspects,
The Journal of Prosthetic Dentistry, 49 (6), pp. 832-837, 1983.
[60] D. Julka, R. Vasishta and K. Gill, Distribution of Aluminum in Different Brain
Regions and Body Organs of Rat, Biological Trace Element Research, 52 (2),
pp. 181-192, 1996. Available: http://dx.doi.org/10.1007/BF02789460.
[61] J. G. Joshi, Aluminum, a Neurotoxin which Affects Diverse Metabolic
Reactions, Biofactors, 2 (3), pp. 163-9, 1990.
[62] J. Scales, Black Staining Around Titanium Alloy Prostheses--an Orthopaedic
Enigma, Journal of Bone and Joint Surgery, British Version, 73-B (4), pp. 534-
536, 1991.
[63] C. R. F. Azevedo, Failure Analysis of a Commercially Pure Titanium Plate for
Osteosynthesis, Engineering Failure Analysis, 10 (2), pp. 153-164, 2003.
[64] J. Black, H. Sherk, J. Bonini, W. Rostoker, F. Schajowicz and J. Galante,
Metallosis Associated with a Stable Titanium-Alloy Femoral Component in
Total Hip Replacement. A Case Report, Journal of Bone and Joint Surgery, 72
(1), pp. 126-130, 1990.
[65] J. J. Jacobs, A. K. Skipor, L. M. Patterson, N. J. Hallab, W. G. Paprosky, J.
Black and J. O. Galante, Metal Release in Patients Who have had a Primary
Total Hip Arthroplasty. A Prospective, Controlled, Longitudinal Study, Journal
of Bone and Joint Surgery, 80 (10), pp. 1447-58, 1998.
[66] R. M. Urban, J. L. Gilbert and J. J. Jacobs, Corrosion of Modular Titanium
Alloy Stems in Cementless Hip Replacement, Journal of ASTM International , 2
(10), pp. 357-366, 2005, Available: http://dx.doi.org/10.1520/JAI12810.
[67] O. Matsumoto, M. Konuma and Y. Kanzaki, Nitriding of Titanium in an r.f.
Discharge II: Effect of the Addition of Hydrogen to Nitrogen on Nitriding,
Journal of the Less Common Metals , 84 pp. 157-163, 1982.
[68] Calphad website, Titanium-Aluminium Phase Diagram, 2012. [online] Accessed
(18/01/2012) Available: http://www.calphad.com/titanium-aluminum.html
[69] H. Baker, "Introduction to alloy phase diagrams" in ASM Handbook Vol.3: Alloy
Phase Diagrams, 3rd ed., H. Baker and H. Okamoto, Eds. Ohio, USA: ASM
International, pp. 1-24, 2001.

7-177
[70] G. L tjering, G. Lo tjering and J. S. Williams, Titanium, 2007. Available:
http://isbndb.com/d/book/titanium_a05.
[71] M. Atapour, A. Pilchak, G. S. Frankel, J. C. Williams, M. H. Fathi and M.
Shamanian, Corrosion Behavior of Ti-6Al-4V with Different Thermomechanical
Treatments and Microstructures, Corrosion , 66 (6), pp. 1-9, 2010. Available:
http://link.aip.org/link/?COR/66/065004/1.
[72] R. W. Schutz and D. E. Thomas, "Corrosion of titanium and titanium alloys" in
ASM Handbook Volume 13 (9th ed.)Anonymous 2003, Available:
http://isbndb.com/d/book/asm_handbook_corrosion.
[73] D. Brabazon, PhD Thesis: Processing and Properties of Rheocast Alloys,
University College Dublin, 2001.
[74] W. Kurz and D. J. Fisher, Fundamentals of Solidification 1998, Available:
http://isbndb.com/d/book/fundamentals_of_solidification.
[75] W. M. Steen, J. Mazumder and K. Watkins, Laser Material Processing 2010,
Available: http://isbndb.com/d/book/laser_material_processing_a04.
[76] M. Furukawa, Z. Horita, M. Nemoto, R. Z. Valiev and T. G. Langdon,
Microhardness Measurements and the Hall-Petch Relationship in an Al-Mg
Alloy with Submicrometer Grain Size, Acta Materialia , 44 (11), pp. 4619-4629,
1996.
[77] G. Giavaresi, L. Ambrosio, G. A. Battiston, U. Casellato, R. Gerbasi, M. Finia,
N. Aldini, L. Martini, L. Rimondini and R. Giardino, Histomorphometric,
Ultrastructural and Microhardness Evaluation of the Osseointegration of a
Nanostructured Titanium Oxide Coating by Metal-Organic Chemical Vapour
Deposition: An in Vivo Study, Biomaterials , 25 (25), pp. 5583-5591, 2004.
[78] J. R. Goldberg and J. L. Gilbert, The Electrochemical and Mechanical Behavior
of Passivated and TiN/AlN-Coated CoCrMo and Ti6Al4V Alloys, Biomaterials,
25 (5), pp. 851-864, 2004.
[79] H. Güleryüz and H. Çimenoglu, Effect of Thermal Oxidation on Corrosion and
corrosion–wear Behaviour of a Ti–6Al–4V Alloy, Biomaterials, 25 (16), pp.
3325-3333, 2004.
[80] J. D. Majumdar and I. Manna, Laser Processing of Materials, Sadhana, 28
(3&4), pp. 11/05/2009-495–562. 2003.
7-178
[81] J. Epinette and M. Manley, Fifteen Years of Clinical Experience with
Hydroxyapatite Coatings in Joint Arthroplasty 2003. Available:
http://isbndb.com/d/book/fifteen_years_of_clinical_experience_with_hydroxyap
atite_coa.
[82] J. de Damborenea, Surface Modification of Metals by High Power Lasers,
Surface and Coatings Technology , 100-101 pp. 377-382, 1998.
[83] J. J. JACOBS, J. L. GILBERT and R. M. URBAN, Current Concepts Review -
Corrosion of Metal Orthopaedic Implants, Journal of Bone and Joint Surgery ,
80 (2), pp. 268-82, 1998.
[84] L. L. Hench and E. C. Ethridge, Biomaterials - the Interfacial Problem,
Advances in Biomedical Engineering , 5, pp. 35-150, 1975.
[85] A. W. E. Hodgson, S. Kurz, S. Virtanen, V. Fervel, C. -. A. Olsson and S.
Mischler, Passive and Transpassive Behaviour of CoCrMo in Simulated
Biological Solutions, Electrochimica Acta, 49 (13), pp. 2167-2178, 2004.
Available: http://dx.doi.org/10.1016/j.electacta.2003.12.043.
[86] H. J. Mueller and E. H. Greener, Polarization Studies of Surgical Materials in
Ringer's Solution, Journal of Biomedical Materials Research, 4 (1), pp. 29-41,
1970.
[87] M. Aziz-Kerrzo, K. G. Conroy, A. M. Fenelon, S. T. Farrell and C. B. Breslin,
Electrochemical Studies on the Stability and Corrosion Resistance of Titanium-
Based Implant Materials, Biomaterials , 22 (12), pp. 1531-1539, 2001.
Available: http://dx.doi.org/10.1016/S0142-9612(00)00309-4.
[88] Y. Mu, T. Kobayashi, M. Sumita, A. Yamamoto and T. Hanawa, Metal Ion
Release from Titanium with Active Oxygen Species Generated by Rat
Macrophages in Vitro, Journal of Biomedical Materials Research , 49 (2), pp.
238-243, 2000. Available: http://dx.doi.org/10.1002/(SICI)1097-
4636(200002)49:2<238::AID-JBM12>3.0.CO;2-J.
[89] M. Browne and P. J. Gregson, Effect of Mechanical Surface Pretreatment on
Metal Ion Release, Biomaterials, 21 (4), pp. 385-392, 2000. Available:
http://dx.doi.org/10.1016/S0142-9612(99)00200-8.
[90] L. Hao, Laser Surface Treatment of Bio-Implant Materials 2005, Available:
http://isbndb.com/d/book/laser_surface_treatment_of_bio_implant_materials.
7-179
[91] E. A. Vogler, Structure and Reactivity of Water at Biomaterial Surfaces,
Advances in Colloid and Interface Science, 74 (1-3), pp. 69-117, 1998.
[92] J. Lawrence and L. Li, Laser Modification of the Wettability Characteristics of
Engineering Materials (Engineering Research) 2001. Available:
http://isbndb.com/d/book/laser_modification_of_the_wettability_characteristics_
of_eng.
[93] I. Gentle and G. Barnes, Interfacial Science: An Introduction 2005. Available:
http://isbndb.com/d/book/interfacial_science_a01.
[94] S. C. Wong, Y. D. Ramkissoon, M. Lopez, K. Page, I. P. Parkin and P. M.
Sullivan, Use of Hydroxypropylmethylcellulose 2% for Removing Adherent
Silicone Oil from Silicone Intraocular Lenses, British Journal of Ophthalmology
, 93 (8), pp. 1085-1088, 2009.
[95] Gelwell Biotech Website, Hydrophilic and Hydrophobic Coatings, 2011 [online]
Accessed (23/09/2011), Available: http://www.gelwell.com/1.htm.
[96] Pacific BioLabs, Assessing Biocompatibility, 2009 [online] Accessed
(19/01/2009) Available:
http://www.pacificbiolabs.com/downloads/PBL%20biocompatibility%202008%
20-final.pdf.
[97] J. F. Ready and D. Farson, LIA Handbook of Laser Materials Processing, 2001.
Available:
http://isbndb.com/d/book/lia_handbook_of_laser_materials_processing.
[98] D. T. A. Matthews, V. Ocelík and J. T. M. de Hosson, Tribological and
Mechanical Properties of High Power Laser Surface-Treated Metallic Glasses,
Materials Science and Engineering: A, 471 (1-2), pp. 155-164, 2007.
[99] T. Mahank, PhD Thesis: Laser Glazing of Metals and Metallic and Ceramic
Coatings, Pennsylvania State University, 2004.
[100] A. A. Peligrad, E. Zhou, D. Morton and L. Li, A Melt Depth Prediction Model
for Quality Control of Laser Surface Glazing of Inhomogeneous Materials,
Optics & Laser Technology , 33 (1), pp. 7-13, 2001.
[101] H. L. Tsai and P. C. Tsai, Laser Glazing of Plasma-Sprayed Zirconia Coatings,
Journal of Materials Engineering and Performance, 7 (2), pp. 258-264, 1998.

7-180
[102] S. N. Aqida, D. Brabazon and S. Naher, H13 Die Steel Modified Surface by
Pulse Laser Glazing, AMPT Proceedings, Malaysia, 2009.
[103] J. C. Ion, Laser Processing of Engineering Materials: Principles, Procedure and
Industrial Application 2005, Available:
http://isbndb.com/d/book/laser_processing_of_engineering_materials.
[104] R. J. DiMelfi, P. G. Sanders, B. Hunter, J. A. Eastman, K. J. Sawley, K. H.
Leong and J. M. Kramer, Mitigation of Subsurface Crack Propagation in
Railroad Rails by Laser Surface Modification, Surface and Coatings
Technology, 106 (1), pp. 30-43, 1998. Available:
http://dx.doi.org/10.1016/S0257-8972(98)00487-3.
[105] C. Sreedhar, G. Santhanakrishnan, C. V. Gokularathnam and R. Krishnamurthy,
Effect of Processing Parameters on the Laser Glazing of Plasma-Sprayed
alumina–titania Ceramic, Journal of Materials Processing Technology , 114 (3),
pp. 246-251, 2001.
[106] W. Jiang and P. Molian, Nanocrystalline TiC Powder Alloying and Glazing of
H13 Steel using a CO2 Laser for Improved Life of Die-Casting Dies, Surface
and Coatings Technology , 135 (2-3), pp. 139-149, 2001.
[107] W. L. Johnson, Bulk Metallic Glasses - a New Engineering Material, Current
Opinion in Solid State and Materials Science, 1 (3), pp. 383-386, 1996.
[108] W. L. Johnson, Fundamental Aspects of Bulk Metallic Glass Formation in
Multicomponent Alloys, Presented at: ISMANAM-95, pp. 35-50, 1996.
[109] B. Lemley, Glassy Metals, Materials Science: Discover Magazine, 2008 [online]
Accessed (19/11/2008), Available:
http://discovermagazine.com/2004/apr/glassymetals/article_view?b_start:int=1&
-C=.
[110] F. Audebert, R. Colaco, R. Vilar and H. Sirkin, Production of Glassy Metallic
Layers by Laser Surface Treatment, Scripta Materialia , 48 (3), pp. 281-6, 2003.
Available: http://dx.doi.org/10.1016/S1359-6462(02)00382-2.
[111] A. Inoue, Stabilization of Metallic Supercooled Liquid and Bulk Amorphous
Alloys, Acta Materialia, 48 (1), pp. 279-306, 2000.

7-181
[112] G. Malakondaiah and T. Nicholas, The Influence of Laser Glazing on Fatigue
Crack Growth in Ti-24Al-11Nb, Metallurgical and Materials Transactions A
(Physical Metallurgy and Materials Science), 25A (1), pp. 183-92, 1994.
[113] O. V. Akgun and O. T. Inal, Laser Surface Melting of Ti-6Al-4V Alloy, Journal
of Materials Science , 27 (5), pp. 1404-1408, 1992, Available:
http://dx.doi.org/10.1007/BF01142062.
[114] A. Bandyopadhyay,V. Balla,M. Roy and S. Bose, Laser Surface Modification of
Metallic Biomaterials, JOM Journal of the Minerals, Metals and Materials
Society, 63 (6), pp. 94-99, 2011.
[115] X. K. Xi, D. Q. Zhao, M. X. Pan, W. H. Wang, Y. Wu and J. J. Lewandowski,
Fracture of Brittle Metallic Glasses: Brittleness Or Plasticity, Physical Review
Letters , 94 (12), pp. 125510, 2005. Available:
http://link.aps.org/doi/10.1103/PhysRevLett.94.125510.
[116] C. W. Draper and C. A. Ewing, Laser Surface Alloying: A Bibliography,
Journal of Materials Science, 19 (12), pp. 3815-3825, 1984.
[117] S. V. Joshi and G. Sundararajan, "Lasers for metallic and intermetallic coatings"
in Lasers in Surface Engineering, N. B. Dahotre, Ed. 1998, Available:
http://isbndb.com/d/book/lasers_in_surface_engineering.
[118] H. Chen and Q. Luo, Study on Laser Gas Alloying for Titanium Alloy, Jiguang
Zazhi/Laser Journal , 18 (3), pp. 32-36, 44, 1997.
[119] J. Liu, Q. Luo and Z. Zou, Laser Gas Alloying of Titanium Alloy with Nitrogen,
Surface and Coatings Technology, 57 (2-3), pp. 191-195, 1993. Available:
http://dx.doi.org/10.1016/0257-8972(93)90039-Q.
[120] H. Chmelickova, L. Kucharicova and J. Grezl, Powder Alloying of Low-Carbon
Steel by CO2 Laser, Presented at: Sixth International Workshop on Laser
Physics (LPHYS'97), pp. 349-51, 1998.
[121] O. d. Diniz Neto and R. M. C. Vilar, Interaction between the Laser Beam and the
Powder Jet in Blown Powder Laser Alloying and Cladding, Presented at:
Proceedings of International Congress on the Applications of Lasers and
Electro-Optics, 1998, pp. 180-8.
[122] E. Brandl, F. Palm, V. Michailov, B. Viehweger and C. Leyens, Mechanical
Properties of Additive Manufactured Titanium (Ti-6Al-4V) Blocks Deposited by

7-182
a Solid-State Laser and Wire, Materials and Design , 32 (10), pp. 4665-4675,
2011. Available: http://dx.doi.org/10.1016/j.matdes.2011.06.062.
[123] H. C. Man, M. Bai and F. T. Cheng, Laser Diffusion Nitriding of Ti-6Al-4V for
Improving Hardness and Wear Resistance, Applied Surface Science , 258 (1), pp.
436-441, 2011, Available: http://dx.doi.org/10.1016/j.apsusc.2011.08.114.
[124] R. Filip, Laser Nitriding of the Surface Layer of Ti6Al4V Titanium Alloy, Int.
Sci. Journal, 30 (1), pp. 25, 2008.http://www.archivesmse.org/vol30_1/3016.pdf
[125] A. R. Hamad, J. H. Abboud, F. M. Shuaeib and K. Y. Benyounis, Surface
Hardening of Commercially Pure Titanium by Laser Nitriding: Response
Surface Analysis, Advances in Engineering Software, 41 (4), pp. 674-679, 2010.
[126] S. Fare, N. Lecis, M. Vedani, G. Vimercati, A. Silipigni, D. Corti and P.
Favoino, Ion Nitriding of a Commercially Pure Titanium Alloy and of a Ti-6Al-
4V; Metallurgia Italiana , 102 (6), pp. 13-18, 2010.
[127] C. Hu and T. N. Baker, The Importance of Preheat before Laser Nitriding a Ti–
6Al–4V Alloy, Materials Science and Engineering A, 265 (1-2), pp. 268-275,
1999.
[128] C. Gerdes, A. Karimi and H. W. Bieler, Water Droplet Erosion and
Microstructure of Laser-Nitrided Ti-6A1-4V, Wear, 186-187 (Part 2), pp. 368-
374, 1995.
[129] T. I. Khan, A Review of Methods used for Surface Melting and Gaseous
Alloying, Proc. Pakistan Acad. Sci., 1 (44), pp. 63, 2006.
[130] M. Geetha, U. K. Mudali, N. D. Pandey, R. Asokamani and B. Raj,
Microstructural and Corrosion Evaluation of Laser Surface Nitrided Ti-13Nb-
13Zr Alloy, Surface Engineering , 20 (1), pp. 68-74, 2004.
[131] Y. S. Tian, C. Z. Chen, S. T. Li and Q. H. Huo, Research Progress on Laser
Surface Modification of Titanium Alloys, Applied Surface Science , 242 (1-2),
pp. 177-184, 2005.
[132] H. O. Pierson, Handbook of Refractory Carbides and Nitrides: Properties,
Characteristics, Processing and Applications, 1996, Available:
http://isbndb.com/d/book/handbook_of_refractory_carbides_and_nitrides.

7-183
[133] S. Ettaqi, V. Hays, J. J. Hantzpergue, G. Saindrenan and J. C. Remy,
Mechanical, Structural and Tribological Properties of Titanium Nitrided by a
Pulsed Laser, Surface and Coatings Technology , 100-101 pp. 428-432, 1998.
[134] J. C. Mori, P. Serra, E. Martínez, G. Sardin, J. Esteve and J. L. Morenza, Surface
Treatment of Titanium by Nd:YAG Laser Irradiation in the Presence of
Nitrogen, Applied Physics A: Materials Science & Processing , 69 (7), pp. S699,
1999.
[135] MatWeb Website, Titanium Nitride (TiN) Coating, 2010 [online] Accessed
(1/13/2010), Available:
http://www.matweb.com/search/datasheet.aspx?MatGUID=ffbf753c500949db95
e502e043f9a404&ckck=1.
[136] [136] P. Jiang, X. L. He, X. X. Li, L. G. Yu and H. M. Wang, Wear Resistance
of a Laser Surface Alloyed Ti–6Al–4V Alloy, Surface and Coatings
Technology, 130 (1), pp. 24-28, 2000.
[137] E. György, A. Pérez del Pino, P. Serra and J. L. Morenza, Surface Nitridation of
Titanium by Pulsed Nd:YAG Laser Irradiation, Applied Surface Science , 186
(1-4), pp. 130-134, 2002.
[138] S. Yerramareddy and S. Bahadur, The Effect of Laser Surface Treatments on the
Tribological Behavior of Ti-6Al-4V, Wear, 157 (2), pp. 245-262, 1992.
[139] H. C. Man, Z. D. Cui, T. M. Yue and F. T. Cheng, Cavitation Erosion Behavior
of Laser Gas Nitrided Ti and Ti6Al4V Alloy, Materials Science and
Engineering A , 355 (1-2), pp. 167-173, 2003.
[140] S. Mridha and T. N. Baker, Crack-Free Hard Surfaces Produced by Laser
Nitriding of Commercial Purity Titanium, Materials Science and Engineering A,
A188 (1-2), pp. 229-239, 1994.
[141] R. L. Sun, J. F. Mao and D. Z. Yang, Microstructural Characterization of
NiCr1BSiC Laser Clad Layer on Titanium Alloy Substrate, Surface and
Coatings Technology , 150 (2-3), pp. 199-204, 2002.
[142] S. Yang, W. Liu and M. Zhong, Microstructure Characteristics and Properties of
in-Situ Formed TiC/Ni Based Alloy Composite Coating by Laser Cladding,
Presented at: First International Symposium on High-Power Laser
7-184
Macroprocessing, 2003, pp. 481-6. Available:
http://dx.doi.org/10.1117/12.497602.
[143] M. Qingwu, G. Lin and Z. Zhenzhu, Laser Cladding Ni-Base Composite Coating
on Titanium Alloy with Pre-Placed B4C+NiCoCrAlY, Presented at: Fifth
Pacific Rim International Conference on Advanced Materials and Processing
PRICM-5, 2005, pp. 905-8.
[144] Y. Wang and H. M. Wang, Wear Resistance of Laser Clad Ti2Ni3Si Reinforced
Intermetallic Composite Coatings on Titanium Alloy, Applied Surface Science,
229 (1-4), pp. 81-86, 2004.
[145] A. Hirose, T. Ueda and K. F. Kobayashi, Wear and Oxidation Properties of
Titanium Aluminides Formed on Titanium Surface by Laser Alloying, Materials
Science and Engineering: A, 160 (1), pp. 143-153, 1993.
[146] B. Guo, J. Zhou, S. Zhang, H. Zhou, Y. Pu and J. Chen, Microstructure and
Tribological Properties of in Situ Synthesized TiN/Ti3Al Intermetallic Matrix
Composite Coatings on Titanium by Laser Cladding and Laser Nitriding,
Materials Science and Engineering: A , 480 (1-2), pp. 404-410, 2008.
[147] Y. Pu, B. Guo, J. Zhou, S. Zhang, H. Zhou and J. Chen, Microstructure and
Tribological Properties of in Situ Synthesized TiC, TiN, and SiC Reinforced
Ti3Al Intermetallic Matrix Composite Coatings on Pure Ti by Laser Cladding,
Applied Surface Science , 255 (5, Part 2), pp. 2697-2703, 2008.
[148] L. Cai, Y. Zhang and L. Shi, Microstructure and Formation Mechanism of
Titanium Matrix Composites Coating on Ti-6Al-4V by Laser Cladding, Rare
Metals, 26 (4), pp. 342-346, 2007.
[149] J. Dutta Majumdar, I. Manna, A. Kumar, P. Bhargava and A. K. Nath, Direct
Laser Cladding of Co on Ti–6Al–4V with a Compositionally Graded Interface,
Journal of Materials Processing Technology , 209 (5), pp. 2237-2243, 2009.
[150] A. Kruusing, Underwater and Water-Assisted Laser Processing: Part 2 - Etching,
Cutting and Rarely used Methods, Optics and Lasers in Engineering, 41 (2), pp.
329-352, 2004.
[151] M. Rozmus-Gornikowska, Surface Modifications of a Ti6A14V Alloy by a
Laser Shock Processing, 2010, pp. 808-811.

7-185
[152] T. N. Baker, "Laser surface modification of Ti alloys" in Surface Engineering of
Light Alloys - Aluminium, Magnesium and Titanium Alloys, H. Dong, Ed. 2009.
[153] T. M. Yue, T. M. Cheung and H. C. Man, The Effects of Laser Surface
Treatment on the Corrosion Properties of Ti-6Al-4V Alloy in Hank's Solution,
Journal of Materials Science Letters , 19 (3), pp. 205-8, 2000, Available:
http://dx.doi.org/10.1023/A:1006750422831.
[154] J. Hyzak and I. Bernstein, The Role of Microstructure on the Strength and
Toughness of Fully Pearlitic Steels, Metallurgical and Materials Transactions A,
7 (8), pp. 1217-1224, 1976.
[155] A. Lasalmonie and J. L. Strudel, Influence of Grain Size on the Mechanical
Behaviour of some High Strength Materials, Journal of Materials Science, 21
(6), pp. 1837-1852, 1986.
[156] M. Pellizzari and M. G. De Flora, Influence of Laser Hardening on the
Tribological Properties of Forged Steel for Hot Rolls, Wear , 271 (9-10), pp.
2402-2411, 2011.
[157] J. C. Ion, Laser transformation hardening, Surface Engineering, 18 (1), pp. 14-
31, 2002.
[158] P. A. A. Khan and T. Debroy, Absorption of CO2 Laser Beam by AISI 4340
Steel, Metallurgical Transactions B, 16 (4), pp. 853, 1985.
[159] Y. Touloukian, Thermophysical Properties of Matter - Thermal Radiative
Properties – Coatings, 1973, Available:
http://isbndb.com/d/book/touloukian_thermophysical_properties_of_matter_ther
mal_r_a01.
[160] L. Quintino, A. Costa, R. Miranda, D. Yapp, V. Kumar and C. J. Kong, Welding
with High Power Fiber Lasers – A Preliminary Study, Materials & Design , 28
(4), pp. 1231-1237, 2007.
[161] W. M. Steen and K. Watkins, Laser Material Processing, 2003, Available:
http://isbndb.com/d/book/laser_material_processing_a02.
[162] D. Bergström, J. Powell and A. F. H. Kaplan, The Absorptance of Steels to
Nd:YLF and Nd:YAG Laser Light at Room Temperature, Applied Surface
Science, 253 (11), pp. 5017-5028, 2007.
7-186
[163] V. C. Kumar, Process Parameters Influencing Melt Profile and Hardness of
Pulsed Laser Treated Ti-6Al-4V, Surface & Coatings Technology , 201 (6), pp.
3174-80, 2006, Available: http://dx.doi.org/10.1016/j.surfcoat.2006.06.035.
[164] A. N. Samant, B. Du, S. R. Paital, S. Kumar and N. B. Dahotre, Pulsed Laser
Surface Treatment of Magnesium Alloy: Correlation between Thermal Model
and Experimental Observations, Journal of Materials Processing Technology ,
209 (11), pp. 5060-5067, 2009.
[165] A. J. Pinkerton and L. Li, An Investigation of the Effect of Pulse Frequency in
Laser Multiple-Layer Cladding of Stainless Steel, Applied Surface Science, 208-
209 pp. 405-410, 2003.
[166] A. N. Samant, S. P. Harimkar and N. B. Dahotre, Laser Beam Operation Mode
Dependent Grain Morphology of Alumina, Journal of Applied Physics , 102
(12), 2007, Available: http://dx.doi.org/10.1063/1.2825403.
[167] J. T. Black, "Machining" in ASM Handbook, 9th Edition, ASM-International,
Ohio USA, 1997.
[168] N. Zaveri, M. Mahapatra, A. Deceuster, Y. Peng, L. Li and A. Zhou, Corrosion
Resistance of Pulsed Laser-Treated Ti-6Al-4V Implant in Simulated Biofluids,
Electrochimica Acta , 53 (15), pp. 5022-5032, 2008. Available:
http://dx.doi.org/10.1016/j.electacta.2008.01.086.
[169] Z. Sun, I. Annergren, D. Pan and T. A. Mai, Effect of Laser Surface Remelting
on the Corrosion Behavior of Commercially Pure Titanium Sheet, Materials
Science & Engineering A (Structural Materials: Properties, Microstructure and
Processing) , A345 (1-2), pp. 293-300, 2003, Available:
http://dx.doi.org/10.1016/S0921-5093(02)00477-X.
[170] A. Issa, PhD Thesis: Computational Control of Laser Systems for Micro-
Machining, Dublin City University, 2007.
[171] W. W. Duley, Laser Processing and Analysis of Materials 1983. Available:
http://isbndb.com/d/book/laser_processing_and_analysis_of_materials.
[172] E. V. Bordatchev and S. K. Nikumb, Effect of Focus Position on Informational
Properties of Acoustic Emission Generated by laser–material Interactions,
Applied Surface Science , 253 (3), pp. 1122-1129, 2006.

7-187
[173] P. H. Morton, T. Bell, A. Weisheit, J. Kroll, B. L. Mordike and K. Sagoo, "Laser
gas nitriding of titanium and titanium alloys" in Surface Modification
Technologies V, T. S. Sudarshan and J. Braza, Eds. 1992.
[174] H. Xin, S. Mridha and T. N. Baker, The Effect of Laser Surface Nitriding with a
Spinning Laser Beam on the Wear Resistance of Commercial Purity Titanium,
Journal of Materials Science , 31 (1), pp. 22-30, 1996.
[175] C. Hu and T. Baker, Overlapping Laser Tracks to Produce a Continuous Nitrided
Layer in Ti–6Al–4V Alloy, Journal of Materials Science, 32 (11), pp. 2821-
2826, 1997.
[176] F. Laroudie, C. Tassin and M. Pons, Laser Surface Alloying of 316L Stainless
Steel: Different Hardening Routes and Related Microstructures, Journal De
Physique, 4 (4), pp. 77-80, 1994.
[177] G. Manivasagam, D. Dhinasekaran and A. Rajamanickam, Biomedical Implants:
Corrosion and its Prevention - A Review~, Recent Patents on Corrosion
Science, 2 (1), pp. 40, 2010.
[178] U. Mudali, M. Pujar and R. Dayal, Effects of Laser Surface Melting on the
Pitting Resistance of Sensitized Nitrogen-Bearing Type 316L Stainless Steel,
Journal of Materials Engineering and Performance , 7 (2), pp. 214-220, 1998.
Available: http://dx.doi.org/10.1361/105994998770347945.
[179] M. Sivakumar and S. Rajeswari, Investigation of Failures in Stainless Steel
Orthopaedic Implant Devices: Pit-Induced Stress Corrosion Cracking, Journal of
Materials Science Letters, 11 (15), pp. 1039-42, 1992.
[180] O. V. Akgun and O. T. Inal, Laser Surface Melting and Alloying of Type 304L
Stainless Steel, Journal of Materials Science , 30 (23), pp. 6105-6112, 1995,
Available: http://dx.doi.org/10.1007/BF01151534.
[181] N. Parvathavarthini, R. V. Subbarao, S. Kumar, R. K. Dayal and H. S. Khatak,
Elimination of Intergranular Corrosion Susceptibility of Cold-Worked and
Sensitized AISI 316 SS by Laser Surface Melting, Journal of Materials
Engineering and Performance , 10 (1), pp. 5-13, 2001, Available:
http://dx.doi.org/10.1361/105994901770345277.
7-188
[182] A. Ossowska and A. Zieliński, Properties of Surface Layers of Titanium Alloy
TI6AL4V After Laser Melting Processes, Advances in Materials Sciences , (4),
pp. 63, 2010.
[183] L. Lavisse, D. Grevey, C. Langlade and B. Vannes, The Early Stage of the
Laser-Induced Oxidation of Titanium Substrates, Applied Surface Science, 186
(1-4), pp. 150-155, 2002.
[184] R. R. Boyer, "ASM handbook volume 09: Metallography and microstructures."
in Vander Voort, G.; ASM Handbook Volume 09: Metallography and
Microstructures, Ed. 2004, pp. 458-475.
[185] K. Ferjutz and J. R. Davis, "Welding, brazing, and soldering" in ASM Handbook,
1990, Available: http://isbndb.com/d/book/asm_handbook_a09.
[186] W. Liu and J. N. DuPont, Effects of Melt-Pool Geometry on Crystal Growth and
Microstructure Development in Laser Surface-Melted Superalloy Single
Crystals: Mathematical Modelling of Single-Crystal Growth in a Melt Pool (Part
I), Acta Materialia , 52 (16), pp. 4833-4847, 2004.
[187] K. Farooq and A. Kar, Effects of Laser Mode and Scanning Direction on Melt
Pool Shape, Journal of Applied Physics , 85 (9), pp. 6415-20, 1999, Available:
http://dx.doi.org/10.1063/1.370145.
[188] L. Han, F. W. Liou and S. Musti, Thermal Behavior and Geometry Model of
Melt Pool in Laser Material Process, Journal of Heat Transfer , 127 (9), pp.
1005-1014, 2005, Available: http://dx.doi.org/10.1115/1.2005275.
[189] C. L. Chan, J. Mazumder and M. M. Chen, Effect of Surface Tension Gradient
Driven Convection in a Laser Melt Pool: Three‐dimensional Perturbation Model,
Journal of Applied Physics, 64 (11), pp. 6166-6174, 1988.
[190] M. Bamberger, "Rapid melting kinetics" in Handbook of Laser Materials
Processing, J. F. Ready, Ed. Library of congress control, 2001.
[191] H. Li, S. Costil, V. Barnier, R. Oltra, O. Heintz and C. Coddet, Surface
Modifications Induced by Nanosecond Pulsed Nd:YAG Laser Irradiation of
Metallic Substrates, Surface and Coatings Technology , 201, (3-4), pp. 1383-
1392, 2006.
7-189
[192] N. Axén, S. Jacobson and S. Hogmark, Influence of Hardness of the
Counterbody in Three-Body Abrasive Wear - an Overlooked Hardness Effect,
Tribology International , 27 (4), pp. 233-241, 1994.
[193] Y. S. Tian, C. Z. Chen, D. Y. Wang and T. Q. Lei, Laser Surface Modification
of Titanium Alloys - a Review, Surface Review and Letters , 12 (1), pp. 123-30,
2005, Available: http://dx.doi.org/10.1142/S0218625X0500686X.
[194] G. Gray,S. Chen and K. Vecchio, Influence of Grain Size on the Constitutive
Response and Substructure Evolution of MONEL 400, Metallurgical and
Materials Transactions A, 30 (5), pp. 1235-1247, 1999.
[195] A. Biswas, T. K. Maity, U. K. Chatterjee, I. Manna, L. Li and J. Dutta
Majumdar, Laser Surface Nitriding of Ti-6Al-4V for Bio-Implant Application,
Trends in Biomaterials and Artificial Organs , 20 (1), pp. 68-71, 2006.
[196] K. Miyoshi and D. H. Buckley, Adhesion and Friction of Transition Metals in
Contact with Non-Metallic Hard Materials, Wear , 77 (2), pp. 253-264, 1982.
[197] F. M. Kustas and M. S. Misra, "Friction and wear of titanium alloys" in ASM
Handbook Volume 18, Friction, Lubrication, and Wear Technology, ASM
International, Ohio USA, 2001.
[198] A. Biswas, I. Manna, U. K. Chatterjee, U. Bhattacharyya and J. D. Majumdar,
Evaluation of Electrochemical Properties of Thermally Oxidised Ti-6Al-4V for
Bioimplant Application, Surface Engineering , 25 (2), pp. 141-145, 2009.
Available: http://dx.doi.org/10.1179/174329409X379264.
[199] S. Meassick and H. Champaign, Noble Metal Cathodic Arc Implantation for
Corrosion Control of Ti-6A1-4V, Surface and Coatings Technology , 93 (2-3),
pp. 292-296, 1997.
[200] J. L. - Gilbert,C. A. - Buckley and J. J. - Jacobs, In Vivo Corrosion of Modular
Hip Prosthesis Components in Mixed and Similar Metal Combinations: the
Effect of Crevice, Stress, Motion, and Alloy Coupling, - Journal of Biomedical
Materials Research, - 27 (- 12), pp. - 1533-- 1544, - 1993.
[201] A. Gaggl, G. Schultes, W. D. Muller and H. Karcher, Scanning Electron
Microscopical Analysis of Laser-Treated Titanium Implant Surfaces-a
Comparative Study, Biomaterials , 21 (10), pp. 1067-73, 2000. Available:
http://dx.doi.org/10.1016/S0142-9612(00)00002-8.

7-190
[202] N. Mirhosseini, P. L. Crouse, M. J. J. Schmidth, L. Li and D. Garrod, Laser
Surface Micro-Texturing of Ti-6Al-4V Substrates for Improved Cell Integration,
Applied Surface Science , 253 (19), pp. 7738-43, 2007. Available:
http://dx.doi.org/10.1016/j.apsusc.2007.02.168.
[203] X. Liu, P. K. Chu and C. Ding, Surface Modification of Titanium, Titanium
Alloys, and Related Materials for Biomedical Applications, Materials Science
and Engineering: R: Reports , 47 (3-4), pp. 49-121, 2004.
[204] A. Göransson, E. Jansson, P. Tengvall and A. Wennerberg, Bone Formation
After 4 Weeks Around Blood-Plasma-Modified Titanium Implants with Varying
Surface Topographies: An in Vivo Study, Biomaterials , 24 (2), pp. 197-205,
2003.
[205] T. M. Lee, E. Chang and C. Y. Yang, Attachment and Proliferation of Neonatal
Rat Calvarial Osteoblasts on Ti6Al4V: Effect of Surface Chemistries of the
Alloy, Biomaterials, 25 (1), pp. 23-32, 2004.
[206] A. Bagno and C. Di Bello, Surface Treatments and Roughness Properties of Ti-
Based Biomaterials, Journal of Materials Science: Materials in Medicine, 15
(9), pp. 935-949, 2004.
[207] L. Hao, J. Lawrence and L. Li, Manipulation of the Osteoblast Response to a Ti-
6Al-4V Titanium Alloy using a High Power Diode Laser, Applied Surface
Science , 247 (1-4), pp. 602-606, 2005.
[208] J. Chen, J. P. Ulerich, E. Abelev, A. Fasasi, C. B. Arnold and W. O. Soboyejo,
An Investigation of the Initial Attachment and Orientation of Osteoblast-Like
Cells on Laser Grooved Ti-6Al-4V Surfaces, Materials Science and
Engineering: C , 29 (4), pp. 1442-1452, 2009.
[209] C. Hallgren, H. Reimers, D. Chakarov, J. Gold and A. Wennerberg, An in Vivo
Study of Bone Response to Implants Topographically Modified by Laser
Micromachining, Biomaterials , 24 (5), pp. 701-10, 2003, Available:
http://dx.doi.org/10.1016/S0142-9612(02)00266-1.
[210] K. Anselme and M. Bigerelle, Topography Effects of Pure Titanium Substrates
on Human Osteoblast Long-Term Adhesion, Acta Biomaterialia , 1 (2), pp. 211-
222, 2005.

7-191
[211] T. Chung, D. Liu, S. Wang and S. Wang, Enhancement of the Growth of Human
Endothelial Cells by Surface Roughness at Nanometer Scale, Biomaterials, 24
(25), pp. 4655-4661, 2003.
[212] D. Sowden and J. P. Schmitz, AO Self-Drilling and Self-Tapping Screws in Rat
Calvarial Bone: An Ultrastructural Study of the Implant Interface, Journal of
Oral and Maxillofacial Surgery, 60 (3), pp. 294-299, 2002.
[213] J. Vlacic-Zischke, S. M. Hamlet, T. Friis, M. S. Tonetti and S. Ivanovski, The
Influence of Surface Microroughness and Hydrophilicity of Titanium on the Up-
Regulation of TGFβ/BMP Signalling in Osteoblasts. Biomaterials, 32 (3), pp.
665-671, 2011.
[214] Guyson Website, Blast Media, 2010 [online] Accessed (6/23/2010), Available:
http://www.guyson.co.uk/consumables/media.html.
[215] N. Blackstone, Fundamentals of ultrasonic cleaning, Process Cleaning
Magazine, 2000 Available: www.blackstone-ney.com/pdfs/T_Fundametals.htm.
[216] D. R. Whitehouse, Understanding CO2 Lasers, 2010 [Online] Accessed
(2/21/2010), Available: http://www.laserk.com/newsletters/whiteCO.html.
[217] M.B Bever, “Metallurgical Techniques and Microstructures” in ASM
Handbook: Metallography and Microstructures”, 9, ASM International, pp. 163.
2003.
[218] Metallography Website, Metallographic Cleaning, 2010 [online] Accessed
(3/9/2010), Available: http://www.metallographic.com/Technical/Etching.htm.
[219] G. F. Vander Voort, Materials Characterization & Testing: Microstructure of
Titanium and its Alloys, International Journal of Thermal Technology, 2006.
[220] J. S. Selvan, G. Soundararajan and K. Subramanian, Laser Alloying of
Aluminium with Electrodeposited Nickel: Optimisation of Plating Thickness and
Processing Parameters, Surface and Coatings Technology, 124 (2-3), pp. 117-
127, 2000.
[221] A to Z of Material Website, Stainless Steel - Grade 316L - Properties,
Fabrication and Applications, 2008 [online] Accessed (12/12/2008), Available:
http://www.azom.com/details.asp?ArticleID=2382.
[222] W. H. Walton, Feret's Statistical Diameter as a Measure of Particle Size, Nature,
162 (4113), pp. 329, 1948.

7-192
[223] X. D. Hou, Study of the Interaction between the Indentation Size Effect and
Hall–Petch Effect with Spherical Indenters on Annealed Polycrystalline Copper,
Journal of Physics D: Applied Physics, 41 (7), 074006, 2008. Available:
http://stacks.iop.org/0022-3727/41/i=7/a=074006.
[224] B. D. Cullity, Elements of x-Ray Diffraction USA: Reading, Addison-Wesley P,
2001.
[225] S. J. B. Reed, Electron Microprobe Analysis 1993, Available:
http://isbndb.com/d/book/electron_microprobe_analysis_a02.
[226] M. P. Gispert, A. P. Serro, R. Colaço and B. Saramago, Friction and Wear
Mechanisms in Hip Prosthesis: Comparison of Joint Materials Behaviour in
several Lubricants, Wear , 260 (1-2), pp. 149-158, 2006.
[227] M. G. Fontana, Corrosion Engineering 1986, Available:
http://isbndb.com/d/book/corrosion_engineering.
[228] ASTM International, "ASTM G102 – 89 (2010) standard practice for calculation
of corrosion rates and related information from electrochemical measurements"
in Corrosion Standards and Wear Standards: ASTM International, pp. 422,
2010.
[229] First Ten Angstroms, FTA 200 operating manual, 2006 [online] Available:
http://www.firsttenangstroms.com/products/fta200/fta200.html
[230] HPACC Website , Health Protection Agency Culture Collection: Cell Counting
using a Haemocytometer, 2011 [online] Accessed (08/05/2011) Available:
http://www.hpacultures.org.uk/technical/ccp/cellcounting.jsp .
[231] G. R. Speich, "Martensitic structures" in ASM Handbook Vol 9: Metallography
and Microstructures, G. F. Vander Voort, Ed. Ohio, USA: ASM International,
2001.
[232] S. N. Aqida, PhD Thesis: Laser Surface Modification of Steel, Dublin City
University, 2011.
[233] S. L. R. da Silva, L. O. Kerber, L. Amaral and C. A. dos Santos, X-Ray
Diffraction Measurements of Plasma-Nitrided Ti–6Al–4V, Surface and Coatings
Technology , 116-119 (0), pp. 342-346, 1999.
[234] Y. A. Alsultanny, Laser Beam Analysis using Image Processing, Journal of
Computer Science , 2, pp. 109-113, 2006.
7-193
[235] B. D. Cullity and S. H. Stock, Elements of x-Ray Diffraction 2001, Available:
http://isbndb.com/d/book/elements_of_x_ray_diffraction.
[236] H. Dong and T. Bell, Tribological Behaviour of Alumina Sliding Against
Ti6Al4V in Unlubricated Contact, Wear , 225-229, Part 2 (0), pp. 874-884,
1999.
[237] M. Long and H. J. Rack, Friction and Surface Behavior of Selected Titanium
Alloys during Reciprocating-Sliding Motion, Wear, 249 (1-2), pp. 157-167,
2001.
[238] A. Molinari, G. Straffelini, B. Tesi and T. Bacci, Dry Sliding Wear Mechanisms
of the Ti6Al4V Alloy, Wear , 208 (1-2), pp. 105-112, 1997.
[239] J. Qu, P. J. Blau, T. R. Watkins, O. B. Cavin and N. S. Kulkarni, Friction and
Wear of Titanium Alloys Sliding Against Metal, Polymer, and Ceramic
Counterfaces, Wear , 258 (9), pp. 1348-56, 2005. Available:
http://dx.doi.org/10.1016/j.wear.2004.09.062.
[240] A. Bloyce, P. -. Qi, H. Dong and T. Bell, Surface Modification of Titanium
Alloys for Combined Improvements in Corrosion and Wear Resistance, Surface
and Coatings Technology , 107 (2-3), pp. 125-32, 1998, Available:
http://dx.doi.org/10.1016/S0257-8972(98)00580-5.
[241] M. Pourbaix, Atlas of Electrochemical Equilibrium in Aqueous Solutions, 1974.
Available:
http://isbndb.com/d/book/atlas_of_electrochemical_equilibria_in_aqueous_soluti
ons.
[242] C. E. B. Marino, E. M. d. Oliveira, R. C. Rocha-Filho and S. R. Biaggio, On the
Stability of Thin-Anodic-Oxide Films of Titanium in Acid Phosphoric Media,
Corrosion Science , 43 (8), pp. 1465-1476, 2001.
[243] Y. Okazaki, M. Ohota, Y. Ito and T. Tateishi, Corrosion Resistance of Implant
Alloys in Pseudo Physiological Solution and Role of Alloying Elements in
Passive Films, Journal of the Japan Institute of Metals , 59 (2), pp. 229-36,
1995, .
[244] M. Ask, J. Lausmaa and B. Kasemo, Preparation and Surface Spectroscopic
Characterization of Oxide Films on Ti6Al4V, Applied Surface Science, 35 (3),
pp. 283-301, 1989. Available: http://dx.doi.org/10.1016/0169-4332(89)90013-5.
7-194
[245] M. Metikos-Hukovic, A. Kwokal and J. Piljac, The Influence of Niobium and
Vanadium on Passivity of Titanium-Based Implants in Physiological Solution,
Biomaterials, 24 (21), pp. 3765-3775, 2003.
[246] I. Cvijovic-Alagic, Z. Cvijovic, S. Mitrovic, V. Panic and M. Rakin, Wear and
Corrosion Behaviour of Ti-13Nb-13Zr and Ti-6Al-4V Alloys in Simulated
Physiological Solution, Corrosion Science , 53 (2), pp. 796-808, 2011.
[247] S. Y. Yu and J. R. Scully, Corrosion and Passivity of Ti-13% Nb-13% Zr in
Comparison to Other Biomedical Implant Alloys, Corrosion , 53 (12), pp. 965-
976, 1997, Available: http://link.aip.org/link/?COR/53/965/1.
[248] D. P. Dowling, I. S. Miller, M. Ardhaoui and W. M. Gallagher, Effect of Surface
Wettability and Topography on the Adhesion of Osteosarcoma Cells on Plasma-
Modified Polystyrene, Journal of Biomaterials Applications, 2010.
[249] D. Triantafyllidis, L. Li and F. H. Stott, The Effects of Laser-Induced
Modification of Surface Roughness of Al2O3-Based Ceramics on Fluid Contact
Angle, Materials Science and Engineering: A, 390 (1-2), pp. 271-277, 2005.
[250] L. J, Identification of the Principal Elements Governing the Wettability
Characteristics of Ordinary Portland Cement Following High Power Diode Laser
Surface Treatment, Materials Science and Engineering: A , 356 (1-2), pp. 162-
172, 2003.
[251] J. Bico, U. Thiele and D. Quéré, Wetting of Textured Surfaces, Colloids and
Surfaces A: Physicochemical and Engineering Aspects, 206 (1-3), pp. 41-46,
2002.
[252] A. Feng, B. J. McCoy, Z. A. Munir and D. Cagliostro, Wettability of Transition
Metal Oxide Surfaces, Materials Science and Engineering: A , 242 (1-2), pp. 50-
56, 1998.
[253] J. Chen, S. Mwenifumbo, C. Langhammer, J. -. McGovern, M. Li, A. Beye and
W. O. Soboyejo, Cell/surface Interactions and Adhesion on Ti-6Al-4V: Effects
of Surface Texture, Journal of Biomedical Materials Research Part B: Applied
Biomaterials, 82B (2), pp. 360-373, 2007.
[254] M. Jayaraman, U. Meyer, M. Bühner, U. Joos and H. Wiesmann, Influence of
Titanium Surfaces on Attachment of Osteoblast-Like Cells in Vitro,
Biomaterials , 25 (4), pp. 625-631, 2004.
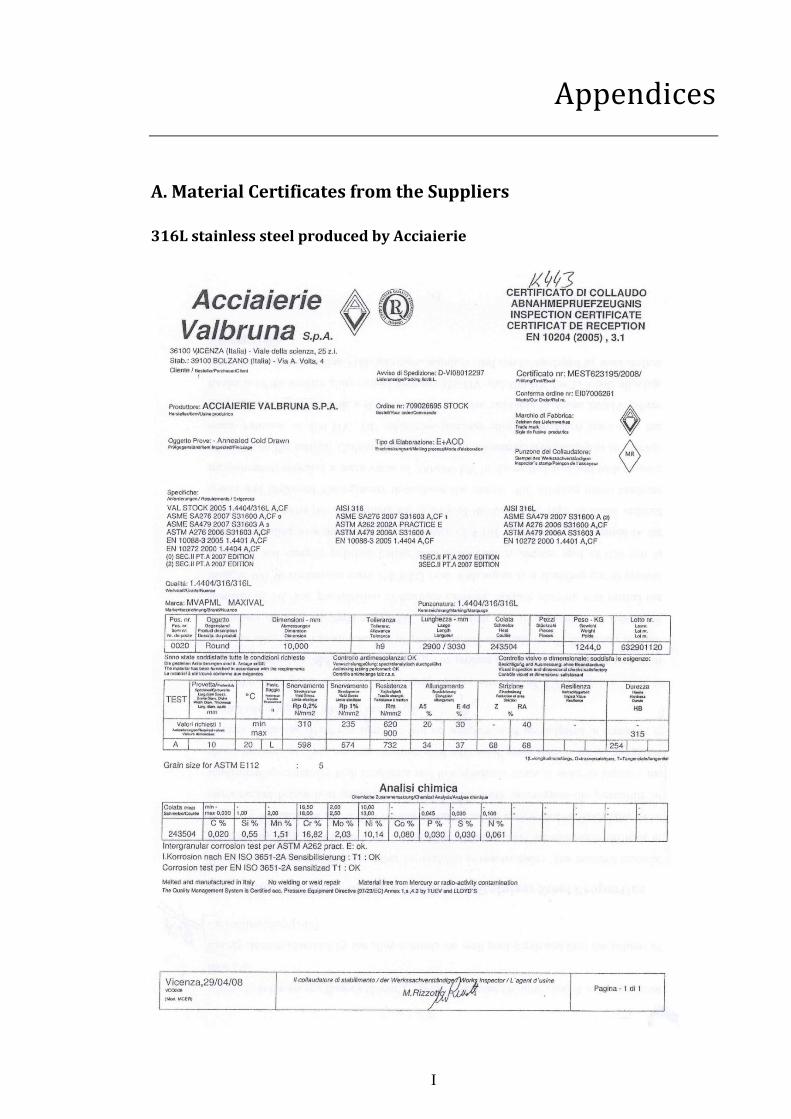
I
Appendices
A. Material Certificates from the Suppliers
316L stainless steel produced by Acciaierie

II
Ti-6Al-4V supplied by Supper Alloys

III

IV
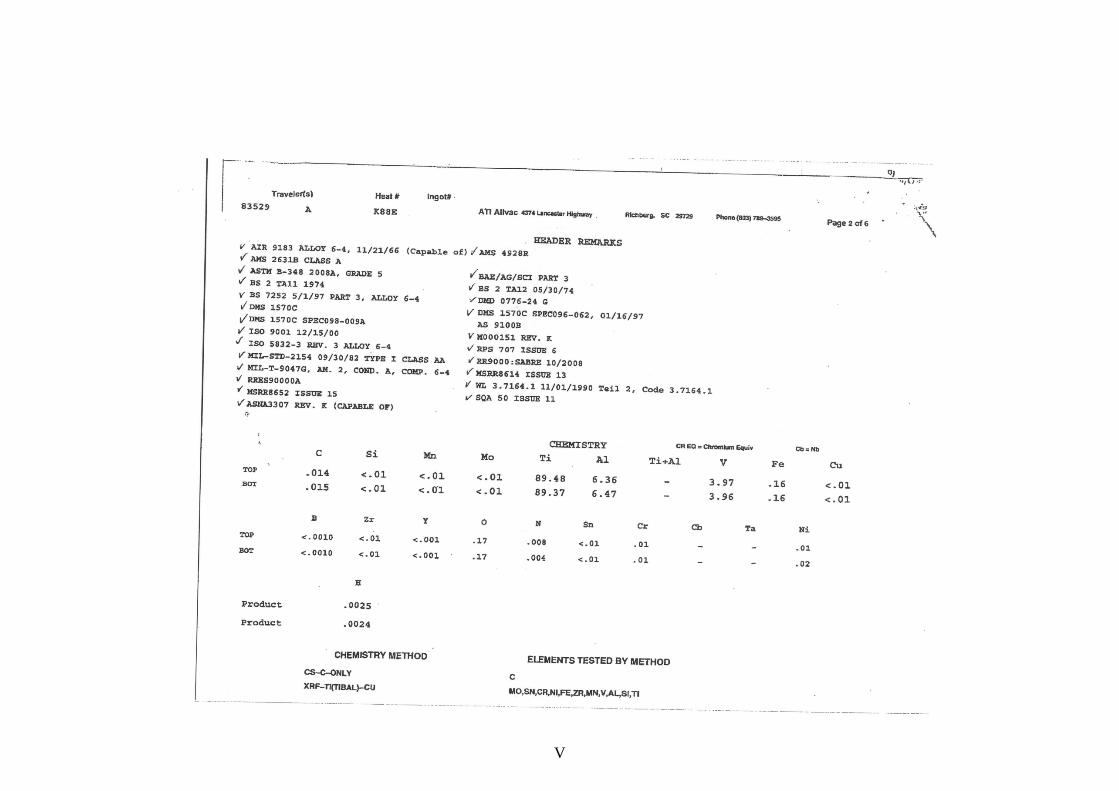
V
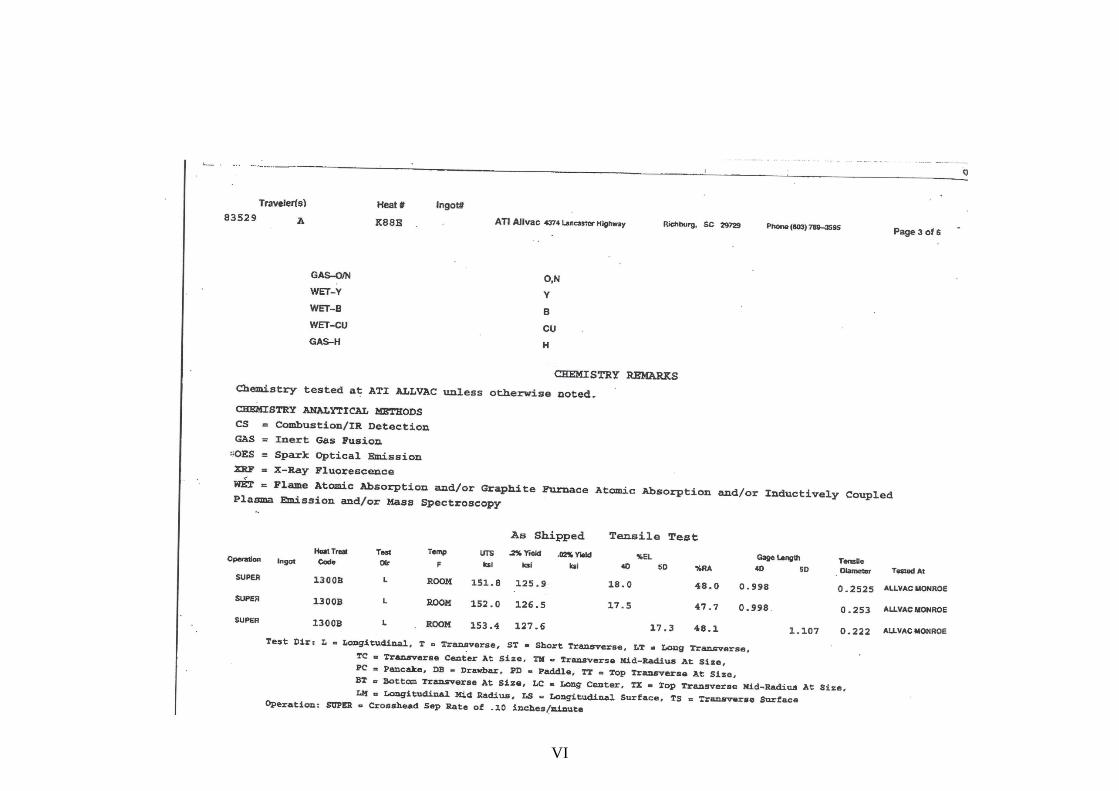
VI

VII
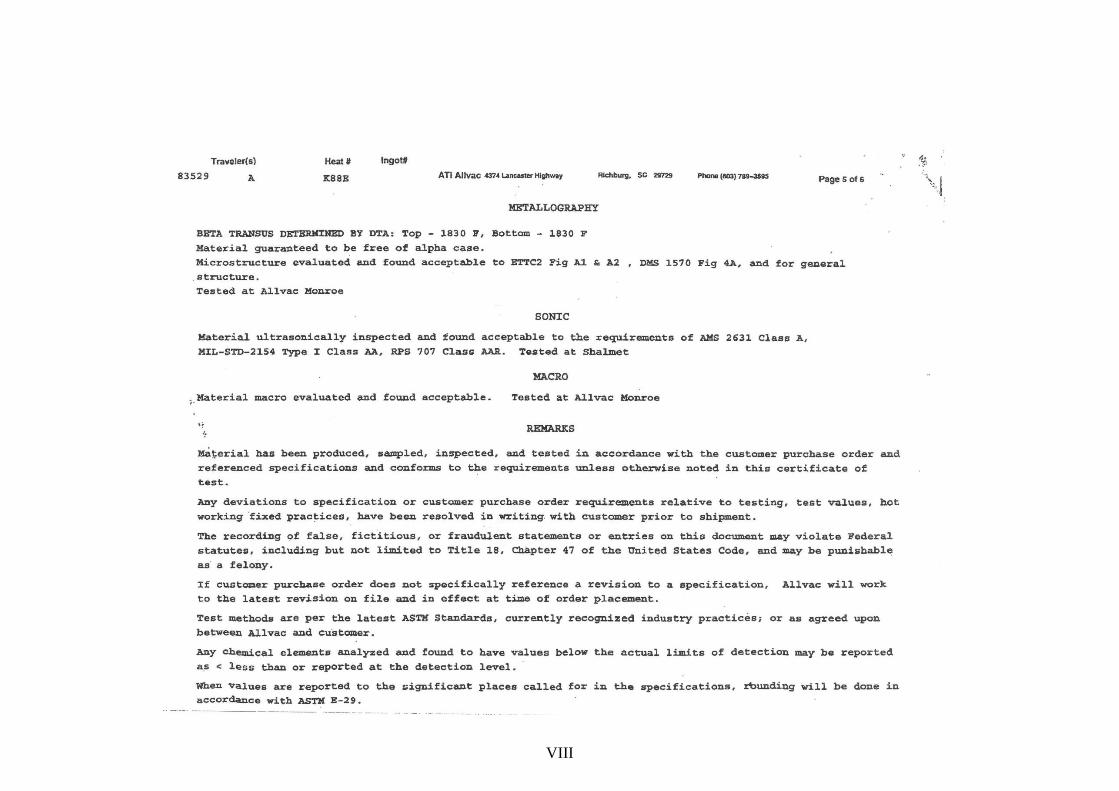
VIII

IX

X
B. Linear stage displacement of laser stage
A high speed camera was set up to determine the acceleration and velocity of the X and
Y direction of the laser stage. Figure B-1 graphs the velocities of all runs, plotted
against their respective displacements. The data was derived from the high-speed
footage by tracking a particular point from frame to frame. In this case the left edge of
the white line that was positioned on the moving table. The high-speed footage was
processed using a LabVIEW VI, please see screen shot as in Figure B-2 The graph
represented the 8 degree polynomial trend line that was fitted to the raw displacement
data to smooth out the 'blockiness' associated with the camera's pixel resolution
(displacement accuracy was +/- 0.806 mm and +/- 0.693 mm for the 320 mm run and
the 115 mm run respectively). The polynomial trend line had an excellent fit for the raw
displacement data. This polynomial was then differentiated to obtain the velocity. The
graph clearly show that at the highest velocity a lead way of approximately 55 mm
needs to be accounted for to achieve uniform velocities during laser processing.
Figure B-1: Velocity profile of laser table in the Y direction
0
20
40
60
80
0 50 100 150 200 250 300
Tab
le v
eloci
ty [
mm
/s]
Table displacement [mm]

XI
Figure B-2: LabVIEW data acquisition of frames from the high speed camera

XII
C. Preliminary DOE for 316L
Design of experiments
A 33 DOE was implemented. Three processing parameters were varied at three levels
irradiance (10.5, 23.9 and 38.2 kW/mm2) residence time (265, 382 and 478 μs) and
overlap (0, 10 and 30%), see Table C-1.
Table C-1: Processing parameter for the initial DOE.
ID Peak Power Irradiance Tangential Speed Residence Time Overlap
(W) (kW/mm2) (mm/s) μs (%)
1 330 10.5
419 265
0
2 750 23.9
3 1200 38.2
4 330 10.5
524 382 5 750 23.9
6 1200 38.2
7 330 10.5
754 478 8 750 23.9
9 1200 38.2
10 330 10.5
419 265
10
11 750 23.9
12 1200 38.2
13 330 10.5
524 382 14 750 23.9
15 1200 38.2
16 330 10.5
754 478 17 750 23.9
18 1200 38.2
19 330 10.5
419 265
30
20 750 23.9
21 1200 38.2
22 330 10.5
524 382 23 750 23.9
24 1200 38.2
25 330 10.5
754 478 26 750 23.9
27 1200 38.2

XIII
Preliminary DOE Results
Figure C-1: Optical micrographs of as received 316L Stainless Steel
(a) SE image and (b) optical micrograph.
Low irradiance
Figure C-2: Optical micrographs processed at low irradiance 10.5 kW/mm2
Figure C-3: Optical micrographs of cross-sectional view of 316L SS
corresponding to Figure C-2.
(a) (b)
(b)(a)
(a) (b)

XIV
At low irradiance marking effect were observed. The pulse energy was too low to
penetrate the surface. Only localised surface melting occurred. The overlap was set at
10% but inform the micrograph no evidence of overlap were visible these images. This
was may be due to two reasons. First reason was may be the speed of rotation was not
constant due to the drill used as rotational mechanism. The other reason was due to the
beam intensity. CO2 laser do not have perfect Gaussian beam. Power intensity was
concentrated on the middle section of the beam. This could be verified by measurements
taken using the SEM. The diameter of the spot seems to be ~ 150 µ but the laser was set
to output a 200 µ diameter beam.
High Irradiance
Figure C-4: Optical micrograph of samples processed at high irradiance
(38.2 kW/mm2) at various magnifications.
As compared to samples processed at low irradiance, the surface of the samples
processed at high irradiance had full melting effect. The surfaces in Figure C-4 showed
a rougher morphology attributed to low cooling rates. Cracks were not visible due to the
melting and re-solidification. At a higher irradiance u can clearly observe the melt
(a) (b)
(a) (b)
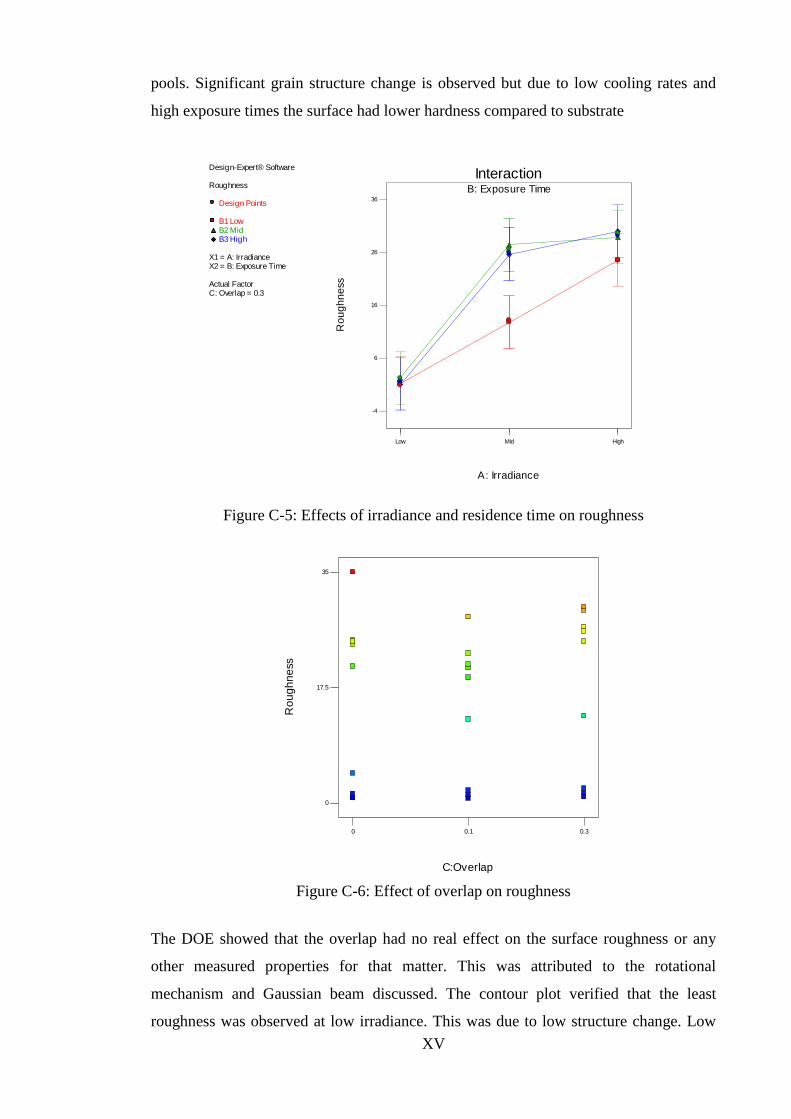
XV
pools. Significant grain structure change is observed but due to low cooling rates and
high exposure times the surface had lower hardness compared to substrate
Figure C-5: Effects of irradiance and residence time on roughness
Figure C-6: Effect of overlap on roughness
The DOE showed that the overlap had no real effect on the surface roughness or any
other measured properties for that matter. This was attributed to the rotational
mechanism and Gaussian beam discussed. The contour plot verified that the least
roughness was observed at low irradiance. This was due to low structure change. Low
Design-Expert® Software
Roughness
Design Points
B1 LowB2 MidB3 High
X1 = A: IrradianceX2 = B: Exposure Time
Actual FactorC: Overlap = 0.3
B: Exposure Time
Low Mid High
Interaction
A: Irradiance
Ro
ug
hn
ess
-4
6
16
26
36
C:Overlap
Ro
ug
hn
ess
0 0.1 0.3
0
17.5
35

XVI
irradiance did not produce melting. Therefore it was be insignificant for this study. High
irradiance proved to produce excessive energy with the melting producing uneven
surfaces.
Figure C-7: Effects of low irradiance and high irradiance on microhardness
Figure C-8 to figure C-13 present EDS analysis of a laser treated samples.
Figure C-8: Micrograph of spectrum 1.
150
200
250
300
0 50 100 150 200 250
Mic
rohar
dnes
s (H
V)
Distance from Surface (µm)
Low Irradiance
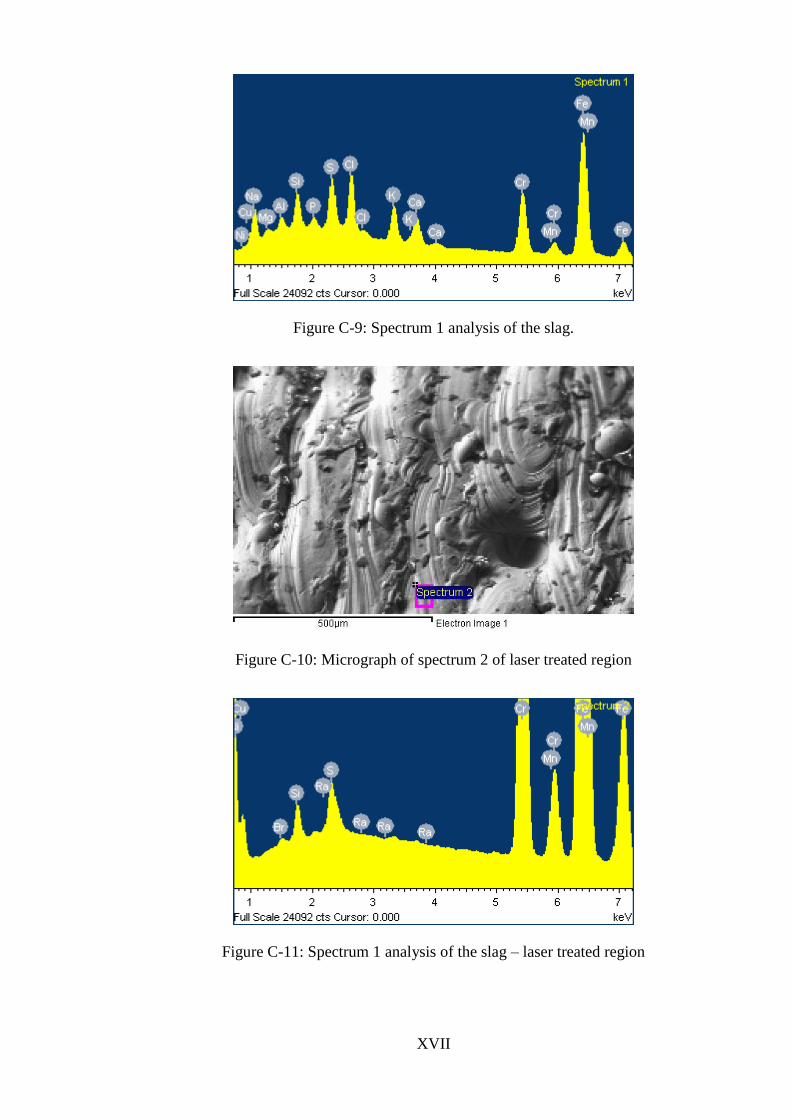
XVII
Figure C-9: Spectrum 1 analysis of the slag.
Figure C-10: Micrograph of spectrum 2 of laser treated region
Figure C-11: Spectrum 1 analysis of the slag – laser treated region
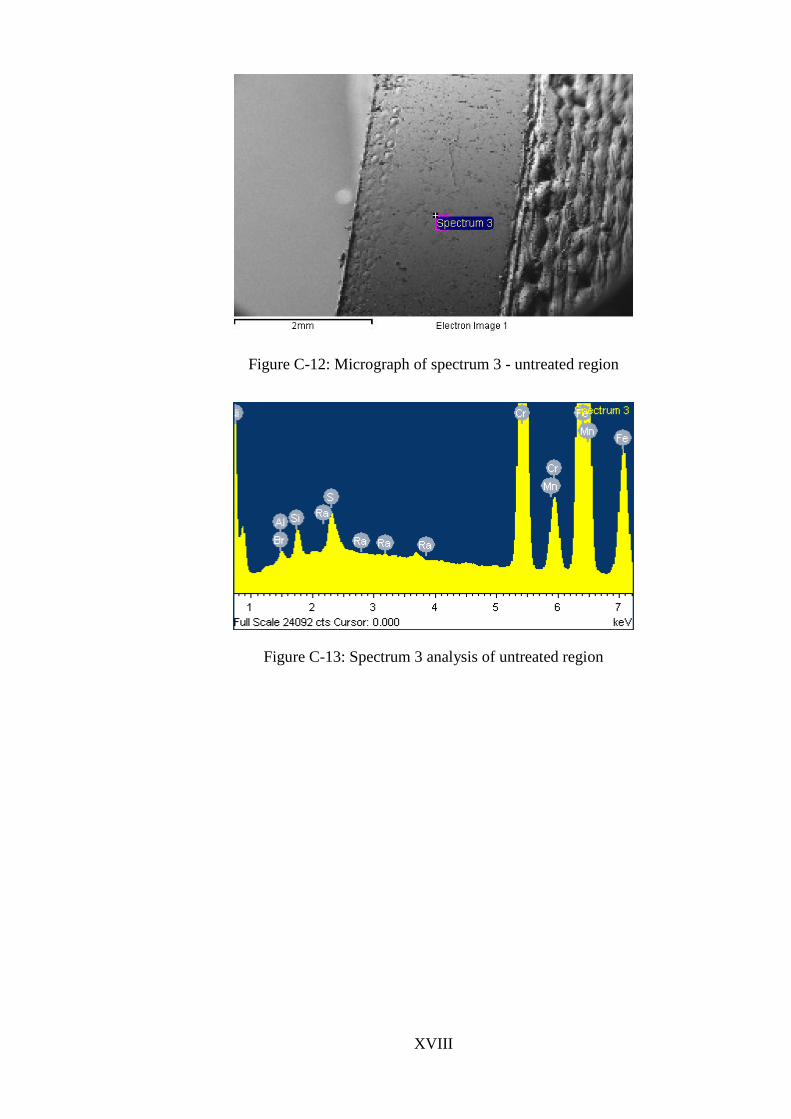
XVIII
Figure C-12: Micrograph of spectrum 3 - untreated region
Figure C-13: Spectrum 3 analysis of untreated region
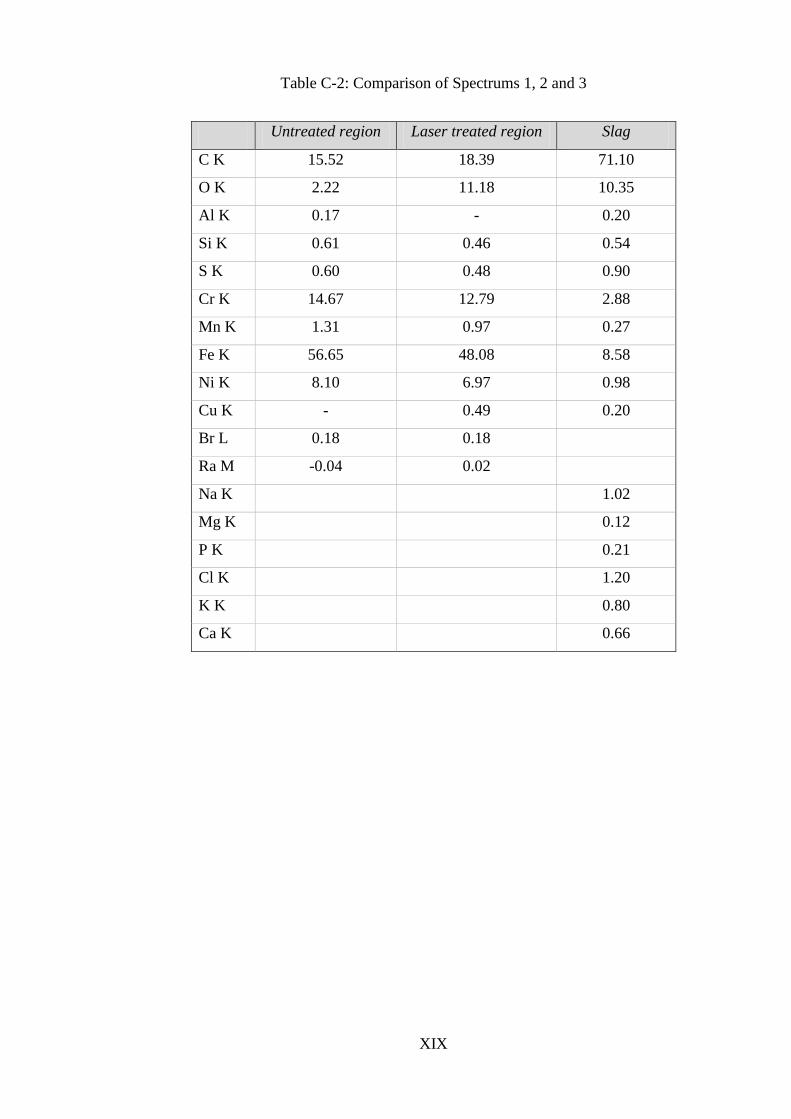
XIX
Table C-2: Comparison of Spectrums 1, 2 and 3
Untreated region Laser treated region Slag
C K 15.52 18.39 71.10
O K 2.22 11.18 10.35
Al K 0.17 - 0.20
Si K 0.61 0.46 0.54
S K 0.60 0.48 0.90
Cr K 14.67 12.79 2.88
Mn K 1.31 0.97 0.27
Fe K 56.65 48.08 8.58
Ni K 8.10 6.97 0.98
Cu K - 0.49 0.20
Br L 0.18 0.18
Ra M -0.04 0.02
Na K 1.02
Mg K 0.12
P K 0.21
Cl K 1.20
K K 0.80
Ca K 0.66

XX
D. Recommended cut-off lengths for roughness measurements
Table D-1: ISO 4288 recommended cut-off lengths for roughness measurements
Non-Periodic Profile Periodic
Profiles
Measuring conditions according to
DIN EN ISO 4288 and DIN EN ISO
3274
Grinding, honing, lapping,
eroding ↓ or ↓
Turning,
milling,
planing
λC=cutoff filter
λC / ln=Cut off / Evaluation Length
Rtip=Maximum radius of the stylus
ln=Evaluation length
l=Sampling length
Rz (μm) Ra (μm) RSm (mm) λC
(mm)
ln
(mm)
λC /
ln
l
(mm)
Rtip
(μm)
>0.025 to 0.1 >0.006 to 0.02 >0.013 to 0.04 0.08 0.4 0.2 0.08 2
>0.1 to 0.5 >0.02 to 0.1 >0.04 to 0.13 0.25 1.25 0.2 0.25 2
>0.5 to 10 >0.1 to 2 >0.13 to 0.4 0.8 4 0.2 0.8 2*
>10 to 50 >2 to 10 >0.4 to 1.3 2.5 12.5 0.2 2.5 5
>50 to 200 >10 to 80 >1.3 to 4 8 40 0.2 8 10
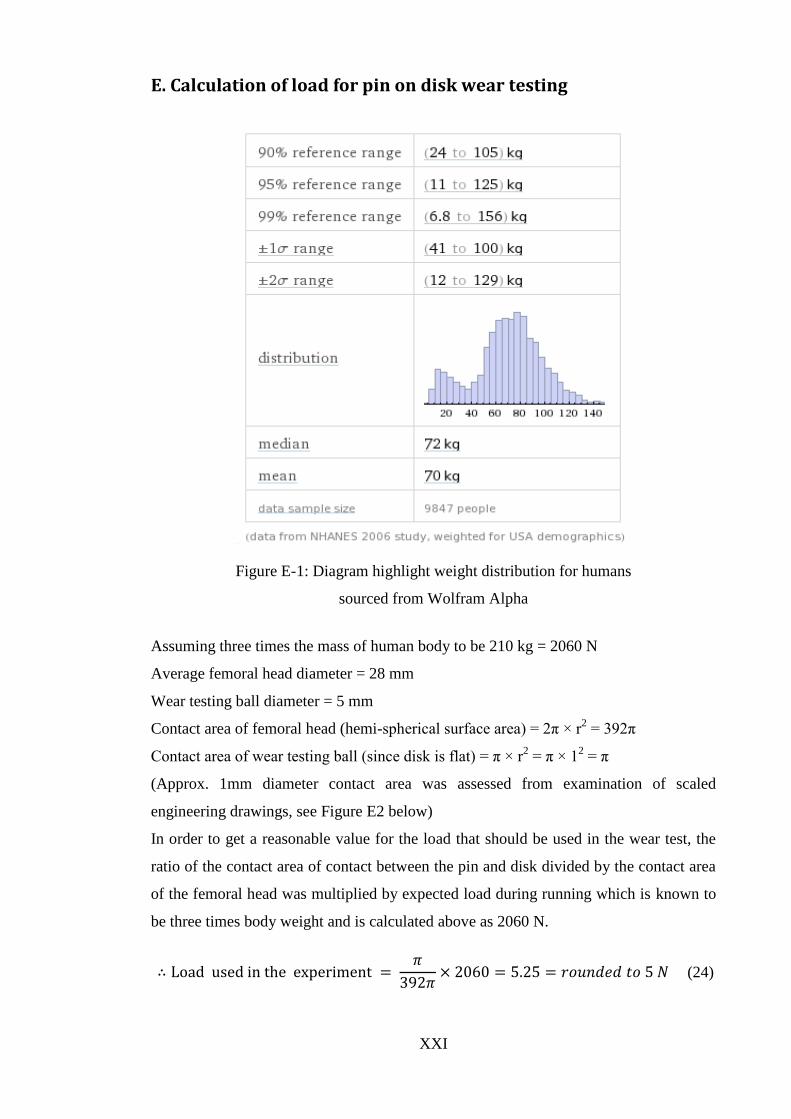
XXI
E. Calculation of load for pin on disk wear testing
Figure E-1: Diagram highlight weight distribution for humans
sourced from Wolfram Alpha
Assuming three times the mass of human body to be 210 kg = 2060 N
Average femoral head diameter = 28 mm
Wear testing ball diameter = 5 mm
Contact area of femoral head (hemi-spherical surface area) = 2π × r2 = 392π
Contact area of wear testing ball (since disk is flat) = π × r2 = π × 1
2 = π
(Approx. 1mm diameter contact area was assessed from examination of scaled
engineering drawings, see Figure E2 below)
In order to get a reasonable value for the load that should be used in the wear test, the
ratio of the contact area of contact between the pin and disk divided by the contact area
of the femoral head was multiplied by expected load during running which is known to
be three times body weight and is calculated above as 2060 N.
(24)
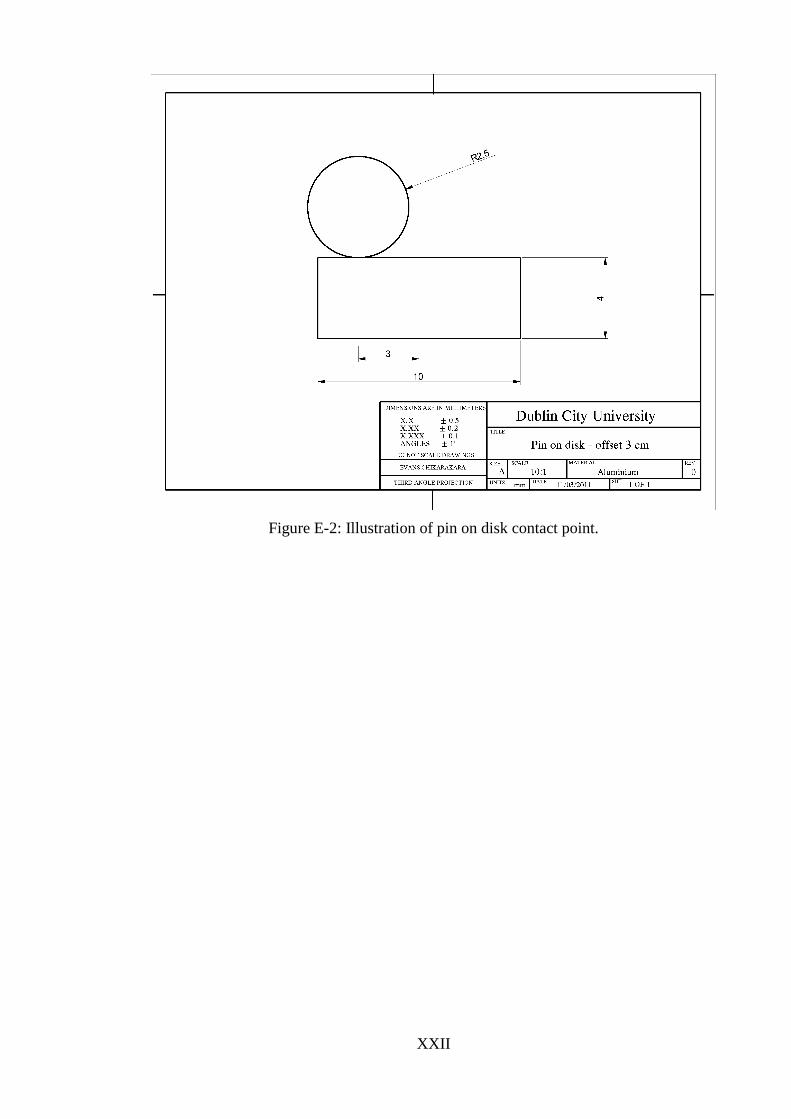
XXII
Figure E-2: Illustration of pin on disk contact point.
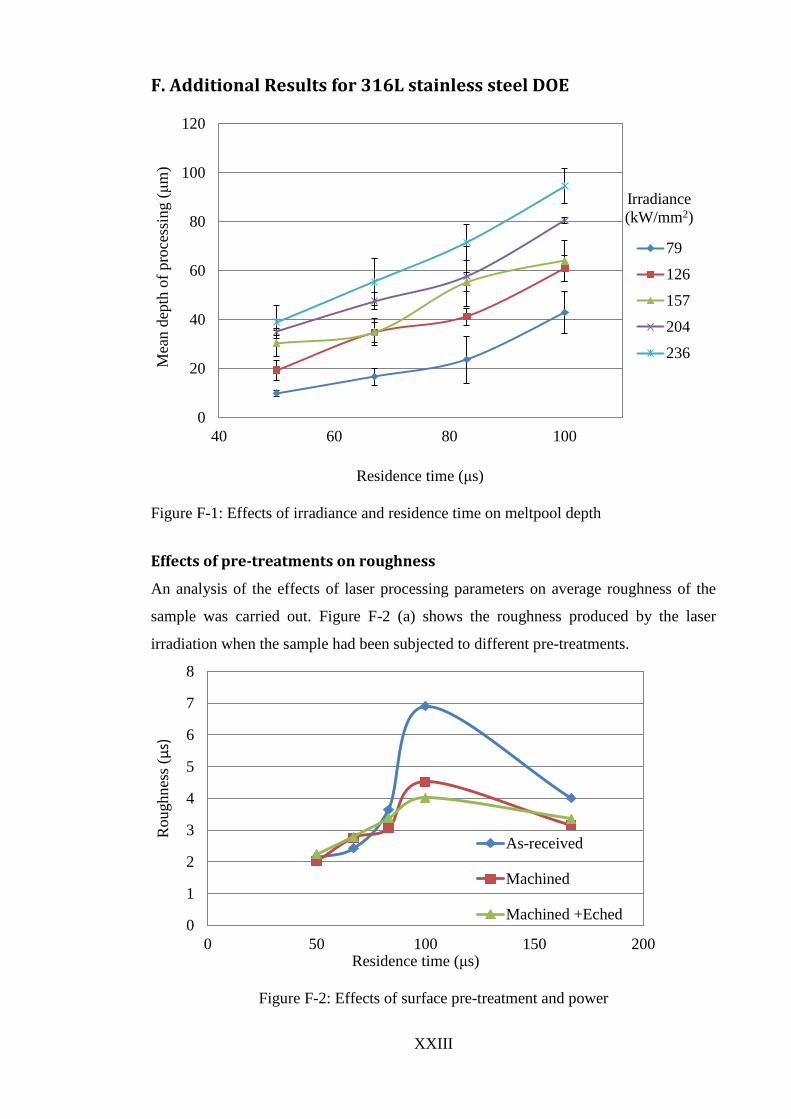
XXIII
F. Additional Results for 316L stainless steel DOE
Figure F-1: Effects of irradiance and residence time on meltpool depth
Effects of pre-treatments on roughness
An analysis of the effects of laser processing parameters on average roughness of the
sample was carried out. Figure F-2 (a) shows the roughness produced by the laser
irradiation when the sample had been subjected to different pre-treatments.
Figure F-2: Effects of surface pre-treatment and power
0
20
40
60
80
100
120
40 60 80 100
Mea
n d
epth
of
pro
cess
ing (μ
m)
Residence time (μs)
79
126
157
204
236
Irradiance
(kW/mm2)
0
1
2
3
4
5
6
7
8
0 50 100 150 200
Roughnes
s (μ
s)
Residence time (μs)
As-received
Machined
Machined +Eched
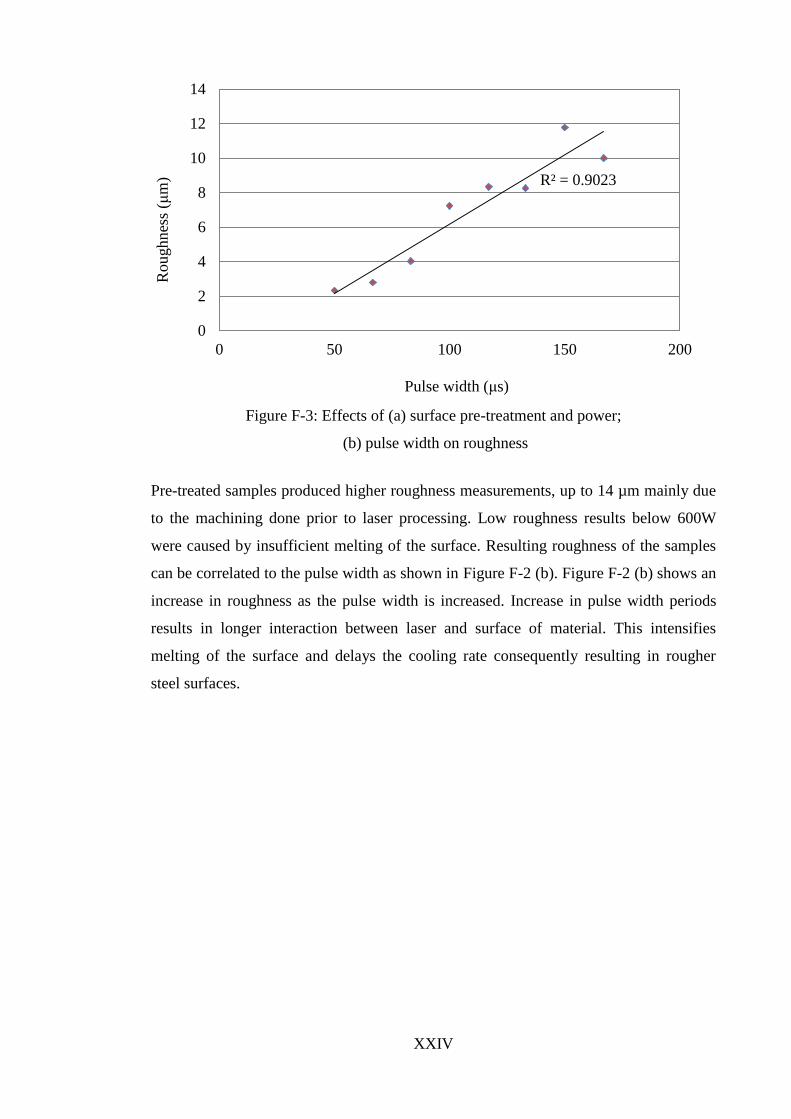
XXIV
Figure F-3: Effects of (a) surface pre-treatment and power;
(b) pulse width on roughness
Pre-treated samples produced higher roughness measurements, up to 14 µm mainly due
to the machining done prior to laser processing. Low roughness results below 600W
were caused by insufficient melting of the surface. Resulting roughness of the samples
can be correlated to the pulse width as shown in Figure F-2 (b). Figure F-2 (b) shows an
increase in roughness as the pulse width is increased. Increase in pulse width periods
results in longer interaction between laser and surface of material. This intensifies
melting of the surface and delays the cooling rate consequently resulting in rougher
steel surfaces.
R² = 0.9023
0
2
4
6
8
10
12
14
0 50 100 150 200
Roughnes
s (μ
m)
Pulse width (μs)
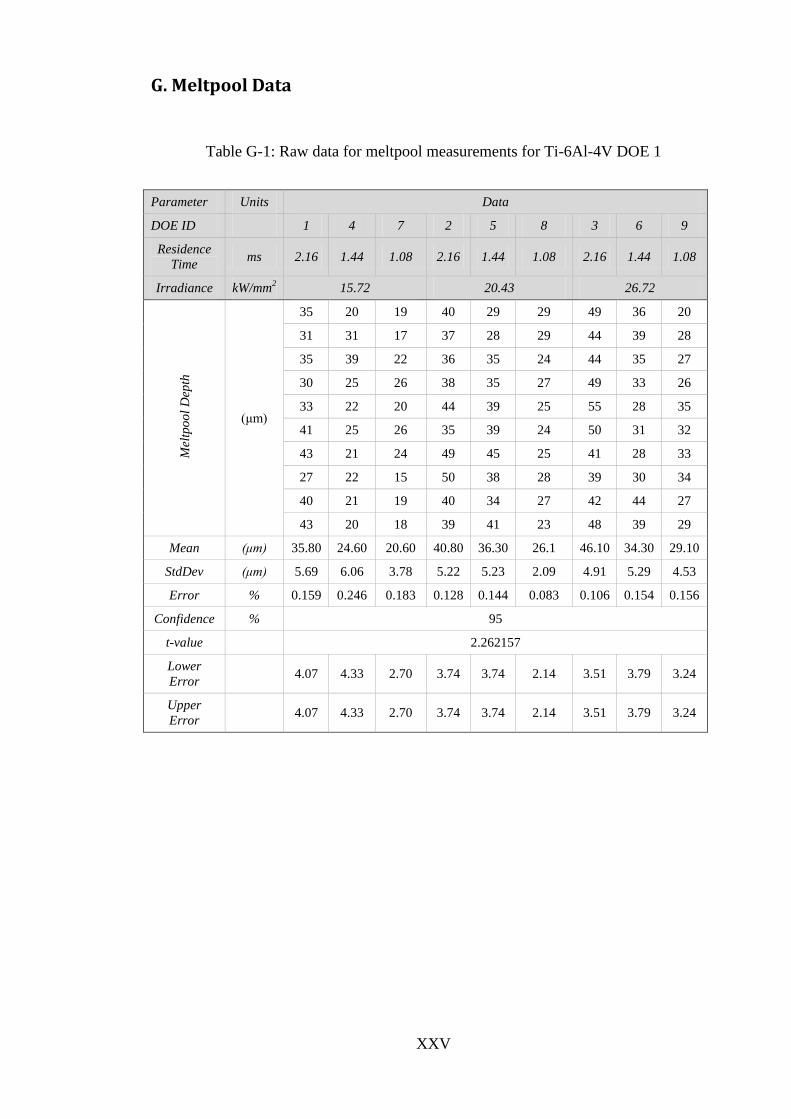
XXV
G. Meltpool Data
Table G-1: Raw data for meltpool measurements for Ti-6Al-4V DOE 1
Parameter Units Data
DOE ID 1 4 7 2 5 8 3 6 9
Residence
Time ms 2.16 1.44 1.08 2.16 1.44 1.08 2.16 1.44 1.08
Irradiance kW/mm2 15.72 20.43 26.72
Mel
tpo
ol
Dep
th
(μm)
35 20 19 40 29 29 49 36 20
31 31 17 37 28 29 44 39 28
35 39 22 36 35 24 44 35 27
30 25 26 38 35 27 49 33 26
33 22 20 44 39 25 55 28 35
41 25 26 35 39 24 50 31 32
43 21 24 49 45 25 41 28 33
27 22 15 50 38 28 39 30 34
40 21 19 40 34 27 42 44 27
43 20 18 39 41 23 48 39 29
Mean (μm) 35.80 24.60 20.60 40.80 36.30 26.1 46.10 34.30 29.10
StdDev (μm) 5.69 6.06 3.78 5.22 5.23 2.09 4.91 5.29 4.53
Error % 0.159 0.246 0.183 0.128 0.144 0.083 0.106 0.154 0.156
Confidence % 95
t-value 2.262157
Lower
Error 4.07 4.33 2.70 3.74 3.74 2.14 3.51 3.79 3.24
Upper
Error 4.07 4.33 2.70 3.74 3.74 2.14 3.51 3.79 3.24
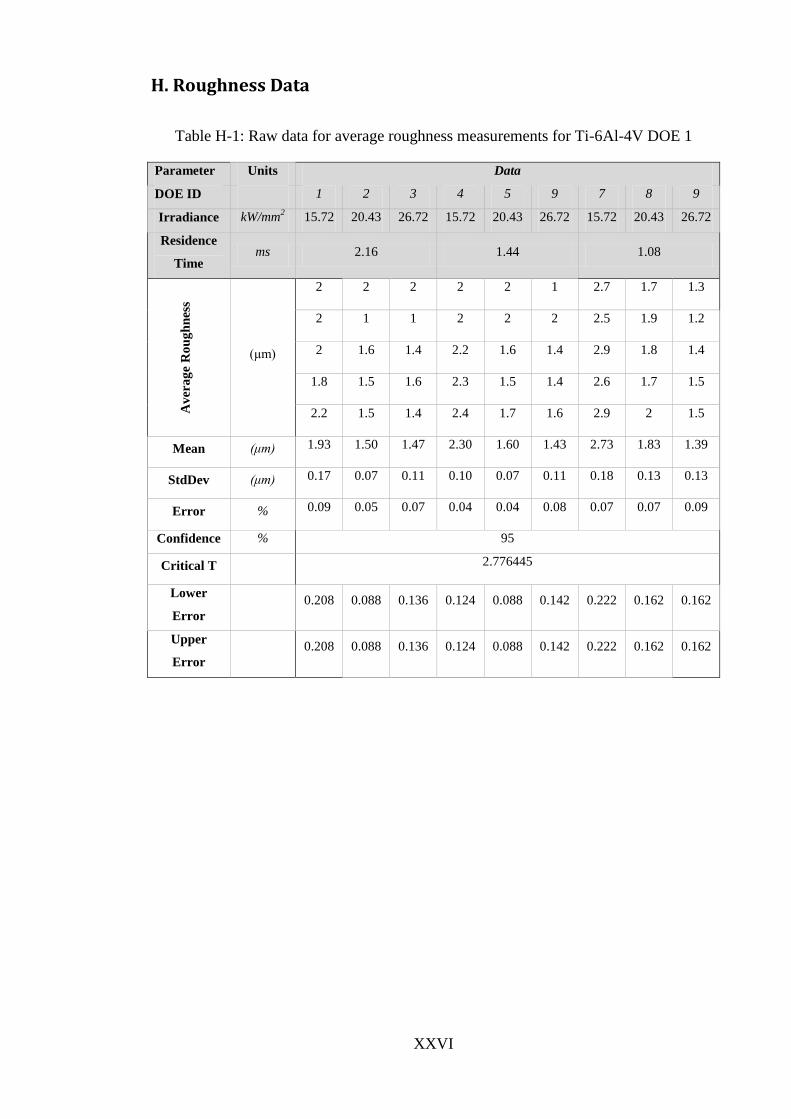
XXVI
H. Roughness Data
Table H-1: Raw data for average roughness measurements for Ti-6Al-4V DOE 1
Parameter Units Data
DOE ID 1 2 3 4 5 9 7 8 9
Irradiance kW/mm2 15.72 20.43 26.72 15.72 20.43 26.72 15.72 20.43 26.72
Residence
Time ms 2.16 1.44 1.08
Av
era
ge
Ro
ug
hn
ess
(μm)
2 2 2 2 2 1 2.7 1.7 1.3
2 1 1 2 2 2 2.5 1.9 1.2
2 1.6 1.4 2.2 1.6 1.4 2.9 1.8 1.4
1.8 1.5 1.6 2.3 1.5 1.4 2.6 1.7 1.5
2.2 1.5 1.4 2.4 1.7 1.6 2.9 2 1.5
Mean (μm) 1.93 1.50 1.47 2.30 1.60 1.43 2.73 1.83 1.39
StdDev (μm) 0.17 0.07 0.11 0.10 0.07 0.11 0.18 0.13 0.13
Error % 0.09 0.05 0.07 0.04 0.04 0.08 0.07 0.07 0.09
Confidence % 95
Critical T 2.776445
Lower
Error 0.208 0.088 0.136 0.124 0.088 0.142 0.222 0.162 0.162
Upper
Error 0.208 0.088 0.136 0.124 0.088 0.142 0.222 0.162 0.162
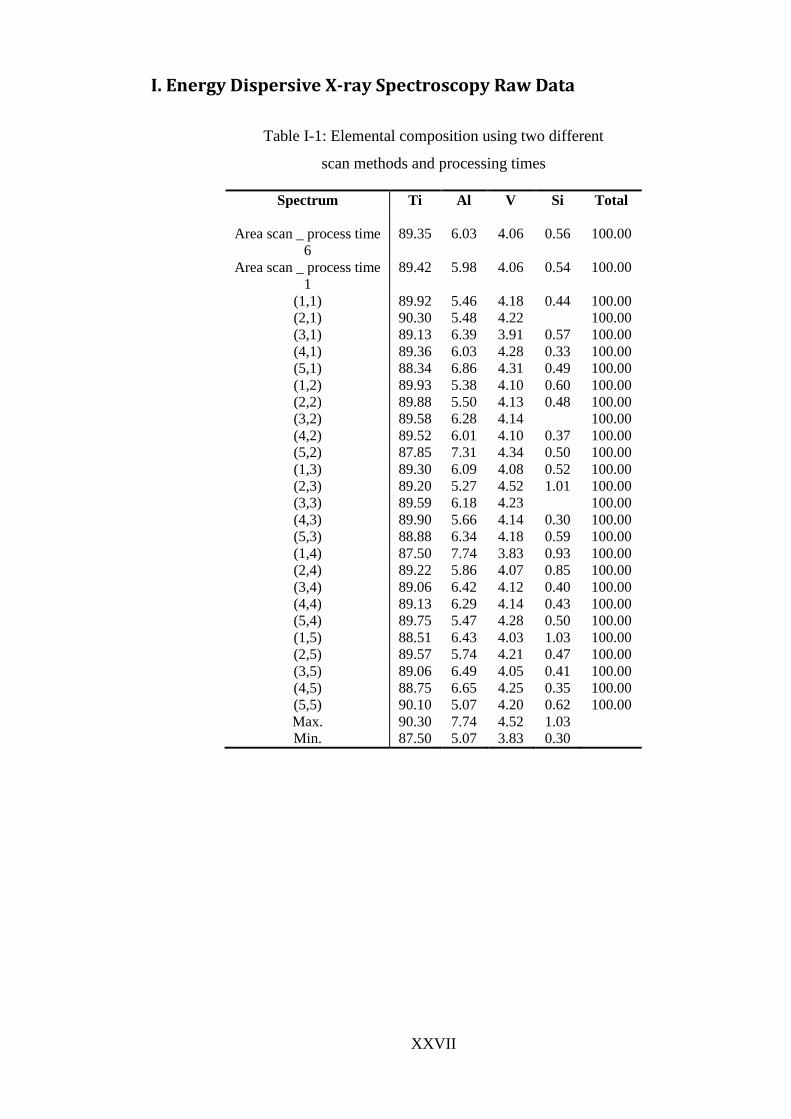
XXVII
I. Energy Dispersive X-ray Spectroscopy Raw Data
Table I-1: Elemental composition using two different
scan methods and processing times
Spectrum Ti Al V Si Total
Area scan _ process time
6
89.35 6.03 4.06 0.56 100.00
Area scan _ process time
1
89.42 5.98 4.06 0.54 100.00
(1,1) 89.92 5.46 4.18 0.44 100.00
(2,1) 90.30 5.48 4.22 100.00
(3,1) 89.13 6.39 3.91 0.57 100.00
(4,1) 89.36 6.03 4.28 0.33 100.00
(5,1) 88.34 6.86 4.31 0.49 100.00
(1,2) 89.93 5.38 4.10 0.60 100.00
(2,2) 89.88 5.50 4.13 0.48 100.00
(3,2) 89.58 6.28 4.14 100.00
(4,2) 89.52 6.01 4.10 0.37 100.00
(5,2) 87.85 7.31 4.34 0.50 100.00
(1,3) 89.30 6.09 4.08 0.52 100.00
(2,3) 89.20 5.27 4.52 1.01 100.00
(3,3) 89.59 6.18 4.23 100.00
(4,3) 89.90 5.66 4.14 0.30 100.00
(5,3) 88.88 6.34 4.18 0.59 100.00
(1,4) 87.50 7.74 3.83 0.93 100.00
(2,4) 89.22 5.86 4.07 0.85 100.00
(3,4) 89.06 6.42 4.12 0.40 100.00
(4,4) 89.13 6.29 4.14 0.43 100.00
(5,4) 89.75 5.47 4.28 0.50 100.00
(1,5) 88.51 6.43 4.03 1.03 100.00
(2,5) 89.57 5.74 4.21 0.47 100.00
(3,5) 89.06 6.49 4.05 0.41 100.00
(4,5) 88.75 6.65 4.25 0.35 100.00
(5,5) 90.10 5.07 4.20 0.62 100.00
Max. 90.30 7.74 4.52 1.03
Min. 87.50 5.07 3.83 0.30

XXVIII
Cross-sectional Analysis
Sample 1
Spectrum Ti Al V C Si Total
1 80.38 5.49 3.53 10.23 0.38 100.00
2 84.76 4.87 4.23 5.65 0.50 100.00
3 86.80 5.33 3.41 4.46 100.00
4 84.14 4.59 5.81 5.45 100.00
5 80.39 4.39 7.79 7.43 100.00
6 84.71 5.00 3.97 6.32 100.00
7 86.21 4.94 3.32 5.53 100.00
8 86.22 5.11 3.75 4.92 100.00
Max. 86.80 5.49 7.79 10.23 0.50 Min. 80.38 4.39 3.32 4.46 0.38
Sample 2

XXIX
Spectrum Ti Al V Si Ca Total
1 89.71 5.67 4.09 0.27 0.27 100.00
2 90.33 5.52 3.85 0.30 100.00
3 90.02 5.68 4.07 0.23 100.00
4 89.77 5.71 4.28 0.23 100.00
5 91.12 6.09 2.79 100.00
6 88.65 5.23 6.12 100.00
7 89.74 5.47 4.79 100.00
8 90.13 5.69 4.18 100.00
Max. 91.12 6.09 6.12 0.30 0.27 Min. 88.65 5.23 2.79 0.23 0.27
Sample 3
Spectrum Ti Al V Si Ca Total
1 89.74 5.62 4.10 0.27 0.27 100
2 89.98 5.77 4.01 0.24 100
3 90.25 5.74 4.01 100
4 89.90 5.74 4.10 0.26 100
5 90.19 5.70 4.12 100
6 88.07 4.94 6.68 100
7 88.82 5.51 5.67 100
8 90.43 5.62 3.95 100
Max. 90.43 5.77 6.68 0.27 0.27 Min. 88.07 4.94 3.95 0.24 0.27
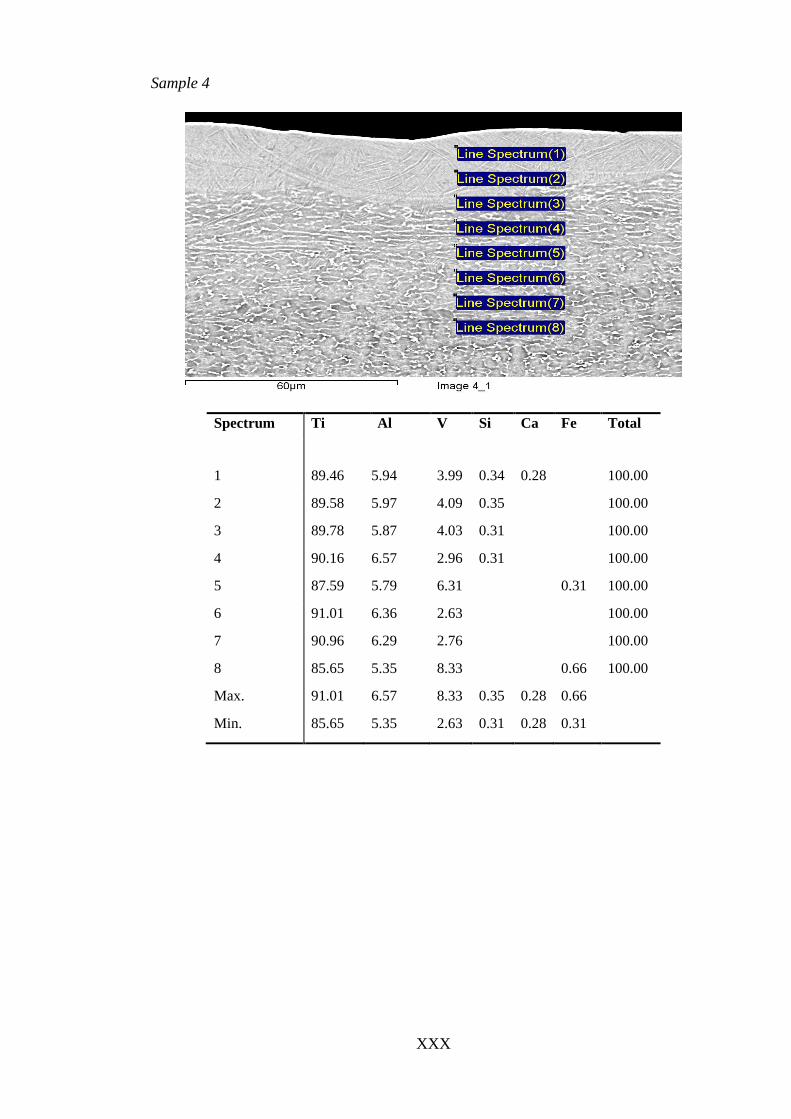
XXX
Sample 4
Spectrum Ti Al V Si Ca Fe Total
1 89.46 5.94 3.99 0.34 0.28 100.00
2 89.58 5.97 4.09 0.35 100.00
3 89.78 5.87 4.03 0.31 100.00
4 90.16 6.57 2.96 0.31 100.00
5 87.59 5.79 6.31 0.31 100.00
6 91.01 6.36 2.63 100.00
7 90.96 6.29 2.76 100.00
8 85.65 5.35 8.33 0.66 100.00
Max. 91.01 6.57 8.33 0.35 0.28 0.66
Min. 85.65 5.35 2.63 0.31 0.28 0.31
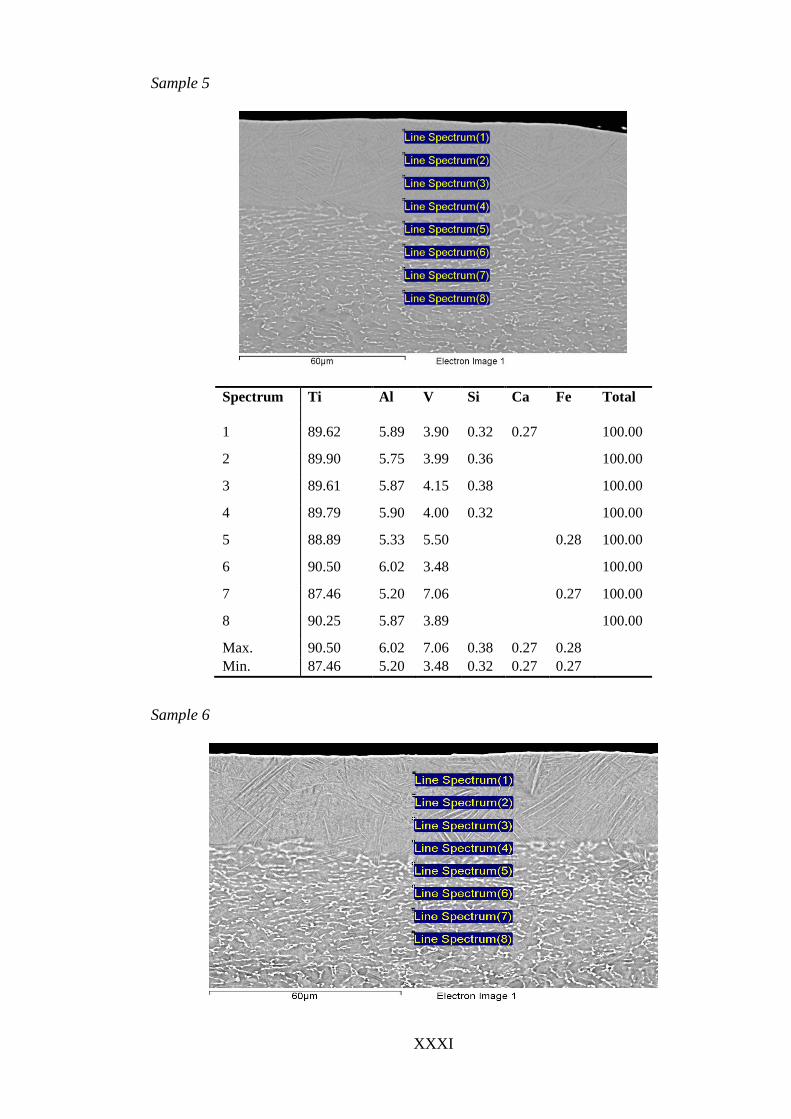
XXXI
Sample 5
Spectrum Ti Al V Si Ca Fe Total 1 89.62 5.89 3.90 0.32 0.27 100.00
2 89.90 5.75 3.99 0.36 100.00
3 89.61 5.87 4.15 0.38 100.00
4 89.79 5.90 4.00 0.32 100.00
5 88.89 5.33 5.50 0.28 100.00
6 90.50 6.02 3.48 100.00
7 87.46 5.20 7.06 0.27 100.00
8 90.25 5.87 3.89 100.00
Max. 90.50 6.02 7.06 0.38 0.27 0.28 Min. 87.46 5.20 3.48 0.32 0.27 0.27
Sample 6
9/9/2010 5:56:13 PM
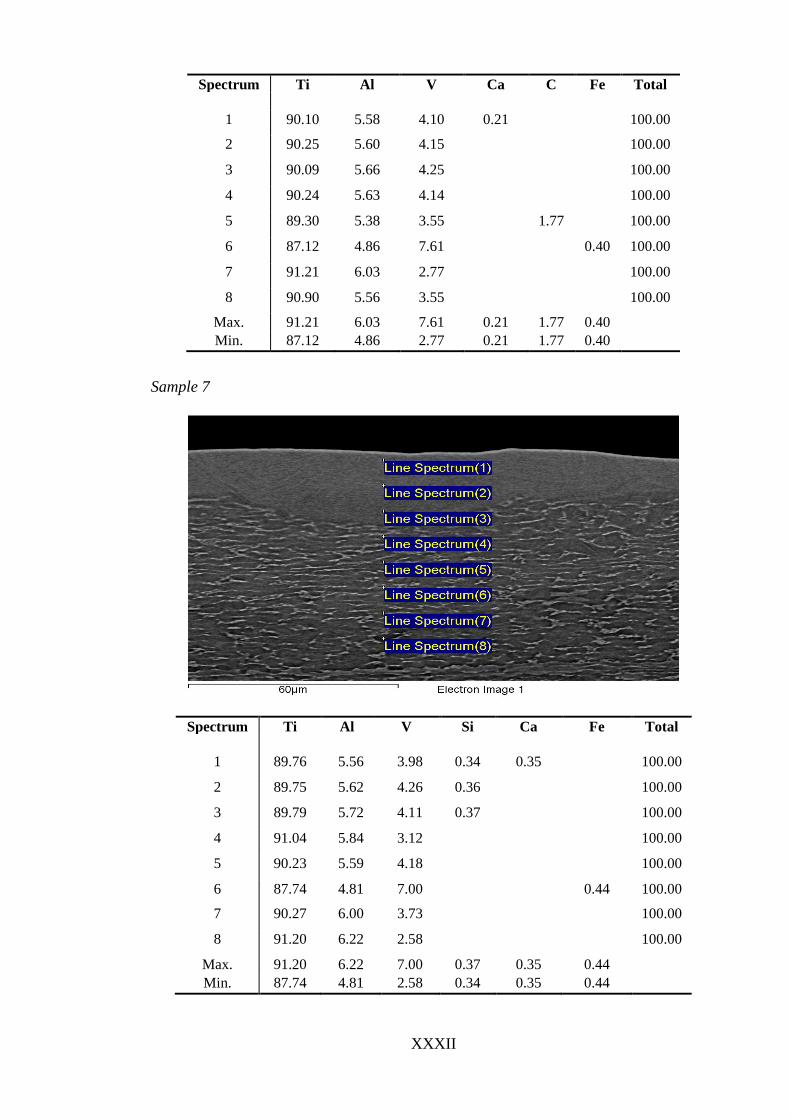
XXXII
Spectrum Ti Al V Ca C Fe Total
1 90.10 5.58 4.10 0.21 100.00
2 90.25 5.60 4.15 100.00
3 90.09 5.66 4.25 100.00
4 90.24 5.63 4.14 100.00
5 89.30 5.38 3.55 1.77 100.00
6 87.12 4.86 7.61 0.40 100.00
7 91.21 6.03 2.77 100.00
8 90.90 5.56 3.55 100.00
Max. 91.21 6.03 7.61 0.21 1.77 0.40 Min. 87.12 4.86 2.77 0.21 1.77 0.40
Sample 7
Spectrum Ti Al V Si Ca Fe Total
1 89.76 5.56 3.98 0.34 0.35 100.00
2 89.75 5.62 4.26 0.36 100.00
3 89.79 5.72 4.11 0.37 100.00
4 91.04 5.84 3.12 100.00
5 90.23 5.59 4.18 100.00
6 87.74 4.81 7.00 0.44 100.00
7 90.27 6.00 3.73 100.00
8 91.20 6.22 2.58 100.00
Max. 91.20 6.22 7.00 0.37 0.35 0.44 Min. 87.74 4.81 2.58 0.34 0.35 0.44
06/09/2010 14:14:33
06/09/2010 14:16:18
06/09/2010 14:18:56 06/09/2010 14:22:33
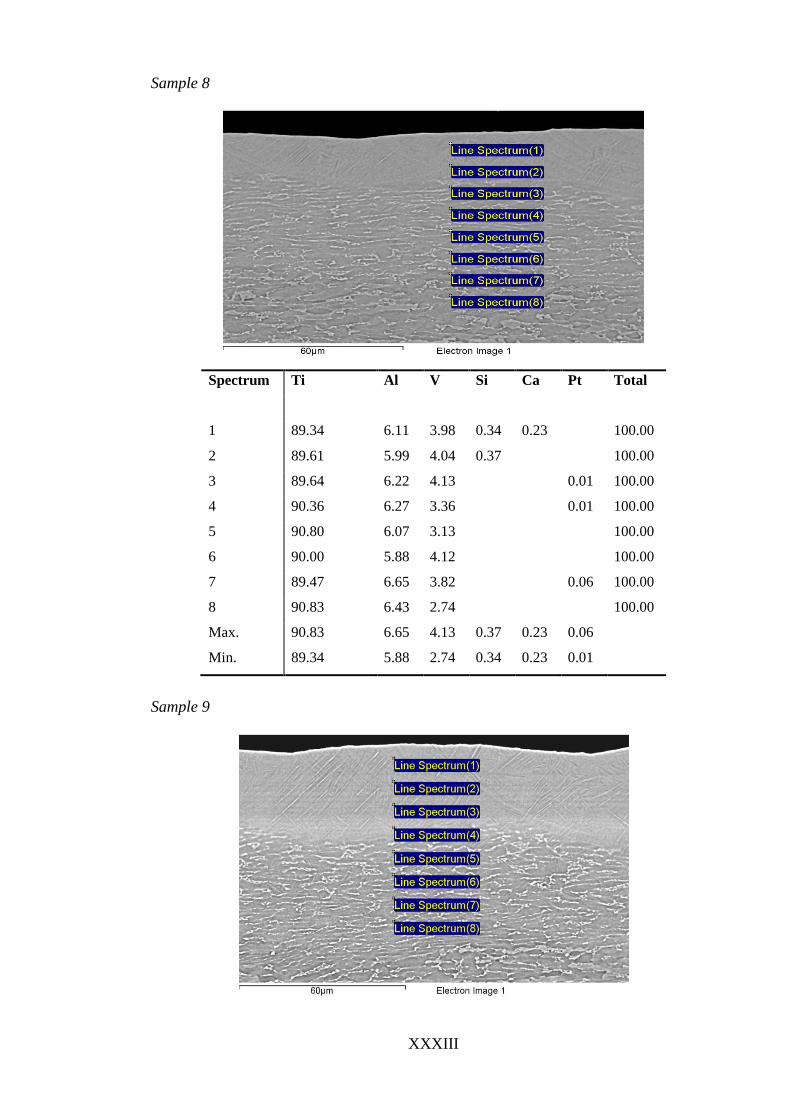
XXXIII
Sample 8
Spectrum Ti Al V Si Ca Pt Total
1 89.34 6.11 3.98 0.34 0.23 100.00
2 89.61 5.99 4.04 0.37 100.00
3 89.64 6.22 4.13 0.01 100.00
4 90.36 6.27 3.36 0.01 100.00
5 90.80 6.07 3.13 100.00
6 90.00 5.88 4.12 100.00
7 89.47 6.65 3.82 0.06 100.00
8 90.83 6.43 2.74 100.00
Max. 90.83 6.65 4.13 0.37 0.23 0.06
Min. 89.34 5.88 2.74 0.34 0.23 0.01
Sample 9

XXXIV
Spectrum Ti Al V C Si Total
1 88.32 5.38 4.01 1.98 0.31 100
2 90.12 5.57 3.93 0.39 100
3 90.09 5.64 3.99 0.28 100
4 90.27 5.55 4.18 100
5 89.83 5.75 4.42 100
6 90.51 6.07 3.42 100
7 90.78 5.94 3.28 100
8 89.14 5.93 2.96 1.97 100
Max. 90.78 6.07 4.42 1.98 0.39
Min. 88.32 5.38 2.96 1.97 0.28

XXXV
J. Ablation Effects
The images below highlight ablation of Ti-6Al-4V caused by extremely high energy
densities.
Figure J-1: Ablation at an energy density of 1.6 kJ/mm2
Figure J-2: Ablation at an energy density of 772 J/mm2

XXXVI
K. Raw Data Material Properties Measured for Ti-6Al-4V
Table K-1: Mean melt-pool depth value (μm)
Melt-pool
Depth
(μm)
Irradiance (kW/mm2)
15.72 20.43 26.72
Res
iden
ce
Tim
e (m
s) 1.08 20.6 26.1 29.1
1.44 24.9 36.3 34.3
2.16 35.80 40.8 46.1
Table K-2: Mean roughness (μm)
Roughness
(μm)
Irradiance (kW/mm2)
15.72 20.43 26.72
Res
iden
ce
Tim
e (m
s) 1.08 2.733 1.833 1.390
1.44 2.300 1.600 1.433
2.16 1.933 1.500 1.467
Table K-3: Mean microhardness (HV)
Hardness
(HV)
Irradiance (kW/mm2)
15.72 20.43 26.72
Res
iden
ce
Tim
e (m
s) 1.08 647.67 685.67 767.00
1.44 666.00 681.00 693.33
2.16 674.00 597.33 633.33

XXXVII
Table K-4: Mean β-Ti volume fraction (%)
β-Ti Volume
Fraction (%)
Irradiance (kW/mm2)
15.72 20.43 26.72
Res
iden
ce
Tim
e (m
s) 1.08 24.139 22.132 18.974
1.44 23.010 21.632 21.486
2.16 21.258 21.470 20.698
Table K-5: Mean specific wear rate (mm/N∙m) for samples tested for 20 m.
Wear rate
(x10-6 mm/N∙m)
Irradiance (kW/mm2)
15.72 20.43 26.72
Res
iden
ce
Tim
e (m
s) 1.08 504.44 548.24 607.48
1.44 512.11 564.83 611.62
2.16 543.61 580.83 654.40
Table K-6: Mean specific wear rate (mm/N∙m) for samples tested for 150 m.
Wear rate
(x10-6 mm/N∙m)
Irradiance (kW/mm2)
15.72 20.43 26.72
Res
iden
ce
Tim
e (m
s) 1.08 571.13 644.14 668.15
1.44 725.16 586.13 630.14
2.16 616.14 620.14 574.13

XXXVIII
Table K-7: Mean corrosion rate nm/yr.
Corrosion Rate
(nm/yr)
Irradiance (kW/mm2)
15.72 20.43 26.72
Res
iden
ce
Tim
e (m
s) 1.08 239.42 188.35 86.618
1.44 106.89 165.88 289.39
2.16 441.31 101.09 202.45-
Table K-8: Mean contact angles (°) of unpolished samples.
Contact Angles
unpolished
(°)
Irradiance (kW/mm2)
15.72 20.43 26.72
Res
iden
ce
Tim
e (m
s) 1.08 58.29 32.19 27.94
1.44 40.43 32.24 38.11
2.16 24.09 33.93 61.24
Table K-9: Mean contact angles (°) of polished samples.
Contact Angles
polished
(°)
Irradiance (kW/mm2)
15.72 20.43 26.72
Res
iden
ce
Tim
e (m
s) 1.08 70.24 68.87 69.86
1.44 60.14 54.52 57.93
2.16 69.67 67.71 63.97

XXXIX
Table K-10: Mean cell attachment (%).
Cell Attachment
(%)
Irradiance (kW/mm2)
15.72 20.43 26.72
Res
iden
ce
Tim
e (m
s) 1.08 15.69 27.77 23.79
1.44 27.05 22.82 20.45
2.16 21.25 24.40 24.89
Table K-11: Mean cell numbers after 3 days.
Cell Numbers
Day 3
Irradiance (kW/mm2)
15.72 20.43 26.72
Res
iden
ce
Tim
e (m
s) 1.08 138.6E+3 106.7E+3 175.8E+3
1.44 127.3E+3 167.3E+3 148.5E+3
2.16 101.7E+3 151.4E+3 144.1E+3
Table K-12: Mean cell numbers after 7 days.
Cell Numbers
Day 7
Irradiance (kW/mm2)
15.72 20.43 26.72
Res
iden
ce
Tim
e (m
s) 1.08 199.4E+3 217.9E+3 256.9E+3
1.44 272.9E+3 202.2E+3 223.2E+3
2.16 222.0E+3 261.1E+3 221.0E+3
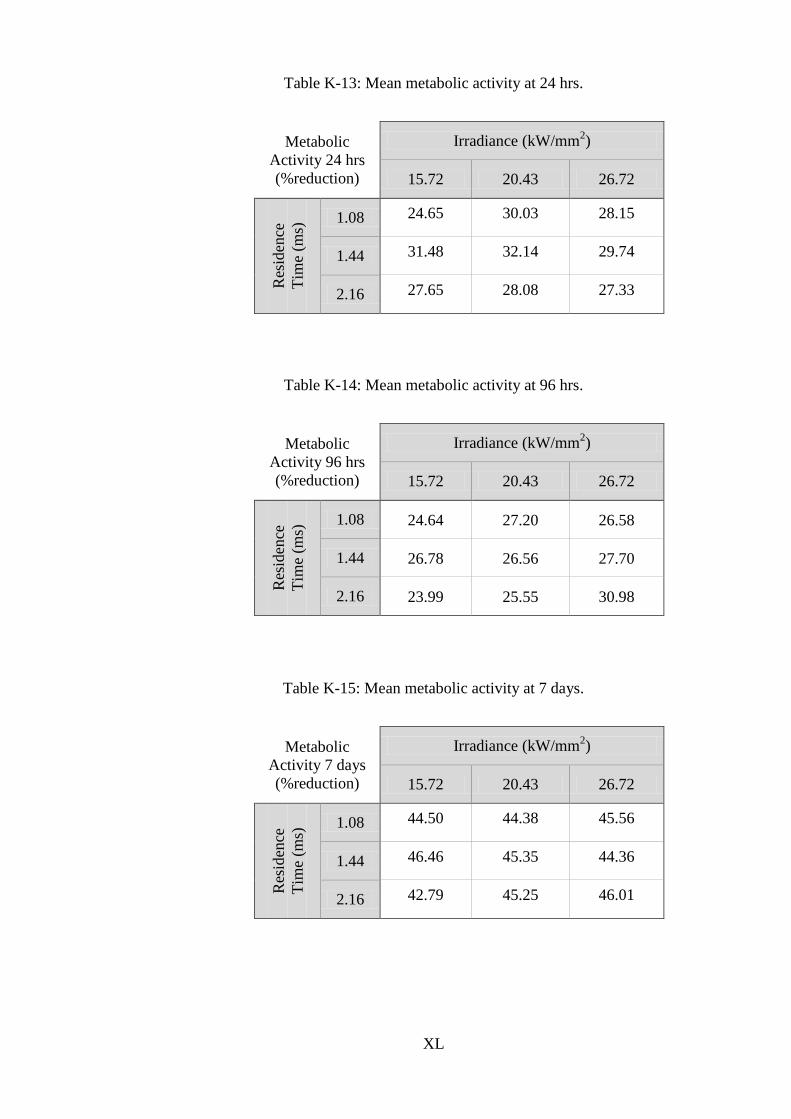
XL
Table K-13: Mean metabolic activity at 24 hrs.
Metabolic
Activity 24 hrs
(%reduction)
Irradiance (kW/mm2)
15.72 20.43 26.72
Res
iden
ce
Tim
e (m
s) 1.08 24.65 30.03 28.15
1.44 31.48 32.14 29.74
2.16 27.65 28.08 27.33
Table K-14: Mean metabolic activity at 96 hrs.
Metabolic
Activity 96 hrs
(%reduction)
Irradiance (kW/mm2)
15.72 20.43 26.72
Res
iden
ce
Tim
e (m
s) 1.08 24.64 27.20 26.58
1.44 26.78 26.56 27.70
2.16 23.99 25.55 30.98
Table K-15: Mean metabolic activity at 7 days.
Metabolic
Activity 7 days
(%reduction)
Irradiance (kW/mm2)
15.72 20.43 26.72
Res
iden
ce
Tim
e (m
s) 1.08 44.50 44.38 45.56
1.44 46.46 45.35 44.36
2.16 42.79 45.25 46.01